UNITED STATES
SECURITIES AND EXCHANGE COMMISSION
Washington, D.C. 20549
Form N-CSR
CERTIFIED SHAREHOLDER REPORT OF REGISTERED MANAGEMENT
INVESTMENT COMPANIES
Investment Company Act File Number 811-04550
THE MAINSTAY FUNDS
(Exact name of Registrant as specified in charter)
51 Madison Avenue, New York, NY 10010
(Address of principal executive offices) (Zip code)
J. Kevin Gao, Esq.
30 Hudson Street
Jersey City, New Jersey 07302
(Name and address of agent for service)
Registrant’s telephone number, including area code: (212) 576-7000
Date of fiscal year end: October 31
Date of reporting period: October 31, 2020
FORM N-CSR
| Item 1. | Reports to Stockholders. |
MainStay Candriam Emerging Markets Debt Fund
Message from the President and Annual Report
October 31, 2020
Beginning on January 1, 2021, paper copies of each MainStay Fund’s annual and semiannual shareholder reports will no longer be sent by mail, unless you specifically request paper copies of the reports from MainStay Funds or from your financial intermediary. Instead, the reports will be made available on the MainStay Funds’ website. You will be notified by mail and provided with a website address to access the report each time a new report is posted to the website.
If you already elected to receive shareholder reports electronically, you will not be affected by this change and you need not take any action. At any time, you may elect to receive reports and other communications from MainStay Funds electronically by calling toll-free 800-624-6782, by sending an e-mail to MainStayShareholderServices@nylim.com, or by contacting your financial intermediary.
You may elect to receive all future shareholder reports in paper form free of charge. If you hold shares of a MainStay Fund directly, you can inform MainStay Funds that you wish to receive paper copies of reports by calling toll-free 800-624-6782 or by sending an e-mail to MainStayShareholderServices@nylim.com. If you hold shares of a MainStay Fund through a financial intermediary, please contact the financial intermediary to make this election. Your election to receive reports in paper form will apply to all MainStay Funds in which you are invested and may apply to all funds held with your financial intermediary.
| | | | | | | | |
| Not FDIC/NCUA Insured | | Not a Deposit | | May Lose Value | | No Bank Guarantee | | Not Insured by Any Government Agency |

This page intentionally left blank
Message from the President
Despite historically high levels of volatility generated by the global coronavirus pandemic and a host of other geopolitical and economic uncertainties, most broad U.S. stock and bond markets gained ground during the 12-month reporting period ended October 31, 2020.
The reporting period began on an upswing, with markets rising on generally positive underlying economic trends and the announcement of a U.S.-China trade deal. However, in mid-February 2020, stock and bond indices began to dip as growing numbers of COVID-19 cases appeared in hotspots around the world. By early March, the disease reached pandemic proportions. As governments struggled to support overburdened health care systems by issuing “stay-at-home” orders and other restrictions on nonessential activity, global economic activity slowed, driving most stocks and bonds sharply lower.
The United States was hit particularly hard by the pandemic, with more reported COVID-19 cases and deaths than any other country in the world throughout the second half of the reporting period. As the pandemic deepened, the U.S. Federal Reserve (“Fed”) twice cut interest rates and announced unlimited quantitative easing. The federal government declared a national emergency, and Congress passed and the President signed a $2 trillion stimulus package. Markets responded positively to these measures, as well as to a gradual lessening of restrictions on nonessential businesses, hopes for additional stimulus and apparent progress in the development of a vaccine. By late August, the S&P 500® Index, a widely regarded benchmark of market performance, had not only regained all the ground it lost earlier in the reporting period, the Index had reached new record levels. However, a resurgence of coronavirus cases in many parts of the country and uncertainties related to the November 3, 2020, U.S. presidential election caused markets to falter as the reporting period drew to a close.
Nevertheless, for the reporting period as a whole, U.S. equity indices generally produced moderate gains. Returns proved strongest among large-cap, growth-oriented stocks, while small- and mid-cap issues lagged. Within the S&P 500® Index, the information technology and consumer discretionary sectors produced exceptionally strong gains, buoyed by strong corporate and consumer spending, while the health care sector outperformed by a smaller margin. Materials and consumer staples sectors generated positive returns, but lagged the S&P 500® Index. The industrials, utilities, communication services, financials, real estate and energy sectors ended the reporting period in negative territory, with the energy sector
suffering the steepest losses due to weak global demand. International equities declined sharply in February and March 2020 before recovering somewhat, but tended to lag their U.S. counterparts due to weaker underlying economic growth and somewhat less aggressive monetary and fiscal stimulus. Emerging-market equities tracked the performance of U.S. equity markets more closely, led by relatively strong returns in Asian markets, such as China and South Korea.
Fixed-income markets experienced an environment that tended to favor higher credit quality and longer duration securities. Corporate bonds followed the pattern of equities, with prices declining in March 2020 before subsequently recovering. Relatively speculative high-yield credit was hardest hit during the market sell-off in early 2020 and continued to underperform during the remainder of the reporting period. Similarly, among municipal bond issues, high-grade bonds outperformed, dipping briefly in mid-March before regaining the lost ground. Recognized safe havens, such as U.S. government bonds, attracted increased investment during the height of the market sell-off, driving yields lower and prices higher. As a result, long-term Treasury bonds delivered particularly strong gains for the reporting period as a whole. Emerging-market debt, on the other hand, underperformed most other bond types as investors sought to minimize currency and sovereign risks.
Although the ongoing pandemic continues to change the way that many of us work and live our lives, at New York Life Investments, we remain dedicated to providing you, as a MainStay investor, with products, information and services to help you to navigate today’s rapidly changing investment environment. By taking appropriate steps to minimize community spread of COVID-19 within our organization and despite the challenges posed by the coronavirus pandemic, we continue to innovate with you in mind, introducing new suites of Funds and providing continuous insights into ever-evolving markets and investment strategies. Our goal is to give you the tools you need to build a resilient portfolio in the face of uncertain times.
Sincerely,

Kirk C. Lehneis
President
The opinions expressed are as of the date of this report and are subject to change. There is no guarantee that any forecast made will come to pass. This material does not constitute investment advice and is not intended as an endorsement of any specific investment. Past performance is no guarantee of future results.
Not part of the Annual Report
Table of Contents
Investors should refer to the Fund’s Summary Prospectus and/or Prospectus and consider the Fund’s investment objectives, strategies, risks, charges and expenses carefully before investing. The Summary Prospectus and/or Prospectus contain this and other information about the Fund. You may obtain copies of the Fund’s Summary Prospectus, Prospectus and Statement of Additional Information free of charge, upon request, by calling toll-free 800-624-6782, by writing to NYLIFE Distributors LLC, Attn: MainStay Marketing Department, 30 Hudson Street, Jersey City, NJ 07302 or by sending an e-mail to MainStayShareholderServices@nylim.com. These documents are also available via the MainStay Funds’ website at newyorklifeinvestments.com. Please read the Summary Prospectus and/or Prospectus carefully before investing.
Investment and Performance Comparison1,2 (Unaudited)
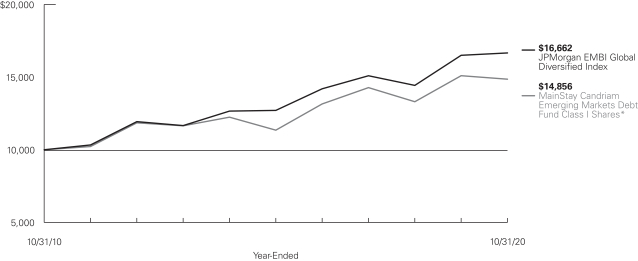
Performance data quoted represents past performance. Past performance is no guarantee of future results. Because of market volatility and other factors, current performance may be lower or higher than the figures shown. Investment return and principal value will fluctuate, and as a result, when shares are redeemed, they may be worth more or less than their original cost. The graph below depicts the historical performance of Class I shares* of the Fund. Performance will vary from class to class based on differences in class-specific expenses and sales charges. For performance information current to the most recent month-end, please call 800-624-6782 or visit newyorklifeinvestments.com.
Average Annual Total Returns for the Year-Ended October 31, 2020
| | | | | | | | | | | | | | | | | | | | | | | | |
| Class | | Sales Charge | | | | Inception
Date | | | One Year | | | Five Years | | | Ten Years | | | Gross
Expense
Ratio3 | |
| | | | | | | |
| Class A Shares | | Maximum 4.5% Initial Sales Charge | | With sales charges Excluding sales charges | |
| 6/1/1998
|
| |
| –6.22
–1.80 | %
| |
| 4.30
5.26 | %
| |
| 3.30
3.77 | %
| |
| 1.27
1.27 | %
|
| Investor Class Shares4 | | Maximum 4% Initial Sales Charge | | With sales charges Excluding sales charges | | | 2/28/2008 | | |
| –6.60
–2.19 |
| |
| 4.04
5.00 |
| |
| 3.10
3.57 |
| |
| 1.57
1.57 |
|
| Class B Shares5 | | Maximum 5% CDSC if Redeemed Within the First Six Years of Purchase | | With sales charges Excluding sales charges | | | 6/1/1998 | | |
| –7.59
–2.91 |
| |
| 3.88
4.22 |
| |
| 2.80
2.80 |
| |
| 2.32
2.32 |
|
| Class C Shares | | Maximum 1% CDSC if Redeemed Within One Year of Purchase | | With sales charges Excluding sales charges | | | 9/1/1998 | | |
| –3.74
–2.81 |
| |
| 4.24
4.24 |
| |
| 2.80
2.80 |
| |
| 2.32
2.32 |
|
| Class I Shares | | No Sales Charge | | | | | 8/31/2007 | | | | –1.59 | | | | 5.53 | | | | 4.04 | | | | 1.02 | |
| * | Previously, the chart presented the Fund’s annual returns for Class B shares. Class I shares are presented for consistency across the MainStay Fund complex. |
| 1. | The performance table and graph do not reflect the deduction of taxes that a shareholder would pay on distributions or Fund share redemptions. Total returns reflect maximum applicable sales charges as indicated in the table above, if any, changes in share price, and reinvestment of dividend and capital gain distributions. The graph assumes the initial investment amount shown above and reflects the deduction of all sales charges that would have applied for the period of investment. Performance figures may reflect certain fee waivers and/or expense limitations, without which total returns may have been lower. For more information on share classes and current fee waivers and/or expense limitations (if any), please refer to the Notes to Financial Statements. |
| 2. | The Fund replaced MacKay and modified its investment objective and principal investment strategies as of June 21, 2019. The performance in the bar chart and table prior to those dates reflects MacKay’s, investment objective and principal investment strategies. |
| 3. | The gross expense ratios presented reflect the Fund’s “Total Annual Fund Operating Expenses” from the most recent Prospectus and may differ from other expense ratios disclosed in this report. |
| 4. | Prior to June 30, 2020, the maximum initial sales charge for Investor Class shares was 4.5%, which is reflected in the average annual total return figures shown. |
| 5. | Class B shares are closed to all new purchases as well as additional investments by existing Class B shareholders. |
The footnotes on the next page are an integral part of the table and graph and should be carefully read in conjunction with them.
| | | | | | | | | | |
| Benchmark Performance | | One Year | | Five Years | | | Ten Years | |
| | | |
JPMorgan EMBI Global Diversified Index6 | | 0.98% | | | 5.57 | % | | | 5.24 | % |
Morningstar Emerging Markets Bond Category Average7 | | 0.53 | | | 4.77 | | | | 3.95 | |
| 6. | The JPMorgan EMBI Global Diversified Index is the Fund’s primary broad-based securities market index for comparison purposes. The JPMorgan EMBI Global Diversified Index is a market-capitalization weighted, total return index tracking the traded market for U.S. dollar-denominated Brady Bonds, Eurobonds, traded loans and local market debt instruments issued by sovereign and quasi-sovereign entities. Results assume reinvestment of all dividends and capital gains. An investment cannot be made directly in an index. |
| 7. | The Morningstar Emerging Markets Bond Category Average is representative of funds that invest more than 65% of their assets in foreign bonds from developing countries. The largest portion of the emerging-markets bond market comes from Latin America, followed by Eastern Europe. Africa, the Middle East, and Asia make up the rest. Results are based on average total returns of similar funds with all dividends and capital gain distributions reinvested. |
The footnotes on the preceding page are an integral part of the table and graph and should be carefully read in conjunction with them.
| | |
| 6 | | MainStay Candriam Emerging Markets Debt Fund |
Cost in Dollars of a $1,000 Investment in MainStay Candriam Emerging Markets Debt Fund (Unaudited)
The example below is intended to describe the fees and expenses borne by shareholders during the six-month period from May 1, 2020, to October 31, 2020, and the impact of those costs on your investment.
Example
As a shareholder of the Fund you incur two types of costs: (1) transaction costs, including exchange fees and sales charges (loads) on purchases (as applicable), and (2) ongoing costs, including management fees, distribution and/or service (12b-1) fees, and other Fund expenses (as applicable). This example is intended to help you understand your ongoing costs (in dollars) of investing in the Fund and to compare these costs with the ongoing costs of investing in other mutual funds. The example is based on an investment of $1,000 made at the beginning of the six-month period and held for the entire period from May 1, 2020, to October 31, 2020.
This example illustrates your Fund’s ongoing costs in two ways:
Actual Expenses
The second and third data columns in the table below provide information about actual account values and actual expenses. You may use the information in these columns, together with the amount you invested, to estimate the expenses that you paid during the six months ended October 31, 2020. Simply divide your account value by $1,000 (for example, an $8,600 account value divided by $1,000 = 8.6), then
multiply the result by the number under the heading entitled “Expenses Paid During Period” to estimate the expenses you paid on your account during this period.
Hypothetical Example for Comparison Purposes
The fourth and fifth data columns in the table below provide information about hypothetical account values and hypothetical expenses based on the Fund’s actual expense ratio and an assumed rate of return of 5% per year before expenses, which is not the Fund’s actual return. The hypothetical account values and expenses may not be used to estimate the actual ending account balances or expenses you paid for the six-month period shown. You may use this information to compare the ongoing costs of investing in the Fund with the ongoing costs of investing in other mutual funds. To do so, compare this 5% hypothetical example with the 5% hypothetical examples that appear in the shareholder reports of the other mutual funds.
Please note that the expenses shown in the table are meant to highlight your ongoing costs only and do not reflect any transactional costs, such as exchange fees or sales charges (loads). Therefore, the fourth and fifth data columns of the table are useful in comparing ongoing costs only and will not help you determine the relative total costs of owning different funds. In addition, if these transactional costs were included, your costs would have been higher.
| | | | | | | | | | | | | | | | | | | | | | |
| | | | | | | | | | | | | | | | | | |
| Share Class | | Beginning
Account
Value
5/1/20 | | | Ending Account
Value (Based
on Actual
Returns and
Expenses)
10/31/20 | | | Expenses
Paid
During
Period1 | | | Ending Account
Value (Based
on Hypothetical
5% Annualized
Return and
Actual Expenses)
10/31/20 | | | Expenses
Paid
During
Period1 | | | Net Expense
Ratio
During
Period2 |
| | | | | | |
| Class A Shares | | $ | 1,000.00 | | | $ | 1,154.30 | | | $ | 6.34 | | | $ | 1,019.25 | | | $ | 5.94 | | | 1.17% |
| | | | | | |
| Investor Class Shares | | $ | 1,000.00 | | | $ | 1,151.90 | | | $ | 8.06 | | | $ | 1,017.65 | | | $ | 7.56 | | | 1.49% |
| | | | | | |
| Class B Shares | | $ | 1,000.00 | | | $ | 1,147.40 | | | $ | 12.09 | | | $ | 1,013.88 | | | $ | 11.34 | | | 2.24% |
| | | | | | |
| Class C Shares | | $ | 1,000.00 | | | $ | 1,148.40 | | | $ | 12.10 | | | $ | 1,013.88 | | | $ | 11.34 | | | 2.24% |
| | | | | | |
| Class I Shares | | $ | 1,000.00 | | | $ | 1,155.70 | | | $ | 4.61 | | | $ | 1,020.86 | | | $ | 4.32 | | | 0.85% |
| 1. | Expenses are equal to the Fund’s annualized expense ratio of each class multiplied by the average account value over the period, divided by 366 and multiplied by 184 (to reflect the six-month period). The table above represents the actual expenses incurred during the six-month period. In addition to the fees and expenses which the Fund bears directly, it also indirectly bears a pro rata share of the fees and expenses of the underlying funds in which it invests. Such indirect expenses are not included in the above-reported expense figures. |
| 2. | Expenses are equal to the Fund’s annualized expense ratio to reflect the six-month period. |
Country Composition as of October 31, 2020 (Unaudited)
| | | | |
| |
| United States | | | 6.4 | % |
| |
| Indonesia | | | 5.0 | |
| |
| Mexico | | | 5.0 | |
| |
| Kazakhstan | | | 4.8 | |
| |
| Philippines | | | 4.7 | |
| |
| Dominican Republic | | | 4.5 | |
| |
| Romania | | | 4.1 | |
| |
| South Africa | | | 4.0 | |
| |
| Brazil | | | 3.9 | |
| |
| United Arab Emirates | | | 3.7 | |
| |
| Qatar | | | 3.1 | |
| |
| Colombia | | | 3.0 | |
| |
| Egypt | | | 2.9 | |
| |
| Chile | | | 2.7 | |
| |
| Panama | | | 2.6 | |
| |
| Croatia | | | 2.5 | |
| |
| Argentina | | | 2.4 | |
| |
| China | | | 2.2 | |
| |
| Uruguay | | | 2.2 | |
| |
| Hungary | | | 2.1 | |
| |
| Jordan | | | 2.1 | |
| |
| Turkey | | | 2.0 | |
| |
| Ghana | | | 1.8 | |
| |
| Kenya | | | 1.8 | |
| |
| Sri Lanka | | | 1.6 | |
| | | | |
| |
| Bahamas | | | 1.5 | % |
| |
| Canada | | | 1.2 | |
| |
| Ecuador | | | 1.2 | |
| |
| India | | | 1.2 | |
| |
| Peru | | | 1.0 | |
| |
| Costa Rica | | | 0.9 | |
| |
| Namibia | | | 0.9 | |
| |
| El Salvador | | | 0.8 | |
| |
| Ukraine | | | 0.8 | |
| |
| Azerbaijan | | | 0.6 | |
| |
| Jamaica | | | 0.6 | |
| |
| Angola | | | 0.5 | |
| |
| Cayman Islands | | | 0.5 | |
| |
| Iraq | | | 0.5 | |
| |
| Ivory Coast | | | 0.5 | |
| |
| Senegal | | | 0.5 | |
| |
| Venezuela | | | 0.5 | |
| |
| Belarus | | | 0.4 | |
| |
| Nigeria | | | 0.4 | |
| |
| Honduras | | | 0.3 | |
| |
| Tunisia | | | 0.3 | |
| |
| Tajikistan | | | 0.2 | |
| |
| Lebanon | | | 0.1 | |
| |
| Other Assets, Less Liabilities | | | 3.5 | |
| | | | |
| | | 100.0 | % |
| | | | |
See Portfolio of Investments beginning on page 11 for specific holdings within these categories. The Fund’s holdings are subject to change.
Top Ten Issuers Held as of October 31, 2020 (excluding short-term investments) (Unaudited)
| 1. | Philippine Government International Bond, 3.00%–3.75%, due 2/1/28–3/1/41 |
| 2. | Dominican Republic International Bond, 4.50%–6.85%, due 1/25/27–1/30/60 |
| 3. | KazMunayGas National Co. JSC, 3.50%–6.375%, due 4/19/27–10/24/48 |
| 4. | Romanian Government International Bond, 2.75%–6.125%, due 2/26/26–2/14/51 |
| 5. | Petroleos Mexicanos, 5.95%–7.69%, due 10/16/25–1/28/60 |
| 6. | Qatar Government International Bond, 3.75%–5.103%, due 4/16/30–3/14/49 |
| 7. | Pertamina Persero PT, 3.10%–5.625%, due 1/21/30–2/25/60 |
| 8. | Republic of South Africa Government International Bond, 4.85%–6.25%, due 4/14/26–9/30/49 |
| 9. | Colombia Government International Bond, 3.00%–6.125%, due 1/30/30–1/18/41 |
| 10. | Egypt Government International Bond, 5.25%–8.70%, due 10/6/25–3/1/49 |
| | |
| 8 | | MainStay Candriam Emerging Markets Debt Fund |
Portfolio Management Discussion and Analysis (Unaudited)
Questions answered by portfolio managers Diliana Deltcheva, CFA, Magda Branet, CFA, and Christopher Mey, CFA, of Candriam Luxembourg S.C.A., the Fund’s Subadvisor.
How did MainStay Candriam Emerging Markets Debt Fund perform relative to its benchmark and peer group during the 12 months ended October 31, 2020?
For the 12 months ended October 31, 2020, Class I shares of MainStay Candriam Emerging Markets Debt Fund returned –1.59%, underperforming the 0.98% return of the Fund’s primary benchmark, the JPMorgan EMBI Global Diversified Index. Over the same period, Class I shares underperformed the 0.53% return of the Morningstar Emerging Markets Bond Category Average.1
What factors affected the Fund’s relative performance during the reporting period?
The Fund underperformed the JPMorgan EMBI Global Diversified Index during the reporting period largely due to declines in investments during the first quarter of 2020, particularly in March at the height of the pandemic-related market sell-off. Approximately half of the Fund’s relative underperformance resulted from overweight exposure in Ecuador, which failed to make coupon payments on some of its bonds, and in Chile-based Latam Airlines, Latin America’s largest airline, which experienced material deterioration of its credit metrics amid a sharp oil price decline and travel restrictions. Ecuador finalized debt restructuring on $16.5 billion of Eurobond debt in August, offering an average recovery of around 55 cents on a dollar, while Latam Airlines entered a Chapter 11 bankruptcy process in May 2020. The remainder of the Fund’s underperformance was a result of underweight exposure to investment-grade rated credits in China, the Philippines, Russia and Saudi Arabia through some of the reporting period. Investment-grade credits generally rallied in line with defensive U.S. Treasury bonds.
During the reporting period, were there any liquidity events that materially impacted the Fund’s performance?
The global spread of the COVID-19 pandemic from February 2020 onward triggered a coincident global recession and led to a material decline in oil prices with unprecedented consequences for global debt markets. In particular, these circumstances led to a sharp rise in emerging-market debt risk premiums during the first quarter of 2020.
The combined pandemic and oil shocks had a material impact on liquidity and aggregate demand conditions for emerging-
market debt. A number of emerging-market countries lost access to public funding markets and experienced sharp deterioration in their external and fiscal positions. These conditions ultimately led six countries to default on their public debt: Argentina, Lebanon, Ecuador, Belize, Suriname and Zambia. Two of the defaults, those of Argentina and Ecuador, were cured after completion of debt restructurings in August and September.
Furthermore, the majority of emerging-market countries experienced broad-based deteriorations in creditworthiness, with rating agency downgrades running into record highs. Credit rating company Moody’s downgraded the ratings or outlooks of 65 out of the 108 sovereigns they covered, with 43 out of the 65 negative rating actions directly triggered by the pandemic outbreak. Constrained access to financing drove the majority of these downgrades, with lower growth or exposure to tourism, oil and other commodities impacting performance as well.
During the reporting period, how was the Fund’s performance materially affected by investments in derivatives?
The Fund held a long 10-year U.S. Treasury futures position between the end of March and June 2020. However, the Fund’s performance was not materially impacted by investments in derivatives.
What was the Fund’s duration2 strategy during the reporting period?
The Fund’s modified duration fluctuated by 0.9 years, in absolute terms, with the low of 7.72 years reached in May 2020 and the high of 8.89 years reached in August. The Fund’s relative duration position versus the JPMorgan EMBI Global Diversified Index ranged between 1.09 years (March 2020) and zero (May 2020). The Fund’s relative duration exposure remained driven by our views on the expected market for U.S. Treasury securities and the shape of the U.S. Treasury yield curve,3 as well as the availability of emerging-market issuer spread4 curve opportunities. The Fund’s duration strategy added approximately 71 basis points (“bps”) to relative performance over the reporting period. (A basis point is one one-hundredth of a percentage point.)
As of October 31, 2020, the Fund’s absolute and relative modified duration5 positions were 8.37 years and 0.49 years,
| 1. | See page 5 for other share class returns, which may be higher or lower than Class I share returns. See page 6 for more information on benchmark and peer group returns. |
| 2. | Duration is a measure of the price sensitivity of a fixed-income investment to changes in interest rates. Duration is expressed as a number of years and is considered a more accurate sensitivity gauge than average maturity. |
| 3. | The yield curve is a line that plots the yields of various securities of similar quality—typically U.S. Treasury issues—across a range of maturities. The U.S. Treasury yield curve serves as a benchmark for other debt and is used in economic forecasting. |
| 4. | The terms “spread” and “yield spread” may refer to the difference in yield between a security or type of security and comparable U.S. Treasury issues. The terms may also refer to the difference in yield between two specific securities or types of securities at a given time. |
| 5. | Modified duration is inversely related to the approximate percentage change in price for a given change in yield. |
respectively, with a neutral stance on the U.S. Treasury, investment-grade rated proxies, and a small positive bias in select, longer-dated, higher-yielding emerging-market issuers. This positioning reflects our belief that broadening and deepening of the recovery in 2021 may create headwinds for U.S. Treasury securities and lower-yielding emerging-market issuers. However, in the medium term, we expect that core rates will remain anchored by monetary policy accommodation and may remain low until recession and health risks are decisively cleared.
How was the Fund affected by shifting currency values during the reporting period?
The Fund was not affected by shifting currency values over the reporting period. Emerging market currencies added 3 bps to relative performance over the same period.
During the reporting period, which countries and/or sectors were the strongest positive contributors to the Fund’s relative performance and which countries and/or sectors were particularly weak?
The strongest positive contributors to the Fund’s performance relative to the JPMorgan EMBI Global Diversified Index included overweight exposure to debt from Lebanon, which entered debt default on March 6, 2020, and overweight exposure to higher-yielding investment-grade Eastern European credits from countries such as Kazakhstan and Romania, which benefited from the asset class recovery in the second half of the reporting period. (Contributions take weightings and total returns into account.) The Fund’s relatively high cash level in March 2020, when the asset class drawdown was generated, also contributed positively to performance.
What were some of the Fund’s largest purchases and sales during the reporting period?
The Fund’s largest purchases during the reporting period were concentrated in China, the Philippines and Uruguay. All
purchases were targeted at adding exposure to investment-grade rated credits, which typically outperform higher-yielding credits during recessionary periods. The Fund’s largest sales were concentrated in Angola, Ecuador and Latam Airlines (Chile/Brazil). The Fund divested its Latam Airlines position after the company launched Chapter 11 bankruptcy proceedings in May 2020.
How did the Fund’s country and/or sector weightings change during the reporting period?
As volatility increased during the reporting period, the Fund covered its underweight exposures to U.S. Treasury-sensitive, Asian and Latin American investment-grade rated credits from countries such as China, the Philippines and Uruguay. During the second half of the year, the Fund reduced its exposure to what we perceived as weaker sub-Saharan African credits from countries such as Angola, where we believe debt restructuring remains likely, and Ecuador, where general elections planned for February 2021 pose risks to policy continuity.
How was the Fund positioned at the end of the reporting period?
As of October 31, 2020, the Fund held overweight positions in investment-grade credits that we believed offered attractive fundamentals versus valuations characteristics and spread compression upside, including credits from Indonesia, Kazakhstan and Romania. As of the same date, the Fund held underweight exposure to investment-grade rated Russian and Saudi Arabian credits where we expect risk premiums to increase on not-yet-fully priced sanctions and geopolitical risks. The Fund’s current strategy aims to avoid further debt restructurings and defaults. We prefer to stay sidelined on countries where public-debt-to-GDP levels have spiked beyond sustainable levels and which may require some form of debt relief (Angola) or are facing election uncertainty (Ecuador).
The opinions expressed are those of the portfolio managers as of the date of this report and are subject to change. There is no guarantee that any forecasts will come to pass. This material does not constitute investment advice and is not intended as an endorsement of any specific investment.
| | |
| 10 | | MainStay Candriam Emerging Markets Debt Fund |
Portfolio of Investments October 31, 2020
| | | | | | | | |
| | | Principal
Amount | | | Value | |
Long-Term Bonds 90.1%† Corporate Bonds 23.2% | |
Azerbaijan 0.6% | | | | | | | | |
State Oil Co. of The Azerbaijan Republic
Series Reg S
6.95%, due 3/18/30 | | $ | 600,000 | | | $ | 710,616 | |
| | | | | | | | |
|
Brazil 1.9% | |
Braskem Netherlands Finance B.V. | | | | | | | | |
Series Reg S
4.50%, due 1/10/28 | | | 500,000 | | | | 480,260 | |
Series Reg S
4.50%, due 1/31/30 | | | 700,000 | | | | 646,485 | |
Rede D’or Finance S.A.R.L.
Series Reg S
4.50%, due 1/22/30 | | | 1,000,000 | | | | 983,750 | |
| | | | | | | | |
| | | | | | | 2,110,495 | |
| | | | | | | | |
Canada 1.2% | | | | | | | | |
State Grid Overseas Investment, Ltd.
Series Reg S
1.625%, due 8/5/30 | | | 1,350,000 | | | | 1,301,387 | |
| | | | | | | | |
| | |
Cayman Islands 0.5% | | | | | | | | |
Bioceanico Sovereign Certificate, Ltd.
Series Reg S
(zero coupon), due 6/5/34 | | | 843,648 | | | | 615,863 | |
| | | | | | | | |
|
Chile 2.1% | |
Corp. Nacional del Cobre de Chile | | | | | | | | |
Series Reg S
3.70%, due 1/30/50 | | | 300,000 | | | | 313,270 | |
Series Reg S
4.25%, due 7/17/42 | | | 1,300,000 | | | | 1,450,052 | |
Empresa de los Ferrocarriles del Estado
Series Reg S
3.068%, due 8/18/50 | | | 300,000 | | | | 279,000 | |
Sociedad Quimica y Minera de Chile S.A.
Series Reg S
4.25%, due 1/22/50 | | | 250,000 | | | | 275,000 | |
| | | | | | | | |
| | | | | | | 2,317,322 | |
| | | | | | | | |
China 1.0% | | | | | | | | |
CNPC Global Capital Co.
Series Reg S
2.00%, due 6/23/30 | | | 500,000 | | | | 496,310 | |
Sinopec Group Overseas Development 2018, Ltd. | | | | | | | | |
Series Reg S
2.70%, due 5/13/30 | | | 450,000 | | | | 468,288 | |
Series Reg S
3.35%, due 5/13/50 | | | 200,000 | | | | 213,956 | |
| | | | | | | | |
| | | | | | | 1,178,554 | |
| | | | | | | | |
| | | | | | | | |
| | | Principal
Amount | | | Value | |
Colombia 0.5% | | | | | | | | |
Ecopetrol S.A.
5.875%, due 5/28/45 | | $ | 500,000 | | | $ | 545,350 | |
| | | | | | | | |
| | |
Croatia 1.0% | | | | | | | | |
Hrvatska Elektroprivreda
Series Reg S
5.875%, due 10/23/22 | | | 1,000,000 | | | | 1,081,416 | |
| | | | | | | | |
| | |
India 0.3% | | | | | | | | |
Vedanta Resources, Ltd.
6.125%, due 8/9/24 (a) | | | 500,000 | | | | 291,403 | |
| | | | | | | | |
|
Indonesia 3.1% | |
Pertamina Persero PT | | | | | | | | |
Series Reg S
3.10%, due 1/21/30 | | | 500,000 | | | | 515,076 | |
Series Reg S
3.10%, due 8/27/30 | | | 500,000 | | | | 516,819 | |
Series Reg S
4.15%, due 2/25/60 | | | 400,000 | | | | 395,010 | |
Series Reg S
4.175%, due 1/21/50 (b) | | | 600,000 | | | | 598,959 | |
5.625%, due 5/20/43 (a) | | | 1,200,000 | | | | 1,404,000 | |
| | | | | | | | |
| | | | | | | 3,429,864 | |
| | | | | | | | |
Kazakhstan 4.8% | |
KazMunayGas National Co. JSC | | | | | | | | |
Series Reg S
3.50%, due 4/14/33 | | | 1,600,000 | | | | 1,649,926 | |
Series Reg S
4.75%, due 4/19/27 | | | 1,000,000 | | | | 1,126,260 | |
Series Reg S
5.75%, due 4/19/47 | | | 1,000,000 | | | | 1,239,908 | |
Series Reg S
6.375%, due 10/24/48 | | | 600,000 | | | | 797,134 | |
Tengizchevroil Finance Co. International, Ltd.
Series Reg S
2.625%, due 8/15/25 | | | 500,000 | | | | 501,325 | |
| | | | | | | | |
| | | | | | | 5,314,553 | |
| | | | | | | | |
Mexico 5.0% | | | | | | | | |
Cemex S.A.B. de C.V.
Series Reg S
5.20%, due 9/17/30 | | | 600,000 | | | | 633,834 | |
Industrias Penoles S.A.B. de C.V.
Series Reg S
4.75%, due 8/6/50 | | | 700,000 | | | | 735,875 | |
Petroleos Mexicanos | | | | | | | | |
Series Reg S
5.95%, due 1/28/31 | | | 500,000 | | | | 418,500 | |
6.50%, due 3/13/27 | | | 1,000,000 | | | | 928,750 | |
| | | | | | |
The notes to the financial statements are an integral part of,
and should be read in conjunction with, the financial statements. | | | | | 11 | |
Portfolio of Investments October 31, 2020 (continued)
| | | | | | | | |
| | | Principal
Amount | | | Value | |
| Corporate Bonds (continued) | |
Mexico (continued) | | | | | | | | |
Petroleos Mexicanos (continued) | | | | | | | | |
6.75%, due 9/21/47 | | $ | 500,000 | | | $ | 388,145 | |
6.84%, due 1/23/30 | | | 800,000 | | | | 715,200 | |
Series Reg S
6.875%, due 10/16/25 | | | 600,000 | | | | 593,100 | |
6.95%, due 1/28/60 | | | 1,000,000 | | | | 782,000 | |
7.69%, due 1/23/50 | | | 500,000 | | | | 415,465 | |
| | | | | | | | |
| | | | | | | 5,610,869 | |
| | | | | | | | |
Panama 0.3% | | | | | | | | |
Banco Nacional de Panama
Series Reg S
2.50%, due 8/11/30 | | | 300,000 | | | | 298,062 | |
| | | | | | | | |
| | |
United Arab Emirates 0.7% | | | | | | | | |
MDGH-GMTN B.V.
Series Reg S
3.95%, due 5/21/50 | | | 700,000 | | | | 804,706 | |
| | | | | | | | |
|
Venezuela 0.2% | |
Petroleos de Venezuela S.A. (c)(d)(e) | | | | | | | | |
Series Reg S
5.375%, due 4/12/27 | | | 3,000,000 | | | | 102,000 | |
Series Reg S
6.00%, due 5/16/24 | | | 2,500,000 | | | | 90,000 | |
Series Reg S
6.00%, due 11/15/26 | | | 2,500,000 | | | | 85,000 | |
| | | | | | | | |
| | | | | | | 277,000 | |
| | | | | | | | |
Total Corporate Bonds
(Cost $28,636,092) | | | | | | | 25,887,460 | |
| | | | | | | | |
|
| Foreign Government Bonds 66.9% | |
Angola 0.5% | |
Angolan Government International Bond | | | | | | | | |
Series Reg S
9.125%, due 11/26/49 | | | 250,000 | | | | 189,852 | |
Series Reg S
9.375%, due 5/8/48 | | | 500,000 | | | | 381,900 | |
| | | | | | | | |
| | | | | | | 571,752 | |
| | | | | | | | |
Argentina 2.4% | |
Argentine Republic Government International Bond | | | | | | | | |
0.125%, due 7/9/30 (f) | | | 513,757 | | | | 188,549 | |
0.125%, due 7/9/35 (f) | | | 3,366,242 | | | | 1,100,761 | |
1.00%, due 7/9/29 | | | 233,373 | | | | 95,683 | |
Provincia de Buenos Aires
7.875%, due 6/15/27 (a) | | | 4,000,000 | | | | 1,310,000 | |
| | | | | | | | |
| | | | | | | 2,694,993 | |
| | | | | | | | |
| | | | | | | | |
| | | Principal
Amount | | | Value | |
Bahamas 1.5% | | | | | | | | |
Bahamas Government International Bond
Series Reg S
6.00%, due 11/21/28 | | $ | 2,000,000 | | | $ | 1,730,000 | |
| | | | | | | | |
|
Belarus 0.4% | |
Republic of Belarus International Bond | | | | | | | | |
7.625%, due 6/29/27 (a) | | | 200,000 | | | | 198,140 | |
Series Reg S
7.625%, due 6/29/27 | | | 200,000 | | | | 198,140 | |
| | | | | | | | |
| | | | | | | 396,280 | |
| | | | | | | | |
Brazil 2.0% | |
Brazilian Government International Bond | | | | | | | | |
2.875%, due 6/6/25 | | | 200,000 | | | | 202,302 | |
3.875%, due 6/12/30 | | | 1,000,000 | | | | 1,012,500 | |
4.75%, due 1/14/50 | | | 1,000,000 | | | | 980,000 | |
| | | | | | | | |
| | | | | | | 2,194,802 | |
| | | | | | | | |
Chile 0.6% | | | | | | | | |
Chile Government International Bond
2.45%, due 1/31/31 | | | 600,000 | | | | 623,250 | |
| | | | | | | | |
|
China 1.2% | |
China Government International Bond | | | | | | | | |
Series Reg S
1.20%, due 10/21/30 | | | 200,000 | | | | 197,578 | |
Series Reg S
2.25%, due 10/21/50 | | | 550,000 | | | | 533,550 | |
Series Reg S
3.50%, due 10/19/28 | | | 500,000 | | | | 581,850 | |
| | | | | | | | |
| | | | | | | 1,312,978 | |
| | | | | | | | |
Colombia 2.5% | |
Colombia Government International Bond | | | | | | | | |
3.00%, due 1/30/30 | | | 1,000,000 | | | | 1,020,000 | |
3.125%, due 4/15/31 | | | 500,000 | | | | 513,250 | |
6.125%, due 1/18/41 | | | 1,000,000 | | | | 1,290,500 | |
| | | | | | | | |
| | | | | | | 2,823,750 | |
| | | | | | | | |
Costa Rica 0.9% | | | | | | | | |
Costa Rica Government International Bond
Series Reg S
7.00%, due 4/4/44 | | | 1,300,000 | | | | 1,017,250 | |
| | | | | | | | |
| | |
Croatia 1.5% | | | | | | | | |
Croatia Government International Bond,
Series Reg S
6.00%, due 1/26/24 | | | 1,500,000 | | | | 1,728,165 | |
| | | | | | | | |
|
Dominican Republic 4.5% | |
Dominican Republic International Bond | | | | | | | | |
Series Reg S
4.50%, due 1/30/30 | | | 600,000 | | | | 604,506 | |
| | | | |
| 12 | | MainStay Candriam Emerging Markets Debt Fund | | The notes to the financial statements are an integral part of,
and should be read in conjunction with, the financial statements. |
| | | | | | | | |
| | | Principal
Amount | | | Value | |
| Foreign Government Bonds (continued) | |
Dominican Republic (continued) | |
Dominican Republic International Bond (continued) | | | | | | | | |
Series Reg S
4.875%, due 9/23/32 | | $ | 600,000 | | | $ | 609,006 | |
Series Reg S
5.875%, due 1/30/60 | | | 800,000 | | | | 764,000 | |
Series Reg S
5.95%, due 1/25/27 | | | 2,250,000 | | | | 2,452,522 | |
Series Reg S
6.85%, due 1/27/45 | | | 500,000 | | | | 535,650 | |
| | | | | | | | |
| | | | | | | 4,965,684 | |
| | | | | | | | |
Ecuador 1.2% | |
Ecuador Government International Bond | | | | | | | | |
Series Reg S
(zero coupon), due 7/31/30 | | | 208,496 | | | | 94,868 | |
Series Reg S
0.50%, due 7/31/35 (f) | | | 1,600,000 | | | | 874,000 | |
Series Reg S
0.50%, due 7/31/40 (f) | | | 862,600 | | | | 426,995 | |
| | | | | | | | |
| | | | | | | 1,395,863 | |
| | | | | | | | |
Egypt 2.9% | |
Egypt Government International Bond | | | | | | | | |
Series Reg S
5.25%, due 10/6/25 | | | 650,000 | | | | 645,255 | |
Series Reg S
6.875%, due 4/30/40 | | | 1,700,000 | | | | 1,583,125 | |
Series Reg S
8.70%, due 3/1/49 | | | 1,000,000 | | | | 1,006,500 | |
| | | | | | | | |
| | | | | | | 3,234,880 | |
| | | | | | | | |
El Salvador 0.8% | |
El Salvador Government International Bond | | | | | | | | |
Series Reg S
5.875%, due 1/30/25 | | | 89,000 | | | | 73,114 | |
Series Reg S
6.375%, due 1/18/27 (b) | | | 90,000 | | | | 73,036 | |
Series Reg S
7.625%, due 2/1/41 | | | 1,000,000 | | | | 763,510 | |
| | | | | | | | |
| | | | | | | 909,660 | |
| | | | | | | | |
Ghana 1.8% | |
Ghana Government International Bond | | | | | | | | |
Series Reg S
7.875%, due 2/11/35 | | | 1,000,000 | | | | 886,250 | |
Series Reg S
8.627%, due 6/16/49 | | | 1,000,000 | | | | 877,500 | |
Series Reg S
8.95%, due 3/26/51 | | | 250,000 | | | | 224,150 | |
| | | | | | | | |
| | | | | | | 1,987,900 | |
| | | | | | | | |
| | | | | | | | |
| | | Principal
Amount | | | Value | |
Honduras 0.3% | | | | | | | | |
Honduras Government International Bond
Series Reg S
5.625%, due 6/24/30 | | $ | 350,000 | | | $ | 385,875 | |
| | | | | | | | |
| | |
Hungary 2.1% | | | | | | | | |
Hungary Government International Bond
5.375%, due 3/25/24 | | | 2,000,000 | | | | 2,292,580 | |
| | | | | | | | |
| | |
India 0.9% | | | | | | | | |
Export-Import Bank of India
Series Reg S
3.375%, due 8/5/26 | | | 1,000,000 | | | | 1,054,340 | |
| | | | | | | | |
|
Indonesia 1.9% | |
Indonesia Government International Bond | | | | | | | | |
3.85%, due 10/15/30 | | | 550,000 | | | | 626,719 | |
5.125%, due 1/15/45 (a) | | | 1,000,000 | | | | 1,254,113 | |
Perusahaan Penerbit SBSN Indonesia III
Series Reg S
3.80%, due 6/23/50 | | | 200,000 | | | | 212,096 | |
| | | | | | | | |
| | | | | | | 2,092,928 | |
| | | | | | | | |
Iraq 0.5% | | | | | | | | |
Iraq International Bond
Series Reg S
6.752%, due 3/9/23 | | | 600,000 | | | | 558,000 | |
| | | | | | | | |
| | |
Ivory Coast 0.5% | | | | | | | | |
Ivory Coast Government International Bond
Series Reg S
5.75%, due 12/31/32 (f) | | | 539,500 | | | | 526,741 | |
| | | | | | | | |
| | |
Jamaica 0.6% | | | | | | | | |
Jamaica Government International Bond
7.875%, due 7/28/45 | | | 500,000 | | | | 651,250 | |
| | | | | | | | |
|
Jordan 2.1% | |
Jordan Government International Bond | | | | | | | | |
Series Reg S
4.95%, due 7/7/25 | | | 1,150,000 | | | | 1,169,134 | |
Series Reg S
5.85%, due 7/7/30 | | | 1,150,000 | | | | 1,157,284 | |
| | | | | | | | |
| | | | | | | 2,326,418 | |
| | | | | | | | |
Kenya 1.8% | |
Kenya Government International Bond | | | | | | | | |
7.25%, due 2/28/28 (a) | | | 200,000 | | | | 209,047 | |
Series Reg S
8.00%, due 5/22/32 | | | 1,500,000 | | | | 1,573,680 | |
Series Reg S
8.25%, due 2/28/48 | | | 200,000 | | | | 204,190 | |
| | | | | | | | |
| | | | | | | 1,986,917 | |
| | | | | | | | |
| | | | | | |
The notes to the financial statements are an integral part of,
and should be read in conjunction with, the financial statements. | | | | | 13 | |
Portfolio of Investments October 31, 2020 (continued)
| | | | | | | | |
| | | Principal
Amount | | | Value | |
| Foreign Government Bonds (continued) | |
Lebanon 0.1% | | | | | | | | |
Lebanon Government International Bond
Series Reg S
6.85%, due 3/23/27 (d)(e) | | $ | 500,000 | | | $ | 70,596 | |
| | | | | | | | |
| | |
Namibia 0.9% | | | | | | | | |
Namibia International Bonds
Series Reg S
5.25%, due 10/29/25 | | | 1,000,000 | | | | 1,011,470 | |
| | | | | | | | |
| | |
Nigeria 0.4% | | | | | | | | |
Nigeria Government International Bond
6.50%, due 11/28/27 (a) | | | 500,000 | | | | 484,906 | |
| | | | | | | | |
|
Panama 2.3% | |
Panama Government International Bond | | | | | | | | |
2.252%, due 9/29/32 | | | 1,000,000 | | | | 1,017,000 | |
3.87%, due 7/23/60 | | | 1,000,000 | | | | 1,126,260 | |
4.50%, due 4/1/56 | | | 300,000 | | | | 369,000 | |
| | | | | | | | |
| | | | | | | 2,512,260 | |
| | | | | | | | |
Peru 1.0% | | | | | | | | |
Peruvian Government International Bond
2.783%, due 1/23/31 | | | 1,000,000 | | | | 1,081,000 | |
| | | | | | | | |
|
Philippines 4.7% | |
Philippine Government International Bond | | | | | | | | |
3.00%, due 2/1/28 | | | 2,000,000 | | | | 2,193,300 | |
3.70%, due 3/1/41 | | | 600,000 | | | | 686,694 | |
3.75%, due 1/14/29 | | | 2,000,000 | | | | 2,315,060 | |
| | | | | | | | |
| | | | | | | 5,195,054 | |
| | | | | | | | |
Qatar 3.1% | |
Qatar Government International Bond | | | | | | | | |
Series Reg S
3.75%, due 4/16/30 | | | 700,000 | | | | 812,694 | |
Series Reg S
4.817%, due 3/14/49 | | | 1,200,000 | | | | 1,597,980 | |
Series Reg S
5.103%, due 4/23/48 | | | 800,000 | | | | 1,102,912 | |
| | | | | | | | |
| | | | | | | 3,513,586 | |
| | | | | | | | |
Romania 4.1% | |
Romanian Government International Bond | | | | | | | | |
Series Reg S
2.75%, due 2/26/26 | | EUR | 750,000 | | | | 943,978 | |
Series Reg S
3.00%, due 2/14/31 | | $ | 1,210,000 | | | | 1,252,970 | |
Series Reg S
3.375%, due 1/28/50 | | EUR | 180,000 | | | | 217,709 | |
Series Reg S
3.624%, due 5/26/30 (b) | | | 400,000 | | | | 534,062 | |
| | | | | | | | |
| | | Principal
Amount | | | Value | |
Romania (continued) | |
Romanian Government International Bond (continued) | | | | | | | | |
Series Reg S
4.00%, due 2/14/51 | | $ | 770,000 | | | $ | 784,448 | |
Series Reg S
5.125%, due 6/15/48 | | | 500,000 | | | | 602,118 | |
Series Reg S
6.125%, due 1/22/44 | | | 190,000 | | | | 255,594 | |
| | | | | | | | |
| | | | | | | 4,590,879 | |
| | | | | | | | |
Senegal 0.5% | | | | | | | | |
Senegal Government International Bond
Series Reg S
6.25%, due 7/30/24 | | | 500,000 | | | | 526,150 | |
| | | | | | | | |
| | |
South Africa 4.0% | | | | | | | | |
Republic of South Africa Government Bond
8.00%, due 1/31/30 | | ZAR | 18,000,000 | | | | 1,017,116 | |
Republic of South Africa Government International Bond | | | | | | | | |
4.85%, due 9/30/29 | | $ | 500,000 | | | | 495,775 | |
4.875%, due 4/14/26 | | | 1,000,000 | | | | 1,036,300 | |
5.75%, due 9/30/49 | | | 1,000,000 | | | | 900,580 | |
6.25%, due 3/8/41 | | | 1,000,000 | | | | 985,080 | |
| | | | | | | | |
| | | | | | | 4,434,851 | |
| | | | | | | | |
Sri Lanka 1.6% | |
Sri Lanka Government International Bond | | | | | | | | |
Series Reg S
6.20%, due 5/11/27 | | | 200,000 | | | | 105,000 | |
Series Reg S
6.75%, due 4/18/28 | | | 800,000 | | | | 420,000 | |
Series Reg S
6.85%, due 11/3/25 | | | 500,000 | | | | 272,469 | |
Series Reg S
7.55%, due 3/28/30 | | | 1,290,000 | | | | 683,585 | |
Series Reg S
7.85%, due 3/14/29 | | | 500,000 | | | | 267,500 | |
| | | | | | | | |
| | | | | | | 1,748,554 | |
| | | | | | | | |
Tajikistan 0.2% | | | | | | | | |
Republic of Tajikistan International Bond
Series Reg S
7.125%, due 9/14/27 | | | 300,000 | | | | 224,784 | |
| | | | | | | | |
| | |
Tunisia 0.3% | | | | | | | | |
Banque Centrale de Tunisie International Bond
Series Reg S
5.75%, due 1/30/25 | | | 400,000 | | | | 336,842 | |
| | | | | | | | |
| | | | |
| 14 | | MainStay Candriam Emerging Markets Debt Fund | | The notes to the financial statements are an integral part of,
and should be read in conjunction with, the financial statements. |
| | | | | | | | |
| | | Principal
Amount | | | Value | |
| Foreign Government Bonds (continued) | |
Turkey 2.0% | |
Turkey Government International Bond | | | | | | | | |
5.25%, due 3/13/30 | | $ | 600,000 | | | $ | 522,000 | |
5.75%, due 5/11/47 | | | 500,000 | | | | 386,960 | |
6.875%, due 3/17/36 | | | 1,500,000 | | | | 1,376,250 | |
| | | | | | | | |
| | | | | | | 2,285,210 | |
| | | | | | | | |
Ukraine 0.8% | | | | | | | | |
Ukraine Government International Bond
Series Reg S
(zero coupon), due 5/31/40 (g) | | | 1,000,000 | | | | 863,760 | |
| | | | | | | | |
| | |
United Arab Emirates 3.0% | | | | | | | | |
Abu Dhabi Government International Bond
Series Reg S
3.125%, due 9/30/49 | | | 400,000 | | | | 421,400 | |
Dubai DOF Sukuk, Ltd.
Series Reg S
2.763%, due 9/9/30 | | | 900,000 | | | | 899,111 | |
Finance Department Government of Sharjah
Series Reg S
4.00%, due 7/28/50 | | | 800,000 | | | | 796,032 | |
Sharjah Sukuk Program, Ltd. | | | | | | | | |
Series Reg S
2.942%, due 6/10/27 | | | 650,000 | | | | 669,305 | |
Series Reg S
3.234%, due 10/23/29 | | | 550,000 | | | | 570,625 | |
| | | | | | | | |
| | | | | | | 3,356,473 | |
| | | | | | | | |
Uruguay 2.2% | |
Uruguay Government International Bond | | | | | | | | |
5.10%, due 6/18/50 | | | 700,000 | | | | 935,207 | |
7.625%, due 3/21/36 | | | 1,000,000 | | | | 1,557,510 | |
| | | | | | | | |
| | | | | | | 2,492,717 | |
| | | | | | | | |
Venezuela 0.3% | | | | | | | | |
Bollivarian Republic of Venezuela
Series Reg S
9.25%, due 5/7/28 (c)(d)(e) | | | 4,095,000 | | | | 374,693 | |
| | | | | | | | |
Total Foreign Government Bonds
(Cost $81,071,339) | | | | | | | 74,566,041 | |
| | | | | | | | |
Total Long-Term Bonds
(Cost $109,707,431) | | | | | | | 100,453,501 | |
| | | | | | | | |
| | | | | | | | |
| | |
Shares | | | Value | |
| Short-Term Investments 6.4% | | | | | | | | |
Affiliated Investment Company 5.2% | | | | | | | | |
MainStay U.S. Government Liquidity Fund, 0.02% (h) | | | 5,821,447 | | | $ | 5,821,447 | |
| | | | | | | | |
| | |
Unaffiliated Investment Company 1.2% | | | | | | | | |
State Street Navigator Securities Lending Government Money Market Portfolio, 0.09% (h)(i) | | | 1,346,253 | | | | 1,346,253 | |
| | | | | | | | |
Total Short-Term Investments
(Cost $7,167,700) | | | | | | | 7,167,700 | |
| | | | | | | | |
Total Investments
(Cost $116,875,131) | | | 96.5 | % | | | 107,621,201 | |
Other Assets, Less Liabilities | | | 3.5 | | | | 3,894,985 | |
Net Assets | | | 100.0 | % | | $ | 111,516,186 | |
| † | Percentages indicated are based on Fund net assets. |
| (a) | May be sold to institutional investors only under Rule 144A or securities offered pursuant to Section 4(a)(2) of the Securities Act of 1933, as amended. |
| (b) | All or a portion of this security was held on loan. As of October 31, 2020, the aggregate market value of securities on loan was $1,379,282. The Fund received cash collateral with a value of $1,346,253 (See Note 2(L)). |
| (c) | Illiquid security—As of October 31, 2020, the total market value of these securities deemed illiquid under procedures approved by the Board of Trustees was $651,693, which represented 0.6% of the Fund’s net assets. (Unaudited) |
| (d) | Issue in non-accrual status. |
| (f) | Step coupon—Rate shown was the rate in effect as of October 31, 2020. |
| (g) | Coupon rate may change based on changes of the underlying collateral or prepayments of principal. Rate shown was the rate in effect as of October 31, 2020. |
| (h) | Current yield as of October 31, 2020. |
| (i) | Represents a security purchased with cash collateral received for securities on loan. |
| | | | | | |
The notes to the financial statements are an integral part of,
and should be read in conjunction with, the financial statements. | | | | | 15 | |
Portfolio of Investments October 31, 2020 (continued)
Foreign Currency Forward Contracts
As of October 31, 2020, the Fund held the following foreign currency forward contracts1:
| | | | | | | | | | | | | | | | | | | | | | |
Currency Purchased | | | Currency Sold | | | Counterparty | | Settlement
Date | | Unrealized
Appreciation
(Depreciation) | |
| USD | | | 2,604,655 | | | EUR | | | 2,200,000 | | | JPMorgan Chase Bank N.A. | | 11/18/20 | | | | | | $ | 41,577 | |
| ZAR | | | 10,000,000 | | | USD | | | 588,989 | | | JPMorgan Chase Bank N.A. | | 11/18/20 | | | | | | | 24,430 | |
| | | | | | | | | | | | | | | | | | | | | | |
| Total unrealized Appreciation | | | | | | | | | | | | 66,007 | |
| | | | | | | | | | | | | | | | | | | | | | |
| USD | | | 1,620,598 | | | ZAR | | | 27,000,000 | | | JPMorgan Chase Bank N.A. | | 11/18/20 | | | | | | $ | (35,633 | ) |
| | | | | | | | | | | | | | | | | | | | | | |
| Total unrealized Depreciation | | | | | | | | | | | | (35,633 | ) |
| | | | | | | | | | | | | | | | | | | | | | |
| Net unrealized Appreciation | | | | | | | | | | | $ | 30,374 | |
| | | | | | | | | | | | | | | | | | | | | | |
| 1. | Foreign Currency Forward Contracts are subject to limitations such that they cannot be “sold or repurchased,” although the Fund would be able to exit the transaction through other means, such as through the execution of an offsetting transaction. |
The following abbreviations are used in the preceding pages:
EUR—Euro
ZAR—South African Rand
USD—United States Dollar
The following is a summary of the fair valuations according to the inputs used as of October 31, 2020, for valuing the Fund’s assets and liabilities:
| | | | | | | | | | | | | | | | |
Description | | Quoted
Prices in
Active
Markets for
Identical
Assets
(Level 1) | | | Significant
Other
Observable
Inputs
(Level 2) | | | Significant
Unobservable
Inputs
(Level 3) | | | Total | |
| | | | |
Asset Valuation Inputs | | | | | | | | | | | | | | | | |
| Investments in Securities (a) | | | | | | | | | | | | | | | | |
| Long-Term Bonds | | | | | | | | | | | | | | | | |
Corporate Bonds | | $ | — | | | $ | 25,887,460 | | | $ | — | | | $ | 25,887,460 | |
Foreign Government Bonds | | | — | | | | 74,566,041 | | | | — | | | | 74,566,041 | |
| | | | | | | | | | | | | | | | |
| Total Long-Term Bonds | | | — | | | | 100,453,501 | | | | — | | | | 100,453,501 | |
| | | | | | | | | | | | | | | | |
| Short-Term Investments | | | | | | | | | | | | | | | | |
Affiliated Investment Company | | | 5,821,447 | | | | — | | | | — | | | | 5,821,447 | |
Unaffiliated Investment Company | | | 1,346,253 | | | | — | | | | — | | | | 1,346,253 | |
| | | | | | | | | | | | | | | | |
| Total Short-Term Investments | | | 7,167,700 | | | | — | | | | — | | | | 7,167,700 | |
| | | | | | | | | | | | | | | | |
| Total Investments in Securities | | | 7,167,700 | | | | 100,453,501 | | | | — | | | | 107,621,201 | |
| | | | | | | | | | | | | | | | |
| Other Financial Instruments | | | | | | | | | | | | | | | | |
Foreign Currency Forward Contracts (b) | | | — | | | | 66,007 | | | | — | | | | 66,007 | |
| | | | | | | | | | | | | | | | |
| Total Investments in Securities and Other Financial Instruments | | $ | 7,167,700 | | | $ | 100,519,508 | | | $ | — | | | $ | 107,687,208 | |
| | | | | | | | | | | | | | | | |
| | | | |
Liability Valuation Inputs | | | | | | | | | | | | | | | | |
| Other Financial Instruments | | | | | | | | | | | | | | | | |
Foreign Currency Forward Contracts (b) | | $ | — | | | $ | (35,633 | ) | | $ | — | | | $ | (35,633 | ) |
| | | | | | | | | | | | | | | | |
| (a) | For a complete listing of investments and their industries, see the Portfolio of Investments. |
| (b) | The value listed for these securities reflects unrealized appreciation (depreciation) as shown on the Portfolio of Investments. |
| | | | |
| 16 | | MainStay Candriam Emerging Markets Debt Fund | | The notes to the financial statements are an integral part of,
and should be read in conjunction with, the financial statements. |
Statement of Assets and Liabilities as of October 31, 2020
| | | | |
| Assets | | | | |
Investment in unaffiliated securities, at value
(identified cost $111,053,684) including securities on loan of $1,379,282 | | $ | 101,799,754 | |
Investment in affiliated investment company, at value (identified cost $5,821,447) | | | 5,821,447 | |
Cash at broker | | | 1,414,610 | |
Cash denominated in foreign currencies
(identified cost $1,067,506) | | | 1,055,586 | |
Receivables: | | | | |
Investment securities sold | | | 2,141,866 | |
Dividends and interest | | | 1,490,111 | |
Fund shares sold | | | 214,515 | |
Securities lending | | | 420 | |
Unrealized appreciation on foreign currency forward contracts | | | 66,007 | |
Other assets | | | 37,901 | |
| | | | |
Total assets | | | 114,042,217 | |
| | | | |
| |
| Liabilities | | | | |
Cash collateral received for securities on loan | | | 1,346,253 | |
Payables: | | | | |
Investment securities purchased | | | 571,614 | |
Fund shares redeemed | | | 391,746 | |
Manager (See Note 3) | | | 47,533 | |
Transfer agent (See Note 3) | | | 37,998 | |
NYLIFE Distributors (See Note 3) | | | 27,990 | |
Professional fees | | | 21,645 | |
Shareholder communication | | | 20,236 | |
Custodian | | | 4,849 | |
Trustees | | | 152 | |
Accrued expenses | | | 2,327 | |
Unrealized depreciation on foreign currency forward contracts | | | 35,633 | |
Dividend payable | | | 18,055 | |
| | | | |
Total liabilities | | | 2,526,031 | |
| | | | |
Net assets | | $ | 111,516,186 | |
| | | | |
| |
| Composition of Net Assets | | | | |
Shares of beneficial interest outstanding (par value of $.01 per share) unlimited number of shares authorized | | $ | 113,700 | |
Additional paid-in capital | | | 134,102,073 | |
| | | | |
| | | 134,215,773 | |
Total distributable earnings (loss) | | | (22,699,587 | ) |
| | | | |
Net assets | | $ | 111,516,186 | |
| | | | |
| | | | |
Class A | | | | |
Net assets applicable to outstanding shares | | $ | 82,873,755 | |
| | | | |
Shares of beneficial interest outstanding | | | 8,449,513 | |
| | | | |
Net asset value per share outstanding | | $ | 9.81 | |
Maximum sales charge (4.50% of offering price) | | | 0.46 | |
| | | | |
Maximum offering price per share outstanding | | $ | 10.27 | |
| | | | |
Investor Class | | | | |
Net assets applicable to outstanding shares | | $ | 13,801,413 | |
| | | | |
Shares of beneficial interest outstanding | | | 1,392,340 | |
| | | | |
Net asset value per share outstanding | | $ | 9.91 | |
Maximum sales charge (4.00% of offering price) | | | 0.41 | |
| | | | |
Maximum offering price per share outstanding | | $ | 10.32 | |
| | | | |
Class B | | | | |
Net assets applicable to outstanding shares | | $ | 1,788,830 | |
| | | | |
Shares of beneficial interest outstanding | | | 186,135 | |
| | | | |
Net asset value and offering price per share outstanding | | $ | 9.61 | |
| | | | |
Class C | | | | |
Net assets applicable to outstanding shares | | $ | 6,364,700 | |
| | | | |
Shares of beneficial interest outstanding | | | 661,247 | |
| | | | |
Net asset value and offering price per share outstanding | | $ | 9.63 | |
| | | | |
Class I | | | | |
Net assets applicable to outstanding shares | | $ | 6,687,488 | |
| | | | |
Shares of beneficial interest outstanding | | | 680,779 | |
| | | | |
Net asset value and offering price per share outstanding | | $ | 9.82 | |
| | | | |
| | | | | | |
The notes to the financial statements are an integral part of,
and should be read in conjunction with, the financial statements. | | | | | 17 | |
Statement of Operations for the year ended October 31, 2020
| | | | |
| Investment Income (Loss) | | | | |
Income | | | | |
Interest (a) | | $ | 7,172,280 | |
Dividends-affiliated | | | 18,885 | |
Securities lending | | | 7,336 | |
Other | | | 11,269 | |
| | | | |
Total income | | | 7,209,770 | |
| | | | |
Expenses | | | | |
Manager (See Note 3) | | | 858,687 | |
Distribution/Service—Class A (See Note 3) | | | 215,242 | |
Distribution/Service—Investor Class (See Note 3) | | | 36,512 | |
Distribution/Service—Class B (See Note 3) | | | 21,553 | |
Distribution/Service—Class C (See Note 3) | | | 87,474 | |
Transfer agent (See Note 3) | | | 246,298 | |
Professional fees | | | 95,797 | |
Registration | | | 87,937 | |
Custodian | | | 59,105 | |
Shareholder communication | | | 31,110 | |
Trustees | | | 2,916 | |
Miscellaneous | | | 26,938 | |
| | | | |
Total expenses before waiver/reimbursement | | | 1,769,569 | |
Expense waiver/reimbursement from Manager (See Note 3) | | | (206,021 | ) |
| | | | |
Net expenses | | | 1,563,548 | |
| | | | |
Net investment income (loss) | | | 5,646,222 | |
| | | | |
| |
| Realized and Unrealized Gain (Loss) | | | | |
Net realized gain (loss) on: | | | | |
Unaffiliated investment transactions | | | (4,174,202 | ) |
Futures transactions | | | (84,740 | ) |
Foreign currency forward transactions | | | (34,327 | ) |
Foreign currency transactions | | | (215,650 | ) |
| | | | |
Net realized gain (loss) | | | (4,508,919 | ) |
| | | | |
Net change in unrealized appreciation (depreciation) on: | | | | |
Unaffiliated investments | | | (6,100,159 | ) |
Foreign currency forward contracts | | | 30,374 | |
Translation of other assets and liabilities in foreign currencies | | | (53,069 | ) |
| | | | |
Net change in unrealized appreciation (depreciation) | | | (6,122,854 | ) |
| | | | |
Net realized and unrealized gain (loss) | | | (10,631,773 | ) |
| | | | |
Net increase (decrease) in net assets resulting from operations | | $ | (4,985,551 | ) |
| | | | |
| (a) | Interest recorded net of foreign withholding taxes in the amount of $1,648. |
| | | | |
| 18 | | MainStay Candriam Emerging Markets Debt Fund | | The notes to the financial statements are an integral part of,
and should be read in conjunction with, the financial statements. |
Statements of Changes in Net Assets
for the years ended October 31, 2020 and October 31, 2019
| | | | | | | | |
| | | 2020 | | | 2019 | |
| Increase (Decrease) in Net Assets | |
Operations: | | | | | | | | |
Net investment income (loss) | | $ | 5,646,222 | | | $ | 6,768,376 | |
Net realized gain (loss) | | | (4,508,919 | ) | | | 3,689,881 | |
Net change in unrealized appreciation (depreciation) | | | (6,122,854 | ) | | | 6,599,282 | |
| | | | |
Net increase (decrease) in net assets resulting from operations | | | (4,985,551 | ) | | | 17,057,539 | |
| | | | |
Distributions to shareholders: | | | | | | | | |
Class A | | | (3,904,404 | ) | | | (4,410,178 | ) |
Investor Class | | | (606,354 | ) | | | (730,210 | ) |
Class B | | | (75,657 | ) | | | (121,596 | ) |
Class C | | | (304,393 | ) | | | (581,845 | ) |
Class I | | | (515,800 | ) | | | (1,065,235 | ) |
| | | | |
Total distributions to shareholders | | | (5,406,608 | ) | | | (6,909,064 | ) |
| | | | |
Capital share transactions: | | | | | | | | |
Net proceeds from sale of shares | | | 12,038,594 | | | | 101,839,510 | |
Net asset value of shares issued to shareholders in reinvestment of distributions | | | 5,139,994 | | | | 6,590,775 | |
Cost of shares redeemed | | | (35,678,634 | ) | | | (113,866,471 | ) |
| | | | |
Increase (decrease) in net assets derived from capital share transactions | | | (18,500,046 | ) | | | (5,436,186 | ) |
| | | | |
Net increase (decrease) in net assets | | | (28,892,205 | ) | | | 4,712,289 | |
| | |
| Net Assets | | | | | | | | |
Beginning of year | | | 140,408,391 | | | | 135,696,102 | |
| | | | |
End of year | | $ | 111,516,186 | | | $ | 140,408,391 | |
| | | | |
| | | | | | |
The notes to the financial statements are an integral part of,
and should be read in conjunction with, the financial statements. | | | | | 19 | |
Financial Highlights selected per share data and ratios
| | | | | | | | | | | | | | | | | | | | |
| |
| | | Year ended October 31, | |
| | | | | |
| Class A | | 2020 | | | 2019 | | | 2018 | | | 2017 | | | 2016 | |
| | | | | |
Net asset value at beginning of year | | $ | 10.46 | | | $ | 9.71 | | | $ | 10.88 | | | $ | 10.52 | | | $ | 9.60 | |
| | | | | | | | | | | | | | | | | | | | |
| | | | | |
Net investment income (loss) (a) | | | 0.47 | | | | 0.49 | | | | 0.45 | | | | 0.53 | | | | 0.57 | |
| | | | | |
Net realized and unrealized gain (loss) on investments | | | (0.65 | ) | | | 0.76 | | | | (1.19 | ) | | | 0.31 | | | | 0.87 | |
| | | | | |
Net realized and unrealized gain (loss) on foreign currency transactions | | | (0.02 | ) | | | 0.00 | ‡ | | | (0.00 | )‡ | | | (0.01 | ) | | | 0.01 | |
| | | | | | | | | | | | | | | | | | | | |
| | | | | |
Total from investment operations | | | (0.20 | ) | | | 1.25 | | | | (0.74 | ) | | | 0.83 | | | | 1.45 | |
| | | | | | | | | | | | | | | | | | | | |
| | | | | |
| Less distributions: | | | | | | | | | | | | | | | | | | | | |
| | | | | |
From net investment income | | | (0.45 | ) | | | (0.50 | ) | | | (0.43 | ) | | | (0.36 | ) | | | (0.29 | ) |
| | | | | |
Return of capital | | | — | | | | — | | | | — | | | | (0.11 | ) | | | (0.24 | ) |
| | | | | | | | | | | | | | | | | | | | |
| | | | | |
Total distributions | | | (0.45 | ) | | | (0.50 | ) | | | (0.43 | ) | | | (0.47 | ) | | | (0.53 | ) |
| | | | | | | | | | | | | | | | | | | | |
| | | | | |
Net asset value at end of year | | $ | 9.81 | | | $ | 10.46 | | | $ | 9.71 | | | $ | 10.88 | | | $ | 10.52 | |
| | | | | | | | | | | | | | | | | | | | |
| | | | | |
Total investment return (b) | | | (1.80 | %) | | | 13.05 | % | | | (6.95 | %) | | | 8.18 | % | | | 15.63 | % |
| | | | | |
| Ratios (to average net assets)/Supplemental Data: | | | | | | | | | | | | | | | | | | | | |
| | | | | |
Net investment income (loss) | | | 4.70 | % | | | 4.78 | % | | | 4.36 | % | | | 5.04 | % | | | 5.70 | %(c) |
| | | | | |
Net expenses (d) | | | 1.17 | % | | | 1.23 | % | | | 1.26 | % | | | 1.22 | % | | | 1.22 | %(e) |
| | | | | |
Expenses (before waiver/reimbursement) (d) | | | 1.33 | % | | | 1.26 | % | | | 1.26 | % | | | 1.22 | % | | | 1.22 | % |
| | | | | |
Portfolio turnover rate | | | 102 | % | | | 102 | % | | | 44 | % | | | 37 | % | | | 38 | % |
| | | | | |
Net assets at end of year (in 000’s) | | $ | 82,874 | | | $ | 93,472 | | | $ | 86,452 | | | $ | 110,238 | | | $ | 109,657 | |
| ‡ | Less than one cent per share. |
| (a) | Per share data based on average shares outstanding during the year. |
| (b) | Total investment return is calculated exclusive of sales charges and assumes the reinvestment of distributions. For periods of less than one year, total return is not annualized. |
| (c) | Without the custody fee reimbursement, net investment income (loss) would have been 5.69%. |
| (d) | In addition to the fees and expenses which the Fund bears directly, it also indirectly bears a pro-rata share of the fees and expenses of the underlying funds in which it invests. Such indirect expenses are not included in the above expense ratios. |
| (e) | Without the custody fee reimbursement, net expenses would have been 1.23%. |
| | | | | | | | | | | | | | | | | | | | |
| |
| | | Year ended October 31, | |
| | | | | |
| Investor Class | | 2020 | | | 2019 | | | 2018 | | | 2017 | | | 2016 | |
| | | | | |
Net asset value at beginning of year | | $ | 10.57 | | | $ | 9.80 | | | $ | 10.98 | | | $ | 10.61 | | | $ | 9.68 | |
| | | | | | | | | | | | | | | | | | | | |
| | | | | |
Net investment income (loss) (a) | | | 0.44 | | | | 0.47 | | | | 0.43 | | | | 0.52 | | | | 0.55 | |
| | | | | |
Net realized and unrealized gain (loss) on investments | | | (0.66 | ) | | | 0.77 | | | | (1.20 | ) | | | 0.31 | | | | 0.88 | |
| | | | | |
Net realized and unrealized gain (loss) on foreign currency transactions | | | (0.02 | ) | | | 0.00 | ‡ | | | (0.00 | )‡ | | | (0.01 | ) | | | 0.01 | |
| | | | | | | | | | | | | | | | | | | | |
| | | | | |
Total from investment operations | | | (0.24 | ) | | | 1.24 | | | | (0.77 | ) | | | 0.82 | | | | 1.44 | |
| | | | | | | | | | | | | | | | | | | | |
| | | | | |
| Less distributions: | | | | | | | | | | | | | | | | | | | | |
| | | | | |
From net investment income | | | (0.42 | ) | | | (0.47 | ) | | | (0.41 | ) | | | (0.35 | ) | | | (0.27 | ) |
| | | | | |
Return of capital | | | — | | | | — | | | | — | | | | (0.10 | ) | | | (0.24 | ) |
| | | | | | | | | | | | | | | | | | | | |
| | | | | |
Total distributions | | | (0.42 | ) | | | (0.47 | ) | | | (0.41 | ) | | | (0.45 | ) | | | (0.51 | ) |
| | | | | | | | | | | | | | | | | | | | |
| | | | | |
Net asset value at end of year | | $ | 9.91 | | | $ | 10.57 | | | $ | 9.80 | | | $ | 10.98 | | | $ | 10.61 | |
| | | | | | | | | | | | | | | | | | | | |
| | | | | |
Total investment return (b) | | | (2.20 | %) | | | 12.82 | % | | | (7.18 | %) | | | 7.99 | % | | | 15.38 | % |
| | | | | |
| Ratios (to average net assets)/Supplemental Data: | | | | | | | | | | | | | | | | | | | | |
| | | | | |
Net investment income (loss) | | | 4.38 | % | | | 4.50 | % | | | 4.15 | % | | | 4.86 | % | | | 5.50 | %(c) |
| | | | | |
Net expenses (d) | | | 1.49 | % | | | 1.52 | % | | | 1.47 | % | | | 1.42 | % | | | 1.42 | %(e) |
| | | | | |
Expenses (before waiver/reimbursement) (d) | | | 1.66 | % | | | 1.56 | % | | | 1.49 | % | | | 1.42 | % | | | 1.42 | % |
| | | | | |
Portfolio turnover rate | | | 102 | % | | | 102 | % | | | 44 | % | | | 37 | % | | | 38 | % |
| | | | | |
Net assets at end of year (in 000’s) | | $ | 13,801 | | | $ | 16,024 | | | $ | 15,911 | | | $ | 18,613 | | | $ | 32,318 | |
| ‡ | Less than one cent per share. |
| (a) | Per share data based on average shares outstanding during the year. |
| (b) | Total investment return is calculated exclusive of sales charges and assumes the reinvestment of distributions. For periods of less than one year, total return is not annualized. |
| (c) | Without the custody fee reimbursement, net investment income (loss) would have been 5.49%. |
| (d) | In addition to the fees and expenses which the Fund bears directly, it also indirectly bears a pro-rata share of the fees and expenses of the underlying funds in which it invests. Such indirect expenses are not included in the above expense ratios. |
| (e) | Without the custody fee reimbursement, net expenses would have been 1.43%. |
| | | | |
| 20 | | MainStay Candriam Emerging Markets Debt Fund | | The notes to the financial statements are an integral part of,
and should be read in conjunction with, the financial statements. |
Financial Highlights selected per share data and ratios
| | | | | | | | | | | | | | | | | | | | |
| |
| | | Year ended October 31, | |
| | | | | |
| Class B | | 2020 | | | 2019 | | | 2018 | | | 2017 | | | 2016 | |
| | | | | |
Net asset value at beginning of year | | $ | 10.26 | | | $ | 9.52 | | | $ | 10.69 | | | $ | 10.34 | | | $ | 9.44 | |
| | | | | | | | | | | | | | | | | | | | |
| | | | | |
Net investment income (loss) (a) | | | 0.36 | | | | 0.38 | | | | 0.34 | | | | 0.43 | | | | 0.47 | |
| | | | | |
Net realized and unrealized gain (loss) on investments | | | (0.64 | ) | | | 0.75 | | | | (1.18 | ) | | | 0.30 | | | | 0.86 | |
| | | | | |
Net realized and unrealized gain (loss) on foreign currency transactions | | | (0.02 | ) | | | 0.00 | ‡ | | | 0.00 | ‡ | | | (0.01 | ) | | | 0.01 | |
| | | | | | | | | | | | | | | | | | | | |
| | | | | |
Total from investment operations | | | (0.30 | ) | | | 1.13 | | | | (0.84 | ) | | | 0.72 | | | | 1.34 | |
| | | | | | | | | | | | | | | | | | | | |
| | | | | |
| Less distributions: | | | | | | | | | | | | | | | | | | | | |
| | | | | |
From net investment income | | | (0.35 | ) | | | (0.39 | ) | | | (0.33 | ) | | | (0.29 | ) | | | (0.20 | ) |
| | | | | |
Return of capital | | | — | | | | — | | | | — | | | | (0.08 | ) | | | (0.24 | ) |
| | | | | | | | | | | | | | | | | | | | |
| | | | | |
Total distributions | | | (0.35 | ) | | | (0.39 | ) | | | (0.33 | ) | | | (0.37 | ) | | | (0.44 | ) |
| | | | | | | | | | | | | | | | | | | | |
| | | | | |
Net asset value at end of year | | $ | 9.61 | | | $ | 10.26 | | | $ | 9.52 | | | $ | 10.69 | | | $ | 10.34 | |
| | | | | | | | | | | | | | | | | | | | |
| | | | | |
Total investment return (b) | | | (2.91 | %) | | | 12.04 | % | | | (7.98 | %) | | | 7.20 | % | | | 14.60 | % |
| | | | | |
| Ratios (to average net assets)/Supplemental Data: | | | | | | | | | | | | | | | | | | | | |
| | | | | |
Net investment income (loss) | | | 3.66 | % | | | 3.76 | % | | | 3.37 | % | | | 4.11 | % | | | 4.78 | %(c) |
| | | | | |
Net expenses (d) | | | 2.24 | % | | | 2.27 | % | | | 2.22 | % | | | 2.17 | % | | | 2.17 | %(e) |
| | | | | |
Expenses (before waiver/reimbursement) (d) | | | 2.40 | % | | | 2.31 | % | | | 2.24 | % | | | 2.17 | % | | | 2.17 | % |
| | | | | |
Portfolio turnover rate | | | 102 | % | | | 102 | % | | | 44 | % | | | 37 | % | | | 38 | % |
| | | | | |
Net assets at end of year (in 000’s) | | $ | 1,789 | | | $ | 2,663 | | | $ | 3,660 | | | $ | 6,012 | | | $ | 7,506 | |
| ‡ | Less than one cent per share. |
| (a) | Per share data based on average shares outstanding during the year. |
| (b) | Total investment return is calculated exclusive of sales charges and assumes the reinvestment of distributions. For periods of less than one year, total return is not annualized. |
| (c) | Without the custody fee reimbursement, net investment income (loss) would have been 4.77%. |
| (d) | In addition to the fees and expenses which the Fund bears directly, it also indirectly bears a pro-rata share of the fees and expenses of the underlying funds in which it invests. Such indirect expenses are not included in the above expense ratios. |
| (e) | Without the custody fee reimbursement, net expenses would have been 2.18%. |
| | | | | | | | | | | | | | | | | | | | |
| |
| | | Year ended October 31, | |
| | | | | |
| Class C | | 2020 | | | 2019 | | | 2018 | | | 2017 | | | 2016 | |
| | | | | |
Net asset value at beginning of year | | $ | 10.27 | | | $ | 9.54 | | | $ | 10.70 | | | $ | 10.35 | | | $ | 9.45 | |
| | | | | | | | | | | | | | | | | | | | |
| | | | | |
Net investment income (loss) (a) | | | 0.36 | | | | 0.38 | | | | 0.35 | | | | 0.43 | | | | 0.47 | |
| | | | | |
Net realized and unrealized gain (loss) on investments | | | (0.64 | ) | | | 0.74 | | | | (1.18 | ) | | | 0.29 | | | | 0.86 | |
| | | | | |
Net realized and unrealized gain (loss) on foreign currency transactions | | | (0.02 | ) | | | 0.00 | ‡ | | | (0.00 | )‡ | | | (0.00 | )‡ | | | 0.01 | |
| | | | | | | | | | | | | | | | | | | | |
| | | | | |
Total from investment operations | | | (0.30 | ) | | | 1.12 | | | | (0.83 | ) | | | 0.72 | | | | 1.34 | |
| | | | | | | | | | | | | | | | | | | | |
| | | | | |
| Less distributions: | | | | | | | | | | | | | | | | | | | | |
| | | | | |
From net investment income | | | (0.34 | ) | | | (0.39 | ) | | | (0.33 | ) | | | (0.29 | ) | | | (0.20 | ) |
| | | | | |
Return of capital | | | — | | | | — | | | | — | | | | (0.08 | ) | | | (0.24 | ) |
| | | | | | | | | | | | | | | | | | | | |
| | | | | |
Total distributions | | | (0.34 | ) | | | (0.39 | ) | | | (0.33 | ) | | | (0.37 | ) | | | (0.44 | ) |
| | | | | | | | | | | | | | | | | | | | |
| | | | | |
Net asset value at end of year | | $ | 9.63 | | | $ | 10.27 | | | $ | 9.54 | | | $ | 10.70 | | | $ | 10.35 | |
| | | | | | | | | | | | | | | | | | | | |
| | | | | |
Total investment return (b) | | | (2.81 | %) | | | 11.91 | % | | | (7.88 | %) | | | 7.19 | % | | | 14.58 | % |
| | | | | |
| Ratios (to average net assets)/Supplemental Data: | | | | | | | | | | | | | | | | | | | | |
| | | | | |
Net investment income (loss) | | | 3.68 | % | | | 3.78 | % | | | 3.39 | % | | | 4.11 | % | | | 4.77 | %(c) |
| | | | | |
Net expenses (d) | | | 2.24 | % | | | 2.27 | % | | | 2.22 | % | | | 2.17 | % | | | 2.17 | %(e) |
| | | | | |
Expenses (before waiver/reimbursement) (d) | | | 2.40 | % | | | 2.31 | % | | | 2.24 | % | | | 2.17 | % | | | 2.17 | % |
| | | | | |
Portfolio turnover rate | | | 102 | % | | | 102 | % | | | 44 | % | | | 37 | % | | | 38 | % |
| | | | | |
Net assets at end of year (in 000’s) | | $ | 6,365 | | | $ | 11,150 | | | $ | 19,246 | | | $ | 28,270 | | | $ | 35,789 | |
| ‡ | Less than one cent per share. |
| (a) | Per share data based on average shares outstanding during the year. |
| (b) | Total investment return is calculated exclusive of sales charges and assumes the reinvestment of distributions. For periods of less than one year, total return is not annualized. |
| (c) | Without the custody fee reimbursement, net investment income (loss) would have been 4.76%. |
| (d) | In addition to the fees and expenses which the Fund bears directly, it also indirectly bears a pro-rata share of the fees and expenses of the underlying funds in which it invests. Such indirect expenses are not included in the above expense ratios. |
| (e) | Without the custody fee reimbursement, net expenses would have been 2.18%. |
| | | | | | |
The notes to the financial statements are an integral part of,
and should be read in conjunction with, the financial statements. | | | | | 21 | |
Financial Highlights selected per share data and ratios
| | | | | | | | | | | | | | | | | | | | |
| |
| | | Year ended October 31, | |
| | | | | |
| Class I | | 2020 | | | 2019 | | | 2018 | | | 2017 | | | 2016 | |
| | | | | |
Net asset value at beginning of year | | $ | 10.48 | | | $ | 9.72 | | | $ | 10.90 | | | $ | 10.53 | | | $ | 9.61 | |
| | | | | | | | | | | | | | | | | | | | |
| | | | | |
Net investment income (loss) (a) | | | 0.51 | | | | 0.52 | | | | 0.48 | | | | 0.56 | | | | 0.59 | |
| | | | | |
Net realized and unrealized gain (loss) on investments | | | (0.67 | ) | | | 0.76 | | | | (1.20 | ) | | | 0.32 | | | | 0.88 | |
| | | | | |
Net realized and unrealized gain (loss) on foreign currency transactions | | | (0.02 | ) | | | 0.00 | ‡ | | | (0.00 | )‡ | | | (0.01 | ) | | | 0.01 | |
| | | | | | | | | | | | | | | | | | | | |
| | | | | |
Total from investment operations | | | (0.18 | ) | | | 1.28 | | | | (0.72 | ) | | | 0.87 | | | | 1.48 | |
| | | | | | | | | | | | | | | | | | | | |
| | | | | |
| Less distributions: | | | | | | | | | | | | | | | | | | | | |
| | | | | |
From net investment income | | | (0.48 | ) | | | (0.52 | ) | | | (0.46 | ) | | | (0.39 | ) | | | (0.32 | ) |
| | | | | |
Return of capital | | | — | | | | — | | | | — | | | | (0.11 | ) | | | (0.24 | ) |
| | | | | | | | | | | | | | | | | | | | |
| | | | | |
Total distributions | | | (0.48 | ) | | | (0.52 | ) | | | (0.46 | ) | | | (0.50 | ) | | | (0.56 | ) |
| | | | | | | | | | | | | | | | | | | | |
| | | | | |
Net asset value at end of year | | $ | 9.82 | | | $ | 10.48 | | | $ | 9.72 | | | $ | 10.90 | | | $ | 10.53 | |
| | | | | | | | | | | | | | | | | | | | |
| | | | | |
Total investment return (b) | | | (1.59 | %) | | | 13.46 | % | | | (6.80 | %) | | | 8.54 | % | | | 15.90 | % |
| | | | | |
| Ratios (to average net assets)/Supplemental Data: | | | | | | | | | | | | | | | | | | | | |
| | | | | |
Net investment income (loss) | | | 5.09 | % | | | 4.99 | % | | | 4.60 | % | | | 5.22 | % | | | 5.96 | %(c) |
| | | | | |
Net expenses (d) | | | 0.85 | % | | | 0.94 | % | | | 1.01 | % | | | 0.97 | % | | | 0.97 | %(e) |
| | | | | |
Expenses (before waiver/reimbursement) (d) | | | 1.07 | % | | | 1.01 | % | | | 1.01 | % | | | 0.97 | % | | | 0.97 | % |
| | | | | |
Portfolio turnover rate | | | 102 | % | | | 102 | % | | | 44 | % | | | 37 | % | | | 38 | % |
| | | | | |
Net assets at end of year (in 000’s) | | $ | 6,687 | | | $ | 17,100 | | | $ | 10,428 | | | $ | 22,717 | | | $ | 13,759 | |
| ‡ | Less than one cent per share. |
| (a) | Per share data based on average shares outstanding during the year. |
| (b) | Total investment return is calculated exclusive of sales charges and assumes the reinvestment of distributions. Class I shares are not subject to sales charges. For periods of less than one year, total return is not annualized. |
| (c) | Without the custody fee reimbursement, net investment income (loss) would have been 5.95%. |
| (d) | In addition to the fees and expenses which the Fund bears directly, it also indirectly bears a pro-rata share of the fees and expenses of the underlying funds in which it invests. Such indirect expenses are not included in the above expense ratios. |
| (e) | Without the custody fee reimbursement, net expenses would have been 0.98%. |
| | | | |
| 22 | | MainStay Candriam Emerging Markets Debt Fund | | The notes to the financial statements are an integral part of,
and should be read in conjunction with, the financial statements. |
Notes to Financial Statements
Note 1–Organization and Business
The MainStay Funds (the “Trust”) was organized on January 9, 1986, as a Massachusetts business trust. The Trust is registered under the Investment Company Act of 1940, as amended (the “1940 Act”), as an open-end management investment company, and is comprised of twelve funds (collectively referred to as the “Funds”). These financial statements and notes relate to the MainStay Candriam Emerging Markets Debt Fund (the “Fund”), a “diversified” fund, as that term is defined in the 1940 Act as interpreted or modified by regulatory authorities having jurisdiction, from time to time.
The Fund currently has seven classes of shares registered for sale. Class A and Class B shares commenced operations on June 1, 1998. Class C shares commenced operations on September 1, 1998. Class I shares commenced operations on August 31, 2007. Investor Class shares commenced operations on February 28, 2008. Class R6 shares were registered for sale effective as of February 28, 2017. As of October 31, 2020, Class R6 shares were not yet offered for sale. SIMPLE Class shares were registered for sale effective as of August 31, 2020. As of October 31, 2020, SIMPLE Class shares were not yet offered for sale.
Class B shares of the MainStay Group of Funds are closed to all new purchases as well as additional investments by existing Class B shareholders. Existing Class B shareholders may continue to reinvest dividends and capital gains distributions, as well as exchange their Class B shares for Class B shares of other funds in the MainStay Group of Funds as permitted by the current exchange privileges. Class B shareholders continue to be subject to any applicable contingent deferred sales charge (“CDSC”) at the time of redemption. All other features of the Class B shares, including but not limited to the fees and expenses applicable to Class B shares, remain unchanged. Unless redeemed, Class B shareholders will remain in Class B shares of their respective fund until the Class B shares are converted to Class A or Investor Class shares pursuant to the applicable conversion schedule.
Class A and Investor Class shares are offered at net asset value (“NAV”) per share plus an initial sales charge. No initial sales charge applies to investments of $1 million or more (and certain other qualified purchases) in Class A and Investor Class shares. However, a CDSC of 1.00% may be imposed on certain redemptions made within 18 months of the date of purchase on shares that were purchased without an initial sales charge. Class C shares are offered at NAV without an initial sales charge, although a 1.00% CDSC may be imposed on certain redemptions of such shares made within one year of the date of purchase of Class C shares. When Class B shares were offered, they were offered at NAV without an initial sales charge, although a CDSC that declines depending on the number of years a shareholder held its Class B shares may be imposed on certain redemptions of such shares made within six years of the date of purchase of such shares. Class I shares are offered at NAV without a sales charge. Class R6 and SIMPLE Class shares are currently expected to be offered at NAV without a sales charge. Depending upon eligibility, Class B shares convert to either Class A or Investor Class shares at the end of the calendar quarter eight years after the date they were purchased. In addition, depending upon eligibility, Class C shares convert to either Class A or Investor Class shares at the end of the calendar quarter ten years after the date they were purchased. Additionally, Investor Class shares may convert
automatically to Class A shares. Under certain circumstances and as may be permitted by the Trust’s multiple class plan pursuant to Rule 18f-3 under the 1940 Act, specified share classes of the Fund may be converted to one or more other share classes of the Fund as disclosed in the capital share transactions within these Notes. The classes of shares have the same voting (except for issues that relate solely to one class), dividend, liquidation and other rights, and the same terms and conditions, except that under distribution plans pursuant to Rule 12b-1 under the 1940 Act, Class B and Class C shares are subject to higher distribution and/or service fees than Class A, Investor Class and SIMPLE Class shares. Class I and Class R6 shares are not subject to a distribution and/or service fee.
The Fund’s investment objective is to seek total return.
Note 2–Significant Accounting Policies
The Fund is an investment company and accordingly follows the investment company accounting and reporting guidance of the Financial Accounting Standards Board (“FASB”) Accounting Standard Codification Topic 946 Financial Services—Investment Companies. The Fund prepares its financial statements in accordance with generally accepted accounting principles (“GAAP”) in the United States of America and follows the significant accounting policies described below.
(A) Securities Valuation. Investments are usually valued as of the close of regular trading on the New York Stock Exchange (the “Exchange”) (usually 4:00 p.m. Eastern time) on each day the Fund is open for business (“valuation date”).
The Board of Trustees of the Trust (the “Board”) adopted procedures establishing methodologies for the valuation of the Fund’s securities and other assets and delegated the responsibility for valuation determinations under those procedures to the Valuation Committee of the Trust (the “Valuation Committee”). The procedures state that, subject to the oversight of the Board and unless otherwise noted, the responsibility for the day-to-day valuation of portfolio assets (including fair value measurements for the Fund’s assets and liabilities) rests with New York Life Investment Management LLC (“New York Life Investments” or the “Manager”), aided to whatever extent necessary by the Subadvisor (as defined in Note 3(A)). To assess the appropriateness of security valuations, the Manager, the Subadvisor or the Fund’s third-party service provider, who is subject to oversight by the Manager, regularly compares prior day prices, prices on comparable securities and the sale prices to the prior and current day prices and challenges prices with changes exceeding certain tolerance levels with third-party pricing services or broker sources.
The Board authorized the Valuation Committee to appoint a Valuation Subcommittee (the “Subcommittee”) to establish the prices of securities for which market quotations are not readily available or the prices of which are not otherwise readily determinable under the procedures. The Subcommittee meets (in person, via electronic mail or via teleconference) on an as-needed basis. The Valuation Committee meets to ensure that actions taken by the Subcommittee were appropriate.
For those securities valued through either a standardized fair valuation methodology or a fair valuation measurement, the Subcommittee deals with such valuation and the Valuation Committee reviews and affirms, if appropriate, the reasonableness of the valuation based on such
Notes to Financial Statements (continued)
methodologies and measurements on a regular basis after considering information that is reasonably available and deemed relevant by the Valuation Committee. Any action taken by the Subcommittee with respect to the valuation of a portfolio security or other asset is submitted for review and ratification (if appropriate) to the Valuation Committee and the Board at the next regularly scheduled meeting.
“Fair value” is defined as the price the Fund would reasonably expect to receive upon selling an asset or liability in an orderly transaction to an independent buyer in the principal or most advantageous market for the asset or liability. Fair value measurements are determined within a framework that establishes a three-tier hierarchy that maximizes the use of observable market data and minimizes the use of unobservable inputs to establish a classification of fair value measurements for disclosure purposes. “Inputs” refer broadly to the assumptions that market participants would use in pricing the asset or liability, including assumptions about risk, such as the risk inherent in a particular valuation technique used to measure fair value using a pricing model and/or the risk inherent in the inputs for the valuation technique. Inputs may be observable or unobservable. Observable inputs reflect the assumptions market participants would use in pricing the asset or liability based on market data obtained from sources independent of the Fund. Unobservable inputs reflect the Fund’s own assumptions about the assumptions market participants would use in pricing the asset or liability based on the information available. The inputs or methodology used for valuing assets or liabilities may not be an indication of the risks associated with investing in those assets or liabilities. The three-tier hierarchy of inputs is summarized below.
| • | | Level 1—quoted prices in active markets for an identical asset or liability |
| • | | Level 2—other significant observable inputs (including quoted prices for a similar asset or liability in active markets, interest rates and yield curves, prepayment speeds, credit risk, etc.) |
| • | | Level 3—significant unobservable inputs (including the Fund’s own assumptions about the assumptions that market participants would use in measuring fair value of an asset or liability) |
The level of an asset or liability within the fair value hierarchy is based on the lowest level of an input, both individually and in the aggregate, that is significant to the fair value measurement. The aggregate value by input level of the Fund’s assets and liabilities as of October 31, 2020, is included at the end of the Portfolio of Investments.
The Fund may use third-party vendor evaluations, whose prices may be derived from one or more of the following standard inputs, among others:
| | |
• Benchmark yields | | • Reported trades |
• Broker/dealer quotes | | • Issuer spreads |
• Two-sided markets | | • Benchmark securities |
• Bids/offers | | • Reference data (corporate actions or material event notices) |
• Industry and economic events | | • Comparable bonds |
• Monthly payment information | | |
An asset or liability for which market values cannot be measured using the methodologies described above is valued by methods deemed
reasonable in good faith by the Valuation Committee, following the procedures established by the Board, to represent fair value. Under these procedures, the Fund generally uses a market-based approach which may use related or comparable assets or liabilities, recent transactions, market multiples, book values and other relevant information. The Fund may also use an income-based valuation approach in which the anticipated future cash flows of the asset or liability are discounted to calculate fair value. Discounts may also be applied due to the nature and/or duration of any restrictions on the disposition of the asset or liability. Fair value represents a good faith approximation of the value of a security. Fair value determinations involve the consideration of a number of subjective factors, an analysis of applicable facts and circumstances and the exercise of judgment. As a result, it is possible that the fair value for a security determined in good faith in accordance with the Fund’s valuation procedures may differ from valuations for the same security determined by other funds using their own valuation procedures. Although the Fund’s valuation procedures are designed to value a security at the price the Fund may reasonably expect to receive upon the security’s sale in an orderly transaction, there can be no assurance that any fair value determination thereunder would, in fact, approximate the amount that the Fund would actually realize upon the sale of the security or the price at which the security would trade if a reliable market price were readily available. During the year ended October 31, 2020, there were no material changes to the fair value methodologies.
Securities which may be valued in this manner include, but are not limited to: (i) a security for which trading has been halted or suspended; (ii) a debt security that has recently gone into default and for which there is not a current market quotation; (iii) a security of an issuer that has entered into a restructuring; (iv) a security that has been delisted from a national exchange; (v) a security for which the market price is not readily available from a third-party pricing source or, if so provided, does not, in the opinion of the Manager or the Subadvisor, reflect the security’s market value; (vi) a security subject to trading collars for which no or limited trading takes place; and (vii) a security whose principal market has been temporarily closed at a time when, under normal conditions, it would be open. Securities valued in this manner are generally categorized as Level 3 in the hierarchy. No securities held by the Fund as of October 31, 2020 were fair valued in such a manner.
Futures contracts are valued at the last posted settlement price on the market where such futures are primarily traded. Investments in mutual funds, including money market funds, are valued at their respective NAVs as of the close of the Exchange on the valuation date. These securities are generally categorized as Level 1 in the hierarchy.
Foreign currency forward contracts are valued at their fair market values measured on the basis of the mean between the last current bid and ask prices based on dealer or exchange quotations and are generally categorized as Level 2 in the hierarchy.
Debt securities (other than convertible and municipal bonds) are valued at the evaluated bid prices (evaluated mean prices in the case of convertible and municipal bonds) supplied by a pricing agent or broker(s) selected by the Manager, in consultation with the Subadvisor. The evaluations are market-based measurements processed through a pricing application and represents the pricing agent’s good faith determination as to what a holder may receive in an orderly transaction
| | |
| 24 | | MainStay Candriam Emerging Markets Debt Fund |
under market conditions. The rules-based logic utilizes valuation techniques that reflect participants’ assumptions and vary by asset class and per methodology, maximizing the use of relevant observable data including quoted prices for similar assets, benchmark yield curves and market corroborated inputs. The evaluated bid or mean prices are deemed by the Manager, in consultation with the Subadvisor, to be representative of market values at the regular close of trading of the Exchange on each valuation date. Debt securities purchased on a delayed delivery basis are marked to market daily until settlement at the forward settlement date. Debt securities, including corporate bonds, U.S. government and federal agency bonds, municipal bonds, foreign bonds, convertible bonds, asset-backed securities and mortgage-backed securities are generally categorized as Level 2 in the hierarchy.
Temporary cash investments acquired in excess of 60 days to maturity at the time of purchase are valued using the latest bid prices or using valuations based on a matrix system (which considers such factors as security prices, yields, maturities and ratings), both as furnished by independent pricing services. Temporary cash investments that mature in 60 days or less at the time of purchase (“Short-Term Investments”) are valued using the amortized cost method of valuation, unless the use of such method would be inappropriate. The amortized cost method involves valuing a security at its cost on the date of purchase and thereafter assuming a constant amortization to maturity of the difference between such cost and the value on maturity date. Amortized cost approximates the current fair value of a security. Securities valued using the amortized cost method are not valued using quoted prices in an active market and are generally categorized as Level 2 in the hierarchy.
The information above is not intended to reflect an exhaustive list of the methodologies that may be used to value portfolio investments. The valuation procedures permit the use of a variety of valuation methodologies in connection with valuing portfolio investments. The methodology used for a specific type of investment may vary based on the market data available or other considerations. The methodologies summarized above may not represent the specific means by which portfolio investments are valued on any particular business day.
A portfolio investment may be classified as an illiquid investment under the Trust’s written liquidity risk management program and related procedures (“Liquidity Program”). Illiquidity of an investment might prevent the sale of such investment at a time when the Manager or the Subadvisor might wish to sell, and these investments could have the effect of decreasing the overall level of the Fund’s liquidity. Further, the lack of an established secondary market may make it more difficult to value illiquid investments, requiring the Fund to rely on judgments that may be somewhat subjective in measuring value, which could vary materially from the amount that the Fund could realize upon disposition. Difficulty in selling illiquid investments may result in a loss or may be costly to the Fund. An illiquid investment is any investment that the Manager or Subadvisor reasonably expects cannot be sold or disposed of in current market conditions in seven calendar days or less without the sale or disposition significantly changing the market value of the investment. The liquidity classification of each investment will be made using information obtained after reasonable inquiry and taking into account, among other things, relevant market, trading and investment-specific considerations in accordance with the Liquidity Program. Illiquid investments are often valued in accordance with methods deemed by the Board in good faith to be reasonable and appropriate to accurately
reflect their fair value. The liquidity of the Fund’s investments, as shown in the Portfolio of Investments, was determined as of October 31, 2020, and can change at any time. Illiquid investments as of October 31, 2020, are shown in the Portfolio of Investments.
(B) Income Taxes. The Fund’s policy is to comply with the requirements of the Internal Revenue Code of 1986, as amended (the “Internal Revenue Code”), applicable to regulated investment companies and to distribute all of its taxable income to the shareholders of the Fund within the allowable time limits.
The Manager evaluates the Fund’s tax positions to determine if the tax positions taken meet the minimum recognition threshold in connection with accounting for uncertainties in income tax positions taken or expected to be taken for the purposes of measuring and recognizing tax liabilities in the financial statements. Recognition of tax benefits of an uncertain tax position is permitted only to the extent the position is “more likely than not” to be sustained assuming examination by taxing authorities. The Manager analyzed the Fund’s tax positions taken on federal, state and local income tax returns for all open tax years (for up to three tax years) and has concluded that no provisions for federal, state and local income tax are required in the Fund’s financial statements. The Fund’s federal, state and local income tax and federal excise tax returns for tax years for which the applicable statutes of limitations have not expired are subject to examination by the Internal Revenue Service and state and local departments of revenue.
(C) Foreign Taxes. The Fund may be subject to foreign taxes on income and other transaction-based taxes imposed by certain countries in which it invests. A portion of the taxes on gains on investments or currency purchases/repatriation may be reclaimable. The Fund will accrue such taxes and reclaims as applicable, based upon its current interpretation of tax rules and regulations that exist in the markets in which it invests.
The Fund may be subject to taxation on realized capital gains, repatriation proceeds and other transaction-based taxes imposed by certain countries in which it invests. The Fund will accrue such taxes as applicable based upon its current interpretation of tax rules and regulations that exist in the market in which it invests. Capital gains taxes relating to positions still held are reflected as a liability in the Statement of Assets and Liabilities, as well as an adjustment to the Fund’s net unrealized appreciation (depreciation). Taxes related to capital gains realized, if any, are reflected as part of net realized gain (loss) in the Statement of Operations. Changes in tax liabilities related to capital gains taxes on unrealized investment gains, if any, are reflected as part of the change in net unrealized appreciation (depreciation) on investments in the Statement of Operations. Transaction-based charges are generally assessed as a percentage of the transaction amount.
(D) Dividends and Distributions to Shareholders. Dividends and distributions are recorded on the ex-dividend date. The Fund intends to declare and pay dividends from net investment income, if any, at least monthly and distributions from net realized capital and currency gains, if any, at least annually. Unless a shareholder elects otherwise, all dividends and distributions are reinvested at NAV in the same class of shares of the Fund. Dividends and distributions to shareholders are determined in accordance with federal income tax regulations and may differ from determinations using GAAP.
Notes to Financial Statements (continued)
(E) Security Transactions and Investment Income. The Fund records security transactions on the trade date. Realized gains and losses on security transactions are determined using the identified cost method. Interest income is accrued as earned using the effective interest rate method. Distributions received from real estate investment trusts may be classified as dividends, capital gains and/or return of capital. Discounts and premiums on securities purchased for the Fund are accreted and amortized, respectively, on the effective interest rate method. Income from payment-in-kind securities, to the extent the Fund held any such securities during the year ended October 31, 2020, is accreted daily based on the effective interest method.
Investment income and realized and unrealized gains and losses on investments of the Fund are allocated pro rata to the separate classes of shares based upon their relative net assets on the date the income is earned or realized and unrealized gains and losses are incurred.
The Fund may place a debt security on non-accrual status and reduce related interest income by ceasing current accruals and writing off all or a portion of any interest receivables when the collection of all or a portion of such interest has become doubtful. A debt security is removed from non-accrual status when the issuer resumes interest payments or when collectability of interest is reasonably assured.
(F) Expenses. Expenses of the Trust are allocated to the individual Funds in proportion to the net assets of the respective Funds when the expenses are incurred, except where direct allocations of expenses can be made. Expenses (other than transfer agent expenses and fees incurred under the shareholder services plans and/or the distribution plans further discussed in Note 3(B)) are allocated to separate classes of shares pro rata based upon their relative net assets on the date the expenses are incurred. The expenses borne by the Fund, including those of related parties to the Fund, are shown in the Statement of Operations.
Additionally, the Fund may invest in mutual funds, which are subject to management fees and other fees that may cause the costs of investing in mutual funds to be greater than the costs of owning the underlying securities directly. These indirect expenses of mutual funds are not included in the amounts shown as expenses in the Fund’s Statement of Operations or in the expense ratios included in the Financial Highlights.
(G) Use of Estimates. In preparing financial statements in conformity with GAAP, the Manager makes estimates and assumptions that affect the reported amounts and disclosures in the financial statements. Actual results could differ from those estimates and assumptions.
(H) Repurchase Agreements. The Fund may enter into repurchase agreements (i.e., buy a security from another party with the agreement that it will be sold back in the future) to earn income. The Fund may enter into repurchase agreements only with counterparties, usually financial institutions, that are deemed by the Manager or the Subadvisor to be creditworthy, pursuant to guidelines established by the Board. During the term of any repurchase agreement, the Manager or the Subadvisor will continue to monitor the creditworthiness of the counterparty. Under the 1940 Act, repurchase agreements are considered to be collateralized loans by the Fund to the counterparty secured by the securities transferred to the Fund.
Repurchase agreements are subject to counterparty risk, meaning the Fund could lose money by the counterparty’s failure to perform under the
terms of the agreement. The Fund mitigates this risk by ensuring the repurchase agreement is collateralized by cash, U.S. government securities, fixed income securities and/or other securities. The collateral is held by the Fund’s custodian and valued daily on a mark to market basis to determine if the value, including accrued interest, exceeds the repurchase price. In the event of the counterparty’s default on the obligation to repurchase, the Fund has the right to liquidate the collateral and apply the proceeds in satisfaction of the obligation. Under certain circumstances, such as in the event of default or bankruptcy by the counterparty, realization and/or retention of the collateral may be limited or subject to delay, to legal proceedings and possible realized loss to the Fund. As of October 31, 2020, the Fund did not hold any repurchase agreements.
(I) Futures Contracts. A futures contract is an agreement to purchase or sell a specified quantity of an underlying instrument at a specified future date and price, or to make or receive a cash payment based on the value of a financial instrument (e.g., foreign currency, interest rate, security or securities index). The Fund is subject to risks such as market price risk and/or interest rate risk in the normal course of investing in these contracts. Upon entering into a futures contract, the Fund is required to pledge to the broker or futures commission merchant an amount of cash and/or U.S. government securities equal to a certain percentage of the collateral amount, known as the “initial margin.” During the period the futures contract is open, changes in the value of the contract are recognized as unrealized appreciation or depreciation by marking to market such contract on a daily basis to reflect the market value of the contract at the end of each day’s trading. The Fund agrees to receive from or pay to the broker or futures commission merchant an amount of cash equal to the daily fluctuation in the value of the contract. Such receipts or payments are known as “variation margin.” When the futures contract is closed, the Fund records a realized gain or loss equal to the difference between the proceeds from (or cost of) the closing transaction and the Fund’s basis in the contract.
The use of futures contracts involves, to varying degrees, elements of market risk in excess of the amount recognized in the Statement of Assets and Liabilities. The contract or notional amounts and variation margin reflect the extent of the Fund’s involvement in open futures positions. There are several risks associated with the use of futures contracts as hedging techniques. There can be no assurance that a liquid market will exist at the time when the Fund seeks to close out a futures contract. If no liquid market exists, the Fund would remain obligated to meet margin requirements until the position is closed. Futures contracts may involve a small initial investment relative to the risk assumed, which could result in losses greater than if the Fund did not invest in futures contracts. Futures contracts may be more volatile than direct investments in the instrument underlying the futures and may not correlate to the underlying instrument, causing a given hedge not to achieve its objectives. The Fund’s activities in futures contracts have minimal counterparty risk as they are conducted through regulated exchanges that guarantee the futures against default by the counterparty. In the event of a bankruptcy or insolvency of a futures commission merchant that holds margin on behalf of the Fund, the Fund may not be entitled to the return of the entire margin owed to the Fund, potentially resulting in a loss. The Fund’s investment in futures contracts and other derivatives may increase the volatility of the Fund’s NAVs and may result in a loss to the Fund. Open futures contracts held as of October 31, 2020, are shown in the Portfolio of Investments.
| | |
| 26 | | MainStay Candriam Emerging Markets Debt Fund |
(J) Foreign Currency Forward Contracts. The Fund may enter into foreign currency forward contracts, which are agreements to buy or sell foreign currencies on a specified future date at a specified rate. The Fund is subject to foreign currency exchange rate risk in the normal course of investing in these transactions. During the period the forward contract is open, changes in the value of the contract are recognized as unrealized appreciation or depreciation by marking to market such contract on a daily basis to reflect the market value of the contract at the end of each day’s trading. Cash movement occurs on settlement date. When the forward contract is closed, the Fund records a realized gain or loss equal to the difference between the proceeds from (or cost of) the closing transaction and the Fund’s basis in the contract. The Fund may purchase and sell foreign currency forward contracts for purposes of seeking to enhance portfolio returns and manage portfolio risk more efficiently. Foreign currency forward contracts may also be used to gain exposure to a particular currency or to hedge against the risk of loss due to changing currency exchange rates. Foreign currency forward contracts to purchase or sell a foreign currency may also be used in anticipation of future purchases or sales of securities denominated in foreign currency, even if the specific investments have not yet been selected.
The use of foreign currency forward contracts involves, to varying degrees, elements of risk in excess of the amount recognized in the Statement of Assets and Liabilities, including counterparty risk, market risk and illiquidity risk. Counterparty risk is heightened for these instruments because foreign currency forward contracts are not exchange-traded and therefore no clearinghouse or exchange stands ready to meet the obligations under such contracts. Thus, the Fund faces the risk that its counterparties under such contracts may not perform their obligations. Market risk is the risk that the value of a foreign currency forward contract will depreciate due to unfavorable changes in exchange rates. Illiquidity risk arises because the secondary market for foreign currency forward contracts may have less liquidity relative to markets for other securities and financial instruments. Risks also arise from the possible movements in the foreign exchange rates underlying these instruments. While the Fund may enter into forward contracts to reduce currency exchange risks, changes in currency exchange rates may result in poorer overall performance for the Fund than if it had not engaged in such transactions. Exchange rate movements can be large, depending on the currency, and can last for extended periods of time, affecting the value of the Fund’s assets. Moreover, there may be an imperfect correlation between the Fund’s holdings of securities denominated in a particular currency and forward contracts entered into by the Fund. Such imperfect correlation may prevent the Fund from achieving the intended hedge or expose the Fund to the risk of currency exchange loss. The unrealized appreciation (depreciation) on forward contracts also reflects the Fund’s exposure at the valuation date to credit loss in the event of a counterparty’s failure to perform its obligations. Open foreign currency forward contracts as of October 31, 2020, are shown in the Portfolio of Investments.
(K) Foreign Currency Transactions. The Fund’s books and records are maintained in U.S. dollars. Prices of securities denominated in foreign currency amounts are translated into U.S. dollars at the mean between the buying and selling rates last quoted by any major U.S. bank at the following dates:
| (i) | market value of investment securities, other assets and liabilities— at the valuation date; and |
| (ii) | purchases and sales of investment securities, income and expenses—at the date of such transactions. |
The assets and liabilities that are denominated in foreign currency amounts are presented at the exchange rates and market values at the close of the period. The realized and unrealized changes in net assets arising from fluctuations in exchange rates and market prices of securities are not separately presented.
Net realized gain (loss) on foreign currency transactions represents net currency gains or losses realized as a result of differences between the amounts of securities sale proceeds or purchase cost, dividends, interest and withholding taxes as recorded on the Fund’s books, and the U.S. dollar equivalent amount actually received or paid. Net currency gains or losses from valuing such foreign currency denominated assets and liabilities, other than investments at valuation date exchange rates, are reflected in unrealized foreign exchange gains or losses.
(L) Securities Lending. In order to realize additional income, the Fund may engage in securities lending, subject to the limitations set forth in the 1940 Act and relevant guidance by the staff of the Securities and Exchange Commission (“SEC”). If the Fund engages in securities lending, the Fund will lend through its custodian, currently State Street Bank and Trust Company (“State Street”) (See Note 12 for securities lending agent change), acting as securities lending agent on behalf of the Fund. Under the current arrangement, State Street will manage the Fund’s collateral in accordance with the securities lending agency agreement between the Fund and State Street, and indemnify the Fund against counterparty risk. The loans will be collateralized by cash (which may be invested in a money market fund) and/or non-cash collateral (which may include U.S. Treasury securities and/or U.S. government agency securities issued or guaranteed by the United States government or its agencies or instrumentalities) at least equal at all times to the market value of the securities loaned. The Fund bears the risk of delay in recovery of, or loss of rights in, the securities loaned. The Fund may also record a realized gain or loss on securities deemed sold due to a borrower’s inability to return securities on loan. The Fund bears the risk of any loss on investment of cash collateral. The Fund will receive compensation for lending its securities in the form of fees or it will retain a portion of interest earned on the investment of any cash collateral. The Fund will also continue to receive interest and dividends on the securities loaned and any gain or loss in the market price of the securities loaned that may occur during the term of the loan will be for the account of the Fund. Income earned from securities lending activities, if any, is reflected in the Statement of Operations. As of October 31, 2020, the Fund had securities on loan with an aggregate market value of $1,379,282 and received cash collateral, which was invested into the State Street Navigator Securities Lending Government Money Market Portfolio, with a value of $1,346,253.
(M) High Yield and General Debt Securities Risk. The ability of issuers of debt securities held by the Fund to meet their obligations may be affected by, among other things, economic or political developments in a specific country, industry or region. Debt securities are also subject to the risks associated with changes in interest rates. The Fund’s principal investments include high yield debt securities (commonly referred to as “junk bonds”), which are considered speculative because they present a greater risk of loss, including default, than higher quality debt securities. These securities pay investors a premium—a higher interest rate or yield than investment grade debt
Notes to Financial Statements (continued)
securities—because of the increased risk of loss. These securities can also be subject to greater price volatility. In times of unusual or adverse market economic or political conditions, these securities may experience higher than normal default rates.
(N) Foreign Securities Risk and Emerging Markets Risk. The ability of issuers of debt securities held by the Fund to meet their obligations may be affected by, among other things, economic or political developments in a specific country, industry or region. Debt securities are also subject to the risks associated with changes in interest rates. The Fund may invest in foreign securities, which carry certain risks that are in addition to the usual risks inherent in domestic securities. These risks include those resulting from currency fluctuations, future adverse political or economic developments and possible imposition of currency exchange blockages or other foreign governmental laws or restrictions. The ability of issuers of debt securities held by the Fund to meet their obligations may be affected by, among other things, economic or political developments in a specific country, industry or region.
The risks related to investing in foreign securities are generally greater with respect to securities of companies that conduct their business activities in emerging markets or whose securities are traded principally in emerging markets. The risks of investing in emerging markets include the risks of illiquidity, increased price volatility, smaller market capitalizations, less government regulation, less extensive and less frequent accounting, financial and other reporting requirements, loss resulting from problems in share registration and custody, substantial economic and political disruptions and the nationalization of foreign deposits or assets.
(O) Counterparty Credit Risk. In order to better define its contractual rights and to secure rights that will help the Fund mitigate its counterparty risk, the Fund may enter into an International Swaps and Derivatives Association, Inc. Master Agreement (“ISDA Master Agreement”) or similar agreement with its counterparties. An ISDA Master Agreement is a bilateral agreement between the Fund and a counterparty that governs certain OTC derivatives and typically contains collateral posting terms and netting provisions. Under an ISDA Master Agreement, the Fund may, under certain circumstances, offset with the counterparty certain derivative financial instruments’ payables and/or receivables with collateral held and/or posted and create one single net payment. The provisions of the ISDA Master Agreement typically permit a single net payment in the event of default including the bankruptcy or insolvency of the counterparty. Bankruptcy or insolvency laws of a particular jurisdiction may restrict or prohibit the right of offset in bankruptcy, insolvency or other events. In addition, certain ISDA Master Agreements may contain provisions for early termination of OTC derivative transactions in the event the net assets of the Fund decline below specific levels or if the Fund fails to meet the terms of its ISDA Master Agreements. The result would cause the Fund to accelerate payment of any net liability owed to the counterparty.
For financial reporting purposes, the Fund does not offset derivative assets and derivative liabilities that are subject to netting arrangements, if any, in the Statement of Assets and Liabilities.
(P) Indemnifications. Under the Trust’s organizational documents, its officers and trustees are indemnified against certain liabilities that may arise out of performance of their duties to the Trust. Additionally, in
the normal course of business, the Fund enters into contracts with third-party service providers that contain a variety of representations and warranties and that may provide general indemnifications. The Fund’s maximum exposure under these arrangements is unknown, as this would involve future claims that may be made against the Fund that have not yet occurred. The Manager believes that the risk of loss in connection with these potential indemnification obligations is remote. However, there can be no assurance that material liabilities related to such obligations will not arise in the future, which could adversely impact the Fund.
(Q) Quantitative Disclosure of Derivative Holdings. The following tables show additional disclosures related to the Fund’s derivative and hedging activities, including how such activities are accounted for and their effect on the Fund’s financial positions, performance and cash flows. The Fund entered into futures contracts in order to hedge against anticipated changes in interest rates that might otherwise have an adverse effect upon the value of the Fund’s securities as well as help manage the duration and yield curve positioning of the portfolio.
Fair value of derivative instruments as of October 31, 2020:
Asset Derivatives
| | | | | | | | |
| | | Foreign
Exchange
Contracts
Risk | | | Total | |
| | |
Forward Contracts—Unrealized appreciation on foreign currency forward contracts | | $ | 66,007 | | | $ | 66,007 | |
| | | | |
Total Fair Value | | $ | 66,007 | | | $ | 66,007 | |
| | | | |
Liability Derivatives
| | | | | | | | |
| | | Foreign
Exchange
Contracts
Risk | | | Total | |
| | |
Forward Contracts—Unrealized depreciation on foreign currency forward contracts | | $ | (35,633 | ) | | $ | (35,633 | ) |
| | | | |
Total Fair Value | | $ | (35,633 | ) | | $ | (35,633 | ) |
| | | | |
The effect of derivative instruments on the Statement of Operations for the year ended October 31, 2020:
Net Realized Gain (Loss) from:
| | | | | | | | | | | | |
| | | Foreign
Exchange
Contracts
Risk | | | Interest
Rate
Contracts
Risk | | | Total | |
| | | |
Futures Contracts | | $ | — | | | $ | (84,740 | ) | | $ | (84,740 | ) |
Forward Contracts | | | (34,327 | ) | | | — | | | | (34,327 | ) |
| | | | |
Total Net Realized Gain (Loss) | | $ | (34,327 | ) | | $ | (84,740 | ) | | $ | (119,067 | ) |
| | | | |
| | |
| 28 | | MainStay Candriam Emerging Markets Debt Fund |
Net Change in Unrealized Appreciation (Depreciation) from:
| | | | | | | | |
| | | Foreign
Exchange
Contracts
Risk | | | Total | |
| | |
Forward Contracts | | $ | 30,374 | | | $ | 30,374 | |
| | | | |
Total Net Change in Unrealized Appreciation (Depreciation) | | $ | 30,374 | | | $ | 30,374 | |
| | | | |
Average Notional Amount
| | | | | | | | | | | | |
| | | Foreign
Exchange
Contracts
Risk | | | Interest
Rate
Contracts
Risk | | | Total | |
| | | |
Futures Contracts Long (a) | | $ | — | | | $ | 4,582,813 | | | $ | 4,582,813 | |
Forward Contracts Long (b) | | $ | 788,311 | | | $ | — | | | $ | 788,311 | |
Forward Contracts Short (b) | | $ | (3,454,627 | ) | | $ | — | | | $ | (3,454,627 | ) |
| | | | |
| (a) | Positions were open three months during the reporting period. |
| (b) | Positions were open five months during the reporting period. |
Note 3–Fees and Related Party Transactions
(A) Manager and Subadvisor. New York Life Investments, a registered investment adviser and an indirect, wholly-owned subsidiary of New York Life Insurance Company (“New York Life”), serves as the Fund’s Manager, pursuant to an Amended and Restated Management Agreement (“Management Agreement”). The Manager provides offices, conducts clerical, recordkeeping and bookkeeping services and keeps most of the financial and accounting records required to be maintained by the Fund. Except for the portion of salaries and expenses that are the responsibility of the Fund, the Manager pays the salaries and expenses of all personnel affiliated with the Fund and certain operational expenses of the Fund. The Fund reimburses New York Life Investments in an amount equal to the portion of the compensation of the Chief Compliance Officer attributable to the Fund. Candriam Luxembourg S.C.A. (“Candriam Luxembourg” or the “Subadvisor”) as the Fund’s subadvisor. Candriam Luxembourg, a registered investment adviser and an indirect, wholly-owned subsidiary of New York Life, serves as Subadvisor to the Fund and is responsible for the day-to-day portfolio management of the Fund. Pursuant to the terms of a Subadvisory Agreement (“Subadvisory Agreement”) between New York Life Investments and Candriam Luxembourg, New York Life Investments pays for the services of the Subadvisor.
Pursuant to the Management Agreement, the Fund pays the Manager a monthly fee for the services performed and the facilities furnished at an annual rate of the Fund’s average daily net assets as follows: 0.70% to $500 million and 0.65% in excess of $500 million.
During the year ended October 31, 2020, the effective management fee rate (exclusive of any applicable waivers/reimbursements) was 0.70%.
New York Life Investments has contractually agreed to waive fees and/or reimburse expenses so that Total Annual Fund Operating Expenses (excluding taxes, interest, litigation, extraordinary expenses, brokerage and other transaction expenses relating to the purchase or sale of portfolio investments, and acquired (underlying) fund fees and expenses) do not exceed the following percentages of average daily net
assets: Class A, 1.17% and Class I, 0.85%. New York Life Investments will apply an equivalent waiver or reimbursement, in an equal number of basis points of the Class A shares waiver/reimbursement to the Investor Class, Class B and Class C shares. This agreement will remain in effect until August 31, 2021, and shall renew automatically for one-year terms unless New York Life Investments provides written notice of termination prior to the start of the next term or upon approval of the Board.
During the year ended October 31, 2020, New York Life Investments earned fees from the Fund in the amount of $858,687 and waived fees/reimbursed expenses in the amount of $206,021 and paid the Subadvisor of $326,210.
State Street provides sub-administration and sub-accounting services to the Fund pursuant to an agreement with New York Life Investments (See Note 12 for sub-administration and sub-accounting service provider change). These services include calculating the daily NAVs of the Fund, maintaining the general ledger and sub-ledger accounts for the calculation of the Fund’s NAVs and assisting New York Life Investments in conducting various aspects of the Fund’s administrative operations. For providing these services to the Fund, State Street is compensated by New York Life Investments.
Pursuant to an agreement between the Trust and New York Life Investments, New York Life Investments is responsible for providing or procuring certain regulatory reporting services for the Fund. The Fund will reimburse New York Life Investments for the actual costs incurred by New York Life Investments in connection with providing or procuring these services for the Fund.
(B) Distribution and Service Fees. The Trust, on behalf of the Fund, has entered into a distribution agreement with NYLIFE Distributors LLC (the “Distributor”), an affiliate of New York Life Investments. The Fund has adopted distribution plans (the “Plans”) in accordance with the provisions of Rule 12b-1 under the 1940 Act.
Pursuant to the Class A and Investor Class Plans, the Distributor receives a monthly distribution fee from the Class A and Investor Class shares at an annual rate of 0.25% of the average daily net assets of the Class A and Investor Class shares for distribution and/or service activities as designated by the Distributor. Pursuant to the Class B and Class C Plans, Class B and Class C shares pay the Distributor a monthly distribution fee at an annual rate of 0.75% of the average daily net assets of the Class B and Class C shares along with a service fee at an annual rate of 0.25% of the average daily net assets of the Class B and Class C shares, for a total 12b-1 fee of 1.00%. Class I shares are not subject to a distribution and/or service fee.
The Plans provide that the distribution and service fees are payable to the Distributor regardless of the amounts actually expended by the Distributor for distribution of the Fund’s shares and service activities.
(C) Sales Charges. The Fund was advised by the Distributor that the amount of initial sales charges retained on sales of Class A and Investor Class shares during the year ended October 31, 2020, were $11,873 and $2,299, respectively.
The Fund was also advised that the Distributor retained CDSCs on redemptions of Class A, Class B and Class C shares during the year ended October 31, 2020, of $665, $1,003 and $752, respectively.
Notes to Financial Statements (continued)
(D) Transfer, Dividend Disbursing and Shareholder Servicing Agent. NYLIM Service Company LLC, an affiliate of New York Life Investments, is the Fund’s transfer, dividend disbursing and shareholder servicing agent pursuant to an agreement between NYLIM Service Company LLC and the Trust. NYLIM Service Company LLC has entered into an agreement with DST Asset Manager Solutions, Inc. (“DST”), pursuant to which DST performs certain transfer agent services on behalf of NYLIM Service Company LLC. New York Life Investments has contractually agreed to limit the transfer agency expenses charged to the Fund’s share classes to a maximum of 0.35% of that share class’s average daily net assets on an annual basis after deducting any applicable Fund or class-level expense reimbursement or small account fees. This agreement will remain in effect February 28, 2021 and shall renew automatically for one-year terms unless New York Life Investments provides written notice of termination prior to the start of the next term or upon approval of the Board. During the year ended October 31, 2020, transfer agent expenses incurred by the Fund and any reimbursements, pursuant to the aforementioned Transfer Agency expense limitation agreement, were as follows:
| | | | | | | | |
Class | | Expense | | | Waived | |
| | |
Class A | | $ | 114,972 | | | $ | — | |
Investor Class | | | 66,672 | | | | — | |
Class B | | | 9,856 | | | | — | |
Class C | | | 40,008 | | | | — | |
Class I | | | 14,790 | | | | — | |
(E) Small Account Fee. Shareholders with small accounts adversely impact the cost of providing transfer agency services. In an effort to reduce total transfer agency expenses, the Fund has implemented a small account fee on certain types of accounts. As described in the Fund’s prospectus, certain shareholders with an account balance of less than $1,000 ($5,000 for Class A share accounts) are charged an annual per account fee of $20 (assessed semi-annually), the proceeds from which offset transfer agent fees as reflected in the Statement of Operations. This small account fee will not apply to certain types of accounts as described further in the Fund’s prospectus.
(F) Investments in Affiliates (in 000’s). During the year ended October 31, 2020, purchases and sales transactions, income earned from investments and shares held of investment companies managed by New York Life Investments or its affiliates were as follows:
| | | | | | | | | | | | | | | | | | | | | | | | | | | | | | | | | | | | |
Affiliated Investment Company | | Value,
Beginning of
Year | | | Purchases
at Cost | | | Proceeds
from Sales | | | Net
Realized
Gain/(Loss)
on Sales | | | Change in
Unrealized
Appreciation/
(Depreciation) | | | Value,
End of
Year | | | Dividend
Income | | | Other
Distributions | | | Shares
End of
Year | |
MainStay U.S. Government Liquidity Fund | | $ | 4,738 | | | $ | 105,355 | | | $ | (104,272 | ) | | $ | — | | | $ | — | | | $ | 5,821 | | | $ | 19 | | | $ | — | | | | 5,821 | |
Note 4–Federal Income Tax
As of October 31, 2020, the cost and unrealized appreciation (depreciation) of the Fund’s investment portfolio, including applicable derivative contracts and other financial instruments, as determined on a federal income tax basis, were as follows:
| | | | | | | | | | | | | | | | |
| | | Federal
Tax
Cost | | | Gross
Unrealized
Appreciation | | | Gross
Unrealized
(Depreciation) | | | Net
Unrealized
Appreciation/
(Depreciation) | |
| | | | |
Investments
in
Securities | | $ | 117,042,459 | | | $ | 4,493,996 | | | $ | (13,915,254 | ) | | $ | (9,421,258 | ) |
As of October 31, 2020, the components of accumulated gain (loss) on a tax basis were as follows:
| | | | | | | | |
Ordinary
Income | | Accumulated
Capital and
Other Gain
(Loss) | | Other
Temporary
Differences | | Unrealized
Appreciation
(Depreciation) | | Total
Accumulated
Gain (Loss) |
| | | | |
| $1,390,017 | | $(13,190,804) | | $(1,465,025) | | $(9,433,775) | | $(22,699,587) |
The difference between book-basis and tax-basis unrealized appreciation (depreciation) is primarily due to wash sale adjustments. The other temporary differences are primarily due to interest accruals on defaulted securities.
As of October 31, 2020, for federal income tax purposes, capital loss carryforwards of $13,082,198 were available as shown in the table below, to the extent provided by the regulations to offset future realized gains of the Fund through the years indicated. To the extent that these
capital loss carryforwards are used to offset future capital gains, it is probable that the capital gains so offset will not be distributed to shareholders. No capital gain distributions shall be made until any capital loss carryforwards have been fully utilized.
| | | | |
Capital Loss
Available Through | | Short-Term
Capital Loss
Amounts (000’s) | | Long-Term
Capital Loss
Amounts (000’s) |
| | |
| Unlimited | | $3,596 | | $9,486 |
The following table discloses the current year reclassifications between total distributable earnings (loss) and additional paid-in capital arising from permanent difference; net assets as of October 31, 2020 were not affected.
| | | | | | |
Total
Distributable
Earnings (Loss) | | | Additional
Paid-In
Capital | |
| $ | 11,760 | | | $ | (11,760 | ) |
The reclassifications for the Fund are primarily due to non-deductible excise tax paid.
During the years ended October 31, 2020, and October 31, 2019, the tax character of distributions paid as reflected in the Statements of Changes in Net Assets were as follows:
| | | | | | | | |
| | | 2020 | | | 2019 | |
| | |
Distributions paid from: | | | | | | | | |
Ordinary Income | | $ | 5,406,608 | | | $ | 6,909,064 | |
| | |
| 30 | | MainStay Candriam Emerging Markets Debt Fund |
Note 5–Custodian
State Street is the custodian of cash and securities held by the Fund (See Note 12 for custodian change). Custodial fees are charged to the Fund based on the Fund’s net assets and/or the market value of securities held by the Fund and the number of certain transactions incurred by the Fund.
Note 6–Line of Credit
The Fund and certain other funds managed by New York Life Investments maintain a line of credit with a syndicate of banks in order to secure a source of funds for temporary purposes to meet unanticipated or excessive redemption requests.
Effective July 28, 2020, under the credit agreement (the “Credit Agreement”), the aggregate commitment amount is $600,000,000 with an additional uncommitted amount of $100,000,000. The commitment fee is an annual rate of 0.15% of the average commitment amount payable quarterly, regardless of usage, to JPMorgan Chase Bank NA, who serves as the agent to the syndicate. The commitment fee is allocated among the Fund and certain other funds managed by New York Life Investments based upon their respective net assets and other factors. Interest on any revolving credit loan is charged based upon the Federal Funds Rate or the one-month London Interbank Offered Rate (“LIBOR”), whichever is higher. The Credit Agreement expires on July 27, 2021, although the Fund, certain other funds managed by New York Life Investments and the syndicate of banks may renew the Credit Agreement for an additional year on the same or different terms or enter into a credit agreement with a different syndicate of banks. Prior to July 28, 2020, the aggregate commitment amount and the commitment fee were the same as those under the current Credit Agreement, but State Street served as agent to the syndicate. During the year ended October 31, 2020, there were no borrowings made or outstanding with respect to the Fund under the Credit Agreement or the credit agreement for which State Street served as agent.
Note 7–Interfund Lending Program
Pursuant to an exemptive order issued by the SEC, the Fund, along with certain other funds managed by New York Life Investments, may participate in an interfund lending program. The interfund lending program provides an alternative credit facility that permits the Fund and certain other funds managed by New York Life Investments to lend or borrow money for temporary purposes directly to or from one another subject to the conditions of the exemptive order. During the year ended October 31, 2020, there were no interfund loans made or outstanding with respect to the Fund.
Note 8–Purchases and Sales of Securities (in 000’s)
During the year ended October 31, 2020, purchases and sales of securities, other than short-term securities, were $116,410 and $140,398, respectively.
Note 9–Capital Share Transactions
Transactions in capital shares for the years ended October 31, 2020, and October 31, 2019, were as follows:
| | | | | | | | |
Class A | | Shares | | | Amount | |
| | |
Year ended October 31, 2020: | | | | | | | | |
Shares sold | | | 696,868 | | | $ | 6,940,578 | |
Shares issued to shareholders in reinvestment of distributions | | | 375,972 | | | | 3,684,567 | |
Shares redeemed | | | (1,678,861 | ) | | | (16,459,620 | ) |
| | | | |
Net increase (decrease) in shares outstanding before conversion | | | (606,021 | ) | | | (5,834,475 | ) |
Shares converted into Class A (See Note 1) | | | 125,083 | | | | 1,241,731 | |
Shares converted from Class A (See Note 1) | | | (3,814 | ) | | | (32,724 | ) |
| | | | |
Net increase (decrease) | | | (484,752 | ) | | $ | (4,625,468 | ) |
| | | | |
Year ended October 31, 2019: | | | | | | | | |
Shares sold | | | 2,555,502 | | | $ | 26,374,018 | |
Shares issued to shareholders in reinvestment of distributions | | | 407,217 | | | | 4,170,024 | |
Shares redeemed | | | (3,094,426 | ) | | | (31,724,904 | ) |
| | | | |
Net increase (decrease) in shares outstanding before conversion | | | (131,707 | ) | | | (1,180,862 | ) |
Shares converted into Class A (See Note 1) | | | 183,520 | | | | 1,899,175 | |
Shares converted from Class A (See Note 1) | | | (24,697 | ) | | | (257,842 | ) |
| | | | |
Net increase (decrease) | | | 27,116 | | | $ | 460,471 | |
| | | | |
|
| |
Investor Class | | Shares | | | Amount | |
| | |
Year ended October 31, 2020: | | | | | | | | |
Shares sold | | | 84,985 | | | $ | 814,508 | |
Shares issued to shareholders in reinvestment of distributions | | | 60,127 | | | | 595,107 | |
Shares redeemed | | | (219,231 | ) | | | (2,167,018 | ) |
| | | | |
Net increase (decrease) in shares outstanding before conversion | | | (74,119 | ) | | | (757,403 | ) |
Shares converted into Investor Class (See Note 1) | | | 43,802 | | | | 437,065 | |
Shares converted from Investor Class (See Note 1) | | | (93,645 | ) | | | (945,640 | ) |
| | | | |
Net increase (decrease) | | | (123,962 | ) | | $ | (1,265,978 | ) |
| | | | |
Year ended October 31, 2019: | | | | | | | | |
Shares sold | | | 266,774 | | | $ | 2,815,350 | |
Shares issued to shareholders in reinvestment of distributions | | | 69,446 | | | | 716,993 | |
Shares redeemed | | | (416,144 | ) | | | (4,359,048 | ) |
| | | | |
Net increase (decrease) in shares outstanding before conversion | | | (79,924 | ) | | | (826,705 | ) |
Shares converted into Investor Class (See Note 1) | | | 106,852 | | | | 1,106,499 | |
Shares converted from Investor Class (See Note 1) | | | (134,281 | ) | | | (1,408,214 | ) |
| | | | |
Net increase (decrease) | | | (107,353 | ) | | $ | (1,128,420 | ) |
| | | | |
|
| |
Notes to Financial Statements (continued)
| | | | | | | | |
Class B | | Shares | | | Amount | |
| | |
Year ended October 31, 2020: | | | | | | | | |
Shares sold | | | 3,472 | | | $ | 31,047 | |
Shares issued to shareholders in reinvestment of distributions | | | 6,737 | | | | 64,708 | |
Shares redeemed | | | (47,132 | ) | | | (446,113 | ) |
| | | | |
Net increase (decrease) in shares outstanding before conversion | | | (36,923 | ) | | | (350,358 | ) |
Shares converted from Class B (See Note 1) | | | (36,532 | ) | | | (357,664 | ) |
| | | | |
Net increase (decrease) | | | (73,455 | ) | | $ | (708,022 | ) |
| | | | |
Year ended October 31, 2019: | | | | | | | | |
Shares sold | | | 75,759 | | | $ | 774,548 | |
Shares issued to shareholders in reinvestment of distributions | | | 10,855 | | | | 108,400 | |
Shares redeemed | | | (161,907 | ) | | | (1,630,432 | ) |
| | | | |
Net increase (decrease) in shares outstanding before conversion | | | (75,293 | ) | | | (747,484 | ) |
Shares converted from Class B (See Note 1) | | | (49,399 | ) | | | (494,342 | ) |
| | | | |
Net increase (decrease) | | | (124,692 | ) | | $ | (1,241,826 | ) |
| | | | |
|
| |
Class C | | Shares | | | Amount | |
| | |
Year ended October 31, 2020: | | | | | | | | |
Shares sold | | | 60,247 | | | $ | 591,756 | |
Shares issued to shareholders in reinvestment of distributions | | | 29,700 | | | | 285,515 | |
Shares redeemed | | | (478,295 | ) | | | (4,597,030 | ) |
| | | | |
Net increase (decrease) in shares outstanding before conversion | | | (388,348 | ) | | | (3,719,759 | ) |
Shares converted from Class C (See Note 1) | | | (35,796 | ) | | | (342,768 | ) |
| | | | |
Net increase (decrease) | | | (424,144 | ) | | $ | (4,062,527 | ) |
| | | | |
Year ended October 31, 2019: | | | | | | | | |
Shares sold | | | 52,255 | | | $ | 529,219 | |
Shares issued to shareholders in reinvestment of distributions | | | 53,732 | | | | 535,313 | |
Shares redeemed | | | (954,406 | ) | | | (9,640,685 | ) |
| | | | |
Net increase (decrease) in shares outstanding before conversion | | | (848,419 | ) | | | (8,576,153 | ) |
Shares converted from Class C (See Note 1) | | | (84,254 | ) | | | (845,276 | ) |
| | | | |
Net increase (decrease) | | | (932,673 | ) | | $ | (9,421,429 | ) |
| | | | |
|
| |
Class I | | Shares | | | Amount | |
| | |
Year ended October 31, 2020: | | | | | | | | |
Shares sold | | | 353,067 | | | $ | 3,660,705 | |
Shares issued to shareholders in reinvestment of distributions | | | 51,147 | | | | 510,097 | |
Shares redeemed | | | (1,355,592 | ) | | | (12,008,853 | ) |
| | | | |
Net increase (decrease) | | | (951,378 | ) | | $ | (7,838,051 | ) |
| | | | |
Year ended October 31, 2019: | | | | | | | | |
Shares sold | | | 6,746,992 | | | $ | 71,346,375 | |
Shares issued to shareholders in reinvestment of distributions | | | 101,826 | | | | 1,060,045 | |
Shares redeemed | | | (6,289,438 | ) | | | (66,511,402 | ) |
| | | | |
Net increase (decrease) | | | 559,380 | | | $ | 5,895,018 | |
| | | | |
Note 10–Recent Accounting Pronouncement
To improve the effectiveness of fair value disclosure requirements, the Financial Accounting Standards Board issued Accounting Standards Update 2018-13, Fair Value Measurement Disclosure Framework— Changes to the Disclosure Requirements for Fair Value Measurement (“ASU 2018-13”), which adds, removes, and modifies certain fair value measurement disclosure requirements. ASU 2018-13 is effective for interim and annual reporting periods beginning after December 15, 2019. The Manager evaluated the implications of certain provisions of ASU 2018-13 and determined to early adopt aspects related to the removal and modifications of certain fair value measurement disclosures, which are currently in place as of October 31, 2020. The Manager is evaluating the implications of certain other provisions of ASU 2018-13 related to new disclosure requirements and has not yet determined the impact of those provisions on the financial statement disclosures, if any.
In March 2020, the Financial Accounting Standards Board (“FASB”) issued Accounting Standards Update 2020-04 (“ASU 2020-04”), which provides optional guidance to ease the potential accounting burden associated with transitioning away from LIBOR and other reference rates that are expected to be discontinued. ASU 2020-04 is effective immediately upon release of the update on March 12, 2020, through December 31, 2022. At this time, the Manager is evaluating the implications of certain other provisions of ASU 2020-04 related to new disclosure requirements and any impact on the financial statement disclosures has not yet been determined.
Note 11–Other Matters
An outbreak of COVID-19, first detected in December 2019, has developed into a global pandemic and has resulted in travel restrictions, closure of international borders, certain businesses and securities markets, restrictions on securities trading activities, prolonged quarantines, supply chain disruptions, and lower consumer demand, as well as general concern and uncertainty. The continued impact of COVID-19 is uncertain and could further adversely affect the global economy, national economies, individual issuers and capital markets in unforeseeable ways and result in a substantial and extended economic downturn. Developments that disrupt global economies and financial markets, such as COVID-19, may magnify factors that affect the Fund’s performance.
Note 12–Subsequent Events
In connection with the preparation of the financial statements of the Fund as of and for the year ended October 31, 2020, events and transactions subsequent to October 31, 2020, through the date the financial statements were issued have been evaluated by the Manager, for possible adjustment and/or disclosure. No subsequent events requiring financial statement adjustment or disclosure have been identified other than the following:
Effective at the close of business on November 20, 2020, all services provided by State Street were transitioned to JPMorgan Chase Bank, N.A.
| | |
| 32 | | MainStay Candriam Emerging Markets Debt Fund |
Report of Independent Registered Public Accounting Firm
To the Shareholders of the Fund and Board of Trustees
The MainStay Funds:
Opinion on the Financial Statements
We have audited the accompanying statement of assets and liabilities of MainStay Candriam Emerging Markets Debt Fund (the Fund), one of the funds constituting The MainStay Funds, including the portfolio of investments, as of October 31, 2020, the related statement of operations for the year then ended, the statements of changes in net assets for each of the years in the two-year period then ended, and the related notes (collectively, the financial statements) and the financial highlights for each of the years in the five-year period then ended. In our opinion, the financial statements and financial highlights present fairly, in all material respects, the financial position of the Fund as of October 31, 2020, the results of its operations for the year then ended, the changes in its net assets for each of the years in the two-year period then ended, and the financial highlights for each of the years in the five-year period then ended, in conformity with U.S. generally accepted accounting principles.
Basis for Opinion
These financial statements and financial highlights are the responsibility of the Fund’s management. Our responsibility is to express an opinion on these financial statements and financial highlights based on our audits. We are a public accounting firm registered with the Public Company Accounting Oversight Board (United States) (PCAOB) and are required to be independent with respect to the Fund in accordance with the U.S. federal securities laws and the applicable rules and regulations of the Securities and Exchange Commission and the PCAOB.
We conducted our audits in accordance with the standards of the PCAOB. Those standards require that we plan and perform the audit to obtain reasonable assurance about whether the financial statements and financial highlights are free of material misstatement, whether due to error or fraud. Our audits included performing procedures to assess the risks of material misstatement of the financial statements and financial highlights, whether due to error or fraud, and performing procedures that respond to those risks. Such procedures included examining, on a test basis, evidence regarding the amounts and disclosures in the financial statements and financial highlights. Such procedures also included confirmation of securities owned as of October 31, 2020, by correspondence with the custodian, the transfer agent, and brokers or by other appropriate auditing procedures when replies from brokers were not received. Our audits also included evaluating the accounting principles used and significant estimates made by management, as well as evaluating the overall presentation of the financial statements and financial highlights. We believe that our audits provide a reasonable basis for our opinion.

We have served as the auditor of one or more New York Life Investment Management investment companies since 2003.
Philadelphia, Pennsylvania
December 23, 2020
Federal Income Tax Information
(Unaudited)
The Fund is required under the Internal Revenue Code to advise shareholders in a written statement as to the federal tax status of dividends paid by the Fund during such fiscal years.
For the fiscal year ended October 31, 2020, the Fund designated approximately $37 under the Internal Revenue Code as qualified dividend income eligible for reduced tax rates.
In February 2021, shareholders will receive an IRS Form 1099-DIV or substitute Form 1099, which will show the federal tax status of the distributions received by shareholders in calendar year 2020. The amounts that will be reported on such 1099-DIV or substitute Form 1099 will be the amounts you are to use on your federal income tax return and will differ from the amounts reported for the Fund’s fiscal year ended October 31, 2020.
Proxy Voting Policies and Procedures and Proxy Voting Record
A description of the policies and procedures that New York Life Investments uses to vote proxies related to the Fund’s securities is available free of charge upon request, by visiting the MainStay Funds’ website at newyorklifeinvestments.com or visiting the SEC’s website at www.sec.gov.
The Fund is required to file with the SEC its proxy voting records for the 12-month period ending June 30 on Form N-PX. The most recent Form N-PX or proxy voting record is available free of charge upon request by calling 800-624-6782; visiting the MainStay Funds’ website at newyorklifeinvestments.com; or visiting the SEC’s website at www.sec.gov.
Shareholder Reports and Quarterly Portfolio Disclosure
The Fund is required to file its complete schedule of portfolio holdings with the SEC 60 days after its first and third fiscal quarter on Form N-PORT. The Fund’s holdings report is available free of charge by visiting the SEC’s website at www.sec.gov or upon request by calling New York Life Investments at 800-624-6782.
| | |
| 34 | | MainStay Candriam Emerging Markets Debt Fund |
Board of Trustees and Officers (Unaudited)
The Trustees and officers of the Funds are listed below. The Board oversees the MainStay Group of Funds (which consists of MainStay Funds and MainStay Funds Trust), MainStay VP Funds Trust, MainStay MacKay DefinedTerm Municipal Opportunities Fund, the Manager and the Subadvisors, and elects the officers of the Funds who are responsible for the day-to-day operations of the Funds. Information pertaining to the Trustees and officers is set forth below. Each Trustee serves until his or her successor is elected and qualified or until his or her
resignation, death or removal. Under the Board’s retirement policy, unless an exception is made, a Trustee must tender his or her resignation by the end of the calendar year during which he or she reaches the age of 75. Officers are elected annually by the Board. The business address of each Trustee and officer listed below is 51 Madison Avenue, New York, New York 10010. A majority of the Trustees are not “interested persons” (as defined by the 1940 Act and rules adopted by the SEC thereunder) of the Fund (“Independent Trustees”).
| | | | | | | | | | | | |
| | | | | Name and
Year of Birth | | Term of Office,
Position(s) Held and
Length of Service | | Principal Occupation(s)
During Past Five Years | | Number of
Portfolios in
Fund Complex
Overseen by
Trustee | | Other Directorships
Held by Trustee |
Interested Trustee | | | | Yie-Hsin Hung* 1962 | | MainStay Funds:
Trustee since 2017 MainStay Funds Trust:
Trustee since 2017 | | Senior Vice President of New York Life since joining in 2010, Member of the Executive Management Committee since 2017, Chief Executive Officer, New York Life Investment Management Holdings LLC & New York Life Investment Management LLC since 2015. Senior Managing Director and Co-President of New York Life Investment Management LLC from 2014 to May 2015. Previously held positions of increasing responsibility, including head of NYLIM International, Alternative Growth Businesses, and Institutional investments since joining New York Life in 2010. | | 78 | | MainStay VP Funds Trust:
Trustee since 2017 (31 portfolios); and
MainStay MacKay DefinedTerm Municipal Opportunities Fund: Trustee since 2017. |
| | * | This Trustee is considered to be an “interested person” of the MainStay Group of Funds, MainStay VP Funds Trust and MainStay MacKay DefinedTerm Municipal Opportunities Fund, within the meaning of the 1940 Act because of her affiliation with New York Life Insurance Company, New York Life Investment Management LLC, Candriam Belgium S.A., Candriam Luxembourg S.C.A., IndexIQ Advisors LLC, MacKay Shields LLC, NYL Investors LLC, NYLIFE Securities LLC and/or NYLIFE Distributors LLC, as described in detail above in the column entitled “Principal Occupation(s) During Past Five Years.” |
Board of Trustees and Officers (Unaudited) (continued)
| | | | | | | | | | | | |
| | | | | Name and
Year of Birth | | Term of Office,
Position(s) Held and
Length of Service | | Principal Occupation(s)
During Past Five Years | | Number of
Portfolios in
Fund Complex
Overseen by
Trustee | | Other Directorships
Held by Trustee |
Independent Trustees | | | | David H. Chow 1957 | | MainStay Funds:
Trustee since 2016, Advisory Board Member (June 2015 to December 2015); MainStay Funds Trust:
Trustee since 2016, Advisory Board Member (June 2015 to December 2015). | | Founder and CEO, DanCourt Management, LLC since 1999 | | 78 | | MainStay VP Funds Trust: Trustee since 2016, Advisory Board Member (June 2015 to December 2015) (31 portfolios);
MainStay MacKay DefinedTerm Municipal Opportunities Fund: Trustee since 2016, Advisory Board Member (June 2015 to December 2015); Market Vectors Group of Exchange-Traded Funds: Independent Chairman of the Board of Trustees since 2008 and Trustee since 2006 (56 portfolios); and
Berea College of Kentucky: Trustee since 2009, Chair of the Investment Committee since 2018. |
| | | | Susan B. Kerley 1951 | | MainStay Funds:
Chairman since 2017 and Trustee since 2007; MainStay Funds Trust: Chairman since 2017 and Trustee since 1990.** | | President, Strategic Management Advisors LLC since 1990 | | 78 | | MainStay VP Funds Trust: Chairman since 2017 and Trustee since 2007 (31 portfolios)***;
MainStay MacKay DefinedTerm Municipal Opportunities Fund: Chairman since 2017 and Trustee since 2011; and
Legg Mason Partners Funds: Trustee since 1991 (45 portfolios). |
| | | | Alan R. Latshaw 1951 | | MainStay Funds:
Trustee; MainStay Funds Trust:
Trustee and Audit Committee Financial Expert since 2007.** | | Retired; Partner, Ernst & Young LLP (2002 to 2003); Partner, Arthur Andersen LLP (1989 to 2002); Consultant to the MainStay Funds Audit and Compliance Committee (2004 to 2006) | | 78 | | MainStay VP Funds Trust: Trustee and Audit Committee Financial Expert since 2007 (31 portfolios)***;
MainStay MacKay DefinedTerm Municipal Opportunities Fund: Trustee and Audit Committee Financial Expert since 2011; and
State Farm Associates Funds Trusts: Trustee since 2005 (4 portfolios). |
| | | | Richard H. Nolan, Jr. 1946 | | MainStay Funds:
Trustee since 2007; MainStay Funds Trust:
Trustee since 2007.** | | Managing Director, ICC Capital Management since 2004; President—Shields/Alliance, Alliance Capital Management (1994 to 2004) | | 78 | | MainStay VP Funds Trust: Trustee since 2006 (31 portfolios)***; and
MainStay MacKay DefinedTerm Municipal Opportunities Fund: Trustee since 2011. |
| | | | Jacques P. Perold 1958 | | MainStay Funds:
Trustee since 2016, Advisory Board Member (June 2015 to December 2015); MainStay Funds Trust:
Trustee since 2016, Advisory Board Member (June 2015 to December 2015). | | Founder and Chief Executive Officer, CapShift LLC since 2018; President, Fidelity Management & Research Company (2009 to 2014); Founder, President and Chief Executive Officer, Geode Capital Management, LLC (2001 to 2009) | | 78 | | MainStay VP Funds Trust: Trustee since 2016, Advisory Board Member (June 2015 to December 2015) (31 portfolios);
MainStay MacKay DefinedTerm Municipal Opportunities Fund: Trustee since 2016, Advisory Board Member (June 2015 to December 2015); Partners in Health: Trustee since 2019; Allstate Corporation: Director since 2015;
MSCI, Inc.: and Director since 2017. |
| | |
| 36 | | MainStay Candriam Emerging Markets Debt Fund |
| | | | | | | | | | | | |
| | | | | Name and
Year of Birth | | Term of Office,
Position(s) Held and
Length of Service | | Principal Occupation(s)
During Past Five Years | | Number of
Portfolios in
Fund Complex
Overseen by
Trustee | | Other Directorships
Held by Trustee |
Independent Trustees | | | | Richard S. Trutanic 1952 | | MainStay Funds: Trustee since 1994; MainStay Funds Trust: Trustee since 2007.** | | Chairman and Chief Executive Officer, Somerset & Company (financial advisory firm) since 2004; Managing Director, The Carlyle Group (private investment firm) (2002 to 2004); Senior Managing Director, Partner and Board Member, Groupe Arnault S.A. (private investment firm) (1999 to 2002) | | 78 | | MainStay VP Funds Trust: Trustee since 2007 (31 portfolios)***; and
MainStay MacKay DefinedTerm Municipal Opportunities Fund: Trustee since 2011. |
| | ** | Includes prior service as a Director/Trustee of certain predecessor entities to MainStay Funds Trust. |
| | *** | Includes prior service as a Director of MainStay VP Series Fund, Inc., the predecessor to MainStay VP Funds Trust. |
Board of Trustees and Officers (Unaudited) (continued)
| | | | | | | | |
| | | | | Name and
Year of Birth | | Position(s) Held and
Length of Service | | Principal Occupation(s)
During Past Five Years |
Officers
of the
Trust
(Who are
not
Trustees)* | | | | Kirk C. Lehneis 1974 | | President, MainStay Funds, MainStay Funds Trust since 2017 | | Chief Operating Officer and Senior Managing Director since 2016, New York Life Investment Management LLC and New York Life Investment Management Holdings LLC; Member of the Board of Managers since 2017 and Senior Managing Director since 2018, NYLIFE Distributors LLC; Chairman of the Board and Senior Managing Director, NYLIM Service Company LLC since 2017; Trustee, President and Principal Executive Officer of IndexIQ Trust, IndexIQ ETF Trust and IndexIQ Active ETF Trust since 2018; President, MainStay MacKay DefinedTerm Municipal Opportunities Fund and MainStay VP Funds Trust since 2017**; Senior Managing Director, Global Product Development (2015 to 2016); Managing Director, Product Development (2010 to 2015), New York Life Investment Management LLC |
| | | | Jack R. Benintende 1964 | | Treasurer and Principal Financial and Accounting Officer, MainStay Funds since 2007, MainStay Funds Trust since 2009 | | Managing Director, New York Life Investment Management LLC since 2007; Treasurer and Principal Financial and Accounting Officer, MainStay MacKay DefinedTerm Municipal Opportunities Fund since 2011 and MainStay VP Funds Trust since 2007**; and Assistant Treasurer, New York Life Investment Management Holdings LLC (2008 to 2012) |
| | | | Yi-Chia Kuo 1981 | | Vice President and Chief Compliance Officer, MainStay Funds and MainStay Funds Trust since January 2020 | | Chief Compliance Officer, Index IQ Trust, Index IQ ETF Trust and Index IQ Active ETF Trust since January 2020; Vice President and Chief Compliance Officer, MainStay MacKay DefinedTerm Municipal Opportunities Fund and MainStay VP Funds Trust since January 2020; Director and Associate General Counsel, New York Life Insurance Company (2015 to 2019) |
| | | | J. Kevin Gao 1967 | | Secretary and Chief Legal Officer, MainStay Funds and MainStay Funds Trust since 2010 | | Managing Director and Associate General Counsel, New York Life Investment Management LLC since 2010; Secretary and Chief Legal Officer, MainStay MacKay DefinedTerm Municipal Opportunities Fund since 2011 and MainStay VP Funds Trust since 2010** |
| | | | Scott T. Harrington 1959 | | Vice President— Administration, MainStay Funds since 2005, MainStay Funds Trust since 2009 | | Managing Director, New York Life Investment Management LLC (including predecessor advisory organizations) since 2000; Member of the Board of Directors, New York Life Trust Company since 2009; Vice President—Administration, MainStay MacKay DefinedTerm Municipal Opportunities Fund since 2011 and MainStay VP Funds Trust since 2005** |
| | * | The officers listed above are considered to be “interested persons” of the MainStay Group of Funds, MainStay VP Funds Trust and MainStay MacKay DefinedTerm Municipal Opportunities Fund within the meaning of the 1940 Act because of their affiliation with the MainStay Group of Funds, New York Life Insurance Company and/or its affiliates, including New York Life Investment Management LLC, NYLIM Service Company LLC, NYLIFE Securities LLC and/or NYLIFE Distributors LLC, as described in detail in the column captioned “Principal Occupation(s) During Past Five Years.” Officers are elected annually by the Board. |
| | ** | Includes prior service as an Officer of MainStay VP Series Fund, Inc., the predecessor to MainStay VP Funds Trust. |
| | |
| 38 | | MainStay Candriam Emerging Markets Debt Fund |
MainStay Funds
Equity
U.S. Equity
MainStay Epoch U.S. All Cap Fund
MainStay Epoch U.S. Equity Yield Fund
MainStay MacKay Common Stock Fund
MainStay MacKay Growth Fund
MainStay MacKay S&P 500 Index Fund
MainStay MacKay Small Cap Core Fund
MainStay MacKay U.S. Equity Opportunities Fund
MainStay MAP Equity Fund
MainStay Winslow Large Cap Growth Fund1
International Equity
MainStay Epoch International Choice Fund
MainStay MacKay International Equity Fund
MainStay MacKay International Opportunities Fund
Emerging Markets Equity
MainStay Candriam Emerging Markets Equity Fund
Global Equity
MainStay Epoch Capital Growth Fund
MainStay Epoch Global Equity Yield Fund
Fixed Income
Taxable Income
MainStay Candriam Emerging Markets Debt Fund
MainStay Floating Rate Fund
MainStay MacKay High Yield Corporate Bond Fund
MainStay MacKay Short Duration High Yield Fund
MainStay MacKay Total Return Bond Fund
MainStay MacKay Unconstrained Bond Fund
MainStay MacKay U.S. Infrastructure Bond Fund2
MainStay Short Term Bond Fund3
Tax-Exempt Income
MainStay MacKay California Tax Free Opportunities Fund4
MainStay MacKay High Yield Municipal Bond Fund
MainStay MacKay Intermediate Tax Free Bond Fund
MainStay MacKay New York Tax Free Opportunities Fund5
MainStay MacKay Short Term Municipal Fund
MainStay MacKay Tax Free Bond Fund
Money Market
MainStay Money Market Fund
Mixed Asset
MainStay Balanced Fund
MainStay Income Builder Fund
MainStay MacKay Convertible Fund
Speciality
MainStay CBRE Global Infrastructure Fund
MainStay CBRE Real Estate Fund
MainStay Cushing MLP Premier Fund
Asset Allocation
MainStay Conservative Allocation Fund
MainStay Conservative ETF Allocation Fund
MainStay Defensive ETF Allocation Fund
MainStay Equity Allocation Fund6
MainStay Equity ETF Allocation Fund
MainStay Growth Allocation Fund7
MainStay Growth ETF Allocation Fund
MainStay Moderate Allocation Fund
MainStay Moderate ETF Allocation Fund
Manager
New York Life Investment Management LLC
New York, New York
Subadvisors
Candriam Belgium S.A.8
Brussels, Belgium
Candriam Luxembourg S.C.A.8
Strassen, Luxembourg
CBRE Clarion Securities LLC
Radnor, Pennsylvania
Cushing Asset Management, LP
Dallas, Texas
Epoch Investment Partners, Inc.
New York, New York
MacKay Shields LLC8
New York, New York
Markston International LLC
White Plains, New York
NYL Investors LLC8
New York, New York
Winslow Capital Management, LLC
Minneapolis, Minnesota
Legal Counsel
Dechert LLP
Washington, District of Columbia
Independent Registered Public Accounting Firm
KPMG LLP
Philadelphia, Pennsylvania
Distributor
NYLIFE Distributors LLC8
Jersey City, New Jersey
Custodian9
State Street Bank and Trust Company
Boston, Massachusetts
| 1. | Formerly known as MainStay Large Cap Growth Fund. |
| 2. | Formerly known as MainStay MacKay Infrastructure Bond Fund. |
| 3. | Formerly known as MainStay Indexed Bond Fund. |
| 4. | This Fund is registered for sale in AZ, CA, NV, OR, TX, UT and WA. Class A and Class I shares are registered for sale in MI. Class I and Class C2 shares are registered for sale in CO, FL, GA, HI, ID, MA, MD, NH, NJ and NY. |
| 5. | This Fund is registered for sale in CA, CT, DE, FL, MA, NJ, NY and VT. |
| 6. | Formerly known as MainStay Growth Allocation Fund. |
| 7. | Formerly known as MainStay Moderate Growth Allocation Fund. |
| 8. | An affiliate of New York Life Investment Management LLC. |
| 9. | JPMorgan Chase Bank, N.A., New York, New York is the custodian for the MainStay ETF Asset Allocation Funds and effective at the close of business on November 20, 2020, became the custodian for other MainStay Funds. The custodian for MainStay Cushing MLP Premier Fund is U.S. Bank National Association, Milwaukee, Wisconsin. |
Not part of the Annual Report
For more information
800-624-6782
newyorklifeinvestments.com
“New York Life Investments” is both a service mark, and the common trade name, of certain investment advisors affiliated with New York Life Insurance Company. The MainStay Funds® are managed by New York Life Investment Management LLC and distributed by NYLIFE Distributors LLC, 30 Hudson Street, Jersey City, NJ 07302, a wholly owned subsidiary of New York Life Insurance Company. NYLIFE Distributors LLC is a Member FINRA/SIPC.
©2020 NYLIFE Distributors LLC. All rights reserved.
| | |
| 1717391 MS203-20 | | MSCEMD11-12/20 (NYLIM) NL218 |
MainStay Income Builder Fund
Message from the President and Annual Report
October 31, 2020
Beginning on January 1, 2021, paper copies of each MainStay Fund’s annual and semiannual shareholder reports will no longer be sent by mail, unless you specifically request paper copies of the reports from MainStay Funds or from your financial intermediary. Instead, the reports will be made available on the MainStay Funds’ website. You will be notified by mail and provided with a website address to access the report each time a new report is posted to the website.
If you already elected to receive shareholder reports electronically, you will not be affected by this change and you need not take any action. At any time, you may elect to receive reports and other communications from MainStay Funds electronically by calling toll-free 800-624-6782, by sending an e-mail to MainStayShareholderServices@nylim.com, or by contacting your financial intermediary.
You may elect to receive all future shareholder reports in paper form free of charge. If you hold shares of a MainStay Fund directly, you can inform MainStay Funds that you wish to receive paper copies of reports by calling toll-free 800-624-6782 or by sending an e-mail to MainStayShareholderServices@nylim.com. If you hold shares of a MainStay Fund through a financial intermediary, please contact the financial intermediary to make this election. Your election to receive reports in paper form will apply to all MainStay Funds in which you are invested and may apply to all funds held with your financial intermediary.
| | | | | | | | |
| Not FDIC/NCUA Insured | | Not a Deposit | | May Lose Value | | No Bank Guarantee | | Not Insured by Any Government Agency |

This page intentionally left blank
Message from the President
Despite historically high levels of volatility generated by the global coronavirus pandemic and a host of other geopolitical and economic uncertainties, most broad U.S. stock and bond markets gained ground during the 12-month reporting period ended October 31, 2020.
The reporting period began on an upswing, with markets rising on generally positive underlying economic trends and the announcement of a U.S.-China trade deal. However, in mid-February 2020, stock and bond indices began to dip as growing numbers of COVID-19 cases appeared in hotspots around the world. By early March, the disease reached pandemic proportions. As governments struggled to support overburdened health care systems by issuing “stay-at-home” orders and other restrictions on nonessential activity, global economic activity slowed, driving most stocks and bonds sharply lower.
The United States was hit particularly hard by the pandemic, with more reported COVID-19 cases and deaths than any other country in the world throughout the second half of the reporting period. As the pandemic deepened, the U.S. Federal Reserve (“Fed”) twice cut interest rates and announced unlimited quantitative easing. The federal government declared a national emergency, and Congress passed and the President signed a $2 trillion stimulus package. Markets responded positively to these measures, as well as to a gradual lessening of restrictions on nonessential businesses, hopes for additional stimulus and apparent progress in the development of a vaccine. By late August, the S&P 500® Index, a widely regarded benchmark of market performance, had not only regained all the ground it lost earlier in the reporting period, the Index had reached new record levels. However, a resurgence of coronavirus cases in many parts of the country and uncertainties related to the November 3, 2020, U.S. presidential election caused markets to falter as the reporting period drew to a close.
Nevertheless, for the reporting period as a whole, U.S. equity indices generally produced moderate gains. Returns proved strongest among large-cap, growth-oriented stocks, while small- and mid-cap issues lagged. Within the S&P 500® Index, the information technology and consumer discretionary sectors produced exceptionally strong gains, buoyed by strong corporate and consumer spending, while the health care sector outperformed by a smaller margin. Materials and consumer staples sectors generated positive returns, but lagged the S&P 500® Index. The industrials, utilities, communication services, financials, real estate and energy sectors ended the reporting period in negative territory, with the energy sector
suffering the steepest losses due to weak global demand. International equities declined sharply in February and March 2020 before recovering somewhat, but tended to lag their U.S. counterparts due to weaker underlying economic growth and somewhat less aggressive monetary and fiscal stimulus. Emerging-market equities tracked the performance of U.S. equity markets more closely, led by relatively strong returns in Asian markets, such as China and South Korea.
Fixed-income markets experienced an environment that tended to favor higher credit quality and longer duration securities. Corporate bonds followed the pattern of equities, with prices declining in March 2020 before subsequently recovering. Relatively speculative high-yield credit was hardest hit during the market sell-off in early 2020 and continued to underperform during the remainder of the reporting period. Similarly, among municipal bond issues, high-grade bonds outperformed, dipping briefly in mid-March before regaining the lost ground. Recognized safe havens, such as U.S. government bonds, attracted increased investment during the height of the market sell-off, driving yields lower and prices higher. As a result, long-term Treasury bonds delivered particularly strong gains for the reporting period as a whole. Emerging-market debt, on the other hand, underperformed most other bond types as investors sought to minimize currency and sovereign risks.
Although the ongoing pandemic continues to change the way that many of us work and live our lives, at New York Life Investments, we remain dedicated to providing you, as a MainStay investor, with products, information and services to help you to navigate today’s rapidly changing investment environment. By taking appropriate steps to minimize community spread of COVID-19 within our organization and despite the challenges posed by the coronavirus pandemic, we continue to innovate with you in mind, introducing new suites of Funds and providing continuous insights into ever-evolving markets and investment strategies. Our goal is to give you the tools you need to build a resilient portfolio in the face of uncertain times.
Sincerely,

Kirk C. Lehneis
President
The opinions expressed are as of the date of this report and are subject to change. There is no guarantee that any forecast made will come to pass. This material does not constitute investment advice and is not intended as an endorsement of any specific investment. Past performance is no guarantee of future results.
Not part of the Annual Report
Table of Contents
Investors should refer to the Fund’s Summary Prospectus and/or Prospectus and consider the Fund’s investment objectives, strategies, risks, charges and expenses carefully before investing. The Summary Prospectus and/or Prospectus contain this and other information about the Fund. You may obtain copies of the Fund’s Summary Prospectus, Prospectus and Statement of Additional Information free of charge, upon request, by calling toll-free 800-624-6782, by writing to NYLIFE Distributors LLC, Attn: MainStay Marketing Department, 30 Hudson Street, Jersey City, NJ 07302 or by sending an e-mail to MainStayShareholderServices@nylim.com. These documents are also available via the MainStay Funds’ website at newyorklifeinvestments.com. Please read the Summary Prospectus and/or Prospectus carefully before investing.
Investment and Performance Comparison1 (Unaudited)
Performance data quoted represents past performance. Past performance is no guarantee of future results. Because of market volatility and other factors, current performance may be lower or higher than the figures shown. Investment return and principal value will fluctuate, and as a result, when shares are redeemed, they may be worth more or less than their original cost. The graph below depicts the historical performance of Class I shares* of the Fund. Performance will vary from class to class based on differences in class-specific expenses and sales charges. For performance information current to the most recent month-end, please call 800-624-6782 or visit newyorklifeinvestments.com.
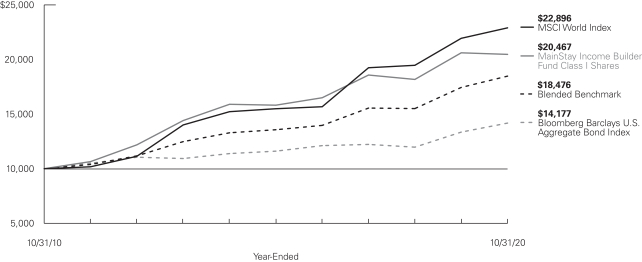
Average Annual Total Returns for the Year-Ended October 31, 2020
| | | | | | | | | | | | | | | | | | | | | | | | |
| Class | | Sales Charge | | | | Inception Date | | | One Year
or Since
Inception | | | Five Years
or Since
Inception | | | Ten Years
or Since
Inception | | | Gross
Expense
Ratio2 | |
| | | | | | | |
| Class A Shares3 | | Maximum 3% Initial Sales Charge | | With sales charges
Excluding sales charges | | | 1/3/1995 | | |
| –6.35
–0.90 | %
| |
| 3.86
5.04 | %
| |
| 6.55
7.15 | %
| |
| 1.02
1.02 | %
|
| Investor Class Shares4 | | Maximum 2.5% Initial Sales Charge | | With sales charges
Excluding sales charges | | | 2/28/2008 | | |
| –6.55
–1.11 |
| |
| 3.71
4.89 |
| |
| 6.34
6.94 |
| |
| 1.17
1.17 |
|
| Class B Shares5 | | Maximum 5% CDSC
if Redeemed Within the First Six Years of Purchase | | With sales charges Excluding sales charges | | | 12/29/1987 | | |
| –6.51
–1.84 |
| |
| 3.76
4.10 |
| |
| 6.14
6.14 |
| |
| 1.92
1.92 |
|
| Class C Shares | | Maximum 1% CDSC
if Redeemed Within One Year of Purchase | | With sales charges
Excluding sales charges | | | 9/1/1998 | | |
| –2.78
–1.85 |
| |
| 4.10
4.10 |
| |
| 6.14
6.14 |
| |
| 1.92
1.92 |
|
| Class I Shares | | No Sales Charge | | | | | 1/2/2004 | | | | –0.69 | | | | 5.29 | | | | 7.43 | | | | 0.77 | |
| Class R2 Shares | | No Sales Charge | | | | | 2/27/2015 | | | | –1.00 | | | | 4.94 | | | | 6.93 | | | | 1.12 | |
| Class R3 Shares | | No Sales Charge | | | | | 2/29/2016 | | | | –1.24 | | | | 6.21 | | | | N/A | | | | 1.37 | |
| Class R6 Shares | | No Sales Charge | | | | | 2/28/2018 | | | | –0.60 | | | | 4.38 | | | | N/A | | | | 0.67 | |
| SIMPLE Class Shares | | No Sales Charge | | | | | 8/31/2020 | | | | –3.39 | | | | N/A | | | | N/A | | | | 1.42 | |
| * | Previously, the chart presented the Fund’s annual returns for Class B shares. Class I shares are presented for consistency across the MainStay Fund complex. |
| 1. | The performance table and graph do not reflect the deduction of taxes that a shareholder would pay on distributions or Fund share redemptions. Total returns reflect maximum applicable sales charges as indicated in the table above, if any, changes in share price, and reinvestment of dividend and capital gain distributions. The graph assumes the initial investment amount shown above and reflects the deduction of all sales charges that would have applied for the period of investment. Performance figures may reflect certain fee waivers and/or expense limitations, without which total returns may have been lower. For more information on share classes and current fee waivers |
| | and/or expense limitations (if any), please refer to the Notes to Financial Statements. |
| 2. | The gross expense ratios presented reflect the Fund’s “Total Annual Fund Operating Expenses” from the most recent Prospectus and may differ from other expense ratios disclosed in this report. |
| 3. | Prior to November 4, 2019, the maximum initial sales charge applicable was 5.5%, which is reflected in the average annual total return figures shown. |
| 4. | Prior to June 30, 2020, the maximum initial sales charge for Investor Class shares was 3%, which is reflected in the average annual total return figures shown. |
| 5. | Class B shares are closed to all new purchases as well as additional investments by existing Class B shareholders. |
The footnotes on the next page are an integral part of the table and graph and should be carefully read in conjunction with them.
| | | | | | | | | | | | |
| Benchmark Performance | | One
Year | | | Five
Years | | | Ten
Years | |
| | | |
MSCI World Index6 | | | 4.36 | % | | | 8.13 | % | | | 8.64 | % |
Bloomberg Barclays U.S. Aggregate Bond Index7 | | | 6.19 | | | | 4.08 | | | | 3.55 | |
Blended Benchmark Index8 | | | 5.93 | | | | 6.37 | | | | 6.33 | |
Morningstar World Allocation Category Average9 | | | –2.08 | | | | 3.97 | | | | 4.61 | |
| 6. | The MSCI World Index is the Fund’s primary broad-based securities market index for comparison purposes. The MSCI World Index is a free float-adjusted market capitalization weighted index that is designed to measure the equity market performance of developed markets. Results assume reinvestment of all dividends and capital gains. An investment cannot be made directly in an index. |
| 7. | The Fund has selected the Bloomberg Barclays U.S. Aggregate Bond Index as a secondary benchmark. The Bloomberg Barclays U.S. Aggregate Bond Index is a broad-based benchmark that measures the investment grade, U.S. dollar-denominated, fixed-rate taxable bond market, including Treasurys, government-related and corporate securities, mortgage-backed securities (agency fixed-rate and hybrid adjustable rate mortgage pass-throughs), asset-backed securities, and commercial mortgage-backed securities. Results assume reinvestment of all dividends and capital gains. An investment cannot be made directly in an index. |
| 8. | The Fund has selected the Blended Benchmark Index as an additional benchmark. The Blended Benchmark Index consists of the MSCI World Index and the Bloomberg Barclays U.S. Aggregate Bond Index weighted 50%/50%, respectively. Results assume reinvestment of all dividends and capital gains. An investment cannot be made directly in an index. |
| 9. | The Morningstar World Allocation Category Average is representative of funds that seek to provide both capital appreciation and income by investing in three major areas: stocks, bonds, and cash. While these portfolios do explore the whole world, most of them focus on the U.S., Canada, Japan, and the larger markets in Europe. It is rare for such portfolios to invest more than 10% of their assets in emerging markets. These portfolios typically have at least 10% of assets in bonds, less than 70% of assets in stocks, and at least 40% of assets in non-U.S. stocks or bonds. Results are based on average total returns of similar funds with all dividends and capital gain distributions reinvested. |
The footnotes on the preceding page are an integral part of the table and graph and should be carefully read in conjunction with them.
| | |
| 6 | | MainStay Income Builder Fund |
Cost in Dollars of a $1,000 Investment in MainStay Income Builder Fund (Unaudited)
The example below is intended to describe the fees and expenses borne by shareholders during the six-month period from May 1, 2020, to October 31, 2020, and the impact of those costs on your investment.
Example
As a shareholder of the Fund you incur two types of costs: (1) transaction costs, including exchange fees and sales charges (loads) on purchases (as applicable), and (2) ongoing costs, including management fees, distribution and/or service (12b-1) fees, and other Fund expenses (as applicable). This example is intended to help you understand your ongoing costs (in dollars) of investing in the Fund and to compare these costs with the ongoing costs of investing in other mutual funds. The example is based on an investment of $1,000 made at the beginning of the six-month period and held for the entire period from May 1, 2020, to October 31, 2020.
This example illustrates your Fund’s ongoing costs in two ways:
Actual Expenses
The second and third data columns in the table below provide information about actual account values and actual expenses. You may use the information in these columns, together with the amount you invested, to estimate the expenses that you paid during the six months ended October 31, 2020. Simply divide your account value by $1,000 (for example, an $8,600 account value divided by $1,000 = 8.6), then
multiply the result by the number under the heading entitled “Expenses Paid During Period” to estimate the expenses you paid on your account during this period.
Hypothetical Example for Comparison Purposes
The fourth and fifth data columns in the table below provide information about hypothetical account values and hypothetical expenses based on the Fund’s actual expense ratio and an assumed rate of return of 5% per year before expenses, which is not the Fund’s actual return. The hypothetical account values and expenses may not be used to estimate the actual ending account balances or expenses you paid for the six-month period shown. You may use this information to compare the ongoing costs of investing in the Fund with the ongoing costs of investing in other mutual funds. To do so, compare this 5% hypothetical example with the 5% hypothetical examples that appear in the shareholder reports of the other mutual funds.
Please note that the expenses shown in the table are meant to highlight your ongoing costs only and do not reflect any transactional costs, such as exchange fees or sales charges (loads). Therefore, the fourth and fifth data columns of the table are useful in comparing ongoing costs only and will not help you determine the relative total costs of owning different funds. In addition, if these transactional costs were included, your costs would have been higher.
| | | | | | | | | | | | | | | | | | | | | | |
| | | | | | | | | | | | | | | | | | |
| Share Class | | Beginning
Account
Value
5/1/20 | | | Ending Account
Value (Based
on Actual
Returns and
Expenses)
10/31/20 | | | Expenses
Paid
During
Period1 | | | Ending Account
Value (Based
on Hypothetical
5% Annualized
Return and
Actual Expenses)
10/31/20 | | | Expenses
Paid
During
Period1 | | | Net Expense
Ratio
During
Period2 |
| | | | | | |
| Class A Shares | | $ | 1,000.00 | | | $ | 1,061.60 | | | $ | 5.23 | | | $ | 1,020.06 | | | $ | 5.13 | | | 1.01% |
| | | | | | |
| Investor Class Shares | | $ | 1,000.00 | | | $ | 1,060.70 | | | $ | 6.11 | | | $ | 1,019.20 | | | $ | 5.99 | | | 1.18% |
| | | | | | |
| Class B Shares | | $ | 1,000.00 | | | $ | 1,056.20 | | | $ | 9.98 | | | $ | 1,015.43 | | | $ | 9.78 | | | 1.93% |
| | | | | | |
| Class C Shares | | $ | 1,000.00 | | | $ | 1,056.40 | | | $ | 9.98 | | | $ | 1,015.43 | | | $ | 9.78 | | | 1.93% |
| | | | | | |
| Class I Shares | | $ | 1,000.00 | | | $ | 1,062.90 | | | $ | 3.94 | | | $ | 1,021.32 | | | $ | 3.86 | | | 0.76% |
| | | | | | |
| Class R2 Shares | | $ | 1,000.00 | | | $ | 1,060.50 | | | $ | 5.75 | | | $ | 1,019.56 | | | $ | 5.63 | | | 1.11% |
| | | | | | |
| Class R3 Shares | | $ | 1,000.00 | | | $ | 1,059.70 | | | $ | 7.04 | | | $ | 1,018.30 | | | $ | 6.90 | | | 1.36% |
| | | | | | |
| Class R6 Shares | | $ | 1,000.00 | | | $ | 1,063.40 | | | $ | 3.48 | | | $ | 1,021.77 | | | $ | 3.40 | | | 0.67% |
| | | | | | |
| SIMPLE Class Shares3,4 | | $ | 1,000.00 | | | $ | 966.10 | | | $ | 2.34 | | | $ | 1,005.95 | | | $ | 2.39 | | | 1.43% |
| 1. | Expenses are equal to the Fund’s annualized expense ratio of each class multiplied by the average account value over the period, divided by 366 and multiplied by 184 (to reflect the six-month period) and 61 days for SIMPLE Class share (to reflect the since-inception period. The table above represents the actual expenses incurred during the six-month period. In addition to the fees and expenses which the Fund bears directly, it also indirectly bears a pro rata share of the fees and expenses of the underlying funds in which it invests. Such indirect expenses are not included in the above-reported expense figures. |
| 2. | Expenses are equal to the Fund’s annualized expense ratio to reflect the six-month period. |
| 3. | The inception date was August 31, 2020. |
| 4. | Expenses paid during the period reflect ongoing costs for the period from inception through October 31, 2020. Had these shares been offered for the full six-month period ended October 31, 2020, and had the Fund provided a hypothetical 5% annualized return, expenses paid during the period would have been $7.10 for SIMPLE Class shares and the ending account value would have been $1,018.10 for SIMPLE Class shares. |
Portfolio Composition as of October 31, 2020 (Unaudited)
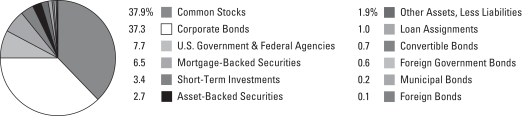
See Portfolio of Investments beginning on page 13 for specific holdings within these categories. The Fund’s holdings are subject to change.
Top Ten Holdings or Issuers Held as of October 31, 2020 (excluding short-term investment) (Unaudited)
| 1. | Federal National Mortgage Association (Mortgage Pass-Through Securities), 2.00%–5.00%, due 9/1/33–10/1/50 |
| 2. | Federal Home Loan Mortgage Corporation (Mortgage Pass-Through Securities), 2.00%–5.00%, due 1/1/40–9/1/50 |
| 3. | Bank of America Corp., 2.496%–8.57%, due 1/23/22–6/19/41 |
| 5. | Federal Home Loan Mortgage Corporation, 3.00%–4.00%, due 9/15/48–1/25/50 |
| 6. | United States Treasury Bonds, 1.375%–4.50%, due 5/15/38–8/15/50 |
| 7. | United States Treasury Notes, 0.125%, due 10/31/22–10/15/23 |
| 9. | Verizon Communications, Inc. |
| | |
| 8 | | MainStay Income Builder Fund |
Portfolio Management Discussion and Analysis (Unaudited)
Questions answered by portfolio managers Jae S. Yoon and Jonathan Swaney of New York Life Investment Management LLC, the Fund’s Manager; Dan Roberts, PhD,1 Stephen R. Cianci, CFA, and Neil Moriarty III, of MacKay Shields LLC, the Subadvisor for the fixed-income portion of the Fund; and William W. Priest, CFA, Michael A. Welhoelter, CFA, John Tobin, PhD, CFA, and Kera Van Valen, CFA, of Epoch Investment Partners, Inc., the Subadvisor for the equity portion of the Fund.
How did MainStay Income Builder Fund perform relative to its benchmarks and peer group during the 12 months ended October 31, 2020?
For the 12 months ended October 31, 2020, Class I shares of MainStay Income Builder Fund returned –0.69%, underperforming the 4.36% return of the Fund’s primary benchmark, the MSCI World Index. Over the same period, Class I shares underperformed the 6.19% return of the Bloomberg Barclays U.S. Aggregate Bond Index, which is the Fund’s secondary benchmark, and the 5.93% return of the Blended Benchmark Index, which is an additional benchmark of the Fund. For 12 months ended October 31, 2020, Class I shares of the Fund outperformed the –2.08% return of the Morningstar World Allocation Category Average.2
During the reporting period, how was the Fund’s performance materially affected by investments in derivatives?
During the reporting period, the use of U.S. Treasury futures by the fixed-income portion of the Fund had minimal impact on returns.
What factors affected the relative performance of the equity portion of the Fund during the reporting period?
The equity portion of the Fund participated in the market rally during the end of 2019. However, performance was challenged during the pandemic-related sell-off in February and March 2020. Fund performance encountered additional headwinds throughout the remainder of the reporting period when the market rally was led by a handful of U.S. mega-cap stocks in the information technology, consumer discretionary and communication services sectors.
Compared to the MSCI World Index, the equity portion of the Fund held underweight exposure to the information technology sector, a stance that significantly detracted from relative returns. Disappointing stock selection in information technology further detracted as the high-flying technology hardware and software stocks that drove the market’s rise did not tend to exhibit the Fund’s targeted shareholder-yield characteristics. Stock selection in communication services was undermined by telecommunications holdings, and by holdings in a movie theater chain operator that the Fund sold in March 2020 near the lowest point of the market’s sell-off. Relatively overweight exposure to pharmaceuticals in the health care sector detracted as the market contemplated the potential regulatory implications of the U.S. presidential election outcome and progress on a
COVID-19 vaccine. By country, holdings in the United States detracted most, followed by holdings in France.
Strong stock selection along with underweight exposure in industrials enhanced the benchmark-relative performance of the equity portion of the Fund.
During the reporting period, which sectors and countries were the strongest positive contributors to the relative performance of the equity portion of the Fund and which sectors and countries were particularly weak?
During the reporting period, the strongest positive sector contributions to the performance of the equity portion of the Fund relative to the MSCI World Index came from industrials, with over half the effect derived from holdings in the aerospace & defense and air freight & logistics industries. (Contributions take weightings and total returns into account.) Relatively underweight exposure to the industrials sector also contributed positively. Within financials, underweight exposure to the banking industry enhanced relative returns, though the effect was offset by disappointing results from insurance industry holdings.
During the same period, underweight exposure to the information technology sector—the strongest performing sector by far in the benchmark—proved the most significant detractor from the relative performance of the equity portion of the Fund. Stock selection within the sector also detracted. Stock selection in communication services was challenged by telecommunications holdings, and by a position in a movie theater chain operator that the Fund exited in the midst of the market sell-off. Stock selection and underweight exposure in the consumer discretionary sector further detracted from relative returns, along with stock selection in health care as pharmaceutical holdings were pressured. Overweight exposure to the energy sector further dampened relative results as an oil price war disrupted supply and global oil demand remained subdued due to the pandemic-related economic slowdown.
On a country basis, the strongest positive contribution to the relative performance of the equity portion of the Fund came from investments in Japan, while U.S. holdings detracted.
During the reporting period, which individual stocks made the strongest positive contributions to absolute performance in the equity portion of the Fund and which stocks detracted the most?
Top positive contributors to the absolute performance of the equity portion of the Fund during the reporting period included
| 1. | Dan Roberts served as a portfolio manager of the Fund until January 1, 2020. |
| 2. | See page 5 for other share class returns, which may be higher or lower than Class I share returns. See page 6 for more information on benchmark and peer group returns. |
semiconductor manufacturer Taiwan Semiconductor and consumer electronics and services company Apple.
Shares in Taiwan Semiconductor, one of the largest semiconductor manufacturers in the world, benefited from production stumbles by competitor Intel and from increased demand for foundry services. With Intel delaying the launch of their next product, expectations grew that Taiwan Semiconductor would see additional foundry demand, making the company one of the two top suppliers of leading-edge semiconductor production in the world, along with Samsung. As of October 31, 2020, the company pays a well-covered dividend.
Apple shares outperformed on strong underlying demand both on its service and accessories side, as well as a return of iPhone sales growth. Customer demand for the company’s iPhone 11 handset lineup proved strong despite the anticipation of a 5G variant which was announced in October 2020. Additionally, service adoption expanded to provide a strong driver of revenue growth regardless of iPhone demand. As of October 31, 2020, Apple returned cash to shareholders through dividends and share repurchases.
Paris-based global real estate company Unibail-Rodamco-Westfield and U.S. regulated utility CenterPoint Energy were the largest detractors from the absolute performance of the equity portion of the Fund during the reporting period. Other significant detractors during the reporting period included Paris-based global insurance company AXA and U.K.-based financial services provider Lloyds Banking Group.
AXA shares traded lower with those of the company’s insurance and financial company peers in the March 2020 market sell-off, then partially recovered as lockdowns were eased and equity markets recovered. Concerns about the impact of low interest rates on investment income, higher mortality experience and disputes over claims for coverage under business interruption contracts remained challenges for the insurance industry. Facing pressure from regulators, AXA’s board decided to pay the annual dividend for 2019 in two installments. While the first was paid, a subsequent regulatory notice in late July 2020 led AXA to cancel the second installment, which pressured shares downward. A further headwind emerged in September 2020 with an adverse ruling in a U.K. court case regarding coverage for business interruption claims. While AXA was not directly involved, the case increased uncertainty as to the ultimate resolution of certain business interruption claims. In our opinion, as of October 31, 2020, AXA’s business franchise remains strong and the company enjoys robust capital strength and liquidity. The company continues to have a transparent capital allocation policy with the ability to pay an attractive, growing dividend supported by earnings and maintain a strong regulatory
capital position. Debt reduction also remains a focus for management.
Lloyds is one of the largest banks operating in the U.K. Following the Global Financial Crisis of 2007-2008, the company repositioned itself as a straightforward, low-risk bank focused on consumer lending (mortgages, autos, and credit cards), business lending to small and medium enterprises, insurance and wealth management. Shares traded lower with those of the company’s financial-sector peers in the March 2020 market sell-off and remained depressed as the U.K. economy continued to struggle with the effects of the pandemic. The equity portion of the Fund sold its position at the end of March 2020 on concerns that regulators would either request or require banks to discontinue shareholder distributions in light of pandemic-related economic uncertainty. Following the decision to sell, under pressure from the Bank of England, Lloyds and the other major U.K. banks canceled dividends that they had announced on 2019 earnings.
What were some of the largest purchases and sales in the equity portion of the Fund during the reporting period?
A few positions were initiated in the equity portion of the Fund during the reporting period, including holdings in industrial equipment distributor MSC Industrial (“MSC”) and medical device maker Medtronic.
Addressing a highly fragmented market, MSC focuses on product availability and customer service. Cash flows are sustained by strong customer relationships and by providing superior logistics and in-stock products to support customer needs. Growth is driven by market share gains and by moving its sales force from fulfillment to a partnership with its customers. This partnership allows MSC to provide customers with unique insights that drive down their bill of materials and improve their products and manufacturing processes, pushing MSC’s cash margins higher. By leveraging its infrastructure and implementing a strong cost-reduction program, we believe the company is positioned to experience margin expansion and lower working capital requirements through better inventory management, leading to better cash generation. As of October 31, 2020, MSC returns cash through a growing dividend and regular share repurchases.
Medtronic develops and sells therapeutic and diagnostic medical devices to treat a variety of conditions, including cardiac rhythm diseases, vascular and heart disease, spinal conditions and diabetes. The company has also developed a line of advanced surgical devices and systems. Cash flows are sustained by Medtronic’s diversification across business segments, customer type and geography. Cash flow growth drivers include
| | |
| 10 | | MainStay Income Builder Fund |
sales growth through penetration of existing markets and the creation of new markets with innovative new therapies, margin expansion from cost reduction and improved sourcing, and higher cash conversion from better working capital management. As of October 31, 2020, Medtronic returned capital to shareholders through regular share repurchases and a consistently growing dividend with a 40% earnings payout target.
Positions closed during the reporting period included global integrated energy company Royal Dutch Shell (another top detractor from the Fund’s total performance) and U.S. health care plan provider UnitedHealth Group.
Royal Dutch Shell shares declined along with those of other integrated oil companies as the energy sector suffered from supply dislocations caused by conflicts between major oil-producing countries along with the pandemic-related slump in energy demand. Given Royal Dutch Shell’s weakened balance sheet, measured by net debt leverage or gearing, we became concerned about the company’s ability to maintain its dividend in a prolonged down cycle. The Fund sold the position to invest the proceeds in other more attractive opportunities.
In our opinion, UnitedHealth faced possible near-term slowing of earning and cash flow growth driven by a confluence of factors. These factors included continued customer assistance measures, normalization in medical utilization, rising acuity as a result of missed and deferred treatment, COVID-19 vaccine and treatment costs, and a shift from higher-margin commercial membership to lower-margin Medicaid membership. In light of these challenges, the Fund exited the position in favor of other opportunities.
How did sector and country weightings change in the equity portion of the Fund during the reporting period?
During the reporting period, the most significant sector allocation changes in the equity portion of the Fund were decreases in exposure to energy and utilities. During the same period, the equity portion of the Fund significantly increased its information technology weighting and made smaller increases in its exposure to the communication services and health care sectors. From a country perspective, the most significant allocation changes included increased exposure to the United States, South Korea and Taiwan, and reduced exposure to the U.K. and France. The sector and country allocations of the equity portion of the Fund are a result of our bottom-up fundamental investment process and reflect the companies and securities that we confidently believe can collect and distribute sustainable, growing shareholder yield.
How was the equity portion of the Fund positioned at the end of the reporting period?
As of October 31, 2020, the largest sector allocations on an absolute basis in the equity portion of the Fund were to information technology and health care, and the smallest total sector allocations were to real estate and energy. As of the same date, relative to the MSCI World Index, the equity portion of the Fund held its most overweight exposure to utilities, a defensive sector that is typically more heavily represented in the Fund, and its most significantly underweight exposures to the information technology and consumer discretionary sectors.
What factors affected the relative performance of the fixed-income portion of the Fund during the reporting period?
During the reporting period, the fixed-income portion of the Fund outperformed the Bloomberg Barclays U.S. Aggregate Bond Index due to advantageous positioning among asset-backed securities (“ABS”), investment-grade corporate bonds and longer-duration3 Treasury bonds, as well as positive asset allocation decisions. Holdings among high-yield bonds and collateralized mortgage obligations underperformed the return of the Bloomberg Barclays U.S. Aggregate Bond Index during the same period.
During the reporting period, were there any market events that materially impacted the performance or liquidity of the fixed-income portion of the Fund?
During the first quarter of 2020, it became increasingly evident that the COVID-19 virus was not merely a medical concern, but an economic one—with perhaps larger fiscal implications than those related to personal health. Other than the U.S. Treasury sector, steep losses were seen among all asset classes, including gold, which is usually a haven during times of uncertainty. Although liquidity was challenged in this environment, the fixed-income portion of the Fund did not encounter any problems selling securities where and when needed.
The liquidity program implemented by the U.S. Federal Reserve (“Fed”) stimulated a recovery in the credit markets during the second quarter of 2020. The Fed provided a supportive hand for investment-grade bond spreads4 (and eventually select high-yield bonds) with the purchase of individual corporate bonds under the Secondary Market Corporate Credit Facility. The stock and credit market rally carried over into the third quarter and the Fed stayed active in the markets and low interest rates created a supportive environment for bond refinancings.
| 3. | Duration is a measure of the price sensitivity of a fixed-income investment to changes in interest rates. Duration is expressed as a number of years and is considered a more accurate sensitivity gauge than average maturity. |
| 4. | The terms “spread” and “yield spread” may refer to the difference in yield between a security or type of security and comparable U.S. Treasury issues. The terms may also refer to the difference in yield between two specific securities or types of securities at a given time. |
What was the duration strategy of the fixed-income portion of the Fund during the reporting period?
The strategy of the fixed-income portion of the Fund was to remain duration neutral relative to the Bloomberg Barclays U.S. Aggregate Bond Index throughout the reporting period
During the reporting period, which sectors were the strongest positive contributors to the relative performance of the fixed-income portion of the Fund and which sectors were particularly weak?
As mentioned above, the strongest contributions to the performance of the fixed-income portion of the Fund relative to the Bloomberg Barclays U.S. Aggregate Bond Index came from holdings of ABS, investment-grade corporate bonds and longer-duration Treasury bonds. Select asset allocation decisions made near the height of the pandemic market sell-off further bolstered relative returns. Conversely, holdings of high-yield bonds and collateralized mortgage obligations underperformed the return of the Bloomberg Barclays U.S. Aggregate Bond Index during the reporting period.
What were some of the largest purchases and sales in the fixed-income portion of the Fund during the reporting period?
During the reporting period, the fixed-income portion of the Fund purchased a seasoned credit risk transfer deal from Freddie Mac (the Federal Home Loan Mortgage Corporation) backed by four-year-old prime mortgage loans. At the time of purchase, the liquidity premium was high as there were forced sellers of this type of paper. Given the underlying fundamentals of the borrower’s credit and the bond structure, we believed the market would eventually price those in. The fixed-income portion of the Fund also purchased corporate bonds issued by graphics processor and software maker NVIDIA, a high-quality, low-levered name in a rapidly growing industry. The issue came
to market during the height of the market’s volatility; as a result, it priced with a very attractive new-issue premium.
To pay for increased exposure to credit after the market correction, we sold down the Fund’s position in agency mortgages, noting that the Fed was an active buyer in that paper. Additionally, we sold the Fund’s position in an ABS deal backed by equipment loans from DLL Finance at a time in early February 2020 when ABS spreads were historically tight, and liquidity was readily available.
How did the sector weightings in the fixed-income portion of the Fund change during the reporting period?
Early in the reporting period, we focused on diversifying the holdings within the fixed-income portion of the Fund while dialing down risk as credit spreads had been narrowing. This led to an increase in securitized5 assets while decreasing the Fund’s credit positions, specifically high yield. After the March 2020 correction, we reversed course and increased the fixed-income portion of the Fund’s exposure to high yield and other spread product at discounted prices. Based on these moves we increased exposure in the fixed-income portion of the Fund to high-yield bonds, commercial mortgage-back securities and emerging-market bonds, while decreasing exposure to agency mortgages.
How was the fixed-income portion of the Fund positioned at the end of the reporting period?
As of October 31, 2020, the fixed-income portion of the Fund held overweight exposure relative to the Bloomberg Barclays U.S. Aggregate Bond Index in high-yield securities, investment-grade corporate bonds and securitized assets. As of the same date, the fixed-income portion of the Fund held relatively underweight exposure to U.S. Treasury securities and agency mortgages.
| 5. | A securitization is a financial instrument created by an issuer by combining a pool of financial assets (such as mortgages). The financial instrument is then marketed to investors, sometimes in tiers. |
The opinions expressed are those of the portfolio managers as of the date of this report and are subject to change. There is no guarantee that any forecasts will come to pass. This material does not constitute investment advice and is not intended as an endorsement of any specific investment.
| | |
| 12 | | MainStay Income Builder Fund |
Portfolio of Investments October 31, 2020
| | | | | | | | |
| | | Principal
Amount | | | Value | |
Long-Term Bonds 56.8%† Asset-Backed Securities 2.7% | |
Auto Floor Plan Asset-Backed Securities 0.7% | | | | | |
Ford Credit Floorplan Master Owner Trust | | | | | | | | |
Series 2019-4, Class A
2.44%, due 9/15/26 | | $ | 2,015,000 | | | $ | 2,137,451 | |
Series 2017-3, Class A
2.48%, due 9/15/24 | | | 1,270,000 | | | | 1,315,907 | |
Series 2018-4, Class A
4.06%, due 11/15/30 | | | 3,055,000 | | | | 3,476,894 | |
General Motors Floorplan Owner Revolving Trust
Series 2019-2, Class A
2.90%, due 4/15/26 (a) | | | 2,815,000 | | | | 3,017,925 | |
| | | | | | | | |
| | | | | | | 9,948,177 | |
| | | | | | | | |
Automobile Asset-Backed Securities 0.5% | |
Avis Budget Rental Car Funding AESOP LLC
Series 2020-1A, Class A
2.33%, due 8/20/26 (a) | | | 1,270,000 | | | | 1,299,516 | |
Chase Auto Credit Linked Notes
Series 2020-1, Class B
0.991%, due 1/25/28 (a) | | | 920,000 | | | | 921,871 | |
Ford Credit Auto Owner Trust (a) | | | | | | | | |
Series 2020-2, Class A
1.06%, due 4/15/33 | | | 2,250,000 | | | | 2,253,259 | |
Series 2020-1, Class A
2.04%, due 8/15/31 | | | 1,610,000 | | | | 1,683,765 | |
Santander Revolving Auto Loan Trust
Series 2019-A, Class A
2.51%, due 1/26/32 (a) | | | 975,000 | | | | 1,033,694 | |
| | | | | | | | |
| | | | | | | 7,192,105 | |
| | | | | | | | |
Credit Cards 0.1% | |
Capital One Multi-Asset Execution Trust
Series 2019-A3, Class A3
2.06%, due 8/15/28 | | | 1,740,000 | | | | 1,851,603 | |
| | | | | | | | |
|
Home Equity Asset-Backed Securities 0.0%‡ | |
MASTR Asset-Backed Securities Trust
Series 2006-HE4, Class A1
0.199% (1 Month LIBOR + 0.05%), due 11/25/36 (b) | | | 557,923 | | | | 255,924 | |
| | | | | | | | |
|
Other Asset-Backed Securities 1.3% | |
Carrington Mortgage Loan Trust
Series 2007-HE1, Class A3
0.339% (1 Month LIBOR + 0.19%), due 6/25/37 (b) | | | 3,972,216 | | | | 3,809,892 | |
CF Hippolyta LLC (a) | | | | | | | | |
Series 2020-1, Class A1
1.69%, due 7/15/60 | | | 1,836,096 | | | | 1,855,502 | |
| | | | | | | | |
| | | Principal
Amount | | | Value | |
Other Asset-Backed Securities (continued) | |
CF Hippolyta LLC (a) (continued) | | | | | | | | |
Series 2020-1, Class A2
1.99%, due 7/15/60 | | $ | 1,127,449 | | | $ | 1,136,502 | |
Chase Funding Trust
Series 2002-2, Class 1A5
6.333%, due 4/25/32 (c) | | | 39,954 | | | | 40,812 | |
Equity One Mortgage Pass-Through Trust
Series 2003-3, Class AF4
5.495%, due 12/25/33 (c) | | | 93,193 | | | | 94,767 | |
JPMorgan Mortgage Acquisition Trust
Series 2007-HE1, Class AF1
0.249% (1 Month LIBOR + 0.10%), due 3/25/47 (b) | | | 359,662 | | | | 224,970 | |
MMAF Equipment Finance LLC
Series 2020-BA, Class A4
0.66%, due 11/15/27 (a) | | | 3,750,000 | | | | 3,735,910 | |
MVW LLC
Series 2019-2A, Class A
2.22%, due 10/20/38 (a) | | | 2,009,972 | | | | 2,062,158 | |
PFS Financing Corp. (a) | | | | | | | | |
Series 2020-B, Class B
1.71%, due 6/15/24 | | | 830,000 | | | | 836,720 | |
Series 2020-A, Class B
1.77%, due 6/15/25 | | | 1,780,000 | | | | 1,802,986 | |
Sierra Timeshare Receivables Funding LLC (a) | | | | | | | | |
Series 2020-2A, Class A
1.33%, due 7/20/37 | | | 1,370,797 | | | | 1,376,537 | |
Series 2020-2A, Class C
3.51%, due 7/20/37 | | | 2,138,443 | | | | 2,175,855 | |
| | | | | | | | |
| | | | | | | 19,152,611 | |
| | | | | | | | |
Student Loans 0.1% | |
KeyCorp Student Loan Trust
Series 2000-A, Class A2
0.57% (3 Month LIBOR + 0.32%), due 5/25/29 (b) | | | 19,083 | | | | 19,070 | |
Navient Private Education Refi Loan Trust
Series 2020-DA, Class A
1.69%, due 5/15/69 (a) | | | 840,151 | | | | 852,938 | |
| | | | | | | | |
| | | | | | | 872,008 | |
| | | | | | | | |
Total Asset-Backed Securities
(Cost $38,111,083) | | | | | | | 39,272,428 | |
| | | | | | | | |
|
| Convertible Bonds 0.7% | |
Machinery—Diversified 0.4% | |
Chart Industries, Inc.
1.00%, due 11/15/24 (a) | | | 3,651,000 | | | | 5,805,090 | |
| | | | | | | | |
| | | | | | |
The notes to the financial statements are an integral part of,
and should be read in conjunction with, the financial statements. | | | | | 13 | |
Portfolio of Investments October 31, 2020 (continued)
| | | | | | | | |
| | | Principal
Amount | | | Value | |
| Convertible Bonds (continued) | |
Semiconductors 0.3% | |
ON Semiconductor Corp.
1.625%, due 10/15/23 | | $ | 3,080,000 | | | $ | 4,396,454 | |
| | | | | | | | |
Total Convertible Bonds
(Cost $6,035,910) | | | | | | | 10,201,544 | |
| | | | | | | | |
|
| Corporate Bonds 37.3% | |
Aerospace & Defense 0.4% | |
BAE Systems PLC
3.00%, due 9/15/50 (a) | | | 2,650,000 | | | | 2,670,437 | |
L3Harris Technologies, Inc.
4.40%, due 6/15/28 | | | 2,215,000 | | | | 2,615,854 | |
| | | | | | | | |
| | | | | | | 5,286,291 | |
| | | | | | | | |
Agriculture 0.5% | |
Altria Group, Inc.
3.80%, due 2/14/24 | | | 3,260,000 | | | | 3,547,458 | |
BAT Capital Corp.
3.734%, due 9/25/40 | | | 2,105,000 | | | | 2,070,925 | |
JBS Investments II GmbH
7.00%, due 1/15/26 (Austria) (a) | | | 1,170,000 | | | | 1,250,028 | |
| | | | | | | | |
| | | | | | | 6,868,411 | |
| | | | | | | | |
Airlines 1.2% | |
American Airlines Pass-Through Trust
Series 2013-2, Class A
4.95%, due 1/15/23 | | | 4,005,293 | | | | 3,471,440 | |
American Airlines, Inc. Pass Through Trust | | | | | | | | |
Series 2016-2, Class AA
3.20%, due 6/15/28 | | | 565,760 | | | | 521,470 | |
Series 2016-2, Class AA
3.65%, due 6/15/28 | | | 199,680 | | | | 148,469 | |
Delta Air Lines Pass-Through Trust
Series 2019-1, Class AA
3.204%, due 4/25/24 | | | 2,355,000 | | | | 2,345,330 | |
Delta Air Lines, Inc.
7.00%, due 5/1/25 (a) | | | 2,310,000 | | | | 2,520,945 | |
Delta Air Lines, Inc. / SkyMiles I.P. Ltd. (a) | | | | | | | | |
4.50%, due 10/20/25 | | | 1,080,000 | | | | 1,096,142 | |
4.75%, due 10/20/28 | | | 755,000 | | | | 771,770 | |
Mileage Plus Holdings LLC / Mileage Plus Intellectual Property Assets, Ltd.
6.50%, due 6/20/27 (a) | | | 1,860,000 | | | | 1,936,725 | |
U.S. Airways Pass-Through Trust | | | | | | | | |
Series 2012-1, Class A, Pass-Through Trust
5.90%, due 1/10/24 | | | 1,272,925 | | | | 1,239,573 | |
Series 2010-1, Class A, Pass-Through Trust
6.25%, due 4/22/23 | | | 580,032 | | | | 531,917 | |
| | | | | | | | |
| | | Principal
Amount | | | Value | |
Airlines (continued) | |
United Airlines Pass-Through Trust | | | | | | | | |
Series 2020-1, Class A
5.875%, due 10/15/27 | | $ | 1,340,000 | | | $ | 1,343,017 | |
Series 2007-1, Pass-Through Trust
6.636%, due 7/2/22 | | | 1,066,308 | | | | 1,000,952 | |
| | | | | | | | |
| | | | | | | 16,927,750 | |
| | | | | | | | |
Apparel 0.1% | |
Hanesbrands, Inc.
5.375%, due 5/15/25 (a) | | | 1,340,000 | | | | 1,410,350 | |
| | | | | | | | |
|
Auto Manufacturers 1.2% | |
Daimler Finance North America LLC
0.799% (3 Month LIBOR + 0.55%), due 5/4/21 (Germany) (a)(b) | | | 2,400,000 | | | | 2,403,420 | |
Ford Motor Co. | | | | | | | | |
8.50%, due 4/21/23 | | | 2,100,000 | | | | 2,317,875 | |
9.00%, due 4/22/25 | | | 2,200,000 | | | | 2,592,469 | |
Ford Motor Credit Co. LLC | | | | | | | | |
3.35%, due 11/1/22 | | | 820,000 | | | | 816,925 | |
4.063%, due 11/1/24 | | | 1,935,000 | | | | 1,940,418 | |
4.25%, due 9/20/22 | | | 655,000 | | | | 664,273 | |
5.875%, due 8/2/21 | | | 350,000 | | | | 357,420 | |
General Motors Co.
6.125%, due 10/1/25 | | | 670,000 | | | | 784,124 | |
General Motors Financial Co., Inc. | | | | | | | | |
3.15%, due 6/30/22 | | | 900,000 | | | | 925,782 | |
3.45%, due 4/10/22 | | | 3,800,000 | | | | 3,910,930 | |
5.20%, due 3/20/23 | | | 810,000 | | | | 878,947 | |
| | | | | | | | |
| | | | | | | 17,592,583 | |
| | | | | | | | |
Banks 8.4% | |
Bank of America Corp. | | | | | | | | |
2.496%, due 2/13/31 (d) | | | 1,600,000 | | | | 1,656,004 | |
2.676%, due 6/19/41 (d) | | | 2,795,000 | | | | 2,821,943 | |
2.738%, due 1/23/22 (d) | | | 3,260,000 | | | | 3,276,969 | |
3.004%, due 12/20/23 (d) | | | 1,794,000 | | | | 1,880,702 | |
3.194%, due 7/23/30 (d) | | | 1,425,000 | | | | 1,565,035 | |
3.458%, due 3/15/25 (d) | | | 1,700,000 | | | | 1,839,038 | |
3.499%, due 5/17/22 (d) | | | 4,490,000 | | | | 4,564,006 | |
4.20%, due 8/26/24 | | | 2,615,000 | | | | 2,914,061 | |
4.30%, due 1/28/25 (d)(e) | | | 3,519,000 | | | | 3,433,242 | |
6.30%, due 3/10/26 (d)(e) | | | 2,085,000 | | | | 2,366,475 | |
8.57%, due 11/15/24 | | | 485,000 | | | | 619,992 | |
BNP Paribas S.A.
3.052%, due 1/13/31 (France) (a)(d) | | | 3,630,000 | | | | 3,847,342 | |
Citibank N.A.
3.40%, due 7/23/21 | | | 3,585,000 | | | | 3,656,987 | |
Citigroup, Inc. | | | | | | | | |
3.352%, due 4/24/25 (d) | | | 2,565,000 | | | | 2,770,713 | |
3.668%, due 7/24/28 (d) | | | 1,180,000 | | | | 1,321,807 | |
3.98%, due 3/20/30 (d) | | | 2,370,000 | | | | 2,718,688 | |
| | | | |
| 14 | | MainStay Income Builder Fund | | The notes to the financial statements are an integral part of,
and should be read in conjunction with, the financial statements. |
| | | | | | | | |
| | | Principal
Amount | | | Value | |
| Corporate Bonds (continued) | |
Banks (continued) | |
Citigroup, Inc. (continued) | | | | | | | | |
4.05%, due 7/30/22 | | $ | 105,000 | | | $ | 111,263 | |
5.30%, due 5/6/44 | | | 1,200,000 | | | | 1,589,987 | |
6.625%, due 6/15/32 | | | 770,000 | | | | 1,069,607 | |
6.875%, due 6/1/25 | | | 1,715,000 | | | | 2,125,126 | |
Citizens Financial Group, Inc.
2.638%, due 9/30/32 (a) | | | 3,405,000 | | | | 3,421,274 | |
Credit Suisse Group A.G.
2.593%, due 9/11/25 (Switzerland) (a)(d) | | | 3,000,000 | | | | 3,144,527 | |
First Horizon National Corp.
4.00%, due 5/26/25 | | | 2,100,000 | | | | 2,301,587 | |
Goldman Sachs Group, Inc. | | | | | | | | |
1.45% (3 Month LIBOR + 1.17%), due 5/15/26 (b) | | | 2,245,000 | | | | 2,267,937 | |
2.905%, due 7/24/23 (d) | | | 880,000 | | | | 913,917 | |
2.908%, due 6/5/23 (d) | | | 800,000 | | | | 828,889 | |
3.50%, due 11/16/26 | | | 1,085,000 | | | | 1,201,250 | |
5.25%, due 7/27/21 | | | 805,000 | | | | 833,902 | |
6.75%, due 10/1/37 | | | 829,000 | | | | 1,207,826 | |
HSBC Holdings PLC
3.973%, due 5/22/30 (United Kingdom) (d) | | | 2,365,000 | | | | 2,652,498 | |
Huntington Bancshares, Inc.
3.15%, due 3/14/21 | | | 3,535,000 | | | | 3,563,648 | |
JPMorgan Chase & Co. (d) | | | | | | | | |
2.182%, due 6/1/28 | | | 2,700,000 | | | | 2,815,641 | |
2.956%, due 5/13/31 | | | 1,115,000 | | | | 1,187,417 | |
3.207%, due 4/1/23 | | | 3,915,000 | | | | 4,067,694 | |
3.54%, due 5/1/28 | | | 2,970,000 | | | | 3,334,904 | |
4.60%, due 2/1/25 (e) | | | 3,427,000 | | | | 3,379,022 | |
Lloyds Banking Group PLC (United Kingdom) | | | | | | | | |
4.582%, due 12/10/25 | | | 1,633,000 | | | | 1,808,191 | |
4.65%, due 3/24/26 | | | 3,090,000 | | | | 3,462,997 | |
Morgan Stanley | | | | | | | | |
3.125%, due 1/23/23 | | | 4,435,000 | | | | 4,688,077 | |
3.847% (3 Month LIBOR + 3.61%), due 1/15/21 (b)(e) | | | 1,890,000 | | | | 1,819,054 | |
3.875%, due 1/27/26 | | | 465,000 | | | | 528,532 | |
5.00%, due 11/24/25 | | | 2,855,000 | | | | 3,365,128 | |
7.25%, due 4/1/32 | | | 490,000 | | | | 740,922 | |
Natwest Group PLC (United Kingdom) | | | | | | | | |
3.073% (CMT + 2.55%), due 5/22/28 (b) | | | 3,705,000 | | | | 3,913,493 | |
6.00%, due 12/19/23 | | | 190,000 | | | | 213,217 | |
PNC Bank N.A.
2.55%, due 12/9/21 | | | 2,185,000 | | | | 2,235,605 | |
PNC Financial Services Group, Inc.
2.55%, due 1/22/30 | | | 1,980,000 | | | | 2,130,891 | |
| | | | | | | | |
| | | Principal
Amount | | | Value | |
Banks (continued) | |
Truist Bank
2.636% (5 Year Treasury Constant Maturity Rate + 1.15%), due 9/17/29 (b) | | $ | 1,900,000 | | | $ | 1,969,550 | |
Truist Financial Corp.
4.95% (5 Year Treasury Constant Maturity Rate + 4.605%), due 9/1/25 (b)(e) | | | 2,205,000 | | | | 2,337,300 | |
Wachovia Corp.
5.50%, due 8/1/35 | | | 315,000 | | | | 408,305 | |
Wells Fargo & Co. | | | | | | | | |
2.406%, due 10/30/25 (d) | | | 1,795,000 | | | | 1,893,396 | |
4.90%, due 11/17/45 | | | 55,000 | | | | 69,194 | |
Wells Fargo Bank N.A. | | | | | | | | |
2.60%, due 1/15/21 | | | 2,595,000 | | | | 2,607,300 | |
3.55%, due 8/14/23 | | | 1,815,000 | | | | 1,963,370 | |
5.85%, due 2/1/37 | | | 140,000 | | | | 187,690 | |
| | | | | | | | |
| | | | | | | 119,613,132 | |
| | | | | | | | |
Beverages 0.3% | |
Anheuser-Busch InBev Worldwide, Inc. (Belgium) | | | | | | | | |
4.15%, due 1/23/25 | | | 635,000 | | | | 720,254 | |
4.75%, due 1/23/29 | | | 3,075,000 | | | | 3,723,902 | |
| | | | | | | | |
| | | | | | | 4,444,156 | |
| | | | | | | | |
Biotechnology 0.3% | |
Biogen, Inc.
3.625%, due 9/15/22 | | | 3,480,000 | | | | 3,681,634 | |
| | | | | | | | |
|
Building Materials 0.8% | |
Builders FirstSource, Inc. (a) | | | | | | | | |
5.00%, due 3/1/30 | | | 2,455,000 | | | | 2,590,025 | |
6.75%, due 6/1/27 | | | 1,170,000 | | | | 1,254,825 | |
Carrier Global Corp.
2.493%, due 2/15/27 (a) | | | 2,650,000 | | | | 2,784,113 | |
Cemex S.A.B. de C.V.
3.125%, due 3/19/26 (Mexico) (a) | | EUR | 4,255,000 | | | | 4,980,314 | |
| | | | | | | | |
| | | | | | | 11,609,277 | |
| | | | | | | | |
Chemicals 0.7% | |
Air Liquide Finance S.A.
1.75%, due 9/27/21 (France) (a) | | $ | 1,725,000 | | | | 1,745,927 | |
Braskem Netherlands Finance B.V.
4.50%, due 1/10/28 (Netherlands) (a) | | | 2,135,000 | | | | 2,050,710 | |
Huntsman International LLC
4.50%, due 5/1/29 | | | 1,862,000 | | | | 2,077,219 | |
Nutrition & Biosciences, Inc.
1.832%, due 10/15/27 (a) | | | 2,300,000 | | | | 2,305,736 | |
Orbia Advance Corp. S.A.B. de C.V.
4.00%, due 10/4/27 (Mexico) (a) | | | 1,800,000 | | | | 1,945,800 | |
| | | | | | | | |
| | | | | | | 10,125,392 | |
| | | | | | | | |
| | | | | | |
The notes to the financial statements are an integral part of,
and should be read in conjunction with, the financial statements. | | | | | 15 | |
Portfolio of Investments October 31, 2020 (continued)
| | | | | | | | |
| | | Principal
Amount | | | Value | |
| Corporate Bonds (continued) | |
Commercial Services 0.7% | |
Allied Universal Holdco LLC / Allied Universal Finance Corp.
6.625%, due 7/15/26 (a) | | $ | 1,650,000 | | | $ | 1,728,433 | |
Ashtead Capital, Inc.
4.00%, due 5/1/28 (United Kingdom) (a) | | | 935,000 | | | | 974,738 | |
California Institute of Technology
3.65%, due 9/1/19 | | | 1,913,000 | | | | 1,942,624 | |
Cintas Corp. No 2
3.70%, due 4/1/27 | | | 2,740,000 | | | | 3,128,621 | |
Herc Holdings, Inc.
5.50%, due 7/15/27 (a) | | | 1,805,000 | | | | 1,854,863 | |
| | | | | | | | |
| | | | | | | 9,629,279 | |
| | | | | | | | |
Computers 0.8% | |
Apple, Inc.
2.75%, due 1/13/25 | | | 1,990,000 | �� | | | 2,151,539 | |
Dell International LLC / EMC Corp. (a) | | | | | | | | |
4.90%, due 10/1/26 | | | 1,749,000 | | | | 1,991,678 | |
5.30%, due 10/1/29 | | | 810,000 | | | | 938,477 | |
8.10%, due 7/15/36 | | | 1,120,000 | | | | 1,512,836 | |
International Business Machines Corp.
7.00%, due 10/30/25 | | | 2,050,000 | | | | 2,645,829 | |
NCR Corp.
5.00%, due 10/1/28 (a) | | | 2,376,000 | | | | 2,352,240 | |
| | | | | | | | |
| | | | | | | 11,592,599 | |
| | | | | | | | |
Cosmetics & Personal Care 0.1% | |
Estee Lauder Cos., Inc.
2.60%, due 4/15/30 | | | 740,000 | | | | 804,559 | |
| | | | | | | | |
|
Distribution & Wholesale 0.5% | |
Avient Corp.
5.75%, due 5/15/25 (a) | | | 2,877,000 | | | | 3,028,043 | |
Performance Food Group, Inc.
5.50%, due 10/15/27 (a) | | | 4,566,000 | | | | 4,680,150 | |
| | | | | | | | |
| | | | | | | 7,708,193 | |
| | | | | | | | |
Diversified Financial Services 2.0% | |
AerCap Ireland Capital DAC / AerCap Global Aviation Trust (Ireland) | | | | | | | | |
3.30%, due 1/23/23 | | | 1,275,000 | | | | 1,286,009 | |
4.625%, due 7/1/22 | | | 964,000 | | | | 998,793 | |
4.45%, due 12/16/21 | | | 1,465,000 | | | | 1,495,396 | |
Air Lease Corp. | | | | | | | | |
2.30%, due 2/1/25 | | | 2,990,000 | | | | 2,939,492 | |
2.75%, due 1/15/23 | | | 1,850,000 | | | | 1,873,497 | |
3.50%, due 1/15/22 | | | 890,000 | | | | 910,763 | |
4.25%, due 9/15/24 | | | 1,185,000 | | | | 1,236,937 | |
Ally Financial, Inc. | | | | | | | | |
3.875%, due 5/21/24 | | | 810,000 | | | | 871,114 | |
8.00%, due 11/1/31 | | | 3,260,000 | | | | 4,499,985 | |
| | | | | | | | |
| | | Principal
Amount | | | Value | |
Diversified Financial Services (continued) | |
Avolon Holdings Funding, Ltd.
2.875%, due 2/15/25 (Ireland) (a) | | $ | 2,720,000 | | | $ | 2,563,607 | |
BOC Aviation, Ltd.
2.625%, due 9/17/30 (a) | | | 2,620,000 | | | | 2,550,467 | |
Capital One Financial Corp.
4.20%, due 10/29/25 | | | 435,000 | | | | 483,724 | |
Charles Schwab Corp.
5.375% (5 Year Treasury Constant Maturity Rate + 4.971%), due 6/1/25 (b)(e) | | | 2,350,000 | | | | 2,571,605 | |
Discover Financial Services
3.85%, due 11/21/22 | | | 1,491,000 | | | | 1,591,721 | |
Intercontinental Exchange, Inc.
3.00%, due 9/15/60 | | | 2,100,000 | | | | 2,111,497 | |
OneMain Finance Corp.
6.125%, due 3/15/24 | | | 540,000 | | | | 567,649 | |
| | | | | | | | |
| | | | | | | 28,552,256 | |
| | | | | | | | |
Electric 1.0% | |
Connecticut Light & Power Co.
4.00%, due 4/1/48 | | | 1,145,000 | | | | 1,434,822 | |
Duquesne Light Holdings, Inc.
3.616%, due 8/1/27 (a) | | | 2,265,000 | | | | 2,436,419 | |
Entergy Louisiana LLC
4.00%, due 3/15/33 | | | 2,200,000 | | | | 2,720,566 | |
Evergy, Inc.
5.292%, due 6/15/22 (c) | | | 1,130,000 | | | | 1,200,334 | |
Public Service Electric & Gas Co.
3.00%, due 5/15/27 | | | 2,235,000 | | | | 2,470,761 | |
Puget Energy, Inc.
5.625%, due 7/15/22 | | | 815,000 | | | | 864,797 | |
Southern California Edison Co. | | | | | | | | |
3.70%, due 8/1/25 | | | 870,000 | | | | 961,427 | |
4.00%, due 4/1/47 | | | 1,320,000 | | | | 1,423,794 | |
WEC Energy Group, Inc.
2.393% (3 Month LIBOR + 2.113%), due 5/15/67 (b) | | | 1,095,000 | | | | 890,500 | |
| | | | | | | | |
| | | | | | | 14,403,420 | |
| | | | | | | | |
Environmental Controls 0.3% | |
Republic Services, Inc.
4.75%, due 5/15/23 | | | 1,615,000 | | | | 1,770,772 | |
Waste Management, Inc.
2.40%, due 5/15/23 | | | 2,275,000 | | | | 2,372,104 | |
| | | | | | | | |
| | | | | | | 4,142,876 | |
| | | | | | | | |
Food 1.5% | |
JBS USA LUX S.A. / JBS USA Food Co. / JBS USA Finance, Inc.
5.50%, due 1/15/30 (a) | | | 1,230,000 | | | | 1,337,625 | |
Kraft Heinz Foods Co. | | | | | | | | |
4.25%, due 3/1/31 (a) | | | 2,888,000 | | | | 3,133,917 | |
5.00%, due 7/15/35 | | | 1,199,000 | | | | 1,381,899 | |
| | | | |
| 16 | | MainStay Income Builder Fund | | The notes to the financial statements are an integral part of,
and should be read in conjunction with, the financial statements. |
| | | | | | | | |
| | | Principal
Amount | | | Value | |
| Corporate Bonds (continued) | |
Food (continued) | |
Nestle Holdings, Inc. (a) | | | | | | | | |
1.00%, due 9/15/27 | | $ | 3,750,000 | | | $ | 3,732,182 | |
3.10%, due 9/24/21 | | | 2,975,000 | | | | 3,042,309 | |
Smithfield Foods, Inc.
3.35%, due 2/1/22 (a) | | | 1,575,000 | | | | 1,597,653 | |
Sysco Corp. | | | | | | | | |
3.30%, due 2/15/50 | | | 1,130,000 | | | | 1,069,628 | |
5.95%, due 4/1/30 | | | 1,161,000 | | | | 1,481,431 | |
Tyson Foods, Inc.
3.95%, due 8/15/24 | | | 2,255,000 | | | | 2,508,163 | |
U.S. Foods, Inc.
6.25%, due 4/15/25 (a) | | | 1,940,000 | | | | 2,027,300 | |
| | | | | | | | |
| | | | | | | 21,312,107 | |
| | | | | | | | |
Food Services 0.1% | |
Aramark Services, Inc.
6.375%, due 5/1/25 (a) | | | 1,776,000 | | | | 1,862,811 | |
| | | | | | | | |
|
Gas 0.1% | |
Southern California Gas Co.
4.30%, due 1/15/49 | | | 845,000 | | | | 1,071,146 | |
| | | | | | | | |
|
Health Care—Services 0.6% | |
Cigna Holding Co.
4.375%, due 12/15/20 | | | 270,000 | | | | 270,572 | |
Health Care Service Corp. A Mutual Legal Reserve Co.
2.20%, due 6/1/30 (a) | | | 3,800,000 | | | | 3,883,120 | |
Laboratory Corp. of America Holdings
2.30%, due 12/1/24 | | | 3,040,000 | | | | 3,215,463 | |
NYU Langone Hospitals
3.38%, due 7/1/55 | | | 1,550,000 | | | | 1,512,818 | |
| | | | | | | | |
| | | | | | | 8,881,973 | |
| | | | | | | | |
Holding Company—Diversified 0.2% | |
CK Hutchison International (17) II, Ltd.
3.25%, due 9/29/27 (Hong Kong) (a) | | | 2,620,000 | | | | 2,858,172 | |
| | | | | | | | |
|
Home Builders 0.1% | |
Lennar Corp.
5.875%, due 11/15/24 | | | 1,345,000 | | | | 1,511,444 | |
| | | | | | | | |
|
Insurance 1.8% | |
Equitable Holdings, Inc.
5.00%, due 4/20/48 | | | 2,305,000 | | | | 2,753,452 | |
Jackson National Life Global Funding
0.73% (3 Month LIBOR + 0.48%), due 6/11/21 (a)(b) | | | 3,660,000 | | | | 3,667,530 | |
Liberty Mutual Group, Inc.
4.25%, due 6/15/23 (a) | | | 850,000 | | | | 930,553 | |
| | | | | | | | |
| | | Principal
Amount | | | Value | |
Insurance (continued) | |
MassMutual Global Funding II(a) | | | | | | | | |
2.50%, due 10/17/22 | | $ | 3,347,000 | | | $ | 3,486,897 | |
2.95%, due 1/11/25 | | | 1,105,000 | | | | 1,199,657 | |
Peachtree Corners Funding Trust
3.976%, due 2/15/25 (a) | | | 940,000 | | | | 1,034,462 | |
Principal Life Global Funding II
2.375%, due 11/21/21 (a) | | | 4,070,000 | | | | 4,158,607 | |
Protective Life Corp.
8.45%, due 10/15/39 | | | 1,640,000 | | | | 2,527,929 | |
Reliance Standard Life Global Funding II
2.50%, due 10/30/24 (a) | | | 2,420,000 | | | | 2,510,985 | |
Voya Financial, Inc.
3.65%, due 6/15/26 | | | 690,000 | | | | 782,655 | |
Willis North America, Inc. | | | | | | | | |
2.95%, due 9/15/29 | | | 1,735,000 | | | | 1,889,206 | |
3.875%, due 9/15/49 | | | 440,000 | | | | 511,975 | |
| | | | | | | | |
| | | | | | | 25,453,908 | |
| | | | | | | | |
Internet 0.6% | |
Cablevision Lightpath LLC
3.875%, due 9/15/27 (a) | | | 960,000 | | | | 952,800 | |
Expedia Group, Inc. | | | | | | | | |
3.25%, due 2/15/30 | | | 3,165,000 | | | | 3,073,900 | |
3.60%, due 12/15/23 (a) | | | 1,135,000 | | | | 1,167,098 | |
3.80%, due 2/15/28 | | | 440,000 | | | | 442,259 | |
5.00%, due 2/15/26 | | | 60,000 | | | | 64,320 | |
6.25%, due 5/1/25 (a) | | | 470,000 | | | | 516,844 | |
Weibo Corp. (China) | | | | | | | | |
3.375%, due 7/8/30 | | | 1,700,000 | | | | 1,705,056 | |
3.50%, due 7/5/24 | | | 1,190,000 | | | | 1,242,233 | |
| | | | | | | | |
| | | | | | | 9,164,510 | |
| | | | | | | | |
Iron & Steel 0.4% | |
ArcelorMittal S.A.
4.55%, due 3/11/26 (Luxembourg) | | | 2,040,000 | | | | 2,196,225 | |
Vale Overseas, Ltd. (Brazil) | | | | | | | | |
6.25%, due 8/10/26 | | | 2,585,000 | | | | 3,084,422 | |
6.875%, due 11/21/36 | | | 864,000 | | | | 1,161,009 | |
| | | | | | | | |
| | | | | | | 6,441,656 | |
| | | | | | | | |
Lodging 0.7% | |
Boyd Gaming Corp.
8.625%, due 6/1/25 (a) | | | 563,000 | | | | 616,316 | |
Hilton Domestic Operating Co., Inc. | | | | | | | | |
4.875%, due 1/15/30 | | | 1,715,000 | | | | 1,764,306 | |
5.75%, due 5/1/28 (a) | | | 740,000 | | | | 775,672 | |
Las Vegas Sands Corp.
3.20%, due 8/8/24 | | | 1,415,000 | | | | 1,431,225 | |
Marriott International, Inc.
2.30%, due 1/15/22 | | | 2,450,000 | | | | 2,479,365 | |
Sands China, Ltd. (Macao) | | | | | | | | |
4.60%, due 8/8/23 | | | 810,000 | | | | 862,399 | |
5.125%, due 8/8/25 | | | 1,310,000 | | | | 1,411,158 | |
| | | | | | | | |
| | | | | | | 9,340,441 | |
| | | | | | | | |
| | | | | | |
The notes to the financial statements are an integral part of,
and should be read in conjunction with, the financial statements. | | | | | 17 | |
Portfolio of Investments October 31, 2020 (continued)
| | | | | | | | |
| | | Principal
Amount | | | Value | |
| Corporate Bonds (continued) | |
Machinery—Construction & Mining 0.3% | |
Caterpillar Financial Services Corp.
2.90%, due 3/15/21 | | $ | 4,990,000 | | | $ | 5,038,559 | |
| | | | | | | | |
|
Machinery—Diversified 0.4% | |
CNH Industrial Capital LLC | | | | | | | | |
4.20%, due 1/15/24 | | | 1,435,000 | | | | 1,553,250 | |
4.875%, due 4/1/21 | | | 3,945,000 | | | | 4,005,838 | |
| | | | | | | | |
| | | | | | | 5,559,088 | |
| | | | | | | | |
Media 0.7% | |
Comcast Corp. | | | | | | | | |
3.25%, due 11/1/39 | | | 1,665,000 | | | | 1,851,148 | |
4.70%, due 10/15/48 | | | 1,410,000 | | | | 1,881,458 | |
Grupo Televisa S.A.B.
5.25%, due 5/24/49 | | | 1,230,000 | | | | 1,441,423 | |
Sirius XM Radio, Inc.
4.125%, due 7/1/30 (a) | | | 2,200,000 | | | | 2,261,622 | |
Sky, Ltd.
3.75%, due 9/16/24 (United Kingdom) (a) | | | 950,000 | | | | 1,058,526 | |
Time Warner Entertainment Co., L.P.
8.375%, due 3/15/23 | | | 800,000 | | | | 936,466 | |
| | | | | | | | |
| | | | | | | 9,430,643 | |
| | | | | | | | |
Metal Fabricate & Hardware 0.3% | |
Precision Castparts Corp.
3.25%, due 6/15/25 | | | 4,040,000 | | | | 4,463,569 | |
| | | | | | | | |
|
Mining 0.5% | |
Anglo American Capital PLC
4.875%, due 5/14/25 (United Kingdom) (a) | | | 1,295,000 | | | | 1,472,751 | |
Corp. Nacional del Cobre de Chile
3.00%, due 9/30/29 (Chile) (a) | | | 2,825,000 | | | | 2,977,703 | |
Glencore Funding LLC
1.625%, due 9/1/25 (a) | | | 2,805,000 | | | | 2,787,942 | |
| | | | | | | | |
| | | | | | | 7,238,396 | |
| | | | | | | | |
Miscellaneous—Manufacturing 0.5% | |
General Electric Co. | | | | | | | | |
3.625%, due 5/1/30 | | | 1,525,000 | | | | 1,610,462 | |
4.25%, due 5/1/40 | | | 1,660,000 | | | | 1,749,733 | |
4.35%, due 5/1/50 | | | 1,300,000 | | | | 1,385,007 | |
Textron Financial Corp.
2.015% (3 Month LIBOR + 1.735%), due 2/15/42 (a)(b) | | | 3,540,000 | | | | 2,460,300 | |
| | | | | | | | |
| | | | | | | 7,205,502 | |
| | | | | | | | |
Oil & Gas 1.1% | |
BP Capital Markets America, Inc.
3.00%, due 2/24/50 | | | 820,000 | | | | 769,105 | |
| | | | | | | | |
| | | Principal
Amount | | | Value | |
Oil & Gas (continued) | |
BP Capital Markets PLC
4.875% (5 Year Treasury Constant Maturity Rate + 4.398%), due 3/22/30 (b)(e) | | $ | 2,620,000 | | | $ | 2,736,695 | |
Gazprom PJSC Via Gaz Capital S.A.
7.288%, due 8/16/37 (Luxembourg) (a) | | | 2,065,000 | | | | 2,891,512 | |
Marathon Petroleum Corp. | | | | | | | | |
4.50%, due 5/1/23 | | | 1,455,000 | | | | 1,565,811 | |
4.70%, due 5/1/25 | | | 1,585,000 | | | | 1,753,637 | |
5.125%, due 12/15/26 | | | 1,260,000 | | | | 1,441,250 | |
Total Capital International S.A.
3.127%, due 5/29/50 | | | 2,285,000 | | | | 2,291,235 | |
Valero Energy Corp. | | | | | | | | |
4.00%, due 4/1/29 | | | 1,435,000 | | | | 1,497,770 | |
6.625%, due 6/15/37 | | | 1,050,000 | | | | 1,234,949 | |
| | | | | | | | |
| | | | | | | 16,181,964 | |
| | | | | | | | |
Packaging & Containers 0.2% | |
Berry Global, Inc.
4.875%, due 7/15/26 (a) | | | 200,000 | | | | 209,191 | |
Owens Brockway Glass Container, Inc.
6.625%, due 5/13/27 (a) | | | 2,640,000 | | | | 2,831,400 | |
Reynolds Group Issuer, Inc. / Reynolds Group Issuer LLC
5.125%, due 7/15/23 (New Zealand) (a) | | | 224,000 | | | | 226,800 | |
| | | | | | | | |
| | | | | | | 3,267,391 | |
| | | | | | | | |
Pharmaceuticals 1.6% | |
AbbVie, Inc. (a) | | | | | | | | |
3.45%, due 3/15/22 | | | 2,715,000 | | | | 2,810,757 | |
4.05%, due 11/21/39 | | | 2,780,000 | | | | 3,187,973 | |
Bausch Health Cos., Inc. (Canada) (a) | | | | | | | | |
5.75%, due 8/15/27 | | | 1,075,000 | | | | 1,152,938 | |
6.25%, due 2/15/29 | | | 1,290,000 | | | | 1,329,422 | |
Becton Dickinson & Co.
4.669%, due 6/6/47 | | | 1,635,000 | | | | 2,023,660 | |
Bristol-Myers Squibb Co.
3.625%, due 5/15/24 | | | 3,600,000 | | | | 3,953,714 | |
CVS Health Corp. | | | | | | | | |
2.70%, due 8/21/40 | | | 2,930,000 | | | | 2,797,278 | |
4.78%, due 3/25/38 | | | 1,110,000 | | | | 1,340,671 | |
CVS Pass-Through Trust
5.789%, due 1/10/26 (a) | | | 119,505 | | | | 129,763 | |
Eli Lilly & Co.
2.50%, due 9/15/60 | | | 1,685,000 | | | | 1,578,157 | |
Teva Pharmaceutical Finance Netherlands III B.V.
3.15%, due 10/1/26 | | | 2,995,000 | | | | 2,635,600 | |
| | | | | | | | |
| | | | | | | 22,939,933 | |
| | | | | | | | |
| | | | |
| 18 | | MainStay Income Builder Fund | | The notes to the financial statements are an integral part of,
and should be read in conjunction with, the financial statements. |
| | | | | | | | |
| | | Principal
Amount | | | Value | |
| Corporate Bonds (continued) | |
Pipelines 0.7% | |
Enterprise Products Operating LLC | | | | | | | | |
3.125%, due 7/31/29 | | $ | 1,595,000 | | | $ | 1,719,668 | |
3.95%, due 1/31/60 | | | 1,460,000 | | | | 1,430,933 | |
4.20%, due 1/31/50 | | | 405,000 | | | | 437,914 | |
MPLX, L.P. | | | | | | | | |
2.65%, due 8/15/30 | | | 1,705,000 | | | | 1,640,822 | |
4.875%, due 6/1/25 | | | 100,000 | | | | 112,927 | |
Spectra Energy Partners, L.P.
4.75%, due 3/15/24 | | | 1,740,000 | | | | 1,933,845 | |
Transcontinental Gas Pipe Line Co. LLC
4.60%, due 3/15/48 | | | 2,340,000 | | | | 2,566,524 | |
Western Midstream Operating L.P.
6.25%, due 2/1/50 | | | 860,000 | | | | 789,953 | |
| | | | | | | | |
| | | | | | | 10,632,586 | |
| | | | | | | | |
Real Estate Investment Trusts 1.5% | |
Alexandria Real Estate Equities, Inc.
3.375%, due 8/15/31 | | | 1,290,000 | | | | 1,447,098 | |
American Tower Corp. | | | | | | | | |
3.375%, due 10/15/26 | | | 1,920,000 | | | | 2,122,734 | |
3.60%, due 1/15/28 | | | 1,025,000 | | | | 1,144,939 | |
Crown Castle International Corp.
5.25%, due 1/15/23 | | | 3,510,000 | | | | 3,850,696 | |
Digital Realty Trust, L.P. | | | | | | | | |
3.60%, due 7/1/29 | | | 2,985,000 | | | | 3,387,612 | |
3.70%, due 8/15/27 | | | 500,000 | | | | 562,906 | |
Equinix, Inc. | | | | | | | | |
1.25%, due 7/15/25 | | | 1,645,000 | | | | 1,655,541 | |
2.625%, due 11/18/24 | | | 1,820,000 | | | | 1,934,519 | |
GLP Capital, L.P. / GLP Financing II, Inc.
3.35%, due 9/1/24 | | | 1,280,000 | | | | 1,299,469 | |
Iron Mountain, Inc.
5.25%, due 7/15/30 (a) | | | 1,690,000 | | | | 1,734,363 | |
Kilroy Realty, L.P.
3.45%, due 12/15/24 | | | 2,060,000 | | | | 2,184,125 | |
| | | | | | | | |
| | | | | | | 21,324,002 | |
| | | | | | | | |
Retail 1.0% | |
AutoNation, Inc.
4.75%, due 6/1/30 | | | 2,430,000 | | | | 2,849,667 | |
Macy’s, Inc.
8.375%, due 6/15/25 (a) | | | 3,145,000 | | | | 3,283,694 | |
McDonald’s Corp.
3.35%, due 4/1/23 | | | 2,875,000 | | | | 3,061,001 | |
QVC, Inc.
4.375%, due 9/1/28 | | | 2,245,000 | | | | 2,246,684 | |
Starbucks Corp. | | | | | | | | |
3.35%, due 3/12/50 | | | 925,000 | | | | 963,489 | |
4.45%, due 8/15/49 | | | 1,305,000 | | | | 1,588,077 | |
| | | | | | | | |
| | | | | | | 13,992,612 | |
| | | | | | | | |
| | | | | | | | |
| | | Principal
Amount | | | Value | |
Semiconductors 0.4% | |
Broadcom, Inc.
3.125%, due 10/15/22 | | $ | 2,405,000 | | | $ | 2,519,755 | |
Intel Corp.
4.75%, due 3/25/50 | | | 1,225,000 | | | | 1,670,871 | |
NXP B.V. / NXP Funding LLC / NXP USA, Inc.
3.40%, due 5/1/30 (a) | | | 1,255,000 | | | | 1,378,350 | |
| | | | | | | | |
| | | | | | | 5,568,976 | |
| | | | | | | | |
Software 0.3% | |
Fiserv, Inc.
3.20%, due 7/1/26 | | | 525,000 | | | | 581,265 | |
salesforce.com, Inc. | | | | | | | | |
3.25%, due 4/11/23 | | | 1,300,000 | | | | 1,388,503 | |
3.70%, due 4/11/28 | | | 1,915,000 | | | | 2,249,136 | |
| | | | | | | | |
| | | | | | | 4,218,904 | |
| | | | | | | | |
Telecommunications 2.2% | |
Altice France S.A.
7.375%, due 5/1/26 (a) | | | 2,515,000 | | | | 2,624,905 | |
AT&T, Inc. | | | | | | | | |
2.875% (EUAM + 3.14%), due 3/2/25 (b)(e) | | EUR | 2,000,000 | | | | 2,218,658 | |
3.50%, due 9/15/53 (a) | | $ | 2,184,000 | | | | 2,087,968 | |
4.35%, due 3/1/29 | | | 795,000 | | | | 925,865 | |
CommScope Technologies LLC
6.00%, due 6/15/25 (a) | | | 736,000 | | | | 729,656 | |
CommScope, Inc.
7.125%, due 7/1/28 (a) | | | 2,540,000 | | | | 2,554,097 | |
Crown Castle Towers LLC
4.241%, due 7/15/28 (a) | | | 2,680,000 | | | | 3,028,144 | |
Level 3 Financing, Inc.
3.40%, due 3/1/27 (a) | | | 2,545,000 | | | | 2,722,565 | |
Sprint Spectrum Co. LLC / Sprint Spectrum Co. II LLC / Sprint Spectrum Co. III LLC
4.738%, due 3/20/25 (a) | | | 4,170,000 | | | | 4,535,792 | |
T-Mobile USA, Inc.
4.50%, due 4/15/50 (a) | | | 1,015,000 | | | | 1,180,277 | |
Telefonica Emisiones S.A.
5.462%, due 2/16/21 | | | 395,000 | | | | 400,596 | |
VEON Holdings B.V.
4.95%, due 6/16/24 (a) | | | 2,430,000 | | | | 2,620,318 | |
Verizon Communications, Inc.
1.38% (3 Month LIBOR + 1.10%), due 5/15/25 (b) | | | 2,705,000 | | | | 2,771,025 | |
Vodafone Group PLC
4.25%, due 9/17/50 (United Kingdom) | | | 2,830,000 | | | | 3,260,226 | |
| | | | | | | | |
| | | | | | | 31,660,092 | |
| | | | | | | | |
| | | | | | |
The notes to the financial statements are an integral part of,
and should be read in conjunction with, the financial statements. | | | | | 19 | |
Portfolio of Investments October 31, 2020 (continued)
| | | | | | | | |
| | | Principal
Amount | | | Value | |
| Corporate Bonds (continued) | |
Toys, Games & Hobbies 0.1% | |
Hasbro, Inc.
2.60%, due 11/19/22 | | $ | 1,230,000 | | | $ | 1,274,809 | |
| | | | | | | | |
|
Transportation 0.1% | |
XPO Logistics, Inc.
6.50%, due 6/15/22 (a) | | | 761,000 | | | | 763,808 | |
| | | | | | | | |
Total Corporate Bonds
(Cost $505,775,609) | | | | | | | 533,051,160 | |
| | | | | | | | |
|
| Foreign Bonds 0.1% | |
Banks 0.1% | |
Barclays Bank PLC
Series Reg S
10.00%, due 5/21/21 (United Kingdom) | | GBP | 1,186,000 | | | | 1,607,278 | |
| | | | | | | | |
Total Foreign Bonds
(Cost $1,878,754) | | | | | | | 1,607,278 | |
| | | | | | | | |
|
| Foreign Government Bonds 0.6% | |
Brazil 0.2% | |
Brazilian Government International Bond
4.625%, due 1/13/28 (Brazil) | | $ | 2,913,000 | | | | 3,164,974 | |
| | | | | | | | |
|
Mexico 0.4% | |
Mexico Government International Bond
3.25%, due 4/16/30 (Mexico) | | | 5,435,000 | | | | 5,615,877 | |
| | | | | | | | |
Total Foreign Government Bonds
(Cost $8,467,435) | | | | | | | 8,780,851 | |
| | | | | | | | |
|
| Loan Assignments 1.0% (b) | |
Buildings & Real Estate 0.2% | |
Realogy Group LLC
2018 Term Loan B
3.00% (1 Month LIBOR + 2.25%), due 2/8/25 | | | 3,036,051 | | | | 2,907,019 | |
| | | | | | | | |
|
Containers, Packaging & Glass 0.2% | |
BWAY Holding Co.
2017 Term Loan B
3.48% (2 Month LIBOR + 3.25%), due 4/3/24 | | | 3,132,622 | | | | 2,923,127 | |
| | | | | | | | |
|
Diversified/Conglomerate Service 0.1% | |
TruGreen, Ltd. Partnership | | | | | | | | |
2020 Term Loan TBD-%, due 10/29/27 | | | 1,345,000 | | | | 1,334,913 | |
2020 2nd Lien Term Loan TBD-%, due 10/30/28 | | | 580,000 | | | | 571,300 | |
| | | | | | | | |
| | | | | | | 1,906,213 | |
| | | | | | | | |
| | | | | | | | |
| | | Principal
Amount | | | Value | |
Finance 0.2% | |
Alliant Holdings Intermediate, LLC
2018 Term Loan B
2.898% (1 Month LIBOR + 2.75%), due 5/9/25 | | $ | 3,123,051 | | | $ | 3,000,568 | |
| | | | | | | | |
|
Personal & Nondurable Consumer Products 0.1% | |
Prestige Brands, Inc.
Term Loan B4
2.148% (1 Month LIBOR + 2.00%), due 1/26/24 | | | 945,317 | | | | 938,227 | |
| | | | | | | | |
|
Telecommunications 0.2% | |
Level 3 Financing, Inc.
2019 Term Loan B
1.898% (1 Month LIBOR + 1.75%), due 3/1/27 | | | 2,142,032 | | | | 2,061,706 | |
| | | | | | | | |
Total Loan Assignments
(Cost $14,033,147) | | | | | | | 13,736,860 | |
| | | | | | | | |
|
| Mortgage-Backed Securities 6.5% | |
Agency (Collateralized Mortgage Obligations) 2.2% | |
Federal Home Loan Mortgage Corporation | | | | | | | | |
REMIC, Series 4926, Class BP
3.00%, due 10/25/49 | | | 4,860,000 | | | | 5,182,556 | |
REMIC Series 4888, Class BA
3.50%, due 9/15/48 | | | 1,164,058 | | | | 1,217,111 | |
REMIC Series 4877, Class AT
3.50%, due 11/15/48 | | | 2,089,376 | | | | 2,207,620 | |
REMIC Series 4877, Class BE
3.50%, due 11/15/48 | | | 2,815,925 | | | | 2,965,016 | |
REMIC, Series 4958, Class DL
4.00%, due 1/25/50 | | | 4,355,000 | | | | 4,682,541 | |
Federal National Mortgage Association | | | | | | | | |
REMIC, Series 2013-77, Class CY
3.00%, due 7/25/43 | | | 1,902,000 | | | | 2,062,367 | |
REMIC, Series 2019-13, Class PE
3.00%, due 3/25/49 | | | 1,942,212 | | | | 2,064,217 | |
REMIC Series 2019-13, Class CA
3.50%, due 4/25/49 | | | 2,793,359 | | | | 3,056,301 | |
REMIC, Series 2020-10, Class DA
3.50%, due 3/25/60 | | | 2,711,974 | | | | 2,986,746 | |
Government National Mortgage Association Series 2013-149, Class BA
3.25%, due 8/16/41 | | | 5,133,686 | | | | 5,413,511 | |
| | | | | | | | |
| | | | | | | 31,837,986 | |
| | | | | | | | |
| | | | |
| 20 | | MainStay Income Builder Fund | | The notes to the financial statements are an integral part of,
and should be read in conjunction with, the financial statements. |
| | | | | | | | |
| | | Principal
Amount | | | Value | |
| Mortgage-Backed Securities (continued) | |
Commercial Mortgage Loans
(Collateralized Mortgage Obligations) 4.0% | |
Bank | | | | | | | | |
Series 2019-BN21, Class A5
2.851%, due 10/17/52 | | $ | 2,970,000 | | | $ | 3,250,571 | |
Series 2019-BN19, Class A2
2.926%, due 8/15/61 | | | 3,050,000 | | | | 3,251,438 | |
Bayview Commercial Asset Trust
Series 2006-4A, Class A1
0.379% (1 Month LIBOR + 0.23%), due 12/25/36 (a)(b) | | | 67,677 | | | | 62,934 | |
Benchmark Mortgage Trust | | | | | | | | |
Series 2020-B19, Class A2
1.691%, due 9/15/53 | | | 2,175,000 | | | | 2,228,856 | |
Series 2019-B12, Class A5
3.116%, due 8/15/52 | | | 2,852,000 | | | | 3,163,620 | |
BX Commercial Mortgage Trust
Series 2020-VIV3, Class B
3.543%, due 3/9/44 (a) | | | 1,128,236 | | | | 1,122,282 | |
BX Trust (a) | | | | | | | | |
Series 2018-BILT, Class A
0.948% (1 Month LIBOR + 0.80%), due 5/15/30 (b) | | | 2,490,000 | | | | 2,390,632 | |
Series 2018-GW, Class A
0.948% (1 Month LIBOR + 0.80%), due 5/15/35 (b) | | | 1,770,000 | | | | 1,696,849 | |
Series 2019-OC11, Class A
3.202%, due 12/9/41 | | | 1,205,000 | | | | 1,251,432 | |
Series 2019-OC11, Class B
3.605%, due 12/9/41 | | | 890,000 | | | | 900,353 | |
Series 2019-OC11, Class C
3.856%, due 12/9/41 | | | 2,440,000 | | | | 2,377,391 | |
CSAIL Commercial Mortgage Trust
Series 2015-C3, Class A4
3.718%, due 8/15/48 | | | 1,890,254 | | | | 2,069,356 | |
FREMF Mortgage Trust (a)(f) | | | | | | | | |
Series 2015-K720, Class B
3.393%, due 7/25/22 | | | 1,080,000 | | | | 1,114,065 | |
Series 2013-K33, Class B
3.498%, due 8/25/46 | | | 2,701,000 | | | | 2,869,817 | |
Series 2014-K41, Class B
3.833%, due 11/25/47 | | | 870,000 | | | | 953,443 | |
Series 2013-K35, Class B
3.935%, due 12/25/46 | | | 965,000 | | | | 1,040,156 | |
GB Trust (a)(b) | | | | | | | | |
Series 2020-FLIX, Class C
1.748% (1 Month LIBOR + 1.60%), due 8/15/37 | | | 1,300,000 | | | | 1,303,017 | |
Series 2020-FLIX, Class D
2.498% (1 Month LIBOR + 2.35%), due 8/15/37 | | | 1,650,000 | | | | 1,653,760 | |
| | | | | | | | |
| | | Principal
Amount | | | Value | |
Commercial Mortgage Loans
(Collateralized Mortgage Obligations) (continued) | |
GS Mortgage Securities Trust | | | | | | | | |
Series 2019-GC42, Class A4
3.001%, due 9/1/52 | | $ | 1,175,000 | | | $ | 1,287,768 | |
Series 2019-GC40, Class A4
3.16%, due 7/10/52 | | | 2,002,000 | | | | 2,224,426 | |
Hawaii Hotel Trust
Series 2019-MAUI, Class A
1.298% (1 Month LIBOR + 1.15%), due 5/15/38 (a)(b) | | | 1,200,000 | | | | 1,159,424 | |
Hudson Yards Mortgage Trust
Series 2019-30HY, Class A
3.228%, due 7/10/39 (a) | | | 1,460,000 | | | | 1,616,438 | |
JP Morgan Chase Commercial Mortgage Securities Trust
Series 2013-C16, Class A4
4.166%, due 12/15/46 | | | 2,472,000 | | | | 2,673,481 | |
Manhattan West
Series 2020-1MW, Class A
2.13%, due 9/10/39 (a) | | | 2,610,000 | | | | 2,686,069 | |
Morgan Stanley Bank of America Merrill Lynch Trust Series-2015-C23, Class A3
3.451%, due 7/15/50 | | | 1,162,420 | | | | 1,243,860 | |
Morgan Stanley Capital I Trust
Series 2015-UBS8, Class A4
3.809%, due 12/15/48 | | | 1,830,000 | | | | 2,031,714 | |
One Bryant Park Trust
Series 2019-OBP, Class A
2.516%, due 9/15/54 (a) | | | 2,725,000 | | | | 2,871,799 | |
Wells Fargo Commercial Mortgage Trust (a)(f) | | | | | | | | |
Series 2018-1745, Class A
3.749%, due 6/15/36 | | | 2,640,000 | | | | 2,877,341 | |
Series 2018-AUS, Class A
4.058%, due 8/17/36 | | | 3,120,000 | | | | 3,378,545 | |
| | | | | | | | |
| | | | | | | 56,750,837 | |
| | | | | | | | |
Whole Loan (Collateralized Mortgage Obligations) 0.3% | |
Chase Home Lending Mortgage Trust (a)(g) | | | | | | | | |
Series 2019-ATR2, Class A3
3.50%, due 7/25/49 | | | 358,618 | | | | 368,213 | |
Series 2019-ATR1, Class A4
4.00%, due 4/25/49 | | | 414,469 | | | | 416,861 | |
JP Morgan Mortgage Trust (a)(g) | | | | | | | | |
Series 2019-3, Class A3
4.00%, due 9/25/49 | | | 466,216 | | | | 478,277 | |
Series 2019-5, Class A4
4.00%, due 11/25/49 | | | 211,863 | | | | 213,107 | |
| | | | | | |
The notes to the financial statements are an integral part of,
and should be read in conjunction with, the financial statements. | | | | | 21 | |
Portfolio of Investments October 31, 2020 (continued)
| | | | | | | | |
| | | Principal
Amount | | | Value | |
| Mortgage-Backed Securities (continued) | |
Whole Loan (Collateralized Mortgage Obligations) (continued) | |
Seasoned Loans Structured Transaction Trust
Series 2019-1, Class A1
3.50%, due 5/25/29 | | $ | 967,762 | | | $ | 1,027,861 | |
Wells Fargo Mortgage Backed Securities Trust
Series 2020-2, Class A1
3.00%, due 12/25/49 (a)(g) | | | 2,245,264 | | | | 2,310,792 | |
| | | | | | | | |
| | | | | | | 4,815,111 | |
| | | | | | | | |
Total Mortgage-Backed Securities
(Cost $90,582,190) | | | | | | | 93,403,934 | |
| | | | | | | | |
|
| Municipal Bonds 0.2% | |
California 0.2% | |
Regents of the University of California Medical Center Pooled, Revenue Bonds
Series N
3.006%, due 5/15/50 | | | 2,700,000 | | | | 2,783,835 | |
| | | | | | | | |
|
New York 0.0%‡ | |
New York State Thruway Authority, Revenue Bonds
Series M
2.90%, due 1/1/35 | | | 450,000 | | | | 479,169 | |
| | | | | | | | |
Total Municipal Bonds
(Cost $3,150,000) | | | | | | | 3,263,004 | |
| | | | | | | | |
|
| U.S. Government & Federal Agencies 7.7% | |
Federal Home Loan Mortgage Corporation
(Mortgage Pass-Through Securities) 2.3% | |
2.00%, due 7/1/50 | | | 1,887,861 | | | | 1,947,786 | |
2.00%, due 8/1/50 | | | 5,963,119 | | | | 6,211,958 | |
2.00%, due 8/1/50 | | | 2,746,600 | | | | 2,833,783 | |
2.00%, due 8/1/50 | | | 3,262,654 | | | | 3,366,218 | |
2.00%, due 9/1/50 | | | 1,645,061 | | | | 1,701,726 | |
2.50%, due 1/1/40 | | | 691,754 | | | | 721,311 | |
2.50%, due 4/1/50 | | | 148,885 | | | | 155,820 | |
3.50%, due 1/1/48 | | | 2,984,064 | | | | 3,202,179 | |
3.50%, due 1/1/50 | | | 3,987,052 | | | | 4,211,410 | |
4.00%, due 2/1/49 | | | 928,613 | | | | 999,937 | |
5.00%, due 12/1/44 | | | 3,252,619 | | | | 3,747,960 | |
5.00%, due 12/1/48 | | | 3,063,346 | | | | 3,362,406 | |
| | | | | | | | |
| | | | | | | 32,462,494 | |
| | | | | | | | |
| | | | | | | | |
| | | Principal
Amount | | | Value | |
Federal National Mortgage Association
(Mortgage Pass-Through Securities) 2.5% | |
2.00%, due 10/1/50 | | $ | 425,000 | | | $ | 440,290 | |
2.50%, due 8/1/35 | | | 2,003,810 | | | | 2,083,941 | |
2.50%, due 5/1/50 | | | 2,055,556 | | | | 2,143,387 | |
2.50%, due 8/1/50 | | | 269,809 | | | | 282,531 | |
2.50%, due 8/1/50 | | | 3,058,009 | | | | 3,208,457 | |
3.00%, due 3/1/50 | | | 3,312,606 | | | | 3,541,892 | |
3.00%, due 4/1/50 | | | 2,860,122 | | | | 2,991,482 | |
3.50%, due 3/1/37 | | | 4,300,133 | | | | 4,777,819 | |
3.50%, due 2/1/42 | | | 2,698,856 | | | | 2,932,806 | |
4.00%, due 5/1/48 | | | 2,580,266 | | | | 2,757,411 | |
4.00%, due 9/1/48 | | | 4,300,942 | | | | 4,656,898 | |
4.00%, due 1/1/49 | | | 1,042,732 | | | | 1,136,020 | |
4.00%, due 2/1/49 | | | 943,609 | | | | 1,014,660 | |
5.00%, due 9/1/33 | | | 3,873,189 | | | | 4,450,371 | |
| | | | | | | | |
| | | | | | | 36,417,965 | |
| | | | | | | | |
Government National Mortgage Association
(Mortgage Pass-Through Securities) 0.0%‡ | |
6.50%, due 4/15/29 | | | 10 | | | | 11 | |
6.50%, due 8/15/29 | | | 7 | | | | 8 | |
| | | | | | | | |
| | | | | | | 19 | |
| | | | | | | | |
United States Treasury Bonds 1.1% | |
1.375%, due 8/15/50 | | | 620,000 | | | | 581,831 | |
4.375%, due 11/15/39 | | | 6,581,000 | | | | 10,023,943 | |
4.375%, due 5/15/40 | | | 2,140,000 | | | | 3,272,277 | |
4.50%, due 5/15/38 | | | 1,390,000 | | | | 2,118,013 | |
| | | | | | | | |
| | | | | | | 15,996,064 | |
| | | | | | | | |
United States Treasury Notes 1.0% | |
0.125%, due 10/31/22 | | | 9,580,000 | | | | 9,574,387 | |
0.125%, due 10/15/23 | | | 5,010,000 | | | | 4,999,823 | |
| | | | | | | | |
| | | | | | | 14,574,210 | |
| | | | | | | | |
United States Treasury Inflation—Indexed Note 0.8% | |
0.875%, due 1/15/29 (h) | | | 9,690,483 | | | | 11,167,524 | |
| | | | | | | | |
Total U.S. Government & Federal Agencies
(Cost $104,548,017) | | | | | | | 110,618,276 | |
| | | | | | | | |
Total Long-Term Bonds
(Cost $772,582,145) | | | | | | | 813,935,335 | |
| | | | | | | | |
| | |
| | | | | | | | |
| | |
| | | Shares | | | | |
| Common Stocks 37.9% | |
Aerospace & Defense 0.7% | |
BAE Systems PLC (United Kingdom) | | | 967,451 | | | | 4,975,729 | |
Lockheed Martin Corp. | | | 14,090 | | | | 4,933,332 | |
| | | | | | | | |
| | | | | | | 9,909,061 | |
| | | | | | | | |
| | | | |
| 22 | | MainStay Income Builder Fund | | The notes to the financial statements are an integral part of,
and should be read in conjunction with, the financial statements. |
| | | | | | | | |
| | |
| | | Shares | | | Value | |
| Common Stocks (continued) | |
Air Freight & Logistics 1.0% | |
Deutsche Post A.G., Registered (Germany) | | | 149,234 | | | $ | 6,611,557 | |
Hyundai Glovis Co., Ltd. (Republic of Korea) | | | 28,206 | | | | 4,163,660 | |
United Parcel Service, Inc., Class B | | | 25,928 | | | | 4,073,548 | |
| | | | | | | | |
| | | | | | | 14,848,765 | |
| | | | | | | | |
Auto Components 0.3% | |
Cie Generale des Etablissements Michelin SCA (France) | | | 45,720 | | | | 4,932,876 | |
| | | | | | | | |
|
Banks 1.2% | |
JPMorgan Chase & Co. | | | 45,606 | | | | 4,471,212 | |
PNC Financial Services Group, Inc. | | | 27,797 | | | | 3,109,928 | |
Royal Bank of Canada (Canada) | | | 74,617 | | | | 5,217,533 | |
Truist Financial Corp. | | | 98,170 | | | | 4,134,921 | |
| | | | | | | | |
| | | | | | | 16,933,594 | |
| | | | | | | | |
Beverages 0.9% | |
Coca-Cola Co. | | | 94,211 | | | | 4,527,781 | |
Coca-Cola European Partners PLC (United Kingdom) | | | 79,961 | | | | 2,855,407 | |
PepsiCo., Inc. | | | 36,417 | | | | 4,854,022 | |
| | | | | | | | |
| | | | | | | 12,237,210 | |
| | | | | | | | |
Biotechnology 0.9% | |
AbbVie, Inc. | | | 92,232 | | | | 7,848,943 | |
Amgen, Inc. | | | 21,771 | | | | 4,723,001 | |
| | | | | | | | |
| | | | | | | 12,571,944 | |
| | | | | | | | |
Capital Markets 1.2% | |
BlackRock, Inc. | | | 7,125 | | | | 4,269,371 | |
CME Group, Inc. | | | 15,042 | | | | 2,267,130 | |
Lazard, Ltd., Class A | | | 105,097 | | | | 3,538,616 | |
Macquarie Group, Ltd. (Australia) | | | 10,671 | | | | 950,707 | |
Singapore Exchange, Ltd. (Singapore) | | | 534,300 | | | | 3,387,414 | |
T. Rowe Price Group, Inc. | | | 23,552 | | | | 2,983,097 | |
| | | | | | | | |
| | | | | | | 17,396,335 | |
| | | | | | | | |
Chemicals 1.5% | |
BASF S.E. (Germany) | | | 94,409 | | | | 5,175,509 | |
Dow, Inc. | | | 107,777 | | | | 4,902,776 | |
LyondellBasell Industries N.V., Class A | | | 54,033 | | | | 3,698,559 | |
Nutrien, Ltd. (Canada) | | | 203,629 | | | | 8,283,627 | |
| | | | | | | | |
| | | | | | | 22,060,471 | |
| | | | | | | | |
Commercial Services & Supplies 0.0%‡ | |
Quad/Graphics, Inc. | | | 10 | | | | 23 | |
| | | | | | | | |
|
Communications Equipment 0.4% | |
Cisco Systems, Inc. | | | 178,294 | | | | 6,400,755 | |
| | | | | | | | |
| | | | | | | | |
| | |
| | | Shares | | | Value | |
Diversified Telecommunication Services 2.5% | |
AT&T, Inc. | | | 229,987 | | | $ | 6,214,249 | |
BCE, Inc. (Canada) | | | 171,401 | | | | 6,887,945 | |
Deutsche Telekom A.G., Registered (Germany) | | | 198,715 | | | | 3,024,835 | |
Orange S.A. (France) | | | 297,677 | | | | 3,338,620 | |
TELUS Corp. (Canada) | | | 329,432 | | | | 5,632,711 | |
Verizon Communications, Inc. | | | 186,048 | | | | 10,602,876 | |
| | | | | | | | |
| | | | | | | 35,701,236 | |
| | | | | | | | |
Electric Utilities 2.0% | |
American Electric Power Co., Inc. | | | 61,950 | | | | 5,571,164 | |
Duke Energy Corp. | | | 50,074 | | | | 4,612,316 | |
Entergy Corp. | | | 60,168 | | | | 6,090,205 | |
Evergy, Inc. | | | 58,981 | | | | 3,255,751 | |
Fortis, Inc. (Canada) | | | 108,660 | | | | 4,292,409 | |
Terna Rete Elettrica Nazionale S.p.A. (Italy) | | | 728,755 | | | | 4,926,113 | |
| | | | | | | | |
| | | | | | | 28,747,958 | |
| | | | | | | | |
Electrical Equipment 0.9% | |
Eaton Corp. PLC | | | 75,013 | | | | 7,785,599 | |
Emerson Electric Co. | | | 71,450 | | | | 4,629,246 | |
| | | | | | | | |
| | | | | | | 12,414,845 | |
| | | | | | | | |
Equity Real Estate Investment Trusts 1.0% | |
American Tower Corp. | | | 15,042 | | | | 3,454,395 | |
Iron Mountain, Inc. | | | 247,800 | | | | 6,457,668 | |
Welltower, Inc. | | | 81,148 | | | | 4,363,328 | |
| | | | | | | | |
| | | | | | | 14,275,391 | |
| | | | | | | | |
Food Products 0.9% | |
Danone S.A. (France) | | | 62,939 | | | | 3,474,511 | |
Nestle S.A., Registered (Switzerland) | | | 47,501 | | | | 5,340,916 | |
Orkla ASA (Norway) | | | 376,648 | | | | 3,553,964 | |
| | | | | | | | |
| | | | | | | 12,369,391 | |
| | | | | | | | |
Gas Utilities 0.6% | |
Snam S.p.A. (Italy) | | | 1,703,332 | | | | 8,312,062 | |
| | | | | | | | |
|
Health Care Equipment & Supplies 0.2% | |
Medtronic PLC (Italy) | | | 30,959 | | | | 3,113,547 | |
| | | | | | | | |
|
Hotels, Restaurants & Leisure 1.0% | |
Las Vegas Sands Corp. | | | 73,429 | | | | 3,528,997 | |
McDonald’s Corp. | | | 14,250 | | | | 3,035,250 | |
Restaurant Brands International, Inc. (Canada) | | | 67,182 | | | | 3,493,464 | |
Vail Resorts, Inc. | | | 17,219 | | | | 3,995,497 | |
| | | | | | | | |
| | | | | | | 14,053,208 | |
| | | | | | | | |
Household Durables 0.2% | |
Leggett & Platt, Inc. | | | 78,575 | | | | 3,278,935 | |
| | | | | | | | |
| | | | | | |
The notes to the financial statements are an integral part of,
and should be read in conjunction with, the financial statements. | | | | | 23 | |
Portfolio of Investments October 31, 2020 (continued)
| | | | | | | | |
| | |
| | | Shares | | | Value | |
| Common Stocks (continued) | |
Household Products 0.8% | |
Kimberly-Clark Corp. | | | 48,887 | | | $ | 6,481,927 | |
Procter & Gamble Co. | | | 33,449 | | | | 4,585,858 | |
| | | | | | | | |
| | | | | | | 11,067,785 | |
| | | | | | | | |
Industrial Conglomerates 0.3% | |
Siemens A.G., Registered (Germany) | | | 36,022 | | | | 4,224,670 | |
| | | | | | | | |
|
Insurance 2.4% | |
Allianz S.E., Registered (Germany) | | | 41,959 | | | | 7,381,932 | |
Assicurazioni Generali S.p.A. (Italy) | | | 279,468 | | | | 3,746,303 | |
AXA S.A. (France) | | | 227,216 | | | | 3,651,854 | |
MetLife, Inc. | | | 163,463 | | | | 6,187,075 | |
Muenchener Rueckversicherungs-Gesellschaft A.G., Registered (Germany) | | | 32,322 | | | | 7,558,879 | |
SCOR S.E. (France) (i) | | | 90,226 | | | | 2,192,005 | |
Tokio Marine Holdings, Inc. (Japan) | | | 90,200 | | | | 4,013,962 | |
| | | | | | | | |
| | | | | | | 34,732,010 | |
| | | | | | | | |
IT Services 0.5% | |
International Business Machines Corp. | | | 68,266 | | | | 7,622,582 | |
| | | | | | | | |
|
Leisure Products 0.3% | |
Hasbro, Inc. | | | 44,137 | | | | 3,651,013 | |
| | | | | | | | |
|
Machinery 0.2% | |
Atlas Copco A.B., Class A (Sweden) | | | 79,961 | | | | 3,530,598 | |
| | | | | | | | |
|
Media 0.2% | |
Comcast Corp., Class A | | | 81,742 | | | | 3,452,782 | |
ION Media Networks, Inc. (i)(j)(k)(l)(m) | | | 12 | | | | 9,504 | |
| | | | | | | | |
| | | | | | | 3,462,286 | |
| | | | | | | | |
Multi-Utilities 1.7% | |
Ameren Corp. | | | 71,648 | | | | 5,812,086 | |
Dominion Energy, Inc. | | | 90,055 | | | | 7,235,019 | |
National Grid PLC (United Kingdom) | | | 408,118 | | | | 4,858,906 | |
WEC Energy Group, Inc. | | | 66,304 | | | | 6,666,867 | |
| | | | | | | | |
| | | | | | | 24,572,878 | |
| | | | | | | | |
Multiline Retail 0.3% | |
Target Corp. | | | 25,891 | | | | 3,941,128 | |
| | | | | | | | |
|
Oil, Gas & Consumable Fuels 1.3% | |
Chevron Corp. | | | 40,574 | | | | 2,819,893 | |
Enterprise Products Partners, L.P. | | | 256,113 | | | | 4,243,793 | |
Magellan Midstream Partners, L.P. | | | 95,795 | | | | 3,404,554 | |
Phillips 66 | | | 53,439 | | | | 2,493,464 | |
TOTAL S.E. (France) | | | 203,189 | | | | 6,110,150 | |
| | | | | | | | |
| | | | | | | 19,071,854 | |
| | | | | | | | |
| | | | | | | | |
| | |
| | | Shares | | | Value | |
Personal Products 0.6% | |
Unilever PLC (United Kingdom) | | | 142,307 | | | $ | 8,119,155 | |
| | | | | | | | |
|
Pharmaceuticals 4.2% | |
AstraZeneca PLC, Sponsored ADR (United Kingdom) | | | 80,357 | | | | 4,030,707 | |
Bayer A.G., Registered (Germany) | | | 52,053 | | | | 2,446,766 | |
GlaxoSmithKline PLC (United Kingdom) | | | 333,501 | | | | 5,581,227 | |
Johnson & Johnson | | | 46,116 | | | | 6,322,965 | |
Merck & Co., Inc. | | | 94,805 | | | | 7,130,284 | |
Novartis A.G., Registered (Switzerland) | | | 60,564 | | | | 4,721,872 | |
Novo Nordisk A/S, Class B (Denmark) | | | 49,480 | | | | 3,178,037 | |
Pfizer, Inc. | | | 169,818 | | | | 6,025,143 | |
Roche Holding A.G. (Switzerland) | | | 17,021 | | | | 5,471,334 | |
Sanofi (France) | | | 79,367 | | | | 7,151,679 | |
Takeda Pharmaceutical Co., Ltd. (Japan) | | | 253,900 | | | | 7,855,027 | |
| | | | | | | | |
| | | | | | | 59,915,041 | |
| | | | | | | | |
Semiconductors & Semiconductor Equipment 3.0% | |
Analog Devices, Inc. | | | 49,876 | | | | 5,911,802 | |
Broadcom, Inc. | | | 16,510 | | | | 5,772,391 | |
Intel Corp. | | | 82,336 | | | | 3,645,838 | |
KLA Corp. | | | 38,793 | | | | 7,649,204 | |
Maxim Integrated Products, Inc. | | | 23,355 | | | | 1,626,676 | |
Taiwan Semiconductor Manufacturing Co., Ltd., Sponsored ADR (Taiwan) | | | 121,525 | | | | 10,192,302 | |
Texas Instruments, Inc. | | | 53,439 | | | | 7,726,745 | |
| | | | | | | | |
| | | | | | | 42,524,958 | |
| | | | | | | | |
Software 0.9% | |
Microsoft Corp. | | | 60,564 | | | | 12,262,393 | |
| | | | | | | | |
|
Specialty Retail 0.3% | |
Home Depot, Inc. | | | 15,301 | | | | 4,080,930 | |
| | | | | | | | |
|
Technology Hardware, Storage & Peripherals 1.1% | |
Apple, Inc. | | | 67,603 | | | | 7,359,263 | |
Samsung Electronics Co., Ltd. GDR (Republic of Korea) (a) | | | 6,169 | | | | 7,791,447 | |
| | | | | | | | |
| | | | | | | 15,150,710 | |
| | | | | | | | |
Textiles, Apparel & Luxury Goods 0.3% | |
Hanesbrands, Inc. | | | 229,591 | | | | 3,689,527 | |
| | | | | | | | |
|
Tobacco 1.5% | |
Altria Group, Inc. | | | 181,496 | | | | 6,548,376 | |
British American Tobacco PLC (United Kingdom) | | | 173,974 | | | | 5,517,382 | |
British American Tobacco PLC Sponsored ADR (United Kingdom) | | | 58,387 | | | | 1,861,377 | |
Philip Morris International, Inc. | | | 104,305 | | | | 7,407,741 | |
| | | | | | | | |
| | | | | | | 21,334,876 | |
| | | | | | | | |
| | | | |
| 24 | | MainStay Income Builder Fund | | The notes to the financial statements are an integral part of,
and should be read in conjunction with, the financial statements. |
| | | | | | | | |
| | |
| | | Shares | | | Value | |
| Common Stocks (continued) | |
Trading Companies & Distributors 0.4% | |
MSC Industrial Direct Co., Inc., Class A | | | 11,695 | | | $ | 814,674 | |
Watsco, Inc. | | | 22,761 | | | | 5,101,650 | |
| | | | | | | | |
| | | | | | | 5,916,324 | |
| | | | | | | | |
Wireless Telecommunication Services 0.2% | |
Rogers Communications, Inc., Class B (Canada) | | | 77,586 | | | | 3,151,658 | |
| | | | | | | | |
Total Common Stocks
(Cost $520,001,602) | | | | | | | 541,579,983 | |
| | | | | | | | |
|
| Short-Term Investment 3.4% | |
Affiliated Investment Company 3.4% | |
MainStay U.S. Government Liquidity Fund, 0.02% (n) | | | 48,169,605 | | | | 48,169,605 | |
| | | | | | | | |
Total Short-Term Investment
(Cost $48,169,605) | | | | | | | 48,169,605 | |
| | | | | | | | |
Total Investments
(Cost $1,340,753,352) | | | 98.1 | % | | | 1,403,684,923 | |
Other Assets, Less Liabilities | | | 1.9 | | | | 26,923,623 | |
Net Assets | | | 100.0 | % | | $ | 1,430,608,546 | |
| † | Percentages indicated are based on Fund net assets. |
| ‡ | Less than one-tenth of a percent. |
| (a) | May be sold to institutional investors only under Rule 144A or securities offered pursuant to Section 4(a)(2) of the Securities Act of 1933, as amended. |
| (b) | Floating rate—Rate shown was the rate in effect as of October 31, 2020. |
| (c) | Step coupon—Rate shown was the rate in effect as of October 31, 2020. |
| (d) | Fixed to floating rate—Rate shown was the rate in effect as of October 31, 2020. |
| (e) | Securities are perpetual and, thus, do not have a predetermined maturity date. The date shown, if applicable, reflects the next call date. |
| (f) | Collateral strip rate—A bond whose interest was based on the weighted net interest rate of the collateral. The coupon rate adjusts periodically based on a predetermined schedule. Rate shown was the rate in effect as of October 31, 2020. |
| (g) | Coupon rate may change based on changes of the underlying collateral or prepayments of principal. Rate shown was the rate in effect as of October 31, 2020. |
| (h) | Treasury Inflation Protected Security—Pays a fixed rate of interest on a principal amount that is continuously adjusted for inflation based on the Consumer Price Index-Urban Consumers. |
| (i) | Non-income producing security. |
| (j) | Security in which significant unobservable inputs (Level 3) were used in determining fair value. |
| (k) | Illiquid security—As of October 31, 2020, the total market value of the security deemed illiquid under procedures approved by the Board of Trustees was $9,504, which represented less than one-tenth of a percent of the Fund’s net assets. |
| (l) | Fair valued security—Represents fair value as measured in good faith under procedures approved by the Board of Trustees. As of October 31, 2020, the total market value of fair valued security was $9,504, which represented less than one-tenth of a percent of the Fund’s net assets. |
| (m) | Restricted security. (See Note 5) |
| (n) | Current yield as of October 31, 2020. |
Foreign Currency Forward Contracts
As of October 31, 2020, the Fund held the following foreign currency forward contracts1:
| | | | | | | | | | | | | | | | | | |
Currency Purchased | | | Currency Sold | | | Counterparty | | Settlement
Date | | Unrealized
Appreciation
(Depreciation) | |
| AUD | | | 23,293,000 | | | USD | | | 16,248,731 | | | JPMorgan Chase Bank N.A. | | 11/2/20 | | $ | 123,924 | |
| JPY | | | 5,081,523,000 | | | USD | | | 47,422,837 | | | JPMorgan Chase Bank N.A. | | 11/2/20 | | | 1,113,607 | |
| JPY | | | 5,081,523,000 | | | USD | | | 48,532,040 | | | JPMorgan Chase Bank N.A. | | 2/1/21 | | | 68,273 | |
| USD | | | 16,576,557 | | | AUD | | | 23,293,000 | | | JPMorgan Chase Bank N.A. | | 11/2/20 | | | 203,901 | |
| USD | | | 5,907,742 | | | EUR | | | 4,988,000 | | | JPMorgan Chase Bank N.A. | | 2/1/21 | | | 85,802 | |
| USD | | | 1,711,354 | | | GBP | | | 1,314,000 | | | JPMorgan Chase Bank N.A. | | 2/1/21 | | | 7,952 | |
| | | | | | | | | | | | | | | | | | |
| Total Unrealized Appreciation | | | 1,603,459 | |
| | | | | | | | | | | | | | | | | | |
| AUD | | | 23,293,000 | | | USD | | | 16,582,846 | | | JPMorgan Chase Bank N.A. | | 2/1/21 | | | (202,644 | ) |
| EUR | | | 4,988,000 | | | USD | | | 5,895,188 | | | JPMorgan Chase Bank N.A. | | 11/2/20 | | | (85,913 | ) |
| GBP | | | 1,314,000 | | | USD | | | 1,710,326 | | | JPMorgan Chase Bank N.A. | | 11/2/20 | | | (8,040 | ) |
| USD | | | 5,687,816 | | | EUR | | | 4,988,000 | | | JPMorgan Chase Bank N.A. | | 11/2/20 | | | (121,458 | ) |
| USD | | | 1,650,752 | | | GBP | | | 1,314,000 | | | JPMorgan Chase Bank N.A. | | 11/2/20 | | | (51,535 | ) |
| USD | | | 48,457,067 | | | JPY | | | 5,081,523,000 | | | JPMorgan Chase Bank N.A. | | 11/2/20 | | | (79,376 | ) |
| | | | | | | | | | | | | | | | | | |
| Total Unrealized Depreciation | | | | | (548,966 | ) |
| | | | | | | | | | | | | | | | | | |
| Net Unrealized Appreciation | | | | $ | 1,054,493 | |
| | | | | | | | | | | | | | | | | | |
| 1. | Foreign Currency Forward Contracts are subject to limitations such that they cannot be “sold or repurchased,” although the Fund would be able to exit the transaction through other means, such as through the execution of an offsetting transaction. |
| | | | | | |
The notes to the financial statements are an integral part of,
and should be read in conjunction with, the financial statements. | | | | | 25 | |
Portfolio of Investments October 31, 2020 (continued)
Futures Contracts
As of October 31, 2020, the Portfolio held the following futures contracts1:
| | | | | | | | | | | | | | | | | | | | |
Type | | Number of
Contracts | | | Expiration
Date | | | Value at
Trade Date | | | Current
Notional
Amount | | | Unrealized Appreciation
(Depreciation)2 | |
Long Contracts | | | | | | | | | | | | | | | | | | | | |
| 2-Year United States Treasury Note | | | 501 | | | | December 2020 | | | $ | 110,686,556 | | | $ | 110,642,719 | | | $ | (43,837 | ) |
| Nikkei 225 | | | 465 | | | | December 2020 | | | | 50,956,388 | | | | 51,398,945 | | | | 442,557 | |
| S&P 500 Index Mini | | | 1,185 | | | | December 2020 | | | | 196,108,705 | | | | 193,433,475 | | | | (2,675,230 | ) |
| United States Treasury Long Bond | | | 48 | | | | December 2020 | | | | 8,455,064 | | | | 8,278,500 | | | | (176,564 | ) |
| United States Treasury Ultra Bond | | | 290 | | | | December 2020 | | | | 64,899,653 | | | | 62,350,000 | | | | (2,549,653 | ) |
| | | | | | | | | | | | | | | | | | | | |
| Total Long Contracts | | | | | | | | | | | | | | | | | | | (5,002,727 | ) |
| | | | | | | | | | | | | | | | | | | | |
Short Contracts | | | | | | | | | | | | | |
| | | | | |
10-Year United States Treasury Note | | | (15 | ) | | | December 2020 | | | | (2,090,356 | ) | | | (2,073,281 | ) | | | 17,075 | |
| | | | | |
10-Year United States Treasury Ultra Note | | | (151 | ) | | | December 2020 | | | | (24,095,477 | ) | | | (23,749,469 | ) | | | 346,008 | |
| 5-Year United States Treasury Note | | | (404 | ) | | | December 2020 | | | | (50,905,068 | ) | | | (50,743,031 | ) | | | 162,037 | |
| | | | | | | | | | | | | | | | | | | | |
| Total Short Contracts | | | | | | | | | | | | | | | | | | | 525,120 | |
| | | | | | | | | | | | | | | | | | | | |
| Net Unrealized Depreciation | | | | | | | | | | | | | | | | | | $ | (4,477,607 | ) |
| | | | | | | | | | | | | | | | | | | | |
| 1. | As of October 31, 2020, cash in the amount of $20,699,572 was on deposit with a broker or futures commission merchant for futures transactions. |
| 2. | Represents the difference between the value of the contracts at the time they were opened and the value as of October 31, 2020. |
The following abbreviations are used in the preceding pages:
ADR—American Depositary Receipt
AUD—Australian Dollar
CMT—1 Year Treasury Constant Maturity Rate
EUAM—European Union Advisory Mission
EUR—Euro
GBP—British Pound Sterling
GDR—Global Depositary Receipt
JPY—Japanese Yen
LIBOR—London Interbank Offered Rate
REMIC—Real Estate Mortgage Investment Conduit
TBD—To Be Determined
USD—United States Dollar
| | | | |
| 26 | | MainStay Income Builder Fund | | The notes to the financial statements are an integral part of,
and should be read in conjunction with, the financial statements. |
The following is a summary of the fair valuations according to the inputs used as of October 31, 2020, for valuing the Fund’s assets and liabilities:
| | | | | | | | | | | | | | | | |
Description | | Quoted
Prices in
Active
Markets for
Identical
Assets
(Level 1) | | | Significant
Other
Observable
Inputs
(Level 2) | | | Significant
Unobservable
Inputs
(Level 3) | | | Total | |
| | | | |
Asset Valuation Inputs | | | | | | | | | | | | | | | | |
| Investments in Securities (a) | | | | | | | | | | | | | | | | |
Long-Term Bonds | | | | | | | | | | | | | | | | |
Asset-Backed Securities | | $ | — | | | $ | 39,272,428 | | | $ | — | | | $ | 39,272,428 | |
Convertible Bonds | | | — | | | | 10,201,544 | | | | — | | | | 10,201,544 | |
Corporate Bonds | | | — | | | | 533,051,160 | | | | — | | | | 533,051,160 | |
Foreign Bonds | | | — | | | | 1,607,278 | | | | — | | | | 1,607,278 | |
Foreign Government Bonds | | | — | | | | 8,780,851 | | | | — | | | | 8,780,851 | |
Loan Assignments | | | — | | | | 13,736,860 | | | | — | | | | 13,736,860 | |
Mortgage-Backed Securities | | | — | | | | 93,403,934 | | | | — | | | | 93,403,934 | |
Municipal Bonds | | | — | | | | 3,263,004 | | | | — | | | | 3,263,004 | |
U.S. Government & Federal Agencies | | | — | | | | 110,618,276 | | | | — | | | | 110,618,276 | |
| | | | | | | | | | | | | | | | |
| Total Long-Term Bonds | | | — | | | | 813,935,335 | | | | — | | | | 813,935,335 | |
| | | | | | | | | | | | | | | | |
| Common Stocks (b) | | | 541,570,479 | | | | — | | | | 9,504 | | | | 541,579,983 | |
| Short-Term Investments | | | | | | | | | | | | | | | | |
Affiliated Investment Company | | | 48,169,605 | | | | — | | | | — | | | | 48,169,605 | |
| | | | | | | | | | | | | | | | |
| Total Investments in Securities | | | 589,740,084 | | | | 813,935,335 | | | | 9,504 | | | | 1,403,684,923 | |
| | | | | | | | | | | | | | | | |
| Other Financial Instruments | | | | | | | | | | | | | | | | |
Foreign Currency Forward Contracts (c) | | | — | | | | 1,603,459 | | | | — | | | | 1,603,459 | |
Futures Contracts (c) | | | 967,677 | | | | — | | | | — | | | | 967,677 | |
| | | | | | | | | | | | | | | | |
| Total Other Financial Instruments | | | 967,677 | | | | 1,603,459 | | | | — | | | | 2,571,136 | |
| | | | | | | | | | | | | | | | |
| Total Investments in Securities and Other Financial Instruments | | $ | 590,707,761 | | | $ | 815,538,794 | | | $ | 9,504 | | | $ | 1,406,256,059 | |
| | | | | | | | | | | | | | | | |
| | | | |
Liability Valuation Inputs | | | | | | | | | | | | | | | | |
| Other Financial Instruments | | | | | | | | | | | | | | | | |
Foreign Currency Forward Contracts (c) | | $ | — | | | $ | (548,966 | ) | | $ | — | | | $ | (548,966 | ) |
Futures Contracts (c) | | | (5,445,284 | ) | | | — | | | | — | | | | (5,445,284 | ) |
| | | | | | | | | | | | | | | | |
| Total Other Financial Instruments | | $ | (5,445,284 | ) | | $ | (548,966 | ) | | $ | — | | | $ | (5,994,250 | ) |
| | | | | | | | | | | | | | | | |
| (a) | For a complete listing of investments and their industries, see the Portfolio of Investments. |
| (b) | The Level 3 security valued at $9,504 is held in Media within the Common Stocks section of the Portfolio of Investments. |
| (c) | The value listed for these securities reflects unrealized appreciation (depreciation) as shown on the Portfolio of Investments. |
| | | | | | |
The notes to the financial statements are an integral part of,
and should be read in conjunction with, the financial statements. | | | | | 27 | |
Statement of Assets and Liabilities as of October 31, 2020
| | | | |
| Assets | | | | |
Investment in unaffiliated securities, at value
(identified cost $1,292,583,747) | | $ | 1,355,515,318 | |
Investment in affiliated investment company, at value
(identified cost $48,169,605) | | | 48,169,605 | |
Cash collateral on deposit at broker for futures contracts | | | 20,699,572 | |
Cash denominated in foreign currencies
(identified cost $19,837) | | | 32,918 | |
Receivables: | | | | |
Investment securities sold | | | 21,200,239 | |
Dividends and interest | | | 8,901,167 | |
Fund shares sold | | | 995,943 | |
Securities lending | | | 1,481 | |
Unrealized appreciation on foreign currency forward contracts | | | 1,603,459 | |
Other assets | | | 78,858 | |
| | | | |
Total assets | | | 1,457,198,560 | |
| | | | |
| |
| Liabilities | | | | |
Due to custodian | | | 215,813 | |
Payables: | | | | |
Investment securities purchased | | | 17,630,117 | |
Variation margin on futures contracts | | | 4,845,992 | |
Fund shares redeemed | | | 1,580,537 | |
Manager (See Note 3) | | | 772,380 | |
NYLIFE Distributors (See Note 3) | | | 305,446 | |
Transfer agent (See Note 3) | | | 302,261 | |
Shareholder communication | | | 89,114 | |
Professional fees | | | 48,924 | |
Custodian | | | 16,693 | |
Trustees | | | 1,955 | |
Accrued expenses | | | 1,909 | |
Unrealized depreciation on foreign currency forward contracts | | | 548,966 | |
Dividend payable | | | 229,907 | |
| | | | |
Total liabilities | | | 26,590,014 | |
| | | | |
Net assets | | $ | 1,430,608,546 | |
| | | | |
| |
| Composition of Net Assets | | | | |
Shares of beneficial interest outstanding (par value of $.01 per share) unlimited number of shares authorized | | $ | 765,243 | |
Additional paid-in capital | | | 1,404,547,251 | |
| | | | |
| | | 1,405,312,494 | |
Total distributable earnings (loss) | | | 25,296,052 | |
| | | | |
Net assets | | $ | 1,430,608,546 | |
| | | | |
| | | | |
Class A | | | | |
Net assets applicable to outstanding shares | | $ | 638,250,210 | |
| | | | |
Shares of beneficial interest outstanding | | | 34,299,307 | |
| | | | |
Net asset value per share outstanding | | $ | 18.61 | |
Maximum sales charge (3.00% of offering price) | | | 0.58 | |
| | | | |
Maximum offering price per share outstanding | | $ | 19.19 | |
| | | | |
Investor Class | | | | |
Net assets applicable to outstanding shares | | $ | 79,992,014 | |
| | | | |
Shares of beneficial interest outstanding | | | 4,294,968 | |
| | | | |
Net asset value per share outstanding | | $ | 18.62 | |
Maximum sales charge (2.50% of offering price) | | | 0.48 | |
| | | | |
Maximum offering price per share outstanding | | $ | 19.10 | |
| | | | |
Class B | | | | |
Net assets applicable to outstanding shares | | $ | 19,409,117 | |
| | | | |
Shares of beneficial interest outstanding | | | 1,035,033 | |
| | | | |
Net asset value and offering price per share outstanding | | $ | 18.75 | |
| | | | |
Class C | | | | |
Net assets applicable to outstanding shares | | $ | 148,220,200 | |
| | | | |
Shares of beneficial interest outstanding | | | 7,920,244 | |
| | | | |
Net asset value and offering price per share outstanding | | $ | 18.71 | |
| | | | |
Class I | | | | |
Net assets applicable to outstanding shares | | $ | 448,922,302 | |
| | | | |
Shares of beneficial interest outstanding | | | 23,877,168 | |
| | | | |
Net asset value and offering price per share outstanding | | $ | 18.80 | |
| | | | |
Class R2 | | | | |
Net assets applicable to outstanding shares | | $ | 3,043,553 | |
| | | | |
Shares of beneficial interest outstanding | | | 163,580 | |
| | | | |
Net asset value and offering price per share outstanding | | $ | 18.61 | |
| | | | |
Class R3 | | | | |
Net assets applicable to outstanding shares | | $ | 1,196,045 | |
| | | | |
Shares of beneficial interest outstanding | | | 64,269 | |
| | | | |
Net asset value and offering price per share outstanding | | $ | 18.61 | |
| | | | |
Class R6 | | | | |
Net assets applicable to outstanding shares | | $ | 91,550,947 | |
| | | | |
Shares of beneficial interest outstanding | | | 4,868,457 | |
| | | | |
Net asset value and offering price per share outstanding | | $ | 18.80 | |
| | | | |
SIMPLE Class | | | | |
Net assets applicable to outstanding shares | | $ | 24,158 | |
| | | | |
Shares of beneficial interest outstanding | | | 1,297 | |
| | | | |
Net asset value and offering price per share outstanding (a) | | $ | 18.62 | |
| | | | |
| (a) | The difference between the recalculated and stated NAV was caused by rounding. |
| | | | |
| 28 | | MainStay Income Builder Fund | | The notes to the financial statements are an integral part of,
and should be read in conjunction with, the financial statements. |
Statement of Operations for the year ended October 31, 2020
| | | | |
| Investment Income (Loss) | | | | |
Income | | | | |
Interest (a) | | $ | 25,589,269 | |
Dividends-unaffiliated (b) | | | 23,280,263 | |
Dividends-affiliated | | | 307,019 | |
Securities lending | | | 81,241 | |
Other | | | 479 | |
| | | | |
Total income | | | 49,258,271 | |
| | | | |
Expenses | | | | |
Manager (See Note 3) | | | 9,117,556 | |
Distribution/Service—Class A (See Note 3) | | | 1,580,889 | |
Distribution/Service—Investor Class (See Note 3) | | | 207,659 | |
Distribution/Service—Class B (See Note 3) | | | 225,131 | |
Distribution/Service—Class C (See Note 3) | | | 1,723,825 | |
Distribution/Service—Class R2 (See Note 3) | | | 6,730 | |
Distribution/Service—Class R3 (See Note 3) | | | 5,058 | |
Distribution/Service—SIMPLE Class (See Note 3) | | | 21 | |
Transfer agent (See Note 3) | | | 1,813,414 | |
Professional fees | | | 192,648 | |
Registration | | | 177,122 | |
Shareholder communication | | | 144,863 | |
Custodian | | | 99,160 | |
Trustees | | | 34,740 | |
Shareholder service (See Note 3) | | | 3,704 | |
Miscellaneous | | | 65,972 | |
| | | | |
Total expenses | | | 15,398,492 | |
| | | | |
Net investment income (loss) | | | 33,859,779 | |
| | | | |
| |
| Realized and Unrealized Gain (Loss) | | | | |
Net realized gain (loss) on: | | | | |
Unaffiliated investment transactions | | | (55,555,290 | ) |
Futures transactions | | | 21,320,390 | |
Foreign currency forward transactions | | | 1,330,347 | |
Foreign currency transactions | | | 184,573 | |
| | | | |
Net realized gain (loss) | | | (32,719,980 | ) |
| | | | |
Net change in unrealized appreciation (depreciation) on: | | | | |
Unaffiliated investments | | | (13,102,932 | ) |
Futures contracts | | | (8,805,738 | ) |
Foreign currency forward contracts | | | 1,984,842 | |
Translation of other assets and liabilities in foreign currencies | | | 195,197 | |
| | | | |
Net change in unrealized appreciation (depreciation) | | | (19,728,631 | ) |
| | | | |
Net realized and unrealized gain (loss) | | | (52,448,611 | ) |
| | | | |
Net increase (decrease) in net assets resulting from operations | | $ | (18,588,832 | ) |
| | | | |
| (a) | Interest recorded net of foreign withholding taxes in the amount of $1,316. |
| (b) | Dividends recorded net of foreign withholding taxes in the amount of $1,133,351. |
| | | | | | |
The notes to the financial statements are an integral part of,
and should be read in conjunction with, the financial statements. | | | | | 29 | |
Statements of Changes in Net Assets
for the years ended October 31, 2020 and October 31, 2019
| | | | | | | | |
| | | 2020 | | | 2019 | |
| Increase (Decrease) in Net Assets | |
Operations: | | | | | | | | |
Net investment income (loss) | | $ | 33,859,779 | | | $ | 41,347,682 | |
Net realized gain (loss) | | | (32,719,980 | ) | | | 42,442,017 | |
Net change in unrealized appreciation (depreciation) | | | (19,728,631 | ) | | | 97,209,538 | |
| | | | |
Net increase (decrease) in net assets resulting from operations | | | (18,588,832 | ) | | | 180,999,237 | |
| | | | |
Distributions to shareholders: | | | | | | | | |
Class A | | | (38,695,065 | ) | | | (27,133,176 | ) |
Investor Class | | | (4,945,627 | ) | | | (3,905,630 | ) |
Class B | | | (1,245,001 | ) | | | (1,069,632 | ) |
Class C | | | (9,531,711 | ) | | | (7,608,473 | ) |
Class I | | | (30,256,759 | ) | | | (23,286,147 | ) |
Class R2 | | | (155,024 | ) | | | (156,842 | ) |
Class R3 | | | (49,678 | ) | | | (10,576 | ) |
Class R6 | | | (6,279,420 | ) | | | (4,774,290 | ) |
SIMPLE Class | | | (72 | ) | | | — | |
| | | | |
Total distributions to shareholders | | | (91,158,357 | ) | | | (67,944,766 | ) |
| | | | |
Capital share transactions: | | | | | | | | |
Net proceeds from sale of shares | | | 320,543,037 | | | | 256,736,076 | |
Net asset value of shares issued to shareholders in reinvestment of distributions | | | 83,497,446 | | | | 62,014,408 | |
Cost of shares redeemed | | | (384,329,610 | ) | | | (408,508,034 | ) |
| | | | |
Increase (decrease) in net assets derived from capital share transactions | | | 19,710,873 | | | | (89,757,550 | ) |
| | | | |
Net increase (decrease) in net assets | | | (90,036,316 | ) | | | 23,296,921 | |
| | |
| Net Assets | | | | | | | | |
Beginning of year | | | 1,520,644,862 | | | | 1,497,347,941 | |
| | | | |
End of year | | $ | 1,430,608,546 | | | $ | 1,520,644,862 | |
| | | | |
| | | | |
| 30 | | MainStay Income Builder Fund | | The notes to the financial statements are an integral part of,
and should be read in conjunction with, the financial statements. |
Financial Highlights selected per share data and ratios
| | | | | | | | | | | | | | | | | | | | |
| |
| | | Year ended October 31, | |
| | | | | |
| Class A | | 2020 | | | 2019 | | | 2018 | | | 2017 | | | 2016 | |
| | | | | |
Net asset value at beginning of year | | $ | 19.96 | | | $ | 18.51 | | | $ | 19.97 | | | $ | 18.30 | | | $ | 18.79 | |
| | | | | | | | | | | | | | | | | | | | |
| | | | | |
Net investment income (loss) (a) | | | 0.44 | | | | 0.54 | | | | 0.52 | | | | 0.48 | | | | 0.58 | |
| | | | | |
Net realized and unrealized gain (loss) on investments | | | (0.65 | ) | | | 1.73 | | | | (1.04 | ) | | | 1.83 | | | | (0.17 | ) |
| | | | | |
Net realized and unrealized gain (loss) on foreign currency transactions | | | 0.04 | | | | 0.06 | | | | 0.07 | | | | (0.09 | ) | | | 0.30 | |
| | | | | | | | | | | | | | | | | | | | |
| | | | | |
Total from investment operations | | | (0.17 | ) | | | 2.33 | | | | (0.45 | ) | | | 2.22 | | | | 0.71 | |
| | | | | | | | | | | | | | | | | | | | |
| | | | | |
| Less distributions: | | | | | | | | | | | | | | | | | | | | |
| | | | | |
From net investment income | | | (0.42 | ) | | | (0.56 | ) | | | (0.52 | ) | | | (0.55 | ) | | | (0.61 | ) |
| | | | | |
From net realized gain on investments | | | (0.76 | ) | | | (0.32 | ) | | | (0.49 | ) | | | — | | | | (0.59 | ) |
| | | | | | | | | | | | | | | | | | | | |
| | | | | |
Total distributions | | | (1.18 | ) | | | (0.88 | ) | | | (1.01 | ) | | | (0.55 | ) | | | (1.20 | ) |
| | | | | | | | | | | | | | | | | | | | |
| | | | | |
Net asset value at end of year | | $ | 18.61 | | | $ | 19.96 | | | $ | 18.51 | | | $ | 19.97 | | | $ | 18.30 | |
| | | | | | | | | | | | | | | | | | | | |
| | | | | |
Total investment return (b) | | | (0.90 | %) | | | 13.09 | % | | | (2.38 | %) | | | 12.30 | % | | | 4.08 | % |
| | | | | |
| Ratios (to average net assets)/Supplemental Data: | | | | | | | | | | | | | | | | | | | | |
| | | | | |
Net investment income (loss) | | | 2.32 | % | | | 2.83 | % | | | 2.72 | % | | | 2.52 | % | | | 3.21 | % |
| | | | | |
Net expenses (c) | | | 1.02 | % | | | 1.02 | % | | | 1.01 | % | | | 1.01 | % | | | 1.02 | % |
| | | | | |
Portfolio turnover rate | | | 65 | % (d) | | | 62 | %(d) | | | 44 | % (d) | | | 29 | % | | | 27 | % |
| | | | | |
Net assets at end of year (in 000’s) | | $ | 638,250 | | | $ | 625,049 | | | $ | 571,206 | | | $ | 652,333 | | | $ | 574,390 | |
| (a) | Per share data based on average shares outstanding during the year. |
| (b) | Total investment return is calculated exclusive of sales charges and assumes the reinvestment of distributions. For periods of less than one year, total return is not annualized. |
| (c) | In addition to the fees and expenses which the Fund bears directly, it also indirectly bears a pro-rata share of the fees and expenses of the underlying funds in which it invests. Such indirect expenses are not included in the above expense ratios. |
| (d) | The portfolio turnover rates not including mortgage dollar rolls were 62%, 54% and 36% for the years ended October 31, 2020, 2019 and 2018, respectively. |
| | | | | | | | | | | | | | | | | | | | |
| |
| | | Year ended October 31, | |
| | | | | |
| Investor Class | | 2020 | | | 2019 | | | 2018 | | | 2017 | | | 2016 | |
| | | | | |
Net asset value at beginning of year | | $ | 19.98 | | | $ | 18.52 | | | $ | 19.99 | | | $ | 18.31 | | | $ | 18.80 | |
| | | | | | | | | | | | | | | | | | | | |
| | | | | |
Net investment income (loss) (a) | | | 0.41 | | | | 0.51 | | | | 0.50 | | | | 0.47 | | | | 0.56 | |
| | | | | |
Net realized and unrealized gain (loss) on investments | | | (0.66 | ) | | | 1.74 | | | | (1.05 | ) | | | 1.82 | | | | (0.16 | ) |
| | | | | |
Net realized and unrealized gain (loss) on foreign currency transactions | | | 0.04 | | | | 0.06 | | | | 0.07 | | | | (0.09 | ) | | | 0.28 | |
| | | | | | | | | | | | | | | | | | | | |
| | | | | |
Total from investment operations | | | (0.21 | ) | | | 2.31 | | | | (0.48 | ) | | | 2.20 | | | | 0.68 | |
| | | | | | | | | | | | | | | | | | | | |
| | | | | |
| Less distributions: | | | | | | | | | | | | | | | | | | | | |
| | | | | |
From net investment income | | | (0.39 | ) | | | (0.53 | ) | | | (0.50 | ) | | | (0.52 | ) | | | (0.58 | ) |
| | | | | |
From net realized gain on investments | | | (0.76 | ) | | | (0.32 | ) | | | (0.49 | ) | | | — | | | | (0.59 | ) |
| | | | | | | | | | | | | | | | | | | | |
| | | | | |
Total distributions | | | (1.15 | ) | | | (0.85 | ) | | | (0.99 | ) | | | (0.52 | ) | | | (1.17 | ) |
| | | | | | | | | | | | | | | | | | | | |
| | | | | |
Net asset value at end of year | | $ | 18.62 | | | $ | 19.98 | | | $ | 18.52 | | | $ | 19.99 | | | $ | 18.31 | |
| | | | | | | | | | | | | | | | | | | | |
| | | | | |
Total investment return (b) | | | (1.11 | %) | | | 12.98 | % | | | (2.56 | %) | | | 12.19 | % | | | 3.93 | % |
| | | | | |
| Ratios (to average net assets)/Supplemental Data: | | | | | | | | | | | | | | | | | | | | |
| | | | | |
Net investment income (loss) | | | 2.16 | % | | | 2.70 | % | | | 2.59 | % | | | 2.45 | % | | | 3.09 | % |
| | | | | |
Net expenses (c) | | | 1.17 | % | | | 1.16 | % | | | 1.13 | % | | | 1.14 | % | | | 1.16 | % |
| | | | | |
Expenses (before waiver/reimbursement) (c) | | | 1.17 | % | | | 1.17 | % | | | 1.14 | % | | | 1.14 | % | | | 1.16 | % |
| | | | | |
Portfolio turnover rate | | | 65 | % (d) | | | 62 | %(d) | | | 44 | % (d) | | | 29 | % | | | 27 | % |
| | | | | |
Net assets at end of year (in 000’s) | | $ | 79,992 | | | $ | 88,050 | | | $ | 85,132 | | | $ | 94,000 | | | $ | 153,137 | |
| (a) | Per share data based on average shares outstanding during the year. |
| (b) | Total investment return is calculated exclusive of sales charges and assumes the reinvestment of distributions. For periods of less than one year, total return is not annualized. |
| (c) | In addition to the fees and expenses which the Fund bears directly, it also indirectly bears a pro-rata share of the fees and expenses of the underlying funds in which it invests. Such indirect expenses are not included in the above expense ratios. |
| (d) | The portfolio turnover rates not including mortgage dollar rolls were 62%, 54% and 36% for the years ended October 31, 2020, 2019 and 2018, respectively. |
| | | | | | |
The notes to the financial statements are an integral part of,
and should be read in conjunction with, the financial statements. | | | | | 31 | |
Financial Highlights selected per share data and ratios
| | | | | | | | | | | | | | | | | | | | |
| |
| | | Year ended October 31, | |
| | | | | |
| Class B | | 2020 | | | 2019 | | | 2018 | | | 2017 | | | 2016 | |
| | | | | |
Net asset value at beginning of year | | $ | 20.11 | | | $ | 18.64 | | | $ | 20.10 | | | $ | 18.40 | | | $ | 18.89 | |
| | | | | | | | | | | | | | | | | | | | |
| | | | | |
Net investment income (loss) (a) | | | 0.27 | | | | 0.37 | | | | 0.36 | | | | 0.32 | | | | 0.42 | |
| | | | | |
Net realized and unrealized gain (loss) on investments | | | (0.66 | ) | | | 1.75 | | | | (1.05 | ) | | | 1.83 | | | | (0.17 | ) |
| | | | | |
Net realized and unrealized gain (loss) on foreign currency transactions | | | 0.04 | | | | 0.06 | | | | 0.07 | | | | (0.09 | ) | | | 0.30 | |
| | | | | | | | | | | | | | | | | | | | |
| | | | | |
Total from investment operations | | | (0.35 | ) | | | 2.18 | | | | (0.62 | ) | | | 2.06 | | | | 0.55 | |
| | | | | | | | | | | | | | | | | | | | |
| | | | | |
| Less distributions: | | | | | | | | | | | | | | | | | | | | |
| | | | | |
From net investment income | | | (0.25 | ) | | | (0.39 | ) | | | (0.35 | ) | | | (0.36 | ) | | | (0.45 | ) |
| | | | | |
From net realized gain on investments | | | (0.76 | ) | | | (0.32 | ) | | | (0.49 | ) | | | — | | | | (0.59 | ) |
| | | | | | | | | | | | | | | | | | | | |
| | | | | |
Total distributions | | | (1.01 | ) | | | (0.71 | ) | | | (0.84 | ) | | | (0.36 | ) | | | (1.04 | ) |
| | | | | | | | | | | | | | | | | | | | |
| | | | | |
Net asset value at end of year | | $ | 18.75 | | | $ | 20.11 | | | $ | 18.64 | | | $ | 20.10 | | | $ | 18.40 | |
| | | | | | | | | | | | | | | | | | | | |
| | | | | |
Total investment return (b) | | | (1.84 | %) | | | 12.11 | % | | | (3.22 | %) | | | 11.27 | % | | | 3.20 | % |
| | | | | |
| Ratios (to average net assets)/Supplemental Data: | | | | | | | | | | | | | | | | | | | | |
| | | | | |
Net investment income (loss) | | | 1.42 | % | | | 1.96 | % | | | 1.85 | % | | | 1.67 | % | | | 2.34 | % |
| | | | | |
Net expenses (c) | | | 1.92 | % | | | 1.91 | % | | | 1.88 | % | | | 1.89 | % | | | 1.91 | % |
| | | | | |
Expenses (before waiver/reimbursement) (c) | | | 1.92 | % | | | 1.92 | % | | | 1.89 | % | | | 1.89 | % | | | 1.91 | % |
| | | | | |
Portfolio turnover rate | | | 65 | % (d) | | | 62 | %(d) | | | 44 | % (d) | | | 29 | % | | | 27 | % |
| | | | | |
Net assets at end of year (in 000’s) | | $ | 19,409 | | | $ | 26,396 | | | $ | 30,343 | | | $ | 39,475 | | | $ | 42,253 | |
| (a) | Per share data based on average shares outstanding during the year. |
| (b) | Total investment return is calculated exclusive of sales charges and assumes the reinvestment of distributions. For periods of less than one year, total return is not annualized. |
| (c) | In addition to the fees and expenses which the Fund bears directly, it also indirectly bears a pro-rata share of the fees and expenses of the underlying funds in which it invests. Such indirect expenses are not included in the above expense ratios. |
| (d) | The portfolio turnover rates not including mortgage dollar rolls were 62%, 54% and 36% for the years ended October 31, 2020, 2019 and 2018, respectively. |
| | | | | | | | | | | | | | | | | | | | |
| |
| | | Year ended October 31, | |
| | | | | |
| Class C | | 2020 | | | 2019 | | | 2018 | | | 2017 | | | 2016 | |
| | | | | |
Net asset value at beginning of year | | $ | 20.07 | | | $ | 18.60 | | | $ | 20.07 | | | $ | 18.37 | | | $ | 18.86 | |
| | | | | | | | | | | | | | | | | | | | |
| | | | | |
Net investment income (loss) (a) | | | 0.27 | | | | 0.37 | | | | 0.36 | | | | 0.32 | | | | 0.42 | |
| | | | | |
Net realized and unrealized gain (loss) on investments | | | (0.66 | ) | | | 1.75 | | | | (1.06 | ) | | | 1.83 | | | | (0.17 | ) |
| | | | | |
Net realized and unrealized gain (loss) on foreign currency transactions | | | 0.04 | | | | 0.06 | | | | 0.07 | | | | (0.09 | ) | | | 0.30 | |
| | | | | | | | | | | | | | | | | | | | |
| | | | | |
Total from investment operations | | | (0.35 | ) | | | 2.18 | | | | (0.63 | ) | | | 2.06 | | | | 0.55 | |
| | | | | | | | | | | | | | | | | | | | |
| | | | | |
| Less distributions: | | | | | | | | | | | | | | | | | | | | |
| | | | | |
From net investment income | | | (0.25 | ) | | | (0.39 | ) | | | (0.35 | ) | | | (0.36 | ) | | | (0.45 | ) |
| | | | | |
From net realized gain on investments | | | (0.76 | ) | | | (0.32 | ) | | | (0.49 | ) | | | — | | | | (0.59 | ) |
| | | | | | | | | | | | | | | | | | | | |
| | | | | |
Total distributions | | | (1.01 | ) | | | (0.71 | ) | | | (0.84 | ) | | | (0.36 | ) | | | (1.04 | ) |
| | | | | | | | | | | | | | | | | | | | |
| | | | | |
Net asset value at end of year | | $ | 18.71 | | | $ | 20.07 | | | $ | 18.60 | | | $ | 20.07 | | | $ | 18.37 | |
| | | | | | | | | | | | | | | | | | | | |
| | | | | |
Total investment return (b) | | | (1.85 | %) | | | 12.13 | % | | | (3.28 | %) | | | 11.35 | % | | | 3.15 | % |
| | | | | |
| Ratios (to average net assets)/Supplemental Data: | | | | | | | | | | | | | | | | | | | | |
| | | | | |
Net investment income (loss) | | | 1.42 | % | | | 1.95 | % | | | 1.85 | % | | | 1.65 | % | | | 2.32 | % |
| | | | | |
Net expenses (c) | | | 1.92 | % | | | 1.91 | % | | | 1.88 | % | | | 1.89 | % | | | 1.91 | % |
| | | | | |
Expenses (before waiver/reimbursement) (c) | | | 1.92 | % | | | 1.92 | % | | | 1.89 | % | | | 1.89 | % | | | 1.91 | % |
| | | | | |
Portfolio turnover rate | | | 65 | % (d) | | | 62 | %(d) | | | 44 | % (d) | | | 29 | % | | | 27 | % |
| | | | | |
Net assets at end of year (in 000’s) | | $ | 148,220 | | | $ | 191,737 | | | $ | 212,400 | | | $ | 266,592 | | | $ | 254,312 | |
| (a) | Per share data based on average shares outstanding during the year. |
| (b) | Total investment return is calculated exclusive of sales charges and assumes the reinvestment of distributions. For periods of less than one year, total return is not annualized. |
| (c) | In addition to the fees and expenses which the Fund bears directly, it also indirectly bears a pro-rata share of the fees and expenses of the underlying funds in which it invests. Such indirect expenses are not included in the above expense ratios. |
| (d) | The portfolio turnover rates not including mortgage dollar rolls were 62%, 54% and 36% for the years ended October 31, 2020, 2019 and 2018, respectively. |
| | | | |
| 32 | | MainStay Income Builder Fund | | The notes to the financial statements are an integral part of,
and should be read in conjunction with, the financial statements. |
Financial Highlights selected per share data and ratios
| | | | | | | | | | | | | | | | | | | | |
| |
| | | Year ended October 31, | |
| | | | | |
| Class I | | 2020 | | | 2019 | | | 2018 | | | 2017 | | | 2016 | |
| | | | | |
Net asset value at beginning of year | | $ | 20.16 | | | $ | 18.68 | | | $ | 20.15 | | | $ | 18.46 | | | $ | 18.95 | |
| | | | | | | | | | | | | | | | | | | | |
| | | | | |
Net investment income (loss) (a) | | | 0.49 | | | | 0.59 | | | | 0.58 | | | | 0.54 | | | | 0.63 | |
| | | | | |
Net realized and unrealized gain (loss) on investments | | | (0.66 | ) | | | 1.76 | | | | (1.06 | ) | | | 1.84 | | | | (0.16 | ) |
| | | | | |
Net realized and unrealized gain (loss) on foreign currency transactions | | | 0.04 | | | | 0.06 | | | | 0.07 | | | | (0.09 | ) | | | 0.28 | |
| | | | | | | | | | | | | | | | | | | | |
| | | | | |
Total from investment operations | | | (0.13 | ) | | | 2.41 | | | | (0.41 | ) | | | 2.29 | | | | 0.75 | |
| | | | | | | | | | | | | | | | | | | | |
| | | | | |
| Less distributions: | | | | | | | | | | | | | | | | | | | | |
| | | | | |
From net investment income | | | (0.47 | ) | | | (0.61 | ) | | | (0.57 | ) | | | (0.60 | ) | | | (0.65 | ) |
| | | | | |
From net realized gain on investments | | | (0.76 | ) | | | (0.32 | ) | | | (0.49 | ) | | | — | | | | (0.59 | ) |
| | | | | | | | | | | | | | | | | | | | |
| | | | | |
Total distributions | | | (1.23 | ) | | | (0.93 | ) | | | (1.06 | ) | | | (0.60 | ) | | | (1.24 | ) |
| | | | | | | | | | | | | | | | | | | | |
| | | | | |
Net asset value at end of year | | $ | 18.80 | | | $ | 20.16 | | | $ | 18.68 | | | $ | 20.15 | | | $ | 18.46 | |
| | | | | | | | | | | | | | | | | | | | |
| | | | | |
Total investment return (b) | | | (0.69 | %) | | | 13.41 | % | | | (2.17 | %) | | | 12.60 | % | | | 4.30 | % |
| | | | | |
| Ratios (to average net assets)/Supplemental Data: | | | | | | | | | | | | | | | | | | | | |
| | | | | |
Net investment income (loss) | | | 2.57 | % | | | 3.09 | % | | | 3.03 | % | | | 2.77 | % | | | 3.44 | % |
| | | | | |
Net expenses (c) | | | 0.77 | % | | | 0.77 | % | | | 0.76 | % | | | 0.76 | % | | | 0.77 | % |
| | | | | |
Portfolio turnover rate | | | 65 | % (d) | | | 62 | %(d) | | | 44 | % (d) | | | 29 | % | | | 27 | % |
| | | | | |
Net assets at end of year (in 000’s) | | $ | 448,922 | | | $ | 484,614 | | | $ | 499,675 | | | $ | 766,054 | | | $ | 542,330 | |
| (a) | Per share data based on average shares outstanding during the year. |
| (b) | Total investment return is calculated exclusive of sales charges and assumes the reinvestment of distributions. Class I shares are not subject to sales charges. For periods of less than one year, total return is not annualized. |
| (c) | In addition to the fees and expenses which the Fund bears directly, it also indirectly bears a pro-rata share of the fees and expenses of the underlying funds in which it invests. Such indirect expenses are not included in the above expense ratios. |
| (d) | The portfolio turnover rates not including mortgage dollar rolls were 62%, 54% and 36% for the years ended October 31, 2020, 2019 and 2018, respectively. |
| | | | | | | | | | | | | | | | | | | | |
| |
| | | Year ended October 31, | |
| | | | | |
| Class R2 | | 2020 | | | 2019 | | | 2018 | | | 2017 | | | 2016 | |
| | | | | |
Net asset value at beginning of year | | $ | 19.95 | | | $ | 18.50 | | | $ | 19.96 | | | $ | 18.29 | | | $ | 18.78 | |
| | | | | | | | | | | | | | | | | | | | |
| | | | | |
Net investment income (loss) (a) | | | 0.42 | | | | 0.52 | | | | 0.50 | | | | 0.46 | | | | 0.55 | |
| | | | | |
Net realized and unrealized gain (loss) on investments | | | (0.63 | ) | | | 1.73 | | | | (1.04 | ) | | | 1.83 | | | | (0.19 | ) |
| | | | | |
Net realized and unrealized gain (loss) on foreign currency transactions | | | 0.04 | | | | 0.06 | | | | 0.07 | | | | (0.09 | ) | | | 0.33 | |
| | | | | | | | | | | | | | | | | | | | |
| | | | | |
Total from investment operations | | | (0.17 | ) | | | 2.31 | | | | (0.47 | ) | | | 2.20 | | | | 0.69 | |
| | | | | | | | | | | | | | | | | | | | |
| | | | | |
| Less distributions: | | | | | | | | | | | | | | | | | | | | |
| | | | | |
From net investment income | | | (0.41 | ) | | | (0.54 | ) | | | (0.50 | ) | | | (0.53 | ) | | | (0.59 | ) |
| | | | | |
From net realized gain on investments | | | (0.76 | ) | | | (0.32 | ) | | | (0.49 | ) | | | — | | | | (0.59 | ) |
| | | | | | | | | | | | | | | | | | | | |
| | | | | |
Total distributions | | | (1.17 | ) | | | (0.86 | ) | | | (0.99 | ) | | | (0.53 | ) | | | (1.18 | ) |
| | | | | | | | | | | | | | | | | | | | |
| | | | | |
Net asset value at end of year | | $ | 18.61 | | | $ | 19.95 | | | $ | 18.50 | | | $ | 19.96 | | | $ | 18.29 | |
| | | | | | | | | | | | | | | | | | | | |
| | | | | |
Total investment return (b) | | | (1.00 | %) | | | 12.98 | % | | | (2.48 | %) | | | 12.20 | % | | | 3.99 | % |
| | | | | |
| Ratios (to average net assets)/Supplemental Data: | | | | | | | | | | | | | | | | | | | | |
| | | | | |
Net investment income (loss) | | | 2.21 | % | | | 2.77 | % | | | 2.61 | % | | | 2.36 | % | | | 3.03 | % |
| | | | | |
Net expenses (c) | | | 1.11 | % | | | 1.12 | % | | | 1.11 | % | | | 1.11 | % | | | 1.12 | % |
| | | | | |
Portfolio turnover rate | | | 65 | % (d) | | | 62 | %(d) | | | 44 | % (d) | | | 29 | % | | | 27 | % |
| | | | | |
Net assets at end of year (in 000’s) | | $ | 3,044 | | | $ | 2,524 | | | $ | 3,587 | | | $ | 4,409 | | | $ | 838 | |
| (a) | Per share data based on average shares outstanding during the period. |
| (b) | Total investment return is calculated exclusive of sales charges and assumes the reinvestment of distributions. Class R2 shares are not subject to sales charges. For periods of less than one year, total return is not annualized. |
| (c) | In addition to the fees and expenses which the Fund bears directly, it also indirectly bears a pro-rata share of the fees and expenses of the underlying funds in which it invests. Such indirect expenses are not included in the above expense ratios. |
| (d) | The portfolio turnover rates not including mortgage dollar rolls were 62%, 54% and 36% for the years ended October 31, 2020, 2019 and 2018, respectively. |
| | | | | | |
The notes to the financial statements are an integral part of,
and should be read in conjunction with, the financial statements. | | | | | 33 | |
Financial Highlights selected per share data and ratios
| | | | | | | | | | | | | | | | | | | | |
| | |
| | | Year ended October 31, | | | February 29,
2016^
through
October 31,
2016 | |
| Class R3 | | 2020 | | | 2019 | | | 2018 | | | 2017 | |
| | | | | |
Net asset value at beginning of period | | $ | 19.96 | | | $ | 18.51 | | | $ | 19.97 | | | $ | 18.30 | | | $ | 17.10 | |
| | | | | | | | | | | | | | | | | | | | |
| | | | | |
Net investment income (loss) (a) | | | 0.37 | | | | 0.45 | | | | 0.42 | | | | 0.42 | | | | 0.35 | |
| | | | | |
Net realized and unrealized gain (loss) on investments | | | (0.64 | ) | | | 1.76 | | | | (1.00 | ) | | | 1.82 | | | | (1.69 | ) |
| | | | | |
Net realized and unrealized gain (loss) on foreign currency transactions | | | 0.04 | | | | 0.06 | | | | 0.06 | | | | (0.09 | ) | | | 2.95 | |
| | | | | | | | | | | | | | | | | | | | |
| | | | | |
Total from investment operations | | | (0.23 | ) | | | 2.27 | | | | (0.52 | ) | | | 2.15 | | | | 1.61 | |
| | | | | | | | | | | | | | | | | | | | |
| | | | | |
| Less distributions: | | | | | | | | | | | | | | | | | | | | |
| | | | | |
From net investment income | | | (0.36 | ) | | | (0.50 | ) | | | (0.45 | ) | | | (0.48 | ) | | | (0.41 | ) |
| | | | | |
From net realized gain on investments | | | (0.76 | ) | | | (0.32 | ) | | | (0.49 | ) | | | — | | | | — | |
| | | | | | | | | | | | | | | | | | | | |
| | | | | |
Total distributions | | | (1.12 | ) | | | (0.82 | ) | | | (0.94 | ) | | | (0.48 | ) | | | (0.41 | ) |
| | | | | | | | | | | | | | | | | | | | |
| | | | | |
Net asset value at end of period | | $ | 18.61 | | | $ | 19.96 | | | $ | 18.51 | | | $ | 19.97 | | | $ | 18.30 | |
| | | | | | | | | | | | | | | | | | | | |
| | | | | |
Total investment return (b) | | | (1.24 | %) | | | 12.70 | % | | | (2.73 | %) | | | 11.89 | % | | | 9.42 | % |
| | | | | |
| Ratios (to average net assets)/Supplemental Data: | | | | | | | | | | | | | | | | | | | | |
| | | | | |
Net investment income (loss) | | | 1.97 | % | | | 2.34 | % | | | 2.19 | % | | | 2.16 | % | | | 2.81 | %†† |
| | | | | |
Net expenses (c) | | | 1.37 | % | | | 1.36 | % | | | 1.35 | % | | | 1.36 | % | | | 1.36 | %†† |
| | | | | |
Portfolio turnover rate | | | 65 | % (d) | | | 62 | %(d) | | | 44 | % (d) | | | 29 | % | | | 27 | % |
| | | | | |
Net assets at end of period (in 000’s) | | $ | 1,196 | | | $ | 590 | | | $ | 136 | | | $ | 201 | | | $ | 39 | |
| (a) | Per share data based on average shares outstanding during the period. |
| (b) | Total investment return is calculated exclusive of sales charges and assumes the reinvestment of distributions. Class R3 shares are not subject to sales charges. For periods of less than one year, total return is not annualized. |
| (c) | In addition to the fees and expenses which the Fund bears directly, it also indirectly bears a pro-rata share of the fees and expenses of the underlying funds in which it invests. Such indirect expenses are not included in the above expense ratios. |
| (d) | The portfolio turnover rates not including mortgage dollar rolls were 62%, 54% and 36% for the years ended October 31, 2020, 2019 and 2018, respectively. |
| | | | |
| 34 | | MainStay Income Builder Fund | | The notes to the financial statements are an integral part of,
and should be read in conjunction with, the financial statements. |
Financial Highlights selected per share data and ratios
| | | | | | | | | | | | |
| | |
| | | Year ended October 31, | | | February 28,
2018^
through
October 31,
2018 | |
| Class R6 | | 2020 | | | 2019 | |
| | | |
Net asset value at beginning of period | | $ | 20.16 | | | $ | 18.68 | | | $ | 19.19 | |
| | | | | | | | | | | | |
| | | |
Net investment income (loss) (a) | | | 0.51 | | | | 0.61 | | | | 0.33 | |
| | | |
Net realized and unrealized gain (loss) on investments | | | (0.66 | ) | | | 1.76 | | | | (0.47 | ) |
| | | |
Net realized and unrealized gain (loss) on foreign
currency transactions | | | 0.04 | | | | 0.06 | | | | 0.03 | |
| | | | | | | | | | | | |
| | | |
Total from investment operations | | | (0.11 | ) | | | 2.43 | | | | (0.11 | ) |
| | | | | | | | | | | | |
| | | |
| Less distributions: | | | | | | | | | | | | |
| | | |
From net investment income | | | (0.49 | ) | | | (0.63 | ) | | | (0.40 | ) |
| | | |
From net realized gain on investments | | | (0.76 | ) | | | (0.32 | ) | | | — | |
| | | | | | | | | | | | |
| | | |
Total distributions | | | (1.25 | ) | | | (0.95 | ) | | | (0.40 | ) |
| | | | | | | | | | | | |
| | | |
Net asset value at end of period | | $ | 18.80 | | | $ | 20.16 | | | $ | 18.68 | |
| | | | | | | | | | | | |
| | | |
Total investment return (b) | | | (0.60 | %) | | | 13.52 | % | | | (0.61 | %) |
| | | |
| Ratios (to average net assets)/Supplemental Data: | | | | | | | | | | | | |
| | | |
Net investment income (loss) | | | 2.67 | % | | | 3.18 | % | | | 2.55 | % †† |
| | | |
Net expenses (c) | | | 0.67 | % | | | 0.67 | % | | | 0.66 | % †† |
| | | |
Portfolio turnover rate (d) | | | 65 | % | | | 62 | % | | | 44 | % |
| | | |
Net assets at end of period (in 000’s) | | $ | 91,551 | | | $ | 101,685 | | | $ | 94,869 | |
| (a) | Per share data based on average shares outstanding during the year. |
| (b) | Total investment return is calculated exclusive of sales charges and assumes the reinvestment of distributions. Class R6 shares are not subject to sales charges. For periods of less than one year, total return is not annualized. |
| (c) | In addition to the fees and expenses which the Fund bears directly, it also indirectly bears a pro-rata share of the fees and expenses of the underlying funds in which it invests. Such indirect expenses are not included in the above expense ratios. |
| (d) | The portfolio turnover rates not including mortgage dollar rolls were 62%, 54% and 36% for the years ended October 31, 2020, 2019 and period ended October 31, 2018, respectively. |
| | | | |
| |
| SIMPLE Class | | August 31, 2020^
through
October 31, 2020 | |
| |
Net asset value at beginning of period* | | $ | 19.33 | |
| | | | |
| |
Net investment income (loss) (a) | | | 0.04 | |
| |
Net realized and unrealized gain (loss) on investments | | | (0.74 | ) |
| |
Net realized and unrealized gain (loss) on foreign
currency transactions | | | 0.05 | |
| | | | |
| |
Total from investment operations | | | (0.65 | ) |
| | | | |
| |
| Less distributions: | | | | |
| |
From net investment income | | | (0.06 | ) |
| | | | |
| |
Net asset value at end of period | | $ | 18.62 | |
| | | | |
| |
Total investment return (b) | | | (3.39 | %) |
| |
| Ratios (to average net assets)/Supplemental Data: | | | | |
| |
Net investment income (loss) †† | | | 1.62 | % |
| |
Net expenses (c) †† | | | 1.43 | % |
| |
Portfolio turnover rate | | | 65 | % |
| |
Net assets at end of period (in 000’s) | | $ | 24 | |
| * | Based on the net asset value of Investor Class as of August 31, 2020. |
| (a) | Per share data based on average shares outstanding during the period. |
| (b) | Total investment return is calculated exclusive of sales charges and assumes the reinvestment of distributions. SIMPLE Class shares are not subject to sales charges. For periods of less than one year, total return is not annualized. |
| (c) | In addition to the fees and expenses which the Fund bears directly, it also indirectly bears a pro-rata share of the fees and expenses of the underlying funds in which it invests. Such indirect expenses are not included in the above expense ratios. |
| | | | | | |
The notes to the financial statements are an integral part of,
and should be read in conjunction with, the financial statements. | | | | | 35 | |
Notes to Financial Statements
Note 1–Organization and Business
The MainStay Funds (the “Trust”) was organized on January 9, 1986, as a Massachusetts business trust. The Trust is registered under the Investment Company Act of 1940, as amended (the “1940 Act”), as an open-end management investment company, and is comprised of twelve funds (collectively referred to as the “Funds”). These financial statements and notes relate to the MainStay Income Builder Fund (the “Fund”), a “diversified” fund, as that term is defined in the 1940 Act, as interpreted or modified by regulatory authorities having jurisdiction, from time to time.
The Fund currently has nine classes of shares registered for sale. Class A shares commenced operations on January 3, 1995. Class B shares commenced operations on December 29, 1987. Class C shares commenced operations on September 1, 1998. Class I shares commenced operations on January 2, 2004. Investor Class shares commenced operations on February 28, 2008. Class R2 shares commenced operations on February 27, 2015. Class R3 shares commenced operations on February 29, 2016. Class R6 shares commenced operations on February 28, 2018. SIMPLE Class shares commenced operations on August 31, 2020.
Class B shares of the MainStay Group of Funds are closed to all new purchases as well as additional investments by existing Class B shareholders. Existing Class B shareholders may continue to reinvest dividends and capital gains distributions, as well as exchange their Class B shares for Class B shares of other funds in the MainStay Group of Funds as permitted by the current exchange privileges. Class B shareholders continue to be subject to any applicable contingent deferred sales charge (“CDSC”) at the time of redemption. All other features of the Class B shares, including but not limited to the fees and expenses applicable to Class B shares, remain unchanged. Unless redeemed, Class B shareholders will remain in Class B shares of their respective fund until the Class B shares are converted to Class A or Investor Class shares pursuant to the applicable conversion schedule.
Class A and Investor Class shares are offered at net asset value (“NAV”) per share plus an initial sales charge. No initial sales charge applies to investments of $250,000 or more (and certain other qualified purchases) in Class A and Investor Class shares. However, a CDSC of 1.00% may be imposed on certain redemptions made within 18 months of the date of purchase on shares that were purchased without an initial sales charge. Class C shares are offered at NAV without an initial sales charge, although a 1.00% CDSC may be imposed on certain redemptions of such shares made within one year of the date of purchase of Class C shares. When Class B shares were offered, they were offered at NAV without an initial sales charge, although a CDSC that declines depending on the number of years a shareholder has held its Class B shares may be imposed on certain redemptions of such shares made within six years of the date of purchase of such shares. Class I, Class R2, Class R3, Class R6 and SIMPLE Class shares are offered at NAV without a sales charge. Depending upon eligibility, Class B shares convert to either Class A or Investor Class shares at the end of the calendar quarter eight years after the date they were purchased. In addition, depending upon eligibility, Class C shares convert to either Class A or Investor Class shares at the end of the calendar quarter ten years after the date they were purchased. Additionally, Investor Class shares may convert automatically to Class A shares. Under certain circumstances and as may be permitted by the Trust’s multiple class
plan pursuant to Rule 18f-3 under the 1940 Act, specified share classes of the Fund may be converted to one or more other share classes of the Fund as disclosed in the capital share transactions within these Notes. The classes of shares have the same voting (except for issues that relate solely to one class), dividend, liquidation and other rights, and the same terms and conditions, except that under distribution plans pursuant to Rule 12b-1 under the 1940 Act, Class B and Class C shares are subject to higher distribution and/or service fees than Class A, Investor Class, Class R2, Class R3 and SIMPLE Class shares. Class I and Class R6 shares are not subject to a distribution and/or service fee. Class R2 and Class R3 shares are subject to a shareholder service fee, which is in addition to fees paid under the distribution plans for Class R2 and Class R3 shares.
The Fund’s investment objective is to seek current income consistent with reasonable opportunity for future growth of capital and income.
Note 2–Significant Accounting Policies
The Fund is an investment company and accordingly follows the investment company accounting and reporting guidance of the Financial Accounting Standards Board (“FASB”) Accounting Standard Codification Topic 946 Financial Services—Investment Companies. The Fund prepares its financial statements in accordance with generally accepted accounting principles (“GAAP”) in the United States of America and follows the significant accounting policies described below.
(A) Securities Valuation. Investments are usually valued as of the close of regular trading on the New York Stock Exchange (the “Exchange”) (usually 4:00 p.m. Eastern time) on each day the Fund is open for business (“valuation date”).
The Board of Trustees of the Trust (the “Board”) adopted procedures establishing methodologies for the valuation of the Fund’s securities and other assets and delegated the responsibility for valuation determinations under those procedures to the Valuation Committee of the Trust (the “Valuation Committee”). The procedures state that, subject to the oversight of the Board and unless otherwise noted, the responsibility for the day-to-day valuation of portfolio assets (including fair value measurements for the Fund’s assets and liabilities) rests with New York Life Investment Management LLC (“New York Life Investments” or the “Manager”), aided to whatever extent necessary by the Subadvisors (as defined in Note 3(A)). To assess the appropriateness of security valuations, the Manager, the Subadvisors or the Fund’s third-party service provider, who is subject to oversight by the Manager, regularly compares prior day prices, prices on comparable securities and the sale prices to the prior and current day prices and challenges prices with changes exceeding certain tolerance levels with third-party pricing services or broker sources.
The Board authorized the Valuation Committee to appoint a Valuation Subcommittee (the “Subcommittee”) to establish the prices of securities for which market quotations are not readily available or the prices of which are not otherwise readily determinable under the procedures. The Subcommittee meets (in person, via electronic mail or via teleconference) on an as-needed basis. The Valuation Committee meets to ensure that actions taken by the Subcommittee were appropriate.
For those securities valued through either a standardized fair valuation methodology or a fair valuation measurement, the Subcommittee deals
| | |
| 36 | | MainStay Income Builder Fund |
with such valuation and the Valuation Committee reviews and affirms, if appropriate, the reasonableness of the valuation based on such methodologies and measurements on a regular basis after considering information that is reasonably available and deemed relevant by the Valuation Committee. Any action taken by the Subcommittee with respect to the valuation of a portfolio security or other asset is submitted for review and ratification (if appropriate) to the Valuation Committee and the Board at the next regularly scheduled meeting.
“Fair value” is defined as the price the Fund would reasonably expect to receive upon selling an asset or liability in an orderly transaction to an independent buyer in the principal or most advantageous market for the asset or liability. Fair value measurements are determined within a framework that establishes a three-tier hierarchy that maximizes the use of observable market data and minimizes the use of unobservable inputs to establish a classification of fair value measurements for disclosure purposes. “Inputs” refer broadly to the assumptions that market participants would use in pricing the asset or liability, including assumptions about risk, such as the risk inherent in a particular valuation technique used to measure fair value using a pricing model and/or the risk inherent in the inputs for the valuation technique. Inputs may be observable or unobservable. Observable inputs reflect the assumptions market participants would use in pricing the asset or liability based on market data obtained from sources independent of the Fund. Unobservable inputs reflect the Fund’s own assumptions about the assumptions market participants would use in pricing the asset or liability based on the information available. The inputs or methodology used for valuing assets or liabilities may not be an indication of the risks associated with investing in those assets or liabilities. The three-tier hierarchy of inputs is summarized below.
| • | | Level 1—quoted prices in active markets for an identical asset or liability |
| • | | Level 2—other significant observable inputs (including quoted prices for a similar asset or liability in active markets, interest rates and yield curves, prepayment speeds, credit risk, etc.) |
| • | | Level 3—significant unobservable inputs (including the Fund’s own assumptions about the assumptions that market participants would use in measuring fair value of an asset or liability) |
The level of an asset or liability within the fair value hierarchy is based on the lowest level of an input, both individually and in the aggregate, that is significant to the fair value measurement. The aggregate value by input level of the Fund’s assets and liabilities as of October 31, 2020, is included at the end of the Portfolio of Investments.
The Fund may use third-party vendor evaluations, whose prices may be derived from one or more of the following standard inputs, among others:
| | |
• Benchmark yields | | • Reported trades |
• Broker/dealer quotes | | • Issuer spreads |
• Two-sided markets | | • Benchmark securities |
• Bids/offers | | • Reference data (corporate actions or material event notices) |
• Industry and economic events | | • Comparable bonds |
• Monthly payment information | | |
An asset or liability for which market values cannot be measured using the methodologies described above is valued by methods deemed reasonable in good faith by the Valuation Committee, following the procedures established by the Board, to represent fair value. Under these procedures, the Fund generally uses a market-based approach which may use related or comparable assets or liabilities, recent transactions, market multiples, book values and other relevant information. The Fund may also use an income-based valuation approach in which the anticipated future cash flows of the asset or liability are discounted to calculate fair value. Discounts may also be applied due to the nature and/or duration of any restrictions on the disposition of the asset or liability. Fair value represents a good faith approximation of the value of a security. Fair value determinations involve the consideration of a number of subjective factors, an analysis of applicable facts and circumstances and the exercise of judgment. As a result, it is possible that the fair value for a security determined in good faith in accordance with the Fund’s valuation procedures may differ from valuations for the same security determined by other funds using their own valuation procedures. Although the Fund’s valuation procedures are designed to value a security at the price the Fund may reasonably expect to receive upon the security’s sale in an orderly transaction, there can be no assurance that any fair value determination thereunder would, in fact, approximate the amount that the Fund would actually realize upon the sale of the security or the price at which the security would trade if a reliable market price were readily available. During the year ended October 31, 2020, there were no material changes to the fair value methodologies.
Securities which may be valued in this manner include, but are not limited to: (i) a security for which trading has been halted or suspended; (ii) a debt security that has recently gone into default and for which there is not a current market quotation; (iii) a security of an issuer that has entered into a restructuring; (iv) a security that has been delisted from a national exchange; (v) a security for which the market price is not readily available from a third-party pricing source or, if so provided, does not, in the opinion of the Manager or the Subadvisors, reflect the security’s market value; (vi) a security subject to trading collars for which no or limited trading takes place; and (vii) a security whose principal market has been temporarily closed at a time when, under normal conditions, it would be open. Securities valued in this manner are generally categorized as Level 3 in the hierarchy. Securities that were fair valued in such a manner as of October 31, 2020 are shown in the Portfolio of Investments.
Certain securities held by the Fund may principally trade in foreign markets. Events may occur between the time the foreign markets close and the time at which the Fund’s NAVs are calculated. These events may include, but are not limited to, situations relating to a single issuer in a market sector, significant fluctuations in U.S. or foreign markets, natural disasters, armed conflicts, governmental actions or other developments not tied directly to the securities markets. Should the Manager or the Subadvisors conclude that such events may have affected the accuracy of the last price of such securities reported on the local foreign market, the Subcommittee may, pursuant to procedures adopted by the Board, adjust the value of the local price to reflect the estimated impact on the price of such securities as a result of such events. In this instance, securities are generally categorized as Level 3 in the hierarchy. Additionally, certain foreign equity securities are also fair valued
Notes to Financial Statements (continued)
whenever the movement of a particular index exceeds certain thresholds. In such cases, the securities are fair valued by applying factors provided by a third-party vendor in accordance with valuation procedures adopted by the Board and are generally categorized as Level 2 in the hierarchy. No foreign equity securities held by the Fund as of October 31, 2020, were fair valued in such a manner.
Equity securities are valued at the last quoted sales prices as of the close of regular trading on the relevant exchange on each valuation date. Securities that are not traded on the valuation date are valued at the mean of the last quoted bid and ask prices. Prices are normally taken from the principal market in which each security trades. These securities are generally categorized as Level 1 in the hierarchy.
Futures contracts are valued at the last posted settlement price on the market where such futures are primarily traded. Investments in mutual funds, including money market funds, are valued at their respective NAVs as of the close of the Exchange on the valuation date. These securities are generally categorized as Level 1 in the hierarchy.
Debt securities (other than convertible and municipal bonds) are valued at the evaluated bid prices (evaluated mean prices in the case of convertible and municipal bonds) supplied by a pricing agent or brokers selected by the Manager, in consultation with the Subadvisors. The evaluations are market-based measurements processed through a pricing application and represents the pricing agent’s good faith determination as to what a holder may receive in an orderly transaction under market conditions. The rules based logic utilizes valuation techniques that reflect participants’ assumptions and vary by asset class and per methodology, maximizing the use of relevant observable data including quoted prices for similar assets, benchmark yield curves and market corroborated inputs. The evaluated bid or mean prices are deemed by the Manager, in consultation with the Subadvisors to be representative of market values at the regular close of trading of the Exchange on each valuation date. Debt securities purchased on a delayed delivery basis are marked to market daily until settlement at the forward settlement date. Debt securities, including corporate bonds, U.S. government and federal agency bonds, municipal bonds, foreign bonds, convertible bonds, asset-backed securities and mortgage-backed securities are generally categorized as Level 2 in the hierarchy.
Foreign currency forward contracts are valued at their fair market values measured on the basis of the mean between the last current bid and ask prices based on dealer or exchange quotations and are generally categorized as Level 2 in the hierarchy.
Loan assignments, participations and commitments are valued at the average of bid quotations obtained from the engaged independent pricing service and are generally categorized as Level 2 in the hierarchy. Certain loan assignments, participations and commitments may be valued by utilizing significant unobservable inputs obtained from the pricing service and are generally categorized as Level 3 in the hierarchy. No loan assignments held by the Fund as of October 31, 2020, were fair valued in such a manner.
Temporary cash investments acquired in excess of 60 days to maturity at the time of purchase are valued using the latest bid prices or using valuations based on a matrix system (which considers such factors as security prices, yields, maturities and ratings), both as furnished by independent pricing services. Temporary cash investments that mature
in 60 days or less at the time of purchase (“Short-Term Investments”) are valued using the amortized cost method of valuation, unless the use of such method would be inappropriate. The amortized cost method involves valuing a security at its cost on the date of purchase and thereafter assuming a constant amortization to maturity of the difference between such cost and the value on maturity date. Amortized cost approximates the current fair value of a security. Securities valued using the amortized cost method are not valued using quoted prices in an active market and are generally categorized as Level 2 in the hierarchy.
The information above is not intended to reflect an exhaustive list of the methodologies that may be used to value portfolio investments. The valuation procedures permit the use of a variety of valuation methodologies in connection with valuing portfolio investments. The methodology used for a specific type of investment may vary based on the market data available or other considerations. The methodologies summarized above may not represent the specific means by which portfolio investments are valued on any particular business day.
A portfolio investment may be classified as an illiquid investment under the Fund’s written liquidity risk management program and related procedures (“Liquidity Program”). Illiquidity of an investment might prevent the sale of such investment at a time when the Manager or the Subadvisors might wish to sell, and these investments could have the effect of decreasing the overall level of the Fund’s liquidity. Further, the lack of an established secondary market may make it more difficult to value illiquid investments, requiring the Portfolio to rely on judgments that may be somewhat subjective in measuring value, which could vary materially from the amount that the Fund could realize upon disposition. Difficulty in selling illiquid investments may result in a loss or may be costly to the Fund. An illiquid investment is any investment that the Manager or Subadvisors reasonably expects cannot be sold or disposed of in current market conditions in seven calendar days or less without the sale or disposition significantly changing the market value of the investment. The liquidity classification of each investment will be made using information obtained after reasonable inquiry and taking into account, among other things, relevant market, trading and investment-specific considerations in accordance with the Liquidity Program. Illiquid investments are often valued in accordance with methods deemed by the Board in good faith to be reasonable and appropriate to accurately reflect their fair value. The liquidity of the Fund’s investments was determined as of October 31, 2020 and can change at any time. Illiquid investments as of October 31, 2020, are shown in the Portfolio of Investments.
(B) Income Taxes. The Fund’s policy is to comply with the requirements of the Internal Revenue Code of 1986, as amended (the “Internal Revenue Code”), applicable to regulated investment companies and to distribute all of its taxable income to the shareholders of the Fund within the allowable time limits.
The Manager evaluates the Fund’s tax positions to determine if the tax positions taken meet the minimum recognition threshold in connection with accounting for uncertainties in income tax positions taken or expected to be taken for the purposes of measuring and recognizing tax liabilities in the financial statements. Recognition of tax benefits of an uncertain tax position is permitted only to the extent the position is “more likely than not” to be sustained assuming examination by taxing authorities. The Manager analyzed the Fund’s tax positions taken on
| | |
| 38 | | MainStay Income Builder Fund |
federal, state and local income tax returns for all open tax years (for up to three tax years) and has concluded that no provisions for federal, state and local income tax are required in the Fund’s financial statements. The Fund’s federal, state and local income tax and federal excise tax returns for tax years for which the applicable statutes of limitations have not expired are subject to examination by the Internal Revenue Service and state and local departments of revenue.
(C) Foreign Taxes. The Fund may be subject to foreign taxes on income and other transaction-based taxes imposed by certain countries in which it invests. A portion of the taxes on gains on investments or currency purchases/repatriation may be reclaimable. The Fund will accrue such taxes and reclaims as applicable, based upon its current interpretation of tax rules and regulations that exist in the markets in which it invests.
The Fund may be subject to taxation on realized capital gains, repatriation proceeds and other transaction-based taxes imposed by certain countries in which it invests. The Fund will accrue such taxes as applicable based upon its current interpretation of tax rules and regulations that exist in the market in which it invests. Capital gains taxes relating to positions still held are reflected as a liability in the Statement of Assets and Liabilities, as well as an adjustment to the Fund’s net unrealized appreciation (depreciation). Taxes related to capital gains realized, if any, are reflected as part of net realized gain (loss) in the Statement of Operations. Changes in tax liabilities related to capital gains taxes on unrealized investment gains, if any, are reflected as part of the change in net unrealized appreciation (depreciation) on investments in the Statement of Operations. Transaction-based charges are generally assessed as a percentage of the transaction amount.
(D) Dividends and Distributions to Shareholders. Dividends and distributions are recorded on the ex-dividend date. The Fund intends to declare and pay dividends from net investment income, if any, at least monthly and distributions from net realized capital and currency gains, if any, at least annually. Unless a shareholder elects otherwise, all dividends and distributions are reinvested at NAV in the same class of shares of the Fund. Dividends and distributions to shareholders are determined in accordance with federal income tax regulations and may differ from determinations using GAAP.
(E) Security Transactions and Investment Income. The Fund records security transactions on the trade date. Realized gains and losses on security transactions are determined using the identified cost method. Dividend income is recognized on the ex-dividend date, net of any foreign tax withheld at the source, and interest income is accrued as earned using the effective interest rate method and includes any realized gains and losses from repayments of principal on mortgage-backed securities. Discounts and premiums on securities purchased for the Fund are accreted and amortized, respectively, on the effective interest rate method. Income from payment-in-kind securities, to the extent the Fund held any such securities during the year ended October 31, 2020, is accreted daily based on the effective interest method.
Investment income and realized and unrealized gains and losses on investments of the Fund are allocated pro rata to the separate classes of shares based upon their relative net assets on the date the income is earned or realized and unrealized gains and losses are incurred.
The Fund may place a debt security on non-accrual status and reduce related interest income by ceasing current accruals and writing off all or a portion of any interest receivables when the collection of all or a portion of such interest has become doubtful. A debt security is removed from non-accrual status when the issuer resumes interest payments or when collectability of interest is reasonably assured.
(F) Expenses. Expenses of the Trust are allocated to the individual Funds in proportion to the net assets of the respective Funds when the expenses are incurred, except where direct allocations of expenses can be made. Expenses (other than transfer agent expenses and fees incurred under the shareholder services plans and/or the distribution plans further discussed in Note 3(B)) are allocated to separate classes of shares pro rata based upon their relative net assets on the date the expenses are incurred. The expenses borne by the Fund, including those of related parties to the Fund, are shown in the Statement of Operations.
Additionally, the Fund may invest in mutual funds, which are subject to management fees and other fees that may cause the costs of investing in mutual funds to be greater than the costs of owning the underlying securities directly. These indirect expenses of mutual funds are not included in the amounts shown as expenses in the Fund’s Statement of Operations or in the expense ratios included in the Financial Highlights.
(G) Use of Estimates. In preparing financial statements in conformity with GAAP, the Manager makes estimates and assumptions that affect the reported amounts and disclosures in the financial statements. Actual results could differ from those estimates and assumptions.
(H) Repurchase Agreements. The Fund may enter into repurchase agreements (i.e., buy a security from another party with the agreement that it will be sold back in the future) to earn income. The Fund may enter into repurchase agreements only with counterparties, usually financial institutions, that are deemed by the Manager or the Subadvisors to be creditworthy, pursuant to guidelines established by the Board. During the term of any repurchase agreement, the Manager or the Subadvisors will continue to monitor the creditworthiness of the counterparty. Under the 1940 Act, repurchase agreements are considered to be collateralized loans by the Fund to the counterparty secured by the securities transferred to the Fund.
Repurchase agreements are subject to counterparty risk, meaning the Fund could lose money by the counterparty’s failure to perform under the terms of the agreement. The Fund mitigates this risk by ensuring the repurchase agreement is collateralized by cash, U.S. government securities, fixed income securities and/or other securities. The collateral is held by the Fund’s custodian and valued daily on a mark to market basis to determine if the value, including accrued interest, exceeds the repurchase price. In the event of the counterparty’s default on the obligation to repurchase, the Fund has the right to liquidate the collateral and apply the proceeds in satisfaction of the obligation. Under certain circumstances, such as in the event of default or bankruptcy by the counterparty, realization and/or retention of the collateral may be limited or subject to delay, to legal proceedings and possible realized loss to the Fund. As of October 31, 2020, the Fund did not hold any repurchase agreements.
Notes to Financial Statements (continued)
(I) Loan Assignments, Participations and Commitments. The Fund may invest in loan assignments and participations (“loans”). Commitments are agreements to make money available to a borrower in a specified amount, at a specified rate and within a specified time. The Fund records an investment when the borrower withdraws money on a commitment or when a funded loan is purchased (trade date) and records interest as earned. These loans pay interest at rates that are periodically reset by reference to a base lending rate plus a spread. These base lending rates are generally the prime rate offered by a designated U.S. bank or the London Interbank Offered Rate (“LIBOR”).
The loans in which the Fund may invest are generally readily marketable, but may be subject to some restrictions on resale. For example, the Fund may be contractually obligated to receive approval from the agent bank and/or borrower prior to the sale of these investments. If the Fund purchases an assignment from a lender, the Fund will generally have direct contractual rights against the borrower in favor of the lender. If the Fund purchases a participation interest either from a lender or a participant, the Fund typically will have established a direct contractual relationship with the seller of the participation interest, but not with the borrower. Consequently, the Fund is subject to the credit risk of the lender or participant who sold the participation interest to the Fund, in addition to the usual credit risk of the borrower. In the event that the borrower, selling participant or intermediate participants become insolvent or enter into bankruptcy, the Fund may incur certain costs and delays in realizing payment, or may suffer a loss of principal and/or interest.
Unfunded commitments represent the remaining obligation of the Fund to the borrower. At any point in time, up to the maturity date of the issue, the borrower may demand the unfunded portion. Unfunded amounts, if any, are marked to market and any unrealized gains or losses are recorded in the Statement of Assets and Liabilities. As of October 31, 2020, the Fund did not hold any unfunded commitments.
(J) Futures Contracts. A futures contract is an agreement to purchase or sell a specified quantity of an underlying instrument at a specified future date and price, or to make or receive a cash payment based on the value of a financial instrument (e.g., foreign currency, interest rate, security or securities index). The Fund is subject to risks such as market price risk and/or interest rate risk in the normal course of investing in these contracts. Upon entering into a futures contract, the Fund is required to pledge to the broker or futures commission merchant an amount of cash and/or U.S. government securities equal to a certain percentage of the collateral amount, known as the “initial margin.” During the period the futures contract is open, changes in the value of the contract are recognized as unrealized appreciation or depreciation by marking to market such contract on a daily basis to reflect the market value of the contract at the end of each day’s trading. The Fund agrees to receive from or pay to the broker or futures commission merchant an amount of cash equal to the daily fluctuation in the value of the contract. Such receipts or payments are known as “variation margin.” When the futures contract is closed, the Fund records a realized gain or loss equal to the difference between the proceeds from (or cost of) the closing transaction and the Fund’s basis in the contract.
The use of futures contracts involves, to varying degrees, elements of market risk in excess of the amount recognized in the Statement of
Assets and Liabilities. The contract or notional amounts and variation margin reflect the extent of the Fund’s involvement in open futures positions. There are several risks associated with the use of futures contracts as hedging techniques. There can be no assurance that a liquid market will exist at the time when the Fund seeks to close out a futures contract. If no liquid market exists, the Fund would remain obligated to meet margin requirements until the position is closed. Futures contracts may involve a small initial investment relative to the risk assumed, which could result in losses greater than if the Fund did not invest in futures contracts. Futures contracts may be more volatile than direct investments in the instrument underlying the futures and may not correlate to the underlying instrument, causing a given hedge not to achieve its objectives. The Fund’s activities in futures contracts have minimal counterparty risk as they are conducted through regulated exchanges that guarantee the futures against default by the counterparty. In the event of a bankruptcy or insolvency of a futures commission merchant that holds margin on behalf of the Fund, the Fund may not be entitled to the return of the entire margin owed to the Fund, potentially resulting in a loss. The Fund may invest in futures contracts in order to hedge against anticipated changes in interest rates that might otherwise have an adverse effect upon the value of the Fund’s securities. The Fund may also use equity index futures contracts to increase the equity sensitivity to the Fund. The Fund’s investment in futures contracts and other derivatives may increase the volatility of the Fund’s NAVs and may result in a loss to the Fund. Open futures contracts held as of October 31, 2020, are shown in the Portfolio of Investments.
(K) Foreign Currency Forward Contracts. The Fund may enter into foreign currency forward contracts, which are agreements to buy or sell foreign currencies on a specified future date at a specified rate. The Fund is subject to foreign currency exchange rate risk in the normal course of investing in these transactions. During the period the forward contract is open, changes in the value of the contract are recognized as unrealized appreciation or depreciation by marking to market such contract on a daily basis to reflect the market value of the contract at the end of each day’s trading. Cash movement occurs on settlement date. When the forward contract is closed, the Fund records a realized gain or loss equal to the difference between the proceeds from (or cost of) the closing transaction and the Fund’s basis in the contract. The Fund may purchase and sell foreign currency forward contracts for purposes of seeking to enhance portfolio returns and manage portfolio risk more efficiently. Foreign currency forward contracts may also be used to gain exposure to a particular currency or to hedge against the risk of loss due to changing currency exchange rates. Foreign currency forward contracts to purchase or sell a foreign currency may also be used in anticipation of future purchases or sales of securities denominated in foreign currency, even if the specific investments have not yet been selected.
The use of foreign currency forward contracts involves, to varying degrees, elements of risk in excess of the amount recognized in the Statement of Assets and Liabilities, including counterparty risk, market risk and illiquidity risk. Counterparty risk is heightened for these instruments because foreign currency forward contracts are not exchange-traded and therefore no clearinghouse or exchange stands ready to meet the obligations under such contracts. Thus, the Fund faces the risk that its counterparties under such contracts may not perform their
| | |
| 40 | | MainStay Income Builder Fund |
obligations. Market risk is the risk that the value of a foreign currency forward contract will depreciate due to unfavorable changes in exchange rates. Illiquidity risk arises because the secondary market for foreign currency forward contracts may have less liquidity relative to markets for other securities and financial instruments. Risks also arise from the possible movements in the foreign exchange rates underlying these instruments. While the Fund may enter into forward contracts to reduce currency exchange risks, changes in currency exchange rates may result in poorer overall performance for the Fund than if it had not engaged in such transactions. Exchange rate movements can be large, depending on the currency, and can last for extended periods of time, affecting the value of the Fund’s assets. Moreover, there may be an imperfect correlation between the Fund’s holdings of securities denominated in a particular currency and forward contracts entered into by the Fund. Such imperfect correlation may prevent the Fund from achieving the intended hedge or expose the Fund to the risk of currency exchange loss. The unrealized appreciation (depreciation) on forward contracts also reflects the Fund’s exposure at the valuation date to credit loss in the event of a counterparty’s failure to perform its obligations. Open foreign currency forward contracts as of October 31, 2020, are shown in the Portfolio of Investments.
(L) Foreign Currency Transactions. The Fund’s books and records are maintained in U.S. dollars. Prices of securities denominated in foreign currency amounts are translated into U.S. dollars at the mean between the buying and selling rates last quoted by any major U.S. bank at the following dates:
| (i) | market value of investment securities, other assets and liabilities—at the valuation date; and |
| (ii) | purchases and sales of investment securities, income and expenses—at the date of such transactions. |
The assets and liabilities that are denominated in foreign currency amounts are presented at the exchange rates and market values at the close of the period. The realized and unrealized changes in net assets arising from fluctuations in exchange rates and market prices of securities are not separately presented.
Net realized gain (loss) on foreign currency transactions represents net currency gains or losses realized as a result of differences between the amounts of securities sale proceeds or purchase cost, dividends, interest and withholding taxes as recorded on the Fund’s books, and the U.S. dollar equivalent amount actually received or paid. Net currency gains or losses from valuing such foreign currency denominated assets and liabilities, other than investments at valuation date exchange rates, are reflected in unrealized foreign exchange gains or losses.
(M) Securities Lending. In order to realize additional income, the Fund may engage in securities lending, subject to the limitations set forth in the 1940 Act and relevant guidance by the staff of the Securities and Exchange Commission (“SEC”). If the Fund engages in securities lending, the Fund will lend through its custodian, currently State Street Bank and Trust Company (“State Street”) (See Note 13 for securities lending agent change), acting as securities lending agent on behalf of the Fund. Under the current arrangement, State Street will manage the Fund’s collateral in accordance with the securities lending agency agreement between the Fund and State Street, and indemnify the Fund against counterparty risk. The loans will be collateralized by cash (which
may be invested in a money market fund) and/or non-cash collateral (which may include U.S. Treasury securities and/or U.S. government agency securities issued or guaranteed by the United States government or its agencies or instrumentalities) at least equal at all times to the market value of the securities loaned. The Fund bears the risk of delay in recovery of, or loss of rights in, the securities loaned. The Fund may also record a realized gain or loss on securities deemed sold due to a borrower’s inability to return securities on loan. The Fund bears the risk of any loss on investment of cash collateral. The Fund will receive compensation for lending its securities in the form of fees or it will retain a portion of interest earned on the investment of any cash collateral. The Fund will also continue to receive interest and dividends on the securities loaned and any gain or loss in the market price of the securities loaned that may occur during the term of the loan will be for the account of the Fund. Income earned from securities lending activities, if any, is reflected in the Statement of Operations. As of October 31, 2020, the Fund did not have any portfolio securities on loan.
(N) Dollar Rolls. The Fund may enter into dollar roll transactions in which it sells mortgage-backed securities (“MBS”) from its portfolio to a counterparty from whom it simultaneously agrees to buy a similar security on a delayed delivery basis. The Fund generally transfers MBS where the MBS are “to be announced,” therefore, the Fund accounts for these transactions as purchases and sales.
When accounted for as purchase and sales, the securities sold in connection with the dollar rolls are removed from the portfolio and a realized gain or loss is recognized. The securities the Fund has agreed to acquire are included at market value in the Portfolio of Investments and liabilities for such purchase commitments are included as payables for investments purchased. During the roll period, the Fund foregoes principal and interest paid on the securities. The Fund is compensated by the difference between the current sales price and the forward price for the future as well as by the earnings on the cash proceeds of the initial sale. Dollar rolls may be renewed without physical delivery of the securities subject to the contract. The Fund maintains liquid assets from its portfolio having a value not less than the repurchase price, including accrued interest. Dollar roll transactions involve certain risks, including the risk that the securities returned to the Fund at the end of the roll period, while substantially similar, could be inferior to what was initially sold to the counterparty.
(O) Securities Risk. The ability of issuers of debt securities held by the Fund to meet their obligations may be affected by, among other things, economic or political developments in a specific country, industry or region. Debt securities are also subject to the risks associated with changes in interest rates.
The Fund may invest in high-yield debt securities (sometimes called “junk bonds”), which are generally considered speculative because they present a greater risk of loss, including default, than higher quality debt securities. These securities pay investors a premium—a higher interest rate or yield than investment grade debt securities—because of the increased risk of loss. These securities can also be subject to greater price volatility. In times of unusual or adverse market, economic or political conditions, these securities may experience higher than normal default rates.
Notes to Financial Statements (continued)
The Fund may invest in foreign securities, which carry certain risks that are in addition to the usual risks inherent in domestic securities. These risks include those resulting from currency fluctuations, future adverse political or economic developments and possible imposition of currency exchange blockages or other foreign governmental laws or restrictions. These risks are likely to be greater in emerging markets than in developed markets. The ability of issuers of securities held by the Fund to meet their obligations may be affected by, among other things, economic or political developments in a specific country, industry or region.
The Fund may invest in loans which are usually rated below investment grade and are generally considered speculative because they present a greater risk of loss, including default, than higher rated debt securities. These investments pay investors a higher interest rate than investment grade debt securities because of the increased risk of loss. Although certain loans are collateralized, there is no guarantee that the value of the collateral will be sufficient to repay the loan. In a recession or serious credit event, the value of these investments could decline significantly. As a result, the Fund’s NAVs could go down and you could lose money.
In addition, loans generally are subject to extended settlement periods that may be longer than seven days. As a result, the Fund may be adversely affected by selling other investments at an unfavorable time and/or under unfavorable conditions or engaging in borrowing transactions, such as borrowing against its credit facility, to raise cash to meet redemption obligations or pursue other investment opportunities.
In certain circumstances, loans may not be deemed to be securities. As a result, the Fund may not have the protection of anti-fraud provisions of the federal securities laws. In such cases, the Fund generally must rely on the contractual provisions in the loan agreement and common-law fraud protections under applicable state law.
(P) Counterparty Credit Risk. In order to better define its contractual rights and to secure rights that will help the Fund mitigate its counterparty risk, the Fund may enter into an International Swaps and Derivatives Association, Inc. Master Agreement (“ISDA Master Agreement”) or similar agreement with its counterparties. An ISDA Master Agreement is a bilateral agreement between the Fund and a counterparty that governs certain OTC derivatives and typically contains collateral posting terms and netting provisions. Under an ISDA Master Agreement, the Fund may, under certain circumstances, offset with the counterparty certain derivative financial instruments’ payables and/or receivables with collateral held and/or posted and create one single net payment. The provisions of the ISDA Master Agreement typically permit a single net payment in the event of default including the bankruptcy or insolvency of the counterparty. Bankruptcy or insolvency laws of a particular jurisdiction may restrict or prohibit the right of offset in bankruptcy, insolvency or other events. In addition, certain ISDA Master Agreements may contain provisions for early termination of OTC derivative transactions in the event the net assets of the Fund decline below specific levels or if the Fund fails to meet the terms of its ISDA Master Agreements. The result would cause the Fund to accelerate payment of any net liability owed to the counterparty.
For financial reporting purposes, the Fund does not offset derivative assets and derivative liabilities that are subject to netting arrangements, if any, in the Statement of Assets and Liabilities.
(Q) LIBOR Replacement Risk. The Fund may invest in certain debt securities, derivatives or other financial instruments that utilize the LIBOR, as a “benchmark” or “reference rate” for various interest rate calculations. The United Kingdom Financial Conduct Authority, which regulates LIBOR, announced that after 2021 it will cease its active encouragement of banks to provide the quotations needed to sustain LIBOR. As a result, it is anticipated that LIBOR will be discontinued or will no longer be sufficiently robust to be representative of its underlying market around that time. Although financial regulators and industry working groups have suggested alternative reference rates, such as the European Interbank Offer Rate (“EURIBOR”), Sterling Overnight Interbank Average Rate (“SONIA”) and Secured Overnight Financing Rate (“SOFR”), there are challenges to converting certain contracts and transactions to a new benchmark and neither the full effects of the transition process nor its ultimate outcome is known. Management is currently working to assess exposure and will modify contracts as necessary.
The elimination of LIBOR or changes to other reference rates or any other changes or reforms to the determination or supervision of reference rates could have an adverse impact on the market for, or value of, any securities or payments linked to those reference rates, which may adversely affect the Fund’s performance and/or net asset value. Uncertainty and risk also remain regarding the willingness and ability of issuers and lenders to include revised provisions in new and existing contracts or instruments. Consequently, the transition away from LIBOR to other reference rates may lead to increased volatility and illiquidity in markets that are tied to LIBOR, fluctuations in values of LIBOR-related investments or investments in issuers that utilize LIBOR, increased difficulty in borrowing or refinancing and diminished effectiveness of hedging strategies, adversely affecting the Fund’s performance. Accordingly, the potential effect of a transition away from LIBOR on the Fund or the debt securities or other instruments based on LIBOR in which the Fund invests cannot yet be determined. Furthermore, the risks associated with the expected discontinuation of LIBOR and transition may be exacerbated if the work necessary to effect an orderly transition to an alternative reference rate is not completed in a timely manner. Because the usefulness of LIBOR as a benchmark could deteriorate during the transition period, these effects could occur prior to the end of 2021.
(R) Indemnifications. Under the Trust’s organizational documents, its officers and trustees are indemnified against certain liabilities that may arise out of performance of their duties to the Trust. Additionally, in the normal course of business, the Fund enters into contracts with third-party service providers that contain a variety of representations and warranties and that may provide general indemnifications. The Fund’s maximum exposure under these arrangements is unknown, as this would involve future claims that may be made against the Fund that have not yet occurred. The Manager believes that the risk of loss in connection with these potential indemnification obligations is remote. However, there can be no assurance that material liabilities related to such obligations will not arise in the future, which could adversely impact the Fund.
(S) Quantitative Disclosure of Derivative Holdings. The following tables show additional disclosures related to the Fund’s derivative and hedging activities, including how such activities are accounted for and their effect on the Fund’s financial positions,
| | |
| 42 | | MainStay Income Builder Fund |
performance and cash flows. The Fund entered into Treasury futures contracts in order to hedge against anticipated changes in interest rates that might otherwise have an adverse effect upon the value of the Fund’s securities. The Fund also entered into domestic and foreign equity index futures contracts to increase the equity sensitivity to the
Fund. Foreign currency forward contracts were used to gain exposure to a particular currency or to hedge against the risk of loss due to
changing currency exchange rates. These derivatives are not accounted for as hedging instruments.
Fair value of derivative instruments as of October 31, 2020:
Asset Derivatives
| | | | | | | | | | | | | | | | |
| | | Foreign Exchange Contracts Risk | | | Equity
Contracts
Risk | | | Interest
Rate
Contracts
Risk | | | Total | |
| | | | |
Futures Contracts—Net Assets—Net unrealized appreciation on investments and futures contracts (a) | | $ | — | | | $ | 442,557 | | | $ | 525,120 | | | $ | 967,677 | |
Forward Contracts—Unrealized appreciation on foreign currency forward contracts | | | 1,603,459 | | | | — | | | | — | | | | 1,603,459 | |
| | | | |
Total Fair Value | | $ | 1,603,459 | | | $ | 442,557 | | | $ | 525,120 | | | $ | 2,571,136 | |
| | | | |
Liability Derivatives
| | | | | | | | | | | | | | | | |
| | | Foreign
Exchange
Contracts
Risk | | | Equity
Contracts
Risk | | | Interest
Rate
Contracts
Risk | | | Total | |
| | | | |
Futures Contracts—Net Assets—Net unrealized depreciation on investments and futures contracts (a) | | $ | — | | | $ | (2,675,230 | ) | | $ | (2,770,054 | ) | | $ | (5,445,284 | ) |
Forward Contracts—Unrealized depreciation on foreign currency forward contracts | | | (548,966 | ) | | | — | | | | — | | | | (548,966 | ) |
| | | | |
Total Fair Value | | $ | (548,966 | ) | | $ | (2,675,230 | ) | | $ | (2,770,054 | ) | | $ | (5,994,250 | ) |
| | | | |
| (a) | Includes cumulative appreciation (depreciation) of futures contracts as reported in the Portfolio of Investments. Only current day’s variation margin is reported within the Statement of Assets and Liabilities. |
The effect of derivative instruments on the Statement of Operations for the year ended October 31, 2020:
Net Realized Gain (Loss) from:
| | | | | | | | | | | | | | | | |
| | | Foreign Exchange Contracts Risk | | | Equity
Contracts
Risk | | | Interest
Rate
Contracts
Risk | | | Total | |
| | | | |
Futures Contracts | | $ | — | | | $ | 15,033,538 | | | $ | 6,286,852 | | | $ | 21,320,390 | |
Forward Contracts | | | 1,330,347 | | | | — | | | | — | | | | 1,330,347 | |
| | | | |
Total Net Realized Gain (Loss) | | $ | 1,330,347 | | | $ | 15,033,538 | | | $ | 6,286,852 | | | $ | 22,650,737 | |
| | | | |
Net Change in Unrealized Appreciation (Depreciation) from:
| | | | | | | | | | | | | | | | |
| | | Foreign Exchange Contracts Risk | | | Equity
Contracts
Risk | | | Interest
Rate
Contracts
Risk | | | Total | |
Futures Contracts | | $ | — | | | $ | (8,487,638 | ) | | $ | (318,100 | ) | | $ | (8,805,738 | ) |
Forward Contracts | | | 1,984,842 | | | | — | | | | — | | | | 1,984,842 | |
| | | | |
Total Net Change in Unrealized Appreciation (Depreciation) | | $ | 1,984,842 | | | $ | (8,487,638 | ) | | $ | (318,100 | ) | | $ | (6,820,896 | ) |
| | | | |
Notes to Financial Statements (continued)
Average Notional Amount
| | | | | | | | | | | | | | | | |
| | | Foreign
Exchange
Contracts Risk | | | Equity
Contracts
Risk | | | Interest Rate
Contracts
Risk | | | Total | |
| | | | |
Futures Contracts Long | | $ | — | | | $ | 213,485,354 | | | $ | 177,550,802 | | | $ | 391,036,156 | |
Futures Contracts Short | | $ | — | | | $ | (7,526,169 | ) | | $ | (61,139,340 | ) | | $ | (68,665,509 | ) |
Forward Contracts Long | | $ | 112,280,999 | | | $ | — | | | $ | — | | | $ | 112,280,999 | |
Forward Contracts Short | | $ | (129,326,461 | ) | | $ | — | | | $ | — | | | $ | (129,326,461 | ) |
| | | | |
Note 3–Fees and Related Party Transactions
(A) Manager and Subadvisors. New York Life Investments, a registered investment adviser and an indirect, wholly-owned subsidiary of New York Life Insurance Company (“New York Life”), serves as the Fund’s Manager, pursuant to an Amended and Restated Management Agreement (“Management Agreement”). The Manager provides offices, conducts clerical, recordkeeping and bookkeeping services and keeps most of the financial and accounting records required to be maintained by the Fund. Except for the portion of salaries and expenses that are the responsibility of the Fund, the Manager pays the salaries and expenses of all personnel affiliated with the Fund and certain operational expenses of the Fund. The Fund reimburses New York Life Investments in an amount equal to the portion of the compensation of the Chief Compliance Officer attributable to the Fund. MacKay Shields LLC (“MacKay Shields” or the “Subadvisor”), a registered investment adviser and an indirect, wholly-owned subsidiary of New York Life, serves as a Subadvisor to the Fund and is responsible for the day-to-day portfolio management of the fixed-income portion of the Fund, pursuant to the terms of an Amended and Restated Subadvisory Agreement (“Subadvisory Agreement”) between New York Life Investments and MacKay Shields. Epoch Investment Partners, Inc. (“Epoch” or “Subadvisor” and, together with MacKay Shields, the “Subadvisors”), a registered investment adviser, also serves as a Subadvisor to the Fund and is responsible for the day-to-day portfolio management of the equity portion of the Fund, pursuant to the terms of an Amended and Restated Subadvisory Agreement between New York Life Investments and Epoch. Asset allocation decisions for the Fund are made by a committee chaired by MacKay Shields in collaboration with New York Life Investments. New York Life Investments pays for the services of the Subadvisors.
Pursuant to the Management Agreement, the Fund pays the Manager a monthly fee for the services performed and the facilities furnished at an annual rate of the Fund’s average daily net assets as follows: 0.64% up to $500 million; 0.60% from $500 million to $1 billion; 0.575% from $1 billion to $5 billion; and 0.565% in excess of $5 billion, plus a fee for fund accounting services previously provided by New York Life Investments under a separate fund accounting agreement furnished at an annual rate of the Fund’s average daily net assets as follows: 0.05% up to $20 million; 0.0333% from $20 million to $100 million; and 0.01% in excess of $100 million. During the year ended October 31, 2020, the effective management fee rate was 0.62%, inclusive of a fee for fund accounting services of 0.01% of the Fund’s average daily net assets (exclusive of any applicable waivers/reimbursements).
New York Life Investments has contractually agreed to waive fees and/or reimburse expenses so that Total Annual Fund Operating Expenses (excluding taxes, interest, litigation, extraordinary expenses,
brokerage and other transaction expenses relating to the purchase or sale of portfolio investments, and acquired (underlying) fund fees and expenses) of Class R6 do not exceed those of Class I. This agreement will remain in effect until August 31, 2021 and shall renew automatically for one-year terms unless New York Life Investments provides written notice of termination prior to the start of the next term or upon approval of the Board.
During the year ended October 31, 2020, New York Life Investments earned fees from the Fund in the amount of $9,117,556 and paid MacKay Shields and Epoch $2,690,418 and $1,940,809, respectively.
State Street provides sub-administration and sub-accounting services to the Fund pursuant to an agreement with New York Life Investments (See Note 13 for sub-administration and sub-accounting service provider change). These services include calculating the daily NAVs of the Fund, maintaining the general ledger and sub-ledger accounts for the calculation of the Fund’s NAVs and assisting New York Life Investments in conducting various aspects of the Fund’s administrative operations. For providing these services to the Fund, State Street is compensated by New York Life Investments.
Pursuant to an agreement between the Trust and New York Life Investments, New York Life Investments is responsible for providing or procuring certain regulatory reporting services for the Fund. The Fund will reimburse New York Life Investments for the actual costs incurred by New York Life Investments in connection with providing or procuring these services for the Fund.
(B) Distribution, Service and Shareholder Service Fees. The Trust, on behalf of the Fund, has entered into a distribution agreement with NYLIFE Distributors LLC (the “Distributor”), an affiliate of New York Life Investments. The Fund has adopted distribution plans (the “Plans”) in accordance with the provisions of Rule 12b-1 under the 1940 Act.
Pursuant to the Class A, Investor Class and Class R2 Plans, the Distributor receives a monthly distribution fee from the Class A, Investor Class and Class R2 shares at an annual rate of 0.25% of the average daily net assets of the Class A, Investor Class and Class R2 shares for distribution and/or service activities as designated by the Distributor. Pursuant to the Class B and Class C Plans, Class B and Class C shares pay the Distributor a monthly distribution fee at an annual rate of 0.75% of the average daily net assets of the Class B and Class C shares, along with a service fee at an annual rate of 0.25% of the average daily net assets of the Class B and Class C shares, for a total 12b-1 fee of 1.00%. Pursuant to the Class R3 and SIMPLE Class Plan, Class R3 and SIMPLE Class shares pay the Distributor a monthly fee at an annual rate of 0.25% of the average daily net assets of the Class R3 and SIMPLE Class shares, along with a service fee at an annual rate of 0.25% of the
| | |
| 44 | | MainStay Income Builder Fund |
average daily net assets of the Class R3 and SIMPLE Class shares, for a total 12b-1 fee of 0.50%. Class I and Class R1 shares are not subject to a distribution and/or service fee.
The Plans provide that the distribution and service fees are payable to the Distributor regardless of the amounts actually expended by the Distributor for distribution of the Fund’s shares and service activities.
In accordance with the Shareholder Services Plan for the Class R2 and Class R3 shares, the Manager has agreed to provide, through its affiliates or independent third parties, various shareholder and administrative support services to shareholders of the Class R2 and Class R3 shares. For its services, the Manager, its affiliates or independent third-party service providers are entitled to a shareholder service fee accrued daily and paid monthly at an annual rate of 0.10% of the average daily net assets of the Class R2 and Class R3 shares. This is in addition to any fees paid under the Class R2 and Class R3 Plans.
During the year ended October 31, 2020, shareholder service fees incurred by the Fund were as follows:
| | | | |
| |
Class R2 | | $ | 2,692 | |
Class R3 | | | 1,012 | |
(C) Sales Charges. The Fund was advised by the Distributor that the amount of initial sales charges retained on sales of Class A and Investor Class shares during the year ended October 31, 2020, were $52,518 and $13,519, respectively.
The Fund was also advised that the Distributor retained CDSCs on redemptions of Class A, Investor Class, Class B and Class C shares during the year ended October 31, 2020, of $25,832, $167, $16,065 and $10,265, respectively.
(D) Transfer, Dividend Disbursing and Shareholder Servicing Agent. NYLIM Service Company LLC, an affiliate of New York Life Investments, is the Fund’s transfer, dividend disbursing and shareholder servicing agent pursuant to an agreement between NYLIM Service Company LLC and the Trust. NYLIM Service Company LLC has entered into an agreement with DST Asset Manager Solutions, Inc. (“DST”), pursuant to which DST performs certain transfer agent services on behalf of NYLIM Service Company LLC. New York Life Investments has contractually agreed to limit the transfer agency expenses charged to the Fund’s share classes to a maximum of 0.35% of that share class’s average daily net assets on an annual basis after deducting any
applicable Fund or class-level expense reimbursement or small account fees. This agreement will remain in effect until August 31, 2021 for SIMPLE Class shares and February 28, 2021 for all other share classes, and shall renew automatically for one-year terms unless New York Life Investments provides written notice of termination prior to the start of the next term or upon approval of the Board. During the year ended October 31, 2020, transfer agent expenses incurred by the Fund and any reimbursements, pursuant to the aforementioned Transfer Agency expense limitation agreement, were as follows:
| | | | | | | | |
Class | | Expense | | | Waived | |
Class A | | $ | 626,005 | | | $ | — | |
Investor Class | | | 214,925 | | | | — | |
Class B | | | 58,090 | | | | — | |
Class C | | | 445,225 | | | | — | |
Class I | | | 461,629 | | | | — | |
Class R2 | | | 2,662 | | | | — | |
Class R3 | | | 1,005 | | | | — | |
Class R6 | | | 3,862 | | | | — | |
SIMPLE Class | | | 11 | | | | — | |
(E) Small Account Fee. Shareholders with small accounts adversely impact the cost of providing transfer agency services. In an effort to reduce total transfer agency expenses, the Fund has implemented a small account fee on certain types of accounts. As described in the Fund’s prospectus, certain shareholders with an account balance of less than $1,000 ($5,000 for Class A share accounts) are charged an annual per account fee of $20 (assessed semi-annually), the proceeds from which offset transfer agent fees as reflected in the Statement of Operations. This small account fee will not apply to certain types of accounts as described further in the Fund’s prospectus.
(F) Capital. As of October 31, 2020, New York Life and its affiliates beneficially held shares of the Fund with the values and percentages of net assets as follows:
| | | | | | | | |
| | |
Class R2 | | $ | 30,517 | | | | 1.0 | % |
Class R3 | | | 33,086 | | | | 2.8 | |
Class R6 | | | 89,224,774 | | | | 97.5 | |
SIMPLE Class | | | 24,116 | | | | 99.8 | |
(G) Investments in Affiliates (in 000’s). During the year ended October 31, 2020, purchases and sales transactions, income earned from investments and shares held of investment companies managed by New York Life Investments or its affiliates were as follows:
| | | | | | | | | | | | | | | | | | | | | | | | | | | | | | | | | | | | |
Affiliated Investment Company | | Value,
Beginning
of Year | | | Purchases
at Cost | | | Proceeds
from
Sales | | | Net
Realized
Gain/
(Loss)
on Sales | | | Change in
Unrealized
Appreciation/
(Depreciation) | | | Value,
End of
Year | | | Dividend
Income | | | Other
Distributions | | | Shares
End of
Year | |
| | | | | | | | | |
MainStay U.S. Government Liquidity Fund | | $ | 44,612 | | | $ | 612,155 | | | $ | (608,597 | ) | | $ | — | | | $ | — | | | $ | 48,170 | | | $ | 307 | | | $ | — | | | | 48,170 | |
Notes to Financial Statements (continued)
Note 4–Federal Income Tax
As of October 31, 2020, the cost and unrealized appreciation (depreciation) of the Fund’s investment portfolio, including applicable derivative contracts and other financial instruments, as determined on a federal income tax basis, were as follows:
| | | | | | | | | | | | | | |
| | | Federal
Tax
Cost | | | Gross
Unrealized
Appreciation | | Gross
Unrealized
(Depreciation) | | | Net
Unrealized
Appreciation/
(Depreciation) | |
| | | | |
Investments in Securities | | $ | 1,340,839,480 | | | $120,485,735 | | $ | (57,640,314 | ) | | $ | 62,845,421 | |
As of October 31, 2020, the components of accumulated gain (loss) on a tax basis were as follows:
| | | | | | | | |
Ordinary
Income | | Accumulated
Capital and
Other Gain
(Loss) | | Other
Temporary
Differences | | Unrealized
Appreciation
(Depreciation) | | Total
Accumulated
Gain (Loss) |
| | | | |
| $5,707,955 | | $(43,136,560) | | $(229,907) | | $62,954,564 | | $25,296,052 |
The difference between book-basis and tax-basis unrealized appreciation (depreciation) is primarily due to wash sale adjustments, mark to market of futures, mark to market of forwards, and partnerships adjustments. The other temporary differences are primarily due to straddle loss deferral, dividends payable and cumulative bond amortization adjustment.
As of October 31, 2020, for federal income tax purposes, capital loss carryforwards of $40,388,892 were available as shown in the table below, to the extent provided by the regulations to offset future realized gains of the Fund through the years indicated. To the extent that these capital loss carryforwards are used to offset future capital gains, it is probable that the capital gains so offset will not be distributed to shareholders. No capital gain distributions shall be made until any capital loss carryforwards have been fully utilized.
| | | | |
Capital Loss
Available Through | | Short-Term
Capital Loss
Amounts (000’s) | | Long-Term
Capital Loss
Amounts (000’s) |
| | |
| Unlimited | | $11,815 | | $28,574 |
The following table discloses the current year reclassifications between total distributable earnings (loss) and additional paid-in capital arising from permanent differences; net assets as of October 31, 2020, were not affected.
| | | | |
Total
Distributable
Earnings (Loss) | | Additional
Paid-In
Capital | |
| $2,485 | | $ | (2,485 | ) |
The reclassifications for the Fund are primarily due to partnerships.
During the years ended October 31, 2020, and October 31, 2019, the tax character of distributions paid as reflected in the Statements of Changes in Net Assets were as follows:
| | | | | | | | |
| | | 2020 | | | 2019 | |
| | |
Distributions paid from: | | | | | | | | |
Ordinary Income | | $ | 54,765,080 | | | $ | 42,706,502 | |
Long-Term Capital Gain | | | 36,393,277 | | | | 25,238,264 | |
Total | | $ | 91,158,357 | | | $ | 67,944,766 | |
Note 5–Restricted Securities
Restricted securities are subject to legal or contractual restrictions on resale. Private placement securities are generally considered to be restricted except for those securities traded between qualified institutional investors under the provisions of Rule 144A of the Securities Act of 1933, as amended. Disposal of restricted securities may involve time consuming negotiations and expenses, and prompt sale at an acceptable price may be difficult to achieve.
As of October 31, 2020, the Fund held the following restricted security.
| | | | | | | | | | | | | | | | | | | | |
Security | | Date(s) of
Acquisition | | | Shares | | | Cost | | | 10/31/20
Value | | | Percent
of Net
Assets | |
| | | | | |
ION Media Networks, Inc. | | | | | | | | | | | | | | | | | | | | |
Common Stock | | | 3/11/14 | | | | 12 | | | $ | 1 | | | $ | 9,504 | | | | 0.0 | %‡ |
| ‡ | Less than one-tenth of a percent. |
Note 6–Custodian
State Street is the custodian of cash and securities held by the Fund (See Note 13 for custodian change). Custodial fees are charged to the Fund based on the Fund’s net assets and/or the market value of securities held by the Fund and the number of certain transactions incurred by the Fund.
Note 7–Line of Credit
The Fund and certain other funds managed by New York Life Investments maintain a line of credit with a syndicate of banks in order to secure a source of funds for temporary purposes to meet unanticipated or excessive redemption requests.
Effective July 28, 2020, under the credit agreement (the “Credit Agreement”), the aggregate commitment amount is $600,000,000 with an additional uncommitted amount of $100,000,000. The commitment fee is an annual rate of 0.15% of the average commitment amount payable quarterly, regardless of usage, to JP Morgan Chase Bank NA, who serves as the agent to the syndicate. The commitment fee is allocated among the Fund and certain other funds managed by New York Life Investments based upon their respective net assets and other factors. Interest on any revolving credit loan is charged based upon the Federal Funds Rate or the one-month LIBOR, whichever is higher. The Credit Agreement expires on July 27, 2021, although the Fund, certain other funds managed by New York Life Investments and the syndicate of banks may renew the Credit Agreement for an additional year on the same or different terms or enter into a credit agreement with a different syndicate of banks. Prior to July 28, 2020, the aggregate commitment
| | |
| 46 | | MainStay Income Builder Fund |
amount and the commitment fee were the same as those under the current Credit Agreement, but State Street served as agent to the syndicate. During the year ended October 31, 2020, there were no borrowings made or outstanding with respect to the Fund under the Credit Agreement or the credit agreement for which State Street served as agent.
Note 8–Interfund Lending Program
Pursuant to an exemptive order issued by the SEC, the Fund, along with certain other funds managed by New York Life Investments, may participate in an interfund lending program. The interfund lending program provides an alternative credit facility that permits the Fund and certain other funds managed by New York Life Investments to lend or borrow money for temporary purposes directly to or from one another subject to the conditions of the exemptive order. During the year ended October 31, 2020, there were no interfund loans made or outstanding with respect to the Fund.
Note 9–Purchases and Sales of Securities (in 000’s)
During the year ended October 31, 2020, purchases and sales of U.S. government securities were $355,494 and $488,142, respectively. Purchases and sales of securities, other than U.S. government securities and short-term securities, were $553,992 and $463,271, respectively.
Note 10–Capital Share Transactions
Transactions in capital shares for the years ended October 31, 2020, and October 31, 2019, were as follows:
| | | | | | | | |
Class A | | Shares | | | Amount | |
| | |
Year ended October 31, 2020: | | | | | | | | |
Shares sold | | | 7,127,473 | | | $ | 133,913,849 | |
Shares issued to shareholders in reinvestment of distributions | | | 1,951,567 | | | | 37,506,471 | |
Shares redeemed | | | (6,670,244 | ) | | | (123,495,824 | ) |
| | | | |
Net increase (decrease) in shares outstanding before conversion | | | 2,408,796 | | | | 47,924,496 | |
Shares converted into Class A (See Note 1) | | | 608,398 | | | | 11,635,143 | |
Shares converted from Class A (See Note 1) | | | (31,742 | ) | | | (572,507 | ) |
| | | | |
Net increase (decrease) | | | 2,985,452 | | | $ | 58,987,132 | |
| | | | |
Year ended October 31, 2019: | | | | | | | | |
Shares sold | | | 4,981,898 | | | $ | 96,149,062 | |
Shares issued to shareholders in reinvestment of distributions | | | 1,421,551 | | | | 26,274,145 | |
Shares redeemed | | | (6,544,982 | ) | | | (125,247,849 | ) |
| | | | |
Net increase (decrease) in shares outstanding before conversion | | | (141,533 | ) | | | (2,824,642 | ) |
Shares converted into Class A (See Note 1) | | | 711,316 | | | | 13,662,314 | |
Shares converted from Class A (See Note 1) | | | (117,451 | ) | | | (2,263,396 | ) |
| | | | |
Net increase (decrease) | | | 452,332 | | | $ | 8,574,276 | |
| | | | |
| | | | | | | | |
Investor Class | | Shares | | | Amount | |
| | |
Year ended October 31, 2020: | | | | | | | | |
Shares sold | | | 468,570 | | | $ | 8,788,800 | |
Shares issued to shareholders in reinvestment of distributions | | | 255,745 | | | | 4,923,774 | |
Shares redeemed | | | (419,834 | ) | | | (7,927,609 | ) |
| | | | |
Net increase (decrease) in shares outstanding before conversion | | | 304,481 | | | | 5,784,965 | |
Shares converted into Investor Class (See Note 1) | | | 67,654 | | | | 1,261,890 | |
Shares converted from Investor Class (See Note 1) | | | (484,829 | ) | | | (9,324,546 | ) |
| | | | |
Net increase (decrease) | | | (112,694 | ) | | $ | (2,277,691 | ) |
| | | | |
Year ended October 31, 2019: | | | | | | | | |
Shares sold | | | 796,415 | | | $ | 15,532,775 | |
Shares issued to shareholders in reinvestment of distributions | | | 210,462 | | | | 3,887,189 | |
Shares redeemed | | | (860,683 | ) | | | (16,734,223 | ) |
| | | | |
Net increase (decrease) in shares outstanding before conversion | | | 146,194 | | | | 2,685,741 | |
Shares converted into Investor Class (See Note 1) | | | 192,064 | | | | 3,674,269 | |
Shares converted from Investor Class (See Note 1) | | | (526,692 | ) | | | (10,169,050 | ) |
| | | | |
Net increase (decrease) | | | (188,434 | ) | | $ | (3,809,040 | ) |
| | | | |
| | |
| | | | | | | | |
Class B | | Shares | | | Amount | |
| | |
Year ended October 31, 2020: | | | | | | | | |
Shares sold | | | 30,233 | | | $ | 569,662 | |
Shares issued to shareholders in reinvestment of distributions | | | 54,023 | | | | 1,052,476 | |
Shares redeemed | | | (224,781 | ) | | | (4,229,189 | ) |
| | | | |
Net increase (decrease) in shares outstanding before conversion | | | (140,525 | ) | | | (2,607,051 | ) |
Shares converted from Class B (See Note 1) | | | (137,306 | ) | | | (2,609,221 | ) |
| | | | |
Net increase (decrease) | | | (277,831 | ) | | $ | (5,216,272 | ) |
| | | | |
Year ended October 31, 2019: | | | | | | | | |
Shares sold | | | 275,897 | | | $ | 5,486,040 | |
Shares issued to shareholders in reinvestment of distributions | | | 49,952 | | | | 921,406 | |
Shares redeemed | | | (503,382 | ) | | | (9,808,333 | ) |
| | | | |
Net increase (decrease) in shares outstanding before conversion | | | (177,533 | ) | | | (3,400,887 | ) |
Shares converted from Class B (See Note 1) | | | (137,683 | ) | | | (2,631,122 | ) |
| | | | |
Net increase (decrease) | | | (315,216 | ) | | $ | (6,032,009 | ) |
| | | | |
|
| |
Notes to Financial Statements (continued)
| | | | | | | | |
Class C | | Shares | | | Amount | |
| | |
Year ended October 31, 2020: | | | | | | | | |
Shares sold | | | 917,156 | | | $ | 17,512,908 | |
Shares issued to shareholders in reinvestment of distributions | | | 442,234 | | | | 8,593,985 | |
Shares redeemed | | | (2,960,648 | ) | | | (55,532,149 | ) |
| | | | |
Net increase (decrease) in shares outstanding before conversion | | | (1,601,258 | ) | | | (29,425,256 | ) |
Shares converted from Class C (See Note 1) | | | (33,696 | ) | | | (627,959 | ) |
| | | | |
Net increase (decrease) | | | (1,634,954 | ) | | $ | (30,053,215 | ) |
| | | | |
Year ended October 31, 2019: | | | | | | | | |
Shares sold | | | 1,170,495 | | | $ | 22,132,425 | |
Shares issued to shareholders in reinvestment of distributions | | | 369,675 | | | | 6,808,882 | |
Shares redeemed | | | (3,266,139 | ) | | | (61,979,887 | ) |
| | | | |
Net increase (decrease) in shares outstanding before conversion | | | (1,725,969 | ) | | | (33,038,580 | ) |
Shares converted from Class C (See Note 1) | | | (137,067 | ) | | | (2,598,707 | ) |
| | | | |
Net increase (decrease) | | | (1,863,036 | ) | | $ | (35,637,287 | ) |
| | | | |
|
| |
Class I | | Shares | | | Amount | |
| | |
Year ended October 31, 2020: | | | | | | | | |
Shares sold | | | 8,019,937 | | | $ | 150,877,719 | |
Shares issued to shareholders in reinvestment of distributions | | | 1,292,612 | | | | 25,075,976 | |
Shares redeemed | | | (9,493,240 | ) | | | (176,280,540 | ) |
| | | | |
Net increase in shares outstanding before conversion | | | (180,691 | ) | | | (326,845 | ) |
Shares converted into Class I (See Note 1) | | | 14,271 | | | | 262,557 | |
| | | | |
Net increase (decrease) | | | (166,420 | ) | | $ | (64,288 | ) |
| | | | |
Year ended October 31, 2019: | | | | | | | | |
Shares sold | | | 5,652,692 | | | $ | 108,456,027 | |
Shares issued to shareholders in reinvestment of distributions | | | 1,032,556 | | | | 19,283,867 | |
Shares redeemed | | | (9,407,029 | ) | | | (179,386,061 | ) |
| | | | |
Net increase (decrease) in shares outstanding before conversion | | | (2,721,781 | ) | | | (51,646,167 | ) |
Shares converted into Class I (See Note 1) | | | 17,180 | | | | 325,692 | |
| | | | |
Net increase (decrease) | | | (2,704,601 | ) | | $ | (51,320,475 | ) |
| | | | |
| | |
| | | | | | | | |
Class R2 | | Shares | | | Amount | |
| | |
Year ended October 31, 2020: | | | | | | | | |
Shares sold | | | 39,504 | | | $ | 733,426 | |
Shares issued to shareholders in reinvestment of distributions | | | 3,946 | | | | 75,822 | |
Shares redeemed | | | (6,397 | ) | | | (122,183 | ) |
| | | | |
Net increase (decrease) | | | 37,053 | | | $ | 687,065 | |
| | | | |
Year ended October 31, 2019: | | | | | | | | |
Shares sold | | | 18,671 | | | $ | 351,189 | |
Shares issued to shareholders in reinvestment of distributions | | | 3,483 | | | | 64,008 | |
Shares redeemed | | | (89,592 | ) | | | (1,709,718 | ) |
| | | | |
Net increase (decrease) | | | (67,438 | ) | | $ | (1,294,521 | ) |
| | | | |
|
| |
| | | | | | | | |
Class R3 | | Shares | | | Amount | |
| | |
Year ended October 31, 2020: | | | | | | | | |
Shares sold | | | 36,748 | | | $ | 715,768 | |
Shares issued to shareholders in reinvestment of distributions | | | 2,565 | | | | 49,126 | |
Shares redeemed | | | (4,574 | ) | | | (86,605 | ) |
| | | | |
Net increase (decrease) | | | 34,739 | | | $ | 678,289 | |
| | | | |
Year ended October 31, 2019: | | | | | | | | |
Shares sold | | | 21,615 | | | $ | 416,299 | |
Shares issued to shareholders in reinvestment of distributions | | | 551 | | | | 10,372 | |
| | | | |
Net increase (decrease) | | | 22,166 | | | $ | 426,671 | |
| | | | |
|
| |
Class R6 | | Shares | | | Amount | |
| | |
Year ended October 31, 2020: | | | | | | | | |
Shares sold | | | 393,526 | | | $ | 7,405,905 | |
Shares issued to shareholders in reinvestment of distributions | | | 320,653 | | | | 6,219,744 | |
Shares redeemed | | | (888,573 | ) | | | (16,655,511 | ) |
| | | | |
Net increase (decrease) in shares outstanding before conversion | | | (174,394 | ) | | | (3,029,862 | ) |
Shares converted from Class R6 (See Note 1) | | | (1,261 | ) | | | (25,357 | ) |
| | | | |
Net increase (decrease) | | | (175,655 | ) | | $ | (3,055,219 | ) |
| | | | |
Year ended October 31, 2019: | | | | | | | | |
Shares sold | | | 425,473 | | | $ | 8,212,259 | |
Shares issued to shareholders in reinvestment of distributions | | | 254,786 | | | | 4,764,539 | |
Shares redeemed | | | (713,908 | ) | | | (13,641,963 | ) |
| | | | |
Net increase (decrease) | | | (33,649 | ) | | $ | (665,165 | ) |
| | | | |
|
| |
SIMPLE Class | | Shares | | | Amount | |
| | |
Period ended October 31, 2020 (a): | | | | | | | | |
Shares sold | | | 1,293 | | | $ | 25,000 | |
Shares issued to shareholders in reinvestment of distributions | | | 4 | | | | 72 | |
| | | | |
Net increase (decrease) | | | 1,297 | | | $ | 25,072 | |
| | | | |
| (a) | The inception date of the class was August 31, 2020. |
Note 11–Recent Accounting Pronouncement
To improve the effectiveness of fair value disclosure requirements, the Financial Accounting Standards Board issued Accounting Standards Update 2018-13, Fair Value Measurement Disclosure Framework—Changes to the Disclosure Requirements for Fair Value Measurement (“ASU 2018-13”), which adds, removes, and modifies certain fair value measurement disclosure requirements. ASU 2018-13 is effective for interim and annual reporting periods beginning after December 15, 2019. The Manager evaluated the implications of certain provisions of ASU 2018-13 and determined to early adopt aspects related to the removal and modifications of certain fair value measurement disclosures, which are currently in place as of October 31, 2020. The Manager is evaluating the implications of certain other provisions of ASU 2018-13 related to new disclosure requirements and has not yet determined the impact of those provisions on the financial statement disclosures, if any.
| | |
| 48 | | MainStay Income Builder Fund |
In March 2020, the Financial Accounting Standards Board (“FASB”) issued Accounting Standards Update 2020-04 (“ASU 2020-04”), which provides optional guidance to ease the potential accounting burden associated with transitioning away from LIBOR and other reference rates that are expected to be discontinued. ASU 2020-04 is effective immediately upon release of the update on March 12, 2020, through December 31, 2022. At this time, the Manager is evaluating the implications of certain other provisions of ASU 2020-04 related to new disclosure requirements and any impact on the financial statement disclosures has not yet been determined.
Note 12–Other Matters
An outbreak of COVID-19, first detected in December 2019, has developed into a global pandemic and has resulted in travel restrictions, closure of international borders, certain businesses and securities markets, restrictions on securities trading activities, prolonged quarantines, supply chain disruptions, and lower consumer demand, as well as general concern and uncertainty. The continued impact of COVID-19 is uncertain and could further adversely affect the global
economy, national economies, individual issuers and capital markets in unforeseeable ways and result in a substantial and extended economic downturn. Developments that disrupt global economies and financial markets, such as COVID-19, may magnify factors that affect the Fund’s performance.
Note 13–Subsequent Events
In connection with the preparation of the financial statements of the Fund as of and for the year ended October 31, 2020, events and transactions subsequent to October 31, 2020, through the date the financial statements were issued have been evaluated by the Manager, for possible adjustment and/or disclosure. No subsequent events requiring financial statement adjustment or disclosure have been identified other than the following:
Effective at the close of business on November 20, 2020, all services provided by State Street were transitioned to JPMorgan Chase Bank, N.A.
Report of Independent Registered Public Accounting Firm
To the Shareholders of the Fund and Board of Trustees
The MainStay Funds:
Opinion on the Financial Statements
We have audited the accompanying statement of assets and liabilities of MainStay Income Builder Fund (the Fund), one of the funds constituting The MainStay Funds, including the portfolio of investments, as of October 31, 2020, the related statement of operations for the year then ended, the statements of changes in net assets for each of the years in the two-year period then ended, and the related notes (collectively, the financial statements) and the financial highlights for each of the years or periods in the five-year period then ended. In our opinion, the financial statements and financial highlights present fairly, in all material respects, the financial position of the Fund as of October 31, 2020, the results of its operations for the year then ended, the changes in its net assets for each of the years in the two-year period then ended, and the financial highlights for each of the years or periods in the five-year period then ended, in conformity with U.S. generally accepted accounting principles.
Basis for Opinion
These financial statements and financial highlights are the responsibility of the Fund’s management. Our responsibility is to express an opinion on these financial statements and financial highlights based on our audits. We are a public accounting firm registered with the Public Company Accounting Oversight Board (United States) (PCAOB) and are required to be independent with respect to the Fund in accordance with the
U.S. federal securities laws and the applicable rules and regulations of the Securities and Exchange Commission and the PCAOB.
We conducted our audits in accordance with the standards of the PCAOB. Those standards require that we plan and perform the audit to obtain reasonable assurance about whether the financial statements and financial highlights are free of material misstatement, whether due to error or fraud. Our audits included performing procedures to assess the risks of material misstatement of the financial statements and financial highlights, whether due to error or fraud, and performing procedures that respond to those risks. Such procedures included examining, on a test basis, evidence regarding the amounts and disclosures in the financial statements and financial highlights. Such procedures also included confirmation of securities owned as of October 31, 2020, by correspondence with custodians, the transfer agent, and brokers or by other appropriate auditing procedures when replies from brokers were not received. Our audits also included evaluating the accounting principles used and significant estimates made by management, as well as evaluating the overall presentation of the financial statements and financial highlights. We believe that our audits provide a reasonable basis for our opinion.

We have served as the auditor of one or more New York Life Investment Management investment companies since 2003.
Philadelphia, Pennsylvania
December 23, 2020
| | |
| 50 | | MainStay Income Builder Fund |
Federal Income Tax Information
(Unaudited)
The Fund is required under the Internal Revenue Code to advise shareholders in a written statement as to the federal tax status of dividends paid by the Fund during such fiscal years. Accordingly, the Fund paid $36,341,347 as long term capital gain distributions.
For the fiscal year ended October 31, 2020, the Fund designated approximately $26,419,877 under the Internal Revenue Code as qualified dividend income eligible for reduced tax rates.
The dividends paid by the Fund during the fiscal year ended October 31, 2020 should be multiplied by 25.66% to arrive at the amount eligible for the corporate dividend-received deduction.
In February 2021, shareholders will receive an IRS Form 1099-DIV or substitute Form 1099, which will show the federal tax status of the distributions received by shareholders in calendar year 2020. The amounts that will be reported on such 1099-DIV or substitute Form 1099 will be the amounts you are to use on your federal income tax return and will differ from the amounts reported for the Fund’s fiscal year ended October 31, 2020.
Proxy Voting Policies and Procedures and Proxy Voting Record
A description of the policies and procedures that New York Life Investments uses to vote proxies related to the Fund’s securities is available free of charge upon request, by visiting the MainStay Funds’ website at newyorklifeinvestments.com or visiting the SEC’s website at www.sec.gov.
The Fund is required to file with the SEC its proxy voting records for the 12-month period ending June 30 on Form N-PX. The most recent Form N-PX or proxy voting record is available free of charge upon request by calling 800-624-6782; visiting the MainStay Funds’ website at newyorklifeinvestments.com; or visiting the SEC’s website at www.sec.gov.
Shareholder Reports and Quarterly Portfolio Disclosure
The Fund is required to file its complete schedule of portfolio holdings with the SEC 60 days after its first and third fiscal quarter on Form N-PORT. The Fund’s holdings report is available free of charge by visiting the SEC’s website at www.sec.gov or upon request by calling New York Life Investments at 800-624-6782.
Board of Trustees and Officers (Unaudited)
The Trustees and officers of the Funds are listed below. The Board oversees the MainStay Group of Funds (which consists of MainStay Funds and MainStay Funds Trust), MainStay VP Funds Trust, MainStay MacKay DefinedTerm Municipal Opportunities Fund, the Manager and the Subadvisors, and elects the officers of the Funds who are responsible for the day-to-day operations of the Funds. Information pertaining to the Trustees and officers is set forth below. Each Trustee serves until his or her successor is elected and qualified or until his or her
resignation, death or removal. Under the Board’s retirement policy, unless an exception is made, a Trustee must tender his or her resignation by the end of the calendar year during which he or she reaches the age of 75. Officers are elected annually by the Board. The business address of each Trustee and officer listed below is 51 Madison Avenue, New York, New York 10010. A majority of the Trustees are not “interested persons” (as defined by the 1940 Act and rules adopted by the SEC thereunder) of the Fund (“Independent Trustees”).
| | | | | | | | | | | | |
| | | | | Name and
Year of Birth | | Term of Office,
Position(s) Held and
Length of Service | | Principal Occupation(s)
During Past Five Years | | Number of
Portfolios in
Fund Complex
Overseen by
Trustee | | Other Directorships
Held by Trustee |
Interested Trustee | | | | Yie-Hsin Hung* 1962 | | MainStay Funds:
Trustee since 2017 MainStay Funds Trust:
Trustee since 2017 | | Senior Vice President of New York Life since joining in 2010, Member of the Executive Management Committee since 2017, Chief Executive Officer, New York Life Investment Management Holdings LLC & New York Life Investment Management LLC since 2015. Senior Managing Director and Co-President of New York Life Investment Management LLC from 2014 to May 2015. Previously held positions of increasing responsibility, including head of NYLIM International, Alternative Growth Businesses, and Institutional investments since joining New York Life in 2010. | | 78 | | MainStay VP Funds Trust:
Trustee since 2017 (31 portfolios); and
MainStay MacKay DefinedTerm Municipal Opportunities Fund: Trustee since 2017. |
| | * | This Trustee is considered to be an “interested person” of the MainStay Group of Funds, MainStay VP Funds Trust and MainStay MacKay DefinedTerm Municipal Opportunities Fund, within the meaning of the 1940 Act because of her affiliation with New York Life Insurance Company, New York Life Investment Management LLC, Candriam Belgium S.A., Candriam Luxembourg S.C.A., IndexIQ Advisors LLC, MacKay Shields LLC, NYL Investors LLC, NYLIFE Securities LLC and/or NYLIFE Distributors LLC, as described in detail above in the column entitled “Principal Occupation(s) During Past Five Years.” |
| | |
| 52 | | MainStay Income Builder Fund |
| | | | | | | | | | | | |
| | | | | Name and
Year of Birth | | Term of Office,
Position(s) Held and
Length of Service | | Principal Occupation(s)
During Past Five Years | | Number of
Portfolios in
Fund Complex
Overseen by
Trustee | | Other Directorships
Held by Trustee |
Independent Trustees | | | | David H. Chow 1957 | | MainStay Funds:
Trustee since 2016, Advisory Board Member (June 2015 to December 2015); MainStay Funds Trust:
Trustee since 2016, Advisory Board Member (June 2015 to December 2015). | | Founder and CEO, DanCourt Management, LLC since 1999 | | 78 | | MainStay VP Funds Trust: Trustee since 2016, Advisory Board Member (June 2015 to December 2015) (31 portfolios);
MainStay MacKay DefinedTerm Municipal Opportunities Fund: Trustee since 2016, Advisory Board Member (June 2015 to December 2015); Market Vectors Group of Exchange-Traded Funds: Independent Chairman of the Board of Trustees since 2008 and Trustee since 2006 (56 portfolios); and
Berea College of Kentucky: Trustee since 2009, Chair of the Investment Committee since 2018. |
| | | | Susan B. Kerley 1951 | | MainStay Funds:
Chairman since 2017 and Trustee since 2007; MainStay Funds Trust: Chairman since 2017 and Trustee since 1990.** | | President, Strategic Management Advisors LLC since 1990 | | 78 | | MainStay VP Funds Trust: Chairman since 2017 and Trustee since 2007 (31 portfolios)***;
MainStay MacKay DefinedTerm Municipal Opportunities Fund: Chairman since 2017 and Trustee since 2011; and
Legg Mason Partners Funds: Trustee since 1991 (45 portfolios). |
| | | | Alan R. Latshaw 1951 | | MainStay Funds:
Trustee; MainStay Funds Trust:
Trustee and Audit Committee Financial Expert since 2007.** | | Retired; Partner, Ernst & Young LLP (2002 to 2003); Partner, Arthur Andersen LLP (1989 to 2002); Consultant to the MainStay Funds Audit and Compliance Committee (2004 to 2006) | | 78 | | MainStay VP Funds Trust: Trustee and Audit Committee Financial Expert since 2007 (31 portfolios)***;
MainStay MacKay DefinedTerm Municipal Opportunities Fund: Trustee and Audit Committee Financial Expert since 2011; and
State Farm Associates Funds Trusts: Trustee since 2005 (4 portfolios). |
| | | | Richard H. Nolan, Jr. 1946 | | MainStay Funds:
Trustee since 2007; MainStay Funds Trust:
Trustee since 2007.** | | Managing Director, ICC Capital Management since 2004; President—Shields/Alliance, Alliance Capital Management (1994 to 2004) | | 78 | | MainStay VP Funds Trust: Trustee since 2006 (31 portfolios)***; and
MainStay MacKay DefinedTerm Municipal Opportunities Fund: Trustee since 2011. |
| | | | Jacques P. Perold 1958 | | MainStay Funds:
Trustee since 2016, Advisory Board Member (June 2015 to December 2015); MainStay Funds Trust:
Trustee since 2016, Advisory Board Member (June 2015 to December 2015). | | Founder and Chief Executive Officer, CapShift LLC since 2018; President, Fidelity Management & Research Company (2009 to 2014); Founder, President and Chief Executive Officer, Geode Capital Management, LLC (2001 to 2009) | | 78 | | MainStay VP Funds Trust: Trustee since 2016, Advisory Board Member (June 2015 to December 2015) (31 portfolios);
MainStay MacKay DefinedTerm Municipal Opportunities Fund: Trustee since 2016, Advisory Board Member (June 2015 to December 2015); Partners in Health: Trustee since 2019; Allstate Corporation: Director since 2015;
MSCI, Inc.: and Director since 2017. |
Board of Trustees and Officers (Unaudited) (continued)
| | | | | | | | | | | | |
| | | | | Name and
Year of Birth | | Term of Office,
Position(s) Held and
Length of Service | | Principal Occupation(s)
During Past Five Years | | Number of
Portfolios in
Fund Complex
Overseen by
Trustee | | Other Directorships
Held by Trustee |
Independent Trustees | | | | Richard S. Trutanic 1952 | | MainStay Funds: Trustee since 1994; MainStay Funds Trust: Trustee since 2007.** | | Chairman and Chief Executive Officer, Somerset & Company (financial advisory firm) since 2004; Managing Director, The Carlyle Group (private investment firm) (2002 to 2004); Senior Managing Director, Partner and Board Member, Groupe Arnault S.A. (private investment firm) (1999 to 2002) | | 78 | | MainStay VP Funds Trust: Trustee since 2007 (31 portfolios)***; and
MainStay MacKay DefinedTerm Municipal Opportunities Fund: Trustee since 2011. |
| | ** | Includes prior service as a Director/Trustee of certain predecessor entities to MainStay Funds Trust. |
| | *** | Includes prior service as a Director of MainStay VP Series Fund, Inc., the predecessor to MainStay VP Funds Trust. |
| | |
| 54 | | MainStay Income Builder Fund |
| | | | | | | | |
| | | | | Name and
Year of Birth | | Position(s) Held and
Length of Service | | Principal Occupation(s)
During Past Five Years |
Officers
of the
Trust
(Who are
not
Trustees)* | | | | Kirk C. Lehneis 1974 | | President, MainStay Funds, MainStay Funds Trust since 2017 | | Chief Operating Officer and Senior Managing Director since 2016, New York Life Investment Management LLC and New York Life Investment Management Holdings LLC; Member of the Board of Managers since 2017 and Senior Managing Director since 2018, NYLIFE Distributors LLC; Chairman of the Board and Senior Managing Director, NYLIM Service Company LLC since 2017; Trustee, President and Principal Executive Officer of IndexIQ Trust, IndexIQ ETF Trust and IndexIQ Active ETF Trust since 2018; President, MainStay MacKay DefinedTerm Municipal Opportunities Fund and MainStay VP Funds Trust since 2017**; Senior Managing Director, Global Product Development (2015 to 2016); Managing Director, Product Development (2010 to 2015), New York Life Investment Management LLC |
| | | | Jack R. Benintende 1964 | | Treasurer and Principal Financial and Accounting Officer, MainStay Funds since 2007, MainStay Funds Trust since 2009 | | Managing Director, New York Life Investment Management LLC since 2007; Treasurer and Principal Financial and Accounting Officer, MainStay MacKay DefinedTerm Municipal Opportunities Fund since 2011 and MainStay VP Funds Trust since 2007**; and Assistant Treasurer, New York Life Investment Management Holdings LLC (2008 to 2012) |
| | | | Yi-Chia Kuo 1981 | | Vice President and Chief Compliance Officer, MainStay Funds and MainStay Funds Trust since January 2020 | | Chief Compliance Officer, Index IQ Trust, Index IQ ETF Trust and Index IQ Active ETF Trust since January 2020; Vice President and Chief Compliance Officer, MainStay MacKay DefinedTerm Municipal Opportunities Fund and MainStay VP Funds Trust since January 2020; Director and Associate General Counsel, New York Life Insurance Company (2015 to 2019) |
| | | | J. Kevin Gao 1967 | | Secretary and Chief Legal Officer, MainStay Funds and MainStay Funds Trust since 2010 | | Managing Director and Associate General Counsel, New York Life Investment Management LLC since 2010; Secretary and Chief Legal Officer, MainStay MacKay DefinedTerm Municipal Opportunities Fund since 2011 and MainStay VP Funds Trust since 2010** |
| | | | Scott T. Harrington 1959 | | Vice President— Administration, MainStay Funds since 2005, MainStay Funds Trust since 2009 | | Managing Director, New York Life Investment Management LLC (including predecessor advisory organizations) since 2000; Member of the Board of Directors, New York Life Trust Company since 2009; Vice President—Administration, MainStay MacKay DefinedTerm Municipal Opportunities Fund since 2011 and MainStay VP Funds Trust since 2005** |
| | * | The officers listed above are considered to be “interested persons” of the MainStay Group of Funds, MainStay VP Funds Trust and MainStay MacKay DefinedTerm Municipal Opportunities Fund within the meaning of the 1940 Act because of their affiliation with the MainStay Group of Funds, New York Life Insurance Company and/or its affiliates, including New York Life Investment Management LLC, NYLIM Service Company LLC, NYLIFE Securities LLC and/or NYLIFE Distributors LLC, as described in detail in the column captioned “Principal Occupation(s) During Past Five Years.” Officers are elected annually by the Board. |
| | ** | Includes prior service as an Officer of MainStay VP Series Fund, Inc., the predecessor to MainStay VP Funds Trust. |
MainStay Funds
Equity
U.S. Equity
MainStay Epoch U.S. All Cap Fund
MainStay Epoch U.S. Equity Yield Fund
MainStay MacKay Common Stock Fund
MainStay MacKay Growth Fund
MainStay MacKay S&P 500 Index Fund
MainStay MacKay Small Cap Core Fund
MainStay MacKay U.S. Equity Opportunities Fund
MainStay MAP Equity Fund
MainStay Winslow Large Cap Growth Fund1
International Equity
MainStay Epoch International Choice Fund
MainStay MacKay International Equity Fund
MainStay MacKay International Opportunities Fund
Emerging Markets Equity
MainStay Candriam Emerging Markets Equity Fund
Global Equity
MainStay Epoch Capital Growth Fund
MainStay Epoch Global Equity Yield Fund
Fixed Income
Taxable Income
MainStay Candriam Emerging Markets Debt Fund
MainStay Floating Rate Fund
MainStay MacKay High Yield Corporate Bond Fund
MainStay MacKay Short Duration High Yield Fund
MainStay MacKay Total Return Bond Fund
MainStay MacKay Unconstrained Bond Fund
MainStay MacKay U.S. Infrastructure Bond Fund2
MainStay Short Term Bond Fund3
Tax-Exempt Income
MainStay MacKay California Tax Free Opportunities Fund4
MainStay MacKay High Yield Municipal Bond Fund
MainStay MacKay Intermediate Tax Free Bond Fund
MainStay MacKay New York Tax Free Opportunities Fund5
MainStay MacKay Short Term Municipal Fund
MainStay MacKay Tax Free Bond Fund
Money Market
MainStay Money Market Fund
Mixed Asset
MainStay Balanced Fund
MainStay Income Builder Fund
MainStay MacKay Convertible Fund
Speciality
MainStay CBRE Global Infrastructure Fund
MainStay CBRE Real Estate Fund
MainStay Cushing MLP Premier Fund
Asset Allocation
MainStay Conservative Allocation Fund
MainStay Conservative ETF Allocation Fund
MainStay Defensive ETF Allocation Fund
MainStay Equity Allocation Fund6
MainStay Equity ETF Allocation Fund
MainStay Growth Allocation Fund7
MainStay Growth ETF Allocation Fund
MainStay Moderate Allocation Fund
MainStay Moderate ETF Allocation Fund
Manager
New York Life Investment Management LLC
New York, New York
Subadvisors
Candriam Belgium S.A.8
Brussels, Belgium
Candriam Luxembourg S.C.A.8
Strassen, Luxembourg
CBRE Clarion Securities LLC
Radnor, Pennsylvania
Cushing Asset Management, LP
Dallas, Texas
Epoch Investment Partners, Inc.
New York, New York
MacKay Shields LLC8
New York, New York
Markston International LLC
White Plains, New York
NYL Investors LLC8
New York, New York
Winslow Capital Management, LLC
Minneapolis, Minnesota
Legal Counsel
Dechert LLP
Washington, District of Columbia
Independent Registered Public Accounting Firm
KPMG LLP
Philadelphia, Pennsylvania
Distributor
NYLIFE Distributors LLC8
Jersey City, New Jersey
Custodian9
State Street Bank and Trust Company
Boston, Massachusetts
| 1. | Formerly known as MainStay Large Cap Growth Fund. |
| 2. | Formerly known as MainStay MacKay Infrastructure Bond Fund. |
| 3. | Formerly known as MainStay Indexed Bond Fund. |
| 4. | This Fund is registered for sale in AZ, CA, NV, OR, TX, UT and WA. Class A and Class I shares are registered for sale in MI. Class I and Class C2 shares are registered for sale in CO, FL, GA, HI, ID, MA, MD, NH, NJ and NY. |
| 5. | This Fund is registered for sale in CA, CT, DE, FL, MA, NJ, NY and VT. |
| 6. | Formerly known as MainStay Growth Allocation Fund. |
| 7. | Formerly known as MainStay Moderate Growth Allocation Fund. |
| 8. | An affiliate of New York Life Investment Management LLC. |
| 9. | JPMorgan Chase Bank, N.A., New York, New York is the custodian for the MainStay ETF Asset Allocation Funds and effective at the close of business on November 20, 2020, became the custodian for other MainStay Funds. The custodian for MainStay Cushing MLP Premier Fund is U.S. Bank National Association, Milwaukee, Wisconsin. |
Not part of the Annual Report
For more information
800-624-6782
newyorklifeinvestments.com
“New York Life Investments” is both a service mark, and the common trade name, of certain investment advisors affiliated with New York Life Insurance Company. The MainStay Funds® are managed by New York Life Investment Management LLC and distributed by NYLIFE Distributors LLC, 30 Hudson Street, Jersey City, NJ 07302, a wholly owned subsidiary of New York Life Insurance Company. NYLIFE Distributors LLC is a Member FINRA/SIPC.
©2020 NYLIFE Distributors LLC. All rights reserved.
| | |
| 1717042 MS203-20 | | MSIB11-12/20 (NYLIM) NL216 |
MainStay MacKay Common Stock Fund
Message from the President and Annual Report
October 31, 2020
Beginning on January 1, 2021, paper copies of each MainStay Fund’s annual and semiannual shareholder reports will no longer be sent by mail, unless you specifically request paper copies of the reports from MainStay Funds or from your financial intermediary. Instead, the reports will be made available on the MainStay Funds’ website. You will be notified by mail and provided with a website address to access the report each time a new report is posted to the website.
If you already elected to receive shareholder reports electronically, you will not be affected by this change and you need not take any action. At any time, you may elect to receive reports and other communications from MainStay Funds electronically by calling toll-free 800-624-6782, by sending an e-mail to MainStayShareholderServices@nylim.com, or by contacting your financial intermediary.
You may elect to receive all future shareholder reports in paper form free of charge. If you hold shares of a MainStay Fund directly, you can inform MainStay Funds that you wish to receive paper copies of reports by calling toll-free 800-624-6782 or by sending an e-mail to MainStayShareholderServices@nylim.com. If you hold shares of a MainStay Fund through a financial intermediary, please contact the financial intermediary to make this election. Your election to receive reports in paper form will apply to all MainStay Funds in which you are invested and may apply to all funds held with your financial intermediary.
| | | | | | | | |
| Not FDIC/NCUA Insured | | Not a Deposit | | May Lose Value | | No Bank Guarantee | | Not Insured by Any Government Agency |

This page intentionally left blank
Message from the President
Despite historically high levels of volatility generated by the global coronavirus pandemic and a host of other geopolitical and economic uncertainties, most broad U.S. stock and bond markets gained ground during the 12-month reporting period ended October 31, 2020.
The reporting period began on an upswing, with markets rising on generally positive underlying economic trends and the announcement of a U.S.-China trade deal. However, in mid-February 2020, stock and bond indices began to dip as growing numbers of COVID-19 cases appeared in hotspots around the world. By early March, the disease reached pandemic proportions. As governments struggled to support overburdened health care systems by issuing “stay-at-home” orders and other restrictions on nonessential activity, global economic activity slowed, driving most stocks and bonds sharply lower.
The United States was hit particularly hard by the pandemic, with more reported COVID-19 cases and deaths than any other country in the world throughout the second half of the reporting period. As the pandemic deepened, the U.S. Federal Reserve (“Fed”) twice cut interest rates and announced unlimited quantitative easing. The federal government declared a national emergency, and Congress passed and the President signed a $2 trillion stimulus package. Markets responded positively to these measures, as well as to a gradual lessening of restrictions on nonessential businesses, hopes for additional stimulus and apparent progress in the development of a vaccine. By late August, the S&P 500® Index, a widely regarded benchmark of market performance, had not only regained all the ground it lost earlier in the reporting period, the Index had reached new record levels. However, a resurgence of coronavirus cases in many parts of the country and uncertainties related to the November 3, 2020, U.S. presidential election caused markets to falter as the reporting period drew to a close.
Nevertheless, for the reporting period as a whole, U.S. equity indices generally produced moderate gains. Returns proved strongest among large-cap, growth-oriented stocks, while small- and mid-cap issues lagged. Within the S&P 500® Index, the information technology and consumer discretionary sectors produced exceptionally strong gains, buoyed by strong corporate and consumer spending, while the health care sector outperformed by a smaller margin. Materials and consumer staples sectors generated positive returns, but lagged the S&P 500® Index. The industrials, utilities, communication services, financials, real estate and energy sectors ended the reporting period in negative territory, with the energy sector
suffering the steepest losses due to weak global demand. International equities declined sharply in February and March 2020 before recovering somewhat, but tended to lag their U.S. counterparts due to weaker underlying economic growth and somewhat less aggressive monetary and fiscal stimulus. Emerging-market equities tracked the performance of U.S. equity markets more closely, led by relatively strong returns in Asian markets, such as China and South Korea.
Fixed-income markets experienced an environment that tended to favor higher credit quality and longer duration securities. Corporate bonds followed the pattern of equities, with prices declining in March 2020 before subsequently recovering. Relatively speculative high-yield credit was hardest hit during the market sell-off in early 2020 and continued to underperform during the remainder of the reporting period. Similarly, among municipal bond issues, high-grade bonds outperformed, dipping briefly in mid-March before regaining the lost ground. Recognized safe havens, such as U.S. government bonds, attracted increased investment during the height of the market sell-off, driving yields lower and prices higher. As a result, long-term Treasury bonds delivered particularly strong gains for the reporting period as a whole. Emerging-market debt, on the other hand, underperformed most other bond types as investors sought to minimize currency and sovereign risks.
Although the ongoing pandemic continues to change the way that many of us work and live our lives, at New York Life Investments, we remain dedicated to providing you, as a MainStay investor, with products, information and services to help you to navigate today’s rapidly changing investment environment. By taking appropriate steps to minimize community spread of COVID-19 within our organization and despite the challenges posed by the coronavirus pandemic, we continue to innovate with you in mind, introducing new suites of Funds and providing continuous insights into ever-evolving markets and investment strategies. Our goal is to give you the tools you need to build a resilient portfolio in the face of uncertain times.
Sincerely,

Kirk C. Lehneis
President
The opinions expressed are as of the date of this report and are subject to change. There is no guarantee that any forecast made will come to pass. This material does not constitute investment advice and is not intended as an endorsement of any specific investment. Past performance is no guarantee of future results.
Not part of the Annual Report
Table of Contents
Investors should refer to the Fund’s Summary Prospectus and/or Prospectus and consider the Fund’s investment objectives, strategies, risks, charges and expenses carefully before investing. The Summary Prospectus and/or Prospectus contain this and other information about the Fund. You may obtain copies of the Fund’s Summary Prospectus, Prospectus and Statement of Additional Information free of charge, upon request, by calling toll-free 800-624-6782, by writing to NYLIFE Distributors LLC, Attn: MainStay Marketing Department, 30 Hudson Street, Jersey City, NJ 07302 or by sending an e-mail to MainStayShareholderServices@nylim.com. These documents are also available via the MainStay Funds’ website at newyorklifeinvestments.com. Please read the Summary Prospectus and/or Prospectus carefully before investing.
Investment and Performance Comparison1 (Unaudited)
Performance data quoted represents past performance. Past performance is no guarantee of future results. Because of market volatility and other factors, current performance may be lower or higher than the figures shown. Investment return and principal value will fluctuate, and as a result, when shares are redeemed, they may be worth more or less than their original cost. The graph below depicts the historical performance of Class I shares* of the Fund. Performance will vary from class to class based on differences in class-specific expenses and sales charges. For performance information current to the most recent month-end, please call 800-624-6782 or visit newyorklifeinvestments.com.
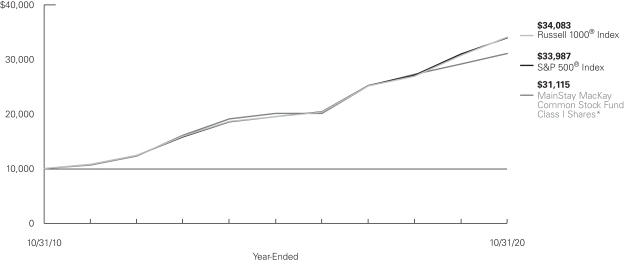
Average Annual Total Returns for the Year-Ended October 31, 2020
| | | | | | | | | | | | | | | | | | | | | | | | |
| Class | | Sales Charge | | | | Inception
Date | | | One Year | | | Five Years or Since Inception | | | Ten Years | | | Gross
Expense
Ratio2 | |
| | | | | | | |
| Class A Shares | | Maximum 5.5%
Initial Sales Charge | | With sales charges Excluding sales charges | |
| 6/1/1998
|
| |
| 0.56
6.42 | %
| |
| 7.63
8.85 | %
| |
| 11.11
11.74 | %
| |
| 0.97
0.97 | %
|
| Investor Class Shares3 | | Maximum 5%
Initial Sales Charge | | With sales charges Excluding sales charges | |
| 2/28/2008
|
| |
| 0.21
6.05 |
| |
| 7.33
8.55 |
| |
| 10.74
11.37 |
| |
| 1.27
1.27 |
|
| Class B Shares4 | | Maximum 5% CDSC
if Redeemed Within the
First Six Years of Purchase | | With sales charges Excluding sales charges | |
| 6/1/1998
|
| |
| 0.30
5.28 |
| |
| 7.45
7.75 |
| |
| 10.55
10.55 |
| |
| 2.02
2.02 |
|
| Class C Shares | | Maximum 1% CDSC
if Redeemed Within
One Year of Purchase | | With sales charges Excluding sales charges | |
| 9/1/1998
|
| |
| 4.29
5.29 |
| |
| 7.75
7.75 |
| |
| 10.54
10.54 |
| |
| 2.02
2.02 |
|
| Class I Shares | | No Sales Charge | | | | | 12/28/2004 | | | | 6.66 | | | | 9.12 | | | | 12.02 | | | | 0.72 | |
| Class R3 Shares | | No Sales Charge | | | | | 2/29/2016 | | | | 6.02 | | | | 10.98 | | | | N/A | | | | 1.32 | |
| * | Previously, the chart presented the Fund’s annual returns for Class B shares. Class I shares are presented for consistency across the MainStay Fund complex. |
| 1. | The performance table and graph do not reflect the deduction of taxes that a shareholder would pay on distributions or Fund share redemptions. Total returns reflect maximum applicable sales charges as indicated in the table above, if any, changes in share price, and reinvestment of dividend and capital gain distributions. The graph assumes the initial investment amount shown above and reflects the deduction of all sales charges that would have applied for the period of investment. Performance figures may reflect certain fee waivers and/or expense limitations, without which total returns may have |
| | been lower. For more information on share classes and current fee waivers and/or expense limitations (if any), please refer to the Notes to Financial Statements. |
| 2. | The gross expense ratios presented reflect the Fund’s “Total Annual Fund Operating Expenses” from the most recent Prospectus and may differ from other expense ratios disclosed in this report. |
| 3. | Prior to June 30, 2020, the maximum initial sales charge for Investor Class shares was 5.5%, which is reflected in the average annual total return figures shown. |
| 4. | Class B shares are closed to all new purchases as well as additional investments by existing Class B shareholders. |
The footnotes on the next page are an integral part of the table and graph and should be carefully read in conjunction with them.
| | | | | | | | | | | | |
| Benchmark Performance | | One Year | | | Five Years | | | Ten Years | |
| | | |
| S&P 500® Index5 | | | 9.71 | % | | | 11.71 | % | | | 13.01 | % |
Russell 1000® Index6 | | | 10.87 | | | | 11.79 | | | | 13.05 | |
Morningstar Large Blend Category Average7 | | | 6.30 | | | | 9.64 | | | | 11.28 | |
| 5. | The S&P 500® Index is the Fund’s primary broad-based securities market index for comparison purposes. “S&P 500®” is a trademark of the McGraw-Hill Companies, Inc. The S&P 500® Index is widely regarded as the standard index for measuring large-cap U.S. stock market performance. Results assume reinvestment of all dividends and capital gains. An investment cannot be made directly in an index. |
| 6. | The Russell 1000® Index is the Fund’s secondary benchmark. The Russell 1000® Index measures the performance of the large-cap segment of the U.S. equity universe. It is a subset of the Russell 3000® Index and includes approximately 1,000 of the largest companies based on a combination of their market cap and current index membership. Results assume |
| | reinvestment of all dividends and capital gains. An investment cannot be made directly in an index. |
| 7. | The Morningstar Large Blend Category Average is representative of funds that represent the overall U.S. stock market in size, growth rates and price. Stocks in the top 70% of the capitalization of the U.S. equity market are defined as large cap. The blend style is assigned to portfolios where neither growth nor value characteristics predominate. These portfolios tend to invest across the spectrum of U.S. industries, and owing to their broad exposure, the portfolios’ returns are often similar to those of the S&P 500 Index. Results are based on average total returns of similar funds with all dividends and capital gain distributions reinvested. |
The footnotes on the preceding page are an integral part of the table and graph and should be carefully read in conjunction with them.
| | |
| 6 | | MainStay MacKay Common Stock Fund |
Cost in Dollars of a $1,000 Investment in MainStay MacKay Common Stock Fund (Unaudited)
The example below is intended to describe the fees and expenses borne by shareholders during the six-month period from May 1, 2020, to October 31, 2020, and the impact of those costs on your investment.
Example
As a shareholder of the Fund you incur two types of costs: (1) transaction costs, including exchange fees and sales charges (loads) on purchases (as applicable), and (2) ongoing costs, including management fees, distribution and/or service (12b-1) fees, and other Fund expenses (as applicable). This example is intended to help you understand your ongoing costs (in dollars) of investing in the Fund and to compare these costs with the ongoing costs of investing in other mutual funds. The example is based on an investment of $1,000 made at the beginning of the six-month period and held for the entire period from May 1, 2020, to October 31, 2020.
This example illustrates your Fund’s ongoing costs in two ways:
Actual Expenses
The second and third data columns in the table below provide information about actual account values and actual expenses. You may use the information in these columns, together with the amount you invested, to estimate the expenses that you paid during the six months ended October 31, 2020. Simply divide your account value by $1,000 (for example, an $8,600 account value divided by $1,000 = 8.6), then
multiply the result by the number under the heading entitled “Expenses Paid During Period” to estimate the expenses you paid on your account during this period.
Hypothetical Example for Comparison Purposes
The fourth and fifth data columns in the table below provide information about hypothetical account values and hypothetical expenses based on the Fund’s actual expense ratio and an assumed rate of return of 5% per year before expenses, which is not the Fund’s actual return. The hypothetical account values and expenses may not be used to estimate the actual ending account balances or expenses you paid for the six-month period shown. You may use this information to compare the ongoing costs of investing in the Fund with the ongoing costs of investing in other mutual funds. To do so, compare this 5% hypothetical example with the 5% hypothetical examples that appear in the shareholder reports of the other mutual funds.
Please note that the expenses shown in the table are meant to highlight your ongoing costs only and do not reflect any transactional costs, such as exchange fees or sales charges (loads). Therefore, the fourth and fifth data columns of the table are useful in comparing ongoing costs only and will not help you determine the relative total costs of owning different funds. In addition, if these transactional costs were included, your costs would have been higher.
| | | | | | | | | | | | | | | | | | | | | | |
| | | | | | | | | | | | | | | | | | |
| Share Class | | Beginning
Account
Value
5/1/20 | | | Ending Account
Value (Based
on Actual
Returns and
Expenses)
10/31/20 | | | Expenses
Paid
During
Period1 | | | Ending Account
Value (Based
on Hypothetical
5% Annualized
Return and
Actual Expenses)
10/31/20 | | | Expenses
Paid
During
Period1 | | | Net Expense
Ratio
During
Period2 |
| | | | | | |
| Class A Shares | | $ | 1,000.00 | | | $ | 1,115.30 | | | $ | 5.37 | | | $ | 1,020.06 | | | $ | 5.13 | | | 1.01% |
| | | | | | |
| Investor Class Shares | | $ | 1,000.00 | | | $ | 1,113.50 | | | $ | 6.96 | | | $ | 1,018.55 | | | $ | 6.65 | | | 1.31% |
| | | | | | |
| Class B Shares | | $ | 1,000.00 | | | $ | 1,109.40 | | | $ | 10.92 | | | $ | 1,014.78 | | | $ | 10.43 | | | 2.06% |
| | | | | | |
| Class C Shares | | $ | 1,000.00 | | | $ | 1,109.50 | | | $ | 10.92 | | | $ | 1,014.78 | | | $ | 10.43 | | | 2.06% |
| | | | | | |
| Class I Shares | | $ | 1,000.00 | | | $ | 1,116.60 | | | $ | 3.99 | | | $ | 1,021.37 | | | $ | 3.81 | | | 0.75% |
| | | | | | |
| Class R3 Shares | | $ | 1,000.00 | | | $ | 1,113.20 | | | $ | 7.22 | | | $ | 1,018.30 | | | $ | 6.90 | | | 1.36% |
| 1. | Expenses are equal to the Fund’s annualized expense ratio of each class multiplied by the average account value over the period, divided by 366 and multiplied by 184 (to reflect the six-month period). The table above represents the actual expenses incurred during the six-month period. In addition to the fees and expenses which the Fund bears directly, it also indirectly bears a pro rata share of the fees and expenses of the underlying funds in which it invests. Such indirect expenses are not included in the above-reported expense figures. |
| 2. | Expenses are equal to the Fund’s annualized expense ratio to reflect the six-month period. |
Industry Composition as of October 31, 2020 (Unaudited)
| | | | |
| |
| Software | | | 10.4 | % |
| |
| Technology Hardware, Storage & Peripherals | | | 7.9 | |
| |
| Interactive Media & Services | | | 6.8 | |
| |
| Internet & Direct Marketing Retail | | | 6.1 | |
| |
| Health Care Providers & Services | | | 5.6 | |
| |
| Semiconductors & Semiconductor Equipment | | | 4.9 | |
| |
| IT Services | | | 4.5 | |
| |
| Specialty Retail | | | 4.4 | |
| |
| Biotechnology | | | 3.9 | |
| |
| Capital Markets | | | 3.7 | |
| |
| Pharmaceuticals | | | 3.7 | |
| |
| Food & Staples Retailing | | | 3.5 | |
| |
| Household Products | | | 2.7 | |
| |
| Banks | | | 2.4 | |
| |
| Aerospace & Defense | | | 1.8 | |
| |
| Electronic Equipment, Instruments & Components | | | 1.7 | |
| |
| Life Sciences Tools & Services | | | 1.7 | |
| |
| Exchange-Traded Fund | | | 1.6 | |
| |
| Hotels, Restaurants & Leisure | | | 1.6 | |
| |
| Oil, Gas & Consumable Fuels | | | 1.6 | |
| |
| Air Freight & Logistics | | | 1.3 | |
| |
| Multiline Retail | | | 1.3 | |
| |
| Machinery | | | 1.2 | |
| |
| Building Products | | | 1.1 | |
| |
| Media | | | 1.1 | |
| |
| Health Care Equipment & Supplies | | | 1.0 | |
| | | | |
| |
| Metals & Mining | | | 1.0 | % |
| |
| Chemicals | | | 0.9 | |
| |
| Consumer Finance | | | 0.9 | |
| |
| Multi-Utilities | | | 0.9 | |
| |
| Diversified Financial Services | | | 0.8 | |
| |
| Electric Utilities | | | 0.8 | |
| |
| Entertainment | | | 0.8 | |
| |
| Equity Real Estate Investment Trusts | | | 0.8 | |
| |
| Construction & Engineering | | | 0.7 | |
| |
| Electrical Equipment | | | 0.7 | |
| |
| Food Products | | | 0.7 | |
| |
| Professional Services | | | 0.7 | |
| |
| Road & Rail | | | 0.7 | |
| |
| Leisure Products | | | 0.5 | |
| |
| Health Care Technology | | | 0.4 | |
| |
| Beverages | | | 0.2 | |
| |
| Diversified Telecommunication Services | | | 0.2 | |
| |
| Energy Equipment & Services | | | 0.2 | |
| |
| Tobacco | | | 0.2 | |
| |
| Auto Components | | | 0.1 | |
| |
| Household Durables | | | 0.1 | |
| |
| Insurance | | | 0.1 | |
| |
| Thrifts & Mortgage Finance | | | 0.1 | |
| |
| Short-Term Investment | | | 0.1 | |
| |
| Other Assets, Less Liabilities | | | –0.1 | |
| | | | |
| | | 100.0 | % |
| | | | |
See Portfolio of Investments beginning on page 10 for specific holdings within these categories. The Fund’s holdings are subject to change.
Top Ten Holdings as of October 31, 2020 (excluding short-term investment) (Unaudited)
| 5. | Facebook, Inc., Class A |
| 8. | UnitedHealth Group, Inc. |
| | |
| 8 | | MainStay MacKay Common Stock Fund |
Portfolio Management Discussion and Analysis (Unaudited)
Questions answered by Migene Kim, CFA, and Mona Patni of MacKay Shields LLC, the Fund’s Subadvisor.
How did MainStay MacKay Common Stock Fund perform relative to its benchmarks and peer group during the 12 months ended October 31, 2020?
For the 12 months ended October 31, 2020, Class I shares of MainStay MacKay Common Stock Fund returned 6.66%, underperforming the 9.71% return of the Fund’s primary benchmark, the S&P 500® Index, and the 10.87% return of the Fund’s secondary benchmark, the Russell 1000® Index. Over the same period, Class I shares outperformed the 6.30% return of the Morningstar Large Blend Category Average.1
What factors affected the Fund’s relative performance during the reporting period?
During the reporting period, market dynamics were influenced by several significant exogenous factors, most prominently the global COVID-19 pandemic, international trade disputes and uncertainties regarding the U.S. presidential election. While domestic equities rallied in the final months of 2019, the investment landscape abruptly changed during the first quarter of 2020 when the pandemic provoked the worst quarterly drop for most major equity market indices since the financial crisis of 2007-2008. Stock performance in the second quarter proved equally dramatic in the opposite direction; as global central banks intervened and massive fiscal stimulus was deployed, U.S. equity markets reported their best quarterly gain since 1999. The third quarter saw an extension of the equity market rally, despite continuing restrictions on global mobility and economic activities.
Although U.S. equities proved quite resilient during the reporting period, markets were subject to many volatility surges, abrupt short-term style gyrations and frequent risk appetite reversals. Large-cap growth stocks were the definitive winner both before and after the pandemic-driven market sell-off, as investors piled onto familiar technology and Internet names that were seen as less impacted by “contact economy.” Similarly, investors penalized smaller and cheaper stocks, deeming them comparatively risky. These extreme market conditions led to a collapse in market breadth, diminished diversification and factor dislocations, which provided a challenging backdrop for the Fund’s diversified stock selection framework. In this environment, valuation suffered one of the worst drawdowns in its history. The Fund’s trend-following stock selection factors mitigated some of the headwinds from the value sell-off, but trend-following factors were also subject to sharp, volatile sell-offs amid market uncertainties and inflection points. Quality and profitability signals mitigated some downside risk, particularly during the March 2020 market downturn; however, hedge fund sentiment was not efficacious, with the hedge fund community in aggregate having a challenging time coping with market turmoil. The Fund’s balanced approach and defensive positioning with respect to risk helped contain some of the losses in this adverse investment climate.
During the reporting period, which sectors were the strongest positive contributors to the Fund’s relative performance, and which sectors were particularly weak?
During the reporting period, the strongest positive contributions to the Fund’s performance relative to the S&P 500® Index came from the financials, communication services and energy sectors. (Contributions take weightings and total returns into account.) During the same period, the most significant detractors from relative performance were the consumer discretionary, consumer staples and materials sectors.
During the reporting period, which individual stocks made the strongest positive contributions to the Fund’s absolute performance and which stocks detracted the most?
The individual stocks that made the strongest positive contributions to the Fund’s absolute performance during the reporting period included technology hardware, storage & peripherals maker Apple; Internet & direct marketing retailer Amazon.com; and systems software developer Microsoft. The stocks that detracted most significantly from the Fund’s absolute performance during the same period were oil & gas refiner Valero Energy; hotels, resorts & cruise line operator Norwegian Cruise Line; and environmental & facilities services provider Clean Harbors.
What were some of the Fund’s largest purchases and sales during the reporting period?
During the reporting period, the Fund’s largest initial purchase was in financial information and analytics firm S&P Global while the largest increased position was in Apple, described above. During the same period, the Fund’s largest full sale was in international coffeehouse chain Starbucks, while the most significantly reduced position size was in insurance holding company Berkshire Hathaway Class B.
How did the Fund’s sector and/or country weightings change during the reporting period?
The Fund’s largest increases in sector exposures relative to the S&P 500® Index were in the health care and industrials sectors. Conversely, the Fund’s largest decreases in benchmark-relative sector exposures were in financials and communication services.
How was the Fund positioned at the end of the reporting period?
As of October 31, 2020, the Fund held its largest overweight exposures relative to the S&P 500® Index in the consumer discretionary and health care sectors. As of the same date, the Fund held its most significantly underweight exposures in the communication services and real estate sectors.
| 1. | See page 5 for other share class returns, which may be higher or lower than Class I share returns. See page 6 for more information on benchmark and peer group returns. |
The opinions expressed are those of the portfolio managers as of the date of this report and are subject to change. There is no guarantee that any forecasts will come to pass. This material does not constitute investment advice and is not intended as an endorsement of any specific investment.
Portfolio of Investments October 31, 2020
| | | | | | | | |
| | |
| | | Shares | | | Value | |
| Common Stocks 98.4%† | |
Aerospace & Defense 1.8% | |
Boeing Co. | | | 2,424 | | | $ | 350,001 | |
Huntington Ingalls Industries, Inc. | | | 183 | | | | 26,989 | |
Lockheed Martin Corp. | | | 2,403 | | | | 841,362 | |
Northrop Grumman Corp. | | | 68 | | | | 19,708 | |
Raytheon Technologies Corp. | | | 6,977 | | | | 378,991 | |
Textron, Inc. | | | 19,203 | | | | 687,467 | |
| | | | | | | | |
| | | | | | | 2,304,518 | |
| | | | | | | | |
Air Freight & Logistics 1.3% | |
FedEx Corp. | | | 2,042 | | | | 529,838 | |
United Parcel Service, Inc., Class B | | | 6,804 | | | | 1,068,976 | |
| | | | | | | | |
| | | | | | | 1,598,814 | |
| | | | | | | | |
Auto Components 0.1% | |
Aptiv PLC | | | 1,235 | | | | 119,165 | |
| | | | | | | | |
|
Banks 2.4% | |
Bank of America Corp. | | | 47,581 | | | | 1,127,670 | |
First Republic Bank | | | 2,251 | | | | 283,941 | |
JPMorgan Chase & Co. | | | 5,530 | | | | 542,161 | |
Signature Bank | | | 10,388 | | | | 838,727 | |
Synovus Financial Corp. | | | 7,200 | | | | 187,200 | |
Truist Financial Corp. | | | 314 | | | | 13,226 | |
| | | | | | | | |
| | | | | | | 2,992,925 | |
| | | | | | | | |
Beverages 0.2% | |
Coca-Cola Co. | | | 678 | | | | 32,585 | |
Molson Coors Beverage Co., Class B | | | 7,095 | | | | 250,170 | |
PepsiCo., Inc. | | | 243 | | | | 32,389 | |
| | | | | | | | |
| | | | | | | 315,144 | |
| | | | | | | | |
Biotechnology 3.9% | |
AbbVie, Inc. | | | 4,147 | | | | 352,910 | |
Alexion Pharmaceuticals, Inc. (a) | | | 3,410 | | | | 392,627 | |
Amgen, Inc. | | | 2,157 | | | | 467,939 | |
Biogen, Inc. (a) | | | 4,041 | | | | 1,018,615 | |
Emergent BioSolutions, Inc. (a) | | | 722 | | | | 64,958 | |
Exelixis, Inc. (a) | | | 25,291 | | | | 517,960 | |
Gilead Sciences, Inc. | | | 19,624 | | | | 1,141,136 | |
Incyte Corp. (a) | | | 1,787 | | | | 154,826 | |
Regeneron Pharmaceuticals, Inc. (a) | | | 959 | | | | 521,274 | |
United Therapeutics Corp. (a) | | | 2,552 | | | | 342,555 | |
| | | | | | | | |
| | | | | | | 4,974,800 | |
| | | | | | | | |
Building Products 1.1% | |
Carrier Global Corp. | | | 3,713 | | | | 123,977 | |
Johnson Controls International PLC | | | 7,157 | | | | 302,097 | |
Masco Corp. | | | 16,269 | | | | 872,018 | |
Owens Corning | | | 61 | | | | 3,994 | |
Trane Technologies PLC | | | 169 | | | | 22,435 | |
| | | | | | | | |
| | | | | | | 1,324,521 | |
| | | | | | | | |
| | | | | | | | |
| | |
| | | Shares | | | Value | |
Capital Markets 3.7% | |
Ameriprise Financial, Inc. | | | 5,582 | | | $ | 897,753 | |
Bank of New York Mellon Corp. | | | 14,948 | | | | 513,613 | |
BlackRock, Inc. | | | 941 | | | | 563,857 | |
Moody’s Corp. | | | 506 | | | | 133,027 | |
Nasdaq, Inc. | | | 1,405 | | | | 169,991 | |
Raymond James Financial, Inc. | | | 11,340 | | | | 866,830 | |
S&P Global, Inc. | | | 3,599 | | | | 1,161,505 | |
State Street Corp. | | | 6,451 | | | | 379,964 | |
| | | | | | | | |
| | | | | | | 4,686,540 | |
| | | | | | | | |
Chemicals 0.9% | |
CF Industries Holdings, Inc. | | | 31,385 | | | | 866,540 | |
Mosaic Co. | | | 16,605 | | | | 307,192 | |
| | | | | | | | |
| | | | | | | 1,173,732 | |
| | | | | | | | |
Construction & Engineering 0.7% | |
Quanta Services, Inc. | | | 13,613 | | | | 849,860 | |
| | | | | | | | |
|
Consumer Finance 0.9% | |
American Express Co. | | | 3,410 | | | | 311,128 | |
Synchrony Financial | | | 34,421 | | | | 861,214 | |
| | | | | | | | |
| | | | | | | 1,172,342 | |
| | | | | | | | |
Diversified Financial Services 0.8% | |
Berkshire Hathaway, Inc., Class B (a) | | | 5,003 | | | | 1,010,106 | |
| | | | | | | | |
|
Diversified Telecommunication Services 0.2% | |
AT&T, Inc. | | | 2,059 | | | | 55,634 | |
Verizon Communications, Inc. | | | 4,523 | | | | 257,766 | |
| | | | | | | | |
| | | | | | | 313,400 | |
| | | | | | | | |
Electric Utilities 0.8% | |
Duke Energy Corp. | | | 341 | | | | 31,409 | |
NRG Energy, Inc. | | | 3,268 | | | | 103,334 | |
PPL Corp. | | | 16,348 | | | | 449,570 | |
Southern Co. | | | 8,088 | | | | 464,656 | |
| | | | | | | | |
| | | | | | | 1,048,969 | |
| | | | | | | | |
Electrical Equipment 0.7% | |
Eaton Corp. PLC | | | 4,134 | | | | 429,068 | |
Regal Beloit Corp. | | | 4,943 | | | | 487,627 | |
| | | | | | | | |
| | | | | | | 916,695 | |
| | | | | | | | |
Electronic Equipment, Instruments & Components 1.7% | |
Arrow Electronics, Inc. (a) | | | 6,496 | | | | 505,974 | |
Jabil, Inc. | | | 24,545 | | | | 813,421 | |
SYNNEX Corp. | | | 6,158 | | | | 810,639 | |
| | | | | | | | |
| | | | | | | 2,130,034 | |
| | | | | | | | |
Energy Equipment & Services 0.2% | |
TechnipFMC PLC | | | 52,639 | | | | 291,094 | |
| | | | | | | | |
|
Entertainment 0.8% | |
Activision Blizzard, Inc. | | | 1,849 | | | | 140,025 | |
| | | | |
| 10 | | MainStay MacKay Common Stock Fund | | The notes to the financial statements are an integral part of,
and should be read in conjunction with, the financial statements. |
| | | | | | | | |
| | |
| | | Shares | | | Value | |
| Common Stocks (continued) | |
Entertainment (continued) | |
Electronic Arts, Inc. (a) | | | 3,518 | | | $ | 421,562 | |
Netflix, Inc. (a) | | | 397 | | | | 188,869 | |
Take-Two Interactive Software, Inc. (a) | | | 118 | | | | 18,280 | |
Walt Disney Co. | | | 1,545 | | | | 187,331 | |
| | | | | | | | |
| | | | | | | 956,067 | |
| | | | | | | | |
Equity Real Estate Investment Trusts 0.8% | |
American Tower Corp. | | | 1,212 | | | | 278,336 | |
Crown Castle International Corp. | | | 723 | | | | 112,933 | |
Equinix, Inc. | | | 150 | | | | 109,686 | |
Prologis, Inc. | | | 1,492 | | | | 148,006 | |
SBA Communications Corp. | | | 1,096 | | | | 318,245 | |
| | | | | | | | |
| | | | | | | 967,206 | |
| | | | | | | | |
Food & Staples Retailing 3.5% | |
BJ’s Wholesale Club Holdings, Inc. (a) | | | 11,777 | | | | 450,941 | |
Costco Wholesale Corp. | | | 3,884 | | | | 1,388,996 | |
Kroger Co. | | | 28,771 | | | | 926,714 | |
Walmart, Inc. | | | 12,157 | | | | 1,686,784 | |
| | | | | | | | |
| | | | | | | 4,453,435 | |
| | | | | | | | |
Food Products 0.7% | |
Tyson Foods, Inc., Class A | | | 15,558 | | | | 890,384 | |
| | | | | | | | |
|
Health Care Equipment & Supplies 1.0% | |
Abbott Laboratories | | | 7,690 | | | | 808,296 | |
Becton Dickinson & Co. | | | 1,320 | | | | 305,092 | |
Danaher Corp. | | | 65 | | | | 14,920 | |
Hologic, Inc. (a) | | | 1,310 | | | | 90,154 | |
| | | | | | | | |
| | | | | | | 1,218,462 | |
| | | | | | | | |
Health Care Providers & Services 5.6% | |
Anthem, Inc. | | | 4,125 | | | | 1,125,300 | |
Cardinal Health, Inc. | | | 5,746 | | | | 263,109 | |
HCA Healthcare, Inc. | | | 7,691 | | | | 953,223 | |
Humana, Inc. | | | 2,655 | | | | 1,060,088 | |
McKesson Corp. | | | 5,004 | | | | 738,040 | |
Molina Healthcare, Inc. (a) | | | 962 | | | | 179,384 | |
UnitedHealth Group, Inc. | | | 7,016 | | | | 2,140,862 | |
Universal Health Services, Inc., Class B | | | 5,736 | | | | 628,379 | |
| | | | | | | | |
| | | | | | | 7,088,385 | |
| | | | | | | | |
Health Care Technology 0.4% | |
Cerner Corp. | | | 6,474 | | | | 453,763 | |
| | | | | | | | |
|
Hotels, Restaurants & Leisure 1.6% | |
Darden Restaurants, Inc. | | | 9,396 | | | | 863,680 | |
Domino’s Pizza, Inc. | | | 2,283 | | | | 863,705 | |
Yum! Brands, Inc. | | | 3,392 | | | | 316,575 | |
| | | | | | | | |
| | | | | | | 2,043,960 | |
| | | | | | | | |
Household Durables 0.1% | |
Mohawk Industries, Inc. (a) | | | 1,340 | | | | 138,275 | |
| | | | | | | | |
| | | | | | | | |
| | |
| | | Shares | | | Value | |
Household Products 2.7% | |
Colgate-Palmolive Co. | | | 5,300 | | | $ | 418,117 | |
Kimberly-Clark Corp. | | | 4,541 | | | | 602,091 | |
Procter & Gamble Co. | | | 16,979 | | | | 2,327,821 | |
| | | | | | | | |
| | | | | | | 3,348,029 | |
| | | | | | | | |
Insurance 0.1% | |
Unum Group | | | 9,250 | | | | 163,355 | |
| | | | | | | | |
|
Interactive Media & Services 6.8% | |
Alphabet, Inc. (a) | | | | | | | | |
Class A | | | 1,529 | | | | 2,471,032 | |
Class C | | | 1,512 | | | | 2,450,967 | |
Facebook, Inc., Class A (a) | | | 13,867 | | | | 3,648,547 | |
| | | | | | | | |
| | | | | | | 8,570,546 | |
| | | | | | | | |
Internet & Direct Marketing Retail 6.1% | |
Amazon.com, Inc. (a) | | | 2,154 | | | | 6,539,867 | |
Booking Holdings, Inc. (a) | | | 142 | | | | 230,395 | |
eBay, Inc. | | | 19,090 | | | | 909,257 | |
| | | | | | | | |
| | | | | | | 7,679,519 | |
| | | | | | | | |
IT Services 4.5% | |
Accenture PLC, Class A | | | 2,690 | | | | 583,488 | |
DXC Technology Co. | | | 23,473 | | | | 432,372 | |
Leidos Holdings, Inc. | | | 10,637 | | | | 882,871 | |
Mastercard, Inc., Class A | | | 4,028 | | | | 1,162,642 | |
PayPal Holdings, Inc. (a) | | | 6,385 | | | | 1,188,440 | |
Visa, Inc., Class A | | | 7,690 | | | | 1,397,350 | |
| | | | | | | | |
| | | | | | | 5,647,163 | |
| | | | | | | | |
Leisure Products 0.5% | |
Polaris, Inc. | | | 6,398 | | | | 581,322 | |
| | | | | | | | |
|
Life Sciences Tools & Services 1.7% | |
IQVIA Holdings, Inc. (a) | | | 5,731 | | | | 882,517 | |
PRA Health Sciences, Inc. (a) | | | 4,014 | | | | 391,124 | |
Thermo Fisher Scientific, Inc. | | | 1,927 | | | | 911,702 | |
| | | | | | | | |
| | | | | | | 2,185,343 | |
| | | | | | | | |
Machinery 1.2% | |
AGCO Corp. | | | 5,127 | | | | 394,933 | |
Deere & Co. | | | 4,998 | | | | 1,129,098 | |
| | | | | | | | |
| | | | | | | 1,524,031 | |
| | | | | | | | |
Media 1.1% | |
Charter Communications, Inc., Class A (a) | | | 1,988 | | | | 1,200,394 | |
Comcast Corp., Class A | | | 1,890 | | | | 79,834 | |
News Corp., Class A | | | 8,398 | | | | 110,266 | |
| | | | | | | | |
| | | | | | | 1,390,494 | |
| | | | | | | | |
Metals & Mining 1.0% | |
Freeport-McMoRan, Inc. | | | 6,592 | | | | 114,305 | |
Newmont Corp. | | | 17,146 | | | | 1,077,455 | |
Steel Dynamics, Inc. | | | 927 | | | | 29,182 | |
| | | | | | | | |
| | | | | | | 1,220,942 | |
| | | | | | | | |
| | | | | | |
The notes to the financial statements are an integral part of,
and should be read in conjunction with, the financial statements. | | | | | 11 | |
Portfolio of Investments October 31, 2020 (continued)
| | | | | | | | |
| | |
| | | Shares | | | Value | |
| Common Stocks (continued) | |
Multi-Utilities 0.9% | |
Dominion Energy, Inc. | | | 13,895 | | | $ | 1,116,324 | |
| | | | | | | | |
|
Multiline Retail 1.3% | |
Dollar General Corp. | | | 2,160 | | | | 450,814 | |
Target Corp. | | | 7,560 | | | | 1,150,783 | |
| | | | | | | | |
| | | | | | | 1,601,597 | |
| | | | | | | | |
Oil, Gas & Consumable Fuels 1.6% | |
Chevron Corp. | | | 2,710 | | | | 188,345 | |
EOG Resources, Inc. | | | 11,179 | | | | 382,769 | |
HollyFrontier Corp. | | | 46,470 | | | | 860,160 | |
Kinder Morgan, Inc. | | | 22,757 | | | | 270,808 | |
Valero Energy Corp. | | | 8,869 | | | | 342,432 | |
| | | | | | | | |
| | | | | | | 2,044,514 | |
| | | | | | | | |
Pharmaceuticals 3.7% | |
Bristol-Myers Squibb Co. | | | 1,860 | | | | 108,717 | |
Eli Lilly and Co. | | | 548 | | | | 71,492 | |
Johnson & Johnson | | | 16,885 | | | | 2,315,102 | |
Merck & Co., Inc. | | | 14,759 | | | | 1,110,025 | |
Perrigo Co. PLC | | | 19,762 | | | | 866,959 | |
Pfizer, Inc. | | | 5,969 | | | | 211,780 | |
| | | | | | | | |
| | | | | | | 4,684,075 | |
| | | | | | | | |
Professional Services 0.7% | |
ManpowerGroup, Inc. | | | 12,128 | | | | 823,127 | |
| | | | | | | | |
|
Road & Rail 0.7% | |
J.B. Hunt Transport Services, Inc. | | | 3,245 | | | | 395,046 | |
Knight-Swift Transportation Holdings, Inc. | | | 11,900 | | | | 452,081 | |
| | | | | | | | |
| | | | | | | 847,127 | |
| | | | | | | | |
Semiconductors & Semiconductor Equipment 4.9% | |
Advanced Micro Devices, Inc. (a) | | | 144 | | | | 10,842 | |
Applied Materials, Inc. | | | 5,886 | | | | 348,628 | |
Broadcom, Inc. | | | 2,955 | | | | 1,033,157 | |
Intel Corp. | | | 35,825 | | | | 1,586,331 | |
NVIDIA Corp. | | | 2,815 | | | | 1,411,328 | |
Qorvo, Inc. (a) | | | 2,320 | | | | 295,475 | |
QUALCOMM, Inc. | | | 11,590 | | | | 1,429,742 | |
Texas Instruments, Inc. | | | 689 | | | | 99,623 | |
| | | | | | | | |
| | | | | | | 6,215,126 | |
| | | | | | | | |
Software 10.4% | |
Adobe, Inc. (a) | | | 1,042 | | | | 465,878 | |
Autodesk, Inc. (a) | | | 4,353 | | | | 1,025,306 | |
CDK Global, Inc. | | | 7,825 | | | | 337,257 | |
Citrix Systems, Inc. | | | 7,707 | | | | 872,972 | |
Fortinet, Inc. (a) | | | 7,515 | | | | 829,430 | |
Intuit, Inc. | | | 204 | | | | 64,195 | |
Microsoft Corp. | | | 38,504 | | | | 7,795,905 | |
Oracle Corp. | | | 2,507 | | | | 140,668 | |
| | | | | | | | |
| | |
| | | Shares | | | Value | |
Software (continued) | |
salesforce.com, Inc. (a) | | | 4,151 | | | $ | 964,153 | |
ServiceNow, Inc. (a) | | | 1,315 | | | | 654,305 | |
Synopsys, Inc. (a) | | | 112 | | | | 23,952 | |
| | | | | | | | |
| | | | | | | 13,174,021 | |
| | | | | | | | |
Specialty Retail 4.4% | |
Aaron’s Holdings Co., Inc. | | | 2,893 | | | | 151,188 | |
Best Buy Co., Inc. | | | 8,300 | | | | 925,865 | |
Dick’s Sporting Goods, Inc. | | | 8,612 | | | | 487,870 | |
Foot Locker, Inc. | | | 9,145 | | | | 337,268 | |
Home Depot, Inc. | | | 4,582 | | | | 1,222,065 | |
L Brands, Inc. | | | 16,205 | | | | 518,722 | |
Lithia Motors, Inc., Class A | | | 1,824 | | | | 418,736 | |
Lowe’s Cos., Inc. | | | 3,786 | | | | 598,566 | |
Murphy USA, Inc. | | | 2,892 | | | | 353,663 | |
Tractor Supply Co. | | | 3,561 | | | | 474,361 | |
| | | | | | | | |
| | | | | | | 5,488,304 | |
| | | | | | | | |
Technology Hardware, Storage & Peripherals 7.9% | |
Apple, Inc. | | | 80,399 | | | | 8,752,235 | |
HP, Inc. | | | 52,062 | | | | 935,033 | |
Xerox Holdings Corp. | | | 15,983 | | | | 277,785 | |
| | | | | | | | |
| | | | | | | 9,965,053 | |
| | | | | | | | |
Thrifts & Mortgage Finance 0.1% | |
New York Community Bancorp, Inc. | | | 22,690 | | | | 188,554 | |
| | | | | | | | |
|
Tobacco 0.2% | |
Altria Group, Inc. | | | 992 | | | | 35,791 | |
Philip Morris International, Inc. | | | 3,789 | | | | 269,095 | |
| | | | | | | | |
| | | | | | | 304,886 | |
| | | | | | | | |
Total Common Stocks
(Cost $96,850,229) | | | | | | | 124,196,048 | |
| | | | | | | | |
|
| Exchange-Traded Fund 1.6% | |
SPDR S&P 500 ETF Trust | | | 6,171 | | | | 2,015,078 | |
| | | | | | | | |
Total Exchange-Traded Fund
(Cost $1,718,924) | | | | | | | 2,015,078 | |
| | | | | | | | |
|
| Short-Term Investment 0.1% | |
Affiliated Investment Company 0.1% | |
MainStay U.S. Government Liquidity Fund, 0.02% (b) | | | 70,723 | | | | 70,723 | |
| | | | | | | | |
Total Short-Term Investment
(Cost $70,723) | | | | | | | 70,723 | |
| | | | | | | | |
Total Investments
(Cost $98,639,876) | | | 100.1 | % | | | 126,281,849 | |
Other Assets, Less Liabilities | | | (0.1 | ) | | | (120,621 | ) |
Net Assets | | | 100.0 | % | | $ | 126,161,228 | |
| | | | |
| 12 | | MainStay MacKay Common Stock Fund | | The notes to the financial statements are an integral part of,
and should be read in conjunction with, the financial statements. |
| † | Percentages indicated are based on Fund net assets. |
| (a) | Non-income producing security. |
| (b) | Current yield as of October 31, 2020. |
The following abbreviations are used in the preceding pages:
ETF—Exchange-Traded Fund
SPDR—Standard & Poor’s Depositary Receipt
The following is a summary of the fair valuations according to the inputs used as of October 31, 2020, for valuing the Fund’s assets:
| | | | | | | | | | | | | | | | |
Description | | Quoted
Prices in
Active
Markets for
Identical
Assets
(Level 1) | | | Significant
Other
Observable
Inputs
(Level 2) | | | Significant
Unobservable
Inputs
(Level 3) | | | Total | |
| | | | |
Asset Valuation Inputs | | | | | | | | | | | | | | | | |
| Investments in Securities (a) | | | | | | | | | | | | | | | | |
| Common Stocks | | $ | 124,196,048 | | | $ | — | | | $ | — | | | $ | 124,196,048 | |
| Exchange-Traded Fund | | | 2,015,078 | | | | — | | | | — | | | | 2,015,078 | |
| Short-Term Investment | | | | | | | | | | | | | | | | |
Affiliated Investment Company | | | 70,723 | | | | — | | | | — | | | | 70,723 | |
| | | | | | | | | | | | | | | | |
| Total Investments in Securities | | $ | 126,281,849 | | | $ | — | | | $ | — | | | $ | 126,281,849 | |
| | | | | | | | | | | | | | | | |
| (a) | For a complete listing of investments and their industries, see the Portfolio of Investments. |
| | | | | | |
The notes to the financial statements are an integral part of,
and should be read in conjunction with, the financial statements. | | | | | 13 | |
Statement of Assets and Liabilities as of October 31, 2020
| | | | |
| Assets | | | | |
Investment in unaffiliated securities, at value
(identified cost $98,569,153) | | $ | 126,211,126 | |
Investment in affiliated investment company, at value (identified cost $70,723) | | | 70,723 | |
Receivables: | | | | |
Investment securities sold | | | 13,866,096 | |
Dividends | | | 87,430 | |
Fund shares sold | | | 15,897 | |
Other assets | | | 37,894 | |
| | | | |
Total assets | | | 140,289,166 | |
| | | | |
| |
| Liabilities | | | | |
Payables: | | | | |
Investment securities purchased | | | 13,924,886 | |
Manager (See Note 3) | | | 62,970 | |
Fund shares redeemed | | | 44,714 | |
Transfer agent (See Note 3) | | | 27,961 | |
NYLIFE Distributors (See Note 3) | | | 26,873 | |
Professional fees | | | 17,617 | |
Shareholder communication | | | 15,449 | |
Custodian | | | 4,335 | |
Trustees | | | 195 | |
Accrued expenses | | | 2,938 | |
| | | | |
Total liabilities | | | 14,127,938 | |
| | | | |
Net assets | | $ | 126,161,228 | |
| | | | |
| |
| Composition of Net Assets | | | | |
Shares of beneficial interest outstanding (par value of $.01 per share) unlimited number of shares authorized | | $ | 50,962 | |
Additional paid-in capital | | | 98,545,035 | |
| | | | |
| | | 98,595,997 | |
Total distributable earnings (loss) | | | 27,565,231 | |
| | | | |
Net assets | | $ | 126,161,228 | |
| | | | |
| | | | |
Class A | | | | |
Net assets applicable to outstanding shares | | $ | 62,611,454 | |
| | | | |
Shares of beneficial interest outstanding | | | 2,509,377 | |
| | | | |
Net asset value per share outstanding | | $ | 24.95 | |
Maximum sales charge (5.50% of offering price) | | | 1.45 | |
| | | | |
Maximum offering price per share outstanding | | $ | 26.40 | |
| | | | |
Investor Class | | | | |
Net assets applicable to outstanding shares | | $ | 15,544,477 | |
| | | | |
Shares of beneficial interest outstanding | | | 623,801 | |
| | | | |
Net asset value per share outstanding | | $ | 24.92 | |
Maximum sales charge (5.00% of offering price) | | | 1.31 | |
| | | | |
Maximum offering price per share outstanding | | $ | 26.23 | |
| | | | |
Class B | | | | |
Net assets applicable to outstanding shares | | $ | 3,666,026 | |
| | | | |
Shares of beneficial interest outstanding | | | 163,631 | |
| | | | |
Net asset value and offering price per share outstanding | | $ | 22.40 | |
| | | | |
Class C | | | | |
Net assets applicable to outstanding shares | | $ | 6,641,383 | |
| | | | |
Shares of beneficial interest outstanding | | | 296,708 | |
| | | | |
Net asset value and offering price per share outstanding | | $ | 22.38 | |
| | | | |
Class I | | | | |
Net assets applicable to outstanding shares | | $ | 37,491,107 | |
| | | | |
Shares of beneficial interest outstanding | | | 1,494,292 | |
| | | | |
Net asset value and offering price per share outstanding | | $ | 25.09 | |
| | | | |
Class R3 | | | | |
Net assets applicable to outstanding shares | | $ | 206,781 | |
| | | | |
Shares of beneficial interest outstanding | | | 8,346 | |
| | | | |
Net asset value and offering price per share outstanding | | $ | 24.78 | |
| | | | |
| | | | |
| 14 | | MainStay MacKay Common Stock Fund | | The notes to the financial statements are an integral part of,
and should be read in conjunction with, the financial statements. |
Statement of Operations for the year ended October 31, 2020
| | | | |
| Investment Income (Loss) | | | | |
Income | | | | |
Dividends-unaffiliated | | $ | 2,825,344 | |
Securities lending | | | 1,745 | |
Dividends-affiliated | | | 295 | |
Other | | | 25 | |
| | | | |
Total income | | | 2,827,409 | |
| | | | |
Expenses | | | | |
Manager (See Note 3) | | | 931,401 | |
Distribution/Service—Class A (See Note 3) | | | 157,408 | |
Distribution/Service—Investor Class (See Note 3) | | | 40,966 | |
Distribution/Service—Class B (See Note 3) | | | 41,816 | |
Distribution/Service—Class C (See Note 3) | | | 88,596 | |
Distribution/Service—Class R3 (See Note 3) | | | 1,132 | |
Transfer agent (See Note 3) | | | 167,935 | |
Registration | | | 107,526 | |
Professional fees | | | 71,788 | |
Custodian | | | 26,110 | |
Shareholder communication | | | 22,274 | |
Trustees | | | 4,030 | |
Shareholder service (See Note 3) | | | 227 | |
Miscellaneous | | | 16,410 | |
| | | | |
Total expenses before waiver/reimbursement | | | 1,677,619 | |
Expense waiver/reimbursement from Manager (See Note 3) | | | (2,211 | ) |
| | | | |
Net expenses | | | 1,675,408 | |
| | | | |
Net investment income (loss) | | | 1,152,001 | |
| | | | |
| |
| Realized and Unrealized Gain (Loss) | | | | |
Net realized gain (loss) on unaffiliated investments | | | (392,753 | ) |
Net change in unrealized appreciation (depreciation) on unaffiliated investments | | | 8,091,461 | |
| | | | |
Net realized and unrealized gain (loss) | | | 7,698,708 | |
| | | | |
Net increase (decrease) in net assets resulting from operations | | $ | 8,850,709 | |
| | | | |
| | | | | | |
The notes to the financial statements are an integral part of,
and should be read in conjunction with, the financial statements. | | | | | 15 | |
Statements of Changes in Net Assets
for the years ended October 31, 2020 and October 31, 2019
| | | | | | | | |
| | | 2020 | | | 2019 | |
| Increase (Decrease) in Net Assets | |
Operations: | | | | | | | | |
Net investment income (loss) | | $ | 1,152,001 | | | $ | 2,178,124 | |
Net realized gain (loss) | | | (392,753 | ) | | | 10,856,225 | |
Net change in unrealized appreciation (depreciation) | | | 8,091,461 | | | | (457,951 | ) |
| | | | |
Net increase (decrease) in net assets resulting from operations | | | 8,850,709 | | | | 12,576,398 | |
| | | | |
Distributions to shareholders: | | | | | | | | |
Class A | | | (3,811,045 | ) | | | (7,174,046 | ) |
Investor Class | | | (982,374 | ) | | | (1,811,319 | ) |
Class B | | | (257,924 | ) | | | (659,612 | ) |
Class C | | | (565,775 | ) | | | (1,668,996 | ) |
Class I | | | (6,060,406 | ) | | | (11,081,969 | ) |
Class R3 | | | (13,142 | ) | | | (14,964 | ) |
| | | | |
Total distributions to shareholders | | | (11,690,666 | ) | | | (22,410,906 | ) |
| | | | |
Capital share transactions: | | | | | | | | |
Net proceeds from sale of shares | | | 15,271,205 | | | | 66,241,784 | |
Net asset value of shares issued to shareholders in reinvestment of distributions | | | 11,515,981 | | | | 21,959,979 | |
Cost of shares redeemed | | | (92,597,286 | ) | | | (83,441,713 | ) |
| | | | |
Increase (decrease) in net assets derived from capital share transactions | | | (65,810,100 | ) | | | 4,760,050 | |
| | | | |
Net increase (decrease) in net assets | | | (68,650,057 | ) | | | (5,074,458 | ) |
| | |
| Net Assets | | | | | | | | |
Beginning of year | | | 194,811,285 | | | | 199,885,743 | |
| | | | |
End of year | | $ | 126,161,228 | | | $ | 194,811,285 | |
| | | | |
| | | | |
| 16 | | MainStay MacKay Common Stock Fund | | The notes to the financial statements are an integral part of,
and should be read in conjunction with, the financial statements. |
Financial Highlights selected per share data and ratios
| | | | | | | | | | | | | | | | | | | | |
| |
| | | Year ended October 31, | |
| | | | | |
| Class A | | 2020 | | | 2019 | | | 2018 | | | 2017 | | | 2016 | |
| | | | | |
Net asset value at beginning of year | | $ | 24.92 | | | $ | 26.31 | | | $ | 24.56 | | | $ | 19.95 | | | $ | 20.20 | |
| | | | | | | | | | | | | | | | | | | | |
| | | | | |
Net investment income (loss) (a) | | | 0.16 | | | | 0.26 | | | | 0.24 | | | | 0.23 | | | | 0.25 | |
| | | | | |
Net realized and unrealized gain (loss) on investments | | | 1.36 | | | | 1.28 | | | | 1.74 | | | | 4.63 | | | | (0.28 | ) |
| | | | | | | | | | | | | | | | | | | | |
| | | | | |
Total from investment operations | | | 1.52 | | | | 1.54 | | | | 1.98 | | | | 4.86 | | | | (0.03 | ) |
| | | | | | | | | | | | | | | | | | | | |
| | | | | |
| Less distributions: | | | | | | | | | | | | | | | | | | | | |
| | | | | |
From net investment income | | | (0.27 | ) | | | (0.22 | ) | | | (0.23 | ) | | | (0.25 | ) | | | (0.22 | ) |
| | | | | |
From net realized gain on investments | | | (1.22 | ) | | | (2.71 | ) | | | — | | | | — | | | | — | |
| | | | | | | | | | | | | | | | | | | | |
| | | | | |
Total distributions | | | (1.49 | ) | | | (2.93 | ) | | | (0.23 | ) | | | (0.25 | ) | | | (0.22 | ) |
| | | | | | | | | | | | | | | | | | | | |
| | | | | |
Net asset value at end of year | | $ | 24.95 | | | $ | 24.92 | | | $ | 26.31 | | | $ | 24.56 | | | $ | 19.95 | |
| | | | | | | | | | | | | | | | | | | | |
| | | | | |
Total investment return (b) | | | 6.42 | % | | | 6.80 | % | | | 8.07 | % | | | 24.59 | % | | | (0.13 | %) |
| | | | | |
| Ratios (to average net assets)/Supplemental Data: | | | | | | | | | | | | | | | | | | | | |
| | | | | |
Net investment income (loss) | | | 0.64 | % | | | 1.08 | % | | | 0.90 | % | | | 1.05 | % | | | 1.29 | % (c) |
| | | | | |
Net expenses (d) | | | 0.99 | % | | | 0.97 | % | | | 0.97 | % | | | 0.96 | % | | | 0.95 | % (e) |
| | | | | |
Portfolio turnover rate | | | 166 | % | | | 164 | % | | | 137 | % | | | 134 | % | | | 164 | % |
| | | | | |
Net assets at end of year (in 000’s) | | $ | 62,611 | | | $ | 63,814 | | | $ | 63,956 | | | $ | 53,909 | | | $ | 42,928 | |
| (a) | Per share data based on average shares outstanding during the year. |
| (b) | Total investment return is calculated exclusive of sales charges and assumes the reinvestment of distributions. For periods of less than one year, total return is not annualized. |
| (c) | Without the custody fee reimbursement, net investment income (loss) would have been 1.28%. |
| (d) | In addition to the fees and expenses which the Fund bears directly, it also indirectly bears a pro-rata share of the fees and expenses of the underlying funds in which it invests. Such indirect expenses are not included in the above expense ratios. |
| (e) | Without the custody fee reimbursement, net expenses would have been 0.96%. |
| | | | | | | | | | | | | | | | | | | | |
| |
| | | Year ended October 31, | |
| | | | | |
| Investor Class | | 2020 | | | 2019 | | | 2018 | | | 2017 | | | 2016 | |
| | | | | |
Net asset value at beginning of year | | $ | 24.90 | | | $ | 26.29 | | | $ | 24.53 | | | $ | 19.93 | | | $ | 20.19 | |
| | | | | | | | | | | | | | | | | | | | |
| | | | | |
Net investment income (loss) (a) | | | 0.08 | | | | 0.20 | | | | 0.18 | | | | 0.18 | | | | 0.21 | |
| | | | | |
Net realized and unrealized gain (loss) on investments | | | 1.37 | | | | 1.27 | | | | 1.74 | | | | 4.62 | | | | (0.29 | ) |
| | | | | | | | | | | | | | | | | | | | |
| | | | | |
Total from investment operations | | | 1.45 | | �� | | 1.47 | | | | 1.92 | | | | 4.80 | | | | (0.08 | ) |
| | | | | | | | | | | | | | | | | | | | |
| | | | | |
| Less distributions: | | | | | | | | | | | | | | | | | | | | |
| | | | | |
From net investment income | | | (0.21 | ) | | | (0.15 | ) | | | (0.16 | ) | | | (0.20 | ) | | | (0.18 | ) |
| | | | | |
From net realized gain on investments | | | (1.22 | ) | | | (2.71 | ) | | | — | | | | — | | | | — | |
| | | | | | | | | | | | | | | | | | | | |
| | | | | |
Total distributions | | | (1.43 | ) | | | (2.86 | ) | | | (0.16 | ) | | | (0.20 | ) | | | (0.18 | ) |
| | | | | | | | | | | | | | | | | | | | |
| | | | | |
Net asset value at end of year | | $ | 24.92 | | | $ | 24.90 | | | $ | 26.29 | | | $ | 24.53 | | | $ | 19.93 | |
| | | | | | | | | | | | | | | | | | | | |
| | | | | |
Total investment return (b) | | | 6.05 | % | | | 6.51 | % | | | 7.82 | % | | | 24.25 | % | | | (0.39 | %) |
| | | | | |
| Ratios (to average net assets)/Supplemental Data: | | | | | | | | | | | | | | | | | | | | |
| | | | | |
Net investment income (loss) | | | 0.35 | % | | | 0.82 | % | | | 0.68 | % | | | 0.83 | % | | | 1.05 | % (c) |
| | | | | |
Net expenses (d) | | | 1.30 | % | | | 1.23 | % | | | 1.21 | % | | | 1.22 | % | | | 1.20 | % (e) |
| | | | | |
Expenses (before waiver/reimbursement) (d) | | | 1.31 | % | | | 1.27 | % | | | 1.23 | % | | | 1.22 | % | | | 1.20 | % (e) |
| | | | | |
Portfolio turnover rate | | | 166 | % | | | 164 | % | | | 137 | % | | | 134 | % | | | 164 | % |
| | | | | |
Net assets at end of year (in 000’s) | | $ | 15,544 | | | $ | 17,203 | | | $ | 16,580 | | | $ | 17,216 | | | $ | 21,880 | |
| (a) | Per share data based on average shares outstanding during the year. |
| (b) | Total investment return is calculated exclusive of sales charges and assumes the reinvestment of distributions. For periods of less than one year, total return is not annualized. |
| (c) | Without the custody fee reimbursement, net investment income (loss) would have been 1.04%. |
| (d) | In addition to the fees and expenses which the Fund bears directly, it also indirectly bears a pro-rata share of the fees and expenses of the underlying funds in which it invests. Such indirect expenses are not included in the above expense ratios. |
| (e) | Without the custody fee reimbursement, net expenses would have been 1.21%. |
| | | | | | |
The notes to the financial statements are an integral part of,
and should be read in conjunction with, the financial statements. | | | | | 17 | |
Financial Highlights selected per share data and ratios
| | | | | | | | | | | | | | | | | | | | |
| |
| | | Year ended October 31, | |
| | | | | |
| Class B | | 2020 | | | 2019 | | | 2018 | | | 2017 | | | 2016 | |
| | | | | |
Net asset value at beginning of year | | $ | 22.50 | | | $ | 24.04 | | | $ | 22.46 | | | $ | 18.25 | | | $ | 18.49 | |
| | | | | | | | | | | | | | | | | | | | |
| | | | | |
Net investment income (loss) (a) | | | (0.08 | ) | | | 0.02 | | | | (0.02 | ) | | | 0.01 | | | | 0.05 | |
| | | | | |
Net realized and unrealized gain (loss) on investments | | | 1.22 | | | | 1.15 | | | | 1.60 | | | | 4.24 | | | | (0.26 | ) |
| | | | | | | | | | | | | | | | | | | | |
| | | | | |
Total from investment operations | | | 1.14 | | | | 1.17 | | | | 1.58 | | | | 4.25 | | | | (0.21 | ) |
| | | | | | | | | | | | | | | | | | | | |
| | | | | |
| Less distributions: | | | | | | | | | | | | | | | | | | | | |
| | | | | |
From net investment income | | | (0.02 | ) | | | — | | | | — | | | | (0.04 | ) | | | (0.03 | ) |
| | | | | |
From net realized gain on investments | | | (1.22 | ) | | | (2.71 | ) | | | — | | | | — | | | | — | |
| | | | | | | | | | | | | | | | | | | | |
| | | | | |
Total distributions | | | (1.24 | ) | | | (2.71 | ) | | | — | | | | (0.04 | ) | | | (0.03 | ) |
| | | | | | | | | | | | | | | | | | | | |
| | | | | |
Net asset value at end of year | | $ | 22.40 | | | $ | 22.50 | | | $ | 24.04 | | | $ | 22.46 | | | $ | 18.25 | |
| | | | | | | | | | | | | | | | | | | | |
| | | | | |
Total investment return (b) | | | 5.28 | % | | | 5.71 | % | | | 7.03 | % | | | 23.31 | % | | | (1.12 | %) |
| | | | | |
| Ratios (to average net assets)/Supplemental Data: | | | | | | | | | | | | | | | | | | | | |
| | | | | |
Net investment income (loss) | | | (0.39 | %) | | | 0.10 | % | | | (0.07 | %) | | | 0.06 | % | | | 0.30 | % (c) |
| | | | | |
Net expenses (d) | | | 2.05 | % | | | 1.98 | % | | | 1.96 | % | | | 1.97 | % | | | 1.95 | % (e) |
| | | | | |
Expenses (before waiver/reimbursement) (d) | | | 2.06 | % | | | 2.02 | % | | | 1.98 | % | | | 1.97 | % | | | 1.95 | % (e) |
| | | | | |
Portfolio turnover rate | | | 166 | % | | | 164 | % | | | 137 | % | | | 134 | % | | | 164 | % |
| | | | | |
Net assets at end of year (in 000’s) | | $ | 3,666 | | | $ | 4,718 | | | $ | 5,855 | | | $ | 6,635 | | | $ | 6,604 | |
| (a) | Per share data based on average shares outstanding during the year. |
| (b) | Total investment return is calculated exclusive of sales charges and assumes the reinvestment of distributions. For periods of less than one year, total return is not annualized. |
| (c) | Without the custody fee reimbursement, net investment income (loss) would have been 0.29%. |
| (d) | In addition to the fees and expenses which the Fund bears directly, it also indirectly bears a pro-rata share of the fees and expenses of the underlying funds in which it invests. Such indirect expenses are not included in the above expense ratios. |
| (e) | Without the custody fee reimbursement, net expenses would have been 1.96%. |
| | | | | | | | | | | | | | | | | | | | |
| |
| | | Year ended October 31, | |
| | | | | |
| Class C | | 2020 | | | 2019 | | | 2018 | | | 2017 | | | 2016 | |
| | | | | |
Net asset value at beginning of year | | $ | 22.48 | | | $ | 24.02 | | | $ | 22.45 | | | $ | 18.24 | | | $ | 18.48 | |
| | | | | | | | | | | | | | | | | | | | |
| | | | | |
Net investment income (loss) (a) | | | (0.08 | ) | | | 0.02 | | | | (0.02 | ) | | | 0.01 | | | | 0.06 | |
| | | | | |
Net realized and unrealized gain (loss) on investments | | | 1.22 | | | | 1.15 | | | | 1.59 | | | | 4.24 | | | | (0.27 | ) |
| | | | | | | | | | | | | | | | | | | | |
| | | | | |
Total from investment operations | | | 1.14 | | | | 1.17 | | | | 1.57 | | | | 4.25 | | | | (0.21 | ) |
| | | | | | | | | | | | | | | | | | | | |
| | | | | |
| Less distributions: | | | | | | | | | | | | | | | | | | | | |
| | | | | |
From net investment income | | | (0.02 | ) | | | — | | | | — | | | | (0.04 | ) | | | (0.03 | ) |
| | | | | |
From net realized gain on investments | | | (1.22 | ) | | | (2.71 | ) | | | — | | | | — | | | | — | |
| | | | | | | | | | | | | | | | | | | | |
| | | | | |
Total distributions | | | (1.24 | ) | | | (2.71 | ) | | | — | | | | (0.04 | ) | | | (0.03 | ) |
| | | | | | | | | | | | | | | | | | | | |
| | | | | |
Net asset value at end of year | | $ | 22.38 | | | $ | 22.48 | | | $ | 24.02 | | | $ | 22.45 | | | $ | 18.24 | |
| | | | | | | | | | | | | | | | | | | | |
| | | | | |
Total investment return (b) | | | 5.29 | % | | | 5.72 | % | | | 6.99 | % | | | 23.33 | % | | | (1.12 | %) |
| | | | | |
| Ratios (to average net assets)/Supplemental Data: | | | | | | | | | | | | | | | | | | | | |
| | | | | |
Net investment income (loss) | | | (0.38 | %) | | | 0.10 | % | | | (0.08 | %) | | | 0.06 | % | | | 0.34 | % (c) |
| | | | | |
Net expenses (d) | | | 2.05 | % | | | 1.98 | % | | | 1.96 | % | | | 1.97 | % | | | 1.95 | % (e) |
| | | | | |
Expenses (before waiver/reimbursement) (d) | | | 2.06 | % | | | 2.02 | % | | | 1.98 | % | | | 1.97 | % | | | 1.95 | % (e) |
| | | | | |
Portfolio turnover rate | | | 166 | % | | | 164 | % | | | 137 | % | | | 134 | % | | | 164 | % |
| | | | | |
Net assets at end of year (in 000’s) | | $ | 6,641 | | | $ | 10,946 | | | $ | 14,964 | | | $ | 15,459 | | | $ | 16,509 | |
| (a) | Per share data based on average shares outstanding during the year. |
| (b) | Total investment return is calculated exclusive of sales charges and assumes the reinvestment of distributions. For periods of less than one year, total return is not annualized. |
| (c) | Without the custody fee reimbursement, net investment income (loss) would have been 0.33%. |
| (d) | In addition to the fees and expenses which the Fund bears directly, it also indirectly bears a pro-rata share of the fees and expenses of the underlying funds in which it invests. Such indirect expenses are not included in the above expense ratios. |
| (e) | Without the custody fee reimbursement, net expenses would have been 1.96%. |
| | | | |
| 18 | | MainStay MacKay Common Stock Fund | | The notes to the financial statements are an integral part of,
and should be read in conjunction with, the financial statements. |
Financial Highlights selected per share data and ratios
| | | | | | | | | | | | | | | | | | | | |
| |
| | | Year ended October 31, | |
| | | | | |
| Class I | | 2020 | | | 2019 | | | 2018 | | | 2017 | | | 2016 | |
| | | | | |
Net asset value at beginning of year | | $ | 25.05 | | | $ | 26.44 | | | $ | 24.67 | | | $ | 20.04 | | | $ | 20.29 | |
| | | | | | | | | | | | | | | | | | | | |
| | | | | |
Net investment income (loss) (a) | | | 0.23 | | | | 0.32 | | | | 0.31 | | | | 0.29 | | | | 0.31 | |
| | | | | |
Net realized and unrealized gain (loss) on investments | | | 1.37 | | | | 1.28 | | | | 1.74 | | | | 4.65 | | | | (0.29 | ) |
| | | | | | | | | | | | | | | | | | | | |
| | | | | |
Total from investment operations | | | 1.60 | | | | 1.60 | | | | 2.05 | | | | 4.94 | | | | 0.02 | |
| | | | | | | | | | | | | | | | | | | | |
| | | | | |
| Less distributions: | | | | | | | | | | | | | | | | | | | | |
| | | | | |
From net investment income | | | (0.34 | ) | | | (0.28 | ) | | | (0.28 | ) | | | (0.31 | ) | | | (0.27 | ) |
| | | | | |
From net realized gain on investments | | | (1.22 | ) | | | (2.71 | ) | | | — | | | | — | | | | — | |
| | | | | | | | | | | | | | | | | | | | |
| | | | | |
Total distributions | | | (1.56 | ) | | | (2.99 | ) | | | (0.28 | ) | | | (0.31 | ) | | | (0.27 | ) |
| | | | | | | | | | | | | | | | | | | | |
| | | | | |
Net asset value at end of year | | $ | 25.09 | | | $ | 25.05 | | | $ | 26.44 | | | $ | 24.67 | | | $ | 20.04 | |
| | | | | | | | | | | | | | | | | | | | |
| | | | | |
Total investment return (b) | | | 6.66 | % | | | 7.06 | % | | | 8.36 | % | | | 24.89 | % | | | 0.12 | % |
| | | | | |
| Ratios (to average net assets)/Supplemental Data: | | | | | | | | | | | | | | | | | | | | |
| | | | | |
Net investment income (loss) | | | 0.96 | % | | | 1.34 | % | | | 1.16 | % | | | 1.31 | % | | | 1.55 | %(c) |
| | | | | |
Net expenses (d) | | | 0.74 | % | | | 0.72 | % | | | 0.71 | % | | | 0.71 | % | | | 0.70 | %(e) |
| | | | | |
Portfolio turnover rate | | | 166 | % | | | 164 | % | | | 137 | % | | | 134 | % | | | 164 | % |
| | | | | |
Net assets at end of year (in 000’s) | | $ | 37,491 | | | $ | 97,903 | | | $ | 98,395 | | | $ | 96,441 | | | $ | 87,774 | |
| (a) | Per share data based on average shares outstanding during the year. |
| (b) | Total investment return is calculated exclusive of sales charges and assumes the reinvestment of distributions. Class I shares are not subject to sales charges. For periods of less than one year, total return is not annualized. |
| (c) | Without the custody fee reimbursement, net investment income (loss) would have been 1.54%. |
| (d) | In addition to the fees and expenses which the Fund bears directly, it also indirectly bears a pro-rata share of the fees and expenses of the underlying funds in which it invests. Such indirect expenses are not included in the above expense ratios. |
| (e) | Without the custody fee reimbursement, net expenses would have been 0.71%. |
| | | | | | | | | | | | | | | | | | | | |
| | |
| | | Year ended October 31, | | | February 29,
2016^
through
October 31, | |
| | | | | |
| Class R3 | | 2020 | | | 2019 | | | 2018 | | | 2017 | | | 2016 | |
| | | | | |
Net asset value at beginning of period | | $ | 24.77 | | | $ | 26.17 | | | $ | 24.48 | | | $ | 19.90 | | | $ | 18.44 | |
| | | | | | | | | | | | | | | | | | | | |
| | | | | |
Net investment income (loss) (a) | | | 0.07 | | | | 0.17 | | | | 0.14 | | | | 0.13 | | | | 0.10 | |
| | | | | |
Net realized and unrealized gain (loss) on investments | | | 1.36 | | | | 1.28 | | | | 1.73 | | | | 4.65 | | | | 1.36 | |
| | | | | | | | | | | | | | | | | | | | |
| | | | | |
Total from investment operations | | | 1.43 | | | | 1.45 | | | | 1.87 | | | | 4.78 | | | | 1.46 | |
| �� | | | | | | | | | | | | | | | | | | | |
| | | | | |
| Less distributions: | | | | | | | | | | | | | | | | | | | | |
| | | | | |
From net investment income | | | (0.20 | ) | | | (0.14 | ) | | | (0.18 | ) | | | (0.20 | ) | | | — | |
| | | | | |
From net realized gain on investments | | | (1.22 | ) | | | (2.71 | ) | | | — | | | | — | | | | — | |
| | | | | | | | | | | | | | | | | | | | |
| | | | | |
Total distributions | | | (1.42 | ) | | | (2.85 | ) | | | (0.18 | ) | | | (0.20 | ) | | | — | |
| | | | | | | | | | | | | | | | | | | | |
| | | | | |
Net asset value at end of period | | $ | 24.78 | | | $ | 24.77 | | | $ | 26.17 | | | $ | 24.48 | | | $ | 19.90 | |
| | | | | | | | | | | | | | | | | | | | |
| | | | | |
Total investment return (b) | | | 6.02 | % | | | 6.42 | % | | | 7.66 | % | | | 24.17 | % | | | 7.92 | %(c) |
| | | | | |
| Ratios (to average net assets)/Supplemental Data: | | | | | | | | | | | | | | | | | | | | |
| | | | | |
Net investment income (loss) | | | 0.30 | % | | | 0.70 | % | | �� | 0.52 | % | | | 0.60 | % | | | 0.74 | %††(d) |
| | | | | |
Net expenses (e) | | | 1.34 | % | | | 1.32 | % | | | 1.32 | % | | | 1.31 | % | | | 1.31 | %††(f) |
| | | | | |
Portfolio turnover rate | | | 166 | % | | | 164 | % | | | 137 | % | | | 134 | % | | | 164 | % |
| | | | | |
Net assets at end of period (in 000’s) | | $ | 207 | | | $ | 227 | | | $ | 137 | | | $ | 86 | | | $ | 29 | |
| (a) | Per share data based on average shares outstanding during the year. |
| (b) | Total investment return is calculated exclusive of sales charges and assumes the reinvestment of distributions. Class R3 shares are not subject to sales charges. For periods of less than one year, total return is not annualized. |
| (c) | Total investment return may reflect adjustments to conform to generally accepted accounting principles. |
| (d) | Without the custody fee reimbursement, net investment income (loss) would have been 0.73%. |
| (e) | In addition to the fees and expenses which the Fund bears directly, it also indirectly bears a pro-rata share of the fees and expenses of the underlying funds in which it invests. Such indirect expenses are not included in the above expense ratios. |
| (f) | Without the custody fee reimbursement, net expenses would have been 1.32%. |
| | | | | | |
The notes to the financial statements are an integral part of,
and should be read in conjunction with, the financial statements. | | | | | 19 | |
Notes to Financial Statements
Note 1–Organization and Business
The MainStay Funds (the “Trust”) was organized on January 9, 1986, as a Massachusetts business trust. The Trust is registered under the Investment Company Act of 1940, as amended (the “1940 Act”), as an open-end management investment company, and is comprised of twelve funds (collectively referred to as the “Funds”). These financial statements and notes relate to the MainStay MacKay Common Stock Fund (the “Fund”), a “diversified” fund, as that term is defined in the 1940 Act, as interpreted or modified by regulatory authorities having jurisdiction, from time to time.
The Fund currently has nine classes of shares registered for sale. Class A and Class B shares commenced operations on June 1, 1998. Class C shares commenced operations on September 1, 1998. Class I shares commenced operations on December 28, 2004. Investor Class shares commenced operations on February 28, 2008. Class R3 shares commenced operations on February 29, 2016. Class R2 shares were registered for sale effective as of December 14, 2007. Class R6 shares were registered for sale effective as of February 28, 2017. SIMPLE Class shares were registered for sale effective as of August 31, 2020. As of October 31, 2020, Class R2, Class R6 and SIMPLE Class shares were not yet offered for sale.
Class B shares of the MainStay Group of Funds are closed to all new purchases as well as additional investments by existing Class B shareholders. Existing Class B shareholders may continue to reinvest dividends and capital gains distributions, as well as exchange their Class B shares for Class B shares of other funds in the MainStay Group of Funds as permitted by the current exchange privileges. Class B shareholders continue to be subject to any applicable contingent deferred sales charge (“CDSC”) at the time of redemption. All other features of the Class B shares, including but not limited to the fees and expenses applicable to Class B shares, remain unchanged. Unless redeemed, Class B shareholders will remain in Class B shares of their respective fund until the Class B shares are converted to Class A or Investor Class shares pursuant to the applicable conversion schedule.
Class A and Investor Class shares are offered at net asset value (“NAV”) per share plus an initial sales charge. No initial sales charge applies to investments of $1 million or more (and certain other qualified purchases) in Class A and Investor Class shares. However, a CDSC of 1.00% may be imposed on certain redemptions made within 18 months of the date of purchase on shares that were purchased without an initial sales charge. Class C shares are offered at NAV without an initial sales charge, although a 1.00% CDSC may be imposed on certain redemptions of such shares made within one year of the date of purchase of Class C shares. When Class B shares were offered, they were offered at NAV without an initial sales charge, although a CDSC that declines depending on the number of years a shareholder held its Class B shares may be imposed on certain redemptions of such shares made within six years of the date of purchase of such shares. Class I, Class R1, Class R2, Class R3 and Class R6 shares are offered at NAV without a sales charge. Class R2, Class R6 and SIMPLE Class shares are currently expected to be offered at NAV without a sales charge. Depending upon eligibility, Class B shares convert to either Class A or Investor Class shares at the end of the calendar quarter eight years after the date they were purchased. In addition, depending upon eligibility, Class C shares convert to either Class A or Investor Class shares at the
end of the calendar quarter ten years after the date they were purchased. Additionally, Investor Class shares may convert automatically to Class A shares. Under certain circumstances and as may be permitted by the Trust’s multiple class plan pursuant to Rule 18f-3 under the 1940 Act, specified share classes of the Fund may be converted to one or more other share classes of the Fund as disclosed in the capital share transactions within these Notes. The classes of shares have the same voting (except for issues that relate solely to one class), dividend, liquidation and other rights, and the same terms and conditions, except that under distribution plans pursuant to Rule 12b-1 under the 1940 Act, Class B and Class C shares are subject to higher distribution and/or service fees than Class A, Investor Class, Class R2, Class R3 and SIMPLE Class shares. Class I, Class R1 and Class R6 shares are not subject to a distribution and/or service fee. Class R1, Class R2 and Class R3 shares are subject to a shareholder service fee, which is in addition to fees paid under the distribution plans for Class R2 and Class R3 shares.
The Fund’s investment objective is to seek long-term growth of capital.
Note 2–Significant Accounting Policies
The Fund is an investment company and accordingly follows the investment company accounting and reporting guidance of the Financial Accounting Standards Board (“FASB”) Accounting Standard Codification Topic 946 Financial Services—Investment Companies. The Fund prepares its financial statements in accordance with generally accepted accounting principles (“GAAP”) in the United States of America and follows the significant accounting policies described below.
(A) Securities Valuation. Investments are usually valued as of the close of regular trading on the New York Stock Exchange (the “Exchange”) (usually 4:00 p.m. Eastern time) on each day the Fund is open for business (“valuation date”).
The Board of Trustees of the Trust (the “Board”) adopted procedures establishing methodologies for the valuation of the Fund’s securities and other assets and delegated the responsibility for valuation determinations under those procedures to the Valuation Committee of the Trust (the “Valuation Committee”). The procedures state that, subject to the oversight of the Board and unless otherwise noted, the responsibility for the day-to-day valuation of portfolio assets (including fair value measurements for the Fund’s assets and liabilities) rests with New York Life Investment Management LLC (“New York Life Investments” or the “Manager”), aided to whatever extent necessary by the Subadvisor (as defined in Note 3(A)). To assess the appropriateness of security valuations, the Manager, the Subadvisor or the Fund’s third-party service provider, who is subject to oversight by the Manager, regularly compares prior day prices, prices on comparable securities and the sale prices to the prior and current day prices and challenges prices with changes exceeding certain tolerance levels with third-party pricing services or broker sources.
The Board authorized the Valuation Committee to appoint a Valuation Subcommittee (the “Subcommittee”) to establish the prices of securities for which market quotations are not readily available or the prices of which are not otherwise readily determinable under the procedures. The Subcommittee meets (in person, via electronic mail or via teleconference) on an as-needed basis. The Valuation Committee meets to ensure that actions taken by the Subcommittee were appropriate.
| | |
| 20 | | MainStay MacKay Common Stock Fund |
For those securities valued through either a standardized fair valuation methodology or a fair valuation measurement, the Subcommittee deals with such valuation and the Valuation Committee reviews and affirms, if appropriate, the reasonableness of the valuation based on such methodologies and measurements on a regular basis after considering information that is reasonably available and deemed relevant by the Valuation Committee. Any action taken by the Subcommittee with respect to the valuation of a portfolio security or other asset is submitted for review and ratification (if appropriate) to the Valuation Committee and the Board at the next regularly scheduled meeting.
“Fair value” is defined as the price the Fund would reasonably expect to receive upon selling an asset or liability in an orderly transaction to an independent buyer in the principal or most advantageous market for the asset or liability. Fair value measurements are determined within a framework that establishes a three-tier hierarchy that maximizes the use of observable market data and minimizes the use of unobservable inputs to establish a classification of fair value measurements for disclosure purposes. “Inputs” refer broadly to the assumptions that market participants would use in pricing the asset or liability, including assumptions about risk, such as the risk inherent in a particular valuation technique used to measure fair value using a pricing model and/or the risk inherent in the inputs for the valuation technique. Inputs may be observable or unobservable. Observable inputs reflect the assumptions market participants would use in pricing the asset or liability based on market data obtained from sources independent of the Fund. Unobservable inputs reflect the Fund’s own assumptions about the assumptions market participants would use in pricing the asset or liability based on the information available. The inputs or methodology used for valuing assets or liabilities may not be an indication of the risks associated with investing in those assets or liabilities. The three-tier hierarchy of inputs is summarized below.
| • | | Level 1—quoted prices in active markets for an identical asset or liability |
| • | | Level 2—other significant observable inputs (including quoted prices for a similar asset or liability in active markets, interest rates and yield curves, prepayment speeds, credit risk, etc.) |
| • | | Level 3—significant unobservable inputs (including the Fund’s own assumptions about the assumptions that market participants would use in measuring fair value of an asset or liability) |
The level of an asset or liability within the fair value hierarchy is based on the lowest level of an input, both individually and in the aggregate, that is significant to the fair value measurement. The aggregate value by input level of the Fund’s assets and liabilities as of October 31, 2020, is included at the end of the Portfolio of Investments.
The Fund may use third-party vendor evaluations, whose prices may be derived from one or more of the following standard inputs, among others:
| | |
• Broker/dealer quotes | | • Benchmark securities |
• Two-sided markets | | • Reference data (corporate actions or material event notices) |
• Bids/offers | | • Monthly payment information |
• Industry and economic events | | • Reported trades |
An asset or liability for which market values cannot be measured using the methodologies described above is valued by methods deemed reasonable in good faith by the Valuation Committee, following the procedures established by the Board, to represent fair value. Under these procedures, the Fund generally uses a market-based approach which may use related or comparable assets or liabilities, recent transactions, market multiples, book values and other relevant information. The Fund may also use an income-based valuation approach in which the anticipated future cash flows of the asset or liability are discounted to calculate fair value. Discounts may also be applied due to the nature and/or duration of any restrictions on the disposition of the asset or liability. Fair value represents a good faith approximation of the value of a security. Fair value determinations involve the consideration of a number of subjective factors, an analysis of applicable facts and circumstances and the exercise of judgment. As a result, it is possible that the fair value for a security determined in good faith in accordance with the Fund’s valuation procedures may differ from valuations for the same security determined by other funds using their own valuation procedures. Although the Fund’s valuation procedures are designed to value a security at the price the Fund may reasonably expect to receive upon the security’s sale in an orderly transaction, there can be no assurance that any fair value determination thereunder would, in fact, approximate the amount that the Fund would actually realize upon the sale of the security or the price at which the security would trade if a reliable market price were readily available. During the year ended October 31, 2020, there were no material changes to the fair value methodologies.
Securities which may be valued in this manner include, but are not limited to: (i) a security for which trading has been halted or suspended; (ii) a debt security that has recently gone into default and for which there is not a current market quotation; (iii) a security of an issuer that has entered into a restructuring; (iv) a security that has been delisted from a national exchange; (v) a security for which the market price is not readily available from a third-party pricing source or, if so provided, does not, in the opinion of the Manager or the Subadvisor, reflect the security’s market value; (vi) a security subject to trading collars for which no or limited trading takes place; and (vii) a security whose principal market has been temporarily closed at a time when, under normal conditions, it would be open. Securities valued in this manner are generally categorized as Level 3 in the hierarchy. No securities held by the Fund as of October 31, 2020 were fair valued in such a manner.
Equity securities, including exchange-traded funds (“ETFs”), are valued at the last quoted sales prices as of the close of regular trading on the relevant exchange on each valuation date. Securities that are not traded on the valuation date are valued at the mean of the last quoted bid and ask prices. Prices are normally taken from the principal market in which each security trades. These securities are generally categorized as Level 1 in the hierarchy.
Investments in mutual funds, including money market funds, are valued at their respective NAVs as of the close of the Exchange on the valuation date. These securities are generally categorized as Level 1 in the hierarchy.
Temporary cash investments acquired in excess of 60 days to maturity at the time of purchase are valued using the latest bid prices or using valuations based on a matrix system (which considers such factors as
Notes to Financial Statements (continued)
security prices, yields, maturities and ratings), both as furnished by independent pricing services. Temporary cash investments that mature in 60 days or less at the time of purchase (“Short-Term Investments”) are valued using the amortized cost method of valuation, unless the use of such method would be inappropriate. The amortized cost method involves valuing a security at its cost on the date of purchase and thereafter assuming a constant amortization to maturity of the difference between such cost and the value on maturity date. Amortized cost approximates the current fair value of a security. Securities valued using the amortized cost method are not valued using quoted prices in an active market and are generally categorized as Level 2 in the hierarchy.
The information above is not intended to reflect an exhaustive list of the methodologies that may be used to value portfolio investments. The valuation procedures permit the use of a variety of valuation methodologies in connection with valuing portfolio investments. The methodology used for a specific type of investment may vary based on the market data available or other considerations. The methodologies summarized above may not represent the specific means by which portfolio investments are valued on any particular business day.
(B) Income Taxes. The Fund’s policy is to comply with the requirements of the Internal Revenue Code of 1986, as amended (the “Internal Revenue Code”), applicable to regulated investment companies and to distribute all of its taxable income to the shareholders of the Fund within the allowable time limits.
The Manager evaluates the Fund’s tax positions to determine if the tax positions taken meet the minimum recognition threshold in connection with accounting for uncertainties in income tax positions taken or expected to be taken for the purposes of measuring and recognizing tax liabilities in the financial statements. Recognition of tax benefits of an uncertain tax position is permitted only to the extent the position is “more likely than not” to be sustained assuming examination by taxing authorities. The Manager analyzed the Fund’s tax positions taken on federal, state and local income tax returns for all open tax years (for up to three tax years) and has concluded that no provisions for federal, state and local income tax are required in the Fund’s financial statements. The Fund’s federal, state and local income tax and federal excise tax returns for tax years for which the applicable statutes of limitations have not expired are subject to examination by the Internal Revenue Service and state and local departments of revenue.
(C) Dividends and Distributions to Shareholders. Dividends and distributions are recorded on the ex-dividend date. The Fund intends to declare and pay dividends from net investment income and distributions from net realized capital and currency gains, if any, at least annually. Unless a shareholder elects otherwise, all dividends and distributions are reinvested at NAV in the same class of shares of the Fund. Dividends and distributions to shareholders are determined in accordance with federal income tax regulations and may differ from determinations using GAAP.
(D) Security Transactions and Investment Income. The Fund records security transactions on the trade date. Realized gains and losses on security transactions are determined using the identified cost method. Dividend income is recognized on the ex-dividend date, net of any foreign tax withheld at the source, and interest income is accrued as earned using the effective interest rate method. Distributions
received from real estate investment trusts may be classified as dividends, capital gains and/or return of capital.
Investment income and realized and unrealized gains and losses on investments of the Fund are allocated pro rata to the separate classes of shares based upon their relative net assets on the date the income is earned or realized and unrealized gains and losses are incurred.
(E) Expenses. Expenses of the Trust are allocated to the individual Funds in proportion to the net assets of the respective Funds when the expenses are incurred, except where direct allocations of expenses can be made. Expenses (other than transfer agent expenses and fees incurred under the shareholder services plans and/or the distribution plans further discussed in Note 3(B)) are allocated to separate classes of shares pro rata based upon their relative net assets on the date the expenses are incurred. The expenses borne by the Fund, including those of related parties to the Fund, are shown in the Statement of Operations.
Additionally, the Fund may invest in ETFs and mutual funds, which are subject to management fees and other fees that may cause the costs of investing in ETFs and mutual funds to be greater than the costs of owning the underlying securities directly. These indirect expenses of ETFs and mutual funds are not included in the amounts shown as expenses in the Fund’s Statement of Operations or in the expense ratios included in the Financial Highlights.
(F) Use of Estimates. In preparing financial statements in conformity with GAAP, the Manager makes estimates and assumptions that affect the reported amounts and disclosures in the financial statements. Actual results could differ from those estimates and assumptions.
(G) Securities Lending. In order to realize additional income, the Fund may engage in securities lending, subject to the limitations set forth in the 1940 Act and relevant guidance by the staff of the Securities and Exchange Commission (“SEC”). If the Fund engages in securities lending, the Fund will lend through its custodian, currently State Street Bank and Trust Company (“State Street”) (See Note 13 for securities lending agent change), acting as securities lending agent on behalf of the Fund. Under the current arrangement, State Street will manage the Fund’s collateral in accordance with the securities lending agency agreement between the Fund and State Street, and indemnify the Fund against counterparty risk. The loans will be collateralized by cash (which may be invested in a money market fund) and/or non-cash collateral (which may include U.S. Treasury securities and/or U.S. government agency securities issued or guaranteed by the United States government or its agencies or instrumentalities) at least equal at all times to the market value of the securities loaned. The Fund bears the risk of delay in recovery of, or loss of rights in, the securities loaned. The Fund may also record a realized gain or loss on securities deemed sold due to a borrower’s inability to return securities on loan. The Fund bears the risk of any loss on investment of cash collateral. The Fund will receive compensation for lending its securities in the form of fees or it will retain a portion of interest earned on the investment of any cash collateral. The Fund will also continue to receive interest and dividends on the securities loaned and any gain or loss in the market price of the securities loaned that may occur during the term of the loan will be for the account of the Fund. Income earned from securities lending activities, if any, is reflected in the Statement of Operations. As of October 31, 2020, the Fund did not have any portfolio securities on loan.
| | |
| 22 | | MainStay MacKay Common Stock Fund |
(H) Indemnifications. Under the Trust’s organizational documents, its officers and trustees are indemnified against certain liabilities that may arise out of performance of their duties to the Trust. Additionally, in the normal course of business, the Fund enters into contracts with third-party service providers that contain a variety of representations and warranties and that may provide general indemnifications. The Fund’s maximum exposure under these arrangements is unknown, as this would involve future claims that may be made against the Fund that have not yet occurred. The Manager believes that the risk of loss in connection with these potential indemnification obligations is remote. However, there can be no assurance that material liabilities related to such obligations will not arise in the future, which could adversely impact the Fund.
Note 3–Fees and Related Party Transactions
(A) Manager and Subadvisor. New York Life Investments, a registered investment adviser and an indirect, wholly-owned subsidiary of New York Life Insurance Company (“New York Life”), serves as the Fund’s Manager, pursuant to an Amended and Restated Management Agreement (“Management Agreement”). The Manager provides offices, conducts clerical, recordkeeping and bookkeeping services and keeps most of the financial and accounting records required to be maintained by the Fund. Except for the portion of salaries and expenses that are the responsibility of the Fund, the Manager pays the salaries and expenses of all personnel affiliated with the Fund and certain operational expenses of the Fund. The Fund reimburses New York Life Investments in an amount equal to the portion of the compensation of the Chief Compliance Officer attributable to the Fund. MacKay Shields LLC (“MacKay Shields” or the “Subadvisor”), a registered investment adviser and an indirect, wholly-owned subsidiary of New York Life, serves as Subadvisor to the Fund and is responsible for the day-to-day portfolio management of the Fund. Pursuant to the terms of an Amended and Restated Subadvisory Agreement (“Subadvisory Agreement”) between New York Life Investments and MacKay Shields, New York Life Investments pays for the services of the Subadvisor.
Pursuant to the Management Agreement, the Fund pays the Manager a monthly fee for the services performed and facilities furnished at an annual rate of the Fund’s average daily net assets as follows: 0.55% up to $500 million; 0.525% from $500 million to $1 billion; and 0.50% on assets in excess of $1 billion. During the year ended October 31, 2020, the effective management fee rate was 0.55%.
New York Life Investments has agreed to voluntarily waive fees and/or reimburse expenses so that Total Annual Fund Operating Expenses (excluding taxes, interest, litigation, extraordinary expenses, brokerage and other transaction expenses relating to the purchase and sale of portfolio investments, and acquired (underlying) fund fees and expenses) of a class do not exceed the following percentages of average daily net assets: Investor Class, 1.85%; Class B, 2.60%; and Class C, 2.60%. These voluntary waivers or reimbursements may be discontinued at any time without notice.
During the year ended October 31, 2020, New York Life Investments earned fees from the Fund in the amount of $931,401 and waived fees and/or reimbursed expenses, including the waiver/reimbursement of certain class specific expenses in the amount of $2,211 and paid the Subadvisor in the amount of $464,595.
State Street provides sub-administration and sub-accounting services to the Fund pursuant to an agreement with New York Life Investments (See Note 13 for sub-administration and sub-accounting service provider change). These services include calculating the daily NAVs of the Fund, maintaining the general ledger and sub-ledger accounts for the calculation of the Fund’s NAVs and assisting New York Life Investments in conducting various aspects of the Fund’s administrative operations. For providing these services to the Fund, State Street is compensated by New York Life Investments.
Pursuant to an agreement between the Trust and New York Life Investments, New York Life Investments is responsible for providing or procuring certain regulatory reporting services for the Fund. The Fund will reimburse New York Life Investments for the actual costs incurred by New York Life Investments in connection with providing or procuring these services for the Fund.
(B) Distribution, Service and Shareholder Service Fees. The Trust, on behalf of the Fund, has entered into a distribution agreement with NYLIFE Distributors LLC (the “Distributor”), an affiliate of New York Life Investments. The Fund has adopted distribution plans (the “Plans”) in accordance with the provisions of Rule 12b-1 under the 1940 Act.
Pursuant to the Class A, Investor Class and Class R2 Plans, the Distributor receives a monthly distribution fee from the Class A, Investor Class and Class R2 shares at an annual rate of 0.25% of the average daily net assets of the Class A, Investor Class and Class R2 shares for distribution and/or service activities as designated by the Distributor. Pursuant to the Class B and Class C Plans, Class B and Class C shares pay the Distributor a monthly distribution fee at an annual rate of 0.75% of the average daily net assets of the Class B and Class C shares, along with a service fee at an annual rate of 0.25% of the average daily net assets of the Class B and Class C shares, for a total 12b-1 fee of 1.00%. Pursuant to the Class R3 Plan, Class R3 shares pay the Distributor a monthly fee at an annual rate of 0.25% of the average daily net assets of the Class R3 Shares, along with a service fee at an annual rate of 0.25% of the average daily net assets of the Class R3 shares, for a total 12b-1 fee of 0.50%. at an annual rate of 0.50% of the average daily net assets of the Class R3 shares. Class I shares are not subject to a distribution and/or service fee.
The Plans provide that the distribution and service fees are payable to the Distributor regardless of the amounts actually expended by the Distributor for distribution of the Fund’s shares and service activities.
In accordance with the Shareholder Services Plan for the Class R2 and Class R3 shares, the Manager has agreed to provide, through its affiliates or independent third parties, various shareholder and administrative support services to shareholders of the Class R2 and Class R3 shares. For its services, the Manager, its affiliates or independent third-party service providers are entitled to a shareholder service fee accrued daily and paid monthly at an annual rate of 0.10% of the average daily net assets of the Class R2 and Class R3 shares. This is in addition to any fees paid under the Class R2 and Class R3 Plans.
During the year ended October 31, 2020, shareholder service fees incurred by the Fund were as follows:
Notes to Financial Statements (continued)
(C) Sales Charges. The Fund was advised by the Distributor that the amount of initial sales charges retained on sales of Class A and Investor Class shares during the year ended October 31, 2020, were $8,918 and $6,162, respectively.
The Fund was also advised that the Distributor retained CDSCs on redemptions of Class A, Class B and Class C shares during the year ended October 31, 2020, of $203, $3,931 and $357, respectively.
(D) Transfer, Dividend Disbursing and Shareholder Servicing Agent. NYLIM Service Company LLC, an affiliate of New York Life Investments, is the Fund’s transfer, dividend disbursing and shareholder servicing agent pursuant to an agreement between NYLIM Service Company LLC and the Trust. NYLIM Service Company LLC has entered into an agreement with DST Asset Manager Solutions, Inc. (“DST”), pursuant to which DST performs certain transfer agent services on behalf of NYLIM Service Company LLC. New York Life Investments has contractually agreed to limit the transfer agency expenses charged to the Fund’s share classes to a maximum of 0.35% of that share class’s average daily net assets on an annual basis after deducting any applicable Fund or class-level expense reimbursement or small account fees. This agreement will remain in effect until February 28, 2021, and shall renew automatically for one-year terms unless New York Life Investments provides written notice of termination prior to the start of
the next term or upon approval of the Board. During the year ended October 31, 2020, transfer agent expenses incurred by the Fund and any reimbursements, pursuant to the aforementioned Transfer Agency expense limitation agreement, were as follows:
| | | | | | | | |
Class | | Expense | | | Waived | |
Class A | | $ | 28,658 | | | $ | — | |
Investor Class | | | 58,492 | | | | (1,186 | ) |
Class B | | | 14,924 | | | | (300 | ) |
Class C | | | 31,713 | | | | (725 | ) |
Class I | | | 34,045 | | | | — | |
Class R3 | | | 103 | | | | — | |
(E) Small Account Fee. Shareholders with small accounts adversely impact the cost of providing transfer agency services. In an effort to reduce total transfer agency expenses, the Fund has implemented a small account fee on certain types of accounts. As described in the Fund’s prospectus, certain shareholders with an account balance of less than $1,000 ($5,000 for Class A share accounts) are charged an annual per account fee of $20 (assessed semi-annually), the proceeds from which offset transfer agent fees as reflected in the Statement of Operations. This small account fee will not apply to certain types of accounts as described further in the Fund’s prospectus.
(F) Investments in Affiliates (in 000’s). During the year ended October 31, 2020, purchases and sales transactions, income earned from investments and shares held of investment companies managed by New York Life Investments or its affiliates were as follows:
| | | | | | | | | | | | | | | | | | | | | | | | | | | | | | | | | | | | |
Affiliated Investment Company | | Value,
Beginning of
Year | | | Purchases
at Cost | | | Proceeds
from Sales | | | Net
Realized
Gain/(Loss)
on Sales | | | Change in
Unrealized
Appreciation/
(Depreciation) | | | Value,
End of
Year | | | Dividend
Income | | | Other
Distributions | | | Shares
End of
Year | |
MainStay U.S. Government Liquidity Fund | | $ | 30 | | | $ | 7,782 | | | $ | (7,741 | ) | | $ | — | | | $ | — | | | $ | 71 | | | $ | 0 | (a) | | $ | — | | | | 71 | |
(G) Capital. As of October 31, 2020, New York Life and its affiliates beneficially held shares of the Fund with the values and percentages of net assets as follows:
Note 4–Federal Income Tax
As of October 31, 2020, the cost and unrealized appreciation (depreciation) of the Fund’s investment portfolio, including applicable derivative contracts and other financial instruments, as determined on a federal income tax basis, were as follows:
| | | | | | | | | | | | | | | | |
| | | Federal Tax
Cost | | | Gross
Unrealized
Appreciation | | | Gross
Unrealized
(Depreciation) | | | Net
Unrealized
Appreciation/
(Depreciation) | |
| | | | |
Investments
in Securities | | $ | 99,428,811 | | | $ | 29,863,605 | | | $ | (3,010,567 | ) | | $ | 26,853,038 | |
As of October 31, 2020, the components of accumulated gain (loss) on a tax basis were as follows:
| | | | | | | | |
Ordinary
Income | | Accumulated
Capital and
Other Gain
(Loss) | | Other
Temporary
Differences | | Unrealized
Appreciation
(Depreciation) | | Total
Accumulated
Gain (Loss) |
| | | | |
| $1,090,367 | | $(378,174) | | $ — | | $26,853,038 | | $27,565,231 |
The difference between book-basis and tax-basis unrealized appreciation (depreciation) is primarily due to wash sale adjustments.
As of October 31, 2020, for federal income tax purposes, capital loss carryforwards of $378,174 were available as shown in the table below, to the extent provided by the regulations to offset future realized gains of the Fund through the years indicated. To the extent that these capital loss carryforwards are used to offset future capital gains, it is probable that the capital gains so offset will not be distributed to shareholders. No capital gain distributions shall be made until any capital loss carryforwards have been fully utilized.
| | | | |
Capital Loss
Available Through | | Short-Term
Capital Loss
Amounts (000’s) | | Long-Term
Capital Loss
Amounts (000’s) |
| | |
| Unlimited | | $378 | | $ — |
| | |
| 24 | | MainStay MacKay Common Stock Fund |
During the years ended October 31, 2020, and October 31, 2019, the tax character of distributions paid as reflected in the Statements of Changes in Net Assets were as follows:
| | | | | | | | |
| | | 2020 | | | 2019 | |
| | |
Distributions paid from: | | | | | | | | |
Ordinary Income | | $ | 2,154,756 | | | $ | 8,124,295 | |
Long-Term Capital Gain | | | 9,535,910 | | | | 14,286,611 | |
Total | | $ | 11,690,666 | | | $ | 22,410,906 | |
Note 5–Custodian
State Street is the custodian of cash and securities held by the Fund (See Note 13 for custodian change). Custodial fees are charged to the Fund based on the Fund’s net assets and/or the market value of securities held by the Fund and the number of certain transactions incurred by the Fund.
Note 6–Line of Credit
The Fund and certain other funds managed by New York Life Investments maintain a line of credit with a syndicate of banks in order to secure a source of funds for temporary purposes to meet unanticipated or excessive redemption requests.
Effective July 28, 2020, under the credit agreement (the “Credit Agreement”), the aggregate commitment amount is $600,000,000 with an additional uncommitted amount of $100,000,000. The commitment fee is an annual rate of 0.15% of the average commitment amount payable quarterly, regardless of usage, to JPMorgan Chase Bank NA, who serves as the agent to the syndicate. The commitment fee is allocated among the Fund and certain other funds managed by New York Life Investments based upon their respective net assets and other factors. Interest on any revolving credit loan is charged based upon the Federal Funds Rate or the one-month London Interbank Offered Rate (“LIBOR”), whichever is higher. The Credit Agreement expires on July 27, 2021, although the Fund, certain other funds managed by New York Life Investments and the syndicate of banks may renew the Credit Agreement for an additional year on the same or different terms or enter into a credit agreement with a different syndicate of banks. Prior to July 28, 2020, the aggregate commitment amount and the commitment fee were the same as those under the current Credit Agreement, but State Street served as agent to the syndicate. During the year ended October 31, 2020, there were no borrowings made or outstanding with respect to the Fund under the Credit Agreement or the credit agreement for which State Street served as agent.
Note 7–Interfund Lending Program
Pursuant to an exemptive order issued by the SEC, the Fund, along with certain other funds managed by New York Life Investments, may participate in an interfund lending program. The interfund lending program provides an alternative credit facility that permits the Fund and certain other funds managed by New York Life Investments to lend or borrow money for temporary purposes directly to or from one another subject to the conditions of the exemptive order. During the year ended October 31, 2020, there were no interfund loans made or outstanding with respect to the Fund.
Note 8–Purchases and Sales of Securities (in 000’s)
During the year ended October 31, 2020, purchases and sales of securities, other than short-term securities, were $280,054 and $356,299, respectively.
Note 9–Capital Share Transactions
Transactions in capital shares for the years ended October 31, 2020, and October 31, 2019, were as follows:
| | | | | | | | |
Class A | | Shares | | | Amount | |
| | |
Year ended October 31, 2020: | | | | | | | | |
Shares sold | | | 371,300 | | | $ | 8,874,189 | |
Shares issued to shareholders in reinvestment of distributions | | | 157,411 | | | | 3,758,985 | |
Shares redeemed | | | (681,380 | ) | | | (16,032,818 | ) |
| | | | |
Net increase (decrease) in shares outstanding before conversion | | | (152,669 | ) | | | (3,399,644 | ) |
Shares converted into Class A (See Note 1) | | | 104,209 | | | | 2,571,686 | |
Shares converted from Class A (See Note 1) | | | (3,304 | ) | | | (71,354 | ) |
| | | | |
Net increase (decrease) | | | (51,764 | ) | | $ | (899,312 | ) |
| | | | |
Year ended October 31, 2019: | | | | | | | | |
Shares sold | | | 634,867 | | | $ | 15,446,282 | |
Shares issued to shareholders in reinvestment of distributions | | | 308,961 | | | | 7,090,652 | |
Shares redeemed | | | (864,519 | ) | | | (20,741,150 | ) |
| | | | |
Net increase (decrease) in shares outstanding before conversion | | | 79,309 | | | | 1,795,784 | |
Shares converted into Class A (See Note 1) | | | 77,193 | | | | 1,826,016 | |
Shares converted from Class A (See Note 1) | | | (25,769 | ) | | | (619,768 | ) |
| | | | |
Net increase (decrease) | | | 130,733 | | | $ | 3,002,032 | |
| | | | |
| | |
| | | | | | | | |
Investor Class | | Shares | | | Amount | |
| | |
Year ended October 31, 2020: | | | | | | | | |
Shares sold | | | 56,719 | | | $ | 1,340,955 | |
Shares issued to shareholders in reinvestment of distributions | | | 41,039 | | | | 981,666 | |
Shares redeemed | | | (95,721 | ) | | | (2,291,076 | ) |
| | | | |
Net increase (decrease) in shares outstanding before conversion | | | 2,037 | | | | 31,545 | |
Shares converted into Investor Class (See Note 1) | | | 16,201 | | | | 379,207 | |
Shares converted from Investor Class (See Note 1) | | | (85,403 | ) | | | (2,129,027 | ) |
| | | | |
Net increase (decrease) | | | (67,165 | ) | | $ | (1,718,275 | ) |
| | | | |
Year ended October 31, 2019: | | | | | | | | |
Shares sold | | | 208,041 | | | $ | 5,077,628 | |
Shares issued to shareholders in reinvestment of distributions | | | 78,698 | | | | 1,809,263 | |
Shares redeemed | | | (217,777 | ) | | | (5,309,122 | ) |
| | | | |
Net increase (decrease) in shares outstanding before conversion | | | 68,962 | | | | 1,577,769 | |
Shares converted into Investor Class (See Note 1) | | | 47,135 | | | | 1,116,052 | |
Shares converted from Investor Class (See Note 1) | | | (55,763 | ) | | | (1,323,068 | ) |
| | | | |
Net increase (decrease) | | | 60,334 | | | $ | 1,370,753 | |
| | | | |
|
| |
Notes to Financial Statements (continued)
| | | | | | | | |
Class B | | Shares | | | Amount | |
| | |
Year ended October 31, 2020: | | | | | | | | |
Shares sold | | | 10,544 | | | $ | 208,129 | |
Shares issued to shareholders in reinvestment of distributions | | | 11,381 | | | | 246,389 | |
Shares redeemed | | | (37,905 | ) | | | (829,164 | ) |
| | | | |
Net increase (decrease) in shares outstanding before conversion | | | (15,980 | ) | | | (374,646 | ) |
Shares converted from Class B (See Note 1) | | | (30,111 | ) | | | (643,112 | ) |
| | | | |
Net increase (decrease) | | | (46,091 | ) | | $ | (1,017,758 | ) |
| | | | |
Year ended October 31, 2019: | | | | | | | | |
Shares sold | | | 75,506 | | | $ | 1,687,776 | |
Shares issued to shareholders in reinvestment of distributions | | | 30,000 | | | | 627,606 | |
Shares redeemed | | | (111,007 | ) | | | (2,443,239 | ) |
| | | | |
Net increase (decrease) in shares outstanding before conversion | | | (5,501 | ) | | | (127,857 | ) |
Shares converted from Class B (See Note 1) | | | (28,333 | ) | | | (600,229 | ) |
| | | | |
Net increase (decrease) | | | (33,834 | ) | | $ | (728,086 | ) |
| | | | |
| | |
| | | | | | | | |
Class C | | Shares | | | Amount | |
| | |
Year ended October 31, 2020: | | | | | | | | |
Shares sold | | | 27,320 | | | $ | 517,704 | |
Shares issued to shareholders in reinvestment of distributions | | | 21,541 | | | | 465,937 | |
Shares redeemed | | | (234,136 | ) | | | (5,092,314 | ) |
| | | | |
Net increase (decrease) in shares outstanding before conversion | | | (185,275 | ) | | | (4,108,673 | ) |
Shares converted from Class C (See Note 1) | | | (4,980 | ) | | | (107,400 | ) |
| | | | |
Net increase (decrease) | | | (190,255 | ) | | $ | (4,216,073 | ) |
| | | | |
Year ended October 31, 2019: | | | | | | | | |
Shares sold | | | 84,098 | | | $ | 1,779,072 | |
Shares issued to shareholders in reinvestment of distributions | | | 65,052 | | | | 1,359,589 | |
Shares redeemed | | | (266,298 | ) | | | (5,719,806 | ) |
| | | | |
Net increase (decrease) in shares outstanding before conversion | | | (117,148 | ) | | | (2,581,145 | ) |
Shares converted from Class C (See Note 1) | | | (18,800 | ) | | | (399,003 | ) |
| | | | |
Net increase (decrease) | | | (135,948 | ) | | $ | (2,980,148 | ) |
| | | | |
|
| |
Class I | | Shares | | | Amount | |
| | |
Year ended October 31, 2020: | | | | | | | | |
Shares sold | | | 209,862 | | | $ | 4,279,265 | |
Shares issued to shareholders in reinvestment of distributions | | | 252,734 | | | | 6,052,970 | |
Shares redeemed | | | (2,876,895 | ) | | | (68,274,019 | ) |
| | | | |
Net increase (decrease) | | | (2,414,299 | ) | | $ | (57,941,784 | ) |
| | | | |
Year ended October 31, 2019: | | | | | | | | |
Shares sold | | | 1,781,608 | | | $ | 42,155,132 | |
Shares issued to shareholders in reinvestment of distributions | | | 480,594 | | | | 11,063,276 | |
Shares redeemed | | | (2,074,881 | ) | | | (49,216,070 | ) |
| | | | |
Net increase (decrease) | | | 187,321 | | | $ | 4,002,338 | |
| | | | |
| | |
| | | | | | | | |
| | | | | | | | |
Class R3 | | Shares | | | Amount | |
| | |
Year ended October 31, 2020: | | | | | | | | |
Shares sold | | | 2,143 | | | $ | 50,963 | |
Shares issued to shareholders in reinvestment of distributions | | | 422 | | | | 10,034 | |
Shares redeemed | | | (3,390 | ) | | | (77,895 | ) |
| | | | |
Net increase (decrease) | | | (825 | ) | | $ | (16,898 | ) |
| | | | |
Year ended October 31, 2019: | | | | | | | | |
Shares sold | | | 4,060 | | | $ | 95,894 | |
Shares issued to shareholders in reinvestment of distributions | | | 419 | | | | 9,593 | |
Shares redeemed | | | (531 | ) | | | (12,326 | ) |
| | | | |
Net increase (decrease) | | | 3,948 | | | $ | 93,161 | |
| | | | |
Note 10–Litigation
The Fund has been named as a defendant in the case entitled Kirschner v. FitzSimons, No. 12-2652 (S.D.N.Y.) (the “FitzSimons action”) as a result of its ownership of shares in the Tribune Company (“Tribune”) in 2007 when Tribune effected a leveraged buyout transaction (“LBO”) by which Tribune converted to a privately-held company. In its complaint, the plaintiff asserts claims against certain insiders, shareholders, professional advisers, and others involved in the LBO. Separately, the complaint also seeks to obtain from former Tribune shareholders, including the Fund, any proceeds they received in connection with the LBO. The sole claim and cause of action brought against the Fund is for fraudulent conveyance pursuant to United States Bankruptcy Code Section 548(a)(1)(A).
In June 2011, certain Tribune creditors filed numerous additional actions asserting state law constructive fraudulent conveyance claims (the “SLCFC actions”) against specifically-named former Tribune shareholders and, in some cases, putative defendant classes comprised of former Tribune shareholders. One of the SLCFC actions, entitled Deutsche Bank Trust Co. Americas v. Blackrock Institutional Trust Co., No. 11-9319 (S.D.N.Y.) (the “Deutsche Bank action”), named the Fund as a defendant.
The FitzSimons action and Deutsche Bank action have been consolidated with the majority of the other Tribune LBO-related lawsuits in a multidistrict litigation proceeding entitled In re Tribune Co. Fraudulent Conveyance Litig., No. 11-md-2296 (S.D.N.Y.) (the “MDL Proceeding”).
On September 23, 2013, the District Court granted the defendants’ motion to dismiss the SLCFC actions, including the Deutsche Bank action, on the basis that the plaintiffs did not have standing to pursue their claims. On September 30, 2013, the plaintiffs in the SLCFC actions filed a notice of appeal to the United States Court of Appeals for the Second Circuit. On October 28, 2013, the defendants filed a joint notice of cross-appeal of that same order. On November 5, 2014, the Second Circuit Court of Appeals held an oral argument on appeal. On March 29, 2016, the United States Court of Appeals for the Second Circuit issued its opinion on the appeal of the SLCFC actions. The appeals court affirmed the District Court’s dismissal of those lawsuits, but on different grounds than the District Court. The appeals court held that while the plaintiffs have standing under the U.S. Bankruptcy Code, their claims were preempted by Section 546(e) of the Bankruptcy Code—the statutory safe harbor for settlement payments. On April 12, 2016, the plaintiffs in the SLCFC actions filed a petition seeking rehearing en banc
| | |
| 26 | | MainStay MacKay Common Stock Fund |
before the appeals court. On July 22, 2016, the appeals court denied the petition. On September 9, 2016, the plaintiffs filed a petition for writ of certiorari in the U.S. Supreme Court challenging the Second Circuit’s decision that the safe harbor of Section 546(e) applied to their claims. Certain shareholder defendants filed a joint brief in opposition to the petition for certiorari on October 24, 2016. The plaintiffs filed a reply in support of the petition on November 4, 2016. On April 3, 2018, Justice Kennedy and Justice Thomas issued a “Statement” related to the petition for certiorari suggesting that the Second Circuit and/or District Court may want to take steps to reexamine the application of the Section 546(e) safe harbor to the previously dismissed state law constructive fraudulent transfer claims based on the Supreme Court’s decision in Merit Management Group LP v. FTI Consulting, Inc. On April 10, 2018, the plaintiffs filed in the Second Circuit a motion for that court to recall its mandate, vacate its prior decision, and remand to the District Court for further proceedings consistent with Merit Management. On April 20, 2018, the shareholder defendants filed a response to the plaintiffs’ motion to recall the mandate. On May 15, 2018, the Second Circuit issued an order recalling the mandate “in anticipation of further panel review.” On December 19, 2019, the Second Circuit issued an amended opinion that again affirmed the district court’s ruling on the basis that plaintiffs’ claims were preempted by Section 546(e) of the Bankruptcy Code. Plaintiffs filed a motion for rehearing and rehearing en banc on January 2, 2020, which was denied on February 6, 2020. Plaintiffs filed a new petition for certiorari with the Supreme Court on July 6, 2020. In that petition, plaintiffs stated that “[t]o make it more likely that there will be a quorum for this petition,” they have “abandon[ed] the case and let the judgment below stand” with respect to certain defendants. That list did not include the Fund. Defendants filed an opposition to the certiorari petition on August 26, 2020.
On August 2, 2013, the plaintiff in the FitzSimons action filed a Fifth Amended Complaint. On May 23, 2014, the defendants filed motions to dismiss the FitzSimons action, including a global motion to dismiss Count I, which is the claim brought against former Tribune shareholders for intentional fraudulent conveyance under U.S. federal law. On January 6, 2017, the United States District Court for the Southern District of New York granted the shareholder defendants’ motion to dismiss the intentional fraudulent conveyance claim in the FitzSimons action. In dismissing the intentional fraudulent conveyance claim, the Court denied the plaintiff’s request to amend the complaint. The Court’s order is not immediately appealable, but the plaintiff has asked the Court to direct entry of a final judgment in order to make the order immediately appealable. On February 23, 2017, the Court issued an order stating that it intends to permit an interlocutory appeal of the dismissal order, but will wait to do so until it has resolved outstanding motions to dismiss filed by other defendants.
On July 18, 2017, the plaintiff submitted a letter to the District Court seeking leave to amend its complaint to add a constructive fraudulent transfer claim. The shareholder defendants opposed that request.
On August 24, 2017, the Court denied the plaintiff’s request without prejudice to renewal of the request in the event of an intervening change in the law. On March 8, 2018, plaintiff renewed the request for leave to file a motion to amend the complaint to assert a constructive fraudulent transfer claim based on the Supreme Court’s ruling in Merit Management. The shareholder defendants opposed that request. On
June 18, 2018, the District Court ordered that the request would be stayed pending further action by the Second Circuit in the still-pending appeal, discussed above. On December 18, 2018, the plaintiff filed a letter with the District Court requesting that the stay be dissolved in order to permit briefing on the motion to amend the complaint and indicating the plaintiff’s intention to file another motion to amend the complaint to reinstate claims for intentional fraudulent transfer. The shareholder defendants opposed that request. On January 14, 2019, the Court held a case management conference, during which the Court stated that it would not lift the stay prior to further action from the Second Circuit. The Court stated that it would allow the plaintiff to file a motion to amend to try to reinstate its intentional fraudulent transfer claim. On January 23, 2019, the Court ordered the parties still facing pending claims to participate in a mediation. On March 27, 2019, the Court held a telephone conference and decided to allow the plaintiff to file a motion for leave to amend. On April 4, 2019, the plaintiff filed a motion to amend the Fifth Amended Complaint to assert a federal constructive fraudulent transfer claim against certain shareholder defendants. On April 10, 2019, the shareholders’ defendants filed a brief in opposition to the plaintiff’s motion to amend. On April 12, 2019, the plaintiff filed a reply brief. The Court denied leave to amend the complaint on April 23, 2019. On June 13, 2019, the Court entered judgment pursuant to Rule 54(b), which would permit an appeal of the Court’s dismissal of the claim against the shareholder defendants. On July 15, 2019, the Trustee filed a notice of appeal to the Second Circuit. Appellant filed his brief on January 7, 2020. The shareholder defendants filed an opposition brief on April 27, 2020, and Appellant filed a reply brief on May 18, 2020. The Court held oral argument on August 24, 2020. In addition, the District Court has entered two bar orders in connection with the plaintiff’s settlement with certain non-shareholder defendants. The orders bar claims against the settling defendants, but contain a judgment reduction provision that preserves the value of any potential claim by a shareholder defendant against a settling defendant. Specifically, the judgment reduction provision reduces the amount of money recoverable against a shareholder defendant to the extent the shareholder defendant could have recovered on a claim against a settling defendant.
The value of the proceeds received by the Fund in connection with the LBO and the Fund’s cost basis in shares of Tribune was as follows:
| | | | | | | | |
Fund | | Proceeds | | | Cost Basis | |
MainStay MacKay Common Stock Fund | | $ | 751,774 | | | $ | 729,369 | |
At this stage of the proceedings, the Fund does not believe a loss is probable; however, it is difficult to assess with any reasonable certainty the outcome of the pending litigation or the effect, if any, on the Fund’s net asset value.
Note 11–Recent Accounting Pronouncement
To improve the effectiveness of fair value disclosure requirements, the Financial Accounting Standards Board issued Accounting Standards Update 2018-13, Fair Value Measurement Disclosure Framework— Changes to the Disclosure Requirements for Fair Value Measurement (“ASU 2018-13”), which adds, removes, and modifies certain fair value measurement disclosure requirements. ASU 2018-13 is effective for interim and annual reporting periods beginning after December 15,
Notes to Financial Statements (continued)
2019. The Manager evaluated the implications of certain provisions of ASU 2018-13 and determined to early adopt aspects related to the removal and modifications of certain fair value measurement disclosures, which are currently in place as of October 31, 2020. The Manager is evaluating the implications of certain other provisions of ASU 2018-13 related to new disclosure requirements and has not yet determined the impact of those provisions on the financial statement disclosures, if any.
In March 2020, the Financial Accounting Standards Board (“FASB”) issued Accounting Standards Update 2020-04 (“ASU 2020-04”), which provides optional guidance to ease the potential accounting burden associated with transitioning away from LIBOR and other reference rates that are expected to be discontinued. ASU 2020-04 is effective immediately upon release of the update on March 12, 2020, through December 31, 2022. At this time, the Manager is evaluating the implications of certain other provisions of ASU 2020-04 related to new disclosure requirements and any impact on the financial statement disclosures has not yet been determined.
Note 12–Other Matters
An outbreak of COVID-19, first detected in December 2019, has developed into a global pandemic and has resulted in travel restrictions,
closure of international borders, certain businesses and securities markets, restrictions on securities trading activities, prolonged quarantines, supply chain disruptions, and lower consumer demand, as well as general concern and uncertainty. The continued impact of COVID-19 is uncertain and could further adversely affect the global economy, national economies, individual issuers and capital markets in unforeseeable ways and result in a substantial and extended economic downturn. Developments that disrupt global economies and financial markets, such as COVID-19, may magnify factors that affect the Fund’s performance.
Note 13–Subsequent Events
In connection with the preparation of the financial statements of the Fund as of and for the year ended October 31, 2020, events and transactions subsequent to October 31, 2020, through the date the financial statements were issued have been evaluated by the Manager, for possible adjustment and/or disclosure. No subsequent events requiring financial statement adjustment or disclosure have been identified other than the following:
Effective at the close of business on November 20, 2020, all services provided by State Street were transitioned to JPMorgan Chase Bank, N.A.
| | |
| 28 | | MainStay MacKay Common Stock Fund |
Report of Independent Registered Public Accounting Firm
To the Shareholders of the Fund and Board of Trustees
The MainStay Funds:
Opinion on the Financial Statements
We have audited the accompanying statement of assets and liabilities of MainStay MacKay Common Stock Fund (the Fund), one of the funds constituting The MainStay Funds, including the portfolio of investments, as of October 31, 2020, the related statement of operations for the year then ended, the statements of changes in net assets for each of the years in the two-year period then ended, and the related notes (collectively, the financial statements) and the financial highlights for each of the years or periods in the five-year period then ended. In our opinion, the financial statements and financial highlights present fairly, in all material respects, the financial position of the Fund as of October 31, 2020, the results of its operations for the year then ended, the changes in its net assets for each of the years in the two-year period then ended, and the financial highlights for each of the years or periods in the five-year period then ended, in conformity with U.S. generally accepted accounting principles.
Basis for Opinion
These financial statements and financial highlights are the responsibility of the Fund’s management. Our responsibility is to express an opinion on these financial statements and financial highlights based on our audits. We are a public accounting firm registered with the Public Company Accounting Oversight Board (United States) (PCAOB) and are required to be independent with respect to the Fund in accordance with the U.S. federal securities laws and the applicable rules and regulations of the Securities and Exchange Commission and the PCAOB.
We conducted our audits in accordance with the standards of the PCAOB. Those standards require that we plan and perform the audit to obtain reasonable assurance about whether the financial statements and financial highlights are free of material misstatement, whether due to error or fraud. Our audits included performing procedures to assess the risks of material misstatement of the financial statements and financial highlights, whether due to error or fraud, and performing procedures that respond to those risks. Such procedures included examining, on a test basis, evidence regarding the amounts and disclosures in the financial statements and financial highlights. Such procedures also included confirmation of securities owned as of October 31, 2020, by correspondence with the custodian, the transfer agent, and brokers or by other appropriate auditing procedures when replies from brokers were not received. Our audits also included evaluating the accounting principles used and significant estimates made by management, as well as evaluating the overall presentation of the financial statements and financial highlights. We believe that our audits provide a reasonable basis for our opinion.

We have served as the auditor of one or more New York Life Investment Management investment companies since 2003.
Philadelphia, Pennsylvania
December 23, 2020
Federal Income Tax Information
(Unaudited)
The Fund is required under the Internal Revenue Code to advise shareholders in a written statement as to the federal tax status of dividends paid by the Fund during such fiscal years. Accordingly, the Fund paid $9,528,946 as long term capital gain distributions.
For the fiscal year ended October 31, 2020, the Fund designated approximately $2,154,756 under the Internal Revenue Code as qualified dividend income eligible for reduced tax rates.
The dividends paid by the Fund during the fiscal year ended October 31, 2020 should be multiplied by 100.00% to arrive at the amount eligible for the corporate dividend-received deduction.
In February 2021, shareholders will receive an IRS Form 1099-DIV or substitute Form 1099, which will show the federal tax status of the distributions received by shareholders in calendar year 2020. The amounts that will be reported on such 1099-DIV or substitute Form 1099 will be the amounts you are to use on your federal income tax return and will differ from the amounts reported for the Fund’s fiscal year ended October 31, 2020.
Proxy Voting Policies and Procedures and Proxy Voting Record
A description of the policies and procedures that New York Life Investments uses to vote proxies related to the Fund’s securities is available free of charge upon request, by visiting the MainStay Funds’ website at newyorklifeinvestments.com or visiting the SEC’s website at www.sec.gov.
The Fund is required to file with the SEC its proxy voting records for the 12-month period ending June 30 on Form N-PX. The most recent Form N-PX or proxy voting record is available free of charge upon request by calling 800-624-6782; visiting the MainStay Funds’ website at newyorklifeinvestments.com; or visiting the SEC’s website at www.sec.gov.
Shareholder Reports and Quarterly Portfolio Disclosure
The Fund is required to file its complete schedule of portfolio holdings with the SEC 60 days after its first and third fiscal quarter on Form N-PORT. The Fund’s holdings report is available free of charge by visiting the SEC’s website at www.sec.gov or upon request by calling New York Life Investments at 800-624-6782.
| | |
| 30 | | MainStay MacKay Common Stock Fund |
Board of Trustees and Officers (Unaudited)
The Trustees and officers of the Funds are listed below. The Board oversees the MainStay Group of Funds (which consists of MainStay Funds and MainStay Funds Trust), MainStay VP Funds Trust, MainStay MacKay DefinedTerm Municipal Opportunities Fund, the Manager and the Subadvisors, and elects the officers of the Funds who are responsible for the day-to-day operations of the Funds. Information pertaining to the Trustees and officers is set forth below. Each Trustee serves until his or her successor is elected and qualified or until his or her
resignation, death or removal. Under the Board’s retirement policy, unless an exception is made, a Trustee must tender his or her resignation by the end of the calendar year during which he or she reaches the age of 75. Officers are elected annually by the Board. The business address of each Trustee and officer listed below is 51 Madison Avenue, New York, New York 10010. A majority of the Trustees are not “interested persons” (as defined by the 1940 Act and rules adopted by the SEC thereunder) of the Fund (“Independent Trustees”).
| | | | | | | | | | | | |
| | | | | Name and
Year of Birth | | Term of Office,
Position(s) Held and
Length of Service | | Principal Occupation(s)
During Past Five Years | | Number of
Portfolios in
Fund Complex
Overseen by
Trustee | | Other Directorships
Held by Trustee |
Interested Trustee | | | | Yie-Hsin Hung* 1962 | | MainStay Funds:
Trustee since 2017 MainStay Funds Trust:
Trustee since 2017 | | Senior Vice President of New York Life since joining in 2010, Member of the Executive Management Committee since 2017, Chief Executive Officer, New York Life Investment Management Holdings LLC & New York Life Investment Management LLC since 2015. Senior Managing Director and Co-President of New York Life Investment Management LLC from 2014 to May 2015. Previously held positions of increasing responsibility, including head of NYLIM International, Alternative Growth Businesses, and Institutional investments since joining New York Life in 2010. | | 78 | | MainStay VP Funds Trust:
Trustee since 2017 (31 portfolios); and
MainStay MacKay DefinedTerm Municipal Opportunities Fund: Trustee since 2017. |
| | * | This Trustee is considered to be an “interested person” of the MainStay Group of Funds, MainStay VP Funds Trust and MainStay MacKay DefinedTerm Municipal Opportunities Fund, within the meaning of the 1940 Act because of her affiliation with New York Life Insurance Company, New York Life Investment Management LLC, Candriam Belgium S.A., Candriam Luxembourg S.C.A., IndexIQ Advisors LLC, MacKay Shields LLC, NYL Investors LLC, NYLIFE Securities LLC and/or NYLIFE Distributors LLC, as described in detail above in the column entitled “Principal Occupation(s) During Past Five Years.” |
Board of Trustees and Officers (Unaudited) (continued)
| | | | | | | | | | | | |
| | | | | Name and
Year of Birth | | Term of Office,
Position(s) Held and
Length of Service | | Principal Occupation(s)
During Past Five Years | | Number of
Portfolios in
Fund Complex
Overseen by
Trustee | | Other Directorships
Held by Trustee |
Independent Trustees | | | | David H. Chow 1957 | | MainStay Funds:
Trustee since 2016, Advisory Board Member (June 2015 to December 2015); MainStay Funds Trust:
Trustee since 2016, Advisory Board Member (June 2015 to December 2015). | | Founder and CEO, DanCourt Management, LLC since 1999 | | 78 | | MainStay VP Funds Trust: Trustee since 2016, Advisory Board Member (June 2015 to December 2015) (31 portfolios);
MainStay MacKay DefinedTerm Municipal Opportunities Fund: Trustee since 2016, Advisory Board Member (June 2015 to December 2015); Market Vectors Group of Exchange-Traded Funds: Independent Chairman of the Board of Trustees since 2008 and Trustee since 2006 (56 portfolios); and
Berea College of Kentucky: Trustee since 2009, Chair of the Investment Committee since 2018. |
| | | | Susan B. Kerley 1951 | | MainStay Funds:
Chairman since 2017 and Trustee since 2007; MainStay Funds Trust: Chairman since 2017 and Trustee since 1990.** | | President, Strategic Management Advisors LLC since 1990 | | 78 | | MainStay VP Funds Trust: Chairman since 2017 and Trustee since 2007 (31 portfolios)***;
MainStay MacKay DefinedTerm Municipal Opportunities Fund: Chairman since 2017 and Trustee since 2011; and
Legg Mason Partners Funds: Trustee since 1991 (45 portfolios). |
| | | | Alan R. Latshaw 1951 | | MainStay Funds:
Trustee; MainStay Funds Trust:
Trustee and Audit Committee Financial Expert since 2007.** | | Retired; Partner, Ernst & Young LLP (2002 to 2003); Partner, Arthur Andersen LLP (1989 to 2002); Consultant to the MainStay Funds Audit and Compliance Committee (2004 to 2006) | | 78 | | MainStay VP Funds Trust: Trustee and Audit Committee Financial Expert since 2007 (31 portfolios)***;
MainStay MacKay DefinedTerm Municipal Opportunities Fund: Trustee and Audit Committee Financial Expert since 2011; and
State Farm Associates Funds Trusts: Trustee since 2005 (4 portfolios). |
| | | | Richard H. Nolan, Jr. 1946 | | MainStay Funds:
Trustee since 2007; MainStay Funds Trust:
Trustee since 2007.** | | Managing Director, ICC Capital Management since 2004; President—Shields/Alliance, Alliance Capital Management (1994 to 2004) | | 78 | | MainStay VP Funds Trust: Trustee since 2006 (31 portfolios)***; and
MainStay MacKay DefinedTerm Municipal Opportunities Fund: Trustee since 2011. |
| | | | Jacques P. Perold 1958 | | MainStay Funds:
Trustee since 2016, Advisory Board Member (June 2015 to December 2015); MainStay Funds Trust:
Trustee since 2016, Advisory Board Member (June 2015 to December 2015). | | Founder and Chief Executive Officer, CapShift LLC since 2018; President, Fidelity Management & Research Company (2009 to 2014); Founder, President and Chief Executive Officer, Geode Capital Management, LLC (2001 to 2009) | | 78 | | MainStay VP Funds Trust: Trustee since 2016, Advisory Board Member (June 2015 to December 2015) (31 portfolios);
MainStay MacKay DefinedTerm Municipal Opportunities Fund: Trustee since 2016, Advisory Board Member (June 2015 to December 2015); Partners in Health: Trustee since 2019; Allstate Corporation: Director since 2015;
MSCI, Inc.: and Director since 2017. |
| | |
| 32 | | MainStay MacKay Common Stock Fund |
| | | | | | | | | | | | |
| | | | | Name and
Year of Birth | | Term of Office,
Position(s) Held and
Length of Service | | Principal Occupation(s)
During Past Five Years | | Number of
Portfolios in
Fund Complex
Overseen by
Trustee | | Other Directorships
Held by Trustee |
Independent Trustees | | | | Richard S. Trutanic 1952 | | MainStay Funds: Trustee since 1994; MainStay Funds Trust: Trustee since 2007.** | | Chairman and Chief Executive Officer, Somerset & Company (financial advisory firm) since 2004; Managing Director, The Carlyle Group (private investment firm) (2002 to 2004); Senior Managing Director, Partner and Board Member, Groupe Arnault S.A. (private investment firm) (1999 to 2002) | | 78 | | MainStay VP Funds Trust: Trustee since 2007 (31 portfolios)***; and
MainStay MacKay DefinedTerm Municipal Opportunities Fund: Trustee since 2011. |
| | ** | Includes prior service as a Director/Trustee of certain predecessor entities to MainStay Funds Trust. |
| | *** | Includes prior service as a Director of MainStay VP Series Fund, Inc., the predecessor to MainStay VP Funds Trust. |
Board of Trustees and Officers (Unaudited) (continued)
| | | | | | | | |
| | | | | Name and
Year of Birth | | Position(s) Held and
Length of Service | | Principal Occupation(s)
During Past Five Years |
Officers
of the
Trust
(Who are
not
Trustees)* | | | | Kirk C. Lehneis 1974 | | President, MainStay Funds, MainStay Funds Trust since 2017 | | Chief Operating Officer and Senior Managing Director since 2016, New York Life Investment Management LLC and New York Life Investment Management Holdings LLC; Member of the Board of Managers since 2017 and Senior Managing Director since 2018, NYLIFE Distributors LLC; Chairman of the Board and Senior Managing Director, NYLIM Service Company LLC since 2017; Trustee, President and Principal Executive Officer of IndexIQ Trust, IndexIQ ETF Trust and IndexIQ Active ETF Trust since 2018; President, MainStay MacKay DefinedTerm Municipal Opportunities Fund and MainStay VP Funds Trust since 2017**; Senior Managing Director, Global Product Development (2015 to 2016); Managing Director, Product Development (2010 to 2015), New York Life Investment Management LLC |
| | | | Jack R. Benintende 1964 | | Treasurer and Principal Financial and Accounting Officer, MainStay Funds since 2007, MainStay Funds Trust since 2009 | | Managing Director, New York Life Investment Management LLC since 2007; Treasurer and Principal Financial and Accounting Officer, MainStay MacKay DefinedTerm Municipal Opportunities Fund since 2011 and MainStay VP Funds Trust since 2007**; and Assistant Treasurer, New York Life Investment Management Holdings LLC (2008 to 2012) |
| | | | Yi-Chia Kuo 1981 | | Vice President and Chief Compliance Officer, MainStay Funds and MainStay Funds Trust since January 2020 | | Chief Compliance Officer, Index IQ Trust, Index IQ ETF Trust and Index IQ Active ETF Trust since January 2020; Vice President and Chief Compliance Officer, MainStay MacKay DefinedTerm Municipal Opportunities Fund and MainStay VP Funds Trust since January 2020; Director and Associate General Counsel, New York Life Insurance Company (2015 to 2019) |
| | | | J. Kevin Gao 1967 | | Secretary and Chief Legal Officer, MainStay Funds and MainStay Funds Trust since 2010 | | Managing Director and Associate General Counsel, New York Life Investment Management LLC since 2010; Secretary and Chief Legal Officer, MainStay MacKay DefinedTerm Municipal Opportunities Fund since 2011 and MainStay VP Funds Trust since 2010** |
| | | | Scott T. Harrington 1959 | | Vice President— Administration, MainStay Funds since 2005, MainStay Funds Trust since 2009 | | Managing Director, New York Life Investment Management LLC (including predecessor advisory organizations) since 2000; Member of the Board of Directors, New York Life Trust Company since 2009; Vice President—Administration, MainStay MacKay DefinedTerm Municipal Opportunities Fund since 2011 and MainStay VP Funds Trust since 2005** |
| | * | The officers listed above are considered to be “interested persons” of the MainStay Group of Funds, MainStay VP Funds Trust and MainStay MacKay DefinedTerm Municipal Opportunities Fund within the meaning of the 1940 Act because of their affiliation with the MainStay Group of Funds, New York Life Insurance Company and/or its affiliates, including New York Life Investment Management LLC, NYLIM Service Company LLC, NYLIFE Securities LLC and/or NYLIFE Distributors LLC, as described in detail in the column captioned “Principal Occupation(s) During Past Five Years.” Officers are elected annually by the Board. |
| | ** | Includes prior service as an Officer of MainStay VP Series Fund, Inc., the predecessor to MainStay VP Funds Trust. |
| | |
| 34 | | MainStay MacKay Common Stock Fund |
MainStay Funds
Equity
U.S. Equity
MainStay Epoch U.S. All Cap Fund
MainStay Epoch U.S. Equity Yield Fund
MainStay MacKay Common Stock Fund
MainStay MacKay Growth Fund
MainStay MacKay S&P 500 Index Fund
MainStay MacKay Small Cap Core Fund
MainStay MacKay U.S. Equity Opportunities Fund
MainStay MAP Equity Fund
MainStay Winslow Large Cap Growth Fund1
International Equity
MainStay Epoch International Choice Fund
MainStay MacKay International Equity Fund
MainStay MacKay International Opportunities Fund
Emerging Markets Equity
MainStay Candriam Emerging Markets Equity Fund
Global Equity
MainStay Epoch Capital Growth Fund
MainStay Epoch Global Equity Yield Fund
Fixed Income
Taxable Income
MainStay Candriam Emerging Markets Debt Fund
MainStay Floating Rate Fund
MainStay MacKay High Yield Corporate Bond Fund
MainStay MacKay Short Duration High Yield Fund
MainStay MacKay Total Return Bond Fund
MainStay MacKay Unconstrained Bond Fund
MainStay MacKay U.S. Infrastructure Bond Fund2
MainStay Short Term Bond Fund3
Tax-Exempt Income
MainStay MacKay California Tax Free Opportunities Fund4
MainStay MacKay High Yield Municipal Bond Fund
MainStay MacKay Intermediate Tax Free Bond Fund
MainStay MacKay New York Tax Free Opportunities Fund5
MainStay MacKay Short Term Municipal Fund
MainStay MacKay Tax Free Bond Fund
Money Market
MainStay Money Market Fund
Mixed Asset
MainStay Balanced Fund
MainStay Income Builder Fund
MainStay MacKay Convertible Fund
Speciality
MainStay CBRE Global Infrastructure Fund
MainStay CBRE Real Estate Fund
MainStay Cushing MLP Premier Fund
Asset Allocation
MainStay Conservative Allocation Fund
MainStay Conservative ETF Allocation Fund
MainStay Defensive ETF Allocation Fund
MainStay Equity Allocation Fund6
MainStay Equity ETF Allocation Fund
MainStay Growth Allocation Fund7
MainStay Growth ETF Allocation Fund
MainStay Moderate Allocation Fund
MainStay Moderate ETF Allocation Fund
Manager
New York Life Investment Management LLC
New York, New York
Subadvisors
Candriam Belgium S.A.8
Brussels, Belgium
Candriam Luxembourg S.C.A.8
Strassen, Luxembourg
CBRE Clarion Securities LLC
Radnor, Pennsylvania
Cushing Asset Management, LP
Dallas, Texas
Epoch Investment Partners, Inc.
New York, New York
MacKay Shields LLC8
New York, New York
Markston International LLC
White Plains, New York
NYL Investors LLC8
New York, New York
Winslow Capital Management, LLC
Minneapolis, Minnesota
Legal Counsel
Dechert LLP
Washington, District of Columbia
Independent Registered Public Accounting Firm
KPMG LLP
Philadelphia, Pennsylvania
Distributor
NYLIFE Distributors LLC8
Jersey City, New Jersey
Custodian9
State Street Bank and Trust Company
Boston, Massachusetts
| 1. | Formerly known as MainStay Large Cap Growth Fund. |
| 2. | Formerly known as MainStay MacKay Infrastructure Bond Fund. |
| 3. | Formerly known as MainStay Indexed Bond Fund. |
| 4. | This Fund is registered for sale in AZ, CA, NV, OR, TX, UT and WA. Class A and Class I shares are registered for sale in MI. Class I and Class C2 shares are registered for sale in CO, FL, GA, HI, ID, MA, MD, NH, NJ and NY. |
| 5. | This Fund is registered for sale in CA, CT, DE, FL, MA, NJ, NY and VT. |
| 6. | Formerly known as MainStay Growth Allocation Fund. |
| 7. | Formerly known as MainStay Moderate Growth Allocation Fund. |
| 8. | An affiliate of New York Life Investment Management LLC. |
| 9. | JPMorgan Chase Bank, N.A., New York, New York is the custodian for the MainStay ETF Asset Allocation Funds and effective at the close of business on November 20, 2020, became the custodian for other MainStay Funds. The custodian for MainStay Cushing MLP Premier Fund is U.S. Bank National Association, Milwaukee, Wisconsin. |
Not part of the Annual Report
For more information
800-624-6782
newyorklifeinvestments.com
“New York Life Investments” is both a service mark, and the common trade name, of certain investment advisors affiliated with New York Life Insurance Company. The MainStay Funds® are managed by New York Life Investment Management LLC and distributed by NYLIFE Distributors LLC, 30 Hudson Street, Jersey City, NJ 07302, a wholly owned subsidiary of New York Life Insurance Company. NYLIFE Distributors LLC is a Member FINRA/SIPC.
©2020 NYLIFE Distributors LLC. All rights reserved.
| | |
| 1716826 MS203-20 | | MSCS11-12/20 (NYLIM) NL219 |
MainStay MacKay Convertible Fund
Message from the President and Annual Report
October 31, 2020
Beginning on January 1, 2021, paper copies of each MainStay Fund’s annual and semiannual shareholder reports will no longer be sent by mail, unless you specifically request paper copies of the reports from MainStay Funds or from your financial intermediary. Instead, the reports will be made available on the MainStay Funds’ website. You will be notified by mail and provided with a website address to access the report each time a new report is posted to the website.
If you already elected to receive shareholder reports electronically, you will not be affected by this change and you need not take any action. At any time, you may elect to receive reports and other communications from MainStay Funds electronically by calling toll-free 800-624-6782, by sending an e-mail to MainStayShareholderServices@nylim.com, or by contacting your financial intermediary.
You may elect to receive all future shareholder reports in paper form free of charge. If you hold shares of a MainStay Fund directly, you can inform MainStay Funds that you wish to receive paper copies of reports by calling toll-free 800-624-6782 or by sending an e-mail to MainStayShareholderServices@nylim.com. If you hold shares of a MainStay Fund through a financial intermediary, please contact the financial intermediary to make this election. Your election to receive reports in paper form will apply to all MainStay Funds in which you are invested and may apply to all funds held with your financial intermediary.
| | | | | | | | |
| Not FDIC/NCUA Insured | | Not a Deposit | | May Lose Value | | No Bank Guarantee | | Not Insured by Any Government Agency |

This page intentionally left blank
Message from the President
Despite historically high levels of volatility generated by the global coronavirus pandemic and a host of other geopolitical and economic uncertainties, most broad U.S. stock and bond markets gained ground during the 12-month reporting period ended October 31, 2020.
The reporting period began on an upswing, with markets rising on generally positive underlying economic trends and the announcement of a U.S.-China trade deal. However, in mid-February 2020, stock and bond indices began to dip as growing numbers of COVID-19 cases appeared in hotspots around the world. By early March, the disease reached pandemic proportions. As governments struggled to support overburdened health care systems by issuing “stay-at-home” orders and other restrictions on nonessential activity, global economic activity slowed, driving most stocks and bonds sharply lower.
The United States was hit particularly hard by the pandemic, with more reported COVID-19 cases and deaths than any other country in the world throughout the second half of the reporting period. As the pandemic deepened, the U.S. Federal Reserve (“Fed”) twice cut interest rates and announced unlimited quantitative easing. The federal government declared a national emergency, and Congress passed and the President signed a $2 trillion stimulus package. Markets responded positively to these measures, as well as to a gradual lessening of restrictions on nonessential businesses, hopes for additional stimulus and apparent progress in the development of a vaccine. By late August, the S&P 500® Index, a widely regarded benchmark of market performance, had not only regained all the ground it lost earlier in the reporting period, the Index had reached new record levels. However, a resurgence of coronavirus cases in many parts of the country and uncertainties related to the November 3, 2020, U.S. presidential election caused markets to falter as the reporting period drew to a close.
Nevertheless, for the reporting period as a whole, U.S. equity indices generally produced moderate gains. Returns proved strongest among large-cap, growth-oriented stocks, while small- and mid-cap issues lagged. Within the S&P 500® Index, the information technology and consumer discretionary sectors produced exceptionally strong gains, buoyed by strong corporate and consumer spending, while the health care sector outperformed by a smaller margin. Materials and consumer staples sectors generated positive returns, but lagged the S&P 500® Index. The industrials, utilities, communication services, financials, real estate and energy sectors ended the reporting period in negative territory, with the energy sector
suffering the steepest losses due to weak global demand. International equities declined sharply in February and March 2020 before recovering somewhat, but tended to lag their U.S. counterparts due to weaker underlying economic growth and somewhat less aggressive monetary and fiscal stimulus. Emerging-market equities tracked the performance of U.S. equity markets more closely, led by relatively strong returns in Asian markets, such as China and South Korea.
Fixed-income markets experienced an environment that tended to favor higher credit quality and longer duration securities. Corporate bonds followed the pattern of equities, with prices declining in March 2020 before subsequently recovering. Relatively speculative high-yield credit was hardest hit during the market sell-off in early 2020 and continued to underperform during the remainder of the reporting period. Similarly, among municipal bond issues, high-grade bonds outperformed, dipping briefly in mid-March before regaining the lost ground. Recognized safe havens, such as U.S. government bonds, attracted increased investment during the height of the market sell-off, driving yields lower and prices higher. As a result, long-term Treasury bonds delivered particularly strong gains for the reporting period as a whole. Emerging-market debt, on the other hand, underperformed most other bond types as investors sought to minimize currency and sovereign risks.
Although the ongoing pandemic continues to change the way that many of us work and live our lives, at New York Life Investments, we remain dedicated to providing you, as a MainStay investor, with products, information and services to help you to navigate today’s rapidly changing investment environment. By taking appropriate steps to minimize community spread of COVID-19 within our organization and despite the challenges posed by the coronavirus pandemic, we continue to innovate with you in mind, introducing new suites of Funds and providing continuous insights into ever-evolving markets and investment strategies. Our goal is to give you the tools you need to build a resilient portfolio in the face of uncertain times.
Sincerely,

Kirk C. Lehneis
President
The opinions expressed are as of the date of this report and are subject to change. There is no guarantee that any forecast made will come to pass. This material does not constitute investment advice and is not intended as an endorsement of any specific investment. Past performance is no guarantee of future results.
Not part of the Annual Report
Table of Contents
Investors should refer to the Fund’s Summary Prospectus and/or Prospectus and consider the Fund’s investment objectives, strategies, risks, charges and expenses carefully before investing. The Summary Prospectus and/or Prospectus contain this and other information about the Fund. You may obtain copies of the Fund’s Summary Prospectus, Prospectus and Statement of Additional Information free of charge, upon request, by calling toll-free 800-624-6782, by writing to NYLIFE Distributors LLC, Attn: MainStay Marketing Department, 30 Hudson Street, Jersey City, NJ 07302 or by sending an e-mail to MainStayShareholderServices@nylim.com. These documents are also available via the MainStay Funds’ website at newyorklifeinvestments.com. Please read the Summary Prospectus and/or Prospectus carefully before investing.
Investment and Performance Comparison1 (Unaudited)
Performance data quoted represents past performance. Past performance is no guarantee of future results. Because of market volatility and other factors, current performance may be lower or higher than the figures shown. Investment return and principal value will fluctuate, and as a result, when shares are redeemed, they may be worth more or less than their original cost. The graph below depicts the historical performance of Class I shares* of the Fund. Performance will vary from class to class based on differences in class-specific expenses and sales charges. For performance information current to the most recent month-end, please call 800-624-6782 or visit newyorklifeinvestments.com.
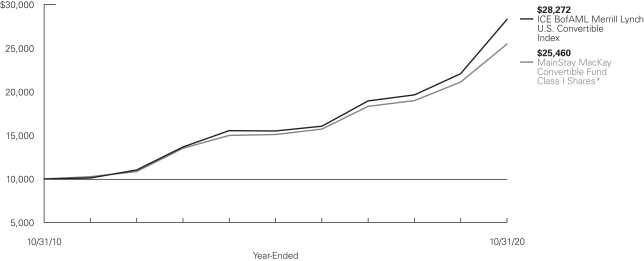
Average Annual Total Returns for the Year-Ended October 31, 2020
| | | | | | | | | | | | | | | | | | | | | | | | |
| Class | | Sales Charge | | | | Inception
Date | | | One
Year | | | Five
Years | | | Ten
Years | | | Gross
Expense
Ratio2 | |
| | | | | | | |
| Class A Shares | | Maximum 5.5% Initial Sales Charge | | With sales charges Excluding sales charges | | | 1/3/1995 | | |
| 13.65
20.27 | %
| |
| 9.41
10.66 | %
| |
| 8.86
9.48 | %
| |
| 0.99
0.99 | %
|
| Investor Class Shares3 | | Maximum 5% Initial Sales Charge | | With sales charges Excluding sales charges | | | 2/28/2008 | | |
| 13.48
20.08 |
| |
| 9.24
10.48 |
| |
| 8.66
9.28 |
| |
| 1.18
1.18 |
|
| Class B Shares4 | | Maximum 5% CDSC if Redeemed Within the First Six Years of Purchase | | With sales charges Excluding sales charges | | | 5/1/1986 | | |
| 14.15
19.15 |
| |
| 9.38
9.66 |
| |
| 8.46
8.46 |
| |
| 1.93
1.93 |
|
| Class C Shares | | Maximum 1% CDSC
if Redeemed Within One Year of Purchase | | With sales charges Excluding sales charges | | | 9/1/1998 | | |
| 18.18
19.18 |
| |
| 9.64
9.64 |
| |
| 8.46
8.46 |
| |
| 1.93
1.93 |
|
| Class I Shares | | No Sales Charge | | | | | 11/28/2008 | | | | 20.71 | | | | 11.02 | | | | 9.80 | | | | 0.74 | |
| * | Previously, the chart presented the Fund’s annual returns for Class B shares. Class I shares are presented for consistency across the MainStay Fund complex. |
| 1. | The performance table and graph do not reflect the deduction of taxes that a shareholder would pay on distributions or Fund share redemptions. Total returns reflect maximum applicable sales charges as indicated in the table above, if any, changes in share price, and reinvestment of dividend and capital gain distributions. The graph assumes the initial investment amount shown above and reflects the deduction of all sales charges that would have applied for the period of investment. Performance figures may reflect certain fee waivers and/or expense limitations, without which total returns may have |
| | been lower. For more information on share classes and current fee waivers and/or expense limitations (if any), please refer to the Notes to Financial Statements. |
| 2. | The gross expense ratios presented reflect the Fund’s “Total Annual Fund Operating Expenses” from the most recent Prospectus and may differ from other expense ratios disclosed in this report. |
| 3. | Prior to June 30, 2020, the maximum initial sales charge for Investor Class shares was 5.5%, which is reflected in the average annual total return figures shown. |
| 4. | Class B shares are closed to all new purchases as well as additional investments by existing Class B shareholders. |
The footnotes on the next page are an integral part of the table and graph and should be carefully read in conjunction with them.
| | | | | | | | | | | | |
| Benchmark Performance | | One
Year | | | Five
Years | | | Ten
Years | |
| | | |
ICE BofAML Merrill Lynch U.S. Convertible Index5 | | | 28.11 | % | | | 12.79 | % | | | 10.95 | % |
Morningstar Convertibles Category Average6 | | | 24.74 | | | | 11.38 | | | | 9.58 | |
| 5. | The ICE BofAML Merrill Lynch U.S. Convertible Index is the Fund’s primary broad–based securities market index for comparison purposes. The ICE BofAML U.S. Convertible Index is a market-capitalization weighted index of domestic corporate convertible securities. In order to be included in this Index, bonds and preferred stocks must be convertible only to common stock. Results assume reinvestment of all income and capital gains. An investment cannot be made directly in an index. |
| 6. | The Morningstar Convertibles Category Average is representative of funds that are designed to offer some of the capital-appreciation potential of stock portfolios while also supplying some of the safety and yield of bond portfolios. Results are based on average total returns of similar funds with all dividends and capital gain distributions reinvested. |
The footnotes on the preceding page are an integral part of the table and graph and should be carefully read in conjunction with them.
| | |
| 6 | | MainStay MacKay Convertible Fund |
Cost in Dollars of a $1,000 Investment in MainStay MacKay Convertible Fund (Unaudited)
The example below is intended to describe the fees and expenses borne by shareholders during the six-month period from May 1, 2020, to October 31, 2020, and the impact of those costs on your investment.
Example
As a shareholder of the Fund you incur two types of costs: (1) transaction costs, including exchange fees and sales charges (loads) on purchases (as applicable), and (2) ongoing costs, including management fees, distribution and/or service (12b-1) fees, and other Fund expenses (as applicable). This example is intended to help you understand your ongoing costs (in dollars) of investing in the Fund and to compare these costs with the ongoing costs of investing in other mutual funds. The example is based on an investment of $1,000 made at the beginning of the six-month period and held for the entire period from May 1, 2020, to October 31, 2020.
This example illustrates your Fund’s ongoing costs in two ways:
Actual Expenses
The second and third data columns in the table below provide information about actual account values and actual expenses. You may use the information in these columns, together with the amount you invested, to estimate the expenses that you paid during the six months ended October 31, 2020. Simply divide your account value by $1,000 (for example, an $8,600 account value divided by $1,000 = 8.6), then
multiply the result by the number under the heading entitled “Expenses Paid During Period” to estimate the expenses you paid on your account during this period.
Hypothetical Example for Comparison Purposes
The fourth and fifth data columns in the table below provide information about hypothetical account values and hypothetical expenses based on the Fund’s actual expense ratio and an assumed rate of return of 5% per year before expenses, which is not the Fund’s actual return. The hypothetical account values and expenses may not be used to estimate the actual ending account balances or expenses you paid for the six-month period shown. You may use this information to compare the ongoing costs of investing in the Fund with the ongoing costs of investing in other mutual funds. To do so, compare this 5% hypothetical example with the 5% hypothetical examples that appear in the shareholder reports of the other mutual funds.
Please note that the expenses shown in the table are meant to highlight your ongoing costs only and do not reflect any transactional costs, such as exchange fees or sales charges (loads). Therefore, the fourth and fifth data columns of the table are useful in comparing ongoing costs only and will not help you determine the relative total costs of owning different funds. In addition, if these transactional costs were included, your costs would have been higher.
| | | | | | | | | | | | | | | | | | | | | | |
| | | | | | | | | | | | | | | | | | |
| Share Class | | Beginning
Account
Value
5/1/20 | | | Ending Account
Value (Based
on Actual
Returns and
Expenses)
10/31/20 | | | Expenses
Paid
During
Period1 | | | Ending Account
Value (Based
on Hypothetical
5% Annualized
Return and
Actual Expenses)
10/31/20 | | | Expenses
Paid
During
Period1 | | | Net Expense
Ratio
During
Period2 |
| | | | | | |
| Class A Shares | | $ | 1,000.00 | | | $ | 1,203.60 | | | $ | 5.32 | | | $ | 1,020.31 | | | $ | 4.88 | | | 0.96% |
| | | | | | |
| Investor Class Shares | | $ | 1,000.00 | | | $ | 1,203.10 | | | $ | 6.42 | | | $ | 1,019.30 | | | $ | 5.89 | | | 1.16% |
| | | | | | |
| Class B Shares | | $ | 1,000.00 | | | $ | 1,198.30 | | | $ | 10.55 | | | $ | 1,015.53 | | | $ | 9.68 | | | 1.91% |
| | | | | | |
| Class C Shares | | $ | 1,000.00 | | | $ | 1,197.90 | | | $ | 10.55 | | | $ | 1,015.53 | | | $ | 9.68 | | | 1.91% |
| | | | | | |
| Class I Shares | | $ | 1,000.00 | | | $ | 1,205.70 | | | $ | 3.38 | | | $ | 1,022.07 | | | $ | 3.10 | | | 0.61% |
| 1. | Expenses are equal to the Fund’s annualized expense ratio of each class multiplied by the average account value over the period, divided by 366 and multiplied by 184 (to reflect the six-month period). The table above represents the actual expenses incurred during the six-month period. In addition to the fees and expenses which the Fund bears directly, it also indirectly bears a pro rata share of the fees and expenses of the underlying funds in which it invests. Such indirect expenses are not included in the above-reported expense figures. |
| 2. | Expenses are equal to the Fund’s annualized expense ratio to reflect the six-month period. |
Portfolio Composition as of October 31, 2020 (Unaudited)

See Portfolio of Investments beginning on page 11 for specific holdings within these categories. The Fund’s holdings are subject to change.
Top Ten Holdings or Issuers Held as of October 31, 2020 (excluding short-term investments) (Unaudited)
| 1. | Danaher Corp., (zero coupon), due 1/22/21 |
| 2. | NICE Systems, Inc., 1.25%, due 1/15/24 |
| 3. | Anthem, Inc., 2.75%, due 10/15/42 |
| 4. | Tesla, Inc., 1.25%, due 3/1/21 |
| 5. | Chart Industries, Inc., 1.00%, due 11/15/24 |
| 6. | Lumentum Holdings, Inc., 0.25%, due 3/15/24 |
| 7. | Southwest Airlines Co., 1.25%, due 5/1/25 |
| 8. | Teladoc Health, Inc., 1.25%–1.375%, due 5/15/25–6/1/27 |
| 9. | Microchip Technology, Inc., 1.625%, due 2/15/25–2/15/27 |
| 10. | BioMarin Pharmaceutical, Inc., 0.599%, due 8/1/24 |
| | |
| 8 | | MainStay MacKay Convertible Fund |
Portfolio Management Discussion and Analysis (Unaudited)
Questions answered by portfolio manager Edward Silverstein, CFA, of MacKay Shields LLC, the Fund’s Subadvisor.
How did MainStay MacKay Convertible Fund perform relative to its benchmark and peer group during the 12 months ended October 31, 2020?
For the 12 months ended October 31, 2020, Class I shares of MainStay MacKay Convertible Fund returned 20.71%, underperforming the 28.11% return of the Fund’s primary benchmark, the ICE BofAML U.S. Convertible Index. Over the same period, Class I shares also underperformed the 24.74% return of the Morningstar Convertibles Category Average.1
What factors affected the Fund’s relative performance during the reporting period?
The Fund underperformed the ICE BofAML U.S. Convertible Index due to the Fund’s underweight exposure to the consumer discretionary sector, which accounted for most of the Fund’s benchmark-relative underperformance. In particular, underweight exposure to the convertible bonds of electric automaker Tesla—the largest constituent in the Index and the Index’s best performer during the reporting period—detracted from the Fund’s relative performance. Lack of any exposure to the convertible bonds of online retailer Wayfair further undermined relative results, as did several holdings in the energy sector. On the positive side, the Fund’s relative returns benefited from several strong performers in the health care and information technology sectors.
During the reporting period, were there any market events that materially impacted the Fund’s performance or liquidity?
During the reporting period, the performance of the U.S. convertible market was driven by the ICE BofAML U.S. Convertible Index’s large weighting in the information technology and consumer discretionary sectors, both of which produced remarkably strong performance. Both sectors rose sharply as investors perceived them as beneficiaries of the pandemic environment. In information technology, stocks of many software firms soared as the remote-work phenomenon highlighted the need for cloud-based software in a “virtual” environment. In the consumer discretionary sector, investors drove up the convertible bond prices of several online retailers seen as among the few options available to consumers when many brick-and-mortar retailers were forced to close.
During the reporting period, which sectors were the strongest positive contributors to the Fund’s relative performance and which sectors were particularly weak?
The sectors providing the strongest positive contributions to the Fund’s relative performance during the reporting period
included information technology, health care and industrials. (Contributions take weightings and total returns into account.) Within information technology, the Fund saw large gains in the convertible bonds of semiconductor maker Inphi, enterprise software company NICE Systems; software-as-a-service solution provider RingCentral; and cloud-based platform company Wix.com. Within health care, the Fund benefited from holdings of telemedicine company Teladoc Health, and diversified instrument and device manufacturer Danaher. Within the industrials sector, performance benefited from the Fund’s large holding of shares in energy and industrial gas equipment maker Chart Industries, which gained ground on the shift toward cleaner fuels, such as natural gas and hydrogen. During the same period, the most significant detractors from the Fund’s relative performance included the consumer discretionary, energy and media sectors, particularly due to underweight exposure to Tesla and Wayfair, mentioned earlier, as well as online real estate company Zillow Group.
During the reporting period, which individual stocks made the strongest positive contributions to the Fund’s absolute performance and which stocks detracted the most?
The individual holdings making the strongest positive contributions to the Fund’s absolute performance included the convertible bonds of Teladoc Health, Danaher and NICE Systems, described above. Teledoc Health rose during the reporting period as the company’s business saw a surge of new customers seeking treatments online through Teladoc Health’s Internet portal. While we believe the level of patient visits is nearly certain to recede once the virus fears pass, the acceptance of telemedicine as an alternative to in-office visits is likely to persist, which will have longer-term benefits for the company. Danaher, with its large presence in medical diagnostics and testing businesses, rose as its medical customers increased their spending on COVID-19 testing and laboratory equipment. NICE Systems performed well as the company continued to steadily grow its customer relationship management and data analysis software with little, if any, impact from the pandemic.
The holdings that detracted most significantly from the Fund’s absolute performance during the reporting period included convertible bonds from two energy sector companies: offshore energy driller Valaris, and oil equipment and services company Oil States International. The convertible bonds of Valaris declined as it became increasingly evident that, with the collapse of oil prices, few if any exploration and production companies would be interested in leasing Valaris’ rigs. The company was forced to file for bankruptcy in an attempt to reorganize its finances. The convertible bonds of Oil States
| 1. | See page 5 for other share class returns, which may be higher or lower than Class I share returns. See page 6 for more information on benchmark and peer group returns. |
International declined as investors grew increasingly concerned that only the best-capitalized energy companies would survive the industry downturn. From early March 2020 through the end of the reporting period, low oil prices made it uneconomical for most U.S. producers to drill or explore for oil. We believe that Oil States can survive if the price of oil is able to rebound to $45–$50 per barrel in the next 12 to 18 months.
What were some of the Fund’s largest purchases and sales during the reporting period?
Notable purchases during the reporting period included convertible bonds from air carrier Southwest Airlines; Permian Basin oil producer Pioneer Natural Resources; and medical device maker DexCom. We view Southwest Airlines as a well-run investment-grade airline that is likely to eventually return to profitability along with most industry operators. The Fund purchased the convertible bonds of Pioneer Natural Resources in light of our view of the company’s ability to generate free cash flow even with sub-$45 crude oil due to its low-cost structure. In addition, we expect commodity prices to eventually rise due to a sharp decline in U.S. output. DexCom’s glucose monitoring devices are achieving rapid adoption by diabetics as a better alternative to daily blood-sugar needle sticks, making the company’s convertible bonds an attractive investment in our view.
During the same period, the Fund sold several securities that benefited from the market euphoria for companies that were seen as benefiting from the pandemic. We believed that the share prices of many of these companies rose to levels that were not supported by fundamentals and valuation. We, therefore, sold a portion of our holdings in Teladoc Health, described earlier, cloud-based website platform Wix.com, and online retailer Etsy. We also sold a portion of the Fund’s Tesla position,
as we believed that the company’s common shares were overvalued. In addition, we sold a portion of the Fund’s holding in semiconductor companies Microchip, Inphi and ON Semiconductor, as the appreciation in value of these positions caused the Fund’s exposure to semiconductors to become excessive in our view.
How did the Fund’s sector weightings change during the reporting period?
During the reporting period, exposure to the communication services sector decreased as the result of the sale of a portion the Fund’s position in convertible bonds from DISH Network. The Fund also decreased its weighting to the health care sector through the sale of a portion of its Teladoc Health position. Conversely, the Fund’s exposure to the consumer discretionary sector increased due to the addition of convertible bonds from Tesla, and the purchase of convertible bonds from apparel retailers Burlington Stores and American Eagle Outfitters. The Fund also increased its weighting to the utilities sector through the purchase of the convertible preferred shares of Pacific Electric & Gas. All other sectors remained relatively unchanged.
How was the Fund positioned at the end of the reporting period?
As of October 31, 2020, the Fund held overweight exposure relative to the ICE BofAML U.S. Convertible Index in the health care, information technology and energy sectors. As of the same date, the Fund held relatively underweight exposure to the financials, real estate, utilities, communication services and consumer discretionary sectors, while exposure to the consumer staples and materials sectors stood at approximately market weight.
The opinions expressed are those of the portfolio managers as of the date of this report and are subject to change. There is no guarantee that any forecasts will come to pass. This material does not constitute investment advice and is not intended as an endorsement of any specific investment.
| | |
| 10 | | MainStay MacKay Convertible Fund |
Portfolio of Investments October 31, 2020
| | | | | | | | |
| | | Principal
Amount | | | Value | |
Convertible Securities 93.9%† Convertible Bonds 87.8% | |
Aerospace & Defense 0.9% | |
Aerojet Rocketdyne Holdings, Inc.
2.25%, due 12/15/23 | | $ | 11,001,000 | | | $ | 14,662,620 | |
| | | | | | | | |
|
Airlines 2.7% | |
American Airlines Group, Inc.
6.50%, due 7/1/25 | | | 7,040,000 | | | | 6,070,301 | |
Southwest Airlines Co.
1.25%, due 5/1/25 | | | 27,566,000 | | | | 37,214,100 | |
| | | | | | | | |
| | | | | | | 43,284,401 | |
| | | | | | | | |
Auto Manufacturers 2.6% | |
Tesla, Inc.
1.25%, due 3/1/21 | | | 7,752,000 | | | | 41,877,320 | |
| | | | | | | | |
|
Biotechnology 6.0% | |
Apellis Pharmaceuticals, Inc.
3.50%, due 9/15/26 | | | 7,350,000 | | | | 8,164,682 | |
BioMarin Pharmaceutical, Inc.
0.599%, due 8/1/24 (a) | | | 28,812,000 | | | | 29,712,375 | |
BridgeBio Pharma, Inc.
2.50%, due 3/15/27 (b) | | | 6,975,000 | | | | 8,045,004 | |
Exact Sciences Corp.
1.00%, due 1/15/25 (a) | | | 13,521,000 | | | | 24,058,929 | |
Illumina, Inc.
(zero coupon), due 8/15/23 (a) | | | 12,566,000 | | | | 13,372,687 | |
Ionis Pharmaceuticals, Inc.
1.00%, due 11/15/21 | | | 14,497,000 | | | | 14,932,035 | |
| | | | | | | | |
| | | | | | | 98,285,712 | |
| | | | | | | | |
Building Materials 1.0% | |
Patrick Industries, Inc.
1.00%, due 2/1/23 | | | 17,232,000 | | | | 16,952,965 | |
| | | | | | | | |
|
Commercial Services 2.8% | |
Chegg, Inc.
(zero coupon), due 9/1/26 (b) | | | 8,817,000 | | | | 8,937,992 | |
Euronet Worldwide, Inc.
0.75%, due 3/15/49 | | | 11,900,000 | | | | 11,476,062 | |
Sabre GLBL, Inc.
4.00%, due 4/15/25 (a)(b) | | | 1,835,000 | | | | 2,168,741 | |
Square, Inc. | | | | | | | | |
0.125%, due 3/1/25 (b) | | | 7,055,000 | | | | 10,386,449 | |
0.50%, due 5/15/23 | | | 6,031,000 | | | | 12,485,312 | |
| | | | | | | | |
| | | | | | | 45,454,556 | |
| | | | | | | | |
Computers 3.4% | |
Lumentum Holdings, Inc.
0.25%, due 3/15/24 | | | 25,786,000 | | | | 38,484,457 | |
| | | | | | | | |
| | | Principal
Amount | | | Value | |
Computers (continued) | | | | | | | | |
Parsons Corp.
0.25%, due 8/15/25 (b) | | $ | 4,641,000 | | | $ | 4,536,721 | |
Western Digital Corp.
1.50%, due 2/1/24 | | | 6,616,000 | | | | 6,347,605 | |
Zscaler, Inc.
0.125%, due 7/1/25 (b) | | | 5,870,000 | | | | 6,817,360 | |
| | | | | | | | |
| | | | | | | 56,186,143 | |
| | | | | | | | |
Diversified Financial Services 0.4% | |
LendingTree, Inc.
0.625%, due 6/1/22 | | | 4,144,000 | | | | 6,783,210 | |
| | | | | | | | |
|
Electric 1.0% | |
NRG Energy, Inc.
2.75%, due 6/1/48 | | | 15,207,000 | | | | 15,891,315 | |
| | | | | | | | |
|
Energy—Alternate Sources 1.3% | |
Enphase Energy, Inc.
0.25%, due 3/1/25 (b) | | | 8,840,000 | | | | 12,665,766 | |
SolarEdge Technologies, Inc.
(zero coupon), due 9/15/25 (b) | | | 7,010,000 | | | | 8,629,310 | |
| | | | | | | | |
| | | | | | | 21,295,076 | |
| | | | | | | | |
Entertainment 0.4% | |
Live Nation Entertainment, Inc.
2.50%, due 3/15/23 | | | 6,833,000 | | | | 7,341,204 | |
| | | | | | | | |
|
Food 0.4% | |
Chefs’ Warehouse, Inc.
1.875%, due 12/1/24 (b) | | | 8,676,000 | | | | 6,658,941 | |
| | | | | | | | |
|
Health Care—Products 6.8% | |
Cantel Medical Corp.
3.25%, due 5/15/25 (b) | | | 4,372,000 | | | | 5,904,933 | |
CONMED Corp.
2.625%, due 2/1/24 | | | 14,746,000 | | | | 16,858,541 | |
Danaher Corp.
(zero coupon), due 1/22/21 | | | 8,558,000 | | | | 74,516,340 | |
Integra LifeSciences Holdings Corp.
0.50%, due 8/15/25 (b) | | | 6,602,000 | | | | 6,057,335 | |
NuVasive, Inc.
0.375%, due 3/15/25 (b) | | | 8,085,000 | | | | 6,953,100 | |
| | | | | | | | |
| | | | | | | 110,290,249 | |
| | | | | | | | |
Health Care—Services 5.0% | |
Anthem, Inc.
2.75%, due 10/15/42 | | | 11,746,000 | | | | 44,460,781 | |
Teladoc Health, Inc. | | | | | | | | |
1.25%, due 6/1/27 (b) | | | 13,962,000 | | | | 16,325,379 | |
1.375%, due 5/15/25 | | | 5,682,000 | | | | 20,799,926 | |
| | | | | | | | |
| | | | | | | 81,586,086 | |
| | | | | | | | |
| | | | | | |
The notes to the financial statements are an integral part of,
and should be read in conjunction with, the financial statements. | | | | | 11 | |
Portfolio of Investments October 31, 2020 (continued)
| | | | | | | | |
| | | Principal
Amount | | | Value | |
| Convertible Bonds (continued) | |
Internet 10.5% | |
Boingo Wireless, Inc.
1.00%, due 10/1/23 | | $ | 7,786,000 | | | $ | 6,810,414 | |
Booking Holdings, Inc.
0.90%, due 9/15/21 | | | 19,156,000 | | | | 20,045,431 | |
Etsy, Inc.
0.125%, due 10/1/26 | | | 15,403,000 | | | | 24,196,218 | |
Match Group Financeco 2, Inc.
0.875%, due 6/15/26 (b) | | | 12,450,000 | | | | 18,692,339 | |
Match Group Financeco, Inc.
0.875%, due 10/1/22 (b) | | | 2,000 | | | | 5,330 | |
Okta, Inc.
0.125%, due 9/1/25 | | | 5,611,000 | | | | 7,357,424 | |
Palo Alto Networks, Inc. | | | | | | | | |
0.375%, due 6/1/25 (b) | | | 9,385,000 | | | | 9,584,431 | |
0.75%, due 7/1/23 | | | 13,659,000 | | | | 14,678,452 | |
Q2 Holdings, Inc.
0.75%, due 6/1/26 | | | 4,395,000 | | | | 5,452,547 | |
Shopify, Inc.
0.125%, due 11/1/25 | | | 16,390,000 | | | | 18,008,513 | |
Snap, Inc.
0.75%, due 8/1/26 | | | 10,150,000 | | | | 18,924,134 | |
Wix.com, Ltd.
(zero coupon), due 7/1/23 | | | 9,213,000 | | | | 16,749,880 | |
Zendesk, Inc.
0.625%, due 6/15/25 (b) | | | 8,790,000 | | | | 11,033,985 | |
| | | | | | | | |
| | | | | | | 171,539,098 | |
| | | | | | | | |
Leisure Time 1.8% | |
Carnival Corp.
5.75%, due 4/1/23 (b) | | | 9,498,000 | | | | 14,802,538 | |
NCL Corp., Ltd. (b) | | | | | | | | |
5.375%, due 8/1/25 | | | 4,670,000 | | | | 5,425,956 | |
6.00%, due 5/15/24 | | | 2,849,000 | | | | 4,042,552 | |
Royal Caribbean Cruises, Ltd.
4.25%, due 6/15/23 (b) | | | 5,055,000 | | | | 5,261,983 | |
| | | | | | | | |
| | | | | | | 29,533,029 | |
| | | | | | | | |
Machinery—Diversified 2.4% | |
Chart Industries, Inc.
1.00%, due 11/15/24 (b) | | | 24,911,000 | | | | 39,608,490 | |
| | | | | | | | |
|
Media 2.3% | |
DISH Network Corp.
3.375%, due 8/15/26 | | | 16,129,000 | | | | 14,296,902 | |
Liberty Media Corp-Liberty Formula One
1.00%, due 1/30/23 | | | 9,441,000 | | | | 11,234,790 | |
Liberty Media Corp.
1.375%, due 10/15/23 | | | 11,345,000 | | | | 12,738,598 | |
| | | | | | | | |
| | | | | | | 38,270,290 | |
| | | | | | | | |
| | | | | | | | |
| | | Principal
Amount | | | Value | |
Oil & Gas 3.0% | |
Ensco Jersey Finance, Ltd.
3.00%, due 1/31/24 (c) | | $ | 20,143,000 | | | $ | 2,270,603 | |
EQT Corp.
1.75%, due 5/1/26 (b) | | | 19,418,000 | | | | 24,902,595 | |
Pioneer Natural Resources Co.
0.25%, due 5/15/25 (b) | | | 20,049,000 | | | | 21,460,108 | |
| | | | | | | | |
| | | | | | | 48,633,306 | |
| | | | | | | | |
Oil & Gas Services 1.7% | |
Helix Energy Solutions Group, Inc.
6.75%, due 2/15/26 | | | 10,842,000 | | | | 8,737,661 | |
Newpark Resources, Inc.
4.00%, due 12/1/21 | | | 7,687,000 | | | | 6,841,430 | |
Oil States International, Inc.
1.50%, due 2/15/23 | | | 19,764,000 | | | | 11,214,903 | |
| | | | | | | | |
| | | | | | | 26,793,994 | |
| | | | | | | | |
Pharmaceuticals 3.2% | |
DexCom, Inc.
0.25%, due 11/15/25 (b) | | | 29,265,000 | | | | 28,287,943 | |
Neurocrine Biosciences, Inc.
2.25%, due 5/15/24 | | | 10,073,000 | | | | 14,128,134 | |
Pacira BioSciences, Inc. | | | | | | | | |
0.75%, due 8/1/25 (b) | | | 7,100,000 | | | | 7,236,306 | |
2.375%, due 4/1/22 | | | 1,655,000 | | | | 1,807,852 | |
| | | | | | | | |
| | | | | | | 51,460,235 | |
| | | | | | | | |
Real Estate 0.2% | |
Redfin Corp.
(zero coupon), due 10/15/25 (b) | | | 2,765,000 | | | | 2,609,607 | |
| | | | | | | | |
|
Retail 1.5% | |
American Eagle Outfitters, Inc.
3.75%, due 4/15/25 (b) | | | 5,529,000 | | | | 9,725,957 | |
Burlington Stores, Inc.
2.25%, due 4/15/25 (b) | | | 13,238,000 | | | | 15,216,752 | |
| | | | | | | | |
| | | | | | | 24,942,709 | |
| | | | | | | | |
Semiconductors 7.0% | |
Cree, Inc.
1.75%, due 5/1/26 (b) | | | 2,320,000 | | | | 3,556,850 | |
Inphi Corp.
0.75%, due 4/15/25 (b) | | | 19,787,000 | | | | 25,412,951 | |
Microchip Technology, Inc. | | | | | | | | |
1.625%, due 2/15/25 | | | 8,778,000 | | | | 19,809,311 | |
1.625%, due 2/15/27 | | | 7,129,000 | | | | 11,107,722 | |
Micron Technology, Inc.
3.125%, due 5/1/32 | | | 3,183,000 | | | | 15,843,813 | |
Novellus Systems, Inc.
2.625%, due 5/15/41 | | | 1,076,000 | | | | 11,566,976 | |
ON Semiconductor Corp.
1.625%, due 10/15/23 | | | 2,305,000 | | | | 3,290,203 | |
| | | | |
| 12 | | MainStay MacKay Convertible Fund | | The notes to the financial statements are an integral part of,
and should be read in conjunction with, the financial statements. |
| | | | | | | | |
| | | Principal
Amount | | | Value | |
| Convertible Bonds (continued) | |
Semiconductors (continued) | |
Rambus, Inc.
1.375%, due 2/1/23 | | $ | 9,996,000 | | | $ | 10,421,124 | |
Silicon Laboratories, Inc.
0.625%, due 6/15/25 (b) | | | 11,680,000 | | | | 13,045,185 | |
| | | | | | | | |
| | | | | | | 114,054,135 | |
| | | | | | | | |
Software 16.3% | |
Akamai Technologies, Inc.
0.375%, due 9/1/27 | | | 11,420,000 | | | | 12,233,675 | |
Atlassian, Inc.
0.625%, due 5/1/23 | | | 7,719,000 | | | | 18,140,996 | |
Coupa Software, Inc.
0.375%, due 6/15/26 (b) | | | 6,055,000 | | | | 7,058,285 | |
Datadog, Inc.
0.125%, due 6/15/25 (b) | | | 7,470,000 | | | | 9,371,860 | |
Envestnet, Inc.
1.75%, due 6/1/23 | | | 12,037,000 | | | | 15,316,805 | |
Everbridge, Inc.
0.125%, due 12/15/24 (b) | | | 5,415,000 | | | | 6,366,009 | |
Five9, Inc.
0.50%, due 6/1/25 (b) | | | 4,675,000 | | | | 6,206,062 | |
J2 Global, Inc.
1.75%, due 11/1/26 (b) | | | 5,220,000 | | | | 4,695,308 | |
MongoDB, Inc.
0.25%, due 1/15/26 (b) | | | 7,075,000 | | | | 9,203,710 | |
NICE Systems, Inc.
1.25%, due 1/15/24 | | | 19,683,000 | | | | 53,892,349 | |
Nuance Communications, Inc.
1.25%, due 4/1/25 | | | 11,278,000 | | | | 19,442,125 | |
Omnicell, Inc.
0.25%, due 9/15/25 (b) | | | 2,760,000 | | | | 3,028,261 | |
PagerDuty, Inc.
1.25%, due 7/1/25 (b) | | | 535,000 | | | | 544,609 | |
RingCentral, Inc.
(zero coupon), due 3/1/25 (b) | | | 27,757,000 | | | | 29,416,578 | |
Slack Technologies, Inc.
0.50%, due 4/15/25 (b) | | | 6,747,000 | | | | 7,729,532 | |
Splunk, Inc.
0.50%, due 9/15/23 | | | 17,437,000 | | | | 25,160,425 | |
Twilio, Inc.
0.25%, due 6/1/23 | | | 3,269,000 | | | | 12,759,598 | |
Workday, Inc.
0.25%, due 10/1/22 | | | 7,982,000 | | | | 12,039,792 | |
Zynga, Inc.
0.25%, due 6/1/24 | | | 10,627,000 | | | | 13,409,946 | |
| | | | | | | | |
| | | | | | | 266,015,925 | |
| | | | | | | | |
Telecommunications 2.3% | |
Infinera Corp.
2.50%, due 3/1/27 (b) | | | 7,050,000 | | | | 7,513,586 | |
| | | | | | | | |
| | | Principal
Amount | | | Value | |
Telecommunications (continued) | |
InterDigital, Inc.
2.00%, due 6/1/24 | | $ | 4,500,000 | | | $ | 4,615,741 | |
Viavi Solutions, Inc.
1.00%, due 3/1/24 | | | 14,679,000 | | | | 17,012,194 | |
Vonage Holdings Corp.
1.75%, due 6/1/24 | | | 8,091,000 | | | | 7,928,211 | |
| | | | | | | | |
| | | | | | | 37,069,732 | |
| | | | | | | | |
Transportation 0.9% | |
Atlas Air Worldwide Holdings, Inc.
2.25%, due 6/1/22 | | | 13,687,000 | | | | 14,687,115 | |
| | | | | | | | |
Total Convertible Bonds
(Cost $1,131,292,985) | | | | | | | 1,431,767,463 | |
| | | | | | | | |
|
| Corporate Bonds 0.0% | |
Weatherford International, Ltd.
11.00%, due 12/1/24 (a)(b) | | | 1,970,000 | | | | 1,165,531 | |
| | | | | | | | |
Total Corporate Bonds
(Cost $25,400,044) | | | | | | | 1,165,531 | |
| | | | | | | | |
| | |
| | | | | | | | |
| | |
| | | Shares | | | | |
| Convertible Preferred Stocks 6.1% | |
Banks 2.0% | | | | | | | | |
Bank of America Corp. (d)
Series L
7.25% | | | 12,072 | | | | 17,708,417 | |
Wells Fargo & Co. (d)
Series L
7.50% | | | 11,552 | | | | 15,580,875 | |
| | | | | | | | |
| | | | | | | 33,289,292 | |
| | | | | | | | |
Capital Markets 0.5% | |
KKR & Co., Inc.
6.00%
Series C | | | 165,650 | | | | 8,620,426 | |
| | | | | | | | |
|
Chemicals 0.4% | |
Lyondellbasell Advanced
Polymers, Inc. (d)
6.00% | | | 5,832 | | | | 5,983,632 | |
| | | | | | | | |
|
Electric Utilities 1.0% | |
PG&E Corp.
5.50% | | | 160,900 | | | | 16,028,858 | |
| | | | | | | | |
|
Health Care Equipment & Supplies 0.3% | |
Becton Dickinson & Co.
6.00% | | | 86,450 | | | | 4,502,316 | |
| | | | | | | | |
|
Machinery 1.2% | |
Stanley Black & Decker, Inc.
5.25% | | | 182,200 | | | | 19,018,036 | |
| | | | | | | | |
| | | | | | |
The notes to the financial statements are an integral part of,
and should be read in conjunction with, the financial statements. | | | | | 13 | |
Portfolio of Investments October 31, 2020 (continued)
| | | | | | | | |
| | |
| | | Shares | | | Value | |
| Convertible Preferred Stocks (continued) | |
Semiconductors & Semiconductor Equipment 0.7% | |
Broadcom, Inc.
8.00% | | | 9,655 | | | $ | 11,489,354 | |
| | | | | | | | |
Total Convertible Preferred Stocks
(Cost $92,659,680) | | | | | | | 98,931,914 | |
| | | | | | | | |
Total Convertible Securities
(Cost $1,249,352,709) | | | | | | | 1,531,864,908 | |
| | | | | | | | |
| | |
| | | | | | | | |
| Common Stocks 1.6% | |
Aerospace & Defense 0.2% | | | | | | | | |
Raytheon Technologies Corp. | | | 53,105 | | | | 2,884,663 | |
| | | | | | | | |
|
Banks 0.6% | |
Bank of America Corp. | | | 398,621 | | | | 9,447,318 | |
| | | | | | | | |
|
Energy Equipment & Services 0.0%‡ | |
Weatherford International PLC (a)(e) | | | 272,914 | | | | 570,390 | |
| | | | | | | | |
|
Health Care Equipment & Supplies 0.8% | |
Teleflex, Inc. | | | 41,951 | | | | 13,350,067 | |
| | | | | | | | |
Total Common Stocks
(Cost $21,430,079) | | | | | | | 26,252,438 | |
| | | | | | | | |
|
| Short-Term Investments 4.1% | |
Affiliated Investment Company 3.7% | | | | | | | | |
MainStay U.S. Government Liquidity Fund, 0.02% (f) | | | 60,631,391 | | | | 60,631,391 | |
| | | | | | | | |
| | | | | | | | |
| | |
| | | Shares | | | Value | |
Unaffiliated Investment Company 0.4% | |
State Street Navigator Securities Lending Government Money Market Portfolio, 0.09% (f)(g) | | | 5,572,039 | | | $ | 5,572,039 | |
| | | | | | | | |
Total Short-Term Investments
(Cost $66,203,430) | | | | | | | 66,203,430 | |
| | | | | | | | |
Total Investments
(Cost $1,336,986,218) | | | 99.6 | % | | | 1,624,320,776 | |
Other Assets, Less Liabilities | | | 0.4 | | | | 7,326,484 | |
Net Assets | | | 100.0 | % | | $ | 1,631,647,260 | |
| † | Percentages indicated are based on Fund net assets. |
| ‡ | Less than one-tenth of a percent. |
| (a) | All or a portion of this security was held on loan. As of October 31, 2020, the aggregate market value of securities on loan was $5,410,194. The Fund received cash collateral with a value of $5,572,039. (See Note 2(H)). |
| (b) | May be sold to institutional investors only under Rule 144A or securities offered pursuant to Section 4(a)(2) of the Securities Act of 1933, as amended. |
| (d) | Securities are perpetual and, thus, do not have a predetermined maturity date. The date shown, if applicable, reflects the next call date. |
| (e) | Non-income producing security. |
| (f) | Current yield as of October 31, 2020. |
| (g) | Represents a security purchased with cash collateral received for securities on loan. |
The following is a summary of the fair valuations according to the inputs used as of October 31, 2020, for valuing the Fund’s assets:
| | | | | | | | | | | | | | | | |
Description | | Quoted
Prices in
Active
Markets for
Identical
Assets
(Level 1) | | | Significant
Other
Observable
Inputs
(Level 2) | | | Significant
Unobservable
Inputs
(Level 3) | | | Total | |
| | | | |
Asset Valuation Inputs | | | | | | | | | | | | | | | | |
| Investments in Securities (a) | | | | | | | | | | | | | | | | |
| Convertible Securities | | | | | | | | | | | | | | | | |
Convertible Bonds | | $ | — | | | $ | 1,431,767,463 | | | $ | — | | | $ | 1,431,767,463 | |
Convertible Preferred Stocks | | | 98,931,914 | | | | — | | | | — | | | | 98,931,914 | |
| | | | | | | | | | | | | | | | |
| Total Convertible Securities | | | 98,931,914 | | | | 1,432,932,994 | | | | — | | | | 1,531,864,908 | |
| | | | | | | | | | | | | | | | |
| Corporate Bonds | | | — | | | | — | | | | — | | | | 1,165,531 | |
| Common Stocks | | | 26,252,438 | | | | — | | | | — | | | | 26,252,438 | |
| Short-Term Investments | | | | | | | | | | | | | | | | |
Affiliated Investment Company | | | 60,631,391 | | | | — | | | | — | | | | 60,631,391 | |
Unaffiliated Investment Company | | | 5,572,039 | | | | — | | | | — | | | | 5,572,039 | |
| | | | | | | | | | | | | | | | |
| Total Short-Term Investments | | | 66,203,430 | | | | — | | | | — | | | | 66,203,430 | |
| | | | | | | | | | | | | | | | |
| Total Investments in Securities | | $ | 191,387,782 | | | $ | 1,432,932,994 | | | $ | — | | | $ | 1,624,320,776 | |
| | | | | | | | | | | | | | | | |
| (a) | For a complete listing of investments and their industries, see the Portfolio of Investments. |
| | | | |
| 14 | | MainStay MacKay Convertible Fund | | The notes to the financial statements are an integral part of,
and should be read in conjunction with, the financial statements. |
Statement of Assets and Liabilities as of October 31, 2020
| | | | |
| Assets | |
Investment in unaffiliated securities, at value
(identified cost $1,276,354,827) including securities on loan of $5,410,194 | | $ | 1,563,689,385 | |
Investment in affiliated investment company, at value (identified cost $60,631,391) | | | 60,631,391 | |
Receivables: | | | | |
Fund shares sold | | | 11,816,165 | |
Dividends and interest | | | 3,762,353 | |
Securities lending | | | 4,027 | |
Other assets | | | 54,383 | |
| | | | |
Total assets | | | 1,639,957,704 | |
| | | | |
| |
| Liabilities | | | | |
Cash collateral received for securities on loan | | | 5,572,039 | |
Payables: | | | | |
Fund shares redeemed | | | 1,379,886 | |
Manager (See Note 3) | | | 721,172 | |
Transfer agent (See Note 3) | | | 308,636 | |
NYLIFE Distributors (See Note 3) | | | 211,971 | |
Shareholder communication | | | 55,769 | |
Professional fees | | | 46,570 | |
Custodian | | | 5,604 | |
Trustees | | | 2,055 | |
Accrued expenses | | | 6,742 | |
| | | | |
Total liabilities | | | 8,310,444 | |
| | | | |
Net assets | | $ | 1,631,647,260 | |
| | | | |
| |
| Composition of Net Assets | | | | |
Shares of beneficial interest outstanding (par value of $.01 per share) unlimited number of shares authorized | | $ | 780,029 | |
Additional paid-in capital | | | 1,240,829,993 | |
| | | | |
| | | 1,241,610,022 | |
Total distributable earnings (loss) | | | 390,037,238 | |
| | | | |
Net assets | | $ | 1,631,647,260 | |
| | | | |
| | | | |
Class A | | | | |
Net assets applicable to outstanding shares | | $ | 657,625,894 | |
| | | | |
Shares of beneficial interest outstanding | | | 31,459,398 | |
| | | | |
Net asset value per share outstanding | | $ | 20.90 | |
Maximum sales charge (5.50% of offering price) | | | 1.22 | |
| | | | |
Maximum offering price per share outstanding | | $ | 22.12 | |
| | | | |
Investor Class | | | | |
Net assets applicable to outstanding shares | | $ | 57,829,162 | |
| | | | |
Shares of beneficial interest outstanding | | | 2,767,070 | |
| | | | |
Net asset value per share outstanding | | $ | 20.90 | |
Maximum sales charge (5.00% of offering price) | | | 1.10 | |
| | | | |
Maximum offering price per share outstanding | | $ | 22.00 | |
| | | | |
Class B | | | | |
Net assets applicable to outstanding shares | | $ | 10,453,996 | |
| | | | |
Shares of beneficial interest outstanding | | | 505,830 | |
| | | | |
Net asset value and offering price per share outstanding | | $ | 20.67 | |
| | | | |
Class C | | | | |
Net assets applicable to outstanding shares | | $ | 52,999,488 | |
| | | | |
Shares of beneficial interest outstanding | | | 2,567,572 | |
| | | | |
Net asset value and offering price per share outstanding | | $ | 20.64 | |
| | | | |
Class I | | | | |
Net assets applicable to outstanding shares | | $ | 852,738,720 | |
| | | | |
Shares of beneficial interest outstanding | | | 40,703,008 | |
| | | | |
Net asset value and offering price per share outstanding | | $ | 20.95 | |
| | | | |
| | | | | | |
The notes to the financial statements are an integral part of,
and should be read in conjunction with, the financial statements. | | | | | 15 | |
Statement of Operations for the year ended October 31, 2020
| | | | |
| Investment Income (Loss) | |
Income | | | | |
Interest | | $ | 13,214,505 | |
Dividends-unaffiliated | | | 5,271,877 | |
Dividends-affiliated | | | 653,475 | |
Securities lending | | | 268,802 | |
Other | | | 34,219 | |
| | | | |
Total income | | | 19,442,878 | |
| | | | |
Expenses | | | | |
Manager (See Note 3) | | | 8,449,827 | |
Distribution/Service—Class A (See Note 3) | | | 1,467,195 | |
Distribution/Service—Investor Class (See Note 3) | | | 147,950 | |
Distribution/Service—Class B (See Note 3) | | | 109,408 | |
Distribution/Service—Class C (See Note 3) | | | 571,312 | |
Transfer agent (See Note 3) | | | 1,887,697 | |
Professional fees | | | 179,071 | |
Registration | | | 126,942 | |
Shareholder communication | | | 113,051 | |
Trustees | | | 35,580 | |
Custodian | | | 34,279 | |
Miscellaneous | | | 53,524 | |
| | | | |
Total expenses before waiver/reimbursement | | | 13,175,836 | |
Expense waiver/reimbursement from Manager (See Note 3) | | | (756,070 | ) |
| | | | |
Net expenses | | | 12,419,766 | |
| | | | |
Net investment income (loss) | | | 7,023,112 | |
| | | | |
|
| Realized and Unrealized Gain (Loss) | |
Net realized gain (loss) on unaffiliated investments | | | 136,092,037 | |
Net change in unrealized appreciation (depreciation) on unaffiliated investments | | | 126,219,090 | |
| | | | |
Net realized and unrealized gain (loss) | | | 262,311,127 | |
| | | | |
Net increase (decrease) in net assets resulting from operations | | $ | 269,334,239 | |
| | | | |
| | | | |
| 16 | | MainStay MacKay Convertible Fund | | The notes to the financial statements are an integral part of,
and should be read in conjunction with, the financial statements. |
Statements of Changes in Net Assets
for the years ended October 31, 2020 and October 31, 2019
| | | | | | | | |
| | | 2020 | | | 2019 | |
| Increase (Decrease) in Net Assets | |
Operations: | | | | | | | | |
Net investment income (loss) | | $ | 7,023,112 | | | $ | 10,965,747 | |
Net realized gain (loss) | | | 136,092,037 | | | | 27,902,416 | |
Net change in unrealized appreciation (depreciation) | | | 126,219,090 | | | | 93,983,449 | |
| | | | |
Net increase (decrease) in net assets resulting from operations | | | 269,334,239 | | | | 132,851,612 | |
| | | | |
Distributions to shareholders: | | | | | | | | |
Class A | | | (13,476,076 | ) | | | (29,204,205 | ) |
Investor Class | | | (1,333,183 | ) | | | (2,974,246 | ) |
Class B | | | (222,915 | ) | | | (745,657 | ) |
Class C | | | (1,152,529 | ) | | | (3,987,604 | ) |
Class I | | | (21,838,382 | ) | | | (40,493,755 | ) |
| | | | |
Total distributions to shareholders | | | (38,023,085 | ) | | | (77,405,467 | ) |
| | | | |
Capital share transactions: | | | | | | | | |
Net proceeds from sale of shares | | | 441,125,603 | | | | 519,115,443 | |
Net asset value of shares issued to shareholders in reinvestment of distributions | | | 34,121,687 | | | | 67,531,715 | |
Cost of shares redeemed | | | (526,300,928 | ) | | | (541,282,880 | ) |
| | | | |
Increase (decrease) in net assets derived from capital share transactions | | | (51,053,638 | ) | | | 45,364,278 | |
| | | | |
Net increase (decrease) in net assets | | | 180,257,516 | | | | 100,810,423 | |
|
| Net Assets | |
Beginning of year | | | 1,451,389,744 | | | | 1,350,579,321 | |
| | | | |
End of year | | $ | 1,631,647,260 | | | $ | 1,451,389,744 | |
| | | | |
| | | | | | |
The notes to the financial statements are an integral part of,
and should be read in conjunction with, the financial statements. | | | | | 17 | |
Financial Highlights selected per share data and ratios
| | | | | | | | | | | | | | | | | | | | |
| |
| | | Year ended October 31, | |
| | | | | |
| Class A | | 2020 | | | 2019 | | | 2018 | | | 2017 | | | 2016 | |
| | | | | |
Net asset value at beginning of year | | $ | 17.81 | | | $ | 17.07 | | | $ | 17.75 | | | $ | 15.72 | | | $ | 16.51 | |
| | | | | | | | | | | | | | | | | | | | |
| | | | | |
Net investment income (loss) (a) | | | 0.06 | | | | 0.12 | | | | 0.15 | | | | 0.19 | | | | 0.20 | |
| | | | | |
Net realized and unrealized gain (loss) on investments | | | 3.47 | | | | 1.60 | | | | 0.40 | | | | 2.34 | | �� | | 0.35 | |
| | | | | | | | | | | | | | | | | | | | |
| | | | | |
Total from investment operations | | | 3.53 | | | | 1.72 | | | | 0.55 | | | | 2.53 | | | | 0.55 | |
| | | | | | | | | | | | | | | | | | | | |
| | | | | |
| Less distributions: | | | | | | | | | | | | | | | | | | | | |
| | | | | |
From net investment income | | | (0.13 | ) | | | (0.15 | ) | | | (0.22 | ) | | | (0.24 | ) | | | (0.64 | ) |
| | | | | |
From net realized gain on investments | | | (0.31 | ) | | | (0.83 | ) | | | (1.01 | ) | | | (0.26 | ) | | | (0.70 | ) |
| | | | | | | | | | | | | �� | | | | | | | |
| | | | | |
Total distributions | | | (0.44 | ) | | | (0.98 | ) | | | (1.23 | ) | | | (0.50 | ) | | | (1.34 | ) |
| | | | | | | | | | | | | | | | | | | | |
| | | | | |
Net asset value at end of year | | $ | 20.90 | | | $ | 17.81 | | | $ | 17.07 | | | $ | 17.75 | | | $ | 15.72 | |
| | | | | | | | | | | | | | | | | | | | |
| | | | | |
Total investment return (b) | | | 20.27 | % | | | 10.75 | % | | | 3.28 | % | | | 16.30 | % | | | 3.71 | % |
| | | | | |
| Ratios (to average net assets)/Supplemental Data: | | | | | | | | | | | | | | | | | | | | |
| | | | | |
Net investment income (loss) | | | 0.33 | % | | | 0.67 | % | | | 0.87 | % | | | 1.12 | % | | | 1.31 | % |
| | | | | |
Net expenses (c) | | | 0.96 | % | | | 0.98 | % | | | 0.98 | % | | | 0.98 | % | | | 1.01 | % |
| | | | | |
Expenses (before waiver/reimbursement) (c) | | | 0.96 | % | | | 0.98 | % | | | 0.98 | % | | | 0.99 | % | | | 1.01 | % |
| | | | | |
Portfolio turnover rate | | | 46 | % | | | 23 | % | | | 43 | % | | | 38 | % | | | 24 | % |
| | | | | |
Net assets at end of year (in 000’s) | | $ | 657,626 | | | $ | 545,605 | | | $ | 518,381 | | | $ | 482,341 | | | $ | 368,583 | |
| (a) | Per share data based on average shares outstanding during the year. |
| (b) | Total investment return is calculated exclusive of sales charges and assumes the reinvestment of distributions. For periods of less than one year, total return is not annualized. |
| (c) | In addition to the fees and expenses which the Fund bears directly, it also indirectly bears a pro-rata share of the fees and expenses of the underlying funds in which it invests. Such indirect expenses are not included in the above expense ratios. |
| | | | | | | | | | | | | | | | | | | | |
| |
| | | Year ended October 31, | |
| | | | | |
| Investor Class | | 2020 | | | 2019 | | | 2018 | | | 2017 | | | 2016 | |
| | | | | |
Net asset value at beginning of year | | $ | 17.80 | | | $ | 17.07 | | | $ | 17.75 | | | $ | 15.72 | | | $ | 16.50 | |
| | | | | | | | | | | | | | | | | | | | |
| | | | | |
Net investment income (loss) (a) | | | 0.03 | | | | 0.09 | | | | 0.13 | | | | 0.16 | | | | 0.18 | |
| | | | | |
Net realized and unrealized gain (loss) on investments | | | 3.47 | | | | 1.59 | | | | 0.39 | | | | 2.34 | | | | 0.36 | |
| | | | | | | | | | | | | | | | | | | | |
| | | | | |
Total from investment operations | | | 3.50 | | | | 1.68 | | | | 0.52 | | | | 2.50 | | | | 0.54 | |
| | | | | | | | | | | | | | | | | | | | |
| | | | | |
| Less distributions: | | | | | | | | | | | | | | | | | | | | |
| | | | | |
From net investment income | | | (0.09 | ) | | | (0.12 | ) | | | (0.19 | ) | | | (0.21 | ) | | | (0.62 | ) |
| | | | | |
From net realized gain on investments | | | (0.31 | ) | | | (0.83 | ) | | | (1.01 | ) | | | (0.26 | ) | | | (0.70 | ) |
| | | | | | | | | | | | | | | | | | | | |
| | | | | |
Total distributions | | | (0.40 | ) | | | (0.95 | ) | | | (1.20 | ) | | | (0.47 | ) | | | (1.32 | ) |
| | | | | | | | | | | | | | | | | | | | |
| | | | | |
Net asset value at end of year | | $ | 20.90 | | | $ | 17.80 | | | $ | 17.07 | | | $ | 17.75 | | | $ | 15.72 | |
| | | | | | | | | | | | | | | | | | | | |
| | | | | |
Total investment return (b) | | | 20.08 | % | | | 10.50 | % | | | 3.12 | % | | | 16.11 | % | | | 3.60 | % |
| | | | | |
| Ratios (to average net assets)/Supplemental Data: | | | | | | | | | | | | | | | | | | | | |
| | | | | |
Net investment income (loss) | | | 0.13 | % | | | 0.51 | % | | | 0.72 | % | | | 0.95 | % | | | 1.14 | % |
| | | | | |
Net expenses (c) | | | 1.16 | % | | | 1.15 | % | | | 1.13 | % | | | 1.14 | % | | | 1.18 | % |
| | | | | |
Expenses (before waiver/reimbursement) (c) | | | 1.16 | % | | | 1.17 | % | | | 1.14 | % | | | 1.15 | % | | | 1.18 | % |
| | | | | |
Portfolio turnover rate | | | 46 | % | | | 23 | % | | | 43 | % | | | 38 | % | | | 24 | % |
| | | | | |
Net assets at end of year (in 000’s) | | $ | 57,829 | | | $ | 59,242 | | | $ | 52,723 | | | $ | 56,289 | | | $ | 79,430 | |
| (a) | Per share data based on average shares outstanding during the year. |
| (b) | Total investment return is calculated exclusive of sales charges and assumes the reinvestment of distributions. For periods of less than one year, total return is not annualized. |
| (c) | In addition to the fees and expenses which the Fund bears directly, it also indirectly bears a pro-rata share of the fees and expenses of the underlying funds in which it invests. Such indirect expenses are not included in the above expense ratios. |
| | | | |
| 18 | | MainStay MacKay Convertible Fund | | The notes to the financial statements are an integral part of,
and should be read in conjunction with, the financial statements. |
Financial Highlights selected per share data and ratios
| | | | | | | | | | | | | | | | | | | | |
| |
| | | Year ended October 31, | |
| | | | | |
| Class B | | 2020 | | | 2019 | | | 2018 | | | 2017 | | | 2016 | |
| | | | | |
Net asset value at beginning of year | | $ | 17.68 | | | $ | 16.98 | | | $ | 17.67 | | | $ | 15.66 | | | $ | 16.45 | |
| | | | | | | | | | | | | | | | | | | | |
| | | | | |
Net investment income (loss) (a) | | | (0.11 | ) | | | (0.04 | ) | | | (0.01 | ) | | | 0.04 | | | | 0.06 | |
| | | | | |
Net realized and unrealized gain (loss) on investments | | | 3.44 | | | | 1.60 | | | | 0.39 | | | | 2.32 | | | | 0.35 | |
| | | | | | | | | | | | | | | | | | | | |
| | | | | |
Total from investment operations | | | 3.33 | | | | 1.56 | | | | 0.38 | | | | 2.36 | | | | 0.41 | |
| | | | | | | | | | | | | | | | | | | | |
| | | | | |
| Less distributions: | | | | | | | | | | | | | | | | | | | | |
| | | | | |
From net investment income | | | (0.03 | ) | | | (0.03 | ) | | | (0.06 | ) | | | (0.09 | ) | | | (0.50 | ) |
| | | | | |
From net realized gain on investments | | | (0.31 | ) | | | (0.83 | ) | | | (1.01 | ) | | | (0.26 | ) | | | (0.70 | ) |
| | | | | | | | | | | | | | | | | | | | |
| | | | | |
Total distributions | | | (0.34 | ) | | | (0.86 | ) | | | (1.07 | ) | | | (0.35 | ) | | | (1.20 | ) |
| | | | | | | | | | | | | | | | | | | | |
| | | | | |
Net asset value at end of year | | $ | 20.67 | | | $ | 17.68 | | | $ | 16.98 | | | $ | 17.67 | | | $ | 15.66 | |
| | | | | | | | | | | | | | | | | | | | |
| | | | | |
Total investment return (b) | | | 19.15 | % | | | 9.76 | % | | | 2.35 | % | | | 15.21 | % | | | 2.83 | % |
| | | | | |
| Ratios (to average net assets)/Supplemental Data: | | | | | | | | | | | | | | | | | | | | |
| | | | | |
Net investment income (loss) | | | (0.61 | %) | | | (0.23 | %) | | | (0.03 | %) | | | 0.21 | % | | | 0.39 | % |
| | | | | |
Net expenses (c) | | | 1.91 | % | | | 1.90 | % | | | 1.88 | % | | | 1.89 | % | | | 1.93 | % |
| | | | | |
Expenses (before waiver/reimbursement) (c) | | | 1.91 | % | | | 1.92 | % | | | 1.89 | % | | | 1.90 | % | | | 1.93 | % |
| | | | | |
Portfolio turnover rate | | | 46 | % | | | 23 | % | | | 43 | % | | | 38 | % | | | 24 | % |
| | | | | |
Net assets at end of year (in 000’s) | | $ | 10,454 | | | $ | 11,786 | | | $ | 15,051 | | | $ | 19,290 | | | $ | 21,436 | |
| (a) | Per share data based on average shares outstanding during the year. |
| (b) | Total investment return is calculated exclusive of sales charges and assumes the reinvestment of distributions. For periods of less than one year, total return is not annualized. |
| (c) | In addition to the fees and expenses which the Fund bears directly, it also indirectly bears a pro-rata share of the fees and expenses of the underlying funds in which it invests. Such indirect expenses are not included in the above expense ratios. |
| | | | | | | | | | | | | | | | | | | | |
| |
| | | Year ended October 31, | |
| | | | | |
| Class C | | 2020 | | | 2019 | | | 2018 | | | 2017 | | | 2016 | |
| | | | | |
Net asset value at beginning of year | | $ | 17.65 | | | $ | 16.96 | | | $ | 17.65 | | | $ | 15.64 | | | $ | 16.43 | |
| | | | | | | | | | | | | | | | | | | | |
| | | | | |
Net investment income (loss) (a) | | | (0.11 | ) | | | (0.04 | ) | | | (0.00 | )‡ | | | 0.04 | | | | 0.06 | |
| | | | | |
Net realized and unrealized gain (loss) on investments | | | 3.44 | | | | 1.59 | | | | 0.38 | | | | 2.32 | | | | 0.35 | |
| | | | | | | | | | | | | | | | | | | | |
| | | | | |
Total from investment operations | | | 3.33 | | | | 1.55 | | | | 0.38 | | | | 2.36 | | | | 0.41 | |
| | | | | | | | | | | | | | | | | | | | |
| | | | | |
| Less distributions: | | | | | | | | | | | | | | | | | | | | |
| | | | | |
From net investment income | | | (0.03 | ) | | | (0.03 | ) | | | (0.06 | ) | | | (0.09 | ) | | | (0.50 | ) |
| | | | | |
From net realized gain on investments | | | (0.31 | ) | | | (0.83 | ) | | | (1.01 | ) | | | (0.26 | ) | | | (0.70 | ) |
| | | | | | | | | | | | | | | | | | | | |
| | | | | |
Total distributions | | | (0.34 | ) | | | (0.86 | ) | | | (1.07 | ) | | | (0.35 | ) | | | (1.20 | ) |
| | | | | | | | | | | | | | | | | | | | |
| | | | | |
Net asset value at end of year | | $ | 20.64 | | | $ | 17.65 | | | $ | 16.96 | | | $ | 17.65 | | | $ | 15.64 | |
| | | | | | | | | | | | | | | | | | | | |
| | | | | |
Total investment return (b) | | | 19.18 | % | | | 9.71 | % | | | 2.35 | % | | | 15.23 | % | | | 2.77 | % |
| | | | | |
| Ratios (to average net assets)/Supplemental Data: | | | | | | | | | | | | | | | | | | | | |
| | | | | |
Net investment income (loss) | | | (0.61 | %) | | | (0.23 | %) | | | (0.03 | %) | | | 0.21 | % | | | 0.39 | % |
| | | | | |
Net expenses (c) | | | 1.91 | % | | | 1.90 | % | | | 1.88 | % | | | 1.89 | % | | | 1.93 | % |
| | | | | |
Expenses (before waiver/reimbursement) (c) | | | 1.91 | % | | | 1.92 | % | | | 1.89 | % | | | 1.90 | % | | | 1.93 | % |
| | | | | |
Portfolio turnover rate | | | 46 | % | | | 23 | % | | | 43 | % | | | 38 | % | | | 24 | % |
| | | | | |
Net assets at end of year (in 000’s) | | $ | 52,999 | | | $ | 60,891 | | | $ | 80,830 | | | $ | 82,335 | | | $ | 76,501 | |
| ‡ | Less than one cent per share. |
| (a) | Per share data based on average shares outstanding during the year. |
| (b) | Total investment return is calculated exclusive of sales charges and assumes the reinvestment of distributions. For periods of less than one year, total return is not annualized. |
| (c) | In addition to the fees and expenses which the Fund bears directly, it also indirectly bears a pro-rata share of the fees and expenses of the underlying funds in which it invests. Such indirect expenses are not included in the above expense ratios. |
| | | | | | |
The notes to the financial statements are an integral part of,
and should be read in conjunction with, the financial statements. | | | | | 19 | |
Financial Highlights selected per share data and ratios
| | | | | | | | | | | | | | | | | | | | |
| |
| | | Year ended October 31, | |
| | | | | |
| Class I | | 2020 | | | 2019 | | | 2018 | | | 2017 | | | 2016 | |
| | | | | |
Net asset value at beginning of year | | $ | 17.85 | | | $ | 17.11 | | | $ | 17.79 | | | $ | 15.75 | | | $ | 16.54 | |
| | | | | | | | | | | | | | | | | | | | |
| | | | | |
Net investment income (loss) (a) | | | 0.13 | | | | 0.18 | | | | 0.22 | | | | 0.25 | | | | 0.24 | |
| | | | | |
Net realized and unrealized gain (loss) on investments | | | 3.48 | | | | 1.60 | | | | 0.39 | | | | 2.34 | | | | 0.35 | |
| | | | | | | | | | | | | | | | | | | | |
| | | | | |
Total from investment operations | | | 3.61 | | | | 1.78 | | | | 0.61 | | | | 2.59 | | | | 0.59 | |
| | | | | | | | | | | | | | | | | | | | |
| | | | | |
| Less distributions: | | | | | | | | | | | | | | | | | | | | |
| | | | | |
From net investment income | | | (0.20 | ) | | | (0.21 | ) | | | (0.28 | ) | | | (0.29 | ) | | | (0.68 | ) |
| | | | | |
From net realized gain on investments | | | (0.31 | ) | | | (0.83 | ) | | | (1.01 | ) | | | (0.26 | ) | | | (0.70 | ) |
| | | | | | | | | | | | | | | | | | | | |
| | | | | |
Total distributions | | | (0.51 | ) | | | (1.04 | ) | | | (1.29 | ) | | | (0.55 | ) | | | (1.38 | ) |
| | | | | | | | | | | | | | | | | | | | |
| | | | | |
Net asset value at end of year | | $ | 20.95 | | | $ | 17.85 | | | $ | 17.11 | | | $ | 17.79 | | | $ | 15.75 | |
| | | | | | | | | | | | | | | | | | | | |
| | | | | |
Total investment return (b) | | | 20.71 | % | | | 11.14 | % | | | 3.65 | % | | | 16.69 | % | | | 3.96 | % |
| | | | | |
| Ratios (to average net assets)/Supplemental Data: | | | | | | | | | | | | | | | | | | | | |
| | | | | |
Net investment income (loss) | | | 0.68 | % | | | 1.04 | % | | | 1.25 | % | | | 1.45 | % | | | 1.56 | % |
| | | | | |
Net expenses (c) | | | 0.61 | % | | | 0.61 | % | | | 0.61 | % | | | 0.64 | % | | | 0.76 | % |
| | | | | |
Expenses (before waiver/reimbursement) (c) | | | 0.71 | % | | | 0.73 | % | | | 0.73 | % | | | 0.74 | % | | | 0.76 | % |
| | | | | |
Portfolio turnover rate | | | 46 | % | | | 23 | % | | | 43 | % | | | 38 | % | | | 24 | % |
| | | | | |
Net assets at end of year (in 000’s) | | $ | 852,739 | | | $ | 773,865 | | | $ | 683,594 | | | $ | 562,526 | | | $ | 252,852 | |
| (a) | Per share data based on average shares outstanding during the year. |
| (b) | Total investment return is calculated exclusive of sales charges and assumes the reinvestment of distributions. Class I shares are not subject to sales charges. For periods of less than one year, total return is not annualized. |
| (c) | In addition to the fees and expenses which the Fund bears directly, it also indirectly bears a pro-rata share of the fees and expenses of the underlying funds in which it invests. Such indirect expenses are not included in the above expense ratios. |
| | | | |
| 20 | | MainStay MacKay Convertible Fund | | The notes to the financial statements are an integral part of,
and should be read in conjunction with, the financial statements. |
Notes to Financial Statements
Note 1–Organization and Business
The MainStay Funds (the “Trust”) was organized on January 9, 1986, as a Massachusetts business trust. The Trust is registered under the Investment Company Act of 1940, as amended (the “1940 Act”), as an open-end management investment company, and is comprised of twelve funds (collectively referred to as the “Funds”). These financial statements and notes relate to the MainStay MacKay Convertible Fund (the “Fund”), a “diversified” fund, as that term is defined in the 1940 Act, as interpreted or modified by regulatory authorities having jurisdiction, from time to time.
The Fund currently has seven classes of shares registered for sale. Class A shares commenced operations on January 3, 1995. Class B shares commenced operations on May 1, 1986. Class C shares commenced operations on September 1, 1998. Investor Class shares commenced operations on February 28, 2008. Class I shares commenced operations on November 28, 2008. Class R6 shares were registered for sale effective as of February 28, 2017. SIMPLE Class shares were registered for sale effective as of August 31, 2020. As of October 31, 2020, Class R6 and SIMPLE Class shares were not yet offered for sale.
Class B shares of the MainStay Group of Funds are closed to all new purchases as well as additional investments by existing Class B shareholders. Existing Class B shareholders may continue to reinvest dividends and capital gains distributions, as well as exchange their Class B shares for Class B shares of other funds in the MainStay Group of Funds as permitted by the current exchange privileges. Class B shareholders continue to be subject to any applicable contingent deferred sales charge (“CDSC”) at the time of redemption. All other features of the Class B shares, including but not limited to the fees and expenses applicable to Class B shares, remain unchanged. Unless redeemed, Class B shareholders will remain in Class B shares of their respective fund until the Class B shares are converted to Class A or Investor Class shares pursuant to the applicable conversion schedule.
Class A and Investor Class shares are offered at net asset value (“NAV”) per share plus an initial sales charge. No initial sales charge applies to investments of $1 million or more (and certain other qualified purchases) in Class A and Investor Class shares. However, a CDSC of 1.00% may be imposed on certain redemptions made within 18 months of the date of purchase on shares that were purchased without an initial sales charge. Class C shares are offered at NAV without an initial sales charge, although a 1.00% CDSC may be imposed on certain redemptions of such shares made within one year of the date of purchase of Class C shares. When Class B shares were offered, they were offered at NAV without an initial sales charge, although a CDSC that declines depending on the number of years a shareholder held its Class B shares may be imposed on certain redemptions of such shares made within six years of the date of purchase of such shares. Class I shares are offered at NAV without a sales charge. Class R6 and SIMPLE Class shares are currently expected to be offered at NAV without a sales charge. Depending upon eligibility, Class B shares convert to either Class A or Investor Class shares at the end of the calendar quarter eight years after the date they were purchased. In addition, depending upon eligibility, Class C shares convert to either Class A or Investor Class shares at the end of the calendar quarter ten years after the date they
were purchased. Additionally, Investor Class shares may convert automatically to Class A shares. Under certain circumstances and as may be permitted by the Trust’s multiple class plan pursuant to Rule 18f-3 under the 1940 Act, specified share classes of the Fund may be converted to one or more other share classes of the Fund as disclosed in the capital share transactions within these Notes. The classes of shares have the same voting (except for issues that relate solely to one class), dividend, liquidation and other rights, and the same terms and conditions, except that under distribution plans pursuant to Rule 12b-1 under the 1940 Act, Class B and Class C shares are subject to higher distribution and/or service fees than Class A, Investor Class and SIMPLE Class shares. Class I and Class R6 shares are not subject to a distribution and/or service fee.
The Fund’s investment objective is to seek capital appreciation together with current income.
Note 2–Significant Accounting Policies
The Fund is an investment company and accordingly follows the investment company accounting and reporting guidance of the Financial Accounting Standards Board (“FASB”) Accounting Standard Codification Topic 946 Financial Services—Investment Companies. The Fund prepares its financial statements in accordance with generally accepted accounting principles (“GAAP”) in the United States of America and follows the significant accounting policies described below.
(A) Securities Valuation. Investments are usually valued as of the close of regular trading on the New York Stock Exchange (the “Exchange”) (usually 4:00 p.m. Eastern time) on each day the Fund is open for business (“valuation date”).
The Board of Trustees of the Trust (the “Board”) adopted procedures establishing methodologies for the valuation of the Fund’s securities and other assets and delegated the responsibility for valuation determinations under those procedures to the Valuation Committee of the Trust (the “Valuation Committee”). The procedures state that, subject to the oversight of the Board and unless otherwise noted, the responsibility for the day-to-day valuation of portfolio assets (including fair value measurements for the Fund’s assets and liabilities) rests with New York Life Investment Management LLC (“New York Life Investments” or the “Manager”), aided to whatever extent necessary by the Subadvisor (as defined in Note 3(A)). To assess the appropriateness of security valuations, the Manager, the Subadvisor or the Fund’s third-party service provider, who is subject to oversight by the Manager, regularly compares prior day prices, prices on comparable securities and the sale prices to the prior and current day prices and challenges prices with changes exceeding certain tolerance levels with third-party pricing services or broker sources.
The Board authorized the Valuation Committee to appoint a Valuation Subcommittee (the “Subcommittee”) to establish the prices of securities for which market quotations are not readily available or the prices of which are not otherwise readily determinable under the procedures. The Subcommittee meets (in person, via electronic mail or via teleconference) on an as-needed basis. The Valuation Committee meets to ensure that actions taken by the Subcommittee were appropriate.
Notes to Financial Statements (continued)
For those securities valued through either a standardized fair valuation methodology or a fair valuation measurement, the Subcommittee deals with such valuation and the Valuation Committee reviews and affirms, if appropriate, the reasonableness of the valuation based on such methodologies and measurements on a regular basis after considering information that is reasonably available and deemed relevant by the Valuation Committee. Any action taken by the Subcommittee with respect to the valuation of a portfolio security or other asset is submitted for review and ratification (if appropriate) to the Valuation Committee and the Board at the next regularly scheduled meeting.
“Fair value” is defined as the price the Fund would reasonably expect to receive upon selling an asset or liability in an orderly transaction to an independent buyer in the principal or most advantageous market for the asset or liability. Fair value measurements are determined within a framework that establishes a three-tier hierarchy that maximizes the use of observable market data and minimizes the use of unobservable inputs to establish a classification of fair value measurements for disclosure purposes. “Inputs” refer broadly to the assumptions that market participants would use in pricing the asset or liability, including assumptions about risk, such as the risk inherent in a particular valuation technique used to measure fair value using a pricing model and/or the risk inherent in the inputs for the valuation technique. Inputs may be observable or unobservable. Observable inputs reflect the assumptions market participants would use in pricing the asset or liability based on market data obtained from sources independent of the Fund. Unobservable inputs reflect the Fund’s own assumptions about the assumptions market participants would use in pricing the asset or liability based on the information available. The inputs or methodology used for valuing assets or liabilities may not be an indication of the risks associated with investing in those assets or liabilities. The three-tier hierarchy of inputs is summarized below.
| • | | Level 1—quoted prices in active markets for an identical asset or liability |
| • | | Level 2—other significant observable inputs (including quoted prices for a similar asset or liability in active markets, interest rates and yield curves, prepayment speeds, credit risk, etc.) |
| • | | Level 3—significant unobservable inputs (including the Fund’s own assumptions about the assumptions that market participants would use in measuring fair value of an asset or liability) |
The level of an asset or liability within the fair value hierarchy is based on the lowest level of an input, both individually and in the aggregate, that is significant to the fair value measurement. The aggregate value by input level of the Fund’s assets and liabilities as of October 31, 2020, is included at the end of the Portfolio of Investments.
The Fund may use third-party vendor evaluations, whose prices may be derived from one or more of the following standard inputs, among others:
| | |
• Benchmark yields | | • Reported trades |
• Broker/dealer quotes | | • Issuer spreads |
• Two-sided markets | | • Benchmark securities |
• Bids/offers | | • Reference data (corporate actions or material event notices) |
• Industry and economic events | | • Comparable bonds |
• Monthly payment information | | |
An asset or liability for which market values cannot be measured using the methodologies described above is valued by methods deemed reasonable in good faith by the Valuation Committee, following the procedures established by the Board, to represent fair value. Under these procedures, the Fund generally uses a market-based approach which may use related or comparable assets or liabilities, recent transactions, market multiples, book values and other relevant information. The Fund may also use an income-based valuation approach in which the anticipated future cash flows of the asset or liability are discounted to calculate fair value. Discounts may also be applied due to the nature and/or duration of any restrictions on the disposition of the asset or liability. Fair value represents a good faith approximation of the value of a security. Fair value determinations involve the consideration of a number of subjective factors, an analysis of applicable facts and circumstances and the exercise of judgment. As a result, it is possible that the fair value for a security determined in good faith in accordance with the Fund’s valuation procedures may differ from valuations for the same security determined by other funds using their own valuation procedures. Although the Fund’s valuation procedures are designed to value a security at the price the Fund may reasonably expect to receive upon the security’s sale in an orderly transaction, there can be no assurance that any fair value determination thereunder would, in fact, approximate the amount that the Fund would actually realize upon the sale of the security or the price at which the security would trade if a reliable market price were readily available. During the year ended October 31, 2020, there were no material changes to the fair value methodologies.
Securities which may be valued in this manner include, but are not limited to: (i) a security for which trading has been halted or suspended; (ii) a debt security that has recently gone into default and for which there is not a current market quotation; (iii) a security of an issuer that has entered into a restructuring; (iv) a security that has been delisted from a national exchange; (v) a security for which the market price is not readily available from a third-party pricing source or, if so provided, does not, in the opinion of the Manager or the Subadvisor, reflect the security’s market value; (vi) a security subject to trading collars for which no or limited trading takes place; and (vii) a security whose principal market has been temporarily closed at a time when, under normal conditions, it would be open. Securities valued in this manner are generally categorized as Level 3 in the hierarchy. No securities held by the Fund as of October 31, 2020 were fair valued in such a manner.
Equity securities are valued at the last quoted sales prices as of the close of regular trading on the relevant exchange on each valuation date. Securities that are not traded on the valuation date are valued at the mean of the last quoted bid and ask prices. Prices are normally taken from the principal market in which each security trades. These securities are generally categorized as Level 1 in the hierarchy.
Investments in mutual funds, including money market funds, are valued at their respective NAVs as of the close of the Exchange on the valuation date. These securities are generally categorized as Level 1 in the hierarchy.
Debt securities (other than convertible and municipal bonds) are valued at the evaluated bid prices (evaluated mean prices in the case of convertible and municipal bonds) supplied by a pricing agent or broker(s) selected by the Manager, in consultation with the Subadvisor. The
| | |
| 22 | | MainStay MacKay Convertible Fund |
evaluations are market-based measurements processed through a pricing application and represents the pricing agent’s good faith determination as to what a holder may receive in an orderly transaction under market conditions. The rules-based logic utilizes valuation techniques that reflect participants’ assumptions and vary by asset class and per methodology, maximizing the use of relevant observable data including quoted prices for similar assets, benchmark yield curves and market corroborated inputs. The evaluated bid or mean prices are deemed by the Manager, in consultation with the Subadvisor, to be representative of market values at the regular close of trading of the Exchange on each valuation date. Debt securities purchased on a delayed delivery basis are marked to market daily until settlement at the forward settlement date. Debt securities, including corporate bonds, U.S. government and federal agency bonds, municipal bonds, foreign bonds, convertible bonds, asset-backed securities and mortgage-backed securities are generally categorized as Level 2 in the hierarchy.
Temporary cash investments acquired in excess of 60 days to maturity at the time of purchase are valued using the latest bid prices or using valuations based on a matrix system (which considers such factors as security prices, yields, maturities and ratings), both as furnished by independent pricing services. Temporary cash investments that mature in 60 days or less at the time of purchase (“Short-Term Investments”) are valued using the amortized cost method of valuation, unless the use of such method would be inappropriate. The amortized cost method involves valuing a security at its cost on the date of purchase and thereafter assuming a constant amortization to maturity of the difference between such cost and the value on maturity date. Amortized cost approximates the current fair value of a security. Securities valued using the amortized cost method are not valued using quoted prices in an active market and are generally categorized as Level 2 in the hierarchy.
The information above is not intended to reflect an exhaustive list of the methodologies that may be used to value portfolio investments. The valuation procedures permit the use of a variety of valuation methodologies in connection with valuing portfolio investments. The methodology used for a specific type of investment may vary based on the market data available or other considerations. The methodologies summarized above may not represent the specific means by which portfolio investments are valued on any particular business day.
(B) Income Taxes. The Fund’s policy is to comply with the requirements of the Internal Revenue Code of 1986, as amended (the “Internal Revenue Code”), applicable to regulated investment companies and to distribute all of its taxable income to the shareholders of the Fund within the allowable time limits.
The Manager evaluates the Fund’s tax positions to determine if the tax positions taken meet the minimum recognition threshold in connection with accounting for uncertainties in income tax positions taken or expected to be taken for the purposes of measuring and recognizing tax liabilities in the financial statements. Recognition of tax benefits of an uncertain tax position is permitted only to the extent the position is “more likely than not” to be sustained assuming examination by taxing authorities. The Manager analyzed the Fund’s tax positions taken on federal, state and local income tax returns for all open tax years (for up to three tax years) and has concluded that no provisions for federal, state and local income tax are required in the Fund’s financial statements. The Fund’s federal, state and local income tax and federal
excise tax returns for tax years for which the applicable statutes of limitations have not expired are subject to examination by the Internal Revenue Service and state and local departments of revenue.
(C) Dividends and Distributions to Shareholders. Dividends and distributions are recorded on the ex-dividend date. The Fund intends to declare and pay dividends from net investment income, if any, at least quarterly and distributions from net realized capital and currency gains, if any, at least annually. Unless a shareholder elects otherwise, all dividends and distributions are reinvested at NAV in the same class of shares of the Fund. Dividends and distributions to shareholders are determined in accordance with federal income tax regulations and may differ from determinations using GAAP.
(D) Security Transactions and Investment Income. The Fund records security transactions on the trade date. Realized gains and losses on security transactions are determined using the identified cost method. Dividend income is recognized on the ex-dividend date, net of any foreign tax withheld at the source, and interest income is accrued as earned using the effective interest rate method. Distributions received from real estate investment trusts may be classified as dividends, capital gains and/or return of capital. Discounts and premiums on securities purchased for the Fund are accreted and amortized, respectively, on the effective interest rate method.
Investment income and realized and unrealized gains and losses on investments of the Fund are allocated pro rata to the separate classes of shares based upon their relative net assets on the date the income is earned or realized and unrealized gains and losses are incurred.
The Fund may place a debt security on non-accrual status and reduce related interest income by ceasing current accruals and writing off all or a portion of any interest receivables when the collection of all or a portion of such interest has become doubtful. A debt security is removed from non-accrual status when the issuer resumes interest payments or when collectability of interest is reasonably assured.
(E) Expenses. Expenses of the Trust are allocated to the individual Funds in proportion to the net assets of the respective Funds when the expenses are incurred, except where direct allocations of expenses can be made. Expenses (other than transfer agent expenses and fees incurred under the shareholder services plans and/or the distribution plans further discussed in Note 3(B)) are allocated to separate classes of shares pro rata based upon their relative net assets on the date the expenses are incurred. The expenses borne by the Fund, including those of related parties to the Fund, are shown in the Statement of Operations.
Additionally, the Fund may invest in mutual funds, which are subject to management fees and other fees that may cause the costs of investing in mutual funds to be greater than the costs of owning the underlying securities directly. These indirect expenses of mutual funds are not included in the amounts shown as expenses in the Statement of Operations or in the expense ratios included in the Financial Highlights.
(F) Use of Estimates. In preparing financial statements in conformity with GAAP, the Manager makes estimates and assumptions that affect the reported amounts and disclosures in the financial statements. Actual results could differ from those estimates and assumptions.
Notes to Financial Statements (continued)
(G) Repurchase Agreements. The Fund may enter into repurchase agreements (i.e., buy a security from another party with the agreement that it will be sold back in the future) to earn income. The Fund may enter into repurchase agreements only with counterparties, usually financial institutions, that are deemed by the Manager or the Subadvisor to be creditworthy, pursuant to guidelines established by the Board. During the term of any repurchase agreement, the Manager or the Subadvisor will continue to monitor the creditworthiness of the counterparty. Under the 1940 Act, repurchase agreements are considered to be collateralized loans by the Fund to the counterparty secured by the securities transferred to the Fund.
Repurchase agreements are subject to counterparty risk, meaning the Fund could lose money by the counterparty’s failure to perform under the terms of the agreement. The Fund mitigates this risk by ensuring the repurchase agreement is collateralized by cash, U.S. government securities, fixed income securities and/or other securities. The collateral is held by the Fund’s custodian and valued daily on a mark to market basis to determine if the value, including accrued interest, exceeds the repurchase price. In the event of the counterparty’s default on the obligation to repurchase, the Fund has the right to liquidate the collateral and apply the proceeds in satisfaction of the obligation. Under certain circumstances, such as in the event of default or bankruptcy by the counterparty, realization and/or retention of the collateral may be limited or subject to delay, to legal proceedings and possible realized loss to the Fund. As of October 31, 2020, the Fund did not hold any repurchase agreements.
(H) Securities Lending. In order to realize additional income, the Fund may engage in securities lending, subject to the limitations set forth in the 1940 Act and relevant guidance by the staff of the Securities and Exchange Commission (“SEC”). If the Fund engages in securities lending, the Fund will lend through its custodian, currently State Street Bank and Trust Company (“State Street”) (See Note 12 for securities lending agent change), acting as securities lending agent on behalf of the Fund. Under the current arrangement, State Street will manage the Fund’s collateral in accordance with the securities lending agency agreement between the Fund and State Street, and indemnify the Fund against counterparty risk. The loans will be collateralized by cash (which may be invested in a money market fund) and/or non-cash collateral (which may include U.S. Treasury securities and/or U.S. government agency securities issued or guaranteed by the United States government or its agencies or instrumentalities) at least equal at all times to the market value of the securities loaned. The Fund bears the risk of delay in recovery of, or loss of rights in, the securities loaned. The Fund may also record a realized gain or loss on securities deemed sold due to a borrower’s inability to return securities on loan. The Fund bears the risk of any loss on investment of cash collateral. The Fund will receive compensation for lending its securities in the form of fees or it will retain a portion of interest earned on the investment of any cash collateral. The Fund will also continue to receive interest and dividends on the securities loaned and any gain or loss in the market price of the securities loaned that may occur during the term of the loan will be for the account of the Fund. Income earned from securities lending activities, if any, is reflected in the Statement of Operations. As of October 31, 2020, the Fund had securities on loan with an aggregate market value of $5,410,194 and received cash collateral, which was invested into the
State Street Navigator Securities Lending Government Money Market Portfolio, with a value of $5,572,039.
(I) Debt and Convertible Securities Risk. The ability of issuers of debt securities held by the Fund to meet their obligations may be affected by, among other things, economic or political developments in a specific country, industry or region. Debt securities are also subject to the risks associated with changes in interest rates.
Convertible securities may be subordinate to other securities. In part, the total return for a convertible security depends upon the performance of the underlying stock into which it can be converted. Also, issuers of convertible securities are often not as strong financially as those issuing securities with higher credit ratings, are more likely to encounter financial difficulties and typically are more vulnerable to changes in the economy, such as a recession or a sustained period of rising interest rates, which could affect their ability to make interest and principal payments.
(J) Indemnifications. Under the Trust’s organizational documents, its officers and trustees are indemnified against certain liabilities that may arise out of performance of their duties to the Trust. Additionally, in the normal course of business, the Fund enters into contracts with third-party service providers that contain a variety of representations and warranties and that may provide general indemnifications. The Fund’s maximum exposure under these arrangements is unknown, as this would involve future claims that may be made against the Fund that have not yet occurred. The Manager believes that the risk of loss in connection with these potential indemnification obligations is remote. However, there can be no assurance that material liabilities related to such obligations will not arise in the future, which could adversely impact the Fund.
Note 3–Fees and Related Party Transactions
(A) Manager and Subadvisor. New York Life Investments, a registered investment adviser and an indirect, wholly-owned subsidiary of New York Life Insurance Company (“New York Life”), serves as the Fund’s Manager, pursuant to an Amended and Restated Management Agreement (“Management Agreement”). The Manager provides offices, conducts clerical, recordkeeping and bookkeeping services and keeps most of the financial and accounting records required to be maintained by the Fund. Except for the portion of salaries and expenses that are the responsibility of the Fund, the Manager pays the salaries and expenses of all personnel affiliated with the Fund and certain operational expenses of the Fund. The Fund reimburses New York Life Investments in an amount equal to the portion of the compensation of the Chief Compliance Officer attributable to the Fund. MacKay Shields LLC (“MacKay Shields” or the “Subadvisor”), a registered investment adviser and an indirect, wholly-owned subsidiary of New York Life, serves as Subadvisor to the Fund and is responsible for the day-to-day portfolio management of the Fund. Pursuant to the terms of an Amended and Restated Subadvisory Agreement (“Subadvisory Agreement”) between New York Life Investments and MacKay Shields, New York Life Investments pays for the services of the Subadvisor.
Pursuant to the Management Agreement, the Fund pays the Manager a monthly fee for the services performed and the facilities furnished at an annual rate of the Fund’s average daily net assets as follows: 0.60% up
| | |
| 24 | | MainStay MacKay Convertible Fund |
to $500 million; 0.55% from $500 million to $1 billion; 0.50% from $1 billion to $2 billion; and 0.49% in excess of $2 billion, plus a fee for fund accounting services, previously provided by New York Life Investments under a separate fund accounting agreement, furnished at an annual rate of the Fund’s average daily net assets as follows: 0.05% up to $20 million; 0.0333% from $20 million to $100 million; and 0.01% in excess of $100 million. During the year ended October 31, 2020, the effective management fee rate (exclusive of any applicable waivers/reimbursements) was 0.56%, inclusive of a fee for fund accounting services of 0.01% of the Fund’s average daily net assets.
New York Life Investments has contractually agreed to waive fees and/or reimburse expenses (excluding taxes, interest, litigation, extraordinary expenses, brokerage and other transaction expenses relating to the purchase or sale of portfolio investments and acquired (underlying) fund fees and expenses) of Class I shares so that Total Annual Fund Operating Expenses of Class I shares do not exceed 0.61% of the Fund’s average daily net assets. This agreement will remain in effect until August 31, 2021, and shall renew automatically for one-year terms unless New York Life Investments provides written notice of termination prior to the start of the next term or upon approval of the Board.
During the year ended October 31, 2020, New York Life Investments earned fees from the Fund in the amount of $8,449,827 and waived fees and/or reimbursed expenses in the amount of $756,070 and paid the Subadvisor in the amount of $3,758,319.
State Street provides sub-administration and sub-accounting services to the Fund pursuant to an agreement with New York Life Investments (See Note 12 for sub-administration and sub-accounting service provider change). These services include calculating the daily NAVs of the Fund, maintaining the general ledger and sub-ledger accounts for the calculation of the Fund’s NAVs and assisting New York Life Investments in conducting various aspects of the Fund’s administrative operations. For providing these services to the Fund, State Street is compensated by New York Life Investments.
Pursuant to an agreement between the Trust and New York Life Investments, New York Life Investments is responsible for providing or procuring certain regulatory reporting services for the Fund. The Fund will reimburse New York Life Investments for the actual costs incurred by New York Life Investments in connection with providing or procuring these services for the Fund.
(B) Distribution and Service Fees. The Trust, on behalf of the Fund, has entered into a distribution agreement with NYLIFE Distributors LLC (the “Distributor”), an affiliate of New York Life Investments. The Fund has adopted distribution plans (the “Plans”) in accordance with the provisions of Rule 12b-1 under the 1940 Act.
Pursuant to the Class A and Investor Class Plans, the Distributor receives a monthly distribution fee from the Class A and Investor Class shares at an annual rate of 0.25% of the average daily net assets of the Class A and Investor Class shares for distribution and/or service activities as designated by the Distributor. Pursuant to the Class B and Class C Plans, Class B and Class C shares pay the Distributor a monthly distribution fee at an annual rate of 0.75% of the average daily net assets of the Class B and Class C shares along with a service fee at an annual rate of 0.25% of the average daily net assets of the Class B and
Class C shares, for a total 12b-1 fee of 1.00%. Class I shares are not subject to a distribution and/or service fee.
The Plans provide that the distribution and service fees are payable to the Distributor regardless of the amounts actually expended by the Distributor for distribution of the Fund’s shares and service activities.
(C) Sales Charges. The Fund was advised by the Distributor that the amount of initial sales charges retained on sales of Class A and Investor Class shares during the year ended October 31, 2020, were $132,617 and $28,349, respectively.
The Fund was also advised that the Distributor retained CDSCs on redemptions of Class A, Class B and Class C shares during the year ended October 31, 2020, of $8,996, $6,665 and $10,807, respectively.
(D) Transfer, Dividend Disbursing and Shareholder Servicing Agent. NYLIM Service Company LLC, an affiliate of New York Life Investments, is the Fund’s transfer, dividend disbursing and shareholder servicing agent pursuant to an agreement between NYLIM Service Company LLC and the Trust. NYLIM Service Company LLC has entered into an agreement with DST Asset Manager Solutions, Inc. (“DST”), pursuant to which DST performs certain transfer agent services on behalf of NYLIM Service Company LLC. New York Life Investments has contractually agreed to limit the transfer agency expenses charged to the Fund’s share classes to a maximum of 0.35% of that share class’s average daily net assets on an annual basis after deducting any applicable Fund or class-level expense reimbursement or small account fees. This agreement will remain in effect until February 28, 2021, and shall renew automatically for one-year terms unless New York Life Investments provides written notice of termination prior to the start of the next term or upon approval of the Board. During the year ended October 31, 2020, transfer agent expenses incurred by the Fund and any reimbursements, pursuant to the aforementioned Transfer Agency expense limitation agreement were as follows:
| | | | | | | | |
Class | | | Expense | | | | Waived | |
Class A | | $ | 631,422 | | | $ | — | |
Investor Class | | | 187,273 | | | | — | |
Class B | | | 34,616 | | | | — | |
Class C | | | 180,929 | | | | — | |
Class I | | | 853,457 | | | | — | |
(E) Small Account Fee. Shareholders with small accounts adversely impact the cost of providing transfer agency services. In an effort to reduce total transfer agency expenses, the Fund has implemented a small account fee on certain types of accounts. As described in the Fund’s prospectus, certain shareholders with an account balance of less than $1,000 ($5,000 for Class A share accounts) are charged an annual per account fee of $20 (assessed semi-annually), the proceeds from which offset transfer agent fees as reflected in the Statement of Operations. This small account fee will not apply to certain types of accounts as described further in the Fund’s prospectus.
Notes to Financial Statements (continued)
(F) Investments in Affiliates (in 000’s). During the year ended October 31, 2020, purchases and sales transactions, income earned from investments and shares held of investment companies managed by New York Life Investments or its affiliates were as follows:
| | | | | | | | | | | | | | | | | | | | | | | | | | | | | | | | | | | | |
Affiliated Investment Company | | Value,
Beginning of
Year | | | Purchases
at Cost | | | Proceeds
from Sales | | | Net
Realized
Gain/(Loss)
on Sales | | | Change in
Unrealized
Appreciation/
(Depreciation) | | | Value,
End of
Year | | | Dividend
Income | | | Other
Distributions | | | Shares
End of
Year | |
MainStay U.S. Government Liquidity Fund | | $ | 151,034 | | | $ | 455,315 | | | $ | (545,718 | ) | | $ | — | | | $ | — | | | $ | 60,631 | | | $ | 653 | | | $ | — | | | | 60,631 | |
Note 4–Federal Income Tax
As of October 31, 2020, the cost and unrealized appreciation (depreciation) of the Fund’s investment portfolio, including applicable derivative contracts and other financial instruments, as determined on a federal income tax basis, were as follows:
| | | | | | | | | | | | | | | | |
| | | Federal Tax
Cost | | | Gross
Unrealized
Appreciation | | | Gross
Unrealized
(Depreciation) | | | Net
Unrea-
lized
Appre-
ciation/
(Depre-
ciation) | |
| | | | |
Investments in Securities | | $ | 1,351,048,046 | | | $ | 352,999,396 | | | $ | (79,726,666 | ) | | $ | 273,272,730 | |
As of October 31, 2020, the components of accumulated gain (loss) on a tax basis were as follows:
| | | | | | | | |
Ordinary
Income | | Accumulated
Capital and
Other Gain
(Loss) | | Other
Temporary
Differences | | Unrealized
Appreciation
(Depreciation) | | Total
Accumulated
Gain (Loss) |
| | | | |
| $16,997,088 | | $101,195,730 | | $(1,428,310) | | $273,272,730 | | $390,037,238 |
The difference between book-basis and tax-basis unrealized appreciation (depreciation) is primarily due to Cumulative Convertible Bond Adjustment and Contingent Payment Debt Instruments. The Other temporary differences are primarily due to defaulted bond income accruals.
The following table discloses the current year reclassifications between total distributable earnings (loss) and additional paid-in capital arising from permanent differences; net assets as of October 31, 2020 were not affected.
| | |
Total
Distributable
Earnings (Loss) | | Additional
Paid-In
Capital |
| |
| $(19,176,935) | | $19,176,935 |
The reclassifications for the Fund are primarily due to distributions in connection with redemption of fund shares.
During the years ended October 31, 2020, and October 31, 2019, the tax character of distributions paid as reflected in the Statements of Changes in Net Assets were as follows:
| | | | | | | | |
| | | 2020 | | | 2019 | |
| | |
Distributions paid from: | | | | | | | | |
Ordinary Income | | $ | 12,864,160 | | | $ | 38,353,094 | |
Long-Term Capital Gain | | | 25,158,925 | | | | 39,052,373 | |
Total | | $ | 38,023,085 | | | $ | 77,405,467 | |
Note 5–Custodian
State Street is the custodian of cash and securities held by the Fund (See Note 12 for custodian change). Custodial fees are charged to the Fund based on the Fund’s net assets and/or the market value of securities held by the Fund and the number of certain transactions incurred by the Fund.
Note 6–Line of Credit
The Fund and certain other funds managed by New York Life Investments maintain a line of credit with a syndicate of banks in order to secure a source of funds for temporary purposes to meet unanticipated or excessive redemption requests.
Effective July 28, 2020, under the credit agreement (the “Credit Agreement”), the aggregate commitment amount is $600,000,000 with an additional uncommitted amount of $100,000,000. The commitment fee is an annual rate of 0.15% of the average commitment amount payable quarterly, regardless of usage, to JPMorgan Chase Bank NA, who serves as the agent to the syndicate. The commitment fee is allocated among the Fund and certain other funds managed by New York Life Investments based upon their respective net assets and other factors. Interest on any revolving credit loan is charged based upon the Federal Funds Rate or the one-month London Interbank Offered Rate (“LIBOR”), whichever is higher. The Credit Agreement expires on July 27, 2021, although the Fund, certain other funds managed by New York Life Investments and the syndicate of banks may renew the Credit Agreement for an additional year on the same or different terms or enter into a credit agreement with a different syndicate of banks. Prior to July 28, 2020, the aggregate commitment amount and the commitment fee were the same as those under the current Credit Agreement, but State Street served as agent to the syndicate. During the year ended October 31, 2020, there were no borrowings made or outstanding with respect to the Fund under the Credit Agreement or the credit agreement for which State Street served as agent.
Note 7–Interfund Lending Program
Pursuant to an exemptive order issued by the SEC, the Fund, along with certain other funds managed by New York Life Investments, may participate in an interfund lending program. The interfund lending program provides an alternative credit facility that permits the Fund and certain other funds managed by New York Life Investments to lend or borrow money for temporary purposes directly to or from one another subject to the conditions of the exemptive order. During the year ended October 31, 2020, there were no interfund loans made or outstanding with respect to the Fund.
| | |
| 26 | | MainStay MacKay Convertible Fund |
Note 8–Purchases and Sales of Securities (in 000’s)
During the year ended October 31, 2020, purchases and sales of securities, other than short-term securities, were $660,122 and $695,240, respectively.
Note 9–Capital Share Transactions
Transactions in capital shares for the years ended October 31, 2020, and October 31, 2019, were as follows:
| | | | | | | | |
Class A | | Shares | | | Amount | |
| | |
Year ended October 31, 2020: | | | | | | | | |
Shares sold | | | 4,824,291 | | | $ | 91,966,797 | |
Shares issued to shareholders in reinvestment of distributions | | | 740,743 | | | | 13,145,043 | |
Shares redeemed | | | (5,573,401 | ) | | | (102,784,136 | ) |
| | | | |
Net increase (decrease) in shares outstanding before conversion | | | (8,367 | ) | | | 2,327,704 | |
Shares converted into Class A (See Note 1) | | | 880,877 | | | | 16,956,773 | |
Shares converted from Class A (See Note 1) | | | (53,288 | ) | | | (999,795 | ) |
| | | | |
Net increase (decrease) | | | 819,222 | | | $ | 18,284,682 | |
| | | | |
Year ended October 31, 2019: | | | | | | | | |
Shares sold | | | 6,440,230 | | | $ | 111,352,512 | |
Shares issued to shareholders in reinvestment of distributions | | | 1,782,190 | | | | 28,552,030 | |
Shares redeemed | | | (8,400,694 | ) | | | (142,983,194 | ) |
| | | | |
Net increase (decrease) in shares outstanding before conversion | | | (178,274 | ) | | | (3,078,652 | ) |
Shares converted into Class A (See Note 1) | | | 581,531 | | | | 10,062,755 | |
Shares converted from Class A (See Note 1) | | | (128,941 | ) | | | (2,245,389 | ) |
| | | | |
Net increase (decrease) | | | 274,316 | | | $ | 4,738,714 | |
| | | | |
|
| |
Investor Class | | Shares | | | Amount | |
| | |
Year ended October 31, 2020: | | | | | | | | |
Shares sold | | | 437,729 | | | $ | 8,173,460 | |
Shares issued to shareholders in reinvestment of distributions | | | 74,975 | | | | 1,326,608 | |
Shares redeemed | | | (338,316 | ) | | | (6,247,912 | ) |
| | | | |
Net increase (decrease) in shares outstanding before conversion | | | 174,388 | | | | 3,252,156 | |
Shares converted into Investor Class (See Note 1) | | | 61,840 | | | | 1,123,928 | |
Shares converted from Investor Class (See Note 1) | | | (796,900 | ) | | | (15,363,947 | ) |
| | | | |
Net increase (decrease) | | | (560,672 | ) | | $ | (10,987,863 | ) |
| | | | |
Year ended October 31, 2019: | | | | | | | | |
Shares sold | | | 859,898 | | | $ | 14,934,377 | |
Shares issued to shareholders in reinvestment of distributions | | | 185,052 | | | | 2,959,367 | |
Shares redeemed | | | (653,130 | ) | | | (11,388,345 | ) |
| | | | |
Net increase (decrease) in shares outstanding before conversion | | | 391,820 | | | | 6,505,399 | |
Shares converted into Investor Class (See Note 1) | | | 206,666 | | | | 3,561,867 | |
Shares converted from Investor Class (See Note 1) | | | (360,146 | ) | | | (6,250,197 | ) |
| | | | |
Net increase (decrease) | | | 238,340 | | | $ | 3,817,069 | |
| | | | |
| | | | | | | | |
Class B | | Shares | | | Amount | |
| | |
Year ended October 31, 2020: | | | | | | | | |
Shares sold | | | 28,921 | | | $ | 552,676 | |
Shares issued to shareholders in reinvestment of distributions | | | 11,800 | | | | 208,506 | |
Shares redeemed | | | (110,550 | ) | | | (2,042,015 | ) |
| | | | |
Net increase (decrease) in shares outstanding before conversion | | | (69,829 | ) | | | (1,280,833 | ) |
Shares converted from Class B (See Note 1) | | | (91,151 | ) | | | (1,666,664 | ) |
| | | | |
Net increase (decrease) | | | (160,980 | ) | | $ | (2,947,497 | ) |
| | | | |
Year ended October 31, 2019: | | | | | | | | |
Shares sold | | | 178,224 | | | $ | 3,106,135 | |
Shares issued to shareholders in reinvestment of distributions | | | 43,221 | | | | 684,526 | |
Shares redeemed | | | (319,067 | ) | | | (5,486,747 | ) |
| | | | |
Net increase (decrease) in shares outstanding before conversion | | | (97,622 | ) | | | (1,696,086 | ) |
Shares converted from Class B (See Note 1) | | | (121,828 | ) | | | (2,066,900 | ) |
| | | | |
Net increase (decrease) | | | (219,450 | ) | | $ | (3,762,986 | ) |
| | | | |
|
| |
Class C | | Shares | | | Amount | |
| | |
Year ended October 31, 2020: | | | | | | | | |
Shares sold | | | 464,089 | | | $ | 8,568,551 | |
Shares issued to shareholders in reinvestment of distributions | | | 54,069 | | | | 954,315 | |
Shares redeemed | | | (1,360,299 | ) | | | (25,010,993 | ) |
| | | | |
Net increase (decrease) in shares outstanding before conversion | | | (842,141 | ) | | | (15,488,127 | ) |
Shares converted from Class C (See Note 1) | | | (39,567 | ) | | | (762,500 | ) |
| | | | |
Net increase (decrease) | | | (881,708 | ) | | $ | (16,250,627 | ) |
| | | | |
Year ended October 31, 2019: | | | | | | | | |
Shares sold | | | 797,545 | | | $ | 13,650,632 | |
Shares issued to shareholders in reinvestment of distributions | | | 214,714 | | | | 3,396,089 | |
Shares redeemed | | | (2,127,881 | ) | | | (36,129,333 | ) |
| | | | |
Net increase (decrease) in shares outstanding before conversion | | | (1,115,622 | ) | | | (19,082,612 | ) |
Shares converted from Class C (See Note 1) | | | (200,541 | ) | | | (3,422,405 | ) |
| | | | |
Net increase (decrease) | | | (1,316,163 | ) | | $ | (22,505,017 | ) |
| | | | |
|
| |
Class I | | Shares | | | Amount | |
| | |
Year ended October 31, 2020: | | | | | | | | |
Shares sold | | | 17,361,683 | | | $ | 331,864,119 | |
Shares issued to shareholders in reinvestment of distributions | | | 1,037,248 | | | | 18,487,215 | |
Shares redeemed | | | (21,094,224 | ) | | | (390,215,872 | ) |
| | | | |
Net increase in shares outstanding before conversion | | | (2,695,293 | ) | | | (39,864,538 | ) |
Shares converted into Class I (See Note 1) | | | 36,723 | | | | 712,205 | |
| | | | |
Net increase (decrease) | | | (2,658,570 | ) | | $ | (39,152,333 | ) |
| | | | |
Year ended October 31, 2019: | | | | | | | | |
Shares sold | | | 21,928,440 | | | $ | 376,071,787 | |
Shares issued to shareholders in reinvestment of distributions | | | 1,979,627 | | | | 31,939,703 | |
Shares redeemed | | | (20,528,571 | ) | | | (345,295,261 | ) |
| | | | |
Net increase (decrease) in shares outstanding before conversion | | | 3,379,496 | | | | 62,716,229 | |
Shares converted into Class I (See Note 1) | | | 20,893 | | | | 360,269 | |
| | | | |
Net increase (decrease) | | | 3,400,389 | | | $ | 63,076,498 | |
| | | | |
Notes to Financial Statements (continued)
Note 10–Recent Accounting Pronouncement
To improve the effectiveness of fair value disclosure requirements, the Financial Accounting Standards Board issued Accounting Standards Update 2018-13, Fair Value Measurement Disclosure Framework—Changes to the Disclosure Requirements for Fair Value Measurement (“ASU 2018-13”), which adds, removes, and modifies certain fair value measurement disclosure requirements. ASU 2018-13 is effective for interim and annual reporting periods beginning after December 15, 2019. The Manager evaluated the implications of certain provisions of ASU 2018-13 and determined to early adopt aspects related to the removal and modifications of certain fair value measurement disclosures, which are currently in place as of October 31, 2020. The Manager is evaluating the implications of certain other provisions of ASU 2018-13 related to new disclosure requirements and has not yet determined the impact of those provisions on the financial statement disclosures, if any.
In March 2020, the Financial Accounting Standards Board (“FASB”) issued Accounting Standards Update 2020-04 (“ASU 2020-04”), which provides optional guidance to ease the potential accounting burden associated with transitioning away from LIBOR and other reference rates that are expected to be discontinued. ASU 2020-04 is effective immediately upon release of the update on March 12, 2020, through December 31, 2022. At this time, the Manager is evaluating the implications of certain other provisions of ASU 2020-04 related to new disclosure requirements and any impact on the financial statement disclosures has not yet been determined.
Note 11–Other Matters
An outbreak of COVID-19, first detected in December 2019, has developed into a global pandemic and has resulted in travel restrictions, closure of international borders, certain businesses and securities markets, restrictions on securities trading activities, prolonged quarantines, supply chain disruptions, and lower consumer demand, as well as general concern and uncertainty. The continued impact of COVID-19 is uncertain and could further adversely affect the global economy, national economies, individual issuers and capital markets in unforeseeable ways and result in a substantial and extended economic downturn. Developments that disrupt global economies and financial markets, such as COVID-19, may magnify factors that affect the Fund’s performance.
Note 12–Subsequent Events
In connection with the preparation of the financial statements of the Fund as of and for the year ended October 31, 2020, events and transactions subsequent to October 31, 2020, through the date the financial statements were issued have been evaluated by the Manager, for possible adjustment and/or disclosure. No subsequent events requiring financial statement adjustment or disclosure have been identified other than the following:
Effective at the close of business on November 20, 2020, all services provided by State Street were transitioned to JPMorgan Chase Bank, N.A.
| | |
| 28 | | MainStay MacKay Convertible Fund |
Report of Independent Registered Public Accounting Firm
To the Shareholders of the Fund and Board of Trustees
The MainStay Funds:
Opinion on the Financial Statements
We have audited the accompanying statement of assets and liabilities of MainStay MacKay Convertible Fund (the Fund), one of the funds constituting The MainStay Funds, including the portfolio of investments, as of October 31, 2020, the related statement of operations for the year then ended, the statements of changes in net assets for each of the years in the two-year period then ended, and the related notes (collectively, the financial statements) and the financial highlights for each of the years in the five-year period then ended. In our opinion, the financial statements and financial highlights present fairly, in all material respects, the financial position of the Fund as of October 31, 2020, the results of its operations for the year then ended, the changes in its net assets for each of the years in the two-year period then ended, and the financial highlights for each of the years in the five-year period then ended, in conformity with U.S. generally accepted accounting principles.
Basis for Opinion
These financial statements and financial highlights are the responsibility of the Fund’s management. Our responsibility is to express an opinion on these financial statements and financial highlights based on our audits. We are a public accounting firm registered with the Public Company Accounting Oversight Board (United States) (PCAOB) and are required to be independent with respect to the Fund in accordance with the U.S. federal securities laws and the applicable rules and regulations of the Securities and Exchange Commission and the PCAOB.
We conducted our audits in accordance with the standards of the PCAOB. Those standards require that we plan and perform the audit to obtain reasonable assurance about whether the financial statements and financial highlights are free of material misstatement, whether due to error or fraud. Our audits included performing procedures to assess the risks of material misstatement of the financial statements and financial highlights, whether due to error or fraud, and performing procedures that respond to those risks. Such procedures included examining, on a test basis, evidence regarding the amounts and disclosures in the financial statements and financial highlights. Such procedures also included confirmation of securities owned as of October 31, 2020, by correspondence with the custodian and the transfer agent. Our audits also included evaluating the accounting principles used and significant estimates made by management, as well as evaluating the overall presentation of the financial statements and financial highlights. We believe that our audits provide a reasonable basis for our opinion.

We have served as the auditor of one or more New York Life Investment Management investment companies since 2003.
Philadelphia, Pennsylvania
December 23, 2020
Federal Income Tax Information
(Unaudited)
The Fund is required under the Internal Revenue Code to advise shareholders in a written statement as to the federal tax status of dividends paid by the Fund during such fiscal years. Accordingly, the Fund paid $25,158,925 as long term capital gain distributions.
For the fiscal year ended October 31, 2020, the Fund designated approximately $5,140,006 under the Internal Revenue Code as qualified dividend income eligible for reduced tax rates.
The dividends paid by the Fund during the fiscal year ended October 31, 2020 should be multiplied by 26.14% to arrive at the amount eligible for the corporate dividend-received deduction.
In February 2021, shareholders will receive an IRS Form 1099-DIV or substitute Form 1099, which will show the federal tax status of the distributions received by shareholders in calendar year 2020. The amounts that will be reported on such 1099-DIV or substitute Form 1099 will be the amounts you are to use on your federal income tax return and will differ from the amounts reported for the Fund’s fiscal year ended October 31, 2020.
Proxy Voting Policies and Procedures and Proxy Voting Record
A description of the policies and procedures that New York Life Investments uses to vote proxies related to the Fund’s securities is available free of charge upon request, by visiting the MainStay Funds’ website at newyorklifeinvestments.com or visiting the SEC’s website at www.sec.gov.
The Fund is required to file with the SEC its proxy voting records for the 12-month period ending June 30 on Form N-PX. The most recent Form N-PX or proxy voting record is available free of charge upon request by calling 800-624-6782; visiting the MainStay Funds’ website at newyorklifeinvestments.com; or visiting the SEC’s website at www.sec.gov.
Shareholder Reports and Quarterly Portfolio Disclosure
The Fund is required to file its complete schedule of portfolio holdings with the SEC 60 days after its first and third fiscal quarter on Form N-PORT. The Fund’s holdings report is available free of charge by visiting the SEC’s website at www.sec.gov or upon request by calling New York Life Investments at 800-624-6782.
| | |
| 30 | | MainStay MacKay Convertible Fund |
Board of Trustees and Officers (Unaudited)
The Trustees and officers of the Funds are listed below. The Board oversees the MainStay Group of Funds (which consists of MainStay Funds and MainStay Funds Trust), MainStay VP Funds Trust, MainStay MacKay DefinedTerm Municipal Opportunities Fund, the Manager and the Subadvisors, and elects the officers of the Funds who are responsible for the day-to-day operations of the Funds. Information pertaining to the Trustees and officers is set forth below. Each Trustee serves until his or her successor is elected and qualified or until his or her
resignation, death or removal. Under the Board’s retirement policy, unless an exception is made, a Trustee must tender his or her resignation by the end of the calendar year during which he or she reaches the age of 75. Officers are elected annually by the Board. The business address of each Trustee and officer listed below is 51 Madison Avenue, New York, New York 10010. A majority of the Trustees are not “interested persons” (as defined by the 1940 Act and rules adopted by the SEC thereunder) of the Fund (“Independent Trustees”).
| | | | | | | | | | | | |
| | | | | Name and
Year of Birth | | Term of Office,
Position(s) Held and
Length of Service | | Principal Occupation(s)
During Past Five Years | | Number of
Portfolios in
Fund Complex
Overseen by
Trustee | | Other Directorships
Held by Trustee |
Interested Trustee | | | | Yie-Hsin Hung* 1962 | | MainStay Funds:
Trustee since 2017 MainStay Funds Trust:
Trustee since 2017 | | Senior Vice President of New York Life since joining in 2010, Member of the Executive Management Committee since 2017, Chief Executive Officer, New York Life Investment Management Holdings LLC & New York Life Investment Management LLC since 2015. Senior Managing Director and Co-President of New York Life Investment Management LLC from 2014 to May 2015. Previously held positions of increasing responsibility, including head of NYLIM International, Alternative Growth Businesses, and Institutional investments since joining New York Life in 2010. | | 78 | | MainStay VP Funds Trust:
Trustee since 2017 (31 portfolios); and
MainStay MacKay DefinedTerm Municipal Opportunities Fund: Trustee since 2017. |
| | * | This Trustee is considered to be an “interested person” of the MainStay Group of Funds, MainStay VP Funds Trust and MainStay MacKay DefinedTerm Municipal Opportunities Fund, within the meaning of the 1940 Act because of her affiliation with New York Life Insurance Company, New York Life Investment Management LLC, Candriam Belgium S.A., Candriam Luxembourg S.C.A., IndexIQ Advisors LLC, MacKay Shields LLC, NYL Investors LLC, NYLIFE Securities LLC and/or NYLIFE Distributors LLC, as described in detail above in the column entitled “Principal Occupation(s) During Past Five Years.” |
Board of Trustees and Officers (Unaudited) (continued)
| | | | | | | | | | | | |
| | | | | Name and
Year of Birth | | Term of Office,
Position(s) Held and
Length of Service | | Principal Occupation(s)
During Past Five Years | | Number of
Portfolios in
Fund Complex
Overseen by
Trustee | | Other Directorships
Held by Trustee |
Independent Trustees | | | | David H. Chow 1957 | | MainStay Funds:
Trustee since 2016, Advisory Board Member (June 2015 to December 2015); MainStay Funds Trust:
Trustee since 2016, Advisory Board Member (June 2015 to December 2015). | | Founder and CEO, DanCourt Management, LLC since 1999 | | 78 | | MainStay VP Funds Trust: Trustee since 2016, Advisory Board Member (June 2015 to December 2015) (31 portfolios);
MainStay MacKay DefinedTerm Municipal Opportunities Fund: Trustee since 2016, Advisory Board Member (June 2015 to December 2015); Market Vectors Group of Exchange-Traded Funds: Independent Chairman of the Board of Trustees since 2008 and Trustee since 2006 (56 portfolios); and
Berea College of Kentucky: Trustee since 2009, Chair of the Investment Committee since 2018. |
| | | | Susan B. Kerley 1951 | | MainStay Funds:
Chairman since 2017 and Trustee since 2007; MainStay Funds Trust: Chairman since 2017 and Trustee since 1990.** | | President, Strategic Management Advisors LLC since 1990 | | 78 | | MainStay VP Funds Trust: Chairman since 2017 and Trustee since 2007 (31 portfolios)***;
MainStay MacKay DefinedTerm Municipal Opportunities Fund: Chairman since 2017 and Trustee since 2011; and
Legg Mason Partners Funds: Trustee since 1991 (45 portfolios). |
| | | | Alan R. Latshaw 1951 | | MainStay Funds:
Trustee; MainStay Funds Trust:
Trustee and Audit Committee Financial Expert since 2007.** | | Retired; Partner, Ernst & Young LLP (2002 to 2003); Partner, Arthur Andersen LLP (1989 to 2002); Consultant to the MainStay Funds Audit and Compliance Committee (2004 to 2006) | | 78 | | MainStay VP Funds Trust: Trustee and Audit Committee Financial Expert since 2007 (31 portfolios)***;
MainStay MacKay DefinedTerm Municipal Opportunities Fund: Trustee and Audit Committee Financial Expert since 2011; and
State Farm Associates Funds Trusts: Trustee since 2005 (4 portfolios). |
| | | | Richard H. Nolan, Jr. 1946 | | MainStay Funds:
Trustee since 2007; MainStay Funds Trust:
Trustee since 2007.** | | Managing Director, ICC Capital Management since 2004; President—Shields/Alliance, Alliance Capital Management (1994 to 2004) | | 78 | | MainStay VP Funds Trust: Trustee since 2006 (31 portfolios)***; and
MainStay MacKay DefinedTerm Municipal Opportunities Fund: Trustee since 2011. |
| | | | Jacques P. Perold 1958 | | MainStay Funds:
Trustee since 2016, Advisory Board Member (June 2015 to December 2015); MainStay Funds Trust:
Trustee since 2016, Advisory Board Member (June 2015 to December 2015). | | Founder and Chief Executive Officer, CapShift LLC since 2018; President, Fidelity Management & Research Company (2009 to 2014); Founder, President and Chief Executive Officer, Geode Capital Management, LLC (2001 to 2009) | | 78 | | MainStay VP Funds Trust: Trustee since 2016, Advisory Board Member (June 2015 to December 2015) (31 portfolios);
MainStay MacKay DefinedTerm Municipal Opportunities Fund: Trustee since 2016, Advisory Board Member (June 2015 to December 2015); Partners in Health: Trustee since 2019; Allstate Corporation: Director since 2015;
MSCI, Inc.: and Director since 2017. |
| | |
| 32 | | MainStay MacKay Convertible Fund |
| | | | | | | | | | | | |
| | | | | Name and
Year of Birth | | Term of Office,
Position(s) Held and
Length of Service | | Principal Occupation(s)
During Past Five Years | | Number of
Portfolios in
Fund Complex
Overseen by
Trustee | | Other Directorships
Held by Trustee |
Independent Trustees | | | | Richard S. Trutanic 1952 | | MainStay Funds: Trustee since 1994; MainStay Funds Trust: Trustee since 2007.** | | Chairman and Chief Executive Officer, Somerset & Company (financial advisory firm) since 2004; Managing Director, The Carlyle Group (private investment firm) (2002 to 2004); Senior Managing Director, Partner and Board Member, Groupe Arnault S.A. (private investment firm) (1999 to 2002) | | 78 | | MainStay VP Funds Trust: Trustee since 2007 (31 portfolios)***; and
MainStay MacKay DefinedTerm Municipal Opportunities Fund: Trustee since 2011. |
| | ** | Includes prior service as a Director/Trustee of certain predecessor entities to MainStay Funds Trust. |
| | *** | Includes prior service as a Director of MainStay VP Series Fund, Inc., the predecessor to MainStay VP Funds Trust. |
Board of Trustees and Officers (Unaudited) (continued)
| | | | | | | | |
| | | | | Name and
Year of Birth | | Position(s) Held and
Length of Service | | Principal Occupation(s)
During Past Five Years |
Officers
of the
Trust
(Who are
not
Trustees)* | | | | Kirk C. Lehneis 1974 | | President, MainStay Funds, MainStay Funds Trust since 2017 | | Chief Operating Officer and Senior Managing Director since 2016, New York Life Investment Management LLC and New York Life Investment Management Holdings LLC; Member of the Board of Managers since 2017 and Senior Managing Director since 2018, NYLIFE Distributors LLC; Chairman of the Board and Senior Managing Director, NYLIM Service Company LLC since 2017; Trustee, President and Principal Executive Officer of IndexIQ Trust, IndexIQ ETF Trust and IndexIQ Active ETF Trust since 2018; President, MainStay MacKay DefinedTerm Municipal Opportunities Fund and MainStay VP Funds Trust since 2017**; Senior Managing Director, Global Product Development (2015 to 2016); Managing Director, Product Development (2010 to 2015), New York Life Investment Management LLC |
| | | | Jack R. Benintende 1964 | | Treasurer and Principal Financial and Accounting Officer, MainStay Funds since 2007, MainStay Funds Trust since 2009 | | Managing Director, New York Life Investment Management LLC since 2007; Treasurer and Principal Financial and Accounting Officer, MainStay MacKay DefinedTerm Municipal Opportunities Fund since 2011 and MainStay VP Funds Trust since 2007**; and Assistant Treasurer, New York Life Investment Management Holdings LLC (2008 to 2012) |
| | | | Yi-Chia Kuo 1981 | | Vice President and Chief Compliance Officer, MainStay Funds and MainStay Funds Trust since January 2020 | | Chief Compliance Officer, Index IQ Trust, Index IQ ETF Trust and Index IQ Active ETF Trust since January 2020; Vice President and Chief Compliance Officer, MainStay MacKay DefinedTerm Municipal Opportunities Fund and MainStay VP Funds Trust since January 2020; Director and Associate General Counsel, New York Life Insurance Company (2015 to 2019) |
| | | | J. Kevin Gao 1967 | | Secretary and Chief Legal Officer, MainStay Funds and MainStay Funds Trust since 2010 | | Managing Director and Associate General Counsel, New York Life Investment Management LLC since 2010; Secretary and Chief Legal Officer, MainStay MacKay DefinedTerm Municipal Opportunities Fund since 2011 and MainStay VP Funds Trust since 2010** |
| | | | Scott T. Harrington 1959 | | Vice President— Administration, MainStay Funds since 2005, MainStay Funds Trust since 2009 | | Managing Director, New York Life Investment Management LLC (including predecessor advisory organizations) since 2000; Member of the Board of Directors, New York Life Trust Company since 2009; Vice President—Administration, MainStay MacKay DefinedTerm Municipal Opportunities Fund since 2011 and MainStay VP Funds Trust since 2005** |
| | * | The officers listed above are considered to be “interested persons” of the MainStay Group of Funds, MainStay VP Funds Trust and MainStay MacKay DefinedTerm Municipal Opportunities Fund within the meaning of the 1940 Act because of their affiliation with the MainStay Group of Funds, New York Life Insurance Company and/or its affiliates, including New York Life Investment Management LLC, NYLIM Service Company LLC, NYLIFE Securities LLC and/or NYLIFE Distributors LLC, as described in detail in the column captioned “Principal Occupation(s) During Past Five Years.” Officers are elected annually by the Board. |
| | ** | Includes prior service as an Officer of MainStay VP Series Fund, Inc., the predecessor to MainStay VP Funds Trust. |
| | |
| 34 | | MainStay MacKay Convertible Fund |
MainStay Funds
Equity
U.S. Equity
MainStay Epoch U.S. All Cap Fund
MainStay Epoch U.S. Equity Yield Fund
MainStay MacKay Common Stock Fund
MainStay MacKay Growth Fund
MainStay MacKay S&P 500 Index Fund
MainStay MacKay Small Cap Core Fund
MainStay MacKay U.S. Equity Opportunities Fund
MainStay MAP Equity Fund
MainStay Winslow Large Cap Growth Fund1
International Equity
MainStay Epoch International Choice Fund
MainStay MacKay International Equity Fund
MainStay MacKay International Opportunities Fund
Emerging Markets Equity
MainStay Candriam Emerging Markets Equity Fund
Global Equity
MainStay Epoch Capital Growth Fund
MainStay Epoch Global Equity Yield Fund
Fixed Income
Taxable Income
MainStay Candriam Emerging Markets Debt Fund
MainStay Floating Rate Fund
MainStay MacKay High Yield Corporate Bond Fund
MainStay MacKay Short Duration High Yield Fund
MainStay MacKay Total Return Bond Fund
MainStay MacKay Unconstrained Bond Fund
MainStay MacKay U.S. Infrastructure Bond Fund2
MainStay Short Term Bond Fund3
Tax-Exempt Income
MainStay MacKay California Tax Free Opportunities Fund4
MainStay MacKay High Yield Municipal Bond Fund
MainStay MacKay Intermediate Tax Free Bond Fund
MainStay MacKay New York Tax Free Opportunities Fund5
MainStay MacKay Short Term Municipal Fund
MainStay MacKay Tax Free Bond Fund
Money Market
MainStay Money Market Fund
Mixed Asset
MainStay Balanced Fund
MainStay Income Builder Fund
MainStay MacKay Convertible Fund
Speciality
MainStay CBRE Global Infrastructure Fund
MainStay CBRE Real Estate Fund
MainStay Cushing MLP Premier Fund
Asset Allocation
MainStay Conservative Allocation Fund
MainStay Conservative ETF Allocation Fund
MainStay Defensive ETF Allocation Fund
MainStay Equity Allocation Fund6
MainStay Equity ETF Allocation Fund
MainStay Growth Allocation Fund7
MainStay Growth ETF Allocation Fund
MainStay Moderate Allocation Fund
MainStay Moderate ETF Allocation Fund
Manager
New York Life Investment Management LLC
New York, New York
Subadvisors
Candriam Belgium S.A.8
Brussels, Belgium
Candriam Luxembourg S.C.A.8
Strassen, Luxembourg
CBRE Clarion Securities LLC
Radnor, Pennsylvania
Cushing Asset Management, LP
Dallas, Texas
Epoch Investment Partners, Inc.
New York, New York
MacKay Shields LLC8
New York, New York
Markston International LLC
White Plains, New York
NYL Investors LLC8
New York, New York
Winslow Capital Management, LLC
Minneapolis, Minnesota
Legal Counsel
Dechert LLP
Washington, District of Columbia
Independent Registered Public Accounting Firm
KPMG LLP
Philadelphia, Pennsylvania
Distributor
NYLIFE Distributors LLC8
Jersey City, New Jersey
Custodian9
State Street Bank and Trust Company
Boston, Massachusetts
| 1. | Formerly known as MainStay Large Cap Growth Fund. |
| 2. | Formerly known as MainStay MacKay Infrastructure Bond Fund. |
| 3. | Formerly known as MainStay Indexed Bond Fund. |
| 4. | This Fund is registered for sale in AZ, CA, NV, OR, TX, UT and WA. Class A and Class I shares are registered for sale in MI. Class I and Class C2 shares are registered for sale in CO, FL, GA, HI, ID, MA, MD, NH, NJ and NY. |
| 5. | This Fund is registered for sale in CA, CT, DE, FL, MA, NJ, NY and VT. |
| 6. | Formerly known as MainStay Growth Allocation Fund. |
| 7. | Formerly known as MainStay Moderate Growth Allocation Fund. |
| 8. | An affiliate of New York Life Investment Management LLC. |
| 9. | JPMorgan Chase Bank, N.A., New York, New York is the custodian for the MainStay ETF Asset Allocation Funds and effective at the close of business on November 20, 2020, became the custodian for other MainStay Funds. The custodian for MainStay Cushing MLP Premier Fund is U.S. Bank National Association, Milwaukee, Wisconsin. |
Not part of the Annual Report
For more information
800-624-6782
newyorklifeinvestments.com
“New York Life Investments” is both a service mark, and the common trade name, of certain investment advisors affiliated with New York Life Insurance Company. The MainStay Funds® are managed by New York Life Investment Management LLC and distributed by NYLIFE Distributors LLC, 30 Hudson Street, Jersey City, NJ 07302, a wholly owned subsidiary of New York Life Insurance Company. NYLIFE Distributors LLC is a Member FINRA/SIPC.
©2020 NYLIFE Distributors LLC. All rights reserved.
| | |
| 1716013 MS203-20 | | MSC11-12/20 (NYLIM) NL210 |
MainStay MacKay High Yield Corporate Bond Fund
Message from the President and Annual Report
October 31, 2020
Beginning on January 1, 2021, paper copies of each MainStay Fund’s annual and semiannual shareholder reports will no longer be sent by mail, unless you specifically request paper copies of the reports from MainStay Funds or from your financial intermediary. Instead, the reports will be made available on the MainStay Funds’ website. You will be notified by mail and provided with a website address to access the report each time a new report is posted to the website.
If you already elected to receive shareholder reports electronically, you will not be affected by this change and you need not take any action. At any time, you may elect to receive reports and other communications from MainStay Funds electronically by calling toll-free 800-624-6782, by sending an e-mail to MainStayShareholderServices@nylim.com, or by contacting your financial intermediary.
You may elect to receive all future shareholder reports in paper form free of charge. If you hold shares of a MainStay Fund directly, you can inform MainStay Funds that you wish to receive paper copies of reports by calling toll-free 800-624-6782 or by sending an e-mail to MainStayShareholderServices@nylim.com. If you hold shares of a MainStay Fund through a financial intermediary, please contact the financial intermediary to make this election. Your election to receive reports in paper form will apply to all MainStay Funds in which you are invested and may apply to all funds held with your financial intermediary.
| | | | | | | | |
| Not FDIC/NCUA Insured | | Not a Deposit | | May Lose Value | | No Bank Guarantee | | Not Insured by Any Government Agency |

This page intentionally left blank
Message from the President
Despite historically high levels of volatility generated by the global coronavirus pandemic and a host of other geopolitical and economic uncertainties, most broad U.S. stock and bond markets gained ground during the 12-month reporting period ended October 31, 2020.
The reporting period began on an upswing, with markets rising on generally positive underlying economic trends and the announcement of a U.S.-China trade deal. However, in mid-February 2020, stock and bond indices began to dip as growing numbers of COVID-19 cases appeared in hotspots around the world. By early March, the disease reached pandemic proportions. As governments struggled to support overburdened health care systems by issuing “stay-at-home” orders and other restrictions on nonessential activity, global economic activity slowed, driving most stocks and bonds sharply lower.
The United States was hit particularly hard by the pandemic, with more reported COVID-19 cases and deaths than any other country in the world throughout the second half of the reporting period. As the pandemic deepened, the U.S. Federal Reserve (“Fed”) twice cut interest rates and announced unlimited quantitative easing. The federal government declared a national emergency, and Congress passed and the President signed a $2 trillion stimulus package. Markets responded positively to these measures, as well as to a gradual lessening of restrictions on nonessential businesses, hopes for additional stimulus and apparent progress in the development of a vaccine. By late August, the S&P 500® Index, a widely regarded benchmark of market performance, had not only regained all the ground it lost earlier in the reporting period, the Index had reached new record levels. However, a resurgence of coronavirus cases in many parts of the country and uncertainties related to the November 3, 2020, U.S. presidential election caused markets to falter as the reporting period drew to a close.
Nevertheless, for the reporting period as a whole, U.S. equity indices generally produced moderate gains. Returns proved strongest among large-cap, growth-oriented stocks, while small- and mid-cap issues lagged. Within the S&P 500® Index, the information technology and consumer discretionary sectors produced exceptionally strong gains, buoyed by strong corporate and consumer spending, while the health care sector outperformed by a smaller margin. Materials and consumer staples sectors generated positive returns, but lagged the S&P 500® Index. The industrials, utilities, communication services, financials, real estate and energy sectors ended the reporting period in negative territory, with the energy sector
suffering the steepest losses due to weak global demand. International equities declined sharply in February and March 2020 before recovering somewhat, but tended to lag their U.S. counterparts due to weaker underlying economic growth and somewhat less aggressive monetary and fiscal stimulus. Emerging-market equities tracked the performance of U.S. equity markets more closely, led by relatively strong returns in Asian markets, such as China and South Korea.
Fixed-income markets experienced an environment that tended to favor higher credit quality and longer duration securities. Corporate bonds followed the pattern of equities, with prices declining in March 2020 before subsequently recovering. Relatively speculative high-yield credit was hardest hit during the market sell-off in early 2020 and continued to underperform during the remainder of the reporting period. Similarly, among municipal bond issues, high-grade bonds outperformed, dipping briefly in mid-March before regaining the lost ground. Recognized safe havens, such as U.S. government bonds, attracted increased investment during the height of the market sell-off, driving yields lower and prices higher. As a result, long-term Treasury bonds delivered particularly strong gains for the reporting period as a whole. Emerging-market debt, on the other hand, underperformed most other bond types as investors sought to minimize currency and sovereign risks.
Although the ongoing pandemic continues to change the way that many of us work and live our lives, at New York Life Investments, we remain dedicated to providing you, as a MainStay investor, with products, information and services to help you to navigate today’s rapidly changing investment environment. By taking appropriate steps to minimize community spread of COVID-19 within our organization and despite the challenges posed by the coronavirus pandemic, we continue to innovate with you in mind, introducing new suites of Funds and providing continuous insights into ever-evolving markets and investment strategies. Our goal is to give you the tools you need to build a resilient portfolio in the face of uncertain times.
Sincerely,

Kirk C. Lehneis
President
The opinions expressed are as of the date of this report and are subject to change. There is no guarantee that any forecast made will come to pass. This material does not constitute investment advice and is not intended as an endorsement of any specific investment. Past performance is no guarantee of future results.
Not part of the Annual Report
Table of Contents
Investors should refer to the Fund’s Summary Prospectus and/or Prospectus and consider the Fund’s investment objectives, strategies, risks, charges and expenses carefully before investing. The Summary Prospectus and/or Prospectus contain this and other information about the Fund. You may obtain copies of the Fund’s Summary Prospectus, Prospectus and Statement of Additional Information free of charge, upon request, by calling toll-free 800-624-6782, by writing to NYLIFE Distributors LLC, Attn: MainStay Marketing Department, 30 Hudson Street, Jersey City, NJ 07302 or by sending an e-mail to MainStayShareholderServices@nylim.com. These documents are also available via the MainStay Funds’ website at newyorklifeinvestments.com. Please read the Summary Prospectus and/or Prospectus carefully before investing.
Investment and Performance Comparison1 (Unaudited)
Performance data quoted represents past performance. Past performance is no guarantee of future results. Because of market volatility and other factors, current performance may be lower or higher than the figures shown. Investment return and principal value will fluctuate, and as a result, when shares are redeemed, they may be worth more or less than their original cost. The graph below depicts the historical performance of Class I shares* of the Fund. Performance will vary from class to class based on differences in class-specific expenses and sales charges. For performance information current to the most recent month-end, please call 800-624-6782 or visit newyorklifeinvestments.com.
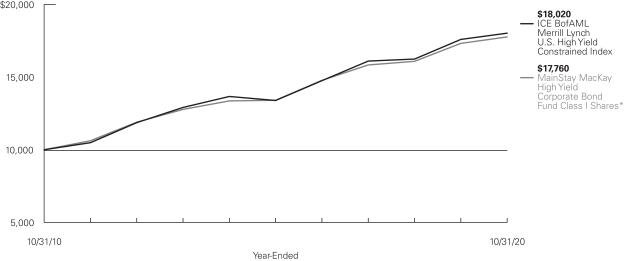
Average Annual Total Returns for the Year-Ended October 31, 2020
| | | | | | | | | | | | | | | | | | | | | | | | |
| Class | | Sales Charge | | | | Inception
Date | | | One Year
or Since
Inception | | | Five Years
or Since
Inception | | | Ten Years
or Since
Inception | | | Gross
Expense
Ratio2 | |
| | | | | | | |
| Class A Shares | | Maximum 4.5% Initial Sales Charge | | With sales charges Excluding sales charges | | | 1/3/1995 | | |
| –2.34
2.26 | %
| |
| 4.58
5.55 | %
| |
| 5.16
5.65 | %
| |
| 0.99
0.99 | %
|
| Investor Class Shares3 | | Maximum 4% Initial Sales Charge | | With sales charges Excluding sales charges | | | 2/28/2008 | | |
| –2.36
2.24 |
| |
| 4.52
5.48 |
| |
| 5.10
5.59 |
| |
| 1.05
1.05 |
|
| Class B Shares4 | | Maximum 5% CDSC
if Redeemed Within the First Six Years of Purchase | | With sales charges Excluding sales charges | | | 5/1/1986 | | |
| –3.43
1.39 |
| |
| 4.32
4.64 |
| |
| 4.79
4.79 |
| |
| 1.80
1.80 |
|
| Class C Shares | | Maximum 1% CDSC
if Redeemed Within One Year of Purchase | | With sales charges Excluding sales charges | | | 9/1/1998 | | |
| 0.42
1.39 |
| |
| 4.68
4.68 |
| |
| 4.80
4.80 |
| |
| 1.80
1.80 |
|
| Class I Shares | | No Sales Charge | | | | | 1/2/2004 | | | | 2.56 | | | | 5.79 | | | | 5.91 | | | | 0.74 | |
| Class R1 Shares | | No Sales Charge | | | | | 6/29/2012 | | | | 2.45 | | | | 5.69 | | | | 5.44 | | | | 0.84 | |
| Class R2 Shares | | No Sales Charge | | | | | 5/1/2008 | | | | 2.17 | | | | 5.45 | | | | 5.53 | | | | 1.09 | |
| Class R3 Shares | | No Sales Charge | | | | | 2/29/2016 | | | | 1.90 | | | | 6.74 | | | | N/A | | | | 1.34 | |
| Class R6 Shares | | No Sales Charge | | | | | 6/17/2013 | | | | 2.70 | | | | 5.92 | | | | 5.07 | | | | 0.59 | |
| SIMPLE Class Shares | | No Sales Charge | | | | | 8/31/2020 | | | | –0.72 | | | | N/A | | | | N/A | | | | 1.30 | |
| * | Previously, the chart presented the Fund’s annual returns for Class B shares. Class I shares are presented for consistency across the MainStay Fund complex. |
| 1. | The performance table and graph do not reflect the deduction of taxes that a shareholder would pay on distributions or Fund share redemptions. Total returns reflect maximum applicable sales charges as indicated in the table above, if any, changes in share price, and reinvestment of dividend and capital gain distributions. The graph assumes the initial investment amount shown above and reflects the deduction of all sales charges that would have applied for the period of investment. Performance figures may reflect certain fee waivers and/or expense limitations, without which total returns may have been |
| | lower. For more information on share classes and current fee waivers and/or expense limitations (if any), please refer to the Notes to Financial Statements. |
| 2. | The gross expense ratios presented reflect the Fund’s “Total Annual Fund Operating Expenses” from the most recent Prospectus and may differ from other expense ratios disclosed in this report. |
| 3. | Prior to June 30, 2020, the maximum initial sales charge for Investor Class shares was 4.5%, which is reflected in the average annual total return figures shown. |
| 4. | Class B shares are closed to all new purchases as well as additional investments by existing Class B shareholders. |
The footnotes on the next page are an integral part of the table and graph and should be carefully read in conjunction with them.
| | | | | | | | | | | | |
| Benchmark Performance | | One
Year | | | Five
Years | | | Ten
Years | |
| | | |
ICE BofAML Merrill Lynch U.S. High Yield Constrained Index5 | | | 2.44 | % | | | 6.12 | % | | | 6.06 | % |
Morningstar High Yield Bond Category Average6 | | | 1.43 | | | | 4.78 | | | | 5.06 | |
| 5. | The ICE BofAML Merrill Lynch U.S. High Yield Constrained Index is the Fund’s primary broad-based securities market index for comparison purposes. The ICE BofAML U.S. High Yield Constrained Index is a market value-weighted index of all domestic and Yankee high-yield bonds, including deferred interest bonds and payment-in-kind securities. Issuers included in the Index have maturities of one year or more and have a credit rating lower than BBB-/Baa3, but are not in default. No single issuer may constitute greater than 2% of the Index. Results assume reinvestment of all dividends and capital gains. An investment cannot be made directly in an index. |
| 6. | The Morningstar High Yield Bond Category Average is representative of funds that concentrate on lower-quality bonds, which are riskier than those of higher-quality companies. These portfolios primarily invest in U.S. high-income debt securities where at least 65% or more of bond assets are not rated or are rated by a major agency such as Standard & Poor’s or Moody’s at the level of BB and below. Results are based on average total returns of similar funds with all dividends and capital gain distributions reinvested. |
The footnotes on the preceding page are an integral part of the table and graph and should be carefully read in conjunction with them.
| | |
| 6 | | MainStay MacKay High Yield Corporate Bond Fund |
Cost in Dollars of a $1,000 Investment in MainStay MacKay High Yield Corporate Bond Fund (Unaudited)
The example below is intended to describe the fees and expenses borne by shareholders during the six-month period from May 1, 2020, to October 31, 2020, and the impact of those costs on your investment.
Example
As a shareholder of the Fund you incur two types of costs: (1) transaction costs, including exchange fees and sales charges (loads) on purchases (as applicable), and (2) ongoing costs, including management fees, distribution and/or service (12b-1) fees, and other Fund expenses (as applicable). This example is intended to help you understand your ongoing costs (in dollars) of investing in the Fund and to compare these costs with the ongoing costs of investing in other mutual funds. The example is based on an investment of $1,000 made at the beginning of the six-month period and held for the entire period from May 1, 2020, to October 31, 2020.
This example illustrates your Fund’s ongoing costs in two ways:
Actual Expenses
The second and third data columns in the table below provide information about actual account values and actual expenses. You may use the information in these columns, together with the amount you invested, to estimate the expenses that you paid during the six months ended October 31, 2020. Simply divide your account value by $1,000 (for example, an $8,600 account value divided by $1,000 = 8.6), then
multiply the result by the number under the heading entitled “Expenses Paid During Period” to estimate the expenses you paid on your account during this period.
Hypothetical Example for Comparison Purposes
The fourth and fifth data columns in the table below provide information about hypothetical account values and hypothetical expenses based on the Fund’s actual expense ratio and an assumed rate of return of 5% per year before expenses, which is not the Fund’s actual return. The hypothetical account values and expenses may not be used to estimate the actual ending account balances or expenses you paid for the six-month period shown. You may use this information to compare the ongoing costs of investing in the Fund with the ongoing costs of investing in other mutual funds. To do so, compare this 5% hypothetical example with the 5% hypothetical examples that appear in the shareholder reports of the other mutual funds.
Please note that the expenses shown in the table are meant to highlight your ongoing costs only and do not reflect any transactional costs, such as exchange fees or sales charges (loads). Therefore, the fourth and fifth data columns of the table are useful in comparing ongoing costs only and will not help you determine the relative total costs of owning different funds. In addition, if these transactional costs were included, your costs would have been higher.
| | | | | | | | | | | | | | | | | | | | | | |
| | | | | | | | | | | | | | | | | | |
| Share Class | | Beginning
Account
Value
5/1/20 | | | Ending Account
Value (Based
on Actual
Returns and
Expenses)
10/31/20 | | | Expenses
Paid
During
Period1 | | | Ending Account
Value (Based
on Hypothetical
5% Annualized
Return and
Actual Expenses)
10/31/20 | | | Expenses
Paid
During
Period1 | | | Net Expense
Ratio
During
Period2 |
| | | | | | |
| Class A Shares | | $ | 1,000.00 | | | $ | 1,096.70 | | | $ | 5.06 | | | $ | 1,020.31 | | | $ | 4.88 | | | 0.96% |
| | | | | | |
| Investor Class Shares | | $ | 1,000.00 | | | $ | 1,095.90 | | | $ | 5.54 | | | $ | 1,019.86 | | | $ | 5.33 | | | 1.05% |
| | | | | | |
| Class B Shares | | $ | 1,000.00 | | | $ | 1,090.30 | | | $ | 9.46 | | | $ | 1,016.09 | | | $ | 9.12 | | | 1.80% |
| | | | | | |
| Class C Shares | | $ | 1,000.00 | | | $ | 1,092.30 | | | $ | 9.47 | | | $ | 1,016.09 | | | $ | 9.12 | | | 1.80% |
| | | | | | |
| Class I Shares | | $ | 1,000.00 | | | $ | 1,098.20 | | | $ | 3.74 | | | $ | 1,021.57 | | | $ | 3.61 | | | 0.71% |
| | | | | | |
| Class R1 Shares | | $ | 1,000.00 | | | $ | 1,097.80 | | | $ | 4.25 | | | $ | 1,021.06 | | | $ | 4.12 | | | 0.81% |
| | | | | | |
| Class R2 Shares | | $ | 1,000.00 | | | $ | 1,096.20 | | | $ | 5.59 | | | $ | 1,019.81 | | | $ | 5.38 | | | 1.06% |
| | | | | | |
| Class R3 Shares | | $ | 1,000.00 | | | $ | 1,092.70 | | | $ | 6.89 | | | $ | 1,018.55 | | | $ | 6.65 | | | 1.31% |
| | | | | | |
| Class R6 Shares | | $ | 1,000.00 | | | $ | 1,099.20 | | | $ | 3.00 | | | $ | 1,022.27 | | | $ | 2.90 | | | 0.57% |
| | | | | | |
| SIMPLE Class Shares3,4 | | $ | 1,000.00 | | | $ | 992.80 | | | $ | 2.16 | | | $ | 1,006.17 | | | $ | 2.17 | | | 1.30% |
| 1. | Expenses are equal to the Fund’s annualized expense ratio of each class multiplied by the average account value over the period, divided by 366 and multiplied by 184 (to reflect the six-month period) and 61 days for SIMPLE Class share (to reflect the since-inception period. The table above represents the actual expenses incurred during the six-month period. In addition to the fees and expenses which the Fund bears directly, it also indirectly bears a pro rata share of the fees and expenses of the underlying funds in which it invests. Such indirect expenses are not included in the above-reported expense figures. |
| 2. | Expenses are equal to the Fund’s annualized expense ratio to reflect the six-month period. |
| 3. | The inception date was August 31, 2020. |
| 4. | Expenses paid during the period reflect ongoing costs for the period from inception through October 31, 2020. Had these shares been offered for the full six-month period ended October 31, 2020, and had the Fund provided a hypothetical 5% annualized return, expenses paid during the period would have been $6.60 for SIMPLE Class shares and the ending account value would have been $1,018.60 for SIMPLE Class shares. |
Portfolio Composition as of October 31, 2020 (Unaudited)
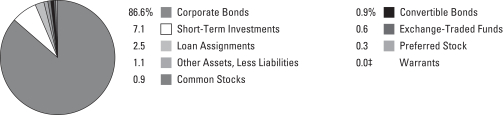
See Portfolio of Investments beginning on page 11 for specific holdings within these categories. The Fund’s holdings are subject to change.
| ‡ | Less than one-tenth of a percent. |
Top Ten Holdings or Issuers Held as of October 31, 2020 (excluding short-term investments) (Unaudited)
| 1. | CCO Holdings LLC / CCO Holdings Capital Corp., 4.25%–5.875%, due 5/1/25–5/1/32 |
| 2. | HCA, Inc., 3.50%–8.36%, due 5/1/23–11/6/33 |
| 3. | T-Mobile USA, Inc., 4.00%–6.50%, due 4/15/22–4/15/50 |
| 4. | TransDigm, Inc., 6.25%–8.00%, due 7/15/24–3/15/27 |
| 5. | Netflix, Inc., 3.625%–5.875%, due 2/15/22–6/15/30 |
| 6. | Sprint Capital Corp., 6.875%, due 11/15/28 |
| 7. | Kraft Heinz Foods Co., 3.875%–7.125%, due 7/15/25–2/9/40 |
| 8. | MSCI, Inc., 3.625%–5.375%, due 8/1/26–2/15/31 |
| 9. | Occidental Petroleum Corp., 2.70%–7.15%, due 8/15/22–9/15/36 |
| 10. | MGM Growth Properties Operating Partnership, L.P. / MGP Finance Co-Issuer, Inc., 4.625%–5.75%, due 5/1/24–2/1/27 |
| | |
| 8 | | MainStay MacKay High Yield Corporate Bond Fund |
Portfolio Management Discussion and Analysis (Unaudited)
Questions answered by portfolio manager Andrew Susser of MacKay Shields LLC, the Fund’s Subadvisor.
How did MainStay MacKay High Yield Corporate Bond Fund perform relative to its benchmark and peer group during the 12 months ended October 31, 2020?
For the 12 months ended October 31, 2020, Class I shares of MainStay MacKay High Yield Corporate Bond Fund returned 2.56%, outperforming the 2.44% return of the Fund’s primary benchmark, the ICE BofAML U.S. High Yield Constrained Index. Over the same period, Class I shares also outperformed the 1.43% return of the Morningstar High Yield Bond Category Average.1
What factors affected the Fund’s relative performance during the reporting period?
Relative to the ICE BofAML U.S. High Yield Constrained Index, the Fund’s performance during the reporting period benefited from strong security selection in the energy sector, the weakest-performing sector in the Index. Security selection in telecom and leisure also made positive contributions to the Fund’s relative returns, as did comparatively underweight exposure to riskier credits rated CCC.2 (Contributions take weightings and total returns into account.) Conversely, underweight exposure to health care and security selection in capital goods detracted from the Fund’s relative performance.
During the reporting period, were there any liquidity events that materially impacted the Fund’s performance?
As the COVID-19 pandemic spread fear, undermined the global economy and shook investor sentiment in the first quarter of 2020, the U.S. high-yield market experienced high levels of volatility last seen during the financial crisis of 2007-2008. Mirroring equity markets, the high-yield bond market declined sharply in the first three weeks of March, before partly rebounding in the final week of the month. The market then continued to rise until the advance faltered in September.
The U.S. Federal Reserve (“Fed”) played a significant role in the recovery of credit markets through unprecedented actions. During the first three weeks of March, liquidity worsened as the intense sell-off in equities and stress in the investment-grade market pressured high-yield bonds. The reversal started on March 23, triggered by the Fed’s announcement that it would
begin buying investment-grade corporate bonds and exchange-traded funds (“ETFs”). The easing of stress in the investment-grade market carried over to the high-yield market. On April 9, the Fed announced more expansive measures, including extending loans to companies and a further expansion of its direct purchase program to include recent “fallen angels” (credits downgraded from investment grade to high yield), syndicated loans and high yield ETFs.
What was the Fund’s duration3 strategy during the reporting period?
The Fund’s duration is the result of our bottom-up fundamental analysis and is a residual of the investment process. However, the Fund did have a lower duration than the ICE BofAML U.S. High Yield Constrained Index throughout the reporting period. As of October 31, 2020, the Fund’s modified duration to worst4 was 3.13 years compared with 3.80 years for the benchmark.
During the reporting period, which sectors were the strongest positive contributors to the Fund’s relative performance and which sectors were particularly weak?
As mentioned above, security selection in the energy sector, the weakest performing sector during the reporting period, was accretive to the Fund’s benchmark-relative returns. Security selection in telecom and leisure were also positive contributors, as was the Fund’s underweight exposure to CCC-rated credits. Relatively underweight exposure to health care and security selection in capital goods detracted from relative performance.
What were some of the Fund’s largest purchases and sales during the reporting period?
The Fund’s purchases focused on crossover investment-grade and fallen-angel credits that traded at attractive spreads.5 For example, the Fund purchased bonds issued by food product firm Kraft Heinz as the issuer was downgraded from investment grade. The Fund also purchased bonds issued by oil & gas exploration & production company Occidental Petroleum at lower dollar prices later in the reporting period. In terms of sales, the Fund trimmed positions in pandemic-affected sectors such as bonds from American Axle & Manufacturing in the automotive sector and Triumph Group in the aerospace/defense sector.
| 1. | See page 5 for other share class returns, which may be higher or lower than Class I share returns. See page 6 for more information on benchmark and peer group returns. |
| 2. | An obligation rated ‘CCC’ by Standard & Poor’s (“S&P”) is deemed by S&P to be currently vulnerable to nonpayment and is dependent upon favorable business, financial and economic conditions for the obligor to meet its financial commitment on the obligation. It is the opinion of S&P that in the event of adverse business, financial or economic conditions, the obligor is not likely to have the capacity to meet its financial commitment on the obligation. When applied to Fund holdings, ratings are based solely on the creditworthiness of the bonds in the portfolio and are not meant to represent the security or safety of the Fund. |
| 3. | Duration is a measure of the price sensitivity of a fixed-income investment to changes in interest rates. Duration is expressed as a number of years and is considered a more accurate sensitivity gauge than average maturity. |
| 4. | Modified duration is inversely related to the approximate percentage change in price for a given change in yield. Duration to worst is the duration of a bond computed using the bond’s nearest call date or maturity, whichever comes first. This measure ignores future cash flow fluctuations due to embedded optionality. |
| 5. | The terms “spread” and “yield spread” may refer to the difference in yield between a security or type of security and comparable U.S. Treasury issues. The terms may also refer to the difference in yield between two specific securities or types of securities at a given time. |
How did the Fund’s sector weightings change during the reporting period?
There were no material changes to the Fund’s sector weightings during the reporting period. Minor changes included a decrease in telecommunications exposure due to a large issuer’s bond being called and a decrease in retail exposure.
How was the Fund positioned at the end of the reporting period?
As of October 31, 2020, the Fund held underweight exposure relative to the ICE BofAML U.S. High Yield Constrained Index in
CCC-rated bonds. As of the same date, the Fund held relatively overweight exposure to higher-quality issuers. Across industries, the Fund held overweight exposure to energy, basic industry and leisure, and underweight exposure to health care and services.
The opinions expressed are those of the portfolio managers as of the date of this report and are subject to change. There is no guarantee that any forecasts will come to pass. This material does not constitute investment advice and is not intended as an endorsement of any specific investment.
| | |
| 10 | | MainStay MacKay High Yield Corporate Bond Fund |
Portfolio of Investments October 31, 2020
| | | | | | | | |
| | | Principal
Amount | | | Value | |
Long-Term Bonds 90.0%† Convertible Bonds 0.9% | |
Investment Companies 0.2% | |
Ares Capital Corp. | | | | | | | | |
3.75%, due 2/1/22 | | $ | 6,000,000 | | | $ | 6,048,000 | |
4.625%, due 3/1/24 | | | 18,360,000 | | | | 19,118,268 | |
| | | | | | | | |
| | | | | | | 25,166,268 | |
| | | | | | | | |
Media 0.5% | |
DISH Network Corp. | | | | | | | | |
2.375%, due 3/15/24 | | | 37,339,000 | | | | 33,679,588 | |
3.375%, due 8/15/26 | | | 23,500,000 | | | | 20,830,627 | |
| | | | | | | | |
| | | | | | | 54,510,215 | |
| | | | | | | | |
Oil & Gas Services 0.2% | |
Forum Energy Technologies, Inc.
9.00% (6.25% Cash and 2.75% PIK), due 8/4/25 (a) | | | 44,467,780 | | | | 27,570,024 | |
| | | | | | | | |
Total Convertible Bonds
(Cost $119,622,185) | | | | | | | 107,246,507 | |
| | | | | | | | |
|
| Corporate Bonds 86.6% | |
Advertising 1.4% | |
Lamar Media Corp. | | | | | | | | |
3.75%, due 2/15/28 | | | 21,000,000 | | | | 20,915,160 | |
4.00%, due 2/15/30 | | | 18,500,000 | | | | 18,661,875 | |
4.875%, due 1/15/29 | | | 6,000,000 | | | | 6,240,000 | |
5.75%, due 2/1/26 | | | 46,042,000 | | | | 47,639,657 | |
Outfront Media Capital LLC / Outfront Media Capital Corp. | | | | | | | | |
4.625%, due 3/15/30 (b) | | | 5,305,000 | | | | 4,873,969 | |
5.00%, due 8/15/27 (b) | | | 26,000,000 | | | | 24,635,260 | |
5.625%, due 2/15/24 | | | 23,126,000 | | | | 23,299,445 | |
6.25%, due 6/15/25 (b) | | | 15,570,000 | | | | 15,891,131 | |
| | | | | | | | |
| | | | | | | 162,156,497 | |
| | | | | | | | |
Aerospace & Defense 1.7% | |
F-Brasile S.p.A. / F-Brasile U.S. LLC
7.375%, due 8/15/26 (b) | | | 25,280,000 | | | | 21,930,400 | |
Rolls-royce PLC
5.75%, due 10/15/27 (b) | | | 6,500,000 | | | | 6,581,250 | |
Spirit AeroSystems, Inc.
5.50%, due 1/15/25 (b) | | | 2,500,000 | | | | 2,543,750 | |
SSL Robotics LLC
9.75%, due 12/31/23 (b) | | | 5,000,000 | | | | 5,560,625 | |
TransDigm UK Holdings PLC
6.875%, due 5/15/26 | | | 18,100,000 | | | | 18,009,500 | |
TransDigm, Inc. | | | | | | | | |
6.25%, due 3/15/26 (b) | | | 80,375,000 | | | | 83,790,134 | |
6.50%, due 7/15/24 | | | 32,441,000 | | | | 32,400,449 | |
6.50%, due 5/15/25 | | | 5,000,000 | | | | 5,000,000 | |
7.50%, due 3/15/27 | | | 11,350,000 | | | | 11,722,847 | |
8.00%, due 12/15/25 (b) | | | 11,000,000 | | | | 11,910,800 | |
| | | | | | | | |
| | | Principal
Amount | | | Value | |
Aerospace & Defense (continued) | |
Triumph Group, Inc.
8.875%, due 6/1/24 (b) | | $ | 8,960,000 | | | $ | 9,511,488 | |
| | | | | | | | |
| | | | | | | 208,961,243 | |
| | | | | | | | |
Airlines 0.8% | |
Delta Air Lines, Inc. | | | | | | | | |
7.00%, due 5/1/25 (b) | | | 6,000,000 | | | | 6,547,909 | |
7.375%, due 1/15/26 | | | 8,500,000 | | | | 8,797,500 | |
Delta Air Lines, Inc. / SkyMiles I.P. Ltd. (b) | | | | | | | | |
4.50%, due 10/20/25 | | | 17,200,000 | | | | 17,457,073 | |
4.75%, due 10/20/28 | | | 23,500,000 | | | | 24,021,979 | |
Mileage Plus Holdings LLC / Mileage Plus Intellectual Property Assets, Ltd.
6.50%, due 6/20/27 (b) | | | 22,235,000 | | | | 23,152,194 | |
Spirit Loyalty Cayman, Ltd. / Spirit I.P. Cayman, Ltd.
8.00%, due 9/20/25 (b) | | | 10,500,000 | | | | 11,130,000 | |
| | | | | | | | |
| | | | | | | 91,106,655 | |
| | | | | | | | |
Apparel 0.1% | |
Levi Strauss & Co.
5.00%, due 5/1/25 | | | 15,000,000 | | | | 15,375,000 | |
| | | | | | | | |
|
Auto Manufacturers 2.3% | |
Allison Transmission, Inc.
5.00%, due 10/1/24 (b) | | | 7,550,000 | | | | 7,617,573 | |
BCD Acquisition, Inc.
9.625%, due 9/15/23 (b) | | | 21,080,000 | | | | 21,106,350 | |
Ford Holdings LLC
9.30%, due 3/1/30 | | | 30,695,000 | | | | 36,993,614 | |
Ford Motor Co. | | | | | | | | |
7.45%, due 7/16/31 | | | 16,935,000 | | | | 20,173,819 | |
9.00%, due 4/22/25 | | | 8,400,000 | | | | 9,898,518 | |
9.625%, due 4/22/30 | | | 7,000,000 | | | | 9,397,500 | |
Ford Motor Credit Co. LLC | | | | | | | | |
3.336%, due 3/18/21 | | | 2,000,000 | | | | 2,000,000 | |
3.339%, due 3/28/22 | | | 6,000,000 | | | | 5,985,000 | |
4.125%, due 8/17/27 | | | 4,000,000 | | | | 3,940,000 | |
4.271%, due 1/9/27 | | | 7,500,000 | | | | 7,490,625 | |
4.389%, due 1/8/26 | | | 2,500,000 | | | | 2,518,750 | |
5.125%, due 6/16/25 | | | 13,000,000 | | | | 13,549,770 | |
5.584%, due 3/18/24 | | | 3,660,000 | | | | 3,846,514 | |
General Motors Co.
6.80%, due 10/1/27 | | | 5,500,000 | | | | 6,751,919 | |
General Motors Financial Co., Inc. | | | | | | | | |
4.35%, due 4/9/25 | | | 7,410,000 | | | | 8,097,655 | |
5.10%, due 1/17/24 | | | 1,900,000 | | | | 2,085,876 | |
5.25%, due 3/1/26 | | | 14,220,000 | | | | 16,231,517 | |
J.B. Poindexter & Company, Inc.
7.125%, due 4/15/26 (b) | | | 30,945,000 | | | | 32,888,655 | |
McLaren Finance PLC
5.75%, due 8/1/22 (b) | | | 26,535,000 | | | | 24,345,862 | |
| | | | | | |
The notes to the financial statements are an integral part of,
and should be read in conjunction with, the financial statements. | | | | | 11 | |
Portfolio of Investments October 31, 2020 (continued)
| | | | | | | | |
| | | Principal
Amount | | | Value | |
| Corporate Bonds (continued) | |
Auto Manufacturers (continued) | |
PM General Purchaser LLC
9.50%, due 10/1/28 (b) | | $ | 16,975,000 | | | $ | 17,738,875 | |
Wabash National Corp.
5.50%, due 10/1/25 (b) | | | 17,824,000 | | | | 17,827,743 | |
| | | | | | | | |
| | | | | | | 270,486,135 | |
| | | | | | | | |
Auto Parts & Equipment 1.9% | |
Adient Global Holdings, Ltd.
4.875%, due 8/15/26 (b) | | | 21,225,000 | | | | 20,320,390 | |
Adient U.S. LLC (b) | | | | | | | | |
7.00%, due 5/15/26 | | | 17,905,000 | | | | 19,099,801 | |
9.00%, due 4/15/25 | | | 6,000,000 | | | | 6,598,200 | |
American Axle & Manufacturing, Inc.
6.25%, due 4/1/25 (c) | | | 2,676,000 | | | | 2,711,965 | |
Dana Financing Luxembourg S.A.R.L.
5.75%, due 4/15/25 (b) | | | 4,000,000 | | | | 4,140,000 | |
Exide Global Holding Netherlands C.V.
10.75%, due 6/30/24 (d)(e)(f) | | | 13,730,000 | | | | 10,984,000 | |
Exide Technologies
11.00%, due 10/31/24 (b)(d)(e)(f)(g)(h) | | | 69,082,727 | | | | 69,083 | |
IHO Verwaltungs GmbH (a)(b) | | | | | | | | |
4.75% (4.75% Cash or 5.50% PIK), due 9/15/26 | | | 33,725,000 | | | | 34,062,250 | |
6.00% (6.00% Cash or 6.75% PIK), due 5/15/27 | | | 28,859,000 | | | | 30,085,507 | |
6.375% (6.375% Cash or 7.125% PIK), due 5/15/29 | | | 30,170,000 | | | | 31,904,775 | |
Lithia Motors, Inc.
4.375%, due 1/15/31 (b) | | | 11,000,000 | | | | 11,357,500 | |
Meritor, Inc. | | | | | | | | |
6.25%, due 2/15/24 | | | 5,000,000 | | | | 5,093,750 | |
6.25%, due 6/1/25 (b) | | | 8,000,000 | | | | 8,360,000 | |
Nexteer Automotive Group, Ltd.
5.875%, due 11/15/21 (b) | | | 24,020,000 | | | | 24,047,258 | |
Tenneco, Inc. | | | | | | | | |
5.00%, due 7/15/26 | | | 11,053,000 | | | | 8,455,545 | |
5.375%, due 12/15/24 | | | 8,800,000 | | | | 7,273,640 | |
| | | | | | | | |
| | | | | | | 224,563,664 | |
| | | | | | | | |
Banks 0.0%‡ | |
Freedom Mortgage Corp.
8.125%, due 11/15/24 (b) | | | 4,000,000 | | | | 4,030,000 | |
| | | | | | | | |
|
Building Materials 1.0% | |
BMC East LLC
5.50%, due 10/1/24 (b) | | | 5,000,000 | | | | 5,125,000 | |
Griffon Corp.
5.75%, due 3/1/28 | | | 3,000,000 | | | | 3,127,500 | |
| | | | | | | | |
| | | Principal
Amount | | | Value | |
Building Materials (continued) | |
James Hardie International Finance DAC (b) | | | | | | | | |
4.75%, due 1/15/25 | | $ | 13,000,000 | | | $ | 13,325,000 | |
5.00%, due 1/15/28 | | | 31,840,000 | | | | 33,750,400 | |
Patrick Industries, Inc.
7.50%, due 10/15/27 (b) | | | 18,400,000 | | | | 19,935,112 | |
Standard Industries, Inc.
5.00%, due 2/15/27 (b) | | | 2,015,000 | | | | 2,077,969 | |
Summit Materials LLC / Summit Materials Finance Corp. (b) | | | | | | | | |
5.125%, due 6/1/25 | | | 7,815,000 | | | | 7,912,687 | |
5.25%, due 1/15/29 | | | 15,500,000 | | | | 15,965,000 | |
6.50%, due 3/15/27 | | | 21,730,000 | | | | 22,762,175 | |
| | | | | | | | |
| | | | | | | 123,980,843 | |
| | | | | | | | |
Chemicals 1.6% | |
Axalta Coating Systems LLC / Axalta Coating Systems Dutch Holding B.V.
4.75%, due 6/15/27 (b) | | | 5,000,000 | | | | 5,237,500 | |
Blue Cube Spinco LLC | | | | | | | | |
9.75%, due 10/15/23 | | | 4,448,000 | | | | 4,576,013 | |
10.00%, due 10/15/25 | | | 24,400,000 | | | | 25,763,716 | |
Innophos Holdings, Inc.
9.375%, due 2/15/28 (b) | | | 25,251,000 | | | | 27,018,570 | |
Neon Holdings, Inc.
10.125%, due 4/1/26 (b) | | | 23,162,000 | | | | 24,493,815 | |
NOVA Chemicals Corp. (b) | | | | | | | | |
4.875%, due 6/1/24 | | | 9,810,000 | | | | 9,704,052 | |
5.25%, due 6/1/27 | | | 12,500,000 | | | | 12,206,250 | |
Olin Corp. | | | | | | | | |
5.50%, due 8/15/22 | | | 8,000,000 | | | | 8,220,000 | |
5.625%, due 8/1/29 | | | 10,290,000 | | | | 10,637,185 | |
9.50%, due 6/1/25 (b) | | | 7,000,000 | | | | 8,278,340 | |
TPC Group, Inc.
10.50%, due 8/1/24 (b) | | | 55,497,000 | | | | 46,339,995 | |
Valvoline, Inc.
4.375%, due 8/15/25 | | | 8,000,000 | | | | 8,230,000 | |
W.R. Grace & Co.
4.875%, due 6/15/27 (b) | | | 2,500,000 | | | | 2,604,400 | |
| | | | | | | | |
| | | | | | | 193,309,836 | |
| | | | | | | | |
Coal 0.1% | |
Natural Resource Partners LP / NRP Finance Corp.
9.125%, due 6/30/25 (b) | | | 10,000,000 | | | | 8,925,000 | |
| | | | | | | | |
|
Commercial Services 3.4% | |
Allied Universal Holdco LLC / Allied Universal Finance Corp. (b) | | | | | | | | |
6.625%, due 7/15/26 | | | 8,350,000 | | | | 8,746,917 | |
9.75%, due 7/15/27 | | | 14,705,000 | | | | 15,683,177 | |
| | | | |
| 12 | | MainStay MacKay High Yield Corporate Bond Fund | | The notes to the financial statements are an integral part of,
and should be read in conjunction with, the financial statements. |
| | | | | | | | |
| | | Principal
Amount | | | Value | |
| Corporate Bonds (continued) | |
Commercial Services (continued) | |
Amn Healthcare, Inc.
4.00%, due 4/15/29 (b) | | $ | 9,500,000 | | | $ | 9,464,375 | |
AMN Healthcare, Inc.
4.625%, due 10/1/27 (b) | | | 9,802,000 | | | | 10,022,545 | |
Ashtead Capital, Inc. (b) | | | | | | | | |
4.00%, due 5/1/28 | | | 16,665,000 | | | | 17,373,262 | |
4.25%, due 11/1/29 | | | 13,400,000 | | | | 14,301,150 | |
4.375%, due 8/15/27 | | | 12,944,000 | | | | 13,558,840 | |
5.25%, due 8/1/26 | | | 17,120,000 | | | | 18,125,800 | |
Booz Allen Hamilton, Inc.
3.875%, due 9/1/28 (b) | | | 6,100,000 | | | | 6,191,500 | |
Cimpress PLC
7.00%, due 6/15/26 (b) | | | 30,585,000 | | | | 30,432,075 | |
Gartner, Inc. (b) | | | | | | | | |
3.75%, due 10/1/30 | | | 18,000,000 | | | | 18,406,800 | |
4.50%, due 7/1/28 | | | 4,000,000 | | | | 4,175,840 | |
Graham Holdings Co.
5.75%, due 6/1/26 (b) | | | 39,695,000 | | | | 41,618,223 | |
Harsco Corp.
5.75%, due 7/31/27 (b) | | | 14,190,000 | | | | 14,509,275 | |
IHS Markit, Ltd. (b) | | | | | | | | |
4.75%, due 2/15/25 | | | 3,000,000 | | | | 3,382,500 | |
5.00%, due 11/1/22 | | | 28,545,000 | | | | 30,550,997 | |
Jaguar Holding Co. II / Pharmaceutical Product Development LLC
5.00%, due 6/15/28 (b) | | | 5,585,000 | | | | 5,821,301 | |
Korn Ferry
4.625%, due 12/15/27 (b) | | | 10,685,000 | | | | 10,871,988 | |
Mph Acquisition Holdings LLC
5.75%, due 11/1/28 (b) | | | 10,000,000 | | | | 9,825,000 | |
Nielsen Co. Luxembourg S.A.R.L. (b) | | | | | | | | |
5.00%, due 2/1/25 | | | 14,887,000 | | | | 15,291,926 | |
5.50%, due 10/1/21 | | | 1,164,000 | | | | 1,165,455 | |
Nielsen Finance LLC / Nielsen Finance Co. (b) | | | | | | | | |
5.00%, due 4/15/22 | | | 12,997,000 | | | | 13,003,498 | |
5.625%, due 10/1/28 | | | 10,000,000 | | | | 10,312,500 | |
5.875%, due 10/1/30 | | | 2,200,000 | | | | 2,310,000 | |
Ritchie Bros. Auctioneers, Inc.
5.375%, due 1/15/25 (b) | | | 21,925,000 | | | | 22,555,344 | |
Service Corp. International
3.375%, due 8/15/30 | | | 17,700,000 | | | | 17,943,375 | |
United Rentals North America, Inc. | | | | | | | | |
3.875%, due 11/15/27 | | | 14,735,000 | | | | 15,269,144 | |
3.875%, due 2/15/31 | | | 17,500,000 | | | | 17,675,000 | |
4.875%, due 1/15/28 | | | 8,300,000 | | | | 8,715,000 | |
5.25%, due 1/15/30 | | | 3,500,000 | | | | 3,793,125 | |
| | | | | | | | |
| | | | | | | 411,095,932 | |
| | | | | | | | |
| | | | | | | | |
| | | Principal
Amount | | | Value | |
Cosmetics & Personal Care 0.4% | |
Edgewell Personal Care Co. | | | | | | | | |
4.70%, due 5/24/22 | | $ | 27,458,000 | | | $ | 28,281,740 | |
5.50%, due 6/1/28 (b) | | | 16,275,000 | | | | 17,104,700 | |
| | | | | | | | |
| | | | | | | 45,386,440 | |
| | | | | | | | |
Distribution & Wholesale 0.5% | |
Avient Corp. | | | | | | | | |
5.25%, due 3/15/23 | | | 26,406,000 | | | | 28,238,180 | |
5.75%, due 5/15/25 (b) | | | 8,150,000 | | | | 8,577,875 | |
G III Apparel Group, Ltd.
7.875%, due 8/15/25 (b) | | | 24,000,000 | | | | 24,300,000 | |
| | | | | | | | |
| | | | | | | 61,116,055 | |
| | | | | | | | |
Diversified Financial Services 1.5% | |
Credit Acceptance Corp. | | | | | | | | |
5.125%, due 12/31/24 (b) | | | 15,215,000 | | | | 15,100,888 | |
6.625%, due 3/15/26 | | | 31,675,000 | | | | 32,862,812 | |
Genworth Mortgage Holdings, Inc.
6.50%, due 8/15/25 (b) | | | 18,800,000 | | | | 19,599,000 | |
Jefferies Finance LLC / JFIN Co-Issuer Corp.
6.25%, due 6/3/26 (b) | | | 11,500,000 | | | | 11,673,650 | |
LPL Holdings, Inc. (b) | | | | | | | | |
4.625%, due 11/15/27 | | | 10,000,000 | | | | 10,250,000 | |
5.75%, due 9/15/25 | | | 42,820,000 | | | | 44,333,687 | |
Oxford Finance LLC / Oxford Finance Co-Issuer II, Inc.
6.375%, due 12/15/22 (b) | | | 17,860,000 | | | | 17,717,120 | |
PRA Group, Inc.
7.375%, due 9/1/25 (b) | | | 15,000,000 | | | | 15,735,000 | |
StoneX Group, Inc.
8.625%, due 6/15/25 (b) | | | 6,311,000 | | | | 6,658,105 | |
| | | | | | | | |
| | | | | | | 173,930,262 | |
| | | | | | | | |
Electric 1.2% | |
Clearway Energy Operating LLC
4.75%, due 3/15/28 (b) | | | 10,350,000 | | | | 10,880,438 | |
DPL, Inc.
4.125%, due 7/1/25 (b) | | | 22,825,000 | | | | 23,852,125 | |
Keystone Power Pass-Through Holders LLC / Conemaugh Power Pass-Through Holders
13.00% (13.00% PIK), due 6/1/24 (a)(b)(f) | | | 10,427,183 | | | | 8,341,746 | |
NextEra Energy Operating Partners, L.P. (b) | | | | | | | | |
3.875%, due 10/15/26 | | | 16,330,000 | | | | 16,907,184 | |
4.25%, due 9/15/24 | | | 2,000,000 | | | | 2,095,000 | |
NRG Energy, Inc. | | | | | | | | |
5.75%, due 1/15/28 | | | 6,000,000 | | | | 6,470,700 | |
6.625%, due 1/15/27 | | | 7,000,000 | | | | 7,367,500 | |
| | | | | | |
The notes to the financial statements are an integral part of,
and should be read in conjunction with, the financial statements. | | | | | 13 | |
Portfolio of Investments October 31, 2020 (continued)
| | | | | | | | |
| | | Principal
Amount | | | Value | |
| Corporate Bonds (continued) | |
Electric (continued) | |
Pattern Energy Operations L.P. / Pattern Energy Operations, Inc.
4.50%, due 8/15/28 (b) | | $ | 20,055,000 | | | $ | 20,909,945 | |
PG&E Corp. | | | | | | | | |
5.00%, due 7/1/28 | | | 22,300,000 | | | | 22,356,307 | |
5.25%, due 7/1/30 | | | 12,000,000 | | | | 12,000,000 | |
Vistra Operations Co. LLC
5.00%, due 7/31/27 (b) | | | 16,000,000 | | | | 16,720,000 | |
| | | | | | | | |
| | | | | | | 147,900,945 | |
| | | | | | | | |
Electrical Components & Equipment 0.5% | |
Energizer Holdings, Inc.
7.75%, due 1/15/27 (b) | | | 16,055,000 | | | | 17,339,400 | |
WESCO Distribution, Inc. | | | | | | | | |
5.375%, due 12/15/21 | | | 11,549,000 | | | | 11,534,564 | |
7.125%, due 6/15/25 (b) | | | 16,665,000 | | | | 17,956,537 | |
7.25%, due 6/15/28 (b) | | | 14,250,000 | | | | 15,603,750 | |
| | | | | | | | |
| | | | | | | 62,434,251 | |
| | | | | | | | |
Electronics 0.2% | |
Itron, Inc.
5.00%, due 1/15/26 (b) | | | 18,066,000 | | | | 18,427,320 | |
| | | | | | | | |
|
Energy—Alternate Sources 0.1% | |
Terraform Power Operating LLC
4.75%, due 1/15/30 (b) | | | 6,000,000 | | | | 6,437,940 | |
| | | | | | | | |
|
Engineering & Construction 0.4% | |
Great Lakes Dredge & Dock Corp.
8.00%, due 5/15/22 | | | 12,874,000 | | | | 13,160,189 | |
PowerTeam Services LLC
9.033%, due 12/4/25 (b) | | | 12,925,000 | | | | 13,684,344 | |
Weekley Homes LLC / Weekley Finance Corp.
4.875%, due 9/15/28 (b) | | | 20,500,000 | | | | 20,762,810 | |
| | | | | | | | |
| | | | | | | 47,607,343 | |
| | | | | | | | |
Entertainment 2.2% | |
Allen Media LLC / Allen Media Co-Issuer, Inc.
10.50%, due 2/15/28 (b) | | | 23,020,000 | | | | 22,329,400 | |
Boyne USA, Inc.
7.25%, due 5/1/25 (b) | | | 15,500,000 | | | | 16,197,500 | |
CCM Merger, Inc.
6.375%, due 5/1/26 (b) | | | 2,000,000 | | | | 2,050,000 | |
Churchill Downs, Inc. (b) | | | | | | | | |
4.75%, due 1/15/28 | | | 15,830,000 | | | | 16,067,450 | |
5.50%, due 4/1/27 | | | 36,227,000 | | | | 37,517,587 | |
International Game Technology PLC
6.25%, due 1/15/27 (b) | | | 22,700,000 | | | | 24,118,750 | |
| | | | | | | | |
| | | Principal
Amount | | | Value | |
Entertainment (continued) | |
Jacobs Entertainment, Inc.
7.875%, due 2/1/24 (b) | | $ | 10,359,000 | | | $ | 10,151,820 | |
Live Nation Entertainment, Inc. (b) | | | | | | | | |
4.75%, due 10/15/27 | | | 10,000,000 | | | | 9,190,600 | |
4.875%, due 11/1/24 | | | 3,000,000 | | | | 2,888,640 | |
6.50%, due 5/15/27 | | | 38,280,000 | | | | 40,959,600 | |
Merlin Entertainments PLC
5.75%, due 6/15/26 (b) | | | 34,400,000 | | | | 31,648,000 | |
Motion Bondco DAC
6.625%, due 11/15/27 (b) | | | 12,225,000 | | | | 10,494,551 | |
Powdr Corp.
6.00%, due 8/1/25 (b) | | | 7,500,000 | | | | 7,562,250 | |
Twin River Worldwide Holdings, Inc.
6.75%, due 6/1/27 (b) | | | 23,765,000 | | | | 24,063,964 | |
Vail Resorts, Inc.
6.25%, due 5/15/25 (b) | | | 9,000,000 | | | | 9,450,000 | |
| | | | | | | | |
| | | | | | | 264,690,112 | |
| | | | | | | | |
Food 2.0% | |
B&G Foods, Inc.
5.25%, due 4/1/25 | | | 24,375,000 | | | | 25,106,250 | |
Ingles Markets, Inc.
5.75%, due 6/15/23 | | | 1,736,000 | | | | 1,749,020 | |
Kraft Heinz Foods Co. | | | | | | | | |
3.875%, due 5/15/27 (b) | | | 17,155,000 | | | | 18,147,551 | |
3.95%, due 7/15/25 | | | 42,000 | | | | 45,418 | |
4.25%, due 3/1/31 (b) | | | 13,000,000 | | | | 14,106,965 | |
6.50%, due 2/9/40 | | | 24,794,000 | | | | 31,488,268 | |
6.875%, due 1/26/39 | | | 34,650,000 | | | | 46,354,311 | |
7.125%, due 8/1/39 (b) | | | 11,000,000 | | | | 14,832,823 | |
Lamb Weston Holdings, Inc.
4.875%, due 5/15/28 (b) | | | 12,310,000 | | | | 13,337,823 | |
Land O’Lakes Capital Trust I
7.45%, due 3/15/28 (b) | | | 18,024,000 | | | | 20,457,240 | |
Land O’Lakes, Inc.
6.00%, due 11/15/22 (b) | | | 23,000,000 | | | | 24,444,285 | |
Nathan’s Famous, Inc.
6.625%, due 11/1/25 (b) | | | 4,000,000 | | | | 4,080,000 | |
Post Holdings, Inc.
4.625%, due 4/15/30 (b) | | | 4,000,000 | | | | 4,110,000 | |
TreeHouse Foods, Inc. | | | | | | | | |
4.00%, due 9/1/28 | | | 10,600,000 | | | | 10,613,250 | |
6.00%, due 2/15/24 (b) | | | 14,115,000 | | | | 14,379,656 | |
| | | | | | | | |
| | | | | | | 243,252,860 | |
| | | | | | | | |
Food Services 0.2% | |
Aramark Services, Inc.
6.375%, due 5/1/25 (b) | | | 24,315,000 | | | | 25,503,517 | |
| | | | | | | | |
| | | | |
| 14 | | MainStay MacKay High Yield Corporate Bond Fund | | The notes to the financial statements are an integral part of,
and should be read in conjunction with, the financial statements. |
| | | | | | | | |
| | | Principal
Amount | | | Value | |
| Corporate Bonds (continued) | |
Forest Products & Paper 1.1% | |
Mercer International, Inc. | | | | | | | | |
5.50%, due 1/15/26 | | $ | 2,585,000 | | | $ | 2,449,287 | |
6.50%, due 2/1/24 | | | 22,682,000 | | | | 22,795,410 | |
7.375%, due 1/15/25 | | | 26,085,000 | | | | 26,525,315 | |
Schweitzer-Mauduit International, Inc.
6.875%, due 10/1/26 (b) | | | 14,605,000 | | | | 15,408,275 | |
Smurfit Kappa Treasury Funding DAC
7.50%, due 11/20/25 | | | 52,580,000 | | | | 63,621,800 | |
| | | | | | | | |
| | | | | | | 130,800,087 | |
| | | | | | | | |
Gas 0.7% | |
AmeriGas Partners, L.P. / AmeriGas Finance Corp. | | | | | | | | |
5.625%, due 5/20/24 | | | 25,131,000 | | | | 26,701,687 | |
5.75%, due 5/20/27 | | | 13,560,000 | | | | 14,858,641 | |
5.875%, due 8/20/26 | | | 25,075,000 | | | | 27,466,403 | |
Rockpoint Gas Storage Canada, Ltd.
7.00%, due 3/31/23 (b) | | | 19,230,000 | | | | 17,835,825 | |
| | | | | | | | |
| | | | | | | 86,862,556 | |
| | | | | | | | |
Hand & Machine Tools 0.4% | |
Colfax Corp. (b) | | | | | | | | |
6.00%, due 2/15/24 | | | 11,000,000 | | | | 11,442,310 | |
6.375%, due 2/15/26 | | | 18,640,000 | | | | 19,618,600 | |
Werner FinCo, L.P. / Werner FinCo, Inc.
8.75%, due 7/15/25 (b) | | | 13,030,000 | | | | 12,183,050 | |
| | | | | | | | |
| | | | | | | 43,243,960 | |
| | | | | | | | |
Health Care—Products 0.8% | |
Hologic, Inc. (b) | | | | | | | | |
3.25%, due 2/15/29 | | | 29,000,000 | | | | 29,145,000 | |
4.625%, due 2/1/28 | | | 5,630,000 | | | | 5,883,350 | |
Teleflex, Inc. | | | | | | | | |
4.25%, due 6/1/28 (b) | | | 32,685,000 | | | | 34,155,825 | |
4.625%, due 11/15/27 | | | 5,000,000 | | | | 5,272,625 | |
4.875%, due 6/1/26 | | | 6,250,000 | | | | 6,500,000 | |
Varex Imaging Corp.
7.875%, due 10/15/27 (b) | | | 19,900,000 | | | | 20,248,250 | |
| | | | | | | | |
| | | | | | | 101,205,050 | |
| | | | | | | | |
Health Care—Services 4.7% | |
Acadia Healthcare Co., Inc. | | | | | | | | |
5.00%, due 4/15/29 (b) | | | 9,100,000 | | | | 9,375,730 | |
5.50%, due 7/1/28 (b) | | | 8,950,000 | | | | 9,308,000 | |
5.625%, due 2/15/23 | | | 12,490,000 | | | | 12,536,837 | |
6.50%, due 3/1/24 | | | 11,195,000 | | | | 11,446,887 | |
AHP Health Partners, Inc.
9.75%, due 7/15/26 (b) | | | 21,000,000 | | | | 22,260,000 | |
Catalent Pharma Solutions, Inc. (b) | | | | | | | | |
4.875%, due 1/15/26 | | | 10,264,000 | | | | 10,469,280 | |
5.00%, due 7/15/27 | | | 9,385,000 | | | | 9,783,863 | |
| | | | | | | | |
| | | Principal
Amount | | | Value | |
Health Care—Services (continued) | |
Centene Corp. | | | | | | | | |
3.00%, due 10/15/30 | | $ | 13,000,000 | | | $ | 13,499,889 | |
4.25%, due 12/15/27 | | | 6,200,000 | | | | 6,526,740 | |
4.625%, due 12/15/29 | | | 20,070,000 | | | | 21,850,911 | |
4.75%, due 1/15/25 | | | 16,000,000 | | | | 16,440,000 | |
5.375%, due 6/1/26 (b) | | | 3,045,000 | | | | 3,203,979 | |
5.375%, due 8/15/26 (b) | | | 4,255,000 | | | | 4,499,663 | |
Charles River Laboratories International, Inc.
5.50%, due 4/1/26 (b) | | | 5,235,000 | | | | 5,470,575 | |
DaVita, Inc.
3.75%, due 2/15/31 (b) | | | 12,500,000 | | | | 12,015,625 | |
Encompass Health Corp. | | | | | | | | |
4.50%, due 2/1/28 | | | 23,185,000 | | | | 23,744,222 | |
4.625%, due 4/1/31 | | | 5,000,000 | | | | 5,150,000 | |
4.75%, due 2/1/30 | | | 24,790,000 | | | | 25,821,760 | |
5.75%, due 11/1/24 | | | 15,958,000 | | | | 15,958,000 | |
HCA, Inc. | | | | | | | | |
3.50%, due 9/1/30 | | | 20,920,000 | | | | 21,392,575 | |
5.25%, due 4/15/25 | | | 15,000,000 | | | | 17,373,703 | |
5.25%, due 6/15/26 | | | 5,000,000 | | | | 5,823,683 | |
5.375%, due 2/1/25 | | | 26,525,000 | | | | 29,371,928 | |
5.375%, due 9/1/26 | | | 4,170,000 | | | | 4,686,038 | |
5.625%, due 9/1/28 | | | 11,000,000 | | | | 12,803,450 | |
5.875%, due 5/1/23 | | | 7,240,000 | | | | 7,873,500 | |
5.875%, due 2/15/26 | | | 25,000,000 | | | | 28,250,000 | |
5.875%, due 2/1/29 | | | 4,565,000 | | | | 5,370,677 | |
7.50%, due 12/15/23 | | | 1,500,000 | | | | 1,706,250 | |
7.50%, due 11/6/33 | | | 19,975,000 | | | | 26,982,230 | |
7.58%, due 9/15/25 | | | 8,520,000 | | | | 10,096,200 | |
7.69%, due 6/15/25 | | | 31,650,000 | | | | 37,742,625 | |
8.36%, due 4/15/24 | | | 4,524,000 | | | | 5,259,150 | |
IQVIA, Inc. (b) | | | | | | | | |
5.00%, due 10/15/26 | | | 30,113,000 | | | | 31,208,963 | |
5.00%, due 5/15/27 | | | 5,000,000 | | | | 5,237,500 | |
Legacy LifePoint Health LLC
6.75%, due 4/15/25 (b) | | | 9,190,000 | | | | 9,718,425 | |
Molina Healthcare, Inc. | | | | | | | | |
4.375%, due 6/15/28 (b) | | | 8,000,000 | | | | 8,200,000 | |
5.375%, due 11/15/22 | | | 8,180,000 | | | | 8,500,206 | |
RegionalCare Hospital Partners Holdings, Inc. / LifePoint Health, Inc.
9.75%, due 12/1/26 (b) | | | 35,490,000 | | | | 38,240,475 | |
Select Medical Corp.
6.25%, due 8/15/26 (b) | | | 9,950,000 | | | | 10,497,250 | |
| | | | | | | | |
| | | | | | | 565,696,789 | |
| | | | | | | | |
Holding Companies—Diversified 0.3% | |
Stena International S.A. (b) | | | | | | | | |
5.75%, due 3/1/24 | | | 5,000,000 | | | | 4,825,000 | |
6.125%, due 2/1/25 | | | 34,560,000 | | | | 32,486,400 | |
| | | | | | | | |
| | | | | | | 37,311,400 | |
| | | | | | | | |
| | | | | | |
The notes to the financial statements are an integral part of,
and should be read in conjunction with, the financial statements. | | | | | 15 | |
Portfolio of Investments October 31, 2020 (continued)
| | | | | | | | |
| | | Principal
Amount | | | Value | |
| Corporate Bonds (continued) | |
Home Builders 2.2% | |
Adams Homes, Inc.
7.50%, due 2/15/25 (b) | | $ | 15,630,000 | | | $ | 15,708,150 | |
Ashton Woods USA LLC / Ashton Woods Finance Co. (b) | | | | | | | | |
6.625%, due 1/15/28 | | | 6,000,000 | | | | 6,030,000 | |
6.75%, due 8/1/25 | | | 5,496,000 | | | | 5,660,880 | |
9.875%, due 4/1/27 | | | 10,540,000 | | | | 11,699,400 | |
Brookfield Residential Properties, Inc. / Brookfield Residential U.S. Corp. (b) | | | | | | | | |
4.875%, due 2/15/30 | | | 5,000,000 | | | | 4,750,000 | |
6.25%, due 9/15/27 | | | 17,360,000 | | | | 17,788,792 | |
6.375%, due 5/15/25 | | | 7,665,000 | | | | 7,703,325 | |
Century Communities, Inc. | | | | | | | | |
5.875%, due 7/15/25 | | | 4,630,000 | | | | 4,768,900 | |
6.75%, due 6/1/27 | | | 23,305,000 | | | | 24,819,825 | |
Installed Building Products, Inc.
5.75%, due 2/1/28 (b) | | | 17,080,000 | | | | 17,998,050 | |
M/I Homes, Inc. | | | | | | | | |
4.95%, due 2/1/28 | | | 7,500,000 | | | | 7,762,500 | |
5.625%, due 8/1/25 | | | 6,000,000 | | | | 6,166,260 | |
Meritage Homes Corp.
5.125%, due 6/6/27 | | | 6,015,000 | | | | 6,646,575 | |
New Home Co., Inc.
7.25%, due 4/1/22 | | | 20,030,000 | | | | 20,318,432 | |
Picasso Finance Sub, Inc.
6.125%, due 6/15/25 (b) | | | 15,000,000 | | | | 15,819,000 | |
Pultegroup, Inc.
6.375%, due 5/15/33 | | | 8,125,000 | | | | 10,359,375 | |
Shea Homes, L.P. / Shea Homes Funding Corp. (b) | | | | | | | | |
4.75%, due 2/15/28 | | | 22,525,000 | | | | 22,750,250 | |
4.75%, due 4/1/29 | | | 7,000,000 | | | | 7,105,000 | |
STL Holding Co., LLC
7.50%, due 2/15/26 (b) | | | 12,000,000 | | | | 11,940,000 | |
Taylor Morrison Communities, Inc.
5.75%, due 1/15/28 (b) | | | 5,000,000 | | | | 5,550,000 | |
Williams Scotsman International, Inc.
4.625%, due 8/15/28 (b) | | | 12,000,000 | | | | 12,075,000 | |
Winnebago Industries, Inc.
6.25%, due 7/15/28 (b) | | | 15,795,000 | | | | 16,703,213 | |
| | | | | | | | |
| | | | | | | 260,122,927 | |
| | | | | | | | |
Household Products & Wares 0.8% | |
Central Garden & Pet Co.
4.125%, due 10/15/30 | | | 9,350,000 | | | | 9,466,875 | |
Prestige Brands, Inc. (b) | | | | | | | | |
5.125%, due 1/15/28 | | | 24,750,000 | | | | 25,709,062 | |
6.375%, due 3/1/24 | | | 44,988,000 | | | | 46,000,230 | |
Spectrum Brands, Inc. | | | | | | | | |
5.75%, due 7/15/25 | | | 11,687,000 | | | | 12,023,001 | |
6.125%, due 12/15/24 | | | 6,945,000 | | | | 7,101,263 | |
| | | | | | | | |
| | | | | | | 100,300,431 | |
| | | | | | | | |
| | | | | | | | |
| | | Principal
Amount | | | Value | |
Housewares 0.0%‡ | |
Newell Brands, Inc.
4.875%, due 6/1/25 | | $ | 5,035,000 | | | $ | 5,451,898 | |
| | | | | | | | |
|
Insurance 1.0% | |
American Equity Investment Life Holding Co.
5.00%, due 6/15/27 | | | 26,515,000 | | | | 29,611,655 | |
Fairfax Financial Holdings, Ltd.
8.30%, due 4/15/26 | | | 5,435,000 | | | | 6,767,618 | |
Fidelity & Guaranty Life Holdings, Inc.
5.50%, due 5/1/25 (b) | | | 15,725,000 | | | | 18,010,314 | |
MGIC Investment Corp.
5.25%, due 8/15/28 | | | 14,145,000 | | | | 14,533,988 | |
NMI Holdings, Inc.
7.375%, due 6/1/25 (b) | | | 16,000,000 | | | | 17,440,000 | |
Radian Group, Inc.
4.875%, due 3/15/27 | | | 5,000,000 | | | | 5,112,500 | |
USI, Inc.
6.875%, due 5/1/25 (b) | | | 25,170,000 | | | | 25,579,013 | |
| | | | | | | | |
| | | | | | | 117,055,088 | |
| | | | | | | | |
Internet 2.3% | |
Cars.com, Inc.
6.375%, due 11/1/28 (b) | | | 7,200,000 | | | | 7,164,000 | |
Cogent Communications Group, Inc.
5.375%, due 3/1/22 (b) | | | 7,970,000 | | | | 8,109,475 | |
Expedia Group, Inc. (b) | | | | | | | | |
6.25%, due 5/1/25 | | | 8,600,000 | | | | 9,457,142 | |
7.00%, due 5/1/25 | | | 16,415,000 | | | | 17,577,803 | |
GrubHub Holdings, Inc.
5.50%, due 7/1/27 (b) | | | 7,000,000 | | | | 7,280,000 | |
Netflix, Inc. | | | | | | | | |
3.625%, due 6/15/25 (b) | | | 10,000,000 | | | | 10,387,500 | |
4.875%, due 4/15/28 | | | 2,000,000 | | | | 2,249,400 | |
4.875%, due 6/15/30 (b) | | | 10,000,000 | | | | 11,412,500 | |
5.375%, due 11/15/29 (b) | | | 9,205,000 | | | | 10,781,356 | |
5.50%, due 2/15/22 | | | 22,265,000 | | | | 23,392,166 | |
5.75%, due 3/1/24 | | | 24,961,000 | | | | 27,613,106 | |
5.875%, due 2/15/25 | | | 7,411,000 | | | | 8,383,694 | |
5.875%, due 11/15/28 | | | 32,450,000 | | | | 38,771,098 | |
Uber Technologies, Inc. (b) | | | | | | | | |
6.25%, due 1/15/28 | | | 4,125,000 | | | | 4,181,719 | |
7.50%, due 5/15/25 | | | 11,175,000 | | | | 11,747,719 | |
7.50%, due 9/15/27 | | | 21,160,000 | | | | 22,117,490 | |
VeriSign, Inc. | | | | | | | | |
4.625%, due 5/1/23 | | | 6,615,000 | | | | 6,683,597 | |
4.75%, due 7/15/27 | | | 19,419,000 | | | | 20,584,140 | |
5.25%, due 4/1/25 | | | 26,661,000 | | | | 29,871,651 | |
| | | | | | | | |
| | | | | | | 277,765,556 | |
| | | | | | | | |
| | | | |
| 16 | | MainStay MacKay High Yield Corporate Bond Fund | | The notes to the financial statements are an integral part of,
and should be read in conjunction with, the financial statements. |
| | | | | | | | |
| | | Principal
Amount | | | Value | |
| Corporate Bonds (continued) | |
Investment Companies 1.4% | |
Ares Capital Corp. | | | | | | | | |
3.875%, due 1/15/26 | | $ | 4,000,000 | | | $ | 4,099,749 | |
4.20%, due 6/10/24 | | | 5,000,000 | | | | 5,222,628 | |
Compass Group Diversified Holdings LLC
8.00%, due 5/1/26 (b) | | | 27,650,000 | | | | 29,072,040 | |
FS Energy & Power Fund
7.50%, due 8/15/23 (b) | | | 72,217,000 | | | | 64,453,672 | |
Icahn Enterprises, L.P. / Icahn Enterprises Finance Corp. | | | | | | | | |
4.75%, due 9/15/24 | | | 13,065,000 | | | | 13,293,638 | |
5.25%, due 5/15/27 | | | 24,290,000 | | | | 25,135,452 | |
6.25%, due 5/15/26 | | | 29,425,000 | | | | 30,528,437 | |
| | | | | | | | |
| | | | | | | 171,805,616 | |
| | | | | | | | |
Iron & Steel 0.9% | |
Allegheny Ludlum LLC
6.95%, due 12/15/25 | | | 22,688,000 | | | | 22,688,000 | |
Allegheny Technologies, Inc.
7.875%, due 8/15/23 | | | 4,610,000 | | | | 4,653,565 | |
Big River Steel LLC / BRS Finance Corp.
6.625%, due 1/31/29 (b) | | | 35,000,000 | | | | 36,050,000 | |
Mineral Resources, Ltd.
8.125%, due 5/1/27 (b) | | | 38,363,000 | | | | 41,815,670 | |
| | | | | | | | |
| | | | | | | 105,207,235 | |
| | | | | | | | |
Leisure Time 1.8% | |
Carlson Travel, Inc. (b) | | | | | | | | |
6.75%, due 12/15/25 | | | 77,516,000 | | | | 54,261,200 | |
8.50%, due 3/31/25 | | | 14,821,219 | | | | 14,821,219 | |
11.50% (9.50% Cash and 2.00% PIK), due 12/15/26 (a) | | | 47,475,000 | | | | 25,636,500 | |
Carnival Corp. (b) | | | | | | | | |
9.875%, due 8/1/27 | | | 28,143,000 | | | | 29,251,131 | |
10.50%, due 2/1/26 | | | 27,445,000 | | | | 29,709,212 | |
11.50%, due 4/1/23 | | | 5,600,000 | | | | 6,150,704 | |
Silversea Cruise Finance, Ltd.
7.25%, due 2/1/25 (b) | | | 38,952,000 | | | | 39,207,136 | |
Vista Outdoor, Inc.
5.875%, due 10/1/23 | | | 16,327,000 | | | | 16,469,861 | |
| | | | | | | | |
| | | | | | | 215,506,963 | |
| | | | | | | | |
Lodging 2.1% | |
Boyd Gaming Corp. | | | | | | | | |
4.75%, due 12/1/27 | | | 17,920,000 | | | | 17,427,379 | |
6.00%, due 8/15/26 | | | 32,365,000 | | | | 33,164,092 | |
6.375%, due 4/1/26 | | | 12,450,000 | | | | 12,917,871 | |
8.625%, due 6/1/25 (b) | | | 8,000,000 | | | | 8,757,600 | |
Hilton Domestic Operating Co., Inc. | | | | | | | | |
4.875%, due 1/15/30 | | | 23,325,000 | | | | 23,995,594 | |
5.125%, due 5/1/26 | | | 40,515,000 | | | | 41,021,437 | |
5.375%, due 5/1/25 (b) | | | 5,000,000 | | | | 5,166,900 | |
5.75%, due 5/1/28 (b) | | | 12,500,000 | | | | 13,102,562 | |
| | | | | | | | |
| | | Principal
Amount | | | Value | |
Lodging (continued) | |
Hyatt Hotels Corp. | | | | | | | | |
5.375%, due 4/23/25 | | $ | 11,500,000 | | | $ | 12,472,084 | |
5.75%, due 4/23/30 | | | 10,595,000 | | | | 11,971,161 | |
Marriott International, Inc. | | | | | | | | |
3.50%, due 10/15/32 | | | 9,200,000 | | | | 9,079,870 | |
3.75%, due 3/15/25 | | | 5,000,000 | | | | 5,156,056 | |
3.75%, due 10/1/25 | | | 5,000,000 | | | | 5,139,407 | |
4.625%, due 6/15/30 | | | 3,000,000 | | | | 3,201,203 | |
5.75%, due 5/1/25 | | | 28,075,000 | | | | 31,215,587 | |
Marriott Ownership Resorts, Inc. / ILG LLC
6.50%, due 9/15/26 | | | 11,006,000 | | | | 11,336,180 | |
MGM Resorts International | | | | | | | | |
5.50%, due 4/15/27 | | | 2,000,000 | | | | 2,019,220 | |
5.75%, due 6/15/25 | | | 4,996,000 | | | | 5,191,219 | |
| | | | | | | | |
| | | | | | | 252,335,422 | |
| | | | | | | | |
Machinery—Construction & Mining 0.1% | |
BWX Technologies, Inc. (b) | | | | | | | | |
4.125%, due 6/30/28 | | | 7,200,000 | | | | 7,272,000 | |
5.375%, due 7/15/26 | | | 3,000,000 | | | | 3,109,890 | |
| | | | | | | | |
| | | | | | | 10,381,890 | |
| | | | | | | | |
Machinery—Diversified 0.5% | |
Briggs & Stratton Corp.
6.875%, due 12/15/20 (g)(h) | | | 9,200,000 | | | | 839,500 | |
Stevens Holding Co., Inc.
6.125%, due 10/1/26 (b) | | | 14,965,000 | | | | 15,993,844 | |
Tennant Co.
5.625%, due 5/1/25 | | | 21,840,000 | | | | 22,648,080 | |
Vertical Holdco GmbH Co.
7.625%, due 7/15/28 (b) | | | 6,070,000 | | | | 6,297,625 | |
Vertical U.S. Newco, Inc.
5.25%, due 7/15/27 (b) | | | 11,025,000 | | | | 11,346,930 | |
| | | | | | | | |
| | | | | | | 57,125,979 | |
| | | | | | | | |
Media 5.6% | |
Altice Financing S.A.
7.50%, due 5/15/26 (b) | | | 5,000,000 | | | | 5,218,750 | |
Block Communications, Inc.
4.875%, due 3/1/28 (b) | | | 14,000,000 | | | | 14,350,000 | |
Cable One, Inc.
4.00%, due 11/15/30 (b) | | | 5,000,000 | | | | 5,075,000 | |
CCO Holdings LLC / CCO Holdings Capital Corp. (b) | | | | | | | | |
4.25%, due 2/1/31 | | | 23,250,000 | | | | 23,826,367 | |
4.50%, due 8/15/30 | | | 47,430,000 | | | | 49,291,865 | |
4.50%, due 5/1/32 | | | 34,500,000 | | | | 35,664,375 | |
4.75%, due 3/1/30 | | | 28,935,000 | | | | 30,435,280 | |
5.00%, due 2/1/28 | | | 21,000,000 | | | | 22,060,500 | |
5.125%, due 5/1/27 | | | 41,225,000 | | | | 43,286,250 | |
5.375%, due 5/1/25 | | | 3,025,000 | | | | 3,106,675 | |
| | | | | | |
The notes to the financial statements are an integral part of,
and should be read in conjunction with, the financial statements. | | | | | 17 | |
Portfolio of Investments October 31, 2020 (continued)
| | | | | | | | |
| | | Principal
Amount | | | Value | |
| Corporate Bonds (continued) | |
Media (continued) | |
CCO Holdings LLC / CCO Holdings Capital Corp. (b) (continued) | | | | | | | | |
5.375%, due 6/1/29 | | $ | 9,495,000 | | | $ | 10,278,338 | |
5.50%, due 5/1/26 | | | 825,000 | | | | 858,000 | |
5.75%, due 2/15/26 | | | 31,845,000 | | | | 33,012,438 | |
5.875%, due 5/1/27 | | | 5,920,000 | | | | 6,176,810 | |
CSC Holdings LLC (b) | | | | | | | | |
5.75%, due 1/15/30 | | | 31,435,000 | | | | 33,605,430 | |
6.50%, due 2/1/29 | | | 11,075,000 | | | | 12,287,934 | |
Diamond Sports Group LLC / Diamond Sports Finance Co.
6.625%, due 8/15/27 (b) | | | 20,385,000 | | | | 8,136,673 | |
DISH DBS Corp. | | | | | | | | |
5.875%, due 7/15/22 | | | 24,537,000 | | | | 25,273,110 | |
6.75%, due 6/1/21 | | | 10,205,000 | | | | 10,409,100 | |
7.75%, due 7/1/26 | | | 36,775,000 | | | | 38,980,948 | |
LCPR Senior Secured Financing DAC
6.75%, due 10/15/27 (b) | | | 54,680,000 | | | | 58,097,500 | |
Meredith Corp. | | | | | | | | |
6.50%, due 7/1/25 (b) | | | 5,000,000 | | | | 5,137,500 | |
6.875%, due 2/1/26 | | | 69,860,000 | | | | 57,896,475 | |
Quebecor Media, Inc.
5.75%, due 1/15/23 | | | 30,005,000 | | | | 32,210,367 | |
Sirius XM Radio, Inc. (b) | | | | | | | | |
4.625%, due 7/15/24 | | | 5,000,000 | | | | 5,156,000 | |
5.00%, due 8/1/27 | | | 13,000,000 | | | | 13,617,500 | |
5.375%, due 7/15/26 | | | 6,000,000 | | | | 6,248,760 | |
5.50%, due 7/1/29 | | | 11,590,000 | | | | 12,615,135 | |
Sterling Entertainment Enterprises LLC
10.25%, due 1/15/25 (d)(e)(f)(i) | | | 20,000,000 | | | | 20,962,000 | |
TEGNA, Inc.
4.625%, due 3/15/28 (b) | | | 2,000,000 | | | | 1,972,160 | |
Videotron, Ltd. | | | | | | | | |
5.00%, due 7/15/22 | | | 15,949,000 | | | | 16,708,172 | |
5.375%, due 6/15/24 (b) | | | 17,850,000 | | | | 19,411,875 | |
Virgin Media Finance PLC
5.00%, due 7/15/30 (b) | | | 11,500,000 | | | | 11,442,500 | |
| | | | | | | | |
| | | | | | | 672,809,787 | |
| | | | | | | | |
Metal Fabricate & Hardware 0.8% | |
Advanced Drainage Systems, Inc.
5.00%, due 9/30/27 (b) | | | 11,115,000 | | | | 11,630,514 | |
Grinding Media, Inc. / Moly-Cop AltaSteel, Ltd.
7.375%, due 12/15/23 (b) | | | 67,820,000 | | | | 68,498,200 | |
Park-Ohio Industries, Inc.
6.625%, due 4/15/27 | | | 17,990,000 | | | | 17,273,998 | |
| | | | | | | | |
| | | | | | | 97,402,712 | |
| | | | | | | | |
Mining 2.2% | |
Alcoa Nederland Holding B.V. (b) | | | | | | | | |
6.75%, due 9/30/24 | | | 7,910,000 | | | | 8,157,188 | |
7.00%, due 9/30/26 | | | 20,510,000 | | | | 21,561,548 | |
| | | | | | | | |
| | | Principal
Amount | | | Value | |
Mining (continued) | |
Arconic Corp.
6.00%, due 5/15/25 (b) | | $ | 14,435,000 | | | $ | 15,283,056 | |
Century Aluminum Co.
12.00% (10.00% Cash and 2.00% PIK), due 7/1/25 (a)(b) | | | 17,585,000 | | | | 18,420,287 | |
Compass Minerals International, Inc. (b) | | | | | | | | |
4.875%, due 7/15/24 | | | 7,000,000 | | | | 7,105,000 | |
6.75%, due 12/1/27 | | | 25,500,000 | | | | 27,660,360 | |
First Quantum Minerals, Ltd. (b) | | | | | | | | |
6.875%, due 10/15/27 | | | 10,000,000 | | | | 9,974,900 | |
7.25%, due 4/1/23 | | | 25,027,000 | | | | 25,152,135 | |
7.50%, due 4/1/25 | | | 4,000,000 | | | | 4,020,000 | |
Hecla Mining Co.
7.25%, due 2/15/28 | | | 4,350,000 | | | | 4,665,375 | |
IAMGOLD Corp.
5.75%, due 10/15/28 (b) | | | 27,000,000 | | | | 27,021,600 | |
Joseph T. Ryerson & Son, Inc
8.50%, due 8/1/28 (b) | | | 11,700,000 | | | | 12,537,135 | |
Novelis Corp. (b) | | | | | | | | |
4.75%, due 1/30/30 | | | 16,745,000 | | | | 16,981,356 | |
5.875%, due 9/30/26 | | | 64,580,000 | | | | 66,638,810 | |
| | | | | | | | |
| | | | | | | 265,178,750 | |
| | | | | | | | |
Miscellaneous—Manufacturing 0.9% | |
Amsted Industries, Inc. (b) | | | | | | | | |
4.625%, due 5/15/30 | | | 2,100,000 | | | | 2,157,750 | |
5.625%, due 7/1/27 | | | 23,395,000 | | | | 24,564,750 | |
EnPro Industries, Inc.
5.75%, due 10/15/26 | | | 21,784,000 | | | | 22,927,660 | |
FXI Holdings, Inc. (b) | | | | | | | | |
7.875%, due 11/1/24 | | | 2,445,000 | | | | 2,286,075 | |
12.25%, due 11/15/26 | | | 22,892,000 | | | | 23,922,140 | |
Hillenbrand, Inc.
5.75%, due 6/15/25 | | | 7,850,000 | | | | 8,379,875 | |
Koppers, Inc.
6.00%, due 2/15/25 (b) | | | 27,535,000 | | | | 28,154,538 | |
| | | | | | | | |
| | | | | | | 112,392,788 | |
| | | | | | | | |
Oil & Gas 7.4% | |
Apache Corp. | | | | | | | | |
4.625%, due 11/15/25 | | | 6,000,000 | | | | 5,700,000 | |
4.875%, due 11/15/27 | | | 13,500,000 | | | | 12,669,750 | |
Ascent Resources Utica Holdings LLC / ARU Finance Corp. (b) | | | | | | | | |
7.00%, due 11/1/26 | | | 11,790,000 | | | | 10,434,150 | |
9.00%, due 11/1/27 | | | 4,324,000 | | | | 4,194,280 | |
Callon Petroleum Co.
6.125%, due 10/1/24 | | | 21,000,000 | | | | 7,560,000 | |
Comstock Resources, Inc. | | | | | | | | |
9.75%, due 8/15/26 | | | 63,555,000 | | | | 66,955,192 | |
9.76%, due 8/15/26 | | | 11,535,000 | | | | 12,155,006 | |
| | | | |
| 18 | | MainStay MacKay High Yield Corporate Bond Fund | | The notes to the financial statements are an integral part of,
and should be read in conjunction with, the financial statements. |
| | | | | | | | |
| | | Principal
Amount | | | Value | |
| Corporate Bonds (continued) | |
Oil & Gas (continued) | |
Continental Resources, Inc. | | | | | | | | |
4.50%, due 4/15/23 | | $ | 24,225,000 | | | $ | 23,030,465 | |
5.00%, due 9/15/22 | | | 3,000,000 | | | | 2,955,000 | |
CVR Energy, Inc. (b) | | | | | | | | |
5.25%, due 2/15/25 | | | 3,585,000 | | | | 2,608,088 | |
5.75%, due 2/15/28 | | | 2,000,000 | | | | 1,365,000 | |
Endeavor Energy Resources, L.P. / EER Finance, Inc.
6.625%, due 7/15/25 (b) | | | 7,025,000 | | | | 7,288,437 | |
Energy Ventures Gom LLC / EnVen Finance Corp.
11.00%, due 2/15/23 (b) | | | 16,000,000 | | | | 11,800,000 | |
EQT Corp.
7.875%, due 2/1/25 | | | 21,899,000 | | | | 24,362,637 | |
Gulfport Energy Corp. | | | | | | | | |
6.00%, due 10/15/24 | | | 50,754,000 | | | | 27,660,930 | |
6.375%, due 5/15/25 | | | 24,354,000 | | | | 13,516,470 | |
6.375%, due 1/15/26 | | | 11,915,000 | | | | 6,523,463 | |
6.625%, due 5/1/23 | | | 17,072,000 | | | | 9,359,724 | |
Hess Corp.
6.00%, due 1/15/40 | | | 5,000,000 | | | | 5,545,669 | |
Indigo Natural Resources LLC
6.875%, due 2/15/26 (b) | | | 18,620,000 | | | | 18,294,150 | |
Jagged Peak Energy LLC
5.875%, due 5/1/26 | | | 4,150,000 | | | | 4,274,500 | |
Marathon Oil Corp. | | | | | | | | |
4.40%, due 7/15/27 | | | 21,000,000 | | | | 21,110,229 | |
6.60%, due 10/1/37 | | | 3,100,000 | | | | 3,198,126 | |
6.80%, due 3/15/32 | | | 8,000,000 | | | | 8,603,471 | |
Matador Resources Co.
5.875%, due 9/15/26 | | | 14,600,000 | | | | 11,753,000 | |
Montage Resources Corp.
8.875%, due 7/15/23 | | | 18,500,000 | | | | 18,777,500 | |
Moss Creek Resources Holdings, Inc.
7.50%, due 1/15/26 (b) | | | 12,465,000 | | | | 6,201,338 | |
Murphy Oil Corp.
6.875%, due 8/15/24 | | | 10,590,000 | | | | 9,478,050 | |
Noble Energy, Inc. | | | | | | | | |
3.85%, due 1/15/28 | | | 5,560,000 | | | | 6,353,443 | |
3.90%, due 11/15/24 | | | 6,550,000 | | | | 7,237,172 | |
4.95%, due 8/15/47 | | | 10,000,000 | | | | 13,089,466 | |
5.05%, due 11/15/44 | | | 33,000,000 | | | | 42,967,236 | |
5.25%, due 11/15/43 | | | 6,500,000 | | | | 8,656,644 | |
6.00%, due 3/1/41 | | | 3,500,000 | | | | 4,916,518 | |
Occidental Petroleum Corp. | | | | | | | | |
2.70%, due 8/15/22 | | | 10,374,000 | | | | 9,593,356 | |
2.70%, due 2/15/23 | | | 16,691,000 | | | | 14,938,445 | |
2.90%, due 8/15/24 | | | 8,000,000 | | | | 6,658,400 | |
3.20%, due 8/15/26 | | | 12,000,000 | | | | 9,270,000 | |
3.40%, due 4/15/26 | | | 2,744,000 | | | | 2,146,302 | |
| | | | | | | | |
| | | Principal
Amount | | | Value | |
Oil & Gas (continued) | |
Occidental Petroleum Corp. (continued) | | | | | | | | |
3.50%, due 8/15/29 | | $ | 5,000,000 | | | $ | 3,607,300 | |
5.55%, due 3/15/26 | | | 30,505,000 | | | | 26,539,350 | |
5.875%, due 9/1/25 | | | 6,000,000 | | | | 5,280,000 | |
6.375%, due 9/1/28 | | | 6,635,000 | | | | 5,805,625 | |
6.45%, due 9/15/36 | | | 6,850,000 | | | | 5,548,500 | |
6.625%, due 9/1/30 | | | 13,270,000 | | | | 11,628,501 | |
6.95%, due 7/1/24 | | | 13,950,000 | | | | 13,182,750 | |
7.15%, due 5/15/28 | | | 4,000,000 | | | | 3,754,680 | |
Parkland Corp. (b) | | | | | | | | |
5.875%, due 7/15/27 | | | 11,025,000 | | | | 11,378,737 | |
6.00%, due 4/1/26 | | | 6,855,000 | | | | 7,077,788 | |
Parsley Energy LLC / Parsley Finance Corp. (b) | | | | | | | | |
5.25%, due 8/15/25 | | | 5,320,000 | | | | 5,479,600 | |
5.625%, due 10/15/27 | | | 4,000,000 | | | | 4,255,000 | |
PBF Holding Co. LLC / PBF Finance Corp. | | | | | | | | |
6.00%, due 2/15/28 (b) | | | 32,850,000 | | | | 12,645,607 | |
7.25%, due 6/15/25 | | | 22,900,000 | | | | 9,503,500 | |
9.25%, due 5/15/25 (b) | | | 19,420,000 | | | | 17,235,250 | |
PDC Energy, Inc.
6.125%, due 9/15/24 | | | 22,880,000 | | | | 22,250,800 | |
PetroQuest Energy, Inc.
10.00% (10.00% PIK), due 2/15/24 (a)(d)(e)(f) | | | 23,069,065 | | | | 2,307 | |
QEP Resources, Inc. | | | | | | | | |
5.25%, due 5/1/23 | | | 15,450,000 | | | | 12,282,750 | |
5.625%, due 3/1/26 | | | 19,790,000 | | | | 12,566,650 | |
Range Resources Corp. | | | | | | | | |
5.875%, due 7/1/22 | | | 9,604,000 | | | | 9,604,000 | |
9.25%, due 2/1/26 (b) | | | 36,000,000 | | | | 38,160,000 | |
Southwestern Energy Co. | | | | | | | | |
6.45%, due 1/23/25 | | | 25,936,000 | | | | 25,984,630 | |
7.50%, due 4/1/26 | | | 26,545,000 | | | | 27,017,501 | |
7.75%, due 10/1/27 | | | 2,500,000 | | | | 2,584,375 | |
8.375%, due 9/15/28 | | | 8,000,000 | | | | 8,360,000 | |
Sunoco, L.P. / Sunoco Finance Corp.
6.00%, due 4/15/27 | | | 19,965,000 | | | | 20,638,020 | |
Talos Production LLC / Talos Production Finance, Inc.
11.00%, due 4/3/22 | | | 35,232,348 | | | | 33,294,569 | |
Transocean Guardian, Ltd.
5.875%, due 1/15/24 (b) | | | 8,931,000 | | | | 5,447,910 | |
Transocean Pontus, Ltd.
6.125%, due 8/1/25 (b) | | | 2,168,400 | | | | 1,915,651 | |
Transocean Poseidon, Ltd.
6.875%, due 2/1/27 (b) | | | 11,750,000 | | | | 8,812,500 | |
Transocean Sentry, Ltd.
5.375%, due 5/15/23 (b) | | | 12,500,000 | | | | 8,031,250 | |
Ultra Resources, Inc.
6.875%, due 4/15/22 (b)(f)(g)(h) | | | 28,880,000 | | | | 93,860 | |
| | | | | | |
The notes to the financial statements are an integral part of,
and should be read in conjunction with, the financial statements. | | | | | 19 | |
Portfolio of Investments October 31, 2020 (continued)
| | | | | | | | |
| | | Principal
Amount | | | Value | |
| Corporate Bonds (continued) | |
Oil & Gas (continued) | |
Viper Energy Partners, L.P.
5.375%, due 11/1/27 (b) | | $ | 14,350,000 | | | $ | 14,647,045 | |
WPX Energy, Inc.
5.875%, due 6/15/28 | | | 5,000,000 | | | | 5,112,500 | |
| | | | | | | | |
| | | | | | | 882,930,113 | |
| | | | | | | | |
Oil & Gas Services 0.1% | |
Nine Energy Service, Inc.
8.75%, due 11/1/23 (b) | | | 19,795,000 | | | | 5,839,525 | |
| | | | | | | | |
|
Packaging 0.1% | |
Graphic Packaging International LLC
3.50%, due 3/1/29 (b) | | | 7,000,000 | | | | 7,000,000 | |
| | | | | | | | |
|
Packaging & Containers 0.5% | |
ARD Finance S.A.
6.50% (6.50% Cash or 7.25% PIK), due 6/30/27 (a)(b) | | | 21,985,000 | | | | 22,342,256 | |
Cascades, Inc. / Cascades U.S.A., Inc. (b) | | | | | | | | |
5.125%, due 1/15/26 | | | 11,306,000 | | | | 11,814,770 | |
5.375%, due 1/15/28 | | | 21,100,000 | | | | 21,996,750 | |
Matthews International Corp.
5.25%, due 12/1/25 (b) | | | 3,000,000 | | | | 2,850,000 | |
Silgan Holdings, Inc.
4.125%, due 2/1/28 | | | 3,515,000 | | | | 3,651,382 | |
| | | | | | | | |
| | | | | | | 62,655,158 | |
| | | | | | | | |
Pharmaceuticals 1.3% | |
Bausch Health Americas, Inc. (b) | | | | | | | | |
8.50%, due 1/31/27 | | | 11,915,000 | | | | 13,028,099 | |
9.25%, due 4/1/26 | | | 14,000,000 | | | | 15,435,000 | |
Bausch Health Cos., Inc. (b) | | | | | | | | |
5.00%, due 1/30/28 | | | 10,315,000 | | | | 10,195,140 | |
5.25%, due 1/30/30 | | | 8,735,000 | | | | 8,626,249 | |
6.125%, due 4/15/25 | | | 18,000,000 | | | | 18,481,500 | |
6.25%, due 2/15/29 | | | 11,000,000 | | | | 11,336,160 | |
7.00%, due 1/15/28 | | | 7,000,000 | | | | 7,402,500 | |
7.25%, due 5/30/29 | | | 5,000,000 | | | | 5,378,475 | |
Cheplapharm Arzneimittel Gmbh
5.50%, due 1/15/28 (b) | | | 9,000,000 | | | | 9,114,390 | |
Endo Dac / Endo Finance LLC / Endo Finco, Inc. (b) | | | | | | | | |
6.00%, due 6/30/28 | | | 8,352,000 | | | | 6,451,920 | |
9.50%, due 7/31/27 | | | 6,255,000 | | | | 6,709,801 | |
Par Pharmaceutical, Inc.
7.50%, due 4/1/27 (b) | | | 26,701,000 | | | | 28,303,060 | |
Vizient, Inc.
6.25%, due 5/15/27 (b) | | | 12,000,000 | | | | 12,690,000 | |
| | | | | | | | |
| | | | | | | 153,152,294 | |
| | | | | | | | |
| | | | | | | | |
| | | Principal
Amount | | | Value | |
Pipelines 4.6% | |
ANR Pipeline Co. | | | | | | | | |
7.375%, due 2/15/24 | | $ | 2,555,000 | | | $ | 3,013,030 | |
9.625%, due 11/1/21 | | | 10,349,000 | | | | 11,240,783 | |
Antero Midstream Partners, L.P. / Antero Midstream Finance Corp. | | | | | | | | |
5.375%, due 9/15/24 | | | 10,720,000 | | | | 10,025,344 | |
5.75%, due 1/15/28 (b) | | | 14,110,000 | | | | 12,557,900 | |
Cheniere Energy Partners, L.P. | | | | | | | | |
5.25%, due 10/1/25 | | | 14,515,000 | | | | 14,764,658 | |
5.625%, due 10/1/26 | | | 15,530,000 | | | | 15,943,098 | |
CNX Midstream Partners, L.P. / CNX Midstream Finance Corp.
6.50%, due 3/15/26 (b) | | | 22,036,000 | | | | 22,390,780 | |
Enable Midstream Partners, L.P. | | | | | | | | |
3.90%, due 5/15/24 | | | 3,000,000 | | | | 2,947,970 | |
4.15%, due 9/15/29 | | | 9,295,000 | | | | 8,330,214 | |
4.40%, due 3/15/27 | | | 20,475,000 | | | | 19,440,887 | |
4.95%, due 5/15/28 | | | 17,610,000 | | | | 16,889,740 | |
EQM Midstream Partners, L.P. (b) | | | | | | | | |
6.00%, due 7/1/25 | | | 11,250,000 | | | | 11,531,250 | |
6.50%, due 7/1/27 | | | 8,900,000 | | | | 9,334,275 | |
Harvest Midstream I L.P.
7.50%, due 9/1/28 (b) | | | 16,590,000 | | | | 16,465,575 | |
Hess Midstream Operations L.P.
5.625%, due 2/15/26 (b) | | | 1,000,000 | | | | 1,000,000 | |
Holly Energy Partners, L.P. / Holly Energy Finance Corp.
5.00%, due 2/1/28 (b) | | | 9,870,000 | | | | 9,351,825 | |
MPLX, L.P. | | | | | | | | |
4.875%, due 12/1/24 | | | 19,495,000 | | | | 21,831,980 | |
4.875%, due 6/1/25 | | | 5,000,000 | | | | 5,646,356 | |
NGPL PipeCo LLC (b) | | | | | | | | |
4.875%, due 8/15/27 | | | 16,630,000 | | | | 18,098,503 | |
7.768%, due 12/15/37 | | | 10,630,000 | | | | 13,160,567 | |
NuStar Logistics, L.P. | | | | | | | | |
5.75%, due 10/1/25 | | | 3,000,000 | | | | 3,020,490 | |
6.00%, due 6/1/26 | | | 15,000,000 | | | | 14,812,500 | |
6.375%, due 10/1/30 | | | 2,000,000 | | | | 2,012,500 | |
6.75%, due 2/1/21 | | | 15,215,000 | | | | 15,348,131 | |
ONEOK Partners, L.P. | | | | | | | | |
6.125%, due 2/1/41 | | | 2,000,000 | | | | 2,073,541 | |
6.20%, due 9/15/43 | | | 3,255,000 | | | | 3,471,028 | |
6.65%, due 10/1/36 | | | 1,500,000 | | | | 1,656,046 | |
PBF Logistics, L.P. / PBF Logistics Finance Corp.
6.875%, due 5/15/23 | | | 6,050,000 | | | | 4,749,250 | |
Plains All American Pipeline, L.P.
6.125%, due 11/15/22 (j)(k) | | | 44,328,000 | | | | 27,372,540 | |
Plains All American Pipeline, L.P. / PAA Finance Corp.
3.65%, due 6/1/22 | | | 13,175,000 | | | | 13,498,219 | |
| | | | |
| 20 | | MainStay MacKay High Yield Corporate Bond Fund | | The notes to the financial statements are an integral part of,
and should be read in conjunction with, the financial statements. |
| | | | | | | | |
| | | Principal
Amount | | | Value | |
| Corporate Bonds (continued) | |
Pipelines (continued) | |
Rockies Express Pipeline LLC (b) | | | | | | | | |
3.60%, due 5/15/25 | | $ | 7,000,000 | | | $ | 6,982,500 | |
4.80%, due 5/15/30 | | | 15,220,000 | | | | 14,310,605 | |
Ruby Pipeline LLC
7.75%, due 4/1/22 (b) | | | 42,062,136 | | | | 36,108,057 | |
Tallgrass Energy Partners, L.P. / Tallgrass Energy Finance Corp. (b) | | | | | | | | |
5.50%, due 9/15/24 | | | 26,235,000 | | | | 25,211,310 | |
6.00%, due 3/1/27 | | | 19,000,000 | | | | 17,955,000 | |
7.50%, due 10/1/25 | | | 8,500,000 | | | | 8,585,000 | |
Targa Resources Partners, L.P. / Targa Resources Partners Finance Corp. | | | | | | | | |
5.00%, due 1/15/28 | | | 6,320,000 | | | | 6,241,000 | |
5.875%, due 4/15/26 | | | 7,590,000 | | | | 7,741,800 | |
6.50%, due 7/15/27 | | | 18,950,000 | | | | 19,850,125 | |
TransMontaigne Partners, L.P. / TLP Finance Corp.
6.125%, due 2/15/26 | | | 19,738,000 | | | | 20,176,381 | |
Western Midstream Operating, L.P. | | | | | | | | |
3.95%, due 6/1/25 | | | 3,715,000 | | | | 3,473,525 | |
4.10%, due 2/1/25 | | | 33,100,000 | | | | 31,184,172 | |
4.65%, due 7/1/26 | | | 5,000,000 | | | | 4,800,000 | |
4.75%, due 8/15/28 | | | 12,000,000 | | | | 11,220,000 | |
5.30%, due 3/1/48 | | | 7,500,000 | | | | 6,037,500 | |
6.25%, due 2/1/50 | | | 3,000,000 | | | | 2,755,650 | |
| | | | | | | | |
| | | | | | | 554,611,605 | |
| | | | | | | | |
Real Estate 0.9% | |
CBRE Services, Inc.
5.25%, due 3/15/25 | | | 2,905,000 | | | | 3,367,751 | |
Howard Hughes Corp.
5.375%, due 3/15/25 (b) | | | 23,000,000 | | | | 23,028,750 | |
Kennedy-Wilson, Inc.
5.875%, due 4/1/24 | | | 18,100,000 | | | | 17,466,500 | |
Newmark Group, Inc.
6.125%, due 11/15/23 | | | 43,914,000 | | | | 46,429,070 | |
Realogy Group LLC / Realogy Co-Issuer Corp.
9.375%, due 4/1/27 (b) | | | 16,000,000 | | | | 16,943,200 | |
| | | | | | | | |
| | | | | | | 107,235,271 | |
| | | | | | | | |
Real Estate Investment Trusts 3.7% | |
Crown Castle International Corp.
5.25%, due 1/15/23 | | | 25,000,000 | | | | 27,426,613 | |
CTR Partnership, L.P. / CareTrust Capital Corp.
5.25%, due 6/1/25 | | | 6,575,000 | | | | 6,772,250 | |
Diversified Healthcare Trust
9.75%, due 6/15/25 | | | 14,800,000 | | | | 16,280,000 | |
Equinix, Inc.
5.375%, due 5/15/27 | | | 55,635,000 | | | | 60,651,290 | |
| | | | | | | | |
| | | Principal
Amount | | | Value | |
Real Estate Investment Trusts (continued) | |
GLP Capital, L.P. / GLP Financing II, Inc. | | | | | | | | |
4.00%, due 1/15/31 | | $ | 3,400,000 | | | $ | 3,554,904 | |
5.25%, due 6/1/25 | | | 10,000,000 | | | | 10,924,800 | |
5.30%, due 1/15/29 | | | 14,080,000 | | | | 15,720,883 | |
5.375%, due 11/1/23 | | | 6,000,000 | | | | 6,420,900 | |
5.375%, due 4/15/26 | | | 5,620,000 | | | | 6,241,797 | |
5.75%, due 6/1/28 | | | 7,700,000 | | | | 8,758,288 | |
Host Hotels & Resorts, L.P.
3.50%, due 9/15/30 | | | 12,000,000 | | | | 11,459,943 | |
Ladder Capital Finance Holdings LLLP / Ladder Capital Finance Corp. (b) | | | | | | | | |
5.25%, due 3/15/22 | | | 5,000,000 | | | | 4,859,400 | |
5.875%, due 8/1/21 | | | 19,934,000 | | | | 19,859,247 | |
MGM Growth Properties Operating Partnership, L.P. / MGP Finance Co-Issuer, Inc. | | | | | | | | |
4.625%, due 6/15/25 (b) | | | 21,650,000 | | | | 22,049,659 | |
5.625%, due 5/1/24 | | | 63,960,000 | | | | 67,330,692 | |
5.75%, due 2/1/27 | | | 25,800,000 | | | | 27,841,683 | |
MPT Operating Partnership, L.P. / MPT Finance Corp. | | | | | | | | |
4.625%, due 8/1/29 | | | 11,640,000 | | | | 12,187,080 | |
5.00%, due 10/15/27 | | | 27,425,000 | | | | 28,698,891 | |
5.25%, due 8/1/26 | | | 5,500,000 | | | | 5,706,250 | |
Park Intermediate Holdings LLC / PK Domestic Property LLC / PK Finance Co-Issuer
5.875%, due 10/1/28 (b) | | | 11,500,000 | | | | 11,270,000 | |
RHP Hotel Properties, L.P. / RHP Finance Corp.
4.75%, due 10/15/27 | | | 26,050,000 | | | | 24,073,326 | |
SBA Communications Corp.
3.875%, due 2/15/27 (b) | | | 12,400,000 | | | | 12,601,500 | |
VICI Properties, L.P. / VICI Note Co., Inc. (b) | | | | | | | | |
3.50%, due 2/15/25 | | | 1,840,000 | | | | 1,846,808 | |
3.75%, due 2/15/27 | | | 16,637,000 | | | | 16,678,593 | |
4.125%, due 8/15/30 | | | 9,580,000 | | | | 9,699,750 | |
| | | | | | | | |
| | | | | | | 438,914,547 | |
| | | | | | | | |
Retail 2.7% | |
1011778 B.C. ULC / New Red Finance, Inc.
4.00%, due 10/15/30 (b) | | | 33,000,000 | | | | 32,793,750 | |
Asbury Automotive Group, Inc. (b) | | | | | | | | |
4.50%, due 3/1/28 | | | 22,302,000 | | | | 22,692,285 | |
4.75%, due 3/1/30 | | | 13,400,000 | �� | | | 13,835,500 | |
Beacon Roofing Supply, Inc.
4.875%, due 11/1/25 (b) | | | 16,935,000 | | | | 16,613,235 | |
Dave & Buster’s, Inc.
7.625%, due 11/1/25 (b) | | | 5,000,000 | | | | 4,906,250 | |
| | | | | | |
The notes to the financial statements are an integral part of,
and should be read in conjunction with, the financial statements. | | | | | 21 | |
Portfolio of Investments October 31, 2020 (continued)
| | | | | | | | |
| | | Principal
Amount | | | Value | |
| Corporate Bonds (continued) | |
Retail (continued) | |
Group 1 Automotive, Inc.
4.00%, due 8/15/28 (b) | | $ | 7,000,000 | | | $ | 7,008,750 | |
Ken Garff Automotive LLC
4.875%, due 9/15/28 (b) | | | 23,200,000 | | | | 22,987,140 | |
KFC Holding Co. / Pizza Hut Holdings LLC / Taco Bell of America LLC (b) | | | | | | | | |
4.75%, due 6/1/27 | | | 12,287,000 | | | | 12,715,386 | |
5.25%, due 6/1/26 | | | 34,750,000 | | | | 35,908,044 | |
Kohl’s Corp.
9.50%, due 5/15/25 | | | 14,630,000 | | | | 17,505,754 | |
L Brands, Inc.
6.875%, due 7/1/25 (b) | | | 3,000,000 | | | | 3,215,940 | |
Murphy Oil USA, Inc. | | | | | | | | |
4.75%, due 9/15/29 | | | 5,000,000 | | | | 5,237,500 | |
5.625%, due 5/1/27 | | | 10,417,000 | | | | 10,937,850 | |
Penske Automotive Group, Inc. | | | | | | | | |
3.50%, due 9/1/25 | | | 15,900,000 | | | | 15,939,750 | |
5.375%, due 12/1/24 | | | 16,840,000 | | | | 17,197,850 | |
5.50%, due 5/15/26 | | | 15,855,000 | | | | 16,360,378 | |
TPro Acquisition Corp.
11.00%, due 10/15/24 (b) | | | 3,500,000 | | | | 3,517,500 | |
Yum! Brands, Inc. | | | | | | | | |
3.625%, due 3/15/31 | | | 28,900,000 | | | | 28,358,125 | |
4.75%, due 1/15/30 (b) | | | 31,090,000 | | | | 33,421,750 | |
7.75%, due 4/1/25 (b) | | | 4,500,000 | | | | 4,943,025 | |
| | | | | | | | |
| | | | | | | 326,095,762 | |
| | | | | | | | |
Semiconductors 0.1% | |
Microchip Technology, Inc.
4.25%, due 9/1/25 (b) | | | 8,000,000 | | | | 8,305,352 | |
| | | | | | | | |
|
Software 3.7% | |
ACI Worldwide, Inc.
5.75%, due 8/15/26 (b) | | | 7,500,000 | | | | 7,912,500 | |
Ascend Learning LLC
6.875%, due 8/1/25 (b) | | | 27,000,000 | | | | 27,438,750 | |
Black Knight InfoServ, LLC
3.625%, due 9/1/28 (b) | | | 2,000,000 | | | | 2,025,000 | |
BY Crown Parent LLC
7.375%, due 10/15/24 (b) | | | 30,140,000 | | | | 30,441,400 | |
BY Crown Parent LLC / BY Bond Finance, Inc.
4.25%, due 1/31/26 (b) | | | 13,200,000 | | | | 13,365,000 | |
Camelot Finance S.A.
4.50%, due 11/1/26 (b) | | | 15,990,000 | | | | 16,629,600 | |
CDK Global, Inc. | | | | | | | | |
4.875%, due 6/1/27 | | | 6,750,000 | | | | 6,995,194 | |
5.25%, due 5/15/29 (b) | | | 14,500,000 | | | | 15,554,150 | |
5.875%, due 6/15/26 | | | 39,397,000 | | | | 41,022,126 | |
| | | | | | | | |
| | | Principal
Amount | | | Value | |
Software (continued) | |
Change Healthcare Holdings LLC / Change Healthcare Finance, Inc.
5.75%, due 3/1/25 (b) | | $ | 13,500,000 | | | $ | 13,494,195 | |
Fair Isaac Corp. (b) | | | | | | | | |
4.00%, due 6/15/28 | | | 1,500,000 | | | | 1,550,625 | |
5.25%, due 5/15/26 | | | 12,250,000 | | | | 13,597,500 | |
Logan Merger Sub, Inc
5.50%, due 9/1/27 (b) | | | 7,500,000 | | | | 7,603,125 | |
MSCI, Inc. (b) | | | | | | | | |
3.625%, due 9/1/30 | | | 7,125,000 | | | | 7,320,938 | |
3.875%, due 2/15/31 | | | 40,360,000 | | | | 42,176,200 | |
4.00%, due 11/15/29 | | | 31,330,000 | | | | 32,697,868 | |
4.75%, due 8/1/26 | | | 13,290,000 | | | | 13,804,988 | |
5.375%, due 5/15/27 | | | 22,685,000 | | | | 24,216,237 | |
Open Text Corp. (b) | | | | | | | | |
3.875%, due 2/15/28 | | | 17,385,000 | | | | 17,659,335 | |
5.875%, due 6/1/26 | | | 30,090,000 | | | | 31,293,600 | |
Open Text Holdings, Inc.
4.125%, due 2/15/30 (b) | | | 22,327,000 | | | | 23,164,262 | |
PTC, Inc. (b) | | | | | | | | |
3.625%, due 2/15/25 | | | 11,000,000 | | | | 11,199,375 | |
4.00%, due 2/15/28 | | | 22,759,000 | | | | 23,527,116 | |
SS&C Technologies, Inc.
5.50%, due 9/30/27 (b) | | | 22,095,000 | | | | 23,483,229 | |
| | | | | | | | |
| | | | | | | 448,172,313 | |
| | | | | | | | |
Telecommunications 5.9% | |
Altice France S.A.
7.375%, due 5/1/26 (b) | | | 28,300,000 | | | | 29,536,710 | |
CenturyLink, Inc. | | | | | | | | |
5.80%, due 3/15/22 | | | 28,940,000 | | | | 30,097,600 | |
6.45%, due 6/15/21 | | | 10,000,000 | | | | 10,212,500 | |
CommScope Technologies LLC
6.00%, due 6/15/25 (b) | | | 4,779,000 | | | | 4,737,805 | |
CommScope, Inc. (b) | | | | | | | | |
7.125%, due 7/1/28 | | | 7,250,000 | | | | 7,290,238 | |
8.25%, due 3/1/27 | | | 27,815,000 | | | | 28,788,386 | |
Connect Finco SARL / Connect U.S. Finco LLC
6.75%, due 10/1/26 (b) | | | 54,590,000 | | | | 54,983,048 | |
Hughes Satellite Systems Corp. | | | | | | | | |
5.25%, due 8/1/26 | | | 18,000,000 | | | | 19,291,950 | |
6.625%, due 8/1/26 | | | 19,275,000 | | | | 20,877,234 | |
7.625%, due 6/15/21 | | | 18,000,000 | | | | 18,495,000 | |
Level 3 Financing, Inc.
5.375%, due 5/1/25 | | | 31,477,000 | | | | 32,373,780 | |
Qualitytech, L.P. / QTS Finance Corp. (b) | | | | | | | | |
3.875%, due 10/1/28 | | | 14,500,000 | | | | 14,529,435 | |
4.75%, due 11/15/25 | | | 26,321,000 | | | | 27,271,188 | |
Sprint Capital Corp.
6.875%, due 11/15/28 | | | 104,520,000 | | | | 132,217,800 | |
| | | | |
| 22 | | MainStay MacKay High Yield Corporate Bond Fund | | The notes to the financial statements are an integral part of,
and should be read in conjunction with, the financial statements. |
| | | | | | | | |
| | | Principal
Amount | | | Value | |
| Corporate Bonds (continued) | |
Telecommunications (continued) | |
Sprint Corp. | | | | | | | | |
7.25%, due 9/15/21 | | $ | 4,185,000 | | | $ | 4,359,012 | |
7.875%, due 9/15/23 | | | 46,900,000 | | | | 53,466,000 | |
Switch, Ltd.
3.75%, due 9/15/28 (b) | | | 18,000,000 | | | | 18,022,500 | |
T-Mobile USA, Inc. | | | | | | | | |
4.00%, due 4/15/22 | | | 3,000,000 | | | | 3,094,455 | |
4.50%, due 4/15/50 (b) | | | 30,000,000 | | | | 34,885,050 | |
4.75%, due 2/1/28 | | | 31,435,000 | | | | 33,679,358 | |
5.125%, due 4/15/25 | | | 28,045,000 | | | | 28,746,125 | |
5.375%, due 4/15/27 | | | 33,000,000 | | | | 35,227,500 | |
6.00%, due 4/15/24 | | | 15,315,000 | | | | 15,586,076 | |
6.50%, due 1/15/26 | | | 46,900,000 | | | | 48,869,800 | |
| | | | | | | | |
| | | | | | | 706,638,550 | |
| | | | | | | | |
Textiles 0.2% | |
Eagle Intermediate Global Holding B.V. / Ruyi U.S. Finance LLC
7.50%, due 5/1/25 (b) | | | 33,344,000 | | | | 23,340,800 | |
| | | | | | | | |
|
Toys, Games & Hobbies 0.8% | |
Mattel, Inc. (b) | | | | | | | | |
5.875%, due 12/15/27 | | | 19,775,000 | | | | 21,489,492 | |
6.75%, due 12/31/25 | | | 64,645,000 | | | | 67,990,379 | |
| | | | | | | | |
| | | | | | | 89,479,871 | |
| | | | | | | | |
Transportation 0.4% | |
Teekay Corp.
9.25%, due 11/15/22 (b) | | | 6,000,000 | | | | 5,762,400 | |
Watco Cos. LLC / Watco Finance Corp.
6.50%, due 6/15/27 (b) | | | 38,100,000 | | | | 39,528,750 | |
| | | | | | | | |
| | | | | | | 45,291,150 | |
| | | | | | | | |
Trucking & Leasing 0.1% | |
Fortress Transportation & Infrastructure Investors LLC
6.75%, due 3/15/22 (b) | | | 9,000,000 | | | | 8,932,163 | |
| | | | | | | | |
Total Corporate Bonds
(Cost $10,173,820,490) | | | | | | | 10,365,235,208 | |
| | | | | | | | |
|
| Loan Assignments 2.5% | |
Automobile 0.1% | |
Dealer Tire LLC
2020 Term Loan B
4.398% (1 Month LIBOR + 4.25%), due 12/12/25 (l) | | | 17,353,750 | | | | 16,854,830 | |
| | | | | | | | |
|
Beverage, Food & Tobacco 0.2% | |
United Natural Foods, Inc.
Term Loan B
4.398% (1 Month LIBOR + 4.25%), due 10/22/25 (l) | | | 18,577,964 | | | | 18,270,275 | |
| | | | | | | | |
| | | | | | | | |
| | | Principal
Amount | | | Value | |
Chemicals, Plastics & Rubber 0.1% | |
SCIH Salt Holdings, Inc.
Term Loan B
5.50% (3 Month LIBOR + 4.50%), due 3/16/27 (l) | | $ | 12,967,500 | | | $ | 12,870,244 | |
| | | | | | | | |
|
Containers, Packaging & Glass 0.1% | |
Neenah Foundry Co.
2017 Term Loan
10.00% (2 Month LIBOR + 9.00%), due 12/13/22 (e)(l) | | | 8,910,435 | | | | 7,573,870 | |
| | | | | | | | |
|
Finance 0.1% | |
Jefferies Finance LLC
2019 Term Loan
3.188% (1 Month LIBOR + 3.00%), due 6/3/26 (l) | | | 9,875,000 | | | | 9,570,554 | |
| | | | | | | | |
|
Healthcare, Education & Childcare 0.2% | |
Ascend Learning LLC
2017 Term Loan B
4.00% (1 Month LIBOR + 3.00%), due 7/12/24 (l) | | | 5,911,135 | | | | 5,751,044 | |
Jaguar Holding Co. II
2018 Term Loan
3.50% (1 Month LIBOR + 2.50%), due 8/18/22 (l) | | | 14,738,180 | | | | 14,614,247 | |
RegionalCare Hospital Partners Holdings, Inc.
2018 Term Loan B
3.898% (1 Month LIBOR + 3.75%), due 11/16/25 (l) | | | 10,000,000 | | | | 9,691,670 | |
| | | | | | | | |
| | | | | | | 30,056,961 | |
| | | | | | | | |
Insurance 0.1% | |
USI, Inc.
2017 Repriced Term Loan
3.22% (3 Month LIBOR + 3.00%), due 5/16/24 (l) | | | 14,558,733 | | | | 14,009,752 | |
| | | | | | | | |
|
Leisure, Amusement, Motion Pictures & Entertainment 0.0%‡ | |
NASCAR Holdings, Inc.
Term Loan B
2.902% (1 Month LIBOR + 2.75%), due 10/19/26 (l) | | | 5,589,149 | | | | 5,432,452 | |
| | | | | | | | |
|
Manufacturing 0.1% | |
Adient U.S. LLC
Term Loan B
4.422%-4.492% (1 Month LIBOR + 4.25%, 3 Month LIBOR + 4.25%), due 5/6/24 (l) | | | 6,658,175 | | | | 6,549,980 | |
| | | | | | | | |
| | | | | | |
The notes to the financial statements are an integral part of,
and should be read in conjunction with, the financial statements. | | | | | 23 | |
Portfolio of Investments October 31, 2020 (continued)
| | | | | | | | |
| | | Principal
Amount | | | Value | |
| Loan Assignments (continued) | |
Media 0.1% | |
Allen Media LLC
2020 Term Loan B
5.72% (3 Month LIBOR + 5.50%), due 2/10/27 (l) | | $ | 9,948,423 | | | $ | 9,616,812 | |
| | | | | | | | |
|
Oil & Gas 0.2% | |
Ascent Resources—Utica 2020 Fixed 2nd Lien Term Loan
9.00%, due 11/1/25 | | | 9,011,000 | | | | 9,461,550 | |
PetroQuest Energy LLC
2020 Term Loan
8.50% (1 Month LIBOR + 7.50%), due 11/8/23 (d)(f)(l) | | | 1,812,750 | | | | 1,812,750 | |
PetroQuest Energy, Inc.
Term Loan Note
10.013%, due 11/8/23 (d)(e)(f) | | | 17,525,232 | | | | 14,370,690 | |
| | | | | | | | |
| | | | | | | 25,644,990 | |
| | | | | | | | |
Retail Store 0.6% | |
Bass Pro Group LLC
Term Loan B
5.75% (3 Month LIBOR + 5.00%), due 9/25/24 (l) | | | 75,667,149 | | | | 75,236,300 | |
| | | | | | | | |
|
Software 0.1% | |
By Crown Parent LLC
Term Loan B1
4.00% (1 Month LIBOR + 3.00%), due 1/31/26 (l) | | | 9,880,790 | | | | 9,633,770 | |
| | | | | | | | |
|
Utilities 0.5% | |
Hamilton Projects Acquiror LLC
Term Loan B
5.75% (3 Month LIBOR + 4.75%), due 6/17/27 (l) | | | 5,985,000 | | | | 5,960,060 | |
Pacific Gas & Electric Co.
2020 Term Loan
5.50% (3 Month LIBOR + 4.50%), due 6/23/25 (l) | | | 53,865,000 | | | | 53,427,347 | |
| | | | | | | | |
| | | | | | | 59,387,407 | |
| | | | | | | | |
Total Loan Assignments
(Cost $303,939,171) | | | | | | | 300,708,197 | |
| | | | | | | | |
Total Long-Term Bonds
(Cost $10,597,381,846) | | | | | | | 10,773,189,912 | |
| | | | | | | | |
| | | | | | | | |
| | |
| | | Shares | | | Value | |
| Common Stocks 0.9% | |
Auto Parts & Equipment 0.1% | |
ATD New Holdings, Inc. (f)(m) | | | 142,545 | | | $ | 1,995,630 | |
Energy Technology (d)(e)(f) | | | 16,724 | | | | 9,316,940 | |
| | | | | | | | |
| | | | | | | 11,312,570 | |
| | | | | | | | |
Commercial Services 0.0%‡ | |
Carlson Travel, Inc. (d)(e)(i)(m) | | | 15,152 | | | | 841,845 | |
| | | | | | | | |
|
Electric Utilities 0.0%‡ | |
Keycon Power Holdings LLC (d)(e)(f)(m) | | | 38,680 | | | | 387 | |
| | | | | | | | |
|
Independent Power & Renewable Electricity Producers 0.5% | |
GenOn Energy, Inc. (d)(e)(i)(m) | | | 386,241 | | | | 61,798,560 | |
| | | | | | | | |
|
Media 0.0%‡ | |
ION Media Networks, Inc. (d)(e)(f)(i)(m) | | | 2,287 | | | | 1,811,304 | |
| | | | | | | | |
|
Metals & Mining 0.1% | |
Neenah Enterprises, Inc. (d)(e)(f)(m) | | | 720,961 | | | | 6,265,151 | |
| | | | | | | | |
|
Oil, Gas & Consumable Fuels 0.2% | |
California Resources Corp. (d)(h)(i)(m) | | | 180,041 | | | | 1,149,014 | |
California Resources Corp. (m) | | | 126,222 | | | | 1,691,375 | |
Talos Energy, Inc. (m) | | | 2,074,193 | | | | 13,648,190 | |
Titan Energy LLC (f)(m) | | | 91,174 | | | | 3,651 | |
Whiting Petroleum Corp. (m) | | | 433,615 | | | | 6,330,779 | |
| | | | | | | | |
| | | | | | | 22,823,009 | |
| | | | | | | | |
Oil & Gas 0.0%‡ | |
PetroQuest Energy, Inc. (d)(e)(f) | | | 2,314,883 | | | | 0 | |
| | | | | | | | |
|
Software 0.0%‡ | |
ASG Corp. (d)(e)(f)(m) | | | 12,502 | | | | 0 | |
| | | | | | | | |
Total Common Stocks
(Cost $177,263,605) | | | | | | | 104,852,826 | |
| | | | | | | | |
|
| Preferred Stock 0.3% | |
Auto Parts & Equipment 0.3% | |
Energy Technology (d)(e)(f) | | | 37,258 | | | | 33,565,732 | |
| | | | | | | | |
Total Convertible Preferred Stock
(Cost $35,514,837) | | | | | | | 33,565,732 | |
| | | | | | | | |
|
| Exchange-Traded Funds 0.6% | |
iShares Gold Trust (m) | | | 1,859,000 | | | | 33,257,510 | |
SPDR Gold Shares (m) | | | 177,786 | | | | 31,325,893 | |
Vanguard Value ETF | | | 36,762 | | | | 3,772,149 | |
| | | | | | | | |
Total Exchange-Traded Funds
(Cost $51,391,364) | | | | | | | 68,355,552 | |
| | | | | | | | |
| | | | |
| 24 | | MainStay MacKay High Yield Corporate Bond Fund | | The notes to the financial statements are an integral part of,
and should be read in conjunction with, the financial statements. |
| | | | | | | | |
| | | Number of
Warrants | | | Value | |
| Warrants 0.0%‡ | |
Oil, Gas & Consumable Fuels 0.0%‡ | |
California Resources Corp. Expires 10/27/24 | | | 38,941 | | | $ | 15,576 | |
| | | | | | | | |
Total Warrants
(Cost $15,576) | | | | | | | 15,576 | |
| | | | | | | | |
| | |
| | | | | | | | |
| | |
| | | Shares | | | | |
| Short-Term Investments 7.1% | |
Unaffiliated Investment Company 7.1% | |
State Street Institutional U.S. Government Money Market Fund, Premier Class, 0.03% (n) | | | 853,877,172 | | | | 853,877,172 | |
State Street Navigator Securities Lending Government Money Market Portfolio, 0.09% (n)(o) | | | 2,741,715 | | | | 2,741,715 | |
| | | | | | | | |
Total Short-Term Investments
(Cost $856,618,887) | | | | | | | 856,618,887 | |
| | | | | | | | |
Total Investments
(Cost $11,718,186,115) | | | 98.9 | % | | | 11,836,598,485 | |
Other Assets, Less Liabilities | | | 1.1 | | | | 127,384,452 | |
Net Assets | | | 100.0 | % | | $ | 11,963,982,937 | |
| † | Percentages indicated are based on Fund net assets. |
| ‡ | Less than one-tenth of a percent. |
| (a) | PIK ("Payment-in-Kind")—issuer may pay interest or dividends with additional securities and/or in cash. |
| (b) | May be sold to institutional investors only under Rule 144A or securities offered pursuant to Section 4(a)(2) of the Securities Act of 1933, as amended. |
| (c) | All or a portion of this security was held on loan. As of October 31, 2020, the aggregate market value of securities on loan was $2,697,938. The Fund received cash collateral with a value of $2,741,715 (See Note 2(H)). |
| (d) | Fair valued security—Represents fair value as measured in good faith under procedures approved by the Board of Trustees. As of October 31, 2020, the total market value of fair valued securities was $162,949,763, which represented 1.4% of the Fund’s net assets. |
| (e) | Security in which significant unobservable inputs (Level 3) were used in determining fair value. |
| (f) | Illiquid security—As of October 31, 2020, the total market value of these securities deemed illiquid under procedures approved by the Board of Trustees was $109,595,231, which represented 0.9% of the Fund’s net assets. (Unaudited) |
| (g) | Issue in non-accrual status. |
| (i) | Restricted security. (See Note 6) |
| (j) | Fixed to floating rate—Rate shown was the rate in effect as of October 31, 2020. |
| (k) | Securities are perpetual and, thus, do not have a predetermined maturity date. The date shown, if applicable, reflects the next call date. |
| (l) | Floating rate—Rate shown was the rate in effect as of October 31, 2020. |
| (m) | Non-income producing security. |
| (n) | Current yield as of October 31, 2020. |
| (o) | Represents a security purchased with cash collateral received for securities on loan. |
The following abbreviations are used in the preceding pages:
ETF—Exchange-Traded Fund
LIBOR—London Interbank Offered Rate
SPDR—Standard & Poor’s Depositary Receipt
| | | | | | |
The notes to the financial statements are an integral part of,
and should be read in conjunction with, the financial statements. | | | | | 25 | |
Portfolio of Investments October 31, 2020 (continued)
The following is a summary of the fair valuations according to the inputs used as of October 31, 2020, for valuing the Fund’s assets:
| | | | | | | | | | | | | | | | |
Description | | Quoted
Prices in
Active
Markets for
Identical
Assets
(Level 1) | | | Significant
Other
Observable
Inputs (Level 2) | | | Significant
Unobservable
Inputs
(Level 3) | | | Total | |
| | | | |
Asset Valuation Inputs | | | | | | | | | | | | | | | | |
| Investments in Securities (a) | | | | | | | | | | | | | | | | |
| Long-Term Bonds | | | | | | | | | | | | | | | | |
Convertible Bonds | | $ | — | | | $ | 107,246,507 | | | $ | — | | | $ | 107,246,507 | |
Corporate Bonds (b) | | | — | | | | 10,333,217,818 | | | | 32,017,390 | | | | 10,365,235,208 | |
Loan Assignments (c) | | | — | | | | 278,763,637 | | | | 21,944,560 | | | | 300,708,197 | |
| | | | | | | | | | | | | | | | |
| Total Long-Term Bonds | | | — | | | | 10,719,227,962 | | | | 53,961,950 | | | | 10,773,189,912 | |
| | | | | | | | | | | | | | | | |
| Common Stocks | | | 21,673,995 | | | | 3,144,644 | (d) | | | 80,034,187 | (e) | | | 104,852,826 | |
| Preferred Stock (f) | | | — | | | | — | | | | 33,565,732 | | | | 33,565,732 | |
| Exchange-Traded Funds | | | 68,355,552 | | | | — | | | | — | | | | 68,355,552 | |
| Warrants | | | 15,576 | | | | — | | | | — | | | | 15,576 | |
| Short-Term Investments | | | | | | | | | | | | | | | | |
Unaffiliated Investment Company | | | 856,618,887 | | | | — | | | | — | | | | 856,618,887 | |
| | | | | | | | | | | | | | | | |
| Total Investments in Securities | | $ | 946,664,010 | | | $ | 10,722,372,606 | | | $ | 167,561,869 | | | $ | 11,836,598,485 | |
| | | | | | | | | | | | | | | | |
| (a) | For a complete listing of investments and their industries, see the Portfolio of Investments. |
| (b) | The Level 3 securities valued at $11,053,083, $20,962,000, and $2,307 are held in Auto Parts & Equipment, Media, and Oil & Gas, respectively, within the Corporate Bonds section of the Portfolio of Investments. |
| (c) | The Level 3 securities valued at $7,573,870 and $14,370,690 are held in Oil & Gas and Containers, Packaging & Glass, respectively, within the Loan Assignments section of the Portfolio of Investments. |
| (d) | The Level 2 securities valued at $1,995,630 and $1,149,014 are held in Auto Parts & Equipment and Oil, Gas & Consumable Fuels, respectively, within the Common Stocks section of the Portfolio of Investments. |
| (e) | The Level 3 securities valued at $9,316,940, $841,845, $387, $61,798,560, $1,811,304, $6,265,151 and $0 are held in Auto Parts & Equipment, Commercial Services, Electric Utilities, Independent Power & Renewable Electricity Producers, Media, Metals & Mining and Software, respectively, within the Common Stocks section of the Portfolio of Investments. |
| (f) | The Level 3 security valued at $33,565,732 is held in Auto Parts & Equipment within the Preferred Stock section of the Portfolio of Investments. |
The following is a reconciliation of investments in which significant unobservable inputs (Level 3) were used in determining value:
| | | | | | | | | | | | | | | | | | | | | | | | | | | | | | | | | | | | | | | | |
Investments in
Securities | | Balance
as of
October 31,
2019 | | | Accrued
Discounts
(Premiums) | | | Realized
Gain
(Loss) | | | Change in
Unrealized
Appreciation
(Depreciation) | | | Purchases | | | Sales | | | Transfers
in to
Level 3 | | | Transfers
out of
Level 3 | | | Balance
as of
October 31,
2020 | | | Change in
Unrealized
Appreciation
(Depreciation)
from
Investments
Still Held as
of October 31,
2020 | |
| Long-Term Bonds | | | | | | | | | | | | | | | | | | | | | | | | | | | | | | | | | | | | | | | | |
Convertible Bonds | | $ | 27,739,709 | | | $ | 334,934 | | | $ | 54 | | | $ | 2,626,831 | | | $ | 2,577,296 | | | $ | (33,278,824 | ) | | $ | — | | | $ | — | | | $ | — | | | $ | — | |
Corporate Bonds | | | 156,761,758 | | | | (3,199,262 | ) | | | (91,462,830 | ) | | | (6,756,879 | ) | | | 18,591,303 | (a) | | | (41,916,700 | ) | | | — | | | | — | | | | 32,017,390 | | | | (4,700,284 | ) |
Loan Assignments | | | 16,636,467 | | | | 18,556 | | | | 2,683 | | | | (4,230,668 | ) | | | 924,404 | | | | (514,481 | ) | | | 9,107,599 | | | | — | | | | 21,944,560 | | | | (4,230,668 | ) |
| Common��Stocks | | | 21,695,317 | | | | — | | | | (93,668,619 | ) | | | 15,950,187 | | | | 42,505,939 | | | | — | | | | 97,542,623 | | | | (3,991,260 | ) | | | 80,034,187 | | | | (37,182,346 | ) |
| Convertible Preferred Stock | | | — | | | | — | | | | — | | | | (1,949,105 | ) | | | 35,514,837 | | | | — | | | | — | | | | — | | | | 33,565,732 | | | | (1,949,105 | ) |
| | | | | | | | | | | | | | | | | | | | | | | | | | | | | | | | | | | | | | | | |
| Total | | $ | 222,833,251 | | | $ | (2,845,772 | ) | | $ | (185,128,712 | ) | | $ | 5,640,366 | | | $ | 100,113,779 | | | $ | (75,710,005 | ) | | $ | 106,650,222 | | | $ | (3,991,260 | ) | | $ | 167,561,869 | | | $ | (48,062,403 | ) |
| | | | | | | | | | | | | | | | | | | | | | | | | | | | | | | | | | | | | | | | |
| (a) | Purchases include PIK securities. |
As of October 31, 2020, a Common Stock with a market value of $97,524,623 transferred from Level 2 to Level 3 as the the fair value obtained for this Common Stock utilized significant unobservable inputs. As of October 31, 2019, the fair value obtained for this Common Stock utilized significant other observable inputs.
As of October 31, 2020, a Common Stock with a market value of $3,991,260 transferred from Level 3 to Level 2 as the the fair value obtained for this Common Stock utilized significant other observable inputs. As of October 31, 2019, the fair value obtained for this Common Stock utilized significant unobservable inputs.
As of October 31, 2020, a Loan Assignment with a market value of $9,107,599 transferred from Level 2 to Level 3 as the the fair value obtained by an independent pricing service, utilized significant unobservable inputs. As of October 31, 2019, the fair value obtained for this Loan Assignment, as determined by an independent pricing service, utilized significant other observable inputs.
| | | | |
| 26 | | MainStay MacKay High Yield Corporate Bond Fund | | The notes to the financial statements are an integral part of,
and should be read in conjunction with, the financial statements. |
Statement of Assets and Liabilities as of October 31, 2020
| | | | |
| Assets | | | | |
Investment in securities, at value
(identified cost $11,718,186,115) including securities on loan of $2,697,938 | | $ | 11,836,598,485 | |
Receivables: | | | | |
Interest | | | 174,990,671 | |
Fund shares sold | | | 23,733,723 | |
Investment securities sold | | | 2,105,880 | |
Securities lending | | | 672 | |
Other assets | | | 242,366 | |
| | | | |
Total assets | | | 12,037,671,797 | |
| | | | |
| |
| Liabilities | | | | |
Due to custodian | | | 1,622,069 | |
Cash collateral received for securities on loan | | | 2,741,715 | |
Payables: | | | | |
Investment securities purchased | | | 29,975,668 | |
Fund shares redeemed | | | 25,999,574 | |
Manager (See Note 3) | | | 5,460,264 | |
Transfer agent (See Note 3) | | | 1,906,600 | |
NYLIFE Distributors (See Note 3) | | | 1,079,934 | |
Shareholder communication | | | 723,965 | |
Professional fees | | | 179,482 | |
Custodian | | | 16,205 | |
Trustees | | | 15,402 | |
Accrued expenses | | | 23,445 | |
Dividend payable | | | 3,944,537 | |
| | | | |
Total liabilities | | | 73,688,860 | |
| | | | |
Net assets | | $ | 11,963,982,937 | |
| | | | |
| |
| Composition of Net Assets | | | | |
Shares of beneficial interest outstanding (par value of $.01 per share) unlimited number of shares authorized | | $ | 22,132,956 | |
Additional paid-in capital | | | 12,319,297,926 | |
| | | | |
| | | 12,341,430,882 | |
Total distributable earnings (loss) | | | (377,447,945 | ) |
| | | | |
Net assets | | $ | 11,963,982,937 | |
| | | | |
| | | | |
Class A | | | | |
Net assets applicable to outstanding shares | | $ | 3,525,781,777 | |
| | | | |
Shares of beneficial interest outstanding | | | 651,814,244 | |
| | | | |
Net asset value per share outstanding | | $ | 5.41 | |
Maximum sales charge (4.50% of offering price) | | | 0.25 | |
| | | | |
Maximum offering price per share outstanding | | $ | 5.66 | |
| | | | |
Investor Class | | | | |
Net assets applicable to outstanding shares | | $ | 149,726,201 | |
| | | | |
Shares of beneficial interest outstanding | | | 27,472,732 | |
| | | | |
Net asset value per share outstanding | | $ | 5.45 | |
Maximum sales charge (4.00% of offering price) | | | 0.23 | |
| | | | |
Maximum offering price per share outstanding | | $ | 5.68 | |
| | | | |
Class B | | | | |
Net assets applicable to outstanding shares | | $ | 45,660,648 | |
| | | | |
Shares of beneficial interest outstanding | | | 8,479,411 | |
| | | | |
Net asset value and offering price per share outstanding | | $ | 5.38 | |
| | | | |
Class C | | | | |
Net assets applicable to outstanding shares | | $ | 297,431,457 | |
| | | | |
Shares of beneficial interest outstanding | | | 55,205,381 | |
| | | | |
Net asset value and offering price per share outstanding | | $ | 5.39 | |
| | | | |
Class I | | | | |
Net assets applicable to outstanding shares | | $ | 3,509,954,138 | |
| | | | |
Shares of beneficial interest outstanding | | | 648,705,595 | |
| | | | |
Net asset value and offering price per share outstanding | | $ | 5.41 | |
| | | | |
Class R1 | | | | |
Net assets applicable to outstanding shares | | $ | 50,698 | |
| | | | |
Shares of beneficial interest outstanding | | | 9,387 | |
| | | | |
Net asset value and offering price per share outstanding | | $ | 5.40 | |
| | | | |
Class R2 | | | | |
Net assets applicable to outstanding shares | | $ | 13,005,821 | |
| | | | |
Shares of beneficial interest outstanding | | | 2,404,060 | |
| | | | |
Net asset value and offering price per share outstanding | | $ | 5.41 | |
| | | | |
Class R3 | | | | |
Net assets applicable to outstanding shares | | $ | 1,923,823 | |
| | | | |
Shares of beneficial interest outstanding | | | 355,991 | |
| | | | |
Net asset value and offering price per share outstanding | | $ | 5.40 | |
| | | | |
Class R6 | | | | |
Net assets applicable to outstanding shares | | $ | 4,420,423,551 | |
| | | | |
Shares of beneficial interest outstanding | | | 818,844,257 | |
| | | | |
Net asset value and offering price per share outstanding | | $ | 5.40 | |
| | | | |
SIMPLE Class | | | | |
Net assets applicable to outstanding shares | | $ | 24,823 | |
| | | | |
Shares of beneficial interest outstanding | | | 4,554 | |
| | | | |
Net asset value and offering price per share outstanding | | $ | 5.45 | |
| | | | |
| | | | | | |
The notes to the financial statements are an integral part of,
and should be read in conjunction with, the financial statements. | | | | | 27 | |
Statement of Operations for the year ended October 31, 2020
| | | | |
| Investment Income (Loss) | | | | |
Income | | | | |
Interest | | $ | 622,994,466 | |
Dividends | | | 43,089,178 | |
Securities lending | | | 29,853 | |
Other | | | 284,129 | |
| | | | |
Total income | | | 666,397,626 | |
| | | | |
Expenses | | | | |
Manager (See Note 3) | | | 57,205,955 | |
Distribution/Service—Class A (See Note 3) | | | 8,387,184 | |
Distribution/Service—Investor Class (See Note 3) | | | 383,564 | |
Distribution/Service—Class B (See Note 3) | | | 537,199 | |
Distribution/Service—Class C (See Note 3) | | | 3,358,506 | |
Distribution/Service—Class R2 (See Note 3) | | | 32,669 | |
Distribution/Service—Class R3 (See Note 3) | | | 7,781 | |
Distribution/Service—SIMPLE Class (See Note 3) | | | 21 | |
Transfer agent (See Note 3) | | | 11,515,947 | |
Shareholder communication | | | 1,423,620 | |
Professional fees | | | 826,301 | |
Registration | | | 444,830 | |
Trustees | | | 250,347 | |
Custodian | | | 98,270 | |
Shareholder service (See Note 3) | | | 14,672 | |
Miscellaneous | | | 326,723 | |
| | | | |
Total expenses | | | 84,813,589 | |
| | | | |
Net investment income (loss) | | | 581,584,037 | |
| | | | |
| |
| Realized and Unrealized Gain (Loss) | | | | |
Net realized gain (loss) on investments | | | (211,397,989 | ) |
Net change in unrealized appreciation (depreciation) on investments | | | 64,514,837 | |
| | | | |
Net realized and unrealized gain (loss) | | | (146,883,152 | ) |
| | | | |
Net increase (decrease) in net assets resulting from operations | | $ | 434,700,885 | |
| | | | |
| | | | |
| 28 | | MainStay MacKay High Yield Corporate Bond Fund | | The notes to the financial statements are an integral part of,
and should be read in conjunction with, the financial statements. |
Statements of Changes in Net Assets
for the years ended October 31, 2020 and October 31, 2019
| | | | | | | | |
| | | 2020 | | | 2019 | |
| Increase (Decrease) in Net Assets | |
Operations: | | | | | | | | |
Net investment income (loss) | | $ | 581,584,037 | | | $ | 488,798,531 | |
Net realized gain (loss) | | | (211,397,989 | ) | | | (93,603,555 | ) |
Net change in unrealized appreciation (depreciation) | | | 64,514,837 | | | | 274,010,854 | |
| | | | |
Net increase (decrease) in net assets resulting from operations | | | 434,700,885 | | | | 669,205,830 | |
| | | | |
Distributions to shareholders: | | | | | | | | |
Class A | | | (177,680,636 | ) | | | (174,086,103 | ) |
Investor Class | | | (8,009,437 | ) | | | (8,349,190 | ) |
Class B | | | (2,399,380 | ) | | | (3,177,793 | ) |
Class C | | | (15,036,249 | ) | | | (19,959,506 | ) |
Class I | | | (186,258,181 | ) | | | (180,095,815 | ) |
Class R1 | | | (2,637 | ) | | | (2,575 | ) |
Class R2 | | | (677,108 | ) | | | (634,929 | ) |
Class R3 | | | (79,045 | ) | | | (42,832 | ) |
Class R6 | | | (193,592,509 | ) | | | (106,629,614 | ) |
SIMPLE Class | | | (205 | ) | | | — | |
| | | | |
| | | (583,735,387 | ) | | | (492,978,357 | ) |
| | | | |
Distributions to shareholders from return of capital: | | | | | | | | |
Class A | | | (18,631,215 | ) | | | (14,976,081 | ) |
Investor Class | | | (839,853 | ) | | | (718,255 | ) |
Class B | | | (251,594 | ) | | | (273,376 | ) |
Class C | | | (1,576,669 | ) | | | (1,717,054 | ) |
Class I | | | (19,530,637 | ) | | | (15,493,078 | ) |
Class R1 | | | (276 | ) | | | (221 | ) |
Class R2 | | | (71,000 | ) | | | (54,621 | ) |
Class R3 | | | (8,289 | ) | | | (3,685 | ) |
Class R6 | | | (20,299,700 | ) | | | (9,173,011 | ) |
SIMPLE Class | | | (21 | ) | | | — | |
| | | | |
| | | (61,209,254 | ) | | | (42,409,382 | ) |
| | | | |
Total distributions to shareholders | | | (644,944,641 | ) | | | (535,387,739 | ) |
| | | | |
Capital share transactions: | | | | | | | | |
Net proceeds from sale of shares | | | 5,414,314,356 | | | | 4,156,205,964 | |
Net asset value of shares issued to shareholders in reinvestment of distributions | | | 598,382,398 | | | | 485,322,513 | |
Cost of shares redeemed | | | (3,491,257,176 | ) | | | (3,830,355,865 | ) |
| | | | |
Increase (decrease) in net assets derived from capital share transactions | | | 2,521,439,578 | | | | 811,172,612 | |
| | | | |
Net increase (decrease) in net assets | | | 2,311,195,822 | | | | 944,990,703 | |
| | |
| Net Assets | | | | | | | | |
Beginning of year | | | 9,652,787,115 | | | | 8,707,796,412 | |
| | | | |
End of year | | $ | 11,963,982,937 | | | $ | 9,652,787,115 | |
| | | | |
| | | | | | |
The notes to the financial statements are an integral part of,
and should be read in conjunction with, the financial statements. | | | | | 29 | |
Financial Highlights selected per share data and ratios
| | | | | | | | | | | | | | | | | | | | |
| |
| | | Year ended October 31, | |
| | | | | |
| Class A | | 2020 | | | 2019 | | | 2018 | | | 2017 | | | 2016 | |
| | | | | |
Net asset value at beginning of year | | $ | 5.61 | | | $ | 5.52 | | | $ | 5.77 | | | $ | 5.74 | | | $ | 5.57 | |
| | | | | | | | | | | | | | | | | | | | |
| | | | | |
Net investment income (loss) (a) | | | 0.29 | | | | 0.29 | | | | 0.29 | | | | 0.30 | | | | 0.33 | |
| | | | | |
Net realized and unrealized gain (loss) on investments | | | (0.17 | ) | | | 0.12 | | | | (0.22 | ) | | | 0.09 | | | | 0.20 | |
| | | | | |
Net realized and unrealized gain (loss) on foreign currency transactions | | | — | | | | — | | | | — | | | | — | | | | 0.00 | ‡ |
| | | | | | | | | | | | | | | | | | | | |
| | | | | |
Total from investment operations | | | 0.12 | | | | 0.41 | | | | 0.07 | | | | 0.39 | | | | 0.53 | |
| | | | | | | | | | | | | | | | | | | | |
| | | | | |
| Less distributions: | | | | | | | | | | | | | | | | | | | | |
| | | | | |
From net investment income | | | (0.29 | ) | | | (0.29 | ) | | | (0.29 | ) | | | (0.31 | ) | | | (0.34 | ) |
| | | | | |
Return of capital | | | (0.03 | ) | | | (0.03 | ) | | | (0.03 | ) | | | (0.05 | ) | | | (0.02 | ) |
| | | | | | | | | | | | | | | | | | | | |
| | | | | |
Total distributions | | | (0.32 | ) | | | (0.32 | ) | | | (0.32 | ) | | | (0.36 | ) | | | (0.36 | ) |
| | | | | | | | | | | | | | | | | | | | |
| | | | | |
Net asset value at end of year | | $ | 5.41 | | | $ | 5.61 | | | $ | 5.52 | | | $ | 5.77 | | | $ | 5.74 | |
| | | | | | | | | | | | | | | | | | | | |
| | | | | |
Total investment return (b) | | | 2.26 | % | | | 7.58 | % | | | 1.29 | % | | | 6.91 | % | | | 9.96 | % |
| | | | | |
| Ratios (to average net assets)/Supplemental Data: | | | | | | | | | | | | | | | | | | | | |
| | | | | |
Net investment income (loss) | | | 5.35 | % | | | 5.21 | % | | | 5.15 | % | | | 5.25 | % | | | 5.98 | % |
| | | | | |
Net expenses (c) | | | 0.97 | % | | | 0.99 | % | | | 0.99 | % | | | 0.97 | % | | | 0.95 | % |
| | | | | |
Portfolio turnover rate | | | 38 | % | | | 30 | % | | | 30 | % | | | 43 | % | | | 41 | % |
| | | | | |
Net assets at end of year (in 000’s) | | $ | 3,525,782 | | | $ | 3,405,587 | | | $ | 3,290,659 | | | $ | 3,683,113 | | | $ | 3,551,864 | |
| ‡ | Less than one cent per share. |
| (a) | Per share data based on average shares outstanding during the year. |
| (b) | Total investment return is calculated exclusive of sales charges and assumes the reinvestment of distributions. For periods of less than one year, total return is not annualized. |
| (c) | In addition to the fees and expenses which the Fund bears directly, it also indirectly bears a pro-rata share of the fees and expenses of the underlying funds in which it invests. Such indirect expenses are not included in the above expense ratios. |
| | | | | | | | | | | | | | | | | | | | |
| |
| | | Year ended October 31, | |
| | | | | |
| Investor Class | | 2020 | | | 2019 | | | 2018 | | | 2017 | | | 2016 | |
| | | | | |
Net asset value at beginning of year | | $ | 5.65 | | | $ | 5.57 | | | $ | 5.82 | | | $ | 5.79 | | | $ | 5.62 | |
| | | | | | | | | | | | | | | | | | | | |
| | | | | |
Net investment income (loss) (a) | | | 0.29 | | | | 0.29 | | | | 0.29 | | | | 0.30 | | | | 0.33 | |
| | | | | |
Net realized and unrealized gain (loss) on investments | | | (0.17 | ) | | | 0.11 | | | | (0.22 | ) | | | 0.09 | | | | 0.20 | |
| | | | | |
Net realized and unrealized gain (loss) on foreign currency transactions | | | — | | | | — | | | | — | | | | — | | | | 0.00 | ‡ |
| | | | | | | | | | | | | | | | | | | | |
| | | | | |
Total from investment operations | | | 0.12 | | | | 0.40 | | | | 0.07 | | | | 0.39 | | | | 0.53 | |
| | | | | | | | | | | | | | | | | | | | |
| | | | | |
| Less distributions: | | | | | | | | | | | | | | | | | | | | |
| | | | | |
From net investment income | | | (0.29 | ) | | | (0.29 | ) | | | (0.29 | ) | | | (0.31 | ) | | | (0.34 | ) |
| | | | | |
Return of capital | | | (0.03 | ) | | | (0.03 | ) | | | (0.03 | ) | | | (0.05 | ) | | | (0.02 | ) |
| | | | | | | | | | | | | | | | | | | | |
| | | | | |
Total distributions | | | (0.32 | ) | | | (0.32 | ) | | | (0.32 | ) | | | (0.36 | ) | | | (0.36 | ) |
| | | | | | | | | | | | | | | | | | | | |
| | | | | |
Net asset value at end of year | | $ | 5.45 | | | $ | 5.65 | | | $ | 5.57 | | | $ | 5.82 | | | $ | 5.79 | |
| | | | | | | | | | | | | | | | | | | | |
| | | | | |
Total investment return (b) | | | 2.24 | % | | | 7.33 | % | | | 1.29 | % | | | 6.90 | % | | | 9.91 | % |
| | | | | |
| Ratios (to average net assets)/Supplemental Data: | | | | | | | | | | | | | | | | | | | | |
| | | | | |
Net investment income (loss) | | | 5.27 | % | | | 5.15 | % | | | 5.12 | % | | | 5.21 | % | | | 5.90 | % |
| | | | | |
Net expenses (c) | | | 1.06 | % | | | 1.05 | % | | | 1.03 | % | | | 1.02 | % | | | 1.03 | % |
| | | | | |
Portfolio turnover rate | | | 38 | % | | | 30 | % | | | 30 | % | | | 43 | % | | | 41 | % |
| | | | | |
Net assets at end of year (in 000’s) | | $ | 149,726 | | | $ | 162,260 | | | $ | 159,970 | | | $ | 167,139 | | | $ | 287,493 | |
| ‡ | Less than one cent per share. |
| (a) | Per share data based on average shares outstanding during the year. |
| (b) | Total investment return is calculated exclusive of sales charges and assumes the reinvestment of distributions. For periods of less than one year, total return is not annualized. |
| (c) | In addition to the fees and expenses which the Fund bears directly, it also indirectly bears a pro-rata share of the fees and expenses of the underlying funds in which it invests. Such indirect expenses are not included in the above expense ratios. |
| | | | |
| 30 | | MainStay MacKay High Yield Corporate Bond Fund | | The notes to the financial statements are an integral part of,
and should be read in conjunction with, the financial statements. |
Financial Highlights selected per share data and ratios
| | | | | | | | | | | | | | | | | | | | |
| |
| | | Year ended October 31, | |
| | | | | |
| Class B | | 2020 | | | 2019 | | | 2018 | | | 2017 | | | 2016 | |
| | | | | |
Net asset value at beginning of year | | $ | 5.58 | | | $ | 5.50 | | | $ | 5.74 | | | $ | 5.71 | | | $ | 5.54 | |
| | | | | | | | | | | | | | | | | | | | |
| | | | | |
Net investment income (loss) (a) | | | 0.25 | | | | 0.24 | | | | 0.25 | | | | 0.26 | | | | 0.28 | |
| | | | | |
Net realized and unrealized gain (loss) on investments | | | (0.18 | ) | | | 0.11 | | | | (0.21 | ) | | | 0.08 | | | | 0.20 | |
| | | | | |
Net realized and unrealized gain (loss) on foreign currency transactions | | | — | | | | — | | | | — | | | | — | | | | 0.00 | ‡ |
| | | | | | | | | | | | | | | | | | | | |
| | | | | |
Total from investment operations | | | 0.07 | | | | 0.35 | | | | 0.04 | | | | 0.34 | | | | 0.48 | |
| | | | | | | | | | | | | | | | | | | | |
| | | | | |
| Less distributions: | | | | | | | | | | | | | | | | | | | | |
| | | | | |
From net investment income | | | (0.24 | ) | | | (0.25 | ) | | | (0.26 | ) | | | (0.27 | ) | | | (0.29 | ) |
| | | | | |
Return of capital | | | (0.03 | ) | | | (0.02 | ) | | | (0.02 | ) | | | (0.04 | ) | | | (0.02 | ) |
| | | | | | | | | | | | | | | | | | | | |
| | | | | |
Total distributions | | | (0.27 | ) | | | (0.27 | ) | | | (0.28 | ) | | | (0.31 | ) | | | (0.31 | ) |
| | | | | | | | | | | | | | | | | | | | |
| | | | | |
Net asset value at end of year | | $ | 5.38 | | | $ | 5.58 | | | $ | 5.50 | | | $ | 5.74 | | | $ | 5.71 | |
| | | | | | | | | | | | | | | | | | | | |
| | | | | |
Total investment return (b) | | | 1.39 | % | | | 6.52 | % | | | 0.64 | % | | | 6.06 | % | | | 8.85 | % |
| | | | | |
| Ratios (to average net assets)/Supplemental Data: | | | | | | | | | | | | | | | | | | | | |
| | | | | |
Net investment income (loss) | | | 4.55 | % | | | 4.41 | % | | | 4.37 | % | | | 4.47 | % | | | 5.16 | % |
| | | | | |
Net expenses (c) | | | 1.81 | % | | | 1.80 | % | | | 1.78 | % | | | 1.77 | % | | | 1.78 | % |
| | | | | |
Portfolio turnover rate | | | 38 | % | | | 30 | % | | | 30 | % | | | 43 | % | | | 41 | % |
| | | | | |
Net assets at end of year (in 000’s) | | $ | 45,661 | | | $ | 63,517 | | | $ | 81,221 | | | $ | 108,263 | | | $ | 132,509 | |
| ‡ | Less than one cent per share. |
| (a) | Per share data based on average shares outstanding during the year. |
| (b) | Total investment return is calculated exclusive of sales charges and assumes the reinvestment of distributions. For periods of less than one year, total return is not annualized. |
| (c) | In addition to the fees and expenses which the Fund bears directly, it also indirectly bears a pro-rata share of the fees and expenses of the underlying funds in which it invests. Such indirect expenses are not included in the above expense ratios. |
| | | | | | | | | | | | | | | | | | | | |
| |
| | | Year ended October 31, | |
| | | | | |
| Class C | | 2020 | | | 2019 | | | 2018 | | | 2017 | | | 2016 | |
| | | | | |
Net asset value at beginning of year | | $ | 5.59 | | | $ | 5.50 | | | $ | 5.74 | | | $ | 5.72 | | | $ | 5.55 | |
| | | | | | | | | | | | | | | | | | | | |
| | | | | |
Net investment income (loss) (a) | | | 0.25 | | | | 0.24 | | | | 0.25 | | | | 0.26 | | | | 0.28 | |
| | | | | |
Net realized and unrealized gain (loss) on investments | | | (0.18 | ) | | | 0.12 | | | | (0.21 | ) | | | 0.07 | | | | 0.20 | |
| | | | | |
Net realized and unrealized gain (loss) on foreign currency transactions | | | — | | | | — | | | | — | | | | — | | | | 0.00 | ‡ |
| | | | | | | | | | | | | | | | | | | | |
| | | | | |
Total from investment operations | | | 0.07 | | | | 0.36 | | | | 0.04 | | | | 0.33 | | | | 0.48 | |
| | | | | | | | | | | | | | | | | | | | |
| | | | | |
| Less distributions: | | | | | | | | | | | | | | | | | | | | |
| | | | | |
From net investment income | | | (0.24 | ) | | | (0.25 | ) | | | (0.26 | ) | | | (0.27 | ) | | | (0.29 | ) |
| | | | | |
Return of capital | | | (0.03 | ) | | | (0.02 | ) | | | (0.02 | ) | | | (0.04 | ) | | | (0.02 | ) |
| | | | | | | | | | | | | | | | | | | | |
| | | | | |
Total distributions | | | (0.27 | ) | | | (0.27 | ) | | | (0.28 | ) | | | (0.31 | ) | | | (0.31 | ) |
| | | | | | | | | | | | | | | | | | | | |
| | | | | |
Net asset value at end of year | | $ | 5.39 | | | $ | 5.59 | | | $ | 5.50 | | | $ | 5.74 | | | $ | 5.72 | |
| | | | | | | | | | | | | | | | | | | | |
| | | | | |
Total investment return (b) | | | 1.39 | % | | | 6.71 | % | | | 0.64 | % | | | 5.87 | % | | | 9.04 | % |
| | | | | |
| Ratios (to average net assets)/Supplemental Data: | | | | | | | | | | | | | | | | | | | | |
| | | | | |
Net investment income (loss) | | | 4.54 | % | | | 4.41 | % | | | 4.36 | % | | | 4.45 | % | | | 5.15 | % |
| | | | | |
Net expenses (c) | | | 1.81 | % | | | 1.80 | % | | | 1.78 | % | | | 1.77 | % | | | 1.78 | % |
| | | | | |
Portfolio turnover rate | | | 38 | % | | | 30 | % | | | 30 | % | | | 43 | % | | | 41 | % |
| | | | | |
Net assets at end of year (in 000’s) | | $ | 297,431 | | | $ | 373,760 | | | $ | 550,819 | | | $ | 676,463 | | | $ | 678,364 | |
| ‡ | Less than one cent per share. |
| (a) | Per share data based on average shares outstanding during the year. |
| (b) | Total investment return is calculated exclusive of sales charges and assumes the reinvestment of distributions. For periods of less than one year, total return is not annualized. |
| (c) | In addition to the fees and expenses which the Fund bears directly, it also indirectly bears a pro-rata share of the fees and expenses of the underlying funds in which it invests. Such indirect expenses are not included in the above expense ratios. |
| | | | | | |
The notes to the financial statements are an integral part of,
and should be read in conjunction with, the financial statements. | | | | | 31 | |
Financial Highlights selected per share data and ratios
| | | | | | | | | | | | | | | | | | | | |
| |
| | | Year ended October 31, | |
| | | | | |
| Class I | | 2020 | | | 2019 | | | 2018 | | | 2017 | | | 2016 | |
| | | | | |
Net asset value at beginning of year | | $ | 5.61 | | | $ | 5.53 | | | $ | 5.78 | | | $ | 5.75 | | | $ | 5.58 | |
| | | | | | | | | | | | | | | | | | | | |
| | | | | |
Net investment income (loss) (a) | | | 0.30 | | | | 0.30 | | | | 0.31 | | | | 0.32 | | | | 0.34 | |
| | | | | |
Net realized and unrealized gain (loss) on investments | | | (0.17 | ) | | | 0.11 | | | | (0.22 | ) | | | 0.08 | | | | 0.20 | |
| | | | | |
Net realized and unrealized gain (loss) on foreign currency transactions | | | — | | | | — | | | | — | | | | — | | | | 0.00 | ‡ |
| | | | | | | | | | | | | | | | | | | | |
| | | | | |
Total from investment operations | | | 0.13 | | | | 0.41 | | | | 0.09 | | | | 0.40 | | | | 0.54 | |
| | | | | | | | | | | | | | | | | | | | |
| | | | | |
| Less distributions: | | | | | | | | | | | | | | | | | | | | |
| | | | | |
From net investment income | | | (0.30 | ) | | | (0.30 | ) | | | (0.31 | ) | | | (0.32 | ) | | | (0.35 | ) |
| | | | | |
Return of capital | | | (0.03 | ) | | | (0.03 | ) | | | (0.03 | ) | | | (0.05 | ) | | | (0.02 | ) |
| | | | | | | | | | | | | | | | | | | | |
| | | | | |
Total distributions | | | (0.33 | ) | | | (0.33 | ) | | | (0.34 | ) | | | (0.37 | ) | | | (0.37 | ) |
| | | | | | | | | | | | | | | | | | | | |
| | | | | |
Net asset value at end of year | | $ | 5.41 | | | $ | 5.61 | | | $ | 5.53 | | | $ | 5.78 | | | $ | 5.75 | |
| | | | | | | | | | | | | | | | | | | | |
| | | | | |
Total investment return (b) | | | 2.56 | % | | | 7.68 | % | | | 1.57 | % | | | 7.17 | % | | | 10.23 | % |
| | | | | |
| Ratios (to average net assets)/Supplemental Data: | | | | | | | | | | | | | | | | | | | | |
| | | | | |
Net investment income (loss) | | | 5.60 | % | | | 5.45 | % | | | 5.40 | % | | | 5.51 | % | | | 6.23 | % |
| | | | | |
Net expenses (c) | | | 0.72 | % | | | 0.74 | % | | | 0.74 | % | | | 0.72 | % | | | 0.70 | % |
| | | | | |
Portfolio turnover rate | | | 38 | % | | | 30 | % | | | 30 | % | | | 43 | % | | | 41 | % |
| | | | | |
Net assets at end of year (in 000’s) | | $ | 3,509,954 | | | $ | 3,451,487 | | | $ | 3,709,306 | | | $ | 4,067,560 | | | $ | 5,313,266 | |
| ‡ | Less than one cent per share. |
| (a) | Per share data based on average shares outstanding during the year. |
| (b) | Total investment return is calculated exclusive of sales charges and assumes the reinvestment of distributions. Class I shares are not subject to sales charges. For periods of less than one year, total return is not annualized. |
| (c) | In addition to the fees and expenses which the Fund bears directly, it also indirectly bears a pro-rata share of the fees and expenses of the underlying funds in which it invests. Such indirect expenses are not included in the above expense ratios. |
| | | | | | | | | | | | | | | | | | | | |
| |
| | | Year ended October 31, | |
| | | | | |
| Class R1 | | 2020 | | | 2019 | | | 2018 | | | 2017 | | | 2016 | |
| | | | | |
Net asset value at beginning of year | | $ | 5.60 | | | $ | 5.52 | | | $ | 5.77 | | | $ | 5.74 | | | $ | 5.57 | |
| | | | | | | | | | | | | | | | | | | | |
| | | | | |
Net investment income (loss) (a) | | | 0.30 | | | | 0.30 | | | | 0.30 | | | | 0.32 | | | | 0.34 | |
| | | | | |
Net realized and unrealized gain (loss) on investments | | | (0.17 | ) | | | 0.11 | | | | (0.22 | ) | | | 0.07 | | | | 0.19 | |
| | | | | |
Net realized and unrealized gain (loss) on foreign currency transactions | | | — | | | | — | | | | — | | | | — | | | | 0.00 | ‡ |
| | | | | | | | | | | | | | | | | | | | |
| | | | | |
Total from investment operations | | | 0.13 | | | | 0.41 | | | | 0.08 | | | | 0.39 | | | | 0.53 | |
| | | | | | | | | | | | | | | | | | | | |
| | | | | |
| Less distributions: | | | | | | | | | | | | | | | | | | | | |
| | | | | |
From net investment income | | | (0.30 | ) | | | (0.30 | ) | | | (0.30 | ) | | | (0.31 | ) | | | (0.34 | ) |
| | | | | |
Return of capital | | | (0.03 | ) | | | (0.03 | ) | | | (0.03 | ) | | | (0.05 | ) | | | (0.02 | ) |
| | | | | | | | | | | | | | | | | | | | |
| | | | | |
Total distributions | | | (0.33 | ) | | | (0.33 | ) | | | (0.33 | ) | | | (0.36 | ) | | | (0.36 | ) |
| | | | | | | | | | | | | | | | | | | | |
| | | | | |
Net asset value at end of year | | $ | 5.40 | | | $ | 5.60 | | | $ | 5.52 | | | $ | 5.77 | | | $ | 5.74 | |
| | | | | | | | | | | | | | | | | | | | |
| | | | | |
Total investment return (b) | | | 2.45 | % | | | 7.58 | % | | | 1.46 | % | | | 7.07 | % | | | 10.13 | % |
| | | | | |
| Ratios (to average net assets)/Supplemental Data: | | | | | | | | | | | | | | | | | | | | |
| | | | | |
Net investment income (loss) (c) | | | 5.52 | % | | | 5.36 | % | | | 5.25 | % | | | 5.48 | % | | | 6.11 | % |
| | | | | |
Net expenses | | | 0.82 | % | | | 0.84 | % | | | 0.84 | % | | | 0.82 | % | | | 0.80 | % |
| | | | | |
Portfolio turnover rate | | | 38 | % | | | 30 | % | | | 30 | % | | | 43 | % | | | 41 | % |
| | | | | |
Net assets at end of year (in 000’s) | | $ | 51 | | | $ | 53 | | | $ | 72 | | | $ | 37 | | | $ | 59 | |
| ‡ | Less than one cent per share. |
| (a) | Per share data based on average shares outstanding during the year. |
| (b) | Total investment return is calculated exclusive of sales charges and assumes the reinvestment of distributions. Class R1 shares are not subject to sales charges. For periods of less than one year, total return is not annualized. |
| (c) | In addition to the fees and expenses which the Fund bears directly, it also indirectly bears a pro-rata share of the fees and expenses of the underlying funds in which it invests. Such indirect expenses are not included in the above expense ratios. |
| | | | |
| 32 | | MainStay MacKay High Yield Corporate Bond Fund | | The notes to the financial statements are an integral part of,
and should be read in conjunction with, the financial statements. |
Financial Highlights selected per share data and ratios
| | | | | | | | | | | | | | | | | | | | |
| |
| | | Year ended October 31, | |
| | | | | |
| Class R2 | | 2020 | | | 2019 | | | 2018 | | | 2017 | | | 2016 | |
| | | | | |
Net asset value at beginning of year | | $ | 5.61 | | | $ | 5.52 | | | $ | 5.77 | | | $ | 5.74 | | | $ | 5.57 | |
| | | | | | | | | | | | | | | | | | | | |
| | | | | |
Net investment income (loss) (a) | | | 0.29 | | | | 0.28 | | | | 0.29 | | | | 0.30 | | | | 0.32 | |
| | | | | |
Net realized and unrealized gain (loss) on investments | | | (0.18 | ) | | | 0.12 | | | | (0.22 | ) | | | 0.08 | | | | 0.20 | |
| | | | | |
Net realized and unrealized gain (loss) on foreign currency transactions | | | — | | | | — | | | | — | | | | — | | | | 0.00 | ‡ |
| | | | | | | | | | | | | | | | | | | | |
| | | | | |
Total from investment operations | | | 0.11 | | | | 0.40 | | | | 0.07 | | | | 0.38 | | | | 0.52 | |
| | | | | | | | | | | | | | | | | | | | |
| | | | | |
| Less distributions: | | | | | | | | | | | | | | | | | | | | |
| | | | | |
From net investment income | | | (0.28 | ) | | | (0.29 | ) | | | (0.29 | ) | | | (0.30 | ) | | | (0.33 | ) |
| | | | | |
Return of capital | | | (0.03 | ) | | | (0.02 | ) | | | (0.03 | ) | | | (0.05 | ) | | | (0.02 | ) |
| | | | | | | | | | | | | | | | | | | | |
| | | | | |
Total distributions | | | (0.31 | ) | | | (0.31 | ) | | | (0.32 | ) | | | (0.35 | ) | | | (0.35 | ) |
| | | | | | | | | | | | | | | | | | | | |
| | | | | |
Net asset value at end of year | | $ | 5.41 | | | $ | 5.61 | | | $ | 5.52 | | | $ | 5.77 | | | $ | 5.74 | |
| | | | | | | | | | | | | | | | | | | | |
| | | | | |
Total investment return (b) | | | 2.17 | % | | | 7.49 | % | | | 1.20 | % | | | 6.80 | % | | | 9.83 | % |
| | | | | |
| Ratios (to average net assets)/Supplemental Data: | | | | | | | | | | | | | | | | | | | | |
| | | | | |
Net investment income (loss) | | | 5.26 | % | | | 5.10 | % | | | 5.06 | % | | | 5.16 | % | | | 5.89 | % |
| | | | | |
Net expenses (c) | | | 1.07 | % | | | 1.09 | % | | | 1.09 | % | | | 1.07 | % | | | 1.05 | % |
| | | | | |
Portfolio turnover rate | | | 38 | % | | | 30 | % | | | 30 | % | | | 43 | % | | | 41 | % |
| | | | | |
Net assets at end of year (in 000’s) | | $ | 13,006 | | | $ | 13,866 | | | $ | 11,116 | | | $ | 9,562 | | | $ | 10,917 | |
| ‡ | Less than one cent per share. |
| (a) | Per share data based on average shares outstanding during the year. |
| (b) | Total investment return is calculated exclusive of sales charges and assumes the reinvestment of distributions. Class R2 shares are not subject to sales charges. For periods of less than one year, total return is not annualized. |
| (c) | In addition to the fees and expenses which the Fund bears directly, it also indirectly bears a pro-rata share of the fees and expenses of the underlying funds in which it invests. Such indirect expenses are not included in the above expense ratios. |
| | | | | | | | | | | | | | | | | | | | |
| | |
| | | Year ended October 31, | | | February 29,
2016^
through
October 31, 2016 | |
| Class R3 | | 2020 | | | 2019 | | | 2018 | | | 2017 | |
| | | | | |
Net asset value at beginning of period | | $ | 5.60 | | | $ | 5.52 | | | $ | 5.77 | | | $ | 5.74 | | | $ | 5.17 | |
| | | | | | | | | | | | | | | | | | | | |
| | | | | |
Net investment income (loss) (a) | | | 0.27 | | | | 0.27 | | | | 0.27 | | | | 0.28 | | | | 0.20 | |
| | | | | |
Net realized and unrealized gain (loss) on investments | | | (0.17 | ) | | | 0.11 | | | | (0.22 | ) | | | 0.09 | | | | 0.60 | |
| | | | | | | | | | | | | | | | | | | | |
| | | | | |
Total from investment operations | | | 0.10 | | | | 0.38 | | | | 0.05 | | | | 0.37 | | | | 0.80 | |
| | | | | | | | | | | | | | | | | | | | |
| | | | | |
| Less distributions: | | | | | | | | | | | | | | | | | | | | |
| | | | | |
From net investment income | | | (0.27 | ) | | | (0.28 | ) | | | (0.28 | ) | | | (0.29 | ) | | | (0.21 | ) |
| | | | | |
Return of capital | | | (0.03 | ) | | | (0.02 | ) | | | (0.02 | ) | | | (0.05 | ) | | | (0.02 | ) |
| | | | | | | | | | | | | | | | | | | | |
| | | | | |
Total distributions | | | (0.30 | ) | | | (0.30 | ) | | | (0.30 | ) | | | (0.34 | ) | | | (0.23 | ) |
| | | | | | | | | | | | | | | | | | | | |
| | | | | |
Net asset value at end of period | | $ | 5.40 | | | $ | 5.60 | | | $ | 5.52 | | | $ | 5.77 | | | $ | 5.74 | |
| | | | | | | | | | | | | | | | | | | | |
| | | | | |
Total investment return (b) | | | 1.90 | % | | | 7.03 | % | | | 0.96 | % | | | 6.58 | % | | | 15.59 | % |
| | | | | |
| Ratios (to average net assets)/Supplemental Data: | | | | | | | | | | | | | | | | | | | | |
| | | | | |
Net investment income (loss) | | | 4.96 | % | | | 4.84 | % | | | 4.77 | % | | | 4.81 | % | | | 5.40 | %†† |
| | | | | |
Net expenses (c) | | | 1.32 | % | | | 1.34 | % | | | 1.34 | % | | | 1.32 | % | | | 1.30 | %†† |
| | | | | |
Portfolio turnover rate | | | 38 | % | | | 30 | % | | | 30 | % | | | 43 | % | | | 41 | % |
| | | | | |
Net assets at end of period (in 000’s) | | $ | 1,924 | | | $ | 1,281 | | | $ | 606 | | | $ | 392 | | | $ | 130 | |
| (a) | Per share data based on average shares outstanding during the period. |
| (b) | Total investment return is calculated exclusive of sales charges and assumes the reinvestment of distributions. Class R3 shares are not subject to sales charges. For periods of less than one year, total return is not annualized. |
| (c) | In addition to the fees and expenses which the Fund bears directly, it also indirectly bears a pro-rata share of the fees and expenses of the underlying funds in which it invests. Such indirect expenses are not included in the above expense ratios. |
| | | | | | |
The notes to the financial statements are an integral part of,
and should be read in conjunction with, the financial statements. | | | | | 33 | |
Financial Highlights selected per share data and ratios
| | | | | | | | | | | | | | | | | | | | |
| |
| | | Year ended October 31, | |
| | | | | |
| Class R6 | | 2020 | | | 2019 | | | 2018 | | | 2017 | | | 2016 | |
| | | | | |
Net asset value at beginning of year | | $ | 5.60 | | | $ | 5.52 | | | $ | 5.77 | | | $ | 5.74 | | | $ | 5.58 | |
| | | | | | | | | | | | | | | | | | | | |
| | | | | |
Net investment income (loss) (a) | | | 0.31 | | | | 0.31 | | | | 0.31 | | | | 0.32 | | | | 0.35 | |
| | | | | |
Net realized and unrealized gain (loss) on investments | | | (0.17 | ) | | | 0.11 | | | | (0.21 | ) | | | 0.09 | | | | 0.19 | |
| | | | | | | | | | | | | | | | | | | | |
| | | | | |
Total from investment operations | | | 0.14 | | | | 0.42 | | | | 0.10 | | | | 0.41 | | | | 0.54 | |
| | | | | | | | | | | | | | | | | | | | |
| | | | | |
| Less distributions: | | | | | | | | | | | | | | | | | | | | |
| | | | | |
From net investment income | | | (0.31 | ) | | | (0.31 | ) | | | (0.32 | ) | | | (0.33 | ) | | | (0.36 | ) |
| | | | | |
Return of capital | | | (0.03 | ) | | | (0.03 | ) | | | (0.03 | ) | | | (0.05 | ) | | | (0.02 | ) |
| | | | | | | | | | | | | | | | | | | | |
| | | | | |
Total distributions | | | (0.34 | ) | | | (0.34 | ) | | | (0.35 | ) | | | (0.38 | ) | | | (0.38 | ) |
| | | | | | | | | | | | | | | | | | | | |
| | | | | |
Net asset value at end of year | | $ | 5.40 | | | $ | 5.60 | | | $ | 5.52 | | | $ | 5.77 | | | $ | 5.74 | |
| | | | | | | | | | | | | | | | | | | | |
| | | | | |
Total investment return (b) | | | 2.70 | % | | | 7.84 | % | | | 1.71 | % | | | 7.36 | % | | | 10.24 | % |
| | | | | |
| Ratios (to average net assets)/Supplemental Data: | | | | | | | | | | | | | | | | | | | | |
| | | | | |
Net investment income (loss) | | | 5.65 | % | | | 5.60 | % | | | 5.54 | % | | | 5.45 | % | | | 6.23 | % |
| | | | | |
Net expenses (c) | | | 0.58 | % | | | 0.58 | % | | | 0.58 | % | | | 0.58 | % | | | 0.58 | % |
| | | | | |
Portfolio turnover rate | | | 38 | % | | | 30 | % | | | 30 | % | | | 43 | % | | | 41 | % |
| | | | | |
Net assets at end of year (in 000’s) | | $ | 4,420,424 | | | $ | 2,180,977 | | | $ | 904,028 | | | $ | 1,668,163 | | | $ | 53,712 | |
| (a) | Per share data based on average shares outstanding during the year. |
| (b) | Total investment return is calculated exclusive of sales charges and assumes the reinvestment of distributions. Class R6 shares are not subject to sales charges. For periods of less than one year, total return is not annualized. |
| (c) | In addition to the fees and expenses which the Fund bears directly, it also indirectly bears a pro-rata share of the fees and expenses of the underlying funds in which it invests. Such indirect expenses are not included in the above expense ratios. |
| | | | |
| |
| SIMPLE Class | | August 31,
2020^
through
October 31,
2020 | |
| |
Net asset value at beginning of period | | $ | 5.54 | |
| | | | |
| |
Net investment income (loss) (a) | | | 0.04 | |
| |
Net realized and unrealized gain (loss) on investments | | | (0.08 | ) |
| | | | |
| |
Total from investment operations | | | (0.04 | ) |
| | | | |
| |
| Less distributions: | | | | |
| |
From net investment income | | | (0.05 | ) |
| |
Return of capital ‡ | | | (0.00 | )‡ |
| | | | |
| |
Total distributions | | | (0.05 | ) |
| | | | |
| |
Net asset value at end of period | | $ | 5.45 | |
| | | | |
| |
Total investment return (b) | | | (0.72 | %) |
| |
| Ratios (to average net assets)/Supplemental Data: | | | | |
| |
Net investment income (loss) †† | | | 4.74 | % |
| |
Net expenses (c)†† | | | 1.30 | % |
| |
Portfolio turnover rate | | | 38 | % |
| |
Net assets at end of period (in 000’s) | | $ | 25 | |
| ‡ | Less than one cent per share. |
| (a) | Per share data based on average shares outstanding during the period. |
| (b) | Total investment return is calculated exclusive of sales charges and assumes the reinvestment of distributions. SIMPLE Class shares are not subject to sales charges. For periods of less than one year, total return is not annualized. |
| (c) | In addition to the fees and expenses which the Fund bears directly, it also indirectly bears a pro-rata share of the fees and expenses of the underlying funds in which it invests. Such indirect expenses are not included in the above expense ratios. |
| | | | |
| 34 | | MainStay MacKay High Yield Corporate Bond Fund | | The notes to the financial statements are an integral part of,
and should be read in conjunction with, the financial statements. |
Notes to Financial Statements
Note 1–Organization and Business
The MainStay Funds (the “Trust”) was organized on January 9, 1986, as a Massachusetts business trust. The Trust is registered under the Investment Company Act of 1940, as amended (the “1940 Act”), as an open-end management investment company, and is comprised of twelve funds (collectively referred to as the “Funds”). These financial statements and notes relate to the MainStay MacKay High Yield Corporate Bond Fund (the “Fund”), a “diversified” fund, as that term is defined in the 1940 Act, as interpreted or modified by regulatory authorities having jurisdiction, from time to time.
The Fund currently has ten classes of shares registered for sale. Class A shares commenced operations on January 3, 1995. Class B shares commenced operations on May 1, 1986. Class C shares commenced operations on September 1, 1998. Class I shares commenced operations on January 2, 2004. Class R2 shares were first offered to the public on December 14, 2007, but did not commence operations until May 1, 2008. Investor Class shares commenced operations on February 28, 2008. Class R1 shares commenced operations on June 29, 2012. Class R6 shares commenced operations on June 17, 2013. Class R3 shares commenced operations on February 29, 2016. SIMPLE Class shares commenced operations on August 31, 2020.
Class B shares of the MainStay Group of Funds are closed to all new purchases as well as additional investments by existing Class B shareholders. Existing Class B shareholders may continue to reinvest dividends and capital gains distributions, as well as exchange their Class B shares for Class B shares of other funds in the MainStay Group of Funds as permitted by the current exchange privileges. Class B shareholders continue to be subject to any applicable contingent deferred sales charge (“CDSC”) at the time of redemption. All other features of the Class B shares, including but not limited to the fees and expenses applicable to Class B shares, remain unchanged. Unless redeemed, Class B shareholders will remain in Class B shares of their respective fund until the Class B shares are converted to Class A or Investor Class shares pursuant to the applicable conversion schedule.
Class A and Investor Class shares are offered at net asset value (“NAV”) per share plus an initial sales charge. No initial sales charge applies to investments of $1 million or more (and certain other qualified purchases) in Class A and Investor Class shares. However, a CDSC of 1.00% may be imposed on certain redemptions made within 18 months of the date of purchase on shares that were purchased without an initial sales charge. Class C shares are offered at NAV without an initial sales charge, although a 1.00% CDSC may be imposed on certain redemptions of such shares made within one year of the date of purchase of Class C shares. When Class B shares were offered, they were offered at NAV without an initial sales charge, although a CDSC that declines depending on the number of years a shareholder held its Class B shares may be imposed on certain redemptions of such shares made within six years of the date of purchase of such shares. Class I, Class R1, Class R2, Class R3, Class R6 and SIMPLE Class shares are offered at NAV without a sales charge. Depending upon eligibility, Class B shares convert to either Class A or Investor Class shares at the end of the calendar quarter eight years after the date they were purchased. In addition, depending upon eligibility, Class C shares convert to either Class A or Investor Class shares at the end of the calendar quarter ten years after the date they were purchased. Additionally, Investor Class shares may convert automatically to Class A
shares. Under certain circumstances and as may be permitted by the Trust’s multiple class plan pursuant to Rule 18f-3 under the 1940 Act, specified share classes of the Fund may be converted to one or more other share classes of the Fund as disclosed in the capital share transactions within these Notes. The classes of shares have the same voting (except for issues that relate solely to one class), dividend, liquidation and other rights, and the same terms and conditions, except that under distribution plans pursuant to Rule 12b-1 under the 1940 Act, Class B and Class C shares are subject to higher distribution and/or service fees than Class A, Investor Class, Class R2, Class R3 and SIMPLE Class shares. Class I, Class R1 and Class R6 shares are not subject to a distribution and/or service fee. Class R1, Class R2 and Class R3 shares are subject to a shareholder service fee, which is in addition to fees paid under the distribution plans for Class R2 and Class R3 shares.
The Fund’s investment objective is to seek maximum current income through investment in a diversified portfolio of high-yield debt securities. Capital appreciation is a secondary objective.
Note 2–Significant Accounting Policies
The Fund is an investment company and accordingly follows the investment company accounting and reporting guidance of the Financial Accounting Standards Board (“FASB”) Accounting Standard Codification Topic 946 Financial Services—Investment Companies. The Fund prepares its financial statements in accordance with generally accepted accounting principles (“GAAP”) in the United States of America and follows the significant accounting policies described below.
(A) Securities Valuation. Investments are usually valued as of the close of regular trading on the New York Stock Exchange (the “Exchange”) (usually 4:00 p.m. Eastern time) on each day the Fund is open for business (“valuation date”).
The Board of Trustees of the Trust (the “Board”) adopted procedures establishing methodologies for the valuation of the Fund’s securities and other assets and delegated the responsibility for valuation determinations under those procedures to the Valuation Committee of the Trust (the “Valuation Committee”). The procedures state that, subject to the oversight of the Board and unless otherwise noted, the responsibility for the day-to-day valuation of portfolio assets (including fair value measurements for the Fund’s assets and liabilities) rests with New York Life Investment Management LLC (“New York Life Investments” or the “Manager”), aided to whatever extent necessary by the Subadvisor (as defined in Note 3(A)). To assess the appropriateness of security valuations, the Manager, the Subadvisor or the Fund’s third-party service provider, who is subject to oversight by the Manager, regularly compares prior day prices, prices on comparable securities and the sale prices to the prior and current day prices and challenges prices with changes exceeding certain tolerance levels with third-party pricing services or broker sources.
The Board authorized the Valuation Committee to appoint a Valuation Subcommittee (the “Subcommittee”) to establish the prices of securities for which market quotations are not readily available or the prices of which are not otherwise readily determinable under the procedures. The Subcommittee meets (in person, via electronic mail or via teleconference) on an as-needed basis. The Valuation Committee meets to ensure that actions taken by the Subcommittee were appropriate.
Notes to Financial Statements (continued)
For those securities valued through either a standardized fair valuation methodology or a fair valuation measurement, the Subcommittee deals with such valuation and the Valuation Committee reviews and affirms, if appropriate, the reasonableness of the valuation based on such methodologies and measurements on a regular basis after considering information that is reasonably available and deemed relevant by the Valuation Committee. Any action taken by the Subcommittee with respect to the valuation of a portfolio security or other asset is submitted for review and ratification (if appropriate) to the Valuation Committee and the Board at the next regularly scheduled meeting.
“Fair value” is defined as the price the Fund would reasonably expect to receive upon selling an asset or liability in an orderly transaction to an independent buyer in the principal or most advantageous market for the asset or liability. Fair value measurements are determined within a framework that establishes a three-tier hierarchy that maximizes the use of observable market data and minimizes the use of unobservable inputs to establish a classification of fair value measurements for disclosure purposes. “Inputs” refer broadly to the assumptions that market participants would use in pricing the asset or liability, including assumptions about risk, such as the risk inherent in a particular valuation technique used to measure fair value using a pricing model and/or the risk inherent in the inputs for the valuation technique. Inputs may be observable or unobservable. Observable inputs reflect the assumptions market participants would use in pricing the asset or liability based on market data obtained from sources independent of the Fund. Unobservable inputs reflect the Fund’s own assumptions about the assumptions market participants would use in pricing the asset or liability based on the information available. The inputs or methodology used for valuing assets or liabilities may not be an indication of the risks associated with investing in those assets or liabilities. The three-tier hierarchy of inputs is summarized below.
| • | | Level 1—quoted prices in active markets for an identical asset or liability |
| • | | Level 2—other significant observable inputs (including quoted prices for a similar asset or liability in active markets, interest rates and yield curves, prepayment speeds, credit risk, etc.) |
| • | | Level 3—significant unobservable inputs (including the Fund’s own assumptions about the assumptions that market participants would use in measuring fair value of an asset or liability) |
The level of an asset or liability within the fair value hierarchy is based on the lowest level of an input, both individually and in the aggregate, that is significant to the fair value measurement. The aggregate value by input level of the Fund’s assets and liabilities as of October 31, 2020, is included at the end of the Portfolio of Investments.
The Fund may use third-party vendor evaluations, whose prices may be derived from one or more of the following standard inputs, among others:
| | |
• Benchmark yields | | • Reported trades |
• Broker/dealer quotes | | • Issuer spreads |
• Two-sided markets | | • Benchmark securities |
• Bids/offers | | • Reference data (corporate actions or material event notices) |
• Industry and economic events | | • Comparable bonds |
• Monthly payment information | | |
An asset or liability for which market values cannot be measured using the methodologies described above is valued by methods deemed reasonable in good faith by the Valuation Committee, following the procedures established by the Board, to represent fair value. Under these procedures, the Fund generally uses a market-based approach which may use related or comparable assets or liabilities, recent transactions, market multiples, book values and other relevant information. The Fund may also use an income-based valuation approach in which the anticipated future cash flows of the asset or liability are discounted to calculate fair value. Discounts may also be applied due to the nature and/or duration of any restrictions on the disposition of the asset or liability. Fair value represents a good faith approximation of the value of a security. Fair value determinations involve the consideration of a number of subjective factors, an analysis of applicable facts and circumstances and the exercise of judgment. As a result, it is possible that the fair value for a security determined in good faith in accordance with the Fund’s valuation procedures may differ from valuations for the same security determined by other funds using their own valuation procedures. Although the Fund’s valuation procedures are designed to value a security at the price the Fund may reasonably expect to receive upon the security’s sale in an orderly transaction, there can be no assurance that any fair value determination thereunder would, in fact, approximate the amount that the Fund would actually realize upon the sale of the security or the price at which the security would trade if a reliable market price were readily available. During the year ended October 31, 2020, there were no material changes to the fair value methodologies.
Securities which may be valued in this manner include, but are not limited to: (i) a security for which trading has been halted or suspended; (ii) a debt security that has recently gone into default and for which there is not a current market quotation; (iii) a security of an issuer that has entered into a restructuring; (iv) a security that has been delisted from a national exchange; (v) a security for which the market price is not readily available from a third-party pricing source or, if so provided, does not, in the opinion of the Manager or the Subadvisor, reflect the security’s market value; (vi) a security subject to trading collars for which no or limited trading takes place; and (vii) a security whose principal market has been temporarily closed at a time when, under normal conditions, it would be open. Securities valued in this manner are generally categorized as Level 3 in the hierarchy. Securities that were fair valued in such a manner as of October 31, 2020, are shown in the Portfolio of Investments.
Equity securities, including exchange-traded funds (“ETFs”), are valued at the last quoted sales prices as of the close of regular trading on the relevant exchange on each valuation date. Securities that are not traded on the valuation date are valued at the mean of the last quoted bid and ask prices. Prices are normally taken from the principal market in which each security trades. These securities are generally categorized as Level 1 in the hierarchy.
Investments in mutual funds, including money market funds, are valued at their respective NAVs as of the close of the Exchange on the valuation date. These securities are generally categorized as Level 1 in the hierarchy.
Debt securities (other than convertible and municipal bonds) are valued at the evaluated bid prices (evaluated mean prices in the case of convertible and municipal bonds) supplied by a pricing agent or broker(s)
| | |
| 36 | | MainStay MacKay High Yield Corporate Bond Fund |
selected by the Manager, in consultation with the Subadvisor. The evaluations are market-based measurements processed through a pricing application and represents the pricing agent’s good faith determination as to what a holder may receive in an orderly transaction under market conditions. The rules-based logic utilizes valuation techniques that reflect participants’ assumptions and vary by asset class and per methodology, maximizing the use of relevant observable data including quoted prices for similar assets, benchmark yield curves and market corroborated inputs. The evaluated bid or mean prices are deemed by the Manager, in consultation with the Subadvisor, to be representative of market values at the regular close of trading of the Exchange on each valuation date. Debt securities purchased on a delayed delivery basis are marked to market daily until settlement at the forward settlement date. Debt securities, including corporate bonds, U.S. government and federal agency bonds, municipal bonds, foreign bonds, convertible bonds, asset-backed securities and mortgage-backed securities are generally categorized as Level 2 in the hierarchy.
Certain loan assignments, participations and commitments may be valued by utilizing significant unobservable inputs obtained from the pricing service and are generally categorized as Level 3 in the hierarchy. As of October 31, 2020, securities that were fair valued in such manner are shown in the Portfolio of Investments.
Temporary cash investments acquired in excess of 60��days to maturity at the time of purchase are valued using the latest bid prices or using valuations based on a matrix system (which considers such factors as security prices, yields, maturities and ratings), both as furnished by independent pricing services. Temporary cash investments that mature in 60 days or less at the time of purchase (“Short-Term Investments”) are valued using the amortized cost method of valuation, unless the use of such method would be inappropriate. The amortized cost method involves valuing a security at its cost on the date of purchase and thereafter assuming a constant amortization to maturity of the difference between such cost and the value on maturity date. Amortized cost approximates the current fair value of a security. Securities valued using the amortized cost method are not valued using quoted prices in an active market and are generally categorized as Level 2 in the hierarchy.
The information above is not intended to reflect an exhaustive list of the methodologies that may be used to value portfolio investments. The valuation procedures permit the use of a variety of valuation methodologies in connection with valuing portfolio investments. The methodology used for a specific type of investment may vary based on the market data available or other considerations. The methodologies summarized above may not represent the specific means by which portfolio investments are valued on any particular business day.
The valuation techniques and significant amounts of unobservable inputs used in the fair valuation measurement of the Fund’s Level 3 securities are outlined in the table below. A significant increase or
decrease in any of those inputs in isolation would result in a significantly higher or lower fair value measurement.
| | | | | | | | | | | | |
Asset Class | | Fair Value
at 10/31/20* | | | Valuation
Technique | | Unobservable
Inputs | | Inputs/Range | |
| | | | |
Corporate Bonds | | | 10,984,000 | | | Income Approach | | Spread Adjustment | | | 7.22% | |
| | | | |
| | | 69,083 | | | Qualitative Assessment | | | | | | |
| | | | |
| | | 2,307 | | | Market Approach | | Implied naturalgas price | | | $2.00 | |
| | | | |
Loan Assignment | | | 14,370,690 | | | Market Approach | | Implied natural gas price | | | $2.00 | |
| | | | |
Common Stocks | | | 9,316,940 | | | Market Approach | | Implied Enterprise Value | | | $332m | |
| | | | |
| | | | | | | | EBITDA Multiple | | | 5.9x | |
| | | | |
| | | 841,845 | | | Market Approach | | Implied Enterprise Value | | | $139m | |
| | | | |
| | | 387 | | | Market Approach | | Ownership % of equity interest | | | 16.56%, 39.7% | |
| | | | |
| | | 0 | | | Market Approach | | Implied natural gas price | | | $2.00 | |
| | | | |
| | | 1,811,304 | | | Market Approach | | Implied Enterprise Value | | | 1,310m | |
| | | | |
| | | 6,265,151 | | | Market Approach | | EBITDA Multiple | | | 7.0x | |
| | | | |
| | | 0 | | | Qualitative Assessment | | | | | | |
| | | | |
Preferred
Stock | | | 33,565,732 | | | Market Approach | | Spread Adjustment | | | 4.43% | |
| | | | | | | | | | | | |
| | $ | 77,227,439 | | | | | | | | | |
| | | | | | | | | | | | |
| * | The table above does not include the Level 3 investments that were valued by a broker. As of October 30, 2020, the value of these investments were $90,334,430. The input for these investments were not readily available or cannot be reasonably estimated. |
A portfolio investment may be classified as an illiquid investment under the Trust’s written liquidity risk management program and related procedures (“Liquidity Program”). Illiquidity of an investment might prevent the sale of such investment at a time when the Manager or the Subadvisor might wish to sell, and these investments could have the effect of decreasing the overall level of the Fund’s liquidity. Further, the lack of an established secondary market may make it more difficult to value illiquid investments, requiring the Fund to rely on judgments that may be somewhat subjective in measuring value, which could vary materially from the amount that the Fund could realize upon disposition. Difficulty in selling illiquid investments may result in a loss or may be costly to the Fund. An illiquid investment is any investment that the Manager or Subadvisor reasonably expects cannot be sold or disposed of in current market conditions in seven calendar days or less without the sale or disposition significantly changing the market value of the investment. The liquidity classification of each investment will be made using information obtained after reasonable inquiry and taking into account, among other things, relevant market, trading and investment-specific considerations in accordance with the Liquidity Program. Illiquid investments are often valued in accordance with methods deemed by
Notes to Financial Statements (continued)
the Board in good faith to be reasonable and appropriate to accurately reflect their fair value. The liquidity of the Fund’s investments was determined as of October 31, 2020, and can change at any time. Illiquid investments as of October 31, 2020, are shown in the Portfolio of Investments.
(B) Income Taxes. Loan assignments, participations and commitments are valued at the average of bid quotations obtained from the engaged independent pricing service and are generally categorized as Level 2 in the hierarchy. The Fund’s policy is to comply with the requirements of the Internal Revenue Code of 1986, as amended (the “Internal Revenue Code”), applicable to regulated investment companies and to distribute all of its taxable income to the shareholders of the Fund within the allowable time limits.
The Manager evaluates the Fund’s tax positions to determine if the tax positions taken meet the minimum recognition threshold in connection with accounting for uncertainties in income tax positions taken or expected to be taken for the purposes of measuring and recognizing tax liabilities in the financial statements. Recognition of tax benefits of an uncertain tax position is permitted only to the extent the position is “more likely than not” to be sustained assuming examination by taxing authorities. The Manager analyzed the Fund’s tax positions taken on federal, state and local income tax returns for all open tax years (for up to three tax years) and has concluded that no provisions for federal, state and local income tax are required in the Fund’s financial statements. The Fund’s federal, state and local income tax and federal excise tax returns for tax years for which the applicable statutes of limitations have not expired are subject to examination by the Internal Revenue Service and state and local departments of revenue.
(C) Dividends and Distributions to Shareholders. Dividends and distributions are recorded on the ex-dividend date. The Fund intends to declare and pay dividends from net investment income, if any, at least monthly and distributions from net realized capital and currency gains, if any, at least annually. Unless a shareholder elects otherwise, all dividends and distributions are reinvested at NAV in the same class of shares of the Fund. Dividends and distributions to shareholders are determined in accordance with federal income tax regulations and may differ from determinations using GAAP.
(D) Security Transactions and Investment Income. The Fund records security transactions on the trade date. Realized gains and
losses on security transactions are determined using the identified cost method. Dividend income is recognized on the ex-dividend date, net of any foreign tax withheld at the source, and interest income is accrued as earned using the effective interest rate method. Distributions received from real estate investment trusts may be classified as dividends, capital gains and/or return of capital. Discounts and premiums on securities purchased for the Fund are accreted and amortized, respectively, on the effective interest rate method. Income from payment-in-kind securities is accreted daily based on the effective interest method.
Investment income and realized and unrealized gains and losses on investments of the Fund are allocated pro rata to the separate classes of shares based upon their relative net assets on the date the income is earned or realized and unrealized gains and losses are incurred.
The Fund may place a debt security on non-accrual status and reduce related interest income by ceasing current accruals and writing off all or a portion of any interest receivables when the collection of all or a portion of such interest has become doubtful. A debt security is removed from non-accrual status when the issuer resumes interest payments or when collectability of interest is reasonably assured.
(E) Expenses. Expenses of the Trust are allocated to the individual Funds in proportion to the net assets of the respective Funds when the expenses are incurred, except where direct allocations of expenses can be made. Expenses (other than transfer agent expenses and fees incurred under the shareholder services plans and/or the distribution plans further discussed in Note 3(B)) are allocated to separate classes of shares pro rata based upon their relative net assets on the date the expenses are incurred. The expenses borne by the Fund, including those of related parties to the Fund, are shown in the Statement of Operations.
Additionally, the Fund may invest in ETFs and mutual funds, which are subject to management fees and other fees that may cause the costs of investing in ETFs and mutual funds to be greater than the costs of owning the underlying securities directly. These indirect expenses of ETFs and mutual funds are not included in the amounts shown as expenses in the Fund’s Statement of Operations or in the expense ratios included in the Financial Highlights.
(F) Use of Estimates. In preparing financial statements in conformity with GAAP, the Manager makes estimates and assumptions that affect the reported amounts and disclosures in the financial statements. Actual results could differ from those estimates.
(G) Loan Assignments, Participations and Commitments. The Fund may invest in loan assignments and participations (“loans”). Commitments are agreements to make money available to a borrower in a specified amount, at a specified rate and within a specified time. The Fund records an investment when the borrower withdraws money on a commitment or when a funded loan is purchased (trade date) and records interest as earned. These loans pay interest at rates that are periodically reset by reference to a base lending rate plus a spread. These base lending rates are generally the prime rate offered by a designated U.S. bank or the London Interbank Offered Rate (“LIBOR”).
The loans in which the Fund may invest are generally readily marketable, but may be subject to some restrictions on resale. For example, the Fund may be contractually obligated to receive approval from the agent bank and/or borrower prior to the sale of these investments. If the Fund purchases an assignment from a lender, the Fund will generally have direct contractual rights against the borrower in favor of the lender. If the Fund purchases a participation interest either from a lender or a participant, the Fund typically will have established a direct contractual relationship with the seller of the participation interest, but not with the borrower. Consequently, the Fund is subject to the credit risk of the lender or participant who sold the participation interest to the Fund, in addition to the usual credit risk of the borrower. In the event that the borrower, selling participant or intermediate participants become insolvent or enter into bankruptcy, the Fund may incur certain costs and delays in realizing payment, or may suffer a loss of principal and/or interest.
| | |
| 38 | | MainStay MacKay High Yield Corporate Bond Fund |
Unfunded commitments represent the remaining obligation of the Fund to the borrower. At any point in time, up to the maturity date of the issue, the borrower may demand the unfunded portion. Unfunded amounts, if any, are marked to market and any unrealized gains or losses are recorded in the Statement of Assets and Liabilities. As of October 31, 2020, the Fund held unfunded commitments. (See Note 5)
(H) Securities Lending. In order to realize additional income, the Fund may engage in securities lending, subject to the limitations set forth in the 1940 Act and relevant guidance by the staff of the Securities and Exchange Commission (“SEC”). If the Fund engages in securities lending, the Fund will lend through its custodian, currently State Street Bank and Trust Company (“State Street”) (See Note 14 for securities lending agent change), acting as securities lending agent on behalf of the Fund. Under the current arrangement, State Street will manage the Fund’s collateral in accordance with the securities lending agency agreement between the Fund and State Street, and indemnify the Fund against counterparty risk. The loans will be collateralized by cash (which may be invested in a money market fund) and/or non-cash collateral (which may include U.S. Treasury securities and/or U.S. government agency securities issued or guaranteed by the United States government or its agencies or instrumentalities) at least equal at all times to the market value of the securities loaned. The Fund bears the risk of delay in recovery of, or loss of rights in, the securities loaned. The Fund may also record a realized gain or loss on securities deemed sold due to a borrower’s inability to return securities on loan. The Fund bears the risk of any loss on investment of cash collateral. The Fund will receive compensation for lending its securities in the form of fees or it will retain a portion of interest earned on the investment of any cash collateral. The Fund will also continue to receive interest and dividends on the securities loaned and any gain or loss in the market price of the securities loaned that may occur during the term of the loan will be for the account of the Fund. Income earned from securities lending activities, if any, is reflected in the Statement of Operations. As of October 31, 2020, the Fund had securities on loan with an aggregate market value of $2,697,938 and received cash collateral, which was invested into the State Street Navigator Securities Lending Government Money Market Portfolio, with a value of $2,741,715.
(I) Securities Risk. The ability of issuers of debt securities held by the Fund to meet their obligations may be affected by, among other things, economic or political developments in a specific country, industry or region. Debt securities are also subject to the risks associated with changes in interest rates. The Fund primarily invests in high-yield debt securities (commonly referred to as “junk bonds”), which are considered speculative because they present a greater risk of loss, including default, than higher rated debt securities. These securities pay investors a premium—a higher interest rate or yield than investment grade debt securities—because of the increased risk of loss. These securities can also be subject to greater price volatility. In times of unusual or adverse market, economic or political conditions, these securities may experience higher than normal default rates.
The loans in which the Fund invests are usually rated below investment grade, or if unrated, determined by the Subadvisor to be of comparable quality (commonly referred to as “junk bonds”) and are generally considered speculative because they present a greater risk of loss, including default, than higher quality debt securities. Moreover, such securities may, under certain circumstances, be particularly susceptible
to liquidity and valuation risks. Although certain loans are collateralized, there is no guarantee that the value of the collateral will be sufficient or available to satisfy the borrower’s obligation. In times of unusual or adverse market, economic or political conditions, loans may experience higher than normal default rates. In the event of a recession or serious credit event, among other eventualities, the value of the Fund’s investments in loans are more likely to decline. The secondary market for loans is limited and, thus, the Fund’s ability to sell or realize the full value of its investment in these loans to reinvest sale proceeds or to meet redemption obligations may be impaired. In addition, loans generally are subject to extended settlement periods that may be longer than seven days. As a result, the Fund may be adversely affected by selling other investments at an unfavorable time and/or under unfavorable conditions or engaging in borrowing transactions, such as borrowing against its credit facility, to raise cash to meet redemption obligations or pursue other investment opportunities.
In certain circumstances, loans may not be deemed to be securities. As a result, the Fund may not have the protection of the anti-fraud provisions of the federal securities laws. In such cases, the Fund generally must rely on the contractual provisions in the loan agreement and common-law fraud protections under applicable state law.
(J) LIBOR Replacement Risk. The Fund may invest in certain debt securities, derivatives or other financial instruments that utilize the LIBOR, as a “benchmark” or “reference rate” for various interest rate calculations. The United Kingdom Financial Conduct Authority, which regulates LIBOR, announced that after 2021 it will cease its active encouragement of banks to provide the quotations needed to sustain LIBOR. As a result, it is anticipated that LIBOR will be discontinued or will no longer be sufficiently robust to be representative of its underlying market around that time. Although financial regulators and industry working groups have suggested alternative reference rates, such as the European Interbank Offer Rate (“EURIBOR”), Sterling Overnight Interbank Average Rate (“SONIA”) and Secured Overnight Financing Rate (“SOFR”), there are challenges to converting certain contracts and transactions to a new benchmark and neither the full effects of the transition process nor its ultimate outcome is known. Management is currently working to assess exposure and will modify contracts as necessary.
The elimination of LIBOR or changes to other reference rates or any other changes or reforms to the determination or supervision of reference rates could have an adverse impact on the market for, or value of, any securities or payments linked to those reference rates, which may adversely affect the Fund’s performance and/or net asset value. Uncertainty and risk also remain regarding the willingness and ability of issuers and lenders to include revised provisions in new and existing contracts or instruments. Consequently, the transition away from LIBOR to other reference rates may lead to increased volatility and illiquidity in markets that are tied to LIBOR, fluctuations in values of LIBOR-related investments or investments in issuers that utilize LIBOR, increased difficulty in borrowing or refinancing and diminished effectiveness of hedging strategies, adversely affecting the Fund’s performance. Accordingly, the potential effect of a transition away from LIBOR on the Fund or the debt securities or other instruments based on LIBOR in which the Fund invests cannot yet be determined. Furthermore, the risks associated with the expected discontinuation of LIBOR and transition may be
Notes to Financial Statements (continued)
exacerbated if the work necessary to effect an orderly transition to an alternative reference rate is not completed in a timely manner. Because the usefulness of LIBOR as a benchmark could deteriorate during the transition period, these effects could occur prior to the end of 2021.
(K) Indemnifications. Under the Trust’s organizational documents, its officers and trustees are indemnified against certain liabilities that may arise out of performance of their duties to the Trust. Additionally, in the normal course of business, the Fund enters into contracts with third-party service providers that contain a variety of representations and warranties and that may provide general indemnifications. The Fund’s maximum exposure under these arrangements is unknown, as this would involve future claims that may be made against the Fund that have not yet occurred. The Manager believes that the risk of loss in connection with these potential indemnification obligations is remote. However, there can be no assurance that material liabilities related to such obligations will not arise in the future, which could adversely impact the Fund.
Note 3–Fees and Related Party Transactions
(A) Manager and Subadvisor. New York Life Investments, a registered investment adviser and an indirect, wholly-owned subsidiary of New York Life Insurance Company (“New York Life”), serves as the Fund’s Manager, pursuant to an Amended and Restated Management Agreement (“Management Agreement”). The Manager provides offices, conducts clerical, recordkeeping and bookkeeping services and keeps most of the financial and accounting records required to be maintained by the Fund. Except for the portion of salaries and expenses that are the responsibility of the Fund, the Manager pays the salaries and expenses of all personnel affiliated with the Fund and certain operational expenses of the Fund. The Fund reimburses New York Life Investments in an amount equal to the portion of the compensation of the Chief Compliance Officer attributable to the Fund. MacKay Shields LLC (“MacKay Shields” or the “Subadvisor”), a registered investment adviser and an indirect, wholly-owned subsidiary of New York Life, serves as Subadvisor to the Fund and is responsible for the day-to-day portfolio management of the Fund. Pursuant to the terms of an Amended and Restated Subadvisory Agreement (“Subadvisory Agreement”) between New York Life Investments and MacKay Shields, New York Life Investments pays for the services of the Subadvisor.
Pursuant to the Management Agreement, the Fund pays the Manager a monthly fee for the services performed and the facilities furnished at an annual rate of the Fund’s average daily net assets as follows: 0.60% up to $500 million; 0.55% from $500 million up to $5 billion; 0.525% from $5 billion up to $7 billion; 0.50% from $7 billion up to $10 billion; 0.49% from $10 billion to $15 billion; and 0.48% in excess of $15 billion, plus a fee for fund accounting services previously provided by New York Life Investments under a separate fund accounting agreement furnished at an annual rate of the Fund’s average daily net assets as follows: 0.05% up to $20 million; 0.0333% from $20 million to $100 million; and 0.01% in excess of $100 million.
During the year ended October 31, 2020, the effective management fee rate (exclusive of any applicable waivers/reimbursements) was 0.54% inclusive of a fee for fund accounting services of 0.01% of the Fund’s average daily net assets.
New York Life Investments has contractually agreed to waive fees and/or reimburse expenses so that Total Annual Fund Operating Expenses (excluding taxes, interest, litigation, extraordinary expenses, brokerage and other transaction expenses relating to the purchase or sale of portfolio investments, and acquired (underlying) fund fees and expenses) of Class R6 do not exceed those of Class I. This agreement will remain in effect until August 31, 2021, and shall renew automatically for one-year terms unless New York Life Investments provides written notice of termination prior to the start of the next term or upon approval of the Board.
During the year ended October 31, 2020, New York Life Investments earned fees from the Fund in the amount of $57,205,955 and paid the Subadvisor in the amount of $28,060,187.
State Street provides sub-administration and sub-accounting services to the Fund pursuant to an agreement with New York Life Investments (See Note 14 for sub-administration and sub-accounting service provider change). These services include calculating the daily NAVs of the Fund, maintaining the general ledger and sub-ledger accounts for the calculation of the Fund’s NAVs and assisting New York Life Investments in conducting various aspects of the Fund’s administrative operations. For providing these services to the Fund, State Street is compensated by New York Life Investments.
Pursuant to an agreement between the Trust and New York Life Investments, New York Life Investments is responsible for providing or procuring certain regulatory reporting services for the Fund. The Fund will reimburse New York Life Investments for the actual costs incurred by New York Life Investments in connection with providing or procuring these services for the Fund.
(B) Distribution, Service and Shareholder Service Fees. The Trust, on behalf of the Fund, has entered into a distribution agreement with NYLIFE Distributors LLC (the “Distributor”), an affiliate of New York Life Investments. The Fund has adopted distribution plans (the “Plans”) in accordance with the provisions of Rule 12b-1 under the 1940 Act.
Pursuant to the Class A, Investor Class and Class R2 Plans, the Distributor receives a monthly distribution fee from the Class A, Investor Class and Class R2 shares at an annual rate of 0.25% of the average daily net assets of the Class A, Investor Class and Class R2 shares for distribution and/or service activities as designated by the Distributor. Pursuant to the Class B and Class C Plans, Class B and Class C shares pay the Distributor a monthly distribution fee at an annual rate of 0.75% of the average daily net assets of the Class B and Class C shares, along with a service fee at an annual rate of 0.25% of the average daily net assets of the Class B and Class C shares, for a total 12b-1 fee of 1.00%. Pursuant to the Class R3 and SIMPLE Class Plans, Class R3 and SIMPLE Class shares pay the Distributor a monthly fee at an annual rate of 0.25% of the average daily net assets of the Class R3 and SIMPLE Class shares, along with a service fee at an annual rate of 0.25% of the average daily net assets of the Class R3 and SIMPLE Class shares, for a total 12b-1 fee of 0.50%. Class I, Class R1 and Class R6 shares are not subject to a distribution and/or service fee.
The Plans provide that the distribution and service fees are payable to the Distributor regardless of the amounts actually expended by the Distributor for distribution of the Fund’s shares and service activities.
In accordance with the Shareholder Services Plans for the Class R1, Class R2 and Class R3 shares, the Manager has agreed to provide,
| | |
| 40 | | MainStay MacKay High Yield Corporate Bond Fund |
through its affiliates or independent third parties, various shareholder and administrative support services to shareholders of the Class R1, Class R2 and Class R3 shares. For its services, the Manager, its affiliates or independent third-party service providers are entitled to a shareholder service fee accrued daily and paid monthly at an annual rate of 0.10% of the average daily net assets of the Class R1, Class R2 and Class R3 shares. This is in addition to any fees paid under the Class R2 and Class R3 Plans.
During the year ended October 31, 2020, shareholder service fees incurred by the Fund were as follows:
| | | | |
| |
Class R1 | | $ | 48 | |
Class R2 | | | 13,068 | |
Class R3 | | | 1,556 | |
(C) Sales Charges. The Fund was advised by the Distributor that the amount of initial sales charges retained on sales of Class A and Investor Class shares during the year ended October 31, 2020, were $660,892 and $63,108, respectively.
The Fund was also advised that the Distributor retained CDSCs on redemptions of Class A, Class B and Class C shares during the year ended October 31, 2020, of $38,593, $24,075 and $19,213, respectively.
(D) Transfer, Dividend Disbursing and Shareholder Servicing Agent. NYLIM Service Company LLC, an affiliate of New York Life Investments, is the Fund’s transfer, dividend disbursing and shareholder servicing agent pursuant to an agreement between NYLIM Service Company LLC and the Trust. NYLIM Service Company LLC has entered into an agreement with DST Asset Manager Solutions, Inc. (“DST”), pursuant to which DST performs certain transfer agent services on behalf of NYLIM Service Company LLC. New York Life Investments has contractually agreed to limit the transfer agency expenses charged to the Fund’s share classes to a maximum of 0.35% of that share class’s average daily net assets on an annual basis after deducting any applicable Fund or class-level expense reimbursement or small account fees. This agreement will remain in effect until August 31, 2021 for SIMPLE Class shares and February 28, 2021 for all other share classes, and shall renew automatically for one-year terms unless New York Life Investments provides written notice of termination prior to the start of the next term or upon approval of the Board. During the year ended October 31, 2020, transfer agent expenses incurred by the Fund and any reimbursements, pursuant to the aforementioned Transfer Agency expense limitation agreement, were as follows:
| | | | | | | | |
Class | | Expense | | | Waived | |
Class A | | $ | 5,039,062 | | | $ | — | |
Investor Class | | | 364,751 | | | | — | |
Class B | | | 127,761 | | | | — | |
Class C | | | 798,638 | | | | — | |
Class I | | | 5,030,759 | | | | — | |
Class R1 | | | 73 | | | | — | |
Class R2 | | | 19,644 | | | | — | |
Class R3 | | | 2,329 | | | | — | |
Class R6 | | | 132,921 | | | | — | |
SIMPLE Class | | | 9 | | | | — | |
(E) Small Account Fee. Shareholders with small accounts adversely impact the cost of providing transfer agency services. In an effort to reduce total transfer agency expenses, the Fund has implemented a small account fee on certain types of accounts. As described in the Fund’s prospectus, certain shareholders with an account balance of less than $1,000 ($5,000 for Class A share accounts) are charged an annual per account fee of $20 (assessed semi-annually), the proceeds from which offset transfer agent fees as reflected in the Statement of Operations. This small account fee will not apply to certain types of accounts as described further in the Fund’s prospectus.
(F) Capital. As of October 31, 2020, New York Life and its affiliates beneficially held shares of the Fund with the values and percentages of net assets as follows:
| | | | | | | | |
| | |
Class I | | $ | 419,727 | | | | 0.0 | %‡ |
Class R1 | | | 38,694 | | | | 76.3 | |
SIMPLE Class | | | 24,823 | | | | 100 | |
| ‡ | Less than one-tenth of a percent. |
Note 4–Federal Income Tax
As of October 31, 2020, the cost and unrealized appreciation (depreciation) of the Fund’s investment portfolio, including applicable derivative contracts and other financial instruments, as determined on a federal income tax basis, were as follows:
| | | | | | | | | | | | | | | | |
| | | Federal
Tax
Cost | | | Gross
Unrealized
Appreciation | | | Gross
Unrealized
(Depreciation) | | | Net
Unrealized
Appreciation/
(Depreciation) | |
| | | | |
Investments in Securities | | $ | 11,712,261,800 | | | $ | 584,400,696 | | | $ | (460,064,011 | ) | | $ | 124,336,685 | |
As of October 31, 2020, the components of accumulated gain (loss) on a tax basis were as follows:
| | | | | | | | |
Ordinary
Income | | Accumulated
Capital and
Other Gain
(Loss) | | Other
Temporary Differences | | Unrealized
Appreciation
(Depreciation) | | Total
Accumulated
Gain (Loss) |
| | | | |
| $ — | | $(486,147,859) | | $(15,609,342) | | $124,309,256 | | $(377,447,945) |
The difference between book-basis and tax-basis unrealized appreciation (depreciation) is primarily due to wash sales and cumulative bond amortization adjustment. The other temporary differences are primarily due to interest accruals on defaulted securities.
As of October 31, 2020, for federal income tax purposes, capital loss carryforwards of $486,147,859 were available as shown in the table below, to the extent provided by the regulations to offset future realized gains of the Fund through the years indicated. To the extent that these capital loss carryforwards are used to offset future capital gains, it is probable that the capital gains so offset will not be distributed to shareholders. No capital gain distributions shall be made until any capital loss carryforwards have been fully utilized.
| | | | |
Capital Loss
Available Through | | Short-Term
Capital Loss
Amounts (000’s) | | Long-Term
Capital Loss
Amounts (000’s) |
| | |
| Unlimited | | $11,928 | | $474,220 |
Notes to Financial Statements (continued)
During the years ended October 31, 2020, and October 31, 2019, the tax character of distributions paid as reflected in the Statements of Changes in Net Assets were as follows:
| | | | | | | | |
| | | 2020 | | | 2019 | |
| | |
Distributions paid from: | | | | | | | | |
Ordinary Income | | $ | 583,735,387 | | | $ | 492,978,357 | |
Return of Capital | | | 61,209,254 | | | | 42,409,382 | |
Total | | $ | 644,944,641 | | | $ | 535,387,739 | |
Note 5–Commitments and Contingencies
As of October 31, 2020, the Fund had an unfunded commitment pursuant to the following loan agreement:
| | | | | | | | |
Borrower | | Unfunded
Commitment | | | Unrealized
Appreciation/
(Depreciation) | |
| | |
Neenah Foundry Co. | | | | | | | | |
2020 PIK Delayed Draw Term Loan TBD, due 12/31/22 | | $ | 1,285,000 | | | $ | 0 | |
Commitment is available until maturity date.
Note 6–Restricted Securities
Restricted securities are subject to legal or contractual restrictions on resale. Private placement securities are generally considered to be restricted except for those securities traded between qualified institutional investors under the provisions of Rule 144A of the Securities Act
of 1933, as amended. Disposal of restricted securities may involve time consuming negotiations and expenses, and prompt sale at an acceptable price may be difficult to achieve.
As of October 31, 2020, the Fund held the following restricted securities:
| | | | | | | | | | | | | | | | | | | | |
Security | | Date(s) of
Acquisition | | | Principal
Amount/
Shares | | | Cost | | | 10/31/20
Value | | | Percent of
Net Assets | |
| | | | | |
California Resources | | | | | | | | | | | | | | | | | | | | |
Common Stock | | | 10/27/20 | | | | 180,041 | | | $ | 1,149,014 | | | $ | 1,149,014 | | | | 0.0 | %‡ |
| Carlson Travel, Inc. | | | | | | | | | | | | | | | | | | | | |
Common Stock | | | 9/4/20 | | | | 15,152 | | | | — | | | | 841,845 | | | | 0.0 | ‡ |
| GenOn Energy, Inc. | | | | | | | | | | | | | | | | | | | | |
Common Stock | | | 12/14/18 | | | | 386,241 | | | | 43,250,890 | | | | 61,798,560 | | | | 0.5 | |
| ION Media Networks, Inc. | | | | | | | | | | | | | | | | | | | | |
Common Stock | | | 3/12/10-9/29/17 | | | | 2,287 | | | | 13,572 | | | | 1,811,304 | | | | 0.0 | ‡ |
| Sterling Entertainment Enterprises LLC | | | | | | | | | | | | | | | | | | | | |
Corporate Bond
10.25%, due 1/15/25 | | | 12/28/17 | | | $ | 20,000,000 | | | | 19,795,920 | | | | 20,962,000 | | | | 0.2 | |
Total | | | | | | | | | | $ | 64,209,396 | | | $ | 86,562,723 | | | | 0.7 | % |
| ‡ | Less than one-tenth of a percent. |
Note 7–Custodian
State Street is the custodian of cash and securities held by the Fund (See Note 14 for custodian change). Custodial fees are charged to the Fund based on the Fund’s net assets and/or the market value of securities held by the Fund and the number of certain transactions incurred by the Fund.
Note 8–Line of Credit
The Fund and certain other funds managed by New York Life Investments maintain a line of credit with a syndicate of banks in order to secure a source of funds for temporary purposes to meet unanticipated or excessive redemption requests.
Effective July 28, 2020, under the credit agreement (the “Credit Agreement”), the aggregate commitment amount is $600,000,000 with an additional uncommitted amount of $100,000,000. The commitment fee is an annual rate of 0.15% of the average commitment amount
payable quarterly, regardless of usage, to JP Morgan Chase Bank NA, who serves as the agent to the syndicate. The commitment fee is allocated among the Fund and certain other funds managed by New York Life Investments based upon their respective net assets and other factors. Interest on any revolving credit loan is charged based upon the Federal Funds Rate or the one-month LIBOR, whichever is higher. The Credit Agreement expires on July 27, 2021, although the Fund, certain other funds managed by New York Life Investments and the syndicate of banks may renew the Credit Agreement for an additional year on the same or different terms or enter into a credit agreement with a different syndicate of banks. Prior to July 28, 2020, the aggregate commitment amount and the commitment fee were the same as those under the current Credit Agreement, but State Street served as agent to the syndicate. During the year ended October 31, 2020, there were no borrowings made or outstanding with respect to the Fund under the Credit Agreement or the credit agreement for which State Street served as agent.
| | |
| 42 | | MainStay MacKay High Yield Corporate Bond Fund |
Note 9–Interfund Lending Program
Pursuant to an exemptive order issued by the SEC, the Fund, along with certain other funds managed by New York Life Investments, may participate in an interfund lending program. The interfund lending program provides an alternative credit facility that permits the Fund and certain other funds managed by New York Life Investments to lend or borrow money for temporary purposes directly to or from one another subject to the conditions of the exemptive order. During the year ended October 31, 2020, there were no interfund loans made or outstanding with respect to the Fund.
Note 10–Purchases and Sales of Securities (in 000’s)
During the year ended October 31, 2020, purchases and sales of securities, other than short-term securities, were $5,609,946 and $3,739,185, respectively.
The Fund may purchase securities from or sell securities to other portfolios managed by the Subadvisor. These interportfolio transactions are primarily used for cash management purposes and are made pursuant to Rule 17a-7 under the 1940 Act. During the year ended October 31, 2020, such purchases were $6,693.
Note 11–Capital Share Transactions
Transactions in capital shares for the years ended October 31, 2020, and October 31, 2019, were as follows:
| | | | | | | | |
Class A | | Shares | | | Amount | |
| | |
Year ended October 31, 2020: | | | | | | | | |
Shares sold | | | 162,189,152 | | | $ | 862,805,279 | |
Shares issued to shareholders in reinvestment of distributions | | | 31,290,846 | | | | 168,572,345 | |
Shares redeemed | | | (153,726,255 | ) | | | (818,209,762 | ) |
| | | | |
Net increase (decrease) in shares outstanding before conversion | | | 39,753,743 | | | | 213,167,862 | |
Shares converted into Class A (See Note 1) | | | 7,327,259 | | | | 39,745,182 | |
Shares converted from Class A (See Note 1) | | | (2,426,758 | ) | | | (13,511,692 | ) |
| | | | |
Net increase (decrease) | | | 44,654,244 | | | $ | 239,401,352 | |
| | | | |
Year ended October 31, 2019: | | | | | | | | |
Shares sold | | | 109,026,669 | | | $ | 609,230,133 | |
Shares issued to shareholders in reinvestment of distributions | | | 29,125,162 | | | | 161,795,187 | |
Shares redeemed | | | (135,631,071 | ) | | | (754,132,210 | ) |
| | | | |
Net increase (decrease) in shares outstanding before conversion | | | 2,520,760 | | | | 16,893,110 | |
Shares converted into Class A (See Note 1) | | | 11,659,035 | | | | 64,979,916 | |
Shares converted from Class A (See Note 1) | | | (2,901,647 | ) | | | (16,231,977 | ) |
| | | | |
Net increase (decrease) | | | 11,278,148 | | | $ | 65,641,049 | |
| | | | |
| | | | | | | | |
Investor Class | | Shares | | | Amount | |
| | |
Year ended October 31, 2020: | | | | | | | | |
Shares sold | | | 3,476,036 | | | $ | 18,943,660 | |
Shares issued to shareholders in reinvestment of distributions | | | 1,553,045 | | | | 8,430,250 | |
Shares redeemed | | | (3,567,862 | ) | | | (19,332,577 | ) |
| | | | |
Net increase (decrease) in shares outstanding before conversion | | | 1,461,219 | | | | 8,041,333 | |
Shares converted into Investor Class (See Note 1) | | | 949,252 | | | | 5,122,805 | |
Shares converted from Investor Class (See Note 1) | | | (3,638,926 | ) | | | (19,982,653 | ) |
| | | | |
Net increase (decrease) | | | (1,228,455 | ) | | $ | (6,818,515 | ) |
| | | | |
Year ended October 31, 2019: | | | | | | | | |
Shares sold | | | 5,791,537 | | | $ | 32,673,618 | |
Shares issued to shareholders in reinvestment of distributions | | | 1,538,599 | | | | 8,616,122 | |
Shares redeemed | | | (5,534,938 | ) | | | (31,190,804 | ) |
| | | | |
Net increase (decrease) in shares outstanding before conversion | | | 1,795,198 | | | | 10,098,936 | |
Shares converted into Investor Class (See Note 1) | | | 2,396,950 | | | | 13,491,296 | |
Shares converted from Investor Class (See Note 1) | | | (4,225,489 | ) | | | (23,777,106 | ) |
| | | | |
Net increase (decrease) | | | (33,341 | ) | | $ | (186,874 | ) |
| | | | |
|
| |
Class B | | Shares | | | Amount | |
| | |
Year ended October 31, 2020: | | | | | | | | |
Shares sold | | | 220,973 | | | $ | 1,194,012 | |
Shares issued to shareholders in reinvestment of distributions | | | 453,682 | | | | 2,434,490 | |
Shares redeemed | | | (2,243,156 | ) | | | (12,006,607 | ) |
| | | | |
Net increase (decrease) in shares outstanding before conversion | | | (1,568,501 | ) | | | (8,378,105 | ) |
Shares converted from Class B (See Note 1) | | | (1,327,691 | ) | | | (7,151,912 | ) |
| | | | |
Net increase (decrease) | | | (2,896,192 | ) | | $ | (15,530,017 | ) |
| | | | |
Year ended October 31, 2019: | | | | | | | | |
Shares sold | | | 1,087,084 | | | $ | 6,091,354 | |
Shares issued to shareholders in reinvestment of distributions | | | 566,778 | | | | 3,131,419 | |
Shares redeemed | | | (3,842,049 | ) | | | (21,308,958 | ) |
| | | | |
Net increase (decrease) in shares outstanding before conversion | | | (2,188,187 | ) | | | (12,086,185 | ) |
Shares converted from Class B (See Note 1) | | | (1,211,970 | ) | | | (6,700,688 | ) |
| | | | |
Net increase (decrease) | | | (3,400,157 | ) | | $ | (18,786,873 | ) |
| | | | |
Notes to Financial Statements (continued)
| | | | | | | | |
Class C | | Shares | | | Amount | |
| | |
Year ended October 31, 2020: | | | | | | | | |
Shares sold | | | 9,226,500 | | | $ | 48,471,453 | |
Shares issued to shareholders in reinvestment of distributions | | | 2,812,640 | | | | 15,100,791 | |
Shares redeemed | | | (22,129,547 | ) | | | (118,456,173 | ) |
| | | | |
Net increase (decrease) in shares outstanding before conversion | | | (10,090,407 | ) | | | (54,883,929 | ) |
Shares converted from Class C (See Note 1) | | | (1,610,770 | ) | | | (8,681,316 | ) |
| | | | |
Net increase (decrease) | | | (11,701,177 | ) | | $ | (63,565,245 | ) |
| | | | |
Year ended October 31, 2019: | | | | | | | | |
Shares sold | | | 4,723,186 | | | $ | 26,187,539 | |
Shares issued to shareholders in reinvestment of distributions | | | 3,506,055 | | | | 19,364,942 | |
Shares redeemed | | | (35,272,423 | ) | | | (195,600,323 | ) |
| | | | |
Net increase (decrease) in shares outstanding before conversion | | | (27,043,182 | ) | | | (150,047,842 | ) |
Shares converted from Class C (See Note 1) | | | (6,213,278 | ) | | | (34,434,490 | ) |
| | | | |
Net increase (decrease) | | | (33,256,460 | ) | | $ | (184,482,332 | ) |
| | | | |
|
| |
Class I | | Shares | | | Amount | |
| | |
Year ended October 31, 2020: | | | | | | | | |
Shares sold | | | 316,267,141 | | | $ | 1,685,293,008 | |
Shares issued to shareholders in reinvestment of distributions | | | 35,224,225 | | | | 189,883,002 | |
Shares redeemed | | | (318,299,322 | ) | | | (1,713,046,438 | ) |
| | | | |
Net increase in shares outstanding before conversion | | | 33,192,044 | | | | 162,129,572 | |
Shares converted into Class I (See Note 1) | | | 570,677 | | | | 3,030,446 | |
| | | | |
Net increase (decrease) | | | 33,762,721 | | | $ | 165,160,018 | |
| | | | |
Year ended October 31, 2019: | | | | | | | | |
Shares sold | | | 369,778,310 | | | $ | 2,055,115,359 | |
Shares issued to shareholders in reinvestment of distributions | | | 31,677,016 | | | | 176,272,793 | |
Shares redeemed | | | (349,772,567 | ) | | | (1,938,607,921 | ) |
| | | | |
Net increase (decrease) in shares outstanding before conversion | | | 51,682,759 | | | | 292,780,231 | |
Shares converted into Class I (See Note 1) | | | 1,803,168 | | | | 10,045,070 | |
Shares converted from Class I (See Note 1) | | | (109,697,991 | ) | | | (600,048,104 | ) |
| | | | |
Net increase (decrease) | | | (56,212,064 | ) | | $ | (297,222,803 | ) |
| | | | |
|
| |
Class R1 | | Shares | | | Amount | |
| | |
Year ended October 31, 2020: | | | | | | | | |
Shares sold | | | 638 | | | $ | 3,461 | |
Shares issued to shareholders in reinvestment of distributions | | | 542 | | | | 2,913 | |
Shares redeemed | | | (1,231 | ) | | | (6,888 | ) |
| | | | |
Net increase (decrease) | | | (51 | ) | | $ | (514 | ) |
| | | | |
Year ended October 31, 2019: | | | | | | | | |
Shares sold | | | 1,657 | | | $ | 9,192 | |
Shares issued to shareholders in reinvestment of distributions | | | 504 | | | | 2,796 | |
Shares redeemed | | | (5,695 | ) | | | (31,491 | ) |
| | | | |
Net increase (decrease) | | | (3,534 | ) | | $ | (19,503 | ) |
| | | | |
| | | | | | | | |
Class R2 | | Shares | | | Amount | |
| | |
Year ended October 31, 2020: | | | | | | | | |
Shares sold | | | 385,054 | | | $ | 2,096,445 | |
Shares issued to shareholders in reinvestment of distributions | | | 119,352 | | | | 643,342 | |
Shares redeemed | | | (565,097 | ) | | | (3,035,083 | ) |
| | | | |
Net increase (decrease) in shares outstanding before conversion | | | (60,691 | ) | | | (295,296 | ) |
Shares converted from Class R2 (See Note 1) | | | (6,682 | ) | | | (36,415 | ) |
| | | | |
Net increase (decrease) | | | (67,373 | ) | | $ | (331,711 | ) |
| | | | |
Year ended October 31, 2019: | | | | | | | | |
Shares sold | | | 829,133 | | | $ | 4,598,857 | |
Shares issued to shareholders in reinvestment of distributions | | | 106,098 | | | | 590,024 | |
Shares redeemed | | | (476,028 | ) | | | (2,623,840 | ) |
| | | | |
Net increase (decrease) | | | 459,203 | | | $ | 2,565,041 | |
| | | | |
|
| |
Class R3 | | Shares | | | Amount | |
| | |
Year ended October 31, 2020: | | | | | | | | |
Shares sold | | | 166,149 | | | $ | 909,222 | |
Shares issued to shareholders in reinvestment of distributions | | | 15,330 | | | | 82,408 | |
Shares redeemed | | | (52,384 | ) | | | (283,628 | ) |
| | | | |
Net increase (decrease) in shares outstanding before conversion | | | 129,095 | | | | 708,002 | |
Shares converted from Class R3 (See Note 1) | | | (1,651 | ) | | | (9,031 | ) |
| | | | |
Net increase (decrease) | | | 127,444 | | | $ | 698,971 | |
| | | | |
Year ended October 31, 2019: | | | | | | | | |
Shares sold | | | 121,247 | | | $ | 675,686 | |
Shares issued to shareholders in reinvestment of distributions | | | 7,957 | | | | 44,264 | |
Shares redeemed | | | (9,822 | ) | | | (55,038 | ) |
| | | | |
Net increase (decrease) in shares outstanding before conversion | | | 119,382 | | | | 664,912 | |
Shares converted from Class R3 (See Note 1) | | | (607 | ) | | | (3,230 | ) |
| | | | |
Net increase (decrease) | | | 118,775 | | | $ | 661,682 | |
| | | | |
| | |
| 44 | | MainStay MacKay High Yield Corporate Bond Fund |
| | | | | | | | |
Class R6 | | Shares | | | Amount | |
| | |
Year ended October 31, 2020: | | | | | | | | |
Shares sold | | | 541,233,062 | | | $ | 2,794,572,816 | |
Shares issued to shareholders in reinvestment of distributions | | | 39,761,619 | | | | 213,232,631 | |
Shares redeemed | | | (151,718,551 | ) | | | (806,880,020 | ) |
| | | | |
Net increase (decrease) in shares outstanding before conversion | | | 429,276,130 | | | | 2,200,925,427 | |
Shares converted into Class R6 (See Note 1) | | | 1,761,091 | | | | 10,020,608 | |
Shares converted from Class R6 (See Note 1) | | | (1,588,011 | ) | | | (8,546,022 | ) |
| | | | |
Net increase (decrease) | | | 429,449,210 | | | $ | 2,202,400,013 | |
| | | | |
Year ended October 31, 2019: | | | | | | | | |
Shares sold | | | 255,911,222 | | | $ | 1,421,624,226 | |
Shares issued to shareholders in reinvestment of distributions | | | 20,797,362 | | | | 115,504,966 | |
Shares redeemed | | | (159,723,301 | ) | | | (886,805,280 | ) |
| | | | |
Net increase (decrease) in shares outstanding before conversion | | | 116,985,283 | | | | 650,323,912 | |
Shares converted into Class R6 (See Note 1) | | | 109,898,841 | | | | 600,047,709 | |
Shares converted from Class R6 (See Note 1) | | | (1,330,027 | ) | | | (7,368,396 | ) |
| | | | |
Net increase (decrease) | | | 225,554,097 | | | $ | 1,243,003,225 | |
| | | | |
|
| |
SIMPLE Class | | Shares | | | Amount | |
| | |
Period ended October 31, 2020 (a): | | | | | | | | |
Shares sold | | | 4,513 | | | $ | 25,000 | |
Shares issued to shareholders in reinvestment of distributions | | | 41 | | | | 226 | |
| | | | |
Net increase (decrease) | | | 4,554 | | | $ | 25,226 | |
| | | | |
| (a) | The inception date of the class was August 31, 2020. |
Note 12–Recent Accounting Pronouncement
To improve the effectiveness of fair value disclosure requirements, the Financial Accounting Standards Board issued Accounting Standards Update 2018-13, Fair Value Measurement Disclosure Framework— Changes to the Disclosure Requirements for Fair Value Measurement (“ASU 2018-13”), which adds, removes, and modifies certain fair value measurement disclosure requirements. ASU 2018-13 is effective for interim and annual reporting periods beginning after December 15, 2019. The Manager evaluated the implications of certain provisions of ASU 2018-13 and determined to early adopt aspects related to the
removal and modifications of certain fair value measurement disclosures, which are currently in place as of October 31, 2020. The Manager is evaluating the implications of certain other provisions of ASU 2018-13 related to new disclosure requirements and has not yet determined the impact of those provisions on the financial statement disclosures, if any.
In March 2020, the Financial Accounting Standards Board (“FASB”) issued Accounting Standards Update 2020-04 (“ASU 2020-04”), which provides optional guidance to ease the potential accounting burden associated with transitioning away from LIBOR and other reference rates that are expected to be discontinued. ASU 2020-04 is effective immediately upon release of the update on March 12, 2020, through December 31, 2022. At this time, the Manager is evaluating the implications of certain other provisions of ASU 2020-04 related to new disclosure requirements and any impact on the financial statement disclosures has not yet been determined.
Note 13–Other Matters
An outbreak of COVID-19, first detected in December 2019, has developed into a global pandemic and has resulted in travel restrictions, closure of international borders, certain businesses and securities markets, restrictions on securities trading activities, prolonged quarantines, supply chain disruptions, and lower consumer demand, as well as general concern and uncertainty. The continued impact of COVID-19 is uncertain and could further adversely affect the global economy, national economies, individual issuers and capital markets in unforeseeable ways and result in a substantial and extended economic downturn. Developments that disrupt global economies and financial markets, such as COVID-19, may magnify factors that affect the Fund’s performance.
Note 14–Subsequent Events
In connection with the preparation of the financial statements of the Fund as of and for the year ended October 31, 2020, events and transactions subsequent to October 31, 2020, through the date the financial statements were issued have been evaluated by the Manager, for possible adjustment and/or disclosure. No subsequent events requiring financial statement adjustment or disclosure have been identified other than the following:
Effective at the close of business on November 20, 2020, all services provided by State Street were transitioned to JPMorgan Chase Bank, N.A.
Report of Independent Registered Public Accounting Firm
To the Shareholders of the Fund and Board of Trustees
The MainStay Funds:
Opinion on the Financial Statements
We have audited the accompanying statement of assets and liabilities of MainStay MacKay High Yield Corporate Bond Fund (the Fund), one of the funds constituting The MainStay Funds, including the portfolio of investments, as of October 31, 2020, the related statement of operations for the year then ended, the statements of changes in net assets for each of the years in the two-year period then ended, and the related notes (collectively, the financial statements) and the financial highlights for each of the years or periods in the five-year period then ended. In our opinion, the financial statements and financial highlights present fairly, in all material respects, the financial position of the Fund as of October 31, 2020, the results of its operations for the year then ended, the changes in its net assets for each of the years in the two-year period then ended, and the financial highlights for each of the years or periods in the five-year period then ended, in conformity with U.S. generally accepted accounting principles.
Basis for Opinion
These financial statements and financial highlights are the responsibility of the Fund’s management. Our responsibility is to express an opinion on these financial statements and financial highlights based on our audits. We are a public accounting firm registered with the Public Company Accounting Oversight Board (United States) (PCAOB) and are required to be independent with respect to the Fund in accordance with the U.S. federal securities laws and the applicable rules and regulations of the Securities and Exchange Commission and the PCAOB.
We conducted our audits in accordance with the standards of the PCAOB. Those standards require that we plan and perform the audit to obtain reasonable assurance about whether the financial statements and financial highlights are free of material misstatement, whether due to error or fraud. Our audits included performing procedures to assess the risks of material misstatement of the financial statements and financial highlights, whether due to error or fraud, and performing procedures that respond to those risks. Such procedures included examining, on a test basis, evidence regarding the amounts and disclosures in the financial statements and financial highlights. Such procedures also included confirmation of securities owned as of October 31, 2020, by correspondence with custodians, agents and brokers or by other appropriate auditing procedures when replies from brokers were not received. Our audits also included evaluating the accounting principles used and significant estimates made by management, as well as evaluating the overall presentation of the financial statements and financial highlights. We believe that our audits provide a reasonable basis for our opinion.

We have served as the auditor of one or more New York Life Investment Management investment companies since 2003.
Philadelphia, Pennsylvania
December 23, 2020
| | |
| 46 | | MainStay MacKay High Yield Corporate Bond Fund |
Federal Income Tax Information
(Unaudited)
The Fund is required under the Internal Revenue Code to advise shareholders in a written statement as to the federal tax status of dividends paid by the Fund during such fiscal years.
For the fiscal year ended October 31, 2020, the Fund designated approximately $43,017,132 under the Internal Revenue Code as qualified dividend income eligible for reduced tax rates.
The dividends paid by the Fund during the fiscal year ended October 31, 2020 should be multiplied by 7.37% to arrive at the amount eligible for the corporate dividend-received deduction.
In February 2021, shareholders will receive an IRS Form 1099-DIV or substitute Form 1099, which will show the federal tax status of the distributions received by shareholders in calendar year 2020. The amounts that will be reported on such 1099-DIV or substitute Form 1099 will be the amounts you are to use on your federal income tax return and will differ from the amounts reported for the Fund’s fiscal year ended October 31, 2020.
Proxy Voting Policies and Procedures and Proxy Voting Record
A description of the policies and procedures that New York Life Investments uses to vote proxies related to the Fund’s securities is available free of charge upon request, by visiting the MainStay Funds’ website at newyorklifeinvestments.com or visiting the SEC’s website at www.sec.gov.
The Fund is required to file with the SEC its proxy voting records for the 12-month period ending June 30 on Form N-PX. The most recent Form N-PX or proxy voting record is available free of charge upon request by calling 800-624-6782; visiting the MainStay Funds’ website at newyorklifeinvestments.com; or visiting the SEC’s website at www.sec.gov.
Shareholder Reports and Quarterly Portfolio Disclosure
The Fund is required to file its complete schedule of portfolio holdings with the SEC 60 days after its first and third fiscal quarter on Form N-PORT. The Fund’s holdings report is available free of charge by visiting the SEC’s website at www.sec.gov or upon request by calling New York Life Investments at 800-624-6782.
Board of Trustees and Officers (Unaudited)
The Trustees and officers of the Funds are listed below. The Board oversees the MainStay Group of Funds (which consists of MainStay Funds and MainStay Funds Trust), MainStay VP Funds Trust, MainStay MacKay DefinedTerm Municipal Opportunities Fund, the Manager and the Subadvisors, and elects the officers of the Funds who are responsible for the day-to-day operations of the Funds. Information pertaining to the Trustees and officers is set forth below. Each Trustee serves until his or her successor is elected and qualified or until his or her
resignation, death or removal. Under the Board’s retirement policy, unless an exception is made, a Trustee must tender his or her resignation by the end of the calendar year during which he or she reaches the age of 75. Officers are elected annually by the Board. The business address of each Trustee and officer listed below is 51 Madison Avenue, New York, New York 10010. A majority of the Trustees are not “interested persons” (as defined by the 1940 Act and rules adopted by the SEC thereunder) of the Fund (“Independent Trustees”).
| | | | | | | | | | | | |
| | | | | Name and
Year of Birth | | Term of Office,
Position(s) Held and
Length of Service | | Principal Occupation(s)
During Past Five Years | | Number of
Portfolios in
Fund Complex
Overseen by
Trustee | | Other Directorships
Held by Trustee |
Interested Trustee | | | | Yie-Hsin Hung* 1962 | | MainStay Funds:
Trustee since 2017 MainStay Funds Trust:
Trustee since 2017 | | Senior Vice President of New York Life since joining in 2010, Member of the Executive Management Committee since 2017, Chief Executive Officer, New York Life Investment Management Holdings LLC & New York Life Investment Management LLC since 2015. Senior Managing Director and Co-President of New York Life Investment Management LLC from 2014 to May 2015. Previously held positions of increasing responsibility, including head of NYLIM International, Alternative Growth Businesses, and Institutional investments since joining New York Life in 2010. | | 78 | | MainStay VP Funds Trust:
Trustee since 2017 (31 portfolios); and
MainStay MacKay DefinedTerm Municipal Opportunities Fund: Trustee since 2017. |
| | * | This Trustee is considered to be an “interested person” of the MainStay Group of Funds, MainStay VP Funds Trust and MainStay MacKay DefinedTerm Municipal Opportunities Fund, within the meaning of the 1940 Act because of her affiliation with New York Life Insurance Company, New York Life Investment Management LLC, Candriam Belgium S.A., Candriam Luxembourg S.C.A., IndexIQ Advisors LLC, MacKay Shields LLC, NYL Investors LLC, NYLIFE Securities LLC and/or NYLIFE Distributors LLC, as described in detail above in the column entitled “Principal Occupation(s) During Past Five Years.” |
| | |
| 48 | | MainStay MacKay High Yield Corporate Bond Fund |
| | | | | | | | | | | | |
| | | | | Name and
Year of Birth | | Term of Office,
Position(s) Held and
Length of Service | | Principal Occupation(s)
During Past Five Years | | Number of
Portfolios in
Fund Complex
Overseen by
Trustee | | Other Directorships
Held by Trustee |
Independent Trustees | | | | David H. Chow 1957 | | MainStay Funds:
Trustee since 2016, Advisory Board Member (June 2015 to December 2015); MainStay Funds Trust:
Trustee since 2016, Advisory Board Member (June 2015 to December 2015). | | Founder and CEO, DanCourt Management, LLC since 1999 | | 78 | | MainStay VP Funds Trust: Trustee since 2016, Advisory Board Member (June 2015 to December 2015) (31 portfolios);
MainStay MacKay DefinedTerm Municipal Opportunities Fund: Trustee since 2016, Advisory Board Member (June 2015 to December 2015); Market Vectors Group of Exchange-Traded Funds: Independent Chairman of the Board of Trustees since 2008 and Trustee since 2006 (56 portfolios); and
Berea College of Kentucky: Trustee since 2009, Chair of the Investment Committee since 2018. |
| | | | Susan B. Kerley 1951 | | MainStay Funds:
Chairman since 2017 and Trustee since 2007; MainStay Funds Trust: Chairman since 2017 and Trustee since 1990.** | | President, Strategic Management Advisors LLC since 1990 | | 78 | | MainStay VP Funds Trust: Chairman since 2017 and Trustee since 2007 (31 portfolios)***;
MainStay MacKay DefinedTerm Municipal Opportunities Fund: Chairman since 2017 and Trustee since 2011; and
Legg Mason Partners Funds: Trustee since 1991 (45 portfolios). |
| | | | Alan R. Latshaw 1951 | | MainStay Funds:
Trustee; MainStay Funds Trust:
Trustee and Audit Committee Financial Expert since 2007.** | | Retired; Partner, Ernst & Young LLP (2002 to 2003); Partner, Arthur Andersen LLP (1989 to 2002); Consultant to the MainStay Funds Audit and Compliance Committee (2004 to 2006) | | 78 | | MainStay VP Funds Trust: Trustee and Audit Committee Financial Expert since 2007 (31 portfolios)***;
MainStay MacKay DefinedTerm Municipal Opportunities Fund: Trustee and Audit Committee Financial Expert since 2011; and
State Farm Associates Funds Trusts: Trustee since 2005 (4 portfolios). |
| | | | Richard H. Nolan, Jr. 1946 | | MainStay Funds:
Trustee since 2007; MainStay Funds Trust:
Trustee since 2007.** | | Managing Director, ICC Capital Management since 2004; President—Shields/Alliance, Alliance Capital Management (1994 to 2004) | | 78 | | MainStay VP Funds Trust: Trustee since 2006 (31 portfolios)***; and
MainStay MacKay DefinedTerm Municipal Opportunities Fund: Trustee since 2011. |
| | | | Jacques P. Perold 1958 | | MainStay Funds:
Trustee since 2016, Advisory Board Member (June 2015 to December 2015); MainStay Funds Trust:
Trustee since 2016, Advisory Board Member (June 2015 to December 2015). | | Founder and Chief Executive Officer, CapShift LLC since 2018; President, Fidelity Management & Research Company (2009 to 2014); Founder, President and Chief Executive Officer, Geode Capital Management, LLC (2001 to 2009) | | 78 | | MainStay VP Funds Trust: Trustee since 2016, Advisory Board Member (June 2015 to December 2015) (31 portfolios);
MainStay MacKay DefinedTerm Municipal Opportunities Fund: Trustee since 2016, Advisory Board Member (June 2015 to December 2015); Partners in Health: Trustee since 2019; Allstate Corporation: Director since 2015;
MSCI, Inc.: and Director since 2017. |
Board of Trustees and Officers (Unaudited) (continued)
| | | | | | | | | | | | |
| | | | | Name and
Year of Birth | | Term of Office,
Position(s) Held and
Length of Service | | Principal Occupation(s)
During Past Five Years | | Number of
Portfolios in
Fund Complex
Overseen by
Trustee | | Other Directorships
Held by Trustee |
Independent Trustees | | | | Richard S. Trutanic 1952 | | MainStay Funds: Trustee since 1994; MainStay Funds Trust: Trustee since 2007.** | | Chairman and Chief Executive Officer, Somerset & Company (financial advisory firm) since 2004; Managing Director, The Carlyle Group (private investment firm) (2002 to 2004); Senior Managing Director, Partner and Board Member, Groupe Arnault S.A. (private investment firm) (1999 to 2002) | | 78 | | MainStay VP Funds Trust: Trustee since 2007 (31 portfolios)***; and
MainStay MacKay DefinedTerm Municipal Opportunities Fund: Trustee since 2011. |
| | ** | Includes prior service as a Director/Trustee of certain predecessor entities to MainStay Funds Trust. |
| | *** | Includes prior service as a Director of MainStay VP Series Fund, Inc., the predecessor to MainStay VP Funds Trust. |
| | |
| 50 | | MainStay MacKay High Yield Corporate Bond Fund |
| | | | | | | | |
| | | | | Name and
Year of Birth | | Position(s) Held and
Length of Service | | Principal Occupation(s)
During Past Five Years |
Officers
of the
Trust
(Who are
not
Trustees)* | | | | Kirk C. Lehneis 1974 | | President, MainStay Funds, MainStay Funds Trust since 2017 | | Chief Operating Officer and Senior Managing Director since 2016, New York Life Investment Management LLC and New York Life Investment Management Holdings LLC; Member of the Board of Managers since 2017 and Senior Managing Director since 2018, NYLIFE Distributors LLC; Chairman of the Board and Senior Managing Director, NYLIM Service Company LLC since 2017; Trustee, President and Principal Executive Officer of IndexIQ Trust, IndexIQ ETF Trust and IndexIQ Active ETF Trust since 2018; President, MainStay MacKay DefinedTerm Municipal Opportunities Fund and MainStay VP Funds Trust since 2017**; Senior Managing Director, Global Product Development (2015 to 2016); Managing Director, Product Development (2010 to 2015), New York Life Investment Management LLC |
| | | | Jack R. Benintende 1964 | | Treasurer and Principal Financial and Accounting Officer, MainStay Funds since 2007, MainStay Funds Trust since 2009 | | Managing Director, New York Life Investment Management LLC since 2007; Treasurer and Principal Financial and Accounting Officer, MainStay MacKay DefinedTerm Municipal Opportunities Fund since 2011 and MainStay VP Funds Trust since 2007**; and Assistant Treasurer, New York Life Investment Management Holdings LLC (2008 to 2012) |
| | | | Yi-Chia Kuo 1981 | | Vice President and Chief Compliance Officer, MainStay Funds and MainStay Funds Trust since January 2020 | | Chief Compliance Officer, Index IQ Trust, Index IQ ETF Trust and Index IQ Active ETF Trust since January 2020; Vice President and Chief Compliance Officer, MainStay MacKay DefinedTerm Municipal Opportunities Fund and MainStay VP Funds Trust since January 2020; Director and Associate General Counsel, New York Life Insurance Company (2015 to 2019) |
| | | | J. Kevin Gao 1967 | | Secretary and Chief Legal Officer, MainStay Funds and MainStay Funds Trust since 2010 | | Managing Director and Associate General Counsel, New York Life Investment Management LLC since 2010; Secretary and Chief Legal Officer, MainStay MacKay DefinedTerm Municipal Opportunities Fund since 2011 and MainStay VP Funds Trust since 2010** |
| | | | Scott T. Harrington 1959 | | Vice President— Administration, MainStay Funds since 2005, MainStay Funds Trust since 2009 | | Managing Director, New York Life Investment Management LLC (including predecessor advisory organizations) since 2000; Member of the Board of Directors, New York Life Trust Company since 2009; Vice President—Administration, MainStay MacKay DefinedTerm Municipal Opportunities Fund since 2011 and MainStay VP Funds Trust since 2005** |
| | * | The officers listed above are considered to be “interested persons” of the MainStay Group of Funds, MainStay VP Funds Trust and MainStay MacKay DefinedTerm Municipal Opportunities Fund within the meaning of the 1940 Act because of their affiliation with the MainStay Group of Funds, New York Life Insurance Company and/or its affiliates, including New York Life Investment Management LLC, NYLIM Service Company LLC, NYLIFE Securities LLC and/or NYLIFE Distributors LLC, as described in detail in the column captioned “Principal Occupation(s) During Past Five Years.” Officers are elected annually by the Board. |
| | ** | Includes prior service as an Officer of MainStay VP Series Fund, Inc., the predecessor to MainStay VP Funds Trust. |
MainStay Funds
Equity
U.S. Equity
MainStay Epoch U.S. All Cap Fund
MainStay Epoch U.S. Equity Yield Fund
MainStay MacKay Common Stock Fund
MainStay MacKay Growth Fund
MainStay MacKay S&P 500 Index Fund
MainStay MacKay Small Cap Core Fund
MainStay MacKay U.S. Equity Opportunities Fund
MainStay MAP Equity Fund
MainStay Winslow Large Cap Growth Fund1
International Equity
MainStay Epoch International Choice Fund
MainStay MacKay International Equity Fund
MainStay MacKay International Opportunities Fund
Emerging Markets Equity
MainStay Candriam Emerging Markets Equity Fund
Global Equity
MainStay Epoch Capital Growth Fund
MainStay Epoch Global Equity Yield Fund
Fixed Income
Taxable Income
MainStay Candriam Emerging Markets Debt Fund
MainStay Floating Rate Fund
MainStay MacKay High Yield Corporate Bond Fund
MainStay MacKay Short Duration High Yield Fund
MainStay MacKay Total Return Bond Fund
MainStay MacKay Unconstrained Bond Fund
MainStay MacKay U.S. Infrastructure Bond Fund2
MainStay Short Term Bond Fund3
Tax-Exempt Income
MainStay MacKay California Tax Free Opportunities Fund4
MainStay MacKay High Yield Municipal Bond Fund
MainStay MacKay Intermediate Tax Free Bond Fund
MainStay MacKay New York Tax Free Opportunities Fund5
MainStay MacKay Short Term Municipal Fund
MainStay MacKay Tax Free Bond Fund
Money Market
MainStay Money Market Fund
Mixed Asset
MainStay Balanced Fund
MainStay Income Builder Fund
MainStay MacKay Convertible Fund
Speciality
MainStay CBRE Global Infrastructure Fund
MainStay CBRE Real Estate Fund
MainStay Cushing MLP Premier Fund
Asset Allocation
MainStay Conservative Allocation Fund
MainStay Conservative ETF Allocation Fund
MainStay Defensive ETF Allocation Fund
MainStay Equity Allocation Fund6
MainStay Equity ETF Allocation Fund
MainStay Growth Allocation Fund7
MainStay Growth ETF Allocation Fund
MainStay Moderate Allocation Fund
MainStay Moderate ETF Allocation Fund
Manager
New York Life Investment Management LLC
New York, New York
Subadvisors
Candriam Belgium S.A.8
Brussels, Belgium
Candriam Luxembourg S.C.A.8
Strassen, Luxembourg
CBRE Clarion Securities LLC
Radnor, Pennsylvania
Cushing Asset Management, LP
Dallas, Texas
Epoch Investment Partners, Inc.
New York, New York
MacKay Shields LLC8
New York, New York
Markston International LLC
White Plains, New York
NYL Investors LLC8
New York, New York
Winslow Capital Management, LLC
Minneapolis, Minnesota
Legal Counsel
Dechert LLP
Washington, District of Columbia
Independent Registered Public Accounting Firm
KPMG LLP
Philadelphia, Pennsylvania
Distributor
NYLIFE Distributors LLC8
Jersey City, New Jersey
Custodian9
State Street Bank and Trust Company
Boston, Massachusetts
| 1. | Formerly known as MainStay Large Cap Growth Fund. |
| 2. | Formerly known as MainStay MacKay Infrastructure Bond Fund. |
| 3. | Formerly known as MainStay Indexed Bond Fund. |
| 4. | This Fund is registered for sale in AZ, CA, NV, OR, TX, UT and WA. Class A and Class I shares are registered for sale in MI. Class I and Class C2 shares are registered for sale in CO, FL, GA, HI, ID, MA, MD, NH, NJ and NY. |
| 5. | This Fund is registered for sale in CA, CT, DE, FL, MA, NJ, NY and VT. |
| 6. | Formerly known as MainStay Growth Allocation Fund. |
| 7. | Formerly known as MainStay Moderate Growth Allocation Fund. |
| 8. | An affiliate of New York Life Investment Management LLC. |
| 9. | JPMorgan Chase Bank, N.A., New York, New York is the custodian for the MainStay ETF Asset Allocation Funds and effective at the close of business on November 20, 2020, became the custodian for other MainStay Funds. The custodian for MainStay Cushing MLP Premier Fund is U.S. Bank National Association, Milwaukee, Wisconsin. |
Not part of the Annual Report
For more information
800-624-6782
newyorklifeinvestments.com
“New York Life Investments” is both a service mark, and the common trade name, of certain investment advisors affiliated with New York Life Insurance Company. The MainStay Funds® are managed by New York Life Investment Management LLC and distributed by NYLIFE Distributors LLC, 30 Hudson Street, Jersey City, NJ 07302, a wholly owned subsidiary of New York Life Insurance Company. NYLIFE Distributors LLC is a Member FINRA/SIPC.
©2020 NYLIFE Distributors LLC. All rights reserved.
| | |
| 1717584 MS203-20 | | MSHY11-12/20 (NYLIM) NL212 |
MainStay MacKay International Equity Fund
Message from the President and Annual Report
October 31, 2020
Beginning on January 1, 2021, paper copies of each MainStay Fund’s annual and semiannual shareholder reports will no longer be sent by mail, unless you specifically request paper copies of the reports from MainStay Funds or from your financial intermediary. Instead, the reports will be made available on the MainStay Funds’ website. You will be notified by mail and provided with a website address to access the report each time a new report is posted to the website.
If you already elected to receive shareholder reports electronically, you will not be affected by this change and you need not take any action. At any time, you may elect to receive reports and other communications from MainStay Funds electronically by calling toll-free 800-624-6782, by sending an e-mail to MainStayShareholderServices@ nylim.com, or by contacting your financial intermediary.
You may elect to receive all future shareholder reports in paper form free of charge. If you hold shares of a MainStay Fund directly, you can inform MainStay Funds that you wish to receive paper copies of reports by calling toll-free 800-624-6782 or by sending an e-mail to MainStayShareholderServices@nylim.com. If you hold shares of a MainStay Fund through a financial intermediary, please contact the financial intermediary to make this election. Your election to receive reports in paper form will apply to all MainStay Funds in which you are invested and may apply to all funds held with your financial intermediary.
| | | | | | | | |
| Not FDIC/NCUA Insured | | Not a Deposit | | May Lose Value | | No Bank Guarantee | | Not Insured by Any Government Agency |

This page intentionally left blank
Message from the President
Despite historically high levels of volatility generated by the global coronavirus pandemic and a host of other geopolitical and economic uncertainties, most broad U.S. stock and bond markets gained ground during the 12-month reporting period ended October 31, 2020.
The reporting period began on an upswing, with markets rising on generally positive underlying economic trends and the announcement of a U.S.-China trade deal. However, in mid-February 2020, stock and bond indices began to dip as growing numbers of COVID-19 cases appeared in hotspots around the world. By early March, the disease reached pandemic proportions. As governments struggled to support overburdened health care systems by issuing “stay-at-home” orders and other restrictions on nonessential activity, global economic activity slowed, driving most stocks and bonds sharply lower.
The United States was hit particularly hard by the pandemic, with more reported COVID-19 cases and deaths than any other country in the world throughout the second half of the reporting period. As the pandemic deepened, the U.S. Federal Reserve (“Fed”) twice cut interest rates and announced unlimited quantitative easing. The federal government declared a national emergency, and Congress passed and the President signed a $2 trillion stimulus package. Markets responded positively to these measures, as well as to a gradual lessening of restrictions on nonessential businesses, hopes for additional stimulus and apparent progress in the development of a vaccine. By late August, the S&P 500® Index, a widely regarded benchmark of market performance, had not only regained all the ground it lost earlier in the reporting period, the Index had reached new record levels. However, a resurgence of coronavirus cases in many parts of the country and uncertainties related to the November 3, 2020, U.S. presidential election caused markets to falter as the reporting period drew to a close.
Nevertheless, for the reporting period as a whole, U.S. equity indices generally produced moderate gains. Returns proved strongest among large-cap, growth-oriented stocks, while small- and mid-cap issues lagged. Within the S&P 500® Index, the information technology and consumer discretionary sectors produced exceptionally strong gains, buoyed by strong corporate and consumer spending, while the health care sector outperformed by a smaller margin. Materials and consumer staples sectors generated positive returns, but lagged the S&P 500® Index. The industrials, utilities, communication services, financials, real estate and energy sectors ended the reporting period in negative territory, with the energy sector
suffering the steepest losses due to weak global demand. International equities declined sharply in February and March 2020 before recovering somewhat, but tended to lag their U.S. counterparts due to weaker underlying economic growth and somewhat less aggressive monetary and fiscal stimulus. Emerging-market equities tracked the performance of U.S. equity markets more closely, led by relatively strong returns in Asian markets, such as China and South Korea.
Fixed-income markets experienced an environment that tended to favor higher credit quality and longer duration securities. Corporate bonds followed the pattern of equities, with prices declining in March 2020 before subsequently recovering. Relatively speculative high-yield credit was hardest hit during the market sell-off in early 2020 and continued to underperform during the remainder of the reporting period. Similarly, among municipal bond issues, high-grade bonds outperformed, dipping briefly in mid-March before regaining the lost ground. Recognized safe havens, such as U.S. government bonds, attracted increased investment during the height of the market sell-off, driving yields lower and prices higher. As a result, long-term Treasury bonds delivered particularly strong gains for the reporting period as a whole. Emerging-market debt, on the other hand, underperformed most other bond types as investors sought to minimize currency and sovereign risks.
Although the ongoing pandemic continues to change the way that many of us work and live our lives, at New York Life Investments, we remain dedicated to providing you, as a MainStay investor, with products, information and services to help you to navigate today’s rapidly changing investment environment. By taking appropriate steps to minimize community spread of COVID-19 within our organization and despite the challenges posed by the coronavirus pandemic, we continue to innovate with you in mind, introducing new suites of Funds and providing continuous insights into ever-evolving markets and investment strategies. Our goal is to give you the tools you need to build a resilient portfolio in the face of uncertain times.
Sincerely,

Kirk C. Lehneis
President
The opinions expressed are as of the date of this report and are subject to change. There is no guarantee that any forecast made will come to pass. This material does not constitute investment advice and is not intended as an endorsement of any specific investment. Past performance is no guarantee of future results.
Not part of the Annual Report
Table of Contents
Investors should refer to the Fund’s Summary Prospectus and/or Prospectus and consider the Fund’s investment objectives, strategies, risks, charges and expenses carefully before investing. The Summary Prospectus and/or Prospectus contain this and other information about the Fund. You may obtain copies of the Fund’s Summary Prospectus, Prospectus and Statement of Additional Information free of charge, upon request, by calling toll-free 800-624-6782, by writing to NYLIFE Distributors LLC, Attn: MainStay Marketing Department, 30 Hudson Street, Jersey City, NJ 07302 or by sending an e-mail to MainStayShareholderServices@nylim.com. These documents are also available via the MainStay Funds’ website at newyorklifeinvestments.com. Please read the Summary Prospectus and/or Prospectus carefully before investing.
Investment and Performance Comparison1 (Unaudited)
Performance data quoted represents past performance. Past performance is no guarantee of future results. Because of market volatility and other factors, current performance may be lower or higher than the figures shown. Investment return and principal value will fluctuate, and as a result, when shares are redeemed, they may be worth more or less than their original cost. The graph below depicts the historical performance of Class I shares* of the Fund. Performance will vary from class to class based on differences in class-specific expenses and sales charges. For performance information current to the most recent month-end, please call 800-624-6782 or visit newyorklifeinvestments.com.
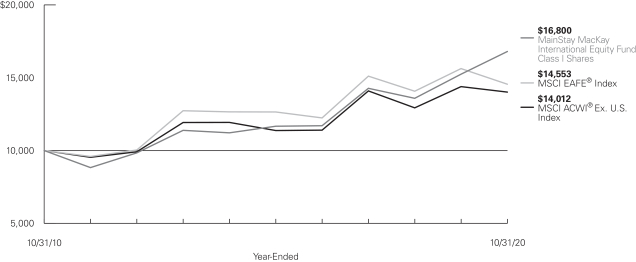
Average Annual Total Returns for the Year-Ended October 31, 2020
| | | | | | | | | | | | | | | | | | | | | | | | |
| Class | | Sales Charge | | | | Inception
Date | | | One
Year | | | Five Years
or Since
Inception | | | Ten
Years | | | Gross
Expense
Ratio2 | |
| | | | | | | |
| Class A Shares | | Maximum 5.5% Initial Sales Charge | | With sales charges Excluding sales charges | | | 1/3/1995 | | |
| 3.80
9.84 | %
| |
| 6.04
7.24 | %
| |
| 4.45
5.04 | %
| |
| 1.35
1.35 | %
|
| Investor Class Shares3 | | Maximum 5% Initial Sales Charge | | With sales charges Excluding sales charges | | | 2/28/2008 | | |
| 3.39
9.40 |
| |
| 5.66
6.86 |
| |
| 4.09
4.68 |
| |
| 1.75
1.75 |
|
| Class B Shares4 | | Maximum 5% CDSC
if Redeemed Within the
First Six Years of Purchase | | With sales charges Excluding sales charges | | | 9/13/1994 | | |
| 3.57
8.57 |
| |
| 5.74
6.06 |
| |
| 3.90
3.90 |
| |
| 2.50
2.50 |
|
| Class C Shares | | Maximum 1% CDSC if Redeemed Within One Year of Purchase | | With sales charges Excluding sales charges | | | 9/1/1998 | | |
| 7.64
8.64 |
| |
| 6.07
6.07 |
| |
| 3.90
3.90 |
| |
| 2.50
2.50 |
|
| Class I Shares | | No Sales Charge | | | | | 1/2/2004 | | | | 10.22 | | | | 7.56 | | | | 5.32 | | | | 1.10 | |
| Class R1 Shares | | No Sales Charge | | | | | 1/2/2004 | | | | 10.05 | | | | 7.41 | | | | 5.20 | | | | 1.20 | |
| Class R2 Shares | | No Sales Charge | | | | | 1/2/2004 | | | | 9.72 | | | | 7.14 | | | | 4.93 | | | | 1.45 | |
| Class R3 Shares | | No Sales Charge | | | | | 4/28/2006 | | | | 9.46 | | | | 6.88 | | | | 4.67 | | | | 1.70 | |
| Class R6 Shares | | No Sales Charge | | | | | 2/28/2019 | | | | 10.27 | | | | 7.57 | | | | N/A | | | | 1.00 | |
| * | Previously, the chart presented the Fund’s annual returns for Class B shares. Class I shares are presented for consistency across the MainStay Fund complex. |
| 1. | The performance table and graph do not reflect the deduction of taxes that a shareholder would pay on distributions or Fund share redemptions. Total returns reflect maximum applicable sales charges as indicated in the table above, if any, changes in share price, and reinvestment of dividend and capital gain distributions. The graph assumes the initial investment amount shown above and reflects the deduction of all sales charges that would have applied for the period of investment. Performance figures may reflect certain fee waivers and/or expense limitations, without which total returns may have |
| | been lower. For more information on share classes and current fee waivers and/or expense limitations (if any), please refer to the Notes to Financial Statements. |
| 2. | The gross expense ratios presented reflect the Fund’s “Total Annual Fund Operating Expenses” from the most recent Prospectus and may differ from other expense ratios disclosed in this report. |
| 3. | Prior to June 30, 2020, the maximum initial sales charge for Investor Class shares was 5.5%, which is reflected in the average annual total return figures shown. |
| 4. | Class B shares are closed to all new purchases as well as additional investments by existing Class B shareholders. |
The footnotes on the next page are an integral part of the table and graph and should be carefully read in conjunction with them.
| | | | | | | | | | | | |
| Benchmark Performance | | One
Year | | | Five
Years | | | Ten
Years | |
| | | |
MSCI ACWI® Ex U.S. Index5 | | | –2.61 | % | | | 4.26 | % | | | 3.43 | % |
MSCI EAFE® Index6 | | | –6.86 | | | | 2.85 | | | | 3.82 | |
Morningstar Foreign Large Growth Category Average7 | | | 12.71 | | | | 7.86 | | | | 6.47 | |
| 5. | The Fund has selected the MSCI ACWI® (All Country World Index) Ex U.S. Index as its primary broad-based securities market index for comparison purposes. The MSCI ACWI® Ex U.S. Index is a free float-adjusted market capitalization weighted index that is designed to measure the equity market performance of developed and emerging markets, excluding the U.S. Results assume reinvestment of all income and capital gains. An investment cannot be made directly in an index. |
| 6. | The MSCI EAFE® Index is the Fund’s secondary benchmark. The MSCI EAFE® Index consists of international stocks representing the developed world outside of North America. Results assume reinvestment of all income and capital gains. An investment cannot be made directly in an index. |
| 7. | The Morningstar Foreign Large Growth Category Average is representative of funds that focus on high-priced growth stocks, mainly outside of the United States. Most of these portfolios divide their assets among a dozen or more developed markets, including Japan, Britain, France, and Germany. These portfolios primarily invest in stocks that have market caps in the top 70% of each economically integrated market and will have less than 20% of assets invested in U.S. stocks. Results are based on average total returns of similar funds with all dividends and capital gain distributions reinvested. |
The footnotes on the preceding page are an integral part of the table and graph and should be carefully read in conjunction with them.
| | |
| 6 | | MainStay MacKay International Equity Fund |
Cost in Dollars of a $1,000 Investment in MainStay MacKay International Equity Fund (Unaudited)
The example below is intended to describe the fees and expenses borne by shareholders during the six-month period from May 1, 2020, to October 31, 2020, and the impact of those costs on your investment.
Example
As a shareholder of the Fund you incur two types of costs: (1) transaction costs, including exchange fees and sales charges (loads) on purchases (as applicable), and (2) ongoing costs, including management fees, distribution and/or service (12b-1) fees, and other Fund expenses (as applicable). This example is intended to help you understand your ongoing costs (in dollars) of investing in the Fund and to compare these costs with the ongoing costs of investing in other mutual funds. The example is based on an investment of $1,000 made at the beginning of the six-month period and held for the entire period from May 1, 2020, to October 31, 2020.
This example illustrates your Fund’s ongoing costs in two ways:
Actual Expenses
The second and third data columns in the table below provide information about actual account values and actual expenses. You may use the information in these columns, together with the amount you invested, to estimate the expenses that you paid during the six months ended October 31, 2020. Simply divide your account value by $1,000 (for example, an $8,600 account value divided by $1,000 = 8.6), then
multiply the result by the number under the heading entitled “Expenses Paid During Period” to estimate the expenses you paid on your account during this period.
Hypothetical Example for Comparison Purposes
The fourth and fifth data columns in the table below provide information about hypothetical account values and hypothetical expenses based on the Fund’s actual expense ratio and an assumed rate of return of 5% per year before expenses, which is not the Fund’s actual return. The hypothetical account values and expenses may not be used to estimate the actual ending account balances or expenses you paid for the six-month period shown. You may use this information to compare the ongoing costs of investing in the Fund with the ongoing costs of investing in other mutual funds. To do so, compare this 5% hypothetical example with the 5% hypothetical examples that appear in the shareholder reports of the other mutual funds.
Please note that the expenses shown in the table are meant to highlight your ongoing costs only and do not reflect any transactional costs, such as exchange fees or sales charges (loads). Therefore, the fourth and fifth data columns of the table are useful in comparing ongoing costs only and will not help you determine the relative total costs of owning different funds. In addition, if these transactional costs were included, your costs would have been higher.
| | | | | | | | | | | | | | | | | | | | | | |
| | | | | | | | | | | | | | | | | | |
| Share Class | | Beginning
Account
Value
5/1/20 | | | Ending Account
Value (Based
on Actual
Returns and
Expenses)
10/31/20 | | | Expenses
Paid
During
Period1 | | | Ending Account
Value (Based
on Hypothetical
5% Annualized
Return and
Actual Expenses)
10/31/20 | | | Expenses
Paid
During
Period1 | | | Net Expense
Ratio
During
Period2 |
| | | | | | |
| Class A Shares | | $ | 1,000.00 | | | $ | 1,165.90 | | | $ | 6.53 | | | $ | 1,019.10 | | | $ | 6.09 | | | 1.20% |
| | | | | | |
| Investor Class Shares | | $ | 1,000.00 | | | $ | 1,163.70 | | | $ | 8.32 | | | $ | 1,017.44 | | | $ | 7.76 | | | 1.53% |
| | | | | | |
| Class B Shares | | $ | 1,000.00 | | | $ | 1,159.10 | | | $ | 12.37 | | | $ | 1,013.67 | | | $ | 11.54 | | | 2.28% |
| | | | | | |
| Class C Shares | | $ | 1,000.00 | | | $ | 1,159.80 | | | $ | 12.38 | | | $ | 1,013.67 | | | $ | 11.54 | | | 2.28% |
| | | | | | |
| Class I Shares | | $ | 1,000.00 | | | $ | 1,167.90 | | | $ | 4.63 | | | $ | 1,020.86 | | | $ | 4.32 | | | 0.85% |
| | | | | | |
| Class R1 Shares | | $ | 1,000.00 | | | $ | 1,167.00 | | | $ | 5.72 | | | $ | 1,019.86 | | | $ | 5.33 | | | 1.05% |
| | | | | | |
| Class R2 Shares | | $ | 1,000.00 | | | $ | 1,165.60 | | | $ | 7.08 | | | $ | 1,018.60 | | | $ | 6.60 | | | 1.30% |
| | | | | | |
| Class R3 Shares | | $ | 1,000.00 | | | $ | 1,164.20 | | | $ | 8.43 | | | $ | 1,017.34 | | | $ | 7.86 | | | 1.55% |
| | | | | | |
| Class R6 Shares | | $ | 1,000.00 | | | $ | 1,168.50 | | | $ | 4.52 | | | $ | 1,020.96 | | | $ | 4.22 | | | 0.83% |
| 1. | Expenses are equal to the Fund’s annualized expense ratio of each class multiplied by the average account value over the period, divided by 366 and multiplied by 184 (to reflect the six-month period). The table above represents the actual expenses incurred during the six-month period. In addition to the fees and expenses which the Fund bears directly, it also indirectly bears a pro rata share of the fees and expenses of the underlying funds in which it invests. Such indirect expenses are not included in the above-reported expense figures. |
| 2. | Expenses are equal to the Fund’s annualized expense ratio to reflect the six-month period. |
Country Composition as of October 31, 2020 (Unaudited)
| | | | |
| |
| United Kingdom | | | 16.5 | % |
| |
| Germany | | | 13.2 | |
| |
| Japan | | | 11.8 | |
| |
| Netherlands | | | 7.5 | |
| |
| France | | | 6.1 | |
| |
| Denmark | | | 5.5 | |
| |
| India | | | 5.0 | |
| |
| Spain | | | 5.0 | |
| |
| Ireland | | | 4.8 | |
| |
| China | | | 4.5 | |
| |
| United States | | | 4.2 | |
| | | | |
| |
| Switzerland | | | 3.2 | % |
| |
| Taiwan | | | 3.2 | |
| |
| Sweden | | | 2.8 | |
| |
| Canada | | | 2.4 | |
| |
| Brazil | | | 1.3 | |
| |
| Mexico | | | 1.0 | |
| |
| Argentina | | | 0.9 | |
| |
| Israel | | | 0.9 | |
| |
| Other Assets, Less Liabilities | | | 0.2 | |
| | | | |
| | | 100.0 | % |
| | | | |
See Portfolio of Investments beginning on page 10 for specific holdings within these categories. The Fund’s holdings are subject to change.
Top Ten Holdings as of October 31, 2020 (excluding short-term investments) (Unaudited)
| 1. | Koninklijke Philips N.V. |
| 6. | Taiwan Semiconductor Manufacturing Co., Ltd., Sponsored ADR |
| 7. | Novo Nordisk A/S, Class B |
| 8. | Housing Development Finance Corp., Ltd. |
| | |
| 8 | | MainStay MacKay International Equity Fund |
Portfolio Management Discussion and Analysis (Unaudited)
Questions answered by portfolio managers Carlos Garcia-Tunon, CFA, Ian Murdoch, CFA, and Lawrence Rosenberg, CFA, of MacKay Shields LLC, the Fund’s Subadvisor.
How did MainStay MacKay International Equity Fund perform relative to its benchmarks and peer group during the 12 months ended October 31, 2020?
For the 12 months ended October 31, 2020, Class I shares of MainStay MacKay International Equity Fund returned 10.22%, outperforming the –2.61% return of the Fund’s primary benchmark, the MSCI ACWI® Ex U.S. Index, and the –6.86% return of the Fund’s secondary benchmark, the MSCI EAFE® Index. Over the same reporting period, Class I shares underperformed the 12.71% return of the Morningstar Foreign Large Growth Category Average.1
What factors affected the Fund’s relative performance during the reporting period?
During the reporting period, the Fund outperformed the MSCI ACWI® Ex U.S. Index on the basis of strong stock selection and, to a slightly lesser degree, positive asset allocation.
During the reporting period, which sectors were the strongest positive contributors to the Fund’s relative performance and which sectors were particularly weak?
During the reporting period, the strongest positive contributions to the Fund’s performance relative to the MSCI ACWI® Ex U.S. Index included the health care, communication services, and industrials sectors. (Contributions take weightings and total returns into account.) During the same period, the weakest contributor to benchmark-relative performance was the consumer discretionary sector.
During the reporting period, which individual stocks made the strongest positive contributions to the Fund’s absolute performance and which stocks detracted the most?
The leading contributors to the Fund’s absolute performance during the reporting period included Chinese Internet
value-added services provider Tencent; Japanese Internet-based services provider CyberAgent; and Swiss contract development and manufacturing organization (“CDMO”) Lonza Group. The most significant detractors from the Fund’s absolute performance during the same period were U.K.-domiciled multinational food caterer Compass Group; Mexican bank Regional; and Japanese online apparel shopping site operator ZOZO.
What were some of the Fund’s largest purchases and sales during the reporting period?
During the reporting period, the Fund’s largest initial purchase was in French prepaid corporate services specialist Edenred, while the largest increased position size was in CyberAgent. The Fund’s largest full sale was in U.K. specialty chemicals company Johnson Matthey, while the most significantly reduced position size was in Irish clinical research outsourcer ICON.
How did the Fund’s sector and/or country weightings change during the reporting period?
During the reporting period, the Fund’s largest increases in sector exposure relative to the MSCI ACWI® Ex U.S. Index were in information technology and communication services. Conversely, the Fund’s largest decreases in benchmark-relative sector exposure were in consumer discretionary and health care.
How was the Fund positioned at the end of the reporting period?
As of October 31, 2020, compared to the MSCI ACWI® Ex U.S. Index, the Fund held overweight exposure to the information technology and health care sectors. As of the same date, the Fund held underweight exposure to the consumer discretionary and consumer staples sectors.
| 1. | See page 5 for other share class returns, which may be higher or lower than Class I share returns. See page 6 for more information on benchmark and peer group returns. |
The opinions expressed are those of the portfolio managers as of the date of this report and are subject to change. There is no guarantee that any forecasts will come to pass. This material does not constitute investment advice and is not intended as an endorsement of any specific investment.
Portfolio of Investments October 31, 2020
| | | | | | | | |
| | |
| | | Shares | | | Value | |
| Common Stocks 96.8%† | |
Argentina 0.9% | |
Globant S.A. (IT Services) (a) | | | 15,830 | | | $ | 2,859,056 | |
| | | | | | | | |
|
Brazil 1.3% | |
Notre Dame Intermedica Participacoes S.A. (Health Care Providers & Services) | | | 381,609 | | | | 4,372,780 | |
| | | | | | | | |
|
Canada 2.4% | |
Constellation Software, Inc. (Software) | | | 7,440 | | | | 7,810,185 | |
| | | | | | | | |
|
China 4.5% | |
Tencent Holdings, Ltd. (Interactive Media & Services) | | | 191,418 | | | | 14,592,459 | |
| | | | | | | | |
|
Denmark 5.5% | |
Chr Hansen Holding A/S (Chemicals) | | | 75,765 | | | | 7,631,024 | |
Novo Nordisk A/S, Class B (Pharmaceuticals) | | | 163,419 | | | | 10,496,194 | |
| | | | | | | | |
| | | | | | | 18,127,218 | |
| | | | | | | | |
France 6.1% | |
Dassault Systemes S.E. (Software) | | | 33,856 | | | | 5,778,524 | |
Edenred (IT Services) | | | 204,894 | | | | 9,554,738 | |
Teleperformance S.E. (Professional Services) | | | 15,665 | | | | 4,701,541 | |
| | | | | | | | |
| | | | | | | 20,034,803 | |
| | | | | | | | |
Germany 13.2% | |
Carl Zeiss Meditec A.G. (Health Care Equipment & Supplies) | | | 27,239 | | | | 3,518,181 | |
Deutsche Boerse A.G. (Capital Markets) | | | 59,324 | | | | 8,729,736 | |
Fresenius Medical Care A.G. & Co. KGaA (Health Care Providers & Services) | | | 116,009 | | | | 8,860,507 | |
SAP S.E. (Software) | | | 75,754 | | | | 8,071,879 | |
Scout24 A.G. (Interactive Media & Services) (b) | | | 78,034 | | | | 6,284,511 | |
Symrise A.G. (Chemicals) | | | 63,199 | | | | 7,791,060 | |
| | | | | | | | |
| | | | | | | 43,255,874 | |
| | | | | | | | |
India 5.0% | |
HDFC Bank, Ltd. (Banks) (a) | | | 387,375 | | | | 6,180,646 | |
Housing Development Finance Corp., Ltd. (Thrifts & Mortgage Finance) | | | 399,253 | | | | 10,349,357 | |
| | | | | | | | |
| | | | | | | 16,530,003 | |
| | | | | | | | |
Ireland 4.8% | |
Accenture PLC, Class A (IT Services) | | | 51,563 | | | | 11,184,530 | |
ICON PLC (Life Sciences Tools & Services) (a) | | | 25,286 | | | | 4,559,066 | |
| | | | | | | | |
| | | | | | | 15,743,596 | |
| | | | | | | | |
Israel 0.9% | |
Nice, Ltd., Sponsored ADR (Software) (a) | | | 13,179 | | | | 3,008,239 | |
| | | | | | | | |
|
Japan 11.8% | |
CyberAgent, Inc. (Media) | | | 194,300 | | | | 12,155,929 | |
| | | | | | | | |
| | |
| | | Shares | | | Value | |
Japan (continued) | | | | | | | | |
Menicon Co., Ltd. (Health Care Equipment & Supplies) | | | 88,300 | | | $ | 6,224,309 | |
Relo Group, Inc. (Real Estate Management & Development) | | | 334,900 | | | | 7,990,641 | |
SMS Co., Ltd. (Professional Services) | | | 187,300 | | | | 5,492,249 | |
TechnoPro Holdings, Inc. (Professional Services) | | | 111,000 | | | | 6,859,640 | |
| | | | | | | | |
| | | | | | | 38,722,768 | |
| | | | | | | | |
Mexico 1.0% | |
Regional S.A.B. de C.V. (Banks) (a) | | | 1,186,405 | | | | 3,221,133 | |
| | | | | | | | |
|
Netherlands 7.5% | |
Koninklijke DSM N.V. (Chemicals) | | | 55,275 | | | | 8,848,486 | |
Koninklijke Philips N.V. (Health Care Equipment & Supplies) | | | 335,175 | | | | 15,565,668 | |
| | | | | | | | |
| | | | | | | 24,414,154 | |
| | | | | | | | |
Spain 5.0% | |
Amadeus IT Group S.A. (IT Services) | | | 138,739 | | | | 6,623,262 | |
Industria de Diseno Textil S.A. (Specialty Retail) (c) | | | 392,770 | | | | 9,693,146 | |
| | | | | | | | |
| | | | | | | 16,316,408 | |
| | | | | | | | |
Sweden 2.8% | |
Hexagon A.B., Class B (Electronic Equipment, Instruments & Components) | | | 124,158 | | | | 9,074,931 | |
| | | | | | | | |
|
Switzerland 3.2% | |
Lonza Group A.G., Registered (Life Sciences Tools & Services) | | | 5,814 | | | | 3,520,293 | |
TE Connectivity, Ltd. (Electronic Equipment, Instruments & Components) | | | 73,230 | | | | 7,094,523 | |
| | | | | | | | |
| | | | | | | 10,614,816 | |
| | | | | | | | |
Taiwan 3.2% | |
Taiwan Semiconductor Manufacturing Co., Ltd., Sponsored ADR (Semiconductors & Semiconductor Equipment) | | | 125,182 | | | | 10,499,014 | |
| | | | | | | | |
|
United Kingdom 16.5% | |
Big Yellow Group PLC (Equity Real Estate Investment Trusts) | | | 244,499 | | | | 3,484,232 | |
Diageo PLC (Beverages) | | | 301,039 | | | | 9,745,997 | |
Experian PLC (Professional Services) | | | 89,473 | | | | 3,265,248 | |
HomeServe PLC (Commercial Services & Supplies) | | | 448,826 | | | | 6,425,066 | |
Linde PLC (Chemicals) | | | 40,954 | | | | 9,023,804 | |
Prudential PLC (Insurance) | | | 979,756 | | | | 11,966,710 | |
St. James’s Place PLC (Capital Markets) | | | 860,833 | | | | 10,027,957 | |
| | | | | | | | |
| | | | | | | 53,939,014 | |
| | | | | | | | |
| | | | |
| 10 | | MainStay MacKay International Equity Fund | | The notes to the financial statements are an integral part of,
and should be read in conjunction with, the financial statements. |
| | | | | | | | |
| | |
| | | Shares | | | Value | |
| Common Stocks (continued) | |
United States 1.2% | |
STERIS PLC (Health Care Equipment & Supplies) | | | 22,754 | | | $ | 4,031,781 | |
| | | | | | | | |
Total Common Stocks
(Cost $275,049,945) | | | | | | | 317,168,232 | |
| | | | | | | | |
|
| Short-Term Investments 3.0% | |
Affiliated Investment Company 0.2% | |
United States 0.2% | |
MainStay U.S. Government Liquidity Fund, 0.02% (d) | | | 565,442 | | | | 565,442 | |
| | | | | | | | |
|
Unaffiliated Investment Company 2.8% | |
United States 2.8% | |
State Street Navigator Securities Lending Government Money Market Portfolio, 0.09% (d)(e) | | | 9,261,517 | | | | 9,261,517 | |
| | | | | | | | |
Total Short-Term Investments
(Cost $9,826,959) | | | | | | | 9,826,959 | |
| | | | | | | | |
Total Investments
(Cost $284,876,904) | | | 99.8 | % | | | 326,995,191 | |
Other Assets, Less Liabilities | | | 0.2 | | | | 678,019 | |
Net Assets | | | 100.0 | % | | $ | 327,673,210 | |
| † | Percentages indicated are based on Fund net assets. |
| (a) | Non-income producing security. |
| (b) | May be sold to institutional investors only under Rule 144A or securities offered pursuant to Section 4(a)(2) of the Securities Act of 1933, as amended. |
| (c) | All or a portion of this security was held on loan. As of October 31, 2020, the aggregate market value of securities on loan was $8,723,081.The Fund received cash collateral with a value of $9,261,517.(See Note 2(I)). |
| (d) | Current yield as of October 31, 2020. |
| (e) | Represents a security purchased with cash collateral received for securities on loan. |
The following abbreviation is used in the preceding pages:
ADR—American Depositary Receipt
The following is a summary of the fair valuations according to the inputs used as of October 31, 2020, for valuing the Fund’s assets:
| | | | | | | | | | | | | | | | |
Description | | Quoted
Prices in Active
Markets for
Identical
Assets
(Level 1) | | | Significant Other
Observable
Inputs
(Level 2) | | | Significant
Unobservable
Inputs
(Level 3) | | | Total | |
| | | | |
Asset Valuation Inputs | | | | | | | | | | | | | | | | |
| Investments in Securities (a) | | | | | | | | | | | | | | | | |
| Common Stocks | | $ | 317,168,232 | | | $ | — | | | $ | — | | | $ | 317,168,232 | |
| Short-Term Investments | | | | | | | | | | | | | | | | |
Affiliated Investment Company | | | 565,442 | | | | — | | | | — | | | | 565,442 | |
Unaffiliated Investment Company | | | 9,261,517 | | | | — | | | | — | | | | 9,261,517 | |
| | | | | | | | | | | | | | | | |
| Total Short-Term Investments | | | 9,826,959 | | | | — | | | | — | | | | 9,826,959 | |
| | | | | | | | | | | | | | | | |
| Total Investments in Securities | | $ | 326,995,191 | | | $ | — | | | $ | — | | | $ | 326,995,191 | |
| | | | | | | | | | | | | | | | |
| (a) | For a complete listing of investments and their industries, see the Portfolio of Investments. |
| | | | | | |
The notes to the financial statements are an integral part of,
and should be read in conjunction with, the financial statements. | | | | | 11 | |
Portfolio of Investments October 31, 2020 (continued)
The table below sets forth the diversification of the Fund’s investments by industry.
Industry Diversification
| | | | | | | | |
| | | Value | | | Percent † | |
Banks | | $ | 9,401,779 | | | | 2.9 | % |
Beverages | | | 9,745,997 | | | | 3.0 | |
Capital Markets | | | 18,757,693 | | | | 5.7 | |
Chemicals | | | 33,294,374 | | | | 10.2 | |
Commercial Services & Supplies | | | 6,425,066 | | | | 2.0 | |
Electronic Equipment, Instruments & Components | | | 16,169,454 | | | | 4.9 | |
Equity Real Estate Investment Trusts | | | 3,484,232 | | | | 1.1 | |
Health Care Equipment & Supplies | | | 29,339,939 | | | | 8.9 | |
Health Care Providers & Services | | | 13,233,287 | | | | 4.0 | |
Insurance | | | 11,966,710 | | | | 3.6 | |
Interactive Media & Services | | | 20,876,970 | | | | 6.4 | |
IT Services | | | 30,221,586 | | | | 9.2 | |
Life Sciences Tools & Services | | | 8,079,359 | | | | 2.5 | |
Media | | | 12,155,929 | | | | 3.7 | |
Pharmaceuticals | | | 10,496,194 | | | | 3.2 | |
Professional Services | | | 20,318,678 | | | | 6.2 | |
Real Estate Management & Development | | | 7,990,641 | | | | 2.4 | |
Semiconductors & Semiconductor Equipment | | | 10,499,014 | | | | 3.2 | |
Software | | | 24,668,827 | | | | 7.5 | |
Specialty Retail | | | 9,693,146 | | | | 3.0 | |
Thrifts & Mortgage Finance | | | 10,349,357 | | | | 3.2 | |
| | | | | | | | |
| | | 317,168,232 | | | | 96.8 | |
Short-Term Investments | | | 9,826,959 | | | | 3.0 | |
Other Assets, Less Liabilities | | | 678,019 | | | | 0.2 | |
| | | | | | | | |
Net Assets | | $ | 327,673,210 | | | | 100.0 | % |
| | | | | | | | |
| † | Percentages indicated are based on Fund net assets. |
| | | | |
| 12 | | MainStay MacKay International Equity Fund | | The notes to the financial statements are an integral part of,
and should be read in conjunction with, the financial statements. |
Statement of Assets and Liabilities as of October 31, 2020
| | | | |
| Assets | |
Investment in unaffiliated securities, at value
(identified cost $284,311,462) including securities on loan of $8,723,081 | | $ | 326,429,749 | |
Investment in affiliated investment company, at value (identified cost $565,442) | | | 565,442 | |
Cash denominated in foreign currencies
(identified cost $9,899,663) | | | 9,782,446 | |
Receivables: | | | | |
Dividends | | | 578,010 | |
Fund shares sold | | | 77,935 | |
Securities lending | | | 1,927 | |
Other assets | | | 45,407 | |
| | | | |
Total assets | | | 337,480,916 | |
| | | | |
| |
| Liabilities | | | | |
Cash collateral received for securities on loan | | | 9,261,517 | |
Payables: | | | | |
Manager (See Note 3) | | | 199,935 | |
Fund shares redeemed | | | 174,506 | |
Transfer agent (See Note 3) | | | 45,459 | |
Foreign capital gains tax (See Note 2(C)) | | | 40,199 | |
NYLIFE Distributors (See Note 3) | | | 24,248 | |
Professional fees | | | 21,848 | |
Shareholder communication | | | 21,040 | |
Custodian | | | 18,513 | |
Trustees | | | 441 | |
| | | | |
Total liabilities | | | 9,807,706 | |
| | | | |
Net assets | | $ | 327,673,210 | |
| | | | |
| |
| Composition of Net Assets | | | | |
Shares of beneficial interest outstanding (par value of $.01 per share) unlimited number of shares authorized | | $ | 178,738 | |
Additional paid-in capital | | | 276,053,336 | |
| | | | |
| | | 276,232,074 | |
Total distributable earnings (loss) | | | 51,441,136 | |
| | | | |
Net assets | | $ | 327,673,210 | |
| | | | |
| | | | |
Class A | | | | |
Net assets applicable to outstanding shares | | $ | 61,795,322 | |
| | | | |
Shares of beneficial interest outstanding | | | 3,381,650 | |
| | | | |
Net asset value per share outstanding | | $ | 18.27 | |
Maximum sales charge (5.50% of offering price) | | | 1.06 | |
| | | | |
Maximum offering price per share outstanding | | $ | 19.33 | |
| | | | |
Investor Class | | | | |
Net assets applicable to outstanding shares | | $ | 21,699,203 | |
| | | | |
Shares of beneficial interest outstanding | | | 1,201,416 | |
| | | | |
Net asset value per share outstanding | | $ | 18.06 | |
Maximum sales charge (5.00% of offering price) | | | 0.95 | |
| | | | |
Maximum offering price per share outstanding | | $ | 19.01 | |
| | | | |
Class B | | | | |
Net assets applicable to outstanding shares | | $ | 2,367,777 | |
| | | | |
Shares of beneficial interest outstanding | | | 150,392 | |
| | | | |
Net asset value and offering price per share outstanding | | $ | 15.74 | |
| | | | |
Class C | | | | |
Net assets applicable to outstanding shares | | $ | 2,952,041 | |
| | | | |
Shares of beneficial interest outstanding | | | 187,482 | |
| | | | |
Net asset value and offering price per share outstanding | | $ | 15.75 | |
| | | | |
Class I | | | | |
Net assets applicable to outstanding shares | | $ | 35,879,812 | |
| | | | |
Shares of beneficial interest outstanding | | | 1,946,991 | |
| | | | |
Net asset value and offering price per share outstanding | | $ | 18.43 | |
| | | | |
Class R1 | | | | |
Net assets applicable to outstanding shares | | $ | 142,636 | |
| | | | |
Shares of beneficial interest outstanding | | | 7,792 | |
| | | | |
Net asset value and offering price per share outstanding | | $ | 18.31 | |
| | | | |
Class R2 | | | | |
Net assets applicable to outstanding shares | | $ | 485,797 | |
| | | | |
Shares of beneficial interest outstanding | | | 26,547 | |
| | | | |
Net asset value and offering price per share outstanding | | $ | 18.30 | |
| | | | |
Class R3 | | | | |
Net assets applicable to outstanding shares | | $ | 1,140,320 | |
| | | | |
Shares of beneficial interest outstanding | | | 63,083 | |
| | | | |
Net asset value and offering price per share outstanding | | $ | 18.08 | |
| | | | |
Class R6 | | | | |
Net assets applicable to outstanding shares | | $ | 201,210,302 | |
| | | | |
Shares of beneficial interest outstanding | | | 10,908,476 | |
| | | | |
Net asset value and offering price per share outstanding | | $ | 18.45 | |
| | | | |
| | | | | | |
The notes to the financial statements are an integral part of,
and should be read in conjunction with, the financial statements. | | | | | 13 | |
Statement of Operations for the year ended October 31, 2020
| | | | |
| Investment Income (Loss) | | | | |
Income | | | | |
Dividends (a) | | $ | 3,550,837 | |
Securities lending | | | 50,253 | |
Interest | | | 8,574 | |
Other | | | 63 | |
| | | | |
Total income | | | 3,609,727 | |
| | | | |
Expenses | | | | |
Manager (See Note 3) | | | 2,839,641 | |
Transfer agent (See Note 3) | | | 283,090 | |
Distribution/Service—Class A (See Note 3) | | | 146,882 | |
Distribution/Service—Investor Class (See Note 3) | | | 56,553 | |
Distribution/Service—Class B (See Note 3) | | | 27,788 | |
Distribution/Service—Class C (See Note 3) | | | 34,212 | |
Distribution/Service—Class R2 (See Note 3) | | | 1,133 | |
Distribution/Service—Class R3 (See Note 3) | | | 5,500 | |
Registration | | | 128,949 | |
Custodian | | | 107,046 | |
Professional fees | | | 103,381 | |
Shareholder communication | | | 31,203 | |
Trustees | | | 7,525 | |
Shareholder service (See Note 3) | | | 1,735 | |
Miscellaneous | | | 33,308 | |
| | | | |
Total expenses before waiver/reimbursement | | | 3,807,946 | |
Expense waiver/reimbursement from Manager (See Note 3) | | | (659,274 | ) |
| | | | |
Net expenses | | | 3,148,672 | |
| | | | |
Net investment income (loss) | | | 461,055 | |
| | | | |
| |
| Realized and Unrealized Gain (Loss) | | | | |
Net realized gain (loss) on: | | | | |
Unaffiliated investment transactions | | | 10,463,697 | |
Foreign currency forward transactions | | | 682 | |
Foreign currency transactions | | | (130,413 | ) |
| | | | |
Net realized gain (loss) | | | 10,333,966 | |
| | | | |
Net change in unrealized appreciation (depreciation) on: | | | | |
Unaffiliated investments (b) | | | 17,853,419 | |
Translation of other assets and liabilities in foreign currencies | | | (72,487 | ) |
| | | | |
Net change in unrealized appreciation (depreciation) | | | 17,780,932 | |
| | | | |
Net realized and unrealized gain (loss) | | | 28,114,898 | |
| | | | |
Net increase (decrease) in net assets resulting from operations | | $ | 28,575,953 | |
| | | | |
| (a) | Dividends recorded net of foreign withholding taxes in the amount of $312,890. |
| (b) | Net change in unrealized appreciation (depreciation) on investments recorded net of foreign capital gains tax in the amount of $(33,201). |
| | | | |
| 14 | | MainStay MacKay International Equity Fund | | The notes to the financial statements are an integral part of,
and should be read in conjunction with, the financial statements. |
Statements of Changes in Net Assets
for the years ended October 31, 2020 and October 31, 2019
| | | | | | | | |
| | | 2020 | | | 2019 | |
| Increase (Decrease) in Net Assets | |
Operations: | | | | | | | | |
Net investment income (loss) | | $ | 461,055 | | | $ | 2,286,041 | |
Net realized gain (loss) | | | 10,333,966 | | | | 9,379,454 | |
Net change in unrealized appreciation (depreciation) | | | 17,780,932 | | | | 22,656,074 | |
| | | | |
Net increase (decrease) in net assets resulting from operations | | | 28,575,953 | | | | 34,321,569 | |
| | | | |
Distributions to shareholders: | | | | | | | | |
Class A | | | (1,722,435 | ) | | | (588,241 | ) |
Investor Class | | | (658,491 | ) | | | (216,775 | ) |
Class B | | | (97,268 | ) | | | (45,981 | ) |
Class C | | | (119,383 | ) | | | (75,618 | ) |
Class I | | | (1,446,255 | ) | | | (2,235,732 | ) |
Class R1 | | | (8,457 | ) | | | (20,555 | ) |
Class R2 | | | (12,558 | ) | | | (4,901 | ) |
Class R3 | | | (31,572 | ) | | | (8,671 | ) |
Class R6 | | | (6,312,311 | ) | | | — | |
| | | | |
Total distributions to shareholders | | | (10,408,730 | ) | | | (3,196,474 | ) |
| | | | |
Capital share transactions: | | | | | | | | |
Net proceeds from sale of shares | | | 37,289,281 | | | | 52,866,647 | |
Net asset value of shares issued to shareholders in reinvestment of distributions | | | 10,370,218 | | | | 3,166,285 | |
Cost of shares redeemed | | | (49,485,401 | ) | | | (84,971,939 | ) |
| | | | |
Increase (decrease) in net assets derived from capital share transactions | | | (1,825,902 | ) | | | (28,939,007 | ) |
| | | | |
Net increase (decrease) in net assets | | | 16,341,321 | | | | 2,186,088 | |
| | |
| Net Assets | | | | | | | | |
Beginning of year | | | 311,331,889 | | | | 309,145,801 | |
| | | | |
End of year | | $ | 327,673,210 | | | $ | 311,331,889 | |
| | | | |
| | | | | | |
The notes to the financial statements are an integral part of,
and should be read in conjunction with, the financial statements. | | | | | 15 | |
Financial Highlights selected per share data and ratios
| | | | | | | | | | | | | | | | | | | | |
| |
| | | Year ended October 31, | |
| | | | | |
| Class A | | 2020 | | | 2019 | | | 2018 | | | 2017 | | | 2016 | |
| | | | | |
Net asset value at beginning of year | | $ | 17.12 | | | $ | 15.48 | | | $ | 16.38 | | | $ | 13.51 | | | $ | 13.51 | |
| | | | | | | | | | | | | | | | | | | | |
| | | | | |
Net investment income (loss) (a) | | | (0.01 | ) | | | 0.09 | | | | 0.03 | | | | 0.00 | ‡ | | | 0.04 | |
| | | | | |
Net realized and unrealized gain (loss) on investments | | | 1.69 | | | | 1.73 | | | | (0.83 | ) | | | 2.90 | | | | (0.04 | ) |
| | | | | |
Net realized and unrealized gain (loss) on foreign currency transactions | | | (0.01 | ) | | | (0.03 | ) | | | (0.01 | ) | | | 0.01 | | | | 0.01 | |
| | | | | | | | | | | | | | | | | | | | |
| | | | | |
Total from investment operations | | | 1.67 | | | | 1.79 | | | | (0.81 | ) | | | 2.91 | | | | 0.01 | |
| | | | | | | | | | | | | | | | | | | | |
| | | | | |
| Less distributions: | | | | | | | | | | | | | | | | | | | | |
| | | | | |
From net investment income | | | (0.05 | ) | | | — | | | | (0.09 | ) | | | (0.04 | ) | | | (0.01 | ) |
| | | | | |
From net realized gain on investments | | | (0.47 | ) | | | (0.15 | ) | | | — | | | | — | | | | — | |
| | | | | | | | | | | | | | | | | | | | |
| | | | | |
Total distributions | | | (0.52 | ) | | | (0.15 | ) | | | (0.09 | ) | | | (0.04 | ) | | | (0.01 | ) |
| | | | | | | | | | | | | | | | | | | | |
| | | | | |
Net asset value at end of year | | $ | 18.27 | | | $ | 17.12 | | | $ | 15.48 | | | $ | 16.38 | | | $ | 13.51 | |
| | | | | | | | | | | | | | | | | | | | |
| | | | | |
Total investment return (b) | | | 9.84 | % | | | 11.74 | % | | | (4.98 | %) | | | 21.59 | % | | | 0.05 | % |
| | | | | |
| Ratios (to average net assets)/Supplemental Data: | | | | | | | | | | | | | | | | | | | | |
| | | | | |
Net investment income (loss) | | | (0.09 | %) | | | 0.57 | % | | | 0.17 | % | | | 0.01 | % | | | 0.28 | %(c) |
| | | | | |
Net expenses (d) | | | 1.21 | % | | | 1.21 | % | | | 1.32 | % | | | 1.34 | % | | | 1.32 | %(e) |
| | | | | |
Expenses (before waiver/reimbursement) (d) | | | 1.40 | % | | | 1.35 | % | | | 1.32 | % | | | 1.34 | % | | | 1.32 | %(e) |
| | | | | |
Portfolio turnover rate | | | 135 | % | | | 58 | % | | | 53 | % | | | 45 | % | | | 33 | % |
| | | | | |
Net assets at end of year (in 000’s) | | $ | 61,795 | | | $ | 57,566 | | | $ | 59,304 | | | $ | 54,553 | | | $ | 41,891 | |
| ‡ | Less than one cent per share. |
| (a) | Per share data based on average shares outstanding during the year. |
| (b) | Total investment return is calculated exclusive of sales charges and assumes the reinvestment of distributions. For periods of less than one year, total return is not annualized. |
| (c) | Without the custody fee reimbursement, net investment income (loss) would have been 0.27%. |
| (d) | In addition to the fees and expenses which the Fund bears directly, it also indirectly bears a pro-rata share of the fees and expenses of the underlying funds in which it invests. Such indirect expenses are not included in the above expense ratios. |
| (e) | Without the custody fee reimbursement, net expenses would have been 1.33%. |
| | | | | | | | | | | | | | | | | | | | |
| |
| | | Year ended October 31, | |
| | | | | |
| Investor Class | | 2020 | | | 2019 | | | 2018 | | | 2017 | | | 2016 | |
| | | | | |
Net asset value at beginning of year | | $ | 16.94 | | | $ | 15.38 | | | $ | 16.27 | | | $ | 13.43 | | | $ | 13.47 | |
| | | | | | | | | | | | | | | | | | | | |
| | | | | |
Net investment income (loss) (a) | | | (0.07 | ) | | | 0.03 | | | | (0.03 | ) | | | (0.04 | ) | | | (0.01 | ) |
| | | | | |
Net realized and unrealized gain (loss) on investments | | | 1.67 | | | | 1.71 | | | | (0.82 | ) | | | 2.87 | | | | (0.04 | ) |
| | | | | |
Net realized and unrealized gain (loss) on foreign currency transactions | | | (0.01 | ) | | | (0.03 | ) | | | (0.01 | ) | | | 0.01 | | | | 0.01 | |
| | | | | | | | | | | | | | | | | | | | |
| | | | | |
Total from investment operations | | | 1.59 | | | | 1.71 | | | | (0.86 | ) | | | 2.84 | | | | (0.04 | ) |
| | | | | | | | | | | | | | | | | | | | |
| | | | | |
| Less distributions: | | | | | | | | | | | | | | | | | | | | |
| | | | | |
From net investment income | | | — | | | | — | | | | (0.03 | ) | | | — | | | | — | |
| | | | | |
From net realized gain on investments | | | (0.47 | ) | | | (0.15 | ) | | | — | | | | — | | | | — | |
| | | | | | | | | | | | | | | | | | | | |
| | | | | |
Total distributions | | | (0.47 | ) | | | (0.15 | ) | | | (0.03 | ) | | | — | | | | — | |
| | | | | | | | | | | | | | | | | | | | |
| | | | | |
Net asset value at end of year | | $ | 18.06 | | | $ | 16.94 | | | $ | 15.38 | | | $ | 16.27 | | | $ | 13.43 | |
| | | | | | | | | | | | | | | | | | | | |
| | | | | |
Total investment return (b) | | | 9.40 | % | | | 11.36 | % | | | (5.31 | %) | | | 21.15 | % | | | (0.30 | %) |
| | | | | |
| Ratios (to average net assets)/Supplemental Data: | | | | | | | | | | | | | | | | | | | | |
| | | | | |
Net investment income (loss) | | | (0.43 | %) | | | 0.21 | % | | | (0.19 | %) | | | (0.26 | %) | | | (0.11 | %)(c) |
| | | | | |
Net expenses (d) | | | 1.56 | % | | | 1.59 | % | | | 1.66 | % | | | 1.69 | % | | | 1.69 | % (e) |
| | | | | |
Expenses (before waiver/reimbursement) (d) | | | 1.75 | % | | | 1.75 | % | | | 1.70 | % | | | 1.69 | % | | | 1.69 | % (e) |
| | | | | |
Portfolio turnover rate | | | 135 | % | | | 58 | % | | | 53 | % | | | 45 | % | | | 33 | % |
| | | | | |
Net assets at end of year (in 000’s) | | $ | 21,699 | | | $ | 23,870 | | | $ | 21,679 | | | $ | 25,029 | | | $ | 31,523 | |
| (a) | Per share data based on average shares outstanding during the year. |
| (b) | Total investment return is calculated exclusive of sales charges and assumes the reinvestment of distributions. For periods of less than one year, total return is not annualized. |
| (c) | Without the custody fee reimbursement, net investment income (loss) would have been (0.12)%. |
| (d) | In addition to the fees and expenses which the Fund bears directly, it also indirectly bears a pro-rata share of the fees and expenses of the underlying funds in which it invests. Such indirect expenses are not included in the above expense ratios. |
| (e) | Without the custody fee reimbursement, net expenses would have been 1.70%. |
| | | | |
| 16 | | MainStay MacKay International Equity Fund | | The notes to the financial statements are an integral part of,
and should be read in conjunction with, the financial statements. |
Financial Highlights selected per share data and ratios
| | | | | | | | | | | | | | | | | | | | |
| |
| | | Year ended October 31, | |
| | | | | |
| Class B | | 2020 | | | 2019 | | | 2018 | | | 2017 | | | 2016 | |
| | | | | |
Net asset value at beginning of year | | $ | 14.94 | | | $ | 13.68 | | | $ | 14.55 | | | $ | 12.10 | | | $ | 12.23 | |
| | | | | | | | | | | | | | | | | | | | |
| | | | | |
Net investment income (loss) (a) | | | (0.18 | ) | | | (0.08 | ) | | | (0.14 | ) | | | (0.14 | ) | | | (0.10 | ) |
| | | | | |
Net realized and unrealized gain (loss) on investments | | | 1.46 | | | | 1.51 | | | | (0.72 | ) | | | 2.58 | | | | (0.04 | ) |
| | | | | |
Net realized and unrealized gain (loss) on foreign currency transactions | | | (0.01 | ) | | | (0.02 | ) | | | (0.01 | ) | | | 0.01 | | | | 0.01 | |
| | | | | | | | | | | | | | | | | | | | |
| | | | | |
Total from investment operations | | | 1.27 | | | | 1.41 | | | | (0.87 | ) | | | 2.45 | | | | (0.13 | ) |
| | | | | | | | | | | | | | | | | | | | |
| | | | | |
| Less distributions: | | | | | | | | | | | | | | | | | | | | |
| | | | | |
From net realized gain on investments | | | (0.47 | ) | | | (0.15 | ) | | | — | | | | — | | | | — | |
| | | | | | | | | | | | | | | | | | | | |
| | | | | |
Net asset value at end of year | | $ | 15.74 | | | $ | 14.94 | | | $ | 13.68 | | | $ | 14.55 | | | $ | 12.10 | |
| | | | | | | | | | | | | | | | | | | | |
| | | | | |
Total investment return (b) | | | 8.57 | % | | | 10.49 | % | | | (5.98 | %) | | | 20.25 | % | | | (1.06 | %) |
| | | | | |
| Ratios (to average net assets)/Supplemental Data: | | | | | | | | | | | | | | | | | | | | |
| | | | | |
Net investment income (loss) | | | (1.20 | %) | | | (0.59 | %) | | | (0.95 | %) | | | (1.05 | %) | | | (0.86 | %)(c) |
| | | | | |
Net expenses (d) | | | 2.31 | % | | | 2.35 | % | | | 2.41 | % | | | 2.44 | % | | | 2.44 | % (e) |
| | | | | |
Expenses (before waiver/reimbursement) (d) | | | 2.50 | % | | | 2.50 | % | | | 2.44 | % | | | 2.44 | % | | | 2.44 | % (e) |
| | | | | |
Portfolio turnover rate | | | 135 | % | | | 58 | % | | | 53 | % | | | 45 | % | | | 33 | % |
| | | | | |
Net assets at end of year (in 000’s) | | $ | 2,368 | | | $ | 3,345 | | | $ | 4,404 | | | $ | 6,210 | | | $ | 6,991 | |
| (a) | Per share data based on average shares outstanding during the year. |
| (b) | Total investment return is calculated exclusive of sales charges and assumes the reinvestment of distributions. For periods of less than one year, total return is not annualized. |
| (c) | Without the custody fee reimbursement, net investment income (loss) would have been (0.87)%. |
| (d) | In addition to the fees and expenses which the Fund bears directly, it also indirectly bears a pro-rata share of the fees and expenses of the underlying funds in which it invests. Such indirect expenses are not included in the above expense ratios. |
| (e) | Without the custody fee reimbursement, net expenses would have been 2.45%. |
| | | | | | | | | | | | | | | | | | | | |
| |
| | | Year ended October 31, | |
| | | | | |
| Class C | | 2020 | | | 2019 | | | 2018 | | | 2017 | | | 2016 | |
| | | | | |
Net asset value at beginning of year | | $ | 14.93 | | | $ | 13.68 | | | $ | 14.56 | | | $ | 12.10 | | | $ | 12.23 | |
| | | | | | | | | | | | | | | | | | | | |
| | | | | |
Net investment income (loss) (a) | | | (0.18 | ) | | | (0.09 | ) | | | (0.14 | ) | | | (0.14 | ) | | | (0.10 | ) |
| | | | | |
Net realized and unrealized gain (loss) on investments | | | 1.48 | | | | 1.51 | | | | (0.73 | ) | | | 2.59 | | | | (0.04 | ) |
| | | | | |
Net realized and unrealized gain (loss) on foreign currency transactions | | | (0.01 | ) | | | (0.02 | ) | | | (0.01 | ) | | | 0.01 | | | | 0.01 | |
| | | | | | | | | | | | | | | | | | | | |
| | | | | |
Total from investment operations | | | 1.29 | | | | 1.40 | | | | (0.88 | ) | | | 2.46 | | | | (0.13 | ) |
| | | | | | | | | | | | | | | | | | | | |
| | | | | |
| Less distributions: | | | | | | | | | | | | | | | | | | | | |
| | | | | |
From net realized gain on investments | | | (0.47 | ) | | | (0.15 | ) | | | — | | | | — | | | | — | |
| | | | | | | | | | | | | | | | | | | | |
| | | | | |
Net asset value at end of year | | $ | 15.75 | | | $ | 14.93 | | | $ | 13.68 | | | $ | 14.56 | | | $ | 12.10 | |
| | | | | | | | | | | | | | | | | | | | |
| | | | | |
Total investment return (b) | | | 8.64 | % | | | 10.49 | % | | | (6.04 | %) | | | 20.33 | % | | | (1.06 | %) |
| | | | | |
| Ratios (to average net assets)/Supplemental Data: | | | | | | | | | | | | | | | | | | | | |
| | | | | |
Net investment income (loss) | | | (1.20 | %) | | | (0.65 | %) | | | (0.93 | %) | | | (1.05 | %) | | | (0.84 | %)(c) |
| | | | | |
Net expenses (d) | | | 2.31 | % | | | 2.35 | % | | | 2.41 | % | | | 2.44 | % | | | 2.44 | % (e) |
| | | | | |
Expenses (before waiver/reimbursement) (d) | | | 2.50 | % | | | 2.50 | % | | | 2.44 | % | | | 2.44 | % | | | 2.44 | % (e) |
| | | | | |
Portfolio turnover rate | | | 135 | % | | | 58 | % | | | 53 | % | | | 45 | % | | | 33 | % |
| | | | | |
Net assets at end of year (in 000’s) | | $ | 2,952 | | | $ | 3,915 | | | $ | 6,960 | | | $ | 7,564 | | | $ | 7,850 | |
| (a) | Per share data based on average shares outstanding during the year. |
| (b) | Total investment return is calculated exclusive of sales charges and assumes the reinvestment of distributions. For periods of less than one year, total return is not annualized. |
| (c) | Without the custody fee reimbursement, net investment income (loss) would have been (0.85)%. |
| (d) | In addition to the fees and expenses which the Fund bears directly, it also indirectly bears a pro-rata share of the fees and expenses of the underlying funds in which it invests. Such indirect expenses are not included in the above expense ratios. |
| (e) | Without the custody fee reimbursement, net expenses would have been 2.45%. |
| | | | | | |
The notes to the financial statements are an integral part of,
and should be read in conjunction with, the financial statements. | | | | | 17 | |
Financial Highlights selected per share data and ratios
| | | | | | | | | | | | | | | | | | | | |
| |
| | | Year ended October 31, | |
| | | | | |
| Class I | | 2020 | | | 2019 | | | 2018 | | | 2017 | | | 2016 | |
| | | | | |
Net asset value at beginning of year | | $ | 17.28 | | | $ | 15.57 | | | $ | 16.48 | | | $ | 13.59 | | | $ | 13.59 | |
| | | | | | | | | | | | | | | | | | | | |
| | | | | |
Net investment income (loss) (a) | | | 0.05 | | | | 0.09 | | | | 0.07 | | | | 0.05 | | | | 0.07 | |
| | | | | |
Net realized and unrealized gain (loss) on investments | | | 1.70 | | | | 1.81 | | | | (0.84 | ) | | | 2.90 | | | | (0.04 | ) |
| | | | | |
Net realized and unrealized gain (loss) on foreign currency transactions | | | (0.01 | ) | | | (0.03 | ) | | | (0.01 | ) | | | 0.01 | | | | 0.01 | |
| | | | | | | | | | | | | | | | | | | | |
| | | | | |
Total from investment operations | | | 1.74 | | | | 1.87 | | | | (0.78 | ) | | | 2.96 | | | | 0.04 | |
| | | | | | | | | | | | | | | | | | | | |
| | | | | |
| Less distributions: | | | | | | | | | | | | | | | | | | | | |
| | | | | |
From net investment income | | | (0.12 | ) | | | (0.01 | ) | | | (0.13 | ) | | | (0.07 | ) | | | (0.04 | ) |
| | | | | |
From net realized gain on investments | | | (0.47 | ) | | | (0.15 | ) | | | — | | | | — | | | | — | |
| | | | | | | | | | | | | | | | | | | | |
| | | | | |
Total distributions | | | (0.59 | ) | | | (0.16 | ) | | | (0.13 | ) | | | (0.07 | ) | | | (0.04 | ) |
| | | | | | | | | | | | | | | | | | | | |
| | | | | |
Net asset value at end of year | | $ | 18.43 | | | $ | 17.28 | | | $ | 15.57 | | | $ | 16.48 | | | $ | 13.59 | |
| | | | | | | | | | | | | | | | | | | | |
| | | | | |
Total investment return (b) | | | 10.22 | % | | | 12.19 | % | | | (4.80 | %) | | | 21.94 | % | | | 0.29 | % |
| | | | | |
| Ratios (to average net assets)/Supplemental Data: | | | | | | | | | | | | | | | | | | | | |
| | | | | |
Net investment income (loss) | | | 0.27 | % | | | 0.55 | % | | | 0.42 | % | | | 0.31 | % | | | 0.54 | %(c) |
| | | | | |
Net expenses (d) | | | 0.85 | % | | | 0.92 | % | | | 1.07 | % | | | 1.09 | % | | | 1.07 | %(e) |
| | | | | |
Expenses (before waiver/reimbursement) (d) | | | 1.16 | % | | | 1.10 | % | | | 1.07 | % | | | 1.09 | % | | | 1.07 | %(e) |
| | | | | |
Portfolio turnover rate | | | 135 | % | | | 58 | % | | | 53 | % | | | 45 | % | | | 33 | % |
| | | | | |
Net assets at end of year (in 000’s) | | $ | 35,880 | | | $ | 43,280 | | | $ | 213,030 | | | $ | 205,009 | | | $ | 179,274 | |
| (a) | Per share data based on average shares outstanding during the year. |
| (b) | Total investment return is calculated exclusive of sales charges and assumes the reinvestment of distributions. Class I shares are not subject to sales charges. For periods of less than one year, total return is not annualized. |
| (c) | Without the custody fee reimbursement, net investment income (loss) would have been 0.53%. |
| (d) | In addition to the fees and expenses which the Fund bears directly, it also indirectly bears a pro-rata share of the fees and expenses of the underlying funds in which it invests. Such indirect expenses are not included in the above expense ratios. |
| (e) | Without the custody fee reimbursement, net expenses would have been 1.08%. |
| | | | | | | | | | | | | | | | | | | | |
| |
| | | Year ended October 31, | |
| | | | | |
| Class R1 | | 2020 | | | 2019 | | | 2018 | | | 2017 | | | 2016 | |
| | | | | |
Net asset value at beginning of year | | $ | 17.15 | | | $ | 15.48 | | | $ | 16.38 | | | $ | 13.51 | | | $ | 13.51 | |
| | | | | | | | | | | | | | | | | | | | |
| | | | | |
Net investment income (loss) (a) | | | (0.01 | ) | | | 0.05 | | | | 0.05 | | | | 0.03 | | | | 0.06 | |
| | | | | |
Net realized and unrealized gain (loss) on investments | | | 1.72 | | | | 1.80 | | | | (0.83 | ) | | | 2.89 | | | | (0.05 | ) |
| | | | | |
Net realized and unrealized gain (loss) on foreign currency transactions | | | (0.01 | ) | | | (0.03 | ) | | | (0.01 | ) | | | 0.01 | | | | 0.01 | |
| | | | | | | | | | | | | | | | | | | | |
| | | | | |
Total from investment operations | | | 1.70 | | | | 1.82 | | | | (0.79 | ) | | | 2.93 | | | | 0.02 | |
| | | | | | | | | | | | | | | | | | | | |
| | | | | |
| Less distributions: | | | | | | | | | | | | | | | | | | | | |
| | | | | |
From net investment income | | | (0.07 | ) | | | — | | | | (0.11 | ) | | | (0.06 | ) | | | (0.02 | ) |
| | | | | |
From net realized gain on investments | | | (0.47 | ) | | | (0.15 | ) | | | — | | | | — | | | | — | |
| | | | | | | | | | | | | | | | | | | | |
| | | | | |
Total distributions | | | (0.54 | ) | | | (0.15 | ) | | | (0.11 | ) | | | (0.06 | ) | | | (0.02 | ) |
| | | | | | | | | | | | | | | | | | | | |
| | | | | |
Net asset value at end of year | | $ | 18.31 | | | $ | 17.15 | | | $ | 15.48 | | | $ | 16.38 | | | $ | 13.51 | |
| | | | | | | | | | | | | | | | | | | | |
| | | | | |
Total investment return (b) | | | 10.05 | % | | | 11.93 | % | | | (4.86 | %) | | | 21.78 | % | | | 0.18 | % |
| | | | | |
| Ratios (to average net assets)/Supplemental Data: | | | | | | | | | | | | | | | | | | | | |
| | | | | |
Net investment income (loss) | | | (0.05 | %) | | | 0.33 | % | | | 0.29 | % | | | 0.21 | % | | | 0.41 | %(c) |
| | | | | |
Net expenses (d) | | | 1.06 | % | | | 1.11 | % | | | 1.17 | % | | | 1.19 | % | | | 1.17 | %(e) |
| | | | | |
Expenses (before waiver/reimbursement) (d) | | | 1.25 | % | | | 1.19 | % | | | 1.17 | % | | | 1.19 | % | | | 1.17 | %(e) |
| | | | | |
Portfolio turnover rate | | | 135 | % | | | 58 | % | | | 53 | % | | | 45 | % | | | 33 | % |
| | | | | |
Net assets at end of year (in 000’s) | | $ | 143 | | | $ | 265 | | | $ | 2,109 | | | $ | 2,616 | | | $ | 2,478 | |
| (a) | Per share data based on average shares outstanding during the year. |
| (b) | Total investment return is calculated exclusive of sales charges and assumes the reinvestment of distributions. Class R1 shares are not subject to sales charges. For periods of less than one year, total return is not annualized. |
| (c) | Without the custody fee reimbursement, net investment income (loss) would have been 0.40%. |
| (d) | In addition to the fees and expenses which the Fund bears directly, it also indirectly bears a pro-rata share of the fees and expenses of the underlying funds in which it invests. Such indirect expenses are not included in the above expense ratios. |
| (e) | Without the custody fee reimbursement, net expenses would have been 1.18%. |
| | | | |
| 18 | | MainStay MacKay International Equity Fund | | The notes to the financial statements are an integral part of,
and should be read in conjunction with, the financial statements. |
Financial Highlights selected per share data and ratios
| | | | | | | | | | | | | | | | | | | | |
| |
| | | Year ended October 31, | |
| | | | | |
| Class R2 | | 2020 | | | 2019 | | | 2018 | | | 2017 | | | 2016 | |
| | | | | |
Net asset value at beginning of year | | $ | 17.15 | | | $ | 15.52 | | | $ | 16.42 | | | $ | 13.54 | | | $ | 13.54 | |
| | | | | | | | | | | | | | | | | | | | |
| | | | | |
Net investment income (loss) (a) | | | (0.03 | ) | | | 0.06 | | | | (0.02 | ) | | | 0.01 | | | | 0.01 | |
| | | | | |
Net realized and unrealized gain (loss) on investments | | | 1.69 | | | | 1.75 | | | | (0.79 | ) | | | 2.88 | | | | (0.01 | ) |
| | | | | |
Net realized and unrealized gain (loss) on foreign currency transactions | | | (0.01 | ) | | | (0.03 | ) | | | (0.01 | ) | | | 0.01 | | | | 0.00 | ‡ |
| | | | | | | | | | | | | | | | | | | | |
| | | | | |
Total from investment operations | | | 1.65 | | | | 1.78 | | | | (0.82 | ) | | | 2.90 | | | | 0.00 | ‡ |
| | | | | | | | | | | | | | | | | | | | |
| | | | | |
| Less distributions: | | | | | | | | | | | | | | | | | | | | |
| | | | | |
From net investment income | | | (0.03 | ) | | | — | | | | (0.08 | ) | | | (0.02 | ) | | | — | |
| | | | | |
From net realized gain on investments | | | (0.47 | ) | | | (0.15 | ) | | | — | | | | — | | | | — | |
| | | | | | | | | | | | | | | | | | | | |
| | | | | |
Total distributions | | | (0.50 | ) | | | (0.15 | ) | | | (0.08 | ) | | | (0.02 | ) | | | — | |
| | | | | | | | | | | | | | | | | | | | |
| | | | | |
Net asset value at end of year | | $ | 18.30 | | | $ | 17.15 | | | $ | 15.52 | | | $ | 16.42 | | | $ | 13.54 | |
| | | | | | | | | | | | | | | | | | | | |
| | | | | |
Total investment return (b) | | | 9.72 | % | | | 11.64 | % | | | (5.06 | %)(c) | | | 21.55 | %(c) | | | (0.07 | %) |
| | | | | |
| Ratios (to average net assets)/Supplemental Data: | | | | | | | | | | | | | | | | | | | | |
| | | | | |
Net investment income (loss) | | | (0.18 | %) | | | 0.38 | % | | | (0.13 | %) | | | 0.06 | % | | | 0.08 | % |
| | | | | |
Net expenses (d) | | | 1.31 | % | | | 1.31 | % | | | 1.42 | % | | | 1.44 | % | | | 1.42 | % |
| | | | | |
Expenses (before waiver/reimbursement) (d) | | | 1.50 | % | | | 1.45 | % | | | 1.42 | % | | | 1.44 | % | | | 1.42 | % |
| | | | | |
Portfolio turnover rate | | | 135 | % | | | 58 | % | | | 53 | % | | | 45 | % | | | 33 | % |
| | | | | |
Net assets at end of year (in 000’s) | | $ | 486 | | | $ | 454 | | | $ | 602 | | | $ | 1,201 | | | $ | 847 | |
| ‡ | Less than one cent per share. |
| (a) | Per share data based on average shares outstanding during the year. |
| (b) | Total investment return is calculated exclusive of sales charges and assumes the reinvestment of distributions. Class R2 shares are not subject to sales charges. For periods of less than one year, total return is not annualized. |
| (c) | Total investment return may reflect adjustments to conform to generally accepted accounting principles. |
| (d) | In addition to the fees and expenses which the Fund bears directly, it also indirectly bears a pro-rata share of the fees and expenses of the underlying funds in which it invests. Such indirect expenses are not included in the above expense ratios. |
| | | | | | | | | | | | | | | | | | | | |
| |
| | | Year ended October 31, | |
| | | | | |
| Class R3 | | 2020 | | | 2019 | | | 2018 | | | 2017 | | | 2016 | |
| | | | | |
Net asset value at beginning of year | | $ | 16.96 | | | $ | 15.38 | | | $ | 16.29 | | | $ | 13.44 | | | $ | 13.48 | |
| | | | | | | | | | | | | | | | | | | | |
| | | | | |
Net investment income (loss) (a) | | | (0.08 | ) | | | 0.03 | | | | (0.04 | ) | | | (0.04 | ) | | | (0.01 | ) |
| | | | | |
Net realized and unrealized gain (loss) on investments | | | 1.68 | | | | 1.73 | | | | (0.82 | ) | | | 2.88 | | | | (0.04 | ) |
| | | | | |
Net realized and unrealized gain (loss) on foreign currency transactions | | | (0.01 | ) | | | (0.03 | ) | | | (0.01 | ) | | | 0.01 | | | | 0.01 | |
| | | | | | | | | | | | | | | | | | | | |
| | | | | |
Total from investment operations | | | 1.59 | | | | 1.73 | | | | (0.87 | ) | | | 2.85 | | | | (0.04 | ) |
| | | | | | | | | | | | | | | | | | | | |
| | | | | |
| Less distributions: | | | | | | | | | | | | | | | | | | | | |
| | | | | |
From net investment income | | | — | | | | — | | | | (0.04 | ) | | | — | | | | — | |
| | | | | |
From net realized gain on investments | | | (0.47 | ) | | | (0.15 | ) | | | — | | | | — | | | | — | |
| | | | | | | | | | | | | | | | | | | | |
| | | | | |
Total distributions | | | (0.47 | ) | | | (0.15 | ) | | | (0.04 | ) | | | — | | | | — | |
| | | | | | | | | | | | | | | | | | | | |
| | | | | |
Net asset value at end of year | | $ | 18.08 | | | $ | 16.96 | | | $ | 15.38 | | | $ | 16.29 | | | $ | 13.44 | |
| | | | | | | | | | | | | | | | | | | | |
| | | | | |
Total investment return (b) | | | 9.46 | % | | | 11.35 | % | | | (5.39 | %)(c) | | | 21.21 | % | | | (0.30 | %) |
| | | | | |
| Ratios (to average net assets)/Supplemental Data: | | | | | | | | | | | | | | | | | | | | |
| | | | | |
Net investment income (loss) | | | (0.46 | %) | | | 0.22 | % | | | (0.21 | %) | | | (0.27 | %) | | | (0.11 | %)(d) |
| | | | | |
Net expenses (e) | | | 1.56 | % | | | 1.56 | % | | | 1.67 | % | | | 1.69 | % | | | 1.67 | % (f) |
| | | | | |
Expenses (before reimbursement/waiver) (e) | | | 1.75 | % | | | 1.70 | % | | | 1.67 | % | | | 1.69 | % | | | 1.67 | % (f) |
| | | | | |
Portfolio turnover rate | | | 135 | % | | | 58 | % | | | 53 | % | | | 45 | % | | | 33 | % |
| | | | | |
Net assets at end of year (in 000’s) | | $ | 1,140 | | | $ | 1,154 | | | $ | 1,057 | | | $ | 1,446 | | | $ | 1,108 | |
| (a) | Per share data based on average shares outstanding during the year. |
| (b) | Total investment return is calculated exclusive of sales charges and assumes the reinvestment of distributions. Class R3 shares are not subject to sales charges. For periods of less than one year, total return is not annualized. |
| (c) | Total investment return may reflect adjustments to conform to generally accepted accounting principles. |
| (d) | Without the custody fee reimbursement, net investment income (loss) would have been (0.12)%. |
| (e) | In addition to the fees and expenses which the Fund bears directly, it also indirectly bears a pro-rata share of the fees and expenses of the underlying funds in which it invests. Such indirect expenses are not included in the above expense ratios. |
| (f) | Without the custody fee reimbursement, net expenses would have been 1.68%. |
| | | | | | |
The notes to the financial statements are an integral part of,
and should be read in conjunction with, the financial statements. | | | | | 19 | |
Financial Highlights selected per share data and ratios
| | | | | | | | |
| | |
| Class R6 | | Year
ended
October 31,
2020 | | | February 28,
2019^ through
October 31,
2019 | |
| | |
Net asset value at beginning of period | | $ | 17.28 | | | $ | 16.13 | |
| | | | | | | | |
| | |
Net investment income (loss) (a) | | | 0.05 | | | | 0.15 | |
| | |
Net realized and unrealized gain (loss) on investments | | | 1.71 | | | | 1.02 | |
| | |
Net realized and unrealized gain (loss) on foreign currency transactions | | | (0.01 | ) | | | (0.02 | ) |
| | | | | | | | |
| | |
Total from investment operations | | | 1.75 | | | | 1.15 | |
| | | | | | | | |
| | |
| Less distributions: | | | | | | | | |
| | |
From net investment income | | | (0.11 | ) | | | — | |
| | |
From net realized gain on investments | | | (0.47 | ) | | | — | |
| | | | | | | | |
| | |
Total distributions | | | (0.58 | ) | | | — | |
| | | | | | | | |
| | |
Net asset value at end of period | | $ | 18.45 | | | $ | 17.28 | |
| | | | | | | | |
| | |
Total investment return (b) | | | 10.27 | % | | | 7.13 | % |
| | |
| Ratios (to average net assets)/Supplemental Data: | | | | | | | | |
| | |
Net investment income (loss) | | | 0.31 | % | | | 1.37 | %†† |
| | |
Net expenses (c) | | | 0.83 | % | | | 0.83 | %†† |
| | |
Expenses (before waiver/reimbursement) (c) | | | 1.02 | % | | | 1.00 | %†† |
| | |
Portfolio turnover rate | | | 135 | % | | | 58 | % |
| | |
Net assets at end of period (in 000’s) | | $ | 201,210 | | | $ | 177,483 | |
| (a) | Per share data based on average shares outstanding during the period. |
| (b) | Total investment return is calculated exclusive of sales charges and assumes the reinvestment of distributions. Class R6 shares are not subject to sales charges. For periods of less than one year, total return is not annualized. |
| (c) | In addition to the fees and expenses which the Fund bears directly, it also indirectly bears a pro-rata share of the fees and expenses of the underlying funds in which it invests. Such indirect expenses are not included in the above expense ratios. |
| | | | |
| 20 | | MainStay MacKay International Equity Fund | | The notes to the financial statements are an integral part of,
and should be read in conjunction with, the financial statements. |
Notes to Financial Statements
Note 1–Organization and Business
The MainStay Funds (the “Trust”) was organized on January 9, 1986, as a Massachusetts business trust. The Trust is registered under the Investment Company Act of 1940, as amended (the “1940 Act”), as an open-end management investment company, and is comprised of twelve funds (collectively referred to as the “Funds”). These financial statements and notes relate to the MainStay MacKay International Equity Fund (the “Fund”), a “diversified” fund, as that term is defined in the 1940 Act, as interpreted or modified by regulatory authorities having jurisdiction, from time to time.
The Fund currently has ten classes of shares registered for sale. Class A shares commenced operations on January 3, 1995. Class B shares commenced operations on September 13, 1994. Class C shares commenced operations on September 1, 1998. Class I, Class R1 and Class R2 shares commenced operations on January 2, 2004. Class R3 shares commenced operations on April 28, 2006. Investor Class shares commenced operations on February 28, 2008. Class R6 shares commenced operations on February 28, 2019. SIMPLE Class shares were registered for sale effective as of August 31, 2020. As of October 31, 2020, SIMPLE Class shares were not yet offered for sale.
Class B shares of the MainStay Group of Funds are closed to all new purchases as well as additional investments by existing Class B shareholders. Existing Class B shareholders may continue to reinvest dividends and capital gains distributions, as well as exchange their Class B shares for Class B shares of other funds in the MainStay Group of Funds as permitted by the current exchange privileges. Class B shareholders continue to be subject to any applicable contingent deferred sales charge (“CDSC”) at the time of redemption. All other features of the Class B shares, including but not limited to the fees and expenses applicable to Class B shares, remain unchanged. Unless redeemed, Class B shareholders will remain in Class B shares of their respective fund until the Class B shares are converted to Class A or Investor Class shares pursuant to the applicable conversion schedule.
Class A and Investor Class shares are offered at net asset value (“NAV”) per share plus an initial sales charge. No initial sales charge applies to investments of $1 million or more (and certain other qualified purchases) in Class A and Investor Class shares. However, a CDSC of 1.00% may be imposed on certain redemptions made within 18 months of the date of purchase on shares that were purchased without an initial sales charge. Class C shares are offered at NAV without an initial sales charge, although a 1.00% CDSC may be imposed on certain redemptions of such shares made within one year of the date of purchase of Class C shares. When Class B shares were offered, they were offered at NAV without an initial sales charge, although a CDSC that declines depending on the number of years a shareholder held its Class B shares may be imposed on certain redemptions of such shares made within six years of the date of purchase of such shares. Class I, Class R1, Class R2, Class R3 and Class R6 shares are offered at NAV without a sales charge. SIMPLE Class shares are currently expected to be offered at NAV without a sales charge. Depending upon eligibility, Class B shares convert to either Class A or Investor Class shares at the end of the calendar quarter eight years after the date they were purchased. In addition, depending upon eligibility, Class C shares convert to either Class A or Investor Class shares at the end of the calendar quarter ten years after the date they were purchased. Additionally,
Investor Class shares may convert automatically to Class A shares. Under certain circumstances and as may be permitted by the Trust’s multiple class plan pursuant to Rule 18f-3 under the 1940 Act, specified share classes of the Fund may be converted to one or more other share classes of the Fund as disclosed in the capital share transactions within these Notes. The classes of shares have the same voting (except for issues that relate solely to one class), dividend, liquidation and other rights, and the same terms and conditions, except that under distribution plans pursuant to Rule 12b-1 under the 1940 Act, Class B and Class C shares are subject to higher distribution and/or service fees than Class A, Investor Class, Class R2, Class R3 and SIMPLE Class shares. Class I, Class R1 and Class R6 shares are not subject to a distribution and/or service fee. Class R1, Class R2 and Class R3 shares are subject to a shareholder service fee, which is in addition to fees paid under the distribution plans for Class R2 and Class R3 shares.
The Fund’s investment objective is to seek long-term growth of capital.
Note 2–Significant Accounting Policies
The Fund is an investment company and accordingly follows the investment company accounting and reporting guidance of the Financial Accounting Standards Board (“FASB”) Accounting Standard Codification Topic 946 Financial Services—Investment Companies. The Fund prepares its financial statements in accordance with generally accepted accounting principles (“GAAP”) in the United States of America and follows the significant accounting policies described below.
(A) Securities Valuation. Investments are usually valued as of the close of regular trading on the New York Stock Exchange (the “Exchange”) (usually 4:00 p.m. Eastern time) on each day the Fund is open for business (“valuation date”).
The Board of Trustees of the Trust (the “Board”) adopted procedures establishing methodologies for the valuation of the Fund’s securities and other assets and delegated the responsibility for valuation determinations under those procedures to the Valuation Committee of the Trust (the “Valuation Committee”). The procedures state that, subject to the oversight of the Board and unless otherwise noted, the responsibility for the day-to-day valuation of portfolio assets (including fair value measurements for the Fund’s assets and liabilities) rests with New York Life Investment Management LLC (“New York Life Investments” or the “Manager”), aided to whatever extent necessary by the Subadvisor (as defined in Note 3(A)). To assess the appropriateness of security valuations, the Manager, the Subadvisor or the Fund’s third-party service provider, who is subject to oversight by the Manager, regularly compares prior day prices, prices on comparable securities and the sale prices to the prior and current day prices and challenges prices with changes exceeding certain tolerance levels with third-party pricing services or broker sources.
The Board authorized the Valuation Committee to appoint a Valuation Subcommittee (the “Subcommittee”) to establish the prices of securities for which market quotations are not readily available or the prices of which are not otherwise readily determinable under the procedures. The Subcommittee meets (in person, via electronic mail or via teleconference) on an as-needed basis. The Valuation Committee meets to ensure that actions taken by the Subcommittee were appropriate.
Notes to Financial Statements (continued)
For those securities valued through either a standardized fair valuation methodology or a fair valuation measurement, the Subcommittee deals with such valuation and the Valuation Committee reviews and affirms, if appropriate, the reasonableness of the valuation based on such methodologies and measurements on a regular basis after considering information that is reasonably available and deemed relevant by the Valuation Committee. Any action taken by the Subcommittee with respect to the valuation of a portfolio security or other asset is submitted for review and ratification (if appropriate) to the Valuation Committee and the Board at the next regularly scheduled meeting.
“Fair value” is defined as the price the Fund would reasonably expect to receive upon selling an asset or liability in an orderly transaction to an independent buyer in the principal or most advantageous market for the asset or liability. Fair value measurements are determined within a framework that establishes a three-tier hierarchy that maximizes the use of observable market data and minimizes the use of unobservable inputs to establish a classification of fair value measurements for disclosure purposes. “Inputs” refer broadly to the assumptions that market participants would use in pricing the asset or liability, including assumptions about risk, such as the risk inherent in a particular valuation technique used to measure fair value using a pricing model and/or the risk inherent in the inputs for the valuation technique. Inputs may be observable or unobservable. Observable inputs reflect the assumptions market participants would use in pricing the asset or liability based on market data obtained from sources independent of the Fund. Unobservable inputs reflect the Fund’s own assumptions about the assumptions market participants would use in pricing the asset or liability based on the information available. The inputs or methodology used for valuing assets or liabilities may not be an indication of the risks associated with investing in those assets or liabilities. The three-tier hierarchy of inputs is summarized below.
| • | | Level 1—quoted prices in active markets for an identical asset or liability |
| • | | Level 2—other significant observable inputs (including quoted prices for a similar asset or liability in active markets, interest rates and yield curves, prepayment speeds, credit risk, etc.) |
| • | | Level 3—significant unobservable inputs (including the Fund’s own assumptions about the assumptions that market participants would use in measuring fair value of an asset or liability) |
The level of an asset or liability within the fair value hierarchy is based on the lowest level of an input, both individually and in the aggregate, that is significant to the fair value measurement. The aggregate value by input level of the Fund’s assets and liabilities as of October 31, 2020, is included at the end of the Portfolio of Investments.
The Fund may use third-party vendor evaluations, whose prices may be derived from one or more of the following standard inputs, among others:
| | |
• Broker/dealer quotes | | • Benchmark securities |
• Two-sided markets | | • Reference data (corporate actions or material event notices) |
• Bids/offers | | • Monthly payment information |
• Industry and economic events | | • Reported trades |
An asset or liability for which market values cannot be measured using the methodologies described above is valued by methods deemed reasonable in good faith by the Valuation Committee, following the procedures established by the Board, to represent fair value. Under these procedures, the Fund generally uses a market-based approach which may use related or comparable assets or liabilities, recent transactions, market multiples, book values and other relevant information. The Fund may also use an income-based valuation approach in which the anticipated future cash flows of the asset or liability are discounted to calculate fair value. Discounts may also be applied due to the nature and/or duration of any restrictions on the disposition of the asset or liability. Fair value represents a good faith approximation of the value of a security. Fair value determinations involve the consideration of a number of subjective factors, an analysis of applicable facts and circumstances and the exercise of judgment. As a result, it is possible that the fair value for a security determined in good faith in accordance with the Fund’s valuation procedures may differ from valuations for the same security determined by other funds using their own valuation procedures. Although the Fund’s valuation procedures are designed to value a security at the price the Fund may reasonably expect to receive upon the security’s sale in an orderly transaction, there can be no assurance that any fair value determination thereunder would, in fact, approximate the amount that the Fund would actually realize upon the sale of the security or the price at which the security would trade if a reliable market price were readily available. During the year ended October 31, 2020, there were no material changes to the fair value methodologies.
Securities which may be valued in this manner include, but are not limited to: (i) a security for which trading has been halted or suspended; (ii) a debt security that has recently gone into default and for which there is not a current market quotation; (iii) a security of an issuer that has entered into a restructuring; (iv) a security that has been delisted from a national exchange; (v) a security for which the market price is not readily available from a third-party pricing source or, if so provided, does not, in the opinion of the Manager or the Subadvisor, reflect the security’s market value; (vi) a security subject to trading collars for which no or limited trading takes place; and (vii) a security whose principal market has been temporarily closed at a time when, under normal conditions, it would be open. Securities valued in this manner are generally categorized as Level 3 in the hierarchy. No securities held by the Fund as of October 31, 2020 were fair valued in such a manner.
Certain securities held by the Fund may principally trade in foreign markets. Events may occur between the time the foreign markets close and the time at which the Fund’s NAVs are calculated. These events may include, but are not limited to, situations relating to a single issuer in a market sector, significant fluctuations in U.S. or foreign markets, natural disasters, armed conflicts, governmental actions or other developments not tied directly to the securities markets. Should the Manager or the Subadvisor conclude that such events may have affected the accuracy of the last price of such securities reported on the local foreign market, the Subcommittee may, pursuant to procedures adopted by the Board, adjust the value of the local price to reflect the estimated impact on the price of such securities as a result of such events. In this instance, securities are generally categorized as Level 3 in the hierarchy. Additionally, certain foreign equity securities are also fair valued whenever the movement of a particular index exceeds certain thresh-
| | |
| 22 | | MainStay MacKay International Equity Fund |
olds. In such cases, the securities are fair valued by applying factors provided by a third-party vendor in accordance with valuation procedures adopted by the Board and are generally categorized as Level 2 in the hierarchy. No foreign equity securities held by the Fund as of October 31, 2020, were fair valued in such a manner.
Equity securities, including exchange-traded funds (“ETFs”), are valued at the last quoted sales prices as of the close of regular trading on the relevant exchange on each valuation date. Securities that are not traded on the valuation date are valued at the mean of the last quoted bid and ask prices. Prices are normally taken from the principal market in which each security trades. These securities are generally categorized as Level 1 in the hierarchy.
Investments in mutual funds, including money market funds, are valued at their respective NAVs as of the close of the Exchange on the valuation date. These securities are generally categorized as Level 1 in the hierarchy.
Temporary cash investments acquired in excess of 60 days to maturity at the time of purchase are valued using the latest bid prices or using valuations based on a matrix system (which considers such factors as security prices, yields, maturities and ratings), both as furnished by independent pricing services. Temporary cash investments that mature in 60 days or less at the time of purchase (“Short-Term Investments”) are valued using the amortized cost method of valuation, unless the use of such method would be inappropriate. The amortized cost method involves valuing a security at its cost on the date of purchase and thereafter assuming a constant amortization to maturity of the difference between such cost and the value on maturity date. Amortized cost approximates the current fair value of a security. Securities valued using the amortized cost method are not valued using quoted prices in an active market and are generally categorized as Level 2 in the hierarchy.
The information above is not intended to reflect an exhaustive list of the methodologies that may be used to value portfolio investments. The valuation procedures permit the use of a variety of valuation methodologies in connection with valuing portfolio investments. The methodology used for a specific type of investment may vary based on the market data available or other considerations. The methodologies summarized above may not represent the specific means by which portfolio investments are valued on any particular business day.
(B) Income Taxes. The Fund’s policy is to comply with the requirements of the Internal Revenue Code of 1986, as amended (the “Internal Revenue Code”), applicable to regulated investment companies and to distribute all of its taxable income to the shareholders of the Fund within the allowable time limits.
The Manager evaluates the Fund’s tax positions to determine if the tax positions taken meet the minimum recognition threshold in connection with accounting for uncertainties in income tax positions taken or expected to be taken for the purposes of measuring and recognizing tax liabilities in the financial statements. Recognition of tax benefits of an uncertain tax position is permitted only to the extent the position is “more likely than not” to be sustained assuming examination by taxing authorities. The Manager analyzed the Fund’s tax positions taken on federal, state and local income tax returns for all open tax years (for up to three tax years) and has concluded that no provisions for federal, state and local income tax are required in the Fund’s financial state-
ments. The Fund’s federal, state and local income tax and federal excise tax returns for tax years for which the applicable statutes of limitations have not expired are subject to examination by the Internal Revenue Service and state and local departments of revenue.
(C) Foreign Taxes. The Fund may be subject to foreign taxes on income and other transaction-based taxes imposed by certain countries in which it invests. A portion of the taxes on gains on investments or currency purchases/repatriation may be reclaimable. The Fund will accrue such taxes and reclaims as applicable, based upon its current interpretation of tax rules and regulations that exist in the markets in which it invests.
The Fund may be subject to taxation on realized capital gains, repatriation proceeds and other transaction-based taxes imposed by certain countries in which it invests. The Fund will accrue such taxes as applicable based upon its current interpretation of tax rules and regulations that exist in the market in which it invests. Capital gains taxes relating to positions still held are reflected as a liability in the Statement of Assets and Liabilities, as well as an adjustment to the Fund’s net unrealized appreciation (depreciation). Taxes related to capital gains realized, if any, are reflected as part of net realized gain (loss) in the Statement of Operations. Changes in tax liabilities related to capital gains taxes on unrealized investment gains, if any, are reflected as part of the change in net unrealized appreciation (depreciation) on investments in the Statement of Operations. Transaction-based charges are generally assessed as a percentage of the transaction amount.
(D) Dividends and Distributions to Shareholders. Dividends and distributions are recorded on the ex-dividend date. The Fund intends to declare and pay dividends from net investment income and distributions from net realized capital and currency gains, if any, at least annually. Unless a shareholder elects otherwise, all dividends and distributions are reinvested at NAV in the same class of shares of the Fund. Dividends and distributions to shareholders are determined in accordance with federal income tax regulations and may differ from determinations using GAAP.
(E) Security Transactions and Investment Income. The Fund records security transactions on the trade date. Realized gains and losses on security transactions are determined using the identified cost method. Dividend income is recognized on the ex-dividend date, net of any foreign tax withheld at the source, and interest income is accrued as earned using the effective interest rate method. Distributions received from real estate investment trusts may be classified as dividends, capital gains and/or return of capital.
Investment income and realized and unrealized gains and losses on investments of the Fund are allocated pro rata to the separate classes of shares based upon their relative net assets on the date the income is earned or realized and unrealized gains and losses are incurred.
(F) Expenses. Expenses of the Trust are allocated to the individual Funds in proportion to the net assets of the respective Funds when the expenses are incurred, except where direct allocations of expenses can be made. Expenses (other than transfer agent expenses and fees incurred under the shareholder services plans and/or the distribution plans further discussed in Note 3(B)) are allocated to separate classes of shares pro rata based upon their relative net assets on the date the expenses are incurred. The expenses borne by the Fund, including
Notes to Financial Statements (continued)
those of related parties to the Fund, are shown in the Statement of Operations.
Additionally, the Fund may invest in ETFs and mutual funds, which are subject to management fees and other fees that may cause the costs of investing in ETFs and mutual funds to be greater than the costs of owning the underlying securities directly. These indirect expenses of ETFs and mutual funds are not included in the amounts shown as expenses in the Statement of Operations or in the expense ratios included in the Financial Highlights.
(G) Use of Estimates. In preparing financial statements in conformity with GAAP, the Manager makes estimates and assumptions that affect the reported amounts and disclosures in the financial statements. Actual results could differ from those estimates and assumptions.
(H) Repurchase Agreements. The Fund may enter into repurchase agreements (i.e., buy a security from another party with the agreement that it will be sold back in the future) to earn income. The Fund may enter into repurchase agreements only with counterparties, usually financial institutions, that are deemed by the Manager or the Subadvisor to be creditworthy, pursuant to guidelines established by the Board. During the term of any repurchase agreement, the Manager or the Subadvisor will continue to monitor the creditworthiness of the counterparty. Under the 1940 Act, repurchase agreements are considered to be collateralized loans by the Fund to the counterparty secured by the securities transferred to the Fund.
Repurchase agreements are subject to counterparty risk, meaning the Fund could lose money by the counterparty’s failure to perform under the terms of the agreement. The Fund mitigates this risk by ensuring the repurchase agreement is collateralized by cash, U.S. government securities, fixed income securities and/or other securities. The collateral is held by the Fund’s custodian and valued daily on a mark to market basis to determine if the value, including accrued interest, exceeds the repurchase price. In the event of the counterparty’s default on the obligation to repurchase, the Fund has the right to liquidate the collateral and apply the proceeds in satisfaction of the obligation. Under certain circumstances, such as in the event of default or bankruptcy by the counterparty, realization and/or retention of the collateral may be limited or subject to delay, to legal proceedings and possible realized loss to the Fund. As of October 31, 2020, the Fund did not hold any repurchase agreements.
(I) Securities Lending. In order to realize additional income, the Fund may engage in securities lending, subject to the limitations set forth in the 1940 Act and relevant guidance by the staff of the Securities and Exchange Commission (“SEC”). If the Fund engages in securities lending, the Fund will lend through its custodian, currently State Street Bank and Trust Company (“State Street”) (See Note 12 for securities lending agent change), acting as securities lending agent on behalf of the Fund. Under the current arrangement, State Street will manage the Fund’s collateral in accordance with the securities lending agency agreement between the Fund and State Street, and indemnify the Fund against counterparty risk. The loans will be collateralized by cash (which may be invested in a money market fund) and/or non-cash collateral (which may include U.S. Treasury securities and/or U.S. government agency securities issued or guaranteed by the United States government or its agencies or instrumentalities) at least equal at all times to the market value of the securities loaned. The Fund bears the risk of delay
in recovery of, or loss of rights in, the securities loaned. The Fund may also record a realized gain or loss on securities deemed sold due to a borrower’s inability to return securities on loan. The Fund bears the risk of any loss on investment of cash collateral. The Fund will receive compensation for lending its securities in the form of fees or it will retain a portion of interest earned on the investment of any cash collateral. The Fund will also continue to receive interest and dividends on the securities loaned and any gain or loss in the market price of the securities loaned that may occur during the term of the loan will be for the account of the Fund. Income earned from securities lending activities, if any, is reflected in the Statement of Operations. As of October 31, 2020, the Fund had securities on loan with an aggregate market value of $8,723,081 and received cash collateral, which was invested into the State Street Navigator Securities Lending Government Money Market Portfolio, with a value of $9,261,517.
(J) Foreign Currency Forward Contracts. The Fund may enter into foreign currency forward contracts, which are agreements to buy or sell foreign currencies on a specified future date at a specified rate. The Fund is subject to foreign currency exchange rate risk in the normal course of investing in these transactions. During the period the forward contract is open, changes in the value of the contract are recognized as unrealized appreciation or depreciation by marking to market such contract on a daily basis to reflect the market value of the contract at the end of each day’s trading. Cash movement occurs on settlement date. When the forward contract is closed, the Fund records a realized gain or loss equal to the difference between the proceeds from (or cost of) the closing transaction and the Fund’s basis in the contract. The Fund may purchase and sell foreign currency forward contracts for purposes of seeking to enhance portfolio returns and manage portfolio risk more efficiently. Foreign currency forward contracts may also be used to gain exposure to a particular currency or to hedge against the risk of loss due to changing currency exchange rates. Foreign currency forward contracts to purchase or sell a foreign currency may also be used in anticipation of future purchases or sales of securities denominated in foreign currency, even if the specific investments have not yet been selected.
The use of foreign currency forward contracts involves, to varying degrees, elements of risk in excess of the amount recognized in the Statement of Assets and Liabilities, including counterparty risk, market risk and illiquidity risk. Counterparty risk is heightened for these instruments because foreign currency forward contracts are not exchange-traded and therefore no clearinghouse or exchange stands ready to meet the obligations under such contracts. Thus, the Fund faces the risk that its counterparties under such contracts may not perform their obligations. Market risk is the risk that the value of a foreign currency forward contract will depreciate due to unfavorable changes in exchange rates. Illiquidity risk arises because the secondary market for foreign currency forward contracts may have less liquidity relative to markets for other securities and financial instruments. Risks also arise from the possible movements in the foreign exchange rates underlying these instruments. While the Fund may enter into forward contracts to reduce currency exchange risks, changes in currency exchange rates may result in poorer overall performance for the Fund than if it had not engaged in such transactions. Exchange rate movements can be large, depending on the currency, and can last for extended periods of time, affecting the value of the Fund’s assets. Moreover, there may be an imperfect correlation between the Fund’s holdings of securities denomi-
| | |
| 24 | | MainStay MacKay International Equity Fund |
nated in a particular currency and forward contracts entered into by the Fund. Such imperfect correlation may prevent the Fund from achieving the intended hedge or expose the Fund to the risk of currency exchange loss. The unrealized appreciation (depreciation) on forward contracts also reflects the Fund’s exposure at the valuation date to credit loss in the event of a counterparty’s failure to perform its obligations. As of October 31, 2020, the Fund did not hold any foreign currency forward contracts.
(K) Foreign Currency Transactions. The Fund’s books and records are maintained in U.S. dollars. Prices of securities denominated in foreign currency amounts are translated into U.S. dollars at the mean between the buying and selling rates last quoted by any major U.S. bank at the following dates:
| (i) | market value of investment securities, other assets and liabilities—at the valuation date; and |
| (ii) | purchases and sales of investment securities, income and expenses—at the date of such transactions. |
The assets and liabilities that are denominated in foreign currency amounts are presented at the exchange rates and market values at the close of the period. The realized and unrealized changes in net assets arising from fluctuations in exchange rates and market prices of securities are not separately presented.
Net realized gain (loss) on foreign currency transactions represents net currency gains or losses realized as a result of differences between the amounts of securities sale proceeds or purchase cost, dividends, interest and withholding taxes as recorded on the Fund’s books, and the U.S. dollar equivalent amount actually received or paid. Net currency gains or losses from valuing such foreign currency denominated assets and liabilities, other than investments at valuation date exchange rates, are reflected in unrealized foreign exchange gains or losses.
(L) Foreign Securities Risk. The Fund invests in foreign securities, which carry certain risks that are in addition to the usual risks inherent in domestic securities. These risks include those resulting from currency fluctuations, future adverse political or economic developments and possible imposition of currency exchange blockages or other foreign governmental laws or restrictions. These risks are likely to be greater in emerging markets than in developed markets. The ability of issuers of securities held by the Fund to meet their obligations may be affected by, among other things, economic or political developments in a specific country, industry or region.
(M) Indemnifications. Under the Trust’s organizational documents, its officers and trustees are indemnified against certain liabilities that may arise out of performance of their duties to the Trust. Additionally, in the normal course of business, the Fund enters into contracts with third-party service providers that contain a variety of representations and warranties and that may provide general indemnifications. The Fund’s maximum exposure under these arrangements is unknown, as this would involve future claims that may be made against the Fund that have not yet occurred. The Manager believes that the risk of loss in connection with these potential indemnification obligations is remote. However, there can be no assurance that material liabilities related to such obligations will not arise in the future, which could adversely impact the Fund.
The following tables show additional disclosures related to the Fund’s derivative and hedging activities, including how such activities are accounted for and their effect on the Fund’s financial positions, performance and cash flows. Foreign currency forward contracts were used to hedge against the risk of loss due to changing currency exchange rates. These derivatives are not accounted for as hedging instruments.
The effect of derivative instruments on the Statement of Operations for the year ended October 31, 2020:
| | | | | | | | |
Net Realized Gain (Loss) from: | | Foreign
Exchange
Contracts
Risk | | | Total | |
| | |
Forward Contracts | | $ | 682 | | | $ | 682 | |
| | | | |
Total Net Realized Gain (Loss) | | $ | 682 | | | $ | 682 | |
| | | | |
| | | | | | | | |
| | |
Average Notional Amount | | Foreign
Exchange
Contracts
Risk | | | Total | |
| | |
Forward Contracts Short (a) | | $ | 107,592 | | | $ | 107,592 | |
| | | | |
| (a) | Positions were open less than one month during the reporting period. |
Note 3–Fees and Related Party Transactions
(A) Manager and Subadvisor. New York Life Investments, a registered investment adviser and an indirect, wholly-owned subsidiary of New York Life Insurance Company (“New York Life”), serves as the Fund’s Manager, pursuant to an Amended and Restated Management Agreement (“Management Agreement”). The Manager provides offices, conducts clerical, recordkeeping and bookkeeping services and keeps most of the financial and accounting records required to be maintained by the Fund. Except for the portion of salaries and expenses that are the responsibility of the Fund, the Manager pays the salaries and expenses of all personnel affiliated with the Fund and certain operational expenses of the Fund. The Fund reimburses New York Life Investments in an amount equal to the portion of the compensation of the Chief Compliance Officer attributable to the Fund. MacKay Shields LLC (“MacKay Shields” or the “Subadvisor”), a registered investment adviser and an indirect, wholly-owned subsidiary of New York Life, serves as Subadvisor to the Fund and is responsible for the day-to-day portfolio management of the Fund. Pursuant to the terms of an Amended and Restated Subadvisory Agreement (“Subadvisory Agreement”) between New York Life Investments and MacKay Shields, New York Life Investments pays for the services of the Subadvisor.
Pursuant to the Management Agreement, the Fund pays the Manager a monthly fee for the services performed and the facilities furnished at an annual rate of the Fund’s average daily net assets as follows: 0.89% up to $500 million; and 0.85% in excess of $500 million. During the year ended October 31, 2020, the effective management fee rate (exclusive of any applicable waivers/reimbursements) was 0.89%.
New York Life Investments has contractually agreed to waive fees and/or reimburse expenses so that Total Annual Fund Operating Expenses (excluding taxes, interest, litigation, extraordinary expenses, brokerage
Notes to Financial Statements (continued)
and other transaction expenses relating to the purchase or sale of portfolio investments and acquired (underlying) fund fees and expenses) do not exceed the following percentages of average daily net assets: Class I, 0.85% and Class R6, 0.83%. New York Life Investments will apply an equivalent waiver or reimbursement, in an equal number of basis points of the Class R6 shares waiver/reimbursement to the Class A, Investor Class, Class B, Class C, Class R1, Class R2 and Class R3 shares. This agreement will remain in effect until August 31, 2021, and shall renew automatically for one-year terms unless New York Life Investments provides written notice of termination prior to the start of the next term or upon approval of the Board.
Additionally, New York Life Investments has agreed to voluntarily waive fees and/or reimburse expenses so that Total Annual Fund Operating Expenses (excluding taxes, interest, litigation, extraordinary expenses, brokerage and other transaction expenses relating to the purchase or sale of portfolio investments and acquired (underlying) fund fees and expenses) of a class do not exceed the following percentages of average daily net assets: Investor Class, 1.85%; Class B, 2.60%; and Class C, 2.60%. These voluntary waivers or reimbursements may be discontinued at any time without notice.
During the year ended October 31, 2020, New York Life Investments earned fees from the Fund in the amount of $2,839,641 and waived fees and/or reimbursed expenses in the amount of $659,274 and paid the Subadvisor in the amount of $1,089,956.
State Street provides sub-administration and sub-accounting services to the Fund pursuant to an agreement with New York Life Investments (See Note 12 for sub-administration and sub-accounting service provider change). These services include calculating the daily NAVs of the Fund, maintaining the general ledger and sub-ledger accounts for the calculation of the Fund’s NAVs and assisting New York Life Investments in conducting various aspects of the Fund’s administrative operations. For providing these services to the Fund, State Street is compensated by New York Life Investments.
Pursuant to an agreement between the Trust and New York Life Investments, New York Life Investments is responsible for providing or procuring certain regulatory reporting services for the Fund. The Fund will reimburse New York Life Investments for the actual costs incurred by New York Life Investments in connection with providing or procuring these services for the Fund.
(B) Distribution, Service and Shareholder Service Fees. The Trust, on behalf of the Fund, has entered into a distribution agreement with NYLIFE Distributors LLC (the “Distributor”), an affiliate of New York Life Investments. The Fund has adopted distribution plans (the “Plans”) in accordance with the provisions of Rule 12b-1 under the 1940 Act.
Pursuant to the Class A, Investor Class and Class R2 Plans, the Distributor receives a monthly distribution fee from the Class A, Investor Class and Class R2 shares at an annual rate of 0.25% of the average daily net assets of the Class A, Investor Class and Class R2 shares for distribution and/or service activities as designated by the Distributor. Pursuant to the Class B and Class C Plans, Class B and Class C shares pay the Distributor a monthly distribution fee at an annual rate of 0.75% of the average daily net assets of the Class B and Class C shares, along with a service fee at an annual rate of 0.25% of the average daily net
assets of the Class B and Class C shares, for a total 12b-1 fee of 1.00%. Pursuant to the Class R3 Plan, Class R3 shares pay the Distributor a monthly fee at an annual rate of 0.25% of the average daily net assets of the Class R3 shares, along with a service fee at an annual rate of 0.25% of the average daily net assets of the Class R3 shares, for a total 12b-1 fee of 0.50%. Class I, Class R1 and Class R6 shares are not subject to a distribution and/or service fee.
The Plans provide that the distribution and service fees are payable to the Distributor regardless of the amounts actually expended by the Distributor for distribution of the Fund’s shares and service activities.
In accordance with the Shareholder Services Plans for the Class R1, Class R2 and Class R3 shares, the Manager has agreed to provide, through its affiliates or independent third parties, various shareholder and administrative support services to shareholders of the Class R1, Class R2 and Class R3 shares. For its services, the Manager, its affiliates or independent third-party service providers are entitled to a shareholder service fee accrued daily and paid monthly at an annual rate of 0.10% of the average daily net assets of the Class R1, Class R2 and Class R3 shares. This is in addition to any fees paid under the Class R2 and Class R3 Plans.
During the year ended October 31, 2020, shareholder service fees incurred by the Fund were as follows:
| | | | |
Class R1 | | $ | 181 | |
Class R2 | | | 454 | |
Class R3 | | | 1,100 | |
(C) Sales Charges. The Fund was also advised by the Distributor that the amount of initial sales charges retained on sales of Class A and Investor Class shares during the year ended October 31, 2020, were $9,488 and $5,871, respectively.
The Fund was also advised that the Distributor retained CDSCs on redemptions of Class A, Class B and Class C shares during the year ended October 31, 2020, of $867, $1,507 and $103, respectively.
(D) Transfer, Dividend Disbursing and Shareholder Servicing Agent. NYLIM Service Company LLC, an affiliate of New York Life Investments, is the Fund’s transfer, dividend disbursing and shareholder servicing agent pursuant to an agreement between NYLIM Service Company LLC and the Trust. NYLIM Service Company LLC has entered into an agreement with DST Asset Manager Solutions, Inc. (“DST”), pursuant to which DST performs certain transfer agent services on behalf of NYLIM Service Company LLC. New York Life Investments has contractually agreed to limit the transfer agency expenses charged to the Fund’s share classes to a maximum of 0.35% of that share class’s average daily net assets on an annual basis after deducting any applicable Fund or class-level expense reimbursement or small account fees. This agreement will remain in effect until February 28, 2021, and shall renew automatically for one-year terms unless New York Life Investments provides written notice of termination prior to the start of the next term or upon approval of the Board. During the year ended October 31, 2020, transfer agent expenses incurred by the Fund and any reimbursements, pursuant to the aforementioned Transfer Agency expense limitation agreement, were as follows:
| | |
| 26 | | MainStay MacKay International Equity Fund |
| | | | | | | | |
Class | | Expense | | | Waived | |
Class A | | $ | 80,082 | | | $ | — | |
Investor Class | | | 109,660 | | | | — | |
Class B | | | 13,523 | | | | — | |
Class C | | | 16,614 | | | | — | |
Class I | | | 53,204 | | | | — | |
Class R1 | | | 250 | | | | — | |
Class R2 | | | 617 | | | | — | |
Class R3 | | | 1,498 | | | | — | |
Class R6 | | | 7,642 | | | | — | |
(E) Small Account Fee. Shareholders with small accounts adversely impact the cost of providing transfer agency services. In an effort to reduce total transfer agency expenses, the Fund has implemented a small account fee on certain types of accounts. As described in the Fund’s prospectus, certain shareholders with an account balance of less than $1,000 ($5,000 for Class A share accounts) are charged an annual per account fee of $20 (assessed semi-annually), the proceeds from which offset transfer agent fees as reflected in the Statement of Operations. This small account fee will not apply to certain types of accounts as described further in the Fund’s prospectus.
(F) Investments in Affiliates (in 000’s). During the year ended October 31, 2020, purchases and sales transactions, income earned from investments and shares held of investment companies managed by New York Life Investments or its affiliates were as follows:
| | | | | | | | | | | | | | | | | | | | | | | | | | | | | | | | | | | | |
Affiliated Investment Company | | Value,
Beginning
of Year | | | Purchases
at Cost | | | Proceeds
from Sales | | | Net Realized
Gain/(Loss)
on Sales | | | Change in
Unrealized
Appreciation/
(Depreciation) | | | Value,
End of
Year | | | Dividend
Income | | | Other
Distributions | | | Shares
End of
Year | |
MainStay U.S. Government Liquidity Fund | | $ | 599 | | | $ | 31,238 | | | $ | (31,272 | ) | | $ | — | | | $ | — | | | $ | 565 | | | $ | 3 | | | $ | — | | | | 565 | |
(G) Capital. As of October 31, 2020, New York Life and its affiliates beneficially held shares of the Fund with the values and percentages of net assets as follows:
| | | | | | | | |
Class R6 | | $ | 82,530,748 | | | | 41.0 | % |
Note 4–Federal Income Tax
As of October 31, 2020, the cost and unrealized appreciation (depreciation) of the Fund’s investment portfolio, including applicable derivative contracts and other financial instruments, as determined on a federal income tax basis, were as follows:
| | | | | | | | | | | | | | | | |
| | | Federal Tax
Cost | | | Gross
Unrealized
Appreciation | | | Gross
Unrealized
(Depreciation) | | | Net
Unrealized
Appreciation/
(Depreciation) | |
| | | | |
Investments in Securities | | $ | 288,930,880 | | | $ | 50,165,677 | | | $ | (12,101,366 | ) | | $ | 38,064,311 | |
As of October 31, 2020, the components of accumulated gain (loss) on a tax basis were as follows:
| | | | | | | | |
Ordinary
Income | | Accumulated
Capital and Other Gain (Loss) | | Other
Temporary
Differences | | Unrealized
Appreciation
(Depreciation) | | Total
Accumulated Gain (Loss) |
| | | | |
| $8,006,576 | | $5,547,731 | | $(30,291) | | $37,917,120 | | $51,441,136 |
The difference between book-basis and tax-basis unrealized appreciation (depreciation) is primarily due to wash sale adjustments and Passive Foreign Investment Company (“PFIC”) adjustments. The other temporary differences are primarily due to foreign taxes payable.
During the years ended October 31, 2020, and October 31, 2019, the tax character of distributions paid as reflected in the Statements of Changes in Net Assets were as follows:
| | | | | | | | |
| | | 2020 | | | 2019 | |
| | |
Distributions paid from: | | | | | | | | |
Ordinary Income | | $ | 1,693,597 | | | $ | 119,582 | |
Long-Term Capital Gain | | | 8,715,133 | | | | 3,076,892 | |
Total | | $ | 10,408,730 | | | $ | 3,196,474 | |
Note 5–Custodian
State Street is the custodian of cash and securities held by the Fund (See Note 12 for custodian change). Custodial fees are charged to the Fund based on the Fund’s net assets and/or the market value of securities held by the Fund and the number of certain transactions incurred by the Fund.
Note 6–Line of Credit
The Fund and certain other funds managed by New York Life Investments maintain a line of credit with a syndicate of banks in order to secure a source of funds for temporary purposes to meet unanticipated or excessive redemption requests.
Effective July 28, 2020, under the credit agreement (the “Credit Agreement”), the aggregate commitment amount is $600,000,000 with an additional uncommitted amount of $100,000,000. The commitment fee is an annual rate of 0.15% of the average commitment amount payable quarterly, regardless of usage, to JPMorgan Chase Bank NA, who serves as the agent to the syndicate. The commitment fee is allocated among the Fund and certain other funds managed by New York Life Investments based upon their respective net assets and other factors. Interest on any revolving credit loan is charged based upon the Federal Funds Rate or the one-month London Interbank Offered Rate (“LIBOR”), whichever is higher. The Credit Agreement expires on July 27, 2021, although the Fund, certain other funds managed by
Notes to Financial Statements (continued)
New York Life Investments and the syndicate of banks may renew the Credit Agreement for an additional year on the same or different terms or enter into a credit agreement with a different syndicate of banks. Prior to July 28, 2020, the aggregate commitment amount and the commitment fee were the same as those under the current Credit Agreement, but State Street served as agent to the syndicate. During the year ended October 31, 2020, there were no borrowings made or outstanding with respect to the Fund under the Credit Agreement or the credit agreement for which State Street served as agent.
Note 7–Interfund Lending Program
Pursuant to an exemptive order issued by the SEC, the Fund, along with certain other funds managed by New York Life Investments, may participate in an interfund lending program. The interfund lending program provides an alternative credit facility that permits the Fund and certain other funds managed by New York Life Investments to lend or borrow money for temporary purposes directly to or from one another subject to the conditions of the exemptive order. During the year ended October 31, 2020, there were no interfund loans made or outstanding with respect to the Fund.
Note 8–Purchases and Sales of Securities (in 000’s)
During the year ended October 31, 2020, purchases and sales of securities, other than short-term securities, were $413,014 and $424,913, respectively.
Note 9–Capital Share Transactions
Transactions in capital shares for the years ended October 31, 2020, and October 31, 2019, were as follows:
| | | | | | | | |
Class A | | Shares | | | Amount | |
| | |
Year ended October 31, 2020: | | | | | | | | |
Shares sold | | | 305,883 | | | $ | 5,330,979 | |
Shares issued to shareholders in reinvestment of distributions | | | 95,951 | | | | 1,698,341 | |
Shares redeemed | | | (600,551 | ) | | | (10,083,501 | ) |
| | | | |
Net increase (decrease) in shares outstanding before conversion | | | (198,717 | ) | | | (3,054,181 | ) |
Shares converted into Class A (See Note 1) | | | 223,664 | | | | 4,030,614 | |
Shares converted from Class A (See Note 1) | | | (5,124 | ) | | | (79,523 | ) |
| | | | |
Net increase (decrease) | | | 19,823 | | | $ | 896,910 | |
| | | | |
Year ended October 31, 2019: | | | | | | | | |
Shares sold | | | 891,776 | | | $ | 14,799,175 | |
Shares issued to shareholders in reinvestment of distributions | | | 39,110 | | | | 581,950 | |
Shares redeemed | | | (1,432,293 | ) | | | (23,509,575 | ) |
| | | | |
Net increase (decrease) in shares outstanding before conversion | | | (501,407 | ) | | | (8,128,450 | ) |
Shares converted into Class A (See Note 1) | | | 87,551 | | | | 1,426,304 | |
Shares converted from Class A (See Note 1) | | | (55,231 | ) | | | (895,055 | ) |
| | | | |
Net increase (decrease) | | | (469,087 | ) | | $ | (7,597,201 | ) |
| | | | |
| | |
| | | | | | | | |
| | | | | | | | |
Investor Class | | Shares | | | Amount | |
| | |
Year ended October 31, 2020: | | | | | | | | |
Shares sold | | | 83,420 | | | $ | 1,384,378 | |
Shares issued to shareholders in reinvestment of distributions | | | 37,405 | | | | 656,557 | |
Shares redeemed | | | (147,323 | ) | | | (2,489,350 | ) |
| | | | |
Net increase (decrease) in shares outstanding before conversion | | | (26,498 | ) | | | (448,415 | ) |
Shares converted into Investor Class (See Note 1) | | | 27,800 | | | | 458,079 | |
Shares converted from Investor Class (See Note 1) | | | (208,691 | ) | | | (3,739,070 | ) |
| | | | |
Net increase (decrease) | | | (207,389 | ) | | $ | (3,729,406 | ) |
| | | | |
Year ended October 31, 2019: | | | | | | | | |
Shares sold | | | 387,057 | | | $ | 6,426,137 | |
Shares issued to shareholders in reinvestment of distributions | | | 14,658 | | | | 216,498 | |
Shares redeemed | | | (451,502 | ) | | | (7,463,061 | ) |
| | | | |
Net increase (decrease) in shares outstanding before conversion | | | (49,787 | ) | | | (820,426 | ) |
Shares converted into Investor Class (See Note 1) | | | 110,259 | | | | 1,756,513 | |
Shares converted from Investor Class (See Note 1) | | | (61,483 | ) | | | (998,419 | ) |
| | | | |
Net increase (decrease) | | | (1,011 | ) | | $ | (62,332 | ) |
| | | | |
| | |
| | | | | | | | |
Class B | | Shares | | | Amount | |
| | |
Year ended October 31, 2020: | | | | | | | | |
Shares sold | | | 1,072 | | | $ | 15,470 | |
Shares issued to shareholders in reinvestment of distributions | | | 6,316 | | | | 97,267 | |
Shares redeemed | | | (39,599 | ) | | | (579,400 | ) |
| | | | |
Net increase (decrease) in shares outstanding before conversion | | | (32,211 | ) | | | (466,663 | ) |
Shares converted from Class B (See Note 1) | | | (41,338 | ) | | | (610,299 | ) |
| | | | |
Net increase (decrease) | | | (73,549 | ) | | $ | (1,076,962 | ) |
| | | | |
Year ended October 31, 2019: | | | | | | | | |
Shares sold | | | 116,426 | | | $ | 1,720,865 | |
Shares issued to shareholders in reinvestment of distributions | | | 3,501 | | | | 45,898 | |
Shares redeemed | | | (171,357 | ) | | | (2,495,992 | ) |
| | | | |
Net increase (decrease) in shares outstanding before conversion | | | (51,430 | ) | | | (729,229 | ) |
Shares converted from Class B (See Note 1) | | | (46,670 | ) | | | (652,096 | ) |
| | | | |
Net increase (decrease) | | | (98,100 | ) | | $ | (1,381,325 | ) |
| | | | |
| | |
| | | | | | | | |
| | |
| 28 | | MainStay MacKay International Equity Fund |
| | | | | | | | |
Class C | | Shares | | | Amount | |
| | |
Year ended October 31, 2020: | | | | | | | | |
Shares sold | | | 17,456 | | | $ | 265,182 | |
Shares issued to shareholders in reinvestment of distributions | | | 7,668 | | | | 118,089 | |
Shares redeemed | | | (95,370 | ) | | | (1,445,206 | ) |
| | | | |
Net increase (decrease) in shares outstanding before conversion | | | (70,246 | ) | | | (1,061,935 | ) |
Shares converted from Class C (See Note 1) | | | (4,412 | ) | | | (64,219 | ) |
| | | | |
Net increase (decrease) | | | (74,658 | ) | | $ | (1,126,154 | ) |
| | | | |
Year ended October 31, 2019: | | | | | | | | |
Shares sold | | | 62,946 | | | $ | 898,110 | |
Shares issued to shareholders in reinvestment of distributions | | | 5,556 | | | | 72,842 | |
Shares redeemed | | | (269,808 | ) | | | (3,860,218 | ) |
| | | | |
Net increase (decrease) in shares outstanding before conversion | | | (201,306 | ) | | | (2,889,266 | ) |
Shares converted from Class C (See Note 1) | | | (45,392 | ) | | | (638,968 | ) |
| | | | |
Net increase (decrease) | | | (246,698 | ) | | $ | (3,528,234 | ) |
| | | | |
| | |
| | | | | | | | |
Class I | | Shares | | | Amount | |
| | |
Year ended October 31, 2020: | | | | | | | | |
Shares sold | | | 176,080 | | | $ | 3,133,855 | |
Shares issued to shareholders in reinvestment of distributions | | | 80,878 | | | | 1,438,833 | |
Shares redeemed | | | (815,405 | ) | | | (13,551,566 | ) |
| | | | |
Net increase in shares outstanding before conversion | | | (558,447 | ) | | | (8,978,878 | ) |
Shares converted into Class I (See Note 1) | | | 232 | | | | 4,418 | |
| | | | |
Net increase (decrease) | | | (558,215 | ) | | $ | (8,974,460 | ) |
| | | | |
Year ended October 31, 2019: | | | | | | | | |
Shares sold | | | 1,072,727 | | | $ | 17,223,161 | |
Shares issued to shareholders in reinvestment of distributions | | | 149,207 | | | | 2,233,635 | |
Shares redeemed | | | (1,629,800 | ) | | | (26,063,040 | ) |
| | | | |
Net increase (decrease) in shares outstanding before conversion | | | (407,866 | ) | | | (6,606,244 | ) |
Shares converted into Class I (See Note 1) | | | 104 | | | | 1,721 | |
Shares converted from Class I (See Note 1) | | | (10,765,614 | ) | | | (174,508,600 | ) |
| | | | |
Net increase (decrease) | | | (11,173,376 | ) | | $ | (181,113,123 | ) |
| | | | |
| | |
| | | | | | | | |
Class R1 | | Shares | | | Amount | |
| | |
Year ended October 31, 2020: | | | | | | | | |
Shares sold | | | 1,016 | | | $ | 17,294 | |
Shares issued to shareholders in reinvestment of distributions | | | 478 | | | | 8,457 | |
Shares redeemed | | | (9,157 | ) | | | (160,158 | ) |
| | | | |
Net increase (decrease) | | | (7,663 | ) | | $ | (134,407 | ) |
| | | | |
| | |
Year ended October 31, 2019: | | | | | | | | |
Shares sold | | | 1,899 | | | $ | 30,050 | |
Shares issued to shareholders in reinvestment of distributions | | | 204 | | | | 3,038 | |
Shares redeemed | | | (122,890 | ) | | | (1,840,520 | ) |
| | | | |
Net increase (decrease) | | | (120,787 | ) | | $ | (1,807,432 | ) |
| | | | |
| | |
| | | | | | | | |
| | | | | | | | |
Class R2 | | Shares | | | Amount | |
| | |
Year ended October 31, 2020: | | | | | | | | |
Shares sold | | | 1,521 | | | $ | 26,460 | |
Shares issued to shareholders in reinvestment of distributions | | | 501 | | | | 8,885 | |
Shares redeemed | | | (1,949 | ) | | | (34,210 | ) |
| | | | |
Net increase (decrease) | | | 73 | | | $ | 1,135 | |
| | | | |
| | |
Year ended October 31, 2019: | | | | | | | | |
Shares sold | | | 3,373 | | | $ | 53,250 | |
Shares issued to shareholders in reinvestment of distributions | | | 254 | | | | 3,783 | |
Shares redeemed | | | (15,961 | ) | | | (257,168 | ) |
| | | | |
Net increase (decrease) | | | (12,334 | ) | | $ | (200,135 | ) |
| | | | |
| | |
| | | | | | | | |
Class R3 | | Shares | | | Amount | |
| | |
Year ended October 31, 2020: | | | | | | | | |
Shares sold | | | 14,635 | | | $ | 248,807 | |
Shares issued to shareholders in reinvestment of distributions | | | 1,793 | | | | 31,478 | |
Shares redeemed | | | (21,410 | ) | | | (336,531 | ) |
| | | | |
Net increase (decrease) | | | (4,982 | ) | | $ | (56,246 | ) |
| | | | |
| | |
Year ended October 31, 2019: | | | | | | | | |
Shares sold | | | 16,622 | | | $ | 265,663 | |
Shares issued to shareholders in reinvestment of distributions | | | 585 | | | | 8,641 | |
Shares redeemed | | | (17,844 | ) | | | (273,670 | ) |
| | | | |
Net increase (decrease) | | | (637 | ) | | $ | 634 | |
| | | | |
| | |
| | | | | | | | |
Class R6 | | Shares | | | Amount | |
| | |
Year ended October 31, 2020: | | | | | | | | |
Shares sold | | | 1,496,857 | | | $ | 26,866,856 | |
Shares issued to shareholders in reinvestment of distributions | | | 354,425 | | | | 6,312,311 | |
Shares redeemed | | | (1,215,108 | ) | | | (20,805,479 | ) |
| | | | |
Net increase (decrease) | | | 636,174 | | | $ | 12,373,688 | |
| | | | |
| | |
Period ended October 31, 2019 (a): | | | | | | | | |
Shares sold | | | 687,023 | | | $ | 11,450,236 | |
Shares redeemed | | | (1,178,021 | ) | | | (19,208,695 | ) |
| | | | |
Net increase (decrease) in shares outstanding before conversion | | | (490,998 | ) | | | (7,758,459 | ) |
Shares converted into Class R6 (See Note 1) | | | 10,763,300 | | | | 174,508,600 | |
| | | | |
Net increase (decrease) | | | 10,272,302 | | | $ | 166,750,141 | |
| | | | | | | | |
| (a) | The inception date of the class was February 28, 2019. |
Note 10–Recent Accounting Pronouncement
To improve the effectiveness of fair value disclosure requirements, the Financial Accounting Standards Board issued Accounting Standards Update 2018-13, Fair Value Measurement Disclosure Framework—Changes to the Disclosure Requirements for Fair Value Measurement (“ASU 2018-13”), which adds, removes, and modifies certain fair value measurement disclosure requirements. ASU 2018-13 is effective for interim and annual reporting periods beginning after December 15, 2019. The Manager evaluated the implications of certain provisions of ASU 2018-13 and determined to early adopt aspects related to the
Notes to Financial Statements (continued)
removal and modifications of certain fair value measurement disclosures, which are currently in place as of October 31, 2020. The Manager is evaluating the implications of certain other provisions of ASU 2018-13 related to new disclosure requirements and has not yet determined the impact of those provisions on the financial statement disclosures, if any.
In March 2020, the Financial Accounting Standards Board (“FASB”) issued Accounting Standards Update 2020-04 (“ASU 2020-04”), which provides optional guidance to ease the potential accounting burden associated with transitioning away from LIBOR and other reference rates that are expected to be discontinued. ASU 2020-04 is effective immediately upon release of the update on March 12, 2020, through December 31, 2022. At this time, the Manager is evaluating the implications of certain other provisions of ASU 2020-04 related to new disclosure requirements and any impact on the financial statement disclosures has not yet been determined.
Note 11–Other Matters
An outbreak of COVID-19, first detected in December 2019, has developed into a global pandemic and has resulted in travel restrictions, closure of international borders, certain businesses and securities
markets, restrictions on securities trading activities, prolonged quarantines, supply chain disruptions, and lower consumer demand, as well as general concern and uncertainty. The continued impact of COVID-19 is uncertain and could further adversely affect the global economy, national economies, individual issuers and capital markets in unforeseeable ways and result in a substantial and extended economic downturn. Developments that disrupt global economies and financial markets, such as COVID-19, may magnify factors that affect the Fund’s performance.
Note 12–Subsequent Events
In connection with the preparation of the financial statements of the Fund as of and for the year ended October 31, 2020, events and transactions subsequent to October 31, 2020, through the date the financial statements were issued have been evaluated by the Manager, for possible adjustment and/or disclosure. No subsequent events requiring financial statement adjustment or disclosure have been identified other than the following:
Effective at the close of business on November 20, 2020, all services provided by State Street were transitioned to JPMorgan Chase Bank, N.A.
| | |
| 30 | | MainStay MacKay International Equity Fund |
Report of Independent Registered Public Accounting Firm
To the Shareholders of the Fund and Board of Trustees
The MainStay Funds:
Opinion on the Financial Statements
We have audited the accompanying statement of assets and liabilities of MainStay MacKay International Equity Fund (the Fund), one of the funds constituting The MainStay Funds, including the portfolio of investments, as of October 31, 2020, the related statement of operations for the year then ended, the statements of changes in net assets for each of the years in the two-year period then ended, and the related notes (collectively, the financial statements) and the financial highlights for each of the years or periods in the five-year period then ended. In our opinion, the financial statements and financial highlights present fairly, in all material respects, the financial position of the Fund as of October 31, 2020, the results of its operations for the year then ended, the changes in its net assets for each of the years in the two-year period then ended, and the financial highlights for each of the years or periods in the five-year period then ended, in conformity with U.S. generally accepted accounting principles.
Basis for Opinion
These financial statements and financial highlights are the responsibility of the Fund’s management. Our responsibility is to express an opinion on these financial statements and financial highlights based on our audits. We are a public accounting firm registered with the Public Company Accounting Oversight Board (United States) (PCAOB) and are required to be independent with respect to the Fund in accordance with the U.S. federal securities laws and the applicable rules and regulations of the Securities and Exchange Commission and the PCAOB.
We conducted our audits in accordance with the standards of the PCAOB. Those standards require that we plan and perform the audit to obtain reasonable assurance about whether the financial statements and financial highlights are free of material misstatement, whether due to error or fraud. Our audits included performing procedures to assess the risks of material misstatement of the financial statements and financial highlights, whether due to error or fraud, and performing procedures that respond to those risks. Such procedures included examining, on a test basis, evidence regarding the amounts and disclosures in the financial statements and financial highlights. Such procedures also included confirmation of securities owned as of October 31, 2020, by correspondence with the custodian and the transfer agent. Our audits also included evaluating the accounting principles used and significant estimates made by management, as well as evaluating the overall presentation of the financial statements and financial highlights. We believe that our audits provide a reasonable basis for our opinion.

We have served as the auditor of one or more New York Life Investment Management investment companies since 2003.
Philadelphia, Pennsylvania
December 23, 2020
Federal Income Tax Information
(Unaudited)
The Fund is required under the Internal Revenue Code to advise shareholders in a written statement as to the federal tax status of dividends paid by the Fund during such fiscal years. Accordingly, the Fund paid $8,715,133 as long term capital gain distributions.
For the fiscal year ended October 31, 2020, the Fund designated approximately $1,800,135 under the Internal Revenue Code as qualified dividend income eligible for reduced tax rates.
In accordance with federal tax law, the Fund elected to provide each shareholder with their portion of the Fund’s foreign taxes paid and the income sourced from foreign countries. Accordingly, the Fund made the following designations regarding its fiscal year ended October 31, 2020:
| • | | the total amount of taxes credited to foreign countries was $261,180. |
| • | | the total amount of income sourced from foreign countries was $2,558,128. |
In February 2021, shareholders will receive an IRS Form 1099-DIV or substitute Form 1099, which will show the federal tax status of the distributions received by shareholders in calendar year 2020. The amounts that will be reported on such 1099-DIV or substitute Form 1099 will be the amounts you are to use on your federal income tax return and will differ from the amounts reported for the Fund’s fiscal year ended October 31, 2020.
Proxy Voting Policies and Procedures and Proxy Voting Record
A description of the policies and procedures that New York Life Investments uses to vote proxies related to the Fund’s securities is available free of charge upon request, by visiting the MainStay Funds’ website at newyorklifeinvestments.com or visiting the SEC’s website at www.sec.gov.
The Fund is required to file with the SEC its proxy voting records for the 12-month period ending June 30 on Form N-PX. The most recent Form N-PX or proxy voting record is available free of charge upon request by calling 800-624-6782; visiting the MainStay Funds’ website at newyorklifeinvestments.com; or visiting the SEC’s website at www.sec.gov.
Shareholder Reports and Quarterly Portfolio Disclosure
The Fund is required to file its complete schedule of portfolio holdings with the SEC 60 days after its first and third fiscal quarter on Form N-PORT. The Fund’s holdings report is available free of charge by visiting the SEC’s website at www.sec.gov or upon request by calling New York Life Investments at 800-624-6782.
| | |
| 32 | | MainStay MacKay International Equity Fund |
Board of Trustees and Officers (Unaudited)
The Trustees and officers of the Funds are listed below. The Board oversees the MainStay Group of Funds (which consists of MainStay Funds and MainStay Funds Trust), MainStay VP Funds Trust, MainStay MacKay DefinedTerm Municipal Opportunities Fund, the Manager and the Subadvisors, and elects the officers of the Funds who are responsible for the day-to-day operations of the Funds. Information pertaining to the Trustees and officers is set forth below. Each Trustee serves until his or her successor is elected and qualified or until his or her
resignation, death or removal. Under the Board’s retirement policy, unless an exception is made, a Trustee must tender his or her resignation by the end of the calendar year during which he or she reaches the age of 75. Officers are elected annually by the Board. The business address of each Trustee and officer listed below is 51 Madison Avenue, New York, New York 10010. A majority of the Trustees are not “interested persons” (as defined by the 1940 Act and rules adopted by the SEC thereunder) of the Fund (“Independent Trustees”).
| | | | | | | | | | | | |
| | | | | Name and
Year of Birth | | Term of Office,
Position(s) Held and
Length of Service | | Principal Occupation(s)
During Past Five Years | | Number of
Portfolios in
Fund Complex
Overseen by
Trustee | | Other Directorships
Held by Trustee |
Interested Trustee | | | | Yie-Hsin Hung* 1962 | | MainStay Funds:
Trustee since 2017 MainStay Funds Trust:
Trustee since 2017 | | Senior Vice President of New York Life since joining in 2010, Member of the Executive Management Committee since 2017, Chief Executive Officer, New York Life Investment Management Holdings LLC & New York Life Investment Management LLC since 2015. Senior Managing Director and Co-President of New York Life Investment Management LLC from 2014 to May 2015. Previously held positions of increasing responsibility, including head of NYLIM International, Alternative Growth Businesses, and Institutional investments since joining New York Life in 2010. | | 78 | | MainStay VP Funds Trust:
Trustee since 2017 (31 portfolios); and
MainStay MacKay DefinedTerm Municipal Opportunities Fund: Trustee since 2017. |
| | * | This Trustee is considered to be an “interested person” of the MainStay Group of Funds, MainStay VP Funds Trust and MainStay MacKay DefinedTerm Municipal Opportunities Fund, within the meaning of the 1940 Act because of her affiliation with New York Life Insurance Company, New York Life Investment Management LLC, Candriam Belgium S.A., Candriam Luxembourg S.C.A., IndexIQ Advisors LLC, MacKay Shields LLC, NYL Investors LLC, NYLIFE Securities LLC and/or NYLIFE Distributors LLC, as described in detail above in the column entitled “Principal Occupation(s) During Past Five Years.” |
Board of Trustees and Officers (Unaudited) (continued)
| | | | | | | | | | | | |
| | | | | Name and
Year of Birth | | Term of Office,
Position(s) Held and
Length of Service | | Principal Occupation(s)
During Past Five Years | | Number of
Portfolios in
Fund Complex
Overseen by
Trustee | | Other Directorships
Held by Trustee |
Independent Trustees | | | | David H. Chow 1957 | | MainStay Funds:
Trustee since 2016, Advisory Board Member (June 2015 to December 2015); MainStay Funds Trust:
Trustee since 2016, Advisory Board Member (June 2015 to December 2015). | | Founder and CEO, DanCourt Management, LLC since 1999 | | 78 | | MainStay VP Funds Trust: Trustee since 2016, Advisory Board Member (June 2015 to December 2015) (31 portfolios);
MainStay MacKay DefinedTerm Municipal Opportunities Fund: Trustee since 2016, Advisory Board Member (June 2015 to December 2015); Market Vectors Group of Exchange-Traded Funds: Independent Chairman of the Board of Trustees since 2008 and Trustee since 2006 (56 portfolios); and
Berea College of Kentucky: Trustee since 2009, Chair of the Investment Committee since 2018. |
| | | | Susan B. Kerley 1951 | �� | MainStay Funds:
Chairman since 2017 and Trustee since 2007; MainStay Funds Trust: Chairman since 2017 and Trustee since 1990.** | | President, Strategic Management Advisors LLC since 1990 | | 78 | | MainStay VP Funds Trust: Chairman since 2017 and Trustee since 2007 (31 portfolios)***;
MainStay MacKay DefinedTerm Municipal Opportunities Fund: Chairman since 2017 and Trustee since 2011; and
Legg Mason Partners Funds: Trustee since 1991 (45 portfolios). |
| | | | Alan R. Latshaw 1951 | | MainStay Funds:
Trustee; MainStay Funds Trust:
Trustee and Audit Committee Financial Expert since 2007.** | | Retired; Partner, Ernst & Young LLP (2002 to 2003); Partner, Arthur Andersen LLP (1989 to 2002); Consultant to the MainStay Funds Audit and Compliance Committee (2004 to 2006) | | 78 | | MainStay VP Funds Trust: Trustee and Audit Committee Financial Expert since 2007 (31 portfolios)***;
MainStay MacKay DefinedTerm Municipal Opportunities Fund: Trustee and Audit Committee Financial Expert since 2011; and
State Farm Associates Funds Trusts: Trustee since 2005 (4 portfolios). |
| | | | Richard H. Nolan, Jr. 1946 | | MainStay Funds:
Trustee since 2007; MainStay Funds Trust:
Trustee since 2007.** | | Managing Director, ICC Capital Management since 2004; President—Shields/Alliance, Alliance Capital Management (1994 to 2004) | | 78 | | MainStay VP Funds Trust: Trustee since 2006 (31 portfolios)***; and
MainStay MacKay DefinedTerm Municipal Opportunities Fund: Trustee since 2011. |
| | | | Jacques P. Perold 1958 | | MainStay Funds:
Trustee since 2016, Advisory Board Member (June 2015 to December 2015); MainStay Funds Trust:
Trustee since 2016, Advisory Board Member (June 2015 to December 2015). | | Founder and Chief Executive Officer, CapShift LLC since 2018; President, Fidelity Management & Research Company (2009 to 2014); Founder, President and Chief Executive Officer, Geode Capital Management, LLC (2001 to 2009) | | 78 | | MainStay VP Funds Trust: Trustee since 2016, Advisory Board Member (June 2015 to December 2015) (31 portfolios);
MainStay MacKay DefinedTerm Municipal Opportunities Fund: Trustee since 2016, Advisory Board Member (June 2015 to December 2015); Partners in Health: Trustee since 2019; Allstate Corporation: Director since 2015;
MSCI, Inc.: and Director since 2017. |
| | |
| 34 | | MainStay MacKay International Equity Fund |
| | | | | | | | | | | | |
| | | | | Name and
Year of Birth | | Term of Office,
Position(s) Held and
Length of Service | | Principal Occupation(s)
During Past Five Years | | Number of
Portfolios in
Fund Complex
Overseen by
Trustee | | Other Directorships
Held by Trustee |
Independent Trustees | | | | Richard S. Trutanic 1952 | | MainStay Funds: Trustee since 1994; MainStay Funds Trust: Trustee since 2007.** | | Chairman and Chief Executive Officer, Somerset & Company (financial advisory firm) since 2004; Managing Director, The Carlyle Group (private investment firm) (2002 to 2004); Senior Managing Director, Partner and Board Member, Groupe Arnault S.A. (private investment firm) (1999 to 2002) | | 78 | | MainStay VP Funds Trust: Trustee since 2007 (31 portfolios)***; and
MainStay MacKay DefinedTerm Municipal Opportunities Fund: Trustee since 2011. |
| | ** | Includes prior service as a Director/Trustee of certain predecessor entities to MainStay Funds Trust. |
| | *** | Includes prior service as a Director of MainStay VP Series Fund, Inc., the predecessor to MainStay VP Funds Trust. |
Board of Trustees and Officers (Unaudited) (continued)
| | | | | | | | |
| | | | | Name and
Year of Birth | | Position(s) Held and
Length of Service | | Principal Occupation(s)
During Past Five Years |
Officers
of the
Trust
(Who are
not
Trustees)* | | | | Kirk C. Lehneis 1974 | | President, MainStay Funds, MainStay Funds Trust since 2017 | | Chief Operating Officer and Senior Managing Director since 2016, New York Life Investment Management LLC and New York Life Investment Management Holdings LLC; Member of the Board of Managers since 2017 and Senior Managing Director since 2018, NYLIFE Distributors LLC; Chairman of the Board and Senior Managing Director, NYLIM Service Company LLC since 2017; Trustee, President and Principal Executive Officer of IndexIQ Trust, IndexIQ ETF Trust and IndexIQ Active ETF Trust since 2018; President, MainStay MacKay DefinedTerm Municipal Opportunities Fund and MainStay VP Funds Trust since 2017**; Senior Managing Director, Global Product Development (2015 to 2016); Managing Director, Product Development (2010 to 2015), New York Life Investment Management LLC |
| | | | Jack R. Benintende 1964 | | Treasurer and Principal Financial and Accounting Officer, MainStay Funds since 2007, MainStay Funds Trust since 2009 | | Managing Director, New York Life Investment Management LLC since 2007; Treasurer and Principal Financial and Accounting Officer, MainStay MacKay DefinedTerm Municipal Opportunities Fund since 2011 and MainStay VP Funds Trust since 2007**; and Assistant Treasurer, New York Life Investment Management Holdings LLC (2008 to 2012) |
| | | | Yi-Chia Kuo 1981 | | Vice President and Chief Compliance Officer, MainStay Funds and MainStay Funds Trust since January 2020 | | Chief Compliance Officer, Index IQ Trust, Index IQ ETF Trust and Index IQ Active ETF Trust since January 2020; Vice President and Chief Compliance Officer, MainStay MacKay DefinedTerm Municipal Opportunities Fund and MainStay VP Funds Trust since January 2020; Director and Associate General Counsel, New York Life Insurance Company (2015 to 2019) |
| | | | J. Kevin Gao 1967 | | Secretary and Chief Legal Officer, MainStay Funds and MainStay Funds Trust since 2010 | | Managing Director and Associate General Counsel, New York Life Investment Management LLC since 2010; Secretary and Chief Legal Officer, MainStay MacKay DefinedTerm Municipal Opportunities Fund since 2011 and MainStay VP Funds Trust since 2010** |
| | | | Scott T. Harrington 1959 | | Vice President— Administration, MainStay Funds since 2005, MainStay Funds Trust since 2009 | | Managing Director, New York Life Investment Management LLC (including predecessor advisory organizations) since 2000; Member of the Board of Directors, New York Life Trust Company since 2009; Vice President—Administration, MainStay MacKay DefinedTerm Municipal Opportunities Fund since 2011 and MainStay VP Funds Trust since 2005** |
| | * | The officers listed above are considered to be “interested persons” of the MainStay Group of Funds, MainStay VP Funds Trust and MainStay MacKay DefinedTerm Municipal Opportunities Fund within the meaning of the 1940 Act because of their affiliation with the MainStay Group of Funds, New York Life Insurance Company and/or its affiliates, including New York Life Investment Management LLC, NYLIM Service Company LLC, NYLIFE Securities LLC and/or NYLIFE Distributors LLC, as described in detail in the column captioned “Principal Occupation(s) During Past Five Years.” Officers are elected annually by the Board. |
| | ** | Includes prior service as an Officer of MainStay VP Series Fund, Inc., the predecessor to MainStay VP Funds Trust. |
| | |
| 36 | | MainStay MacKay International Equity Fund |
MainStay Funds
Equity
U.S. Equity
MainStay Epoch U.S. All Cap Fund
MainStay Epoch U.S. Equity Yield Fund
MainStay MacKay Common Stock Fund
MainStay MacKay Growth Fund
MainStay MacKay S&P 500 Index Fund
MainStay MacKay Small Cap Core Fund
MainStay MacKay U.S. Equity Opportunities Fund
MainStay MAP Equity Fund
MainStay Winslow Large Cap Growth Fund1
International Equity
MainStay Epoch International Choice Fund
MainStay MacKay International Equity Fund
MainStay MacKay International Opportunities Fund
Emerging Markets Equity
MainStay Candriam Emerging Markets Equity Fund
Global Equity
MainStay Epoch Capital Growth Fund
MainStay Epoch Global Equity Yield Fund
Fixed Income
Taxable Income
MainStay Candriam Emerging Markets Debt Fund
MainStay Floating Rate Fund
MainStay MacKay High Yield Corporate Bond Fund
MainStay MacKay Short Duration High Yield Fund
MainStay MacKay Total Return Bond Fund
MainStay MacKay Unconstrained Bond Fund
MainStay MacKay U.S. Infrastructure Bond Fund2
MainStay Short Term Bond Fund3
Tax-Exempt Income
MainStay MacKay California Tax Free Opportunities Fund4
MainStay MacKay High Yield Municipal Bond Fund
MainStay MacKay Intermediate Tax Free Bond Fund
MainStay MacKay New York Tax Free Opportunities Fund5
MainStay MacKay Short Term Municipal Fund
MainStay MacKay Tax Free Bond Fund
Money Market
MainStay Money Market Fund
Mixed Asset
MainStay Balanced Fund
MainStay Income Builder Fund
MainStay MacKay Convertible Fund
Speciality
MainStay CBRE Global Infrastructure Fund
MainStay CBRE Real Estate Fund
MainStay Cushing MLP Premier Fund
Asset Allocation
MainStay Conservative Allocation Fund
MainStay Conservative ETF Allocation Fund
MainStay Defensive ETF Allocation Fund
MainStay Equity Allocation Fund6
MainStay Equity ETF Allocation Fund
MainStay Growth Allocation Fund7
MainStay Growth ETF Allocation Fund
MainStay Moderate Allocation Fund
MainStay Moderate ETF Allocation Fund
Manager
New York Life Investment Management LLC
New York, New York
Subadvisors
Candriam Belgium S.A.8
Brussels, Belgium
Candriam Luxembourg S.C.A.8
Strassen, Luxembourg
CBRE Clarion Securities LLC
Radnor, Pennsylvania
Cushing Asset Management, LP
Dallas, Texas
Epoch Investment Partners, Inc.
New York, New York
MacKay Shields LLC8
New York, New York
Markston International LLC
White Plains, New York
NYL Investors LLC8
New York, New York
Winslow Capital Management, LLC
Minneapolis, Minnesota
Legal Counsel
Dechert LLP
Washington, District of Columbia
Independent Registered Public Accounting Firm
KPMG LLP
Philadelphia, Pennsylvania
Distributor
NYLIFE Distributors LLC8
Jersey City, New Jersey
Custodian9
State Street Bank and Trust Company
Boston, Massachusetts
| 1. | Formerly known as MainStay Large Cap Growth Fund. |
| 2. | Formerly known as MainStay MacKay Infrastructure Bond Fund. |
| 3. | Formerly known as MainStay Indexed Bond Fund. |
| 4. | This Fund is registered for sale in AZ, CA, NV, OR, TX, UT and WA. Class A and Class I shares are registered for sale in MI. Class I and Class C2 shares are registered for sale in CO, FL, GA, HI, ID, MA, MD, NH, NJ and NY. |
| 5. | This Fund is registered for sale in CA, CT, DE, FL, MA, NJ, NY and VT. |
| 6. | Formerly known as MainStay Growth Allocation Fund. |
| 7. | Formerly known as MainStay Moderate Growth Allocation Fund. |
| 8. | An affiliate of New York Life Investment Management LLC. |
| 9. | JPMorgan Chase Bank, N.A., New York, New York is the custodian for the MainStay ETF Asset Allocation Funds and effective at the close of business on November 20, 2020, became the custodian for other MainStay Funds. The custodian for MainStay Cushing MLP Premier Fund is U.S. Bank National Association, Milwaukee, Wisconsin. |
Not part of the Annual Report
For more information
800-624-6782
newyorklifeinvestments.com
“New York Life Investments” is both a service mark, and the common trade name, of investment advisors affiliated with New York Life Insurance Company. The MainStay Funds® are managed by New York Life Investment Management LLC and distributed by NYLIFE Distributors LLC, 30 Hudson Street, Jersey City, NJ 07302, a wholly owned subsidiary of New York Life Insurance Company. NYLIFE Distributors LLC is a Member FINRA/SIPC.
©2020 NYLIFE Distributors LLC. All rights reserved.
| | |
| 1715994 MS203-20 | | MSIE11-12/20 (NYLIM) NL213 |
MainStay MacKay Tax Free
Bond Fund
Message from the President and Annual Report
October 31, 2020
Beginning on January 1, 2021, paper copies of each MainStay Fund’s annual and semiannual shareholder reports will no longer be sent by mail, unless you specifically request paper copies of the reports from MainStay Funds or from your financial intermediary. Instead, the reports will be made available on the MainStay Funds’ website. You will be notified by mail and provided with a website address to access the report each time a new report is posted to the website.
If you already elected to receive shareholder reports electronically, you will not be affected by this change and you need not take any action. At any time, you may elect to receive reports and other communications from MainStay Funds electronically by calling toll-free 800-624-6782, by sending an e-mail to MainStayShareholderServices@nylim.com, or by contacting your financial intermediary.
You may elect to receive all future shareholder reports in paper form free of charge. If you hold shares of a MainStay Fund directly, you can inform MainStay Funds that you wish to receive paper copies of reports by calling toll-free 800-624-6782 or by sending an e-mail to MainStayShareholderServices@nylim.com. If you hold shares of a MainStay Fund through a financial intermediary, please contact the financial intermediary to make this election. Your election to receive reports in paper form will apply to all MainStay Funds in which you are invested and may apply to all funds held with your financial intermediary.
| | | | | | | | |
| Not FDIC/NCUA Insured | | Not a Deposit | | May Lose Value | | No Bank Guarantee | | Not Insured by Any Government Agency |

This page intentionally left blank
Message from the President
Despite historically high levels of volatility generated by the global coronavirus pandemic and a host of other geopolitical and economic uncertainties, most broad U.S. stock and bond markets gained ground during the 12-month reporting period ended October 31, 2020.
The reporting period began on an upswing, with markets rising on generally positive underlying economic trends and the announcement of a U.S.-China trade deal. However, in mid-February 2020, stock and bond indices began to dip as growing numbers of COVID-19 cases appeared in hotspots around the world. By early March, the disease reached pandemic proportions. As governments struggled to support overburdened health care systems by issuing “stay-at-home” orders and other restrictions on nonessential activity, global economic activity slowed, driving most stocks and bonds sharply lower.
The United States was hit particularly hard by the pandemic, with more reported COVID-19 cases and deaths than any other country in the world throughout the second half of the reporting period. As the pandemic deepened, the U.S. Federal Reserve (“Fed”) twice cut interest rates and announced unlimited quantitative easing. The federal government declared a national emergency, and Congress passed and the President signed a $2 trillion stimulus package. Markets responded positively to these measures, as well as to a gradual lessening of restrictions on nonessential businesses, hopes for additional stimulus and apparent progress in the development of a vaccine. By late August, the S&P 500® Index, a widely regarded benchmark of market performance, had not only regained all the ground it lost earlier in the reporting period, the Index had reached new record levels. However, a resurgence of coronavirus cases in many parts of the country and uncertainties related to the November 3, 2020, U.S. presidential election caused markets to falter as the reporting period drew to a close.
Nevertheless, for the reporting period as a whole, U.S. equity indices generally produced moderate gains. Returns proved strongest among large-cap, growth-oriented stocks, while small- and mid-cap issues lagged. Within the S&P 500® Index, the information technology and consumer discretionary sectors produced exceptionally strong gains, buoyed by strong corporate and consumer spending, while the health care sector outperformed by a smaller margin. Materials and consumer staples sectors generated positive returns, but lagged the S&P 500® Index. The industrials, utilities, communication services, financials, real estate and energy sectors ended the reporting period in negative territory, with the energy sector
suffering the steepest losses due to weak global demand. International equities declined sharply in February and March 2020 before recovering somewhat, but tended to lag their U.S. counterparts due to weaker underlying economic growth and somewhat less aggressive monetary and fiscal stimulus. Emerging-market equities tracked the performance of U.S. equity markets more closely, led by relatively strong returns in Asian markets, such as China and South Korea.
Fixed-income markets experienced an environment that tended to favor higher credit quality and longer duration securities. Corporate bonds followed the pattern of equities, with prices declining in March 2020 before subsequently recovering. Relatively speculative high-yield credit was hardest hit during the market sell-off in early 2020 and continued to underperform during the remainder of the reporting period. Similarly, among municipal bond issues, high-grade bonds outperformed, dipping briefly in mid-March before regaining the lost ground. Recognized safe havens, such as U.S. government bonds, attracted increased investment during the height of the market sell-off, driving yields lower and prices higher. As a result, long-term Treasury bonds delivered particularly strong gains for the reporting period as a whole. Emerging-market debt, on the other hand, underperformed most other bond types as investors sought to minimize currency and sovereign risks.
Although the ongoing pandemic continues to change the way that many of us work and live our lives, at New York Life Investments, we remain dedicated to providing you, as a MainStay investor, with products, information and services to help you to navigate today’s rapidly changing investment environment. By taking appropriate steps to minimize community spread of COVID-19 within our organization and despite the challenges posed by the coronavirus pandemic, we continue to innovate with you in mind, introducing new suites of Funds and providing continuous insights into ever-evolving markets and investment strategies. Our goal is to give you the tools you need to build a resilient portfolio in the face of uncertain times.
Sincerely,

Kirk C. Lehneis
President
The opinions expressed are as of the date of this report and are subject to change. There is no guarantee that any forecast made will come to pass. This material does not constitute investment advice and is not intended as an endorsement of any specific investment. Past performance is no guarantee of future results.
Not part of the Annual Report
Table of Contents
Investors should refer to the Fund’s Summary Prospectus and/or Prospectus and consider the Fund’s investment objectives, strategies, risks, charges and expenses carefully before investing. The Summary Prospectus and/or Prospectus contain this and other information about the Fund. You may obtain copies of the Fund’s Summary Prospectus, Prospectus and Statement of Additional Information free of charge, upon request, by calling toll-free 800-624-6782, by writing to NYLIFE Distributors LLC, Attn: MainStay Marketing Department, 30 Hudson Street, Jersey City, NJ 07302 or by sending an e-mail to MainStayShareholderServices@nylim.com. These documents are also available via the MainStay Funds’ website at newyorklifeinvestments.com. Please read the Summary Prospectus and/or Prospectus carefully before investing.
Investment and Performance Comparison1 (Unaudited)
Performance data quoted represents past performance. Past performance is no guarantee of future results. Because of market volatility and other factors, current performance may be lower or higher than the figures shown. Investment return and principal value will fluctuate, and as a result, when shares are redeemed, they may be worth more or less than their original cost. The graph below depicts the historical performance of Class I shares* of the Fund. Performance will vary from class to class based on differences in class-specific expenses and sales charges. For performance information current to the most recent month-end, please call 800-624-6782 or visit newyorklifeinvestments.com.
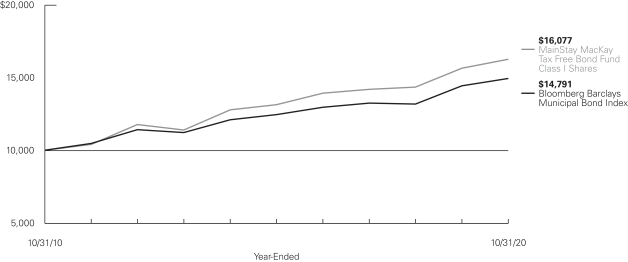
Average Annual Total Returns for the Year-Ended October 31, 2020
| | | | | | | | | | | | | | | | | | | | | | | | |
| Class | | Sales Charge | | | | Inception
Date | | | One Year
or Since
Inception | | | Five
Years | | | Ten
Years | | | Gross Expense Ratio2 | |
| | | | | | | |
| Class A Shares | | Maximum 4.5% Initial Sales Charge | | With sales charges Excluding sales charges | |
| 1/3/1995
|
| |
| –1.01
3.66 | %
| |
| 3.08
4.04 | %
| |
| 4.11
4.59 | %
| |
| 0.78
0.78 | %
|
| Investor Class Shares3 | | Maximum 4% Initial Sales Charge | | With sales charges Excluding sales charges | |
| 2/28/2008
|
| |
| –1.03
3.64 |
| |
| 3.11
4.06 |
| |
| 4.09
4.57 |
| |
| 0.77
0.77 |
|
| Class B Shares4 | | Maximum 5% CDSC
if Redeemed Within the First Six Years of Purchase | | With sales charges Excluding sales charges | |
| 5/1/1986
|
| |
| –1.62
3.38 |
| |
| 3.46
3.81 |
| |
| 4.31
4.31 |
| |
| 1.02
1.02 |
|
| Class C Shares | | Maximum 1% CDSC
if Redeemed Within One Year of Purchase | | With sales charges Excluding sales charges | |
| 9/1/1998
|
| |
| 2.38
3.38 |
| |
| 3.81
3.81 |
| |
| 4.31
4.31 |
| |
| 1.02
1.02 |
|
| Class C2 Shares | | Maximum 1% CDSC
if Redeemed Within One Year of Purchase | | With sales charges Excluding sales charges | |
| 8/31/2020
|
| |
| –1.54
–0.54 |
| |
| N/A
N/A |
| |
| N/A
N/A |
| |
| 1.17
1.17 |
|
| Class I Shares | | No Sales Charge | | | | | 12/21/2009 | | | | 3.91 | | | | 4.32 | | | | 4.86 | | | | 0.53 | |
| Class R6 Shares | | No Sales Charge | | | | | 11/1/2019 | | | | 3.95 | | | | N/A | | | | N/A | | | | 0.45 | |
| * | Previously, the bar chart presented the Fund’s annual returns for Class B shares. Class I shares are presented for consistency across the MainStay Fund complex. |
| 1. | The performance table and graph do not reflect the deduction of taxes that a shareholder would pay on distributions or Fund share redemptions. Total returns reflect maximum applicable sales charges as indicated in the table above, if any, changes in share price, and reinvestment of dividend and capital gain distributions. The graph assumes the initial investment amount shown above and reflects the deduction of all sales charges that would have applied for the period of investment. Performance figures may reflect certain fee waivers and/or expense limitations, without which total returns may have |
| | been lower. For more information on share classes and current fee waivers and/or expense limitations (if any), please refer to the Notes to Financial Statements. |
| 2. | The gross expense ratios presented reflect the Fund’s “Total Annual Fund Operating Expenses” from the most recent Prospectus and may differ from other expense ratios disclosed in this report. |
| 3. | Prior to June 30, 2020, the maximum initial sales charge for Investor Class shares was 1.0%, which is reflected in the average annual total return figures shown. |
| 4. | Class B shares are closed to all new purchases as well as additional investments by existing Class B shareholders. |
The footnotes on the next page are an integral part of the table and graph and should be carefully read in conjunction with them.
| | | | | | | | | | | | |
| Benchmark Performance | | One
Year | | | Five
Years | | | Ten
Years | |
| | | |
Bloomberg Barclays Municipal Bond Index5 | | | 3.59 | % | | | 3.70 | % | | | 3.99 | % |
Morningstar Muni National Long Category Average6 | | | 2.57 | | | | 3.66 | | | | 4.13 | |
| 5. | The Bloomberg Barclays Municipal Bond Index is the Fund’s primary broad-based securities market index for comparison purposes. The Bloomberg Barclays Municipal Bond Index is considered representative of the broad-based market for investment-grade, tax-exempt bonds with a maturity of at least one year. Bonds subject to the alternative minimum tax or with floating or zero coupons are excluded. Results assume reinvestment of all dividends and capital gains. An investment cannot be made directly in an index. |
| 6. | The Morningstar Muni National Long Category Average is representative of funds that invest in bonds issued by various state and local governments to fund public projects. The income from these bonds is generally free from federal taxes. These portfolios have durations of more than 7.0 years. Results are based on average total returns of similar funds with all dividends and capital gain distributions reinvested. |
The footnotes on the preceding page are an integral part of the table and graph and should be carefully read in conjunction with them.
| | |
| 6 | | MainStay MacKay Tax Free Bond Fund |
Cost in Dollars of a $1,000 Investment in MainStay MacKay Tax Free Bond Fund (Unaudited)
The example below is intended to describe the fees and expenses borne by shareholders during the six-month period from May 1, 2020, to October 31, 2020, and the impact of those costs on your investment.
Example
As a shareholder of the Fund you incur two types of costs: (1) transaction costs, including exchange fees and sales charges (loads) on purchases (as applicable), and (2) ongoing costs, including management fees, distribution and/or service (12b-1) fees, and other Fund expenses (as applicable). This example is intended to help you understand your ongoing costs (in dollars) of investing in the Fund and to compare these costs with the ongoing costs of investing in other mutual funds. The example is based on an investment of $1,000 made at the beginning of the six-month period and held for the entire period from May 1, 2020, to October 31, 2020.
This example illustrates your Fund’s ongoing costs in two ways:
Actual Expenses
The second and third data columns in the table below provide information about actual account values and actual expenses. You may use the information in these columns, together with the amount you invested, to estimate the expenses that you paid during the six months ended October 31, 2020. Simply divide your account value by $1,000 (for example, an $8,600 account value divided by $1,000 = 8.6), then
multiply the result by the number under the heading entitled “Expenses Paid During Period” to estimate the expenses you paid on your account during this period.
Hypothetical Example for Comparison Purposes
The fourth and fifth data columns in the table below provide information about hypothetical account values and hypothetical expenses based on the Fund’s actual expense ratio and an assumed rate of return of 5% per year before expenses, which is not the Fund’s actual return. The hypothetical account values and expenses may not be used to estimate the actual ending account balances or expenses you paid for the six-month period shown. You may use this information to compare the ongoing costs of investing in the Fund with the ongoing costs of investing in other mutual funds. To do so, compare this 5% hypothetical example with the 5% hypothetical examples that appear in the shareholder reports of the other mutual funds.
Please note that the expenses shown in the table are meant to highlight your ongoing costs only and do not reflect any transactional costs, such as exchange fees or sales charges (loads). Therefore, the fourth and fifth data columns of the table are useful in comparing ongoing costs only and will not help you determine the relative total costs of owning different funds. In addition, if these transactional costs were included, your costs would have been higher.
| | | | | | | | | | | | | | | | | | | | | | |
| | | | | | | | | | | | | | | | | | |
| Share Class | | Beginning
Account
Value
5/1/20 | | | Ending Account
Value (Based
on Actual
Returns and
Expenses)
10/31/20 | | | Expenses
Paid
During
Period1 | | | Ending Account
Value (Based
on Hypothetical
5% Annualized
Return and
Actual Expenses)
10/31/20 | | | Expenses
Paid
During
Period1 | | | Net Expense
Ratio
During
Period2 |
| | | | | | |
| Class A Shares | | $ | 1,000.00 | | | $ | 1,057.60 | | | $ | 3.88 | | | $ | 1,021.37 | | | $ | 3.81 | | | 0.75% |
| | | | | | |
| Investor Class Shares | | $ | 1,000.00 | | | $ | 1,058.30 | | | $ | 3.98 | | | $ | 1,021.27 | | | $ | 3.91 | | | 0.77% |
| | | | | | |
| Class B Shares | | $ | 1,000.00 | | | $ | 1,057.20 | | | $ | 5.27 | | | $ | 1,020.01 | | | $ | 5.18 | | | 1.02% |
| | | | | | |
| Class C Shares | | $ | 1,000.00 | | | $ | 1,057.20 | | | $ | 5.27 | | | $ | 1,020.01 | | | $ | 5.18 | | | 1.02% |
| | | | | | |
| Class C2 Shares3,4 | | $ | 1,000.00 | | | $ | 1,031.00 | | | $ | 1.95 | | | $ | 1,006.42 | | | $ | 1.92 | | | 1.15% |
| | | | | | |
| Class I Shares | | $ | 1,000.00 | | | $ | 1,059.90 | | | $ | 2.59 | | | $ | 1,022.62 | | | $ | 2.54 | | | 0.50% |
| | | | | | |
| Class R6 Shares | | $ | 1,000.00 | | | $ | 1,059.10 | | | $ | 2.33 | | | $ | 1,022.87 | | | $ | 2.29 | | | 0.45% |
| 1. | Expenses are equal to the Fund’s annualized expense ratio of each class multiplied by the average account value over the period, divided by 366 and multiplied by 184 (to reflect the six-month period) and 61 days for Class C2 share (to reflect the since-inception period. The table above represents the actual expenses incurred during the six-month period. In addition to the fees and expenses which the Fund bears directly, it also indirectly bears a pro rata share of the fees and expenses of the underlying funds in which it invests. Such indirect expenses are not included in the above-reported expense figures. |
| 2. | Expenses are equal to the Fund’s annualized expense ratio to reflect the six-month period. |
| 3. | The inception date was August 31, 2020. |
| 4. | Expenses paid during the period reflect ongoing costs for the period from inception through October 31, 2020. Had these shares been offered for the full six-month period ended October 31, 2020, and had the Fund provided a hypothetical 5% annualized return, expenses paid during the period would have been $5.89 for Class C2 shares and the ending account value would have been $1,019 for Class C2 shares. |
Portfolio Composition as of October 31, 2020 (Unaudited)
| | | | |
| |
| New York | | | 21.0 | % |
| |
| California | | | 16.1 | |
| |
| Illinois | | | 9.9 | |
| |
| Texas | | | 5.2 | |
| |
| New Jersey | | | 4.3 | |
| |
| Pennsylvania | | | 3.2 | |
| |
| Connecticut | | | 2.8 | |
| |
| Florida | | | 2.7 | |
| |
| Georgia | | | 2.5 | |
| |
| Nevada | | | 2.5 | |
| |
| Michigan | | | 2.3 | |
| |
| South Carolina | | | 2.2 | |
| |
| Utah | | | 2.0 | |
| |
| Virginia | | | 2.0 | |
| |
| Puerto Rico | | | 1.9 | |
| |
| Colorado | | | 1.3 | |
| |
| Iowa | | | 1.0 | |
| |
| Louisiana | | | 1.0 | |
| |
| Missouri | | | 1.0 | |
| |
| Arizona | | | 0.9 | |
| |
| Ohio | | | 0.8 | |
| |
| Washington | | | 0.8 | |
| |
| Alabama | | | 0.7 | |
| |
| Delaware | | | 0.7 | |
| |
| Tennessee | | | 0.7 | |
| |
| Arkansas | | | 0.6 | |
| |
| District of Columbia | | | 0.6 | |
| |
| Oklahoma | | | 0.6 | |
| | | | |
| |
| U.S. Virgin Islands | | | 0.6 | % |
| |
| Idaho | | | 0.5 | |
| |
| Indiana | | | 0.5 | |
| |
| Kentucky | | | 0.5 | |
| |
| Maryland | | | 0.5 | |
| |
| Nebraska | | | 0.5 | |
| |
| Wisconsin | | | 0.5 | |
| |
| Guam | | | 0.4 | |
| |
| Minnesota | | | 0.4 | |
| |
| Montana | | | 0.4 | |
| |
| Oregon | | | 0.4 | |
| |
| Hawaii | | | 0.3 | |
| |
| Massachusetts | | | 0.3 | |
| |
| Rhode Island | | | 0.3 | |
| |
| Kansas | | | 0.2 | |
| |
| Alaska | | | 0.1 | |
| |
| Mississippi | | | 0.1 | |
| |
| New Hampshire | | | 0.1 | |
| |
| North Carolina | | | 0.1 | |
| |
| North Dakota | | | 0.1 | |
| |
| South Dakota | | | 0.1 | |
| |
| Vermont | | | 0.1 | |
| |
| Wyoming | | | 0.1 | |
| |
| Maine | | | 0.0 | ‡ |
| |
| New Mexico | | | 0.0 | ‡ |
| |
| Other Assets, Less Liabilities | | | 1.6 | |
| | | | |
| | | 100.0 | % |
| | | | |
See Portfolio of Investments beginning on page 11 for specific holdings within these categories. The Fund’s holdings are subject to change.
| ‡ | Less than one-tenth of a percent. |
Top Ten Issuers Held as of October 31, 2020 (excluding short-term investment) (Unaudited)
| 1. | New York City Transitional Finance Authority, Future Tax Secured, Revenue Bonds, 3.00%–5.00%, due 5/1/32–11/1/42 |
| 2. | State of California, Unlimited General Obligation, 3.00%–5.25%, due 10/1/34–3/1/46 |
| 3. | State of Illinois, Unlimited General Obligation, 4.00%–6.00%, due 11/1/20–10/1/45 |
| 4. | Triborough Bridge & Tunnel Authority, MTA Bridges & Tunnels, Revenue Bonds, 5.00%, due 11/15/46–11/15/54 |
| 5. | San Francisco City & County Airport Commission, San Francisco International Airport, Revenue Bonds, 5.00%, due 5/1/35–5/1/50 |
| 6. | South Carolina Public Service Authority, Revenue Bonds, 3.00%–5.25%, due 12/1/29–12/1/56 |
| 7. | Metropolitan Transportation Authority, Revenue Bonds, 4.00%–5.25%, due 2/1/22–11/15/41 |
| 8. | New York State Thruway Authority, Revenue Bonds, 3.50%–5.00%, due 1/1/31–1/1/50 |
| 9. | Hampton Roads Transportation Accountability Commission, Revenue Bonds, 4.00%–5.00%, due 7/1/50–7/1/55 |
| 10. | New Jersey Transportation Trust Fund Authority, Transportation System, Revenue Bonds, (zero coupon)–5.25%, due 12/15/26–6/15/46 |
| | |
| 8 | | MainStay MacKay Tax Free Bond Fund |
Portfolio Management Discussion and Analysis (Unaudited)
Questions answered by portfolio managers John Loffredo, CFA, Robert DiMella, CFA, Michael Petty, David Dowden, Scott Sprauer and Frances Lewis of MacKay Shields LLC, the Fund’s Subadvisor.
How did MainStay MacKay Tax Free Bond Fund perform relative to its benchmark and peer group during the 12 months ended October 31, 2020?
For the 12 months ended October 31, 2020, Class I shares of MainStay MacKay Tax Free Bond Fund returned 3.91%, outperforming the 3.59% return of the Fund’s primary benchmark, the Bloomberg Barclays Municipal Bond Index. Over the same period, Class I shares also outperformed the 2.57% return of the Morningstar Muni National Long Category Average.1
What factors affected the Fund’s relative performance during the reporting period?
The below-investment-grade, tax-exempt segment of the municipal bond market underperformed the investment-grade, tax-exempt segment of the municipal bond market, while the overall municipal market underperformed the taxable bond market. Bonds with short-end maturities outperformed those with long-end maturities. Among ratings categories, higher-quality bonds outperformed their lower-quality counterparts. Municipal bonds from Texas and Michigan generally outperformed the market, while issues from Illinois and New York underperformed.
During the reporting period, the Fund outperformed the Bloomberg Barclays Municipal Bond Index primarily due to strong security selection.
During the reporting period, were there any market events that materially impacted the Fund’s performance or liquidity?
The rapid spread of the COVID-19 pandemic in March 2020 resulted in a significant risk-off response in the global financial markets. The municipal bond market’s response to the crisis reflected the significant disruption to our economy, the financial markets and, of course, our personal lives. During the early months of the pandemic, municipal volatility surged and credit spreads2 widened. The extreme volatility in the municipal market was primarily due to a liquidity squeeze exacerbated by a sharp repricing of credit risk. Market technical conditions were upended as investors in municipal bond mutual funds and exchange-traded funds sought to exit a market that offered little liquidity, resulting in severe price declines. During this time, yields of variable-rate demand notes spiked to over 9% and the new-issue market was shut down. Credit spreads widened as market participants attempted to discount the impact of an abrupt shutdown of the U.S. economy. Notably, some high-yield
municipal bonds experienced price swings exceeding 10 points in a day. (A point represents one percent of a bond’s face value.) In our view, leveraged open-end mutual funds that were ill-prepared to meet shareholder redemptions contributed to municipal market volatility as they resorted to forced sales. (Contributions take weightings and total returns into account.)
The pandemic produced a significant credit shift in the municipal market. With mandatory stay-at-home requirements and the closing of large segments of the economy, including travel, leisure and retail, the economic conditions of state and local governments and related entities weakened. Fortunately, the municipal market’s credit condition at the start of 2020 was at an all-time high as state governments had accumulated large reserves due to record tax revenues in the wake of the Great Recession of 2007-2009. Nevertheless, as of the end of the reporting period, we believe that several municipal “front-line” sectors—including infrastructure, hospitals, state and local governments, and higher education—are likely to be the sectors most immediately impacted by the pandemic-related economic slowdown. We expect the magnitude of the impact to be a function of the duration and the severity of the crisis, as well as the specific geographic location of the credits.
Since the end of 2019, our municipal bond management team has increased the Fund’s overall credit quality, and added additional liquidity and cash reserves to offset short-term financial losses. This enabled the Fund to take advantage of the market dislocation and rotate into sectors and credits that were most adversely impacted by the pandemic. As the market returns to more historically normal conditions, we believe these positions will benefit from fiscal support from the federal government and medical advances to end the pandemic. As always, we continue to assess the ability of each municipal issuer to manage through these times. We continue to believe there will be limited defaults in the municipal market, reflective of historical market trends.
During the reporting period, how was the Fund’s performance materially affected by investments in derivatives?
During the reporting period, the Fund used U.S. Treasury futures in an attempt to maintain a neutral duration3 relative to the Bloomberg Barclays Municipal Bond Index. This hedge detracted from performance as Treasury yields were significantly lower on October 31, 2020 than at the beginning of the reporting period.
| 1. | See page 5 for other share class returns, which may be higher or lower than Class I share returns. See page 6 for more information on benchmark and peer group returns. |
| 2. | The terms “spread” and “yield spread” may refer to the difference in yield between a security or type of security and comparable U.S. Treasury issues. The terms may also refer to the difference in yield between two specific securities or types of securities at a given time. |
| 3. | Duration is a measure of the price sensitivity of a fixed-income investment to changes in interest rates. Duration is expressed as a number of years and is considered a more accurate sensitivity gauge than average maturity. |
What was the Fund’s duration strategy during the reporting period?
During the reporting period, the Fund used a U.S. Treasury futures hedge to help remain neutral to the duration of the Bloomberg Barclays Municipal Bond Index. As of October 31, 2020, the Fund’s modified duration to worst4 was 5.27 years, while the Index had a modified duration to worst of 4.77 years.
During the reporting period, which sectors were the strongest positive contributors to the Fund’s relative performance and which sectors were particularly weak?
During the reporting period, yield curve5 positioning in the special tax sector made the strongest positive contribution to the Fund’s performance relative to the Bloomberg Barclays Municipal Bond Index. Security selection within the hospital sector further bolstered relative performance. While security selection in the state general obligation sector also proved accretive to relative returns, the Fund’s comparatively underweight exposure to the sector detracted from relative returns. Underweight exposure to the water & sewer sector undermined relative performance as well.
From a state perspective, California and Texas outperformed because many issuers in those states are high quality and rallied soon after the market dislocation in March 2020. Bonds trading at wider spreads in Illinois and New York lagged the overall market after widening out significantly during the spring. However, toward the end of the reporting period, spread paper began to rally; and if the trend continues, positions in those states could be well positioned to benefit.
Regarding credit quality, security selection in the A-rated bucket drove performance. During the reporting period, the Fund opportunistically bought positions in lower-quality investment-grade paper after the market dislocation in March 2020. Many of the positions were added at relatively high yields and spreads. As the market normalized from April thorough the end
of the reporting period, many of these bonds proved to be strong drivers of relative performance. However, given that higher-quality paper rallied first after the dislocation in March, the Fund’s underweight exposure to AAA-rated bonds was a drag on relative performance.6
What were some of the Fund’s largest purchases and sales during the reporting period?
There were no material purchases or sales during the reporting period.
How did the Fund’s sector weighting change during the reporting period?
During the reporting period, the Fund increased its exposure to the transportation and state general obligation sectors. Among states, the Fund increased its exposure to bonds from New York, Connecticut and Illinois, while reducing exposure to bonds from Texas and California. Lastly, the Fund decreased its credit exposure to bonds rated AAA and AA+, and increased its credit exposure to bonds rated A.7
How was the Fund positioned at the end of the reporting period?
As of October 31, 2020, the Fund held a small overweight position relative to the Bloomberg Barclays Municipal Bond Index in the local general obligation, housing, and transportation sectors. In addition, the Fund held overweight exposure to bonds from Illinois and New York. The Fund also held an overweight position relative to the Index in credits rated A and low AA.
As of the same date, the Fund held relatively underweight exposure to the state general obligation and prerefunded/ETM (escrowed to maturity) sectors. Additional underweight exposures included AAA-rated securities and bonds from California and Texas.
| 4. | Modified duration is inversely related to the approximate percentage change in price for a given change in yield. Duration to worst is the duration of a bond computed using the bond’s nearest call date or maturity, whichever comes first. This measure ignores future cash flow fluctuations due to embedded optionality. |
| 5. | The yield curve is a line that plots the yields of various securities of similar quality—typically U.S. Treasury issues—across a range of maturities. The U.S. Treasury yield curve serves as a benchmark for other debt and is used in economic forecasting. |
| 6. | An obligation rated ‘AAA’ has the highest rating assigned by Standard & Poor’s (“S&P”), and in the opinion of S&P, the obligor’s capacity to meet its financial commitment on the obligation is extremely strong. An obligation rated ‘A’ by S&P is deemed by S&P to be somewhat more susceptible to the adverse effects of changes in circumstances and economic conditions than obligations in higher-rated categories. In the opinion of S&P, however, the obligor’s capacity to meet its financial commitment on the obligation is still strong. When applied to Fund holdings, ratings are based solely on the creditworthiness of the bonds in the portfolio and are not meant to represent the security or safety of the Fund. |
| 7. | An obligation rated ‘AA’ by S&P is deemed by S&P to differ from the highest-rated obligations only to a small degree. In the opinion of S&P, the obligor’s capacity to meet its financial commitment on the obligation is very strong. When applied to Fund holdings, ratings are based solely on the creditworthiness of the bonds in the portfolio and are not meant to represent the security or safety of the Fund. Ratings from ‘AA’ to ‘CCC may be modified by the addition of a plus (+) or minus (–) sign to show relative standing within the major rating categories. |
The opinions expressed are those of the portfolio managers as of the date of this report and are subject to change. There is no guarantee that any forecasts will come to pass. This material does not constitute investment advice and is not intended as an endorsement of any specific investment.
| | |
| 10 | | MainStay MacKay Tax Free Bond Fund |
Portfolio of Investments October 31, 2020
| | | | | | | | |
| | | Principal
Amount | | | Value | |
Municipal Bonds 98.4%† Long-Term Municipal Bonds 94.4% | |
Alabama 0.7% | |
City of Birmingham AL, Unlimited General Obligation
Series A
5.00%, due 3/1/43 (a) | | $ | 2,650,000 | | | $ | 2,941,315 | |
County of Jefferson AL, Sewer, Revenue Bonds
Series D
6.00%, due 10/1/42 | | | 5,910,000 | | | | 6,851,167 | |
Health Care Authority of the City of Huntsville, HH Health System, Revenue Bonds
Series B1
4.00%, due 6/1/45 | | | 11,060,000 | | | | 12,191,438 | |
Houston County Health Care Authority, Southeast Alabama Medical, Revenue Bonds
5.00%, due 10/1/25 | | | 1,000,000 | | | | 1,167,140 | |
Lower Alabama Gas District, Revenue Bonds | | | | | | | | |
4.00%, due 12/1/50 (b) | | | 750,000 | | | | 857,678 | |
Series A
5.00%, due 9/1/46 | | | 10,000,000 | | | | 13,712,900 | |
University of South Alabama, Revenue Bonds | | | | | | | | |
Insured: AGM
4.00%, due 11/1/35 | | | 2,000,000 | | | | 2,213,380 | |
Insured: AGM
5.00%, due 11/1/29 | | | 1,110,000 | | | | 1,340,913 | |
Insured: AGM
5.00%, due 11/1/30 | | | 2,000,000 | | | | 2,406,000 | |
Water Works Board of the City of Birmingham, Revenue Bonds
Series B
5.00%, due 1/1/32 | | | 6,140,000 | | | | 7,534,578 | |
| | | | | | | | |
| | | | | | | 51,216,509 | |
| | | | | | | | |
Alaska 0.1% | |
Alaska Industrial Development & Export Authority, FairBanks Community Hospital, Revenue Bonds
5.00%, due 4/1/32 | | | 3,550,000 | | | | 3,822,001 | |
| | | | | | | | |
|
Arizona 0.9% | |
Arizona Board of Regents, Revenue Bonds | | | | | | | | |
Series A
5.00%, due 7/1/35 | | | 1,000,000 | | | | 1,305,500 | |
Series A
5.00%, due 7/1/37 | | | 1,500,000 | | | | 1,942,095 | |
| | | | | | | | |
| | | Principal
Amount | | | Value | |
Arizona (continued) | |
Arizona Board of Regents, Revenue Bonds (continued) | | | | | | | | |
Series A
5.00%, due 7/1/39 | | $ | 2,000,000 | | | $ | 2,572,040 | |
Series A
5.00%, due 7/1/41 | | | 3,500,000 | | | | 4,470,060 | |
Series A
5.00%, due 7/1/43 | | | 3,480,000 | | | | 4,417,964 | |
Arizona Health Facilities Authority, Phoenix Children’s Hospital, Revenue Bonds
Series A
5.00%, due 2/1/42 | | | 1,000,000 | | | | 1,039,440 | |
Arizona Industrial Development Authority, NCCU Properties LLC, Central University Project, Revenue Bonds
Series A,
Insured: BAM
4.00%, due 6/1/44 | | | 940,000 | | | | 1,015,661 | |
Arizona Industrial Development Authority, Phoenix Children’s Hospital, Revenue Bonds
Series 2020A
4.00%, due 2/1/50 | | | 14,515,000 | | | | 16,115,569 | |
Maricopa County Industrial Development Authority, Banner Health Obligated Group, Revenue Bonds | | | | | | | | |
Series 2019E
4.00%, due 1/1/45 | | | 7,000,000 | | | | 7,977,760 | |
Series 2019F
4.00%, due 1/1/45 | | | 10,850,000 | | | | 12,365,528 | |
5.00%, due 1/1/34 | | | 5,500,000 | | | | 6,577,285 | |
Maricopa County Unified School District No. 90 Saddle Mountain, Unlimited General Obligation
Insured: AGM
4.00%, due 7/1/35 | | | 7,175,000 | | | | 8,417,925 | |
| | | | | | | | |
| | | | | | | 68,216,827 | |
| | | | | | | | |
Arkansas 0.5% | |
County of Pulaski AR, Arkansas Children’s Hospital, Revenue Bonds
5.00%, due 3/1/34 | | | 2,000,000 | | | | 2,344,160 | |
Pulaski County Special School District, Limited General Obligation
Insured: State Aid Withholding
4.00%, due 2/1/48 | | | 15,500,000 | | | | 16,126,820 | |
Springdale Public Facilities Board, Arkansas Children’s Northwest, Revenue Bonds
5.00%, due 3/1/34 | | | 2,890,000 | | | | 3,387,311 | |
| | | | | | |
The notes to the financial statements are an integral part of,
and should be read in conjunction with, the financial statements. | | | | | 11 | |
Portfolio of Investments October 31, 2020 (continued)
| | | | | | | | |
| | | Principal
Amount | | | Value | |
| Long-Term Municipal Bonds (continued) | |
Arkansas (continued) | |
Springdale School District No. 50, Limited General Obligation | | | | | | | | |
Insured: State Aid Withholding
4.00%, due 6/1/36 | | $ | 2,500,000 | | | $ | 2,603,500 | |
Insured: State Aid Withholding
4.00%, due 6/1/40 | | | 10,400,000 | | | | 10,788,336 | |
University of Arkansas, UALR Campus, Revenue Bonds | | | | | | | | |
5.00%, due 10/1/29 | | | 1,315,000 | | | | 1,613,387 | |
5.00%, due 10/1/30 | | | 1,110,000 | | | | 1,355,998 | |
5.00%, due 10/1/31 | | | 1,205,000 | | | | 1,465,810 | |
| | | | | | | | |
| | | | | | | 39,685,322 | |
| | | | | | | | |
California 15.1% | |
Alta Loma School District, Unlimited General Obligation | | | | | | | | |
Series A
4.00%, due 8/1/45 | | | 4,500,000 | | | | 5,270,895 | |
Series B
5.00%, due 8/1/44 | | | 4,000,000 | | | | 4,818,360 | |
Antelope Valley Community College District, Election 2016, Unlimited General Obligation
Series A
4.50%, due 8/1/38 | | | 11,500,000 | | | | 13,490,305 | |
Bay Area Toll Authority, Revenue Bonds Subseries S-H
5.00%, due 4/1/44 | | | 2,615,000 | | | | 3,241,214 | |
California Health Facilities Financing Authority, City of Hope Obligated Group, Revenue Bonds | | | | | | | | |
4.00%, due 11/15/45 | | | 5,000,000 | | | | 5,650,850 | |
5.00%, due 11/15/49 | | | 24,410,000 | | | | 28,485,738 | |
California Health Facilities Financing Authority, CommonSpirit Health Obligated Group, Revenue Bonds
Series A
4.00%, due 4/1/45 | | | 6,500,000 | | | | 7,163,325 | |
California Health Facilities Financing Authority, Providence St. Joseph Health, Revenue Bonds
Series A
4.00%, due 10/1/35 | | | 1,230,000 | | | | 1,378,006 | |
California Health Facilities Financing Authority, Sutter Health, Revenue Bonds
Series A
5.00%, due 11/15/41 | | | 5,000,000 | | | | 6,136,550 | |
| | | | | | | | |
| | | Principal
Amount | | | Value | |
California (continued) | |
California Infrastructure & Economic Development Bank, Green Bond, Revenue Bonds
5.00%, due 8/1/49 | | $ | 9,060,000 | | | $ | 11,051,569 | |
California Municipal Finance Authority, CHF Davis I LLC, Revenue Bonds Insured: BAM
5.00%, due 5/15/36 | | | 4,400,000 | | | | 5,282,288 | |
California Municipal Finance Authority, Southern California Institute of Architecture Project, Revenue Bonds | | | | | | | | |
5.00%, due 12/1/23 | | | 405,000 | | | | 446,743 | |
5.00%, due 12/1/24 | | | 425,000 | | | | 481,772 | |
5.00%, due 12/1/25 | | | 450,000 | | | | 522,657 | |
5.00%, due 12/1/26 | | | 470,000 | | | | 554,854 | |
5.00%, due 12/1/27 | | | 495,000 | | | | 592,188 | |
5.00%, due 12/1/28 | | | 520,000 | | | | 617,131 | |
California Municipal Finance Authority, West Village Student Housing Project, Revenue Bonds | | | | | | | | |
5.00%, due 5/15/32 | | | 1,570,000 | | | | 1,881,724 | |
Insured: BAM
5.00%, due 5/15/32 | | | 1,500,000 | | | | 1,828,470 | |
Insured: BAM
5.00%, due 5/15/39 | | | 9,815,000 | | | | 11,684,169 | |
Insured: BAM
5.00%, due 5/15/43 | | | 11,750,000 | | | | 13,852,662 | |
California School Facilities Financing Authority, Azusa Unified School District, Revenue Bonds
Insured: AGM
(zero coupon), due 8/1/49 | | | 16,000,000 | | | | 4,901,280 | |
California State Educational Facilities Authority, Sutter Health, Revenue Bonds
Series A
5.00%, due 11/15/34 | | | 5,000,000 | | | | 6,136,550 | |
California State University, Revenue Bonds
Series A
5.00%, due 11/1/44 | | | 21,530,000 | | | | 27,088,831 | |
Chino Valley Unified School District, Limited General Obligation
Series B
4.00%, due 8/1/45 | | | 14,310,000 | | | | 16,761,446 | |
Chula Vista Elementary School District, Revenue Bonds
(zero coupon), due 8/1/23 | | | 5,000,000 | | | | 4,949,100 | |
City of Escondido CA, Unlimited General Obligation
5.00%, due 9/1/36 | | | 5,000,000 | | | | 5,933,550 | |
| | | | |
| 12 | | MainStay MacKay Tax Free Bond Fund | | The notes to the financial statements are an integral part of,
and should be read in conjunction with, the financial statements. |
| | | | | | | | |
| | | Principal
Amount | | | Value | |
| Long-Term Municipal Bonds (continued) | |
California (continued) | |
City of Long Beach CA Harbor, Revenue Bonds
Series A
5.00%, due 12/15/20 | | $ | 7,940,000 | | | $ | 7,984,146 | |
City of Long Beach CA, Airport System, Revenue Bonds
Series A
5.00%, due 6/1/30 | | | 5,000,000 | | | | 5,015,650 | |
City of Los Angeles CA, Wastewater System Revenue, Revenue Bonds Subseries A
5.00%, due 6/1/43 | | | 10,000,000 | | | | 12,444,500 | |
City of Los Angeles, Department of Airports, Los Angeles International Airport, Revenue Bonds | | | | | | | | |
Subseries E
5.00%, due 5/15/36 | | | 3,205,000 | | | | 3,942,855 | |
Series C
5.00%, due 5/15/44 (c) | | | 4,285,000 | | | | 4,990,011 | |
Subseries E
5.00%, due 5/15/44 | | | 10,230,000 | | | | 12,303,621 | |
City of Los Angeles, Department of Airports, Revenue Bonds | | | | | | | | |
Series D
5.00%, due 5/15/30 (c) | | | 1,225,000 | | | | 1,423,377 | |
Series D
5.00%, due 5/15/31 (c) | | | 2,530,000 | | | | 2,932,447 | |
Series D
5.00%, due 5/15/33 (c) | | | 1,000,000 | | | | 1,153,360 | |
Series D
5.00%, due 5/15/34 (c) | | | 1,400,000 | | | | 1,614,032 | |
5.00%, due 5/15/37 (c) | | | 2,350,000 | | | | 2,860,161 | |
Subseries E
5.00%, due 5/15/37 | | | 1,000,000 | | | | 1,226,090 | |
Series A
5.00%, due 5/15/40 | | | 6,850,000 | | | | 8,520,235 | |
City of Sacramento CA Transient Occupancy Tax Revenue, Convention Center Complex, Revenue Bonds | | | | | | | | |
Series A
5.00%, due 6/1/28 | | | 2,700,000 | | | | 3,233,169 | |
Series A
5.00%, due 6/1/29 | | | 3,165,000 | | | | 3,760,368 | |
Series A
5.00%, due 6/1/30 | | | 4,920,000 | | | | 5,801,812 | |
Series A
5.00%, due 6/1/32 | | | 2,260,000 | | | | 2,636,652 | |
Series A
5.00%, due 6/1/33 | | | 1,225,000 | | | | 1,422,237 | |
| | | | | | | | |
| | | Principal
Amount | | | Value | |
California (continued) | |
City of San Francisco CA, Public Utilities Commission Water, Revenue Bonds | | | | | | | | |
Series D
3.00%, due 11/1/45 | | $ | 2,000,000 | | | $ | 2,135,660 | |
Series C
4.00%, due 11/1/50 | | | 12,500,000 | | | | 14,683,500 | |
Coachella Valley Unified School District, Election 2005, Unlimited General Obligation
Series F, Insured: BAM
5.00%, due 8/1/46 | | | 12,385,000 | | | | 14,624,456 | |
Coast Community College District, Election 2012, Unlimited General Obligation
Series D
4.50%, due 8/1/39 | | | 15,000,000 | | | | 17,950,650 | |
Compton Unified School District, Unlimited General Obligation | | | | | | | | |
Series B, Insured: BAM
(zero coupon), due 6/1/38 | | | 1,250,000 | | | | 756,075 | |
Series B, Insured: BAM
(zero coupon), due 6/1/39 | | | 1,340,000 | | | | 779,800 | |
Series B, Insured: BAM
(zero coupon), due 6/1/40 | | | 1,500,000 | | | | 839,160 | |
Series B, Insured: BAM
(zero coupon), due 6/1/41 | | | 1,750,000 | | | | 941,238 | |
Corona-Norco Unified School District, Unlimited General Obligation
Series C
4.00%, due 8/1/49 | | | 7,000,000 | | | | 7,994,280 | |
Cotati-Rohnert Park Unified School District, Unlimited General Obligation
Series C, Insured: AGM
5.00%, due 8/1/42 | | | 2,865,000 | | | | 3,426,397 | |
El Monte Union High School District, Unlimited General Obligation
Series A
5.00%, due 6/1/49 | | | 17,390,000 | | | | 20,758,791 | |
Enterprise Elementary School District, Unlimited General Obligation Insured: AGM
5.00%, due 8/1/49 | | | 5,000,000 | | | | 5,922,150 | |
Firebaugh-Las Deltas Unified School District, Election 2016, Unlimited General Obligation
Series A, Insured: AGM
5.25%, due 8/1/41 | | | 3,000,000 | | | | 3,627,510 | |
Fontana Public Finance Authority, Revenue Bonds
Series A, Insured: BAM
5.00%, due 9/1/32 | | | 1,320,000 | | | | 1,531,609 | |
| | | | | | |
The notes to the financial statements are an integral part of,
and should be read in conjunction with, the financial statements. | | | | | 13 | |
Portfolio of Investments October 31, 2020 (continued)
| | | | | | | | |
| | | Principal
Amount | | | Value | |
| Long-Term Municipal Bonds (continued) | |
California (continued) | |
Fontana Unified School District, Unlimited General Obligation | | | | | | | | |
Series C
(zero coupon), due 8/1/35 | | $ | 14,800,000 | | | $ | 7,355,748 | |
Series C
(zero coupon), due 8/1/36 | | | 15,500,000 | | | | 7,156,195 | |
Foothill-Eastern Transportation Corridor Agency, Revenue Bonds
Subseries B-2, Insured: AGM
3.50%, due 1/15/53 | | | 4,800,000 | | | | 5,188,896 | |
Fresno Unified School District, Election 2001, Unlimited General Obligation | | | | | | | | |
Series G
(zero coupon), due 8/1/32 | | | 6,000,000 | | | | 2,838,060 | |
Series G
(zero coupon), due 8/1/33 | | | 10,000,000 | | | | 4,394,800 | |
Series G
(zero coupon), due 8/1/41 | | | 23,485,000 | | | | 5,910,940 | |
Golden State Tobacco Securitization Corp., Asset-Backed, Revenue Bonds
Series A, Insured: AGM
5.00%, due 6/1/40 | | | 5,410,000 | | | | 6,349,014 | |
Golden State Tobacco Securitization Corp., Revenue Bonds
Series A-1
5.00%, due 6/1/33 | | | 12,545,000 | | | | 15,257,605 | |
Invesco California Value Municipal | | | | | | | | |
Income Trust
1.14%, due 12/1/22 (b)(d) | | | 80,000,000 | | | | 80,000,000 | |
Invesco Muni, Inc.
1.00%, due 12/1/22 (d) | | | 5,000,000 | | | | 5,000,000 | |
Jurupa Unified School District, Unlimited General Obligation
Series C
5.25%, due 8/1/43 | | | 5,500,000 | | | | 6,956,785 | |
Live Oak Elementary School District, Certificates of Participation Insured: AGM
5.00%, due 8/1/39 | | | 3,205,000 | | | | 3,793,021 | |
Live Oak Unified School District, Election 2016, Unlimited General Obligation
Series B, Insured: AGM
5.00%, due 8/1/48 | | | 1,500,000 | | | | 1,807,545 | |
Los Angeles County Metropolitan Transportation Authority, Green Bond, Revenue Bonds
4.00%, due 6/1/35 | | | 1,900,000 | | | | 2,299,038 | |
Los Angeles County Metropolitan Transportation Authority, Revenue Bonds | | | | | | | | |
5.00%, due 6/1/35 | | | 23,015,000 | | | | 30,312,366 | |
5.00%, due 6/1/36 | | | 5,000,000 | | | | 6,535,500 | |
| | | | | | | | |
| | | Principal
Amount | | | Value | |
California (continued) | |
Los Angeles County Public Works Financing Authority, Revenue Bonds
Series E-1
5.00%, due 12/1/49 | | $ | 7,630,000 | | | $ | 9,432,435 | |
Los Angeles Unified School District, Election 2008, Unlimited General Obligation
Series B-1
5.25%, due 7/1/42 | | | 68,405,000 | | | | 84,680,602 | |
Los Angeles Unified School District, Unlimited General Obligation | | | | | | | | |
Series C
3.00%, due 7/1/35 | | | 4,400,000 | | | | 4,744,740 | |
Series C
4.00%, due 7/1/36 | | | 6,000,000 | | | | 7,074,060 | |
Series C
4.00%, due 7/1/37 | | | 5,000,000 | | | | 5,872,050 | |
Napa Valley Unified School District, Unlimited General Obligation
Series C, Insured: AGM
4.00%, due 8/1/44 | | | 11,250,000 | | | | 12,543,750 | |
Oakland Unified School District, Alameda County, Unlimited General Obligation | | | | | | | | |
Insured: AGM
5.00%, due 8/1/27 | | | 1,160,000 | | | | 1,382,094 | |
Insured: AGM
5.00%, due 8/1/28 | | | 1,755,000 | | | | 2,082,062 | |
Insured: AGM
5.00%, due 8/1/29 | | | 2,535,000 | | | | 2,992,998 | |
Paramount Unified School District, Unlimited General Obligation
Insured: BAM
(zero coupon), due 8/1/43 | | | 25,000,000 | | | | 6,289,500 | |
Pomona Unified School District, Election 2008, Unlimited General Obligation
Series E, Insured: AGM
5.00%, due 8/1/30 | | | 3,285,000 | | | | 3,523,885 | |
Richmond Joint Powers Financing Authority, Civic Center Project, Revenue Bonds
Series A, Insured: AGM
5.00%, due 11/1/37 | | | 3,660,000 | | | | 4,543,927 | |
Riverside County Redevelopment Successor Agency, Jurupa Valley Project, Tax Allocation
Series B, Insured: BAM
5.00%, due 10/1/30 | | | 2,645,000 | | | | 3,086,450 | |
Riverside County Transportation Commission, Sales Tax, Revenue Bonds
Series B,
4.00%, due 6/1/36 | | | 20,000,000 | | | | 23,172,000 | |
| | | | |
| 14 | | MainStay MacKay Tax Free Bond Fund | | The notes to the financial statements are an integral part of,
and should be read in conjunction with, the financial statements. |
| | | | | | | | |
| | | Principal
Amount | | | Value | |
| Long-Term Municipal Bonds (continued) | |
California (continued) | |
Riverside Unified School District, Election 2016, Unlimited General Obligation
Series B,
4.00%, due 8/1/42 | | $ | 5,000,000 | | | $ | 5,712,950 | |
San Bernardino City Unified School District, Election 2012, Unlimited General Obligation
Series A, Insured: AGM
5.00%, due 8/1/30 | | | 1,000,000 | | | | 1,127,480 | |
San Bernardino Community College District, Election 2018, Unlimited General Obligation
Series A
3.00%, due 8/1/41 | | | 9,175,000 | | | | 9,716,875 | |
San Diego Association of Governments, South Bay Expressway, Senior Lien, Revenue Bonds | | | | | | | | |
Series A
5.00%, due 7/1/30 | | | 2,475,000 | | | | 2,965,619 | |
Series A
5.00%, due 7/1/32 | | | 1,800,000 | | | | 2,131,074 | |
Series A
5.00%, due 7/1/38 | | | 1,150,000 | | | | 1,335,714 | |
San Diego County Regional Airport Authority, Revenue Bonds
Series A
4.00%, due 7/1/38 | | | 1,750,000 | | | | 2,000,863 | |
San Diego County Water Authority, Revenue Bonds
5.00%, due 5/1/34 | | | 2,000,000 | | | | 2,190,560 | |
San Diego Public Facilities Financing Authority, Capital Improvement Projects, Revenue Bonds
Series A
5.00%, due 10/15/44 | | | 3,000,000 | | | | 3,504,870 | |
San Diego Unified School District, Unlimited General Obligation | | | | | | | | |
Series D-2
2.00%, due 7/1/45 | | | 11,000,000 | | | | 10,148,380 | |
Series D-2
3.00%, due 7/1/41 | | | 10,000,000 | | | | 10,698,800 | |
Series M-2
3.00%, due 7/1/50 | | | 25,810,000 | | | | 27,108,501 | |
San Francisco City & County Airport Commission, San Francisco International Airport, Revenue Bonds | | | | | | | | |
Series E
5.00%, due 5/1/35 (c) | | | 8,350,000 | | | | 10,175,059 | |
| | | | | | | | |
| | | Principal
Amount | | | Value | |
California (continued) | |
San Francisco City & County Airport Commission, San Francisco International Airport, Revenue Bonds (continued) | | | | | | | | |
Series E
5.00%, due 5/1/37 (c) | | $ | 3,210,000 | | | $ | 3,882,367 | |
Series A
5.00%, due 5/1/47 (c) | | | 9,000,000 | | | | 10,348,380 | |
2nd Series
5.00%, due 5/1/48 (c) | | | 9,000,000 | | | | 10,421,280 | |
Series A
5.00%, due 5/1/49 (c) | | | 23,995,000 | | | | 28,246,194 | |
Series E
5.00%, due 5/1/50 (c) | | | 15,000,000 | | | | 17,639,850 | |
Series F
5.00%, due 5/1/50 | | | 29,580,000 | | | | 35,406,668 | |
San Francisco City & County International Airports Commission, Revenue Bonds
Series E
5.00%, due 5/1/45 (c) | | | 3,250,000 | | | | 3,842,832 | |
San Jose Evergreen Community College District, Election 2016, Unlimited General Obligation | | | | | | | | |
Series B
3.00%, due 9/1/35 | | | 1,250,000 | | | | 1,367,913 | |
Series B
3.00%, due 9/1/36 | | | 1,700,000 | | | | 1,853,102 | |
Series B
3.00%, due 9/1/37 | | | 1,565,000 | | | | 1,700,435 | |
San Marcos School Financing Authority, Revenue Bonds | | | | | | | | |
Insured: AGM
5.00%, due 8/15/34 | | | 1,000,000 | | | | 1,189,110 | |
Insured: AGM
5.00%, due 8/15/35 | | | 1,000,000 | | | | 1,185,560 | |
Insured: AGM
5.00%, due 8/15/36 | | | 1,100,000 | | | | 1,299,859 | |
Santa Clara Valley Water District, Revenue Bonds
Series A
5.00%, due 6/1/49 | | | 2,865,000 | | | | 3,447,999 | |
Santa Monica Community College District, Election 2016, Unlimited General Obligation
Series A
4.00%, due 8/1/47 | | | 8,580,000 | | | | 9,851,127 | |
Selma Unified School District, Election 2006, Unlimited General Obligation | | | | | | | | |
Series D, Insured: AGM
(zero coupon), due 8/1/39 | | | 730,000 | | | | 444,986 | |
Series D, Insured: AGM
(zero coupon), due 8/1/41 | | | 730,000 | | | | 415,231 | |
| | | | | | |
The notes to the financial statements are an integral part of,
and should be read in conjunction with, the financial statements. | | | | | 15 | |
Portfolio of Investments October 31, 2020 (continued)
| | | | | | | | |
| | | Principal
Amount | | | Value | |
| Long-Term Municipal Bonds (continued) | |
California (continued) | |
Sierra Joint Community College District, Election 2018, Unlimited General Obligation
4.00%, due 8/1/53 | | $ | 3,500,000 | | | $ | 3,985,030 | |
Simi Valley Unified School District, Election 2016, Unlimited General Obligation | | | | | | | | |
Series A
5.00%, due 8/1/39 | | | 1,000,000 | | | | 1,224,420 | |
Series A
5.00%, due 8/1/40 | | | 1,195,000 | | | | 1,459,716 | |
Solano County Community College District, Election 2012, Unlimited General Obligation
Series C
5.25%, due 8/1/42 | | | 16,460,000 | | | | 20,169,096 | |
Southern California Water Replenishment District, Revenue Bonds
5.00%, due 8/1/38 | | | 1,750,000 | | | | 2,174,760 | |
State of California, Unlimited General Obligation | | | | | | | | |
3.00%, due 11/1/35 | | | 4,000,000 | | | | 4,426,960 | |
4.00%, due 10/1/34 | | | 20,790,000 | | | | 25,056,108 | |
4.00%, due 3/1/36 | | | 13,000,000 | | | | 15,544,100 | |
4.00%, due 3/1/37 | | | 20,100,000 | | | | 24,020,103 | |
4.00%, due 3/1/38 | | | 10,000,000 | | | | 11,937,300 | |
4.00%, due 3/1/40 | | | 10,500,000 | | | | 12,412,365 | |
4.00%, due 3/1/46 | | | 20,000,000 | | | | 23,235,400 | |
5.25%, due 10/1/39 | | | 5,635,000 | | | | 6,808,432 | |
Tahoe-Truckee Unified School District, Unlimited General Obligation
Series B
5.00%, due 8/1/41 | | | 2,200,000 | | | | 2,660,790 | |
Turlock Irrigation District, Revenue Bonds
5.00%, due 1/1/44 | | | 4,000,000 | | | | 5,074,560 | |
Twin Rivers Unified School District, Unrefunded Election 2006, Unlimited General Obligation
Insured: AGM
(zero coupon), due 8/1/32 | | | 5,120,000 | | | | 4,071,526 | |
University of California, Revenue Bonds | | | | | | | | |
Series AV
5.00%, due 5/15/42 | | | 1,725,000 | | | | 2,099,290 | |
Series AZ
5.00%, due 5/15/43 | | | 9,180,000 | | | | 11,324,632 | |
Series AZ
5.25%, due 5/15/58 | | | 5,905,000 | | | | 7,274,547 | |
Westminster School District, Election 2008, Unlimited General Obligation
Series B, Insured: BAM
(zero coupon), due 8/1/48 | | | 13,900,000 | | | | 2,444,871 | |
| | | | | | | | |
| | | Principal
Amount | | | Value | |
California (continued) | |
Winters Joint Unified School District, Unlimited General Obligation
Series B, Insured: BAM
5.00%, due 8/1/46 | | $ | 1,400,000 | | | $ | 1,679,622 | |
| | | | | | | | |
| | | | | | | 1,142,457,558 | |
| | | | | | | | |
Colorado 1.3% | |
Adams State University, Revenue Bonds | | | | | | | | |
Series A, Insured: State Higher Education Intercept Program
4.00%, due 5/15/37 | | | 750,000 | | | | 873,135 | |
Series A, Insured: State Higher Education Intercept Program
4.00%, due 5/15/39 | | | 1,085,000 | | | | 1,250,658 | |
Series A, Insured: State Higher Education Intercept Program
4.00%, due 5/15/42 | | | 1,500,000 | | | | 1,700,160 | |
City & County of Denver CO, Convention Center Expansion Project, Certificates of Participation
Series A
5.375%, due 6/1/43 | | | 2,875,000 | | | | 3,358,978 | |
Colorado Health Facilities Authority, AdventHealth Obligated Group, Revenue Bonds
4.00%, due 11/15/43 | | | 3,905,000 | | | | 4,430,027 | |
Colorado Health Facilities Authority, CommonSpirit Health Obligated Group, Revenue Bonds | | | | | | | | |
Series A
4.00%, due 8/1/49 | | | 15,975,000 | | | | 17,207,950 | |
Series A-2
5.00%, due 8/1/44 | | | 4,500,000 | | | | 5,324,940 | |
Colorado State Housing & Finance Authority, Revenue Bonds
Series C, Insured: GNMA
4.25%, due 11/1/48 | | | 5,235,000 | | | | 5,816,399 | |
Denver City & County Airport System Revenue (c) | | | | | | | | |
Series A
5.00%, due 12/1/25 | | | 5,370,000 | | | | 6,433,797 | |
Series A
5.25%, due 12/1/48 | | | 10,000,000 | | | | 11,879,100 | |
Denver Convention Center Hotel Authority, Revenue Bonds
5.00%, due 12/1/36 | | | 1,000,000 | | | | 1,064,780 | |
Regional Transportation District, Certificates of Participation
Series A
4.50%, due 6/1/44 | | | 10,000,000 | | | | 10,739,500 | |
| | | | |
| 16 | | MainStay MacKay Tax Free Bond Fund | | The notes to the financial statements are an integral part of,
and should be read in conjunction with, the financial statements. |
| | | | | | | | |
| | | Principal
Amount | | | Value | |
| Long-Term Municipal Bonds (continued) | |
Colorado (continued) | |
South Suburban Park & Recreation District, Unlimited General Obligation
4.00%, due 12/15/38 | | $ | 1,140,000 | | | $ | 1,340,127 | |
State of Colorado, Certificates of Participation
Series A
3.00%, due 12/15/36 | | | 22,745,000 | | | | 24,910,779 | |
Vista Ridge Metropolitan District, Unlimited General Obligation
Series A, Insured: BAM
5.00%, due 12/1/31 | | | 1,250,000 | | | | 1,523,025 | |
| | | | | | | | |
| | | | | | | 97,853,355 | |
| | | | | | | | |
Connecticut 2.7% | |
City of Bridgeport CT, Unlimited General Obligation | | | | | | | | |
Series D, Insured: AGM
5.00%, due 8/15/33 | | | 3,090,000 | | | | 3,649,197 | |
Series D, Insured: AGM
5.00%, due 8/15/34 | | | 3,090,000 | | | | 3,634,273 | |
Series D, Insured: AGM
5.00%, due 8/15/35 | | | 3,090,000 | | | | 3,623,149 | |
Series D, Insured: AGM
5.00%, due 8/15/36 | | | 3,090,000 | | | | 3,612,055 | |
City of Hartford CT, Unlimited General Obligation | | | | | | | | |
Series A, Insured: State Guaranteed
5.00%, due 4/1/28 | | | 2,500,000 | | | | 2,639,725 | |
Series C, Insured: AGM, State Guaranteed
5.00%, due 7/15/32 | | | 7,470,000 | | | | 8,627,551 | |
Series C, Insured: AGM, State Guaranteed
5.00%, due 7/15/34 | | | 2,500,000 | | | | 2,873,375 | |
City of Hartford CT, Unrefunded, Unlimited General Obligation | | | | | | | | |
Series A, Insured: State Guaranteed
5.00%, due 4/1/29 | | | 895,000 | | | | 943,446 | |
Series A, Insured: AGM, State Guaranteed
5.00%, due 4/1/32 | | | 195,000 | | | | 205,060 | |
City of New Haven CT, Unlimited General Obligation
Series A, Insured: AGM
5.00%, due 8/15/29 | | | 1,450,000 | | | | 1,722,948 | |
Connecticut State Health & Educational Facility Authority, Quinnipiac University, Revenue Bonds
Series L
5.00%, due 7/1/32 | | | 10,425,000 | | | | 11,903,265 | |
| | | | | | | | |
| | | Principal
Amount | | | Value | |
Connecticut (continued) | |
Connecticut State Housing Finance Authority, Revenue Bonds | | | | | | | | |
Subseries C-1
4.00%, due 11/15/45 | | $ | 4,995,000 | | | $ | 5,491,203 | |
Series B-1
4.00%, due 5/15/49 | | | 2,660,000 | | | | 3,022,851 | |
State of Connecticut Special Tax, Transportation Infrastructure, Revenue Bonds | | | | | | | | |
Series A
5.00%, due 9/1/30 | | | 6,830,000 | | | | 8,013,687 | |
Series A
5.00%, due 1/1/31 | | | 5,000,000 | | | | 6,224,150 | |
Series A, Insured: BAM
5.00%, due 9/1/31 | | | 14,470,000 | | | | 17,530,260 | |
Series A
5.00%, due 9/1/33 | | | 13,000,000 | | | | 15,635,880 | |
Series A
5.00%, due 9/1/34 | | | 3,250,000 | | | | 3,731,162 | |
Series A
5.00%, due 1/1/36 | | | 4,075,000 | | | | 4,945,542 | |
State of Connecticut, Special Tax, Revenue Bonds | | | | | | | | |
Series A
3.125%, due 5/1/40 | | | 4,250,000 | | | | 4,491,655 | |
Series A
4.00%, due 5/1/39 | | | 9,550,000 | | | | 10,963,113 | |
5.00%, due 5/1/34 | | | 3,400,000 | | | | 4,340,678 | |
Series A
5.00%, due 5/1/37 | | | 6,000,000 | | | | 7,558,740 | |
State of Connecticut, Unlimited General Obligation | | | | | | | | |
Series A
4.00%, due 4/15/37 | | | 2,920,000 | | | | 3,354,204 | |
Series A
4.00%, due 4/15/38 | | | 1,460,000 | | | | 1,671,802 | |
Series A
5.00%, due 3/1/28 | | | 1,990,000 | | | | 2,258,949 | |
Series F
5.00%, due 9/15/28 | | | 12,810,000 | | | | 16,569,094 | |
Series A
5.00%, due 3/15/32 | | | 5,130,000 | | | | 6,085,360 | |
Series C
5.00%, due 6/15/33 | | | 1,775,000 | | | | 2,194,078 | |
Series E, Insured: BAM
5.00%, due 9/15/33 | | | 4,500,000 | | | | 5,683,410 | |
Series C
5.00%, due 6/15/34 | | | 1,375,000 | | | | 1,689,188 | |
Series A
5.00%, due 4/15/35 | | | 6,000,000 | | | | 7,238,700 | |
| | | | | | |
The notes to the financial statements are an integral part of,
and should be read in conjunction with, the financial statements. | | | | | 17 | |
Portfolio of Investments October 31, 2020 (continued)
| | | | | | | | |
| | | Principal
Amount | | | Value | |
| Long-Term Municipal Bonds (continued) | |
Connecticut (continued) | |
State of Connecticut, Unlimited General Obligation (continued) | | | | | | | | |
Series E, Insured: BAM
5.00%, due 9/15/35 | | $ | 2,325,000 | | | $ | 2,918,875 | |
Series A
5.00%, due 4/15/36 | | | 2,050,000 | | | | 2,547,146 | |
Series E, Insured: BAM
5.00%, due 9/15/37 | | | 2,000,000 | | | | 2,493,860 | |
Series A
5.00%, due 4/15/39 | | | 1,250,000 | | | | 1,538,250 | |
Series A
5.00%, due 1/15/40 | | | 750,000 | | | | 932,603 | |
University of Connecticut, Revenue Bonds | | | | | | | | |
Series A
5.00%, due 11/1/33 | | | 2,000,000 | | | | 2,483,220 | |
Series A
5.00%, due 11/1/35 | | | 3,990,000 | | | | 4,924,498 | |
| | | | | | | | |
| | | | | | | 199,966,202 | |
| | | | | | | | |
Delaware 0.7% | |
Delaware State Health Facilities Authority, Christiana Health Care System Obligated Group, Revenue Bonds | | | | | | | | |
4.00%, due 10/1/49 | | | 1,000,000 | | | | 1,125,750 | |
5.00%, due 10/1/34 | | | 6,360,000 | | | | 8,113,897 | |
5.00%, due 10/1/35 | | | 8,085,000 | | | | 10,258,005 | |
5.00%, due 10/1/37 | | | 9,135,000 | | | | 11,503,523 | |
5.00%, due 10/1/38 | | | 5,000,000 | | | | 6,267,150 | |
5.00%, due 10/1/45 | | | 13,155,000 | | | | 16,137,107 | |
| | | | | | | | |
| | | | | | | 53,405,432 | |
| | | | | | | | |
District of Columbia 0.5% | |
District of Columbia Water & Sewer Authority, Revenue Bonds
Insured: AGM
5.50%, due 10/1/28 | | | 1,250,000 | | | | 1,602,100 | |
District of Columbia, Bryant Street Project, Tax Allocation | | | | | | | | |
4.00%, due 6/1/39 | | | 2,370,000 | | | | 2,796,505 | |
4.00%, due 6/1/43 | | | 2,035,000 | | | | 2,367,193 | |
District of Columbia, Friendship Public Charter School, Inc., Revenue Bonds
5.00%, due 6/1/42 | | | 5,500,000 | | | | 5,719,560 | |
District of Columbia, Revenue Bonds
Series A
4.00%, due 3/1/39 | | | 3,500,000 | | | | 4,146,940 | |
Metropolitan Washington Airports Authority Dulles Toll Road, Metrorail & Capital Improvement Project, Revenue Bonds | | | | | | | | |
Series B
4.00%, due 10/1/39 | | | 1,000,000 | | | | 1,115,190 | |
| | | | | | | | |
| | | Principal
Amount | | | Value | |
District of Columbia (continued) | |
Metropolitan Washington Airports Authority Dulles Toll Road, Metrorail & Capital Improvement Project, Revenue Bonds (continued) | | | | | | | | |
Series B
5.00%, due 10/1/33 | | $ | 1,500,000 | | | $ | 1,854,150 | |
Metropolitan Washington Airports Authority Dulles Toll Road, Revenue Bonds (a) | | | | | | | | |
Series C, Insured: AGC
6.50%, due 10/1/41 | | | 8,000,000 | | | | 9,996,240 | |
Series B
6.50%, due 10/1/44 | | | 7,140,000 | | | | 9,205,031 | |
| | | | | | | | |
| | | | | | | 38,802,909 | |
| | | | | | | | |
Florida 2.7% | |
Broward County FL, Water & Sewer Utility, Revenue Bonds
Series A
5.00%, due 10/1/38 | | | 650,000 | | | | 838,754 | |
Central Florida Expressway Authority, Senior Lien, Revenue Bonds
Series A
5.00%, due 7/1/35 | | | 2,205,000 | | | | 2,795,168 | |
City of Miami Beach FL Parking, Revenue Bonds
Insured: BAM
5.00%, due 9/1/40 | | | 2,500,000 | | | | 2,912,850 | |
City of Miami FL Parking System, Revenue Bonds | | | | | | | | |
Insured: BAM
4.00%, due 10/1/33 | | | 1,520,000 | | | | 1,788,265 | |
Insured: BAM
4.00%, due 10/1/36 | | | 3,395,000 | | | | 3,950,354 | |
Insured: BAM
4.00%, due 10/1/37 | | | 2,535,000 | | | | 2,939,561 | |
Insured: BAM
4.00%, due 10/1/38 | | | 1,675,000 | | | | 1,935,998 | |
Insured: BAM
4.00%, due 10/1/39 | | | 2,820,000 | | | | 3,249,204 | |
City of Orlando FL, Unrefunded Third Lien, Tourist Development Tax, Revenue Bonds
Insured: AGC
5.50%, due 11/1/38 | | | 1,600,000 | | | | 1,603,760 | |
County of Broward FL, Airport System, Revenue Bonds Class A
5.00%, due 10/1/49 (c) | | | 4,000,000 | | | | 4,744,280 | |
County of Miami-Dade FL Aviation, Unlimited General Obligation
Series A
5.00%, due 7/1/37 | | | 2,000,000 | | | | 2,441,720 | |
| | | | |
| 18 | | MainStay MacKay Tax Free Bond Fund | | The notes to the financial statements are an integral part of,
and should be read in conjunction with, the financial statements. |
| | | | | | | | |
| | | Principal
Amount | | | Value | |
| Long-Term Municipal Bonds (continued) | |
Florida (continued) | |
County of Miami-Dade FL, Transit System, Revenue Bonds | | | | | | | | |
Series A
4.00%, due 7/1/44 | | $ | 10,000,000 | | | $ | 11,639,100 | |
Series A
4.00%, due 7/1/48 | | | 9,340,000 | | | | 10,739,506 | |
County of Miami-Dade FL, Unlimited General Obligation | | | | | | | | |
3.00%, due 7/1/36 | | | 9,875,000 | | | | 10,862,697 | |
Series A
5.00%, due 11/1/20 | | | 3,510,000 | | | | 3,510,000 | |
County of Miami-Dade Florida Water & Sewer System, Revenue Bonds | | | | | | | | |
Series A
4.00%, due 10/1/44 | | | 9,500,000 | | | | 10,776,420 | |
Series B
5.00%, due 10/1/31 | | | 10,000,000 | | | | 11,933,100 | |
Series B
5.00%, due 10/1/44 | | | 20,000,000 | | | | 25,107,000 | |
County of Sarasota FL Utility System, Revenue Bonds
Series A
5.00%, due 10/1/40 | | | 5,750,000 | | | | 7,237,985 | |
Florida Governmental Utility Authority, Revenue Bonds | | | | | | | | |
Insured: AGM
4.00%, due 10/1/37 | | | 1,375,000 | | | | 1,631,369 | |
Insured: AGM
4.00%, due 10/1/39 | | | 1,400,000 | | | | 1,637,860 | |
Florida Keys Aqueduct Authority, Revenue Bonds
Series A
5.00%, due 9/1/49 | | | 6,000,000 | | | | 6,930,180 | |
JEA Electric System, Revenue Bonds
Series B
4.00%, due 10/1/36 | | | 4,500,000 | | | | 5,157,090 | |
Orange County Health Facilities Authority, Presbyterian Retirement Communities, Revenue Bonds
5.00%, due 8/1/31 | | | 1,500,000 | | | | 1,658,295 | |
Putnam County Development Authority, Revenue Bonds
Series A
5.00%, due 3/15/42 | | | 5,000,000 | | | | 5,991,300 | |
South Miami Health Facilities Authority, Baptist Health South Florida, Revenue Bonds
5.00%, due 8/15/42 | | | 20,000,000 | | | | 23,440,600 | |
| | | | | | | | |
| | | Principal
Amount | | | Value | |
Florida (continued) | |
Village Community Development District No. 8, Special Assessment Insured: AGM
3.50%, due 5/1/40 | | $ | 6,260,000 | | | $ | 6,617,696 | |
West Palm Beach Community Redevelopment Agency, City Center Community Redevelopment Area, Tax Allocation | | | | | | | | |
5.00%, due 3/1/34 | | | 10,100,000 | | | | 12,633,888 | |
5.00%, due 3/1/35 | | | 10,620,000 | | | | 13,246,857 | |
| | | | | | | | |
| | | | | | | 199,950,857 | |
| | | | | | | | |
Georgia 2.2% | |
Atlanta Development Authority, Revenue Bonds
Series A-1
5.00%, due 7/1/33 | | | 1,000,000 | | | | 1,098,380 | |
Brookhaven Development Authority, Children’s Healthcare of Atlanta, Revenue Bonds | | | | | | | | |
Series A
4.00%, due 7/1/44 | | | 9,915,000 | | | | 11,260,862 | |
Series A
4.00%, due 7/1/49 | | | 3,000,000 | | | | 3,391,140 | |
Series A
5.00%, due 7/1/32 | | | 1,550,000 | | | | 1,987,147 | |
Series A
5.00%, due 7/1/33 | | | 2,380,000 | | | | 3,030,502 | |
Series A
5.00%, due 7/1/35 | | | 1,900,000 | | | | 2,399,795 | |
Series A
5.00%, due 7/1/36 | | | 2,850,000 | | | | 3,585,129 | |
Series A
5.00%, due 7/1/37 | | | 2,800,000 | | | | 3,509,996 | |
Series A
5.00%, due 7/1/38 | | | 2,250,000 | | | | 2,811,712 | |
Series A
5.00%, due 7/1/39 | | | 1,300,000 | | | | 1,619,657 | |
Coweta County Development Authority, Piedmont Healthcare, Inc., Revenue Bonds
5.00%, due 7/1/44 | | | 5,000,000 | | | | 6,043,650 | |
Dalton GA, Board of Water Light & Sinking Fund Commissioners, Revenue Bonds
5.00%, due 3/1/30 | | | 2,055,000 | | | | 2,450,752 | |
Development Authority of Appling County, Oglethorpe Power Corp Project, Revenue Bonds
Series A
1.50%, due 1/1/38 (b) | | | 2,500,000 | | | | 2,529,650 | |
| | | | | | |
The notes to the financial statements are an integral part of,
and should be read in conjunction with, the financial statements. | | | | | 19 | |
Portfolio of Investments October 31, 2020 (continued)
| | | | | | | | |
| | | Principal
Amount | | | Value | |
| Long-Term Municipal Bonds (continued) | |
Georgia (continued) | |
Development Authority of Burke County, Oglethorpe Power Corp Project, Revenue Bonds
Series A
1.50%, due 1/1/40 (b) | | $ | 7,365,000 | | | $ | 7,452,349 | |
Development Authority of Monroe County, Oglethorpe Power Corp Project, Revenue Bonds
1.50%, due 1/1/39 (b) | | | 3,750,000 | | | | 3,794,475 | |
Etowah Water & Sewer Authority, Revenue Bonds | | | | | | | | |
Insured: BAM
4.00%, due 3/1/33 | | | 1,000,000 | | | | 1,162,290 | |
Insured: BAM
4.00%, due 3/1/35 | | | 1,250,000 | | | | 1,443,013 | |
Fulton County Development Authority, Piedmont Healthcare, Inc. Project, Revenue Bonds | | | | | | | | |
4.00%, due 7/1/37 | | | 2,200,000 | | | | 2,514,094 | |
4.00%, due 7/1/39 | | | 2,500,000 | | | | 2,839,025 | |
Gainesville & Hall County Hospital Authority, Northeast Health System, Inc. Project, Revenue Bonds | | | | | | | | |
4.00%, due 2/15/38 | | | 8,310,000 | | | | 9,500,324 | |
Series A, Insured: County Guaranteed
5.25%, due 8/15/49 | | | 5,155,000 | | | | 5,916,857 | |
Main Street Natural Gas, Inc., Revenue Bonds | | | | | | | | |
Series A
5.00%, due 5/15/35 | | | 3,000,000 | | | | 3,960,480 | |
Series A
5.00%, due 5/15/36 | | | 3,700,000 | | | | 4,914,673 | |
Municipal Electric Authority of Georgia, Plant Vogtle Units 3 & 4 Project, Revenue Bonds | | | | | | | | |
Series A
5.00%, due 1/1/37 | | | 1,000,000 | | | | 1,219,260 | |
Series A
5.00%, due 1/1/38 | | | 1,000,000 | | | | 1,215,760 | |
Series A
5.00%, due 1/1/49 | | | 52,395,000 | | | | 61,869,064 | |
Municipal Electric Authority of Georgia, Revenue Bonds | | | | | | | | |
Series A
5.00%, due 1/1/35 | | | 5,000,000 | | | | 5,666,500 | |
5.00%, due 1/1/45 | | | 3,300,000 | | | | 4,055,436 | |
5.00%, due 1/1/50 | | | 4,000,000 | | | | 4,886,520 | |
| | | | | | | | |
| | | | | | | 168,128,492 | |
| | | | | | | | |
| | | | | | | | |
| | | Principal
Amount | | | Value | |
Guam 0.4% | |
Antonio B Won Pat International Airport Authority, Revenue Bonds
Series C, Insured: AGM
6.125%, due 10/1/43 (c) | | $ | 5,000,000 | | | $ | 5,441,650 | |
Guam Government Waterworks Authority, Water & Wastewater Systems Revenue, Revenue Bonds
5.00%, due 7/1/40 | | | 1,730,000 | | | | 1,988,445 | |
Guam Government, Business Privilege Tax, Revenue Bonds
Series A
5.125%, due 1/1/42 | | | 3,085,000 | | | | 3,170,702 | |
Guam Government, Waterworks Authority, Revenue Bonds | | | | | | | | |
5.00%, due 1/1/46 | | | 5,000,000 | | | | 5,594,050 | |
Series A
5.00%, due 1/1/50 | | | 1,660,000 | | | | 1,986,472 | |
5.25%, due 7/1/33 | | | 1,000,000 | | | | 1,129,390 | |
Guam Power Authority, Revenue Bonds | | | | | | | | |
Series A, Insured: AGM
5.00%, due 10/1/30 | | | 5,610,000 | | | | 6,046,458 | |
Series A, Insured: AGM
5.00%, due 10/1/44 | | | 655,000 | | | | 727,908 | |
Territory of Guam, Section 30, Revenue Bonds | | | | | | | | |
Series A
5.00%, due 12/1/27 | | | 2,265,000 | | | | 2,603,074 | |
Series A
5.00%, due 12/1/34 | | | 2,290,000 | | | | 2,589,463 | |
| | | | | | | | |
| | | | | | | 31,277,612 | |
| | | | | | | | |
Hawaii 0.3% | |
State of Hawaii Department of Budget & Finance, Hawaii Pacific Health Obligation, Revenue Bonds
Series A
6.00%, due 7/1/33 | | | 3,000,000 | | | | 3,322,830 | |
State of Hawaii Department of Budget & Finance, Hawaiian Electric Co., Inc, Revenue Bonds
3.50%, due 10/1/49 (c) | | | 7,000,000 | | | | 7,065,590 | |
State of Hawaii Highway Fund, Revenue Bonds | | | | | | | | |
Series A
5.00%, due 1/1/38 | | | 2,765,000 | | | | 3,468,637 | |
Series A
5.00%, due 1/1/39 | | | 3,150,000 | | | | 3,940,052 | |
Series A
5.00%, due 1/1/40 | | | 2,140,000 | | | | 2,669,179 | |
| | | | | | | | |
| | | | | | | 20,466,288 | |
| | | | | | | | |
| | | | |
| 20 | | MainStay MacKay Tax Free Bond Fund | | The notes to the financial statements are an integral part of,
and should be read in conjunction with, the financial statements. |
| | | | | | | | |
| | | Principal
Amount | | | Value | |
| Long-Term Municipal Bonds (continued) | |
Idaho 0.4% | |
Idaho Housing & Finance Association, Federal Highway Trust Fund, Revenue Bonds | | | | | | | | |
Series A
5.00%, due 7/15/36 | | $ | 16,920,000 | | | $ | 21,283,499 | |
Series A
5.00%, due 7/15/37 | | | 10,000,000 | | | | 12,489,800 | |
| | | | | | | | |
| | | | | | | 33,773,299 | |
| | | | | | | | |
Illinois 9.7% | |
Chicago Board of Education, Revenue Bonds
6.00%, due 4/1/46 | | | 19,485,000 | | | | 22,387,486 | |
Chicago Board of Education, School Reform, Unlimited General Obligation
Series A, Insured: NATL-RE
(zero coupon), due 12/1/26 | | | 19,995,000 | | | | 16,869,981 | |
Chicago Board of Education, Unlimited General Obligation | | | | | | | | |
Series A, Insured: AGM
5.00%, due 12/1/27 | | | 8,250,000 | | | | 10,126,132 | |
Series A, Insured: AGM
5.50%, due 12/1/39 | | | 11,455,000 | | | | 11,838,628 | |
Chicago Midway International Airport, Revenue Bonds
Series A
5.375%, due 1/1/33 (c) | | | 2,500,000 | | | | 2,689,150 | |
Chicago O’Hare International Airport, Passenger Facility Charge, Revenue Bonds | | | | | | | | |
Series A
5.00%, due 1/1/30 | | | 2,915,000 | | | | 3,055,386 | |
Series B
5.00%, due 1/1/31 (c) | | | 2,000,000 | | | | 2,085,380 | |
Chicago O’Hare International Airport, Revenue Bonds | | | | | | | | |
Series A
4.00%, due 1/1/32 (c) | | | 2,900,000 | | | | 3,019,770 | |
Series A
4.00%, due 1/1/37 | | | 5,000,000 | | | | 5,615,100 | |
Series A, Insured: AGM
4.00%, due 1/1/37 | | | 15,000,000 | | | | 17,029,350 | |
Series B, Insured: AGM
4.00%, due 1/1/53 | | | 10,000,000 | | | | 10,870,500 | |
Series A
5.00%, due 1/1/32 (c) | | | 15,000,000 | | | | 17,124,600 | |
Series C
5.00%, due 1/1/35 | | | 6,000,000 | | | | 6,875,100 | |
Series D
5.00%, due 1/1/47 (c) | | | 5,000,000 | | | | 5,641,700 | |
Series C
5.50%, due 1/1/34 (c) | | | 3,000,000 | | | | 3,248,220 | |
| | | | | | | | |
| | | Principal
Amount | | | Value | |
Illinois (continued) | |
Chicago Park District, Limited General Obligation | | | | | | | | |
Series A, Insured: BAM
4.00%, due 1/1/31 | | $ | 1,955,000 | | | $ | 2,213,353 | |
Series C, Insured: BAM
4.00%, due 1/1/38 | | | 2,800,000 | | | | 3,052,364 | |
Series C, Insured: BAM
4.00%, due 1/1/39 | | | 3,145,000 | | | | 3,417,294 | |
Series A
5.00%, due 1/1/28 | | | 1,000,000 | | | | 1,145,330 | |
Series A
5.00%, due 1/1/29 | | | 750,000 | | | | 852,233 | |
Series B, Insured: BAM
5.00%, due 1/1/29 | | | 2,500,000 | | | | 2,761,625 | |
Series A
5.00%, due 1/1/31 | | | 1,000,000 | | | | 1,123,650 | |
Series A
5.00%, due 1/1/35 | | | 2,000,000 | | | | 2,220,140 | |
Chicago Park District, Limited Tax, Limited General Obligation | | | | | | | | |
Series A
5.50%, due 1/1/33 | | | 2,000,000 | | | | 2,180,960 | |
Series A
5.75%, due 1/1/38 | | | 4,000,000 | | | | 4,373,040 | |
Chicago Park District, Personal Property Replacement Tax, Unlimited General Obligation
Insured: BAM
4.00%, due 1/1/34 | | | 4,555,000 | | | | 5,038,923 | |
Chicago Park District, Special Recreation Activity Alternate Revenue Source, Unlimited General Obligation Insured: BAM
5.00%, due 11/15/30 | | | 1,435,000 | | | | 1,765,811 | |
Chicago Park District, Unlimited General Obligation | | | | | | | | |
Series F-2
4.00%, due 1/1/38 | | | 1,150,000 | | | | 1,240,183 | |
Series F-2
5.00%, due 1/1/37 | | | 2,050,000 | | | | 2,408,586 | |
Chicago Transit Authority Sales Tax Receipts Fund, Revenue Bonds
Series A
4.00%, due 12/1/55 | | | 6,000,000 | | | | 6,420,660 | |
Chicago Transit Authority, Revenue Bonds
5.25%, due 12/1/29 | | | 2,000,000 | | | | 2,108,000 | |
Chicago Transit Authority, Sales Tax Receipts, Revenue Bonds | | | | | | | | |
4.00%, due 12/1/50 | | | 32,730,000 | | | | 35,210,279 | |
5.25%, due 12/1/31 | | | 1,735,000 | | | | 1,828,690 | |
Chicago, Unlimited General Obligation
Series A
6.00%, due 1/1/38 | | | 43,000,000 | | | | 47,063,070 | |
| | | | | | |
The notes to the financial statements are an integral part of,
and should be read in conjunction with, the financial statements. | | | | | 21 | |
Portfolio of Investments October 31, 2020 (continued)
| | | | | | | | |
| | | Principal
Amount | | | Value | |
| Long-Term Municipal Bonds (continued) | |
Illinois (continued) | |
City of Chicago Heights IL, Unlimited General Obligation
Series B, Insured: BAM
5.25%, due 12/1/34 | | $ | 2,115,000 | | | $ | 2,504,795 | |
City of Chicago IL Motor Fuel Tax, Revenue Bonds
Insured: AGM
5.00%, due 1/1/33 | | | 4,725,000 | | | | 5,141,225 | |
City of Chicago IL, Unlimited General Obligation | | | | | | | | |
Series A
5.00%, due 1/1/40 | | | 1,750,000 | | | | 1,749,790 | |
Series A
5.50%, due 1/1/49 | | | 10,000,000 | | | | 10,590,500 | |
Series A, Insured: BAM
6.00%, due 1/1/38 | | | 6,000,000 | | | | 7,383,120 | |
City of Chicago IL, Wastewater Transmission Second Lien, Revenue Bonds
5.00%, due 1/1/39 | | | 8,420,000 | | | | 9,179,316 | |
City of Chicago IL, Wastewater Transmission, Revenue Bonds | | | | | | | | |
5.00%, due 1/1/28 | | | 1,000,000 | | | | 1,102,780 | |
Series B, Insured: AGM
5.00%, due 1/1/30 | | | 7,585,000 | | | | 9,183,311 | |
5.00%, due 1/1/33 | | | 2,000,000 | | | | 2,195,180 | |
Series B
5.00%, due 1/1/33 | | | 2,490,000 | | | | 2,950,426 | |
5.00%, due 1/1/44 | | | 13,090,000 | | | | 14,207,624 | |
Series A, Insured: AGM
5.25%, due 1/1/42 | | | 4,000,000 | | | | 4,810,000 | |
City of Chicago IL, Wastewater, Revenue Bonds | | | | | | | | |
5.00%, due 11/1/27 | | | 1,655,000 | | | | 1,904,475 | |
Series 2017-2, Insured: AGM
5.00%, due 11/1/28 | | | 2,000,000 | | | | 2,489,980 | |
5.00%, due 11/1/29 | | | 1,700,000 | | | | 1,938,867 | |
Series 2017-2, Insured: AGM
5.00%, due 11/1/30 | | | 3,000,000 | | | | 3,656,520 | |
Series 2017-2, Insured: AGM
5.00%, due 11/1/32 | | | 5,000,000 | | | | 6,031,400 | |
Series 2017-2, Insured: AGM
5.00%, due 11/1/33 | | | 10,000,000 | | | | 12,015,300 | |
Series 2017-2, Insured: AGM
5.00%, due 11/1/38 | | | 3,500,000 | | | | 4,147,290 | |
Insured: AGM
5.25%, due 11/1/33 | | | 5,000,000 | | | | 6,089,100 | |
Insured: AGM
5.25%, due 11/1/34 | | | 1,785,000 | | | | 2,169,596 | |
Insured: AGM
5.25%, due 11/1/35 | | | 3,025,000 | | | | 3,664,485 | |
| | | | | | | | |
| | | Principal
Amount | | | Value | |
Illinois (continued) | |
City of Chicago IL, Waterworks Second Lien, Revenue Bonds
4.00%, due 11/1/37 | | $ | 1,240,000 | | | $ | 1,274,100 | |
Cook County Community College District No. 508, City College of Chicago, Unlimited General Obligation Insured: BAM
5.50%, due 12/1/38 | | | 5,000,000 | | | | 5,570,100 | |
Cook County Community High School District No. 212 Leyden, Revenue Bonds | | | | | | | | |
Series C, Insured: BAM
5.00%, due 12/1/30 | | | 3,370,000 | | | | 3,948,191 | |
Series C, Insured: BAM
5.00%, due 12/1/31 | | | 2,610,000 | | | | 3,056,649 | |
Cook County School District No. 162, Unlimited General Obligation
Series C, Insured: BAM
4.00%, due 12/1/38 | | | 2,000,000 | | | | 2,183,200 | |
County of Will IL, Unlimited General Obligation
5.00%, due 11/15/45 | | | 18,000,000 | | | | 21,139,380 | |
Illinois Finance Authority, Rehab Institute of Chicago, Revenue Bonds
Series A
6.00%, due 7/1/43 | | | 9,600,000 | | | | 10,553,664 | |
Illinois Sports Facilities Authority, Revenue Bonds
Insured: AGM
5.25%, due 6/15/31 | | | 5,000,000 | | | | 5,547,650 | |
Illinois State Toll Highway Authority, Revenue Bonds
Series B
5.00%, due 1/1/41 | | | 5,665,000 | | | | 6,683,340 | |
Madison County Community Unit School, District No. 7 Edwardsville, Unlimited General Obligation
Insured: BAM
4.00%, due 12/1/20 | | | 2,085,000 | | | | 2,090,796 | |
Metropolitan Pier & Exposition Authority, Capital Appreciation, Revenue Bonds
Series A, Insured: AGM
(zero coupon), due 6/15/30 | | | 14,250,000 | | | | 11,029,072 | |
Metropolitan Pier & Exposition Authority, Capital Appreciation-McCormick, Revenue Bonds
Series A, Insured: NATL-RE
(zero coupon), due 6/15/36 | | | 58,750,000 | | | | 33,697,237 | |
Rock Island County, Public Building Commission, Revenue Bonds Insured: AGM
5.00%, due 12/1/36 | | | 2,645,000 | | | | 3,174,714 | |
| | | | |
| 22 | | MainStay MacKay Tax Free Bond Fund | | The notes to the financial statements are an integral part of,
and should be read in conjunction with, the financial statements. |
| | | | | | | | |
| | | Principal
Amount | | | Value | |
| Long-Term Municipal Bonds (continued) | |
Illinois (continued) | |
Sales Tax Securitization Corp., Revenue Bonds | | | | | | | | |
Series C
5.00%, due 1/1/33 | | $ | 2,000,000 | | | $ | 2,387,520 | |
Series A, Insured: BAM
5.00%, due 1/1/37 | | | 1,650,000 | | | | 1,976,915 | |
Series A
5.00%, due 1/1/40 | | | 2,665,000 | | | | 3,050,999 | |
Series C
5.25%, due 1/1/35 | | | 9,000,000 | | | | 10,801,800 | |
Sangamon County School District No. 186 Springfield, Unlimited General Obligation | | | | | | | | |
Series C, Insured: AGM
5.00%, due 6/1/28 | | | 1,005,000 | | | | 1,266,561 | |
Series C, Insured: AGM
5.00%, due 6/1/34 | | | 1,000,000 | | | | 1,272,540 | |
Series C, Insured: AGM
5.00%, due 6/1/38 | | | 1,635,000 | | | | 2,049,064 | |
Series C, Insured: AGM
5.00%, due 6/1/39 | | | 1,000,000 | | | | 1,249,150 | |
Series C, Insured: AGM
5.00%, due 6/1/44 | | | 5,000,000 | | | | 6,149,050 | |
Southern Illinois University, Housing & Auxiliary Facilities System, Revenue Bonds | | | | | | | | |
Series B, Insured: BAM
5.00%, due 4/1/26 | | | 1,175,000 | | | | 1,302,805 | |
Series B, Insured: BAM
5.00%, due 4/1/29 | | | 1,620,000 | | | | 1,768,846 | |
Series B, Insured: BAM
5.00%, due 4/1/30 | | | 1,000,000 | | | | 1,087,390 | |
State of Illinois, Sales Tax, Revenue Bonds | | | | | | | | |
Series C
4.00%, due 6/15/27 | | | 2,000,000 | | | | 2,144,320 | |
4.50%, due 6/15/36 | | | 17,500,000 | | | | 17,658,025 | |
State of Illinois, Unlimited General Obligation | | | | | | | | |
Series C
4.00%, due 10/1/40 | | | 5,000,000 | | | | 4,787,600 | |
Insured: BAM
4.00%, due 6/1/41 | | | 12,600,000 | | | | 12,987,198 | |
Series C
4.00%, due 10/1/41 | | | 6,000,000 | | | | 5,729,220 | |
Series C
4.25%, due 10/1/45 | | | 10,000,000 | | | | 9,685,700 | |
Series D
5.00%, due 11/1/20 | | | 8,000,000 | | | | 8,000,000 | |
Series D
5.00%, due 11/1/26 | | | 8,725,000 | | | | 9,428,933 | |
5.00%, due 2/1/27 | | | 4,730,000 | | | | 5,174,715 | |
5.00%, due 1/1/28 | | | 6,155,000 | | | | 6,609,301 | |
| | | | | | | | |
| | | Principal
Amount | | | Value | |
Illinois (continued) | |
State of Illinois, Unlimited General Obligation (continued) | | | | | | | | |
Series D
5.00%, due 11/1/28 | | $ | 7,380,000 | | | $ | 7,951,655 | |
5.25%, due 2/1/32 | | | 10,000,000 | | | | 10,431,900 | |
5.50%, due 5/1/39 | | | 15,000,000 | | | | 16,552,200 | |
5.75%, due 5/1/45 | | | 5,000,000 | | | | 5,540,850 | |
Series A
6.00%, due 5/1/27 | | | 9,665,000 | | | | 11,149,737 | |
United City of Yorkville, Special Tax Insured: AGM
5.00%, due 3/1/32 | | | 3,778,000 | | | | 4,447,764 | |
Village of Bellwood IL, Unlimited General Obligation
Insured: AGM
5.00%, due 12/1/29 | | | 1,500,000 | | | | 1,790,580 | |
Village of Oswego IL, Unlimited General Obligation
5.00%, due 12/15/33 | | | 7,670,000 | | | | 9,172,476 | |
Village of Rosemont IL, Corporate Purpose Bond, Unlimited General Obligation
Series A, Insured: AGM
5.00%, due 12/1/40 | | | 8,090,000 | | | | 9,611,972 | |
Village of Rosemont IL, Unlimited General Obligation
Series A, Insured: BAM
4.00%, due 12/1/49 | | | 10,130,000 | | | | 10,902,311 | |
Village of Schaumburg IL, Unlimited General Obligation
Series A
4.00%, due 12/1/41 | | | 37,350,000 | | | | 39,552,903 | |
Western Illinois Economic Development Authority, City of Quincy, Revenue Bonds
Series B, Insured: BAM
4.00%, due 12/1/34 | | | 1,500,000 | | | | 1,692,255 | |
| | | | | | | | |
| | | | | | | 735,318,102 | |
| | | | | | | | |
Indiana 0.5% | |
Indiana Finance Authority, Educational Facilities-Butler University, Revenue Bonds | | | | | | | | |
Series B
5.00%, due 2/1/24 | | | 2,100,000 | | | | 2,192,337 | |
Series A
5.00%, due 2/1/25 | | | 2,215,000 | | | | 2,313,767 | |
Series B
5.00%, due 2/1/25 | | | 2,210,000 | | | | 2,308,544 | |
Series B
5.00%, due 2/1/26 | | | 2,320,000 | | | | 2,420,920 | |
Indiana Finance Authority, Revenue Bonds
4.00%, due 7/1/50 | | | 12,500,000 | | | | 13,427,250 | |
| | | | | | |
The notes to the financial statements are an integral part of,
and should be read in conjunction with, the financial statements. | | | | | 23 | |
Portfolio of Investments October 31, 2020 (continued)
| | | | | | | | |
| | | Principal
Amount | | | Value | |
| Long-Term Municipal Bonds (continued) | |
Indiana (continued) | |
Indiana University Lease Purchase, Revenue Bonds | | | | | | | | |
Series A
4.00%, due 6/1/32 | | $ | 2,595,000 | | | $ | 3,201,529 | |
Series A
4.00%, due 6/1/33 | | | 1,885,000 | | | | 2,311,255 | |
Series A
4.00%, due 6/1/38 | | | 3,015,000 | | | | 3,625,115 | |
Series A
4.00%, due 6/1/39 | | | 3,095,000 | | | | 3,708,708 | |
Vanderburgh County Redevelopment District, Tax Allocation
Insured: AGM
5.00%, due 2/1/31 | | | 2,310,000 | | | | 2,755,853 | |
| | | | | | | | |
| | | | | | | 38,265,278 | |
| | | | | | | | |
Iowa 1.0% | |
City of Coralville IA, Certificates of Participation | | | | | | | | |
Series E
4.00%, due 6/1/21 | | | 545,000 | | | | 544,090 | |
Series E
4.00%, due 6/1/22 | | | 1,405,000 | | | | 1,398,593 | |
Series E
4.00%, due 6/1/23 | | | 1,320,000 | | | | 1,310,021 | |
Iowa Finance Authority, Mortgage-Backed Securities Program, Revenue Bonds | | | | | | | | |
Series A, Insured: GNMA/FNMA/FHLMC
4.00%, due 7/1/47 | | | 2,755,000 | | | | 3,131,168 | |
Series C, Insured: GNMA/FNMA/FHLMC
4.00%, due 7/1/48 | | | 1,765,000 | | | | 1,934,475 | |
PEFA, Inc., Revenue Bonds
5.00%, due 9/1/49 (b) | | | 52,525,000 | | | | 63,497,998 | |
| | | | | | | | |
| | | | | | | 71,816,345 | |
| | | | | | | | |
Kansas 0.2% | |
City of Hutchinson KS, Hutchinson Regional Medical Center, Inc., Revenue Bonds | | | | | | | | |
5.00%, due 12/1/26 | | | 565,000 | | | | 633,478 | |
5.00%, due 12/1/28 | | | 410,000 | | | | 454,243 | |
5.00%, due 12/1/30 | | | 500,000 | | | | 549,095 | |
University of Kansas Hospital Authority, KU Health System, Revenue Bonds | | | | | | | | |
5.00%, due 9/1/33 | | | 2,500,000 | | | | 2,905,025 | |
5.00%, due 9/1/34 | | | 5,000,000 | | | | 5,795,450 | |
5.00%, due 9/1/35 | | | 2,800,000 | | | | 3,235,288 | |
| | | | | | | | |
| | | | | | | 13,572,579 | |
| | | | | | | | |
| | | | | | | | |
| | | Principal
Amount | | | Value | |
Kentucky 0.4% | |
City of Ashland KY, King’s Daughters Medical Center Project, Revenue Bonds | | | | | | | | |
Series A
4.00%, due 2/1/21 | | $ | 1,070,000 | | | $ | 1,076,259 | |
Series A
5.00%, due 2/1/23 | | | 1,525,000 | | | | 1,634,998 | |
Fayette County School District Finance Corp., Revenue Bonds
Series A, Insured: State Intercept
4.00%, due 5/1/38 | | | 2,995,000 | | | | 3,333,645 | |
Kentucky Public Energy Authority, Revenue Bonds
Series A
4.00%, due 4/1/48 (b) | | | 15,000,000 | | | | 16,506,300 | |
Louisville & Jefferson County Metropolitan Sewer District, Sewer & Drain System, Revenue Bonds
Series A
3.00%, due 5/15/37 | | | 5,000,000 | | | | 5,466,600 | |
| | | | | | | | |
| | | | | | | 28,017,802 | |
| | | | | | | | |
Louisiana 1.0% | |
City of Shreveport LA, Unlimited General Obligation | | | | | | | | |
Insured: BAM
5.00%, due 8/1/28 | | | 2,285,000 | | | | 2,792,681 | |
Insured: BAM
5.00%, due 8/1/30 | | | 5,355,000 | | | | 6,464,288 | |
Louisiana Public Facilities Authority, Loyola University, Revenue Bonds
5.25%, due 10/1/30 | | | 2,930,000 | | | | 3,058,832 | |
Louisiana Public Facilities Authority, Unrefunded-Ochsner Clinic Foundation Project, Revenue Bonds
5.00%, due 5/15/34 | | | 2,010,000 | | | | 2,350,072 | |
Louisiana Stadium & Exposition District, Revenue Bonds | | | | | | | | |
5.00%, due 7/3/23 | | | 8,550,000 | | | | 9,259,565 | |
Series A
5.00%, due 7/1/30 | | | 1,485,000 | | | | 1,609,295 | |
Port New Orleans Board of Commissioners, Revenue Bonds
Series D
5.00%, due 4/1/50 | | | 12,325,000 | | | | 14,792,095 | |
State of Louisiana, Unlimited General Obligation | | | | | | | | |
Series A
4.00%, due 2/1/34 | | | 9,830,000 | | | | 10,658,472 | |
Series A
4.00%, due 4/1/37 | | | 16,845,000 | | | | 19,287,020 | |
Series A
5.00%, due 3/1/37 | | | 6,995,000 | | | | 8,862,875 | |
| | | | | | | | |
| | | | | | | 79,135,195 | |
| | | | | | | | |
| | | | |
| 24 | | MainStay MacKay Tax Free Bond Fund | | The notes to the financial statements are an integral part of,
and should be read in conjunction with, the financial statements. |
| | | | | | | | |
| | | Principal
Amount | | | Value | |
| Long-Term Municipal Bonds (continued) | |
Maine 0.0%‡ | |
Maine Housing Authority, Revenue Bonds
Series F
3.65%, due 11/15/42 | | $ | 1,110,000 | | | $ | 1,176,589 | |
| | | | | | | | |
|
Maryland 0.5% | |
City of Baltimore MD, Water Projects, Revenue Bonds
Series A
4.00%, due 7/1/37 | | | 2,065,000 | | | | 2,413,056 | |
County of Baltimore, Unlimited General Obligation
4.00%, due 3/1/37 | | | 5,565,000 | | | | 6,646,892 | |
County of Montgomery MD, Unlimited General Obligation
Series A
5.00%, due 11/1/20 | | | 2,000,000 | | | | 2,000,000 | |
Maryland Stadium Authority, Construction & Revitalization, Revenue Bonds
Insured: State Intercept
5.00%, due 5/1/42 | | | 24,645,000 | | | | 29,521,752 | |
| | | | | | | | |
| | | | | | | 40,581,700 | |
| | | | | | | | |
Massachusetts 0.3% | |
Massachusetts Development Finance Agency, UMass Boston Student Housing Project, Revenue Bonds | | | | | | | | |
5.00%, due 10/1/30 | | | 1,200,000 | | | | 1,199,016 | |
5.00%, due 10/1/31 | | | 1,200,000 | | | | 1,197,948 | |
5.00%, due 10/1/32 | | | 1,240,000 | | | | 1,236,640 | |
5.00%, due 10/1/33 | | | 1,500,000 | | | | 1,492,875 | |
5.00%, due 10/1/34 | | | 2,170,000 | | | | 2,154,875 | |
Massachusetts Development Finance Agency, WGBH Educational Foundation, Revenue Bonds
4.00%, due 1/1/33 | | | 1,000,000 | | | | 1,129,160 | |
Massachusetts Educational Financing Authority, Revenue Bonds
Series I
6.00%, due 1/1/28 | | | 450,000 | | | | 456,444 | |
Massachusetts Housing Finance Agency, Single Family Housing, Revenue Bonds
Series 199
4.00%, due 12/1/48 | | | 3,255,000 | | | | 3,558,561 | |
Massachusetts School Building Authority, Revenue Bonds
Series A
5.00%, due 8/15/45 | | | 4,585,000 | | | | 5,875,540 | |
| | | | | | | | |
| | | Principal
Amount | | | Value | |
Massachusetts (continued) | |
Metropolitan Boston Transit Parking Corp., Revenue Bonds
5.25%, due 7/1/36 | | $ | 2,000,000 | | | $ | 2,053,360 | |
| | | | | | | | |
| | | | | | | 20,354,419 | |
| | | | | | | | |
Michigan 2.2% | |
City of Detroit MI, Sewage Disposal System, Second Lien, Revenue Bonds
Series A, Insured: BHAC, NATL-RE
5.00%, due 7/1/35 | | | 5,345,000 | | | | 5,511,497 | |
Detroit City School District, Improvement School Building & Site, Unlimited General Obligation | | | | | | | | |
Series A, Insured: Q-SBLF
5.00%, due 5/1/29 | | | 3,620,000 | | | | 3,858,920 | |
Series A, Insured: Q-SBLF
5.00%, due 5/1/33 | | | 4,535,000 | | | | 4,828,006 | |
Downriver Utility Wastewater Authority, Revenue Bonds
Insured: AGM
5.00%, due 4/1/31 | | | 1,600,000 | | | | 2,004,672 | |
Grand Rapids Public Schools, Unlimited General Obligation
Insured: AGM
5.00%, due 11/1/42 | | | 1,400,000 | | | | 1,735,384 | |
Great Lakes Water Authority, Sewage Disposal System, Revenue Bonds Senior Lien-Series A
5.25%, due 7/1/39 | | | 12,400,000 | | | | 13,429,200 | |
Great Lakes Water Authority, Water Supply System, Revenue Bonds | | | | | | | | |
Series C
5.25%, due 7/1/35 | | | 20,000,000 | | | | 24,383,800 | |
Senior Lien-Series A
5.25%, due 7/1/41 | | | 5,000,000 | | | | 5,167,400 | |
Senior Lien-Series A
5.75%, due 7/1/37 | | | 5,550,000 | | | | 5,754,129 | |
Hudsonville Public Schools, Unlimited General Obligation
Series I, Insured: Q-SBLF
4.00%, due 5/1/42 | | | 1,800,000 | | | | 2,103,246 | |
Lincoln Consolidated School District, Unlimited General Obligation | | | | | | | | |
Series A, Insured: AGM
5.00%, due 5/1/28 | | | 2,030,000 | | | | 2,476,275 | |
Series A, Insured: AGM
5.00%, due 5/1/30 | | | 1,455,000 | | | | 1,765,293 | |
Series A, Insured: AGM
5.00%, due 5/1/40 | | | 1,500,000 | | | | 1,779,285 | |
Livonia Public School District, Unlimited General Obligation
Series II, Insured: AGM
5.00%, due 5/1/40 | | | 4,365,000 | | | | 5,107,530 | |
| | | | | | |
The notes to the financial statements are an integral part of,
and should be read in conjunction with, the financial statements. | | | | | 25 | |
Portfolio of Investments October 31, 2020 (continued)
| | | | | | | | |
| | | Principal
Amount | | | Value | |
| Long-Term Municipal Bonds (continued) | |
Michigan (continued) | |
Michigan Finance Authority, Great Lakes Water, Revenue Bonds | | | | | | | | |
Series C-7, Insured: NATL-RE
5.00%, due 7/1/32 | | $ | 2,500,000 | | | $ | 2,855,650 | |
Series C-3, Insured: AGM
5.00%, due 7/1/33 | | | 3,000,000 | | | | 3,432,600 | |
Michigan Finance Authority, Local Government Loan Program, Revenue Bonds | | | | | | | | |
Series D2, Insured: AGM
5.00%, due 7/1/28 | | | 500,000 | | | | 576,785 | |
Series D-1
5.00%, due 7/1/34 | | | 500,000 | | | | 587,955 | |
Series D1, Insured: AGM
5.00%, due 7/1/35 | | | 2,000,000 | | | | 2,281,420 | |
Series D6, Insured: NATL-RE
5.00%, due 7/1/36 | | | 7,400,000 | | | | 8,404,106 | |
Michigan Finance Authority, Revenue Bonds | | | | | | | | |
Series A, Class 1
4.00%, due 6/1/36 | | | 2,000,000 | | | | 2,302,300 | |
Insured: BAM, State Intercept
4.00%, due 11/1/55 | | | 20,000,000 | | | | 22,176,400 | |
Series C-1
5.00%, due 7/1/44 | | | 2,500,000 | | | | 2,694,975 | |
Michigan Finance Authority, Revenue Notes
Series A-2, Insured: State Aid Witholding
4.00%, due 8/20/21 | | | 20,000,000 | | | | 20,602,200 | |
Michigan Finance Authority, Wayne County Criminal Justice Center Project, Revenue Bonds | | | | | | | | |
5.00%, due 11/1/25 | | | 1,000,000 | | | | 1,207,100 | |
5.00%, due 11/1/27 | | | 1,200,000 | | | | 1,507,824 | |
South Huron Valley Utility Authority, Revenue Bonds
Insured: BAM
4.00%, due 5/1/34 | | | 5,185,000 | | | | 6,095,019 | |
State of Michigan, Environmental Program Bonds, Unlimited General Obligation
Series A
3.00%, due 5/15/36 | | | 1,515,000 | | | | 1,689,528 | |
Thornapple Kellogg School District, Unlimited General Obligation Insured: Q-SBLF
4.00%, due 5/1/44 | | | 1,665,000 | | | | 1,911,570 | |
Tri-County Area School District, Unlimited General Obligation | | | | | | | | |
Insured: AGM
4.00%, due 5/1/30 | | | 1,225,000 | | | | 1,499,853 | |
| | | | | | | | |
| | | Principal
Amount | | | Value | |
Michigan (continued) | |
Tri-County Area School District, Unlimited General Obligation (continued) | | | | | | | | |
Insured: AGM
4.00%, due 5/1/31 | | $ | 1,285,000 | | | $ | 1,564,038 | |
Insured: AGM
4.00%, due 5/1/32 | | | 1,350,000 | | | | 1,632,812 | |
Wayne County Michigan, Capital Improvement, Limited General Obligation
Series A, Insured: AGM
5.00%, due 2/1/38 | | | 2,340,000 | | | | 2,347,161 | |
| | | | | | | | |
| | | | | | | 165,273,933 | |
| | | | | | | | |
Minnesota 0.1% | |
Housing & Redevelopment Authority of The City of St. Paul Minnesota, Fairview Health Services, Revenue Bonds
Series A
4.00%, due 11/15/37 | | | 1,000,000 | | | | 1,116,820 | |
Minnesota Housing Finance Agency, Residential Housing Finance, Revenue Bonds
Series E, Insured: GNMA/FMNA/FHLMC
4.25%, due 1/1/49 | | | 4,385,000 | | | | 4,881,952 | |
Minnesota Office of Higher Education, Revenue Bonds
2.65%, due 11/1/38 (c) | | | 3,240,000 | | | | 3,172,122 | |
| | | | | | | | |
| | | | | | | 9,170,894 | |
| | | | | | | | |
Mississippi 0.1% | |
Mississippi Development Bank, Meridian Combined Water & Sewer System, Revenue Bonds | | | | | | | | |
Insured: BAM
4.00%, due 7/1/45 | | | 1,750,000 | | | | 2,008,230 | |
Insured: BAM
4.00%, due 7/1/50 | | | 3,250,000 | | | | 3,701,100 | |
Mississippi Home Corp., Mortgage Revenue, Revenue Bonds
Series A, Insured: GNMA/FNMA/FHLMC
4.00%, due 12/1/44 | | | 1,735,000 | | | | 1,912,126 | |
| | | | | | | | |
| | | | | | | 7,621,456 | |
| | | | | | | | |
Missouri 0.8% | |
City of Kansas City MO, Improvement Downtown Arena Project, Revenue Bonds
Series E
5.00%, due 4/1/40 | | | 10,055,000 | | | | 11,419,463 | |
Health & Educational Facilities Authority of the State of Missouri, SSM Health Care, Revenue Bonds
Series A
5.00%, due 6/1/30 | | | 4,000,000 | | | | 4,500,920 | |
| | | | |
| 26 | | MainStay MacKay Tax Free Bond Fund | | The notes to the financial statements are an integral part of,
and should be read in conjunction with, the financial statements. |
| | | | | | | | |
| | | Principal
Amount | | | Value | |
| Long-Term Municipal Bonds (continued) | |
Missouri (continued) | |
Kansas City Industrial Development Authority, Kansas City International Airport Terminal Modernization Project, Revenue Bonds
Insured: AGM
4.00%, due 3/1/50 (c) | | $ | 21,000,000 | | | $ | 22,664,460 | |
Missouri Housing Development Commission Mortgage Revenue, Homeownership Loan Program, Revenue Bonds | | | | | | | | |
Series A, Insured: GNMA/FNMA/FHLMC
4.25%, due 5/1/47 | | | 7,035,000 | | | | 7,914,093 | |
Series A, Insured: GNMA/FNMA/FHLMC
4.25%, due 5/1/49 | | | 3,955,000 | | | | 4,409,469 | |
Springfield School District No. R-12, Unlimited General Obligation
4.00%, due 3/1/35 | | | 3,140,000 | | | | 3,821,035 | |
St. Louis Municipal Finance Corp., Convention Center Expansion, Revenue Bonds
Insured: AGM
5.00%, due 10/1/49 | | | 5,260,000 | | | | 6,209,220 | |
| | | | | | | | |
| | | | | | | 60,938,660 | |
| | | | | | | | |
Montana 0.4% | |
Montana Board of Housing, Revenue Bonds | | | | | | | | |
Series B
3.40%, due 12/1/33 | | | 1,645,000 | | | | 1,790,467 | |
Series B
3.60%, due 6/1/37 | | | 2,125,000 | | | | 2,309,089 | |
Montana Facilities Finance Authority, Revenue Bonds | | | | | | | | |
5.00%, due 2/15/30 | | | 1,790,000 | | | | 2,163,555 | |
5.00%, due 2/15/31 | | | 1,500,000 | | | | 1,805,100 | |
5.00%, due 2/15/33 | | | 1,320,000 | | | | 1,573,981 | |
5.00%, due 2/15/34 | | | 1,200,000 | | | | 1,426,512 | |
Silver Bow County School District No. 1, Unlimited General Obligation | | | | | | | | |
4.00%, due 7/1/30 | | | 1,745,000 | | | | 2,114,539 | |
4.00%, due 7/1/32 | | | 1,945,000 | | | | 2,318,829 | |
4.00%, due 7/1/33 | | | 2,020,000 | | | | 2,395,053 | |
Yellowstone County K-12, School District No. 26 Lockwood, Unlimited General Obligation | | | | | | | | |
5.00%, due 7/1/29 | | | 2,260,000 | | | | 2,914,971 | |
5.00%, due 7/1/30 | | | 2,500,000 | | | | 3,204,825 | |
5.00%, due 7/1/31 | | | 3,015,000 | | | | 3,844,577 | |
5.00%, due 7/1/32 | | | 3,300,000 | | | | 4,183,938 | |
| | | | | | | | |
| | | | | | | 32,045,436 | |
| | | | | | | | |
| | | | | | | | |
| | | Principal
Amount | | | Value | |
Nebraska 0.5% | |
Central Plains Energy, Project No. 3, Revenue Bonds | | | | | | | | |
5.00%, due 9/1/42 | | $ | 13,960,000 | | | $ | 14,958,140 | |
Series A
5.00%, due 9/1/42 | | | 14,495,000 | | | | 19,726,825 | |
Nebraska Investment Finance Authority Single Family Housing, Revenue Bonds
Series C
4.00%, due 9/1/48 | | | 4,715,000 | | | | 5,193,290 | |
| | | | | | | | |
| | | | | | | 39,878,255 | |
| | | | | | | | |
Nevada 2.5% | |
City of Henderson NV, Limited General Obligation
Series A-1
4.00%, due 6/1/50 | | | 26,725,000 | | | | 31,054,717 | |
Clark County School District, Limited General Obligation | | | | | | | | |
Series C
4.00%, due 6/15/32 | | | 5,000,000 | | | | 5,545,800 | |
Series B, Insured: AGM
4.00%, due 6/15/35 | | | 5,395,000 | | | | 6,256,312 | |
Series C
4.00%, due 6/15/37 | | | 4,845,000 | | | | 5,440,305 | |
Series B, Insured: BAM
5.00%, due 6/15/34 | | | 5,750,000 | | | | 7,148,860 | |
County of Clark N.V., Limited General Obligation | | | | | | | | |
4.00%, due 12/1/35 | | | 8,425,000 | | | | 9,880,840 | |
4.00%, due 12/1/36 | | | 5,000,000 | | | | 5,821,050 | |
Las Vegas Convention & Visitors Authority, Convention Center Expansion, Revenue Bonds | | | | | | | | |
Series B
4.00%, due 7/1/49 | | | 9,800,000 | | | | 10,254,818 | |
Series B
5.00%, due 7/1/31 | | | 1,245,000 | | | | 1,463,025 | |
Series B
5.00%, due 7/1/43 | | | 30,000,000 | | | | 34,502,400 | |
Las Vegas Valley Water District, Water Improvement, Limited General Obligation
Series A
5.00%, due 6/1/46 | | | 3,665,000 | | | | 4,367,177 | |
Washoe County School District, Limited General Obligation | | | | | | | | |
Series A, Insured: BAM
3.00%, due 6/1/33 | | | 3,000,000 | | | | 3,252,300 | |
Series A, Insured: BAM
3.00%, due 6/1/34 | | | 2,490,000 | | | | 2,689,997 | |
| | | | | | |
The notes to the financial statements are an integral part of,
and should be read in conjunction with, the financial statements. | | | | | 27 | |
Portfolio of Investments October 31, 2020 (continued)
| | | | | | | | |
| | | Principal
Amount | | | Value | |
| Long-Term Municipal Bonds (continued) | |
Nevada (continued) | |
Washoe County School District, School Improvement Bonds, Limited General Obligation | | | | | | | | |
Series A
4.00%, due 10/1/45 | | $ | 15,585,000 | | | $ | 17,735,730 | |
Series A
4.00%, due 10/1/49 | | | 36,610,000 | | | | 41,476,567 | |
| | | | | | | | |
| | | | | | | 186,889,898 | |
| �� | | | | | | | |
New Hampshire 0.1% | |
City of Manchester NH, General Airport, Revenue Bonds
Series A, Insured: AGM
5.00%, due 1/1/26 | | | 1,800,000 | | | | 1,880,676 | |
New Hampshire Business Finance Authority, Pennichuck Water Works, Inc. Project, Revenue Bonds
Series A
4.00%, due 4/1/50 (c) | | | 5,525,000 | | | | 5,872,633 | |
| | | | | | | | |
| | | | | | | 7,753,309 | |
| | | | | | | | |
New Jersey 4.0% | |
Atlantic County Improvement Authority, Stockton University-Atlantic City, Revenue Bonds | | | | | | | | |
Series A, Insured: AGM
5.00%, due 7/1/31 | | | 2,670,000 | | | | 3,116,931 | |
Series A, Insured: AGM
5.00%, due 7/1/32 | | | 1,305,000 | | | | 1,515,836 | |
Series A, Insured: AGM
5.00%, due 7/1/33 | | | 1,395,000 | | | | 1,614,699 | |
City of Atlantic City NJ, Unlimited General Obligation
Series B, Insured: AGM
5.00%, due 3/1/32 | | | 3,400,000 | | | | 4,089,996 | |
New Brunswick Parking Authority, Revenue Bonds | | | | | | | | |
Series A, Insured: BAM
5.00%, due 9/1/28 | | | 4,780,000 | | | | 5,758,084 | |
Series A, Insured: BAM
5.00%, due 9/1/29 | | | 2,370,000 | | | | 2,843,170 | |
Series A, Insured: BAM
5.00%, due 9/1/30 | | | 4,605,000 | | | | 5,498,784 | |
Series A, Insured: BAM
5.00%, due 9/1/31 | | | 6,780,000 | | | | 8,058,437 | |
New Jersey Building Authority, Unrefunded, Revenue Bonds | | | | | | | | |
Series A, Insured: BAM
5.00%, due 6/15/25 | | | 2,015,000 | | | | 2,335,506 | |
Series A, Insured: BAM
5.00%, due 6/15/28 | | | 1,805,000 | | | | 2,110,171 | |
| | | | | | | | |
| | | Principal
Amount | | | Value | |
New Jersey (continued) | |
New Jersey Economic Development Authority, Revenue Bonds (c) | | | | | | | | |
5.00%, due 1/1/28 | | $ | 1,000,000 | | | $ | 1,101,770 | |
5.50%, due 1/1/26 | | | 1,000,000 | | | | 1,123,290 | |
New Jersey Educational Facilities Authority, Green Bond, Revenue Bonds
Series A
3.00%, due 7/1/50 | | | 1,775,000 | | | | 1,693,226 | |
New Jersey Educational Facilities Authority, Stockton University, Revenue Bonds | | | | | | | | |
Series A, Insured: BAM
5.00%, due 7/1/29 | | | 4,775,000 | | | | 5,649,541 | |
Series A, Insured: BAM
5.00%, due 7/1/30 | | | 5,000,000 | | | | 5,873,400 | |
Series A, Insured: BAM
5.00%, due 7/1/31 | | | 3,000,000 | | | | 3,509,850 | |
New Jersey Health Care Facilities Financing Authority, Barnabas Health, Revenue Bonds
Series A
5.625%, due 7/1/32 | | | 25,000 | | | | 25,891 | |
New Jersey Health Care Facilities Financing Authority, Hackensack Meridian Health, Inc., Revenue Bonds
Series A
5.00%, due 7/1/38 | | | 10,000,000 | | | | 11,913,700 | |
New Jersey Higher Education Student Assistance Authority, Revenue Bonds
Series C
4.00%, due 12/1/48 (c) | | | 2,250,000 | | | | 2,297,160 | |
New Jersey Housing & Mortgage Finance Agency, Revenue Bonds | | | | | | | | |
Series E
3.50%, due 4/1/51 | | | 28,000,000 | | | | 31,307,360 | |
Series C
4.75%, due 10/1/50 | | | 11,015,000 | | | | 12,582,985 | |
New Jersey State Economic Development Authority, Revenue Bonds
Series A, Insured: BAM
5.00%, due 7/1/28 | | | 2,000,000 | | | | 2,396,600 | |
New Jersey Transportation Trust Fund Authority, Federal Highway Reimbursement, Revenue Bonds | | | | | | | | |
Series A
5.00%, due 6/15/28 | | | 4,800,000 | | | | 5,573,568 | |
Series A
5.00%, due 6/15/29 | | | 8,380,000 | | | | 9,652,671 | |
New Jersey Transportation Trust Fund Authority, Transportation System, Revenue Bonds | | | | | | | | |
Series C, Insured: NATL-RE
(zero coupon), due 12/15/30 | | | 20,000,000 | | | | 14,780,400 | |
| | | | |
| 28 | | MainStay MacKay Tax Free Bond Fund | | The notes to the financial statements are an integral part of,
and should be read in conjunction with, the financial statements. |
| | | | | | | | |
| | | Principal
Amount | | | Value | |
| Long-Term Municipal Bonds (continued) | |
New Jersey (continued) | |
New Jersey Transportation Trust Fund Authority, Transportation System, Revenue Bonds (continued) | | | | | | | | |
Series C, Insured: AGM
(zero coupon), due 12/15/34 | | $ | 30,000,000 | | | $ | 19,765,500 | |
5.00%, due 12/15/26 | | | 4,500,000 | | | | 5,192,055 | |
Series AA
5.00%, due 6/15/44 | | | 13,255,000 | | | | 14,042,082 | |
Series BB
5.00%, due 6/15/44 | | | 10,800,000 | | | | 12,044,052 | |
5.00%, due 6/15/46 | | | 7,440,000 | | | | 8,278,265 | |
5.25%, due 6/15/43 | | | 10,205,000 | | | | 11,592,064 | |
New Jersey Turnpike Authority, Revenue Bonds
Series E
5.00%, due 1/1/45 | | | 2,000,000 | | | | 2,266,820 | |
Newark Housing Authority, Revenue Bonds | | | | | | | | |
Insured: AGM
4.00%, due 12/1/27 | | | 500,000 | | | | 570,790 | |
Insured: AGM
4.00%, due 12/1/29 | | | 250,000 | | | | 281,995 | |
Insured: AGM
4.00%, due 12/1/30 | | | 250,000 | | | | 279,867 | |
Insured: AGM
4.00%, due 12/1/31 | | | 225,000 | | | | 250,758 | |
Insured: AGM
5.00%, due 12/1/28 | | | 750,000 | | | | 915,292 | |
Insured: AGM
5.00%, due 12/1/38 | | | 1,740,000 | | | | 2,070,670 | |
Passaic Valley Sewerage Commission, Revenue Bonds | | | | | | | | |
Series J, Insured: AGM
3.00%, due 12/1/31 | | | 6,785,000 | | | | 7,550,687 | |
Series J, Insured: AGM
3.00%, due 12/1/32 | | | 4,395,000 | | | | 4,859,991 | |
South Jersey Transportation Authority, Revenue Bonds | | | | | | | | |
Series A, Insured: AGM
5.00%, due 11/1/31 | | | 1,750,000 | | | | 2,225,912 | |
Series A, Insured: AGM
5.00%, due 11/1/32 | | | 1,500,000 | | | | 1,893,675 | |
Series A, Insured: BAM
5.00%, due 11/1/45 | | | 2,000,000 | | | | 2,398,880 | |
State of New Jersey, Unlimited General Obligation | | | | | | | | |
5.00%, due 6/1/39 | | | 5,000,000 | | | | 5,955,100 | |
5.00%, due 6/1/40 | | | 6,000,000 | | | | 7,124,220 | |
5.00%, due 6/1/41 | | | 11,500,000 | | | | 13,600,360 | |
5.00%, due 6/1/42 | | | 10,000,000 | | | | 11,780,900 | |
| | | | | | | | |
| | | Principal
Amount | | | Value | |
New Jersey (continued) | |
Tobacco Settlement Financing Corp., Revenue Bonds | | | | | | | | |
Series A
5.00%, due 6/1/31 | | $ | 3,000,000 | | | $ | 3,717,750 | |
Series A
5.00%, due 6/1/33 | | | 6,500,000 | | | | 7,952,555 | |
Series A
5.00%, due 6/1/34 | | | 1,500,000 | | | | 1,827,900 | |
Series A
5.00%, due 6/1/36 | | | 6,000,000 | | | | 7,263,240 | |
| | | | | | | | |
| | | | | | | 302,124,406 | |
| | | | | | | | |
New Mexico 0.0%‡ | |
City of Albuquerque NM, Gross Receipts Lodgers Tax Revenue, Revenue Bonds
Series A
4.00%, due 7/1/36 | | | 2,490,000 | | | | 2,997,437 | |
| | | | | | | | |
|
New York 20.8% | |
Battery Park City Authority, Revenue Bonds
Series B
5.00%, due 11/1/38 | | | 2,575,000 | | | | 3,323,424 | |
Build NYC Resource Corp., Royal Charter Properties, Revenue Bonds | | | | | | | | |
Insured: AGM
5.00%, due 12/15/20 | | | 1,025,000 | | | | 1,030,433 | |
Insured: AGM
5.00%, due 12/15/21 | | | 1,075,000 | | | | 1,128,793 | |
City of New York NY, Unlimited General Obligation | | | | | | | | |
Series D-1, Insured: BAM
4.00%, due 3/1/41 | | | 12,500,000 | | | | 14,132,500 | |
Series D-1, Insured: BAM
4.00%, due 3/1/50 | | | 22,760,000 | | | | 25,287,498 | |
Series D, Subseries D-1
5.00%, due 12/1/36 | | | 10,955,000 | | | | 13,389,530 | |
Series A, Subseries A-1
5.00%, due 8/1/39 | | | 4,000,000 | | | | 4,893,560 | |
Subseries A-1
5.25%, due 10/1/32 | | | 20,000,000 | | | | 24,838,400 | |
City of New York, Unlimited General Obligation | | | | | | | | |
Series A, Subseries A-1
3.00%, due 8/1/36 | | | 4,875,000 | | | | 5,105,003 | |
Subseries A-1
4.00%, due 8/1/38 | | | 10,000,000 | | | | 11,323,800 | |
Series I
5.00%, due 8/1/23 | | | 3,675,000 | | | | 3,954,925 | |
Series B-1
5.00%, due 10/1/42 | | | 2,870,000 | | | | 3,484,467 | |
| | | | | | |
The notes to the financial statements are an integral part of,
and should be read in conjunction with, the financial statements. | | | | | 29 | |
Portfolio of Investments October 31, 2020 (continued)
| | | | | | | | |
| | | Principal
Amount | | | Value | |
| Long-Term Municipal Bonds (continued) | |
New York (continued) | |
City of New York, Unlimited General Obligation (continued) | | | | | | | | |
Series B-1
5.00%, due 10/1/43 | | $ | 3,555,000 | | | $ | 4,303,328 | |
County of Nassau NY, Limited General Obligation | | | | | | | | |
Series C, Insured: BAM
5.00%, due 4/1/37 | | | 2,525,000 | | | | 2,958,719 | |
Series B, Insured: AGM
5.00%, due 4/1/44 | | | 5,000,000 | | | | 6,229,900 | |
Long Island Power Authority, Electric System, Revenue Bonds
Insured: BAM
5.00%, due 9/1/44 | | | 10,000,000 | | | | 11,435,900 | |
Long Island Power Authority, Revenue Bonds | | | | | | | | |
5.00%, due 9/1/39 | | | 1,875,000 | | | | 2,315,325 | |
Series A, Insured: BAM
5.00%, due 9/1/39 | | | 10,000,000 | | | | 11,456,200 | |
Series B
5.00%, due 9/1/45 | | | 8,970,000 | | | | 10,469,605 | |
Metropolitan Transportation Authority, Green Bond, Revenue Bonds | | | | | | | | |
Series A-1, Insured: AGM
4.00%, due 11/15/42 | | | 7,500,000 | | | | 8,303,475 | |
Series A-1, Insured: AGM
4.00%, due 11/15/44 | | | 4,845,000 | | | | 5,328,483 | |
Series C, Insured: AGM
4.00%, due 11/15/47 | | | 1,880,000 | | | | 2,054,238 | |
Series C, Insured: AGM
4.00%, due 11/15/48 | | | 10,715,000 | | | | 11,699,173 | |
Series C, Insured: BAM
5.00%, due 11/15/44 | | | 14,845,000 | | | | 17,648,478 | |
Series D1
5.00%, due 11/15/45 | | | 20,500,000 | | | | 22,304,000 | |
Metropolitan Transportation Authority, Green, Revenue Bonds
Series B-1
5.00%, due 11/15/36 | | | 13,340,000 | | | | 15,423,174 | |
Metropolitan Transportation Authority, Revenue Bonds | | | | | | | | |
Series A-2S
4.00%, due 2/1/22 | | | 8,000,000 | | | | 7,994,800 | |
Series D-1
5.00%, due 9/1/22 | | | 23,000,000 | | | | 23,400,200 | |
Series D
5.00%, due 11/15/26 | | | 2,000,000 | | | | 2,059,100 | |
Series D-1
5.00%, due 11/15/26 | | | 2,785,000 | | | | 2,978,725 | |
| | | | | | | | |
| | | Principal
Amount | | | Value | |
New York (continued) | |
Metropolitan Transportation Authority, Revenue Bonds (continued) | | | | | | | | |
Series D
5.00%, due 11/15/30 | | $ | 8,150,000 | | | $ | 8,365,975 | |
Series C-1
5.00%, due 11/15/34 | | | 7,570,000 | | | | 8,038,810 | |
Subseries A-1
5.00%, due 11/15/40 | | | 4,035,000 | | | | 4,212,621 | |
Series C
5.00%, due 11/15/41 | | | 3,500,000 | | | | 3,572,450 | |
Series C, Insured: AGM
5.00%, due 11/15/41 | | | 8,365,000 | | | | 10,029,133 | |
Subseries A-1
5.00%, due 11/15/41 | | | 2,910,000 | | | | 3,063,444 | |
Subseries C-1
5.25%, due 11/15/29 | | | 2,230,000 | | | | 2,396,224 | |
Series A
5.25%, due 11/15/33 | | | 8,750,000 | | | | 10,357,462 | |
Series A
5.25%, due 11/15/34 | | | 10,000,000 | | | | 11,819,500 | |
Metropolitan Transportation Authority, Transportation, Revenue Bonds | | | | | | | | |
Subseries A-1
5.00%, due 11/15/37 | | | 1,300,000 | | | | 1,356,680 | |
Series C
5.00%, due 11/15/38 | | | 7,500,000 | | | | 7,689,825 | |
Series C
5.00%, due 11/15/42 | | | 10,000,000 | | | | 10,255,500 | |
Series B
5.00%, due 11/15/43 | | | 1,575,000 | | | | 1,615,241 | |
Series E
5.00%, due 11/15/43 | | | 2,500,000 | | | | 2,575,750 | |
Series B
5.25%, due 11/15/35 | | | 2,870,000 | | | | 2,997,658 | |
New York City Housing Development Corp., Revenue Bonds | | | | | | | | |
Series J
3.00%, due 11/1/44 | | | 5,000,000 | | | | 5,147,000 | |
Series J
3.05%, due 11/1/49 | | | 10,820,000 | | | | 11,065,614 | |
Series B
3.05%, due 5/1/50 | | | 24,270,000 | | | | 24,743,022 | |
Series J
3.15%, due 11/1/54 | | | 23,145,000 | | | | 23,691,916 | |
Series E-1-C
4.95%, due 11/1/46 | | | 4,625,000 | | | | 5,325,502 | |
New York City Industrial Development Agency, Yankee Stadium Project, Revenue Bonds
Insured: AGM
4.00%, due 3/1/45 | | | 3,500,000 | | | | 3,974,985 | |
| | | | |
| 30 | | MainStay MacKay Tax Free Bond Fund | | The notes to the financial statements are an integral part of,
and should be read in conjunction with, the financial statements. |
| | | | | | | | |
| | | Principal
Amount | | | Value | |
| Long-Term Municipal Bonds (continued) | |
New York (continued) | |
New York City Transitional Finance Authority, Building Aid, Revenue Bonds | | | | | | | | |
Series S-1, Insured: State Aid Withholding
5.00%, due 7/15/33 | | $ | 6,060,000 | | | $ | 7,040,993 | |
Series S-2, Insured: State Aid Withholding
5.00%, due 7/15/34 | | | 3,000,000 | | | | 3,537,690 | |
Series S-1, Insured: State Aid Withholding
5.00%, due 7/15/36 | | | 10,000,000 | | | | 11,551,800 | |
Series S
5.00%, due 7/15/40 | | | 7,500,000 | | | | 8,761,650 | |
Series S-1, Insured: State Aid Withholding
5.00%, due 7/15/43 | | | 8,555,000 | | | | 10,014,055 | |
New York City Transitional Finance Authority, Future Tax Secured, Revenue Bonds | | | | | | | | |
3.00%, due 11/1/37 | | | 15,110,000 | | | | 16,040,625 | |
Subseries B-1
4.00%, due 11/1/37 | | | 30,300,000 | | | | 34,951,959 | |
4.00%, due 5/1/38 | | | 14,250,000 | | | | 16,612,792 | |
Series C-1
4.00%, due 11/1/38 | | | 11,380,000 | | | | 12,988,563 | |
Subseries B-1
4.00%, due 11/1/38 | | | 7,875,000 | | | | 9,047,509 | |
4.00%, due 5/1/39 | | | 6,500,000 | | | | 7,538,570 | |
4.00%, due 5/1/40 | | | 4,500,000 | | | | 5,196,915 | |
4.00%, due 5/1/42 | | | 5,000,000 | | | | 5,726,600 | |
Subseries B-1
4.00%, due 11/1/42 | | | 12,315,000 | | | | 13,922,970 | |
Subseries F-1
5.00%, due 5/1/32 | | | 4,000,000 | | | | 4,944,640 | |
Subseries A-1
5.00%, due 5/1/33 | | | 10,000,000 | | | | 12,014,000 | |
Series A-2
5.00%, due 8/1/34 | | | 7,795,000 | | | | 9,621,602 | |
Subseries E-1
5.00%, due 2/1/37 | | | 5,000,000 | | | | 5,926,950 | |
Series E-1
5.00%, due 2/1/41 | | | 2,500,000 | | | | 2,881,600 | |
Subseries F-1
5.00%, due 5/1/42 | | | 11,500,000 | | | | 13,808,970 | |
New York City Transitional Finance Authority, Revenue Bonds
Series B-1
4.00%, due 11/1/41 | | | 11,500,000 | | | | 13,040,655 | |
| | | | | | | | |
| | | Principal
Amount | | | Value | |
New York (continued) | |
New York City Water & Sewer System, 2nd General Resolution, Revenue Bonds
Subseries DD-3
4.00%, due 6/15/42 | | $ | 5,000,000 | | | $ | 5,802,350 | |
New York City Water & Sewer System, Revenue Bonds | | | | | | | | |
Series DD-2
3.50%, due 6/15/40 | | | 2,585,000 | | | | 2,834,659 | |
Subseries FF-2
4.00%, due 6/15/41 | | | 2,500,000 | | | | 2,870,200 | |
Series EE
5.00%, due 6/15/40 | | | 15,585,000 | | | | 19,023,986 | |
Series EE
5.00%, due 6/15/47 | | | 11,710,000 | | | | 12,960,862 | |
New York City Water & Sewer System, Second General Resolution, Revenue Bonds
Series CC
5.00%, due 6/15/47 | | | 10,000,000 | | | | 11,303,200 | |
New York Convention Center Development Corp., Hotel Unit Fee, Revenue Bonds Insured: BAM
(zero coupon), due 11/15/36 | | | 5,050,000 | | | | 3,101,357 | |
New York Liberty Development Corp., Bank of America Tower at One Bryant Park Project, Revenue Bonds
2.45%, due 9/15/69 | | | 12,925,000 | | | | 12,684,078 | |
New York Liberty Development Corp., Revenue Bonds
5.00%, due 12/15/41 | | | 12,315,000 | | | | 12,851,811 | |
New York Liberty Development Corp., World Trade Center, Revenue Bonds
5.75%, due 11/15/51 | | | 18,940,000 | | | | 19,890,599 | |
New York State Dormitory Authority, Personal Income Tax, Revenue Bonds
Series D
4.00%, due 2/15/47 | | | 25,250,000 | | | | 28,293,130 | |
New York State Dormitory Authority, Revenue Bonds | | | | | | | | |
Series D
4.00%, due 2/15/39 | | | 10,480,000 | | | | 12,035,861 | |
Series D
4.00%, due 2/15/40 | | | 3,615,000 | | | | 4,131,873 | |
Series C
4.00%, due 3/15/44 | | | 11,385,000 | | | | 12,646,003 | |
Series A
4.00%, due 3/15/46 | | | 7,540,000 | | | | 8,509,267 | |
Series E
5.00%, due 3/15/34 | | | 4,190,000 | | | | 4,949,521 | |
| | | | | | |
The notes to the financial statements are an integral part of,
and should be read in conjunction with, the financial statements. | | | | | 31 | |
Portfolio of Investments October 31, 2020 (continued)
| | | | | | | | |
| | | Principal
Amount | | | Value | |
| Long-Term Municipal Bonds (continued) | |
New York (continued) | |
New York State Dormitory Authority, Revenue Bonds (continued) | | | | | | | | |
Series D
5.00%, due 2/15/48 | | $ | 10,200,000 | | | $ | 12,519,888 | |
Series A
5.25%, due 3/15/39 | | | 1,840,000 | | | | 2,287,727 | |
New York State Dormitory Authority, Revenue Notes
Series B
5.00%, due 3/31/21 | | | 28,000,000 | | | | 28,554,400 | |
New York State Dormitory Authority, Sales Tax, Revenue Bonds | | | | | | | | |
Series E
5.00%, due 3/15/37 | | | 5,250,000 | | | | 6,477,555 | |
Series A
5.00%, due 3/15/40 | | | 31,860,000 | | | | 38,394,209 | |
Series E
5.00%, due 3/15/40 | | | 5,000,000 | | | | 6,113,150 | |
Series A
5.00%, due 3/15/43 | | | 10,000,000 | | | | 12,014,900 | |
Series A
5.00%, due 3/15/44 | | | 5,000,000 | | | | 5,911,000 | |
Series A
5.00%, due 3/15/45 | | | 3,000,000 | | | | 3,593,190 | |
New York State Dormitory Authority, School District Revenue Financing Program, Revenue Bonds | | | | | | | | |
Series A, Insured: AGM
5.00%, due 10/1/33 | | | 750,000 | | | | 929,768 | |
Series A, Insured: AGM
5.00%, due 10/1/34 | | | 3,700,000 | | | | 4,576,086 | |
New York State Dormitory Authority, State Personal Income Tax, Revenue Bonds
Series B
5.00%, due 2/15/38 | | | 13,490,000 | | | | 16,389,271 | |
New York State Dormitory Authority, University Facilities, Revenue Bonds | | | | | | | | |
Series A
5.00%, due 7/1/36 | | | 1,000,000 | | | | 1,196,270 | |
Series A
5.00%, due 7/1/38 | | | 1,000,000 | | | | 1,188,610 | |
New York State Thruway Authority, General Revenue Junior Indebtedness Obligation, Revenue Bonds
Series B, Insured: AGM
4.00%, due 1/1/50 | | | 10,940,000 | | | | 12,251,268 | |
New York State Thruway Authority, Revenue Bonds | | | | | | | | |
Series L
3.50%, due 1/1/37 | | | 3,645,000 | | | | 3,980,121 | |
| | | | | | | | |
| | | Principal
Amount | | | Value | |
New York (continued) | |
New York State Thruway Authority, Revenue Bonds (continued) | | | | | | | | |
Series B
4.00%, due 1/1/39 | | $ | 7,055,000 | | | $ | 8,018,078 | |
Series B
4.00%, due 1/1/45 | | | 8,900,000 | | | | 9,937,918 | |
Series N
4.00%, due 1/1/45 | | | 5,000,000 | | | | 5,622,200 | |
Series B
4.00%, due 1/1/50 | | | 5,500,000 | | | | 6,102,195 | |
Series L
5.00%, due 1/1/31 | | | 3,550,000 | | | | 4,402,746 | |
Series L
5.00%, due 1/1/34 | | | 2,430,000 | | | | 2,965,937 | |
Series N
5.00%, due 1/1/34 | | | 10,855,000 | | | | 13,909,488 | |
Series N
5.00%, due 1/1/35 | | | 5,000,000 | | | | 6,379,500 | |
Series N
5.00%, due 1/1/36 | | | 19,130,000 | | | | 24,304,474 | |
Series N
5.00%, due 1/1/38 | | | 6,095,000 | | | | 7,674,580 | |
New York State Urban Development Corp., Personal Income Tax, Revenue Bonds | | | | | | | | |
3.00%, due 3/15/40 | | | 18,965,000 | | | | 19,780,685 | |
Series A
5.00%, due 3/15/30 | | | 12,350,000 | | | | 15,040,694 | |
5.00%, due 3/15/38 | | | 12,140,000 | | | | 15,358,435 | |
Series A
5.00%, due 3/15/43 | | | 10,360,000 | | | | 12,444,743 | |
5.00%, due 3/15/44 | | | 11,755,000 | | | | 14,573,379 | |
New York State Urban Development Corp., Revenue Bonds | | | | | | | | |
Series A
5.00%, due 3/15/36 | | | 10,000,000 | | | | 12,769,200 | |
Series A
5.00%, due 3/15/41 | | | 19,500,000 | | | | 24,341,870 | |
New York State Urban Development Corp., State Personal Income Tax, Revenue Bonds | | | | | | | | |
4.00%, due 3/15/42 | | | 4,635,000 | | | | 5,276,716 | |
4.00%, due 3/15/45 | | | 11,450,000 | | | | 12,922,355 | |
5.00%, due 3/15/47 | | | 14,100,000 | | | | 17,393,196 | |
New York Transportation Development Corp., LaGuardia Airport Terminal B Redevelopment Project, Revenue Bonds (c) | | | | | | | | |
Insured: AGM
4.00%, due 7/1/31 | | | 10,925,000 | | | | 11,662,110 | |
Series A, Insured: AGM
4.00%, due 7/1/36 | | | 24,800,000 | | | | 26,196,736 | |
| | | | |
| 32 | | MainStay MacKay Tax Free Bond Fund | | The notes to the financial statements are an integral part of,
and should be read in conjunction with, the financial statements. |
| | | | | | | | |
| | | Principal
Amount | | | Value | |
| Long-Term Municipal Bonds (continued) | |
New York (continued) | |
Onondaga County Trust Cultural Resource Revenue, Syracuse University Project, Revenue Bonds | | | | | | | | |
4.00%, due 12/1/49 | | $ | 3,000,000 | | | $ | 3,414,390 | |
5.00%, due 12/1/38 | | | 1,075,000 | | | | 1,368,873 | |
5.00%, due 12/1/43 | | | 16,995,000 | | | | 21,317,508 | |
Port Authority of New York & New Jersey, Consolidated 172nd, Revenue Bonds
4.25%, due 10/1/32 (c) | | | 5,000,000 | | | | 5,206,550 | |
Port Authority of New York & New Jersey, Consolidated 218th, Revenue Bonds (c) | | | | | | | | |
5.00%, due 11/1/44 | | | 3,190,000 | | | | 3,829,340 | |
5.00%, due 11/1/49 | | | 3,500,000 | | | | 4,177,985 | |
Port Authority of New York & New Jersey, Revenue Bonds | | | | | | | | |
Series 222
4.00%, due 7/15/37 | | | 4,250,000 | | | | 4,885,375 | |
Series 218
4.00%, due 11/1/37 (c) | | | 1,720,000 | | | | 1,934,570 | |
Series 222
4.00%, due 7/15/38 | | | 3,430,000 | | | | 3,932,186 | |
Series 222
4.00%, due 7/15/39 | | | 6,480,000 | | | | 7,385,450 | |
Series 222
4.00%, due 7/15/40 | | | 2,000,000 | | | | 2,271,980 | |
Series 214
4.00%, due 9/1/43 (c) | | | 9,355,000 | | | | 10,317,068 | |
Series 209
5.00%, due 7/15/30 | | | 2,475,000 | | | | 3,098,849 | |
Series 197
5.00%, due 11/15/34 (c) | | | 14,760,000 | | | | 17,337,096 | |
Series 221
5.00%, due 7/15/35 (c) | | | 3,000,000 | | | | 3,759,720 | |
Series 197
5.00%, due 11/15/35 (c) | | | 13,450,000 | | | | 15,764,879 | |
Series 197
5.00%, due 11/15/41 (c) | | | 11,550,000 | | | | 13,437,847 | |
Rensselaer City School District, Certificates of Participation | | | | | | | | |
Insured: AGM
5.00%, due 6/1/30 | | | 1,880,000 | | | | 2,287,490 | |
Insured: AGM
5.00%, due 6/1/32 | | | 2,000,000 | | | | 2,420,200 | |
Suffolk County NY, Public Improvement, Limited General Obligation | | | | | | | | |
Series B, Insured: AGM
3.00%, due 10/15/31 | | | 4,460,000 | | | | 4,775,099 | |
Series B, Insured: AGM
5.00%, due 10/15/28 | | | 4,020,000 | | | | 5,000,438 | |
| | | | | | | | |
| | | Principal
Amount | | | Value | |
New York (continued) | |
Triborough Bridge & Tunnel Authority, MTA Bridges & Tunnels, Revenue Bonds | | | | | | | | |
Series A
5.00%, due 11/15/46 | | $ | 7,855,000 | | | $ | 9,355,619 | |
Series A
5.00%, due 11/15/49 | | | 73,080,000 | | | | 89,609,491 | |
Series A
5.00%, due 11/15/54 | | | 5,000,000 | | | | 6,129,100 | |
Triborough Bridge & Tunnel Authority, Revenue Bonds | | | | | | | | |
Series B
5.00%, due 11/15/35 | | | 8,560,000 | | | | 10,282,700 | |
Series B
5.00%, due 11/15/38 | | | 3,600,000 | | | | 4,282,452 | |
Series A
5.00%, due 11/15/43 | | | 6,000,000 | | | | 7,284,900 | |
Series A
5.00%, due 11/15/45 | | | 12,540,000 | | | | 14,946,802 | |
TSASC, Inc., Revenue Bonds | | | | | | | | |
Series A
5.00%, due 6/1/34 | | | 6,990,000 | | | | 8,229,187 | |
Series A
5.00%, due 6/1/35 | | | 2,865,000 | | | | 3,361,648 | |
West Islip Union Free School District, Limited General Obligation
Insured: State Aid Witholding
1.75%, due 6/21/21 | | | 5,000,000 | | | | 5,041,550 | |
| | | | | | | | |
| | | | | | | 1,571,510,323 | |
| | | | | | | | |
North Carolina 0.1% | |
North Carolina Turnpike Authority, Revenue Bonds
5.00%, due 2/1/24 | | | 6,000,000 | | | | 6,784,800 | |
| | | | | | | | |
|
North Dakota 0.1% | |
North Dakota Board of Higher Education, University of North Dakota Housing & Auxiliary Facilities, Revenue Bonds
Series A, Insured: AGM
4.00%, due 4/1/44 | | | 4,000,000 | | | | 4,541,840 | |
| | | | | | | | |
|
Ohio 0.8% | |
Akron Bath Copley Joint Township Hospital District, Children’s Hospital Medical Center of Akron, Revenue Bonds
5.00%, due 11/15/42 | | | 7,000,000 | | | | 7,296,030 | |
Buckeye Tobacco Settlement Financing Authority, Revenue Bonds | | | | | | | | |
Series A-2, Class 1
4.00%, due 6/1/37 | | | 2,000,000 | | | | 2,336,740 | |
Series A-2, Class 1
5.00%, due 6/1/36 | | | 1,000,000 | | | | 1,273,620 | |
| | | | | | |
The notes to the financial statements are an integral part of,
and should be read in conjunction with, the financial statements. | | | | | 33 | |
Portfolio of Investments October 31, 2020 (continued)
| | | | | | | | |
| | | Principal
Amount | | | Value | |
| Long-Term Municipal Bonds (continued) | |
Ohio (continued) | |
Clermont County Port Authority, W. Clermont Local School District Project, Revenue Bonds | | | | | | | | |
Insured: BAM
5.00%, due 12/1/32 | | $ | 2,200,000 | | | $ | 2,627,394 | |
Insured: BAM
5.00%, due 12/1/33 | | | 1,335,000 | | | | 1,589,985 | |
Cleveland-Cuyahoga County Port Authority, Revenue Bonds
Series A
6.00%, due 11/15/25 | | | 1,980,000 | | | | 1,988,277 | |
County of Hamilton OH, Christ Hospital Project, Revenue Bonds
5.50%, due 6/1/42 | | | 2,000,000 | | | | 2,163,900 | |
County of Hamilton OH, TriHealth, Inc. Obligated Group, Revenue Bonds
3.75%, due 8/15/50 | | | 7,250,000 | | | | 7,839,135 | |
Ohio Higher Educational Facility Commission, Oberlin College Project, Revenue Bonds
5.00%, due 10/1/31 | | | 2,800,000 | | | | 3,076,024 | |
Ohio Hospital Facilities, Cleveland Clinic Health System, Revenue Bonds
4.00%, due 1/1/46 | | | 10,850,000 | | | | 12,283,502 | |
Ohio Housing Finance Agency, Residential Mortgage Revenue, Revenue Bonds
Series A, Insured: GNMA/FNMA/FHLMC
4.50%, due 9/1/48 | | | 5,260,000 | | | | 5,890,937 | |
University of Cincinnati, Revenue Bonds
Series A
5.00%, due 6/1/45 | | | 10,000,000 | | | | 11,822,700 | |
| | | | | | | | |
| | | | | | | 60,188,244 | |
| | | | | | | | |
Oklahoma 0.6% | |
Garfield County Educational Facilities Authority, Enid Public Schools Project, Revenue Bonds | | | | | | | | |
Series A
5.00%, due 9/1/26 | | | 1,800,000 | | | | 2,246,112 | |
Series A
5.00%, due 9/1/27 | | | 3,780,000 | | | | 4,686,822 | |
Series A
5.00%, due 9/1/28 | | | 5,000,000 | | | | 6,160,950 | |
Series A
5.00%, due 9/1/29 | | | 4,620,000 | | | | 5,656,913 | |
Lincoln County Educational Facilities Authority, Stroud Public Schools Project, Revenue Bonds | | | | | | | | |
5.00%, due 9/1/28 | | | 3,200,000 | | | | 3,882,208 | |
5.00%, due 9/1/29 | | | 2,370,000 | | | | 2,858,694 | |
| | | | | | | | |
| | | Principal
Amount | | | Value | |
Oklahoma (continued) | |
Oklahoma Housing Finance Agency, Homeownership Loan Program, Revenue Bonds
Series A
4.75%, due 9/1/48 | | $ | 2,840,000 | | | $ | 3,219,282 | |
Oklahoma Municipal Power Authority, Revenue Bonds
Series A
4.00%, due 1/1/47 | | | 7,650,000 | | | | 7,961,508 | |
Weatherford Industrial Trust Educational Facilities, Weatherford Public Schools Project, Revenue Bonds | | | | | | | | |
5.00%, due 3/1/31 | | | 1,820,000 | | | | 2,295,966 | |
5.00%, due 3/1/33 | | | 2,500,000 | | | | 3,108,450 | |
| | | | | | | | |
| | | | | | | 42,076,905 | |
| | | | | | | | |
Oregon 0.3% | |
Oregon State Housing & Community Services Department, Single Family Mortgage Program, Revenue Bonds
Series C
4.50%, due 7/1/49 | | | 10,125,000 | | | | 11,220,930 | |
Port of Portland OR, Airport, Revenue Bonds
Series 27-A
5.00%, due 7/1/37 (c) | | | 10,550,000 | | | | 12,799,260 | |
| | | | | | | | |
| | | | | | | 24,020,190 | |
| | | | | | | | |
Pennsylvania 3.2% | |
City of Philadelphia PA, Unlimited General Obligation
Series B
5.00%, due 2/1/38 | | | 5,650,000 | | | | 6,999,841 | |
Commonwealth Financing Authority PA, Tobacco Master Settlement Payment, Revenue Bonds
Insured: AGM
4.00%, due 6/1/39 | | | 6,000,000 | | | | 6,770,940 | |
Commonwealth Financing Authority, Tobacco Master Settlement Payment, Revenue Bonds
Insured: BAM
5.00%, due 6/1/31 | | | 10,000,000 | | | | 12,629,500 | |
Commonwealth of Pennsylvania, Unlimited General Obligation | | | | | | | | |
1st Series
3.00%, due 5/1/36 | | | 21,495,000 | | | | 23,511,876 | |
1st Series
4.00%, due 3/1/35 | | | 5,000,000 | | | | 5,811,750 | |
Dubois Hospital Authority, Revenue Bonds
4.00%, due 7/15/50 | | | 5,000,000 | | | | 5,307,400 | |
| | | | |
| 34 | | MainStay MacKay Tax Free Bond Fund | | The notes to the financial statements are an integral part of,
and should be read in conjunction with, the financial statements. |
| | | | | | | | |
| | | Principal
Amount | | | Value | |
| Long-Term Municipal Bonds (continued) | |
Pennsylvania (continued) | |
Monroeville Finance Authority, Revenue Bonds
4.25%, due 2/15/42 | | $ | 15,000,000 | | | $ | 15,687,300 | |
Pennsylvania Economic Development Financing Authority, Revenue Bonds
Series A
4.00%, due 11/15/36 | | | 4,965,000 | | | | 5,560,155 | |
Pennsylvania Higher Educational Facilities Authority, Revenue Bonds
Series A, Insured: AGM
5.00%, due 5/1/46 | | | 3,000,000 | | | | 3,668,850 | |
Pennsylvania Higher Educational Facilities Authority, University of Pennsylvania Health System, Revenue Bonds | | | | | | | | |
4.00%, due 8/15/44 | | | 13,355,000 | | | | 15,173,817 | |
4.00%, due 8/15/49 | | | 30,785,000 | | | | 34,766,732 | |
Pennsylvania Turnpike Commission, Revenue Bonds | | | | | | | | |
Series A, Insured: BAM
5.00%, due 12/1/44 | | | 10,000,000 | | | | 12,172,400 | |
Series A-1
5.00%, due 12/1/46 | | | 5,705,000 | | | | 6,610,041 | |
Series A
5.00%, due 12/1/49 | | | 5,000,000 | | | | 6,057,050 | |
Philadelphia Gas Works Co., 1998 General Ordinance, Revenue Bonds
Series 14T
5.00%, due 10/1/31 | | | 2,300,000 | | | | 2,770,695 | |
Philadelphia Water & Wastewater Revenue, Revenue Bonds
Series A
5.00%, due 10/1/47 | | | 12,000,000 | | | | 14,361,240 | |
Pittsburgh Water & Sewer Authority, Revenue Bonds
Series A, Insured: AGM
5.00%, due 9/1/44 | | | 4,530,000 | | | | 5,599,216 | |
School District of Philadelphia, Revenue Notes
Series A
4.00%, due 6/30/21 | | | 15,000,000 | | | | 15,369,300 | |
State Public School Building Authority, Philadelphia Community College, Revenue Bonds
Series A, Insured: BAM
5.00%, due 6/15/28 | | | 5,505,000 | | | | 6,472,669 | |
State Public School Building Authority, Philadelphia School District, Revenue Bonds
Series A, Insured: AGM
5.00%, due 6/1/31 | | | 30,000,000 | | | | 36,220,800 | |
| | | | | | | | |
| | | | | | | 241,521,572 | |
| | | | | | | | |
| | | | | | | | |
| | | Principal
Amount | | | Value | |
Puerto Rico 1.9% | |
Commonwealth of Puerto Rico, Aqueduct & Sewer Authority, Revenue Bonds
Series A, Insured: AGC
5.125%, due 7/1/47 | | $ | 14,410,000 | | | $ | 14,783,363 | |
Commonwealth of Puerto Rico, Public Improvement, Unlimited General Obligation | | | | | | | | |
Series A, Insured: AGC
5.00%, due 7/1/26 | | | 575,000 | | | | 586,673 | |
Series A, Insured: AGC
5.00%, due 7/1/27 | | | 525,000 | | | | 535,658 | |
Series A-4, Insured: AGM
5.00%, due 7/1/31 | | | 5,170,000 | | | | 5,188,198 | |
Series A, Insured: AGM
5.00%, due 7/1/35 | | | 35,025,000 | | | | 36,692,190 | |
Series A, Insured: NATL-RE
5.25%, due 7/1/21 | | | 440,000 | | | | 442,112 | |
Series C, Insured: AGM
5.375%, due 7/1/28 | | | 700,000 | | | | 725,669 | |
Series C, Insured: AGM
5.75%, due 7/1/37 | | | 1,150,000 | | | | 1,202,095 | |
Series C-7, Insured: NATL-RE
6.00%, due 7/1/27 | | | 2,240,000 | | | | 2,294,410 | |
Commonwealth of Puerto Rico, Unrefunded, Unlimited General Obligation | | | | | | | | |
Series A, Insured: AGC
5.00%, due 7/1/34 | | | 285,000 | | | | 290,788 | |
Insured: AGC
5.25%, due 7/1/32 | | | 500,000 | | | | 516,240 | |
Puerto Rico Commonwealth, Aqueduct & Sewer Authority, Revenue Bonds | | | | | | | | |
Series A, Insured: AGC
5.00%, due 7/1/28 | | | 4,350,000 | | | | 4,438,305 | |
Series A, Insured: AGC
6.125%, due 7/1/24 (a) | | | 545,000 | | | | 584,175 | |
Puerto Rico Convention Center District Authority, Revenue Bonds
Series A, Insured: AGC
4.50%, due 7/1/36 | | | 4,855,000 | | | | 4,856,796 | |
Puerto Rico Electric Power Authority, Revenue Bonds | | | | | | | | |
Series DDD, Insured: AGM
3.625%, due 7/1/23 | | | 3,115,000 | | | | 3,117,648 | |
Series UU, Insured: AGC
4.25%, due 7/1/27 | | | 2,345,000 | | | | 2,346,266 | |
Series NN, Insured: NATL-RE
4.75%, due 7/1/33 | | | 1,140,000 | | | | 1,147,433 | |
Series RR, Insured: NATL-RE
5.00%, due 7/1/22 | | | 1,450,000 | | | | 1,456,684 | |
| | | | | | |
The notes to the financial statements are an integral part of,
and should be read in conjunction with, the financial statements. | | | | | 35 | |
Portfolio of Investments October 31, 2020 (continued)
| | | | | | | | |
| | | Principal
Amount | | | Value | |
| Long-Term Municipal Bonds (continued) | |
Puerto Rico (continued) | |
Puerto Rico Electric Power Authority, Revenue Bonds (continued) | | | | | | | | |
Series PP, Insured: NATL-RE
5.00%, due 7/1/23 | | $ | 1,105,000 | | | $ | 1,111,796 | |
Series SS, Insured: NATL-RE
5.00%, due 7/1/23 | | | 825,000 | | | | 830,074 | |
Series UU, Insured: AGM
5.00%, due 7/1/23 | | | 2,290,000 | | | | 2,336,487 | |
Series PP, Insured: NATL-RE
5.00%, due 7/1/24 | | | 2,915,000 | | | | 2,937,445 | |
Series UU, Insured: AGM
5.00%, due 7/1/24 | | | 4,415,000 | | | | 4,504,624 | |
Series TT, Insured: AGM
5.00%, due 7/1/27 | | | 500,000 | | | | 510,150 | |
Series SS, Insured: AGM
5.00%, due 7/1/30 | | | 550,000 | | | | 561,171 | |
Series VV, Insured: NATL-RE
5.25%, due 7/1/26 | | | 1,875,000 | | | | 1,945,106 | |
Series VV, Insured: NATL-RE
5.25%, due 7/1/29 | | | 1,470,000 | | | | 1,529,432 | |
Series VV, Insured: NATL-RE
5.25%, due 7/1/32 | | | 1,225,000 | | | | 1,276,523 | |
Series VV, Insured: NATL-RE
5.25%, due 7/1/34 | | | 550,000 | | | | 572,330 | |
Series VV, Insured: NATL-RE
5.25%, due 7/1/35 | | | 120,000 | | | | 124,757 | |
Puerto Rico Highway & Transportation Authority, Revenue Bonds | | | | | | | | |
Series L, Insured: NATL-RE
5.25%, due 7/1/24 | | | 2,195,000 | | | | 2,265,986 | |
Series N, Insured: NATL-RE
5.25%, due 7/1/32 | | | 5,525,000 | | | | 5,757,381 | |
Series CC, Insured: AGM
5.25%, due 7/1/33 | | | 2,100,000 | | | | 2,418,066 | |
Series N, Insured: NATL-RE
5.25%, due 7/1/33 | | | 5,030,000 | | | | 5,241,210 | |
Series N, Insured: AGC
5.25%, due 7/1/34 | | | 4,335,000 | | | | 5,011,954 | |
Series N, Insured: AGC, AGM
5.25%, due 7/1/36 | | | 1,425,000 | | | | 1,645,661 | |
Series N, Insured: AGC
5.25%, due 7/1/39 | | | 100,000 | | | | 115,115 | |
Series L, Insured: AGC
5.25%, due 7/1/41 | | | 2,535,000 | | | | 2,909,065 | |
Series E, Insured: AGM
5.50%, due 7/1/21 | | | 670,000 | | | | 687,922 | |
Series N, Insured: AGC, AGM
5.50%, due 7/1/29 | | | 3,270,000 | | | | 3,763,901 | |
Series CC, Insured: AGC
5.50%, due 7/1/31 | | | 1,480,000 | | | | 1,729,395 | |
| | | | | | | | |
| | | Principal
Amount | | | Value | |
Puerto Rico (continued) | |
Puerto Rico Highway & Transportation Authority, Unrefunded, Revenue Bonds | | | | | | | | |
Series D, Insured: AGM
5.00%, due 7/1/27 | | $ | 2,240,000 | | | $ | 2,285,472 | |
Series J, Insured: NATL-RE
5.00%, due 7/1/29 | | | 650,000 | | | | 654,531 | |
Puerto Rico Municipal Finance Agency, Revenue Bonds | | | | | | | | |
Series A, Insured: AGM
4.75%, due 8/1/22 | | | 820,000 | | | | 822,640 | |
Series A, Insured: AGM
5.00%, due 8/1/21 | | | 195,000 | | | | 198,959 | |
Series A, Insured: AGM
5.00%, due 8/1/27 | | | 290,000 | | | | 295,887 | |
Series A, Insured: AGM
5.00%, due 8/1/30 | | | 1,440,000 | | | | 1,469,246 | |
Series C, Insured: AGC
5.25%, due 8/1/23 | | | 340,000 | | | | 364,402 | |
Puerto Rico Public Buildings Authority, Government Facilities, Revenue Bonds | | | | | | | | |
Series F, Insured: NATL-RE, XLCA
5.25%, due 7/1/23 | | | 265,000 | | | | 272,057 | |
Series K, Insured: AGM, State Guaranteed
5.25%, due 7/1/27 | | | 1,150,000 | | | | 1,187,352 | |
Series M-3, Insured: NATL-RE
6.00%, due 7/1/26 | | | 300,000 | | | | 307,287 | |
Series M-3, Insured: NATL-RE
6.00%, due 7/1/27 | | | 7,465,000 | | | | 7,646,325 | |
Puerto Rico Sales Tax Financing Corp Sales Tax, Revenue Bonds Insured: BHAC
(zero coupon), due 8/1/54 | | | 98,098 | | | | 20,123 | |
| | | | | | | | |
| | | | | | | 146,514,535 | |
| | | | | | | | |
Rhode Island 0.3% | |
City of Cranston RI, Unlimited General Obligation
Series A, Insured: BAM
5.00%, due 8/1/37 | | | 1,335,000 | | | | 1,705,810 | |
Providence Public Buildings Authority, Revenue Bonds
Series A, Insured: AGM
5.875%, due 6/15/26 | | | 1,565,000 | | | | 1,610,870 | |
Rhode Island Health & Educational Building Corp., Hospital Financing-Lifespan Obligated Group, Revenue Bonds
5.00%, due 5/15/26 | | | 5,000,000 | | | | 5,874,150 | |
| | | | |
| 36 | | MainStay MacKay Tax Free Bond Fund | | The notes to the financial statements are an integral part of,
and should be read in conjunction with, the financial statements. |
| | | | | | | | |
| | | Principal
Amount | | | Value | |
| Long-Term Municipal Bonds (continued) | |
Rhode Island (continued) | |
Rhode Island Health & Educational Building Corp., Public Schools Financing Program, Revenue Bonds | | | | | | | | |
Series B
5.00%, due 5/15/33 | | $ | 1,045,000 | | | $ | 1,336,116 | |
Series B
5.00%, due 5/15/34 | | | 1,095,000 | | | | 1,393,267 | |
Series B
5.00%, due 5/15/35 | | | 1,150,000 | | | | 1,453,278 | |
Series B
5.00%, due 5/15/36 | | | 1,205,000 | | | | 1,512,359 | |
Series B
5.00%, due 5/15/37 | | | 1,265,000 | | | | 1,582,047 | |
Rhode Island Housing & Mortgage Finance Corp., Homeownership Opportunity, Revenue Bonds
Series 69-B, Insured: GNMA/FNMA/FHLMC
4.00%, due 10/1/48 | | | 4,780,000 | | | | 5,293,038 | |
| | | | | | | | |
| | | | | | | 21,760,935 | |
| | | | | | | | |
South Carolina 2.2% | |
Patriots Energy Group Financing Agency, Gas Supply, Revenue Bonds
Series A
4.00%, due 10/1/48 (b) | | | 4,355,000 | | | | 4,798,600 | |
Piedmont Municipal Power Agency, Revenue Bonds
Series C, Insured: AGC
5.75%, due 1/1/34 | | | 10,345,000 | | | | 10,629,177 | |
South Carolina Public Service Authority, Revenue Bonds | | | | | | | | |
Series A
3.00%, due 12/1/41 | | | 6,500,000 | | | | 6,554,665 | |
Series A
4.00%, due 12/1/40 | | | 7,750,000 | | | | 8,827,948 | |
Series A
4.00%, due 12/1/42 | | | 9,750,000 | | | | 11,025,203 | |
Series C
5.00%, due 12/1/29 | | | 5,000,000 | | | | 5,786,400 | |
Series A
5.00%, due 12/1/32 | | | 10,000,000 | | | | 11,896,300 | |
Series A
5.00%, due 12/1/43 | | | 13,000,000 | | | | 16,110,900 | |
Series B
5.00%, due 12/1/46 | | | 3,125,000 | | | | 3,648,938 | |
Series B
5.00%, due 12/1/56 | | | 2,500,000 | | | | 2,902,725 | |
Series E
5.25%, due 12/1/55 | | | 27,430,000 | | | | 31,631,453 | |
| | | | | | | | |
| | | Principal
Amount | | | Value | |
South Carolina (continued) | |
South Carolina Public Service Authority, Santee Cooper Project, Revenue Bonds | | | | | | | | |
Series A
5.00%, due 12/1/25 | | $ | 6,445,000 | | | $ | 6,775,757 | |
Series D
5.00%, due 12/1/26 | | | 1,215,000 | | | | 1,305,019 | |
Series C
5.00%, due 12/1/36 | | | 3,860,000 | | | | 4,027,370 | |
Series C, Insured: AGM
5.00%, due 12/1/36 | | | 2,000,000 | | | | 2,087,820 | |
Series D
5.00%, due 12/1/43 | | | 5,290,000 | | | | 5,569,788 | |
South Carolina State Housing Finance & Development Authority, Revenue Bonds
Series A
4.50%, due 7/1/48 | | | 3,390,000 | | | | 3,759,476 | |
South Carolina Transportation Infrastructure Bank, Revenue Bonds | | | | | | | | |
Insured: AGM
5.00%, due 10/1/35 | | | 6,110,000 | | | | 7,535,035 | |
5.00%, due 10/1/36 | | | 15,000,000 | | | | 18,217,200 | |
Sumter Two School Facilities Inc., Sumter School District Project, Revenue Bonds Insured: BAM
5.00%, due 12/1/27 | | | 1,100,000 | | | | 1,300,552 | |
| | | | | | | | |
| | | | | | | 164,390,326 | |
| | | | | | | | |
South Dakota 0.1% | |
South Dakota Conservancy District, Revenue Bonds | | | | | | | | |
5.00%, due 8/1/37 | | | 1,750,000 | | | | 2,205,630 | |
5.00%, due 8/1/38 | | | 3,000,000 | | | | 3,770,340 | |
| | | | | | | | |
| | | | | | | 5,975,970 | |
| | | | | | | | |
Tennessee 0.7% | |
Metropolitan Nashville Airport Authority, Revenue Bonds (c) | | | | | | | | |
Series B
4.00%, due 7/1/49 | | | 1,785,000 | | | | 1,926,104 | |
Series B
5.00%, due 7/1/32 | | | 2,500,000 | | | | 3,102,950 | |
Series B
5.00%, due 7/1/33 | | | 5,700,000 | | | | 7,033,686 | |
Series B
5.00%, due 7/1/49 | | | 17,490,000 | | | | 20,631,379 | |
Series B
5.00%, due 7/1/54 | | | 7,600,000 | | | | 8,919,208 | |
Tennessee Housing & Development Agency, Residential Finance Program, Revenue Bonds
4.50%, due 7/1/49 | | | 7,195,000 | | | | 8,069,552 | |
| | | | | | | | |
| | | | | | | 49,682,879 | |
| | | | | | | | |
| | | | | | |
The notes to the financial statements are an integral part of,
and should be read in conjunction with, the financial statements. | | | | | 37 | |
Portfolio of Investments October 31, 2020 (continued)
| | | | | | | | |
| | | Principal
Amount | | | Value | |
| Long-Term Municipal Bonds (continued) | |
Texas 4.7% | |
Bexar County Hospital District, Limited General Obligation
4.00%, due 2/15/37 | | $ | 4,200,000 | | | $ | 4,793,376 | |
Central Texas Turnpike System, Revenue Bonds | | | | | | | | |
Series C
5.00%, due 8/15/34 | | | 5,000,000 | | | | 5,658,150 | |
Series C
5.00%, due 8/15/42 | | | 2,135,000 | | | | 2,385,329 | |
City of Austin TX, Airport System, Revenue Bonds (c) | | | | | | | | |
5.00%, due 11/15/24 | | | 4,000,000 | | | | 4,672,360 | |
5.00%, due 11/15/25 | | | 4,000,000 | | | | 4,813,400 | |
Series B
5.00%, due 11/15/44 | | | 28,655,000 | | | | 34,339,865 | |
Series B
5.00%, due 11/15/48 | | | 2,490,000 | | | | 2,968,429 | |
City of Corpus Christi TX, Utility System, Revenue Bonds | | | | | | | | |
Series A
3.00%, due 7/15/39 | | | 4,400,000 | | | | 4,852,232 | |
Series A
3.00%, due 7/15/40 | | | 3,085,000 | | | | 3,384,708 | |
City of Donna TX, Tax & Toll Bridge, Limited General Obligation Insured: BAM
5.00%, due 2/15/30 | | | 1,035,000 | | | | 1,179,134 | |
City of Houston TX, Utility System, Revenue Bonds | | | | | | | | |
Series B
5.00%, due 11/15/33 | | | 2,000,000 | | | | 2,453,960 | |
Series B
5.00%, due 11/15/34 | | | 1,500,000 | | | | 1,968,135 | |
Series B
5.00%, due 11/15/35 | | | 300,000 | | | | 392,262 | |
City of Houston, Limited General Obligation
Series A
5.00%, due 3/1/29 | | | 5,000,000 | | | | 6,240,000 | |
Dallas Area Rapid Transit Sales Tax Revenue, Revenue Bonds | | | | | | | | |
Series B
4.00%, due 12/1/36 | | | 9,000,000 | | | | 10,214,910 | |
Series B
4.00%, due 12/1/37 | | | 6,155,000 | | | | 6,974,477 | |
Dallas County Hospital District, Limited General Obligation
5.00%, due 8/15/30 | | | 10,000,000 | | | | 12,759,900 | |
| | | | | | | | |
| | | Principal
Amount | | | Value | |
Texas (continued) | |
Dallas-Fort Worth International Airport, Revenue Bonds | | | | | | | | |
4.00%, due 11/1/35 | | $ | 18,890,000 | | | $ | 21,987,204 | |
Series A
4.00%, due 11/1/35 | | | 5,445,000 | | | | 6,337,762 | |
Series C
5.125%, due 11/1/43 (c) | | | 5,310,000 | | | | 5,655,681 | |
Grand Parkway Transportation Corp., 1st Tier Toll, Revenue Bonds
4.00%, due 10/1/49 | | | 9,900,000 | | | | 11,287,584 | |
Grand Parkway Transportation Corp., Revenue Bonds | | | | | | | | |
Series A
5.00%, due 10/1/35 | | | 1,500,000 | | | | 1,883,430 | |
Series A
5.00%, due 10/1/43 | | | 8,625,000 | | | | 10,594,950 | |
Harris County Cultural Education Facilities Finance Corp., Memorial Hermann Health System, Revenue Bonds
5.00%, due 7/1/38 | | | 4,280,000 | | | | 4,995,145 | |
Houston Hotel Occupancy Tax & Special Revenue, Convention & Entertainment Facilities Department, Revenue Bonds | | | | | | | | |
5.00%, due 9/1/26 | | | 565,000 | | | | 608,562 | |
5.00%, due 9/1/31 | | | 2,450,000 | | | | 2,555,497 | |
5.00%, due 9/1/34 | | | 1,550,000 | | | | 1,605,242 | |
North Harris County Regional Water Authority, Senior Lien, Revenue Bonds Insured: BAM
5.00%, due 12/15/32 | �� | | 3,215,000 | | | | 3,515,731 | |
North Texas Tollway Authority, Revenue Bonds | | | | | | | | |
Series A
5.00%, due 1/1/34 | | | 1,400,000 | | | | 1,617,294 | |
Series A
5.00%, due 1/1/35 | | | 2,950,000 | | | | 3,402,678 | |
Series A
5.00%, due 1/1/38 | | | 10,000,000 | | | | 12,424,000 | |
Series A, Insured: BAM
5.00%, due 1/1/38 | | | 9,500,000 | | | | 10,924,335 | |
Series B
5.00%, due 1/1/40 | | | 22,140,000 | | | | 23,811,349 | |
San Antonio Water System, Junior Lien, Revenue Bonds
Series A
5.00%, due 5/15/37 | | | 7,585,000 | | | | 9,898,804 | |
State of Texas, Revenue Notes
4.00%, due 8/26/21 | | | 50,000,000 | | | | 51,537,000 | |
| | | | |
| 38 | | MainStay MacKay Tax Free Bond Fund | | The notes to the financial statements are an integral part of,
and should be read in conjunction with, the financial statements. |
| | | | | | | | |
| | | Principal
Amount | | | Value | |
| Long-Term Municipal Bonds (continued) | |
Texas (continued) | |
Tarrant County Cultural Education Facilities Finance Corp., Buckner Retirement Services, Revenue Bonds | | | | | | | | |
Series A
5.00%, due 11/15/23 | | $ | 1,245,000 | | | $ | 1,365,952 | |
Series A
5.00%, due 11/15/24 | | | 1,305,000 | | | | 1,467,290 | |
Series A
5.00%, due 11/15/25 | | | 1,370,000 | | | | 1,577,911 | |
Series A
5.00%, due 11/15/26 | | | 1,440,000 | | | | 1,696,018 | |
Series B
5.00%, due 11/15/46 | | | 3,590,000 | | | | 3,987,700 | |
Texas Department of Housing & Community Affairs, Revenue Bonds
Series A, Insured: GNMA/FNMA
4.75%, due 1/1/49 | | | 25,000 | | | | 28,248 | |
Texas Municipal Gas Acquisition & Supply Corp. III, Revenue Bonds | | | | | | | | |
5.00%, due 12/15/30 | | | 17,100,000 | | | | 18,267,417 | |
5.00%, due 12/15/31 | | | 7,575,000 | | | | 8,075,404 | |
Texas Private Activity Bond Surface Transportation Corp., LBJ Infrastructure Group LLC, Revenue Bonds | | | | | | | | |
4.00%, due 12/31/37 | | | 4,250,000 | | | | 4,776,787 | |
4.00%, due 12/31/38 | | | 3,000,000 | | | | 3,356,970 | |
4.00%, due 6/30/39 | | | 3,000,000 | | | | 3,345,480 | |
Texas Public Finance Authority, Financing System-Texas Southern University, Revenue Bonds | | | | | | | | |
Insured: BAM
4.00%, due 5/1/31 | | | 1,000,000 | | | | 1,096,340 | |
Insured: BAM
4.00%, due 5/1/32 | | | 1,295,000 | | | | 1,413,752 | |
Texas State Municipal Power Agency, Revenue Bonds
5.00%, due 9/1/47 | | | 2,750,000 | | | | 2,758,910 | |
Texas State University System, Revenue Bonds
Series A
4.00%, due 3/15/35 | | | 2,000,000 | | | | 2,379,340 | |
Town of Prosper TX, Limited General Obligation
4.00%, due 2/15/31 | | | 1,235,000 | | | | 1,474,911 | |
Viridian Municipal Management District, Unlimited General Obligation Insured: BAM
6.00%, due 12/1/32 | | | 500,000 | | | | 605,390 | |
| | | | | | | | |
| | | Principal
Amount | | | Value | |
Texas (continued) | |
West Harris County Regional Water Authority, Revenue Bonds
5.00%, due 12/15/39 | | $ | 1,200,000 | | | $ | 1,518,624 | |
| | | | | | | | |
| | | | | | | 353,885,319 | |
| | | | | | | | |
U.S. Virgin Islands 0.6% | |
Virgin Islands Public Finance Authority, Matching Fund Loan, Revenue Bonds | | | | | | | | |
Series A
5.00%, due 10/1/32 | | | 5,100,000 | | | | 5,004,834 | |
Series A
6.625%, due 10/1/29 | | | 6,455,000 | | | | 6,481,272 | |
Series A
6.75%, due 10/1/37 | | | 5,000,000 | | | | 5,018,700 | |
Virgin Islands Public Finance Authority, Revenue Bonds | | | | | | | | |
5.00%, due 9/1/30 (d) | | | 5,000,000 | | | | 5,611,300 | |
Series A, Insured: AGM
5.00%, due 10/1/32 | | | 15,655,000 | | | | 16,739,892 | |
Series C, Insured: AGM
5.00%, due 10/1/39 | | | 5,920,000 | | | | 6,559,715 | |
| | | | | | | | |
| | | | | | | 45,415,713 | |
| | | | | | | | |
Utah 2.0% | |
County of Utah UT, IHC Health Services, Inc., Revenue Bonds | | | | | | | | |
Series A
4.00%, due 5/15/43 | | | 5,000,000 | | | | 5,772,600 | |
Series B
4.00%, due 5/15/47 | | | 1,670,000 | | | | 1,782,909 | |
Series A
5.00%, due 5/15/43 | | | 17,350,000 | | | | 21,856,142 | |
Salt Lake City Airport, Revenue Bonds (c) | | | | | | | | |
Series A
5.00%, due 7/1/42 | | | 18,790,000 | | | | 21,561,149 | |
Series A
5.00%, due 7/1/47 | | | 17,710,000 | | | | 20,166,200 | |
Utah Charter School Finance Authority, Spectrum Academy Project, Revenue Bonds
Insured: UT CSCE
4.00%, due 4/15/45 | | | 2,975,000 | | | | 3,316,084 | |
Utah Housing Corp., Revenue Bonds | | | | | | | | |
Series H, Insured: GNMA
4.50%, due 10/21/48 | | | 2,172,324 | | | | 2,347,044 | |
Series J, Insured: GNMA
4.50%, due 12/21/48 | | | 2,757,472 | | | | 2,979,256 | |
Series A, Insured: GNMA
4.50%, due 1/21/49 | | | 5,726,812 | | | | 6,187,419 | |
Series B, Insured: GNMA
4.50%, due 2/21/49 | | | 3,715,593 | | | | 4,014,439 | |
| | | | | | |
The notes to the financial statements are an integral part of,
and should be read in conjunction with, the financial statements. | | | | | 39 | |
Portfolio of Investments October 31, 2020 (continued)
| | | | | | | | |
| | | Principal
Amount | | | Value | |
| Long-Term Municipal Bonds (continued) | |
Utah (continued) | |
Utah Infrastructure Agency, Revenue Bonds | | | | | | | | |
5.00%, due 10/15/38 | | $ | 1,990,000 | | | $ | 2,420,716 | |
5.00%, due 10/15/41 | | | 2,175,000 | | | | 2,622,637 | |
Utah Transit Authority, Revenue Bonds | | | | | | | | |
4.00%, due 6/15/39 | | | 27,885,000 | | | | 28,982,832 | |
4.00%, due 12/15/41 | | | 13,300,000 | | | | 14,945,875 | |
Utah Transit Authority, Sales Tax, Revenue Bonds
Insured: BAM
5.00%, due 12/15/40 | | | 2,780,000 | | | | 3,415,730 | |
Weber Basin Water Conservancy District, Revenue Bonds
5.00%, due 10/1/44 | | | 5,130,000 | | | | 6,463,902 | |
| | | | | | | | |
| | | | | | | 148,834,934 | |
| | | | | | | | |
Vermont 0.1% | |
Vermont Educational & Health Building Financing Agency, Revenue Bonds
5.00%, due 11/1/40 | | | 6,775,000 | | | | 6,775,000 | |
Vermont Educational & Health Buildings Financing Agency, Middlebury College Project, Revenue Bonds
4.00%, due 11/1/36 | | | 1,250,000 | | | | 1,472,625 | |
| | | | | | | | |
| | | | | | | 8,247,625 | |
| | | | | | | | |
Virginia 2.0% | |
Arlington County Industrial Development Authority, Virginia Hospital Center, Revenue Bonds | | | | | | | | |
3.75%, due 7/1/50 | | | 20,350,000 | | | | 22,168,679 | |
4.00%, due 7/1/45 | | | 12,000,000 | | | | 13,648,080 | |
Hampton Roads Transportation Accountability Commission, Revenue Bonds | | | | | | | | |
Series A
4.00%, due 7/1/50 | | | 10,000,000 | | | | 11,631,600 | |
Series A
4.00%, due 7/1/55 | | | 50,000,000 | | | | 57,492,500 | |
Series A
5.00%, due 7/1/50 | | | 16,955,000 | | | | 21,415,013 | |
Virginia Housing Development Authority, Revenue Bonds
Series B
3.35%, due 5/1/54 | | | 3,800,000 | | | | 3,934,558 | |
Virginia Resources Authority, Infrastructure Revenue, Revenue Bonds
Series A, Insured: Moral Obligation
5.00%, due 11/1/30 | | | 2,245,000 | | | | 2,454,661 | |
| | | | | | | | |
| | | Principal
Amount | | | Value | |
Virginia (continued) | |
Virginia Small Business Financing Authority, Express Lanes LLC Project, Revenue Bonds
5.00%, due 7/1/49 (c) | | $ | 20,000,000 | | | $ | 20,617,600 | |
| | | | | | | | |
| | | | | | | 153,362,691 | |
| | | | | | | | |
Washington 0.8% | |
Thurston & Pierce Counties Community Schools, Unlimited General Obligation Insured: School Bond Guaranty
4.00%, due 12/1/35 | | | 3,900,000 | | | | 4,606,173 | |
University of Washington, Revenue Bonds | | | | | | | | |
Series A
4.00%, due 4/1/38 | | | 1,860,000 | | | | 2,210,257 | |
Series A
4.00%, due 4/1/39 | | | 2,345,000 | | | | 2,777,254 | |
Series B
5.00%, due 6/1/37 | | | 2,765,000 | | | | 3,192,718 | |
Washington Higher Educational Facilities Authority, Seattle Pacific University Project, Revenue Bonds | | | | | | | | |
5.00%, due 10/1/32 | | | 1,330,000 | | | | 1,617,772 | |
5.00%, due 10/1/35 | | | 1,000,000 | | | | 1,201,780 | |
5.00%, due 10/1/38 | | | 1,175,000 | | | | 1,396,581 | |
5.00%, due 10/1/45 | | | 1,600,000 | | | | 1,862,608 | |
Washington State Convention Center Public Facilities District, Revenue Bonds | | | | | | | | |
Insured: AGM
4.00%, due 7/1/58 | | | 20,000,000 | | | | 21,320,400 | |
5.00%, due 7/1/48 | | | 8,115,000 | | | | 8,946,950 | |
Insured: AGM
5.00%, due 7/1/58 | | | 2,935,000 | | | | 3,338,856 | |
Washington State Housing Finance Commission, Single Family Program, Revenue Bonds | | | | | | | | |
Series 1N
4.00%, due 12/1/48 | | | 5,585,000 | | | | 6,131,213 | |
Series 1N
4.00%, due 6/1/49 | | | 285,000 | | | | 315,156 | |
| | | | | | | | |
| | | | | | | 58,917,718 | |
| | | | | | | | |
Wisconsin 0.2% | |
Wisconsin Center District, Junior Dedicated, Revenue Bonds | | | | | | | | |
Series A
5.00%, due 12/15/31 | | | 3,665,000 | | | | 3,873,319 | |
Series A
5.00%, due 12/15/32 | | | 2,850,000 | | | | 3,006,123 | |
Wisconsin Health & Educational Facilities Authority, Marshfield Clinic Health System, Revenue Bonds
Series C
5.00%, due 2/15/23 | | | 2,110,000 | | | | 2,290,025 | |
| | | | |
| 40 | | MainStay MacKay Tax Free Bond Fund | | The notes to the financial statements are an integral part of,
and should be read in conjunction with, the financial statements. |
| | | | | | | | |
| | | Principal
Amount | | | Value | |
| Long-Term Municipal Bonds (continued) | |
Wisconsin (continued) | |
Wisconsin Housing & Economic Development Authority, Revenue Bonds
Series D
4.00%, due 3/1/47 | | $ | 5,125,000 | | | $ | 5,649,851 | |
| | | | | | | | |
| | | | | | | 14,819,318 | |
| | | | | | | | |
Wyoming 0.1% | |
West Park Hospital District, Revenue Bonds | | | | | | | | |
Series A
5.50%, due 6/1/21 | | | 250,000 | | | | 255,552 | |
Series A
6.375%, due 6/1/26 | | | 1,000,000 | | | | 1,028,720 | |
Wyoming Community Development Authority, Revenue Bonds | | | | | | | | |
Series 3
4.00%, due 6/1/43 | | | 3,780,000 | | | | 4,134,035 | |
Series 1
4.00%, due 12/1/48 | | | 3,565,000 | | | | 3,929,236 | |
| | | | | | | | |
| | | | | | | 9,347,543 | |
| | | | | | | | |
Total Long-Term Municipal Bonds
(Cost $6,833,928,705) | | | | | | | 7,123,753,736 | |
| | | | | | | | |
|
| Short-Term Municipal Notes 4.0% | |
Arkansas 0.1% | |
City of Osceola AR, Plum Point Energy Associates LLC Project, Revenue Bonds
0.13%, due 4/1/36 (c)(e) | | | 5,000,000 | | | | 5,000,000 | |
| | | | | | | | |
|
California 1.0% | |
California Infrastructure & Economic Development Bank, Brightline West Passenger Rail Project, Revenue Bonds
Series A
0.45%, due 1/1/50 (b)(c)(d) | | | 42,000,000 | | | | 41,983,200 | |
Nuveen AMT-Free Quality Municipal Income Fund | | | | | | | | |
Series A
0.60%, due 5/1/47 (b)(d) | | | 20,000,000 | | | | 20,000,000 | |
Series D
0.60%, due 3/1/29 (b) | | | 11,800,000 | | | | 11,800,000 | |
| | | | | | | | |
| | | | | | | 73,783,200 | |
| | | | | | | | |
Connecticut 0.1% | |
Connecticut State Health & Educational Facility Authority, Yale-New Haven Health Obligated Group, Revenue Bonds
0.11%, due 7/1/25 (e) | | | 8,400,000 | | | | 8,400,000 | |
| | | | | | | | |
| | | | | | | | |
| | | Principal
Amount | | | Value | |
District of Columbia 0.1% | |
Tender Option Bond Trust Receipts, Revenue Bonds
Series 2020-YX1120
0.17%, due 10/1/49 (d)(e) | | $ | 8,390,000 | | | $ | 8,390,000 | |
| | | | | | | | |
|
Georgia 0.3% | |
Burke County Development Authority, Georgia Power Co., Vogtle Project, Revenue Bonds
0.15%, due 11/1/52 (e) | | | 22,655,000 | | | | 22,655,000 | |
| | | | | | | | |
|
Idaho 0.1% | |
Idaho Health Facilities Authority, Trinity Health Credit Group, Revenue Bonds
0.23%, due 12/1/48 (e) | | | 6,500,000 | | | | 6,500,000 | |
| | | | | | | | |
|
Illinois 0.2% | |
Tender Option Bond Trust Receipts, Revenue Bonds
Series 2015-XF1009, Insured: AGM
0.18%, due 6/15/32 (d)(e) | | | 17,390,000 | | | | 17,390,000 | |
| | | | | | | | |
|
Kentucky 0.1% | |
County of Meade KY, Nucor Corp., Revenue Bonds
0.21%, due 7/1/60 (c)(e) | | | 8,160,000 | | | | 8,160,000 | |
| | | | | | | | |
|
Michigan 0.1% | |
Michigan State Building Authority, Multi-Modal Facilities Program, Revenue Bonds
Series III
0.24%, due 10/15/42 (e) | | | 3,500,000 | | | | 3,500,000 | |
| | | | | | | | |
|
Minnesota 0.3% | |
County of Hennepin MN, Unlimited General Obligation
Series B
0.12%, due 12/1/38 (e) | | | 23,530,000 | | | | 23,530,000 | |
| | | | | | | | |
|
Missouri 0.2% | |
RIB Floater Trust, Revenue Bonds
Series 2019-016
0.16%, due 6/1/45 (d)(e) | | | 11,000,000 | | | | 11,000,000 | |
| | | | | | | | |
|
New Jersey 0.3% | |
New Jersey Turnpike Authority, Revenue Bonds
Series D-1
0.804%, due 1/1/24 (e) | | | 25,750,000 | | | | 25,726,825 | |
| | | | | | | | |
| | | | | | |
The notes to the financial statements are an integral part of,
and should be read in conjunction with, the financial statements. | | | | | 41 | |
Portfolio of Investments October 31, 2020 (continued)
| | | | | | | | |
| | | Principal
Amount | | | Value | |
| Short-Term Municipal Notes (continued) | |
New York 0.2% | |
New York City Housing Development Corp., Revenue Bonds
Series G
0.20%, due 5/1/52 (b) | | $ | 3,500,000 | | | $ | 3,499,195 | |
New York City NY, Housing Development Corp., Multifamily, Sustainable Neighborhood, Revenue Bonds
Series E-3
0.12%, due 5/1/59 (e) | | | 2,300,000 | | | | 2,300,000 | |
Tender Option Bond Trust Receipts, Revenue Bonds
Series 2016-XM0454
0.20%, due 9/15/40 (d)(e) | | | 5,000,000 | | | | 5,000,000 | |
| | | | | | | | |
| | | | | | | 10,799,195 | |
| | | | | | | | |
Oregon 0.1% | |
Oregon State Facilities Authority, PeaceHealth Obligated Group, Revenue Bonds
Series B
0.10%, due 8/1/34 (e) | | | 9,200,000 | | | | 9,200,000 | |
| | | | | | | | |
|
Texas 0.5% | |
Harris County Health Facilities Development Corp., Methodist Hospital System, Revenue Bonds (e) | | | | | | | | |
Series A-1
0.10%, due 12/1/41 | | | 23,000,000 | | | | 23,000,000 | |
Series A-2
0.10%, due 12/1/41 | | | 15,000,000 | | | | 15,000,000 | |
| | | | | | | | |
| | | | | | | 38,000,000 | |
| | | | | | | | |
Wisconsin 0.3% | |
State of Wisconsin, Unlimited General Obligation
Series A
0.15%, due 5/1/29 (e) | | | 6,000,000 | | | | 6,000,000 | |
Wisconsin Health & Educational Facilities Authority, Marshfield Clinic Health System, Revenue Bonds
Series A
0.11%, due 2/15/50 (e) | | | 18,685,000 | | | | 18,685,000 | |
| | | | | | | | |
| | | | | | | 24,685,000 | |
| | | | | | | | |
Total Short-Term Municipal Notes
(Cost $296,725,817) | | | | | | | 296,719,220 | |
| | | | | | | | |
Total Municipal Bonds
(Cost $7,130,654,522) | | | 98.4 | % | | | 7,420,472,956 | |
| | | | | | | | |
| | | | | | | | |
| | | Principal
Amount | | | Value | |
Other Assets, Less Liabilities | | | 1.6 | | | | 122,040,211 | |
Net Assets | | | 100.0 | % | | $ | 7,542,513,167 | |
| † | Percentages indicated are based on Fund net assets. |
| ‡ | Less than one-tenth of a percent. |
| (a) | Step coupon—Rate shown was the rate in effect as of October 31, 2020. |
| (b) | Floating rate—Rate shown was the rate in effect as of October 31, 2020. |
| (c) | Interest on these securities was subject to alternative minimum tax. |
| (d) | May be sold to institutional investors only under Rule 144A or securities offered pursuant to Section 4(a)(2) of the Securities Act of 1933, as amended. |
| (e) | Variable-rate demand notes (VRDNs)—Provide the right to sell the security at face value on either that day or within the rate-reset period. VRDNs will normally trade as if the maturity is the earlier put date, even though stated maturity is longer. The interest rate is reset on the put date at a stipulated daily, weekly, monthly, quarterly, or other specified time interval to reflect current market conditions. These securities do not indicate a reference rate and spread in their description. The maturity date shown is the final maturity. |
| | | | |
| 42 | | MainStay MacKay Tax Free Bond Fund | | The notes to the financial statements are an integral part of,
and should be read in conjunction with, the financial statements. |
Futures Contracts
As of October 31, 2020, the Portfolio held the following futures contracts1:
| | | | | | | | | | | | | | | | | | | | |
Type | | Number of
Contracts | | | Expiration
Date | | | Value at
Trade Date | | | Current
Notional
Amount | | | Unrealized
Appreciation
(Depreciation)2 | |
| | | | | |
Short Contracts | | | | | | | | | | | | | | | | | | | | |
| 10-Year United States Treasury Note | | | (3,500 | ) | | | December 2020 | | | $ | (486,589,364 | ) | | $ | (483,765,625 | ) | | $ | 2,823,739 | |
| | | | | | | | | | | | | | | | | | | | |
| 1. | As of October 31, 2020, cash in the amount of $5,425,000 was on deposit with a broker or futures commission merchant for futures transactions. |
| 2. | Represents the difference between the value of the contracts at the time they were opened and the value as of October 31, 2020. |
The following abbreviations are used in the preceding pages:
AGC—Assured Guaranty Corp.
AGM—Assured Guaranty Municipal Corp.
BAM—Build America Mutual Assurance Co.
BHAC—Berkshire Hathaway Assurance Corp.
CHF—Collegiate Housing Foundation
FHLMC—Federal Home Loan Mortgage Corp.
FNMA—Federal National Mortgage Association
GNMA—Government National Mortgage Association
NATL-RE—National Public Finance Guarantee Corp.
Q-SBLF—Qualified School Board Loan Fund
UT CSCE—Utah Charter School Credit Enhancement Program
XLCA—XL Capital Assurance, Inc.
The following is a summary of the fair valuations according to the inputs used as of October 31, 2020, for valuing the Fund’s assets and liabilities:
| | | | | | | | | | | | | | | | |
Description | | Quoted
Prices in
Active
Markets for
Identical
Assets
(Level 1) | | | Significant
Other
Observable
Inputs
(Level 2) | | | Significant
Unobservable
Inputs
(Level 3) | | | Total | |
| | | | |
Asset Valuation Inputs | | | | | | | | | | | | | | | | |
| Investments in Securities (a) | | | | | | | | | | | | | | | | |
| Municipal Bonds | | | | | | | | | | | | | | | | |
Long-Term Municipal Bonds | | $ | — | | | $ | 7,123,753,736 | | | $ | — | | | $ | 7,123,753,736 | |
Short-Term Municipal Notes | | | — | | | | 296,719,220 | | | | — | | | | 296,719,220 | |
| | | | | | | | | | | | | | | | |
| Total Investments in Securities | | $ | — | | | $ | 7,420,472,956 | | | $ | — | | | $ | 7,420,472,956 | |
| | | | | | | | | | | | | | | | |
| Other Financial Instruments | | | | | | | | | | | | | | | | |
Futures Contracts (b) | | $ | 2,823,739 | | | $ | — | | | $ | — | | | $ | 2,823,739 | |
| | | | | | | | | | | | | | | | |
| Total Investments in Securities and Other Financial Instruments | | $ | 2,823,739 | | | $ | 7,420,472,956 | | | $ | — | | | $ | 7,423,296,695 | |
| | | | | | | | | | | | | | | | |
| (a) | For a complete listing of investments and their industries, see the Portfolio of Investments. |
| (b) | The value listed for these securities reflects unrealized appreciation (depreciation) as shown on the Portfolio of Investments. |
| | | | | | |
The notes to the financial statements are an integral part of,
and should be read in conjunction with, the financial statements. | | | | | 43 | |
Statement of Assets and Liabilities as of October 31, 2020
| | | | |
| Assets | |
Investment in securities, at value
(identified cost $7,130,654,522) | | $ | 7,420,472,956 | |
Cash | | | 144,307,642 | |
Cash collateral on deposit at broker for futures contracts | | | 5,425,000 | |
Receivables: | | | | |
Interest | | | 82,078,483 | |
Fund shares sold | | | 24,000,829 | |
Investment securities sold | | | 11,733,132 | |
Variation margin on futures contracts | | | 656,221 | |
Other assets | | | 325,871 | |
| | | | |
Total assets | | | 7,689,000,134 | |
| | | | |
|
| Liabilities | |
Payables: | | | | |
Investment securities purchased | | | 118,199,632 | |
Fund shares redeemed | | | 19,803,182 | |
Manager (See Note 3) | | | 2,622,243 | |
NYLIFE Distributors (See Note 3) | | | 672,154 | |
Transfer agent (See Note 3) | | | 619,055 | |
Professional fees | | | 112,939 | |
Shareholder communication | | | 102,706 | |
Custodian | | | 11,781 | |
Trustees | | | 9,547 | |
Accrued expenses | | | 6,322 | |
Dividend payable | | | 4,327,406 | |
| | | | |
Total liabilities | | | 146,486,967 | |
| | | | |
Net assets | | $ | 7,542,513,167 | |
| | | | |
| |
| Composition of Net Assets | | | | |
Shares of beneficial interest outstanding (par value of $.01 per share) unlimited number of shares authorized | | $ | 7,227,399 | |
Additional paid-in capital | | | 7,336,582,601 | |
| | | | |
| | | 7,343,810,000 | |
Total distributable earnings (loss) | | | 198,703,167 | |
| | | | |
Net assets | | $ | 7,542,513,167 | |
| | | | |
| | | | |
Class A | | | | |
Net assets applicable to outstanding shares | | $ | 2,674,765,401 | |
| | | | |
Shares of beneficial interest outstanding | | | 256,353,188 | |
| | | | |
Net asset value per share outstanding | | $ | 10.43 | |
Maximum sales charge (4.50% of offering price) | | | 0.49 | |
| | | | |
Maximum offering price per share outstanding | | $ | 10.92 | |
| | | | |
Investor Class | | | | |
Net assets applicable to outstanding shares | | $ | 9,333,771 | |
| | | | |
Shares of beneficial interest outstanding | | | 890,647 | |
| | | | |
Net asset value per share outstanding | | $ | 10.48 | |
Maximum sales charge (4.00% of offering price) | | | 0.44 | |
| | | | |
Maximum offering price per share outstanding | | $ | 10.92 | |
| | | | |
Class B | | | | |
Net assets applicable to outstanding shares | | $ | 9,286,081 | |
| | | | |
Shares of beneficial interest outstanding | | | 890,237 | |
| | | | |
Net asset value and offering price per share outstanding | | $ | 10.43 | |
| | | | |
Class C | | | | |
Net assets applicable to outstanding shares | | $ | 220,145,567 | |
| | | | |
Shares of beneficial interest outstanding | | | 21,093,478 | |
| | | | |
Net asset value and offering price per share outstanding | | $ | 10.44 | |
| | | | |
Class C2 | | | | |
Net assets applicable to outstanding shares | | $ | 250,581 | |
| | | | |
Shares of beneficial interest outstanding | | | 24,027 | |
| | | | |
Net asset value and offering price per share outstanding | | $ | 10.43 | |
| | | | |
Class I | | | | |
Net assets applicable to outstanding shares | | $ | 4,430,985,490 | |
| | | | |
Shares of beneficial interest outstanding | | | 424,551,724 | |
| | | | |
Net asset value and offering price per share outstanding | | $ | 10.44 | |
| | | | |
Class R6 | | | | |
Net assets applicable to outstanding shares | | $ | 197,746,276 | |
| | | | |
Shares of beneficial interest outstanding | | | 18,936,596 | |
| | | | |
Net asset value and offering price per share outstanding | | $ | 10.44 | |
| | | | |
| | | | |
| 44 | | MainStay MacKay Tax Free Bond Fund | | The notes to the financial statements are an integral part of,
and should be read in conjunction with, the financial statements. |
Statement of Operations for the year ended October 31, 2020
| | | | |
| Investment Income (Loss) | |
Income | | | | |
Interest | | $ | 170,399,238 | |
Dividends | | | 658,055 | |
Other | | | 1,132 | |
| | | | |
Total income | | | 171,058,425 | |
| | | | |
Expenses | | | | |
Manager (See Note 3) | | | 25,489,278 | |
Distribution/Service—Class A (See Note 3) | | | 5,867,288 | |
Distribution/Service—Investor Class (See Note 3) | | | 24,060 | |
Distribution/Service—Class B (See Note 3) | | | 57,197 | |
Distribution/Service—Class C (See Note 3) | | | 1,141,770 | |
Distribution/Service—Class C2 (See Note 3) | | | 114 | |
Transfer agent (See Note 3) | | | 3,625,664 | |
Registration | | | 491,971 | |
Professional fees | | | 444,024 | |
Shareholder communication | | | 220,257 | |
Trustees | | | 146,644 | |
Custodian | | | 70,175 | |
Miscellaneous | | | 202,375 | |
| | | | |
Total expenses | | | 37,780,817 | |
| | | | |
Net investment income (loss) | | | 133,277,608 | |
| | | | |
|
| Realized and Unrealized Gain (Loss) | |
Net realized gain (loss) on: | | | | |
Investment transactions | | | 25,764,052 | |
Futures transactions | | | (9,530,765 | ) |
| | | | |
Net realized gain (loss) | | | 16,233,287 | |
| | | | |
Net change in unrealized appreciation (depreciation) on: | | | | |
Investments | | | 85,343,012 | |
Futures contracts | | | 31,465 | |
| | | | |
Net change in unrealized appreciation (depreciation) | | | 85,374,477 | |
| | | | |
Net realized and unrealized gain (loss) | | | 101,607,764 | |
| | | | |
Net increase (decrease) in net assets resulting from operations | | $ | 234,885,372 | |
| | | | |
| | | | | | |
The notes to the financial statements are an integral part of,
and should be read in conjunction with, the financial statements. | | | | | 45 | |
Statements of Changes in Net Assets
for the years ended October 31, 2020 and October 31, 2019
| | | | | | | | |
| | | 2020 | | | 2019 | |
| Increase (Decrease) in Net Assets | |
Operations: | | | | | | | | |
Net investment income (loss) | | $ | 133,277,608 | | | $ | 115,109,951 | |
Net realized gain (loss) | | | 16,233,287 | | | | (10,471,549 | ) |
Net change in unrealized appreciation (depreciation) | | | 85,374,477 | | | | 201,479,641 | |
| | | | |
Net increase (decrease) in net assets resulting from operations | | | 234,885,372 | | | | 306,118,043 | |
| | | | |
Distributions to shareholders: | | | | | | | | |
Class A | | | (61,436,754 | ) | | | (43,092,131 | ) |
Investor Class | | | (252,488 | ) | | | (285,978 | ) |
Class B | | | (272,310 | ) | | | (365,433 | ) |
Class C | | | (5,412,059 | ) | | | (5,995,944 | ) |
Class C2 | | | (295 | ) | | | — | |
Class I | | | (98,634,481 | ) | | | (65,371,209 | ) |
Class R6 | | | (2,964,947 | ) | | | — | |
| | | | |
Total distributions to shareholders | | | (168,973,334 | ) | | | (115,110,695 | ) |
| | | | |
Capital share transactions: | | | | | | | | |
Net proceeds from sale of shares | | | 4,265,384,837 | | | | 2,425,735,828 | |
Net asset value of shares issued to shareholders in reinvestment of distributions | | | 122,276,059 | | | | 81,410,601 | |
Cost of shares redeemed | | | (1,754,536,854 | ) | | | (819,347,697 | ) |
| | | | |
Increase (decrease) in net assets derived from capital share transactions | | | 2,633,124,042 | | | | 1,687,798,732 | |
| | | | |
Net increase (decrease) in net assets | | | 2,699,036,080 | | | | 1,878,806,080 | |
|
| Net Assets | |
Beginning of year | | | 4,843,477,087 | | | | 2,964,671,007 | |
| | | | |
End of year | | $ | 7,542,513,167 | | | $ | 4,843,477,087 | |
| | | | |
| | | | |
| 46 | | MainStay MacKay Tax Free Bond Fund | | The notes to the financial statements are an integral part of,
and should be read in conjunction with, the financial statements. |
Financial Highlights selected per share data and ratios
| | | | | | | | | | | | | | | | | | | | |
| |
| | | Year ended October 31, | |
| | | | | |
| Class A | | 2020 | | | 2019 | | | 2018 | | | 2017 | | | 2016 | |
| | | | | |
Net asset value at beginning of year | | $ | 10.33 | | | $ | 9.80 | | | $ | 10.02 | | | $ | 10.18 | | | $ | 9.93 | |
| | | | | | | | | | | | | | | | | | | | |
| | | | | |
Net investment income (loss) | | | 0.26 | | | | 0.30 | | | | 0.31 | | | | 0.31 | | | | 0.32 | |
| | | | | |
Net realized and unrealized gain (loss) on investments | | | 0.11 | | | | 0.53 | | | | (0.22 | ) | | | (0.16 | ) | | | 0.25 | |
| | | | | | | | | | | | | | | | | | | | |
| | | | | |
Total from investment operations | | | 0.37 | | | | 0.83 | | | | 0.09 | | | | 0.15 | | | | 0.57 | |
| | | | | | | | | | | | | | | | | | | | |
| | | | | |
| Less distributions: | | | | | | | | | | | | | | | | | | | | |
| | | | | |
From net investment income | | | (0.27 | ) | | | (0.30 | ) | | | (0.31 | ) | | | (0.31 | ) | | | (0.32 | ) |
| | | | | | | | | | | | | | | | | | | | |
| | | | | |
Net asset value at end of year | | $ | 10.43 | | | $ | 10.33 | | | $ | 9.80 | | | $ | 10.02 | | | $ | 10.18 | |
| | | | | | | | | | | | | | | | | | | | |
| | | | | |
Total investment return (a) | | | 3.66 | % | | | 8.55 | % | | | 0.94 | % | | | 1.50 | % | | | 5.73 | % |
| | | | | |
| Ratios (to average net assets)/Supplemental Data: | | | | | | | | | | | | | | | | | | | | |
| | | | | |
Net investment income (loss) | | | 2.04 | % | | | 2.93 | % | | | 3.15 | % | | | 3.05 | % | | | 3.04 | % |
| | | | | |
Net expenses (b) | | | 0.75 | % | | | 0.78 | % | | | 0.80 | % | | | 0.81 | % | | | 0.80 | % |
| | | | | |
Portfolio turnover rate | | | 72 | %(c) | | | 38 | %(c) | | | 40 | % | | | 62 | % | | | 47 | % |
| | | | | |
Net assets at end of year (in 000’s) | | $ | 2,674,765 | | | $ | 1,728,643 | | | $ | 1,405,803 | | | $ | 1,564,955 | | | $ | 1,248,065 | |
| (a) | Total investment return is calculated exclusive of sales charges and assumes the reinvestment of distributions. For periods of less than one year, total return is not annualized. |
| (b) | In addition to the fees and expenses which the Fund bears directly, it also indirectly bears a pro-rata share of the fees and expenses of the underlying funds in which it invests. Such indirect expenses are not included in the above expense ratios. |
| (c) | The portfolio turnover rate includes variable rate demand notes. |
| | | | | | | | | | | | | | | | | | | | |
| |
| | | Year ended October 31, | |
| | | | | |
| Investor Class | | 2020 | | | 2019 | | | 2018 | | | 2017 | | | 2016 | |
| | | | | |
Net asset value at beginning of year | | $ | 10.38 | | | $ | 9.84 | | | $ | 10.06 | | | $ | 10.23 | | | $ | 9.97 | |
| | | | | | | | | | | | | | | | | | | | |
| | | | | |
Net investment income (loss) | | | 0.20 | | | | 0.30 | | | | 0.32 | | | | 0.31 | | | | 0.32 | |
| | | | | |
Net realized and unrealized gain (loss) on investments | | | 0.17 | | | | 0.54 | | | | (0.22 | ) | | | (0.17 | ) | | | 0.26 | |
| | | | | | | | | | | | | | | | | | | | |
| | | | | |
Total from investment operations | | | 0.37 | | | | 0.84 | | | | 0.10 | | | | 0.14 | | | | 0.58 | |
| | | | | | | | | | | | | | | | | | | | |
| | | | | |
| Less distributions: | | | | | | | | | | | | | | | | | | | | |
| | | | | |
From net investment income | | | (0.27 | ) | | | (0.30 | ) | | | (0.32 | ) | | | (0.31 | ) | | | (0.32 | ) |
| | | | | | | | | | | | | | | | | | | | |
| | | | | |
Net asset value at end of year | | $ | 10.48 | | | $ | 10.38 | | | $ | 9.84 | | | $ | 10.06 | | | $ | 10.23 | |
| | | | | | | | | | | | | | | | | | | | |
| | | | | |
Total investment return (a) | | | 3.64 | % | | | 8.63 | % | | | 0.97 | % | | | 1.43 | % | | | 5.83 | % |
| | | | | |
| Ratios (to average net assets)/Supplemental Data: | | | | | | | | | | | | | | | | | | | | |
| | | | | |
Net investment income (loss) | | | 2.04 | % | | | 2.95 | % | | | 3.17 | % | | | 3.10 | % | | | 3.11 | % |
| | | | | |
Net expenses (b) | | | 0.76 | % | | | 0.77 | % | | | 0.78 | % | | | 0.79 | % | | | 0.79 | % |
| | | | | |
Portfolio turnover rate | | | 72 | %(c) | | | 38 | %(c) | | | 40 | % | | | 62 | % | | | 47 | % |
| | | | | |
Net assets at end of year (in 000’s) | | $ | 9,334 | | | $ | 9,815 | | | $ | 9,690 | | | $ | 10,216 | | | $ | 16,344 | |
| (a) | Total investment return is calculated exclusive of sales charges and assumes the reinvestment of distributions. For periods of less than one year, total return is not annualized. |
| (b) | In addition to the fees and expenses which the Fund bears directly, it also indirectly bears a pro-rata share of the fees and expenses of the underlying funds in which it invests. Such indirect expenses are not included in the above expense ratios. |
| (c) | The portfolio turnover rate includes variable rate demand notes. |
| | | | | | |
The notes to the financial statements are an integral part of,
and should be read in conjunction with, the financial statements. | | | | | 47 | |
Financial Highlights selected per share data and ratios
| | | | | | | | | | | | | | | | | | | | |
| |
| | | Year ended October 31, | |
| | | | | |
| Class B | | 2020 | | | 2019 | | | 2018 | | | 2017 | | | 2016 | |
| | | | | |
Net asset value at beginning of year | | $ | 10.33 | | | $ | 9.80 | | | $ | 10.01 | | | $ | 10.18 | | | $ | 9.92 | |
| | | | | | | | | | | | | | | | | | | | |
| | | | | |
Net investment income (loss) | | | 0.12 | | | | 0.27 | | | | 0.29 | | | | 0.28 | | | | 0.29 | |
| | | | | |
Net realized and unrealized gain (loss) on investments | | | 0.23 | | | | 0.53 | | | | (0.21 | ) | | | (0.17 | ) | | | 0.26 | |
| | | | | | | | | | | | | | | | | | | | |
| | | | | |
Total from investment operations | | | 0.35 | | | | 0.80 | | | | 0.08 | | | | 0.11 | | | | 0.55 | |
| | | | | | | | | | | | | | | | | | | | |
| | | | | |
| Less distributions: | | | | | | | | | | | | | | | | | | | | |
| | | | | |
From net investment income | | | (0.25 | ) | | | (0.27 | ) | | | (0.29 | ) | | | (0.28 | ) | | | (0.29 | ) |
| | | | | | | | | | | | | | | | | | | | |
| | | | | |
Net asset value at end of year | | $ | 10.43 | | | $ | 10.33 | | | $ | 9.80 | | | $ | 10.01 | | | $ | 10.18 | |
| | | | | | | | | | | | | | | | | | | | |
| | | | | |
Total investment return (a) | | | 3.38 | % | | | 8.28 | % | | | 0.81 | % | | | 1.17 | % | | | 5.58 | % |
| | | | | |
| Ratios (to average net assets)/Supplemental Data: | | | | | | | | | | | | | | | | | | | | |
| | | | | |
Net investment income (loss) | | | 1.80 | % | | | 2.71 | % | | | 2.92 | % | | | 2.85 | % | | | 2.84 | % |
| | | | | |
Net expenses (b) | | | 1.01 | % | | | 1.02 | % | | | 1.03 | % | | | 1.04 | % | | | 1.04 | % |
| | | | | |
Portfolio turnover rate | | | 72 | %(c) | | | 38 | %(c) | | | 40 | % | | | 62 | % | | | 47 | % |
| | | | | |
Net assets at end of year (in 000’s) | | $ | 9,286 | | | $ | 12,354 | | | $ | 14,704 | | | $ | 17,068 | | | $ | 19,318 | |
| (a) | Total investment return is calculated exclusive of sales charges and assumes the reinvestment of distributions. For periods of less than one year, total return is not annualized. |
| (b) | In addition to the fees and expenses which the Fund bears directly, it also indirectly bears a pro-rata share of the fees and expenses of the underlying funds in which it invests. Such indirect expenses are not included in the above expense ratios. |
| (c) | The portfolio turnover rate includes variable rate demand notes. |
| | | | | | | | | | | | | | | | | | | | |
| |
| | | Year ended October 31, | |
| | | | | |
| Class C | | 2020 | | | 2019 | | | 2018 | | | 2017 | | | 2016 | |
| | | | | |
Net asset value at beginning of year | | $ | 10.34 | | | $ | 9.80 | | | $ | 10.02 | | | $ | 10.18 | | | $ | 9.93 | |
| | | | | | | | | | | | | | | | | | | | |
| | | | | |
Net investment income (loss) | | | 0.18 | | | | 0.27 | | | | 0.29 | | | | 0.28 | | | | 0.29 | |
| | | | | |
Net realized and unrealized gain (loss) on investments | | | 0.17 | | | | 0.54 | | | | (0.22 | ) | | | (0.16 | ) | | | 0.25 | |
| | | | | | | | | | | | | | | | | | | | |
| | | | | |
Total from investment operations | | | 0.35 | | | | 0.81 | | | | 0.07 | | | | 0.12 | | | | 0.54 | |
| | | | | | | | | | | | | | | | | | | | |
| | | | | |
| Less distributions: | | | | | | | | | | | | | | | | | | | | |
| | | | | |
From net investment income | | | (0.25 | ) | | | (0.27 | ) | | | (0.29 | ) | | | (0.28 | ) | | | (0.29 | ) |
| | | | | | | | | | | | | | | | | | | | |
| | | | | |
Net asset value at end of year | | $ | 10.44 | | | $ | 10.34 | | | $ | 9.80 | | | $ | 10.02 | | | $ | 10.18 | |
| | | | | | | | | | | | | | | | | | | | |
| | | | | |
Total investment return (a) | | | 3.38 | % | | | 8.39 | % | | | 0.71 | % | | | 1.27 | % | | | 5.48 | % |
| | | | | |
| Ratios (to average net assets)/Supplemental Data: | | | | | | | | | | | | | | | | | | | | |
| | | | | |
Net investment income (loss) | | | 1.79 | % | | | 2.69 | % | | | 2.92 | % | | | 2.85 | % | | | 2.81 | % |
| | | | | |
Net expenses (b) | | | 1.01 | % | | | 1.02 | % | | | 1.03 | % | | | 1.04 | % | | | 1.04 | % |
| | | | | |
Portfolio turnover rate | | | 72 | %(c) | | | 38 | %(c) | | | 40 | % | | | 62 | % | | | 47 | % |
| | | | | |
Net assets at end of year (in 000’s) | | $ | 220,146 | | | $ | 225,762 | | | $ | 213,883 | | | $ | 241,526 | | | $ | 273,386 | |
| (a) | Total investment return is calculated exclusive of sales charges and assumes the reinvestment of distributions. For periods of less than one year, total return is not annualized. |
| (b) | In addition to the fees and expenses which the Fund bears directly, it also indirectly bears a pro-rata share of the fees and expenses of the underlying funds in which it invests. Such indirect expenses are not included in the above expense ratios. |
| (c) | The portfolio turnover rate includes variable rate demand notes. |
| | | | |
| 48 | | MainStay MacKay Tax Free Bond Fund | | The notes to the financial statements are an integral part of,
and should be read in conjunction with, the financial statements. |
Financial Highlights selected per share data and ratios
| | | | |
| |
| Class C2 | | August 31,
2020^
through
October 31,
2020 | |
| |
Net asset value at beginning of period | | $ | 10.52 | |
| | | | |
| |
Net investment income (loss) ‡ | | | 0.03 | |
| |
Net realized and unrealized gain (loss) on investments | | | (0.09 | ) |
| | | | |
| |
Total from investment operations | | | (0.06 | ) |
| | | | |
| |
| Less distributions: | | | | |
| |
From net investment income | | | (0.03 | ) |
| | | | |
| |
Net asset value at end of period | | $ | 10.43 | |
| | | | |
| |
Total investment return (a) | |
| (0.54
| %)
|
| |
| Ratios (to average net assets)/Supplemental Data: | | | | |
| |
Net investment income (loss) †† | | | 1.02 | % |
| |
Net expenses †† (b) | | | 1.15 | % |
| |
Portfolio turnover rate (c) | | | 72 | % |
| |
Net assets at end of period (in 000’s) | | $ | 251 | |
| ‡ | Less than one cent per share. |
| (a) | Total investment return is calculated exclusive of sales charges and assumes the reinvestment of distributions. For periods of less than one year, total return is not annualized. |
| (b) | In addition to the fees and expenses which the Fund bears directly, it also indirectly bears a pro-rata share of the fees and expenses of the underlying funds in which it invests. Such indirect expenses are not included in the above expense ratios. |
| (c) | The portfolio turnover rate includes variable rate demand notes. |
| | | | | | | | | | | | | | | | | | | | |
| |
| | | Year ended October 31, | |
| | | | | |
| Class I | | 2020 | | | 2019 | | | 2018 | | | 2017 | | | 2016 | |
| | | | | |
Net asset value at beginning of year | | $ | 10.34 | | | $ | 9.80 | | | $ | 10.02 | | | $ | 10.18 | | | $ | 9.93 | |
| | | | | | | | | | | | | | | | | | | | |
| | | | | |
Net investment income (loss) | | | 0.29 | | | | 0.32 | | | | 0.34 | | | | 0.33 | | | | 0.34 | |
| | | | | |
Net realized and unrealized gain (loss) on investments | | | 0.11 | | | | 0.54 | | | | (0.22 | ) | | | (0.16 | ) | | | 0.25 | |
| | | | | | | | | | | | | | | | | | | | |
| | | | | |
Total from investment operations | | | 0.40 | | | | 0.86 | | | | 0.12 | | | | 0.17 | | | | 0.59 | |
| | | | | | | | | | | | | | | | | | | | |
| | | | | |
| Less distributions: | | | | | | | | | | | | | | | | | | | | |
| | | | | |
From net investment income | | | (0.30 | ) | | | (0.32 | ) | | | (0.34 | ) | | | (0.33 | ) | | | (0.34 | ) |
| | | | | | | | | | | | | | | | | | | | |
| | | | | |
Net asset value at end of year | | $ | 10.44 | | | $ | 10.34 | | | $ | 9.80 | | | $ | 10.02 | | | $ | 10.18 | |
| | | | | | | | | | | | | | | | | | | | |
| | | | | |
Total investment return (a) | | | 3.91 | % | | | 8.93 | % | | | 1.19 | % | | | 1.75 | % | | | 5.99 | % |
| | | | | |
| Ratios (to average net assets)/Supplemental Data: | | | | | | | | | | | | | | | | | | | | |
| | | | | |
Net investment income (loss) | | | 2.28 | % | | | 3.14 | % | | | 3.40 | % | | | 3.31 | % | | | 3.29 | % |
| | | | | |
Net expenses (b) | | | 0.50 | % | | | 0.52 | % | | | 0.55 | % | | | 0.56 | % | | | 0.55 | % |
| | | | | |
Portfolio turnover rate | | | 72 | %(c) | | | 38 | %(c) | | | 40 | % | | | 62 | % | | | 47 | % |
| | | | | |
Net assets at end of year (in 000’s) | | $ | 4,430,985 | | | $ | 2,866,903 | | | $ | 1,320,591 | | | $ | 1,019,263 | | | $ | 899,128 | |
| (a) | Total investment return is calculated exclusive of sales charges and assumes the reinvestment of distributions. Class I shares are not subject to sales charges. For periods of less than one year, total return is not annualized. |
| (b) | In addition to the fees and expenses which the Fund bears directly, it also indirectly bears a pro-rata share of the fees and expenses of the underlying funds in which it invests. Such indirect expenses are not included in the above expense ratios. |
| (c) | The portfolio turnover rate includes variable rate demand notes. |
| | | | | | |
The notes to the financial statements are an integral part of,
and should be read in conjunction with, the financial statements. | | | | | 49 | |
Financial Highlights selected per share data and ratios
| | | | |
| |
| Class R6 | | November 1,
2019^
through
October 31,
2020 | |
| |
Net asset value at beginning of period | | $ | 10.34 | |
| | | | |
| |
Net investment income (loss) | | | 0.27 | |
| |
Net realized and unrealized gain (loss) on investments | | | 0.13 | |
| | | | |
| |
Total from investment operations | | | 0.40 | |
| | | | |
| |
| Less distributions: | | | | |
| |
From net investment income | | | (0.30 | ) |
| | | | |
| |
Net asset value at end of period | | $ | 10.44 | |
| | | | |
| |
Total investment return (a) | | | 3.95 | % |
| |
| Ratios (to average net assets)/Supplemental Data: | | | | |
| |
Net investment income (loss) | | | 2.27 | % |
| |
Net expenses (b) | | | 0.44 | % |
| |
Portfolio turnover rate (c) | | | 72 | % |
| |
Net assets at end of period (in 000’s) | | $ | 197,746 | |
| (a) | Total investment return is calculated exclusive of sales charges and assumes the reinvestment of distributions. Class R6 shares are not subject to sales charges. For periods of less than one year, total return is not annualized. |
| (b) | In addition to the fees and expenses which the Fund bears directly, it also indirectly bears a pro-rata share of the fees and expenses of the underlying funds in which it invests. Such indirect expenses are not included in the above expense ratios. |
| (c) | The portfolio turnover rate includes variable rate demand notes. |
| | | | |
| 50 | | MainStay MacKay Tax Free Bond Fund | | The notes to the financial statements are an integral part of,
and should be read in conjunction with, the financial statements. |
Notes to Financial Statements
Note 1–Organization and Business
The MainStay Funds (the “Trust”) was organized on January 9, 1986, as a Massachusetts business trust. The Trust is registered under the Investment Company Act of 1940, as amended (the “1940 Act”), as an open-end management investment company, and is comprised of twelve funds (collectively referred to as the “Funds”). These financial statements and notes relate to the MainStay MacKay Tax Free Bond Fund (the “Fund”), a “diversified” fund, as that term is defined in the 1940 Act, as interpreted or modified by regulatory authorities having jurisdiction, from time to time.
The Fund currently has eight classes of shares registered for sale. Class A shares commenced operations on January 3, 1995. Class B shares commenced operations on May 1, 1986. Class C shares commenced operations on September 1, 1998. Investor Class shares commenced operations on February 28, 2008. Class I shares commenced operations on December 21, 2009. Class R6 shares commenced operations on November 1, 2019. Class C2 shares commenced operations on August 31, 2020. SIMPLE Class shares were registered for sale effective as of August 31, 2020. As of October 31, 2020, SIMPLE Class shares were not yet offered for sale.
Class B shares of the MainStay Group of Funds are closed to all new purchases as well as additional investments by existing Class B shareholders. Existing Class B shareholders may continue to reinvest dividends and capital gains distributions, as well as exchange their Class B shares for Class B shares of other funds in the MainStay Group of Funds as permitted by the current exchange privileges. Class B shareholders continue to be subject to any applicable contingent deferred sales charge (“CDSC”) at the time of redemption. All other features of the Class B shares, including but not limited to the fees and expenses applicable to Class B shares, remain unchanged. Unless redeemed, Class B shareholders will remain in Class B shares of their respective fund until the Class B shares are converted to Class A or Investor Class shares pursuant to the applicable conversion schedule.
Class A and Investor Class shares are offered at net asset value (“NAV”) per share plus an initial sales charge. No initial sales charge applies to investments of $250,000 or more (and certain other qualified purchases) in Class A and Investor Class shares. However, a CDSC of 1.00% may be imposed on certain redemptions made within 18 months of the date of purchase on shares that were purchased without an initial sales charge. Class C and Class C2 shares are offered at NAV without an initial sales charge, although a 1.00% CDSC may be imposed on certain redemptions of such shares made within one year of the date of purchase of Class C and Class C2 shares. When Class B shares were offered, they were offered at NAV without an initial sales charge, although a CDSC that declines depending on the number of years a shareholder held its Class B shares may be imposed on certain redemptions of such shares made within six years of the date of purchase of such shares. Class I and Class R6 shares are offered at NAV without a sales charge. SIMPLE Class shares are currently expected to be offered at NAV without a sales charge. Depending upon eligibility, Class B shares convert to either Class A or Investor Class shares at the end of the calendar quarter eight years after the date they were purchased. In addition, depending upon eligibility, Class C shares convert to either Class A or Investor Class shares at the end of the calendar quarter ten years after the date they were purchased. Additionally,
Investor Class shares may convert automatically to Class A shares. Under certain circumstances and as may be permitted by the Trust’s multiple class plan pursuant to Rule 18f-3 under the 1940 Act, specified share classes of the Fund may be converted to one or more other share classes of the Fund as disclosed in the capital share transactions within these Notes. The classes of shares have the same voting (except for issues that relate solely to one class), dividend, liquidation and other rights, and the same terms and conditions, except that under distribution plans pursuant to Rule 12b-1 under the 1940 Act, Class B, Class C and Class C2 shares are subject to higher distribution and/or service fees than Class A, Investor Class or SIMPLE Class shares. Class I and Class R6 shares are not subject to a distribution and/or service fee.
The Fund’s investment objective is to seek current income exempt from regular federal income tax.
Note 2–Significant Accounting Policies
The Fund is an investment company and accordingly follows the investment company accounting and reporting guidance of the Financial Accounting Standards Board (“FASB”) Accounting Standard Codification Topic 946 Financial Services—Investment Companies. The Fund prepares its financial statements in accordance with generally accepted accounting principles (“GAAP”) in the United States of America and follows the significant accounting policies described below.
(A) Securities Valuation. Investments are usually valued as of the close of regular trading on the New York Stock Exchange (the “Exchange”) (usually 4:00 p.m. Eastern time) on each day the Fund is open for business (“valuation date”).
The Board of Trustees of the Trust (the “Board”) adopted procedures establishing methodologies for the valuation of the Fund’s securities and other assets and delegated the responsibility for valuation determinations under those procedures to the Valuation Committee of the Trust (the “Valuation Committee”). The procedures state that, subject to the oversight of the Board and unless otherwise noted, the responsibility for the day-to-day valuation of portfolio assets (including fair value measurements for the Fund’s assets and liabilities) rests with New York Life Investment Management LLC (“New York Life Investments” or the “Manager”), aided to whatever extent necessary by the Subadvisor (as defined in Note 3(A)). To assess the appropriateness of security valuations, the Manager, the Subadvisor or the Fund’s third-party service provider, who is subject to oversight by the Manager, regularly compares prior day prices, prices on comparable securities and the sale prices to the prior and current day prices and challenges prices with changes exceeding certain tolerance levels with third-party pricing services or broker sources.
The Board authorized the Valuation Committee to appoint a Valuation Subcommittee (the “Subcommittee”) to establish the prices of securities for which market quotations are not readily available or the prices of which are not otherwise readily determinable under the procedures. The Subcommittee meets (in person, via electronic mail or via teleconference) on an as-needed basis. The Valuation Committee meets to ensure that actions taken by the Subcommittee were appropriate.
For those securities valued through either a standardized fair valuation methodology or a fair valuation measurement, the Subcommittee deals
Notes to Financial Statements (continued)
with such valuation and the Valuation Committee reviews and affirms, if appropriate, the reasonableness of the valuation based on such methodologies and measurements on a regular basis after considering information that is reasonably available and deemed relevant by the Valuation Committee. Any action taken by the Subcommittee with respect to the valuation of a portfolio security or other asset is submitted for review and ratification (if appropriate) to the Valuation Committee and the Board at the next regularly scheduled meeting.
“Fair value” is defined as the price the Fund would reasonably expect to receive upon selling an asset or liability in an orderly transaction to an independent buyer in the principal or most advantageous market for the asset or liability. Fair value measurements are determined within a framework that establishes a three-tier hierarchy that maximizes the use of observable market data and minimizes the use of unobservable inputs to establish a classification of fair value measurements for disclosure purposes. “Inputs” refer broadly to the assumptions that market participants would use in pricing the asset or liability, including assumptions about risk, such as the risk inherent in a particular valuation technique used to measure fair value using a pricing model and/or the risk inherent in the inputs for the valuation technique. Inputs may be observable or unobservable. Observable inputs reflect the assumptions market participants would use in pricing the asset or liability based on market data obtained from sources independent of the Fund. Unobservable inputs reflect the Fund’s own assumptions about the assumptions market participants would use in pricing the asset or liability based on the information available. The inputs or methodology used for valuing assets or liabilities may not be an indication of the risks associated with investing in those assets or liabilities. The three-tier hierarchy of inputs is summarized below.
| • | | Level 1—quoted prices in active markets for an identical asset or liability |
| • | | Level 2—other significant observable inputs (including quoted prices for a similar asset or liability in active markets, interest rates and yield curves, prepayment speeds, credit risk, etc.) |
| • | | Level 3—significant unobservable inputs (including the Fund’s own assumptions about the assumptions that market participants would use in measuring fair value of an asset or liability) |
The level of an asset or liability within the fair value hierarchy is based on the lowest level of an input, both individually and in the aggregate, that is significant to the fair value measurement. The aggregate value by input level of the Fund’s assets and liabilities as of October 31, 2020, is included at the end of the Portfolio of Investments.
The Fund may use third-party vendor evaluations, whose prices may be derived from one or more of the following standard inputs, among others:
| | |
• Benchmark yields | | • Reported trades |
• Broker/dealer quotes | | • Issuer spreads |
• Two-sided markets | | • Benchmark securities |
• Bids/offers | | • Reference data (corporate actions or material event notices) |
• Industry and economic events | | • Comparable bonds |
• Monthly payment information | | |
An asset or liability for which market values cannot be measured using the methodologies described above is valued by methods deemed reasonable in good faith by the Valuation Committee, following the procedures established by the Board, to represent fair value. Under these procedures, the Fund generally uses a market-based approach which may use related or comparable assets or liabilities, recent transactions, market multiples, book values and other relevant information. The Fund may also use an income-based valuation approach in which the anticipated future cash flows of the asset or liability are discounted to calculate fair value. Discounts may also be applied due to the nature and/or duration of any restrictions on the disposition of the asset or liability. Fair value represents a good faith approximation of the value of a security. Fair value determinations involve the consideration of a number of subjective factors, an analysis of applicable facts and circumstances and the exercise of judgment. As a result, it is possible that the fair value for a security determined in good faith in accordance with the Fund’s valuation procedures may differ from valuations for the same security determined by other funds using their own valuation procedures. Although the Fund’s valuation procedures are designed to value a security at the price the Fund may reasonably expect to receive upon the security’s sale in an orderly transaction, there can be no assurance that any fair value determination thereunder would, in fact, approximate the amount that the Fund would actually realize upon the sale of the security or the price at which the security would trade if a reliable market price were readily available. During the year ended October 31, 2020, there were no material changes to the fair value methodologies.
Securities which may be valued in this manner include, but are not limited to: (i) a security for which trading has been halted or suspended; (ii) a debt security that has recently gone into default and for which there is not a current market quotation; (iii) a security of an issuer that has entered into a restructuring; (iv) a security that has been delisted from a national exchange; (v) a security for which the market price is not readily available from a third-party pricing source or, if so provided, does not, in the opinion of the Manager or the Subadvisor, reflect the security’s market value; (vi) a security subject to trading collars for which no or limited trading takes place; and (vii) a security whose principal market has been temporarily closed at a time when, under normal conditions, it would be open. Securities valued in this manner are generally categorized as Level 3 in the hierarchy. No securities held by the Fund as of October 31, 2020 were fair valued in such a manner.
Futures contracts are valued at the last posted settlement price on the market where such futures are primarily traded. Investments in mutual funds, including money market funds, are valued at their respective NAVs as of the close of the Exchange on the valuation date. These securities are generally categorized as Level 1 in the hierarchy.
Municipal debt securities are valued at the evaluated mean prices supplied by a pricing agent or broker(s) selected by the Manager, in consultation with the Subadvisor. The evaluations are market-based measurements processed through a pricing application and represents the pricing agent’s good faith determination as to what a holder may receive in an orderly transaction under market conditions. The rules-based logic utilizes valuation techniques that reflect participants’ assumptions and vary by asset class and per methodology, maximizing the use of relevant observable data including quoted prices for similar
| | |
| 52 | | MainStay MacKay Tax Free Bond Fund |
assets, benchmark yield curves and market corroborated inputs. The evaluated bid or mean prices are deemed by the Manager, in consultation with the Subadvisor, to be representative of market values, at the regular close of trading of the Exchange on each valuation date. Debt securities purchased on a delayed delivery basis are marked to market daily until settlement at the forward settlement date. Municipal debt securities are generally categorized as Level 2 in the hierarchy.
In calculating NAV, each closed end fund is valued at market value, which will generally be determined using the last reported official closing or last trading price on the exchange or market on which the security is primarily traded at the time of valuation. Price information on closed end funds is taken from the exchange where the security is primarily traded. In addition, because closed-end funds and exchange-traded funds trade on a secondary market, their shares may trade at a premium or discount to the actual net asset value of their portfolio securities and their shares may have greater volatility because of the potential lack of liquidity. These closed end funds are generally categorized as Level 1 in the hierarchy.
Temporary cash investments acquired in excess of 60 days to maturity at the time of purchase are valued using the latest bid prices or using valuations based on a matrix system (which considers such factors as security prices, yields, maturities and ratings), both as furnished by independent pricing services. Temporary cash investments that mature in 60 days or less at the time of purchase (“Short-Term Investments”) are valued using the amortized cost method of valuation, unless the use of such method would be inappropriate. The amortized cost method involves valuing a security at its cost on the date of purchase and thereafter assuming a constant amortization to maturity of the difference between such cost and the value on maturity date. Amortized cost approximates the current fair value of a security. Securities valued using the amortized cost method are not valued using quoted prices in an active market and are generally categorized as Level 2 in the hierarchy.
The information above is not intended to reflect an exhaustive list of the methodologies that may be used to value portfolio investments. The valuation procedures permit the use of a variety of valuation methodologies in connection with valuing portfolio investments. The methodology used for a specific type of investment may vary based on the market data available or other considerations. The methodologies summarized above may not represent the specific means by which portfolio investments are valued on any particular business day.
(B) Income Taxes. The Fund’s policy is to comply with the requirements of the Internal Revenue Code of 1986, as amended (the “Internal Revenue Code”), applicable to regulated investment companies and to distribute all of its taxable income to the shareholders of the Fund within the allowable time limits.
The Manager evaluates the Fund’s tax positions to determine if the tax positions taken meet the minimum recognition threshold in connection with accounting for uncertainties in income tax positions taken or expected to be taken for the purposes of measuring and recognizing tax liabilities in the financial statements. Recognition of tax benefits of an uncertain tax position is permitted only to the extent the position is “more likely than not” to be sustained assuming examination by taxing authorities. The Manager analyzed the Fund’s tax positions taken on federal, state and local income tax returns for all open tax years (for up
to three tax years) and has concluded that no provisions for federal, state and local income tax are required in the Fund’s financial statements. The Fund’s federal, state and local income tax and federal excise tax returns for tax years for which the applicable statutes of limitations have not expired are subject to examination by the Internal Revenue Service and state and local departments of revenue.
(C) Dividends and Distributions to Shareholders. Dividends and distributions are recorded on the ex-dividend date. The Fund intends to declare dividends from net investment income, if any, daily and intends to pay them at least monthly and declares and pays distributions from net realized capital gains, if any, at least annually. Unless a shareholder elects otherwise, all dividends and distributions are reinvested at NAV in the same class of shares of the Fund. Dividends and distributions to shareholders are determined in accordance with federal income tax regulations and may differ from determinations using GAAP.
(D) Security Transactions and Investment Income. The Fund records security transactions on the trade date. Realized gains and losses on security transactions are determined using the identified cost method. Interest income is accrued as earned using the effective interest rate method. Distributions received from real estate investment trusts may be classified as dividends, capital gains and/or return of capital. Discounts and premiums on securities purchased for the Fund are accreted and amortized, respectively, on the effective interest rate method.
Investment income and realized and unrealized gains and losses on investments of the Fund are allocated pro rata to the separate classes of shares based upon their relative net assets on the date the income is earned or realized and unrealized gains and losses are incurred.
The Fund may place a debt security on non-accrual status and reduce related interest income by ceasing current accruals and writing off all or a portion of any interest receivables when the collection of all or a portion of such interest has become doubtful. A debt security is removed from non-accrual status when the issuer resumes interest payments or when collectability of interest is reasonably assured.
(E) Expenses. Expenses of the Trust are allocated to the individual Funds in proportion to the net assets of the respective Funds when the expenses are incurred, except where direct allocations of expenses can be made. Expenses (other than transfer agent expenses and fees incurred under the shareholder services plans and/or the distribution plans further discussed in Note 3(B) are allocated to separate classes of shares pro rata based upon their relative net assets on the date the expenses are incurred. The expenses borne by the Fund, including those of related parties to the Fund, are shown in the Statement of Operations.
Additionally, the Fund may invest in mutual funds, which are subject to management fees and other fees that may cause the costs of investing in mutual funds to be greater than the costs of owning the underlying securities directly. These indirect expenses of mutual funds are not included in the amounts shown as expenses in the Statement of Operations or in the expense ratios included in the Financial Highlights.
(F) Use of Estimates. In preparing financial statements in conformity with GAAP, the Manager makes estimates and assumptions that
Notes to Financial Statements (continued)
affect the reported amounts and disclosures in the financial statements. Actual results could differ from those estimates and assumptions.
(G) Futures Contracts. A futures contract is an agreement to purchase or sell a specified quantity of an underlying instrument at a specified future date and price, or to make or receive a cash payment based on the value of a financial instrument (e.g., interest rate, security or securities index). The Fund is subject to risks such as market price risk and/or interest rate risk in the normal course of investing in these contracts. Upon entering into a futures contract, the Fund is required to pledge to the broker or futures commission merchant an amount of cash and/or U.S. government securities equal to a certain percentage of the collateral amount, known as the “initial margin.” During the period the futures contract is open, changes in the value of the contract are recognized as unrealized appreciation or depreciation by marking to market such contract on a daily basis to reflect the market value of the contract at the end of each day’s trading. The Fund agrees to receive from or pay to the broker or futures commission merchant an amount of cash equal to the daily fluctuation in the value of the contract. Such receipts or payments are known as “variation margin.” When the futures contract is closed, the Fund records a realized gain or loss equal to the difference between the proceeds from (or cost of) the closing transaction and the Fund’s basis in the contract.
The use of futures contracts involves, to varying degrees, elements of market risk in excess of the amount recognized in the Statement of Assets and Liabilities. The contract or notional amounts and variation margin reflect the extent of the Fund’s involvement in open futures positions. There are several risks associated with the use of futures contracts as hedging techniques. There can be no assurance that a liquid market will exist at the time when the Fund seeks to close out a futures contract. If no liquid market exists, the Fund would remain obligated to meet margin requirements until the position is closed. Futures contracts may involve a small initial investment relative to the risk assumed, which could result in losses greater than if the Fund did not invest in futures contracts. Futures contracts may be more volatile than direct investments in the instrument underlying the futures and may not correlate to the underlying instrument, causing a given hedge not to achieve its objectives. The Fund’s activities in futures contracts have minimal counterparty risk as they are conducted through regulated exchanges that guarantee the futures against default by the counterparty. In the event of a bankruptcy or insolvency of a futures commission merchant that holds margin on behalf of the Fund, the Fund may not be entitled to the return of the entire margin owed to the Fund, potentially resulting in a loss. The Fund’s investment in futures contracts and other derivatives may increase the volatility of the Fund’s NAVs and may result in a loss to the Fund. Open futures contracts held as of October 31, 2020, are shown in the Portfolio of Investments.
(H) Municipal Bond Risk. The Fund may invest more heavily in municipal bonds from certain cities, states or regions than others, which may increase the Fund’s exposure to losses resulting from economic, political, regulatory occurrences, or declines in tax revenue impacting these particular cities, states or regions. In addition, many state and municipal governments that issue securities are under significant economic and financial stress and may not be able to satisfy their obligations, and these events may be made worse due to economic challenges posed by COVID-19. The Fund may invest a substantial
amount of its assets in municipal bonds whose interest is paid solely from revenues of similar projects, such as tobacco settlement bonds. If the Fund concentrates its investments in this manner, it assumes the legal and economic risks relating to such projects and this may have a significant impact on the Fund’s investment performance.
Certain of the issuers in which the Fund may invest have recently experienced, or may experience, significant financial difficulties and repeated credit rating downgrades. On May 3, 2017, the Commonwealth of Puerto Rico began proceedings pursuant to the Puerto Rico Oversight, Management, and Economic Stability Act (“PROMESA”) to seek bankruptcy-type protections from approximately $74 billion in debt and approximately $48 billion in unfunded pension obligations. In addition, the economic downturn following the outbreak of COVID-19 and the resulting pressure on Puerto Rico’s budget have further contributed to its financial challenges. Puerto Rico has reached agreements with certain bondholders to restructure outstanding debt issued by certain of Puerto Rico’s instrumentalities and is negotiating the restructuring of its debt with certain other bondholders. Any agreement to restructure such outstanding debt must be approved by the judge overseeing the debt restructuring. Puerto Rico’s debt restructuring process and other economic, political, social, environmental or health factors or developments could occur rapidly and may significantly affect the value of municipal securities of Puerto Rico. Due to the ongoing budget impact from Covid-19 on the Commonwealth’s finances, the Federal Oversight and Management Board or the Commonwealth could seek to revise or even terminate earlier agreements reached with certain creditors prior to the outbreak of COVID-19. Any agreement between the Federal Oversight and Management Board and creditors is subject to approval by the judge overseeing the Title III proceedings. The composition of the Federal Oversight and Management Board is changing significantly due to existing members either stepping down or being replaced as the current board’s term has expired. There is no assurance that newly appointed board members will approve the restructuring agreements the prior board had negotiated.
The Fund’s vulnerability to potential losses associated with such developments may be reduced through investing in municipal securities that feature credit enhancements (such as bond insurance). The bond insurance provider pays both principal and interest when due to the bond holder. The magnitude of Puerto Rico’s debt restructuring or other adverse economic developments could pose significant strains on the ability of municipal securities insurers to meet all future claims. As of October 31, 2020, 100.0% of the Puerto Rico municipal securities held by the Fund were insured.
(I) Indemnifications. Under the Trust’s organizational documents, its officers and trustees are indemnified against certain liabilities that may arise out of performance of their duties to the Trust. Additionally, in the normal course of business, the Fund enters into contracts with third-party service providers that contain a variety of representations and warranties and that may provide general indemnifications. The Fund’s maximum exposure under these arrangements is unknown, as this would involve future claims that may be made against the Fund that have not yet occurred. The Manager believes that the risk of loss in connection with these potential indemnification obligations is remote. However, there can be no assurance that material liabilities related to such obligations will not arise in the future, which could adversely impact the Fund.
| | |
| 54 | | MainStay MacKay Tax Free Bond Fund |
(J) Quantitative Disclosure of Derivative Holdings. The following tables show additional disclosures related to the Fund’s derivative and hedging activities, including how such activities are accounted for and their effect on the Fund’s financial positions, performance and cash flows. The Fund entered into futures contracts to help manage the duration and yield curve positioning of the portfolio. These derivatives are not accounted for as hedging instruments.
Fair value of derivative instruments as of October 31, 2020:
| | | | | | | | |
Asset Derivatives | | Interest
Rate
Contracts
Risk | | | Total | |
| | |
Futures Contracts—Net Assets—Net unrealized appreciation on investments and futures contracts (a) | | $ | 2,823,739 | | | $ | 2,823,739 | |
| | | | | | | | |
Total Fair Value | | $ | 2,823,739 | | | $ | 2,823,739 | |
| | | | | | | | |
| (a) | Includes cumulative appreciation (depreciation) of futures contracts as reported in the Portfolio of Investments. Only current day’s variation margin is reported within the Statement of Assets and Liabilities. |
The effect of derivative instruments on the Statement of Operations for the year ended October 31, 2020:
| | | | | | | | |
Net Realized Gain (Loss) from: | | Interest
Rate
Contracts
Risk | | | Total | |
| | |
Futures Contracts | | $ | (9,530,765 | ) | | $ | (9,530,765 | ) |
| | | | | | | | |
Total Net Realized Gain (Loss) | | $ | (9,530,765 | ) | | $ | (9,530,765 | ) |
| | | | | | | | |
| | | | | | | | |
Net Change in Unrealized Appreciation
(Depreciation) from: | | Interest
Rate
Contracts
Risk | | | Total | |
| | |
Futures Contracts | | $ | 31,465 | | | $ | 31,465 | |
| | | | | | | | |
Total Net Change in Unrealized Appreciation (Depreciation) | | $ | 31,465 | | | $ | 31,465 | |
| | | | | | | | |
| | | | | | | | |
Average Notional Amount | | Interest
Rate
Contracts
Risk | | | Total | |
| | |
Futures Contracts Short | | $ | (388,804,891 | ) | | $ | (388,804,891 | ) |
| | | | | | | | |
Note 3–Fees and Related Party Transactions
(A) Manager and Subadvisor. New York Life Investments, a registered investment adviser and an indirect, wholly-owned subsidiary of New York Life Insurance Company (“New York Life”), serves as the Fund’s Manager, pursuant to an Amended and Restated Management Agreement (“Management Agreement”). The Manager provides offices, conducts clerical, recordkeeping and bookkeeping services and keeps most of the financial and accounting records required to be maintained by the Fund. Except for the portion of salaries and expenses that are the responsibility of the Fund, the Manager pays the salaries and expenses of all personnel affiliated with the Fund and certain operational expenses of the Fund. The Fund reimburses New York Life Investments in an
amount equal to the portion of the compensation of the Chief Compliance Officer attributable to the Fund. MacKay Shields LLC (“MacKay Shields” or the “Subadvisor”), a registered investment adviser and an indirect, wholly-owned subsidiary of New York Life, serves as Subadvisor to the Fund and is responsible for the day-to-day portfolio management of the Fund. Pursuant to the terms of an Amended and Restated Subadvisory Agreement (“Subadvisory Agreement”) between New York Life Investments and MacKay Shields, New York Life Investments pays for the services of the Subadvisor.
Pursuant to the Management Agreement, the Fund pays the Manager a monthly fee for the services performed and the facilities furnished at an annual rate of the Fund’s average daily net assets as follows: 0.45% up to $500 million; 0.425% from $500 million to $1 billion; 0.40% from $1 billion to $5 billion; and 0.39% in excess of $5 billion plus a fee for fund accounting services, previously provided by New York Life Investments under a separate fund accounting agreement, furnished at an annual rate of the Fund’s average daily net assets as follows: 0.05% up to $20 million; 0.0333% from $20 million to $100 million; and 0.01% in excess of $100 million.
During the year ended October 31, 2020, the effective management fee rate (exclusive of any applicable waivers/reimbursements) was 0.41% inclusive of a fee for fund accounting services of 0.01% of the Fund’s average daily net assets.
New York Life Investments has contractually agreed to waive fees and/or reimburse expenses so that Total Annual Fund Operating Expenses (excluding taxes, interest, litigation, extraordinary expenses, brokerage and other transaction expenses relating to the purchase or sale of portfolio investments and acquired (underlying) fund fees and expenses) for Class A shares do not exceed 0.82% of the Fund’s average daily net assets. New York Life Investments will apply an equivalent waiver or reimbursement, in an equal number of basis points, to the other share classes of the Fund, except for Class R6. New York Life Investments has also contractually agreed to waive fees and/or reimburse expenses so that Total Annual Fund Operating Expenses (excluding taxes, interest, litigation, extraordinary expenses, brokerage and other transaction expenses relating to the purchase or sale of portfolio investments, and acquired (underlying) fund fees and expenses) of Class R6 do not exceed those of Class I. These agreements will remain in effect until August 31, 2021, and shall renew automatically for one year terms unless New York Life Investments provides written notice of termination prior to the start of the next term or upon approval by the Board.
During the year ended October 31, 2020, New York Life Investments earned fees from the Fund in the amount of $25,489,278 and paid the Subadvisor in the amount of $12,423,950.
State Street provides sub-administration and sub-accounting services to the Fund pursuant to an agreement with New York Life Investments (See Note 12 for sub-administration and sub-accounting service provider change). These services include calculating the daily NAVs of the Fund, maintaining the general ledger and sub-ledger accounts for the calculation of the Fund’s NAVs and assisting New York Life Investments in conducting various aspects of the Fund’s administrative operations. For providing these services to the Fund, State Street is compensated by New York Life Investments.
Pursuant to an agreement between the Trust and New York Life Investments, New York Life Investments is responsible for providing or
Notes to Financial Statements (continued)
procuring certain regulatory reporting services for the Fund. The Fund will reimburse New York Life Investments for the actual costs incurred by New York Life Investments in connection with providing or procuring these services for the Fund.
(B) Distribution and Service Fees. The Trust, on behalf of the Fund, has entered into a distribution agreement with NYLIFE Distributors LLC (the “Distributor”), an affiliate of New York Life Investments. The Fund has adopted distribution plans (the “Plans”) in accordance with the provisions of Rule 12b-1 under the 1940 Act.
Pursuant to the Class A and Investor Class Plans, the Distributor receives a monthly distribution fee from the Class A and Investor Class shares at an annual rate of 0.25% of the average daily net assets of the Class A and Investor Class shares for distribution and/or service activities as designated by the Distributor. Pursuant to the Class B and Class C Plans, Class B and Class C shares pay the Distributor a monthly distribution fee at an annual rate of 0.25% of the average daily net assets of the Class B and Class C shares along with a service fee at an annual rate of 0.25% of the average daily net assets of the Class B and Class C shares, for a total 12b-1 fee of 0.50%. Pursuant to the Class C2 Plan, Class C2 shares pay the Distributor a monthly distribution fee at an annual rate of 0.40% of the average daily net assets of the Class C2 shares, along with a service fee at an annual rate of 0.25% of the average daily net assets of the Class C shares, for a total 12b-1 fee of 0.65%. Class I and Class R6 shares are not subject to a distribution and/or service fee.
The Plans provide that the distribution and service fees are payable to the Distributor regardless of the amounts actually expended by the Distributor for distribution of the Fund’s shares and service activities.
(C) Sales Charges. The Fund was advised by the Distributor that the amount of initial sales charges retained on sales of Class A and Investor Class shares during the year ended October 31, 2020, were $68,693 and $4,037, respectively.
The Fund was also advised that the Distributor retained CDSCs on redemptions of Class A, Class B and Class C shares during the year ended October 31, 2020, of $243,743, $19,389 and $32,591, respectively.
(D) Transfer, Dividend Disbursing and Shareholder Servicing Agent. NYLIM Service Company LLC, an affiliate of New York Life Investments, is the Fund’s transfer, dividend disbursing and shareholder servicing agent pursuant to an agreement between NYLIM Service Company LLC and the Trust. NYLIM Service Company LLC has entered into an agreement with DST Asset Manager Solutions, Inc. (“DST”), pursuant to which DST performs certain transfer agent services on behalf of NYLIM Service Company LLC. New York Life Investments has contractually agreed to limit the transfer agency expenses charged to the Fund’s share classes to a maximum of 0.35% of that share class’s average daily net assets on an annual basis after deducting any applicable Fund or class-level expense reimbursement or small account fees. This agreement will remain in effect until August 31, 2021 for Class C2 shares and February 28, 2021 for all other share classes, and shall renew automatically for one-year terms unless New York Life Investments provides written notice of termination prior to the start of the next term or upon approval of the Board. During the year ended October 31, 2020, transfer agent expenses incurred by the Fund and
any reimbursements, pursuant to the aforementioned Transfer Agency expense limitation agreement, were as follows:
| | | | | | | | |
Class | | Expense | | | Waived | |
Class A | | $ | 1,394,202 | | | $ | — | |
Investor Class | | | 7,019 | | | | — | |
Class B | | | 8,360 | | | | — | |
Class C | | | 166,901 | | | | — | |
Class C2 | | | 13 | | | | — | |
Class I | | | 2,045,027 | | | | — | |
Class R6 | | | 4,142 | | | | — | |
(E) Small Account Fee. Shareholders with small accounts adversely impact the cost of providing transfer agency services. In an effort to reduce total transfer agency expenses, the Fund has implemented a small account fee on certain types of accounts. As described in the Fund’s prospectus, certain shareholders with an account balance of less than $1,000 ($5,000 for Class A share accounts) are charged an annual per account fee of $20 (assessed semi-annually), the proceeds from which offset transfer agent fees as reflected in the Statement of Operations. This small account fee will not apply to certain types of accounts as described further in the Fund’s prospectus.
(F) Capital. As of October 31, 2020, New York Life and its affiliates beneficially held shares of the Fund with the values and percentages of net assets as follows:
| | | | | | | | |
| | |
Class C2 | | $ | 24,829 | | | | 9.9 | % |
Class R6 | | | 25,927 | | | | 0.0 | ‡ |
Note 4–Federal Income Tax
As of October 31, 2020, the cost and unrealized appreciation (depreciation) of the Fund’s investment portfolio, including applicable derivative contracts and other financial instruments, as determined on a federal income tax basis, were as follows:
| | | | | | | | | | | | | | | | |
| | | Federal Tax
Cost | | | Gross
Unrealized
Appreciation | | | Gross
Unrealized
(Depreciation) | | | Net
Unrealized
Appreciation/
(Depreciation) | |
| | | | |
Investments
in Securities | | $ | 7,149,820,906 | | | $ | 299,415,162 | | | $ | (28,763,111 | ) | | $ | 270,652,051 | |
As of October 31, 2020, the components of accumulated gain (loss) on a tax basis were as follows:
| | | | | | | | | | | | | | | | | | | | |
Ordinary
Income | | Undistributed
Tax Exempt
Income | | | Accumulated
Capital and
Other Gain
(Loss) | | | Other
Temporary
Differences | | | Unrealized
Appreciation
(Depreciation) | | | Total
Accumulated
Gain (Loss) | |
| $ — | | $ | 3,735,747 | | | $ | (24,598,626 | ) | | $ | (4,327,406 | ) | | $ | 223,893,452 | | | $ | 198,703,167 | |
The difference between book-basis and tax-basis unrealized appreciation (depreciation) is primarily due to mark to market of futures contracts and cumulative bond amortization adjustments. The other temporary differences are primarily due to dividends payable and wash sales.
| | |
| 56 | | MainStay MacKay Tax Free Bond Fund |
As of October 31, 2020, for federal income tax purposes, capital loss carryforwards of $24,598,626 were available as shown in the table below, to the extent provided by the regulations to offset future realized gains of the Fund through the years indicated. To the extent that these capital loss carryforwards are used to offset future capital gains, it is probable that the capital gains so offset will not be distributed to shareholders. No capital gain distributions shall be made until any capital loss carryforwards have been fully utilized.
| | | | |
Capital Loss
Available Through | | Short-Term
Capital Loss
Amounts (000’s) | | Long-Term
Capital Loss
Amounts (000’s) |
| | |
| Unlimited | | $24,599 | | $ — |
During the years ended October 31, 2020, and October 31, 2019, the tax character of distributions paid as reflected in the Statements of Changes in Net Assets were as follows:
| | | | | | | | |
| | | 2020 | | | 2019 | |
| | |
Distributions paid from: | | | | | | | | |
Ordinary Income | | $ | 322,848 | | | $ | 316,849 | |
Exempt Interest Dividends | | | 168,650,486 | | | | 114,793,846 | |
Total | | $ | 168,973,334 | | | $ | 115,110,695 | |
Note 5–Custodian
State Street is the custodian of cash and securities held by the Fund (See Note 12 for custodian change). Custodial fees are charged to the Fund based on the Fund’s net assets and/or the market value of securities held by the Fund and the number of certain transactions incurred by the Fund.
Note 6–Line of Credit
The Fund and certain other funds managed by New York Life Investments maintain a line of credit with a syndicate of banks in order to secure a source of funds for temporary purposes to meet unanticipated or excessive redemption requests.
Effective July 28, 2020, under the credit agreement (the “Credit Agreement”), the aggregate commitment amount is $600,000,000 with an additional uncommitted amount of $100,000,000. The commitment fee is an annual rate of 0.15% of the average commitment amount payable quarterly, regardless of usage, to JPMorgan Chase Bank NA, who serves as the agent to the syndicate. The commitment fee is allocated among the Fund and certain other funds managed by New York Life Investments based upon their respective net assets and other factors. Interest on any revolving credit loan is charged based upon the Federal Funds Rate or the one-month London Interbank Offered Rate (“LIBOR”), whichever is higher. The Credit Agreement expires on July 27, 2021, although the Fund, certain other funds managed by New York Life Investments and the syndicate of banks may renew the Credit Agreement for an additional year on the same or different terms or enter into a credit agreement with a different syndicate of banks. Prior to July 28, 2020, the aggregate commitment amount and the commitment fee were the same as those under the current Credit Agreement, but State Street served as agent to the syndicate. During the year ended October 31, 2020, there were no borrowings made or outstanding with respect to the Fund under the Credit Agreement or the credit agreement for which State Street served as agent.
Note 7–Interfund Lending Program
Pursuant to an exemptive order issued by the SEC, the Fund, along with certain other funds managed by New York Life Investments, may participate in an interfund lending program. The interfund lending program provides an alternative credit facility that permits the Fund and certain other funds managed by New York Life Investments to lend or borrow money for temporary purposes directly to or from one another subject to the conditions of the exemptive order. During the year ended October 31, 2020, there were no interfund loans made or outstanding with respect to the Fund.
Note 8–Purchases and Sales of Securities (in 000’s)
During the year ended October 31, 2020, purchases and sales of securities, other than short-term securities, were $6,700,424 and $4,258,749, respectively.
Note 9–Capital Share Transactions
Transactions in capital shares for the years ended October 31, 2020, and October 31, 2019, were as follows:
| | | | | | | | |
Class A | | Shares | | | Amount | |
| | |
Year ended October 31, 2020: | | | | | | | | |
Shares sold | | | 157,611,398 | | | $ | 1,621,322,710 | |
Shares issued to shareholders in reinvestment of distributions | | | 5,260,382 | | | | 54,696,460 | |
Shares redeemed | | | (73,877,620 | ) | | | (761,621,950 | ) |
| | | | |
Net increase (decrease) in shares outstanding before conversion | | | 88,994,160 | | | | 914,397,220 | |
Shares converted into Class A (See Note 1) | | | 541,773 | | | | 5,625,267 | |
Shares converted from Class A (See Note 1) | | | (472,247 | ) | | | (4,948,405 | ) |
| | | | |
Net increase (decrease) | | | 89,063,686 | | | $ | 915,074,082 | |
| | | | |
Year ended October 31, 2019: | | | | | | | | |
Shares sold | | | 53,958,287 | | | $ | 549,133,349 | |
Shares issued to shareholders in reinvestment of distributions | | | 3,742,394 | | | | 37,953,702 | |
Shares redeemed | | | (34,141,572 | ) | | | (342,393,081 | ) |
| | | | |
Net increase (decrease) in shares outstanding before conversion | | | 23,559,109 | | | | 244,693,970 | |
Shares converted into Class A (See Note 1) | | | 340,145 | | | | 3,445,378 | |
Shares converted from Class A (See Note 1) | | | (91,670 | ) | | | (936,239 | ) |
| | | | |
Net increase (decrease) | | | 23,807,584 | | | $ | 247,203,109 | |
| | | | |
Notes to Financial Statements (continued)
| | | | | | | | |
Investor Class | | Shares | | | Amount | |
| | |
Year ended October 31, 2020: | | | | | | | | |
Shares sold | | | 218,794 | | | $ | 2,273,329 | |
Shares issued to shareholders in reinvestment of distributions | | | 22,612 | | | | 236,084 | |
Shares redeemed | | | (114,676 | ) | | | (1,193,871 | ) |
| | | | |
Net increase (decrease) in shares outstanding before conversion | | | 126,730 | | | | 1,315,542 | |
Shares converted into Investor Class (See Note 1) | | | 39,045 | | | | 407,397 | |
Shares converted from Investor Class (See Note 1) | | | (221,001 | ) | | | (2,293,359 | ) |
| | | | |
Net increase (decrease) | | | (55,226 | ) | | $ | (570,420 | ) |
| | | | |
Year ended October 31, 2019: | | | | | | | | |
Shares sold | | | 165,195 | | | $ | 1,687,358 | |
Shares issued to shareholders in reinvestment of distributions | | | 26,056 | | | | 265,116 | |
Shares redeemed | | | (113,885 | ) | | | (1,158,170 | ) |
| | | | |
Net increase (decrease) in shares outstanding before conversion | | | 77,366 | | | | 794,304 | |
Shares converted into Investor Class (See Note 1) | | | 71,731 | | | | 734,316 | |
Shares converted from Investor Class (See Note 1) | | | (188,084 | ) | | | (1,918,730 | ) |
| | | | |
Net increase (decrease) | | | (38,987 | ) | | $ | (390,110 | ) |
| | | | |
|
| |
Class B | | Shares | | | Amount | |
| | |
Year ended October 31, 2020: | | | | | | | | |
Shares sold | | | 253,107 | | | $ | 2,612,189 | |
Shares issued to shareholders in reinvestment of distributions | | | 24,633 | | | | 255,982 | |
Shares redeemed | | | (546,601 | ) | | | (5,546,225 | ) |
| | | | |
Net increase (decrease) in shares outstanding before conversion | | | (268,861 | ) | | | (2,678,054 | ) |
Shares converted from Class B (See Note 1) | | | (36,760 | ) | | | (381,759 | ) |
| | | | |
Net increase (decrease) | | | (305,621 | ) | | $ | (3,059,813 | ) |
| | | | |
Year ended October 31, 2019: | | | | | | | | |
Shares sold | | | 129,834 | | | $ | 1,308,467 | |
Shares issued to shareholders in reinvestment of distributions | | | 33,382 | | | | 337,837 | |
Shares redeemed | | | (438,612 | ) | | | (4,424,630 | ) |
| | | | |
Net increase (decrease) in shares outstanding before conversion | | | (275,396 | ) | | | (2,778,326 | ) |
Shares converted from Class B (See Note 1) | | | (29,908 | ) | | | (303,895 | ) |
| | | | |
Net increase (decrease) | | | (305,304 | ) | | $ | (3,082,221 | ) |
| | | | |
|
| |
| | | | | | | | |
Class C | | Shares | | | Amount | |
| | |
Year ended October 31, 2020: | | | | | | | | |
Shares sold | | | 6,054,077 | | | $ | 62,779,856 | |
Shares issued to shareholders in reinvestment of distributions | | | 382,748 | | | | 3,980,400 | |
Shares redeemed | | | (6,954,302 | ) | | | (72,186,731 | ) |
| | | | |
Net increase (decrease) in shares outstanding before conversion | | | (517,477 | ) | | | (5,426,475 | ) |
Shares converted from Class C (See Note 1) | | | (230,958 | ) | | | (2,395,190 | ) |
| | | | |
Net increase (decrease) | | | (748,435 | ) | | $ | (7,821,665 | ) |
| | | | |
Year ended October 31, 2019: | | | | | | | | |
Shares sold | | | 5,430,844 | | | $ | 54,932,748 | |
Shares issued to shareholders in reinvestment of distributions | | | 440,074 | | | | 4,460,962 | |
Shares redeemed | | | (5,711,197 | ) | | | (58,029,277 | ) |
| | | | |
Net increase (decrease) in shares outstanding before conversion | | | 159,721 | | | | 1,364,433 | |
Shares converted from Class C (See Note 1) | | | (141,573 | ) | | | (1,426,691 | ) |
| | | | |
Net increase (decrease) | | | 18,148 | | | $ | (62,258 | ) |
| | | | |
|
| |
Class C2 | | Shares | | | Amount | |
| | |
Period ended October 31, 2020 (a): | | | | | | | | |
Shares sold | | | 23,999 | | | $ | 250,964 | |
Shares issued to shareholders in reinvestment of distributions | | | 28 | | | | 295 | |
Shares redeemed | | | (0 | )‡ | | | (5 | ) |
| | | | |
Net increase (decrease) | | | 24,027 | | | $ | 251,254 | |
| | | | |
| | |
| | | | | | | | |
Class I | | Shares | | | Amount | |
| | |
Year ended October 31, 2020: | | | | | | | | |
Shares sold | | | 229,489,098 | | | $ | 2,384,123,938 | |
Shares issued to shareholders in reinvestment of distributions | | | 6,061,484 | | | | 63,084,471 | |
Shares redeemed | | | (84,329,184 | ) | | | (869,303,407 | ) |
| | | | |
Net increase in shares outstanding before conversion | | | 151,221,398 | | | | 1,577,905,002 | |
Shares converted into Class I (See Note 1) | | | 459,012 | | | | 4,807,540 | |
Shares converted from Class I (See Note 1) | | | (4,502,591 | ) | | | (47,113,382 | ) |
| | | | |
Net increase (decrease) | | | 147,177,819 | | | $ | 1,535,599,160 | |
| | | | |
Year ended October 31, 2019: | | | | | | | | |
Shares sold | | | 179,763,292 | | | $ | 1,818,673,906 | |
Shares issued to shareholders in reinvestment of distributions | | | 3,761,656 | | | | 38,392,984 | |
Shares redeemed | | | (40,947,185 | ) | | | (413,342,539 | ) |
| | | | |
Net increase (decrease) in shares outstanding before conversion | | | 142,577,763 | | | | 1,443,724,351 | |
Shares converted into Class I (See Note 1) | | | 39,940 | | | | 405,861 | |
| | | | |
Net increase (decrease) | | | 142,617,703 | | | $ | 1,444,130,212 | |
| | | | |
|
| |
| | |
| 58 | | MainStay MacKay Tax Free Bond Fund |
| | | | | | | | |
Class R6 | | Shares | | | Amount | |
| | |
Year ended October 31, 2020 (b): | | | | | | | | |
Shares sold | | | 18,912,996 | | | $ | 192,021,851 | |
Shares issued to shareholders in reinvestment of distributions | | | 2,153 | | | | 22,367 | |
Shares redeemed | | | (4,398,883 | ) | | | (44,684,665 | ) |
| | | | |
Net increase (decrease) in shares outstanding before conversion | | | 14,516,266 | | | | 147,359,553 | |
Shares converted into Class R6 (See Note 1) | | | 4,510,631 | | | | 47,243,588 | |
Shares converted from Class R6 (See Note 1) | | | (90,301 | ) | | | (951,697 | ) |
| | | | |
Net increase (decrease) | | | 18,936,596 | | | $ | 193,651,444 | |
| | | | |
| ‡ | Less than one cent per share. |
| (a) | The inception date of the class was August 31, 2020. |
| (b) | The inception date of the class was November 1, 2019. |
Note 10–Recent Accounting Pronouncement
To improve the effectiveness of fair value disclosure requirements, the Financial Accounting Standards Board issued Accounting Standards Update 2018-13, Fair Value Measurement Disclosure Framework— Changes to the Disclosure Requirements for Fair Value Measurement (“ASU 2018-13”), which adds, removes, and modifies certain fair value measurement disclosure requirements. ASU 2018-13 is effective for interim and annual reporting periods beginning after December 15, 2019. The Manager evaluated the implications of certain provisions of ASU 2018-13 and determined to early adopt aspects related to the removal and modifications of certain fair value measurement disclosures, which are currently in place as of October 31, 2020. The Manager is evaluating the implications of certain other provisions of ASU 2018-13 related to new disclosure requirements and has not yet determined the impact of those provisions on the financial statement disclosures, if any.
In March 2020, the Financial Accounting Standards Board (“FASB”) issued Accounting Standards Update 2020-04 (“ASU 2020-04”), which
provides optional guidance to ease the potential accounting burden associated with transitioning away from LIBOR and other reference rates that are expected to be discontinued. ASU 2020-04 is effective immediately upon release of the update on March 12, 2020, through December 31, 2022. At this time, the Manager is evaluating the implications of certain other provisions of ASU 2020-04 related to new disclosure requirements and any impact on the financial statement disclosures has not yet been determined.
Note 11–Other Matters
An outbreak of COVID-19, first detected in December 2019, has developed into a global pandemic and has resulted in travel restrictions, closure of international borders, certain businesses and securities markets, restrictions on securities trading activities, prolonged quarantines, supply chain disruptions, and lower consumer demand, as well as general concern and uncertainty. The continued impact of COVID-19 is uncertain and could further adversely affect the global economy, national economies, individual issuers and capital markets in unforeseeable ways and result in a substantial and extended economic downturn. Developments that disrupt global economies and financial markets, such as COVID-19, may magnify factors that affect the Fund’s performance.
Note 12–Subsequent Events
In connection with the preparation of the financial statements of the Fund as of and for the year ended October 31, 2020, events and transactions subsequent to October 31, 2020, through the date the financial statements were issued have been evaluated by the Manager, for possible adjustment and/or disclosure. No subsequent events requiring financial statement adjustment or disclosure have been identified other than the following:
Effective at the close of business on November 20, 2020, all services provided by State Street were transitioned to JPMorgan Chase Bank, N.A.
Report of Independent Registered Public Accounting Firm
To the Shareholders of the Fund and Board of Trustees
The MainStay Funds:
Opinion on the Financial Statements
We have audited the accompanying statement of assets and liabilities of MainStay MacKay Tax Free Bond Fund (the Fund), one of the funds constituting The MainStay Funds, including the portfolio of investments, as of October 31, 2020, the related statement of operations for the year then ended, the statements of changes in net assets for each of the years in the two-year period then ended, and the related notes (collectively, the financial statements) and the financial highlights for each of the years or periods in the five-year period then ended. In our opinion, the financial statements and financial highlights present fairly, in all material respects, the financial position of the Fund as of October 31, 2020, the results of its operations for the year then ended, the changes in its net assets for each of the years in the two-year period then ended, and the financial highlights for each of the years or periods in the five-year period then ended, in conformity with U.S. generally accepted accounting principles.
Basis for Opinion
These financial statements and financial highlights are the responsibility of the Fund’s management. Our responsibility is to express an opinion on these financial statements and financial highlights based on our audits. We are a public accounting firm registered with the Public Company Accounting Oversight Board (United States) (PCAOB) and are required to be independent with respect to the Fund in accordance with the U.S. federal securities laws and the applicable rules and regulations of the Securities and Exchange Commission and the PCAOB.
We conducted our audits in accordance with the standards of the PCAOB. Those standards require that we plan and perform the audit to obtain reasonable assurance about whether the financial statements and financial highlights are free of material misstatement, whether due to error or fraud. Our audits included performing procedures to assess the risks of material misstatement of the financial statements and financial highlights, whether due to error or fraud, and performing procedures that respond to those risks. Such procedures included examining, on a test basis, evidence regarding the amounts and disclosures in the financial statements and financial highlights. Such procedures also included confirmation of securities owned as of October 31, 2020, by correspondence with the custodian and brokers or by other appropriate auditing procedures when replies from brokers were not received. Our audits also included evaluating the accounting principles used and significant estimates made by management, as well as evaluating the overall presentation of the financial statements and financial highlights. We believe that our audits provide a reasonable basis for our opinion.

We have served as the auditor of one or more New York Life Investment Management investment companies since 2003.
Philadelphia, Pennsylvania
December 23, 2020
| | |
| 60 | | MainStay MacKay Tax Free Bond Fund |
Federal Income Tax Information
(Unaudited)
The Fund is required under the Internal Revenue Code to advise shareholders in a written statement as to the federal tax status of dividends paid by the Fund during such fiscal years.
For Federal individual income tax purposes, the Fund designated 99.8% of the ordinary income dividends paid during its fiscal year ended October 31, 2020 as attributable to interest income from Tax Exempt Municipal Bonds. Such dividends are currently exempt from Federal income taxes under Section 103(a) of the Internal Revenue Code.
In February 2021, shareholders will receive an IRS Form 1099-DIV or substitute Form 1099, which will show the federal tax status of the distributions received by shareholders in calendar year 2020. The amounts that will be reported on such 1099-DIV or substitute Form 1099 will be the amounts you are to use on your federal income tax return and will differ from the amounts reported for the Fund’s fiscal year ended October 31, 2020.
Proxy Voting Policies and Procedures and Proxy Voting Record
A description of the policies and procedures that New York Life Investments uses to vote proxies related to the Fund’s securities is available free of charge upon request, by visiting the MainStay Funds’ website at newyorklifeinvestments.com or visiting the SEC’s website at www.sec.gov.
The Fund is required to file with the SEC its proxy voting records for the 12-month period ending June 30 on Form N-PX. The most recent Form N-PX or proxy voting record is available free of charge upon request by calling 800-624-6782; visiting the MainStay Funds’ website at newyorklifeinvestments.com; or visiting the SEC’s website at www.sec.gov.
Shareholder Reports and Quarterly Portfolio Disclosure
The Fund is required to file its complete schedule of portfolio holdings with the SEC 60 days after its first and third fiscal quarter on Form N-PORT. The Fund’s holdings report is available free of charge by visiting the SEC’s website at www.sec.gov or upon request by calling New York Life Investments at 800-624-6782.
Board of Trustees and Officers (Unaudited)
The Trustees and officers of the Funds are listed below. The Board oversees the MainStay Group of Funds (which consists of MainStay Funds and MainStay Funds Trust), MainStay VP Funds Trust, MainStay MacKay DefinedTerm Municipal Opportunities Fund, the Manager and the Subadvisors, and elects the officers of the Funds who are responsible for the day-to-day operations of the Funds. Information pertaining to the Trustees and officers is set forth below. Each Trustee serves until his or her successor is elected and qualified or until his or her
resignation, death or removal. Under the Board’s retirement policy, unless an exception is made, a Trustee must tender his or her resignation by the end of the calendar year during which he or she reaches the age of 75. Officers are elected annually by the Board. The business address of each Trustee and officer listed below is 51 Madison Avenue, New York, New York 10010. A majority of the Trustees are not “interested persons” (as defined by the 1940 Act and rules adopted by the SEC thereunder) of the Fund (“Independent Trustees”).
| | | | | | | | | | | | |
| | | | | Name and
Year of Birth | | Term of Office,
Position(s) Held and
Length of Service | | Principal Occupation(s)
During Past Five Years | | Number of
Portfolios in
Fund Complex
Overseen by
Trustee | | Other Directorships
Held by Trustee |
Interested Trustee | | | | Yie-Hsin Hung* 1962 | | MainStay Funds:
Trustee since 2017 MainStay Funds Trust:
Trustee since 2017 | | Senior Vice President of New York Life since joining in 2010, Member of the Executive Management Committee since 2017, Chief Executive Officer, New York Life Investment Management Holdings LLC & New York Life Investment Management LLC since 2015. Senior Managing Director and Co-President of New York Life Investment Management LLC from 2014 to May 2015. Previously held positions of increasing responsibility, including head of NYLIM International, Alternative Growth Businesses, and Institutional investments since joining New York Life in 2010. | | 78 | | MainStay VP Funds Trust:
Trustee since 2017 (31 portfolios); and
MainStay MacKay DefinedTerm Municipal Opportunities Fund: Trustee since 2017. |
| | * | This Trustee is considered to be an “interested person” of the MainStay Group of Funds, MainStay VP Funds Trust and MainStay MacKay DefinedTerm Municipal Opportunities Fund, within the meaning of the 1940 Act because of her affiliation with New York Life Insurance Company, New York Life Investment Management LLC, Candriam Belgium S.A., Candriam Luxembourg S.C.A., IndexIQ Advisors LLC, MacKay Shields LLC, NYL Investors LLC, NYLIFE Securities LLC and/or NYLIFE Distributors LLC, as described in detail above in the column entitled “Principal Occupation(s) During Past Five Years.” |
| | |
| 62 | | MainStay MacKay Tax Free Bond Fund |
| | | | | | | | | | | | |
| | | | | Name and
Year of Birth | | Term of Office,
Position(s) Held and
Length of Service | | Principal Occupation(s)
During Past Five Years | | Number of
Portfolios in
Fund Complex
Overseen by
Trustee | | Other Directorships
Held by Trustee |
Independent Trustees | | | | David H. Chow 1957 | | MainStay Funds:
Trustee since 2016, Advisory Board Member (June 2015 to December 2015); MainStay Funds Trust:
Trustee since 2016, Advisory Board Member (June 2015 to December 2015). | | Founder and CEO, DanCourt Management, LLC since 1999 | | 78 | | MainStay VP Funds Trust: Trustee since 2016, Advisory Board Member (June 2015 to December 2015) (31 portfolios);
MainStay MacKay DefinedTerm Municipal Opportunities Fund: Trustee since 2016, Advisory Board Member (June 2015 to December 2015); Market Vectors Group of Exchange-Traded Funds: Independent Chairman of the Board of Trustees since 2008 and Trustee since 2006 (56 portfolios); and
Berea College of Kentucky: Trustee since 2009, Chair of the Investment Committee since 2018. |
| | | | Susan B. Kerley 1951 | | MainStay Funds:
Chairman since 2017 and Trustee since 2007; MainStay Funds Trust: Chairman since 2017 and Trustee since 1990.** | | President, Strategic Management Advisors LLC since 1990 | | 78 | | MainStay VP Funds Trust: Chairman since 2017 and Trustee since 2007 (31 portfolios)***;
MainStay MacKay DefinedTerm Municipal Opportunities Fund: Chairman since 2017 and Trustee since 2011; and
Legg Mason Partners Funds: Trustee since 1991 (45 portfolios). |
| | | | Alan R. Latshaw 1951 | | MainStay Funds:
Trustee; MainStay Funds Trust:
Trustee and Audit Committee Financial Expert since 2007.** | | Retired; Partner, Ernst & Young LLP (2002 to 2003); Partner, Arthur Andersen LLP (1989 to 2002); Consultant to the MainStay Funds Audit and Compliance Committee (2004 to 2006) | | 78 | | MainStay VP Funds Trust: Trustee and Audit Committee Financial Expert since 2007 (31 portfolios)***;
MainStay MacKay DefinedTerm Municipal Opportunities Fund: Trustee and Audit Committee Financial Expert since 2011; and
State Farm Associates Funds Trusts: Trustee since 2005 (4 portfolios). |
| | | | Richard H. Nolan, Jr. 1946 | | MainStay Funds:
Trustee since 2007; MainStay Funds Trust:
Trustee since 2007.** | | Managing Director, ICC Capital Management since 2004; President—Shields/Alliance, Alliance Capital Management (1994 to 2004) | | 78 | | MainStay VP Funds Trust: Trustee since 2006 (31 portfolios)***; and
MainStay MacKay DefinedTerm Municipal Opportunities Fund: Trustee since 2011. |
| | | | Jacques P. Perold 1958 | | MainStay Funds:
Trustee since 2016, Advisory Board Member (June 2015 to December 2015); MainStay Funds Trust:
Trustee since 2016, Advisory Board Member (June 2015 to December 2015). | | Founder and Chief Executive Officer, CapShift LLC since 2018; President, Fidelity Management & Research Company (2009 to 2014); Founder, President and Chief Executive Officer, Geode Capital Management, LLC (2001 to 2009) | | 78 | | MainStay VP Funds Trust: Trustee since 2016, Advisory Board Member (June 2015 to December 2015) (31 portfolios);
MainStay MacKay DefinedTerm Municipal Opportunities Fund: Trustee since 2016, Advisory Board Member (June 2015 to December 2015); Partners in Health: Trustee since 2019; Allstate Corporation: Director since 2015;
MSCI, Inc.: and Director since 2017. |
Board of Trustees and Officers (Unaudited) (continued)
| | | | | | | | | | | | |
| | | | | Name and
Year of Birth | | Term of Office,
Position(s) Held and
Length of Service | | Principal Occupation(s)
During Past Five Years | | Number of
Portfolios in
Fund Complex
Overseen by
Trustee | | Other Directorships
Held by Trustee |
Independent Trustees | | | | Richard S. Trutanic 1952 | | MainStay Funds: Trustee since 1994; MainStay Funds Trust: Trustee since 2007.** | | Chairman and Chief Executive Officer, Somerset & Company (financial advisory firm) since 2004; Managing Director, The Carlyle Group (private investment firm) (2002 to 2004); Senior Managing Director, Partner and Board Member, Groupe Arnault S.A. (private investment firm) (1999 to 2002) | | 78 | | MainStay VP Funds Trust: Trustee since 2007 (31 portfolios)***; and
MainStay MacKay DefinedTerm Municipal Opportunities Fund: Trustee since 2011. |
| | ** | Includes prior service as a Director/Trustee of certain predecessor entities to MainStay Funds Trust. |
| | *** | Includes prior service as a Director of MainStay VP Series Fund, Inc., the predecessor to MainStay VP Funds Trust. |
| | |
| 64 | | MainStay MacKay Tax Free Bond Fund |
| | | | | | | | |
| | | | | Name and
Year of Birth | | Position(s) Held and
Length of Service | | Principal Occupation(s)
During Past Five Years |
Officers
of the
Trust
(Who are
not
Trustees)* | | | | Kirk C. Lehneis 1974 | | President, MainStay Funds, MainStay Funds Trust since 2017 | | Chief Operating Officer and Senior Managing Director since 2016, New York Life Investment Management LLC and New York Life Investment Management Holdings LLC; Member of the Board of Managers since 2017 and Senior Managing Director since 2018, NYLIFE Distributors LLC; Chairman of the Board and Senior Managing Director, NYLIM Service Company LLC since 2017; Trustee, President and Principal Executive Officer of IndexIQ Trust, IndexIQ ETF Trust and IndexIQ Active ETF Trust since 2018; President, MainStay MacKay DefinedTerm Municipal Opportunities Fund and MainStay VP Funds Trust since 2017**; Senior Managing Director, Global Product Development (2015 to 2016); Managing Director, Product Development (2010 to 2015), New York Life Investment Management LLC |
| | | | Jack R. Benintende 1964 | | Treasurer and Principal Financial and Accounting Officer, MainStay Funds since 2007, MainStay Funds Trust since 2009 | | Managing Director, New York Life Investment Management LLC since 2007; Treasurer and Principal Financial and Accounting Officer, MainStay MacKay DefinedTerm Municipal Opportunities Fund since 2011 and MainStay VP Funds Trust since 2007**; and Assistant Treasurer, New York Life Investment Management Holdings LLC (2008 to 2012) |
| | | | Yi-Chia Kuo 1981 | | Vice President and Chief Compliance Officer, MainStay Funds and MainStay Funds Trust since January 2020 | | Chief Compliance Officer, Index IQ Trust, Index IQ ETF Trust and Index IQ Active ETF Trust since January 2020; Vice President and Chief Compliance Officer, MainStay MacKay DefinedTerm Municipal Opportunities Fund and MainStay VP Funds Trust since January 2020; Director and Associate General Counsel, New York Life Insurance Company (2015 to 2019) |
| | | | J. Kevin Gao 1967 | | Secretary and Chief Legal Officer, MainStay Funds and MainStay Funds Trust since 2010 | | Managing Director and Associate General Counsel, New York Life Investment Management LLC since 2010; Secretary and Chief Legal Officer, MainStay MacKay DefinedTerm Municipal Opportunities Fund since 2011 and MainStay VP Funds Trust since 2010** |
| | | | Scott T. Harrington 1959 | | Vice President— Administration, MainStay Funds since 2005, MainStay Funds Trust since 2009 | | Managing Director, New York Life Investment Management LLC (including predecessor advisory organizations) since 2000; Member of the Board of Directors, New York Life Trust Company since 2009; Vice President—Administration, MainStay MacKay DefinedTerm Municipal Opportunities Fund since 2011 and MainStay VP Funds Trust since 2005** |
| | * | The officers listed above are considered to be “interested persons” of the MainStay Group of Funds, MainStay VP Funds Trust and MainStay MacKay DefinedTerm Municipal Opportunities Fund within the meaning of the 1940 Act because of their affiliation with the MainStay Group of Funds, New York Life Insurance Company and/or its affiliates, including New York Life Investment Management LLC, NYLIM Service Company LLC, NYLIFE Securities LLC and/or NYLIFE Distributors LLC, as described in detail in the column captioned “Principal Occupation(s) During Past Five Years.” Officers are elected annually by the Board. |
| | ** | Includes prior service as an Officer of MainStay VP Series Fund, Inc., the predecessor to MainStay VP Funds Trust. |
MainStay Funds
Equity
U.S. Equity
MainStay Epoch U.S. All Cap Fund
MainStay Epoch U.S. Equity Yield Fund
MainStay MacKay Common Stock Fund
MainStay MacKay Growth Fund
MainStay MacKay S&P 500 Index Fund
MainStay MacKay Small Cap Core Fund
MainStay MacKay U.S. Equity Opportunities Fund
MainStay MAP Equity Fund
MainStay Winslow Large Cap Growth Fund1
International Equity
MainStay Epoch International Choice Fund
MainStay MacKay International Equity Fund
MainStay MacKay International Opportunities Fund
Emerging Markets Equity
MainStay Candriam Emerging Markets Equity Fund
Global Equity
MainStay Epoch Capital Growth Fund
MainStay Epoch Global Equity Yield Fund
Fixed Income
Taxable Income
MainStay Candriam Emerging Markets Debt Fund
MainStay Floating Rate Fund
MainStay MacKay High Yield Corporate Bond Fund
MainStay MacKay Short Duration High Yield Fund
MainStay MacKay Total Return Bond Fund
MainStay MacKay Unconstrained Bond Fund
MainStay MacKay U.S. Infrastructure Bond Fund2
MainStay Short Term Bond Fund3
Tax-Exempt Income
MainStay MacKay California Tax Free Opportunities Fund4
MainStay MacKay High Yield Municipal Bond Fund
MainStay MacKay Intermediate Tax Free Bond Fund
MainStay MacKay New York Tax Free Opportunities Fund5
MainStay MacKay Short Term Municipal Fund
MainStay MacKay Tax Free Bond Fund
Money Market
MainStay Money Market Fund
Mixed Asset
MainStay Balanced Fund
MainStay Income Builder Fund
MainStay MacKay Convertible Fund
Speciality
MainStay CBRE Global Infrastructure Fund
MainStay CBRE Real Estate Fund
MainStay Cushing MLP Premier Fund
Asset Allocation
MainStay Conservative Allocation Fund
MainStay Conservative ETF Allocation Fund
MainStay Defensive ETF Allocation Fund
MainStay Equity Allocation Fund6
MainStay Equity ETF Allocation Fund
MainStay Growth Allocation Fund7
MainStay Growth ETF Allocation Fund
MainStay Moderate Allocation Fund
MainStay Moderate ETF Allocation Fund
Manager
New York Life Investment Management LLC
New York, New York
Subadvisors
Candriam Belgium S.A.8
Brussels, Belgium
Candriam Luxembourg S.C.A.8
Strassen, Luxembourg
CBRE Clarion Securities LLC
Radnor, Pennsylvania
Cushing Asset Management, LP
Dallas, Texas
Epoch Investment Partners, Inc.
New York, New York
MacKay Shields LLC8
New York, New York
Markston International LLC
White Plains, New York
NYL Investors LLC8
New York, New York
Winslow Capital Management, LLC
Minneapolis, Minnesota
Legal Counsel
Dechert LLP
Washington, District of Columbia
Independent Registered Public Accounting Firm
KPMG LLP
Philadelphia, Pennsylvania
Distributor
NYLIFE Distributors LLC8
Jersey City, New Jersey
Custodian9
State Street Bank and Trust Company
Boston, Massachusetts
| 1. | Formerly known as MainStay Large Cap Growth Fund. |
| 2. | Formerly known as MainStay MacKay Infrastructure Bond Fund. |
| 3. | Formerly known as MainStay Indexed Bond Fund. |
| 4. | This Fund is registered for sale in AZ, CA, NV, OR, TX, UT and WA. Class A and Class I shares are registered for sale in MI. Class I and Class C2 shares are registered for sale in CO, FL, GA, HI, ID, MA, MD, NH, NJ and NY. |
| 5. | This Fund is registered for sale in CA, CT, DE, FL, MA, NJ, NY and VT. |
| 6. | Formerly known as MainStay Growth Allocation Fund. |
| 7. | Formerly known as MainStay Moderate Growth Allocation Fund. |
| 8. | An affiliate of New York Life Investment Management LLC. |
| 9. | JPMorgan Chase Bank, N.A., New York, New York is the custodian for the MainStay ETF Asset Allocation Funds and effective at the close of business on November 20, 2020, became the custodian for other MainStay Funds. The custodian for MainStay Cushing MLP Premier Fund is U.S. Bank National Association, Milwaukee, Wisconsin. |
Not part of the Annual Report
For more information
800-624-6782
newyorklifeinvestments.com
“New York Life Investments” is both a service mark, and the common trade name, of certain investment advisors affiliated with New York Life Insurance Company. The MainStay Funds® are managed by New York Life Investment Management LLC and distributed by NYLIFE Distributors LLC, 30 Hudson Street, Jersey City, NJ 07302, a wholly owned subsidiary of New York Life Insurance Company. NYLIFE Distributors LLC is a Member FINRA/SIPC.
©2020 NYLIFE Distributors LLC. All rights reserved.
| | |
| 1716275 MS203-20 | | MST11-12/20 (NYLIM) NL215 |
MainStay MacKay Unconstrained Bond Fund
Message from the President and Annual Report
October 31, 2020
Beginning on January 1, 2021, paper copies of each MainStay Fund’s annual and semiannual shareholder reports will no longer be sent by mail, unless you specifically request paper copies of the reports from MainStay Funds or from your financial intermediary. Instead, the reports will be made available on the MainStay Funds’ website. You will be notified by mail and provided with a website address to access the report each time a new report is posted to the website.
If you already elected to receive shareholder reports electronically, you will not be affected by this change and you need not take any action. At any time, you may elect to receive reports and other communications from MainStay Funds electronically by calling toll-free 800-624-6782, by sending an e-mail to MainStayShareholderServices@nylim.com, or by contacting your financial intermediary.
You may elect to receive all future shareholder reports in paper form free of charge. If you hold shares of a MainStay Fund directly, you can inform MainStay Funds that you wish to receive paper copies of reports by calling toll-free 800-624-6782 or by sending an e-mail to MainStayShareholderServices@nylim.com. If you hold shares of a MainStay Fund through a financial intermediary, please contact the financial intermediary to make this election. Your election to receive reports in paper form will apply to all MainStay Funds in which you are invested and may apply to all funds held with your financial intermediary.
| | | | | | | | |
| Not FDIC/NCUA Insured | | Not a Deposit | | May Lose Value | | No Bank Guarantee | | Not Insured by Any Government Agency |

This page intentionally left blank
Message from the President
Despite historically high levels of volatility generated by the global coronavirus pandemic and a host of other geopolitical and economic uncertainties, most broad U.S. stock and bond markets gained ground during the 12-month reporting period ended October 31, 2020.
The reporting period began on an upswing, with markets rising on generally positive underlying economic trends and the announcement of a U.S.-China trade deal. However, in mid-February 2020, stock and bond indices began to dip as growing numbers of COVID-19 cases appeared in hotspots around the world. By early March, the disease reached pandemic proportions. As governments struggled to support overburdened health care systems by issuing “stay-at-home” orders and other restrictions on nonessential activity, global economic activity slowed, driving most stocks and bonds sharply lower.
The United States was hit particularly hard by the pandemic, with more reported COVID-19 cases and deaths than any other country in the world throughout the second half of the reporting period. As the pandemic deepened, the U.S. Federal Reserve (“Fed”) twice cut interest rates and announced unlimited quantitative easing. The federal government declared a national emergency, and Congress passed and the President signed a $2 trillion stimulus package. Markets responded positively to these measures, as well as to a gradual lessening of restrictions on nonessential businesses, hopes for additional stimulus and apparent progress in the development of a vaccine. By late August, the S&P 500® Index, a widely regarded benchmark of market performance, had not only regained all the ground it lost earlier in the reporting period, the Index had reached new record levels. However, a resurgence of coronavirus cases in many parts of the country and uncertainties related to the November 3, 2020, U.S. presidential election caused markets to falter as the reporting period drew to a close.
Nevertheless, for the reporting period as a whole, U.S. equity indices generally produced moderate gains. Returns proved strongest among large-cap, growth-oriented stocks, while small- and mid-cap issues lagged. Within the S&P 500® Index, the information technology and consumer discretionary sectors produced exceptionally strong gains, buoyed by strong corporate and consumer spending, while the health care sector outperformed by a smaller margin. Materials and consumer staples sectors generated positive returns, but lagged the S&P 500® Index. The industrials, utilities, communication services, financials, real estate and energy sectors ended the reporting period in negative territory, with the energy sector
suffering the steepest losses due to weak global demand. International equities declined sharply in February and March 2020 before recovering somewhat, but tended to lag their U.S. counterparts due to weaker underlying economic growth and somewhat less aggressive monetary and fiscal stimulus. Emerging-market equities tracked the performance of U.S. equity markets more closely, led by relatively strong returns in Asian markets, such as China and South Korea.
Fixed-income markets experienced an environment that tended to favor higher credit quality and longer duration securities. Corporate bonds followed the pattern of equities, with prices declining in March 2020 before subsequently recovering. Relatively speculative high-yield credit was hardest hit during the market sell-off in early 2020 and continued to underperform during the remainder of the reporting period. Similarly, among municipal bond issues, high-grade bonds outperformed, dipping briefly in mid-March before regaining the lost ground. Recognized safe havens, such as U.S. government bonds, attracted increased investment during the height of the market sell-off, driving yields lower and prices higher. As a result, long-term Treasury bonds delivered particularly strong gains for the reporting period as a whole. Emerging-market debt, on the other hand, underperformed most other bond types as investors sought to minimize currency and sovereign risks.
Although the ongoing pandemic continues to change the way that many of us work and live our lives, at New York Life Investments, we remain dedicated to providing you, as a MainStay investor, with products, information and services to help you to navigate today’s rapidly changing investment environment. By taking appropriate steps to minimize community spread of COVID-19 within our organization and despite the challenges posed by the coronavirus pandemic, we continue to innovate with you in mind, introducing new suites of Funds and providing continuous insights into ever-evolving markets and investment strategies. Our goal is to give you the tools you need to build a resilient portfolio in the face of uncertain times.
Sincerely,

Kirk C. Lehneis
President
The opinions expressed are as of the date of this report and are subject to change. There is no guarantee that any forecast made will come to pass. This material does not constitute investment advice and is not intended as an endorsement of any specific investment. Past performance is no guarantee of future results.
Not part of the Annual Report
Table of Contents
Investors should refer to the Fund’s Summary Prospectus and/or Prospectus and consider the Fund’s investment objectives, strategies, risks, charges and expenses carefully before investing. The Summary Prospectus and/or Prospectus contain this and other information about the Fund. You may obtain copies of the Fund’s Summary Prospectus, Prospectus and Statement of Additional Information free of charge, upon request, by calling toll-free 800-624-6782, by writing to NYLIFE Distributors LLC, Attn: MainStay Marketing Department, 30 Hudson Street, Jersey City, NJ 07302 or by sending an e-mail to MainStayShareholderServices@nylim.com. These documents are also available via the MainStay Funds’ website at newyorklifeinvestments.com. Please read the Summary Prospectus and/or Prospectus carefully before investing.
Investment and Performance Comparison1 (Unaudited)
Performance data quoted represents past performance. Past performance is no guarantee of future results. Because of market volatility and other factors, current performance may be lower or higher than the figures shown. Investment return and principal value will fluctuate, and as a result, when shares are redeemed, they may be worth more or less than their original cost. The graph below depicts the historical performance of Class I shares* of the Fund. Performance will vary from class to class based on differences in class-specific expenses and sales charges. For performance information current to the most recent month-end, please call 800-624-6782 or visit newyorklifeinvestments.com.
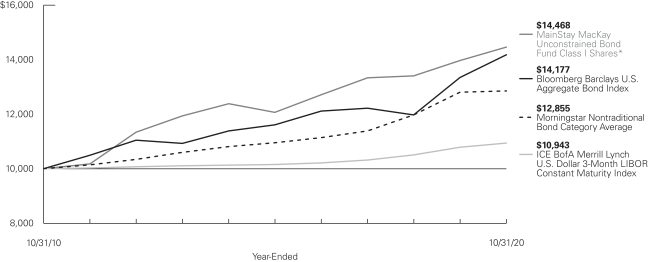
Average Annual Total Returns for the Year-Ended October 31, 2020
| | | | | | | | | | | | | | | | | | | | | | | | |
| Class | | Sales Charge | | | | Inception
Date | | | One Year | | | Five Years or Since Inception | | | Ten Years or Since Inception | | | Gross
Expense
Ratio2 | |
| | | | | | | |
| Class A Shares | | Maximum 4.5% Initial Sales Charge | | With sales charges Excluding sales charges | | | 2/28/1997 | | |
| –1.38
3.27 | %
| |
| 2.46
3.41 | %
| |
| 3.03
3.51 | %
| |
| 1.27
1.27 | %
|
| Investor Class Shares3 | | Maximum 4% Initial Sales Charge | | With sales charges Excluding sales charges | | | 2/28/2008 | | |
| –1.36
3.29 |
| |
| 2.45
3.39 |
| |
| 2.95
3.43 |
| |
| 1.29
1.29 |
|
| Class B Shares4 | | Maximum 5% CDSC
if Redeemed Within the First Six Years of Purchase | | With sales charges Excluding sales charges | |
| 2/28/1997
|
| |
| –2.56
2.44 |
| |
| 2.25
2.62 |
| |
| 2.66
2.66 |
| |
| 2.04
2.04 |
|
| Class C Shares | | Maximum 1% CDSC if Redeemed Within
One Year of Purchase | | With sales charges Excluding sales charges | |
| 9/1/1998
|
| |
| 1.45
2.45 |
| |
| 2.62
2.62 |
| |
| 2.65
2.65 |
| |
| 2.04
2.04 |
|
| Class I Shares | | No Sales Charge | | | | | 1/2/2004 | | | | 3.53 | | | | 3.69 | | | | 3.76 | | | | 1.02 | |
| Class R2 Shares | | No Sales Charge | | | | | 2/28/2014 | | | | 3.27 | | | | 3.33 | | | | 2.20 | | | | 1.37 | |
| Class R3 Shares | | No Sales Charge | | | | | 2/29/2016 | | | | 2.90 | | | | 4.34 | | | | N/A | | | | 1.62 | |
| Class R6 Shares | | No Sales Charge | | | | | 2/28/2018 | | | | 4.04 | | | | 3.36 | | | | N/A | | | | 0.85 | |
| * | Previously, the chart presented the Fund’s annual returns for Class B shares. Class I shares are presented for consistency across the MainStay Fund complex. |
| 1. | The performance table and graph do not reflect the deduction of taxes that a shareholder would pay on distributions or Fund share redemptions. Total returns reflect maximum applicable sales charges as indicated in the table above, if any, changes in share price, and reinvestment of dividend and capital gain distributions. The graph assumes the initial investment amount shown above and reflects the deduction of all sales charges that would have applied for the period of investment. Performance figures may reflect certain fee waivers and/or expense limitations, without which total returns may have |
| | been lower. For more information on share classes and current fee waivers and/or expense limitations (if any), please refer to the Notes to Financial Statements. |
| 2. | The gross expense ratios presented reflect the Fund’s “Total Annual Fund Operating Expenses” from the most recent Prospectus and may differ from other expense ratios disclosed in this report. |
| 3. | Prior to June 30, 2020, the maximum initial sales charge for Investor Class shares was 4.5%, which is reflected in the average annual total return figures shown. |
| 4. | Class B shares are closed to all new purchases as well as additional investments by existing Class B shareholders. |
The footnotes on the next page are an integral part of the table and graph and should be carefully read in conjunction with them.
| | | | | | | | | | | | |
| Benchmark Performance | | One Year | | | Five Years | | | Ten Years | |
| | | |
Bloomberg Barclays U.S. Aggregate Bond Index5 | | | 6.19 | % | | | 4.08 | % | | | 3.55 | % |
ICE BofA Merrill Lynch U.S. Dollar 3-Month Deposit Offered Rate Constant Maturity Index6 | | | 1.37 | | | | 1.50 | | | | 0.90 | |
Morningstar Nontraditional Bond Category Average7 | | | 1.64 | | | | 2.88 | | | | 2.54 | |
| 5. | The Bloomberg Barclays U.S. Aggregate Bond Index is the Fund’s primary broad-based securities market index for comparison purposes. The Bloomberg Barclays U.S. Aggregate Bond Index is a broad-based benchmark that measures the investment grade, U.S. dollar-denominated, fixed-rate taxable bond market, including Treasuries, government-related and corporate securities, mortgage-backed securities (agency fixed-rate and hybrid adjustable rate mortgage pass-throughs), asset-backed securities, and commercial mortgage-backed securities. Results assume reinvestment of all dividends and capital gains. An investment cannot be made directly in an index. |
| 6. | The Fund has selected the ICE BofA Merrill Lynch U.S. Dollar 3-Month Deposit Offered Rate Constant Maturity Index as a secondary benchmark. The ICE BofAML U.S. Dollar 3-Month Deposit Offered Rate Constant Maturity Index is unmanaged and tracks the performance of a synthetic asset paying London Interbank Offered Rate to a stated maturity. The index is based on |
| | the assumed purchase at par of a synthetic instrument having exactly its stated maturity and with a coupon equal to that day’s fixing rate. That issue is assumed to be sold the following business day (priced at a yield equal to the current day fixing rate) and rolled into a new instrument. Results assume reinvestment of all dividends and capital gains. An investment cannot be made directly in an index. |
| 7. | The Fund has selected the Morningstar Nontraditional Bond Category Average as an additional benchmark. The Morningstar Nontraditional Bond Category Average contains funds that pursue strategies divergent in one or more ways from conventional practice in the broader bond-fund universe. Morningstar category averages are equal-weighted returns based on constituents of the category at the end of the period. Results assume reinvestment of all dividends and capital gains. An investment cannot be made directly in an index. |
The footnotes on the preceding page are an integral part of the table and graph and should be carefully read in conjunction with them.
| | |
| 6 | | MainStay MacKay Unconstrained Bond Fund |
Cost in Dollars of a $1,000 Investment in MainStay MacKay Unconstrained Bond Fund (Unaudited)
The example below is intended to describe the fees and expenses borne by shareholders during the six-month period from May 1, 2020, to October 31, 2020, and the impact of those costs on your investment.
Example
As a shareholder of the Fund you incur two types of costs: (1) transaction costs, including exchange fees and sales charges (loads) on purchases (as applicable), and (2) ongoing costs, including management fees, distribution and/or service (12b-1) fees, and other Fund expenses (as applicable). This example is intended to help you understand your ongoing costs (in dollars) of investing in the Fund and to compare these costs with the ongoing costs of investing in other mutual funds. The example is based on an investment of $1,000 made at the beginning of the six-month period and held for the entire period from May 1, 2020, to October 31, 2020.
This example illustrates your Fund’s ongoing costs in two ways:
Actual Expenses
The second and third data columns in the table below provide information about actual account values and actual expenses. You may use the information in these columns, together with the amount you invested, to estimate the expenses that you paid during the six months ended October 31, 2020. Simply divide your account value by $1,000 (for example, an $8,600 account value divided by $1,000 = 8.6), then
multiply the result by the number under the heading entitled “Expenses Paid During Period” to estimate the expenses you paid on your account during this period.
Hypothetical Example for Comparison Purposes
The fourth and fifth data columns in the table below provide information about hypothetical account values and hypothetical expenses based on the Fund’s actual expense ratio and an assumed rate of return of 5% per year before expenses, which is not the Fund’s actual return. The hypothetical account values and expenses may not be used to estimate the actual ending account balances or expenses you paid for the six-month period shown. You may use this information to compare the ongoing costs of investing in the Fund with the ongoing costs of investing in other mutual funds. To do so, compare this 5% hypothetical example with the 5% hypothetical examples that appear in the shareholder reports of the other mutual funds.
Please note that the expenses shown in the table are meant to highlight your ongoing costs only and do not reflect any transactional costs, such as exchange fees or sales charges (loads). Therefore, the fourth and fifth data columns of the table are useful in comparing ongoing costs only and will not help you determine the relative total costs of owning different funds. In addition, if these transactional costs were included, your costs would have been higher.
| | | | | | | | | | | | | | | | | | | | | | |
| | | | | | | | | | | | | | | | | | |
| Share Class | | Beginning
Account
Value
5/1/20 | | | Ending Account
Value (Based
on Actual
Returns and
Expenses)
10/31/20 | | | Expenses
Paid
During
Period1 | | | Ending Account
Value (Based
on Hypothetical
5% Annualized
Return and
Actual Expenses)
10/31/20 | | | Expenses
Paid
During
Period1 | | | Net Expense
Ratio
During
Period2,3 |
| | | | | | |
| Class A Shares | | $ | 1,000.00 | | | $ | 1,073.90 | | | $ | 5.63 | | | $ | 1,019.71 | | | $ | 5.48 | | | 1.08% |
| | | | | | |
| Investor Class Shares | | $ | 1,000.00 | | | $ | 1,073.90 | | | $ | 6.20 | | | $ | 1,019.15 | | | $ | 6.04 | | | 1.19% |
| | | | | | |
| Class B Shares | | $ | 1,000.00 | | | $ | 1,069.60 | | | $ | 10.09 | | | $ | 1,015.38 | | | $ | 9.83 | | | 1.94% |
| | | | | | |
| Class C Shares | | $ | 1,000.00 | | | $ | 1,069.70 | | | $ | 10.09 | | | $ | 1,015.38 | | | $ | 9.83 | | | 1.94% |
| | | | | | |
| Class I Shares | | $ | 1,000.00 | | | $ | 1,075.10 | | | $ | 4.33 | | | $ | 1,020.96 | | | $ | 4.22 | | | 0.83% |
| | | | | | |
| Class R2 Shares | | $ | 1,000.00 | | | $ | 1,075.70 | | | $ | 6.21 | | | $ | 1,019.15 | | | $ | 6.04 | | | 1.19% |
| | | | | | |
| Class R3 Shares | | $ | 1,000.00 | | | $ | 1,071.80 | | | $ | 7.45 | | | $ | 1,017.95 | | | $ | 7.25 | | | 1.43% |
| | | | | | |
| Class R6 Shares | | $ | 1,000.00 | | | $ | 1,080.60 | | | $ | 3.92 | | | $ | 1,021.37 | | | $ | 3.81 | | | 0.75% |
| 1. | Expenses are equal to the Fund’s annualized expense ratio of each class multiplied by the average account value over the period, divided by 366 and multiplied by 184 (to reflect the six-month period). The table above represents the actual expenses incurred during the six-month period. In addition to the fees and expenses which the Fund bears directly, it also indirectly bears a pro rata share of the fees and expenses of the underlying funds in which it invests. Such indirect expenses are not included in the above-reported expense figures. |
| 2. | Expenses are equal to the Fund’s annualized expense ratio to reflect the six-month period. |
| 3. | Expenses are inclusive of dividends and interest on investments sold short. |
Portfolio Composition as of October 31, 2020 (Unaudited)
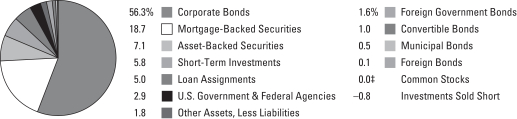
| ‡ | Less than one-tenth of a percent. |
See Portfolio of Investments beginning on page 11 for specific holdings within these categories. The Fund’s holdings are subject to change.
Top Ten Holdings or Issuers Held as of October 31, 2020 (excluding short-term investments) (Unaudited)
| 1. | United States Treasury Inflation—Indexed Notes, 0.125%–0.875%, due 1/15/29–1/15/30 |
| 2. | Fannie Mae Connecticut Avenue Securities, 3.799%–4.599%, due 1/25/29–9/25/29 |
| 3. | Bank of America Corp., 2.676%–8.57%, due 11/15/24–6/19/41 |
| 4. | Wells Fargo Commercial Mortgage Trust, 3.04%–4.058%, due 6/15/36–10/15/52 |
| 5. | Federal Home Loan Mortgage Corporation Structured Agency Credit Risk Debt Notes, 1.999%–6.499%, due 9/25/28–2/25/50 |
| 6. | Ally Financial, Inc., 5.75%–8.00%, due 11/20/25–11/1/31 |
| 7. | Bank, 2.851%–2.926%, due 10/17/52–8/15/61 |
| 8. | FREMF Mortgage Trust, 3.393%–3.935%, due 7/25/22–11/25/47 |
| 9. | Marathon Petroleum Corp., 4.50%–5.125%, due 5/1/23–5/1/25 |
| 10. | GS Mortgage Securities Trust, 3.001%–3.43%, due 8/10/50–9/1/52 |
| | |
| 8 | | MainStay MacKay Unconstrained Bond Fund |
Portfolio Management Discussion and Analysis (Unaudited)
Questions answered by portfolio managers Dan Roberts, PhD,1 Joseph Cantwell, Stephen R. Cianci, CFA, Matt Jacob, Neil Moriarty III, and Shu-Yang Tan, CFA, of MacKay Shields LLC, the Fund’s Subadvisor.
How did MainStay MacKay Unconstrained Bond Fund perform relative to its benchmarks and peer group during the 12 months ended October 31, 2020?
For the 12 months ended October 31, 2020, Class I shares of MainStay MacKay Unconstrained Bond Fund returned 3.53%, underperforming the 6.19% return of the Fund’s primary benchmark, the Bloomberg Barclays U.S. Aggregate Bond Index, and outperforming the 1.37% return of the Fund’s secondary benchmark, the ICE BofA Merrill Lynch U.S. Dollar 3-Month Deposit Offered Rate Constant Maturity Index. Over the same period, Class I shares outperformed the 1.64% return of the Morningstar Nontraditional Bond Category Average.2
What factors affected the Fund’s relative performance during the reporting period?
During the reporting period the Fund’s performance relative to the Bloomberg Barclays U.S. Aggregate Bond Index suffered due to overweight exposure to investment-grade and high-yield corporate bonds, and underweight exposure to U.S. Treasury securities. Although credit underperformed for the reporting period as a whole, our decision to increase the Fund’s holdings of select credits and securitized assets bolstered the Fund’s returns after the March 2020 market correction.
During the reporting period, were there any market events that materially impacted the Fund’s performance or liquidity?
During the first quarter of 2020, it became increasingly evident that the COVID-19 virus was not merely a medical concern, but an economic one—with perhaps larger fiscal implications than those related to personal health. Other than the U.S. Treasury sector, steep losses were seen among all asset classes, including gold, which is usually a haven during times of uncertainty. Although liquidity was challenged in this environment, the Fund did not encounter any problems selling securities where and when needed.
The liquidity program implemented by the U.S. Federal Reserve (“Fed”) stimulated a recovery in the credit markets during the second quarter of 2020. The Fed provided a supportive hand for investment-grade bond spreads3 (and eventually select high-yield bonds) with the purchase of individual corporate bonds under the Secondary Market Corporate Credit Facility. The stock and credit market rally carried over into the third quarter as well, as the Fed stayed active in the markets and low interest rates created a supportive environment for bond refinancings.
During the reporting period, how was the Fund’s performance materially affected by investments in derivatives?
During the reporting period, the Fund used U.S. Treasury futures as a duration4 hedge. This position had a slightly negative impact on performance.
What was the Fund’s duration strategy during the reporting period?
Although we extended the Fund’s duration during the reporting period, it remained below that of the Bloomberg Barclays U.S. Aggregate Bond Index, thereby detracting from performance relative to the benchmark.
During the reporting period, which sectors were the strongest positive contributors to the Fund’s relative performance and which sectors were particularly weak?
As mentioned above, overweight exposure to investment-grade and high-yield corporate bonds detracted from performance for the reporting period as a whole, relative to the Bloomberg Barclays U.S. Aggregate Bond Index, as did underweight exposure to U.S. Treasury securities. However, after the market correction in March 2020, the Fund’s select and timely purchase of both investment-grade and high-yield corporate issues enhanced relative returns. Among the Fund’s Treasury holdings, holdings of bonds with longer maturities were accretive to returns. The Fund’s relative returns also benefited from security selection in both the collateralized mortgage obligation and emerging-market sovereign debt markets.
What were some of the Fund’s largest purchases and sales during the reporting period?
During the reporting period, the Fund purchased a seasoned credit risk transfer deal from Freddie Mac (the Federal Home Loan Mortgage Corporation) backed by four-year-old prime mortgage loans. At the time of purchase, the liquidity premium was high since there were forced sellers of this type of paper. Given the underlying fundamentals of the borrower’s credit and the bond structure, we believed the market would eventually price those in. The Fund also purchased corporate bonds issued by graphics processor and software maker NVIDIA, a high-quality, low-levered name in a rapidly growing industry. The issue came to market during the height of the market’s volatility; as a result, it priced with a very attractive new issue premium.
| 1. | Dan Roberts served as a portfolio manager of the Fund until January 1, 2020. |
| 2. | See page 5 for other share class returns, which may be higher or lower than Class I share returns. See page 6 for more information on benchmark and peer group returns. |
| 3. | The terms “spread” and “yield spread” may refer to the difference in yield between a security or type of security and comparable U.S. Treasury issues. The terms may also refer to the difference in yield between two specific securities or types of securities at a given time. |
| 4. | Duration is a measure of the price sensitivity of a fixed-income investment to changes in interest rates. Duration is expressed as a number of years and is considered a more accurate sensitivity gauge than average maturity. |
To pay for increased exposure to credit after the market correction, we sold down the Fund’s position in agency mortgages, noting that the Fed was an active buyer in that paper. Additionally, we sold the Fund’s position in an ABS deal backed by equipment loans from DLL Finance at a time in early February when ABS spreads were historically tight, and liquidity was readily available.
How did the Fund’s sector weightings change during the reporting period?
Early in the reporting period, we focused on diversifying the Fund’s holdings while dialing down risk as credit spreads had been narrowing. This led to an increase in securitized5 assets while decreasing the Fund’s credit positions, specifically high
yield. After the March 2020 correction, we reversed course and increased the Fund’s exposure to high yield and other spread product at discounted prices. Additionally the Fund selectively purchased a few convertible bonds that we thought were trading at attractive levels.
How was the Fund positioned at the end of the reporting period?
As of October 31, 2020, relative to the Bloomberg Barclays U.S. Aggregate Bond Index, the Fund held overweight exposure in high-yield securities, investment-grade corporate bonds, and securitized assets. As of the same date, the Fund held relatively underweight exposure to U.S. Treasury securities and agency mortgages.
| 5. | A securitization is a financial instrument created by an issuer by combining a pool of financial assets (such as mortgages). The financial instrument is then marketed to investors, sometimes in tiers. |
The opinions expressed are those of the portfolio managers as of the date of this report and are subject to change. There is no guarantee that any forecasts will come to pass. This material does not constitute investment advice and is not intended as an endorsement of any specific investment.
| | |
| 10 | | MainStay MacKay Unconstrained Bond Fund |
Portfolio of Investments October 31, 2020
| | | | | | | | |
| | | Principal Amount | | | Value | |
Long-Term Bonds 93.2%† Asset-Backed Securities 7.1% | |
Auto Floor Plan Asset-Backed Securities 1.4% | |
Ford Credit Floorplan Master Owner Trust
Series 2019-4, Class A
2.44%, due 9/15/26 | | $ | 1,465,000 | | | $ | 1,554,028 | |
Series 2017-3, Class A
2.48%, due 9/15/24 | | | 1,095,000 | | | | 1,134,581 | |
Series 2018-4, Class A
4.06%, due 11/15/30 | | | 2,780,000 | | | | 3,163,917 | |
GMF Floorplan Owner Revolving Trust (a)
Series 2020-1, Class B
1.03%, due 8/15/25 | | | 1,695,000 | | | | 1,693,283 | |
Series 2020-1, Class C
1.48%, due 8/15/25 | | | 1,471,000 | | | | 1,469,792 | |
| | | | | | | | |
| | | | | | | 9,015,601 | |
| | | | | | | | |
Automobile Asset-Backed Securities 1.5% | |
American Credit Acceptance Receivables Trust
Series 2020-2, Class C
3.88%, due 4/13/26 (a) | | | 1,970,000 | | | | 2,085,472 | |
Avis Budget Rental Car Funding AESOP LLC (a) | | | | | | | | |
Series 2020-2A, Class A
2.02%, due 2/20/27 | | | 1,425,000 | | | | 1,438,264 | |
Series 2020-1A, Class A
2.33%, due 8/20/26 | | | 1,360,000 | | | | 1,391,608 | |
Series 2015-2A, Class A
2.63%, due 12/20/21 | | | 81,667 | | | | 81,799 | |
Series 2017-2A, Class A
2.97%, due 3/20/24 | | | 1,095,000 | | | | 1,127,319 | |
Series 2018-2A, Class A
4.00%, due 3/20/25 | | | 945,000 | | | | 1,011,274 | |
Ford Credit Auto Owner Trust
Series 2020-1, Class A
2.04%, due 8/15/31 (a) | | | 1,745,000 | | | | 1,824,950 | |
Santander Revolving Auto Loan Trust
Series 2019-A, Class A
2.51%, due 1/26/32 (a) | | | 1,210,000 | | | | 1,282,841 | |
| | | | | | | | |
| | | | | | | 10,243,527 | |
| | | | | | | | |
Home Equity 0.1% | |
First NLC Trust
Series 2007-1, Class A1
0.219% (1 Month LIBOR + 0.07%), due 8/25/37 (a)(b) | | | 292,101 | | | | 177,575 | |
GSAA Home Equity Trust
Series 2007-8, Class A3
0.599% (1 Month LIBOR + 0.45%), due 8/25/37 (b) | | | 121,385 | | | | 119,690 | |
| | | | | | | | |
| | | Principal Amount | | | Value | |
Home Equity (continued) | | | | | | | | |
MASTR Asset-Backed Securities Trust
Series 2006-HE4, Class A1
0.199% (1 Month LIBOR + 0.05%), due 11/25/36 (b) | | $ | 78,797 | | | $ | 36,145 | |
Morgan Stanley ABS Capital I Trust
Series 2007-HE4, Class A2A
0.259% (1 Month LIBOR + 0.11%), due 2/25/37 (b) | | | 81,579 | | | | 33,904 | |
| | | | | | | | |
| | | | | | | 367,314 | |
| | | | | | | | |
Other Asset-Backed Securities 3.8% | |
Carrington Mortgage Loan Trust
Series 2007-HE1, Class A3
0.339% (1 Month LIBOR + 0.19%), due 6/25/37 (b) | | | 3,649,474 | | | | 3,500,339 | |
CF Hippolyta LLC (a) | | | | | | | | |
Series 2020-1, Class A1
1.69%, due 7/15/60 | | | 1,441,237 | | | | 1,456,469 | |
Series 2020-1, Class A2
1.99%, due 7/15/60 | | | 984,672 | | | | 992,578 | |
DB Master Finance LLC (a) | | | | | | | | |
Series 2017-1A, Class A2I
3.629%, due 11/20/47 | | | 1,355,250 | | | | 1,393,251 | |
Series 2019-1A, Class A23
4.352%, due 5/20/49 | | | 1,435,500 | | | | 1,551,718 | |
Domino’s Pizza Master Issuer LLC (a) | | | | | | | | |
Series 2018-1A, Class A2I
4.116%, due 7/25/48 | | | 156,400 | | | | 165,202 | |
Series 2015-1A, Class A2II
4.474%, due 10/25/45 | | | 1,680,413 | | | | 1,782,951 | |
Hilton Grand Vacations Trust (a) | | | | | | | | |
Series 2019-AA, Class A
2.34%, due 7/25/33 | | | 2,362,376 | | | | 2,421,259 | |
Series 2020-AA, Class A
2.74%, due 2/25/39 | | | 1,370,893 | | | | 1,419,914 | |
Series 2020-AA, Class B
4.22%, due 2/25/39 | | | 654,491 | | | | 691,021 | |
JPMorgan Mortgage Acquisition Trust
Series 2007-HE1, Class AF1
0.249% (1 Month LIBOR + 0.10%), due 3/25/47 (b) | | | 99,638 | | | | 62,324 | |
MVW LLC
Series 2019-2A, Class A
2.22%, due 10/20/38 (a) | | | 2,238,907 | | | | 2,297,037 | |
PFS Financing Corp. (a) | | | | | | | | |
Series 2020-B, Class B
1.71%, due 6/15/24 | | | 685,000 | | | | 690,546 | |
Series 2020-A, Class B
1.77%, due 6/15/25 | | | 1,475,000 | | | | 1,494,048 | |
Sierra Timeshare Receivables Funding LLC (a) | | | | | | | | |
Series 2019-3A, Class A
2.34%, due 8/20/36 | | | 1,466,334 | | | | 1,497,446 | |
| | | | | | |
The notes to the financial statements are an integral part of,
and should be read in conjunction with, the financial statements. | | | | | 11 | |
Portfolio of Investments October 31, 2020 (continued)
| | | | | | | | |
| | | Principal Amount | | | Value | |
| Asset-Backed Securities (continued) | |
Other Asset-Backed Securities (continued) | |
Sierra Timeshare Receivables Funding LLC (a) (continued) | | | | | | | | |
Series 2018-2A, Class A
3.50%, due 6/20/35 | | $ | 624,566 | | | $ | 648,567 | |
Series 2020-2A, Class C
3.51%, due 7/20/37 | | | 1,644,956 | | | | 1,673,735 | |
Wendy’s Funding LLC
Series 2019-1A, Class A2I
3.783%, due 6/15/49 (a) | | | 1,691,075 | | | | 1,782,427 | |
| | | | | | | | |
| | | | | | | 25,520,832 | |
| | | | | | | | |
Student Loans 0.3% | |
KeyCorp Student Loan Trust
Series 2000-A, Class A2
0.57% (3 Month LIBOR + 0.32%), due 5/25/29 (b) | | | 38,612 | | | | 38,585 | |
Navient Private Education Refi Loan Trust (a) | | | | | | | | |
Series 2020-GA, Class B
2.50%, due 9/16/69 | | | 1,145,000 | | | | 1,140,880 | |
Series 2020-FA, Class B
2.69%, due 7/15/69 | | | 1,000,000 | | | | 994,253 | |
| | | | | | | | |
| | | | | | | 2,173,718 | |
| | | | | | | | |
Total Asset-Backed Securities
(Cost $45,766,596) | | | | | | | 47,320,992 | |
| | | | | | | | |
| | |
| Convertible Bonds 1.0% | | | | | | | | |
Machinery—Diversified 0.6% | |
Chart Industries, Inc.
1.00%, due 11/15/24 (a) | | | 2,465,000 | | | | 3,919,350 | |
| | | | | | | | |
| | |
Semiconductors 0.4% | | | | | | | | |
ON Semiconductor Corp.
1.625%, due 10/15/23 | | | 2,080,000 | | | | 2,969,033 | |
| | | | | | | | |
Total Convertible Bonds
(Cost $4,075,818) | | | | | | | 6,888,383 | |
| | | | | | | | |
| | |
| Corporate Bonds 56.3% | | | | | | | | |
Advertising 0.2% | | | | | | | | |
Clear Channel International B.V.
6.625%, due 8/1/25 (a) | | | 1,077,000 | | | | 1,093,155 | |
| | | | | | | | |
| | |
Aerospace & Defense 0.2% | | | | | | | | |
BAE Systems PLC
3.00%, due 9/15/50 (a) | | | 1,250,000 | | | | 1,259,640 | |
| | | | | | | | |
| | |
Agriculture 0.4% | | | | | | | | |
BAT Capital Corp.
3.734%, due 9/25/40 | | | 615,000 | | | | 605,045 | |
JBS Investments II GmbH
7.00%, due 1/15/26 (a) | | | 1,915,000 | | | | 2,045,986 | |
| | | | | | | | |
| | | | | | | 2,651,031 | |
| | | | | | | | |
| | | | | | | | |
| | | Principal Amount | | | Value | |
Airlines 3.3% | |
American Airlines Pass-Through Trust
Series 2013-2, Class A
4.95%, due 7/15/24 | | $ | 3,039,284 | | | $ | 2,634,188 | |
Continental Airlines Pass-Through Trust | | | | | | | | |
Series 2007-1, Class A
5.983%, due 10/19/23 | | | 2,018,039 | | | | 1,967,197 | |
Series 2005-ERJ1
9.798%, due 10/1/22 | | | 12,304 | | | | 11,746 | |
Delta Air Lines Pass-Through Trust | | | | | | | | |
Series 2019-1, Class AA,
3.204%, due 10/25/25 | | | 3,360,000 | | | | 3,346,203 | |
Series 2007-1, Class A
6.821%, due 2/10/24 | | | 1,081,221 | | | | 1,097,316 | |
Delta Air Lines, Inc.
7.00%, due 5/1/25 (a) | | | 2,010,000 | | | | 2,193,549 | |
Delta Air Lines, Inc. / SkyMiles I.P. Ltd. (a)
4.50%, due 10/20/25 | | | 845,000 | | | | 857,629 | |
4.75%, due 10/20/28 | | | 590,000 | | | | 603,105 | |
Mileage Plus Holdings LLC / Mileage Plus Intellectual Property Assets, Ltd.
6.50%, due 6/20/27 (a) | | | 1,520,000 | | | | 1,582,700 | |
U.S. Airways Pass-Through Trust
Series 2010-1, Class A
6.25%, due 10/22/24 | | | 3,963,550 | | | | 3,634,770 | |
United Airlines Pass-Through Trust | | | | | | | | |
Series 2014-2, Class B
4.625%, due 3/3/24 | | | 3,310,803 | | | | 3,151,421 | |
Series 2020-1, Class A
5.875%, due 4/15/29 | | | 1,030,000 | | | | 1,032,319 | |
| | | | | | | | |
| | | | | | | 22,112,143 | |
| | | | | | | | |
Apparel 0.3% | |
Hanesbrands, Inc. (a)
4.875%, due 5/15/26 | | | 650,000 | | | | 698,750 | |
5.375%, due 5/15/25 | | | 1,160,000 | | | | 1,220,900 | |
| | | | | | | | |
| | | | | | | 1,919,650 | |
| | | | | | | | |
Auto Manufacturers 2.3% | |
Ford Motor Co.
8.50%, due 4/21/23 | | | 1,925,000 | | | | 2,124,719 | |
9.00%, due 4/22/25 | | | 2,000,000 | | | | 2,356,790 | |
Ford Motor Credit Co. LLC
3.35%, due 11/1/22 | | | 1,115,000 | | | | 1,110,819 | |
4.063%, due 11/1/24 | | | 2,280,000 | | | | 2,286,384 | |
4.25%, due 9/20/22 | | | 860,000 | | | | 872,175 | |
General Motors Co.
6.125%, due 10/1/25 | | | 585,000 | | | | 684,645 | |
General Motors Financial Co., Inc.
2.90%, due 2/26/25 | | | 2,500,000 | | | | 2,596,392 | |
3.45%, due 4/10/22 | | | 2,230,000 | | | | 2,295,098 | |
5.20%, due 3/20/23 | | | 715,000 | | | | 775,861 | |
| | | | | | | | |
| | | | | | | 15,102,883 | |
| | | | | | | | |
| | | | |
| 12 | | MainStay MacKay Unconstrained Bond Fund | | The notes to the financial statements are an integral part of,
and should be read in conjunction with, the financial statements. |
| | | | | | | | |
| | | Principal Amount | | | Value | |
| Corporate Bonds (continued) | |
Banks 7.1% | |
Bank of America Corp.
2.676%, due 6/19/41 (c) | | $ | 2,200,000 | | | $ | 2,221,208 | |
4.30%, due 1/28/25 (c)(d) | | | 3,526,000 | | | | 3,440,071 | |
6.30%, due 3/10/26 (c)(d) | | | 3,570,000 | | | | 4,051,950 | |
8.57%, due 11/15/24 | | | 1,645,000 | | | | 2,102,859 | |
Barclays PLC
2.852%, due 5/7/26 (c) | | | 2,375,000 | | | | 2,490,727 | |
BNP Paribas S.A.
3.052%, due 1/13/31 (a)(c) | | | 2,135,000 | | | | 2,262,831 | |
Citigroup, Inc.
6.30%, due 5/15/24 (c)(d) | | | 3,260,000 | | | | 3,384,059 | |
Citizens Financial Group, Inc.
2.638%, due 9/30/32 (a) | | | 2,270,000 | | | | 2,280,849 | |
JPMorgan Chase & Co. (c)
2.956%, due 5/13/31 | | | 980,000 | | | | 1,043,649 | |
4.60%, due 2/1/25 (d) | | | 4,752,000 | | | | 4,685,472 | |
Lloyds Banking Group PLC
4.582%, due 12/10/25 | | | 1,365,000 | | | | 1,511,439 | |
4.65%, due 3/24/26 | | | 1,985,000 | | | | 2,224,611 | |
Morgan Stanley
3.847% (3 Month LIBOR + 3.61%), due 1/15/21 (b)(d) | | | 4,098,000 | | | | 3,944,172 | |
Natwest Group PLC
3.073% (1 Year Treasury Constant Maturity Rate + 2.55%), due 5/22/28 (b) | | | 2,145,000 | | | | 2,265,706 | |
Popular, Inc.
6.125%, due 9/14/23 | | | 1,582,000 | | | | 1,693,341 | |
Santander Holdings USA, Inc.
3.40%, due 1/18/23 | | | 1,500,000 | | | | 1,574,831 | |
Truist Financial Corp.
4.95% (5 Year Treasury Constant Maturity Rate + 4.605%), due 9/1/25 (b)(d) | | | 1,915,000 | | | | 2,029,900 | |
Wells Fargo & Co. (c)
3.584%, due 5/22/28 | | | 380,000 | | | | 421,865 | |
5.90%, due 6/15/24 (d) | | | 3,690,000 | | | | 3,722,172 | |
| | | | | | | | |
| | | | | | | 47,351,712 | |
| | | | | | | | |
Beverages 0.3% | |
Anheuser-Busch InBev Worldwide, Inc.
4.75%, due 1/23/29 | | | 1,770,000 | | | | 2,143,514 | |
| | | | | | | | |
| | |
Biotechnology 0.1% | | | | | | | | |
Biogen, Inc.
3.15%, due 5/1/50 | | | 890,000 | | | | 861,264 | |
| | | | | | | | |
| | |
Building Materials 0.5% | | | | | | | | |
Builders FirstSource, Inc. (a)
5.00%, due 3/1/30 | | | 2,335,000 | | | | 2,463,425 | |
6.75%, due 6/1/27 | | | 705,000 | | | | 756,112 | |
| | | | | | | | |
| | | | | | | 3,219,537 | |
| | | | | | | | |
| | | | | | | | |
| | | Principal Amount | | | Value | |
Chemicals 0.8% | | | | | | | | |
Braskem Netherlands Finance B.V.
4.50%, due 1/10/28 (a) | | $ | 1,250,000 | | | $ | 1,200,650 | |
Nutrition & Biosciences, Inc.
2.30%, due 11/1/30 (a) | | | 1,475,000 | | | | 1,483,286 | |
Orbia Advance Corp. S.A.B. de C.V.
4.00%, due 10/4/27 (a) | | | 2,600,000 | | | | 2,810,600 | |
| | | | | | | | |
| | | | | | | 5,494,536 | |
| | | | | | | | |
Commercial Services 2.3% | |
Allied Universal Holdco LLC / Allied Universal Finance Corp.
6.625%, due 7/15/26 (a) | | | 2,130,000 | | | | 2,231,250 | |
Ashtead Capital, Inc.
4.25%, due 11/1/29 (a) | | | 2,060,000 | | | | 2,198,535 | |
California Institute of Technology
3.65%, due 9/1/19 | | | 2,218,000 | | | | 2,252,347 | |
Herc Holdings, Inc.
5.50%, due 7/15/27 (a) | | | 2,320,000 | | | | 2,384,090 | |
IHS Markit, Ltd.
3.625%, due 5/1/24 | | | 3,710,000 | | | | 4,012,068 | |
Trustees of the University of Pennsylvania
3.61%, due 2/15/19 | | | 2,315,000 | | | | 2,390,158 | |
| | | | | | | | |
| | | | | | | 15,468,448 | |
| | | | | | | | |
Computers 1.4% | |
Dell International LLC / EMC Corp. (a)
4.90%, due 10/1/26 | | | 4,000,000 | | | | 4,555,009 | |
8.10%, due 7/15/36 | | | 1,045,000 | | | | 1,411,530 | |
NCR Corp. (a)
5.00%, due 10/1/28 | | | 1,629,000 | | | | 1,612,710 | |
6.125%, due 9/1/29 | | | 717,000 | | | | 751,057 | |
8.125%, due 4/15/25 | | | 1,193,000 | | | | 1,312,300 | |
| | | | | | | | |
| | | | | | | 9,642,606 | |
| | | | | | | | |
Distribution & Wholesale 0.4% | |
Performance Food Group, Inc.
5.50%, due 10/15/27 (a) | | | 2,866,000 | | | | 2,937,650 | |
| | | | | | | | |
| | |
Diversified Financial Services 4.3% | | | | | | | | |
AerCap Ireland Capital DAC / AerCap Global Aviation Trust
3.50%, due 5/26/22 | | | 4,430,000 | | | | 4,498,695 | |
4.50%, due 5/15/21 | | | 480,000 | | | | 488,543 | |
Air Lease Corp.
2.30%, due 2/1/25 | | | 3,275,000 | | | | 3,219,678 | |
3.25%, due 3/1/25 | | | 4,000,000 | | | | 4,064,954 | |
Ally Financial, Inc.
5.75%, due 11/20/25 | | | 3,820,000 | | | | 4,341,380 | |
8.00%, due 11/1/31 | | | 3,280,000 | | | | 4,527,592 | |
Avolon Holdings Funding, Ltd.
3.25%, due 2/15/27 (a) | | | 2,125,000 | | | | 1,939,680 | |
| | | | | | |
The notes to the financial statements are an integral part of,
and should be read in conjunction with, the financial statements. | | | | | 13 | |
Portfolio of Investments October 31, 2020 (continued)
| | | | | | | | |
| | | Principal Amount | | | Value | |
| Corporate Bonds (continued) | |
Diversified Financial Services (continued) | |
Capital One Financial Corp.
4.046% (3 Month LIBOR + 3.80%), due 12/1/20 (b)(d) | | $ | 1,535,000 | | | $ | 1,387,962 | |
Charles Schwab Corp.
5.375% (5 Year Treasury Constant Maturity Rate + 4.971%), due 6/1/25 (b)(d) | | | 2,060,000 | | | | 2,254,258 | |
Intercontinental Exchange, Inc.
3.00%, due 9/15/60 | | | 1,660,000 | | | | 1,669,089 | |
Nationstar Mortgage Holdings, Inc.
6.00%, due 1/15/27 (a) | | | 565,000 | | | | 565,000 | |
| | | | | | | | |
| | | | | | | 28,956,831 | |
| | | | | | | | |
Electric 1.7% | |
Appalachian Power Co.
3.30%, due 6/1/27 | | | 1,800,000 | | | | 1,975,527 | |
Duke Energy Corp.
4.875% (5 Year Treasury Constant Maturity Rate + 3.388%), due 9/16/24 (b)(d) | | | 2,415,000 | | | | 2,556,157 | |
Pacific Gas & Electric Co.
3.50%, due 8/1/50 | | | 1,205,000 | | | | 1,089,064 | |
Potomac Electric Power Co.
4.15%, due 3/15/43 | | | 1,305,000 | | | | 1,557,752 | |
WEC Energy Group, Inc.
2.393% (3 Month LIBOR + 2.113%), due 5/15/67 (b) | | | 5,495,000 | | | | 4,468,767 | |
| | | | | | | | |
| | | | | | | 11,647,267 | |
| | | | | | | | |
Electronics 0.2% | |
FLIR Systems, Inc.
2.50%, due 8/1/30 | | | 965,000 | | | | 994,199 | |
| | | | | | | | |
|
Entertainment 0.6% | |
International Game Technology PLC
6.25%, due 2/15/22 (a) | | | 1,322,000 | | | | 1,353,404 | |
Six Flags Theme Parks, Inc.
7.00%, due 7/1/25 (a) | | | 2,285,000 | | | | 2,419,244 | |
| | | | | | | | |
| | | | | | | 3,772,648 | |
| | | | | | | | |
Food 1.4% | |
JBS USA LUX S.A. / JBS USA Food Co. / JBS USA Finance, Inc.
5.50%, due 1/15/30 (a) | | | 1,035,000 | | | | 1,125,562 | |
Kraft Heinz Foods Co.
4.25%, due 3/1/31 (a) | | | 1,722,000 | | | | 1,868,630 | |
5.00%, due 7/15/35 | | | 809,000 | | | | 932,408 | |
Smithfield Foods, Inc. (a)
3.00%, due 10/15/30 | | | 1,520,000 | | | | 1,548,622 | |
3.35%, due 2/1/22 | | | 2,490,000 | | | | 2,525,813 | |
Tyson Foods, Inc.
3.95%, due 8/15/24 | | | 2,000 | | | | 2,224 | |
| | | | | | | | |
| | | Principal Amount | | | Value | |
Food (continued) | | | | | | | | |
U.S. Foods, Inc.
6.25%, due 4/15/25 (a) | | $ | 1,185,000 | | | $ | 1,238,325 | |
| | | | | | | | |
| | | | | | | 9,241,584 | |
| | | | | | | | |
Food Services 0.2% | |
Aramark Services, Inc.
6.375%, due 5/1/25 (a) | | | 1,075,000 | | | | 1,127,546 | |
| | | | | | | | |
|
Health Care—Services 0.5% | |
Health Care Service Corp. A Mutual Legal Reserve Co.
3.20%, due 6/1/50 (a) | | | 1,445,000 | | | | 1,483,045 | |
NYU Langone Hospitals
3.38%, due 7/1/55 | | | 1,700,000 | | | | 1,659,219 | |
| | | | | | | | |
| | | | | | | 3,142,264 | |
| | | | | | | | |
Home Builders 1.8% | |
Lennar Corp.
4.75%, due 11/29/27 | | | 188,000 | | | | 215,260 | |
6.25%, due 12/15/21 (e) | | | 2,875,000 | | | | 2,946,875 | |
8.375%, due 1/15/21 | | | 2,540,000 | | | | 2,573,020 | |
Meritage Homes Corp.
7.00%, due 4/1/22 | �� | | 1,585,000 | | | | 1,686,044 | |
Toll Brothers Finance Corp.
3.80%, due 11/1/29 | | | 495,000 | | | | 525,858 | |
4.35%, due 2/15/28 | | | 303,000 | | | | 330,822 | |
5.875%, due 2/15/22 | | | 3,735,000 | | | | 3,884,400 | |
| | | | | | | | |
| | | | | | | 12,162,279 | |
| | | | | | | | |
Insurance 1.8% | |
Empower Finance L.P.
3.075%, due 9/17/51 (a) | | | 1,495,000 | | | | 1,546,172 | |
Lincoln National Corp.
2.638% (3 Month LIBOR + 2.358%), due 5/17/66 (b) | | | 3,537,000 | | | | 2,511,270 | |
NMI Holdings, Inc.
7.375%, due 6/1/25 (a) | | | 685,000 | | | | 746,650 | |
Protective Life Corp.
8.45%, due 10/15/39 | | | 2,476,000 | | | | 3,816,557 | |
Reliance Standard Life Global Funding II
2.50%, due 10/30/24 (a) | | | 2,900,000 | | | | 3,009,032 | |
Willis North America, Inc.
3.875%, due 9/15/49 | | | 425,000 | | | | 494,521 | |
| | | | | | | | |
| | | | | | | 12,124,202 | |
| | | | | | | | |
Internet 1.3% | |
Cablevision Lightpath LLC
3.875%, due 9/15/27 (a) | | | 640,000 | | | | 635,200 | |
Expedia Group, Inc.
3.25%, due 2/15/30 | | | 3,920,000 | | | | 3,807,168 | |
3.60%, due 12/15/23 (a) | | | 895,000 | | | | 920,311 | |
6.25%, due 5/1/25 (a) | | | 430,000 | | | | 472,857 | |
| | | | |
| 14 | | MainStay MacKay Unconstrained Bond Fund | | The notes to the financial statements are an integral part of,
and should be read in conjunction with, the financial statements. |
| | | | | | | | |
| | | Principal Amount | | | Value | |
| Corporate Bonds (continued) | |
Internet (continued) | |
Match Group Holdings II LLC
4.125%, due 8/1/30 (a) | | $ | 122,000 | | | $ | 124,593 | |
Weibo Corp.
3.375%, due 7/8/30 | | | 1,340,000 | | | | 1,343,985 | |
3.50%, due 7/5/24 | | | 1,515,000 | | | | 1,581,498 | |
| | | | | | | | |
| | | | | | | 8,885,612 | |
| | | | | | | | |
Iron & Steel 1.2% | |
ArcelorMittal S.A.
4.55%, due 3/11/26 | | | 3,470,000 | | | | 3,735,736 | |
Vale Overseas, Ltd.
3.75%, due 7/8/30 | | | 1,660,000 | | | | 1,747,963 | |
6.25%, due 8/10/26 | | | 1,980,000 | | | | 2,362,536 | |
| | | | | | | | |
| | | | | | | 7,846,235 | |
| | | | | | | | |
Lodging 1.2% | |
Boyd Gaming Corp.
8.625%, due 6/1/25 (a) | | | 500,000 | | | | 547,350 | |
Hilton Domestic Operating Co., Inc. | |
4.875%, due 1/15/30 | | | 1,930,000 | | | | 1,985,488 | |
5.375%, due 5/1/25 (a) | | | 935,000 | | | | 966,210 | |
Marriott International, Inc.
3.75%, due 10/1/25 | | | 4,253,000 | | | | 4,371,579 | |
| | | | | | | | |
| | | | | | | 7,870,627 | |
| | | | | | | | |
Machinery—Diversified 0.2% | |
Clark Equipment Co.
5.875%, due 6/1/25 (a) | | | 1,225,000 | | | | 1,274,000 | |
| | | | | | | | |
|
Media 0.5% | |
Grupo Televisa S.A.B.
5.25%, due 5/24/49 | | | 1,695,000 | | | | 1,986,352 | |
Time Warner Entertainment Co., L.P.
8.375%, due 3/15/23 | | | 1,087,000 | | | | 1,272,423 | |
| | | | | | | | |
| | | | | | | 3,258,775 | |
| | | | | | | | |
Mining 2.0% | |
Anglo American Capital PLC
4.875%, due 5/14/25 (a) | | | 3,000,000 | | | | 3,411,777 | |
Corp. Nacional del Cobre de Chile (a) | |
3.00%, due 9/30/29 | | | 1,890,000 | | | | 1,992,162 | |
3.75%, due 1/15/31 | | | 1,290,000 | | | | 1,423,322 | |
Glencore Funding LLC
1.625%, due 9/1/25 (a) | | | 2,225,000 | | | | 2,211,469 | |
Indonesia Asahan Aluminium Persero PT
5.45%, due 5/15/30 (a) | | | 2,115,000 | | | | 2,409,458 | |
Industrias Penoles S.A.B de C.V.
4.75%, due 8/6/50 (a) | | | 1,962,000 | | | | 2,062,552 | |
| | | | | | | | |
| | | | | | | 13,510,740 | |
| | | | | | | | |
| | | | | | | | |
| | | Principal Amount | | | Value | |
Miscellaneous—Manufacturing 1.2% | |
General Electric Co. | |
3.625%, due 5/1/30 | | $ | 1,400,000 | | | $ | 1,478,457 | |
4.25%, due 5/1/40 | | | 1,525,000 | | | | 1,607,435 | |
4.35%, due 5/1/50 | | | 1,960,000 | | | | 2,088,165 | |
Textron Financial Corp.
2.015% (3 Month LIBOR + 1.735%), due 2/15/67 (a)(b) | | | 4,350,000 | | | | 3,023,250 | |
| | | | | | | | |
| | | | | | | 8,197,307 | |
| | | | | | | | |
Oil & Gas 2.8% | |
BP Capital Markets PLC
4.875% (5 Year Treasury Constant Maturity Rate + 4.398%), due 3/22/30 (b)(d) | | | 2,170,000 | | | | 2,266,652 | |
Gazprom PJSC Via Gaz Capital S.A.
7.288%, due 8/16/37 (a) | | | 2,520,000 | | | | 3,528,625 | |
Marathon Petroleum Corp. | |
4.50%, due 5/1/23 | | | 1,330,000 | | | | 1,431,291 | |
4.70%, due 5/1/25 | | | 1,450,000 | | | | 1,604,274 | |
5.125%, due 4/1/24 | | | 4,350,000 | | | | 4,390,195 | |
Petrobras Global Finance B.V.
6.75%, due 6/3/50 | | | 1,645,000 | | | | 1,805,124 | |
Petroleos Mexicanos
6.75%, due 9/21/47 | | | 4,835,000 | | | | 3,753,362 | |
| | | | | | | | |
| | | | | | | 18,779,523 | |
| | | | | | | | |
Packaging & Containers 1.2% | |
Berry Global, Inc.
4.875%, due 7/15/26 (a) | | | 135,000 | | | | 141,204 | |
Crown European Holdings S.A.
4.00%, due 7/15/22 (a) | | | EUR 3,540,000 | | | | 4,256,459 | |
Graham Packaging Co., Inc.
7.125%, due 8/15/28 (a) | | $ | 750,000 | | | | 783,750 | |
Owens Brockway Glass Container, Inc.
6.625%, due 5/13/27 (a) | | | 2,325,000 | | | | 2,493,562 | |
Reynolds Group Issuer, Inc. / Reynolds Group Issuer LLC
5.125%, due 7/15/23 (a) | | | 438,000 | | | | 443,475 | |
Sealed Air Corp.
4.00%, due 12/1/27 (a) | | | 123,000 | | | | 128,843 | |
| | | | | | | | |
| | | | | | | 8,247,293 | |
| | | | | | | | |
Pharmaceuticals 1.8% | |
AbbVie, Inc.
4.25%, due 11/21/49 (a) | | | 2,790,000 | | | | 3,258,461 | |
Bausch Health Cos., Inc. (a) | |
5.50%, due 11/1/25 | | | 3,735,000 | | | | 3,836,965 | |
5.75%, due 8/15/27 | | | 2,835,000 | | | | 3,040,538 | |
CVS Pass-Through Trust
5.789%, due 1/10/26 (a) | | | 38,103 | | | | 41,374 | |
Teva Pharmaceutical Finance Netherlands III B.V.
3.15%, due 10/1/26 | | | 2,146,000 | | | | 1,888,480 | |
| | | | | | | | |
| | | | | | | 12,065,818 | |
| | | | | | | | |
| | | | | | |
The notes to the financial statements are an integral part of,
and should be read in conjunction with, the financial statements. | | | | | 15 | |
Portfolio of Investments October 31, 2020 (continued)
| | | | | | | | |
| | | Principal Amount | | | Value | |
| Corporate Bonds (continued) | |
Pipelines 2.6% | |
Enterprise Products Operating LLC | |
3.95%, due 1/31/60 | | $ | 1,630,000 | | | $ | 1,597,548 | |
4.20%, due 1/31/50 | | | 520,000 | | | | 562,260 | |
Hess Midstream Operations L.P.
5.625%, due 2/15/26 (a) | | | 367,000 | | | | 367,000 | |
Kinder Morgan, Inc. | |
5.625%, due 11/15/23 (a) | | | 2,449,000 | | | | 2,756,718 | |
7.75%, due 1/15/32 | | | 2,035,000 | | | | 2,783,716 | |
MPLX, L.P.
4.00%, due 3/15/28 | | | 560,000 | | | | 607,662 | |
Plains All American Pipeline, L.P. / PAA Finance Corp.
3.80%, due 9/15/30 | | | 1,040,000 | | | | 1,005,326 | |
Sabine Pass Liquefaction LLC
5.75%, due 5/15/24 | | | 2,146,000 | | | | 2,416,690 | |
Targa Resources Partners, L.P. / Targa Resources Partners Finance Corp.
5.25%, due 5/1/23 | | | 3,725,000 | | | | 3,723,137 | |
Western Midstream Operating, L.P.
6.25%, due 2/1/50 | | | 1,800,000 | | | | 1,653,390 | |
| | | | | | | | |
| | | | | | | 17,473,447 | |
| | | | | | | | |
Real Estate 0.2% | | | | | | | | |
Realogy Group LLC / Realogy Co-Issuer Corp.
7.625%, due 6/15/25 (a) | | | 1,490,000 | | | | 1,573,813 | |
| | | | | | | | |
| | |
Real Estate Investment Trusts 0.9% | | | | | | | | |
CyrusOne L.P. / CyrusOne Finance Corp.
3.45%, due 11/15/29 | | | 1,850,000 | | | | 1,967,964 | |
GLP Capital, L.P. / GLP Financing II, Inc.
3.35%, due 9/1/24 | | | 1,535,000 | | | | 1,558,347 | |
Host Hotels & Resorts, L.P.
3.75%, due 10/15/23 | | | 472,000 | | | | 488,388 | |
Iron Mountain, Inc.
4.875%, due 9/15/29 (a) | | | 1,941,000 | | | | 1,961,380 | |
| | | | | | | | |
| | | | | | | 5,976,079 | |
| | | | | | | | |
Retail 2.0% | |
AutoNation, Inc.
4.75%, due 6/1/30 | | | 2,300,000 | | | | 2,697,215 | |
Darden Restaurants, Inc.
3.85%, due 5/1/27 | | | 3,512,000 | | | | 3,749,515 | |
Kohl’s Corp.
9.50%, due 5/15/25 | | | 820,000 | | | | 981,184 | |
Macy’s, Inc.
8.375%, due 6/15/25 (a) | | | 2,035,000 | | | | 2,124,743 | |
QVC, Inc.
4.375%, due 9/1/28 | | | 1,730,000 | | | | 1,731,298 | |
Starbucks Corp.
4.45%, due 8/15/49 | | | 1,970,000 | | | | 2,397,327 | |
| | | | | | | | |
| | | | | | | 13,681,282 | |
| | | | | | | | |
| | | | | | | | |
| | | Principal Amount | | | Value | |
Semiconductors 0.5% | |
Broadcom, Inc.
3.625%, due 10/15/24 | | $ | 2,040,000 | | | $ | 2,225,950 | |
NXP B.V. / NXP Funding LLC / NXP USA, Inc.
3.40%, due 5/1/30 (a) | | | 1,135,000 | | | | 1,246,556 | |
| | | | | | | | |
| | | | | | | 3,472,506 | |
| | | | | | | | |
Telecommunications 4.6% | |
Altice France S.A.
7.375%, due 5/1/26 (a) | | | 2,491,000 | | | | 2,599,857 | |
AT&T, Inc. | | | | | | | | |
2.875% (5 Month Euribor ICE Swap Rate + 3.14%), due 3/2/25 (b)(d) | | | EUR 2,200,000 | | | | 2,440,524 | |
3.65%, due 6/1/51 | | $ | 1,485,000 | | | | 1,449,236 | |
CommScope Technologies LLC
5.00%, due 3/15/27 (a) | | | 1,899,000 | | | | 1,772,042 | |
Crown Castle Towers LLC
4.241%, due 7/15/48 (a) | | | 3,825,000 | | | | 4,321,885 | |
Sprint Corp.
7.875%, due 9/15/23 | | | 3,620,000 | | | | 4,126,800 | |
Sprint Spectrum Co. LLC / Sprint Spectrum Co. II LLC / Sprint Spectrum Co. III LLC
4.738%, due 9/20/29 (a) | | | 2,255,000 | | | | 2,452,809 | |
T-Mobile USA, Inc. | | | | | | | | |
3.50%, due 4/15/25 (a) | | | 1,790,000 | | | | 1,961,142 | |
4.50%, due 4/15/50 (a) | | | 920,000 | | | | 1,069,808 | |
6.00%, due 3/1/23 | | | 3,000,000 | | | | 3,000,000 | |
Telefonica Emisiones S.A.
5.462%, due 2/16/21 | | | 1,000 | | | | 1,014 | |
VEON Holdings B.V.
4.95%, due 6/16/24 (a) | | | 3,345,000 | | | | 3,606,981 | |
Vodafone Group PLC
4.25%, due 9/17/50 | | | 1,815,000 | | | | 2,090,922 | |
| | | | | | | | |
| | | | | | | 30,893,020 | |
| | | | | | | | |
Total Corporate Bonds
(Cost $364,791,409) | | | | | | | 377,432,666 | |
| | | | | | | | |
| | |
| Foreign Bonds 0.1% | | | | | | | | |
Banks 0.1% | | | | | | | | |
Barclays Bank PLC
Series Reg S
10.00%, due 5/21/21 | | | GBP 449,000 | | | | 608,489 | |
| | | | | | | | |
Total Foreign Bonds
(Cost $711,342) | | | | | | | 608,489 | |
| | | | | | | | |
|
| Foreign Government Bonds 1.6% | |
Brazil 1.0% | | | | | | | | |
Brazilian Government International Bond
4.625%, due 1/13/28 | | $ | 6,444,000 | | | | 7,001,406 | |
| | | | | | | | |
| | | | |
| 16 | | MainStay MacKay Unconstrained Bond Fund | | The notes to the financial statements are an integral part of,
and should be read in conjunction with, the financial statements. |
| | | | | | | | |
| | | Principal Amount | | | Value | |
| Foreign Government Bonds (continued) | |
Mexico 0.6% | | | | | | | | |
Mexico Government International Bond
3.25%, due 4/16/30 | | $ | 3,558,000 | | | $ | 3,676,410 | |
| | | | | | | | |
Total Foreign Government Bonds
(Cost $10,441,263) | | | | | | | 10,677,816 | |
| | | | | | | | |
| | |
| Loan Assignments 5.0% (b) | | | | | | | | |
Buildings & Real Estate 0.6% | | | | | | | | |
Realogy Group LLC
2018 Term Loan B
3.00% (1 Month LIBOR + 2.25%), due 2/8/25 | | | 3,939,491 | | | | 3,772,063 | |
| | | | | | | | |
|
Containers, Packaging & Glass 0.6% | |
BWAY Holding Co.
2017 Term Loan B
3.48% (2 Month LIBOR + 3.25%, 3 Month LIBOR + 3.25%), due 4/3/24 | | | 4,607,379 | | | | 4,299,260 | |
| | | | | | | | |
|
Diversified/Conglomerate Service 0.8% | |
Change Healthcare Holdings LLC
2017 Term Loan B
3.50% (1 Month LIBOR + 2.50%, 3 Month LIBOR + 2.50%), due 3/1/24 | | | 3,961,299 | | | | 3,865,095 | |
TruGreen, Ltd. Partnership 2020 Term Loan
TBD, due 10/29/27 | | | 1,045,000 | | | | 1,037,163 | |
2020 2nd Lien Term Loan
TBD, due 10/30/28 | | | 450,000 | | | | 443,250 | |
| | | | | | | | |
| | | | | | | 5,345,508 | |
| | | | | | | | |
Finance 0.5% | |
Alliant Holdings Intermediate, LLC
2018 Term Loan B
2.898% (1 Month LIBOR + 2.75%), due 5/9/25 | | | 3,642,734 | | | | 3,499,870 | |
| | | | | | | | |
|
Healthcare, Education & Childcare 0.4% | |
Syneos Health, Inc.
2018 Term Loan B
1.898% (1 Month LIBOR + 1.75%), due 8/1/24 | | | 3,030,372 | | | | 2,962,946 | |
| | | | | | | | |
|
Personal & Nondurable Consumer Products 0.4% | |
Prestige Brands, Inc.
Term Loan B4
2.148% (1 Month LIBOR + 2.00%), due 1/26/24 | | | 2,957,868 | | | | 2,935,683 | |
| | | | | | | | |
| | | | | | | | |
| | | Principal Amount | | | Value | |
Personal, Food & Miscellaneous Services 0.2% | |
1011778 B.C. Unlimited Liability Co.
Term Loan B4
1.898% (1 Month LIBOR + 1.75%), due 11/19/26 | | $ | 1,395,982 | | | $ | 1,338,107 | |
| | | | | | | | |
|
Radio and TV Broadcasting 0.6% | |
Nielsen Finance LLC
Term Loan B4
2.147% (1 Month LIBOR + 2.00%), due 10/4/23 | | | 3,826,225 | | | | 3,732,961 | |
| | | | | | | | |
|
Telecommunications 0.9% | |
Level 3 Financing, Inc.
2019 Term Loan B
1.898% (1 Month LIBOR + 1.75%), due 3/1/27 | | | 2,698,623 | | | | 2,597,424 | |
SBA Senior Finance II LLC
2018 Term Loan B
1.90% (1 Month LIBOR + 1.75%), due 4/11/25 | | | 3,472,738 | | | | 3,362,045 | |
| | | | | | | | |
| | | | | | | 5,959,469 | |
| | | | | | | | |
Total Loan Assignments
(Cost $34,834,007) | | | | 33,845,867 | |
| | | | | |
|
| Mortgage-Backed Securities 18.7% | |
Agency (Collateralized Mortgage Obligations) 1.3% | |
Federal Home Loan Mortgage Corporation | |
REMIC, Series 4908, Class BD
3.00%, due 4/25/49 | | | 2,313,280 | | | | 2,384,982 | |
REMIC Series 4888, Class BA
3.50%, due 9/15/48 | | | 1,481,191 | | | | 1,548,696 | |
REMIC, Series 4924, Class NS
5.902% (1 Month LIBOR + 6.05%), due 10/25/49 (b) | | | 5,829,052 | | | | 792,781 | |
REMIC, Series 4957, Class SB
5.902% (1 Month LIBOR + 6.05%), due 11/25/49 (b) | | | 4,021,884 | | | | 548,639 | |
Federal National Mortgage Association | |
REMIC 2020-78, Class TI
2.00%, due 11/25/50 | | | 4,500,000 | | | | 453,335 | |
REMIC, Series 2020-10, Class DA
3.50%, due 3/25/60 | | | 2,843,053 | | | | 3,131,105 | |
| | | | | | | | |
| | | | | | | 8,859,538 | |
| | | | | | | | |
Commercial Mortgage Loans
(Collateralized Mortgage Obligations) 12.3% | |
Bank | |
Series 2019-BN21, Class A5
2.851%, due 10/17/52 | | | 3,480,000 | | | | 3,808,750 | |
Series 2019-BN19, Class A2
2.926%, due 8/15/61 | | | 3,695,000 | | | | 3,939,037 | |
| | | | | | |
The notes to the financial statements are an integral part of,
and should be read in conjunction with, the financial statements. | | | | | 17 | |
Portfolio of Investments October 31, 2020 (continued)
| | | | | | | | |
| | | Principal Amount | | | Value | |
| Mortgage-Backed Securities (continued) | |
Commercial Mortgage Loans
(Collateralized Mortgage Obligations) (continued) | |
Bayview Commercial Asset Trust (a)(b) | |
Series 2006-4A, Class A1
0.379% (1 Month LIBOR + 0.23%), due 12/25/36 | | $ | 14,455 | | | $ | 13,442 | |
Series 2005-3A, Class A1
0.469% (1 Month LIBOR + 0.32%), due 11/25/35 | | | 995,147 | | | | 935,098 | |
Benchmark Mortgage Trust | |
Series 2020-B19, Class AS
2.148%, due 9/15/53 | | | 750,000 | | | | 751,680 | |
Series 2020-B18, Class AM
2.335%, due 7/15/53 | | | 1,550,000 | | | | 1,582,909 | |
Series 2019-B12, Class A5
3.116%, due 8/15/52 | | | 3,316,216 | | | | 3,678,558 | |
Series 2020-IG3, Class AS
3.229%, due 9/15/48 (a)(h) | | | 1,210,000 | | | | 1,303,121 | |
BX Commercial Mortgage Trust
Series 2019-OC11, Class D
4.076%, due 12/9/41 (a)(i) | | | 630,000 | | | | 600,195 | |
BX Trust (a) | |
Series 2018-BILT, Class A
0.948% (1 Month LIBOR + 0.80%), due 5/15/30 (b) | | | 2,110,000 | | | | 2,025,796 | |
Series 2018-GW, Class A
0.948% (1 Month LIBOR + 0.80%), due 5/15/35 (b) | | | 1,555,000 | | | | 1,490,734 | |
Series 2019-OC11, Class A
3.202%, due 12/9/41 | | | 1,000,000 | | | | 1,038,533 | |
Series 2019-OC11, Class B
3.605%, due 12/9/41 | | | 985,000 | | | | 996,458 | |
Series 2019-OC11, Class C
3.856%, due 12/9/41 | | | 2,700,000 | | | | 2,630,719 | |
Citigroup Commercial Mortgage Trust
Series 2015-GC27, Class AS
3.571%, due 2/10/48 | | | 840,000 | | | | 899,566 | |
CSAIL Commercial Mortgage Trust
Series 2015-C3, Class A4
3.718%, due 8/15/48 | | | 2,541,000 | | | | 2,781,761 | |
CSMC WEST Trust
Series 2020-WEST, Class A
3.04%, due 2/15/35 (a) | | | 2,250,000 | | | | 2,172,706 | |
FREMF Mortgage Trust (a)(h) | |
Series 2015-K720, Class B
3.393%, due 7/25/22 | | | 945,000 | | | | 974,807 | |
Series 2013-K30, Class B
3.556%, due 6/25/45 | | | 3,975,000 | | | | 4,219,824 | |
Series 2015-K721, Class B
3.565%, due 11/25/47 | | | 1,500,000 | | | | 1,562,532 | |
Series 2013-K35, Class B
3.935%, due 12/25/46 | | | 800,000 | | | | 862,306 | |
| | | | | | | | |
| | | Principal Amount | | | Value | |
Commercial Mortgage Loans
(Collateralized Mortgage Obligations) (continued) | |
GB Trust (a)(b) | |
Series 2020-FLIX, Class C
1.748% (1 Month LIBOR + 1.60%), due 8/15/37 | | $ | 1,000,000 | | | $ | 1,002,321 | |
Series 2020-FLIX, Class D
2.498% (1 Month LIBOR + 2.35%), due 8/15/37 | | | 1,275,000 | | | | 1,277,905 | |
GS Mortgage Securities Corp Trust
Series 2019-BOCA, Class A
1.348% (1 Month LIBOR + 1.20%), due 6/15/38 (a)(b) | | | 4,110,000 | | | | 4,017,925 | |
GS Mortgage Securities Trust | |
Series 2019-GC42, Class A4
3.001%, due 9/1/52 | | | 1,365,000 | | | | 1,496,003 | |
Series 2019-GC40, Class A4
3.16%, due 7/10/52 | | | 2,560,000 | | | | 2,844,421 | |
Series 2017-GS7, Class A4
3.43%, due 8/10/50 | | | 2,720,000 | | | | 3,046,215 | |
Hawaii Hotel Trust
Series 2019-MAUI, Class A
1.298% (1 Month LIBOR + 1.15%), due 5/15/38 (a)(b) | | | 1,860,000 | | | | 1,797,108 | |
Hudson Yards Mortgage Trust
Series 2019-30HY, Class A
3.228%, due 7/10/39 (a) | | | 1,360,000 | | | | 1,505,723 | |
JP Morgan Chase Commercial Mortgage Securities Corp.
Series 2018-AON, Class A
4.128%, due 7/5/31 (a) | | | 3,370,000 | | | | 3,558,887 | |
JP Morgan Chase Commercial Mortgage Securities Trust
Series 2013-C16, Class A4
4.166%, due 12/15/46 | | | 2,795,000 | | | | 3,022,807 | |
JPMBB Commercial Mortgage Securities Trust
Series 2014-C26, Class A3
3.231%, due 1/15/48 | | | 1,940,777 | | | | 2,057,796 | |
Manhattan West (a) | |
Series 2020-1MW, Class A
2.13%, due 9/10/39 | | | 1,260,000 | | | | 1,296,723 | |
Series 2020-1MW, Class D
2.335%, due 9/10/39 (h) | | | 815,000 | | | | 789,537 | |
Morgan Stanley Bank of America Merrill Lynch Trust
Series-2015-C23, Class A3
3.451%, due 7/15/50 | | | 1,254,830 | | | | 1,342,744 | |
One Bryant Park Trust
Series 2019-OBP, Class A
2.516%, due 9/15/54 (a) | | | 3,825,000 | | | | 4,031,057 | |
| | | | |
| 18 | | MainStay MacKay Unconstrained Bond Fund | | The notes to the financial statements are an integral part of,
and should be read in conjunction with, the financial statements. |
| | | | | | | | |
| | | Principal Amount | | | Value | |
| Mortgage-Backed Securities (continued) | |
Commercial Mortgage Loans
(Collateralized Mortgage Obligations) (continued) | |
Wells Fargo Commercial Mortgage Trust | |
Series 2019-C53, Class A4
3.04%, due 10/15/52 | | $ | 3,100,000 | | | $ | 3,418,225 | |
Series 2018-1745, Class A
3.749%, due 6/15/36 (a)(h) | | | 2,900,000 | | | | 3,160,716 | |
Series 2018-AUS, Class A
4.058%, due 8/17/36 (a)(h) | | | 4,310,000 | | | | 4,667,157 | |
| | | | | | | | |
| | | | | | | 82,601,802 | |
| | | | | | | | |
Residential Mortgage (Collateralized Mortgage Obligation) 0.1% | |
JP Morgan Mortgage Trust
Series 2019-1, Class A3
4.00%, due 5/25/49 (a)(i) | | | 514,671 | | | | 528,263 | |
| | | | | | | | |
|
Whole Loan (Collateralized Mortgage Obligations) 5.0% | |
Banc of America Alternative Loan Trust
Series 2005-11, Class 2CB1
6.00%, due 12/25/35 | | | 627,920 | | | | 627,473 | |
Chase Home Lending Mortgage Trust
Series 2019-ATR2, Class A3
3.50%, due 7/25/49 (a)(i) | | | 620,779 | | | | 637,389 | |
Connecticut Avenue Securities Trust | |
Series 2020-R02, Class 2M2
2.149% (1 Month LIBOR + 2.00%), due 1/25/40 (a)(b) | | | 2,111,000 | | | | 2,047,514 | |
Series 2015-C04, Class 1M2
5.849% (1 Month LIBOR + 5.70%), due 4/25/28 | | | 805,660 | | | | 852,990 | |
Fannie Mae Connecticut Avenue Securities (b) | |
Series 2017-C02, Class 2M2
3.799% (1 Month LIBOR + 3.65%), due 9/25/29 | | | 989,559 | | | | 998,663 | |
Series 2016-C04, Class 1M2
4.399% (1 Month LIBOR + 4.25%), due 1/25/29 | | | 1,505,995 | | | | 1,556,512 | |
Series 2016-C06, Class 1M2
4.399% (1 Month LIBOR + 4.25%), due 4/25/29 | | | 2,593,628 | | | | 2,681,421 | |
Series 2016-C07, Class 2M2
4.499% (1 Month LIBOR + 4.35%), due 5/25/29 | | | 2,271,552 | | | | 2,362,605 | |
Series 2016-C05, Class 2M2
4.599% (1 Month LIBOR + 4.45%), due 1/25/29 | | | 5,067,297 | | | | 5,261,349 | |
Federal Home Loan Mortgage Corporation Structured Agency Credit Risk Debt Notes (b) | | | | | | | | |
Series 2020-DNA2, Class M2
1.999% (1 Month LIBOR + 1.85%), due 2/25/50 (a) | | | 1,723,000 | | | | 1,685,663 | |
| | | | | | | | |
| | | Principal Amount | | | Value | |
Whole Loan (Collateralized Mortgage Obligations) (continued) | |
Federal Home Loan Mortgage Corporation Structured Agency Credit Risk Debt Notes (b) (continued) | | | | | | | | |
Series 2016-DNA4, Class M3
3.949% (1 Month LIBOR + 3.80%), due 3/25/29 | | $ | 1,708,326 | | | $ | 1,771,380 | |
Series 2016-HQA3, Class M3
3.999% (1 Month LIBOR + 3.85%), due 3/25/29 | | | 4,820,000 | | | | 4,988,739 | |
Series 2016-HQA4, Class M3
4.049% (1 Month LIBOR + 3.90%), due 4/25/29 | | | 721,030 | | | | 745,707 | |
Series 2016-HQA1, Class M3
6.499% (1 Month LIBOR + 6.35%), due 9/25/28 | | | 1,731,945 | | | | 1,822,891 | |
Galton Funding Mortgage Trust
Series 2018-2, Class A51
4.50%, due 10/25/58 (a)(i) | | | 1,570,000 | | | | 1,646,200 | |
GreenPoint Mortgage Funding Trust
Series 2007-AR3, Class A1
0.369% (1 Month LIBOR + 0.22%), due 6/25/37 (b) | | | 584,271 | | | | 556,432 | |
Impac Secured Assets Corp.
Series 2006-5, Class 2A
0.349% (1 Month LIBOR + 0.20%), due 12/25/36 (b) | | | 141,285 | | | | 133,448 | |
MASTR Alternative Loans Trust
Series 2004-11, Class BI1
6.092%, due 11/25/34 (h) | | | 316,029 | | | | 295,779 | |
Sequoia Mortgage Trust (a)(i) | |
Series 2017-1, Class A4
3.50%, due 2/25/47 | | | 400,640 | | | | 403,636 | |
Series 2018-7, Class B3
4.22%, due 9/25/48 | | | 1,446,057 | | | | 1,456,806 | |
WaMu Mortgage Pass-Through Certificates Trust
Series 2006-AR9, Class 2A
2.029% (11th District Cost of Funds Index + 1.50%), due 8/25/46 (b) | | | 729,053 | | | | 686,118 | |
| | | | | | | | |
| | | | | | | 33,218,715 | |
| | | | | | | | |
Total Mortgage-Backed Securities
(Cost $120,427,704) | | | | 125,208,318 | |
| | | | | |
|
| Municipal Bonds 0.5% | |
California 0.4% | |
Regents of the University of California Medical Center Pooled, Revenue Bonds
Series N
3.006%, due 5/15/50 | | | 2,760,000 | | | | 2,845,698 | |
| | | | | | | | |
| | | | | | |
The notes to the financial statements are an integral part of,
and should be read in conjunction with, the financial statements. | | | | | 19 | |
Portfolio of Investments October 31, 2020 (continued)
| | | | | | | | |
| | | Principal Amount | | | Value | |
| Municipal Bonds (continued) | | | | | | | | |
New York 0.1% | |
New York State Thruway Authority, Revenue Bonds
Series M
2.90%, due 1/1/35 | | $ | 645,000 | | | $ | 686,809 | |
| | | | | | | | |
Total Municipal Bonds
(Cost $3,405,000) | | | | 3,532,507 | |
| | | | | |
|
| U.S. Government & Federal Agencies 2.9% | |
United States Treasury Inflation—Indexed Notes 2.9% (j) | |
0.125%, due 1/15/30 | | | 4,459,768 | | | | 4,869,045 | |
0.875%, due 1/15/29 | | | 12,345,974 | | | | 14,227,770 | |
| | | | | | | | |
Total U.S. Government & Federal Agencies
(Cost $17,049,738) | | | | 19,096,815 | |
| | | | | |
Total Long-Term Bonds
(Cost $601,502,877) | | | | 624,611,853 | |
| | | | | |
| | |
| | | | | | | | |
| | |
| | | Shares | | | | |
| Common Stocks 0.0%‡ | |
Commercial Services & Supplies 0.0%‡ | |
Quad/Graphics, Inc. | | | 14 | | | | 32 | |
| | | | | | | | |
|
Media 0.0%‡ | |
ION Media Networks,
Inc. (f)(g)(k)(l)(m) | | | 22 | | | | 17,424 | |
| | | | | | | | |
|
Tobacco 0.0% ‡ | |
Turning Point Brands, Inc. | | | 6,802 | | | | 254,871 | |
| | | | | | | | |
Total Common Stocks
(Cost $0) | | | | 272,327 | |
| | | | | |
|
| Short-Term Investments 5.8% | |
Affiliated Investment Company 4.6% | |
MainStay U.S. Government Liquidity Fund, 0.02% (n) | | | 30,618,826 | | | | 30,618,826 | |
| | | | | | | | |
Total Affiliated Investment Company
(Cost $30,618,826) | | | | | | | 30,618,826 | |
| | | | | | | | |
Unaffiliated Investment Company 0.0%‡ | |
State Street Navigator Securities Lending | | | | | | | | |
Government Money Market Portfolio, 0.09% (n)(p) | | | 106,750 | | | | 106,750 | |
| | | | | | | | |
Total Unaffiliated Investment Company
(Cost $106,750) | | | | | | | 106,750 | |
| | | | | | | | |
| | | | | | | | |
| | | Principal Amount | | | Value | |
| Short-Term Investments (continued) | | | | | |
U.S. Governments 1.2% | | | | | | | | |
United States Treasury Bills
0.072%, due 11/19/20 (o) | | $ | 8,365,000 | | | $ | 8,364,680 | |
| | | | | | | | |
Total U.S. Governments
(Cost $8,364,680) | | | | 8,364,680 | |
| | | | | |
Total Short-Term Investments
(Cost $39,090,256) | | | | 39,090,256 | |
| | | | | |
Total Investments, Before Investments Sold Short
(Cost $640,593,133) | | | 99.0 | % | | | 663,974,436 | |
| | | | | | | | |
|
Investments Sold Short (0.8%) Corporate Bonds Sold Short (0.8%) | |
Mining (0.8%) | |
FMG Resources (August 2006) Pty, Ltd. (a) | | | (5,000,000 | ) | | | (5,349,425 | ) |
| | | | | | | | |
Total Investments Sold Short
(Proceeds $5,218,925) | | | | (5,349,425 | ) |
| | | | | |
Total Investments, Net of Investments Sold Short
(Cost $635,374,208) | | | 98.2 | % | | | 658,625,011 | |
Other Assets, Less Liabilities | | | 1.8 | | | | 11,863,390 | |
Net Assets | | | 100.0 | % | | $ | 670,488,401 | |
| † | Percentages indicated are based on Fund net assets. |
| ‡ | Less than one-tenth of a percent. |
| (a) | May be sold to institutional investors only under Rule 144A or securities offered pursuant to Section 4(a)(2) of the Securities Act of 1933, as amended. |
| (b) | Floating rate—Rate shown was the rate in effect as of October 31, 2020. |
| (c) | Fixed to floating rate—Rate shown was the rate in effect as of October 31, 2020. |
| (d) | Securities are perpetual and, thus, do not have a predetermined maturity date. The date shown, if applicable, reflects the next call date. |
| (e) | All or a portion of this security was held on loan. As of October 31, 2020, the aggregate market value of securities on loan was $104,844. The Fund received cash collateral with a value of $106,750 (See Note 2(O)). |
| (f) | Fair valued security—Represents fair value as measured in good faith under procedures approved by the Board of Trustees. As of October 31, 2020, the total market value of fair valued securities was $17.424, which represented 0.0% of the Fund’s net assets. |
| (g) | Security in which significant unobservable inputs (Level 3) were used in determining fair value. |
| (h) | Collateral strip rate—A bond whose interest was based on the weighted net interest rate of the collateral. The coupon rate adjusts periodically based on a predetermined schedule. Rate shown was the rate in effect as of October 31, 2020. |
| | | | |
| 20 | | MainStay MacKay Unconstrained Bond Fund | | The notes to the financial statements are an integral part of,
and should be read in conjunction with, the financial statements. |
| (i) | Coupon rate may change based on changes of the underlying collateral or prepayments of principal. Rate shown was the rate in effect as of October 31, 2020. |
| (j) | Treasury Inflation Protected Security—Pays a fixed rate of interest on a principal amount that is continuously adjusted for inflation based on the Consumer Price Index-Urban Consumers. |
| (k) | Illiquid security—As of October 31, 2020, the total market value of the security deemed illiquid under procedures approved by the Board of Trustees was $17,424, which represented less than one-tenth of a percent of the Fund’s net assets. (Unaudited) |
| (l) | Non-income producing security. |
| (m) | Restricted security. (See Note 5) |
| (n) | Current yield as of October 31, 2020. |
| (o) | Interest rate shown represents yield to maturity. |
| (p) | Represents a security purchased with cash collateral received for securities on loan. |
Foreign Currency Forward Contracts
As of October 31, 2020, the Fund held the following foreign currency forward contracts1:
| | | | | | | | | | | | | | | | | | |
Currency Purchased | | | Currency Sold | | | Counterparty | | Settlement
Date | | Unrealized
Appreciation
(Depreciation) | |
| USD | | | 7,083,843 | | | EUR | | | 5,981,000 | | | JPMorgan Chase Bank N.A. | | 2/1/21 | | $ | 102,883 | |
| USD | | | 643,386 | | | GBP | | | 494,000 | | | JPMorgan Chase Bank N.A. | | 2/1/21 | | | 2,990 | |
| | | | |
| Total Unrealized Appreciation | | | 105,873 | |
| | | | |
| EUR | | | 6,016,000 | | | USD | | | 7,110,154 | | | JPMorgan Chase Bank N.A. | | 11/2/20 | | | (103,619 | ) |
| GBP | | | 8,015,000 | | | USD | | | 10,495,171 | | | JPMorgan Chase Bank N.A. | | 11/2/20 | | | (111,742 | ) |
| USD | | | 6,866,116 | | | EUR | | | 6,016,000 | | | JPMorgan Chase Bank N.A. | | 11/2/20 | | | (140,420 | ) |
| USD | | | 10,069,084 | | | GBP | | | 8,015,000 | | | JPMorgan Chase Bank N.A. | | 11/2/20 | | | (314,345 | ) |
| | �� | | |
| Total Unrealized Depreciation | | | (670,126 | ) |
| | | | |
| Net Unrealized Depreciation | | $ | (564,253 | ) |
| | | | |
| 1. | Foreign Currency Forward Contracts are subject to limitations such that they cannot be “sold or repurchased,” although the Fund would be able to exit the transaction through other means, such as through the execution of an offsetting transaction. |
Futures Contracts
As of October 31, 2020, the Fund held the following futures contracts1:
| | | | | | | | | | | | | | | | | | | | |
Type | | Number of
Contracts | | | Expiration
Date | | | Value at
Trade Date | | | Current
Notional
Amount | | | Unrealized
Appreciation
(Depreciation)2 | |
Long Contracts | |
| 2-Year United States Treasury Note | | | 58 | | | | December 2020 | | | $ | 12,813,142 | | | $ | 12,808,938 | | | $ | (4,204 | ) |
| | | | | | | | | | | | | |
| Total Long Contracts | | | | | | | | | | | | (4,204 | ) |
| | | | | | | | | | | | | |
Short Contracts | |
| 10-Year United States Treasury Note | | | (191 | ) | | | December 2020 | | | | (26,594,929 | ) | | | (26,399,781 | ) | | | 195,148 | |
| 10-Year United States Treasury Ultra Note | | | (326 | ) | | | December 2020 | | | | (52,095,820 | ) | | | (51,273,688 | ) | | | 822,132 | |
| United States Treasury Long Bond | | | (70 | ) | | | December 2020 | | | | (12,393,128 | ) | | | (12,072,813 | ) | | | 320,315 | |
| United States Treasury Ultra Bond | | | (131 | ) | | | December 2020 | | | | (29,290,610 | ) | | | (28,165,000 | ) | | | 1,125,610 | |
| | | | | | | | | | | | | |
| Total Short Contracts | | | | | | | | | | | | 2,463,205 | |
| | | | | | | | | | | | | |
| Net Unrealized Appreciation | | | | | | | | | | | $ | 2,459,001 | |
| | | | | | | | | | | | | |
| 1. | As of October 31, 2020, cash in the amount of $3,011,817 was on deposit with a broker or futures commission merchant for futures transactions. |
| 2. | Represents the difference between the value of the contracts at the time they were opened and the value as of October 31, 2020. |
| | | | | | |
The notes to the financial statements are an integral part of,
and should be read in conjunction with, the financial statements. | | | | | 21 | |
Portfolio of Investments October 31, 2020 (continued)
Swap Contracts
As of October 31, 2020, the Fund held the following centrally cleared interest rate swap agreements1:
| | | | | | | | | | | | | | | | | | | | | | | | | | | | | | | | |
Notional Amount | | | Currency | | | Expiration Date | | | Payments
made by Fund | | | Payments
Received by Fund | | Payment
Frequency
Paid/
Received | | | Upfront
Premiums
Received/
(Paid) | | | Value | | | Unrealized
Appreciation/
(Depreciation) | |
| | $40,000,000 | | | | USD | | | | 3/16/2023 | | | | Fixed 2.793 | % | | 3-Month USD-LIBOR | | | Quarterly | | | $ | — | | | $ | (2,415,637 | ) | | $ | (2,415,637 | ) |
| | 41,000,000 | | | | USD | | | | 3/29/2023 | | | | Fixed 2.762 | % | | 3-Month USD-LIBOR | | | Quarterly | | | | — | | | | (2,482,230 | ) | | | (2,482,230 | ) |
| | | | | | | | | | | | | | | | | | | | | | | | | | | | | | | | |
| | | | $ | — | | | $ | (4,897,867 | ) | | $ | (4,897,867 | ) |
| | | | | | | | | | | | | | |
| 1. | As of October 31, 2020, cash in the amount of $971,872 was on deposit with a broker for centrally cleared swap agreements. |
The following abbreviations are used in the preceding pages:
DB—Deutsche Bank
EUR—Euro
GBP—British Pound Sterling
LIBOR—London Interbank Offered Rate
REMIC—Real Estate Mortgage Investment Conduit
USD—United States Dollar
The following is a summary of the fair valuations according to the inputs used as of October 31, 2020, for valuing the Fund’s assets and liabilities:
| | | | | | | | | | | | | | | | |
Description | | Quoted Prices in
Active Markets for Identical Assets (Level 1) | | | Significant Other Observable Inputs (Level 2) | | | Significant Unobservable Inputs (Level 3) | | | Total | |
| | | | |
Asset Valuation Inputs | | | | | | | | | | | | | | | | |
| Investments in Securities (a) | | | | | | | | | | | | | | | | |
| Long-Term Bonds | | | | | | | | | | | | | | | | |
Asset-Backed Securities | | $ | — | | | $ | 47,320,992 | | | $ | — | | | $ | 47,320,992 | |
Convertible Bonds | | | — | | | | 6,888,383 | | | | — | | | | 6,888,383 | |
Corporate Bonds | | | — | | | | 377,432,666 | | | | — | | | | 377,432,666 | |
Foreign Bonds | | | — | | | | 608,489 | | | | — | | | | 608,489 | |
Foreign Government Bonds | | | — | | | | 10,677,816 | | | | — | | | | 10,677,816 | |
Loan Assignments | | | — | | | | 33,845,867 | | | | — | | | | 33,845,867 | |
Mortgage-Backed Securities | | | — | | | | 125,208,318 | | | | — | | | | 125,208,318 | |
Municipal Bonds | | | — | | | | 3,532,507 | | | | — | | | | 3,532,507 | |
U.S. Government & Federal Agencies | | | — | | | | 19,096,815 | | | | — | | | | 19,096,815 | |
| | | | | | | | | | | | | | | | |
| Total Long-Term Bonds | | | — | | | | 624,611,853 | | | | — | | | | 624,611,853 | |
| | | | | | | | | | | | | | | | |
| Common Stocks (b) | | | 254,903 | | | | — | | | | 17,424 | | | | 272,327 | |
| Short-Term Investments | | | | | | | | | | | | | | | | |
Affiliated Investment Company | | | 30,618,826 | | | | — | | | | — | | | | 30,618,826 | |
Unaffiliated Investment Company | | | 106,750 | | | | — | | | | — | | | | 106,750 | |
U.S. Governments | | | — | | | | 8,364,680 | | | | — | | | | 8,364,680 | |
| | | | | | | | | | | | | | | | |
| Total Short-Term Investments | | | 30,725,576 | | | | 8,364,680 | | | | — | | | | 39,090,256 | |
| | | | | | | | | | | | | | | | |
| Total Investments in Securities | | | 30,980,479 | | | | 632,976,533 | | | | 17,424 | | | | 663,974,436 | |
| | | | | | | | | | | | | | | | |
| Other Financial Instruments | | | | | | | | | | | | | | | | |
Foreign Currency Forward Contracts (c) | | | — | | | | 105,873 | | | | — | | | | 105,873 | |
Futures Contracts (c) | | | 2,463,205 | | | | — | | | | — | | | | 2,463,205 | |
| | | | | | | | | | | | | | | | |
| Total Other Financial Instruments | | | 2,463,205 | | | | 105,873 | | | | — | | | | 2,569,078 | |
| | | | | | | | | | | | | | | | |
| Total Investments in Securities and Other Financial Instruments | | $ | 33,443,684 | | | $ | 633,082,406 | | | $ | 17,424 | | | $ | 666,543,514 | |
| | | | | | | | | | | | | | | | |
| | | | |
| 22 | | MainStay MacKay Unconstrained Bond Fund | | The notes to the financial statements are an integral part of,
and should be read in conjunction with, the financial statements. |
| | | | | | | | | | | | | | | | |
Description | | Quoted Prices in
Active Markets for Identical Assets (Level 1) | | | Significant Other Observable Inputs (Level 2) | | | Significant Unobservable Inputs (Level 3) | | | Total | |
| | | | |
Liability Valuation Inputs | | | | | | | | | | | | | | | | |
| Long-Term Bonds Sold Short | | | | | | | | | | | | | | | | |
Corporate Bonds Sold Short | | $ | — | | | $ | (5,349,425 | ) | | $ | — | | | $ | (5,349,425 | ) |
| | | | | | | | | | | | | | | | |
| Total Long-Term Bonds Sold Short | | | — | | | | (5,349,425 | ) | | | — | | | | (5,349,425 | ) |
| | | | | | | | | | | | | | | | |
| Other Financial Instruments | | | | | | | | | | | | | | | | |
Foreign Currency Forward Contracts (c) | | | — | | | | (670,126 | ) | | | — | | | | (670,126 | ) |
Futures Contracts (c) | | | (4,204 | ) | | | — | | | | — | | | | (4,204 | ) |
Interest Rate Swap Contracts (c) | | | — | | | | (4,897,867 | ) | | | — | | | | (4,897,867 | ) |
| | | | | | | | | | | | | | | | |
| Total Other Financial Instruments | | | (4,204 | ) | | | (5,567,993 | ) | | | — | | | | (5,572,197 | ) |
| | | | | | | | | | | | | | | | |
| Total Investments in Securities Sold Short and Other Financial Instruments | | $ | (4,204 | ) | | $ | (10,917,418 | ) | | $ | — | | | $ | (10,921,622 | ) |
| | | | | | | | | | | | | | | | |
| (a) | For a complete listing of investments and their industries, see the Portfolio of Investments. |
| (b) | The Level 3 security valued at $17,424 is held in Media within the Common Stocks section of the Portfolio of Investments. |
| (c) | The value listed for these securities reflects unrealized appreciation (depreciation) as shown on the Portfolio of Investments. |
| | | | | | |
The notes to the financial statements are an integral part of,
and should be read in conjunction with, the financial statements. | | | | | 23 | |
Statement of Assets and Liabilities as of October 31, 2020
| | | | |
| Assets | |
Investment in unaffiliated securities before investments sold short, at value (identified cost $609,974,307) including securities on loan of $104,844 | | $ | 633,355,610 | |
Investment in affiliated investment company, at value (identified cost $30,618,826) | | | 30,618,826 | |
Cash collateral on deposit at broker for futures contracts | | | 3,011,817 | |
Cash collateral on deposit at broker for swap contracts | | | 971,872 | |
Cash denominated in foreign currencies (identified cost $108,910) | | | 111,276 | |
Cash | | | 8,793 | |
Receivables: | |
Investment securities sold | | | 5,871,834 | |
Dividends and interest | | | 5,262,162 | |
Fund shares sold | | | 1,133,716 | |
Variation margin on futures contracts | | | 311,789 | |
Securities lending | | | 509 | |
Unrealized appreciation on foreign currency forward contracts | | | 105,873 | |
Other assets | | | 46,080 | |
| | | | |
Total assets | | | 680,810,157 | |
| | | | |
| |
| Liabilities | | | | |
Investments sold short (proceeds $5,218,925) | | | 5,349,425 | |
Cash collateral received for securities on loan | | | 106,750 | |
Payables: | | | | |
Fund shares redeemed | | | 1,713,231 | |
Investment securities purchased | | | 1,475,550 | |
Manager (See Note 3) | | | 343,903 | |
Transfer agent (See Note 3) | | | 172,035 | |
Interest on investments sold short | | | 118,160 | |
NYLIFE Distributors (See Note 3) | | | 101,705 | |
Shareholder communication | | | 60,562 | |
Professional fees | | | 31,672 | |
Broker fees and charges on short sales | | | 16,166 | |
Custodian | | | 7,722 | |
Variation margin on centrally cleared swap contracts | | | 2,157 | |
Trustees | | | 921 | |
Accrued expenses | | | 5,042 | |
Unrealized depreciation on foreign currency forward contracts | | | 670,126 | |
Dividend payable | | | 146,629 | |
| | | | |
Total liabilities | | | 10,321,756 | |
| | | | |
Net assets | | $ | 670,488,401 | |
| | | | |
| |
| Composition of Net Assets | | | | |
Shares of beneficial interest outstanding (par value of $.01 per share) unlimited number of shares authorized | | $ | 761,535 | |
Additional paid-in capital | | | 859,678,967 | |
| | | | |
| | | 860,440,502 | |
Total distributable earnings (loss) | | | (189,952,101 | ) |
| | | | |
Net assets | | $ | 670,488,401 | |
| | | | |
| | | | |
Class A | | | | |
Net assets applicable to outstanding shares | | $ | 175,682,454 | |
| | | | |
Shares of beneficial interest outstanding | | | 19,958,098 | |
| | | | |
Net asset value per share outstanding | | $ | 8.80 | |
Maximum sales charge (4.50% of offering price) | | | 0.41 | |
| | | | |
Maximum offering price per share outstanding | | $ | 9.21 | |
| | | | |
Investor Class | | | | |
Net assets applicable to outstanding shares | | $ | 18,138,528 | |
| | | | |
Shares of beneficial interest outstanding | | | 2,042,991 | |
| | | | |
Net asset value per share outstanding | | $ | 8.88 | |
Maximum sales charge (4.00% of offering price) | | | 0.37 | |
| | | | |
Maximum offering price per share outstanding | | $ | 9.25 | |
| | | | |
Class B | | | | |
Net assets applicable to outstanding shares | | $ | 4,871,739 | |
| | | | |
Shares of beneficial interest outstanding | | | 556,378 | |
| | | | |
Net asset value and offering price per share outstanding | | $ | 8.76 | |
| | | | |
Class C | | | | |
Net assets applicable to outstanding shares | | $ | 65,157,712 | |
| | | | |
Shares of beneficial interest outstanding | | | 7,446,861 | |
| | | | |
Net asset value and offering price per share outstanding | | $ | 8.75 | |
| | | | |
Class I | | | | |
Net assets applicable to outstanding shares | | $ | 404,963,784 | |
| | | | |
Shares of beneficial interest outstanding | | | 45,959,240 | |
| | | | |
Net asset value and offering price per share outstanding | | $ | 8.81 | |
| | | | |
Class R2 | | | | |
Net assets applicable to outstanding shares | | $ | 933,771 | |
| | | | |
Shares of beneficial interest outstanding | | | 106,043 | |
| | | | |
Net asset value and offering price per share outstanding | | $ | 8.81 | |
| | | | |
Class R3 | | | | |
Net assets applicable to outstanding shares | | $ | 275,504 | |
| | | | |
Shares of beneficial interest outstanding | | | 31,290 | |
| | | | |
Net asset value and offering price per share outstanding | | $ | 8.80 | |
| | | | |
Class R6 | | | | |
Net assets applicable to outstanding shares | | $ | 464,909 | |
| | | | |
Shares of beneficial interest outstanding | | | 52,588 | |
| | | | |
Net asset value and offering price per share outstanding | | $ | 8.84 | |
| | | | |
| | | | |
| 24 | | MainStay MacKay Unconstrained Bond Fund | | The notes to the financial statements are an integral part of,
and should be read in conjunction with, the financial statements. |
Statement of Operations for the year ended October 31, 2020
| | | | |
| Investment Income (Loss) | |
Income | | | | |
Interest | | $ | 29,490,841 | |
Dividends-affiliated | | | 205,564 | |
Securities lending | | | 26,105 | |
Dividends-unaffiliated | | | 1,331 | |
Other | | | 1,992 | |
| | | | |
Total income | | | 29,725,833 | |
| | | | |
Expenses | | | | |
Manager (See Note 3) | | | 4,692,436 | |
Distribution/Service—Class A (See Note 3) | | | 449,439 | |
Distribution/Service—Investor Class (See Note 3) | | | 46,632 | |
Distribution/Service—Class B (See Note 3) | | | 65,502 | |
Distribution/Service—Class C (See Note 3) | | | 775,389 | |
Distribution/Service—Class R2 (See Note 3) | | | 15,711 | |
Distribution/Service—Class R3 (See Note 3) | | | 1,204 | |
Transfer agent (See Note 3) | | | 1,315,174 | |
Dividends and interest on investments sold short | | | 653,253 | |
Broker fees and charges on short sales | | | 250,204 | |
Registration | | | 162,561 | |
Professional fees | | | 133,066 | |
Shareholder communication | | | 89,858 | |
Custodian | | | 71,819 | |
Trustees | | | 18,517 | |
Shareholder service (See Note 3) | | | 6,525 | |
Miscellaneous | | | 33,846 | |
| | | | |
Total expenses | | | 8,781,136 | |
| | | | |
Net investment income (loss) | | | 20,944,697 | |
| | | | |
|
| Realized and Unrealized Gain (Loss) | |
Net realized gain (loss) on: | | | | |
Unaffiliated investment transactions | | | 16,011,503 | |
Investments sold short | | | (1,482,755 | ) |
Futures transactions | | | (17,343,363 | ) |
Swap transactions | | | (1,257,335 | ) |
Foreign currency forward transactions | | | 23,279 | |
Foreign currency transactions | | | (84,670 | ) |
| | | | |
Net realized gain (loss) | | | (4,133,341 | ) |
| | | | |
Net change in unrealized appreciation (depreciation) on: | |
Unaffiliated investments | | | (717,904 | ) |
Investments sold short | | | 809,814 | |
Futures contracts | | | 644,345 | |
Swap contracts | | | (1,508,350 | ) |
Foreign currency forward contracts | | | (261,166 | ) |
Translation of other assets and liabilities in foreign currencies | | | (36,818 | ) |
| | | | |
Net change in unrealized appreciation (depreciation) | | | (1,070,079 | ) |
| | | | |
Net realized and unrealized gain (loss) | | | (5,203,420 | ) |
| | | | |
Net increase (decrease) in net assets resulting from operations | | $ | 15,741,277 | |
| | | | |
| | | | | | |
The notes to the financial statements are an integral part of,
and should be read in conjunction with, the financial statements. | | | | | 25 | |
Statements of Changes in Net Assets
for the years ended October 31, 2020 and October 31, 2019
| | | | | | | | |
| | | 2020 | | | 2019 | |
| Increase (Decrease) in Net Assets | |
Operations: | | | | | | | | |
Net investment income (loss) | | $ | 20,944,697 | | | $ | 28,754,267 | |
Net realized gain (loss) | | | (4,133,341 | ) | | | (28,186,885 | ) |
Net change in unrealized appreciation (depreciation) | | | (1,070,079 | ) | | | 39,981,208 | |
| | | | |
Net increase (decrease) in net assets resulting from operations | | | 15,741,277 | | | | 40,548,590 | |
| | | | |
Distributions to shareholders: | | | | | | | | |
Class A | | | (4,402,631 | ) | | | (5,918,444 | ) |
Investor Class | | | (440,469 | ) | | | (567,935 | ) |
Class B | | | (108,106 | ) | | | (194,065 | ) |
Class C | | | (1,281,225 | ) | | | (2,298,974 | ) |
Class I | | | (13,052,942 | ) | | | (20,315,490 | ) |
Class R2 | | | (143,506 | ) | | | (190,167 | ) |
Class R3 | | | (5,136 | ) | | | (4,980 | ) |
Class R6 | | | (197,722 | ) | | | (1,364,064 | ) |
| | | | |
| | | (19,631,737 | ) | | | (30,854,119 | ) |
| | | | |
Distributions to shareholders from return of capital | | | | | | | | |
Class A | | | (131,689 | ) | | | — | |
Investor Class | | | (13,175 | ) | | | — | |
Class B | | | (3,234 | ) | | | — | |
Class C | | | (38,323 | ) | | | — | |
Class I | | | (390,433 | ) | | | — | |
Class R2 | | | (4,292 | ) | | | — | |
Class R3 | | | (154 | ) | | | — | |
Class R6 | | | (5,914 | ) | | | — | |
| | | | |
| | | (587,214 | ) | | | — | |
| | | | |
Total distributions to shareholders | | | (20,218,951 | ) | | | (30,854,119 | ) |
| | | | |
Capital share transactions: | | | | | | | | |
Net proceeds from sale of shares | | | 207,685,790 | | | | 243,248,062 | |
Net asset value of shares issued to shareholders in reinvestment of distributions | | | 18,303,153 | | | | 28,366,577 | |
Cost of shares redeemed | | | (503,088,197 | ) | | | (486,086,847 | ) |
| | | | |
Increase (decrease) in net assets derived from capital share transactions | | | (277,099,254 | ) | | | (214,472,208 | ) |
| | | | | | | | |
Net increase (decrease) in net assets | | | (281,576,928 | ) | | | (204,777,737 | ) |
|
| Net Assets | |
Beginning of year | | | 952,065,329 | | | | 1,156,843,066 | |
| | | | |
End of year | | $ | 670,488,401 | | | $ | 952,065,329 | |
| | | | |
| | | | |
| 26 | | MainStay MacKay Unconstrained Bond Fund | | The notes to the financial statements are an integral part of,
and should be read in conjunction with, the financial statements. |
Financial Highlights selected per share data and ratios
| | | | | | | | | | | | | | | | | | | | |
| |
| | | Year ended October 31, | |
| | | | | |
| Class A | | 2020 | | | 2019 | | | 2018 | | | 2017 | | | 2016 | |
| | | | | |
Net asset value at beginning of year | | $ | 8.74 | | | $ | 8.65 | | | $ | 8.90 | | | $ | 8.81 | | | $ | 8.72 | |
| | | | | | | | | | | | | | | | | | | | |
| | | | | |
Net investment income (loss) (a) | | | 0.22 | | | | 0.23 | | | | 0.24 | | | | 0.25 | | | | 0.35 | |
| | | | | |
Net realized and unrealized gain (loss) on investments | | | 0.06 | | | | 0.11 | | | | (0.23 | ) | | | 0.15 | | | | 0.08 | |
| | | | | |
Net realized and unrealized gain (loss) on foreign currency transactions | | | 0.00 | ‡ | | | 0.00 | ‡ | | | 0.01 | | | | (0.00 | )‡ | | | (0.02 | ) |
| | | | | | | | | | | | | | | | | | | | |
| | | | | |
Total from investment operations | | | 0.28 | | | | 0.34 | | | | 0.02 | | | | 0.40 | | | | 0.41 | |
| | | | | | | | | | | | | | | | | | | | |
| | | | | |
| Less distributions: | | | | | | | | | | | | | | | | | | | | |
| | | | | |
From net investment income | | | (0.21 | ) | | | (0.25 | ) | | | (0.27 | ) | | | (0.31 | ) | | | (0.32 | ) |
| | | | | |
Return of capital | | | (0.01 | ) | | | — | | | | (0.00 | )‡ | | | (0.00 | )‡ | | | — | |
| | | | | | | | | | | | | | | | | | | | |
| | | | | |
Total distributions | | | (0.22 | ) | | | (0.25 | ) | | | (0.27 | ) | | | (0.31 | ) | | | (0.32 | ) |
| | | | | | | | | | | | | | | | | | | | |
| | | | | |
Net asset value at end of year | | $ | 8.80 | | | $ | 8.74 | | | $ | 8.65 | | | $ | 8.90 | | | $ | 8.81 | |
| | | | | | | | | | | | | | | | | | | | |
| | | | | |
Total investment return (b) | | | 3.27 | % | | | 3.99 | % | | | 0.25 | % | | | 4.65 | % | | | 4.94 | % |
| | | | | |
| Ratios (to average net assets)/Supplemental Data: | | | | | | | | | | | | | | | | | | | | |
| | | | | |
Net investment income (loss) | | | 2.60 | % | | | 2.66 | % | | | 2.69 | % | | | 2.79 | % | | | 4.04 | % |
| | | | | |
Net expenses (c)(d) | | | 1.18 | % | | | 1.27 | % | | | 1.25 | % | | | 1.13 | % | | | 1.16 | % |
| | | | | |
Portfolio turnover rate | | | 56 | %(e) | | | 50 | %(e) | | | 22 | % | | | 41 | % | | | 15 | % |
| | | | | |
Net assets at end of year (in 000’s) | | $ | 175,682 | | | $ | 197,686 | | | $ | 220,618 | | | $ | 302,192 | | | $ | 412,834 | |
| ‡ | Less than one cent per share. |
| (a) | Per share data based on average shares outstanding during the year. |
| (b) | Total investment return is calculated exclusive of sales charges and assumes the reinvestment of distributions. For periods of less than one year, total return is not annualized. |
| (c) | In addition to the fees and expenses which the Fund bears directly, it also indirectly bears a pro-rata share of the fees and expenses of the underlying funds in which it invests. Such indirect expenses are not included in the above expense ratios. |
| (d) | The expense ratios presented below show the impact of short sales expense: |
| | | | | | | | | | |
Year Ended | | Net Expenses
(excluding short
sale expenses) | | Short Sale
Expenses |
| October 31, 2020 | | | | 1.07 | % | | | | 0.11 | % |
| October 31, 2019 | | | | 1.07 | % | | | | 0.20 | % |
| October 31, 2018 | | | | 1.03 | % | | | | 0.22 | % |
| October 31, 2017 | | | | 1.01 | % | | | | 0.12 | % |
| October 31, 2016 | | | | 1.00 | % | | | | 0.16 | % |
| (e) | The portfolio turnover rate not including mortgage dollar rolls was 53% and 44% for the years ended October 31, 2020 and 2019, respectively. |
| | | | | | |
The notes to the financial statements are an integral part of,
and should be read in conjunction with, the financial statements. | | | | | 27 | |
Financial Highlights selected per share data and ratios
| | | | | | | | | | | | | | | | | | | | |
| |
| | | Year ended October 31, | |
| | | | | |
| Investor Class | | 2020 | | | 2019 | | | 2018 | | | 2017 | | | 2016 | |
| | | | | |
Net asset value at beginning of year | | $ | 8.81 | | | $ | 8.72 | | | $ | 8.97 | | | $ | 8.88 | | | $ | 8.78 | |
| | | | | | | | | | | | | | | | | | | | |
| | | | | |
Net investment income (loss) (a) | | | 0.22 | | | | 0.23 | | | | 0.24 | | | | 0.24 | | | | 0.35 | |
| | | | | |
Net realized and unrealized gain (loss) on investments | | | 0.06 | | | | 0.11 | | | | (0.23 | ) | | | 0.16 | | | | 0.10 | |
| | | | | |
Net realized and unrealized gain (loss) on foreign currency transactions | | | 0.00 | ‡ | | | 0.00 | ‡ | | | 0.01 | | | | (0.00 | )‡ | | | (0.03 | ) |
| | | | | | | | | | | | | | | | | | | | |
| | | | | |
Total from investment operations | | | 0.28 | | | | 0.34 | | | | 0.02 | | | | 0.40 | | | | 0.42 | |
| | | | | | | | | | | | | | | | | | | | |
| | | | | |
| Less distributions: | | | | | | | | | | | | | | | | | | | | |
| | | | | |
From net investment income | | | (0.20 | ) | | | (0.25 | ) | | | (0.27 | ) | | | (0.31 | ) | | | (0.32 | ) |
| | | | | |
Return of capital | | | (0.01 | ) | | | — | | | | (0.00 | )‡ | | | (0.00 | )‡ | | | — | |
| | | | | | | | | | | | | | | | | | | | |
| | | | | |
Total distributions | | | (0.21 | ) | | | (0.25 | ) | | | (0.27 | ) | | | (0.31 | ) | | | (0.32 | ) |
| | | | | | | | | | | | | | | | | | | | |
| | | | | |
Net asset value at end of year | | $ | 8.88 | | | $ | 8.81 | | | $ | 8.72 | | | $ | 8.97 | | | $ | 8.88 | |
| | | | | | | | | | | | | | | | | | | | |
| | | | | |
Total investment return (b) | | | 3.29 | % | | | 3.93 | % | | | 0.23 | % | | | 4.59 | % | | | 5.00 | % |
| | | | | |
| Ratios (to average net assets)/Supplemental Data: | | | | | | | | | | | | | | | | | | | | |
| | | | | |
Net investment income (loss) | | | 2.54 | % | | | 2.63 | % | | | 2.68 | % | | | 2.74 | % | | | 4.01 | % |
| | | | | |
Net expenses (c)(d) | | | 1.24 | % | | | 1.29 | % | | | 1.27 | % | | | 1.15 | % | | | 1.18 | % |
| | | | | |
Portfolio turnover rate | | | 56 | %(e) | | | 50 | %(e) | | | 22 | % | | | 41 | % | | | 15 | % |
| | | | | |
Net assets at end of year (in 000’s) | | $ | 18,139 | | | $ | 19,748 | | | $ | 20,451 | | | $ | 22,033 | | | $ | 31,851 | |
| ‡ | Less than one cent per share. |
| (a) | Per share data based on average shares outstanding during the year. |
| (b) | Total investment return is calculated exclusive of sales charges and assumes the reinvestment of distributions. For periods of less than one year, total return is not annualized. |
| (c) | In addition to the fees and expenses which the Fund bears directly, it also indirectly bears a pro-rata share of the fees and expenses of the underlying funds in which it invests. Such indirect expenses are not included in the above expense ratios. |
| (d) | The expense ratios presented below show the impact of short sales expense: |
| | | | | | | | | | |
Year Ended | | Net Expenses
(excluding short
sale expenses) | | Short Sale
Expenses |
| October 31, 2020 | | | | 1.13 | % | | | | 0.11 | % |
| October 31, 2019 | | | | 1.09 | % | | | | 0.20 | % |
| October 31, 2018 | | | | 1.05 | % | | | | 0.22 | % |
| October 31, 2017 | | | | 1.03 | % | | | | 0.12 | % |
| October 31, 2016 | | | | 1.02 | % | | | | 0.16 | % |
| (e) | The portfolio turnover rate not including mortgage dollar rolls was 53% and 44% for the years ended October 31, 2020 and 2019, respectively. |
| | | | |
| 28 | | MainStay MacKay Unconstrained Bond Fund | | The notes to the financial statements are an integral part of,
and should be read in conjunction with, the financial statements. |
Financial Highlights selected per share data and ratios
| | | | | | | | | | | | | | | | | | | | |
| |
| | | Year ended October 31, | |
| | | | | |
| Class B | | 2020 | | | 2019 | | | 2018 | | | 2017 | | | 2016 | |
| | | | | |
Net asset value at beginning of year | | $ | 8.70 | | | $ | 8.61 | | | $ | 8.86 | | | $ | 8.77 | | | $ | 8.68 | |
| | | | | | | | | | | | | | | | | | | | |
| | | | | |
Net investment income (loss) (a) | | | 0.15 | | | | 0.16 | | | | 0.17 | | | | 0.18 | | | | 0.28 | |
| | | | | |
Net realized and unrealized gain (loss) on investments | | | 0.06 | | | | 0.11 | | | | (0.23 | ) | | | 0.15 | | | | 0.10 | |
| | | | | |
Net realized and unrealized gain (loss) on foreign currency transactions | | | 0.00 | ‡ | | | 0.00 | ‡ | | | 0.01 | | | | (0.00 | )‡ | | | (0.03 | ) |
| | | | | | | | | | | | | | | | | | | | |
| | | | | |
Total from investment operations | | | 0.21 | | | | 0.27 | | | | (0.05 | ) | | | 0.33 | | | | 0.35 | |
| | | | | | | | | | | | | | | | | | | | |
| | | | | |
| Less distributions: | | | | | | | | | | | | | | | | | | | | |
| | | | | |
From net investment income | | | (0.15 | ) | | | (0.18 | ) | | | (0.20 | ) | | | (0.24 | ) | | | (0.26 | ) |
| | | | | |
Return of capital | | | (0.00 | )‡ | | | — | | | | (0.00 | )‡ | | | (0.00 | )‡ | | | — | |
| | | | | | | | | | | | | | | | | | | | |
| | | | | |
Total distributions | | | (0.15 | ) | | | (0.18 | ) | | | (0.20 | ) | | | (0.24 | ) | | | (0.26 | ) |
| | | | | | | | | | | | | | | | | | | | |
| | | | | |
Net asset value at end of year | | $ | 8.76 | | | $ | 8.70 | | | $ | 8.61 | | | $ | 8.86 | | | $ | 8.77 | |
| | | | | | | | | | | | | | | | | | | | |
| | | | | |
Total investment return (b) | | | 2.44 | % | | | 3.20 | % | | | (0.52 | %) | | | 3.86 | % | | | 4.16 | % |
| | | | | |
| Ratios (to average net assets)/Supplemental Data: | | | | | | | | | | | | | | | | | | | | |
| | | | | |
Net investment income (loss) | | | 1.77 | % | | | 1.90 | % | | | 1.92 | % | | | 2.00 | % | | | 3.26 | % |
| | | | | |
Net expenses (c)(d) | | | 2.00 | % | | | 2.04 | % | | | 2.02 | % | | | 1.90 | % | | | 1.93 | % |
| | | | | |
Portfolio turnover rate | | | 56 | %(e) | | | 50 | %(e) | | | 22 | % | | | 41 | % | | | 15 | % |
| | | | | |
Net assets at end of year (in 000’s) | | $ | 4,872 | | | $ | 7,970 | | | $ | 11,015 | | | $ | 15,223 | | | $ | 18,313 | |
| ‡ | Less than one cent per share. |
| (a) | Per share data based on average shares outstanding during the year. |
| (b) | Total investment return is calculated exclusive of sales charges and assumes the reinvestment of distributions. For periods of less than one year, total return is not annualized. |
| (c) | In addition to the fees and expenses which the Fund bears directly, it also indirectly bears a pro-rata share of the fees and expenses of the underlying funds in which it invests. Such indirect expenses are not included in the above expense ratios. |
| (d) | The expense ratios presented below show the impact of short sales expense: |
| | | | | | | | | | |
Year Ended | | Net Expenses
(excluding short
sale expenses) | | Short Sale
Expenses |
| October 31, 2020 | | | | 1.89 | % | | | | 0.11 | % |
| October 31, 2019 | | | | 1.84 | % | | | | 0.20 | % |
| October 31, 2018 | | | | 1.80 | % | | | | 0.22 | % |
| October 31, 2017 | | | | 1.78 | % | | | | 0.12 | % |
| October 31, 2016 | | | | 1.77 | % | | | | 0.16 | % |
| (e) | The portfolio turnover rate not including mortgage dollar rolls was 53% and 44% for the years ended October 31, 2020 and 2019, respectively. |
| | | | | | |
The notes to the financial statements are an integral part of,
and should be read in conjunction with, the financial statements. | | | | | 29 | |
Financial Highlights selected per share data and ratios
| | | | | | | | | | | | | | | | | | | | |
| |
| | | Year ended October 31, | |
| | | | | |
| Class C | | 2020 | | | 2019 | | | 2018 | | | 2017 | | | 2016 | |
| | | | | |
Net asset value at beginning of year | | $ | 8.69 | | | $ | 8.60 | | | $ | 8.85 | | | $ | 8.76 | | | $ | 8.67 | |
| | | | | | | | | | | | | | | | | | | | |
| | | | | |
Net investment income (loss) (a) | | | 0.15 | | | | 0.16 | | | | 0.17 | | | | 0.18 | | | | 0.28 | |
| | | | | |
Net realized and unrealized gain (loss) on investments | | | 0.06 | | | | 0.11 | | | | (0.23 | ) | | | 0.15 | | | | 0.10 | |
| | | | | |
Net realized and unrealized gain (loss) on foreign currency transactions | | | 0.00 | ‡ | | | 0.00 | ‡ | | | 0.01 | | | | (0.00 | )‡ | | | (0.03 | ) |
| | | | | | | | | | | | | | | | | | | | |
| | | | | |
Total from investment operations | | | 0.21 | | | | 0.27 | | | | (0.05 | ) | | | 0.33 | | | | 0.35 | |
| | | | | | | | | | | | | | | | | | | | |
| | | | | |
| Less distributions: | | | | | | | | | | | | | | | | | | | | |
| | | | | |
From net investment income | | | (0.15 | ) | | | (0.18 | ) | | | (0.20 | ) | | | (0.24 | ) | | | (0.26 | ) |
| | | | | |
Return of capital | | | (0.00 | )‡ | | | — | | | | (0.00 | )‡ | | | (0.00 | )‡ | | | — | |
| | | | | | | | | | | | | | | | | | | | |
| | | | | |
Total distributions | | | (0.15 | ) | | | (0.18 | ) | | | (0.20 | ) | | | (0.24 | ) | | | (0.26 | ) |
| | | | | | | | | | | | | | | | | | | | |
| | | | | |
Net asset value at end of year | | $ | 8.75 | | | $ | 8.69 | | | $ | 8.60 | | | $ | 8.85 | | | $ | 8.76 | |
| | | | | | | | | | | | | | | | | | | | |
| | | | | |
Total investment return (b) | | | 2.45 | % | | | 3.21 | % | | | (0.52 | %) | | | 3.86 | % | | | 4.16 | % |
| | | | | |
| Ratios (to average net assets)/Supplemental Data: | | | | | | | | | | | | | | | | | | | | |
| | | | | |
Net investment income (loss) | | | 1.78 | % | | | 1.90 | % | | | 1.92 | % | | | 2.00 | % | | | 3.27 | % |
| | | | | |
Net expenses (c)(d) | | | 2.00 | % | | | 2.04 | % | | | 2.02 | % | | | 1.90 | % | | | 1.93 | % |
| | | | | |
Portfolio turnover rate | | | 56 | %(e) | | | 50 | %(e) | | | 22 | % | | | 41 | % | | | 15 | % |
| | | | | |
Net assets at end of year (in 000’s) | | $ | 65,158 | | | $ | 91,598 | | | $ | 128,279 | | | $ | 167,595 | | | $ | 220,513 | |
| ‡ | Less than one cent per share. |
| (a) | Per share data based on average shares outstanding during the year. |
| (b) | Total investment return is calculated exclusive of sales charges and assumes the reinvestment of distributions. For periods of less than one year, total return is not annualized. |
| (c) | In addition to the fees and expenses which the Fund bears directly, it also indirectly bears a pro-rata share of the fees and expenses of the underlying funds in which it invests. Such indirect expenses are not included in the above expense ratios. |
| (d) | The expense ratios presented below show the impact of short sales expense: |
| | | | | | | | | | |
Year Ended | | Net Expenses
(excluding short
sale expenses) | | Short Sale
Expenses |
| October 31, 2020 | | | | 1.89 | % | | | | 0.11 | % |
| October 31, 2019 | | | | 1.84 | % | | | | 0.20 | % |
| October 31, 2018 | | | | 1.80 | % | | | | 0.22 | % |
| October 31, 2017 | | | | 1.78 | % | | | | 0.12 | % |
| October 31, 2016 | | | | 1.77 | % | | | | 0.16 | % |
| (e) | The portfolio turnover rate not including mortgage dollar rolls was 53% and 44% for the years ended October 31, 2020 and 2019, respectively. |
| | | | |
| 30 | | MainStay MacKay Unconstrained Bond Fund | | The notes to the financial statements are an integral part of,
and should be read in conjunction with, the financial statements. |
Financial Highlights selected per share data and ratios
| | | | | | | | | | | | | | | | | | | | |
| |
| | | Year ended October 31, | |
| | | | | |
| Class I | | 2020 | | | 2019 | | | 2018 | | | 2017 | | | 2016 | |
| | | | | |
Net asset value at beginning of year | | $ | 8.75 | | | $ | 8.66 | | | $ | 8.91 | | | $ | 8.82 | | | $ | 8.72 | |
| | | | | | | | | | | | | | | | | | | | |
| | | | | |
Net investment income (loss) (a) | | | 0.24 | | | | 0.25 | | | | 0.26 | | | | 0.26 | | | | 0.37 | |
| | | | | |
Net realized and unrealized gain (loss) on investments | | | 0.06 | | | | 0.11 | | | | (0.23 | ) | | | 0.16 | | | | 0.11 | |
| | | | | |
Net realized and unrealized gain (loss) on foreign currency transactions | | | 0.00 | ‡ | | | 0.00 | ‡ | | | 0.01 | | | | (0.00 | )‡ | | | (0.03 | ) |
| | | | | | | | | | | | | | | | | | | | |
| | | | | |
Total from investment operations | | | 0.30 | | | | 0.36 | | | | 0.04 | | | | 0.42 | | | | 0.45 | |
| | | | | | | | | | | | | | | | | | | | |
| | | | | |
| Less distributions: | | | | | | | | | | | | | | | | | | | | |
| | | | | |
From net investment income | | | (0.23 | ) | | | (0.27 | ) | | | (0.29 | ) | | | (0.33 | ) | | | (0.35 | ) |
| | | | | |
Return of capital | | | (0.01 | ) | | | — | | | | (0.00 | )‡ | | | (0.00 | )‡ | | | — | |
| | | | | | | | | | | | | | | | | | | | |
| | | | | |
Total distributions | | | (0.24 | ) | | | (0.27 | ) | | | (0.29 | ) | | | (0.33 | ) | | | (0.35 | ) |
| | | | | | | | | | | | | | | | | | | | |
| | | | | |
Net asset value at end of year | | $ | 8.81 | | | $ | 8.75 | | | $ | 8.66 | | | $ | 8.91 | | | $ | 8.82 | |
| | | | | | | | | | | | | | | | | | | | |
| | | | | |
Total investment return (b) | | | 3.53 | % | | | 4.24 | % | | | 0.51 | % | | | 4.90 | % | | | 5.32 | % |
| | | | | |
| Ratios (to average net assets)/Supplemental Data: | | | | | | | | | | | | | | | | | | | | |
| | | | | |
Net investment income (loss) | | | 2.83 | % | | | 2.91 | % | | | 2.94 | % | | | 2.99 | % | | | 4.30 | % |
| | | | | |
Net expenses (c)(d) | | | 0.94 | % | | | 1.02 | % | | | 1.00 | % | | | 0.88 | % | | | 0.91 | % |
| | | | | |
Portfolio turnover rate | | | 56 | %(e) | | | 50 | %(e) | | | 22 | % | | | 41 | % | | | 15 | % |
| | | | | |
Net assets at end of year (in 000’s) | | $ | 404,964 | | | $ | 604,981 | | | $ | 717,129 | | | $ | 837,363 | | | $ | 735,359 | |
| ‡ | Less than one cent per share. |
| (a) | Per share data based on average shares outstanding during the year. |
| (b) | Total investment return is calculated exclusive of sales charges and assumes the reinvestment of distributions. Class I shares are not subject to sales charges. For periods of less than one year, total return is not annualized. |
| (c) | In addition to the fees and expenses which the Fund bears directly, it also indirectly bears a pro-rata share of the fees and expenses of the underlying funds in which it invests. Such indirect expenses are not included in the above expense ratios. |
| (d) | The expense ratios presented below show the impact of short sales expense: |
| | | | | | | | | | |
Year Ended | | Net Expenses
(excluding short
sale expenses) | | Short Sale
Expenses |
| October 31, 2020 | | | | 0.83 | % | | | | 0.11 | % |
| October 31, 2019 | | | | 0.82 | % | | | | 0.20 | % |
| October 31, 2018 | | | | 0.78 | % | | | | 0.22 | % |
| October 31, 2017 | | | | 0.76 | % | | | | 0.12 | % |
| October 31, 2016 | | | | 0.75 | % | | | | 0.16 | % |
| (e) | The portfolio turnover rate not including mortgage dollar rolls was 53% and 44% for the years ended October 31, 2020 and 2019, respectively. |
| | | | | | |
The notes to the financial statements are an integral part of,
and should be read in conjunction with, the financial statements. | | | | | 31 | |
Financial Highlights selected per share data and ratios
| | | | | | | | | | | | | | | | | | | | |
| |
| | | Year ended October 31, | |
| | | | | |
| Class R2 | | 2020 | | | 2019 | | | 2018 | | | 2017 | | | 2016 | |
| | | | | |
Net asset value at beginning of year | | $ | 8.74 | | | $ | 8.65 | | | $ | 8.90 | | | $ | 8.81 | | | $ | 8.72 | |
| | | | | | | | | | | | | | | | | | | | |
| | | | | |
Net investment income (loss) (a) | | | 0.21 | | | | 0.22 | | | | 0.23 | | | | 0.23 | | | | 0.34 | |
| | | | | |
Net realized and unrealized gain (loss) on investments | | | 0.07 | | | | 0.11 | | | | (0.23 | ) | | | 0.16 | | | | 0.10 | |
| | | | | |
Net realized and unrealized gain (loss) on foreign currency transactions | | | 0.00 | ‡ | | | 0.00 | ‡ | | | 0.01 | | | | (0.00 | )‡ | | | (0.03 | ) |
| | | | | | | | | | | | | | | | | | | | |
| | | | | |
Total from investment operations | | | 0.28 | | | | 0.33 | | | | 0.01 | | | | 0.39 | | | | 0.41 | |
| | | | | | | | | | | | | | | | | | | | |
| | | | | |
| Less distributions: | | | | | | | | | | | | | | | | | | | | |
| | | | | |
From net investment income | | | (0.20 | ) | | | (0.24 | ) | | | (0.26 | ) | | | (0.30 | ) | | | (0.32 | ) |
| | | | | |
Return of capital | | | (0.01 | ) | | | — | | | | (0.00 | )‡ | | | (0.00 | )‡ | | | — | |
| | | | | | | | | | | | | | | | | | | | |
| | | | | |
Total distributions | | | (0.21 | ) | | | (0.24 | ) | | | (0.26 | ) | | | (0.30 | ) | | | (0.32 | ) |
| | | | | | | | | | | | | | | | | | | | |
| | | | | |
Net asset value at end of year | | $ | 8.81 | | | $ | 8.74 | | | $ | 8.65 | | | $ | 8.90 | | | $ | 8.81 | |
| | | | | | | | | | | | | | | | | | | | |
| | | | | |
Total investment return (b) | | | 3.27 | % | | | 3.89 | % | | | 0.16 | % | | | 4.54 | % | | | 4.84 | % |
| | | | | |
| Ratios (to average net assets)/Supplemental Data: | | | | | | | | | | | | | | | | | | | | |
| | | | | |
Net investment income (loss) | | | 2.49 | % | | | 2.54 | % | | | 2.67 | % | | | 2.63 | % | | | 3.97 | % |
| | | | | |
Net expenses (c)(d) | | | 1.29 | % | | | 1.37 | % | | | 1.34 | % | | | 1.23 | % | | | 1.28 | % |
| | | | | |
Portfolio turnover rate | | | 56 | %(e) | | | 50 | %(e) | | | 22 | % | | | 41 | % | | | 15 | % |
| | | | | |
Net assets at end of year (in 000’s) | | $ | 934 | | | $ | 7,232 | | | $ | 6,657 | | | $ | 773 | | | $ | 662 | |
| ‡ | Less than one cent per share. |
| (a) | Per share data based on average shares outstanding during the period. |
| (b) | Total investment return is calculated exclusive of sales charges and assumes the reinvestment of distributions. Class R2 shares are not subject to sales charges. For periods of less than one year, total return is not annualized. |
| (c) | In addition to the fees and expenses which the Fund bears directly, it also indirectly bears a pro-rata share of the fees and expenses of the underlying funds in which it invests. Such indirect expenses are not included in the above expense ratios. |
| (d) | The expense ratios presented below show the impact of short sales expense: |
| | | | | | | | | | |
Year Ended | | Net Expenses
(excluding short
sale expenses) | | Short Sale
Expenses |
| October 31, 2020 | | | | 1.18 | % | | | | 0.11 | % |
| October 31, 2019 | | | | 1.17 | % | | | | 0.20 | % |
| October 31, 2018 | | | | 1.14 | % | | | | 0.20 | % |
| October 31, 2017 | | | | 1.11 | % | | | | 0.12 | % |
| October 31, 2016 | | | | 1.12 | % | | | | 0.16 | % |
| (e) | The portfolio turnover rate not including mortgage dollar rolls was 53% and 44% for the years ended October 31, 2020 and 2019, respectively. |
| | | | |
| 32 | | MainStay MacKay Unconstrained Bond Fund | | The notes to the financial statements are an integral part of,
and should be read in conjunction with, the financial statements. |
Financial Highlights selected per share data and ratios
| | | | | | | | | | | | | | | | | | | | |
| | |
| | | Year ended October 31, | | | February 29,
2016^
through
October 31, | |
| | | | | |
| Class R3 | | 2020 | | | 2019 | | | 2018 | | | 2017 | | | 2016 | |
| | | | | |
Net asset value at beginning of period | | $ | 8.74 | | | $ | 8.65 | | | $ | 8.90 | | | $ | 8.81 | | | $ | 8.20 | |
| | | | | | | | | | | | | | | | | | | | |
| | | | | |
Net investment income (loss) (a) | | | 0.20 | | | | 0.20 | | | | 0.21 | | | | 0.21 | | | | 0.21 | |
| | | | | |
Net realized and unrealized gain (loss) on investments | | | 0.05 | | | | 0.11 | | | | (0.23 | ) | | | 0.16 | | | | 0.86 | |
| | | | | |
Net realized and unrealized gain (loss) on foreign currency transactions | | | 0.00 | ‡ | | | 0.00 | ‡ | | | 0.01 | | | | (0.00 | )‡ | | | (0.27 | ) |
| | | | | | | | | | | | | | | | | | | | |
| | | | | |
Total from investment operations | | | 0.25 | | | | 0.31 | | | | (0.01 | ) | | | 0.37 | | | | 0.80 | |
| | | | | | | | | | | | | | | | | | | | |
| | | | | |
| Less distributions: | | | | | | | | | | | | | | | | | | | | |
| | | | | |
From net investment income | | | (0.18 | ) | | | (0.22 | ) | | | (0.24 | ) | | | (0.28 | ) | | | (0.19 | ) |
| | | | | |
Return of capital | | | (0.01 | ) | | | — | | | | (0.00 | )‡ | | | (0.00 | )‡ | | | — | |
| | | | | | | | | | | | | | | | | | | | |
| | | | | |
Total distributions | | | (0.19 | ) | | | (0.22 | ) | | | (0.24 | ) | | | (0.28 | ) | | | (0.19 | ) |
| | | | | | | | | | | | | | | | | | | | |
| | | | | |
Net asset value at end of period | | $ | 8.80 | | | $ | 8.74 | | | $ | 8.65 | | | $ | 8.90 | | | $ | 8.81 | |
| | | | | | | | | | | | | | | | | | | | |
| | | | | |
Total investment return (b) | | | 2.90 | % | | | 3.63 | % | | | (0.09 | %) | | | 4.28 | % | | | 9.77 | % |
| | | | | |
| Ratios (to average net assets)/Supplemental Data: | | | | | | | | | | | | | | | | | | | | |
| | | | | |
Net investment income (loss) | | | 2.27 | % | | | 2.29 | % | | | 2.36 | % | | | 2.34 | % | | | 3.32 | %†† |
| | | | | |
Net expenses (c)(d) | | | 1.52 | % | | | 1.62 | % | | | 1.60 | % | | | 1.48 | % | | | 1.50 | %†† |
| | | | | |
Portfolio turnover rate | | | 56 | %(e) | | | 50 | %(e) | | | 22 | % | | | 41 | % | | | 15 | % |
| | | | | |
Net assets at end of period (in 000’s) | | $ | 276 | | | $ | 218 | | | $ | 190 | | | $ | 114 | | | $ | 32 | |
| ‡ | Less than one cent per share. |
| (a) | Per share data based on average shares outstanding during the period. |
| (b) | Total investment return is calculated exclusive of sales charges and assumes the reinvestment of distributions. Class R3 shares are not subject to sales charges. For periods of less than one year, total return is not annualized. |
| (c) | In addition to the fees and expenses which the Fund bears directly, it also indirectly bears a pro-rata share of the fees and expenses of the underlying funds in which it invests. Such indirect expenses are not included in the above expense ratios. |
| (d) | The expense ratios presented below show the impact of short sales expense: |
| | | | | | | | | | |
Year Ended | | Net Expenses
(excluding short
sale expenses) | | Short Sale
Expenses |
| October 31, 2020 | | | | 1.41 | % | | | | 0.11 | % |
| October 31, 2019 | | | | 1.42 | % | | | | 0.20 | % |
| October 31, 2018 | | | | 1.38 | % | | | | 0.22 | % |
| October 31, 2017 | | | | 1.36 | % | | | | 0.12 | % |
| October 31, 2016†† | | | | 1.34 | % | | | | 0.16 | % |
| (e) | The portfolio turnover rate not including mortgage dollar rolls was 53% and 44% for the years ended October 31, 2020 and 2019, respectively. |
| | | | | | |
The notes to the financial statements are an integral part of,
and should be read in conjunction with, the financial statements. | | | | | 33 | |
Financial Highlights selected per share data and ratios
| | | | | | | | | | | | |
| | |
| | | Year ended October 31, | | | February 28,
2018^
through
October 31, | |
| | | |
| Class R6 | | 2020 | | | 2019 | | | 2018 | |
| | | |
Net asset value at beginning of period | | $ | 8.75 | | | $ | 8.66 | | | $ | 8.83 | |
| | | | | | | | | | | | |
| | | |
Net investment income (loss) (a) | | | 0.25 | | | | 0.27 | | | | 0.19 | |
| | | |
Net realized and unrealized gain (loss) on investments | | | 0.08 | | | | 0.11 | | | | (0.15 | ) |
| | | |
Net realized and unrealized gain (loss) on foreign currency transactions | | | 0.01 | | | | 0.00 | ‡ | | | 0.01 | |
| | | | | | | | | | | | |
| | | |
Total from investment operations | | | 0.34 | | | | 0.38 | | | | 0.05 | |
| | | | | | | | | | | | |
| | | |
| Less distributions: | | | | | | | | | | | | |
| | | |
From net investment income | | | (0.24 | ) | | | (0.29 | ) | | | (0.22 | ) |
| | | |
Return of capital | | | (0.01 | ) | | | — | | | | (0.00 | )‡ |
| | | | | | | | | | | | |
| | | |
Total distributions | | | (0.25 | ) | | | (0.29 | ) | | | (0.22 | ) |
| | | | | | | | | | | | |
| | | |
Net asset value at end of period | | $ | 8.84 | | | $ | 8.75 | | | $ | 8.66 | |
| | | | | | | | | | | | |
| | | |
Total investment return (b) | | | 4.04 | % | | | 4.43 | % | | | 0.54 | % |
| | | |
| Ratios (to average net assets)/Supplemental Data: | | | | | | | | | | | | |
| | | |
Net investment income (loss) | | | 2.88 | % | | | 3.13 | % | | | 3.18 | %†† |
| | | |
Net expenses (c)(d) | | | 0.82 | % | | | 0.84 | % | | | 0.85 | %†† |
| | | |
Portfolio turnover rate | | | 56 | %(e) | | | 50 | %(e) | | | 22 | % |
| | | |
Net assets at end of period (in 000’s) | | $ | 465 | | | $ | 22,632 | | | $ | 52,504 | |
| ‡ | Less than one cent per share. |
| (a) | Per share data based on average shares outstanding during the period. |
| (b) | Total investment return is calculated exclusive of sales charges and assumes the reinvestment of distributions. Class R6 shares are not subject to sales charges. For periods of less than one year, total return is not annualized. |
| (c) | In addition to the fees and expenses which the Fund bears directly, it also indirectly bears a pro-rata share of the fees and expenses of the underlying funds in which it invests. Such indirect expenses are not included in the above expense ratios. |
| (d) | The expense ratios presented below show the impact of short sales expense: |
| | | | | | | | | | |
Year Ended | | Net Expenses
(excluding short
sale expenses) | | Short Sale
Expenses |
| October 31, 2020 | | | | 0.66 | % | | | | 0.16 | % |
| October 31, 2019 | | | | 0.64 | % | | | | 0.20 | % |
| October 31, 2018†† | | | | 0.62 | % | | | | 0.23 | % |
| (e) | The portfolio turnover rate not including mortgage dollar rolls was 53% and 44% for the years ended October 31, 2020 and 2019, respectively. |
| | | | |
| 34 | | MainStay MacKay Unconstrained Bond Fund | | The notes to the financial statements are an integral part of,
and should be read in conjunction with, the financial statements. |
Notes to Financial Statements
Note 1–Organization and Business
The MainStay Funds (the ‘‘Trust’’) was organized on January 9, 1986, as a Massachusetts business trust. The Trust is registered under the Investment Company Act of 1940, as amended (the “1940 Act”), as an open-end management investment company, and is comprised of twelve funds (collectively referred to as the “Funds”). These financial statements and notes relate to the MainStay MacKay Unconstrained Bond Fund (the “Fund”), a “diversified” fund, as that term is defined in the 1940 Act, as interpreted or modified by regulatory authorities having jurisdiction, from time to time.
The Fund currently has nine classes of shares registered for sale. Class A and Class B shares commenced operations on February 28, 1997. Class C shares commenced operations on September 1, 1998. Class I shares commenced operations on January 2, 2004. Investor Class shares commenced operations on February 28, 2008. Class R2 shares commenced operations on February 28, 2014. Class R3 shares commenced operations on February 29, 2016. Class R6 shares were registered for sale effective February 28, 2017. Class R6 shares commenced operations on February 28, 2018. SIMPLE Class shares were registered for sale effective as of August 31, 2020. As of October 31, 2020, SIMPLE Class shares were not yet offered for sale.
Class B shares of the MainStay Group of Funds are closed to all new purchases as well as additional investments by existing Class B shareholders. Existing Class B shareholders may continue to reinvest dividends and capital gains distributions, as well as exchange their Class B shares for Class B shares of other funds in the MainStay Group of Funds as permitted by the current exchange privileges. Class B shareholders continue to be subject to any applicable contingent deferred sales charge (“CDSC”) at the time of redemption. All other features of the Class B shares, including but not limited to the fees and expenses applicable to Class B shares, remain unchanged. Unless redeemed, Class B shareholders will remain in Class B shares of their respective fund until the Class B shares are converted to Class A or Investor Class shares pursuant to the applicable conversion schedule.
Class A and Investor Class shares are offered at net asset value (“NAV”) per share plus an initial sales charge. No initial sales charge applies to investments of $1 million or more (and certain other qualified purchases) in Class A and Investor Class shares. However, a CDSC of 1.00% may be imposed on certain redemptions made within 18 months of the date of purchase on shares that were purchased without an initial sales charge. Class C shares are offered at NAV without an initial sales charge, although a 1.00% CDSC may be imposed on certain redemptions of such shares made within one year of the date of purchase of Class C shares. When Class B shares were offered, they were offered at NAV without an initial sales charge, although a CDSC that declines depending on the number of years a shareholder held its Class B shares may be imposed on certain redemptions of such shares made within six years of the date of purchase of such shares. Class I, Class R2, Class R3 and Class R6 shares are offered at NAV without a sales charge. SIMPLE Class shares are currently expected to be offered at NAV without a sales charge. Depending upon eligibility, Class B shares convert to either Class A or Investor Class shares at the end of the calendar quarter eight years after the date they were purchased. In addition, depending upon eligibility, Class C shares convert to either Class A or Investor Class shares at the end of the calendar quarter ten
years after the date they were purchased. Additionally, Investor Class shares may convert automatically to Class A shares. Under certain circumstances and as may be permitted by the Trust’s multiple class plan pursuant to Rule 18f-3 under the 1940 Act, specified share classes of the Fund may be converted to one or more other share classes of the Fund as disclosed in the capital share transactions within these Notes. The classes of shares have the same voting (except for issues that relate solely to one class), dividend, liquidation and other rights, and the same terms and conditions, except that under distribution plans pursuant to Rule 12b-1 under the 1940 Act, Class B and Class C shares are subject to higher distribution and/or service fees than Class A, Investor Class, Class R2 and SIMPLE Class shares. Class I and Class R6 shares are not subject to a distribution and/or service fee. Class R2 and Class R3 shares are subject to a shareholder service fee. This is in addition to any fees paid under a distribution plan, where applicable.
The Fund’s investment objective is to seek total return by investing primarily in domestic and foreign debt securities.
Note 2–Significant Accounting Policies
The Fund is an investment company and accordingly follows the investment company accounting and reporting guidance of the Financial Accounting Standards Board (“FASB”) Accounting Standard Codification Topic 946 Financial Services—Investment Companies. The Fund prepares its financial statements in accordance with generally accepted accounting principles (“GAAP”) in the United States of America and follows the significant accounting policies described below.
(A) Securities Valuation. Investments are usually valued as of the close of regular trading on the New York Stock Exchange (the “Exchange”) (usually 4:00 p.m. Eastern time) on each day the Fund is open for business (“valuation date”).
The Board of Trustees of the Trust (the “Board”) adopted procedures establishing methodologies for the valuation of the Fund’s securities and other assets and delegated the responsibility for valuation determinations under those procedures to the Valuation Committee of the Trust (the “Valuation Committee”). The procedures state that, subject to the oversight of the Board and unless otherwise noted, the responsibility for the day-to-day valuation of portfolio assets (including fair value measurements for the Fund’s assets and liabilities) rests with New York Life Investment Management LLC (“New York Life Investments” or the “Manager”), aided to whatever extent necessary by the Subadvisor (as defined in Note 3(A)). To assess the appropriateness of security valuations, the Manager, the Subadvisor or the Fund’s third-party service provider, who is subject to oversight by the Manager, regularly compares prior day prices, prices on comparable securities and the sale prices to the prior and current day prices and challenges prices with changes exceeding certain tolerance levels with third-party pricing services or broker sources.
The Board authorized the Valuation Committee to appoint a Valuation Subcommittee (the “Subcommittee”) to establish the prices of securities for which market quotations are not readily available or the prices of which are not otherwise readily determinable under the procedures. The Subcommittee meets (in person, via electronic mail or via teleconference) on an as-needed basis. The Valuation Committee meets to ensure that actions taken by the Subcommittee were appropriate.
Notes to Financial Statements (continued)
For those securities valued through either a standardized fair valuation methodology or a fair valuation measurement, the Subcommittee deals with such valuation and the Valuation Committee reviews and affirms, if appropriate, the reasonableness of the valuation based on such methodologies and measurements on a regular basis after considering information that is reasonably available and deemed relevant by the Valuation Committee. Any action taken by the Subcommittee with respect to the valuation of a portfolio security or other asset is submitted for review and ratification (if appropriate) to the Valuation Committee and the Board at the next regularly scheduled meeting.
“Fair value” is defined as the price the Fund would reasonably expect to receive upon selling an asset or liability in an orderly transaction to an independent buyer in the principal or most advantageous market for the asset or liability. Fair value measurements are determined within a framework that establishes a three-tier hierarchy that maximizes the use of observable market data and minimizes the use of unobservable inputs to establish a classification of fair value measurements for disclosure purposes. “Inputs” refer broadly to the assumptions that market participants would use in pricing the asset or liability, including assumptions about risk, such as the risk inherent in a particular valuation technique used to measure fair value using a pricing model and/or the risk inherent in the inputs for the valuation technique. Inputs may be observable or unobservable. Observable inputs reflect the assumptions market participants would use in pricing the asset or liability based on market data obtained from sources independent of the Fund. Unobservable inputs reflect the Fund’s own assumptions about the assumptions market participants would use in pricing the asset or liability based on the information available. The inputs or methodology used for valuing assets or liabilities may not be an indication of the risks associated with investing in those assets or liabilities. The three-tier hierarchy of inputs is summarized below.
| • | | Level 1—quoted prices in active markets for an identical asset or liability |
| • | | Level 2—other significant observable inputs (including quoted prices for a similar asset or liability in active markets, interest rates and yield curves, prepayment speeds, credit risk, etc.) |
| • | | Level 3—significant unobservable inputs (including the Fund’s own assumptions about the assumptions that market participants would use in measuring fair value of an asset or liability) |
The level of an asset or liability within the fair value hierarchy is based on the lowest level of an input, both individually and in the aggregate, that is significant to the fair value measurement. The aggregate value by input level of the Fund’s assets and liabilities as of October 31, 2020, is included at the end of the Portfolio of Investments.
The Fund may use third-party vendor evaluations, whose prices may be derived from one or more of the following standard inputs, among others:
| | |
• Benchmark yields | | • Reported trades |
• Broker/dealer quotes | | • Issuer spreads |
• Two-sided markets | | • Benchmark securities |
• Bids/offers | | • Reference data (corporate actions or material event notices) |
• Industry and economic events | | • Comparable bonds |
• Monthly payment information | | |
An asset or liability for which market values cannot be measured using the methodologies described above is valued by methods deemed reasonable in good faith by the Valuation Committee, following the procedures established by the Board, to represent fair value. Under these procedures, the Fund generally uses a market-based approach which may use related or comparable assets or liabilities, recent transactions, market multiples, book values and other relevant information. The Fund may also use an income-based valuation approach in which the anticipated future cash flows of the asset or liability are discounted to calculate fair value. Discounts may also be applied due to the nature and/or duration of any restrictions on the disposition of the asset or liability. Fair value represents a good faith approximation of the value of a security. Fair value determinations involve the consideration of a number of subjective factors, an analysis of applicable facts and circumstances and the exercise of judgment. As a result, it is possible that the fair value for a security determined in good faith in accordance with the Fund’s valuation procedures may differ from valuations for the same security determined by other funds using their own valuation procedures. Although the Fund’s valuation procedures are designed to value a security at the price the Fund may reasonably expect to receive upon the security’s sale in an orderly transaction, there can be no assurance that any fair value determination thereunder would, in fact, approximate the amount that the Fund would actually realize upon the sale of the security or the price at which the security would trade if a reliable market price were readily available. During the year ended October 31, 2020, there were no material changes to the fair value methodologies.
Securities which may be valued in this manner include, but are not limited to: (i) a security for which trading has been halted or suspended; (ii) a debt security that has recently gone into default and for which there is not a current market quotation; (iii) a security of an issuer that has entered into a restructuring; (iv) a security that has been delisted from a national exchange; (v) a security for which the market price is not readily available from a third-party pricing source or, if so provided, does not, in the opinion of the Manager or the Subadvisor, reflect the security’s market value; (vi) a security subject to trading collars for which no or limited trading takes place; and (vii) a security whose principal market has been temporarily closed at a time when, under normal conditions, it would be open. Securities valued in this manner are generally categorized as Level 3 in the hierarchy. Securities that were fair valued in such a manner as of October 31, 2020, are shown in the Portfolio of Investments.
Equity securities are valued at the last quoted sales prices as of the close of regular trading on the relevant exchange on each valuation date. Securities that are not traded on the valuation date are valued at the mean of the last quoted bid and ask prices. Prices are normally taken from the principal market in which each security trades. These securities are generally categorized as Level 1 in the hierarchy.
Futures contracts are valued at the last posted settlement price on the market where such futures are primarily traded. Investments in mutual funds, including money market funds, are valued at their respective NAVs as of the close of the Exchange on the valuation date. These securities are generally categorized as Level 1 in the hierarchy.
Debt securities (other than convertible and municipal bonds) are valued at the evaluated bid prices (evaluated mean prices in the case of con-
| | |
| 36 | | MainStay MacKay Unconstrained Bond Fund |
vertible and municipal bonds) supplied by a pricing agent or broker(s) selected by the Manager, in consultation with the Subadvisor. The evaluations are market-based measurements processed through a pricing application and represents the pricing agent’s good faith determination as to what a holder may receive in an orderly transaction under market conditions. The rules-based logic utilizes valuation techniques that reflect participants’ assumptions and vary by asset class and per methodology, maximizing the use of relevant observable data including quoted prices for similar assets, benchmark yield curves and market corroborated inputs. The evaluated bid or mean prices are deemed by the Manager, in consultation with the Subadvisor, to be representative of market values at the regular close of trading of the Exchange on each valuation date. Debt securities purchased on a delayed delivery basis are marked to market daily until settlement at the forward settlement date. Debt securities, including corporate bonds, U.S. government and federal agency bonds, municipal bonds, foreign bonds, convertible bonds, asset-backed securities and mortgage-backed securities are generally categorized as Level 2 in the hierarchy.
Certain securities held by the Fund may principally trade in foreign markets. Events may occur between the time the foreign markets close and the time at which the Fund’s NAVs are calculated. These events may include, but are not limited to, situations relating to a single issuer in a market sector, significant fluctuations in U.S. or foreign markets, natural disasters, armed conflicts, governmental actions or other developments not tied directly to the securities markets. Should the Manager or the Subadvisor conclude that such events may have affected the accuracy of the last price of such securities reported on the local foreign market, the Subcommittee may, pursuant to procedures adopted by the Board, adjust the value of the local price to reflect the estimated impact on the price of such securities as a result of such events. In this instance, securities are generally categorized as Level 3 in the hierarchy. Additionally, certain foreign equity securities are also fair valued whenever the movement of a particular index exceeds certain thresholds. In such cases, the securities are fair valued by applying factors provided by a third-party vendor in accordance with valuation procedures adopted by the Board and are generally categorized as Level 2 in the hierarchy. No foreign equity securities held by the Fund as of October 31, 2020, were fair valued in such a manner.
Foreign currency forward contracts are valued at their fair market values measured on the basis of the mean between the last current bid and ask prices based on dealer or exchange quotations and are generally categorized as Level 2 in the hierarchy.
Loan assignments, participations and commitments are valued at the average of bid quotations obtained from the engaged independent pricing service and are generally categorized as Level 2 in the hierarchy. Certain loan assignments, participations and commitments may be valued by utilizing significant unobservable inputs obtained from the pricing service and are generally categorized as Level 3 in the hierarchy. Securities that were fair valued in such a manner as of October 31, 2020, are shown in the Portfolio of Investments.
Temporary cash investments acquired in excess of 60 days to maturity at the time of purchase are valued using the latest bid prices or using valuations based on a matrix system (which considers such factors as security prices, yields, maturities and ratings), both as furnished by independent pricing services. Temporary cash investments that mature
in 60 days or less at the time of purchase (“Short-Term Investments”) are valued using the amortized cost method of valuation, unless the use of such method would be inappropriate. The amortized cost method involves valuing a security at its cost on the date of purchase and thereafter assuming a constant amortization to maturity of the difference between such cost and the value on maturity date. Amortized cost approximates the current fair value of a security. Securities valued using the amortized cost method are not valued using quoted prices in an active market and are generally categorized as Level 2 in the hierarchy.
Swaps are marked to market daily based upon quotations from pricing agents, brokers or market makers. These securities are generally categorized as Level 2 in the hierarchy.
The information above is not intended to reflect an exhaustive list of the methodologies that may be used to value portfolio investments. The valuation procedures permit the use of a variety of valuation methodologies in connection with valuing portfolio investments. The methodology used for a specific type of investment may vary based on the market data available or other considerations. The methodologies summarized above may not represent the specific means by which portfolio investments are valued on any particular business day.
A portfolio investment may be classified as an illiquid investment under the Trust’s written liquidity risk management program and related procedures (“Liquidity Program”). Illiquidity of an investment might prevent the sale of such investment at a time when the Manager or the Subadvisor might wish to sell, and these investments could have the effect of decreasing the overall level of the Fund’s liquidity. Further, the lack of an established secondary market may make it more difficult to value illiquid investments, requiring the Fund to rely on judgments that may be somewhat subjective in measuring value, which could vary materially from the amount that the Fund could realize upon disposition. Difficulty in selling illiquid investments may result in a loss or may be costly to the Fund. An illiquid investment is any investment that the Manager or Subadvisor reasonably expects cannot be sold or disposed of in current market conditions in seven calendar days or less without the sale or disposition significantly changing the market value of the investment. The liquidity classification of each investment will be made using information obtained after reasonable inquiry and taking into account, among other things, relevant market, trading and investment-specific considerations in accordance with the Liquidity Program. Illiquid investments are often valued in accordance with methods deemed by the Board in good faith to be reasonable and appropriate to accurately reflect their fair value. The liquidity of the Fund’s investments was determined as of October 31, 2020, and can change at any time. Illiquid investments as of October 31, 2020, are shown in the Portfolio of Investments.
(B) Income Taxes. The Fund’s policy is to comply with the requirements of the Internal Revenue Code of 1986, as amended (the “Internal Revenue Code”), applicable to regulated investment companies and to distribute all of its taxable income to the shareholders of the Fund within the allowable time limits.
The Manager evaluates the Fund’s tax positions to determine if the tax positions taken meet the minimum recognition threshold in connection with accounting for uncertainties in income tax positions taken or expected to be taken for the purposes of measuring and recognizing tax
Notes to Financial Statements (continued)
liabilities in the financial statements. Recognition of tax benefits of an uncertain tax position is permitted only to the extent the position is “more likely than not” to be sustained assuming examination by taxing authorities. The Manager analyzed the Fund’s tax positions taken on federal, state and local income tax returns for all open tax years (for up to three tax years) and has concluded that no provisions for federal, state and local income tax are required in the Fund’s financial statements. The Fund’s federal, state and local income tax and federal excise tax returns for tax years for which the applicable statutes of limitations have not expired are subject to examination by the Internal Revenue Service and state and local departments of revenue.
(C) Foreign Taxes. The Fund may be subject to foreign taxes on income and other transaction-based taxes imposed by certain countries in which it invests. A portion of the taxes on gains on investments or currency purchases/repatriation may be reclaimable. The Fund will accrue such taxes and reclaims as applicable, based upon its current interpretation of tax rules and regulations that exist in the markets in which it invests.
The Fund may be subject to taxation on realized capital gains, repatriation proceeds and other transaction-based taxes imposed by certain countries in which it invests. The Fund will accrue such taxes as applicable based upon its current interpretation of tax rules and regulations that exist in the market in which it invests. Capital gains taxes relating to positions still held are reflected as a liability in the Statement of Assets and Liabilities, as well as an adjustment to the Fund’s net unrealized appreciation (depreciation). Taxes related to capital gains realized, if any, are reflected as part of net realized gain (loss) in the Statement of Operations. Changes in tax liabilities related to capital gains taxes on unrealized investment gains, if any, are reflected as part of the change in net unrealized appreciation (depreciation) on investments in the Statement of Operations. Transaction-based charges are generally assessed as a percentage of the transaction amount.
(D) Dividends and Distributions to Shareholders. Dividends and distributions are recorded on the ex-dividend date. The Fund intends to declare and pay dividends from net investment income, if any, at least monthly and distributions from net realized capital and currency gains, if any, at least annually. Unless a shareholder elects otherwise, all dividends and distributions are reinvested at NAV in the same class of shares of the Fund. Dividends and distributions to shareholders are determined in accordance with federal income tax regulations and may differ from determinations using GAAP.
(E) Security Transactions and Investment Income. The Fund records security transactions on the trade date. Realized gains and losses on security transactions are determined using the identified cost method. Dividend income is recognized on the ex-dividend date, net of any foreign tax withheld at the source, and interest income is accrued as earned using the effective interest rate method and includes any realized gains and losses from repayments of principal on mortgage-backed securities. Distributions received from real estate investment trusts may be classified as dividends, capital gains and/or return of capital. Discounts and premiums on securities purchased for the Fund are accreted and amortized, respectively, on the effective interest rate method.
Investment income and realized and unrealized gains and losses on investments of the Fund are allocated pro rata to the separate classes of
shares based upon their relative net assets on the date the income is earned or realized and unrealized gains and losses are incurred.
The Fund may place a debt security on non-accrual status and reduce related interest income by ceasing current accruals and writing off all or a portion of any interest receivables when the collection of all or a portion of such interest has become doubtful. A debt security is removed from non-accrual status when the issuer resumes interest payments or when collectability of interest is reasonably assured.
(F) Expenses. Expenses of the Trust are allocated to the individual Funds in proportion to the net assets of the respective Funds when the expenses are incurred, except where direct allocations of expenses can be made. Expenses (other than transfer agent expenses and fees incurred under the shareholder services plans and/or the distribution plans further discussed in Note 3(B)) are allocated to separate classes of shares pro rata based upon their relative net assets on the date the expenses are incurred. The expenses borne by the Fund, including those of related parties to the Fund, are shown in the Statement of Operations.
Additionally, the Fund may invest in mutual funds, which are subject to management fees and other fees that may cause the costs of investing in mutual funds to be greater than the costs of owning the underlying securities directly. These indirect expenses of mutual funds are not included in the amounts shown as expenses in the Fund’s Statement of Operations or in the expense ratios included in the Financial Highlights.
(G) Use of Estimates. In preparing financial statements in conformity with GAAP, the Manager makes estimates and assumptions that affect the reported amounts and disclosures in the financial statements. Actual results could differ from those estimates and assumptions.
(H) Repurchase Agreements. The Fund may enter into repurchase agreements (i.e., buy a security from another party with the agreement that it will be sold back in the future) to earn income. The Fund may enter into repurchase agreements only with counterparties, usually financial institutions, that are deemed by the Manager or the Subadvisor to be creditworthy, pursuant to guidelines established by the Board. During the term of any repurchase agreement, the Manager or the Subadvisor will continue to monitor the creditworthiness of the counterparty. Under the 1940 Act, repurchase agreements are considered to be collateralized loans by the Fund to the counterparty secured by the securities transferred to the Fund.
Repurchase agreements are subject to counterparty risk, meaning the Fund could lose money by the counterparty’s failure to perform under the terms of the agreement. The Fund mitigates this risk by ensuring the repurchase agreement is collateralized by cash, U.S. government securities, fixed income securities and/or other securities. The collateral is held by the Fund’s custodian and valued daily on a mark to market basis to determine if the value, including accrued interest, exceeds the repurchase price. In the event of the counterparty’s default on the obligation to repurchase, the Fund has the right to liquidate the collateral and apply the proceeds in satisfaction of the obligation. Under certain circumstances, such as in the event of default or bankruptcy by the counterparty, realization and/or retention of the collateral may be limited or subject to delay, to legal proceedings and possible realized loss to the Fund. As of October 31, 2020, the Fund did not hold any repurchase agreements.
| | |
| 38 | | MainStay MacKay Unconstrained Bond Fund |
(I) Futures Contracts. A futures contract is an agreement to purchase or sell a specified quantity of an underlying instrument at a specified future date and price, or to make or receive a cash payment based on the value of a financial instrument (e.g., foreign currency, interest rate, security or securities index). The Fund is subject to risks such as market price risk and/or interest rate risk in the normal course of investing in these contracts. Upon entering into a futures contract, the Fund is required to pledge to the broker or futures commission merchant an amount of cash and/or U.S. government securities equal to a certain percentage of the collateral amount, known as the “initial margin.” During the period the futures contract is open, changes in the value of the contract are recognized as unrealized appreciation or depreciation by marking to market such contract on a daily basis to reflect the market value of the contract at the end of each day’s trading. The Fund agrees to receive from or pay to the broker or futures commission merchant an amount of cash equal to the daily fluctuation in the value of the contract. Such receipts or payments are known as “variation margin.” When the futures contract is closed, the Fund records a realized gain or loss equal to the difference between the proceeds from (or cost of) the closing transaction and the Fund’s basis in the contract.
The use of futures contracts involves, to varying degrees, elements of market risk in excess of the amount recognized in the Statement of Assets and Liabilities. The contract or notional amounts and variation margin reflect the extent of the Fund’s involvement in open futures positions. There are several risks associated with the use of futures contracts as hedging techniques. There can be no assurance that a liquid market will exist at the time when the Fund seeks to close out a futures contract. If no liquid market exists, the Fund would remain obligated to meet margin requirements until the position is closed. Futures contracts may involve a small initial investment relative to the risk assumed, which could result in losses greater than if the Fund did not invest in futures contracts. Futures contracts may be more volatile than direct investments in the instrument underlying the futures and may not correlate to the underlying instrument, causing a given hedge not to achieve its objectives. The Fund’s activities in futures contracts have minimal counterparty risk as they are conducted through regulated exchanges that guarantee the futures against default by the counterparty. In the event of a bankruptcy or insolvency of a futures commission merchant that holds margin on behalf of the Fund, the Fund may not be entitled to the return of the entire margin owed to the Fund, potentially resulting in a loss. The Fund may invest in futures contracts to help manage the duration and yield curve of the portfolio while minimizing the exposure to wider bid/ask spreads in traditional bonds. The Fund’s investment in futures contracts and other derivatives may increase the volatility of the Fund’s NAVs and may result in a loss to the Fund. Open futures contracts held as of October 31, 2020, are shown in the Portfolio of Investments.
(J) Loan Assignments, Participations and Commitments. The Fund may invest in loan assignments and participations (“loans”). Commitments are agreements to make money available to a borrower in a specified amount, at a specified rate and within a specified time. The Fund records an investment when the borrower withdraws money on a commitment or when a funded loan is purchased (trade date) and records interest as earned. These loans pay interest at rates that are periodically reset by reference to a base lending rate plus a spread. These base lending rates are generally the prime rate offered
by a designated U.S. bank or the London Interbank Offered Rate (“LIBOR”).
The loans in which the Fund may invest are generally readily marketable, but may be subject to some restrictions on resale. For example, the Fund may be contractually obligated to receive approval from the agent bank and/or borrower prior to the sale of these investments. If the Fund purchases an assignment from a lender, the Fund will generally have direct contractual rights against the borrower in favor of the lender. If the Fund purchases a participation interest either from a lender or a participant, the Fund typically will have established a direct contractual relationship with the seller of the participation interest, but not with the borrower. Consequently, the Fund is subject to the credit risk of the lender or participant who sold the participation interest to the Fund, in addition to the usual credit risk of the borrower. In the event that the borrower, selling participant or intermediate participants become insolvent or enter into bankruptcy, the Fund may incur certain costs and delays in realizing payment, or may suffer a loss of principal and/or interest.
Unfunded commitments represent the remaining obligation of the Fund to the borrower. At any point in time, up to the maturity date of the issue, the borrower may demand the unfunded portion. Unfunded amounts, if any, are marked to market and any unrealized gains or losses are recorded in the Statement of Assets and Liabilities. As of October 31, 2020, the Fund did not hold any unfunded commitments.
(K) Swap Contracts. The Fund may enter into credit default, interest rate, equity, index and currency exchange rate swap contracts (“swaps”). In a typical swap transaction, two parties agree to exchange the future returns (or differentials in rates of future returns) earned or realized at periodic intervals on a particular investment or instrument based on a notional principal amount. Generally, the Fund will enter into a swap on a net basis, which means that the two payment streams under the swap are netted, with the Fund receiving or paying (as the case may be) only the net amount of the two payment streams. Therefore, the Fund’s current obligation under a swap generally will be equal to the net amount to be paid or received under the swap, based on the relative value of notional positions attributable to each counterparty to the swap. The payments may be adjusted for transaction costs, interest payments, the amount of interest paid on the investment or instrument or other factors. Collateral, in the form of cash or securities, may be required to be held in segregated accounts with the custodian bank or broker in accordance with the terms of the swap. Swap agreements are privately negotiated in the over the counter (“OTC”) market and may be executed in a multilateral or other trade facilities platform, such as a registered commodities exchange (“centrally cleared swaps”).
Certain standardized swaps, including certain credit default and interest rate swaps, are subject to mandatory clearing and exchange-trading, and more types of standardized swaps are expected to be subject to mandatory clearing and exchange-trading in the future. The counterparty risk for exchange-traded and cleared derivatives is expected to be generally lower than for uncleared derivatives, but cleared contracts are not risk-free. In a cleared derivative transaction, the Fund typically enters into the transaction with a financial institution counterparty, and performance of the transaction is effectively guaranteed by a central clearinghouse, thereby reducing or eliminating the Fund’s exposure to the credit risk of its original counterparty. The Fund will be required to
Notes to Financial Statements (continued)
post specified levels of margin with the clearinghouse or at the instruction of the clearinghouse; the margin required by a clearinghouse may be greater than the margin the Fund would be required to post in an uncleared transaction. As of October 31, 2020, all swap positions are shown in the Portfolio of Investments.
Swaps are marked to market daily based upon quotations from pricing agents, brokers or market makers and the change in value, if any, is recorded as unrealized appreciation or depreciation. Any payments made or received upon entering into a swap would be amortized or accreted over the life of the swap and recorded as a realized gain or loss. Early termination of a swap is recorded as a realized gain or loss. Daily changes in valuation of centrally cleared swaps, if any, are recorded as a receivable or payable for the change in value as appropriate (“variation margin”) on the Statement of Assets and Liabilities.
The Fund bears the risk of loss of the amount expected to be received under a swap in the event of the default or bankruptcy of the swap counterparty. The Fund may be able to eliminate its exposure under a swap either by assignment or other disposition, or by entering into an offsetting swap with the same party or a similar credit-worthy party. Swaps are not actively traded on financial markets. Entering into swaps involves elements of credit, market and documentation risk in excess of the amounts recognized on the Statement of Assets and Liabilities. Such risks involve the possibilities that there will be no liquid market for these swaps, that the counterparty to the swaps may default on its obligation to perform or disagree as to the meaning of the contractual terms in the swaps and that there may be unfavorable changes in interest rates, the price of the index or the security underlying these transactions.
Interest Rate Swaps: An interest rate swap is an agreement between two parties where one stream of future interest payments is exchanged for another based on a specified principal amount. Interest rate swaps often exchange a fixed payment for a floating payment that is linked to an interest rate (most often LIBOR). The Fund will typically use interest rate swaps to limit, or manage, its exposure to fluctuations in interest rates, or to obtain a marginally lower interest rate than it would have been able to get without the swap.
Credit Default Swaps: The Fund may enter into credit default swaps to simulate long and short bond positions or to take an active long or short position with respect to the likelihood of a default or credit event by the issuer of the underlying reference obligation. The types of reference obligations underlying the swaps that may be entered into by the Fund include debt obligations of a single issuer of corporate or sovereign debt, a basket of obligations of different issuers or a credit index. A credit index is an equally-weighted credit default swap index that is designed to track a representative segment of the credit default swap market (e.g., investment grade, high volatility, below investment grade or emerging markets) and provides an investor with exposure to specific “baskets” of issuers of certain debt instruments. Index credit default swaps have standardized terms including a fixed spread and standard maturity dates. The composition of the obligations within a particular index changes periodically. Credit default swaps involve one party, the protection buyer, making a stream of payments to another party, the protection seller, in exchange for the right to receive a contingent payment if there is a credit event related to the underlying reference obligation. In the event that the reference obligation matures prior to the termination date of the contract, a similar security will be substituted for
the duration of the contract term. Credit events are defined under individual swap agreements and generally include bankruptcy, failure to pay, restructuring, repudiation/moratorium, obligation acceleration and obligation default. Selling protection effectively adds leverage to a portfolio up to the notional amount of the swap agreement. Potential liabilities under these contracts may be reduced by: the auction rates of the underlying reference obligations; upfront payments received at the inception of a swap; and net amounts received from credit default swaps purchased with the identical reference obligation. As of October 31, 2020, open swap agreements are shown in the Portfolio of Investments.
(L) Foreign Currency Forward Contracts. The Fund may enter into foreign currency forward contracts, which are agreements to buy or sell foreign currencies on a specified future date at a specified rate. The Fund is subject to foreign currency exchange rate risk in the normal course of investing in these transactions. During the period the forward contract is open, changes in the value of the contract are recognized as unrealized appreciation or depreciation by marking to market such contract on a daily basis to reflect the market value of the contract at the end of each day’s trading. Cash movement occurs on settlement date. When the forward contract is closed, the Fund records a realized gain or loss equal to the difference between the proceeds from (or cost of) the closing transaction and the Fund’s basis in the contract. The Fund may purchase and sell foreign currency forward contracts for purposes of seeking to enhance portfolio returns and manage portfolio risk more efficiently. Foreign currency forward contracts may also be used to gain exposure to a particular currency or to hedge against the risk of loss due to changing currency exchange rates. Foreign currency forward contracts to purchase or sell a foreign currency may also be used in anticipation of future purchases or sales of securities denominated in foreign currency, even if the specific investments have not yet been selected.
The use of foreign currency forward contracts involves, to varying degrees, elements of risk in excess of the amount recognized in the Statement of Assets and Liabilities, including counterparty risk, market risk and illiquidity risk. Counterparty risk is heightened for these instruments because foreign currency forward contracts are not exchange-traded and therefore no clearinghouse or exchange stands ready to meet the obligations under such contracts. Thus, the Fund faces the risk that its counterparties under such contracts may not perform their obligations. Market risk is the risk that the value of a foreign currency forward contract will depreciate due to unfavorable changes in exchange rates. Illiquidity risk arises because the secondary market for foreign currency forward contracts may have less liquidity relative to markets for other securities and financial instruments. Risks also arise from the possible movements in the foreign exchange rates underlying these instruments. While the Fund may enter into forward contracts to reduce currency exchange risks, changes in currency exchange rates may result in poorer overall performance for the Fund than if it had not engaged in such transactions. Exchange rate movements can be large, depending on the currency, and can last for extended periods of time, affecting the value of the Fund’s assets. Moreover, there may be an imperfect correlation between the Fund’s holdings of securities denominated in a particular currency and forward contracts entered into by the Fund. Such imperfect correlation may prevent the Fund from achieving the intended hedge or expose the Fund to the risk of currency exchange
| | |
| 40 | | MainStay MacKay Unconstrained Bond Fund |
loss. The unrealized appreciation (depreciation) on forward contracts also reflects the Fund’s exposure at the valuation date to credit loss in the event of a counterparty’s failure to perform its obligations. Open foreign currency forward contracts as of October 31, 2020, are shown in the Portfolio of Investments.
(M) Foreign Currency Transactions. The Fund’s books and records are maintained in U.S. dollars. Prices of securities denominated in foreign currency amounts are translated into U.S. dollars at the mean between the buying and selling rates last quoted by any major U.S. bank at the following dates:
| (i) | market value of investment securities, other assets and liabilities—at the valuation date; and |
| (ii) | purchases and sales of investment securities, income and expenses—at the date of such transactions. |
The assets and liabilities that are denominated in foreign currency amounts are presented at the exchange rates and market values at the close of the period. The realized and unrealized changes in net assets arising from fluctuations in exchange rates and market prices of securities are not separately presented.
Net realized gain (loss) on foreign currency transactions represents net currency gains or losses realized as a result of differences between the amounts of securities sale proceeds or purchase cost, dividends, interest and withholding taxes as recorded on the Fund’s books, and the U.S. dollar equivalent amount actually received or paid. Net currency gains or losses from valuing such foreign currency denominated assets and liabilities, other than investments at valuation date exchange rates, are reflected in unrealized foreign exchange gains or losses.
(N) Securities Sold Short. During the year ended October 31, 2020, the Fund engaged in sales of securities it did not own (“short sales”) as part of its investment strategies. When the Fund enters into a short sale, it must segregate or maintain with a broker the cash proceeds from the security sold short or other securities as collateral for its obligation to deliver the security upon conclusion of the sale. During the period a short position is open, depending on the nature and type of security, a short position is reflected as a liability and is marked to market in accordance with the valuation methodologies previously detailed (See Note 2(A)). Liabilities for securities sold short are closed out by purchasing the applicable securities for delivery to the counterparty broker. A gain, limited to the price at which the Fund sold the security short, or a loss, unlimited as to dollar amount, will be recognized upon termination of a short sale if the market price on the date the short position is closed out is less or greater, respectively, than the proceeds originally received. Any such gain or loss may be offset, completely or in part, by the change in the value of the hedged investments. Interest on short positions held is accrued daily, while dividends declared on short positions existing on the record date are recorded on the ex-dividend date as a dividend expense in the Statement of Operations. Broker fees and other expenses related to securities sold short are disclosed in the Statement of Operations. Short sales involve risk of loss in excess of the related amounts reflected in the Statement of Assets and Liabilities. As of October 31, 2020, securities sold short are shown in the Portfolio of Investments.
(O) Securities Lending. In order to realize additional income, the Fund may engage in securities lending, subject to the limitations set
forth in the 1940 Act and relevant guidance by the staff of the Securities and Exchange Commission (“SEC”). If the Fund engages in securities lending, the Fund will lend through its custodian, currently State Street Bank and Trust Company (“State Street”) (See Note 13 for securities lending agent change), acting as securities lending agent on behalf of the Fund. Under the current arrangement, State Street will manage the Fund’s collateral in accordance with the securities lending agency agreement between the Fund and State Street, and indemnify the Fund against counterparty risk. The loans will be collateralized by cash (which may be invested in a money market fund) and/or non-cash collateral (which may include U.S. Treasury securities and/or U.S. government agency securities issued or guaranteed by the United States government or its agencies or instrumentalities) at least equal at all times to the market value of the securities loaned. The Fund bears the risk of delay in recovery of, or loss of rights in, the securities loaned. The Fund may also record a realized gain or loss on securities deemed sold due to a borrower’s inability to return securities on loan. The Fund bears the risk of any loss on investment of cash collateral. The Fund will receive compensation for lending its securities in the form of fees or it will retain a portion of interest earned on the investment of any cash collateral. The Fund will also continue to receive interest and dividends on the securities loaned and any gain or loss in the market price of the securities loaned that may occur during the term of the loan will be for the account of the Fund. Income earned from securities lending activities, if any, is reflected in the Statement of Operations. As of October 31, 2020, the Fund had securities on loan with an aggregate market value of $104,844 and received cash collateral, which was invested into the State Street Navigator Securities Lending Government Money Market Portfolio, with a value of $106,750.
(P) Dollar Rolls. The Fund may enter into dollar roll transactions in which it sells mortgage-backed securities (“MBS”) from its portfolio to a counterparty from whom it simultaneously agrees to buy a similar security on a delayed delivery basis. The Fund generally transfers MBS where the MBS are “to be announced,” therefore, the Fund accounts for these transactions as purchases and sales.
When accounted for as purchase and sales, the securities sold in connection with the dollar rolls are removed from the portfolio and a realized gain or loss is recognized. The securities the Fund has agreed to acquire are included at market value in the Portfolio of Investments and liabilities for such purchase commitments are included as payables for investments purchased. During the roll period, the Fund foregoes principal and interest paid on the securities. The Fund is compensated by the difference between the current sales price and the forward price for the future as well as by the earnings on the cash proceeds of the initial sale. Dollar rolls may be renewed without physical delivery of the securities subject to the contract. The Fund maintains liquid assets from its portfolio having a value not less than the repurchase price, including accrued interest. Dollar roll transactions involve certain risks, including the risk that the securities returned to the Fund at the end of the roll period, while substantially similar, could be inferior to what was initially sold to the counterparty.
(Q) Debt and Foreign Securities Risk. The ability of issuers of debt securities held by the Fund to meet their obligations may be affected by, among other things, economic or political developments in a specific country, industry or region. Debt securities are also subject to the risks associated with changes in interest rates. The Fund primarily
Notes to Financial Statements (continued)
invests in high yield debt securities (commonly referred to as “junk bonds”), which are considered speculative because they present a greater risk of loss, including default, than higher rated debt securities. These securities pay investors a premium—a higher interest rate or yield than investment grade debt securities—because of the increased risk of loss. These securities can also be subject to greater price volatility. In times of unusual or adverse market, economic or political conditions, these securities may experience higher than normal default rates.
The Fund may invest in loans which are usually rated below investment grade and are generally considered speculative because they present a greater risk of loss, including default, than higher rated debt securities. These investments pay investors a higher interest rate than investment grade debt securities because of the increased risk of loss. Although certain loans are collateralized, there is no guarantee that the value of the collateral will be sufficient to repay the loan. In a recession or serious credit event, the value of these investments could decline significantly. As a result of these and other events, the Fund’s NAVs could go down and you could lose money.
In addition, loans generally are subject to the extended settlement periods that may be longer than seven days. As a result, the Fund may be adversely affected by selling other investments at an unfavorable time and/or under unfavorable conditions or engaging in borrowing transactions, such as borrowing against its credit facility, to raise cash to meet redemption obligations or pursue other investment opportunities.
In certain circumstances, loans may not be deemed to be securities. As a result, the Fund may not have the protection of anti-fraud provisions of the federal securities laws. In such cases, the Fund generally must rely on the contractual provisions in the loan agreement and common-law fraud protections under applicable state law.
The ability of issuers of debt securities held by the Fund to meet their obligations may be affected by, among other things, economic or political developments in a specific country, industry or region. Debt securities are also subject to the risks associated with changes in interest rates. The Fund may invest in foreign securities, which carry certain risks that are in addition to the usual risks inherent in domestic securities. These risks include those resulting from currency fluctuations, future adverse political or economic developments and possible imposition of currency exchange blockages or other foreign governmental laws or restrictions. These risks are likely to be greater in emerging markets than in developed markets. The ability of issuers of debt securities held by the Fund to meet their obligations may be affected by, among other things, economic or political developments in a specific country, industry or region.
(R) Counterparty Credit Risk. In order to better define its contractual rights and to secure rights that will help the Fund mitigate its counterparty risk, the Fund may enter into an International Swaps and Derivatives Association, Inc. Master Agreement (“ISDA Master Agreement”) or similar agreement with its counterparties. An ISDA Master Agreement is a bilateral agreement between the Fund and a counterparty that governs certain OTC derivatives and typically contains collateral posting terms and netting provisions. Under an ISDA Master Agreement, the Fund may, under certain circumstances, offset with the counterparty certain derivative financial instruments’ payables and/or receivables with collateral held and/or posted and create one single net
payment. The provisions of the ISDA Master Agreement typically permit a single net payment in the event of default including the bankruptcy or insolvency of the counterparty. Bankruptcy or insolvency laws of a particular jurisdiction may restrict or prohibit the right of offset in bankruptcy, insolvency or other events. In addition, certain ISDA Master Agreements may contain provisions for early termination of OTC derivative transactions in the event the net assets of the Fund decline below specific levels or if the Fund fails to meet the terms of its ISDA Master Agreements. The result would cause the Fund to accelerate payment of any net liability owed to the counterparty.
For financial reporting purposes, the Fund does not offset derivative assets and derivative liabilities that are subject to netting arrangements, if any, in the Statement of Assets and Liabilities.
(S) LIBOR Replacement Risk. The Fund may invest in certain debt securities, derivatives or other financial instruments that utilize LIBOR, as a “benchmark” or “reference rate” for various interest rate calculations. The United Kingdom Financial Conduct Authority, which regulates LIBOR, announced that after 2021 it will cease its active encouragement of banks to provide the quotations needed to sustain LIBOR. As a result, it is anticipated that LIBOR will be discontinued or will no longer be sufficiently robust to be representative of its underlying market around that time. Although financial regulators and industry working groups have suggested alternative reference rates, such as the European Interbank Offer Rate (“EURIBOR”), Sterling Overnight Interbank Average Rate (“SONIA”) and Secured Overnight Financing Rate (“SOFR”), there are challenges to converting certain contracts and transactions to a new benchmark and neither the full effects of the transition process nor its ultimate outcome is known. Management is currently working to assess exposure and will modify contracts as necessary.
The elimination of LIBOR or changes to other reference rates or any other changes or reforms to the determination or supervision of reference rates could have an adverse impact on the market for, or value of, any securities or payments linked to those reference rates, which may adversely affect the Fund’s performance and/or net asset value. Uncertainty and risk also remain regarding the willingness and ability of issuers and lenders to include revised provisions in new and existing contracts or instruments. Consequently, the transition away from LIBOR to other reference rates may lead to increased volatility and illiquidity in markets that are tied to LIBOR, fluctuations in values of LIBOR-related investments or investments in issuers that utilize LIBOR, increased difficulty in borrowing or refinancing and diminished effectiveness of hedging strategies, adversely affecting the Fund’s performance. Accordingly, the potential effect of a transition away from LIBOR on the Fund or the debt securities or other instruments based on LIBOR in which the Fund invests cannot yet be determined. Furthermore, the risks associated with the expected discontinuation of LIBOR and transition may be exacerbated if the work necessary to effect an orderly transition to an alternative reference rate is not completed in a timely manner. Because the usefulness of LIBOR as a benchmark could deteriorate during the transition period, these effects could occur prior to the end of 2021.
(T) Indemnifications. Under the Trust’s organizational documents, its officers and trustees are indemnified against certain liabilities that may arise out of performance of their duties to the Trust. Additionally, in the normal course of business, the Fund enters into contracts with third-party service providers that contain a variety of representations and
| | |
| 42 | | MainStay MacKay Unconstrained Bond Fund |
warranties and that may provide general indemnifications. The Fund’s maximum exposure under these arrangements is unknown, as this would involve future claims that may be made against the Fund that have not yet occurred. The Manager believes that the risk of loss in connection with these potential indemnification obligations is remote. However, there can be no assurance that material liabilities related to such obligations will not arise in the future, which could adversely impact the Fund.
(U) Quantitative Disclosure of Derivative Holdings. The following tables show additional disclosures related to the Fund’s derivative and hedging activities, including how such activities are accounted for and their effect on the Fund’s financial positions, performance and cash flows. The Fund entered into futures contracts to help manage the duration and yield curve positioning of the portfolio while minimizing the exposure to wider bid/ask spreads in traditional bonds. The Fund entered into interest rate and credit default swap contracts in order to obtain a desired return at a lower cost to the Fund, rather than directly investing in an instrument yielding that desired return or to hedge against credit and interest rate risk. The Fund also entered into foreign currency forward contracts to gain exposure to a particular currency or to hedge against the risk of loss due to changing currency exchange rates. These derivatives are not accounted for as hedging instruments.
Fair value of derivative instruments as of October 31, 2020:
Asset Derivatives
| | | | | | | | | | | | |
| | | Foreign
Exchange
Contracts
Risk | | | Interest
Rate
Contracts
Risk | | | Total | |
| | | |
Futures Contracts—Net Assets—Net unrealized appreciation on investments, swap contracts and futures contracts (a) | | $ | | | | $ | 2,463,205 | | | $ | 2,463,205 | |
Forward Contracts—Unrealized appreciation on foreign currency forward contracts | | | 105,873 | | | | | | | | 105,873 | |
| | | | |
Total Fair Value | | $ | 105,873 | | | $ | 2,463,205 | | | $ | 2,569,078 | |
| | | | |
Liability Derivatives
| | | | | | | | | | | | |
| | | Foreign
Exchange
Contracts
Risk | | | Interest
Rate
Contracts
Risk | | | Total | |
| | | |
Futures Contracts—Net Assets—Net unrealized depreciation on investments, swap contracts and futures contracts (a) | | $ | — | | | $ | (4,204 | ) | | $ | (4,204 | ) |
Centrally Cleared Swap Contracts—Net Assets—Net unrealized depreciation on investments, swap contracts and futures contracts (b) | | | — | | | | (4,897,867 | ) | | | (4,897,867 | ) |
Forward Contracts—Unrealized depreciation on foreign currency forward contracts | | | (670,126 | ) | | | — | | | | (670,126 | ) |
| | | | |
Total Fair Value | | $ | (670,126 | ) | | $ | (4,902,071 | ) | | $ | (5,572,197 | ) |
| | | | |
| (a) | Includes cumulative appreciation (depreciation) of futures contracts as reported in the Portfolio of Investments. Only current day’s variation margin is reported within the Statement of Assets and Liabilities. |
| (b) | Includes cumulative appreciation (depreciation) of centrally cleared swap agreements as reported in the Portfolio of Investments. Only the current day’s variation margin is reported within the Statement of Assets and Liabilities. |
The effect of derivative instruments on the Statement of Operations for the year ended October 31, 2020:
Net Realized Gain (Loss) from:
| | | | | | | | | | | | |
| | | Foreign
Exchange
Contracts
Risk | | | Interest
Rate
Contracts
Risk | | | Total | |
| | | |
Futures Contracts | | $ | — | | | $ | (17,343,363 | ) | | $ | (17,343,363 | ) |
| Swap Contracts | | | — | | | | (1,257,335 | ) | | | (1,257,335 | ) |
| Forward Contracts | | | 23,279 | | | | — | | | | 23,279 | |
| | | | |
Total Net Realized Gain (Loss) | | $ | 23,279 | | | $ | (18,600,698 | ) | | $ | (18,577,419 | ) |
| | | | |
Net Change in Unrealized Appreciation (Depreciation) from:
| | | | | | | | | | | | |
| | | Foreign
Exchange
Contracts
Risk | | | Interest
Rate
Contracts
Risk | | | Total | |
| | | |
Futures Contracts | | $ | — | | | $ | 644,345 | | | $ | 644,345 | |
| Swap Contracts | | | — | | | | (1,508,350 | ) | | | (1,508,350 | ) |
| Forward Contracts | | | (261,166 | ) | | | — | | | | (261,166 | ) |
| | | | |
Total Net Change in Unrealized Appreciation (Depreciation) | | $ | (261,166 | ) | | $ | (864,005 | ) | | $ | (1,125,171 | ) |
| | | | |
Average Notional Amount
| | | | | | | | | | | | |
| | | Foreign
Exchange
Contracts
Risk | | | Interest
Rate
Contracts
Risk | | | Total | |
| | | |
Futures Contracts Long (a) | | $ | — | | | $ | 65,139,408 | | | $ | 65,139,408 | |
Futures Contracts Short | | $ | — | | | $ | (194,735,585 | ) | | $ | (194,735,585 | ) |
Swap Contracts Long | | $ | — | | | $ | 81,000,000 | | | $ | 81,000,000 | |
Forward Contracts Long (b) | | $ | 10,098,519 | | | $ | — | | | $ | 10,098,519 | |
Forward Contracts Short | | $ | (21,579,162 | ) | | $ | — | | | $ | (21,579,162 | ) |
| | | | |
| (a) | Positions were open eight months during the reporting period. |
| (b) | Positions were open nine months during the reporting period. |
Note 3–Fees and Related Party Transactions
(A) Manager and Subadvisor. New York Life Investments, a registered investment adviser and an indirect, wholly-owned subsidiary of New York Life Insurance Company (“New York Life”), serves as the Fund’s Manager, pursuant to an Amended and Restated Management Agreement (“Management Agreement”). The Manager provides offices, conducts clerical, recordkeeping and bookkeeping services and keeps most of the financial and accounting records required to be maintained by the Fund. Except for the portion of salaries and expenses that are the responsibility of the Fund, the Manager pays the salaries and expenses of all personnel affiliated with the Fund and certain operational expenses
Notes to Financial Statements (continued)
of the Fund. The Fund reimburses New York Life Investments in an amount equal to the portion of the compensation of the Chief Compliance Officer attributable to the Fund. MacKay Shields LLC (‘‘MacKay Shields” or the “Subadvisor’’), a registered investment adviser and an indirect, wholly-owned subsidiary of New York Life, serves as Subadvisor to the Fund and is responsible for the day-to-day portfolio management of the Fund. Pursuant to the terms of an Amended and Restated Subadvisory Agreement (“Subadvisory Agreement”) between New York Life Investments and MacKay Shields, New York Life Investments pays for the services of the Subadvisor.
Pursuant to the Management Agreement, the Fund pays the Manager a monthly fee for the services performed and the facilities furnished at an annual rate of the Fund’s average daily net assets as follows: 0.60% up to $500 million; 0.55% from $500 million to $1 billion; 0.50% from $1 billion to $5 billion; and 0.475% in excess of $5 billion, plus a fee for fund accounting services previously provided by New York Life Investments under a separate fund accounting agreement furnished at an annual rate of the Fund’s average daily net assets as follows: 0.05% up to $20 million; 0.0333% from $20 million to $100 million; and 0.01% in excess of $100 million. During the year ended October 31, 2020, the effective management fee rate was 0.60%, inclusive of a fee for fund accounting services of 0.01% of the Fund’s average daily net assets.
New York Life Investments has contractually agreed to waive fees and/ or reimburse expenses so that Total Annual Fund Operating Expenses (excluding taxes, interest, litigation, extraordinary expenses, brokerage and other transaction expenses relating to the purchase or sale of portfolio investments, and acquired (underlying) fund fees and expenses) of Class R6 do not exceed those of Class I. This agreement will remain in effect until August 31, 2021 and shall renew automatically for one-year terms unless New York Life Investments provides written notice of termination prior to the start of the next term or upon approval by the Board.
During the year ended October 31, 2020, New York Life Investments earned fees from the Fund in the amount of $4,692,436 and paid the Subadvisor in the amount of $2,293,460.
State Street provides sub-administration and sub-accounting services to the Fund pursuant to an agreement with New York Life Investments (See Note 13 for sub-administration and sub-accounting service provider change). These services include calculating the daily NAVs of the Fund, maintaining the general ledger and sub-ledger accounts for the calculation of the Fund’s NAVs and assisting New York Life Investments in conducting various aspects of the Fund’s administrative operations. For providing these services to the Fund, State Street is compensated by New York Life Investments.
Pursuant to an agreement between the Trust and New York Life Investments, New York Life Investments is responsible for providing or procuring certain regulatory reporting services for the Fund. The Fund will reimburse New York Life Investments for the actual costs incurred by New York Life Investments in connection with providing or procuring these services for the Fund.
(B) Distribution and Service Fees. The Trust, on behalf of the Fund, has entered into a distribution agreement with NYLIFE Distributors LLC (the “Distributor”), an affiliate of New York Life Investments. The Fund has adopted distribution plans (the “Plans”) in accordance with the provisions of Rule 12b-1 under the 1940 Act.
Pursuant to the Class A, Investor Class and Class R2 Plans, the Distributor receives a monthly distribution fee from the Class A, Investor Class and Class R2 shares at an annual rate of 0.25% of the average daily net assets of the Class A, Investor Class and Class R2 shares for distribution and/or service activities as designated by the Distributor. Pursuant to the Class B and Class C Plans, Class B and Class C shares pay the Distributor a monthly distribution fee at an annual rate of 0.75% of the average daily net assets of the Class B and Class C shares, along with a service fee at an annual rate of 0.25% of the average daily net assets of the Class B and Class C shares, for a total 12b-1 fee of 1.00%. Pursuant to the Class R3 Plan, Class R3 shares pay the Distributor a monthly fee at an annual rate of 0.25% of the average daily net assets of the Class R3 shares, along with a service fee at an annual rate of 0.25% of the average daily net assets of the Class R3 shares, for a total 12b-1 fee of 0.50%. Class I and Class R6 shares are not subject to a distribution and/or service fee.
The Plans provide that the distribution and service fees are payable to the Distributor regardless of the amounts actually expended by the Distributor for distribution of the Fund’s shares and service activities.
In accordance with the Shareholder Services Plan for the Class R2 and Class R3 shares, the Manager has agreed to provide, through its affiliates or independent third parties, various shareholder and administrative support services to shareholders of the Class R2 and Class R3 shares. For its services, the Manager, its affiliates or independent third-party service providers are entitled to a shareholder service fee accrued daily and paid monthly at an annual rate of 0.10% of the average daily net assets of the Class R2 and Class R3 shares. This is in addition to any fees paid under the Class R2 and Class R3 Plans.
During the year ended October 31, 2020, shareholder service fees incurred by the Fund were as follows:
| | | | |
| |
Class R2 | | $ | 6,284 | |
Class R3 | | | 241 | |
(C) Sales Charges. The Fund was advised by the Distributor that the amount of initial sales charges retained on sales of Class A and Investor Class shares during the year ended October 31, 2020, were $19,012 and $4,003, respectively.
The Fund was also advised that the Distributor retained CDSCs on redemptions of Class A, Class B and Class C shares during the year ended October 31, 2020, of $588, $4,734 and $1,947, respectively.
(D) Transfer, Dividend Disbursing and Shareholder Servicing Agent. NYLIM Service Company LLC, an affiliate of New York Life Investments, is the Fund’s transfer, dividend disbursing and shareholder servicing agent pursuant to an agreement between NYLIM Service Company LLC and the Trust. NYLIM Service Company LLC has entered into an agreement with DST Asset Manager Solutions, Inc. (“DST”), pursuant to which DST performs certain transfer agent services on behalf of NYLIM Service Company LLC. New York Life Investments has contractually agreed to limit the transfer agency expenses charged to the Fund’s share classes to a maximum of 0.35% of that share class’s average daily net assets on an annual basis after deducting any applicable Fund or class-level expense reimbursement or small account fees. This agreement will remain in effect until February 28, 2021, and shall renew automatically for one-year terms unless New York Life
| | |
| 44 | | MainStay MacKay Unconstrained Bond Fund |
Investments provides written notice of termination prior to the start of the next term or upon approval of the Board. During the year ended October 31, 2020, transfer agent expenses incurred by the Fund and any reimbursements, pursuant to the aforementioned Transfer Agency expense limitation agreement, were as follows:
| | | | | | | | |
Class | | Expense | | | Waived | |
| | |
Class A | | $ | 286,795 | | | $ | — | |
Investor Class | | | 42,065 | | | | — | |
Class B | | | 14,792 | | | | — | |
Class C | | | 174,994 | | | | — | |
Class I | | | 785,733 | | | | — | |
Class R2 | | | 10,104 | | | | — | |
Class R3 | | | 384 | | | | — | |
Class R6 | | | 307 | | | | — | |
(E) Small Account Fee. Shareholders with small accounts adversely impact the cost of providing transfer agency services. In an effort to reduce total transfer agency expenses, the Fund has implemented a small account fee on certain types of accounts. As described in the Fund’s prospectus, certain shareholders with an account balance of less than $1,000 ($5,000 for Class A share accounts) are charged an annual per account fee of $20 (assessed semi-annually), the proceeds from which offset transfer agent fees as reflected in the Statement of Operations. This small account fee will not apply to certain types of accounts as described further in the Fund’s prospectus.
(F) Investments in Affiliates (in 000’s). During the year ended October 31, 2020, purchases and sales transactions, income earned from investments and shares held of investment companies managed by New York Life Investments or its affiliates were as follows:
| | | | | | | | | | | | | | | | | | | | | | | | | | | | | | | | | | | | |
Affiliated Investment Company | | Value,
Beginning
of Year | | | Purchases
at Cost | | | Proceeds
from
Sales | | | Net
Realized
Gain/(Loss)
on Sales | | | Change in
Unrealized
Appreciation/
(Depreciation) | | | Value,
End of
Year | | | Dividend
Income | | | Other
Distributions | | | Shares
End of
Year | |
MainStay U.S. Government Liquidity Fund | | $ | 51,822 | | | $ | 487,532 | | | $ | (508,735 | ) | | $ | — | | | $ | — | | | $ | 30,619 | �� | | $ | 206 | | | $ | — | | | | 30,619 | |
(G) Capital. As of October 31, 2020, New York Life and its affiliates beneficially held shares of the Fund with the values and percentages of net assets as follows:
| | | | | | | | |
Class R3 | | $ | 30,433 | | | | 11.0 | % |
Class R6 | | | 27,245 | | | | 5.9 | |
Note 4–Federal Income Tax
As of October 31, 2020, the cost and unrealized appreciation (depreciation) of the Fund’s investment portfolio, including applicable derivative contracts and other financial instruments, as determined on a federal income tax basis, were as follows:
| | | | | | | | | | | | | | | | |
| | | Federal Tax
Cost | | | Gross
Unrealized
Appreciation | | | Gross
Unrealized
(Depreciation) | | | Net
Unrealized
Appreciation/
(Depreciation) | |
| | | | |
Investments in Securities | | $ | 635,299,105 | | | $ | 32,218,607 | | | $ | (13,790,567 | ) | | $ | 18,428,040 | |
As of October 31, 2020, the components of accumulated gain (loss) on a tax basis were as follows:
| | | | | | | | |
Ordinary
Income | | Accumulated
Capital and Other Gain (Loss) | | Other
Temporary
Differences | | Unrealized
Appreciation
(Depreciation) | | Total
Accumulated Gain (Loss) |
| | | | |
| $ — | | $(207,740,474) | | $(146,629) | | $17,935,002 | | $(189,952,101) |
The difference between book-basis and tax-basis unrealized appreciation (depreciation) is primarily due to mark to market of forwards and futures contracts. The other temporary differences are primarily due to dividends payable.
As of October 31, 2020, for federal income tax purposes, capital loss carryforwards of $207,740,474 were available as shown in the table below, to the extent provided by the regulations to offset future realized gains of the Fund through the years indicated. To the extent that these capital loss carryforwards are used to offset future capital gains, it is probable that the capital gains so offset will not be distributed to shareholders. No capital gain distributions shall be made until any capital loss carryforwards have been fully utilized.
| | | | |
Capital Loss Available Through | | Short-Term Capital Loss Amounts (000’s) | | Long-Term Capital Loss Amounts (000’s) |
| | |
| Unlimited | | $37,596 | | $170,144 |
During the years ended October 31, 2020, and October 31, 2019, the tax character of distributions paid as reflected in the Statements of Changes in Net Assets were as follows:
| | | | | | | | |
| | | 2020 | | | 2019 | |
| | |
Distributions paid from: | | | | | | | | |
Ordinary Income | | $ | 19,631,737 | | | $ | 30,854,119 | |
Return of capital | | | 587,214 | | | | — | |
Total | | $ | 20,218,951 | | | $ | 30,854,119 | |
Note 5–Restricted Securities
Restricted securities are subject to legal or contractual restrictions on resale. Private placement securities are generally considered to be restricted except for those securities traded between qualified institutional investors under the provisions of Rule 144A of the Securities Act of 1933, as amended. Disposal of restricted securities may involve time consuming negotiations and expenses, and prompt sale at an acceptable price may be difficult to achieve.
Notes to Financial Statements (continued)
As of October 31, 2020, the Fund held the following restricted securities:
| | | | | | | | | | | | | | | | | | | | |
Security | | Date(s) of
Acquisition | | | Shares | | | Cost | | | 10/31/20
Value | | | Percent of
Net Assets | |
ION Media Networks, Inc. | | | | | | | | | | | | | | | | | | | | |
Common Stock | | | 3/11/14 | | | | 22 | | | $ | — | | | $ | 17,424 | | | | 0.0 | %‡ |
| ‡ | Less than one-tenth of a percent. |
Note 6–Custodian
State Street is the custodian of cash and securities held by the Fund (See Note 13 for custodian change). Custodial fees are charged to the Fund based on the Fund’s net assets and/or the market value of securities held by the Fund and the number of certain transactions incurred by the Fund.
Note 7–Line of Credit
The Fund and certain other funds managed by New York Life Investments maintain a line of credit with a syndicate of banks in order to secure a source of funds for temporary purposes to meet unanticipated or excessive redemption requests.
Effective July 28, 2020, under the credit agreement (the “Credit Agreement”), the aggregate commitment amount is $600,000,000 with an additional uncommitted amount of $100,000,000. The commitment fee is an annual rate of 0.15% of the average commitment amount payable quarterly, regardless of usage, to JP Morgan Chase Bank NA, who serves as the agent to the syndicate. The commitment fee is allocated among the Fund and certain other funds managed by New York Life Investments based upon their respective net assets and other factors. Interest on any revolving credit loan is charged based upon the Federal Funds Rate or the one-month LIBOR, whichever is higher. The Credit Agreement expires on July 27, 2021, although the Fund, certain other funds managed by New York Life Investments and the syndicate of banks may renew the Credit Agreement for an additional year on the same or different terms or enter into a credit agreement with a different syndicate of banks. Prior to July 28, 2020, the aggregate commitment amount and the commitment fee were the same as those under the current Credit Agreement, but State Street served as agent to the syndicate. During the year ended October 31, 2020, there were no borrowings made or outstanding with respect to the Fund under the Credit Agreement or the credit agreement for which State Street served as agent.
Note 8–Interfund Lending Program
Pursuant to an exemptive order issued by the SEC, the Fund, along with certain other funds managed by New York Life Investments, may participate in an interfund lending program. The interfund lending program provides an alternative credit facility that permits the Fund and certain other funds managed by New York Life Investments to lend or borrow money for temporary purposes directly to or from one another subject to the conditions of the exemptive order. During the year ended October 31, 2020, there were no interfund loans made or outstanding with respect to the Fund.
Note 9–Purchases and Sales of Securities (in 000’s)
During the year ended October 31, 2020, purchases and sales of U.S. government securities were $119,684 and $191,026, respectively. Purchases and sales of securities, other than U.S. government securities and short-term securities, were $311,205 and $550,213, respectively.
Note 10–Capital Share Transactions
Transactions in capital shares for the years ended October 31, 2020, and October 31, 2019, were as follows:
| | | | | | | | |
Class A | | Shares | | | Amount | |
| | |
Year ended October 31, 2020: | | | | | | | | |
Shares sold | | | 3,549,959 | | | $ | 30,759,137 | |
Shares issued to shareholders in reinvestment of distributions | | | 488,987 | | | | 4,220,842 | |
Shares redeemed | | | (6,892,108 | ) | | | (59,273,038 | ) |
| | | | |
Net increase (decrease) in shares outstanding before conversion | | | (2,853,162 | ) | | | (24,293,059 | ) |
Shares converted into Class A (See Note 1) | | | 265,023 | | | | 2,297,846 | |
Shares converted from Class A (See Note 1) | | | (70,039 | ) | | | (603,380 | ) |
| | | | |
Net increase (decrease) | | | (2,658,178 | ) | | $ | (22,598,593 | ) |
| | | | |
Year ended October 31, 2019: | | | | | | | | |
Shares sold | | | 3,923,370 | | | $ | 34,022,695 | |
Shares issued to shareholders in reinvestment of distributions | | | 648,525 | | | | 5,604,208 | |
Shares redeemed | | | (7,651,832 | ) | | | (66,214,975 | ) |
| | | | |
Net increase (decrease) in shares outstanding before conversion | | | (3,079,937 | ) | | | (26,588,072 | ) |
Shares converted into Class A (See Note 1) | | | 322,178 | | | | 2,786,179 | |
Shares converted from Class A (See Note 1) | | | (128,869 | ) | | | (1,117,966 | ) |
| | | | |
Net increase (decrease) | | | (2,886,628 | ) | | $ | (24,919,859 | ) |
| | | | |
|
| |
Investor Class | | Shares | | | Amount | |
| | |
Year ended October 31, 2020: | | | | | | | | |
Shares sold | | | 155,915 | | | $ | 1,356,863 | |
Shares issued to shareholders in reinvestment of distributions | | | 51,115 | | | | 444,676 | |
Shares redeemed | | | (304,909 | ) | | | (2,639,908 | ) |
| | | | |
Net increase (decrease) in shares outstanding before conversion | | | (97,879 | ) | | | (838,369 | ) |
Shares converted into Investor Class (See Note 1) | | | 83,544 | | | | 726,787 | |
Shares converted from Investor Class (See Note 1) | | | (183,114 | ) | | | (1,598,912 | ) |
| | | | |
Net increase (decrease) | | | (197,449 | ) | | $ | (1,710,494 | ) |
| | | | |
Year ended October 31, 2019: | | | | | | | | |
Shares sold | | | 415,571 | | | $ | 3,647,957 | |
Shares issued to shareholders in reinvestment of distributions | | | 63,631 | | | | 554,684 | |
Shares redeemed | | | (546,532 | ) | | | (4,791,206 | ) |
| | | | |
Net increase (decrease) in shares outstanding before conversion | | | (67,330 | ) | | | (588,565 | ) |
Shares converted into Investor Class (See Note 1) | | | 178,617 | | | | 1,558,761 | |
Shares converted from Investor Class (See Note 1) | | | (215,720 | ) | | | (1,882,993 | ) |
| | | | |
Net increase (decrease) | | | (104,433 | ) | | $ | (912,797 | ) |
| | | | |
| | |
| 46 | | MainStay MacKay Unconstrained Bond Fund |
| | | | | | | | |
Class B | | Shares | | | Amount | |
| | |
Year ended October 31, 2020: | | | | | | | | |
Shares sold | | | 13,761 | | | $ | 117,932 | |
Shares issued to shareholders in reinvestment of distributions | | | 10,913 | | | | 93,552 | |
Shares redeemed | | | (309,879 | ) | | | (2,667,687 | ) |
| | | | |
Net increase (decrease) in shares outstanding before conversion | | | (285,205 | ) | | | (2,456,203 | ) |
Shares converted from Class B (See Note 1) | | | (74,998 | ) | | | (645,966 | ) |
| | | | |
Net increase (decrease) | | | (360,203 | ) | | $ | (3,102,169 | ) |
| | | | |
Year ended October 31, 2019: | | | | | | | | |
Shares sold | �� | | 104,200 | | | $ | 905,650 | |
Shares issued to shareholders in reinvestment of distributions | | | 18,886 | | | | 162,262 | |
Shares redeemed | | | (416,600 | ) | | | (3,591,602 | ) |
| | | | |
Net increase (decrease) in shares outstanding before conversion | | | (293,514 | ) | | | (2,523,690 | ) |
Shares converted from Class B (See Note 1) | | | (69,649 | ) | | | (598,047 | ) |
| | | | |
Net increase (decrease) | | | (363,163 | ) | | $ | (3,121,737 | ) |
| | | | |
|
| |
Class C | | Shares | | | Amount | |
| | |
Year ended October 31, 2020: | | | | | | | | |
Shares sold | | | 425,749 | | | $ | 3,655,007 | |
Shares issued to shareholders in reinvestment of distributions | | | 140,651 | | | | 1,205,409 | |
Shares redeemed | | | (3,582,005 | ) | | | (30,766,598 | ) |
| | | | |
Net increase (decrease) in shares outstanding before conversion | | | (3,015,605 | ) | | | (25,906,182 | ) |
Shares converted from Class C (See Note 1) | | | (79,690 | ) | | | (688,962 | ) |
| | | | |
Net increase (decrease) | | | (3,095,295 | ) | | $ | (26,595,144 | ) |
| | | | |
Year ended October 31, 2019: | | | | | | | | |
Shares sold | | | 594,342 | | | $ | 5,094,058 | |
Shares issued to shareholders in reinvestment of distributions | | | 236,574 | | | | 2,030,445 | |
Shares redeemed | | | (5,070,579 | ) | | | (43,589,224 | ) |
| | | | |
Net increase (decrease) in shares outstanding before conversion | | | (4,239,663 | ) | | | (36,464,721 | ) |
Shares converted from Class C (See Note 1) | | | (134,378 | ) | | | (1,153,207 | ) |
| | | | |
Net increase (decrease) | | | (4,374,041 | ) | | $ | (37,617,928 | ) |
| | | | |
|
| |
Class I | | Shares | | | Amount | |
| | |
Year ended October 31, 2020: | | | | | | | | |
Shares sold | | | 19,754,574 | | | $ | 169,630,141 | |
Shares issued to shareholders in reinvestment of distributions | | | 1,386,876 | | | | 11,983,027 | |
Shares redeemed | | | (44,391,197 | ) | | | (377,209,880 | ) |
| | | | |
Net increase in shares outstanding before conversion | | | (23,249,747 | ) | | | (195,596,712 | ) |
Shares converted into Class I (See Note 1) | | | 59,162 | | | | 512,587 | |
| | | | |
Net increase (decrease) | | | (23,190,585 | ) | | $ | (195,084,125 | ) |
| | | | |
Year ended October 31, 2019: | | | | | | | | |
Shares sold | | | 22,646,970 | | | $ | 196,115,570 | |
Shares issued to shareholders in reinvestment of distributions | | | 2,133,464 | | | | 18,457,022 | |
Shares redeemed | | | (38,501,534 | ) | | | (333,217,757 | ) |
| | | | |
Net increase (decrease) in shares outstanding before conversion | | | (13,721,100 | ) | | | (118,645,165 | ) |
Shares converted into Class I (See Note 1) | | | 46,998 | | | | 407,273 | |
| | | | |
Net increase (decrease) | | | (13,674,102 | ) | | $ | (118,237,892 | ) |
| | | | |
| | | | | | | | |
Class R2 | | Shares | | | Amount | |
| | |
Year ended October 31, 2020: | | | | | | | | |
Shares sold | | | 134,616 | | | $ | 1,173,741 | |
Shares issued to shareholders in reinvestment of distributions | | | 17,187 | | | | 147,798 | |
Shares redeemed | | | (873,599 | ) | | | (7,642,240 | ) |
| | | | |
Net increase (decrease) | | | (721,796 | ) | | $ | (6,320,701 | ) |
| | | | |
Year ended October 31, 2019: | | | | | | | | |
Shares sold | | | 132,894 | | | $ | 1,151,880 | |
Shares issued to shareholders in reinvestment of distributions | | | 22,001 | | | | 190,167 | |
Shares redeemed | | | (97,010 | ) | | | (839,676 | ) |
| | | | |
Net increase (decrease) | | | 57,885 | | | $ | 502,371 | |
| | | | |
|
| |
Class R3 | | Shares | | | Amount | |
| | |
Year ended October 31, 2020: | | | | | | | | |
Shares sold | | | 7,100 | | | $ | 62,561 | |
Shares issued to shareholders in reinvestment of distributions | | | 488 | | | | 4,213 | |
Shares redeemed | | | (1,200 | ) | | | (10,300 | ) |
| | | | |
Net increase (decrease) | | | 6,388 | | | $ | 56,474 | |
| | | | |
Year ended October 31, 2019: | | | | | | | | |
Shares sold | | | 3,394 | | | $ | 29,402 | |
Shares issued to shareholders in reinvestment of distributions | | | 431 | | | | 3,725 | |
Shares redeemed | | | (931 | ) | | | (8,016 | ) |
| | | | |
Net increase (decrease) | | | 2,894 | | | $ | 25,111 | |
| | | | |
|
| |
Class R6 | | Shares | | | Amount | |
| | |
Year ended October 31, 2020: | | | | | | | | |
Shares sold | | | 107,790 | | | $ | 930,408 | |
Shares issued to shareholders in reinvestment of distributions | | | 23,680 | | | | 203,636 | |
Shares redeemed | | | (2,666,072 | ) | | | (22,878,546 | ) |
| | | | |
Net increase (decrease) | | | (2,534,602 | ) | | $ | (21,744,502 | ) |
| | | | |
Year ended October 31, 2019: | | | | | | | | |
Shares sold | | | 262,885 | | | $ | 2,280,850 | |
Shares issued to shareholders in reinvestment of distributions | | | 157,868 | | | | 1,364,064 | |
Shares redeemed | | | (3,896,936 | ) | | | (33,834,391 | ) |
| | | | |
Net increase (decrease) | | | (3,476,183 | ) | | $ | (30,189,477 | ) |
| | | | |
Note 11–Recent Accounting Pronouncement
To improve the effectiveness of fair value disclosure requirements, the Financial Accounting Standards Board issued Accounting Standards Update 2018-13, Fair Value Measurement Disclosure Framework—Changes to the Disclosure Requirements for Fair Value Measurement (“ASU 2018-13”), which adds, removes, and modifies certain fair value measurement disclosure requirements. ASU 2018-13 is effective for interim and annual reporting periods beginning after December 15, 2019. The Manager evaluated the implications of certain provisions of ASU 2018-13 and determined to early adopt aspects related to the removal and modifications of certain fair value measurement disclosures, which are currently in place as of October 31, 2020. The Manager is evaluating the implications of certain other provisions of ASU 2018-13 related to new disclosure requirements and has not yet
Notes to Financial Statements (continued)
determined the impact of those provisions on the financial statement disclosures, if any.
In March 2020, the Financial Accounting Standards Board (“FASB”) issued Accounting Standards Update 2020-04 (“ASU 2020-04”), which provides optional guidance to ease the potential accounting burden associated with transitioning away from LIBOR and other reference rates that are expected to be discontinued. ASU 2020-04 is effective immediately upon release of the update on March 12, 2020, through December 31, 2022. At this time, the Manager is evaluating the implications of certain other provisions of ASU 2020-04 related to new disclosure requirements and any impact on the financial statement disclosures has not yet been determined.
Note 12–Other Matters
An outbreak of COVID-19, first detected in December 2019, has developed into a global pandemic and has resulted in travel restrictions, closure of international borders, certain businesses and securities markets, restrictions on securities trading activities, prolonged quarantines, supply chain disruptions, and lower consumer demand, as well
as general concern and uncertainty. The continued impact of COVID-19 is uncertain and could further adversely affect the global economy, national economies, individual issuers and capital markets in unforeseeable ways and result in a substantial and extended economic downturn. Developments that disrupt global economies and financial markets, such as COVID-19, may magnify factors that affect the Fund’s performance.
Note 13–Subsequent Events
In connection with the preparation of the financial statements of the Fund as of and for the year ended October 31, 2020, events and transactions subsequent to October 31, 2020, through the date the financial statements were issued have been evaluated by the Manager, for possible adjustment and/or disclosure. No subsequent events requiring financial statement adjustment or disclosure have been identified other than the following:
Effective at the close of business on November 20, 2020, all services provided by State Street were transitioned to JPMorgan Chase Bank, N.A.
| | |
| 48 | | MainStay MacKay Unconstrained Bond Fund |
Report of Independent Registered Public Accounting Firm
To the Shareholders of the Fund and Board of Trustees
The MainStay Funds:
Opinion on the Financial Statements
We have audited the accompanying statement of assets and liabilities of MainStay MacKay Unconstrained Bond Fund (the Fund), one of the funds constituting The MainStay Funds, including the portfolio of investments, as of October 31, 2020, the related statement of operations for the year then ended, the statements of changes in net assets for each of the years in the two-year period then ended, and the related notes (collectively, the financial statements) and the financial highlights for each of the years or periods in the five-year period then ended. In our opinion, the financial statements and financial highlights present fairly, in all material respects, the financial position of the Fund as of October 31, 2020, the results of its operations for the year then ended, the changes in its net assets for each of the years in the two-year period then ended, and the financial highlights for each of the years or periods in the five-year period then ended, in conformity with U.S. generally accepted accounting principles.
Basis for Opinion
These financial statements and financial highlights are the responsibility of the Fund’s management. Our responsibility is to express an opinion on these financial statements and financial highlights based on our audits. We are a public accounting firm registered with the Public Company Accounting Oversight Board (United States) (PCAOB) and are required to be independent with respect to the Fund in accordance with the U.S. federal securities laws and the applicable rules and regulations of the Securities and Exchange Commission and the PCAOB.
We conducted our audits in accordance with the standards of the PCAOB. Those standards require that we plan and perform the audit to obtain reasonable assurance about whether the financial statements and financial highlights are free of material misstatement, whether due to error or fraud. Our audits included performing procedures to assess the risks of material misstatement of the financial statements and financial highlights, whether due to error or fraud, and performing procedures that respond to those risks. Such procedures included examining, on a test basis, evidence regarding the amounts and disclosures in the financial statements and financial highlights. Such procedures also included confirmation of securities owned as of October 31, 2020, by correspondence with custodians, the transfer agent, and brokers or by other appropriate auditing procedures when replies from brokers were not received. Our audits also included evaluating the accounting principles used and significant estimates made by management, as well as evaluating the overall presentation of the financial statements and financial highlights. We believe that our audits provide a reasonable basis for our opinion.

We have served as the auditor of one or more New York Life Investment Management investment companies since 2003.
Philadelphia, Pennsylvania
December 23, 2020
Federal Income Tax Information
(Unaudited)
For the fiscal year ended October 31, 2020, the Fund designated approximately $135,993 under the Internal Revenue Code as qualified dividend income eligible for reduced tax rates.
In February 2021, shareholders will receive an IRS Form 1099-DIV or substitute Form 1099, which will show the federal tax status of the distributions received by shareholders in calendar year 2020. The amounts that will be reported on such 1099-DIV or substitute Form 1099 will be the amounts you are to use on your federal income tax return and will differ from the amounts reported for the Fund’s fiscal year ended October 31, 2020.
Proxy Voting Policies and Procedures and Proxy Voting Record
A description of the policies and procedures that New York Life Investments uses to vote proxies related to the Fund’s securities is available free of charge upon request, by visiting the MainStay Funds’ website at newyorklifeinvestments.com or visiting the SEC’s website at www.sec.gov.
The Fund is required to file with the SEC its proxy voting records for the 12-month period ending June 30 on Form N-PX. The most recent Form N-PX or proxy voting record is available free of charge upon request by calling 800-624-6782; visiting the MainStay Funds’ website at newyorklifeinvestments.com; or visiting the SEC’s website at www.sec.gov.
Shareholder Reports and Quarterly Portfolio Disclosure
The Fund is required to file its complete schedule of portfolio holdings with the SEC 60 days after its first and third fiscal quarter on Form N-PORT. The Fund’s holdings report is available free of charge by visiting the SEC’s website at www.sec.gov or upon request by calling New York Life Investments at 800-624-6782.
| | |
| 50 | | MainStay MacKay Unconstrained Bond Fund |
Board of Trustees and Officers (Unaudited)
The Trustees and officers of the Funds are listed below. The Board oversees the MainStay Group of Funds (which consists of MainStay Funds and MainStay Funds Trust), MainStay VP Funds Trust, MainStay MacKay DefinedTerm Municipal Opportunities Fund, the Manager and the Subadvisors, and elects the officers of the Funds who are responsible for the day-to-day operations of the Funds. Information pertaining to the Trustees and officers is set forth below. Each Trustee serves until his or her successor is elected and qualified or until his or her
resignation, death or removal. Under the Board’s retirement policy, unless an exception is made, a Trustee must tender his or her resignation by the end of the calendar year during which he or she reaches the age of 75. Officers are elected annually by the Board. The business address of each Trustee and officer listed below is 51 Madison Avenue, New York, New York 10010. A majority of the Trustees are not “interested persons” (as defined by the 1940 Act and rules adopted by the SEC thereunder) of the Fund (“Independent Trustees”).
| | | | | | | | | | | | |
| | | | | Name and
Year of Birth | | Term of Office,
Position(s) Held and
Length of Service | | Principal Occupation(s)
During Past Five Years | | Number of
Portfolios in
Fund Complex
Overseen by
Trustee | | Other Directorships
Held by Trustee |
Interested Trustee | | | | Yie-Hsin Hung* 1962 | | MainStay Funds:
Trustee since 2017 MainStay Funds Trust:
Trustee since 2017 | | Senior Vice President of New York Life since joining in 2010, Member of the Executive Management Committee since 2017, Chief Executive Officer, New York Life Investment Management Holdings LLC & New York Life Investment Management LLC since 2015. Senior Managing Director and Co-President of New York Life Investment Management LLC from 2014 to May 2015. Previously held positions of increasing responsibility, including head of NYLIM International, Alternative Growth Businesses, and Institutional investments since joining New York Life in 2010. | | 78 | | MainStay VP Funds Trust:
Trustee since 2017 (31 portfolios); and
MainStay MacKay DefinedTerm Municipal Opportunities Fund: Trustee since 2017. |
| | * | This Trustee is considered to be an “interested person” of the MainStay Group of Funds, MainStay VP Funds Trust and MainStay MacKay DefinedTerm Municipal Opportunities Fund, within the meaning of the 1940 Act because of her affiliation with New York Life Insurance Company, New York Life Investment Management LLC, Candriam Belgium S.A., Candriam Luxembourg S.C.A., IndexIQ Advisors LLC, MacKay Shields LLC, NYL Investors LLC, NYLIFE Securities LLC and/or NYLIFE Distributors LLC, as described in detail above in the column entitled “Principal Occupation(s) During Past Five Years.” |
Board of Trustees and Officers (Unaudited) (continued)
| | | | | | | | | | | | |
| | | | | Name and
Year of Birth | | Term of Office,
Position(s) Held and
Length of Service | | Principal Occupation(s)
During Past Five Years | | Number of
Portfolios in
Fund Complex
Overseen by
Trustee | | Other Directorships
Held by Trustee |
Independent Trustees | | | | David H. Chow 1957 | | MainStay Funds:
Trustee since 2016, Advisory Board Member (June 2015 to December 2015); MainStay Funds Trust:
Trustee since 2016, Advisory Board Member (June 2015 to December 2015). | | Founder and CEO, DanCourt Management, LLC since 1999 | | 78 | | MainStay VP Funds Trust: Trustee since 2016, Advisory Board Member (June 2015 to December 2015) (31 portfolios);
MainStay MacKay DefinedTerm Municipal Opportunities Fund: Trustee since 2016, Advisory Board Member (June 2015 to December 2015); Market Vectors Group of Exchange-Traded Funds: Independent Chairman of the Board of Trustees since 2008 and Trustee since 2006 (56 portfolios); and
Berea College of Kentucky: Trustee since 2009, Chair of the Investment Committee since 2018. |
| | | | Susan B. Kerley 1951 | | MainStay Funds:
Chairman since 2017 and Trustee since 2007; MainStay Funds Trust: Chairman since 2017 and Trustee since 1990.** | | President, Strategic Management Advisors LLC since 1990 | | 78 | | MainStay VP Funds Trust: Chairman since 2017 and Trustee since 2007 (31 portfolios)***;
MainStay MacKay DefinedTerm Municipal Opportunities Fund: Chairman since 2017 and Trustee since 2011; and
Legg Mason Partners Funds: Trustee since 1991 (45 portfolios). |
| | | | Alan R. Latshaw 1951 | | MainStay Funds:
Trustee; MainStay Funds Trust:
Trustee and Audit Committee Financial Expert since 2007.** | | Retired; Partner, Ernst & Young LLP (2002 to 2003); Partner, Arthur Andersen LLP (1989 to 2002); Consultant to the MainStay Funds Audit and Compliance Committee (2004 to 2006) | | 78 | | MainStay VP Funds Trust: Trustee and Audit Committee Financial Expert since 2007 (31 portfolios)***;
MainStay MacKay DefinedTerm Municipal Opportunities Fund: Trustee and Audit Committee Financial Expert since 2011; and
State Farm Associates Funds Trusts: Trustee since 2005 (4 portfolios). |
| | | | Richard H. Nolan, Jr. 1946 | | MainStay Funds:
Trustee since 2007; MainStay Funds Trust:
Trustee since 2007.** | | Managing Director, ICC Capital Management since 2004; President—Shields/Alliance, Alliance Capital Management (1994 to 2004) | | 78 | | MainStay VP Funds Trust: Trustee since 2006 (31 portfolios)***; and
MainStay MacKay DefinedTerm Municipal Opportunities Fund: Trustee since 2011. |
| | | | Jacques P. Perold 1958 | | MainStay Funds:
Trustee since 2016, Advisory Board Member (June 2015 to December 2015); MainStay Funds Trust:
Trustee since 2016, Advisory Board Member (June 2015 to December 2015). | | Founder and Chief Executive Officer, CapShift LLC since 2018; President, Fidelity Management & Research Company (2009 to 2014); Founder, President and Chief Executive Officer, Geode Capital Management, LLC (2001 to 2009) | | 78 | | MainStay VP Funds Trust: Trustee since 2016, Advisory Board Member (June 2015 to December 2015) (31 portfolios);
MainStay MacKay DefinedTerm Municipal Opportunities Fund: Trustee since 2016, Advisory Board Member (June 2015 to December 2015); Partners in Health: Trustee since 2019; Allstate Corporation: Director since 2015;
MSCI, Inc.: and Director since 2017. |
| | |
| 52 | | MainStay MacKay Unconstrained Bond Fund |
| | | | | | | | | | | | |
| | | | | Name and
Year of Birth | | Term of Office,
Position(s) Held and
Length of Service | | Principal Occupation(s)
During Past Five Years | | Number of
Portfolios in
Fund Complex
Overseen by
Trustee | | Other Directorships
Held by Trustee |
Independent Trustees | | | | Richard S. Trutanic 1952 | | MainStay Funds: Trustee since 1994; MainStay Funds Trust: Trustee since 2007.** | | Chairman and Chief Executive Officer, Somerset & Company (financial advisory firm) since 2004; Managing Director, The Carlyle Group (private investment firm) (2002 to 2004); Senior Managing Director, Partner and Board Member, Groupe Arnault S.A. (private investment firm) (1999 to 2002) | | 78 | | MainStay VP Funds Trust: Trustee since 2007 (31 portfolios)***; and
MainStay MacKay DefinedTerm Municipal Opportunities Fund: Trustee since 2011. |
| | ** | Includes prior service as a Director/Trustee of certain predecessor entities to MainStay Funds Trust. |
| | *** | Includes prior service as a Director of MainStay VP Series Fund, Inc., the predecessor to MainStay VP Funds Trust. |
Board of Trustees and Officers (Unaudited) (continued)
| | | | | | | | |
| | | | | Name and
Year of Birth | | Position(s) Held and
Length of Service | | Principal Occupation(s)
During Past Five Years |
Officers
of the
Trust
(Who are
not
Trustees)* | | | | Kirk C. Lehneis 1974 | | President, MainStay Funds, MainStay Funds Trust since 2017 | | Chief Operating Officer and Senior Managing Director since 2016, New York Life Investment Management LLC and New York Life Investment Management Holdings LLC; Member of the Board of Managers since 2017 and Senior Managing Director since 2018, NYLIFE Distributors LLC; Chairman of the Board and Senior Managing Director, NYLIM Service Company LLC since 2017; Trustee, President and Principal Executive Officer of IndexIQ Trust, IndexIQ ETF Trust and IndexIQ Active ETF Trust since 2018; President, MainStay MacKay DefinedTerm Municipal Opportunities Fund and MainStay VP Funds Trust since 2017**; Senior Managing Director, Global Product Development (2015 to 2016); Managing Director, Product Development (2010 to 2015), New York Life Investment Management LLC |
| | | | Jack R. Benintende 1964 | | Treasurer and Principal Financial and Accounting Officer, MainStay Funds since 2007, MainStay Funds Trust since 2009 | | Managing Director, New York Life Investment Management LLC since 2007; Treasurer and Principal Financial and Accounting Officer, MainStay MacKay DefinedTerm Municipal Opportunities Fund since 2011 and MainStay VP Funds Trust since 2007**; and Assistant Treasurer, New York Life Investment Management Holdings LLC (2008 to 2012) |
| | | | Yi-Chia Kuo 1981 | | Vice President and Chief Compliance Officer, MainStay Funds and MainStay Funds Trust since January 2020 | | Chief Compliance Officer, Index IQ Trust, Index IQ ETF Trust and Index IQ Active ETF Trust since January 2020; Vice President and Chief Compliance Officer, MainStay MacKay DefinedTerm Municipal Opportunities Fund and MainStay VP Funds Trust since January 2020; Director and Associate General Counsel, New York Life Insurance Company (2015 to 2019) |
| | | | J. Kevin Gao 1967 | | Secretary and Chief Legal Officer, MainStay Funds and MainStay Funds Trust since 2010 | | Managing Director and Associate General Counsel, New York Life Investment Management LLC since 2010; Secretary and Chief Legal Officer, MainStay MacKay DefinedTerm Municipal Opportunities Fund since 2011 and MainStay VP Funds Trust since 2010** |
| | | | Scott T. Harrington 1959 | | Vice President— Administration, MainStay Funds since 2005, MainStay Funds Trust since 2009 | | Managing Director, New York Life Investment Management LLC (including predecessor advisory organizations) since 2000; Member of the Board of Directors, New York Life Trust Company since 2009; Vice President—Administration, MainStay MacKay DefinedTerm Municipal Opportunities Fund since 2011 and MainStay VP Funds Trust since 2005** |
| | * | The officers listed above are considered to be “interested persons” of the MainStay Group of Funds, MainStay VP Funds Trust and MainStay MacKay DefinedTerm Municipal Opportunities Fund within the meaning of the 1940 Act because of their affiliation with the MainStay Group of Funds, New York Life Insurance Company and/or its affiliates, including New York Life Investment Management LLC, NYLIM Service Company LLC, NYLIFE Securities LLC and/or NYLIFE Distributors LLC, as described in detail in the column captioned “Principal Occupation(s) During Past Five Years.” Officers are elected annually by the Board. |
| | ** | Includes prior service as an Officer of MainStay VP Series Fund, Inc., the predecessor to MainStay VP Funds Trust. |
| | |
| 54 | | MainStay MacKay Unconstrained Bond Fund |
MainStay Funds
Equity
U.S. Equity
MainStay Epoch U.S. All Cap Fund
MainStay Epoch U.S. Equity Yield Fund
MainStay MacKay Common Stock Fund
MainStay MacKay Growth Fund
MainStay MacKay S&P 500 Index Fund
MainStay MacKay Small Cap Core Fund
MainStay MacKay U.S. Equity Opportunities Fund
MainStay MAP Equity Fund
MainStay Winslow Large Cap Growth Fund1
International Equity
MainStay Epoch International Choice Fund
MainStay MacKay International Equity Fund
MainStay MacKay International Opportunities Fund
Emerging Markets Equity
MainStay Candriam Emerging Markets Equity Fund
Global Equity
MainStay Epoch Capital Growth Fund
MainStay Epoch Global Equity Yield Fund
Fixed Income
Taxable Income
MainStay Candriam Emerging Markets Debt Fund
MainStay Floating Rate Fund
MainStay MacKay High Yield Corporate Bond Fund
MainStay MacKay Short Duration High Yield Fund
MainStay MacKay Total Return Bond Fund
MainStay MacKay Unconstrained Bond Fund
MainStay MacKay U.S. Infrastructure Bond Fund2
MainStay Short Term Bond Fund3
Tax-Exempt Income
MainStay MacKay California Tax Free Opportunities Fund4
MainStay MacKay High Yield Municipal Bond Fund
MainStay MacKay Intermediate Tax Free Bond Fund
MainStay MacKay New York Tax Free Opportunities Fund5
MainStay MacKay Short Term Municipal Fund
MainStay MacKay Tax Free Bond Fund
Money Market
MainStay Money Market Fund
Mixed Asset
MainStay Balanced Fund
MainStay Income Builder Fund
MainStay MacKay Convertible Fund
Speciality
MainStay CBRE Global Infrastructure Fund
MainStay CBRE Real Estate Fund
MainStay Cushing MLP Premier Fund
Asset Allocation
MainStay Conservative Allocation Fund
MainStay Conservative ETF Allocation Fund
MainStay Defensive ETF Allocation Fund
MainStay Equity Allocation Fund6
MainStay Equity ETF Allocation Fund
MainStay Growth Allocation Fund7
MainStay Growth ETF Allocation Fund
MainStay Moderate Allocation Fund
MainStay Moderate ETF Allocation Fund
Manager
New York Life Investment Management LLC
New York, New York
Subadvisors
Candriam Belgium S.A.8
Brussels, Belgium
Candriam Luxembourg S.C.A.8
Strassen, Luxembourg
CBRE Clarion Securities LLC
Radnor, Pennsylvania
Cushing Asset Management, LP
Dallas, Texas
Epoch Investment Partners, Inc.
New York, New York
MacKay Shields LLC8
New York, New York
Markston International LLC
White Plains, New York
NYL Investors LLC8
New York, New York
Winslow Capital Management, LLC
Minneapolis, Minnesota
Legal Counsel
Dechert LLP
Washington, District of Columbia
Independent Registered Public Accounting Firm
KPMG LLP
Philadelphia, Pennsylvania
Distributor
NYLIFE Distributors LLC8
Jersey City, New Jersey
Custodian9
State Street Bank and Trust Company
Boston, Massachusetts
| 1. | Formerly known as MainStay Large Cap Growth Fund. |
| 2. | Formerly known as MainStay MacKay Infrastructure Bond Fund. |
| 3. | Formerly known as MainStay Indexed Bond Fund. |
| 4. | This Fund is registered for sale in AZ, CA, NV, OR, TX, UT and WA. Class A and Class I shares are registered for sale in MI. Class I and Class C2 shares are registered for sale in CO, FL, GA, HI, ID, MA, MD, NH, NJ and NY. |
| 5. | This Fund is registered for sale in CA, CT, DE, FL, MA, NJ, NY and VT. |
| 6. | Formerly known as MainStay Growth Allocation Fund. |
| 7. | Formerly known as MainStay Moderate Growth Allocation Fund. |
| 8. | An affiliate of New York Life Investment Management LLC. |
| 9. | JPMorgan Chase Bank, N.A., New York, New York is the custodian for the MainStay ETF Asset Allocation Funds and effective at the close of business on November 20, 2020, became the custodian for other MainStay Funds. The custodian for MainStay Cushing MLP Premier Fund is U.S. Bank National Association, Milwaukee, Wisconsin. |
Not part of the Annual Report
For more information
800-624-6782
newyorklifeinvestments.com
“New York Life Investments” is both a service mark, and the common trade name, of certain investment advisors affiliated with New York Life Insurance Company. The MainStay Funds® are managed by New York Life Investment Management LLC and distributed by NYLIFE Distributors LLC, 30 Hudson Street, Jersey City, NJ 07302, a wholly owned subsidiary of New York Life Insurance Company. NYLIFE Distributors LLC is a Member FINRA/SIPC.
©2020 NYLIFE Distributors LLC. All rights reserved.
| | |
| 1717044 MS203-20 | | MSUB11-12/20 (NYLIM) NL217 |
MainStay MacKay U.S. Infrastructure Bond Fund
(Formerly known as MainStay MacKay Infrastructure Bond Fund)
Message from the President and Annual Report
October 31, 2020
Beginning on January 1, 2021, paper copies of each MainStay Fund’s annual and semiannual shareholder reports will no longer be sent by mail, unless you specifically request paper copies of the reports from MainStay Funds or from your financial intermediary. Instead, the reports will be made available on the MainStay Funds’ website. You will be notified by mail and provided with a website address to access the report each time a new report is posted to the website.
If you already elected to receive shareholder reports electronically, you will not be affected by this change and you need not take any action. At any time, you may elect to receive reports and other communications from MainStay Funds electronically by calling toll-free 800-624-6782, by sending an e-mail to MainStayShareholderServices@nylim.com, or by contacting your financial intermediary.
You may elect to receive all future shareholder reports in paper form free of charge. If you hold shares of a MainStay Fund directly, you can inform MainStay Funds that you wish to receive paper copies of reports by calling toll-free 800-624-6782 or by sending an e-mail to MainStayShareholderServices@nylim.com. If you hold shares of a MainStay Fund through a financial intermediary, please contact the financial intermediary to make this election. Your election to receive reports in paper form will apply to all MainStay Funds in which you are invested and may apply to all funds held with your financial intermediary.
| | | | | | | | |
| Not FDIC/NCUA Insured | | Not a Deposit | | May Lose Value | | No Bank Guarantee | | Not Insured by Any Government Agency |

This page intentionally left blank
Message from the President
Despite historically high levels of volatility generated by the global coronavirus pandemic and a host of other geopolitical and economic uncertainties, most broad U.S. stock and bond markets gained ground during the 12-month reporting period ended October 31, 2020.
The reporting period began on an upswing, with markets rising on generally positive underlying economic trends and the announcement of a U.S.-China trade deal. However, in mid-February 2020, stock and bond indices began to dip as growing numbers of COVID-19 cases appeared in hotspots around the world. By early March, the disease reached pandemic proportions. As governments struggled to support overburdened health care systems by issuing “stay-at-home” orders and other restrictions on nonessential activity, global economic activity slowed, driving most stocks and bonds sharply lower.
The United States was hit particularly hard by the pandemic, with more reported COVID-19 cases and deaths than any other country in the world throughout the second half of the reporting period. As the pandemic deepened, the U.S. Federal Reserve (“Fed”) twice cut interest rates and announced unlimited quantitative easing. The federal government declared a national emergency, and Congress passed and the President signed a $2 trillion stimulus package. Markets responded positively to these measures, as well as to a gradual lessening of restrictions on nonessential businesses, hopes for additional stimulus and apparent progress in the development of a vaccine. By late August, the S&P 500® Index, a widely regarded benchmark of market performance, had not only regained all the ground it lost earlier in the reporting period, the Index had reached new record levels. However, a resurgence of coronavirus cases in many parts of the country and uncertainties related to the November 3, 2020, U.S. presidential election caused markets to falter as the reporting period drew to a close.
Nevertheless, for the reporting period as a whole, U.S. equity indices generally produced moderate gains. Returns proved strongest among large-cap, growth-oriented stocks, while small- and mid-cap issues lagged. Within the S&P 500® Index, the information technology and consumer discretionary sectors produced exceptionally strong gains, buoyed by strong corporate and consumer spending, while the health care sector outperformed by a smaller margin. Materials and consumer staples sectors generated positive returns, but lagged the S&P 500® Index. The industrials, utilities, communication services, financials, real estate and energy sectors ended the reporting period in negative territory, with the energy sector
suffering the steepest losses due to weak global demand. International equities declined sharply in February and March 2020 before recovering somewhat, but tended to lag their U.S. counterparts due to weaker underlying economic growth and somewhat less aggressive monetary and fiscal stimulus. Emerging-market equities tracked the performance of U.S. equity markets more closely, led by relatively strong returns in Asian markets, such as China and South Korea.
Fixed-income markets experienced an environment that tended to favor higher credit quality and longer duration securities. Corporate bonds followed the pattern of equities, with prices declining in March 2020 before subsequently recovering. Relatively speculative high-yield credit was hardest hit during the market sell-off in early 2020 and continued to underperform during the remainder of the reporting period. Similarly, among municipal bond issues, high-grade bonds outperformed, dipping briefly in mid-March before regaining the lost ground. Recognized safe havens, such as U.S. government bonds, attracted increased investment during the height of the market sell-off, driving yields lower and prices higher. As a result, long-term Treasury bonds delivered particularly strong gains for the reporting period as a whole. Emerging-market debt, on the other hand, underperformed most other bond types as investors sought to minimize currency and sovereign risks.
Although the ongoing pandemic continues to change the way that many of us work and live our lives, at New York Life Investments, we remain dedicated to providing you, as a MainStay investor, with products, information and services to help you to navigate today’s rapidly changing investment environment. By taking appropriate steps to minimize community spread of COVID-19 within our organization and despite the challenges posed by the coronavirus pandemic, we continue to innovate with you in mind, introducing new suites of Funds and providing continuous insights into ever-evolving markets and investment strategies. Our goal is to give you the tools you need to build a resilient portfolio in the face of uncertain times.
Sincerely,

Kirk C. Lehneis
President
The opinions expressed are as of the date of this report and are subject to change. There is no guarantee that any forecast made will come to pass. This material does not constitute investment advice and is not intended as an endorsement of any specific investment. Past performance is no guarantee of future results.
Not part of the Annual Report
Table of Contents
Investors should refer to the Fund’s Summary Prospectus and/or Prospectus and consider the Fund’s investment objectives, strategies, risks, charges and expenses carefully before investing. The Summary Prospectus and/or Prospectus contain this and other information about the Fund. You may obtain copies of the Fund’s Summary Prospectus, Prospectus and Statement of Additional Information free of charge, upon request, by calling toll-free 800-624-6782, by writing to NYLIFE Distributors LLC, Attn: MainStay Marketing Department, 30 Hudson Street, Jersey City, NJ 07302 or by sending an e-mail to MainStayShareholderServices@nylim.com. These documents are also available via the MainStay Funds’ website at newyorklifeinvestments.com. Please read the Summary Prospectus and/or Prospectus carefully before investing.
Investment and Performance Comparison1 (Unaudited)
Performance data quoted represents past performance. Past performance is no guarantee of future results. Because of market volatility and other factors, current performance may be lower or higher than the figures shown. Investment return and principal value will fluctuate, and as a result, when shares are redeemed, they may be worth more or less than their original cost. The graph below depicts the historical performance of Class I shares* of the Fund. Performance will vary from class to class based on differences in class-specific expenses and sales charges. For performance information current to the most recent month-end, please call 800-624-6782 or visit newyorklifeinvestments.com.
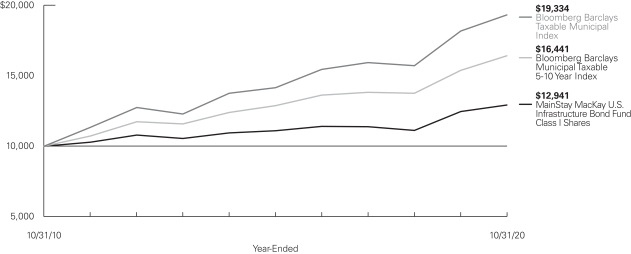
Average Annual Total Returns for the Year-Ended October 31, 20202
| | | | | | | | | | | | | | | | | | | | | | | | |
| Class | | Sales Charge | | | | Inception
Date | | | One
Year | | | Five
Years | | | Ten
Years | | | Gross
Expense
Ratio3 | |
| | | | | | | |
| Class A Shares | | Maximum 4.5% Initial Sales Charge | | With sales charges Excluding sales charges | |
| 1/3/1995
|
| |
| –1.21
3.45 | %
| |
| 1.88
2.82 | %
| |
| 1.88
2.35 | %
| |
| 1.02
1.02 | %
|
| Investor Class Shares4 | | Maximum 4% Initial Sales Charge | | With sales charges Excluding sales charges | |
| 2/28/2008
|
| |
| –1.50
3.14 |
| |
| 1.59
2.53 |
| |
| 1.63
2.10 |
| |
| 1.35
1.35 |
|
| Class B Shares5 | | Maximum 5% CDSC if Redeemed Within the First
Six Years of Purchase | | With sales charges Excluding sales charges | |
| 5/1/1986
|
| |
| –2.61
2.39 |
| |
| 1.38
1.75 |
| |
| 1.33
1.33 |
| |
| 2.10
2.10 |
|
| Class C Shares | | Maximum 1% CDSC if Redeemed Within One Year of Purchase | | With sales charges Excluding sales charges | |
| 9/1/1998
|
| |
| 1.38
2.38 |
| |
| 1.77
1.77 |
| |
| 1.33
1.33 |
| |
| 2.10
2.10 |
|
| Class I Shares | | No Sales Charge | | | | | 1/2/2004 | | | | 3.78 | | | | 3.10 | | | | 2.61 | | | | 0.77 | |
| Class R6 Shares | | No Sales Charge | | | | | 11/1/2019 | | | | 3.85 | | | | 3.12 | | | | 2.62 | | | | 0.66 | |
| * | Previously, the chart presented the Fund’s annual returns for Class B shares. Class I shares are presented for consistency across the MainStay Fund complex. |
| 1. | The performance table and graph do not reflect the deduction of taxes that a shareholder would pay on distributions or Fund share redemptions. Total returns reflect maximum applicable sales charges as indicated in the table above, if any, changes in share price, and reinvestment of dividend and capital gain distributions. The graph assumes the initial investment amount shown above and reflects the deduction of all sales charges that would have applied for the period of investment. Performance figures may reflect certain fee waivers and/or expense limitations, without which total returns may have been lower. For more information on share classes and current fee waivers and/or expense limitations (if any), please refer to the Notes to Financial Statements. |
| 2. | Effective February 28, 2019 and June 21, 2019, the Fund modified its principal investment strategies. The past performance in the bar chart and table prior to those dates reflects the Fund’s prior principal investment strategies. |
| 3. | The gross expense ratios presented reflect the Fund’s “Total Annual Fund Operating Expenses” from the most recent Prospectus and may differ from other expense ratios disclosed in this report. |
| 4. | Prior to June 30, 2020, the maximum initial sales charge for Investor Class shares was 4.5%, which is reflected in the average annual total return figures shown. |
| 5. | Class B shares are closed to all new purchases as well as additional investments by existing Class B shareholders. |
The footnotes on the next page are an integral part of the table and graph and should be carefully read in conjunction with them.
| | | | | | | | | | | | |
| Benchmark Performance | | One Year | | | Five Years | | | Ten Years | |
| | | |
Bloomberg Barclays Taxable Municipal Index6 | | | 6.29 | % | | | 6.43 | % | | | 6.82 | % |
| | | |
Bloomberg Barclays 5-10 Year Taxable Municipal Bond Index7 | | | 6.74 | | | | 5.00 | | | | 5.10 | |
Morningstar Intermediate Core Bond Category Average8 | | | 5.95 | | | | 3.84 | | | | 3.40 | |
| 6. | The Bloomberg Barclays Taxable Municipal Index is the Fund’s primary broad-based securities market index for comparison purposes. The Bloomberg Barclays Taxable Municipal Index is a rules-based, market-value-weighted index engineered for the long-term taxable bond market. Results assume reinvestment of all income and capital gains. An investment cannot be made directly in an index. |
| 7. | The Fund has selected the Bloomberg Barclays 5-10 Year Taxable Municipal Bond Index as its secondary benchmark. The Bloomberg Barclays 5-10 Year Taxable Municipal Bond Index is the 5-10 year component of the Bloomberg Barclays Taxable Municipal Bond Index. |
| 8. | The Morningstar Intermediate Core Bond Category Average is representative of funds that invest primarily in investment-grade U.S. fixed-income issues including government, corporate, and securitized debt, and hold less than 5% in below-investment-grade exposures. Their durations (a measure of interest-rate sensitivity) typically range between 75% and 125% of the three-year average of the effective duration of the Morningstar Core Bond Index. Results are based on average total returns of similar funds with all dividends and capital gain distributions reinvested. |
The footnotes on the preceding page are an integral part of the table and graph and should be carefully read in conjunction with them.
| | |
| 6 | | MainStay MacKay U.S. Infrastructure Bond Fund |
Cost in Dollars of a $1,000 Investment in MainStay MacKay U.S. Infrastructure Bond Fund (Unaudited)
The example below is intended to describe the fees and expenses borne by shareholders during the six-month period from May 1, 2020, to October 31, 2020, and the impact of those costs on your investment.
Example
As a shareholder of the Fund you incur two types of costs: (1) transaction costs, including exchange fees and sales charges (loads) on purchases (as applicable), and (2) ongoing costs, including management fees, distribution and/or service (12b-1) fees, and other Fund expenses (as applicable). This example is intended to help you understand your ongoing costs (in dollars) of investing in the Fund and to compare these costs with the ongoing costs of investing in other mutual funds. The example is based on an investment of $1,000 made at the beginning of the six-month period and held for the entire period from May 1, 2020, to October 31, 2020.
This example illustrates your Fund’s ongoing costs in two ways:
Actual Expenses
The second and third data columns in the table below provide information about actual account values and actual expenses. You may use the information in these columns, together with the amount you invested, to estimate the expenses that you paid during the six months ended October 31, 2020. Simply divide your account value by $1,000 (for example, an $8,600 account value divided by $1,000 = 8.6), then
multiply the result by the number under the heading entitled “Expenses Paid During Period” to estimate the expenses you paid on your account during this period.
Hypothetical Example for Comparison Purposes
The fourth and fifth data columns in the table below provide information about hypothetical account values and hypothetical expenses based on the Fund’s actual expense ratio and an assumed rate of return of 5% per year before expenses, which is not the Fund’s actual return. The hypothetical account values and expenses may not be used to estimate the actual ending account balances or expenses you paid for the six-month period shown. You may use this information to compare the ongoing costs of investing in the Fund with the ongoing costs of investing in other mutual funds. To do so, compare this 5% hypothetical example with the 5% hypothetical examples that appear in the shareholder reports of the other mutual funds.
Please note that the expenses shown in the table are meant to highlight your ongoing costs only and do not reflect any transactional costs, such as exchange fees or sales charges (loads). Therefore, the fourth and fifth data columns of the table are useful in comparing ongoing costs only and will not help you determine the relative total costs of owning different funds. In addition, if these transactional costs were included, your costs would have been higher.
| | | | | | | | | | | | | | | | | | | | | | |
| | | | | | | | | | | | | | | | | | |
| Share Class | | Beginning
Account
Value
5/1/20 | | | Ending Account
Value (Based
on Actual
Returns and
Expenses)
10/31/20 | | | Expenses
Paid
During
Period1 | | | Ending Account
Value (Based
on Hypothetical
5% Annualized
Return and
Actual Expenses)
10/31/20 | | | Expenses
Paid
During
Period1 | | | Net Expense
Ratio
During
Period2 |
| | | | | | |
| Class A Shares | | $ | 1,000.00 | | | $ | 1,032.60 | | | $ | 4.34 | | | $ | 1,020.86 | | | $ | 4.32 | | | 0.85% |
| | | | | | |
| Investor Class Shares | | $ | 1,000.00 | | | $ | 1,031.10 | | | $ | 5.77 | | | $ | 1,019.46 | | | $ | 5.74 | | | 1.13% |
| | | | | | |
| Class B Shares | | $ | 1,000.00 | | | $ | 1,026.20 | | | $ | 9.52 | | | $ | 1,015.74 | | | $ | 9.48 | | | 1.87% |
| | | | | | |
| Class C Shares | | $ | 1,000.00 | | | $ | 1,027.30 | | | $ | 9.53 | | | $ | 1,015.74 | | | $ | 9.48 | | | 1.87% |
| | | | | | |
| Class I Shares | | $ | 1,000.00 | | | $ | 1,033.60 | | | $ | 3.07 | | | $ | 1,022.12 | | | $ | 3.05 | | | 0.60% |
| | | | | | |
| Class R6 Shares | | $ | 1,000.00 | | | $ | 1,034.00 | | | $ | 2.71 | | | $ | 1,022.47 | | | $ | 2.69 | | | 0.53% |
| 1. | Expenses are equal to the Fund’s annualized expense ratio of each class multiplied by the average account value over the period, divided by 366 and multiplied by 184 (to reflect the six-month period). The table above represents the actual expenses incurred during the six-month period. In addition to the fees and expenses which the Fund bears directly, it also indirectly bears a pro rata share of the fees and expenses of the underlying funds in which it invests. Such indirect expenses are not included in the above-reported expense figures. |
| 2. | Expenses are equal to the Fund’s annualized expense ratio to reflect the six-month period. |
Portfolio Composition as of October 31, 2020 (Unaudited)
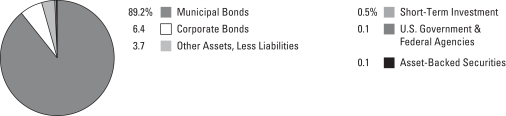
See Portfolio of Investments beginning on page 11 for specific holdings within these categories. The Fund’s holdings are subject to change.
Top Ten Issuers Held as of October 31, 2020 (excluding short-term investment) (Unaudited)
| 1. | South Carolina Public Service Authority, Revenue Bonds, 2.388%–4.322%, due 12/1/23–12/1/27 |
| 2. | County of Miami-Dade FL Aviation, Revenue Bonds, 1.885%–3.275%, due 10/1/21–10/1/29 |
| 3. | Reading Area Water Authority, Revenue Bonds, 2.209%–2.439%, due 12/1/28–12/1/31 |
| 4. | State of California, Construction Bond-Bid Group, Unlimited General Obligation, 1.75%, due 11/1/30 |
| 5. | University of Michigan, Revenue Bonds, 1.004%–1.672%, due 4/1/25–4/1/30 |
| 6. | State of Ohio, Unlimited General Obligation, 1.50%, due 8/1/29–9/15/29 |
| 7. | Guam Government Waterworks Authority, Revenue Bonds, 2.75%, due 7/1/30 |
| 8. | Oneida County Local Development Corp., Mohawk Valley Health System Project, Revenue Bonds, 2.499%–2.549%, due 12/1/23–12/1/24 |
| 9. | Temple University of the Commonwealth System of Higher Education, Revenue Bonds, 1.657%–1.857%, due 4/1/26–4/1/27 |
| 10. | County of Allegheny PA, Unlimited General Obligation, 1.248%–1.438%, due 11/1/26–11/1/27 |
| | |
| 8 | | MainStay MacKay U.S. Infrastructure Bond Fund |
Portfolio Management Discussion and Analysis (Unaudited)
Questions answered by portfolio managers John Loffredo, CFA, Robert DiMella, CFA, Michael Petty, David Dowden, Scott Sprauer, Frances Lewis, Robert Burke, CFA, and John Lawlor of MacKay Shields LLC, the Fund’s Subadvisor.
How did MainStay MacKay U.S. Infrastructure Bond Fund perform relative to its benchmarks and peer group during the 12 months ended October 31, 2020?
For the 12 months ended October 31, 2020, Class I shares of MainStay MacKay U.S. Infrastructure Bond Fund returned 3.78%, underperforming the 6.29% return of the Fund’s primary benchmark, the Bloomberg Barclays Taxable Municipal Bond Index. Over the same period, Class I shares underperformed both the 6.74% return of the Bloomberg Barclays 5–10 Year Taxable Municipal Bond Index, which is the Fund’s secondary benchmark, and the 5.95% return of the Morningstar Intermediate Core Bond Category Average.1
Were there any changes to the Fund during the reporting period?
Effective August 31, 2020, the Fund was renamed MainStay MacKay U.S. Infrastructure Bond Fund and the Fund’s principal investment strategies were modified. For more information about this change, refer to the supplement dated June 25, 2020.
What factors affected the Fund’s relative performance during the reporting period?
The below-investment-grade, tax-exempt segment of the municipal bond market underperformed the investment-grade, tax-exempt segment, while the overall municipal market underperformed the taxable bond market. Bonds with short-end maturities outperformed those with long-end maturities. Among ratings categories, higher-quality bonds outperformed their lower-quality counterparts.
During the reporting period, the Fund underperformed the Bloomberg Barclays Taxable Municipal Bond Index largely due to security selection and yield curve2 positioning. Specifically, the disappointing performance of holdings in the state general obligation sector detracted from relative returns, as did the Fund’s relatively underweight exposure to maturities of less than 10 years. Conversely, relative performance benefited from the Fund’s hospital sector holdings, and from the overweight exposure to long-maturity bonds.
During the reporting period, were there any market events that materially impacted the Fund’s performance or liquidity?
The rapid spread of the COVID-19 pandemic in March 2020 resulted in a significant risk-off response in the global financial markets. All asset classes reacted to this abrupt shift in investor sentiment, although equities and high-yield fixed-income securities bore the brunt of the sell-off. While municipal bonds were not immune, experiencing extreme intra-month spread3 widening and broad underperformance, they quickly reversed course upon passage of the $2 trillion U.S. CARES Act stimulus package on March 27, 2020. This stimulus package earmarked significant amounts of money to help specific municipal sectors impacted by the economic slowdown. As a result, municipal spreads rapidly tightened and prices appreciated during the last few days of the month of March, helping to deliver returns that were more consistent with other credit-focused, fixed-income asset classes. Indices with a heavy weighting toward U.S. Treasury securities delivered the strongest returns during the reporting period as a flight-to-quality bid drove Treasury bond prices appreciably higher.
During the reporting period, how was the Fund’s performance materially affected by investments in derivatives?
The Fund employed a hedge combining 10-year and 30-year U.S. Treasury futures during the reporting period. This hedge detracted from the Fund’s performance as interest rates moved lower.
What was the Fund’s duration4 strategy during the reporting period?
The Fund’s modified duration to worst5 shortened during the reporting period, starting at 6.45 years and ending at 5.93 years.
During the reporting period, which sectors were the strongest positive contributors to the Fund’s relative performance and which sectors were particularly weak?
During the reporting period, the strongest positive contributions to performance relative to the Bloomberg Barclays Taxable Municipal Bond Index came from holdings in the hospital, education and other revenue sectors. (Contributions take
| 1. | See page 5 for other share class returns, which may be higher or lower than Class I share returns. See page 6 for more information on benchmark and peer group returns. |
| 2. | The yield curve is a line that plots the yields of various securities of similar quality—typically U.S. Treasury issues—across a range of maturities. The U.S. Treasury yield curve serves as a benchmark for other debt and is used in economic forecasting. |
| 3. | The terms “spread” and “yield spread” may refer to the difference in yield between a security or type of security and comparable U.S. Treasury issues. The terms may also refer to the difference in yield between two specific securities or types of securities at a given time. |
| 4. | Duration is a measure of the price sensitivity of a fixed-income investment to changes in interest rates. Duration is expressed as a number of years and is considered a more accurate sensitivity gauge than average maturity. |
| 5. | Modified duration is inversely related to the approximate percentage change in price for a given change in yield. Duration to worst is the duration of a bond computed using the bond’s nearest call date or maturity, whichever comes first. This measure ignores future cash flow fluctuations due to embedded optionality. |
weightings and total returns into account.) Conversely, security selection in the state general obligation and special tax sectors detracted from relative returns. Among states, holdings in bonds from Illinois, California and Virginia enhanced relative returns, while holdings in bonds from Oregon, Texas and New York detracted. In terms of credit quality, bonds rated AA and A- bolstered relative performance, while higher-quality AAA and AA+ bonds detracted.6 Lastly, the Fund’s overweight exposure to bonds with maturities of 10 years and longer contributed positively to relative returns, while bonds with 5-to-10-year maturities hampered relative returns.
What were some of the Fund’s largest purchases and sales during the reporting period?
The Fund remained focused on diversification and liquidity, so no individual transaction was considered significant.
How did the Fund’s sector weighting change during the reporting period?
During the reporting period, the Fund increased its exposure to the water/sewer, state general obligation and higher education sectors. At the same time, the Fund reduced its exposure to the other revenue, hospital and prerefunded sectors. Among state
exposures, the Fund increased its allocations to bonds from California, Texas and Florida, while decreasing allocations to bonds from New York, Illinois and Washington. The Fund also increased its exposure to bonds maturing in 3 to 12 years, and decreased its exposure to bonds maturing in more than 15 years. Lastly, the Fund increased its exposure to credits rated AA- and AA+, while decreasing its exposure to other credits rated AAA and A-.
How was the Fund positioned at the end of the reporting period?
As of October 31, 2020, the Fund held overweight positions relative to the Bloomberg Barclays Taxable Municipal Bond Index in the 11-year-plus segment of the maturity spectrum, and underweight exposure to bonds with 5-to-10-year maturities. In terms of sector exposure, the Fund held overweight positions in hospital, education and other revenue bonds, and underweight positions in state general obligation and special tax bonds. Across states, the Fund held overweight allocations to bonds from Illinois and California and underweight allocations to bonds from New York and Oregon. From a credit-quality perspective, the Fund held overweight positions to credits rated A and A-, and underweight positions to bonds rated AA+ and AAA.
| 6. | An obligation rated ‘AAA’ has the highest rating assigned by Standard & Poor’s (“S&P”), and in the opinion of S&P, the obligor’s capacity to meet its financial commitment on the obligation is extremely strong. An obligation rated ‘AA’ by S&P is deemed by S&P to differ from the highest-rated obligations only to a small degree. In the opinion of S&P, the obligor’s capacity to meet its financial commitment on the obligation is very strong. An obligation rated ‘A’ by S&P is deemed by S&P to be somewhat more susceptible to the adverse effects of changes in circumstances and economic conditions than obligations in higher-rated categories. In the opinion of S&P, however, the obligor’s capacity to meet its financial commitment on the obligation is still strong. When applied to Fund holdings, ratings are based solely on the creditworthiness of the bonds in the portfolio and are not meant to represent the security or safety of the Fund. Ratings from ‘AA’ to ‘CCC’ may be modified by the addition of a plus (+) or minus (–) sign to show relative standing within the major rating categories. |
The opinions expressed are those of the portfolio managers as of the date of this report and are subject to change. There is no guarantee that any forecasts will come to pass. This material does not constitute investment advice and is not intended as an endorsement of any specific investment.
| | |
| 10 | | MainStay MacKay U.S. Infrastructure Bond Fund |
Portfolio of Investments October 31, 2020
| | | | | | | | |
| | | Principal
Amount | | | Value | |
Long-Term Bonds 95.8%† Asset-Backed Securities 0.1% | |
Utilities 0.1% | |
Atlantic City Electric Transition Funding LLC
Series 2002-1, Class A4
5.55%, due 10/20/23 | | $ | 356,402 | | | $ | 367,763 | |
| | | | | | | | |
Total Asset-Backed Securities
(Cost $360,730) | | | | | | | 367,763 | |
| | | | | | | | |
|
| Corporate Bonds 6.4% | |
Commercial Services 2.3% | |
Emory University
1.566%, due 9/1/25 | | | 4,500,000 | | | | 4,599,202 | |
Howard University | | | | | | | | |
Insured: AGM
1.991%, due 10/1/25 | | | 2,860,000 | | | | 2,912,081 | |
Insured: AGM
2.657%, due 10/1/26 | | | 1,500,000 | | | | 1,536,719 | |
Leland Standford Junior University
1.289%, due 6/1/27 | | | 2,750,000 | | | | 2,777,173 | |
| | | | | | | | |
| | | | | | | 11,825,175 | |
| | | | | | | | |
Electric 0.2% | |
Duke Energy Florida Project Finance LLC
2.538%, due 9/1/31 | | | 1,100,000 | | | | 1,180,283 | |
| | | | | | | | |
|
Entertainment 0.5% | |
Smithsonian Institution | | | | | | | | |
1.218%, due 9/1/25 | | | 1,000,000 | | | | 999,757 | |
1.967%, due 9/1/31 | | | 1,500,000 | | | | 1,513,538 | |
| | | | | | | | |
| | | | | | | 2,513,295 | |
| | | | | | | | |
Health Care—Services 2.8% | |
Adventist Health System
3.378%, due 3/1/23 | | | 1,600,000 | | | | 1,671,525 | |
Baptist Health Obligated Group
3.289%, due 12/1/28 | | | 650,000 | | | | 657,776 | |
Jackson Laboratory
3.287%, due 7/1/23 | | | 1,415,000 | | | | 1,503,100 | |
Ohiohealth Corp. | | | | | | | | |
1.169%, due 11/15/22 | | | 520,000 | | | | 520,499 | |
1.364%, due 11/15/23 | | | 600,000 | | | | 598,391 | |
2.175%, due 11/15/27 | | | 1,040,000 | | | | 1,046,154 | |
Rogers Memorial Hospital, Inc. | | | | | | | | |
2.631%, due 7/1/26 | | | 1,080,000 | | | | 1,130,051 | |
2.988%, due 7/1/29 | | | 505,000 | | | | 524,230 | |
3.188%, due 7/1/31 | | | 640,000 | | | | 664,159 | |
3.792%, due 7/1/39 | | | 2,480,000 | | | | 2,515,920 | |
Sun Health Services
2.85%, due 11/15/27 | | | 1,250,000 | | | | 1,268,820 | |
Toledo Hospital
5.325%, due 11/15/28 | | | 2,000,000 | | | | 2,237,450 | |
| | | | | | | | |
| | | | | | | 14,338,075 | |
| | | | | | | | |
| | | | | | | | |
| | | Principal
Amount | | | Value | |
Leisure Time 0.6% | |
YMCA of Greater New York
5.021%, due 8/1/38 | | $ | 2,440,000 | | | $ | 2,711,471 | |
| | | | | | | | |
Total Corporate Bonds
(Cost $31,690,005) | | | | | | | 32,568,299 | |
| | | | | | | | |
|
| Municipal Bonds 89.2% | |
Arizona 0.7% | |
Arizona Industrial Development Authority, NCCU Properties LLC, Revenue Bonds
Series B, Insured: BAM
3.10%, due 6/1/25 | | | 600,000 | | | | 615,936 | |
Arizona Industrial Development Authority, Voyager Foundation Inc., Project, Revenue Bonds | | | | | | | | |
Series 2020
3.65%, due 10/1/29 | | | 1,115,000 | | | | 1,102,925 | |
Series 2020
3.90%, due 10/1/34 | | | 1,900,000 | | | | 1,859,074 | |
| | | | | | | | |
| | | | | | | 3,577,935 | |
| | | | | | | | |
Arkansas 1.1% | |
City of Rogers, Sales & Use Tax, Revenue Bonds
Series A
3.828%, due 11/1/25 | | | 1,675,000 | | | | 1,879,317 | |
City of Springdale AR, Sales Use & Tax, Revenue Bonds | | | | | | | | |
Insured: BAM
1.59%, due 11/1/20 | | | 345,000 | | | | 345,000 | |
Insured: BAM
1.598%, due 11/1/22 | | | 1,085,000 | | | | 1,091,846 | |
Insured: BAM
1.60%, due 11/1/23 | | | 1,575,000 | | | | 1,585,820 | |
Insured: BAM
1.62%, due 11/1/21 | | | 755,000 | | | | 758,020 | |
| | | | | | | | |
| | | | | | | 5,660,003 | |
| | | | | | | | |
California 18.8% | |
Anaheim Housing & Public Improvement Authority, Revenue Bonds | | | | | | | | |
Series B
1.998%, due 10/1/27 | | | 1,000,000 | | | | 1,043,710 | |
Series B
2.123%, due 10/1/28 | | | 1,000,000 | | | | 1,039,870 | |
Series B
2.273%, due 10/1/30 | | | 1,000,000 | | | | 1,034,930 | |
Antelope Valley Community College District, Unlimited General Obligation | | | | | | | | |
2.338%, due 8/1/31 | | | 2,000,000 | | | | 2,071,420 | |
2.418%, due 8/1/32 | | | 940,000 | | | | 969,836 | |
| | | | | | |
The notes to the financial statements are an integral part of,
and should be read in conjunction with, the financial statements. | | | | | 11 | |
Portfolio of Investments October 31, 2020 (continued)
| | | | | | | | |
| | | Principal
Amount | | | Value | |
| Municipal Bonds (continued) | |
California (continued) | |
Bay Area Toll Authority, Revenue Bonds
Series F-1
2.574%, due 4/1/31 | | $ | 1,500,000 | | | $ | 1,576,215 | |
California Educational Facilities Authority, Chapman University, Revenue Bonds
Series A
3.661%, due 4/1/33 | | | 3,300,000 | | | | 3,560,535 | |
California Health Facilities Financing Authority, No Place Like Home Program, Revenue Bonds
2.584%, due 6/1/29 | | | 3,000,000 | | | | 3,150,810 | |
California Infrastructure & Economic Development Bank, J. David Gladstone Institutes, Revenue Bonds
3.20%, due 10/1/29 | | | 1,785,000 | | | | 1,883,871 | |
California Municipal Finance Authority, Harvey Mudd College, Revenue Bonds | | | | | | | | |
1.896%, due 12/1/25 | | | 1,370,000 | | | | 1,428,677 | |
2.262%, due 12/1/30 | | | 1,520,000 | | | | 1,568,503 | |
California State Educational Facilities Authority, Chapman University, Revenue Bonds
Series A
3.281%, due 4/1/28 | | | 1,000,000 | | | | 1,085,740 | |
California State University, Revenue Bonds
Series D
1.74%, due 11/1/30 | | | 750,000 | | | | 739,995 | |
California Statewide Communities Development Authority, Revenue Bonds Insured: AGM
2.148%, due 11/15/30 | | | 3,985,000 | | | | 3,991,217 | |
City of Montebello CA, Revenue Bonds | | | | | | | | |
Insured: AGM
3.343%, due 6/1/31 | | | 1,000,000 | | | | 1,068,940 | |
Insured: AGM
3.393%, due 6/1/32 | | | 1,000,000 | | | | 1,069,910 | |
City of Sacramento CA Water Revenue, Revenue Bonds | | | | | | | | |
1.814%, due 9/1/25 | | | 1,100,000 | | | | 1,144,341 | |
2.297%, due 9/1/30 | | | 1,000,000 | | | | 1,032,100 | |
Coast Community College District, Unlimited General Obligation
2.588%, due 8/1/29 | | | 2,565,000 | | | | 2,754,374 | |
County of Riverside CA, Revenue Bonds
2.667%, due 2/15/25 | | | 4,000,000 | | | | 4,251,320 | |
El Cajon Redevelopment Agency, Tax Allocation
Insured: AGM
7.70%, due 10/1/30 | | | 2,000,000 | | | | 2,673,240 | |
| | | | | | | | |
| | | Principal
Amount | | | Value | |
California (continued) | |
El Dorado Irrigation District, Revenue Bonds
Series C
2.055%, due 3/1/29 | | $ | 4,500,000 | | | $ | 4,646,160 | |
El Rancho Unified School District, Unlimited General Obligation
Insured: AGM
2.60%, due 8/1/26 | | | 1,250,000 | | | | 1,305,225 | |
Inglewood Joint Powers Authority, Revenue Bonds
Insured: BAM
3.469%, due 8/1/29 | | | 1,000,000 | | | | 1,084,130 | |
Los Angeles Community College District, Election 2008, Unlimited General Obligation
Series B
7.53%, due 8/1/29 | | | 2,250,000 | | | | 3,194,145 | |
Lynwood Housing Authority, Revenue Bonds
4.00%, due 9/1/29 | | | 2,370,000 | | | | 2,498,288 | |
Ontario International Airport Authority, Revenue Bonds
Insured: AGM
2.634%, due 5/15/23 | | | 1,000,000 | | | | 1,030,390 | |
San Bernardino City Unified School District, Qualified School Construction Bonds, Certificates of Participation
Insured: AGM
7.703%, due 2/1/21 | | | 385,000 | | | | 391,295 | |
San Bernardino Community College District, Election 2018, Unlimited General Obligation
Series A-1
2.64%, due 8/1/29 | | | 3,500,000 | | | | 3,808,840 | |
San Diego County Regional Transportation Commission, Revenue Bonds
Series A
2.499%, due 4/1/30 | | | 2,000,000 | | | | 2,138,360 | |
San Diego Public Facilities Financing Authority, Revenue Bonds | | | | | | | | |
Series B
1.532%, due 8/1/24 | | | 1,185,000 | | | | 1,220,064 | |
Series B
1.903%, due 8/1/26 | | | 2,750,000 | | | | 2,865,225 | |
San Luis Unit/Westlands Water District Financing Authority, Revenue Bonds | | | | | | | | |
Series A, Insured: AGM
1.828%, due 9/1/26 | | | 3,000,000 | | | | 3,114,510 | |
Series A, Insured: AGM
2.028%, due 9/1/27 | | | 2,000,000 | | | | 2,085,240 | |
Santa Clarita Community College District, Unlimited General Obligation | | | | | | | | |
2.632%, due 8/1/28 | | | 500,000 | | | | 535,630 | |
| | | | |
| 12 | | MainStay MacKay U.S. Infrastructure Bond Fund | | The notes to the financial statements are an integral part of,
and should be read in conjunction with, the financial statements. |
| | | | | | | | |
| | | Principal
Amount | | | Value | |
| Municipal Bonds (continued) | |
California (continued) | |
Santa Clarita Community College District, Unlimited General Obligation (continued) | | | | | | | | |
2.682%, due 8/1/29 | | $ | 600,000 | | | $ | 644,820 | |
2.762%, due 8/1/30 | | | 600,000 | | | | 648,504 | |
2.812%, due 8/1/31 | | | 650,000 | | | | 703,807 | |
Solano County Community College District, Unlimited General Obligation | | | | | | | | |
2.717%, due 8/1/29 | | | 450,000 | | | | 483,372 | |
2.817%, due 8/1/30 | | | 575,000 | | | | 617,906 | |
2.867%, due 8/1/31 | | | 675,000 | | | | 731,052 | |
2.917%, due 8/1/32 | | | 650,000 | | | | 703,124 | |
2.967%, due 8/1/33 | | | 630,000 | | | | 679,896 | |
State of California, Construction Bond-Bid Group, Unlimited General Obligation
1.75%, due 11/1/30 | | | 7,500,000 | | | | 7,543,200 | |
State of California, Unlimited General Obligation
2.375%, due 10/1/26 | | | 2,100,000 | | | | 2,256,534 | |
Transbay Joint Powers Authority, Green Bond, Tax Allocation
3.58%, due 10/1/32 | | | 2,730,000 | | | | 2,820,254 | |
University of California, Revenue Bonds
Series BD
3.349%, due 7/1/29 | | | 1,500,000 | | | | 1,686,750 | |
Ventura County Public Financing Authority, Revenue Bonds
Series A
1.741%, due 11/1/27 | | | 2,000,000 | | | | 2,023,700 | |
West Contra Costa Unified School District, Unlimited General Obligation
2.177%, due 8/1/27 | | | 4,805,000 | | | | 4,888,415 | |
| | | | | | | | |
| | | | | | | 95,488,390 | |
| | | | | | | | |
Colorado 0.9% | |
City & County of Denver CO, Airport System, Revenue Bonds
Series C
1.722%, due 11/15/27 | | | 3,500,000 | | | | 3,476,025 | |
Colorado State Housing & Finance Authority, Revenue Bonds
Series G-1, Insured: GNMA
3.65%, due 11/1/46 | | | 1,010,000 | | | | 1,071,357 | |
| | | | | | | | |
| | | | | | | 4,547,382 | |
| | | | | | | | |
Connecticut 2.7% | |
City of Bridgeport CT, Unlimited General Obligation
Series D, Insured: BAM
2.913%, due 9/15/28 | | | 1,650,000 | | | | 1,704,450 | |
| | | | | | | | |
| | | Principal
Amount | | | Value | |
Connecticut (continued) | |
City of Waterbury CT, Unlimited General Obligation
Series C
2.492%, due 9/1/31 | | $ | 2,855,000 | | | $ | 3,056,335 | |
Connecticut Airport Authority, Ground Transportation Center Project, Revenue Bonds | | | | | | | | |
Series B
3.024%, due 7/1/25 | | | 2,045,000 | | | | 2,034,918 | |
Series B
4.282%, due 7/1/45 | | | 1,100,000 | | | | 985,204 | |
State of Connecticut, Unlimited General Obligation | | | | | | | | |
Series A
2.098%, due 7/1/25 | | | 3,000,000 | | | | 3,147,120 | |
Series A
5.85%, due 3/15/32 | | | 1,000,000 | | | | 1,379,390 | |
Town of Hamden CT, Unlimited General Obligation
Series B, Insured: BAM
2.80%, due 8/1/31 | | | 1,250,000 | | | | 1,256,350 | |
| | | | | | | | |
| | | | | | | 13,563,767 | |
| | | | | | | | |
Delaware 0.1% | |
Delaware Municipal Electric Corp., Middletown & Seaford Projects, Revenue Bonds
Series B, Insured: BAM
4.35%, due 10/1/34 | | | 500,000 | | | | 541,860 | |
| | | | | | | | |
|
District of Columbia 0.2% | |
District of Columbia Income Tax Secured, Revenue Bonds
Series B
2.632%, due 3/1/30 | | | 1,000,000 | | | | 1,073,110 | |
| | | | | | | | |
|
Florida 5.8% | |
City of Fort Lauderdale FL, Revenue Bonds
1.30%, due 1/1/27 | | | 2,800,000 | | | | 2,805,796 | |
City of Miami FL, Street & Sidewalk Improvement Program, Revenue Bonds
Series B, Insured: AGM
4.592%, due 1/1/33 (a) | | | 1,115,000 | | | | 1,248,967 | |
City of Tampa FL Water & Wastewater System, Revenue Bonds
Series B
1.348%, due 10/1/29 | | | 2,250,000 | | | | 2,227,523 | |
County of Broward FL, Airport System, Revenue Bonds
Insured: BAM
2.504%, due 10/1/28 | | | 1,965,000 | | | | 1,958,181 | |
| | | | | | |
The notes to the financial statements are an integral part of,
and should be read in conjunction with, the financial statements. | | | | | 13 | |
Portfolio of Investments October 31, 2020 (continued)
| | | | | | | | |
| | | Principal
Amount | | | Value | |
| Municipal Bonds (continued) | |
Florida (continued) | |
County of Miami-Dade FL Aviation, Revenue Bonds | | | | | | | | |
Series B
1.885%, due 10/1/21 | | $ | 6,000,000 | | | $ | 6,017,460 | |
Series B
3.275%, due 10/1/29 | | | 2,715,000 | | | | 2,794,848 | |
County of Miami-Dade FL, Transit System, Revenue Bonds
Series B
1.25%, due 7/1/27 | | | 2,750,000 | | | | 2,685,870 | |
County of Miami-Dade Florida Water & Sewer System, Revenue Bonds
Series C
2.601%, due 10/1/29 | | | 2,145,000 | | | | 2,277,132 | |
Reedy Creek Improvement District, Limited General Obligation
Series A
2.047%, due 6/1/28 | | | 2,000,000 | | | | 2,048,780 | |
St. Johns County Industrial Development Authority, Flagler Health, Revenue Bonds
Series B, Insured: AGM
2.538%, due 10/1/30 | | | 2,500,000 | | | | 2,481,800 | |
Tampa-Hillsborough County Expressway Authority, Revenue Bonds
Series B, Insured: BAM
1.64%, due 7/1/27 | | | 3,000,000 | | | | 2,982,930 | |
| | | | | | | | |
| | | | | | | 29,529,287 | |
| | | | | | | | |
Guam 1.4% | |
Guam Government Waterworks Authority, Revenue Bonds
Series B
2.75%, due 7/1/30 | | | 6,500,000 | | | | 6,328,985 | |
Port Authority of Guam, Revenue Bonds
Series C
4.532%, due 7/1/27 | | | 500,000 | | | | 541,815 | |
| | | | | | | | |
| | | | | | | 6,870,800 | |
| | | | | | | | |
Hawaii 0.9% | |
City & County of Honolulu HI, Build America Bonds, Unlimited General Obligation
5.518%, due 12/1/28 | | | 2,400,000 | | | | 3,150,936 | |
Hawaii Airports Systems, Revenue Bonds
Series A
3.14%, due 7/1/47 | | | 1,500,000 | | | | 1,380,570 | |
| | | | | | | | |
| | | | | | | 4,531,506 | |
| | | | | | | | |
Illinois 7.0% | |
Chicago O’Hare International Airport, Revenue Bonds
Series D
1.704%, due 1/1/26 | | | 5,000,000 | | | | 4,993,850 | |
| | | | | | | | |
| | | Principal
Amount | | | Value | |
Illinois (continued) | |
Chicago Transit Authority, Sales Tax Receipts, Revenue Bonds
2.214%, due 12/1/25 | | $ | 1,500,000 | | | $ | 1,517,010 | |
City of Chicago Heights IL, Unlimited General Obligation
Series A, Insured: BAM
7.25%, due 12/1/34 | | | 3,815,000 | | | | 5,222,849 | |
City of Chicago IL, Unlimited General Obligation
Series C1, Insured: BAM
7.781%, due 1/1/35 | | | 2,195,000 | | | | 3,124,209 | |
Cook County School District No. 89 Maywood, Unlimited General Obligation
Series C, Insured: AGM
6.50%, due 12/15/20 | | | 400,000 | | | | 402,008 | |
County of Cook IL, Build America Bonds, Unlimited General Obligation | | | | | | | | |
Series B, Insured: AGM
6.229%, due 11/15/34 | | | 1,725,000 | | | | 2,448,155 | |
Series B
6.36%, due 11/15/33 | | | 1,500,000 | | | | 2,095,230 | |
Lake County Community Unit School District No. 187, Unlimited General Obligation | | | | | | | | |
Series A, Insured: BAM
4.25%, due 1/1/26 | | | 500,000 | | | | 546,700 | |
Series A, Insured: BAM
4.25%, due 1/1/29 | | | 750,000 | | | | 815,843 | |
Series A, Insured: BAM
4.25%, due 1/1/30 | | | 750,000 | | | | 811,365 | |
Sales Tax Securitization Corp., Revenue Bonds
Series B, Insured: BAM
2.857%, due 1/1/31 | | | 3,000,000 | | | | 3,131,880 | |
Sangamon County Water Reclamation District, Alternative Revenue Source, Unlimited General Obligation
Series B
2.907%, due 1/1/34 | | | 1,885,000 | | | | 1,912,766 | |
State of Illinois, Build America Bonds, Unlimited General Obligation | | | | | | | | |
5.95%, due 3/1/23 | | | 450,000 | | | | 481,617 | |
Series 3, Insured: AGM
6.725%, due 4/1/35 | | | 1,510,000 | | | | 1,853,570 | |
Insured: AGM
6.875%, due 7/1/25 | | | 2,000,000 | | | | 2,257,900 | |
State of Illinois, Sales Tax, Revenue Bonds
3.00%, due 6/15/25 | | | 3,750,000 | | | | 3,709,500 | |
State of Illinois, Unlimited General Obligation
Series B
4.31%, due 4/1/23 | | | 500,000 | | | | 516,735 | |
| | | | | | | | |
| | | | | | | 35,841,187 | |
| | | | | | | | |
| | | | |
| 14 | | MainStay MacKay U.S. Infrastructure Bond Fund | | The notes to the financial statements are an integral part of,
and should be read in conjunction with, the financial statements. |
| | | | | | | | |
| | | Principal
Amount | | | Value | |
| Municipal Bonds (continued) | |
Indiana 0.5% | |
Indiana University Lease Purchase, Revenue Bonds | | | | | | | | |
Series B
2.19%, due 6/1/30 | | $ | 1,000,000 | | | $ | 1,051,200 | |
Series B
2.29%, due 6/1/31 | | | 1,250,000 | | | | 1,323,175 | |
| | | | | | | | |
| | | | | | | 2,374,375 | |
| | | | | | | | |
Kentucky 1.4% | |
Kenton County Airport Board, Senior Customer Facility Charge, Revenue Bonds | | | | | | | | |
3.826%, due 1/1/29 | | | 925,000 | | | | 973,516 | |
4.489%, due 1/1/39 | | | 2,500,000 | | | | 2,635,725 | |
4.689%, due 1/1/49 | | | 1,400,000 | | | | 1,471,932 | |
Kentucky Economic Development Finance Authority, Louisville Arena Project, Revenue Bonds
Series B, Insured: AGM
4.435%, due 12/1/38 | | | 2,000,000 | | | | 2,178,140 | |
| | | | | | | | |
| | | | | | | 7,259,313 | |
| | | | | | | | |
Louisiana 2.6% | |
Louisiana Local Government Environmental Facility & Community Development Authority, Revenue Bonds | | | | | | | | |
1.447%, due 2/1/26 | | | 1,900,000 | | | | 1,889,227 | |
1.547%, due 2/1/27 | | | 3,000,000 | | | | 2,966,460 | |
Louisiana Public Facilities Authority, Tulane University, Revenue Bonds
Series B
2.688%, due 12/15/23 | | | 1,250,000 | | | | 1,288,750 | |
State of Louisiana Gasoline & Fuels Tax, Revenue Bonds | | | | | | | | |
Series A-2
0.869%, due 5/1/25 | | | 1,675,000 | | | | 1,661,014 | |
Series A-2
1.498%, due 5/1/28 | | | 1,700,000 | | | | 1,682,524 | |
State of Louisiana, Unlimited General Obligation
Series C-1
1.864%, due 6/1/32 | | | 4,000,000 | | | | 3,994,920 | |
| | | | | | | | |
| | | | | | | 13,482,895 | |
| | | | | | | | |
Maryland 2.3% | |
County of Baltimore MD, Build America Bonds, Unlimited General Obligation
4.90%, due 11/1/32 | | | 1,000,000 | | | | 1,298,560 | |
County of Montgomery MD, Unlimited General Obligation
Series C
1.25%, due 11/1/28 | | | 4,000,000 | | | | 3,954,840 | |
| | | | | | | | |
| | | Principal
Amount | | | Value | |
Maryland (continued) | |
Maryland Community Development Administration, Department of Housing & Community Development, Revenue Bonds
Series D
2.644%, due 3/1/50 | | $ | 1,470,000 | | | $ | 1,501,326 | |
Maryland Economic Development Corp., Seagirt Marine Terminal Project, Revenue Bonds | | | | | | | | |
Series B
4.00%, due 6/1/26 | | | 3,650,000 | | | | 3,910,902 | |
Series B
4.125%, due 6/1/29 | | | 580,000 | | | | 624,700 | |
Series B
4.125%, due 6/1/30 | | | 500,000 | | | | 534,020 | |
| | | | | | | | |
| | | | | | | 11,824,348 | |
| | | | | | | | |
Massachusetts 2.1% | |
Massachusetts Development Finance Agency, Berklee College of Music Issue, Revenue Bonds
Series A
1.902%, due 10/1/27 | | | 1,000,000 | | | | 1,005,190 | |
Massachusetts Development Finance Agency, Lesley University, Revenue Bonds
Series B
3.165%, due 7/1/32 | | | 1,705,000 | | | | 1,747,063 | |
Massachusetts Development Finance Agency, Wellforce Obligated Group, Revenue Bonds
Series B, Insured: AGM
4.496%, due 7/1/33 | | | 2,545,000 | | | | 2,867,095 | |
University of Massachusetts Building Authority, Revenue Bonds
Senior Series 2020-1
1.391%, due 11/1/27 | | | 4,900,000 | | | | 4,873,883 | |
| | | | | | | | |
| | | | | | | 10,493,231 | |
| | | | | | | | |
Michigan 1.9% | |
Michigan Finance Authority, Local Government Loan Program, Revenue Bonds
Series E, Insured: State Aid Direct Deposit
8.369%, due 11/1/35 | | | 715,000 | | | | 1,080,429 | |
Michigan Finance Authority, Revenue Bonds
Series C-1, Insured: State Aid Direct Deposit
3.585%, due 11/1/35 | | | 1,000,000 | | | | 1,110,220 | |
University of Michigan, Revenue Bonds | | | | | | | | |
Series B
1.004%, due 4/1/25 | | | 3,500,000 | | | | 3,504,410 | |
Series B
1.372%, due 4/1/27 | | | 1,500,000 | | | | 1,496,670 | |
Series B
1.672%, due 4/1/30 | | | 2,500,000 | | | | 2,478,750 | |
| | | | | | | | |
| | | | | | | 9,670,479 | |
| | | | | | | | |
| | | | | | |
The notes to the financial statements are an integral part of,
and should be read in conjunction with, the financial statements. | | | | | 15 | |
Portfolio of Investments October 31, 2020 (continued)
| | | | | | | | |
| | | Principal
Amount | | | Value | |
| Municipal Bonds (continued) | |
Mississippi 0.2% | |
State of Mississippi, Unlimited General Obligation
Series A
1.382%, due 11/1/29 | | $ | 1,000,000 | | | $ | 996,500 | |
| | | | | | | | |
|
Missouri 0.4% | |
Bi-State Development Agency of the Missouri-Illinois Metropolitan District, Revenue Bonds
Series B
1.344%, due 10/1/25 | | | 1,000,000 | | | | 1,006,490 | |
Missouri Health & Educational Facilities Authority, A.T. Still University of Health Sciences, Revenue Bonds
Series B
2.744%, due 10/1/26 | | | 1,185,000 | | | | 1,244,712 | |
| | | | | | | | |
| | | | | | | 2,251,202 | |
| | | | | | | | |
Nebraska 0.3% | |
Nebraska Public Power District, Revenue Bonds
Series B1
2.593%, due 1/1/29 | | | 1,350,000 | | | | 1,446,444 | |
| | | | | | | | |
|
New Jersey 4.7% | |
Casino Reinvestment Development Authority, Inc., Revenue Bonds
Series B, Insured: NATL-RE
5.46%, due 6/1/25 | | | 2,250,000 | | | | 2,355,457 | |
City of Vineland NJ, Unlimited General Obligation
3.193%, due 4/15/29 | | | 1,175,000 | | | | 1,284,863 | |
New Jersey Economic Development Authority, Revenue Bonds | | | | | | | | |
3.282%, due 6/15/25 | | | 3,675,000 | | | | 3,798,958 | |
Series A, Insured: NATL-RE
7.425%, due 2/15/29 | | | 534,000 | | | | 660,868 | |
New Jersey Educational Facilities Authority, Kean University, Revenue Bonds
Series C
3.236%, due 9/1/25 | | | 1,445,000 | | | | 1,503,913 | |
New Jersey Educational Facilities Authority, Revenue Bonds
Series G, Insured: BAM
3.459%, due 7/1/32 | | | 1,330,000 | | | | 1,469,451 | |
New Jersey Educational Facilities Authority, Seton Hall University, Revenue Bonds
Series D, Insured: AGM
2.302%, due 7/1/25 | | | 1,400,000 | | | | 1,414,504 | |
| | | | | | | | |
| | | Principal
Amount | | | Value | |
New Jersey (continued) | |
New Jersey Transportation Trust Fund Authority, Transportation System, Revenue Bonds
Series B
2.631%, due 6/15/24 | | $ | 4,150,000 | | | $ | 4,194,612 | |
North Hudson Sewerage Authority, Senior Lien Lease Certificates, Revenue Bonds Insured: AGM
2.978%, due 6/1/29 | | | 1,000,000 | | | | 1,064,960 | |
Rutgers State University, Revenue Bonds
Series S
1.464%, due 5/1/27 | | | 1,000,000 | | | | 980,150 | |
South Jersey Transportation Authority, Revenue Bonds | | | | | | | | |
Series B, Insured: BAM
2.381%, due 11/1/27 | | | 1,750,000 | | | | 1,753,307 | |
Series B
3.02%, due 11/1/25 | | | 500,000 | | | | 517,905 | |
Series B
3.12%, due 11/1/26 | | | 500,000 | | | | 517,385 | |
Series B
3.26%, due 11/1/27 | | | 500,000 | | | | 515,755 | |
Series B
3.36%, due 11/1/28 | | | 2,000,000 | | | | 2,069,580 | |
| | | | | | | | |
| | | | | | | 24,101,668 | |
| | | | | | | | |
New York 3.5% | |
Brookhaven Local Development Corp., Long Island Community Hospital, Revenue Bonds | | | | | | | | |
4.50%, due 10/1/25 | | | 2,000,000 | | | | 1,985,020 | |
6.00%, due 10/1/30 | | | 1,855,000 | | | | 1,852,422 | |
City of Yonkers, Limited General Obligation
Series C, Insured: BAM
2.818%, due 5/1/28 | | | 1,000,000 | | | | 1,059,220 | |
Metropolitan Transportation Authority, Revenue Bonds
4.955%, due 11/15/20 | | | 300,000 | | | | 300,294 | |
New York City Industrial Development Agency, Yankee Stadium Project, Revenue Bonds Insured: AGM
2.681%, due 3/1/33 | | | 1,750,000 | | | | 1,735,090 | |
New York State Dormitory Authority, Montefiore Obligated Group, Revenue Bonds
Series B, Insured: AGM
4.946%, due 8/1/48 | | | 1,000,000 | | | | 1,102,380 | |
New York State Energy Research & Development Authority, Green, Revenue Bonds | | | | | | | | |
Series A
3.62%, due 4/1/25 | | | 750,000 | | | | 751,957 | |
| | | | |
| 16 | | MainStay MacKay U.S. Infrastructure Bond Fund | | The notes to the financial statements are an integral part of,
and should be read in conjunction with, the financial statements. |
| | | | | | | | |
| | | Principal
Amount | | | Value | |
| Municipal Bonds (continued) | |
New York (continued) | |
New York State Energy Research & Development Authority, Green, Revenue Bonds (continued) | | | | | | | | |
Series A
3.77%, due 4/1/26 | | $ | 1,045,000 | | | $ | 1,041,677 | |
Series A
3.927%, due 4/1/27 | | | 995,000 | | | | 991,070 | |
Oneida County Local Development Corp., Mohawk Valley Health System Project, Revenue Bonds | | | | | | | | |
Series B, Insured: AGM
2.499%, due 12/1/23 | | | 3,680,000 | | | | 3,761,070 | |
Series B, Insured: AGM
2.549%, due 12/1/24 | | | 2,455,000 | | | | 2,509,575 | |
Port Authority of New York & New Jersey, Consolidated 159th, Revenue Bonds
Series B
6.04%, due 12/1/29 | | | 620,000 | | | | 806,087 | |
| | | | | | | | |
| | | | | | | 17,895,862 | |
| | | | | | | | |
Ohio 5.7% | |
American Municipal Power, Inc., Hydroelectric Projects, Revenue Bonds
Series C
7.334%, due 2/15/28 | | | 4,000,000 | | | | 5,045,360 | |
American Municipal Power, Inc., Prairie State Energy Campus Project, Revenue Bonds
Series D
3.014%, due 2/15/31 | | | 2,000,000 | | | | 2,129,840 | |
City of Cleveland OH, Airport System, Revenue Bonds
Series A, Insured: BAM
2.882%, due 1/1/31 | | | 1,400,000 | | | | 1,458,240 | |
Dayton Metro Library, Unlimited General Obligation
2.676%, due 12/1/29 | | | 2,035,000 | | | | 2,259,461 | |
JobsOhio Beverage System, Revenue Bonds
Series B
3.985%, due 1/1/29 | | | 2,050,000 | | | | 2,340,095 | |
Northeast Ohio Regional Sewer District, Revenue Bonds | | | | | | | | |
2.419%, due 11/15/30 | | | 1,245,000 | | | | 1,310,076 | |
2.519%, due 11/15/31 | | | 1,655,000 | | | | 1,742,152 | |
State of Ohio, Unlimited General Obligation | | | | | | | | |
Series A
1.50%, due 8/1/29 | | | 4,000,000 | | | | 4,017,480 | |
Series A
1.50%, due 9/15/29 | | | 3,000,000 | | | | 3,013,620 | |
| | | | | | | | |
| | | Principal
Amount | | | Value | |
Ohio (continued) | |
Summit County Development Finance Authority, Franciscan University of Steubenville Project, Revenue Bonds | | | | | | | | |
Series B
5.125%, due 11/1/48 | | $ | 1,000,000 | | | $ | 1,114,460 | |
Series A
6.00%, due 11/1/48 (a) | | | 1,750,000 | | | | 2,071,143 | |
University of Cincinnati, Revenue Bonds
Series B
2.533%, due 6/1/29 | | | 2,500,000 | | | | 2,605,575 | |
| | | | | | | | |
| | | | | | | 29,107,502 | |
| | | | | | | | |
Oregon 1.8% | |
Oregon State Facilities Authority, Lewis & Clark College Project, Revenue Bonds
Series A
2.486%, due 10/1/35 | | | 4,000,000 | | | | 3,742,720 | |
Port of Portland Airport, Portland International Airport, Revenue Bonds
4.067%, due 7/1/39 | | | 1,000,000 | | | | 993,080 | |
State of Oregon, Unlimited General Obligation | | | | | | | | |
0.895%, due 5/1/25 | | | 2,000,000 | | | | 2,014,580 | |
1.315%, due 5/1/27 | | | 1,000,000 | | | | 1,009,720 | |
Washington & Multnomah Counties School District No. 48J Beaverton, Unlimited General Obligation
Insured: School Bond Guaranty
1.693%, due 6/15/30 | | | 1,500,000 | | | | 1,513,260 | |
| | | | | | | | |
| | | | | | | 9,273,360 | |
| | | | | | | | |
Pennsylvania 6.0% | |
Authority Improvement Municipalities, Carlow University, Revenue Bonds
Series B
5.00%, due 11/1/53 | | | 1,000,000 | | | | 1,018,890 | |
City of Pittsburgh PA, Unlimited General Obligation
Series B
1.679%, due 9/1/30 | | | 800,000 | | | | 787,280 | |
County of Allegheny PA, Unlimited General Obligation | | | | | | | | |
Series C-79
1.248%, due 11/1/26 | | | 1,875,000 | | | | 1,886,494 | |
Series C-79
1.438%, due 11/1/27 | | | 3,605,000 | | | | 3,618,555 | |
County of Beaver PA, Unlimited General Obligation
Series B, Insured: BAM
3.979%, due 11/15/29 | | | 1,805,000 | | | | 2,029,542 | |
| | | | | | |
The notes to the financial statements are an integral part of,
and should be read in conjunction with, the financial statements. | | | | | 17 | |
Portfolio of Investments October 31, 2020 (continued)
| | | | | | | | |
| | | Principal
Amount | | | Value | |
| Municipal Bonds (continued) | |
Pennsylvania (continued) | |
Pennsylvania Economic Development Financing Authority, Build America Bonds, Revenue Bonds
Series B
6.532%, due 6/15/39 | | $ | 1,495,000 | | | $ | 2,092,327 | |
Philadelphia Water & Wastewater Revenue, Revenue Bonds
Series B
1.734%, due 11/1/28 | | | 2,740,000 | | | | 2,732,712 | |
Reading Area Water Authority, Revenue Bonds | | | | | | | | |
Insured: BAM
2.209%, due 12/1/28 | | | 2,345,000 | | | | 2,381,981 | |
Insured: BAM
2.309%, due 12/1/29 | | | 2,390,000 | | | | 2,441,194 | |
Insured: BAM
2.439%, due 12/1/31 | | | 3,295,000 | | | | 3,371,773 | |
State Public School Building Authority, School District of Philadelphia Project, Revenue Bonds
Series A, Insured: State Aid Witholding
3.046%, due 4/1/28 | | | 1,920,000 | | | | 1,967,424 | |
Temple University of the Commonwealth System of Higher Education, Revenue Bonds | | | | | | | | |
1st Series of 2020,
Insured: State Appropriations
1.657%, due 4/1/26 | | | 2,520,000 | | | | 2,558,732 | |
1st Series of 2020,
Insured: State Appropriations
1.857%, due 4/1/27 | | | 3,445,000 | | | | 3,505,425 | |
| | | | | | | | |
| | | | | | | 30,392,329 | |
| | | | | | | | |
Rhode Island 0.5% | |
Rhode Island Commerce Corp., Historic Structures Tax Credit Financing Program, Revenue Bonds
Series A
3.297%, due 5/1/28 | | | 1,000,000 | | | | 1,125,850 | |
Rhode Island Turnpike & Bridge Authority, Revenue Bonds
Series 1
2.761%, due 12/1/29 | | | 1,570,000 | | | | 1,621,276 | |
| | | | | | | | |
| | | | | | | 2,747,126 | |
| | | | | | | | |
South Carolina 2.0% | |
South Carolina Public Service Authority, Revenue Bonds | | | | | | | | |
Series D
2.388%, due 12/1/23 | | | 2,280,000 | | | | 2,382,030 | |
| | | | | | | | |
| | | Principal
Amount | | | Value | |
South Carolina (continued) | |
South Carolina Public Service Authority, Revenue Bonds (continued) | | | | | | | | |
Series E
3.922%, due 12/1/24 | | $ | 813,000 | | | $ | 906,349 | |
Series E
4.322%, due 12/1/27 | | | 6,040,000 | | | | 7,126,777 | |
| | | | | | | | |
| | | | | | | 10,415,156 | |
| | | | | | | | |
Tennessee 0.8% | |
Metropolitan Government Nashville & Davidson County Health & Educational Facilities Board, Lipscomb University Project, Revenue Bonds
Series B
4.409%, due 10/1/34 | | | 1,280,000 | | | | 1,362,368 | |
Tennessee Energy Acquisition Corp., Revenue Bonds
Series A
4.00%, due 5/1/48 (b) | | | 2,500,000 | | | | 2,683,475 | |
| | | | | | | | |
| | | | | | | 4,045,843 | |
| | | | | | | | |
Texas 8.1% | |
Central Texas Regional Mobility Authority, Revenue Bonds | | | | | | | | |
Series C
1.445%, due 1/1/25 | | | 600,000 | | | | 594,672 | |
Series C
1.837%, due 1/1/27 | | | 1,290,000 | | | | 1,267,902 | |
City of Brownsville TX, Utilities System, Revenue Bonds
Series A, Insured: AGM
1.477%, due 9/1/27 | | | 1,500,000 | | | | 1,509,270 | |
City of Corpus Christi TX, Utility System, Revenue Bonds | | | | | | | | |
Series B
1.489%, due 7/15/27 | | | 2,250,000 | | | | 2,264,782 | |
Series B
1.706%, due 7/15/28 | | | 2,500,000 | | | | 2,532,925 | |
City of Dallas TX, Waterworks & Sewer System, Revenue Bonds | | | | | | | | |
Series D
1.007%, due 10/1/25 | | | 1,600,000 | | | | 1,613,040 | |
Series D
1.347%, due 10/1/26 | | | 1,000,000 | | | | 1,020,430 | |
City of Houston TX, Airport System, Revenue Bonds
Subseries C
1.816%, due 7/1/27 | | | 2,000,000 | | | | 1,994,400 | |
City of Houston TX, Utility System, Revenue Bonds
Series C
2.255%, due 11/15/29 | | | 1,000,000 | | | | 1,048,320 | |
| | | | |
| 18 | | MainStay MacKay U.S. Infrastructure Bond Fund | | The notes to the financial statements are an integral part of,
and should be read in conjunction with, the financial statements. |
| | | | | | | | |
| | | Principal
Amount | | | Value | |
| Municipal Bonds (continued) | |
Texas (continued) | |
City of Houston, Limited General Obligation
Series B
2.366%, due 3/1/28 | | $ | 2,855,000 | | | $ | 3,022,360 | |
City of San Antonio TX, Limited General Obligation
1.433%, due 2/1/28 | | | 2,500,000 | | | | 2,535,200 | |
Dallas Fort Worth Taxable International Airport, Revenue Bonds | | | | | | | | |
Series C
1.329%, due 11/1/25 | | | 2,250,000 | | | | 2,253,398 | |
Series C
1.749%, due 11/1/27 | | | 2,000,000 | | | | 2,000,980 | |
El Paso Independent School District, Unlimited General Obligation
Series A, Insured: PSF
5.00%, due 8/15/28 | | | 4,000,000 | | | | 5,024,240 | |
Gainesville Hospital District, Limited General Obligation
Series A
4.753%, due 8/15/23 | | | 1,520,000 | | | | 1,602,658 | |
Harris County Cultural Education Facilities Finance Corp., Memorial Hermann Health System, Revenue Bonds
Insured: AGM
1.266%, due 7/1/25 | | | 1,000,000 | | | | 999,000 | |
Port of Corpus Christi Authority of Nueces County, Revenue Bonds
Series B
4.875%, due 12/1/38 | | | 2,000,000 | | | | 2,318,940 | |
Texas Tech University System, Revenue Bonds
0.938%, due 2/15/25 | | | 2,500,000 | | | | 2,508,300 | |
Texas Transportation Commission, Unlimited General Obligation
1.383%, due 10/1/28 | | | 5,000,000 | | | | 5,052,700 | |
| | | | | | | | |
| | | | | | | 41,163,517 | |
| | | | | | | | |
Utah 0.7% | |
County of Salt Lake UT, Convention Hotel, Revenue Bonds
5.25%, due 10/1/34 (a) | | | 3,610,000 | | | | 3,440,366 | |
| | | | | | | | |
|
Virginia 2.1% | |
Farmville Industrial Development Authority Facilities, Longwood University Student Housing Project, Revenue Bonds
5.00%, due 1/1/34 | | | 2,000,000 | | | | 1,968,600 | |
Fredericksburg Economic Development Authority, Fredericksburg Stadium Project, Revenue Bonds
Series A
4.00%, due 9/1/29 (a) | | | 2,315,000 | | | | 2,487,768 | |
| | | | | | | | |
| | | Principal
Amount | | | Value | |
Virginia (continued) | |
Virginia College Building Authority, 21st Century College & Equipment Program, Revenue Bonds
1.227%, due 2/1/27 | | $ | 3,500,000 | | | $ | 3,445,995 | |
Virginia Resources Authority, Infrastructure Revenue, Revenue Bonds
Series C, Insured: Moral Obligation
2.55%, due 11/1/28 | | | 2,550,000 | | | | 2,737,094 | |
| | | | | | | | |
| | | | | | | 10,639,457 | |
| | | | | | | | |
Washington 0.4% | |
Energy Northwest Electric Revenue, Build America Bonds, Bonneville Power Administration, Revenue Bonds
Series B
5.71%, due 7/1/24 | | | 1,000,000 | | | | 1,178,680 | |
Klickitat County Public Utility District No. 1, Revenue Bonds
Series B, Insured: AGM
2.803%, due 12/1/29 | | | 700,000 | | | | 722,358 | |
| | | | | | | | |
| | | | | | | 1,901,038 | |
| | | | | | | | |
West Virginia 0.6% | |
County of Ohio WV, Special District Excise Tax Revenue, The Highlands Project, Revenue Bonds
Series A
4.00%, due 3/1/40 | | | 3,500,000 | | | | 2,948,785 | |
| | | | | | | | |
|
Wisconsin 1.0% | |
State of Wisconsin, Revenue Bonds
Series A
2.399%, due 5/1/30 | | | 2,000,000 | | | | 2,115,680 | |
Wisconsin Department of Transportation, Revenue Bonds
Series 1
1.007%, due 7/1/26 | | | 3,000,000 | | | | 3,013,470 | |
| | | | | | | | |
| | | | | | | 5,129,150 | |
| | | | | | | | |
Total Municipal Bonds
(Cost $442,973,187) | | | | | | | 454,225,173 | |
| | | | | | | | |
|
| U.S. Government & Federal Agencies 0.1% | |
Federal Home Loan Mortgage Corporation
(Mortgage Pass-Through Securities) 0.1% | |
4.00%, due 10/1/48 | | | 228,601 | | | | 250,723 | |
6.50%, due 4/1/37 | | | 35,602 | | | | 40,839 | |
| | | | | | | | |
| | | | | | | 291,562 | |
| | | | | | | | |
| | | | | | |
The notes to the financial statements are an integral part of,
and should be read in conjunction with, the financial statements. | | | | | 19 | |
Portfolio of Investments October 31, 2020 (continued)
| | | | | | | | |
| | | Principal
Amount | | | Value | |
| U.S. Government & Federal Agencies (continued) | |
Government National Mortgage Association
(Mortgage Pass-Through Securities) 0.0%‡ | |
6.50%, due 4/15/31 | | $ | 140,442 | | | $ | 162,544 | |
| | | | | | | | |
Total U.S. Government & Federal Agencies
(Cost $408,468) | | | | | | | 454,106 | |
| | | | | | | | |
Total Long-Term Bonds
(Cost $475,432,390) | | | | | | | 487,615,341 | |
| | | | | | | | |
|
| Short-Term Investments 0.5% | |
Short-Term Municipal Note 0.5% | |
County of Sacramento CA, Pension Funding, Revenue Bonds
Insured: AGM
1.597%, due 7/10/30 (c) | | | 2,500,000 | | | | 2,493,225 | |
| | | | | | | | |
Total Short-Term Investment
(Cost $2,494,323) | | | | | | | 2,493,225 | |
| | | | | | | | |
Total Investments
(Cost $477,926,713) | | | 96.3 | % | | | 490,108,566 | |
Other Assets, Less Liabilities | | | 3.7 | | | | 18,639,663 | |
Net Assets | | | 100.0 | % | | $ | 508,748,229 | |
| † | Percentages indicated are based on Fund net assets. |
| ‡ | Less than one-tenth of a percent. |
| (a) | May be sold to institutional investors only under Rule 144A or securities offered pursuant to Section 4(a)(2) of the Securities Act of 1933, as amended. |
| (b) | Floating rate—Rate shown was the rate in effect as of October 31, 2020. |
| (c) | Variable-rate demand notes (VRDNs)—Provide the right to sell the security at face value on either that day or within the rate-reset period. VRDNs will normally trade as if the maturity is the earlier put date, even though stated maturity is longer. The interest rate is reset on the put date at a stipulated daily, weekly, monthly, quarterly, or other specified time interval to reflect current market conditions. These securities do not indicate a reference rate and spread in their description. The maturity date shown is the final maturity. |
Futures Contracts
As of October 31, 2020, the Portfolio held the following futures contracts1:
| | | | | | | | | | | | | | | | | | | | |
Type | | Number of
Contracts | | | Expiration
Date | | | Value at
Trade Date | | | Current
Notional
Amount | | | Unrealized
Appreciation
(Depreciation)2 | |
Short Contracts | | | | | | | | | | | | | | | | | | | | |
| 10-Year United States Treasury Note | | | (250 | ) | | | December 2020 | | | $ | (34,782,588 | ) | | $ | (34,554,687 | ) | | $ | 227,901 | |
| | | | | | | | | | | | | | | | | | | | |
| Net Unrealized Appreciation | | | | | | | | | | | | | | | | | | $ | 227,901 | |
| | | | | | | | | | | | | | | | | | | | |
| 1. | As of October 31, 2020, cash in the amount of $387,500 was on deposit with a broker or futures commission merchant for futures transactions. |
| 2. | Represents the difference between the value of the contracts at the time they were opened and the value as of October 31, 2020. |
The following abbreviations are used in the preceding pages:
AGM—Assured Guaranty Municipal Corp.
BAM—Build America Mutual Assurance Co.
GNMA—Government National Mortgage Association
NATL-RE—National Public Finance Guarantee Corp.
| | | | |
| 20 | | MainStay MacKay U.S. Infrastructure Bond Fund | | The notes to the financial statements are an integral part of,
and should be read in conjunction with, the financial statements. |
The following is a summary of the fair valuations according to the inputs used as of October 31, 2020, for valuing the Fund’s assets and liabilities:
| | | | | | | | | | | | | | | | |
Description | | Quoted
Prices in
Active
Markets for
Identical
Assets
(Level 1) | | | Significant
Other
Observable
Inputs
(Level 2) | | | Significant
Unobservable
Inputs
(Level 3) | | | Total | |
| | | | |
Asset Valuation Inputs | | | | | | | | | | | | | | | | |
| Investments in Securities (a) | | | | | | | | | | | | | | | | |
| Long-Term Bonds | | | | | | | | | | | | | | | | |
Asset-Backed Securities | | $ | — | | | $ | 367,763 | | | $ | — | | | $ | 367,763 | |
Corporate Bonds | | | — | | | | 32,568,299 | | | | — | | | | 32,568,299 | |
Municipal Bonds | | | — | | | | 454,225,173 | | | | — | | | | 454,225,173 | |
U.S. Government & Federal Agencies | | | — | | | | 454,106 | | | | — | | | | 454,106 | |
| | | | | | | | | | | | | | | | |
| Total Long-Term Bonds | | | — | | | | 487,615,341 | | | | — | | | | 487,615,341 | |
| | | | | | | | | | | | | | | | |
| Short-Term Investment | | | | | | | | | | | | | | | | |
Short Term Municipal Notes | | | — | | | | 2,493,225 | | | | — | | | | 2,493,225 | |
| | | | | | | | | | | | | | | | |
| Total Investments in Securities | | | — | | | | 490,108,566 | | | | — | | | | 490,108,566 | |
| | | | | | | | | | | | | | | | |
| Other Financial Instruments | | | | | | | | | | | | | | | | |
Futures Contracts (b) | | | 227,901 | | | | — | | | | — | | | | 227,901 | |
| | | | | | | | | | | | | | | | |
| Total Investments in Securities and Other Financial Instruments | | $ | 227,901 | | | $ | 490,108,566 | | | $ | — | | | $ | 490,336,467 | |
| | | | | | | | | | | | | | | | |
| (a) | For a complete listing of investments and their industries, see the Portfolio of Investments. |
| (b) | The value listed for these securities reflects unrealized appreciation (depreciation) as shown on the Portfolio of Investments. |
| | | | | | |
The notes to the financial statements are an integral part of,
and should be read in conjunction with, the financial statements. | | | | | 21 | |
Statement of Assets and Liabilities as of October 31, 2020
| | | | |
| Assets | |
Investment in securities, at value (identified cost $477,926,713) | | $ | 490,108,566 | |
Cash | | | 18,655,879 | |
Cash collateral on deposit at broker for futures contracts | | | 387,500 | |
Receivables: | | | | |
Investment securities sold | | | 6,891,913 | |
Fund shares sold | | | 5,499,509 | |
Interest | | | 3,601,979 | |
Variation margin on futures contracts | | | 46,872 | |
Other assets | | | 60,821 | |
| | | | |
Total assets | | | 525,253,039 | |
| | | | |
|
| Liabilities | |
Due to custodian | | | 1,134,906 | |
Payables: | | | | |
Investment securities purchased | | | 12,581,912 | |
Fund shares redeemed | | | 2,291,940 | |
Manager (See Note 3) | | | 118,651 | |
Transfer agent (See Note 3) | | | 113,031 | |
NYLIFE Distributors (See Note 3) | | | 35,285 | |
Professional fees | | | 26,167 | |
Shareholder communication | | | 25,178 | |
Custodian | | | 4,883 | |
Trustees | | | 651 | |
Accrued expenses | | | 3,800 | |
Dividend payable | | | 168,406 | |
| | | | |
Total liabilities | | | 16,504,810 | |
| | | | |
Net assets | | $ | 508,748,229 | |
| | | | |
|
| Composition of Net Assets | |
Shares of beneficial interest outstanding (par value of $.01 per share) unlimited number of shares authorized | | $ | 575,282 | |
Additional paid-in capital | | | 489,511,917 | |
| | | | |
| | | 490,087,199 | |
Total distributable earnings (loss) | | | 18,661,030 | |
| | | | |
Net assets | | $ | 508,748,229 | |
| | | | |
| | | | |
Class A | | | | |
Net assets applicable to outstanding shares | | $ | 103,474,851 | |
| | | | |
Shares of beneficial interest outstanding | | | 11,798,588 | |
| | | | |
Net asset value per share outstanding | | $ | 8.77 | |
Maximum sales charge (4.50% of offering price) | | | 0.41 | |
| | | | |
Maximum offering price per share outstanding | | $ | 9.18 | |
| | | | |
Investor Class | | | | |
Net assets applicable to outstanding shares | | $ | 19,459,247 | |
| | | | |
Shares of beneficial interest outstanding | | | 2,209,052 | |
| | | | |
Net asset value per share outstanding | | $ | 8.81 | |
Maximum sales charge (4.00% of offering price) | | | 0.37 | |
| | | | |
Maximum offering price per share outstanding | | $ | 9.18 | |
| | | | |
Class B | | | | |
Net assets applicable to outstanding shares | | $ | 1,901,501 | |
| | | | |
Shares of beneficial interest outstanding | | | 216,801 | |
| | | | |
Net asset value and offering price per share outstanding | | $ | 8.77 | |
| | | | |
Class C | | | | |
Net assets applicable to outstanding shares | | $ | 8,708,157 | |
| | | | |
Shares of beneficial interest outstanding | | | 993,045 | |
| | | | |
Net asset value and offering price per share outstanding | | $ | 8.77 | |
| | | | |
Class I | | | | |
Net assets applicable to outstanding shares | | $ | 292,000,011 | |
| | | | |
Shares of beneficial interest outstanding | | | 32,933,123 | |
| | | | |
Net asset value and offering price per share outstanding | | $ | 8.87 | |
| | | | |
Class R6 | | | | |
Net assets applicable to outstanding shares | | $ | 83,204,462 | |
| | | | |
Shares of beneficial interest outstanding | | | 9,377,604 | |
| | | | |
Net asset value and offering price per share outstanding | | $ | 8.87 | |
| | | | |
| | | | |
| 22 | | MainStay MacKay U.S. Infrastructure Bond Fund | | The notes to the financial statements are an integral part of,
and should be read in conjunction with, the financial statements. |
Statement of Operations for the year ended October 31, 2020
| | | | |
| Investment Income (Loss) | |
Income | | | | |
Interest | | $ | 11,987,727 | |
Securities lending | | | 18 | |
Other | | | 80 | |
| | | | |
Total income | | | 11,987,825 | |
| | | | |
Expenses | | | | |
Manager (See Note 3) | | | 2,262,345 | |
Transfer agent (See Note 3) | | | 565,872 | |
Distribution/Service—Class A (See Note 3) | | | 233,729 | |
Distribution/Service—Investor Class (See Note 3) | | | 50,174 | |
Distribution/Service—Class B (See Note 3) | | | 22,506 | |
Distribution/Service—Class C (See Note 3) | | | 101,536 | |
Registration | | | 131,067 | |
Professional fees | | | 108,391 | |
Shareholder communication | | | 52,080 | |
Custodian | | | 29,294 | |
Trustees | | | 11,267 | |
Miscellaneous | | | 25,859 | |
| | | | |
Total expenses before waiver/reimbursement | | | 3,594,120 | |
Expense waiver/reimbursement from Manager (See Note 3) | | | (469,112 | ) |
| | | | |
Net expenses | | | 3,125,008 | |
| | | | |
Net investment income (loss) | | | 8,862,817 | |
| | | | |
|
| Realized and Unrealized Gain (Loss) | |
Net realized gain (loss) on: | | | | |
Investment transactions | | | 13,149,914 | |
Futures transactions | | | (5,378,722 | ) |
| | | | |
Net realized gain (loss) | | | 7,771,192 | |
| | | | |
Net change in unrealized appreciation (depreciation) on: | | | | |
Investments | | | 4,693,471 | |
Futures contracts | | | (111,302 | ) |
Unfunded commitments | | | 938 | |
| | | | |
Net change in unrealized appreciation (depreciation) | | | 4,583,107 | |
| | | | |
Net realized and unrealized gain (loss) | | | 12,354,299 | |
| | | | |
Net increase (decrease) in net assets resulting from operations | | $ | 21,217,116 | |
| | | | |
| | | | | | |
The notes to the financial statements are an integral part of,
and should be read in conjunction with, the financial statements. | | | | | 23 | |
Statements of Changes in Net Assets
for the years ended October 31, 2020 and October 31, 2019
| | | | | | | | |
| | | 2020 | | | 2019 | |
| Increase (Decrease) in Net Assets | |
Operations: | | | | | | | | |
Net investment income (loss) | | $ | 8,862,817 | | | $ | 3,513,724 | |
Net realized gain (loss) | | | 7,771,192 | | | | 1,385,688 | |
Net change in unrealized appreciation (depreciation) | | | 4,583,107 | | | | 8,274,472 | |
| | | | |
Net increase (decrease) in net assets resulting from operations | | | 21,217,116 | | | | 13,173,884 | |
| | | | |
Distributions to shareholders: | | | | | | | | |
Class A | | | (1,754,280 | ) | | | (1,786,354 | ) |
Investor Class | | | (324,263 | ) | | | (463,383 | ) |
Class B | | | (20,251 | ) | | | (42,411 | ) |
Class C | | | (93,576 | ) | | | (199,615 | ) |
Class I | | | (3,817,800 | ) | | | (1,044,927 | ) |
Class R6 | | | (2,994,329 | ) | | | — | |
| | | | |
| | | (9,004,499 | ) | | | (3,536,690 | ) |
| | | | |
Distributions to shareholders from return of capital: | | | | | | | | |
Class A | | | — | | | | (11,271 | ) |
Investor Class | | | — | | | | (2,924 | ) |
Class B | | | — | | | | (268 | ) |
Class C | | | — | | | | (1,260 | ) |
Class I | | | — | | | | (6,594 | ) |
| | | — | | | | (22,317 | ) |
| | | | |
Total distributions to shareholders | | | (9,004,499 | ) | | | (3,559,007 | ) |
| | | | |
Capital share transactions: | | | | | | | | |
Net proceeds from sale of shares | | | 506,198,949 | | | | 226,660,069 | |
Net asset value of shares issued to shareholders in reinvestment of distributions | | | 8,017,362 | | | | 3,378,523 | |
Cost of shares redeemed | | | (316,791,224 | ) | | | (45,662,835 | ) |
| | | | |
Increase (decrease) in net assets derived from capital share transactions | | | 197,425,087 | | | | 184,375,757 | |
| | | | |
Net increase (decrease) in net assets | | | 209,637,704 | | | | 193,990,634 | |
|
| Net Assets | |
Beginning of year | | | 299,110,525 | | | | 105,119,891 | |
| | | | |
End of year | | $ | 508,748,229 | | | $ | 299,110,525 | |
| | | | |
| | | | |
| 24 | | MainStay MacKay U.S. Infrastructure Bond Fund | | The notes to the financial statements are an integral part of,
and should be read in conjunction with, the financial statements. |
Financial Highlights selected per share data and ratios
| | | | | | | | | | | | | | | | | | | | |
| |
| | | Year ended October 31, | |
| | | | | |
| Class A | | 2020 | | | 2019 | | | 2018 | | | 2017 | | | 2016 | |
| | | | | |
Net asset value at beginning of year | | $ | 8.64 | | | $ | 7.93 | | | $ | 8.33 | | | $ | 8.56 | | | $ | 8.51 | |
| | | | | | | | | | | | | | | | | | | | |
| | | | | |
Net investment income (loss) (a) | | | 0.16 | | | | 0.21 | | | | 0.19 | | | | 0.17 | | | | 0.17 | |
| | | | | |
Net realized and unrealized gain (loss) on investments | | | 0.14 | | | | 0.71 | | | | (0.40 | ) | | | (0.22 | ) | | | 0.05 | |
| | | | | | | | | | | | | | | | | | | | |
| | | | | |
Total from investment operations | | | 0.30 | | | | 0.92 | | | | (0.21 | ) | | | (0.05 | ) | | | 0.22 | |
| | | | | | | | | | | | | | | | | | | | |
| | | | | |
| Less distributions: | | | | | | | | | | | | | | | | | | | | |
| | | | | |
From net investment income | | | (0.17 | ) | | | (0.21 | ) | | | (0.19 | ) | | | (0.18 | ) | | | (0.17 | ) |
| | | | | |
Return of capital | | | — | | | | (0.00 | )‡ | | | — | | | | — | | | | — | |
| | | | | | | | | | | | | | | | | | | | |
| | | | | |
Total distributions | | | (0.17 | ) | | | (0.21 | ) | | | (0.19 | ) | | | (0.18 | ) | | | (0.17 | ) |
| | | | | | | | | | | | | | | | | | | | |
| | | | | |
Net asset value at end of year | | $ | 8.77 | | | $ | 8.64 | | | $ | 7.93 | | | $ | 8.33 | | | $ | 8.56 | |
| | | | | | | | | | | | | | | | | | | | |
| | | | | |
Total investment return (b) | | | 3.45 | % | | | 11.76 | % | | | (2.54 | %) | | | (0.60 | %) | | | 2.60 | % |
| | | | | |
| Ratios (to average net assets)/Supplemental Data: | | | | | | | | | | | | | | | | | | | | |
| | | | | |
Net investment income (loss) | | | 1.84 | % | | | 2.52 | % | | | 2.31 | % | | | 2.07 | % | | | 1.99 | %(c) |
| | | | | |
Net expenses (d) | | | 0.85 | % | | | 0.89 | % | | | 1.00 | % | | | 1.00 | % | | | 0.98 | %(e) |
| | | | | |
Expenses (before waiver/reimbursement) (d) | | | 0.98 | % | | | 1.02 | % | | | 1.04 | % | | | 1.00 | % | | | 0.99 | % |
| | | | | |
Portfolio turnover rate | | | 89 | %(f) | | | 124 | %(f) | | | 58 | % (g) | | | 20 | % (g) | | | 41 | %(g) |
| | | | | |
Net assets at end of year (in 000’s) | | $ | 103,475 | | | $ | 84,513 | | | $ | 68,269 | | | $ | 82,828 | | | $ | 93,242 | |
| ‡ | Less than one cent per share. |
| (a) | Per share data based on average shares outstanding during the year. |
| (b) | Total investment return is calculated exclusive of sales charges and assumes the reinvestment of distributions. For periods of less than one year, total return is not annualized. |
| (c) | Without the custody fee reimbursement, net investment income (loss) would have been 1.98%. |
| (d) | In addition to the fees and expenses which the Fund bears directly, it also indirectly bears a pro-rata share of the fees and expenses of the underlying funds in which it invests. Such indirect expenses are not included in the above expense ratios. |
| (e) | Without the custody fee reimbursement, net expenses would have been 0.99%. |
| (f) | The portfolio turnover rate includes variable rate demand notes. |
| (g) | The portfolio turnover rates not including mortgage dollar rolls were 52%, 6% and 16% for the years ended October 31, 2018, 2017 and 2016, respectively. |
| | | | | | | | | | | | | | | | | | | | |
| |
| | | Year ended October 31, | |
| | | | | |
| Investor Class | | 2020 | | | 2019 | | | 2018 | | | 2017 | | | 2016 | |
| | | | | |
Net asset value at beginning of year | | $ | 8.68 | | | $ | 7.97 | | | $ | 8.36 | | | $ | 8.59 | | | $ | 8.54 | |
| | | | | | | | | | | | | | | | | | | | |
| | | | | |
Net investment income (loss) (a) | | | 0.14 | | | | 0.19 | | | | 0.16 | | | | 0.15 | | | | 0.15 | |
| | | | | |
Net realized and unrealized gain (loss) on investments | | | 0.13 | | | | 0.71 | | | | (0.39 | ) | | | (0.23 | ) | | | 0.05 | |
| | | | | | | | | | | | | | | | | | | | |
| | | | | |
Total from investment operations | | | 0.27 | | | | 0.90 | | | | (0.23 | ) | | | (0.08 | ) | | | 0.20 | |
| | | | | | | | | | | | | | | | | | | | |
| | | | | |
| Less distributions: | | | | | | | | | | | | | | | | | | | | |
| | | | | |
From net investment income | | | (0.14 | ) | | | (0.19 | ) | | | (0.16 | ) | | | (0.15 | ) | | | (0.15 | ) |
| | | | | |
Return of capital | | | — | | | | (0.00 | )‡ | | | — | | | | — | | | | — | |
| | | | | | | | | | | | | | | | | | | | |
| | | | | |
Total distributions | | | (0.14 | ) | | | (0.19 | ) | | | (0.16 | ) | | | (0.15 | ) | | | (0.15 | ) |
| | | | | | | | | | | | | | | | | | | | |
| | | | | |
Net asset value at end of year | | $ | 8.81 | | | $ | 8.68 | | | $ | 7.97 | | | $ | 8.36 | | | $ | 8.59 | |
| | | | | | | | | | | | | | | | | | | | |
| | | | | |
Total investment return (b) | | | 3.14 | % | | | 11.36 | % | | | (2.72 | %) | | | (0.91 | %) | | | 2.34 | % |
| | | | | |
| Ratios (to average net assets)/Supplemental Data: | | | | | | | | | | | | | | | | | | | | |
| | | | | |
Net investment income (loss) | | | 1.57 | % | | | 2.21 | % | | | 1.98 | % | | | 1.77 | % | | | 1.74 | %(c) |
| | | | | |
Net expenses (d) | | | 1.15 | % | | | 1.21 | % | | | 1.33 | % | | | 1.30 | % | | | 1.23 | %(e) |
| | | | | |
Expenses (before waiver/reimbursement) (d) | | | 1.28 | % | | | 1.35 | % | | | 1.44 | % | | | 1.30 | % | | | 1.24 | % |
| | | | | |
Portfolio turnover rate | | | 89 | %(f) | | | 124 | %(f) | | | 58 | % (g) | | | 20 | % (g) | | | 41 | %(g) |
| | | | | |
Net assets at end of year (in 000’s) | | $ | 19,459 | | | $ | 20,520 | | | $ | 21,012 | | | $ | 24,187 | | | $ | 40,094 | |
| ‡ | Less than one cent per share. |
| (a) | Per share data based on average shares outstanding during the year. |
| (b) | Total investment return is calculated exclusive of sales charges and assumes the reinvestment of distributions. For periods of less than one year, total return is not annualized. |
| (c) | Without the custody fee reimbursement, net investment income (loss) would have been 1.73%. |
| (d) | In addition to the fees and expenses which the Fund bears directly, it also indirectly bears a pro-rata share of the fees and expenses of the underlying funds in which it invests. Such indirect expenses are not included in the above expense ratios. |
| (e) | Without the custody fee reimbursement, net expenses would have been 1.24%. |
| (f) | The portfolio turnover rate includes variable rate demand notes. |
| (g) | The portfolio turnover rates not including mortgage dollar rolls were 52%, 6% and 16% for the years ended October 31, 2018, 2017 and 2016, respectively. |
| | | | | | |
The notes to the financial statements are an integral part of,
and should be read in conjunction with, the financial statements. | | | | | 25 | |
Financial Highlights selected per share data and ratios
| | | | | | | | | | | | | | | | | | | | |
| |
| | | Year ended October 31, | |
| | | | | |
| Class B | | 2020 | | | 2019 | | | 2018 | | | 2017 | | | 2016 | |
| | | | | |
Net asset value at beginning of year | | $ | 8.64 | | | $ | 7.94 | | | $ | 8.33 | | | $ | 8.56 | | | $ | 8.51 | |
| | | | | | | | | | | | | | | | | | | | |
| | | | | |
Net investment income (loss) (a) | | | 0.07 | | | | 0.12 | | | | 0.10 | | | | 0.08 | | | | 0.08 | |
| | | | | |
Net realized and unrealized gain (loss) on investments | | | 0.14 | | | | 0.70 | | | | (0.39 | ) | | | (0.22 | ) | | | 0.05 | |
| | | | | | | | | | | | | | | | | | | | |
| | | | | |
Total from investment operations | | | 0.21 | | | | 0.82 | | | | (0.29 | ) | | | (0.14 | ) | | | 0.13 | |
| | | | | | | | | | | | | | | | | | | | |
| | | | | |
| Less distributions: | | | | | | | | | | | | | | | | | | | | |
| | | | | |
From net investment income | | | (0.08 | ) | | | (0.12 | ) | | | (0.10 | ) | | | (0.09 | ) | | | (0.08 | ) |
| | | | | |
Return of capital | | | — | | | | (0.00 | )‡ | | | — | | | | — | | | | — | |
| | | | | | | | | | | | | | | | | | | | |
| | | | | |
Total distributions | | | (0.08 | ) | | | (0.12 | ) | | | (0.10 | ) | | | (0.09 | ) | | | (0.08 | ) |
| | | | | | | | | | | | | | | | | | | | |
| | | | | |
Net asset value at end of year | | $ | 8.77 | | | $ | 8.64 | | | $ | 7.94 | | | $ | 8.33 | | | $ | 8.56 | |
| | | | | | | | | | | | | | | | | | | | |
| | | | | |
Total investment return (b) | | | 2.39 | % | | | 10.46 | % | | | (3.46 | %) | | | (1.66 | %) | | | 1.59 | % |
| | | | | |
| Ratios (to average net assets)/Supplemental Data: | | | | | | | | | | | | | | | | | | | | |
| | | | | |
Net investment income (loss) | | | 0.85 | % | | | 1.46 | % | | | 1.23 | % | | | 1.01 | % | | | 0.99 | %(c) |
| | | | | |
Net expenses (d) | | | 1.90 | % | | | 1.96 | % | | | 2.08 | % | | | 2.05 | % | | | 1.98 | %(e) |
| | | | | |
Expenses (before waiver/reimbursement) (d) | | | 2.03 | % | | | 2.10 | % | | | 2.19 | % | | | 2.05 | % | | | 1.99 | % |
| | | | | |
Portfolio turnover rate (g) | | | 89 | %(f) | | | 124 | %(f) | | | 58 | % (g) | | | 20 | % | | | 41 | %(g) |
| | | | | |
Net assets at end of year (in 000’s) | | $ | 1,902 | | | $ | 2,621 | | | $ | 3,224 | | | $ | 4,730 | | | $ | 7,154 | |
| ‡ | Less than one cent per share. |
| (a) | Per share data based on average shares outstanding during the year. |
| (b) | Total investment return is calculated exclusive of sales charges and assumes the reinvestment of distributions. For periods of less than one year, total return is not annualized. |
| (c) | Without the custody fee reimbursement, net investment income (loss) would have been 0.98%. |
| (d) | In addition to the fees and expenses which the Fund bears directly, it also indirectly bears a pro-rata share of the fees and expenses of the underlying funds in which it invests. Such indirect expenses are not included in the above expense ratios. |
| (e) | Without the custody fee reimbursement, net expenses would have been 1.99%. |
| (f) | The portfolio turnover rate includes variable rate demand notes. |
| (g) | The portfolio turnover rates not including mortgage dollar rolls were 52%, 6% and 16% for the years ended October 31, 2018, 2017 and 2016, respectively. |
| | | | | | | | | | | | | | | | | | | | |
| |
| | | Year ended October 31, | |
| | | | | |
| Class C | | 2020 | | | 2019 | | | 2018 | | | 2017 | | | 2016 | |
| | | | | |
Net asset value at beginning of year | | $ | 8.64 | | | $ | 7.93 | | | $ | 8.32 | | | $ | 8.55 | | | $ | 8.50 | |
| | | | | | | | | | | | | | | | | | | | |
| | | | | |
Net investment income (loss) (a) | | | 0.08 | | | | 0.12 | | | | 0.10 | | | | 0.08 | | | | 0.08 | |
| | | | | |
Net realized and unrealized gain (loss) on investments | | | 0.13 | | | | 0.71 | | | | (0.39 | ) | | | (0.22 | ) | | | 0.05 | |
| | | | | | | | | | | | | | | | | | | | |
| | | | | |
Total from investment operations | | | 0.21 | | | | 0.83 | | | | (0.29 | ) | | | (0.14 | ) | | | 0.13 | |
| | | | | | | | | | | | | | | | | | | | |
| | | | | |
| Less distributions: | | | | | | | | | | | | | | | | | | | | |
| | | | | |
From net investment income | | | (0.08 | ) | | | (0.12 | ) | | | (0.10 | ) | | | (0.09 | ) | | | (0.08 | ) |
| | | | | |
Return of capital | | | — | | | | (0.00 | )‡ | | | — | | | | — | | | | — | |
| | | | | | | | | | | | | | | | | | | | |
| | | | | |
Total distributions | | | (0.08 | ) | | | (0.12 | ) | | | (0.10 | ) | | | (0.09 | ) | | | (0.08 | ) |
| | | | | | | | | | | | | | | | | | | | |
| | | | | |
Net asset value at end of year | | $ | 8.77 | | | $ | 8.64 | | | $ | 7.93 | | | $ | 8.32 | | | $ | 8.55 | |
| | | | | | | | | | | | | | | | | | | | |
| | | | | |
Total investment return (b) | | | 2.38 | % | | | 10.59 | % | | | (3.46 | %) | | | (1.66 | %) | | | 1.59 | % |
| | | | | |
| Ratios (to average net assets)/Supplemental Data: | | | | | | | | | | | | | | | | | | | | |
| | | | | |
Net investment income (loss) | | | 0.88 | % | | | 1.47 | % | | | 1.23 | % | | | 1.00 | % | | | 0.99 | %(c) |
| | | | | |
Net expenses (d) | | | 1.90 | % | | | 1.96 | % | | | 2.08 | % | | | 2.05 | % | | | 1.98 | %(e) |
| | | | | |
Expenses (before waiver/reimbursement) (d) | | | 2.02 | % | | | 2.10 | % | | | 2.19 | % | | | 2.05 | % | | | 1.99 | % |
| | | | | |
Portfolio turnover rate | | | 89 | %(f) | | | 124 | %(f) | | | 58 | % (g) | | | 20 | % (g) | | | 41 | %(g) |
| | | | | |
Net assets at end of year (in 000’s) | | $ | 8,708 | | | $ | 14,152 | | | $ | 7,612 | | | $ | 9,472 | | | $ | 19,338 | |
| ‡ | Less than one cent per share. |
| (a) | Per share data based on average shares outstanding during the year. |
| (b) | Total investment return is calculated exclusive of sales charges and assumes the reinvestment of distributions. For periods of less than one year, total return is not annualized. |
| (c) | Without the custody fee reimbursement, net investment income (loss) would have been 0.98%. |
| (d) | In addition to the fees and expenses which the Fund bears directly, it also indirectly bears a pro-rata share of the fees and expenses of the underlying funds in which it invests. Such indirect expenses are not included in the above expense ratios. |
| (e) | Without the custody fee reimbursement, net expenses would have been 1.99%. |
| (f) | The portfolio turnover rate includes variable rate demand notes. |
| (g) | The portfolio turnover rates not including mortgage dollar rolls were 52%, 6% and 16% for the years ended October 31, 2018, 2017 and 2016, respectively. |
| | | | |
| 26 | | MainStay MacKay U.S. Infrastructure Bond Fund | | The notes to the financial statements are an integral part of,
and should be read in conjunction with, the financial statements. |
Financial Highlights selected per share data and ratios
| | | | | | | �� | | | | | | | | | | | | | |
| |
| | | Year ended October 31, | |
| | | | | |
| Class I | | 2020 | | | 2019 | | | 2018 | | | 2017 | | | 2016 | |
| | | | | |
Net asset value at beginning of year | | $ | 8.73 | | | $ | 8.02 | | | $ | 8.42 | | | $ | 8.64 | | | $ | 8.59 | |
| | | | | | | | | | | | | | | | | | | | |
| | | | | |
Net investment income (loss) (a) | | | 0.17 | | | | 0.24 | | | | 0.21 | | | | 0.20 | | | | 0.19 | |
| | | | | |
Net realized and unrealized gain (loss) on investments | | | 0.16 | | | | 0.71 | | | | (0.40 | ) | | | (0.22 | ) | | | 0.05 | |
| | | | | | | | | | | | | | | | | | | | |
| | | | | |
Total from investment operations | | | 0.33 | | | | 0.95 | | | | (0.19 | ) | | | (0.02 | ) | | | 0.24 | |
| | | | | | | | | | | | | | | | | | | | |
| | | | | |
| Less distributions: | | | | | | | | | | | | | | | | | | | | |
| | | | | |
From net investment income | | | (0.19 | ) | | | (0.24 | ) | | | (0.21 | ) | | | (0.20 | ) | | | (0.19 | ) |
| | | | | |
Return of capital | | | — | | | | (0.00 | )‡ | | | — | | | | — | | | | — | |
| | | | | |
Total distributions | | | (0.19 | ) | | | (0.24 | ) | | | (0.21 | ) | | | (0.20 | ) | | | (0.19 | ) |
| | | | | | | | | | | | | | | | | | | | |
| | | | | |
Net asset value at end of year | | $ | 8.87 | | | $ | 8.73 | | | $ | 8.02 | | | $ | 8.42 | | | $ | 8.64 | |
| | | | | | | | | | | | | | | | | | | | |
| | | | | |
Total investment return (b) | | | 3.78 | % | | | 11.95 | % | | | (2.26 | %) | | | (0.23 | %) | | | 2.83 | % |
| | | | | |
| Ratios (to average net assets)/Supplemental Data: | | | | | | | | | | | | | | | | | | | | |
| | | | | |
Net investment income (loss) | | | 1.97 | % | | | 2.64 | % | | | 2.56 | % | | | 2.33 | % | | | 2.16 | %(c) |
| | | | | |
Net expenses (d) | | | 0.60 | % | | | 0.60 | % | | | 0.75 | % | | | 0.75 | % | | | 0.73 | %(e) |
| | | | | |
Expenses (before waiver/reimbursement) (d) | | | 0.72 | % | | | 0.74 | % | | | 0.79 | % | | | 0.75 | % | | | 0.74 | % |
| | | | | |
Portfolio turnover rate | | | 89 | %(f) | | | 124 | %(f) | | | 58 | % (g) | | | 20 | % (g) | | | 41 | %(g) |
| | | | | |
Net assets at end of year (in 000’s) | | $ | 292,000 | | | $ | 177,305 | | | $ | 5,003 | | | $ | 6,926 | | | $ | 14,061 | |
| ‡ | Less than one cent per share. |
| (a) | Per share data based on average shares outstanding during the year. |
| (b) | Total investment return is calculated exclusive of sales charges and assumes the reinvestment of distributions. Class I shares are not subject to sales charges. For periods of less than one year, total return is not annualized. |
| (c) | Without the custody fee reimbursement, net investment income (loss) would have been 2.15%. |
| (d) | In addition to the fees and expenses which the Fund bears directly, it also indirectly bears a pro-rata share of the fees and expenses of the underlying funds in which it invests. Such indirect expenses are not included in the above expense ratios. |
| (e) | Without the custody fee reimbursement, net expenses would have been 0.74%. |
| (f) | The portfolio turnover rate includes variable rate demand notes. |
| (g) | The portfolio turnover rates not including mortgage dollar rolls were 52%, 6% and 16% for the years ended October 31, 2018, 2017 and 2016, respectively. |
| | | | |
| |
| Class R6 | | November 1,
2019^
through
October 31,
2020 | |
| |
Net asset value at beginning of period* | | $ | 8.72 | |
| | | | |
| |
Net investment income (loss) (a) | | | 0.19 | |
| |
Net realized and unrealized gain (loss) on investments | | | 0.15 | |
| | | | |
| |
Total from investment operations | | | 0.34 | |
| | | | |
| |
| Less distributions: | | | | |
| |
From net investment income | | | (0.19 | ) |
| | | | |
| |
Net asset value at end of period | | $ | 8.87 | |
| | | | |
| |
Total investment return (b) | | | 3.85 | % |
| |
| Ratios (to average net assets)/Supplemental Data: | | | | |
| |
Net investment income (loss) | | | 2.16 | % |
| |
Net expenses (c) | | | 0.53 | % |
| |
Expenses (before waiver/reimbursement) (c) | | | 0.58 | % |
| |
Portfolio turnover rate (d) | | | 89 | % |
| |
Net assets at end of period (in 000’s) | | $ | 83,204 | |
| * | Based on the net asset value of Class I as of November 1, 2019. |
| (a) | Per share data based on average shares outstanding during the period. |
| (b) | Total investment return is calculated exclusive of sales charges and assumes the reinvestment of distributions. Class R6 shares are not subject to sales charges. For periods of less than one year, total return is not annualized. |
| (c) | In addition to the fees and expenses which the Fund bears directly, it also indirectly bears a pro-rata share of the fees and expenses of the underlying funds in which it invests. Such indirect expenses are not included in the above expense ratios. |
| (d) | The portfolio turnover rate includes variable rate demand notes. |
| | | | | | |
The notes to the financial statements are an integral part of,
and should be read in conjunction with, the financial statements. | | | | | 27 | |
Notes to Financial Statements
Note 1–Organization and Business
The MainStay Funds (the “Trust”) was organized on January 9, 1986, as a Massachusetts business trust. The Trust is registered under the Investment Company Act of 1940, as amended (the “1940 Act”), as an open-end management investment company, and is comprised of twelve funds (collectively referred to as the “Funds”). These financial statements and notes relate to the MainStay MacKay U.S. Infrastructure Bond Fund (formerly known as MainStay MacKay Infrastructure Bond Fund) (the “Fund”), a “diversified” fund, as that term is defined in the 1940 Act, as interpreted or modified by regulatory authorities having jurisdiction, from time to time.
The Fund currently has seven classes of shares registered for sale. Class A shares commenced operations on January 3, 1995. Class B shares commenced operations on May 1, 1986. Class C shares commenced operations on September 1, 1998. Class I shares commenced operations on January 2, 2004. Investor Class shares commenced operations on February 28, 2008. Class R6 shares commenced operations on November 1, 2019. SIMPLE Class shares were registered for sale effective as of August 31, 2020. As of October 31, 2020, SIMPLE Class shares were not yet offered for sale.
Class B shares of the MainStay Group of Funds are closed to all new purchases as well as additional investments by existing Class B shareholders. Existing Class B shareholders may continue to reinvest dividends and capital gains distributions, as well as exchange their Class B shares for Class B shares of other funds in the MainStay Group of Funds as permitted by the current exchange privileges. Class B shareholders continue to be subject to any applicable contingent deferred sales charge (“CDSC”) at the time of redemption. All other features of the Class B shares, including but not limited to the fees and expenses applicable to Class B shares, remain unchanged. Unless redeemed, Class B shareholders will remain in Class B shares of their respective fund until the Class B shares are converted to Class A or Investor Class shares pursuant to the applicable conversion schedule.
Class A and Investor Class shares are offered at net asset value (“NAV”) per share plus an initial sales charge. No initial sales charge applies to investments of $250,000 or more (and certain other qualified purchases) in Class A and Investor Class shares. Effective April 15, 2019, a CDSC of 1.00% may be imposed on certain redemptions of Class A and Investor Class shares made within 18 months of the date of purchase on shares that were purchased without an initial sales charge. For purchases of Class A and Investor Class shares made from August 1, 2017 through April 14, 2019, a CDSC of 1.00% may be imposed on certain redemptions (for investments of $500,000 which paid no initial sales charge) of such shares within 18 months of the date of purchase on shares that were purchased without an initial sales charge. Class C shares are offered at NAV without an initial sales charge, although a 1.00% CDSC may be imposed on certain redemptions of such shares made within one year of the date of purchase of Class C shares. Investments in Class C shares are subject to a purchase maximum of $250,000. When Class B shares were offered, they were offered at NAV without an initial sales charge, although a CDSC that declines depending on the number of years a shareholder held its Class B shares may be imposed on certain redemptions of such shares made within six years of the date of purchase of such shares. Class I and Class R6 shares are offered at NAV without a sales charge. SIMPLE Class
shares are currently expected to be offered at NAV without a sales charge. Depending upon eligibility, Class B shares convert to either Class A or Investor Class shares at the end of the calendar quarter eight years after the date they were purchased. In addition, depending upon eligibility, Class C shares convert to either Class A or Investor Class shares at the end of the calendar quarter ten years after the date they were purchased. Additionally, Investor Class shares may convert automatically to Class A shares. Under certain circumstances and as may be permitted by the Trust’s multiple class plan pursuant to Rule 18f-3 under the 1940 Act, specified share classes of the Fund may be converted to one or more other share classes of the Fund as disclosed in the capital share transactions within these Notes. The classes of shares have the same voting (except for issues that relate solely to one class), dividend, liquidation and other rights, and the same terms and conditions, except that under distribution plans pursuant to Rule 12b-1 under the 1940 Act, Class B and Class C shares are subject to higher distribution and/or service fees than Class A, Investor Class and SIMPLE Class shares. Class I and Class R6 shares are not subject to a distribution and/or service fee.
The Fund’s investment objective is to seek current income.
Note 2–Significant Accounting Policies
The Fund is an investment company and accordingly follows the investment company accounting and reporting guidance of the Financial Accounting Standards Board (“FASB”) Accounting Standard Codification Topic 946 Financial Services—Investment Companies. The Fund prepares its financial statements in accordance with generally accepted accounting principles (“GAAP”) in the United States of America and follows the significant accounting policies described below.
(A) Securities Valuation. Investments are usually valued as of the close of regular trading on the New York Stock Exchange (the “Exchange”) (usually 4:00 p.m. Eastern time) on each day the Fund is open for business (“valuation date”).
The Board of Trustees of the Trust (the “Board”) adopted procedures establishing methodologies for the valuation of the Fund’s securities and other assets and delegated the responsibility for valuation determinations under those procedures to the Valuation Committee of the Trust (the “Valuation Committee”). The procedures state that, subject to the oversight of the Board and unless otherwise noted, the responsibility for the day-to-day valuation of portfolio assets (including fair value measurements for the Fund’s assets and liabilities) rests with New York Life Investment Management LLC (“New York Life Investments” or the “Manager”), aided to whatever extent necessary by the Subadvisor (as defined in Note 3(A)). To assess the appropriateness of security valuations, the Manager, the Subadvisor or the Fund’s third-party service provider, who is subject to oversight by the Manager, regularly compares prior day prices, prices on comparable securities and the sale prices to the prior and current day prices and challenges prices with changes exceeding certain tolerance levels with third-party pricing services or broker sources.
The Board authorized the Valuation Committee to appoint a Valuation Subcommittee (the “Subcommittee”) to establish the prices of securities for which market quotations are not readily available or the prices of which are not otherwise readily determinable under the procedures. The Subcommittee meets (in person, via electronic mail or via tele-
| | |
| 28 | | MainStay MacKay U.S. Infrastructure Bond Fund |
conference) on an as-needed basis. The Valuation Committee meets to ensure that actions taken by the Subcommittee were appropriate.
For those securities valued through either a standardized fair valuation methodology or a fair valuation measurement, the Subcommittee deals with such valuation and the Valuation Committee reviews and affirms, if appropriate, the reasonableness of the valuation based on such methodologies and measurements on a regular basis after considering information that is reasonably available and deemed relevant by the Valuation Committee. Any action taken by the Subcommittee with respect to the valuation of a portfolio security or other asset is submitted for review and ratification (if appropriate) to the Valuation Committee and the Board at the next regularly scheduled meeting.
“Fair value” is defined as the price the Fund would reasonably expect to receive upon selling an asset or liability in an orderly transaction to an independent buyer in the principal or most advantageous market for the asset or liability. Fair value measurements are determined within a framework that establishes a three-tier hierarchy that maximizes the use of observable market data and minimizes the use of unobservable inputs to establish a classification of fair value measurements for disclosure purposes. “Inputs” refer broadly to the assumptions that market participants would use in pricing the asset or liability, including assumptions about risk, such as the risk inherent in a particular valuation technique used to measure fair value using a pricing model and/or the risk inherent in the inputs for the valuation technique. Inputs may be observable or unobservable. Observable inputs reflect the assumptions market participants would use in pricing the asset or liability based on market data obtained from sources independent of the Fund. Unobservable inputs reflect the Fund’s own assumptions about the assumptions market participants would use in pricing the asset or liability based on the information available. The inputs or methodology used for valuing assets or liabilities may not be an indication of the risks associated with investing in those assets or liabilities. The three-tier hierarchy of inputs is summarized below.
| • | | Level 1—quoted prices in active markets for an identical asset or liability |
| • | | Level 2—other significant observable inputs (including quoted prices for a similar asset or liability in active markets, interest rates and yield curves, prepayment speeds, credit risk, etc.) |
| • | | Level 3—significant unobservable inputs (including the Fund’s own assumptions about the assumptions that market participants would use in measuring fair value of an asset or liability) |
The level of an asset or liability within the fair value hierarchy is based on the lowest level of an input, both individually and in the aggregate, that is significant to the fair value measurement. The aggregate value by input level of the Fund’s assets and liabilities as of October 31, 2020, is included at the end of the Portfolio of Investments.
The Fund may use third-party vendor evaluations, whose prices may be derived from one or more of the following standard inputs, among others:
| | |
• Benchmark yields | | • Reported trades |
• Broker/dealer quotes | | • Issuer spreads |
• Two-sided markets | | • Benchmark securities |
• Bids/offers | | • Reference data (corporate actions or material event notices) |
• Industry and economic events | | • Comparable bonds |
• Monthly payment information | | |
An asset or liability for which market values cannot be measured using the methodologies described above is valued by methods deemed reasonable in good faith by the Valuation Committee, following the procedures established by the Board, to represent fair value. Under these procedures, the Fund generally uses a market-based approach which may use related or comparable assets or liabilities, recent transactions, market multiples, book values and other relevant information. The Fund may also use an income-based valuation approach in which the anticipated future cash flows of the asset or liability are discounted to calculate fair value. Discounts may also be applied due to the nature and/or duration of any restrictions on the disposition of the asset or liability. Fair value represents a good faith approximation of the value of a security. Fair value determinations involve the consideration of a number of subjective factors, an analysis of applicable facts and circumstances and the exercise of judgment. As a result, it is possible that the fair value for a security determined in good faith in accordance with the Fund’s valuation procedures may differ from valuations for the same security determined by other funds using their own valuation procedures. Although the Fund’s valuation procedures are designed to value a security at the price the Fund may reasonably expect to receive upon the security’s sale in an orderly transaction, there can be no assurance that any fair value determination thereunder would, in fact, approximate the amount that the Fund would actually realize upon the sale of the security or the price at which the security would trade if a reliable market price were readily available. During the year ended October 31, 2020, there were no material changes to the fair value methodologies.
Securities which may be valued in this manner include, but are not limited to: (i) a security for which trading has been halted or suspended; (ii) a debt security that has recently gone into default and for which there is not a current market quotation; (iii) a security of an issuer that has entered into a restructuring; (iv) a security that has been delisted from a national exchange; (v) a security for which the market price is not readily available from a third-party pricing source or, if so provided, does not, in the opinion of the Manager or the Subadvisor, reflect the security’s market value; (vi) a security subject to trading collars for which no or limited trading takes place; and (vii) a security whose principal market has been temporarily closed at a time when, under normal conditions, it would be open. Securities valued in this manner are generally categorized as Level 3 in the hierarchy. No securities held by the Fund as of October 31, 2020, were fair valued in such a manner.
Debt securities (other than convertible and municipal bonds) are valued at the evaluated bid prices (evaluated mean prices in the case of convertible and municipal bonds) supplied by a pricing agent or broker(s)
Notes to Financial Statements (continued)
selected by the Manager, in consultation with the Subadvisor. The evaluations are market-based measurements processed through a pricing application and represents the pricing agent’s good faith determination as to what a holder may receive in an orderly transaction under market conditions. The rules-based logic utilizes valuation techniques that reflect participants’ assumptions and vary by asset class and per methodology, maximizing the use of relevant observable data including quoted prices for similar assets, benchmark yield curves and market corroborated inputs. The evaluated bid or mean prices are deemed by the Manager, in consultation with the Subadvisor, to be representative of market values at the regular close of trading of the Exchange on each valuation date. Debt securities purchased on a delayed delivery basis are marked to market daily until settlement at the forward settlement date. Debt securities, including corporate bonds, U.S. government and federal agency bonds, municipal bonds, foreign bonds, convertible bonds, asset-backed securities and mortgage-backed securities are generally categorized as Level 2 in the hierarchy.
Futures contracts are valued at the last posted settlement price on the market where such futures are primarily traded. Investments in mutual funds, including money market funds, are valued at their respective NAVs as of the close of the Exchange on the valuation date. These securities are generally categorized as Level 1 in the hierarchy.
Temporary cash investments acquired in excess of 60 days to maturity at the time of purchase are valued using the latest bid prices or using valuations based on a matrix system (which considers such factors as security prices, yields, maturities and ratings), both as furnished by independent pricing services. Temporary cash investments that mature in 60 days or less at the time of purchase (“Short-Term Investments”) are valued using the amortized cost method of valuation, unless the use of such method would be inappropriate. The amortized cost method involves valuing a security at its cost on the date of purchase and thereafter assuming a constant amortization to maturity of the difference between such cost and the value on maturity date. Amortized cost approximates the current fair value of a security. Securities valued using the amortized cost method are not valued using quoted prices in an active market and are generally categorized as Level 2 in the hierarchy.
The information above is not intended to reflect an exhaustive list of the methodologies that may be used to value portfolio investments. The valuation procedures permit the use of a variety of valuation methodologies in connection with valuing portfolio investments. The methodology used for a specific type of investment may vary based on the market data available or other considerations. The methodologies summarized above may not represent the specific means by which portfolio investments are valued on any particular business day.
(B) Income Taxes. The Fund’s policy is to comply with the requirements of the Internal Revenue Code of 1986, as amended (the “Internal Revenue Code”), applicable to regulated investment companies and to distribute all of its taxable income to the shareholders of the Fund within the allowable time limits.
The Manager evaluates the Fund’s tax positions to determine if the tax positions taken meet the minimum recognition threshold in connection with accounting for uncertainties in income tax positions taken or expected to be taken for the purposes of measuring and recognizing tax liabilities in the financial statements. Recognition of tax benefits of an
uncertain tax position is permitted only to the extent the position is “more likely than not” to be sustained assuming examination by taxing authorities. The Manager analyzed the Fund’s tax positions taken on federal, state and local income tax returns for all open tax years (for up to three tax years) and has concluded that no provisions for federal, state and local income tax are required in the Fund’s financial statements. The Fund’s federal, state and local income tax and federal excise tax returns for tax years for which the applicable statutes of limitations have not expired are subject to examination by the Internal Revenue Service and state and local departments of revenue.
(C) Dividends and Distributions to Shareholders. Dividends and distributions are recorded on the ex-dividend date. The Fund intends to declare dividends from net investment income, if any, daily and intends to pay them at least monthly and pays distributions from net realized capital and currency gains, if any, at least annually. Unless a shareholder elects otherwise, all dividends and distributions are reinvested at NAV in the same class of shares of the Fund. Dividends and distributions to shareholders are determined in accordance with federal income tax regulations and may differ from determinations using GAAP.
(D) Security Transactions and Investment Income. The Fund records security transactions on the trade date. Realized gains and losses on security transactions are determined using the identified cost method. Interest income is accrued as earned using the effective interest rate method and includes any realized gains and losses from repayments of principal on mortgage-backed securities. Distributions received from real estate investment trusts may be classified as dividends, capital gains and/or return of capital. Discounts and premiums on securities purchased for the Fund are accreted and amortized, respectively, on the effective interest rate method.
Investment income and realized and unrealized gains and losses on investments of the Fund are allocated pro rata to the separate classes of shares based upon their relative net assets on the date the income is earned or realized and unrealized gains and losses are incurred.
The Fund may place a debt security on non-accrual status and reduce related interest income by ceasing current accruals and writing off all or a portion of any interest receivables when the collection of all or a portion of such interest has become doubtful. A debt security is removed from non-accrual status when the issuer resumes interest payments or when collectability of interest is reasonably assured.
(E) Expenses. Expenses of the Trust are allocated to the individual Funds in proportion to the net assets of the respective Funds when the expenses are incurred, except where direct allocations of expenses can be made. Expenses (other than transfer agent expenses and fees incurred under the shareholder services plans and/or the distribution plans further discussed in Note 3(B)) are allocated to separate classes of shares pro rata based upon their relative net assets on the date the expenses are incurred. The expenses borne by the Fund, including those of related parties to the Fund, are shown in the Statement of Operations.
Additionally, the Fund may invest in mutual funds, which are subject to management fees and other fees that may cause the costs of investing in mutual funds to be greater than the costs of owning the underlying securities directly. These indirect expenses of mutual funds are not
| | |
| 30 | | MainStay MacKay U.S. Infrastructure Bond Fund |
included in the amounts shown as expenses in the Fund’s Statement of Operations or in the expense ratios included in the Financial Highlights.
(F) Use of Estimates. In preparing financial statements in conformity with GAAP, the Manager makes estimates and assumptions that affect the reported amounts and disclosures in the financial statements. Actual results could differ from those estimates and assumptions.
(G) Repurchase Agreements. The Fund may enter into repurchase agreements (i.e., buy a security from another party with the agreement that it will be sold back in the future) to earn income. The Fund may enter into repurchase agreements only with counterparties, usually financial institutions, that are deemed by the Manager or the Subadvisor to be creditworthy, pursuant to guidelines established by the Board. During the term of any repurchase agreement, the Manager or the Subadvisor will continue to monitor the creditworthiness of the counterparty. Under the 1940 Act, repurchase agreements are considered to be collateralized loans by the Fund to the counterparty secured by the securities transferred to the Fund.
Repurchase agreements are subject to counterparty risk, meaning the Fund could lose money by the counterparty’s failure to perform under the terms of the agreement. The Fund mitigates this risk by ensuring the repurchase agreement is collateralized by cash, U.S. government securities, fixed income securities and/or other securities. The collateral is held by the Fund’s custodian and valued daily on a mark to market basis to determine if the value, including accrued interest, exceeds the repurchase price. In the event of the counterparty’s default on the obligation to repurchase, the Fund has the right to liquidate the collateral and apply the proceeds in satisfaction of the obligation. Under certain circumstances, such as in the event of default or bankruptcy by the counterparty, realization and/or retention of the collateral may be limited or subject to delay, to legal proceedings and possible realized loss to the Fund. As of October 31, 2020, the Fund did not hold any repurchase agreements.
(H) Dollar Rolls. The Fund may enter into dollar roll transactions in which it sells mortgage-backed securities (“MBS”) from its portfolio to a counterparty from whom it simultaneously agrees to buy a similar security on a delayed delivery basis. The Fund generally transfers MBS where the MBS are “to be announced,” therefore, the Fund accounts for these transactions as purchases and sales.
When accounted for as purchase and sales, the securities sold in connection with the dollar rolls are removed from the portfolio and a realized gain or loss is recognized. The securities the Fund has agreed to acquire are included at market value in the Portfolio of Investments and liabilities for such purchase commitments are included as payables for investments purchased. During the roll period, the Fund foregoes principal and interest paid on the securities. The Fund is compensated by the difference between the current sales price and the forward price for the future as well as by the earnings on the cash proceeds of the initial sale. Dollar rolls may be renewed without physical delivery of the securities subject to the contract. The Fund maintains liquid assets from its portfolio having a value not less than the repurchase price, including accrued interest. Dollar roll transactions involve certain risks, including the risk that the securities returned to the Fund at the end of the roll period, while substantially similar, could be inferior to what was initially sold to the counterparty. During the year ended October 31, 2020, the Fund did not enter into dollar roll transactions.
(I) Loan Assignments, Participations and Commitments. The Fund may invest in loan assignments and participations (“loans”). Commitments are agreements to make money available to a borrower in a specified amount, at a specified rate and within a specified time. The Fund records an investment when the borrower withdraws money on a commitment or when a funded loan is purchased (trade date) and records interest as earned. These loans pay interest at rates that are periodically reset by reference to a base lending rate plus a spread. These base lending rates are generally the prime rate offered by a designated U.S. bank or the London Interbank Offered Rate (“LIBOR”).
The loans in which the Fund may invest are generally readily marketable, but may be subject to some restrictions on resale. For example, the Fund may be contractually obligated to receive approval from the agent bank and/or borrower prior to the sale of these investments. If the Fund purchases an assignment from a lender, the Fund will generally have direct contractual rights against the borrower in favor of the lender. If the Fund purchases a participation interest either from a lender or a participant, the Fund typically will have established a direct contractual relationship with the seller of the participation interest, but not with the borrower. Consequently, the Fund is subject to the credit risk of the lender or participant who sold the participation interest to the Fund, in addition to the usual credit risk of the borrower. In the event that the borrower, selling participant or intermediate participants become insolvent or enter into bankruptcy, the Fund may incur certain costs and delays in realizing payment, or may suffer a loss of principal and/or interest.
Unfunded commitments represent the remaining obligation of the Fund to the borrower. At any point in time, up to the maturity date of the issue, the borrower may demand the unfunded portion. Unfunded amounts, if any, are marked to market and any unrealized gains or losses are recorded in the Statement of Assets and Liabilities. As of October 31, 2020, the Fund did not hold any unfunded commitments.
(J) Futures Contracts. A futures contract is an agreement to purchase or sell a specified quantity of an underlying instrument at a specified future date and price, or to make or receive a cash payment based on the value of a financial instrument (e.g., foreign currency, interest rate, security or securities index). The Fund is subject to risks such as market price risk and/or interest rate risk in the normal course of investing in these contracts. Upon entering into a futures contract, the Fund is required to pledge to the broker or futures commission merchant an amount of cash and/or U.S. government securities equal to a certain percentage of the collateral amount, known as the “initial margin.” During the period the futures contract is open, changes in the value of the contract are recognized as unrealized appreciation or depreciation by marking to market such contract on a daily basis to reflect the market value of the contract at the end of each day’s trading. The Fund agrees to receive from or pay to the broker or futures commission merchant an amount of cash equal to the daily fluctuation in the value of the contract. Such receipts or payments are known as “variation margin.” When the futures contract is closed, the Fund records a realized gain or loss equal to the difference between the proceeds from (or cost of) the closing transaction and the Fund’s basis in the contract.
Notes to Financial Statements (continued)
The use of futures contracts involves, to varying degrees, elements of market risk in excess of the amount recognized in the Statement of Assets and Liabilities. The contract or notional amounts and variation margin reflect the extent of the Fund’s involvement in open futures positions. There are several risks associated with the use of futures contracts as hedging techniques. There can be no assurance that a liquid market will exist at the time when the Fund seeks to close out a futures contract. If no liquid market exists, the Fund would remain obligated to meet margin requirements until the position is closed. Futures contracts may involve a small initial investment relative to the risk assumed, which could result in losses greater than if the Fund did not invest in futures contracts. Futures contracts may be more volatile than direct investments in the instrument underlying the futures and may not correlate to the underlying instrument, causing a given hedge not to achieve its objectives. The Fund’s activities in futures contracts have minimal counterparty risk as they are conducted through regulated exchanges that guarantee the futures against default by the counterparty. In the event of a bankruptcy or insolvency of a futures commission merchant that holds margin on behalf of the Fund, the Fund may not be entitled to the return of the entire margin owed to the Fund, potentially resulting in a loss. The Fund’s investment in futures contracts and other derivatives may increase the volatility of the Fund’s NAVs and may result in a loss to the Fund. Open futures contracts held as of October 31, 2020, are shown in the Portfolio of Investments.
(K) Securities Lending. In order to realize additional income, the Fund may engage in securities lending, subject to the limitations set forth in the 1940 Act and relevant guidance by the staff of the Securities and Exchange Commission (“SEC”). If the Fund engages in securities lending, the Fund will lend through its custodian, currently State Street Bank and Trust Company (“State Street”) (See Note 12 for securities lending agent change), acting as securities lending agent on behalf of the Fund. Under the current arrangement, State Street will manage the Fund’s collateral in accordance with the securities lending agency agreement between the Fund and State Street, and indemnify the Fund against counterparty risk. The loans will be collateralized by cash (which may be invested in a money market fund) and/or non-cash collateral (which may include U.S. Treasury securities and/or U.S. government agency securities issued or guaranteed by the United States government or its agencies or instrumentalities) at least equal at all times to the market value of the securities loaned. The Fund bears the risk of delay in recovery of, or loss of rights in, the securities loaned. The Fund may also record a realized gain or loss on securities deemed sold due to a borrower’s inability to return securities on loan. The Fund bears the risk of any loss on investment of cash collateral. The Fund will receive compensation for lending its securities in the form of fees or it will retain a portion of interest earned on the investment of any cash collateral. The Fund will also continue to receive interest and dividends on the securities loaned and any gain or loss in the market price of the securities loaned that may occur during the term of the loan will be for the account of the Fund. Income earned from securities lending activities, if any, is reflected in the Statement of Operations. As of October 31, 2020, the Fund did not have any portfolio securities on loan.
(L) Government, Infrastructure Investment and Municipal Bond Risk. Investments in the Fund are not guaranteed, even though some of the Fund’s underlying investments are guaranteed by the U.S. government or its agencies or instrumentalities. The principal risk of
mortgage-related and asset-backed securities is that the underlying debt may be prepaid ahead of schedule, if interest rates fall, thereby reducing the value of the Fund’s investment. If interest rates rise, less of the debt may be prepaid and the Fund may lose money because the Fund may be unable to invest in higher yielding assets. The Fund is subject to interest-rate risk and can lose principal value when interest rates rise. Bonds are also subject to credit risk, in which the bond issuer may fail to pay interest and principal in a timely manner.
The Fund’s investments in infrastructure-related securities will expose the Fund to potential adverse economic, regulatory, political, legal and other changes affecting such investments. Issuers of securities in infrastructure-related businesses are subject to a variety of factors that may adversely affect their business or operations, including high interest costs in connection with capital construction programs, high leverage, costs associated with environmental or other regulations and the effects of economic slowdowns. Rising interest rates could lead to higher financing costs and reduced earnings for infrastructure companies.
Municipal bond risks include the inability of the issuer to repay the obligation, the relative lack of information about certain issuers, and the possibility of future tax and legislative changes, which could affect the market for and value of municipal securities.
Municipalities continue to experience political, economic and financial difficulties in the current economic environment. The ability of a municipal issuer to make payments and the value of municipal bonds can be affected by uncertainties in the municipal securities market. Such uncertainties could cause increased volatility in the municipal securities market and could negatively impact the Fund’s net asset value, and/or the distributions paid by the Fund.
(M) LIBOR Replacement Risk. The Fund may invest in certain debt securities, derivatives or other financial instruments that utilize the London Interbank Offered Rate (“LIBOR”), as a “benchmark” or “reference rate” for various interest rate calculations. The United Kingdom Financial Conduct Authority, which regulates LIBOR, announced that after 2021 it will cease its active encouragement of banks to provide the quotations needed to sustain LIBOR. As a result, it is anticipated that LIBOR will be discontinued or will no longer be sufficiently robust to be representative of its underlying market around that time. Although financial regulators and industry working groups have suggested alternative reference rates, such as the European Interbank Offer Rate (“EURIBOR”), Sterling Overnight Interbank Average Rate (“SONIA”) and Secured Overnight Financing Rate (“SOFR”), there are challenges to converting certain contracts and transactions to a new benchmark and neither the full effects of the transition process nor its ultimate outcome is known. Management is currently working to assess exposure and will modify contracts as necessary.
The elimination of LIBOR or changes to other reference rates or any other changes or reforms to the determination or supervision of reference rates could have an adverse impact on the market for, or value of, any securities or payments linked to those reference rates, which may adversely affect the Fund’s performance and/or net asset value. Uncertainty and risk also remain regarding the willingness and ability of issuers and lenders to include revised provisions in new and existing contracts or instruments. Consequently, the transition away from LIBOR to other reference rates may lead to increased volatility and illiquidity in markets that are tied to LIBOR, fluctuations in values of LIBOR-related
| | |
| 32 | | MainStay MacKay U.S. Infrastructure Bond Fund |
investments or investments in issuers that utilize LIBOR, increased difficulty in borrowing or refinancing and diminished effectiveness of hedging strategies, adversely affecting the Fund’s performance. Accordingly, the potential effect of a transition away from LIBOR on the Fund or the debt securities or other instruments based on LIBOR in which the Fund invests cannot yet be determined. Furthermore, the risks associated with the expected discontinuation of LIBOR and transition may be exacerbated if the work necessary to effect an orderly transition to an alternative reference rate is not completed in a timely manner. Because the usefulness of LIBOR as a benchmark could deteriorate during the transition period, these effects could occur prior to the end of 2021.
(N) Indemnifications. Under the Trust’s organizational documents, its officers and trustees are indemnified against certain liabilities that may arise out of performance of their duties to the Trust. Additionally, in the normal course of business, the Fund enters into contracts with third-party service providers that contain a variety of representations and warranties and that may provide general indemnifications. The Fund’s maximum exposure under these arrangements is unknown, as this would involve future claims that may be made against the Fund that have not yet occurred. The Manager believes that the risk of loss in connection with these potential indemnification obligations is remote. However, there can be no assurance that material liabilities related to such obligations will not arise in the future, which could adversely impact the Fund.
(O) Quantitative Disclosure of Derivative Holdings. The following tables show additional disclosures related to the Fund’s derivative and hedging activities, including how such activities are accounted for and their effect on the Fund’s financial positions, performance and cash flows. The Fund entered into futures contracts to help manage the duration and yield curve positioning of the portfolio. These derivatives are not accounted for as hedging instruments.
Fair value of derivative instruments as of October 31, 2020:
Asset Derivatives
| | | | | | |
| | | Interest Rate Contracts Risk | | Total | |
| | |
Futures Contracts—Net Assets—Net unrealized appreciation on investments and futures contracts (a) | | $227,901 | | $ | 227,901 | |
| | | | | | |
Total Fair Value | | $227,901 | | $ | 227,901 | |
| | | |
| (a) | Includes cumulative appreciation (depreciation) of futures contracts as reported in the Portfolio of Investments. Only current day’s variation margin is reported within the Statement of Assets and Liabilities. |
The effect of derivative instruments on the Statement of Operations for the year ended October 31, 2020:
Net Realized Gain (Loss) from:
| | | | | | |
| | | Interest Rate Contracts Risk | | Total | |
| | |
Futures Contracts | | $(5,378,722) | | $ | (5,378,722 | ) |
| | | |
Total Net Realized Gain (Loss) | | $(5,378,722) | | $ | (5,378,722 | ) |
| | | |
Net Change in Unrealized Appreciation (Depreciation) from:
| | | | | | |
| | | Interest Rate Contracts Risk | | Total | |
| | |
Futures Contracts | | $(111,302) | | $ | (111,302 | ) |
| | | |
Total Net Change in Unrealized Appreciation (Depreciation) | | $(111,302) | | $ | (111,302 | ) |
| | | |
Average Notional Amount
| | | | | | |
| | | Interest Rate Contracts Risk | | Total | |
| | |
Futures Contracts Short | | $(48,084,375) | | $ | (48,084,375 | ) |
| | | |
Note 3–Fees and Related Party Transactions
(A) Manager and Subadvisor. New York Life Investments, a registered investment adviser and an indirect, wholly-owned subsidiary of New York Life Insurance Company (“New York Life”), serves as the Fund’s Manager, pursuant to an Amended and Restated Management Agreement (“Management Agreement”). The Manager provides offices, conducts clerical, recordkeeping and bookkeeping services and keeps most of the financial and accounting records required to be maintained by the Fund. Except for the portion of salaries and expenses that are the responsibility of the Fund, the Manager pays the salaries and expenses of all personnel affiliated with the Fund and certain operational expenses of the Fund. The Fund reimburses New York Life Investments in an amount equal to the portion of the compensation of the Chief Compliance Officer attributable to the Fund. MacKay Shields LLC (“MacKay Shields” or the “Subadvisor”), a registered investment adviser and an indirect, wholly-owned subsidiary of New York Life, serves as Subadvisor to the Fund and is responsible for the day-to-day portfolio management of the Fund. Pursuant to the terms of an Amended and Restated Subadvisory Agreement (“Subadvisory Agreement”) between New York Life Investments and MacKay Shields, New York Life Investments pays for the services of the Subadvisor.
Pursuant to the Management Agreement, the Fund pays the Manager a monthly fee for the services performed and the facilities furnished at an annual rate of the Fund’s average daily net assets as follows: 0.50% up to $500 million; 0.475% from $500 million to $1 billion; and 0.45% in excess of $1 billion. During the year ended October 31, 2020, the effective management fee rate (exclusive of any applicable waivers/reimbursements) was 0.50%.
New York Life Investments has contractually agreed to waive fees and/or reimburse expenses so that Total Annual Fund Operating Expenses (excluding taxes, interest, litigation, extraordinary expenses, brokerage and other transaction expenses relating to the purchase or sale of portfolio investments, and acquired (underlying) fund fees and expenses) do not exceed the following percentage of the Fund’s average daily net assets: Class A, 0.85% and Class R6, 0.53%. New York Life Investments will apply an equivalent waiver or reimbursement, in an equal number of basis points of the Class A shares waiver/ reimbursement to Investor Class, Class B, Class C and Class I shares. This
Notes to Financial Statements (continued)
agreement will remain in effect until August 31, 2021, and shall renew automatically for one-year terms unless New York Life Investments provides written notice of termination prior to the start of the next term or upon approval of the Board of Trustees of the Fund.
During the year ended October 31, 2020, New York Life Investments earned fees from the Fund in the amount of $2,262,345 and waived fees and/or reimbursed expenses in the amount of $469,112 and paid the Subadvisor in the amount of $892,171.
State Street provides sub-administration and sub-accounting services to the Fund pursuant to an agreement with New York Life Investments (See Note 12 for sub-administration and sub-accounting service provider change). These services include calculating the daily NAVs of the Fund, maintaining the general ledger and sub-ledger accounts for the calculation of the Fund’s NAVs and assisting New York Life Investments in conducting various aspects of the Fund’s administrative operations. For providing these services to the Fund, State Street is compensated by New York Life Investments.
Pursuant to an agreement between the Trust and New York Life Investments, New York Life Investments is responsible for providing or procuring certain regulatory reporting services for the Fund. The Fund will reimburse New York Life Investments for the actual costs incurred by New York Life Investments in connection with providing or procuring these services for the Fund.
(B) Distribution and Service Fees. The Trust, on behalf of the Fund, has entered into a distribution agreement with NYLIFE Distributors LLC (the “Distributor”), an affiliate of New York Life Investments. The Fund has adopted distribution plans (the “Plans”) in accordance with the provisions of Rule 12b-1 under the 1940 Act.
Pursuant to the Class A and Investor Class Plans, the Distributor receives a monthly distribution fee from the Class A and Investor Class shares at an annual rate of 0.25% of the average daily net assets of the Class A and Investor Class shares for distribution and/or service activities as designated by the Distributor. Pursuant to the Class B and Class C Plans, Class B and Class C shares pay the Distributor a monthly distribution fee at an annual rate of 0.75% of the average daily net assets of the Class B and Class C shares along with a service fee at an annual rate of 0.25% of the average daily net assets of the Class B and Class C shares, for a total 12b-1 fee of 1.00%. Class I and Class R6 shares are not subject to a distribution and/or service fee.
The Plans provide that the distribution and service fees are payable to the Distributor regardless of the amounts actually expended by the Distributor for distribution of the Fund’s shares and service activities.
(C) Sales Charges. The Fund was advised by the Distributor that the amount of initial sales charges retained on sales of Class A and Investor Class shares during the year ended October 31, 2020, were $6,477 and $1,784, respectively.
The Fund was also advised that the Distributor retained CDSCs on redemptions of Class A and Class B shares during the year ended October 31, 2020, of $5,510 and $1,398, respectively.
(D) Transfer, Dividend Disbursing and Shareholder Servicing Agent. NYLIM Service Company LLC, an affiliate of New York Life Investments, is the Fund’s transfer, dividend disbursing
and shareholder servicing agent pursuant to an agreement between NYLIM Service Company LLC and the Trust. NYLIM Service Company LLC has entered into an agreement with DST Asset Manager Solutions, Inc. (“DST”), pursuant to which DST performs certain transfer agent services on behalf of NYLIM Service Company LLC. New York Life Investments has contractually agreed to limit the transfer agency expenses charged to the Fund’s share classes to a maximum of 0.35% of that share class’s average daily net assets on an annual basis after deducting any applicable Fund or class-level expense reimbursement or small account fees. This agreement will remain in effect until February 28, 2021, and shall renew automatically for one-year terms unless New York Life Investments provides written notice of termination prior to the start of the next term or upon approval of the Board. During the year ended October 31, 2020, transfer agent expenses incurred by the Fund and any reimbursements, pursuant to the aforementioned Transfer Agency expense limitation agreement, were as follows:
| | | | | | | | |
Class | | Expense | | | Waived | |
Class A | | $ | 136,027 | | | $ | — | |
Investor Class | | | 89,319 | | | | — | |
Class B | | | 10,016 | | | | — | |
Class C | | | 45,190 | | | | — | |
Class I | | | 279,899 | | | | — | |
Class R6 | | | 5,421 | | | | — | |
(E) Small Account Fee. Shareholders with small accounts adversely impact the cost of providing transfer agency services. In an effort to reduce total transfer agency expenses, the Fund has implemented a small account fee on certain types of accounts. As described in the Fund’s prospectus, certain shareholders with an account balance of less than $1,000 ($5,000 for Class A share accounts) are charged an annual per account fee of $20 (assessed semi-annually), the proceeds from which offset transfer agent fees as reflected in the Statement of Operations. This small account fee will not apply to certain types of accounts as described further in the Fund’s prospectus.
(F) Capital. As of October 31, 2020, New York Life and its affiliates beneficially held shares of the Fund with the values and percentages of net assets as follows:
| ‡ | Less than one-tenth of a percent. |
Note 4–Federal Income Tax
As of October 31, 2020, the cost and unrealized appreciation (depreciation) of the Fund’s investment portfolio, including applicable derivative contracts and other financial instruments, as determined on a federal income tax basis, were as follows:
| | | | | | | | | | | | | | | | |
| | | Federal Tax
Cost | | | Gross
Unrealized
Appreciation | | | Gross
Unrealized
(Depreciation) | | | Net
Unrealized
Appreciation/
(Depreciation) | |
| | | | |
Investments in Securities | | $ | 477,938,851 | | | $ | 14,271,256 | | | $ | (2,101,541 | ) | | $ | 12,169,715 | |
| | |
| 34 | | MainStay MacKay U.S. Infrastructure Bond Fund |
As of October 31, 2020, the components of accumulated gain (loss) on a tax basis were as follows:
| | | | | | | | |
Ordinary
Income | | Accumulated
Capital and
Other Gain
(Loss) | | Other
Temporary
Differences | | Unrealized
Appreciation
(Depreciation) | | Total
Accumulated
Gain (Loss) |
| | | | |
| $6,727,422 | | $ — | | $(168,406) | | $12,102,014 | | $18,661,030 |
The difference between book-basis and tax-basis unrealized appreciation (depreciation) is primarily due to mark to market of futures contracts. The other temporary differences are primarily due to dividends payable and cumulative bond amortization adjustments.
The Fund utilized $886,685 of capital loss carryforwards during the year ended October 31, 2020.
During the years ended October 31, 2020, and October 31, 2019, the tax character of distributions paid as reflected in the Statements of Changes in Net Assets were as follows:
| | | | | | | | |
| | | 2020 | | | 2019 | |
| | |
Distributions paid from: | | | | | | | | |
Ordinary Income | | $ | 9,004,499 | | | $ | 3,536,690 | |
Return of Capital | | | — | | | | 22,317 | |
Total | | $ | 9,004,499 | | | $ | 3,559,007 | |
Note 5–Custodian
State Street is the custodian of cash and securities held by the Fund (See Note 12 for custodian change). Custodial fees are charged to the Fund based on the Fund’s net assets and/or the market value of securities held by the Fund and the number of certain transactions incurred by the Fund.
Note 6–Line of Credit
The Fund and certain other funds managed by New York Life Investments maintain a line of credit with a syndicate of banks in order to secure a source of funds for temporary purposes to meet unanticipated or excessive redemption requests.
Effective July 28, 2020, under the credit agreement (the “Credit Agreement”), the aggregate commitment amount is $600,000,000 with an additional uncommitted amount of $100,000,000. The commitment fee is an annual rate of 0.15% of the average commitment amount payable quarterly, regardless of usage, to JPMorgan Chase Bank NA, who serves as the agent to the syndicate. The commitment fee is allocated among the Fund and certain other funds managed by New York Life Investments based upon their respective net assets and other factors. Interest on any revolving credit loan is charged based upon the Federal Funds Rate or the one-month London Interbank Offered Rate (“LIBOR”), whichever is higher. The Credit Agreement expires on July 27, 2021, although the Fund, certain other funds managed by New York Life Investments and the syndicate of banks may renew the Credit Agreement for an additional year on the same or different terms or enter into a credit agreement with a different syndicate of banks. Prior to July 28, 2020, the aggregate commitment amount and the commitment fee were the same as those under the current Credit Agreement, but State Street served as agent to the syndicate. During the year ended October 31, 2020, there were no borrow-
ings made or outstanding with respect to the Fund under the Credit Agreement or the credit agreement for which State Street served as agent.
Note 7–Interfund Lending Program
Pursuant to an exemptive order issued by the SEC, the Fund, along with certain other funds managed by New York Life Investments, may participate in an interfund lending program. The interfund lending program provides an alternative credit facility that permits the Fund and certain other funds managed by New York Life Investments to lend or borrow money for temporary purposes directly to or from one another subject to the conditions of the exemptive order. During the year ended October 31, 2020, there were no interfund loans made or outstanding with respect to the Fund.
Note 8–Purchases and Sales of Securities (in 000’s)
During the year ended October 31, 2020, purchases and sales of U.S. government securities were $0 and $2,082, respectively. Purchases and sales of securities, other than U.S. government securities and short-term securities, were $572,576 and $373,411, respectively.
The Fund may purchase securities from or sell securities to other portfolios managed by the Subadvisor. These interportfolio transactions are primarily used for cash management purposes and are made pursuant to Rule 17a-7 under the 1940 Act. During the year ended October 31, 2020, such purchases were $3,871.
Note 9–Capital Share Transactions
Transactions in capital shares for the years ended October 31, 2020, and October 31, 2019, were as follows:
| | | | | | | | |
Class A | | Shares | | | Amount | |
| | |
Year ended October 31, 2020: | | | | | | | | |
Shares sold | | | 3,581,160 | | | $ | 31,130,263 | |
Shares issued to shareholders in reinvestment of distributions | | | 188,669 | | | | 1,645,048 | |
Shares redeemed | | | (1,957,726 | ) | | | (16,997,883 | ) |
| | | | |
Net increase (decrease) in shares outstanding before conversion | | | 1,812,103 | | | | 15,777,428 | |
Shares converted into Class A (See Note 1) | | | 217,000 | | | | 1,885,861 | |
Shares converted from Class A (See Note 1) | | | (11,740 | ) | | | (99,177 | ) |
| | | | |
Net increase (decrease) | | | 2,017,363 | | | $ | 17,564,112 | |
| | | | |
Year ended October 31, 2019: | | | | | | | | |
Shares sold | | | 2,483,034 | | | $ | 21,267,086 | |
Shares issued to shareholders in reinvestment of distributions | | | 198,336 | | | | 1,655,770 | |
Shares redeemed | | | (1,723,515 | ) | | | (14,417,422 | ) |
| | | | |
Net increase (decrease) in shares outstanding before conversion | | | 957,855 | | | | 8,505,434 | |
Shares converted into Class A (See Note 1) | | | 264,044 | | | | 2,211,330 | |
Shares converted from Class A (See Note 1) | | | (44,428 | ) | | | (372,608 | ) |
| | | | |
Net increase (decrease) | | | 1,177,471 | | | $ | 10,344,156 | |
| | | | |
|
| |
Notes to Financial Statements (continued)
| | | | | | | | |
Investor Class | | Shares | | | Amount | |
| | |
Year ended October 31, 2020: | | | | | | | | |
Shares sold | | | 149,694 | | | $ | 1,311,706 | |
Shares issued to shareholders in reinvestment of distributions | | | 35,776 | | | | 313,146 | |
Shares redeemed | | | (225,826 | ) | | | (1,968,500 | ) |
| | | | |
Net increase (decrease) in shares outstanding before conversion | | | (40,356 | ) | | | (343,648 | ) |
Shares converted into Investor Class (See Note 1) | | | 56,369 | | | | 495,075 | |
Shares converted from Investor Class (See Note 1) | | | (171,249 | ) | | | (1,493,289 | ) |
| | | | |
Net increase (decrease) | | | (155,236 | ) | | $ | (1,341,862 | ) |
| | | | |
Year ended October 31, 2019: | | | | | | | | |
Shares sold | | | 330,191 | | | $ | 2,828,870 | |
Shares issued to shareholders in reinvestment of distributions | | | 53,195 | | | | 445,473 | |
Shares redeemed | | | (541,415 | ) | | | (4,576,168 | ) |
| | | | |
Net increase (decrease) in shares outstanding before conversion | | | (158,029 | ) | | | (1,301,825 | ) |
Shares converted into Investor Class (See Note 1) | | | 106,250 | | | | 884,152 | |
Shares converted from Investor Class (See Note 1) | | | (220,504 | ) | | | (1,863,200 | ) |
| | | | |
Net increase (decrease) | | | (272,283 | ) | | $ | (2,280,873 | ) |
| | | | |
|
| |
Class B | | Shares | | | Amount | |
| | |
Year ended October 31, 2020: | | | | | | | | |
Shares sold | | | 15,226 | | | $ | 128,529 | |
Shares issued to shareholders in reinvestment of distributions | | | 2,122 | | | | 18,468 | |
Shares redeemed | | | (48,244 | ) | | | (417,353 | ) |
| | | | |
Net increase (decrease) in shares outstanding before conversion | | | (30,896 | ) | | | (270,356 | ) |
Shares converted from Class B (See Note 1) | | | (55,577 | ) | | | (487,410 | ) |
| | | | |
Net increase (decrease) | | | (86,473 | ) | | $ | (757,766 | ) |
| | | | |
Year ended October 31, 2019: | | | | | | | | |
Shares sold | | | 131,792 | | | $ | 1,127,557 | |
Shares issued to shareholders in reinvestment of distributions | | | 4,588 | | | | 38,174 | |
Shares redeemed | | | (186,750 | ) | | | (1,576,294 | ) |
| | | | |
Net increase (decrease) in shares outstanding before conversion | | | (50,370 | ) | | | (410,563 | ) |
Shares converted from Class B (See Note 1) | | | (52,599 | ) | | | (436,179 | ) |
| | | | |
Net increase (decrease) | | | (102,969 | ) | | $ | (846,742 | ) |
| | | | |
|
| |
| | | | | | | | |
Class C | | Shares | | | Amount | |
| | |
Year ended October 31, 2020: | | | | | | | | |
Shares sold | | | 1,153,768 | | | $ | 10,234,702 | |
Shares issued to shareholders in reinvestment of distributions | | | 9,972 | | | | 86,769 | |
Shares redeemed | | | (1,786,435 | ) | | | (15,500,354 | ) |
| | | | |
Net increase (decrease) in shares outstanding before conversion | | | (622,695 | ) | | | (5,178,883 | ) |
Shares converted from Class C (See Note 1) | | | (22,622 | ) | | | (197,934 | ) |
| | | | |
Net increase (decrease) | | | (645,317 | ) | | $ | (5,376,817 | ) |
| | | | |
Year ended October 31, 2019: | | | | | | | | |
Shares sold | | | 1,317,967 | | | $ | 10,719,427 | |
Shares issued to shareholders in reinvestment of distributions | | | 22,738 | | | | 189,819 | |
Shares redeemed | | | (609,489 | ) | | | (5,041,814 | ) |
| | | | |
Net increase (decrease) in shares outstanding before conversion | | | 731,216 | | | | 5,867,432 | |
Shares converted from Class C (See Note 1) | | | (52,338 | ) | | | (423,495 | ) |
| | | | |
Net increase (decrease) | | | 678,878 | | | $ | 5,443,937 | |
| | | | |
|
| |
Class I | | Shares | | | Amount | |
| | |
Year ended October 31, 2020: | | | | | | | | |
Shares sold | | | 36,185,559 | | | $ | 318,007,846 | |
Shares issued to shareholders in reinvestment of distributions | | | 418,535 | | | | 3,695,502 | |
Shares redeemed | | | (12,947,404 | ) | | | (114,102,580 | ) |
| | | | |
Net increase in shares outstanding before conversion | | | 23,656,690 | | | | 207,600,768 | |
Shares converted from Class I (See Note 1) | | | (11,026,106 | ) | | | (96,147,647 | ) |
| | | | |
Net increase (decrease) | | | 12,630,584 | | | $ | 111,453,121 | |
| | | | |
Year ended October 31, 2019: | | | | | | | | |
Shares sold | | | 21,884,723 | | | $ | 190,717,129 | |
Shares issued to shareholders in reinvestment of distributions | | | 120,425 | | | | 1,049,287 | |
Shares redeemed | | | (2,326,238 | ) | | | (20,051,137 | ) |
| | | | |
Net increase (decrease) | | | 19,678,910 | | | $ | 171,715,279 | |
| | | | |
|
| |
Class R6 | | Shares | | | Amount | |
| | |
Year ended October 31, 2020 (a): | | | | | | | | |
Shares sold | | | 16,784,819 | | | $ | 145,385,903 | |
Shares issued to shareholders in reinvestment of distributions | | | 256,439 | | | | 2,258,429 | |
Shares redeemed | | | (18,678,194 | ) | | | (167,804,554 | ) |
| | | | |
Net increase (decrease) in shares outstanding before conversion | | | (1,636,936 | ) | | | (20,160,222 | ) |
Shares converted into Class R6 (See Note 1) | | | 11,026,106 | | | | 96,147,647 | |
Shares converted from Class R6 (See Note 1) | | | (11,566 | ) | | | (103,126 | ) |
| | | | |
Net increase (decrease) | | | 9,377,604 | | | $ | 75,884,299 | |
| | | | |
| (a) | The inception date of the class was November 1, 2019. |
Note 10–Recent Accounting Pronouncement
To improve the effectiveness of fair value disclosure requirements, the Financial Accounting Standards Board issued Accounting Standards Update 2018-13, Fair Value Measurement Disclosure Framework— Changes to the Disclosure Requirements for Fair Value Measurement
| | |
| 36 | | MainStay MacKay U.S. Infrastructure Bond Fund |
(“ASU 2018-13”), which adds, removes, and modifies certain fair value measurement disclosure requirements. ASU 2018-13 is effective for interim and annual reporting periods beginning after December 15, 2019. The Manager evaluated the implications of certain provisions of ASU 2018-13 and determined to early adopt aspects related to the removal and modifications of certain fair value measurement disclosures, which are currently in place as of October 31, 2020. The Manager is evaluating the implications of certain other provisions of ASU 2018-13 related to new disclosure requirements and has not yet determined the impact of those provisions on the financial statement disclosures, if any.
In March 2020, the Financial Accounting Standards Board (“FASB”) issued Accounting Standards Update 2020-04 (“ASU 2020-04”), which provides optional guidance to ease the potential accounting burden associated with transitioning away from LIBOR and other reference rates that are expected to be discontinued. ASU 2020-04 is effective immediately upon release of the update on March 12, 2020, through December 31, 2022. At this time, the Manager is evaluating the implications of certain other provisions of ASU 2020-04 related to new disclosure requirements and any impact on the financial statement disclosures has not yet been determined.
Note 11–Other Matters
An outbreak of COVID-19, first detected in December 2019, has developed into a global pandemic and has resulted in travel restrictions,
closure of international borders, certain businesses and securities markets, restrictions on securities trading activities, prolonged quarantines, supply chain disruptions, and lower consumer demand, as well as general concern and uncertainty. The continued impact of COVID-19 is uncertain and could further adversely affect the global economy, national economies, individual issuers and capital markets in unforeseeable ways and result in a substantial and extended economic downturn. Developments that disrupt global economies and financial markets, such as COVID-19, may magnify factors that affect the Fund’s performance.
Note 12–Subsequent Events
In connection with the preparation of the financial statements of the Fund as of and for the year ended October 31, 2020, events and transactions subsequent to October 31, 2020, through the date the financial statements were issued have been evaluated by the Manager, for possible adjustment and/or disclosure. No subsequent events requiring financial statement adjustment or disclosure have been identified other than the following:
Effective at the close of business on November 20, 2020, all services provided by State Street were transitioned to JPMorgan Chase Bank, N.A.
Report of Independent Registered Public Accounting Firm
To the Shareholders of the Fund and Board of Trustees
The MainStay Funds:
Opinion on the Financial Statements
We have audited the accompanying statement of assets and liabilities of MainStay MacKay U.S. Infrastructure Bond Fund (formerly, MainStay MacKay Infrastructure Bond Fund) (the Fund), one of the funds constituting The MainStay Funds, including the portfolio of investments, as of October 31, 2020, the related statement of operations for the year then ended, the statements of changes in net assets for each of the years in the two-year period then ended, and the related notes (collectively, the financial statements) and the financial highlights for each of the years or periods in the five-year period then ended. In our opinion, the financial statements and financial highlights present fairly, in all material respects, the financial position of the Fund as of October 31, 2020, the results of its operations for the year then ended, the changes in its net assets for each of the years in the two-year period then ended, and the financial highlights for each of the years or periods in the five-year period then ended, in conformity with U.S. generally accepted accounting principles.
Basis for Opinion
These financial statements and financial highlights are the responsibility of the Fund’s management. Our responsibility is to express an opinion on these financial statements and financial highlights based on our audits. We are a public accounting firm registered with the Public Company Accounting Oversight Board (United States) (PCAOB) and are required to be independent with respect to the Fund in accordance with the U.S. federal securities laws and the applicable rules and regulations of the Securities and Exchange Commission and the PCAOB.
We conducted our audits in accordance with the standards of the PCAOB. Those standards require that we plan and perform the audit to obtain reasonable assurance about whether the financial statements and financial highlights are free of material misstatement, whether due to error or fraud. Our audits included performing procedures to assess the risks of material misstatement of the financial statements and financial highlights, whether due to error or fraud, and performing procedures that respond to those risks. Such procedures included examining, on a test basis, evidence regarding the amounts and disclosures in the financial statements and financial highlights. Such procedures also included confirmation of securities owned as of October 31, 2020, by correspondence with the custodian and brokers or by other appropriate auditing procedures when replies from brokers were not received. Our audits also included evaluating the accounting principles used and significant estimates made by management, as well as evaluating the overall presentation of the financial statements and financial highlights. We believe that our audits provide a reasonable basis for our opinion.

We have served as the auditor of one or more New York Life Investment Management investment companies since 2003.
Philadelphia, Pennsylvania
December 23, 2020
| | |
| 38 | | MainStay MacKay U.S. Infrastructure Bond Fund |
Federal Income Tax Information
(Unaudited)
The Fund is required under the Internal Revenue Code to advise shareholders in a written statement as to the federal tax status of dividends paid by the Fund during such fiscal years.
In February 2021, shareholders will receive an IRS Form 1099-DIV or substitute Form 1099, which will show the federal tax status of the distributions received by shareholders in calendar year 2020. The amounts that will be reported on such 1099-DIV or substitute Form 1099 will be the amounts you are to use on your federal income tax return and will differ from the amounts reported for the Fund’s fiscal year ended October 31, 2020.
Proxy Voting Policies and Procedures and Proxy Voting Record
A description of the policies and procedures that New York Life Investments uses to vote proxies related to the Fund’s securities is available free of charge upon request, by visiting the MainStay Funds’ website at newyorklifeinvestments.com or visiting the SEC’s website at www.sec.gov.
The Fund is required to file with the SEC its proxy voting records for the 12-month period ending June 30 on Form N-PX. The most recent Form N-PX or proxy voting record is available free of charge upon request by calling 800-624-6782; visiting the MainStay Funds’ website at newyorklifeinvestments.com; or visiting the SEC’s website at www.sec.gov.
Shareholder Reports and Quarterly Portfolio Disclosure
The Fund is required to file its complete schedule of portfolio holdings with the SEC 60 days after its first and third fiscal quarter on Form N-PORT. The Fund’s holdings report is available free of charge by visiting the SEC’s website at www.sec.gov or upon request by calling New York Life Investments at 800-624-6782.
Board of Trustees and Officers (Unaudited)
The Trustees and officers of the Funds are listed below. The Board oversees the MainStay Group of Funds (which consists of MainStay Funds and MainStay Funds Trust), MainStay VP Funds Trust, MainStay MacKay DefinedTerm Municipal Opportunities Fund, the Manager and the Subadvisors, and elects the officers of the Funds who are responsible for the day-to-day operations of the Funds. Information pertaining to the Trustees and officers is set forth below. Each Trustee serves until his or her successor is elected and qualified or until his or her
resignation, death or removal. Under the Board’s retirement policy, unless an exception is made, a Trustee must tender his or her resignation by the end of the calendar year during which he or she reaches the age of 75. Officers are elected annually by the Board. The business address of each Trustee and officer listed below is 51 Madison Avenue, New York, New York 10010. A majority of the Trustees are not “interested persons” (as defined by the 1940 Act and rules adopted by the SEC thereunder) of the Fund (“Independent Trustees”).
| | | | | | | | | | | | |
| | | | | Name and
Year of Birth | | Term of Office,
Position(s) Held and
Length of Service | | Principal Occupation(s)
During Past Five Years | | Number of
Portfolios in
Fund Complex
Overseen by
Trustee | | Other Directorships
Held by Trustee |
Interested Trustee | | | | Yie-Hsin Hung* 1962 | | MainStay Funds:
Trustee since 2017 MainStay Funds Trust:
Trustee since 2017 | | Senior Vice President of New York Life since joining in 2010, Member of the Executive Management Committee since 2017, Chief Executive Officer, New York Life Investment Management Holdings LLC & New York Life Investment Management LLC since 2015. Senior Managing Director and Co-President of New York Life Investment Management LLC from 2014 to May 2015. Previously held positions of increasing responsibility, including head of NYLIM International, Alternative Growth Businesses, and Institutional investments since joining New York Life in 2010. | | 78 | | MainStay VP Funds Trust:
Trustee since 2017 (31 portfolios); and
MainStay MacKay DefinedTerm Municipal Opportunities Fund: Trustee since 2017. |
| | * | This Trustee is considered to be an “interested person” of the MainStay Group of Funds, MainStay VP Funds Trust and MainStay MacKay DefinedTerm Municipal Opportunities Fund, within the meaning of the 1940 Act because of her affiliation with New York Life Insurance Company, New York Life Investment Management LLC, Candriam Belgium S.A., Candriam Luxembourg S.C.A., IndexIQ Advisors LLC, MacKay Shields LLC, NYL Investors LLC, NYLIFE Securities LLC and/or NYLIFE Distributors LLC, as described in detail above in the column entitled “Principal Occupation(s) During Past Five Years.” |
| | |
| 40 | | MainStay MacKay U.S. Infrastructure Bond Fund |
| | | | | | | | | | | | |
| | | | | Name and
Year of Birth | | Term of Office,
Position(s) Held and
Length of Service | | Principal Occupation(s)
During Past Five Years | | Number of
Portfolios in
Fund Complex
Overseen by
Trustee | | Other Directorships
Held by Trustee |
Independent Trustees | | | | David H. Chow 1957 | | MainStay Funds:
Trustee since 2016, Advisory Board Member (June 2015 to December 2015); MainStay Funds Trust:
Trustee since 2016, Advisory Board Member (June 2015 to December 2015). | | Founder and CEO, DanCourt Management, LLC since 1999 | | 78 | | MainStay VP Funds Trust: Trustee since 2016, Advisory Board Member (June 2015 to December 2015) (31 portfolios);
MainStay MacKay DefinedTerm Municipal Opportunities Fund: Trustee since 2016, Advisory Board Member (June 2015 to December 2015); Market Vectors Group of Exchange-Traded Funds: Independent Chairman of the Board of Trustees since 2008 and Trustee since 2006 (56 portfolios); and
Berea College of Kentucky: Trustee since 2009, Chair of the Investment Committee since 2018. |
| | | | Susan B. Kerley 1951 | | MainStay Funds:
Chairman since 2017 and Trustee since 2007; MainStay Funds Trust: Chairman since 2017 and Trustee since 1990.** | | President, Strategic Management Advisors LLC since 1990 | | 78 | | MainStay VP Funds Trust: Chairman since 2017 and Trustee since 2007 (31 portfolios)***;
MainStay MacKay DefinedTerm Municipal Opportunities Fund: Chairman since 2017 and Trustee since 2011; and
Legg Mason Partners Funds: Trustee since 1991 (45 portfolios). |
| | | | Alan R. Latshaw 1951 | | MainStay Funds:
Trustee; MainStay Funds Trust:
Trustee and Audit Committee Financial Expert since 2007.** | | Retired; Partner, Ernst & Young LLP (2002 to 2003); Partner, Arthur Andersen LLP (1989 to 2002); Consultant to the MainStay Funds Audit and Compliance Committee (2004 to 2006) | | 78 | | MainStay VP Funds Trust: Trustee and Audit Committee Financial Expert since 2007 (31 portfolios)***;
MainStay MacKay DefinedTerm Municipal Opportunities Fund: Trustee and Audit Committee Financial Expert since 2011; and
State Farm Associates Funds Trusts: Trustee since 2005 (4 portfolios). |
| | | | Richard H. Nolan, Jr. 1946 | | MainStay Funds:
Trustee since 2007; MainStay Funds Trust:
Trustee since 2007.** | | Managing Director, ICC Capital Management since 2004; President—Shields/Alliance, Alliance Capital Management (1994 to 2004) | | 78 | | MainStay VP Funds Trust: Trustee since 2006 (31 portfolios)***; and
MainStay MacKay DefinedTerm Municipal Opportunities Fund: Trustee since 2011. |
| | | | Jacques P. Perold 1958 | | MainStay Funds:
Trustee since 2016, Advisory Board Member (June 2015 to December 2015); MainStay Funds Trust:
Trustee since 2016, Advisory Board Member (June 2015 to December 2015). | | Founder and Chief Executive Officer, CapShift LLC since 2018; President, Fidelity Management & Research Company (2009 to 2014); Founder, President and Chief Executive Officer, Geode Capital Management, LLC (2001 to 2009) | | 78 | | MainStay VP Funds Trust: Trustee since 2016, Advisory Board Member (June 2015 to December 2015) (31 portfolios);
MainStay MacKay DefinedTerm Municipal Opportunities Fund: Trustee since 2016, Advisory Board Member (June 2015 to December 2015); Partners in Health: Trustee since 2019; Allstate Corporation: Director since 2015;
MSCI, Inc.: and Director since 2017. |
Board of Trustees and Officers (Unaudited) (continued)
| | | | | | | | | | | | |
| | | | | Name and
Year of Birth | | Term of Office,
Position(s) Held and
Length of Service | | Principal Occupation(s)
During Past Five Years | | Number of
Portfolios in
Fund Complex
Overseen by
Trustee | | Other Directorships
Held by Trustee |
Independent Trustees | | | | Richard S. Trutanic 1952 | | MainStay Funds: Trustee since 1994; MainStay Funds Trust: Trustee since 2007.** | | Chairman and Chief Executive Officer, Somerset & Company (financial advisory firm) since 2004; Managing Director, The Carlyle Group (private investment firm) (2002 to 2004); Senior Managing Director, Partner and Board Member, Groupe Arnault S.A. (private investment firm) (1999 to 2002) | | 78 | | MainStay VP Funds Trust: Trustee since 2007 (31 portfolios)***; and
MainStay MacKay DefinedTerm Municipal Opportunities Fund: Trustee since 2011. |
| | ** | Includes prior service as a Director/Trustee of certain predecessor entities to MainStay Funds Trust. |
| | *** | Includes prior service as a Director of MainStay VP Series Fund, Inc., the predecessor to MainStay VP Funds Trust. |
| | |
| 42 | | MainStay MacKay U.S. Infrastructure Bond Fund |
| | | | | | | | |
| | | | | Name and
Year of Birth | | Position(s) Held and
Length of Service | | Principal Occupation(s)
During Past Five Years |
Officers
of the
Trust
(Who are
not
Trustees)* | | | | Kirk C. Lehneis 1974 | | President, MainStay Funds, MainStay Funds Trust since 2017 | | Chief Operating Officer and Senior Managing Director since 2016, New York Life Investment Management LLC and New York Life Investment Management Holdings LLC; Member of the Board of Managers since 2017 and Senior Managing Director since 2018, NYLIFE Distributors LLC; Chairman of the Board and Senior Managing Director, NYLIM Service Company LLC since 2017; Trustee, President and Principal Executive Officer of IndexIQ Trust, IndexIQ ETF Trust and IndexIQ Active ETF Trust since 2018; President, MainStay MacKay DefinedTerm Municipal Opportunities Fund and MainStay VP Funds Trust since 2017**; Senior Managing Director, Global Product Development (2015 to 2016); Managing Director, Product Development (2010 to 2015), New York Life Investment Management LLC |
| | | | Jack R. Benintende 1964 | | Treasurer and Principal Financial and Accounting Officer, MainStay Funds since 2007, MainStay Funds Trust since 2009 | | Managing Director, New York Life Investment Management LLC since 2007; Treasurer and Principal Financial and Accounting Officer, MainStay MacKay DefinedTerm Municipal Opportunities Fund since 2011 and MainStay VP Funds Trust since 2007**; and Assistant Treasurer, New York Life Investment Management Holdings LLC (2008 to 2012) |
| | | | Yi-Chia Kuo 1981 | | Vice President and Chief Compliance Officer, MainStay Funds and MainStay Funds Trust since January 2020 | | Chief Compliance Officer, Index IQ Trust, Index IQ ETF Trust and Index IQ Active ETF Trust since January 2020; Vice President and Chief Compliance Officer, MainStay MacKay DefinedTerm Municipal Opportunities Fund and MainStay VP Funds Trust since January 2020; Director and Associate General Counsel, New York Life Insurance Company (2015 to 2019) |
| | | | J. Kevin Gao 1967 | | Secretary and Chief Legal Officer, MainStay Funds and MainStay Funds Trust since 2010 | | Managing Director and Associate General Counsel, New York Life Investment Management LLC since 2010; Secretary and Chief Legal Officer, MainStay MacKay DefinedTerm Municipal Opportunities Fund since 2011 and MainStay VP Funds Trust since 2010** |
| | | | Scott T. Harrington 1959 | | Vice President— Administration, MainStay Funds since 2005, MainStay Funds Trust since 2009 | | Managing Director, New York Life Investment Management LLC (including predecessor advisory organizations) since 2000; Member of the Board of Directors, New York Life Trust Company since 2009; Vice President—Administration, MainStay MacKay DefinedTerm Municipal Opportunities Fund since 2011 and MainStay VP Funds Trust since 2005** |
| | * | The officers listed above are considered to be “interested persons” of the MainStay Group of Funds, MainStay VP Funds Trust and MainStay MacKay DefinedTerm Municipal Opportunities Fund within the meaning of the 1940 Act because of their affiliation with the MainStay Group of Funds, New York Life Insurance Company and/or its affiliates, including New York Life Investment Management LLC, NYLIM Service Company LLC, NYLIFE Securities LLC and/or NYLIFE Distributors LLC, as described in detail in the column captioned “Principal Occupation(s) During Past Five Years.” Officers are elected annually by the Board. |
| | ** | Includes prior service as an Officer of MainStay VP Series Fund, Inc., the predecessor to MainStay VP Funds Trust. |
MainStay Funds
Equity
U.S. Equity
MainStay Epoch U.S. All Cap Fund
MainStay Epoch U.S. Equity Yield Fund
MainStay MacKay Common Stock Fund
MainStay MacKay Growth Fund
MainStay MacKay S&P 500 Index Fund
MainStay MacKay Small Cap Core Fund
MainStay MacKay U.S. Equity Opportunities Fund
MainStay MAP Equity Fund
MainStay Winslow Large Cap Growth Fund1
International Equity
MainStay Epoch International Choice Fund
MainStay MacKay International Equity Fund
MainStay MacKay International Opportunities Fund
Emerging Markets Equity
MainStay Candriam Emerging Markets Equity Fund
Global Equity
MainStay Epoch Capital Growth Fund
MainStay Epoch Global Equity Yield Fund
Fixed Income
Taxable Income
MainStay Candriam Emerging Markets Debt Fund
MainStay Floating Rate Fund
MainStay MacKay High Yield Corporate Bond Fund
MainStay MacKay Short Duration High Yield Fund
MainStay MacKay Total Return Bond Fund
MainStay MacKay Unconstrained Bond Fund
MainStay MacKay U.S. Infrastructure Bond Fund2
MainStay Short Term Bond Fund3
Tax-Exempt Income
MainStay MacKay California Tax Free Opportunities Fund4
MainStay MacKay High Yield Municipal Bond Fund
MainStay MacKay Intermediate Tax Free Bond Fund
MainStay MacKay New York Tax Free Opportunities Fund5
MainStay MacKay Short Term Municipal Fund
MainStay MacKay Tax Free Bond Fund
Money Market
MainStay Money Market Fund
Mixed Asset
MainStay Balanced Fund
MainStay Income Builder Fund
MainStay MacKay Convertible Fund
Speciality
MainStay CBRE Global Infrastructure Fund
MainStay CBRE Real Estate Fund
MainStay Cushing MLP Premier Fund
Asset Allocation
MainStay Conservative Allocation Fund
MainStay Conservative ETF Allocation Fund
MainStay Defensive ETF Allocation Fund
MainStay Equity Allocation Fund6
MainStay Equity ETF Allocation Fund
MainStay Growth Allocation Fund7
MainStay Growth ETF Allocation Fund
MainStay Moderate Allocation Fund
MainStay Moderate ETF Allocation Fund
Manager
New York Life Investment Management LLC
New York, New York
Subadvisors
Candriam Belgium S.A.8
Brussels, Belgium
Candriam Luxembourg S.C.A.8
Strassen, Luxembourg
CBRE Clarion Securities LLC
Radnor, Pennsylvania
Cushing Asset Management, LP
Dallas, Texas
Epoch Investment Partners, Inc.
New York, New York
MacKay Shields LLC8
New York, New York
Markston International LLC
White Plains, New York
NYL Investors LLC8
New York, New York
Winslow Capital Management, LLC
Minneapolis, Minnesota
Legal Counsel
Dechert LLP
Washington, District of Columbia
Independent Registered Public Accounting Firm
KPMG LLP
Philadelphia, Pennsylvania
Distributor
NYLIFE Distributors LLC8
Jersey City, New Jersey
Custodian9
State Street Bank and Trust Company
Boston, Massachusetts
| 1. | Formerly known as MainStay Large Cap Growth Fund. |
| 2. | Formerly known as MainStay MacKay Infrastructure Bond Fund. |
| 3. | Formerly known as MainStay Indexed Bond Fund. |
| 4. | This Fund is registered for sale in AZ, CA, NV, OR, TX, UT and WA. Class A and Class I shares are registered for sale in MI. Class I and Class C2 shares are registered for sale in CO, FL, GA, HI, ID, MA, MD, NH, NJ and NY. |
| 5. | This Fund is registered for sale in CA, CT, DE, FL, MA, NJ, NY and VT. |
| 6. | Formerly known as MainStay Growth Allocation Fund. |
| 7. | Formerly known as MainStay Moderate Growth Allocation Fund. |
| 8. | An affiliate of New York Life Investment Management LLC. |
| 9. | JPMorgan Chase Bank, N.A., New York, New York is the custodian for the MainStay ETF Asset Allocation Funds and effective at the close of business on November 20, 2020, became the custodian for other MainStay Funds. The custodian for MainStay Cushing MLP Premier Fund is U.S. Bank National Association, Milwaukee, Wisconsin. |
Not part of the Annual Report
For more information
800-624-6782
newyorklifeinvestments.com
“New York Life Investments” is both a service mark, and the common trade name, of certain investment advisors affiliated with New York Life Insurance Company. The MainStay Funds® are managed by New York Life Investment Management LLC and distributed by NYLIFE Distributors LLC, 30 Hudson Street, Jersey City, NJ 07302, a wholly owned subsidiary of New York Life Insurance Company. NYLIFE Distributors LLC is a Member FINRA/SIPC.
©2020 NYLIFE Distributors LLC. All rights reserved.
| | |
| 1716016 MS203-20 | | MSINF11-12/20 (NYLIM) NL211 |
MainStay MAP Equity Fund
Message from the President and Annual Report
October 31, 2020
Beginning on January 1, 2021, paper copies of each MainStay Fund’s annual and semiannual shareholder reports will no longer be sent by mail, unless you specifically request paper copies of the reports from MainStay Funds or from your financial intermediary. Instead, the reports will be made available on the MainStay Funds’ website. You will be notified by mail and provided with a website address to access the report each time a new report is posted to the website.
If you already elected to receive shareholder reports electronically, you will not be affected by this change and you need not take any action. At any time, you may elect to receive reports and other communications from MainStay Funds electronically by calling toll-free 800-624-6782, by sending an e-mail to MainStayShareholderServices@nylim.com, or by contacting your financial intermediary.
You may elect to receive all future shareholder reports in paper form free of charge. If you hold shares of a MainStay Fund directly, you can inform MainStay Funds that you wish to receive paper copies of reports by calling toll-free 800-624-6782 or by sending an e-mail to MainStayShareholderServices@nylim.com. If you hold shares of a MainStay Fund through a financial intermediary, please contact the financial intermediary to make this election. Your election to receive reports in paper form will apply to all MainStay Funds in which you are invested and may apply to all funds held with your financial intermediary.
| | | | | | | | |
| Not FDIC/NCUA Insured | | Not a Deposit | | May Lose Value | | No Bank Guarantee | | Not Insured by Any Government Agency |

This page intentionally left blank
Message from the President
Despite historically high levels of volatility generated by the global coronavirus pandemic and a host of other geopolitical and economic uncertainties, most broad U.S. stock and bond markets gained ground during the 12-month reporting period ended October 31, 2020.
The reporting period began on an upswing, with markets rising on generally positive underlying economic trends and the announcement of a U.S.-China trade deal. However, in mid-February 2020, stock and bond indices began to dip as growing numbers of COVID-19 cases appeared in hotspots around the world. By early March, the disease reached pandemic proportions. As governments struggled to support overburdened health care systems by issuing “stay-at-home” orders and other restrictions on nonessential activity, global economic activity slowed, driving most stocks and bonds sharply lower.
The United States was hit particularly hard by the pandemic, with more reported COVID-19 cases and deaths than any other country in the world throughout the second half of the reporting period. As the pandemic deepened, the U.S. Federal Reserve (“Fed”) twice cut interest rates and announced unlimited quantitative easing. The federal government declared a national emergency, and Congress passed and the President signed a $2 trillion stimulus package. Markets responded positively to these measures, as well as to a gradual lessening of restrictions on nonessential businesses, hopes for additional stimulus and apparent progress in the development of a vaccine. By late August, the S&P 500® Index, a widely regarded benchmark of market performance, had not only regained all the ground it lost earlier in the reporting period, the Index had reached new record levels. However, a resurgence of coronavirus cases in many parts of the country and uncertainties related to the November 3, 2020, U.S. presidential election caused markets to falter as the reporting period drew to a close.
Nevertheless, for the reporting period as a whole, U.S. equity indices generally produced moderate gains. Returns proved strongest among large-cap, growth-oriented stocks, while small- and mid-cap issues lagged. Within the S&P 500® Index, the information technology and consumer discretionary sectors produced exceptionally strong gains, buoyed by strong corporate and consumer spending, while the health care sector outperformed by a smaller margin. Materials and consumer staples sectors generated positive returns, but lagged the S&P 500® Index. The industrials, utilities, communication services, financials, real estate and energy sectors ended the reporting period in negative territory, with the energy sector
suffering the steepest losses due to weak global demand. International equities declined sharply in February and March 2020 before recovering somewhat, but tended to lag their U.S. counterparts due to weaker underlying economic growth and somewhat less aggressive monetary and fiscal stimulus. Emerging-market equities tracked the performance of U.S. equity markets more closely, led by relatively strong returns in Asian markets, such as China and South Korea.
Fixed-income markets experienced an environment that tended to favor higher credit quality and longer duration securities. Corporate bonds followed the pattern of equities, with prices declining in March 2020 before subsequently recovering. Relatively speculative high-yield credit was hardest hit during the market sell-off in early 2020 and continued to underperform during the remainder of the reporting period. Similarly, among municipal bond issues, high-grade bonds outperformed, dipping briefly in mid-March before regaining the lost ground. Recognized safe havens, such as U.S. government bonds, attracted increased investment during the height of the market sell-off, driving yields lower and prices higher. As a result, long-term Treasury bonds delivered particularly strong gains for the reporting period as a whole. Emerging-market debt, on the other hand, underperformed most other bond types as investors sought to minimize currency and sovereign risks.
Although the ongoing pandemic continues to change the way that many of us work and live our lives, at New York Life Investments, we remain dedicated to providing you, as a MainStay investor, with products, information and services to help you to navigate today’s rapidly changing investment environment. By taking appropriate steps to minimize community spread of COVID-19 within our organization and despite the challenges posed by the coronavirus pandemic, we continue to innovate with you in mind, introducing new suites of Funds and providing continuous insights into ever-evolving markets and investment strategies. Our goal is to give you the tools you need to build a resilient portfolio in the face of uncertain times.
Sincerely,

Kirk C. Lehneis
President
The opinions expressed are as of the date of this report and are subject to change. There is no guarantee that any forecast made will come to pass. This material does not constitute investment advice and is not intended as an endorsement of any specific investment. Past performance is no guarantee of future results.
Not part of the Annual Report
Table of Contents
Investors should refer to the Fund’s Summary Prospectus and/or Prospectus and consider the Fund’s investment objectives, strategies, risks, charges and expenses carefully before investing. The Summary Prospectus and/or Prospectus contain this and other information about the Fund. You may obtain copies of the Fund’s Summary Prospectus, Prospectus and Statement of Additional Information free of charge, upon request, by calling toll-free 800-624-6782, by writing to NYLIFE Distributors LLC, Attn: MainStay Marketing Department, 30 Hudson Street, Jersey City, NJ 07302 or by sending an e-mail to MainStayShareholderServices@nylim.com. These documents are also available via the MainStay Funds’ website at newyorklifeinvestments.com. Please read the Summary Prospectus and/or Prospectus carefully before investing.
Investment and Performance Comparison1 (Unaudited)
Performance data quoted represents past performance. Past performance is no guarantee of future results. Because of market volatility and other factors, current performance may be lower or higher than the figures shown. Investment return and principal value will fluctuate, and as a result, when shares are redeemed, they may be worth more or less than their original cost. The graph below depicts the historical performance of Class I shares of the Fund. Performance will vary from class to class based on differences in class-specific expenses and sales charges. For performance information current to the most recent month-end, please call 800-624-6782 or visit newyorklifeinvestments.com.
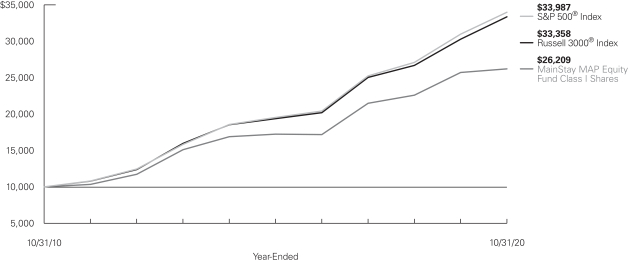
Average Annual Total Returns for the Year-Ended October 31, 2020
| | | | | | | | | | | | | | | | | | | | | | | | |
| Class | | Sales Charge | | | | Inception
Date | | | One Year | | | Five Years | | | Ten Years | | | Gross
Expense
Ratio2 | |
| | | | | | | |
| Class A Shares | | Maximum 5.5% Initial Sales Charge | | With sales charges Excluding sales charges | |
| 6/9/1999
|
| |
| –3.93
1.66 | %
| |
| 7.24
8.46 | %
| |
| 9.22
9.84 | %
| |
| 1.11
1.11 | %
|
| Investor Class Shares3 | | Maximum 5% Initial Sales Charge | | With sales charges Excluding sales charges | |
| 2/28/2008
|
| |
| –4.22
1.35 |
| |
| 7.01
8.22 |
| |
| 9.00
9.62 |
| |
| 1.38
1.38 |
|
| Class B Shares4 | | Maximum 5% CDSC if Redeemed Within the First Six Years of Purchase | | With sales charges Excluding sales charges | | | 6/9/1999 | | |
| –4.04
0.57 |
| |
| 7.15
7.41 |
| |
| 8.80
8.80 |
| |
| 2.13
2.13 |
|
| Class C Shares | | Maximum 1% CDSC if Redeemed Within One Year of Purchase | | With sales charges Excluding sales charges | |
| 6/9/1999
|
| |
| –0.33
0.60 |
| |
| 7.42
7.42 |
| |
| 8.80
8.80 |
| |
| 2.13
2.13 |
|
| Class I Shares | | No Sales Charge | | | | | 1/21/1971 | | | | 1.92 | | | | 8.74 | | | | 10.11 | | | | 0.86 | |
| Class R1 Shares | | No Sales Charge | | | | | 1/2/2004 | | | | 1.82 | | | | 8.63 | | | | 10.00 | | | | 0.96 | |
| Class R2 Shares | | No Sales Charge | | | | | 1/2/2004 | | | | 1.57 | | | | 8.35 | | | | 9.72 | | | | 1.21 | |
| Class R3 Shares | | No Sales Charge | | | | | 4/28/2006 | | | | 1.29 | | | | 8.08 | | | | 9.45 | | | | 1.46 | |
| 1. | The performance table and graph do not reflect the deduction of taxes that a shareholder would pay on distributions or Fund share redemptions. Total returns reflect maximum applicable sales charges as indicated in the table above, if any, changes in share price, and reinvestment of dividend and capital gain distributions. The graph assumes the initial investment amount shown above and reflects the deduction of all sales charges that would have applied for the period of investment. Performance figures may reflect certain fee waivers and/or expense limitations, without which total returns may have been lower. For more information on share classes and current fee waivers and/or expense limitations, if any, please refer to the Notes to Financial Statements. |
| 2. | The gross expense ratios presented reflect the Fund’s “Total Annual Fund Operating Expenses” from the most recent Prospectus and may differ from other expense ratios disclosed in this report. |
| 3. | Prior to June 30, 2020, the maximum initial sales charge for Investor Class shares was 5.5%, which is reflected in the average annual total return figures shown. |
| 4. | Class B shares are closed to all new purchases as well as additional investments by existing Class B shareholders. |
The footnotes on the next page are an integral part of the table and graph and should be carefully read in conjunction with them.
| | | | | | | | | | | | |
| Benchmark Performance | | One Year | | | Five Years | | | Ten Years | |
| | | |
Russell 3000® Index5 | | | 10.15 | % | | | 11.48 | % | | | 12.80 | % |
S&P 500® Index6 | | | 9.71 | | | | 11.71 | | | | 13.01 | |
Morningstar Large Blend Category Average7 | | | 6.30 | | | | 9.64 | | | | 11.28 | |
| 5. | The Russell 3000® Index is the Fund’s primary broad-based securities market index for comparison purposes. The Russell 3000® Index measures the performance of the largest 3,000 U.S. companies representing approximately 98% of the investable U.S. equity market. Results assume reinvestment of all dividends and capital gains. An investment cannot be made directly in an index. |
| 6. | The S&P 500® Index is the Fund’s secondary benchmark. “S&P 500®” is a trademark of The McGraw-Hill Companies, Inc. The S&P 500® Index is widely regarded as the standard index for measuring large-cap U.S. stock market performance. Results assume reinvestment of all dividends and capital gains. An investment cannot be made directly in an index. |
| 7. | The Morningstar Large Blend Category Average is representative of funds that represent the overall U.S. stock market in size, growth rates and price. Stocks in the top 70% of the capitalization of the U.S. equity market are defined as large cap. The blend style is assigned to portfolios where neither growth nor value characteristics predominate. These portfolios tend to invest across the spectrum of U.S. industries, and owing to their broad exposure, the portfolios’ returns are often similar to those of the S&P 500 Index. Results are based on average total returns of similar funds with all dividends and capital gain distributions reinvested. |
The footnotes on the preceding page are an integral part of the table and graph and should be carefully read in conjunction with them.
| | |
| 6 | | MainStay MAP Equity Fund |
Cost in Dollars of a $1,000 Investment in MainStay MAP Equity Fund (Unaudited)
The example below is intended to describe the fees and expenses borne by shareholders during the six-month period from May 1, 2020, to October 31, 2020, and the impact of those costs on your investment.
Example
As a shareholder of the Fund you incur two types of costs: (1) transaction costs, including exchange fees and sales charges (loads) on purchases (as applicable), and (2) ongoing costs, including management fees, distribution and/or service (12b-1) fees, and other Fund expenses (as applicable). This example is intended to help you understand your ongoing costs (in dollars) of investing in the Fund and to compare these costs with the ongoing costs of investing in other mutual funds. The example is based on an investment of $1,000 made at the beginning of the six-month period and held for the entire period from May 1, 2020, to October 31, 2020.
This example illustrates your Fund’s ongoing costs in two ways:
Actual Expenses
The second and third data columns in the table below provide information about actual account values and actual expenses. You may use the information in these columns, together with the amount you invested, to estimate the expenses that you paid during the six months ended October 31, 2020. Simply divide your account value by $1,000 (for example, an $8,600 account value divided by $1,000 = 8.6), then
multiply the result by the number under the heading entitled “Expenses Paid During Period” to estimate the expenses you paid on your account during this period.
Hypothetical Example for Comparison Purposes
The fourth and fifth data columns in the table below provide information about hypothetical account values and hypothetical expenses based on the Fund’s actual expense ratio and an assumed rate of return of 5% per year before expenses, which is not the Fund’s actual return. The hypothetical account values and expenses may not be used to estimate the actual ending account balances or expenses you paid for the six-month period shown. You may use this information to compare the ongoing costs of investing in the Fund with the ongoing costs of investing in other mutual funds. To do so, compare this 5% hypothetical example with the 5% hypothetical examples that appear in the shareholder reports of the other mutual funds.
Please note that the expenses shown in the table are meant to highlight your ongoing costs only and do not reflect any transactional costs, such as exchange fees or sales charges (loads). Therefore, the fourth and fifth data columns of the table are useful in comparing ongoing costs only and will not help you determine the relative total costs of owning different funds. In addition, if these transactional costs were included, your costs would have been higher.
| | | | | | | | | | | | | | | | | | | | | | |
| | | | | | | | | | | | | | | | | | |
| Share Class | | Beginning
Account
Value
5/1/20 | | | Ending Account
Value (Based
on Actual
Returns and
Expenses)
10/31/20 | | | Expenses
Paid
During
Period1 | | | Ending Account
Value (Based
on Hypothetical
5% Annualized
Return and
Actual Expenses)
10/31/20 | | | Expenses
Paid
During
Period1 | | | Net Expense
Ratio
During
Period2 |
| | | | | | |
| Class A Shares | | $ | 1,000.00 | | | $ | 1,142.00 | | | $ | 5.92 | | | $ | 1,019.61 | | | $ | 5.58 | | | 1.10% |
| | | | | | |
| Investor Class Shares | | $ | 1,000.00 | | | $ | 1,140.40 | | | $ | 7.53 | | | $ | 1,018.10 | | | $ | 7.10 | | | 1.40% |
| | | | | | |
| Class B Shares | | $ | 1,000.00 | | | $ | 1,136.10 | | | $ | 11.54 | | | $ | 1,014.33 | | | $ | 10.89 | | | 2.15% |
| | | | | | |
| Class C Shares | | $ | 1,000.00 | | | $ | 1,136.10 | | | $ | 11.54 | | | $ | 1,014.33 | | | $ | 10.89 | | | 2.15% |
| | | | | | |
| Class I Shares | | $ | 1,000.00 | | | $ | 1,143.70 | | | $ | 4.58 | | | $ | 1,020.86 | | | $ | 4.32 | | | 0.85% |
| | | | | | |
| Class R1 Shares | | $ | 1,000.00 | | | $ | 1,142.90 | | | $ | 5.17 | | | $ | 1,020.31 | | | $ | 4.88 | | | 0.96% |
| | | | | | |
| Class R2 Shares | | $ | 1,000.00 | | | $ | 1,141.60 | | | $ | 6.46 | | | $ | 1,019.10 | | | $ | 6.09 | | | 1.20% |
| | | | | | |
| Class R3 Shares | | $ | 1,000.00 | | | $ | 1,140.10 | | | $ | 7.80 | | | $ | 1,017.85 | | | $ | 7.35 | | | 1.45% |
| 1. | Expenses are equal to the Fund’s annualized expense ratio of each class multiplied by the average account value over the period, divided by 366 and multiplied by 184 (to reflect the six-month period). The table above represents the actual expenses incurred during the six-month period. In addition to the fees and expenses which the Fund bears directly, it also indirectly bears a pro rata share of the fees and expenses of the underlying funds in which it invests. Such indirect expenses are not included in the above-reported expense figures. |
| 2. | Expenses are equal to the Fund’s annualized expense ratio to reflect the six-month period. |
Industry Composition as of October 31, 2020 (Unaudited)
| | | | |
| |
| Software | | | 10.1 | % |
| |
| Interactive Media & Services | | | 9.9 | |
| |
| Technology Hardware, Storage & Peripherals | | | 7.2 | |
| |
| Media | | | 6.1 | |
| |
| IT Services | | | 5.2 | |
| |
| Banks | | | 5.0 | |
| |
| Specialty Retail | | | 3.9 | |
| |
| Entertainment | | | 3.4 | |
| |
| Insurance | | | 3.4 | |
| |
| Semiconductors & Semiconductor Equipment | | | 3.2 | |
| |
| Road & Rail | | | 3.0 | |
| |
| Aerospace & Defense | | | 2.9 | |
| |
| Health Care Equipment & Supplies | | | 2.9 | |
| |
| Health Care Providers & Services | | | 2.8 | |
| |
| Capital Markets | | | 2.7 | |
| |
| Pharmaceuticals | | | 2.3 | |
| |
| Life Sciences Tools & Services | | | 2.1 | |
| |
| Oil, Gas & Consumable Fuels | | | 1.6 | |
| |
| Food & Staples Retailing | | | 1.4 | |
| |
| Internet & Direct Marketing Retail | | | 1.4 | |
| |
| Beverages | | | 1.3 | |
| |
| Hotels, Restaurants & Leisure | | | 1.3 | |
| |
| Biotechnology | | | 1.2 | |
| |
| Chemicals | | | 1.1 | |
| |
| Consumer Finance | | | 1.1 | |
| | | | |
| |
| Diversified Financial Services | | | 1.1 | % |
| |
| Diversified Telecommunication Services | | | 1.1 | |
| |
| Electrical Equipment | | | 1.1 | |
| |
| Food Products | | | 1.1 | |
| |
| Multiline Retail | | | 1.1 | |
| |
| Industrial Conglomerates | | | 0.8 | |
| |
| Machinery | | | 0.7 | |
| |
| Electronic Equipment, Instruments & Components | | | 0.6 | |
| |
| Wireless Telecommunication Services | | | 0.6 | |
| |
| Communications Equipment | | | 0.5 | |
| |
| Construction & Engineering | | | 0.5 | |
| |
| Household Durables | | | 0.5 | |
| |
| Thrifts & Mortgage Finance | | | 0.5 | |
| |
| Air Freight & Logistics | | | 0.4 | |
| |
| Real Estate Management & Development | | | 0.4 | |
| |
| Tobacco | | | 0.4 | |
| |
| Construction Materials | | | 0.3 | |
| |
| Household Products | | | 0.3 | |
| |
| Professional Services | | | 0.3 | |
| |
| Building Products | | | 0.2 | |
| |
| Energy Equipment & Services | | | 0.1 | |
| |
| Short-Term Investment | | | 0.8 | |
| |
| Other Assets, Less Liabilities | | | 0.1 | |
| | | | |
| | | 100.0 | % |
| | | | |
See Portfolio of Investments beginning on page 14 for specific holdings within these categories. The Fund’s holdings are subject to change.
Top Ten Holdings as of October 31, 2020 (excluding short-term investments) (Unaudited)
| 6. | Liberty Media Corp-Liberty SiriusXM |
| 8. | Liberty Broadband Corp. |
| | |
| 8 | | MainStay MAP Equity Fund |
Portfolio Management Discussion and Analysis (Unaudited)
Questions answered by portfolio managers Christopher Mullarkey and James Mulvey of Markston International LLC (“Markston”), a Subadvisor to the Fund; and portfolio managers William W. Priest, CFA, Michael A. Welhoelter, CFA, David N. Pearl and Justin Howell of Epoch Investment Partners, Inc. (“Epoch”), a Subadvisor to the Fund.
How did MainStay MAP Equity Fund perform relative to its benchmarks and peer group during the 12 months ended October 31, 2020?
For the 12 months ended October 31, 2020, Class I shares of MainStay MAP Equity Fund returned 1.92%, underperforming the 10.15% return of the Fund’s primary benchmark, the Russell 3000® Index, and the 9.71% return of the S&P 500® Index, which is the Fund’s secondary benchmark. Over the same period, Class I shares underperformed the 6.30% return of the Morningstar Large Blend Category Average.1
What factors affected the Fund’s relative performance during the reporting period?
Markston
As the COVID-19 virus spread around the globe, the initial shock caused businesses to shut down and people to shelter at home. This led to a huge spike in unemployment and severely reduced consumer spending. U.S. equities suffered a sharp pullback in March as the uncertainty of the pandemic eroded business confidence. However, the economy and the stock market started to recover in the wake of massive monetary and fiscal stimulus as companies learned to grapple with the “new normal” by leaning into remote working and as shelter-in-place orders were largely removed.
During the reporting period, the Markston portion of the Fund held relatively overweight exposure to the financials and industrials sectors, which weighed on performance relative to the Russell 3000® Index. A steep decline in interest rates, lower lending activity and broad economic weakness hurt financial services companies. In addition, aircraft maker Boeing, a sizeable Fund holding, underperformed due to the ongoing grounding of the company’s 737 MAX aircraft combined with steep declines in global air travel. Relative performance also suffered due to lagging returns from the Fund’s consumer discretionary and health care holdings.
Epoch
During the reporting period, the Epoch portion of the Fund underperformed the Russell 3000® Index largely due to disappointing security selection in the consumer discretionary, industrials and real estate sectors. The strong performance of a few companies that constituted a large percentage of the Index, but were not held in the Fund, further detracted from relative returns.
During the reporting period, were there any market events that materially impacted the Fund’s performance or liquidity?
Markston
The pandemic caused the U.S. unemployment rate to approach Depression-era levels, as much of the global economy shut
down amid shelter-in-place orders during the spring of 2020. The sudden and unprecedented drop in supply and demand exposed a lack of liquidity within the Repo (repurchase agreement) market. In turn, congestion in the debt markets quickly led to a steep correction in U.S. equity markets. However, as the reporting period progressed, equities recovered most of their losses as the transition to remote work proved successful, businesses reopened and e-commerce accelerated with a return of consumer confidence.
Epoch
Equity markets and, by extension, Fund performance were strongly influenced during the reporting period by widespread pandemic-related economic impacts. However, the Fund’s liquidity was not affected by these conditions.
During the reporting period, which sectors were the strongest positive contributors to the Fund’s relative performance and which sectors were particularly weak?
Markston
The strongest positive sector contributions to the relative performance in the Markston portion of the Fund came from health care, energy and financials. (Contributions take weightings and total returns into account.) Notable detractors from relative performance included investments in the consumer discretionary, information technology and industrials sectors.
Epoch
In the Epoch portion of the Fund, the health care, energy and financials sectors generated the strongest positive contributions to relative performance during the reporting period, while the consumer discretionary, information technology and industrials sectors detracted most significantly.
During the reporting period, which individual stocks made the strongest positive contributions to the Fund’s absolute performance and which stocks detracted the most?
Markston
The stocks that made the strongest positive contributions to absolute performance in the Markston portion of the Fund included consumer technology company Apple; software giant Microsoft; and financial technology company PayPal.
During the reporting period, Apple saw tremendous growth of its high-margin services business and increased its paid subscription target for services users from 500 million to 600 million by the end of 2020. We expect growth of the
| 1. | See page 5 for other share class returns, which may be higher or lower than Class I share returns. See page 6 for more information on benchmark and peer group returns. |
company’s services areas to outpace that of its products divisions going forward as smartphone sales continue to mature. The increasing size of services helps boost margins while also supporting Apple’s valuation with more recurring revenue. While the pandemic caused some volatility in the company’s supply chain, hardware sales proved resilient, with Mac and iPad showing their strongest growth in years, driven by remote work and learning. We believe the company may also be on the cusp of an iPhone “super cycle” as it launches its long-awaited 5G-enabled phones. Apple ended the reporting period with $81 billion in net cash as it gradually targets a cash-neutral balance sheet.
Microsoft continued to generate impressive results during the reporting period, posting consistent double-digit revenue growth. Cloud remains a key driver, with Microsoft Azure, the company’s cloud computing service, growing rapidly. With remote work becoming a long-term persistent trend, Windows 10 monthly active devices grew by double digits. Microsoft Teams, the company’s proprietary business communications platform, grew to 115 million daily active users and engagement remains high. While Microsoft appears to be fairly valued as of October 31, 2020, we believe it is likely to continue to have visible, steady double-digit revenue growth as it remains well positioned to benefit from secular tailwinds. The cloud business is still in its early growth phase and margins continue to expand. At the same time, the more mature parts of Microsoft’s business generate meaningful free cash flow that is being returned to shareholders through buybacks and dividends, while also being reinvested into the company’s growth businesses.
PayPal, which facilitates online and offline commerce, continued to report robust growth in new active accounts and transaction volume. Despite the pandemic’s negative impact on the wider economy, during the reporting period PayPal experienced several years’ worth of growth, with many people coming into the digital payments system for the first time. Even with in-person spending, the company saw an acceleration of prepaying with PayPal. Recent surveys suggest e-commerce behavior is likely to remain more widespread after the pandemic recedes. With so many secular tailwinds, we believe that PayPal will eventually be able to reach its lofty target of 1 billion users, three times the current number. In our opinion, PayPal is well positioned for the accelerating move to e-commerce despite prevailing economic weakness.
Holdings that detracted most from absolute performance in the Markston portion of the Fund included shares in aircraft maker Boeing and commercial aerospace & defense company Raytheon Technologies.
As mentioned earlier, Boeing underperformed due to the ongoing 737 MAX grounding combined with severe pandemic-related declines in air travel demand. The magnitude of stress in
the airline industry has been unprecedented and will likely weigh on demand for new planes until the COVID-19 virus is controlled. IATA (International Air Transport Association) has released some telling data on the stress in the system; IATA expects the industry to burn through $77 billion in cash during the second half of 2020. This corresponds to $13 billion per month, which is lower than the rate of $17 billion per month in the second quarter of 2020, but still worrisome. We expect a slow recovery in air travel to extend into 2021, resulting in the airline industry burning through cash, but at a lower rate. We continue to monitor the position in Boeing as the company and its new management team has to re-earn trust after a number of mistakes. The industry’s full recovery to pre-pandemic levels will probably take several years, requiring airlines to make purchase decisions years ahead to secure limited supply. If travel starts to recover and the industry begins to normalize, well-capitalized airlines will look to make forward purchases of aircraft to secure the ability to meet demand.
Raytheon Technologies was formed from an April 2020 merger of United Technologies’ aerospace business with defense-contractor Raytheon. The merger combined United Technologies’ leadership positions in aerospace systems and jet engines with Raytheon’s strong standing in missile systems and defense electronics. The combined firm underperformed due to its exposure to the commercial aviation industry, which faced an unprecedented drop in air-travel demand. In response, the company took immediate action to reduce costs by $2 billion, and is undertaking $4 billion of longer-term initiatives to boost cash, including reductions in capital and discretionary spending. Moreover, legacy Raytheon’s consistently strong cash flows and solid balance sheet should help Raytheon Technologies ride out the pandemic. The defense side of the firm, which is responsible for more than half of all sales, should see minimal impact from the pandemic as it has little exposure to macroeconomic conditions, but instead is leveraged to the relative stability of domestic and foreign defense budgets.
Epoch
Systems software developer Microsoft made the strongest positive contribution to absolute performance in the Epoch portion of the Fund, with shares driven higher by rising revenues and net income. Much of the growth came from Microsoft’s Azure cloud computing business, which scored a high-profile win from the U.S. Department of Defense for the Joint Enterprise Defense Infrastructure (“JEDI”) cloud contract, worth up to $10 billion over a decade. Additionally, rival Salesforce said it would tap Azure to run its marketing cloud service. We believe Microsoft is successfully transitioning its customers to the cloud and is also moving to more of a recurring revenue model with Office 365. In our opinion, the cloud computing opportunity is vast and the company is investing appropriately to capture their fair share of this growth.
| | |
| 10 | | MainStay MAP Equity Fund |
Social media company Facebook, another leading contributor to the Epoch portion of the Fund’s absolute performance, reported better-than-expected first quarter 2020 revenue, up strongly from the company’s year-earlier revenues. The company also counted growing numbers of monthly users across its family of apps. While it saw a steep decline in ad revenue in March due to the coronavirus pandemic, investors were buoyed by the fact that revenues began to stabilize by the first few weeks of April, injecting optimism into the stock. As of October 31, 2020, Facebook remains one of the world’s most profitable companies, and has made significant investments toward transitioning its monetization strategy on both the Facebook and Instagram platforms. The company is focused on increasing its average revenue per user. Fueling this growth has been advertising revenue as Facebook continues to find new ways of increasing ad space within its platforms without diluting the end user experience. In our opinion, the current valuation does not reflect the company’s eventual return to double-digit growth.
One of the most prominent detractors from the absolute performance of the Epoch portion of the Fund was aircraft maker Boeing. The company’s stock came under pressure due to the grounding of the company’s 737 MAX aircraft, and more recently the perceived fear that a decline in air travel due to the COVID-19 pandemic may lead to new-plane order cancellations. The outlook for the commercial air travel industry grew worse during the reporting period, with forecasts for the return of air service and customers en mass increasingly extended, a trend that will likely have a large and adverse impact on the financial health of the airline companies and Boeing. We took particular note of United Airlines’ decision on May 9, 2020, to abandon its effort to raise $2.25 billion in the bond market. The proposed bond offering—backed by a pool of 360 aircraft owned by United (representing 40 percent of its fleet)—was designed to repay a loan the airline secured from a group of banks in early March, when the pandemic was taking hold outside China. Sources familiar with the deal said that the interest rate demanded by investors proved to be too high for the company. That event helped inform our decision to sell the shares in Boeing held by the Epoch portion of the Fund.
Another prominent detractor from the absolute performance of the Epoch portion of the Fund was real estate investment trust (“REIT”) Ventas. Ventas is one of the largest owners and operators of nursing homes and assisted living facilities. Prior to the pandemic, Ventas’ shares had come under pressure due to a temporary increase in supply in its senior housing business due to new construction. With the advent of the pandemic, investors grew concerned that senior housing was among the most vulnerable real estate sectors because so many senior-housing residents are in their 70s and 80s, a high-risk demographic. With a net decline in occupancy likely and supply dynamics not
expected to improve in 2020, we opted to sell the Ventas shares held in the Epoch portion of the Fund in March.
What were some of the Fund’s largest purchases and sales during the reporting period?
Markston
The largest purchase in the Markston portion of the Fund during the reporting period was a new position in Booking Holdings, a leading online travel company that operates the popular Booking.com website. The travel industry’s pandemic-induced sell-off allowed the Fund to invest in the company at a substantial discount to our estimate of intrinsic value. Although the travel industry experienced an unprecedented drop in demand, we believe Booking Holdings is the best positioned company in the space to weather the crisis due to its dominant position in the European lodging market. This crucial market has roughly 75% of its hotels run as independents. Unlike branded chains such as Marriott and Hilton, these independent hotels lack their own marketing teams and therefore rely more heavily on online travel agencies to fill rooms These independents are willing to pay relatively high commission rates. Booking Holdings maintains the best balance sheet of leading travel companies, and can be solvent with virtually no revenue well into 2021. While corporate travel is likely to be structurally challenged longer term, we expect leisure travel to fully recover, and for Booking to get most of its revenue from that source. In the meantime, we believe that the company is well positioned to benefit as travel gradually returns.
The Markston portion of the Fund also increased its positions in bank Wells Fargo and multi-line insurer American International Group (“AIG”) amid the pandemic-related macroeconomic uncertainty. In the former case, although Wells Fargo continues to face a number of challenges, we remain constructive on the company. Our outlook is predicated on a meaningful increase in earnings power and profitability in coming years as the company’s capital base is optimized, its cost structure is right-sized and the asset cap imposed on the company by the U.S. Federal Reserve is eventually lifted, allowing revenues to grow. In the latter case, we judged AIG shares to be selling at a discount to our estimate of tangible book value. AIG recently announced that it intends to separate its life and retirement (L&R) business from its general insurance (P&C) business. In recent years, the P&C side of the business has been strong, while L&R has been a drag on results.
The largest sales by the Markston portion of the Fund were shares of consumer electronics maker Apple; systems software developer Microsoft; and institutional asset management firm State Street. We slightly reduced the Fund’s Apple and Microsoft positions in order to meet redemptions and manage portfolio concentration risk. The Markston portion of the Fund eliminated its full position in State Street, using the proceeds to
buy shares of Wells Fargo, described above. State Street had been losing share in its crucial electronic funds transfer business and, in our opinion, is not as well positioned to manage low rates as Wells Fargo.
Epoch
During the reporting period, the largest purchases in the Epoch portion of the Fund were in shares of semiconductor equipment manufacturer Lam Research and defense contractor Northrop Grumman.
Lam Research is focused on the etch, deposition, and clean markets, which are key steps in the semiconductor manufacturing process, especially for 3D NAND flash storage, advanced DRAM and leading-edge logic/foundry chipmakers. The company’s flagship Kiyo, Vector and Sabre products are sold in all major geographies to key customers such as Samsung Electronics and Taiwan Semiconductor Manufacturing. Lam’s leadership position creates scale advantages that fuel research and development spending. The company’s large installed base creates stickiness and offers Lam an intimate look into problems faced by chipmakers, providing valuable information it can use to implement solutions and additional capabilities in future tools. Chipmakers have endured significant challenges in terms of cost and complexity. Equipment providers are vital to making the pursuit more economical via advanced chip manufacturing tools. Lam has benefited from the sharp rise in etch, deposition and clean steps required as a result of major inflections—including FinFET and planar to 3D NAND—that feature multiple patterning and vertical layers well suited to Lam’s advanced etch and deposition offerings. Consequently, we believe Lam is poised to grow faster than the overall equipment industry, capturing a larger share of the market with technically superior tools.
Northrop Grumman is diversified across short-cycle and long-cycle businesses. The firm’s segments include aeronautics, mission systems, defense services and space systems. The company’s aerospace segment creates the fuselage for the massive F-35 program and produces various piloted and autonomous flight systems. Mission systems creates a variety of sensors and processors for defense hardware. The defense systems segment manufactures long-range missiles and provides defense information technology services. Finally, the company’s space systems segment produces various space structures, sensors and satellites. After a substantial boom in defense spending over 2018-19 to modernize the military, we’re expecting a slowdown in defense budget growth to inflationary levels. However, we believe that defense prime contractors will continue to see business growth because of the 2018 National Defense Strategy’s focus toward defending against great powers conflicts. The three biggest stock-specific growth opportunities we see for Northrop are the Ground Based
Strategic Deterrent, the further militarization of space and the development of the B-21 bomber. Regulated margins, mature markets, customer-paid research and development, and long-term revenue visibility allow defense prime contractors to deliver a lot of cash to shareholders, which we view positively. In our opinion, the growth and stability in the company’s forward cash flows is undervalued.
During the reporting period, the Epoch portion of the Fund sold its position in semiconductor equipment maker Applied Materials for several reasons. The company reported second quarter 2020 revenue and profit growth that fell short of expectations. Although the company’s display business had been posting record growth levels for several years, we believe that growth rate could slow, due partly to lower demand growth for consumer electronics products such as TVs and smartphones, and partly to the current trade tensions between the U.S. and China. One of the key drivers of this projected decline in growth has been the weakness in the TV space, with delays in some major TV factory projects pushing equipment demand into 2021. We believe there could be some pressure in the market for advanced OLED digital displays as well. Although OLED investments and production are expected to pick up in 2021 compared to 2020, it appears that Applied’s OLED production equipment is falling behind the technology sold by its rivals in the backplane and encapsulation space, resulting in some market share losses. With the stock price up over 40% since the low point reached in mid-March, we opted to sell the Epoch portion of the Fund’s holdings and reinvested the proceeds into Lam Research, described above.
Another major sale involved holdings in pharmaceutical developer Pfizer after the company reported a major clinical failure in its adjuvant breast cancer study seeking to combine Pallas with cancer drug Ibrance. Although Pfizer’s management team reiterated its expectation for 6% revenue growth through 2025 (based on the strength of its overall portfolio), in our opinion, the trial failure increased the risk embedded in the company’s revenue forecast. With the shares having recovered by over 25% since the low point reached on March 23, we opted to sell the position.
How did the Fund’s sector weightings change during the reporting period?
Markston
During the reporting period, the most significant sector weightings increases in the Markston portion of the Fund were in information technology, followed by communication services and consumer discretionary. Over the same period, the Markston portion of the Fund decreased its sector exposures to financials, industrials and health care.
| | |
| 12 | | MainStay MAP Equity Fund |
Epoch
The Epoch portion of the Fund increased its sector weightings to information technology and consumer staples. Over the same period, the Epoch portion of the Fund decreased sector allocations to industrials and financials.
How was the Fund positioned at the end of the reporting period?
Markston
As of October 31, 2020, the Markston portion of the Fund held its most overweight exposure relative to the Russell 3000® Index in shares of Apple, Alphabet (the parent company of Internet advertising leader Google) and PayPal. As of the same
date, the Markston portion of the Fund held no exposure to the real estate or utilities sectors, and no exposure to online retailer Amazon.com, all of which represent significant benchmark weights.
Epoch
As of October 31, 2020, the largest overweight sector positions relative to the Russell 3000® Index in the Epoch portion of the Fund were in communication services and financials. As of the same date, the Epoch portion of the Fund held its most underweight benchmark-relative exposures to information technology and utilities.
The opinions expressed are those of the portfolio managers as of the date of this report and are subject to change. There is no guarantee that any forecasts will come to pass. This material does not constitute investment advice and is not intended as an endorsement of any specific investment.
Portfolio of Investments October 31, 2020
| | | | | | | | |
| | |
| | | Shares | | | Value | |
| Common Stocks 99.1%† | |
Aerospace & Defense 2.9% | |
Boeing Co. | | | 69,383 | | | $ | 10,018,211 | |
Northrop Grumman Corp. | | | 13,008 | | | | 3,769,979 | |
Raytheon Technologies Corp. | | | 233,008 | | | | 12,656,994 | |
| | | | | | | | |
| | | | | | | 26,445,184 | |
| | | | | | | | |
Air Freight & Logistics 0.4% | |
XPO Logistics, Inc. (a) | | | 35,495 | | | | 3,194,550 | |
| | | | | | | | |
|
Banks 5.0% | |
Bank of America Corp. | | | 741,036 | | | | 17,562,553 | |
Bank OZK | | | 147,659 | | | | 3,658,990 | |
Citigroup, Inc. | | | 86,035 | | | | 3,563,570 | |
Citizens Financial Group, Inc. | | | 75,211 | | | | 2,049,500 | |
JPMorgan Chase & Co. | | | 96,575 | | | | 9,468,213 | |
U.S. Bancorp | | | 96,343 | | | | 3,752,560 | |
Wells Fargo & Co. | | | 249,901 | | | | 5,360,376 | |
| | | | | | | | |
| | | | | | | 45,415,762 | |
| | | | | | | | |
Beverages 1.3% | |
Coca-Cola Co. | | | 45,817 | | | | 2,201,965 | |
PepsiCo., Inc. | | | 69,699 | | | | 9,290,180 | |
| | | | | | | | |
| | | | | | | 11,492,145 | |
| | | | | | | | |
Biotechnology 1.2% | |
AbbVie, Inc. | | | 87,149 | | | | 7,416,380 | |
Alexion Pharmaceuticals, Inc. (a) | | | 28,050 | | | | 3,229,677 | |
| | | | | | | | |
| | | | | | | 10,646,057 | |
| | | | | | | | |
Building Products 0.2% | |
Carrier Global Corp. | | | 52,752 | | | | 1,761,389 | |
| | | | | | | | |
|
Capital Markets 2.7% | |
Bank of New York Mellon Corp. | | | 61,577 | | | | 2,115,786 | |
Goldman Sachs Group, Inc. | | | 36,638 | | | | 6,926,048 | |
KKR & Co., Inc. | | | 118,074 | | | | 4,032,227 | |
Morgan Stanley | | | 236,898 | | | | 11,406,638 | |
| | | | | | | | |
| | | | | | | 24,480,699 | |
| | | | | | | | |
Chemicals 1.1% | |
Dow, Inc. | | | 51,700 | | | | 2,351,833 | |
DuPont de Nemours, Inc. | | | 53,527 | | | | 3,044,616 | |
Linde PLC | | | 18,649 | | | | 4,109,120 | |
| | | | | | | | |
| | | | | | | 9,505,569 | |
| | | | | | | | |
Communications Equipment 0.5% | |
Arista Networks, Inc. (a) | | | 21,028 | | | | 4,392,749 | |
| | | | | | | | |
|
Construction & Engineering 0.5% | |
Jacobs Engineering Group, Inc. | | | 49,653 | | | | 4,717,035 | |
| | | | | | | | |
|
Construction Materials 0.3% | |
Martin Marietta Materials, Inc. | | | 11,511 | | | | 3,065,955 | |
| | | | | | | | |
| | | | | | | | |
| | |
| | | Shares | | | Value | |
Consumer Finance 1.1% | |
American Express Co. | | | 89,526 | | | $ | 8,168,352 | |
Discover Financial Services | | | 34,200 | | | | 2,223,342 | |
| | | | | | | | |
| | | | | | | 10,391,694 | |
| | | | | | | | |
Diversified Financial Services 1.1% | |
Berkshire Hathaway, Inc., Class B (a) | | | 34,132 | | | | 6,891,251 | |
Equitable Holdings, Inc. | | | 159,286 | | | | 3,423,056 | |
| | | | | | | | |
| | | | | | | 10,314,307 | |
| | | | | | | | |
Diversified Telecommunication Services 1.1% | |
AT&T, Inc. | | | 291,049 | | | | 7,864,144 | |
GCI Liberty, Inc., Class A (a) | | | 21,455 | | | | 1,742,790 | |
| | | | | | | | |
| | | | | | | 9,606,934 | |
| | | | | | | | |
Electrical Equipment 1.1% | |
AMETEK, Inc. | | | 43,169 | | | | 4,239,196 | |
Rockwell Automation, Inc. | | | 25,086 | | | | 5,948,392 | |
| | | | | | | | |
| | | | | | | 10,187,588 | |
| | | | | | | | |
Electronic Equipment, Instruments & Components 0.6% | |
TE Connectivity, Ltd. | | | 59,361 | | | | 5,750,894 | |
| | | | | | | | |
|
Energy Equipment & Services 0.1% | |
Schlumberger N.V. | | | 59,316 | | | | 886,181 | |
| | | | | | | | |
|
Entertainment 3.4% | |
Electronic Arts, Inc. (a) | | | 45,050 | | | | 5,398,341 | |
Liberty Media Corp-Liberty Formula One, Class C (a) | | | 53,385 | | | | 1,928,800 | |
Madison Square Garden Entertainment Corp. (a) | | | 36,793 | | | | 2,391,545 | |
Madison Square Garden Sports Corp. (a) | | | 36,793 | | | | 5,211,361 | |
Walt Disney Co. | | | 129,999 | | | | 15,762,379 | |
| | | | | | | | |
| | | | | | | 30,692,426 | |
| | | | | | | | |
Food & Staples Retailing 1.4% | |
Performance Food Group Co. (a) | | | 89,140 | | | | 2,995,995 | |
Walgreens Boots Alliance, Inc. | | | 86,794 | | | | 2,954,468 | |
Walmart, Inc. | | | 46,508 | | | | 6,452,985 | |
| | | | | | | | |
| | | | | | | 12,403,448 | |
| | | | | | | | |
Food Products 1.1% | |
Lamb Weston Holdings, Inc. | | | 46,623 | | | | 2,958,229 | |
McCormick & Co., Inc. | | | 24,136 | | | | 4,356,790 | |
Mondelez International, Inc., Class A | | | 53,391 | | | | 2,836,130 | |
| | | | | | | | |
| | | | | | | 10,151,149 | |
| | | | | | | | |
Health Care Equipment & Supplies 2.9% | |
Abbott Laboratories | | | 48,017 | | | | 5,047,067 | |
Danaher Corp. | | | 36,607 | | | | 8,402,771 | |
Medtronic PLC | | | 131,154 | | | | 13,190,157 | |
| | | | | | | | |
| | | | | | | 26,639,995 | |
| | | | | | | | |
| | | | |
| 14 | | MainStay MAP Equity Fund | | The notes to the financial statements are an integral part of,
and should be read in conjunction with, the financial statements. |
| | | | | | | | |
| | |
| | | Shares | | | Value | |
| Common Stocks (continued) | |
Health Care Providers & Services 2.8% | |
Centene Corp. (a) | | | 94,589 | | | $ | 5,590,210 | |
CVS Health Corp. | | | 222,164 | | | | 12,461,179 | |
UnitedHealth Group, Inc. | | | 22,908 | | | | 6,990,147 | |
| | | | | | | | |
| | | | | | | 25,041,536 | |
| | | | | | | | |
Hotels, Restaurants & Leisure 1.3% | |
Marriott International, Inc., Class A | | | 22,550 | | | | 2,094,444 | |
McDonald’s Corp. | | | 23,205 | | | | 4,942,665 | |
Restaurant Brands International, Inc. | | | 70,721 | | | | 3,677,492 | |
Vail Resorts, Inc. | | | 6,101 | | | | 1,415,676 | |
| | | | | | | | |
| | | | | | | 12,130,277 | |
| | | | | | | | |
Household Durables 0.5% | |
NVR, Inc. (a) | | | 1,036 | | | | 4,095,401 | |
| | | | | | | | |
|
Household Products 0.3% | |
Procter & Gamble Co. | | | 20,874 | | | | 2,861,825 | |
| | | | | | | | |
|
Industrial Conglomerates 0.8% | |
Honeywell International, Inc. | | | 45,617 | | | | 7,524,524 | |
| | | | | | | | |
|
Insurance 3.4% | |
American International Group, Inc. | | | 328,895 | | | | 10,356,903 | |
Chubb, Ltd. | | | 27,936 | | | | 3,629,166 | |
MetLife, Inc. | | | 138,433 | | | | 5,239,689 | |
Travelers Cos., Inc. | | | 71,100 | | | | 8,582,481 | |
Willis Towers Watson PLC | | | 16,653 | | | | 3,038,840 | |
| | | | | | | | |
| | | | | | | 30,847,079 | |
| | | | | | | | |
Interactive Media & Services 9.9% | |
Alphabet, Inc. (a) | | | | | | | | |
Class A | | | 9,298 | | | | 15,026,591 | |
Class C | | | 26,486 | | | | 42,934,071 | |
Facebook, Inc., Class A (a) | | | 105,212 | | | | 27,682,329 | |
Tencent Holdings, Ltd., ADR | | | 54,231 | | | | 4,139,995 | |
| | | | | | | | |
| | | | | | | 89,782,986 | |
| | | | | | | | |
Internet & Direct Marketing Retail 1.4% | |
Alibaba Group Holding, Ltd., Sponsored ADR (a) | | | 11,285 | | | | 3,438,427 | |
Booking Holdings, Inc. (a) | | | 2,347 | | | | 3,808,007 | |
eBay, Inc. | | | 83,641 | | | | 3,983,821 | |
Trip.com Group, Ltd., ADR (a) | | | 38,990 | | | | 1,121,352 | |
| | | | | | | | |
| | | | | | | 12,351,607 | |
| | | | | | | | |
IT Services 5.2% | |
Automatic Data Processing, Inc. | | | 25,600 | | | | 4,043,776 | |
PayPal Holdings, Inc. (a) | | | 173,449 | | | | 32,284,062 | |
Visa, Inc., Class A | | | 59,495 | | | | 10,810,837 | |
| | | | | | | | |
| | | | | | | 47,138,675 | |
| | | | | | | | |
Life Sciences Tools & Services 2.1% | |
Agilent Technologies, Inc. | | | 65,042 | | | | 6,640,138 | |
| | | | | | | | |
| | |
| | | Shares | | | Value | |
Life Sciences Tools & Services (continued) | |
Charles River Laboratories International, Inc. (a) | | | 27,168 | | | $ | 6,186,154 | |
Thermo Fisher Scientific, Inc. | | | 12,893 | | | | 6,099,936 | |
| | | | | | | | |
| | | | | | | 18,926,228 | |
| | | | | | | | |
Machinery 0.7% | |
Caterpillar, Inc. | | | 13,558 | | | | 2,129,284 | |
Middleby Corp. (a) | | | 29,201 | | | | 2,906,668 | |
Otis Worldwide Corp. | | | 18,148 | | | | 1,112,109 | |
| | | | | | | | |
| | | | | | | 6,148,061 | |
| | | | | | | | |
Media 6.1% | |
Comcast Corp., Class A | | | 310,596 | | | | 13,119,575 | |
Fox Corp., Class A | | | 84,543 | | | | 2,242,081 | |
Liberty Broadband Corp. (a) | | | | | | | | |
Class A | | | 16,626 | | | | 2,336,784 | |
Class C | | | 97,998 | | | | 13,887,297 | |
Liberty Media Corp-Liberty SiriusXM (a) | | | | | | | | |
Class A | | | 221,067 | | | | 7,642,286 | |
Class C | | | 379,692 | | | | 13,137,343 | |
Nexstar Media Group, Inc., Class A | | | 40,483 | | | | 3,335,799 | |
| | | | | | | | |
| | | | | | | 55,701,165 | |
| | | | | | | | |
Multiline Retail 1.1% | |
Dollar General Corp. | | | 19,838 | | | | 4,140,389 | |
Dollar Tree, Inc. (a) | | | 65,502 | | | | 5,916,141 | |
| | | | | | | | |
| | | | | | | 10,056,530 | |
| | | | | | | | |
Oil, Gas & Consumable Fuels 1.6% | |
ConocoPhillips | | | 54,735 | | | | 1,566,516 | |
Enbridge, Inc. | | | 116,560 | | | | 3,212,394 | |
EOG Resources, Inc. | | | 14,518 | | | | 497,096 | |
Marathon Petroleum Corp. | | | 123,847 | | | | 3,653,486 | |
Phillips 66 | | | 43,873 | | | | 2,047,114 | |
Texas Pacific Land Trust (b) | | | 5,564 | | | | 2,506,081 | |
Williams Cos., Inc. | | | 73,662 | | | | 1,413,574 | |
| | | | | | | | |
| | | | | | | 14,896,261 | |
| | | | | | | | |
Pharmaceuticals 2.3% | |
Bristol-Myers Squibb Co. | | | 35,213 | | | | 2,058,200 | |
Johnson & Johnson | | | 37,159 | | | | 5,094,870 | |
Merck & Co., Inc. | | | 128,873 | | | | 9,692,539 | |
Pfizer, Inc. | | | 115,657 | | | | 4,103,510 | |
| | | | | | | | |
| | | | | | | 20,949,119 | |
| | | | | | | | |
Professional Services 0.3% | |
Insperity, Inc. | | | 39,831 | | | | 3,050,258 | |
| | | | | | | | |
|
Real Estate Management & Development 0.4% | |
Jones Lang LaSalle, Inc. | | | 31,197 | | | | 3,520,893 | |
| | | | | | | | |
|
Road & Rail 3.0% | |
CSX Corp. | | | 86,541 | | | | 6,831,546 | |
Norfolk Southern Corp. | | | 19,033 | | | | 3,980,181 | |
| | | | | | |
The notes to the financial statements are an integral part of,
and should be read in conjunction with, the financial statements. | | | | | 15 | |
Portfolio of Investments October 31, 2020 (continued)
| | | | | | | | |
| | |
| | | Shares | | | Value | |
| Common Stocks (continued) | |
Road & Rail (continued) | |
Union Pacific Corp. | | | 90,525 | | | $ | 16,040,125 | |
| | | | | | | | |
| | | | | | | 26,851,852 | |
| | | | | | | | |
Semiconductors & Semiconductor Equipment 3.2% | |
Broadcom, Inc. | | | 24,251 | | | | 8,478,877 | |
Intel Corp. | | | 31,286 | | | | 1,385,344 | |
Lam Research Corp. | | | 16,730 | | | | 5,722,998 | |
Micron Technology, Inc. (a) | | | 108,864 | | | | 5,480,214 | |
Texas Instruments, Inc. | | | 14,876 | | | | 2,150,921 | |
Universal Display Corp. | | | 31,312 | | | | 6,209,483 | |
| | | | | | | | |
| | | | | | | 29,427,837 | |
| | | | | | | | |
Software 10.1% | |
Aspen Technology, Inc. (a) | | | 36,607 | | | | 4,019,815 | |
Dropbox, Inc., Class A (a) | | | 202,341 | | | | 3,694,746 | |
Microsoft Corp. | | | 360,940 | | | | 73,079,522 | |
Oracle Corp. | | | 195,371 | | | | 10,962,267 | |
| | | | | | | | |
| | | | | | | 91,756,350 | |
| | | | | | | | |
Specialty Retail 3.9% | |
CarMax, Inc. (a) | | | 33,115 | | | | 2,862,460 | |
Home Depot, Inc. | | | 58,157 | | | | 15,511,054 | |
Lowe’s Cos., Inc. | | | 78,150 | | | | 12,355,515 | |
TJX Cos., Inc. | | | 92,978 | | | | 4,723,282 | |
| | | | | | | | |
| | | | | | | 35,452,311 | |
| | | | | | | | |
Technology Hardware, Storage & Peripherals 7.2% | |
Apple, Inc. | | | 603,325 | | | | 65,677,960 | |
| | | | | | | | |
|
Thrifts & Mortgage Finance 0.5% | |
Axos Financial, Inc. (a) | | | 150,959 | | | | 4,115,142 | |
| | | | | | | | |
|
Tobacco 0.4% | |
Philip Morris International, Inc. | | | 53,540 | | | | 3,802,411 | |
| | | | | | | | |
| | | | | | | | |
| | |
| | | Shares | | | Value | |
Wireless Telecommunication Services 0.6% | |
T-Mobile U.S., Inc. (a) | | | 50,422 | | | $ | 5,524,739 | |
| | | | | | | | |
Total Common Stocks
(Cost $494,563,425) | | | | | | | 899,772,737 | |
| | | | | | | | |
|
| Short-Term Investments 0.8% | |
Affiliated Investment Company 0.5% | |
MainStay U.S. Government Liquidity Fund, 0.02% (c) | | | 5,057,209 | | | | 5,057,209 | |
| | | | | | | | |
|
Unaffiliated Investment Company 0.3% | |
State Street Navigator Securities Lending Government Money Market Portfolio, 0.09% (c)(d) | | | 2,610,792 | | | | 2,610,792 | |
| | | | | | | | |
Total Short-Term Investments
(Cost $7,668,001) | | | | | | | 7,668,001 | |
| | | | | | | | |
Total Investments
(Cost $502,231,426) | | | 99.9 | % | | | 907,440,738 | |
Other Assets, Less Liabilities | | | 0.1 | | | | 564,128 | |
Net Assets | | | 100.0 | % | | $ | 908,004,866 | |
| † | Percentages indicated are based on Fund net assets. |
| (a) | Non-income producing security. |
| (b) | All or a portion of this security was held on loan. As of October 31, 2020, the aggregate market value of securities on loan was $2,480,858. The Fund received cash collateral with a value of $2,610,792 (See Note 2(J)). |
| (c) | Current yield as of October 31, 2020. |
| (d) | Represents a security purchased with cash collateral received for securities on loan. |
The following abbreviations are used in the preceding pages:
ADR—American Depositary Receipt
The following is a summary of the fair valuations according to the inputs used as of October 31, 2020, for valuing the Fund’s assets:
| | | | | | | | | | | | | | | | |
Description | | Quoted
Prices in
Active
Markets for
Identical
Assets
(Level 1) | | | Significant
Other
Observable
Inputs
(Level 2) | | | Significant
Unobservable
Inputs
(Level 3) | | | Total | |
| | | | |
Asset Valuation Inputs | | | | | | | | | | | | | | | | |
| Investments in Securities (a) | | | | | | | | | | | | | | | | |
| Common Stocks | | $ | 899,772,737 | | | $ | — | | | $ | — | | | $ | 899,772,737 | |
| Short-Term Investments | | | | | | | | | | | | | | | | |
Affiliated Investment Company | | | 5,057,209 | | | | — | | | | — | | | | 5,057,209 | |
Unaffiliated Investment Company | | | 2,610,792 | | | | — | | | | — | | | | 2,610,792 | |
| | | | | | | | | | | | | | | | |
| Total Short-Term Investments | | | 7,668,001 | | | | — | | | | — | | | | 7,668,001 | |
| | | | | | | | | | | | | | | | |
| Total Investments in Securities | | $ | 907,440,738 | | | $ | — | | | $ | — | | | $ | 907,440,738 | |
| | | | | | | | | | | | | | | | |
| (a) | For a complete listing of investments and their industries, see the Portfolio of Investments. |
| | | | |
| 16 | | MainStay MAP Equity Fund | | The notes to the financial statements are an integral part of,
and should be read in conjunction with, the financial statements. |
Statement of Assets and Liabilities as of October 31, 2020
| | | | |
| Assets | |
Investment in unaffiliated securities, at value
(identified cost $497,174,217) including
securities on loan of $2,480,858 | | $ | 902,383,529 | |
Investment in affiliated investment company, at value
(identified cost $5,057,209) | | | 5,057,209 | |
Cash | | | 240,548 | |
Receivables: | | | | |
Investment securities sold | | | 3,228,962 | |
Dividends | | | 824,046 | |
Fund shares sold | | | 243,560 | |
Securities lending | | | 922 | |
Other assets | | | 48,337 | |
| | | | |
Total assets | | | 912,027,113 | |
| | | | |
|
| Liabilities | |
Cash collateral received for securities on loan | | | 2,610,792 | |
Payables: | | | | |
Manager (See Note 3) | | | 616,166 | |
Fund shares redeemed | | | 417,678 | |
Transfer agent (See Note 3) | | | 133,972 | |
NYLIFE Distributors (See Note 3) | | | 128,461 | |
Shareholder communication | | | 39,486 | |
Investment securities purchased | | | 38,967 | |
Professional fees | | | 30,312 | |
Custodian | | | 5,166 | |
Trustees | | | 1,247 | |
| | | | |
Total liabilities | | | 4,022,247 | |
| | | | |
Net assets | | $ | 908,004,866 | |
| | | | |
| |
| Composition of Net Assets | | | | |
Shares of beneficial interest outstanding (par value of $.01 per share) unlimited number of shares authorized | | $ | 227,291 | |
Additional paid-in capital | | | 468,095,542 | |
| | | | |
| | | 468,322,833 | |
Total distributable earnings (loss) | | | 439,682,033 | |
| | | | |
Net assets | | $ | 908,004,866 | |
| | | | |
| | | | |
Class A | | | | |
Net assets applicable to outstanding shares | | $ | 389,530,070 | |
| | | | |
Shares of beneficial interest outstanding | | | 9,864,221 | |
| | | | |
Net asset value per share outstanding | | $ | 39.49 | |
Maximum sales charge (5.50% of offering price) | | | 2.30 | |
| | | | |
Maximum offering price per share outstanding | | $ | 41.79 | |
| | | | |
Investor Class | | | | |
Net assets applicable to outstanding shares | | $ | 69,423,495 | |
| | | | |
Shares of beneficial interest outstanding | | | 1,761,936 | |
| | | | |
Net asset value per share outstanding | | $ | 39.40 | |
Maximum sales charge (5.00% of offering price) | | | 2.07 | |
| | | | |
Maximum offering price per share outstanding | | $ | 41.47 | |
| | | | |
Class B | | | | |
Net assets applicable to outstanding shares | | $ | 14,211,836 | |
| | | | |
Shares of beneficial interest outstanding | | | 418,348 | |
| | | | |
Net asset value and offering price per share outstanding | | $ | 33.97 | |
| | | | |
Class C | | | | |
Net assets applicable to outstanding shares | | $ | 14,314,764 | |
| | | | |
Shares of beneficial interest outstanding | | | 421,284 | |
| | | | |
Net asset value and offering price per share outstanding | | $ | 33.98 | |
| | | | |
Class I | | | | |
Net assets applicable to outstanding shares | | $ | 417,328,506 | |
| | | | |
Shares of beneficial interest outstanding | | | 10,182,463 | |
| | | | |
Net asset value and offering price per share outstanding | | $ | 40.99 | |
| | | | |
Class R1 | | | | |
Net assets applicable to outstanding shares | | $ | 38,272 | |
| | | | |
Shares of beneficial interest outstanding | | | 959 | |
| | | | |
Net asset value and offering price per share outstanding (a) | | $ | 39.90 | |
| | | | |
Class R2 | | | | |
Net assets applicable to outstanding shares | | $ | 715,918 | |
| | | | |
Shares of beneficial interest outstanding | | | 18,016 | |
| | | | |
Net asset value and offering price per share outstanding | | $ | 39.74 | |
| | | | |
Class R3 | | | | |
Net assets applicable to outstanding shares | | $ | 2,442,005 | |
| | | | |
Shares of beneficial interest outstanding | | | 61,850 | |
| | | | |
Net asset value and offering price per share outstanding | | $ | 39.48 | |
| | | | |
| (a) | The difference between the recalculated and stated NAV was caused by rounding. |
| | | | | | |
The notes to the financial statements are an integral part of,
and should be read in conjunction with, the financial statements. | | | | | 17 | |
Statement of Operations for the year ended October 31, 2020
| | | | |
| Investment Income (Loss) | |
Income | | | | |
Dividends-unaffiliated (a) | | $ | 16,213,155 | |
Dividends-affiliated | | | 67,493 | |
Securities lending | | | 20,778 | |
Other | | | 159 | |
| | | | |
Total income | | | 16,301,585 | |
| | | | |
Expenses | | | | |
Manager (See Note 3) | | | 7,493,498 | |
Distribution/Service—Class A (See Note 3) | | | 1,010,431 | |
Distribution/Service—Investor Class (See Note 3) | | | 181,394 | |
Distribution/Service—Class B (See Note 3) | | | 172,807 | |
Distribution/Service—Class C (See Note 3) | | | 192,210 | |
Distribution/Service—Class R2 (See Note 3) | | | 1,786 | |
Distribution/Service—Class R3 (See Note 3) | | | 11,537 | |
Transfer agent (See Note 3) | | | 797,340 | |
Professional fees | | | 134,077 | |
Registration | | | 117,611 | |
Shareholder communication | | | 64,847 | |
Custodian | | | 33,430 | |
Trustees | | | 23,452 | |
Shareholder service (See Note 3) | | | 3,058 | |
Interest expense | | | 1,067 | |
Miscellaneous | | | 52,901 | |
| | | | |
Total expenses before waiver/reimbursement | | | 10,291,446 | |
Expense waiver/reimbursement from Manager (See Note 3) | | | (7,093 | ) |
| | | | |
Net expenses | | | 10,284,353 | |
| | | | |
Net investment income (loss) | | | 6,017,232 | |
| | | | |
|
| Realized and Unrealized Gain (Loss) | |
Net realized gain (loss) on: | | | | |
Unaffiliated investment transactions | | | 33,051,619 | |
Foreign currency transactions | | | 8,156 | |
| | | | |
Net realized gain (loss) | | | 33,059,775 | |
| | | | |
Net change in unrealized appreciation (depreciation) on: | | | | |
Unaffiliated investments | | | (14,978,064 | ) |
Translation of other assets and liabilities in foreign currencies | | | (1,285 | ) |
| | | | |
Net change in unrealized appreciation (depreciation) | | | (14,979,349 | ) |
| | | | |
Net realized and unrealized gain (loss) | | | 18,080,426 | |
| | | | |
Net increase (decrease) in net assets resulting from operations | | $ | 24,097,658 | |
| | | | |
| (a) | Dividends recorded net of foreign withholding taxes in the amount of $60,263. |
| | | | |
| 18 | | MainStay MAP Equity Fund | | The notes to the financial statements are an integral part of,
and should be read in conjunction with, the financial statements. |
Statements of Changes in Net Assets
for the years ended October 31, 2020 and October 31, 2019
| | | | | | | | |
| | | 2020 | | | 2019 | |
| Increase (Decrease) in Net Assets | |
Operations: | | | | | | | | |
Net investment income (loss) | | $ | 6,017,232 | | | $ | 7,385,878 | |
Net realized gain (loss) | | | 33,059,775 | | | | 94,810,173 | |
Net change in unrealized appreciation (depreciation) | | | (14,979,349 | ) | | | 30,309,825 | |
| | | | |
Net increase (decrease) in net assets resulting from operations | | | 24,097,658 | | | | 132,505,876 | |
| | | | |
Distributions to shareholders: | | | | | | | | |
Class A | | | (35,152,551 | ) | | | (37,992,504 | ) |
Investor Class | | | (6,477,707 | ) | | | (7,461,062 | ) |
Class B | | | (1,807,649 | ) | | | (2,760,444 | ) |
Class C | | | (1,954,564 | ) | | | (6,682,486 | ) |
Class I | | | (39,605,302 | ) | | | (47,487,185 | ) |
Class R1 | | | (2,963 | ) | | | (3,004 | ) |
Class R2 | | | (63,839 | ) | | | (85,314 | ) |
Class R3 | | | (184,909 | ) | | | (183,995 | ) |
| | | | |
Total distributions to shareholders | | | (85,249,484 | ) | | | (102,655,994 | ) |
| | | | |
Capital share transactions: | | | | | | | | |
Net proceeds from sale of shares | | | 56,997,188 | | | | 206,925,503 | |
Net asset value of shares issued to shareholders in reinvestment of distributions | | | 83,179,267 | | | | 100,091,433 | |
Cost of shares redeemed | | | (214,672,993 | ) | | | (334,234,347 | ) |
| | | | |
Increase (decrease) in net assets derived from capital share transactions | | | (74,496,538 | ) | | | (27,217,411 | ) |
| | | | |
Net increase (decrease) in net assets | | | (135,648,364 | ) | | | 2,632,471 | |
|
| Net Assets | |
Beginning of year | | | 1,043,653,230 | | | | 1,041,020,759 | |
| | | | |
End of year | | $ | 908,004,866 | | | $ | 1,043,653,230 | |
| | | | |
| | | | | | |
The notes to the financial statements are an integral part of,
and should be read in conjunction with, the financial statements. | | | | | 19 | |
Financial Highlights selected per share data and ratios
| | | | | | | | | | | | | | | | | | | | |
| |
| | | Year ended October 31, | |
| | | | | |
| Class A | | 2020 | | | 2019 | | | 2018 | | | 2017 | | | 2016 | |
| | | | | |
Net asset value at beginning of year | | $ | 42.24 | | | $ | 41.20 | | | $ | 43.76 | | | $ | 35.92 | | | $ | 43.32 | |
| | | | | | | | | | | | | | | | | | | | |
| | | | | |
Net investment income (loss) (a) | | | 0.21 | | | | 0.26 | | | | 0.23 | | | | 0.21 | | | | 0.33 | |
| | | | | |
Net realized and unrealized gain (loss) on investments | | | 0.55 | | | | 4.88 | | | | 1.78 | | | | 8.50 | | | | (0.63 | ) |
| | | | | |
Net realized and unrealized gain (loss) on foreign currency transactions | | | 0.00 | ‡ | | | 0.00 | ‡ | | | 0.01 | | | | 0.00 | ‡ | | | (0.00 | )‡ |
| | | | | | | | | | | | | | | | | | | | |
| | | | | |
Total from investment operations | | | 0.76 | | | | 5.14 | | | | 2.02 | | | | 8.71 | | | | (0.30 | ) |
| | | | | | | | | | | | | | | | | | | | |
| | | | | |
| Less distributions: | | | | | | | | | | | | | | | | | | | | |
| | | | | |
From net investment income | | | (0.31 | ) | | | (0.28 | ) | | | (0.21 | ) | | | (0.48 | ) | | | (0.40 | ) |
| | | | | |
From net realized gain on investments | | | (3.20 | ) | | | (3.82 | ) | | | (4.37 | ) | | | (0.39 | ) | | | (6.70 | ) |
| | | | | | | | | | | | | | | | | | | | |
| | | | | |
Total distributions | | | (3.51 | ) | | | (4.10 | ) | | | (4.58 | ) | | | (0.87 | ) | | | (7.10 | ) |
| | | | | | | | | | | | | | | | | | | | |
| | | | | |
Net asset value at end of year | | $ | 39.49 | | | $ | 42.24 | | | $ | 41.20 | | | $ | 43.76 | | | $ | 35.92 | |
| | | | | | | | | | | | | | | | | | | | |
| | | | | |
Total investment return (b) | | | 1.66 | % | | | 13.54 | % | | | 4.88 | % | | | 24.73 | % | | | (0.57 | %) |
| | | | | |
| Ratios (to average net assets)/Supplemental Data: | | | | | | | | | | | | | | | | | | | | |
| | | | | |
Net investment income (loss) | | | 0.55 | % | | | 0.67 | % | | | 0.57 | % | | | 0.52 | % | | | 0.92 | % |
| | | | | |
Net expenses (c) | | | 1.10 | %(d) | | | 1.11 | % | | | 1.10 | % | | | 1.10 | %(d) | | | 1.09 | % (d) |
| | | | | |
Portfolio turnover rate | | | 16 | % | | | 20 | % | | | 15 | % | | | 15 | % | | | 42 | % |
| | | | | |
Net assets at end of year (in 000’s) | | $ | 389,530 | | | $ | 427,040 | | | $ | 384,637 | | | $ | 389,582 | | | $ | 285,431 | |
| ‡ | Less than one cent per share. |
| (a) | Per share data based on average shares outstanding during the year. |
| (b) | Total investment return is calculated exclusive of sales charges and assumes the reinvestment of distributions. For periods of less than one year, total return is not annualized. |
| (c) | In addition to the fees and expenses which the Fund bears directly, it also indirectly bears a pro-rata share of the fees and expenses of the underlying funds in which it invests. Such indirect expenses are not included in the above expense ratios. |
| (d) | Net of interest expense which is less than one-tenth of a percent. (See Note 6) |
| | | | | | | | | | | | | | | | | | | | |
| |
| | | Year ended October 31, | |
| | | | | |
| Investor Class | | 2020 | | | 2019 | | | 2018 | | | 2017 | | | 2016 | |
| | | | | |
Net asset value at beginning of year | | $ | 42.17 | | | $ | 41.15 | | | $ | 43.68 | | | $ | 35.85 | | | $ | 43.27 | |
| | | | | | | | | | | | | | | | | | | | |
| | | | | |
Net investment income (loss) (a) | | | 0.10 | | | | 0.18 | | | | 0.17 | | | | 0.14 | | | | 0.25 | |
| | | | | |
Net realized and unrealized gain (loss) on investments | | | 0.53 | | | | 4.86 | | | | 1.78 | | | | 8.49 | | | | (0.63 | ) |
| | | | | |
Net realized and unrealized gain (loss) on foreign currency transactions ‡ | | | 0.00 | | | | 0.00 | | | | (0.00 | ) | | | 0.00 | | | | (0.00 | ) |
| | | | | | | | | | | | | | | | | | | | |
| | | | | |
Total from investment operations | | | 0.63 | | | | 5.04 | | | | 1.95 | | | | 8.63 | | | | (0.38 | ) |
| | | | | | | | | | | | | | | | | | | | |
| | | | | |
| Less distributions: | | | | | | | | | | | | | | | | | | | | |
| | | | | |
From net investment income | | | (0.20 | ) | | | (0.20 | ) | | | (0.11 | ) | | | (0.41 | ) | | | (0.34 | ) |
| | | | | |
From net realized gain on investments | | | (3.20 | ) | | | (3.82 | ) | | | (4.37 | ) | | | (0.39 | ) | | | (6.70 | ) |
| | | | | | | | | | | | | | | | | | | | |
| | | | | |
Total distributions | | | (3.40 | ) | | | (4.02 | ) | | | (4.48 | ) | | | (0.80 | ) | | | (7.04 | ) |
| | | | | | | | | | | | | | | | | | | | |
| | | | | |
Net asset value at end of year | | $ | 39.40 | | | $ | 42.17 | | | $ | 41.15 | | | $ | 43.68 | | | $ | 35.85 | |
| | | | | | | | | | | | | | | | | | | | |
| | | | | |
Total investment return (b) | | | 1.35 | % | | | 13.27 | % | | | 4.69 | % | | | 24.50 | % | | | (0.79 | %) |
| | | | | |
| Ratios (to average net assets)/Supplemental Data: | | | | | | | | | | | | | | | | | | | | |
| | | | | |
Net investment income (loss) | | | 0.25 | % | | | 0.46 | % | | | 0.39 | % | | | 0.36 | % | | | 0.71 | % |
| | | | | |
Net expenses (c) | | | 1.40 | %(d) | | | 1.33 | % | | | 1.29 | % | | | 1.29 | %(d) | | | 1.29 | % (d) |
| | | | | |
Expenses (before waiver/reimbursement) | | | 1.41 | % | | | 1.38 | % | | | 1.31 | % | | | 1.29 | % | | | 1.29 | % |
| | | | | |
Portfolio turnover rate | | | 16 | % | | | 20 | % | | | 15 | % | | | 15 | % | | | 42 | % |
| | | | | |
Net assets at end of year (in 000’s) | | $ | 69,423 | | | $ | 80,733 | | | $ | 76,844 | | | $ | 90,928 | | | $ | 139,775 | |
| ‡ | Less than one cent per share. |
| (a) | Per share data based on average shares outstanding during the year. |
| (b) | Total investment return is calculated exclusive of sales charges and assumes the reinvestment of distributions. For periods of less than one year, total return is not annualized. |
| (c) | In addition to the fees and expenses which the Fund bears directly, it also indirectly bears a pro-rata share of the fees and expenses of the underlying funds in which it invests. Such indirect expenses are not included in the above expense ratios. |
| (d) | Net of interest expense which is less than one-tenth of a percent. (See Note 6) |
| | | | |
| 20 | | MainStay MAP Equity Fund | | The notes to the financial statements are an integral part of,
and should be read in conjunction with, the financial statements. |
Financial Highlights selected per share data and ratios
| | | | | | | | | | | | | | | | | | | | |
| |
| | | Year ended October 31, | |
| | | | | |
| Class B | | 2020 | | | 2019 | | | 2018 | | | 2017 | | | 2016 | |
| | | | | |
Net asset value at beginning of year | | $ | 36.88 | | | $ | 36.53 | | | $ | 39.43 | | | $ | 32.42 | | | $ | 39.74 | |
| | | | | | | | | | | | | | | | | | | | |
| | | | | |
Net investment income (loss) (a) | | | (0.16 | ) | | | (0.09 | ) | | | (0.13 | ) | | | (0.13 | ) | | | (0.01 | ) |
| | | | | |
Net realized and unrealized gain (loss) on investments | | | 0.45 | | | | 4.26 | | | | 1.60 | | | | 7.67 | | | | (0.60 | ) |
| | | | | |
Net realized and unrealized gain (loss) on foreign currency transactions ‡ | | | 0.00 | | | | 0.00 | | | | (0.00 | ) | | | 0.00 | | | | (0.00 | ) |
| | | | | | | | | | | | | | | | | | | | |
| | | | | |
Total from investment operations | | | 0.29 | | | | 4.17 | | | | 1.47 | | | | 7.54 | | | | (0.61 | ) |
| | | | | | | | | | | | | | | | | | | | |
| | | | | |
| Less distributions: | | | | | | | | | | | | | | | | | | | | |
| | | | | |
From net investment income | | | — | | | | — | | | | — | | | | (0.14 | ) | | | (0.01 | ) |
| | | | | |
From net realized gain on investments | | | (3.20 | ) | | | (3.82 | ) | | | (4.37 | ) | | | (0.39 | ) | | | (6.70 | ) |
| | | | | | | | | | | | | | | | | | | | |
| | | | | |
Total distributions | | | (3.20 | ) | | | (3.82 | ) | | | (4.37 | ) | | | (0.53 | ) | | | (6.71 | ) |
| | | | | | | | | | | | | | | | | | | | |
| | | | | |
Net asset value at end of year | | $ | 33.97 | | | $ | 36.88 | | | $ | 36.53 | | | $ | 39.43 | | | $ | 32.42 | |
| | | | | | | | | | | | | | | | | | | | |
| | | | | |
Total investment return (b) | | | 0.57 | % | | | 12.45 | % | | | 3.91 | % | | | 23.55 | % | | | (1.52 | %) |
| | | | | |
| Ratios (to average net assets)/Supplemental Data: | | | | | | | | | | | | | | | | | | | | |
| | | | | |
Net investment income (loss) | | | (0.48 | %) | | | (0.27 | %) | | | (0.35 | %) | | | (0.37 | %) | | | (0.03 | %) |
| | | | | |
Net expenses (c) | | | 2.15 | % (d) | | | 2.08 | % | | | 2.04 | % | | | 2.05 | % (d) | | | 2.04 | % (d) |
| | | | | |
Expenses (before waiver/reimbursement) | | | 2.16 | % | | | 2.13 | % | | | 2.06 | % | | | 2.05 | % | | | 2.04 | % |
| | | | | |
Portfolio turnover rate | | | 16 | % | | | 20 | % | | | 15 | % | | | 15 | % | | | 42 | % |
| | | | | |
Net assets at end of year (in 000’s) | | $ | 14,212 | | | $ | 21,088 | | | $ | 26,571 | | | $ | 35,841 | | | $ | 40,977 | |
| ‡ | Less than one cent per share. |
| (a) | Per share data based on average shares outstanding during the year. |
| (b) | Total investment return is calculated exclusive of sales charges and assumes the reinvestment of distributions. For periods of less than one year, total return is not annualized. |
| (c) | In addition to the fees and expenses which the Fund bears directly, it also indirectly bears a pro-rata share of the fees and expenses of the underlying funds in which it invests. Such indirect expenses are not included in the above expense ratios. |
| (d) | Net of interest expense which is less than one-tenth of a percent. (See Note 6) |
| | | | | | | | | | | | | | | | | | | | |
| |
| | | Year ended October 31, | |
| | | | | |
| Class C | | 2020 | | | 2019 | | | 2018 | | | 2017 | | | 2016 | |
| | | | | |
Net asset value at beginning of year | | $ | 36.88 | | | $ | 36.53 | | | $ | 39.43 | | | $ | 32.42 | | | $ | 39.73 | |
| | | | | | | | | | | | | | | | | | | | |
| | | | | |
Net investment income (loss) (a) | | | (0.16 | ) | | | (0.07 | ) | | | (0.14 | ) | | | (0.13 | ) | | | (0.01 | ) |
| | | | | |
Net realized and unrealized gain (loss) on investments | | | 0.46 | | | | 4.24 | | | | 1.61 | | | | 7.67 | | | | (0.59 | ) |
| | | | | |
Net realized and unrealized gain (loss) on foreign currency transactions ‡ | | | 0.00 | | | | 0.00 | | | | (0.00 | ) | | | 0.00 | | | | (0.00 | ) |
| | | | | | | | | | | | | | | | | | | | |
| | | | | |
Total from investment operations | | | 0.30 | | | | 4.17 | | | | 1.47 | | | | 7.54 | | | | (0.60 | ) |
| | | | | | | | | | | | | | | | | | | | |
| | | | | |
| Less distributions: | | | | | | | | | | | | | | | | | | | | |
| | | | | |
From net investment income | | | — | | | | — | | | | — | | | | (0.14 | ) | | | (0.01 | ) |
| | | | | |
From net realized gain on investments | | | (3.20 | ) | | | (3.82 | ) | | | (4.37 | ) | | | (0.39 | ) | | | (6.70 | ) |
| | | | | | | | | | | | | | | | | | | | |
| | | | | |
Total distributions | | | (3.20 | ) | | | (3.82 | ) | | | (4.37 | ) | | | (0.53 | ) | | | (6.71 | ) |
| | | | | | | | | | | | | | | | | | | | |
| | | | | |
Net asset value at end of year | | $ | 33.98 | | | $ | 36.88 | | | $ | 36.53 | | | $ | 39.43 | | | $ | 32.42 | |
| | | | | | | | | | | | | | | | | | | | |
| | | | | |
Total investment return (b) | | | 0.60 | % | | | 12.45 | % | | | 3.91 | % | | | 23.55 | % | | | (1.52 | %) |
| | | | | |
| Ratios (to average net assets)/Supplemental Data: | | | | | | | | | | | | | | | | | | | | |
| | | | | |
Net investment income (loss) | | | (0.48 | %) | | | (0.22 | %) | | | (0.36 | %) | | | (0.37 | %) | | | (0.03 | %) |
| | | | | |
Net expenses (c) | | | 2.15 | % (d) | | | 2.07 | % | | | 2.04 | % | | | 2.05 | % (d) | | | 2.04 | % (d) |
| | | | | |
Expenses (before waiver/reimbursement) | | | 2.16 | % | | | 2.12 | % | | | 2.06 | % | | | 2.05 | % | | | 2.04 | % |
| | | | | |
Portfolio turnover rate | | | 16 | % | | | 20 | % | | | 15 | % | | | 15 | % | | | 42 | % |
| | | | | |
Net assets at end of year (in 000’s) | | $ | 14,315 | | | $ | 22,933 | | | $ | 65,288 | | | $ | 79,665 | | | $ | 92,457 | |
| ‡ | Less than one cent per share. |
| (a) | Per share data based on average shares outstanding during the year. |
| (b) | Total investment return is calculated exclusive of sales charges and assumes the reinvestment of distributions. For periods of less than one year, total return is not annualized. |
| (c) | In addition to the fees and expenses which the Fund bears directly, it also indirectly bears a pro-rata share of the fees and expenses of the underlying funds in which it invests. Such indirect expenses are not included in the above expense ratios. |
| (d) | Net of interest expense which is less than one-tenth of a percent. (See Note 6) |
| | | | | | |
The notes to the financial statements are an integral part of,
and should be read in conjunction with, the financial statements. | | | | | 21 | |
Financial Highlights selected per share data and ratios
| | | | | | | | | | | | | | | | | | | | |
| |
| | | Year ended October 31, | |
| | | | | |
| Class I | | 2020 | | | 2019 | | | 2018 | | | 2017 | | | 2016 | |
| | | | | |
Net asset value at beginning of year | | $ | 43.71 | | | $ | 42.51 | | | $ | 45.00 | | | $ | 36.92 | | | $ | 44.35 | |
| | | | | | | | | | | | | | | | | | | | |
| | | | | |
Net investment income (loss) (a) | | | 0.32 | | | | 0.38 | | | | 0.36 | | | | 0.34 | | | | 0.43 | |
| | | | | |
Net realized and unrealized gain (loss) on investments | | | 0.57 | | | | 5.02 | | | | 1.84 | | | | 8.70 | | | | (0.65 | ) |
| | | | | |
Net realized and unrealized gain (loss) on foreign currency transactions ‡ | | | 0.00 | | | | 0.00 | | | | (0.00 | ) | | | 0.00 | | | | (0.00 | ) |
| | | | | | | | | | | | | | | | | | | | |
| | | | | |
Total from investment operations | | | 0.89 | | | | 5.40 | | | | 2.20 | | | | 9.04 | | | | (0.22 | ) |
| | | | | | | | | | | | | | | | | | | | |
| | | | | |
| Less distributions: | | | | | | | | | | | | | | | | | | | | |
| | | | | |
From net investment income | | | (0.41 | ) | | | (0.38 | ) | | | (0.32 | ) | | | (0.57 | ) | | | (0.51 | ) |
| | | | | |
From net realized gain on investments | | | (3.20 | ) | | | (3.82 | ) | | | (4.37 | ) | | | (0.39 | ) | | | (6.70 | ) |
| | | | | | | | | | | | | | | | | | | | |
| | | | | |
Total distributions | | | (3.61 | ) | | | (4.20 | ) | | | (4.69 | ) | | | (0.96 | ) | | | (7.21 | ) |
| | | | | | | | | | | | | | | | | | | | |
| | | | | |
Net asset value at end of year | | $ | 40.99 | | | $ | 43.71 | | | $ | 42.51 | | | $ | 45.00 | | | $ | 36.92 | |
| | | | | | | | | | | | | | | | | | | | |
| | | | | |
Total investment return (b) | | | 1.92 | % | | | 13.80 | % | | | 5.17 | % | | | 25.01 | % | | | (0.33 | %) |
| | | | | |
| Ratios (to average net assets)/Supplemental Data: | | | | | | | | | | | | | | | | | | | | |
| | | | | |
Net investment income (loss) | | | 0.81 | % | | | 0.93 | % | | | 0.83 | % | | | 0.84 | % | | | 1.17 | % |
| | | | | |
Net expenses (c) | | | 0.85 | % (d) | | | 0.86 | % | | | 0.85 | % | | | 0.85 | %(d) | | | 0.84 | % (d) |
| | | | | |
Portfolio turnover rate | | | 16 | % | | | 20 | % | | | 15 | % | | | 15 | % | | | 42 | % |
| | | | | |
Net assets at end of year (in 000’s) | | $ | 417,329 | | | $ | 488,730 | | | $ | 484,839 | | | $ | 634,730 | | | $ | 807,694 | |
| ‡ | Less than one cent per share. |
| (a) | Per share data based on average shares outstanding during the year. |
| (b) | Total investment return is calculated exclusive of sales charges and assumes the reinvestment of distributions. Class I shares are not subject to sales charges. For periods of less than one year, total return is not annualized. |
| (c) | In addition to the fees and expenses which the Fund bears directly, it also indirectly bears a pro-rata share of the fees and expenses of the underlying funds in which it invests. Such indirect expenses are not included in the above expense ratios. |
| (d) | Net of interest expense which is less than one-tenth of a percent. (See Note 6) |
| | | | | | | | | | | | | | | | | | | | |
| |
| | | Year ended October 31, | |
| | | | | |
| Class R1 | | 2020 | | | 2019 | | | 2018 | | | 2017 | | | 2016 | |
| | | | | |
Net asset value at beginning of year | | $ | 42.64 | | | $ | 41.53 | | | $ | 44.07 | | | $ | 36.16 | | | $ | 43.57 | |
| | | | | | | | | | | | | | | | | | | | |
| | | | | |
Net investment income (loss) (a) | | | 0.27 | | | | 0.33 | | | | 0.37 | | | | 0.27 | | | | 0.38 | |
| | | | | |
Net realized and unrealized gain (loss) on investments | | | 0.56 | | | | 4.91 | | | | 1.73 | | | | 8.56 | | | | (0.63 | ) |
| | | | | |
Net realized and unrealized gain (loss) on foreign currency transactions ‡ | | | 0.00 | | | | 0.00 | | | | (0.00 | ) | | | 0.00 | | | | (0.00 | ) |
| | | | | | | | | | | | | | | | | | | | |
| | | | | |
Total from investment operations | | | 0.83 | | | | 5.24 | | | | 2.10 | | | | 8.83 | | | | (0.25 | ) |
| | | | | | | | | | | | | | | | | | | | |
| | | | | |
| Less distributions: | | | | | | | | | | | | | | | | | | | | |
| | | | | |
From net investment income | | | (0.37 | ) | | | (0.31 | ) | | | (0.27 | ) | | | (0.53 | ) | | | (0.46 | ) |
| | | | | |
From net realized gain on investments | | | (3.20 | ) | | | (3.82 | ) | | | (4.37 | ) | | | (0.39 | ) | | | (6.70 | ) |
| | | | | | | | | | | | | | | | | | | | |
| | | | | |
Total distributions | | | (3.57 | ) | | | (4.13 | ) | | | (4.64 | ) | | | (0.92 | ) | | | (7.16 | ) |
| | | | | | | | | | | | | | | | | | | | |
| | | | | |
Net asset value at end of year | | $ | 39.90 | | | $ | 42.64 | | | $ | 41.53 | | | $ | 44.07 | | | $ | 36.16 | |
| | | | | | | | | | | | | | | | | | | | |
| | | | | |
Total investment return (b) | | | 1.82 | % | | | 13.71 | % | | | 5.05 | % | | | 24.92 | % | | | (0.43 | %) |
| | | | | |
| Ratios (to average net assets)/Supplemental Data: | | | | | | | | | | | | | | | | | | | | |
| | | | | |
Net investment income (loss) | | | 0.69 | % | | | 0.83 | % | | | 0.88 | % | | | 0.67 | % | | | 1.06 | % |
| | | | | |
Net expenses (c) | | | 0.95 | %(d) | | | 0.96 | % | | | 0.95 | % | | | 0.95 | %(d) | | | 0.94 | % (d) |
| | | | | |
Portfolio turnover rate | | | 16 | % | | | 20 | % | | | 15 | % | | | 15 | % | | | 42 | % |
| | | | | |
Net assets at end of year (in 000’s) | | $ | 38 | | | $ | 35 | | | $ | 30 | | | $ | 3,208 | | | $ | 2,500 | |
| ‡ | Less than one cent per share. |
| (a) | Per share data based on average shares outstanding during the year. |
| (b) | Total investment return is calculated exclusive of sales charges and assumes the reinvestment of distributions. Class R1 shares are not subject to sales charges. For periods of less than one year, total return is not annualized. |
| (c) | In addition to the fees and expenses which the Fund bears directly, it also indirectly bears a pro-rata share of the fees and expenses of the underlying funds in which it invests. Such indirect expenses are not included in the above expense ratios. |
| (d) | Net of interest expense which is less than one-tenth of a percent. (See Note 6) |
| | | | |
| 22 | | MainStay MAP Equity Fund | | The notes to the financial statements are an integral part of,
and should be read in conjunction with, the financial statements. |
Financial Highlights selected per share data and ratios
| | | | | | | | | | | | | | | | | | | | |
| |
| | | Year ended October 31, | |
| | | | | |
| Class R2 | | 2020 | | | 2019 | | | 2018 | | | 2017 | | | 2016 | |
| | | | | |
Net asset value at beginning of year | | $ | 42.48 | | | $ | 41.38 | | | $ | 43.93 | | | $ | 36.05 | | | $ | 43.44 | |
| | | | | | | | | | | | | | | | | | | | |
| | | | | |
Net investment income (loss) (a) | | | 0.18 | | | | 0.23 | | | | 0.21 | | | | 0.20 | | | | 0.29 | |
| | | | | |
Net realized and unrealized gain (loss) on investments | | | 0.55 | | | | 4.89 | | | | 1.78 | | | | 8.50 | | | | (0.63 | ) |
| | | | | |
Net realized and unrealized gain (loss) on foreign currency transactions ‡ | | | 0.00 | | | | 0.00 | | | | (0.00 | ) | | | 0.00 | | | | (0.00 | ) |
| | | | | | | | | | | | | | | | | | | | |
| | | | | |
Total from investment operations | | | 0.73 | | | | 5.12 | | | | 1.99 | | | | 8.70 | | | | (0.34 | ) |
| | | | | | | | | | | | | | | | | | | | |
| | | | | |
| Less distributions: | | | | | | | | | | | | | | | | | | | | |
| | | | | |
From net investment income | | | (0.27 | ) | | | (0.20 | ) | | | (0.17 | ) | | | (0.43 | ) | | | (0.35 | ) |
| | | | | |
From net realized gain on investments | | | (3.20 | ) | | | (3.82 | ) | | | (4.37 | ) | | | (0.39 | ) | | | (6.70 | ) |
| | | | | | | | | | | | | | | | | | | | |
| | | | | |
Total distributions | | | (3.47 | ) | | | (4.02 | ) | | | (4.54 | ) | | | (0.82 | ) | | | (7.05 | ) |
| | | | | | | | | | | | | | | | | | | | |
| | | | | |
Net asset value at end of year | | $ | 39.74 | | | $ | 42.48 | | | $ | 41.38 | | | $ | 43.93 | | | $ | 36.05 | |
| | | | | | | | | | | | | | | | | | | | |
| | | | | |
Total investment return (b) | | | 1.57 | % | | | 13.42 | % | | | 4.77 | % | | | 24.60 | % | | | (0.68 | %) |
| | | | | |
| Ratios (to average net assets)/Supplemental Data: | | | | | | | | | | | | | | | | | | | | |
| | | | | |
Net investment income (loss) | | | 0.45 | % | | | 0.59 | % | | | 0.50 | % | | | 0.51 | % | | | 0.80 | % |
| | | | | |
Net expenses (c) | | | 1.20 | %(d) | | | 1.21 | % | | | 1.20 | % | | | 1.20 | %(d) | | | 1.20 | % (d) |
| | | | | |
Portfolio turnover rate | | | 16 | % | | | 20 | % | | | 15 | % | | | 15 | % | | | 42 | % |
| | | | | |
Net assets at end of year (in 000’s) | | $ | 716 | | | $ | 780 | | | $ | 881 | | | $ | 2,583 | | | $ | 3,528 | |
| ‡ | Less than one cent per share. |
| (a) | Per share data based on average shares outstanding during the year. |
| (b) | Total investment return is calculated exclusive of sales charges and assumes the reinvestment of distributions. Class R2 shares are not subject to sales charges. For periods of less than one year, total return is not annualized. |
| (c) | In addition to the fees and expenses which the Fund bears directly, it also indirectly bears a pro-rata share of the fees and expenses of the underlying funds in which it invests. Such indirect expenses are not included in the above expense ratios. |
| (d) | Net of interest expense which is less than one-tenth of a percent. (See Note 6) |
| | | | | | | | | | | | | | | | | | | | |
| |
| | | Year ended October 31, | |
| | | | | |
| Class R3 | | 2020 | | | 2019 | | | 2018 | | | 2017 | | | 2016 | |
| | | | | |
Net asset value at beginning of year | | $ | 42.24 | | | $ | 41.15 | | | $ | 43.71 | | | $ | 35.87 | | | $ | 43.22 | |
| | | | | | | | | | | | | | | | | | | | |
| | | | | |
Net investment income (loss) (a) | | | 0.07 | | | | 0.13 | | | | 0.08 | | | | 0.07 | | | | 0.20 | |
| | | | | |
Net realized and unrealized gain (loss) on investments | | | 0.54 | | | | 4.87 | | | | 1.79 | | | | 8.50 | | | | (0.62 | ) |
| | | | | |
Net realized and unrealized gain (loss) on foreign currency transactions ‡ | | | 0.00 | | | | 0.00 | | | | (0.00 | ) | | | 0.00 | | | | (0.00 | ) |
| | | | | | | | | | | | | | | | | | | | |
| | | | | |
Total from investment operations | | | 0.61 | | | | 5.00 | | | | 1.87 | | | | 8.57 | | | | (0.42 | ) |
| | | | | | | | | | | | | | | | | | | | |
| | | | | |
| Less distributions: | | | | | | | | | | | | | | | | | | | | |
| | | | | |
From net investment income | | | (0.17 | ) | | | (0.09 | ) | | | (0.06 | ) | | | (0.34 | ) | | | (0.23 | ) |
| | | | | |
From net realized gain on investments | | | (3.20 | ) | | | (3.82 | ) | | | (4.37 | ) | | | (0.39 | ) | | | (6.70 | ) |
| | | | | | | | | | | | | | | | | | | | |
| | | | | |
Total distributions | | | (3.37 | ) | | | (3.91 | ) | | | (4.43 | ) | | | (0.73 | ) | | | (6.93 | ) |
| | | | | | | | | | | | | | | | | | | | |
| | | | | |
Net asset value at end of year | | $ | 39.48 | | | $ | 42.24 | | | $ | 41.15 | | | $ | 43.71 | | | $ | 35.87 | |
| | | | | | | | | | | | | | | | | | | | |
| | | | | |
Total investment return (b) | | | 1.29 | % | | | 13.14 | % | | | 4.51 | % | | | 24.29 | % | | | (0.91 | %) |
| | | | | |
| Ratios (to average net assets)/Supplemental Data: | | | | | | | | | | | | | | | | | | | | |
| | | | | |
Net investment income (loss) | | | 0.19 | % | | | 0.32 | % | | | 0.20 | % | | | 0.17 | % | | | 0.57 | % |
| | | | | |
Net expenses (c) | | | 1.45 | %(d) | | | 1.46 | % | | | 1.45 | % | | | 1.45 | %(d) | | | 1.44 | % (d) |
| | | | | |
Portfolio turnover rate | | | 16 | % | | | 20 | % | | | 15 | % | | | 15 | % | | | 42 | % |
| | | | | |
Net assets at end of year (in 000’s) | | $ | 2,442 | | | $ | 2,314 | | | $ | 1,931 | | | $ | 1,004 | | | $ | 806 | |
| ‡ | Less than one cent per share. |
| (a) | Per share data based on average shares outstanding during the year. |
| (b) | Total investment return is calculated exclusive of sales charges and assumes the reinvestment of distributions. Class R3 shares are not subject to sales charges. For periods of less than one year, total return is not annualized. |
| (c) | In addition to the fees and expenses which the Fund bears directly, it also indirectly bears a pro-rata share of the fees and expenses of the underlying funds in which it invests. Such indirect expenses are not included in the above expense ratios. |
| (d) | Net of interest expense which is less than one-tenth of a percent. (See Note 6) |
| | | | | | |
The notes to the financial statements are an integral part of,
and should be read in conjunction with, the financial statements. | | | | | 23 | |
Notes to Financial Statements
Note 1–Organization and Business
The MainStay Funds (the “Trust”) was organized on January 9, 1986, as a Massachusetts business trust. The Trust is registered under the Investment Company Act of 1940, as amended (the “1940 Act”), as an open-end management investment company, and is comprised of twelve funds (collectively referred to as the “Funds”). These financial statements and notes relate to the MainStay MAP Equity Fund (the “Fund”), a “diversified fund,” as that term is defined in the 1940 Act, as interpreted or modified by regulatory authorities having jurisdiction, from time to time.
The Fund currently has ten classes of shares registered for sale. Class A, Class B and Class C shares commenced operations on June 9, 1999. Class I shares commenced operations in January 21, 1971 (under a former class designation) and were redesignated as Class I shares on June 9, 1999. Class R1 and Class R2 shares commenced operations on January 2, 2004. Class R3 shares commenced operations on April 28, 2006. Investor Class shares commenced operations on February 28, 2008. Class R6 shares were registered for sale effective as of February 28, 2017. SIMPLE Class shares were registered for sale effective as of August 31, 2020. As of October 31, 2020, Class R6 and SIMPLE Class shares were not yet offered for sale.
Class B shares of the MainStay Group of Funds are closed to all new purchases as well as additional investments by existing Class B shareholders. Existing Class B shareholders may continue to reinvest dividends and capital gains distributions, as well as exchange their Class B shares for Class B shares of other funds in the MainStay Group of Funds as permitted by the current exchange privileges. Class B shareholders continue to be subject to any applicable contingent deferred sales charge (“CDSC”) at the time of redemption. All other features of the Class B shares, including but not limited to the fees and expenses applicable to Class B shares, remain unchanged. Unless redeemed, Class B shareholders will remain in Class B shares of their respective fund until the Class B shares are converted to Class A or Investor Class shares pursuant to the applicable conversion schedule.
Class A and Investor Class shares are offered at net asset value (“NAV”) per share plus an initial sales charge. No initial sales charge applies to investments of $1 million or more (and certain other qualified purchases) in Class A and Investor Class shares. However, a CDSC of 1.00% may be imposed on certain redemptions made within 18 months of the date of purchase on shares that were purchased without an initial sales charge. Class C shares are offered at NAV without an initial sales charge, although a 1.00% CDSC may be imposed on certain redemptions of such shares made within one year of the date of purchase of Class C shares. When Class B shares were offered, they were offered at NAV without an initial sales charge, although a CDSC that declines depending on the number of years a shareholder held its Class B shares may be imposed on certain redemptions of such shares made within six years of the date of purchase of such shares. Class I, Class R1, Class R2 and Class R3 shares are offered at NAV without a sales charge. Class R6 and SIMPLE Class shares are currently expected to be offered at NAV without a sales charge. Depending upon eligibility, Class B shares convert to either Class A or Investor Class shares at the end of the calendar quarter eight years after the date they were purchased. In addition, depending upon eligibility, Class C shares convert to either Class A or Investor Class shares at the end of the calendar
quarter ten years after the date they were purchased. Additionally, Investor Class shares may convert automatically to Class A shares. Under certain circumstances and as may be permitted by the Trust’s multiple class plan pursuant to Rule 18f-3 under the 1940 Act, specified share classes of the Fund may be converted to one or more other share classes of the Fund as disclosed in the capital share transactions within these Notes. The classes of shares have the same voting (except for issues that relate solely to one class), dividend, liquidation and other rights, and the same terms and conditions, except that under distribution plans pursuant to Rule 12b-1 under the 1940 Act, Class B and Class C shares are subject to higher distribution and/or service fees than Class A, Investor Class, Class R2, Class R3 and SIMPLE Class shares. Class I, Class R1 and Class R6 shares are not subject to a distribution and/or service fee. Class R1, Class R2 and Class R3 shares are subject to a shareholder service fee, which is in addition to fees paid under the distribution plans for Class R2 and Class R3 shares.
The Fund’s investment objective is to seek long-term appreciation of capital.
Note 2–Significant Accounting Policies
The Fund is an investment company and accordingly follows the investment company accounting and reporting guidance of the Financial Accounting Standards Board (“FASB”) Accounting Standard Codification Topic 946 Financial Services—Investment Companies. The Fund prepares its financial statements in accordance with generally accepted accounting principles (“GAAP”) in the United States of America and follows the significant accounting policies described below.
(A) Securities Valuation. Investments are usually valued as of the close of regular trading on the New York Stock Exchange (the “Exchange”) (usually 4:00 p.m. Eastern time) on each day the Fund is open for business (“valuation date”).
The Board of Trustees of the Trust (the “Board”) adopted procedures establishing methodologies for the valuation of the Fund’s securities and other assets and delegated the responsibility for valuation determinations under those procedures to the Valuation Committee of the Trust (the “Valuation Committee”). The procedures state that, subject to the oversight of the Board and unless otherwise noted, the responsibility for the day-to-day valuation of portfolio assets (including fair value measurements for the Fund’s assets and liabilities) rests with New York Life Investment Management LLC (“New York Life Investments” or the “Manager”), aided to whatever extent necessary by the Subadvisor (as defined in Note 3(A)). To assess the appropriateness of security valuations, the Manager, the Subadvisor or the Fund’s third-party service provider, who is subject to oversight by the Manager, regularly compares prior day prices, prices on comparable securities and the sale prices to the prior and current day prices and challenges prices with changes exceeding certain tolerance levels with third-party pricing services or broker sources.
The Board authorized the Valuation Committee to appoint a Valuation Subcommittee (the “Subcommittee”) to establish the prices of securities for which market quotations are not readily available or the prices of which are not otherwise readily determinable under the procedures. The Subcommittee meets (in person, via electronic mail or via teleconference) on an as-needed basis. The Valuation Committee meets to ensure that actions taken by the Subcommittee were appropriate.
| | |
| 24 | | MainStay MAP Equity Fund |
For those securities valued through either a standardized fair valuation methodology or a fair valuation measurement, the Subcommittee deals with such valuation and the Valuation Committee reviews and affirms, if appropriate, the reasonableness of the valuation based on such methodologies and measurements on a regular basis after considering information that is reasonably available and deemed relevant by the Valuation Committee. Any action taken by the Subcommittee with respect to the valuation of a portfolio security or other asset is submitted for review and ratification (if appropriate) to the Valuation Committee and the Board at the next regularly scheduled meeting.
“Fair value” is defined as the price the Fund would reasonably expect to receive upon selling an asset or liability in an orderly transaction to an independent buyer in the principal or most advantageous market for the asset or liability. Fair value measurements are determined within a framework that establishes a three-tier hierarchy that maximizes the use of observable market data and minimizes the use of unobservable inputs to establish a classification of fair value measurements for disclosure purposes. “Inputs” refer broadly to the assumptions that market participants would use in pricing the asset or liability, including assumptions about risk, such as the risk inherent in a particular valuation technique used to measure fair value using a pricing model and/or the risk inherent in the inputs for the valuation technique. Inputs may be observable or unobservable. Observable inputs reflect the assumptions market participants would use in pricing the asset or liability based on market data obtained from sources independent of the Fund. Unobservable inputs reflect the Fund’s own assumptions about the assumptions market participants would use in pricing the asset or liability based on the information available. The inputs or methodology used for valuing assets or liabilities may not be an indication of the risks associated with investing in those assets or liabilities. The three-tier hierarchy of inputs is summarized below.
| • | | Level 1—quoted prices in active markets for an identical asset or liability |
| • | | Level 2—other significant observable inputs (including quoted prices for a similar asset or liability in active markets, interest rates and yield curves, prepayment speeds, credit risk, etc.) |
| • | | Level 3—significant unobservable inputs (including the Fund’s own assumptions about the assumptions that market participants would use in measuring fair value of an asset or liability) |
The level of an asset or liability within the fair value hierarchy is based on the lowest level of an input, both individually and in the aggregate, that is significant to the fair value measurement. The aggregate value by input level of the Fund’s assets and liabilities as of October 31, 2020, is included at the end of the Portfolio of Investments.
The Fund may use third-party vendor evaluations, whose prices may be derived from one or more of the following standard inputs, among others:
| | |
• Broker/dealer quotes | | • Benchmark securities |
• Two-sided markets | | • Reference data (corporate actions or material event notices) |
• Bids/offers | | • Monthly payment information |
• Industry and economic events | | • Reported trades |
An asset or liability for which market values cannot be measured using the methodologies described above is valued by methods deemed reasonable in good faith by the Valuation Committee, following the procedures established by the Board, to represent fair value. Under these procedures, the Fund generally uses a market-based approach which may use related or comparable assets or liabilities, recent transactions, market multiples, book values and other relevant information. The Fund may also use an income-based valuation approach in which the anticipated future cash flows of the asset or liability are discounted to calculate fair value. Discounts may also be applied due to the nature and/or duration of any restrictions on the disposition of the asset or liability. Fair value represents a good faith approximation of the value of a security. Fair value determinations involve the consideration of a number of subjective factors, an analysis of applicable facts and circumstances and the exercise of judgment. As a result, it is possible that the fair value for a security determined in good faith in accordance with the Fund’s valuation procedures may differ from valuations for the same security determined by other funds using their own valuation procedures. Although the Fund’s valuation procedures are designed to value a security at the price the Fund may reasonably expect to receive upon the security’s sale in an orderly transaction, there can be no assurance that any fair value determination thereunder would, in fact, approximate the amount that the Fund would actually realize upon the sale of the security or the price at which the security would trade if a reliable market price were readily available. During the year ended October 31, 2020, there were no material changes to the fair value methodologies.
Securities which may be valued in this manner include, but are not limited to: (i) a security for which trading has been halted or suspended; (ii) a debt security that has recently gone into default and for which there is not a current market quotation; (iii) a security of an issuer that has entered into a restructuring; (iv) a security that has been delisted from a national exchange; (v) a security for which the market price is not readily available from a third-party pricing source or, if so provided, does not, in the opinion of the Manager or the Subadvisors, reflect the security’s market value; (vi) a security subject to trading collars for which no or limited trading takes place; and (vii) a security whose principal market has been temporarily closed at a time when, under normal conditions, it would be open. Securities valued in this manner are generally categorized as Level 3 in the hierarchy. No securities held by the Fund as of October 31, 2020 were fair valued in such a manner.
Certain securities held by the Fund may principally trade in foreign markets. Events may occur between the time the foreign markets close and the time at which the Fund’s NAVs are calculated. These events may include, but are not limited to, situations relating to a single issuer in a market sector, significant fluctuations in U.S. or foreign markets, natural disasters, armed conflicts, governmental actions or other developments not tied directly to the securities markets. Should the Manager or the Subadvisors conclude that such events may have affected the accuracy of the last price of such securities reported on the local foreign market, the Subcommittee may, pursuant to procedures adopted by the Board, adjust the value of the local price to reflect the estimated impact on the price of such securities as a result of such events. In this instance, securities are generally categorized as Level 3 in the hierarchy. Additionally, certain foreign equity securities are also fair valued whenever the movement of a particular index exceeds certain thresh-
Notes to Financial Statements (continued)
olds. In such cases, the securities are fair valued by applying factors provided by a third-party vendor in accordance with valuation procedures adopted by the Board and are generally categorized as Level 2 in the hierarchy. No securities held by the Fund as of October 31, 2020 were fair valued in such a manner.
Equity securities are valued at the last quoted sales prices as of the close of regular trading on the relevant exchange on each valuation date. Securities that are not traded on the valuation date are valued at the mean of the last quoted bid and ask prices. Prices are normally taken from the principal market in which each security trades. These securities are generally categorized as Level 1 in the hierarchy.
Investments in mutual funds, including money market funds, are valued at their respective NAVs as of the close of the Exchange on the valuation date. These securities are generally categorized as Level 1 in the hierarchy.
Temporary cash investments acquired in excess of 60 days to maturity at the time of purchase are valued using the latest bid prices or using valuations based on a matrix system (which considers such factors as security prices, yields, maturities and ratings), both as furnished by independent pricing services. Temporary cash investments that mature in 60 days or less at the time of purchase (“Short-Term Investments”) are valued using the amortized cost method of valuation, unless the use of such method would be inappropriate. The amortized cost method involves valuing a security at its cost on the date of purchase and thereafter assuming a constant amortization to maturity of the difference between such cost and the value on maturity date. Amortized cost approximates the current fair value of a security. Securities valued using the amortized cost method are not valued using quoted prices in an active market and are generally categorized as Level 2 in the hierarchy.
The information above is not intended to reflect an exhaustive list of the methodologies that may be used to value portfolio investments. The valuation procedures permit the use of a variety of valuation methodologies in connection with valuing portfolio investments. The methodology used for a specific type of investment may vary based on the market data available or other considerations. The methodologies summarized above may not represent the specific means by which portfolio investments are valued on any particular business day.
(B) Income Taxes. The Fund’s policy is to comply with the requirements of the Internal Revenue Code of 1986, as amended (the “Internal Revenue Code”), applicable to regulated investment companies and to distribute all of its taxable income to the shareholders of the Fund within the allowable time limits.
The Manager evaluates the Fund’s tax positions to determine if the tax positions taken meet the minimum recognition threshold in connection with accounting for uncertainties in income tax positions taken or expected to be taken for the purposes of measuring and recognizing tax liabilities in the financial statements. Recognition of tax benefits of an uncertain tax position is permitted only to the extent the position is “more likely than not” to be sustained assuming examination by taxing authorities. The Manager analyzed the Fund’s tax positions taken on federal, state and local income tax returns for all open tax years (for up to three tax years) and has concluded that no provisions for federal, state and local income tax are required in the Fund’s financial statements. The Fund’s federal, state and local income tax and federal excise tax returns for tax years for which the applicable statutes of limi-
tations have not expired are subject to examination by the Internal Revenue Service and state and local departments of revenue.
(C) Foreign Taxes. The Fund may be subject to foreign taxes on income and other transaction-based taxes imposed by certain countries in which it invests. A portion of the taxes on gains on investments or currency purchases/repatriation may be reclaimable. The Fund will accrue such taxes and reclaims as applicable, based upon its current interpretation of tax rules and regulations that exist in the markets in which it invests.
The Fund may be subject to taxation on realized capital gains, repatriation proceeds and other transaction-based taxes imposed by certain countries in which it invests. The Fund will accrue such taxes as applicable based upon its current interpretation of tax rules and regulations that exist in the market in which it invests. Capital gains taxes relating to positions still held are reflected as a liability in the Statement of Assets and Liabilities, as well as an adjustment to the Fund’s net unrealized appreciation (depreciation). Taxes related to capital gains realized, if any, are reflected as part of net realized gain (loss) in the Statement of Operations. Changes in tax liabilities related to capital gains taxes on unrealized investment gains, if any, are reflected as part of the change in net unrealized appreciation (depreciation) on investments in the Statement of Operations. Transaction-based charges are generally assessed as a percentage of the transaction amount.
(D) Dividends and Distributions to Shareholders. Dividends and distributions are recorded on the ex-dividend date. The Fund intends to declare and pay dividends from net investment income and distributions from net realized capital and currency gains, if any, at least annually. Unless a shareholder elects otherwise, all dividends and distributions are reinvested at NAV in the same class of shares of the Fund. Dividends and distributions to shareholders are determined in accordance with federal income tax regulations and may differ from determinations using GAAP.
(E) Security Transactions and Investment Income. The Fund records security transactions on the trade date. Realized gains and losses on security transactions are determined using the identified cost method. Dividend income is recognized on the ex-dividend date, net of any foreign tax withheld at the source, and interest income is accrued as earned using the effective interest rate method. Distributions received from real estate investment trusts may be classified as dividends, capital gains and/or return of capital.
Investment income and realized and unrealized gains and losses on investments of the Fund are allocated pro rata to the separate classes of shares based upon their relative net assets on the date the income is earned or realized and unrealized gains and losses are incurred.
(F) Expenses. Expenses of the Trust are allocated to the individual Funds in proportion to the net assets of the respective Funds when the expenses are incurred, except where direct allocations of expenses can be made. Expenses (other than transfer agent expenses and fees incurred under the shareholder services plans and/or the distribution plans further discussed in Note 3(B)) are allocated to separate classes of shares pro rata based upon their relative net assets on the date the expenses are incurred. The expenses borne by the Fund, including those of related parties to the Fund, are shown in the Statement of Operations.
| | |
| 26 | | MainStay MAP Equity Fund |
Additionally, the Fund may invest in mutual funds, which are subject to management fees and other fees that may cause the costs of investing in mutual funds to be greater than the costs of owning the underlying securities directly. These indirect expenses of mutual funds are not included in the amounts shown as expenses in the Fund’s Statement of Operations or in the expense ratios included in the Financial Highlights.
(G) Use of Estimates. In preparing financial statements in conformity with GAAP, the Manager makes estimates and assumptions that affect the reported amounts and disclosures in the financial statements. Actual results could differ from those estimates and assumptions.
(H) Repurchase Agreements. The Fund may enter into repurchase agreements (i.e., buy a security from another party with the agreement that it will be sold back in the future) to earn income. The Fund may enter into repurchase agreements only with counterparties, usually financial institutions, that are deemed by the Manager or the Subadvisors to be creditworthy, pursuant to guidelines established by the Board. During the term of any repurchase agreement, the Manager or the Subadvisors will continue to monitor the creditworthiness of the counterparty. Under the 1940 Act, repurchase agreements are considered to be collateralized loans by the Fund to the counterparty secured by the securities transferred to the Fund.
Repurchase agreements are subject to counterparty risk, meaning the Fund could lose money by the counterparty’s failure to perform under the terms of the agreement. The Fund mitigates this risk by ensuring the repurchase agreement is collateralized by cash, U.S. government securities, fixed income securities and/or other securities. The collateral is held by the Fund’s custodian and valued daily on a mark to market basis to determine if the value, including accrued interest, exceeds the repurchase price. In the event of the counterparty’s default on the obligation to repurchase, the Fund has the right to liquidate the collateral and apply the proceeds in satisfaction of the obligation. Under certain circumstances, such as in the event of default or bankruptcy by the counterparty, realization and/or retention of the collateral may be limited or subject to delay, to legal proceedings and possible realized loss to the Fund. As of October 31, 2020, the Fund did not hold any repurchase agreements.
(I) Rights and Warrants. Rights are certificates that permit the holder to purchase a certain number of shares, or a fractional share, of a new stock from the issuer at a specific price. Warrants are instruments that entitle the holder to buy an equity security at a specific price for a specific period of time. These investments can provide a greater potential for profit or loss than an equivalent investment in the underlying security. Prices of these investments do not necessarily move in tandem with the prices of the underlying securities.
There is risk involved in the purchase of rights and warrants in that these investments are speculative investments. The Fund could also lose the entire value of its investment in warrants if such warrants are not exercised by the date of its expiration. The Fund is exposed to risk until the sale or exercise of each right or warrant is completed. As of October 31, 2020, the Fund did not hold any rights or warrants.
(J) Securities Lending. In order to realize additional income, the Fund may engage in securities lending, subject to the limitations set forth in the 1940 Act and relevant guidance by the staff of the Securities and Exchange Commission (“SEC”). If the Fund engages in securities
lending, the Fund will lend through its custodian, currently State Street Bank and Trust Company (“State Street”) (See Note 12 for securities lending agent change), acting as securities lending agent on behalf of the Fund. Under the current arrangement, State Street will manage the Fund’s collateral in accordance with the securities lending agency agreement between the Fund and State Street, and indemnify the Fund against counterparty risk. The loans will be collateralized by cash (which may be invested in a money market fund) and/or non-cash collateral (which may include U.S. Treasury securities and/or U.S. government agency securities issued or guaranteed by the United States government or its agencies or instrumentalities) at least equal at all times to the market value of the securities loaned. The Fund bears the risk of delay in recovery of, or loss of rights in, the securities loaned. The Fund may also record a realized gain or loss on securities deemed sold due to a borrower’s inability to return securities on loan. The Fund bears the risk of any loss on investment of cash collateral. The Fund will receive compensation for lending its securities in the form of fees or it will retain a portion of interest earned on the investment of any cash collateral. The Fund will also continue to receive interest and dividends on the securities loaned and any gain or loss in the market price of the securities loaned that may occur during the term of the loan will be for the account of the Fund. Income earned from securities lending activities, if any, is reflected in the Statement of Operations. As of October 31, 2020, the Fund had securities on loan with an aggregate market value of $2,480,858 and received cash collateral, which was invested into the State Street Navigator Securities Lending Government Money Market Portfolio, with a value of $2,610,792.
(K) Foreign Currency Transactions. The Fund’s books and records are maintained in U.S. dollars. Prices of securities denominated in foreign currency amounts are translated into U.S. dollars at the mean between the buying and selling rates last quoted by any major U.S. bank at the following dates:
| (i) | market value of investment securities, other assets and liabilities—at the valuation date; and |
| (ii) | purchases and sales of investment securities, income and expenses—at the date of such transactions. |
The assets and liabilities that are denominated in foreign currency amounts are presented at the exchange rates and market values at the close of the period. The realized and unrealized changes in net assets arising from fluctuations in exchange rates and market prices of securities are not separately presented.
Net realized gain (loss) on foreign currency transactions represents net currency gains or losses realized as a result of differences between the amounts of securities sale proceeds or purchase cost, dividends, interest and withholding taxes as recorded on the Fund’s books, and the U.S. dollar equivalent amount actually received or paid. Net currency gains or losses from valuing such foreign currency denominated assets and liabilities, other than investments at valuation date exchange rates, are reflected in unrealized foreign exchange gains or losses.
(L) Foreign Securities Risk. The ability of issuers of debt securities held by the Fund to meet their obligations may be affected by, among other things, economic or political developments in a specific country, industry or region. Debt securities are also subject to the risks associated with changes in interest rates. The Fund may invest in foreign securities, which carry certain risks that are in addition to the usual
Notes to Financial Statements (continued)
risks inherent in domestic securities. These risks include those resulting from currency fluctuations, future adverse political or economic developments and possible imposition of currency exchange blockages or other foreign governmental laws or restrictions. These risks are likely to be greater in emerging markets than in developed markets. The ability of issuers of debt securities held by the Fund to meet their obligations may be affected by, among other things, economic or political developments in a specific country, industry or region.
(M) Indemnifications. Under the Trust’s organizational documents, its officers and trustees are indemnified against certain liabilities that may arise out of performance of their duties to the Trust. Additionally, in the normal course of business, the Fund enters into contracts with third-party service providers that contain a variety of representations and warranties and that may provide general indemnifications. The Fund’s maximum exposure under these arrangements is unknown, as this would involve future claims that may be made against the Fund that have not yet occurred. The Manager believes that the risk of loss in connection with these potential indemnification obligations is remote. However, there can be no assurance that material liabilities related to such obligations will not arise in the future, which could adversely impact the Fund.
Note 3–Fees and Related Party Transactions
(A) Manager and Subadvisors. New York Life Investments, a registered investment adviser and an indirect, wholly-owned subsidiary of New York Life Insurance Company (“New York Life”), serves as the Fund’s Manager, pursuant to an Amended and Restated Management Agreement (“Management Agreement”). The Manager provides offices, conducts clerical, recordkeeping and bookkeeping services and keeps most of the financial and accounting records required to be maintained by the Fund. Except for the portion of salaries and expenses that are the responsibility of the Fund, the Manager pays the salaries and expenses of all personnel affiliated with the Fund and certain operational expenses of the Fund. The Fund reimburses New York Life Investments in an amount equal to the portion of the compensation of the Chief Compliance Officer attributable to the Fund. Markston International LLC (“Markston” or a “Subadvisor”) and Epoch Investment Partners, Inc. (“Epoch” or a “Subadvisor”), each a registered investment adviser, serve as Subadvisors to the Fund and each manages a portion of the Fund’s assets, as designated by New York Life Investments from time to time. Each Subadvisor is responsible for the day-to-day portfolio management of the Fund with respect to its allocated portion of the Fund’s assets. Pursuant to the terms of an Amended and Restated Subadvisory Agreement between New York Life Investments and Epoch, and pursuant to the terms of a Subadvisory Agreement between New York Life Investments and Markston (“Subadvisory Agreements”), New York Life Investments pays for the services of the Subadvisors.
Pursuant to the Management Agreement, the Fund pays the Manager a monthly fee for the services performed and the facilities furnished at an annual rate of the Fund’s average daily net assets as follows: 0.75% up to $1 billion; 0.70% from $1 billion to $3 billion; and 0.675% in excess of $3 billion, plus a fee for fund accounting services previously provided by New York Life Investments under a separate fund accounting agreement furnished at an annual rate of the Fund’s average daily net assets as follows: 0.05% up to $20 million; 0.0333% from $20 million to $100 million; and 0.01% in excess of $100 million. During the year
ended October 31, 2020, the effective management fee rate was 0.76% inclusive of a fee for fund accounting services of 0.01% of the Fund’s average daily net assets.
During the year ended October 31, 2020, New York Life Investments earned fees from the Fund in the amount of $7,493,498 and waived fees and/or reimbursed certain class specific expenses in the amount of $7,093 and paid Markston and Epoch $2,714,880 and $1,342,675, respectively.
State Street provides sub-administration and sub-accounting services to the Fund pursuant to an agreement with New York Life Investments (See Note 12 for sub-administration and sub-accounting service provider change). These services include calculating the daily NAVs of the Fund, maintaining the general ledger and sub-ledger accounts for the calculation of the Fund’s NAVs and assisting New York Life Investments in conducting various aspects of the Fund’s administrative operations. For providing these services to the Fund, State Street is compensated by New York Life Investments.
Pursuant to an agreement between the Trust and New York Life Investments, New York Life Investments is responsible for providing or procuring certain regulatory reporting services for the Fund. The Fund will reimburse New York Life Investments for the actual costs incurred by New York Life Investments in connection with providing or procuring these services for the Fund.
(B) Distribution, Service and Shareholder Service Fees. The Trust, on behalf of the Fund, has entered into a distribution agreement with NYLIFE Distributors LLC (the “Distributor”), an affiliate of New York Life Investments. The Fund has adopted distribution plans (the “Plans”) in accordance with the provisions of Rule 12b-1 under the 1940 Act.
Pursuant to the Class A, Investor Class and Class R2 Plans, the Distributor receives a monthly distribution fee from the Class A, Investor Class and Class R2 shares at an annual rate of 0.25% of the average daily net assets of the Class A, Investor Class and Class R2 shares for distribution and/or service activities as designated by the Distributor. Pursuant to the Class B and Class C Plans, Class B and Class C shares pay the Distributor a monthly distribution fee at an annual rate of 0.75% of the average daily net assets of the Class B and Class C shares, along with a service fee at an annual rate of 0.25% of the average daily net assets of the Class B and Class C shares, for a total 12b-1 fee of 1.00%. Pursuant to the Class R3 Plan, the Distributor receives a monthly distribution and/or service fee from the Class R3 shares at an annual rate of 0.50% of the average daily net assets of the Class R3 shares. Class I and Class R1 shares are not subject to a distribution and/or service fee.
The Plans provide that the distribution and service fees are payable to the Distributor regardless of the amounts actually expended by the Distributor for distribution of the Fund’s shares and service activities.
In accordance with the Shareholder Services Plans for the Class R1, Class R2 and Class R3 shares, the Manager has agreed to provide, through its affiliates or independent third parties, various shareholder and administrative support services to shareholders of the Class R1, Class R2 and Class R3 shares. For its services, the Manager, its affiliates or independent third-party service providers are entitled to a shareholder service fee accrued daily and paid monthly at an annual rate of 0.10% of the average daily net assets of the Class R1, Class R2
| | |
| 28 | | MainStay MAP Equity Fund |
and Class R3 shares. This is in addition to any fees paid under the Class R2 and Class R3 Plans.
During the year ended October 31, 2020, shareholder service fees incurred by the Fund were as follows:
| | | | |
| |
Class R1 | | $ | 36 | |
Class R2 | | | 715 | |
Class R3 | | | 2,307 | |
(C) Sales Charges. The Fund was advised by the Distributor that the amount of initial sales charges retained on sales of Class A and Investor Class shares during the year ended October 31, 2020, were $38,616 and $18,400, respectively.
The Fund was also advised that the Distributor retained CDSCs on redemptions of Class A, Investor Class, Class B and Class C shares during the year ended October 31, 2020, of $1,045, $3, $12,388 and $328, respectively.
(D) Transfer, Dividend Disbursing and Shareholder Servicing Agent. NYLIM Service Company LLC, an affiliate of New York Life Investments, is the Fund’s transfer, dividend disbursing and shareholder servicing agent pursuant to an agreement between NYLIM Service Company LLC and the Trust. NYLIM Service Company LLC has entered into an agreement with DST Asset Manager Solutions, Inc. (“DST”), pursuant to which DST performs certain transfer agent services on behalf of NYLIM Service Company LLC. New York Life Investments has contractually agreed to limit the transfer agency expenses charged to the Fund’s share classes to a maximum of 0.35% of that share class’s average daily net assets on an annual basis after deducting any applicable Fund or class-level expense reimbursement or
small account fees. This agreement will remain in effect until February 28, 2021 and shall renew automatically for one-year terms unless New York Life Investments provides written notice of termination prior to the start of the next term or upon approval of the Board. During the year ended October 31, 2020, transfer agent expenses incurred by the Fund and any reimbursements, pursuant to the aforementioned Transfer Agency expense limitation agreement, were as follows:
| | | | | | | | |
Class | | Expense | | | Waived | |
Class A | | $ | 188,507 | | | $ | — | |
Investor Class | | | 258,449 | | | | (4,652 | ) |
Class B | | | 61,556 | | | | (1,105 | ) |
Class C | | | 68,577 | | | | (1,336 | ) |
Class I | | | 218,826 | | | | — | |
Class R1 | | | 17 | | | | — | |
Class R2 | | | 333 | | | | — | |
Class R3 | | | 1,075 | | | | — | |
(E) Small Account Fee. Shareholders with small accounts adversely impact the cost of providing transfer agency services. In an effort to reduce total transfer agency expenses, the Fund has implemented a small account fee on certain types of accounts. As described in the Fund’s prospectus, certain shareholders with an account balance of less than $1,000 ($5,000 for Class A share accounts) are charged an annual per account fee of $20 (assessed semi-annually), the proceeds from which offset transfer agent fees as reflected in the Statement of Operations. This small account fee will not apply to certain types of accounts as described further in the Fund’s prospectus.
(F) Investments in Affiliates (in 000’s). During the year ended October 31, 2020, purchases and sales transactions, income earned from investments and shares held of investment companies managed by New York Life Investments or its affiliates were as follows:
| | | | | | | | | | | | | | | | | | | | | | | | | | | | | | | | | | | | |
Affiliated Investment Company | | Value,
Beginning
of Year | | | Purchases
at Cost | | | Proceeds
from Sales | | | Net
Realized
Gain/(Loss)
on Sales | | | Change in
Unrealized
Appreciation/
(Depreciation) | | | Value,
End of
Year | | | Dividend
Income | | | Other
Distributions | | | Shares
End of
Year | |
MainStay U.S. Government Liquidity Fund | | $ | 10,979 | | | $ | 189,136 | | | $ | (195,058 | ) | | $ | — | | | $ | — | | | $ | 5,057 | | | $ | 67 | | | $ | — | | | | 5,057 | |
(G) Capital. As of October 31, 2020, New York Life and its affiliates beneficially held shares of the Fund with the values and percentages of net assets as follows:
Note 4–Federal Income Tax
As of October 31, 2020, the cost and unrealized appreciation (depreciation) of the Fund’s investment portfolio, including applicable derivative contracts and other financial instruments, as determined on a federal income tax basis, were as follows:
| | | | | | | | | | | | | | | | |
| | | Federal Tax
Cost | | | Gross
Unrealized
Appreciation | | | Gross
Unrealized
(Depreciation) | | | Net
Unrealized
Appreciation/
(Depreciation) | |
| | | | |
Investments in
Securities | | $ | 505,156,658 | | | $ | 434,299,971 | | | $ | (32,015,891 | ) | | $ | 402,284,080 | |
As of October 31, 2020, the components of accumulated gain (loss) on a tax basis were as follows:
| | | | | | | | |
Ordinary
Income | | Accumulated
Capital and
Other Gain
(Loss) | | Other
Temporary
Differences | | Unrealized
Appreciation
(Depreciation) | | Total
Accumulated
Gain (Loss) |
| | | | |
| $6,050,311 | | $31,347,642 | | $— | | $402,284,080 | | $439,682,033 |
The difference between book-basis and tax-basis unrealized appreciation (depreciation) is primarily due to wash sale adjustments.
Notes to Financial Statements (continued)
During the years ended October 31, 2020, and October 31, 2019, the tax character of distributions paid as reflected in the Statements of Changes in Net Assets were as follows:
| | | | | | | | |
| | | 2020 | | | 2019 | |
| | |
Distributions paid from: | | | | | | | | |
Ordinary Income | | $ | 7,936,116 | | | $ | 9,513,106 | |
Long-Term Capital Gain | | | 77,313,368 | | | | 93,142,888 | |
Total | | $ | 85,249,484 | | | $ | 102,655,994 | |
Note 5–Custodian
State Street is the custodian of cash and securities held by the Fund (See Note 12 for custodian change). Custodial fees are charged to the Fund based on the Fund’s net assets and/or the market value of securities held by the Fund and the number of certain transactions incurred by the Fund.
Note 6–Line of Credit
The Fund and certain other funds managed by New York Life Investments maintain a line of credit with a syndicate of banks in order to secure a source of funds for temporary purposes to meet unanticipated or excessive redemption requests.
Effective July 28, 2020, under the credit agreement (the “Credit Agreement”), the aggregate commitment amount is $600,000,000 with an additional uncommitted amount of $100,000,000. The commitment fee is an annual rate of 0.15% of the average commitment amount payable quarterly, regardless of usage, to JP Morgan Chase Bank NA, who serves as the agent to the syndicate. The commitment fee is allocated among the Fund and certain other funds managed by New York Life Investments based upon their respective net assets and other factors. Interest on any revolving credit loan is charged based upon the Federal Funds Rate or the one-month London Interbank Offered Rate (“LIBOR”), whichever is higher. The Credit Agreement expires on July 27, 2021, although the Fund, certain other funds managed by New York Life Investments and the syndicate of banks may renew the Credit Agreement for an additional year on the same or different terms or enter into a credit agreement with a different syndicate of banks. Prior to July 28, 2020, the aggregate commitment amount and the commitment fee were the same as those under the current Credit Agreement, but State Street served as agent to the syndicate.
During the year ended October 31, 2020, the Fund utilized the line of credit for 4 days, maintained an average daily balance of $6,872,000 at a weighted average interest rate of 1.40% and incurred interest expense in the amount of $1,067. As of October 31, 2020, there were no borrowings outstanding with respect to the Fund under the Credit Agreement.
Note 7–Interfund Lending Program
Pursuant to an exemptive order issued by the SEC, the Fund, along with certain other funds managed by New York Life Investments, may participate in an interfund lending program. The interfund lending program provides an alternative credit facility that permits the Fund and certain other funds managed by New York Life Investments to lend or borrow money for temporary purposes directly to or from one another, subject to the conditions of the exemptive order. During the year ended October 31, 2020, there were no interfund loans made or outstanding with respect to the Fund.
Note 8–Purchases and Sales of Securities (in 000’s)
During the year ended October 31, 2020, purchases and sales of securities, other than short-term securities, were $150,982 and $295,205, respectively.
Note 9–Capital Share Transactions
Transactions in capital shares for the years ended October 31, 2020, and October 31, 2019, were as follows:
| | | | | | | | |
Class A | | Shares | | | Amount | |
| | |
Year ended October 31, 2020: | | | | | | | | |
Shares sold | | | 529,300 | | | $ | 20,239,103 | |
Shares issued to shareholders in reinvestment of distributions | | | 843,190 | | | | 33,837,200 | |
Shares redeemed | | | (1,951,518 | ) | | | (74,696,185 | ) |
| | | | |
Net increase (decrease) in shares outstanding before conversion | | | (579,028 | ) | | | (20,619,882 | ) |
Shares converted into Class A (See Note 1) | | | 339,901 | | | | 13,474,760 | |
Shares converted from Class A (See Note 1) | | | (7,078 | ) | | | (251,232 | ) |
| | | | |
Net increase (decrease) | | | (246,205 | ) | | $ | (7,396,354 | ) |
| | | | |
Year ended October 31, 2019: | | | | | | | | |
Shares sold | | | 2,193,042 | | | $ | 88,416,773 | |
Shares issued to shareholders in reinvestment of distributions | | | 959,941 | | | | 36,592,967 | |
Shares redeemed | | | (2,695,902 | ) | | | (108,469,574 | ) |
| | | | |
Net increase (decrease) in shares outstanding before conversion | | | 457,081 | | | | 16,540,166 | |
Shares converted into Class A (See Note 1) | | | 381,380 | | | | 15,059,585 | |
Shares converted from Class A (See Note 1) | | | (63,849 | ) | | | (2,494,726 | ) |
| | | | |
Net increase (decrease) | | | 774,612 | | | $ | 29,105,025 | |
| | | | |
|
| |
Investor Class | | Shares | | | Amount | |
| | |
Year ended October 31, 2020: | | | | | | | | |
Shares sold | | | 96,681 | | | $ | 3,654,326 | |
Shares issued to shareholders in reinvestment of distributions | | | 160,931 | | | | 6,462,976 | |
Shares redeemed | | | (196,367 | ) | | | (7,659,132 | ) |
| | | | |
Net increase (decrease) in shares outstanding before conversion | | | 61,245 | | | | 2,458,170 | |
Shares converted into Investor Class (See Note 1) | | | 47,537 | | | | 1,774,854 | |
Shares converted from Investor Class (See Note 1) | | | (261,205 | ) | | | (10,496,913 | ) |
| | | | |
Net increase (decrease) | | | (152,423 | ) | | $ | (6,263,889 | ) |
| | | | |
Year ended October 31, 2019: | | | | | | | | |
Shares sold | | | 376,122 | | | $ | 15,510,818 | |
Shares issued to shareholders in reinvestment of distributions | | | 195,177 | | | | 7,444,065 | |
Shares redeemed | | | (487,973 | ) | | | (19,883,494 | ) |
| | | | |
Net increase (decrease) in shares outstanding before conversion | | | 83,326 | | | | 3,071,389 | |
Shares converted into Investor Class (See Note 1) | | | 163,198 | | | | 6,249,214 | |
Shares converted from Investor Class (See Note 1) | | | (199,711 | ) | | | (8,062,305 | ) |
| | | | |
Net increase (decrease) | | | 46,813 | | | $ | 1,258,298 | |
| | | | |
|
| |
| | |
| 30 | | MainStay MAP Equity Fund |
| | | | | | | | |
Class B | | Shares | | | Amount | |
| | |
Year ended October 31, 2020: | | | | | | | | |
Shares sold | | | 9,341 | | | $ | 302,019 | |
Shares issued to shareholders in reinvestment of distributions | | | 51,808 | | | | 1,806,015 | |
Shares redeemed | | | (100,807 | ) | | | (3,293,066 | ) |
| | | | |
Net increase (decrease) in shares outstanding before conversion | | | (39,658 | ) | | | (1,185,032 | ) |
Shares converted from Class B (See Note 1) | | | (113,870 | ) | | | (3,737,122 | ) |
| | | | |
Net increase (decrease) | | | (153,528 | ) | | $ | (4,922,154 | ) |
| | | | |
Year ended October 31, 2019: | | | | | | | | |
Shares sold | | | 193,247 | | | $ | 7,064,260 | |
Shares issued to shareholders in reinvestment of distributions | | | 82,120 | | | | 2,757,564 | |
Shares redeemed | | | (306,929 | ) | | | (10,953,996 | ) |
| | | | |
Net increase (decrease) in shares outstanding before conversion | | | (31,562 | ) | | | (1,132,172 | ) |
Shares converted from Class B (See Note 1) | | | (123,914 | ) | | | (4,171,710 | ) |
| | | | |
Net increase (decrease) | | | (155,476 | ) | | $ | (5,303,882 | ) |
| | | | |
|
| |
Class C | | Shares | | | Amount | |
| | |
Year ended October 31, 2020: | | | | | | | | |
Shares sold | | | 48,129 | | | $ | 1,523,344 | |
Shares issued to shareholders in reinvestment of distributions | | | 52,580 | | | | 1,833,460 | |
Shares redeemed | | | (275,982 | ) | | | (9,304,419 | ) |
| | | | |
Net increase (decrease) in shares outstanding before conversion | | | (175,273 | ) | | | (5,947,615 | ) |
Shares converted from Class C (See Note 1) | | | (25,291 | ) | | | (816,851 | ) |
| | | | |
Net increase (decrease) | | | (200,564 | ) | | $ | (6,764,466 | ) |
| | | | |
Year ended October 31, 2019: | | | | | | | | |
Shares sold | | | 136,922 | | | $ | 4,460,201 | |
Shares issued to shareholders in reinvestment of distributions | | | 192,648 | | | | 6,467,171 | |
Shares redeemed | | | (1,292,587 | ) | | | (43,926,478 | ) |
| | | | |
Net increase (decrease) in shares outstanding before conversion | | | (963,017 | ) | | | (32,999,106 | ) |
Shares converted from Class C (See Note 1) | | | (202,437 | ) | | | (6,793,370 | ) |
| | | | |
Net increase (decrease) | | | (1,165,454 | ) | | $ | (39,792,476 | ) |
| | | | |
|
| |
Class I | | Shares | | | Amount | |
| | |
Year ended October 31, 2020: | | | | | | | | |
Shares sold | | | 991,315 | | | $ | 30,868,280 | |
Shares issued to shareholders in reinvestment of distributions | | | 938,246 | | | | 38,993,531 | |
Shares redeemed | | | (2,929,764 | ) | | | (119,324,440 | ) |
| | | | |
Net increase in shares outstanding before conversion | | | (1,000,203 | ) | | | (49,462,629 | ) |
Shares converted into Class I (See Note 1) | | | 1,177 | | | | 52,504 | |
| | | | |
Net increase (decrease) | | | (999,026 | ) | | $ | (49,410,125 | ) |
| | | | |
Year ended October 31, 2019: | | | | | | | | |
Shares sold | | | 2,323,482 | | | $ | 91,108,977 | |
Shares issued to shareholders in reinvestment of distributions | | | 1,183,116 | | | | 46,567,457 | |
Shares redeemed | | | (3,736,910 | ) | | | (150,569,250 | ) |
| | | | |
Net increase (decrease) in shares outstanding before conversion | | | (230,312 | ) | | | (12,892,816 | ) |
Shares converted into Class I (See Note 1) | | | 5,272 | | | | 213,312 | |
| | | | |
Net increase (decrease) | | | (225,040 | ) | | $ | (12,679,504 | ) |
| | | | |
| | | | | | | | |
Class R1 | | Shares | | | Amount | |
| | |
Year ended October 31, 2020: | | | | | | | | |
Shares sold | | | 58 | | | $ | 2,266 | |
Shares issued to shareholders in reinvestment of distributions | | | 73 | | | | 2,963 | |
| | | | |
Net increase (decrease) | | | 131 | | | $ | 5,229 | |
| | | | |
Year ended October 31, 2019: | | | | | | | | |
Shares sold | | | 32 | | | $ | 1,259 | |
Shares issued to shareholders in reinvestment of distributions | | | 78 | | | | 3,004 | |
Shares redeemed | | | (7 | ) | | | (283 | ) |
| | | | |
Net increase (decrease) | | | 103 | | | $ | 3,980 | |
| | | | |
|
| |
Class R2 | | Shares | | | Amount | |
| | |
Year ended October 31, 2020: | | | | | | | | |
Shares sold | | | 2,112 | | | $ | 80,909 | |
Shares issued to shareholders in reinvestment of distributions | | | 1,445 | | | | 58,398 | |
Shares redeemed | | | (3,897 | ) | | | (155,577 | ) |
| | | | |
Net increase (decrease) | | | (340 | ) | | $ | (16,270 | ) |
| | | | |
Year ended October 31, 2019: | | | | | | | | |
Shares sold | | | 3,044 | | | $ | 115,295 | |
Shares issued to shareholders in reinvestment of distributions | | | 1,962 | | | | 75,316 | |
Shares redeemed | | | (7,940 | ) | | | (306,623 | ) |
| | | | |
Net increase (decrease) | | | (2,934 | ) | | $ | (116,012 | ) |
| | | | |
|
| |
Class R3 | | Shares | | | Amount | |
| | |
Year ended October 31, 2020: | | | | | | | | |
Shares sold | | | 8,700 | | | $ | 326,941 | |
Shares issued to shareholders in reinvestment of distributions | | | 4,589 | | | | 184,724 | |
Shares redeemed | | | (6,220 | ) | | | (240,174 | ) |
| | | | |
Net increase (decrease) | | | 7,069 | | | $ | 271,491 | |
| | | | |
Year ended October 31, 2019: | | | | | | | | |
Shares sold | | | 6,211 | | | $ | 247,920 | |
Shares issued to shareholders in reinvestment of distributions | | | 4,809 | | | | 183,889 | |
Shares redeemed | | | (3,161 | ) | | | (124,649 | ) |
| | | | |
Net increase (decrease) | | | 7,859 | | | $ | 307,160 | |
| | | | |
Note 10–Recent Accounting Pronouncements
To improve the effectiveness of fair value disclosure requirements, the Financial Accounting Standards Board issued Accounting Standards Update 2018-13, Fair Value Measurement Disclosure Framework—Changes to the Disclosure Requirements for Fair Value Measurement (“ASU 2018-13”), which adds, removes, and modifies certain fair value measurement disclosure requirements. ASU 2018-13 is effective for interim and annual reporting periods beginning after December 15, 2019. The Manager evaluated the implications of certain provisions of ASU 2018-13 and determined to early adopt aspects related to the removal and modifications of certain fair value measurement disclosures, which are currently in place as of October 31, 2020. The Manager is evaluating the implications of certain other provisions of ASU 2018-13 related to new disclosure requirements and has not yet determined the impact of those provisions on the financial statement disclosures, if any.
Notes to Financial Statements (continued)
In March 2020, the Financial Accounting Standards Board (“FASB”) issued Accounting Standards Update 2020-04 (“ASU 2020-04”), which provides optional guidance to ease the potential accounting burden associated with transitioning away from LIBOR and other reference rates that are expected to be discontinued. ASU 2020-04 is effective immediately upon release of the update on March 12, 2020, through December 31, 2022. At this time, the Manager is evaluating the implications of certain other provisions of ASU 2020-04 related to new disclosure requirements and any impact on the financial statement disclosures has not yet been determined.
Note 11–Other Matters
An outbreak of COVID-19, first detected in December 2019, has developed into a global pandemic and has resulted in travel restrictions, closure of international borders, certain businesses and securities markets, restrictions on securities trading activities, prolonged quarantines, supply chain disruptions, and lower consumer demand, as well as general concern and uncertainty. The continued impact of COVID-19 is uncertain and could further adversely affect the global economy,
national economies, individual issuers and capital markets in unforeseeable ways and result in a substantial and extended economic downturn. Developments that disrupt global economies and financial markets, such as COVID-19, may magnify factors that affect the Fund’s performance.
Note 12–Subsequent Events
In connection with the preparation of the financial statements of the Fund as of and for the year ended October 31, 2020, events and transactions subsequent to October 31, 2020, through the date the financial statements were issued have been evaluated by the Manager, for possible adjustment and/or disclosure. No subsequent events requiring financial statement adjustment or disclosure have been identified other than the following:
Effective at the close of business on November 20, 2020, all services provided by State Street were transitioned to JPMorgan Chase Bank, N.A.
| | |
| 32 | | MainStay MAP Equity Fund |
Report of Independent Registered Public Accounting Firm
To the Shareholders of the Fund and Board of Trustees
The MainStay Funds:
Opinion on the Financial Statements
We have audited the accompanying statement of assets and liabilities of MainStay MAP Equity Fund (the Fund), one of the funds constituting The MainStay Funds, including the portfolio of investments, as of October 31, 2020, the related statement of operations for the year then ended, the statements of changes in net assets for each of the years in the two-year period then ended, and the related notes (collectively, the financial statements) and the financial highlights for each of the years in the five-year period then ended. In our opinion, the financial statements and financial highlights present fairly, in all material respects, the financial position of the Fund as of October 31, 2020, the results of its operations for the year then ended, the changes in its net assets for each of the years in the two-year period then ended, and the financial highlights for each of the years in the five-year period then ended, in conformity with U.S. generally accepted accounting principles.
Basis for Opinion
These financial statements and financial highlights are the responsibility of the Fund’s management. Our responsibility is to express an opinion on these financial statements and financial highlights based on our audits. We are a public accounting firm registered with the Public Company Accounting Oversight Board (United States) (PCAOB) and are required to be independent with respect to the Fund in accordance with the U.S. federal securities laws and the applicable rules and regulations of the Securities and Exchange Commission and the PCAOB.
We conducted our audits in accordance with the standards of the PCAOB. Those standards require that we plan and perform the audit to obtain reasonable assurance about whether the financial statements and financial highlights are free of material misstatement, whether due to error or fraud. Our audits included performing procedures to assess the risks of material misstatement of the financial statements and financial highlights, whether due to error or fraud, and performing procedures that respond to those risks. Such procedures included examining, on a test basis, evidence regarding the amounts and disclosures in the financial statements and financial highlights. Such procedures also included confirmation of securities owned as of October 31, 2020, by correspondence with the custodian, the transfer agent, and brokers or by other appropriate auditing procedures when replies from brokers were not received. Our audits also included evaluating the accounting principles used and significant estimates made by management, as well as evaluating the overall presentation of the financial statements and financial highlights. We believe that our audits provide a reasonable basis for our opinion.

We have served as the auditor of one or more New York Life Investment Management investment companies since 2003.
Philadelphia, Pennsylvania
December 23, 2020
Federal Income Tax Information
(Unaudited)
The Fund is required under the Internal Revenue Code to advise shareholders in a written statement as to the federal tax status of dividends paid by the Fund during such fiscal years. Accordingly, the Fund paid $77,313,368 as long term capital gain distributions.
For the fiscal year ended October 31, 2020, the Fund designated approximately $7,936,116 under the Internal Revenue Code as qualified dividend income eligible for reduced tax rates.
The dividends paid by the Fund during the fiscal year ended October 31, 2020 should be multiplied by 100.00% to arrive at the amount eligible for the corporate dividend-received deduction.
In February 2021, shareholders will receive an IRS Form 1099-DIV or substitute Form 1099, which will show the federal tax status of the distributions received by shareholders in calendar year 2020. The amounts that will be reported on such 1099-DIV or substitute Form 1099 will be the amounts you are to use on your federal income tax return and will differ from the amounts reported for the Fund’s fiscal year ended October 31, 2020.
Proxy Voting Policies and Procedures and Proxy Voting Record
A description of the policies and procedures that New York Life Investments uses to vote proxies related to the Fund’s securities is available free of charge upon request, by visiting the MainStay Funds’ website at newyorklifeinvestments.com or visiting the SEC’s website at www.sec.gov.
The Fund is required to file with the SEC its proxy voting records for the 12-month period ending June 30 on Form N-PX. The most recent Form N-PX or proxy voting record is available free of charge upon request by calling 800-624-6782; visiting the MainStay Funds’ website at newyorklifeinvestments.com; or visiting the SEC’s website at www.sec.gov.
Shareholder Reports and Quarterly Portfolio Disclosure
The Fund is required to file its complete schedule of portfolio holdings with the SEC 60 days after its first and third fiscal quarter on Form N-PORT. The Fund’s holdings report is available free of charge by visiting the SEC’s website at www.sec.gov or upon request by calling New York Life Investments at 800-624-6782.
| | |
| 34 | | MainStay MAP Equity Fund |
Board of Trustees and Officers (Unaudited)
The Trustees and officers of the Funds are listed below. The Board oversees the MainStay Group of Funds (which consists of MainStay Funds and MainStay Funds Trust), MainStay VP Funds Trust, MainStay MacKay DefinedTerm Municipal Opportunities Fund, the Manager and the Subadvisors, and elects the officers of the Funds who are responsible for the day-to-day operations of the Funds. Information pertaining to the Trustees and officers is set forth below. Each Trustee serves until his or her successor is elected and qualified or until his or her
resignation, death or removal. Under the Board’s retirement policy, unless an exception is made, a Trustee must tender his or her resignation by the end of the calendar year during which he or she reaches the age of 75. Officers are elected annually by the Board. The business address of each Trustee and officer listed below is 51 Madison Avenue, New York, New York 10010. A majority of the Trustees are not “interested persons” (as defined by the 1940 Act and rules adopted by the SEC thereunder) of the Fund (“Independent Trustees”).
| | | | | | | | | | | | |
| | | | | Name and
Year of Birth | | Term of Office,
Position(s) Held and
Length of Service | | Principal Occupation(s)
During Past Five Years | | Number of
Portfolios in
Fund Complex
Overseen by
Trustee | | Other Directorships
Held by Trustee |
Interested Trustee | | | | Yie-Hsin Hung* 1962 | | MainStay Funds:
Trustee since 2017 MainStay Funds Trust:
Trustee since 2017 | | Senior Vice President of New York Life since joining in 2010, Member of the Executive Management Committee since 2017, Chief Executive Officer, New York Life Investment Management Holdings LLC & New York Life Investment Management LLC since 2015. Senior Managing Director and Co-President of New York Life Investment Management LLC from 2014 to May 2015. Previously held positions of increasing responsibility, including head of NYLIM International, Alternative Growth Businesses, and Institutional investments since joining New York Life in 2010. | | 78 | | MainStay VP Funds Trust:
Trustee since 2017 (31 portfolios); and
MainStay MacKay DefinedTerm Municipal Opportunities Fund: Trustee since 2017. |
| | * | This Trustee is considered to be an “interested person” of the MainStay Group of Funds, MainStay VP Funds Trust and MainStay MacKay DefinedTerm Municipal Opportunities Fund, within the meaning of the 1940 Act because of her affiliation with New York Life Insurance Company, New York Life Investment Management LLC, Candriam Belgium S.A., Candriam Luxembourg S.C.A., IndexIQ Advisors LLC, MacKay Shields LLC, NYL Investors LLC, NYLIFE Securities LLC and/or NYLIFE Distributors LLC, as described in detail above in the column entitled “Principal Occupation(s) During Past Five Years.” |
Board of Trustees and Officers (Unaudited) (continued)
| | | | | | | | | | | | |
| | | | | Name and
Year of Birth | | Term of Office,
Position(s) Held and
Length of Service | | Principal Occupation(s)
During Past Five Years | | Number of
Portfolios in
Fund Complex
Overseen by
Trustee | | Other Directorships
Held by Trustee |
Independent Trustees | | | | David H. Chow 1957 | | MainStay Funds:
Trustee since 2016, Advisory Board Member (June 2015 to December 2015); MainStay Funds Trust:
Trustee since 2016, Advisory Board Member (June 2015 to December 2015). | | Founder and CEO, DanCourt Management, LLC since 1999 | | 78 | | MainStay VP Funds Trust: Trustee since 2016, Advisory Board Member (June 2015 to December 2015) (31 portfolios);
MainStay MacKay DefinedTerm Municipal Opportunities Fund: Trustee since 2016, Advisory Board Member (June 2015 to December 2015); Market Vectors Group of Exchange-Traded Funds: Independent Chairman of the Board of Trustees since 2008 and Trustee since 2006 (56 portfolios); and
Berea College of Kentucky: Trustee since 2009, Chair of the Investment Committee since 2018. |
| | | | Susan B. Kerley 1951 | | MainStay Funds:
Chairman since 2017 and Trustee since 2007; MainStay Funds Trust: Chairman since 2017 and Trustee since 1990.** | | President, Strategic Management Advisors LLC since 1990 | | 78 | | MainStay VP Funds Trust: Chairman since 2017 and Trustee since 2007 (31 portfolios)***;
MainStay MacKay DefinedTerm Municipal Opportunities Fund: Chairman since 2017 and Trustee since 2011; and
Legg Mason Partners Funds: Trustee since 1991 (45 portfolios). |
| | | | Alan R. Latshaw 1951 | | MainStay Funds:
Trustee; MainStay Funds Trust:
Trustee and Audit Committee Financial Expert since 2007.** | | Retired; Partner, Ernst & Young LLP (2002 to 2003); Partner, Arthur Andersen LLP (1989 to 2002); Consultant to the MainStay Funds Audit and Compliance Committee (2004 to 2006) | | 78 | | MainStay VP Funds Trust: Trustee and Audit Committee Financial Expert since 2007 (31 portfolios)***;
MainStay MacKay DefinedTerm Municipal Opportunities Fund: Trustee and Audit Committee Financial Expert since 2011; and
State Farm Associates Funds Trusts: Trustee since 2005 (4 portfolios). |
| | | | Richard H. Nolan, Jr. 1946 | | MainStay Funds:
Trustee since 2007; MainStay Funds Trust:
Trustee since 2007.** | | Managing Director, ICC Capital Management since 2004; President—Shields/Alliance, Alliance Capital Management (1994 to 2004) | | 78 | | MainStay VP Funds Trust: Trustee since 2006 (31 portfolios)***; and
MainStay MacKay DefinedTerm Municipal Opportunities Fund: Trustee since 2011. |
| | | | Jacques P. Perold 1958 | | MainStay Funds:
Trustee since 2016, Advisory Board Member (June 2015 to December 2015); MainStay Funds Trust:
Trustee since 2016, Advisory Board Member (June 2015 to December 2015). | | Founder and Chief Executive Officer, CapShift LLC since 2018; President, Fidelity Management & Research Company (2009 to 2014); Founder, President and Chief Executive Officer, Geode Capital Management, LLC (2001 to 2009) | | 78 | | MainStay VP Funds Trust: Trustee since 2016, Advisory Board Member (June 2015 to December 2015) (31 portfolios);
MainStay MacKay DefinedTerm Municipal Opportunities Fund: Trustee since 2016, Advisory Board Member (June 2015 to December 2015); Partners in Health: Trustee since 2019; Allstate Corporation: Director since 2015;
MSCI, Inc.: and Director since 2017. |
| | |
| 36 | | MainStay MAP Equity Fund |
| | | | | | | | | | | | |
| | | | | Name and
Year of Birth | | Term of Office,
Position(s) Held and
Length of Service | | Principal Occupation(s)
During Past Five Years | | Number of
Portfolios in
Fund Complex
Overseen by
Trustee | | Other Directorships
Held by Trustee |
Independent Trustees | | | | Richard S. Trutanic 1952 | | MainStay Funds: Trustee since 1994; MainStay Funds Trust: Trustee since 2007.** | | Chairman and Chief Executive Officer, Somerset & Company (financial advisory firm) since 2004; Managing Director, The Carlyle Group (private investment firm) (2002 to 2004); Senior Managing Director, Partner and Board Member, Groupe Arnault S.A. (private investment firm) (1999 to 2002) | | 78 | | MainStay VP Funds Trust: Trustee since 2007 (31 portfolios)***; and
MainStay MacKay DefinedTerm Municipal Opportunities Fund: Trustee since 2011. |
| | ** | Includes prior service as a Director/Trustee of certain predecessor entities to MainStay Funds Trust. |
| | *** | Includes prior service as a Director of MainStay VP Series Fund, Inc., the predecessor to MainStay VP Funds Trust. |
Board of Trustees and Officers (Unaudited) (continued)
| | | | | | | | |
| | | | | Name and
Year of Birth | | Position(s) Held and
Length of Service | | Principal Occupation(s)
During Past Five Years |
Officers
of the
Trust
(Who are
not
Trustees)* | | | | Kirk C. Lehneis 1974 | | President, MainStay Funds, MainStay Funds Trust since 2017 | | Chief Operating Officer and Senior Managing Director since 2016, New York Life Investment Management LLC and New York Life Investment Management Holdings LLC; Member of the Board of Managers since 2017 and Senior Managing Director since 2018, NYLIFE Distributors LLC; Chairman of the Board and Senior Managing Director, NYLIM Service Company LLC since 2017; Trustee, President and Principal Executive Officer of IndexIQ Trust, IndexIQ ETF Trust and IndexIQ Active ETF Trust since 2018; President, MainStay MacKay DefinedTerm Municipal Opportunities Fund and MainStay VP Funds Trust since 2017**; Senior Managing Director, Global Product Development (2015 to 2016); Managing Director, Product Development (2010 to 2015), New York Life Investment Management LLC |
| | | | Jack R. Benintende 1964 | | Treasurer and Principal Financial and Accounting Officer, MainStay Funds since 2007, MainStay Funds Trust since 2009 | | Managing Director, New York Life Investment Management LLC since 2007; Treasurer and Principal Financial and Accounting Officer, MainStay MacKay DefinedTerm Municipal Opportunities Fund since 2011 and MainStay VP Funds Trust since 2007**; and Assistant Treasurer, New York Life Investment Management Holdings LLC (2008 to 2012) |
| | | | Yi-Chia Kuo 1981 | | Vice President and Chief Compliance Officer, MainStay Funds and MainStay Funds Trust since January 2020 | | Chief Compliance Officer, Index IQ Trust, Index IQ ETF Trust and Index IQ Active ETF Trust since January 2020; Vice President and Chief Compliance Officer, MainStay MacKay DefinedTerm Municipal Opportunities Fund and MainStay VP Funds Trust since January 2020; Director and Associate General Counsel, New York Life Insurance Company (2015 to 2019) |
| | | | J. Kevin Gao 1967 | | Secretary and Chief Legal Officer, MainStay Funds and MainStay Funds Trust since 2010 | | Managing Director and Associate General Counsel, New York Life Investment Management LLC since 2010; Secretary and Chief Legal Officer, MainStay MacKay DefinedTerm Municipal Opportunities Fund since 2011 and MainStay VP Funds Trust since 2010** |
| | | | Scott T. Harrington 1959 | | Vice President— Administration, MainStay Funds since 2005, MainStay Funds Trust since 2009 | | Managing Director, New York Life Investment Management LLC (including predecessor advisory organizations) since 2000; Member of the Board of Directors, New York Life Trust Company since 2009; Vice President—Administration, MainStay MacKay DefinedTerm Municipal Opportunities Fund since 2011 and MainStay VP Funds Trust since 2005** |
| | * | The officers listed above are considered to be “interested persons” of the MainStay Group of Funds, MainStay VP Funds Trust and MainStay MacKay DefinedTerm Municipal Opportunities Fund within the meaning of the 1940 Act because of their affiliation with the MainStay Group of Funds, New York Life Insurance Company and/or its affiliates, including New York Life Investment Management LLC, NYLIM Service Company LLC, NYLIFE Securities LLC and/or NYLIFE Distributors LLC, as described in detail in the column captioned “Principal Occupation(s) During Past Five Years.” Officers are elected annually by the Board. |
| | ** | Includes prior service as an Officer of MainStay VP Series Fund, Inc., the predecessor to MainStay VP Funds Trust. |
| | |
| 38 | | MainStay MAP Equity Fund |
MainStay Funds
Equity
U.S. Equity
MainStay Epoch U.S. All Cap Fund
MainStay Epoch U.S. Equity Yield Fund
MainStay MacKay Common Stock Fund
MainStay MacKay Growth Fund
MainStay MacKay S&P 500 Index Fund
MainStay MacKay Small Cap Core Fund
MainStay MacKay U.S. Equity Opportunities Fund
MainStay MAP Equity Fund
MainStay Winslow Large Cap Growth Fund1
International Equity
MainStay Epoch International Choice Fund
MainStay MacKay International Equity Fund
MainStay MacKay International Opportunities Fund
Emerging Markets Equity
MainStay Candriam Emerging Markets Equity Fund
Global Equity
MainStay Epoch Capital Growth Fund
MainStay Epoch Global Equity Yield Fund
Fixed Income
Taxable Income
MainStay Candriam Emerging Markets Debt Fund
MainStay Floating Rate Fund
MainStay MacKay High Yield Corporate Bond Fund
MainStay MacKay Short Duration High Yield Fund
MainStay MacKay Total Return Bond Fund
MainStay MacKay Unconstrained Bond Fund
MainStay MacKay U.S. Infrastructure Bond Fund2
MainStay Short Term Bond Fund3
Tax-Exempt Income
MainStay MacKay California Tax Free Opportunities Fund4
MainStay MacKay High Yield Municipal Bond Fund
MainStay MacKay Intermediate Tax Free Bond Fund
MainStay MacKay New York Tax Free Opportunities Fund5
MainStay MacKay Short Term Municipal Fund
MainStay MacKay Tax Free Bond Fund
Money Market
MainStay Money Market Fund
Mixed Asset
MainStay Balanced Fund
MainStay Income Builder Fund
MainStay MacKay Convertible Fund
Speciality
MainStay CBRE Global Infrastructure Fund
MainStay CBRE Real Estate Fund
MainStay Cushing MLP Premier Fund
Asset Allocation
MainStay Conservative Allocation Fund
MainStay Conservative ETF Allocation Fund
MainStay Defensive ETF Allocation Fund
MainStay Equity Allocation Fund6
MainStay Equity ETF Allocation Fund
MainStay Growth Allocation Fund7
MainStay Growth ETF Allocation Fund
MainStay Moderate Allocation Fund
MainStay Moderate ETF Allocation Fund
Manager
New York Life Investment Management LLC
New York, New York
Subadvisors
Candriam Belgium S.A.8
Brussels, Belgium
Candriam Luxembourg S.C.A.8
Strassen, Luxembourg
CBRE Clarion Securities LLC
Radnor, Pennsylvania
Cushing Asset Management, LP
Dallas, Texas
Epoch Investment Partners, Inc.
New York, New York
MacKay Shields LLC8
New York, New York
Markston International LLC
White Plains, New York
NYL Investors LLC8
New York, New York
Winslow Capital Management, LLC
Minneapolis, Minnesota
Legal Counsel
Dechert LLP
Washington, District of Columbia
Independent Registered Public Accounting Firm
KPMG LLP
Philadelphia, Pennsylvania
Distributor
NYLIFE Distributors LLC8
Jersey City, New Jersey
Custodian9
State Street Bank and Trust Company
Boston, Massachusetts
| 1. | Formerly known as MainStay Large Cap Growth Fund. |
| 2. | Formerly known as MainStay MacKay Infrastructure Bond Fund. |
| 3. | Formerly known as MainStay Indexed Bond Fund. |
| 4. | This Fund is registered for sale in AZ, CA, NV, OR, TX, UT and WA. Class A and Class I shares are registered for sale in MI. Class I and Class C2 shares are registered for sale in CO, FL, GA, HI, ID, MA, MD, NH, NJ and NY. |
| 5. | This Fund is registered for sale in CA, CT, DE, FL, MA, NJ, NY and VT. |
| 6. | Formerly known as MainStay Growth Allocation Fund. |
| 7. | Formerly known as MainStay Moderate Growth Allocation Fund. |
| 8. | An affiliate of New York Life Investment Management LLC. |
| 9. | JPMorgan Chase Bank, N.A., New York, New York is the custodian for the MainStay ETF Asset Allocation Funds and effective at the close of business on November 20, 2020, became the custodian for other MainStay Funds. The custodian for MainStay Cushing MLP Premier Fund is U.S. Bank National Association, Milwaukee, Wisconsin. |
Not part of the Annual Report
For more information
800-624-6782
newyorklifeinvestments.com
“New York Life Investments” is both a service mark, and the common trade name, of certain investment advisors affiliated with New York Life Insurance Company. The MainStay Funds® are managed by New York Life Investment Management LLC and distributed by NYLIFE Distributors LLC, 30 Hudson Street, Jersey City, NJ 07302, a wholly owned subsidiary of New York Life Insurance Company. NYLIFE Distributors LLC is a Member FINRA/SIPC.
©2020 NYLIFE Distributors LLC. All rights reserved.
| | |
| 1717394 MS203-20 | | MSMP11-12/20 (NYLIM) NL220 |
MainStay Money Market Fund
Message from the President and Annual Report
October 31, 2020
Beginning on January 1, 2021, paper copies of each MainStay Fund’s annual and semiannual shareholder reports will no longer be sent by mail, unless you specifically request paper copies of the reports from MainStay Funds or from your financial intermediary. Instead, the reports will be made available on the MainStay Funds’ website. You will be notified by mail and provided with a website address to access the report each time a new report is posted to the website.
If you already elected to receive shareholder reports electronically, you will not be affected by this change and you need not take any action. At any time, you may elect to receive reports and other communications from MainStay Funds electronically by calling toll-free 800-624-6782, by sending an e-mail to MainStayShareholderServices@nylim.com, or by contacting your financial intermediary.
You may elect to receive all future shareholder reports in paper form free of charge. If you hold shares of a MainStay Fund directly, you can inform MainStay Funds that you wish to receive paper copies of reports by calling toll-free 800-624-6782 or by sending an e-mail to MainStayShareholderServices@nylim.com. If you hold shares of a MainStay Fund through a financial intermediary, please contact the financial intermediary to make this election. Your election to receive reports in paper form will apply to all MainStay Funds in which you are invested and may apply to all funds held with your financial intermediary.
| | | | | | | | |
| Not FDIC/NCUA Insured | | Not a Deposit | | May Lose Value | | No Bank Guarantee | | Not Insured by Any Government Agency |

This page intentionally left blank
Message from the President
Despite historically high levels of volatility generated by the global coronavirus pandemic and a host of other geopolitical and economic uncertainties, most broad U.S. stock and bond markets gained ground during the 12-month reporting period ended October 31, 2020.
The reporting period began on an upswing, with markets rising on generally positive underlying economic trends and the announcement of a U.S.-China trade deal. However, in mid-February 2020, stock and bond indices began to dip as growing numbers of COVID-19 cases appeared in hotspots around the world. By early March, the disease reached pandemic proportions. As governments struggled to support overburdened health care systems by issuing “stay-at-home” orders and other restrictions on nonessential activity, global economic activity slowed, driving most stocks and bonds sharply lower.
The United States was hit particularly hard by the pandemic, with more reported COVID-19 cases and deaths than any other country in the world throughout the second half of the reporting period. As the pandemic deepened, the U.S. Federal Reserve (“Fed”) twice cut interest rates and announced unlimited quantitative easing. The federal government declared a national emergency, and Congress passed and the President signed a $2 trillion stimulus package. Markets responded positively to these measures, as well as to a gradual lessening of restrictions on nonessential businesses, hopes for additional stimulus and apparent progress in the development of a vaccine. By late August, the S&P 500® Index, a widely regarded benchmark of market performance, had not only regained all the ground it lost earlier in the reporting period, the Index had reached new record levels. However, a resurgence of coronavirus cases in many parts of the country and uncertainties related to the November 3, 2020, U.S. presidential election caused markets to falter as the reporting period drew to a close.
Nevertheless, for the reporting period as a whole, U.S. equity indices generally produced moderate gains. Returns proved strongest among large-cap, growth-oriented stocks, while small- and mid-cap issues lagged. Within the S&P 500® Index, the information technology and consumer discretionary sectors produced exceptionally strong gains, buoyed by strong corporate and consumer spending, while the health care sector outperformed by a smaller margin. Materials and consumer staples sectors generated positive returns, but lagged the S&P 500® Index. The industrials, utilities, communication services, financials, real estate and energy sectors ended the reporting period in negative territory, with the energy sector
suffering the steepest losses due to weak global demand. International equities declined sharply in February and March 2020 before recovering somewhat, but tended to lag their U.S. counterparts due to weaker underlying economic growth and somewhat less aggressive monetary and fiscal stimulus. Emerging-market equities tracked the performance of U.S. equity markets more closely, led by relatively strong returns in Asian markets, such as China and South Korea.
Fixed-income markets experienced an environment that tended to favor higher credit quality and longer duration securities. Corporate bonds followed the pattern of equities, with prices declining in March 2020 before subsequently recovering. Relatively speculative high-yield credit was hardest hit during the market sell-off in early 2020 and continued to underperform during the remainder of the reporting period. Similarly, among municipal bond issues, high-grade bonds outperformed, dipping briefly in mid-March before regaining the lost ground. Recognized safe havens, such as U.S. government bonds, attracted increased investment during the height of the market sell-off, driving yields lower and prices higher. As a result, long-term Treasury bonds delivered particularly strong gains for the reporting period as a whole. Emerging-market debt, on the other hand, underperformed most other bond types as investors sought to minimize currency and sovereign risks.
Although the ongoing pandemic continues to change the way that many of us work and live our lives, we remain dedicated to providing you, as a MainStay investor, with products, information and services to help you to navigate today’s rapidly changing investment environment. By taking appropriate steps to minimize community spread of COVID-19 within our organization and despite the challenges posed by the coronavirus pandemic, we continue to innovate with you in mind, introducing new suites of Funds and providing continuous insights into ever-evolving markets and investment strategies. Our goal is to give you the tools you need to build a resilient portfolio in the face of uncertain times.
Sincerely,

Kirk C. Lehneis
President
The opinions expressed are as of the date of this report and are subject to change. There is no guarantee that any forecast made will come to pass. This material does not constitute investment advice and is not intended as an endorsement of any specific investment. Past performance is no guarantee of future results.
Not part of the Annual Report
Table of Contents
An investment in the Fund is not insured or guaranteed by the Federal Deposit Insurance Corporation or any other government agency. Although the Fund seeks to preserve the value of your investment at $1.00 per share, it is possible to lose money by investing in the Fund. The Fund’s sponsor has no legal obligation to provide financial support to the Fund, and you should not expect that the sponsor will provide financial support at any time. The Fund may impose a fee upon the sale of your shares or may temporarily suspend your ability to sell shares if the Fund’s liquidity falls below required minimums because of market conditions or other factors.
Investors should refer to the Fund’s Summary Prospectus and/or Prospectus and consider the Fund’s investment objectives, strategies, risks, charges and expenses carefully before investing. The Summary Prospectus and/or Prospectus contain this and other information about the Fund. You may obtain copies of the Fund’s Summary Prospectus, Prospectus and Statement of Additional Information free of charge, upon request, by calling toll-free 800-624-6782, by writing to NYLIFE Distributors LLC, Attn: MainStay Marketing Department, 30 Hudson Street, Jersey City, NJ 07302 or by sending an e-mail to MainStayShareholderServices@nylim.com. These documents are also available via the MainStay Funds’ website at newyorklifeinvestments.com. Please read the Summary Prospectus and/or Prospectus carefully before investing.
Investment and Performance Comparison1 (Unaudited)
Performance data quoted represents past performance. Past performance is no guarantee of future results. Because of market volatility and other factors, current performance may be lower or higher than the figures shown. Investment return and principal value will fluctuate, and as a result, when shares are redeemed, they may be worth more or less than their original cost. The graph below depicts the historical performance of Class B2 shares of the Fund. Performance will vary from class to class based on differences in class-specific expenses. For performance information current to the most recent month-end, please call 800-624-6782 or visit newyorklifeinvestments.com.
An investment in the Fund is not insured or guaranteed by the Federal Deposit Insurance Corporation or any other government agency. Although the Fund seeks to preserve the value of your investment at $1.00 per share, it is possible to lose money by investing in the Fund.
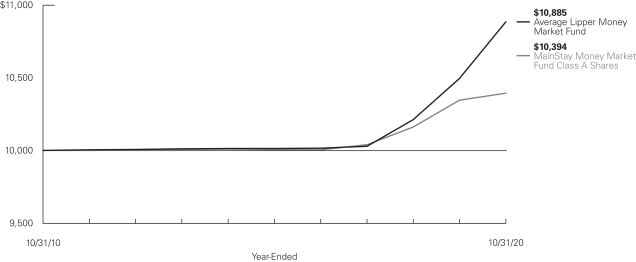
Average Annual Total Returns for the Year-Ended October 31, 2020
| | | | | | | | | | | | | | | | | | | | | | |
| Class | | Sales Charge | | Inception
Date | | | One Year
or Since
Inception | | | Five Years | | | Ten Years | | | Gross Expense Ratio2 | |
| | | | | | |
| Class A Shares3 | | No Sales Charge | | | 1/3/1995 | | | | 0.45 | % | | | 0.77 | % | | | 0.39 | % | | | 0.56 | % |
| Investor Class Shares3 | | No Sales Charge | | | 2/28/2008 | | | | 0.35 | | | | 0.62 | | | | 0.32 | | | | 0.88 | |
| Class B Shares3,4 | | No Sales Charge | | | 5/1/1986 | | | | 0.35 | | | | 0.62 | | | | 0.32 | | | | 0.88 | |
| Class C Shares3 | | No Sales Charge | | | 9/1/1998 | | | | 0.35 | | | | 0.62 | | | | 0.32 | | | | 0.88 | |
| SIMPLE Class Shares | | No Sales Charge | | | 8/31/2020 | | | | 0.00 | | | | N/A | | | | N/A | | | | 0.88 | |
| 1. | The performance table and graph do not reflect the deduction of taxes that a shareholder would pay on distributions or Fund share redemptions. Total returns reflect changes in share price, and reinvestment of dividend and capital gain distributions. The graph assumes the initial investment amount shown above. Performance figures may reflect certain fee waivers and/or expense limitations, without which total returns would have been lower. For more information on share classes and current fee waivers and/or expense limitations (if any), please refer to the Notes to Financial Statements. |
| 2. | The gross expense ratios presented reflect the Fund’s “Total Annual Fund Operating Expenses” from the most recent Prospectus and may differ from other expense ratios disclosed in this report. |
| 3. | As of October 31, 2020, MainStay Money Market Fund had an effective 7-day yield of 0.01% for Class A, 0.01% for Investor Class, 0.01% for |
| | Class B, 0.01% for Class C and 0.15% for SIMPLE Class shares. The 7-day current yield was 0.01% for Class A, 0.01% for Investor Class, 0.01% for Class B, 0.01% for Class C and 0.15% for SIMPLE Class shares. These yields reflect certain expense limitations. Had these expense limitations not been in effect, the effective 7-day yield would have been -0.04%, -0.08%, -0.08%, -0.08% and -0.08%, for Class A, Investor Class, Class B, Class C and SIMPLE Class shares, respectively, and the 7-day current yield would have been -0.04%, -0.08%, -0.08%, -0.08% and -0.08%, for Class A, Investor Class, Class B, Class C and SIMPLE Class shares, respectively. The current yield reflects the Fund’s earnings better than the Fund’s total return. |
| 4. | Class B shares are closed to all new purchases as well as additional investments by existing Class B shareholders. |
The footnotes on the next page are an integral part of the table and graph and should be carefully read in conjunction with them.
| | | | | | | | | | | | |
| Benchmark Performance | | One
Year | | | Five
Years | | | Ten
Years | |
| | | |
Average Lipper Money Market Fund5 | | | 1.14 | % | | | 1.45 | % | | | 0.85 | % |
Morningstar Prime Money Market Category Average6 | | | 0.63 | | | | 0.96 | | | | 0.50 | |
| 5. | The Average Lipper Money Market Fund is an equally weighted performance average adjusted for capital gains distributions and income dividends of all of the money market funds in the Lipper Universe. Lipper Inc., a wholly-owned subsidiary of Thomson Reuters, is an independent monitor of mutual fund performance. Results do not reflect any deduction of sales charges. Lipper averages are not class specific. Lipper returns are unaudited. Results are based on average total returns of similar funds with all dividend and capital gain distributions reinvested. |
| 6. | The Morningstar Prime Money Market Category Average is representative of funds that invest in short-term money market securities in order to provide a level of current income that is consistent with the preservation of capital. Results are based on average total returns of similar funds with all dividends and capital gain distributions reinvested. |
The footnotes on the preceding page are an integral part of the table and graph and should be carefully read in conjunction with them.
| | |
| 6 | | MainStay Money Market Fund |
Cost in Dollars of a $1,000 Investment in MainStay Money Market Fund (Unaudited)
The example below is intended to describe the fees and expenses borne by shareholders during the six-month period from May 1, 2020, to October 31, 2020, and the impact of those costs on your investment.
Example
As a shareholder of the Fund you incur two types of costs: (1) transaction costs, including exchange fees and sales charges (loads) on purchases (as applicable), and (2) ongoing costs, including management fees, distribution and/or service (12b-1) fees, and other Fund expenses (as applicable). This example is intended to help you understand your ongoing costs (in dollars) of investing in the Fund and to compare these costs with the ongoing costs of investing in other mutual funds. The example is based on an investment of $1,000 made at the beginning of the six-month period and held for the entire period from May 1, 2020, to October 31, 2020.
This example illustrates your Fund’s ongoing costs in two ways:
Actual Expenses
The second and third data columns in the table below provide information about actual account values and actual expenses. You may use the information in these columns, together with the amount you invested, to estimate the expenses that you paid during the six months ended October 31, 2020. Simply divide your account value by $1,000 (for example, an $8,600 account value divided by $1,000 = 8.6), then
multiply the result by the number under the heading entitled “Expenses Paid During Period” to estimate the expenses you paid on your account during this period.
Hypothetical Example for Comparison Purposes
The fourth and fifth data columns in the table below provide information about hypothetical account values and hypothetical expenses based on the Fund’s actual expense ratio and an assumed rate of return of 5% per year before expenses, which is not the Fund’s actual return. The hypothetical account values and expenses may not be used to estimate the actual ending account balances or expenses you paid for the six-month period shown. You may use this information to compare the ongoing costs of investing in the Fund with the ongoing costs of investing in other mutual funds. To do so, compare this 5% hypothetical example with the 5% hypothetical examples that appear in the shareholder reports of the other mutual funds.
Please note that the expenses shown in the table are meant to highlight your ongoing costs only and do not reflect any transactional costs, such as exchange fees or sales charges (loads). Therefore, the fourth and fifth data columns of the table are useful in comparing ongoing costs only and will not help you determine the relative total costs of owning different funds. In addition, if these transactional costs were included, your costs would have been higher.
| | | | | | | | | | | | | | | | | | | | | | |
| | | | | | | | | | | | | | | | | | |
| Share Class | | Beginning
Account
Value
5/1/20 | | | Ending Account
Value (Based
on Actual
Returns and
Expenses)
10/31/20 | | | Expenses
Paid
During
Period1 | | | Ending Account
Value (Based
on Hypothetical
5% Annualized
Return and
Actual Expenses)
10/31/20 | | | Expenses
Paid
During
Period1 | | | Net Expense
Ratio
During
Period2 |
| | | | | | |
| Class A Shares | | $ | 1,000.00 | | | $ | 1,000.10 | | | $ | 1.36 | | | $ | 1,023.78 | | | $ | 1.37 | | | 0.27% |
| | | | | | |
| Investor Class Shares | | $ | 1,000.00 | | | $ | 1,000.10 | | | $ | 1.41 | | | $ | 1,023.73 | | | $ | 1.42 | | | 0.28% |
| | | | | | |
| Class B Shares | | $ | 1,000.00 | | | $ | 1,000.10 | | | $ | 1.36 | | | $ | 1,023.78 | | | $ | 1.37 | | | 0.27% |
| | | | | | |
| Class C Shares | | $ | 1,000.00 | | | $ | 1,000.10 | | | $ | 1.46 | | | $ | 1,023.68 | | | $ | 1.48 | | | 0.29% |
| | | | | | |
| SIMPLE Class Shares3,4 | | $ | 1,000.00 | | | $ | 1,000.10 | | | $ | 0.32 | | | $ | 1,008.02 | | | $ | 0.32 | | | 0.19% |
| 1. | Expenses are equal to the Fund’s annualized expense ratio of each class multiplied by the average account value over the period, divided by 366 and multiplied by 184 (to reflect the six-month period) and 61 days for SIMPLE Class share (to reflect the since-inception period.) The table above represents the actual expenses incurred during the six-month period. |
| 2. | Expenses are equal to the Fund’s annualized expense ratio to reflect the six-month period. |
| 3. | The inception date was August 31, 2020. |
| 4. | Expenses paid during the period reflect ongoing costs for the period from inception through October 31, 2020. Had these shares been offered for the full six-month period ended October 31, 2020, and had the Fund provided a hypothetical 5% annualized return, expenses paid during the period would have been $0.97 for SIMPLE Class shares and the ending account value would have been $1,024.18 for SIMPLE Class shares. |
Portfolio Composition as of October 31, 2020 (Unaudited)

See Portfolio of Investments beginning on page 10 for specific holdings within these categories. The Fund’s holdings are subject to change.
| | |
| 8 | | MainStay Money Market Fund |
Portfolio Management Discussion and Analysis (Unaudited)
Questions answered by NYL Investors LLC, the Fund’s Subadvisor.
How did MainStay Money Market Fund perform relative to its benchmark and peer group during the 12 months ended October 31, 2020?
As of October 31, 2020, Class A shares of MainStay Money Market Fund provided a 7-day effective yield of 0.01% and a 7-day current yield of 0.01%. For the 12 months ended October 31, 2020, Class A shares returned 0.45%, underperforming the 1.14% return of the Average Lipper Money Market Fund. Over the same period, Class A shares also underperformed the 0.63% return of the Morningstar Prime Money Market Category Average.1
What factors affected the Fund’s relative performance during the reporting period?
The Fund’s relative performance was most significantly affected by the COVID-19 pandemic. One of the larger changes that took place in the markets was a decrease in the amount of commercial paper issuance, which led to much tighter spreads2 in this asset class.
During the reporting period, were there any liquidity events that materially impacted the Fund’s performance?
While many money market funds experienced significant runs on cash during the initial weeks of the pandemic-related market upheaval, the Fund experienced consistent levels of cash inflows from the beginning of the crisis throughout the remainder of the reporting period.
What was the Fund’s duration3 strategy during the reporting period?
The Fund increased its duration from 15 days to 44 days over the reporting period. In a challenging environment of lower commercial paper issuance and tighter spreads over U.S.
Treasury bills, this extension helped the Fund take advantage of term premium and helped mitigate some of the otherwise lost yield.
During the reporting period, which sectors were the strongest positive contributors to the Fund’s relative performance and which sectors were particularly weak?
Commercial paper and agency floaters provided the strongest positive contributions to the Fund’s performance relative to the Average Lipper Money Market Fund. (Contributions take weightings and total returns into account.) Over the same period, U.S. Treasury bills and agency discount notes were the Fund’s weakest relative performers.
What were some of the Fund’s largest purchases and sales during the reporting period?
At the initial onset of the pandemic, the Fund’s management team was able to exercise good credit judgement and take advantage of significantly higher yields in the commercial paper market. Although the Fund did not sell any assets during the reporting period, two relatively high-yielding, short-dated, corporate floaters matured.
How did the Fund’s sector weightings change during the reporting period?
The Fund’s holdings of commercial paper declined significantly during the reporting period, largely due to lower issuance. Holdings of agency discount notes were replaced in the Fund with U.S. Treasury bills, which proved more liquid, while being issued at virtually identical yields. U.S. Treasury bill holdings increased significantly, helping the Fund meet its liquidity requirements.
| 1. | See page 5 for other share class returns, which may be higher or lower than Class A share returns. See page 6 for more information on benchmark and peer group returns. |
| 2. | The terms “spread” and “yield spread” may refer to the difference in yield between a security or type of security and comparable U.S. Treasury issues. The terms may also refer to the difference in yield between two specific securities or types of securities at a given time. |
| 3. | Duration is a measure of the price sensitivity of a fixed-income investment to changes in interest rates. Duration is expressed as a number of years and is considered a more accurate sensitivity gauge than average maturity. |
The opinions expressed are those of the portfolio managers as of the date of this report and are subject to change. There is no guarantee that any forecasts will come to pass. This material does not constitute investment advice and is not intended as an endorsement of any specific investment.
Portfolio of Investments October 31, 2020
| | | | | | | | |
| | | Principal
Amount | | | Value | |
| Short-Term Investments 99.6%† | |
Certificates of Deposit 7.0% | |
Bank of Nova Scotia
0.37% (3 Month LIBOR + 0.09%), due 2/16/21 (a) | | $ | 10,000,000 | | | $ | 10,000,000 | |
Nordea Bank Abp
0.348% (3 Month LIBOR + 0.10%), due 6/7/21 (a) | | | 20,000,000 | | | | 20,000,000 | |
Royal Bank of Canada
0.357% (3 Month LIBOR + 0.12%), due 6/16/21 (a) | | | 5,000,000 | | | | 5,000,000 | |
| | | | | | | | |
Total Certificates of Deposit
(Cost $35,000,000) | | | | | | | 35,000,000 | |
| | | | | | | | |
|
Financial Company Commercial Paper 23.1% | |
Bank of Montreal
0.117%, due 11/23/20 | | | 17,000,000 | | | | 16,998,234 | |
Bank of Nova Scotia
0.123%, due 11/24/20 (b) | | | 7,000,000 | | | | 6,999,329 | |
CDP Financial, Inc.
0.111%, due 12/21/20 (b) | | | 17,000,000 | | | | 16,996,930 | |
PSP Capital Inc.
0.131%, due 3/23/21 (b) | | | 18,000,000 | | | | 17,987,220 | |
Royal Bank of Canada
0.324% (3 Month LIBOR + 0.09%), due 1/4/21 (a)(b) | | | 5,000,000 | | | | 5,000,000 | |
Toronto Dominion Bank
0.36% (3 Month LIBOR + 0.11%), due 6/10/21 (a)(b) | | | 20,000,000 | | | | 20,000,000 | |
Total Capital Canada Ltd.
0.089%, due 11/9/20 (b) | | | 17,000,000 | | | | 16,999,396 | |
Westpac Banking Corp.
0.346% (3 Month LIBOR + 0.09%), due 5/28/21 (a)(b) | | | 15,000,000 | | | | 15,000,551 | |
| | | | | | | | |
Total Financial Company Commercial Paper
(Cost $115,981,660) | | | | | | | 115,981,660 | |
| | | | | | | | |
|
Other Commercial Paper 28.1% | |
BASF SE
0.16%, due 12/28/20 (b) | | | 18,000,000 | | | | 17,994,870 | |
Canadian Imperial Bank of Commerce
0.161%, due 2/1/21 (b) | | | 10,000,000 | | | | 9,990,289 | |
Canadian National Railway Co. (b) | | | | | | | | |
0.111%, due 12/1/20 | | | 10,000,000 | | | | 9,999,000 | |
0.126%, due 1/7/21 | | | 5,000,000 | | | | 4,998,697 | |
Exxon Mobil Corp. | | | | | | | | |
0.122%, due 2/1/21 | | | 5,000,000 | | | | 4,998,147 | |
0.126%, due 2/9/21 | | | 6,000,000 | | | | 5,997,500 | |
0.155%, due 3/23/21 | | | 7,000,000 | | | | 6,994,754 | |
GlaxoSmithKline LLC
0.09%, due 11/2/20 (b) | | | 18,000,000 | | | | 17,999,940 | |
| | | | | | | | |
| | | Principal
Amount | | | Value | |
Other Commercial Paper (continued) | | | | | | | | |
Henkel of America, Inc.
0.158%, due 3/5/21 (b) | | $ | 5,975,000 | | | $ | 5,971,089 | |
Hydro-Quebec
0.077%, due 11/25/20 (b) | | | 17,000,000 | | | | 16,998,640 | |
John Deere Canada ULC
0.092%, due 11/17/20 (b) | | | 17,260,000 | | | | 17,259,003 | |
Ontario Teachers Finance Trust
0.073%, due 11/19/20 (b) | | | 5,000,000 | | | | 4,999,675 | |
Province of British Columbia
0.141%, due 2/19/21 | | | 17,000,000 | | | | 16,991,689 | |
| | | | | | | | |
Total Other Commercial Paper
(Cost $141,193,293) | | | | | | | 141,193,293 | |
| | | | | | | | |
|
Treasury Debt 30.3% (c) | |
United States Cash Management Bill | | | | | | | | |
0.096%, due 2/2/21 | | | 15,000,000 | | | | 14,995,641 | |
United States Treasury Bills | | | | | | | | |
0.072%, due 11/17/20 | | | 19,000,000 | | | | 18,999,282 | |
0.073%, due 11/5/20 | | | 7,000,000 | | | | 6,999,936 | |
0.073%, due 11/12/20 | | | 3,000,000 | | | | 2,999,924 | |
0.086%, due 12/3/20 | | | 10,000,000 | | | | 9,999,262 | |
0.088%, due 12/8/20 | | | 90,000,000 | | | | 89,991,958 | |
0.091%, due 12/10/20 | | | 4,300,000 | | | | 4,299,616 | |
0.102%, due 2/25/21 | | | 3,600,000 | | | | 3,598,898 | |
| | | | | | | | |
Total Treasury Debt
(Cost $151,884,517) | | | | | | | 151,884,517 | |
| | | | | | | | |
|
Treasury Repurchase Agreements 11.1% | |
Bank of America N.A.
0.07%, dated 10/30/20
due 11/2/20
Proceeds at Maturity $15,000,088 (Collateralized by United States Treasury security with a rate of 1.625% and maturity date of 11/30/26, with a Principal Amount of $14,252,400 and a Market Value of $15,300,017) | | | 15,000,000 | | | | 15,000,000 | |
RBC Capital Markets LLC
0.07%, dated 10/30/20
due 11/2/20
Proceeds at Maturity $26,006,152 (Collateralized by United States Treasury securities with rates between 2.25% and 2.62% and maturity dates between 1/31/26 and 8/15/46, with a Principal Amount of $23,107,300 and a Market Value of $26,526,364) | | | 26,006,000 | | | | 26,006,000 | |
| | | | |
| 10 | | MainStay Money Market Fund | | The notes to the financial statements are an integral part of,
and should be read in conjunction with, the financial statements. |
| | | | | | | | |
| | | Principal
Amount | | | Value | |
| Short-Term Investments (continued) | |
Treasury Repurchase Agreements (continued) | |
TD Securities (U.S.A.) LLC
0.07%, dated 10/30/20
due 11/2/20
Proceeds at Maturity $15,000,088 (Collateralized by a United States Treasury securities with a rate of 0.00% maturity date of 12/17/20, with a Principal Amount of $15,301,900 and a Market Value of $15,300,033) | | $ | 15,000,000 | | | $ | 15,000,000 | |
| | | | | | | | |
Total Treasury Repurchase Agreements
(Cost $56,006,000) | | | | | | | 56,006,000 | |
| | | | | | | | |
Total Short-Term Investments (Cost $500,065,470) | | | 99.6 | % | | | 500,065,470 | |
| | | | | | | | |
Other Assets, Less Liabilities | | | 0.4 | | | | 1,812,922 | |
Net Assets | | | 100.0 | % | | $ | 501,878,392 | |
| † | Percentages indicated are based on Fund net assets. |
| (a) | Floating rate—Rate shown was the rate in effect as of October 31, 2020. |
| (b) | May be sold to institutional investors only under Rule 144A or securities offered pursuant to Section 4(a)(2) of the Securities Act of 1933, as amended. |
| (c) | Interest rate shown represents yield to maturity. |
The following abbreviations are used in the preceding pages:
LIBOR—London Interbank Offered Rate
The following is a summary of the fair valuations according to the inputs used as of October 31, 2020, for valuing the Fund’s assets:
| | | | | | | | | | | | | | | | |
Description | | Quoted
Prices in
Active
Markets for
Identical
Assets
(Level 1) | | | Significant
Other
Observable
Inputs
(Level 2) | | | Significant
Unobservable
Inputs
(Level 3) | | | Total | |
| | | | |
Asset Valuation Inputs | | | | | | | | | | | | | | | | |
| Investments in Securities (a) | | | | | | | | | | | | | | | | |
| Short-Term Investments | | | | | | | | | | | | | | | | |
Certificates of Deposit | | $ | — | | | $ | 35,000,000 | | | $ | — | | | $ | 35,000,000 | |
Financial Company Commercial Paper | | | — | | | | 115,981,660 | | | | — | | | | 115,981,660 | |
Other Commercial Paper | | | — | | | | 141,193,293 | | | | — | | | | 141,193,293 | |
Treasury Debt | | | — | | | | 151,884,517 | | | | — | | | | 151,884,517 | |
Treasury Repurchase Agreements | | | — | | | | 56,006,000 | | | | — | | | | 56,006,000 | |
| | | | | | | | | | | | | | | | |
| Total Investments in Securities | | $ | — | | | $ | 500,065,470 | | | $ | — | | | $ | 500,065,470 | |
| | | | | | | | | | | | | | | | |
| (a) | For a complete listing of investments and their industries, see the Portfolio of Investments. |
| | | | | | |
The notes to the financial statements are an integral part of,
and should be read in conjunction with, the financial statements. | | | | | 11 | |
Statement of Assets and Liabilities as of October 31, 2020
| | | | |
| Assets | | | | |
Investment in securities, at value
(amortized cost $444,059,470) | | $ | 444,059,470 | |
Repurchase agreements, at value
(amortized cost $56,006,000) | | | 56,006,000 | |
Cash | | | 4,070 | |
Receivables: | | | | |
Fund shares sold | | | 2,594,982 | |
Interest | | | 41,677 | |
Manager (See Note 3) | | | 28,128 | |
Other assets | | | 63,777 | |
| | | | |
Total assets | | | 502,798,104 | |
| | | | |
| |
| Liabilities | | | | |
Payables: | | | | |
Fund shares redeemed | | | 754,933 | |
Transfer agent (See Note 3) | | | 105,900 | |
Shareholder communication | | | 23,454 | |
Professional fees | | | 22,097 | |
Custodian | | | 7,160 | |
Trustees | | | 688 | |
Accrued expenses | | | 3,968 | |
Dividend payable | | | 1,512 | |
| | | | |
Total liabilities | | | 919,712 | |
| | | | |
Net assets | | $ | 501,878,392 | |
| | | | |
| |
| Composition of Net Assets | | | | |
Shares of beneficial interest outstanding (par value of $.01 per share) unlimited number of shares authorized | | $ | 5,018,882 | |
Additional paid-in capital | | | 496,818,425 | |
| | | | |
| | | 501,837,307 | |
Total distributable earnings (loss) | | | 41,085 | |
| | | | |
Net assets | | $ | 501,878,392 | |
| | | | |
| | | | |
Class A | | | | |
Net assets applicable to outstanding shares | | $ | 415,040,844 | |
| | | | |
Shares of beneficial interest outstanding | | | 415,038,076 | |
| | | | |
Net asset value and offering price per share outstanding | | $ | 1.00 | |
| | | | |
Investor Class | | | | |
Net assets applicable to outstanding shares | | $ | 28,426,885 | |
| | | | |
Shares of beneficial interest outstanding | | | 28,436,456 | |
| | | | |
Net asset value and offering price per share outstanding | | $ | 1.00 | |
| | | | |
Class B | | | | |
Net assets applicable to outstanding shares | | $ | 30,215,113 | |
| | | | |
Shares of beneficial interest outstanding | | | 30,218,321 | |
| | | | |
Net asset value and offering price per share outstanding | | $ | 1.00 | |
| | | | |
Class C | | | | |
Net assets applicable to outstanding shares | | $ | 28,170,549 | |
| | | | |
Shares of beneficial interest outstanding | | | 28,170,357 | |
| | | | |
Net asset value and offering price per share outstanding | | $ | 1.00 | |
| | | | |
SIMPLE Class | | | | |
Net assets applicable to outstanding shares | | $ | 25,001 | |
| | | | |
Shares of beneficial interest outstanding | | | 25,001 | |
| | | | |
Net asset value and offering price per share outstanding | | $ | 1.00 | |
| | | | |
| | | | |
| 12 | | MainStay Money Market Fund | | The notes to the financial statements are an integral part of,
and should be read in conjunction with, the financial statements. |
Statement of Operations for the year ended October 31, 2020
| | | | |
| Investment Income (Loss) | | | | |
Income | | | | |
Interest | | $ | 3,362,957 | |
Other | | | 75 | |
| | | | |
Total income | | | 3,363,032 | |
| | | | |
Expenses | | | | |
Manager (See Note 3) | | | 1,729,637 | |
Transfer agent (See Note 3) | | | 623,843 | |
Registration | | | 121,440 | |
Professional fees | | | 90,399 | |
Custodian | | | 42,710 | |
Shareholder communication | | | 36,823 | |
Trustees | | | 9,894 | |
Miscellaneous | | | 18,212 | |
| | | | |
Total expenses before waiver/reimbursement | | | 2,672,958 | |
Expense waiver/reimbursement from Manager (See Note 3) | | | (881,321 | ) |
| | | | |
Net expenses | | | 1,791,637 | |
| | | | |
Net investment income (loss) | | | 1,571,395 | |
| | | | |
| |
| Realized and Unrealized Gain (Loss) | | | | |
Net realized gain (loss) | | | 39,794 | |
| | | | |
Net increase (decrease) in net assets resulting from operations | | $ | 1,611,189 | |
| | | | |
| | | | | | |
The notes to the financial statements are an integral part of,
and should be read in conjunction with, the financial statements. | | | | | 13 | |
Statements of Changes in Net Assets
for the years ended October 31, 2020 and October 31, 2019
| | | | | | | | |
| | | 2020 | | | 2019 | |
| Increase (Decrease) in Net Assets | |
Operations: | | | | | | | | |
Net investment income (loss) | | $ | 1,571,395 | | | $ | 6,249,000 | |
Net realized gain (loss) | | | 39,794 | | | | 1,026 | |
| | | | |
Net increase (decrease) in net assets resulting from operations | | | 1,611,189 | | | | 6,250,026 | |
| | | | |
Distributions to shareholders: | | | | | | | | |
Class A | | | (1,296,502 | ) | | | (4,900,195 | ) |
Investor Class | | | (95,085 | ) | | | (426,770 | ) |
Class B | | | (108,934 | ) | | | (557,854 | ) |
Class C | | | (70,584 | ) | | | (363,990 | ) |
SIMPLE Class | | | (1 | ) | | | — | |
| | | | |
Total distributions to shareholders | | | (1,571,106 | ) | | | (6,248,809 | ) |
| | | | |
Capital share transactions: | | | | | | | | |
Net proceeds from sale of shares | | | 684,343,367 | | | | 454,831,292 | |
Net asset value of shares issued to shareholders in reinvestment of distributions | | | 1,524,810 | | | | 6,060,427 | |
Cost of shares redeemed | | | (555,872,249 | ) | | | (411,720,332 | ) |
| | | | |
Increase (decrease) in net assets derived from capital share transactions | | | 129,995,928 | | | | 49,171,387 | |
| | | | |
Net increase (decrease) in net assets | | | 130,036,011 | | | | 49,172,604 | |
| | |
| Net Assets | | | | | | | | |
Beginning of year | | | 371,842,381 | | | | 322,669,777 | |
| | | | |
End of year | | $ | 501,878,392 | | | $ | 371,842,381 | |
| | | | |
| | | | |
| 14 | | MainStay Money Market Fund | | The notes to the financial statements are an integral part of,
and should be read in conjunction with, the financial statements. |
Financial Highlights selected per share data and ratios
| | | | | | | | | | | | | | | | | | | | |
| |
| | | Year ended October 31, | |
| | | | | |
| Class A | | 2020 | | | 2019 | | | 2018 | | | 2017 | | | 2016 | |
| | | | | |
Net asset value at beginning of year | | $ | 1.00 | | | $ | 1.00 | | | $ | 1.00 | | | $ | 1.00 | | | $ | 1.00 | |
| | | | | | | | | | | | | | | | | | | | |
| | | | | |
Net investment income (loss) (a) | | | 0.00 | ‡ | | | 0.02 | | | | 0.01 | | | | 0.00 | ‡ | | | 0.00 | ‡ |
| | | | | |
Net realized and unrealized gain (loss) on investments | | | 0.00 | ‡ | | | 0.00 | ‡ | | | (0.00 | )‡ | | | 0.00 | ‡ | | | 0.00 | ‡ |
| | | | | | | | | | | | | | | | | | | | |
| | | | | |
Total from investment operations | | | 0.00 | ‡ | | | 0.02 | | | | 0.01 | | | | 0.00 | ‡ | | | 0.00 | ‡ |
| | | | | | | | | | | | | | | | | | | | |
| | | | | |
| Less distributions: | | | | | | | | | | | | | | | | | | | | |
| | | | | |
From net investment income | | | (0.00 | )‡ | | | (0.02 | ) | | | (0.01 | ) | | | (0.00 | )‡ | | | (0.00 | )‡ |
| | | | | | | | | | | | | | | | | | | | |
| | | | | |
Net asset value at end of year | | $ | 1.00 | | | $ | 1.00 | | | $ | 1.00 | | | $ | 1.00 | | | $ | 1.00 | |
| | | | | | | | | | | | | | | | | | | | |
| | | | | |
Total investment return (b) | | | 0.45 | % | | | 1.84 | % | | | 1.21 | % | | | 0.35 | % | | | 0.01 | % |
| | | | | |
| Ratios (to average net assets)/Supplemental Data: | | | | | | | | | | | | | | | | | | | | |
| | | | | |
Net investment income (loss) | | | 0.37 | % | | | 1.82 | % | | | 1.20 | % | | | 0.32 | % | | | 0.02 | % |
| | | | | |
Net expenses | | | 0.39 | % | | | 0.56 | % | | | 0.57 | % | | | 0.59 | % | | | 0.43 | % |
| | | | | |
Expenses (before waiver/reimbursement) | | | 0.55 | % | | | 0.56 | % | | | 0.57 | % | | | 0.60 | % | | | 0.64 | % |
| | | | | |
Net assets at end of year (in 000’s) | | $ | 415,041 | | | $ | 290,421 | | | $ | 235,855 | | | $ | 227,572 | | | $ | 226,181 | |
| ‡ | Less than one cent per share. |
| (a) | Per share data based on average shares outstanding during the year. |
| (b) | Total investment return is calculated exclusive of sales charges and assumes the reinvestment of distributions. For periods of less than one year, total return is not annualized. |
| | | | | | | | | | | | | | | | | | | | |
| |
| | | Year ended October 31, | |
| | | | | |
| Investor Class | | 2020 | | | 2019 | | | 2018 | | | 2017 | | | 2016 | |
| | | | | |
Net asset value at beginning of year | | $ | 1.00 | | | $ | 1.00 | | | $ | 1.00 | | | $ | 1.00 | | | $ | 1.00 | |
| | | | | | | | | | | | | | | | | | | | |
| | | | | |
Net investment income (loss) (a) | | | 0.00 | ‡ | | | 0.02 | | | | 0.01 | | | | 0.00 | ‡ | | | 0.00 | ‡ |
| | | | | |
Net realized and unrealized gain (loss) on investments | | | 0.00 | ‡ | | | 0.00 | ‡ | | | (0.00 | )‡ | | | 0.00 | ‡ | | | 0.00 | ‡ |
| | | | | | | | | | | | | | | | | | | | |
| | | | | |
Total from investment operations | | | 0.00 | ‡ | | | 0.02 | | | | 0.01 | | | | 0.00 | ‡ | | | 0.00 | ‡ |
| | | | | | | | | | | | | | | | | | | | |
| | | | | |
| Less distributions: | | | | | | | | | | | | | | | | | | | | |
| | | | | |
From net investment income | | | (0.00 | )‡ | | | (0.02 | ) | | | (0.01 | ) | | | (0.00 | )‡ | | | (0.00 | )‡ |
| | | | | | | | | | | | | | | | | | | | |
| | | | | |
Net asset value at end of year | | $ | 1.00 | | | $ | 1.00 | | | $ | 1.00 | | | $ | 1.00 | | | $ | 1.00 | |
| | | | | | | | | | | | | | | | | | | | |
| | | | | |
Total investment return (b) | | | 0.35 | % | | | 1.59 | % | | | 0.98 | % | | | 0.20 | % | | | 0.01 | % |
| | | | | |
| Ratios (to average net assets)/Supplemental Data: | | | | | | | | | | | | | | | | | | | | |
| | | | | |
Net investment income (loss) | | | 0.33 | % | | | 1.58 | % | | | 0.97 | % | | | 0.18 | % | | | 0.02 | % |
| | | | | |
Net expenses | | | 0.51 | % | | | 0.80 | % | | | 0.80 | % | | | 0.73 | % | | | 0.43 | % |
| | | | | |
Expenses (before waiver/reimbursement) | | | 0.91 | % | | | 0.88 | % | | | 0.84 | % | | | 0.79 | % | | | 0.83 | % |
| | | | | |
Net assets at end of year (in 000’s) | | $ | 28,427 | | | $ | 28,133 | | | $ | 26,548 | | | $ | 27,087 | | | $ | 58,658 | |
| ‡ | Less than one cent per share. |
| (a) | Per share data based on average shares outstanding during the year. |
| (b) | Total investment return is calculated exclusive of sales charges and assumes the reinvestment of distributions. For periods of less than one year, total return is not annualized. |
| | | | | | |
The notes to the financial statements are an integral part of,
and should be read in conjunction with, the financial statements. | | | | | 15 | |
Financial Highlights selected per share data and ratios
| | | | | | | | | | | | | | | | | | | | |
| |
| | | Year ended October 31, | |
| | | | | |
| Class B | | 2020 | | | 2019 | | | 2018 | | | 2017 | | | 2016 | |
| | | | | |
Net asset value at beginning of year | | $ | 1.00 | | | $ | 1.00 | | | $ | 1.00 | | | $ | 1.00 | | | $ | 1.00 | |
| | | | | | | | | | | | | | | | | | | | |
| | | | | |
Net investment income (loss) (a) | | | 0.00 | ‡ | | | 0.02 | | | | 0.01 | | | | 0.00 | ‡ | | | 0.00 | ‡ |
| | | | | |
Net realized and unrealized gain (loss) on investments | | | 0.00 | ‡ | | | 0.00 | ‡ | | | (0.00 | )‡ | | | 0.00 | ‡ | | | 0.00 | ‡ |
| | | | | | | | | | | | | | | | | | | | |
| | | | | |
Total from investment operations | | | 0.00 | ‡ | | | 0.02 | | | | 0.01 | | | | 0.00 | ‡ | | | 0.00 | ‡ |
| | | | | | | | | | | | | | | | | | | | |
| | | | | |
| Less distributions: | | | | | | | | | | | | | | | | | | | | |
| | | | | |
From net investment income | | | (0.00 | )‡ | | | (0.02 | ) | | | (0.01 | ) | | | (0.00 | )‡ | | | (0.00 | )‡ |
| | | | | | | | | | | | | | | | | | | | |
| | | | | |
Net asset value at end of year | | $ | 1.00 | | | $ | 1.00 | | | $ | 1.00 | | | $ | 1.00 | | | $ | 1.00 | |
| | | | | | | | | | | | | | | | | | | | |
| | | | | |
Total investment return (b) | | | 0.35 | % | | | 1.59 | % | | | 0.98 | % | | | 0.20 | % | | | 0.01 | % |
| | | | | |
| Ratios (to average net assets)/Supplemental Data: | | | | | | | | | | | | | | | | | | | | |
| | | | | |
Net investment income (loss) | | | 0.35 | % | | | 1.59 | % | | | 0.96 | % | | | 0.17 | % | | | 0.02 | % |
| | | | | |
Net expenses | | | 0.52 | % | | | 0.80 | % | | | 0.80 | % | | | 0.73 | % | | | 0.43 | % |
| | | | | |
Expenses (before waiver/reimbursement) | | | 0.90 | % | | | 0.88 | % | | | 0.84 | % | | | 0.79 | % | | | 0.83 | % |
| | | | | |
Net assets at end of year (in 000’s) | | $ | 30,215 | | | $ | 32,981 | | | $ | 37,284 | | | $ | 43,351 | | | $ | 53,341 | |
| ‡ | Less than one cent per share. |
| (a) | Per share data based on average shares outstanding during the year. |
| (b) | Total investment return is calculated exclusive of sales charges and assumes the reinvestment of distributions. For periods of less than one year, total return is not annualized. |
| | | | | | | | | | | | | | | | | | | | |
| |
| | | Year ended October 31, | |
| | | | | |
| Class C | | 2020 | | | 2019 | | | 2018 | | | 2017 | | | 2016 | |
| | | | | |
Net asset value at beginning of year | | $ | 1.00 | | | $ | 1.00 | | | $ | 1.00 | | | $ | 1.00 | | | $ | 1.00 | |
| | | | | | | | | | | | | | | | | | | | |
| | | | | |
Net investment income (loss) (a) | | | 0.00 | ‡ | | | 0.02 | | | | 0.01 | | | | 0.00 | ‡ | | | 0.00 | ‡ |
| | | | | |
Net realized and unrealized gain (loss) on investments | | | 0.00 | ‡ | | | 0.00 | ‡ | | | (0.00 | )‡ | | | 0.00 | ‡ | | | 0.00 | ‡ |
| | | | | | | | | | | | | | | | | | | | |
| | | | | |
Total from investment operations | | | 0.00 | ‡ | | | 0.02 | | | | 0.01 | | | | 0.00 | ‡ | | | 0.00 | ‡ |
| | | | | | | | | | | | | | | | | | | | |
| | | | | |
| Less distributions: | | | | | | | | | | | | | | | | | | | | |
| | | | | |
From net investment income | | | (0.00 | )‡ | | | (0.02 | ) | | | (0.01 | ) | | | (0.00 | )‡ | | | (0.00 | )‡ |
| | | | | | | | | | | | | | | | | | | | |
| | | | | |
Net asset value at end of year | | $ | 1.00 | | | $ | 1.00 | | | $ | 1.00 | | | $ | 1.00 | | | $ | 1.00 | |
| | | | | | | | | | | | | | | | | | | | |
| | | | | |
Total investment return (b) | | | 0.35 | % | | | 1.60 | % | | | 0.98 | % | | | 0.20 | % | | | 0.01 | % |
| | | | | |
| Ratios (to average net assets)/Supplemental Data: | | | | | | | | | | | | | | | | | | | | |
| | | | | |
Net investment income (loss) | | | 0.27 | % | | | 1.59 | % | | | 0.94 | % | | | 0.17 | % | | | 0.02 | % |
| | | | | |
Net expenses | | | 0.50 | % | | | 0.80 | % | | | 0.80 | % | | | 0.73 | % | | | 0.43 | % |
| | | | | |
Expenses (before waiver/reimbursement) | | | 0.90 | % | | | 0.88 | % | | | 0.84 | % | | | 0.79 | % | | | 0.83 | % |
| | | | | |
Net assets at end of year (in 000’s) | | $ | 28,171 | | | $ | 20,308 | | | $ | 22,983 | | | $ | 30,831 | | | $ | 41,311 | |
| ‡ | Less than one cent per share. |
| (a) | Per share data based on average shares outstanding during the year. |
| (b) | Total investment return is calculated exclusive of sales charges and assumes the reinvestment of distributions. For periods of less than one year, total return is not annualized. |
| | | | |
| 16 | | MainStay Money Market Fund | | The notes to the financial statements are an integral part of,
and should be read in conjunction with, the financial statements. |
Financial Highlights selected per share data and ratios
| | | | |
| |
| SIMPLE Class | | August 31,
2020^
through
October 31,
2020 | |
| |
Net asset value at beginning of period * | | $ | 1.00 | |
| | | | |
| |
Net investment income (loss) (a) | | | (0.00 | )‡ |
| |
Net realized and unrealized gain (loss) on investments | | | 0.00 | ‡ |
| | | | |
| |
Total from investment operations | | | 0.00 | ‡ |
| | | | |
| |
| Less distributions: | | | | |
| |
From net investment income | | | (0.00 | )‡ |
| | | | |
| |
Net asset value at end of period | | $ | 1.00 | |
| | | | |
| |
Total investment return (b) | | | 0.00 | % ‡‡ |
| |
| Ratios (to average net assets)/Supplemental Data: | | | | |
| |
Net investment income (loss) †† | | | (0.02 | %) |
| |
Net expenses †† | | | 0.19 | % |
| |
Expenses (before waiver/reimbursement) †† | | | 0.95 | % |
| |
Net assets at end of period (in 000’s) | | $ | 25 | |
| ‡ | Less than one cent per share. |
| ‡‡ | Less than one-tenth percent. |
| * | Based on the net asset value of Investor Class as of August 31, 2020. |
| (a) | Per share data based on average shares outstanding during the year. |
| (b) | Total investment return is calculated exclusive of sales charges and assumes the reinvestment of distributions. SIMPLE Class shares are not subject to sales charges. For periods of less than one year, total return is not annualized. |
| | | | | | |
The notes to the financial statements are an integral part of,
and should be read in conjunction with, the financial statements. | | | | | 17 | |
Notes to Financial Statements
Note 1–Organization and Business
The MainStay Funds (the “Trust”) was organized on January 9, 1986, as a Massachusetts business trust. The Trust is registered under the Investment Company Act of 1940, as amended (the “1940 Act”), as an open-end management investment company, and is comprised of twelve funds (collectively referred to as the “Funds”). These financial statements and notes relate to the MainStay Money Market Fund (the “Fund”), a “diversified” fund, as that term is defined in the 1940 Act, as interpreted or modified by regulatory authorities having jurisdiction, from time to time.
The Fund currently has six classes of shares registered for sale. Class A shares commenced operations on January 3, 1995. Class B shares commenced operations on May 1, 1986. Class C shares commenced operations on September 1, 1998. Investor Class shares commenced operations on February 28, 2008. SIMPLE Class shares commenced operations on August 31, 2020. Class R6 shares were registered for sale effective as of February 28, 2020. As of October 31, 2020, Class R6 shares were not yet offered for sale.
Class A, Class C, Investor Class and SIMPLE Class shares are offered at net asset value (“NAV”) without an initial sales charge. Class B shares of the MainStay Group of Funds are closed to all new purchases as well as additional investments by existing Class B shareholders. Existing Class B shareholders may continue to reinvest dividends and capital gains distributions, as well as exchange their Class B shares for Class B shares of other funds in the MainStay Group of Funds as permitted by the current exchange privileges. Class B shareholders continue to be subject to any applicable contingent deferred sales charge (“CDSC”) at the time of redemption. All other features of the Class B shares, including but not limited to the fees and expenses applicable to Class B shares, remain unchanged. Unless redeemed, Class B shareholders will remain in Class B shares of their respective fund until the Class B shares are converted to Class A or Investor Class shares pursuant to the applicable conversion schedule. Depending upon eligibility, Class B shares convert to either Class A or Investor Class shares at the end of the calendar quarter eight years after the date they were purchased. Additionally, Investor Class shares may convert automatically to Class A shares based on a shareholder’s account balance as described in the Fund’s prospectus. Under certain circumstances and as may be permitted by the Trust’s multiple class plan pursuant to Rule 18f-3 under the 1940 Act, specified share classes of the Fund may be converted to one or more other share classes of the Fund as disclosed in the capital share transactions within these Notes. The classes of shares have the same voting (except for issues that relate solely to one class), dividend, liquidation and other rights, and the same terms and conditions.
The Fund’s investment objective is to seek a high level of current income while preserving capital and maintaining liquidity.
Note 2–Significant Accounting Policies
The Fund is an investment company and accordingly follows the investment company accounting and reporting guidance of the Financial Accounting Standards Board (“FASB”) Accounting Standard Codification Topic 946 Financial Services—Investment Companies. The Fund prepares its financial statements in accordance with generally accepted accounting principles (“GAAP”) in the United States of America and follows the significant accounting policies described below.
(A) Valuation of Shares. You could lose money by investing in the Fund. Although the Fund seeks to preserve the value of your investment at $1.00 per share by using the amortized cost method of valuation, it cannot guarantee it will do so. The Fund may impose a fee upon the sale of your shares or may temporarily suspend your ability to sell shares if the Fund’s liquidity falls below required minimums because of market conditions or other factors. An investment in the Fund is not insured or guaranteed by the Federal Deposit Insurance Corporation or any other government agency. The Fund’s sponsor has no legal obligation to provide financial support to the Fund, and you should not expect that the sponsor will provide financial support to the Fund at any time.
(B) Securities Valuation. Securities are valued using the amortized cost method of valuation, unless the use of such method would be inappropriate per the requirements of Rule 2a-7 under the 1940 Act. The amortized cost method involves valuing a security at its cost on the date of purchase and thereafter assuming a constant amortization to maturity of the difference between such cost and the value on maturity date. Amortized cost approximates the current fair value of a security.
The Board of Trustees of the Trust (the “Board”) adopted procedures establishing methodologies for the valuation of the Fund’s securities and other assets and delegated the responsibility for valuation determinations under those procedures to the Valuation Committee of the Trust (the “Valuation Committee”). The procedures state that, subject to the oversight of the Board and unless otherwise noted, the responsibility for the day-to-day valuation of portfolio assets (including fair value measurements for the Fund’s assets and liabilities) rests with New York Life Investment Management LLC (“New York Life Investments” or the “Manager”), aided to whatever extent necessary by the Subadvisor (as defined in Note 3(A)). To assess the appropriateness of security valuations, the Manager, the Subadvisor or the Fund’s third-party service provider, who is subject to oversight by the Manager, regularly compares prior day prices, prices on comparable securities and the sale prices to the prior and current day prices and challenges prices with changes exceeding certain tolerance levels with third-party pricing services or broker sources.
The Board authorized the Valuation Committee to appoint a Valuation Subcommittee (the “Subcommittee”) to establish the prices of securities for which market quotations are not readily available or the prices of which are not otherwise readily determinable under the procedures. The Subcommittee meets (in person, via electronic mail or via teleconference) on an as-needed basis. The Valuation Committee meets to ensure that actions taken by the Subcommittee were appropriate.
For those securities valued through either a standardized fair valuation methodology or a fair valuation measurement, the Subcommittee deals with such valuation and the Valuation Committee reviews and affirms, if appropriate, the reasonableness of the valuation based on such methodologies and measurements on a regular basis after considering information that is reasonably available and deemed relevant by the Valuation Committee. Any action taken by the Subcommittee with respect to the valuation of a portfolio security or other asset is submitted for review and ratification (if appropriate) to the Valuation Committee and the Board at the next regularly scheduled meeting.
“Fair value” is defined as the price the Fund would reasonably expect to receive upon selling an asset or liability in an orderly transaction to an
| | |
| 18 | | MainStay Money Market Fund |
independent buyer in the principal or most advantageous market for the asset or liability. Fair value measurements are determined within a framework that establishes a three-tier hierarchy that maximizes the use of observable market data and minimizes the use of unobservable inputs to establish a classification of fair value measurements for disclosure purposes. “Inputs” refer broadly to the assumptions that market participants would use in pricing the asset or liability, including assumptions about risk, such as the risk inherent in a particular valuation technique used to measure fair value using a pricing model and/or the risk inherent in the inputs for the valuation technique. Inputs may be observable or unobservable. Observable inputs reflect the assumptions market participants would use in pricing the asset or liability based on market data obtained from sources independent of the Fund. Unobservable inputs reflect the Fund’s own assumptions about the assumptions market participants would use in pricing the asset or liability based on the information available. The inputs or methodology used for valuing assets or liabilities may not be an indication of the risks associated with investing in those assets or liabilities. The three-tier hierarchy of inputs is summarized below.
| • | | Level 1—quoted prices in active markets for an identical asset or liability |
| • | | Level 2—other significant observable inputs (including quoted prices for a similar asset or liability in active markets, interest rates and yield curves, prepayment speeds, credit risk, etc.) |
| • | | Level 3—significant unobservable inputs (including the Fund’s own assumptions about the assumptions that market participants would use in measuring fair value of an asset or liability) |
Securities valued at amortized cost are not obtained from a quoted price in an active market and are generally categorized as Level 2 in the hierarchy. The level of an asset or liability within the fair value hierarchy is based on the lowest level of an input, both individually and in the aggregate, that is significant to the fair value measurement. The aggregate value by input level of the Fund’s assets and liabilities as of October 31, 2020 is included at the end of the Portfolio of Investments.
The Fund may use third-party vendor evaluations, whose prices may be derived from one or more of the following standard inputs, among others:
| | |
• Benchmark yields | | • Reported trades |
• Broker/dealer quotes | | • Issuer spreads |
• Two-sided markets | | • Benchmark securities |
• Bids/offers | | • Reference data (corporate actions or material event notices) |
• Industry and economic events | | • Comparable bonds |
• Monthly payment information | | |
An asset or liability for which market values cannot be measured using the methodologies described above is valued by methods deemed reasonable in good faith by the Valuation Committee, following the procedures established by the Board, to represent fair value. Under these procedures, the Fund may utilize some of the following fair value techniques: multi-dimensional relational pricing models and option adjusted spread pricing. During the year ended October 31, 2020, there were no material changes to the fair value methodologies. Securities
valued in this manner are generally categorized as Level 3 in the hierarchy. No securities held by the Fund as of October 31, 2020, were fair valued in such a manner.
The information above is not intended to reflect an exhaustive list of the methodologies that may be used to value portfolio investments. The valuation procedures permit the use of a variety of valuation methodologies in connection with valuing portfolio investments. The methodology used for a specific type of investment may vary based on the market data available or other considerations. The methodologies summarized above may not represent the specific means by which portfolio investments are valued on any particular business day.
(C) Income Taxes. The Fund’s policy is to comply with the requirements of the Internal Revenue Code of 1986, as amended (the “Internal Revenue Code”), applicable to regulated investment companies and to distribute all of its taxable income to the shareholders of the Fund within the allowable time limits.
The Manager evaluates the Fund’s tax positions to determine if the tax positions taken meet the minimum recognition threshold in connection with accounting for uncertainties in income tax positions taken or expected to be taken for the purposes of measuring and recognizing tax liabilities in the financial statements. Recognition of tax benefits of an uncertain tax position is permitted only to the extent the position is “more likely than not” to be sustained assuming examination by taxing authorities. The Manager analyzed the Fund’s tax positions taken on federal, state and local income tax returns for all open tax years (for up to three tax years) and has concluded that no provisions for federal, state and local income tax are required in the Fund’s financial statements. The Fund’s federal, state and local income tax and federal excise tax returns for tax years for which the applicable statutes of limitations have not expired are subject to examination by the Internal Revenue Service and state and local departments of revenue.
(D) Dividends and Distributions to Shareholders. Dividends and distributions are recorded on the ex-dividend date. The Fund intends to declare dividends from net investment income, if any, daily and intends to pay them at least monthly and declares and pays distributions from net realized capital and currency gains, if any, at least annually. Unless a shareholder elects otherwise, all dividends and distributions are reinvested at NAV in the same class of shares of the Fund. Dividends and distributions to shareholders are determined in accordance with federal income tax regulations and may differ from determinations using GAAP.
(E) Security Transactions and Investment Income. The Fund records security transactions on the trade date. Realized gains and losses on security transactions are determined using the identified cost method. Interest income is accrued daily and discounts and premiums on securities purchased for the Fund are accreted and amortized, respectively, on the straight-line method. The straight-line method approximates the effective interest rate for short-term investments. Income from payment-in-kind securities, to the extent the Fund held any such securities during the year ended October 31, 2020, is recorded daily based on the effective interest method.
Investment income and realized and unrealized gains and losses on investments of the Fund are allocated pro rata to the separate classes of shares based upon their relative net assets on the date the income is earned or realized and unrealized gains and losses are incurred.
Notes to Financial Statements (continued)
(F) Expenses. Expenses of the Trust are allocated to the individual Funds in proportion to the net assets of the respective Funds when the expenses are incurred, except where direct allocations of expenses can be made. Expenses (other than transfer agent expenses) are allocated to separate classes of shares pro rata based upon their relative net assets on the date the expenses are incurred. The expenses borne by the Fund, including those of related parties to the Fund, are shown in the Statement of Operations.
(G) Use of Estimates. In preparing financial statements in conformity with GAAP, the Manager makes estimates and assumptions that affect the reported amounts and disclosures in the financial statements. Actual results could differ from those estimates and assumptions.
(H) Repurchase Agreements. The Fund may enter into repurchase agreements (i.e., buy a security from another party with the agreement that it will be sold back in the future) to earn income. The Fund may enter into repurchase agreements only with counterparties, usually financial institutions, that are deemed by the Manager or the Subadvisor to be creditworthy, pursuant to guidelines established by the Board. During the term of any repurchase agreement, the Manager or the Subadvisor will continue to monitor the creditworthiness of the counterparty. Under the 1940 Act, repurchase agreements are considered to be collateralized loans by the Fund to the counterparty secured by the securities transferred to the Fund.
Repurchase agreements are subject to counterparty risk, meaning the Fund could lose money by the counterparty’s failure to perform under the terms of the agreement. The Fund mitigates this risk by ensuring the repurchase agreement is collateralized by cash, U.S. government securities, fixed income securities and/or other securities. The collateral is held by the Fund’s custodian and valued daily on a mark to market basis to determine if the value, including accrued interest, exceeds the repurchase price. In the event of the counterparty’s default on the obligation to repurchase, the Fund has the right to liquidate the collateral and apply the proceeds in satisfaction of the obligation. Under certain circumstances, such as in the event of default or bankruptcy by the counterparty, realization and/or retention of the collateral may be limited or subject to delay, to legal proceedings and possible realized loss to the Fund. Repurchase agreements as of October 31, 2020, are shown in the Portfolio of Investments.
(I) Debt Securities. The Fund’s investments may include securities such as variable rate notes, floaters and mortgage-related and asset-backed securities. If expectations about changes in interest rates or assessments of an issuer’s credit worthiness or market conditions are incorrect, investments in these types of securities could lose money for the Fund.
The Fund may also invest in U.S. dollar-denominated securities of foreign issuers, which carry certain risks in addition to the usual risks inherent in domestic instruments. These risks include those resulting from future adverse political or economic developments and possible imposition of foreign governmental laws or restrictions. The ability of issuers of debt securities held by the Fund to meet their obligations may be affected by, among other things, economic or political developments in a specific country, industry or region.
(J) LIBOR Replacement Risk. The Fund may invest in certain debt securities, derivatives or other financial instruments that utilize the London Interbank Offered Rate (“LIBOR”), as a “benchmark” or “reference rate” for various interest rate calculations. The United
Kingdom Financial Conduct Authority, which regulates LIBOR, announced that after 2021 it will cease its active encouragement of banks to provide the quotations needed to sustain LIBOR. As a result, it is anticipated that LIBOR will be discontinued or will no longer be sufficiently robust to be representative of its underlying market around that time. Although financial regulators and industry working groups have suggested alternative reference rates, such as the European Interbank Offer Rate (“EURIBOR”), Sterling Overnight Interbank Average Rate (“SONIA”) and Secured Overnight Financing Rate (“SOFR”), there are challenges to converting certain contracts and transactions to a new benchmark and neither the full effects of the transition process nor its ultimate outcome is known. Management is currently working to assess exposure and will modify contracts as necessary.
The elimination of LIBOR or changes to other reference rates or any other changes or reforms to the determination or supervision of reference rates could have an adverse impact on the market for, or value of, any securities or payments linked to those reference rates, which may adversely affect the Fund’s performance and/or net asset value. Uncertainty and risk also remain regarding the willingness and ability of issuers and lenders to include revised provisions in new and existing contracts or instruments. Consequently, the transition away from LIBOR to other reference rates may lead to increased volatility and illiquidity in markets that are tied to LIBOR, fluctuations in values of LIBOR-related investments or investments in issuers that utilize LIBOR, increased difficulty in borrowing or refinancing and diminished effectiveness of hedging strategies, adversely affecting the Fund’s performance. Accordingly, the potential effect of a transition away from LIBOR on the Fund or the debt securities or other instruments based on LIBOR in which the Fund invests cannot yet be determined. Furthermore, the risks associated with the expected discontinuation of LIBOR and transition may be exacerbated if the work necessary to effect an orderly transition to an alternative reference rate is not completed in a timely manner. Because the usefulness of LIBOR as a benchmark could deteriorate during the transition period, these effects could occur prior to the end of 2021.
(K) Indemnifications. Under the Trust’s organizational documents, its officers and trustees are indemnified against certain liabilities that may arise out of performance of their duties to the Trust. Additionally, in the normal course of business, the Fund enters into contracts with third-party service providers that contain a variety of representations and warranties and that may provide general indemnifications. The Fund’s maximum exposure under these arrangements is unknown, as this would involve future claims that may be made against the Fund that have not yet occurred. The Manager believes that the risk of loss in connection with these potential indemnification obligations is remote. However, there can be no assurance that material liabilities related to such obligations will not arise in the future, which could adversely impact the Fund.
Note 3–Fees and Related Party Transactions
(A) Manager and Subadvisor. New York Life Investments, a registered investment adviser and an indirect, wholly-owned subsidiary of New York Life Insurance Company (“New York Life”), serves as the Fund’s Manager, pursuant to an Amended and Restated Management Agreement (“Management Agreement”). The Manager provides offices, conducts clerical, recordkeeping and bookkeeping services and keeps most of the financial and accounting records required to be maintained
| | |
| 20 | | MainStay Money Market Fund |
by the Fund. Except for the portion of salaries and expenses that are the responsibility of the Fund, the Manager pays the salaries and expenses of all personnel affiliated with the Fund and certain operational expenses of the Fund. The Fund reimburses New York Life Investments in an amount equal to the portion of the compensation of the Chief Compliance Officer attributable to the Fund. NYL Investors LLC (“NYL Investors” or the “Subadvisor”), a registered investment adviser and a direct, wholly-owned subsidiary of New York Life, serves as Subadvisor to the Fund and is responsible for the day-to-day portfolio management of the Fund. Pursuant to the terms of a Subadvisory Agreement (“Subadvisory Agreement”) between New York Life Investments and NYL Investors, New York Life Investments pays for the services of the Subadvisor.
Pursuant to the Management Agreement, the Fund pays the Manager a monthly fee for the services performed and the facilities furnished at an annual rate of the Fund’s average daily net assets as follows: 0.40% up to $500 million; 0.35% from $500 million to $1 billion; and 0.30% in excess of $1 billion. During the year ended October 31, 2020, the effective management fee rate was 0.40% of the Fund’s average daily net assets, exclusive of any applicable waivers/reimbursements.
New York Life Investments has contractually agreed to waive fees and/or reimburse expenses so that Total Annual Fund Operating Expenses (excluding taxes, interest, litigation, extraordinary expenses, brokerage and other transaction expenses relating to the purchase or sale of portfolio investments, and acquired (underlying) fund fees and expenses) do not exceed the following percentages of the Fund’s average daily net assets: Class A, 0.70%; Investor Class, 0.80%; Class B, 0.80%; Class C, 0.80% and SIMPLE Class, 0.80%. This agreement will remain in effect until August 31, 2021, and shall renew automatically for one-year terms unless New York Life Investments provides written notice of termination prior to the start of the next term or upon approval of the Board.
New York Life Investments may voluntarily waive or reimburse expenses of the Fund to the extent it deems appropriate to enhance the yield of the Fund during periods when expenses have a significant impact on the yield of the Fund, as applicable, because of low interest rates. This expense limitation policy is voluntary and in addition to any contractual arrangements that may be in place with respect to the Fund and described in the Fund’s prospectus.
During the year ended October 31, 2020, New York Life Investments earned fees from the Fund in the amount of $1,729,637 and paid the Subadvisor in the amount of $817,483. Additionally, New York Life Investments reimbursed expenses in the amount of $881,321, without which the Fund’s total returns would have been lower.
State Street Bank and Trust Company (“State Street”) provides sub-administration and sub-accounting services to the Fund pursuant to an agreement with New York Life Investments (See Note 10 for sub-administration and sub-accounting service provider change). These services include calculating the daily NAV of the Fund, maintaining the general ledger and sub-ledger accounts for the calculation of the Fund’s NAV, and assisting New York Life Investments in conducting various aspects of the Fund’s administrative operations. For providing these services to the Fund, State Street is compensated by New York Life Investments.
(B) Sales Charges. Although the Fund does not assess a CDSC upon redemption of Class B or Class C shares of the Fund, the applicable CDSC will be assessed when shares are redeemed from the Fund if the shareholder previously exchanged his or her investment into the Fund from another fund within the MainStay Group of Funds. The Fund was advised that the Distributer received from shareholders the proceeds from CDSCs of Class A, Class B and Class C during the year ended October 31, 2020, of $150,276, $48,348 and $8,832, respectively.
(C) Transfer, Dividend Disbursing and Shareholder Servicing Agent. NYLIM Service Company LLC, an affiliate of New York Life Investments, is the Fund’s transfer, dividend disbursing and shareholder servicing agent pursuant to an agreement between NYLIM Service Company LLC and the Trust. NYLIM Service Company LLC has entered into an agreement with DST Asset Manager Solutions, Inc. (“DST”), pursuant to which DST performs certain transfer agent services on behalf of NYLIM Service Company LLC. New York Life Investments has contractually agreed to limit the transfer agency expenses charged to the Fund’s share classes to a maximum of 0.35% of that share class’s average daily net assets on an annual basis after deducting any applicable Fund or class-level expense reimbursement or small account fees. This agreement will remain in effect until August 31, 2021 for SIMPLE Class shares and February 28, 2021 for all other share classes, and shall renew automatically for one-year terms unless New York Life Investments provides written notice of termination prior to the start of the next term or upon approval of the Board. During the year ended October 31, 2020, transfer agent expenses incurred by the Fund and any reimbursements, pursuant to the aforementioned Transfer Agency expense limitation agreement, were as follows:
| | | | | | | | |
Class | | Expense | | | Waived | |
Class A | | | $256,954 | | | $ | — | |
Investor Class | | | 123,381 | | | | — | |
Class B | | | 131,961 | | | | — | |
Class C | | | 111,528 | | | | — | |
SIMPLE Class | | | 19 | | | | — | |
(D) Small Account Fee. Shareholders with small accounts adversely impact the cost of providing transfer agency services. In an effort to reduce total transfer agency expenses, the Fund has implemented a small account fee on certain types of accounts. As described in the Fund’s prospectus, certain shareholders with an account balance of less than $1,000 ($5,000 for Class A share accounts) are charged an annual per account fee of $20 (assessed semi-annually), the proceeds from which offset transfer agent fees as reflected in the Statement of Operations. This small account fee will not apply to certain types of accounts as described further in the Fund’s prospectus.
(E) Capital. As of October 31, 2020, New York Life and its affiliates beneficially held shares of the Fund with the values and percentages of net assets as follows:
| | | | | | | | |
SIMPLE Class | | $ | 25,000 | | | | 100.0 | % |
Note 4–Federal Income Tax
The amortized cost also represents the aggregate cost for federal income tax purposes.
Notes to Financial Statements (continued)
As of October 31, 2020, the components of accumulated gain (loss) on a tax basis were as follows:
| | | | | | | | |
Ordinary
Income | | Accumulated
Capital and
Other Gain
(Loss) | | Other
Temporary
Differences | | Unrealized
Appreciation
(Depreciation) | | Total
Accumulated
Gain (Loss) |
| | | | |
| $42,597 | | $— | | $(1,512) | | $— | | $41,085 |
The other temporary differences are primarily due to dividends payable.
During the years ended October 31, 2020, and October 31, 2019, the tax character of distributions paid as reflected in the Statements of Changes in Net Assets were as follows:
| | | | | | | | |
| | | 2020 | | | 2019 | |
| | |
Distributions paid from: | | | | | | | | |
Ordinary Income | | $ | 1,571,106 | | | $ | 6,248,809 | |
Note 5–Custodian
State Street is the custodian of cash and securities held by the Fund (See Note 10 for custodian change). Custodial fees are charged to the Fund based on the Fund’s net assets and/or the market value of securities held by the Fund and the number of certain transactions incurred by the Fund.
Note 6–Interfund Lending Program
Pursuant to an exemptive order issued by the SEC, the Fund, along with certain other funds managed by New York Life Investments, may participate in an interfund lending program. The interfund lending program provides an alternative credit facility that permits the Fund and certain other funds managed by New York Life Investments to lend or borrow money for temporary purposes directly to or from one another subject to the conditions of the exemptive order. During the year ended October 31, 2020, there were no interfund loans made or outstanding with respect to the Fund.
Note 7–Capital Share Transactions
Transactions in capital shares for the years ended October 31, 2020, and October 31, 2019, were as follows:
| | | | |
Class A (at $1 per share) | | Shares | |
| |
Year ended October 31, 2020: | | | | |
Shares sold | | | 601,124,007 | |
Shares issued to shareholders in reinvestment of distributions | | | 1,257,799 | |
Shares redeemed | | | (492,493,653 | ) |
| | | | |
Net increase (decrease) in shares outstanding before conversion | | | 109,888,153 | |
Shares converted into Class A (See Note 1) | | | 15,683,919 | |
Shares converted from Class A (See Note 1) | | | (983,961 | ) |
| | | | |
Net increase (decrease) | | | 124,588,111 | |
| | | | |
Year ended October 31, 2019: | | | | |
Shares sold | | | 394,765,732 | |
Shares issued to shareholders in reinvestment of distributions | | | 4,747,751 | |
Shares redeemed | | | (353,199,964 | ) |
| | | | |
Net increase (decrease) in shares outstanding before conversion | | | 46,313,519 | |
Shares converted into Class A (See Note 1) | | | 11,931,559 | |
Shares converted from Class A (See Note 1) | | | (3,680,285 | ) |
| | | | |
Net increase (decrease) | | | 54,564,793 | |
| | | | |
|
| |
Investor Class (at $1 per share) | | Shares | |
| |
Year ended October 31, 2020: | | | | |
Shares sold | | | 38,675,933 | |
Shares issued to shareholders in reinvestment of distributions | | | 90,306 | |
Shares redeemed | | | (23,968,779 | ) |
| | | | |
Net increase (decrease) in shares outstanding before conversion | | | 14,797,460 | |
Shares converted into Investor Class (See Note 1) | | | 1,036,162 | |
Shares converted from Investor Class (See Note 1) | | | (15,542,396 | ) |
| | | | |
Net increase (decrease) | | | 291,226 | |
| | | | |
Year ended October 31, 2019: | | | | |
Shares sold | | | 32,376,821 | |
Shares issued to shareholders in reinvestment of distributions | | | 410,863 | |
Shares redeemed | | | (23,653,343 | ) |
| | | | |
Net increase (decrease) in shares outstanding before conversion | | | 9,134,341 | |
Shares converted into Investor Class (See Note 1) | | | 4,004,631 | |
Shares converted from Investor Class (See Note 1) | | | (11,554,017 | ) |
| | | | |
Net increase (decrease) | | | 1,584,955 | |
| | | | |
|
| |
| | |
| 22 | | MainStay Money Market Fund |
| | | | |
Class B (at $1 per share) | | Shares | |
| |
Year ended October 31, 2020: | | | | |
Shares sold | | | 6,683,934 | |
Shares issued to shareholders in reinvestment of distributions | | | 107,207 | |
Shares redeemed | | | (9,441,545 | ) |
| | | | |
Net increase (decrease) in shares outstanding before conversion | | | (2,650,404 | ) |
Shares converted from Class B (See Note 1) | | | (117,832 | ) |
| | | | |
Net increase (decrease) | | | (2,768,236 | ) |
| | | | |
Year ended October 31, 2019: | | | | |
Shares sold | | | 11,573,190 | |
Shares issued to shareholders in reinvestment of distributions | | | 544,149 | |
Shares redeemed | | | (16,351,512 | ) |
| | | | |
Net increase (decrease) in shares outstanding before conversion | | | (4,234,173 | ) |
Shares converted from Class B (See Note 1) | | | (69,054 | ) |
| | | | |
Net increase (decrease) | | | (4,303,227 | ) |
| | | | |
|
| |
Class C (at $1 per share) | | Shares | |
| |
Year ended October 31, 2020: | | | | |
Shares sold | | | 37,834,493 | |
Shares issued to shareholders in reinvestment of distributions | | | 69,497 | |
Shares redeemed | | | (29,968,272 | ) |
| | | | |
Net increase (decrease) in shares outstanding before conversion | | | 7,935,718 | |
Shares converted from Class C (See Note 1) | | | (75,892 | ) |
| | | | |
Net increase (decrease) | | | 7,859,826 | |
| | | | |
Year ended October 31, 2019: | | | | |
Shares sold | | | 16,115,549 | |
Shares issued to shareholders in reinvestment of distributions | | | 357,664 | |
Shares redeemed | | | (18,515,513 | ) |
| | | | |
Net increase (decrease) in shares outstanding before conversion | | | (2,042,300 | ) |
Shares converted from Class C (See Note 1) | | | (632,834 | ) |
| | | | |
Net increase (decrease) | | | (2,675,134 | ) |
| | | | |
|
| |
SIMPLE Class (at $1 per share) | | Shares | |
| |
Period ended October 31, 2020 (a): | | | | |
Shares sold | | | 25,000 | |
Shares issued to shareholders in reinvestment of distributions | | | 1 | |
| | | | |
Net increase (decrease) | | | 25,001 | |
| | | | |
| (a) | The inception date of the class was August 31, 2020. |
Note 8–Recent Accounting Pronouncement
To improve the effectiveness of fair value disclosure requirements, the Financial Accounting Standards Board issued Accounting Standards Update 2018-13, Fair Value Measurement Disclosure Framework—Changes to the Disclosure Requirements for Fair Value Measurement
(“ASU 2018-13”), which adds, removes, and modifies certain fair value measurement disclosure requirements. ASU 2018-13 is effective for interim and annual reporting periods beginning after December 15, 2019. The Manager evaluated the implications of certain provisions of ASU 2018-13 and determined to early adopt aspects related to the removal and modifications of certain fair value measurement disclosures, which are currently in place as of October 31, 2020. The Manager is evaluating the implications of certain other provisions of ASU 2018-13 related to new disclosure requirements and has not yet determined the impact of those provisions on the financial statement disclosures, if any.
In March 2020, the Financial Accounting Standards Board (“FASB”) issued Accounting Standards Update 2020-04 (“ASU 2020-04”), which provides optional guidance to ease the potential accounting burden associated with transitioning away from LIBOR and other reference rates that are expected to be discontinued. ASU 2020-04 is effective immediately upon release of the update on March 12, 2020, through December 31, 2022. At this time, the Manager is evaluating the implications of certain other provisions of ASU 2020-04 related to new disclosure requirements and any impact on the financial statement disclosures has not yet been determined.
Note 9–Other Matters
An outbreak of COVID-19, first detected in December 2019, has developed into a global pandemic and has resulted in travel restrictions, closure of international borders, certain businesses and securities markets, restrictions on securities trading activities, prolonged quarantines, supply chain disruptions, and lower consumer demand, as well as general concern and uncertainty. The continued impact of COVID-19 is uncertain and could further adversely affect the global economy, national economies, individual issuers and capital markets in unforeseeable ways and result in a substantial and extended economic downturn. Developments that disrupt global economies and financial markets, such as COVID-19, may magnify factors that affect the Fund’s performance.
Note 10–Subsequent Events
In connection with the preparation of the financial statements of the Fund as of and for the year ended October 31, 2020, events and transactions subsequent to October 31, 2020, through the date the financial statements were issued have been evaluated by the Manager, for possible adjustment and/or disclosure. No subsequent events requiring financial statement adjustment or disclosure have been identified other than the following:
Effective at the close of business on November 20, 2020, all services provided by State Street were transitioned to JPMorgan Chase Bank, N.A.
Report of Independent Registered Public Accounting Firm
To the Shareholders of the Fund and Board of Trustees
The MainStay Funds:
Opinion on the Financial Statements
We have audited the accompanying statement of assets and liabilities of MainStay Money Market Fund (the Fund), one of the funds constituting The MainStay Funds, including the portfolio of investments, as of October 31, 2020, the related statement of operations for the year then ended, the statements of changes in net assets for each of the years in the two-year period then ended, and the related notes (collectively, the financial statements) and the financial highlights for each of the years or periods in the five-year period then ended. In our opinion, the financial statements and financial highlights present fairly, in all material respects, the financial position of the Fund as of October 31, 2020, the results of its operations for the year then ended, the changes in its net assets for each of the years in the two-year period then ended, and the financial highlights for each of the years or periods in the five-year period then ended, in conformity with U.S. generally accepted accounting principles.
Basis for Opinion
These financial statements and financial highlights are the responsibility of the Fund’s management. Our responsibility is to express an opinion on these financial statements and financial highlights based on our audits. We are a public accounting firm registered with the Public Company Accounting Oversight Board (United States) (PCAOB) and are required to be independent with respect to the Fund in accordance with the U.S. federal securities laws and the applicable rules and regulations of the Securities and Exchange Commission and the PCAOB.
We conducted our audits in accordance with the standards of the PCAOB. Those standards require that we plan and perform the audit to obtain reasonable assurance about whether the financial statements and financial highlights are free of material misstatement, whether due to error or fraud. Our audits included performing procedures to assess the risks of material misstatement of the financial statements and financial highlights, whether due to error or fraud, and performing procedures that respond to those risks. Such procedures included examining, on a test basis, evidence regarding the amounts and disclosures in the financial statements and financial highlights. Such procedures also included confirmation of securities owned as of October 31, 2020, by correspondence with the custodian and brokers or by other appropriate auditing procedures when replies from brokers were not received. Our audits also included evaluating the accounting principles used and significant estimates made by management, as well as evaluating the overall presentation of the financial statements and financial highlights. We believe that our audits provide a reasonable basis for our opinion.

We have served as the auditor of one or more New York Life Investment Management investment companies since 2003.
Philadelphia, Pennsylvania
December 23, 2020
| | |
| 24 | | MainStay Money Market Fund |
Federal Income Tax Information
(Unaudited)
In February 2021, shareholders will receive an IRS Form 1099-DIV or substitute Form 1099, which will show the federal tax status of the distributions received by shareholders in calendar year 2020. The amounts that will be reported on such 1099-DIV or substitute Form 1099 will be the amounts you are to use on your federal income tax return and will differ from the amounts reported for the Fund’s fiscal year ended October 31, 2020.
Proxy Voting Policies and Procedures and Proxy Voting Record
A description of the policies and procedures that New York Life Investments uses to vote proxies related to the Fund’s securities is available free of charge upon request, by visiting the MainStay Funds’ website at newyorklifeinvestments.com or visiting the Securities and Exchange Commission’s (“SEC”) website at www.sec.gov.
The Fund is required to file with the SEC its proxy voting records for the 12-month period ending June 30 on Form N-PX. The most recent Form N-PX or proxy voting record is available free of charge upon request by calling 800-624-6782; visiting the MainStay Funds’ website at newyorklifeinvestments.com; or visiting the SEC’s website at www.sec.gov.
Shareholder Reports and Quarterly Portfolio Disclosure
The Fund is required to file a Form N-MFP every month disclosing its portfolio holdings. The Fund’s Form N-MFP is available free of charge by visiting the SEC’s website at www.sec.gov or upon request by calling New York Life Investments at 800-624-6782.
Board of Trustees and Officers (Unaudited)
The Trustees and officers of the Funds are listed below. The Board oversees the MainStay Group of Funds (which consists of MainStay Funds and MainStay Funds Trust), MainStay VP Funds Trust, MainStay MacKay DefinedTerm Municipal Opportunities Fund, the Manager and the Subadvisors, and elects the officers of the Funds who are responsible for the day-to-day operations of the Funds. Information pertaining to the Trustees and officers is set forth below. Each Trustee serves until his or her successor is elected and qualified or until his or her
resignation, death or removal. Under the Board’s retirement policy, unless an exception is made, a Trustee must tender his or her resignation by the end of the calendar year during which he or she reaches the age of 75. Officers are elected annually by the Board. The business address of each Trustee and officer listed below is 51 Madison Avenue, New York, New York 10010. A majority of the Trustees are not “interested persons” (as defined by the 1940 Act and rules adopted by the SEC thereunder) of the Fund (“Independent Trustees”).
| | | | | | | | | | | | |
| | | | | Name and
Year of Birth | | Term of Office,
Position(s) Held and
Length of Service | | Principal Occupation(s)
During Past Five Years | | Number of
Portfolios in
Fund Complex
Overseen by
Trustee | | Other Directorships
Held by Trustee |
Interested Trustee | | | | Yie-Hsin Hung* 1962 | | MainStay Funds:
Trustee since 2017 MainStay Funds Trust:
Trustee since 2017 | | Senior Vice President of New York Life since joining in 2010, Member of the Executive Management Committee since 2017, Chief Executive Officer, New York Life Investment Management Holdings LLC & New York Life Investment Management LLC since 2015. Senior Managing Director and Co-President of New York Life Investment Management LLC from 2014 to May 2015. Previously held positions of increasing responsibility, including head of NYLIM International, Alternative Growth Businesses, and Institutional investments since joining New York Life in 2010. | | 78 | | MainStay VP Funds Trust:
Trustee since 2017 (31 portfolios); and
MainStay MacKay DefinedTerm Municipal Opportunities Fund: Trustee since 2017. |
| | * | This Trustee is considered to be an “interested person” of the MainStay Group of Funds, MainStay VP Funds Trust and MainStay MacKay DefinedTerm Municipal Opportunities Fund, within the meaning of the 1940 Act because of her affiliation with New York Life Insurance Company, New York Life Investment Management LLC, Candriam Belgium S.A., Candriam Luxembourg S.C.A., IndexIQ Advisors LLC, MacKay Shields LLC, NYL Investors LLC, NYLIFE Securities LLC and/or NYLIFE Distributors LLC, as described in detail above in the column entitled “Principal Occupation(s) During Past Five Years.” |
| | |
| 26 | | MainStay Money Market Fund |
| | | | | | | | | | | | |
| | | | | Name and
Year of Birth | | Term of Office,
Position(s) Held and
Length of Service | | Principal Occupation(s)
During Past Five Years | | Number of
Portfolios in
Fund Complex
Overseen by
Trustee | | Other Directorships
Held by Trustee |
Independent Trustees | | | | David H. Chow 1957 | | MainStay Funds:
Trustee since 2016, Advisory Board Member (June 2015 to December 2015); MainStay Funds Trust:
Trustee since 2016, Advisory Board Member (June 2015 to December 2015). | | Founder and CEO, DanCourt Management, LLC since 1999 | | 78 | | MainStay VP Funds Trust: Trustee since 2016, Advisory Board Member (June 2015 to December 2015) (31 portfolios);
MainStay MacKay DefinedTerm Municipal Opportunities Fund: Trustee since 2016, Advisory Board Member (June 2015 to December 2015); Market Vectors Group of Exchange-Traded Funds: Independent Chairman of the Board of Trustees since 2008 and Trustee since 2006 (56 portfolios); and
Berea College of Kentucky: Trustee since 2009, Chair of the Investment Committee since 2018. |
| | | | Susan B. Kerley 1951 | | MainStay Funds:
Chairman since 2017 and Trustee since 2007; MainStay Funds Trust: Chairman since 2017 and Trustee since 1990.** | | President, Strategic Management Advisors LLC since 1990 | | 78 | | MainStay VP Funds Trust: Chairman since 2017 and Trustee since 2007 (31 portfolios)***;
MainStay MacKay DefinedTerm Municipal Opportunities Fund: Chairman since 2017 and Trustee since 2011; and
Legg Mason Partners Funds: Trustee since 1991 (45 portfolios). |
| | | | Alan R. Latshaw 1951 | | MainStay Funds:
Trustee; MainStay Funds Trust:
Trustee and Audit Committee Financial Expert since 2007.** | | Retired; Partner, Ernst & Young LLP (2002 to 2003); Partner, Arthur Andersen LLP (1989 to 2002); Consultant to the MainStay Funds Audit and Compliance Committee (2004 to 2006) | | 78 | | MainStay VP Funds Trust: Trustee and Audit Committee Financial Expert since 2007 (31 portfolios)***;
MainStay MacKay DefinedTerm Municipal Opportunities Fund: Trustee and Audit Committee Financial Expert since 2011; and
State Farm Associates Funds Trusts: Trustee since 2005 (4 portfolios). |
| | | | Richard H. Nolan, Jr. 1946 | | MainStay Funds:
Trustee since 2007; MainStay Funds Trust:
Trustee since 2007.** | | Managing Director, ICC Capital Management since 2004; President—Shields/Alliance, Alliance Capital Management (1994 to 2004) | | 78 | | MainStay VP Funds Trust: Trustee since 2006 (31 portfolios)***; and
MainStay MacKay DefinedTerm Municipal Opportunities Fund: Trustee since 2011. |
| | | | Jacques P. Perold 1958 | | MainStay Funds:
Trustee since 2016, Advisory Board Member (June 2015 to December 2015); MainStay Funds Trust:
Trustee since 2016, Advisory Board Member (June 2015 to December 2015). | | Founder and Chief Executive Officer, CapShift LLC since 2018; President, Fidelity Management & Research Company (2009 to 2014); Founder, President and Chief Executive Officer, Geode Capital Management, LLC (2001 to 2009) | | 78 | | MainStay VP Funds Trust: Trustee since 2016, Advisory Board Member (June 2015 to December 2015) (31 portfolios);
MainStay MacKay DefinedTerm Municipal Opportunities Fund: Trustee since 2016, Advisory Board Member (June 2015 to December 2015); Partners in Health: Trustee since 2019; Allstate Corporation: Director since 2015;
MSCI, Inc.: and Director since 2017. |
Board of Trustees and Officers (Unaudited) (continued)
| | | | | | | | | | | | |
| | | | | Name and
Year of Birth | | Term of Office,
Position(s) Held and
Length of Service | | Principal Occupation(s)
During Past Five Years | | Number of
Portfolios in
Fund Complex
Overseen by
Trustee | | Other Directorships
Held by Trustee |
Independent Trustees | | | | Richard S. Trutanic 1952 | | MainStay Funds: Trustee since 1994; MainStay Funds Trust: Trustee since 2007.** | | Chairman and Chief Executive Officer, Somerset & Company (financial advisory firm) since 2004; Managing Director, The Carlyle Group (private investment firm) (2002 to 2004); Senior Managing Director, Partner and Board Member, Groupe Arnault S.A. (private investment firm) (1999 to 2002) | | 78 | | MainStay VP Funds Trust: Trustee since 2007 (31 portfolios)***; and
MainStay MacKay DefinedTerm Municipal Opportunities Fund: Trustee since 2011. |
| | ** | Includes prior service as a Director/Trustee of certain predecessor entities to MainStay Funds Trust. |
| | *** | Includes prior service as a Director of MainStay VP Series Fund, Inc., the predecessor to MainStay VP Funds Trust. |
| | |
| 28 | | MainStay Money Market Fund |
| | | | | | | | |
| | | | | Name and
Year of Birth | | Position(s) Held and
Length of Service | | Principal Occupation(s)
During Past Five Years |
Officers
of the
Trust
(Who are
not
Trustees)* | | | | Kirk C. Lehneis 1974 | | President, MainStay Funds, MainStay Funds Trust since 2017 | | Chief Operating Officer and Senior Managing Director since 2016, New York Life Investment Management LLC and New York Life Investment Management Holdings LLC; Member of the Board of Managers since 2017 and Senior Managing Director since 2018, NYLIFE Distributors LLC; Chairman of the Board and Senior Managing Director, NYLIM Service Company LLC since 2017; Trustee, President and Principal Executive Officer of IndexIQ Trust, IndexIQ ETF Trust and IndexIQ Active ETF Trust since 2018; President, MainStay MacKay DefinedTerm Municipal Opportunities Fund and MainStay VP Funds Trust since 2017**; Senior Managing Director, Global Product Development (2015 to 2016); Managing Director, Product Development (2010 to 2015), New York Life Investment Management LLC |
| | | | Jack R. Benintende 1964 | | Treasurer and Principal Financial and Accounting Officer, MainStay Funds since 2007, MainStay Funds Trust since 2009 | | Managing Director, New York Life Investment Management LLC since 2007; Treasurer and Principal Financial and Accounting Officer, MainStay MacKay DefinedTerm Municipal Opportunities Fund since 2011 and MainStay VP Funds Trust since 2007**; and Assistant Treasurer, New York Life Investment Management Holdings LLC (2008 to 2012) |
| | | | Yi-Chia Kuo 1981 | | Vice President and Chief Compliance Officer, MainStay Funds and MainStay Funds Trust since January 2020 | | Chief Compliance Officer, Index IQ Trust, Index IQ ETF Trust and Index IQ Active ETF Trust since January 2020; Vice President and Chief Compliance Officer, MainStay MacKay DefinedTerm Municipal Opportunities Fund and MainStay VP Funds Trust since January 2020; Director and Associate General Counsel, New York Life Insurance Company (2015 to 2019) |
| | | | J. Kevin Gao 1967 | | Secretary and Chief Legal Officer, MainStay Funds and MainStay Funds Trust since 2010 | | Managing Director and Associate General Counsel, New York Life Investment Management LLC since 2010; Secretary and Chief Legal Officer, MainStay MacKay DefinedTerm Municipal Opportunities Fund since 2011 and MainStay VP Funds Trust since 2010** |
| | | | Scott T. Harrington 1959 | | Vice President— Administration, MainStay Funds since 2005, MainStay Funds Trust since 2009 | | Managing Director, New York Life Investment Management LLC (including predecessor advisory organizations) since 2000; Member of the Board of Directors, New York Life Trust Company since 2009; Vice President—Administration, MainStay MacKay DefinedTerm Municipal Opportunities Fund since 2011 and MainStay VP Funds Trust since 2005** |
| | * | The officers listed above are considered to be “interested persons” of the MainStay Group of Funds, MainStay VP Funds Trust and MainStay MacKay DefinedTerm Municipal Opportunities Fund within the meaning of the 1940 Act because of their affiliation with the MainStay Group of Funds, New York Life Insurance Company and/or its affiliates, including New York Life Investment Management LLC, NYLIM Service Company LLC, NYLIFE Securities LLC and/or NYLIFE Distributors LLC, as described in detail in the column captioned “Principal Occupation(s) During Past Five Years.” Officers are elected annually by the Board. |
| | ** | Includes prior service as an Officer of MainStay VP Series Fund, Inc., the predecessor to MainStay VP Funds Trust. |
MainStay Funds
Equity
U.S. Equity
MainStay Epoch U.S. All Cap Fund
MainStay Epoch U.S. Equity Yield Fund
MainStay MacKay Common Stock Fund
MainStay MacKay Growth Fund
MainStay MacKay S&P 500 Index Fund
MainStay MacKay Small Cap Core Fund
MainStay MacKay U.S. Equity Opportunities Fund
MainStay MAP Equity Fund
MainStay Winslow Large Cap Growth Fund1
International Equity
MainStay Epoch International Choice Fund
MainStay MacKay International Equity Fund
MainStay MacKay International Opportunities Fund
Emerging Markets Equity
MainStay Candriam Emerging Markets Equity Fund
Global Equity
MainStay Epoch Capital Growth Fund
MainStay Epoch Global Equity Yield Fund
Fixed Income
Taxable Income
MainStay Candriam Emerging Markets Debt Fund
MainStay Floating Rate Fund
MainStay MacKay High Yield Corporate Bond Fund
MainStay MacKay Short Duration High Yield Fund
MainStay MacKay Total Return Bond Fund
MainStay MacKay Unconstrained Bond Fund
MainStay MacKay U.S. Infrastructure Bond Fund2
MainStay Short Term Bond Fund3
Tax-Exempt Income
MainStay MacKay California Tax Free Opportunities Fund4
MainStay MacKay High Yield Municipal Bond Fund
MainStay MacKay Intermediate Tax Free Bond Fund
MainStay MacKay New York Tax Free Opportunities Fund5
MainStay MacKay Short Term Municipal Fund
MainStay MacKay Tax Free Bond Fund
Money Market
MainStay Money Market Fund
Mixed Asset
MainStay Balanced Fund
MainStay Income Builder Fund
MainStay MacKay Convertible Fund
Speciality
MainStay CBRE Global Infrastructure Fund
MainStay CBRE Real Estate Fund
MainStay Cushing MLP Premier Fund
Asset Allocation
MainStay Conservative Allocation Fund
MainStay Conservative ETF Allocation Fund
MainStay Defensive ETF Allocation Fund
MainStay Equity Allocation Fund6
MainStay Equity ETF Allocation Fund
MainStay Growth Allocation Fund7
MainStay Growth ETF Allocation Fund
MainStay Moderate Allocation Fund
MainStay Moderate ETF Allocation Fund
Manager
New York Life Investment Management LLC
New York, New York
Subadvisors
Candriam Belgium S.A.8
Brussels, Belgium
Candriam Luxembourg S.C.A.8
Strassen, Luxembourg
CBRE Clarion Securities LLC
Radnor, Pennsylvania
Cushing Asset Management, LP
Dallas, Texas
Epoch Investment Partners, Inc.
New York, New York
MacKay Shields LLC8
New York, New York
Markston International LLC
White Plains, New York
NYL Investors LLC8
New York, New York
Winslow Capital Management, LLC
Minneapolis, Minnesota
Legal Counsel
Dechert LLP
Washington, District of Columbia
Independent Registered Public Accounting Firm
KPMG LLP
Philadelphia, Pennsylvania
Distributor
NYLIFE Distributors LLC8
Jersey City, New Jersey
Custodian9
State Street Bank and Trust Company
Boston, Massachusetts
| 1. | Formerly known as MainStay Large Cap Growth Fund. |
| 2. | Formerly known as MainStay MacKay Infrastructure Bond Fund. |
| 3. | Formerly known as MainStay Indexed Bond Fund. |
| 4. | This Fund is registered for sale in AZ, CA, NV, OR, TX, UT and WA. Class A and Class I shares are registered for sale in MI. Class I and Class C2 shares are registered for sale in CO, FL, GA, HI, ID, MA, MD, NH, NJ and NY. |
| 5. | This Fund is registered for sale in CA, CT, DE, FL, MA, NJ, NY and VT. |
| 6. | Formerly known as MainStay Growth Allocation Fund. |
| 7. | Formerly known as MainStay Moderate Growth Allocation Fund. |
| 8. | An affiliate of New York Life Investment Management LLC. |
| 9. | JPMorgan Chase Bank, N.A., New York, New York is the custodian for the MainStay ETF Asset Allocation Funds and effective at the close of business on November 20, 2020, became the custodian for other MainStay Funds. The custodian for MainStay Cushing MLP Premier Fund is U.S. Bank National Association, Milwaukee, Wisconsin. |
Not part of the Annual Report
For more information
800-624-6782
newyorklifeinvestments.com
“New York Life Investments” is both a service mark, and the common trade name, of certain investment advisors affiliated with New York Life Insurance Company. The MainStay Funds® are managed by New York Life Investment Management LLC and distributed by NYLIFE Distributors LLC, 30 Hudson Street, Jersey City, NJ 07302, a wholly owned subsidiary of New York Life Insurance Company. NYLIFE Distributors LLC is a Member FINRA/SIPC.
©2020 NYLIFE Distributors LLC. All rights reserved.
| | |
| 1715987 MS203-20 | | MSMM11-12/20 (NYLIM) NL214 |
MainStay Winslow Large Cap Growth Fund
(Formerly known as MainStay Large Cap Growth Fund)
Message from the President and Annual Report
October 31, 2020
Beginning on January 1, 2021, paper copies of each MainStay Fund’s annual and semiannual shareholder reports will no longer be sent by mail, unless you specifically request paper copies of the reports from MainStay Funds or from your financial intermediary. Instead, the reports will be made available on the MainStay Funds’ website. You will be notified by mail and provided with a website address to access the report each time a new report is posted to the website.
If you already elected to receive shareholder reports electronically, you will not be affected by this change and you need not take any action. At any time, you may elect to receive reports and other communications from MainStay Funds electronically by calling toll-free 800-624-6782, by sending an e-mail to MainStayShareholderServices@nylim.com, or by contacting your financial intermediary.
You may elect to receive all future shareholder reports in paper form free of charge. If you hold shares of a MainStay Fund directly, you can inform MainStay Funds that you wish to receive paper copies of reports by calling toll-free 800-624-6782 or by sending an e-mail to MainStayShareholderServices@nylim.com. If you hold shares of a MainStay Fund through a financial intermediary, please contact the financial intermediary to make this election. Your election to receive reports in paper form will apply to all MainStay Funds in which you are invested and may apply to all funds held with your financial intermediary.
| | | | | | | | |
| Not FDIC/NCUA Insured | | Not a Deposit | | May Lose Value | | No Bank Guarantee | | Not Insured by Any Government Agency |

This page intentionally left blank
Message from the President
Despite historically high levels of volatility generated by the global coronavirus pandemic and a host of other geopolitical and economic uncertainties, most broad U.S. stock and bond markets gained ground during the 12-month reporting period ended October 31, 2020.
The reporting period began on an upswing, with markets rising on generally positive underlying economic trends and the announcement of a U.S.-China trade deal. However, in mid-February 2020, stock and bond indices began to dip as growing numbers of COVID-19 cases appeared in hotspots around the world. By early March, the disease reached pandemic proportions. As governments struggled to support overburdened health care systems by issuing “stay-at-home” orders and other restrictions on nonessential activity, global economic activity slowed, driving most stocks and bonds sharply lower.
The United States was hit particularly hard by the pandemic, with more reported COVID-19 cases and deaths than any other country in the world throughout the second half of the reporting period. As the pandemic deepened, the U.S. Federal Reserve (“Fed”) twice cut interest rates and announced unlimited quantitative easing. The federal government declared a national emergency, and Congress passed and the President signed a $2 trillion stimulus package. Markets responded positively to these measures, as well as to a gradual lessening of restrictions on nonessential businesses, hopes for additional stimulus and apparent progress in the development of a vaccine. By late August, the S&P 500® Index, a widely regarded benchmark of market performance, had not only regained all the ground it lost earlier in the reporting period, the Index had reached new record levels. However, a resurgence of coronavirus cases in many parts of the country and uncertainties related to the November 3, 2020, U.S. presidential election caused markets to falter as the reporting period drew to a close.
Nevertheless, for the reporting period as a whole, U.S. equity indices generally produced moderate gains. Returns proved strongest among large-cap, growth-oriented stocks, while small- and mid-cap issues lagged. Within the S&P 500® Index, the information technology and consumer discretionary sectors produced exceptionally strong gains, buoyed by strong corporate and consumer spending, while the health care sector outperformed by a smaller margin. Materials and consumer staples sectors generated positive returns, but lagged the S&P 500® Index. The industrials, utilities, communication services, financials, real estate and energy sectors ended the reporting period in negative territory, with the energy sector
suffering the steepest losses due to weak global demand. International equities declined sharply in February and March 2020 before recovering somewhat, but tended to lag their U.S. counterparts due to weaker underlying economic growth and somewhat less aggressive monetary and fiscal stimulus. Emerging-market equities tracked the performance of U.S. equity markets more closely, led by relatively strong returns in Asian markets, such as China and South Korea.
Fixed-income markets experienced an environment that tended to favor higher credit quality and longer duration securities. Corporate bonds followed the pattern of equities, with prices declining in March 2020 before subsequently recovering. Relatively speculative high-yield credit was hardest hit during the market sell-off in early 2020 and continued to underperform during the remainder of the reporting period. Similarly, among municipal bond issues, high-grade bonds outperformed, dipping briefly in mid-March before regaining the lost ground. Recognized safe havens, such as U.S. government bonds, attracted increased investment during the height of the market sell-off, driving yields lower and prices higher. As a result, long-term Treasury bonds delivered particularly strong gains for the reporting period as a whole. Emerging-market debt, on the other hand, underperformed most other bond types as investors sought to minimize currency and sovereign risks.
Although the ongoing pandemic continues to change the way that many of us work and live our lives, at New York Life Investments, we remain dedicated to providing you, as a MainStay investor, with products, information and services to help you to navigate today’s rapidly changing investment environment. By taking appropriate steps to minimize community spread of COVID-19 within our organization and despite the challenges posed by the coronavirus pandemic, we continue to innovate with you in mind, introducing new suites of Funds and providing continuous insights into ever-evolving markets and investment strategies. Our goal is to give you the tools you need to build a resilient portfolio in the face of uncertain times.
Sincerely,

Kirk C. Lehneis
President
The opinions expressed are as of the date of this report and are subject to change. There is no guarantee that any forecast made will come to pass. This material does not constitute investment advice and is not intended as an endorsement of any specific investment. Past performance is no guarantee of future results.
Not part of the Annual Report
Table of Contents
Investors should refer to the Fund’s Summary Prospectus and/or Prospectus and consider the Fund’s investment objectives, strategies, risks, charges and expenses carefully before investing. The Summary Prospectus and/or Prospectus contain this and other information about the Fund. You may obtain copies of the Fund’s Summary Prospectus, Prospectus and Statement of Additional Information free of charge, upon request, by calling toll-free 800-624-6782, by writing to NYLIFE Distributors LLC, Attn: MainStay Marketing Department, 30 Hudson Street, Jersey City, NJ 07302 or by sending an e-mail to MainStayShareholderServices@nylim.com. These documents are also available via the MainStay Funds’ website at newyorklifeinvestments.com. Please read the Summary Prospectus and/or Prospectus carefully before investing.
Investment and Performance Comparison1 (Unaudited)
Performance data quoted represents past performance. Past performance is no guarantee of future results. Because of market volatility and other factors, current performance may be lower or higher than the figures shown. Investment return and principal value will fluctuate, and as a result, when shares are redeemed, they may be worth more or less than their original cost. The graph below depicts the historical performance of Class I shares of the Fund. Performance will vary from class to class based on differences in class-specific expenses and sales charges. For performance information current to the most recent month-end, please call 800-624-6782 or visit newyorklifeinvestments.com.
(With sales charges)
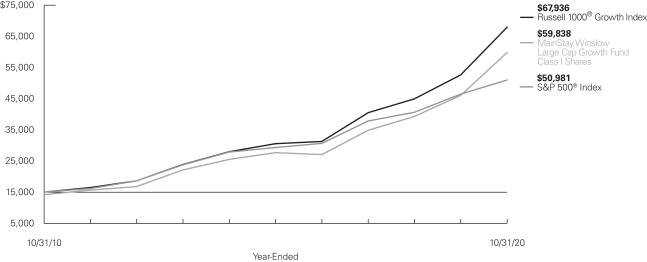
Average Annual Total Returns for the Year-Ended October 31, 2020
| | | | | | | | | | | | | | | | | | | | | | |
| Class | | Sales Charge | | | | Inception
Date | | | One Year
or Since
Inception | | Five
Years | | | Ten Years
or Since
Inception | | | Gross
Expense
Ratio2 | |
| | | | | | | |
| Class A Shares | | Maximum 5.5% Initial Sales Charge | | With sales charges Excluding sales charges | | | 7/1/1995 | | | 22.32%
29.44 | |
| 15.07%
16.38 |
| |
| 14.55%
15.20 |
| |
| 0.99
0.99 | %
|
| Investor Class Shares3 | | Maximum 5% Initial Sales Charge | | With sales charges Excluding sales charges | | | 2/28/2008 | | | 22.09
29.19 | |
| 14.93
16.23 |
| |
| 14.47
15.12 |
| |
| 1.10
1.10 |
|
| Class B Shares4 | | Maximum 5% CDSC if Redeemed Within the First Six Years of Purchase | | With sales charges Excluding sales charges | |
| 4/1/2005
|
| | 23.37
28.37 | |
| 15.20
15.39 |
| |
| 14.26
14.26 |
| |
| 1.85
1.85 |
|
| Class C Shares | | Maximum 1% CDSC if Redeemed Within One Year of Purchase | | With sales charges Excluding sales charges | |
| 4/1/2005
|
| | 27.46
28.46 | |
| 15.40
15.40 |
| |
| 14.27
14.27 |
| |
| 1.85
1.85 |
|
| Class I Shares | | No Sales Charge | | | | | 4/1/2005 | | | 29.80 | | | 16.67 | | | | 15.49 | | | | 0.74 | |
| Class R1 Shares | | No Sales Charge | | | | | 4/1/2005 | | | 29.64 | | | 16.54 | | | | 15.37 | | | | 0.84 | |
| Class R2 Shares | | No Sales Charge | | | | | 4/1/2005 | | | 29.29 | | | 16.24 | | | | 15.08 | | | | 1.09 | |
| Class R3 Shares | | No Sales Charge | | | | | 4/28/2006 | | | 28.99 | | | 15.96 | | | | 14.81 | | | | 1.34 | |
| Class R6 Shares | | No Sales Charge | | | | | 6/17/2013 | | | 29.83 | | | 16.77 | | | | 16.61 | | | | 0.64 | |
SIMPLE Class Shares | | No Sales Charge | | | | | 8/31/2020 | | | –8.45 | | | N/A | | | | N/A | | | | 1.35 | |
| 1. | The performance table and graph do not reflect the deduction of taxes that a shareholder would pay on distributions or Fund share redemptions. Total returns reflect maximum applicable sales charges as indicated in the table above, if any, changes in share price, and reinvestment of dividend and capital gain distributions. The graph assumes the initial investment amount shown above and reflects the deduction of all sales charges that would have applied for the period of investment. Performance figures may reflect certain fee waivers and/or expense limitations, without which total returns may have been lower. For more information on share classes and current fee waivers |
| | and/or expense limitations (if any), please refer to the Notes to Financial Statements. |
| 2. | The gross expense ratios presented reflect the Fund’s “Total Annual Fund Operating Expenses” from the most recent Prospectus and may differ from other expense ratios disclosed in this report. |
| 3. | Prior to June 30, 2020, the maximum initial sales charge for Investor Class shares was 5.5%, which is reflected in the average annual total return figures shown. |
| 4. | Class B shares are closed to all new purchases as well as additional investments by existing Class B shareholders. |
The footnotes on the next page are an integral part of the table and graph and should be carefully read in conjunction with them.
| | | | | | | | | | | | |
| Benchmark Performance | | One
Year | | | Five
Years | | | Ten
Years | |
| | | |
Russell 1000® Growth Index5 | | | 29.22 | % | | | 17.32 | % | | | 16.31 | % |
S&P 500® Index6 | | | 9.71 | | | | 11.71 | | | | 13.01 | |
Morningstar Large Growth Category Average7 | | | 25.92 | | | | 14.64 | | | | 14.19 | |
| 5. | The Russell 1000® Growth Index is the Fund’s primary broad-based securities market index for comparison purposes. The Russell 1000® Growth Index measures the performance of the large-cap growth segment of the U.S. equity universe. It includes those Russell 1000® Index companies with higher price-to-book ratios and higher forecasted growth values. Results assume reinvestment of all dividends and capital gains. An investment cannot be made directly in an index. |
| 6. | The S&P 500® Index is the Fund’s secondary benchmark. “S&P 500®” is a trademark of The McGraw-Hill Companies, Inc. The S&P 500® Index is widely regarded as the standard index for measuring large-cap U.S. stock- |
| | market performance. Results assume reinvestment of all dividends and capital gains. An investment cannot be made directly in an index. |
| 7. | The Morningstar Large Growth Category Average is representative of funds that invest primarily in big U.S. companies that are projected to grow faster than other large-cap stocks. Stocks in the top 70% of the capitalization of the U.S. equity market are defined as large cap. Growth is defined based on fast growth and high valuations. Most of these portfolios focus on companies in rapidly expanding industries. Results are based on average total returns of similar funds with all dividends and capital gain distributions reinvested. |
The footnotes on the preceding page are an integral part of the table and graph and should be carefully read in conjunction with them.
| | |
| 6 | | MainStay Winslow Large Cap Growth Fund |
Cost in Dollars of a $1,000 Investment in MainStay Winslow Large Cap Growth Fund (Unaudited)
The example below is intended to describe the fees and expenses borne by shareholders during the six-month period from May 1, 2020, to October 31, 2020, and the impact of those costs on your investment.
Example
As a shareholder of the Fund you incur two types of costs: (1) transaction costs, including exchange fees and sales charges (loads) on purchases (as applicable), and (2) ongoing costs, including management fees, distribution and/or service (12b-1) fees, and other Fund expenses (as applicable). This example is intended to help you understand your ongoing costs (in dollars) of investing in the Fund and to compare these costs with the ongoing costs of investing in other mutual funds. The example is based on an investment of $1,000 made at the beginning of the six-month period and held for the entire period from May 1, 2020, to October 31, 2020.
This example illustrates your Fund’s ongoing costs in two ways:
Actual Expenses
The second and third data columns in the table below provide information about actual account values and actual expenses. You may use the information in these columns, together with the amount you invested, to estimate the expenses that you paid during the six months ended October 31, 2020. Simply divide your account value by $1,000 (for example, an $8,600 account value divided by $1,000 = 8.6), then
multiply the result by the number under the heading entitled “Expenses Paid During Period” to estimate the expenses you paid on your account during this period.
Hypothetical Example for Comparison Purposes
The fourth and fifth data columns in the table below provide information about hypothetical account values and hypothetical expenses based on the Fund’s actual expense ratio and an assumed rate of return of 5% per year before expenses, which is not the Fund’s actual return. The hypothetical account values and expenses may not be used to estimate the actual ending account balances or expenses you paid for the six-month period shown. You may use this information to compare the ongoing costs of investing in the Fund with the ongoing costs of investing in other mutual funds. To do so, compare this 5% hypothetical example with the 5% hypothetical examples that appear in the shareholder reports of the other mutual funds.
Please note that the expenses shown in the table are meant to highlight your ongoing costs only and do not reflect any transactional costs, such as exchange fees or sales charges (loads). Therefore, the fourth and fifth data columns of the table are useful in comparing ongoing costs only and will not help you determine the relative total costs of owning different funds. In addition, if these transactional costs were included, your costs would have been higher.
| | | | | | | | | | | | | | | | | | | | | | |
| | | | | | | | | | | | | | | | | | |
| Share Class | | Beginning
Account
Value
5/1/20 | | | Ending Account
Value (Based
on Actual
Returns and
Expenses)
10/31/20 | | | Expenses
Paid
During
Period1 | | | Ending Account
Value (Based
on Hypothetical
5% Annualized
Return and
Actual Expenses)
10/31/20 | | | Expenses
Paid
During
Period1 | | | Net Expense
Ratio
During
Period2 |
| | | | | | |
| Class A Shares | | $ | 1,000.00 | | | $ | 1,212.30 | | | $ | 5.28 | | | $ | 1,020.36 | | | $ | 4.82 | | | 0.95% |
| | | | | | |
| Investor Class Shares | | $ | 1,000.00 | | | $ | 1,209.80 | | | $ | 5.94 | | | $ | 1,019.76 | | | $ | 5.43 | | | 1.07% |
| | | | | | |
| Class B Shares | | $ | 1,000.00 | | | $ | 1,207.80 | | | $ | 10.10 | | | $ | 1,015.99 | | | $ | 9.22 | | | 1.82% |
| | | | | | |
| Class C Shares | | $ | 1,000.00 | | | $ | 1,206.60 | | | $ | 10.09 | | | $ | 1,015.99 | | | $ | 9.22 | | | 1.82% |
| | | | | | |
| Class I Shares | | $ | 1,000.00 | | | $ | 1,213.40 | | | $ | 3.89 | | | $ | 1,021.62 | | | $ | 3.56 | | | 0.70% |
| | | | | | |
| Class R1 Shares | | $ | 1,000.00 | | | $ | 1,212.90 | | | $ | 4.45 | | | $ | 1,021.11 | | | $ | 4.06 | | | 0.80% |
| | | | | | |
| Class R2 Shares | | $ | 1,000.00 | | | $ | 1,211.70 | | | $ | 5.84 | | | $ | 1,019.86 | | | $ | 5.33 | | | 1.05% |
| | | | | | |
| Class R3 Shares | | $ | 1,000.00 | | | $ | 1,210.20 | | | $ | 7.22 | | | $ | 1,018.60 | | | $ | 6.60 | | | 1.30% |
| | | | | | |
| Class R6 Shares | | $ | 1,000.00 | | | $ | 1,213.50 | | | $ | 3.51 | | | $ | 1,021.97 | | | $ | 3.20 | | | 0.63% |
| | | | | | |
| SIMPLE Class Shares3,4 | | $ | 1,000.00 | | | $ | 915.50 | | | $ | 2.12 | | | $ | 1,006.12 | | | $ | 2.22 | | | 1.33% |
| 1. | Expenses are equal to the Fund’s annualized expense ratio of each class multiplied by the average account value over the period, divided by 366 and multiplied by 184 (to reflect the six-month period) and 61 days for SIMPLE Class share (to reflect the since-inception period. The table above represents the actual expenses incurred during the six-month period. In addition to the fees and expenses which the Fund bears directly, it also indirectly bears a pro rata share of the fees and expenses of the underlying funds in which it invests. Such indirect expenses are not included in the above-reported expense figures. |
| 2. | Expenses are equal to the Fund’s annualized expense ratio to reflect the six-month period. |
| 3. | The inception date was August 31, 2020. |
| 4. | Expenses paid during the period reflect ongoing costs for the period from inception through October 31, 2020. Had these shares been offered for the full six-month period ended October 31, 2020, and had the Fund provided a hypothetical 5% annualized return, expenses paid during the period would have been $6.75 for SIMPLE Class shares and the ending account value would have been $1,018.45 for SIMPLE Class shares. |
Industry Composition as of October 31, 2020 (Unaudited)
| | | | |
| |
| Software | | | 22.1 | % |
| |
| IT Services | | | 11.4 | |
| |
| Interactive Media & Services | | | 10.1 | |
| |
| Internet & Direct Marketing Retail | | | 10.1 | |
| |
| Technology Hardware, Storage & Peripherals | | | 7.1 | |
| |
| Semiconductors & Semiconductor Equipment | | | 5.1 | |
| |
| Textiles, Apparel & Luxury Goods | | | 4.1 | |
| |
| Pharmaceuticals | | | 3.8 | |
| |
| Life Sciences Tools & Services | | | 3.1 | |
| |
| Capital Markets | | | 2.7 | |
| |
| Equity Real Estate Investment Trusts | | | 2.5 | |
| |
| Health Care Providers & Services | | | 2.2 | |
| |
| Health Care Equipment & Supplies | | | 2.0 | |
| |
| Professional Services | | | 1.9 | |
| | | | |
| |
| Media | | | 1.5 | % |
| |
| Containers & Packaging | | | 1.4 | |
| |
| Food & Staples Retailing | | | 1.4 | |
| |
| Automobiles | | | 1.3 | |
| |
| Personal Products | | | 1.3 | |
| |
| Hotels, Restaurants & Leisure | | | 1.2 | |
| |
| Chemicals | | | 1.1 | |
| |
| Entertainment | | | 1.1 | |
| |
| Health Care Technology | | | 1.1 | |
| |
| Road & Rail | | | 0.2 | |
| |
| Short-Term Investment | | | 0.3 | |
| |
| Other Assets, Less Liabilities | | | –0.1 | |
| | | | |
| | | 100.0 | % |
| | | | |
See Portfolio of Investments beginning on page 10 for specific holdings within these categories. The Fund’s holdings are subject to change.
Top Ten Holdings as of October 31, 2020 (excluding short-term investment) (Unaudited)
| 5. | Facebook, Inc., Class A |
| 10. | Mastercard, Inc., Class A |
| | |
| 8 | | MainStay Winslow Large Cap Growth Fund |
Portfolio Management Discussion and Analysis (Unaudited)
Questions answered by portfolio managers Justin H. Kelly, CFA, and Patrick M. Burton, CFA, of Winslow Capital Management, LLC, the Fund’s Subadvisor.
How did MainStay Winslow Large Cap Growth Fund perform relative to its benchmarks and peer group during the 12 months ended October 31, 2020?
For the 12 months ended October 31, 2020, Class I shares of MainStay Winslow Large Cap Growth Fund returned 29.80%, outperforming the 29.22% return of the Fund’s primary benchmark, the Russell 1000® Growth Index. Over the same period, Class I shares also outperformed the 9.71% return of the S&P 500® Index, which is the Fund’s secondary benchmark, and the 25.92% return of the Morningstar Large Growth Category Average.1
Were there any changes to the Fund during the reporting period?
Effective February 28, 2020, MainStay Large Cap Growth Fund was renamed MainStay Winslow Large Cap Growth Fund.
What factors affected the Fund’s relative performance during the reporting period?
The Fund’s outperformance relative to the Russell 1000® Growth Index was driven by allocation, particularly in the industrials and consumer staples sectors. The Fund’s relative outperformance was broadly based, with seven of eleven sectors making positive contributions. (Contributions take weightings and total returns into account.)
During the reporting period, which sectors were the strongest positive contributors to the Fund’s relative performance and which sectors were particularly weak?
The industrials and consumer staples sectors made the strongest positive contributions to the Fund’s performance relative to the Russell 1000® Growth Index during the reporting period. The consumer discretionary and information technology sectors detracted most from relative performance.
During the reporting period, which individual stocks made the strongest positive contributions to the Fund’s absolute performance and which stocks detracted the most?
The two stocks that made the strongest positive contributions to the Fund’s absolute performance during the reporting period
were e-commerce and web-services leader Amazon.com, and the world’s largest software company Microsoft Corporation. The two most significant detractors from the Fund’s absolute performance during the same period included shares in Chinese coffee company Luckin Coffee and home improvement retailer Lowe’s, both of which were eliminated from the Fund.
What were some of the Fund’s largest purchases and sales during the reporting period?
During the reporting period, the Fund’s largest purchases included shares in medical device manufacturer Boston Scientific, and pharmaceutical company Eli Lilly and Company. The Fund’s largest sales during the same period were its positions in Boston Scientific and surgical robotic products manufacturer Intuitive Surgical, both of which we viewed as providing less visibility on long-term growth in the face of growing competition and more challenged hospital finances due to the COVID-19 pandemic.
How did the Fund’s sector weightings change during the reporting period?
The Fund’s largest sector-weighting increases occurred in the information technology and consumer staples sectors. Conversely, the Fund’s most significant sector-weighting decreases occurred in the industrials and consumer discretionary sectors.
How was the Fund positioned at the end of the reporting period?
As of October 31, 2020, the Fund’s exposure to three types of growth investing placed the greatest emphasis on consistent growth, followed by dynamic growth and, lastly, cyclical growth. From a sector perspective, the Fund’s two largest overweight exposures as of the same date were to materials and information technology, while its most significantly underweight exposures were to industrials and consumer staples.
| 1. | See page 5 for other share class returns, which may be higher or lower than Class I share returns. See page 6 for more information on benchmark and peer group returns. |
The opinions expressed are those of the portfolio managers as of the date of this report and are subject to change. There is no guarantee that any forecasts will come to pass. This material does not constitute investment advice and is not intended as an endorsement of any specific investment.
Portfolio of Investments October 31, 2020
| | | | | | | | |
| | |
| | | Shares | | | Value | |
| Common Stocks 99.8%† | |
Automobiles 1.3% | |
Ferrari N.V. | | | 996,760 | | | $ | 177,841,919 | |
| | | | | | | | |
|
Capital Markets 2.7% | |
Moody’s Corp. | | | 795,050 | | | | 209,018,645 | |
MSCI, Inc. | | | 443,150 | | | | 155,031,596 | |
| | | | | | | | |
| | | | | | | 364,050,241 | |
| | | | | | | | |
Chemicals 1.1% | |
Linde PLC | | | 695,630 | | | | 153,275,114 | |
| | | | | | | | |
|
Containers & Packaging 1.4% | |
Ball Corp. | | | 2,105,100 | | | | 187,353,900 | |
| | | | | | | | |
|
Entertainment 1.1% | |
Netflix, Inc. (a) | | | 312,900 | | | | 148,859,046 | |
| | | | | | | | |
|
Equity Real Estate Investment Trusts 2.5% | |
American Tower Corp. | | | 763,600 | | | | 175,360,740 | |
Equinix, Inc. | | | 226,350 | | | | 165,516,174 | |
| | | | | | | | |
| | | | | | | 340,876,914 | |
| | | | | | | | |
Food & Staples Retailing 1.4% | |
Costco Wholesale Corp. | | | 523,200 | | | | 187,106,784 | |
| | | | | | | | |
|
Health Care Equipment & Supplies 2.0% | |
Abbott Laboratories | | | 1,350,120 | | | | 141,911,113 | |
Align Technology, Inc. (a) | | | 290,900 | | | | 123,946,672 | |
| | | | | | | | |
| | | | | | | 265,857,785 | |
| | | | | | | | |
Health Care Providers & Services 2.2% | |
UnitedHealth Group, Inc. | | | 981,300 | | | | 299,433,882 | |
| | | | | | | | |
|
Health Care Technology 1.1% | |
Veeva Systems, Inc., Class A (a) | | | 532,950 | | | | 143,923,148 | |
| | | | | | | | |
|
Hotels, Restaurants & Leisure 1.2% | |
Chipotle Mexican Grill, Inc. (a) | | | 133,900 | | | | 160,878,172 | |
| | | | | | | | |
|
Interactive Media & Services 10.1% | |
Alphabet, Inc. (a) | | | | | | | | |
Class A | | | 247,290 | | | | 399,647,842 | |
Class C | | | 249,641 | | | | 404,670,557 | |
Facebook, Inc., Class A (a) | | | 2,114,380 | | | | 556,314,522 | |
| | | | | | | | |
| | | | | | | 1,360,632,921 | |
| | | | | | | | |
Internet & Direct Marketing Retail 10.1% | |
Alibaba Group Holding, Ltd., Sponsored ADR (a) | | | 456,560 | | | | 139,109,266 | |
Amazon.com, Inc. (a) | | | 402,990 | | | | 1,223,538,089 | |
| | | | | | | | |
| | | | | | | 1,362,647,355 | |
| | | | | | | | |
| | | | | | | | |
| | |
| | | Shares | | | Value | |
IT Services 11.4% | |
Mastercard, Inc., Class A | | | 1,257,900 | | | $ | 363,080,256 | |
PayPal Holdings, Inc. (a) | | | 1,725,430 | | | | 321,154,286 | |
Shopify, Inc., Class A (a) | | | 150,800 | | | | 139,554,844 | |
Square, Inc., Class A (a) | | | 559,200 | | | | 86,608,896 | |
Visa, Inc., Class A | | | 2,760,600 | | | | 501,628,626 | |
Wix.com, Ltd. (a) | | | 518,500 | | | | 128,235,420 | |
| | | | | | | | |
| | | | | | | 1,540,262,328 | |
| | | | | | | | |
Life Sciences Tools & Services 3.1% | |
IQVIA Holdings, Inc. (a) | | | 1,349,800 | | | | 207,855,702 | |
Thermo Fisher Scientific, Inc. | | | 441,520 | | | | 208,891,942 | |
| | | | | | | | |
| | | | | | | 416,747,644 | |
| | | | | | | | |
Media 1.5% | |
Charter Communications, Inc., Class A (a) | | | 340,000 | | | | 205,298,800 | |
| | | | | | | | |
|
Personal Products 1.3% | |
Estee Lauder Cos., Inc., Class A | | | 810,800 | | | | 178,100,328 | |
| | | | | | | | |
|
Pharmaceuticals 3.8% | |
AstraZeneca PLC, Sponsored ADR | | | 3,298,300 | | | | 165,442,728 | |
Eli Lilly & Co. | | | 956,800 | | | | 124,824,128 | |
Zoetis, Inc. | | | 1,433,140 | | | | 227,224,347 | |
| | | | | | | | |
| | | | | | | 517,491,203 | |
| | | | | | | | |
Professional Services 1.9% | |
CoStar Group, Inc. (a) | | | 156,300 | | | | 128,730,243 | |
TransUnion | | | 1,577,100 | | | | 125,631,786 | |
| | | | | | | | |
| | | | | | | 254,362,029 | |
| | | | | | | | |
Road & Rail 0.2% | |
Uber Technologies, Inc. (a) | | | 786,100 | | | | 26,263,601 | |
| | | | | | | | |
|
Semiconductors & Semiconductor Equipment 5.1% | |
ASML Holding N.V., Registered | | | 475,650 | | | | 171,809,537 | |
NVIDIA Corp. | | | 686,800 | | | | 344,334,048 | |
Texas Instruments, Inc. | | | 1,207,500 | | | | 174,592,425 | |
| | | | | | | | |
| | | | | | | 690,736,010 | |
| | | | | | | | |
Software 22.1% | |
Adobe, Inc. (a) | | | 1,079,960 | | | | 482,850,116 | |
Atlassian Corp. PLC, Class A (a) | | | 829,850 | | | | 159,015,857 | |
Intuit, Inc. | | | 1,066,260 | | | | 335,530,697 | |
Microsoft Corp. | | | 5,731,130 | | | | 1,160,381,891 | |
salesforce.com, Inc. (a) | | | 2,293,690 | | | | 532,755,376 | |
Splunk, Inc. (a) | | | 843,400 | | | | 167,026,936 | |
Workday, Inc., Class A (a) | | | 698,370 | | | | 146,741,505 | |
| | | | | | | | |
| | | | | | | 2,984,302,378 | |
| | | | | | | | |
Technology Hardware, Storage & Peripherals 7.1% | |
Apple, Inc. | | | 8,772,400 | | | | 954,963,464 | |
| | | | | | | | |
| | | | |
| 10 | | MainStay Winslow Large Cap Growth Fund | | The notes to the financial statements are an integral part of,
and should be read in conjunction with, the financial statements. |
| | | | | | | | |
| | |
| | | Shares | | | Value | |
| Common Stocks (continued) | |
Textiles, Apparel & Luxury Goods 4.1% | |
Lululemon Athletica, Inc. (a) | | | 512,400 | | | $ | 163,604,196 | |
NIKE, Inc., Class B | | | 3,223,240 | | | | 387,046,659 | |
| | | | | | | | |
| | | | | | | 550,650,855 | |
| | | | | | | | |
Total Common Stocks
(Cost $6,199,560,047) | | | | | | | 13,471,915,821 | |
| | | | | | | | |
|
| Short-Term Investment 0.3% | |
Affiliated Investment Company 0.3% | |
MainStay U.S. Government Liquidity Fund, 0.02% (b)(c) | | | 41,323,989 | | | | 41,323,989 | |
| | | | | | | | |
Total Short-Term Investment
(Cost $41,323,989) | | | | | | | 41,323,989 | |
| | | | | | | | |
Total Investments
(Cost $6,240,884,036) | | | 100.1 | % | | | 13,513,239,810 | |
Other Assets, Less Liabilities | | | (0.1 | ) | | | (8,724,813 | ) |
Net Assets | | | 100.0 | % | | $ | 13,504,514,997 | |
| † | Percentages indicated are based on Fund net assets. |
| (a) | Non-income producing security. |
| (b) | Current yield as of October 31, 2020. |
| (c) | As of October 31, 2020, the Fund’s ownership exceeds 5% of the outstanding shares of the Underlying Fund’s share class. |
The following abbreviation is used in the preceding pages:
ADR—American Depositary Receipt
The following is a summary of the fair valuations according to the inputs used as of October 31, 2020, for valuing the Fund’s assets:
| | | | | | | | | | | | | | | | |
Description | | Quoted
Prices in
Active
Markets for
Identical
Assets
(Level 1) | | | Significant
Other
Observable
Inputs
(Level 2) | | | Significant
Unobservable
Inputs
(Level 3) | | | Total | |
| | | | |
Asset Valuation Inputs | | | | | | | | | | | | | | | | |
| Investments in Securities (a) | | | | | | | | | | | | | | | | |
| Common Stocks | | $ | 13,471,915,821 | | | $ | — | | | $ | — | | | $ | 13,471,915,821 | |
| Short-Term Investment | | | | | | | | | | | | | | | | |
Affiliated Investment Company | | | 41,323,989 | | | | — | | | | — | | | | 41,323,989 | |
| | | | | | | | | | | | | | | | |
| Total Investments in Securities | | $ | 13,513,239,810 | | | $ | — | | | $ | — | | | $ | 13,513,239,810 | |
| | | | | | | | | | | | | | | | |
| (a) | For a complete listing of investments and their industries, see the Portfolio of Investments. |
| | | | | | |
The notes to the financial statements are an integral part of,
and should be read in conjunction with, the financial statements. | | | | | 11 | |
Statement of Assets and Liabilities as of October 31, 2020
| | | | |
| Assets | | | | |
Investment in unaffiliated securities, at value
(identified cost $6,199,560,047) | | $ | 13,471,915,821 | |
Investment in affiliated investment company, at value (identified cost $41,323,989) | | | 41,323,989 | |
Receivables: | | | | |
Investment securities sold | | | 57,196,209 | |
Fund shares sold | | | 23,792,138 | |
Dividends | | | 2,907,392 | |
Securities lending | | | 333 | |
Other assets | | | 140,092 | |
| | | | |
Total assets | | | 13,597,275,974 | |
| | | | |
| |
| Liabilities | | | | |
Payables: | | | | |
Investment securities purchased | | | 55,724,165 | |
Fund shares redeemed | | | 27,291,791 | |
Manager (See Note 3) | | | 7,446,503 | |
Transfer agent (See Note 3) | | | 1,376,540 | |
NYLIFE Distributors (See Note 3) | | | 494,682 | |
Professional fees | | | 206,579 | |
Shareholder communication | | | 174,559 | |
Trustees | | | 17,891 | |
Custodian | | | 16,549 | |
Accrued expenses | | | 11,718 | |
| | | | |
Total liabilities | | | 92,760,977 | |
| | | | |
Net assets | | $ | 13,504,514,997 | |
| | | | |
| |
| Composition of Net Assets | | | | |
Shares of beneficial interest outstanding (par value of $.01 per share) unlimited number of shares authorized | | $ | 11,196,834 | |
Additional paid-in capital | | | 5,508,742,103 | |
| | | | |
| | | 5,519,938,937 | |
Total distributable earnings (loss) | | | 7,984,576,060 | |
| | | | |
Net assets | | $ | 13,504,514,997 | |
| | | | |
| | | | |
Class A | | | | |
Net assets applicable to outstanding shares | | $ | 1,341,380,683 | |
| | | | |
Shares of beneficial interest outstanding | | | 121,072,357 | |
| | | | |
Net asset value per share outstanding | | $ | 11.08 | |
Maximum sales charge (5.50% of offering price) | | | 0.64 | |
| | | | |
Maximum offering price per share outstanding | | $ | 11.72 | |
| | | | |
Investor Class | | | | |
Net assets applicable to outstanding shares | | $ | 110,830,641 | |
| | | | |
Shares of beneficial interest outstanding | | | 10,221,408 | |
| | | | |
Net asset value per share outstanding | | $ | 10.84 | |
Maximum sales charge (5.00% of offering price) | | | 0.57 | |
| | | | |
Maximum offering price per share outstanding | | $ | 11.41 | |
| | | | |
Class B | | | | |
Net assets applicable to outstanding shares | | $ | 20,172,200 | |
| | | | |
Shares of beneficial interest outstanding | | | 2,411,175 | |
| | | | |
Net asset value and offering price per share outstanding | | $ | 8.37 | |
| | | | |
Class C | | | | |
Net assets applicable to outstanding shares | | $ | 95,760,852 | |
| | | | |
Shares of beneficial interest outstanding | | | 11,474,079 | |
| | | | |
Net asset value and offering price per share outstanding | | $ | 8.35 | |
| | | | |
Class I | | | | |
Net assets applicable to outstanding shares | | $ | 6,824,223,525 | |
| | | | |
Shares of beneficial interest outstanding | | | 555,905,024 | |
| | | | |
Net asset value and offering price per share outstanding | | $ | 12.28 | |
| | | | |
Class R1 | | | | |
Net assets applicable to outstanding shares | | $ | 914,358,524 | |
| | | | |
Shares of beneficial interest outstanding | | | 77,188,508 | |
| | | | |
Net asset value and offering price per share outstanding | | $ | 11.85 | |
| | | | |
Class R2 | | | | |
Net assets applicable to outstanding shares | | $ | 159,296,687 | |
| | | | |
Shares of beneficial interest outstanding | | | 14,493,415 | |
| | | | |
Net asset value and offering price per share outstanding | | $ | 10.99 | |
| | | | |
Class R3 | | | | |
Net assets applicable to outstanding shares | | $ | 56,656,930 | |
| | | | |
Shares of beneficial interest outstanding | | | 5,562,443 | |
| | | | |
Net asset value and offering price per share outstanding | | $ | 10.19 | |
| | | | |
Class R6 | | | | |
Net assets applicable to outstanding shares | | $ | 3,981,812,072 | |
| | | | |
Shares of beneficial interest outstanding | | | 321,352,860 | |
| | | | |
Net asset value and offering price per share outstanding | | $ | 12.39 | |
| | | | |
SIMPLE Class | | | | |
Net assets applicable to outstanding shares | | $ | 22,883 | |
| | | | |
Shares of beneficial interest outstanding | | | 2,111 | |
| | | | |
Net asset value and offering price per share outstanding | | $ | 10.84 | |
| | | | |
| | | | |
| 12 | | MainStay Winslow Large Cap Growth Fund | | The notes to the financial statements are an integral part of,
and should be read in conjunction with, the financial statements. |
Statement of Operations for the year ended October 31, 2020
| | | | |
| Investment Income (Loss) | | | | |
Income | | | | |
Dividends-unaffiliated (a) | | $ | 81,816,565 | |
Dividends-affiliated | | | 400,994 | |
Securities lending | | | 779,848 | |
Interest | | | 49 | |
Other | | | 2,211 | |
| | | | |
Total income | | | 82,999,667 | |
| | | | �� |
Expenses | | | | |
Manager (See Note 3) | | | 77,721,584 | |
Transfer agent (See Note 3) | | | 8,181,743 | |
Distribution/Service—Class A (See Note 3) | | | 2,908,403 | |
Distribution/Service—Investor Class (See Note 3) | | | 284,743 | |
Distribution/Service—Class B (See Note 3) | | | 203,280 | |
Distribution/Service—Class C (See Note 3) | | | 1,211,523 | |
Distribution/Service—Class R2 (See Note 3) | | | 404,844 | |
Distribution/Service—Class R3 (See Note 3) | | | 284,569 | |
Distribution/Service—SIMPLE Class (See Note 3) | | | 20 | |
Shareholder service (See Note 3) | | | 1,112,821 | |
Professional fees | | | 871,557 | |
Shareholder communication | | | 367,724 | |
Trustees | | | 299,239 | |
Registration | | | 245,108 | |
Custodian | | | 107,229 | |
Miscellaneous | | | 403,647 | |
| | | | |
Total expenses before waiver/reimbursement | | | 94,608,034 | |
Expense waiver/reimbursement from Manager (See Note 3) | | | (511,340 | ) |
| | | | |
Net expenses | | | 94,096,694 | |
| | | | |
Net investment income (loss) | | | (11,097,027 | ) |
| | | | |
| |
| Realized and Unrealized Gain (Loss) | | | | |
Net realized gain (loss) on unaffiliated investments | | | 820,924,239 | |
Net change in unrealized appreciation (depreciation) on unaffiliated investments | | | 2,446,952,380 | |
| | | | |
Net realized and unrealized gain (loss) | | | 3,267,876,619 | |
| | | | |
Net increase (decrease) in net assets resulting from operations | | $ | 3,256,779,592 | |
| | | | |
| (a) | Dividends recorded net of foreign withholding taxes in the amount of $254,777. |
| | | | | | |
The notes to the financial statements are an integral part of,
and should be read in conjunction with, the financial statements. | | | | | 13 | |
Statements of Changes in Net Assets
for the years ended October 31, 2020 and October 31, 2019
| | | | | | | | |
| | | 2020 | | | 2019 | |
| Increase (Decrease) in Net Assets | |
Operations: | | | | | | | | |
Net investment income (loss) | | $ | (11,097,027 | ) | | $ | 1,397,481 | |
Net realized gain (loss) | | | 820,924,239 | | | | 1,343,085,065 | |
Net change in unrealized appreciation (depreciation) | | | 2,446,952,380 | | | | 462,179,012 | |
| | | | |
Net increase (decrease) in net assets resulting from operations | | | 3,256,779,592 | | | | 1,806,661,558 | |
| | | | |
Distributions to shareholders: | | | | | | | | |
Class A | | | (111,361,863 | ) | | | (198,645,333 | ) |
Investor Class | | | (12,020,268 | ) | | | (19,327,235 | ) |
Class B | | | (2,904,982 | ) | | | (5,587,234 | ) |
Class C | | | (18,187,627 | ) | | | (41,980,795 | ) |
Class I | | | (608,819,185 | ) | | | (1,039,849,373 | ) |
Class R1 | | | (94,596,707 | ) | | | (190,986,946 | ) |
Class R2 | | | (17,824,571 | ) | | | (40,446,981 | ) |
Class R3 | | | (6,648,447 | ) | | | (11,941,266 | ) |
Class R6 | | | (315,525,286 | ) | | | (419,727,421 | ) |
| | | | |
Total distributions to shareholders | | | (1,187,888,936 | ) | | | (1,968,492,584 | ) |
| | | | |
Capital share transactions: | | | | | | | | |
Net proceeds from sale of shares | | | 2,681,398,278 | | | | 2,510,739,822 | |
Net asset value of shares issued to shareholders in reinvestment of distributions | | | 1,090,257,801 | | | | 1,806,158,715 | |
Cost of shares redeemed | | | (3,975,423,287 | ) | | | (4,066,296,731 | ) |
| | | | |
Increase (decrease) in net assets derived from capital share transactions | | | (203,767,208 | ) | | | 250,601,806 | |
| | | | |
Net increase (decrease) in net assets | | | 1,865,123,448 | | | | 88,770,780 | |
| | |
| Net Assets | | | | | | | | |
Beginning of year | | | 11,639,391,549 | | | | 11,550,620,769 | |
| | | | |
End of year | | $ | 13,504,514,997 | | | $ | 11,639,391,549 | |
| | | | |
| | | | |
| 14 | | MainStay Winslow Large Cap Growth Fund | | The notes to the financial statements are an integral part of,
and should be read in conjunction with, the financial statements. |
Financial Highlights selected per share data and ratios
| | | | | | | | | | | | | | | | | | | | |
| |
| | | Year ended October 31, | |
| | | | | |
| Class A | | 2020 | | | 2019 | | | 2018 | | | 2017 | | | 2016 | |
| | | | | |
Net asset value at beginning of year | | $ | 9.59 | | | $ | 9.95 | | | $ | 10.41 | | | $ | 9.17 | | | $ | 10.68 | |
| | | | | | | | | | | | | | | | | | | | |
| | | | | |
Net investment income (loss) (a) | | | (0.03 | ) | | | (0.02 | ) | | | (0.02 | ) | | | (0.01 | ) | | | (0.01 | ) |
| | | | | |
Net realized and unrealized gain (loss) on investments | | | 2.58 | | | | 1.48 | | | | 1.12 | | | | 2.31 | | | | (0.23 | ) |
| | | | | | | | | | | | | | | | | | | | |
| | | | | |
Total from investment operations | | | 2.55 | | | | 1.46 | | | | 1.10 | | | | 2.30 | | | | (0.24 | ) |
| | | | | | | | | | | | | | | | | | | | |
| | | | | |
| Less distributions: | | | | | | | | | | | | | | | | | | | | |
| | | | | |
From net investment income | | | — | | | | — | | | | (0.00 | )‡ | | | — | | | | — | |
| | | | | |
From net realized gain on investments | | | (1.06 | ) | | | (1.82 | ) | | | (1.56 | ) | | | (1.06 | ) | | | (1.27 | ) |
| | | | | | | | | | | | | | | | | | | | |
| | | | | |
Total distributions | | | (1.06 | ) | | | (1.82 | ) | | | (1.56 | ) | | | (1.06 | ) | | | (1.27 | ) |
| | | | | | | | | | | | | | | | | | | | |
| | | | | |
Net asset value at end of year | | $ | 11.08 | | | $ | 9.59 | | | $ | 9.95 | | | $ | 10.41 | | | $ | 9.17 | |
| | | | | | | | | | | | | | | | | | | | |
| | | | | |
Total investment return (b) | | | 29.44 | % | | | 17.05 | % | | | 12.36 | % | | | 28.54 | % | | | (2.44 | %) |
| | | | | |
| Ratios (to average net assets)/Supplemental Data: | | | | | | | | | | | | | | | | | | | | |
| | | | | |
Net investment income (loss) | | | (0.31 | %) | | | (0.20 | %) | | | (0.21 | %) | | | (0.15 | %) | | | (0.13 | %) |
| | | | | |
Net expenses (c) | | | 0.97 | % | | | 0.99 | % | | | 0.97 | % | | | 1.00 | % | | | 0.99 | % |
| | | | | |
Expenses (before waiver/reimbursement) (c) | | | 0.97 | % | | | 0.99 | % | | | 0.98 | % | | | 1.00 | % | | | 1.00 | % |
| | | | | |
Portfolio turnover rate | | | 44 | % | | | 54 | % | | | 52 | % | | | 61 | % | | | 84 | % |
| | | | | |
Net assets at end of year (in 000’s) | | $ | 1,341,381 | | | $ | 1,008,608 | | | $ | 1,092,962 | | | $ | 960,123 | | | $ | 882,021 | |
| ‡ | Less than one cent per share. |
| (a) | Per share data based on average shares outstanding during the year. |
| (b) | Total investment return is calculated exclusive of sales charges and assumes the reinvestment of distributions. For periods of less than one year, total return is not annualized. |
| (c) | In addition to the fees and expenses which the Fund bears directly, it also indirectly bears a pro-rata share of the fees and expenses of the underlying funds in which it invests. Such indirect expenses are not included in the above expense ratios. |
| | | | | | | | | | | | | | | | | | | | |
| |
| | | Year ended October 31, | |
| | | | | |
| Investor Class | | 2020 | | | 2019 | | | 2018 | | | 2017 | | | 2016 | |
| | | | | |
Net asset value at beginning of year | | $ | 9.42 | | | $ | 9.81 | | | $ | 10.30 | | | $ | 9.09 | | | $ | 10.61 | |
| | | | | | | | | | | | | | | | | | | | |
| | | | | |
Net investment income (loss) (a) | | | (0.04 | ) | | | (0.03 | ) | | | (0.03 | ) | | | (0.02 | ) | | | (0.02 | ) |
| | | | | |
Net realized and unrealized gain (loss) on investments | | | 2.52 | | | | 1.46 | | | | 1.10 | | | | 2.29 | | | | (0.23 | ) |
| | | | | | | | | | | | | | | | | | | | |
| | | | | |
Total from investment operations | | | 2.48 | | | | 1.43 | | | | 1.07 | | | | 2.27 | | | | (0.25 | ) |
| | | | | | | | | | | | | | | | | | | | |
| | | | | |
| Less distributions: | | | | | | | | | | | | | | | | | | | | |
| | | | | |
From net realized gain on investments | | | (1.06 | ) | | | (1.82 | ) | | | (1.56 | ) | | | (1.06 | ) | | | (1.27 | ) |
| | | | | | | | | | | | | | | | | | | | |
| | | | | |
Net asset value at end of year | | $ | 10.84 | | | $ | 9.42 | | | $ | 9.81 | | | $ | 10.30 | | | $ | 9.09 | |
| | | | | | | | | | | | | | | | | | | | |
| | | | | |
Total investment return (b) | | | 29.19 | % | | | 16.96 | % | | | 12.19 | % | | | 28.45 | % | | | (2.57 | %) |
| | | | | |
| Ratios (to average net assets)/Supplemental Data: | | | | | | | | | | | | | | | | | | | | |
| | | | | |
Net investment income (loss) | | | (0.43 | %) | | | (0.31 | %) | | | (0.30 | %) | | | (0.19 | %) | | | (0.19 | %) |
| | | | | |
Net expenses (c) | | | 1.10 | % | | | 1.09 | % | | | 1.06 | % | | | 1.07 | % | | | 1.05 | % |
| | | | | |
Expenses (before waiver/reimbursement) (c) | | | 1.10 | % | | | 1.10 | % | | | 1.07 | % | | | 1.07 | % | | | 1.06 | % |
| | | | | |
Portfolio turnover rate | | | 44 | % | | | 54 | % | | | 52 | % | | | 61 | % | | | 84 | % |
| | | | | |
Net assets at end of year (in 000’s) | | $ | 110,831 | | | $ | 109,236 | | | $ | 103,987 | | | $ | 108,078 | | | $ | 167,631 | |
| (a) | Per share data based on average shares outstanding during the year. |
| (b) | Total investment return is calculated exclusive of sales charges and assumes the reinvestment of distributions. For periods of less than one year, total return is not annualized. |
| (c) | In addition to the fees and expenses which the Fund bears directly, it also indirectly bears a pro-rata share of the fees and expenses of the underlying funds in which it invests. Such indirect expenses are not included in the above expense ratios. |
| | | | | | |
The notes to the financial statements are an integral part of,
and should be read in conjunction with, the financial statements. | | | | | 15 | |
Financial Highlights selected per share data and ratios
| | | | | | | | | | | | | | | | | | | | |
| |
| | | Year ended October 31, | |
| | | | | |
| Class B | | 2020 | | | 2019 | | | 2018 | | | 2017 | | | 2016 | |
| | | | | |
Net asset value at beginning of year | | $ | 7.55 | | | $ | 8.26 | | | $ | 8.98 | | | $ | 8.11 | | | $ | 9.67 | |
| | | | | | | | | | | | | | | | | | | | |
| | | | | |
Net investment income (loss) (a) | | | (0.09 | ) | | | (0.08 | ) | | | (0.09 | ) | | | (0.08 | ) | | | (0.08 | ) |
| | | | | |
Net realized and unrealized gain (loss) on investments | | | 1.97 | | | | 1.19 | | | | 0.93 | | | | 2.01 | | | | (0.21 | ) |
| | | | | | | | | | | | | | | | | | | | |
| | | | | |
Total from investment operations | | | 1.88 | | | | 1.11 | | | | 0.84 | | | | 1.93 | | | | (0.29 | ) |
| | | | | | | | | | | | | | | | | | | | |
| | | | | |
| Less distributions: | | | | | | | | | | | | | | | | | | | | |
| | | | | |
From net realized gain on investments | | | (1.06 | ) | | | (1.82 | ) | | | (1.56 | ) | | | (1.06 | ) | | | (1.27 | ) |
| | | | | | | | | | | | | | | | | | | | |
| | | | | |
Net asset value at end of year | | $ | 8.37 | | | $ | 7.55 | | | $ | 8.26 | | | $ | 8.98 | | | $ | 8.11 | |
| | | | | | | | | | | | | | | | | | | | |
| | | | | |
Total investment return (b) | | | 28.37 | % | | | 15.96 | % | | | 11.28 | % (c) | | | 27.61 | % | | | (3.32 | %) |
| | | | | |
| Ratios (to average net assets)/Supplemental Data: | | | | | | | | | | | | | | | | | | | | |
| | | | | |
Net investment income (loss) | | | (1.17 | %) | | | (1.05 | %) | | | (1.04 | %) | | | (0.96 | %) | | | (0.94 | %) |
| | | | | |
Net expenses (d) | | | 1.85 | % | | | 1.84 | % | | | 1.81 | % | | | 1.82 | % | | | 1.80 | % |
| | | | | |
Expenses (before waiver/reimbursement) (d) | | | 1.85 | % | | | 1.85 | % | | | 1.82 | % | | | 1.82 | % | | | 1.81 | % |
| | | | | |
Portfolio turnover rate | | | 44 | % | | | 54 | % | | | 52 | % | | | 61 | % | | | 84 | % |
| | | | | |
Net assets at end of year (in 000’s) | | $ | 20,172 | | | $ | 21,015 | | | $ | 25,685 | | | $ | 31,793 | | | $ | 36,549 | |
| (a) | Per share data based on average shares outstanding during the year. |
| (b) | Total investment return is calculated exclusive of sales charges and assumes the reinvestment of distributions. For periods of less than one year, total return is not annualized. |
| (c) | Total investment return may reflect adjustments to conform to generally accepted accounting principles. |
| (d) | In addition to the fees and expenses which the Fund bears directly, it also indirectly bears a pro-rata share of the fees and expenses of the underlying funds in which it invests. Such indirect expenses are not included in the above expense ratios. |
| | | | | | | | | | | | | | | | | | | | |
| |
| | | Year ended October 31, | |
| | | | | |
| Class C | | 2020 | | | 2019 | | | 2018 | | | 2017 | | | 2016 | |
| | | | | |
Net asset value at beginning of year | | $ | 7.53 | | | $ | 8.25 | | | $ | 8.96 | | | $ | 8.10 | | | $ | 9.66 | |
| | | | | | | | | | | | | | | | | | | | |
| | | | | |
Net investment income (loss) (a) | | | (0.09 | ) | | | (0.07 | ) | | | (0.09 | ) | | | (0.08 | ) | | | (0.08 | ) |
| | | | | |
Net realized and unrealized gain (loss) on investments | | | 1.97 | | | | 1.17 | | | | 0.94 | | | | 2.00 | | | | (0.21 | ) |
| | | | | | | | | | | | | | | | | | | | |
| | | | | |
Total from investment operations | | | 1.88 | | | | 1.10 | | | | 0.85 | | | | 1.92 | | | | (0.29 | ) |
| | | | | | | | | | | | | | | | | | | | |
| | | | | |
| Less distributions: | | | | | | | | | | | | | | | | | | | | |
| | | | | |
From net realized gain on investments | | | (1.06 | ) | | | (1.82 | ) | | | (1.56 | ) | | | (1.06 | ) | | | (1.27 | ) |
| | | | | | | | | | | | | | | | | | | | |
| | | | | |
Net asset value at end of year | | $ | 8.35 | | | $ | 7.53 | | | $ | 8.25 | | | $ | 8.96 | | | $ | 8.10 | |
| | | | | | | | | | | | | | | | | | | | |
| | | | | |
Total investment return (b) | | | 28.46 | % | | | 15.97 | % | | | 11.42 | % | | | 27.51 | % | | | (3.31 | %) |
| | | | | |
| Ratios (to average net assets)/Supplemental Data: | | | | | | | | | | | | | | | | | | | | |
| | | | | |
Net investment income (loss) | | | (1.17 | %) | | | (1.04 | %) | | | (1.05 | %) | | | (0.96 | %) | | | (0.94 | %) |
| | | | | |
Net expenses (c) | | | 1.85 | % | | | 1.84 | % | | | 1.81 | % | | | 1.82 | % | | | 1.80 | % |
| | | | | |
Expenses (before waiver/reimbursement) (c) | | | 1.85 | % | | | 1.85 | % | | | 1.82 | % | | | 1.82 | % | | | 1.81 | % |
| | | | | |
Portfolio turnover rate | | | 44 | % | | | 54 | % | | | 52 | % | | | 61 | % | | | 84 | % |
| | | | | |
Net assets at end of year (in 000’s) | | $ | 95,761 | | | $ | 131,945 | | | $ | 197,231 | | | $ | 229,283 | | | $ | 306,409 | |
| (a) | Per share data based on average shares outstanding during the year. |
| (b) | Total investment return is calculated exclusive of sales charges and assumes the reinvestment of distributions. For periods of less than one year, total return is not annualized. |
| (c) | In addition to the fees and expenses which the Fund bears directly, it also indirectly bears a pro-rata share of the fees and expenses of the underlying funds in which it invests. Such indirect expenses are not included in the above expense ratios. |
| | | | |
| 16 | | MainStay Winslow Large Cap Growth Fund | | The notes to the financial statements are an integral part of,
and should be read in conjunction with, the financial statements. |
Financial Highlights selected per share data and ratios
| | | | | | | | | | | | | | | | | | | | |
| |
| | | Year ended October 31, | |
| | | | | |
| Class I | | 2020 | | | 2019 | | | 2018 | | | 2017 | | | 2016 | |
| | | | | |
Net asset value at beginning of year | | $ | 10.49 | | | $ | 10.69 | | | $ | 11.06 | | | $ | 9.65 | | | $ | 11.15 | |
| | | | | | | | | | | | | | | | | | | | |
| | | | | |
Net investment income (loss) (a) | | | (0.01 | ) | | | 0.00 | ‡ | | | 0.00 | ‡ | | | 0.01 | | | | 0.01 | |
| | | | | |
Net realized and unrealized gain (loss) on investments | | | 2.86 | | | | 1.62 | | | | 1.20 | | | | 2.46 | | | | (0.24 | ) |
| | | | | | | | | | | | | | | | | | | | |
| | | | | |
Total from investment operations | | | 2.85 | | | | 1.62 | | | | 1.20 | | | | 2.47 | | | | (0.23 | ) |
| | | | | | | | | | | | | | | | | | | | |
| | | | | |
| Less distributions: | | | | | | | | | | | | | | | | | | | | |
| | | | | |
From net investment income | | | — | | | | — | | | | (0.01 | ) | | | — | | | | — | |
| | | | | |
From net realized gain on investments | | | (1.06 | ) | | | (1.82 | ) | | | (1.56 | ) | | | (1.06 | ) | | | (1.27 | ) |
| | | | | | | | | | | | | | | | | | | | |
| | | | | |
Total distributions | | | (1.06 | ) | | | (1.82 | ) | | | (1.57 | ) | | | (1.06 | ) | | | (1.27 | ) |
| | | | | | | | | | | | | | | | | | | | |
| | | | | |
Net asset value at end of year | | $ | 12.28 | | | $ | 10.49 | | | $ | 10.69 | | | $ | 11.06 | | | $ | 9.65 | |
| | | | | | | | | | | | | | | | | | | | |
| | | | | |
Total investment return (b) | | | 29.80 | % | | | 17.29 | % | | | 12.54 | %(c) | | | 28.92 | % | | | (2.23 | %) |
| | | | | |
| Ratios (to average net assets)/Supplemental Data: | | | | | | | | | | | | | | | | | | | | |
| | | | | |
Net investment income (loss) | | | (0.06 | %) | | | 0.05 | % | | | 0.04 | % | | | 0.12 | % | | | 0.12 | % |
| | | | | |
Net expenses (d) | | | 0.72 | % | | | 0.74 | % | | | 0.72 | % | | | 0.75 | % | | | 0.74 | % |
| | | | | |
Expenses (before waiver/reimbursement) (d) | | | 0.72 | % | | | 0.74 | % | | | 0.73 | % | | | 0.75 | % | | | 0.75 | % |
| | | | | |
Portfolio turnover rate | | | 44 | % | | | 54 | % | | | 52 | % | | | 61 | % | | | 84 | % |
| | | | | |
Net assets at end of year (in 000’s) | | $ | 6,824,224 | | | $ | 6,080,320 | | | $ | 6,275,780 | | | $ | 6,752,754 | | | $ | 8,994,997 | |
| ‡ | Less than one cent per share. |
| (a) | Per share data based on average shares outstanding during the year. |
| (b) | Total investment return is calculated exclusive of sales charges and assumes the reinvestment of distributions. Class I shares are not subject to sales charges. For periods of less than one year, total return is not annualized. |
| (c) | Total investment return may reflect adjustments to conform to generally accepted accounting principles. |
| (d) | In addition to the fees and expenses which the Fund bears directly, it also indirectly bears a pro-rata share of the fees and expenses of the underlying funds in which it invests. Such indirect expenses are not included in the above expense ratios. |
| | | | | | | | | | | | | | | | | | | | |
| |
| | | Year ended October 31, | |
| | | | | |
| Class R1 | | 2020 | | | 2019 | | | 2018 | | | 2017 | | | 2016 | |
| | | | | |
Net asset value at beginning of year | | $ | 10.17 | | | $ | 10.43 | | | $ | 10.83 | | | $ | 9.48 | | | $ | 10.99 | |
| | | | | | | | | | | | | | | | | | | | |
| | | | | |
Net investment income (loss) (a) | | | (0.02 | ) | | | (0.00 | )‡ | | | (0.01 | ) | | | 0.00 | ‡ | | | 0.00 | ‡ |
| | | | | |
Net realized and unrealized gain (loss) on investments | | | 2.76 | | | | 1.56 | | | | 1.17 | | | | 2.41 | | | | (0.24 | ) |
| | | | | | | | | | | | | | | | | | | | |
| | | | | |
Total from investment operations | | | 2.74 | | | | 1.56 | | | | 1.16 | | | | 2.41 | | | | (0.24 | ) |
| | | | | | | | | | | | | | | | | | | | |
| | | | | |
| Less distributions: | | | | | | | | | | | | | | | | | | | | |
| | | | | |
From net realized gain on investments | | | (1.06 | ) | | | (1.82 | ) | | | (1.56 | ) | | | (1.06 | ) | | | (1.27 | ) |
| | | | | | | | | | | | | | | | | | | | |
| | | | | |
Net asset value at end of year | | $ | 11.85 | | | $ | 10.17 | | | $ | 10.43 | | | $ | 10.83 | | | $ | 9.48 | |
| | | | | | | | | | | | | | | | | | | | |
| | | | | |
Total investment return (b) | | | 29.64 | % | | | 17.25 | % | | | 12.46 | % | | | 28.79 | % | | | (2.37 | %) |
| | | | | |
| Ratios (to average net assets)/Supplemental Data: | | | | | | | | | | | | | | | | | | | | |
| | | | | |
Net investment income (loss) | | | (0.15 | %) | | | (0.04 | %) | | | (0.06 | %) | | | 0.01 | % | | | 0.02 | % |
| | | | | |
Net expenses (c) | | | 0.82 | % | | | 0.84 | % | | | 0.82 | % | | | 0.85 | % | | | 0.84 | % |
| | | | | |
Expenses (before waiver/reimbursement) (c) | | | 0.82 | % | | | 0.84 | % | | | 0.83 | % | | | 0.85 | % | | | 0.85 | % |
| | | | | |
Portfolio turnover rate | | | 44 | % | | | 54 | % | | | 52 | % | | | 61 | % | | | 84 | % |
| | | | | |
Net assets at end of year (in 000’s) | | $ | 914,359 | | | $ | 919,236 | | | $ | 1,102,423 | | | $ | 1,596,638 | | | $ | 1,636,560 | |
| ‡ | Less than one cent per share. |
| (a) | Per share data based on average shares outstanding during the year. |
| (b) | Total investment return is calculated exclusive of sales charges and assumes the reinvestment of distributions. Class R1 shares are not subject to sales charges. For periods of less than one year, total return is not annualized. |
| (c) | In addition to the fees and expenses which the Fund bears directly, it also indirectly bears a pro-rata share of the fees and expenses of the underlying funds in which it invests. Such indirect expenses are not included in the above expense ratios. |
| | | | | | |
The notes to the financial statements are an integral part of,
and should be read in conjunction with, the financial statements. | | | | | 17 | |
Financial Highlights selected per share data and ratios
| | | | | | | | | | | | | | | | | | | | |
| |
| | | Year ended October 31, | |
| | | | | |
| Class R2 | | 2020 | | | 2019 | | | 2018 | | | 2017 | | | 2016 | |
| | | | | |
Net asset value at beginning of year | | $ | 9.53 | | | $ | 9.90 | | | $ | 10.38 | | | $ | 9.15 | | | $ | 10.68 | |
| | | | | | | | | | | | | | | | | | | | |
| | | | | |
Net investment income (loss) (a) | | | (0.04 | ) | | | (0.03 | ) | | | (0.03 | ) | | | (0.02 | ) | | | (0.02 | ) |
| | | | | |
Net realized and unrealized gain (loss) on investments | | | 2.56 | | | | 1.48 | | | | 1.11 | | | | 2.31 | | | | (0.24 | ) |
| | | | | | | | | | | | | | | | | | | | |
| | | | | |
Total from investment operations | | | 2.52 | | | | 1.45 | | | | 1.08 | | | | 2.29 | | | | (0.26 | ) |
| | | | | | | | | | | | | | | | | | | | |
| | | | | |
| Less distributions: | | | | | | | | | | | | | | | | | | | | |
| | | | | |
From net realized gain on investments | | | (1.06 | ) | | | (1.82 | ) | | | (1.56 | ) | | | (1.06 | ) | | | (1.27 | ) |
| | | | | | | | | | | | | | | | | | | | |
| | | | | |
Net asset value at end of year | | $ | 10.99 | | | $ | 9.53 | | | $ | 9.90 | | | $ | 10.38 | | | $ | 9.15 | |
| | | | | | | | | | | | | | | | | | | | |
| | | | | |
Total investment return (b) | | | 29.29 | % | | | 16.89 | % | | | 12.17 | % (c) | | | 28.49 | % | | | (2.66 | %) |
| | | | | |
| Ratios (to average net assets)/Supplemental Data: | | | | | | | | | | | | | | | | | | | | |
| | | | | |
Net investment income (loss) | | | (0.40 | %) | | | (0.29 | %) | | | (0.31 | %) | | | (0.24 | %) | | | (0.23 | %) |
| | | | | |
Net expenses (d) | | | 1.07 | % | | | 1.09 | % | | | 1.07 | % | | | 1.10 | % | | | 1.09 | % |
| | | | | |
Expenses (before waiver/reimbursement) (d) | | | 1.07 | % | | | 1.09 | % | | | 1.08 | % | | | 1.10 | % | | | 1.10 | % |
| | | | | |
Portfolio turnover rate | | | 44 | % | | | 54 | % | | | 52 | % | | | 61 | % | | | 84 | % |
| | | | | |
Net assets at end of year (in 000’s) | | $ | 159,297 | | | $ | 163,288 | | | $ | 227,298 | | | $ | 303,192 | | | $ | 391,535 | |
| (a) | Per share data based on average shares outstanding during the year. |
| (b) | Total investment return is calculated exclusive of sales charges and assumes the reinvestment of distributions. Class R2 shares are not subject to sales charges. For periods of less than one year, total return is not annualized. |
| (c) | Total investment return may reflect adjustments to conform to generally accepted accounting principles. |
| (d) | In addition to the fees and expenses which the Fund bears directly, it also indirectly bears a pro-rata share of the fees and expenses of the underlying funds in which it invests. Such indirect expenses are not included in the above expense ratios. |
| | | | | | | | | | | | | | | | | | | | |
| |
| | | Year ended October 31, | |
| | | | | |
| Class R3 | | 2020 | | | 2019 | | | 2018 | | | 2017 | | | 2016 | |
| | | | | |
Net asset value at beginning of year | | $ | 8.93 | | | $ | 9.41 | | | $ | 9.96 | | | $ | 8.85 | | | $ | 10.39 | |
| | | | | | | | | | | | | | | | | | | | |
| | | | | |
Net investment income (loss) (a) | | | (0.06 | ) | | | (0.05 | ) | | | (0.05 | ) | | | (0.04 | ) | | | (0.04 | ) |
| | | | | |
Net realized and unrealized gain (loss) on investments | | | 2.38 | | | | 1.39 | | | | 1.06 | | | | 2.21 | | | | (0.23 | ) |
| | | | | | | | | | | | | | | | | | | | |
| | | | | |
Total from investment operations | | | 2.32 | | | | 1.34 | | | | 1.01 | | | | 2.17 | | | | (0.27 | ) |
| | | | | | | | | | | | | | | | | | | | |
| | | | | |
| Less distributions: | | | | | | | | | | | | | | | | | | | | |
| | | | | |
From net realized gain on investments | | | (1.06 | ) | | | (1.82 | ) | | | (1.56 | ) | | | (1.06 | ) | | | (1.27 | ) |
| | | | | | | | | | | | | | | | | | | | |
| | | | | |
Net asset value at end of year | | $ | 10.19 | | | $ | 8.93 | | | $ | 9.41 | | | $ | 9.96 | | | $ | 8.85 | |
| | | | | | | | | | | | | | | | | | | | |
| | | | | |
Total investment return (b) | | | 28.99 | % | | | 16.69 | % | | | 11.97 | % | | | 28.05 | % | | | (2.83 | %) |
| | | | | |
| Ratios (to average net assets)/Supplemental Data: | | | | | | | | | | | | | | | | | | | | |
| | | | | |
Net investment income (loss) | | | (0.65 | %) | | | (0.55 | %) | | | (0.55 | %) | | | (0.49 | %) | | | (0.48 | %) |
| | | | | |
Net expenses (c) | | | 1.32 | % | | | 1.34 | % | | | 1.32 | % | | | 1.35 | % | | | 1.34 | % |
| | | | | |
Expenses (before reimbursement/waiver) (c) | | | 1.32 | % | | | 1.34 | % | | | 1.33 | % | | | 1.35 | % | | | 1.35 | % |
| | | | | |
Portfolio turnover rate | | | 44 | % | | | 54 | % | | | 52 | % | | | 61 | % | | | 84 | % |
| | | | | |
Net assets at end of year (in 000’s) | | $ | 56,657 | | | $ | 57,283 | | | $ | 61,850 | | | $ | 78,634 | | | $ | 87,060 | |
| (a) | Per share data based on average shares outstanding during the year. |
| (b) | Total investment return is calculated exclusive of sales charges and assumes the reinvestment of distributions. Class R3 shares are not subject to sales charges. For periods of less than one year, total return is not annualized. |
| (c) | In addition to the fees and expenses which the Fund bears directly, it also indirectly bears a pro-rata share of the fees and expenses of the underlying funds in which it invests. Such indirect expenses are not included in the above expense ratios. |
| | | | |
| 18 | | MainStay Winslow Large Cap Growth Fund | | The notes to the financial statements are an integral part of,
and should be read in conjunction with, the financial statements. |
Financial Highlights selected per share data and ratios
| | | | | | | | | | | | | | | | | | | | |
| |
| | | Year ended October 31, | |
| | | | | |
| Class R6 | | 2020 | | | 2019 | | | 2018 | | | 2017 | | | 2016 | |
| | | | | |
Net asset value at beginning of year | | $ | 10.58 | | | $ | 10.76 | | | $ | 11.12 | | | $ | 9.69 | | | $ | 11.18 | |
| | | | | | | | | | | | | | | | | | | | |
| | | | | |
Net investment income (loss) (a) | | | 0.00 | ‡ | | | 0.01 | | | | 0.01 | | | | 0.02 | | | | 0.02 | |
| | | | | |
Net realized and unrealized gain (loss) on investments | | | 2.88 | | | | 1.63 | | | | 1.21 | | | | 2.47 | | | | (0.24 | ) |
| | | | | | | | | | | | | | | | | | | | |
| | | | | |
Total from investment operations | | | 2.88 | | | | 1.64 | | | | 1.22 | | | | 2.49 | | | | (0.22 | ) |
| | | | | | | | | | | | | | | | | | | | |
| | | | | |
| Less distributions: | | | | | | | | | | | | | | | | | | | | |
| | | | | |
From net investment income | | | (0.01 | ) | | | — | | | | (0.02 | ) | | | — | | | | — | |
| | | | | |
From net realized gain on investments | | | (1.06 | ) | | | (1.82 | ) | | | (1.56 | ) | | | (1.06 | ) | | | (1.27 | ) |
| | | | | | | | | | | | | | | | | | | | |
| | | | | |
Total distributions | | | (1.07 | ) | | | (1.82 | ) | | | (1.58 | ) | | | (1.06 | ) | | | (1.27 | ) |
| | | | | | | | | | | | | | | | | | | | |
| | | | | |
Net asset value at end of year | | $ | 12.39 | | | $ | 10.58 | | | $ | 10.76 | | | $ | 11.12 | | | $ | 9.69 | |
| | | | | | | | | | | | | | | | | | | | |
| | | | | |
Total investment return (b) | | | 29.83 | % | | | 17.49 | % | | | 12.72 | % | | | 29.02 | % | | | (2.12 | %) |
| | | | | |
| Ratios (to average net assets)/Supplemental Data: | | | | | | | | | | | | | | | | | | | | |
| | | | | |
Net investment income (loss) | | | 0.02 | % | | | 0.13 | % | | | 0.13 | % | | | 0.21 | % | | | 0.23 | % |
| | | | | |
Net expenses (c) | | | 0.64 | % | | | 0.64 | % | | | 0.63 | % | | | 0.63 | % | | | 0.62 | % |
| | | | | |
Expenses (before waiver/reimbursement) (c) | | | 0.64 | % | | | 0.64 | % | | | 0.64 | % | | | 0.63 | % | | | 0.63 | % |
| | | | | |
Portfolio turnover rate | | | 44 | % | | | 54 | % | | | 52 | % | | | 61 | % | | | 84 | % |
| | | | | |
Net assets at end of year (in 000’s) | | $ | 3,981,812 | | | $ | 3,148,459 | | | $ | 2,463,405 | | | $ | 2,122,217 | | | $ | 1,693,868 | |
| ‡ | Less than one cent per share. |
| (a) | Per share data based on average shares outstanding during the year. |
| (b) | Total investment return is calculated exclusive of sales charges and assumes the reinvestment of distributions. Class R6 shares are not subject to sales charges. For periods of less than one year, total return is not annualized. |
| (c) | In addition to the fees and expenses which the Fund bears directly, it also indirectly bears a pro-rata share of the fees and expenses of the underlying funds in which it invests. Such indirect expenses are not included in the above expense ratios. |
| | | | |
| |
| SIMPLE Class | | August 31,
2020^
through
October 31,
2020 | |
| |
Net asset value at beginning of period * | | $ | 11.84 | |
| | | | |
| |
Net investment income (loss) (a) | | | (0.02 | ) |
| |
Net realized and unrealized gain (loss) on investments | | | (0.98 | ) |
| | | | |
| |
Total from investment operations | | | (1.00 | ) |
| | | | |
| |
Net asset value at end of period | | $ | 10.84 | |
| | | | |
| |
Total investment return (b) | | | (8.45 | %) |
| |
| Ratios (to average net assets)/Supplemental Data: | | | | |
| |
Net investment income (loss) †† | | | (1.00 | %) |
| |
Net expenses (c)†† | | | 1.32 | % |
| |
Expenses (before waiver/reimbursement) (c)†† | | | 1.33 | % |
| |
Portfolio turnover rate | | | 44 | % |
| |
Net assets at end of period (in 000’s) | | $ | 23 | |
| * | Based on the net asset value of Investor Class as of August 31, 2020. |
| (a) | Per share data based on average shares outstanding during the period. |
| (b) | Total investment return is calculated exclusive of sales charges and assumes the reinvestment of distributions. SIMPLE Class shares are not subject to sales charges. For periods of less than one year, total return is not annualized. |
| (c) | In addition to the fees and expenses which the Fund bears directly, it also indirectly bears a pro-rata share of the fees and expenses of the underlying funds in which it invests. Such indirect expenses are not included in the above expense ratios. |
| | | | | | |
The notes to the financial statements are an integral part of,
and should be read in conjunction with, the financial statements. | | | | | 19 | |
Notes to Financial Statements
Note 1–Organization and Business
The MainStay Funds (the “Trust”) was organized on January 9, 1986, as a Massachusetts business trust. The Trust is registered under the Investment Company Act of 1940, as amended (the “1940 Act”), as an open-end management investment company, and is comprised of twelve funds (collectively referred to as the “Funds”). These financial statements and notes relate to the MainStay Winslow Large Cap Growth Fund (formerly known as MainStay Large Cap Growth Fund) (the “Fund”), a “diversified” fund, as that term is defined in the 1940 Act, as interpreted or modified by regulatory authorities having jurisdiction, from time to time.
The Fund currently has ten classes of shares registered for sale. Class A shares commenced operations on July 1, 1995. Class B, Class C, Class I, Class R1 and Class R2 shares commenced operations on April 1, 2005. Class R3 shares commenced operations on April 28, 2006. Investor Class shares commenced operations on February 28, 2008. Class R6 shares commenced operations on June 17, 2013. SIMPLE Class shares commenced operations on August 31, 2020.
Class B shares of the MainStay Group of Funds are closed to all new purchases as well as additional investments by existing Class B shareholders. Existing Class B shareholders may continue to reinvest dividends and capital gains distributions, as well as exchange their Class B shares for Class B shares of other funds in the MainStay Group of Funds as permitted by the current exchange privileges. Class B shareholders continue to be subject to any applicable contingent deferred sales charge (“CDSC”) at the time of redemption. All other features of the Class B shares, including but not limited to the fees and expenses applicable to Class B shares, remain unchanged. Unless redeemed, Class B shareholders will remain in Class B shares of their respective fund until the Class B shares are converted to Class A or Investor Class shares pursuant to the applicable conversion schedule.
Class A and Investor Class shares are offered at net asset value (“NAV”) per share plus an initial sales charge. No initial sales charge applies to investments of $1 million or more (and certain other qualified purchases) in Class A and Investor Class shares. However, a CDSC of 1.00% may be imposed on certain redemptions made within 18 months of the date of purchase on shares that were purchased without an initial sales charge. Class C shares are offered at NAV without an initial sales charge, although a 1.00% CDSC may be imposed on certain redemptions of such shares made within one year of the date of purchase of Class C shares. When Class B shares were offered, they were offered at NAV without an initial sales charge, although a CDSC that declines depending on the number of years a shareholder held its Class B shares may be imposed on certain redemptions of such shares made within six years of the date of purchase of such shares. Class I, Class R1, Class R2, Class R3, Class R6 and SIMPLE Class shares are offered at NAV without a sales charge. Depending upon eligibility, Class B shares convert to either Class A or Investor Class shares at the end of the calendar quarter eight years after the date they were purchased. In addition, depending upon eligibility, Class C shares convert to either Class A or Investor Class shares at the end of the calendar quarter ten years after the date they were purchased. Additionally, Investor Class shares may convert automatically to Class A shares. Under certain circumstances and as may be permitted by the Trust’s multiple class plan pursuant to Rule 18f-3 under the 1940 Act,
specified share classes of the Fund may be converted to one or more other share classes of the Fund as disclosed in the capital share transactions within these Notes. The classes of shares have the same voting (except for issues that relate solely to one class), dividend, liquidation and other rights, and the same terms and conditions, except that under distribution plans pursuant to Rule 12b-1 under the 1940 Act, Class B and Class C shares are subject to higher distribution and/or service fees than Class A, Investor Class, Class R2, Class R3 and SIMPLE Class shares. Class I, Class R1 and Class R6 shares are not subject to a distribution and/or service fee. Class R1, Class R2 and Class R3 shares are subject to a shareholder service fee, which is in addition to fees paid under the distribution plans for Class R2 and Class R3 shares.
The Fund’s investment objective is to seek long-term growth of capital.
Note 2–Significant Accounting Policies
The Fund is an investment company and accordingly follows the investment company accounting and reporting guidance of the Financial Accounting Standards Board (“FASB”) Accounting Standard Codification Topic 946 Financial Services—Investment Companies. The Fund prepares its financial statements in accordance with generally accepted accounting principles (“GAAP”) in the United States of America and follows the significant accounting policies described below.
(A) Securities Valuation. Investments are usually valued as of the close of regular trading on the New York Stock Exchange (the “Exchange”) (usually 4:00 p.m. Eastern time) on each day the Fund is open for business (“valuation date”).
The Board of Trustees of the Trust (the “Board”) adopted procedures establishing methodologies for the valuation of the Fund’s securities and other assets and delegated the responsibility for valuation determinations under those procedures to the Valuation Committee of the Trust (the “Valuation Committee”). The procedures state that, subject to the oversight of the Board and unless otherwise noted, the responsibility for the day-to-day valuation of portfolio assets (including fair value measurements for the Fund’s assets and liabilities) rests with New York Life Investment Management LLC (“New York Life Investments” or the “Manager”), aided to whatever extent necessary by the Subadvisor (as defined in Note 3(A)). To assess the appropriateness of security valuations, the Manager, the Subadvisor or the Fund’s third-party service provider, who is subject to oversight by the Manager, regularly compares prior day prices, prices on comparable securities and the sale prices to the prior and current day prices and challenges prices with changes exceeding certain tolerance levels with third-party pricing services or broker sources.
The Board authorized the Valuation Committee to appoint a Valuation Subcommittee (the “Subcommittee”) to establish the prices of securities for which market quotations are not readily available or the prices of which are not otherwise readily determinable under the procedures. The Subcommittee meets (in person, via electronic mail or via teleconference) on an as-needed basis. The Valuation Committee meets to ensure that actions taken by the Subcommittee were appropriate.
For those securities valued through either a standardized fair valuation methodology or a fair valuation measurement, the Subcommittee deals with such valuation and the Valuation Committee reviews and affirms, if appropriate, the reasonableness of the valuation based on such
| | |
| 20 | | MainStay Winslow Large Cap Growth Fund |
methodologies and measurements on a regular basis after considering information that is reasonably available and deemed relevant by the Valuation Committee. Any action taken by the Subcommittee with respect to the valuation of a portfolio security or other asset is submitted for review and ratification (if appropriate) to the Valuation Committee and the Board at the next regularly scheduled meeting.
“Fair value” is defined as the price the Fund would reasonably expect to receive upon selling an asset or liability in an orderly transaction to an independent buyer in the principal or most advantageous market for the asset or liability. Fair value measurements are determined within a framework that establishes a three-tier hierarchy that maximizes the use of observable market data and minimizes the use of unobservable inputs to establish a classification of fair value measurements for disclosure purposes. “Inputs” refer broadly to the assumptions that market participants would use in pricing the asset or liability, including assumptions about risk, such as the risk inherent in a particular valuation technique used to measure fair value using a pricing model and/or the risk inherent in the inputs for the valuation technique. Inputs may be observable or unobservable. Observable inputs reflect the assumptions market participants would use in pricing the asset or liability based on market data obtained from sources independent of the Fund. Unobservable inputs reflect the Fund’s own assumptions about the assumptions market participants would use in pricing the asset or liability based on the information available. The inputs or methodology used for valuing assets or liabilities may not be an indication of the risks associated with investing in those assets or liabilities. The three-tier hierarchy of inputs is summarized below.
| • | | Level 1—quoted prices in active markets for an identical asset or liability |
| • | | Level 2—other significant observable inputs (including quoted prices for a similar asset or liability in active markets, interest rates and yield curves, prepayment speeds, credit risk, etc.) |
| • | | Level 3—significant unobservable inputs (including the Fund’s own assumptions about the assumptions that market participants would use in measuring fair value of an asset or liability) |
The level of an asset or liability within the fair value hierarchy is based on the lowest level of an input, both individually and in the aggregate, that is significant to the fair value measurement. The aggregate value by input level of the Fund’s assets and liabilities as of October 31, 2020, is included at the end of the Portfolio of Investments.
The Fund may use third-party vendor evaluations, whose prices may be derived from one or more of the following standard inputs, among others:
| | |
• Broker/dealer quotes | | • Benchmark securities |
• Two-sided markets | | • Reference data (corporate actions or material event notices) |
• Bids/offers | | • Monthly payment information |
• Industry and economic events | | • Reported trades |
An asset or liability for which market values cannot be measured using the methodologies described above is valued by methods deemed reasonable in good faith by the Valuation Committee, following the procedures established by the Board, to represent fair value. Under
these procedures, the Fund generally uses a market-based approach which may use related or comparable assets or liabilities, recent transactions, market multiples, book values and other relevant information. The Fund may also use an income-based valuation approach in which the anticipated future cash flows of the asset or liability are discounted to calculate fair value. Discounts may also be applied due to the nature and/or duration of any restrictions on the disposition of the asset or liability. Fair value represents a good faith approximation of the value of a security. Fair value determinations involve the consideration of a number of subjective factors, an analysis of applicable facts and circumstances and the exercise of judgment. As a result, it is possible that the fair value for a security determined in good faith in accordance with the Fund’s valuation procedures may differ from valuations for the same security determined by other funds using their own valuation procedures. Although the Fund’s valuation procedures are designed to value a security at the price the Fund may reasonably expect to receive upon the security’s sale in an orderly transaction, there can be no assurance that any fair value determination thereunder would, in fact, approximate the amount that the Fund would actually realize upon the sale of the security or the price at which the security would trade if a reliable market price were readily available. During the year ended October 31, 2020, there were no material changes to the fair value methodologies.
Securities which may be valued in this manner include, but are not limited to: (i) a security for which trading has been halted or suspended; (ii) a debt security that has recently gone into default and for which there is not a current market quotation; (iii) a security of an issuer that has entered into a restructuring; (iv) a security that has been delisted from a national exchange; (v) a security for which the market price is not readily available from a third-party pricing source or, if so provided, does not, in the opinion of the Manager or the Subadvisor, reflect the security’s market value; (vi) a security subject to trading collars for which no or limited trading takes place; and (vii) a security whose principal market has been temporarily closed at a time when, under normal conditions, it would be open. Securities valued in this manner are generally categorized as Level 3 in the hierarchy. No securities held by the Fund as of October 31, 2020 were fair valued in such a manner.
Equity securities are valued at the last quoted sales prices as of the close of regular trading on the relevant exchange on each valuation date. Securities that are not traded on the valuation date are valued at the mean of the last quoted bid and ask prices. Prices are normally taken from the principal market in which each security trades. These securities are generally categorized as Level 1 in the hierarchy.
Investments in mutual funds, including money market funds, are valued at their respective NAVs as of the close of the Exchange on the valuation date. These securities are generally categorized as Level 1 in the hierarchy.
Temporary cash investments acquired in excess of 60 days to maturity at the time of purchase are valued using the latest bid prices or using valuations based on a matrix system (which considers such factors as security prices, yields, maturities and ratings), both as furnished by independent pricing services. Temporary cash investments that mature in 60 days or less at the time of purchase (“Short-Term Investments”) are valued using the amortized cost method of valuation, unless the use of such method would be inappropriate. The amortized cost method
Notes to Financial Statements (continued)
involves valuing a security at its cost on the date of purchase and thereafter assuming a constant amortization to maturity of the difference between such cost and the value on maturity date. Amortized cost approximates the current fair value of a security. Securities valued using the amortized cost method are not valued using quoted prices in an active market and are generally categorized as Level 2 in the hierarchy.
The information above is not intended to reflect an exhaustive list of the methodologies that may be used to value portfolio investments. The valuation procedures permit the use of a variety of valuation methodologies in connection with valuing portfolio investments. The methodology used for a specific type of investment may vary based on the market data available or other considerations. The methodologies summarized above may not represent the specific means by which portfolio investments are valued on any particular business day.
(B) Income Taxes. The Fund’s policy is to comply with the requirements of the Internal Revenue Code of 1986, as amended (the “Internal Revenue Code”), applicable to regulated investment companies and to distribute all of its taxable income to the shareholders of the Fund within the allowable time limits.
The Manager evaluates the Fund’s tax positions to determine if the tax positions taken meet the minimum recognition threshold in connection with accounting for uncertainties in income tax positions taken or expected to be taken for the purposes of measuring and recognizing tax liabilities in the financial statements. Recognition of tax benefits of an uncertain tax position is permitted only to the extent the position is “more likely than not” to be sustained assuming examination by taxing authorities. The Manager analyzed the Fund’s tax positions taken on federal, state and local income tax returns for all open tax years (for up to three tax years) and has concluded that no provisions for federal, state and local income tax are required in the Fund’s financial statements. The Fund’s federal, state and local income tax and federal excise tax returns for tax years for which the applicable statutes of limitations have not expired are subject to examination by the Internal Revenue Service and state and local departments of revenue.
(C) Dividends and Distributions to Shareholders. Dividends and distributions are recorded on the ex-dividend date. The Fund intends to declare and pay dividends from net investment income and distributions from net realized capital and currency gains, if any, at least annually. Unless a shareholder elects otherwise, all dividends and distributions are reinvested at NAV in the same class of shares of the Fund. Dividends and distributions to shareholders are determined in accordance with federal income tax regulations and may differ from determinations using GAAP.
(D) Security Transactions and Investment Income. The Fund records security transactions on the trade date. Realized gains and losses on security transactions are determined using the identified cost method. Dividend income is recognized on the ex-dividend date, net of any foreign tax withheld at the source, and interest income is accrued as earned using the effective interest rate method. Distributions received from real estate investment trusts may be classified as dividends, capital gains and/or return of capital.
Investment income and realized and unrealized gains and losses on investments of the Fund are allocated pro rata to the separate classes of shares based upon their relative net assets on the date the income is
earned or realized and unrealized gains and losses are incurred.
(E) Expenses. Expenses of the Trust are allocated to the individual Funds in proportion to the net assets of the respective Funds when the expenses are incurred, except where direct allocations of expenses can be made. Expenses (other than transfer agent expenses and fees incurred under the shareholder services plans and/or the distribution plans further discussed in Note 3(B)) are allocated to separate classes of shares pro rata based upon their relative net assets on the date the expenses are incurred. The expenses borne by the Fund, including those of related parties to the Fund, are shown in the Statement of Operations.
Additionally, the Fund may invest in mutual funds, which are subject to management fees and other fees that may cause the costs of investing in mutual funds to be greater than the costs of owning the underlying securities directly. These indirect expenses of mutual funds are not included in the amounts shown as expenses in the Fund’s Statement of Operations or in the expense ratios included in the Financial Highlights.
(F) Use of Estimates. In preparing financial statements in conformity with GAAP, the Manager makes estimates and assumptions that affect the reported amounts and disclosures in the financial statements. Actual results could differ from those estimates and assumptions.
(G) Securities Lending. In order to realize additional income, the Fund may engage in securities lending, subject to the limitations set forth in the 1940 Act and relevant guidance by the staff of the Securities and Exchange Commission (“SEC”). If the Fund engages in securities lending, the Fund will lend through its custodian, currently State Street Bank and Trust Company (“State Street”) (See Note 12 for securities lending agent change), acting as securities lending agent on behalf of the Fund. Under the current arrangement, State Street will manage the Fund’s collateral in accordance with the securities lending agency agreement between the Fund and State Street, and indemnify the Fund against counterparty risk. The loans will be collateralized by cash (which may be invested in a money market fund) and/or non-cash collateral (which may include U.S. Treasury securities and/or U.S. government agency securities issued or guaranteed by the United States government or its agencies or instrumentalities) at least equal at all times to the market value of the securities loaned. The Fund bears the risk of delay in recovery of, or loss of rights in, the securities loaned. The Fund may also record a realized gain or loss on securities deemed sold due to a borrower’s inability to return securities on loan. The Fund bears the risk of any loss on investment of cash collateral. The Fund will receive compensation for lending its securities in the form of fees or it will retain a portion of interest earned on the investment of any cash collateral. The Fund will also continue to receive interest and dividends on the securities loaned and any gain or loss in the market price of the securities loaned that may occur during the term of the loan will be for the account of the Fund. Income earned from securities lending activities, if any, is reflected in the Statement of Operations. As of October 31, 2020, the Fund did not have any portfolio securities on loan.
(H) Indemnifications. Under the Trust’s organizational documents, its officers and trustees are indemnified against certain liabilities that may arise out of performance of their duties to the Trust. Additionally, in the normal course of business, the Fund enters into contracts with third-party service providers that contain a variety of representations and warranties and that may provide general indemnifications. The Fund’s
| | |
| 22 | | MainStay Winslow Large Cap Growth Fund |
maximum exposure under these arrangements is unknown, as this would involve future claims that may be made against the Fund that have not yet occurred. The Manager believes that the risk of loss in connection with these potential indemnification obligations is remote. However, there can be no assurance that material liabilities related to such obligations will not arise in the future, which could adversely impact the Fund.
Note 3–Fees and Related Party Transactions
(A) Manager and Subadvisor. New York Life Investments, a registered investment adviser and an indirect, wholly-owned subsidiary of New York Life Insurance Company (“New York Life”), serves as the Fund’s Manager, pursuant to an Amended and Restated Management Agreement (“Management Agreement”). The Manager provides offices, conducts clerical, recordkeeping and bookkeeping services and keeps most of the financial and accounting records required to be maintained by the Fund. Except for the portion of salaries and expenses that are the responsibility of the Fund, the Manager pays the salaries and expenses of all personnel affiliated with the Fund and certain operational expenses of the Fund. The Fund reimburses New York Life Investments in an amount equal to the portion of the compensation of the Chief Compliance Officer attributable to the Fund. Winslow Capital Management, LLC. (“Winslow” or the “Subadvisor”), a registered investment adviser, serves as Subadvisor to the Fund and is responsible for the day-to-day portfolio management of the Fund. Pursuant to the terms of a Subadvisory Agreement (“Subadvisory Agreement”) between New York Life Investments and Winslow, New York Life Investments pays for the services of the Subadvisor.
Pursuant to the Management Agreement, the Fund pays the Manager a monthly fee for the services performed and the facilities furnished at an annual rate of the Fund’s average daily net assets as follows: 0.75% up to $500 million; 0.725% from $500 million to $750 million; 0.71% from $750 million to $1 billion; 0.70% from $1 billion to $2 billion; 0.66% from $2 billion to $3 billion; 0.61% from $3 billion to $7 billion; 0.585% from $7 billion to $9 billion; and 0.575% in excess of $9 billion. During the year ended October 31, 2020, the effective management fee rate was 0.62%, exclusive of any applicable waivers/reimbursements.
New York Life Investments has contractually agreed to waive a portion of its management fee so that the management fee does not exceed 0.55% of the Fund’s average daily net assets from $11 billion to $13 billion; and 0.525% of the Fund’s average daily net assets over $13 billion. This agreement will remain in effect until February 28, 2021 and shall renew automatically for one-year terms unless New York Life Investments provides written notice of termination prior to the start of the next term or upon approval of the Board.
New York Life Investments has also contractually agreed to waive fees and/or reimburse expenses so that Total Annual Fund Operating Expenses (excluding taxes, interest, litigation, extraordinary expenses, brokerage and other transaction expenses relating to the purchase and sale of portfolio investments, and acquired (underlying) fund fees and expenses) of Class I shares do not exceed 0.88% of the Fund’s average daily net assets. New York Life Investments has also contractually agreed to waive fees and/or reimburse expenses so that Total Annual Fund Operating Expenses (excluding taxes, interest, litigation, extraordinary expenses, brokerage and other transaction expenses relating to the purchase or sale of portfolio investments, and acquired (underlying)
fund fees and expenses) of Class R6 do not exceed those of Class I. These agreements will remain in effect until August 31, 2021, and shall renew automatically for one-year terms unless New York Life Investments provides written notice of termination prior to the start of the next term or upon approval of the Board.
Additionally, New York Life Investments has agreed to further voluntarily waive fees and/or reimburse expenses so that Total Annual Fund Operating Expenses (excluding taxes, interest, litigation, extraordinary expenses, brokerage and other transaction expenses relating to the purchase and sale of portfolio investments, and acquired (underlying) fund fees and expenses) of Class R1 shares do not exceed 0.95% of its average daily net assets. This voluntary waiver or reimbursement may be discontinued at any time without notice.
During the year ended October 31, 2020, New York Life Investments earned fees from the Fund in the amount of $77,721,584 and voluntarily waived and/or reimbursed certain class specific expenses in the amount of $511,340 and paid the Subadvisor in the amount of $30,326,118.
State Street provides sub-administration and sub-accounting services to the Fund pursuant to an agreement with New York Life Investments (See Note 12 for sub-administration and sub-accounting service provider change). These services include calculating the daily NAVs of the Fund, maintaining the general ledger and sub-ledger accounts for the calculation of the Fund’s NAVs and assisting New York Life Investments in conducting various aspects of the Fund’s administrative operations. For providing these services to the Fund, State Street is compensated by New York Life Investments.
Pursuant to an agreement between the Trust and New York Life Investments, New York Life Investments is responsible for providing or procuring certain regulatory reporting services for the Fund. The Fund will reimburse New York Life Investments for the actual costs incurred by New York Life Investments in connection with providing or procuring these services for the Fund.
(B) Distribution, Service and Shareholder Service Fees. The Trust, on behalf of the Fund, has entered into a distribution agreement with NYLIFE Distributors LLC (the “Distributor”), an affiliate of New York Life Investments. The Fund has adopted distribution plans (the “Plans”) in accordance with the provisions of Rule 12b-1 under the 1940 Act.
Pursuant to the Class A, Investor Class and Class R2 Plans, the Distributor receives a monthly distribution fee from the Class A, Investor Class and Class R2 shares at an annual rate of 0.25% of the average daily net assets of the Class A, Investor Class and Class R2 shares for distribution and/or service activities as designated by the Distributor. Pursuant to the Class B and Class C Plans, Class B and Class C shares pay the Distributor a monthly distribution fee at an annual rate of 0.75% of the average daily net assets of the Class B and Class C shares, along with a service fee at an annual rate of 0.25% of the average daily net assets of the Class B and Class C shares, for a total 12b-1 fee of 1.00%. Pursuant to the Class R3 and SIMPLE Class Plans, Class R3 and SIMPLE Class shares pay the Distributor a monthly fee at an annual rate of 0.25% of the average daily net assets of the Class R3 and SIMPLE Class shares, along with a service fee at an annual rate of 0.25% of the average daily net assets of the Class R3 and SIMPLE Class shares, for a total 12b-1fee of 0.50%. Class I, Class R1 and Class R6 shares are not subject to a distribution and/or service fee.
Notes to Financial Statements (continued)
The Plans provide that the distribution and service fees are payable to the Distributor regardless of the amounts actually expended by the Distributor for distribution of the Fund’s shares and service activities.
In accordance with the Shareholder Services Plans for the Class R1, Class R2 and Class R3 shares, the Manager has agreed to provide, through its affiliates or independent third parties, various shareholder and administrative support services to shareholders of the Class R1, Class R2 and Class R3 shares. For its services, the Manager, its affiliates or independent third-party service providers are entitled to a shareholder service fee accrued daily and paid monthly at an annual rate of 0.10% of the average daily net assets of the Class R1, Class R2 and Class R3 shares. This is in addition to any fees paid under the Class R2 and Class R3 Plans.
During the year ended October 31, 2020, shareholder service fees incurred by the Fund were as follows:
| | | | |
| |
Class R1 | | $ | 893,969 | |
Class R2 | | | 161,938 | |
Class R3 | | | 56,914 | |
(C) Sales Charges. The Fund was advised by the Distributor that the amount of initial sales charges retained on sales of Class A and Investor Class shares during the year ended October 31, 2020, were $240,736 and $74,210, respectively.
The Fund was also advised that the Distributor retained CDSCs on redemptions of Class A, Investor Class, Class B and Class C shares during the year ended October 31, 2020, of $32,690, $71, $9,481 and $11,549, respectively.
(D) Transfer, Dividend Disbursing and Shareholder Servicing Agent. NYLIM Service Company LLC, an affiliate of New York Life Investments, is the Fund’s transfer, dividend disbursing and shareholder servicing agent pursuant to an agreement between NYLIM Service Company LLC and the Trust. NYLIM Service Company LLC has entered into an agreement with DST Asset Manager Solutions, Inc. (“DST”), pursuant to which DST performs certain transfer agent services on behalf of NYLIM Service Company LLC. New York Life
Investments has contractually agreed to limit the transfer agency expenses charged to the Fund’s share classes to a maximum of 0.35% of that share class’s average daily net assets on an annual basis after deducting any applicable Fund or class-level expense reimbursement or small account fees. This agreement will remain in effect until August 31, 2021 for SIMPLE Class shares and February 28, 2021 for all other share classes, and shall renew automatically for one-year terms unless New York Life Investments provides written notice of termination prior to the start of the next term or upon approval of the Board. During the year ended October 31, 2020, transfer agent expenses incurred by the Fund and any reimbursements, pursuant to the aforementioned Transfer Agency expense limitation agreement were as follows:
| | | | | | | | |
Class | | Expense | | | Waived | |
| | |
Class A | | $ | 992,986 | | | $ | — | |
Investor Class | | | 243,837 | | | | — | |
Class B | | | 43,625 | | | | — | |
Class C | | | 261,183 | | | | — | |
Class I | | | 5,541,669 | | | | — | |
Class R1 | | | 766,693 | | | | — | |
Class R2 | | | 139,058 | | | | — | |
Class R3 | | | 48,831 | | | | — | |
Class R6 | | | 143,853 | | | | — | |
SIMPLE Class | | | 8 | | | | — | |
(E) Small Account Fee. Shareholders with small accounts adversely impact the cost of providing transfer agency services. In an effort to reduce total transfer agency expenses, the Fund has implemented a small account fee on certain types of accounts. As described in the Fund’s prospectus, certain shareholders with an account balance of less than $1,000 ($5,000 for Class A share accounts) are charged an annual per account fee of $20 (assessed semi-annually), the proceeds from which offset transfer agent fees as reflected in the Statement of Operations. This small account fee will not apply to certain types of accounts as described further in the Fund’s prospectus.
(F) Investments in Affiliates (in 000’s). During the year ended October 31, 2020, purchases and sales transactions, income earned from investments and shares held of investment companies managed by New York Life Investments or its affiliates were as follows:
| | | | | | | | | | | | | | | | | | | | | | | | | | | | | | | | | | | | |
Affiliated Investment Company | | Value,
Beginning of
Year | | | Purchases
at Cost | | | Proceeds
from Sales | | | Net
Realized
Gain/(Loss)
on Sales | | | Change in
Unrealized
Appreciation/
(Depreciation) | | | Value,
End of
Year | | | Dividend
Income | | | Other
Distributions | | | Shares
End of
Year | |
MainStay U.S. Government Liquidity Fund | | $ | 35,343 | | | $ | 2,301,662 | | | $ | (2,295,681 | ) | | $ | — | | | $ | — | | | $ | 41,324 | | | $ | 401 | | | $ | — | | | | 41,324 | |
(G) Capital. As of October 31, 2020, New York Life and its affiliates beneficially held shares of the Fund with the values and percentages of net assets as follows:
| | | | | | | | |
| | |
SIMPLE Class | | $ | 22,883 | | | | 100.0 | % |
Note 4–Federal Income Tax
As of October 31, 2020, the cost and unrealized appreciation (depreciation) of the Fund’s investment portfolio, including applicable
derivative contracts and other financial instruments, as determined on a federal income tax basis, were as follows:
| | | | | | | | | | | | | | | | |
| | | Federal Tax
Cost | | | Gross
Unrealized
Appreciation | | | Gross
Unrealized
(Depreciation) | | | Net Unrealized
Appreciation/
(Depreciation) | |
| | | | |
Investments
in Securities | | $ | 6,246,745,677 | | | $ | 7,311,085,896 | | | $ | (44,591,763 | ) | | $ | 7,266,494,133 | |
| | |
| 24 | | MainStay Winslow Large Cap Growth Fund |
As of October 31, 2020, the components of accumulated gain (loss) on a tax basis were as follows:
| | | | | | | | |
Ordinary
Income | | Accumulated
Capital and
Other Gain
(Loss) | | Other
Temporary
Differences | | Unrealized
Appreciation
(Depreciation) | | Total
Accumulated
Gain (Loss) |
| | | | |
| $— | | $718,081,927 | | $— | | $7,266,494,133 | | $7,984,576,060 |
The difference between book-basis and tax-basis unrealized appreciation (depreciation) is primarily due to wash sale adjustments.
The following table discloses the current year reclassifications between total distributable earnings (loss) and additional paid-in capital arising from permanent differences; net assets as of October 31, 2020, were not affected.
| | | | |
Total
Distributable
Earnings (Loss) | | Additional
Paid-In
Capital | |
| $(81,124,870) | | $ | 81,124,870 | |
The reclassifications for the Fund are primarily due to equalization, and net operating losses.
During the years ended October 31, 2020, and October 31, 2019, the tax character of distributions paid as reflected in the Statements of Changes in Net Assets were as follows:
| | | | | | | | |
| | | 2020 | | | 2019 | |
| | |
Distributions paid from: | | | | | | | | |
Ordinary Income | | $ | 37,642,284 | | | $ | 18,825,573 | |
Long-Term Capital Gain | | | 1,150,246,652 | | | | 1,949,667,011 | |
Total | | $ | 1,187,888,936 | | | $ | 1,968,492,584 | |
Note 5–Custodian
State Street is the custodian of cash and securities held by the Fund (See Note 12 for custodian change). Custodial fees are charged to the Fund based on the Fund’s net assets and/or the market value of securities held by the Fund and the number of certain transactions incurred by the Fund.
Note 6–Line of Credit
The Fund and certain other funds managed by New York Life Investments maintain a line of credit with a syndicate of banks in order to secure a source of funds for temporary purposes to meet unanticipated or excessive redemption requests.
Effective July 28, 2020, under the credit agreement (the “Credit Agreement”), the aggregate commitment amount is $600,000,000 with an additional uncommitted amount of $100,000,000. The commitment fee is an annual rate of 0.15% of the average commitment amount payable quarterly, regardless of usage, to JPMorgan Chase Bank NA, who serves as the agent to the syndicate. The commitment fee is allocated among the Fund and certain other funds managed by New York Life Investments based upon their respective net assets and other factors. Interest on any revolving credit loan is charged based upon the Federal Funds Rate or the one-month London Interbank Offered Rate (“LIBOR”), whichever is higher. The Credit Agreement expires on July 27, 2021, although the Fund, certain other funds managed by
New York Life Investments and the syndicate of banks may renew the Credit Agreement for an additional year on the same or different terms or enter into a credit agreement with a different syndicate of banks. Prior to July 28, 2020, the aggregate commitment amount and the commitment fee were the same as those under the current Credit Agreement, but State Street served as agent to the syndicate. During the year ended October 31, 2020, there were no borrowings made or outstanding with respect to the Fund under the Credit Agreement or the credit agreement for which State Street served as agent.
Note 7–Interfund Lending Program
Pursuant to an exemptive order issued by the SEC, the Fund, along with certain other funds managed by New York Life Investments, may participate in an interfund lending program. The interfund lending program provides an alternative credit facility that permits the Fund and certain other funds managed by New York Life Investments to lend or borrow money for temporary purposes directly to or from one another subject to the conditions of the exemptive order. During the year ended October 31, 2020, there were no interfund loans made or outstanding with respect to the Fund.
Note 8–Purchases and Sales of Securities (in 000’s)
During the year ended October 31, 2020, purchases and sales of securities, other than short-term securities, were $5,469,730 and $6,857,994, respectively.
Note 9–Capital Share Transactions
Transactions in capital shares for the years ended October 31, 2020, and October 31, 2019, were as follows:
| | | | | | | | |
Class A | | Shares | | | Amount | |
| | |
Year ended October 31, 2020: | | | | | | | | |
Shares sold | | | 32,993,648 | | | $ | 322,813,743 | |
Shares issued to shareholders in reinvestment of distributions | | | 10,490,222 | | | | 92,418,858 | |
Shares redeemed | | | (31,378,235 | ) | | | (300,975,018 | ) |
| | | | |
Net increase (decrease) in shares outstanding before conversion | | | 12,105,635 | | | | 114,257,583 | |
Shares converted into Class A (See Note 1) | | | 4,046,114 | | | | 41,357,685 | |
Shares converted from Class A (See Note 1) | | | (269,689 | ) | | | (2,459,106 | ) |
| | | | |
Net increase (decrease) | | | 15,882,060 | | | $ | 153,156,162 | |
| | | | |
Year ended October 31, 2019: | | | | | | | | |
Shares sold | | | 29,353,059 | | | $ | 268,426,134 | |
Shares issued to shareholders in reinvestment of distributions | | | 20,331,404 | | | | 172,410,314 | |
Shares redeemed | | | (55,548,829 | ) | | | (472,290,215 | ) |
| | | | |
Net increase (decrease) in shares outstanding before conversion | | | (5,864,366 | ) | | | (31,453,767 | ) |
Shares converted into Class A (See Note 1) | | | 1,705,566 | | | | 15,553,995 | |
Shares converted from Class A (See Note 1) | | | (536,402 | ) | | | (4,840,292 | ) |
| | | | |
Net increase (decrease) | | | (4,695,202 | ) | | $ | (20,740,064 | ) |
| | | | |
|
| |
Notes to Financial Statements (continued)
| | | | | | | | |
Investor Class | | Shares | | | Amount | |
| | |
Year ended October 31, 2020: | | | | | | | | |
Shares sold | | | 3,060,260 | | | $ | 28,957,683 | |
Shares issued to shareholders in reinvestment of distributions | | | 1,389,575 | | | | 12,005,927 | |
Shares redeemed | | | (2,341,927 | ) | | | (22,496,141 | ) |
| | | | |
Net increase (decrease) in shares outstanding before conversion | | | 2,107,908 | | | | 18,467,469 | |
Shares converted into Investor Class (See Note 1) | | | 198,705 | | | | 1,823,319 | |
Shares converted from Investor Class (See Note 1) | | | (3,683,197 | ) | | | (37,084,878 | ) |
| | | | |
Net increase (decrease) | | | (1,376,584 | ) | | $ | (16,794,090 | ) |
| | | | |
Year ended October 31, 2019: | | | | | | | | |
Shares sold | | | 3,830,144 | | | $ | 34,793,099 | |
Shares issued to shareholders in reinvestment of distributions | | | 2,314,791 | | | | 19,305,358 | |
Shares redeemed | | | (4,639,102 | ) | | | (42,517,572 | ) |
| | | | |
Net increase (decrease) in shares outstanding before conversion | | | 1,505,833 | | | | 11,580,885 | |
Shares converted into Investor Class (See Note 1) | | | 523,941 | | | | 4,642,395 | |
Shares converted from Investor Class (See Note 1) | | | (1,032,429 | ) | | | (9,357,385 | ) |
| | | | |
Net increase (decrease) | | | 997,345 | | | $ | 6,865,895 | |
| | | | |
|
| |
Class B | | Shares | | | Amount | |
| | |
Year ended October 31, 2020: | | | | | | | | |
Shares sold | | | 222,509 | | | $ | 1,622,326 | |
Shares issued to shareholders in reinvestment of distributions | | | 419,160 | | | | 2,812,565 | |
Shares redeemed | | | (543,653 | ) | | | (3,974,624 | ) |
| | | | |
Net increase (decrease) in shares outstanding before conversion | | | 98,016 | | | | 460,267 | |
Shares converted from Class B (See Note 1) | | | (470,044 | ) | | | (3,397,144 | ) |
| | | | |
Net increase (decrease) | | | (372,028 | ) | | $ | (2,936,877 | ) |
| | | | |
Year ended October 31, 2019: | | | | | | | | |
Shares sold | | | 1,028,282 | | | $ | 7,641,188 | |
Shares issued to shareholders in reinvestment of distributions | | | 790,046 | | | | 5,317,008 | |
Shares redeemed | | | (1,621,167 | ) | | | (11,932,161 | ) |
| | | | |
Net increase (decrease) in shares outstanding before conversion | | | 197,161 | | | | 1,026,035 | |
Shares converted from Class B (See Note 1) | | | (522,415 | ) | | | (3,658,594 | ) |
| | | | |
Net increase (decrease) | | | (325,254 | ) | | $ | (2,632,559 | ) |
| | | | |
|
| |
| | | | | | | | |
Class C | | Shares | | | Amount | |
| | |
Year ended October 31, 2020: | | | | | | | | |
Shares sold | | | 3,316,185 | | | $ | 23,558,218 | |
Shares issued to shareholders in reinvestment of distributions | | | 1,763,435 | | | | 11,797,381 | |
Shares redeemed | | | (10,845,199 | ) | | | (82,589,582 | ) |
| | | | |
Net increase (decrease) in shares outstanding before conversion | | | (5,765,579 | ) | | | (47,233,983 | ) |
Shares converted from Class C (See Note 1) | | | (273,731 | ) | | | (2,045,824 | ) |
| | | | |
Net increase (decrease) | | | (6,039,310 | ) | | $ | (49,279,807 | ) |
| | | | |
Year ended October 31, 2019: | | | | | | | | |
Shares sold | | | 5,117,693 | | | $ | 35,118,258 | |
Shares issued to shareholders in reinvestment of distributions | | | 4,192,160 | | | | 28,171,313 | |
Shares redeemed | | | (15,033,369 | ) | | | (106,518,704 | ) |
| | | | |
Net increase (decrease) in shares outstanding before conversion | | | (5,723,516 | ) | | | (43,229,133 | ) |
Shares converted from Class C (See Note 1) | | | (678,697 | ) | | | (4,791,685 | ) |
| | | | |
Net increase (decrease) | | | (6,402,213 | ) | | $ | (48,020,818 | ) |
| | | | |
|
| |
Class I | | Shares | | | Amount | |
| | |
Year ended October 31, 2020: | | | | | | | | |
Shares sold | | | 119,737,170 | | | $ | 1,266,637,622 | |
Shares issued to shareholders in reinvestment of distributions | | | 56,071,825 | | | | 546,139,579 | |
Shares redeemed | | | (199,076,962 | ) | | | (2,136,259,259 | ) |
| | | | |
Net increase in shares outstanding before conversion | | | (23,267,967 | ) | | | (323,482,058 | ) |
Shares converted into Class I (See Note 1) | | | 196,676 | | | | 1,988,212 | |
Shares converted from Class I (See Note 1) | | | (696,227 | ) | | | (8,127,755 | ) |
| | | | |
Net increase (decrease) | | | (23,767,518 | ) | | $ | (329,621,601 | ) |
| | | | |
Year ended October 31, 2019: | | | | | | | | |
Shares sold | | | 107,314,262 | | | $ | 1,046,676,942 | |
Shares issued to shareholders in reinvestment of distributions | | | 101,104,248 | | | | 936,225,334 | |
Shares redeemed | | | (210,936,037 | ) | | | (2,057,495,143 | ) |
| | | | |
Net increase (decrease) in shares outstanding before conversion | | | (2,517,527 | ) | | | (74,592,867 | ) |
Shares converted into Class I (See Note 1) | | | 264,091 | | | | 2,538,508 | |
Shares converted from Class I (See Note 1) | | | (5,018,712 | ) | | | (47,690,432 | ) |
| | | | |
Net increase (decrease) | | | (7,272,148 | ) | | $ | (119,744,791 | ) |
| | | | |
|
| |
| | |
| 26 | | MainStay Winslow Large Cap Growth Fund |
| | | | | | | | |
Class R1 | | Shares | | | Amount | |
| | |
Year ended October 31, 2020: | | | | | | | | |
Shares sold | | | 16,027,615 | | | $ | 165,681,100 | |
Shares issued to shareholders in reinvestment of distributions | | | 10,052,287 | | | | 94,592,017 | |
Shares redeemed | | | (39,307,312 | ) | | | (405,516,655 | ) |
| | | | |
Net increase (decrease) | | | (13,227,410 | ) | | $ | (145,243,538 | ) |
| | | | |
Year ended October 31, 2019: | | | | | | | | |
Shares sold | | | 13,776,879 | | | $ | 131,313,852 | |
Shares issued to shareholders in reinvestment of distributions | | | 21,267,138 | | | | 190,978,900 | |
Shares redeemed | | | (50,343,112 | ) | | | (459,758,100 | ) |
| | | | |
Net increase (decrease) in shares outstanding before conversion | | | (15,299,095 | ) | | | (137,465,348 | ) |
Shares converted from Class R1 (See Note 1) | | | (8,876 | ) | | | (86,942 | ) |
| | | | |
Net increase (decrease) | | | (15,307,971 | ) | | $ | (137,552,290 | ) |
| | | | |
|
| |
Class R2 | | Shares | | | Amount | |
| | |
Year ended October 31, 2020: | | | | | | | | |
Shares sold | | | 3,470,793 | | | $ | 33,305,555 | |
Shares issued to shareholders in reinvestment of distributions | | | 1,377,180 | | | | 12,050,323 | |
Shares redeemed | | | (7,490,386 | ) | | | (72,813,229 | ) |
| | | | |
Net increase (decrease) | | | (2,642,413 | ) | | $ | (27,457,351 | ) |
| | | | |
Year ended October 31, 2019: | | | | | | | | |
Shares sold | | | 5,658,840 | | | $ | 49,861,139 | |
Shares issued to shareholders in reinvestment of distributions | | | 3,133,404 | | | | 26,445,932 | |
Shares redeemed | | | (14,608,830 | ) | | | (132,155,213 | ) |
| | | | |
Net increase (decrease) | | | (5,816,586 | ) | | $ | (55,848,142 | ) |
| | | | |
|
| |
Class R3 | | Shares | | | Amount | |
| | |
Year ended October 31, 2020: | | | | | | | | |
Shares sold | | | 1,075,483 | | | $ | 9,564,113 | |
Shares issued to shareholders in reinvestment of distributions | | | 761,865 | | | | 6,193,959 | |
Shares redeemed | | | (2,690,447 | ) | | | (24,467,750 | ) |
| | | | |
Net increase (decrease) in shares outstanding before conversion | | | (853,099 | ) | | | (8,709,678 | ) |
Shares converted from Class R3 (See Note 1) | | | (2,332 | ) | | | (25,933 | ) |
| | | | |
Net increase (decrease) | | | (855,431 | ) | | $ | (8,735,611 | ) |
| | | | |
Year ended October 31, 2019: | | | | | | | | |
Shares sold | | | 1,243,682 | | | $ | 10,656,909 | |
Shares issued to shareholders in reinvestment of distributions | | | 1,368,016 | | | | 10,834,685 | |
Shares redeemed | | | (2,768,367 | ) | | | (23,244,763 | ) |
| | | | |
Net increase (decrease) | | | (156,669 | ) | | $ | (1,753,169 | ) |
| | | | |
|
| |
| | | | | | | | |
Class R6 | | Shares | | | Amount | |
| | |
Year ended October 31, 2020: | | | | | | | | |
Shares sold | | | 76,258,553 | | | $ | 829,232,918 | |
Shares issued to shareholders in reinvestment of distributions | | | 31,764,719 | | | | 312,247,192 | |
Shares redeemed | | | (85,028,835 | ) | | | (926,331,029 | ) |
| | | | |
Net increase (decrease) in shares outstanding before conversion | | | 22,994,437 | | | | 215,149,081 | |
Shares converted into Class R6 (See Note 1) | | | 689,835 | | | | 8,127,756 | |
Shares converted from Class R6 (See Note 1) | | | (12,916 | ) | | | (156,332 | ) |
| | | | |
Net increase (decrease) | | | 23,671,356 | | | $ | 223,120,505 | |
| | | | |
Year ended October 31, 2019: | | | | | | | | |
Shares sold | | | 96,897,227 | | | $ | 926,252,301 | |
Shares issued to shareholders in reinvestment of distributions | | | 44,637,714 | | | | 416,469,871 | |
Shares redeemed | | | (77,804,055 | ) | | | (760,384,860 | ) |
| | | | |
Net increase (decrease) in shares outstanding before conversion | | | 63,730,886 | | | | 582,337,312 | |
Shares converted into Class R6 (See Note 1) | | | 4,982,451 | | | | 47,690,432 | |
| | | | |
Net increase (decrease) | | | 68,713,337 | | | $ | 630,027,744 | |
| | | | |
|
| |
SIMPLE Class | | Shares | | | Amount | |
| | |
Period ended October 31, 2020 (a): | | | | | | | | |
Shares sold | | | 2,111 | | | $ | 25,000 | |
| | | | |
Net increase (decrease) | | | 2,111 | | | $ | 25,000 | |
| | | | |
| (a) | The inception date of the class was August 31, 2020. |
Note 10–Recent Accounting Pronouncement
To improve the effectiveness of fair value disclosure requirements, the Financial Accounting Standards Board issued Accounting Standards Update 2018-13, Fair Value Measurement Disclosure Framework— Changes to the Disclosure Requirements for Fair Value Measurement (“ASU 2018-13”), which adds, removes, and modifies certain fair value measurement disclosure requirements. ASU 2018-13 is effective for interim and annual reporting periods beginning after December 15, 2019. The Manager evaluated the implications of certain provisions of ASU 2018-13 and determined to early adopt aspects related to the removal and modifications of certain fair value measurement disclosures, which are currently in place as of October 31, 2020. The Manager is evaluating the implications of certain other provisions of ASU 2018-13 related to new disclosure requirements and has not yet determined the impact of those provisions on the financial statement disclosures, if any.
In March 2020, the Financial Accounting Standards Board (“FASB”) issued Accounting Standards Update 2020-04 (“ASU 2020-04”), which provides optional guidance to ease the potential accounting burden associated with transitioning away from LIBOR and other reference rates that are expected to be discontinued. ASU 2020-04 is effective immediately upon release of the update on March 12, 2020, through December 31, 2022. At this time, the Manager is evaluating the implications of certain other provisions of ASU 2020-04 related to new disclosure requirements and any impact on the financial statement disclosures has not yet been determined.
Notes to Financial Statements (continued)
Note 11–Other Matters
An outbreak of COVID-19, first detected in December 2019, has developed into a global pandemic and has resulted in travel restrictions, closure of international borders, certain businesses and securities markets, restrictions on securities trading activities, prolonged quarantines, supply chain disruptions, and lower consumer demand, as well as general concern and uncertainty. The continued impact of COVID-19 is uncertain and could further adversely affect the global economy, national economies, individual issuers and capital markets in unforeseeable ways and result in a substantial and extended economic downturn. Developments that disrupt global economies and financial markets, such as COVID-19, may magnify factors that affect the Fund’s performance.
Note 12–Subsequent Events
In connection with the preparation of the financial statements of the Fund as of and for the year ended October 31, 2020, events and transactions subsequent to October 31, 2020, through the date the financial statements were issued have been evaluated by the Manager, for possible adjustment and/or disclosure. No subsequent events requiring financial statement adjustment or disclosure have been identified other than the following:
Effective at the close of business on November 20, 2020, all services provided by State Street were transitioned to JPMorgan Chase Bank, N.A.
| | |
| 28 | | MainStay Winslow Large Cap Growth Fund |
Report of Independent Registered Public Accounting Firm
To the Shareholders of the Fund and Board of Trustees
The MainStay Funds:
Opinion on the Financial Statements
We have audited the accompanying statement of assets and liabilities of MainStay Winslow Large Cap Growth Fund (formerly MainStay Large Cap Growth Fund) (the Fund), one of the funds constituting The MainStay Funds, including the portfolio of investments, as of October 31, 2020, the related statement of operations for the year then ended, the statements of changes in net assets for each of the years in the two-year period then ended, and the related notes (collectively, the financial statements) and the financial highlights for each of the years or periods in the five-year period then ended. In our opinion, the financial statements and financial highlights present fairly, in all material respects, the financial position of the Fund as of October 31, 2020, the results of its operations for the year then ended, the changes in its net assets for each of the years in the two-year period then ended, and the financial highlights for each of the years or periods in the five-year period then ended, in conformity with U.S. generally accepted accounting principles.
Basis for Opinion
These financial statements and financial highlights are the responsibility of the Fund’s management. Our responsibility is to express an opinion on these financial statements and financial highlights based on our audits. We are a public accounting firm registered with the Public Company Accounting Oversight Board (United States) (PCAOB) and are required to be independent with respect to the Fund in accordance with the U.S. federal securities laws and the applicable rules and regulations of the Securities and Exchange Commission and the PCAOB.
We conducted our audits in accordance with the standards of the PCAOB. Those standards require that we plan and perform the audit to obtain reasonable assurance about whether the financial statements and financial highlights are free of material misstatement, whether due to error or fraud. Our audits included performing procedures to assess the risks of material misstatement of the financial statements and financial highlights, whether due to error or fraud, and performing procedures that respond to those risks. Such procedures included examining, on a test basis, evidence regarding the amounts and disclosures in the financial statements and financial highlights. Such procedures also included confirmation of securities owned as of October 31, 2020, by correspondence with the custodian, the transfer agent, and brokers or by other appropriate auditing procedures when replies from brokers were not received. Our audits also included evaluating the accounting principles used and significant estimates made by management, as well as evaluating the overall presentation of the financial statements and financial highlights. We believe that our audits provide a reasonable basis for our opinion.

We have served as the auditor of one or more New York Life Investment Management investment companies since 2003.
Philadelphia, Pennsylvania
December 23, 2020
Federal Income Tax Information
(Unaudited)
The Fund is required under the Internal Revenue Code to advise shareholders in a written statement as to the federal tax status of dividends paid by the Fund during such fiscal years. Accordingly, the Fund paid $1,148,629,429 as long term capital gain distributions.
For the fiscal year ended October 31, 2020, the Fund designated approximately $37,642,284 under the Internal Revenue Code as qualified dividend income eligible for reduced tax rates.
The dividends paid by the Fund during the fiscal year ended October 31, 2020 should be multiplied by 100.00% to arrive at the amount eligible for the corporate dividend-received deduction.
In February 2021, shareholders will receive an IRS Form 1099-DIV or substitute Form 1099, which will show the federal tax status of the distributions received by shareholders in calendar year 2020. The amounts that will be reported on such 1099-DIV or substitute Form 1099 will be the amounts you are to use on your federal income tax return and will differ from the amounts reported for the Fund’s fiscal year ended October 31, 2020.
Proxy Voting Policies and Procedures and Proxy Voting Record
A description of the policies and procedures that New York Life Investments uses to vote proxies related to the Fund’s securities is available free of charge upon request, by visiting the MainStay Funds’ website at newyorklifeinvestments.com or visiting the SEC’s website at www.sec.gov.
The Fund is required to file with the SEC its proxy voting records for the 12-month period ending June 30 on Form N-PX. The most recent Form N-PX or proxy voting record is available free of charge upon request by calling 800-624-6782; visiting the MainStay Funds’ website at newyorklifeinvestments.com; or visiting the SEC’s website at www.sec.gov.
Shareholder Reports and Quarterly Portfolio Disclosure
The Fund is required to file its complete schedule of portfolio holdings with the SEC 60 days after its first and third fiscal quarter on Form N-PORT. The Fund’s holdings report is available free of charge by visiting the SEC’s website at www.sec.gov or upon request by calling New York Life Investments at 800-624-6782.
| | |
| 30 | | MainStay Winslow Large Cap Growth Fund |
Board of Trustees and Officers (Unaudited)
The Trustees and officers of the Funds are listed below. The Board oversees the MainStay Group of Funds (which consists of MainStay Funds and MainStay Funds Trust), MainStay VP Funds Trust, MainStay MacKay DefinedTerm Municipal Opportunities Fund, the Manager and the Subadvisors, and elects the officers of the Funds who are responsible for the day-to-day operations of the Funds. Information pertaining to the Trustees and officers is set forth below. Each Trustee serves until his or her successor is elected and qualified or until his or her
resignation, death or removal. Under the Board’s retirement policy, unless an exception is made, a Trustee must tender his or her resignation by the end of the calendar year during which he or she reaches the age of 75. Officers are elected annually by the Board. The business address of each Trustee and officer listed below is 51 Madison Avenue, New York, New York 10010. A majority of the Trustees are not “interested persons” (as defined by the 1940 Act and rules adopted by the SEC thereunder) of the Fund (“Independent Trustees”).
| | | | | | | | | | | | |
| | | | | Name and
Year of Birth | | Term of Office,
Position(s) Held and
Length of Service | | Principal Occupation(s)
During Past Five Years | | Number of
Portfolios in
Fund Complex
Overseen by
Trustee | | Other Directorships
Held by Trustee |
Interested Trustee | | | | Yie-Hsin Hung* 1962 | | MainStay Funds:
Trustee since 2017 MainStay Funds Trust:
Trustee since 2017 | | Senior Vice President of New York Life since joining in 2010, Member of the Executive Management Committee since 2017, Chief Executive Officer, New York Life Investment Management Holdings LLC & New York Life Investment Management LLC since 2015. Senior Managing Director and Co-President of New York Life Investment Management LLC from 2014 to May 2015. Previously held positions of increasing responsibility, including head of NYLIM International, Alternative Growth Businesses, and Institutional investments since joining New York Life in 2010. | | 78 | | MainStay VP Funds Trust:
Trustee since 2017 (31 portfolios); and
MainStay MacKay DefinedTerm Municipal Opportunities Fund: Trustee since 2017. |
| | * | This Trustee is considered to be an “interested person” of the MainStay Group of Funds, MainStay VP Funds Trust and MainStay MacKay DefinedTerm Municipal Opportunities Fund, within the meaning of the 1940 Act because of her affiliation with New York Life Insurance Company, New York Life Investment Management LLC, Candriam Belgium S.A., Candriam Luxembourg S.C.A., IndexIQ Advisors LLC, MacKay Shields LLC, NYL Investors LLC, NYLIFE Securities LLC and/or NYLIFE Distributors LLC, as described in detail above in the column entitled “Principal Occupation(s) During Past Five Years.” |
Board of Trustees and Officers (Unaudited) (continued)
| | | | | | | | | | | | |
| | | | | Name and
Year of Birth | | Term of Office,
Position(s) Held and
Length of Service | | Principal Occupation(s)
During Past Five Years | | Number of
Portfolios in
Fund Complex
Overseen by
Trustee | | Other Directorships
Held by Trustee |
Independent Trustees | | | | David H. Chow 1957 | | MainStay Funds:
Trustee since 2016, Advisory Board Member (June 2015 to December 2015); MainStay Funds Trust:
Trustee since 2016, Advisory Board Member (June 2015 to December 2015). | | Founder and CEO, DanCourt Management, LLC since 1999 | | 78 | | MainStay VP Funds Trust: Trustee since 2016, Advisory Board Member (June 2015 to December 2015) (31 portfolios);
MainStay MacKay DefinedTerm Municipal Opportunities Fund: Trustee since 2016, Advisory Board Member (June 2015 to December 2015); Market Vectors Group of Exchange-Traded Funds: Independent Chairman of the Board of Trustees since 2008 and Trustee since 2006 (56 portfolios); and
Berea College of Kentucky: Trustee since 2009, Chair of the Investment Committee since 2018. |
| | | | Susan B. Kerley 1951 | | MainStay Funds:
Chairman since 2017 and Trustee since 2007; MainStay Funds Trust: Chairman since 2017 and Trustee since 1990.** | | President, Strategic Management Advisors LLC since 1990 | | 78 | | MainStay VP Funds Trust: Chairman since 2017 and Trustee since 2007 (31 portfolios)***;
MainStay MacKay DefinedTerm Municipal Opportunities Fund: Chairman since 2017 and Trustee since 2011; and
Legg Mason Partners Funds: Trustee since 1991 (45 portfolios). |
| | | | Alan R. Latshaw 1951 | | MainStay Funds:
Trustee; MainStay Funds Trust:
Trustee and Audit Committee Financial Expert since 2007.** | | Retired; Partner, Ernst & Young LLP (2002 to 2003); Partner, Arthur Andersen LLP (1989 to 2002); Consultant to the MainStay Funds Audit and Compliance Committee (2004 to 2006) | | 78 | | MainStay VP Funds Trust: Trustee and Audit Committee Financial Expert since 2007 (31 portfolios)***;
MainStay MacKay DefinedTerm Municipal Opportunities Fund: Trustee and Audit Committee Financial Expert since 2011; and
State Farm Associates Funds Trusts: Trustee since 2005 (4 portfolios). |
| | | | Richard H. Nolan, Jr. 1946 | | MainStay Funds:
Trustee since 2007; MainStay Funds Trust:
Trustee since 2007.** | | Managing Director, ICC Capital Management since 2004; President—Shields/Alliance, Alliance Capital Management (1994 to 2004) | | 78 | | MainStay VP Funds Trust: Trustee since 2006 (31 portfolios)***; and
MainStay MacKay DefinedTerm Municipal Opportunities Fund: Trustee since 2011. |
| | | | Jacques P. Perold 1958 | | MainStay Funds:
Trustee since 2016, Advisory Board Member (June 2015 to December 2015); MainStay Funds Trust:
Trustee since 2016, Advisory Board Member (June 2015 to December 2015). | | Founder and Chief Executive Officer, CapShift LLC since 2018; President, Fidelity Management & Research Company (2009 to 2014); Founder, President and Chief Executive Officer, Geode Capital Management, LLC (2001 to 2009) | | 78 | | MainStay VP Funds Trust: Trustee since 2016, Advisory Board Member (June 2015 to December 2015) (31 portfolios);
MainStay MacKay DefinedTerm Municipal Opportunities Fund: Trustee since 2016, Advisory Board Member (June 2015 to December 2015); Partners in Health: Trustee since 2019; Allstate Corporation: Director since 2015;
MSCI, Inc.: and Director since 2017. |
| | |
| 32 | | MainStay Winslow Large Cap Growth Fund |
| | | | | | | | | | | | |
| | | | | Name and
Year of Birth | | Term of Office,
Position(s) Held and
Length of Service | | Principal Occupation(s)
During Past Five Years | | Number of
Portfolios in
Fund Complex
Overseen by
Trustee | | Other Directorships
Held by Trustee |
Independent Trustees | | | | Richard S. Trutanic 1952 | | MainStay Funds: Trustee since 1994; MainStay Funds Trust: Trustee since 2007.** | | Chairman and Chief Executive Officer, Somerset & Company (financial advisory firm) since 2004; Managing Director, The Carlyle Group (private investment firm) (2002 to 2004); Senior Managing Director, Partner and Board Member, Groupe Arnault S.A. (private investment firm) (1999 to 2002) | | 78 | | MainStay VP Funds Trust: Trustee since 2007 (31 portfolios)***; and
MainStay MacKay DefinedTerm Municipal Opportunities Fund: Trustee since 2011. |
| | ** | Includes prior service as a Director/Trustee of certain predecessor entities to MainStay Funds Trust. |
| | *** | Includes prior service as a Director of MainStay VP Series Fund, Inc., the predecessor to MainStay VP Funds Trust. |
Board of Trustees and Officers (Unaudited) (continued)
| | | | | | | | |
| | | | | Name and
Year of Birth | | Position(s) Held and
Length of Service | | Principal Occupation(s)
During Past Five Years |
Officers
of the
Trust
(Who are
not
Trustees)* | | | | Kirk C. Lehneis 1974 | | President, MainStay Funds, MainStay Funds Trust since 2017 | | Chief Operating Officer and Senior Managing Director since 2016, New York Life Investment Management LLC and New York Life Investment Management Holdings LLC; Member of the Board of Managers since 2017 and Senior Managing Director since 2018, NYLIFE Distributors LLC; Chairman of the Board and Senior Managing Director, NYLIM Service Company LLC since 2017; Trustee, President and Principal Executive Officer of IndexIQ Trust, IndexIQ ETF Trust and IndexIQ Active ETF Trust since 2018; President, MainStay MacKay DefinedTerm Municipal Opportunities Fund and MainStay VP Funds Trust since 2017**; Senior Managing Director, Global Product Development (2015 to 2016); Managing Director, Product Development (2010 to 2015), New York Life Investment Management LLC |
| | | | Jack R. Benintende 1964 | | Treasurer and Principal Financial and Accounting Officer, MainStay Funds since 2007, MainStay Funds Trust since 2009 | | Managing Director, New York Life Investment Management LLC since 2007; Treasurer and Principal Financial and Accounting Officer, MainStay MacKay DefinedTerm Municipal Opportunities Fund since 2011 and MainStay VP Funds Trust since 2007**; and Assistant Treasurer, New York Life Investment Management Holdings LLC (2008 to 2012) |
| | | | Yi-Chia Kuo 1981 | | Vice President and Chief Compliance Officer, MainStay Funds and MainStay Funds Trust since January 2020 | | Chief Compliance Officer, Index IQ Trust, Index IQ ETF Trust and Index IQ Active ETF Trust since January 2020; Vice President and Chief Compliance Officer, MainStay MacKay DefinedTerm Municipal Opportunities Fund and MainStay VP Funds Trust since January 2020; Director and Associate General Counsel, New York Life Insurance Company (2015 to 2019) |
| | | | J. Kevin Gao 1967 | | Secretary and Chief Legal Officer, MainStay Funds and MainStay Funds Trust since 2010 | | Managing Director and Associate General Counsel, New York Life Investment Management LLC since 2010; Secretary and Chief Legal Officer, MainStay MacKay DefinedTerm Municipal Opportunities Fund since 2011 and MainStay VP Funds Trust since 2010** |
| | | | Scott T. Harrington 1959 | | Vice President— Administration, MainStay Funds since 2005, MainStay Funds Trust since 2009 | | Managing Director, New York Life Investment Management LLC (including predecessor advisory organizations) since 2000; Member of the Board of Directors, New York Life Trust Company since 2009; Vice President—Administration, MainStay MacKay DefinedTerm Municipal Opportunities Fund since 2011 and MainStay VP Funds Trust since 2005** |
| | * | The officers listed above are considered to be “interested persons” of the MainStay Group of Funds, MainStay VP Funds Trust and MainStay MacKay DefinedTerm Municipal Opportunities Fund within the meaning of the 1940 Act because of their affiliation with the MainStay Group of Funds, New York Life Insurance Company and/or its affiliates, including New York Life Investment Management LLC, NYLIM Service Company LLC, NYLIFE Securities LLC and/or NYLIFE Distributors LLC, as described in detail in the column captioned “Principal Occupation(s) During Past Five Years.” Officers are elected annually by the Board. |
| | ** | Includes prior service as an Officer of MainStay VP Series Fund, Inc., the predecessor to MainStay VP Funds Trust. |
| | |
| 34 | | MainStay Winslow Large Cap Growth Fund |
MainStay Funds
Equity
U.S. Equity
MainStay Epoch U.S. All Cap Fund
MainStay Epoch U.S. Equity Yield Fund
MainStay MacKay Common Stock Fund
MainStay MacKay Growth Fund
MainStay MacKay S&P 500 Index Fund
MainStay MacKay Small Cap Core Fund
MainStay MacKay U.S. Equity Opportunities Fund
MainStay MAP Equity Fund
MainStay Winslow Large Cap Growth Fund1
International Equity
MainStay Epoch International Choice Fund
MainStay MacKay International Equity Fund
MainStay MacKay International Opportunities Fund
Emerging Markets Equity
MainStay Candriam Emerging Markets Equity Fund
Global Equity
MainStay Epoch Capital Growth Fund
MainStay Epoch Global Equity Yield Fund
Fixed Income
Taxable Income
MainStay Candriam Emerging Markets Debt Fund
MainStay Floating Rate Fund
MainStay MacKay High Yield Corporate Bond Fund
MainStay MacKay Short Duration High Yield Fund
MainStay MacKay Total Return Bond Fund
MainStay MacKay Unconstrained Bond Fund
MainStay MacKay U.S. Infrastructure Bond Fund2
MainStay Short Term Bond Fund3
Tax-Exempt Income
MainStay MacKay California Tax Free Opportunities Fund4
MainStay MacKay High Yield Municipal Bond Fund
MainStay MacKay Intermediate Tax Free Bond Fund
MainStay MacKay New York Tax Free Opportunities Fund5
MainStay MacKay Short Term Municipal Fund
MainStay MacKay Tax Free Bond Fund
Money Market
MainStay Money Market Fund
Mixed Asset
MainStay Balanced Fund
MainStay Income Builder Fund
MainStay MacKay Convertible Fund
Speciality
MainStay CBRE Global Infrastructure Fund
MainStay CBRE Real Estate Fund
MainStay Cushing MLP Premier Fund
Asset Allocation
MainStay Conservative Allocation Fund
MainStay Conservative ETF Allocation Fund
MainStay Defensive ETF Allocation Fund
MainStay Equity Allocation Fund6
MainStay Equity ETF Allocation Fund
MainStay Growth Allocation Fund7
MainStay Growth ETF Allocation Fund
MainStay Moderate Allocation Fund
MainStay Moderate ETF Allocation Fund
Manager
New York Life Investment Management LLC
New York, New York
Subadvisors
Candriam Belgium S.A.8
Brussels, Belgium
Candriam Luxembourg S.C.A.8
Strassen, Luxembourg
CBRE Clarion Securities LLC
Radnor, Pennsylvania
Cushing Asset Management, LP
Dallas, Texas
Epoch Investment Partners, Inc.
New York, New York
MacKay Shields LLC8
New York, New York
Markston International LLC
White Plains, New York
NYL Investors LLC8
New York, New York
Winslow Capital Management, LLC
Minneapolis, Minnesota
Legal Counsel
Dechert LLP
Washington, District of Columbia
Independent Registered Public Accounting Firm
KPMG LLP
Philadelphia, Pennsylvania
Distributor
NYLIFE Distributors LLC8
Jersey City, New Jersey
Custodian9
State Street Bank and Trust Company
Boston, Massachusetts
| 1. | Formerly known as MainStay Large Cap Growth Fund. |
| 2. | Formerly known as MainStay MacKay Infrastructure Bond Fund. |
| 3. | Formerly known as MainStay Indexed Bond Fund. |
| 4. | This Fund is registered for sale in AZ, CA, NV, OR, TX, UT and WA. Class A and Class I shares are registered for sale in MI. Class I and Class C2 shares are registered for sale in CO, FL, GA, HI, ID, MA, MD, NH, NJ and NY. |
| 5. | This Fund is registered for sale in CA, CT, DE, FL, MA, NJ, NY and VT. |
| 6. | Formerly known as MainStay Growth Allocation Fund. |
| 7. | Formerly known as MainStay Moderate Growth Allocation Fund. |
| 8. | An affiliate of New York Life Investment Management LLC. |
| 9. | JPMorgan Chase Bank, N.A., New York, New York is the custodian for the MainStay ETF Asset Allocation Funds and effective at the close of business on November 20, 2020, became the custodian for other MainStay Funds. The custodian for MainStay Cushing MLP Premier Fund is U.S. Bank National Association, Milwaukee, Wisconsin. |
Not part of the Annual Report
For more information
800-624-6782
newyorklifeinvestments.com
“New York Life Investments” is both a service mark, and the common trade name, of certain investment advisors affiliated with New York Life Insurance Company. The MainStay Funds® are managed by New York Life Investment Management LLC and distributed by NYLIFE Distributors LLC, 30 Hudson Street, Jersey City, NJ 07302, a wholly owned subsidiary of New York Life Insurance Company. NYLIFE Distributors LLC is a Member FINRA/SIPC.
©2020 NYLIFE Distributors LLC. All rights reserved.
| | |
| 1715995 MS203-20 | | MSLG11-12/20 (NYLIM) NL221 |
As of the end of the period covered by this report, the Registrant has adopted a code of ethics (the “Code”) that applies to the Registrant’s principal executive officer (“PEO”) and principal financial officer (“PFO”). During the period covered by this report, no amendments were made to the provisions of the Code. The Registrant did not grant any waivers, including implicit waivers, from any provisions of the Code to the PEO or PFO during the period covered by this report. A copy of the Code is filed herewith.
| Item 3. | Audit Committee Financial Expert. |
The Board of Trustees has determined that the Registrant has three “audit committee financial experts” (as defined by Item 3 of Form N-CSR) serving on its Audit Committee. The Audit Committee financial experts are Alan R. Latshaw, David H. Chow and Susan B. Kerley. Mr. Latshaw, Mr. Chow and Ms. Kerley are “independent” (as defined by Item 3 of Form N-CSR).
| Item 4. | Principal Accountant Fees and Services. |
(a) Audit Fees
The aggregate fees billed for the fiscal year ended October 31, 2020 for professional services rendered by KPMG LLP (“KPMG”) for the audit of the Registrant’s annual financial statements or services that are normally provided by KPMG in connection with statutory and regulatory filings or engagements for that fiscal year were $777,081.
The aggregate fees billed for the fiscal year ended October 31, 2019 for professional services rendered by KPMG for the audit of the Registrant’s annual financial statements or services that are normally provided by KPMG in connection with statutory and regulatory filings or engagements for that fiscal year were $781,900.
(b) Audit-Related Fees
The aggregate fees billed for assurance and related services by KPMG that are reasonably related to the performance of the audit of the Registrant’s financial statements and are not reported under paragraph (a) of this Item were: (i) $0 for the fiscal year ended October 31, 2020, and (ii) $0 for the fiscal year ended October 31, 2019.
(c) Tax Fees
The aggregate fees billed for professional services rendered by KPMG for tax compliance, tax advice, and tax planning were: (i) $0 during the fiscal year ended October 31, 2020, and (ii) $0 during the fiscal year ended October 31, 2019. These services primarily included preparation of federal, state and local income tax returns and excise tax returns, as well as services relating to excise tax distribution requirements.
(d) All Other Fees
The aggregate fees billed for products and services provided by KPMG, other than the services reported in paragraphs (a) through (c) of this Item were: (i) $0 during the fiscal year ended October 31, 2020, and (ii) $0 during the fiscal year ended October 31, 2019.
(e) Pre-Approval Policies and Procedures
| | (1) | The Registrant’s Audit Committee has adopted pre-approval policies and procedures (the “Procedures”) to govern the Committee’s pre-approval of (i) all audit services and permissible non-audit services to be provided to the Registrant by its independent accountant, and (ii) all permissible non-audit services to be provided by such independent accountant to the Registrant’s investment adviser and to any entity controlling, controlled by or under common control with the investment adviser that provides ongoing services to the Registrant (collectively, the “Service Affiliates”) if the services directly relate to the Registrant’s operations and financial reporting. In accordance with the Procedures, the Audit Committee is responsible for the engagement of the independent accountant to certify the Registrant’s financial statements for each fiscal year. With respect to the pre-approval of non-audit services provided to the Registrant and its Service Affiliates, the Procedures provide that the Audit Committee may annually pre-approve a list of the types of services that may be provided to the Registrant or its Service Affiliates, or the Audit Committee may pre-approve such services on a project-by-project basis as they arise. Unless a type of service has received general pre-approval, it will require specific pre-approval by the Audit Committee if it is to be provided by the independent accountant. The Procedures also permit the Audit Committee to delegate authority to one or more of its members to pre-approve any proposed non-audit services that have not been previously pre-approved by the Audit Committee, subject to the ratification by the full Audit Committee no later than its next scheduled meeting. To date, the Audit Committee has not delegated such authority. |
| | (2) | With respect to the services described in paragraphs (b) through (d) of this Item 4, no amount was approved by the Audit Committee pursuant to paragraph (c)(7)(i)(C) of Rule 2-01 of Regulation S-X. |
(f) There were no hours expended on KPMG’s engagement to audit the Registrant’s financial statements for the most recent fiscal year was attributable to work performed by persons other than KPMG’s full-time, permanent employees.
(g) All non-audit fees billed by KPMG for services rendered to the Registrant for the fiscal years ended October 31, 2020 and October 31, 2019 are disclosed in 4(b)-(d) above.
The aggregate non-audit fees billed by KPMG for services rendered to the Registrant’s investment adviser (not including any sub-adviser whose role is primarily portfolio management and is subcontracted with or overseen by another investment adviser), and any entity controlling, controlled by, or under common control with the adviser that provides ongoing services to the Registrant were approximately: (i) $197,052 for the fiscal year ended October 31, 2020, and (ii) $24,200 for the fiscal year ended October 31, 2019.
(h) The Registrant’s Audit Committee has determined that the non-audit services rendered by KPMG for the fiscal year ended October 31, 2020 to the Registrant’s investment adviser and any entity controlling, controlled by, or under common control with the Registrant’s investment adviser that provides ongoing services to the Registrant that were not required to be pre-approved by the Audit Committee because they
did not relate directly to the operations and financial reporting of the registrant were compatible with maintaining the respective independence of KPMG during the relevant time period.
| Item 5. | Audit Committee of Listed Registrants. |
Not applicable.
The Schedule of Investments is included as part of Item 1 of this report.
| Item 7. | Disclosure of Proxy Voting Policies and Procedures for Closed-End Management Investment Companies. |
Not applicable.
| Item 8. | Portfolio Managers of Closed-End Management Investment Companies. |
Not applicable.
| Item 9. | Purchases of Equity Securities by Closed-End Management Investment Company and Affiliated Purchasers. |
Not applicable.
| Item 10. | Submission of Matters to a Vote of Security Holders. |
Since the Registrant’s last response to this Item, there have been no material changes to the procedures by which shareholders may recommend nominees to the Registrant’s Board of Trustees.
Item 11. Controls and Procedures.
(a) Based on an evaluation of the Registrant’s Disclosure Controls and Procedures (as defined in Rule 30a-3(c) under the Investment Company Act of 1940) (the “Disclosure Controls”), as of a date within 90 days prior to the filing date (the “Filing Date”) of this Form N-CSR (the “Report”), the Registrant’s principal executive officer and principal financial officer have concluded that the Disclosure Controls are reasonably designed to ensure that information required to be disclosed by the Registrant in the Report is recorded, processed, summarized and reported by the Filing Date, including ensuring that information required to be disclosed in the Report is accumulated and communicated to the Registrant’s management, including the Registrant’s principal executive officer and principal financial officer, as appropriate to allow timely decisions regarding required disclosure.
(b) There were no changes in the Registrant’s internal control over financial reporting (as defined in Rule 30a-3(d)) under the Investment Company Act of 1940 that occurred during the period covered by this report that has materially affected, or is reasonably likely to materially affect, the Registrant’s internal control over financial reporting.
Item 12. Disclosure of Securities Lending Activities for Closed End Management Investment Companies.
Not applicable.
SIGNATURES
Pursuant to the requirements of the Securities Exchange Act of 1934 and the Investment Company Act of 1940, the Registrant has duly caused this Report to be signed on its behalf by the undersigned, thereunto duly authorized.
| | |
| THE MAINSTAY FUNDS |
| |
| By: | | /s/ Kirk C. Lehneis |
| | Kirk C. Lehneis |
| | President and Principal Executive Officer |
|
| Date: January 8, 2021 |
Pursuant to the requirements of the Securities Exchange Act of 1934 and the Investment Company Act of 1940, this Report has been signed below by the following persons on behalf of the Registrant and in the capacities and on the dates indicated.
| | |
| By: | | /s/ Kirk C. Lehneis |
| | Kirk C. Lehneis |
| | President and Principal Executive Officer |
|
| Date: January 8, 2021 |
| |
| By: | | /s/ Jack R. Benintende |
| | Jack R. Benintende |
| | Treasurer and Principal Financial |
| | and Accounting Officer |
|
| Date: January 8, 2021 |