UNITED STATES
SECURITIES AND EXCHANGE COMMISSION
Washington, D.C. 20549
Form N-CSR
CERTIFIED SHAREHOLDER REPORT OF REGISTERED MANAGEMENT
INVESTMENT COMPANIES
Investment Company Act File Number 811-04550
THE MAINSTAY FUNDS
(Exact name of Registrant as specified in charter)
51 Madison Avenue, New York, NY 10010
(Address of principal executive offices) (Zip code)
J. Kevin Gao, Esq.
30 Hudson Street
Jersey City, New Jersey 07302
(Name and address of agent for service)
Registrant’s telephone number, including area code: (212) 576-7000
Date of fiscal year end: October 31
Date of reporting period: April 30, 2024
| Item 1. | Reports to Stockholders. |
MainStay Candriam Emerging Markets Debt Fund
Message from the President and Semiannual Report
Unaudited | April 30, 2024
Special Notice:
Beginning in July 2024, new regulations issued by the Securities and Exchange Commission (SEC) will take effect requiring open-end mutual fund companies and ETFs to (1) overhaul the content of their shareholder reports and (2) mail paper copies of the new tailored shareholder reports to shareholders who have not opted to receive these documents electronically.
If you have not yet elected to receive your shareholder reports electronically, please contact your financial intermediary or visit newyorklifeinvestments.com/accounts.
| Not FDIC/NCUA Insured | Not a Deposit | May Lose Value | No Bank Guarantee | Not Insured by Any Government Agency |
This page intentionally left blank
Message from the President
Stock and bond markets gained broad ground during the six-month period ended April 30, 2024, bolstered by better-than-expected economic growth and the prospect of monetary easing in the face of a myriad of macroeconomic and geopolitical challenges.
Throughout the reporting period, interest rates remained at their highest levels in decades in most developed countries, with the U.S. federal funds rate in the 5.25%−5.50% range, as central banks struggled to bring inflation under control. Early in the reporting period, the U.S. Federal Reserve began to forecast interest rate cuts in 2024, but delayed action as inflation remained stubbornly high, fluctuating between 3.1% and 3.5%. Nevertheless, despite the increasing cost of capital and tighter lending environment that resulted from sustained high rates, economic growth remained surprisingly robust, supported by high levels of consumer spending, low unemployment and strong corporate earnings. Investors tended to shrug off concerns related to sticky inflation and high interest rates—not to mention the ongoing war in Ukraine, intensifying hostilities in the Middle East and simmering tensions between China and the United States—focusing instead on the positives of continued economic growth and surprisingly strong corporate profits.
The S&P 500® Index, a widely regarded benchmark of U.S. market performance, produced double-digit gains, reaching record levels in March 2024. Market strength, which had been narrowly focused on mega-cap, technology-related stocks during the previous six months broadened significantly during the reporting period. All industry sectors produced positive results, with the strongest returns in communication services, information technology and industrials, and more moderate gains in the lagging energy, real estate and consumer staples areas. Growth-oriented shares slightly outperformed value-oriented
issues, while large- and mid-cap stocks modestly outperformed their small-cap counterparts. Most overseas equity markets trailed the U.S. market, as developed international economies experienced relatively low growth rates, and weak economic conditions in China undermined emerging markets.
Bonds generally gained ground as well. The yield on the 10-year Treasury note ranged between approximately 4.7% and 3.8%, while the 2-year Treasury yield remained slightly higher, between approximately 5.0% and 4.1%, in an inverted curve pattern often viewed as indicative of an impending economic slowdown. Nevertheless, the prevailing environment of stable interest rates and attractive yields provided a favorable environment for fixed-income investors. Long-term Treasury bonds and investment-grade corporate bonds produced similar gains, while high yield bonds advanced by a slightly greater margin, despite the added risks implicit in an uptick in default rates. International bond markets modestly outperformed their U.S. counterparts, led by a rebound in the performance of emerging-markets debt.
The risks and uncertainties inherent in today’s markets call for the kind of insight and expertise that New York Life Investments offers through our one-on-one philosophy, long-lasting focus, and multi-boutique approach.
Thank you for trusting us to help you meet your investment needs.
Sincerely,
Kirk C. Lehneis
President
The opinions expressed are as of the date of this report and are subject to change. There is no guarantee that any forecast made will come to pass. This material does not constitute investment advice and is not intended as an endorsement of any specific investment. Past performance is no guarantee of future results.
Not part of the Semiannual Report
Investors should refer to the Fund’s Summary Prospectus and/or Prospectus and consider the Fund’s investment objectives, strategies, risks, charges and expenses carefully before investing. The Summary Prospectus and/or Prospectus contain this and other information about the Fund. You may obtain copies of the Fund’s Summary Prospectus, Prospectus and Statement of Additional Information, which includes information about The MainStay Funds' Trustees, free of charge, upon request, by calling toll-free 800-624-6782, by writing to NYLIFE Distributors LLC, Attn: MainStay Marketing Department, 30 Hudson Street, Jersey City, NJ 07302 or by sending an e-mail to MainStayShareholderServices@nylim.com. These documents are also available on dfinview.com/NYLIM. Please read the Fund’s Summary Prospectus and/or Prospectus carefully before investing.
Investment and Performance Comparison (Unaudited)
Performance data quoted represents past performance. Past performance is no guarantee of future results. Because of market volatility and other factors, current performance may be lower or higher than the figures shown. Investment return and principal value will fluctuate, and as a result, when shares are redeemed, they may be worth more or less than their original cost. The graph below depicts the historical performance of Class I shares of the Fund. Performance will vary from class to class based on differences in class-specific expenses and sales charges. For performance information current to the most recent month-end, please call 800-624-6782 or visit newyorklifeinvestments.com.
The performance table and graph do not reflect the deduction of taxes that a shareholder would pay on distributions or Fund share redemptions. Total returns reflect maximum applicable sales charges as indicated in the table below, if any, changes in share price, and reinvestment of dividend and capital gain distributions. The graph assumes the initial investment amount shown below and reflects the deduction of all sales charges that would have applied for the period of investment. Performance figures may reflect certain fee waivers and/or expense limitations, without which total returns may have been lower. For more information on share classes and current fee waivers and/or expense limitations (if any), please refer to the Notes to Financial Statements.

| Average Annual Total Returns for the Period-Ended April 30, 2024 |
| Class | Sales Charge | | Inception
Date1 | Six
Months2 | One
Year | Five
Years | Ten
Years | Gross
Expense
Ratio3 |
| Class A Shares | Maximum 4.50% Initial Sales Charge | With sales charges | 6/1/1998 | 7.62% | 8.02% | -1.25% | 1.22% | 1.46% |
| | | Excluding sales charges | | 12.69 | 13.11 | -0.33 | 1.68 | 1.46 |
| Investor Class Shares4 | Maximum 4.00% Initial Sales Charge | With sales charges | 2/28/2008 | 7.94 | 8.09 | -1.64 | 0.92 | 1.95 |
| | | Excluding sales charges | | 12.44 | 12.60 | -0.73 | 1.38 | 1.95 |
| Class C Shares | Maximum 1.00% CDSC | With sales charges | 9/1/1998 | 11.04 | 10.79 | -1.47 | 0.63 | 2.70 |
| | if Redeemed Within One Year of Purchase | Excluding sales charges | | 12.04 | 11.79 | -1.47 | 0.63 | 2.70 |
| Class I Shares | No Sales Charge | | 8/31/2007 | 12.84 | 13.42 | -0.05 | 1.96 | 1.21 |
| 1. | Prior to February 28, 2017, the Fund's primary investment strategies were changed. Effective June 21, 2019, the Fund replaced its prior subadvisor and modified its investment objective and principal investment strategies. The performance in the graph and table prior to those dates reflects its prior subadvisor's, investment objective and principal investment strategies. |
| 2. | Not annualized. |
| 3. | The gross expense ratios presented reflect the Fund’s “Total Annual Fund Operating Expenses” from the most recent Prospectus, as supplemented, and may differ from other expense ratios disclosed in this report. |
| 4. | Prior to June 30, 2020, the maximum initial sales charge was 4.50%, which is reflected in the applicable average annual total return figures shown. |
The footnotes on the next page are an integral part of the table and graph and should be carefully read in conjunction with them.
| Benchmark Performance* | Six
Months1 | One
Year | Five
Years | Ten
Years |
| JPMorgan EMBI Global Diversified Index2 | 10.57% | 8.39% | 0.24% | 2.71% |
| Morningstar Emerging Markets Bond Category Average3 | 9.98 | 9.06 | 0.88 | 2.24 |
| * | Returns for indices reflect no deductions for fees, expenses or taxes, except for foreign withholding taxes where applicable. Results assume reinvestment of all dividends and capital gains. An investment cannot be made directly in an index. |
| 1. | Not annualized. |
| 2. | In accordance with new regulatory requirements, the Fund has selected the JPMorgan EMBI Global Diversified Index, which represents a broad measure of market performance, and is generally representative of the market sectors or types of investments in which the Fund invests. The JPMorgan EMBI Global Diversified Index is the Fund’s primary broad-based securities market index for comparison purposes, which is generally representative of the market sectors or types of investments in which the Fund invests. The JPMorgan EMBI Global Diversified Index is a market-capitalization weighted, total return index tracking the traded market for U.S. dollar-denominated Brady Bonds, Eurobonds, traded loans and local market debt instruments issued by sovereign and quasi-sovereign entities. |
| 3. | The Morningstar Emerging Markets Bond Category Average is representative of funds that invest more than 65% of their assets in foreign bonds from developing countries. The largest portion of the emerging-markets bond market comes from Latin America, followed by Eastern Europe. Africa, the Middle East, and Asia make up the rest. Results are based on average total returns of similar funds with all dividends and capital gain distributions reinvested. |
The footnotes on the preceding page are an integral part of the table and graph and should be carefully read in conjunction with them.
| 6 | MainStay Candriam Emerging Markets Debt Fund |
Cost in Dollars of a $1,000 Investment in MainStay Candriam Emerging Markets Debt Fund (Unaudited)
The example below is intended to describe the fees and expenses borne by shareholders during the six-month period from November 1, 2023 to April 30, 2024, and the impact of those costs on your investment.
Example
As a shareholder of the Fund you incur two types of costs: (1) transaction costs, including exchange fees and sales charges (loads) on purchases (as applicable), and (2) ongoing costs, including management fees, distribution and/or service (12b-1) fees and other Fund expenses (as applicable). This example is intended to help you understand your ongoing costs (in dollars) of investing in the Fund and to compare these costs with the ongoing costs of investing in other mutual funds. The example is based on an investment of $1,000 made at the beginning of the six-month period and held for the entire period from November 1, 2023 to April 30, 2024.
This example illustrates your Fund’s ongoing costs in two ways:
Actual Expenses
The second and third data columns in the table below provide information about actual account values and actual expenses. You may use the information in these columns, together with the amount you invested, to estimate the expenses that you paid during the six months ended April 30, 2024. Simply divide your account value by $1,000 (for example, an $8,600 account value divided by $1,000 = 8.6), then multiply the
result by the number under the heading entitled “Expenses Paid During Period” to estimate the expenses you paid on your account during this period.
Hypothetical Example for Comparison Purposes
The fourth and fifth data columns in the table below provide information about hypothetical account values and hypothetical expenses based on the Fund’s actual expense ratio and an assumed rate of return of 5% per year before expenses, which is not the Fund’s actual return. The hypothetical account values and expenses may not be used to estimate the actual ending account balances or expenses you paid for the six-month period shown. You may use this information to compare the ongoing costs of investing in the Fund with the ongoing costs of investing in other mutual funds. To do so, compare this 5% hypothetical example with the 5% hypothetical examples that appear in the shareholder reports of the other mutual funds.
Please note that the expenses shown in the table are meant to highlight your ongoing costs only and do not reflect any transactional costs, such as exchange fees or sales charges (loads). Therefore, the fourth and fifth data columns of the table are useful in comparing ongoing costs only and will not help you determine the relative total costs of owning different funds. In addition, if these transactional costs were included, your costs would have been higher.
| Share Class | Beginning
Account
Value
11/1/23 | Ending Account
Value (Based
on Actual
Returns and
Expenses)
4/30/24 | Expenses
Paid
During
Period1 | Ending Account
Value (Based
on Hypothetical
5% Annualized
Return and
Actual Expenses)
4/30/24 | Expenses
Paid
During
Period1 | Net Expense
Ratio
During
Period2 |
| Class A Shares | $1,000.00 | $1,126.90 | $ 6.08 | $1,019.14 | $ 5.77 | 1.15% |
| Investor Class Shares | $1,000.00 | $1,124.40 | $ 8.40 | $1,016.96 | $ 7.97 | 1.59% |
| Class C Shares | $1,000.00 | $1,120.40 | $12.34 | $1,013.23 | $11.71 | 2.34% |
| Class I Shares | $1,000.00 | $1,128.40 | $ 4.50 | $1,020.64 | $ 4.27 | 0.85% |
| 1. | Expenses are equal to the Fund’s annualized expense ratio of each class multiplied by the average account value over the period, divided by 366 and multiplied by 182 (to reflect the six-month period). The table above represents the actual expenses incurred during the six-month period. In addition to the fees and expenses which the Fund bears directly, it also indirectly bears a pro rata share of the fees and expenses of the underlying funds in which it invests. Such indirect expenses are not included in the above-reported expense figures. |
| 2. | Expenses are equal to the Fund's annualized expense ratio to reflect the six-month period. |
Country Composition as of April 30, 2024 (Unaudited)
| Dominican Republic | 6.4% |
| Saudi Arabia | 6.1 |
| Romania | 5.9 |
| Colombia | 5.8 |
| Brazil | 5.4 |
| Turkey | 5.0 |
| Argentina | 4.0 |
| Cote D'Ivoire | 3.3 |
| Mexico | 3.2 |
| Egypt | 3.2 |
| Hungary | 2.6 |
| Chile | 2.4 |
| Panama | 2.4 |
| Oman | 2.2 |
| Angola | 2.2 |
| Ecuador | 2.1 |
| South Africa | 2.1 |
| Bahrain | 2.0 |
| Nigeria | 2.0 |
| Kazakhstan | 1.9 |
| Poland | 1.8 |
| Senegal | 1.7 |
| United States | 1.6 |
| El Salvador | 1.5 |
| Peru | 1.4% |
| Kenya | 1.4 |
| Montenegro | 1.3 |
| Venezuela | 1.2 |
| Benin | 1.0 |
| China | 1.0 |
| Sri Lanka | 1.0 |
| Morocco | 0.9 |
| Azerbaijan | 0.9 |
| Pakistan | 0.9 |
| Tunisia | 0.9 |
| Ghana | 0.9 |
| Ukraine | 0.9 |
| Mozambique | 0.8 |
| United Arab Emirates | 0.8 |
| Papua New Guinea | 0.7 |
| Costa Rica | 0.4 |
| Republic of the Congo | 0.4 |
| Uruguay | 0.4 |
| Zambia | 0.4 |
| Georgia | 0.3 |
| Other Assets, Less Liabilities | 5.3 |
| | 100.0% |
See Portfolio of Investments beginning on page 9 for specific holdings within these categories. The Fund's holdings are subject to change.
Top Ten Holdings and/or Issuers Held as of April 30, 2024 (excluding short-term investments) (Unaudited)
| 1. | Dominican Republic Government Bond, 4.875%-13.625%, due 1/29/26–1/30/60 |
| 2. | Romanian Government Bond, 5.625%-6.625%, due 9/27/29–2/22/36 |
| 3. | Brazil Government Bond, 4.75%-8.75%, due 2/4/25–5/13/54 |
| 4. | Argentina Government Bond, 0.75%-3.50%, due 7/9/29–7/9/41 |
| 5. | Colombia Government Bond, 5.00%-8.75%, due 4/20/33–11/14/53 |
| 6. | Ivory Coast Government Bond, 4.875%-8.25%, due 1/30/32–3/22/48 |
| 7. | GACI First Investment Co., 4.875%-5.375%, due 1/29/34–1/29/54 |
| 8. | Egypt Government Bond, 8.50%-8.875%, due 1/31/47–5/29/50 |
| 9. | Panama Government Bond, 3.87%-9.375%, due 4/1/29–7/23/60 |
| 10. | Oman Government Bond, 6.00%-6.75%, due 8/1/29–1/17/48 |
| 8 | MainStay Candriam Emerging Markets Debt Fund |
Portfolio of Investments April 30, 2024†^(Unaudited)
| | Principal
Amount | Value |
| Long-Term Bonds 93.1% |
| Corporate Bonds 16.3% |
| Brazil 1.2% |
| Minerva Luxembourg SA | | |
| Series Reg S | | |
| 8.875%, due 9/13/33 | $ 467,000 | $ 479,007 |
| Rumo Luxembourg SARL | | |
| Series Reg S | | |
| 4.20%, due 1/18/32 | 300,000 | 248,547 |
| | | 727,554 |
| Chile 0.5% |
| Antofagasta plc | | |
| Series Reg S | | |
| 6.25%, due 5/2/34 | 334,000 | 332,664 |
| China 1.0% |
| Alibaba Group Holding Ltd. | | |
| 4.20%, due 12/6/47 | 800,000 | 622,586 |
| Georgia 0.3% |
| Georgian Railway JSC | | |
| Series Reg S | | |
| 4.00%, due 6/17/28 | 200,000 | 179,321 |
| Kazakhstan 1.9% |
| KazMunayGas National Co. JSC | | |
| Series Reg S | | |
| 6.375%, due 10/24/48 | 1,300,000 | 1,154,824 |
| Peru 0.0% ‡ |
| Lima Metro Line 2 Finance Ltd. | | |
| Series Reg S | | |
| 4.35%, due 4/5/36 | 2 | 1 |
| Romania 1.6% |
| Banca Transilvania SA | | |
| Series Reg S | | |
| 7.25%, due 12/7/28 (a) | EUR 889,000 | 985,193 |
| Saudi Arabia 6.1% |
| EIG Pearl Holdings SARL | | |
| Series Reg S | | |
| 4.387%, due 11/30/46 | $ 1,300,000 | 974,503 |
| GACI First Investment Co. | | |
| Series Reg S | | |
| 4.875%, due 2/14/35 | 250,000 | 230,142 |
| | Principal
Amount | Value |
| |
| Saudi Arabia (continued) |
| GACI First Investment Co. (continued) | | |
| Series Reg S | | |
| 5.25%, due 1/29/34 | $ 979,000 | $ 934,553 |
| Series Reg S | | |
| 5.375%, due 1/29/54 | 979,000 | 827,653 |
| Greensaif Pipelines Bidco SARL | | |
| Series Reg S | | |
| 6.129%, due 2/23/38 | 250,000 | 246,675 |
| Series Reg S | | |
| 6.129%, due 2/23/38 (b) | 550,000 | 542,684 |
| | | 3,756,210 |
| Turkey 3.3% |
| Sisecam UK plc | | |
| Series Reg S | | |
| 8.25%, due 5/2/29 | 562,000 | 571,673 |
| TAV Havalimanlari Holding A/S | | |
| Series Reg S | | |
| 8.50%, due 12/7/28 | 1,111,000 | 1,134,998 |
| WE Soda Investments Holding plc | | |
| Series Reg S | | |
| 9.50%, due 10/6/28 | 350,000 | 360,475 |
| | | 2,067,146 |
| Venezuela 0.4% |
| Petroleos de Venezuela SA | | |
| 5.375%, due 4/12/27 (c)(d) | 2,000,000 | 240,014 |
Total Corporate Bonds
(Cost $10,736,307) | | 10,065,513 |
| Foreign Government Bonds 76.8% |
| Angola 2.2% |
| Angola Government Bond | | |
| Series Reg S | | |
| 8.75%, due 4/14/32 | 650,000 | 587,080 |
| Series Reg S | | |
| 9.125%, due 11/26/49 | 900,000 | 747,675 |
| | | 1,334,755 |
| Argentina 4.0% |
| Argentina Government Bond | | |
| 0.75%, due 7/9/30 (e) | 1,100,000 | 636,361 |
| 1.00%, due 7/9/29 | 1,600,000 | 941,531 |
| 3.50%, due 7/9/41 (e) | 2,000,000 | 874,318 |
| | | 2,452,210 |
The notes to the financial statements are an integral part of, and should be read in conjunction with, the financial statements.
9
Portfolio of Investments April 30, 2024†^(Unaudited) (continued)
| | Principal
Amount | Value |
| Foreign Government Bonds (continued) |
| Azerbaijan 0.9% |
| Azerbaijan Government Bond | | |
| Series Reg S | | |
| 3.50%, due 9/1/32 | $ 700,000 | $ 577,352 |
| Bahrain 2.0% |
| Bahrain Government Bond | | |
| Series Reg S | | |
| 6.25%, due 1/25/51 | 600,000 | 479,702 |
| Series Reg S | | |
| 7.50%, due 2/12/36 | 400,000 | 397,516 |
| Series Reg S | | |
| 7.50%, due 9/20/47 | 400,000 | 369,000 |
| | | 1,246,218 |
| Benin 1.0% |
| Benin Government Bond | | |
| Series Reg S | | |
| 4.875%, due 1/19/32 (b) | EUR 500,000 | 450,839 |
| Series Reg S | | |
| 7.96%, due 2/13/38 | $ 208,000 | 196,252 |
| | | 647,091 |
| Brazil 4.2% |
| Brazil Government Bond | | |
| 4.75%, due 1/14/50 | 300,000 | 211,137 |
| 6.125%, due 3/15/34 | 714,000 | 682,724 |
| 6.25%, due 3/18/31 | 862,000 | 854,554 |
| 7.125%, due 5/13/54 | 362,000 | 345,781 |
| 8.75%, due 2/4/25 | 500,000 | 509,693 |
| | | 2,603,889 |
| Chile 1.9% |
| Chile Government Bond | | |
| 3.25%, due 9/21/71 | 800,000 | 468,620 |
| Corp. Nacional del Cobre de Chile | | |
| Series Reg S | | |
| 5.95%, due 1/8/34 | 500,000 | 484,718 |
| Series Reg S | | |
| 6.30%, due 9/8/53 | 250,000 | 237,810 |
| | | 1,191,148 |
| Colombia 5.8% |
| Colombia Government Bond | | |
| 5.00%, due 6/15/45 | 300,000 | 206,532 |
| 5.20%, due 5/15/49 | 300,000 | 206,395 |
| 6.125%, due 1/18/41 | 400,000 | 327,907 |
| 7.50%, due 2/2/34 | 500,000 | 491,498 |
| | Principal
Amount | Value |
| |
| Colombia (continued) |
| Colombia Government Bond (continued) | | |
| 8.00%, due 4/20/33 | $ 700,000 | $ 714,146 |
| 8.00%, due 11/14/35 | 201,000 | 202,598 |
| 8.75%, due 11/14/53 | 203,000 | 209,167 |
| Ecopetrol SA | | |
| 4.625%, due 11/2/31 | 300,000 | 242,248 |
| 8.375%, due 1/19/36 | 700,000 | 680,503 |
| 8.875%, due 1/13/33 | 300,000 | 307,050 |
| | | 3,588,044 |
| Costa Rica 0.4% |
| Costa Rica Government Bond | | |
| Series Reg S | | |
| 7.30%, due 11/13/54 | 248,000 | 257,960 |
| Cote D'Ivoire 3.3% |
| Ivory Coast Government Bond | | |
| Series Reg S | | |
| 4.875%, due 1/30/32 | EUR 700,000 | 622,284 |
| Series Reg S | | |
| 6.625%, due 3/22/48 | 800,000 | 665,933 |
| Series Reg S | | |
| 7.625%, due 1/30/33 | $ 412,000 | 393,819 |
| Series Reg S | | |
| 8.25%, due 1/30/37 | 368,000 | 351,587 |
| | | 2,033,623 |
| Dominican Republic 6.4% |
| Dominican Republic Government Bond | | |
| Series Reg S | | |
| 4.875%, due 9/23/32 | 300,000 | 262,500 |
| Series Reg S | | |
| 5.30%, due 1/21/41 (b) | 500,000 | 411,057 |
| Series Reg S | | |
| 5.50%, due 2/22/29 | 300,000 | 285,048 |
| Series Reg S | | |
| 5.875%, due 1/30/60 | 1,000,000 | 814,311 |
| Series Reg S | | |
| 5.95%, due 1/25/27 | 700,000 | 686,540 |
| Series Reg S | | |
| 6.875%, due 1/29/26 | 1,000,000 | 1,002,109 |
| Series Reg S | | |
| 11.25%, due 9/15/35 | DOP 12,350,000 | 221,264 |
| Series Reg S | | |
| 13.625%, due 2/3/33 | 14,000,000 | 283,338 |
| | | 3,966,167 |
The notes to the financial statements are an integral part of, and should be read in conjunction with, the financial statements.
| 10 | MainStay Candriam Emerging Markets Debt Fund |
| | Principal
Amount | Value |
| Foreign Government Bonds (continued) |
| Ecuador 2.1% |
| Ecuador Government Bond (e) | | |
| Series Reg S | | |
| 2.50%, due 7/31/40 | $ 1,200,000 | $ 612,000 |
| Series Reg S | | |
| 6.00%, due 7/31/30 | 1,000,000 | 702,157 |
| | | 1,314,157 |
| Egypt 3.2% |
| Egypt Government Bond | | |
| Series Reg S | | |
| 8.50%, due 1/31/47 | 200,000 | 152,348 |
| Series Reg S | | |
| 8.70%, due 3/1/49 | 500,000 | 386,575 |
| Series Reg S | | |
| 8.875%, due 5/29/50 | 1,800,000 | 1,411,776 |
| | | 1,950,699 |
| El Salvador 1.5% |
| El Salvador Government Bond | | |
| Series Reg S | | |
| 7.65%, due 6/15/35 | 770,000 | 554,186 |
| Series Reg S | | |
| 9.50%, due 7/15/52 | 500,000 | 394,060 |
| | | 948,246 |
| Ghana 0.9% |
| Ghana Government Bond (c)(d) | | |
| Series Reg S | | |
| 7.75%, due 4/7/29 | 200,000 | 96,700 |
| Series Reg S | | |
| 7.875%, due 2/11/35 | 900,000 | 434,250 |
| | | 530,950 |
| Hungary 2.6% |
| Hungary Government Bond | | |
| Series Reg S | | |
| 5.25%, due 6/16/29 | 700,000 | 677,516 |
| Series Reg S | | |
| 5.50%, due 3/26/36 | 300,000 | 279,750 |
| 7.625%, due 3/29/41 | 300,000 | 332,640 |
| Magyar Export-Import Bank Zrt. | | |
| Series Reg S | | |
| 6.00%, due 5/16/29 | EUR 302,000 | 336,798 |
| | | 1,626,704 |
| | Principal
Amount | Value |
| |
| Kenya 1.4% |
| Kenya Government Bond | | |
| Series Reg S | | |
| 8.25%, due 2/28/48 | $ 500,000 | $ 420,000 |
| Series Reg S | | |
| 9.75%, due 2/16/31 | 430,000 | 430,000 |
| | | 850,000 |
| Mexico 3.2% |
| Comision Federal de Electricidad | | |
| Series Reg S | | |
| 3.875%, due 7/26/33 | 500,000 | 393,440 |
| Series Reg S | | |
| 4.677%, due 2/9/51 | 700,000 | 475,666 |
| Mexico Government Bond | | |
| 4.28%, due 8/14/41 | 400,000 | 306,390 |
| 4.75%, due 3/8/44 | 400,000 | 315,821 |
| 5.75%, due 10/12/10 (b) | 200,000 | 164,655 |
| 6.00%, due 5/7/36 | 350,000 | 336,975 |
| | | 1,992,947 |
| Montenegro 1.3% |
| Montenegro Government Bond | | |
| Series Reg S | | |
| 2.875%, due 12/16/27 | EUR 500,000 | 486,142 |
| Series Reg S | | |
| 7.25%, due 3/12/31 | $ 300,000 | 299,700 |
| | | 785,842 |
| Morocco 0.9% |
| Morocco Government Bond | | |
| Series Reg S | | |
| 4.00%, due 12/15/50 | 900,000 | 590,040 |
| Mozambique 0.8% |
| Mozambique Government Bond | | |
| Series Reg S | | |
| 9.00%, due 9/15/31 (e) | 600,000 | 502,800 |
| Nigeria 2.0% |
| Nigeria Government Bond | | |
| Series Reg S | | |
| 7.625%, due 11/21/25 | 400,000 | 396,968 |
| Series Reg S | | |
| 7.875%, due 2/16/32 | 500,000 | 437,038 |
| Series Reg S | | |
| 8.25%, due 9/28/51 | 500,000 | 391,280 |
| | | 1,225,286 |
The notes to the financial statements are an integral part of, and should be read in conjunction with, the financial statements.
11
Portfolio of Investments April 30, 2024†^(Unaudited) (continued)
| | Principal
Amount | Value |
| Foreign Government Bonds (continued) |
| Oman 2.2% |
| Oman Government Bond | | |
| Series Reg S | | |
| 6.00%, due 8/1/29 | $ 400,000 | $ 399,811 |
| Series Reg S | | |
| 6.75%, due 1/17/48 | 1,000,000 | 988,460 |
| | | 1,388,271 |
| Pakistan 0.9% |
| Pakistan Government Bond | | |
| Series Reg S | | |
| 8.875%, due 4/8/51 | 750,000 | 572,109 |
| Panama 2.4% |
| Panama Government Bond | | |
| 3.87%, due 7/23/60 | 500,000 | 273,026 |
| 4.50%, due 4/1/56 | 400,000 | 247,880 |
| 6.40%, due 2/14/35 | 400,000 | 366,642 |
| 6.875%, due 1/31/36 | 417,000 | 392,419 |
| 9.375%, due 4/1/29 | 200,000 | 217,892 |
| | | 1,497,859 |
| Papua New Guinea 0.7% |
| Papua New Guinea Government Bond | | |
| Series Reg S | | |
| 8.375%, due 10/4/28 | 434,000 | 408,394 |
| Peru 1.4% |
| Peru Government Bond | | |
| 3.23%, due 7/28/21 | 600,000 | 314,280 |
| 3.60%, due 1/15/72 | 400,000 | 243,000 |
| 6.55%, due 3/14/37 | 300,000 | 309,960 |
| | | 867,240 |
| Poland 1.8% |
| Bank Gospodarstwa Krajowego | | |
| Series Reg S | | |
| 4.375%, due 3/13/39 | EUR 600,000 | 634,109 |
| Poland Government Bond | | |
| 5.50%, due 3/18/54 | $ 492,000 | 461,309 |
| | | 1,095,418 |
| Republic of the Congo 0.4% |
| Congo Government Bond | | |
| Series Reg S | | |
| 6.00%, due 6/30/29 (e) | 292,125 | 244,655 |
| | Principal
Amount | Value |
| |
| Romania 4.3% |
| Romanian Government Bond | | |
| Series Reg S | | |
| 5.625%, due 2/22/36 | $ 1,000,000 | $ 1,051,062 |
| Series Reg S | | |
| 6.625%, due 9/27/29 | EUR 1,400,000 | 1,604,044 |
| | | 2,655,106 |
| Senegal 1.7% |
| Senegal Government Bond | | |
| Series Reg S | | |
| 5.375%, due 6/8/37 | 1,358,000 | 1,070,080 |
| South Africa 2.1% |
| South Africa Government Bond | | |
| 4.30%, due 10/12/28 | $ 300,000 | 267,000 |
| 5.75%, due 9/30/49 | 500,000 | 352,900 |
| 5.875%, due 4/20/32 | 300,000 | 266,625 |
| 7.30%, due 4/20/52 | 500,000 | 421,870 |
| | | 1,308,395 |
| Sri Lanka 1.0% |
| Sri Lanka Government Bond (c)(d) | | |
| Series Reg S | | |
| 6.20%, due 5/11/27 | 300,000 | 169,550 |
| Series Reg S | | |
| 6.825%, due 7/18/26 | 250,000 | 141,947 |
| Series Reg S | | |
| 7.55%, due 3/28/30 | 550,000 | 307,491 |
| | | 618,988 |
| Tunisia 0.9% |
| Tunisia Government Bond | | |
| Series Reg S | | |
| 5.75%, due 1/30/25 | 600,000 | 563,088 |
| Turkey 1.7% |
| Turkey Government Bond | | |
| 5.75%, due 5/11/47 | 1,450,000 | 1,071,187 |
| Ukraine 0.9% |
| State Agency of Roads of Ukraine | | |
| Series Reg S | | |
| 6.25%, due 6/24/30 (c)(d) | 1,000,000 | 283,750 |
| Ukraine Government Bond | | |
| Series Reg S | | |
| 7.253%, due 3/15/35 (c)(d) | 1,000,000 | 246,418 |
| | | 530,168 |
The notes to the financial statements are an integral part of, and should be read in conjunction with, the financial statements.
| 12 | MainStay Candriam Emerging Markets Debt Fund |
| | Principal
Amount | | Value |
| Foreign Government Bonds (continued) |
| United Arab Emirates 0.8% |
| Sharjah Government Bond | | | |
| Series Reg S | | | |
| 4.00%, due 7/28/50 | $ 800,000 | | $ 495,904 |
| Uruguay 0.4% |
| Uruguay Government Bond | | | |
| 9.75%, due 7/20/33 | UYU 8,542,218 | | 231,815 |
| Venezuela 0.8% |
| Petroleos de Venezuela SA (c)(d) | | | |
| Series Reg S | | | |
| 6.00%, due 5/16/24 | $ 2,500,000 | | 300,000 |
| Series Reg S | | | |
| 6.00%, due 11/15/26 | 1,500,000 | | 182,250 |
| | | | 482,250 |
| Zambia 0.4% |
| Zambia Government Bond | | | |
| Series Reg S | | | |
| 8.97%, due 7/30/27 (c)(d) | 300,000 | | 219,312 |
Total Foreign Government Bonds
(Cost $50,497,940) | | | 47,536,367 |
Total Long-Term Bonds
(Cost $61,234,247) | | | 57,601,880 |
| |
| | Shares | | |
| |
| Short-Term Investment 1.6% |
| Unaffiliated Investment Company 1.6% |
| United States 1.6% |
| Invesco Government & Agency Portfolio, 5.309% (f)(g) | 964,095 | | 964,095 |
Total Short-Term Investment
(Cost $964,095) | | | 964,095 |
Total Investments
(Cost $62,198,342) | 94.7% | | 58,565,975 |
| Other Assets, Less Liabilities | 5.3 | | 3,267,545 |
| Net Assets | 100.0% | | $ 61,833,520 |
| † | Percentages indicated are based on Fund net assets. |
| ^ | Industry and country classifications may be different than those used for compliance monitoring purposes. |
| ‡ | Less than one-tenth of a percent. |
| (a) | Fixed to floating rate—Rate shown was the rate in effect as of April 30, 2024. |
| (b) | All or a portion of this security was held on loan. As of April 30, 2024, the aggregate market value of securities on loan was $918,979. The Fund received cash collateral with a value of $964,095. (See Note 2(J)) |
| (c) | Issue in default. |
| (d) | Issue in non-accrual status. |
| (e) | Step coupon—Rate shown was the rate in effect as of April 30, 2024. |
| (f) | Current yield as of April 30, 2024. |
| (g) | Represents a security purchased with cash collateral received for securities on loan. |
The notes to the financial statements are an integral part of, and should be read in conjunction with, the financial statements.
13
Portfolio of Investments April 30, 2024†^(Unaudited) (continued)
Foreign Currency Forward Contracts
As of April 30, 2024, the Fund held the following foreign currency forward contracts1:
| Currency Purchased | Currency Sold | Counterparty | Settlement
Date | Unrealized
Appreciation
(Depreciation) |
| USD | 1,489,765 | MXN | 25,000,000 | JPMorgan Chase Bank N.A. | 5/15/24 | $ 33,469 |
| Total Unrealized Appreciation | 33,469 |
| MXN | 25,000,000 | USD | 1,468,288 | JPMorgan Chase Bank N.A. | 5/15/24 | (11,992) |
| USD | 9,083,679 | EUR | 8,500,000 | Barclays Capital | 6/26/24 | (8,816) |
| USD | 426,144 | EUR | 400,000 | Goldman Sachs International | 6/26/24 | (1,738) |
| Total Unrealized Depreciation | (22,546) |
| Net Unrealized Appreciation | $ 10,923 |
| 1. | Foreign Currency Forward Contracts are subject to limitations such that they cannot be “sold or repurchased,” although the Fund would be able to exit the transaction through other means, such as through the execution of an offsetting transaction. |
Futures Contracts
As of April 30, 2024, the Fund held the following futures contracts1:
| Type | Number of
Contracts | Expiration
Date | Value at
Trade Date | Current
Notional
Amount | Unrealized
Appreciation
(Depreciation)2 |
| Long Contracts | | | | | |
| U.S. Treasury 5 Year Notes | 34 | June 2024 | $ 3,635,926 | $ 3,561,234 | $ (74,692) |
| 1. | As of April 30, 2024, cash in the amount of $52,360 was on deposit with a broker or futures commission merchant for futures transactions. |
| 2. | Represents the difference between the value of the contracts at the time they were opened and the value as of April 30, 2024. |
| Abbreviation(s): |
| DOP—Dominican Republic Peso |
| EUR—Euro |
| MXN—Mexico Peso |
| USD—United States Dollar |
| UYU—Uruguay Peso |
The notes to the financial statements are an integral part of, and should be read in conjunction with, the financial statements.
| 14 | MainStay Candriam Emerging Markets Debt Fund |
The following is a summary of the fair valuations according to the inputs used as of April 30, 2024, for valuing the Fund’s assets and liabilities:
| Description | Quoted
Prices in
Active
Markets for
Identical
Assets
(Level 1) | | Significant
Other
Observable
Inputs
(Level 2) | | Significant
Unobservable
Inputs
(Level 3) | | Total |
| Asset Valuation Inputs | | | | | | | |
| Investments in Securities (a) | | | | | | | |
| Long-Term Bonds | | | | | | | |
| Corporate Bonds | $ — | | $ 10,065,513 | | $ — | | $ 10,065,513 |
| Foreign Government Bonds | — | | 47,536,367 | | — | | 47,536,367 |
| Total Long-Term Bonds | — | | 57,601,880 | | — | | 57,601,880 |
| Short-Term Investment | | | | | | | |
| Unaffiliated Investment Company | 964,095 | | — | | — | | 964,095 |
| Total Investments in Securities | 964,095 | | 57,601,880 | | — | | 58,565,975 |
| Other Financial Instruments | | | | | | | |
| Foreign Currency Forward Contracts (b) | — | | 33,469 | | — | | 33,469 |
| Total Investments in Securities and Other Financial Instruments | $ 964,095 | | $ 57,635,349 | | $ — | | $ 58,599,444 |
| Liability Valuation Inputs | | | | | | | |
| Other Financial Instruments (b) | | | | | | | |
| Foreign Currency Forward Contracts | $ — | | $ (22,546) | | $ — | | $ (22,546) |
| Futures Contracts | (74,692) | | — | | — | | (74,692) |
| Total Other Financial Instruments | $ (74,692) | | $ (22,546) | | $ — | | $ (97,238) |
| (a) | For a complete listing of investments and their industries, see the Portfolio of Investments. |
| (b) | The value listed for these securities reflects unrealized appreciation (depreciation) as shown on the Portfolio of Investments. |
The notes to the financial statements are an integral part of, and should be read in conjunction with, the financial statements.
15
Statement of Assets and Liabilities as of April 30, 2024 (Unaudited)
| Assets |
Investment in securities, at value
(identified cost $62,198,342) including securities on loan of $918,979 | $ 58,565,975 |
| Cash | 1,670,091 |
Cash denominated in foreign currencies
(identified cost $856,109) | 854,253 |
| Cash collateral on deposit at broker for futures contracts | 52,360 |
| Receivables: | |
| Variation margin on futures contracts | 1,696,162 |
| Interest | 1,031,023 |
| Fund shares sold | 2,915 |
| Securities lending | 550 |
| Unrealized appreciation on foreign currency forward contracts | 33,469 |
| Other assets | 50,706 |
| Total assets | 63,957,504 |
| Liabilities |
| Cash collateral received for securities on loan | 964,095 |
| Payables: | |
| Investment securities purchased | 894,043 |
| Fund shares redeemed | 100,588 |
| Professional fees | 42,126 |
| Transfer agent (See Note 3) | 28,163 |
| Manager (See Note 3) | 23,343 |
| Custodian | 17,992 |
| NYLIFE Distributors (See Note 3) | 11,650 |
| Shareholder communication | 5,750 |
| Accrued expenses | 723 |
| Distributions payable | 12,965 |
| Unrealized depreciation on foreign currency forward contracts | 22,546 |
| Total liabilities | 2,123,984 |
| Net assets | $ 61,833,520 |
| Composition of Net Assets |
| Shares of beneficial interest outstanding (par value of $.01 per share) unlimited number of shares authorized | $ 80,268 |
| Additional paid-in-capital | 106,039,300 |
| | 106,119,568 |
| Total distributable earnings (loss) | (44,286,048) |
| Net assets | $ 61,833,520 |
| Class A | |
| Net assets applicable to outstanding shares | $44,010,597 |
| Shares of beneficial interest outstanding | 5,722,770 |
| Net asset value per share outstanding | $ 7.69 |
| Maximum sales charge (4.50% of offering price) | 0.36 |
| Maximum offering price per share outstanding | $ 8.05 |
| Investor Class | |
| Net assets applicable to outstanding shares | $ 8,933,831 |
| Shares of beneficial interest outstanding | 1,147,392 |
| Net asset value per share outstanding | $ 7.79 |
| Maximum sales charge (4.00% of offering price) | 0.32 |
| Maximum offering price per share outstanding | $ 8.11 |
| Class C | |
| Net assets applicable to outstanding shares | $ 828,639 |
| Shares of beneficial interest outstanding | 110,357 |
| Net asset value and offering price per share outstanding | $ 7.51 |
| Class I | |
| Net assets applicable to outstanding shares | $ 8,060,453 |
| Shares of beneficial interest outstanding | 1,046,251 |
| Net asset value and offering price per share outstanding | $ 7.70 |
The notes to the financial statements are an integral part of, and should be read in conjunction with, the financial statements.
| 16 | MainStay Candriam Emerging Markets Debt Fund |
Statement of Operations for the six months ended April 30, 2024 (Unaudited)
| Investment Income (Loss) |
| Income | |
| Interest | $ 2,130,018 |
| Securities lending, net | 3,289 |
| Total income | 2,133,307 |
| Expenses | |
| Manager (See Note 3) | 219,173 |
| Transfer agent (See Note 3) | 72,783 |
| Distribution/Service—Class A (See Note 3) | 55,853 |
| Distribution/Service—Investor Class (See Note 3) | 11,179 |
| Distribution/Service—Class B (See Note 3)(a) | 676 |
| Distribution/Service—Class C (See Note 3) | 4,426 |
| Registration | 35,752 |
| Professional fees | 27,481 |
| Custodian | 20,578 |
| Shareholder communication | 5,131 |
| Trustees | 750 |
| Miscellaneous | 1,953 |
| Total expenses before waiver/reimbursement | 455,735 |
| Expense waiver/reimbursement from Manager (See Note 3) | (81,814) |
| Net expenses | 373,921 |
| Net investment income (loss) | 1,759,386 |
| Realized and Unrealized Gain (Loss) |
| Net realized gain (loss) on: | |
| Unaffiliated investment transactions | (3,240,935) |
| Futures transactions | 161,445 |
| Foreign currency transactions | 77,321 |
| Foreign currency forward transactions | (128,158) |
| Net realized gain (loss) | (3,130,327) |
| Net change in unrealized appreciation (depreciation) on: | |
| Unaffiliated investments | 8,272,715 |
| Futures contracts | 481,561 |
| Foreign currency forward contracts | 40,229 |
| Translation of other assets and liabilities in foreign currencies | 678 |
| Net change in unrealized appreciation (depreciation) | 8,795,183 |
| Net realized and unrealized gain (loss) | 5,664,856 |
| Net increase (decrease) in net assets resulting from operations | $ 7,424,242 |
| (a) | Class B shares converted into Class A or Investor Class shares pursuant to the applicable conversion schedule and are no longer offered for sale as of February 20, 2024. |
The notes to the financial statements are an integral part of, and should be read in conjunction with, the financial statements.
17
Statements of Changes in Net Assets
for the six months ended April 30, 2024 (Unaudited) and the year ended October 31, 2023
| | Six months
ended
April 30,
2024 | Year
ended
October 31,
2023 |
| Increase (Decrease) in Net Assets |
| Operations: | | |
| Net investment income (loss) | $ 1,759,386 | $ 3,403,374 |
| Net realized gain (loss) | (3,130,327) | (7,378,622) |
| Net change in unrealized appreciation (depreciation) | 8,795,183 | 10,298,583 |
| Net increase (decrease) in net assets resulting from operations | 7,424,242 | 6,323,335 |
| Distributions to shareholders: | | |
| Class A | (2,364,876) | (2,607,140) |
| Investor Class | (445,578) | (434,942) |
| Class B(a) | (8,081) | (16,986) |
| Class C | (43,700) | (52,711) |
| Class I | (466,836) | (205,389) |
| Total distributions to shareholders | (3,329,071) | (3,317,168) |
| Capital share transactions: | | |
| Net proceeds from sales of shares | 9,814,846 | 17,806,161 |
| Net asset value of shares issued to shareholders in reinvestment of distributions | 3,190,783 | 3,170,418 |
| Cost of shares redeemed | (11,373,043) | (30,021,359) |
| Increase (decrease) in net assets derived from capital share transactions | 1,632,586 | (9,044,780) |
| Net increase (decrease) in net assets | 5,727,757 | (6,038,613) |
| Net Assets |
| Beginning of period | 56,105,763 | 62,144,376 |
| End of period | $ 61,833,520 | $ 56,105,763 |
| (a) | Class B shares converted into Class A or Investor Class shares pursuant to the applicable conversion schedule and are no longer offered for sale as of February 20, 2024. |
The notes to the financial statements are an integral part of, and should be read in conjunction with, the financial statements.
| 18 | MainStay Candriam Emerging Markets Debt Fund |
Financial Highlights selected per share data and ratios
| | Six months ended
April 30,
2024* | | Year Ended October 31, |
| Class A | 2023 | | 2022 | | 2021 | | 2020 | | 2019 |
| Net asset value at beginning of period | $ 7.19 | | $ 6.88 | | $ 9.73 | | $ 9.81 | | $ 10.46 | | $ 9.71 |
| Net investment income (loss) (a) | 0.22 | | 0.41 | | 0.38 | | 0.36 | | 0.47 | | 0.49 |
| Net realized and unrealized gain (loss) | 0.69 | | 0.29 | | (2.73) | | 0.04 | | (0.67) | | 0.76 |
| Total from investment operations | 0.91 | | 0.70 | | (2.35) | | 0.40 | | (0.20) | | 1.25 |
| Less distributions: | | | | | | | | | | | |
| From net investment income | (0.41) | | (0.39) | | (0.46) | | (0.48) | | (0.45) | | (0.50) |
| Return of capital | — | | — | | (0.04) | | — | | — | | — |
| Total distributions | (0.41) | | (0.39) | | (0.50) | | (0.48) | | (0.45) | | (0.50) |
| Net asset value at end of period | $ 7.69 | | $ 7.19 | | $ 6.88 | | $ 9.73 | | $ 9.81 | | $ 10.46 |
| Total investment return (b) | 12.69% | | 10.21% | | (24.93)% | | 4.00% | | (1.80)% | | 13.05% |
| Ratios (to average net assets)/Supplemental Data: | | | | | | | | | | | |
| Net investment income (loss) | 5.66%†† | | 5.57% | | 4.53% | | 3.58% | | 4.70% | | 4.78% |
| Net expenses (c) | 1.15%†† | | 1.15% | | 1.15% | | 1.16% | | 1.17% | | 1.23% |
| Expenses (before waiver/reimbursement) (c) | 1.40%†† | | 1.46% | | 1.36% | | 1.31% | | 1.33% | | 1.26% |
| Portfolio turnover rate | 54% | | 133% | | 116% | | 112% | | 102% | | 102% |
| Net assets at end of period (in 000’s) | $ 44,011 | | $ 43,665 | | $ 48,053 | | $ 81,092 | | $ 82,874 | | $ 93,472 |
| * | Unaudited. |
| †† | Annualized. |
| (a) | Per share data based on average shares outstanding during the period. |
| (b) | Total investment return is calculated exclusive of sales charges and assumes the reinvestment of dividends and distributions. For periods of less than one year, total return is not annualized. |
| (c) | In addition to the fees and expenses which the Fund bears directly, it also indirectly bears a pro-rata share of the fees and expenses of the underlying funds in which it invests. Such indirect expenses are not included in the above expense ratios. |
| | Six months ended
April 30,
2024* | | Year Ended October 31, |
| Investor Class | 2023 | | 2022 | | 2021 | | 2020 | | 2019 |
| Net asset value at beginning of period | $ 7.28 | | $ 6.96 | | $ 9.84 | | $ 9.91 | | $ 10.57 | | $ 9.80 |
| Net investment income (loss) (a) | 0.20 | | 0.38 | | 0.35 | | 0.33 | | 0.44 | | 0.47 |
| Net realized and unrealized gain (loss) | 0.70 | | 0.30 | | (2.77) | | 0.04 | | (0.68) | | 0.77 |
| Total from investment operations | 0.90 | | 0.68 | | (2.42) | | 0.37 | | (0.24) | | 1.24 |
| Less distributions: | | | | | | | | | | | |
| From net investment income | (0.39) | | (0.36) | | (0.43) | | (0.44) | | (0.42) | | (0.47) |
| Return of capital | — | | — | | (0.03) | | — | | — | | — |
| Total distributions | (0.39) | | (0.36) | | (0.46) | | (0.44) | | (0.42) | | (0.47) |
| Net asset value at end of period | $ 7.79 | | $ 7.28 | | $ 6.96 | | $ 9.84 | | $ 9.91 | | $ 10.57 |
| Total investment return (b) | 12.44% | | 9.73% | | (25.27)% | | 3.70% | | (2.20)% | | 12.82% |
| Ratios (to average net assets)/Supplemental Data: | | | | | | | | | | | |
| Net investment income (loss) | 5.22%†† | | 5.09% | | 4.14% | | 3.21% | | 4.38% | | 4.50% |
| Net expenses (c) | 1.59%†† | | 1.64% | | 1.56% | | 1.53% | | 1.49% | | 1.52% |
| Expenses (before waiver/reimbursement) (c) | 1.86%†† | | 1.95% | | 1.78% | | 1.70% | | 1.66% | | 1.56% |
| Portfolio turnover rate | 54% | | 133% | | 116% | | 112% | | 102% | | 102% |
| Net assets at end of period (in 000's) | $ 8,934 | | $ 8,436 | | $ 8,670 | | $ 12,806 | | $ 13,801 | | $ 16,024 |
| * | Unaudited. |
| †† | Annualized. |
| (a) | Per share data based on average shares outstanding during the period. |
| (b) | Total investment return is calculated exclusive of sales charges and assumes the reinvestment of dividends and distributions. For periods of less than one year, total return is not annualized. |
| (c) | In addition to the fees and expenses which the Fund bears directly, it also indirectly bears a pro-rata share of the fees and expenses of the underlying funds in which it invests. Such indirect expenses are not included in the above expense ratios. |
The notes to the financial statements are an integral part of, and should be read in conjunction with, the financial statements.
19
Financial Highlights selected per share data and ratios
| | Six months ended
April 30,
2024* | | Year Ended October 31, |
| Class C | 2023 | | 2022 | | 2021 | | 2020 | | 2019 |
| Net asset value at beginning of period | $ 7.03 | | $ 6.74 | | $ 9.54 | | $ 9.63 | | $ 10.27 | | $ 9.54 |
| Net investment income (loss) (a) | 0.17 | | 0.31 | | 0.27 | | 0.25 | | 0.36 | | 0.38 |
| Net realized and unrealized gain (loss) | 0.67 | | 0.28 | | (2.67) | | 0.03 | | (0.66) | | 0.74 |
| Total from investment operations | 0.84 | | 0.59 | | (2.40) | | 0.28 | | (0.30) | | 1.12 |
| Less distributions: | | | | | | | | | | | |
| From net investment income | (0.36) | | (0.30) | | (0.37) | | (0.37) | | (0.34) | | (0.39) |
| Return of capital | — | | — | | (0.03) | | — | | — | | — |
| Total distributions | (0.36) | | (0.30) | | (0.40) | | (0.37) | | (0.34) | | (0.39) |
| Net asset value at end of period | $ 7.51 | | $ 7.03 | | $ 6.74 | | $ 9.54 | | $ 9.63 | | $ 10.27 |
| Total investment return (b) | 12.04% | | 8.96% | | (25.90)% | | 2.87% | | (2.81)% | | 11.91% |
| Ratios (to average net assets)/Supplemental Data: | | | | | | | | | | | |
| Net investment income (loss) | 4.47%†† | | 4.34% | | 3.31% | | 2.52% | | 3.68% | | 3.78% |
| Net expenses (c) | 2.34%†† | | 2.39% | | 2.31% | | 2.28% | | 2.24% | | 2.27% |
| Expenses (before waiver/reimbursement) (c) | 2.61%†† | | 2.70% | | 2.52% | | 2.45% | | 2.40% | | 2.31% |
| Portfolio turnover rate | 54% | | 133% | | 116% | | 112% | | 102% | | 102% |
| Net assets at end of period (in 000’s) | $ 829 | | $ 878 | | $ 1,358 | | $ 3,511 | | $ 6,365 | | $ 11,150 |
| * | Unaudited. |
| †† | Annualized. |
| (a) | Per share data based on average shares outstanding during the period. |
| (b) | Total investment return is calculated exclusive of sales charges and assumes the reinvestment of dividends and distributions. For periods of less than one year, total return is not annualized. |
| (c) | In addition to the fees and expenses which the Fund bears directly, it also indirectly bears a pro-rata share of the fees and expenses of the underlying funds in which it invests. Such indirect expenses are not included in the above expense ratios. |
| | Six months ended
April 30,
2024* | | Year Ended October 31, |
| Class I | 2023 | | 2022 | | 2021 | | 2020 | | 2019 |
| Net asset value at beginning of period | $ 7.20 | | $ 6.89 | | $ 9.75 | | $ 9.82 | | $ 10.48 | | $ 9.72 |
| Net investment income (loss) (a) | 0.23 | | 0.43 | | 0.40 | | 0.39 | | 0.51 | | 0.52 |
| Net realized and unrealized gain (loss) | 0.69 | | 0.29 | | (2.74) | | 0.05 | | (0.69) | | 0.76 |
| Total from investment operations | 0.92 | | 0.72 | | (2.34) | | 0.44 | | (0.18) | | 1.28 |
| Less distributions: | | | | | | | | | | | |
| From net investment income | (0.42) | | (0.41) | | (0.48) | | (0.51) | | (0.48) | | (0.52) |
| Return of capital | — | | — | | (0.04) | | — | | — | | — |
| Total distributions | (0.42) | | (0.41) | | (0.52) | | (0.51) | | (0.48) | | (0.52) |
| Net asset value at end of period | $ 7.70 | | $ 7.20 | | $ 6.89 | | $ 9.75 | | $ 9.82 | | $ 10.48 |
| Total investment return (b) | 12.84% | | 10.52% | | (24.75)% | | 4.42% | | (1.59)% | | 13.46% |
| Ratios (to average net assets)/Supplemental Data: | | | | | | | | | | | |
| Net investment income (loss) | 5.96%†† | | 5.88% | | 4.89% | | 3.86% | | 5.09% | | 4.99% |
| Net expenses (c) | 0.85%†† | | 0.85% | | 0.85% | | 0.85% | | 0.85% | | 0.94% |
| Expenses (before waiver/reimbursement) (c) | 1.15%†† | | 1.21% | | 1.12% | | 1.06% | | 1.07% | | 1.01% |
| Portfolio turnover rate | 54% | | 133% | | 116% | | 112% | | 102% | | 102% |
| Net assets at end of period (in 000’s) | $ 8,060 | | $ 2,892 | | $ 3,637 | | $ 5,729 | | $ 6,687 | | $ 17,100 |
| * | Unaudited. |
| †† | Annualized. |
| (a) | Per share data based on average shares outstanding during the period. |
| (b) | Total investment return is calculated exclusive of sales charges and assumes the reinvestment of dividends and distributions. Class I shares are not subject to sales charges. For periods of less than one year, total return is not annualized. |
| (c) | In addition to the fees and expenses which the Fund bears directly, it also indirectly bears a pro-rata share of the fees and expenses of the underlying funds in which it invests. Such indirect expenses are not included in the above expense ratios. |
The notes to the financial statements are an integral part of, and should be read in conjunction with, the financial statements.
| 20 | MainStay Candriam Emerging Markets Debt Fund |
Notes to Financial Statements (Unaudited)
Note 1-Organization and Business
The MainStay Funds (the “Trust”) was organized on January 9, 1986, as a Massachusetts business trust. The Trust is registered under the Investment Company Act of 1940, as amended (the “1940 Act”), as an open-end management investment company, and is comprised of eleven funds (collectively referred to as the "Funds"). These financial statements and notes relate to the MainStay Candriam Emerging Markets Debt Fund (the "Fund"), a “diversified” fund, as that term is defined in the 1940 Act, as interpreted or modified by regulatory authorities having jurisdiction, from time to time.
The following table lists the Fund's share classes that have been registered and commenced operations:
| Class | Commenced Operations |
| Class A | June 1, 1998 |
| Investor Class | February 28, 2008 |
| Class C | September 1, 1998 |
| Class I | August 31, 2007 |
Effective at the close of business on February 20, 2024, all outstanding Class B shares converted into Class A or Investor Class shares pursuant to the applicable conversion schedule.
Class A and Investor Class shares are offered at net asset value (“NAV”) per share plus an initial sales charge. No initial sales charge applies to investments of $1 million or more (and certain other qualified purchases) in Class A and Investor Class shares. However, a CDSC of 1.00% may be imposed on certain redemptions made within 18 months of the date of purchase on shares that were purchased without an initial sales charge. Class C shares are offered at NAV without an initial sales charge, although a 1.00% CDSC may be imposed on certain redemptions of such shares made within one year of the date of purchase of Class C shares. Class I shares are offered at NAV without a sales charge. Depending upon eligibility, Class C shares convert to either Class A or Investor Class shares at the end of the calendar quarter eight years after the date they were purchased. Additionally, Investor Class shares may convert automatically to Class A shares. Under certain circumstances and as may be permitted by the Trust’s multiple class plan pursuant to Rule 18f-3 under the 1940 Act, specified share classes of the Fund may be converted to one or more other share classes of the Fund as disclosed in the capital share transactions within these Notes. The classes of shares have the same voting (except for issues that relate solely to one class), dividend, liquidation and other rights, and the same terms and conditions, except that under distribution plans pursuant to Rule 12b-1 under the 1940 Act, Class C shares are subject to higher distribution and/or service fees than Class A and Investor Class shares. Class I shares are not subject to a distribution and/or service fee.
The Fund's investment objective is to seek total return.
Note 2–Significant Accounting Policies
The Fund is an investment company and accordingly follows the investment company accounting and reporting guidance of the Financial Accounting Standards Board (“FASB”) Accounting Standards Codification Topic 946 Financial Services—Investment Companies. The Fund prepares its financial statements in accordance with generally accepted accounting principles (“GAAP”) in the United States of America and follows the significant accounting policies described below.
(A) Securities Valuation. Investments are usually valued as of the close of regular trading on the New York Stock Exchange (the "Exchange") (usually 4:00 p.m. Eastern time) on each day the Fund is open for business ("valuation date").
Pursuant to Rule 2a-5 under the 1940 Act, the Board of Trustees of the Trust (the "Board") has designated New York Life Investment Management LLC ("New York Life Investments" or the "Manager") as its Valuation Designee (the "Valuation Designee"). The Valuation Designee is responsible for performing fair valuations relating to all investments in the Fund’s portfolio for which market quotations are not readily available; periodically assessing and managing material valuation risks; establishing and applying fair value methodologies; testing fair valuation methodologies; evaluating and overseeing pricing services; ensuring appropriate segregation of valuation and portfolio management functions; providing quarterly, annual and prompt reporting to the Board, as appropriate; identifying potential conflicts of interest; and maintaining appropriate records. The Valuation Designee has established a valuation committee ("Valuation Committee") to assist in carrying out the Valuation Designee’s responsibilities and establish prices of securities for which market quotations are not readily available. The Fund's and the Valuation Designee's policies and procedures ("Valuation Procedures") govern the Valuation Designee’s selection and application of methodologies for determining and calculating the fair value of Fund investments. The Valuation Designee may value the Fund's portfolio securities for which market quotations are not readily available and other Fund assets utilizing inputs from pricing services and other third-party sources. The Valuation Committee meets (in person, via electronic mail or via teleconference) on an ad-hoc basis to determine fair valuations and on a quarterly basis to review fair value events with respect to certain securities for which market quotations are not readily available, including valuation risks and back-testing results, and to preview reports to the Board.
The Valuation Committee establishes prices of securities for which market quotations are not readily available based on such methodologies and measurements on a regular basis after considering information that is reasonably available and deemed relevant by the Valuation Committee. The Board shall oversee the Valuation Designee and review fair valuation materials on a prompt, quarterly and annual basis and approve proposed revisions to the Valuation Procedures.
Investments for which market quotations are not readily available are valued at fair value as determined in good faith pursuant to the Valuation Procedures. A market quotation is readily available only when that
Notes to Financial Statements (Unaudited) (continued)
quotation is a quoted price (unadjusted) in active markets for identical investments that the Fund can access at the measurement date, provided that a quotation will not be readily available if it is not reliable. "Fair value" is defined as the price the Fund would reasonably expect to receive upon selling an asset or liability in an orderly transaction to an independent buyer in the principal or most advantageous market for the asset or liability. Fair value measurements are determined within a framework that establishes a three-tier hierarchy that maximizes the use of observable market data and minimizes the use of unobservable inputs to establish a classification of fair value measurements for disclosure purposes. "Inputs" refer broadly to the assumptions that market participants would use in pricing the asset or liability, including assumptions about risk, such as the risk inherent in a particular valuation technique used to measure fair value using a pricing model and/or the risk inherent in the inputs for the valuation technique. Inputs may be observable or unobservable. Observable inputs reflect the assumptions market participants would use in pricing the asset or liability based on market data obtained from sources independent of the Fund. Unobservable inputs reflect the Fund’s own assumptions about the assumptions market participants would use in pricing the asset or liability based on the information available. The inputs or methodology used for valuing assets or liabilities may not be an indication of the risks associated with investing in those assets or liabilities. The three-tier hierarchy of inputs is summarized below.
| • | Level 1—quoted prices (unadjusted) in active markets for an identical asset or liability |
| • | Level 2—other significant observable inputs (including quoted prices for a similar asset or liability in active markets, interest rates and yield curves, prepayment speeds, credit risk, etc.) |
| • | Level 3—significant unobservable inputs (including the Fund's own assumptions about the assumptions that market participants would use in measuring fair value of an asset or liability) |
The level of an asset or liability within the fair value hierarchy is based on the lowest level of an input, both individually and in the aggregate, that is significant to the fair value measurement. The aggregate value by input level of the Fund’s assets and liabilities as of April 30, 2024, is included at the end of the Portfolio of Investments.
The Fund may use third-party vendor evaluations, whose prices may be derived from one or more of the following standard inputs, among others:
| • Benchmark yields | • Reported trades |
| • Broker/dealer quotes | • Issuer spreads |
| • Two-sided markets | • Benchmark securities |
| • Bids/offers | • Reference data (corporate actions or material event notices) |
| • Industry and economic events | • Comparable bonds |
| • Monthly payment information | |
An asset or liability for which a market quotation is not readily available is valued by methods deemed reasonable in good faith by the Valuation Committee, following the Valuation Procedures to represent fair value.
Under these procedures, the Valuation Designee generally uses a market-based approach which may use related or comparable assets or liabilities, recent transactions, market multiples, book values and other relevant information. The Valuation Designee may also use an income-based valuation approach in which the anticipated future cash flows of the asset or liability are discounted to calculate fair value. Discounts may also be applied due to the nature and/or duration of any restrictions on the disposition of the asset or liability. Fair value represents a good faith approximation of the value of a security. Fair value determinations involve the consideration of a number of subjective factors, an analysis of applicable facts and circumstances and the exercise of judgment. As a result, it is possible that the fair value for a security determined in good faith in accordance with the Valuation Procedures may differ from valuations for the same security determined for other funds using their own valuation procedures. Although the Valuation Procedures are designed to value a security at the price the Fund may reasonably expect to receive upon the security's sale in an orderly transaction, there can be no assurance that any fair value determination thereunder would, in fact, approximate the amount that the Fund would actually realize upon the sale of the security or the price at which the security would trade if a reliable market price were readily available. During the six-month period ended April 30, 2024, there were no material changes to the fair value methodologies.
Securities which may be valued in this manner include, but are not limited to: (i) a security for which trading has been halted or suspended or otherwise does not have a readily available market quotation on a given day; (ii) a debt security that has recently gone into default and for which there is not a current market quotation; (iii) a security of an issuer that has entered into a restructuring; (iv) a security that has been delisted from a national exchange; (v) a security subject to trading collars for which no or limited trading takes place; and (vi) a security whose principal market has been temporarily closed at a time when, under normal conditions, it would be open. Securities valued in this manner are generally categorized as Level 2 or 3 in the hierarchy.
Investments in mutual funds, including money market funds, are valued at their respective NAVs at the close of business each day on the valuation date. These securities are generally categorized as Level 1 in the hierarchy.
Futures contracts are valued at the last posted settlement price on the market where such futures are primarily traded. These securities are generally categorized as Level 1 in the hierarchy.
Debt securities (other than convertible and municipal bonds) are valued at the evaluated bid prices (evaluated mean prices in the case of convertible and municipal bonds) supplied by a pricing agent or broker selected by the Valuation Designee, in consultation with the Subadvisor. The evaluations are market-based measurements processed through a pricing application and represents the pricing agent’s good faith determination as to what a holder may receive in an orderly transaction under market conditions. The rules-based logic utilizes valuation techniques that reflect participants’ assumptions and vary by asset class and per methodology,
| 22 | MainStay Candriam Emerging Markets Debt Fund |
maximizing the use of relevant observable data including quoted prices for similar assets, benchmark yield curves and market corroborated inputs. The evaluated bid or mean prices are deemed by the Valuation Designee, in consultation with the Subadvisor, to be representative of market values at the regular close of trading of the Exchange on each valuation date. Debt securities purchased on a delayed delivery basis are marked to market daily until settlement at the forward settlement date. Debt securities, including corporate bonds, U.S. government and federal agency bonds, municipal bonds, foreign bonds, convertible bonds, asset-backed securities and mortgage-backed securities are generally categorized as Level 2 in the hierarchy.
Foreign currency forward contracts are valued at their fair market values measured on the basis of the mean between the last current bid and ask prices based on dealer or exchange quotations and are generally categorized as Level 2 in the hierarchy.
Temporary cash investments acquired in excess of 60 days to maturity at the time of purchase are valued using the latest bid prices or using valuations based on a matrix system (which considers such factors as security prices, yields, maturities and ratings), both as furnished by independent pricing services. Temporary cash investments that mature in 60 days or less at the time of purchase ("Short-Term Investments") are valued using the amortized cost method of valuation, unless the use of such method would be inappropriate. The amortized cost method involves valuing a security at its cost on the date of purchase and thereafter assuming a constant amortization to maturity of the difference between such cost and the value on maturity date. Amortized cost approximates the current fair value of a security. Securities valued using the amortized cost method are not valued using quoted prices in an active market and are generally categorized as Level 2 in the hierarchy.
The information above is not intended to reflect an exhaustive list of the methodologies that may be used to value portfolio investments. The Valuation Procedures permit the use of a variety of valuation methodologies in connection with valuing portfolio investments. The methodology used for a specific type of investment may vary based on the market data available or other considerations. The methodologies summarized above may not represent the specific means by which portfolio investments are valued on any particular business day.
(B) Income Taxes. The Fund's policy is to comply with the requirements of the Internal Revenue Code of 1986, as amended (the “Internal Revenue Code”), applicable to regulated investment companies and to distribute all of its taxable income to the shareholders of the Fund within the allowable time limits.
The Manager evaluates the Fund’s tax positions to determine if the tax positions taken meet the minimum recognition threshold in connection with accounting for uncertainties in income tax positions taken or expected to be taken for the purposes of measuring and recognizing tax liabilities in the financial statements. Recognition of tax benefits of an uncertain tax position is permitted only to the extent the position is “more likely than not” to be sustained assuming examination by taxing
authorities. The Manager analyzed the Fund's tax positions taken on federal, state and local income tax returns for all open tax years (for up to three tax years) and has concluded that no provisions for federal, state and local income tax are required in the Fund's financial statements. The Fund's federal, state and local income tax and federal excise tax returns for tax years for which the applicable statutes of limitations have not expired are subject to examination by the Internal Revenue Service and state and local departments of revenue.
(C) Dividends and Distributions to Shareholders. Dividends and distributions are recorded on the ex-dividend date. The Fund intends to declare and pay dividends from net investment income, if any, at least monthly and distributions from net realized capital and currency gains, if any, at least annually. Unless a shareholder elects otherwise, all dividends and distributions are reinvested at NAV in the same class of shares of the Fund. Dividends and distributions to shareholders are determined in accordance with federal income tax regulations and may differ from determinations using GAAP.
(D) Security Transactions and Investment Income. The Fund records security transactions on the trade date. Realized gains and losses on security transactions are determined using the identified cost method. Interest income is accrued as earned using the effective interest rate method. Distributions received from real estate investment trusts may be classified as dividends, capital gains and/or return of capital. Discounts and premiums on securities purchased for the Fund are accreted and amortized, respectively, on the effective interest rate method. Income from payment-in-kind securities, to the extent the Fund held any such securities during the six-month period ended April 30, 2024, is accreted daily based on the effective interest method.
Investment income and realized and unrealized gains and losses on investments of the Fund are allocated pro rata to the separate classes of shares based upon their relative net assets on the date the income is earned or realized and unrealized gains and losses are incurred.
The Fund may place a debt security on non-accrual status and reduce related interest income by ceasing current accruals and writing off all or a portion of any interest receivables when the collection of all or a portion of such interest has become doubtful. A debt security is removed from non-accrual status when the issuer resumes interest payments or when collectability of interest is reasonably assured.
(E) Expenses. Expenses of the Trust are allocated to the individual Funds in proportion to the net assets of the respective Funds when the expenses are incurred, except where direct allocations of expenses can be made. Expenses (other than transfer agent expenses and fees incurred under the shareholder services plans and/or the distribution plans further discussed in Note 3(B)) are allocated to separate classes of shares pro rata based upon their relative net assets on the date the expenses are incurred. The expenses borne by the Fund, including those of related parties to the Fund, are shown in the Statement of Operations.
Additionally, the Fund may invest in mutual funds, which are subject to management fees and other fees that may cause the costs of investing in
Notes to Financial Statements (Unaudited) (continued)
mutual funds to be greater than the costs of owning the underlying securities directly. These indirect expenses of mutual funds are not included in the amounts shown as expenses in the Statement of Operations or in the expense ratios included in the Financial Highlights.
(F) Use of Estimates. In preparing financial statements in conformity with GAAP, the Manager makes estimates and assumptions that affect the reported amounts and disclosures in the financial statements. Actual results could differ from those estimates and assumptions.
(G) Futures Contracts. A futures contract is an agreement to purchase or sell a specified quantity of an underlying instrument at a specified future date and price, or to make or receive a cash payment based on the value of a financial instrument (e.g., foreign currency, interest rate, security or securities index). The Fund is subject to risks such as market price risk, leverage risk, liquidity risk, counterparty risk, operational risk, legal risk and/or interest rate risk in the normal course of investing in these contracts. Upon entering into a futures contract, the Fund is required to pledge to the broker or futures commission merchant an amount of cash and/or U.S. government securities equal to a certain percentage of the collateral amount, known as the “initial margin.” During the period the futures contract is open, changes in the value of the contract are recognized as unrealized appreciation or depreciation by marking to market such contract on a daily basis to reflect the market value of the contract at the end of each day’s trading. The Fund agrees to receive from or pay to the broker or futures commission merchant an amount of cash equal to the daily fluctuation in the value of the contract. Such receipts or payments are known as “variation margin.” When the futures contract is closed, the Fund records a realized gain or loss equal to the difference between the proceeds from (or cost of) the closing transaction and the Fund's basis in the contract.
The use of futures contracts involves, to varying degrees, elements of market risk in excess of the amount recognized in the Statement of Assets and Liabilities. The contract or notional amounts and variation margin reflect the extent of the Fund's involvement in open futures positions. There are several risks associated with the use of futures contracts as hedging techniques. There can be no assurance that a liquid market will exist at the time when the Fund seeks to close out a futures contract. If no liquid market exists, the Fund would remain obligated to meet margin requirements until the position is closed. Futures contracts may involve a small initial investment relative to the risk assumed, which could result in losses greater than if the Fund did not invest in futures contracts. Futures contracts may be more volatile than direct investments in the instrument underlying the futures and may not correlate to the underlying instrument, causing a given hedge not to achieve its objectives. The Fund's activities in futures contracts have minimal counterparty risk as they are conducted through regulated exchanges that guarantee the futures against default by the counterparty. In the event of a bankruptcy or insolvency of a futures commission merchant that holds margin on behalf of the Fund, the Fund may not be entitled to the return of the entire margin owed to the Fund, potentially resulting in a loss. The Fund may invest in futures contracts to seek
enhanced returns or to reduce the risk of loss by hedging certain of its holdings. The Fund's investment in futures contracts and other derivatives may increase the volatility of the Fund's NAVs and may result in a loss to the Fund.
(H) Foreign Currency Forward Contracts. The Fund may enter into foreign currency forward contracts, which are agreements to buy or sell foreign currencies on a specified future date at a specified rate. The Fund is subject to foreign currency exchange rate risk in the normal course of investing in these transactions. During the period the forward contract is open, changes in the value of the contract are recognized as unrealized appreciation or depreciation by marking to market such contract on a daily basis to reflect the market value of the contract at the end of each day’s trading. Cash movement occurs on the settlement date. When the forward contract is closed, the Fund records a realized gain or loss equal to the difference between the proceeds from (or cost of) the closing transaction and the Fund's basis in the contract. The Fund may purchase and sell foreign currency forward contracts for purposes of seeking to enhance portfolio returns and manage portfolio risk more efficiently. Foreign currency forward contracts may also be used to gain exposure to a particular currency or to hedge against the risk of loss due to changing currency exchange rates. Foreign currency forward contracts to purchase or sell a foreign currency may also be used in anticipation of future purchases or sales of securities denominated in foreign currency, even if the specific investments have not yet been selected.
The use of foreign currency forward contracts involves, to varying degrees, elements of risk in excess of the amount recognized in the Statement of Assets and Liabilities, including counterparty risk, market risk, leverage risk, operational risk, legal risk and liquidity risk. Counterparty risk is heightened for these instruments because foreign currency forward contracts are not exchange-traded and therefore no clearinghouse or exchange stands ready to meet the obligations under such contracts. Thus, the Fund faces the risk that its counterparties under such contracts may not perform their obligations. Market risk is the risk that the value of a foreign currency forward contract will depreciate due to unfavorable changes in exchange rates. Liquidity risk arises because the secondary market for foreign currency forward contracts may have less liquidity relative to markets for other securities and financial instruments. Liquidity risk also can arise when forward currency contracts create margin or settlement payment obligations for the Fund. Leverage risk is the risk that a foreign currency forward contract can magnify the Fund's gains and losses. Operational risk refers to risk related to potential operational issues (including documentation issues, settlement issues, systems failures, inadequate controls and human error), and legal risk refers to insufficient documentation, insufficient capacity or authority of the counterparty, or legality or enforceability of a foreign currency forward contract. Risks also arise from the possible movements in the foreign exchange rates underlying these instruments. While the Fund may enter into forward contracts to reduce currency exchange risks, changes in currency exchange rates may result in poorer overall performance for the Fund than if it had not engaged in such transactions. Exchange rate movements can be large, depending on the currency, and can last for
| 24 | MainStay Candriam Emerging Markets Debt Fund |
extended periods of time, affecting the value of the Fund's assets. Moreover, there may be an imperfect correlation between the Fund's holdings of securities denominated in a particular currency and forward contracts entered into by the Fund. Such imperfect correlation may prevent the Fund from achieving the intended hedge or expose the Fund to the risk of currency exchange loss. The unrealized appreciation (depreciation) on forward contracts also reflects the Fund's exposure at the valuation date to credit loss in the event of a counterparty’s failure to perform its obligations.
(I) Foreign Currency Transactions. The Fund's books and records are maintained in U.S. dollars. Prices of securities denominated in foreign currency amounts are translated into U.S. dollars at the mean between the buying and selling rates last quoted by any major U.S. bank at the following dates:
(i) market value of investment securities, other assets and liabilities— at the valuation date; and
(ii) purchases and sales of investment securities, income and expenses—at the date of such transactions.
The assets and liabilities that are denominated in foreign currency amounts are presented at the exchange rates and market values at the close of the period. The realized and unrealized changes in net assets arising from fluctuations in exchange rates and market prices of securities are not separately presented.
Net realized gain (loss) on foreign currency transactions represents net currency gains or losses realized as a result of differences between the amounts of securities sale proceeds or purchase cost, dividends, interest and withholding taxes as recorded on the Fund's books, and the U.S. dollar equivalent amount actually received or paid. Net currency gains or losses from valuing such foreign currency denominated assets and liabilities, other than investments at valuation date exchange rates, are reflected in unrealized foreign exchange gains or losses.
(J) Securities Lending. In order to realize additional income, the Fund may engage in securities lending, subject to the limitations set forth in the 1940 Act and relevant guidance by the staff of the Securities and Exchange Commission (“SEC”). If the Fund engages in securities lending, the Fund will lend through its custodian, JPMorgan Chase Bank, N.A., ("JPMorgan"), acting as securities lending agent on behalf of the Fund. Under the current arrangement, JPMorgan will manage the Fund's collateral in accordance with the securities lending agency agreement between the Fund and JPMorgan, and indemnify the Fund against counterparty risk. The loans will be collateralized by cash (which may be invested in a money market fund) and/or non-cash collateral (which may include U.S. Treasury securities and/or U.S. government agency securities issued or guaranteed by the United States government or its agencies or instrumentalities) at least equal at all times to the market value of the securities loaned. Non-cash collateral held at year end is segregated and cannot be transferred by the Fund. The Fund bears the risk of delay in recovery of, or loss of rights in, the securities loaned. The Fund may also record a realized gain or loss on securities deemed sold due to a
borrower’s inability to return securities on loan. The Fund bears the risk of any loss on investment of cash collateral. The Fund will receive compensation for lending its securities in the form of fees or it will retain a portion of interest earned on the investment of any cash collateral. The Fund will also continue to receive interest and dividends on the securities loaned and any gain or loss in the market price of the securities loaned that may occur during the term of the loan will be for the account of the Fund. Income earned from securities lending activities, if any, is reflected in the Statement of Operations.
(K) High Yield and General Debt Securities Risk. The ability of issuers of debt securities held by the Fund to meet their obligations may be affected by, among other things, economic or political developments in a specific country, industry or region. Debt securities are also subject to the risks associated with changes in interest rates. The Fund’s principal investments include high yield debt securities (commonly referred to as “junk bonds”), which are considered speculative because they present a greater risk of loss, including default, than higher quality debt securities. These securities pay investors a premium—a higher interest rate or yield than investment grade debt securities—because of the increased risk of loss. These securities can also be subject to greater price volatility. In times of unusual or adverse market economic or political conditions, these securities may experience higher than normal default rates.
(L) Foreign Securities Risk and Emerging Markets Risk. The ability of issuers of debt securities held by the Fund to meet their obligations may be affected by, among other things, economic or political developments in a specific country, industry or region. Debt securities are also subject to the risks associated with changes in interest rates. The Fund may invest in foreign securities, which carry certain risks that are in addition to the usual risks inherent in domestic securities. Foreign regulatory regimes and securities markets can have less stringent investor protections and disclosure standards and less liquid trading markets than U.S. regulatory regimes and securities markets, and can experience political, social and economic developments that may affect the value of investments in foreign securities. These risks include those resulting from currency fluctuations, future adverse political or economic developments and possible imposition of currency exchange blockages or other foreign governmental laws or restrictions. Economic sanctions and other similar governmental actions or developments could, among other things, effectively restrict or eliminate the Fund’s ability to purchase or sell certain foreign securities or groups of foreign securities, and thus may make the Fund’s investments in such securities less liquid or more difficult to value. The ability of issuers of debt securities held by the Fund to meet their obligations may be affected by, among other things, economic or political developments in a specific country, industry or region.
The risks related to investing in foreign securities are generally greater with respect to securities of companies that conduct their business activities in emerging markets or whose securities are traded principally in emerging markets. The risks of investing in emerging markets include the risks of illiquidity, increased price volatility, smaller market
Notes to Financial Statements (Unaudited) (continued)
capitalizations, less government regulation, less extensive and less frequent accounting, financial and other reporting requirements, loss resulting from problems in share registration and custody, substantial economic and political disruptions and the nationalization of foreign deposits or assets.
(M) Counterparty Credit Risk. In order to better define its contractual rights and to secure rights that will help the Fund mitigate its counterparty risk, the Fund may enter into an International Swaps and Derivatives Association, Inc. Master Agreement (“ISDA Master Agreement”) or similar agreement with its counterparties. An ISDA Master Agreement is a bilateral agreement between the Fund and a counterparty that governs certain OTC derivatives and typically contains collateral posting terms and netting provisions. Under an ISDA Master Agreement, the Fund may, under certain circumstances, offset with the counterparty certain derivative financial instruments’ payables and/ or receivables with collateral held and/or posted and create one single net payment. The provisions of the ISDA Master Agreement typically permit a single net payment in the event of default including the bankruptcy or insolvency of the counterparty. Bankruptcy or insolvency laws of a particular jurisdiction may restrict or prohibit the right of offset in bankruptcy, insolvency or other events. In addition, certain ISDA Master Agreements may contain provisions for early termination of OTC derivative transactions in the event the net assets of the Fund decline below specific levels or if the Fund fails to meet the terms of its ISDA Master Agreements. The result would cause the Fund to accelerate payment of any net liability owed to the counterparty.
For financial reporting purposes, the Fund does not offset derivative assets and derivative liabilities that are subject to netting arrangements, if any, in the Statement of Assets and Liabilities.
(N) Indemnifications. Under the Trust’s organizational documents, its officers and trustees are indemnified against certain liabilities that may arise out of performance of their duties to the Trust. Additionally, in the normal course of business, the Fund enters into contracts with third-party service providers that contain a variety of representations and warranties and that may provide general indemnifications. The Fund's maximum exposure under these arrangements is unknown, as this would involve future claims that may be made against the Fund that have not yet occurred. The Manager believes that the risk of loss in connection with these potential indemnification obligations is remote. However, there can be no assurance that material liabilities related to such obligations will not arise in the future, which could adversely impact the Fund.
(O) Quantitative Disclosure of Derivative Holdings. The following tables show additional disclosures related to the Fund's derivative and hedging activities, including how such activities are accounted for and their effect on the Fund's financial positions, performance and cash flows.
The Fund entered into futures contracts to hedge against anticipated changes in interest rates that might otherwise have an adverse effect
upon the value of the Fund’s securities as well as help manage the duration and yield curve positioning of the portfolio.
The Fund also entered into foreign currency forward contracts to gain exposure to a particular currency or to hedge against the risk of loss due to changing currency exchange rates.
Fair value of derivative instruments as of April 30, 2024:
| Asset Derivatives | Foreign
Exchange
Contracts
Risk | Total |
| Forward Contracts - Unrealized appreciation on foreign currency forward contracts | $33,469 | $33,469 |
| Total Fair Value | $33,469 | $33,469 |
| Liability Derivatives | Foreign
Exchange
Contracts
Risk | Interest
Rate
Contracts
Risk | Total |
| Futures Contracts - Net Assets—Net unrealized depreciation on futures contracts (a) | $ — | $(74,692) | $(74,692) |
| Forward Contracts - Unrealized depreciation on foreign currency forward contracts | (22,546) | — | (22,546) |
| Total Fair Value | $(22,546) | $(74,692) | $(97,238) |
| (a) | Includes cumulative appreciation (depreciation) of futures contracts as reported in the Portfolio of Investments. Only current day’s variation margin is reported within the Statement of Assets and Liabilities. |
The effect of derivative instruments on the Statement of Operations for the six-month period ended April 30, 2024:
| Net Realized Gain (Loss) from: | Foreign
Exchange
Contracts
Risk | Interest
Rate
Contracts
Risk | Total |
| Futures Transactions | $ — | $161,445 | $ 161,445 |
| Forward Transactions | (128,158) | — | (128,158) |
| Total Net Realized Gain (Loss) | $(128,158) | $161,445 | $ 33,287 |
| Net Change in Unrealized Appreciation (Depreciation) | Foreign
Exchange
Contracts
Risk | Interest
Rate
Contracts
Risk | Total |
| Futures Contracts | $ — | $481,561 | $481,561 |
| Forward Contracts | 40,229 | — | 40,229 |
| Total Net Change in Unrealized Appreciation (Depreciation) | $40,229 | $481,561 | $521,790 |
| 26 | MainStay Candriam Emerging Markets Debt Fund |
| Average Notional Amount | Total |
| Futures Contracts Long | $ 9,105,672 |
| Forward Contracts Long (a) | $ 2,041,369 |
| Forward Contracts Short | $(13,551,635) |
| (a) | Positions were open three months during the reporting period. |
Note 3–Fees and Related Party Transactions
(A) Manager and Subadvisor. New York Life Investments, a registered investment adviser and an indirect, wholly-owned subsidiary of New York Life Insurance Company ("New York Life"), serves as the Fund's Manager, pursuant to an Amended and Restated Management Agreement (“Management Agreement”). The Manager provides offices, conducts clerical, recordkeeping and bookkeeping services and keeps most of the financial and accounting records required to be maintained by the Fund. Except for the portion of salaries and expenses that are the responsibility of the Fund, the Manager pays the salaries and expenses of all personnel affiliated with the Fund and certain operational expenses of the Fund. The Fund reimburses New York Life Investments in an amount equal to the portion of the compensation of the Chief Compliance Officer attributable to the Fund. Candriam (the "Subadvisor"), a registered investment adviser and an indirect, wholly-owned subsidiary of New York Life, serves as the Subadvisor to the Fund and is responsible for the day-to-day portfolio management of the Fund. Pursuant to the terms of a Subadvisory Agreement ("Subadvisory Agreement") between New York Life Investments and Candriam, New York Life Investments pays for the services of the Subadvisor.
Pursuant to the Management Agreement, the Fund pays the Manager a monthly fee for the services performed and the facilities furnished at an annual rate of the Fund’s average daily net assets as follows: 0.70% to $500 million and 0.65% in excess of $500 million. During the six-month period ended April 30, 2024, the effective management fee rate was 0.70% of the Fund’s average daily net assets, exclusive of any applicable waivers/reimbursements.
New York Life Investments has contractually agreed to waive fees and/or reimburse expenses so that Total Annual Fund Operating Expenses (excluding taxes, interest, litigation, extraordinary expenses, brokerage and other transaction expenses relating to the purchase or sale of portfolio investments and acquired (underlying) fund fees and expenses) do not exceed the following percentages of daily net assets: Class A, 1.15% and Class I, 0.85%. New York Life Investments will apply an equivalent waiver or reimbursement, in an equal number of basis points of the Class A shares waiver/reimbursement to the Investor Class, Class B and Class C shares. This agreement will remain in effect until February 28, 2025, and shall renew automatically for one-year terms unless New York Life Investments provides written notice of termination prior to the start of the next term or upon approval of the Board.
During the six-month period ended April 30, 2024, New York Life Investments earned fees from the Fund in the amount of $219,173 and
waived fees and/or reimbursed expenses, including the waiver/reimbursement of certain class specific expenses in the amount of $81,814 and paid the Subadvisor fees in the amount of $69,147.
JPMorgan provides sub-administration and sub-accounting services to the Fund pursuant to an agreement with New York Life Investments. These services include calculating the daily NAVs of the Fund, maintaining the general ledger and sub-ledger accounts for the calculation of the Fund's NAVs, and assisting New York Life Investments in conducting various aspects of the Fund's administrative operations. For providing these services to the Fund, JPMorgan is compensated by New York Life Investments.
Pursuant to an agreement between the Trust and New York Life Investments, New York Life Investments is responsible for providing or procuring certain regulatory reporting services for the Fund. The Fund will reimburse New York Life Investments for the actual costs incurred by New York Life Investments in connection with providing or procuring these services for the Fund.
(B) Distribution and Service Fees. The Trust, on behalf of the Fund, has entered into a distribution agreement with NYLIFE Distributors LLC (the “Distributor”), an affiliate of New York Life Investments. The Fund has adopted distribution plans (the “Plans”) in accordance with the provisions of Rule 12b-1 under the 1940 Act.
Pursuant to the Class A and Investor Class Plans, the Distributor receives a monthly fee from the Class A and Investor Class shares at an annual rate of 0.25% of the average daily net assets of the Class A and Investor Class shares for distribution and/or service activities as designated by the Distributor. Pursuant to the Class B and Class C Plans, Class B and Class C shares pay the Distributor a monthly distribution fee at an annual rate of 0.75% of the average daily net assets of the Class B and Class C shares along with a service fee at an annual rate of 0.25% of the average daily net assets of the Class B and Class C shares, for a total 12b-1 fee of 1.00%. Class I shares are not subject to a distribution and/or service fee.
The Plans provide that the distribution and service fees are payable to the Distributor regardless of the amounts actually expended by the Distributor for distribution of the Fund's shares and service activities.
(C) Sales Charges. The Fund was advised by the Distributor that the amount of initial sales charges retained on sales of Class A and Investor Class shares during the six-month period ended April 30, 2024, were $951 and $298, respectively.
The Fund was also advised that the Distributor retained CDSCs on redemptions of Class A shares during the six-month period ended April 30, 2024, of $53.
(D) Transfer, Dividend Disbursing and Shareholder Servicing Agent. NYLIM Service Company LLC, an affiliate of New York Life Investments, is the Fund's transfer, dividend disbursing and shareholder servicing agent pursuant to an agreement between NYLIM Service Company LLC and the Trust. NYLIM Service Company LLC has entered
Notes to Financial Statements (Unaudited) (continued)
into an agreement with SS&C Global Investor & Distribution Solutions, Inc. ("SS&C"), pursuant to which SS&C performs certain transfer agent services on behalf of NYLIM Service Company LLC. New York Life Investments has contractually agreed to limit the transfer agency expenses charged to the Fund’s share classes to a maximum of 0.35% of that share class’s average daily net assets on an annual basis after deducting any applicable Fund or class-level expense reimbursement or small account fees. This agreement will remain in effect until February 28, 2025, and shall renew automatically for one-year terms unless New York Life Investments provides written notice of termination prior to the start of the next term or upon approval of the Board. During the six-month period ended April 30, 2024, transfer agent expenses incurred by the Fund and any reimbursements, pursuant to the aforementioned Transfer Agency expense limitation agreement, were as follows:
| Class | Expense | Waived |
| Class A | $35,551 | $ — |
| Investor Class | 27,743 | (825) |
| Class B* | 378 | (46) |
| Class C | 2,729 | (63) |
| Class I | 6,382 | — |
| * | Effective at the close of business on February 20, 2024, all outstanding Class B shares converted into Class A or Investor Class shares pursuant to the applicable conversion schedule . |
(E) Small Account Fee. Shareholders with small accounts adversely impact the cost of providing transfer agency services. In an effort to reduce total transfer agency expenses, the Fund has implemented a small account fee on certain types of accounts. As described in the Fund's prospectus, certain shareholders with an account balance of less than $1,000 ($5,000 for Class A share accounts) are charged an annual per account fee of $20 (assessed semi-annually), the proceeds from which offset transfer agent fees as reflected in the Statement of Operations. This small account fee will not apply to certain types of accounts as described further in the Fund’s prospectus.
Note 4-Federal Income Tax
As of April 30, 2024, the cost and unrealized appreciation (depreciation) of the Fund’s investment portfolio, including applicable derivative contracts and other financial instruments, as determined on a federal income tax basis, were as follows:
| | Federal Tax
Cost | Gross
Unrealized
Appreciation | Gross
Unrealized
(Depreciation) | Net
Unrealized
Appreciation/
(Depreciation) |
| Investments in Securities | $62,278,502 | $2,019,793 | $(5,732,320) | $(3,712,527) |
As of October 31, 2023, for federal income tax purposes, capital loss carryforwards of $34,675,783, as shown in the table below, were
available to the extent provided by the regulations to offset future realized gains of the Fund. Accordingly, no capital gains distributions are expected to be paid to shareholders until net gains have been realized in excess of such amounts.
Capital Loss
Available Through | Short-Term
Capital Loss
Amounts (000’s) | Long-Term
Capital Loss
Amounts (000’s) |
| Unlimited | $11,576 | $23,100 |
During the year ended October 31, 2023, the tax character of distributions paid as reflected in the Statements of Changes in Net Assets was as follows:
| | 2023 |
| Distributions paid from: | |
| Ordinary Income | $3,317,168 |
Note 5–Custodian
JPMorgan is the custodian of cash and securities held by the Fund. Custodial fees are charged to the Fund based on the Fund's net assets and/or the market value of securities held by the Fund and the number of certain transactions incurred by the Fund.
Note 6–Line of Credit
The Fund and certain other funds managed by New York Life Investments maintain a line of credit with a syndicate of banks in order to secure a source of funds for temporary purposes to meet unanticipated or excessive redemption requests.
Effective July 25, 2023, under the credit agreement (the “Credit Agreement”), the aggregate commitment amount is $600,000,000 with an additional uncommitted amount of $100,000,000. The commitment fee is an annual rate of 0.15% of the average commitment amount payable quarterly, regardless of usage, to JPMorgan, who serves as the agent to the syndicate. The commitment fee is allocated among the Fund and certain other funds managed by New York Life Investments based upon their respective net assets and other factors. Interest on any revolving credit loan is charged based upon the Federal Funds Rate, Daily Simple Secured Overnight Financing Rate ("SOFR") + 0.10%, or the Overnight Bank Funding Rate, whichever is higher. The Credit Agreement expires on July 23, 2024, although the Fund, certain other funds managed by New York Life Investments and the syndicate of banks may renew the Credit Agreement for an additional year on the same or different terms or enter into a credit agreement with a different syndicate of banks. Prior to July 25, 2023, the aggregate commitment amount and the commitment fee were the same as those under the current Credit Agreement. During the six-month period ended April 30, 2024, there were no borrowings made or outstanding with respect to the Fund under the Credit Agreement.
| 28 | MainStay Candriam Emerging Markets Debt Fund |
Note 7–Interfund Lending Program
Pursuant to an exemptive order issued by the SEC, the Fund, along with certain other funds managed by New York Life Investments, may participate in an interfund lending program. The interfund lending program provides an alternative credit facility that permits the Fund and certain other funds managed by New York Life Investments to lend or borrow money for temporary purposes directly to or from one another, subject to the conditions of the exemptive order. During the six-month period ended April 30, 2024, there were no interfund loans made or outstanding with respect to the Fund.
Note 8–Purchases and Sales of Securities (in 000’s)
During the six-month period ended April 30, 2024, purchases and sales of securities, other than short-term securities, were $36,039 and $30,602, respectively.
Note 9–Capital Share Transactions
Transactions in capital shares for the six-month period ended April 30, 2024 and the year ended October 31, 2023, were as follows:
| Class A | Shares | Amount |
| Six-month period ended April 30, 2024: | | |
| Shares sold | 467,818 | $ 3,569,512 |
| Shares issued to shareholders in reinvestment of distributions | 289,937 | 2,235,042 |
| Shares redeemed | (1,171,669) | (8,977,544) |
| Net increase (decrease) in shares outstanding before conversion | (413,914) | (3,172,990) |
| Shares converted into Class A (See Note 1) | 64,121 | 497,236 |
| Net increase (decrease) | (349,793) | $ (2,675,754) |
| Year ended October 31, 2023: | | |
| Shares sold | 2,366,984 | $ 17,206,042 |
| Shares issued to shareholders in reinvestment of distributions | 338,349 | 2,471,043 |
| Shares redeemed | (3,672,824) | (26,808,536) |
| Net increase (decrease) in shares outstanding before conversion | (967,491) | (7,131,451) |
| Shares converted into Class A (See Note 1) | 64,955 | 474,372 |
| Shares converted from Class A (See Note 1) | (9,556) | (70,346) |
| Net increase (decrease) | (912,092) | $ (6,727,425) |
| |
| Investor Class | Shares | Amount |
| Six-month period ended April 30, 2024: | | |
| Shares sold | 22,250 | $ 174,887 |
| Shares issued to shareholders in reinvestment of distributions | 56,451 | 440,456 |
| Shares redeemed | (62,180) | (485,556) |
| Net increase (decrease) in shares outstanding before conversion | 16,521 | 129,787 |
| Shares converted into Investor Class (See Note 1) | 13,729 | 105,609 |
| Shares converted from Investor Class (See Note 1) | (42,309) | (334,495) |
| Net increase (decrease) | (12,059) | $ (99,099) |
| Year ended October 31, 2023: | | |
| Shares sold | 15,228 | $ 112,580 |
| Shares issued to shareholders in reinvestment of distributions | 57,992 | 428,581 |
| Shares redeemed | (137,037) | (1,014,692) |
| Net increase (decrease) in shares outstanding before conversion | (63,817) | (473,531) |
| Shares converted into Investor Class (See Note 1) | 24,850 | 183,820 |
| Shares converted from Investor Class (See Note 1) | (47,268) | (349,057) |
| Net increase (decrease) | (86,235) | $ (638,768) |
| |
| Class B | Shares | Amount |
| Six-month period ended April 30, 2024: (a) | | |
| Shares issued to shareholders in reinvestment of distributions | 1,076 | $ 8,081 |
| Shares redeemed | (876) | (6,350) |
| Net increase (decrease) in shares outstanding before conversion | 200 | 1,731 |
| Shares converted from Class B (See Note 1) | (33,697) | (250,128) |
| Net increase (decrease) | (33,497) | $ (248,397) |
| Year ended October 31, 2023: | | |
| Shares sold | 97 | $ 688 |
| Shares issued to shareholders in reinvestment of distributions | 2,248 | 16,010 |
| Shares redeemed | (9,253) | (66,177) |
| Net increase (decrease) in shares outstanding before conversion | (6,908) | (49,479) |
| Shares converted from Class B (See Note 1) | (22,978) | (163,994) |
| Net increase (decrease) | (29,886) | $ (213,473) |
| |
Notes to Financial Statements (Unaudited) (continued)
| Class C | Shares | Amount |
| Six-month period ended April 30, 2024: | | |
| Shares sold | 922 | $ 6,885 |
| Shares issued to shareholders in reinvestment of distributions | 5,804 | 43,700 |
| Shares redeemed | (18,893) | (141,535) |
| Net increase (decrease) in shares outstanding before conversion | (12,167) | (90,950) |
| Shares converted from Class C (See Note 1) | (2,392) | (17,888) |
| Net increase (decrease) | (14,559) | $ (108,838) |
| Year ended October 31, 2023: | | |
| Shares sold | 4,802 | $ 34,292 |
| Shares issued to shareholders in reinvestment of distributions | 7,379 | 52,643 |
| Shares redeemed | (65,225) | (465,348) |
| Net increase (decrease) in shares outstanding before conversion | (53,044) | (378,413) |
| Shares converted from Class C (See Note 1) | (23,695) | (168,134) |
| Net increase (decrease) | (76,739) | $ (546,547) |
| |
| Class I | Shares | Amount |
| Six-month period ended April 30, 2024: | | |
| Shares sold | 812,073 | $ 6,063,562 |
| Shares issued to shareholders in reinvestment of distributions | 60,031 | 463,504 |
| Shares redeemed | (227,343) | (1,762,058) |
| Net increase (decrease) in shares outstanding before conversion | 644,761 | 4,765,008 |
| Shares converted from Class I (See Note 1) | (44) | (334) |
| Net increase (decrease) | 644,717 | $ 4,764,674 |
| Year ended October 31, 2023: | | |
| Shares sold | 61,692 | $ 452,559 |
| Shares issued to shareholders in reinvestment of distributions | 27,637 | 202,141 |
| Shares redeemed | (228,398) | (1,666,606) |
| Net increase (decrease) in shares outstanding before conversion | (139,069) | (1,011,906) |
| Shares converted into Class I (See Note 1) | 12,869 | 93,339 |
| Net increase (decrease) | (126,200) | $ (918,567) |
| (a) | Class B shares converted into Class A or Investor Class shares pursuant to the applicable conversion schedule and are no longer offered for sale as of February 20, 2024. |
Note 10–Other Matters
As of the date of this report, the Fund faces a heightened level of risk associated with current uncertainty, volatility and state of economies, financial markets, a high interest rate environment, and labor and health conditions around the world. Events such as war, acts of terrorism, recessions, rapid inflation, the imposition of economic sanctions, earthquakes, hurricanes, epidemics and pandemics and other unforeseen natural or human disasters may have broad adverse social, political and economic effects on the global economy, which could negatively impact
the value of the Fund's investments. Developments that disrupt global economies and financial markets may magnify factors that affect the Fund's performance.
Note 11–Subsequent Events
In connection with the preparation of the financial statements of the Fund as of and for the six-month period ended April 30, 2024, events and transactions subsequent to April 30, 2024, through the date the financial statements were issued, have been evaluated by the Manager for possible adjustment and/or disclosure. No subsequent events requiring financial statement adjustment or disclosure have been identified.
| 30 | MainStay Candriam Emerging Markets Debt Fund |
Board Consideration and Approval of Management Agreement and Subadvisory Agreement (Unaudited)
The continuation of the Management Agreement with respect to the MainStay Candriam Emerging Markets Debt Fund (“Fund”) and New York Life Investment Management LLC (“New York Life Investments”) and the Subadvisory Agreement between New York Life Investments and Candriam with respect to the Fund (together, “Advisory Agreements”) is subject to annual review and approval by the Board of Trustees of The MainStay Funds (“Board” of the “Trust”) in accordance with Section 15 of the Investment Company Act of 1940, as amended (“1940 Act”). At its December 6–7, 2023 meeting, the Board, including the Trustees who are not an “interested person” (as such term is defined in the 1940 Act) of the Trust (“Independent Trustees”) voting separately, unanimously approved the continuation of each of the Advisory Agreements for a one-year period.
In reaching the decision to approve the continuation of each of the Advisory Agreements, the Board considered information and materials furnished by New York Life Investments and Candriam in connection with an annual contract review process undertaken by the Board that took place at meetings of the Board and its Contracts Committee from September 2023 through December 2023, including information and materials furnished by New York Life Investments and Candriam in response to requests prepared on behalf of the Board, and in consultation with the Independent Trustees, by independent legal counsel to the Independent Trustees, which encompassed a variety of topics, including those summarized below. Information and materials requested by and furnished to the Board for consideration in connection with the contract review process included, among other items, reports on the Fund and “peer funds” prepared by Institutional Shareholder Services Inc. (“ISS”), an independent third-party service provider engaged by the Board to report objectively on the Fund’s investment performance, management fee and total expenses. The Board also considered information on the fees charged to other investment advisory clients of New York Life Investments and/or Candriam that follow investment strategies similar to those of the Fund, if any, and, when applicable, the rationale for differences in the Fund’s management and subadvisory fees and the fees charged to those other investment advisory clients. In addition, the Board considered information regarding the legal standards and fiduciary obligations applicable to its consideration of the continuation of each of the Advisory Agreements. The contract review process, including the structure and format for information and materials provided to the Board, has been developed in consultation with the Board. The Independent Trustees also met in executive sessions with their independent legal counsel and, for portions thereof, with senior management of New York Life Investments.
The Board’s deliberations with respect to the continuation of each of the Advisory Agreements reflect a year-long process, and the Board also took into account information furnished to the Board and its Committees throughout the year, as deemed relevant and appropriate by the Trustees, including, among other items, reports on investment performance of the Fund and investment-related matters for the Fund as well as presentations from New York Life Investments and, generally annually, Candriam personnel. In addition, the Board took into account other
information provided by New York Life Investments throughout the year, including, among other items, periodic reports on legal and compliance matters, risk management, portfolio turnover, brokerage commissions and non-advisory services provided to the Fund by New York Life Investments, as deemed relevant and appropriate by the Trustees.
In addition to information provided to the Board throughout the year, the Board received information in connection with its June 2023 meeting provided specifically in response to requests prepared on behalf of the Board, and in consultation with the Independent Trustees, by independent legal counsel to the Independent Trustees regarding the Fund’s distribution arrangements. In addition, the Board received information regarding the Fund’s asset levels, share purchase and redemption activity and the payment of Rule 12b-1 and/or certain other fees by the applicable share classes of the Fund, among other information.
In considering the continuation of each of the Advisory Agreements, the Trustees reviewed and evaluated the information and factors they believed to reasonably be necessary and appropriate in light of legal advice furnished to them by independent legal counsel to the Independent Trustees and through the exercise of their own business judgment. Although individual Trustees may have weighed certain factors or information differently and the Board did not consider any single factor or information controlling in reaching its decision, the factors that figured prominently in the Board’s consideration of the continuation of each of the Advisory Agreements are summarized in more detail below and include, among other factors: (i) the nature, extent and quality of the services provided to the Fund by New York Life Investments and Candriam; (ii) the qualifications of the portfolio managers of the Fund and the historical investment performance of the Fund, New York Life Investments and Candriam; (iii) the costs of the services provided, and profits realized, by New York Life Investments and Candriam with respect to their relationships with the Fund; (iv) the extent to which economies of scale have been realized or may be realized if the Fund grows and the extent to which any economies of scale have been shared, have benefited or may benefit the Fund’s shareholders; and (v) the reasonableness of the Fund’s management and subadvisory fees and total ordinary operating expenses. Although the Board recognized that comparisons between the Fund’s fees and expenses and those of other funds are imprecise given different terms of agreements, variations in fund strategies and other factors, the Board considered the reasonableness of the Fund’s management fee and total ordinary operating expenses as compared to the peer funds identified by ISS. Throughout their considerations, the Trustees acknowledged the commitment of New York Life Investments and its affiliates to serve the MainStay Group of Funds, as well as their capacity, experience, resources, financial stability and reputations. The Trustees also acknowledged the entrepreneurial and other risks assumed by New York Life Investments in sponsoring and managing the Fund. With respect to the Subadvisory Agreement, the Board took into account New York Life Investments’ recommendation to approve the continuation of the Subadvisory Agreement.
Board Consideration and Approval of Management Agreement and Subadvisory Agreement (Unaudited) (continued)
The Trustees noted that, throughout the year, the Trustees are afforded an opportunity to ask questions of, and request additional information or materials from, New York Life Investments and Candriam. The Board’s decision with respect to each of the Advisory Agreements may have also been based, in part, on the Board’s knowledge of New York Life Investments and Candriam resulting from, among other things, the Board’s consideration of each of the Advisory Agreements in prior years, the advisory agreements for other funds in the MainStay Group of Funds, the Board’s review throughout the year of the performance and operations of other funds in the MainStay Group of Funds and each Trustee’s business judgment and industry experience. In addition to considering the above-referenced factors, the Board observed that in the marketplace there are a range of investment options available to investors and that the Fund’s shareholders, having had the opportunity to consider other investment options, have invested in the Fund.
The factors that figured prominently in the Board’s decision to approve the continuation of each of the Advisory Agreements during the Board’s December 6–7, 2023 meeting are summarized in more detail below.
Nature, Extent and Quality of Services Provided by New York Life Investments and Candriam
The Board examined the nature, extent and quality of the services that New York Life Investments provides to the Fund. The Board evaluated New York Life Investments’ experience and capabilities in serving as manager of the Fund and considered that the Fund operates in a “manager-of-managers” structure. The Board also considered New York Life Investments’ responsibilities and services provided pursuant to this structure, including overseeing the services provided by Candriam, evaluating the performance of Candriam, making recommendations to the Board as to whether the Subadvisory Agreement should be renewed, modified or terminated and periodically reporting to the Board regarding the results of New York Life Investments’ evaluation and monitoring functions. The Board noted that New York Life Investments manages other mutual funds, serves a variety of other investment advisory clients, including other pooled investment vehicles, and has experience overseeing mutual fund service providers, including subadvisors. The Board considered the experience of senior personnel at New York Life Investments providing management and administrative and other non-advisory services to the Fund. The Board observed that New York Life Investments devotes significant resources and time to providing management and administrative and other non-advisory services to the Fund, including New York Life Investments’ oversight and due diligence reviews of Candriam and ongoing analysis of, and interactions with, Candriam with respect to, among other things, the Fund’s investment performance and risks as well as Candriam’s investment capabilities and subadvisory services with respect to the Fund.
The Board also considered the range of services that New York Life Investments provides to the Fund under the terms of the Management Agreement, including: (i) fund accounting and ongoing supervisory services provided by New York Life Investments’ Fund Administration and Accounting Group; (ii) investment supervisory and analytical services
provided by New York Life Investments’ Investment Consulting Group; (iii) compliance services provided by the Trust’s Chief Compliance Officer as well as New York Life Investments’ compliance department, including supervision and implementation of the Fund’s compliance program; (iv) legal services provided by New York Life Investments’ Office of the General Counsel; and (v) risk management monitoring and analysis by compliance and investment personnel. In addition, the Board considered New York Life Investments’ willingness to invest in personnel and other resources, such as cyber security, information security and business continuity planning, that may benefit the Fund and noted that New York Life Investments is responsible for compensating the Trust’s officers, except for a portion of the salary of the Trust’s Chief Compliance Officer. The Board recognized that New York Life Investments provides certain other non-advisory services to the Fund and has over time provided an increasingly broad array of non-advisory services to the MainStay Group of Funds as a result of regulatory and other developments.
The Board also examined the range, and the nature, extent and quality, of the investment advisory services that Candriam provides to the Fund and considered the terms of each of the Advisory Agreements. The Board evaluated Candriam’s experience and performance in serving as subadvisor to the Fund and advising other portfolios and Candriam’s track record and experience in providing investment advisory services as well as the experience of investment advisory, senior management and/or administrative personnel at Candriam. The Board considered New York Life Investments’ and Candriam’s overall resources, legal and compliance environment, capabilities, reputation, financial condition and history. In addition to information provided in connection with quarterly meetings with the Trust’s Chief Compliance Officer, the Board considered information regarding the compliance policies and procedures of New York Life Investments and Candriam and acknowledged their commitment to further developing and strengthening compliance programs that may relate to the Fund. The Board also considered Candriam’s ability to recruit and retain qualified investment professionals and willingness to invest in personnel and other resources that may benefit the Fund. In this regard, the Board considered the qualifications and experience of the Fund’s portfolio managers, the number of accounts managed by the portfolio managers and the method for compensating the portfolio managers.
In addition, the Board considered information provided by New York Life Investments and Candriam regarding their respective business continuity and disaster recovery plans.
Based on these considerations, among others, the Board concluded that the Fund would likely continue to benefit from the nature, extent and quality of these services.
Investment Performance
In evaluating the Fund’s investment performance, the Board considered investment performance results over various periods in light of the Fund’s investment objective, strategies and risks. The Board considered investment reports on, and analysis of, the Fund’s performance provided
| 32 | MainStay Candriam Emerging Markets Debt Fund |
to the Board throughout the year. These reports include, among other items, information on the Fund’s gross and net returns, the Fund’s investment performance compared to a relevant investment category and the Fund’s benchmark, the Fund’s risk-adjusted investment performance and the Fund’s investment performance as compared to peer funds, as appropriate, as well as portfolio attribution information and commentary on the effect of market conditions. The Board also considered information provided by ISS showing the investment performance of the Fund as compared to peer funds. In addition, the Board reviewed the methodology used by ISS to construct the group of peer funds for comparative purposes.
The Board also took into account its discussions with senior management at New York Life Investments concerning the Fund’s investment performance over various periods as well as discussions between representatives of Candriam and the members of the Board’s Investment Committee, which generally occur on an annual basis. In considering the investment performance of the Fund, the Board noted that the Fund underperformed its peer funds for the three-, five- and ten-year periods ended July 31, 2023, and performed in line with its peer funds for the one-year period ended July 31, 2023. The Board considered its discussions with representatives from New York Life Investments and Candriam regarding the Fund’s investment performance.
Based on these considerations, among others, the Board concluded that its review of the Fund’s investment performance and related information supported a determination to approve the continuation of each of the Advisory Agreements.
Costs of the Services Provided, and Profits and Other Benefits Realized, by New York Life Investments and Candriam
The Board considered the costs of the services provided under each of the Advisory Agreements. The Board also considered the profitability of New York Life Investments and its affiliates, including Candriam, due to their relationships with the Fund as well as of New York Life Investments and its affiliates due to their relationships with the MainStay Group of Funds. Because Candriam is an affiliate of New York Life Investments whose subadvisory fee is paid by New York Life Investments, not the Fund, the Board considered cost and profitability information for New York Life Investments and Candriam in the aggregate.
In addition, the Board acknowledged the difficulty in obtaining reliable comparative data about mutual fund managers’ profitability because such information generally is not publicly available and may be impacted by numerous factors, including the structure of a fund manager’s organization, the types of funds it manages, the methodology used to allocate certain fixed costs to specific funds and the manager’s capital structure and costs of capital.
In evaluating the costs of the services provided by New York Life Investments and Candriam, and profitability of New York Life Investments and its affiliates, including Candriam, due to their relationships with the Fund, the Board considered, among other factors, New York Life
Investments’ and its affiliates’, including Candriam’s, continuing investments in, or willingness to invest in, personnel and other resources that may support and further enhance the management of the Fund, and that New York Life Investments is responsible for paying the subadvisory fee for the Fund. The Board also considered the financial resources of New York Life Investments and Candriam and acknowledged that New York Life Investments and Candriam must be in a position to recruit and retain experienced professional personnel and to maintain a strong financial position for New York Life Investments and Candriam to continue to provide high-quality services to the Fund. The Board recognized that the Fund benefits from the allocation of certain fixed costs among the funds in the MainStay Group of Funds, among other expected benefits resulting from its relationship with New York Life Investments.
The Board considered information regarding New York Life Investments’ methodology for calculating profitability and allocating costs provided by New York Life Investments in connection with the fund profitability analysis presented to the Board. The Board concluded that New York Life Investments’ methods for allocating costs and procedures for estimating overall profitability of the relationship with the funds in the MainStay Group of Funds were reasonable. The Board recognized the difficulty in calculating and evaluating a manager’s profitability with respect to the Fund and considered that other profitability methodologies may also be reasonable.
The Board also considered certain fall-out benefits that may be realized by New York Life Investments and its affiliates, including Candriam, due to their relationships with the Fund, including reputational and other indirect benefits. In addition, the Board considered its review of the management agreement for a money market fund advised by New York Life Investments and an affiliated subadvisor that serves as an investment option for the Fund, including the potential rationale for and costs associated with investments in this money market fund by the Fund, if any, and considered information from New York Life Investments that the nature and type of specific investment advisory services provided to this money market fund are distinct from, or in addition to, the investment advisory services provided to the Fund.
The Board observed that, in addition to fees earned by New York Life Investments under the Management Agreement for managing the Fund, New York Life Investments’ affiliates also earn revenues from serving the Fund in various other capacities, including as the Fund’s transfer agent and distributor. The Board considered information about these other revenues and their impact on the profitability of the relationship with the Fund to New York Life Investments and its affiliates. The Board noted that, although it assessed the overall profitability of the relationship with the Fund to New York Life Investments and its affiliates as part of the contract review process, when considering the reasonableness of the fee paid to New York Life Investments under the Management Agreement, the Board considered the profitability of New York Life Investments’ relationship with the Fund on a pre-tax basis and without regard to distribution expenses incurred by New York Life Investments from its own resources.
Board Consideration and Approval of Management Agreement and Subadvisory Agreement (Unaudited) (continued)
After evaluating the information deemed relevant by the Trustees, the Board concluded that any profits realized by New York Life Investments and its affiliates, including Candriam, due to their relationships with the Fund were not excessive and other expected benefits that may accrue to New York Life Investments and its affiliates, including Candriam, are reasonable.
Management and Subadvisory Fees and Total Ordinary Operating Expenses
The Board evaluated the reasonableness of the fee paid under each of the Advisory Agreements and the Fund’s total ordinary operating expenses. With respect to the management fee and subadvisory fee, the Board primarily considered the reasonableness of the management fee paid by the Fund to New York Life Investments because the subadvisory fee paid to Candriam is paid by New York Life Investments, not the Fund. The Board also considered the reasonableness of the subadvisory fee paid by New York Life Investments and the amount of the management fee retained by New York Life Investments.
In assessing the reasonableness of the Fund’s fees and expenses, the Board primarily considered comparative data provided by ISS on the fees and expenses of similar mutual funds managed by other investment advisers. The Board reviewed the methodology used by ISS to construct the group of peer funds for comparative purposes. In addition, the Board considered information provided by New York Life Investments and Candriam on fees charged to other investment advisory clients, including institutional separate accounts and/or other funds, that follow investment strategies similar to those of the Fund, if any. The Board considered the contractual management fee schedule for the Fund as compared to those for such other investment advisory clients, taking into account the rationale for differences in fee schedules. The Board also took into account information provided by New York Life Investments about the more extensive scope of services provided to registered investment companies, such as the Fund, as compared with other investment advisory clients. Additionally, the Board considered the impact of contractual breakpoints, voluntary waivers and expense limitation arrangements on the Fund’s net management fee and expenses. The Board also considered that in proposing fees for the Fund, New York Life Investments considers the competitive marketplace for mutual funds.
The Board took into account information from New York Life Investments, as provided in connection with the Board’s June 2023 meeting, regarding the reasonableness of the Fund’s transfer agent fee schedule, including industry data demonstrating that the fees that NYLIM Service Company LLC, an affiliate of New York Life Investments and the Fund’s transfer agent, charges the Fund are within the range of fees charged by transfer agents to other mutual funds. In addition, the Board considered NYLIM Service Company LLC’s profitability in connection with the transfer agent services it provides to the Fund. The Board also took into account information provided by NYLIM Service Company LLC regarding the sub-transfer agency payments it made to intermediaries in connection with the provision of sub-transfer agency services to the Fund.
The Board considered the extent to which transfer agent fees contributed to the total expenses of the Fund. The Board acknowledged the role that the MainStay Group of Funds historically has played in serving the investment needs of New York Life Insurance Company customers, who often maintain smaller account balances than other shareholders of funds, and the impact of small accounts on the expense ratios of Fund share classes. The Board also recognized measures that it and New York Life Investments have taken that are intended to mitigate the effect of small accounts on the expense ratios of Fund share classes, including through the imposition of an expense limitation on net transfer agency expenses. The Board also considered that NYLIM Service Company LLC had waived its contractual cost of living adjustments during certain years.
Based on the factors outlined above, among other considerations, the Board concluded that the Fund’s management fee and total ordinary operating expenses are within a range that is competitive and support a conclusion that these fees and expenses are reasonable.
Economies of Scale
The Board considered information regarding economies of scale, including whether economies of scale may exist with respect to the Fund and whether the Fund’s management fee and expense structure permits any economies of scale to be appropriately shared with the Fund’s shareholders. The Board also considered a report from New York Life Investments, previously prepared at the request of the Board, that addressed economies of scale, including with respect to the mutual fund business generally, and the various ways in which the benefits of economies of scale may be shared with the funds in the MainStay Group of Funds. Although the Board recognized the difficulty of determining economies of scale with precision, the Board acknowledged that economies of scale may be shared with the Fund in a number of ways, including, for example, through the imposition of fee breakpoints, initially setting management fee rates at scale or making additional investments to enhance the services provided to the Fund. The Board reviewed information from New York Life Investments showing how the Fund’s management fee schedule compared to fee schedules of other funds and accounts managed by New York Life Investments. The Board also reviewed information from ISS showing how the Fund’s management fee schedule compared with fees paid for similar services by peer funds at varying asset levels.
Based on this information, the Board concluded that economies of scale are appropriately shared for the benefit of the Fund’s shareholders through the Fund’s management fee and expense structure and other methods to share benefits from economies of scale.
Conclusion
On the basis of the information and factors summarized above, among other information and factors deemed relevant by the Trustees, and the evaluation thereof, the Board, including the Independent Trustees voting separately, unanimously voted to approve the continuation of each of the Advisory Agreements.
| 34 | MainStay Candriam Emerging Markets Debt Fund |
Discussion of the Operation and Effectiveness of the Fund's Liquidity Risk Management Program (Unaudited)
In compliance with Rule 22e-4 under the Investment Company Act of 1940, as amended (the “Liquidity Rule”), the Fund has adopted and implemented a liquidity risk management program (the “Program”), which New York Life Investment Management LLC believes is reasonably designed to assess and manage the Fund's liquidity risk. A Fund's liquidity risk is the risk that the Fund could not meet requests to redeem shares issued by the Fund without significant dilution of the remaining investors’ interests in the Fund. The Board of Trustees of The MainStay Funds (the "Board") previously approved the designation of New York Life Investment Management LLC as administrator of the Program (the “Administrator”). The Administrator has established a Liquidity Risk Management Committee to assist the Administrator in the implementation and day-to-day administration of the Program and to otherwise support the Administrator in fulfilling its responsibilities under the Program.
At a meeting of the Board held on February 27, 2024, the Administrator provided the Board with a written report addressing the Program’s operation and assessing the adequacy and effectiveness of its implementation for the period from January 1, 2023, through December 31, 2023 (the "Review Period"), as required under the Liquidity Rule. The report noted that the Administrator concluded that (i) the Program operated effectively to assess and manage the Fund's liquidity risk, (ii) the Program has been and continues to be adequately and effectively implemented to monitor and, as applicable, respond to the Fund's liquidity developments and (iii) the Fund's investment strategy continues to be appropriate for an open-end fund. In addition, the report summarized the operation of the Program and the information and factors considered by the Administrator in its assessment of the Program’s implementation, such as the liquidity risk assessment framework and the liquidity classification methodologies, and discussed notable geopolitical, market and other economic events that impacted liquidity risk during the Review Period.
In accordance with the Program, the Fund's liquidity risk is assessed no less frequently than annually taking into consideration certain factors, as applicable, such as (i) investment strategy and liquidity of portfolio investments, (ii) short-term and long-term cash flow projections, and (iii) holdings of cash and cash equivalents, as well as borrowing arrangements and other funding sources. Certain factors are considered under both normal and reasonably foreseeable stressed conditions.
Each Fund portfolio investment is classified into one of four liquidity categories. The classification is based on a determination of the number of days it is reasonably expected to take to convert the investment into cash, or sell or dispose of the investment, in current market conditions without significantly changing the market value of the investment. The Administrator has delegated liquidity classification determinations to the Fund’s subadvisor, subject to appropriate oversight by the Administrator, and liquidity classification determinations are made by taking into account the Fund's reasonably anticipated trade size, various market, trading and investment-specific considerations, as well as market depth, and, in certain cases, third-party vendor data.
The Liquidity Rule requires funds that do not primarily hold assets that are highly liquid investments to adopt a minimum amount of net assets that must be invested in highly liquid investments that are assets (an “HLIM”). In addition, the Liquidity Rule limits a fund's investments in illiquid investments. Specifically, the Liquidity Rule prohibits acquisition of illiquid investments if, immediately after acquisition, doing so would result in a fund holding more than 15% of its net assets in illiquid investments that are assets. The Program includes provisions reasonably designed to determine, periodically review and comply with the HLIM requirement, as applicable, and to comply with the 15% limit on illiquid investments.
There can be no assurance that the Program will achieve its objectives under all circumstances in the future. Please refer to the Fund's prospectus for more information regarding the Fund's exposure to liquidity risk and other risks to which it may be subject.
Proxy Voting Policies and Procedures and Proxy Voting Record
The Fund is required to file with the SEC its proxy voting record for the 12-month period ending June 30 on Form N-PX. A description of the policies and procedures that are used to vote proxies relating to portfolio securities of the Fund is available free of charge upon request by calling 800-624-6782 or visiting the SEC’s website at www.sec.gov. The most recent Form N-PX or proxy voting record is available free of charge upon request by calling 800-624-6782; visiting newyorklifeinvestments.com; or visiting the SEC’s website at www.sec.gov.
Shareholder Reports and Quarterly Portfolio Disclosure
The Fund is required to file its complete schedule of portfolio holdings with the SEC 60 days after its first and third fiscal quarter on Form N-PORT. The Fund's holdings report is available free of charge upon request by calling New York Life Investments at 800-624-6782.
| 36 | MainStay Candriam Emerging Markets Debt Fund |
This page intentionally left blank.
This page intentionally left blank.
Equity
U.S. Equity
MainStay Epoch U.S. Equity Yield Fund
MainStay Fiera SMID Growth Fund
MainStay PineStone U.S. Equity Fund
MainStay S&P 500 Index Fund
MainStay Winslow Large Cap Growth Fund
MainStay WMC Enduring Capital Fund
MainStay WMC Growth Fund
MainStay WMC Small Companies Fund
MainStay WMC Value Fund
International Equity
MainStay Epoch International Choice Fund
MainStay PineStone International Equity Fund
MainStay WMC International Research Equity Fund
Emerging Markets Equity
MainStay Candriam Emerging Markets Equity Fund
Global Equity
MainStay Epoch Capital Growth Fund
MainStay Epoch Global Equity Yield Fund
MainStay PineStone Global Equity Fund
Fixed Income
Taxable Income
MainStay Candriam Emerging Markets Debt Fund
MainStay Floating Rate Fund
MainStay MacKay High Yield Corporate Bond Fund
MainStay MacKay Short Duration High Income Fund
MainStay MacKay Strategic Bond Fund
MainStay MacKay Total Return Bond Fund
MainStay MacKay U.S. Infrastructure Bond Fund
MainStay Short Term Bond Fund
Tax-Exempt Income
MainStay MacKay Arizona Muni Fund
MainStay MacKay California Tax Free Opportunities Fund1
MainStay MacKay Colorado Muni Fund
MainStay MacKay High Yield Municipal Bond Fund
MainStay MacKay New York Tax Free Opportunities Fund2
MainStay MacKay Oregon Muni Fund
MainStay MacKay Short Term Municipal Fund
MainStay MacKay Strategic Municipal Allocation Fund
MainStay MacKay Tax Free Bond Fund
MainStay MacKay Utah Muni Fund
Money Market
MainStay Money Market Fund
Mixed Asset
MainStay Balanced Fund
MainStay Income Builder Fund
MainStay MacKay Convertible Fund
Speciality
MainStay CBRE Global Infrastructure Fund
MainStay CBRE Real Estate Fund
MainStay Cushing MLP Premier Fund
Asset Allocation
MainStay Conservative Allocation Fund
MainStay Conservative ETF Allocation Fund
MainStay Equity Allocation Fund
MainStay Equity ETF Allocation Fund
MainStay Growth Allocation Fund
MainStay Growth ETF Allocation Fund
MainStay Moderate Allocation Fund
MainStay Moderate ETF Allocation Fund
Manager
New York Life Investment Management LLC
New York, New York
Subadvisors
Candriam3
Strassen, Luxembourg
CBRE Investment Management Listed Real Assets LLC
Radnor, Pennsylvania
Cushing Asset Management, LP
Dallas, Texas
Epoch Investment Partners, Inc.
New York, New York
Fiera Capital Inc.
New York, New York
IndexIQ Advisors LLC3
New York, New York
MacKay Shields LLC3
New York, New York
NYL Investors LLC3
New York, New York
PineStone Asset Management Inc.
Montreal, Québec
Wellington Management Company LLP
Boston, Massachusetts
Winslow Capital Management, LLC
Minneapolis, Minnesota
Legal Counsel
Dechert LLP
Washington, District of Columbia
Independent Registered Public Accounting Firm
KPMG LLP
Philadelphia, Pennsylvania
Distributor
NYLIFE Distributors LLC3
Jersey City, New Jersey
Custodian
JPMorgan Chase Bank, N.A.
New York, New York
1.
This Fund is registered for sale in AZ, CA, NV, OR, TX, UT, WA (all share classes); and MI (Class A and Class I shares only); and CO, FL, GA, HI, ID, MA, MD, NH, NJ and NY (Class I and Class C2 shares only).
| 2. | This Fund is registered for sale in CA, CT, DE, FL, MA, NJ, NY, VT (all share classes) and SD (Class R6 shares only). |
| 3. | An affiliate of New York Life Investment Management LLC. |
Not part of the Semiannual Report
For more information
800-624-6782
newyorklifeinvestments.com
“New York Life Investments” is both a service mark, and the common trade name, of certain investment advisors affiliated with New York Life Insurance Company. The MainStay Funds® are managed by New York Life Investment Management LLC and distributed by NYLIFE Distributors LLC, 30 Hudson Street, Jersey City, NJ 07302, a wholly owned subsidiary of New York Life Insurance Company. NYLIFE Distributors LLC is a Member FINRA/SIPC.
©2024 NYLIFE Distributors LLC. All rights reserved.
| 5022300 MS081-24 | MSCEMD10-06/24 |
(NYLIM) NL218
MainStay Income Builder Fund
Message from the President and Semiannual Report
Unaudited | April 30, 2024
Special Notice:
Beginning in July 2024, new regulations issued by the Securities and Exchange Commission (SEC) will take effect requiring open-end mutual fund companies and ETFs to (1) overhaul the content of their shareholder reports and (2) mail paper copies of the new tailored shareholder reports to shareholders who have not opted to receive these documents electronically.
If you have not yet elected to receive your shareholder reports electronically, please contact your financial intermediary or visit newyorklifeinvestments.com/accounts.
| Not FDIC/NCUA Insured | Not a Deposit | May Lose Value | No Bank Guarantee | Not Insured by Any Government Agency |
This page intentionally left blank
Message from the President
Stock and bond markets gained broad ground during the six-month period ended April 30, 2024, bolstered by better-than-expected economic growth and the prospect of monetary easing in the face of a myriad of macroeconomic and geopolitical challenges.
Throughout the reporting period, interest rates remained at their highest levels in decades in most developed countries, with the U.S. federal funds rate in the 5.25%−5.50% range, as central banks struggled to bring inflation under control. Early in the reporting period, the U.S. Federal Reserve began to forecast interest rate cuts in 2024, but delayed action as inflation remained stubbornly high, fluctuating between 3.1% and 3.5%. Nevertheless, despite the increasing cost of capital and tighter lending environment that resulted from sustained high rates, economic growth remained surprisingly robust, supported by high levels of consumer spending, low unemployment and strong corporate earnings. Investors tended to shrug off concerns related to sticky inflation and high interest rates—not to mention the ongoing war in Ukraine, intensifying hostilities in the Middle East and simmering tensions between China and the United States—focusing instead on the positives of continued economic growth and surprisingly strong corporate profits.
The S&P 500® Index, a widely regarded benchmark of U.S. market performance, produced double-digit gains, reaching record levels in March 2024. Market strength, which had been narrowly focused on mega-cap, technology-related stocks during the previous six months broadened significantly during the reporting period. All industry sectors produced positive results, with the strongest returns in communication services, information technology and industrials, and more moderate gains in the lagging energy, real estate and consumer staples areas. Growth-oriented shares slightly outperformed value-oriented
issues, while large- and mid-cap stocks modestly outperformed their small-cap counterparts. Most overseas equity markets trailed the U.S. market, as developed international economies experienced relatively low growth rates, and weak economic conditions in China undermined emerging markets.
Bonds generally gained ground as well. The yield on the 10-year Treasury note ranged between approximately 4.7% and 3.8%, while the 2-year Treasury yield remained slightly higher, between approximately 5.0% and 4.1%, in an inverted curve pattern often viewed as indicative of an impending economic slowdown. Nevertheless, the prevailing environment of stable interest rates and attractive yields provided a favorable environment for fixed-income investors. Long-term Treasury bonds and investment-grade corporate bonds produced similar gains, while high yield bonds advanced by a slightly greater margin, despite the added risks implicit in an uptick in default rates. International bond markets modestly outperformed their U.S. counterparts, led by a rebound in the performance of emerging-markets debt.
The risks and uncertainties inherent in today’s markets call for the kind of insight and expertise that New York Life Investments offers through our one-on-one philosophy, long-lasting focus, and multi-boutique approach.
Thank you for trusting us to help you meet your investment needs.
Sincerely,
Kirk C. Lehneis
President
The opinions expressed are as of the date of this report and are subject to change. There is no guarantee that any forecast made will come to pass. This material does not constitute investment advice and is not intended as an endorsement of any specific investment. Past performance is no guarantee of future results.
Not part of the Semiannual Report
Investors should refer to the Fund’s Summary Prospectus and/or Prospectus and consider the Fund’s investment objectives, strategies, risks, charges and expenses carefully before investing. The Summary Prospectus and/or Prospectus contain this and other information about the Fund. You may obtain copies of the Fund’s Summary Prospectus, Prospectus and Statement of Additional Information, which includes information about The MainStay Funds' Trustees, free of charge, upon request, by calling toll-free 800-624-6782, by writing to NYLIFE Distributors LLC, Attn: MainStay Marketing Department, 30 Hudson Street, Jersey City, NJ 07302 or by sending an e-mail to MainStayShareholderServices@nylim.com. These documents are also available on dfinview.com/NYLIM. Please read the Fund’s Summary Prospectus and/or Prospectus carefully before investing.
Investment and Performance Comparison (Unaudited)
Performance data quoted represents past performance. Past performance is no guarantee of future results. Because of market volatility and other factors, current performance may be lower or higher than the figures shown. Investment return and principal value will fluctuate, and as a result, when shares are redeemed, they may be worth more or less than their original cost. The graph below depicts the historical performance of Class I shares of the Fund. Performance will vary from class to class based on differences in class-specific expenses and sales charges. For performance information current to the most recent month-end, please call 800-624-6782 or visit newyorklifeinvestments.com.
The performance table and graph do not reflect the deduction of taxes that a shareholder would pay on distributions or Fund share redemptions. Total returns reflect maximum applicable sales charges as indicated in the table below, if any, changes in share price, and reinvestment of dividend and capital gain distributions. The graph assumes the initial investment amount shown below and reflects the deduction of all sales charges that would have applied for the period of investment. Performance figures may reflect certain fee waivers and/or expense limitations, without which total returns may have been lower. For more information on share classes and current fee waivers and/or expense limitations (if any), please refer to the Notes to Financial Statements.

| Average Annual Total Returns for the Period-Ended April 30, 2024 |
| Class | Sales Charge | | Inception
Date | Six
Months1 | One
Year | Five
Years | Ten Years
or Since
Inception | Gross
Expense
Ratio2 |
| Class A Shares3 | Maximum 3.00% Initial Sales Charge | With sales charges | 1/3/1995 | 10.46% | 4.28% | 2.89% | 3.73% | 1.03% |
| | | Excluding sales charges | | 13.88 | 7.51 | 4.06 | 4.31 | 1.03 |
| Investor Class Shares4 | Maximum 2.50% Initial Sales Charge | With sales charges | 2/28/2008 | 10.95 | 4.55 | 2.68 | 3.55 | 1.29 |
| | | Excluding sales charges | | 13.79 | 7.23 | 3.85 | 4.14 | 1.29 |
| Class B Shares5 | Maximum 5.00% CDSC | With sales charges | 12/29/1987 | 8.36 | 1.47 | 2.73 | 3.36 | 2.04 |
| | if Redeemed Within the First Six Years of Purchase | Excluding sales charges | | 13.36 | 6.47 | 3.08 | 3.36 | 2.04 |
| Class C Shares | Maximum 1.00% CDSC | With sales charges | 9/1/1998 | 12.34 | 5.43 | 3.08 | 3.36 | 2.04 |
| | if Redeemed Within One Year of Purchase | Excluding sales charges | | 13.34 | 6.43 | 3.08 | 3.36 | 2.04 |
| Class I Shares | No Sales Charge | | 1/2/2004 | 14.03 | 7.80 | 4.31 | 4.58 | 0.78 |
| Class R6 Shares | No Sales Charge | | 2/28/2018 | 14.14 | 7.95 | 4.42 | 4.69 | 0.69 |
| SIMPLE Class Shares | No Sales Charge | | 8/31/2020 | 13.82 | 7.34 | N/A | 3.01 | 1.32 |
| 1. | Not annualized. |
| 2. | The gross expense ratios presented reflect the Fund’s “Total Annual Fund Operating Expenses” from the most recent Prospectus, as supplemented, and may differ from other expense ratios disclosed in this report. |
| 3. | Prior to November 4, 2019, the maximum initial sales charge applicable was 5.50%, which is reflected in the applicable average annual total return figures shown. |
| 4. | Prior to June 30, 2020, the maximum initial sales charge was 3.00%, which is reflected in the applicable average annual total return figures shown. |
| 5. | Class B shares are closed to all new purchases as well as additional investments by existing Class B shareholders. |
The footnotes on the next page are an integral part of the table and graph and should be carefully read in conjunction with them.
| Benchmark Performance* | Six
Months1 | One
Year | Five
Years | Ten
Years |
| MSCI World Index (Net)2 | 20.29% | 18.39% | 10.46% | 8.87% |
| Bloomberg U.S. Aggregate Bond Index3 | 4.97 | -1.47 | -0.16 | 1.20 |
| Blended Benchmark Index4 | 14.00 | 10.16 | 6.41 | 5.98 |
| Morningstar Global Allocation Category Average5 | 12.03 | 7.58 | 4.43 | 3.92 |
| * | Returns for indices reflect no deductions for fees, expenses or taxes, except for foreign withholding taxes where applicable. Results assume reinvestment of all dividends and capital gains. An investment cannot be made directly in an index. |
| 1. | Not annualized. |
| 2. | In accordance with new regulatory requirements, the Fund has selected the MSCI World Index (Net), which represents a broad measure of market performance, and is generally representative of the market sectors or types of investments in which the Fund invests. The MSCI World Index (Net) is a free float-adjusted market capitalization weighted index that is designed to measure the equity market performance of developed markets. |
| 3. | The Bloomberg U.S. Aggregate Bond Index is a broad-based benchmark that measures performance of the investment-grade, U.S. dollar-denominated, fixed-rate taxable bond market, including Treasuries, government-related and corporate securities, mortgage-backed securities (agency fixed-rate and hybrid adjustable-rate mortgage pass-throughs), asset-backed securities and commercial mortgage-backed securities. |
| 4. | The Blended Benchmark Index is comprised of the MSCI World Index (Net) and the Bloomberg U.S. Aggregate Bond Index weighted 60%/40%. |
| 5. | Morningstar Global Allocation Category Average funds seek to provide both capital appreciation and income by investing in three major areas: stocks, bonds, and cash. While these funds do explore the whole world, most of them focus on the U.S., Canada, Japan, and the larger markets in Europe. It is rare for such funds to invest more than 10% of their assets in emerging markets. These funds typically have at least 10% of assets in bonds, less than 70% of assets in stocks, and at least 40% of assets in non-U.S. stocks or bonds. |
The footnotes on the preceding page are an integral part of the table and graph and should be carefully read in conjunction with them.
| 6 | MainStay Income Builder Fund |
Cost in Dollars of a $1,000 Investment in MainStay Income Builder Fund (Unaudited)
The example below is intended to describe the fees and expenses borne by shareholders during the six-month period from November 1, 2023 to April 30, 2024, and the impact of those costs on your investment.
Example
As a shareholder of the Fund you incur two types of costs: (1) transaction costs, including exchange fees and sales charges (loads) on purchases (as applicable), and (2) ongoing costs, including management fees, distribution and/or service (12b-1) fees and other Fund expenses (as applicable). This example is intended to help you understand your ongoing costs (in dollars) of investing in the Fund and to compare these costs with the ongoing costs of investing in other mutual funds. The example is based on an investment of $1,000 made at the beginning of the six-month period and held for the entire period from November 1, 2023 to April 30, 2024.
This example illustrates your Fund’s ongoing costs in two ways:
Actual Expenses
The second and third data columns in the table below provide information about actual account values and actual expenses. You may use the information in these columns, together with the amount you invested, to estimate the expenses that you paid during the six months ended April 30, 2024. Simply divide your account value by $1,000 (for example, an $8,600 account value divided by $1,000 = 8.6), then multiply the
result by the number under the heading entitled “Expenses Paid During Period” to estimate the expenses you paid on your account during this period.
Hypothetical Example for Comparison Purposes
The fourth and fifth data columns in the table below provide information about hypothetical account values and hypothetical expenses based on the Fund’s actual expense ratio and an assumed rate of return of 5% per year before expenses, which is not the Fund’s actual return. The hypothetical account values and expenses may not be used to estimate the actual ending account balances or expenses you paid for the six-month period shown. You may use this information to compare the ongoing costs of investing in the Fund with the ongoing costs of investing in other mutual funds. To do so, compare this 5% hypothetical example with the 5% hypothetical examples that appear in the shareholder reports of the other mutual funds.
Please note that the expenses shown in the table are meant to highlight your ongoing costs only and do not reflect any transactional costs, such as exchange fees or sales charges (loads). Therefore, the fourth and fifth data columns of the table are useful in comparing ongoing costs only and will not help you determine the relative total costs of owning different funds. In addition, if these transactional costs were included, your costs would have been higher.
| Share Class | Beginning
Account
Value
11/1/23 | Ending Account
Value (Based
on Actual
Returns and
Expenses)
4/30/24 | Expenses
Paid
During
Period1 | Ending Account
Value (Based
on Hypothetical
5% Annualized
Return and
Actual Expenses)
4/30/24 | Expenses
Paid
During
Period1 | Net Expense
Ratio
During
Period2 |
| Class A Shares | $1,000.00 | $1,138.80 | $ 5.48 | $1,019.74 | $ 5.17 | 1.03% |
| Investor Class Shares | $1,000.00 | $1,137.90 | $ 6.80 | $1,018.50 | $ 6.42 | 1.28% |
| Class B Shares | $1,000.00 | $1,133.60 | $10.77 | $1,014.77 | $10.17 | 2.03% |
| Class C Shares | $1,000.00 | $1,133.40 | $10.77 | $1,014.77 | $10.17 | 2.03% |
| Class I Shares | $1,000.00 | $1,140.30 | $ 4.15 | $1,020.98 | $ 3.92 | 0.78% |
| Class R6 Shares | $1,000.00 | $1,141.40 | $ 3.62 | $1,021.48 | $ 3.42 | 0.68% |
| SIMPLE Class Shares | $1,000.00 | $1,138.20 | $ 6.59 | $1,018.70 | $ 6.22 | 1.24% |
| 1. | Expenses are equal to the Fund’s annualized expense ratio of each class multiplied by the average account value over the period, divided by 366 and multiplied by 182 (to reflect the six-month period). The table above represents the actual expenses incurred during the six-month period. In addition to the fees and expenses which the Fund bears directly, it also indirectly bears a pro rata share of the fees and expenses of the underlying funds in which it invests. Such indirect expenses are not included in the above-reported expense figures. |
| 2. | Expenses are equal to the Fund's annualized expense ratio to reflect the six-month period. |
Portfolio Composition as of April 30, 2024 (Unaudited)
See Portfolio of Investments beginning on page 9 for specific holdings within these categories. The Fund's holdings are subject to change.
Top Ten Holdings and/or Issuers Held as of April 30, 2024 (excluding short-term investments) (Unaudited)
| 1. | GNMA, (zero coupon)-7.888%, due 7/20/49–2/16/66 |
| 2. | FHLMC STACR REMIC Trust, 8.33%-13.13%, due 8/25/33–1/25/51 |
| 3. | UMBS, 30 Year, 2.50%-6.50%, due 8/1/48–3/1/54 |
| 4. | Connecticut Avenue Securities Trust, 7.83%-15.18%, due 11/25/39–2/25/44 |
| 5. | Broadcom, Inc. |
| 6. | Microsoft Corp. |
| 7. | UMBS Pool, 30 Year, 3.00%-6.50%, due 7/1/50–3/1/54 |
| 8. | International Business Machines Corp. |
| 9. | Coca-Cola Europacific Partners plc |
| 10. | Bank of America Corp. |
| 8 | MainStay Income Builder Fund |
Portfolio of Investments April 30, 2024†^(Unaudited)
| | Principal
Amount | Value |
| Long-Term Bonds 39.3% |
| Asset-Backed Securities 2.4% |
| Automobile Asset-Backed Securities 1.1% |
| American Credit Acceptance Receivables Trust (a) | | |
| Series 2021-2, Class D | | |
| 1.34%, due 7/13/27 | $ 624,145 | $ 612,169 |
| Series 2021-2, Class E | | |
| 2.54%, due 7/13/27 | 910,000 | 884,598 |
| CPS Auto Receivables Trust | | |
| Series 2021-C, Class E | | |
| 3.21%, due 9/15/28 (a) | 375,000 | 353,812 |
| DT Auto Owner Trust | | |
| Series 2021-2A, Class E | | |
| 2.97%, due 7/17/28 (a) | 1,130,000 | 1,079,740 |
| Exeter Automobile Receivables Trust | | |
| Series 2021-3A, Class E | | |
| 3.04%, due 12/15/28 (a) | 855,000 | 793,780 |
| Flagship Credit Auto Trust (a) | | |
| Series 2021-1, Class D | | |
| 1.27%, due 3/15/27 | 1,220,000 | 1,141,908 |
| Series 2020-3, Class D | | |
| 2.50%, due 9/15/26 | 580,000 | 556,881 |
| Series 2022-2, Class D | | |
| 5.80%, due 4/17/28 | 1,290,000 | 1,207,398 |
| Series 2024-1, Class D | | |
| 6.30%, due 4/15/30 | 425,000 | 421,612 |
| GLS Auto Receivables Issuer Trust (a) | | |
| Series 2021-2A, Class E | | |
| 2.87%, due 5/15/28 | 1,480,000 | 1,400,626 |
| Series 2019-4A, Class D | | |
| 4.09%, due 8/17/26 | 1,086,028 | 1,083,750 |
| Hertz Vehicle Financing LLC | | |
| Series 2021-1A, Class B | | |
| 1.56%, due 12/26/25 (a) | 1,235,000 | 1,209,872 |
| | | 10,746,146 |
| Other Asset-Backed Securities 1.3% |
| American Airlines Pass-Through Trust | | |
| Series 2016-2, Class AA | | |
| 3.20%, due 6/15/28 | 458,660 | 419,826 |
| Series 2016-2, Class A | | |
| 3.65%, due 6/15/28 | 1,065,710 | 962,167 |
| British Airways Pass-Through Trust | | |
| Series 2021-1, Class A | | |
| 2.90%, due 3/15/35 (United Kingdom) (a) | 1,810,230 | 1,536,540 |
| | Principal
Amount | Value |
| |
| Other Asset-Backed Securities (continued) |
| CF Hippolyta Issuer LLC (a) | | |
| Series 2020-1, Class A1 | | |
| 1.69%, due 7/15/60 | $ 1,236,747 | $ 1,159,225 |
| Series 2020-1, Class A2 | | |
| 1.99%, due 7/15/60 | 1,219,066 | 1,045,425 |
| CVS Pass-Through Trust | | |
| 5.789%, due 1/10/26 (a) | 42,783 | 42,576 |
| FORA Financial Asset Securitization LLC | | |
| Series 2021-1A, Class A | | |
| 2.62%, due 5/15/27 (a) | 720,000 | 693,591 |
| Home Partners of America Trust | | |
| Series 2021-2, Class B | | |
| 2.302%, due 12/17/26 (a) | 485,437 | 440,852 |
| HPEFS Equipment Trust | | |
| Series 2024-1A, Class D | | |
| 5.82%, due 11/20/31 (a) | 1,265,000 | 1,253,860 |
| Navient Private Education Refi Loan Trust (a) | | |
| Series 2021-BA, Class A | | |
| 0.94%, due 7/15/69 | 432,888 | 373,655 |
| Series 2020-EA, Class A | | |
| 1.69%, due 5/15/69 | 621,234 | 557,022 |
| New Economy Assets Phase 1 Sponsor LLC (a) | | |
| Series 2021-1, Class A1 | | |
| 1.91%, due 10/20/61 | 1,585,000 | 1,381,027 |
| Series 2021-1, Class B1 | | |
| 2.41%, due 10/20/61 | 1,640,000 | 1,379,254 |
| U.S. Airways Pass-Through Trust | | |
| Series 2012-1, Class A | | |
| 5.90%, due 10/1/24 | 768,756 | 767,259 |
| United Airlines Pass-Through Trust | | |
| Series 2020-1, Class A | | |
| 5.875%, due 10/15/27 | 1,085,388 | 1,082,408 |
| | | 13,094,687 |
Total Asset-Backed Securities
(Cost $24,920,825) | | 23,840,833 |
| Corporate Bonds 17.0% |
| Aerospace & Defense 0.1% |
| Boeing Co. (The) (a) | | |
| 6.528%, due 5/1/34 | 570,000 | 574,104 |
| 6.858%, due 5/1/54 | 595,000 | 596,612 |
| | | 1,170,716 |
The notes to the financial statements are an integral part of, and should be read in conjunction with, the financial statements.
9
Portfolio of Investments April 30, 2024†^(Unaudited) (continued)
| | Principal
Amount | Value |
| Corporate Bonds (continued) |
| Agriculture 0.1% |
| BAT Capital Corp. | | |
| 3.734%, due 9/25/40 (United Kingdom) | $ 1,005,000 | $ 727,428 |
| Airlines 0.5% |
| American Airlines, Inc. (a) | | |
| 5.50%, due 4/20/26 | 933,333 | 922,506 |
| 5.75%, due 4/20/29 | 850,000 | 820,873 |
| Delta Air Lines, Inc. (a) | | |
| 4.50%, due 10/20/25 | 540,000 | 532,561 |
| 4.75%, due 10/20/28 (b) | 2,125,000 | 2,057,175 |
| Mileage Plus Holdings LLC | | |
| 6.50%, due 6/20/27 (a) | 1,209,000 | 1,211,042 |
| | | 5,544,157 |
| Apparel 0.1% |
| Tapestry, Inc. | | |
| 7.85%, due 11/27/33 | 690,000 | 720,770 |
| Auto Manufacturers 1.1% |
| Ford Motor Credit Co. LLC | | |
| 2.30%, due 2/10/25 | 200,000 | 194,355 |
| 2.70%, due 8/10/26 | 940,000 | 872,759 |
| 4.125%, due 8/17/27 | 1,050,000 | 986,199 |
| 6.80%, due 5/12/28 | 730,000 | 744,929 |
| 6.95%, due 3/6/26 | 660,000 | 668,931 |
| General Motors Financial Co., Inc. | | |
| 2.35%, due 1/8/31 | 810,000 | 651,010 |
| 2.70%, due 6/10/31 | 2,015,000 | 1,632,776 |
| 4.30%, due 4/6/29 | 1,125,000 | 1,054,542 |
| Nissan Motor Acceptance Co. LLC (a) | | |
| 1.125%, due 9/16/24 | 1,935,000 | 1,896,666 |
| 1.85%, due 9/16/26 | 3,205,000 | 2,895,765 |
| | | 11,597,932 |
| Banks 6.2% |
| Australia & New Zealand Banking Group Ltd. | | |
| 5.731% (5 Year Treasury Constant Maturity Rate + 1.618%), due 9/18/34 (Australia) (a)(c) | 1,155,000 | 1,126,489 |
| Banco Santander SA (Spain) | | |
| 5.294%, due 8/18/27 | 1,800,000 | 1,771,621 |
| 6.35%, due 3/14/34 | 1,000,000 | 975,366 |
| Bank of America Corp. (d) | | |
| 2.087%, due 6/14/29 | 820,000 | 713,406 |
| 2.496%, due 2/13/31 | 1,600,000 | 1,346,539 |
| | Principal
Amount | Value |
| |
| Banks (continued) |
| Bank of America Corp. (d) (continued) | | |
| 2.572%, due 10/20/32 | $ 1,195,000 | $ 964,022 |
| Series MM | | |
| 4.30%, due 1/28/25 (e) | 1,424,000 | 1,385,323 |
| Barclays plc (United Kingdom) (c)(e) | | |
| 4.375% (5 Year Treasury Constant Maturity Rate + 3.41%), due 3/15/28 | 2,000,000 | 1,628,579 |
| 8.00% (5 Year Treasury Constant Maturity Rate + 5.431%), due 3/15/29 | 1,035,000 | 1,017,771 |
| BNP Paribas SA (France) (a) | | |
| 3.052%, due 1/13/31 (d) | 1,170,000 | 1,005,764 |
| 4.625% (5 Year Treasury Constant Maturity Rate + 3.196%), due 1/12/27 (c)(e) | 1,450,000 | 1,292,948 |
| 4.625% (5 Year Treasury Constant Maturity Rate + 3.34%), due 2/25/31 (c)(e) | 1,830,000 | 1,468,362 |
| BPCE SA (France) (a) | | |
| 2.045%, due 10/19/27 (d) | 1,255,000 | 1,140,563 |
| 5.125%, due 1/18/28 | 420,000 | 412,884 |
| 6.714%, due 10/19/29 (b)(d) | 490,000 | 504,243 |
| Citigroup, Inc. | | |
| 3.668%, due 7/24/28 (d) | 1,180,000 | 1,111,885 |
| 3.98%, due 3/20/30 (d) | 1,030,000 | 954,327 |
| Series Y | | |
| 4.15% (5 Year Treasury Constant Maturity Rate + 3.00%), due 11/15/26 (c)(e) | 1,760,000 | 1,615,661 |
| 6.625%, due 6/15/32 | 770,000 | 804,575 |
| Citizens Bank NA | | |
| 6.064%, due 10/24/25 (d) | 555,000 | 552,396 |
| Citizens Financial Group, Inc. | | |
| 2.638%, due 9/30/32 | 1,720,000 | 1,280,585 |
| Comerica, Inc. | | |
| 5.982%, due 1/30/30 (d) | 1,075,000 | 1,043,922 |
| Credit Agricole SA | | |
| 4.75% (5 Year Treasury Constant Maturity Rate + 3.237%), due 3/23/29 (France) (a)(c)(e) | 2,340,000 | 1,988,377 |
| Deutsche Bank AG (Germany) | | |
| 3.035%, due 5/28/32 (d) | 600,000 | 491,977 |
| 6.597% (SOFR + 1.219%), due 11/16/27 (c) | 1,945,000 | 1,928,934 |
| First Horizon Bank | | |
| 5.75%, due 5/1/30 | 1,555,000 | 1,435,182 |
The notes to the financial statements are an integral part of, and should be read in conjunction with, the financial statements.
| 10 | MainStay Income Builder Fund |
| | Principal
Amount | Value |
| Corporate Bonds (continued) |
| Banks (continued) |
| First Horizon Corp. | | |
| 4.00%, due 5/26/25 | $ 2,100,000 | $ 2,048,892 |
| Goldman Sachs Group, Inc. (The) | | |
| 1.431%, due 3/9/27 (d) | 1,255,000 | 1,159,650 |
| 1.992%, due 1/27/32 (d) | 1,165,000 | 919,773 |
| 6.75%, due 10/1/37 | 444,000 | 468,621 |
| HSBC Holdings plc | | |
| 3.973%, due 5/22/30 (United Kingdom) (d) | 1,350,000 | 1,237,217 |
| Huntington Bancshares, Inc. | | |
| 5.709%, due 2/2/35 (d) | 1,085,000 | 1,040,193 |
| Intesa Sanpaolo SpA | | |
| 7.00%, due 11/21/25 (Italy) (a) | 585,000 | 592,279 |
| KeyBank NA | | |
| 4.90%, due 8/8/32 | 870,000 | 747,083 |
| KeyCorp | | |
| 6.401%, due 3/6/35 (d) | 520,000 | 511,525 |
| Lloyds Banking Group plc (United Kingdom) | | |
| 4.582%, due 12/10/25 | 1,038,000 | 1,012,877 |
| 4.65%, due 3/24/26 | 1,690,000 | 1,649,907 |
| 4.976% (1 Year Treasury Constant Maturity Rate + 2.30%), due 8/11/33 (c) | 870,000 | 816,277 |
| Macquarie Group Ltd. | | |
| 2.871%, due 1/14/33 (Australia) (a)(d) | 1,925,000 | 1,557,320 |
| Mizuho Financial Group, Inc. (Japan) (c) | | |
| 3.261% (1 Year Treasury Constant Maturity Rate + 1.25%), due 5/22/30 | 795,000 | 708,873 |
| 5.579% (1 Year Treasury Constant Maturity Rate + 1.30%), due 5/26/35 | 860,000 | 837,605 |
| Morgan Stanley (d) | | |
| 2.484%, due 9/16/36 | 2,115,000 | 1,631,524 |
| 2.511%, due 10/20/32 | 1,530,000 | 1,231,182 |
| NatWest Group plc (United Kingdom) (c) | | |
| 3.073% (1 Year Treasury Constant Maturity Rate + 2.55%), due 5/22/28 | 910,000 | 841,055 |
| 5.778% (1 Year Treasury Constant Maturity Rate + 1.50%), due 3/1/35 | 695,000 | 680,691 |
| | Principal
Amount | Value |
| |
| Banks (continued) |
| Santander Holdings USA, Inc. | | |
| 6.499%, due 3/9/29 (d) | $ 735,000 | $ 740,702 |
| Societe Generale SA (France) (a)(c) | | |
| 4.75% (5 Year Treasury Constant Maturity Rate + 3.931%), due 5/26/26 (e) | 935,000 | 830,528 |
| 5.375% (5 Year Treasury Constant Maturity Rate + 4.514%), due 11/18/30 (e) | 2,240,000 | 1,811,825 |
| 7.132% (1 Year Treasury Constant Maturity Rate + 2.95%), due 1/19/55 | 540,000 | 515,583 |
| Standard Chartered plc | | |
| 1.822% (1 Year Treasury Constant Maturity Rate + 0.95%), due 11/23/25 (United Kingdom) (a)(c) | 2,510,000 | 2,447,070 |
| Truist Financial Corp. | | |
| 5.711%, due 1/24/35 (d) | 850,000 | 824,914 |
| UBS Group AG (Switzerland) (a) | | |
| 3.091%, due 5/14/32 (d) | 1,040,000 | 861,165 |
| 4.375% (5 Year Treasury Constant Maturity Rate + 3.313%), due 2/10/31 (c)(e) | 2,350,000 | 1,876,827 |
| 4.751% (1 Year Treasury Constant Maturity Rate + 1.75%), due 5/12/28 (c) | 410,000 | 396,869 |
| 6.442%, due 8/11/28 (d) | 365,000 | 370,568 |
| Wells Fargo & Co. (d) | | |
| 3.35%, due 3/2/33 | 935,000 | 789,290 |
| 5.557%, due 7/25/34 | 665,000 | 648,203 |
| Westpac Banking Corp. | | |
| 3.02% (5 Year Treasury Constant Maturity Rate + 1.53%), due 11/18/36 (Australia) (c) | 1,255,000 | 1,008,788 |
| | | 62,776,577 |
| Biotechnology 0.1% |
| Amgen, Inc. | | |
| 5.75%, due 3/2/63 | 540,000 | 515,793 |
| Chemicals 0.4% |
| Braskem Netherlands Finance BV | | |
| 4.50%, due 1/10/28 (Brazil) (a) | 1,535,000 | 1,370,555 |
| Huntsman International LLC | | |
| 4.50%, due 5/1/29 | 1,862,000 | 1,737,357 |
The notes to the financial statements are an integral part of, and should be read in conjunction with, the financial statements.
11
Portfolio of Investments April 30, 2024†^(Unaudited) (continued)
| | Principal
Amount | Value |
| Corporate Bonds (continued) |
| Chemicals (continued) |
| Sasol Financing USA LLC | | |
| 8.75%, due 5/3/29 (South Africa) (a) | $ 1,260,000 | $ 1,267,037 |
| | | 4,374,949 |
| Commercial Services 0.1% |
| Ashtead Capital, Inc. | | |
| 4.00%, due 5/1/28 (United Kingdom) (a) | 935,000 | 869,847 |
| California Institute of Technology | | |
| 3.65%, due 9/1/2119 | 898,000 | 577,799 |
| | | 1,447,646 |
| Computers 0.3% |
| Dell International LLC | | |
| 3.375%, due 12/15/41 (b) | 2,090,000 | 1,490,227 |
| 8.10%, due 7/15/36 | 1,242,000 | 1,447,236 |
| | | 2,937,463 |
| Diversified Financial Services 1.8% |
| AerCap Ireland Capital DAC | | |
| 2.45%, due 10/29/26 (Ireland) | 1,585,000 | 1,464,432 |
| Air Lease Corp. | | |
| 2.30%, due 2/1/25 | 1,915,000 | 1,861,011 |
| 4.25%, due 9/15/24 | 630,000 | 625,993 |
| Aircastle Ltd. | | |
| 5.25% (5 Year Treasury Constant Maturity Rate + 4.41%), due 6/15/26 (a)(c)(e) | 690,000 | 651,932 |
| Ally Financial, Inc. | | |
| 6.992%, due 6/13/29 (d) | 550,000 | 561,851 |
| 8.00%, due 11/1/31 | 1,685,000 | 1,824,302 |
| American Express Co. | | |
| 5.625%, due 7/28/34 (d) | 570,000 | 557,785 |
| Aviation Capital Group LLC | | |
| 1.95%, due 1/30/26 (a) | 1,210,000 | 1,126,447 |
| Avolon Holdings Funding Ltd. (Ireland) (a) | | |
| 2.125%, due 2/21/26 | 1,515,000 | 1,406,212 |
| 2.875%, due 2/15/25 | 1,830,000 | 1,779,087 |
| Banco BTG Pactual SA | | |
| 2.75%, due 1/11/26 (Brazil) (a) | 1,050,000 | 988,829 |
| Capital One Financial Corp. (d) | | |
| 6.051%, due 2/1/35 (b) | 400,000 | 393,431 |
| 6.312%, due 6/8/29 | 1,070,000 | 1,079,459 |
| Jefferies Financial Group, Inc. | | |
| 6.20%, due 4/14/34 | 880,000 | 869,949 |
| | Principal
Amount | Value |
| |
| Diversified Financial Services (continued) |
| Nomura Holdings, Inc. | | |
| 5.099%, due 7/3/25 (Japan) | $ 1,845,000 | $ 1,825,761 |
| OneMain Finance Corp. | | |
| 3.50%, due 1/15/27 | 885,000 | 814,207 |
| | | 17,830,688 |
| Electric 1.5% |
| AEP Texas, Inc. | | |
| 4.70%, due 5/15/32 | 1,135,000 | 1,052,306 |
| Alabama Power Co. | | |
| 3.00%, due 3/15/52 | 785,000 | 497,827 |
| Arizona Public Service Co. | | |
| 2.20%, due 12/15/31 | 1,930,000 | 1,527,785 |
| Calpine Corp. | | |
| 5.125%, due 3/15/28 (a) | 615,000 | 583,367 |
| Duquesne Light Holdings, Inc. | | |
| 3.616%, due 8/1/27 (a) | 2,265,000 | 2,099,410 |
| EnfraGen Energia Sur SA | | |
| 5.375%, due 12/30/30 (Colombia) (a) | 820,000 | 670,839 |
| Evergy Metro, Inc. | | |
| 5.40%, due 4/1/34 | 910,000 | 888,373 |
| Eversource Energy | | |
| 5.95%, due 7/15/34 | 1,030,000 | 1,022,534 |
| Jersey Central Power & Light Co. | | |
| 2.75%, due 3/1/32 (a) | 1,655,000 | 1,344,192 |
| Nevada Power Co. | | |
| Series GG | | |
| 5.90%, due 5/1/53 | 530,000 | 519,618 |
| Ohio Power Co. | | |
| Series R | | |
| 2.90%, due 10/1/51 | 1,000,000 | 598,654 |
| Sempra | | |
| 5.50%, due 8/1/33 | 1,115,000 | 1,083,047 |
| Southern California Edison Co. | | |
| 4.00%, due 4/1/47 | 660,000 | 493,966 |
| 5.70%, due 3/1/53 | 795,000 | 757,916 |
| Virginia Electric and Power Co. | | |
| 2.95%, due 11/15/51 | 1,035,000 | 630,413 |
| 5.45%, due 4/1/53 | 480,000 | 449,711 |
| Vistra Operations Co. LLC | | |
| 6.875%, due 4/15/32 (a) | 580,000 | 577,571 |
| | | 14,797,529 |
| Entertainment 0.1% |
| Warnermedia Holdings, Inc. | | |
| 4.279%, due 3/15/32 | 1,340,000 | 1,154,258 |
The notes to the financial statements are an integral part of, and should be read in conjunction with, the financial statements.
| 12 | MainStay Income Builder Fund |
| | Principal
Amount | Value |
| Corporate Bonds (continued) |
| Food 0.4% |
| JBS USA Holding LUX SARL | | |
| 5.75%, due 4/1/33 | $ 1,690,000 | $ 1,616,269 |
| Minerva Luxembourg SA | | |
| 8.875%, due 9/13/33 (Brazil) (a) | 1,225,000 | 1,256,497 |
| Smithfield Foods, Inc. | | |
| 4.25%, due 2/1/27 (a) | 1,180,000 | 1,121,560 |
| | | 3,994,326 |
| Gas 0.3% |
| Brooklyn Union Gas Co. (The) | | |
| 6.388%, due 9/15/33 (a) | 865,000 | 869,717 |
| National Fuel Gas Co. | | |
| 2.95%, due 3/1/31 | 1,375,000 | 1,130,387 |
| Southern California Gas Co. | | |
| Series VV | | |
| 4.30%, due 1/15/49 | 845,000 | 662,078 |
| Southern Co. Gas Capital Corp. | | |
| Series 21A | | |
| 3.15%, due 9/30/51 | 1,180,000 | 723,251 |
| | | 3,385,433 |
| Healthcare-Products 0.1% |
| Solventum Corp. | | |
| 5.90%, due 4/30/54 (a) | 665,000 | 620,873 |
| Insurance 0.5% |
| Athene Holding Ltd. | | |
| 6.25%, due 4/1/54 | 620,000 | 602,631 |
| Peachtree Corners Funding Trust | | |
| 3.976%, due 2/15/25 (a) | 940,000 | 921,908 |
| Protective Life Corp. | | |
| 8.45%, due 10/15/39 | 1,195,000 | 1,442,414 |
| Reliance Standard Life Global Funding II | | |
| 2.50%, due 10/30/24 (a) | 2,420,000 | 2,375,330 |
| | | 5,342,283 |
| Iron & Steel 0.1% |
| Algoma Steel, Inc. | | |
| 9.125%, due 4/15/29 (Canada) (a) | 855,000 | 844,312 |
| Lodging 0.5% |
| Hilton Domestic Operating Co., Inc. | | |
| 5.875%, due 4/1/29 (a) | 1,060,000 | 1,045,961 |
| Las Vegas Sands Corp. | | |
| 3.20%, due 8/8/24 | 1,415,000 | 1,401,365 |
| | Principal
Amount | Value |
| |
| Lodging (continued) |
| Sands China Ltd. | | |
| 5.125%, due 8/8/25 (Macao) (b)(f) | $ 1,310,000 | $ 1,295,553 |
| Studio City Finance Ltd. | | |
| 5.00%, due 1/15/29 (Macao) (a) | 965,000 | 820,697 |
| | | 4,563,576 |
| Media 0.1% |
| DISH DBS Corp. | | |
| 5.75%, due 12/1/28 (a) | 1,180,000 | 796,833 |
| Mining 0.1% |
| Perenti Finance Pty. Ltd. | | |
| 7.50%, due 4/26/29 (Australia) (a) | 665,000 | 671,499 |
| Miscellaneous—Manufacturing 0.2% |
| Textron Financial Corp. | | |
| 7.304% (3 Month SOFR + 1.997%), due 2/15/42 (a)(c) | 2,720,000 | 2,336,630 |
| Oil & Gas 0.1% |
| Gazprom PJSC Via Gaz Capital SA | | |
| 7.288%, due 8/16/37 (Russia) (a)(g) | 745,000 | 577,375 |
| Packaging & Containers 0.1% |
| Owens-Brockway Glass Container, Inc. | | |
| 6.625%, due 5/13/27 (a) | 731,000 | 730,396 |
| Pharmaceuticals 0.2% |
| Teva Pharmaceutical Finance Netherlands III BV (Israel) | | |
| 3.15%, due 10/1/26 | 575,000 | 532,691 |
| 4.75%, due 5/9/27 | 1,335,000 | 1,276,731 |
| | | 1,809,422 |
| Pipelines 0.9% |
| Cheniere Corpus Christi Holdings LLC | | |
| 2.742%, due 12/31/39 | 1,580,000 | 1,252,103 |
| Columbia Pipelines Operating Co. LLC | | |
| 6.544%, due 11/15/53 (a)(b) | 740,000 | 763,249 |
| DT Midstream, Inc. | | |
| 4.30%, due 4/15/32 (a) | 1,000,000 | 884,813 |
| Enbridge, Inc. | | |
| 5.70%, due 3/8/33 (Canada) (b) | 355,000 | 350,927 |
| Energy Transfer LP | | |
| 5.35%, due 5/15/45 | 1,000,000 | 877,572 |
The notes to the financial statements are an integral part of, and should be read in conjunction with, the financial statements.
13
Portfolio of Investments April 30, 2024†^(Unaudited) (continued)
| | Principal
Amount | Value |
| Corporate Bonds (continued) |
| Pipelines (continued) |
| EnLink Midstream LLC | | |
| 5.625%, due 1/15/28 (a) | $ 565,000 | $ 555,138 |
| Flex Intermediate Holdco LLC | | |
| 3.363%, due 6/30/31 (a) | 2,030,000 | 1,611,702 |
| MPLX LP | | |
| 2.65%, due 8/15/30 | 1,050,000 | 884,704 |
| Transcontinental Gas Pipe Line Co. LLC | | |
| 4.60%, due 3/15/48 | 1,035,000 | 856,046 |
| Venture Global LNG, Inc. | | |
| 9.875%, due 2/1/32 (a) | 630,000 | 672,277 |
| Western Midstream Operating LP | | |
| 5.25%, due 2/1/50 (f) | 860,000 | 729,412 |
| | | 9,437,943 |
| Real Estate Investment Trusts 0.6% |
| American Tower Corp. | | |
| 3.60%, due 1/15/28 | 1,025,000 | 954,427 |
| Digital Realty Trust LP | | |
| 4.45%, due 7/15/28 | 1,170,000 | 1,117,262 |
| GLP Capital LP | | |
| 3.35%, due 9/1/24 | 1,280,000 | 1,267,062 |
| Invitation Homes Operating Partnership LP | | |
| 2.00%, due 8/15/31 | 1,600,000 | 1,236,588 |
| Starwood Property Trust, Inc. (a) | | |
| 3.75%, due 12/31/24 | 1,120,000 | 1,099,504 |
| 4.375%, due 1/15/27 | 940,000 | 870,537 |
| | | 6,545,380 |
| Retail 0.1% |
| AutoNation, Inc. | | |
| 4.75%, due 6/1/30 | 594,000 | 556,893 |
| Nordstrom, Inc. | | |
| 4.25%, due 8/1/31 | 370,000 | 319,131 |
| | | 876,024 |
| Telecommunications 0.1% |
| AT&T, Inc. | | |
| 3.50%, due 9/15/53 | 1,344,000 | 886,052 |
| T-Mobile USA, Inc. | | |
| 2.625%, due 2/15/29 | 715,000 | 628,312 |
| | | 1,514,364 |
| Transportation 0.0% ‡ |
| Genesee & Wyoming, Inc. | | |
| 6.25%, due 4/15/32 (a) | 480,000 | 477,067 |
| | Principal
Amount | Value |
| |
| Trucking & Leasing 0.1% |
| Penske Truck Leasing Co. LP | | |
| 6.05%, due 8/1/28 (a) | $ 845,000 | $ 854,099 |
| Water 0.1% |
| Aegea Finance SARL | | |
| 6.75%, due 5/20/29 (Brazil) (a) | 690,000 | 669,195 |
Total Corporate Bonds
(Cost $188,890,319) | | 171,642,936 |
| Foreign Government Bonds 0.7% |
| Chile 0.1% |
| Empresa Nacional del Petroleo | | |
| 3.45%, due 9/16/31 (a) | 1,695,000 | 1,421,207 |
| Colombia 0.2% |
| Colombia Government Bond | | |
| 3.25%, due 4/22/32 | 1,780,000 | 1,337,224 |
| 4.50%, due 1/28/26 | 560,000 | 540,568 |
| | | 1,877,792 |
| Dominican Republic 0.1% |
| Dominican Republic Government Bond | | |
| 4.875%, due 9/23/32 (a) | 1,035,000 | 905,624 |
| Egypt 0.1% |
| Egypt Government Bond | | |
| 7.625%, due 5/29/32 (a) | 1,010,000 | 836,139 |
| Israel 0.1% |
| Israel Government Bond | | |
| 5.75%, due 3/12/54 | 1,105,000 | 996,091 |
| Paraguay 0.1% |
| Paraguay Government Bond | | |
| 6.10%, due 8/11/44 (a) | 1,325,000 | 1,224,300 |
Total Foreign Government Bonds
(Cost $8,093,198) | | 7,261,153 |
The notes to the financial statements are an integral part of, and should be read in conjunction with, the financial statements.
| 14 | MainStay Income Builder Fund |
| | Principal
Amount | Value |
| Loan Assignments 0.1% |
| Diversified/Conglomerate Service 0.1% |
| TruGreen LP | | |
| First Lien Second Refinancing Term Loan | | |
| 9.416% (1 Month SOFR + 4.00%), due 11/2/27 (c) | $ 742,832 | $ 713,490 |
Total Loan Assignments
(Cost $739,304) | | 713,490 |
| Mortgage-Backed Securities 15.7% |
| Agency (Collateralized Mortgage Obligations) 6.0% |
| CF Hippolyta Issuer LLC | | |
| Series 2021-1A, Class A1 | | |
| 1.53%, due 3/15/61 (a) | 1,121,513 | 1,013,909 |
| FHLMC | | |
| REMIC, Series 5326, Class QO | | |
| (zero coupon), due 9/25/50 | 1,632,786 | 1,096,474 |
| REMIC, Series 5021, Class SA | | |
| (zero coupon) (SOFR 30A + 3.55%), due 10/25/50 (c)(h) | 2,901,992 | 53,408 |
| REMIC, Series 5092, Class SH | | |
| (zero coupon) (SOFR 30A + 2.45%), due 2/25/51 (c)(h) | 1,410,920 | 4,346 |
| REMIC, Series 5187, Class SA | | |
| (zero coupon) (SOFR 30A + 1.80%), due 1/25/52 (c)(h) | 2,218,200 | 2,441 |
| REMIC, Series 5200, Class SA | | |
| (zero coupon) (SOFR 30A + 3.50%), due 2/25/52 (c)(h) | 419,197 | 6,468 |
| REMIC, Series 5326 | | |
| (zero coupon), due 8/25/53 | 490,113 | 364,904 |
| REMIC, Series 5351, Class DO | | |
| (zero coupon), due 9/25/53 | 957,389 | 740,128 |
| REMIC, Series 5357, Class OE | | |
| (zero coupon), due 11/25/53 | 834,502 | 643,403 |
| REMIC, Series 5363 | | |
| (zero coupon), due 12/25/53 | 905,448 | 730,441 |
| REMIC, Series 5315, Class OQ | | |
| (zero coupon), due 1/25/55 | 793,028 | 630,764 |
| REMIC, Series 4993, Class KS | | |
| 0.605% (SOFR 30A + 5.936%), due 7/25/50 (c)(h) | 3,167,074 | 349,315 |
| REMIC, Series 4994, Class TS | | |
| 0.655% (SOFR 30A + 5.986%), due 7/25/50 (c)(h) | 1,840,643 | 167,330 |
| REMIC, Series 5092, Class XA | | |
| 1.00%, due 1/15/41 | 824,911 | 671,120 |
| | Principal
Amount | Value |
| |
| Agency (Collateralized Mortgage Obligations) (continued) |
| FHLMC (continued) | | |
| REMIC, Series 5070, Class PI | | |
| 3.00%, due 8/25/50 (h) | $ 1,543,382 | $ 278,931 |
| REMIC, Series 5011, Class MI | | |
| 3.00%, due 9/25/50 (h) | 1,738,733 | 284,439 |
| REMIC, Series 5023, Class LI | | |
| 3.00%, due 10/25/50 (h) | 1,228,636 | 207,821 |
| REMIC, Series 5094, Class IP | | |
| 3.00%, due 4/25/51 (h) | 1,357,491 | 214,291 |
| REMIC, Series 5160 | | |
| 3.00%, due 10/25/51 (h) | 1,530,643 | 175,532 |
| REMIC, Series 4710, Class WZ | | |
| 3.50%, due 8/15/47 | 1,047,770 | 910,969 |
| REMIC, Series 4725, Class WZ | | |
| 3.50%, due 11/15/47 | 1,881,550 | 1,615,635 |
| REMIC, Series 5040 | | |
| 3.50%, due 11/25/50 (h) | 1,083,480 | 208,266 |
| REMIC, Series 5268, Class B | | |
| 4.50%, due 10/25/52 | 1,169,554 | 1,084,160 |
| FHLMC, Strips | | |
| Series 272 | | |
| (zero coupon), due 8/15/42 | 1,077,571 | 781,374 |
| Series 311 | | |
| (zero coupon), due 8/15/43 | 634,243 | 457,425 |
| Series 402 | | |
| (zero coupon), due 9/25/53 | 1,113,202 | 869,572 |
| Series 311, Class S1 | | |
| 0.506% (SOFR 30A + 5.836%), due 8/15/43 (c)(h) | 3,246,948 | 258,499 |
| Series 389, Class C35 | | |
| 2.00%, due 6/15/52 (h) | 2,722,596 | 338,453 |
| FNMA | | |
| REMIC, Series 2022-5, Class SN | | |
| (zero coupon) (SOFR 30A + 1.80%), due 2/25/52 (c)(h) | 1,315,239 | 1,473 |
| REMIC, Series 2022-3, Class YS | | |
| (zero coupon) (SOFR 30A + 2.55%), due 2/25/52 (c)(h) | 8,872,447 | 35,676 |
| REMIC, Series 2023-70, Class AO | | |
| (zero coupon), due 3/25/53 | 877,895 | 669,366 |
| REMIC, Series 2023-45 | | |
| (zero coupon), due 10/25/53 | 966,441 | 711,386 |
| REMIC, Series 2023-24, Class OQ | | |
| (zero coupon), due 7/25/54 | 1,027,280 | 824,003 |
| REMIC, Series 2022-10, Class SA | | |
| 0.42% (SOFR 30A + 5.75%), due 2/25/52 (c)(h) | 1,822,812 | 190,008 |
The notes to the financial statements are an integral part of, and should be read in conjunction with, the financial statements.
15
Portfolio of Investments April 30, 2024†^(Unaudited) (continued)
| | Principal
Amount | Value |
| Mortgage-Backed Securities (continued) |
| Agency (Collateralized Mortgage Obligations) (continued) |
| FNMA (continued) | | |
| REMIC, Series 2021-40, Class SI | | |
| 0.506% (SOFR 30A + 5.836%), due 9/25/47 (c)(h) | $ 2,179,183 | $ 180,317 |
| REMIC, Series 2016-57, Class SN | | |
| 0.605% (SOFR 30A + 5.936%), due 6/25/46 (c)(h) | 1,755,455 | 152,556 |
| REMIC, Series 2020-70, Class AD | | |
| 1.50%, due 10/25/50 | 2,052,227 | 1,549,500 |
| REMIC, Series 2021-12, Class JI | | |
| 2.50%, due 3/25/51 (h) | 1,267,049 | 195,124 |
| REMIC, Series 2021-10, Class LI | | |
| 2.50%, due 3/25/51 (h) | 865,830 | 119,640 |
| REMIC, Series 2021-34, Class MI | | |
| 2.50%, due 3/25/51 (h) | 3,578,691 | 486,721 |
| REMIC, Series 2021-54, Class HI | | |
| 2.50%, due 6/25/51 (h) | 573,175 | 71,679 |
| REMIC, Series 2021-53, Class GI | | |
| 3.00%, due 7/25/48 (h) | 4,823,919 | 709,094 |
| REMIC, Series 2021-85, Class BI | | |
| 3.00%, due 12/25/51 (h) | 3,420,208 | 575,906 |
| REMIC, Series 2021-8, Class ID | | |
| 3.50%, due 3/25/51 (h) | 2,246,457 | 487,289 |
| FNMA, Strips | | |
| REMIC, Series 426, Class C32 | | |
| 1.50%, due 2/25/52 (h) | 3,982,679 | 379,223 |
| GNMA | | |
| Series 2019-136, Class YS | | |
| (zero coupon) (1 Month SOFR + 2.716%), due 11/20/49 (c)(h) | 972,450 | 6,769 |
| Series 2020-1, Class YS | | |
| (zero coupon) (1 Month SOFR + 2.716%), due 1/20/50 (c)(h) | 3,132,034 | 21,997 |
| Series 2021-16, Class AS | | |
| (zero coupon) (1 Month SOFR + 2.636%), due 1/20/51 (c)(h) | 4,537,751 | 22,643 |
| Series 2023-101, Class KO | | |
| (zero coupon), due 1/20/51 | 2,354,716 | 1,530,465 |
| Series 2021-29, Class AS | | |
| (zero coupon) (SOFR 30A + 2.70%), due 2/20/51 (c)(h) | 4,414,608 | 33,555 |
| Series 2021-46, Class BS | | |
| (zero coupon) (1 Month SOFR + 2.686%), due 3/20/51 (c)(h) | 4,209,875 | 19,444 |
| Series 2021-64, Class GS | | |
| (zero coupon) (SOFR 30A + 1.65%), due 4/20/51 (c)(h) | 697,085 | 663 |
| | Principal
Amount | Value |
| |
| Agency (Collateralized Mortgage Obligations) (continued) |
| GNMA (continued) | | |
| Series 2021-64, Class SG | | |
| (zero coupon) (SOFR 30A + 1.60%), due 4/20/51 (c)(h) | $ 1,558,610 | $ 1,263 |
| Series 2021-77, Class SN | | |
| (zero coupon) (1 Month SOFR + 2.486%), due 5/20/51 (c)(h) | 6,600,060 | 23,459 |
| Series 2021-97, Class SA | | |
| (zero coupon) (SOFR 30A + 2.60%), due 6/20/51 (c)(h) | 5,985,999 | 34,388 |
| Series 2021-136, Class SB | | |
| (zero coupon) (SOFR 30A + 3.20%), due 8/20/51 (c)(h) | 16,242,115 | 160,373 |
| Series 2021-158, Class SB | | |
| (zero coupon) (SOFR 30A + 3.70%), due 9/20/51 (c)(h) | 3,531,148 | 77,879 |
| Series 2021-205, Class DS | | |
| (zero coupon) (SOFR 30A + 3.20%), due 11/20/51 (c)(h) | 6,519,171 | 81,870 |
| Series 2021-226, Class SA | | |
| (zero coupon) (SOFR 30A + 1.70%), due 12/20/51 (c)(h) | 3,108,291 | 3,840 |
| Series 2022-19, Class SG | | |
| (zero coupon) (SOFR 30A + 2.45%), due 1/20/52 (c)(h) | 5,548,973 | 22,222 |
| Series 2022-24, Class SC | | |
| (zero coupon) (SOFR 30A + 2.37%), due 2/20/52 (c)(h) | 28,737,838 | 132,450 |
| Series 2022-78, Class S | | |
| (zero coupon) (SOFR 30A + 3.70%), due 4/20/52 (c)(h) | 2,282,340 | 24,247 |
| Series 2022-87, Class SA | | |
| (zero coupon) (SOFR 30A + 3.30%), due 5/20/52 (c)(h) | 4,808,357 | 42,249 |
| Series 2022-107, Class SA | | |
| (zero coupon) (SOFR 30A + 3.47%), due 6/20/52 (c)(h) | 12,140,365 | 126,444 |
| Series 2022-101, Class SB | | |
| (zero coupon) (SOFR 30A + 3.30%), due 6/20/52 (c)(h) | 2,409,509 | 20,326 |
| Series 2023-66, Class OQ | | |
| (zero coupon), due 7/20/52 | 1,421,202 | 1,073,866 |
| Series 2023-53 | | |
| (zero coupon), due 4/20/53 | 632,938 | 503,593 |
| Series 2023-80, Class SA | | |
| (zero coupon) (SOFR 30A + 5.25%), due 6/20/53 (c)(h) | 5,717,329 | 162,988 |
The notes to the financial statements are an integral part of, and should be read in conjunction with, the financial statements.
| 16 | MainStay Income Builder Fund |
| | Principal
Amount | Value |
| Mortgage-Backed Securities (continued) |
| Agency (Collateralized Mortgage Obligations) (continued) |
| GNMA (continued) | | |
| Series 2023-60, Class ES | | |
| 0.539% (SOFR 30A + 11.20%), due 4/20/53 (c) | $ 1,410,165 | $ 1,207,425 |
| Series 2020-34, Class SC | | |
| 0.62% (1 Month SOFR + 5.936%), due 3/20/50 (c)(h) | 2,332,493 | 234,916 |
| Series 2020-146, Class SA | | |
| 0.87% (1 Month SOFR + 6.186%), due 10/20/50 (c)(h) | 2,237,964 | 258,238 |
| Series 2021-179, Class SA | | |
| 0.87% (1 Month SOFR + 6.186%), due 11/20/50 (c)(h) | 2,980,800 | 318,241 |
| Series 2020-167, Class SN | | |
| 0.87% (1 Month SOFR + 6.186%), due 11/20/50 (c)(h) | 1,008,675 | 108,377 |
| Series 2020-189, Class NS | | |
| 0.87% (1 Month SOFR + 6.186%), due 12/20/50 (c)(h) | 3,379,431 | 391,424 |
| Series 2020-189, Class SU | | |
| 0.87% (1 Month SOFR + 6.186%), due 12/20/50 (c)(h) | 689,192 | 76,308 |
| Series 2021-57, Class SA | | |
| 0.87% (1 Month SOFR + 6.186%), due 3/20/51 (c)(h) | 4,370,166 | 445,619 |
| Series 2021-57, Class SD | | |
| 0.87% (1 Month SOFR + 6.186%), due 3/20/51 (c)(h) | 7,227,184 | 746,906 |
| Series 2021-46, Class TS | | |
| 0.87% (1 Month SOFR + 6.186%), due 3/20/51 (c)(h) | 1,467,508 | 159,625 |
| Series 2021-96, Class NS | | |
| 0.87% (1 Month SOFR + 6.186%), due 6/20/51 (c)(h) | 4,525,907 | 482,662 |
| Series 2021-96, Class SN | | |
| 0.87% (1 Month SOFR + 6.186%), due 6/20/51 (c)(h) | 2,624,619 | 261,685 |
| Series 2021-122, Class HS | | |
| 0.87% (1 Month SOFR + 6.186%), due 7/20/51 (c)(h) | 2,424,819 | 275,001 |
| Series 2022-137, Class S | | |
| 0.87% (1 Month SOFR + 6.186%), due 7/20/51 (c)(h) | 2,682,776 | 309,535 |
| Series 2021-96, Class JS | | |
| 0.92% (1 Month SOFR + 6.236%), due 6/20/51 (c)(h) | 2,112,490 | 195,460 |
| | Principal
Amount | Value |
| |
| Agency (Collateralized Mortgage Obligations) (continued) |
| GNMA (continued) | | |
| Series 2023-86, Class SE | | |
| 1.32% (SOFR 30A + 6.65%), due 9/20/50 (c)(h) | $ 1,779,669 | $ 205,997 |
| Series 2023-66, Class MP | | |
| 1.639% (SOFR 30A + 12.30%), due 5/20/53 (c) | 1,457,952 | 1,312,782 |
| Series 2020-166, Class IC | | |
| 2.00%, due 11/20/50 (h) | 750,301 | 72,996 |
| Series 2020-188 | | |
| 2.00%, due 12/20/50 (h) | 3,536,525 | 385,089 |
| Series 2020-185, Class BI | | |
| 2.00%, due 12/20/50 (h) | 1,524,170 | 162,126 |
| Series 2022-10, Class IC | | |
| 2.00%, due 11/20/51 (h) | 2,216,683 | 253,389 |
| Series 2021-97, Class IN | | |
| 2.50%, due 8/20/49 (h) | 3,741,173 | 364,777 |
| Series 2022-1, Class IA | | |
| 2.50%, due 6/20/50 (h) | 588,683 | 76,794 |
| Series 2020-122, Class IW | | |
| 2.50%, due 7/20/50 (h) | 1,875,284 | 236,557 |
| Series 2020-151, Class TI | | |
| 2.50%, due 10/20/50 (h) | 1,765,828 | 245,478 |
| Series 2020-188, Class DI | | |
| 2.50%, due 12/20/50 (h) | 4,558,403 | 605,258 |
| Series 2021-1, Class PI | | |
| 2.50%, due 12/20/50 (h) | 976,588 | 120,943 |
| Series 2021-83, Class FM | | |
| 2.50% (SOFR 30A + 0.51%), due 5/20/51 (c) | 3,081,204 | 2,409,198 |
| Series 2021-140, Class GF | | |
| 2.50% (1 Month SOFR + 0.764%), due 8/20/51 (c) | 1,049,492 | 824,104 |
| Series 2021-188 | | |
| 2.50%, due 10/20/51 (h) | 3,828,549 | 609,988 |
| Series 2021-177, Class CI | | |
| 2.50%, due 10/20/51 (h) | 2,039,737 | 257,595 |
| Series 2022-83 | | |
| 2.50%, due 11/20/51 (h) | 3,062,098 | 419,469 |
| Series 2021-1, Class IT | | |
| 3.00%, due 1/20/51 (h) | 2,083,398 | 340,546 |
| Series 2021-44, Class IQ | | |
| 3.00%, due 3/20/51 (h) | 3,492,735 | 551,824 |
| Series 2021-74, Class HI | | |
| 3.00%, due 4/20/51 (h) | 367,061 | 57,323 |
| Series 2021-67, Class PI | | |
| 3.00%, due 4/20/51 (h) | 1,533,837 | 243,093 |
The notes to the financial statements are an integral part of, and should be read in conjunction with, the financial statements.
17
Portfolio of Investments April 30, 2024†^(Unaudited) (continued)
| | Principal
Amount | Value |
| Mortgage-Backed Securities (continued) |
| Agency (Collateralized Mortgage Obligations) (continued) |
| GNMA (continued) | | |
| Series 2021-97, Class FA | | |
| 3.00% (SOFR 30A + 0.40%), due 6/20/51 (c) | $ 3,896,451 | $ 3,216,573 |
| Series 2021-98, Class IN | | |
| 3.00%, due 6/20/51 (h) | 1,415,542 | 242,274 |
| Series 2022-189, Class AT | | |
| 3.00%, due 7/20/51 | 1,109,761 | 943,488 |
| Series 2022-207 | | |
| 3.00%, due 8/20/51 (h) | 2,342,075 | 377,332 |
| Series 2021-139, Class IA | | |
| 3.00%, due 8/20/51 (h) | 4,855,663 | 739,684 |
| Series 2021-158, Class NI | | |
| 3.00%, due 9/20/51 (h) | 3,666,586 | 536,924 |
| Series 2021-177, Class IM | | |
| 3.00%, due 10/20/51 (h) | 3,242,117 | 503,567 |
| Series 2023-19, Class CI | | |
| 3.00%, due 11/20/51 (h) | 2,663,663 | 417,869 |
| Series 2019-92, Class GF | | |
| 3.50% (1 Month SOFR + 0.804%), due 7/20/49 (c) | 506,965 | 440,890 |
| Series 2019-97, Class FG | | |
| 3.50% (1 Month SOFR + 0.804%), due 8/20/49 (c) | 1,413,484 | 1,212,851 |
| Series 2019-128, Class KF | | |
| 3.50% (1 Month SOFR + 0.764%), due 10/20/49 (c) | 516,548 | 445,965 |
| Series 2019-128, Class YF | | |
| 3.50% (1 Month SOFR + 0.764%), due 10/20/49 (c) | 545,439 | 472,025 |
| Series 2020-5, Class FA | | |
| 3.50% (1 Month SOFR + 0.814%), due 1/20/50 (c) | 1,485,216 | 1,274,849 |
| Series 2020-1, Class YF | | |
| 3.50% (1 Month SOFR + 0.784%), due 1/20/50 (c) | 1,135,661 | 959,580 |
| Series 2021-125, Class AF | | |
| 3.50% (SOFR 30A + 0.25%), due 7/20/51 (c) | 1,474,366 | 1,283,173 |
| Series 2021-146, Class IN | | |
| 3.50%, due 8/20/51 (h) | 2,334,141 | 415,563 |
| Series 2023-1, Class HD | | |
| 3.50%, due 1/20/52 | 957,696 | 831,444 |
| Series 2019-106, Class FA | | |
| 4.00% (1 Month SOFR + 0.714%), due 8/20/49 (c) | 517,487 | 462,841 |
| | Principal
Amount | Value |
| |
| Agency (Collateralized Mortgage Obligations) (continued) |
| GNMA (continued) | | |
| Series 2022-69, Class FA | | |
| 4.50% (SOFR 30A + 0.75%), due 4/20/52 (c) | $ 475,606 | $ 431,748 |
| Series 2023-81, Class LA | | |
| 5.00%, due 6/20/52 | 638,647 | 618,917 |
| Series 2023-38, Class WT | | |
| 6.668%, due 12/20/51 (i) | 637,769 | 650,784 |
| Series 2023-59, Class YC | | |
| 6.964%, due 9/20/51 (i) | 1,390,507 | 1,454,836 |
| Series 2023-55, Class CG | | |
| 7.51%, due 7/20/51 (i) | 1,000,826 | 1,058,669 |
| Series 2023-55, Class LB | | |
| 7.888%, due 11/20/51 (i) | 912,512 | 1,009,409 |
| | | 60,853,775 |
| Commercial Mortgage Loans (Collateralized Mortgage Obligations) 4.4% |
| BANK | | |
| Series 2019-BN19, Class C | | |
| 4.163%, due 8/15/61 (j) | 1,285,000 | 964,377 |
| Series 2017-BNK4, Class C | | |
| 4.372%, due 5/15/50 (i) | 1,020,000 | 858,520 |
| Bayview Commercial Asset Trust | | |
| Series 2006-4A, Class A1 | | |
| 5.776% (1 Month SOFR + 0.459%), due 12/25/36 (a)(c) | 34,339 | 32,651 |
| BBCMS Mortgage Trust (a)(c) | | |
| Series 2018-TALL, Class C | | |
| 6.639% (1 Month SOFR + 1.318%), due 3/15/37 | 1,680,000 | 1,512,000 |
| Series 2018-TALL, Class D | | |
| 6.967% (1 Month SOFR + 1.646%), due 3/15/37 | 2,070,000 | 1,780,200 |
| Benchmark Mortgage Trust | | |
| Series 2020-B19, Class A2 | | |
| 1.691%, due 9/15/53 | 1,069,469 | 1,000,160 |
| Series 2019-B15, Class C | | |
| 3.836%, due 12/15/72 (j) | 1,120,000 | 826,748 |
| Series 2019-B14, Class C | | |
| 3.898%, due 12/15/62 (j) | 1,155,000 | 833,861 |
| Series 2018-B3, Class C | | |
| 4.672%, due 4/10/51 (j) | 835,000 | 663,731 |
| BPR Trust | | |
| Series 2021-TY, Class E | | |
| 9.035% (1 Month SOFR + 3.714%), due 9/15/38 (a)(c) | 1,730,000 | 1,708,375 |
The notes to the financial statements are an integral part of, and should be read in conjunction with, the financial statements.
| 18 | MainStay Income Builder Fund |
| | Principal
Amount | Value |
| Mortgage-Backed Securities (continued) |
| Commercial Mortgage Loans (Collateralized Mortgage Obligations) (continued) |
| BX Commercial Mortgage Trust (a) | | |
| Series 2020-VIV2, Class C | | |
| 3.66%, due 3/9/44 (j) | $ 1,070,000 | $ 907,781 |
| Series 2020-VIV3, Class B | | |
| 3.662%, due 3/9/44 (j) | 1,007,236 | 863,308 |
| Series 2020-VIVA, Class D | | |
| 3.667%, due 3/11/44 (j) | 170,000 | 141,751 |
| Series 2022-CSMO, Class D | | |
| 9.658% (1 Month SOFR + 4.337%), due 6/15/27 (c) | 690,000 | 691,725 |
| BX Trust (a) | | |
| Series 2019-OC11, Class B | | |
| 3.605%, due 12/9/41 | 250,000 | 217,757 |
| Series 2021-ARIA, Class E | | |
| 7.68% (1 Month SOFR + 2.359%), due 10/15/36 (c) | 1,940,000 | 1,896,350 |
| BXHPP Trust | | |
| Series 2021-FILM, Class B | | |
| 6.335% (1 Month SOFR + 1.014%), due 8/15/36 (a)(c) | 1,280,000 | 1,213,200 |
| CFCRE Commercial Mortgage Trust | | |
| Series 2011-C2, Class E | | |
| 5.08%, due 12/15/47 (a)(j) | 480,000 | 415,137 |
| Citigroup Commercial Mortgage Trust (i) | | |
| Series 2016-C2, Class C | | |
| 4.031%, due 8/10/49 | 705,000 | 635,426 |
| Series 2014-GC25, Class B | | |
| 4.345%, due 10/10/47 | 1,200,000 | 1,164,808 |
| Commercial Mortgage Trust (j) | | |
| Series 2014-CR15, Class D | | |
| 4.085%, due 2/10/47 (a) | 1,255,000 | 1,127,330 |
| Series 2014-CR17, Class C | | |
| 4.825%, due 5/10/47 | 605,000 | 550,333 |
| CSAIL Commercial Mortgage Trust | | |
| Series 2016-C6, Class D | | |
| 5.082%, due 1/15/49 (a)(j) | 1,140,000 | 836,405 |
| DROP Mortgage Trust | | |
| Series 2021-FILE, Class A | | |
| 6.585% (1 Month SOFR + 1.264%), due 10/15/43 (a)(c) | 875,000 | 835,625 |
| FS Commercial Mortgage Trust | | |
| Series 2023-4SZN, Class D | | |
| 9.383%, due 11/10/39 (a)(i) | 855,000 | 877,307 |
| | Principal
Amount | Value |
| |
| Commercial Mortgage Loans (Collateralized Mortgage Obligations) (continued) |
| GNMA | | |
| Series 2023-194, Class CI | | |
| 0.877%, due 10/16/65 (h)(j) | $ 4,425,481 | $ 304,881 |
| Series 2021-164 | | |
| 0.949%, due 10/16/63 (h)(j) | 3,829,388 | 274,235 |
| Series 2023-159, Class CI | | |
| 0.956%, due 7/16/65 (h)(i) | 5,768,412 | 426,757 |
| Series 2020-168, Class IA | | |
| 0.978%, due 12/16/62 (h)(j) | 2,917,698 | 206,303 |
| Series 2021-47 | | |
| 0.992%, due 3/16/61 (h)(j) | 6,822,687 | 477,138 |
| Series 2022-185, Class DI | | |
| 1.023%, due 10/16/65 (h)(j) | 2,494,205 | 186,400 |
| Series 2023-172 | | |
| 1.386%, due 2/16/66 (h)(j) | 4,003,145 | 399,105 |
| Series 2024-29, Class B | | |
| 2.50%, due 8/16/64 (i) | 1,205,000 | 888,664 |
| Great Wolf Trust | | |
| Series 2024-WOLF, Class E | | |
| 8.96% (1 Month SOFR + 3.639%), due 3/15/39 (a)(c) | 1,965,000 | 1,962,544 |
| Hudson Yards Mortgage Trust | | |
| Series 2019-30HY, Class A | | |
| 3.228%, due 7/10/39 (a) | 1,540,000 | 1,343,325 |
| J.P. Morgan Chase Commercial Mortgage Securities Trust (a)(j) | | |
| Series 2021-1MEM, Class C | | |
| 2.742%, due 10/9/42 | 1,000,000 | 673,589 |
| Series 2012-C6, Class E | | |
| 5.129%, due 5/15/45 | 725,000 | 660,612 |
| JPMDB Commercial Mortgage Securities Trust | | |
| Series 2017-C7, Class D | | |
| 3.00%, due 10/15/50 (a) | 1,055,000 | 762,823 |
| Multifamily Connecticut Avenue Securities Trust (a)(c) | | |
| Series 2019-01, Class M10 | | |
| 8.695% (SOFR 30A + 3.364%), due 10/25/49 | 1,733,962 | 1,705,860 |
| Series 2020-01, Class M10 | | |
| 9.195% (SOFR 30A + 3.864%), due 3/25/50 | 1,998,435 | 1,968,470 |
| Series 2023-01, Class M10 | | |
| 11.83% (SOFR 30A + 6.50%), due 11/25/53 | 2,040,000 | 2,130,193 |
The notes to the financial statements are an integral part of, and should be read in conjunction with, the financial statements.
19
Portfolio of Investments April 30, 2024†^(Unaudited) (continued)
| | Principal
Amount | Value |
| Mortgage-Backed Securities (continued) |
| Commercial Mortgage Loans (Collateralized Mortgage Obligations) (continued) |
| Multifamily Connecticut Avenue Securities Trust (a)(c) (continued) | | |
| Series 2020-01, Class CE | | |
| 12.944% (SOFR 30A + 7.614%), due 3/25/50 | $ 1,015,000 | $ 1,001,062 |
| One Market Plaza Trust | | |
| Series 2017-1MKT, Class C | | |
| 4.016%, due 2/10/32 (a) | 705,000 | 613,491 |
| ORL Trust (a)(c) | | |
| Series 2023-GLKS, Class C | | |
| 8.972% (1 Month SOFR + 3.651%), due 10/19/36 | 940,000 | 941,763 |
| Series 2023-GLKS, Class D | | |
| 9.622% (1 Month SOFR + 4.301%), due 10/19/36 | 760,000 | 761,663 |
| SLG Office Trust (a) | | |
| Series 2021-OVA, Class A | | |
| 2.585%, due 7/15/41 | 2,498,076 | 1,995,213 |
| Series 2021-OVA, Class F | | |
| 2.851%, due 7/15/41 | 785,000 | 540,734 |
| UBS Commercial Mortgage Trust | | |
| Series 2018-C9, Class C | | |
| 5.112%, due 3/15/51 (j) | 755,000 | 556,212 |
| WFRBS Commercial Mortgage Trust | | |
| Series 2013-C11, Class D | | |
| 4.196%, due 3/15/45 (a)(j) | 845,000 | 690,205 |
| | | 44,026,108 |
| Whole Loan (Collateralized Mortgage Obligations) 5.3% |
| CIM Trust | | |
| Series 2021-J2, Class AS | | |
| 0.21%, due 4/25/51 (a)(h)(i) | 40,791,779 | 448,347 |
| Connecticut Avenue Securities Trust (a)(c) | | |
| Series 2024-R02, Class 1B1 | | |
| 7.83% (SOFR 30A + 2.50%), due 2/25/44 | 420,000 | 423,238 |
| Series 2024-R01, Class 1B1 | | |
| 8.03% (SOFR 30A + 2.70%), due 1/25/44 | 1,275,000 | 1,284,826 |
| Series 2024-R02, Class 1B2 | | |
| 9.03% (SOFR 30A + 3.70%), due 2/25/44 | 590,000 | 592,403 |
| Series 2020-SBT1, Class 1M2 | | |
| 9.095% (SOFR 30A + 3.764%), due 2/25/40 | 625,000 | 665,281 |
| | Principal
Amount | Value |
| |
| Whole Loan (Collateralized Mortgage Obligations) (continued) |
| Connecticut Avenue Securities Trust (a)(c) (continued) | | |
| Series 2021-R03, Class 1B2 | | |
| 10.83% (SOFR 30A + 5.50%), due 12/25/41 | $ 840,000 | $ 877,125 |
| Series 2021-R01, Class 1B2 | | |
| 11.33% (SOFR 30A + 6.00%), due 10/25/41 | 2,070,000 | 2,171,686 |
| Series 2022-R01, Class 1B2 | | |
| 11.33% (SOFR 30A + 6.00%), due 12/25/41 | 1,845,000 | 1,939,188 |
| Series 2022-R05, Class 2B2 | | |
| 12.33% (SOFR 30A + 7.00%), due 4/25/42 | 1,650,000 | 1,795,621 |
| Series 2022-R02, Class 2B2 | | |
| 12.98% (SOFR 30A + 7.65%), due 1/25/42 | 750,000 | 813,045 |
| Series 2019-HRP1, Class B1 | | |
| 14.695% (SOFR 30A + 9.364%), due 11/25/39 | 1,950,000 | 2,161,124 |
| Series 2022-R04, Class 1B2 | | |
| 14.83% (SOFR 30A + 9.50%), due 3/25/42 | 750,000 | 850,655 |
| Series 2022-R03, Class 1B2 | | |
| 15.18% (SOFR 30A + 9.85%), due 3/25/42 | 530,000 | 606,459 |
| CSMC Trust | | |
| Series 2021-NQM2, Class A1 | | |
| 1.179%, due 2/25/66 (a)(i) | 837,245 | 715,220 |
| FHLMC STACR REMIC Trust (a)(c) | | |
| Series 2021-HQA1, Class B1 | | |
| 8.33% (SOFR 30A + 3.00%), due 8/25/33 | 3,225,000 | 3,473,938 |
| Series 2021-DNA5, Class B1 | | |
| 8.38% (SOFR 30A + 3.05%), due 1/25/34 | 2,105,000 | 2,225,385 |
| Series 2021-HQA2, Class B1 | | |
| 8.48% (SOFR 30A + 3.15%), due 12/25/33 | 1,445,000 | 1,572,796 |
| Series 2021-HQA4, Class B1 | | |
| 9.08% (SOFR 30A + 3.75%), due 12/25/41 | 380,000 | 391,913 |
| Series 2020-HQA5, Class B1 | | |
| 9.33% (SOFR 30A + 4.00%), due 11/25/50 | 1,070,000 | 1,206,695 |
| Series 2021-DNA1, Class B2 | | |
| 10.08% (SOFR 30A + 4.75%), due 1/25/51 | 2,085,000 | 2,209,686 |
The notes to the financial statements are an integral part of, and should be read in conjunction with, the financial statements.
| 20 | MainStay Income Builder Fund |
| | Principal
Amount | Value |
| Mortgage-Backed Securities (continued) |
| Whole Loan (Collateralized Mortgage Obligations) (continued) |
FHLMC STACR REMIC Trust (a)(c)
(continued) | | |
| Series 2020-DNA2, Class B2 | | |
| 10.244% (SOFR 30A + 4.914%), due 2/25/50 | $ 1,665,000 | $ 1,778,951 |
| Series 2021-HQA1, Class B2 | | |
| 10.33% (SOFR 30A + 5.00%), due 8/25/33 | 1,116,000 | 1,194,023 |
| Series 2020-HQA1, Class B2 | | |
| 10.545% (SOFR 30A + 5.214%), due 1/25/50 | 1,920,000 | 2,042,186 |
| Series 2022-HQA3, Class M2 | | |
| 10.68% (SOFR 30A + 5.35%), due 8/25/42 | 1,965,000 | 2,141,850 |
| Series 2021-HQA2, Class B2 | | |
| 10.78% (SOFR 30A + 5.45%), due 12/25/33 | 1,680,000 | 1,840,170 |
| Series 2021-DNA5, Class B2 | | |
| 10.83% (SOFR 30A + 5.50%), due 1/25/34 | 880,000 | 969,077 |
| Series 2022-HQA2, Class M2 | | |
| 11.33% (SOFR 30A + 6.00%), due 7/25/42 | 1,605,000 | 1,778,035 |
| Series 2021-DNA3, Class B2 | | |
| 11.58% (SOFR 30A + 6.25%), due 10/25/33 | 440,000 | 513,183 |
| Series 2021-HQA3, Class B2 | | |
| 11.58% (SOFR 30A + 6.25%), due 9/25/41 | 1,550,000 | 1,621,228 |
| Series 2021-HQA4, Class B2 | | |
| 12.33% (SOFR 30A + 7.00%), due 12/25/41 | 1,050,000 | 1,109,676 |
| Series 2022-HQA1, Class B1 | | |
| 12.33% (SOFR 30A + 7.00%), due 3/25/42 | 1,830,000 | 2,027,878 |
| Series 2022-DNA1, Class B2 | | |
| 12.43% (SOFR 30A + 7.10%), due 1/25/42 | 1,385,000 | 1,474,875 |
| Series 2021-DNA7, Class B2 | | |
| 13.13% (SOFR 30A + 7.80%), due 11/25/41 | 2,000,000 | 2,171,339 |
| FHLMC STACR Trust | | |
| Series 2019-HQA3, Class B2 | | |
| 12.944% (SOFR 30A + 7.614%), due 9/25/49 (a)(c) | 895,000 | 1,011,268 |
| | Principal
Amount | Value |
| |
| Whole Loan (Collateralized Mortgage Obligations) (continued) |
| Flagstar Mortgage Trust | | |
| Series 2021-6INV, Class A18 | | |
| 2.50%, due 8/25/51 (a)(i) | $ 93,529 | $ 70,895 |
| FNMA Connecticut Avenue Securities | | |
| Series 2021-R02, Class 2B2 | | |
| 11.53% (SOFR 30A + 6.20%), due 11/25/41 (a)(c) | 720,000 | 756,900 |
| Onslow Bay Mortgage Loan Trust | | |
| Series 2021-NQM4, Class A1 | | |
| 1.957%, due 10/25/61 (a)(i) | 2,001,999 | 1,625,112 |
| Sequoia Mortgage Trust | | |
| Series 2021-4, Class A1 | | |
| 0.167%, due 6/25/51 (a)(h)(j) | 30,464,149 | 275,795 |
| STACR Trust | | |
| Series 2018-HRP2, Class B1 | | |
| 9.645% (SOFR 30A + 4.314%), due 2/25/47 (a)(c) | 2,150,000 | 2,394,077 |
| | | 53,221,149 |
Total Mortgage-Backed Securities
(Cost $160,026,371) | | 158,101,032 |
| Municipal Bond 0.1% |
| California 0.1% |
| Regents of the University of California Medical Center, Pooled, Revenue Bonds | | |
| Series N | | |
| 3.006%, due 5/15/50 | 1,815,000 | 1,188,564 |
Total Municipal Bond
(Cost $1,815,000) | | 1,188,564 |
| U.S. Government & Federal Agencies 3.3% |
| Federal Home Loan Mortgage Corporation (Mortgage Pass-Through Securities) 1.2% |
| UMBS Pool, 30 Year | | |
| 3.00%, due 1/1/52 | 3,173,121 | 2,625,770 |
| 3.50%, due 7/1/50 | 1,105,143 | 967,900 |
| 4.50%, due 10/1/52 | 858,538 | 791,466 |
| 5.00%, due 3/1/54 | 735,386 | 697,014 |
| 5.50%, due 7/1/53 | 1,900,306 | 1,844,977 |
| 6.00%, due 10/1/53 | 1,572,443 | 1,563,314 |
| 6.00%, due 10/1/53 | 924,078 | 916,339 |
| 6.00%, due 11/1/53 | 117,201 | 116,437 |
| 6.50%, due 10/1/53 | 1,068,660 | 1,076,899 |
The notes to the financial statements are an integral part of, and should be read in conjunction with, the financial statements.
21
Portfolio of Investments April 30, 2024†^(Unaudited) (continued)
| | Principal
Amount | Value |
| U.S. Government & Federal Agencies (continued) |
| Federal Home Loan Mortgage Corporation (Mortgage Pass-Through Securities) (continued) |
| UMBS Pool, 30 Year (continued) | | |
| 6.50%, due 11/1/53 | $ 1,200,821 | $ 1,210,079 |
| 6.50%, due 12/1/53 | 467,356 | 472,316 |
| | | 12,282,511 |
| Federal National Mortgage Association (Mortgage Pass-Through Securities) 1.9% |
| UMBS, 30 Year | | |
| 2.50%, due 6/1/51 | 384,476 | 309,217 |
| 3.00%, due 2/1/51 | 1,779,572 | 1,484,806 |
| 3.00%, due 6/1/51 | 1,780,245 | 1,477,100 |
| 3.50%, due 7/1/52 | 736,248 | 635,333 |
| 4.00%, due 8/1/48 | 426,020 | 388,086 |
| 4.00%, due 2/1/49 | 246,919 | 223,847 |
| 4.00%, due 6/1/52 | 855,337 | 765,890 |
| 4.00%, due 6/1/52 | 681,458 | 610,835 |
| 4.50%, due 1/1/54 | 2,415,000 | 2,225,929 |
| 5.00%, due 11/1/52 | 2,832,319 | 2,689,226 |
| 5.00%, due 3/1/53 | 1,675,462 | 1,588,642 |
| 5.50%, due 2/1/53 | 428,099 | 416,759 |
| 5.50%, due 8/1/53 | 444,645 | 433,719 |
| 6.00%, due 9/1/53 | 1,147,716 | 1,139,282 |
| 6.00%, due 9/1/53 | 4,710 | 4,669 |
| 6.00%, due 11/1/53 | 104,021 | 103,387 |
| 6.50%, due 10/1/53 | 946,430 | 955,325 |
| 6.50%, due 12/1/53 | 268,415 | 271,343 |
| 6.50%, due 3/1/54 | 3,349,242 | 3,394,334 |
| | | 19,117,729 |
| Government National Mortgage Association (Mortgage Pass-Through Securities) 0.0% ‡ |
| GNMA I, Single Family, 30 Year | | |
| 6.50%, due 4/15/29 | 5 | 6 |
| 6.50%, due 8/15/29 | 3 | 2 |
| | | 8 |
| United States Treasury Bonds 0.1% |
| U.S. Treasury Bonds | | |
| 4.25%, due 2/15/54 | 850,000 | 778,148 |
| | Principal
Amount | Value |
| |
| United States Treasury Notes 0.1% |
| U.S. Treasury Notes | | |
| 4.00%, due 2/15/34 | $ 25,000 | $ 23,672 |
| 4.625%, due 4/30/31 | 670,000 | 666,859 |
| | | 690,531 |
Total U.S. Government & Federal Agencies
(Cost $33,705,701) | | 32,868,927 |
Total Long-Term Bonds
(Cost $418,190,718) | | 395,616,935 |
| |
| | Shares | |
| |
| Common Stocks 59.1% |
| Aerospace & Defense 2.0% |
| BAE Systems plc (United Kingdom) | 373,690 | 6,215,137 |
| General Dynamics Corp. | 14,155 | 4,063,759 |
| Lockheed Martin Corp. | 9,727 | 4,522,374 |
| RTX Corp. | 55,819 | 5,666,745 |
| | | 20,468,015 |
| Air Freight & Logistics 1.2% |
| Deutsche Post AG (Germany) | 129,822 | 5,437,381 |
| Hyundai Glovis Co. Ltd. (Republic of Korea) | 26,013 | 3,396,583 |
| United Parcel Service, Inc., Class B | 24,027 | 3,543,502 |
| | | 12,377,466 |
| Automobile Components 0.4% |
| Cie Generale des Etablissements Michelin SCA (France) | 99,985 | 3,841,792 |
| Automobiles 0.4% |
| Toyota Motor Corp. (Japan) | 194,800 | 4,461,758 |
| Banks 4.0% |
| Bank of America Corp. | 186,213 | 6,891,743 |
| BAWAG Group AG (Austria) (a) | 57,083 | 3,412,801 |
| Columbia Banking System, Inc. | 170,546 | 3,207,970 |
| JPMorgan Chase & Co. | 47,440 | 9,096,146 |
| PNC Financial Services Group, Inc. (The) | 24,061 | 3,687,589 |
| Regions Financial Corp. | 172,415 | 3,322,437 |
| Royal Bank of Canada (Canada) | 32,555 | 3,149,675 |
| Truist Financial Corp. | 95,536 | 3,587,377 |
| U.S. Bancorp | 90,048 | 3,658,650 |
| | | 40,014,388 |
The notes to the financial statements are an integral part of, and should be read in conjunction with, the financial statements.
| 22 | MainStay Income Builder Fund |
| | Shares | Value |
| Common Stocks (continued) |
| Beverages 2.0% |
| Coca-Cola Co. (The) | 71,485 | $ 4,415,628 |
| Coca-Cola Europacific Partners plc (United Kingdom) | 159,875 | 11,514,198 |
| PepsiCo, Inc. | 25,840 | 4,545,514 |
| | | 20,475,340 |
| Biotechnology 0.8% |
| AbbVie, Inc. | 48,248 | 7,847,055 |
| Capital Markets 1.0% |
| BlackRock, Inc. | 4,140 | 3,124,210 |
| Lazard, Inc. | 108,295 | 4,169,357 |
| Schroders plc (United Kingdom) | 674,583 | 2,944,652 |
| | | 10,238,219 |
| Chemicals 2.1% |
| Air Products and Chemicals, Inc. | 14,428 | 3,409,913 |
| Dow, Inc. | 70,824 | 4,029,885 |
| Linde plc | 12,504 | 5,513,764 |
| LyondellBasell Industries NV, Class A | 43,279 | 4,326,602 |
| Nutrien Ltd. (Canada) | 65,179 | 3,439,496 |
| | | 20,719,660 |
| Commercial Services & Supplies 0.0% ‡ |
| Quad/Graphics, Inc. | 10 | 45 |
| Communications Equipment 0.9% |
| Cisco Systems, Inc. | 194,754 | 9,149,543 |
| Construction & Engineering 0.3% |
| Vinci SA (France) | 27,812 | 3,255,104 |
| Consumer Staples Distribution & Retail 0.8% |
| Walmart, Inc. | 137,993 | 8,189,885 |
| Diversified Telecommunication Services 2.5% |
| AT&T, Inc. | 189,948 | 3,208,222 |
| BCE, Inc. (Canada) | 89,207 | 2,930,907 |
| Deutsche Telekom AG (Registered) (Germany) | 372,520 | 8,525,873 |
| Orange SA (France) | 309,812 | 3,445,133 |
| TELUS Corp. (Canada) | 227,575 | 3,655,020 |
| Verizon Communications, Inc. | 80,095 | 3,162,951 |
| | | 24,928,106 |
| | Shares | Value |
| |
| Electric Utilities 2.0% |
| American Electric Power Co., Inc. | 49,775 | $ 4,282,143 |
| Duke Energy Corp. | 33,033 | 3,245,822 |
| Entergy Corp. | 33,222 | 3,543,791 |
| NextEra Energy, Inc. | 82,325 | 5,513,305 |
| Pinnacle West Capital Corp. | 45,604 | 3,358,735 |
| | | 19,943,796 |
| Electrical Equipment 1.2% |
| Eaton Corp. plc | 20,350 | 6,476,591 |
| Emerson Electric Co. | 48,526 | 5,230,132 |
| | | 11,706,723 |
| Food Products 1.1% |
| Mondelez International, Inc., Class A | 59,927 | 4,311,148 |
| Nestle SA (Registered) | 34,507 | 3,461,373 |
| Orkla ASA (Norway) | 419,430 | 2,850,230 |
| | | 10,622,751 |
| Gas Utilities 0.4% |
| Snam SpA (Italy) | 901,153 | 4,137,415 |
| Health Care Equipment & Supplies 0.6% |
| Medtronic plc | 72,508 | 5,818,042 |
| Health Care Providers & Services 1.0% |
| CVS Health Corp. | 43,830 | 2,967,729 |
| UnitedHealth Group, Inc. | 14,218 | 6,877,247 |
| | | 9,844,976 |
| Hotels, Restaurants & Leisure 1.7% |
| McDonald's Corp. | 16,128 | 4,403,589 |
| Restaurant Brands International, Inc. (Canada) | 124,565 | 9,448,256 |
| Vail Resorts, Inc. | 14,741 | 2,791,503 |
| | | 16,643,348 |
| Household Durables 0.4% |
| Garmin Ltd. | 29,886 | 4,317,630 |
| Industrial Conglomerates 0.9% |
| Honeywell International, Inc. | 16,758 | 3,229,769 |
| Siemens AG (Registered) (Germany) | 33,101 | 6,209,268 |
| | | 9,439,037 |
| Insurance 3.0% |
| Allianz SE (Registered) (Germany) | 13,783 | 3,914,438 |
| AXA SA (France) | 134,041 | 4,615,288 |
| Manulife Financial Corp. (Canada) | 282,635 | 6,592,387 |
| MetLife, Inc. | 98,552 | 7,005,076 |
The notes to the financial statements are an integral part of, and should be read in conjunction with, the financial statements.
23
Portfolio of Investments April 30, 2024†^(Unaudited) (continued)
| | Shares | Value |
| Common Stocks (continued) |
| Insurance (continued) |
| Muenchener Rueckversicherungs-Gesellschaft AG (Registered) (Germany) | 10,782 | $ 4,738,338 |
| Travelers Cos., Inc. (The) | 16,212 | 3,439,538 |
| | | 30,305,065 |
| Interactive Media & Services 0.4% |
| Meta Platforms, Inc., Class A | 8,623 | 3,709,356 |
| IT Services 1.2% |
| International Business Machines Corp. | 71,721 | 11,920,030 |
| Leisure Products 0.4% |
| Hasbro, Inc. | 65,625 | 4,022,813 |
| Machinery 0.7% |
| Cummins, Inc. | 25,451 | 7,189,653 |
| Media 0.8% |
| Comcast Corp., Class A | 103,893 | 3,959,362 |
| Omnicom Group, Inc. | 46,627 | 4,328,851 |
| | | 8,288,213 |
| Multi-Utilities 0.7% |
| NiSource, Inc. | 131,968 | 3,676,629 |
| WEC Energy Group, Inc. | 43,272 | 3,575,998 |
| | | 7,252,627 |
| Oil, Gas & Consumable Fuels 2.4% |
| Chevron Corp. | 21,926 | 3,536,006 |
| Enterprise Products Partners LP | 123,516 | 3,468,329 |
| MPLX LP | 78,605 | 3,285,689 |
| TotalEnergies SE (France) | 134,964 | 9,802,798 |
| Williams Cos., Inc. (The) | 103,075 | 3,953,957 |
| | | 24,046,779 |
| Personal Care Products 0.4% |
| Unilever plc (United Kingdom) | 81,272 | 4,201,314 |
| Pharmaceuticals 6.0% |
| Astellas Pharma, Inc. (Japan) | 346,800 | 3,330,038 |
| AstraZeneca plc, Sponsored ADR (United Kingdom) | 127,330 | 9,661,800 |
| Bristol-Myers Squibb Co. | 66,926 | 2,940,729 |
| Eli Lilly & Co. | 10,687 | 8,347,616 |
| GSK plc | 164,676 | 3,413,527 |
| | Shares | Value |
| |
| Pharmaceuticals (continued) |
| Johnson & Johnson | 26,826 | $ 3,878,771 |
| Merck & Co., Inc. | 52,456 | 6,778,364 |
| Novartis AG (Registered) (Switzerland) | 81,873 | 7,908,190 |
| Pfizer, Inc. | 120,845 | 3,096,049 |
| Roche Holding AG | 12,351 | 2,954,845 |
| Sanofi SA | 78,652 | 7,754,806 |
| | | 60,064,735 |
| Professional Services 0.3% |
| Paychex, Inc. | 29,559 | 3,511,905 |
| Retail REITs 0.4% |
| Realty Income Corp. | 74,591 | 3,993,602 |
| Semiconductors & Semiconductor Equipment 5.1% |
| Analog Devices, Inc. | 56,144 | 11,263,048 |
| Broadcom, Inc. | 10,519 | 13,677,540 |
| KLA Corp. | 13,784 | 9,501,173 |
| Taiwan Semiconductor Manufacturing Co. Ltd., Sponsored ADR (Taiwan) | 72,235 | 9,920,755 |
| Texas Instruments, Inc. | 37,655 | 6,643,095 |
| | | 51,005,611 |
| Software 1.3% |
| Microsoft Corp. | 34,827 | 13,559,196 |
| Specialized REITs 1.3% |
| Iron Mountain, Inc. | 120,641 | 9,352,090 |
| VICI Properties, Inc. | 127,519 | 3,640,668 |
| | | 12,992,758 |
| Specialty Retail 0.7% |
| Best Buy Co., Inc. | 42,199 | 3,107,534 |
| Home Depot, Inc. (The) | 13,216 | 4,417,052 |
| | | 7,524,586 |
| Technology Hardware, Storage & Peripherals 3.4% |
| Apple, Inc. | 48,877 | 8,325,219 |
| Dell Technologies, Inc., Class C | 62,209 | 7,753,730 |
| Hewlett Packard Enterprise Co. | 329,834 | 5,607,178 |
| NetApp, Inc. | 61,705 | 6,306,868 |
| Samsung Electronics Co. Ltd., GDR (Republic of Korea) | 4,323 | 6,020,018 |
| | | 34,013,013 |
| Tobacco 1.3% |
| British American Tobacco plc (United Kingdom) | 109,649 | 3,213,677 |
The notes to the financial statements are an integral part of, and should be read in conjunction with, the financial statements.
| 24 | MainStay Income Builder Fund |
| | Shares | | Value |
| Common Stocks (continued) |
| Tobacco (continued) |
| Imperial Brands plc (United Kingdom) | 148,081 | | $ 3,376,571 |
| Philip Morris International, Inc. | 72,865 | | 6,917,803 |
| | | | 13,508,051 |
| Trading Companies & Distributors 0.7% |
| MSC Industrial Direct Co., Inc., Class A | 72,635 | | 6,627,217 |
| Water Utilities 0.3% |
| Essential Utilities, Inc. | 93,572 | | 3,422,864 |
| Wireless Telecommunication Services 0.6% |
| Rogers Communications, Inc., Class B (Canada) (b) | 76,601 | | 2,869,512 |
| SK Telecom Co. Ltd. (Republic of Korea) | 93,390 | | 3,459,779 |
| | | | 6,329,291 |
Total Common Stocks
(Cost $438,255,334) | | | 595,928,773 |
| Short-Term Investments 0.8% |
| Affiliated Investment Company 0.7% |
| MainStay U.S. Government Liquidity Fund, 5.242% (k) | 7,473,594 | | 7,473,594 |
| Unaffiliated Investment Company 0.1% |
| Invesco Government & Agency Portfolio, 5.309% (k)(l) | 638,525 | | 638,525 |
Total Short-Term Investments
(Cost $8,112,119) | | | 8,112,119 |
Total Investments
(Cost $864,558,171) | 99.2% | | 999,657,827 |
| Other Assets, Less Liabilities | 0.8 | | 8,217,016 |
| Net Assets | 100.0% | | $ 1,007,874,843 |
| † | Percentages indicated are based on Fund net assets. |
| ^ | Industry classifications may be different than those used for compliance monitoring purposes. |
| ‡ | Less than one-tenth of a percent. |
| (a) | May be sold to institutional investors only under Rule 144A or securities offered pursuant to Section 4(a)(2) of the Securities Act of 1933, as amended. |
| (b) | All or a portion of this security was held on loan. As of April 30, 2024, the aggregate market value of securities on loan was $619,893; the total market value of collateral held by the Fund was $655,678. The market value of the collateral held included non-cash collateral in the form of U.S. Treasury securities with a value of $17,153. The Fund received cash collateral with a value of $638,525. (See Note 2(L)) |
| (c) | Floating rate—Rate shown was the rate in effect as of April 30, 2024. |
| (d) | Fixed to floating rate—Rate shown was the rate in effect as of April 30, 2024. |
| (e) | Security is perpetual and, thus, does not have a predetermined maturity date. The date shown, if applicable, reflects the next call date. |
| (f) | Step coupon—Rate shown was the rate in effect as of April 30, 2024. |
| (g) | Illiquid security—As of April 30, 2024, the total market value deemed illiquid under procedures approved by the Board of Trustees was $577,375, which represented 0.1% of the Fund’s net assets. |
| (h) | Collateralized Mortgage Obligation Interest Only Strip—Pays a fixed or variable rate of interest based on mortgage loans or mortgage pass-through securities. The principal amount of the underlying pool represents the notional amount on which the current interest was calculated. The value of these stripped securities may be particularly sensitive to changes in prevailing interest rates and are typically more sensitive to changes in prepayment rates than traditional mortgage-backed securities. |
| (i) | Coupon rate may change based on changes of the underlying collateral or prepayments of principal. Rate shown was the rate in effect as of April 30, 2024. |
| (j) | Collateral strip rate—A bond whose interest was based on the weighted net interest rate of the collateral. The coupon rate adjusts periodically based on a predetermined schedule. Rate shown was the rate in effect as of April 30, 2024. |
| (k) | Current yield as of April 30, 2024. |
| (l) | Represents a security purchased with cash collateral received for securities on loan. |
Investments in Affiliates (in 000's)
Investments in issuers considered to be affiliate(s) of the Fund during the six-month period ended April 30, 2024 for purposes of Section 2(a)(3) of the Investment Company Act of 1940, as amended, were as follows:
| Affiliated Investment Companies | Value,
Beginning
of Period | Purchases
at Cost | Proceeds
from
Sales | Net
Realized
Gain/(Loss)
on Sales | Change in
Unrealized
Appreciation/
(Depreciation) | Value,
End of
Period | Dividend
Income | Other
Distributions | Shares
End of
Period |
| MainStay U.S. Government Liquidity Fund | $ 1,560 | $ 145,158 | $ (139,244) | $ — | $ — | $ 7,474 | $ 431 | $ — | 7,474 |
The notes to the financial statements are an integral part of, and should be read in conjunction with, the financial statements.
25
Portfolio of Investments April 30, 2024†^(Unaudited) (continued)
Foreign Currency Forward Contracts
As of April 30, 2024, the Fund held the following foreign currency forward contracts1:
| Currency Purchased | Currency Sold | Counterparty | Settlement
Date | Unrealized
Appreciation
(Depreciation) |
| GBP | 36,000 | USD | 44,814 | JPMorgan Chase Bank N.A. | 5/2/24 | $ 170 |
| USD | 15,146,476 | AUD | 23,293,000 | JPMorgan Chase Bank N.A. | 5/2/24 | 57,270 |
| USD | 5,865,180 | EUR | 5,385,336 | JPMorgan Chase Bank N.A. | 5/2/24 | 117,950 |
| USD | 5,782,491 | EUR | 5,385,336 | JPMorgan Chase Bank N.A. | 8/1/24 | 11,417 |
| USD | 45,819 | GBP | 36,000 | JPMorgan Chase Bank N.A. | 5/2/24 | 835 |
| USD | 44,326,520 | JPY | 6,863,607,000 | JPMorgan Chase Bank N.A. | 5/2/24 | 807,470 |
| Total Unrealized Appreciation | 995,112 |
| AUD | 23,293,000 | USD | 15,414,658 | JPMorgan Chase Bank N.A. | 5/2/24 | (325,452) |
| AUD | 23,293,000 | USD | 15,187,113 | JPMorgan Chase Bank N.A. | 8/1/24 | (57,483) |
| EUR | 5,385,336 | USD | 5,759,089 | JPMorgan Chase Bank N.A. | 5/2/24 | (11,859) |
| JPY | 6,863,607,000 | USD | 47,275,230 | JPMorgan Chase Bank N.A. | 5/2/24 | (3,756,180) |
| JPY | 6,863,607,000 | USD | 44,946,868 | JPMorgan Chase Bank N.A. | 8/1/24 | (811,061) |
| USD | 44,838 | GBP | 36,000 | JPMorgan Chase Bank N.A. | 8/1/24 | (169) |
| Total Unrealized Depreciation | (4,962,204) |
| Net Unrealized Depreciation | $ (3,967,092) |
| 1. | Foreign Currency Forward Contracts are subject to limitations such that they cannot be “sold or repurchased,” although the Fund would be able to exit the transaction through other means, such as through the execution of an offsetting transaction. |
Futures Contracts
As of April 30, 2024, the Fund held the following futures contracts1:
| Type | Number of
Contracts | Expiration
Date | Value at
Trade Date | Current
Notional
Amount | Unrealized
Appreciation
(Depreciation)2 |
| Long Contracts | | | | | |
| E-Mini Energy Select Sector Index | 152 | June 2024 | $ 14,112,488 | $ 14,972,000 | $ 859,512 |
| E-Mini Financial Select Sector Index | 143 | June 2024 | 18,095,777 | 17,892,875 | (202,902) |
| S&P 500 E-Mini Index | 251 | June 2024 | 64,958,830 | 63,590,850 | (1,367,980) |
| S&P Midcap 400 E-Mini Index | 20 | June 2024 | 5,972,546 | 5,754,400 | (218,146) |
| U.S. Treasury 2 Year Notes | 38 | June 2024 | 7,714,258 | 7,700,937 | (13,321) |
| U.S. Treasury 5 Year Notes | 141 | June 2024 | 15,080,205 | 14,768,649 | (311,556) |
| U.S. Treasury 10 Year Notes | 227 | June 2024 | 24,828,151 | 24,388,312 | (439,839) |
| U.S. Treasury Long Bonds | 230 | June 2024 | 27,369,675 | 26,176,875 | (1,192,800) |
| U.S. Treasury Ultra Bonds | 144 | June 2024 | 18,409,535 | 17,217,000 | (1,192,535) |
| Yen Denominated Nikkei 225 Index | 600 | June 2024 | 76,209,963 | 72,596,139 | (3,613,824) |
| Total Long Contracts | | | | | (7,693,391) |
| Short Contracts | | | | | |
| Euro STOXX 50 Index | (768) | June 2024 | (40,125,462) | (40,136,282) | (10,820) |
| FTSE 100 Index | (151) | June 2024 | (14,477,172) | (15,393,625) | (916,453) |
| S&P E-Mini Commercial Service Equity Index | (180) | June 2024 | (18,968,031) | (18,445,500) | 522,531 |
| U.S. Treasury 10 Year Ultra Bonds | (13) | June 2024 | (1,435,658) | (1,432,844) | 2,814 |
| Total Short Contracts | | | | | (401,928) |
| Net Unrealized Depreciation | | | | | $ (8,095,319) |
| 1. | As of April 30, 2024, cash in the amount of $14,968,100 was on deposit with a broker or futures commission merchant for futures transactions. |
| 2. | Represents the difference between the value of the contracts at the time they were opened and the value as of April 30, 2024. |
| Abbreviation(s): |
| ADR—American Depositary Receipt |
| AUD—Australia Dollar |
The notes to the financial statements are an integral part of, and should be read in conjunction with, the financial statements.
| 26 | MainStay Income Builder Fund |
| EUR—Euro |
| FHLMC—Federal Home Loan Mortgage Corp. |
| FNMA—Federal National Mortgage Association |
| FTSE—Financial Times Stock Exchange |
| GBP—British Pound Sterling |
| GDR—Global Depositary Receipt |
| GNMA—Government National Mortgage Association |
| JPY—Japanese Yen |
| REIT—Real Estate Investment Trust |
| REMIC—Real Estate Mortgage Investment Conduit |
| SOFR—Secured Overnight Financing Rate |
| STACR—Structured Agency Credit Risk |
| UMBS—Uniform Mortgage Backed Securities |
| USD—United States Dollar |
The notes to the financial statements are an integral part of, and should be read in conjunction with, the financial statements.
27
Portfolio of Investments April 30, 2024†^(Unaudited) (continued)
The following is a summary of the fair valuations according to the inputs used as of April 30, 2024, for valuing the Fund’s assets and liabilities:
| Description | Quoted
Prices in
Active
Markets for
Identical
Assets
(Level 1) | | Significant
Other
Observable
Inputs
(Level 2) | | Significant
Unobservable
Inputs
(Level 3) | | Total |
| Asset Valuation Inputs | | | | | | | |
| Investments in Securities (a) | | | | | | | |
| Long-Term Bonds | | | | | | | |
| Asset-Backed Securities | $ — | | $ 23,840,833 | | $ — | | $ 23,840,833 |
| Corporate Bonds | — | | 171,642,936 | | — | | 171,642,936 |
| Foreign Government Bonds | — | | 7,261,153 | | — | | 7,261,153 |
| Loan Assignments | — | | 713,490 | | — | | 713,490 |
| Mortgage-Backed Securities | — | | 158,101,032 | | — | | 158,101,032 |
| Municipal Bond | — | | 1,188,564 | | — | | 1,188,564 |
| U.S. Government & Federal Agencies | — | | 32,868,927 | | — | | 32,868,927 |
| Total Long-Term Bonds | — | | 395,616,935 | | — | | 395,616,935 |
| Common Stocks | | | | | | | |
| Aerospace & Defense | 14,252,878 | | 6,215,137 | | — | | 20,468,015 |
| Air Freight & Logistics | 3,543,502 | | 8,833,964 | | — | | 12,377,466 |
| Automobile Components | — | | 3,841,792 | | — | | 3,841,792 |
| Automobiles | — | | 4,461,758 | | — | | 4,461,758 |
| Banks | 36,601,587 | | 3,412,801 | | — | | 40,014,388 |
| Capital Markets | 7,293,567 | | 2,944,652 | | — | | 10,238,219 |
| Construction & Engineering | — | | 3,255,104 | | — | | 3,255,104 |
| Diversified Telecommunication Services | 12,957,100 | | 11,971,006 | | — | | 24,928,106 |
| Food Products | 4,311,148 | | 6,311,603 | | — | | 10,622,751 |
| Gas Utilities | — | | 4,137,415 | | — | | 4,137,415 |
| Industrial Conglomerates | 3,229,769 | | 6,209,268 | | — | | 9,439,037 |
| Insurance | 17,037,001 | | 13,268,064 | | — | | 30,305,065 |
| Oil, Gas & Consumable Fuels | 14,243,981 | | 9,802,798 | | — | | 24,046,779 |
| Personal Care Products | — | | 4,201,314 | | — | | 4,201,314 |
| Pharmaceuticals | 34,703,329 | | 25,361,406 | | — | | 60,064,735 |
| Technology Hardware, Storage & Peripherals | 27,992,995 | | 6,020,018 | | — | | 34,013,013 |
| Tobacco | 6,917,803 | | 6,590,248 | | — | | 13,508,051 |
| Wireless Telecommunication Services | 2,869,512 | | 3,459,779 | | — | | 6,329,291 |
| All Other Industries | 279,676,474 | | — | | — | | 279,676,474 |
| Total Common Stocks | 465,630,646 | | 130,298,127 | | — | | 595,928,773 |
| Short-Term Investments | | | | | | | |
| Affiliated Investment Company | 7,473,594 | | — | | — | | 7,473,594 |
| Unaffiliated Investment Company | 638,525 | | — | | — | | 638,525 |
| Total Short-Term Investments | 8,112,119 | | — | | — | | 8,112,119 |
| Total Investments in Securities | 473,742,765 | | 525,915,062 | | — | | 999,657,827 |
| Other Financial Instruments (b) | | | | | | | |
| Foreign Currency Forward Contracts | — | | 995,112 | | — | | 995,112 |
| Futures Contracts | 1,384,857 | | — | | — | | 1,384,857 |
| Total Other Financial Instruments | 1,384,857 | | 995,112 | | — | | 2,379,969 |
| Total Investments in Securities and Other Financial Instruments | $ 475,127,622 | | $ 526,910,174 | | $ — | | $ 1,002,037,796 |
| Liability Valuation Inputs | | | | | | | |
| Other Financial Instruments (b) | | | | | | | |
| Foreign Currency Forward Contracts | $ — | | $ (4,962,204) | | $ — | | $ (4,962,204) |
| Futures Contracts | (9,480,176) | | — | | — | | (9,480,176) |
| Total Other Financial Instruments | $ (9,480,176) | | $ (4,962,204) | | $ — | | $ (14,442,380) |
The notes to the financial statements are an integral part of, and should be read in conjunction with, the financial statements.
| 28 | MainStay Income Builder Fund |
| (a) | For a complete listing of investments and their industries, see the Portfolio of Investments. |
| (b) | The value listed for these securities reflects unrealized appreciation (depreciation) as shown on the Portfolio of Investments. |
The notes to the financial statements are an integral part of, and should be read in conjunction with, the financial statements.
29
Statement of Assets and Liabilities as of April 30, 2024 (Unaudited)
| Assets |
Investment in unaffiliated securities, at value
(identified cost $857,084,577) including securities on loan of $619,893 | $ 992,184,233 |
Investment in affiliated investment companies, at value
(identified cost $7,473,594) | 7,473,594 |
| Cash | 35,897 |
Cash denominated in foreign currencies
(identified cost $891,400) | 890,785 |
| Cash collateral on deposit at broker for futures contracts | 14,968,100 |
| Due from custodian | 1,563,875 |
| Receivables: | |
| Dividends and interest | 5,614,410 |
| Investment securities sold | 3,366,597 |
| Fund shares sold | 223,771 |
| Unrealized appreciation on foreign currency forward contracts | 995,112 |
| Other assets | 140,132 |
| Total assets | 1,027,456,506 |
| Liabilities |
| Cash collateral received for securities on loan | 638,525 |
| Payables: | |
| Investment securities purchased | 9,308,498 |
| Variation margin on futures contracts | 1,859,119 |
| Fund shares redeemed | 1,456,301 |
| Manager (See Note 3) | 530,562 |
| Transfer agent (See Note 3) | 241,559 |
| NYLIFE Distributors (See Note 3) | 186,089 |
| Shareholder communication | 85,010 |
| Custodian | 49,439 |
| Professional fees | 26,877 |
| Securities lending | 1,788 |
| Trustees | 473 |
| Accrued expenses | 9,314 |
| Distributions payable | 225,905 |
| Unrealized depreciation on foreign currency forward contracts | 4,962,204 |
| Total liabilities | 19,581,663 |
| Net assets | $1,007,874,843 |
| Composition of Net Assets |
| Shares of beneficial interest outstanding (par value of $.01 per share) unlimited number of shares authorized | $ 535,049 |
| Additional paid-in-capital | 1,001,183,259 |
| | 1,001,718,308 |
| Total distributable earnings (loss) | 6,156,535 |
| Net assets | $1,007,874,843 |
| Class A | |
| Net assets applicable to outstanding shares | $638,859,109 |
| Shares of beneficial interest outstanding | 34,034,149 |
| Net asset value per share outstanding | $ 18.77 |
| Maximum sales charge (3.00% of offering price) | 0.58 |
| Maximum offering price per share outstanding | $ 19.35 |
| Investor Class | |
| Net assets applicable to outstanding shares | $ 60,529,070 |
| Shares of beneficial interest outstanding | 3,221,233 |
| Net asset value per share outstanding | $ 18.79 |
| Maximum sales charge (2.50% of offering price) | 0.48 |
| Maximum offering price per share outstanding | $ 19.27 |
| Class B | |
| Net assets applicable to outstanding shares | $ 2,661,443 |
| Shares of beneficial interest outstanding | 140,492 |
| Net asset value and offering price per share outstanding | $ 18.94 |
| Class C | |
| Net assets applicable to outstanding shares | $ 45,404,045 |
| Shares of beneficial interest outstanding | 2,401,974 |
| Net asset value and offering price per share outstanding | $ 18.90 |
| Class I | |
| Net assets applicable to outstanding shares | $255,919,715 |
| Shares of beneficial interest outstanding | 13,470,120 |
| Net asset value and offering price per share outstanding | $ 19.00 |
| Class R6 | |
| Net assets applicable to outstanding shares | $ 4,439,681 |
| Shares of beneficial interest outstanding | 233,612 |
| Net asset value and offering price per share outstanding | $ 19.00 |
| SIMPLE Class | |
| Net assets applicable to outstanding shares | $ 61,780 |
| Shares of beneficial interest outstanding | 3,289 |
| Net asset value and offering price per share outstanding(a) | $ 18.79 |
| (a) | The difference between the calculated and stated NAV was caused by rounding. |
The notes to the financial statements are an integral part of, and should be read in conjunction with, the financial statements.
| 30 | MainStay Income Builder Fund |
Statement of Operations for the six months ended April 30, 2024 (Unaudited)
| Investment Income (Loss) |
| Income | |
| Dividends-unaffiliated (net of foreign tax withholding of $355,683) | $ 10,865,308 |
| Interest | 10,331,262 |
| Dividends-affiliated | 431,319 |
| Securities lending, net | 51,888 |
| Total income | 21,679,777 |
| Expenses | |
| Manager (See Note 3) | 3,237,742 |
| Distribution/Service—Class A (See Note 3) | 800,809 |
| Distribution/Service—Investor Class (See Note 3) | 76,232 |
| Distribution/Service—Class B (See Note 3) | 18,402 |
| Distribution/Service—Class C (See Note 3) | 247,590 |
| Distribution/Service—Class R2 (See Note 3)(a) | 645 |
| Distribution/Service—Class R3 (See Note 3)(a) | 4,309 |
| Distribution/Service—SIMPLE Class (See Note 3) | 131 |
| Transfer agent (See Note 3) | 664,489 |
| Professional fees | 79,582 |
| Registration | 63,183 |
| Custodian | 46,406 |
| Trustees | 12,849 |
| Shareholder communication | 6,558 |
| Shareholder service (See Note 3) | 1,120 |
| Miscellaneous | 35,515 |
| Total expenses before waiver/reimbursement | 5,295,562 |
| Expense waiver/reimbursement from Manager (See Note 3) | (17,619) |
| Net expenses | 5,277,943 |
| Net investment income (loss) | 16,401,834 |
| Realized and Unrealized Gain (Loss) |
| Net realized gain (loss) on: | |
| Unaffiliated investment transactions | 6,171,020 |
| Futures transactions | 14,071,662 |
| Foreign currency transactions | (147,308) |
| Foreign currency forward transactions | (4,077,402) |
| Net realized gain (loss) | 16,017,972 |
| Net change in unrealized appreciation (depreciation) on: | |
| Unaffiliated investments | 95,394,458 |
| Futures contracts | 4,686,611 |
| Foreign currency forward contracts | 1,157,259 |
| Translation of other assets and liabilities in foreign currencies | (1,312,195) |
| Net change in unrealized appreciation (depreciation) | 99,926,133 |
| Net realized and unrealized gain (loss) | 115,944,105 |
| Net increase (decrease) in net assets resulting from operations | $132,345,939 |
| (a) | Class liquidated and is no longer offered for sale as of February 23, 2024. |
The notes to the financial statements are an integral part of, and should be read in conjunction with, the financial statements.
31
Statements of Changes in Net Assets
for the six months ended April 30, 2024 (Unaudited) and the year ended October 31, 2023
| | Six months
ended
April 30,
2024 | Year
ended
October 31,
2023 |
| Increase (Decrease) in Net Assets |
| Operations: | | |
| Net investment income (loss) | $ 16,401,834 | $ 33,244,442 |
| Net realized gain (loss) | 16,017,972 | (39,125,163) |
| Net change in unrealized appreciation (depreciation) | 99,926,133 | 36,567,554 |
| Net increase (decrease) in net assets resulting from operations | 132,345,939 | 30,686,833 |
| Distributions to shareholders: | | |
| Class A | (11,198,642) | (18,746,549) |
| Investor Class | (986,844) | (1,598,498) |
| Class B | (43,545) | (118,720) |
| Class C | (602,681) | (1,191,343) |
| Class I | (4,864,336) | (9,267,066) |
| Class R2(a) | (7,434) | (32,710) |
| Class R3(a) | (21,095) | (60,772) |
| Class R6 | (78,693) | (389,844) |
| SIMPLE Class | (876) | (900) |
| Total distributions to shareholders | (17,804,146) | (31,406,402) |
| Capital share transactions: | | |
| Net proceeds from sales of shares | 35,374,185 | 86,579,835 |
| Net asset value of shares issued to shareholders in reinvestment of distributions | 16,565,410 | 29,119,425 |
| Cost of shares redeemed | (127,616,112) | (390,559,146) |
| Increase (decrease) in net assets derived from capital share transactions | (75,676,517) | (274,859,886) |
| Net increase (decrease) in net assets | 38,865,276 | (275,579,455) |
| Net Assets |
| Beginning of period | 969,009,567 | 1,244,589,022 |
| End of period | $1,007,874,843 | $ 969,009,567 |
| (a) | Class liquidated and is no longer offered for sale as of February 23, 2024. |
The notes to the financial statements are an integral part of, and should be read in conjunction with, the financial statements.
| 32 | MainStay Income Builder Fund |
Financial Highlights selected per share data and ratios
| | Six months ended
April 30,
2024* | | Year Ended October 31, |
| Class A | 2023 | | 2022 | | 2021 | | 2020 | | 2019 |
| Net asset value at beginning of period | $ 16.77 | | $ 16.97 | | $ 21.75 | | $ 18.61 | | $ 19.96 | | $ 18.51 |
| Net investment income (loss) (a) | 0.30 | | 0.53 | | 0.42 | | 0.43 | | 0.44 | | 0.54 |
| Net realized and unrealized gain (loss) | 2.03 | | (0.23) | | (3.63) | | 3.22 | | (0.61) | | 1.79 |
| Total from investment operations | 2.33 | | 0.30 | | (3.21) | | 3.65 | | (0.17) | | 2.33 |
| Less distributions: | | | | | | | | | | | |
| From net investment income | (0.33) | | (0.50) | | (0.42) | | (0.51) | | (0.42) | | (0.56) |
| From net realized gain on investments | — | | — | | (1.14) | | — | | (0.76) | | (0.32) |
| Return of capital | — | | — | | (0.01) | | — | | — | | — |
| Total distributions | (0.33) | | (0.50) | | (1.57) | | (0.51) | | (1.18) | | (0.88) |
| Net asset value at end of period | $ 18.77 | | $ 16.77 | | $ 16.97 | | $ 21.75 | | $ 18.61 | | $ 19.96 |
| Total investment return (b) | 13.88% | | 1.66% | | (15.75)% | | 19.74% | | (0.90)% | | 13.09% |
| Ratios (to average net assets)/Supplemental Data: | | | | | | | | | | | |
| Net investment income (loss) | 3.20%†† | | 2.96% | | 2.24% | | 2.04% | | 2.32% | | 2.83% |
| Net expenses (c) | 1.03%†† | | 1.03% | | 1.02% | | 0.99% | | 1.02% | | 1.02% |
| Portfolio turnover rate | 21% | | 56% | | 61% | | 57%(d) | | 65%(d) | | 62%(d) |
| Net assets at end of period (in 000’s) | $ 638,859 | | $ 595,905 | | $ 664,734 | | $ 818,764 | | $ 638,250 | | $ 625,049 |
| * | Unaudited. |
| †† | Annualized. |
| (a) | Per share data based on average shares outstanding during the period. |
| (b) | Total investment return is calculated exclusive of sales charges and assumes the reinvestment of dividends and distributions. For periods of less than one year, total return is not annualized. |
| (c) | In addition to the fees and expenses which the Fund bears directly, it also indirectly bears a pro-rata share of the fees and expenses of the underlying funds in which it invests. Such indirect expenses are not included in the above expense ratios. |
| (d) | The portfolio turnover rates not including mortgage dollar rolls were 56%, 62%, and 54% for the years ended October 31, 2021, 2020 and 2019, respectively. |
The notes to the financial statements are an integral part of, and should be read in conjunction with, the financial statements.
33
Financial Highlights selected per share data and ratios
| | Six months ended
April 30,
2024* | | Year Ended October 31, |
| Investor Class | 2023 | | 2022 | | 2021 | | 2020 | | 2019 |
| Net asset value at beginning of period | $ 16.78 | | $ 16.99 | | $ 21.77 | | $ 18.62 | | $ 19.98 | | $ 18.52 |
| Net investment income (loss) (a) | 0.27 | | 0.48 | | 0.39 | | 0.40 | | 0.41 | | 0.51 |
| Net realized and unrealized gain (loss) | 2.04 | | (0.23) | | (3.63) | | 3.22 | | (0.62) | | 1.80 |
| Total from investment operations | 2.31 | | 0.25 | | (3.24) | | 3.62 | | (0.21) | | 2.31 |
| Less distributions: | | | | | | | | | | | |
| From net investment income | (0.30) | | (0.46) | | (0.39) | | (0.47) | | (0.39) | | (0.53) |
| From net realized gain on investments | — | | — | | (1.14) | | — | | (0.76) | | (0.32) |
| Return of capital | — | | — | | (0.01) | | — | | — | | — |
| Total distributions | (0.30) | | (0.46) | | (1.54) | | (0.47) | | (1.15) | | (0.85) |
| Net asset value at end of period | $ 18.79 | | $ 16.78 | | $ 16.99 | | $ 21.77 | | $ 18.62 | | $ 19.98 |
| Total investment return (b) | 13.79% | | 1.35% | | (15.89)% | | 19.56% | | (1.11)% | | 12.98% |
| Ratios (to average net assets)/Supplemental Data: | | | | | | | | | | | |
| Net investment income (loss) | 2.95%†† | | 2.72% | | 2.05% | | 1.88% | | 2.16% | | 2.70% |
| Net expenses (c) | 1.28%†† | | 1.28% | | 1.20% | | 1.18% | | 1.17% | | 1.16% |
| Expenses (before waiver/reimbursement) (c) | 1.31%†† | | 1.29% | | 1.20% | | 1.18% | | 1.17% | | 1.17% |
| Portfolio turnover rate | 21% | | 56% | | 61% | | 57%(d) | | 65%(d) | | 62%(d) |
| Net assets at end of period (in 000's) | $ 60,529 | | $ 56,415 | | $ 60,808 | | $ 77,887 | | $ 79,992 | | $ 88,050 |
| * | Unaudited. |
| †† | Annualized. |
| (a) | Per share data based on average shares outstanding during the period. |
| (b) | Total investment return is calculated exclusive of sales charges and assumes the reinvestment of dividends and distributions. For periods of less than one year, total return is not annualized. |
| (c) | In addition to the fees and expenses which the Fund bears directly, it also indirectly bears a pro-rata share of the fees and expenses of the underlying funds in which it invests. Such indirect expenses are not included in the above expense ratios. |
| (d) | The portfolio turnover rates not including mortgage dollar rolls were 56%, 62%, and 54% for the years ended October 31, 2021, 2020 and 2019, respectively. |
The notes to the financial statements are an integral part of, and should be read in conjunction with, the financial statements.
| 34 | MainStay Income Builder Fund |
Financial Highlights selected per share data and ratios
| | Six months ended
April 30,
2024* | | Year Ended October 31, |
| Class B | 2023 | | 2022 | | 2021 | | 2020 | | 2019 |
| Net asset value at beginning of period | $ 16.92 | | $ 17.12 | | $ 21.93 | | $ 18.75 | | $ 20.11 | | $ 18.64 |
| Net investment income (loss) (a) | 0.20 | | 0.36 | | 0.25 | | 0.24 | | 0.27 | | 0.37 |
| Net realized and unrealized gain (loss) | 2.05 | | (0.24) | | (3.67) | | 3.25 | | (0.62) | | 1.81 |
| Total from investment operations | 2.25 | | 0.12 | | (3.42) | | 3.49 | | (0.35) | | 2.18 |
| Less distributions: | | | | | | | | | | | |
| From net investment income | (0.23) | | (0.32) | | (0.24) | | (0.31) | | (0.25) | | (0.39) |
| From net realized gain on investments | — | | — | | (1.14) | | — | | (0.76) | | (0.32) |
| Return of capital | — | | — | | (0.01) | | — | | — | | — |
| Total distributions | (0.23) | | (0.32) | | (1.39) | | (0.31) | | (1.01) | | (0.71) |
| Net asset value at end of period | $ 18.94 | | $ 16.92 | | $ 17.12 | | $ 21.93 | | $ 18.75 | | $ 20.11 |
| Total investment return (b) | 13.36% | | 0.63% | | (16.56)% | | 18.69% | | (1.84)% | | 12.11% |
| Ratios (to average net assets)/Supplemental Data: | | | | | | | | | | | |
| Net investment income (loss) | 2.16%†† | | 1.98% | | 1.28% | | 1.13% | | 1.42% | | 1.96% |
| Net expenses (c) | 2.03%†† | | 2.03% | | 1.95% | | 1.93% | | 1.92% | | 1.91% |
| Expenses (before waiver/reimbursement) (c) | 2.06%†† | | 2.04% | | 1.95% | | 1.93% | | 1.92% | | 1.92% |
| Portfolio turnover rate | 21% | | 56% | | 61% | | 57%(d) | | 65%(d) | | 62%(d) |
| Net assets at end of period (in 000’s) | $ 2,661 | | $ 4,227 | | $ 8,591 | | $ 16,789 | | $ 19,409 | | $ 26,396 |
| * | Unaudited. |
| †† | Annualized. |
| (a) | Per share data based on average shares outstanding during the period. |
| (b) | Total investment return is calculated exclusive of sales charges and assumes the reinvestment of dividends and distributions. For periods of less than one year, total return is not annualized. |
| (c) | In addition to the fees and expenses which the Fund bears directly, it also indirectly bears a pro-rata share of the fees and expenses of the underlying funds in which it invests. Such indirect expenses are not included in the above expense ratios. |
| (d) | The portfolio turnover rates not including mortgage dollar rolls were 56%, 62%, and 54% for the years ended October 31, 2021, 2020 and 2019, respectively. |
The notes to the financial statements are an integral part of, and should be read in conjunction with, the financial statements.
35
Financial Highlights selected per share data and ratios
| | Six months ended
April 30,
2024* | | Year Ended October 31, |
| Class C | 2023 | | 2022 | | 2021 | | 2020 | | 2019 |
| Net asset value at beginning of period | $ 16.88 | | $ 17.08 | | $ 21.88 | | $ 18.71 | | $ 20.07 | | $ 18.60 |
| Net investment income (loss) (a) | 0.20 | | 0.35 | | 0.25 | | 0.24 | | 0.27 | | 0.37 |
| Net realized and unrealized gain (loss) | 2.05 | | (0.23) | | (3.66) | | 3.24 | | (0.62) | | 1.81 |
| Total from investment operations | 2.25 | | 0.12 | | (3.41) | | 3.48 | | (0.35) | | 2.18 |
| Less distributions: | | | | | | | | | | | |
| From net investment income | (0.23) | | (0.32) | | (0.24) | | (0.31) | | (0.25) | | (0.39) |
| From net realized gain on investments | — | | — | | (1.14) | | — | | (0.76) | | (0.32) |
| Return of capital | — | | — | | (0.01) | | — | | — | | — |
| Total distributions | (0.23) | | (0.32) | | (1.39) | | (0.31) | | (1.01) | | (0.71) |
| Net asset value at end of period | $ 18.90 | | $ 16.88 | | $ 17.08 | | $ 21.88 | | $ 18.71 | | $ 20.07 |
| Total investment return (b) | 13.34% | | 0.63% | | (16.55)% | | 18.68% | | (1.85)% | | 12.13% |
| Ratios (to average net assets)/Supplemental Data: | | | | | | | | | | | |
| Net investment income (loss) | 2.19%†† | | 1.98% | | 1.29% | | 1.13% | | 1.42% | | 1.95% |
| Net expenses (c) | 2.03%†† | | 2.03% | | 1.95% | | 1.93% | | 1.92% | | 1.91% |
| Expenses (before waiver/reimbursement) (c) | 2.06%†† | | 2.04% | | 1.95% | | 1.93% | | 1.92% | | 1.92% |
| Portfolio turnover rate | 21% | | 56% | | 61% | | 57%(d) | | 65%(d) | | 62%(d) |
| Net assets at end of period (in 000’s) | $ 45,404 | | $ 49,577 | | $ 76,894 | | $ 132,596 | | $ 148,220 | | $ 191,737 |
| * | Unaudited. |
| †† | Annualized. |
| (a) | Per share data based on average shares outstanding during the period. |
| (b) | Total investment return is calculated exclusive of sales charges and assumes the reinvestment of dividends and distributions. For periods of less than one year, total return is not annualized. |
| (c) | In addition to the fees and expenses which the Fund bears directly, it also indirectly bears a pro-rata share of the fees and expenses of the underlying funds in which it invests. Such indirect expenses are not included in the above expense ratios. |
| (d) | The portfolio turnover rates not including mortgage dollar rolls were 56%, 62%, and 54% for the years ended October 31, 2021, 2020 and 2019, respectively. |
The notes to the financial statements are an integral part of, and should be read in conjunction with, the financial statements.
| 36 | MainStay Income Builder Fund |
Financial Highlights selected per share data and ratios
| | Six months ended
April 30,
2024* | | Year Ended October 31, |
| Class I | 2023 | | 2022 | | 2021 | | 2020 | | 2019 |
| Net asset value at beginning of period | $ 16.97 | | $ 17.17 | | $ 21.99 | | $ 18.80 | | $ 20.16 | | $ 18.68 |
| Net investment income (loss) (a) | 0.32 | | 0.58 | | 0.48 | | 0.49 | | 0.49 | | 0.59 |
| Net realized and unrealized gain (loss) | 2.06 | | (0.23) | | (3.68) | | 3.26 | | (0.62) | | 1.82 |
| Total from investment operations | 2.38 | | 0.35 | | (3.20) | | 3.75 | | (0.13) | | 2.41 |
| Less distributions: | | | | | | | | | | | |
| From net investment income | (0.35) | | (0.55) | | (0.47) | | (0.56) | | (0.47) | | (0.61) |
| From net realized gain on investments | — | | — | | (1.14) | | — | | (0.76) | | (0.32) |
| Return of capital | — | | — | | (0.01) | | — | | — | | — |
| Total distributions | (0.35) | | (0.55) | | (1.62) | | (0.56) | | (1.23) | | (0.93) |
| Net asset value at end of period | $ 19.00 | | $ 16.97 | | $ 17.17 | | $ 21.99 | | $ 18.80 | | $ 20.16 |
| Total investment return (b) | 14.03% | | 1.89% | | (15.55)% | | 20.10% | | (0.69)% | | 13.41% |
| Ratios (to average net assets)/Supplemental Data: | | | | | | | | | | | |
| Net investment income (loss) | 3.45%†† | | 3.22% | | 2.48% | | 2.30% | | 2.57% | | 3.09% |
| Net expenses (c) | 0.78%†† | | 0.78% | | 0.77% | | 0.74% | | 0.77% | | 0.77% |
| Portfolio turnover rate | 21% | | 56% | | 61% | | 57%(d) | | 65%(d) | | 62%(d) |
| Net assets at end of period (in 000’s) | $ 255,920 | | $ 255,677 | | $ 339,868 | | $ 505,806 | | $ 448,922 | | $ 484,614 |
| * | Unaudited. |
| †† | Annualized. |
| (a) | Per share data based on average shares outstanding during the period. |
| (b) | Total investment return is calculated exclusive of sales charges and assumes the reinvestment of dividends and distributions. Class I shares are not subject to sales charges. For periods of less than one year, total return is not annualized. |
| (c) | In addition to the fees and expenses which the Fund bears directly, it also indirectly bears a pro-rata share of the fees and expenses of the underlying funds in which it invests. Such indirect expenses are not included in the above expense ratios. |
| (d) | The portfolio turnover rates not including mortgage dollar rolls were 56%, 62%, and 54% for the years ended October 31, 2021, 2020 and 2019, respectively. |
The notes to the financial statements are an integral part of, and should be read in conjunction with, the financial statements.
37
Financial Highlights selected per share data and ratios
| | Six months ended
April 30,
2024* | | Year Ended October 31, |
| Class R6 | 2023 | | 2022 | | 2021 | | 2020 | | 2019 |
| Net asset value at beginning of period | $ 16.97 | | $ 17.17 | | $ 21.99 | | $ 18.80 | | $ 20.16 | | $ 18.68 |
| Net investment income (loss) (a) | 0.33 | | 0.58 | | 0.49 | | 0.51 | | 0.51 | | 0.61 |
| Net realized and unrealized gain (loss) | 2.06 | | (0.22) | | (3.67) | | 3.26 | | (0.62) | | 1.82 |
| Total from investment operations | 2.39 | | 0.36 | | (3.18) | | 3.77 | | (0.11) | | 2.43 |
| Less distributions: | | | | | | | | | | | |
| From net investment income | (0.36) | | (0.56) | | (0.49) | | (0.58) | | (0.49) | | (0.63) |
| From net realized gain on investments | — | | — | | (1.14) | | — | | (0.76) | | (0.32) |
| Return of capital | — | | — | | (0.01) | | — | | — | | — |
| Total distributions | (0.36) | | (0.56) | | (1.64) | | (0.58) | | (1.25) | | (0.95) |
| Net asset value at end of period | $ 19.00 | | $ 16.97 | | $ 17.17 | | $ 21.99 | | $ 18.80 | | $ 20.16 |
| Total investment return (b) | 14.14% | | 1.98% | | (15.48)% | | 20.20% | | (0.60)% | | 13.52% |
| Ratios (to average net assets)/Supplemental Data: | | | | | | | | | | | |
| Net investment income (loss) | 3.56%†† | | 3.27% | | 2.57% | | 2.38% | | 2.67% | | 3.18% |
| Net expenses (c) | 0.68%†† | | 0.69% | | 0.68% | | 0.66% | | 0.67% | | 0.67% |
| Portfolio turnover rate | 21% | | 56% | | 61% | | 57%(d) | | 65%(d) | | 62%(d) |
| Net assets at end of period (in 000’s) | $ 4,440 | | $ 3,807 | | $ 89,692 | | $ 109,387 | | $ 91,551 | | $ 101,685 |
| * | Unaudited. |
| †† | Annualized. |
| (a) | Per share data based on average shares outstanding during the period. |
| (b) | Total investment return is calculated exclusive of sales charges and assumes the reinvestment of dividends and distributions. Class R6 shares are not subject to sales charges. For periods of less than one year, total return is not annualized. |
| (c) | In addition to the fees and expenses which the Fund bears directly, it also indirectly bears a pro-rata share of the fees and expenses of the underlying funds in which it invests. Such indirect expenses are not included in the above expense ratios. |
| (d) | The portfolio turnover rates not including mortgage dollar rolls were 56%, 62%, and 54% for the years ended October 31, 2021, 2020 and 2019, respectively. |
The notes to the financial statements are an integral part of, and should be read in conjunction with, the financial statements.
| 38 | MainStay Income Builder Fund |
Financial Highlights selected per share data and ratios
| | Six months ended
April 30,
2024* | | Year Ended October 31, | | August 31, 2020^ through
October 31, |
| SIMPLE Class | 2023 | | 2022 | | 2021 | | 2020 |
| Net asset value at beginning of period | $ 16.78 | | $ 16.99 | | $ 21.78 | | $ 18.62 | | $ 19.33 |
| Net investment income (loss) (a) | 0.28 | | 0.47 | | 0.20 | | 0.34 | | 0.04 |
| Net realized and unrealized gain (loss) | 2.04 | | (0.23) | | (3.50) | | 3.24 | | (0.69) |
| Total from investment operations | 2.32 | | 0.24 | | (3.30) | | 3.58 | | (0.65) |
| Less distributions: | | | | | | | | | |
| From net investment income | (0.31) | | (0.45) | | (0.34) | | (0.42) | | (0.06) |
| From net realized gain on investments | — | | — | | (1.14) | | — | | — |
| Return of capital | — | | — | | (0.01) | | — | | — |
| Total distributions | (0.31) | | (0.45) | | (1.49) | | (0.42) | | (0.06) |
| Net asset value at end of period | $ 18.79 | | $ 16.78 | | $ 16.99 | | $ 21.78 | | $ 18.62 |
| Total investment return (b) | 13.82% | | 1.31% | | (16.10)% | | 19.26% | | (3.39)% |
| Ratios (to average net assets)/Supplemental Data: | | | | | | | | | |
| Net investment income (loss) | 3.02%†† | | 2.65% | | 1.06% | | 1.61% | | 1.62%†† |
| Net expenses (c) | 1.24%†† | | 1.32% | | 1.45% | | 1.43% | | 1.43%†† |
| Portfolio turnover rate | 21% | | 56% | | 61% | | 57%(d) | | 65%(d) |
| Net assets at end of period (in 000’s) | $ 62 | | $ 36 | | $ 34 | | $ 29 | | $ 24 |
| * | Unaudited. |
| ^ | Inception date. |
| †† | Annualized. |
| (a) | Per share data based on average shares outstanding during the period. |
| (b) | Total investment return is calculated exclusive of sales charges and assumes the reinvestment of dividends and distributions. SIMPLE Class shares are not subject to sales charges. For periods of less than one year, total return is not annualized. |
| (c) | In addition to the fees and expenses which the Fund bears directly, it also indirectly bears a pro-rata share of the fees and expenses of the underlying funds in which it invests. Such indirect expenses are not included in the above expense ratios. |
| (d) | The portfolio turnover rates not including mortgage dollar rolls were 56% and 62% for the years ended October 31, 2021 and 2020 respectively. |
The notes to the financial statements are an integral part of, and should be read in conjunction with, the financial statements.
39
Notes to Financial Statements (Unaudited)
Note 1-Organization and Business
The MainStay Funds (the “Trust”) was organized on January 9, 1986, as a Massachusetts business trust. The Trust is registered under the Investment Company Act of 1940, as amended (the “1940 Act”), as an open-end management investment company, and is comprised of eleven funds (collectively referred to as the "Funds"). These financial statements and notes relate to the MainStay Income Builder Fund (the "Fund"), a “diversified” fund, as that term is defined in the 1940 Act, as interpreted or modified by regulatory authorities having jurisdiction, from time to time.
The following table lists the Fund's share classes that have been registered and commenced operations:
| Class | Commenced Operations |
| Class A | January 3, 1995 |
| Investor Class | February 28, 2008 |
| Class B | December 29, 1987 |
| Class C | September 1, 1998 |
| Class I | January 2, 2004 |
| Class R6 | February 28, 2018 |
| SIMPLE Class | August 31, 2020 |
Effective at the close of business on February 23, 2024, Class R2 and R3 shares were liquidated.
Class A and Investor Class shares are offered at net asset value (“NAV”) per share plus an initial sales charge. No initial sales charge applies to investments of $250,000 or more (and certain other qualified purchases) in Class A and Investor Class shares. However, a CDSC of 1.00% may be imposed on certain redemptions made within 18 months of the date of purchase on shares that were purchased without an initial sales charge. Class C shares are offered at NAV without an initial sales charge, although a 1.00% CDSC may be imposed on certain redemptions of such shares made within one year of the date of purchase of Class C shares. When Class B shares were offered, they were offered at NAV without an initial sales charge, although a CDSC that declines depending on the number of years a shareholder has held its Class B shares may be imposed on certain redemptions of such shares made within six years of the date of purchase of such shares. Class I, Class R6 and SIMPLE Class shares are offered at NAV without a sales charge. Depending upon eligibility, Class B shares convert to either Class A or Investor Class shares at the end of the calendar quarter eight years after the date they were purchased. In addition, depending upon eligibility, Class C shares convert to either Class A or Investor Class shares at the end of the calendar quarter eight years after the date they were purchased. Additionally, Investor Class shares may convert automatically to Class A shares. SIMPLE Class shares convert to Class A shares, or Investor Class shares if you are not eligible to hold Class A shares, at the end of the calendar quarter, ten years after the date they were purchased. Share class conversions are based on the relevant NAVs of the two classes at the time of the conversion, and no sales load or other charge is imposed. Under certain circumstances and as may be permitted by the Trust’s multiple class plan pursuant to Rule 18f-3 under the 1940 Act, specified
share classes of the Fund may be converted to one or more other share classes of the Fund as disclosed in the capital share transactions within these Notes. The classes of shares have the same voting (except for issues that relate solely to one class), dividend, liquidation and other rights, and the same terms and conditions, except that under distribution plans pursuant to Rule 12b-1 under the 1940 Act, Class B and Class C shares are subject to higher distribution and/or service fees than Class A, Investor Class and SIMPLE Class shares. Class I and Class R6 shares are not subject to a distribution and/or service fee.
The Fund's investment objective is to seek current income consistent with reasonable opportunity for future growth of capital and income.
Note 2–Significant Accounting Policies
The Fund is an investment company and accordingly follows the investment company accounting and reporting guidance of the Financial Accounting Standards Board (“FASB”) Accounting Standards Codification Topic 946 Financial Services—Investment Companies. The Fund prepares its financial statements in accordance with generally accepted accounting principles (“GAAP”) in the United States of America and follows the significant accounting policies described below.
(A) Securities Valuation. Investments are usually valued as of the close of regular trading on the New York Stock Exchange (the "Exchange") (usually 4:00 p.m. Eastern time) on each day the Fund is open for business ("valuation date").
Pursuant to Rule 2a-5 under the 1940 Act, the Board of Trustees of the Trust (the "Board") has designated New York Life Investment Management LLC ("New York Life Investments" or the "Manager") as its Valuation Designee (the "Valuation Designee"). The Valuation Designee is responsible for performing fair valuations relating to all investments in the Fund’s portfolio for which market quotations are not readily available; periodically assessing and managing material valuation risks; establishing and applying fair value methodologies; testing fair valuation methodologies; evaluating and overseeing pricing services; ensuring appropriate segregation of valuation and portfolio management functions; providing quarterly, annual and prompt reporting to the Board, as appropriate; identifying potential conflicts of interest; and maintaining appropriate records. The Valuation Designee has established a valuation committee ("Valuation Committee") to assist in carrying out the Valuation Designee’s responsibilities and establish prices of securities for which market quotations are not readily available. The Fund's and the Valuation Designee's policies and procedures ("Valuation Procedures") govern the Valuation Designee’s selection and application of methodologies for determining and calculating the fair value of Fund investments. The Valuation Designee may value the Fund's portfolio securities for which market quotations are not readily available and other Fund assets utilizing inputs from pricing services and other third-party sources. The Valuation Committee meets (in person, via electronic mail or via teleconference) on an ad-hoc basis to determine fair valuations and on a quarterly basis to review fair value events with respect to certain securities for which
| 40 | MainStay Income Builder Fund |
market quotations are not readily available, including valuation risks and back-testing results, and to preview reports to the Board.
The Valuation Committee establishes prices of securities for which market quotations are not readily available based on such methodologies and measurements on a regular basis after considering information that is reasonably available and deemed relevant by the Valuation Committee. The Board shall oversee the Valuation Designee and review fair valuation materials on a prompt, quarterly and annual basis and approve proposed revisions to the Valuation Procedures.
Investments for which market quotations are not readily available are valued at fair value as determined in good faith pursuant to the Valuation Procedures. A market quotation is readily available only when that quotation is a quoted price (unadjusted) in active markets for identical investments that the Fund can access at the measurement date, provided that a quotation will not be readily available if it is not reliable. "Fair value" is defined as the price the Fund would reasonably expect to receive upon selling an asset or liability in an orderly transaction to an independent buyer in the principal or most advantageous market for the asset or liability. Fair value measurements are determined within a framework that establishes a three-tier hierarchy that maximizes the use of observable market data and minimizes the use of unobservable inputs to establish a classification of fair value measurements for disclosure purposes. "Inputs" refer broadly to the assumptions that market participants would use in pricing the asset or liability, including assumptions about risk, such as the risk inherent in a particular valuation technique used to measure fair value using a pricing model and/or the risk inherent in the inputs for the valuation technique. Inputs may be observable or unobservable. Observable inputs reflect the assumptions market participants would use in pricing the asset or liability based on market data obtained from sources independent of the Fund. Unobservable inputs reflect the Fund’s own assumptions about the assumptions market participants would use in pricing the asset or liability based on the information available. The inputs or methodology used for valuing assets or liabilities may not be an indication of the risks associated with investing in those assets or liabilities. The three-tier hierarchy of inputs is summarized below.
| • | Level 1—quoted prices (unadjusted) in active markets for an identical asset or liability |
| • | Level 2—other significant observable inputs (including quoted prices for a similar asset or liability in active markets, interest rates and yield curves, prepayment speeds, credit risk, etc.) |
| • | Level 3—significant unobservable inputs (including the Fund's own assumptions about the assumptions that market participants would use in measuring fair value of an asset or liability) |
The level of an asset or liability within the fair value hierarchy is based on the lowest level of an input, both individually and in the aggregate, that is significant to the fair value measurement. The aggregate value by input level of the Fund’s assets and liabilities as of April 30, 2024, is included at the end of the Portfolio of Investments.
The Fund may use third-party vendor evaluations, whose prices may be derived from one or more of the following standard inputs, among others:
| • Broker/dealer quotes | • Benchmark securities |
| • Two-sided markets | • Reference data (corporate actions or material event notices) |
| • Bids/offers | • Monthly payment information |
| • Industry and economic events | • Reported trades |
An asset or liability for which a market quotation is not readily available is valued by methods deemed reasonable in good faith by the Valuation Committee, following the Valuation Procedures to represent fair value. Under these procedures, the Valuation Designee generally uses a market-based approach which may use related or comparable assets or liabilities, recent transactions, market multiples, book values and other relevant information. The Valuation Designee may also use an income-based valuation approach in which the anticipated future cash flows of the asset or liability are discounted to calculate fair value. Discounts may also be applied due to the nature and/or duration of any restrictions on the disposition of the asset or liability. Fair value represents a good faith approximation of the value of a security. Fair value determinations involve the consideration of a number of subjective factors, an analysis of applicable facts and circumstances and the exercise of judgment. As a result, it is possible that the fair value for a security determined in good faith in accordance with the Valuation Procedures may differ from valuations for the same security determined for other funds using their own valuation procedures. Although the Valuation Procedures are designed to value a security at the price the Fund may reasonably expect to receive upon the security's sale in an orderly transaction, there can be no assurance that any fair value determination thereunder would, in fact, approximate the amount that the Fund would actually realize upon the sale of the security or the price at which the security would trade if a reliable market price were readily available. During the six-month period ended April 30, 2024, there were no material changes to the fair value methodologies.
Securities which may be valued in this manner include, but are not limited to: (i) a security for which trading has been halted or suspended or otherwise does not have a readily available market quotation on a given day; (ii) a debt security that has recently gone into default and for which there is not a current market quotation; (iii) a security of an issuer that has entered into a restructuring; (iv) a security that has been delisted from a national exchange; (v) a security subject to trading collars for which no or limited trading takes place; and (vi) a security whose principal market has been temporarily closed at a time when, under normal conditions, it would be open. Securities valued in this manner are generally categorized as Level 2 or 3 in the hierarchy.
Certain securities held by the Fund may principally trade in foreign markets. Events may occur between the time the foreign markets close and the time at which the Fund's NAVs are calculated. These events may include, but are not limited to, situations relating to a single issuer in a market sector, significant fluctuations in U.S. or foreign markets, natural disasters, armed conflicts, governmental actions or other developments
Notes to Financial Statements (Unaudited) (continued)
not tied directly to the securities markets. Should the Valuation Designee conclude that such events may have affected the accuracy of the last price of such securities reported on the local foreign market, the Valuation Designee may, pursuant to the Valuation Procedures, adjust the value of the local price to reflect the estimated impact on the price of such securities as a result of such events. In this instance, securities are generally categorized as Level 3 in the hierarchy. Additionally, certain foreign equity securities are also fair valued whenever the movement of a particular index exceeds certain thresholds. In such cases, the securities are fair valued by applying factors provided by a third-party vendor in accordance with the Valuation Procedures and are generally categorized as Level 2 in the hierarchy.
Equity securities, rights and warrants, if applicable, are valued at the last quoted sales prices as of the close of regular trading on the relevant exchange on each valuation date. Securities that are not traded on the valuation date are valued at the mean of the last quoted bid and ask prices. Prices are normally taken from the principal market in which each security trades. These securities are generally categorized as Level 1 in the hierarchy.
Investments in mutual funds, including money market funds, are valued at their respective NAVs at the close of business each day on the valuation date. These securities are generally categorized as Level 1 in the hierarchy.
Futures contracts are valued at the last posted settlement price on the market where such futures are primarily traded. These securities are generally categorized as Level 1 in the hierarchy.
Municipal debt securities are valued at the evaluated mean prices supplied by a pricing agent or broker selected by the Valuation Designee, in consultation with the Subadvisor. The evaluations are market-based measurements processed through a pricing application and represents the pricing agent's good faith determination as to what a holder may receive in an orderly transaction under market conditions. The rules-based logic utilizes valuation techniques that reflect participants' assumptions and vary by asset class and per methodology, maximizing the use of relevant observable data including quoted prices for similar assets, benchmark yield curves and market corroborated inputs. The evaluated bid or mean prices are deemed by the Valuation Designee, in consultation with the Subadvisor, to be representative of market values, at the regular close of trading of the Exchange on each valuation date. Municipal debt securities purchased on a delayed delivery basis are marked to market daily until settlement at the forward settlement date. Municipal debt securities are generally categorized as Level 2 in the hierarchy.
Debt securities (other than convertible and municipal bonds) are valued at the evaluated bid prices (evaluated mean prices in the case of convertible and municipal bonds) supplied by a pricing agent or broker selected by the Valuation Designee, in consultation with the Subadvisors. The evaluations are market-based measurements processed through a pricing application and represents the pricing agent’s good faith determination as to what a holder may receive in an orderly transaction under market
conditions. The rules-based logic utilizes valuation techniques that reflect participants’ assumptions and vary by asset class and per methodology, maximizing the use of relevant observable data including quoted prices for similar assets, benchmark yield curves and market corroborated inputs. The evaluated bid or mean prices are deemed by the Valuation Designee, in consultation with the Subadvisors, to be representative of market values at the regular close of trading of the Exchange on each valuation date. Debt securities purchased on a delayed delivery basis are marked to market daily until settlement at the forward settlement date. Debt securities, including corporate bonds, U.S. government and federal agency bonds, municipal bonds, foreign bonds, convertible bonds, asset-backed securities and mortgage-backed securities are generally categorized as Level 2 in the hierarchy.
Foreign currency forward contracts are valued at their fair market values measured on the basis of the mean between the last current bid and ask prices based on dealer or exchange quotations and are generally categorized as Level 2 in the hierarchy.
Loan assignments, participations and commitments are valued at the average of bid quotations obtained from the engaged independent pricing service and are generally categorized as Level 2 in the hierarchy. Certain loan assignments, participations and commitments may be valued by utilizing significant unobservable inputs obtained from the pricing service and are generally categorized as Level 3 in the hierarchy.
Temporary cash investments acquired in excess of 60 days to maturity at the time of purchase are valued using the latest bid prices or using valuations based on a matrix system (which considers such factors as security prices, yields, maturities and ratings), both as furnished by independent pricing services. Temporary cash investments that mature in 60 days or less at the time of purchase ("Short-Term Investments") are valued using the amortized cost method of valuation, unless the use of such method would be inappropriate. The amortized cost method involves valuing a security at its cost on the date of purchase and thereafter assuming a constant amortization to maturity of the difference between such cost and the value on maturity date. Amortized cost approximates the current fair value of a security. Securities valued using the amortized cost method are not valued using quoted prices in an active market and are generally categorized as Level 2 in the hierarchy.
The information above is not intended to reflect an exhaustive list of the methodologies that may be used to value portfolio investments. The Valuation Procedures permit the use of a variety of valuation methodologies in connection with valuing portfolio investments. The methodology used for a specific type of investment may vary based on the market data available or other considerations. The methodologies summarized above may not represent the specific means by which portfolio investments are valued on any particular business day.
A portfolio investment may be classified as an illiquid investment under the Fund's written liquidity risk management program and related procedures (“Liquidity Program”). Illiquidity of an investment might prevent the sale of such investment at a time when the Manager or the Subadvisors might wish to sell, and these investments could have the
| 42 | MainStay Income Builder Fund |
effect of decreasing the overall level of the Fund's liquidity. Further, the lack of an established secondary market may make it more difficult to value illiquid investments, requiring the Fund to rely on judgments that may be somewhat subjective in measuring value, which could vary materially from the amount that the Fund could realize upon disposition. Difficulty in selling illiquid investments may result in a loss or may be costly to the Fund. An illiquid investment is any investment that the Manager or Subadvisors reasonably expects cannot be sold or disposed of in current market conditions in seven calendar days or less without the sale or disposition significantly changing the market value of the investment. The liquidity classification of each investment will be made using information obtained after reasonable inquiry and taking into account, among other things, relevant market, trading and investment-specific considerations in accordance with the Liquidity Program. Illiquid investments are often fair valued in accordance with the Fund's procedures described above. The liquidity of the Fund's investments was determined as of April 30, 2024, and can change at any time.
(B) Income Taxes. The Fund's policy is to comply with the requirements of the Internal Revenue Code of 1986, as amended (the “Internal Revenue Code”), applicable to regulated investment companies and to distribute all of its taxable income to the shareholders of the Fund within the allowable time limits.
The Manager evaluates the Fund’s tax positions to determine if the tax positions taken meet the minimum recognition threshold in connection with accounting for uncertainties in income tax positions taken or expected to be taken for the purposes of measuring and recognizing tax liabilities in the financial statements. Recognition of tax benefits of an uncertain tax position is permitted only to the extent the position is “more likely than not” to be sustained assuming examination by taxing authorities. The Manager analyzed the Fund's tax positions taken on federal, state and local income tax returns for all open tax years (for up to three tax years) and has concluded that no provisions for federal, state and local income tax are required in the Fund's financial statements. The Fund's federal, state and local income tax and federal excise tax returns for tax years for which the applicable statutes of limitations have not expired are subject to examination by the Internal Revenue Service and state and local departments of revenue.
(C) Foreign Taxes. The Fund may be subject to foreign taxes on income and other transaction-based taxes imposed by certain countries in which it invests. A portion of the taxes on gains on investments or currency purchases/repatriation may be reclaimable. The Fund will accrue such taxes and reclaims as applicable, based upon its current interpretation of tax rules and regulations that exist in the markets in which it invests.
The Fund may be subject to taxation on realized capital gains, repatriation proceeds and other transaction-based taxes imposed by certain countries in which it invests. The Fund will accrue such taxes as applicable based upon its current interpretation of tax rules and regulations that exist in the market in which it invests. Capital gains taxes relating to positions still
held are reflected as a liability in the Statement of Assets and Liabilities, as well as an adjustment to the Fund's net unrealized appreciation (depreciation). Taxes related to capital gains realized, if any, are reflected as part of net realized gain (loss) in the Statement of Operations. Changes in tax liabilities related to capital gains taxes on unrealized investment gains, if any, are reflected as part of the change in net unrealized appreciation (depreciation) on investments in the Statement of Operations. Transaction-based charges are generally assessed as a percentage of the transaction amount.
(D) Dividends and Distributions to Shareholders. Dividends and distributions are recorded on the ex-dividend date. The Fund intends to declare and pay dividends from net investment income, if any, at least monthly and distributions from net realized capital and currency gains, if any, at least annually. Unless a shareholder elects otherwise, all dividends and distributions are reinvested at NAV in the same class of shares of the Fund. Dividends and distributions to shareholders are determined in accordance with federal income tax regulations and may differ from determinations using GAAP.
(E) Security Transactions and Investment Income. The Fund records security transactions on the trade date. Realized gains and losses on security transactions are determined using the identified cost method. Dividend income is recognized on the ex-dividend date, net of any foreign tax withheld at the source, and interest income is accrued as earned using the effective interest rate method and includes any realized gains and losses from repayments of principal on mortgage-backed securities. Distributions received from real estate investment trusts may be classified as dividends, capital gains and/or return of capital. Discounts and premiums on securities purchased for the Fund are accreted and amortized, respectively, on the effective interest rate method. Income from payment-in-kind securities, to the extent the Fund held any such securities during the six-month period ended April 30, 2024, is accreted daily based on the effective interest method.
Investment income and realized and unrealized gains and losses on investments of the Fund are allocated pro rata to the separate classes of shares based upon their relative net assets on the date the income is earned or realized and unrealized gains and losses are incurred.
The Fund may place a debt security on non-accrual status and reduce related interest income by ceasing current accruals and writing off all or a portion of any interest receivables when the collection of all or a portion of such interest has become doubtful. A debt security is removed from non-accrual status when the issuer resumes interest payments or when collectability of interest is reasonably assured.
(F) Expenses. Expenses of the Trust are allocated to the individual Funds in proportion to the net assets of the respective Funds when the expenses are incurred, except where direct allocations of expenses can be made. Expenses (other than transfer agent expenses and fees incurred under the shareholder services plans and/or the distribution plans further discussed in Note 3(B)) are allocated to separate classes of shares pro rata based upon their relative net assets on the date the expenses are
Notes to Financial Statements (Unaudited) (continued)
incurred. The expenses borne by the Fund, including those of related parties to the Fund, are shown in the Statement of Operations.
Additionally, the Fund may invest in mutual funds, which are subject to management fees and other fees that may cause the costs of investing in mutual funds to be greater than the costs of owning the underlying securities directly. These indirect expenses of mutual funds are not included in the amounts shown as expenses in the Statement of Operations or in the expense ratios included in the Financial Highlights.
(G) Use of Estimates. In preparing financial statements in conformity with GAAP, the Manager makes estimates and assumptions that affect the reported amounts and disclosures in the financial statements. Actual results could differ from those estimates and assumptions.
(H) Futures Contracts. A futures contract is an agreement to purchase or sell a specified quantity of an underlying instrument at a specified future date and price, or to make or receive a cash payment based on the value of a financial instrument (e.g., foreign currency, interest rate, security or securities index). The Fund is subject to risks such as market price risk, leverage risk, liquidity risk, counterparty risk, operational risk, legal risk and/or interest rate risk in the normal course of investing in these contracts. Upon entering into a futures contract, the Fund is required to pledge to the broker or futures commission merchant an amount of cash and/or U.S. government securities equal to a certain percentage of the collateral amount, known as the “initial margin.” During the period the futures contract is open, changes in the value of the contract are recognized as unrealized appreciation or depreciation by marking to market such contract on a daily basis to reflect the market value of the contract at the end of each day’s trading. The Fund agrees to receive from or pay to the broker or futures commission merchant an amount of cash equal to the daily fluctuation in the value of the contract. Such receipts or payments are known as “variation margin.” When the futures contract is closed, the Fund records a realized gain or loss equal to the difference between the proceeds from (or cost of) the closing transaction and the Fund's basis in the contract.
The use of futures contracts involves, to varying degrees, elements of market risk in excess of the amount recognized in the Statement of Assets and Liabilities. The contract or notional amounts and variation margin reflect the extent of the Fund's involvement in open futures positions. There are several risks associated with the use of futures contracts as hedging techniques. There can be no assurance that a liquid market will exist at the time when the Fund seeks to close out a futures contract. If no liquid market exists, the Fund would remain obligated to meet margin requirements until the position is closed. Futures contracts may involve a small initial investment relative to the risk assumed, which could result in losses greater than if the Fund did not invest in futures contracts. Futures contracts may be more volatile than direct investments in the instrument underlying the futures and may not correlate to the underlying instrument, causing a given hedge not to achieve its objectives. The Fund's activities in futures contracts have minimal counterparty risk as they are conducted through regulated exchanges that guarantee the futures against default by the counterparty.
In the event of a bankruptcy or insolvency of a futures commission merchant that holds margin on behalf of the Fund, the Fund may not be entitled to the return of the entire margin owed to the Fund, potentially resulting in a loss. The Fund may invest in futures contracts to seek enhanced returns or to reduce the risk of loss by hedging certain of its holdings. The Fund's investment in futures contracts and other derivatives may increase the volatility of the Fund's NAVs and may result in a loss to the Fund.
(I) Loan Assignments, Participations and Commitments. The Fund may invest in loan assignments and participations ("loans"). Commitments are agreements to make money available to a borrower in a specified amount, at a specified rate and within a specified time. The Fund records an investment when the borrower withdraws money on a commitment or when a funded loan is purchased (trade date) and records interest as earned. These loans pay interest at rates that are periodically reset by reference to a base lending rate plus a spread. These base lending rates are generally the prime rate offered by a designated U.S. bank, the Secured Overnight Financing Rate ("SOFR") or an alternative reference rate.
The loans in which the Fund may invest are generally readily marketable, but may be subject to some restrictions on resale. For example, the Fund may be contractually obligated to receive approval from the agent bank and/or borrower prior to the sale of these investments. If the Fund purchases an assignment from a lender, the Fund will generally have direct contractual rights against the borrower in favor of the lender. If the Fund purchases a participation interest either from a lender or a participant, the Fund typically will have established a direct contractual relationship with the seller of the participation interest, but not with the borrower. Consequently, the Fund is subject to the credit risk of the lender or participant who sold the participation interest to the Fund, in addition to the usual credit risk of the borrower. In the event that the borrower, selling participant or intermediate participants become insolvent or enter into bankruptcy, the Fund may incur certain costs and delays in realizing payment, or may suffer a loss of principal and/or interest.
Unfunded commitments represent the remaining obligation of the Fund to the borrower. At any point in time, up to the maturity date of the issue, the borrower may demand the unfunded portion. Unfunded amounts, if any, are marked to market and any unrealized gains or losses are recorded in the Statement of Assets and Liabilities.
(J) Foreign Currency Forward Contracts. The Fund may enter into foreign currency forward contracts, which are agreements to buy or sell foreign currencies on a specified future date at a specified rate. The Fund is subject to foreign currency exchange rate risk in the normal course of investing in these transactions. During the period the forward contract is open, changes in the value of the contract are recognized as unrealized appreciation or depreciation by marking to market such contract on a daily basis to reflect the market value of the contract at the end of each day’s trading. Cash movement occurs on the settlement date. When the forward contract is closed, the Fund records a realized gain or loss equal to the difference between the proceeds from (or cost of) the closing
| 44 | MainStay Income Builder Fund |
transaction and the Fund's basis in the contract. The Fund may purchase and sell foreign currency forward contracts for purposes of seeking to enhance portfolio returns and manage portfolio risk more efficiently. Foreign currency forward contracts may also be used to gain exposure to a particular currency or to hedge against the risk of loss due to changing currency exchange rates. Foreign currency forward contracts to purchase or sell a foreign currency may also be used in anticipation of future purchases or sales of securities denominated in foreign currency, even if the specific investments have not yet been selected.
The use of foreign currency forward contracts involves, to varying degrees, elements of risk in excess of the amount recognized in the Statement of Assets and Liabilities, including counterparty risk, market risk, leverage risk, operational risk, legal risk and liquidity risk. Counterparty risk is heightened for these instruments because foreign currency forward contracts are not exchange-traded and therefore no clearinghouse or exchange stands ready to meet the obligations under such contracts. Thus, the Fund faces the risk that its counterparties under such contracts may not perform their obligations. Market risk is the risk that the value of a foreign currency forward contract will depreciate due to unfavorable changes in exchange rates. Liquidity risk arises because the secondary market for foreign currency forward contracts may have less liquidity relative to markets for other securities and financial instruments. Liquidity risk also can arise when forward currency contracts create margin or settlement payment obligations for the Fund. Leverage risk is the risk that a foreign currency forward contract can magnify the Fund's gains and losses. Operational risk refers to risk related to potential operational issues (including documentation issues, settlement issues, systems failures, inadequate controls and human error), and legal risk refers to insufficient documentation, insufficient capacity or authority of the counterparty, or legality or enforceability of a foreign currency forward contract. Risks also arise from the possible movements in the foreign exchange rates underlying these instruments. While the Fund may enter into forward contracts to reduce currency exchange risks, changes in currency exchange rates may result in poorer overall performance for the Fund than if it had not engaged in such transactions. Exchange rate movements can be large, depending on the currency, and can last for extended periods of time, affecting the value of the Fund's assets. Moreover, there may be an imperfect correlation between the Fund's holdings of securities denominated in a particular currency and forward contracts entered into by the Fund. Such imperfect correlation may prevent the Fund from achieving the intended hedge or expose the Fund to the risk of currency exchange loss. The unrealized appreciation (depreciation) on forward contracts also reflects the Fund's exposure at the valuation date to credit loss in the event of a counterparty’s failure to perform its obligations.
(K) Foreign Currency Transactions. The Fund's books and records are maintained in U.S. dollars. Prices of securities denominated in foreign currency amounts are translated into U.S. dollars at the mean between
the buying and selling rates last quoted by any major U.S. bank at the following dates:
(i) market value of investment securities, other assets and liabilities— at the valuation date; and
(ii) purchases and sales of investment securities, income and expenses—at the date of such transactions.
The assets and liabilities that are denominated in foreign currency amounts are presented at the exchange rates and market values at the close of the period. The realized and unrealized changes in net assets arising from fluctuations in exchange rates and market prices of securities are not separately presented.
Net realized gain (loss) on foreign currency transactions represents net currency gains or losses realized as a result of differences between the amounts of securities sale proceeds or purchase cost, dividends, interest and withholding taxes as recorded on the Fund's books, and the U.S. dollar equivalent amount actually received or paid. Net currency gains or losses from valuing such foreign currency denominated assets and liabilities, other than investments at valuation date exchange rates, are reflected in unrealized foreign exchange gains or losses.
(L) Securities Lending. In order to realize additional income, the Fund may engage in securities lending, subject to the limitations set forth in the 1940 Act and relevant guidance by the staff of the Securities and Exchange Commission (“SEC”). If the Fund engages in securities lending, the Fund will lend through its custodian, JPMorgan Chase Bank, N.A., ("JPMorgan"), acting as securities lending agent on behalf of the Fund. Under the current arrangement, JPMorgan will manage the Fund's collateral in accordance with the securities lending agency agreement between the Fund and JPMorgan, and indemnify the Fund against counterparty risk. The loans will be collateralized by cash (which may be invested in a money market fund) and/or non-cash collateral (which may include U.S. Treasury securities and/or U.S. government agency securities issued or guaranteed by the United States government or its agencies or instrumentalities) at least equal at all times to the market value of the securities loaned. Non-cash collateral held at year end is segregated and cannot be transferred by the Fund. The Fund bears the risk of delay in recovery of, or loss of rights in, the securities loaned. The Fund may also record a realized gain or loss on securities deemed sold due to a borrower’s inability to return securities on loan. The Fund bears the risk of any loss on investment of cash collateral. The Fund will receive compensation for lending its securities in the form of fees or it will retain a portion of interest earned on the investment of any cash collateral. The Fund will also continue to receive interest and dividends on the securities loaned and any gain or loss in the market price of the securities loaned that may occur during the term of the loan will be for the account of the Fund. Income earned from securities lending activities, if any, is reflected in the Statement of Operations.
(M) Debt Securities Risk. The ability of issuers of debt securities held by the Fund to meet their obligations may be affected by, among other things, economic or political developments in a specific country,
Notes to Financial Statements (Unaudited) (continued)
industry or region. Debt securities are also subject to the risks associated with changes in interest rates.
The Fund may invest in high-yield debt securities (sometimes called “junk bonds”), which are generally considered speculative because they present a greater risk of loss, including default, than higher quality debt securities. These securities pay investors a premium—a higher interest rate or yield than investment grade debt securities—because of the increased risk of loss. These securities can also be subject to greater price volatility. In times of unusual or adverse market, economic or political conditions, these securities may experience higher than normal default rates.
The Fund may invest in foreign securities, which carry certain risks that are in addition to the usual risks inherent in domestic securities. Foreign regulatory regimes and securities markets can have less stringent investor protections and disclosure standards and less liquid trading markets than U.S. regulatory regimes and securities markets, and can experience political, social and economic developments that may affect the value of investments in foreign securities. These risks include those resulting from currency fluctuations, future adverse political or economic developments and possible imposition of currency exchange blockages or other foreign governmental laws or restrictions. Economic sanctions and other similar governmental actions or developments could, among other things, effectively restrict or eliminate the Fund’s ability to purchase or sell certain foreign securities or groups of foreign securities, and thus may make the Fund’s investments in such securities less liquid or more difficult to value. These risks are likely to be greater in emerging markets than in developed markets. The ability of issuers of securities held by the Fund to meet their obligations may be affected by, among other things, economic or political developments in a specific country, industry or region.
The Fund may invest in loans which are usually rated below investment grade and are generally considered speculative because they present a greater risk of loss, including default, than higher rated debt securities. These investments pay investors a higher interest rate than investment grade debt securities because of the increased risk of loss. Although certain loans are collateralized, there is no guarantee that the value of the collateral will be sufficient to repay the loan. In a recession or serious credit event, the value of these investments could decline significantly. As a result, the Fund’s NAVs could go down and you could lose money.
In addition, loans generally are subject to extended settlement periods that may be longer than seven days. As a result, the Fund may be adversely affected by selling other investments at an unfavorable time and/or under unfavorable conditions or engaging in borrowing transactions, such as borrowing against its credit facility, to raise cash to meet redemption obligations or pursue other investment opportunities.
In certain circumstances, loans may not be deemed to be securities. As a result, the Fund may not have the protection of anti-fraud provisions of the federal securities laws. In such cases, the Fund generally must rely on the contractual provisions in the loan agreement and common-law fraud protections under applicable state law.
(N) Counterparty Credit Risk. In order to better define its contractual rights and to secure rights that will help the Fund mitigate its counterparty risk, the Fund may enter into an International Swaps and Derivatives Association, Inc. Master Agreement (“ISDA Master Agreement”) or similar agreement with its counterparties. An ISDA Master Agreement is a bilateral agreement between the Fund and a counterparty that governs certain OTC derivatives and typically contains collateral posting terms and netting provisions. Under an ISDA Master Agreement, the Fund may, under certain circumstances, offset with the counterparty certain derivative financial instruments’ payables and/ or receivables with collateral held and/or posted and create one single net payment. The provisions of the ISDA Master Agreement typically permit a single net payment in the event of default including the bankruptcy or insolvency of the counterparty. Bankruptcy or insolvency laws of a particular jurisdiction may restrict or prohibit the right of offset in bankruptcy, insolvency or other events. In addition, certain ISDA Master Agreements may contain provisions for early termination of OTC derivative transactions in the event the net assets of the Fund decline below specific levels or if the Fund fails to meet the terms of its ISDA Master Agreements. The result would cause the Fund to accelerate payment of any net liability owed to the counterparty.
For financial reporting purposes, the Fund does not offset derivative assets and derivative liabilities that are subject to netting arrangements, if any, in the Statement of Assets and Liabilities.
(O) Indemnifications. Under the Trust’s organizational documents, its officers and trustees are indemnified against certain liabilities that may arise out of performance of their duties to the Trust. Additionally, in the normal course of business, the Fund enters into contracts with third-party service providers that contain a variety of representations and warranties and that may provide general indemnifications. The Fund's maximum exposure under these arrangements is unknown, as this would involve future claims that may be made against the Fund that have not yet occurred. The Manager believes that the risk of loss in connection with these potential indemnification obligations is remote. However, there can be no assurance that material liabilities related to such obligations will not arise in the future, which could adversely impact the Fund.
(P) Quantitative Disclosure of Derivative Holdings. The following tables show additional disclosures related to the Fund's derivative and hedging activities, including how such activities are accounted for and their effect on the Fund's financial positions, performance and cash flows.
The Fund entered into Treasury futures contracts to hedge against anticipated changes in interest rates that might otherwise have an adverse effect upon the value of the Fund’s securities. The Fund also entered into domestic and foreign equity index futures contracts to increase the equity sensitivity to the Fund.
Foreign currency forward contracts were used to gain exposure to a particular currency or to hedge against the risk of loss due to changing
| 46 | MainStay Income Builder Fund |
currency exchange rates. These derivatives are not accounted for as hedging instruments.
Fair value of derivative instruments as of April 30, 2024:
| Asset Derivatives | Foreign
Exchange
Contracts
Risk | Equity
Contracts
Risk | Interest
Rate
Contracts
Risk | Total |
| Futures Contracts - Net Assets—Net unrealized appreciation on futures contracts (a) | $ — | $1,382,043 | $2,814 | $1,384,857 |
| Forward Contracts - Unrealized appreciation on foreign currency forward contracts | 995,112 | — | — | 995,112 |
| Total Fair Value | $995,112 | $1,382,043 | $2,814 | $2,379,969 |
| (a) | Includes cumulative appreciation (depreciation) of futures contracts as reported in the Portfolio of Investments. Only current day’s variation margin is reported within the Statement of Assets and Liabilities. |
| Liability Derivatives | Foreign
Exchange
Contracts
Risk | Equity
Contracts
Risk | Interest
Rate
Contracts
Risk | Total |
| Futures Contracts - Net Assets—Net unrealized depreciation on futures contracts (a) | $ — | $(6,330,125) | $(3,150,051) | $ (9,480,176) |
| Forward Contracts - Unrealized depreciation on foreign currency forward contracts | (4,962,204) | — | — | (4,962,204) |
| Total Fair Value | $(4,962,204) | $(6,330,125) | $(3,150,051) | $(14,442,380) |
| (a) | Includes cumulative appreciation (depreciation) of futures contracts as reported in the Portfolio of Investments. Only current day’s variation margin is reported within the Statement of Assets and Liabilities. |
The effect of derivative instruments on the Statement of Operations for the six-month period ended April 30, 2024:
| Net Realized Gain (Loss) from: | Foreign
Exchange
Contracts
Risk | Equity
Contracts
Risk | Interest
Rate
Contracts
Risk | Total |
| Futures Transactions | $ — | $13,574,757 | $496,905 | $14,071,662 |
| Forward Transactions | (4,077,402) | — | — | (4,077,402) |
| Total Net Realized Gain (Loss) | $(4,077,402) | $13,574,757 | $496,905 | $ 9,994,260 |
| Net Change in Unrealized Appreciation (Depreciation) | Foreign
Exchange
Contracts
Risk | Equity
Contracts
Risk | Interest
Rate
Contracts
Risk | Total |
| Futures Contracts | $ — | $2,470,660 | $2,215,951 | $4,686,611 |
| Forward Contracts | 1,157,259 | — | — | 1,157,259 |
| Total Net Change in Unrealized Appreciation (Depreciation) | $1,157,259 | $2,470,660 | $2,215,951 | $5,843,870 |
| Average Notional Amount | Total |
| Futures Contracts Long | $274,792,254 |
| Futures Contracts Short | $ (84,944,179) |
| Forward Contracts Long | $ 84,224,318 |
| Forward Contracts Short | $ (28,044,090) |
Note 3–Fees and Related Party Transactions
(A) Manager and Subadvisors. New York Life Investments, a registered investment adviser and an indirect, wholly-owned subsidiary of New York Life Insurance Company ("New York Life"), serves as the Fund's
Manager, pursuant to an Amended and Restated Management Agreement ("Management Agreement"). The Manager provides offices, conducts clerical, recordkeeping and bookkeeping services and keeps most of the financial and accounting records required to be maintained by the Fund. Except for the portion of salaries and expenses that are the responsibility of the Fund, the Manager pays the salaries and expenses of all personnel affiliated with the Fund and certain operational expenses of the Fund. The Fund reimburses New York Life Investments in an amount equal to the portion of the compensation of the Chief Compliance Officer attributable to the Fund. Pursuant to the terms of an Amended and Restated Subadvisory Agreement with New York Life Investments, MacKay Shields LLC ("MacKay Shields" or "Subadvisor"), a registered investment
Notes to Financial Statements (Unaudited) (continued)
adviser and an indirect, wholly-owned subsidiary of New York Life, serves as a Subadvisor to the Fund and is responsible for the day-to-day portfolio management of the fixed-income portion of the Fund. Pursuant to the terms of an Amended and Restated Subadvisory Agreement with New York Life Investments, Epoch Investment Partners, Inc. (“Epoch” or “Subadvisor” and, together with MacKay Shields, the “Subadvisors”), a registered investment adviser, also serves as a Subadvisor to the Fund and is responsible for the day-to-day portfolio management of the equity portion of the Fund. Asset allocation decisions for the Fund are made by a committee chaired by New York Life Investments in collaboration with MacKay Shields. New York Life Investments pays for the services of the Subadvisors.
Pursuant to the Management Agreement, the Fund pays the Manager a monthly fee for the services performed and the facilities furnished at an annual rate of the Fund’s average daily net assets as follows: 0.64% up to $500 million; 0.60% from $500 million to $1 billion; 0.575% from $1 billion to $5 billion; and 0.565% in excess of $5 billion, plus a fee for fund accounting services previously provided by New York Life Investments under a separate fund accounting agreement furnished at an annual rate of the Fund’s average daily net assets as follows: 0.05% up to $20 million; 0.0333% from $20 million to $100 million; and 0.01% in excess of $100 million. During the six-month period ended April 30, 2024, the effective management fee rate was 0.63%, inclusive of a fee for fund accounting services of 0.01% of the Fund’s average daily net assets.
In addition, New York Life Investments waived fees and/or reimbursed expenses so that Total Annual Fund Operating Expenses (excluding taxes, interest, litigation, extraordinary expenses, brokerage and other transaction expenses relating to the purchase or sale of portfolio investments, and acquired (underlying) fund fees and expenses) for Class R6 shares did not exceed those of Class I.
During the six-month period ended April 30, 2024, New York Life Investments earned fees from the Fund in the amount of $3,237,742 and waived fees and/or reimbursed expenses in the amount of $17,619 and paid MacKay Shields and Epoch fees of $684,731 and $946,679, respectively.
JPMorgan provides sub-administration and sub-accounting services to the Fund pursuant to an agreement with New York Life Investments. These services include calculating the daily NAVs of the Fund, maintaining the general ledger and sub-ledger accounts for the calculation of the Fund's NAVs, and assisting New York Life Investments in conducting various aspects of the Fund's administrative operations. For providing these services to the Fund, JPMorgan is compensated by New York Life Investments.
Pursuant to an agreement between the Trust and New York Life Investments, New York Life Investments is responsible for providing or procuring certain regulatory reporting services for the Fund. The Fund will reimburse New York Life Investments for the actual costs incurred by New York Life Investments in connection with providing or procuring these services for the Fund.
(B) Distribution and Service Fees. The Trust, on behalf of the Fund, has entered into a distribution agreement with NYLIFE Distributors LLC (the “Distributor”), an affiliate of New York Life Investments. The Fund has adopted distribution plans (the “Plans”) in accordance with the provisions of Rule 12b-1 under the 1940 Act.
Pursuant to the Class A, Investor Class and Class R2 Plans, the Distributor receives a monthly fee from the Class A, Investor Class and Class R2 shares at an annual rate of 0.25% of the average daily net assets of the Class A, Investor Class and Class R2 shares for distribution and/or service activities as designated by the Distributor. Pursuant to the Class B and Class C Plans, Class B and Class C shares pay the Distributor a monthly distribution fee at an annual rate of 0.75% of the average daily net assets of the Class B and Class C shares, along with a service fee at an annual rate of 0.25% of the average daily net assets of the Class B and Class C shares, for a total 12b-1 fee of 1.00%. Pursuant to the Class R3 and SIMPLE Class Plans, Class R3 and SIMPLE Class shares pay the Distributor a monthly distribution fee at an annual rate of 0.25% of the average daily net assets of the Class R3 and SIMPLE Class shares, along with a service fee at an annual rate of 0.25% of the average daily net assets of the Class R3 and SIMPLE Class shares, for a total 12b-1 fee of 0.50%. Class I and Class R6 shares are not subject to a distribution and/or service fee.
The Plans provide that the distribution and service fees are payable to the Distributor regardless of the amounts actually expended by the Distributor for distribution of the Fund's shares and service activities.
In accordance with the Shareholder Services Plans for the Class R2 and Class R3 shares, the Manager has agreed to provide, through its affiliates or independent third parties, various shareholder and administrative support services to shareholders of the Class R2 and Class R3 shares. For its services, the Manager, its affiliates or independent third-party service providers are entitled to a shareholder service fee accrued daily and paid monthly at an annual rate of 0.10% of the average daily net assets of the Class R2 and Class R3 shares. This is in addition to any fees paid under the Class R2 and Class R3 Plans.
During the period November 1, 2023 through February 28, 2024, shareholder service fees incurred by the Fund were as follows:
| |
| Class R2* | $258 |
| Class R3* | 862 |
| * | Effective at the close of business on February 23, 2024, Class R2 and R3 shares were liquidated. |
(C) Sales Charges. The Fund was advised by the Distributor that the amount of initial sales charges retained on sales of Class A and Investor Class shares during the six-month period ended April 30, 2024, were $8,361 and $1,483, respectively.
The Fund was also advised that the Distributor retained CDSCs on redemptions of Class A, Investor Class and Class C shares during the
| 48 | MainStay Income Builder Fund |
six-month period ended April 30, 2024, of $2,865, $10 and $971, respectively.
(D) Transfer, Dividend Disbursing and Shareholder Servicing Agent. NYLIM Service Company LLC, an affiliate of New York Life Investments, is the Fund's transfer, dividend disbursing and shareholder servicing agent pursuant to an agreement between NYLIM Service Company LLC and the Trust. NYLIM Service Company LLC has entered into an agreement with SS&C Global Investor & Distribution Solutions, Inc. ("SS&C"), pursuant to which SS&C performs certain transfer agent services on behalf of NYLIM Service Company LLC. New York Life Investments has contractually agreed to limit the transfer agency expenses charged to the Fund’s share classes to a maximum of 0.35% of that share class’s average daily net assets on an annual basis after deducting any applicable Fund or class-level expense reimbursement or small account fees. This agreement will remain in effect until February 28, 2025, and shall renew automatically for one-year terms unless New York Life Investments provides written notice of termination prior to the start of the next term or upon approval of the Board. During the six-month period ended April 30, 2024, transfer agent expenses incurred by the Fund and any reimbursements, pursuant to the aforementioned Transfer Agency expense limitation agreement, were as follows:
| Class | Expense | Waived |
| Class A | $315,650 | $ — |
| Investor Class | 116,452 | (9,727) |
| Class B | 6,985 | (544) |
| Class C | 94,004 | (7,348) |
| Class I | 130,218 | — |
| Class R2* | 246 | — |
| Class R3* | 835 | — |
| Class R6 | 83 | — |
| SIMPLE Class | 16 | — |
| * | Effective at the close of business on February 23, 2024, Class R2 and R3 shares were liquidated. |
(E) Small Account Fee. Shareholders with small accounts adversely impact the cost of providing transfer agency services. In an effort to reduce total transfer agency expenses, the Fund has implemented a small account fee on certain types of accounts. As described in the Fund's prospectus, certain shareholders with an account balance of less than $1,000 ($5,000 for Class A share accounts) are charged an annual per account fee of $20 (assessed semi-annually), the proceeds from which offset transfer agent fees as reflected in the Statement of Operations. This small account fee will not apply to certain types of accounts as described further in the Fund’s prospectus.
(F) Capital. As of April 30, 2024, New York Life and its affiliates beneficially held shares of the Fund with the values and percentages of net assets as follows:
| Class R6 | $33,040 | 0.7% |
| SIMPLE Class | 27,783 | 45.0 |
Note 4-Federal Income Tax
As of April 30, 2024, the cost and unrealized appreciation (depreciation) of the Fund’s investment portfolio, including applicable derivative contracts and other financial instruments, as determined on a federal income tax basis, were as follows:
| | Federal Tax
Cost | Gross
Unrealized
Appreciation | Gross
Unrealized
(Depreciation) | Net
Unrealized
Appreciation/
(Depreciation) |
| Investments in Securities | $868,567,647 | $174,395,158 | $(43,304,978) | $131,090,180 |
As of October 31, 2023, for federal income tax purposes, capital loss carryforwards of $141,562,671, as shown in the table below, were available to the extent provided by the regulations to offset future realized gains of the Fund. Accordingly, no capital gains distributions are expected to be paid to shareholders until net gains have been realized in excess of such amounts.
Capital Loss
Available Through | Short-Term
Capital Loss
Amounts (000’s) | Long-Term
Capital Loss
Amounts (000’s) |
| Unlimited | $68,552 | $73,011 |
During the year ended October 31, 2023, the tax character of distributions paid as reflected in the Statements of Changes in Net Assets was as follows:
| | 2023 |
| Distributions paid from: | |
| Ordinary Income | $31,406,402 |
Note 5–Custodian
JPMorgan is the custodian of cash and securities held by the Fund. Custodial fees are charged to the Fund based on the Fund's net assets and/or the market value of securities held by the Fund and the number of certain transactions incurred by the Fund.
Note 6–Line of Credit
The Fund and certain other funds managed by New York Life Investments maintain a line of credit with a syndicate of banks in order to secure a source of funds for temporary purposes to meet unanticipated or excessive redemption requests.
Notes to Financial Statements (Unaudited) (continued)
Effective July 25, 2023, under the credit agreement (the “Credit Agreement”), the aggregate commitment amount is $600,000,000 with an additional uncommitted amount of $100,000,000. The commitment fee is an annual rate of 0.15% of the average commitment amount payable quarterly, regardless of usage, to JPMorgan, who serves as the agent to the syndicate. The commitment fee is allocated among the Fund and certain other funds managed by New York Life Investments based upon their respective net assets and other factors. Interest on any revolving credit loan is charged based upon the Federal Funds Rate, Daily Simple Secured Overnight Financing Rate ("SOFR") + 0.10%, or the Overnight Bank Funding Rate, whichever is higher. The Credit Agreement expires on July 23, 2024, although the Fund, certain other funds managed by New York Life Investments and the syndicate of banks may renew the Credit Agreement for an additional year on the same or different terms or enter into a credit agreement with a different syndicate of banks. Prior to July 25, 2023, the aggregate commitment amount and the commitment fee were the same as those under the current Credit Agreement. During the six-month period ended April 30, 2024, there were no borrowings made or outstanding with respect to the Fund under the Credit Agreement.
Note 7–Interfund Lending Program
Pursuant to an exemptive order issued by the SEC, the Fund, along with certain other funds managed by New York Life Investments, may participate in an interfund lending program. The interfund lending program provides an alternative credit facility that permits the Fund and certain other funds managed by New York Life Investments to lend or borrow money for temporary purposes directly to or from one another, subject to the conditions of the exemptive order. During the six-month period ended April 30, 2024, there were no interfund loans made or outstanding with respect to the Fund.
Note 8–Purchases and Sales of Securities (in 000’s)
During the six-month period ended April 30, 2024, purchases and sales of U.S. government securities were $42,813 and $40,971, respectively. Purchases and sales of securities, other than U.S. government securities and short-term securities, were $170,844 and $233,497, respectively.
Note 9–Capital Share Transactions
Transactions in capital shares for the six-month period ended April 30, 2024 and the year ended October 31, 2023, were as follows:
| Class A | Shares | Amount |
| Six-month period ended April 30, 2024: | | |
| Shares sold | 1,136,919 | $ 21,308,177 |
| Shares issued to shareholders in reinvestment of distributions | 571,190 | 10,724,254 |
| Shares redeemed | (3,379,999) | (62,645,621) |
| Net increase (decrease) in shares outstanding before conversion | (1,671,890) | (30,613,190) |
| Shares converted into Class A (See Note 1) | 169,378 | 3,198,958 |
| Shares converted from Class A (See Note 1) | (3,062) | (57,700) |
| Net increase (decrease) | (1,505,574) | $ (27,471,932) |
| Year ended October 31, 2023: | | |
| Shares sold | 2,516,059 | $ 44,732,737 |
| Shares issued to shareholders in reinvestment of distributions | 1,005,132 | 17,879,452 |
| Shares redeemed | (7,406,928) | (131,321,645) |
| Net increase (decrease) in shares outstanding before conversion | (3,885,737) | (68,709,456) |
| Shares converted into Class A (See Note 1) | 291,472 | 5,184,646 |
| Shares converted from Class A (See Note 1) | (36,894) | (662,235) |
| Net increase (decrease) | (3,631,159) | $ (64,187,045) |
| |
| Investor Class | Shares | Amount |
| Six-month period ended April 30, 2024: | | |
| Shares sold | 60,704 | $ 1,139,676 |
| Shares issued to shareholders in reinvestment of distributions | 52,254 | 981,976 |
| Shares redeemed | (158,975) | (2,965,353) |
| Net increase (decrease) in shares outstanding before conversion | (46,017) | (843,701) |
| Shares converted into Investor Class (See Note 1) | 26,690 | 499,332 |
| Shares converted from Investor Class (See Note 1) | (120,506) | (2,281,432) |
| Net increase (decrease) | (139,833) | $ (2,625,801) |
| Year ended October 31, 2023: | | |
| Shares sold | 90,287 | $ 1,616,764 |
| Shares issued to shareholders in reinvestment of distributions | 89,388 | 1,591,424 |
| Shares redeemed | (311,892) | (5,555,979) |
| Net increase (decrease) in shares outstanding before conversion | (132,217) | (2,347,791) |
| Shares converted into Investor Class (See Note 1) | 73,402 | 1,313,515 |
| Shares converted from Investor Class (See Note 1) | (159,583) | (2,836,066) |
| Net increase (decrease) | (218,398) | $ (3,870,342) |
| |
| 50 | MainStay Income Builder Fund |
| Class B | Shares | Amount |
| Six-month period ended April 30, 2024: | | |
| Shares sold | 121 | $ 2,281 |
| Shares issued to shareholders in reinvestment of distributions | 2,135 | 40,358 |
| Shares redeemed | (54,510) | (1,031,418) |
| Net increase (decrease) in shares outstanding before conversion | (52,254) | (988,779) |
| Shares converted from Class B (See Note 1) | (57,116) | (1,080,459) |
| Net increase (decrease) | (109,370) | $ (2,069,238) |
| Year ended October 31, 2023: | | |
| Shares sold | 605 | $ 10,870 |
| Shares issued to shareholders in reinvestment of distributions | 5,764 | 103,489 |
| Shares redeemed | (138,480) | (2,470,402) |
| Net increase (decrease) in shares outstanding before conversion | (132,111) | (2,356,043) |
| Shares converted from Class B (See Note 1) | (119,904) | (2,158,112) |
| Net increase (decrease) | (252,015) | $ (4,514,155) |
| |
| Class C | Shares | Amount |
| Six-month period ended April 30, 2024: | | |
| Shares sold | 30,559 | $ 567,110 |
| Shares issued to shareholders in reinvestment of distributions | 30,714 | 580,271 |
| Shares redeemed | (579,017) | (10,874,723) |
| Net increase (decrease) in shares outstanding before conversion | (517,744) | (9,727,342) |
| Shares converted from Class C (See Note 1) | (16,935) | (318,052) |
| Net increase (decrease) | (534,679) | $ (10,045,394) |
| Year ended October 31, 2023: | | |
| Shares sold | 159,179 | $ 2,846,128 |
| Shares issued to shareholders in reinvestment of distributions | 63,835 | 1,143,404 |
| Shares redeemed | (1,697,231) | (30,355,059) |
| Net increase (decrease) in shares outstanding before conversion | (1,474,217) | (26,365,527) |
| Shares converted from Class C (See Note 1) | (90,561) | (1,625,127) |
| Net increase (decrease) | (1,564,778) | $ (27,990,654) |
| |
| Class I | Shares | Amount |
| Six-month period ended April 30, 2024: | | |
| Shares sold | 608,032 | $ 11,453,192 |
| Shares issued to shareholders in reinvestment of distributions | 219,539 | 4,170,026 |
| Shares redeemed | (2,428,869) | (45,521,365) |
| Net increase (decrease) in shares outstanding before conversion | (1,601,298) | (29,898,147) |
| Shares converted into Class I (See Note 1) | 4,494 | 82,521 |
| Shares converted from Class I (See Note 1) | (2,233) | (42,741) |
| Net increase (decrease) | (1,599,037) | $ (29,858,367) |
| Year ended October 31, 2023: | | |
| Shares sold | 1,796,301 | $ 32,376,320 |
| Shares issued to shareholders in reinvestment of distributions | 444,143 | 7,996,518 |
| Shares redeemed | (7,013,152) | (125,777,077) |
| Net increase (decrease) in shares outstanding before conversion | (4,772,708) | (85,404,239) |
| Shares converted into Class I (See Note 1) | 46,598 | 844,048 |
| Shares converted from Class I (See Note 1) | (3,335) | (60,669) |
| Net increase (decrease) | (4,729,445) | $ (84,620,860) |
| |
| Class R2 | Shares | Amount |
| Six-month period ended April 30, 2024: (a) | | |
| Shares sold | 377 | $ 6,824 |
| Shares issued to shareholders in reinvestment of distributions | 305 | 5,634 |
| Shares redeemed | (53,390) | (1,012,078) |
| Net increase (decrease) | (52,708) | $ (999,620) |
| Year ended October 31, 2023: | | |
| Shares sold | 2,805 | $ 50,119 |
| Shares issued to shareholders in reinvestment of distributions | 1,039 | 18,485 |
| Shares redeemed | (52,059) | (910,048) |
| Net increase (decrease) | (48,215) | $ (841,444) |
| |
| Class R3 | Shares | Amount |
| Six-month period ended April 30, 2024: (a) | | |
| Shares sold | 5,786 | $ 104,313 |
| Shares issued to shareholders in reinvestment of distributions | 1,111 | 20,498 |
| Shares redeemed | (154,949) | (2,948,093) |
| Net increase (decrease) in shares outstanding before conversion | (148,052) | (2,823,282) |
| Shares converted from Class R3 (See Note 1) | (23) | (427) |
| Net increase (decrease) | (148,075) | $ (2,823,709) |
| Year ended October 31, 2023: | | |
| Shares sold | 43,427 | $ 771,918 |
| Shares issued to shareholders in reinvestment of distributions | 3,348 | 59,503 |
| Shares redeemed | (31,580) | (565,878) |
| Net increase (decrease) | 15,195 | $ 265,543 |
| |
Notes to Financial Statements (Unaudited) (continued)
| Class R6 | Shares | Amount |
| Six-month period ended April 30, 2024: | | |
| Shares sold | 40,409 | $ 771,975 |
| Shares issued to shareholders in reinvestment of distributions | 2,183 | 41,517 |
| Shares redeemed | (33,279) | (617,461) |
| Net increase (decrease) | 9,313 | $ 196,031 |
| Year ended October 31, 2023: | | |
| Shares sold | 231,026 | $ 4,169,733 |
| Shares issued to shareholders in reinvestment of distributions | 17,949 | 326,250 |
| Shares redeemed | (5,248,518) | (93,598,773) |
| Net increase (decrease) | (4,999,543) | $ (89,102,790) |
| |
| SIMPLE Class | Shares | Amount |
| Six-month period ended April 30, 2024: | | |
| Shares sold | 1,110 | $ 20,637 |
| Shares issued to shareholders in reinvestment of distributions | 46 | 876 |
| Net increase (decrease) | 1,156 | $ 21,513 |
| Year ended October 31, 2023: | | |
| Shares sold | 294 | $ 5,246 |
| Shares issued to shareholders in reinvestment of distributions | 50 | 900 |
| Shares redeemed | (235) | (4,285) |
| Net increase (decrease) | 109 | $ 1,861 |
| (a) | Class liquidated and is no longer offered for sale as of February 23, 2024. |
Note 10–Other Matters
As of the date of this report, the Fund faces a heightened level of risk associated with current uncertainty, volatility and state of economies, financial markets, a high interest rate environment, and labor and health conditions around the world. Events such as war, acts of terrorism, recessions, rapid inflation, the imposition of economic sanctions, earthquakes, hurricanes, epidemics and pandemics and other unforeseen natural or human disasters may have broad adverse social, political and economic effects on the global economy, which could negatively impact the value of the Fund's investments. Developments that disrupt global economies and financial markets may magnify factors that affect the Fund's performance.
Note 11–Subsequent Events
In connection with the preparation of the financial statements of the Fund as of and for the six-month period ended April 30, 2024, events and transactions subsequent to April 30, 2024, through the date the financial statements were issued, have been evaluated by the Manager for possible adjustment and/or disclosure. No subsequent events requiring financial statement adjustment or disclosure have been identified.
| 52 | MainStay Income Builder Fund |
Board Consideration and Approval of Management Agreement and Subadvisory Agreements (Unaudited)
The continuation of the Management Agreement with respect to the MainStay Income Builder Fund (“Fund”) and New York Life Investment Management LLC (“New York Life Investments”) and the Subadvisory Agreements between New York Life Investments and each of MacKay Shields LLC (“MacKay”) and Epoch Investment Partners, Inc. (“Epoch”) with respect to the Fund (together, “Advisory Agreements”) is subject to annual review and approval by the Board of Trustees of The MainStay Funds (“Board” of the “Trust”) in accordance with Section 15 of the Investment Company Act of 1940, as amended (“1940 Act”). At its December 6–7, 2023 meeting, the Board, including the Trustees who are not an “interested person” (as such term is defined in the 1940 Act) of the Trust (“Independent Trustees”) voting separately, unanimously approved the continuation of each of the Advisory Agreements for a one-year period.
In reaching the decision to approve the continuation of each of the Advisory Agreements, the Board considered information and materials furnished by New York Life Investments, MacKay and Epoch in connection with an annual contract review process undertaken by the Board that took place at meetings of the Board and its Contracts Committee from September 2023 through December 2023, including information and materials furnished by New York Life Investments, MacKay and Epoch in response to requests prepared on behalf of the Board, and in consultation with the Independent Trustees, by independent legal counsel to the Independent Trustees, which encompassed a variety of topics, including those summarized below. Information and materials requested by and furnished to the Board for consideration in connection with the contract review process included, among other items, reports on the Fund and “peer funds” prepared by Institutional Shareholder Services Inc. (“ISS”), an independent third-party service provider engaged by the Board to report objectively on the Fund’s investment performance, management fee and total expenses. The Board also considered information on the fees charged to other investment advisory clients of New York Life Investments, MacKay and/or Epoch that follow investment strategies similar to those of the Fund, if any, and, when applicable, the rationale for differences in the Fund’s management and subadvisory fees and the fees charged to those other investment advisory clients. In addition, the Board considered information regarding the legal standards and fiduciary obligations applicable to its consideration of the continuation of each of the Advisory Agreements. The contract review process, including the structure and format for information and materials provided to the Board, has been developed in consultation with the Board. The Independent Trustees also met in executive sessions with their independent legal counsel and, for portions thereof, with senior management of New York Life Investments.
The Board’s deliberations with respect to the continuation of each of the Advisory Agreements reflect a year-long process, and the Board also took into account information furnished to the Board and its Committees throughout the year, as deemed relevant and appropriate by the Trustees, including, among other items, reports on investment performance of the Fund and investment-related matters for the Fund as well as presentations from New York Life Investments and, generally annually,
MacKay and Epoch personnel. In addition, the Board took into account other information provided by New York Life Investments throughout the year, including, among other items, periodic reports on legal and compliance matters, risk management, portfolio turnover, brokerage commissions and non-advisory services provided to the Fund by New York Life Investments, as deemed relevant and appropriate by the Trustees.
In addition to information provided to the Board throughout the year, the Board received information in connection with its June 2023 meeting provided specifically in response to requests prepared on behalf of the Board, and in consultation with the Independent Trustees, by independent legal counsel to the Independent Trustees regarding the Fund’s distribution arrangements. In addition, the Board received information regarding the Fund’s asset levels, share purchase and redemption activity and the payment of Rule 12b-1 and/or certain other fees by the applicable share classes of the Fund, among other information.
In considering the continuation of each of the Advisory Agreements, the Trustees reviewed and evaluated the information and factors they believed to reasonably be necessary and appropriate in light of legal advice furnished to them by independent legal counsel to the Independent Trustees and through the exercise of their own business judgment. Although individual Trustees may have weighed certain factors or information differently and the Board did not consider any single factor or information controlling in reaching its decision, the factors that figured prominently in the Board’s consideration of the continuation of each of the Advisory Agreements are summarized in more detail below and include, among other factors: (i) the nature, extent and quality of the services provided to the Fund by New York Life Investments, MacKay and Epoch; (ii) the qualifications of the portfolio managers of the Fund and the historical investment performance of the Fund, New York Life Investments, MacKay and Epoch; (iii) the costs of the services provided, and profits realized, by New York Life Investments, MacKay and Epoch with respect to their relationships with the Fund; (iv) the extent to which economies of scale have been realized or may be realized if the Fund grows and the extent to which any economies of scale have been shared, have benefited or may benefit the Fund’s shareholders; and (v) the reasonableness of the Fund’s management and subadvisory fees and total ordinary operating expenses. Although the Board recognized that comparisons between the Fund’s fees and expenses and those of other funds are imprecise given different terms of agreements, variations in fund strategies and other factors, the Board considered the reasonableness of the Fund’s management fee and total ordinary operating expenses as compared to the peer funds identified by ISS. Throughout their considerations, the Trustees acknowledged the commitment of New York Life Investments and its affiliates to serve the MainStay Group of Funds, as well as their capacity, experience, resources, financial stability and reputations. The Trustees also acknowledged the entrepreneurial and other risks assumed by New York Life Investments in sponsoring and managing the Fund. With respect to
Board Consideration and Approval of Management Agreement and Subadvisory Agreements (Unaudited) (continued)
each Subadvisory Agreement, the Board took into account New York Life Investments’ recommendation to approve the continuation of the Subadvisory Agreement.
The Trustees noted that, throughout the year, the Trustees are afforded an opportunity to ask questions of, and request additional information or materials from, New York Life Investments, MacKay and Epoch. The Board’s decision with respect to each of the Advisory Agreements may have also been based, in part, on the Board’s knowledge of New York Life Investments, MacKay and Epoch resulting from, among other things, the Board’s consideration of each of the Advisory Agreements in prior years, the advisory agreements for other funds in the MainStay Group of Funds, the Board’s review throughout the year of the performance and operations of other funds in the MainStay Group of Funds and each Trustee’s business judgment and industry experience. In addition to considering the above-referenced factors, the Board observed that in the marketplace there are a range of investment options available to investors and that the Fund’s shareholders, having had the opportunity to consider other investment options, have invested in the Fund.
The factors that figured prominently in the Board’s decision to approve the continuation of each of the Advisory Agreements during the Board’s December 6–7, 2023 meeting are summarized in more detail below.
Nature, Extent and Quality of Services Provided by New York Life Investments, MacKay and Epoch
The Board examined the nature, extent and quality of the services that New York Life Investments provides to the Fund. The Board evaluated New York Life Investments’ experience and capabilities in serving as manager of the Fund and considered that the Fund operates in a “manager-of-managers” structure. The Board also considered New York Life Investments’ responsibilities and services provided pursuant to this structure, including overseeing the services provided by MacKay and Epoch, evaluating the performance of MacKay and Epoch, making recommendations to the Board as to whether the Subadvisory Agreements should be renewed, modified or terminated and periodically reporting to the Board regarding the results of New York Life Investments’ evaluation and monitoring functions. The Board noted that New York Life Investments manages other mutual funds, serves a variety of other investment advisory clients, including other pooled investment vehicles, and has experience overseeing mutual fund service providers, including subadvisors. The Board considered the experience of senior personnel at New York Life Investments providing management and administrative and other non-advisory services to the Fund. The Board observed that New York Life Investments devotes significant resources and time to providing management and administrative and other non-advisory services to the Fund, including New York Life Investments’ oversight and due diligence reviews of MacKay and Epoch and ongoing analysis of, and interactions with, MacKay and Epoch with respect to, among other things, the Fund’s investment performance and risks as well as MacKay’s and Epoch’s investment capabilities and subadvisory services with respect to the Fund.
The Board also considered the range of services that New York Life Investments provides to the Fund under the terms of the Management Agreement, including: (i) fund accounting and ongoing supervisory services provided by New York Life Investments’ Fund Administration and Accounting Group; (ii) investment supervisory and analytical services provided by New York Life Investments’ Investment Consulting Group; (iii) compliance services provided by the Trust’s Chief Compliance Officer as well as New York Life Investments’ compliance department, including supervision and implementation of the Fund’s compliance program; (iv) legal services provided by New York Life Investments’ Office of the General Counsel; and (v) risk management monitoring and analysis by compliance and investment personnel. In addition, the Board considered New York Life Investments’ willingness to invest in personnel and other resources, such as cyber security, information security and business continuity planning, that may benefit the Fund and noted that New York Life Investments is responsible for compensating the Trust’s officers, except for a portion of the salary of the Trust’s Chief Compliance Officer. The Board recognized that New York Life Investments provides certain other non-advisory services to the Fund and has over time provided an increasingly broad array of non-advisory services to the MainStay Group of Funds as a result of regulatory and other developments.
The Board also examined the range, and the nature, extent and quality, of the investment advisory services that MacKay and Epoch provide to the Fund and considered the terms of each of the Advisory Agreements. The Board evaluated MacKay’s and Epoch’s experience and performance in serving as subadvisor to the Fund and advising other portfolios and MacKay’s and Epoch’s track record and experience in providing investment advisory services as well as the experience of investment advisory, senior management and/or administrative personnel at MacKay and Epoch. The Board considered New York Life Investments’, MacKay’s and Epoch’s overall resources, legal and compliance environment, capabilities, reputation, financial condition and history. In addition to information provided in connection with quarterly meetings with the Trust’s Chief Compliance Officer, the Board considered information regarding the compliance policies and procedures of New York Life Investments, MacKay and Epoch and acknowledged their commitment to further developing and strengthening compliance programs that may relate to the Fund. The Board also considered MacKay’s and Epoch’s ability to recruit and retain qualified investment professionals and willingness to invest in personnel and other resources that may benefit the Fund. In this regard, the Board considered the qualifications and experience of the Fund’s portfolio managers, the number of accounts managed by the portfolio managers and the method for compensating the portfolio managers.
In addition, the Board considered information provided by New York Life Investments, MacKay and Epoch regarding their respective business continuity and disaster recovery plans.
Based on these considerations, among others, the Board concluded that the Fund would likely continue to benefit from the nature, extent and quality of these services.
| 54 | MainStay Income Builder Fund |
Investment Performance
In evaluating the Fund’s investment performance, the Board considered investment performance results over various periods in light of the Fund’s investment objective, strategies and risks. The Board considered investment reports on, and analysis of, the Fund’s performance provided to the Board throughout the year. These reports include, among other items, information on the Fund’s gross and net returns, the Fund’s investment performance compared to a relevant investment category and the Fund’s benchmarks, the Fund’s risk-adjusted investment performance and the Fund’s investment performance as compared to peer funds, as appropriate, as well as portfolio attribution information and commentary on the effect of market conditions. The Board also considered information provided by ISS showing the investment performance of the Fund as compared to peer funds. In addition, the Board reviewed the methodology used by ISS to construct the group of peer funds for comparative purposes.
The Board also took into account its discussions with senior management at New York Life Investments concerning the Fund’s investment performance over various periods as well as discussions between representatives of MacKay and Epoch and the members of the Board’s Investment Committee, which generally occur on an annual basis.
Based on these considerations, among others, the Board concluded that its review of the Fund’s investment performance and related information supported a determination to approve the continuation of each of the Advisory Agreements.
Costs of the Services Provided, and Profits and Other Benefits Realized, by New York Life Investments, MacKay and Epoch
The Board considered the costs of the services provided under each of the Advisory Agreements. The Board also considered the profitability of New York Life Investments and its affiliates, including MacKay, due to their relationships with the Fund as well as of New York Life Investments and its affiliates due to their relationships with the MainStay Group of Funds. Because MacKay is an affiliate of New York Life Investments whose subadvisory fee is paid by New York Life Investments, not the Fund, the Board considered cost and profitability information for New York Life Investments and MacKay in the aggregate. With respect to the profitability of Epoch’s relationship with the Fund, the Board considered information from New York Life Investments that Epoch’s subadvisory fee reflected an arm’s-length negotiation and that this fee is paid by New York Life Investments, not the Fund, and the relevance of Epoch’s profitability was considered by the Trustees in that context. On this basis, the Board primarily considered the costs and profitability for New York Life Investments and its affiliates with respect to the Fund.
In addition, the Board acknowledged the difficulty in obtaining reliable comparative data about mutual fund managers’ profitability because such information generally is not publicly available and may be impacted by numerous factors, including the structure of a fund manager’s
organization, the types of funds it manages, the methodology used to allocate certain fixed costs to specific funds and the manager’s capital structure and costs of capital.
In evaluating the costs of the services provided by New York Life Investments, MacKay and Epoch and profitability of New York Life Investments and its affiliates, including MacKay, and Epoch due to their relationships with the Fund, the Board considered, among other factors, New York Life Investments’ and its affiliates’, including MacKay’s, and Epoch’s continuing investments in, or willingness to invest in, personnel and other resources that may support and further enhance the management of the Fund, and that New York Life Investments is responsible for paying the subadvisory fee for the Fund. The Board also considered the financial resources of New York Life Investments, MacKay and Epoch and acknowledged that New York Life Investments, MacKay and Epoch must be in a position to recruit and retain experienced professional personnel and to maintain a strong financial position for New York Life Investments, MacKay and Epoch to continue to provide high-quality services to the Fund. The Board recognized that the Fund benefits from the allocation of certain fixed costs among the funds in the MainStay Group of Funds, among other expected benefits resulting from its relationship with New York Life Investments.
The Board considered information regarding New York Life Investments’ methodology for calculating profitability and allocating costs provided by New York Life Investments in connection with the fund profitability analysis presented to the Board. The Board concluded that New York Life Investments’ methods for allocating costs and procedures for estimating overall profitability of the relationship with the funds in the MainStay Group of Funds were reasonable. The Board recognized the difficulty in calculating and evaluating a manager’s profitability with respect to the Fund and considered that other profitability methodologies may also be reasonable.
The Board also considered certain fall-out benefits that may be realized by New York Life Investments and its affiliates, including MacKay, and Epoch and its affiliates due to their relationships with the Fund, including reputational and other indirect benefits. The Board recognized, for example, the benefits to MacKay and Epoch from legally permitted “soft-dollar” arrangements by which brokers provide research and other services to MacKay and Epoch in exchange for commissions paid by the Fund with respect to trades in the Fund’s portfolio securities. In this regard, the Board also requested and considered information from New York Life Investments concerning other material business relationships between Epoch and its affiliates and New York Life Investments and its affiliates and considered the existence of a strategic partnership between New York Life Investments and Epoch that relates to certain current and future products and represents a potential conflict of interest associated with New York Life Investments’ recommendation to approve the continuation of the Subadvisory Agreement. In addition, the Board considered its review of the management agreement for a money market fund advised by New York Life Investments and an affiliated subadvisor that serves as an investment option for the Fund, including the potential rationale for and costs associated with investments in this money market
Board Consideration and Approval of Management Agreement and Subadvisory Agreements (Unaudited) (continued)
fund by the Fund, if any, and considered information from New York Life Investments that the nature and type of specific investment advisory services provided to this money market fund are distinct from, or in addition to, the investment advisory services provided to the Fund.
The Board observed that, in addition to fees earned by New York Life Investments under the Management Agreement for managing the Fund, New York Life Investments’ affiliates also earn revenues from serving the Fund in various other capacities, including as the Fund’s transfer agent and distributor. The Board considered information about these other revenues and their impact on the profitability of the relationship with the Fund to New York Life Investments and its affiliates. The Board noted that, although it assessed the overall profitability of the relationship with the Fund to New York Life Investments and its affiliates as part of the contract review process, when considering the reasonableness of the fee paid to New York Life Investments under the Management Agreement, the Board considered the profitability of New York Life Investments’ relationship with the Fund on a pre-tax basis and without regard to distribution expenses incurred by New York Life Investments from its own resources.
After evaluating the information deemed relevant by the Trustees, the Board concluded that any profits realized by New York Life Investments and its affiliates, including MacKay, due to their relationships with the Fund were not excessive, other expected benefits that may accrue to New York Life Investments and its affiliates, including MacKay, are reasonable and other expected benefits that may accrue to Epoch and its affiliates are consistent with those expected for a subadvisor to a mutual fund. With respect to Epoch, the Board considered that any profits realized by Epoch due to its relationship with the Fund are the result of arm’s-length negotiations between New York Life Investments and Epoch, acknowledging that any such profits are based on the subadvisory fee paid to Epoch by New York Life Investments, not the Fund.
Management and Subadvisory Fees and Total Ordinary Operating Expenses
The Board evaluated the reasonableness of the fee paid under each of the Advisory Agreements and the Fund’s total ordinary operating expenses. With respect to the management fee and subadvisory fee, the Board primarily considered the reasonableness of the management fee paid by the Fund to New York Life Investments because the subadvisory fee paid to MacKay and Epoch is paid by New York Life Investments, not the Fund. The Board also considered the reasonableness of the subadvisory fee paid by New York Life Investments and the amount of the management fee retained by New York Life Investments.
In assessing the reasonableness of the Fund’s fees and expenses, the Board primarily considered comparative data provided by ISS on the fees and expenses of similar mutual funds managed by other investment advisers. The Board reviewed the methodology used by ISS to construct the group of peer funds for comparative purposes. In addition, the Board considered information provided by New York Life Investments, MacKay and Epoch on fees charged to other investment advisory clients, including
institutional separate accounts and/or other funds, that follow investment strategies similar to those of the Fund, if any. The Board considered the contractual management fee schedule for the Fund as compared to those for such other investment advisory clients, taking into account the rationale for differences in fee schedules. The Board also took into account information provided by New York Life Investments about the more extensive scope of services provided to registered investment companies, such as the Fund, as compared with other investment advisory clients. Additionally, the Board considered the impact of contractual breakpoints, voluntary waivers and expense limitation arrangements on the Fund’s net management fee and expenses. The Board also considered that in proposing fees for the Fund, New York Life Investments considers the competitive marketplace for mutual funds.
The Board took into account information from New York Life Investments, as provided in connection with the Board’s June 2023 meeting, regarding the reasonableness of the Fund’s transfer agent fee schedule, including industry data demonstrating that the fees that NYLIM Service Company LLC, an affiliate of New York Life Investments and the Fund’s transfer agent, charges the Fund are within the range of fees charged by transfer agents to other mutual funds. In addition, the Board considered NYLIM Service Company LLC’s profitability in connection with the transfer agent services it provides to the Fund. The Board also took into account information provided by NYLIM Service Company LLC regarding the sub-transfer agency payments it made to intermediaries in connection with the provision of sub-transfer agency services to the Fund.
The Board considered the extent to which transfer agent fees contributed to the total expenses of the Fund. The Board acknowledged the role that the MainStay Group of Funds historically has played in serving the investment needs of New York Life Insurance Company customers, who often maintain smaller account balances than other shareholders of funds, and the impact of small accounts on the expense ratios of Fund share classes. The Board also recognized measures that it and New York Life Investments have taken that are intended to mitigate the effect of small accounts on the expense ratios of Fund share classes, including through the imposition of an expense limitation on net transfer agency expenses. The Board also considered that NYLIM Service Company LLC had waived its contractual cost of living adjustments during certain years.
Based on the factors outlined above, among other considerations, the Board concluded that the Fund’s management fee and total ordinary operating expenses are within a range that is competitive and support a conclusion that these fees and expenses are reasonable.
Economies of Scale
The Board considered information regarding economies of scale, including whether economies of scale may exist with respect to the Fund and whether the Fund’s management fee and expense structure permits any economies of scale to be appropriately shared with the Fund’s shareholders. The Board also considered a report from New York Life Investments, previously prepared at the request of the Board, that addressed economies of scale, including with respect to the mutual fund
| 56 | MainStay Income Builder Fund |
business generally, and the various ways in which the benefits of economies of scale may be shared with the funds in the MainStay Group of Funds. Although the Board recognized the difficulty of determining economies of scale with precision, the Board acknowledged that economies of scale may be shared with the Fund in a number of ways, including, for example, through the imposition of fee breakpoints, initially setting management fee rates at scale or making additional investments to enhance the services provided to the Fund. The Board reviewed information from New York Life Investments showing how the Fund’s management fee schedule compared to fee schedules of other funds and accounts managed by New York Life Investments. The Board also reviewed information from ISS showing how the Fund’s management fee schedule compared with fees paid for similar services by peer funds at varying asset levels.
Based on this information, the Board concluded that economies of scale are appropriately shared for the benefit of the Fund’s shareholders through the Fund’s management fee and expense structure and other methods to share benefits from economies of scale.
Conclusion
On the basis of the information and factors summarized above, among other information and factors deemed relevant by the Trustees, and the evaluation thereof, the Board, including the Independent Trustees voting separately, unanimously voted to approve the continuation of each of the Advisory Agreements.
Discussion of the Operation and Effectiveness of the Fund's Liquidity Risk Management Program (Unaudited)
In compliance with Rule 22e-4 under the Investment Company Act of 1940, as amended (the “Liquidity Rule”), the Fund has adopted and implemented a liquidity risk management program (the “Program”), which New York Life Investment Management LLC believes is reasonably designed to assess and manage the Fund's liquidity risk. A Fund's liquidity risk is the risk that the Fund could not meet requests to redeem shares issued by the Fund without significant dilution of the remaining investors’ interests in the Fund. The Board of Trustees of The MainStay Funds (the "Board") previously approved the designation of New York Life Investment Management LLC as administrator of the Program (the “Administrator”). The Administrator has established a Liquidity Risk Management Committee to assist the Administrator in the implementation and day-to-day administration of the Program and to otherwise support the Administrator in fulfilling its responsibilities under the Program.
At a meeting of the Board held on February 27, 2024, the Administrator provided the Board with a written report addressing the Program’s operation and assessing the adequacy and effectiveness of its implementation for the period from January 1, 2023, through December 31, 2023 (the "Review Period"), as required under the Liquidity Rule. The report noted that the Administrator concluded that (i) the Program operated effectively to assess and manage the Fund's liquidity risk, (ii) the Program has been and continues to be adequately and effectively implemented to monitor and, as applicable, respond to the Fund's liquidity developments and (iii) the Fund's investment strategy continues to be appropriate for an open-end fund. In addition, the report summarized the operation of the Program and the information and factors considered by the Administrator in its assessment of the Program’s implementation, such as the liquidity risk assessment framework and the liquidity classification methodologies, and discussed notable geopolitical, market and other economic events that impacted liquidity risk during the Review Period.
In accordance with the Program, the Fund's liquidity risk is assessed no less frequently than annually taking into consideration certain factors, as applicable, such as (i) investment strategy and liquidity of portfolio investments, (ii) short-term and long-term cash flow projections, and (iii) holdings of cash and cash equivalents, as well as borrowing arrangements and other funding sources. Certain factors are considered under both normal and reasonably foreseeable stressed conditions.
Each Fund portfolio investment is classified into one of four liquidity categories. The classification is based on a determination of the number of days it is reasonably expected to take to convert the investment into cash, or sell or dispose of the investment, in current market conditions without significantly changing the market value of the investment. The Administrator has delegated liquidity classification determinations to the Fund's subadvisors, subject to appropriate oversight by the Administrator, and liquidity classification determinations are made by taking into account the Fund's reasonably anticipated trade size, various market, trading and investment-specific considerations, as well as market depth, and, in certain cases, third-party vendor data.
The Liquidity Rule requires funds that do not primarily hold assets that are highly liquid investments to adopt a minimum amount of net assets that must be invested in highly liquid investments that are assets (an “HLIM”). In addition, the Liquidity Rule limits a fund's investments in illiquid investments. Specifically, the Liquidity Rule prohibits acquisition of illiquid investments if, immediately after acquisition, doing so would result in a fund holding more than 15% of its net assets in illiquid investments that are assets. The Program includes provisions reasonably designed to determine, periodically review and comply with the HLIM requirement, as applicable, and to comply with the 15% limit on illiquid investments.
There can be no assurance that the Program will achieve its objectives under all circumstances in the future. Please refer to the Fund's prospectus for more information regarding the Fund's exposure to liquidity risk and other risks to which it may be subject.
| 58 | MainStay Income Builder Fund |
Proxy Voting Policies and Procedures and Proxy Voting Record
The Fund is required to file with the SEC its proxy voting record for the 12-month period ending June 30 on Form N-PX. A description of the policies and procedures that are used to vote proxies relating to portfolio securities of the Fund is available free of charge upon request by calling 800-624-6782 or visiting the SEC’s website at www.sec.gov. The most recent Form N-PX or proxy voting record is available free of charge upon request by calling 800-624-6782; visiting newyorklifeinvestments.com; or visiting the SEC’s website at www.sec.gov.
Shareholder Reports and Quarterly Portfolio Disclosure
The Fund is required to file its complete schedule of portfolio holdings with the SEC 60 days after its first and third fiscal quarter on Form N-PORT. The Fund's holdings report is available free of charge upon request by calling New York Life Investments at 800-624-6782.
This page intentionally left blank.
This page intentionally left blank.
This page intentionally left blank.
Equity
U.S. Equity
MainStay Epoch U.S. Equity Yield Fund
MainStay Fiera SMID Growth Fund
MainStay PineStone U.S. Equity Fund
MainStay S&P 500 Index Fund
MainStay Winslow Large Cap Growth Fund
MainStay WMC Enduring Capital Fund
MainStay WMC Growth Fund
MainStay WMC Small Companies Fund
MainStay WMC Value Fund
International Equity
MainStay Epoch International Choice Fund
MainStay PineStone International Equity Fund
MainStay WMC International Research Equity Fund
Emerging Markets Equity
MainStay Candriam Emerging Markets Equity Fund
Global Equity
MainStay Epoch Capital Growth Fund
MainStay Epoch Global Equity Yield Fund
MainStay PineStone Global Equity Fund
Fixed Income
Taxable Income
MainStay Candriam Emerging Markets Debt Fund
MainStay Floating Rate Fund
MainStay MacKay High Yield Corporate Bond Fund
MainStay MacKay Short Duration High Income Fund
MainStay MacKay Strategic Bond Fund
MainStay MacKay Total Return Bond Fund
MainStay MacKay U.S. Infrastructure Bond Fund
MainStay Short Term Bond Fund
Tax-Exempt Income
MainStay MacKay Arizona Muni Fund
MainStay MacKay California Tax Free Opportunities Fund1
MainStay MacKay Colorado Muni Fund
MainStay MacKay High Yield Municipal Bond Fund
MainStay MacKay New York Tax Free Opportunities Fund2
MainStay MacKay Oregon Muni Fund
MainStay MacKay Short Term Municipal Fund
MainStay MacKay Strategic Municipal Allocation Fund
MainStay MacKay Tax Free Bond Fund
MainStay MacKay Utah Muni Fund
Money Market
MainStay Money Market Fund
Mixed Asset
MainStay Balanced Fund
MainStay Income Builder Fund
MainStay MacKay Convertible Fund
Speciality
MainStay CBRE Global Infrastructure Fund
MainStay CBRE Real Estate Fund
MainStay Cushing MLP Premier Fund
Asset Allocation
MainStay Conservative Allocation Fund
MainStay Conservative ETF Allocation Fund
MainStay Equity Allocation Fund
MainStay Equity ETF Allocation Fund
MainStay Growth Allocation Fund
MainStay Growth ETF Allocation Fund
MainStay Moderate Allocation Fund
MainStay Moderate ETF Allocation Fund
Manager
New York Life Investment Management LLC
New York, New York
Subadvisors
Candriam3
Strassen, Luxembourg
CBRE Investment Management Listed Real Assets LLC
Radnor, Pennsylvania
Cushing Asset Management, LP
Dallas, Texas
Epoch Investment Partners, Inc.
New York, New York
Fiera Capital Inc.
New York, New York
IndexIQ Advisors LLC3
New York, New York
MacKay Shields LLC3
New York, New York
NYL Investors LLC3
New York, New York
PineStone Asset Management Inc.
Montreal, Québec
Wellington Management Company LLP
Boston, Massachusetts
Winslow Capital Management, LLC
Minneapolis, Minnesota
Legal Counsel
Dechert LLP
Washington, District of Columbia
Independent Registered Public Accounting Firm
KPMG LLP
Philadelphia, Pennsylvania
Distributor
NYLIFE Distributors LLC3
Jersey City, New Jersey
Custodian
JPMorgan Chase Bank, N.A.
New York, New York
1.
This Fund is registered for sale in AZ, CA, NV, OR, TX, UT, WA (all share classes); and MI (Class A and Class I shares only); and CO, FL, GA, HI, ID, MA, MD, NH, NJ and NY (Class I and Class C2 shares only).
| 2. | This Fund is registered for sale in CA, CT, DE, FL, MA, NJ, NY, VT (all share classes) and SD (Class R6 shares only). |
| 3. | An affiliate of New York Life Investment Management LLC. |
Not part of the Semiannual Report
For more information
800-624-6782
newyorklifeinvestments.com
“New York Life Investments” is both a service mark, and the common trade name, of certain investment advisors affiliated with New York Life Insurance Company. The MainStay Funds® are managed by New York Life Investment Management LLC and distributed by NYLIFE Distributors LLC, 30 Hudson Street, Jersey City, NJ 07302, a wholly owned subsidiary of New York Life Insurance Company. NYLIFE Distributors LLC is a Member FINRA/SIPC.
©2024 NYLIFE Distributors LLC. All rights reserved.
| 5013759 MS081-24 | MSIB10-06/24 |
(NYLIM) NL216
MainStay MacKay Convertible Fund
Message from the President and Semiannual Report
Unaudited | April 30, 2024
Special Notice:
Beginning in July 2024, new regulations issued by the Securities and Exchange Commission (SEC) will take effect requiring open-end mutual fund companies and ETFs to (1) overhaul the content of their shareholder reports and (2) mail paper copies of the new tailored shareholder reports to shareholders who have not opted to receive these documents electronically.
If you have not yet elected to receive your shareholder reports electronically, please contact your financial intermediary or visit newyorklifeinvestments.com/accounts.
| Not FDIC/NCUA Insured | Not a Deposit | May Lose Value | No Bank Guarantee | Not Insured by Any Government Agency |
This page intentionally left blank
Message from the President
Stock and bond markets gained broad ground during the six-month period ended April 30, 2024, bolstered by better-than-expected economic growth and the prospect of monetary easing in the face of a myriad of macroeconomic and geopolitical challenges.
Throughout the reporting period, interest rates remained at their highest levels in decades in most developed countries, with the U.S. federal funds rate in the 5.25%−5.50% range, as central banks struggled to bring inflation under control. Early in the reporting period, the U.S. Federal Reserve began to forecast interest rate cuts in 2024, but delayed action as inflation remained stubbornly high, fluctuating between 3.1% and 3.5%. Nevertheless, despite the increasing cost of capital and tighter lending environment that resulted from sustained high rates, economic growth remained surprisingly robust, supported by high levels of consumer spending, low unemployment and strong corporate earnings. Investors tended to shrug off concerns related to sticky inflation and high interest rates—not to mention the ongoing war in Ukraine, intensifying hostilities in the Middle East and simmering tensions between China and the United States—focusing instead on the positives of continued economic growth and surprisingly strong corporate profits.
The S&P 500® Index, a widely regarded benchmark of U.S. market performance, produced double-digit gains, reaching record levels in March 2024. Market strength, which had been narrowly focused on mega-cap, technology-related stocks during the previous six months broadened significantly during the reporting period. All industry sectors produced positive results, with the strongest returns in communication services, information technology and industrials, and more moderate gains in the lagging energy, real estate and consumer staples areas. Growth-oriented shares slightly outperformed value-oriented
issues, while large- and mid-cap stocks modestly outperformed their small-cap counterparts. Most overseas equity markets trailed the U.S. market, as developed international economies experienced relatively low growth rates, and weak economic conditions in China undermined emerging markets.
Bonds generally gained ground as well. The yield on the 10-year Treasury note ranged between approximately 4.7% and 3.8%, while the 2-year Treasury yield remained slightly higher, between approximately 5.0% and 4.1%, in an inverted curve pattern often viewed as indicative of an impending economic slowdown. Nevertheless, the prevailing environment of stable interest rates and attractive yields provided a favorable environment for fixed-income investors. Long-term Treasury bonds and investment-grade corporate bonds produced similar gains, while high yield bonds advanced by a slightly greater margin, despite the added risks implicit in an uptick in default rates. International bond markets modestly outperformed their U.S. counterparts, led by a rebound in the performance of emerging-markets debt.
The risks and uncertainties inherent in today’s markets call for the kind of insight and expertise that New York Life Investments offers through our one-on-one philosophy, long-lasting focus, and multi-boutique approach.
Thank you for trusting us to help you meet your investment needs.
Sincerely,
Kirk C. Lehneis
President
The opinions expressed are as of the date of this report and are subject to change. There is no guarantee that any forecast made will come to pass. This material does not constitute investment advice and is not intended as an endorsement of any specific investment. Past performance is no guarantee of future results.
Not part of the Semiannual Report
Investors should refer to the Fund’s Summary Prospectus and/or Prospectus and consider the Fund’s investment objectives, strategies, risks, charges and expenses carefully before investing. The Summary Prospectus and/or Prospectus contain this and other information about the Fund. You may obtain copies of the Fund’s Summary Prospectus, Prospectus and Statement of Additional Information, which includes information about The MainStay Funds' Trustees, free of charge, upon request, by calling toll-free 800-624-6782, by writing to NYLIFE Distributors LLC, Attn: MainStay Marketing Department, 30 Hudson Street, Jersey City, NJ 07302 or by sending an e-mail to MainStayShareholderServices@nylim.com. These documents are also available on dfinview.com/NYLIM. Please read the Fund’s Summary Prospectus and/or Prospectus carefully before investing.
Investment and Performance Comparison (Unaudited)
Performance data quoted represents past performance. Past performance is no guarantee of future results. Because of market volatility and other factors, current performance may be lower or higher than the figures shown. Investment return and principal value will fluctuate, and as a result, when shares are redeemed, they may be worth more or less than their original cost. The graph below depicts the historical performance of Class I shares of the Fund. Performance will vary from class to class based on differences in class-specific expenses and sales charges. For performance information current to the most recent month-end, please call 800-624-6782 or visit newyorklifeinvestments.com.
The performance table and graph do not reflect the deduction of taxes that a shareholder would pay on distributions or Fund share redemptions. Total returns reflect maximum applicable sales charges as indicated in the table below, if any, changes in share price, and reinvestment of dividend and capital gain distributions. The graph assumes the initial investment amount shown below and reflects the deduction of all sales charges that would have applied for the period of investment. Performance figures may reflect certain fee waivers and/or expense limitations, without which total returns may have been lower. For more information on share classes and current fee waivers and/or expense limitations (if any), please refer to the Notes to Financial Statements.

| Average Annual Total Returns for the Period-Ended April 30, 2024 |
| Class | Sales Charge | | Inception
Date | Six
Months1 | One
Year | Five
Years | Ten
Years | Gross
Expense
Ratio2 |
| Class A Shares | Maximum 5.50% Initial Sales Charge | With sales charges | 1/3/1995 | 2.58% | 2.11% | 7.21% | 7.43% | 0.95% |
| | | Excluding sales charges | | 8.55 | 8.05 | 8.43 | 8.04 | 0.95 |
| Investor Class Shares3 | Maximum 5.00% Initial Sales Charge | With sales charges | 2/28/2008 | 3.02 | 2.42 | 6.98 | 7.23 | 1.19 |
| | | Excluding sales charges | | 8.44 | 7.82 | 8.20 | 7.84 | 1.19 |
| Class B Shares4 | Maximum 5.00% CDSC | With sales charges | 5/1/1986 | 3.06 | 2.01 | 7.10 | 7.03 | 1.94 |
| | if Redeemed Within the First Six Years of Purchase | Excluding sales charges | | 8.06 | 7.01 | 7.40 | 7.03 | 1.94 |
| Class C Shares | Maximum 1.00% CDSC | With sales charges | 9/1/1998 | 7.08 | 6.02 | 7.40 | 7.04 | 1.94 |
| | if Redeemed Within One Year of Purchase | Excluding sales charges | | 8.08 | 7.02 | 7.40 | 7.04 | 1.94 |
| Class I Shares | No Sales Charge | | 11/28/2008 | 8.76 | 8.44 | 8.80 | 8.38 | 0.70 |
| 1. | Not annualized. |
| 2. | The gross expense ratios presented reflect the Fund’s “Total Annual Fund Operating Expenses” from the most recent Prospectus, as supplemented, and may differ from other expense ratios disclosed in this report. |
| 3. | Prior to June 30, 2020, the maximum initial sales charge was 5.50%, which is reflected in the applicable average annual total return figures shown. |
| 4. | Class B shares are closed to all new purchases as well as additional investments by existing Class B shareholders. |
The footnotes on the next page are an integral part of the table and graph and should be carefully read in conjunction with them.
| Benchmark Performance* | Six
Months1 | One
Year | Five
Years | Ten
Years |
| Bloomberg U.S. Aggregate Bond Index2 | 4.97% | -1.47% | -0.16% | 1.20% |
| ICE BofA U.S. Convertible Index3 | 10.22 | 8.98 | 8.92 | 8.32 |
| Morningstar Convertibles Category Average4 | 9.98 | 7.04 | 7.08 | 6.88 |
| * | Returns for indices reflect no deductions for fees, expenses or taxes, except for foreign withholding taxes where applicable. Results assume reinvestment of all dividends and capital gains. An investment cannot be made directly in an index. |
| 1. | Not annualized. |
| 2. | In accordance with new regulatory requirements, the Fund has selected the Bloomberg U.S. Aggregate Bond Index, which represents a broad measure of market performance, as a replacement for the ICE BofA U.S. Convertible Index. The Bloomberg U.S. Aggregate Bond Index is a broad-based benchmark that measures the investment grade, U.S. dollar-denominated, fixed-rate taxable bond market, including Treasuries, government-related and corporate securities, mortgage-backed securities (agency fixed-rate and hybrid adjustable rate mortgage pass-throughs), asset-backed securities and commercial mortgage-backed securities. |
| 3. | The ICE BofA U.S. Convertible Index, which is generally representative of the market sectors or types of investments in which the Fund invests, is a market-capitalization weighted index of domestic corporate convertible securities. In order to be included in the ICE BofA U.S. Convertible Index, bonds and preferred stocks must be convertible only to common stock. |
| 4. | The Morningstar Convertibles Category Average is representative of funds that are designed to offer some of the capital-appreciation potential of stock funds while also supplying some of the safety and yield of bond funds. Results are based on average total returns of similar funds with all dividends and capital gain distributions reinvested. |
The footnotes on the preceding page are an integral part of the table and graph and should be carefully read in conjunction with them.
| 6 | MainStay MacKay Convertible Fund |
Cost in Dollars of a $1,000 Investment in MainStay MacKay Convertible Fund (Unaudited)
The example below is intended to describe the fees and expenses borne by shareholders during the six-month period from November 1, 2023 to April 30, 2024, and the impact of those costs on your investment.
Example
As a shareholder of the Fund you incur two types of costs: (1) transaction costs, including exchange fees and sales charges (loads) on purchases (as applicable), and (2) ongoing costs, including management fees, distribution and/or service (12b-1) fees and other Fund expenses (as applicable). This example is intended to help you understand your ongoing costs (in dollars) of investing in the Fund and to compare these costs with the ongoing costs of investing in other mutual funds. The example is based on an investment of $1,000 made at the beginning of the six-month period and held for the entire period from November 1, 2023 to April 30, 2024.
This example illustrates your Fund’s ongoing costs in two ways:
Actual Expenses
The second and third data columns in the table below provide information about actual account values and actual expenses. You may use the information in these columns, together with the amount you invested, to estimate the expenses that you paid during the six months ended April 30, 2024. Simply divide your account value by $1,000 (for example, an $8,600 account value divided by $1,000 = 8.6), then multiply the
result by the number under the heading entitled “Expenses Paid During Period” to estimate the expenses you paid on your account during this period.
Hypothetical Example for Comparison Purposes
The fourth and fifth data columns in the table below provide information about hypothetical account values and hypothetical expenses based on the Fund’s actual expense ratio and an assumed rate of return of 5% per year before expenses, which is not the Fund’s actual return. The hypothetical account values and expenses may not be used to estimate the actual ending account balances or expenses you paid for the six-month period shown. You may use this information to compare the ongoing costs of investing in the Fund with the ongoing costs of investing in other mutual funds. To do so, compare this 5% hypothetical example with the 5% hypothetical examples that appear in the shareholder reports of the other mutual funds.
Please note that the expenses shown in the table are meant to highlight your ongoing costs only and do not reflect any transactional costs, such as exchange fees or sales charges (loads). Therefore, the fourth and fifth data columns of the table are useful in comparing ongoing costs only and will not help you determine the relative total costs of owning different funds. In addition, if these transactional costs were included, your costs would have been higher.
| Share Class | Beginning
Account
Value
11/1/23 | Ending Account
Value (Based
on Actual
Returns and
Expenses)
4/30/24 | Expenses
Paid
During
Period1 | Ending Account
Value (Based
on Hypothetical
5% Annualized
Return and
Actual Expenses)
4/30/24 | Expenses
Paid
During
Period1 | Net Expense
Ratio
During
Period2 |
| Class A Shares | $1,000.00 | $1,085.50 | $4.87 | $1,020.19 | $4.72 | 0.94% |
| Investor Class Shares | $1,000.00 | $1,084.40 | $6.12 | $1,019.00 | $5.92 | 1.18% |
| Class B Shares | $1,000.00 | $1,080.60 | $9.98 | $1,015.27 | $9.67 | 1.93% |
| Class C Shares | $1,000.00 | $1,080.80 | $9.98 | $1,015.27 | $9.67 | 1.93% |
| Class I Shares | $1,000.00 | $1,087.60 | $3.17 | $1,021.83 | $3.07 | 0.61% |
| 1. | Expenses are equal to the Fund’s annualized expense ratio of each class multiplied by the average account value over the period, divided by 366 and multiplied by 182 (to reflect the six-month period). The table above represents the actual expenses incurred during the six-month period. In addition to the fees and expenses which the Fund bears directly, it also indirectly bears a pro rata share of the fees and expenses of the underlying funds in which it invests. Such indirect expenses are not included in the above-reported expense figures. |
| 2. | Expenses are equal to the Fund's annualized expense ratio to reflect the six-month period. |
Portfolio Composition as of April 30, 2024 (Unaudited)
See Portfolio of Investments beginning on page 9 for specific holdings within these categories. The Fund's holdings are subject to change.
Top Ten Holdings and/or Issuers Held as of April 30, 2024 (excluding short-term investments) (Unaudited)
| 1. | Pioneer Natural Resources Co., 0.25%, due 5/15/25 |
| 2. | Microchip Technology, Inc., 0.125%, due 11/15/24 |
| 3. | Nice Ltd., (zero coupon), due 9/15/25 |
| 4. | NRG Energy, Inc., 2.75%, due 6/1/48 |
| 5. | BioMarin Pharmaceutical, Inc., 1.25%, due 5/15/27 |
| 6. | Tetra Tech, Inc., 2.25%, due 8/15/28 |
| 7. | Exact Sciences Corp., 1.75%, due 4/15/31 |
| 8. | Ford Motor Co., (zero coupon), due 3/15/26 |
| 9. | Palo Alto Networks, Inc., 0.375%, due 6/1/25 |
| 10. | Southwest Airlines Co., 1.25%, due 5/1/25 |
| 8 | MainStay MacKay Convertible Fund |
Portfolio of Investments April 30, 2024†^(Unaudited)
| | Principal
Amount | Value |
| Long-Term Bonds 0.6% |
| Corporate Bond 0.6% |
| Hotels, Restaurants & Leisure 0.6% |
| NCL Corp. Ltd. | | |
| 5.375%, due 8/1/25 | $ 7,547,000 | $ 9,260,169 |
Total Long-Term Bonds
(Cost $8,053,977) | | 9,260,169 |
| |
| Convertible Securities 96.4% |
| Convertible Bonds 91.7% |
| Automobile Components 1.2% |
| Patrick Industries, Inc. | | |
| 1.75%, due 12/1/28 | 16,362,000 | 19,275,663 |
| Automobiles 2.1% |
| Ford Motor Co. | | |
| (zero coupon), due 3/15/26 | 27,838,000 | 27,824,081 |
| Rivian Automotive, Inc. | | |
| 4.625%, due 3/15/29 | 7,336,000 | 5,017,824 |
| | | 32,841,905 |
| Beverages 1.3% |
| MGP Ingredients, Inc. | | |
| 1.875%, due 11/15/41 | 19,959,000 | 20,692,648 |
| Biotechnology 7.5% |
| Alnylam Pharmaceuticals, Inc. | | |
| 1.00%, due 9/15/27 | 5,460,000 | 5,024,838 |
| BioMarin Pharmaceutical, Inc. | | |
| 1.25%, due 5/15/27 (a) | 33,561,000 | 32,831,048 |
| Bridgebio Pharma, Inc. | | |
| 2.25%, due 2/1/29 | 8,746,000 | 6,887,475 |
| Exact Sciences Corp. | | |
| 1.75%, due 4/15/31 (b) | 30,763,000 | 28,209,671 |
| Halozyme Therapeutics, Inc. | | |
| 1.00%, due 8/15/28 | 17,827,000 | 16,810,861 |
| Ionis Pharmaceuticals, Inc. | | |
| (zero coupon), due 4/1/26 | 11,988,000 | 11,587,686 |
| Mirum Pharmaceuticals, Inc. | | |
| 4.00%, due 5/1/29 (b) | 13,892,000 | 15,678,216 |
| | | 117,029,795 |
| Broadline Retail 1.3% |
| Etsy, Inc. | | |
| 0.25%, due 6/15/28 | 25,139,000 | 19,822,101 |
| | Principal
Amount | Value |
| |
| Commercial Services & Supplies 1.9% |
| Tetra Tech, Inc. | | |
| 2.25%, due 8/15/28 (b) | $ 26,609,000 | $ 30,175,936 |
| Communications Equipment 1.9% |
| Infinera Corp. | | |
| 2.50%, due 3/1/27 | 7,050,000 | 6,615,761 |
| Lumentum Holdings, Inc. | | |
| 0.50%, due 12/15/26 | 25,385,000 | 22,350,750 |
| | | 28,966,511 |
| Consumer Staples Distribution & Retail 1.0% |
| Chefs' Warehouse, Inc. (The) | | |
| 2.375%, due 12/15/28 | 15,112,000 | 15,495,513 |
| Electric Utilities 3.8% |
| NRG Energy, Inc. | | |
| 2.75%, due 6/1/48 | 19,326,000 | 34,641,855 |
| PG&E Corp. | | |
| 4.25%, due 12/1/27 (b) | 24,558,000 | 24,625,534 |
| | | 59,267,389 |
| Electrical Equipment 0.4% |
| Array Technologies, Inc. | | |
| 1.00%, due 12/1/28 | 7,636,000 | 6,511,599 |
| Electronic Equipment, Instruments & Components 1.2% |
| Advanced Energy Industries, Inc. | | |
| 2.50%, due 9/15/28 (b) | 18,209,000 | 18,086,544 |
| Energy Equipment & Services 1.3% |
| Oil States International, Inc. | | |
| 4.75%, due 4/1/26 | 20,837,000 | 19,440,921 |
| Entertainment 3.0% |
| Liberty Media Corp. | | |
| 2.25%, due 8/15/27 | 13,561,000 | 14,138,471 |
| 3.75%, due 3/15/28 | 13,850,000 | 14,944,150 |
| Live Nation Entertainment, Inc. | | |
| 3.125%, due 1/15/29 (a) | 16,065,000 | 17,485,146 |
| | | 46,567,767 |
| Financial Services 3.8% |
| Block, Inc. | | |
| 0.125%, due 3/1/25 | 19,416,000 | 19,279,117 |
| Euronet Worldwide, Inc. | | |
| 0.75%, due 3/15/49 (a) | 11,900,000 | 11,584,650 |
The notes to the financial statements are an integral part of, and should be read in conjunction with, the financial statements.
9
Portfolio of Investments April 30, 2024†^(Unaudited) (continued)
| | Principal
Amount | Value |
| Convertible Bonds (continued) |
| Financial Services (continued) |
| Global Payments, Inc. | | |
| 1.50%, due 3/1/31 (b) | $ 12,415,000 | $ 12,402,585 |
| Shift4 Payments, Inc. | | |
| (zero coupon), due 12/15/25 | 14,428,000 | 14,924,323 |
| | | 58,190,675 |
| Food Products 1.1% |
| Post Holdings, Inc. | | |
| 2.50%, due 8/15/27 | 14,839,000 | 16,634,519 |
| Ground Transportation 1.3% |
| Uber Technologies, Inc. | | |
| Series 2028 | | |
| 0.875%, due 12/1/28 (b) | 17,288,000 | 19,423,068 |
| Health Care Equipment & Supplies 13.3% |
| CONMED Corp. | | |
| 2.25%, due 6/15/27 | 23,095,000 | 20,388,266 |
| DexCom, Inc. | | |
| 0.25%, due 11/15/25 | 16,375,000 | 17,205,529 |
| Envista Holdings Corp. | | |
| 1.75%, due 8/15/28 (b) | 13,795,000 | 11,777,481 |
| Haemonetics Corp. | | |
| (zero coupon), due 3/1/26 | 9,226,000 | 8,467,623 |
| Integer Holdings Corp. | | |
| 2.125%, due 2/15/28 | 17,324,000 | 24,166,980 |
| Integra LifeSciences Holdings Corp. | | |
| 0.50%, due 8/15/25 | 8,670,000 | 8,121,623 |
| iRhythm Technologies, Inc. | | |
| 1.50%, due 9/1/29 (b) | 3,615,000 | 3,676,455 |
| Lantheus Holdings, Inc. | | |
| 2.625%, due 12/15/27 | 23,906,000 | 27,044,872 |
| Merit Medical Systems, Inc. | | |
| 3.00%, due 2/1/29 (b) | 23,436,000 | 25,193,700 |
| NuVasive, Inc. | | |
| 0.375%, due 3/15/25 | 8,085,000 | 7,719,154 |
| Omnicell, Inc. | | |
| 0.25%, due 9/15/25 | 9,388,000 | 8,812,985 |
| Shockwave Medical, Inc. | | |
| 1.00%, due 8/15/28 (b) | 13,928,000 | 17,718,834 |
| TransMedics Group, Inc. | | |
| 1.50%, due 6/1/28 (b) | 21,226,000 | 26,559,033 |
| | | 206,852,535 |
| Health Care Technology 0.6% |
| Teladoc Health, Inc. | | |
| 1.25%, due 6/1/27 | 11,764,000 | 9,925,287 |
| | Principal
Amount | Value |
| |
| Hotel & Resort REITs 0.7% |
| Summit Hotel Properties, Inc. | | |
| 1.50%, due 2/15/26 | $ 12,566,000 | $ 11,045,514 |
| Hotels, Restaurants & Leisure 6.3% |
| Booking Holdings, Inc. | | |
| 0.75%, due 5/1/25 | 10,000,000 | 18,394,000 |
| Carnival Corp. | | |
| 5.75%, due 12/1/27 | 16,225,000 | 22,877,250 |
| Cheesecake Factory, Inc. (The) | | |
| 0.375%, due 6/15/26 | 9,208,000 | 8,135,113 |
| Expedia Group, Inc. | | |
| (zero coupon), due 2/15/26 | 2,822,000 | 2,606,214 |
| Marriott Vacations Worldwide Corp. | | |
| (zero coupon), due 1/15/26 | 3,110,000 | 2,894,788 |
| NCL Corp. Ltd. | | |
| 6.00%, due 5/15/24 | 2,849,000 | 3,933,329 |
| Royal Caribbean Cruises Ltd. | | |
| 6.00%, due 8/15/25 | 3,620,000 | 10,332,838 |
| Sabre GLBL, Inc. | | |
| 4.00%, due 4/15/25 | 1,835,000 | 1,739,580 |
| Vail Resorts, Inc. | | |
| (zero coupon), due 1/1/26 | 28,521,000 | 26,025,413 |
| | | 96,938,525 |
| Interactive Media & Services 2.2% |
| Match Group Financeco 2, Inc. | | |
| 0.875%, due 6/15/26 (b) | 12,450,000 | 11,233,635 |
| Snap, Inc. | | |
| (zero coupon), due 5/1/27 | 10,018,000 | 8,169,679 |
| 0.125%, due 3/1/28 | 12,073,000 | 9,483,341 |
| Ziff Davis, Inc. | | |
| 1.75%, due 11/1/26 | 5,220,000 | 4,746,938 |
| | | 33,633,593 |
| IT Services 2.3% |
| Akamai Technologies, Inc. | | |
| 0.375%, due 9/1/27 | 16,800,000 | 17,127,600 |
| MongoDB, Inc. | | |
| 0.25%, due 1/15/26 | 7,075,000 | 12,579,081 |
| Okta, Inc. | | |
| 0.125%, due 9/1/25 | 5,611,000 | 5,316,422 |
| | | 35,023,103 |
| Machinery 0.6% |
| Greenbrier Cos., Inc. (The) | | |
| 2.875%, due 4/15/28 | 8,991,000 | 9,676,564 |
The notes to the financial statements are an integral part of, and should be read in conjunction with, the financial statements.
| 10 | MainStay MacKay Convertible Fund |
| | Principal
Amount | Value |
| Convertible Bonds (continued) |
| Media 0.6% |
| Liberty Broadband Corp. | | |
| 3.125%, due 3/31/53 (b) | $ 9,263,000 | $ 8,650,716 |
| Oil, Gas & Consumable Fuels 5.1% |
| Kosmos Energy Ltd. | | |
| 3.125%, due 3/15/30 (b) | 8,776,000 | 9,326,694 |
| Northern Oil & Gas, Inc. | | |
| 3.625%, due 4/15/29 | 6,400,000 | 7,917,120 |
| Permian Resources Operating LLC | | |
| 3.25%, due 4/1/28 | 6,937,000 | 19,678,104 |
| Pioneer Natural Resources Co. | | |
| 0.25%, due 5/15/25 | 14,549,000 | 42,697,678 |
| | | 79,619,596 |
| Passenger Airlines 2.2% |
| American Airlines Group, Inc. | | |
| 6.50%, due 7/1/25 | 7,040,000 | 7,697,586 |
| Southwest Airlines Co. | | |
| 1.25%, due 5/1/25 | 27,566,000 | 27,118,052 |
| | | 34,815,638 |
| Pharmaceuticals 2.1% |
| Amphastar Pharmaceuticals, Inc. | | |
| 2.00%, due 3/15/29 (b) | 17,252,000 | 16,737,890 |
| Pacira BioSciences, Inc. | | |
| 0.75%, due 8/1/25 | 16,524,000 | 15,635,835 |
| | | 32,373,725 |
| Professional Services 0.2% |
| Parsons Corp. | | |
| 2.625%, due 3/1/29 (b) | 3,638,000 | 3,818,081 |
| Real Estate Management & Development 1.1% |
| Zillow Group, Inc. | | |
| 2.75%, due 5/15/25 (a) | 16,626,000 | 16,892,016 |
| Semiconductors & Semiconductor Equipment 5.6% |
| Enphase Energy, Inc. | | |
| (zero coupon), due 3/1/26 | 15,816,000 | 14,325,097 |
| Impinj, Inc. | | |
| 1.125%, due 5/15/27 | 4,665,000 | 7,345,975 |
| Microchip Technology, Inc. | | |
| 0.125%, due 11/15/24 (a) | 33,300,000 | 35,964,000 |
| ON Semiconductor Corp. | | |
| 0.50%, due 3/1/29 | 23,069,000 | 22,348,094 |
| | Principal
Amount | Value |
| |
| Semiconductors & Semiconductor Equipment (continued) |
| SolarEdge Technologies, Inc. | | |
| (zero coupon), due 9/15/25 | $ 7,790,000 | $ 7,115,951 |
| | | 87,099,117 |
| Software 11.8% |
| Bentley Systems, Inc. | | |
| 0.125%, due 1/15/26 | 3,570,000 | 3,627,120 |
| BILL Holdings, Inc. | | |
| (zero coupon), due 12/1/25 | 4,680,000 | 4,326,660 |
| Datadog, Inc. | | |
| 0.125%, due 6/15/25 | 9,636,000 | 13,784,298 |
| Dropbox, Inc. | | |
| (zero coupon), due 3/1/28 | 11,036,000 | 10,105,494 |
| Envestnet, Inc. | | |
| 2.625%, due 12/1/27 (a) | 14,212,000 | 15,242,370 |
| Five9, Inc. | | |
| 1.00%, due 3/15/29 (b) | 5,835,000 | 5,775,191 |
| InterDigital, Inc. | | |
| 2.00%, due 6/1/24 | 4,500,000 | 5,464,688 |
| Model N, Inc. | | |
| 1.875%, due 3/15/28 | 9,055,000 | 8,868,724 |
| Nice Ltd. | | |
| (zero coupon), due 9/15/25 | 35,830,000 | 35,615,020 |
| Nutanix, Inc. | | |
| 0.25%, due 10/1/27 | 12,677,000 | 15,364,524 |
| Palo Alto Networks, Inc. | | |
| 0.375%, due 6/1/25 | 9,385,000 | 27,474,587 |
| Progress Software Corp. | | |
| 3.50%, due 3/1/30 (b) | 3,590,000 | 3,503,840 |
| Q2 Holdings, Inc. | | |
| 0.75%, due 6/1/26 | 4,395,000 | 4,129,982 |
| Rapid7, Inc. | | |
| 1.25%, due 3/15/29 (b) | 6,025,000 | 5,855,095 |
| Vertex, Inc. | | |
| 0.75%, due 5/1/29 (b) | 4,856,000 | 5,093,944 |
| Workiva, Inc. | | |
| 1.25%, due 8/15/28 (b) | 7,850,000 | 7,057,150 |
| Zscaler, Inc. | | |
| 0.125%, due 7/1/25 | 8,613,000 | 10,947,123 |
| | | 182,235,810 |
| Specialty Retail 0.7% |
| Burlington Stores, Inc. | | |
| 1.25%, due 12/15/27 (b) | 9,505,000 | 10,374,708 |
| Technology Hardware, Storage & Peripherals 2.2% |
| Seagate HDD Cayman | | |
| 3.50%, due 6/1/28 (b) | 13,575,000 | 16,303,575 |
The notes to the financial statements are an integral part of, and should be read in conjunction with, the financial statements.
11
Portfolio of Investments April 30, 2024†^(Unaudited) (continued)
| | Principal
Amount | Value |
| Convertible Bonds (continued) |
| Technology Hardware, Storage & Peripherals (continued) |
| Super Micro Computer, Inc. | | |
| (zero coupon), due 3/1/29 (b) | $ 7,906,000 | $ 8,087,838 |
| Western Digital Corp. | | |
| 3.00%, due 11/15/28 (b) | 6,875,000 | 10,401,875 |
| | | 34,793,288 |
Total Convertible Bonds
(Cost $1,362,640,071) | | 1,422,190,370 |
| |
| | Shares | |
| |
| Convertible Preferred Stocks 4.7% |
| Banks 1.8% |
| Bank of America Corp. | |
| Series L | | |
| 7.25% (c) | 12,072 | 13,882,800 |
| Wells Fargo & Co. | |
| Series L | | |
| 7.50% (c) | 11,552 | 13,232,123 |
| | | 27,114,923 |
| Electric Utilities 1.2% |
| NextEra Energy, Inc. | |
| 6.926% | 450,000 | 18,337,500 |
| Financial Services 1.1% |
| Apollo Global Management, Inc. | |
| 6.75% | 289,050 | 17,626,269 |
| Machinery 0.6% |
| Chart Industries, Inc. | |
| Series B | | |
| 6.75% | 163,900 | 9,417,694 |
Total Convertible Preferred Stocks
(Cost $73,868,842) | | 72,496,386 |
Total Convertible Securities
(Cost $1,436,508,913) | | 1,494,686,756 |
| Common Stocks 1.4% |
| Life Sciences Tools & Services 1.1% |
| Danaher Corp. | 73,404 | 18,102,894 |
| Oil, Gas & Consumable Fuels 0.3% |
| Kosmos Energy Ltd. (d) | 731,525 | 4,147,747 |
Total Common Stocks
(Cost $23,439,525) | | 22,250,641 |
| | Shares | | Value |
| Short-Term Investments 5.9% |
| Affiliated Investment Company 2.1% |
| MainStay U.S. Government Liquidity Fund, 5.242% (e) | 33,156,122 | | $ 33,156,122 |
| Unaffiliated Investment Companies 3.8% |
| BlackRock Liquidity FedFund, 5.303% (e)(f) | 10,000,000 | | 10,000,000 |
| Dreyfus Treasury Obligations Cash Management Fund, 5.327% (e)(f) | 10,000,000 | | 10,000,000 |
| Fidelity Government Portfolio, 5.296% (e)(f) | 15,000,000 | | 15,000,000 |
| Invesco Government & Agency Portfolio, 5.309% (e)(f) | 4,675,067 | | 4,675,067 |
| Morgan Stanley Institutional Liquidity Fund Government Portfolio, 5.321% (e)(f) | 10,000,000 | | 10,000,000 |
| RBC U.S. Government Money Market Fund, 5.297% (e)(f) | 2,000,000 | | 2,000,000 |
| State Street Institutional U.S. Government Money Market Fund, 5.308% (e)(f) | 5,000,000 | | 5,000,000 |
| Wells Fargo Government Money Market Fund, 5.30% (e)(f) | 2,000,000 | | 2,000,000 |
| | | | 58,675,067 |
Total Short-Term Investments
(Cost $91,831,189) | | | 91,831,189 |
Total Investments
(Cost $1,559,833,604) | 104.3% | | 1,618,028,755 |
| Other Assets, Less Liabilities | (4.3) | | (66,653,869) |
| Net Assets | 100.0% | | $ 1,551,374,886 |
| † | Percentages indicated are based on Fund net assets. |
| ^ | Industry classifications may be different than those used for compliance monitoring purposes. |
| (a) | All or a portion of this security was held on loan. As of April 30, 2024, the aggregate market value of securities on loan was $56,925,532. The Fund received cash collateral with a value of $58,675,067. (See Note 2(G)) |
| (b) | May be sold to institutional investors only under Rule 144A or securities offered pursuant to Section 4(a)(2) of the Securities Act of 1933, as amended. |
| (c) | Security is perpetual and, thus, does not have a predetermined maturity date. The date shown, if applicable, reflects the next call date. |
| (d) | Non-income producing security. |
| (e) | Current yield as of April 30, 2024. |
The notes to the financial statements are an integral part of, and should be read in conjunction with, the financial statements.
| 12 | MainStay MacKay Convertible Fund |
| (f) | Represents a security purchased with cash collateral received for securities on loan. |
Investments in Affiliates (in 000's)
Investments in issuers considered to be affiliate(s) of the Fund during the six-month period ended April 30, 2024 for purposes of Section 2(a)(3) of the Investment Company Act of 1940, as amended, were as follows:
| Affiliated Investment Companies | Value,
Beginning
of Period | Purchases
at Cost | Proceeds
from
Sales | Net
Realized
Gain/(Loss)
on Sales | Change in
Unrealized
Appreciation/
(Depreciation) | Value,
End of
Period | Dividend
Income | Other
Distributions | Shares
End of
Period |
| MainStay U.S. Government Liquidity Fund | $ 121,939 | $ 216,371 | $ (305,154) | $ — | $ — | $ 33,156 | $ 1,893 | $ — | 33,156 |
| Abbreviation(s): |
| REIT—Real Estate Investment Trust |
The following is a summary of the fair valuations according to the inputs used as of April 30, 2024, for valuing the Fund’s assets:
| Description | Quoted
Prices in
Active
Markets for
Identical
Assets
(Level 1) | | Significant
Other
Observable
Inputs
(Level 2) | | Significant
Unobservable
Inputs
(Level 3) | | Total |
| Asset Valuation Inputs | | | | | | | |
| Investments in Securities (a) | | | | | | | |
| Long-Term Bonds | | | | | | | |
| Corporate Bond | $ — | | $ 9,260,169 | | $ — | | $ 9,260,169 |
| Total Corporate Bond | — | | 9,260,169 | | — | | 9,260,169 |
| Convertible Securities | | | | | | | |
| Convertible Bonds | — | | 1,422,190,370 | | — | | 1,422,190,370 |
| Convertible Preferred Stocks | 72,496,386 | | — | | — | | 72,496,386 |
| Total Convertible Securities | 72,496,386 | | 1,422,190,370 | | — | | 1,494,686,756 |
| Common Stocks | 22,250,641 | | — | | — | | 22,250,641 |
| Short-Term Investments | | | | | | | |
| Affiliated Investment Company | 33,156,122 | | — | | — | | 33,156,122 |
| Unaffiliated Investment Companies | 58,675,067 | | — | | — | | 58,675,067 |
| Total Short-Term Investments | 91,831,189 | | — | | — | | 91,831,189 |
| Total Investments in Securities | $ 186,578,216 | | $ 1,431,450,539 | | $ — | | $ 1,618,028,755 |
| (a) | For a complete listing of investments and their industries, see the Portfolio of Investments. |
The notes to the financial statements are an integral part of, and should be read in conjunction with, the financial statements.
13
Statement of Assets and Liabilities as of April 30, 2024 (Unaudited)
| Assets |
Investment in unaffiliated securities, at value
(identified cost $1,526,677,482) including securities on loan of $56,925,532 | $1,584,872,633 |
Investment in affiliated investment companies, at value
(identified cost $33,156,122) | 33,156,122 |
| Cash | 13,630 |
| Receivables: | |
| Investment securities sold | 15,125,885 |
| Dividends and interest | 5,873,144 |
| Fund shares sold | 1,092,384 |
| Securities lending | 104,708 |
| Other assets | 83,890 |
| Total assets | 1,640,322,396 |
| Liabilities |
| Cash collateral received for securities on loan | 58,675,067 |
| Payables: | |
| Investment securities purchased | 28,078,326 |
| Fund shares redeemed | 973,838 |
| Manager (See Note 3) | 648,075 |
| Transfer agent (See Note 3) | 327,360 |
| NYLIFE Distributors (See Note 3) | 170,018 |
| Professional fees | 58,772 |
| Custodian | 14,068 |
| Trustees | 398 |
| Accrued expenses | 1,588 |
| Total liabilities | 88,947,510 |
| Net assets | $1,551,374,886 |
| Composition of Net Assets |
| Shares of beneficial interest outstanding (par value of $.01 per share) unlimited number of shares authorized | $ 858,959 |
| Additional paid-in-capital | 1,460,874,730 |
| | 1,461,733,689 |
| Total distributable earnings (loss) | 89,641,197 |
| Net assets | $1,551,374,886 |
| Class A | |
| Net assets applicable to outstanding shares | $653,748,402 |
| Shares of beneficial interest outstanding | 36,230,545 |
| Net asset value per share outstanding | $ 18.04 |
| Maximum sales charge (5.50% of offering price) | 1.05 |
| Maximum offering price per share outstanding | $ 19.09 |
| Investor Class | |
| Net assets applicable to outstanding shares | $ 40,426,294 |
| Shares of beneficial interest outstanding | 2,241,773 |
| Net asset value per share outstanding | $ 18.03 |
| Maximum sales charge (5.00% of offering price) | 0.95 |
| Maximum offering price per share outstanding | $ 18.98 |
| Class B | |
| Net assets applicable to outstanding shares | $ 1,826,214 |
| Shares of beneficial interest outstanding | 104,191 |
| Net asset value and offering price per share outstanding | $ 17.53 |
| Class C | |
| Net assets applicable to outstanding shares | $ 29,282,450 |
| Shares of beneficial interest outstanding | 1,673,532 |
| Net asset value and offering price per share outstanding | $ 17.50 |
| Class I | |
| Net assets applicable to outstanding shares | $826,091,526 |
| Shares of beneficial interest outstanding | 45,645,903 |
| Net asset value and offering price per share outstanding | $ 18.10 |
The notes to the financial statements are an integral part of, and should be read in conjunction with, the financial statements.
| 14 | MainStay MacKay Convertible Fund |
Statement of Operations for the six months ended April 30, 2024 (Unaudited)
| Investment Income (Loss) |
| Income | |
| Interest | $ 9,606,154 |
| Dividends-unaffiliated | 2,784,309 |
| Dividends-affiliated | 1,892,592 |
| Securities lending, net | 721,990 |
| Total income | 15,005,045 |
| Expenses | |
| Manager (See Note 3) | 4,268,832 |
| Distribution/Service—Class A (See Note 3) | 832,162 |
| Distribution/Service—Investor Class (See Note 3) | 51,081 |
| Distribution/Service—Class B (See Note 3) | 12,255 |
| Distribution/Service—Class C (See Note 3) | 152,568 |
| Transfer agent (See Note 3) | 960,569 |
| Professional fees | 87,526 |
| Registration | 47,778 |
| Shareholder communication | 29,636 |
| Trustees | 19,905 |
| Custodian | 17,282 |
| Miscellaneous | 33,930 |
| Total expenses before waiver/reimbursement | 6,513,524 |
| Expense waiver/reimbursement from Manager (See Note 3) | (328,676) |
| Net expenses | 6,184,848 |
| Net investment income (loss) | 8,820,197 |
| Realized and Unrealized Gain (Loss) |
| Net realized gain (loss) on unaffiliated investments | 54,049,851 |
| Net change in unrealized appreciation (depreciation) on unaffiliated investments | 66,880,983 |
| Net realized and unrealized gain (loss) | 120,930,834 |
| Net increase (decrease) in net assets resulting from operations | $129,751,031 |
The notes to the financial statements are an integral part of, and should be read in conjunction with, the financial statements.
15
Statements of Changes in Net Assets
for the six months ended April 30, 2024 (Unaudited) and the year ended October 31, 2023
| | Six months
ended
April 30,
2024 | Year
ended
October 31,
2023 |
| Increase (Decrease) in Net Assets |
| Operations: | | |
| Net investment income (loss) | $ 8,820,197 | $ 18,793,748 |
| Net realized gain (loss) | 54,049,851 | 37,264,047 |
| Net change in unrealized appreciation (depreciation) | 66,880,983 | (77,962,200) |
| Net increase (decrease) in net assets resulting from operations | 129,751,031 | (21,904,405) |
| Distributions to shareholders: | | |
| Class A | (23,629,062) | (28,543,013) |
| Investor Class | (1,413,517) | (1,663,727) |
| Class B | (83,449) | (165,522) |
| Class C | (1,011,385) | (1,214,881) |
| Class I | (29,988,601) | (36,064,849) |
| Total distributions to shareholders | (56,126,014) | (67,651,992) |
| Capital share transactions: | | |
| Net proceeds from sales of shares | 183,945,256 | 347,611,752 |
| Net asset value of shares issued to shareholders in reinvestment of distributions | 52,622,085 | 63,333,222 |
| Cost of shares redeemed | (278,848,609) | (426,265,819) |
| Increase (decrease) in net assets derived from capital share transactions | (42,281,268) | (15,320,845) |
| Net increase (decrease) in net assets | 31,343,749 | (104,877,242) |
| Net Assets |
| Beginning of period | 1,520,031,137 | 1,624,908,379 |
| End of period | $1,551,374,886 | $1,520,031,137 |
The notes to the financial statements are an integral part of, and should be read in conjunction with, the financial statements.
| 16 | MainStay MacKay Convertible Fund |
Financial Highlights selected per share data and ratios
| | Six months ended
April 30,
2024* | | Year Ended October 31, |
| Class A | 2023 | | 2022 | | 2021 | | 2020 | | 2019 |
| Net asset value at beginning of period | $ 17.21 | | $ 18.22 | | $ 25.40 | | $ 20.90 | | $ 17.81 | | $ 17.07 |
| Net investment income (loss) (a) | 0.09 | | 0.18 | | 0.07 | | 0.05 | | 0.06 | | 0.12 |
| Net realized and unrealized gain (loss) | 1.38 | | (0.45) | | (2.50) | | 6.01 | | 3.47 | | 1.60 |
| Total from investment operations | 1.47 | | (0.27) | | (2.43) | | 6.06 | | 3.53 | | 1.72 |
| Less distributions: | | | | | | | | | | | |
| From net investment income | (0.64) | | (0.29) | | (0.26) | | (0.13) | | (0.13) | | (0.15) |
| From net realized gain on investments | — | | (0.45) | | (4.49) | | (1.43) | | (0.31) | | (0.83) |
| Total distributions | (0.64) | | (0.74) | | (4.75) | | (1.56) | | (0.44) | | (0.98) |
| Net asset value at end of period | $ 18.04 | | $ 17.21 | | $ 18.22 | | $ 25.40 | | $ 20.90 | | $ 17.81 |
| Total investment return (b) | 8.55% | | (1.54)% | | (11.12)% | | 30.06% | | 20.27% | | 10.75% |
| Ratios (to average net assets)/Supplemental Data: | | | | | | | | | | | |
| Net investment income (loss) | 0.99%†† | | 1.03% | | 0.37% | | 0.19% | | 0.33% | | 0.67% |
| Net expenses (c) | 0.94%†† | | 0.94% | | 0.93% | | 0.91% | | 0.96% | | 0.98% |
| Portfolio turnover rate | 18% | | 33% | | 14% | | 49% | | 46% | | 23% |
| Net assets at end of period (in 000’s) | $ 653,748 | | $ 643,975 | | $ 710,774 | | $ 891,433 | | $ 657,626 | | $ 545,605 |
| * | Unaudited. |
| †† | Annualized. |
| (a) | Per share data based on average shares outstanding during the period. |
| (b) | Total investment return is calculated exclusive of sales charges and assumes the reinvestment of dividends and distributions. For periods of less than one year, total return is not annualized. |
| (c) | In addition to the fees and expenses which the Fund bears directly, it also indirectly bears a pro-rata share of the fees and expenses of the underlying funds in which it invests. Such indirect expenses are not included in the above expense ratios. |
| | Six months ended
April 30,
2024* | | Year Ended October 31, |
| Investor Class | 2023 | | 2022 | | 2021 | | 2020 | | 2019 |
| Net asset value at beginning of period | $ 17.20 | | $ 18.21 | | $ 25.39 | | $ 20.90 | | $ 17.80 | | $ 17.07 |
| Net investment income (loss) (a) | 0.07 | | 0.14 | | 0.03 | | (0.00)‡ | | 0.03 | | 0.09 |
| Net realized and unrealized gain (loss) | 1.38 | | (0.45) | | (2.50) | | 6.00 | | 3.47 | | 1.59 |
| Total from investment operations | 1.45 | | (0.31) | | (2.47) | | 6.00 | | 3.50 | | 1.68 |
| Less distributions: | | | | | | | | | | | |
| From net investment income | (0.62) | | (0.25) | | (0.22) | | (0.08) | | (0.09) | | (0.12) |
| From net realized gain on investments | — | | (0.45) | | (4.49) | | (1.43) | | (0.31) | | (0.83) |
| Total distributions | (0.62) | | (0.70) | | (4.71) | | (1.51) | | (0.40) | | (0.95) |
| Net asset value at end of period | $ 18.03 | | $ 17.20 | | $ 18.21 | | $ 25.39 | | $ 20.90 | | $ 17.80 |
| Total investment return (b) | 8.44% | | (1.77)% | | (11.31)% | | 29.77% | | 20.08% | | 10.50% |
| Ratios (to average net assets)/Supplemental Data: | | | | | | | | | | | |
| Net investment income (loss) | 0.75%†† | | 0.79% | | 0.17% | | (0.01)% | | 0.13% | | 0.51% |
| Net expenses (c) | 1.18%††(d) | | 1.18% | | 1.12% | | 1.12% | | 1.16% | | 1.15% |
| Expenses (before waiver/reimbursement) (c) | 1.18%†† | | 1.18% | | 1.12% | | 1.12% | | 1.16% | | 1.17% |
| Portfolio turnover rate | 18% | | 33% | | 14% | | 49% | | 46% | | 23% |
| Net assets at end of period (in 000's) | $ 40,426 | | $ 39,301 | | $ 43,581 | | $ 53,738 | | $ 57,829 | | $ 59,242 |
| * | Unaudited. |
| ‡ | Less than one cent per share. |
| †† | Annualized. |
| (a) | Per share data based on average shares outstanding during the period. |
| (b) | Total investment return is calculated exclusive of sales charges and assumes the reinvestment of dividends and distributions. For periods of less than one year, total return is not annualized. |
| (c) | In addition to the fees and expenses which the Fund bears directly, it also indirectly bears a pro-rata share of the fees and expenses of the underlying funds in which it invests. Such indirect expenses are not included in the above expense ratios. |
| (d) | Expense waiver/reimbursement less than 0.01%. |
The notes to the financial statements are an integral part of, and should be read in conjunction with, the financial statements.
17
Financial Highlights selected per share data and ratios
| | Six months ended
April 30,
2024* | | Year Ended October 31, |
| Class B | 2023 | | 2022 | | 2021 | | 2020 | | 2019 |
| Net asset value at beginning of period | $ 16.75 | | $ 17.75 | | $ 24.95 | | $ 20.67 | | $ 17.68 | | $ 16.98 |
| Net investment income (loss) (a) | 0.00‡ | | 0.01 | | (0.11) | | (0.18) | | (0.11) | | (0.04) |
| Net realized and unrealized gain (loss) | 1.35 | | (0.44) | | (2.45) | | 5.93 | | 3.44 | | 1.60 |
| Total from investment operations | 1.35 | | (0.43) | | (2.56) | | 5.75 | | 3.33 | | 1.56 |
| Less distributions: | | | | | | | | | | | |
| From net investment income | (0.57) | | (0.12) | | (0.15) | | (0.04) | | (0.03) | | (0.03) |
| From net realized gain on investments | — | | (0.45) | | (4.49) | | (1.43) | | (0.31) | | (0.83) |
| Total distributions | (0.57) | | (0.57) | | (4.64) | | (1.47) | | (0.34) | | (0.86) |
| Net asset value at end of period | $ 17.53 | | $ 16.75 | | $ 17.75 | | $ 24.95 | | $ 20.67 | | $ 17.68 |
| Total investment return (b) | 8.06% | | (2.51)% | | (11.97)% | | 28.79% | | 19.15% | | 9.76% |
| Ratios (to average net assets)/Supplemental Data: | | | | | | | | | | | |
| Net investment income (loss) | 0.02%†† | | 0.04% | | (0.59)% | | (0.76)% | | (0.61)% | | (0.23)% |
| Net expenses (c) | 1.93%††(d) | | 1.93% | | 1.87% | | 1.87% | | 1.91% | | 1.90% |
| Expenses (before waiver/reimbursement) (c) | 1.93%†† | | 1.93% | | 1.87% | | 1.87% | | 1.91% | | 1.92% |
| Portfolio turnover rate | 18% | | 33% | | 14% | | 49% | | 46% | | 23% |
| Net assets at end of period (in 000’s) | $ 1,826 | | $ 2,876 | | $ 6,170 | | $ 10,226 | | $ 10,454 | | $ 11,786 |
| * | Unaudited. |
| ‡ | Less than one cent per share. |
| †† | Annualized. |
| (a) | Per share data based on average shares outstanding during the period. |
| (b) | Total investment return is calculated exclusive of sales charges and assumes the reinvestment of dividends and distributions. For periods of less than one year, total return is not annualized. |
| (c) | In addition to the fees and expenses which the Fund bears directly, it also indirectly bears a pro-rata share of the fees and expenses of the underlying funds in which it invests. Such indirect expenses are not included in the above expense ratios. |
| (d) | Expense waiver/reimbursement less than 0.01%. |
The notes to the financial statements are an integral part of, and should be read in conjunction with, the financial statements.
| 18 | MainStay MacKay Convertible Fund |
Financial Highlights selected per share data and ratios
| | Six months ended
April 30,
2024* | | Year Ended October 31, |
| Class C | 2023 | | 2022 | | 2021 | | 2020 | | 2019 |
| Net asset value at beginning of period | $ 16.72 | | $ 17.72 | | $ 24.92 | | $ 20.64 | | $ 17.65 | | $ 16.96 |
| Net investment income (loss) (a) | 0.00‡ | | 0.01 | | (0.11) | | (0.18) | | (0.11) | | (0.04) |
| Net realized and unrealized gain (loss) | 1.35 | | (0.44) | | (2.45) | | 5.93 | | 3.44 | | 1.59 |
| Total from investment operations | 1.35 | | (0.43) | | (2.56) | | 5.75 | | 3.33 | | 1.55 |
| Less distributions: | | | | | | | | | | | |
| From net investment income | (0.57) | | (0.12) | | (0.15) | | (0.04) | | (0.03) | | (0.03) |
| From net realized gain on investments | — | | (0.45) | | (4.49) | | (1.43) | | (0.31) | | (0.83) |
| Total distributions | (0.57) | | (0.57) | | (4.64) | | (1.47) | | (0.34) | | (0.86) |
| Net asset value at end of period | $ 17.50 | | $ 16.72 | | $ 17.72 | | $ 24.92 | | $ 20.64 | | $ 17.65 |
| Total investment return (b) | 8.08% | | (2.51)% | | (11.99)% | | 28.84% | | 19.18% | | 9.71% |
| Ratios (to average net assets)/Supplemental Data: | | | | | | | | | | | |
| Net investment income (loss) | 0.00%††‡‡ | | 0.04% | | (0.58)% | | (0.77)% | | (0.61)% | | (0.23)% |
| Net expenses (c) | 1.93%††(d) | | 1.93% | | 1.87% | | 1.87% | | 1.91% | | 1.90% |
| Expenses (before waiver/reimbursement) (c) | 1.93%†† | | 1.93% | | 1.87% | | 1.87% | | 1.91% | | 1.92% |
| Portfolio turnover rate | 18% | | 33% | | 14% | | 49% | | 46% | | 23% |
| Net assets at end of period (in 000’s) | $ 29,282 | | $ 30,340 | | $ 38,837 | | $ 55,754 | | $ 52,999 | | $ 60,891 |
| * | Unaudited. |
| ‡ | Less than one cent per share. |
| ‡‡ | Less than 0.01%. |
| †† | Annualized. |
| (a) | Per share data based on average shares outstanding during the period. |
| (b) | Total investment return is calculated exclusive of sales charges and assumes the reinvestment of dividends and distributions. For periods of less than one year, total return is not annualized. |
| (c) | In addition to the fees and expenses which the Fund bears directly, it also indirectly bears a pro-rata share of the fees and expenses of the underlying funds in which it invests. Such indirect expenses are not included in the above expense ratios. |
| (d) | Expense waiver/reimbursement less than 0.01%. |
The notes to the financial statements are an integral part of, and should be read in conjunction with, the financial statements.
19
Financial Highlights selected per share data and ratios
| | Six months ended
April 30,
2024* | | Year Ended October 31, |
| Class I | 2023 | | 2022 | | 2021 | | 2020 | | 2019 |
| Net asset value at beginning of period | $ 17.26 | | $ 18.27 | | $ 25.46 | | $ 20.95 | | $ 17.85 | | $ 17.11 |
| Net investment income (loss) (a) | 0.12 | | 0.24 | | 0.13 | | 0.12 | | 0.13 | | 0.18 |
| Net realized and unrealized gain (loss) | 1.39 | | (0.45) | | (2.51) | | 6.02 | | 3.48 | | 1.60 |
| Total from investment operations | 1.51 | | (0.21) | | (2.38) | | 6.14 | | 3.61 | | 1.78 |
| Less distributions: | | | | | | | | | | | |
| From net investment income | (0.67) | | (0.35) | | (0.32) | | (0.20) | | (0.20) | | (0.21) |
| From net realized gain on investments | — | | (0.45) | | (4.49) | | (1.43) | | (0.31) | | (0.83) |
| Total distributions | (0.67) | | (0.80) | | (4.81) | | (1.63) | | (0.51) | | (1.04) |
| Net asset value at end of period | $ 18.10 | | $ 17.26 | | $ 18.27 | | $ 25.46 | | $ 20.95 | | $ 17.85 |
| Total investment return (b) | 8.76% | | (1.20)% | | (10.84)% | | 30.43% | | 20.71% | | 11.14% |
| Ratios (to average net assets)/Supplemental Data: | | | | | | | | | | | |
| Net investment income (loss) | 1.32%†† | | 1.36% | | 0.69% | | 0.49% | | 0.68% | | 1.04% |
| Net expenses (c) | 0.61%†† | | 0.61% | | 0.61% | | 0.61% | | 0.61% | | 0.61% |
| Expenses (before waiver/reimbursement) (c) | 0.69%†† | | 0.69% | | 0.68% | | 0.66% | | 0.71% | | 0.73% |
| Portfolio turnover rate | 18% | | 33% | | 14% | | 49% | | 46% | | 23% |
| Net assets at end of period (in 000’s) | $ 826,092 | | $ 803,539 | | $ 825,546 | | $ 991,630 | | $ 852,739 | | $ 773,865 |
| * | Unaudited. |
| †† | Annualized. |
| (a) | Per share data based on average shares outstanding during the period. |
| (b) | Total investment return is calculated exclusive of sales charges and assumes the reinvestment of dividends and distributions. Class I shares are not subject to sales charges. For periods of less than one year, total return is not annualized. |
| (c) | In addition to the fees and expenses which the Fund bears directly, it also indirectly bears a pro-rata share of the fees and expenses of the underlying funds in which it invests. Such indirect expenses are not included in the above expense ratios. |
The notes to the financial statements are an integral part of, and should be read in conjunction with, the financial statements.
| 20 | MainStay MacKay Convertible Fund |
Notes to Financial Statements (Unaudited)
Note 1-Organization and Business
The MainStay Funds (the “Trust”) was organized on January 9, 1986, as a Massachusetts business trust. The Trust is registered under the Investment Company Act of 1940, as amended (the “1940 Act”), as an open-end management investment company, and is comprised of eleven funds (collectively referred to as the "Funds"). These financial statements and notes relate to the MainStay MacKay Convertible Fund (the "Fund"), a “diversified” fund, as that term is defined in the 1940 Act, as interpreted or modified by regulatory authorities having jurisdiction, from time to time.
The following table lists the Fund's share classes that have been registered and commenced operations:
| Class | Commenced Operations |
| Class A | January 3, 1995 |
| Investor Class | February 28, 2008 |
| Class B | May 1, 1986 |
| Class C | September 1, 1998 |
| Class I | November 28, 2008 |
Class B shares of the MainStay Group of Funds are closed to all new purchases as well as additional investments by existing Class B shareholders. Existing Class B shareholders may continue to reinvest dividends and capital gains distributions, as well as exchange their Class B shares for Class B shares of other funds in the MainStay Group of Funds as permitted by the current exchange privileges. Class B shareholders continue to be subject to any applicable contingent deferred sales charge ("CDSC") at the time of redemption. All other features of the Class B shares, including but not limited to the fees and expenses applicable to Class B shares, remain unchanged. Unless redeemed, Class B shareholders will remain in Class B shares of their respective fund until the Class B shares are converted to Class A or Investor Class shares pursuant to the applicable conversion schedule.
Class A and Investor Class shares are offered at net asset value (“NAV”) per share plus an initial sales charge. No initial sales charge applies to investments of $1 million or more (and certain other qualified purchases) in Class A and Investor Class shares. However, a CDSC of 1.00% may be imposed on certain redemptions made within 18 months of the date of purchase on shares that were purchased without an initial sales charge. Class C shares are offered at NAV without an initial sales charge, although a 1.00% CDSC may be imposed on certain redemptions of such shares made within one year of the date of purchase of Class C shares. When Class B shares were offered, they were offered at NAV without an initial sales charge, although a CDSC that declines depending on the number of years a shareholder held its Class B shares may be imposed on certain redemptions of such shares made within six years of the date of purchase of such shares. Class I shares are offered at NAV without a sales charge. Depending upon eligibility, Class B shares convert to either Class A or Investor Class shares at the end of the calendar quarter eight years after the date they were purchased. In addition, depending upon eligibility, Class C shares convert to either Class A or Investor Class shares at the end of the calendar quarter eight years after the date they
were purchased. Additionally, Investor Class shares may convert automatically to Class A shares. Under certain circumstances and as may be permitted by the Trust’s multiple class plan pursuant to Rule 18f-3 under the 1940 Act, specified share classes of the Fund may be converted to one or more other share classes of the Fund as disclosed in the capital share transactions within these Notes. The classes of shares have the same voting (except for issues that relate solely to one class), dividend, liquidation and other rights, and the same terms and conditions, except that under distribution plans pursuant to Rule 12b-1 under the 1940 Act, Class B and Class C shares are subject to higher distribution and/or service fees than Class A and Investor Class shares. Class I shares are not subject to a distribution and/or service fee.
The Fund's investment objective is to seek capital appreciation together with current income.
Note 2–Significant Accounting Policies
The Fund is an investment company and accordingly follows the investment company accounting and reporting guidance of the Financial Accounting Standards Board (“FASB”) Accounting Standards Codification Topic 946 Financial Services—Investment Companies. The Fund prepares its financial statements in accordance with generally accepted accounting principles (“GAAP”) in the United States of America and follows the significant accounting policies described below.
(A) Securities Valuation. Investments are usually valued as of the close of regular trading on the New York Stock Exchange (the "Exchange") (usually 4:00 p.m. Eastern time) on each day the Fund is open for business ("valuation date").
Pursuant to Rule 2a-5 under the 1940 Act, the Board of Trustees of the Trust (the "Board") has designated New York Life Investment Management LLC (“New York Life Investments” or the "Manager") as its Valuation Designee (the "Valuation Designee"). The Valuation Designee is responsible for performing fair valuations relating to all investments in the Fund’s portfolio for which market quotations are not readily available; periodically assessing and managing material valuation risks; establishing and applying fair value methodologies; testing fair valuation methodologies; evaluating and overseeing pricing services; ensuring appropriate segregation of valuation and portfolio management functions; providing quarterly, annual and prompt reporting to the Board, as appropriate; identifying potential conflicts of interest; and maintaining appropriate records. The Valuation Designee has established a valuation committee ("Valuation Committee") to assist in carrying out the Valuation Designee’s responsibilities and establish prices of securities for which market quotations are not readily available. The Fund's and the Valuation Designee's policies and procedures ("Valuation Procedures") govern the Valuation Designee’s selection and application of methodologies for determining and calculating the fair value of Fund investments. The Valuation Designee may value the Fund's portfolio securities for which market quotations are not readily available and other Fund assets utilizing inputs from pricing services and other third-party sources. The Valuation Committee meets (in person, via electronic mail or via teleconference) on
Notes to Financial Statements (Unaudited) (continued)
an ad-hoc basis to determine fair valuations and on a quarterly basis to review fair value events with respect to certain securities for which market quotations are not readily available, including valuation risks and back-testing results, and to preview reports to the Board.
The Valuation Committee establishes prices of securities for which market quotations are not readily available based on such methodologies and measurements on a regular basis after considering information that is reasonably available and deemed relevant by the Valuation Committee. The Board shall oversee the Valuation Designee and review fair valuation materials on a prompt, quarterly and annual basis and approve proposed revisions to the Valuation Procedures.
Investments for which market quotations are not readily available are valued at fair value as determined in good faith pursuant to the Valuation Procedures. A market quotation is readily available only when that quotation is a quoted price (unadjusted) in active markets for identical investments that the Fund can access at the measurement date, provided that a quotation will not be readily available if it is not reliable. "Fair value" is defined as the price the Fund would reasonably expect to receive upon selling an asset or liability in an orderly transaction to an independent buyer in the principal or most advantageous market for the asset or liability. Fair value measurements are determined within a framework that establishes a three-tier hierarchy that maximizes the use of observable market data and minimizes the use of unobservable inputs to establish a classification of fair value measurements for disclosure purposes. "Inputs" refer broadly to the assumptions that market participants would use in pricing the asset or liability, including assumptions about risk, such as the risk inherent in a particular valuation technique used to measure fair value using a pricing model and/or the risk inherent in the inputs for the valuation technique. Inputs may be observable or unobservable. Observable inputs reflect the assumptions market participants would use in pricing the asset or liability based on market data obtained from sources independent of the Fund. Unobservable inputs reflect the Fund’s own assumptions about the assumptions market participants would use in pricing the asset or liability based on the information available. The inputs or methodology used for valuing assets or liabilities may not be an indication of the risks associated with investing in those assets or liabilities. The three-tier hierarchy of inputs is summarized below.
| • | Level 1—quoted prices (unadjusted) in active markets for an identical asset or liability |
| • | Level 2—other significant observable inputs (including quoted prices for a similar asset or liability in active markets, interest rates and yield curves, prepayment speeds, credit risk, etc.) |
| • | Level 3—significant unobservable inputs (including the Fund's own assumptions about the assumptions that market participants would use in measuring fair value of an asset or liability) |
The level of an asset or liability within the fair value hierarchy is based on the lowest level of an input, both individually and in the aggregate, that is significant to the fair value measurement. The aggregate value by input
level of the Fund’s assets and liabilities as of April 30, 2024, is included at the end of the Portfolio of Investments.
The Fund may use third-party vendor evaluations, whose prices may be derived from one or more of the following standard inputs, among others:
| • Benchmark yields | • Reported trades |
| • Broker/dealer quotes | • Issuer spreads |
| • Two-sided markets | • Benchmark securities |
| • Bids/offers | • Reference data (corporate actions or material event notices) |
| • Industry and economic events | • Comparable bonds |
| • Monthly payment information | |
An asset or liability for which a market quotation is not readily available is valued by methods deemed reasonable in good faith by the Valuation Committee, following the Valuation Procedures to represent fair value. Under these procedures, the Valuation Designee generally uses a market-based approach which may use related or comparable assets or liabilities, recent transactions, market multiples, book values and other relevant information. The Valuation Designee may also use an income-based valuation approach in which the anticipated future cash flows of the asset or liability are discounted to calculate fair value. Discounts may also be applied due to the nature and/or duration of any restrictions on the disposition of the asset or liability. Fair value represents a good faith approximation of the value of a security. Fair value determinations involve the consideration of a number of subjective factors, an analysis of applicable facts and circumstances and the exercise of judgment. As a result, it is possible that the fair value for a security determined in good faith in accordance with the Valuation Procedures may differ from valuations for the same security determined for other funds using their own valuation procedures. Although the Valuation Procedures are designed to value a security at the price the Fund may reasonably expect to receive upon the security's sale in an orderly transaction, there can be no assurance that any fair value determination thereunder would, in fact, approximate the amount that the Fund would actually realize upon the sale of the security or the price at which the security would trade if a reliable market price were readily available. During the six-month period ended April 30, 2024, there were no material changes to the fair value methodologies.
Securities which may be valued in this manner include, but are not limited to: (i) a security for which trading has been halted or suspended or otherwise does not have a readily available market quotation on a given day; (ii) a debt security that has recently gone into default and for which there is not a current market quotation; (iii) a security of an issuer that has entered into a restructuring; (iv) a security that has been delisted from a national exchange; (v) a security subject to trading collars for which no or limited trading takes place; and (vi) a security whose principal market has been temporarily closed at a time when, under normal conditions, it would be open. Securities valued in this manner are generally categorized as Level 2 or 3 in the hierarchy.
| 22 | MainStay MacKay Convertible Fund |
Equity securities, rights and warrants, if applicable, are valued at the last quoted sales prices as of the close of regular trading on the relevant exchange on each valuation date. Securities that are not traded on the valuation date are valued at the mean of the last quoted bid and ask prices. Prices are normally taken from the principal market in which each security trades. These securities are generally categorized as Level 1 in the hierarchy.
Certain convertible preferred stocks may be valued utilizing evaluated prices based on market inputs obtained from the pricing vendor and are generally categorized as Level 2 in the hierarchy.
Investments in mutual funds, including money market funds, are valued at their respective NAVs at the close of business each day on the valuation date. These securities are generally categorized as Level 1 in the hierarchy.
Debt securities (other than convertible and municipal bonds) are valued at the evaluated bid prices (evaluated mean prices in the case of convertible and municipal bonds) supplied by a pricing agent or broker selected by the Valuation Designee, in consultation with the Subadvisor. The evaluations are market-based measurements processed through a pricing application and represents the pricing agent’s good faith determination as to what a holder may receive in an orderly transaction under market conditions. The rules-based logic utilizes valuation techniques that reflect participants’ assumptions and vary by asset class and per methodology, maximizing the use of relevant observable data including quoted prices for similar assets, benchmark yield curves and market corroborated inputs. The evaluated bid or mean prices are deemed by the Valuation Designee, in consultation with the Subadvisor, to be representative of market values at the regular close of trading of the Exchange on each valuation date. Debt securities purchased on a delayed delivery basis are marked to market daily until settlement at the forward settlement date. Debt securities, including corporate bonds, U.S. government and federal agency bonds, municipal bonds, foreign bonds, convertible bonds, asset-backed securities and mortgage-backed securities are generally categorized as Level 2 in the hierarchy.
Temporary cash investments acquired in excess of 60 days to maturity at the time of purchase are valued using the latest bid prices or using valuations based on a matrix system (which considers such factors as security prices, yields, maturities and ratings), both as furnished by independent pricing services. Temporary cash investments that mature in 60 days or less at the time of purchase ("Short-Term Investments") are valued using the amortized cost method of valuation, unless the use of such method would be inappropriate. The amortized cost method involves valuing a security at its cost on the date of purchase and thereafter assuming a constant amortization to maturity of the difference between such cost and the value on maturity date. Amortized cost approximates the current fair value of a security. Securities valued using the amortized cost method are not valued using quoted prices in an active market and are generally categorized as Level 2 in the hierarchy.
The information above is not intended to reflect an exhaustive list of the methodologies that may be used to value portfolio investments. The
Valuation Procedures permit the use of a variety of valuation methodologies in connection with valuing portfolio investments. The methodology used for a specific type of investment may vary based on the market data available or other considerations. The methodologies summarized above may not represent the specific means by which portfolio investments are valued on any particular business day.
(B) Income Taxes. The Fund's policy is to comply with the requirements of the Internal Revenue Code of 1986, as amended (the “Internal Revenue Code”), applicable to regulated investment companies and to distribute all of its taxable income to the shareholders of the Fund within the allowable time limits.
The Manager evaluates the Fund’s tax positions to determine if the tax positions taken meet the minimum recognition threshold in connection with accounting for uncertainties in income tax positions taken or expected to be taken for the purposes of measuring and recognizing tax liabilities in the financial statements. Recognition of tax benefits of an uncertain tax position is permitted only to the extent the position is “more likely than not” to be sustained assuming examination by taxing authorities. The Manager analyzed the Fund's tax positions taken on federal, state and local income tax returns for all open tax years (for up to three tax years) and has concluded that no provisions for federal, state and local income tax are required in the Fund's financial statements. The Fund's federal, state and local income tax and federal excise tax returns for tax years for which the applicable statutes of limitations have not expired are subject to examination by the Internal Revenue Service and state and local departments of revenue.
(C) Dividends and Distributions to Shareholders. Dividends and distributions are recorded on the ex-dividend date. The Fund intends to declare and pay dividends from net investment income, if any, at least quarterly and distributions from net realized capital and currency gains, if any, at least annually. Unless a shareholder elects otherwise, all dividends and distributions are reinvested at NAV in the same class of shares of the Fund. Dividends and distributions to shareholders are determined in accordance with federal income tax regulations and may differ from determinations using GAAP.
(D) Security Transactions and Investment Income. The Fund records security transactions on the trade date. Realized gains and losses on security transactions are determined using the identified cost method. Dividend income is recognized on the ex-dividend date, net of any foreign tax withheld at the source, and interest income is accrued as earned using the effective interest rate method. Distributions received from real estate investment trusts may be classified as dividends, capital gains and/or return of capital. Discounts and premiums on securities purchased for the Fund are accreted and amortized, respectively, on the effective interest rate method. Premium associated with the conversion feature on a convertible bond is not amortized.
Investment income and realized and unrealized gains and losses on investments of the Fund are allocated pro rata to the separate classes of
Notes to Financial Statements (Unaudited) (continued)
shares based upon their relative net assets on the date the income is earned or realized and unrealized gains and losses are incurred.
The Fund may place a debt security on non-accrual status and reduce related interest income by ceasing current accruals and writing off all or a portion of any interest receivables when the collection of all or a portion of such interest has become doubtful. A debt security is removed from non-accrual status when the issuer resumes interest payments or when collectability of interest is reasonably assured.
(E) Expenses. Expenses of the Trust are allocated to the individual Funds in proportion to the net assets of the respective Funds when the expenses are incurred, except where direct allocations of expenses can be made. Expenses (other than transfer agent expenses and fees incurred under the shareholder services plans and/or the distribution plans further discussed in Note 3(B)) are allocated to separate classes of shares pro rata based upon their relative net assets on the date the expenses are incurred. The expenses borne by the Fund, including those of related parties to the Fund, are shown in the Statement of Operations.
Additionally, the Fund may invest in mutual funds, which are subject to management fees and other fees that may cause the costs of investing in mutual funds to be greater than the costs of owning the underlying securities directly. These indirect expenses of mutual funds are not included in the amounts shown as expenses in the Statement of Operations or in the expense ratios included in the Financial Highlights.
(F) Use of Estimates. In preparing financial statements in conformity with GAAP, the Manager makes estimates and assumptions that affect the reported amounts and disclosures in the financial statements. Actual results could differ from those estimates and assumptions.
(G) Securities Lending. In order to realize additional income, the Fund may engage in securities lending, subject to the limitations set forth in the 1940 Act and relevant guidance by the staff of the Securities and Exchange Commission (“SEC”). If the Fund engages in securities lending, the Fund will lend through its custodian, JPMorgan Chase Bank, N.A., ("JPMorgan"), acting as securities lending agent on behalf of the Fund. Under the current arrangement, JPMorgan will manage the Fund's collateral in accordance with the securities lending agency agreement between the Fund and JPMorgan, and indemnify the Fund against counterparty risk. The loans will be collateralized by cash (which may be invested in a money market fund) and/or non-cash collateral (which may include U.S. Treasury securities and/or U.S. government agency securities issued or guaranteed by the United States government or its agencies or instrumentalities) at least equal at all times to the market value of the securities loaned. Non-cash collateral held at year end is segregated and cannot be transferred by the Fund. The Fund bears the risk of delay in recovery of, or loss of rights in, the securities loaned. The Fund may also record a realized gain or loss on securities deemed sold due to a borrower’s inability to return securities on loan. The Fund bears the risk of any loss on investment of cash collateral. The Fund will receive compensation for lending its securities in the form of fees or it will retain a portion of interest earned on the investment of any cash collateral. The
Fund will also continue to receive interest and dividends on the securities loaned and any gain or loss in the market price of the securities loaned that may occur during the term of the loan will be for the account of the Fund. Income earned from securities lending activities, if any, is reflected in the Statement of Operations.
(H) Debt and Convertible Securities Risk. The ability of issuers of debt securities held by the Fund to meet their obligations may be affected by, among other things, economic or political developments in a specific country, industry or region. Debt securities are also subject to the risks associated with changes in interest rates.
Convertible securities may be subordinate to other securities. In part, the total return for a convertible security depends upon the performance of the underlying stock into which it can be converted. Also, issuers of convertible securities are often not as strong financially as those issuing securities with higher credit ratings, are more likely to encounter financial difficulties and typically are more vulnerable to changes in the economy, such as a recession or a sustained period of rising interest rates, which could affect their ability to make interest and principal payments.
(I) Indemnifications. Under the Trust’s organizational documents, its officers and trustees are indemnified against certain liabilities that may arise out of performance of their duties to the Trust. Additionally, in the normal course of business, the Fund enters into contracts with third-party service providers that contain a variety of representations and warranties and that may provide general indemnifications. The Fund's maximum exposure under these arrangements is unknown, as this would involve future claims that may be made against the Fund that have not yet occurred. The Manager believes that the risk of loss in connection with these potential indemnification obligations is remote. However, there can be no assurance that material liabilities related to such obligations will not arise in the future, which could adversely impact the Fund.
Note 3–Fees and Related Party Transactions
(A) Manager and Subadvisor. New York Life Investments, a registered investment adviser and an indirect, wholly-owned subsidiary of New York Life Insurance Company ("New York Life"), serves as the Fund's Manager, pursuant to an Amended and Restated Management Agreement ("Management Agreement"). The Manager provides offices, conducts clerical, recordkeeping and bookkeeping services and keeps most of the financial and accounting records required to be maintained by the Fund. Except for the portion of salaries and expenses that are the responsibility of the Fund, the Manager pays the salaries and expenses of all personnel affiliated with the Fund and certain operational expenses of the Fund. The Fund reimburses New York Life Investments in an amount equal to the portion of the compensation of the Chief Compliance Officer attributable to the Fund. MacKay Shields LLC ("MacKay Shields" or the "Subadvisor"), a registered investment adviser and an indirect, wholly-owned subsidiary of New York Life, serves as the Subadvisor to the Fund and is responsible for the day-to-day portfolio management of the Fund. Pursuant to the terms of an Amended and Restated Subadvisory Agreement
| 24 | MainStay MacKay Convertible Fund |
("Subadvisory Agreement") between New York Life Investments and MacKay Shields, New York Life Investments pays for the services of the Subadvisor.
Effective February 28, 2024, pursuant to the Management Agreement, the Fund pays the Manager a monthly fee for the services performed and the facilities furnished at an annual rate of the Fund’s average daily net assets as follows: 0.60% up to $500 million; 0.55% from $500 million to $1 billion; 0.50% from $1 billion to $2 billion; 0.49% from $2 billion to $5 billion; and 0.48% in excess of $5 billion.
Prior to February 28, 2024, the Fund paid the Manager a monthly fee for the services performed and the facilities furnished at an annual rate of the Fund’s average daily net assets as follows: 0.60% up to $500 million; 0.55% from $500 million to $1 billion; 0.50% from $1 billion to $2 billion; and 0.49% in excess of $2 billion.
During the six-month period ended April 30, 2024, the effective management fee rate was 0.55% of the Fund’s average daily net assets.
New York Life Investments has contractually agreed to waive fees and/or reimburse expenses so that Total Annual Fund Operating Expenses (excluding taxes, interest, litigation, extraordinary expenses, brokerage and other transaction expenses relating to the purchase or sale of portfolio investments and acquired (underlying) fund fees and expenses) of Class I shares do not exceed 0.61% of the Fund's average net assets. This agreement will remain in effect until February 28, 2025, and shall renew automatically for one-year terms unless New York Life Investments provides written notice of termination prior to the start of the next term or upon approval of the Board.
During the six-month period ended April 30, 2024, New York Life Investments earned fees from the Fund in the amount of $4,268,832 and waived fees and/or reimbursed expenses in the amount of $328,676 and paid the Subadvisor fees in the amount of $1,970,087.
JPMorgan provides sub-administration and sub-accounting services to the Fund pursuant to an agreement with New York Life Investments. These services include calculating the daily NAVs of the Fund, maintaining the general ledger and sub-ledger accounts for the calculation of the Fund's NAVs, and assisting New York Life Investments in conducting various aspects of the Fund's administrative operations. For providing these services to the Fund, JPMorgan is compensated by New York Life Investments.
Pursuant to an agreement between the Trust and New York Life Investments, New York Life Investments is responsible for providing or procuring certain regulatory reporting services for the Fund. The Fund will reimburse New York Life Investments for the actual costs incurred by New York Life Investments in connection with providing or procuring these services for the Fund.
(B) Distribution and Service Fees. The Trust, on behalf of the Fund, has entered into a distribution agreement with NYLIFE Distributors LLC (the “Distributor”), an affiliate of New York Life
Investments. The Fund has adopted distribution plans (the “Plans”) in accordance with the provisions of Rule 12b-1 under the 1940 Act.
Pursuant to the Class A and Investor Class Plans, the Distributor receives a monthly fee from the Class A and Investor Class shares at an annual rate of 0.25% of the average daily net assets of the Class A and Investor Class shares for distribution and/or service activities as designated by the Distributor. Pursuant to the Class B and Class C Plans, Class B and Class C shares pay the Distributor a monthly distribution fee at an annual rate of 0.75% of the average daily net assets of the Class B and Class C shares along with a service fee at an annual rate of 0.25% of the average daily net assets of the Class B and Class C shares, for a total 12b-1 fee of 1.00%. Class I shares are not subject to a distribution and/or service fee.
The Plans provide that the distribution and service fees are payable to the Distributor regardless of the amounts actually expended by the Distributor for distribution of the Fund's shares and service activities.
(C) Sales Charges. The Fund was advised by the Distributor that the amount of initial sales charges retained on sales of Class A and Investor Class shares during the six-month period ended April 30, 2024, were $32,758 and $2,810, respectively.
The Fund was also advised that the Distributor retained CDSCs on redemptions of Class A, Class B and Class C shares during the six-month period ended April 30, 2024, of $1,248, $18 and $67, respectively.
(D) Transfer, Dividend Disbursing and Shareholder Servicing Agent. NYLIM Service Company LLC, an affiliate of New York Life Investments, is the Fund's transfer, dividend disbursing and shareholder servicing agent pursuant to an agreement between NYLIM Service Company LLC and the Trust. NYLIM Service Company LLC has entered into an agreement with SS&C Global Investor & Distribution Solutions, Inc. ("SS&C"), pursuant to which SS&C performs certain transfer agent services on behalf of NYLIM Service Company LLC. New York Life Investments has contractually agreed to limit the transfer agency expenses charged to the Fund’s share classes to a maximum of 0.35% of that share class’s average daily net assets on an annual basis after deducting any applicable Fund or class-level expense reimbursement or small account fees. This agreement will remain in effect until February 28, 2025, and shall renew automatically for one-year terms unless New York Life Investments provides written notice of termination prior to the start of the next term or upon approval of the Board. During the six-month period ended April 30, 2024, transfer agent expenses incurred by the Fund and any reimbursements, pursuant to the
Notes to Financial Statements (Unaudited) (continued)
aforementioned Transfer Agency expense limitation agreement, were as follows:
| Class | Expense | Waived |
| Class A | $372,627 | $ — |
| Investor Class | 71,826 | (313) |
| Class B | 4,254 | (7) |
| Class C | 53,540 | (385) |
| Class I | 458,322 | — |
(E) Small Account Fee. Shareholders with small accounts adversely impact the cost of providing transfer agency services. In an effort to reduce total transfer agency expenses, the Fund has implemented a small account fee on certain types of accounts. As described in the Fund's prospectus, certain shareholders with an account balance of less than $1,000 ($5,000 for Class A share accounts) are charged an annual per account fee of $20 (assessed semi-annually), the proceeds from which offset transfer agent fees as reflected in the Statement of Operations. This small account fee will not apply to certain types of accounts as described further in the Fund’s prospectus.
(F) Capital. As of April 30, 2024, New York Life and its affiliates beneficially held shares of the Fund with the values and percentages of net assets as follows:
Note 4-Federal Income Tax
As of April 30, 2024, the cost and unrealized appreciation (depreciation) of the Fund’s investment portfolio, including applicable derivative contracts and other financial instruments, as determined on a federal income tax basis, were as follows:
| | Federal Tax
Cost | Gross
Unrealized
Appreciation | Gross
Unrealized
(Depreciation) | Net
Unrealized
Appreciation/
(Depreciation) |
| Investments in Securities | $1,573,011,866 | $123,926,433 | $(78,909,544) | $45,016,889 |
As of October 31, 2023, for federal income tax purposes, capital loss carryforwards of $9,406,988, as shown in the table below, were available to the extent provided by the regulations to offset future realized gains of the Fund. Accordingly, no capital gains distributions are expected to be paid to shareholders until net gains have been realized in excess of such amounts.
Capital Loss
Available Through | Short-Term
Capital Loss
Amounts (000’s) | Long-Term
Capital Loss
Amounts (000’s) |
| Unlimited | $2,578 | $6,829 |
During the year ended October 31, 2023, the tax character of distributions paid as reflected in the Statements of Changes in Net Assets was as follows:
| | 2023 |
| Distributions paid from: | |
| Ordinary Income | $40,381,747 |
| Long-Term Capital Gains | 27,270,245 |
| Total | $67,651,992 |
Note 5–Custodian
JPMorgan is the custodian of cash and securities held by the Fund. Custodial fees are charged to the Fund based on the Fund's net assets and/or the market value of securities held by the Fund and the number of certain transactions incurred by the Fund.
Note 6–Line of Credit
The Fund and certain other funds managed by New York Life Investments maintain a line of credit with a syndicate of banks in order to secure a source of funds for temporary purposes to meet unanticipated or excessive redemption requests.
Effective July 25, 2023, under the credit agreement (the “Credit Agreement”), the aggregate commitment amount is $600,000,000 with an additional uncommitted amount of $100,000,000. The commitment fee is an annual rate of 0.15% of the average commitment amount payable quarterly, regardless of usage, to JPMorgan, who serves as the agent to the syndicate. The commitment fee is allocated among the Fund and certain other funds managed by New York Life Investments based upon their respective net assets and other factors. Interest on any revolving credit loan is charged based upon the Federal Funds Rate, Daily Simple Secured Overnight Financing Rate ("SOFR") + 0.10%, or the Overnight Bank Funding Rate, whichever is higher. The Credit Agreement expires on July 23, 2024, although the Fund, certain other funds managed by New York Life Investments and the syndicate of banks may renew the Credit Agreement for an additional year on the same or different terms or enter into a credit agreement with a different syndicate of banks. Prior to July 25, 2023, the aggregate commitment amount and the commitment fee were the same as those under the current Credit Agreement. During the six-month period ended April 30, 2024, there were no borrowings made or outstanding with respect to the Fund under the Credit Agreement.
Note 7–Interfund Lending Program
Pursuant to an exemptive order issued by the SEC, the Fund, along with certain other funds managed by New York Life Investments, may participate in an interfund lending program. The interfund lending program provides an alternative credit facility that permits the Fund and certain other funds managed by New York Life Investments to lend or borrow money for temporary purposes directly to or from one another, subject to the conditions of the exemptive order. During the six-month
| 26 | MainStay MacKay Convertible Fund |
period ended April 30, 2024, there were no interfund loans made or outstanding with respect to the Fund.
Note 8–Purchases and Sales of Securities (in 000’s)
During the six-month period ended April 30, 2024, purchases and sales of securities, other than short-term securities, were $274,820 and $264,296, respectively.
Note 9–Capital Share Transactions
Transactions in capital shares for the six-month period ended April 30, 2024 and the year ended October 31, 2023, were as follows:
| Class A | Shares | Amount |
| Six-month period ended April 30, 2024: | | |
| Shares sold | 1,119,328 | $ 20,218,317 |
| Shares issued to shareholders in reinvestment of distributions | 1,271,682 | 22,949,325 |
| Shares redeemed | (3,722,729) | (67,169,589) |
| Net increase (decrease) in shares outstanding before conversion | (1,331,719) | (24,001,947) |
| Shares converted into Class A (See Note 1) | 143,088 | 2,575,227 |
| Shares converted from Class A (See Note 1) | (4,089) | (74,680) |
| Net increase (decrease) | (1,192,720) | $ (21,501,400) |
| Year ended October 31, 2023: | | |
| Shares sold | 2,423,754 | $ 43,368,024 |
| Shares issued to shareholders in reinvestment of distributions | 1,580,362 | 27,763,616 |
| Shares redeemed | (5,759,217) | (102,449,513) |
| Net increase (decrease) in shares outstanding before conversion | (1,755,101) | (31,317,873) |
| Shares converted into Class A (See Note 1) | 292,723 | 5,217,744 |
| Shares converted from Class A (See Note 1) | (120,039) | (2,134,796) |
| Net increase (decrease) | (1,582,417) | $ (28,234,925) |
| |
| Investor Class | Shares | Amount |
| Six-month period ended April 30, 2024: | | |
| Shares sold | 32,910 | $ 593,984 |
| Shares issued to shareholders in reinvestment of distributions | 77,954 | 1,406,303 |
| Shares redeemed | (105,521) | (1,902,306) |
| Net increase (decrease) in shares outstanding before conversion | 5,343 | 97,981 |
| Shares converted into Investor Class (See Note 1) | 25,096 | 455,065 |
| Shares converted from Investor Class (See Note 1) | (73,574) | (1,329,872) |
| Net increase (decrease) | (43,135) | $ (776,826) |
| Year ended October 31, 2023: | | |
| Shares sold | 79,210 | $ 1,411,033 |
| Shares issued to shareholders in reinvestment of distributions | 94,454 | 1,657,134 |
| Shares redeemed | (216,142) | (3,855,341) |
| Net increase (decrease) in shares outstanding before conversion | (42,478) | (787,174) |
| Shares converted into Investor Class (See Note 1) | 52,216 | 943,603 |
| Shares converted from Investor Class (See Note 1) | (117,435) | (2,079,514) |
| Net increase (decrease) | (107,697) | $ (1,923,085) |
| |
| Class B | Shares | Amount |
| Six-month period ended April 30, 2024: | | |
| Shares sold | 698 | $ 12,165 |
| Shares issued to shareholders in reinvestment of distributions | 4,567 | 80,193 |
| Shares redeemed | (27,689) | (488,969) |
| Net increase (decrease) in shares outstanding before conversion | (22,424) | (396,611) |
| Shares converted from Class B (See Note 1) | (45,060) | (796,743) |
| Net increase (decrease) | (67,484) | $ (1,193,354) |
| Year ended October 31, 2023: | | |
| Shares sold | 712 | $ 12,215 |
| Shares issued to shareholders in reinvestment of distributions | 9,324 | 158,942 |
| Shares redeemed | (47,825) | (826,321) |
| Net increase (decrease) in shares outstanding before conversion | (37,789) | (655,164) |
| Shares converted from Class B (See Note 1) | (138,081) | (2,414,958) |
| Net increase (decrease) | (175,870) | $ (3,070,122) |
| |
Notes to Financial Statements (Unaudited) (continued)
| Class C | Shares | Amount |
| Six-month period ended April 30, 2024: | | |
| Shares sold | 117,686 | $ 2,067,112 |
| Shares issued to shareholders in reinvestment of distributions | 56,264 | 985,735 |
| Shares redeemed | (290,375) | (5,095,255) |
| Net increase (decrease) in shares outstanding before conversion | (116,425) | (2,042,408) |
| Shares converted from Class C (See Note 1) | (24,533) | (432,803) |
| Net increase (decrease) | (140,958) | $ (2,475,211) |
| Year ended October 31, 2023: | | |
| Shares sold | 270,449 | $ 4,696,902 |
| Shares issued to shareholders in reinvestment of distributions | 69,055 | 1,175,113 |
| Shares redeemed | (660,914) | (11,384,382) |
| Net increase (decrease) in shares outstanding before conversion | (321,410) | (5,512,367) |
| Shares converted from Class C (See Note 1) | (55,296) | (966,980) |
| Net increase (decrease) | (376,706) | $ (6,479,347) |
| |
| Class I | Shares | Amount |
| Six-month period ended April 30, 2024: | | |
| Shares sold | 8,892,675 | $ 161,053,678 |
| Shares issued to shareholders in reinvestment of distributions | 1,502,322 | 27,200,529 |
| Shares redeemed | (11,288,960) | (204,192,490) |
| Net increase (decrease) in shares outstanding before conversion | (893,963) | (15,938,283) |
| Shares converted into Class I (See Note 1) | 5,996 | 109,786 |
| Shares converted from Class I (See Note 1) | (28,893) | (505,980) |
| Net increase (decrease) | (916,860) | $ (16,334,477) |
| Year ended October 31, 2023: | | |
| Shares sold | 16,680,198 | $ 298,123,578 |
| Shares issued to shareholders in reinvestment of distributions | 1,847,776 | 32,578,417 |
| Shares redeemed | (17,223,174) | (307,750,262) |
| Net increase (decrease) in shares outstanding before conversion | 1,304,800 | 22,951,733 |
| Shares converted into Class I (See Note 1) | 119,564 | 2,132,701 |
| Shares converted from Class I (See Note 1) | (39,362) | (697,800) |
| Net increase (decrease) | 1,385,002 | $ 24,386,634 |
Note 10–Other Matters
As of the date of this report, the Fund faces a heightened level of risk associated with current uncertainty, volatility and state of economies, financial markets, a high interest rate environment, and labor and health conditions around the world. Events such as war, acts of terrorism, recessions, rapid inflation, the imposition of economic sanctions, earthquakes, hurricanes, epidemics and pandemics and other unforeseen natural or human disasters may have broad adverse social, political and economic effects on the global economy, which could negatively impact the value of the Fund's investments. Developments that disrupt global
economies and financial markets may magnify factors that affect the Fund's performance.
Note 11–Subsequent Events
In connection with the preparation of the financial statements of the Fund as of and for the six-month period ended April 30, 2024, events and transactions subsequent to April 30, 2024, through the date the financial statements were issued, have been evaluated by the Manager for possible adjustment and/or disclosure. No subsequent events requiring financial statement adjustment or disclosure have been identified.
| 28 | MainStay MacKay Convertible Fund |
Board Consideration and Approval of Management Agreement and Subadvisory Agreement (Unaudited)
The continuation of the Management Agreement with respect to the MainStay MacKay Convertible Fund (“Fund”) and New York Life Investment Management LLC (“New York Life Investments”) and the Subadvisory Agreement between New York Life Investments and MacKay Shields LLC (“MacKay”) with respect to the Fund (together, “Advisory Agreements”) is subject to annual review and approval by the Board of Trustees of The MainStay Funds (“Board” of the “Trust”) in accordance with Section 15 of the Investment Company Act of 1940, as amended (“1940 Act”). At its December 6–7, 2023 meeting, the Board, including the Trustees who are not an “interested person” (as such term is defined in the 1940 Act) of the Trust (“Independent Trustees”) voting separately, unanimously approved the continuation of each of the Advisory Agreements for a one-year period.
In reaching the decision to approve the continuation of each of the Advisory Agreements, the Board considered information and materials furnished by New York Life Investments and MacKay in connection with an annual contract review process undertaken by the Board that took place at meetings of the Board and its Contracts Committee from September 2023 through December 2023, including information and materials furnished by New York Life Investments and MacKay in response to requests prepared on behalf of the Board, and in consultation with the Independent Trustees, by independent legal counsel to the Independent Trustees, which encompassed a variety of topics, including those summarized below. Information and materials requested by and furnished to the Board for consideration in connection with the contract review process included, among other items, reports on the Fund and “peer funds” prepared by Institutional Shareholder Services Inc. (“ISS”), an independent third-party service provider engaged by the Board to report objectively on the Fund’s investment performance, management fee and total expenses. The Board also considered information on the fees charged to other investment advisory clients of New York Life Investments and/or MacKay that follow investment strategies similar to those of the Fund, if any, and, when applicable, the rationale for differences in the Fund’s management and subadvisory fees and the fees charged to those other investment advisory clients. In addition, the Board considered information regarding the legal standards and fiduciary obligations applicable to its consideration of the continuation of each of the Advisory Agreements. The contract review process, including the structure and format for information and materials provided to the Board, has been developed in consultation with the Board. The Independent Trustees also met in executive sessions with their independent legal counsel and, for portions thereof, with senior management of New York Life Investments.
The Board’s deliberations with respect to the continuation of each of the Advisory Agreements reflect a year-long process, and the Board also took into account information furnished to the Board and its Committees throughout the year, as deemed relevant and appropriate by the Trustees, including, among other items, reports on investment performance of the Fund and investment-related matters for the Fund as well as presentations from New York Life Investments and, generally annually, MacKay personnel. In addition, the Board took into account other
information provided by New York Life Investments throughout the year, including, among other items, periodic reports on legal and compliance matters, risk management, portfolio turnover, brokerage commissions and non-advisory services provided to the Fund by New York Life Investments, as deemed relevant and appropriate by the Trustees.
In addition to information provided to the Board throughout the year, the Board received information in connection with its June 2023 meeting provided specifically in response to requests prepared on behalf of the Board, and in consultation with the Independent Trustees, by independent legal counsel to the Independent Trustees regarding the Fund’s distribution arrangements. In addition, the Board received information regarding the Fund’s asset levels, share purchase and redemption activity and the payment of Rule 12b-1 and/or certain other fees by the applicable share classes of the Fund, among other information.
In considering the continuation of each of the Advisory Agreements, the Trustees reviewed and evaluated the information and factors they believed to reasonably be necessary and appropriate in light of legal advice furnished to them by independent legal counsel to the Independent Trustees and through the exercise of their own business judgment. Although individual Trustees may have weighed certain factors or information differently and the Board did not consider any single factor or information controlling in reaching its decision, the factors that figured prominently in the Board’s consideration of the continuation of each of the Advisory Agreements are summarized in more detail below and include, among other factors: (i) the nature, extent and quality of the services provided to the Fund by New York Life Investments and MacKay; (ii) the qualifications of the portfolio managers of the Fund and the historical investment performance of the Fund, New York Life Investments and MacKay; (iii) the costs of the services provided, and profits realized, by New York Life Investments and MacKay with respect to their relationships with the Fund; (iv) the extent to which economies of scale have been realized or may be realized if the Fund grows and the extent to which any economies of scale have been shared, have benefited or may benefit the Fund’s shareholders; and (v) the reasonableness of the Fund’s management and subadvisory fees and total ordinary operating expenses. Although the Board recognized that comparisons between the Fund’s fees and expenses and those of other funds are imprecise given different terms of agreements, variations in fund strategies and other factors, the Board considered the reasonableness of the Fund’s management fee and total ordinary operating expenses as compared to the peer funds identified by ISS. Throughout their considerations, the Trustees acknowledged the commitment of New York Life Investments and its affiliates to serve the MainStay Group of Funds, as well as their capacity, experience, resources, financial stability and reputations. The Trustees also acknowledged the entrepreneurial and other risks assumed by New York Life Investments in sponsoring and managing the Fund. With respect to the Subadvisory Agreement, the Board took into account New York Life Investments’ recommendation to approve the continuation of the Subadvisory Agreement.
Board Consideration and Approval of Management Agreement and Subadvisory Agreement (Unaudited) (continued)
The Trustees noted that, throughout the year, the Trustees are afforded an opportunity to ask questions of, and request additional information or materials from, New York Life Investments and MacKay. The Board’s decision with respect to each of the Advisory Agreements may have also been based, in part, on the Board’s knowledge of New York Life Investments and MacKay resulting from, among other things, the Board’s consideration of each of the Advisory Agreements in prior years, the advisory agreements for other funds in the MainStay Group of Funds, the Board’s review throughout the year of the performance and operations of other funds in the MainStay Group of Funds and each Trustee’s business judgment and industry experience. In addition to considering the above-referenced factors, the Board observed that in the marketplace there are a range of investment options available to investors and that the Fund’s shareholders, having had the opportunity to consider other investment options, have invested in the Fund.
The factors that figured prominently in the Board’s decision to approve the continuation of each of the Advisory Agreements during the Board’s December 6–7, 2023 meeting are summarized in more detail below.
Nature, Extent and Quality of Services Provided by New York Life Investments and MacKay
The Board examined the nature, extent and quality of the services that New York Life Investments provides to the Fund. The Board evaluated New York Life Investments’ experience and capabilities in serving as manager of the Fund and considered that the Fund operates in a “manager-of-managers” structure. The Board also considered New York Life Investments’ responsibilities and services provided pursuant to this structure, including overseeing the services provided by MacKay, evaluating the performance of MacKay, making recommendations to the Board as to whether the Subadvisory Agreement should be renewed, modified or terminated and periodically reporting to the Board regarding the results of New York Life Investments’ evaluation and monitoring functions. The Board noted that New York Life Investments manages other mutual funds, serves a variety of other investment advisory clients, including other pooled investment vehicles, and has experience overseeing mutual fund service providers, including subadvisors. The Board considered the experience of senior personnel at New York Life Investments providing management and administrative and other non-advisory services to the Fund. The Board observed that New York Life Investments devotes significant resources and time to providing management and administrative and other non-advisory services to the Fund, including New York Life Investments’ oversight and due diligence reviews of MacKay and ongoing analysis of, and interactions with, MacKay with respect to, among other things, the Fund’s investment performance and risks as well as MacKay’s investment capabilities and subadvisory services with respect to the Fund.
The Board also considered the range of services that New York Life Investments provides to the Fund under the terms of the Management Agreement, including: (i) fund accounting and ongoing supervisory services provided by New York Life Investments’ Fund Administration and Accounting Group; (ii) investment supervisory and analytical services
provided by New York Life Investments’ Investment Consulting Group; (iii) compliance services provided by the Trust’s Chief Compliance Officer as well as New York Life Investments’ compliance department, including supervision and implementation of the Fund’s compliance program; (iv) legal services provided by New York Life Investments’ Office of the General Counsel; and (v) risk management monitoring and analysis by compliance and investment personnel. In addition, the Board considered New York Life Investments’ willingness to invest in personnel and other resources, such as cyber security, information security and business continuity planning, that may benefit the Fund and noted that New York Life Investments is responsible for compensating the Trust’s officers, except for a portion of the salary of the Trust’s Chief Compliance Officer. The Board recognized that New York Life Investments provides certain other non-advisory services to the Fund and has over time provided an increasingly broad array of non-advisory services to the MainStay Group of Funds as a result of regulatory and other developments.
The Board also examined the range, and the nature, extent and quality, of the investment advisory services that MacKay provides to the Fund and considered the terms of each of the Advisory Agreements. The Board evaluated MacKay’s experience and performance in serving as subadvisor to the Fund and advising other portfolios and MacKay’s track record and experience in providing investment advisory services as well as the experience of investment advisory, senior management and/or administrative personnel at MacKay. The Board considered New York Life Investments’ and MacKay’s overall resources, legal and compliance environment, capabilities, reputation, financial condition and history. In addition to information provided in connection with quarterly meetings with the Trust’s Chief Compliance Officer, the Board considered information regarding the compliance policies and procedures of New York Life Investments and MacKay and acknowledged their commitment to further developing and strengthening compliance programs that may relate to the Fund. The Board also considered MacKay’s ability to recruit and retain qualified investment professionals and willingness to invest in personnel and other resources that may benefit the Fund. In this regard, the Board considered the qualifications and experience of the Fund’s portfolio managers, the number of accounts managed by the portfolio managers and the method for compensating the portfolio managers.
In addition, the Board considered information provided by New York Life Investments and MacKay regarding their respective business continuity and disaster recovery plans.
Based on these considerations, among others, the Board concluded that the Fund would likely continue to benefit from the nature, extent and quality of these services.
Investment Performance
In evaluating the Fund’s investment performance, the Board considered investment performance results over various periods in light of the Fund’s investment objective, strategies and risks. The Board considered investment reports on, and analysis of, the Fund’s performance provided to the Board throughout the year. These reports include, among other
| 30 | MainStay MacKay Convertible Fund |
items, information on the Fund’s gross and net returns, the Fund’s investment performance compared to a relevant investment category and the Fund’s benchmarks, the Fund’s risk-adjusted investment performance and the Fund’s investment performance as compared to peer funds, as appropriate, as well as portfolio attribution information and commentary on the effect of market conditions. The Board also considered information provided by ISS showing the investment performance of the Fund as compared to peer funds. In addition, the Board reviewed the methodology used by ISS to construct the group of peer funds for comparative purposes.
The Board also took into account its discussions with senior management at New York Life Investments concerning the Fund’s investment performance over various periods as well as discussions between representatives of MacKay and the members of the Board’s Investment Committee, which generally occur on an annual basis.
Based on these considerations, among others, the Board concluded that its review of the Fund’s investment performance and related information supported a determination to approve the continuation of each of the Advisory Agreements.
Costs of the Services Provided, and Profits and Other Benefits Realized, by New York Life Investments and MacKay
The Board considered the costs of the services provided under each of the Advisory Agreements. The Board also considered the profitability of New York Life Investments and its affiliates, including MacKay, due to their relationships with the Fund as well as of New York Life Investments and its affiliates due to their relationships with the MainStay Group of Funds. Because MacKay is an affiliate of New York Life Investments whose subadvisory fee is paid by New York Life Investments, not the Fund, the Board considered cost and profitability information for New York Life Investments and MacKay in the aggregate.
In addition, the Board acknowledged the difficulty in obtaining reliable comparative data about mutual fund managers’ profitability because such information generally is not publicly available and may be impacted by numerous factors, including the structure of a fund manager’s organization, the types of funds it manages, the methodology used to allocate certain fixed costs to specific funds and the manager’s capital structure and costs of capital.
In evaluating the costs of the services provided by New York Life Investments and MacKay, and profitability of New York Life Investments and its affiliates, including MacKay, due to their relationships with the Fund, the Board considered, among other factors, New York Life Investments’ and its affiliates’, including MacKay’s, continuing investments in, or willingness to invest in, personnel and other resources that may support and further enhance the management of the Fund, and that New York Life Investments is responsible for paying the subadvisory fee for the Fund. The Board also considered the financial resources of New York Life Investments and MacKay and acknowledged that New York Life Investments and MacKay must be in a position to recruit and retain experienced professional personnel and to maintain a strong financial
position for New York Life Investments and MacKay to continue to provide high-quality services to the Fund. The Board recognized that the Fund benefits from the allocation of certain fixed costs among the funds in the MainStay Group of Funds, among other expected benefits resulting from its relationship with New York Life Investments.
The Board considered information regarding New York Life Investments’ methodology for calculating profitability and allocating costs provided by New York Life Investments in connection with the fund profitability analysis presented to the Board. The Board concluded that New York Life Investments’ methods for allocating costs and procedures for estimating overall profitability of the relationship with the funds in the MainStay Group of Funds were reasonable. The Board recognized the difficulty in calculating and evaluating a manager’s profitability with respect to the Fund and considered that other profitability methodologies may also be reasonable.
The Board also considered certain fall-out benefits that may be realized by New York Life Investments and its affiliates, including MacKay, due to their relationships with the Fund, including reputational and other indirect benefits. The Board recognized, for example, the benefits to MacKay from legally permitted “soft-dollar” arrangements by which brokers provide research and other services to MacKay in exchange for commissions paid by the Fund with respect to trades in the Fund’s portfolio securities. In addition, the Board considered its review of the management agreement for a money market fund advised by New York Life Investments and an affiliated subadvisor that serves as an investment option for the Fund, including the potential rationale for and costs associated with investments in this money market fund by the Fund, if any, and considered information from New York Life Investments that the nature and type of specific investment advisory services provided to this money market fund are distinct from, or in addition to, the investment advisory services provided to the Fund.
The Board observed that, in addition to fees earned by New York Life Investments under the Management Agreement for managing the Fund, New York Life Investments’ affiliates also earn revenues from serving the Fund in various other capacities, including as the Fund’s transfer agent and distributor. The Board considered information about these other revenues and their impact on the profitability of the relationship with the Fund to New York Life Investments and its affiliates. The Board noted that, although it assessed the overall profitability of the relationship with the Fund to New York Life Investments and its affiliates as part of the contract review process, when considering the reasonableness of the fee paid to New York Life Investments under the Management Agreement, the Board considered the profitability of New York Life Investments’ relationship with the Fund on a pre-tax basis and without regard to distribution expenses incurred by New York Life Investments from its own resources.
Board Consideration and Approval of Management Agreement and Subadvisory Agreement (Unaudited) (continued)
After evaluating the information deemed relevant by the Trustees, the Board concluded that any profits realized by New York Life Investments and its affiliates, including MacKay, due to their relationships with the Fund were not excessive and other expected benefits that may accrue to New York Life Investments and its affiliates, including MacKay, are reasonable.
Management and Subadvisory Fees and Total Ordinary Operating Expenses
The Board evaluated the reasonableness of the fee paid under each of the Advisory Agreements and the Fund’s total ordinary operating expenses. With respect to the management fee and subadvisory fee, the Board primarily considered the reasonableness of the management fee paid by the Fund to New York Life Investments because the subadvisory fee paid to MacKay is paid by New York Life Investments, not the Fund. The Board also considered the reasonableness of the subadvisory fee paid by New York Life Investments and the amount of the management fee retained by New York Life Investments.
In assessing the reasonableness of the Fund’s fees and expenses, the Board primarily considered comparative data provided by ISS on the fees and expenses of similar mutual funds managed by other investment advisers. The Board reviewed the methodology used by ISS to construct the group of peer funds for comparative purposes. In addition, the Board considered information provided by New York Life Investments and MacKay on fees charged to other investment advisory clients, including institutional separate accounts and/or other funds, that follow investment strategies similar to those of the Fund, if any. The Board considered the contractual management fee schedule for the Fund as compared to those for such other investment advisory clients, taking into account the rationale for differences in fee schedules. The Board also took into account information provided by New York Life Investments about the more extensive scope of services provided to registered investment companies, such as the Fund, as compared with other investment advisory clients. Additionally, the Board considered the impact of contractual breakpoints, voluntary waivers and expense limitation arrangements on the Fund’s net management fee and expenses. The Board also considered that in proposing fees for the Fund, New York Life Investments considers the competitive marketplace for mutual funds. The Board noted that New York Life Investments proposed an additional management fee and subadvisory fee breakpoint for the Fund, effective February 28, 2024.
The Board took into account information from New York Life Investments, as provided in connection with the Board’s June 2023 meeting, regarding the reasonableness of the Fund’s transfer agent fee schedule, including industry data demonstrating that the fees that NYLIM Service Company LLC, an affiliate of New York Life Investments and the Fund’s transfer agent, charges the Fund are within the range of fees charged by transfer agents to other mutual funds. In addition, the Board considered NYLIM Service Company LLC’s profitability in connection with the transfer agent services it provides to the Fund. The Board also took into account
information provided by NYLIM Service Company LLC regarding the sub-transfer agency payments it made to intermediaries in connection with the provision of sub-transfer agency services to the Fund.
The Board considered the extent to which transfer agent fees contributed to the total expenses of the Fund. The Board acknowledged the role that the MainStay Group of Funds historically has played in serving the investment needs of New York Life Insurance Company customers, who often maintain smaller account balances than other shareholders of funds, and the impact of small accounts on the expense ratios of Fund share classes. The Board also recognized measures that it and New York Life Investments have taken that are intended to mitigate the effect of small accounts on the expense ratios of Fund share classes, including through the imposition of an expense limitation on net transfer agency expenses. The Board also considered that NYLIM Service Company LLC had waived its contractual cost of living adjustments during certain years.
Based on the factors outlined above, among other considerations, the Board concluded that the Fund’s management fee and total ordinary operating expenses are within a range that is competitive and support a conclusion that these fees and expenses are reasonable.
Economies of Scale
The Board considered information regarding economies of scale, including whether economies of scale may exist with respect to the Fund and whether the Fund’s management fee and expense structure permits any economies of scale to be appropriately shared with the Fund’s shareholders. The Board also considered a report from New York Life Investments, previously prepared at the request of the Board, that addressed economies of scale, including with respect to the mutual fund business generally, and the various ways in which the benefits of economies of scale may be shared with the funds in the MainStay Group of Funds. Although the Board recognized the difficulty of determining economies of scale with precision, the Board acknowledged that economies of scale may be shared with the Fund in a number of ways, including, for example, through the imposition of fee breakpoints, initially setting management fee rates at scale or making additional investments to enhance the services provided to the Fund. The Board reviewed information from New York Life Investments showing how the Fund’s management fee schedule compared to fee schedules of other funds and accounts managed by New York Life Investments. The Board also reviewed information from ISS showing how the Fund’s management fee schedule compared with fees paid for similar services by peer funds at varying asset levels.
Based on this information, the Board concluded that economies of scale are appropriately shared for the benefit of the Fund’s shareholders through the Fund’s management fee and expense structure and other methods to share benefits from economies of scale.
| 32 | MainStay MacKay Convertible Fund |
Conclusion
On the basis of the information and factors summarized above, among other information and factors deemed relevant by the Trustees, and the evaluation thereof, the Board, including the Independent Trustees voting separately, unanimously voted to approve the continuation of each of the Advisory Agreements.
Discussion of the Operation and Effectiveness of the Fund's Liquidity Risk Management Program (Unaudited)
In compliance with Rule 22e-4 under the Investment Company Act of 1940, as amended (the “Liquidity Rule”), the Fund has adopted and implemented a liquidity risk management program (the “Program”), which New York Life Investment Management LLC believes is reasonably designed to assess and manage the Fund's liquidity risk. A Fund's liquidity risk is the risk that the Fund could not meet requests to redeem shares issued by the Fund without significant dilution of the remaining investors’ interests in the Fund. The Board of Trustees of The MainStay Funds (the "Board") previously approved the designation of New York Life Investment Management LLC as administrator of the Program (the “Administrator”). The Administrator has established a Liquidity Risk Management Committee to assist the Administrator in the implementation and day-to-day administration of the Program and to otherwise support the Administrator in fulfilling its responsibilities under the Program.
At a meeting of the Board held on February 27, 2024, the Administrator provided the Board with a written report addressing the Program’s operation and assessing the adequacy and effectiveness of its implementation for the period from January 1, 2023, through December 31, 2023 (the "Review Period"), as required under the Liquidity Rule. The report noted that the Administrator concluded that (i) the Program operated effectively to assess and manage the Fund's liquidity risk, (ii) the Program has been and continues to be adequately and effectively implemented to monitor and, as applicable, respond to the Fund's liquidity developments and (iii) the Fund's investment strategy continues to be appropriate for an open-end fund. In addition, the report summarized the operation of the Program and the information and factors considered by the Administrator in its assessment of the Program’s implementation, such as the liquidity risk assessment framework and the liquidity classification methodologies, and discussed notable geopolitical, market and other economic events that impacted liquidity risk during the Review Period.
In accordance with the Program, the Fund's liquidity risk is assessed no less frequently than annually taking into consideration certain factors, as applicable, such as (i) investment strategy and liquidity of portfolio investments, (ii) short-term and long-term cash flow projections, and (iii) holdings of cash and cash equivalents, as well as borrowing arrangements and other funding sources. Certain factors are considered under both normal and reasonably foreseeable stressed conditions.
Each Fund portfolio investment is classified into one of four liquidity categories. The classification is based on a determination of the number of days it is reasonably expected to take to convert the investment into cash, or sell or dispose of the investment, in current market conditions without significantly changing the market value of the investment. The Administrator has delegated liquidity classification determinations to the Fund’s subadvisor, subject to appropriate oversight by the Administrator, and liquidity classification determinations are made by taking into account the Fund's reasonably anticipated trade size, various market, trading and investment-specific considerations, as well as market depth, and, in certain cases, third-party vendor data.
The Liquidity Rule requires funds that do not primarily hold assets that are highly liquid investments to adopt a minimum amount of net assets that must be invested in highly liquid investments that are assets (an “HLIM”). In addition, the Liquidity Rule limits a fund's investments in illiquid investments. Specifically, the Liquidity Rule prohibits acquisition of illiquid investments if, immediately after acquisition, doing so would result in a fund holding more than 15% of its net assets in illiquid investments that are assets. The Program includes provisions reasonably designed to determine, periodically review and comply with the HLIM requirement, as applicable, and to comply with the 15% limit on illiquid investments.
There can be no assurance that the Program will achieve its objectives under all circumstances in the future. Please refer to the Fund's prospectus for more information regarding the Fund's exposure to liquidity risk and other risks to which it may be subject.
| 34 | MainStay MacKay Convertible Fund |
Proxy Voting Policies and Procedures and Proxy Voting Record
The Fund is required to file with the SEC its proxy voting record for the 12-month period ending June 30 on Form N-PX. A description of the policies and procedures that are used to vote proxies relating to portfolio securities of the Fund is available free of charge upon request by calling 800-624-6782 or visiting the SEC’s website at www.sec.gov. The most recent Form N-PX or proxy voting record is available free of charge upon request by calling 800-624-6782; visiting newyorklifeinvestments.com; or visiting the SEC’s website at www.sec.gov.
Shareholder Reports and Quarterly Portfolio Disclosure
The Fund is required to file its complete schedule of portfolio holdings with the SEC 60 days after its first and third fiscal quarter on Form N-PORT. The Fund's holdings report is available free of charge upon request by calling New York Life Investments at 800-624-6782.
This page intentionally left blank.
This page intentionally left blank.
This page intentionally left blank.
Equity
U.S. Equity
MainStay Epoch U.S. Equity Yield Fund
MainStay Fiera SMID Growth Fund
MainStay PineStone U.S. Equity Fund
MainStay S&P 500 Index Fund
MainStay Winslow Large Cap Growth Fund
MainStay WMC Enduring Capital Fund
MainStay WMC Growth Fund
MainStay WMC Small Companies Fund
MainStay WMC Value Fund
International Equity
MainStay Epoch International Choice Fund
MainStay PineStone International Equity Fund
MainStay WMC International Research Equity Fund
Emerging Markets Equity
MainStay Candriam Emerging Markets Equity Fund
Global Equity
MainStay Epoch Capital Growth Fund
MainStay Epoch Global Equity Yield Fund
MainStay PineStone Global Equity Fund
Fixed Income
Taxable Income
MainStay Candriam Emerging Markets Debt Fund
MainStay Floating Rate Fund
MainStay MacKay High Yield Corporate Bond Fund
MainStay MacKay Short Duration High Income Fund
MainStay MacKay Strategic Bond Fund
MainStay MacKay Total Return Bond Fund
MainStay MacKay U.S. Infrastructure Bond Fund
MainStay Short Term Bond Fund
Tax-Exempt Income
MainStay MacKay Arizona Muni Fund
MainStay MacKay California Tax Free Opportunities Fund1
MainStay MacKay Colorado Muni Fund
MainStay MacKay High Yield Municipal Bond Fund
MainStay MacKay New York Tax Free Opportunities Fund2
MainStay MacKay Oregon Muni Fund
MainStay MacKay Short Term Municipal Fund
MainStay MacKay Strategic Municipal Allocation Fund
MainStay MacKay Tax Free Bond Fund
MainStay MacKay Utah Muni Fund
Money Market
MainStay Money Market Fund
Mixed Asset
MainStay Balanced Fund
MainStay Income Builder Fund
MainStay MacKay Convertible Fund
Speciality
MainStay CBRE Global Infrastructure Fund
MainStay CBRE Real Estate Fund
MainStay Cushing MLP Premier Fund
Asset Allocation
MainStay Conservative Allocation Fund
MainStay Conservative ETF Allocation Fund
MainStay Equity Allocation Fund
MainStay Equity ETF Allocation Fund
MainStay Growth Allocation Fund
MainStay Growth ETF Allocation Fund
MainStay Moderate Allocation Fund
MainStay Moderate ETF Allocation Fund
Manager
New York Life Investment Management LLC
New York, New York
Subadvisors
Candriam3
Strassen, Luxembourg
CBRE Investment Management Listed Real Assets LLC
Radnor, Pennsylvania
Cushing Asset Management, LP
Dallas, Texas
Epoch Investment Partners, Inc.
New York, New York
Fiera Capital Inc.
New York, New York
IndexIQ Advisors LLC3
New York, New York
MacKay Shields LLC3
New York, New York
NYL Investors LLC3
New York, New York
PineStone Asset Management Inc.
Montreal, Québec
Wellington Management Company LLP
Boston, Massachusetts
Winslow Capital Management, LLC
Minneapolis, Minnesota
Legal Counsel
Dechert LLP
Washington, District of Columbia
Independent Registered Public Accounting Firm
KPMG LLP
Philadelphia, Pennsylvania
Distributor
NYLIFE Distributors LLC3
Jersey City, New Jersey
Custodian
JPMorgan Chase Bank, N.A.
New York, New York
1.
This Fund is registered for sale in AZ, CA, NV, OR, TX, UT, WA (all share classes); and MI (Class A and Class I shares only); and CO, FL, GA, HI, ID, MA, MD, NH, NJ and NY (Class I and Class C2 shares only).
| 2. | This Fund is registered for sale in CA, CT, DE, FL, MA, NJ, NY, VT (all share classes) and SD (Class R6 shares only). |
| 3. | An affiliate of New York Life Investment Management LLC. |
Not part of the Semiannual Report
For more information
800-624-6782
newyorklifeinvestments.com
“New York Life Investments” is both a service mark, and the common trade name, of certain investment advisors affiliated with New York Life Insurance Company. The MainStay Funds® are managed by New York Life Investment Management LLC and distributed by NYLIFE Distributors LLC, 30 Hudson Street, Jersey City, NJ 07302, a wholly owned subsidiary of New York Life Insurance Company. NYLIFE Distributors LLC is a Member FINRA/SIPC.
©2024 NYLIFE Distributors LLC. All rights reserved.
| 5022168 MS081-24 | MSC10-06/24 |
(NYLIM) NL210
MainStay MacKay High Yield Corporate Bond Fund
Message from the President and Semiannual Report
Unaudited | April 30, 2024
Special Notice:
Beginning in July 2024, new regulations issued by the Securities and Exchange Commission (SEC) will take effect requiring open-end mutual fund companies and ETFs to (1) overhaul the content of their shareholder reports and (2) mail paper copies of the new tailored shareholder reports to shareholders who have not opted to receive these documents electronically.
If you have not yet elected to receive your shareholder reports electronically, please contact your financial intermediary or visit newyorklifeinvestments.com/accounts.
| Not FDIC/NCUA Insured | Not a Deposit | May Lose Value | No Bank Guarantee | Not Insured by Any Government Agency |
This page intentionally left blank
Message from the President
Stock and bond markets gained broad ground during the six-month period ended April 30, 2024, bolstered by better-than-expected economic growth and the prospect of monetary easing in the face of a myriad of macroeconomic and geopolitical challenges.
Throughout the reporting period, interest rates remained at their highest levels in decades in most developed countries, with the U.S. federal funds rate in the 5.25%−5.50% range, as central banks struggled to bring inflation under control. Early in the reporting period, the U.S. Federal Reserve began to forecast interest rate cuts in 2024, but delayed action as inflation remained stubbornly high, fluctuating between 3.1% and 3.5%. Nevertheless, despite the increasing cost of capital and tighter lending environment that resulted from sustained high rates, economic growth remained surprisingly robust, supported by high levels of consumer spending, low unemployment and strong corporate earnings. Investors tended to shrug off concerns related to sticky inflation and high interest rates—not to mention the ongoing war in Ukraine, intensifying hostilities in the Middle East and simmering tensions between China and the United States—focusing instead on the positives of continued economic growth and surprisingly strong corporate profits.
The S&P 500® Index, a widely regarded benchmark of U.S. market performance, produced double-digit gains, reaching record levels in March 2024. Market strength, which had been narrowly focused on mega-cap, technology-related stocks during the previous six months broadened significantly during the reporting period. All industry sectors produced positive results, with the strongest returns in communication services, information technology and industrials, and more moderate gains in the lagging energy, real estate and consumer staples areas. Growth-oriented shares slightly outperformed value-oriented
issues, while large- and mid-cap stocks modestly outperformed their small-cap counterparts. Most overseas equity markets trailed the U.S. market, as developed international economies experienced relatively low growth rates, and weak economic conditions in China undermined emerging markets.
Bonds generally gained ground as well. The yield on the 10-year Treasury note ranged between approximately 4.7% and 3.8%, while the 2-year Treasury yield remained slightly higher, between approximately 5.0% and 4.1%, in an inverted curve pattern often viewed as indicative of an impending economic slowdown. Nevertheless, the prevailing environment of stable interest rates and attractive yields provided a favorable environment for fixed-income investors. Long-term Treasury bonds and investment-grade corporate bonds produced similar gains, while high yield bonds advanced by a slightly greater margin, despite the added risks implicit in an uptick in default rates. International bond markets modestly outperformed their U.S. counterparts, led by a rebound in the performance of emerging-markets debt.
The risks and uncertainties inherent in today’s markets call for the kind of insight and expertise that New York Life Investments offers through our one-on-one philosophy, long-lasting focus, and multi-boutique approach.
Thank you for trusting us to help you meet your investment needs.
Sincerely,
Kirk C. Lehneis
President
The opinions expressed are as of the date of this report and are subject to change. There is no guarantee that any forecast made will come to pass. This material does not constitute investment advice and is not intended as an endorsement of any specific investment. Past performance is no guarantee of future results.
Not part of the Semiannual Report
Investors should refer to the Fund’s Summary Prospectus and/or Prospectus and consider the Fund’s investment objectives, strategies, risks, charges and expenses carefully before investing. The Summary Prospectus and/or Prospectus contain this and other information about the Fund. You may obtain copies of the Fund’s Summary Prospectus, Prospectus and Statement of Additional Information, which includes information about The MainStay Funds' Trustees, free of charge, upon request, by calling toll-free 800-624-6782, by writing to NYLIFE Distributors LLC, Attn: MainStay Marketing Department, 30 Hudson Street, Jersey City, NJ 07302 or by sending an e-mail to MainStayShareholderServices@nylim.com. These documents are also available on dfinview.com/NYLIM. Please read the Fund’s Summary Prospectus and/or Prospectus carefully before investing.
Investment and Performance Comparison (Unaudited)
Performance data quoted represents past performance. Past performance is no guarantee of future results. Because of market volatility and other factors, current performance may be lower or higher than the figures shown. Investment return and principal value will fluctuate, and as a result, when shares are redeemed, they may be worth more or less than their original cost. The graph below depicts the historical performance of Class I shares of the Fund. Performance will vary from class to class based on differences in class-specific expenses and sales charges. For performance information current to the most recent month-end, please call 800-624-6782 or visit newyorklifeinvestments.com.
The performance table and graph do not reflect the deduction of taxes that a shareholder would pay on distributions or Fund share redemptions. Total returns reflect maximum applicable sales charges as indicated in the table below, if any, changes in share price, and reinvestment of dividend and capital gain distributions. The graph assumes the initial investment amount shown below and reflects the deduction of all sales charges that would have applied for the period of investment. Performance figures may reflect certain fee waivers and/or expense limitations, without which total returns may have been lower. For more information on share classes and current fee waivers and/or expense limitations (if any), please refer to the Notes to Financial Statements.
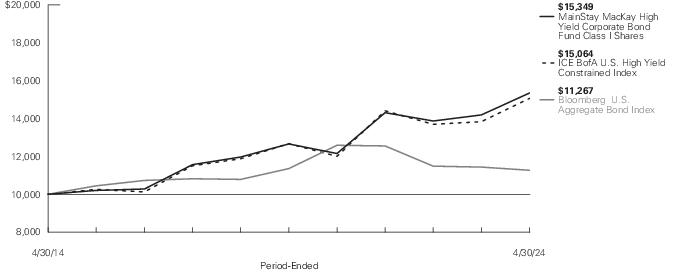
| Average Annual Total Returns for the Period-Ended April 30, 2024 |
| Class | Sales Charge | | Inception
Date | Six
Months1 | One
Year | Five
Years | Ten Years
or Since
Inception | Gross
Expense
Ratio2 |
| Class A Shares | Maximum 4.50% Initial Sales Charge | With sales charges | 1/3/1995 | 2.77% | 3.05% | 2.75% | 3.65% | 0.96% |
| | | Excluding sales charges | | 7.61 | 7.91 | 3.70 | 4.13 | 0.96 |
| Investor Class Shares3 | Maximum 4.00% Initial Sales Charge | With sales charges | 2/28/2008 | 3.36 | 3.35 | 2.60 | 3.55 | 1.14 |
| | | Excluding sales charges | | 7.67 | 7.66 | 3.55 | 4.03 | 1.14 |
| Class B Shares4 | Maximum 5.00% CDSC | With sales charges | 5/1/1986 | 2.16 | 1.74 | 2.43 | 3.25 | 1.89 |
| | if Redeemed Within the First Six Years of Purchase | Excluding sales charges | | 7.16 | 6.74 | 2.75 | 3.25 | 1.89 |
| Class C Shares | Maximum 1.00% CDSC | With sales charges | 9/1/1998 | 6.15 | 5.94 | 2.79 | 3.25 | 1.89 |
| | if Redeemed Within One Year of Purchase | Excluding sales charges | | 7.15 | 6.94 | 2.79 | 3.25 | 1.89 |
| Class I Shares | No Sales Charge | | 1/2/2004 | 7.74 | 8.17 | 3.93 | 4.38 | 0.71 |
| Class R2 Shares | No Sales Charge | | 5/1/2008 | 7.55 | 7.79 | 3.60 | 4.01 | 1.06 |
| Class R3 Shares | No Sales Charge | | 2/29/2016 | 7.44 | 7.55 | 3.30 | 5.32 | 1.31 |
| Class R6 Shares | No Sales Charge | | 6/17/2013 | 7.85 | 8.16 | 4.09 | 4.51 | 0.56 |
| SIMPLE Class Shares | No Sales Charge | | 8/31/2020 | 7.46 | 7.65 | N/A | 3.13 | 1.21 |
| 1. | Not annualized. |
| 2. | The gross expense ratios presented reflect the Fund’s “Total Annual Fund Operating Expenses” from the most recent Prospectus, as supplemented, and may differ from other expense ratios disclosed in this report. |
| 3. | Prior to June 30, 2020, the maximum initial sales charge was 4.50%, which is reflected in the applicable average annual total return figures shown. |
| 4. | Class B shares are closed to all new purchases as well as additional investments by existing Class B shareholders. |
The footnotes on the next page are an integral part of the table and graph and should be carefully read in conjunction with them.
| Benchmark Performance* | Six
Months1 | One
Year | Five
Years | Ten
Years |
| Bloomberg U.S. Aggregate Bond Index2 | 4.97% | -1.47% | -0.16% | 1.20% |
| ICE BofA U.S. High Yield Constrained Index3 | 8.96 | 8.89 | 3.52 | 4.18 |
| Morningstar High Yield Bond Category Average4 | 8.40 | 8.58 | 3.33 | 3.48 |
| * | Returns for indices reflect no deductions for fees, expenses or taxes, except for foreign withholding taxes where applicable. Results assume reinvestment of all dividends and capital gains. An investment cannot be made directly in an index. |
| 1. | Not annualized. |
| 2. | In accordance with new regulatory requirements, the Fund has selected the Bloomberg U.S. Aggregate Bond Index, which represents a broad measure of market performance, as a replacement for the ICE BofA U.S. High Yield Constrained Index. The Bloomberg U.S. Aggregate Bond Index is a broad-based benchmark that measures performance of the investment grade, U.S. dollar denominated, fixed-rate taxable bond market, including Treasuries, government-related and corporate securities, mortgage-backed securities (agency fixed-rate and hybrid adjustable-rate mortgage pass-throughs), asset-backed securities and commercial mortgage-backed securities. |
| 3. | The ICE BofA U.S. High Yield Constrained Index, which is generally representative of the market sectors or types of investments in which the Fund invests, is a market value-weighted index of all domestic and Yankee high-yield bonds, including deferred interest bonds and payment-in-kind securities. Issuers included in the ICE BofA U.S. High Yield Constrained Index have maturities of one year or more and have a credit rating lower than BBB-/Baa3, but are not in default. No single issuer may constitute greater than 2% of the ICE BofA U.S. High Yield Constrained Index. |
| 4. | The Morningstar High Yield Bond Category Average is representative of funds that concentrate on lower-quality bonds, which are riskier than those of higher-quality companies. These funds primarily invest in U.S. high-income debt securities where at least 65% or more of bond assets are not rated or are rated by a major agency such as Standard & Poor’s or Moody’s at the level of BB and below. Results are based on average total returns of similar funds with all dividends and capital gain distributions reinvested. |
The footnotes on the preceding page are an integral part of the table and graph and should be carefully read in conjunction with them.
| 6 | MainStay MacKay High Yield Corporate Bond Fund |
Cost in Dollars of a $1,000 Investment in MainStay MacKay High Yield Corporate Bond Fund (Unaudited)
The example below is intended to describe the fees and expenses borne by shareholders during the six-month period from November 1, 2023 to April 30, 2024, and the impact of those costs on your investment.
Example
As a shareholder of the Fund you incur two types of costs: (1) transaction costs, including exchange fees and sales charges (loads) on purchases (as applicable), and (2) ongoing costs, including management fees, distribution and/or service (12b-1) fees and other Fund expenses (as applicable). This example is intended to help you understand your ongoing costs (in dollars) of investing in the Fund and to compare these costs with the ongoing costs of investing in other mutual funds. The example is based on an investment of $1,000 made at the beginning of the six-month period and held for the entire period from November 1, 2023 to April 30, 2024.
This example illustrates your Fund’s ongoing costs in two ways:
Actual Expenses
The second and third data columns in the table below provide information about actual account values and actual expenses. You may use the information in these columns, together with the amount you invested, to estimate the expenses that you paid during the six months ended April 30, 2024. Simply divide your account value by $1,000 (for example, an $8,600 account value divided by $1,000 = 8.6), then multiply the
result by the number under the heading entitled “Expenses Paid During Period” to estimate the expenses you paid on your account during this period.
Hypothetical Example for Comparison Purposes
The fourth and fifth data columns in the table below provide information about hypothetical account values and hypothetical expenses based on the Fund’s actual expense ratio and an assumed rate of return of 5% per year before expenses, which is not the Fund’s actual return. The hypothetical account values and expenses may not be used to estimate the actual ending account balances or expenses you paid for the six-month period shown. You may use this information to compare the ongoing costs of investing in the Fund with the ongoing costs of investing in other mutual funds. To do so, compare this 5% hypothetical example with the 5% hypothetical examples that appear in the shareholder reports of the other mutual funds.
Please note that the expenses shown in the table are meant to highlight your ongoing costs only and do not reflect any transactional costs, such as exchange fees or sales charges (loads). Therefore, the fourth and fifth data columns of the table are useful in comparing ongoing costs only and will not help you determine the relative total costs of owning different funds. In addition, if these transactional costs were included, your costs would have been higher.
| Share Class | Beginning
Account
Value
11/1/23 | Ending Account
Value (Based
on Actual
Returns and
Expenses)
4/30/24 | Expenses
Paid
During
Period1 | Ending Account
Value (Based
on Hypothetical
5% Annualized
Return and
Actual Expenses)
4/30/24 | Expenses
Paid
During
Period1 | Net Expense
Ratio
During
Period2 |
| Class A Shares | $1,000.00 | $1,076.10 | $4.96 | $1,020.09 | $4.82 | 0.96% |
| Investor Class Shares | $1,000.00 | $1,076.70 | $5.89 | $1,019.19 | $5.72 | 1.14% |
| Class B Shares | $1,000.00 | $1,071.60 | $9.73 | $1,015.46 | $9.47 | 1.89% |
| Class C Shares | $1,000.00 | $1,071.50 | $9.73 | $1,015.46 | $9.47 | 1.89% |
| Class I Shares | $1,000.00 | $1,077.40 | $3.67 | $1,021.33 | $3.57 | 0.71% |
| Class R2 Shares | $1,000.00 | $1,075.50 | $5.47 | $1,019.59 | $5.32 | 1.06% |
| Class R3 Shares | $1,000.00 | $1,074.40 | $6.76 | $1,018.35 | $6.57 | 1.31% |
| Class R6 Shares | $1,000.00 | $1,078.50 | $2.89 | $1,022.08 | $2.82 | 0.56% |
| SIMPLE Class Shares | $1,000.00 | $1,074.60 | $5.98 | $1,019.09 | $5.82 | 1.16% |
| 1. | Expenses are equal to the Fund’s annualized expense ratio of each class multiplied by the average account value over the period, divided by 366 and multiplied by 182 (to reflect the six-month period). The table above represents the actual expenses incurred during the six-month period. In addition to the fees and expenses which the Fund bears directly, it also indirectly bears a pro rata share of the fees and expenses of the underlying funds in which it invests. Such indirect expenses are not included in the above-reported expense figures. |
| 2. | Expenses are equal to the Fund's annualized expense ratio to reflect the six-month period. |
Portfolio Composition as of April 30, 2024 (Unaudited)
‡ Less than one-tenth of a percent.
See Portfolio of Investments beginning on page 9 for specific holdings within these categories. The Fund's holdings are subject to change.
Top Ten Holdings and/or Issuers Held as of April 30, 2024 (excluding short-term investments) (Unaudited)
| 1. | CCO Holdings LLC, 4.25%-5.375%, due 5/1/27–1/15/34 |
| 2. | TransDigm, Inc., 4.625%-7.125%, due 11/15/27–3/1/32 |
| 3. | HCA, Inc., 5.375%-7.69%, due 2/1/25–11/6/33 |
| 4. | Yum! Brands, Inc., 3.625%-5.375%, due 1/15/30–4/1/32 |
| 5. | IHO Verwaltungs GmbH, 4.75%-6.375%, due 9/15/26–5/15/29 |
| 6. | Churchill Downs, Inc., 4.75%-6.75%, due 4/1/27–5/1/31 |
| 7. | Carnival Corp., 4.00%-7.625%, due 3/1/26–8/15/29 |
| 8. | Mineral Resources Ltd., 8.00%-9.25%, due 5/1/27–5/1/30 |
| 9. | Great Outdoors Group LLC, 9.18%, due 3/6/28 |
| 10. | Mercer International, Inc., 5.125%-12.875%, due 1/15/26–2/1/29 |
| 8 | MainStay MacKay High Yield Corporate Bond Fund |
Portfolio of Investments April 30, 2024†^(Unaudited)
| | Principal
Amount | Value |
| Long-Term Bonds 92.4% |
| Convertible Bonds 1.1% |
| Energy-Alternate Sources 0.1% |
| NextEra Energy Partners LP (a) | | |
| (zero coupon), due 11/15/25 | $ 6,750,000 | $ 6,053,063 |
| 2.50%, due 6/15/26 | 10,500,000 | 9,473,258 |
| | | 15,526,321 |
| Media 0.3% |
| Cable One, Inc. | | |
| (zero coupon), due 3/15/26 | 5,000,000 | 4,337,500 |
| 1.125%, due 3/15/28 | 12,645,000 | 9,377,532 |
| DISH Network Corp. | | |
| 3.375%, due 8/15/26 | 30,080,000 | 18,499,144 |
| | | 32,214,176 |
| Oil & Gas 0.5% |
| Gulfport Energy Operating Corp. | | |
| 10.00% (10.00% Cash or 15.00% PIK), due 12/29/49 (b)(c) | 4,201,000 | 47,624,355 |
| Oil & Gas Services 0.2% |
| Forum Energy Technologies, Inc. | | |
| 9.00% (6.25% Cash and 2.75% PIK), due 8/4/25 (c) | 18,220,551 | 18,229,661 |
Total Convertible Bonds
(Cost $79,132,100) | | 113,594,513 |
| Corporate Bonds 85.2% |
| Advertising 0.9% |
| Lamar Media Corp. | | |
| 3.625%, due 1/15/31 | 35,590,000 | 30,429,450 |
| 3.75%, due 2/15/28 | 17,000,000 | 15,690,414 |
| 4.00%, due 2/15/30 | 28,300,000 | 25,258,013 |
| 4.875%, due 1/15/29 | 11,000,000 | 10,401,710 |
| Outfront Media Capital LLC (a) | | |
| 5.00%, due 8/15/27 | 12,000,000 | 11,421,272 |
| 7.375%, due 2/15/31 | 5,000,000 | 5,131,005 |
| | | 98,331,864 |
| Aerospace & Defense 2.3% |
| AAR Escrow Issuer LLC | | |
| 6.75%, due 3/15/29 (a) | 6,500,000 | 6,535,100 |
| F-Brasile SpA | | |
| Series XR | | |
| 7.375%, due 8/15/26 (a) | 23,280,000 | 23,163,600 |
| | Principal
Amount | Value |
| |
| Aerospace & Defense (continued) |
| TransDigm, Inc. | | |
| 4.625%, due 1/15/29 | $ 27,950,000 | $ 25,601,921 |
| 4.875%, due 5/1/29 | 18,920,000 | 17,402,245 |
| 5.50%, due 11/15/27 | 8,900,000 | 8,649,150 |
| 6.375%, due 3/1/29 (a) | 78,065,000 | 77,468,844 |
| 6.625%, due 3/1/32 (a) | 33,150,000 | 33,093,644 |
| 6.75%, due 8/15/28 (a) | 30,390,000 | 30,519,129 |
| 6.875%, due 12/15/30 (a) | 10,650,000 | 10,722,414 |
| 7.125%, due 12/1/31 (a) | 11,560,000 | 11,780,502 |
| | | 244,936,549 |
| Airlines 0.4% |
| American Airlines, Inc. (a) | | |
| 5.50%, due 4/20/26 | 9,333,333 | 9,225,060 |
| 5.75%, due 4/20/29 | 10,000,000 | 9,657,327 |
| Delta Air Lines, Inc. | | |
| 7.375%, due 1/15/26 | 7,000,000 | 7,159,651 |
| Mileage Plus Holdings LLC | | |
| 6.50%, due 6/20/27 (a) | 12,291,500 | 12,312,256 |
| | | 38,354,294 |
| Auto Manufacturers 0.8% |
| General Motors Financial Co., Inc. | | |
| 4.35%, due 4/9/25 | 5,000,000 | 4,932,520 |
| 5.25%, due 3/1/26 | 10,000,000 | 9,915,651 |
| JB Poindexter & Co., Inc. | | |
| 8.75%, due 12/15/31 (a) | 51,440,000 | 52,559,797 |
| PM General Purchaser LLC | | |
| 9.50%, due 10/1/28 (a) | 15,585,000 | 15,788,111 |
| | | 83,196,079 |
| Auto Parts & Equipment 2.1% |
| Adient Global Holdings Ltd. (a) | | |
| 4.875%, due 8/15/26 | 16,000,000 | 15,385,261 |
| 7.00%, due 4/15/28 | 3,340,000 | 3,374,238 |
| 8.25%, due 4/15/31 | 5,000,000 | 5,192,225 |
| IHO Verwaltungs GmbH (a)(c) | | |
| 4.75% (4.75% Cash or 5.50% PIK), due 9/15/26 | 35,785,000 | 34,460,053 |
| 6.00% (6.00% Cash or 6.75% PIK), due 5/15/27 | 49,074,000 | 48,217,758 |
| 6.375% (6.375% Cash or 7.125% PIK), due 5/15/29 | 40,980,000 | 40,284,845 |
| Phinia, Inc. | | |
| 6.75%, due 4/15/29 (a) | 10,000,000 | 10,035,616 |
| Real Hero Merger Sub 2, Inc. | | |
| 6.25%, due 2/1/29 (a) | 37,125,000 | 31,804,702 |
| Tenneco, Inc. | | |
| 8.00%, due 11/17/28 (a) | 23,685,000 | 22,130,404 |
The notes to the financial statements are an integral part of, and should be read in conjunction with, the financial statements.
9
Portfolio of Investments April 30, 2024†^(Unaudited) (continued)
| | Principal
Amount | Value |
| Corporate Bonds (continued) |
| Auto Parts & Equipment (continued) |
| ZF North America Capital, Inc. | | |
| 7.125%, due 4/14/30 (a) | $ 5,000,000 | $ 5,112,430 |
| | | 215,997,532 |
| Building Materials 1.4% |
| Builders FirstSource, Inc. | | |
| 6.375%, due 6/15/32 (a) | 8,385,000 | 8,298,001 |
| EMRLD Borrower LP | | |
| 6.625%, due 12/15/30 (a) | 31,425,000 | 31,143,417 |
| James Hardie International Finance DAC | | |
| 5.00%, due 1/15/28 (a) | 33,195,000 | 31,910,357 |
| Knife River Corp. | | |
| 7.75%, due 5/1/31 (a) | 18,540,000 | 19,256,645 |
| New Enterprise Stone & Lime Co., Inc. | | |
| 5.25%, due 7/15/28 (a) | 8,500,000 | 7,984,319 |
| Summit Materials LLC (a) | | |
| 5.25%, due 1/15/29 | 14,480,000 | 13,913,735 |
| 6.50%, due 3/15/27 | 22,730,000 | 22,671,185 |
| 7.25%, due 1/15/31 | 9,000,000 | 9,246,006 |
| | | 144,423,665 |
| Chemicals 3.2% |
| ASP Unifrax Holdings, Inc. (a) | | |
| 5.25%, due 9/30/28 | 23,160,000 | 13,953,092 |
| 7.50%, due 9/30/29 | 19,530,000 | 10,009,125 |
| Avient Corp. (a) | | |
| 5.75%, due 5/15/25 | 8,550,000 | 8,506,916 |
| 7.125%, due 8/1/30 | 13,745,000 | 13,906,896 |
| Axalta Coating Systems Dutch Holding B BV | | |
| 7.25%, due 2/15/31 (a) | 4,000,000 | 4,079,492 |
| CVR Partners LP | | |
| 6.125%, due 6/15/28 (a) | 2,550,000 | 2,379,147 |
| GPD Cos., Inc. | | |
| 10.125%, due 4/1/26 (a) | 37,122,000 | 34,858,739 |
| Innophos Holdings, Inc. | | |
| 9.375%, due 2/15/28 (a) | 31,386,000 | 27,146,222 |
| Iris Holdings, Inc. | | |
| 8.75% (8.75% Cash or 9.50% PIK), due 2/15/26 (a)(c) | 21,105,000 | 17,740,756 |
| Mativ Holdings, Inc. | | |
| 6.875%, due 10/1/26 (a) | 12,500,000 | 12,322,353 |
| NOVA Chemicals Corp. (a) | | |
| 5.25%, due 6/1/27 | 24,000,000 | 22,576,927 |
| 8.50%, due 11/15/28 | 14,360,000 | 15,093,494 |
| | Principal
Amount | Value |
| |
| Chemicals (continued) |
NOVA Chemicals Corp. (a)
(continued) | | |
| 9.00%, due 2/15/30 | $ 22,710,000 | $ 23,400,337 |
| Olympus Water US Holding Corp. (a) | | |
| 7.125%, due 10/1/27 | 7,400,000 | 7,493,754 |
| 9.75%, due 11/15/28 | 32,000,000 | 33,955,795 |
| SCIH Salt Holdings, Inc. (a) | | |
| 4.875%, due 5/1/28 | 10,000,000 | 9,297,885 |
| 6.625%, due 5/1/29 | 25,980,000 | 23,971,338 |
| SCIL IV LLC | | |
| 5.375%, due 11/1/26 (a) | 16,000,000 | 15,356,362 |
| SK Invictus Intermediate II SARL | | |
| 5.00%, due 10/30/29 (a) | 41,855,000 | 36,488,101 |
| WR Grace Holdings LLC | | |
| 7.375%, due 3/1/31 (a) | 5,000,000 | 5,068,300 |
| | | 337,605,031 |
| Coal 0.1% |
| Coronado Finance Pty. Ltd. | | |
| 10.75%, due 5/15/26 (a) | 10,720,000 | 11,085,473 |
| Commercial Services 2.2% |
| Alta Equipment Group, Inc. | | |
| 5.625%, due 4/15/26 (a) | 6,075,000 | 5,847,015 |
| Gartner, Inc. | | |
| 3.75%, due 10/1/30 (a) | 15,000,000 | 13,054,086 |
| GEO Group, Inc. (The) (a) | | |
| 8.625%, due 4/15/29 | 6,300,000 | 6,377,864 |
| 10.25%, due 4/15/31 | 14,000,000 | 14,433,165 |
| Graham Holdings Co. | | |
| 5.75%, due 6/1/26 (a) | 43,445,000 | 42,881,026 |
| Korn Ferry | | |
| 4.625%, due 12/15/27 (a) | 10,685,000 | 10,132,248 |
| NESCO Holdings II, Inc. | | |
| 5.50%, due 4/15/29 (a) | 35,619,000 | 33,153,926 |
| Service Corp. International | | |
| 3.375%, due 8/15/30 | 7,500,000 | 6,362,167 |
| TriNet Group, Inc. | | |
| 7.125%, due 8/15/31 (a) | 8,500,000 | 8,542,874 |
| United Rentals North America, Inc. | | |
| 3.75%, due 1/15/32 | 4,790,000 | 4,090,499 |
| 3.875%, due 2/15/31 | 16,675,000 | 14,619,847 |
| 4.875%, due 1/15/28 | 12,760,000 | 12,230,830 |
| 5.25%, due 1/15/30 | 2,500,000 | 2,397,673 |
| Wand NewCo 3, Inc. | | |
| 7.625%, due 1/30/32 (a) | 4,000,000 | 4,066,402 |
| Williams Scotsman, Inc. (a) | | |
| 4.625%, due 8/15/28 | 17,860,000 | 16,484,410 |
The notes to the financial statements are an integral part of, and should be read in conjunction with, the financial statements.
| 10 | MainStay MacKay High Yield Corporate Bond Fund |
| | Principal
Amount | Value |
| Corporate Bonds (continued) |
| Commercial Services (continued) |
Williams Scotsman, Inc. (a)
(continued) | | |
| 6.125%, due 6/15/25 | $ 17,550,000 | $ 17,484,187 |
| 7.375%, due 10/1/31 | 11,515,000 | 11,763,416 |
| WW International, Inc. | | |
| 4.50%, due 4/15/29 (a) | 21,010,000 | 8,785,216 |
| | | 232,706,851 |
| Computers 0.2% |
| McAfee Corp. | | |
| 7.375%, due 2/15/30 (a) | 18,010,000 | 16,682,132 |
| Cosmetics & Personal Care 0.4% |
| Edgewell Personal Care Co. (a) | | |
| 4.125%, due 4/1/29 | 22,500,000 | 20,336,879 |
| 5.50%, due 6/1/28 | 20,505,000 | 19,786,513 |
| | | 40,123,392 |
| Distribution & Wholesale 0.8% |
| Dealer Tire LLC | | |
| 8.00%, due 2/1/28 (a) | 17,040,000 | 16,762,759 |
| G-III Apparel Group Ltd. | | |
| 7.875%, due 8/15/25 (a) | 23,000,000 | 23,112,194 |
| H&E Equipment Services, Inc. | | |
| 3.875%, due 12/15/28 (a) | 5,500,000 | 4,866,882 |
| Ritchie Bros Holdings, Inc. (a) | | |
| 6.75%, due 3/15/28 | 13,290,000 | 13,415,631 |
| 7.75%, due 3/15/31 | 28,245,000 | 29,293,539 |
| | | 87,451,005 |
| Diversified Financial Services 2.8% |
| AG TTMT Escrow Issuer LLC | | |
| 8.625%, due 9/30/27 (a) | 29,250,000 | 30,128,962 |
| Aretec Group, Inc. (a) | | |
| 7.50%, due 4/1/29 | 18,467,000 | 17,411,929 |
| 10.00%, due 8/15/30 | 10,600,000 | 11,513,806 |
| Cantor Fitzgerald LP | | |
| 7.20%, due 12/12/28 (a) | 5,000,000 | 5,073,800 |
| Credit Acceptance Corp. | | |
| 6.625%, due 3/15/26 | 31,000,000 | 30,906,051 |
| Enact Holdings, Inc. | | |
| 6.50%, due 8/15/25 (a) | 28,500,000 | 28,474,350 |
| Jane Street Group | | |
| 7.125%, due 4/30/31 (a) | 37,700,000 | 37,936,140 |
| Jefferies Finance LLC | | |
| 5.00%, due 8/15/28 (a) | 37,570,000 | 33,802,140 |
| | Principal
Amount | Value |
| |
| Diversified Financial Services (continued) |
| LPL Holdings, Inc. (a) | | |
| 4.00%, due 3/15/29 | $ 16,810,000 | $ 15,242,626 |
| 4.375%, due 5/15/31 | 6,000,000 | 5,338,226 |
| 4.625%, due 11/15/27 | 15,000,000 | 14,293,457 |
| Osaic Holdings, Inc. | | |
| 10.75%, due 8/1/27 (a) | 10,000,000 | 10,352,900 |
| PennyMac Financial Services, Inc. (a) | | |
| 4.25%, due 2/15/29 | 8,000,000 | 7,093,363 |
| 5.75%, due 9/15/31 | 6,500,000 | 5,891,831 |
| StoneX Group, Inc. (a) | | |
| 7.875%, due 3/1/31 | 36,060,000 | 36,467,118 |
| 8.625%, due 6/15/25 | 9,196,000 | 9,217,224 |
| | | 299,143,923 |
| Electric 2.4% |
| Clearway Energy Operating LLC | | |
| 4.75%, due 3/15/28 (a) | 23,940,000 | 22,559,853 |
| DPL, Inc. | | |
| 4.125%, due 7/1/25 | 18,825,000 | 18,285,792 |
| Keystone Power Pass-Through Holders LLC | | |
| 13.00%, due 6/1/24 (a)(b)(d) | 9,396,256 | 6,023,000 |
| Leeward Renewable Energy Operations LLC | | |
| 4.25%, due 7/1/29 (a) | 15,285,000 | 12,649,557 |
| NextEra Energy Operating Partners LP (a) | | |
| 3.875%, due 10/15/26 | 14,542,000 | 13,604,120 |
| 4.50%, due 9/15/27 | 5,000,000 | 4,658,827 |
| NRG Energy, Inc. | | |
| 6.625%, due 1/15/27 | 3,220,000 | 3,213,340 |
| Pattern Energy Operations LP | | |
| 4.50%, due 8/15/28 (a) | 11,800,000 | 10,551,017 |
| PG&E Corp. | | |
| 5.00%, due 7/1/28 | 19,460,000 | 18,542,029 |
| 5.25%, due 7/1/30 | 15,000,000 | 14,044,400 |
| Talen Energy Supply LLC | | |
| 8.625%, due 6/1/30 (a) | 55,045,000 | 58,239,481 |
| TransAlta Corp. | | |
| 7.75%, due 11/15/29 | 15,150,000 | 15,505,906 |
| Vistra Corp. (a)(e)(f) | | |
| 7.00% (5 Year Treasury Constant Maturity Rate + 5.74%), due 12/15/26 | 10,280,000 | 10,154,360 |
| 8.00% (5 Year Treasury Constant Maturity Rate + 6.93%), due 10/15/26 (b) | 31,800,000 | 32,129,225 |
The notes to the financial statements are an integral part of, and should be read in conjunction with, the financial statements.
11
Portfolio of Investments April 30, 2024†^(Unaudited) (continued)
| | Principal
Amount | Value |
| Corporate Bonds (continued) |
| Electric (continued) |
| Vistra Operations Co. LLC | | |
| 6.875%, due 4/15/32 (a) | $ 10,650,000 | $ 10,605,399 |
| | | 250,766,306 |
| Electrical Components & Equipment 0.4% |
| EnerSys | | |
| 6.625%, due 1/15/32 (a) | 10,000,000 | 9,958,767 |
| WESCO Distribution, Inc. (a) | | |
| 6.375%, due 3/15/29 | 7,500,000 | 7,450,494 |
| 6.625%, due 3/15/32 | 18,220,000 | 18,134,740 |
| 7.125%, due 6/15/25 | 6,665,000 | 6,669,392 |
| | | 42,213,393 |
| Engineering & Construction 0.6% |
| Artera Services LLC | | |
| 8.50%, due 2/15/31 (a) | 17,660,000 | 18,070,666 |
| Great Lakes Dredge & Dock Corp. | | |
| 5.25%, due 6/1/29 (a) | 14,928,000 | 12,528,361 |
| Railworks Holdings LP | | |
| 8.25%, due 11/15/28 (a) | 9,425,000 | 9,412,606 |
| TopBuild Corp. | | |
| 4.125%, due 2/15/32 (a) | 2,500,000 | 2,164,378 |
| Weekley Homes LLC | | |
| 4.875%, due 9/15/28 (a) | 21,580,000 | 19,736,503 |
| | | 61,912,514 |
| Entertainment 3.6% |
| Affinity Interactive | | |
| 6.875%, due 12/15/27 (a) | 12,295,000 | 11,004,694 |
| Boyne USA, Inc. | | |
| 4.75%, due 5/15/29 (a) | 18,355,000 | 16,701,946 |
| Caesars Entertainment, Inc. (a) | | |
| 6.50%, due 2/15/32 | 9,000,000 | 8,867,189 |
| 7.00%, due 2/15/30 | 19,750,000 | 19,888,706 |
| CCM Merger, Inc. | | |
| 6.375%, due 5/1/26 (a) | 5,000,000 | 4,987,881 |
| Churchill Downs, Inc. (a) | | |
| 4.75%, due 1/15/28 | 53,025,000 | 50,098,746 |
| 5.50%, due 4/1/27 | 39,174,000 | 38,144,228 |
| 5.75%, due 4/1/30 | 21,750,000 | 20,696,131 |
| 6.75%, due 5/1/31 | 12,800,000 | 12,707,190 |
| International Game Technology plc | | |
| 6.25%, due 1/15/27 (a) | 25,700,000 | 25,662,517 |
| Jacobs Entertainment, Inc. (a) | | |
| 6.75%, due 2/15/29 | 25,354,000 | 24,051,020 |
| 6.75%, due 2/15/29 | 8,775,000 | 8,309,736 |
| Light & Wonder International, Inc. (a) | | |
| 7.25%, due 11/15/29 | 4,870,000 | 4,911,673 |
| | Principal
Amount | Value |
| |
| Entertainment (continued) |
Light & Wonder International, Inc. (a)
(continued) | | |
| 7.50%, due 9/1/31 | $ 17,500,000 | $ 17,847,428 |
| Live Nation Entertainment, Inc. | | |
| 6.50%, due 5/15/27 (a) | 41,280,000 | 41,361,128 |
| Merlin Entertainments Group US Holdings, Inc. | | |
| 7.375%, due 2/15/31 (a) | 10,750,000 | 10,800,377 |
| Merlin Entertainments Ltd. | | |
| 5.75%, due 6/15/26 (a) | 35,100,000 | 34,683,674 |
| Midwest Gaming Borrower LLC | | |
| 4.875%, due 5/1/29 (a) | 5,000,000 | 4,560,977 |
| Motion Bondco DAC | | |
| 6.625%, due 11/15/27 (a) | 17,500,000 | 16,878,741 |
| Vail Resorts, Inc. | | |
| 6.25%, due 5/15/25 (a) | 10,095,000 | 10,100,513 |
| | | 382,264,495 |
| Food 1.2% |
| B&G Foods, Inc. | | |
| 5.25%, due 4/1/25 | 8,237,000 | 8,140,690 |
| 8.00%, due 9/15/28 (a) | 14,390,000 | 14,911,681 |
| Chobani LLC | | |
| 7.625%, due 7/1/29 (a) | 21,750,000 | 21,980,028 |
| Land O'Lakes Capital Trust I | | |
| 7.45%, due 3/15/28 (a) | 18,956,000 | 18,560,388 |
| Nathan's Famous, Inc. | | |
| 6.625%, due 11/1/25 (a) | 1,602,000 | 1,593,990 |
| Simmons Foods, Inc. | | |
| 4.625%, due 3/1/29 (a) | 44,335,000 | 38,252,535 |
| United Natural Foods, Inc. | | |
| 6.75%, due 10/15/28 (a) | 26,018,000 | 19,967,124 |
| | | 123,406,436 |
| Forest Products & Paper 1.2% |
| Mercer International, Inc. | | |
| 5.125%, due 2/1/29 | 69,075,000 | 60,330,215 |
| 5.50%, due 1/15/26 | 18,500,000 | 17,942,044 |
| 12.875%, due 10/1/28 (a) | 16,750,000 | 18,261,922 |
| Smurfit Kappa Treasury Funding DAC | | |
| 7.50%, due 11/20/25 | 34,120,000 | 34,736,623 |
| | | 131,270,804 |
| Gas 0.2% |
| AmeriGas Partners LP | | |
| 5.75%, due 5/20/27 | 6,000,000 | 5,823,623 |
| 5.875%, due 8/20/26 | 14,575,000 | 14,331,560 |
| | | 20,155,183 |
The notes to the financial statements are an integral part of, and should be read in conjunction with, the financial statements.
| 12 | MainStay MacKay High Yield Corporate Bond Fund |
| | Principal
Amount | Value |
| Corporate Bonds (continued) |
| Hand & Machine Tools 0.4% |
| Regal Rexnord Corp. (a) | | |
| 6.05%, due 2/15/26 | $ 7,250,000 | $ 7,251,028 |
| 6.05%, due 4/15/28 | 7,000,000 | 6,986,473 |
| 6.30%, due 2/15/30 | 5,000,000 | 5,021,380 |
| 6.40%, due 4/15/33 | 3,750,000 | 3,780,413 |
| Werner FinCo. LP (a) | | |
| 11.50%, due 6/15/28 | 5,500,000 | 5,998,696 |
| 14.50% (8.75% Cash and 5.75% PIK), due 10/15/28 (b)(c) | 13,635,841 | 12,903,103 |
| | | 41,941,093 |
| Healthcare-Products 1.5% |
| Bausch + Lomb Corp. | | |
| 8.375%, due 10/1/28 (a) | 32,540,000 | 33,605,685 |
| Hologic, Inc. (a) | | |
| 3.25%, due 2/15/29 | 39,100,000 | 34,531,368 |
| 4.625%, due 2/1/28 | 10,205,000 | 9,705,701 |
| Neogen Food Safety Corp. | | |
| 8.625%, due 7/20/30 (a) | 16,600,000 | 17,502,775 |
| Teleflex, Inc. | | |
| 4.25%, due 6/1/28 (a) | 43,155,000 | 39,878,327 |
| 4.625%, due 11/15/27 | 3,525,000 | 3,356,419 |
| Varex Imaging Corp. | | |
| 7.875%, due 10/15/27 (a) | 21,202,000 | 21,610,361 |
| | | 160,190,636 |
| Healthcare-Services 4.1% |
| Acadia Healthcare Co., Inc. (a) | | |
| 5.00%, due 4/15/29 | 10,000,000 | 9,391,852 |
| 5.50%, due 7/1/28 | 10,840,000 | 10,432,535 |
| Catalent Pharma Solutions, Inc. (a) | | |
| 3.125%, due 2/15/29 | 16,375,000 | 15,628,840 |
| 3.50%, due 4/1/30 | 9,500,000 | 9,037,186 |
| 5.00%, due 7/15/27 | 13,395,000 | 13,135,590 |
| CHS/Community Health Systems, Inc. | | |
| 5.25%, due 5/15/30 (a) | 5,000,000 | 4,087,925 |
| DaVita, Inc. (a) | | |
| 3.75%, due 2/15/31 | 18,035,000 | 14,840,511 |
| 4.625%, due 6/1/30 | 15,790,000 | 13,834,154 |
| Encompass Health Corp. | | |
| 4.50%, due 2/1/28 | 25,720,000 | 24,142,211 |
| 4.625%, due 4/1/31 | 8,200,000 | 7,363,300 |
| 4.75%, due 2/1/30 | 24,390,000 | 22,366,649 |
| Fortrea Holdings, Inc. | | |
| 7.50%, due 7/1/30 (a) | 5,000,000 | 5,043,617 |
| | Principal
Amount | Value |
| |
| Healthcare-Services (continued) |
| HCA, Inc. | | |
| 5.375%, due 2/1/25 | $ 26,525,000 | $ 26,406,079 |
| 5.875%, due 2/15/26 | 20,750,000 | 20,759,659 |
| 7.50%, due 11/6/33 | 42,975,000 | 46,840,671 |
| 7.58%, due 9/15/25 | 11,020,000 | 11,274,446 |
| 7.69%, due 6/15/25 | 31,650,000 | 32,282,803 |
| IQVIA, Inc. (a) | | |
| 5.00%, due 10/15/26 | 29,113,000 | 28,473,713 |
| 5.00%, due 5/15/27 | 5,000,000 | 4,827,028 |
| 6.50%, due 5/15/30 | 6,000,000 | 6,027,222 |
| LifePoint Health, Inc. (a) | | |
| 5.375%, due 1/15/29 | 17,978,000 | 14,374,037 |
| 11.00%, due 10/15/30 | 20,900,000 | 22,245,800 |
| RegionalCare Hospital Partners Holdings, Inc. | | |
| 9.75%, due 12/1/26 (a) | 48,930,000 | 48,718,133 |
| Tenet Healthcare Corp. | | |
| 6.125%, due 6/15/30 | 10,100,000 | 9,927,273 |
| 6.75%, due 5/15/31 (a) | 10,000,000 | 10,019,831 |
| | | 431,481,065 |
| Holding Companies-Diversified 1.0% |
| Benteler International AG | | |
| 10.50%, due 5/15/28 (a) | 42,015,000 | 44,728,768 |
| Stena International SA (a) | | |
| 7.25%, due 1/15/31 | 27,285,000 | 27,307,029 |
| 7.625%, due 2/15/31 | 28,500,000 | 28,806,047 |
| | | 100,841,844 |
| Home Builders 1.8% |
| Adams Homes, Inc. | | |
| 7.50%, due 2/15/25 (a) | 7,527,000 | 7,514,067 |
| Brookfield Residential Properties, Inc. | | |
| 6.25%, due 9/15/27 (a) | 17,360,000 | 16,694,515 |
| Century Communities, Inc. | | |
| 3.875%, due 8/15/29 (a) | 15,245,000 | 13,309,874 |
| 6.75%, due 6/1/27 | 26,205,000 | 26,256,336 |
| Installed Building Products, Inc. | | |
| 5.75%, due 2/1/28 (a) | 25,430,000 | 24,673,907 |
| M/I Homes, Inc. | | |
| 3.95%, due 2/15/30 | 4,000,000 | 3,469,404 |
| 4.95%, due 2/1/28 | 7,500,000 | 7,104,265 |
| Meritage Homes Corp. | | |
| 3.875%, due 4/15/29 (a) | 13,700,000 | 12,420,480 |
| 5.125%, due 6/6/27 | 8,515,000 | 8,286,620 |
| Shea Homes LP | | |
| 4.75%, due 2/15/28 | 26,925,000 | 25,279,376 |
| 4.75%, due 4/1/29 | 6,250,000 | 5,733,616 |
The notes to the financial statements are an integral part of, and should be read in conjunction with, the financial statements.
13
Portfolio of Investments April 30, 2024†^(Unaudited) (continued)
| | Principal
Amount | Value |
| Corporate Bonds (continued) |
| Home Builders (continued) |
| STL Holding Co. LLC | | |
| 8.75%, due 2/15/29 (a) | $ 12,500,000 | $ 12,844,536 |
| Winnebago Industries, Inc. | | |
| 6.25%, due 7/15/28 (a) | 30,155,000 | 29,513,416 |
| | | 193,100,412 |
| Household Products & Wares 0.3% |
| Central Garden & Pet Co. | | |
| 4.125%, due 10/15/30 | 15,620,000 | 13,644,156 |
| 4.125%, due 4/30/31 (a) | 14,875,000 | 12,868,685 |
| | | 26,512,841 |
| Housewares 0.5% |
| Scotts Miracle-Gro Co. (The) | | |
| 4.00%, due 4/1/31 | 25,455,000 | 21,443,169 |
| 4.375%, due 2/1/32 | 14,290,000 | 12,026,607 |
| 4.50%, due 10/15/29 | 26,000,000 | 23,187,421 |
| | | 56,657,197 |
| Insurance 1.0% |
| BroadStreet Partners, Inc. | | |
| 5.875%, due 4/15/29 (a) | 11,800,000 | 10,753,472 |
| Fairfax Financial Holdings Ltd. | | |
| 8.30%, due 4/15/26 | 5,435,000 | 5,644,616 |
| Fidelity & Guaranty Life Holdings, Inc. | | |
| 5.50%, due 5/1/25 (a) | 14,850,000 | 14,707,737 |
| HUB International Ltd. | | |
| 7.25%, due 6/15/30 (a) | 8,000,000 | 8,117,352 |
| MGIC Investment Corp. | | |
| 5.25%, due 8/15/28 | 25,957,000 | 24,915,465 |
| NMI Holdings, Inc. | | |
| 7.375%, due 6/1/25 (a) | 21,500,000 | 21,659,253 |
| Panther Escrow Issuer LLC | | |
| 7.125%, due 6/1/31 (a) | 13,600,000 | 13,670,532 |
| USI, Inc. | | |
| 7.50%, due 1/15/32 (a) | 10,000,000 | 9,946,797 |
| | | 109,415,224 |
| Internet 1.2% |
| Cars.com, Inc. | | |
| 6.375%, due 11/1/28 (a) | 23,300,000 | 22,269,688 |
| Gen Digital, Inc. (a) | | |
| 6.75%, due 9/30/27 | 10,000,000 | 10,037,215 |
| 7.125%, due 9/30/30 | 8,000,000 | 8,082,535 |
| Netflix, Inc. | | |
| 5.875%, due 11/15/28 | 26,300,000 | 26,844,441 |
| | Principal
Amount | Value |
| |
| Internet (continued) |
| Uber Technologies, Inc. (a) | | |
| 6.25%, due 1/15/28 | $ 4,125,000 | $ 4,122,660 |
| 7.50%, due 9/15/27 | 24,710,000 | 25,157,823 |
| VeriSign, Inc. | | |
| 4.75%, due 7/15/27 | 15,194,000 | 14,747,424 |
| 5.25%, due 4/1/25 | 15,391,000 | 15,327,347 |
| | | 126,589,133 |
| Investment Companies 0.5% |
| Compass Group Diversified Holdings LLC (a) | | |
| 5.00%, due 1/15/32 | 6,100,000 | 5,375,239 |
| 5.25%, due 4/15/29 | 30,000,000 | 28,043,705 |
| Icahn Enterprises LP | | |
| 5.25%, due 5/15/27 | 11,380,000 | 10,449,626 |
| 6.25%, due 5/15/26 | 12,770,000 | 12,419,662 |
| | | 56,288,232 |
| Iron & Steel 1.6% |
| Allegheny Ludlum LLC | | |
| 6.95%, due 12/15/25 | 22,688,000 | 22,991,656 |
| Big River Steel LLC | | |
| 6.625%, due 1/31/29 (a) | 38,582,000 | 38,438,459 |
| Mineral Resources Ltd. (a) | | |
| 8.00%, due 11/1/27 | 5,000,000 | 5,056,899 |
| 8.125%, due 5/1/27 | 52,840,000 | 53,335,949 |
| 8.50%, due 5/1/30 | 17,379,000 | 17,799,103 |
| 9.25%, due 10/1/28 | 24,835,000 | 26,035,425 |
| | | 163,657,491 |
| Leisure Time 1.8% |
| Carnival Corp. (a) | | |
| 4.00%, due 8/1/28 | 28,000,000 | 25,600,555 |
| 5.75%, due 3/1/27 | 49,795,000 | 48,597,994 |
| 6.00%, due 5/1/29 | 22,000,000 | 21,318,953 |
| 7.00%, due 8/15/29 | 5,000,000 | 5,132,865 |
| 7.625%, due 3/1/26 | 9,110,000 | 9,166,507 |
| Carnival Holdings Bermuda Ltd. | | |
| 10.375%, due 5/1/28 (a) | 25,400,000 | 27,540,382 |
| MajorDrive Holdings IV LLC | | |
| 6.375%, due 6/1/29 (a) | 7,500,000 | 7,038,102 |
| Royal Caribbean Cruises Ltd. (a) | | |
| 5.375%, due 7/15/27 | 8,895,000 | 8,656,302 |
| 5.50%, due 4/1/28 | 15,000,000 | 14,600,500 |
| 7.25%, due 1/15/30 | 18,215,000 | 18,731,618 |
| 9.25%, due 1/15/29 | 5,000,000 | 5,339,790 |
| | | 191,723,568 |
The notes to the financial statements are an integral part of, and should be read in conjunction with, the financial statements.
| 14 | MainStay MacKay High Yield Corporate Bond Fund |
| | Principal
Amount | Value |
| Corporate Bonds (continued) |
| Lodging 1.6% |
| Boyd Gaming Corp. | | |
| 4.75%, due 12/1/27 | $ 39,340,000 | $ 37,270,416 |
| 4.75%, due 6/15/31 (a) | 48,500,000 | 42,947,050 |
| Hilton Domestic Operating Co., Inc. | | |
| 4.00%, due 5/1/31 (a) | 38,340,000 | 33,594,976 |
| 4.875%, due 1/15/30 | 39,460,000 | 37,093,587 |
| 5.75%, due 5/1/28 (a) | 12,500,000 | 12,355,773 |
| Station Casinos LLC | | |
| 4.50%, due 2/15/28 (a) | 4,000,000 | 3,710,078 |
| | | 166,971,880 |
| Machinery—Construction & Mining 0.3% |
| Terex Corp. | | |
| 5.00%, due 5/15/29 (a) | 10,000,000 | 9,355,482 |
| Vertiv Group Corp. | | |
| 4.125%, due 11/15/28 (a) | 28,670,000 | 26,551,510 |
| | | 35,906,992 |
| Machinery-Diversified 0.8% |
| Briggs & Stratton Corp. Escrow Claim Shares | | |
| 6.875%, due 12/15/20 (d)(g)(h) | 9,200,000 | — |
| Chart Industries, Inc. | | |
| 7.50%, due 1/1/30 (a) | 12,000,000 | 12,273,664 |
| Maxim Crane Works Holdings Capital LLC | | |
| 11.50%, due 9/1/28 (a) | 16,250,000 | 17,210,310 |
| TK Elevator Holdco GmbH | | |
| 7.625%, due 7/15/28 (a) | 16,416,000 | 16,088,970 |
| TK Elevator U.S. Newco, Inc. | | |
| 5.25%, due 7/15/27 (a) | 39,490,000 | 37,774,885 |
| | | 83,347,829 |
| Media 5.8% |
| Block Communications, Inc. | | |
| 4.875%, due 3/1/28 (a) | 16,000,000 | 13,834,200 |
| Cable One, Inc. | | |
| 4.00%, due 11/15/30 (a) | 20,625,000 | 15,734,904 |
| CCO Holdings LLC | | |
| 4.25%, due 2/1/31 (a) | 36,815,000 | 28,812,998 |
| 4.25%, due 1/15/34 (a) | 28,050,000 | 20,322,542 |
| 4.50%, due 8/15/30 (a) | 38,000,000 | 30,880,753 |
| 4.50%, due 5/1/32 | 51,500,000 | 39,542,544 |
| 4.50%, due 6/1/33 (a) | 10,000,000 | 7,519,934 |
| 4.75%, due 3/1/30 (a) | 31,835,000 | 26,453,143 |
| 5.00%, due 2/1/28 (a) | 24,000,000 | 21,856,318 |
| 5.125%, due 5/1/27 (a) | 41,225,000 | 38,634,934 |
| 5.375%, due 6/1/29 (a) | 13,495,000 | 11,886,378 |
| | Principal
Amount | Value |
| |
| Media (continued) |
| CSC Holdings LLC (a) | | |
| 5.50%, due 4/15/27 | $ 5,000,000 | $ 4,099,061 |
| 5.75%, due 1/15/30 | 22,000,000 | 9,647,442 |
| 6.50%, due 2/1/29 | 14,230,000 | 10,613,014 |
| 7.50%, due 4/1/28 | 8,000,000 | 4,328,323 |
| 11.25%, due 5/15/28 | 15,585,000 | 13,785,460 |
| 11.75%, due 1/31/29 | 16,000,000 | 14,214,800 |
| Directv Financing LLC (a) | | |
| 5.875%, due 8/15/27 | 58,500,000 | 54,526,495 |
| 8.875%, due 2/1/30 | 17,530,000 | 17,045,185 |
| LCPR Senior Secured Financing DAC (a) | | |
| 5.125%, due 7/15/29 | 20,650,000 | 17,247,001 |
| 6.75%, due 10/15/27 | 59,087,000 | 54,763,329 |
| News Corp. (a) | | |
| 3.875%, due 5/15/29 | 41,830,000 | 37,673,972 |
| 5.125%, due 2/15/32 | 13,610,000 | 12,470,580 |
| Scripps Escrow II, Inc. | | |
| 3.875%, due 1/15/29 (a) | 8,000,000 | 5,909,567 |
| Sirius XM Radio, Inc. (a) | | |
| 5.00%, due 8/1/27 | 9,425,000 | 8,900,879 |
| 5.50%, due 7/1/29 | 11,590,000 | 10,758,277 |
| Sterling Entertainment Enterprises LLC | | |
| 10.25%, due 1/15/25 (b)(d)(h) | 20,000,000 | 18,586,000 |
| Videotron Ltd. | | |
| 5.375%, due 6/15/24 (a) | 10,000,000 | 9,982,000 |
| Virgin Media Finance plc | | |
| 5.00%, due 7/15/30 (a) | 27,500,000 | 22,520,992 |
| Virgin Media Secured Finance plc | | |
| 5.50%, due 5/15/29 (a) | 12,500,000 | 11,361,744 |
| VZ Secured Financing BV | | |
| 5.00%, due 1/15/32 (a) | 6,000,000 | 5,054,029 |
| Ziggo BV | | |
| 4.875%, due 1/15/30 (a) | 10,500,000 | 9,187,974 |
| | | 608,154,772 |
| Metal Fabricate & Hardware 0.4% |
| Advanced Drainage Systems, Inc. (a) | | |
| 5.00%, due 9/30/27 | 18,315,000 | 17,735,189 |
| 6.375%, due 6/15/30 | 12,615,000 | 12,541,092 |
| Vallourec SACA | | |
| 7.50%, due 4/15/32 (a) | 9,485,000 | 9,562,590 |
| | | 39,838,871 |
| Mining 1.7% |
| Alcoa Nederland Holding BV | | |
| 7.125%, due 3/15/31 (a) | 21,300,000 | 21,545,120 |
The notes to the financial statements are an integral part of, and should be read in conjunction with, the financial statements.
15
Portfolio of Investments April 30, 2024†^(Unaudited) (continued)
| | Principal
Amount | Value |
| Corporate Bonds (continued) |
| Mining (continued) |
| Century Aluminum Co. | | |
| 7.50%, due 4/1/28 (a) | $ 37,330,000 | $ 37,005,901 |
| Compass Minerals International, Inc. | | |
| 6.75%, due 12/1/27 (a) | 27,135,000 | 25,447,162 |
| Eldorado Gold Corp. | | |
| 6.25%, due 9/1/29 (a) | 18,980,000 | 17,874,145 |
| First Quantum Minerals Ltd. (a) | | |
| 6.875%, due 10/15/27 | 22,250,000 | 21,401,841 |
| 8.625%, due 6/1/31 | 8,500,000 | 8,227,136 |
| 9.375%, due 3/1/29 | 11,500,000 | 11,881,513 |
| IAMGOLD Corp. | | |
| 5.75%, due 10/15/28 (a) | 39,275,000 | 36,307,841 |
| | | 179,690,659 |
| Miscellaneous—Manufacturing 1.4% |
| Amsted Industries, Inc. (a) | | |
| 4.625%, due 5/15/30 | 13,090,000 | 11,770,302 |
| 5.625%, due 7/1/27 | 27,395,000 | 26,632,893 |
| Calderys Financing LLC | | |
| 11.25%, due 6/1/28 (a) | 10,730,000 | 11,392,878 |
| EnPro, Inc. | | |
| 5.75%, due 10/15/26 | 26,809,000 | 26,442,856 |
| Gates Global LLC | | |
| 6.25%, due 1/15/26 (a) | 20,750,000 | 20,754,444 |
| Hillenbrand, Inc. | | |
| 5.75%, due 6/15/25 | 7,000,000 | 6,961,626 |
| 6.25%, due 2/15/29 | 8,000,000 | 7,937,269 |
| LSB Industries, Inc. | | |
| 6.25%, due 10/15/28 (a) | 18,955,000 | 17,968,641 |
| Trinity Industries, Inc. | | |
| 7.75%, due 7/15/28 (a) | 12,725,000 | 13,005,179 |
| | | 142,866,088 |
| Office Furnishings 0.2% |
| Interface, Inc. | | |
| 5.50%, due 12/1/28 (a) | 16,952,000 | 15,898,264 |
| Oil & Gas 6.0% |
| Ascent Resources Utica Holdings LLC (a) | | |
| 7.00%, due 11/1/26 | 14,500,000 | 14,478,341 |
| 9.00%, due 11/1/27 | 11,295,000 | 14,098,634 |
| California Resources Corp. | | |
| 7.125%, due 2/1/26 (a) | 10,000,000 | 10,055,350 |
| Chevron USA, Inc. | | |
| 3.85%, due 1/15/28 | 5,560,000 | 5,351,891 |
| | Principal
Amount | Value |
| |
| Oil & Gas (continued) |
| Civitas Resources, Inc. | | |
| 5.00%, due 10/15/26 (a) | $ 5,500,000 | $ 5,319,951 |
| Comstock Resources, Inc. (a) | | |
| 6.75%, due 3/1/29 | 19,915,000 | 18,961,304 |
| 6.75%, due 3/1/29 | 14,000,000 | 13,172,698 |
| Diamond Foreign Asset Co. | | |
| 8.50%, due 10/1/30 (a) | 25,535,000 | 26,709,329 |
| Encino Acquisition Partners Holdings LLC (a) | | |
| 8.50%, due 5/1/28 | 40,500,000 | 40,997,785 |
| 8.75%, due 5/1/31 | 5,000,000 | 5,091,273 |
| Gulfport Energy Corp. | | |
| 8.00%, due 5/17/26 | 1,457,518 | 1,476,295 |
| 8.00%, due 5/17/26 (a) | 30,637,302 | 31,032,002 |
| HF Sinclair Corp. (a) | | |
| 5.00%, due 2/1/28 | 9,870,000 | 9,469,619 |
| 6.375%, due 4/15/27 | 9,500,000 | 9,501,091 |
| Hilcorp Energy I LP | | |
| 5.75%, due 2/1/29 (a) | 5,000,000 | 4,803,158 |
| Marathon Oil Corp. | | |
| 4.40%, due 7/15/27 | 6,825,000 | 6,569,144 |
| 6.80%, due 3/15/32 | 5,000,000 | 5,256,023 |
| Matador Resources Co. (a) | | |
| 6.50%, due 4/15/32 | 8,500,000 | 8,424,260 |
| 6.875%, due 4/15/28 | 6,100,000 | 6,146,732 |
| Moss Creek Resources Holdings, Inc. | | |
| 7.50%, due 1/15/26 (a) | 9,465,000 | 9,438,452 |
| Murphy Oil Corp. | | |
| 5.875%, due 12/1/27 | 8,000,000 | 7,918,885 |
| Noble Finance II LLC | | |
| 8.00%, due 4/15/30 (a) | 10,000,000 | 10,303,969 |
| Occidental Petroleum Corp. | | |
| 5.55%, due 3/15/26 | 30,505,000 | 30,358,501 |
| 6.45%, due 9/15/36 | 6,850,000 | 7,069,145 |
| 6.95%, due 7/1/24 | 6,672,000 | 6,679,395 |
| 7.15%, due 5/15/28 | 4,000,000 | 4,166,412 |
| Parkland Corp. (a) | | |
| 4.50%, due 10/1/29 | 25,035,000 | 22,688,827 |
| 4.625%, due 5/1/30 | 17,195,000 | 15,539,856 |
| 5.875%, due 7/15/27 | 14,025,000 | 13,674,069 |
| Permian Resources Operating LLC (a) | | |
| 5.375%, due 1/15/26 | 18,867,000 | 18,643,975 |
| 7.75%, due 2/15/26 | 20,645,000 | 20,829,339 |
| Rockcliff Energy II LLC | | |
| 5.50%, due 10/15/29 (a) | 40,500,000 | 37,331,159 |
The notes to the financial statements are an integral part of, and should be read in conjunction with, the financial statements.
| 16 | MainStay MacKay High Yield Corporate Bond Fund |
| | Principal
Amount | Value |
| Corporate Bonds (continued) |
| Oil & Gas (continued) |
| Southwestern Energy Co. | | |
| 5.375%, due 3/15/30 | $ 13,830,000 | $ 13,132,801 |
| 5.70%, due 1/23/25 (i) | 3,504,000 | 3,488,078 |
| Sunoco LP | | |
| 6.00%, due 4/15/27 | 18,965,000 | 18,735,651 |
| Talos Production, Inc. (a) | | |
| 9.00%, due 2/1/29 | 24,500,000 | 25,848,971 |
| 9.375%, due 2/1/31 | 28,500,000 | 30,372,411 |
| Transocean Aquila Ltd. | | |
| 8.00%, due 9/30/28 (a) | 6,500,000 | 6,611,118 |
| Transocean Poseidon Ltd. | | |
| 6.875%, due 2/1/27 (a) | 27,705,375 | 27,614,044 |
| Transocean, Inc. | | |
| 8.75%, due 2/15/30 (a) | 38,002,500 | 39,624,409 |
| Viper Energy, Inc. | | |
| 5.375%, due 11/1/27 (a) | 3,500,000 | 3,414,719 |
| Vital Energy, Inc. | | |
| 7.75%, due 7/31/29 (a) | 18,858,000 | 18,981,539 |
| | | 629,380,605 |
| Oil & Gas Services 0.9% |
| Bristow Group, Inc. | | |
| 6.875%, due 3/1/28 (a) | 37,250,000 | 36,126,819 |
| Nine Energy Service, Inc. | | |
| 13.00%, due 2/1/28 | 30,200,000 | 23,937,082 |
| Oceaneering International, Inc. | | |
| 6.00%, due 2/1/28 | 10,600,000 | 10,425,900 |
| Weatherford International Ltd. (a) | | |
| 6.50%, due 9/15/28 | 7,796,000 | 8,050,797 |
| 8.625%, due 4/30/30 | 15,370,000 | 15,960,064 |
| | | 94,500,662 |
| Packaging & Containers 0.3% |
| Cascades USA, Inc. (a) | | |
| 5.125%, due 1/15/26 | 11,306,000 | 10,947,964 |
| 5.375%, due 1/15/28 | 22,385,000 | 20,989,978 |
| | | 31,937,942 |
| Pharmaceuticals 3.2% |
| 1375209 BC Ltd. | | |
| 9.00%, due 1/30/28 (a) | 10,630,000 | 10,435,695 |
| 180 Medical, Inc. | | |
| 3.875%, due 10/15/29 (a) | 20,670,000 | 18,301,317 |
| Bausch Health Cos., Inc. (a) | | |
| 7.00%, due 1/15/28 | 7,000,000 | 3,429,353 |
| 7.25%, due 5/30/29 | 4,250,000 | 1,928,437 |
| 11.00%, due 9/30/28 | 22,232,000 | 17,351,854 |
| 14.00%, due 10/15/30 | 1,974,000 | 1,273,230 |
| | Principal
Amount | Value |
| |
| Pharmaceuticals (continued) |
| BellRing Brands, Inc. | | |
| 7.00%, due 3/15/30 (a) | $ 25,531,000 | $ 25,835,525 |
| Endo Finance Holdings, Inc. | | |
| 8.50%, due 4/15/31 (a) | 37,500,000 | 38,102,526 |
| Jazz Securities DAC | | |
| 4.375%, due 1/15/29 (a) | 49,390,000 | 44,936,380 |
| Organon & Co. (a) | | |
| 4.125%, due 4/30/28 | 32,040,000 | 29,180,647 |
| 5.125%, due 4/30/31 | 23,545,000 | 20,359,401 |
| Owens & Minor, Inc. (a) | | |
| 4.50%, due 3/31/29 | 24,155,000 | 21,654,047 |
| 6.625%, due 4/1/30 | 41,780,000 | 40,538,725 |
| Par Pharmaceutical, Inc. Escrow Claim Shares | | |
| (zero coupon), due 4/1/27 (d)(g) | 62,797,000 | — |
| Prestige Brands, Inc. (a) | | |
| 3.75%, due 4/1/31 | 39,485,000 | 33,589,250 |
| 5.125%, due 1/15/28 | 26,880,000 | 25,806,374 |
| | | 332,722,761 |
| Pipelines 4.9% |
| Antero Midstream Partners LP (a) | | |
| 5.75%, due 3/1/27 | 10,000,000 | 9,818,077 |
| 5.75%, due 1/15/28 | 9,100,000 | 8,906,244 |
| CNX Midstream Partners LP | | |
| 4.75%, due 4/15/30 (a) | 2,500,000 | 2,212,538 |
| DT Midstream, Inc. | | |
| 4.375%, due 6/15/31 (a) | 7,255,000 | 6,440,672 |
| Energy Transfer LP | | |
| 4.40%, due 3/15/27 | 14,700,000 | 14,239,830 |
| 4.95%, due 5/15/28 | 16,000,000 | 15,577,734 |
| EQM Midstream Partners LP (a) | | |
| 6.00%, due 7/1/25 | 4,497,000 | 4,489,490 |
| 6.50%, due 7/1/27 | 6,500,000 | 6,509,028 |
| 7.50%, due 6/1/27 | 5,000,000 | 5,094,125 |
| 7.50%, due 6/1/30 | 4,935,000 | 5,174,698 |
| FTAI Infra Escrow Holdings LLC | | |
| 10.50%, due 6/1/27 (a) | 33,465,000 | 35,066,869 |
| Genesis Energy LP | | |
| 6.25%, due 5/15/26 | 14,670,000 | 14,545,000 |
| 7.75%, due 2/1/28 | 26,315,000 | 26,309,071 |
| 8.00%, due 1/15/27 | 33,484,000 | 33,861,842 |
| 8.25%, due 1/15/29 | 8,915,000 | 9,040,728 |
| Harvest Midstream I LP (a) | | |
| 7.50%, due 9/1/28 | 26,675,000 | 26,748,089 |
| 7.50%, due 5/15/32 | 7,000,000 | 7,008,682 |
| Hess Midstream Operations LP | | |
| 5.625%, due 2/15/26 (a) | 1,000,000 | 988,765 |
The notes to the financial statements are an integral part of, and should be read in conjunction with, the financial statements.
17
Portfolio of Investments April 30, 2024†^(Unaudited) (continued)
| | Principal
Amount | Value |
| Corporate Bonds (continued) |
| Pipelines (continued) |
| ITT Holdings LLC | | |
| 6.50%, due 8/1/29 (a) | $ 24,620,000 | $ 22,237,227 |
| MPLX LP | | |
| 4.875%, due 12/1/24 | 7,500,000 | 7,451,943 |
| New Fortress Energy, Inc. (a) | | |
| 6.50%, due 9/30/26 | 12,930,000 | 12,364,494 |
| 8.75%, due 3/15/29 | 8,250,000 | 8,045,809 |
| NuStar Logistics LP | | |
| 5.75%, due 10/1/25 | 3,000,000 | 2,983,075 |
| 6.00%, due 6/1/26 | 16,000,000 | 15,876,853 |
| Plains All American Pipeline LP | | |
| Series B | | |
| 9.679% (3 Month SOFR + 4.372%), due 5/30/24 (b)(e)(f) | 45,303,000 | 44,790,954 |
| Prairie Acquiror LP | | |
| 9.00%, due 8/1/29 (a) | 21,250,000 | 21,704,965 |
| Summit Midstream Holdings LLC | | |
| 9.50%, due 10/15/26 (a)(i) | 14,860,000 | 15,171,718 |
| Tallgrass Energy Partners LP (a) | | |
| 5.50%, due 1/15/28 | 5,000,000 | 4,747,107 |
| 6.00%, due 3/1/27 | 19,000,000 | 18,507,347 |
| 7.375%, due 2/15/29 | 21,395,000 | 21,418,470 |
| TransMontaigne Partners LP | | |
| 6.125%, due 2/15/26 | 26,447,000 | 25,190,767 |
| Venture Global LNG, Inc. (a) | | |
| 8.125%, due 6/1/28 | 17,810,000 | 18,210,155 |
| 9.50%, due 2/1/29 | 25,850,000 | 27,785,183 |
| Western Midstream Operating LP | | |
| 4.65%, due 7/1/26 | 5,000,000 | 4,883,837 |
| 4.75%, due 8/15/28 | 12,000,000 | 11,578,980 |
| | | 514,980,366 |
| Real Estate 0.0% ‡ |
| Howard Hughes Corp. (The) (a) | | |
| 4.125%, due 2/1/29 | 3,000,000 | 2,649,203 |
| 4.375%, due 2/1/31 | 2,000,000 | 1,695,889 |
| | | 4,345,092 |
| Real Estate Investment Trusts 1.9% |
| CTR Partnership LP | | |
| 3.875%, due 6/30/28 (a) | 11,425,000 | 10,341,362 |
| GLP Capital LP | | |
| 5.25%, due 6/1/25 | 10,000,000 | 9,907,182 |
| 5.30%, due 1/15/29 | 8,000,000 | 7,766,311 |
| 5.375%, due 4/15/26 | 5,620,000 | 5,548,276 |
| MPT Operating Partnership LP | | |
| 4.625%, due 8/1/29 | 16,085,000 | 12,036,508 |
| | Principal
Amount | Value |
| |
| Real Estate Investment Trusts (continued) |
MPT Operating Partnership LP
(continued) | | |
| 5.00%, due 10/15/27 | $ 49,365,000 | $ 40,378,595 |
| 5.25%, due 8/1/26 | 13,665,000 | 12,446,378 |
| RHP Hotel Properties LP | | |
| 4.50%, due 2/15/29 (a) | 10,000,000 | 9,198,261 |
| 4.75%, due 10/15/27 | 28,050,000 | 26,656,946 |
| 6.50%, due 4/1/32 (a) | 16,250,000 | 15,925,991 |
| 7.25%, due 7/15/28 (a) | 8,660,000 | 8,794,256 |
| VICI Properties LP (a) | | |
| 3.875%, due 2/15/29 | 5,000,000 | 4,536,467 |
| 4.625%, due 6/15/25 | 13,000,000 | 12,790,114 |
| 5.75%, due 2/1/27 | 26,800,000 | 26,575,003 |
| | | 202,901,650 |
| Retail 5.6% |
| 1011778 B.C. Unlimited Liability Co. (a) | | |
| 3.875%, due 1/15/28 | 22,685,000 | 20,927,213 |
| 4.00%, due 10/15/30 | 55,052,000 | 47,475,407 |
| Asbury Automotive Group, Inc. | | |
| 4.50%, due 3/1/28 | 23,137,000 | 21,703,985 |
| 4.625%, due 11/15/29 (a) | 11,505,000 | 10,402,984 |
| 4.75%, due 3/1/30 | 17,525,000 | 15,884,604 |
| 5.00%, due 2/15/32 (a) | 9,910,000 | 8,810,046 |
| CEC Entertainment LLC | | |
| 6.75%, due 5/1/26 (a) | 17,640,000 | 17,390,720 |
| Dave & Buster's, Inc. | | |
| 7.625%, due 11/1/25 (a) | 4,000,000 | 4,025,916 |
| Group 1 Automotive, Inc. | | |
| 4.00%, due 8/15/28 (a) | 15,250,000 | 13,869,050 |
| Ken Garff Automotive LLC | | |
| 4.875%, due 9/15/28 (a) | 28,610,000 | 26,431,497 |
| KFC Holding Co. | | |
| 4.75%, due 6/1/27 (a) | 18,287,000 | 17,649,957 |
| LCM Investments Holdings II LLC (a) | | |
| 4.875%, due 5/1/29 | 48,500,000 | 44,296,195 |
| 8.25%, due 8/1/31 | 17,300,000 | 17,971,067 |
| Murphy Oil USA, Inc. | | |
| 4.75%, due 9/15/29 | 7,500,000 | 6,982,415 |
| 5.625%, due 5/1/27 | 10,417,000 | 10,278,263 |
| NMG Holding Co., Inc. | | |
| 7.125%, due 4/1/26 (a) | 94,000,000 | 93,563,985 |
| Papa John's International, Inc. | | |
| 3.875%, due 9/15/29 (a) | 18,284,000 | 15,914,600 |
| Patrick Industries, Inc. (a) | | |
| 4.75%, due 5/1/29 | 4,000,000 | 3,636,108 |
| 7.50%, due 10/15/27 | 21,040,000 | 21,289,450 |
The notes to the financial statements are an integral part of, and should be read in conjunction with, the financial statements.
| 18 | MainStay MacKay High Yield Corporate Bond Fund |
| | Principal
Amount | Value |
| Corporate Bonds (continued) |
| Retail (continued) |
| PetSmart, Inc. (a) | | |
| 4.75%, due 2/15/28 | $ 7,700,000 | $ 7,105,933 |
| 7.75%, due 2/15/29 | 8,000,000 | 7,603,873 |
| Sonic Automotive, Inc. (a) | | |
| 4.625%, due 11/15/29 | 10,000,000 | 8,950,125 |
| 4.875%, due 11/15/31 | 14,045,000 | 12,255,029 |
| Yum! Brands, Inc. | | |
| 3.625%, due 3/15/31 | 40,870,000 | 35,316,867 |
| 4.625%, due 1/31/32 | 40,600,000 | 36,549,699 |
| 4.75%, due 1/15/30 (a) | 31,185,000 | 29,183,668 |
| 5.375%, due 4/1/32 | 30,000,000 | 28,298,461 |
| | | 583,767,117 |
| Software 3.9% |
| ACI Worldwide, Inc. | | |
| 5.75%, due 8/15/26 (a) | 13,784,000 | 13,714,847 |
| Camelot Finance SA | | |
| 4.50%, due 11/1/26 (a) | 19,590,000 | 18,656,744 |
| Central Parent LLC | | |
| 8.00%, due 6/15/29 (a) | 7,500,000 | 7,716,045 |
| Central Parent, Inc. | | |
| 7.25%, due 6/15/29 (a) | 12,750,000 | 12,889,549 |
| Clarivate Science Holdings Corp. (a) | | |
| 3.875%, due 7/1/28 | 31,609,000 | 28,783,300 |
| 4.875%, due 7/1/29 | 68,411,000 | 62,301,711 |
| Fair Isaac Corp. | | |
| 5.25%, due 5/15/26 (a) | 11,250,000 | 11,047,995 |
| MSCI, Inc. (a) | | |
| 3.25%, due 8/15/33 | 10,095,000 | 8,082,809 |
| 3.625%, due 9/1/30 | 19,475,000 | 16,955,060 |
| 3.875%, due 2/15/31 | 36,500,000 | 31,941,461 |
| 4.00%, due 11/15/29 | 29,330,000 | 26,504,374 |
| Open Text Corp. (a) | | |
| 3.875%, due 2/15/28 | 20,685,000 | 18,881,380 |
| 3.875%, due 12/1/29 | 9,000,000 | 7,876,844 |
| 6.90%, due 12/1/27 | 11,340,000 | 11,579,002 |
| Open Text Holdings, Inc. | | |
| 4.125%, due 2/15/30 (a) | 35,147,000 | 30,869,195 |
| PTC, Inc. (a) | | |
| 3.625%, due 2/15/25 | 9,000,000 | 8,814,885 |
| 4.00%, due 2/15/28 | 36,369,000 | 33,692,900 |
| SS&C Technologies, Inc. | | |
| 5.50%, due 9/30/27 (a) | 27,745,000 | 26,968,642 |
| UKG, Inc. | | |
| 6.875%, due 2/1/31 (a) | 17,110,000 | 17,142,606 |
| | Principal
Amount | Value |
| |
| Software (continued) |
| Veritas US, Inc. | | |
| 7.50%, due 9/1/25 (a) | $ 21,290,000 | $ 19,368,972 |
| | | 413,788,321 |
| Telecommunications 2.3% |
| Connect Finco SARL | | |
| 6.75%, due 10/1/26 (a) | 58,100,000 | 56,269,141 |
| Frontier Communications Holdings LLC (a) | | |
| 5.00%, due 5/1/28 | 8,000,000 | 7,359,907 |
| 5.875%, due 10/15/27 | 7,500,000 | 7,193,689 |
| 8.625%, due 3/15/31 | 12,140,000 | 12,261,066 |
| Hughes Satellite Systems Corp. | | |
| 6.625%, due 8/1/26 | 5,000,000 | 2,869,621 |
| Sprint Capital Corp. | | |
| 6.875%, due 11/15/28 | 88,520,000 | 92,696,816 |
| T-Mobile USA, Inc. | | |
| 4.75%, due 2/1/28 | 23,355,000 | 22,734,043 |
| 5.375%, due 4/15/27 | 32,000,000 | 32,063,072 |
| Vmed O2 UK Financing I plc | | |
| 7.75%, due 4/15/32 (a) | 7,500,000 | 7,381,183 |
| | | 240,828,538 |
| Toys, Games & Hobbies 0.1% |
| Mattel, Inc. | | |
| 5.875%, due 12/15/27 (a) | 15,665,000 | 15,577,522 |
| Transportation 1.0% |
| GN Bondco LLC | | |
| 9.50%, due 10/15/31 (a) | 20,000,000 | 19,206,426 |
| RXO, Inc. | | |
| 7.50%, due 11/15/27 (a) | 2,000,000 | 2,026,181 |
| Seaspan Corp. | | |
| 5.50%, due 8/1/29 (a) | 24,865,000 | 21,384,639 |
| Watco Cos. LLC | | |
| 6.50%, due 6/15/27 (a) | 58,345,000 | 57,521,635 |
| | | 100,138,881 |
Total Corporate Bonds
(Cost $9,283,558,302) | | 8,957,970,469 |
| Loan Assignments 6.1% |
| Aerospace & Defense 0.2% |
| Chromalloy Corp. | |
| Term Loan | |
| 9.058% (3 Month SOFR + 3.75%), due 3/27/31 (e) | 21,000,000 | 21,096,243 |
The notes to the financial statements are an integral part of, and should be read in conjunction with, the financial statements.
19
Portfolio of Investments April 30, 2024†^(Unaudited) (continued)
| | Principal
Amount | Value |
| Loan Assignments (continued) |
| Automobile 0.3% |
| Dealer Tire Financial LLC | |
| Term Loan B3 | |
| 9.066% (1 Month SOFR + 3.75%), due 12/14/27 (e) | $ 9,455,290 | $ 9,502,566 |
| Tenneco, Inc. | |
| First Lien Term Loan B 10.169% - 10.402% | |
| (3 Month SOFR + 5.00%), due 11/17/28 (e) | 21,550,000 | 21,073,206 |
| Wand Newco 3, Inc. | |
| First Lien 2024 Refinancing Term Loan | |
| 9.066% (1 Month SOFR + 3.75%), due 1/30/31 (e) | 2,500,000 | 2,513,068 |
| | | 33,088,840 |
| Beverage, Food & Tobacco 0.1% |
| United Natural Foods, Inc. | |
| Initial Term Loan | |
| 8.68% (1 Month SOFR + 3.25%), due 10/22/25 (e) | 10,314,588 | 10,198,549 |
| Buildings & Real Estate 0.1% |
| GEO Group, Inc. (The) | |
| Term Loan | |
| 10.569% (1 Month SOFR + 5.25%), due 4/4/29 (e) | 7,000,000 | 7,081,669 |
| Capital Equipment 0.2% |
| DexKo Global, Inc. | |
| First Lien 2023 Incremental Term Loan | |
| 9.559% (3 Month SOFR + 4.25%), due 10/4/28 (e) | 7,980,000 | 7,962,540 |
| TK Elevator Midco GmbH | |
| USD Facility Term Loan B2 | |
| 8.791% (6 Month SOFR + 3.50%), due 4/30/30 (e) | 16,957,500 | 17,009,780 |
| | | 24,972,320 |
| Cargo Transport 0.2% |
| GN Loanco LLC | |
| Term Loan B | |
| 9.816% (1 Month SOFR + 4.50%), due 12/19/30 (e) | 22,293,333 | 21,784,778 |
| | Principal
Amount | Value |
| |
| Chemicals, Plastics & Rubber 0.2% |
| Jazz Pharmaceuticals plc | |
| Additional Dollar Tranche Term Loan B1 | |
| 8.43% (1 Month SOFR + 3.00%), due 5/5/28 (e) | $ 23,422,655 | $ 23,552,792 |
| Electronics 0.2% |
| Camelot U.S. Acquisition LLC | |
| Amendment No. 6 Refinancing Term Loan | |
| 8.066% (1 Month SOFR + 2.75%), due 1/31/31 (e) | 11,854,818 | 11,866,673 |
| Proofpoint, Inc. | |
| First Lien Initial Term Loan | |
| 8.68% (1 Month SOFR + 3.25%), due 8/31/28 (e) | 6,433,546 | 6,454,455 |
| Vertiv Group Corp. | |
| Term Loan B1 | |
| 7.943% (1 Month SOFR + 2.50%), due 3/2/27 (e) | 7,462,500 | 7,483,955 |
| | | 25,805,083 |
| Energy (Electricity) 0.1% |
| Talen Energy Supply LLC (e) | |
| Initial Term Loan B | |
| 9.826% (3 Month SOFR + 4.50%), due 5/17/30 | 5,920,971 | 5,928,373 |
| Initial Term Loan C | |
| 9.826% (3 Month SOFR + 4.50%), due 5/17/30 | 4,834,286 | 4,840,328 |
| | | 10,768,701 |
| Finance 0.5% |
| Aretec Group, Inc. | |
| Term Loan B1 | |
| 9.916% (1 Month SOFR + 4.50%), due 8/9/30 (e) | 15,383,750 | 15,452,977 |
| Osaic Holdings, Inc. | |
| Term Loan | |
| 9.323%, due 8/17/28 | 17,800,000 | 17,876,291 |
| RealTruck Group, Inc. | |
| Initial Term Loan | |
| 8.93% (1 Month SOFR + 3.50%), due 1/31/28 (e) | $ 19,022,094 | 18,845,455 |
| | | 52,174,723 |
| Healthcare, Education & Childcare 0.5% |
| Endo Luxembourg Finance Co. SARL | |
| Term Loan B | |
| 9.826%, due 4/9/31 | 28,300,000 | 28,202,705 |
The notes to the financial statements are an integral part of, and should be read in conjunction with, the financial statements.
| 20 | MainStay MacKay High Yield Corporate Bond Fund |
| | Principal
Amount | Value |
| Loan Assignments (continued) |
| Healthcare, Education & Childcare (continued) |
| LifePoint Health, Inc. | |
| First Lien 2024 Refinancing Term Loan | |
| 10.056% (3 Month SOFR + 4.75%), due 11/16/28 (e) | $ 16,957,500 | $ 17,014,019 |
| Organon & Co. | |
| Dollar Term Loan | |
| 8.433% (1 Month SOFR + 3.00%), due 6/2/28 (e) | 9,322,500 | 9,357,459 |
| | | 54,574,183 |
| High Tech Industries 0.2% |
| Open Text Corp. | |
| 2023 Replacement Term Loan | |
| 8.166% (1 Month SOFR + 2.75%), due 1/31/30 (e) | 18,814,182 | 18,864,153 |
| Hotels, Motels, Inns & Gaming 0.1% |
| Caesars Entertainment, Inc. | |
| Incremental Term Loan B1 | |
| 8.066% (1 Month SOFR + 2.75%), due 2/6/31 (e) | 9,000,000 | 9,001,872 |
| Insurance 0.2% |
| USI, Inc. | |
| 2023 Term Loan B | |
| 8.302% (3 Month SOFR + 3.00%), due 11/22/29 (e) | 16,417,500 | 16,448,283 |
| Leisure, Amusement, Motion Pictures & Entertainment 0.1% |
| Carnival Corp. | |
| 2024 Repricing Advance Term Loan | |
| 8.067%, due 8/8/27 | 7,866,290 | 7,905,622 |
| NASCAR Holdings LLC | |
| Initial Term Loan | |
| 7.93% (1 Month SOFR + 2.50%), due 10/19/26 (e) | $ 1,634,468 | 1,642,640 |
| | | 9,548,262 |
| Manufacturing 0.0% ‡ |
| Adient U.S. LLC | |
| Term Loan B2 | |
| 8.066% (1 Month SOFR + 2.75%), due 1/31/31 (e) | 1,443,411 | 1,448,146 |
| | Principal
Amount | Value |
| |
| Media 0.4% |
| DIRECTV Financing LLC | |
| 2024 Refinancing Term Loan B | |
| 10.68% (1 Month SOFR + 5.25%), due 8/2/29 (e) | $ 38,897,395 | $ 38,897,395 |
| Mining, Steel, Iron & Non-Precious Metals 0.2% |
| American Rock Salt Co. LLC | |
| First Lien Initial Term Loan | |
| 9.43% (1 Month SOFR + 4.00%), due 6/9/28 (e) | 24,244,491 | 21,476,570 |
| Oil & Gas 0.8% |
| GIP III Stetson I LP | |
| 2023 Initial Term Loan | |
| 9.666% (1 Month SOFR + 4.25%), due 10/31/28 (e) | 11,647,387 | 11,676,505 |
| New Fortress Energy, Inc. | |
| Initial Term Loan | |
| 10.33% (3 Month SOFR + 5.00%), due 10/30/28 (e) | 24,688,125 | 24,785,125 |
| PetroQuest Energy LLC (b)(d) | |
| Term Loan | |
| 15.00% (15.00% PIK), due 11/8/25 (c) | 25,487,290 | 12,233,899 |
| 2020 Term Loan | |
| 15.00% (15.00% PIK) (3 Month LIBOR + 6.50%), due 9/19/26 (c)(e) | 2,631,744 | 2,631,744 |
| Term Loan | |
| 15.00% (3 Month LIBOR + 6.50%), due 1/1/28 (e) | 3,430,486 | 3,430,486 |
| Prairie Acquiror LP | |
| Initial Term Loan B2 | |
| 10.066% (1 Month SOFR + 4.75%), due 8/1/29 (e) | 10,500,000 | 10,506,562 |
| TransMontaigne Operating Co. LP | |
| Tranche Term Loan B | |
| 8.93% (1 Month SOFR + 3.50%), due 11/17/28 (e) | 15,919,503 | 15,926,142 |
| | | 81,190,463 |
| Retail 0.9% |
| Great Outdoors Group LLC | |
| Term Loan B2 | |
| 9.18% (1 Month SOFR + 3.75%), due 3/6/28 (e) | 99,835,518 | 99,735,682 |
The notes to the financial statements are an integral part of, and should be read in conjunction with, the financial statements.
21
Portfolio of Investments April 30, 2024†^(Unaudited) (continued)
| | Principal
Amount | Value |
| Loan Assignments (continued) |
| Services: Business 0.2% |
| Dun & Bradstreet Corp. | |
| 2024 Incremental Term Loan B2 | |
| 8.068% (1 Month SOFR + 2.75%), due 1/18/29 (e) | $ 10,942,003 | $ 10,960,812 |
| GIP II Blue Holding LP | |
| Initial Term Loan | |
| 9.066% (1 Month SOFR + 3.75%), due 9/29/28 (e) | 12,773,361 | 12,834,942 |
| Icon Public Ltd. Co. (e) | |
| Repriced U.S. Term Loan | |
| 7.309% (3 Month SOFR + 2.00%), due 7/3/28 | 524,084 | 525,557 |
| Repriced Lux Term Loan | |
| 7.309% (3 Month SOFR + 2.00%), due 7/3/28 | 2,103,482 | 2,109,397 |
| | | 26,430,708 |
| Software 0.3% |
| Cloud Software Group, Inc. | |
| First Lien Term Loan A | |
| 9.909% (3 Month SOFR + 4.50%), due 9/29/28 (e) | 26,697,160 | 26,663,788 |
| Utilities 0.1% |
| PG&E Corp. | |
| Term Loan | |
| 7.816% (1 Month SOFR + 2.50%), due 6/23/27 (e) | 10,000,000 | 10,009,380 |
Total Loan Assignments
(Cost $645,893,050) | | 644,812,583 |
Total Long-Term Bonds
(Cost $10,008,583,452) | | 9,716,377,565 |
| |
| | Shares | |
| |
| Common Stocks 1.4% |
| Capital Markets 0.1% |
| Ares Capital Corp. | 413,257 | 8,517,227 |
| Consumer Staples Distribution & Retail 0.0% ‡ |
| ASG warrant Corp. (b)(d)(j) | 12,502 | — |
| Distributors 0.0% ‡ |
| ATD New Holdings, Inc. (j) | 142,545 | 3,278,535 |
| | Shares | Value |
| |
| Electric Utilities 0.0% ‡ |
| Keycon Power Holdings LLC (b)(d)(j) | 38,880 | $ — |
| Electrical Equipment 0.1% |
| Energy Technologies, Inc. (b)(d)(j) | 16,724 | 5,435,300 |
| Energy Equipment & Services 0.1% |
| Forum Energy Technologies, Inc. (j)(k) | 616,274 | 11,493,510 |
| Nine Energy Service, Inc. (j) | 97,664 | 210,954 |
| | | 11,704,464 |
| Independent Power and Renewable Electricity Producers 0.1% |
| GenOn Energy, Inc. (h) | 386,241 | 8,304,182 |
| Oil, Gas & Consumable Fuels 0.7% |
| Chord Energy Corp. | 43,842 | 7,759,157 |
| Gulfport Energy Corp. (j) | 224,328 | 35,603,097 |
| PetroQuest Energy, Inc. (b)(d)(j) | 284,709 | — |
| Talos Energy, Inc. (j) | 2,074,193 | 27,337,863 |
| | | 70,700,117 |
| Pharmaceuticals 0.2% |
| Endo Finance Holdings, Inc. (j) | 9,963 | 280,837 |
| Endo, Inc. (j) | 914,895 | 25,789,049 |
| | | 26,069,886 |
| Wireless Telecommunication Services 0.1% |
| Vodafone Group plc, Sponsored ADR | 1,071,152 | 9,008,388 |
Total Common Stocks
(Cost $213,771,839) | | 143,018,099 |
| Preferred Stock 0.3% |
| Electrical Equipment 0.3% |
Energy Technologies Ltd. (b)(d)(j)
| 37,258 | 33,532,200 |
Total Preferred Stock
(Cost $35,514,837) | | 33,532,200 |
| Exchange-Traded Funds 0.5% |
| iShares Gold Trust (j) | 929,500 | 40,247,350 |
| SPDR Gold Shares (j) | 55,336 | 11,724,038 |
Total Exchange-Traded Funds
(Cost $33,598,419) | | 51,971,388 |
| |
The notes to the financial statements are an integral part of, and should be read in conjunction with, the financial statements.
| 22 | MainStay MacKay High Yield Corporate Bond Fund |
| | Number of
Warrants | | Value |
| |
| Warrants 0.0% ‡ |
| Oil, Gas & Consumable Fuels 0.0% ‡ |
| California Resources Corp. | | | |
| Expires 10/27/24 (j) | 36,093 | | $ 621,522 |
Total Warrants
(Cost $14,437) | | | 621,522 |
Total Investments
(Cost $10,291,482,984) | 94.6% | | 9,945,520,774 |
| Other Assets, Less Liabilities | 5.4 | | 570,754,459 |
| Net Assets | 100.0% | | $ 10,516,275,233 |
| † | Percentages indicated are based on Fund net assets. |
| ^ | Industry classifications may be different than those used for compliance monitoring purposes. |
| ‡ | Less than one-tenth of a percent. |
| (a) | May be sold to institutional investors only under Rule 144A or securities offered pursuant to Section 4(a)(2) of the Securities Act of 1933, as amended. |
| (b) | Illiquid security—As of April 30, 2024, the total market value deemed illiquid under procedures approved by the Board of Trustees was $219,320,266, which represented 2.1% of the Fund’s net assets. |
| (c) | PIK ("Payment-in-Kind")—issuer may pay interest or dividends with additional securities and/or in cash. |
| (d) | Security in which significant unobservable inputs (Level 3) were used in determining fair value. |
| (e) | Floating rate—Rate shown was the rate in effect as of April 30, 2024. |
| (f) | Security is perpetual and, thus, does not have a predetermined maturity date. The date shown, if applicable, reflects the next call date. |
| (g) | Issue in non-accrual status. |
| (h) | Restricted security. (See Note 5) |
| (i) | Step coupon—Rate shown was the rate in effect as of April 30, 2024. |
| (j) | Non-income producing security. |
| (k) | As of April 30, 2024, the Fund’s ownership exceeds 5% of the outstanding shares of the company. |
| Abbreviation(s): |
| ADR—American Depositary Receipt |
| LIBOR—London Interbank Offered Rate |
| SOFR—Secured Overnight Financing Rate |
| SPDR—Standard & Poor’s Depositary Receipt |
| USD—United States Dollar |
The following is a summary of the fair valuations according to the inputs used as of April 30, 2024, for valuing the Fund’s assets:
| Description | Quoted
Prices in
Active
Markets for
Identical
Assets
(Level 1) | | Significant
Other
Observable
Inputs
(Level 2) | | Significant
Unobservable
Inputs
(Level 3) | | Total |
| Asset Valuation Inputs | | | | | | | |
| Investments in Securities (a) | | | | | | | |
| Long-Term Bonds | | | | | | | |
| Convertible Bonds | $ — | | $ 113,594,513 | | $ — | | $ 113,594,513 |
| Corporate Bonds | — | | 8,933,361,469 | | 24,609,000 | | 8,957,970,469 |
| Loan Assignments | — | | 626,516,454 | | 18,296,129 | | 644,812,583 |
| Total Long-Term Bonds | — | | 9,673,472,436 | | 42,905,129 | | 9,716,377,565 |
| Common Stocks | 126,000,082 | | 11,582,717 | | 5,435,300 | | 143,018,099 |
| Preferred Stock | — | | — | | 33,532,200 | | 33,532,200 |
| Exchange-Traded Funds | 51,971,388 | | — | | — | | 51,971,388 |
| Warrants | 621,522 | | — | | — | | 621,522 |
| Total Investments in Securities | $ 178,592,992 | | $ 9,685,055,153 | | $ 81,872,629 | | $ 9,945,520,774 |
| (a) | For a complete listing of investments and their industries, see the Portfolio of Investments. |
The notes to the financial statements are an integral part of, and should be read in conjunction with, the financial statements.
23
Statement of Assets and Liabilities as of April 30, 2024 (Unaudited)
| Assets |
Investment in securities, at value
(identified cost $10,291,482,984) | $ 9,945,520,774 |
| Cash | 511,643,443 |
| Due from custodian | 1,037,919 |
| Receivables: | |
| Interest | 150,041,742 |
| Fund shares sold | 15,127,876 |
| Investment securities sold | 426,882 |
| Other assets | 2,883,456 |
| Total assets | 10,626,682,092 |
| Liabilities |
| Payables: | |
| Investment securities purchased | 69,538,444 |
| Fund shares redeemed | 30,164,508 |
| Manager (See Note 3) | 4,725,678 |
| Transfer agent (See Note 3) | 1,724,480 |
| NYLIFE Distributors (See Note 3) | 702,806 |
| Professional fees | 227,990 |
| Shareholder communication | 161,496 |
| Custodian | 63,632 |
| Accrued expenses | 14,177 |
| Distributions payable | 3,083,648 |
| Total liabilities | 110,406,859 |
| Net assets | $10,516,275,233 |
| Composition of Net Assets |
| Shares of beneficial interest outstanding (par value of $.01 per share) unlimited number of shares authorized | $ 20,571,538 |
| Additional paid-in-capital | 11,398,506,021 |
| | 11,419,077,559 |
| Total distributable earnings (loss) | (902,802,326) |
| Net assets | $10,516,275,233 |
| Class A | |
| Net assets applicable to outstanding shares | $2,888,540,658 |
| Shares of beneficial interest outstanding | 564,547,573 |
| Net asset value per share outstanding | $ 5.12 |
| Maximum sales charge (4.50% of offering price) | 0.24 |
| Maximum offering price per share outstanding | $ 5.36 |
| Investor Class | |
| Net assets applicable to outstanding shares | $ 110,942,432 |
| Shares of beneficial interest outstanding | 21,519,477 |
| Net asset value per share outstanding | $ 5.16 |
| Maximum sales charge (4.00% of offering price) | 0.22 |
| Maximum offering price per share outstanding | $ 5.38 |
| Class B | |
| Net assets applicable to outstanding shares | $ 4,216,557 |
| Shares of beneficial interest outstanding | 828,557 |
| Net asset value and offering price per share outstanding | $ 5.09 |
| Class C | |
| Net assets applicable to outstanding shares | $ 91,735,526 |
| Shares of beneficial interest outstanding | 18,004,919 |
| Net asset value and offering price per share outstanding | $ 5.10 |
| Class I | |
| Net assets applicable to outstanding shares | $3,648,849,827 |
| Shares of beneficial interest outstanding | 712,850,071 |
| Net asset value and offering price per share outstanding | $ 5.12 |
| Class R2 | |
| Net assets applicable to outstanding shares | $ 5,826,927 |
| Shares of beneficial interest outstanding | 1,138,227 |
| Net asset value and offering price per share outstanding | $ 5.12 |
| Class R3 | |
| Net assets applicable to outstanding shares | $ 4,724,749 |
| Shares of beneficial interest outstanding | 924,406 |
| Net asset value and offering price per share outstanding | $ 5.11 |
| Class R6 | |
| Net assets applicable to outstanding shares | $3,761,311,713 |
| Shares of beneficial interest outstanding | 737,315,977 |
| Net asset value and offering price per share outstanding | $ 5.10 |
| SIMPLE Class | |
| Net assets applicable to outstanding shares | $ 126,844 |
| Shares of beneficial interest outstanding | 24,604 |
| Net asset value and offering price per share outstanding | $ 5.16 |
The notes to the financial statements are an integral part of, and should be read in conjunction with, the financial statements.
| 24 | MainStay MacKay High Yield Corporate Bond Fund |
Statement of Operations for the six months ended April 30, 2024 (Unaudited)
| Investment Income (Loss) |
| Income | |
| Interest | $341,068,132 |
| Dividends (net of foreign tax withholding of $3,315) | 29,542,736 |
| Other | 13,428,038 |
| Total income | 384,038,906 |
| Expenses | |
| Manager (See Note 3) | 28,446,739 |
| Transfer agent (See Note 3) | 5,216,589 |
| Distribution/Service—Class A (See Note 3) | 3,662,181 |
| Distribution/Service—Investor Class (See Note 3) | 140,925 |
| Distribution/Service—Class B (See Note 3) | 31,638 |
| Distribution/Service—Class C (See Note 3) | 486,223 |
| Distribution/Service—Class R2 (See Note 3) | 7,724 |
| Distribution/Service—Class R3 (See Note 3) | 10,943 |
| Distribution/Service—SIMPLE Class (See Note 3) | 247 |
| Professional fees | 370,008 |
| Registration | 138,084 |
| Trustees | 127,634 |
| Shareholder communication | 110,773 |
| Custodian | 62,217 |
| Shareholder service (See Note 3) | 5,294 |
| Miscellaneous | 215,694 |
| Total expenses | 39,032,913 |
| Net investment income (loss) | 345,005,993 |
| Realized and Unrealized Gain (Loss) |
| Net realized gain (loss) on investments | (44,821,008) |
| Net change in unrealized appreciation (depreciation) on investments | 471,200,188 |
| Net realized and unrealized gain (loss) | 426,379,180 |
| Net increase (decrease) in net assets resulting from operations | $771,385,173 |
The notes to the financial statements are an integral part of, and should be read in conjunction with, the financial statements.
25
Statements of Changes in Net Assets
for the six months ended April 30, 2024 (Unaudited) and the year ended October 31, 2023
| | Six months
ended
April 30,
2024 | Year
ended
October 31,
2023 |
| Increase (Decrease) in Net Assets |
| Operations: | | |
| Net investment income (loss) | $ 345,005,993 | $ 585,063,215 |
| Net realized gain (loss) | (44,821,008) | (220,955,580) |
| Net change in unrealized appreciation (depreciation) | 471,200,188 | 273,111,406 |
| Net increase (decrease) in net assets resulting from operations | 771,385,173 | 637,219,041 |
| Distributions to shareholders: | | |
| Class A | (92,573,170) | (166,062,742) |
| Investor Class | (3,424,935) | (6,127,715) |
| Class B | (166,765) | (452,654) |
| Class C | (2,624,591) | (5,318,208) |
| Class I | (111,974,921) | (180,925,819) |
| Class R1(a) | (778) | (2,626) |
| Class R2 | (189,562) | (360,077) |
| Class R3 | (133,040) | (202,281) |
| Class R6 | (135,355,517) | (224,130,921) |
| SIMPLE Class | (3,207) | (2,223) |
| Total distributions to shareholders | (346,446,486) | (583,585,266) |
| Capital share transactions: | | |
| Net proceeds from sales of shares | 1,583,083,616 | 2,378,286,543 |
| Net asset value of shares issued to shareholders in reinvestment of distributions | 327,666,937 | 550,045,714 |
| Cost of shares redeemed | (1,782,003,262) | (3,136,531,209) |
| Increase (decrease) in net assets derived from capital share transactions | 128,747,291 | (208,198,952) |
| Net increase (decrease) in net assets | 553,685,978 | (154,565,177) |
| Net Assets |
| Beginning of period | 9,962,589,255 | 10,117,154,432 |
| End of period | $10,516,275,233 | $ 9,962,589,255 |
| (a) | Class liquidated and is no longer offered for sale as of February 23, 2024. |
The notes to the financial statements are an integral part of, and should be read in conjunction with, the financial statements.
| 26 | MainStay MacKay High Yield Corporate Bond Fund |
Financial Highlights selected per share data and ratios
| | Six months ended
April 30,
2024* | | Year Ended October 31, |
| Class A | 2023 | | 2022 | | 2021 | | 2020 | | 2019 |
| Net asset value at beginning of period | $ 4.91 | | $ 4.88 | | $ 5.63 | | $ 5.41 | | $ 5.61 | | $ 5.52 |
| Net investment income (loss) (a) | 0.16 | | 0.28 | | 0.24 | | 0.25 | | 0.29 | | 0.29 |
| Net realized and unrealized gain (loss) | 0.21 | | 0.03 | | (0.73) | | 0.25 | | (0.17) | | 0.12 |
| Total from investment operations | 0.37 | | 0.31 | | (0.49) | | 0.50 | | 0.12 | | 0.41 |
| Less distributions: | | | | | | | | | | | |
| From net investment income | (0.16) | | (0.28) | | (0.24) | | (0.25) | | (0.29) | | (0.29) |
| Return of capital | — | | — | | (0.02) | | (0.03) | | (0.03) | | (0.03) |
| Total distributions | (0.16) | | (0.28) | | (0.26) | | (0.28) | | (0.32) | | (0.32) |
| Net asset value at end of period | $ 5.12 | | $ 4.91 | | $ 4.88 | | $ 5.63 | | $ 5.41 | | $ 5.61 |
| Total investment return (b) | 7.61% | | 6.31% | | (8.88)% | | 9.37% | | 2.26% | | 7.58% |
| Ratios (to average net assets)/Supplemental Data: | | | | | | | | | | | |
| Net investment income (loss) | 6.33%†† | | 5.52% | | 4.58% | | 4.38% | | 5.35% | | 5.21% |
| Net expenses (c) | 0.96%†† | | 0.96% | | 0.95% | | 0.95% | | 0.97% | | 0.99% |
| Portfolio turnover rate | 15% | | 20% | | 16% | | 40% | | 38% | | 30% |
| Net assets at end of period (in 000’s) | $ 2,888,541 | | $ 2,876,677 | | $ 3,074,182 | | $ 3,901,512 | | $ 3,525,782 | | $ 3,405,587 |
| * | Unaudited. |
| †† | Annualized. |
| (a) | Per share data based on average shares outstanding during the period. |
| (b) | Total investment return is calculated exclusive of sales charges and assumes the reinvestment of dividends and distributions. For periods of less than one year, total return is not annualized. |
| (c) | In addition to the fees and expenses which the Fund bears directly, it also indirectly bears a pro-rata share of the fees and expenses of the underlying funds in which it invests. Such indirect expenses are not included in the above expense ratios. |
| | Six months ended
April 30,
2024* | | Year Ended October 31, |
| Investor Class | 2023 | | 2022 | | 2021 | | 2020 | | 2019 |
| Net asset value at beginning of period | $ 4.94 | | $ 4.92 | | $ 5.67 | | $ 5.45 | | $ 5.65 | | $ 5.57 |
| Net investment income (loss) (a) | 0.16 | | 0.27 | | 0.24 | | 0.24 | | 0.29 | | 0.29 |
| Net realized and unrealized gain (loss) | 0.22 | | 0.02 | | (0.73) | | 0.26 | | (0.17) | | 0.11 |
| Total from investment operations | 0.38 | | 0.29 | | (0.49) | | 0.50 | | 0.12 | | 0.40 |
| Less distributions: | | | | | | | | | | | |
| From net investment income | (0.16) | | (0.27) | | (0.24) | | (0.25) | | (0.29) | | (0.29) |
| Return of capital | — | | — | | (0.02) | | (0.03) | | (0.03) | | (0.03) |
| Total distributions | (0.16) | | (0.27) | | (0.26) | | (0.28) | | (0.32) | | (0.32) |
| Net asset value at end of period | $ 5.16 | | $ 4.94 | | $ 4.92 | | $ 5.67 | | $ 5.45 | | $ 5.65 |
| Total investment return (b) | 7.67% | | 5.87% | | (8.90)% | | 9.25% | | 2.24% | | 7.33% |
| Ratios (to average net assets)/Supplemental Data: | | | | | | | | | | | |
| Net investment income (loss) | 6.15%†† | | 5.35% | | 4.45% | | 4.26% | | 5.27% | | 5.15% |
| Net expenses (c) | 1.14%†† | | 1.14% | | 1.09% | | 1.08% | | 1.06% | | 1.05% |
| Portfolio turnover rate | 15% | | 20% | | 16% | | 40% | | 38% | | 30% |
| Net assets at end of period (in 000's) | $ 110,942 | | $ 111,541 | | $ 116,961 | | $ 139,214 | | $ 149,726 | | $ 162,260 |
| * | Unaudited. |
| †† | Annualized. |
| (a) | Per share data based on average shares outstanding during the period. |
| (b) | Total investment return is calculated exclusive of sales charges and assumes the reinvestment of dividends and distributions. For periods of less than one year, total return is not annualized. |
| (c) | In addition to the fees and expenses which the Fund bears directly, it also indirectly bears a pro-rata share of the fees and expenses of the underlying funds in which it invests. Such indirect expenses are not included in the above expense ratios. |
The notes to the financial statements are an integral part of, and should be read in conjunction with, the financial statements.
27
Financial Highlights selected per share data and ratios
| | Six months ended
April 30,
2024* | | Year Ended October 31, |
| Class B | 2023 | | 2022 | | 2021 | | 2020 | | 2019 |
| Net asset value at beginning of period | $ 4.88 | | $ 4.86 | | $ 5.60 | | $ 5.38 | | $ 5.58 | | $ 5.50 |
| Net investment income (loss) (a) | 0.14 | | 0.23 | | 0.19 | | 0.20 | | 0.25 | | 0.24 |
| Net realized and unrealized gain (loss) | 0.21 | | 0.02 | | (0.72) | | 0.25 | | (0.18) | | 0.11 |
| Total from investment operations | 0.35 | | 0.25 | | (0.53) | | 0.45 | | 0.07 | | 0.35 |
| Less distributions: | | | | | | | | | | | |
| From net investment income | (0.14) | | (0.23) | | (0.20) | | (0.21) | | (0.24) | | (0.25) |
| Return of capital | — | | — | | (0.01) | | (0.02) | | (0.03) | | (0.02) |
| Total distributions | (0.14) | | (0.23) | | (0.21) | | (0.23) | | (0.27) | | (0.27) |
| Net asset value at end of period | $ 5.09 | | $ 4.88 | | $ 4.86 | | $ 5.60 | | $ 5.38 | | $ 5.58 |
| Total investment return (b) | 7.16% | | 5.12% | | (9.61)% | | 8.52% | | 1.39% | | 6.52% |
| Ratios (to average net assets)/Supplemental Data: | | | | | | | | | | | |
| Net investment income (loss) | 5.46%†† | | 4.58% | | 3.64% | | 3.56% | | 4.55% | | 4.41% |
| Net expenses (c) | 1.89%†† | | 1.89% | | 1.84% | | 1.83% | | 1.81% | | 1.80% |
| Portfolio turnover rate | 15% | | 20% | | 16% | | 40% | | 38% | | 30% |
| Net assets at end of period (in 000’s) | $ 4,217 | | $ 7,690 | | $ 13,032 | | $ 26,622 | | $ 45,661 | | $ 63,517 |
| * | Unaudited. |
| †† | Annualized. |
| (a) | Per share data based on average shares outstanding during the period. |
| (b) | Total investment return is calculated exclusive of sales charges and assumes the reinvestment of dividends and distributions. For periods of less than one year, total return is not annualized. |
| (c) | In addition to the fees and expenses which the Fund bears directly, it also indirectly bears a pro-rata share of the fees and expenses of the underlying funds in which it invests. Such indirect expenses are not included in the above expense ratios. |
| | Six months ended
April 30,
2024* | | Year Ended October 31, |
| Class C | 2023 | | 2022 | | 2021 | | 2020 | | 2019 |
| Net asset value at beginning of period | $ 4.89 | | $ 4.86 | | $ 5.60 | | $ 5.39 | | $ 5.59 | | $ 5.50 |
| Net investment income (loss) (a) | 0.14 | | 0.23 | | 0.19 | | 0.20 | | 0.25 | | 0.24 |
| Net realized and unrealized gain (loss) | 0.21 | | 0.03 | | (0.72) | | 0.24 | | (0.18) | | 0.12 |
| Total from investment operations | 0.35 | | 0.26 | | (0.53) | | 0.44 | | 0.07 | | 0.36 |
| Less distributions: | | | | | | | | | | | |
| From net investment income | (0.14) | | (0.23) | | (0.20) | | (0.21) | | (0.24) | | (0.25) |
| Return of capital | — | | — | | (0.01) | | (0.02) | | (0.03) | | (0.02) |
| Total distributions | (0.14) | | (0.23) | | (0.21) | | (0.23) | | (0.27) | | (0.27) |
| Net asset value at end of period | $ 5.10 | | $ 4.89 | | $ 4.86 | | $ 5.60 | | $ 5.39 | | $ 5.59 |
| Total investment return (b) | 7.15% | | 5.34% | | (9.62)% | | 8.31% | | 1.39% | | 6.71% |
| Ratios (to average net assets)/Supplemental Data: | | | | | | | | | | | |
| Net investment income (loss) | 5.41%†† | | 4.59% | | 3.66% | | 3.54% | | 4.54% | | 4.41% |
| Net expenses (c) | 1.89%†† | | 1.89% | | 1.84% | | 1.83% | | 1.81% | | 1.80% |
| Portfolio turnover rate | 15% | | 20% | | 16% | | 40% | | 38% | | 30% |
| Net assets at end of period (in 000’s) | $ 91,736 | | $ 98,729 | | $ 133,295 | | $ 214,696 | | $ 297,431 | | $ 373,760 |
| * | Unaudited. |
| †† | Annualized. |
| (a) | Per share data based on average shares outstanding during the period. |
| (b) | Total investment return is calculated exclusive of sales charges and assumes the reinvestment of dividends and distributions. For periods of less than one year, total return is not annualized. |
| (c) | In addition to the fees and expenses which the Fund bears directly, it also indirectly bears a pro-rata share of the fees and expenses of the underlying funds in which it invests. Such indirect expenses are not included in the above expense ratios. |
The notes to the financial statements are an integral part of, and should be read in conjunction with, the financial statements.
| 28 | MainStay MacKay High Yield Corporate Bond Fund |
Financial Highlights selected per share data and ratios
| | Six months ended
April 30,
2024* | | Year Ended October 31, |
| Class I | 2023 | | 2022 | | 2021 | | 2020 | | 2019 |
| Net asset value at beginning of period | $ 4.91 | | $ 4.88 | | $ 5.63 | | $ 5.41 | | $ 5.61 | | $ 5.53 |
| Net investment income (loss) (a) | 0.17 | | 0.29 | | 0.25 | | 0.26 | | 0.30 | | 0.30 |
| Net realized and unrealized gain (loss) | 0.21 | | 0.03 | | (0.73) | | 0.26 | | (0.17) | | 0.11 |
| Total from investment operations | 0.38 | | 0.32 | | (0.48) | | 0.52 | | 0.13 | | 0.41 |
| Less distributions: | | | | | | | | | | | |
| From net investment income | (0.17) | | (0.29) | | (0.25) | | (0.27) | | (0.30) | | (0.30) |
| Return of capital | — | | — | | (0.02) | | (0.03) | | (0.03) | | (0.03) |
| Total distributions | (0.17) | | (0.29) | | (0.27) | | (0.30) | | (0.33) | | (0.33) |
| Net asset value at end of period | $ 5.12 | | $ 4.91 | | $ 4.88 | | $ 5.63 | | $ 5.41 | | $ 5.61 |
| Total investment return (b) | 7.74% | | 6.57% | | (8.65)% | | 9.65% | | 2.56% | | 7.68% |
| Ratios (to average net assets)/Supplemental Data: | | | | | | | | | | | |
| Net investment income (loss) | 6.59%†† | | 5.78% | | 4.82% | | 4.62% | | 5.60% | | 5.45% |
| Net expenses (c) | 0.71%†† | | 0.71% | | 0.70% | | 0.70% | | 0.72% | | 0.74% |
| Portfolio turnover rate | 15% | | 20% | | 16% | | 40% | | 38% | | 30% |
| Net assets at end of period (in 000’s) | $ 3,648,850 | | $ 3,001,067 | | $ 3,159,577 | | $ 4,116,697 | | $ 3,509,954 | | $ 3,451,487 |
| * | Unaudited. |
| †† | Annualized. |
| (a) | Per share data based on average shares outstanding during the period. |
| (b) | Total investment return is calculated exclusive of sales charges and assumes the reinvestment of dividends and distributions. Class I shares are not subject to sales charges. For periods of less than one year, total return is not annualized. |
| (c) | In addition to the fees and expenses which the Fund bears directly, it also indirectly bears a pro-rata share of the fees and expenses of the underlying funds in which it invests. Such indirect expenses are not included in the above expense ratios. |
| | Six months ended
April 30,
2024* | | Year Ended October 31, |
| Class R2 | 2023 | | 2022 | | 2021 | | 2020 | | 2019 |
| Net asset value at beginning of period | $ 4.91 | | $ 4.88 | | $ 5.63 | | $ 5.41 | | $ 5.61 | | $ 5.52 |
| Net investment income (loss) (a) | 0.16 | | 0.27 | | 0.23 | | 0.24 | | 0.29 | | 0.28 |
| Net realized and unrealized gain (loss) | 0.21 | | 0.03 | | (0.73) | | 0.26 | | (0.18) | | 0.12 |
| Total from investment operations | 0.37 | | 0.30 | | (0.50) | | 0.50 | | 0.11 | | 0.40 |
| Less distributions: | | | | | | | | | | | |
| From net investment income | (0.16) | | (0.27) | | (0.23) | | (0.25) | | (0.28) | | (0.29) |
| Return of capital | — | | — | | (0.02) | | (0.03) | | (0.03) | | (0.02) |
| Total distributions | (0.16) | | (0.27) | | (0.25) | | (0.28) | | (0.31) | | (0.31) |
| Net asset value at end of period | $ 5.12 | | $ 4.91 | | $ 4.88 | | $ 5.63 | | $ 5.41 | | $ 5.61 |
| Total investment return (b) | 7.55% | | 6.19% | | (8.98)% | | 9.28% | | 2.17% | | 7.49% |
| Ratios (to average net assets)/Supplemental Data: | | | | | | | | | | | |
| Net investment income (loss) | 6.23%†† | | 5.42% | | 4.45% | | 4.28% | | 5.26% | | 5.10% |
| Net expenses (c) | 1.06%†† | | 1.06% | | 1.05% | | 1.05% | | 1.07% | | 1.09% |
| Portfolio turnover rate | 15% | | 20% | | 16% | | 40% | | 38% | | 30% |
| Net assets at end of period (in 000’s) | $ 5,827 | | $ 6,548 | | $ 6,949 | | $ 10,640 | | $ 13,006 | | $ 13,866 |
| * | Unaudited. |
| †† | Annualized. |
| (a) | Per share data based on average shares outstanding during the period. |
| (b) | Total investment return is calculated exclusive of sales charges and assumes the reinvestment of dividends and distributions. Class R2 shares are not subject to sales charges. For periods of less than one year, total return is not annualized. |
| (c) | In addition to the fees and expenses which the Fund bears directly, it also indirectly bears a pro-rata share of the fees and expenses of the underlying funds in which it invests. Such indirect expenses are not included in the above expense ratios. |
The notes to the financial statements are an integral part of, and should be read in conjunction with, the financial statements.
29
Financial Highlights selected per share data and ratios
| | Six months ended
April 30,
2024* | | Year Ended October 31, |
| Class R3 | 2023 | | 2022 | | 2021 | | 2020 | | 2019 |
| Net asset value at beginning of period | $ 4.90 | | $ 4.88 | | $ 5.62 | | $ 5.40 | | $ 5.60 | | $ 5.52 |
| Net investment income (loss) (a) | 0.15 | | 0.26 | | 0.22 | | 0.22 | | 0.27 | | 0.27 |
| Net realized and unrealized gain (loss) | 0.21 | | 0.02 | | (0.72) | | 0.26 | | (0.17) | | 0.11 |
| Total from investment operations | 0.36 | | 0.28 | | (0.50) | | 0.48 | | 0.10 | | 0.38 |
| Less distributions: | | | | | | | | | | | |
| From net investment income | (0.15) | | (0.26) | | (0.22) | | (0.23) | | (0.27) | | (0.28) |
| Return of capital | — | | — | | (0.02) | | (0.03) | | (0.03) | | (0.02) |
| Total distributions | (0.15) | | (0.26) | | (0.24) | | (0.26) | | (0.30) | | (0.30) |
| Net asset value at end of period | $ 5.11 | | $ 4.90 | | $ 4.88 | | $ 5.62 | | $ 5.40 | | $ 5.60 |
| Total investment return (b) | 7.44% | | 5.72% | | (9.07)% | | 9.01% | | 1.90% | | 7.03% |
| Ratios (to average net assets)/Supplemental Data: | | | | | | | | | | | |
| Net investment income (loss) | 5.98%†† | | 5.18% | | 4.25% | | 3.98% | | 4.96% | | 4.84% |
| Net expenses (c) | 1.31%†† | | 1.31% | | 1.30% | | 1.30% | | 1.32% | | 1.34% |
| Portfolio turnover rate | 15% | | 20% | | 16% | | 40% | | 38% | | 30% |
| Net assets at end of period (in 000’s) | $ 4,725 | | $ 3,913 | | $ 3,482 | | $ 3,630 | | $ 1,924 | | $ 1,281 |
| * | Unaudited. |
| †† | Annualized. |
| (a) | Per share data based on average shares outstanding during the period. |
| (b) | Total investment return is calculated exclusive of sales charges and assumes the reinvestment of dividends and distributions. Class R3 shares are not subject to sales charges. For periods of less than one year, total return is not annualized. |
| (c) | In addition to the fees and expenses which the Fund bears directly, it also indirectly bears a pro-rata share of the fees and expenses of the underlying funds in which it invests. Such indirect expenses are not included in the above expense ratios. |
| | Six months ended
April 30,
2024* | | Year Ended October 31, |
| Class R6 | 2023 | | 2022 | | 2021 | | 2020 | | 2019 |
| Net asset value at beginning of period | $ 4.89 | | $ 4.87 | | $ 5.61 | | $ 5.40 | | $ 5.60 | | $ 5.52 |
| Net investment income (loss) (a) | 0.17 | | 0.30 | | 0.26 | | 0.27 | | 0.31 | | 0.31 |
| Net realized and unrealized gain (loss) | 0.21 | | 0.02 | | (0.72) | | 0.24 | | (0.17) | | 0.11 |
| Total from investment operations | 0.38 | | 0.32 | | (0.46) | | 0.51 | | 0.14 | | 0.42 |
| Less distributions: | | | | | | | | | | | |
| From net investment income | (0.17) | | (0.30) | | (0.26) | | (0.27) | | (0.31) | | (0.31) |
| Return of capital | — | | — | | (0.02) | | (0.03) | | (0.03) | | (0.03) |
| Total distributions | (0.17) | | (0.30) | | (0.28) | | (0.30) | | (0.34) | | (0.34) |
| Net asset value at end of period | $ 5.10 | | $ 4.89 | | $ 4.87 | | $ 5.61 | | $ 5.40 | | $ 5.60 |
| Total investment return (b) | 7.85% | | 6.54% | | (8.36)% | | 9.64% | | 2.70% | | 7.84% |
| Ratios (to average net assets)/Supplemental Data: | | | | | | | | | | | |
| Net investment income (loss) | 6.73%†† | | 5.93% | | 4.98% | | 4.79% | | 5.65% | | 5.60% |
| Net expenses (c) | 0.56%†† | | 0.56% | | 0.57% | | 0.57% | | 0.58% | | 0.58% |
| Portfolio turnover rate | 15% | | 20% | | 16% | | 40% | | 38% | | 30% |
| Net assets at end of period (in 000’s) | $ 3,761,312 | | $ 3,856,330 | | $ 3,609,591 | | $ 3,697,586 | | $ 4,420,424 | | $ 2,180,977 |
| * | Unaudited. |
| †† | Annualized. |
| (a) | Per share data based on average shares outstanding during the period. |
| (b) | Total investment return is calculated exclusive of sales charges and assumes the reinvestment of dividends and distributions. Class R6 shares are not subject to sales charges. For periods of less than one year, total return is not annualized. |
| (c) | In addition to the fees and expenses which the Fund bears directly, it also indirectly bears a pro-rata share of the fees and expenses of the underlying funds in which it invests. Such indirect expenses are not included in the above expense ratios. |
The notes to the financial statements are an integral part of, and should be read in conjunction with, the financial statements.
| 30 | MainStay MacKay High Yield Corporate Bond Fund |
Financial Highlights selected per share data and ratios
| | Six months ended
April 30,
2024* | | Year Ended October 31, | | August 31, 2020^ through
October 31, |
| SIMPLE Class | 2023 | | 2022 | | 2021 | | 2020 |
| Net asset value at beginning of period | $ 4.95 | | $ 4.92 | | $ 5.67 | | $ 5.45 | | $ 5.54 |
| Net investment income (loss) | 0.16(a) | | 0.27(a) | | 0.22(a) | | 0.23(a) | | 0.04 |
| Net realized and unrealized gain (loss) | 0.21 | | 0.02 | | (0.73) | | 0.25 | | (0.08) |
| Total from investment operations | 0.37 | | 0.29 | | (0.51) | | 0.48 | | (0.04) |
| Less distributions: | | | | | | | | | |
| From net investment income | (0.16) | | (0.26) | | (0.22) | | (0.23) | | (0.05) |
| Return of capital | — | | — | | (0.02) | | (0.03) | | (0.00)‡ |
| Total distributions | (0.16) | | (0.26) | | (0.24) | | (0.26) | | (0.05) |
| Net asset value at end of period | $ 5.16 | | $ 4.95 | | $ 4.92 | | $ 5.67 | | $ 5.45 |
| Total investment return (b) | 7.46% | | 6.00% | | (9.14)% | | 8.98% | | (0.72)% |
| Ratios (to average net assets)/Supplemental Data: | | | | | | | | | |
| Net investment income (loss) | 6.12%†† | | 5.30% | | 4.23% | | 4.00% | | 4.74%†† |
| Net expenses (c) | 1.16%†† | | 1.21% | | 1.34% | | 1.33% | | 1.30%†† |
| Portfolio turnover rate | 15% | | 20% | | 16% | | 40% | | 38% |
| Net assets at end of period (in 000’s) | $ 127 | | $ 47 | | $ 32 | | $ 27 | | $ 25 |
| * | Unaudited. |
| ^ | Inception date. |
| ‡ | Less than one cent per share. |
| †† | Annualized. |
| (a) | Per share data based on average shares outstanding during the period. |
| (b) | Total investment return is calculated exclusive of sales charges and assumes the reinvestment of dividends and distributions. SIMPLE Class shares are not subject to sales charges. For periods of less than one year, total return is not annualized. |
| (c) | In addition to the fees and expenses which the Fund bears directly, it also indirectly bears a pro-rata share of the fees and expenses of the underlying funds in which it invests. Such indirect expenses are not included in the above expense ratios. |
The notes to the financial statements are an integral part of, and should be read in conjunction with, the financial statements.
31
Notes to Financial Statements (Unaudited)
Note 1-Organization and Business
The MainStay Funds (the “Trust”) was organized on January 9, 1986, as a Massachusetts business trust. The Trust is registered under the Investment Company Act of 1940, as amended (the “1940 Act”), as an open-end management investment company, and is comprised of eleven funds (collectively referred to as the "Funds"). These financial statements and notes relate to the MainStay MacKay High Yield Corporate Bond Fund (the "Fund"), a “diversified” fund, as that term is defined in the 1940 Act, as interpreted or modified by regulatory authorities having jurisdiction, from time to time.
The following table lists the Fund's share classes that have been registered and commenced operations:
| Class | Commenced Operations |
| Class A | January 3, 1995 |
| Investor Class | February 28, 2008 |
| Class B | May 1, 1986 |
| Class C | September 1, 1998 |
| Class I | January 2, 2004 |
| Class R2 | May 1, 2008 |
| Class R3 | February 29, 2016 |
| Class R6 | June 17, 2013 |
| SIMPLE Class | August 31, 2020 |
Effective at the close of business on February 23, 2024, Class R1 shares were liquidated.
Class A and Investor Class shares are offered at net asset value (“NAV”) per share plus an initial sales charge. No initial sales charge applies to investments of $1 million or more (and certain other qualified purchases) in Class A and Investor Class shares. However, a CDSC of 1.00% may be imposed on certain redemptions made within 18 months of the date of purchase on shares that were purchased without an initial sales charge. Class C shares are offered at NAV without an initial sales charge, although a 1.00% CDSC may be imposed on certain redemptions of such shares made within one year of the date of purchase of Class C shares. When Class B shares were offered, they were offered at NAV without an initial sales charge, although a CDSC that declines depending on the number of years a shareholder held its Class B shares may be imposed on certain redemptions of such shares made within six years of the date of purchase of such shares. Class I, Class R2, Class R3, Class R6 and SIMPLE Class shares are offered at NAV without a sales charge. Depending upon eligibility, Class B shares convert to either Class A or Investor Class shares at the end of the calendar quarter eight years after the date they were purchased. In addition, depending upon eligibility, Class C shares convert to either Class A or Investor Class shares at the end of the calendar quarter eight years after the date they were purchased. Additionally, Investor Class shares may convert automatically to Class A shares. SIMPLE Class shares convert to Class A shares, or Investor Class shares if you are not eligible to hold Class A shares, at the end of the calendar quarter, ten years after the date they were purchased. Share class conversions are based on the relevant NAVs of the two
classes at the time of the conversion, and no sales load or other charge is imposed. Under certain circumstances and as may be permitted by the Trust’s multiple class plan pursuant to Rule 18f-3 under the 1940 Act, specified share classes of the Fund may be converted to one or more other share classes of the Fund as disclosed in the capital share trans-actions within these Notes. The classes of shares have the same voting (except for issues that relate solely to one class), dividend, liquidation and other rights, and the same terms and conditions, except that under distribution plans pursuant to Rule 12b-1 under the 1940 Act, Class B and Class C shares are subject to higher distribution and/or service fees than Class A, Investor Class, Class R2, Class R3 and SIMPLE Class shares. Class I and Class R6 shares are not subject to a distribution and/or service fee. Class R2 and Class R3 shares are subject to a shareholder service fee, which is in addition to fees paid under the distribution plans for Class R2 and Class R3 shares.
The Fund's investment objective is to seek maximum current income through investment in a diversified portfolio of high-yield debt securities. Capital appreciation is a secondary objective.
Note 2–Significant Accounting Policies
The Fund is an investment company and accordingly follows the investment company accounting and reporting guidance of the Financial Accounting Standards Board (“FASB”) Accounting Standards Codification Topic 946 Financial Services—Investment Companies. The Fund prepares its financial statements in accordance with generally accepted accounting principles (“GAAP”) in the United States of America and follows the significant accounting policies described below.
(A) Securities Valuation. Investments are usually valued as of the close of regular trading on the New York Stock Exchange (the "Exchange") (usually 4:00 p.m. Eastern time) on each day the Fund is open for business ("valuation date").
Pursuant to Rule 2a-5 under the 1940 Act, the Board of Trustees of the Trust (the "Board") has designated New York Life Investment Management LLC ("New York Life Investments" or the "Manager") as its Valuation Designee (the "Valuation Designee"). The Valuation Designee is responsible for performing fair valuations relating to all investments in the Fund’s portfolio for which market quotations are not readily available; periodically assessing and managing material valuation risks; establishing and applying fair value methodologies; testing fair valuation methodologies; evaluating and overseeing pricing services; ensuring appropriate segregation of valuation and portfolio management functions; providing quarterly, annual and prompt reporting to the Board, as appropriate; identifying potential conflicts of interest; and maintaining appropriate records. The Valuation Designee has established a valuation committee ("Valuation Committee") to assist in carrying out the Valuation Designee’s responsibilities and establish prices of securities for which market quotations are not readily available. The Fund's and the Valuation Designee's policies and procedures ("Valuation Procedures") govern the Valuation Designee’s selection and application of methodologies for determining and calculating the fair value of Fund investments. The
| 32 | MainStay MacKay High Yield Corporate Bond Fund |
Valuation Designee may value the Fund's portfolio securities for which market quotations are not readily available and other Fund assets utilizing inputs from pricing services and other third-party sources. The Valuation Committee meets (in person, via electronic mail or via teleconference) on an ad-hoc basis to determine fair valuations and on a quarterly basis to review fair value events with respect to certain securities for which market quotations are not readily available, including valuation risks and back-testing results, and to preview reports to the Board.
The Valuation Committee establishes prices of securities for which market quotations are not readily available based on such methodologies and measurements on a regular basis after considering information that is reasonably available and deemed relevant by the Valuation Committee. The Board shall oversee the Valuation Designee and review fair valuation materials on a prompt, quarterly and annual basis and approve proposed revisions to the Valuation Procedures.
Investments for which market quotations are not readily available are valued at fair value as determined in good faith pursuant to the Valuation Procedures. A market quotation is readily available only when that quotation is a quoted price (unadjusted) in active markets for identical investments that the Fund can access at the measurement date, provided that a quotation will not be readily available if it is not reliable. "Fair value" is defined as the price the Fund would reasonably expect to receive upon selling an asset or liability in an orderly transaction to an independent buyer in the principal or most advantageous market for the asset or liability. Fair value measurements are determined within a framework that establishes a three-tier hierarchy that maximizes the use of observable market data and minimizes the use of unobservable inputs to establish a classification of fair value measurements for disclosure purposes. "Inputs" refer broadly to the assumptions that market participants would use in pricing the asset or liability, including assumptions about risk, such as the risk inherent in a particular valuation technique used to measure fair value using a pricing model and/or the risk inherent in the inputs for the valuation technique. Inputs may be observable or unobservable. Observable inputs reflect the assumptions market participants would use in pricing the asset or liability based on market data obtained from sources independent of the Fund. Unobservable inputs reflect the Fund’s own assumptions about the assumptions market participants would use in pricing the asset or liability based on the information available. The inputs or methodology used for valuing assets or liabilities may not be an indication of the risks associated with investing in those assets or liabilities. The three-tier hierarchy of inputs is summarized below.
| • | Level 1—quoted prices (unadjusted) in active markets for an identical asset or liability |
| • | Level 2—other significant observable inputs (including quoted prices for a similar asset or liability in active markets, interest rates and yield curves, prepayment speeds, credit risk, etc.) |
| • | Level 3—significant unobservable inputs (including the Fund's own assumptions about the assumptions that market participants would use in measuring fair value of an asset or liability) |
The level of an asset or liability within the fair value hierarchy is based on the lowest level of an input, both individually and in the aggregate, that is significant to the fair value measurement. The aggregate value by input level of the Fund’s assets and liabilities as of April 30, 2024, is included at the end of the Portfolio of Investments.
The Fund may use third-party vendor evaluations, whose prices may be derived from one or more of the following standard inputs, among others:
| • Benchmark yields | • Reported trades |
| • Broker/dealer quotes | • Issuer spreads |
| • Two-sided markets | • Benchmark securities |
| • Bids/offers | • Reference data (corporate actions or material event notices) |
| • Industry and economic events | • Comparable bonds |
| • Monthly payment information | |
An asset or liability for which a market quotation is not readily available is valued by methods deemed reasonable in good faith by the Valuation Committee, following the Valuation Procedures to represent fair value. Under these procedures, the Valuation Designee generally uses a market-based approach which may use related or comparable assets or liabilities, recent transactions, market multiples, book values and other relevant information. The Valuation Designee may also use an income-based valuation approach in which the anticipated future cash flows of the asset or liability are discounted to calculate fair value. Discounts may also be applied due to the nature and/or duration of any restrictions on the disposition of the asset or liability. Fair value represents a good faith approximation of the value of a security. Fair value determinations involve the consideration of a number of subjective factors, an analysis of applicable facts and circumstances and the exercise of judgment. As a result, it is possible that the fair value for a security determined in good faith in accordance with the Valuation Procedures may differ from valuations for the same security determined for other funds using their own valuation procedures. Although the Valuation Procedures are designed to value a security at the price the Fund may reasonably expect to receive upon the security's sale in an orderly transaction, there can be no assurance that any fair value determination thereunder would, in fact, approximate the amount that the Fund would actually realize upon the sale of the security or the price at which the security would trade if a reliable market price were readily available. During the six-month period ended April 30, 2024, there were no material changes to the fair value methodologies.
Securities which may be valued in this manner include, but are not limited to: (i) a security for which trading has been halted or suspended or otherwise does not have a readily available market quotation on a given day; (ii) a debt security that has recently gone into default and for which there is not a current market quotation; (iii) a security of an issuer that has entered into a restructuring; (iv) a security that has been delisted from a national exchange; (v) a security subject to trading collars for which no or limited trading takes place; and (vi) a security whose principal market has been temporarily closed at a time when, under normal
Notes to Financial Statements (Unaudited) (continued)
conditions, it would be open. Securities valued in this manner are generally categorized as Level 2 or 3 in the hierarchy.
Equity securities, rights and warrants, if applicable, are valued at the last quoted sales prices as of the close of regular trading on the relevant exchange on each valuation date. Securities that are not traded on the valuation date are valued at the mean of the last quoted bid and ask prices. Prices are normally taken from the principal market in which each security trades. These securities are generally categorized as Level 1 in the hierarchy.
Exchange-traded funds (“ETFs”) are valued at the last quoted sales prices as of the close of regular trading on the relevant exchange on each valuation date. Securities that are not traded on the valuation date are valued at the mean of the last quoted bid and ask prices. Prices are normally taken from the principal market in which each security trades. These securities are generally categorized as Level 1 in the hierarchy.
Debt securities (other than convertible and municipal bonds) are valued at the evaluated bid prices (evaluated mean prices in the case of convertible and municipal bonds) supplied by a pricing agent or broker selected by the Valuation Designee, in consultation with the Subadvisor. The evaluations are market-based measurements processed through a pricing application and represents the pricing agent’s good faith determination as to what a holder may receive in an orderly transaction under market conditions. The rules-based logic utilizes valuation techniques that reflect participants’ assumptions and vary by asset class and per methodology, maximizing the use of relevant observable data including quoted prices for similar assets, benchmark yield curves and market corroborated inputs. The evaluated bid or mean prices are deemed by the Valuation Designee, in consultation with the Subadvisor, to be representative of market values at the regular close of trading of the Exchange on each valuation date. Debt securities purchased on a delayed delivery basis are marked to market daily until settlement at the forward settlement date. Debt securities, including corporate bonds, U.S. government and federal agency bonds, municipal bonds, foreign bonds, convertible bonds, asset-backed securities and mortgage-backed securities are generally categorized as Level 2 in the hierarchy.
Loan assignments, participations and commitments are valued at the average of bid quotations obtained from the engaged independent pricing service and are generally categorized as Level 2 in the hierarchy. Certain loan assignments, participations and commitments may be valued by utilizing significant unobservable inputs obtained from the pricing service and are generally categorized as Level 3 in the hierarchy.
The information above is not intended to reflect an exhaustive list of the methodologies that may be used to value portfolio investments. The Valuation Procedures permit the use of a variety of valuation methodologies in connection with valuing portfolio investments. The methodology used for a specific type of investment may vary based on the market data available or other considerations. The methodologies summarized above may not represent the specific means by which portfolio investments are valued on any particular business day.
A portfolio investment may be classified as an illiquid investment under the Fund's written liquidity risk management program and related procedures (“Liquidity Program”). Illiquidity of an investment might prevent the sale of such investment at a time when the Manager or the Subadvisor might wish to sell, and these investments could have the effect of decreasing the overall level of the Fund's liquidity. Further, the lack of an established secondary market may make it more difficult to value illiquid investments, requiring the Fund to rely on judgments that may be somewhat subjective in measuring value, which could vary materially from the amount that the Fund could realize upon disposition. Difficulty in selling illiquid investments may result in a loss or may be costly to the Fund. An illiquid investment is any investment that the Manager or Subadvisor reasonably expects cannot be sold or disposed of in current market conditions in seven calendar days or less without the sale or disposition significantly changing the market value of the investment. The liquidity classification of each investment will be made using information obtained after reasonable inquiry and taking into account, among other things, relevant market, trading and investment-specific considerations in accordance with the Liquidity Program. Illiquid investments are often fair valued in accordance with the Fund's procedures described above. The liquidity of the Fund's investments was determined as of April 30, 2024, and can change at any time.
(B) Income Taxes. The Fund’s policy is to comply with the requirements of the Internal Revenue Code of 1986, as amended (the “Internal Revenue Code”), applicable to regulated investment companies and to distribute all of its taxable income to the shareholders of the Fund within the allowable time limits.
The Manager evaluates the Fund’s tax positions to determine if the tax positions taken meet the minimum recognition threshold in connection with accounting for uncertainties in income tax positions taken or expected to be taken for the purposes of measuring and recognizing tax liabilities in the financial statements. Recognition of tax benefits of an uncertain tax position is permitted only to the extent the position is “more likely than not” to be sustained assuming examination by taxing authorities. The Manager analyzed the Fund’s tax positions taken on federal, state and local income tax returns for all open tax years (for up to three tax years) and has concluded that no provisions for federal, state and local income tax are required in the Fund’s financial statements. The Fund’s federal, state and local income tax and federal excise tax returns for tax years for which the applicable statutes of limitations have not expired are subject to examination by the Internal Revenue Service and state and local departments of revenue.
(C) Dividends and Distributions to Shareholders. Dividends and distributions are recorded on the ex-dividend date. The Fund intends to declare and pay dividends from net investment income, if any, at least monthly and distributions from net realized capital and currency gains, if any, at least annually. Unless a shareholder elects otherwise, all dividends and distributions are reinvested at NAV in the same class of shares of the Fund. Dividends and distributions to shareholders are determined in
| 34 | MainStay MacKay High Yield Corporate Bond Fund |
accordance with federal income tax regulations and may differ from determinations using GAAP.
(D) Security Transactions and Investment Income. The Fund records security transactions on the trade date. Realized gains and losses on security transactions are determined using the identified cost method. Dividend income is recognized on the ex-dividend date, net of any foreign tax withheld at the source, and interest income is accrued as earned using the effective interest rate method. Distributions received from real estate investment trusts may be classified as dividends, capital gains and/or return of capital. Discounts and premiums on securities purchased for the Fund are accreted and amortized, respectively, on the effective interest rate method. Income from payment-in-kind securities is accreted daily based on the effective interest rate method.
Investment income and realized and unrealized gains and losses on investments of the Fund are allocated pro rata to the separate classes of shares based upon their relative net assets on the date the income is earned or realized and unrealized gains and losses are incurred.
The Fund may place a debt security on non-accrual status and reduce related interest income by ceasing current accruals and writing off all or a portion of any interest receivables when the collection of all or a portion of such interest has become doubtful. A debt security is removed from non-accrual status when the issuer resumes interest payments or when collectability of interest is reasonably assured.
(E) Expenses. Expenses of the Trust are allocated to the individual Funds in proportion to the net assets of the respective Funds when the expenses are incurred, except where direct allocations of expenses can be made. Expenses (other than transfer agent expenses and fees incurred under the shareholder services plans and/or the distribution plans further discussed in Note 3(B)) are allocated to separate classes of shares pro rata based upon their relative net assets on the date the expenses are incurred. The expenses borne by the Fund, including those of related parties to the Fund, are shown in the Statement of Operations.
Additionally, the Fund may invest in ETFs and mutual funds, which are subject to management fees and other fees that may cause the costs of investing in ETFs and mutual funds to be greater than the costs of owning the underlying securities directly. These indirect expenses of ETFs and mutual funds are not included in the amounts shown as expenses in the Statement of Operations or in the expense ratios included in the Financial Highlights.
(F) Use of Estimates. In preparing financial statements in conformity with GAAP, the Manager makes estimates and assumptions that affect the reported amounts and disclosures in the financial statements. Actual results could differ from those estimates and assumptions.
(G) Loan Assignments, Participations and Commitments. The Fund may invest in loan assignments and participations ("loans"). Commitments are agreements to make money available to a borrower in a specified amount, at a specified rate and within a specified time. The Fund records an investment when the borrower withdraws money on a
commitment or when a funded loan is purchased (trade date) and records interest as earned. These loans pay interest at rates that are periodically reset by reference to a base lending rate plus a spread. These base lending rates are generally the prime rate offered by a designated U.S. bank, the Secured Overnight Financing Rate ("SOFR") or an alternative reference rate.
The loans in which the Fund may invest are generally readily marketable, but may be subject to some restrictions on resale. For example, the Fund may be contractually obligated to receive approval from the agent bank and/or borrower prior to the sale of these investments. If the Fund purchases an assignment from a lender, the Fund will generally have direct contractual rights against the borrower in favor of the lender. If the Fund purchases a participation interest either from a lender or a participant, the Fund typically will have established a direct contractual relationship with the seller of the participation interest, but not with the borrower. Consequently, the Fund is subject to the credit risk of the lender or participant who sold the participation interest to the Fund, in addition to the usual credit risk of the borrower. In the event that the borrower, selling participant or intermediate participants become insolvent or enter into bankruptcy, the Fund may incur certain costs and delays in realizing payment, or may suffer a loss of principal and/or interest.
Unfunded commitments represent the remaining obligation of the Fund to the borrower. At any point in time, up to the maturity date of the issue, the borrower may demand the unfunded portion. Unfunded amounts, if any, are marked to market and any unrealized gains or losses are recorded in the Statement of Assets and Liabilities.
(H) Rights and Warrants. Rights are certificates that permit the holder to purchase a certain number of shares, or a fractional share, of a new stock from the issuer at a specific price. Warrants are instruments that entitle the holder to buy an equity security at a specific price for a specific period of time. These investments can provide a greater potential for profit or loss than an equivalent investment in the underlying security. Prices of these investments do not necessarily move in tandem with the prices of the underlying securities.
There is risk involved in the purchase of rights and warrants in that these investments are speculative investments. The Fund could also lose the entire value of its investment in warrants if such warrants are not exercised by the date of its expiration. The Fund is exposed to risk until the sale or exercise of each right or warrant is completed.
(I) Debt Securities Risk. The ability of issuers of debt securities held by the Fund to meet their obligations may be affected by, among other things, economic or political developments in a specific country, industry or region. Debt securities are also subject to the risks associated with changes in interest rates. The Fund primarily invests in high-yield debt securities (commonly referred to as “junk bonds”), which are considered speculative because they present a greater risk of loss, including default, than higher rated debt securities. These securities pay investors a premium—a higher interest rate or yield than investment grade debt securities—because of the increased risk of loss. These securities can
Notes to Financial Statements (Unaudited) (continued)
also be subject to greater price volatility. In times of unusual or adverse market, economic or political conditions, these securities may experience higher than normal default rates.
The loans in which the Fund invests are usually rated below investment grade, or if unrated, determined by the Subadvisor to be of comparable quality (commonly referred to as “junk bonds”) and are generally considered speculative because they present a greater risk of loss, including default, than higher quality debt securities. Moreover, such securities may, under certain circumstances, be particularly susceptible to liquidity and valuation risks.
Although certain loans are collateralized, there is no guarantee that the value of the collateral will be sufficient to repay the loan. In a recession or serious credit event, the value of these investments could decline significantly. As a result, the Fund’s NAVs could go down and you could lose money.
In addition, loans generally are subject to extended settlement periods that may be longer than seven days. As a result, the Fund may be adversely affected by selling other investments at an unfavorable time and/or under unfavorable conditions or engaging in borrowing transactions, such as borrowing against its credit facility, to raise cash to meet redemption obligations or pursue other investment opportunities.
In certain circumstances, loans may not be deemed to be securities. As a result, the Fund may not have the protection of the anti-fraud provisions of the federal securities laws. In such cases, the Fund generally must rely on the contractual provisions in the loan agreement and common-law fraud protections under applicable state law.
(J) LIBOR Replacement Risk. The Fund may invest in certain debt securities, derivatives or other financial instruments that have relied or continue to rely on LIBOR, as a “benchmark” or “reference rate” for various interest rate calculations. As of January 1, 2022, the United Kingdom Financial Conduct Authority ("FCA"), which regulates LIBOR, ceased its active encouragement of banks to provide the quotations needed to sustain most LIBOR rates due to the absence of an active market for interbank unsecured lending and other reasons. In connection with supervisory guidance from U.S. regulators, certain U.S. regulated entities have generally ceased to enter into certain new LIBOR contracts after January 1, 2022. On March 15, 2022, the Adjustable Interest Rate (LIBOR) Act was signed into law. This law provides a statutory fallback mechanism on a nationwide basis to replace LIBOR with a benchmark rate that is selected by the Board of Governors of the Federal Reserve System and based on SOFR (which measures the cost of overnight borrowings through repurchase agreement transactions collateralized with U.S. Treasury securities) for tough legacy contracts. On February 27, 2023, the Federal Reserve System’s final rule in connection with this law became effective, establishing benchmark replacements based on SOFR and Term SOFR (a forward-looking measurement of market expectations of SOFR implied from certain derivatives markets) for applicable tough legacy contracts governed by U.S. law. In addition, the FCA has announced that it will require the publication of synthetic LIBOR for the
one-month, three-month and six-month U.S. Dollar LIBOR settings after June 30, 2023 through at least September 30, 2024. Certain of the Fund's investments may involve individual tough legacy contracts which may be subject to the Adjustable Interest Rate (LIBOR) Act or synthetic LIBOR and no assurances can be given that these measures will have had the intended effects. Although the transition process away from LIBOR for many instruments has been completed, some LIBOR use is continuing and there are potential effects related to the transition away from LIBOR or continued use of LIBOR on the Fund.
The elimination of LIBOR or changes to other reference rates or any other changes or reforms to the determination or supervision of reference rates could have an adverse impact on the market for, or value of, any securities or payments linked to those reference rates, which may adversely affect the Fund's performance and/or net asset value. It could also lead to a reduction in the interest rates on, and the value of, some LIBOR-based investments and reduce the effectiveness of hedges mitigating risk in connection with LIBOR-based investments. Uncertainty and risk also remain regarding the willingness and ability of issuers and lenders to include enhanced provisions in new and existing contracts or instruments. Consequently, the transition away from LIBOR to other reference rates may lead to increased volatility and illiquidity in markets that are tied to LIBOR, fluctuations in values of LIBOR-related investments or investments in issuers that utilize LIBOR, increased difficulty in borrowing or refinancing and diminished effectiveness of hedging strategies, adversely affecting the Fund's performance. Furthermore, the risks associated with the expected discontinuation of LIBOR and transition may be exacerbated if the work necessary to effect an orderly transition to an alternative reference rate is not completed in a timely manner. The usefulness of LIBOR as a benchmark could deteriorate anytime during this transition period. Any such effects of the transition process, including unforeseen effects, could result in losses to the Fund.
(K) Indemnifications. Under the Trust’s organizational documents, its officers and trustees are indemnified against certain liabilities that may arise out of performance of their duties to the Trust. Additionally, in the normal course of business, the Fund enters into contracts with third-party service providers that contain a variety of representations and warranties and that may provide general indemnifications. The Fund's maximum exposure under these arrangements is unknown, as this would involve future claims that may be made against the Fund that have not yet occurred. The Manager believes that the risk of loss in connection with these potential indemnification obligations is remote. However, there can be no assurance that material liabilities related to such obligations will not arise in the future, which could adversely impact the Fund.
Note 3–Fees and Related Party Transactions
(A) Manager and Subadvisor. New York Life Investments, a registered investment adviser and an indirect, wholly-owned subsidiary of New York Life Insurance Company ("New York Life"), serves as the Fund's Manager, pursuant to an Amended and Restated Management Agreement ("Management Agreement"). The Manager provides offices, conducts
| 36 | MainStay MacKay High Yield Corporate Bond Fund |
clerical, recordkeeping and bookkeeping services and keeps most of the financial and accounting records required to be maintained by the Fund. Except for the portion of salaries and expenses that are the responsibility of the Fund, the Manager pays the salaries and expenses of all personnel affiliated with the Fund and certain operational expenses of the Fund. The Fund reimburses New York Life Investments in an amount equal to the portion of the compensation of the Chief Compliance Officer attributable to the Fund. MacKay Shields LLC ("MacKay Shields" or the "Subadvisor"), a registered investment adviser and an indirect, wholly-owned subsidiary of New York Life, serves as the Subadvisor to the Fund and is responsible for the day-to-day portfolio management of the Fund. Pursuant to the terms of an Amended and Restated Subadvisory Agreement ("Subadvisory Agreement") between New York Life Investments and MacKay Shields, New York Life Investments pays for the services of the Subadvisor.
Pursuant to the Management Agreement, the Fund pays the Manager a monthly fee for the services performed and the facilities furnished at an annual rate of the Fund’s average daily net assets as follows: 0.60% up to $500 million; 0.55% from $500 million up to $5 billion; 0.525% from $5 billion up to $7 billion; 0.50% from $7 billion up to $10 billion; 0.49% from $10 billion to $15 billion; and 0.48% in excess of $15 billion, plus a fee for fund accounting services previously provided by New York Life Investments under a separate fund accounting agreement furnished at an annual rate of the Fund’s average daily net assets as follows: 0.05% up to $20 million; 0.0333% from $20 million to $100 million; and 0.01% in excess of $100 million. During the six-month period ended April 30, 2024, the effective management fee rate was 0.54%, inclusive of a fee for fund accounting services of 0.01% of the Fund’s average daily net assets.
New York Life Investments has contractually agreed to waive fees and/or reimburse expenses so that Total Annual Fund Operating Expenses (excluding taxes, interest, litigation, extraordinary expenses, brokerage and other transaction expenses relating to the purchase or sale of portfolio investments and acquired (underlying) fund fees and expenses) of Class R6 do not exceed those of Class I. This agreement will remain in effect until February 28, 2025, and shall renew automatically for one-year terms unless New York Life Investments provides written notice of termination prior to the start of the next term or upon approval of the Board.
During the six-month period ended April 30, 2024, New York Life Investments earned fees from the Fund in the amount of $28,446,739 and paid the Subadvisor in the amount of $13,953,545.
JPMorgan Chase Bank, N.A. ("JPMorgan") provides sub-administration and sub-accounting services to the Fund pursuant to an agreement with New York Life Investments. These services include calculating the daily NAVs of the Fund, maintaining the general ledger and sub-ledger accounts for the calculation of the Fund's NAVs, and assisting New York Life Investments in conducting various aspects of the Fund's administrative operations. For providing these services to the Fund, JPMorgan is compensated by New York Life Investments.
Pursuant to an agreement between the Trust and New York Life Investments, New York Life Investments is responsible for providing or procuring certain regulatory reporting services for the Fund. The Fund will reimburse New York Life Investments for the actual costs incurred by New York Life Investments in connection with providing or procuring these services for the Fund.
(B) Distribution and Service Fees. The Trust, on behalf of the Fund, has entered into a distribution agreement with NYLIFE Distributors LLC (the “Distributor”), an affiliate of New York Life Investments. The Fund has adopted distribution plans (the “Plans”) in accordance with the provisions of Rule 12b-1 under the 1940 Act.
Pursuant to the Class A, Investor Class and Class R2 Plans, the Distributor receives a monthly fee from the Class A, Investor Class and Class R2 shares at an annual rate of 0.25% of the average daily net assets of the Class A, Investor Class and Class R2 shares for distribution and/or service activities as designated by the Distributor. Pursuant to the Class B and Class C Plans, Class B and Class C shares pay the Distributor a monthly distribution fee at an annual rate of 0.75% of the average daily net assets of the Class B and Class C shares, along with a service fee at an annual rate of 0.25% of the average daily net assets of the Class B and Class C shares, for a total 12b-1 fee of 1.00%. Pursuant to the Class R3 and SIMPLE Class Plans, Class R3 and SIMPLE Class shares pay the Distributor a monthly distribution fee at an annual rate of 0.25% of the average daily net assets of the Class R3 and SIMPLE Class shares, along with a service fee at an annual rate of 0.25% of the average daily net assets of the Class R3 and SIMPLE Class shares, for a total 12b-1 fee of 0.50%. Class I, Class R1 and Class R6 shares are not subject to a distribution and/or service fee.
The Plans provide that the distribution and service fees are payable to the Distributor regardless of the amounts actually expended by the Distributor for distribution of the Fund's shares and service activities.
In accordance with the Shareholder Services Plans for the Class R1, Class R2 and Class R3 shares, the Manager has agreed to provide, through its affiliates or independent third parties, various shareholder and administrative support services to shareholders of the Class R1, Class R2 and Class R3 shares. For its services, the Manager, its affiliates or independent third-party service providers are entitled to a shareholder service fee accrued daily and paid monthly at an annual rate of 0.10% of the average daily net assets of the Class R1, Class R2 and Class R3 shares. This is in addition to any fees paid under the Class R2 and Class R3 Plans.
Notes to Financial Statements (Unaudited) (continued)
During the six-month period ended April 30, 2024, shareholder service fees incurred by the Fund were as follows:
| |
| Class R1* | $ 15 |
| Class R2 | 3,090 |
| Class R3 | 2,189 |
| * | Effective at the close of business on February 23, 2024, Class R1 shares were liquidated. |
(C) Sales Charges. The Fund was advised by the Distributor that the amount of initial sales charges retained on sales of Class A and Investor Class shares during the six-month period ended April 30, 2024, were $157,215 and $10,229, respectively.
The Fund was also advised that the Distributor retained CDSCs on redemptions of Class A and Class C shares during the six-month period ended April 30, 2024, of $21,342 and $547, respectively.
(D) Transfer, Dividend Disbursing and Shareholder Servicing Agent. NYLIM Service Company LLC, an affiliate of New York Life Investments, is the Fund's transfer, dividend disbursing and shareholder servicing agent pursuant to an agreement between NYLIM Service Company LLC and the Trust. NYLIM Service Company LLC has entered into an agreement with SS&C Global Investor & Distribution Solutions, Inc. ("SS&C"), pursuant to which SS&C performs certain transfer agent services on behalf of NYLIM Service Company LLC. New York Life Investments has contractually agreed to limit the transfer agency expenses charged to the Fund’s share classes to a maximum of 0.35% of that share class’s average daily net assets on an annual basis after deducting any applicable Fund or class-level expense reimbursement or small account fees. This agreement will remain in effect until February 28, 2025, and shall renew automatically for one-year terms unless New York Life Investments provides written notice of termination prior to the start of the next term or upon approval of the Board. During the six-month period ended April 30, 2024, transfer agent expenses incurred by the Fund and any reimbursements, pursuant to the
aforementioned Transfer Agency expense limitation agreement, were as follows:
| Class | Expense | Waived |
| Class A | $2,221,152 | $— |
| Investor Class | 188,906 | — |
| Class B | 10,421 | — |
| Class C | 162,698 | — |
| Class I | 2,545,060 | — |
| Class R1* | 23 | — |
| Class R2 | 4,685 | — |
| Class R3 | 3,318 | — |
| Class R6 | 80,274 | — |
| SIMPLE Class | 52 | — |
| * | Effective at the close of business on February 23, 2024, Class R1 shares were liquidated. |
(E) Small Account Fee. Shareholders with small accounts adversely impact the cost of providing transfer agency services. In an effort to reduce total transfer agency expenses, the Fund has implemented a small account fee on certain types of accounts. As described in the Fund's prospectus, certain shareholders with an account balance of less than $1,000 ($5,000 for Class A share accounts) are charged an annual per account fee of $20 (assessed semi-annually), the proceeds from which offset transfer agent fees as reflected in the Statement of Operations. This small account fee will not apply to certain types of accounts as described further in the Fund’s prospectus.
(F) Capital. As of April 30, 2024, New York Life and its affiliates beneficially held shares of the Fund with the values and percentages of net assets as follows:
| Class I | $12,410,897 | 0.3% |
| SIMPLE Class | 27,852 | 22.0 |
Note 4-Federal Income Tax
As of April 30, 2024, the cost and unrealized appreciation (depreciation) of the Fund’s investment portfolio, including applicable derivative contracts and other financial instruments, as determined on a federal income tax basis, were as follows:
| | Federal Tax
Cost | Gross
Unrealized
Appreciation | Gross
Unrealized
(Depreciation) | Net
Unrealized
Appreciation/
(Depreciation) |
| Investments in Securities | $10,267,515,987 | $236,853,146 | $(558,848,359) | $(321,995,213) |
As of October 31, 2023, for federal income tax purposes, capital loss carryforwards of $537,451,087, as shown in the table below, were available to the extent provided by the regulations to offset future realized gains of the Fund. Accordingly, no capital gains distributions are expected
| 38 | MainStay MacKay High Yield Corporate Bond Fund |
to be paid to shareholders until net gains have been realized in excess of such amounts.
Capital Loss
Available Through | Short-Term
Capital Loss
Amounts (000’s) | Long-Term
Capital Loss
Amounts (000’s) |
| Unlimited | $40,757 | $496,694 |
During the year ended October 31, 2023, the tax character of distributions paid as reflected in the Statements of Changes in Net Assets was as follows:
| | 2023 |
| Distributions paid from: | |
| Ordinary Income | $583,585,266 |
Note 5–Restricted Securities
Restricted securities are subject to legal or contractual restrictions on resale. Private placement securities are generally considered to be restricted except for those securities traded between qualified institutional investors under the provisions of Rule 144A of the Securities Act of 1933, as amended. Disposal of restricted securities may involve time consuming negotiations and expenses, and prompt sale at an acceptable price may be difficult to achieve.
As of April 30, 2024, restricted securities held by the Fund were as follows:
| Security | Date(s) of
Acquisition | Principal
Amount/
Shares | Cost | 4/30/24
Value | Percent of
Net Assets |
| Briggs & Stratton Corp. Escrow Claim Shares |
Corporate Bond
6.875%, due 12/15/20 | 2/26/21 | $ 9,200,000 | $ 9,323,706 | $ — | 0.0% ‡ |
| GenOn Energy, Inc. |
| Common Stock | 12/14/18 | 386,241 | 43,250,890 | 8,304,182 | 0.1 |
| Sterling Entertainment Enterprises LLC |
Corporate Bond
10.25%, due 1/15/25 | 12/28/17 | $ 20,000,000 | 19,959,248 | 18,586,000 | 0.2 |
| Total | | | $ 72,533,844 | $ 26,890,182 | 0.3% |
| ‡ | Less than one-tenth of a percent. |
Note 6–Custodian
JPMorgan is the custodian of cash and securities held by the Fund. Custodial fees are charged to the Fund based on the Fund's net assets and/or the market value of securities held by the Fund and the number of certain transactions incurred by the Fund.
Note 7–Line of Credit
The Fund and certain other funds managed by New York Life Investments maintain a line of credit with a syndicate of banks in order to secure a source of funds for temporary purposes to meet unanticipated or excessive redemption requests.
Effective July 25, 2023, under the credit agreement (the “Credit Agreement”), the aggregate commitment amount is $600,000,000 with an additional uncommitted amount of $100,000,000. The commitment fee is an annual rate of 0.15% of the average commitment amount
payable quarterly, regardless of usage, to JPMorgan, who serves as the agent to the syndicate. The commitment fee is allocated among the Fund and certain other funds managed by New York Life Investments based upon their respective net assets and other factors. Interest on any revolving credit loan is charged based upon the Federal Funds Rate, Daily Simple SOFR + 0.10%, or the Overnight Bank Funding Rate, whichever is higher. The Credit Agreement expires on July 23, 2024, although the Fund, certain other funds managed by New York Life Investments and the syndicate of banks may renew the Credit Agreement for an additional year on the same or different terms or enter into a credit agreement with a different syndicate of banks. Prior to July 25, 2023, the aggregate commitment amount and the commitment fee were the same as those under the current Credit Agreement. During the six-month period ended April 30, 2024, there were no borrowings made or outstanding with respect to the Fund under the Credit Agreement.
Notes to Financial Statements (Unaudited) (continued)
Note 8–Interfund Lending Program
Pursuant to an exemptive order issued by the SEC, the Fund, along with certain other funds managed by New York Life Investments, may participate in an interfund lending program. The interfund lending program provides an alternative credit facility that permits the Fund and certain other funds managed by New York Life Investments to lend or borrow money for temporary purposes directly to or from one another, subject to the conditions of the exemptive order. During the six-month period ended April 30, 2024, there were no interfund loans made or outstanding with respect to the Fund.
Note 9–Purchases and Sales of Securities (in 000’s)
During the six-month period ended April 30, 2024, purchases and sales of securities, other than short-term securities, were $1,653,878 and $1,531,259, respectively.
Note 10–Capital Share Transactions
Transactions in capital shares for the six-month period ended April 30, 2024 and the year ended October 31, 2023, were as follows:
| Class A | Shares | Amount |
| Six-month period ended April 30, 2024: | | |
| Shares sold | 33,761,581 | $ 172,080,603 |
| Shares issued to shareholders in reinvestment of distributions | 15,740,495 | 80,646,252 |
| Shares redeemed | (72,597,340) | (371,404,035) |
| Net increase (decrease) in shares outstanding before conversion | (23,095,264) | (118,677,180) |
| Shares converted into Class A (See Note 1) | 2,089,558 | 10,741,013 |
| Shares converted from Class A (See Note 1) | (605,724) | (3,099,725) |
| Net increase (decrease) | (21,611,430) | $ (111,035,892) |
| Year ended October 31, 2023: | | |
| Shares sold | 78,051,343 | $ 389,132,502 |
| Shares issued to shareholders in reinvestment of distributions | 28,889,335 | 144,137,090 |
| Shares redeemed | (154,751,687) | (772,065,976) |
| Net increase (decrease) in shares outstanding before conversion | (47,811,009) | (238,796,384) |
| Shares converted into Class A (See Note 1) | 5,245,041 | 26,189,256 |
| Shares converted from Class A (See Note 1) | (889,764) | (4,470,861) |
| Net increase (decrease) | (43,455,732) | $ (217,077,989) |
| |
| Investor Class | Shares | Amount |
| Six-month period ended April 30, 2024: | | |
| Shares sold | 644,532 | $ 3,327,012 |
| Shares issued to shareholders in reinvestment of distributions | 639,170 | 3,300,133 |
| Shares redeemed | (1,276,627) | (6,580,540) |
| Net increase (decrease) in shares outstanding before conversion | 7,075 | 46,605 |
| Shares converted into Investor Class (See Note 1) | 208,192 | 1,071,015 |
| Shares converted from Investor Class (See Note 1) | (1,256,650) | (6,520,006) |
| Net increase (decrease) | (1,041,383) | $ (5,402,386) |
| Year ended October 31, 2023: | | |
| Shares sold | 1,017,985 | $ 5,121,893 |
| Shares issued to shareholders in reinvestment of distributions | 1,173,564 | 5,897,791 |
| Shares redeemed | (2,488,238) | (12,514,376) |
| Net increase (decrease) in shares outstanding before conversion | (296,689) | (1,494,692) |
| Shares converted into Investor Class (See Note 1) | 528,336 | 2,658,813 |
| Shares converted from Investor Class (See Note 1) | (1,457,838) | (7,322,253) |
| Net increase (decrease) | (1,226,191) | $ (6,158,132) |
| |
| Class B | Shares | Amount |
| Six-month period ended April 30, 2024: | | |
| Shares sold | 9,761 | $ 49,679 |
| Shares issued to shareholders in reinvestment of distributions | 27,199 | 138,605 |
| Shares redeemed | (409,331) | (2,085,101) |
| Net increase (decrease) in shares outstanding before conversion | (372,371) | (1,896,817) |
| Shares converted from Class B (See Note 1) | (373,887) | (1,904,395) |
| Net increase (decrease) | (746,258) | $ (3,801,212) |
| Year ended October 31, 2023: | | |
| Shares sold | 21,680 | $ 107,706 |
| Shares issued to shareholders in reinvestment of distributions | 73,983 | 367,385 |
| Shares redeemed | (465,849) | (2,310,090) |
| Net increase (decrease) in shares outstanding before conversion | (370,186) | (1,834,999) |
| Shares converted from Class B (See Note 1) | (736,809) | (3,657,717) |
| Net increase (decrease) | (1,106,995) | $ (5,492,716) |
| |
| 40 | MainStay MacKay High Yield Corporate Bond Fund |
| Class C | Shares | Amount |
| Six-month period ended April 30, 2024: | | |
| Shares sold | 782,235 | $ 3,990,881 |
| Shares issued to shareholders in reinvestment of distributions | 499,709 | 2,549,992 |
| Shares redeemed | (3,036,684) | (15,512,222) |
| Net increase (decrease) in shares outstanding before conversion | (1,754,740) | (8,971,349) |
| Shares converted from Class C (See Note 1) | (438,891) | (2,234,414) |
| Net increase (decrease) | (2,193,631) | $ (11,205,763) |
| Year ended October 31, 2023: | | |
| Shares sold | 1,129,297 | $ 5,594,569 |
| Shares issued to shareholders in reinvestment of distributions | 1,028,914 | 5,113,581 |
| Shares redeemed | (7,525,687) | (37,352,570) |
| Net increase (decrease) in shares outstanding before conversion | (5,367,476) | (26,644,420) |
| Shares converted from Class C (See Note 1) | (1,842,802) | (9,158,313) |
| Net increase (decrease) | (7,210,278) | $ (35,802,733) |
| |
| Class I | Shares | Amount |
| Six-month period ended April 30, 2024: | | |
| Shares sold | 173,930,867 | $ 890,804,165 |
| Shares issued to shareholders in reinvestment of distributions | 20,932,480 | 107,376,457 |
| Shares redeemed | (93,702,648) | (479,868,394) |
| Net increase (decrease) in shares outstanding before conversion | 101,160,699 | 518,312,228 |
| Shares converted into Class I (See Note 1) | 604,591 | 3,094,481 |
| Shares converted from Class I (See Note 1) | (238,317) | (1,226,302) |
| Net increase (decrease) | 101,526,973 | $ 520,180,407 |
| Year ended October 31, 2023: | | |
| Shares sold | 188,810,621 | $ 943,198,625 |
| Shares issued to shareholders in reinvestment of distributions | 34,478,584 | 172,086,582 |
| Shares redeemed | (259,550,476) | (1,292,981,127) |
| Net increase (decrease) in shares outstanding before conversion | (36,261,271) | (177,695,920) |
| Shares converted into Class I (See Note 1) | 904,096 | 4,543,309 |
| Shares converted from Class I (See Note 1) | (274,234) | (1,380,102) |
| Net increase (decrease) | (35,631,409) | $ (174,532,713) |
| |
| Class R1 | Shares | Amount |
| Six-month period ended April 30, 2024: (a) | | |
| Shares sold | 5 | $ 26 |
| Shares issued to shareholders in reinvestment of distributions | 153 | 778 |
| Shares redeemed | (9,889) | (50,913) |
| Net increase (decrease) | (9,731) | $ (50,109) |
| Year ended October 31, 2023: | | |
| Shares sold | 1,055 | $ 5,252 |
| Shares issued to shareholders in reinvestment of distributions | 518 | 2,582 |
| Shares redeemed | (2,614) | (12,959) |
| Net increase (decrease) | (1,041) | $ (5,125) |
| |
| Class R2 | Shares | Amount |
| Six-month period ended April 30, 2024: | | |
| Shares sold | 134,749 | $ 693,078 |
| Shares issued to shareholders in reinvestment of distributions | 24,822 | 127,288 |
| Shares redeemed | (354,840) | (1,818,976) |
| Net increase (decrease) | (195,269) | $ (998,610) |
| Year ended October 31, 2023: | | |
| Shares sold | 276,469 | $ 1,378,905 |
| Shares issued to shareholders in reinvestment of distributions | 50,618 | 252,583 |
| Shares redeemed | (416,278) | (2,086,972) |
| Net increase (decrease) | (89,191) | $ (455,484) |
| |
| Class R3 | Shares | Amount |
| Six-month period ended April 30, 2024: | | |
| Shares sold | 257,678 | $ 1,322,956 |
| Shares issued to shareholders in reinvestment of distributions | 23,659 | 121,128 |
| Shares redeemed | (152,408) | (784,582) |
| Net increase (decrease) in shares outstanding before conversion | 128,929 | 659,502 |
| Shares converted from Class R3 (See Note 1) | (2,713) | (13,972) |
| Net increase (decrease) | 126,216 | $ 645,530 |
| Year ended October 31, 2023: | | |
| Shares sold | 259,260 | $ 1,296,592 |
| Shares issued to shareholders in reinvestment of distributions | 37,303 | 185,998 |
| Shares redeemed | (212,168) | (1,061,437) |
| Net increase (decrease) | 84,395 | $ 421,153 |
| |
Notes to Financial Statements (Unaudited) (continued)
| Class R6 | Shares | Amount |
| Six-month period ended April 30, 2024: | | |
| Shares sold | 99,788,445 | $ 510,741,686 |
| Shares issued to shareholders in reinvestment of distributions | 26,109,418 | 133,403,097 |
| Shares redeemed | (176,641,873) | (903,898,499) |
| Net increase (decrease) in shares outstanding before conversion | (50,744,010) | (259,753,716) |
| Shares converted into Class R6 (See Note 1) | 25,667 | 131,323 |
| Shares converted from Class R6 (See Note 1) | (7,651) | (39,018) |
| Net increase (decrease) | (50,725,994) | $ (259,661,411) |
| Year ended October 31, 2023: | | |
| Shares sold | 207,906,986 | $ 1,032,437,690 |
| Shares issued to shareholders in reinvestment of distributions | 44,598,388 | 221,999,899 |
| Shares redeemed | (204,221,976) | (1,016,145,702) |
| Net increase (decrease) in shares outstanding before conversion | 48,283,398 | 238,291,887 |
| Shares converted into Class R6 (See Note 1) | 9,706 | 49,014 |
| Shares converted from Class R6 (See Note 1) | (1,494,935) | (7,451,146) |
| Net increase (decrease) | 46,798,169 | $ 230,889,755 |
| |
| SIMPLE Class | Shares | Amount |
| Six-month period ended April 30, 2024: | | |
| Shares sold | 14,424 | $ 73,530 |
| Shares issued to shareholders in reinvestment of distributions | 621 | 3,207 |
| Net increase (decrease) | 15,045 | $ 76,737 |
| Year ended October 31, 2023: | | |
| Shares sold | 2,520 | $ 12,809 |
| Shares issued to shareholders in reinvestment of distributions | 442 | 2,223 |
| Net increase (decrease) | 2,962 | $ 15,032 |
| (a) | Class liquidated and is no longer offered for sale as of February 23, 2024. |
Note 11–Other Matters
As of the date of this report, the Fund faces a heightened level of risk associated with current uncertainty, volatility and state of economies, financial markets, a high interest rate environment, and labor and health conditions around the world. Events such as war, acts of terrorism, recessions, rapid inflation, the imposition of economic sanctions, earthquakes, hurricanes, epidemics and pandemics and other unforeseen natural or human disasters may have broad adverse social, political and economic effects on the global economy, which could negatively impact the value of the Fund's investments. Developments that disrupt global economies and financial markets may magnify factors that affect the Fund's performance.
Note 12–Subsequent Events
In connection with the preparation of the financial statements of the Fund as of and for the six-month period ended April 30, 2024, events and transactions subsequent to April 30, 2024, through the date the financial statements were issued, have been evaluated by the Manager for possible adjustment and/or disclosure. No subsequent events requiring financial statement adjustment or disclosure have been identified.
| 42 | MainStay MacKay High Yield Corporate Bond Fund |
Board Consideration and Approval of Management Agreement and Subadvisory Agreement (Unaudited)
The continuation of the Management Agreement with respect to the MainStay MacKay High Yield Corporate Bond Fund (“Fund”) and New York Life Investment Management LLC (“New York Life Investments”) and the Subadvisory Agreement between New York Life Investments and MacKay Shields LLC (“MacKay”) with respect to the Fund (together, “Advisory Agreements”) is subject to annual review and approval by the Board of Trustees of The MainStay Funds (“Board” of the “Trust”) in accordance with Section 15 of the Investment Company Act of 1940, as amended (“1940 Act”). At its December 6–7, 2023 meeting, the Board, including the Trustees who are not an “interested person” (as such term is defined in the 1940 Act) of the Trust (“Independent Trustees”) voting separately, unanimously approved the continuation of each of the Advisory Agreements for a one-year period.
In reaching the decision to approve the continuation of each of the Advisory Agreements, the Board considered information and materials furnished by New York Life Investments and MacKay in connection with an annual contract review process undertaken by the Board that took place at meetings of the Board and its Contracts Committee from September 2023 through December 2023, including information and materials furnished by New York Life Investments and MacKay in response to requests prepared on behalf of the Board, and in consultation with the Independent Trustees, by independent legal counsel to the Independent Trustees, which encompassed a variety of topics, including those summarized below. Information and materials requested by and furnished to the Board for consideration in connection with the contract review process included, among other items, reports on the Fund and “peer funds” prepared by Institutional Shareholder Services Inc. (“ISS”), an independent third-party service provider engaged by the Board to report objectively on the Fund’s investment performance, management fee and total expenses. The Board also considered information on the fees charged to other investment advisory clients of New York Life Investments and/or MacKay that follow investment strategies similar to those of the Fund, if any, and, when applicable, the rationale for differences in the Fund’s management and subadvisory fees and the fees charged to those other investment advisory clients. In addition, the Board considered information regarding the legal standards and fiduciary obligations applicable to its consideration of the continuation of each of the Advisory Agreements. The contract review process, including the structure and format for information and materials provided to the Board, has been developed in consultation with the Board. The Independent Trustees also met in executive sessions with their independent legal counsel and, for portions thereof, with senior management of New York Life Investments.
The Board’s deliberations with respect to the continuation of each of the Advisory Agreements reflect a year-long process, and the Board also took into account information furnished to the Board and its Committees throughout the year, as deemed relevant and appropriate by the Trustees, including, among other items, reports on investment performance of the Fund and investment-related matters for the Fund as well as presentations from New York Life Investments and, generally annually, MacKay personnel. In addition, the Board took into account other
information provided by New York Life Investments throughout the year, including, among other items, periodic reports on legal and compliance matters, risk management, portfolio turnover, brokerage commissions and non-advisory services provided to the Fund by New York Life Investments, as deemed relevant and appropriate by the Trustees.
In addition to information provided to the Board throughout the year, the Board received information in connection with its June 2023 meeting provided specifically in response to requests prepared on behalf of the Board, and in consultation with the Independent Trustees, by independent legal counsel to the Independent Trustees regarding the Fund’s distribution arrangements. In addition, the Board received information regarding the Fund’s asset levels, share purchase and redemption activity and the payment of Rule 12b-1 and/or certain other fees by the applicable share classes of the Fund, among other information.
In considering the continuation of each of the Advisory Agreements, the Trustees reviewed and evaluated the information and factors they believed to reasonably be necessary and appropriate in light of legal advice furnished to them by independent legal counsel to the Independent Trustees and through the exercise of their own business judgment. Although individual Trustees may have weighed certain factors or information differently and the Board did not consider any single factor or information controlling in reaching its decision, the factors that figured prominently in the Board’s consideration of the continuation of each of the Advisory Agreements are summarized in more detail below and include, among other factors: (i) the nature, extent and quality of the services provided to the Fund by New York Life Investments and MacKay; (ii) the qualifications of the portfolio managers of the Fund and the historical investment performance of the Fund, New York Life Investments and MacKay; (iii) the costs of the services provided, and profits realized, by New York Life Investments and MacKay with respect to their relationships with the Fund; (iv) the extent to which economies of scale have been realized or may be realized if the Fund grows and the extent to which any economies of scale have been shared, have benefited or may benefit the Fund’s shareholders; and (v) the reasonableness of the Fund’s management and subadvisory fees and total ordinary operating expenses. Although the Board recognized that comparisons between the Fund’s fees and expenses and those of other funds are imprecise given different terms of agreements, variations in fund strategies and other factors, the Board considered the reasonableness of the Fund’s management fee and total ordinary operating expenses as compared to the peer funds identified by ISS. Throughout their considerations, the Trustees acknowledged the commitment of New York Life Investments and its affiliates to serve the MainStay Group of Funds, as well as their capacity, experience, resources, financial stability and reputations. The Trustees also acknowledged the entrepreneurial and other risks assumed by New York Life Investments in sponsoring and managing the Fund. With respect to the Subadvisory Agreement, the Board took into account New York Life Investments’ recommendation to approve the continuation of the Subadvisory Agreement.
Board Consideration and Approval of Management Agreement and Subadvisory Agreement (Unaudited) (continued)
The Trustees noted that, throughout the year, the Trustees are afforded an opportunity to ask questions of, and request additional information or materials from, New York Life Investments and MacKay. The Board’s decision with respect to each of the Advisory Agreements may have also been based, in part, on the Board’s knowledge of New York Life Investments and MacKay resulting from, among other things, the Board’s consideration of each of the Advisory Agreements in prior years, the advisory agreements for other funds in the MainStay Group of Funds, the Board’s review throughout the year of the performance and operations of other funds in the MainStay Group of Funds and each Trustee’s business judgment and industry experience. In addition to considering the above-referenced factors, the Board observed that in the marketplace there are a range of investment options available to investors and that the Fund’s shareholders, having had the opportunity to consider other investment options, have invested in the Fund.
The factors that figured prominently in the Board’s decision to approve the continuation of each of the Advisory Agreements during the Board’s December 6–7, 2023 meeting are summarized in more detail below.
Nature, Extent and Quality of Services Provided by New York Life Investments and MacKay
The Board examined the nature, extent and quality of the services that New York Life Investments provides to the Fund. The Board evaluated New York Life Investments’ experience and capabilities in serving as manager of the Fund and considered that the Fund operates in a “manager-of-managers” structure. The Board also considered New York Life Investments’ responsibilities and services provided pursuant to this structure, including overseeing the services provided by MacKay, evaluating the performance of MacKay, making recommendations to the Board as to whether the Subadvisory Agreement should be renewed, modified or terminated and periodically reporting to the Board regarding the results of New York Life Investments’ evaluation and monitoring functions. The Board noted that New York Life Investments manages other mutual funds, serves a variety of other investment advisory clients, including other pooled investment vehicles, and has experience overseeing mutual fund service providers, including subadvisors. The Board considered the experience of senior personnel at New York Life Investments providing management and administrative and other non-advisory services to the Fund. The Board observed that New York Life Investments devotes significant resources and time to providing management and administrative and other non-advisory services to the Fund, including New York Life Investments’ oversight and due diligence reviews of MacKay and ongoing analysis of, and interactions with, MacKay with respect to, among other things, the Fund’s investment performance and risks as well as MacKay’s investment capabilities and subadvisory services with respect to the Fund.
The Board also considered the range of services that New York Life Investments provides to the Fund under the terms of the Management Agreement, including: (i) fund accounting and ongoing supervisory services provided by New York Life Investments’ Fund Administration and Accounting Group; (ii) investment supervisory and analytical services
provided by New York Life Investments’ Investment Consulting Group; (iii) compliance services provided by the Trust’s Chief Compliance Officer as well as New York Life Investments’ compliance department, including supervision and implementation of the Fund’s compliance program; (iv) legal services provided by New York Life Investments’ Office of the General Counsel; and (v) risk management monitoring and analysis by compliance and investment personnel. In addition, the Board considered New York Life Investments’ willingness to invest in personnel and other resources, such as cyber security, information security and business continuity planning, that may benefit the Fund and noted that New York Life Investments is responsible for compensating the Trust’s officers, except for a portion of the salary of the Trust’s Chief Compliance Officer. The Board recognized that New York Life Investments provides certain other non-advisory services to the Fund and has over time provided an increasingly broad array of non-advisory services to the MainStay Group of Funds as a result of regulatory and other developments.
The Board also examined the range, and the nature, extent and quality, of the investment advisory services that MacKay provides to the Fund and considered the terms of each of the Advisory Agreements. The Board evaluated MacKay’s experience and performance in serving as subadvisor to the Fund and advising other portfolios and MacKay’s track record and experience in providing investment advisory services as well as the experience of investment advisory, senior management and/or administrative personnel at MacKay. The Board considered New York Life Investments’ and MacKay’s overall resources, legal and compliance environment, capabilities, reputation, financial condition and history. In addition to information provided in connection with quarterly meetings with the Trust’s Chief Compliance Officer, the Board considered information regarding the compliance policies and procedures of New York Life Investments and MacKay and acknowledged their commitment to further developing and strengthening compliance programs that may relate to the Fund. The Board also considered MacKay’s ability to recruit and retain qualified investment professionals and willingness to invest in personnel and other resources that may benefit the Fund. In this regard, the Board considered the qualifications and experience of the Fund’s portfolio managers, the number of accounts managed by the portfolio managers and the method for compensating the portfolio managers.
In addition, the Board considered information provided by New York Life Investments and MacKay regarding their respective business continuity and disaster recovery plans.
Based on these considerations, among others, the Board concluded that the Fund would likely continue to benefit from the nature, extent and quality of these services.
Investment Performance
In evaluating the Fund’s investment performance, the Board considered investment performance results over various periods in light of the Fund’s investment objective, strategies and risks. The Board considered investment reports on, and analysis of, the Fund’s performance provided to the Board throughout the year. These reports include, among other
| 44 | MainStay MacKay High Yield Corporate Bond Fund |
items, information on the Fund’s gross and net returns, the Fund’s investment performance compared to a relevant investment category and the Fund’s benchmarks, the Fund’s risk-adjusted investment performance and the Fund’s investment performance as compared to peer funds, as appropriate, as well as portfolio attribution information and commentary on the effect of market conditions. The Board also considered information provided by ISS showing the investment performance of the Fund as compared to peer funds. In addition, the Board reviewed the methodology used by ISS to construct the group of peer funds for comparative purposes.
The Board also took into account its discussions with senior management at New York Life Investments concerning the Fund’s investment performance over various periods as well as discussions between representatives of MacKay and the members of the Board’s Investment Committee, which generally occur on an annual basis.
Based on these considerations, among others, the Board concluded that its review of the Fund’s investment performance and related information supported a determination to approve the continuation of each of the Advisory Agreements.
Costs of the Services Provided, and Profits and Other Benefits Realized, by New York Life Investments and MacKay
The Board considered the costs of the services provided under each of the Advisory Agreements. The Board also considered the profitability of New York Life Investments and its affiliates, including MacKay, due to their relationships with the Fund as well as of New York Life Investments and its affiliates due to their relationships with the MainStay Group of Funds. Because MacKay is an affiliate of New York Life Investments whose subadvisory fee is paid by New York Life Investments, not the Fund, the Board considered cost and profitability information for New York Life Investments and MacKay in the aggregate.
In addition, the Board acknowledged the difficulty in obtaining reliable comparative data about mutual fund managers’ profitability because such information generally is not publicly available and may be impacted by numerous factors, including the structure of a fund manager’s organization, the types of funds it manages, the methodology used to allocate certain fixed costs to specific funds and the manager’s capital structure and costs of capital.
In evaluating the costs of the services provided by New York Life Investments and MacKay, and profitability of New York Life Investments and its affiliates, including MacKay, due to their relationships with the Fund, the Board considered, among other factors, New York Life Investments’ and its affiliates’, including MacKay’s, continuing investments in, or willingness to invest in, personnel and other resources that may support and further enhance the management of the Fund, and that New York Life Investments is responsible for paying the subadvisory fee for the Fund. The Board also considered the financial resources of New York Life Investments and MacKay and acknowledged that New York Life Investments and MacKay must be in a position to recruit and retain experienced professional personnel and to maintain a strong financial
position for New York Life Investments and MacKay to continue to provide high-quality services to the Fund. The Board recognized that the Fund benefits from the allocation of certain fixed costs among the funds in the MainStay Group of Funds, among other expected benefits resulting from its relationship with New York Life Investments.
The Board considered information regarding New York Life Investments’ methodology for calculating profitability and allocating costs provided by New York Life Investments in connection with the fund profitability analysis presented to the Board. The Board concluded that New York Life Investments’ methods for allocating costs and procedures for estimating overall profitability of the relationship with the funds in the MainStay Group of Funds were reasonable. The Board recognized the difficulty in calculating and evaluating a manager’s profitability with respect to the Fund and considered that other profitability methodologies may also be reasonable.
The Board also considered certain fall-out benefits that may be realized by New York Life Investments and its affiliates, including MacKay, due to their relationships with the Fund, including reputational and other indirect benefits. The Board recognized, for example, the benefits to MacKay from legally permitted “soft-dollar” arrangements by which brokers provide research and other services to MacKay in exchange for commissions paid by the Fund with respect to trades in the Fund’s portfolio securities. In addition, the Board considered its review of the management agreement for a money market fund advised by New York Life Investments and an affiliated subadvisor that serves as an investment option for the Fund, including the potential rationale for and costs associated with investments in this money market fund by the Fund, if any, and considered information from New York Life Investments that the nature and type of specific investment advisory services provided to this money market fund are distinct from, or in addition to, the investment advisory services provided to the Fund.
The Board observed that, in addition to fees earned by New York Life Investments under the Management Agreement for managing the Fund, New York Life Investments’ affiliates also earn revenues from serving the Fund in various other capacities, including as the Fund’s transfer agent and distributor. The Board considered information about these other revenues and their impact on the profitability of the relationship with the Fund to New York Life Investments and its affiliates. The Board noted that, although it assessed the overall profitability of the relationship with the Fund to New York Life Investments and its affiliates as part of the contract review process, when considering the reasonableness of the fee paid to New York Life Investments under the Management Agreement, the Board considered the profitability of New York Life Investments’ relationship with the Fund on a pre-tax basis and without regard to distribution expenses incurred by New York Life Investments from its own resources.
After evaluating the information deemed relevant by the Trustees, the Board concluded that any profits realized by New York Life Investments and its affiliates, including MacKay, due to their relationships with the
Board Consideration and Approval of Management Agreement and Subadvisory Agreement (Unaudited) (continued)
Fund were not excessive and other expected benefits that may accrue to New York Life Investments and its affiliates, including MacKay, are reasonable.
Management and Subadvisory Fees and Total Ordinary Operating Expenses
The Board evaluated the reasonableness of the fee paid under each of the Advisory Agreements and the Fund’s total ordinary operating expenses. With respect to the management fee and subadvisory fee, the Board primarily considered the reasonableness of the management fee paid by the Fund to New York Life Investments because the subadvisory fee paid to MacKay is paid by New York Life Investments, not the Fund. The Board also considered the reasonableness of the subadvisory fee paid by New York Life Investments and the amount of the management fee retained by New York Life Investments.
In assessing the reasonableness of the Fund’s fees and expenses, the Board primarily considered comparative data provided by ISS on the fees and expenses of similar mutual funds managed by other investment advisers. The Board reviewed the methodology used by ISS to construct the group of peer funds for comparative purposes. In addition, the Board considered information provided by New York Life Investments and MacKay on fees charged to other investment advisory clients, including institutional separate accounts and/or other funds, that follow investment strategies similar to those of the Fund, if any. The Board considered the contractual management fee schedule for the Fund as compared to those for such other investment advisory clients, taking into account the rationale for differences in fee schedules. The Board also took into account information provided by New York Life Investments about the more extensive scope of services provided to registered investment companies, such as the Fund, as compared with other investment advisory clients. Additionally, the Board considered the impact of contractual breakpoints, voluntary waivers and expense limitation arrangements on the Fund’s net management fee and expenses. The Board also considered that in proposing fees for the Fund, New York Life Investments considers the competitive marketplace for mutual funds.
The Board took into account information from New York Life Investments, as provided in connection with the Board’s June 2023 meeting, regarding the reasonableness of the Fund’s transfer agent fee schedule, including industry data demonstrating that the fees that NYLIM Service Company LLC, an affiliate of New York Life Investments and the Fund’s transfer agent, charges the Fund are within the range of fees charged by transfer agents to other mutual funds. In addition, the Board considered NYLIM Service Company LLC’s profitability in connection with the transfer agent services it provides to the Fund. The Board also took into account information provided by NYLIM Service Company LLC regarding the sub-transfer agency payments it made to intermediaries in connection with the provision of sub-transfer agency services to the Fund.
The Board considered the extent to which transfer agent fees contributed to the total expenses of the Fund. The Board acknowledged the role that the MainStay Group of Funds historically has played in serving the
investment needs of New York Life Insurance Company customers, who often maintain smaller account balances than other shareholders of funds, and the impact of small accounts on the expense ratios of Fund share classes. The Board also recognized measures that it and New York Life Investments have taken that are intended to mitigate the effect of small accounts on the expense ratios of Fund share classes, including through the imposition of an expense limitation on net transfer agency expenses. The Board also considered that NYLIM Service Company LLC had waived its contractual cost of living adjustments during certain years.
Based on the factors outlined above, among other considerations, the Board concluded that the Fund’s management fee and total ordinary operating expenses are within a range that is competitive and support a conclusion that these fees and expenses are reasonable.
Economies of Scale
The Board considered information regarding economies of scale, including whether economies of scale may exist with respect to the Fund and whether the Fund’s management fee and expense structure permits any economies of scale to be appropriately shared with the Fund’s shareholders. The Board also considered a report from New York Life Investments, previously prepared at the request of the Board, that addressed economies of scale, including with respect to the mutual fund business generally, and the various ways in which the benefits of economies of scale may be shared with the funds in the MainStay Group of Funds. Although the Board recognized the difficulty of determining economies of scale with precision, the Board acknowledged that economies of scale may be shared with the Fund in a number of ways, including, for example, through the imposition of fee breakpoints, initially setting management fee rates at scale or making additional investments to enhance the services provided to the Fund. The Board reviewed information from New York Life Investments showing how the Fund’s management fee schedule compared to fee schedules of other funds and accounts managed by New York Life Investments. The Board also reviewed information from ISS showing how the Fund’s management fee schedule compared with fees paid for similar services by peer funds at varying asset levels.
Based on this information, the Board concluded that economies of scale are appropriately shared for the benefit of the Fund’s shareholders through the Fund’s management fee and expense structure and other methods to share benefits from economies of scale.
Conclusion
On the basis of the information and factors summarized above, among other information and factors deemed relevant by the Trustees, and the evaluation thereof, the Board, including the Independent Trustees voting separately, unanimously voted to approve the continuation of each of the Advisory Agreements.
| 46 | MainStay MacKay High Yield Corporate Bond Fund |
Discussion of the Operation and Effectiveness of the Fund's Liquidity Risk Management Program (Unaudited)
In compliance with Rule 22e-4 under the Investment Company Act of 1940, as amended (the “Liquidity Rule”), the Fund has adopted and implemented a liquidity risk management program (the “Program”), which New York Life Investment Management LLC believes is reasonably designed to assess and manage the Fund's liquidity risk. A Fund's liquidity risk is the risk that the Fund could not meet requests to redeem shares issued by the Fund without significant dilution of the remaining investors’ interests in the Fund. The Board of Trustees of The MainStay Funds (the "Board") previously approved the designation of New York Life Investment Management LLC as administrator of the Program (the “Administrator”). The Administrator has established a Liquidity Risk Management Committee to assist the Administrator in the implementation and day-to-day administration of the Program and to otherwise support the Administrator in fulfilling its responsibilities under the Program.
At a meeting of the Board held on February 27, 2024, the Administrator provided the Board with a written report addressing the Program’s operation and assessing the adequacy and effectiveness of its implementation for the period from January 1, 2023, through December 31, 2023 (the "Review Period"), as required under the Liquidity Rule. The report noted that the Administrator concluded that (i) the Program operated effectively to assess and manage the Fund's liquidity risk, (ii) the Program has been and continues to be adequately and effectively implemented to monitor and, as applicable, respond to the Fund's liquidity developments and (iii) the Fund's investment strategy continues to be appropriate for an open-end fund. In addition, the report summarized the operation of the Program and the information and factors considered by the Administrator in its assessment of the Program’s implementation, such as the liquidity risk assessment framework and the liquidity classification methodologies, and discussed notable geopolitical, market and other economic events that impacted liquidity risk during the Review Period.
In accordance with the Program, the Fund's liquidity risk is assessed no less frequently than annually taking into consideration certain factors, as applicable, such as (i) investment strategy and liquidity of portfolio investments, (ii) short-term and long-term cash flow projections, and (iii) holdings of cash and cash equivalents, as well as borrowing arrangements and other funding sources. Certain factors are considered under both normal and reasonably foreseeable stressed conditions.
Each Fund portfolio investment is classified into one of four liquidity categories. The classification is based on a determination of the number of days it is reasonably expected to take to convert the investment into cash, or sell or dispose of the investment, in current market conditions without significantly changing the market value of the investment. The Administrator has delegated liquidity classification determinations to the Fund’s subadvisor, subject to appropriate oversight by the Administrator, and liquidity classification determinations are made by taking into account the Fund's reasonably anticipated trade size, various market, trading and investment-specific considerations, as well as market depth, and, in certain cases, third-party vendor data.
The Liquidity Rule requires funds that do not primarily hold assets that are highly liquid investments to adopt a minimum amount of net assets that must be invested in highly liquid investments that are assets (an “HLIM”). In addition, the Liquidity Rule limits a fund's investments in illiquid investments. Specifically, the Liquidity Rule prohibits acquisition of illiquid investments if, immediately after acquisition, doing so would result in a fund holding more than 15% of its net assets in illiquid investments that are assets. The Program includes provisions reasonably designed to determine, periodically review and comply with the HLIM requirement, as applicable, and to comply with the 15% limit on illiquid investments.
There can be no assurance that the Program will achieve its objectives under all circumstances in the future. Please refer to the Fund's prospectus for more information regarding the Fund's exposure to liquidity risk and other risks to which it may be subject.
Proxy Voting Policies and Procedures and Proxy Voting Record
The Fund is required to file with the SEC its proxy voting record for the 12-month period ending June 30 on Form N-PX. A description of the policies and procedures that are used to vote proxies relating to portfolio securities of the Fund is available free of charge upon request by calling 800-624-6782 or visiting the SEC’s website at www.sec.gov. The most recent Form N-PX or proxy voting record is available free of charge upon request by calling 800-624-6782; visiting newyorklifeinvestments.com; or visiting the SEC’s website at www.sec.gov.
Shareholder Reports and Quarterly Portfolio Disclosure
The Fund is required to file its complete schedule of portfolio holdings with the SEC 60 days after its first and third fiscal quarter on Form N-PORT. The Fund's holdings report is available free of charge upon request by calling New York Life Investments at 800-624-6782.
| 48 | MainStay MacKay High Yield Corporate Bond Fund |
This page intentionally left blank.
This page intentionally left blank.
Equity
U.S. Equity
MainStay Epoch U.S. Equity Yield Fund
MainStay Fiera SMID Growth Fund
MainStay PineStone U.S. Equity Fund
MainStay S&P 500 Index Fund
MainStay Winslow Large Cap Growth Fund
MainStay WMC Enduring Capital Fund
MainStay WMC Growth Fund
MainStay WMC Small Companies Fund
MainStay WMC Value Fund
International Equity
MainStay Epoch International Choice Fund
MainStay PineStone International Equity Fund
MainStay WMC International Research Equity Fund
Emerging Markets Equity
MainStay Candriam Emerging Markets Equity Fund
Global Equity
MainStay Epoch Capital Growth Fund
MainStay Epoch Global Equity Yield Fund
MainStay PineStone Global Equity Fund
Fixed Income
Taxable Income
MainStay Candriam Emerging Markets Debt Fund
MainStay Floating Rate Fund
MainStay MacKay High Yield Corporate Bond Fund
MainStay MacKay Short Duration High Income Fund
MainStay MacKay Strategic Bond Fund
MainStay MacKay Total Return Bond Fund
MainStay MacKay U.S. Infrastructure Bond Fund
MainStay Short Term Bond Fund
Tax-Exempt Income
MainStay MacKay Arizona Muni Fund
MainStay MacKay California Tax Free Opportunities Fund1
MainStay MacKay Colorado Muni Fund
MainStay MacKay High Yield Municipal Bond Fund
MainStay MacKay New York Tax Free Opportunities Fund2
MainStay MacKay Oregon Muni Fund
MainStay MacKay Short Term Municipal Fund
MainStay MacKay Strategic Municipal Allocation Fund
MainStay MacKay Tax Free Bond Fund
MainStay MacKay Utah Muni Fund
Money Market
MainStay Money Market Fund
Mixed Asset
MainStay Balanced Fund
MainStay Income Builder Fund
MainStay MacKay Convertible Fund
Speciality
MainStay CBRE Global Infrastructure Fund
MainStay CBRE Real Estate Fund
MainStay Cushing MLP Premier Fund
Asset Allocation
MainStay Conservative Allocation Fund
MainStay Conservative ETF Allocation Fund
MainStay Equity Allocation Fund
MainStay Equity ETF Allocation Fund
MainStay Growth Allocation Fund
MainStay Growth ETF Allocation Fund
MainStay Moderate Allocation Fund
MainStay Moderate ETF Allocation Fund
Manager
New York Life Investment Management LLC
New York, New York
Subadvisors
Candriam3
Strassen, Luxembourg
CBRE Investment Management Listed Real Assets LLC
Radnor, Pennsylvania
Cushing Asset Management, LP
Dallas, Texas
Epoch Investment Partners, Inc.
New York, New York
Fiera Capital Inc.
New York, New York
IndexIQ Advisors LLC3
New York, New York
MacKay Shields LLC3
New York, New York
NYL Investors LLC3
New York, New York
PineStone Asset Management Inc.
Montreal, Québec
Wellington Management Company LLP
Boston, Massachusetts
Winslow Capital Management, LLC
Minneapolis, Minnesota
Legal Counsel
Dechert LLP
Washington, District of Columbia
Independent Registered Public Accounting Firm
KPMG LLP
Philadelphia, Pennsylvania
Distributor
NYLIFE Distributors LLC3
Jersey City, New Jersey
Custodian
JPMorgan Chase Bank, N.A.
New York, New York
1.
This Fund is registered for sale in AZ, CA, NV, OR, TX, UT, WA (all share classes); and MI (Class A and Class I shares only); and CO, FL, GA, HI, ID, MA, MD, NH, NJ and NY (Class I and Class C2 shares only).
| 2. | This Fund is registered for sale in CA, CT, DE, FL, MA, NJ, NY, VT (all share classes) and SD (Class R6 shares only). |
| 3. | An affiliate of New York Life Investment Management LLC. |
Not part of the Semiannual Report
For more information
800-624-6782
newyorklifeinvestments.com
“New York Life Investments” is both a service mark, and the common trade name, of certain investment advisors affiliated with New York Life Insurance Company. The MainStay Funds® are managed by New York Life Investment Management LLC and distributed by NYLIFE Distributors LLC, 30 Hudson Street, Jersey City, NJ 07302, a wholly owned subsidiary of New York Life Insurance Company. NYLIFE Distributors LLC is a Member FINRA/SIPC.
©2024 NYLIFE Distributors LLC. All rights reserved.
| 5022742 MS081-24 | MSHY10-06/24 |
(NYLIM) NL212
MainStay MacKay Strategic Bond Fund
Message from the President and Semiannual Report
Unaudited | April 30, 2024
Special Notice:
Beginning in July 2024, new regulations issued by the Securities and Exchange Commission (SEC) will take effect requiring open-end mutual fund companies and ETFs to (1) overhaul the content of their shareholder reports and (2) mail paper copies of the new tailored shareholder reports to shareholders who have not opted to receive these documents electronically.
If you have not yet elected to receive your shareholder reports electronically, please contact your financial intermediary or visit newyorklifeinvestments.com/accounts.
| Not FDIC/NCUA Insured | Not a Deposit | May Lose Value | No Bank Guarantee | Not Insured by Any Government Agency |
This page intentionally left blank
Message from the President
Stock and bond markets gained broad ground during the six-month period ended April 30, 2024, bolstered by better-than-expected economic growth and the prospect of monetary easing in the face of a myriad of macroeconomic and geopolitical challenges.
Throughout the reporting period, interest rates remained at their highest levels in decades in most developed countries, with the U.S. federal funds rate in the 5.25%−5.50% range, as central banks struggled to bring inflation under control. Early in the reporting period, the U.S. Federal Reserve began to forecast interest rate cuts in 2024, but delayed action as inflation remained stubbornly high, fluctuating between 3.1% and 3.5%. Nevertheless, despite the increasing cost of capital and tighter lending environment that resulted from sustained high rates, economic growth remained surprisingly robust, supported by high levels of consumer spending, low unemployment and strong corporate earnings. Investors tended to shrug off concerns related to sticky inflation and high interest rates—not to mention the ongoing war in Ukraine, intensifying hostilities in the Middle East and simmering tensions between China and the United States—focusing instead on the positives of continued economic growth and surprisingly strong corporate profits.
The S&P 500® Index, a widely regarded benchmark of U.S. market performance, produced double-digit gains, reaching record levels in March 2024. Market strength, which had been narrowly focused on mega-cap, technology-related stocks during the previous six months broadened significantly during the reporting period. All industry sectors produced positive results, with the strongest returns in communication services, information technology and industrials, and more moderate gains in the lagging energy, real estate and consumer staples areas. Growth-oriented shares slightly outperformed value-oriented
issues, while large- and mid-cap stocks modestly outperformed their small-cap counterparts. Most overseas equity markets trailed the U.S. market, as developed international economies experienced relatively low growth rates, and weak economic conditions in China undermined emerging markets.
Bonds generally gained ground as well. The yield on the 10-year Treasury note ranged between approximately 4.7% and 3.8%, while the 2-year Treasury yield remained slightly higher, between approximately 5.0% and 4.1%, in an inverted curve pattern often viewed as indicative of an impending economic slowdown. Nevertheless, the prevailing environment of stable interest rates and attractive yields provided a favorable environment for fixed-income investors. Long-term Treasury bonds and investment-grade corporate bonds produced similar gains, while high yield bonds advanced by a slightly greater margin, despite the added risks implicit in an uptick in default rates. International bond markets modestly outperformed their U.S. counterparts, led by a rebound in the performance of emerging-markets debt.
The risks and uncertainties inherent in today’s markets call for the kind of insight and expertise that New York Life Investments offers through our one-on-one philosophy, long-lasting focus, and multi-boutique approach.
Thank you for trusting us to help you meet your investment needs.
Sincerely,
Kirk C. Lehneis
President
The opinions expressed are as of the date of this report and are subject to change. There is no guarantee that any forecast made will come to pass. This material does not constitute investment advice and is not intended as an endorsement of any specific investment. Past performance is no guarantee of future results.
Not part of the Semiannual Report
Investors should refer to the Fund’s Summary Prospectus and/or Prospectus and consider the Fund’s investment objectives, strategies, risks, charges and expenses carefully before investing. The Summary Prospectus and/or Prospectus contain this and other information about the Fund. You may obtain copies of the Fund’s Summary Prospectus, Prospectus and Statement of Additional Information, which includes information about The MainStay Funds' Trustees, free of charge, upon request, by calling toll-free 800-624-6782, by writing to NYLIFE Distributors LLC, Attn: MainStay Marketing Department, 30 Hudson Street, Jersey City, NJ 07302 or by sending an e-mail to MainStayShareholderServices@nylim.com. These documents are also available on dfinview.com/NYLIM. Please read the Fund’s Summary Prospectus and/or Prospectus carefully before investing.
Investment and Performance Comparison (Unaudited)
Performance data quoted represents past performance. Past performance is no guarantee of future results. Because of market volatility and other factors, current performance may be lower or higher than the figures shown. Investment return and principal value will fluctuate, and as a result, when shares are redeemed, they may be worth more or less than their original cost. The graph below depicts the historical performance of Class I shares of the Fund. Performance will vary from class to class based on differences in class-specific expenses and sales charges. For performance information current to the most recent month-end, please call 800-624-6782 or visit newyorklifeinvestments.com.
The performance table and graph do not reflect the deduction of taxes that a shareholder would pay on distributions or Fund share redemptions. Total returns reflect maximum applicable sales charges as indicated in the table below, if any, changes in share price, and reinvestment of dividend and capital gain distributions. The graph assumes the initial investment amount shown below and reflects the deduction of all sales charges that would have applied for the period of investment. Performance figures may reflect certain fee waivers and/or expense limitations, without which total returns may have been lower. For more information on share classes and current fee waivers and/or expense limitations (if any), please refer to the Notes to Financial Statements.

| Average Annual Total Returns for the Period-Ended April 30, 2024 |
| Class | Sales Charge | | Inception
Date | Six
Months1 | One
Year | Five
Years | Ten Years
or Since
Inception | Gross
Expense
Ratio2 |
| Class A Shares | Maximum 4.50% Initial Sales Charge | With sales charges | 2/28/1997 | 2.07% | 0.95% | 1.35% | 1.61% | 1.04% |
| | | Excluding sales charges | | 6.88 | 5.71 | 2.29 | 2.08 | 1.04 |
| Investor Class Shares3 | Maximum 4.00% Initial Sales Charge | With sales charges | 2/28/2008 | 2.56 | 1.22 | 1.22 | 1.52 | 1.26 |
| | | Excluding sales charges | | 6.84 | 5.44 | 2.15 | 1.99 | 1.26 |
| Class C Shares | Maximum 1.00% CDSC | With sales charges | 9/1/1998 | 5.42 | 3.61 | 1.39 | 1.23 | 2.01 |
| | if Redeemed Within One Year of Purchase | Excluding sales charges | | 6.42 | 4.61 | 1.39 | 1.23 | 2.01 |
| Class I Shares | No Sales Charge | | 1/2/2004 | 7.05 | 6.05 | 2.59 | 2.35 | 0.79 |
| Class R6 Shares | No Sales Charge | | 2/28/2018 | 7.19 | 6.09 | 2.75 | 2.68 | 0.65 |
| 1. | Not annualized. |
| 2. | The gross expense ratios presented reflect the Fund’s “Total Annual Fund Operating Expenses” from the most recent Prospectus, as supplemented, and may differ from other expense ratios disclosed in this report. |
| 3. | Prior to June 30, 2020, the maximum initial sales charge was 4.50%, which is reflected in the applicable average annual total return figures shown. |
The footnotes on the next page are an integral part of the table and graph and should be carefully read in conjunction with them.
| Benchmark Performance* | Six
Months1 | One
Year | Five
Years | Ten
Years |
| Bloomberg U.S. Aggregate Bond Index2 | 4.97% | -1.47% | -0.16% | 1.20% |
| ICE BofA U.S. Dollar 3-Month Deposit Offered Rate Constant Maturity Index3 | 2.71 | 5.43 | 2.19 | 1.61 |
| Morningstar Nontraditional Bond Category Average4 | 5.60 | 5.94 | 2.01 | 2.08 |
| * | Returns for indices reflect no deductions for fees, expenses or taxes, except for foreign withholding taxes where applicable. Results assume reinvestment of all dividends and capital gains. An investment cannot be made directly in an index. |
| 1. | Not annualized. |
| 2. | In accordance with new regulatory requirements, the Fund has selected the Bloomberg U.S. Aggregate Bond Index, which represents a broad measure of market performance, and is generally representative of the market sectors or types of investments in which the Fund invests. The Bloomberg U.S. Aggregate Bond Index is a broad-based benchmark that measures performance of the investment grade, U.S. dollar denominated, fixed-rate taxable bond market, including Treasuries, government-related and corporate securities, mortgage-backed securities (agency fixed-rate and hybrid adjustable-rate mortgage pass-throughs), asset-backed securities and commercial mortgage-backed securities. |
| 3. | The ICE BofA U.S. Dollar 3-Month Deposit Offered Rate Constant Maturity Index is unmanaged and tracks the performance of a synthetic asset paying a deposit offered rate to a stated maturity. The index is based on the assumed purchase at par of a synthetic instrument having exactly its stated maturity and with a coupon equal to that day’s fixing rate. That issue is assumed to be sold the following business day (priced at a yield equal to the current day fixing rate) and rolled into a new instrument. |
| 4. | The Morningstar Nontraditional Bond Category Average contains funds that pursue strategies divergent in one or more ways from conventional practice in the broader bond-fund universe. Morningstar category averages are equal-weighted returns based on constituents of the category at the end of the period. |
The footnotes on the preceding page are an integral part of the table and graph and should be carefully read in conjunction with them.
| 6 | MainStay MacKay Strategic Bond Fund |
Cost in Dollars of a $1,000 Investment in MainStay MacKay Strategic Bond Fund (Unaudited)
The example below is intended to describe the fees and expenses borne by shareholders during the six-month period from November 1, 2023 to April 30, 2024, and the impact of those costs on your investment.
Example
As a shareholder of the Fund you incur two types of costs: (1) transaction costs, including exchange fees and sales charges (loads) on purchases (as applicable), and (2) ongoing costs, including management fees, distribution and/or service (12b-1) fees and other Fund expenses (as applicable). This example is intended to help you understand your ongoing costs (in dollars) of investing in the Fund and to compare these costs with the ongoing costs of investing in other mutual funds. The example is based on an investment of $1,000 made at the beginning of the six-month period and held for the entire period from November 1, 2023 to April 30, 2024.
This example illustrates your Fund’s ongoing costs in two ways:
Actual Expenses
The second and third data columns in the table below provide information about actual account values and actual expenses. You may use the information in these columns, together with the amount you invested, to estimate the expenses that you paid during the six months ended April 30, 2024. Simply divide your account value by $1,000 (for example, an $8,600 account value divided by $1,000 = 8.6), then multiply the
result by the number under the heading entitled “Expenses Paid During Period” to estimate the expenses you paid on your account during this period.
Hypothetical Example for Comparison Purposes
The fourth and fifth data columns in the table below provide information about hypothetical account values and hypothetical expenses based on the Fund’s actual expense ratio and an assumed rate of return of 5% per year before expenses, which is not the Fund’s actual return. The hypothetical account values and expenses may not be used to estimate the actual ending account balances or expenses you paid for the six-month period shown. You may use this information to compare the ongoing costs of investing in the Fund with the ongoing costs of investing in other mutual funds. To do so, compare this 5% hypothetical example with the 5% hypothetical examples that appear in the shareholder reports of the other mutual funds.
Please note that the expenses shown in the table are meant to highlight your ongoing costs only and do not reflect any transactional costs, such as exchange fees or sales charges (loads). Therefore, the fourth and fifth data columns of the table are useful in comparing ongoing costs only and will not help you determine the relative total costs of owning different funds. In addition, if these transactional costs were included, your costs would have been higher.
| Share Class | Beginning
Account
Value
11/1/23 | Ending Account
Value (Based
on Actual
Returns and
Expenses)
4/30/24 | Expenses
Paid
During
Period1 | Ending Account
Value (Based
on Hypothetical
5% Annualized
Return and
Actual Expenses)
4/30/24 | Expenses
Paid
During
Period1 | Net Expense
Ratio
During
Period2 |
| Class A Shares | $1,000.00 | $1,068.80 | $ 5.35 | $1,019.69 | $ 5.22 | 1.04% |
| Investor Class Shares | $1,000.00 | $1,068.40 | $ 6.43 | $1,018.65 | $ 6.27 | 1.25% |
| Class C Shares | $1,000.00 | $1,064.20 | $10.26 | $1,014.92 | $10.02 | 2.00% |
| Class I Shares | $1,000.00 | $1,070.50 | $ 3.60 | $1,021.38 | $ 3.52 | 0.70% |
| Class R6 Shares | $1,000.00 | $1,071.90 | $ 3.35 | $1,021.63 | $ 3.27 | 0.65% |
| 1. | Expenses are equal to the Fund’s annualized expense ratio of each class multiplied by the average account value over the period, divided by 366 and multiplied by 182 (to reflect the six-month period). The table above represents the actual expenses incurred during the six-month period. In addition to the fees and expenses which the Fund bears directly, it also indirectly bears a pro rata share of the fees and expenses of the underlying funds in which it invests. Such indirect expenses are not included in the above-reported expense figures. |
| 2. | Expenses are equal to the Fund's annualized expense ratio to reflect the six-month period. |
Portfolio Composition as of April 30, 2024 (Unaudited)
‡ Less than one-tenth of a percent.
See Portfolio of Investments beginning on page 9 for specific holdings within these categories. The Fund's holdings are subject to change.
Top Ten Holdings and/or Issuers Held as of April 30, 2024 (excluding short-term investments) (Unaudited)
| 1. | FHLMC STACR REMIC Trust, 7.98%-13.13%, due 8/25/33–1/25/51 |
| 2. | GNMA, (zero coupon)-3.50%, due 8/20/49–2/16/66 |
| 3. | Connecticut Avenue Securities Trust, 7.83%-15.18%, due 9/25/31–2/25/44 |
| 4. | U.S. Treasury Notes, 4.00%-4.625%, due 4/15/27–2/15/34 |
| 5. | Flagship Credit Auto Trust, 1.59%-6.30%, due 3/16/26–4/15/30 |
| 6. | Multifamily Connecticut Avenue Securities Trust, 8.695%-14.195%, due 10/25/49–11/25/53 |
| 7. | FHLMC, (zero coupon)-3.50%, due 1/15/33–8/15/56 |
| 8. | FNMA, (zero coupon)-9.545%, due 3/25/31–3/25/60 |
| 9. | GLS Auto Receivables Issuer Trust, 1.48%-8.35%, due 11/16/26–10/15/29 |
| 10. | U.S. Treasury Inflation Linked Notes, 1.375%, due 7/15/33 |
| 8 | MainStay MacKay Strategic Bond Fund |
Portfolio of Investments April 30, 2024†^(Unaudited)
| | Principal
Amount | Value |
| Long-Term Bonds 98.1% |
| Asset-Backed Securities 13.0% |
| Automobile Asset-Backed Securities 8.9% |
| American Credit Acceptance Receivables Trust (a) | |
| Series 2021-2, Class D | | |
| 1.34%, due 7/13/27 | $ 1,274,295 | $ 1,249,845 |
| Series 2022-1, Class D | | |
| 2.46%, due 3/13/28 | 3,050,000 | 2,976,910 |
| Series 2021-2, Class E | | |
| 2.54%, due 7/13/27 | 2,400,000 | 2,333,005 |
| Series 2021-4, Class E | | |
| 3.12%, due 2/14/28 | 1,400,000 | 1,354,478 |
| CPS Auto Receivables Trust | |
| Series 2021-C, Class E | | |
| 3.21%, due 9/15/28 (a) | 1,635,000 | 1,542,622 |
| DT Auto Owner Trust (a) | |
| Series 2021-3A, Class D | | |
| 1.31%, due 5/17/27 | 2,240,000 | 2,108,021 |
| Series 2021-4A, Class D | | |
| 1.99%, due 9/15/27 | 1,385,000 | 1,298,190 |
| Series 2021-3A, Class E | | |
| 2.65%, due 9/15/28 | 920,000 | 857,550 |
| Series 2020-3A, Class E | | |
| 3.62%, due 10/15/27 | 2,295,000 | 2,245,431 |
| Exeter Automobile Receivables Trust | |
| Series 2021-2A, Class D | | |
| 1.40%, due 4/15/27 | 1,605,000 | 1,534,259 |
| Series 2021-3A, Class D | | |
| 1.55%, due 6/15/27 | 2,710,000 | 2,559,443 |
| Series 2021-1A, Class E | | |
| 2.21%, due 2/15/28 (a) | 1,565,000 | 1,482,420 |
| Series 2021-3A, Class E | | |
| 3.04%, due 12/15/28 (a) | 3,790,000 | 3,518,628 |
| Flagship Credit Auto Trust (a) | |
| Series 2021-2, Class D | | |
| 1.59%, due 6/15/27 | 1,190,000 | 1,087,698 |
| Series 2021-3, Class D | | |
| 1.65%, due 9/15/27 | 2,302,000 | 2,090,526 |
| Series 2021-4, Class C | | |
| 1.96%, due 12/15/27 | 1,240,000 | 1,163,758 |
| Series 2021-4, Class D | | |
| 2.26%, due 12/15/27 | 3,507,000 | 3,196,182 |
| Series 2020-1, Class D | | |
| 2.48%, due 3/16/26 | 774,490 | 761,523 |
| Series 2020-1, Class E | | |
| 3.52%, due 6/15/27 | 2,590,000 | 2,480,852 |
| Series 2022-1, Class D | | |
| 3.64%, due 3/15/28 | 1,000,000 | 930,179 |
| | Principal
Amount | Value |
| |
| Automobile Asset-Backed Securities (continued) |
| Flagship Credit Auto Trust (a) (continued) | |
| Series 2019-2, Class E | | |
| 4.52%, due 12/15/26 | $ 1,315,000 | $ 1,295,072 |
| Series 2020-3, Class E | | |
| 4.98%, due 12/15/27 | 1,090,000 | 1,058,555 |
| Series 2022-2, Class D | | |
| 5.80%, due 4/17/28 | 2,585,000 | 2,419,475 |
| Series 2024-1, Class D | | |
| 6.30%, due 4/15/30 | 1,400,000 | 1,388,839 |
| Ford Credit Auto Owner Trust | |
| Series 2023-2, Class B | | |
| 5.92%, due 2/15/36 (a) | 1,618,000 | 1,619,552 |
| GLS Auto Receivables Issuer Trust (a) | |
| Series 2021-3A, Class D | | |
| 1.48%, due 7/15/27 | 2,635,000 | 2,487,597 |
| Series 2021-4A, Class D | | |
| 2.48%, due 10/15/27 | 1,650,000 | 1,555,541 |
| Series 2021-2A, Class E | | |
| 2.87%, due 5/15/28 | 2,340,000 | 2,214,504 |
| Series 2021-1A, Class E | | |
| 3.14%, due 1/18/28 | 1,080,000 | 1,036,253 |
| Series 2021-3A, Class E | | |
| 3.20%, due 10/16/28 | 2,485,000 | 2,304,011 |
| Series 2020-1A, Class D | | |
| 3.68%, due 11/16/26 | 1,019,207 | 1,013,184 |
| Series 2022-3A, Class E | | |
| 8.35%, due 10/15/29 | 670,000 | 669,089 |
| Hertz Vehicle Financing III LLC | |
| Series 2023-1A, Class C | | |
| 6.91%, due 6/25/27 (a) | 680,000 | 677,156 |
| Hertz Vehicle Financing III LP | |
| Series 2021-2A, Class C | | |
| 2.52%, due 12/27/27 (a) | 2,885,000 | 2,609,962 |
| Hertz Vehicle Financing LLC | |
| Series 2021-1A, Class C | | |
| 2.05%, due 12/26/25 (a) | 870,000 | 852,574 |
| | | 59,972,884 |
| Home Equity Asset-Backed Security 0.0% ‡ |
| GSAA Home Equity Trust | |
| Series 2007-8, Class A3 | | |
| 6.331% (1 Month SOFR + 1.014%), due 8/25/37 (b) | 24,508 | 23,380 |
| Other Asset-Backed Securities 4.1% |
| American Airlines Pass-Through Trust | |
| Series 2019-1, Class B | | |
| 3.85%, due 2/15/28 | 665,076 | 610,242 |
The notes to the financial statements are an integral part of, and should be read in conjunction with, the financial statements.
9
Portfolio of Investments April 30, 2024†^(Unaudited) (continued)
| | Principal
Amount | Value |
| Asset-Backed Securities (continued) |
| Other Asset-Backed Securities (continued) |
| American Airlines Pass-Through Trust (continued) | |
| Series 2021-1, Class B | | |
| 3.95%, due 7/11/30 | $ 1,055,300 | $ 953,469 |
| Series 2016-1, Class A | | |
| 4.10%, due 1/15/28 | 819,949 | 759,937 |
| Auxilior Term Funding LLC | |
| Series 2023-1A, Class D | | |
| 7.27%, due 12/16/30 (a) | 940,000 | 934,229 |
| Avant Loans Funding Trust | |
| Series 2022-REV1, Class D | | |
| 11.02%, due 9/15/31 (a) | 1,365,000 | 1,341,855 |
| CF Hippolyta Issuer LLC (a) | |
| Series 2020-1, Class A1 | | |
| 1.69%, due 7/15/60 | 1,029,873 | 965,319 |
| Series 2021-1A, Class B1 | | |
| 1.98%, due 3/15/61 | 3,977,129 | 3,495,169 |
| Series 2020-1, Class A2 | | |
| 1.99%, due 7/15/60 | 1,526,673 | 1,309,216 |
| Series 2020-1, Class B1 | | |
| 2.28%, due 7/15/60 | 2,122,707 | 1,951,540 |
| Series 2020-1, Class B2 | | |
| 2.60%, due 7/15/60 | 2,428,520 | 1,987,158 |
| CVS Pass-Through Trust | |
| 5.789%, due 1/10/26 (a) | 13,641 | 13,575 |
| FirstKey Homes Trust | |
| Series 2020-SFR2, Class E | | |
| 2.668%, due 10/19/37 (a) | 1,650,000 | 1,552,019 |
| FORA Financial Asset Securitization LLC | |
| Series 2021-1A, Class A | | |
| 2.62%, due 5/15/27 (a) | 1,705,000 | 1,642,462 |
| Hilton Grand Vacations Trust | |
| Series 2019-AA, Class B | | |
| 2.54%, due 7/25/33 (a) | 710,619 | 678,100 |
| Home Partners of America Trust | |
| Series 2021-2, Class B | | |
| 2.302%, due 12/17/26 (a) | 759,397 | 689,650 |
| Navient Private Education Refi Loan Trust (a) | |
| Series 2021-BA, Class A | | |
| 0.94%, due 7/15/69 | 600,603 | 518,422 |
| Series 2020-GA, Class B | | |
| 2.50%, due 9/16/69 | 1,145,000 | 865,815 |
| Series 2020-HA, Class B | | |
| 2.78%, due 1/15/69 | 1,820,000 | 1,480,026 |
| New Economy Assets Phase 1 Sponsor LLC | |
| Series 2021-1, Class B1 | | |
| 2.41%, due 10/20/61 (a) | 3,340,000 | 2,808,968 |
| | Principal
Amount | Value |
| |
| Other Asset-Backed Securities (continued) |
| Tricon American Homes | |
| Series 2020-SFR1, Class C | | |
| 2.249%, due 7/17/38 (a) | $ 1,500,000 | $ 1,381,407 |
| United Airlines Pass-Through Trust | |
| Series 2023-1, Class A | | |
| 5.80%, due 1/15/36 | 865,000 | 859,540 |
| Series 2020-1, Class A | | |
| 5.875%, due 10/15/27 | 840,211 | 837,905 |
| | | 27,636,023 |
Total Asset-Backed Securities
(Cost $89,661,183) | | 87,632,287 |
| Corporate Bonds 34.5% |
| Aerospace & Defense 0.3% |
| Boeing Co. (The) (a) | | |
| 6.528%, due 5/1/34 | 925,000 | 931,660 |
| 6.858%, due 5/1/54 | 975,000 | 977,642 |
| | | 1,909,302 |
| Agriculture 0.2% |
| BAT Capital Corp. | | |
| 3.734%, due 9/25/40 | 1,095,000 | 792,571 |
| BAT International Finance plc | | |
| 4.448%, due 3/16/28 | 755,000 | 722,185 |
| | | 1,514,756 |
| Airlines 1.0% |
| American Airlines, Inc. (a) | | |
| 5.50%, due 4/20/26 | 733,333 | 724,826 |
| 5.75%, due 4/20/29 | 2,450,000 | 2,366,045 |
| Delta Air Lines, Inc. (a) | | |
| 4.50%, due 10/20/25 | 420,755 | 414,959 |
| 4.75%, due 10/20/28 | 2,665,000 | 2,579,940 |
| Mileage Plus Holdings LLC | | |
| 6.50%, due 6/20/27 (a) | 988,000 | 989,668 |
| | | 7,075,438 |
| Apparel 0.2% |
| Tapestry, Inc. | | |
| 7.85%, due 11/27/33 | 1,090,000 | 1,138,608 |
| Auto Manufacturers 2.1% |
| Ford Motor Credit Co. LLC | | |
| 2.30%, due 2/10/25 | 1,005,000 | 976,632 |
| 4.125%, due 8/17/27 | 1,295,000 | 1,216,312 |
| 6.80%, due 5/12/28 (c) | 2,105,000 | 2,148,049 |
| 6.95%, due 3/6/26 | 1,195,000 | 1,211,170 |
The notes to the financial statements are an integral part of, and should be read in conjunction with, the financial statements.
| 10 | MainStay MacKay Strategic Bond Fund |
| | Principal
Amount | Value |
| Corporate Bonds (continued) |
| Auto Manufacturers (continued) |
| Ford Motor Credit Co. LLC (continued) | | |
| 7.20%, due 6/10/30 | $ 960,000 | $ 994,667 |
| General Motors Financial Co., Inc. | | |
| 2.35%, due 1/8/31 | 1,178,000 | 946,778 |
| 2.70%, due 6/10/31 | 1,525,000 | 1,235,724 |
| 4.30%, due 4/6/29 | 1,090,000 | 1,021,734 |
| Nissan Motor Acceptance Co. LLC (a) | | |
| 1.85%, due 9/16/26 | 3,610,000 | 3,261,688 |
| 7.05%, due 9/15/28 | 975,000 | 1,000,979 |
| | | 14,013,733 |
| Banks 12.2% |
| Banco Santander SA | | |
| 4.175% (1 Year Treasury Constant Maturity Rate + 2.00%), due 3/24/28 (b) | 2,400,000 | 2,283,381 |
| 6.35%, due 3/14/34 | 1,600,000 | 1,560,585 |
| Bank of America Corp. | | |
| 2.087%, due 6/14/29 (d) | 1,275,000 | 1,109,260 |
| 3.384%, due 4/2/26 (d) | 1,700,000 | 1,661,322 |
| Series MM | | |
| 4.30%, due 1/28/25 (d)(e) | 1,516,000 | 1,474,825 |
| 8.57%, due 11/15/24 | 1,645,000 | 1,666,787 |
| Barclays plc (b)(e) | | |
| 4.375% (5 Year Treasury Constant Maturity Rate + 3.41%), due 3/15/28 | 2,380,000 | 1,938,009 |
| 8.00% (5 Year Treasury Constant Maturity Rate + 5.431%), due 3/15/29 | 1,315,000 | 1,293,111 |
| BNP Paribas SA (a) | | |
| 3.052%, due 1/13/31 (d) | 1,605,000 | 1,379,702 |
| 4.625% (5 Year Treasury Constant Maturity Rate + 3.196%), due 1/12/27 (b)(e) | 1,315,000 | 1,172,570 |
| 4.625% (5 Year Treasury Constant Maturity Rate + 3.34%), due 2/25/31 (b)(e) | 1,610,000 | 1,291,838 |
| BPCE SA (a) | | |
| 2.045%, due 10/19/27 (d) | 2,240,000 | 2,035,746 |
| 5.125%, due 1/18/28 | 570,000 | 560,342 |
| 6.714%, due 10/19/29 (d) | 665,000 | 684,330 |
| Citigroup, Inc. | | |
| 2.52%, due 11/3/32 (d) | 2,115,000 | 1,695,193 |
| | Principal
Amount | Value |
| |
| Banks (continued) |
| Citigroup, Inc. (continued) | | |
| Series Y | | |
| 4.15% (5 Year Treasury Constant Maturity Rate + 3.00%), due 11/15/26 (b)(e) | $ 1,395,000 | $ 1,280,595 |
| Series M | | |
| 6.30%, due 8/15/24 (d)(e) | 3,260,000 | 3,258,519 |
| Comerica, Inc. | | |
| 5.982%, due 1/30/30 (d) | 1,715,000 | 1,665,419 |
| Credit Agricole SA | | |
| 4.75% (5 Year Treasury Constant Maturity Rate + 3.237%), due 3/23/29 (a)(b)(e) | 2,370,000 | 2,013,869 |
| Deutsche Bank AG | | |
| 3.035%, due 5/28/32 (d) | 460,000 | 377,183 |
| 4.875% (USISDA05 + 2.553%), due 12/1/32 (b) | 3,390,000 | 3,123,813 |
| Fifth Third Bank NA | | |
| 3.85%, due 3/15/26 | 1,400,000 | 1,344,770 |
| First Horizon Bank | | |
| 5.75%, due 5/1/30 | 1,673,000 | 1,544,090 |
| Goldman Sachs Group, Inc. (The) | | |
| 1.948%, due 10/21/27 (d) | 3,260,000 | 2,976,627 |
| Series V | | |
| 4.125% (5 Year Treasury Constant Maturity Rate + 2.949%), due 11/10/26 (b)(e) | 980,000 | 905,978 |
| Huntington Bancshares, Inc. | | |
| 5.709%, due 2/2/35 (d) | 2,185,000 | 2,094,766 |
| Intesa Sanpaolo SpA | | |
| 4.198% (1 Year Treasury Constant Maturity Rate + 2.60%), due 6/1/32 (a)(b) | 3,430,000 | 2,811,383 |
| KeyBank NA | | |
| 4.15%, due 8/8/25 | 1,585,000 | 1,538,572 |
| KeyCorp | | |
| 6.401%, due 3/6/35 (d) | 2,020,000 | 1,987,077 |
| Lloyds Banking Group plc | | |
| 4.582%, due 12/10/25 | 1,365,000 | 1,331,962 |
| 4.65%, due 3/24/26 | 1,985,000 | 1,937,908 |
| 4.976% (1 Year Treasury Constant Maturity Rate + 2.30%), due 8/11/33 (b) | 995,000 | 933,559 |
| Macquarie Group Ltd. | | |
| 2.871%, due 1/14/33 (a)(d) | 1,490,000 | 1,205,406 |
| Morgan Stanley (d) | | |
| 2.484%, due 9/16/36 | 2,170,000 | 1,673,951 |
| 2.511%, due 10/20/32 | 3,225,000 | 2,595,139 |
The notes to the financial statements are an integral part of, and should be read in conjunction with, the financial statements.
11
Portfolio of Investments April 30, 2024†^(Unaudited) (continued)
| | Principal
Amount | Value |
| Corporate Bonds (continued) |
| Banks (continued) |
| NatWest Group plc (b) | | |
| 3.073% (1 Year Treasury Constant Maturity Rate + 2.55%), due 5/22/28 | $ 2,145,000 | $ 1,982,486 |
| 4.60% (5 Year Treasury Constant Maturity Rate + 3.10%), due 6/28/31 (e) | 2,650,000 | 2,014,208 |
| 5.778% (1 Year Treasury Constant Maturity Rate + 1.50%), due 3/1/35 | 1,110,000 | 1,087,147 |
| 5.847% (1 Year Treasury Constant Maturity Rate + 1.35%), due 3/2/27 | 1,595,000 | 1,593,841 |
| Santander Holdings USA, Inc. | | |
| 6.499%, due 3/9/29 (d) | 1,315,000 | 1,325,202 |
| Societe Generale SA (a)(b)(e) | | |
| 4.75% (5 Year Treasury Constant Maturity Rate + 3.931%), due 5/26/26 | 1,240,000 | 1,101,449 |
| 5.375% (5 Year Treasury Constant Maturity Rate + 4.514%), due 11/18/30 | 1,920,000 | 1,552,993 |
| Synchrony Bank | | |
| 5.40%, due 8/22/25 | 1,805,000 | 1,782,128 |
| UBS Group AG (a) | | |
| 3.091%, due 5/14/32 (d) | 885,000 | 732,818 |
| 4.375% (5 Year Treasury Constant Maturity Rate + 3.313%), due 2/10/31 (b)(e) | 2,555,000 | 2,040,551 |
| 6.442%, due 8/11/28 (d) | 1,325,000 | 1,345,212 |
| Wells Fargo & Co. | | |
| 3.35%, due 3/2/33 (d) | 2,330,000 | 1,966,894 |
| 3.584%, due 5/22/28 (c)(d) | 380,000 | 357,712 |
| 5.499%, due 1/23/35 (c)(d) | 385,000 | 373,984 |
| 5.557%, due 7/25/34 (d) | 275,000 | 268,054 |
| Series S | | |
| 5.90%, due 6/15/24 (e)(f) | 3,295,000 | 3,281,058 |
| Westpac Banking Corp. | | |
| 3.02% (5 Year Treasury Constant Maturity Rate + 1.53%), due 11/18/36 (b) | 1,692,000 | 1,360,056 |
| | | 82,573,380 |
| Building Materials 0.4% |
| CEMEX Materials LLC | | |
| 7.70%, due 7/21/25 (a) | 2,490,000 | 2,530,462 |
| | Principal
Amount | Value |
| |
| Chemicals 0.9% |
| Alpek SAB de CV | | |
| 3.25%, due 2/25/31 (a) | $ 1,255,000 | $ 1,041,604 |
| Braskem Netherlands Finance BV (a) | | |
| 4.50%, due 1/10/28 | 1,650,000 | 1,473,234 |
| 8.50%, due 1/12/31 | 393,000 | 399,503 |
| Sasol Financing USA LLC | | |
| 8.75%, due 5/3/29 (a) | 2,000,000 | 2,011,170 |
| SK Invictus Intermediate II SARL | | |
| 5.00%, due 10/30/29 (a) | 1,585,000 | 1,381,762 |
| | | 6,307,273 |
| Commercial Services 0.3% |
| Ashtead Capital, Inc. | | |
| 4.25%, due 11/1/29 (a) | 1,640,000 | 1,502,232 |
| California Institute of Technology | | |
| 3.65%, due 9/1/2119 | 1,118,000 | 719,354 |
| | | 2,221,586 |
| Computers 0.2% |
| Dell International LLC | | |
| 8.10%, due 7/15/36 | 879,000 | 1,024,251 |
| Diversified Financial Services 3.8% |
| AerCap Ireland Capital DAC | | |
| 3.00%, due 10/29/28 | 1,650,000 | 1,471,605 |
| Air Lease Corp. | | |
| 2.30%, due 2/1/25 | 3,275,000 | 3,182,669 |
| 3.25%, due 3/1/25 | 4,000,000 | 3,912,388 |
| Aircastle Ltd. | | |
| 5.25% (5 Year Treasury Constant Maturity Rate + 4.41%), due 6/15/26 (a)(b)(e) | 1,110,000 | 1,048,760 |
| Ally Financial, Inc. | | |
| 5.75%, due 11/20/25 | 3,820,000 | 3,788,828 |
| 8.00%, due 11/1/31 | 1,890,000 | 2,046,249 |
| Avolon Holdings Funding Ltd. | | |
| 3.25%, due 2/15/27 (a) | 2,125,000 | 1,959,324 |
| Banco BTG Pactual SA | | |
| 2.75%, due 1/11/26 (a) | 1,585,000 | 1,492,661 |
| Capital One Financial Corp. (d) | | |
| 6.051%, due 2/1/35 (c) | 665,000 | 654,079 |
| 6.312%, due 6/8/29 | 1,860,000 | 1,876,442 |
| Macquarie Airfinance Holdings Ltd. | | |
| 6.40%, due 3/26/29 (a) | 1,610,000 | 1,605,343 |
| Nomura Holdings, Inc. | | |
| 5.099%, due 7/3/25 | 1,660,000 | 1,642,690 |
The notes to the financial statements are an integral part of, and should be read in conjunction with, the financial statements.
| 12 | MainStay MacKay Strategic Bond Fund |
| | Principal
Amount | Value |
| Corporate Bonds (continued) |
| Diversified Financial Services (continued) |
| OneMain Finance Corp. | | |
| 3.50%, due 1/15/27 | $ 1,100,000 | $ 1,012,009 |
| | | 25,693,047 |
| Electric 2.4% |
| AEP Texas, Inc. | | |
| 4.70%, due 5/15/32 | 1,175,000 | 1,089,392 |
| American Electric Power Co., Inc. | | |
| 5.625%, due 3/1/33 | 1,765,000 | 1,725,274 |
| Appalachian Power Co. | | |
| 5.65%, due 4/1/34 | 1,265,000 | 1,228,933 |
| Aydem Yenilenebilir Enerji A/S | | |
| 7.75%, due 2/2/27 (a) | 1,075,000 | 1,034,365 |
| Calpine Corp. | | |
| 5.125%, due 3/15/28 (a) | 1,185,000 | 1,124,049 |
| Dominion Energy, Inc. | | |
| Series C | | |
| 4.35% (5 Year Treasury Constant Maturity Rate + 3.195%), due 1/15/27 (b)(e) | 780,000 | 714,200 |
| EnfraGen Energia Sur SA | | |
| 5.375%, due 12/30/30 (a) | 1,305,000 | 1,067,615 |
| IPALCO Enterprises, Inc. | | |
| 5.75%, due 4/1/34 (a) | 1,485,000 | 1,429,261 |
| Ohio Power Co. | | |
| Series R | | |
| 2.90%, due 10/1/51 | 955,000 | 571,715 |
| Pacific Gas and Electric Co. | | |
| 3.50%, due 8/1/50 | 1,855,000 | 1,189,726 |
| Sempra | | |
| 4.125% (5 Year Treasury Constant Maturity Rate + 2.868%), due 4/1/52 (b) | 2,150,000 | 1,944,177 |
| Virginia Electric and Power Co. | | |
| 5.70%, due 8/15/53 | 1,580,000 | 1,537,275 |
| Vistra Operations Co. LLC | | |
| 6.875%, due 4/15/32 (a) | 1,550,000 | 1,543,509 |
| | | 16,199,491 |
| Environmental Control 0.1% |
| Covanta Holding Corp. | | |
| 4.875%, due 12/1/29 (a) | 950,000 | 832,775 |
| Food 0.8% |
| JBS USA Holding LUX SARL | | |
| 5.75%, due 4/1/33 | 2,140,000 | 2,046,636 |
| | Principal
Amount | Value |
| |
| Food (continued) |
| Minerva Luxembourg SA | | |
| 8.875%, due 9/13/33 (a) | $ 1,935,000 | $ 1,984,753 |
| Smithfield Foods, Inc. | | |
| 3.00%, due 10/15/30 (a) | 1,520,000 | 1,245,904 |
| | | 5,277,293 |
| Gas 0.9% |
| Brooklyn Union Gas Co. (The) | | |
| 6.388%, due 9/15/33 (a) | 1,325,000 | 1,332,226 |
| National Fuel Gas Co. | | |
| 2.95%, due 3/1/31 | 1,695,000 | 1,393,459 |
| 5.50%, due 10/1/26 | 1,395,000 | 1,384,056 |
| Piedmont Natural Gas Co., Inc. | | |
| 5.05%, due 5/15/52 | 1,070,000 | 918,701 |
| Southern Co. Gas Capital Corp. | | |
| Series 21A | | |
| 3.15%, due 9/30/51 | 1,500,000 | 919,386 |
| | | 5,947,828 |
| Household Products & Wares 0.4% |
| Kronos Acquisition Holdings, Inc. | | |
| 5.00%, due 12/31/26 (a) | 2,770,000 | 2,676,639 |
| Insurance 0.9% |
| Lincoln National Corp. | | |
| 7.938% (3 Month SOFR + 2.619%), due 5/17/66 (b) | 3,537,000 | 2,707,078 |
| NMI Holdings, Inc. | | |
| 7.375%, due 6/1/25 (a) | 685,000 | 690,074 |
| Protective Life Corp. | | |
| 8.45%, due 10/15/39 | 2,476,000 | 2,988,634 |
| | | 6,385,786 |
| Iron & Steel 0.2% |
| Algoma Steel, Inc. | | |
| 9.125%, due 4/15/29 (a) | 1,355,000 | 1,338,062 |
| Lodging 0.3% |
| Studio City Finance Ltd. | | |
| 6.50%, due 1/15/28 (a) | 1,905,000 | 1,776,628 |
| Media 0.1% |
| DISH DBS Corp. | | |
| 5.75%, due 12/1/28 (a) | 1,250,000 | 844,102 |
The notes to the financial statements are an integral part of, and should be read in conjunction with, the financial statements.
13
Portfolio of Investments April 30, 2024†^(Unaudited) (continued)
| | Principal
Amount | Value |
| Corporate Bonds (continued) |
| Mining 0.7% |
| First Quantum Minerals Ltd. | | |
| 9.375%, due 3/1/29 (a) | $ 1,628,000 | $ 1,682,009 |
| Perenti Finance Pty. Ltd. | | |
| 7.50%, due 4/26/29 (a) | 1,075,000 | 1,085,506 |
| WE Soda Investments Holding plc | | |
| 9.375%, due 2/14/31 (a) | 1,940,000 | 1,973,950 |
| | | 4,741,465 |
| Miscellaneous—Manufacturing 0.4% |
| Textron Financial Corp. | | |
| 7.304% (3 Month SOFR + 1.997%), due 2/15/42 (a)(b) | 2,905,000 | 2,495,556 |
| Oil & Gas 0.1% |
| Gazprom PJSC Via Gaz Capital SA | | |
| 7.288%, due 8/16/37 (a)(g) | 850,000 | 658,750 |
| Packaging & Containers 0.3% |
| Berry Global, Inc. | | |
| 4.875%, due 7/15/26 (a) | 1,240,000 | 1,213,387 |
| Owens-Brockway Glass Container, Inc. | | |
| 6.625%, due 5/13/27 (a) | 840,000 | 839,306 |
| | | 2,052,693 |
| Pharmaceuticals 0.5% |
| Bayer US Finance LLC | | |
| 6.875%, due 11/21/53 (a) | 1,075,000 | 1,060,546 |
| Teva Pharmaceutical Finance Netherlands III BV | | |
| 3.15%, due 10/1/26 | 221,000 | 204,739 |
| 4.75%, due 5/9/27 | 2,345,000 | 2,242,648 |
| 7.875%, due 9/15/29 | 10,000 | 10,499 |
| | | 3,518,432 |
| Pipelines 3.3% |
| Cheniere Corpus Christi Holdings LLC | | |
| 2.742%, due 12/31/39 | 1,710,000 | 1,355,124 |
| CNX Midstream Partners LP | | |
| 4.75%, due 4/15/30 (a) | 2,570,000 | 2,274,489 |
| DCP Midstream Operating LP | | |
| 3.25%, due 2/15/32 | 3,090,000 | 2,599,449 |
| DT Midstream, Inc. | | |
| 4.30%, due 4/15/32 (a) | 1,715,000 | 1,517,454 |
| Enbridge, Inc. | | |
| 5.70%, due 3/8/33 | 585,000 | 578,289 |
| | Principal
Amount | Value |
| |
| Pipelines (continued) |
| Energy Transfer LP | | |
| Series H | | |
| 6.50% (5 Year Treasury Constant Maturity Rate + 5.694%), due 11/15/26 (b)(e) | $ 2,520,000 | $ 2,445,276 |
| EnLink Midstream LLC | | |
| 5.625%, due 1/15/28 (a) | 750,000 | 736,909 |
| Flex Intermediate Holdco LLC | | |
| 3.363%, due 6/30/31 (a) | 2,490,000 | 1,976,915 |
| Hess Midstream Operations LP | | |
| 5.625%, due 2/15/26 (a) | 367,000 | 362,877 |
| Kinder Morgan, Inc. | | |
| 7.75%, due 1/15/32 | 2,035,000 | 2,253,104 |
| MPLX LP | | |
| 4.00%, due 3/15/28 | 560,000 | 530,790 |
| Plains All American Pipeline LP | | |
| 3.80%, due 9/15/30 | 1,040,000 | 932,025 |
| Sabine Pass Liquefaction LLC | | |
| 5.75%, due 5/15/24 | 146,000 | 145,987 |
| Targa Resources Corp. | | |
| 4.20%, due 2/1/33 | 725,000 | 639,948 |
| Venture Global LNG, Inc. | | |
| 9.875%, due 2/1/32 (a) | 1,015,000 | 1,083,114 |
| Western Midstream Operating LP | | |
| 5.25%, due 2/1/50 (h) | 1,800,000 | 1,526,676 |
| Williams Cos., Inc. (The) | | |
| 3.50%, due 10/15/51 | 1,425,000 | 952,239 |
| | | 21,910,665 |
| Real Estate Investment Trusts 0.9% |
| GLP Capital LP | | |
| 3.35%, due 9/1/24 | 1,535,000 | 1,519,485 |
| Iron Mountain, Inc. | | |
| 4.875%, due 9/15/29 (a) | 1,686,000 | 1,555,784 |
| Starwood Property Trust, Inc. | | |
| 3.625%, due 7/15/26 (a) | 3,172,000 | 2,933,403 |
| | | 6,008,672 |
| Retail 0.2% |
| AutoNation, Inc. | | |
| 4.75%, due 6/1/30 | 1,116,000 | 1,046,283 |
| Nordstrom, Inc. | | |
| 4.25%, due 8/1/31 | 635,000 | 547,698 |
| | | 1,593,981 |
| Semiconductors 0.1% |
| Broadcom, Inc. | | |
| 3.75%, due 2/15/51 (a) | 620,000 | 443,556 |
The notes to the financial statements are an integral part of, and should be read in conjunction with, the financial statements.
| 14 | MainStay MacKay Strategic Bond Fund |
| | Principal
Amount | Value |
| Corporate Bonds (continued) |
| Telecommunications 0.1% |
| AT&T, Inc. | | |
| 3.50%, due 9/15/53 | $ 1,485,000 | $ 979,008 |
| Water 0.2% |
| Aegea Finance SARL | | |
| 6.75%, due 5/20/29 (a) | 1,095,000 | 1,061,984 |
Total Corporate Bonds
(Cost $251,370,085) | | 232,745,202 |
| Foreign Government Bonds 2.7% |
| Brazil 0.1% |
| Brazil Government Bond | | |
| 3.75%, due 9/12/31 | 525,000 | 445,192 |
| Chile 0.6% |
| Corp. Nacional del Cobre de Chile | | |
| 6.44%, due 1/26/36 (a) | 1,645,000 | 1,644,343 |
| Empresa Nacional del Petroleo | | |
| 3.45%, due 9/16/31 (a) | 2,540,000 | 2,129,714 |
| | | 3,774,057 |
| Colombia 0.3% |
| Colombia Government Bond | | |
| 3.25%, due 4/22/32 | 2,335,000 | 1,754,167 |
| 4.50%, due 1/28/26 | 500,000 | 482,650 |
| | | 2,236,817 |
| Dominican Republic 0.2% |
| Dominican Republic Government Bond | | |
| 4.875%, due 9/23/32 (a) | 1,635,000 | 1,430,625 |
| Israel 0.2% |
| Israel Government Bond | | |
| 5.75%, due 3/12/54 | 1,805,000 | 1,627,099 |
| Mexico 1.0% |
| Comision Federal de Electricidad (a) | | |
| 3.875%, due 7/26/33 | 2,385,000 | 1,876,708 |
| 4.677%, due 2/9/51 | 1,855,000 | 1,260,516 |
| Petroleos Mexicanos | | |
| 6.50%, due 3/13/27 | 2,535,000 | 2,374,169 |
| 6.75%, due 9/21/47 | 1,980,000 | 1,264,112 |
| | | 6,775,505 |
| | Principal
Amount | Value |
| |
| Paraguay 0.3% |
| Paraguay Government Bond | | |
| 6.10%, due 8/11/44 (a) | $ 2,100,000 | $ 1,940,400 |
Total Foreign Government Bonds
(Cost $21,299,659) | | 18,229,695 |
| Loan Assignments 0.6% |
| Cargo Transport 0.2% |
| Genesse & Wyoming, Inc. | |
| Initial Term Loan | |
| 7.301% (3 Month SOFR + 2.00%), due 4/10/31 (b) | 1,440,000 | 1,439,551 |
| Diversified/Conglomerate Service 0.1% |
| TruGreen LP | |
| First Lien Second Refinancing Term Loan | |
| 9.416% (1 Month SOFR + 4.00%), due 11/2/27 (b) | 756,303 | 726,429 |
| High Tech Industries 0.3% |
| Ahead DB Holdings LLC | |
| First Lien 2024 Incremental Term Loan | |
| 9.559% (3 Month SOFR + 4.25%), due 2/1/31 (b) | 1,565,000 | 1,572,173 |
Total Loan Assignments
(Cost $3,735,154) | | 3,738,153 |
| Mortgage-Backed Securities 41.3% |
| Agency (Collateralized Mortgage Obligations) 8.8% |
| FHLMC | |
| REMIC, Series 4660 | | |
| (zero coupon), due 1/15/33 | 1,921,341 | 1,457,909 |
| REMIC, Series 5326, Class QO | | |
| (zero coupon), due 9/25/50 | 2,427,758 | 1,630,325 |
| REMIC, Series 5021, Class SA | | |
| (zero coupon) (SOFR 30A + 3.55%), due 10/25/50 (b)(i) | 3,128,711 | 57,581 |
| REMIC, Series 5092, Class SH | | |
| (zero coupon) (SOFR 30A + 2.45%), due 2/25/51 (b)(i) | 2,281,908 | 7,029 |
| REMIC, Series 5200, Class SA | | |
| (zero coupon) (SOFR 30A + 3.50%), due 2/25/52 (b)(i) | 2,502,608 | 38,613 |
| REMIC, Series 5326 | | |
| (zero coupon), due 8/25/53 | 735,169 | 547,355 |
The notes to the financial statements are an integral part of, and should be read in conjunction with, the financial statements.
15
Portfolio of Investments April 30, 2024†^(Unaudited) (continued)
| | Principal
Amount | Value |
| Mortgage-Backed Securities (continued) |
| Agency (Collateralized Mortgage Obligations) (continued) |
| FHLMC (continued) | |
| REMIC, Series 5351, Class EO | | |
| (zero coupon), due 10/25/53 | $ 2,956,094 | $ 2,294,561 |
| REMIC, Series 5357, Class OE | | |
| (zero coupon), due 11/25/53 | 1,325,116 | 1,021,668 |
| REMIC, Series 5363 | | |
| (zero coupon), due 12/25/53 | 1,452,801 | 1,172,001 |
| REMIC, Series 4839, Class WO | | |
| (zero coupon), due 8/15/56 | 1,009,362 | 662,891 |
| REMIC, Series 4993, Class KS | | |
| 0.605% (SOFR 30A + 5.936%), due 7/25/50 (b)(i) | 4,595,496 | 506,863 |
| REMIC, Series 5031, Class IQ | | |
| 2.50%, due 10/25/50 (i) | 1,533,836 | 243,895 |
| REMIC, Series 5038, Class IB | | |
| 2.50%, due 10/25/50 (i) | 1,007,151 | 159,105 |
| REMIC, Series 5149, Class LI | | |
| 2.50%, due 10/25/51 (i) | 3,807,662 | 453,966 |
| REMIC, Series 5205, Class KI | | |
| 3.00%, due 12/25/48 (i) | 1,655,826 | 202,233 |
| REMIC, Series 5152, Class BI | | |
| 3.00%, due 7/25/50 (i) | 3,419,405 | 581,259 |
| REMIC, Series 5023, Class LI | | |
| 3.00%, due 10/25/50 (i) | 1,238,439 | 209,479 |
| REMIC, Series 5094, Class IP | | |
| 3.00%, due 4/25/51 (i) | 1,667,446 | 263,221 |
| REMIC, Series 5155, Class KI | | |
| 3.00%, due 10/25/51 (i) | 4,167,623 | 557,861 |
| REMIC, Series 5160 | | |
| 3.00%, due 10/25/51 (i) | 2,082,431 | 238,810 |
| REMIC, Series 5167, Class GI | | |
| 3.00%, due 11/25/51 (i) | 3,961,037 | 596,233 |
| REMIC, Series 5191 | | |
| 3.50%, due 9/25/50 (i) | 2,128,612 | 408,292 |
| REMIC, Series 5036 | | |
| 3.50%, due 11/25/50 (i) | 2,512,190 | 487,448 |
| REMIC, Series 5040 | | |
| 3.50%, due 11/25/50 (i) | 1,322,213 | 254,155 |
| FHLMC, Strips | |
| Series 311 | | |
| (zero coupon), due 8/15/43 | 679,208 | 489,854 |
| Series 311, Class S1 | | |
| 0.506% (SOFR 30A + 5.836%), due 8/15/43 (b)(i) | 4,356,873 | 346,864 |
| Series 389, Class C35 | | |
| 2.00%, due 6/15/52 (i) | 3,445,857 | 428,363 |
| | Principal
Amount | Value |
| |
| Agency (Collateralized Mortgage Obligations) (continued) |
| FNMA | |
| REMIC, Series 2018-17, Class CS | | |
| (zero coupon) (SOFR 30A + 3.336%), due 3/25/48 (b)(i) | $ 43,399,481 | $ 451,615 |
| REMIC, Series 2021-81, Class SA | | |
| (zero coupon) (SOFR 30A + 2.60%), due 12/25/51 (b)(i) | 13,330,386 | 75,193 |
| REMIC, Series 2022-3, Class YS | | |
| (zero coupon) (SOFR 30A + 2.55%), due 2/25/52 (b)(i) | 7,744,774 | 31,142 |
| REMIC, Series 2022-5, Class SN | | |
| (zero coupon) (SOFR 30A + 1.80%), due 2/25/52 (b)(i) | 1,483,045 | 1,661 |
| REMIC, Series 2023-70, Class AO | | |
| (zero coupon), due 3/25/53 | 1,397,633 | 1,065,648 |
| REMIC, Series 2023-41 | | |
| (zero coupon), due 9/25/53 | 1,160,408 | 848,763 |
| REMIC, Series 2023-45 | | |
| (zero coupon), due 10/25/53 | 1,483,750 | 1,092,170 |
| REMIC, Series 2023-51 | | |
| (zero coupon), due 11/25/53 | 1,435,396 | 1,127,756 |
| REMIC, Series 2022-10, Class SA | | |
| 0.42% (SOFR 30A + 5.75%), due 2/25/52 (b)(i) | 2,256,208 | 235,185 |
| REMIC, Series 2021-40, Class SI | | |
| 0.506% (SOFR 30A + 5.836%), due 9/25/47 (b)(i) | 2,682,913 | 221,998 |
| REMIC, Series 2016-57, Class SN | | |
| 0.605% (SOFR 30A + 5.936%), due 6/25/46 (b)(i) | 2,032,312 | 176,616 |
| REMIC, Series 2019-32, Class SB | | |
| 0.605% (SOFR 30A + 5.936%), due 6/25/49 (b)(i) | 1,581,876 | 126,865 |
| REMIC, Series 2020-23, Class PS | | |
| 0.605% (SOFR 30A + 5.936%), due 2/25/50 (b)(i) | 2,532,136 | 222,134 |
| REMIC, Series 2016-19, Class SD | | |
| 0.655% (SOFR 30A + 5.986%), due 4/25/46 (b)(i) | 4,391,049 | 285,201 |
| REMIC, Series 2021-10, Class LI | | |
| 2.50%, due 3/25/51 (i) | 1,527,076 | 211,010 |
| REMIC, Series 2021-12, Class JI | | |
| 2.50%, due 3/25/51 (i) | 1,826,377 | 281,260 |
| REMIC, Series 2021-95, Class KI | | |
| 2.50%, due 4/25/51 (i) | 5,324,016 | 719,931 |
| REMIC, Series 2021-54, Class HI | | |
| 2.50%, due 6/25/51 (i) | 702,872 | 87,898 |
The notes to the financial statements are an integral part of, and should be read in conjunction with, the financial statements.
| 16 | MainStay MacKay Strategic Bond Fund |
| | Principal
Amount | Value |
| Mortgage-Backed Securities (continued) |
| Agency (Collateralized Mortgage Obligations) (continued) |
| FNMA (continued) | |
| REMIC, Series 2021-85, Class BI | | |
| 3.00%, due 12/25/51 (i) | $ 3,781,968 | $ 636,821 |
| REMIC, Series 2021-8, Class ID | | |
| 3.50%, due 3/25/51 (i) | 2,367,135 | 513,466 |
| REMIC, Series 2020-10, Class DA | | |
| 3.50%, due 3/25/60 | 1,457,947 | 1,229,816 |
| FNMA, Strips | |
| REMIC, Series 426, Class C32 | | |
| 1.50%, due 2/25/52 (i) | 6,702,447 | 638,194 |
| GNMA | |
| Series 2019-136, Class YS | | |
| (zero coupon) (1 Month SOFR + 2.716%), due 11/20/49 (b)(i) | 613,018 | 4,267 |
| Series 2020-1, Class YS | | |
| (zero coupon) (1 Month SOFR + 2.716%), due 1/20/50 (b)(i) | 3,519,696 | 24,719 |
| Series 2020-129, Class SB | | |
| (zero coupon) (1 Month SOFR + 3.086%), due 9/20/50 (b)(i) | 4,857,034 | 40,528 |
| Series 2021-16, Class AS | | |
| (zero coupon) (1 Month SOFR + 2.636%), due 1/20/51 (b)(i) | 7,330,214 | 36,577 |
| Series 2021-29, Class AS | | |
| (zero coupon) (SOFR 30A + 2.70%), due 2/20/51 (b)(i) | 7,135,148 | 54,234 |
| Series 2021-46, Class BS | | |
| (zero coupon) (1 Month SOFR + 2.686%), due 3/20/51 (b)(i) | 6,802,913 | 31,421 |
| Series 2021-64, Class GS | | |
| (zero coupon) (SOFR 30A + 1.65%), due 4/20/51 (b)(i) | 1,126,060 | 1,071 |
| Series 2021-64, Class SG | | |
| (zero coupon) (SOFR 30A + 1.60%), due 4/20/51 (b)(i) | 2,516,654 | 2,039 |
| Series 2021-97, Class SD | | |
| (zero coupon) (SOFR 30A + 2.60%), due 6/20/51 (b)(i) | 11,046,859 | 56,255 |
| Series 2021-158, Class SB | | |
| (zero coupon) (SOFR 30A + 3.70%), due 9/20/51 (b)(i) | 3,799,677 | 83,801 |
| Series 2021-205, Class DS | | |
| (zero coupon) (SOFR 30A + 3.20%), due 11/20/51 (b)(i) | 8,748,966 | 109,873 |
| Series 2021-213, Class ES | | |
| (zero coupon) (SOFR 30A + 1.70%), due 12/20/51 (b)(i) | 11,683,365 | 17,490 |
| | Principal
Amount | Value |
| |
| Agency (Collateralized Mortgage Obligations) (continued) |
| GNMA (continued) | |
| Series 2021-226, Class SA | | |
| (zero coupon) (SOFR 30A + 1.70%), due 12/20/51 (b)(i) | $ 5,023,413 | $ 6,206 |
| Series 2022-19, Class SG | | |
| (zero coupon) (SOFR 30A + 2.45%), due 1/20/52 (b)(i) | 6,667,751 | 26,702 |
| Series 2022-24, Class SC | | |
| (zero coupon) (SOFR 30A + 2.37%), due 2/20/52 (b)(i) | 45,257,768 | 208,589 |
| Series 2022-78, Class S | | |
| (zero coupon) (SOFR 30A + 3.70%), due 4/20/52 (b)(i) | 3,687,198 | 39,172 |
| Series 2022-87, Class SA | | |
| (zero coupon) (SOFR 30A + 3.30%), due 5/20/52 (b)(i) | 7,768,363 | 68,257 |
| Series 2022-101, Class SB | | |
| (zero coupon) (SOFR 30A + 3.30%), due 6/20/52 (b)(i) | 3,890,584 | 32,821 |
| Series 2022-107, Class SA | | |
| (zero coupon) (SOFR 30A + 3.47%), due 6/20/52 (b)(i) | 19,611,702 | 204,260 |
| Series 2022-121, Class SG | | |
| (zero coupon) (SOFR 30A + 3.97%), due 7/20/52 (b)(i) | 8,693,681 | 113,766 |
| Series 2023-66, Class OQ | | |
| (zero coupon), due 7/20/52 | 1,840,274 | 1,390,518 |
| Series 2023-53 | | |
| (zero coupon), due 4/20/53 | 839,428 | 667,886 |
| Series 2023-80, Class SA | | |
| (zero coupon) (SOFR 30A + 5.25%), due 6/20/53 (b)(i) | 8,793,729 | 250,689 |
| Series 2023-101, Class EO | | |
| (zero coupon), due 7/20/53 | 1,212,741 | 1,003,073 |
| Series 2023-60, Class ES | | |
| 0.539% (SOFR 30A + 11.20%), due 4/20/53 (b) | 1,959,746 | 1,677,993 |
| Series 2020-34, Class SC | | |
| 0.62% (1 Month SOFR + 5.936%), due 3/20/50 (b)(i) | 2,080,957 | 209,583 |
| Series 2020-96, Class CS | | |
| 0.67% (1 Month SOFR + 5.986%), due 8/20/49 (b)(i) | 7,060,635 | 629,502 |
| Series 2020-146, Class SA | | |
| 0.87% (1 Month SOFR + 6.186%), due 10/20/50 (b)(i) | 2,544,075 | 293,560 |
The notes to the financial statements are an integral part of, and should be read in conjunction with, the financial statements.
17
Portfolio of Investments April 30, 2024†^(Unaudited) (continued)
| | Principal
Amount | Value |
| Mortgage-Backed Securities (continued) |
| Agency (Collateralized Mortgage Obligations) (continued) |
| GNMA (continued) | |
| Series 2020-167, Class SN | | |
| 0.87% (1 Month SOFR + 6.186%), due 11/20/50 (b)(i) | $ 1,354,058 | $ 145,486 |
| Series 2021-179, Class SA | | |
| 0.87% (1 Month SOFR + 6.186%), due 11/20/50 (b)(i) | 3,962,543 | 423,056 |
| Series 2020-189, Class NS | | |
| 0.87% (1 Month SOFR + 6.186%), due 12/20/50 (b)(i) | 4,260,720 | 493,500 |
| Series 2020-189, Class SU | | |
| 0.87% (1 Month SOFR + 6.186%), due 12/20/50 (b)(i) | 843,090 | 93,347 |
| Series 2021-46, Class TS | | |
| 0.87% (1 Month SOFR + 6.186%), due 3/20/51 (b)(i) | 1,932,481 | 210,201 |
| Series 2021-57, Class SA | | |
| 0.87% (1 Month SOFR + 6.186%), due 3/20/51 (b)(i) | 6,497,055 | 662,494 |
| Series 2021-57, Class SD | | |
| 0.87% (1 Month SOFR + 6.186%), due 3/20/51 (b)(i) | 11,059,439 | 1,142,958 |
| Series 2021-96, Class NS | | |
| 0.87% (1 Month SOFR + 6.186%), due 6/20/51 (b)(i) | 5,742,061 | 612,357 |
| Series 2021-96, Class SN | | |
| 0.87% (1 Month SOFR + 6.186%), due 6/20/51 (b)(i) | 3,430,790 | 342,063 |
| Series 2021-122, Class HS | | |
| 0.87% (1 Month SOFR + 6.186%), due 7/20/51 (b)(i) | 3,260,827 | 369,813 |
| Series 2022-137, Class S | | |
| 0.87% (1 Month SOFR + 6.186%), due 7/20/51 (b)(i) | 3,430,977 | 395,861 |
| Series 2021-135, Class GS | | |
| 0.87% (1 Month SOFR + 6.186%), due 8/20/51 (b)(i) | 6,650,456 | 687,514 |
| Series 2021-96, Class JS | | |
| 0.92% (1 Month SOFR + 6.236%), due 6/20/51 (b)(i) | 3,287,698 | 304,198 |
| Series 2020-166, Class CA | | |
| 1.00%, due 11/20/50 | 2,483,634 | 1,750,975 |
| Series 2023-86, Class SE | | |
| 1.32% (SOFR 30A + 6.65%), due 9/20/50 (b)(i) | 2,539,117 | 293,904 |
| | Principal
Amount | Value |
| |
| Agency (Collateralized Mortgage Obligations) (continued) |
| GNMA (continued) | |
| Series 2023-66, Class MP | | |
| 1.639% (SOFR 30A + 12.30%), due 5/20/53 (b) | $ 2,068,903 | $ 1,862,900 |
| Series 2020-146, Class LI | | |
| 2.00%, due 10/20/50 (i) | 6,574,441 | 697,574 |
| Series 2020-166, Class IC | | |
| 2.00%, due 11/20/50 (i) | 1,354,709 | 131,798 |
| Series 2020-176, Class AI | | |
| 2.00%, due 11/20/50 (i) | 7,917,715 | 750,551 |
| Series 2020-185, Class BI | | |
| 2.00%, due 12/20/50 (i) | 2,054,624 | 218,551 |
| Series 2020-188 | | |
| 2.00%, due 12/20/50 (i) | 3,129,910 | 340,813 |
| Series 2021-30, Class HI | | |
| 2.00%, due 2/20/51 (i) | 6,021,927 | 598,065 |
| Series 2021-57, Class AI | | |
| 2.00%, due 2/20/51 (i) | 4,171,435 | 402,998 |
| Series 2021-49, Class YI | | |
| 2.00%, due 3/20/51 (i) | 575,191 | 59,129 |
| Series 2021-205, Class GA | | |
| 2.00%, due 11/20/51 | 512,449 | 404,152 |
| Series 2021-97, Class IN | | |
| 2.50%, due 8/20/49 (i) | 7,788,602 | 759,414 |
| Series 2019-159, Class P | | |
| 2.50%, due 9/20/49 | 1,045,708 | 874,006 |
| Series 2022-1, Class IA | | |
| 2.50%, due 6/20/50 (i) | 730,149 | 95,248 |
| Series 2020-122, Class IW | | |
| 2.50%, due 7/20/50 (i) | 2,510,107 | 316,636 |
| Series 2020-151, Class TI | | |
| 2.50%, due 10/20/50 (i) | 2,365,271 | 328,810 |
| Series 2021-56, Class FE | | |
| 2.50% (SOFR 30A + 0.20%), due 10/20/50 (b)(i) | 4,042,307 | 475,585 |
| Series 2021-1, Class PI | | |
| 2.50%, due 12/20/50 (i) | 1,255,612 | 155,498 |
| Series 2021-137, Class HI | | |
| 2.50%, due 8/20/51 (i) | 2,905,868 | 386,451 |
| Series 2021-149, Class CI | | |
| 2.50%, due 8/20/51 (i) | 3,642,653 | 509,204 |
| Series 2021-188 | | |
| 2.50%, due 10/20/51 (i) | 4,857,284 | 773,893 |
| Series 2022-83 | | |
| 2.50%, due 11/20/51 (i) | 3,230,842 | 442,585 |
| Series 2021-1, Class IT | | |
| 3.00%, due 1/20/51 (i) | 4,002,062 | 654,164 |
The notes to the financial statements are an integral part of, and should be read in conjunction with, the financial statements.
| 18 | MainStay MacKay Strategic Bond Fund |
| | Principal
Amount | Value |
| Mortgage-Backed Securities (continued) |
| Agency (Collateralized Mortgage Obligations) (continued) |
| GNMA (continued) | |
| Series 2021-67, Class PI | | |
| 3.00%, due 4/20/51 (i) | $ 2,462,213 | $ 390,229 |
| Series 2021-74, Class HI | | |
| 3.00%, due 4/20/51 (i) | 498,917 | 77,915 |
| Series 2021-97, Class FA | | |
| 3.00% (SOFR 30A + 0.40%), due 6/20/51 (b) | 1,158,604 | 956,443 |
| Series 2021-98, Class IN | | |
| 3.00%, due 6/20/51 (i) | 1,595,626 | 273,096 |
| Series 2022-207 | | |
| 3.00%, due 8/20/51 (i) | 2,972,466 | 478,894 |
| Series 2021-158, Class NI | | |
| 3.00%, due 9/20/51 (i) | 4,448,273 | 651,392 |
| Series 2021-177, Class IM | | |
| 3.00%, due 10/20/51 (i) | 2,850,068 | 442,674 |
| Series 2023-19, Class CI | | |
| 3.00%, due 11/20/51 (i) | 3,588,240 | 562,914 |
| Series 2020-1, Class YF | | |
| 3.50% (1 Month SOFR + 0.784%), due 1/20/50 (b) | 1,277,406 | 1,079,348 |
| Series 2023-63, Class MA | | |
| 3.50%, due 5/20/50 | 1,492,701 | 1,320,262 |
| Series 2021-146, Class IN | | |
| 3.50%, due 8/20/51 (i) | 5,112,153 | 910,152 |
| | | 59,192,100 |
| Commercial Mortgage Loans (Collateralized Mortgage Obligations) 13.7% |
| BAMLL Commercial Mortgage Securities Trust (a)(b) | |
| Series 2022-DKLX, Class E | | |
| 9.448% (1 Month SOFR + 4.127%), due 1/15/39 | 1,095,000 | 1,068,144 |
| Series 2022-DKLX, Class F | | |
| 10.278% (1 Month SOFR + 4.957%), due 1/15/39 | 1,650,000 | 1,599,586 |
| BANK | |
| Series 2019-BN22, Class D | | |
| 2.50%, due 11/15/62 (a) | 2,100,000 | 1,421,013 |
| Series 2020-BN25, Class D | | |
| 2.50%, due 1/15/63 (a) | 2,620,000 | 1,751,160 |
| Series 2017-BNK4, Class C | | |
| 4.372%, due 5/15/50 (f) | 2,045,000 | 1,721,248 |
| Bayview Commercial Asset Trust (a)(b) | |
| Series 2005-3A, Class A1 | | |
| 5.751% (1 Month SOFR + 0.594%), due 11/25/35 | 583,845 | 551,287 |
| | Principal
Amount | Value |
| |
| Commercial Mortgage Loans (Collateralized Mortgage Obligations) (continued) |
| Bayview Commercial Asset Trust (a)(b) (continued) | |
| Series 2006-4A, Class A1 | | |
| 5.776% (1 Month SOFR + 0.459%), due 12/25/36 | $ 7,335 | $ 6,974 |
| Series 2007-2A, Class M1 | | |
| 5.986% (1 Month SOFR + 0.669%), due 7/25/37 | 909,905 | 811,060 |
| Series 2007-4A, Class A1 | | |
| 6.106% (1 Month SOFR + 0.789%), due 9/25/37 | 802,829 | 748,069 |
| BBCMS Mortgage Trust (a)(b) | |
| Series 2018-TALL, Class A | | |
| 6.24% (1 Month SOFR + 0.919%), due 3/15/37 | 1,505,000 | 1,429,750 |
| Series 2018-TALL, Class B | | |
| 6.489% (1 Month SOFR + 1.168%), due 3/15/37 | 670,000 | 618,075 |
| Series 2018-TALL, Class C | | |
| 6.639% (1 Month SOFR + 1.318%), due 3/15/37 | 3,180,000 | 2,862,001 |
| Series 2018-TALL, Class D | | |
| 6.967% (1 Month SOFR + 1.646%), due 3/15/37 | 1,715,000 | 1,474,900 |
| Benchmark Mortgage Trust (j) | |
| Series 2019-B14, Class C | | |
| 3.898%, due 12/15/62 | 915,000 | 660,591 |
| Series 2018-B3, Class C | | |
| 4.672%, due 4/10/51 | 1,345,000 | 1,069,124 |
| BPR Trust (a)(b) | |
| Series 2021-TY, Class D | | |
| 7.785% (1 Month SOFR + 2.464%), due 9/15/38 | 900,000 | 887,260 |
| Series 2021-TY, Class E | | |
| 9.035% (1 Month SOFR + 3.714%), due 9/15/38 | 1,470,000 | 1,451,625 |
| BX Commercial Mortgage Trust (a)(j) | |
| Series 2020-VIV3, Class B | | |
| 3.662%, due 3/9/44 | 1,270,000 | 1,088,524 |
| Series 2020-VIVA, Class D | | |
| 3.667%, due 3/11/44 | 960,000 | 800,475 |
| BX Trust (a) | |
| Series 2019-OC11, Class E | | |
| 4.075%, due 12/9/41 (j) | 2,240,000 | 1,876,537 |
| Series 2021-ARIA, Class E | | |
| 7.68% (1 Month SOFR + 2.359%), due 10/15/36 (b) | 3,240,000 | 3,167,100 |
The notes to the financial statements are an integral part of, and should be read in conjunction with, the financial statements.
19
Portfolio of Investments April 30, 2024†^(Unaudited) (continued)
| | Principal
Amount | Value |
| Mortgage-Backed Securities (continued) |
| Commercial Mortgage Loans (Collateralized Mortgage Obligations) (continued) |
| BX Trust (a) (continued) | |
| Series 2024-BIO, Class C | | |
| 7.961% (1 Month SOFR + 2.64%), due 2/15/41 (b) | $ 825,000 | $ 821,906 |
| BXHPP Trust | |
| Series 2021-FILM, Class C | | |
| 6.535% (1 Month SOFR + 1.214%), due 8/15/36 (a)(b) | 1,725,000 | 1,603,711 |
| BXSC Commercial Mortgage Trust | |
| Series 2022-WSS, Class D | | |
| 8.509% (1 Month SOFR + 3.188%), due 3/15/35 (a)(b) | 1,570,000 | 1,548,412 |
| CD Mortgage Trust | |
| Series 2017-CD4, Class D | | |
| 3.30%, due 5/10/50 (a) | 2,590,000 | 2,013,866 |
| CFCRE Commercial Mortgage Trust | |
| Series 2011-C2, Class E | | |
| 5.08%, due 12/15/47 (a)(j) | 765,000 | 661,624 |
| Citigroup Commercial Mortgage Trust (f) | |
| Series 2015-GC35, Class AS | | |
| 4.072%, due 11/10/48 | 1,165,000 | 1,072,451 |
| Series 2014-GC25, Class B | | |
| 4.345%, due 10/10/47 | 1,565,000 | 1,519,104 |
| Commercial Mortgage Trust | |
| Series 2012-CR4, Class AM | | |
| 3.251%, due 10/15/45 | 1,505,000 | 1,304,652 |
| Series 2016-DC2, Class D | | |
| 4.062%, due 2/10/49 (a)(j) | 1,485,000 | 1,253,932 |
| Series 2014-CR15, Class D | | |
| 4.085%, due 2/10/47 (a)(j) | 2,020,000 | 1,814,507 |
| Series 2015-CR22, Class C | | |
| 4.201%, due 3/10/48 (j) | 1,450,000 | 1,319,477 |
| Series 2013-CR7, Class E | | |
| 4.384%, due 3/10/46 (a)(j) | 1,750,000 | 1,501,250 |
| CSAIL Commercial Mortgage Trust | |
| Series 2016-C6, Class D | | |
| 5.082%, due 1/15/49 (a)(j) | 1,535,000 | 1,126,212 |
| CSMC WEST Trust | |
| Series 2020-WEST, Class A | | |
| 3.04%, due 2/15/35 (a) | 1,925,000 | 1,420,608 |
| DROP Mortgage Trust | |
| Series 2021-FILE, Class A | | |
| 6.585% (1 Month SOFR + 1.264%), due 10/15/43 (a)(b) | 2,140,000 | 2,043,700 |
| | Principal
Amount | Value |
| |
| Commercial Mortgage Loans (Collateralized Mortgage Obligations) (continued) |
| FS Commercial Mortgage Trust | |
| Series 2023-4SZN, Class D | | |
| 9.383%, due 11/10/39 (a)(f) | $ 2,525,000 | $ 2,590,876 |
| GNMA (i) | |
| Series 2020-177 | | |
| 0.819%, due 6/16/62 (j) | 5,288,623 | 318,029 |
| Series 2023-194, Class CI | | |
| 0.877%, due 10/16/65 (j) | 7,092,757 | 488,636 |
| Series 2021-164 | | |
| 0.949%, due 10/16/63 (j) | 5,979,950 | 428,243 |
| Series 2023-159, Class CI | | |
| 0.956%, due 7/16/65 (f) | 9,168,634 | 678,311 |
| Series 2020-168, Class IA | | |
| 0.978%, due 12/16/62 (j) | 4,639,765 | 328,067 |
| Series 2021-47 | | |
| 0.992%, due 3/16/61 (j) | 10,457,070 | 731,306 |
| Series 2022-185, Class DI | | |
| 1.023%, due 10/16/65 (j) | 3,997,629 | 298,755 |
| Series 2023-172 | | |
| 1.386%, due 2/16/66 (j) | 6,356,176 | 633,697 |
| Great Wolf Trust | |
| Series 2024-WOLF, Class E | | |
| 8.96% (1 Month SOFR + 3.639%), due 3/15/39 (a)(b) | 2,245,000 | 2,242,194 |
| GS Mortgage Securities Trust | |
| Series 2010-C1, Class D | | |
| 6.572%, due 8/10/43 (a)(j) | 1,695,000 | 1,464,367 |
| Hudson Yards Mortgage Trust (a) | |
| Series 2019-30HY, Class A | | |
| 3.228%, due 7/10/39 | 1,030,000 | 898,457 |
| Series 2019-30HY, Class D | | |
| 3.558%, due 7/10/39 (j) | 1,540,000 | 1,254,246 |
| J.P. Morgan Chase Commercial Mortgage Securities Trust (a) | |
| Series 2021-1MEM, Class C | | |
| 2.742%, due 10/9/42 (j) | 1,390,000 | 936,288 |
| Series 2013-C13, Class E | | |
| 3.986%, due 1/15/46 (f) | 1,065,000 | 937,200 |
| Series 2022-DATA, Class C | | |
| 4.046%, due 6/10/42 (j) | 1,325,000 | 1,101,796 |
| Series 2012-C6, Class E | | |
| 5.129%, due 5/15/45 (j) | 1,775,000 | 1,617,361 |
| JPMCC Commercial Mortgage Securities Trust | |
| Series 2019-COR5, Class D | | |
| 3.00%, due 6/13/52 (a) | 520,000 | 361,421 |
| JPMDB Commercial Mortgage Securities Trust | |
| Series 2017-C7, Class D | | |
| 3.00%, due 10/15/50 (a) | 1,575,000 | 1,138,812 |
The notes to the financial statements are an integral part of, and should be read in conjunction with, the financial statements.
| 20 | MainStay MacKay Strategic Bond Fund |
| | Principal
Amount | Value |
| Mortgage-Backed Securities (continued) |
| Commercial Mortgage Loans (Collateralized Mortgage Obligations) (continued) |
| Life Mortgage Trust | |
| Series 2022-BMR2, Class D | | |
| 7.863% (1 Month SOFR + 2.542%), due 5/15/39 (a)(b) | $ 700,000 | $ 667,188 |
| Multifamily Connecticut Avenue Securities Trust (a)(b) | |
| Series 2019-01, Class M10 | | |
| 8.695% (SOFR 30A + 3.364%), due 10/25/49 | 2,701,861 | 2,658,073 |
| Series 2020-01, Class M10 | | |
| 9.195% (SOFR 30A + 3.864%), due 3/25/50 | 3,478,758 | 3,426,596 |
| Series 2019-01, Class B10 | | |
| 10.945% (SOFR 30A + 5.614%), due 10/25/49 | 2,680,000 | 2,633,177 |
| Series 2023-01, Class M10 | | |
| 11.83% (SOFR 30A + 6.50%), due 11/25/53 | 3,235,000 | 3,378,027 |
| Series 2020-01, Class CE | | |
| 12.944% (SOFR 30A + 7.614%), due 3/25/50 | 2,090,000 | 2,061,299 |
| Series 2019-01, Class CE | | |
| 14.195% (SOFR 30A + 8.864%), due 10/25/49 | 1,500,000 | 1,461,122 |
| One Bryant Park Trust | |
| Series 2019-OBP, Class A | | |
| 2.516%, due 9/15/54 (a) | 705,000 | 585,013 |
| One Market Plaza Trust | |
| Series 2017-1MKT, Class C | | |
| 4.016%, due 2/10/32 (a) | 755,000 | 657,001 |
| ORL Trust (a)(b) | |
| Series 2023-GLKS, Class C | | |
| 8.972% (1 Month SOFR + 3.651%), due 10/19/36 | 790,000 | 791,481 |
| Series 2023-GLKS, Class D | | |
| 9.622% (1 Month SOFR + 4.301%), due 10/19/36 | 1,130,000 | 1,132,472 |
| SLG Office Trust (a) | |
| Series 2021-OVA, Class A | | |
| 2.585%, due 7/15/41 | 1,595,000 | 1,273,926 |
| Series 2021-OVA, Class F | | |
| 2.851%, due 7/15/41 | 1,010,000 | 695,721 |
| UBS Commercial Mortgage Trust | |
| Series 2018-C9, Class C | | |
| 5.112%, due 3/15/51 (j) | 1,215,000 | 895,096 |
| | Principal
Amount | Value |
| |
| Commercial Mortgage Loans (Collateralized Mortgage Obligations) (continued) |
| UBS-Barclays Commercial Mortgage Trust | |
| Series 2013-C5, Class B | | |
| 3.649%, due 3/10/46 (a)(f) | $ 2,041,565 | $ 1,868,075 |
| Wells Fargo Commercial Mortgage Trust | |
| Series 2016-NXS5, Class D | | |
| 5.142%, due 1/15/59 (j) | 1,355,000 | 1,035,694 |
| WFRBS Commercial Mortgage Trust | |
| Series 2013-C11, Class D | | |
| 4.196%, due 3/15/45 (a)(j) | 1,200,000 | 980,173 |
| | | 92,738,111 |
| Whole Loan (Collateralized Mortgage Obligations) 18.8% |
| American Home Mortgage Investment Trust | |
| Series 2005-4, Class 3A1 | | |
| 6.031% (1 Month SOFR + 0.714%), due 11/25/45 (b) | 1,137,841 | 776,285 |
| CIM Trust | |
| Series 2021-J2, Class AS | | |
| 0.21%, due 4/25/51 (a)(f)(i) | 46,076,757 | 506,434 |
| Connecticut Avenue Securities Trust (a)(b) | |
| Series 2024-R02, Class 1B1 | | |
| 7.83% (SOFR 30A + 2.50%), due 2/25/44 | 600,000 | 604,625 |
| Series 2024-R01, Class 1B1 | | |
| 8.03% (SOFR 30A + 2.70%), due 1/25/44 | 3,370,000 | 3,395,970 |
| Series 2024-R02, Class 1B2 | | |
| 9.03% (SOFR 30A + 3.70%), due 2/25/44 | 1,080,000 | 1,084,398 |
| Series 2020-SBT1, Class 1M2 | | |
| 9.095% (SOFR 30A + 3.764%), due 2/25/40 | 1,010,000 | 1,075,094 |
| Series 2024-R01, Class 1B2 | | |
| 9.33% (SOFR 30A + 4.00%), due 1/25/44 | 887,000 | 898,915 |
| Series 2019-R03, Class 1B1 | | |
| 9.545% (SOFR 30A + 4.214%), due 9/25/31 | 1,195,137 | 1,278,295 |
| Series 2021-R03, Class 1B2 | | |
| 10.83% (SOFR 30A + 5.50%), due 12/25/41 | 3,055,000 | 3,190,021 |
| Series 2021-R01, Class 1B2 | | |
| 11.33% (SOFR 30A + 6.00%), due 10/25/41 | 3,210,000 | 3,367,688 |
| Series 2022-R01, Class 1B2 | | |
| 11.33% (SOFR 30A + 6.00%), due 12/25/41 | 3,100,000 | 3,258,257 |
The notes to the financial statements are an integral part of, and should be read in conjunction with, the financial statements.
21
Portfolio of Investments April 30, 2024†^(Unaudited) (continued)
| | Principal
Amount | Value |
| Mortgage-Backed Securities (continued) |
| Whole Loan (Collateralized Mortgage Obligations) (continued) |
| Connecticut Avenue Securities Trust (a)(b) (continued) | |
| Series 2020-SBT1, Class 1B1 | | |
| 12.194% (SOFR 30A + 6.864%), due 2/25/40 | $ 2,300,000 | $ 2,468,932 |
| Series 2022-R05, Class 2B2 | | |
| 12.33% (SOFR 30A + 7.00%), due 4/25/42 | 2,670,000 | 2,905,641 |
| Series 2022-R02, Class 2B2 | | |
| 12.98% (SOFR 30A + 7.65%), due 1/25/42 | 1,100,000 | 1,192,466 |
| Series 2019-HRP1, Class B1 | | |
| 14.695% (SOFR 30A + 9.364%), due 11/25/39 | 3,225,000 | 3,574,167 |
| Series 2022-R04, Class 1B2 | | |
| 14.83% (SOFR 30A + 9.50%), due 3/25/42 | 2,980,000 | 3,379,935 |
| Series 2022-R03, Class 1B2 | | |
| 15.18% (SOFR 30A + 9.85%), due 3/25/42 | 665,000 | 760,934 |
| CSMC Trust (a)(f) | |
| Series 2021-NQM5, Class A1 | | |
| 0.938%, due 5/25/66 | 845,652 | 664,470 |
| Series 2021-NQM2, Class A1 | | |
| 1.179%, due 2/25/66 | 1,376,320 | 1,175,728 |
| FHLMC STACR REMIC Trust (a)(b) | |
| Series 2021-DNA1, Class B1 | | |
| 7.98% (SOFR 30A + 2.65%), due 1/25/51 | 2,760,000 | 2,927,717 |
| Series 2021-HQA1, Class B1 | | |
| 8.33% (SOFR 30A + 3.00%), due 8/25/33 | 4,061,290 | 4,374,781 |
| Series 2020-DNA6, Class B1 | | |
| 8.33% (SOFR 30A + 3.00%), due 12/25/50 | 1,805,000 | 1,943,533 |
| Series 2021-DNA5, Class B1 | | |
| 8.38% (SOFR 30A + 3.05%), due 1/25/34 | 470,000 | 496,879 |
| Series 2021-HQA2, Class B1 | | |
| 8.48% (SOFR 30A + 3.15%), due 12/25/33 | 2,955,000 | 3,216,340 |
| Series 2021-DNA2, Class B1 | | |
| 8.73% (SOFR 30A + 3.40%), due 8/25/33 | 1,565,000 | 1,718,073 |
| Series 2021-DNA3, Class B1 | | |
| 8.83% (SOFR 30A + 3.50%), due 10/25/33 | 2,860,000 | 3,169,252 |
| | Principal
Amount | Value |
| |
| Whole Loan (Collateralized Mortgage Obligations) (continued) |
| FHLMC STACR REMIC Trust (a)(b) (continued) | |
| Series 2021-HQA4, Class B1 | | |
| 9.08% (SOFR 30A + 3.75%), due 12/25/41 | $ 1,415,000 | $ 1,459,359 |
| Series 2020-HQA5, Class B1 | | |
| 9.33% (SOFR 30A + 4.00%), due 11/25/50 | 1,455,000 | 1,640,879 |
| Series 2021-DNA1, Class B2 | | |
| 10.08% (SOFR 30A + 4.75%), due 1/25/51 | 3,355,000 | 3,555,634 |
| Series 2020-DNA2, Class B2 | | |
| 10.244% (SOFR 30A + 4.914%), due 2/25/50 | 2,670,000 | 2,852,732 |
| Series 2021-HQA1, Class B2 | | |
| 10.33% (SOFR 30A + 5.00%), due 8/25/33 | 3,278,300 | 3,507,495 |
| Series 2020-HQA1, Class B2 | | |
| 10.545% (SOFR 30A + 5.214%), due 1/25/50 | 2,940,000 | 3,127,097 |
| Series 2022-HQA1, Class M2 | | |
| 10.58% (SOFR 30A + 5.25%), due 3/25/42 | 1,825,000 | 1,974,431 |
| Series 2022-HQA3, Class M2 | | |
| 10.68% (SOFR 30A + 5.35%), due 8/25/42 | 2,340,000 | 2,550,600 |
| Series 2020-DNA1, Class B2 | | |
| 10.694% (SOFR 30A + 5.364%), due 1/25/50 | 750,000 | 813,296 |
| Series 2021-HQA2, Class B2 | | |
| 10.78% (SOFR 30A + 5.45%), due 12/25/33 | 3,605,000 | 3,948,698 |
| Series 2021-DNA5, Class B2 | | |
| 10.83% (SOFR 30A + 5.50%), due 1/25/34 | 3,130,000 | 3,446,832 |
| Series 2021-DNA2, Class B2 | | |
| 11.33% (SOFR 30A + 6.00%), due 8/25/33 | 2,825,000 | 3,247,880 |
| Series 2022-HQA2, Class M2 | | |
| 11.33% (SOFR 30A + 6.00%), due 7/25/42 | 3,645,000 | 4,037,967 |
| Series 2021-DNA3, Class B2 | | |
| 11.58% (SOFR 30A + 6.25%), due 10/25/33 | 2,810,000 | 3,277,376 |
| Series 2021-HQA3, Class B2 | | |
| 11.58% (SOFR 30A + 6.25%), due 9/25/41 | 1,810,000 | 1,893,176 |
The notes to the financial statements are an integral part of, and should be read in conjunction with, the financial statements.
| 22 | MainStay MacKay Strategic Bond Fund |
| | Principal
Amount | Value |
| Mortgage-Backed Securities (continued) |
| Whole Loan (Collateralized Mortgage Obligations) (continued) |
| FHLMC STACR REMIC Trust (a)(b) (continued) | |
| Series 2021-HQA4, Class B2 | | |
| 12.33% (SOFR 30A + 7.00%), due 12/25/41 | $ 2,825,000 | $ 2,985,558 |
| Series 2022-HQA1, Class B1 | | |
| 12.33% (SOFR 30A + 7.00%), due 3/25/42 | 721,000 | 798,962 |
| Series 2022-DNA1, Class B2 | | |
| 12.43% (SOFR 30A + 7.10%), due 1/25/42 | 1,870,000 | 1,991,348 |
| Series 2020-HQA5, Class B2 | | |
| 12.73% (SOFR 30A + 7.40%), due 11/25/50 | 1,150,000 | 1,374,597 |
| Series 2021-DNA7, Class B2 | | |
| 13.13% (SOFR 30A + 7.80%), due 11/25/41 | 3,660,000 | 3,973,551 |
| FHLMC STACR Trust (a)(b) | |
| Series 2019-HQA3, Class B2 | | |
| 12.944% (SOFR 30A + 7.614%), due 9/25/49 | 1,430,000 | 1,615,769 |
| Series 2018-HQA2, Class B2 | | |
| 16.445% (SOFR 30A + 11.114%), due 10/25/48 | 2,380,000 | 3,022,735 |
| FNMA | |
| Series 2018-C06, Class 2B1 | | |
| 9.545% (SOFR 30A + 4.214%), due 3/25/31 (b) | 2,385,000 | 2,622,021 |
| FNMA Connecticut Avenue Securities | |
| Series 2021-R02, Class 2B2 | | |
| 11.53% (SOFR 30A + 6.20%), due 11/25/41 (a)(b) | 3,890,000 | 4,089,364 |
| Galton Funding Mortgage Trust | |
| Series 2018-2, Class A51 | | |
| 4.50%, due 10/25/58 (a)(f) | 320,524 | 294,742 |
| GreenPoint Mortgage Funding Trust | |
| Series 2007-AR3, Class A1 | | |
| 5.871% (1 Month SOFR + 0.554%), due 6/25/37 (b) | 333,043 | 285,993 |
| MASTR Alternative Loan Trust | |
| Series 2005-6, Class 1A2 | | |
| 5.50%, due 12/25/35 | 1,121,157 | 717,874 |
| Onslow Bay Mortgage Loan Trust | |
| Series 2021-NQM4, Class A1 | | |
| 1.957%, due 10/25/61 (a)(f) | 3,319,084 | 2,694,249 |
| Sequoia Mortgage Trust (a) | |
| Series 2021-4, Class A1 | | |
| 0.167%, due 6/25/51 (i)(j) | 34,476,480 | 312,119 |
| | Principal
Amount | Value |
| |
| Whole Loan (Collateralized Mortgage Obligations) (continued) |
| Sequoia Mortgage Trust (a) (continued) | |
| Series 2018-7, Class B3 | | |
| 4.257%, due 9/25/48 (f) | $ 1,287,459 | $ 1,076,896 |
| STACR Trust | |
| Series 2018-HRP2, Class B1 | | |
| 9.645% (SOFR 30A + 4.314%), due 2/25/47 (a)(b) | 3,395,000 | 3,780,415 |
| Structured Asset Mortgage Investments II Trust | |
| Series 2005-AR8, Class A2 | | |
| 6.538% (12 Month Monthly Treasury Average Index + 1.48%), due 2/25/36 (b) | 362,159 | 297,885 |
| | | 126,672,360 |
Total Mortgage-Backed Securities
(Cost $279,328,031) | | 278,602,571 |
| Municipal Bond 0.3% |
| California 0.3% |
Regents of the University of California Medical Center, Pooled
Revenue Bonds | | |
| Series N | | |
| 3.006%, due 5/15/50 | 2,760,000 | 1,807,403 |
Total Municipal Bond
(Cost $2,760,000) | | 1,807,403 |
| U.S. Government & Federal Agencies 5.7% |
| United States Treasury Bonds 0.4% |
| U.S. Treasury Bonds | | |
| 4.50%, due 2/15/44 | 2,970,000 | 2,819,644 |
| United States Treasury Inflation - Indexed Notes 1.6% |
| U.S. Treasury Inflation Linked Notes | | |
| 1.375%, due 7/15/33 (k) | 11,142,620 | 10,344,265 |
| United States Treasury Notes 3.7% |
| U.S. Treasury Notes | | |
| 4.00%, due 2/15/34 | 685,000 | 648,609 |
The notes to the financial statements are an integral part of, and should be read in conjunction with, the financial statements.
23
Portfolio of Investments April 30, 2024†^(Unaudited) (continued)
| | Principal
Amount | | Value |
| U.S. Government & Federal Agencies (continued) |
| United States Treasury Notes (continued) |
| U.S. Treasury Notes (continued) | | | |
| 4.50%, due 4/15/27 | $ 2,000,000 | | $ 1,979,687 |
| 4.625%, due 4/30/31 | 22,495,000 | | 22,389,555 |
| | | | 25,017,851 |
Total U.S. Government & Federal Agencies
(Cost $38,698,078) | | | 38,181,760 |
Total Long-Term Bonds
(Cost $686,852,190) | | | 660,937,071 |
| |
| | Shares | | |
| |
| Common Stocks 0.0% ‡ |
| Commercial Services & Supplies 0.0% ‡ |
| Quad/Graphics, Inc. | 14 | | 63 |
| Tobacco 0.0% ‡ |
| Turning Point Brands, Inc. | 6,802 | | 196,169 |
Total Common Stocks
(Cost $0) | | | 196,232 |
| Short-Term Investments 1.8% |
| Affiliated Investment Company 1.4% |
| MainStay U.S. Government Liquidity Fund, 5.242% (l) | 9,421,487 | | 9,421,487 |
| Unaffiliated Investment Company 0.1% |
| Invesco Government & Agency Portfolio, 5.309% (l)(m) | 788,485 | | 788,485 |
| |
| | Principal
Amount | | |
| |
| U.S. Treasury Debt 0.3% |
| U.S. Treasury Bills | | | |
| 5.298%, due 6/27/24 (n) | $ 2,000,000 | | 1,983,304 |
Total Short-Term Investments
(Cost $12,193,339) | | | 12,193,276 |
Total Investments
(Cost $699,045,529) | 99.9% | | 673,326,579 |
| Other Assets, Less Liabilities | 0.1 | | 818,133 |
| Net Assets | 100.0% | | $ 674,144,712 |
| † | Percentages indicated are based on Fund net assets. |
| ^ | Industry classifications may be different than those used for compliance monitoring purposes. |
| ‡ | Less than one-tenth of a percent. |
| (a) | May be sold to institutional investors only under Rule 144A or securities offered pursuant to Section 4(a)(2) of the Securities Act of 1933, as amended. |
| (b) | Floating rate—Rate shown was the rate in effect as of April 30, 2024. |
| (c) | All or a portion of this security was held on loan. As of April 30, 2024, the aggregate market value of securities on loan was $757,987. The Fund received cash collateral with a value of $788,485. (See Note 2(J)) |
| (d) | Fixed to floating rate—Rate shown was the rate in effect as of April 30, 2024. |
| (e) | Security is perpetual and, thus, does not have a predetermined maturity date. The date shown, if applicable, reflects the next call date. |
| (f) | Coupon rate may change based on changes of the underlying collateral or prepayments of principal. Rate shown was the rate in effect as of April 30, 2024. |
| (g) | Illiquid security—As of April 30, 2024, the total market value deemed illiquid under procedures approved by the Board of Trustees was $658,750, which represented 0.1% of the Fund’s net assets. |
| (h) | Step coupon—Rate shown was the rate in effect as of April 30, 2024. |
| (i) | Collateralized Mortgage Obligation Interest Only Strip—Pays a fixed or variable rate of interest based on mortgage loans or mortgage pass-through securities. The principal amount of the underlying pool represents the notional amount on which the current interest was calculated. The value of these stripped securities may be particularly sensitive to changes in prevailing interest rates and are typically more sensitive to changes in prepayment rates than traditional mortgage-backed securities. |
| (j) | Collateral strip rate—A bond whose interest was based on the weighted net interest rate of the collateral. The coupon rate adjusts periodically based on a predetermined schedule. Rate shown was the rate in effect as of April 30, 2024. |
| (k) | Treasury Inflation Protected Security—Pays a fixed rate of interest on a principal amount that is continuously adjusted for inflation based on the Consumer Price Index-Urban Consumers. |
| (l) | Current yield as of April 30, 2024. |
| (m) | Represents a security purchased with cash collateral received for securities on loan. |
| (n) | Interest rate shown represents yield to maturity. |
The notes to the financial statements are an integral part of, and should be read in conjunction with, the financial statements.
| 24 | MainStay MacKay Strategic Bond Fund |
Investments in Affiliates (in 000's)
Investments in issuers considered to be affiliate(s) of the Fund during the six-month period ended April 30, 2024 for purposes of Section 2(a)(3) of the Investment Company Act of 1940, as amended, were as follows:
| Affiliated Investment Companies | Value,
Beginning
of Period | Purchases
at Cost | Proceeds
from
Sales | Net
Realized
Gain/(Loss)
on Sales | Change in
Unrealized
Appreciation/
(Depreciation) | Value,
End of
Period | Dividend
Income | Other
Distributions | Shares
End of
Period |
| MainStay U.S. Government Liquidity Fund | $ 6,231 | $ 110,019 | $ (106,829) | $ — | $ — | $ 9,421 | $ 161 | $ — | 9,421 |
Futures Contracts
As of April 30, 2024, the Fund held the following futures contracts1:
| Type | Number of
Contracts | Expiration
Date | Value at
Trade Date | Current
Notional
Amount | Unrealized
Appreciation
(Depreciation)2 |
| Long Contracts | | | | | |
| U.S. Treasury 2 Year Notes | 16 | June 2024 | $ 3,248,109 | $ 3,242,500 | $ (5,609) |
| U.S. Treasury 10 Year Notes | 4 | June 2024 | 433,822 | 429,750 | (4,072) |
| U.S. Treasury 10 Year Ultra Bonds | 873 | June 2024 | 99,471,346 | 96,220,969 | (3,250,377) |
| U.S. Treasury Long Bonds | 24 | June 2024 | 2,857,932 | 2,731,500 | (126,432) |
| U.S. Treasury Ultra Bonds | 44 | June 2024 | 5,623,866 | 5,260,750 | (363,116) |
| Total Long Contracts | | | | | (3,749,606) |
| Short Contracts | | | | | |
| U.S. Treasury 5 Year Notes | (90) | June 2024 | (9,626,156) | (9,426,797) | 199,359 |
| Net Unrealized Depreciation | | | | | $ (3,550,247) |
| 1. | As of April 30, 2024, cash in the amount of $2,732,900 was on deposit with a broker or futures commission merchant for futures transactions. |
| 2. | Represents the difference between the value of the contracts at the time they were opened and the value as of April 30, 2024. |
| Abbreviation(s): |
| FHLMC—Federal Home Loan Mortgage Corp. |
| FNMA—Federal National Mortgage Association |
| GNMA—Government National Mortgage Association |
| REMIC—Real Estate Mortgage Investment Conduit |
| SOFR—Secured Overnight Financing Rate |
| STACR—Structured Agency Credit Risk |
| USISDA—U.S. International Swaps and Derivatives Association |
The notes to the financial statements are an integral part of, and should be read in conjunction with, the financial statements.
25
Portfolio of Investments April 30, 2024†^(Unaudited) (continued)
The following is a summary of the fair valuations according to the inputs used as of April 30, 2024, for valuing the Fund’s assets and liabilities:
| Description | Quoted
Prices in
Active
Markets for
Identical
Assets
(Level 1) | | Significant
Other
Observable
Inputs
(Level 2) | | Significant
Unobservable
Inputs
(Level 3) | | Total |
| Asset Valuation Inputs | | | | | | | |
| Investments in Securities (a) | | | | | | | |
| Long-Term Bonds | | | | | | | |
| Asset-Backed Securities | $ — | | $ 87,632,287 | | $ — | | $ 87,632,287 |
| Corporate Bonds | — | | 232,745,202 | | — | | 232,745,202 |
| Foreign Government Bonds | — | | 18,229,695 | | — | | 18,229,695 |
| Loan Assignments | — | | 3,738,153 | | — | | 3,738,153 |
| Mortgage-Backed Securities | — | | 278,602,571 | | — | | 278,602,571 |
| Municipal Bond | — | | 1,807,403 | | — | | 1,807,403 |
| U.S. Government & Federal Agencies | — | | 38,181,760 | | — | | 38,181,760 |
| Total Long-Term Bonds | — | | 660,937,071 | | — | | 660,937,071 |
| Common Stocks | 196,232 | | — | | — | | 196,232 |
| Short-Term Investments | | | | | | | |
| Affiliated Investment Company | 9,421,487 | | — | | — | | 9,421,487 |
| Unaffiliated Investment Company | 788,485 | | — | | — | | 788,485 |
| U.S. Treasury Debt | — | | 1,983,304 | | — | | 1,983,304 |
| Total Short-Term Investments | 10,209,972 | | 1,983,304 | | — | | 12,193,276 |
| Total Investments in Securities | 10,406,204 | | 662,920,375 | | — | | 673,326,579 |
| Other Financial Instruments | | | | | | | |
| Futures Contracts (b) | 199,359 | | — | | — | | 199,359 |
| Total Investments in Securities and Other Financial Instruments | $ 10,605,563 | | $ 662,920,375 | | $ — | | $ 673,525,938 |
| Liability Valuation Inputs | | | | | | | |
| Other Financial Instruments | | | | | | | |
| Futures Contracts (b) | $ (3,749,606) | | $ — | | $ — | | $ (3,749,606) |
| (a) | For a complete listing of investments and their industries, see the Portfolio of Investments. |
| (b) | The value listed for these securities reflects unrealized appreciation (depreciation) as shown on the Portfolio of Investments. |
The notes to the financial statements are an integral part of, and should be read in conjunction with, the financial statements.
| 26 | MainStay MacKay Strategic Bond Fund |
Statement of Assets and Liabilities as of April 30, 2024 (Unaudited)
| Assets |
Investment in unaffiliated securities, at value
(identified cost $689,624,042) including securities on loan of $757,987 | $ 663,905,092 |
Investment in affiliated investment companies, at value
(identified cost $9,421,487) | 9,421,487 |
| Cash | 47,528 |
Cash denominated in foreign currencies
(identified cost $935) | 928 |
| Cash collateral on deposit at broker for futures contracts | 2,732,900 |
| Due from custodian | 545,886 |
| Receivables: | |
| Dividends and interest | 4,476,187 |
| Investment securities sold | 2,748,456 |
| Fund shares sold | 700,611 |
| Securities lending | 25 |
| Other assets | 92,101 |
| Total assets | 684,671,201 |
| Liabilities |
| Cash collateral received for securities on loan | 788,485 |
| Payables: | |
| Investment securities purchased | 7,016,878 |
| Fund shares redeemed | 1,480,109 |
| Variation margin on futures contracts | 309,055 |
| Manager (See Note 3) | 293,345 |
| Transfer agent (See Note 3) | 180,186 |
| NYLIFE Distributors (See Note 3) | 48,249 |
| Professional fees | 42,696 |
| Custodian | 33,261 |
| Trustees | 261 |
| Accrued expenses | 250 |
| Distributions payable | 333,714 |
| Total liabilities | 10,526,489 |
| Net assets | $ 674,144,712 |
| Composition of Net Assets |
| Shares of beneficial interest outstanding (par value of $.01 per share) unlimited number of shares authorized | $ 807,304 |
| Additional paid-in-capital | 902,396,330 |
| | 903,203,634 |
| Total distributable earnings (loss) | (229,058,922) |
| Net assets | $ 674,144,712 |
| Class A | |
| Net assets applicable to outstanding shares | $177,273,270 |
| Shares of beneficial interest outstanding | 21,248,289 |
| Net asset value per share outstanding | $ 8.34 |
| Maximum sales charge (4.50% of offering price) | 0.39 |
| Maximum offering price per share outstanding | $ 8.73 |
| Investor Class | |
| Net assets applicable to outstanding shares | $ 12,741,449 |
| Shares of beneficial interest outstanding | 1,512,389 |
| Net asset value per share outstanding | $ 8.42 |
| Maximum sales charge (4.00% of offering price) | 0.35 |
| Maximum offering price per share outstanding | $ 8.77 |
| Class C | |
| Net assets applicable to outstanding shares | $ 10,721,319 |
| Shares of beneficial interest outstanding | 1,292,950 |
| Net asset value and offering price per share outstanding | $ 8.29 |
| Class I | |
| Net assets applicable to outstanding shares | $468,785,885 |
| Shares of beneficial interest outstanding | 56,125,111 |
| Net asset value and offering price per share outstanding | $ 8.35 |
| Class R6 | |
| Net assets applicable to outstanding shares | $ 4,622,789 |
| Shares of beneficial interest outstanding | 551,701 |
| Net asset value and offering price per share outstanding | $ 8.38 |
The notes to the financial statements are an integral part of, and should be read in conjunction with, the financial statements.
27
Statement of Operations for the six months ended April 30, 2024 (Unaudited)
| Investment Income (Loss) |
| Income | |
| Interest | $20,111,005 |
| Dividends-affiliated | 161,169 |
| Securities lending, net | 21,820 |
| Dividends-unaffiliated | 919 |
| Total income | 20,294,913 |
| Expenses | |
| Manager (See Note 3) | 2,006,677 |
| Transfer agent (See Note 3) | 496,075 |
| Distribution/Service—Class A (See Note 3) | 223,693 |
| Distribution/Service—Investor Class (See Note 3) | 16,395 |
| Distribution/Service—Class B (See Note 3)(a) | 1,461 |
| Distribution/Service—Class C (See Note 3) | 58,306 |
| Distribution/Service—Class R2 (See Note 3)(b) | 576 |
| Distribution/Service—Class R3 (See Note 3)(b) | 470 |
| Registration | 66,030 |
| Professional fees | 62,328 |
| Custodian | 32,883 |
| Shareholder communication | 23,215 |
| Trustees | 8,560 |
| Shareholder service (See Note 3) | 325 |
| Miscellaneous | 17,881 |
| Total expenses before waiver/reimbursement | 3,014,875 |
| Expense waiver/reimbursement from Manager (See Note 3) | (205,027) |
| Net expenses | 2,809,848 |
| Net investment income (loss) | 17,485,065 |
| Realized and Unrealized Gain (Loss) |
| Net realized gain (loss) on: | |
| Unaffiliated investment transactions | (3,394,765) |
| Futures transactions | 232,890 |
| Foreign currency transactions | 5,930 |
| Net realized gain (loss) | (3,155,945) |
| Net change in unrealized appreciation (depreciation) on: | |
| Unaffiliated investments | 33,290,136 |
| Futures contracts | (451,975) |
| Translation of other assets and liabilities in foreign currencies | (1,063) |
| Net change in unrealized appreciation (depreciation) | 32,837,098 |
| Net realized and unrealized gain (loss) | 29,681,153 |
| Net increase (decrease) in net assets resulting from operations | $47,166,218 |
| (a) | Class B shares converted into Class A or Investor Class shares pursuant to the applicable conversion schedule and are no longer offered for sale as of February 20, 2024. |
| (b) | Class liquidated and is no longer offered for sale as of February 23, 2024. |
The notes to the financial statements are an integral part of, and should be read in conjunction with, the financial statements.
| 28 | MainStay MacKay Strategic Bond Fund |
Statements of Changes in Net Assets
for the six months ended April 30, 2024 (Unaudited) and the year ended October 31, 2023
| | Six months
ended
April 30,
2024 | Year
ended
October 31,
2023 |
| Increase (Decrease) in Net Assets |
| Operations: | | |
| Net investment income (loss) | $ 17,485,065 | $ 31,219,903 |
| Net realized gain (loss) | (3,155,945) | (25,085,632) |
| Net change in unrealized appreciation (depreciation) | 32,837,098 | 29,802,202 |
| Net increase (decrease) in net assets resulting from operations | 47,166,218 | 35,936,473 |
| Distributions to shareholders: | | |
| Class A | (4,483,144) | (7,998,314) |
| Investor Class | (311,199) | (573,435) |
| Class B(a) | (4,981) | (30,984) |
| Class C | (236,271) | (558,210) |
| Class I | (12,695,039) | (22,468,698) |
| Class R2(b) | (8,420) | (45,621) |
| Class R3(b) | (3,606) | (19,860) |
| Class R6 | (112,877) | (99,707) |
| Total distributions to shareholders | (17,855,537) | (31,794,829) |
| Capital share transactions: | | |
| Net proceeds from sales of shares | 93,332,240 | 242,538,209 |
| Net asset value of shares issued to shareholders in reinvestment of distributions | 15,963,262 | 27,732,279 |
| Cost of shares redeemed | (148,198,878) | (241,754,978) |
| Increase (decrease) in net assets derived from capital share transactions | (38,903,376) | 28,515,510 |
| Net increase (decrease) in net assets | (9,592,695) | 32,657,154 |
| Net Assets |
| Beginning of period | 683,737,407 | 651,080,253 |
| End of period | $ 674,144,712 | $ 683,737,407 |
| (a) | Class B shares converted into Class A or Investor Class shares pursuant to the applicable conversion schedule and are no longer offered for sale as of February 20, 2024. |
| (b) | Class liquidated and is no longer offered for sale as of February 23, 2024. |
The notes to the financial statements are an integral part of, and should be read in conjunction with, the financial statements.
29
Financial Highlights selected per share data and ratios
| | Six months ended
April 30,
2024* | | Year Ended October 31, |
| Class A | 2023 | | 2022 | | 2021 | | 2020 | | 2019 |
| Net asset value at beginning of period | $ 8.00 | | $ 7.94 | | $ 9.10 | | $ 8.80 | | $ 8.74 | | $ 8.65 |
| Net investment income (loss) (a) | 0.20 | | 0.35 | | 0.24 | | 0.22 | | 0.22 | | 0.23 |
| Net realized and unrealized gain (loss) | 0.35 | | 0.07 | | (1.19) | | 0.27 | | 0.06 | | 0.11 |
| Total from investment operations | 0.55 | | 0.42 | | (0.95) | | 0.49 | | 0.28 | | 0.34 |
| Less distributions: | | | | | | | | | | | |
| From net investment income | (0.21) | | (0.36) | | (0.21) | | (0.18) | | (0.21) | | (0.25) |
| Return of capital | — | | — | | — | | (0.01) | | (0.01) | | — |
| Total distributions | (0.21) | | (0.36) | | (0.21) | | (0.19) | | (0.22) | | (0.25) |
| Net asset value at end of period | $ 8.34 | | $ 8.00 | | $ 7.94 | | $ 9.10 | | $ 8.80 | | $ 8.74 |
| Total investment return (b) | 6.88% | | 5.30% | | (10.51)% | | 5.61% | | 3.27% | | 3.99% |
| Ratios (to average net assets)/Supplemental Data: | | | | | | | | | | | |
| Net investment income (loss) | 4.90%†† | | 4.32% | | 2.75% | | 2.43% | | 2.60% | | 2.66% |
| Net expenses (c) | 1.04%†† | | 1.04% | | 1.04% | | 1.07%(d) | | 1.18%(d) | | 1.27%(d) |
| Portfolio turnover rate | 56% | | 92% | | 86% | | 53% | | 56%(e) | | 50%(e) |
| Net assets at end of period (in 000’s) | $ 177,273 | | $ 182,027 | | $ 178,508 | | $ 192,190 | | $ 175,682 | | $ 197,686 |
| * | Unaudited. |
| †† | Annualized. |
| (a) | Per share data based on average shares outstanding during the period. |
| (b) | Total investment return is calculated exclusive of sales charges and assumes the reinvestment of dividends and distributions. For periods of less than one year, total return is not annualized. |
| (c) | In addition to the fees and expenses which the Fund bears directly, it also indirectly bears a pro-rata share of the fees and expenses of the underlying funds in which it invests. Such indirect expenses are not included in the above expense ratios. |
| (d) | The expense ratios presented below show the impact of short sales expense: |
| Year Ended | | Net Expenses
(excluding short
sale expenses) | | Short Sales
Expenses |
| October 31, 2021 | | 1.04% | | 0.03% |
| October 31, 2020 | | 1.07% | | 0.11% |
| October 31, 2019 | | 1.07% | | 0.20% |
| (e) | The portfolio turnover rate not including mortgage dollar rolls was 53% and 44% for the years ended October 31, 2020 and 2019, respectively. |
The notes to the financial statements are an integral part of, and should be read in conjunction with, the financial statements.
| 30 | MainStay MacKay Strategic Bond Fund |
Financial Highlights selected per share data and ratios
| | Six months ended
April 30,
2024* | | Year Ended October 31, |
| Investor Class | 2023 | | 2022 | | 2021 | | 2020 | | 2019 |
| Net asset value at beginning of period | $ 8.07 | | $ 8.01 | | $ 9.18 | | $ 8.88 | | $ 8.81 | | $ 8.72 |
| Net investment income (loss) (a) | 0.20 | | 0.34 | | 0.22 | | 0.21 | | 0.22 | | 0.23 |
| Net realized and unrealized gain (loss) | 0.35 | | 0.06 | | (1.19) | | 0.27 | | 0.06 | | 0.11 |
| Total from investment operations | 0.55 | | 0.40 | | (0.97) | | 0.48 | | 0.28 | | 0.34 |
| Less distributions: | | | | | | | | | | | |
| From net investment income | (0.20) | | (0.34) | | (0.20) | | (0.17) | | (0.20) | | (0.25) |
| Return of capital | — | | — | | — | | (0.01) | | (0.01) | | — |
| Total distributions | (0.20) | | (0.34) | | (0.20) | | (0.18) | | (0.21) | | (0.25) |
| Net asset value at end of period | $ 8.42 | | $ 8.07 | | $ 8.01 | | $ 9.18 | | $ 8.88 | | $ 8.81 |
| Total investment return (b) | 6.84% | | 5.03% | | (10.65)% | | 5.41% | | 3.29% | | 3.93% |
| Ratios (to average net assets)/Supplemental Data: | | | | | | | | | | | |
| Net investment income (loss) | 4.68%†† | | 4.11% | | 2.59% | | 2.30% | | 2.54% | | 2.63% |
| Net expenses (c) | 1.25%†† | | 1.25% | | 1.18% | | 1.20%(d) | | 1.24%(d) | | 1.29%(d) |
| Expenses (before waiver/reimbursement) (c) | 1.27%†† | | 1.26% | | 1.18% | | 1.20% | | 1.24% | | 1.29% |
| Portfolio turnover rate | 56% | | 92% | | 86% | | 53% | | 56%(e) | | 50%(e) |
| Net assets at end of period (in 000's) | $ 12,741 | | $ 12,923 | | $ 13,795 | | $ 16,874 | | $ 18,139 | | $ 19,748 |
| * | Unaudited. |
| †† | Annualized. |
| (a) | Per share data based on average shares outstanding during the period. |
| (b) | Total investment return is calculated exclusive of sales charges and assumes the reinvestment of dividends and distributions. For periods of less than one year, total return is not annualized. |
| (c) | In addition to the fees and expenses which the Fund bears directly, it also indirectly bears a pro-rata share of the fees and expenses of the underlying funds in which it invests. Such indirect expenses are not included in the above expense ratios. |
| (d) | The expense ratios presented below show the impact of short sales expense: |
| Year Ended | | Net Expenses
(excluding short
sale expenses) | | Short Sales
Expenses |
| October 31, 2021 | | 1.17% | | 0.03% |
| October 31, 2020 | | 1.13% | | 0.11% |
| October 31, 2019 | | 1.09% | | 0.20% |
| (e) | The portfolio turnover rate not including mortgage dollar rolls was 53% and 44% for the years ended October 31, 2020 and 2019, respectively. |
The notes to the financial statements are an integral part of, and should be read in conjunction with, the financial statements.
31
Financial Highlights selected per share data and ratios
| | Six months ended
April 30,
2024* | | Year Ended October 31, |
| Class C | 2023 | | 2022 | | 2021 | | 2020 | | 2019 |
| Net asset value at beginning of period | $ 7.95 | | $ 7.89 | | $ 9.05 | | $ 8.75 | | $ 8.69 | | $ 8.60 |
| Net investment income (loss) (a) | 0.16 | | 0.27 | | 0.15 | | 0.14 | | 0.15 | | 0.16 |
| Net realized and unrealized gain (loss) | 0.35 | | 0.07 | | (1.17) | | 0.27 | | 0.06 | | 0.11 |
| Total from investment operations | 0.51 | | 0.34 | | (1.02) | | 0.41 | | 0.21 | | 0.27 |
| Less distributions: | | | | | | | | | | | |
| From net investment income | (0.17) | | (0.28) | | (0.14) | | (0.10) | | (0.15) | | (0.18) |
| Return of capital | — | | — | | — | | (0.01) | | (0.00)‡ | | — |
| Total distributions | (0.17) | | (0.28) | | (0.14) | | (0.11) | | (0.15) | | (0.18) |
| Net asset value at end of period | $ 8.29 | | $ 7.95 | | $ 7.89 | | $ 9.05 | | $ 8.75 | | $ 8.69 |
| Total investment return (b) | 6.42% | | 4.33% | | (11.38)% | | 4.69% | | 2.45% | | 3.21% |
| Ratios (to average net assets)/Supplemental Data: | | | | | | | | | | | |
| Net investment income (loss) | 3.93%†† | | 3.34% | | 1.75% | | 1.55% | | 1.78% | | 1.90% |
| Net expenses (c) | 2.00%†† | | 2.00% | | 1.93% | | 1.95%(d) | | 2.00%(d) | | 2.04%(d) |
| Expenses (before waiver/reimbursement) (c) | 2.01%†† | | 2.01% | | 1.93% | | 1.95% | | 2.00% | | 2.04% |
| Portfolio turnover rate | 56% | | 92% | | 86% | | 53% | | 56%(e) | | 50%(e) |
| Net assets at end of period (in 000’s) | $ 10,721 | | $ 12,334 | | $ 20,804 | | $ 46,537 | | $ 65,158 | | $ 91,598 |
| * | Unaudited. |
| ‡ | Less than one cent per share. |
| †† | Annualized. |
| (a) | Per share data based on average shares outstanding during the period. |
| (b) | Total investment return is calculated exclusive of sales charges and assumes the reinvestment of dividends and distributions. For periods of less than one year, total return is not annualized. |
| (c) | In addition to the fees and expenses which the Fund bears directly, it also indirectly bears a pro-rata share of the fees and expenses of the underlying funds in which it invests. Such indirect expenses are not included in the above expense ratios. |
| (d) | The expense ratios presented below show the impact of short sales expense: |
| Year Ended | | Net Expenses
(excluding short
sale expenses) | | Short Sales
Expenses |
| October 31, 2021 | | 1.92% | | 0.03% |
| October 31, 2020 | | 1.89% | | 0.11% |
| October 31, 2019 | | 1.84% | | 0.20% |
| (e) | The portfolio turnover rate not including mortgage dollar rolls was 53% and 44% for the years ended October 31, 2020 and 2019, respectively. |
The notes to the financial statements are an integral part of, and should be read in conjunction with, the financial statements.
| 32 | MainStay MacKay Strategic Bond Fund |
Financial Highlights selected per share data and ratios
| | Six months ended
April 30,
2024* | | Year Ended October 31, |
| Class I | 2023 | | 2022 | | 2021 | | 2020 | | 2019 |
| Net asset value at beginning of period | $ 8.01 | | $ 7.95 | | $ 9.11 | | $ 8.81 | | $ 8.75 | | $ 8.66 |
| Net investment income (loss) (a) | 0.22 | | 0.38 | | 0.27 | | 0.25 | | 0.24 | | 0.25 |
| Net realized and unrealized gain (loss) | 0.35 | | 0.07 | | (1.19) | | 0.27 | | 0.06 | | 0.11 |
| Total from investment operations | 0.57 | | 0.45 | | (0.92) | | 0.52 | | 0.30 | | 0.36 |
| Less distributions: | | | | | | | | | | | |
| From net investment income | (0.23) | | (0.39) | | (0.24) | | (0.21) | | (0.23) | | (0.27) |
| Return of capital | — | | — | | — | | (0.01) | | (0.01) | | — |
| Total distributions | (0.23) | | (0.39) | | (0.24) | | (0.22) | | (0.24) | | (0.27) |
| Net asset value at end of period | $ 8.35 | | $ 8.01 | | $ 7.95 | | $ 9.11 | | $ 8.81 | | $ 8.75 |
| Total investment return (b) | 7.05% | | 5.64% | | (10.19)% | | 5.88% | | 3.53% | | 4.24% |
| Ratios (to average net assets)/Supplemental Data: | | | | | | | | | | | |
| Net investment income (loss) | 5.23%†† | | 4.66% | | 3.09% | | 2.70% | | 2.83% | | 2.91% |
| Net expenses (c) | 0.70%†† | | 0.70% | | 0.70% | | 0.79%(d) | | 0.94%(d) | | 1.02%(d) |
| Expenses (before waiver/reimbursement) (c) | 0.79%†† | | 0.79% | | 0.79% | | 0.82% | | 0.94% | | 1.02% |
| Portfolio turnover rate | 56% | | 92% | | 86% | | 53% | | 56%(e) | | 50%(e) |
| Net assets at end of period (in 000’s) | $ 468,786 | | $ 470,566 | | $ 433,814 | | $ 448,881 | | $ 404,964 | | $ 604,981 |
| * | Unaudited. |
| †† | Annualized. |
| (a) | Per share data based on average shares outstanding during the period. |
| (b) | Total investment return is calculated exclusive of sales charges and assumes the reinvestment of dividends and distributions. Class I shares are not subject to sales charges. For periods of less than one year, total return is not annualized. |
| (c) | In addition to the fees and expenses which the Fund bears directly, it also indirectly bears a pro-rata share of the fees and expenses of the underlying funds in which it invests. Such indirect expenses are not included in the above expense ratios. |
| (d) | The expense ratios presented below show the impact of short sales expense: |
| Year Ended | | Net Expenses
(excluding short
sale expenses) | | Short Sales
Expenses |
| October 31, 2021 | | 0.76% | | 0.03% |
| October 31, 2020 | | 0.83% | | 0.11% |
| October 31, 2019 | | 0.82% | | 0.20% |
| (e) | The portfolio turnover rate not including mortgage dollar rolls was 53% and 44% for the years ended October 31, 2020 and 2019, respectively. |
The notes to the financial statements are an integral part of, and should be read in conjunction with, the financial statements.
33
Financial Highlights selected per share data and ratios
| | Six months ended
April 30,
2024* | | Year Ended October 31, |
| Class R6 | 2023 | | 2022 | | 2021 | | 2020 | | 2019 |
| Net asset value at beginning of period | $ 8.03 | | $ 7.97 | | $ 9.14 | | $ 8.84 | | $ 8.75 | | $ 8.66 |
| Net investment income (loss) (a) | 0.22 | | 0.39 | | 0.27 | | 0.26 | | 0.25 | | 0.27 |
| Net realized and unrealized gain (loss) | 0.36 | | 0.06 | | (1.19) | | 0.26 | | 0.09 | | 0.11 |
| Total from investment operations | 0.58 | | 0.45 | | (0.92) | | 0.52 | | 0.34 | | 0.38 |
| Less distributions: | | | | | | | | | | | |
| From net investment income | (0.23) | | (0.39) | | (0.25) | | (0.21) | | (0.24) | | (0.29) |
| Return of capital | — | | — | | — | | (0.01) | | (0.01) | | — |
| Total distributions | (0.23) | | (0.39) | | (0.25) | | (0.22) | | (0.25) | | (0.29) |
| Net asset value at end of period | $ 8.38 | | $ 8.03 | | $ 7.97 | | $ 9.14 | | $ 8.84 | | $ 8.75 |
| Total investment return (b) | 7.19% | | 5.68% | | (10.23)% | | 5.97% | | 4.04% | | 4.43% |
| Ratios (to average net assets)/Supplemental Data: | | | | | | | | | | | |
| Net investment income (loss) | 5.29%†† | | 4.76% | | 3.14% | | 2.83% | | 2.88% | | 3.13% |
| Net expenses (c) | 0.65%†† | | 0.65% | | 0.66% | | 0.69%(d) | | 0.82%(d) | | 0.84%(d) |
| Portfolio turnover rate | 56% | | 92% | | 86% | | 53% | | 56%(e) | | 50%(e) |
| Net assets at end of period (in 000’s) | $ 4,623 | | $ 3,925 | | $ 1,349 | | $ 1,407 | | $ 465 | | $ 22,632 |
| * | Unaudited. |
| †† | Annualized. |
| (a) | Per share data based on average shares outstanding during the period. |
| (b) | Total investment return is calculated exclusive of sales charges and assumes the reinvestment of dividends and distributions. Class R6 shares are not subject to sales charges. For periods of less than one year, total return is not annualized. |
| (c) | In addition to the fees and expenses which the Fund bears directly, it also indirectly bears a pro-rata share of the fees and expenses of the underlying funds in which it invests. Such indirect expenses are not included in the above expense ratios. |
| (d) | The expense ratios presented below show the impact of short sales expense: |
| Year Ended | | Net Expenses
(excluding short
sale expenses) | | Short Sales
Expenses |
| October 31, 2021 | | 0.67% | | 0.02% |
| October 31, 2020 | | 0.66% | | 0.16% |
| October 31, 2019 | | 0.64% | | 0.20% |
| (e) | The portfolio turnover rate not including mortgage dollar rolls was 53% and 44% for the years ended October 31, 2020 and 2019, respectively. |
The notes to the financial statements are an integral part of, and should be read in conjunction with, the financial statements.
| 34 | MainStay MacKay Strategic Bond Fund |
Notes to Financial Statements (Unaudited)
Note 1-Organization and Business
The MainStay Funds (the “Trust”) was organized on January 9, 1986, as a Massachusetts business trust. The Trust is registered under the Investment Company Act of 1940, as amended (the “1940 Act”), as an open-end management investment company, and is comprised of eleven funds (collectively referred to as the "Funds"). These financial statements and notes relate to the MainStay MacKay Strategic Bond Fund (the "Fund"), a “diversified” fund, as that term is defined in the 1940 Act, as interpreted or modified by regulatory authorities having jurisdiction, from time to time.
The following table lists the Fund's share classes that have been registered and commenced operations:
| Class | Commenced Operations |
| Class A | February 28, 1997 |
| Investor Class | February 28, 2008 |
| Class C | September 1, 1998 |
| Class I | January 2, 2004 |
| Class R6 | February 28, 2018 |
Effective at the close of business on February 20, 2024, all outstanding Class B shares converted into Class A or Investor Class shares pursuant to the applicable conversion schedule and effective February 23, 2024, Class R2 and R3 shares were liquidated.
Class A and Investor Class shares are offered at net asset value (“NAV”) per share plus an initial sales charge. No initial sales charge applies to investments of $1 million or more (and certain other qualified purchases) in Class A and Investor Class shares. However, a CDSC of 1.00% may be imposed on certain redemptions made within 18 months of the date of purchase on shares that were purchased without an initial sales charge. Class C shares are offered at NAV without an initial sales charge, although a 1.00% CDSC may be imposed on certain redemptions of such shares made within one year of the date of purchase of Class C shares. Class I and Class R6 shares are offered at NAV without a sales charge. Depending upon eligibility, Class C shares convert to either Class A or Investor Class shares at the end of the calendar quarter eight years after the date they were purchased. Additionally, Investor Class shares may convert automatically to Class A shares. Under certain circumstances and as may be permitted by the Trust’s multiple class plan pursuant to Rule 18f-3 under the 1940 Act, specified share classes of the Fund may be converted to one or more other share classes of the Fund as disclosed in the capital share transactions within these Notes. The classes of shares have the same voting (except for issues that relate solely to one class), dividend, liquidation and other rights, and the same terms and conditions, except that under distribution plans pursuant to Rule 12b-1 under the 1940 Act, Class C shares are subject to higher distribution and/or service fees than Class A and Investor Class shares. Class I and Class R6 shares are not subject to a distribution and/or service fee. This is in addition to any fees paid under a distribution plan, where applicable.
The Fund's investment objective is to seek total return by investing primarily in domestic and foreign debt securities.
Note 2–Significant Accounting Policies
The Fund is an investment company and accordingly follows the investment company accounting and reporting guidance of the Financial Accounting Standards Board (“FASB”) Accounting Standards Codification Topic 946 Financial Services—Investment Companies. The Fund prepares its financial statements in accordance with generally accepted accounting principles (“GAAP”) in the United States of America and follows the significant accounting policies described below.
(A) Securities Valuation. Investments are usually valued as of the close of regular trading on the New York Stock Exchange (the "Exchange") (usually 4:00 p.m. Eastern time) on each day the Fund is open for business ("valuation date").
Pursuant to Rule 2a-5 under the 1940 Act, the Board of Trustees of the Trust (the "Board") has designated New York Life Investment Management LLC ("New York Life Investments" or the "Manager") as its Valuation Designee (the "Valuation Designee"). The Valuation Designee is responsible for performing fair valuations relating to all investments in the Fund’s portfolio for which market quotations are not readily available; periodically assessing and managing material valuation risks; establishing and applying fair value methodologies; testing fair valuation methodologies; evaluating and overseeing pricing services; ensuring appropriate segregation of valuation and portfolio management functions; providing quarterly, annual and prompt reporting to the Board, as appropriate; identifying potential conflicts of interest; and maintaining appropriate records. The Valuation Designee has established a valuation committee ("Valuation Committee") to assist in carrying out the Valuation Designee’s responsibilities and establish prices of securities for which market quotations are not readily available. The Fund's and the Valuation Designee's policies and procedures ("Valuation Procedures") govern the Valuation Designee’s selection and application of methodologies for determining and calculating the fair value of Fund investments. The Valuation Designee may value the Fund's portfolio securities for which market quotations are not readily available and other Fund assets utilizing inputs from pricing services and other third-party sources. The Valuation Committee meets (in person, via electronic mail or via teleconference) on an ad-hoc basis to determine fair valuations and on a quarterly basis to review fair value events with respect to certain securities for which market quotations are not readily available, including valuation risks and back-testing results, and to preview reports to the Board.
The Valuation Committee establishes prices of securities for which market quotations are not readily available based on such methodologies and measurements on a regular basis after considering information that is reasonably available and deemed relevant by the Valuation Committee. The Board shall oversee the Valuation Designee and review fair valuation materials on a prompt, quarterly and annual basis and approve proposed revisions to the Valuation Procedures.
Investments for which market quotations are not readily available are valued at fair value as determined in good faith pursuant to the Valuation Procedures. A market quotation is readily available only when that
Notes to Financial Statements (Unaudited) (continued)
quotation is a quoted price (unadjusted) in active markets for identical investments that the Fund can access at the measurement date, provided that a quotation will not be readily available if it is not reliable. "Fair value" is defined as the price the Fund would reasonably expect to receive upon selling an asset or liability in an orderly transaction to an independent buyer in the principal or most advantageous market for the asset or liability. Fair value measurements are determined within a framework that establishes a three-tier hierarchy that maximizes the use of observable market data and minimizes the use of unobservable inputs to establish a classification of fair value measurements for disclosure purposes. "Inputs" refer broadly to the assumptions that market participants would use in pricing the asset or liability, including assumptions about risk, such as the risk inherent in a particular valuation technique used to measure fair value using a pricing model and/or the risk inherent in the inputs for the valuation technique. Inputs may be observable or unobservable. Observable inputs reflect the assumptions market participants would use in pricing the asset or liability based on market data obtained from sources independent of the Fund. Unobservable inputs reflect the Fund’s own assumptions about the assumptions market participants would use in pricing the asset or liability based on the information available. The inputs or methodology used for valuing assets or liabilities may not be an indication of the risks associated with investing in those assets or liabilities. The three-tier hierarchy of inputs is summarized below.
| • | Level 1—quoted prices (unadjusted) in active markets for an identical asset or liability |
| • | Level 2—other significant observable inputs (including quoted prices for a similar asset or liability in active markets, interest rates and yield curves, prepayment speeds, credit risk, etc.) |
| • | Level 3—significant unobservable inputs (including the Fund's own assumptions about the assumptions that market participants would use in measuring fair value of an asset or liability) |
The level of an asset or liability within the fair value hierarchy is based on the lowest level of an input, both individually and in the aggregate, that is significant to the fair value measurement. The aggregate value by input level of the Fund’s assets and liabilities as of April 30, 2024, is included at the end of the Portfolio of Investments.
The Fund may use third-party vendor evaluations, whose prices may be derived from one or more of the following standard inputs, among others:
| • Benchmark yields | • Reported trades |
| • Broker/dealer quotes | • Issuer spreads |
| • Two-sided markets | • Benchmark securities |
| • Bids/offers | • Reference data (corporate actions or material event notices) |
| • Industry and economic events | • Comparable bonds |
| • Monthly payment information | |
An asset or liability for which a market quotation is not readily available is valued by methods deemed reasonable in good faith by the Valuation Committee, following the Valuation Procedures to represent fair value.
Under these procedures, the Valuation Designee generally uses a market-based approach which may use related or comparable assets or liabilities, recent transactions, market multiples, book values and other relevant information. The Valuation Designee may also use an income-based valuation approach in which the anticipated future cash flows of the asset or liability are discounted to calculate fair value. Discounts may also be applied due to the nature and/or duration of any restrictions on the disposition of the asset or liability. Fair value represents a good faith approximation of the value of a security. Fair value determinations involve the consideration of a number of subjective factors, an analysis of applicable facts and circumstances and the exercise of judgment. As a result, it is possible that the fair value for a security determined in good faith in accordance with the Valuation Procedures may differ from valuations for the same security determined for other funds using their own valuation procedures. Although the Valuation Procedures are designed to value a security at the price the Fund may reasonably expect to receive upon the security's sale in an orderly transaction, there can be no assurance that any fair value determination thereunder would, in fact, approximate the amount that the Fund would actually realize upon the sale of the security or the price at which the security would trade if a reliable market price were readily available. During the six-month period ended April 30, 2024, there were no material changes to the fair value methodologies.
Securities which may be valued in this manner include, but are not limited to: (i) a security for which trading has been halted or suspended or otherwise does not have a readily available market quotation on a given day; (ii) a debt security that has recently gone into default and for which there is not a current market quotation; (iii) a security of an issuer that has entered into a restructuring; (iv) a security that has been delisted from a national exchange; (v) a security subject to trading collars for which no or limited trading takes place; and (vi) a security whose principal market has been temporarily closed at a time when, under normal conditions, it would be open. Securities valued in this manner are generally categorized as Level 2 or 3 in the hierarchy.
Equity securities, rights and warrants, if applicable, are valued at the last quoted sales prices as of the close of regular trading on the relevant exchange on each valuation date. Securities that are not traded on the valuation date are valued at the mean of the last quoted bid and ask prices. Prices are normally taken from the principal market in which each security trades. These securities are generally categorized as Level 1 in the hierarchy.
Investments in mutual funds, including money market funds, are valued at their respective NAVs at the close of business each day on the valuation date. These securities are generally categorized as Level 1 in the hierarchy.
Futures contracts are valued at the last posted settlement price on the market where such futures are primarily traded. These securities are generally categorized as Level 1 in the hierarchy.
Debt securities (other than convertible and municipal bonds) are valued at the evaluated bid prices (evaluated mean prices in the case of convertible
| 36 | MainStay MacKay Strategic Bond Fund |
and municipal bonds) supplied by a pricing agent or broker selected by the Valuation Designee, in consultation with the Subadvisor. The evaluations are market-based measurements processed through a pricing application and represents the pricing agent’s good faith determination as to what a holder may receive in an orderly transaction under market conditions. The rules-based logic utilizes valuation techniques that reflect participants’ assumptions and vary by asset class and per methodology, maximizing the use of relevant observable data including quoted prices for similar assets, benchmark yield curves and market corroborated inputs. The evaluated bid or mean prices are deemed by the Valuation Designee, in consultation with the Subadvisor, to be representative of market values at the regular close of trading of the Exchange on each valuation date. Debt securities purchased on a delayed delivery basis are marked to market daily until settlement at the forward settlement date. Debt securities, including corporate bonds, U.S. government and federal agency bonds, municipal bonds, foreign bonds, convertible bonds, asset-backed securities and mortgage-backed securities are generally categorized as Level 2 in the hierarchy.
Loan assignments, participations and commitments are valued at the average of bid quotations obtained from the engaged independent pricing service and are generally categorized as Level 2 in the hierarchy. Certain loan assignments, participations and commitments may be valued by utilizing significant unobservable inputs obtained from the pricing service and are generally categorized as Level 3 in the hierarchy.
Temporary cash investments acquired in excess of 60 days to maturity at the time of purchase are valued using the latest bid prices or using valuations based on a matrix system (which considers such factors as security prices, yields, maturities and ratings), both as furnished by independent pricing services. Temporary cash investments that mature in 60 days or less at the time of purchase ("Short-Term Investments") are valued using the amortized cost method of valuation, unless the use of such method would be inappropriate. The amortized cost method involves valuing a security at its cost on the date of purchase and thereafter assuming a constant amortization to maturity of the difference between such cost and the value on maturity date. Amortized cost approximates the current fair value of a security. Securities valued using the amortized cost method are not valued using quoted prices in an active market and are generally categorized as Level 2 in the hierarchy.
The information above is not intended to reflect an exhaustive list of the methodologies that may be used to value portfolio investments. The Valuation Procedures permit the use of a variety of valuation methodologies in connection with valuing portfolio investments. The methodology used for a specific type of investment may vary based on the market data available or other considerations. The methodologies summarized above may not represent the specific means by which portfolio investments are valued on any particular business day.
A portfolio investment may be classified as an illiquid investment under the Fund's written liquidity risk management program and related procedures (“Liquidity Program”). Illiquidity of an investment might prevent the sale of such investment at a time when the Manager or the
Subadvisor might wish to sell, and these investments could have the effect of decreasing the overall level of the Fund's liquidity. Further, the lack of an established secondary market may make it more difficult to value illiquid investments, requiring the Fund to rely on judgments that may be somewhat subjective in measuring value, which could vary materially from the amount that the Fund could realize upon disposition. Difficulty in selling illiquid investments may result in a loss or may be costly to the Fund. An illiquid investment is any investment that the Manager or Subadvisor reasonably expects cannot be sold or disposed of in current market conditions in seven calendar days or less without the sale or disposition significantly changing the market value of the investment. The liquidity classification of each investment will be made using information obtained after reasonable inquiry and taking into account, among other things, relevant market, trading and investment-specific considerations in accordance with the Liquidity Program. Illiquid investments are often fair valued in accordance with the Fund's procedures described above. The liquidity of the Fund's investments was determined as of April 30, 2024, and can change at any time.
(B) Income Taxes. The Fund's policy is to comply with the requirements of the Internal Revenue Code of 1986, as amended (the “Internal Revenue Code”), applicable to regulated investment companies and to distribute all of its taxable income to the shareholders of the Fund within the allowable time limits.
The Manager evaluates the Fund’s tax positions to determine if the tax positions taken meet the minimum recognition threshold in connection with accounting for uncertainties in income tax positions taken or expected to be taken for the purposes of measuring and recognizing tax liabilities in the financial statements. Recognition of tax benefits of an uncertain tax position is permitted only to the extent the position is “more likely than not” to be sustained assuming examination by taxing authorities. The Manager analyzed the Fund's tax positions taken on federal, state and local income tax returns for all open tax years (for up to three tax years) and has concluded that no provisions for federal, state and local income tax are required in the Fund's financial statements. The Fund's federal, state and local income tax and federal excise tax returns for tax years for which the applicable statutes of limitations have not expired are subject to examination by the Internal Revenue Service and state and local departments of revenue.
(C) Dividends and Distributions to Shareholders. Dividends and distributions are recorded on the ex-dividend date. The Fund intends to declare and pay dividends from net investment income, if any, at least monthly and distributions from net realized capital and currency gains, if any, at least annually. Unless a shareholder elects otherwise, all dividends and distributions are reinvested at NAV in the same class of shares of the Fund. Dividends and distributions to shareholders are determined in accordance with federal income tax regulations and may differ from determinations using GAAP.
Notes to Financial Statements (Unaudited) (continued)
(D) Security Transactions and Investment Income. The Fund records security transactions on the trade date. Realized gains and losses on security transactions are determined using the identified cost method. Dividend income is recognized on the ex-dividend date, net of any foreign tax withheld at the source, and interest income is accrued as earned using the effective interest rate method and includes any realized gains and losses from repayments of principal on mortgage-backed securities. Distributions received from real estate investment trusts may be classified as dividends, capital gains and/or return of capital. Discounts and premiums on securities purchased for the Fund are accreted and amortized, respectively, on the effective interest rate method.
Investment income and realized and unrealized gains and losses on investments of the Fund are allocated pro rata to the separate classes of shares based upon their relative net assets on the date the income is earned or realized and unrealized gains and losses are incurred.
The Fund may place a debt security on non-accrual status and reduce related interest income by ceasing current accruals and writing off all or a portion of any interest receivables when the collection of all or a portion of such interest has become doubtful. A debt security is removed from non-accrual status when the issuer resumes interest payments or when collectability of interest is reasonably assured.
(E) Expenses. Expenses of the Trust are allocated to the individual Funds in proportion to the net assets of the respective Funds when the expenses are incurred, except where direct allocations of expenses can be made. Expenses (other than transfer agent expenses and fees incurred under the shareholder services plans and/or the distribution plans further discussed in Note 3(B)) are allocated to separate classes of shares pro rata based upon their relative net assets on the date the expenses are incurred. The expenses borne by the Fund, including those of related parties to the Fund, are shown in the Statement of Operations.
Additionally, the Fund may invest in mutual funds, which are subject to management fees and other fees that may cause the costs of investing in mutual funds to be greater than the costs of owning the underlying securities directly. These indirect expenses of mutual funds are not included in the amounts shown as expenses in the Statement of Operations or in the expense ratios included in the Financial Highlights.
(F) Use of Estimates. In preparing financial statements in conformity with GAAP, the Manager makes estimates and assumptions that affect the reported amounts and disclosures in the financial statements. Actual results could differ from those estimates and assumptions.
(G) Futures Contracts. A futures contract is an agreement to purchase or sell a specified quantity of an underlying instrument at a specified future date and price, or to make or receive a cash payment based on the value of a financial instrument (e.g., foreign currency, interest rate, security or securities index). The Fund is subject to risks such as market price risk, leverage risk, liquidity risk, counterparty risk, operational risk, legal risk and/or interest rate risk in the normal course of investing in these contracts. Upon entering into a futures contract, the Fund is required to pledge to the broker or futures commission merchant
an amount of cash and/or U.S. government securities equal to a certain percentage of the collateral amount, known as the “initial margin.” During the period the futures contract is open, changes in the value of the contract are recognized as unrealized appreciation or depreciation by marking to market such contract on a daily basis to reflect the market value of the contract at the end of each day’s trading. The Fund agrees to receive from or pay to the broker or futures commission merchant an amount of cash equal to the daily fluctuation in the value of the contract. Such receipts or payments are known as “variation margin.” When the futures contract is closed, the Fund records a realized gain or loss equal to the difference between the proceeds from (or cost of) the closing transaction and the Fund's basis in the contract.
The use of futures contracts involves, to varying degrees, elements of market risk in excess of the amount recognized in the Statement of Assets and Liabilities. The contract or notional amounts and variation margin reflect the extent of the Fund's involvement in open futures positions. There are several risks associated with the use of futures contracts as hedging techniques. There can be no assurance that a liquid market will exist at the time when the Fund seeks to close out a futures contract. If no liquid market exists, the Fund would remain obligated to meet margin requirements until the position is closed. Futures contracts may involve a small initial investment relative to the risk assumed, which could result in losses greater than if the Fund did not invest in futures contracts. Futures contracts may be more volatile than direct investments in the instrument underlying the futures and may not correlate to the underlying instrument, causing a given hedge not to achieve its objectives. The Fund's activities in futures contracts have minimal counterparty risk as they are conducted through regulated exchanges that guarantee the futures against default by the counterparty. In the event of a bankruptcy or insolvency of a futures commission merchant that holds margin on behalf of the Fund, the Fund may not be entitled to the return of the entire margin owed to the Fund, potentially resulting in a loss. The Fund may invest in futures contracts to seek enhanced returns or to reduce the risk of loss by hedging certain of its holdings. The Fund's investment in futures contracts and other derivatives may increase the volatility of the Fund's NAVs and may result in a loss to the Fund.
(H) Loan Assignments, Participations and Commitments. The Fund may invest in loan assignments and participations ("loans"). Commitments are agreements to make money available to a borrower in a specified amount, at a specified rate and within a specified time. The Fund records an investment when the borrower withdraws money on a commitment or when a funded loan is purchased (trade date) and records interest as earned. These loans pay interest at rates that are periodically reset by reference to a base lending rate plus a spread. These base lending rates are generally the prime rate offered by a designated U.S. bank, the Secured Overnight Financing Rate ("SOFR") or an alternative reference rate.
The loans in which the Fund may invest are generally readily marketable, but may be subject to some restrictions on resale. For example, the Fund
| 38 | MainStay MacKay Strategic Bond Fund |
may be contractually obligated to receive approval from the agent bank and/or borrower prior to the sale of these investments. If the Fund purchases an assignment from a lender, the Fund will generally have direct contractual rights against the borrower in favor of the lender. If the Fund purchases a participation interest either from a lender or a participant, the Fund typically will have established a direct contractual relationship with the seller of the participation interest, but not with the borrower. Consequently, the Fund is subject to the credit risk of the lender or participant who sold the participation interest to the Fund, in addition to the usual credit risk of the borrower. In the event that the borrower, selling participant or intermediate participants become insolvent or enter into bankruptcy, the Fund may incur certain costs and delays in realizing payment, or may suffer a loss of principal and/or interest.
Unfunded commitments represent the remaining obligation of the Fund to the borrower. At any point in time, up to the maturity date of the issue, the borrower may demand the unfunded portion. Unfunded amounts, if any, are marked to market and any unrealized gains or losses are recorded in the Statement of Assets and Liabilities.
(I) Foreign Currency Transactions. The Fund's books and records are maintained in U.S. dollars. Prices of securities denominated in foreign currency amounts are translated into U.S. dollars at the mean between the buying and selling rates last quoted by any major U.S. bank at the following dates:
(i) market value of investment securities, other assets and liabilities— at the valuation date; and
(ii) purchases and sales of investment securities, income and expenses—at the date of such transactions.
The assets and liabilities that are denominated in foreign currency amounts are presented at the exchange rates and market values at the close of the period. The realized and unrealized changes in net assets arising from fluctuations in exchange rates and market prices of securities are not separately presented.
Net realized gain (loss) on foreign currency transactions represents net currency gains or losses realized as a result of differences between the amounts of securities sale proceeds or purchase cost, dividends, interest and withholding taxes as recorded on the Fund's books, and the U.S. dollar equivalent amount actually received or paid. Net currency gains or losses from valuing such foreign currency denominated assets and liabilities, other than investments at valuation date exchange rates, are reflected in unrealized foreign exchange gains or losses.
(J) Securities Lending. In order to realize additional income, the Fund may engage in securities lending, subject to the limitations set forth in the 1940 Act and relevant guidance by the staff of the Securities and Exchange Commission (“SEC”). If the Fund engages in securities lending, the Fund will lend through its custodian, JPMorgan Chase Bank, N.A., ("JPMorgan"), acting as securities lending agent on behalf of the Fund. Under the current arrangement, JPMorgan will manage the Fund's collateral in accordance with the securities lending agency agreement
between the Fund and JPMorgan, and indemnify the Fund against counterparty risk. The loans will be collateralized by cash (which may be invested in a money market fund) and/or non-cash collateral (which may include U.S. Treasury securities and/or U.S. government agency securities issued or guaranteed by the United States government or its agencies or instrumentalities) at least equal at all times to the market value of the securities loaned. Non-cash collateral held at year end is segregated and cannot be transferred by the Fund. The Fund bears the risk of delay in recovery of, or loss of rights in, the securities loaned. The Fund may also record a realized gain or loss on securities deemed sold due to a borrower’s inability to return securities on loan. The Fund bears the risk of any loss on investment of cash collateral. The Fund will receive compensation for lending its securities in the form of fees or it will retain a portion of interest earned on the investment of any cash collateral. The Fund will also continue to receive interest and dividends on the securities loaned and any gain or loss in the market price of the securities loaned that may occur during the term of the loan will be for the account of the Fund. Income earned from securities lending activities, if any, is reflected in the Statement of Operations.
(K) Debt and Foreign Securities Risk. The ability of issuers of debt securities held by the Fund to meet their obligations may be affected by, among other things, economic or political developments in a specific country, industry or region. Debt securities are also subject to the risks associated with changes in interest rates. The Fund primarily invests in high yield debt securities (commonly referred to as “junk bonds”), which are considered speculative because they present a greater risk of loss, including default, than higher rated debt securities. These securities pay investors a premium—a higher interest rate or yield than investment grade debt securities—because of the increased risk of loss. These securities can also be subject to greater price volatility. In times of unusual or adverse market, economic or political conditions, these securities may experience higher than normal default rates.
Investments in the Fund are not guaranteed, even though some of the Fund’s underlying investments are guaranteed by the U.S. government or its agencies or instrumentalities. The principal risk of mortgage-related and asset-backed securities is that the underlying debt may be prepaid ahead of schedule, if interest rates fall, thereby reducing the value of the Fund’s investment. If interest rates rise, less of the debt may be prepaid and the Fund may lose money because the Fund may be unable to invest in higher yielding assets. The Fund is subject to interest-rate risk and can lose principal value when interest rates rise. Bonds are also subject to credit risk, in which the bond issuer may fail to pay interest and principal in a timely manner.
The Fund may invest in loans which are usually rated below investment grade and are generally considered speculative because they present a greater risk of loss, including default, than higher rated debt securities. These investments pay investors a higher interest rate than investment grade debt securities because of the increased risk of loss. Although certain loans are collateralized, there is no guarantee that the value of the collateral will be sufficient to repay the loan. In a recession or serious
Notes to Financial Statements (Unaudited) (continued)
credit event, the value of these investments could decline significantly. As a result of these and other events, the Fund’s NAVs could go down and you could lose money.
In addition, loans generally are subject to the extended settlement periods that may be longer than seven days. As a result, the Fund may be adversely affected by selling other investments at an unfavorable time and/or under unfavorable conditions or engaging in borrowing transactions, such as borrowing against its credit facility, to raise cash to meet redemption obligations or pursue other investment opportunities.
In certain circumstances, loans may not be deemed to be securities. As a result, the Fund may not have the protection of anti-fraud provisions of the federal securities laws. In such cases, the Fund generally must rely on the contractual provisions in the loan agreement and common-law fraud protections under applicable state law.
The Fund may invest in foreign securities, which carry certain risks that are in addition to the usual risks inherent in domestic securities. Foreign regulatory regimes and securities markets can have less stringent investor protections and disclosure standards and less liquid trading markets than U.S. regulatory regimes and securities markets, and can experience political, social and economic developments that may affect the value of investments in foreign securities. These risks include those resulting from currency fluctuations, future adverse political or economic developments and possible imposition of currency exchange blockages or other foreign governmental laws or restrictions. Economic sanctions and other similar governmental actions or developments could, among other things, effectively restrict or eliminate the Fund’s ability to purchase or sell certain foreign securities or groups of foreign securities, and thus may make the Fund’s investments in such securities less liquid or more difficult to value. These risks are likely to be greater in emerging markets than in developed markets. The ability of issuers of debt securities held by the Fund to meet their obligations may be affected by, among other things, economic or political developments in a specific country, industry or region.
(L) Counterparty Credit Risk. In order to better define its contractual rights and to secure rights that will help the Fund mitigate its counterparty risk, the Fund may enter into an International Swaps and Derivatives Association, Inc. Master Agreement (“ISDA Master Agreement”) or similar agreement with its counterparties. An ISDA Master Agreement is a bilateral agreement between the Fund and a counterparty that governs certain OTC derivatives and typically contains collateral posting terms and netting provisions. Under an ISDA Master Agreement, the Fund may, under certain circumstances, offset with the counterparty certain derivative financial instruments’ payables and/ or receivables with
collateral held and/or posted and create one single net payment. The provisions of the ISDA Master Agreement typically permit a single net payment in the event of default including the bankruptcy or insolvency of the counterparty. Bankruptcy or insolvency laws of a particular jurisdiction may restrict or prohibit the right of offset in bankruptcy, insolvency or other events. In addition, certain ISDA Master Agreements may contain provisions for early termination of OTC derivative transactions in the event the net assets of the Fund decline below specific levels or if the Fund fails to meet the terms of its ISDA Master Agreements. The result would cause the Fund to accelerate payment of any net liability owed to the counterparty.
For financial reporting purposes, the Fund does not offset derivative assets and derivative liabilities that are subject to netting arrangements, if any, in the Statement of Assets and Liabilities.
(M) Indemnifications. Under the Trust’s organizational documents, its officers and trustees are indemnified against certain liabilities that may arise out of performance of their duties to the Trust. Additionally, in the normal course of business, the Fund enters into contracts with third-party service providers that contain a variety of representations and warranties and that may provide general indemnifications. The Fund's maximum exposure under these arrangements is unknown, as this would involve future claims that may be made against the Fund that have not yet occurred. The Manager believes that the risk of loss in connection with these potential indemnification obligations is remote. However, there can be no assurance that material liabilities related to such obligations will not arise in the future, which could adversely impact the Fund.
(N) Quantitative Disclosure of Derivative Holdings. The following tables show additional disclosures related to the Fund's derivative and hedging activities, including how such activities are accounted for and their effect on the Fund's financial positions, performance and cash flows.
The Fund entered into futures contracts to help manage the duration and yield curve positioning of the portfolio while minimizing the exposure to wider bid/ask spreads in traditional bonds. The Fund entered into interest rate and credit default swap contracts in order to obtain a desired return at a lower cost to the Fund, rather than directly investing in an instrument yielding that desired return or to hedge against credit and interest rate risk. The Fund also entered into foreign currency forward contracts to gain exposure to a particular currency or to hedge against the risk of loss due to changing currency exchange rates. These derivatives are not accounted for as hedging instruments.
| 40 | MainStay MacKay Strategic Bond Fund |
Fair value of derivative instruments as of April 30, 2024:
| Asset Derivatives | Interest
Rate
Contracts
Risk | Total |
| Futures Contracts - Net Assets—Net unrealized appreciation on futures contracts (a) | $199,359 | $199,359 |
| Total Fair Value | $199,359 | $199,359 |
| (a) | Includes cumulative appreciation (depreciation) of futures contracts as reported in the Portfolio of Investments. Only current day’s variation margin is reported within the Statement of Assets and Liabilities. |
| Liability Derivatives | Interest
Rate
Contracts
Risk | Total |
| Futures Contracts - Net Assets—Net unrealized depreciation on futures contracts (a) | $(3,749,606) | $(3,749,606) |
| Total Fair Value | $(3,749,606) | $(3,749,606) |
| (a) | Includes cumulative appreciation (depreciation) of futures contracts as reported in the Portfolio of Investments. Only current day’s variation margin is reported within the Statement of Assets and Liabilities. |
The effect of derivative instruments on the Statement of Operations for the six-month period ended April 30, 2024:
| Net Realized Gain (Loss) from: | Interest
Rate
Contracts
Risk | Total |
| Futures Transactions | $232,890 | $232,890 |
| Total Net Realized Gain (Loss) | $232,890 | $232,890 |
| Net Change in Unrealized Appreciation (Depreciation) | Interest
Rate
Contracts
Risk | Total |
| Futures Contracts | $(451,975) | $(451,975) |
| Total Net Change in Unrealized Appreciation (Depreciation) | $(451,975) | $(451,975) |
| Average Notional Amount | Total |
| Futures Contracts Long | $117,429,438 |
| Futures Contracts Short (a) | $ (42,387,959) |
| (a) | Positions were open three months during the reporting period. |
Note 3–Fees and Related Party Transactions
(A) Manager and Subadvisor. New York Life Investments, a registered investment adviser and an indirect, wholly-owned subsidiary of New York Life Insurance Company ("New York Life"), serves as the Fund's Manager, pursuant to an Amended and Restated Management Agreement ("Management Agreement"). The Manager provides offices, conducts clerical, recordkeeping and bookkeeping services and keeps most of the financial and accounting records required to be maintained by the Fund. Except for the portion of salaries and expenses that are the responsibility of the Fund, the Manager pays the salaries and expenses of all personnel
affiliated with the Fund and certain operational expenses of the Fund. The Fund reimburses New York Life Investments in an amount equal to the portion of the compensation of the Chief Compliance Officer attributable to the Fund. MacKay Shields LLC ("MacKay Shields" or the "Subadvisor"), a registered investment adviser and an indirect, wholly-owned subsidiary of New York Life, serves as the Subadvisor to the Fund and is responsible for the day-to-day portfolio management of the Fund. Pursuant to the terms of an Amended and Restated Subadvisory Agreement ("Subadvisory Agreement") between New York Life Investments and MacKay Shields, New York Life Investments pays for the services of the Subadvisor.
Pursuant to the Management Agreement, the Fund pays the Manager a monthly fee for the services performed and the facilities furnished at an annual rate of the Fund’s average daily net assets as follows: 0.60% up to $500 million; 0.55% from $500 million to $1 billion; 0.50% from $1 billion to $5 billion; and 0.475% in excess of $5 billion. During the six-month period ended April 30, 2024, the effective management fee rate was 0.59% of the Fund’s average daily net assets.
Notes to Financial Statements (Unaudited) (continued)
New York Life Investments has contractually agreed to waive fees and/or reimburse expenses so that Total Annual Fund Operating Expenses (excluding taxes, interest expenses (including interest on securities sold short), litigation, extraordinary expenses, brokerage and other transaction expenses relating to the purchase or sale of portfolio investments and acquired (underlying) fund fees and expenses) for Class I shares do not exceed 0.70% of its average daily net assets, and, for Class R6, do not exceed those of Class I. This agreement will remain in effect until February 28, 2025, and shall renew automatically for one-year terms unless New York Life Investments provides written notice of termination prior to the start of the next term or upon approval of the Board.
During the six-month period ended April 30, 2024, New York Life Investments earned fees from the Fund in the amount of $2,006,677 and waived and/or reimbursed in the amount of $205,027 and paid the Subadvisor in the amount of $900,825.
JPMorgan provides sub-administration and sub-accounting services to the Fund pursuant to an agreement with New York Life Investments. These services include calculating the daily NAVs of the Fund, maintaining the general ledger and sub-ledger accounts for the calculation of the Fund's NAVs, and assisting New York Life Investments in conducting various aspects of the Fund's administrative operations. For providing these services to the Fund, JPMorgan is compensated by New York Life Investments.
Pursuant to an agreement between the Trust and New York Life Investments, New York Life Investments is responsible for providing or procuring certain regulatory reporting services for the Fund. The Fund will reimburse New York Life Investments for the actual costs incurred by New York Life Investments in connection with providing or procuring these services for the Fund.
(B) Distribution and Service Fees. The Trust, on behalf of the Fund, has entered into a distribution agreement with NYLIFE Distributors LLC (the “Distributor”), an affiliate of New York Life Investments. The Fund has adopted distribution plans (the “Plans”) in accordance with the provisions of Rule 12b-1 under the 1940 Act.
Pursuant to the Class A, Investor Class and Class R2 Plans, the Distributor receives a monthly fee from the Class A, Investor Class and Class R2 shares at an annual rate of 0.25% of the average daily net assets of the Class A, Investor Class and Class R2 shares for distribution and/or service activities as designated by the Distributor. Pursuant to the Class B and Class C Plans, Class B and Class C shares pay the Distributor a monthly distribution fee at an annual rate of 0.75% of the average daily net assets of the Class B and Class C shares, along with a service fee at an annual rate of 0.25% of the average daily net assets of the Class B and Class C shares, for a total 12b-1 fee of 1.00%. Pursuant to the Class R3 Plan, Class R3 shares pay the Distributor a monthly distribution fee at an annual rate of 0.25% of the average daily net assets of the Class R3 shares, along with a service fee at an annual rate of 0.25% of the average daily net assets of the Class R3 shares, for a total
12b-1 fee of 0.50%. Class I and Class R6 shares are not subject to a distribution and/or service fee.
The Plans provide that the distribution and service fees are payable to the Distributor regardless of the amounts actually expended by the Distributor for distribution of the Fund's shares and service activities.
In accordance with the Shareholder Services Plans for the Class R2 and Class R3 shares, the Manager has agreed to provide, through its affiliates or independent third parties, various shareholder and administrative support services to shareholders of the Class R2 and Class R3 shares. For its services, the Manager, its affiliates or independent third-party service providers are entitled to a shareholder service fee accrued daily and paid monthly at an annual rate of 0.10% of the average daily net assets of the Class R2 and Class R3 shares. This is in addition to any fees paid under the Class R2 and Class R3 Plans.
During the period November 1, 2023 through February 28, 2024, shareholder service fees incurred by the Fund were as follows:
| * | Effective at the close of business on February 20, 2024, all outstanding Class B shares converted into Class A or Investor Class shares pursuant to the applicable conversion schedule and effective February 23, 2024, Class R2 and R3 shares were liquidated. |
(C) Sales Charges. The Fund was advised by the Distributor that the amount of initial sales charges retained on sales of Class A and Investor Class shares during the six-month period ended April 30, 2024, were $7,897 and $543, respectively.
The Fund was also advised that the Distributor retained CDSCs on redemptions of Class A and Class C shares during the six-month period ended April 30, 2024, of $50 and $569, respectively.
(D) Transfer, Dividend Disbursing and Shareholder Servicing Agent. NYLIM Service Company LLC, an affiliate of New York Life Investments, is the Fund's transfer, dividend disbursing and shareholder servicing agent pursuant to an agreement between NYLIM Service Company LLC and the Trust. NYLIM Service Company LLC has entered into an agreement with SS&C Global Investor & Distribution Solutions, Inc. ("SS&C"), pursuant to which SS&C performs certain transfer agent services on behalf of NYLIM Service Company LLC. New York Life Investments has contractually agreed to limit the transfer agency expenses charged to the Fund’s share classes to a maximum of 0.35% of that share class’s average daily net assets on an annual basis after deducting any applicable Fund or class-level expense reimbursement or small account fees. This agreement will remain in effect until February 28, 2025, and shall renew automatically for one-year terms unless New York Life Investments provides written notice of termination prior to the start of the next term or upon approval of the Board. During the six-month period ended April 30, 2024, transfer agent expenses incurred by the Fund and any reimbursements, pursuant to the
| 42 | MainStay MacKay Strategic Bond Fund |
aforementioned Transfer Agency expense limitation agreement, were as follows:
| Class | Expense | Waived |
| Class A | $122,934 | $ — |
| Investor Class | 24,117 | (1,164) |
| Class B* | 476 | (51) |
| Class C | 21,276 | (869) |
| Class I | 326,736 | — |
| Class R2* | 321 | — |
| Class R3* | 132 | — |
| Class R6 | 83 | — |
| * | Effective at the close of business on February 20, 2024, all outstanding Class B shares converted into Class A or Investor Class shares pursuant to the applicable conversion schedule and effective February 23, 2024, Class R2 and R3 shares were liquidated. |
(E) Small Account Fee. Shareholders with small accounts adversely impact the cost of providing transfer agency services. In an effort to reduce total transfer agency expenses, the Fund has implemented a small account fee on certain types of accounts. As described in the Fund's prospectus, certain shareholders with an account balance of less than $1,000 ($5,000 for Class A share accounts) are charged an annual per account fee of $20 (assessed semi-annually), the proceeds from which offset transfer agent fees as reflected in the Statement of Operations. This small account fee will not apply to certain types of accounts as described further in the Fund’s prospectus.
(F) Capital. As of April 30, 2024, New York Life and its affiliates beneficially held shares of the Fund with the values and percentages of net assets as follows:
| Class I | $2,461,383 | 0.5% |
| Class R6 | 29,286 | 0.6 |
Note 4-Federal Income Tax
As of April 30, 2024, the cost and unrealized appreciation (depreciation) of the Fund’s investment portfolio, including applicable derivative contracts and other financial instruments, as determined on a federal income tax basis, were as follows:
| | Federal Tax
Cost | Gross
Unrealized
Appreciation | Gross
Unrealized
(Depreciation) | Net
Unrealized
Appreciation/
(Depreciation) |
| Investments in Securities | $699,704,838 | $9,244,615 | $(35,622,874) | $(26,378,259) |
As of October 31, 2023, for federal income tax purposes, capital loss carryforwards of $199,241,555, as shown in the table below, were available to the extent provided by the regulations to offset future realized gains of the Fund. Accordingly, no capital gains distributions are expected
to be paid to shareholders until net gains have been realized in excess of such amounts.
Capital Loss
Available Through | Short-Term
Capital Loss
Amounts (000’s) | Long-Term
Capital Loss
Amounts (000’s) |
| Unlimited | $26,022 | $173,220 |
During the year ended October 31, 2023, the tax character of distributions paid as reflected in the Statements of Changes in Net Assets was as follows:
| | 2023 |
| Distributions paid from: | |
| Ordinary Income | $31,794,829 |
Note 5–Custodian
JPMorgan is the custodian of cash and securities held by the Fund. Custodial fees are charged to the Fund based on the Fund's net assets and/or the market value of securities held by the Fund and the number of certain transactions incurred by the Fund.
Note 6–Line of Credit
The Fund and certain other funds managed by New York Life Investments maintain a line of credit with a syndicate of banks in order to secure a source of funds for temporary purposes to meet unanticipated or excessive redemption requests.
Effective July 25, 2023, under the credit agreement (the “Credit Agreement”), the aggregate commitment amount is $600,000,000 with an additional uncommitted amount of $100,000,000. The commitment fee is an annual rate of 0.15% of the average commitment amount payable quarterly, regardless of usage, to JPMorgan, who serves as the agent to the syndicate. The commitment fee is allocated among the Fund and certain other funds managed by New York Life Investments based upon their respective net assets and other factors. Interest on any revolving credit loan is charged based upon the Federal Funds Rate, Daily Simple SOFR + 0.10%, or the Overnight Bank Funding Rate, whichever is higher. The Credit Agreement expires on July 23, 2024, although the Fund, certain other funds managed by New York Life Investments and the syndicate of banks may renew the Credit Agreement for an additional year on the same or different terms or enter into a credit agreement with a different syndicate of banks. Prior to July 25, 2023, the aggregate commitment amount and the commitment fee were the same as those under the current Credit Agreement. During the six-month period ended April 30, 2024, there were no borrowings made or outstanding with respect to the Fund under the Credit Agreement.
Note 7–Interfund Lending Program
Pursuant to an exemptive order issued by the SEC, the Fund, along with certain other funds managed by New York Life Investments, may participate in an interfund lending program. The interfund lending
Notes to Financial Statements (Unaudited) (continued)
program provides an alternative credit facility that permits the Fund and certain other funds managed by New York Life Investments to lend or borrow money for temporary purposes directly to or from one another, subject to the conditions of the exemptive order. During the six-month period ended April 30, 2024, there were no interfund loans made or outstanding with respect to the Fund.
Note 8–Purchases and Sales of Securities (in 000’s)
During the six-month period ended April 30, 2024, purchases and sales of U.S. government securities were $148,264 and $142,886, respectively. Purchases and sales of securities, other than U.S. government securities and short-term securities, were $224,996 and $250,709, respectively.
Note 9–Capital Share Transactions
Transactions in capital shares for the six-month period ended April 30, 2024 and the year ended October 31, 2023, were as follows:
| Class A | Shares | Amount |
| Six-month period ended April 30, 2024: | | |
| Shares sold | 1,645,452 | $ 13,843,777 |
| Shares issued to shareholders in reinvestment of distributions | 494,336 | 4,169,839 |
| Shares redeemed | (3,756,575) | (31,310,794) |
| Net increase (decrease) in shares outstanding before conversion | (1,616,787) | (13,297,178) |
| Shares converted into Class A (See Note 1) | 140,752 | 1,190,798 |
| Shares converted from Class A (See Note 1) | (35,820) | (300,949) |
| Net increase (decrease) | (1,511,855) | $ (12,407,329) |
| Year ended October 31, 2023: | | |
| Shares sold | 4,144,382 | $ 33,821,811 |
| Shares issued to shareholders in reinvestment of distributions | 900,510 | 7,387,865 |
| Shares redeemed | (4,890,143) | (40,075,857) |
| Net increase (decrease) in shares outstanding before conversion | 154,749 | 1,133,819 |
| Shares converted into Class A (See Note 1) | 145,028 | 1,189,857 |
| Shares converted from Class A (See Note 1) | (25,889) | (213,426) |
| Net increase (decrease) | 273,888 | $ 2,110,250 |
| |
| Investor Class | Shares | Amount |
| Six-month period ended April 30, 2024: | | |
| Shares sold | 20,765 | $ 177,002 |
| Shares issued to shareholders in reinvestment of distributions | 35,980 | 306,418 |
| Shares redeemed | (107,217) | (908,770) |
| Net increase (decrease) in shares outstanding before conversion | (50,472) | (425,350) |
| Shares converted into Investor Class (See Note 1) | 28,645 | 242,635 |
| Shares converted from Investor Class (See Note 1) | (66,363) | (567,037) |
| Net increase (decrease) | (88,190) | $ (749,752) |
| Year ended October 31, 2023: | | |
| Shares sold | 41,924 | $ 347,440 |
| Shares issued to shareholders in reinvestment of distributions | 68,195 | 564,774 |
| Shares redeemed | (225,662) | (1,871,230) |
| Net increase (decrease) in shares outstanding before conversion | (115,543) | (959,016) |
| Shares converted into Investor Class (See Note 1) | 65,242 | 541,003 |
| Shares converted from Investor Class (See Note 1) | (71,152) | (589,109) |
| Net increase (decrease) | (121,453) | $ (1,007,122) |
| |
| Class B | Shares | Amount |
| Six-month period ended April 30, 2024: (a) | | |
| Shares sold | 25 | $ 208 |
| Shares issued to shareholders in reinvestment of distributions | 570 | 4,782 |
| Shares redeemed | (8,871) | (74,611) |
| Net increase (decrease) in shares outstanding before conversion | (8,276) | (69,621) |
| Shares converted from Class B (See Note 1) | (59,220) | (496,462) |
| Net increase (decrease) | (67,496) | $ (566,083) |
| Year ended October 31, 2023: | | |
| Shares sold | 905 | $ 7,420 |
| Shares issued to shareholders in reinvestment of distributions | 3,214 | 26,255 |
| Shares redeemed | (60,188) | (490,718) |
| Net increase (decrease) in shares outstanding before conversion | (56,069) | (457,043) |
| Shares converted from Class B (See Note 1) | (44,394) | (362,382) |
| Net increase (decrease) | (100,463) | $ (819,425) |
| |
| 44 | MainStay MacKay Strategic Bond Fund |
| Class C | Shares | Amount |
| Six-month period ended April 30, 2024: | | |
| Shares sold | 137,268 | $ 1,143,688 |
| Shares issued to shareholders in reinvestment of distributions | 25,812 | 216,384 |
| Shares redeemed | (382,978) | (3,194,796) |
| Net increase (decrease) in shares outstanding before conversion | (219,898) | (1,834,724) |
| Shares converted from Class C (See Note 1) | (38,508) | (323,274) |
| Net increase (decrease) | (258,406) | $ (2,157,998) |
| Year ended October 31, 2023: | | |
| Shares sold | 238,636 | $ 1,942,371 |
| Shares issued to shareholders in reinvestment of distributions | 64,957 | 529,902 |
| Shares redeemed | (1,293,692) | (10,548,035) |
| Net increase (decrease) in shares outstanding before conversion | (990,099) | (8,075,762) |
| Shares converted from Class C (See Note 1) | (94,324) | (770,651) |
| Net increase (decrease) | (1,084,423) | $ (8,846,413) |
| |
| Class I | Shares | Amount |
| Six-month period ended April 30, 2024: | | |
| Shares sold | 9,156,622 | $ 77,126,411 |
| Shares issued to shareholders in reinvestment of distributions | 1,319,304 | 11,141,007 |
| Shares redeemed | (13,154,214) | (110,596,283) |
| Net increase (decrease) in shares outstanding before conversion | (2,678,288) | (22,328,865) |
| Shares converted into Class I (See Note 1) | 39,390 | 331,727 |
| Shares converted from Class I (See Note 1) | (7,950) | (67,410) |
| Net increase (decrease) | (2,646,848) | $ (22,064,548) |
| Year ended October 31, 2023: | | |
| Shares sold | 24,753,093 | $ 203,140,277 |
| Shares issued to shareholders in reinvestment of distributions | 2,321,193 | 19,064,568 |
| Shares redeemed | (22,915,910) | (187,890,601) |
| Net increase (decrease) in shares outstanding before conversion | 4,158,376 | 34,314,244 |
| Shares converted into Class I (See Note 1) | 31,439 | 260,010 |
| Shares converted from Class I (See Note 1) | (6,780) | (55,302) |
| Net increase (decrease) | 4,183,035 | $ 34,518,952 |
| |
| Class R2 | Shares | Amount |
| Six-month period ended April 30, 2024: (b) | | |
| Shares sold | 189 | $ 1,532 |
| Shares issued to shareholders in reinvestment of distributions | 998 | 8,420 |
| Shares redeemed | (133,129) | (1,110,621) |
| Net increase (decrease) | (131,942) | $ (1,100,669) |
| Year ended October 31, 2023: | | |
| Shares sold | 14,150 | $ 116,117 |
| Shares issued to shareholders in reinvestment of distributions | 5,559 | 45,621 |
| Shares redeemed | (11,519) | (94,722) |
| Net increase (decrease) | 8,190 | $ 67,016 |
| |
| Class R3 | Shares | Amount |
| Six-month period ended April 30, 2024: (b) | | |
| Shares sold | 517 | $ 4,254 |
| Shares issued to shareholders in reinvestment of distributions | 428 | 3,606 |
| Shares redeemed | (45,936) | (389,726) |
| Net increase (decrease) in shares outstanding before conversion | (44,991) | (381,866) |
| Shares converted from Class R3 (See Note 1) | (1,183) | (10,028) |
| Net increase (decrease) | (46,174) | $ (391,894) |
| Year ended October 31, 2023: | | |
| Shares sold | 12,072 | $ 99,196 |
| Shares issued to shareholders in reinvestment of distributions | 1,671 | 13,710 |
| Shares redeemed | (30,618) | (252,824) |
| Net increase (decrease) | (16,875) | $ (139,918) |
| |
| Class R6 | Shares | Amount |
| Six-month period ended April 30, 2024: | | |
| Shares sold | 121,977 | $ 1,035,368 |
| Shares issued to shareholders in reinvestment of distributions | 13,320 | 112,806 |
| Shares redeemed | (72,324) | (613,277) |
| Net increase (decrease) | 62,973 | $ 534,897 |
| Year ended October 31, 2023: | | |
| Shares sold | 371,977 | $ 3,063,577 |
| Shares issued to shareholders in reinvestment of distributions | 12,123 | 99,584 |
| Shares redeemed | (64,521) | (530,991) |
| Net increase (decrease) | 319,579 | $ 2,632,170 |
| (a) | Class B shares converted into Class A or Investor Class shares pursuant to the applicable conversion schedule and are no longer offered for sale as of February 20, 2024. |
| (b) | Class liquidated and is no longer offered for sale as of February 23, 2024. |
Notes to Financial Statements (Unaudited) (continued)
Note 10–Other Matters
As of the date of this report, the Fund faces a heightened level of risk associated with current uncertainty, volatility and state of economies, financial markets, a high interest rate environment, and labor and health conditions around the world. Events such as war, acts of terrorism, recessions, rapid inflation, the imposition of economic sanctions, earthquakes, hurricanes, epidemics and pandemics and other unforeseen natural or human disasters may have broad adverse social, political and economic effects on the global economy, which could negatively impact the value of the Fund's investments. Developments that disrupt global economies and financial markets may magnify factors that affect the Fund's performance.
Note 11–Subsequent Events
In connection with the preparation of the financial statements of the Fund as of and for the six-month period ended April 30, 2024, events and transactions subsequent to April 30, 2024, through the date the financial statements were issued, have been evaluated by the Manager for possible adjustment and/or disclosure. No subsequent events requiring financial statement adjustment or disclosure have been identified.
| 46 | MainStay MacKay Strategic Bond Fund |
Board Consideration and Approval of Management Agreement and Subadvisory Agreement (Unaudited)
The continuation of the Management Agreement with respect to the MainStay MacKay Strategic Bond Fund (“Fund”) and New York Life Investment Management LLC (“New York Life Investments”) and the Subadvisory Agreement between New York Life Investments and MacKay Shields LLC (“MacKay”) with respect to the Fund (together, “Advisory Agreements”) is subject to annual review and approval by the Board of Trustees of The MainStay Funds (“Board” of the “Trust”) in accordance with Section 15 of the Investment Company Act of 1940, as amended (“1940 Act”). At its December 6–7, 2023 meeting, the Board, including the Trustees who are not an “interested person” (as such term is defined in the 1940 Act) of the Trust (“Independent Trustees”) voting separately, unanimously approved the continuation of each of the Advisory Agreements for a one-year period.
In reaching the decision to approve the continuation of each of the Advisory Agreements, the Board considered information and materials furnished by New York Life Investments and MacKay in connection with an annual contract review process undertaken by the Board that took place at meetings of the Board and its Contracts Committee from September 2023 through December 2023, including information and materials furnished by New York Life Investments and MacKay in response to requests prepared on behalf of the Board, and in consultation with the Independent Trustees, by independent legal counsel to the Independent Trustees, which encompassed a variety of topics, including those summarized below. Information and materials requested by and furnished to the Board for consideration in connection with the contract review process included, among other items, reports on the Fund and “peer funds” prepared by Institutional Shareholder Services Inc. (“ISS”), an independent third-party service provider engaged by the Board to report objectively on the Fund’s investment performance, management fee and total expenses. The Board also considered information on the fees charged to other investment advisory clients of New York Life Investments and/or MacKay that follow investment strategies similar to those of the Fund, if any, and, when applicable, the rationale for differences in the Fund’s management and subadvisory fees and the fees charged to those other investment advisory clients. In addition, the Board considered information regarding the legal standards and fiduciary obligations applicable to its consideration of the continuation of each of the Advisory Agreements. The contract review process, including the structure and format for information and materials provided to the Board, has been developed in consultation with the Board. The Independent Trustees also met in executive sessions with their independent legal counsel and, for portions thereof, with senior management of New York Life Investments.
The Board’s deliberations with respect to the continuation of each of the Advisory Agreements reflect a year-long process, and the Board also took into account information furnished to the Board and its Committees throughout the year, as deemed relevant and appropriate by the Trustees, including, among other items, reports on investment performance of the Fund and investment-related matters for the Fund as well as presentations from New York Life Investments and, generally annually, MacKay personnel. In addition, the Board took into account other
information provided by New York Life Investments throughout the year, including, among other items, periodic reports on legal and compliance matters, risk management, portfolio turnover, brokerage commissions and non-advisory services provided to the Fund by New York Life Investments, as deemed relevant and appropriate by the Trustees.
In addition to information provided to the Board throughout the year, the Board received information in connection with its June 2023 meeting provided specifically in response to requests prepared on behalf of the Board, and in consultation with the Independent Trustees, by independent legal counsel to the Independent Trustees regarding the Fund’s distribution arrangements. In addition, the Board received information regarding the Fund’s asset levels, share purchase and redemption activity and the payment of Rule 12b-1 and/or certain other fees by the applicable share classes of the Fund, among other information.
In considering the continuation of each of the Advisory Agreements, the Trustees reviewed and evaluated the information and factors they believed to reasonably be necessary and appropriate in light of legal advice furnished to them by independent legal counsel to the Independent Trustees and through the exercise of their own business judgment. Although individual Trustees may have weighed certain factors or information differently and the Board did not consider any single factor or information controlling in reaching its decision, the factors that figured prominently in the Board’s consideration of the continuation of each of the Advisory Agreements are summarized in more detail below and include, among other factors: (i) the nature, extent and quality of the services provided to the Fund by New York Life Investments and MacKay; (ii) the qualifications of the portfolio managers of the Fund and the historical investment performance of the Fund, New York Life Investments and MacKay; (iii) the costs of the services provided, and profits realized, by New York Life Investments and MacKay with respect to their relationships with the Fund; (iv) the extent to which economies of scale have been realized or may be realized if the Fund grows and the extent to which any economies of scale have been shared, have benefited or may benefit the Fund’s shareholders; and (v) the reasonableness of the Fund’s management and subadvisory fees and total ordinary operating expenses. Although the Board recognized that comparisons between the Fund’s fees and expenses and those of other funds are imprecise given different terms of agreements, variations in fund strategies and other factors, the Board considered the reasonableness of the Fund’s management fee and total ordinary operating expenses as compared to the peer funds identified by ISS. Throughout their considerations, the Trustees acknowledged the commitment of New York Life Investments and its affiliates to serve the MainStay Group of Funds, as well as their capacity, experience, resources, financial stability and reputations. The Trustees also acknowledged the entrepreneurial and other risks assumed by New York Life Investments in sponsoring and managing the Fund. With respect to the Subadvisory Agreement, the Board took into account New York Life Investments’ recommendation to approve the continuation of the Subadvisory Agreement.
Board Consideration and Approval of Management Agreement and Subadvisory Agreement (Unaudited) (continued)
The Trustees noted that, throughout the year, the Trustees are afforded an opportunity to ask questions of, and request additional information or materials from, New York Life Investments and MacKay. The Board’s decision with respect to each of the Advisory Agreements may have also been based, in part, on the Board’s knowledge of New York Life Investments and MacKay resulting from, among other things, the Board’s consideration of each of the Advisory Agreements in prior years, the advisory agreements for other funds in the MainStay Group of Funds, the Board’s review throughout the year of the performance and operations of other funds in the MainStay Group of Funds and each Trustee’s business judgment and industry experience. In addition to considering the above-referenced factors, the Board observed that in the marketplace there are a range of investment options available to investors and that the Fund’s shareholders, having had the opportunity to consider other investment options, have invested in the Fund.
The factors that figured prominently in the Board’s decision to approve the continuation of each of the Advisory Agreements during the Board’s December 6–7, 2023 meeting are summarized in more detail below.
Nature, Extent and Quality of Services Provided by New York Life Investments and MacKay
The Board examined the nature, extent and quality of the services that New York Life Investments provides to the Fund. The Board evaluated New York Life Investments’ experience and capabilities in serving as manager of the Fund and considered that the Fund operates in a “manager-of-managers” structure. The Board also considered New York Life Investments’ responsibilities and services provided pursuant to this structure, including overseeing the services provided by MacKay, evaluating the performance of MacKay, making recommendations to the Board as to whether the Subadvisory Agreement should be renewed, modified or terminated and periodically reporting to the Board regarding the results of New York Life Investments’ evaluation and monitoring functions. The Board noted that New York Life Investments manages other mutual funds, serves a variety of other investment advisory clients, including other pooled investment vehicles, and has experience overseeing mutual fund service providers, including subadvisors. The Board considered the experience of senior personnel at New York Life Investments providing management and administrative and other non-advisory services to the Fund. The Board observed that New York Life Investments devotes significant resources and time to providing management and administrative and other non-advisory services to the Fund, including New York Life Investments’ oversight and due diligence reviews of MacKay and ongoing analysis of, and interactions with, MacKay with respect to, among other things, the Fund’s investment performance and risks as well as MacKay’s investment capabilities and subadvisory services with respect to the Fund.
The Board also considered the range of services that New York Life Investments provides to the Fund under the terms of the Management Agreement, including: (i) fund accounting and ongoing supervisory services provided by New York Life Investments’ Fund Administration and Accounting Group; (ii) investment supervisory and analytical services
provided by New York Life Investments’ Investment Consulting Group; (iii) compliance services provided by the Trust’s Chief Compliance Officer as well as New York Life Investments’ compliance department, including supervision and implementation of the Fund’s compliance program; (iv) legal services provided by New York Life Investments’ Office of the General Counsel; and (v) risk management monitoring and analysis by compliance and investment personnel. In addition, the Board considered New York Life Investments’ willingness to invest in personnel and other resources, such as cyber security, information security and business continuity planning, that may benefit the Fund and noted that New York Life Investments is responsible for compensating the Trust’s officers, except for a portion of the salary of the Trust’s Chief Compliance Officer. The Board recognized that New York Life Investments provides certain other non-advisory services to the Fund and has over time provided an increasingly broad array of non-advisory services to the MainStay Group of Funds as a result of regulatory and other developments.
The Board also examined the range, and the nature, extent and quality, of the investment advisory services that MacKay provides to the Fund and considered the terms of each of the Advisory Agreements. The Board evaluated MacKay’s experience and performance in serving as subadvisor to the Fund and advising other portfolios and MacKay’s track record and experience in providing investment advisory services as well as the experience of investment advisory, senior management and/or administrative personnel at MacKay. The Board considered New York Life Investments’ and MacKay’s overall resources, legal and compliance environment, capabilities, reputation, financial condition and history. In addition to information provided in connection with quarterly meetings with the Trust’s Chief Compliance Officer, the Board considered information regarding the compliance policies and procedures of New York Life Investments and MacKay and acknowledged their commitment to further developing and strengthening compliance programs that may relate to the Fund. The Board also considered MacKay’s ability to recruit and retain qualified investment professionals and willingness to invest in personnel and other resources that may benefit the Fund. In this regard, the Board considered the qualifications and experience of the Fund’s portfolio managers, the number of accounts managed by the portfolio managers and the method for compensating the portfolio managers.
In addition, the Board considered information provided by New York Life Investments and MacKay regarding their respective business continuity and disaster recovery plans.
Based on these considerations, among others, the Board concluded that the Fund would likely continue to benefit from the nature, extent and quality of these services.
Investment Performance
In evaluating the Fund’s investment performance, the Board considered investment performance results over various periods in light of the Fund’s investment objective, strategies and risks. The Board considered investment reports on, and analysis of, the Fund’s performance provided to the Board throughout the year. These reports include, among other
| 48 | MainStay MacKay Strategic Bond Fund |
items, information on the Fund’s gross and net returns, the Fund’s investment performance compared to a relevant investment category and the Fund’s benchmarks, the Fund’s risk-adjusted investment performance and the Fund’s investment performance as compared to peer funds, as appropriate, as well as portfolio attribution information and commentary on the effect of market conditions. The Board also considered information provided by ISS showing the investment performance of the Fund as compared to peer funds. In addition, the Board reviewed the methodology used by ISS to construct the group of peer funds for comparative purposes.
The Board also took into account its discussions with senior management at New York Life Investments concerning the Fund’s investment performance over various periods as well as discussions between representatives of MacKay and the members of the Board’s Investment Committee, which generally occur on an annual basis.
Based on these considerations, among others, the Board concluded that its review of the Fund’s investment performance and related information supported a determination to approve the continuation of each of the Advisory Agreements.
Costs of the Services Provided, and Profits and Other Benefits Realized, by New York Life Investments and MacKay
The Board considered the costs of the services provided under each of the Advisory Agreements. The Board also considered the profitability of New York Life Investments and its affiliates, including MacKay, due to their relationships with the Fund as well as of New York Life Investments and its affiliates due to their relationships with the MainStay Group of Funds. Because MacKay is an affiliate of New York Life Investments whose subadvisory fee is paid by New York Life Investments, not the Fund, the Board considered cost and profitability information for New York Life Investments and MacKay in the aggregate.
In addition, the Board acknowledged the difficulty in obtaining reliable comparative data about mutual fund managers’ profitability because such information generally is not publicly available and may be impacted by numerous factors, including the structure of a fund manager’s organization, the types of funds it manages, the methodology used to allocate certain fixed costs to specific funds and the manager’s capital structure and costs of capital.
In evaluating the costs of the services provided by New York Life Investments and MacKay, and profitability of New York Life Investments and its affiliates, including MacKay, due to their relationships with the Fund, the Board considered, among other factors, New York Life Investments’ and its affiliates’, including MacKay’s, continuing investments in, or willingness to invest in, personnel and other resources that may support and further enhance the management of the Fund, and that New York Life Investments is responsible for paying the subadvisory fee for the Fund. The Board also considered the financial resources of New York Life Investments and MacKay and acknowledged that New York Life Investments and MacKay must be in a position to recruit and retain experienced professional personnel and to maintain a strong financial
position for New York Life Investments and MacKay to continue to provide high-quality services to the Fund. The Board recognized that the Fund benefits from the allocation of certain fixed costs among the funds in the MainStay Group of Funds, among other expected benefits resulting from its relationship with New York Life Investments.
The Board considered information regarding New York Life Investments’ methodology for calculating profitability and allocating costs provided by New York Life Investments in connection with the fund profitability analysis presented to the Board. The Board concluded that New York Life Investments’ methods for allocating costs and procedures for estimating overall profitability of the relationship with the funds in the MainStay Group of Funds were reasonable. The Board recognized the difficulty in calculating and evaluating a manager’s profitability with respect to the Fund and considered that other profitability methodologies may also be reasonable.
The Board also considered certain fall-out benefits that may be realized by New York Life Investments and its affiliates, including MacKay, due to their relationships with the Fund, including reputational and other indirect benefits. The Board recognized, for example, the benefits to MacKay from legally permitted “soft-dollar” arrangements by which brokers provide research and other services to MacKay in exchange for commissions paid by the Fund with respect to trades in the Fund’s portfolio securities. In addition, the Board considered its review of the management agreement for a money market fund advised by New York Life Investments and an affiliated subadvisor that serves as an investment option for the Fund, including the potential rationale for and costs associated with investments in this money market fund by the Fund, if any, and considered information from New York Life Investments that the nature and type of specific investment advisory services provided to this money market fund are distinct from, or in addition to, the investment advisory services provided to the Fund.
The Board observed that, in addition to fees earned by New York Life Investments under the Management Agreement for managing the Fund, New York Life Investments’ affiliates also earn revenues from serving the Fund in various other capacities, including as the Fund’s transfer agent and distributor. The Board considered information about these other revenues and their impact on the profitability of the relationship with the Fund to New York Life Investments and its affiliates. The Board noted that, although it assessed the overall profitability of the relationship with the Fund to New York Life Investments and its affiliates as part of the contract review process, when considering the reasonableness of the fee paid to New York Life Investments under the Management Agreement, the Board considered the profitability of New York Life Investments’ relationship with the Fund on a pre-tax basis and without regard to distribution expenses incurred by New York Life Investments from its own resources.
Board Consideration and Approval of Management Agreement and Subadvisory Agreement (Unaudited) (continued)
After evaluating the information deemed relevant by the Trustees, the Board concluded that any profits realized by New York Life Investments and its affiliates, including MacKay, due to their relationships with the Fund were not excessive and other expected benefits that may accrue to New York Life Investments and its affiliates, including MacKay, are reasonable.
Management and Subadvisory Fees and Total Ordinary Operating Expenses
The Board evaluated the reasonableness of the fee paid under each of the Advisory Agreements and the Fund’s total ordinary operating expenses. With respect to the management fee and subadvisory fee, the Board primarily considered the reasonableness of the management fee paid by the Fund to New York Life Investments because the subadvisory fee paid to MacKay is paid by New York Life Investments, not the Fund. The Board also considered the reasonableness of the subadvisory fee paid by New York Life Investments and the amount of the management fee retained by New York Life Investments.
In assessing the reasonableness of the Fund’s fees and expenses, the Board primarily considered comparative data provided by ISS on the fees and expenses of similar mutual funds managed by other investment advisers. The Board reviewed the methodology used by ISS to construct the group of peer funds for comparative purposes. In addition, the Board considered information provided by New York Life Investments and MacKay on fees charged to other investment advisory clients, including institutional separate accounts and/or other funds, that follow investment strategies similar to those of the Fund, if any. The Board considered the contractual management fee schedule for the Fund as compared to those for such other investment advisory clients, taking into account the rationale for differences in fee schedules. The Board also took into account information provided by New York Life Investments about the more extensive scope of services provided to registered investment companies, such as the Fund, as compared with other investment advisory clients. Additionally, the Board considered the impact of contractual breakpoints, voluntary waivers and expense limitation arrangements on the Fund’s net management fee and expenses. The Board also considered that in proposing fees for the Fund, New York Life Investments considers the competitive marketplace for mutual funds.
The Board took into account information from New York Life Investments, as provided in connection with the Board’s June 2023 meeting, regarding the reasonableness of the Fund’s transfer agent fee schedule, including industry data demonstrating that the fees that NYLIM Service Company LLC, an affiliate of New York Life Investments and the Fund’s transfer agent, charges the Fund are within the range of fees charged by transfer agents to other mutual funds. In addition, the Board considered NYLIM Service Company LLC’s profitability in connection with the transfer agent services it provides to the Fund. The Board also took into account information provided by NYLIM Service Company LLC regarding the sub-transfer agency payments it made to intermediaries in connection with the provision of sub-transfer agency services to the Fund.
The Board considered the extent to which transfer agent fees contributed to the total expenses of the Fund. The Board acknowledged the role that the MainStay Group of Funds historically has played in serving the investment needs of New York Life Insurance Company customers, who often maintain smaller account balances than other shareholders of funds, and the impact of small accounts on the expense ratios of Fund share classes. The Board also recognized measures that it and New York Life Investments have taken that are intended to mitigate the effect of small accounts on the expense ratios of Fund share classes, including through the imposition of an expense limitation on net transfer agency expenses. The Board also considered that NYLIM Service Company LLC had waived its contractual cost of living adjustments during certain years.
Based on the factors outlined above, among other considerations, the Board concluded that the Fund’s management fee and total ordinary operating expenses are within a range that is competitive and support a conclusion that these fees and expenses are reasonable.
Economies of Scale
The Board considered information regarding economies of scale, including whether economies of scale may exist with respect to the Fund and whether the Fund’s management fee and expense structure permits any economies of scale to be appropriately shared with the Fund’s shareholders. The Board also considered a report from New York Life Investments, previously prepared at the request of the Board, that addressed economies of scale, including with respect to the mutual fund business generally, and the various ways in which the benefits of economies of scale may be shared with the funds in the MainStay Group of Funds. Although the Board recognized the difficulty of determining economies of scale with precision, the Board acknowledged that economies of scale may be shared with the Fund in a number of ways, including, for example, through the imposition of fee breakpoints, initially setting management fee rates at scale or making additional investments to enhance the services provided to the Fund. The Board reviewed information from New York Life Investments showing how the Fund’s management fee schedule compared to fee schedules of other funds and accounts managed by New York Life Investments. The Board also reviewed information from ISS showing how the Fund’s management fee schedule compared with fees paid for similar services by peer funds at varying asset levels.
Based on this information, the Board concluded that economies of scale are appropriately shared for the benefit of the Fund’s shareholders through the Fund’s management fee and expense structure and other methods to share benefits from economies of scale.
Conclusion
On the basis of the information and factors summarized above, among other information and factors deemed relevant by the Trustees, and the evaluation thereof, the Board, including the Independent Trustees voting separately, unanimously voted to approve the continuation of each of the Advisory Agreements.
| 50 | MainStay MacKay Strategic Bond Fund |
Discussion of the Operation and Effectiveness of the Fund's Liquidity Risk Management Program (Unaudited)
In compliance with Rule 22e-4 under the Investment Company Act of 1940, as amended (the “Liquidity Rule”), the Fund has adopted and implemented a liquidity risk management program (the “Program”), which New York Life Investment Management LLC believes is reasonably designed to assess and manage the Fund's liquidity risk. A Fund's liquidity risk is the risk that the Fund could not meet requests to redeem shares issued by the Fund without significant dilution of the remaining investors’ interests in the Fund. The Board of Trustees of The MainStay Funds (the "Board") previously approved the designation of New York Life Investment Management LLC as administrator of the Program (the “Administrator”). The Administrator has established a Liquidity Risk Management Committee to assist the Administrator in the implementation and day-to-day administration of the Program and to otherwise support the Administrator in fulfilling its responsibilities under the Program.
At a meeting of the Board held on February 27, 2024, the Administrator provided the Board with a written report addressing the Program’s operation and assessing the adequacy and effectiveness of its implementation for the period from January 1, 2023, through December 31, 2023 (the "Review Period"), as required under the Liquidity Rule. The report noted that the Administrator concluded that (i) the Program operated effectively to assess and manage the Fund's liquidity risk, (ii) the Program has been and continues to be adequately and effectively implemented to monitor and, as applicable, respond to the Fund's liquidity developments and (iii) the Fund's investment strategy continues to be appropriate for an open-end fund. In addition, the report summarized the operation of the Program and the information and factors considered by the Administrator in its assessment of the Program’s implementation, such as the liquidity risk assessment framework and the liquidity classification methodologies, and discussed notable geopolitical, market and other economic events that impacted liquidity risk during the Review Period.
In accordance with the Program, the Fund's liquidity risk is assessed no less frequently than annually taking into consideration certain factors, as applicable, such as (i) investment strategy and liquidity of portfolio investments, (ii) short-term and long-term cash flow projections, and (iii) holdings of cash and cash equivalents, as well as borrowing arrangements and other funding sources. Certain factors are considered under both normal and reasonably foreseeable stressed conditions.
Each Fund portfolio investment is classified into one of four liquidity categories. The classification is based on a determination of the number of days it is reasonably expected to take to convert the investment into cash, or sell or dispose of the investment, in current market conditions without significantly changing the market value of the investment. The Administrator has delegated liquidity classification determinations to the Fund’s subadvisor, subject to appropriate oversight by the Administrator, and liquidity classification determinations are made by taking into account the Fund's reasonably anticipated trade size, various market, trading and investment-specific considerations, as well as market depth, and, in certain cases, third-party vendor data.
The Liquidity Rule requires funds that do not primarily hold assets that are highly liquid investments to adopt a minimum amount of net assets that must be invested in highly liquid investments that are assets (an “HLIM”). In addition, the Liquidity Rule limits a fund's investments in illiquid investments. Specifically, the Liquidity Rule prohibits acquisition of illiquid investments if, immediately after acquisition, doing so would result in a fund holding more than 15% of its net assets in illiquid investments that are assets. The Program includes provisions reasonably designed to determine, periodically review and comply with the HLIM requirement, as applicable, and to comply with the 15% limit on illiquid investments.
There can be no assurance that the Program will achieve its objectives under all circumstances in the future. Please refer to the Fund's prospectus for more information regarding the Fund's exposure to liquidity risk and other risks to which it may be subject.
Proxy Voting Policies and Procedures and Proxy Voting Record
The Fund is required to file with the SEC its proxy voting record for the 12-month period ending June 30 on Form N-PX. A description of the policies and procedures that are used to vote proxies relating to portfolio securities of the Fund is available free of charge upon request by calling 800-624-6782 or visiting the SEC’s website at www.sec.gov. The most recent Form N-PX or proxy voting record is available free of charge upon request by calling 800-624-6782; visiting newyorklifeinvestments.com; or visiting the SEC’s website at www.sec.gov.
Shareholder Reports and Quarterly Portfolio Disclosure
The Fund is required to file its complete schedule of portfolio holdings with the SEC 60 days after its first and third fiscal quarter on Form N-PORT. The Fund's holdings report is available free of charge upon request by calling New York Life Investments at 800-624-6782.
| 52 | MainStay MacKay Strategic Bond Fund |
This page intentionally left blank.
This page intentionally left blank.
Equity
U.S. Equity
MainStay Epoch U.S. Equity Yield Fund
MainStay Fiera SMID Growth Fund
MainStay PineStone U.S. Equity Fund
MainStay S&P 500 Index Fund
MainStay Winslow Large Cap Growth Fund
MainStay WMC Enduring Capital Fund
MainStay WMC Growth Fund
MainStay WMC Small Companies Fund
MainStay WMC Value Fund
International Equity
MainStay Epoch International Choice Fund
MainStay PineStone International Equity Fund
MainStay WMC International Research Equity Fund
Emerging Markets Equity
MainStay Candriam Emerging Markets Equity Fund
Global Equity
MainStay Epoch Capital Growth Fund
MainStay Epoch Global Equity Yield Fund
MainStay PineStone Global Equity Fund
Fixed Income
Taxable Income
MainStay Candriam Emerging Markets Debt Fund
MainStay Floating Rate Fund
MainStay MacKay High Yield Corporate Bond Fund
MainStay MacKay Short Duration High Income Fund
MainStay MacKay Strategic Bond Fund
MainStay MacKay Total Return Bond Fund
MainStay MacKay U.S. Infrastructure Bond Fund
MainStay Short Term Bond Fund
Tax-Exempt Income
MainStay MacKay Arizona Muni Fund
MainStay MacKay California Tax Free Opportunities Fund1
MainStay MacKay Colorado Muni Fund
MainStay MacKay High Yield Municipal Bond Fund
MainStay MacKay New York Tax Free Opportunities Fund2
MainStay MacKay Oregon Muni Fund
MainStay MacKay Short Term Municipal Fund
MainStay MacKay Strategic Municipal Allocation Fund
MainStay MacKay Tax Free Bond Fund
MainStay MacKay Utah Muni Fund
Money Market
MainStay Money Market Fund
Mixed Asset
MainStay Balanced Fund
MainStay Income Builder Fund
MainStay MacKay Convertible Fund
Speciality
MainStay CBRE Global Infrastructure Fund
MainStay CBRE Real Estate Fund
MainStay Cushing MLP Premier Fund
Asset Allocation
MainStay Conservative Allocation Fund
MainStay Conservative ETF Allocation Fund
MainStay Equity Allocation Fund
MainStay Equity ETF Allocation Fund
MainStay Growth Allocation Fund
MainStay Growth ETF Allocation Fund
MainStay Moderate Allocation Fund
MainStay Moderate ETF Allocation Fund
Manager
New York Life Investment Management LLC
New York, New York
Subadvisors
Candriam3
Strassen, Luxembourg
CBRE Investment Management Listed Real Assets LLC
Radnor, Pennsylvania
Cushing Asset Management, LP
Dallas, Texas
Epoch Investment Partners, Inc.
New York, New York
Fiera Capital Inc.
New York, New York
IndexIQ Advisors LLC3
New York, New York
MacKay Shields LLC3
New York, New York
NYL Investors LLC3
New York, New York
PineStone Asset Management Inc.
Montreal, Québec
Wellington Management Company LLP
Boston, Massachusetts
Winslow Capital Management, LLC
Minneapolis, Minnesota
Legal Counsel
Dechert LLP
Washington, District of Columbia
Independent Registered Public Accounting Firm
KPMG LLP
Philadelphia, Pennsylvania
Distributor
NYLIFE Distributors LLC3
Jersey City, New Jersey
Custodian
JPMorgan Chase Bank, N.A.
New York, New York
1.
This Fund is registered for sale in AZ, CA, NV, OR, TX, UT, WA (all share classes); and MI (Class A and Class I shares only); and CO, FL, GA, HI, ID, MA, MD, NH, NJ and NY (Class I and Class C2 shares only).
| 2. | This Fund is registered for sale in CA, CT, DE, FL, MA, NJ, NY, VT (all share classes) and SD (Class R6 shares only). |
| 3. | An affiliate of New York Life Investment Management LLC. |
Not part of the Semiannual Report
For more information
800-624-6782
newyorklifeinvestments.com
“New York Life Investments” is both a service mark, and the common trade name, of certain investment advisors affiliated with New York Life Insurance Company. The MainStay Funds® are managed by New York Life Investment Management LLC and distributed by NYLIFE Distributors LLC, 30 Hudson Street, Jersey City, NJ 07302, a wholly owned subsidiary of New York Life Insurance Company. NYLIFE Distributors LLC is a Member FINRA/SIPC.
©2024 NYLIFE Distributors LLC. All rights reserved.
| 5022154 MS081-24 | MSSB10-06/24 |
(NYLIM) NL052
MainStay MacKay Tax Free Bond Fund
Message from the President and Semiannual Report
Unaudited | April 30, 2024
Special Notice:
Beginning in July 2024, new regulations issued by the Securities and Exchange Commission (SEC) will take effect requiring open-end mutual fund companies and ETFs to (1) overhaul the content of their shareholder reports and (2) mail paper copies of the new tailored shareholder reports to shareholders who have not opted to receive these documents electronically.
If you have not yet elected to receive your shareholder reports electronically, please contact your financial intermediary or visit newyorklifeinvestments.com/accounts.
| Not FDIC/NCUA Insured | Not a Deposit | May Lose Value | No Bank Guarantee | Not Insured by Any Government Agency |
This page intentionally left blank
Message from the President
Stock and bond markets gained broad ground during the six-month period ended April 30, 2024, bolstered by better-than-expected economic growth and the prospect of monetary easing in the face of a myriad of macroeconomic and geopolitical challenges.
Throughout the reporting period, interest rates remained at their highest levels in decades in most developed countries, with the U.S. federal funds rate in the 5.25%−5.50% range, as central banks struggled to bring inflation under control. Early in the reporting period, the U.S. Federal Reserve began to forecast interest rate cuts in 2024, but delayed action as inflation remained stubbornly high, fluctuating between 3.1% and 3.5%. Nevertheless, despite the increasing cost of capital and tighter lending environment that resulted from sustained high rates, economic growth remained surprisingly robust, supported by high levels of consumer spending, low unemployment and strong corporate earnings. Investors tended to shrug off concerns related to sticky inflation and high interest rates—not to mention the ongoing war in Ukraine, intensifying hostilities in the Middle East and simmering tensions between China and the United States—focusing instead on the positives of continued economic growth and surprisingly strong corporate profits.
The S&P 500® Index, a widely regarded benchmark of U.S. market performance, produced double-digit gains, reaching record levels in March 2024. Market strength, which had been narrowly focused on mega-cap, technology-related stocks during the previous six months broadened significantly during the reporting period. All industry sectors produced positive results, with the strongest returns in communication services, information technology and industrials, and more moderate gains in the lagging energy, real estate and consumer staples areas. Growth-oriented shares slightly outperformed value-oriented
issues, while large- and mid-cap stocks modestly outperformed their small-cap counterparts. Most overseas equity markets trailed the U.S. market, as developed international economies experienced relatively low growth rates, and weak economic conditions in China undermined emerging markets.
Bonds generally gained ground as well. The yield on the 10-year Treasury note ranged between approximately 4.7% and 3.8%, while the 2-year Treasury yield remained slightly higher, between approximately 5.0% and 4.1%, in an inverted curve pattern often viewed as indicative of an impending economic slowdown. Nevertheless, the prevailing environment of stable interest rates and attractive yields provided a favorable environment for fixed-income investors. Long-term Treasury bonds and investment-grade corporate bonds produced similar gains, while high yield bonds advanced by a slightly greater margin, despite the added risks implicit in an uptick in default rates. International bond markets modestly outperformed their U.S. counterparts, led by a rebound in the performance of emerging-markets debt.
The risks and uncertainties inherent in today’s markets call for the kind of insight and expertise that New York Life Investments offers through our one-on-one philosophy, long-lasting focus, and multi-boutique approach.
Thank you for trusting us to help you meet your investment needs.
Sincerely,
Kirk C. Lehneis
President
The opinions expressed are as of the date of this report and are subject to change. There is no guarantee that any forecast made will come to pass. This material does not constitute investment advice and is not intended as an endorsement of any specific investment. Past performance is no guarantee of future results.
Not part of the Semiannual Report
Investors should refer to the Fund’s Summary Prospectus and/or Prospectus and consider the Fund’s investment objectives, strategies, risks, charges and expenses carefully before investing. The Summary Prospectus and/or Prospectus contain this and other information about the Fund. You may obtain copies of the Fund’s Summary Prospectus, Prospectus and Statement of Additional Information, which includes information about The MainStay Funds' Trustees, free of charge, upon request, by calling toll-free 800-624-6782, by writing to NYLIFE Distributors LLC, Attn: MainStay Marketing Department, 30 Hudson Street, Jersey City, NJ 07302 or by sending an e-mail to MainStayShareholderServices@nylim.com. These documents are also available on dfinview.com/NYLIM. Please read the Fund’s Summary Prospectus and/or Prospectus carefully before investing.
Investment and Performance Comparison (Unaudited)
Performance data quoted represents past performance. Past performance is no guarantee of future results. Because of market volatility and other factors, current performance may be lower or higher than the figures shown. Investment return and principal value will fluctuate, and as a result, when shares are redeemed, they may be worth more or less than their original cost. The graph below depicts the historical performance of Class I shares of the Fund. Performance will vary from class to class based on differences in class-specific expenses and sales charges. For performance information current to the most recent month-end, please call 800-624-6782 or visit newyorklifeinvestments.com.
The performance table and graph do not reflect the deduction of taxes that a shareholder would pay on distributions or Fund share redemptions. Total returns reflect maximum applicable sales charges as indicated in the table below, if any, changes in share price, and reinvestment of dividend and capital gain distributions. The graph assumes the initial investment amount shown below and reflects the deduction of all sales charges that would have applied for the period of investment. Performance figures may reflect certain fee waivers and/or expense limitations, without which total returns may have been lower. For more information on share classes and current fee waivers and/or expense limitations (if any), please refer to the Notes to Financial Statements.

| Average Annual Total Returns for the Period-Ended April 30, 2024 |
| Class | Sales Charge | | Inception
Date | Six
Months1 | One
Year | Five
Years | Ten Years
or Since
Inception | Gross
Expense
Ratio2 |
| Class A Shares3 | Maximum 3.00% Initial Sales Charge | With sales charges | 1/3/1995 | 4.47% | -0.87% | 0.25% | 2.19% | 0.74% |
| | | Excluding sales charges | | 7.70 | 2.20 | 1.18 | 2.66 | 0.74 |
| Investor Class Shares4, 5 | Maximum 2.50% Initial Sales Charge | With sales charges | 2/28/2008 | 4.95 | -0.41 | 0.23 | 2.17 | 0.78 |
| | | Excluding sales charges | | 7.64 | 2.15 | 1.16 | 2.65 | 0.78 |
| Class B Shares6 | Maximum 5.00% CDSC | With sales charges | 5/1/1986 | 2.55 | -3.03 | 0.55 | 2.39 | 1.03 |
| | if Redeemed Within the First Six Years of Purchase | Excluding sales charges | | 7.55 | 1.91 | 0.91 | 2.39 | 1.03 |
| Class C Shares | Maximum 1.00% CDSC | With sales charges | 9/1/1998 | 6.42 | 0.92 | 0.91 | 2.39 | 1.03 |
| | if Redeemed Within One Year of Purchase | Excluding sales charges | | 7.42 | 1.90 | 0.91 | 2.39 | 1.03 |
| Class C2 Shares | Maximum 1.00% CDSC | With sales charges | 8/31/2020 | 6.35 | 0.66 | N/A | -0.93 | 1.18 |
| | if Redeemed Within One Year of Purchase | Excluding sales charges | | 7.35 | 1.64 | N/A | -0.93 | 1.18 |
| Class I Shares | No Sales Charge | | 12/21/2009 | 7.71 | 2.45 | 1.43 | 2.91 | 0.49 |
| Class R6 Shares | No Sales Charge | | 11/1/2019 | 7.74 | 2.40 | N/A | 0.80 | 0.43 |
| 1. | Not annualized. |
| 2. | The gross expense ratios presented reflect the Fund’s “Total Annual Fund Operating Expenses” from the most recent Prospectus, as supplemented, and may differ from other expense ratios disclosed in this report. |
| 3. | Prior to August 10, 2022, the maximum initial sales charge was 4.50%, which is reflected in the applicable average annual total return figures shown. |
| 4. | Prior to June 30, 2020, the maximum initial sales charge was 4.50%, which is reflected in the applicable average annual total return figures shown. |
| 5. | Prior to August 10, 2022, the maximum initial sales charge was 4.00%, which is reflected in the applicable average annual total return figures shown. |
| 6. | Class B shares are closed to all new purchases as well as additional investments by existing Class B shareholders. |
The footnotes on the next page are an integral part of the table and graph and should be carefully read in conjunction with them.
| Benchmark Performance* | Six
Months1 | One
Year | Five
Years | Ten
Years |
| Bloomberg Municipal Bond Index2 | 7.06% | 2.08% | 1.26% | 2.41% |
| Morningstar Muni National Long Category Average3 | 9.30 | 2.84 | 0.98 | 2.35 |
| * | Returns for indices reflect no deductions for fees, expenses or taxes, except for foreign withholding taxes where applicable. Results assume reinvestment of all dividends and capital gains. An investment cannot be made directly in an index. |
| 1. | Not annualized. |
| 2. | In accordance with new regulatory requirements, the Fund has selected the Bloomberg Municipal Bond Index, which represents a broad measure of market performance, and is generally representative of the market sectors or types of investments in which the Fund invests. The Bloomberg Municipal Bond Index is considered representative of the broad market for investment-grade, tax-exempt bonds with a maturity of at least one year. Bonds subject to the alternative minimum tax or with floating or zero coupons are excluded. |
| 3. | The Morningstar Muni National Long Category Average is representative of funds that invest in bonds issued by various state and local governments to fund public projects. The income from these bonds is generally free from federal taxes. These funds have durations of more than 7 years. Results are based on average total returns of similar funds with all dividends and capital gain distributions reinvested. |
The footnotes on the preceding page are an integral part of the table and graph and should be carefully read in conjunction with them.
| 6 | MainStay MacKay Tax Free Bond Fund |
Cost in Dollars of a $1,000 Investment in MainStay MacKay Tax Free Bond Fund (Unaudited)
The example below is intended to describe the fees and expenses borne by shareholders during the six-month period from November 1, 2023 to April 30, 2024, and the impact of those costs on your investment.
Example
As a shareholder of the Fund you incur two types of costs: (1) transaction costs, including exchange fees and sales charges (loads) on purchases (as applicable), and (2) ongoing costs, including management fees, distribution and/or service (12b-1) fees and other Fund expenses (as applicable). This example is intended to help you understand your ongoing costs (in dollars) of investing in the Fund and to compare these costs with the ongoing costs of investing in other mutual funds. The example is based on an investment of $1,000 made at the beginning of the six-month period and held for the entire period from November 1, 2023 to April 30, 2024.
This example illustrates your Fund’s ongoing costs in two ways:
Actual Expenses
The second and third data columns in the table below provide information about actual account values and actual expenses. You may use the information in these columns, together with the amount you invested, to estimate the expenses that you paid during the six months ended April 30, 2024. Simply divide your account value by $1,000 (for example, an $8,600 account value divided by $1,000 = 8.6), then multiply the
result by the number under the heading entitled “Expenses Paid During Period” to estimate the expenses you paid on your account during this period.
Hypothetical Example for Comparison Purposes
The fourth and fifth data columns in the table below provide information about hypothetical account values and hypothetical expenses based on the Fund’s actual expense ratio and an assumed rate of return of 5% per year before expenses, which is not the Fund’s actual return. The hypothetical account values and expenses may not be used to estimate the actual ending account balances or expenses you paid for the six-month period shown. You may use this information to compare the ongoing costs of investing in the Fund with the ongoing costs of investing in other mutual funds. To do so, compare this 5% hypothetical example with the 5% hypothetical examples that appear in the shareholder reports of the other mutual funds.
Please note that the expenses shown in the table are meant to highlight your ongoing costs only and do not reflect any transactional costs, such as exchange fees or sales charges (loads). Therefore, the fourth and fifth data columns of the table are useful in comparing ongoing costs only and will not help you determine the relative total costs of owning different funds. In addition, if these transactional costs were included, your costs would have been higher.
| Share Class | Beginning
Account
Value
11/1/23 | Ending Account
Value (Based
on Actual
Returns and
Expenses)
4/30/24 | Expenses
Paid
During
Period1 | Ending Account
Value (Based
on Hypothetical
5% Annualized
Return and
Actual Expenses)
4/30/24 | Expenses
Paid
During
Period1 | Net Expense
Ratio
During
Period2 |
| Class A Shares | $1,000.00 | $1,077.00 | $3.82 | $1,021.18 | $3.72 | 0.74% |
| Investor Class Shares | $1,000.00 | $1,076.40 | $4.03 | $1,020.98 | $3.92 | 0.78% |
| Class B Shares | $1,000.00 | $1,075.50 | $5.32 | $1,019.74 | $5.17 | 1.03% |
| Class C Shares | $1,000.00 | $1,074.20 | $5.31 | $1,019.74 | $5.17 | 1.03% |
| Class C2 Shares | $1,000.00 | $1,073.50 | $6.08 | $1,019.00 | $5.92 | 1.18% |
| Class I Shares | $1,000.00 | $1,077.10 | $2.53 | $1,022.43 | $2.46 | 0.49% |
| Class R6 Shares | $1,000.00 | $1,077.40 | $2.22 | $1,022.72 | $2.16 | 0.43% |
| 1. | Expenses are equal to the Fund’s annualized expense ratio of each class multiplied by the average account value over the period, divided by 366 and multiplied by 182 (to reflect the six-month period). The table above represents the actual expenses incurred during the six-month period. In addition to the fees and expenses which the Fund bears directly, it also indirectly bears a pro rata share of the fees and expenses of the underlying funds in which it invests. Such indirect expenses are not included in the above-reported expense figures. |
| 2. | Expenses are equal to the Fund's annualized expense ratio to reflect the six-month period. |
Portfolio Composition as of April 30, 2024 (Unaudited)
| New York | 14.7% |
| Texas | 11.3 |
| California | 10.5 |
| Illinois | 8.2 |
| Florida | 6.0 |
| Georgia | 4.1 |
| Pennsylvania | 3.1 |
| New Jersey | 3.0 |
| Alabama | 2.9 |
| Colorado | 2.7 |
| District of Columbia | 2.6 |
| Utah | 2.5 |
| Washington | 2.2 |
| Michigan | 1.5 |
| Massachusetts | 1.5 |
| Arizona | 1.4 |
| Nevada | 1.4 |
| Connecticut | 1.4 |
| South Carolina | 1.3 |
| Minnesota | 1.3 |
| Tennessee | 1.1 |
| Indiana | 1.1 |
| Kentucky | 0.9 |
| Virginia | 0.9 |
| Ohio | 0.9 |
| Missouri | 0.9 |
| U.S. Virgin Islands | 0.9 |
| Nebraska | 0.9 |
| Wisconsin | 0.8% |
| Oklahoma | 0.7 |
| Oregon | 0.6 |
| North Carolina | 0.6 |
| Maryland | 0.5 |
| New Hampshire | 0.5 |
| Hawaii | 0.4 |
| Iowa | 0.4 |
| Puerto Rico | 0.3 |
| Louisiana | 0.3 |
| West Virginia | 0.3 |
| Alaska | 0.2 |
| New Mexico | 0.2 |
| Arkansas | 0.2 |
| Idaho | 0.2 |
| Guam | 0.1 |
| Kansas | 0.1 |
| Montana | 0.1 |
| South Dakota | 0.1 |
| Wyoming | 0.1 |
| Rhode Island | 0.0‡ |
| Delaware | 0.0‡ |
| Maine | 0.0‡ |
| Short–Term Investment | 1.2 |
| Other Assets, Less Liabilities | 0.9 |
| | 100.0% |
| ‡ | Less than one–tenth of a percent. |
See Portfolio of Investments beginning on page 9 for specific holdings within these categories. The Fund's holdings are subject to change.
Top Ten Holdings and/or Issuers Held as of April 30, 2024 (excluding short-term investments) (Unaudited)
| 1. | New York State Dormitory Authority, 3.00%-5.75%, due 7/1/27–7/1/54 |
| 2. | Triborough Bridge & Tunnel Authority, 3.00%-5.50%, due 3/15/27–5/15/63 |
| 3. | State of California, 3.00%-5.00%, due 9/1/25–4/1/52 |
| 4. | Black Belt Energy Gas District, 4.00%-5.408%, due 6/1/49–5/1/55 |
| 5. | Port Authority of New York & New Jersey, 4.00%-5.50%, due 9/1/27–8/1/52 |
| 6. | State of Texas, 3.00%-5.50%, due 8/1/26–8/1/39 |
| 7. | New York City Municipal Water Finance Authority, 3.00%-5.25%, due 6/15/37–6/15/52 |
| 8. | San Francisco City & County Airport Commission, 5.00%, due 5/1/32–5/1/50 |
| 9. | City of New York, 3.00%-5.50%, due 10/1/33–4/1/49 |
| 10. | Chicago O'Hare International Airport, 4.00%-5.50%, due 1/1/27–1/1/53 |
‡ Less than one–tenth of a percent.
| 8 | MainStay MacKay Tax Free Bond Fund |
Portfolio of Investments April 30, 2024†^(Unaudited)
| | Principal
Amount | Value |
| Municipal Bonds 97.8% |
| Long-Term Municipal Bonds 96.0% |
| Alabama 2.8% |
| Black Belt Energy Gas District, Gas Project, Revenue Bonds | | |
| Series D-1 | | |
| 4.00%, due 7/1/52 (a) | $ 3,000,000 | $ 3,009,198 |
| Series B-1 | | |
| 4.00%, due 4/1/53 (a) | 19,350,000 | 19,323,510 |
| Series B | | |
| 4.42%, due 4/1/53 | 36,990,000 | 36,158,184 |
| Series B-2 | | |
| 5.25%, due 12/1/53 (a) | 12,500,000 | 13,356,673 |
| Series A | | |
| 5.25%, due 5/1/55 (a) | 20,890,000 | 22,378,007 |
| Series D-3 | | |
| 5.408%, due 6/1/49 | 9,250,000 | 9,367,722 |
| Black Belt Energy Gas District, Gas Project No.6, Revenue Bonds | | |
| Series B | | |
| 4.00%, due 10/1/52 (a) | 31,755,000 | 31,729,075 |
| Black Belt Energy Gas District, Gas Project No.7, Revenue Bonds | | |
| Series C-2 | | |
| 4.12%, due 10/1/52 | 6,710,000 | 6,554,790 |
| County of Jefferson, Sewer, Revenue Bonds | | |
| 5.50%, due 10/1/53 | 4,250,000 | 4,552,012 |
| Energy Southeast, A Cooperative District, Revenue Bonds | | |
| Series B-1 | | |
| 5.75%, due 4/1/54 (a) | 16,850,000 | 18,352,194 |
| Series B-2 | | |
| 5.758%, due 4/1/54 | 20,000,000 | 20,155,558 |
| Energy Southeast A Cooperative District, Revenue Bonds | | |
| Series B | | |
| 5.25%, due 7/1/54 (a) | 7,570,000 | 8,011,066 |
| Lower Alabama Gas District (The), Revenue Bonds | | |
| Series A | | |
| 5.00%, due 9/1/46 | 20,795,000 | 21,423,186 |
| Southeast Alabama Gas Supply District (The), Revenue Bonds | | |
| Series B | | |
| 5.00%, due 6/1/49 (a) | 7,505,000 | 7,825,345 |
| | Principal
Amount | Value |
| |
| Alabama (continued) |
| Southeast Energy Authority, A Cooperative District, Project No. 2, Revenue Bonds | | |
| Series B | | |
| 4.00%, due 12/1/51 (a) | $ 14,815,000 | $ 14,508,552 |
| Southeast Energy Authority, A Cooperative District, Project No. 4, Revenue Bonds | | |
| Series B-1 | | |
| 5.00%, due 5/1/53 (a) | 12,230,000 | 12,624,241 |
| Town of Pike Road, Limited General Obligation | | |
| 5.00%, due 3/1/52 | 7,750,000 | 8,184,020 |
| | | 257,513,333 |
| Alaska 0.2% |
| Alaska Housing Finance Corp., General Mortgage, Revenue Bonds | | |
| Series C-II, Insured: GNMA / FNMA / FHLMC | | |
| 5.75%, due 12/1/52 | 6,240,000 | 6,543,034 |
| Alaska Industrial Development & Export Authority, Greater Fairbanks Community Hospital Foundation Obligated Group, Revenue Bonds | | |
| 5.00%, due 4/1/32 | 3,050,000 | 3,054,476 |
| Municipality of Anchorage, Unlimited General Obligation | | |
| Series B | | |
| 5.00%, due 9/1/26 | 5,340,000 | 5,440,752 |
| State of Alaska, International Airports System, Revenue Bonds | | |
| Series C | | |
| 5.00%, due 10/1/27 (b) | 5,000,000 | 5,220,945 |
| | | 20,259,207 |
| Arizona 1.4% |
| Arizona Board of Regents, Arizona State University, Revenue Bonds | | |
| Series A | | |
| 5.50%, due 7/1/48 | 7,500,000 | 8,318,860 |
| Arizona Health Facilities Authority, Banner Health, Revenue Bonds | | |
| Series B | | |
| 4.52%, due 1/1/37 | 5,725,000 | 5,424,952 |
The notes to the financial statements are an integral part of, and should be read in conjunction with, the financial statements.
9
Portfolio of Investments April 30, 2024†^(Unaudited) (continued)
| | Principal
Amount | Value |
| Long-Term Municipal Bonds (continued) |
| Arizona (continued) |
| Arizona Water Infrastructure Finance Authority, Revenue Bonds | | |
| Series A | | |
| 5.00%, due 10/1/26 | $ 5,000,000 | $ 5,026,756 |
| City of Phoenix Civic Improvement Corp., Airport, Revenue Bonds, Senior Lien (b) | | |
| 5.00%, due 7/1/30 | 5,750,000 | 6,238,097 |
| 5.00%, due 7/1/31 | 5,000,000 | 5,489,405 |
| City of Phoenix Civic Improvement Corp., Airport, Revenue Bonds, Junior Lien | | |
| Series D | | |
| 5.00%, due 7/1/37 | 5,000,000 | 5,218,539 |
| Series B | | |
| 5.00%, due 7/1/49 (b) | 3,485,000 | 3,544,689 |
| City of Phoenix Civic Improvement Corp., Water System, Revenue Bonds, Junior Lien | | |
| Series A | | |
| 5.00%, due 7/1/44 | 10,180,000 | 10,844,156 |
| Coconino County Unified School District No. 1, Flagstaff, Unlimited General Obligation | | |
| Series B | | |
| 1.75%, due 7/1/35 | 2,375,000 | 1,792,061 |
| Series B | | |
| 1.75%, due 7/1/36 | 2,760,000 | 2,018,248 |
| Gilbert Water Resource Municipal Property Corp., Waterworks & Sewer System, Revenue Bonds, Senior Lien | | |
| 4.00%, due 7/15/40 | 23,480,000 | 23,883,978 |
| 4.00%, due 7/15/41 | 7,915,000 | 7,974,351 |
| Maricopa County & Phoenix Industrial Development Authorities, Revenue Bonds | | |
| Series B, Insured: GNMA / FNMA / FHLMC | | |
| 6.00%, due 3/1/55 (c) | 5,500,000 | 5,955,294 |
| Maricopa County Industrial Development Authority, Banner Health, Revenue Bonds | | |
| Series A | | |
| 4.00%, due 1/1/41 | 8,000,000 | 7,838,589 |
| Series D | | |
| 4.00%, due 1/1/48 | 6,000,000 | 5,558,719 |
| | Principal
Amount | Value |
| |
| Arizona (continued) |
| Maricopa County Pollution Control Corp., Public Service Co. of New Mexico, Revenue Bonds | | |
| Series A | | |
| 0.875%, due 6/1/43 (a) | $ 3,855,000 | $ 3,532,641 |
| Salt River Project Agricultural Improvement & Power District, Revenue Bonds | | |
| Series A | | |
| 5.00%, due 12/1/45 | 5,000,000 | 5,081,024 |
| Series A | | |
| 5.00%, due 1/1/50 | 10,000,000 | 10,641,458 |
| | | 124,381,817 |
| Arkansas 0.2% |
| Little Rock School District, Limited General Obligation | | |
| Series A, Insured: BAM State Aid Withholding | | |
| 3.00%, due 2/1/46 | 15,230,000 | 11,706,672 |
| Series A, Insured: BAM State Aid Withholding | | |
| 3.00%, due 2/1/50 | 6,180,000 | 4,520,930 |
| | | 16,227,602 |
| California 10.5% |
| Alameda Corridor Transportation Authority, Revenue Bonds | | |
| Series A, Insured: NATL-RE | | |
| (zero coupon), due 10/1/36 | 23,000,000 | 14,095,624 |
| Series C, Insured: AGM | | |
| 5.00%, due 10/1/52 | 6,200,000 | 6,593,089 |
| Alameda Corridor Transportation Authority, Revenue Bonds, Senior Lien | | |
| Series A, Insured: BAM | | |
| (zero coupon), due 10/1/48 (d) | 6,000,000 | 3,233,776 |
| Allan Hancock Joint Community College District, Unlimited General Obligation | | |
| Series C | | |
| (zero coupon), due 8/1/44 (d) | 8,500,000 | 5,967,167 |
| Antelope Valley Community College District, Election of 2016, Unlimited General Obligation | | |
| Series B | | |
| 3.00%, due 8/1/50 | 3,750,000 | 2,785,043 |
The notes to the financial statements are an integral part of, and should be read in conjunction with, the financial statements.
| 10 | MainStay MacKay Tax Free Bond Fund |
| | Principal
Amount | Value |
| Long-Term Municipal Bonds (continued) |
| California (continued) |
| California Community Choice Financing Authority, Clean Energy Project, Revenue Bonds | | |
| Series B-1 | | |
| 4.00%, due 2/1/52 (a) | $ 4,160,000 | $ 4,112,737 |
| Series A-1 | | |
| 4.00%, due 5/1/53 (a) | 4,555,000 | 4,540,263 |
| Series B-2 | | |
| 4.22%, due 2/1/52 | 5,895,000 | 5,460,757 |
| Series E-2 | | |
| 5.228%, due 2/1/54 | 27,500,000 | 27,456,443 |
| Series C | | |
| 5.25%, due 1/1/54 (a) | 22,825,000 | 23,824,502 |
| Series A-2 | | |
| 5.508%, due 12/1/53 | 14,250,000 | 14,388,447 |
| California Health Facilities Financing Authority, CommonSpirit Health, Revenue Bonds | | |
| Series A, Insured: BAM | | |
| 3.00%, due 4/1/44 | 2,075,000 | 1,652,342 |
| Series A | | |
| 4.00%, due 4/1/49 | 5,000,000 | 4,713,850 |
| California Infrastructure & Economic Development Bank, Clean Water and Drinking Water, Revenue Bonds | | |
| 4.00%, due 10/1/40 | 5,100,000 | 5,317,454 |
| 4.00%, due 10/1/45 | 7,400,000 | 7,524,549 |
| California Municipal Finance Authority, Community Health System, Revenue Bonds | | |
| Series A, Insured: AGM-CR | | |
| 4.00%, due 2/1/41 | 2,500,000 | 2,457,524 |
| California Municipal Finance Authority, CHF-Davis I LLC, West Village Student Housing Project, Revenue Bonds | | |
| Insured: BAM | | |
| 5.00%, due 5/15/36 | 3,400,000 | 3,595,818 |
| Insured: BAM | | |
| 5.00%, due 5/15/39 | 8,215,000 | 8,573,957 |
| California Public Finance Authority, Hoag Memorial Hospital Presbyterian, Revenue Bonds | | |
| Series A | | |
| 4.00%, due 7/15/51 | 7,500,000 | 7,309,250 |
| | Principal
Amount | Value |
| |
| California (continued) |
| California State Public Works Board, Various Capital Projects, Revenue Bonds | | |
| Series A | | |
| 5.00%, due 9/1/34 | $ 5,770,000 | $ 5,791,108 |
| California State University, Systemwide, Revenue Bonds | | |
| Series C | | |
| 3.00%, due 11/1/40 | 6,000,000 | 5,196,201 |
| Series A | | |
| 5.00%, due 11/1/42 | 9,725,000 | 10,117,765 |
| Carlsbad Unified School District, Election of 2018, Unlimited General Obligation | | |
| Series B | | |
| 3.00%, due 8/1/46 | 2,725,000 | 2,126,815 |
| Center Joint Unified School District, Election of 2008, Unlimited General Obligation | | |
| Series B, Insured: BAM | | |
| 3.00%, due 8/1/51 | 4,750,000 | 3,536,055 |
| Chabot-Las Positas Community College District, Unlimited General Obligation | | |
| Series C | | |
| 5.25%, due 8/1/48 | 5,000,000 | 5,581,018 |
| Chaffey Joint Union High School District, Unlimited General Obligation | | |
| Series C | | |
| 5.25%, due 8/1/47 | 5,000,000 | 5,182,426 |
| City of Escondido, Unlimited General Obligation | | |
| 5.00%, due 9/1/36 | 4,000,000 | 4,081,171 |
| City of Long Beach, Harbor, Revenue Bonds | | |
| Series A | | |
| 5.00%, due 5/15/44 | 6,070,000 | 6,488,477 |
| City of Los Angeles, Department of Airports, Revenue Bonds (b) | | |
| Series D | | |
| 4.00%, due 5/15/40 | 2,200,000 | 2,164,333 |
| Series A | | |
| 5.00%, due 5/15/44 | 3,535,000 | 3,605,720 |
The notes to the financial statements are an integral part of, and should be read in conjunction with, the financial statements.
11
Portfolio of Investments April 30, 2024†^(Unaudited) (continued)
| | Principal
Amount | Value |
| Long-Term Municipal Bonds (continued) |
| California (continued) |
| City of Los Angeles, Department of Airports, Revenue Bonds, Senior Lien (b) | | |
| Series C | | |
| 4.00%, due 5/15/50 | $ 11,000,000 | $ 10,222,917 |
| Series A | | |
| 4.75%, due 5/15/40 | 6,000,000 | 6,020,384 |
| Series A | | |
| 5.00%, due 5/15/33 | 3,330,000 | 3,365,122 |
| Series G | | |
| 5.00%, due 5/15/47 | 3,250,000 | 3,387,876 |
| Series G | | |
| 5.50%, due 5/15/36 | 15,175,000 | 17,211,115 |
| Series G | | |
| 5.50%, due 5/15/39 | 3,250,000 | 3,611,696 |
| Series G | | |
| 5.50%, due 5/15/40 | 6,700,000 | 7,403,617 |
| Series H | | |
| 5.50%, due 5/15/47 | 8,150,000 | 8,831,614 |
| City of Los Angeles, Wastewater System, Revenue Bonds | | |
| Series A | | |
| 5.00%, due 6/1/43 | 3,000,000 | 3,004,028 |
| El Camino Community College District Foundation (The), Election of 2002, Unlimited General Obligation | | |
| Series C | | |
| (zero coupon), due 8/1/38 | 11,750,000 | 6,808,831 |
| Folsom Cordova Unified School District, School Facilities Improvement District No. 5, Unlimited General Obligation | | |
| Series B, Insured: AGM | | |
| 4.25%, due 10/1/41 | 20,410,000 | 20,478,680 |
| Fontana Public Facilities Financing Authority, City of Fontana, Revenue Bonds | | |
| Series A, Insured: BAM | | |
| 5.00%, due 9/1/32 | 1,320,000 | 1,325,025 |
| Fresno Unified School District, Unlimited General Obligation | | |
| Series B | | |
| 3.00%, due 8/1/43 | 7,500,000 | 5,918,785 |
| | Principal
Amount | Value |
| |
| California (continued) |
| Golden State Tobacco Securitization Corp., Revenue Bonds | | |
| Series A-1 | | |
| 2.587%, due 6/1/29 | $ 10,000,000 | $ 8,710,915 |
| Irvine Facilities Financing Authority, Gateway Preserve Land Acquisition Project, Revenue Bonds | | |
| Series A | | |
| 5.25%, due 5/1/43 | 3,800,000 | 3,907,803 |
| Live Oak Elementary School District, Certificate of Participation | | |
| Insured: AGM | | |
| 5.00%, due 8/1/39 | 2,455,000 | 2,535,195 |
| Long Beach Unified School District, Unlimited General Obligation | | |
| Series D-1 | | |
| (zero coupon), due 8/1/30 | 4,450,000 | 3,476,295 |
| Los Angeles Unified School District, Unlimited General Obligation | | |
| Series C | | |
| 4.00%, due 7/1/33 | 2,750,000 | 2,938,208 |
| Series C | | |
| 4.00%, due 7/1/38 | 5,750,000 | 5,964,949 |
| Series A | | |
| 5.00%, due 7/1/27 | 8,500,000 | 8,989,896 |
| Los Angeles Unified School District, Election of 2008, Unlimited General Obligation | | |
| Series B-1, Insured: AGM-CR | | |
| 5.25%, due 7/1/42 | 37,500,000 | 39,850,819 |
| Metropolitan Water District of Southern California, Waterworks, Revenue Bonds | | |
| Series C | | |
| 3.91%, due 7/1/47 | 12,850,000 | 12,847,956 |
| Modesto Irrigation District, Domestic Water Project, Revenue Bonds | | |
| Series F, Insured: NATL-RE | | |
| 4.334%, due 9/1/27 | 5,805,000 | 5,745,465 |
| Moreno Valley Unified School District, Election 2014, Unlimited General Obligation | | |
| Series C, Insured: BAM | | |
| 3.00%, due 8/1/46 | 4,750,000 | 3,752,836 |
The notes to the financial statements are an integral part of, and should be read in conjunction with, the financial statements.
| 12 | MainStay MacKay Tax Free Bond Fund |
| | Principal
Amount | Value |
| Long-Term Municipal Bonds (continued) |
| California (continued) |
| Murrieta Valley Unified School District, Election of 2014, Unlimited General Obligation | | |
| 5.25%, due 9/1/51 | $ 9,700,000 | $ 10,523,252 |
| Napa Valley Community College District, Unlimited General Obligation | | |
| 4.00%, due 8/1/29 | 5,250,000 | 5,331,051 |
| 4.00%, due 8/1/32 | 5,250,000 | 5,318,368 |
| Norman Y Mineta San Jose International Airport SJC, Revenue Bonds | | |
| Series A | | |
| 5.00%, due 3/1/41 (b) | 8,500,000 | 8,616,135 |
| North Lake Tahoe Public Financing Authority, Health & Human Services Center, Revenue Bonds | | |
| 4.50%, due 12/1/52 | 4,000,000 | 4,015,649 |
| Northern California Energy Authority, Revenue Bonds | | |
| 5.00%, due 12/1/54 (a) | 12,500,000 | 13,239,155 |
| Oak Grove School District, Unlimited General Obligation | | |
| Series A-2, Insured: BAM | | |
| 5.00%, due 8/1/52 | 4,330,000 | 4,664,293 |
| Oakland Unified School District, Alameda County, Unlimited General Obligation | | |
| Insured: AGM | | |
| 5.00%, due 8/1/27 | 1,160,000 | 1,185,631 |
| Insured: AGM | | |
| 5.00%, due 8/1/28 | 1,755,000 | 1,794,718 |
| Ocean View School District of Orange County, Unlimited General Obligation | | |
| Series C, Insured: AGM | | |
| 3.00%, due 8/1/47 | 4,250,000 | 3,227,672 |
| Orange County Sanitation District, Revenue Bonds | | |
| Series A | | |
| 5.00%, due 2/1/30 | 8,500,000 | 8,526,301 |
| Panama-Buena Vista Union School District, Election of 2022, Unlimited General Obligation | | |
| 0.05%, due 8/1/24 | 4,170,000 | 4,122,157 |
| | Principal
Amount | Value |
| |
| California (continued) |
| Peninsula Corridor Joint Powers Board, Green Bond, Revenue Bonds | | |
| Series A | | |
| 5.00%, due 6/1/47 | $ 3,000,000 | $ 3,243,253 |
| Richmond Joint Powers Financing Authority, Civic Center Project, Revenue Bonds | | |
| Series A, Insured: AGM | | |
| 5.00%, due 11/1/36 | 2,750,000 | 2,978,710 |
| Riverside County Transportation Commission, Sales Tax, Revenue Bonds | | |
| Series B | | |
| 4.00%, due 6/1/36 | 7,500,000 | 7,719,361 |
| Sacramento Area Flood Control Agency, Consolidated Capital Assessment District No. 2, Special Assessment | | |
| Series A | | |
| 5.00%, due 10/1/36 | 3,195,000 | 3,316,557 |
| Series A | | |
| 5.00%, due 10/1/41 | 7,785,000 | 8,005,379 |
| Sacramento City Unified School District, Election of 2020, Unlimited General Obligation | | |
| Series A, Insured: BAM | | |
| 5.50%, due 8/1/47 | 8,840,000 | 9,639,643 |
| Series A, Insured: BAM | | |
| 5.50%, due 8/1/52 | 14,920,000 | 16,164,600 |
| San Diego County Regional Airport Authority, Revenue Bonds | | |
| Series B | | |
| 5.00%, due 7/1/33 (b) | 4,990,000 | 5,440,587 |
| San Diego County Regional Airport Authority, Revenue Bonds, Senior Lien | | |
| Series B | | |
| 5.00%, due 7/1/48 (b) | 9,590,000 | 9,982,472 |
| San Diego Public Facilities Financing Authority, Water Utility, Revenue Bonds | | |
| Series A | | |
| 5.25%, due 8/1/48 | 5,250,000 | 5,873,129 |
The notes to the financial statements are an integral part of, and should be read in conjunction with, the financial statements.
13
Portfolio of Investments April 30, 2024†^(Unaudited) (continued)
| | Principal
Amount | Value |
| Long-Term Municipal Bonds (continued) |
| California (continued) |
| San Diego Unified School District, Election of 2012, Unlimited General Obligation | | |
| Series R-2 | | |
| (zero coupon), due 7/1/41 (d) | $ 11,000,000 | $ 10,426,369 |
| Series M-2 | | |
| 3.00%, due 7/1/50 | 5,000,000 | 3,878,327 |
| Series B-4 | | |
| 5.00%, due 7/1/40 | 4,570,000 | 5,195,659 |
| Series I | | |
| 5.00%, due 7/1/41 | 3,750,000 | 3,903,506 |
| San Francisco City & County Airport Commission, San Francisco International Airport, Revenue Bonds, Second Series (b) | | |
| Series C | | |
| 5.00%, due 5/1/32 | 4,000,000 | 4,406,479 |
| Series C | | |
| 5.00%, due 5/1/33 | 35,000,000 | 38,910,245 |
| Series A | | |
| 5.00%, due 5/1/34 | 7,350,000 | 7,998,328 |
| Series E | | |
| 5.00%, due 5/1/50 | 52,055,000 | 52,971,964 |
| San Francisco City & County Airport Commission, San Francisco International Airport, Revenue Bonds | | |
| Series A | | |
| 5.00%, due 5/1/44 (b) | 10,740,000 | 11,034,753 |
| San Jose Evergreen Community College District, Election of 2016, Unlimited General Obligation | | |
| Series B | | |
| 3.00%, due 9/1/41 | 1,065,000 | 900,725 |
| San Leandro Unified School District, Election of 2020, Unlimited General Obligation | | |
| Series B | | |
| 5.25%, due 8/1/48 | 10,900,000 | 11,962,079 |
| San Mateo Union High School District, Capital Appreciation, Election of 2010, Unlimited General Obligation | | |
| Series A | | |
| (zero coupon), due 9/1/41 (d) | 7,840,000 | 7,924,775 |
| | Principal
Amount | Value |
| |
| California (continued) |
| Santa Ana Unified School District, Capital Appreciation, Election 2008, Unlimited General Obligation | | |
| Series B, Insured: AGC | | |
| (zero coupon), due 8/1/33 | $ 14,955,000 | $ 10,193,102 |
| Santa Cruz City High School District, Unlimited General Obligation | | |
| Series C | | |
| 2.00%, due 8/1/37 | 2,870,000 | 2,189,860 |
| State of California, Various Purpose, Unlimited General Obligation | | |
| 3.00%, due 10/1/36 | 5,810,000 | 5,444,640 |
| 3.00%, due 10/1/37 | 5,565,000 | 5,104,126 |
| 3.00%, due 4/1/52 | 5,590,000 | 4,308,072 |
| 4.00%, due 3/1/36 | 20,000,000 | 20,746,774 |
| 4.00%, due 10/1/37 | 5,000,000 | 5,130,991 |
| 4.00%, due 10/1/39 | 5,000,000 | 5,090,483 |
| Series B | | |
| 5.00%, due 11/1/32 | 27,500,000 | 31,788,529 |
| 5.00%, due 9/1/41 | 5,000,000 | 5,454,546 |
| 5.00%, due 10/1/41 | 16,065,000 | 17,452,479 |
| 5.00%, due 9/1/42 | 10,000,000 | 10,982,890 |
| 5.00%, due 4/1/47 | 10,500,000 | 11,321,266 |
| State of California, Unlimited General Obligation | | |
| 5.00%, due 9/1/25 | 28,975,000 | 29,596,604 |
| Sunnyvale School District, Election of 2013, Unlimited General Obligation | | |
| Series C | | |
| 3.00%, due 9/1/44 | 6,750,000 | 5,475,544 |
| Temecula Valley Unified School District, Election 2012, Unlimited General Obligation | | |
| Series D | | |
| 3.00%, due 8/1/47 | 5,000,000 | 3,920,076 |
| Twin Rivers Unified School District, Election 2006, Unlimited General Obligation | | |
| Series 2008, Insured: AGM | | |
| (zero coupon), due 8/1/32 | 4,370,000 | 3,255,269 |
| University of California, Revenue Bonds | | |
| Series AO | | |
| 3.25%, due 5/15/29 | 6,425,000 | 6,335,862 |
| Series AM | | |
| 4.25%, due 5/15/39 | 7,550,000 | 7,550,855 |
The notes to the financial statements are an integral part of, and should be read in conjunction with, the financial statements.
| 14 | MainStay MacKay Tax Free Bond Fund |
| | Principal
Amount | Value |
| Long-Term Municipal Bonds (continued) |
| California (continued) |
| University of California, Revenue Bonds (continued) | | |
| Series AR | | |
| 5.00%, due 5/15/41 | $ 12,260,000 | $ 12,562,794 |
| Series BN | | |
| 5.50%, due 5/15/40 | 10,000,000 | 11,622,537 |
| Val Verde Unified School District, Election of 2012, Unlimited General Obligation | | |
| Series F, Insured: AGM | | |
| 3.00%, due 8/1/47 | 8,910,000 | 6,661,166 |
| Vista Unified School District, Election of 2018, Unlimited General Obligation | | |
| Series B, Insured: BAM | | |
| 5.25%, due 8/1/48 | 6,000,000 | 6,629,245 |
| Yosemite Community College District, Unlimited General Obligation | | |
| Series D | | |
| (zero coupon), due 8/1/42 (d) | 20,655,000 | 16,800,705 |
| | | 951,843,405 |
| Colorado 2.7% |
| Adams County School District No. 1, Unlimited General Obligation | | |
| Insured: State Aid Withholding | | |
| 5.25%, due 12/1/40 | 5,910,000 | 6,094,748 |
| Arapahoe County School District No. 5, Cherry Creek, Unlimited General Obligation | | |
| Series B, Insured: State Aid Withholding | | |
| 2.30%, due 12/15/28 | 5,790,000 | 5,339,448 |
| City & County of Denver, Board of Water Commissioners, Revenue Bonds | | |
| Series A | | |
| 3.00%, due 9/15/47 | 11,725,000 | 8,938,311 |
| City & County of Denver, Airport System, Revenue Bonds (b) | | |
| Series A | | |
| 4.00%, due 12/1/43 | 3,470,000 | 3,257,688 |
| Series A | | |
| 5.00%, due 12/1/29 | 8,750,000 | 9,207,461 |
| Series B-2 | | |
| 5.00%, due 11/15/31 (a) | 2,000,000 | 2,023,820 |
| | Principal
Amount | Value |
| |
| Colorado (continued) |
City & County of Denver, Airport System, Revenue Bonds (b)
(continued) | | |
| Series A | | |
| 5.00%, due 12/1/31 | $ 10,000,000 | $ 10,522,155 |
| Series A | | |
| 5.00%, due 12/1/34 | 6,000,000 | 6,688,420 |
| Series A | | |
| 5.00%, due 12/1/36 | 8,505,000 | 8,868,860 |
| Series A | | |
| 5.00%, due 12/1/37 | 15,675,000 | 16,262,490 |
| Series A | | |
| 5.00%, due 12/1/43 | 10,940,000 | 11,171,897 |
| Series A | | |
| 5.00%, due 12/1/48 | 3,790,000 | 3,833,035 |
| Series A | | |
| 5.50%, due 11/15/35 | 5,250,000 | 6,009,379 |
| Series A | | |
| 5.50%, due 11/15/40 | 17,760,000 | 19,684,749 |
| Series D | | |
| 5.75%, due 11/15/38 | 3,000,000 | 3,441,196 |
| Series D | | |
| 5.75%, due 11/15/45 | 7,100,000 | 7,910,882 |
| City & County of Denver, Convention Center Expansion Project, Certificate of Participation | | |
| Series A | | |
| 5.375%, due 6/1/43 | 12,875,000 | 13,144,027 |
| City of Colorado Springs, Utilities System, Revenue Bonds | | |
| Series B | | |
| 5.25%, due 11/15/52 | 10,000,000 | 10,848,559 |
| Colorado Health Facilities Authority, AdventHealth, Revenue Bonds | | |
| Series A | | |
| 3.00%, due 11/15/51 | 4,500,000 | 3,317,666 |
| Series A | | |
| 4.00%, due 11/15/48 | 24,940,000 | 23,748,172 |
| Colorado Health Facilities Authority, Intermountain Healthcare Obligated Group, Revenue Bonds | | |
| Series B | | |
| 4.00%, due 1/1/40 | 3,000,000 | 2,984,020 |
| Colorado Health Facilities Authority, CommonSpirit Health Obligated Group, Revenue Bonds | | |
| Series A | | |
| 5.50%, due 11/1/47 | 3,335,000 | 3,634,127 |
The notes to the financial statements are an integral part of, and should be read in conjunction with, the financial statements.
15
Portfolio of Investments April 30, 2024†^(Unaudited) (continued)
| | Principal
Amount | Value |
| Long-Term Municipal Bonds (continued) |
| Colorado (continued) |
| Colorado Housing and Finance Authority, Revenue Bonds | | |
| Series B, Insured: GNMA | | |
| 3.00%, due 5/1/51 (b) | $ 4,000,000 | $ 3,866,690 |
| Denver City & County School District No. 1, Unlimited General Obligation | | |
| Insured: State Aid Withholding | | |
| 4.00%, due 12/1/31 | 6,000,000 | 6,019,781 |
| Gunnison Watershed School District No. Re 1J, Unlimited General Obligation | | |
| Insured: State Aid Withholding | | |
| 5.00%, due 12/1/47 | 14,150,000 | 15,220,701 |
| Regional Transportation District Sales Tax, Fastracks Project, Revenue Bonds | | |
| Series A | | |
| 5.00%, due 11/1/31 | 6,500,000 | 7,424,391 |
| State of Colorado, Certificate of Participation | | |
| Series J | | |
| 5.25%, due 3/15/42 | 18,500,000 | 18,998,677 |
| 6.00%, due 12/15/40 | 5,025,000 | 5,936,482 |
| 6.00%, due 12/15/41 | 4,560,000 | 5,365,225 |
| | | 249,763,057 |
| Connecticut 1.4% |
| City of Hartford, Unlimited General Obligation | | |
| Series C, Insured: AGM State Guaranteed | | |
| 5.00%, due 7/15/32 | 6,370,000 | 6,493,010 |
| Series C, Insured: AGM State Guaranteed | | |
| 5.00%, due 7/15/34 | 2,250,000 | 2,292,168 |
| Connecticut State Health & Educational Facilities Authority, Yale University, Revenue Bonds | | |
| Series U-2 | | |
| 1.10%, due 7/1/33 (a) | 6,750,000 | 6,580,053 |
| State of Connecticut, Unlimited General Obligation | | |
| Series A | | |
| 3.00%, due 1/15/37 | 6,420,000 | 5,758,175 |
| Series F | | |
| 5.00%, due 9/15/28 | 6,610,000 | 7,138,056 |
| | Principal
Amount | Value |
| |
| Connecticut (continued) |
| State of Connecticut, Unlimited General Obligation (continued) | | |
| Series A | | |
| 5.00%, due 3/15/29 | $ 5,300,000 | $ 5,363,875 |
| State of Connecticut, Transportation Infrastructure, Special Tax, Revenue Bonds | | |
| Series A | | |
| 5.00%, due 9/1/33 | 10,950,000 | 11,279,098 |
| Series A | | |
| 5.25%, due 7/1/40 | 20,420,000 | 23,257,171 |
| Series A | | |
| 5.25%, due 7/1/41 | 18,980,000 | 21,518,831 |
| Series A | | |
| 5.25%, due 7/1/42 | 25,220,000 | 28,475,736 |
| State of Connecticut Clean Water Fund, State Revolving Fund, Revenue Bonds | | |
| Series A | | |
| 5.00%, due 5/1/33 | 2,250,000 | 2,375,476 |
| Town of North Branford, Unlimited General Obligation | | |
| 5.00%, due 8/2/24 | 9,500,000 | 9,520,983 |
| | | 130,052,632 |
| Delaware 0.0% ‡ |
| Delaware State Health Facilities Authority, Christiana Care Health System, Revenue Bonds | | |
| Series A | | |
| 5.00%, due 10/1/36 | 3,185,000 | 3,418,807 |
| District of Columbia 2.6% |
| District of Columbia, Revenue Bonds | | |
| Series A | | |
| 5.00%, due 7/1/36 | 7,675,000 | 8,724,540 |
| Series A | | |
| 5.50%, due 7/1/47 | 6,250,000 | 6,947,692 |
| District of Columbia, Unlimited General Obligation | | |
| Series A | | |
| 5.00%, due 6/1/37 | 7,000,000 | 7,080,808 |
| Series A | | |
| 5.00%, due 10/15/44 | 11,255,000 | 11,860,517 |
| Series A | | |
| 5.25%, due 1/1/48 | 12,500,000 | 13,673,766 |
The notes to the financial statements are an integral part of, and should be read in conjunction with, the financial statements.
| 16 | MainStay MacKay Tax Free Bond Fund |
| | Principal
Amount | Value |
| Long-Term Municipal Bonds (continued) |
| District of Columbia (continued) |
| District of Columbia, Children's National Medical Center Obligated Group, Revenue Bonds | | |
| 5.00%, due 7/15/40 | $ 4,750,000 | $ 4,812,958 |
| Metropolitan Washington Airports Authority, Dulles Toll Road, Metrorail & Capital Improvement Project, Revenue Bonds, Senior Lien | | |
| Series A, Insured: AGM | | |
| 4.00%, due 10/1/52 | 20,435,000 | 19,271,494 |
| Series B | | |
| 6.50%, due 10/1/44 | 6,040,000 | 6,593,498 |
| Series B | | |
| 6.50%, due 10/1/44 (d) | 2,600,000 | 2,838,261 |
| Metropolitan Washington Airports Authority, Dulles Toll Road, Metrorail & Capital Improvement Project, Revenue Bonds, Second Lien | | |
| Series C, Insured: AGC | | |
| 6.50%, due 10/1/41 (d) | 6,730,000 | 7,225,031 |
| Metropolitan Washington Airports Authority, Aviation, Revenue Bonds (b) | | |
| Series A | | |
| 5.00%, due 10/1/27 | 2,385,000 | 2,491,171 |
| Series B | | |
| 5.00%, due 10/1/31 | 9,500,000 | 9,637,226 |
| Series B | | |
| 5.00%, due 10/1/32 | 9,815,000 | 9,955,834 |
| Series B | | |
| 5.00%, due 10/1/33 | 5,450,000 | 5,527,653 |
| Metropolitan Washington Airports Authority, Revenue Bonds (b) | | |
| Series A | | |
| 5.00%, due 10/1/28 | 2,700,000 | 2,706,263 |
| Series A | | |
| 5.00%, due 10/1/29 | 18,000,000 | 18,045,932 |
| Series A | | |
| 5.00%, due 10/1/31 | 8,000,000 | 8,762,593 |
| Series A | | |
| 5.00%, due 10/1/32 | 16,945,000 | 18,738,835 |
| Series A | | |
| 5.00%, due 10/1/35 | 3,955,000 | 4,210,770 |
| Series A | | |
| 5.00%, due 10/1/36 | 5,380,000 | 5,813,420 |
| | Principal
Amount | Value |
| |
| District of Columbia (continued) |
Metropolitan Washington Airports Authority, Revenue Bonds (b)
(continued) | | |
| Series A | | |
| 5.00%, due 10/1/43 | $ 5,950,000 | $ 6,088,694 |
| Series A | | |
| 5.25%, due 10/1/48 | 5,000,000 | 5,292,202 |
| Washington Metropolitan Area Transit Authority, Green bond, Revenue Bonds | | |
| Series A, Insured: BAM | | |
| 3.00%, due 7/15/36 | 5,175,000 | 4,786,396 |
| Series A | | |
| 4.00%, due 7/15/39 | 5,600,000 | 5,630,565 |
| Series A | | |
| 5.50%, due 7/15/51 | 13,275,000 | 14,684,269 |
| Washington Metropolitan Area Transit Authority, Green bond, Revenue Bonds, Second Lien | | |
| Series A | | |
| 5.00%, due 7/15/44 | 4,500,000 | 4,860,455 |
| Series A | | |
| 5.00%, due 7/15/48 | 6,105,000 | 6,526,916 |
| Series A | | |
| 5.25%, due 7/15/53 | 16,225,000 | 17,548,720 |
| | | 240,336,479 |
| Florida 6.0% |
| Alachua County Health Facilities Authority, Shands Teaching Hospital & Clinics Obligated Group, Revenue Bonds | | |
| Series A | | |
| 4.624%, due 12/1/37 | 15,635,000 | 14,772,562 |
| Central Florida Expressway Authority, Revenue Bonds, Senior Lien | | |
| Series B | | |
| 5.00%, due 7/1/49 | 5,000,000 | 5,172,660 |
| City of Cape Coral, Water & Sewer, Revenue Bonds | | |
| Insured: BAM | | |
| 4.00%, due 10/1/42 | 13,820,000 | 13,612,048 |
| City of Fort Lauderdale, Parks and Recreation Project, Unlimited General Obligation | | |
| Series A | | |
| 5.00%, due 7/1/48 | 4,255,000 | 4,552,988 |
The notes to the financial statements are an integral part of, and should be read in conjunction with, the financial statements.
17
Portfolio of Investments April 30, 2024†^(Unaudited) (continued)
| | Principal
Amount | Value |
| Long-Term Municipal Bonds (continued) |
| Florida (continued) |
| City of Gainesville, Utilities System, Revenue Bonds | | |
| Series A | | |
| 5.00%, due 10/1/44 | $ 14,645,000 | $ 15,310,823 |
| City of South Miami, Miami Health Facilities Authority, Inc., Revenue Bonds | | |
| 5.00%, due 8/15/42 | 17,115,000 | 17,376,480 |
| City of Tampa, Revenue Bonds | | |
| Series C, Insured: BAM | | |
| 3.00%, due 10/1/36 | 4,440,000 | 4,049,514 |
| City of Tampa, BayCare, Revenue Bonds | | |
| Series A | | |
| 5.00%, due 11/15/46 | 6,000,000 | 6,059,620 |
| City of Tampa, Centre & Lower Basis Storm Water, Special Assessment | | |
| 5.25%, due 5/1/43 | 4,155,000 | 4,343,208 |
| 5.25%, due 5/1/46 | 4,000,000 | 4,174,284 |
| Collier County Industrial Development Authority, NCH Healthcare System, Inc. Obligated Group, Revenue Bonds | | |
| Series A, Insured: AGM | | |
| 5.00%, due 10/1/49 | 3,000,000 | 3,144,651 |
| Series A, Insured: AGM | | |
| 5.00%, due 10/1/54 | 3,500,000 | 3,649,274 |
| County of Brevard, Solid Waste Management System, Revenue Bonds | | |
| 5.50%, due 9/1/53 | 8,720,000 | 9,396,865 |
| County of Broward, Tourist Development Tax, Revenue Bonds | | |
| 4.00%, due 9/1/40 | 5,000,000 | 4,840,785 |
| County of Broward, Airport System, Revenue Bonds | | |
| 5.00%, due 10/1/42 (b) | 5,045,000 | 5,136,282 |
| County of Lee, Airport, Revenue Bonds (b) | | |
| Series B | | |
| 4.00%, due 10/1/38 | 7,435,000 | 7,288,543 |
| Series A | | |
| 5.00%, due 10/1/24 | 3,785,000 | 3,795,413 |
| Series A | | |
| 5.00%, due 10/1/24 | 815,000 | 817,242 |
| Series A | | |
| 5.00%, due 10/1/29 | 11,000,000 | 11,710,077 |
| | Principal
Amount | Value |
| |
| Florida (continued) |
| County of Lee, Airport, Revenue Bonds (b) (continued) | | |
| Series B | | |
| 5.00%, due 10/1/37 | $ 3,750,000 | $ 3,974,924 |
| Series B | | |
| 5.00%, due 10/1/46 | 4,750,000 | 4,880,643 |
| County of Miami-Dade, Water & Sewer System, Revenue Bonds | | |
| Insured: BAM | | |
| 3.00%, due 10/1/36 | 2,100,000 | 1,884,271 |
| Series B | | |
| 4.00%, due 10/1/38 | 5,000,000 | 5,021,564 |
| Series B, Insured: BAM | | |
| 4.00%, due 10/1/49 | 39,630,000 | 37,776,323 |
| Series B | | |
| 5.00%, due 10/1/33 | 4,250,000 | 4,312,401 |
| County of Miami-Dade, Transit System, Revenue Bonds | | |
| 3.00%, due 7/1/37 | 4,000,000 | 3,545,426 |
| 4.00%, due 7/1/32 | 10,000,000 | 10,085,580 |
| County of Miami-Dade, Seaport Department, Revenue Bonds | | |
| Series B-1 | | |
| 4.00%, due 10/1/46 (b) | 17,000,000 | 15,434,315 |
| County of Miami-Dade, Aviation, Revenue Bonds (b) | | |
| Series A | | |
| 5.00%, due 10/1/36 | 5,000,000 | 5,006,190 |
| Series A | | |
| 5.00%, due 10/1/38 | 4,650,000 | 4,674,799 |
| Series B | | |
| 5.00%, due 10/1/40 | 8,020,000 | 8,170,887 |
| County of Pasco, State of Florida Cigarette Tax Revenue, Revenue Bonds | | |
| Series A, Insured: AGM | | |
| 5.75%, due 9/1/54 | 21,395,000 | 23,682,121 |
| County of Sarasota, Utility System, Revenue Bonds | | |
| 5.25%, due 10/1/52 | 12,795,000 | 13,888,769 |
| Florida Department of Management Services, Certificate of Participation | | |
| Series A | | |
| 5.00%, due 11/1/26 | 4,500,000 | 4,673,301 |
The notes to the financial statements are an integral part of, and should be read in conjunction with, the financial statements.
| 18 | MainStay MacKay Tax Free Bond Fund |
| | Principal
Amount | Value |
| Long-Term Municipal Bonds (continued) |
| Florida (continued) |
| Florida Municipal Power Agency, All-Requirements Power Supply Project, Revenue Bonds | | |
| Series A | | |
| 5.00%, due 10/1/26 | $ 3,500,000 | $ 3,625,091 |
| Florida State Board of Governors, Revenue Bonds | | |
| Series A, Insured: BAM | | |
| 5.00%, due 11/1/48 | 4,940,000 | 5,200,872 |
| Greater Orlando Aviation Authority, Revenue Bonds (b) | | |
| Series A | | |
| 5.00%, due 10/1/31 | 3,500,000 | 3,550,557 |
| Series A | | |
| 5.00%, due 10/1/32 | 6,980,000 | 7,080,155 |
| Series A | | |
| 5.00%, due 10/1/34 | 4,125,000 | 4,182,945 |
| Series A | | |
| 5.00%, due 10/1/35 | 4,170,000 | 4,225,406 |
| Series A | | |
| 5.00%, due 10/1/47 | 3,335,000 | 3,367,775 |
| Hillsborough County Aviation Authority, Tampa International Airport, Revenue Bonds | | |
| Series A | | |
| 5.00%, due 10/1/47 (b) | 7,000,000 | 7,247,828 |
| JEA Water & Sewer System, Revenue Bonds | | |
| Series A | | |
| 5.50%, due 10/1/54 | 25,000,000 | 27,787,305 |
| Miami-Dade County Health Facilities Authority, Nicklaus Children's Hospital Project, Revenue Bonds | | |
| Series A, Insured: AGM-CR | | |
| 4.00%, due 8/1/46 | 5,000,000 | 4,738,482 |
| Series A, Insured: AGM-CR | | |
| 4.00%, due 8/1/51 | 5,000,000 | 4,603,854 |
| North Broward Hospital District, Revenue Bonds | | |
| Series B | | |
| 5.00%, due 1/1/42 | 6,500,000 | 6,640,866 |
| Okaloosa Gas District, Revenue Bonds (c) | | |
| Series B, Insured: AGM | | |
| 5.00%, due 10/1/43 | 7,900,000 | 8,591,169 |
| Series B, Insured: AGM | | |
| 5.25%, due 10/1/44 | 5,375,000 | 5,931,008 |
| | Principal
Amount | Value |
| |
| Florida (continued) |
| Orange County Health Facilities Authority, Orlando Health, Revenue Bonds | | |
| Series A | | |
| 4.00%, due 10/1/49 | $ 3,530,000 | $ 3,318,085 |
| 4.00%, due 10/1/52 | 7,000,000 | 6,472,427 |
| School Board of Miami-Dade County (The), Unlimited General Obligation | | |
| Series A, Insured: BAM | | |
| 5.00%, due 3/15/35 | 6,060,000 | 6,845,996 |
| Series A, Insured: BAM | | |
| 5.00%, due 3/15/52 | 5,755,000 | 6,068,408 |
| School District of Broward County, Certificate of Participation | | |
| Series A, Insured: AGM | | |
| 5.00%, due 7/1/27 | 3,750,000 | 3,810,566 |
| South Broward Hospital District, Revenue Bonds | | |
| Series A | | |
| 3.00%, due 5/1/51 | 18,060,000 | 13,054,855 |
| Series A, Insured: BAM | | |
| 3.00%, due 5/1/51 | 21,200,000 | 15,845,406 |
| 4.00%, due 5/1/48 | 13,135,000 | 12,378,638 |
| South Florida Water Management District, Certificate of Participation | | |
| 5.00%, due 10/1/34 | 12,955,000 | 13,259,126 |
| State of Florida, Unlimited General Obligation | | |
| Series E | | |
| 3.00%, due 6/1/36 | 12,660,000 | 11,598,199 |
| State of Florida, Department of Transportation Turnpike System, Revenue Bonds | | |
| Series B | | |
| 3.00%, due 7/1/49 | 3,750,000 | 2,899,477 |
| Series C | | |
| 3.00%, due 7/1/51 | 5,000,000 | 3,788,311 |
| Series A | | |
| 3.50%, due 7/1/29 | 6,345,000 | 6,286,265 |
| Tampa Bay Water, Revenue Bonds | | |
| Series A | | |
| 4.00%, due 10/1/28 | 4,500,000 | 4,525,378 |
| Series A | | |
| 5.00%, due 10/1/26 | 5,780,000 | 5,898,426 |
The notes to the financial statements are an integral part of, and should be read in conjunction with, the financial statements.
19
Portfolio of Investments April 30, 2024†^(Unaudited) (continued)
| | Principal
Amount | Value |
| Long-Term Municipal Bonds (continued) |
| Florida (continued) |
| Village Community Development District No. 8, Special Assessment | | |
| Insured: AGM | | |
| 3.50%, due 5/1/40 | $ 4,910,000 | $ 4,519,490 |
| West Palm Beach Community Redevelopment Agency, City center community redevelopment, Tax Allocation | | |
| Insured: AGM-CR | | |
| 5.00%, due 3/1/34 | 8,450,000 | 9,144,309 |
| Insured: AGM-CR | | |
| 5.00%, due 3/1/35 | 9,020,000 | 9,772,108 |
| Wildwood Utility Dependent District, Revenue Bonds | | |
| Insured: AGM | | |
| 5.25%, due 10/1/43 | 10,250,000 | 11,080,963 |
| Insured: AGM | | |
| 5.50%, due 10/1/53 | 14,000,000 | 15,251,524 |
| | | 548,806,103 |
| Georgia 3.1% |
| Augusta Development Authority, WellStar Health System Project, Revenue Bonds | | |
| Series A, Insured: AGM | | |
| 5.125%, due 4/1/53 | 5,400,000 | 5,718,239 |
| Brookhaven Development Authority, Children's Healthcare of Atlanta, Revenue Bonds | | |
| Series A | | |
| 4.00%, due 7/1/44 | 33,335,000 | 32,388,149 |
| Series A | | |
| 4.00%, due 7/1/49 | 17,190,000 | 16,206,694 |
| City of Atlanta, Airport Passenger Facility Charge, Revenue Bonds, Sub. Lien | | |
| Series D | | |
| 4.00%, due 7/1/35 (b) | 13,820,000 | 13,865,584 |
| City of Atlanta, Water & Wastewater, Revenue Bonds | | |
| 5.00%, due 11/1/29 | 4,250,000 | 4,314,444 |
| City of Atlanta, Public Improvement, Unlimited General Obligation | | |
| Series A-1 | | |
| 5.00%, due 12/1/42 | 11,750,000 | 12,952,967 |
| | Principal
Amount | Value |
| |
| Georgia (continued) |
| City of Dalton (The), Georgia Combined Utilities, Revenue Bonds | | |
| 5.00%, due 3/1/30 | $ 1,955,000 | $ 2,028,691 |
| Dalton Whitfield County Joint Development Authority, Hamilton Health Care System, Revenue Bonds | | |
| 4.00%, due 8/15/48 | 4,375,000 | 4,178,344 |
| Development Authority of Appling County, Oglethorpe Power Corp. Project, Revenue Bonds | | |
| Series A | | |
| 1.50%, due 1/1/38 (a) | 2,500,000 | 2,417,990 |
| Development Authority of Burke County (The), Oglethorpe Power Corp. Project, Revenue Bonds | | |
| Series A | | |
| 1.50%, due 1/1/40 (a) | 6,315,000 | 6,107,843 |
| Development Authority of Burke County (The), Georgia Power Co., Revenue Bonds, Second Series | | |
| Series 2 | | |
| 3.375%, due 11/1/48 (a) | 5,650,000 | 5,576,754 |
| Development Authority of Burke County (The), Georgia Power Co., Revenue Bonds (a) | | |
| Series 4 | | |
| 3.80%, due 10/1/32 | 2,000,000 | 2,001,369 |
| Series 4 | | |
| 3.80%, due 10/1/32 | 2,000,000 | 2,001,369 |
| Development Authority of Monroe County (The), Oglethorpe Power Corp. Scherer Project, Revenue Bonds | | |
| Series A | | |
| 1.50%, due 1/1/39 (a) | 5,865,000 | 5,672,605 |
| Gainesville & Hall County Hospital Authority, Northeast Georgia Health System, Revenue Bonds | | |
| Series A | | |
| 2.50%, due 2/15/51 | 8,500,000 | 5,226,276 |
| Series B, Insured: County Guaranteed | | |
| 5.50%, due 2/15/42 | 9,290,000 | 9,672,989 |
The notes to the financial statements are an integral part of, and should be read in conjunction with, the financial statements.
| 20 | MainStay MacKay Tax Free Bond Fund |
| | Principal
Amount | Value |
| Long-Term Municipal Bonds (continued) |
| Georgia (continued) |
| Gainesville & Hall County Hospital Authority, Northeast Georgia Health System Obligated Group, Revenue Bonds | | |
| Series A | | |
| 5.00%, due 2/15/37 | $ 4,215,000 | $ 4,336,674 |
| Georgia Housing & Finance Authority, Revenue Bonds | | |
| Series B | | |
| 3.55%, due 12/1/42 | 3,765,000 | 3,347,207 |
| Georgia Ports Authority, Revenue Bonds | | |
| 4.00%, due 7/1/47 | 3,000,000 | 2,922,908 |
| 5.25%, due 7/1/43 | 4,695,000 | 5,209,771 |
| 5.25%, due 7/1/52 | 4,750,000 | 5,134,890 |
| Griffin-Spalding County Hospital Authority, WellStar Health System, Revenue Bonds | | |
| 4.00%, due 4/1/42 | 3,500,000 | 3,391,959 |
| Main Street Natural Gas, Inc., Revenue Bonds | | |
| Series C | | |
| 4.00%, due 3/1/50 (a) | 2,975,000 | 2,977,405 |
| Series C | | |
| 4.00%, due 5/1/52 (a) | 6,960,000 | 6,956,201 |
| Series A | | |
| 4.00%, due 7/1/52 (a) | 21,645,000 | 21,615,623 |
| Series A | | |
| 4.00%, due 9/1/52 (a) | 21,190,000 | 21,061,167 |
| Series A | | |
| 5.00%, due 5/15/34 | 2,750,000 | 2,858,297 |
| Series A | | |
| 5.00%, due 5/15/37 | 2,265,000 | 2,377,567 |
| Series B | | |
| 5.00%, due 12/1/54 (a) | 19,500,000 | 20,580,784 |
| Municipal Electric Authority of Georgia, Project One Subordinated Bonds, Revenue Bonds | | |
| Series A, Insured: AGM-CR | | |
| 4.00%, due 1/1/41 | 2,545,000 | 2,484,817 |
| Series A | | |
| 4.00%, due 1/1/49 | 4,850,000 | 4,366,822 |
| | Principal
Amount | Value |
| |
| Georgia (continued) |
| Municipal Electric Authority of Georgia, Plant Vogtle Units 3&4 Project, Revenue Bonds | | |
| Series B | | |
| 4.00%, due 1/1/49 | $ 5,500,000 | $ 4,820,862 |
| Series A | | |
| 5.00%, due 1/1/39 | 10,000,000 | 10,264,351 |
| Series A | | |
| 5.25%, due 7/1/64 | 5,000,000 | 5,236,148 |
| Municipal Electric Authority of Georgia, Revenue Bonds | | |
| Series HH | | |
| 5.00%, due 1/1/29 | 3,825,000 | 4,022,716 |
| Series HH | | |
| 5.00%, due 1/1/37 | 3,695,000 | 3,843,811 |
| Municipal Electric Authority of Georgia, Power, Revenue Bonds | | |
| Series HH | | |
| 5.00%, due 1/1/36 | 3,515,000 | 3,671,933 |
| Series GG | | |
| 5.00%, due 1/1/43 | 3,000,000 | 2,999,882 |
| Series HH | | |
| 5.00%, due 1/1/44 | 2,700,000 | 2,758,464 |
| | | 277,570,566 |
| Guam 0.1% |
| Guam Government Waterworks Authority, Water and Wastewater System, Revenue Bonds | | |
| 5.00%, due 1/1/46 | 5,000,000 | 5,066,340 |
| Guam Power Authority, Revenue Bonds | | |
| Series A, Insured: AGM | | |
| 5.00%, due 10/1/44 | 655,000 | 656,112 |
| | | 5,722,452 |
| Hawaii 0.4% |
| City & County of Honolulu, Wastewater System, Revenue Bonds, Senior Lien | | |
| Series B | | |
| 4.00%, due 7/1/29 | 8,450,000 | 8,482,806 |
| City & County of Honolulu, Unlimited General Obligation | | |
| Series C | | |
| 4.00%, due 10/1/31 | 5,500,000 | 5,580,337 |
| Series C | | |
| 4.00%, due 10/1/32 | 4,500,000 | 4,523,356 |
The notes to the financial statements are an integral part of, and should be read in conjunction with, the financial statements.
21
Portfolio of Investments April 30, 2024†^(Unaudited) (continued)
| | Principal
Amount | Value |
| Long-Term Municipal Bonds (continued) |
| Hawaii (continued) |
| City & County of Honolulu, Unlimited General Obligation (continued) | | |
| Series B | | |
| 5.00%, due 10/1/25 | $ 3,725,000 | $ 3,809,408 |
| State of Hawaii, Unlimited General Obligation | | |
| Series FB | | |
| 4.00%, due 4/1/31 | 6,300,000 | 6,358,617 |
| Series FK | | |
| 4.00%, due 5/1/32 | 4,300,000 | 4,363,065 |
| State of Hawaii Department of Budget & Finance, Hawaiian Electric Co., Inc., Revenue Bonds | | |
| Insured: AGM-CR | | |
| 3.50%, due 10/1/49 (b) | 5,675,000 | 4,435,688 |
| | | 37,553,277 |
| Idaho 0.2% |
| Boise State University, Revenue Bonds | | |
| Series A | | |
| 5.25%, due 4/1/53 | 3,600,000 | 3,875,066 |
| Idaho Housing & Finance Association, Revenue Bonds | | |
| Series A, Insured: GNMA / FNMA / FHLMC | | |
| 4.45%, due 1/1/44 | 7,250,000 | 7,253,499 |
| Series A, Insured: GNMA / FNMA / FHLMC | | |
| 4.60%, due 1/1/49 | 5,750,000 | 5,706,077 |
| | | 16,834,642 |
| Illinois 8.2% |
| Chicago Board of Education, Capital Appreciation, School Reform, Unlimited General Obligation | | |
| Series A, Insured: NATL-RE | | |
| (zero coupon), due 12/1/26 | 17,245,000 | 15,450,115 |
| Chicago Board of Education, Unlimited General Obligation | | |
| Series A, Insured: AGM | | |
| 5.00%, due 12/1/27 | 7,000,000 | 7,221,576 |
| Chicago Board of Education, Dedicated Capital Improvement, Revenue Bonds | | |
| 5.75%, due 4/1/48 | 17,000,000 | 18,637,068 |
| 6.00%, due 4/1/46 | 16,560,000 | 17,230,485 |
| | Principal
Amount | Value |
| |
| Illinois (continued) |
| Chicago Midway International Airport, Revenue Bonds, Senior Lien (b) | | |
| Series C | | |
| 5.00%, due 1/1/25 | $ 6,500,000 | $ 6,534,312 |
| Series C | | |
| 5.00%, due 1/1/26 | 4,000,000 | 4,065,715 |
| Series C | | |
| 5.00%, due 1/1/27 | 5,000,000 | 5,143,939 |
| Chicago O'Hare International Airport, General, Revenue Bonds, Senior Lien | | |
| Series A, Insured: AGM | | |
| 4.00%, due 1/1/36 | 8,100,000 | 8,291,625 |
| Series A | | |
| 4.00%, due 1/1/36 | 16,215,000 | 16,515,128 |
| Series A, Insured: BAM | | |
| 4.00%, due 1/1/43 (b) | 13,500,000 | 12,963,048 |
| Series D, Insured: AGM | | |
| 5.00%, due 1/1/38 | 4,750,000 | 5,217,415 |
| Series A | | |
| 5.00%, due 1/1/39 (b) | 4,000,000 | 4,141,182 |
| Series D | | |
| 5.00%, due 1/1/52 (b) | 3,250,000 | 3,255,998 |
| Series F | | |
| 5.25%, due 1/1/29 | 3,060,000 | 3,204,171 |
| Series A, Insured: AGM | | |
| 5.50%, due 1/1/53 (b) | 23,525,000 | 24,903,240 |
| Chicago O'Hare International Airport, General, Revenue Bonds | | |
| Series B | | |
| 5.00%, due 1/1/27 | 5,660,000 | 5,703,431 |
| Series A | | |
| 5.00%, due 1/1/31 (b) | 8,500,000 | 8,539,914 |
| Chicago O'Hare International Airport, Revenue Bonds, Senior Lien | | |
| Series A | | |
| 4.50%, due 1/1/48 (b) | 4,725,000 | 4,643,333 |
| Series B | | |
| 5.00%, due 1/1/39 | 3,970,000 | 4,076,408 |
| Chicago O'Hare International Airport, Revenue Bonds | | |
| Series A | | |
| 5.00%, due 1/1/35 (b) | 7,605,000 | 7,638,889 |
The notes to the financial statements are an integral part of, and should be read in conjunction with, the financial statements.
| 22 | MainStay MacKay Tax Free Bond Fund |
| | Principal
Amount | Value |
| Long-Term Municipal Bonds (continued) |
| Illinois (continued) |
| Chicago O'Hare International Airport, Passenger Facility Charge, Revenue Bonds | | |
| Series A | | |
| 5.00%, due 1/1/30 | $ 2,665,000 | $ 2,666,757 |
| Chicago Park District, Limited Tax, Limited General Obligation | | |
| Series C | | |
| 4.00%, due 1/1/35 | 4,000,000 | 4,047,812 |
| Series B | | |
| 5.00%, due 1/1/25 | 2,140,000 | 2,141,099 |
| Series A | | |
| 5.00%, due 1/1/35 | 2,000,000 | 2,036,206 |
| Chicago Transit Authority Sales Tax Receipts Fund, Revenue Bonds | | |
| Insured: AGM | | |
| 5.00%, due 12/1/44 | 16,690,000 | 16,730,139 |
| Chicago Transit Authority Sales Tax Receipts Fund, Revenue Bonds, Second Lien | | |
| 5.00%, due 12/1/46 | 4,530,000 | 4,582,800 |
| City of Chicago, Unlimited General Obligation | | |
| Series B | | |
| 4.00%, due 1/1/37 | 4,750,000 | 4,700,091 |
| Series A | | |
| 5.00%, due 1/1/32 | 1,400,000 | 1,507,592 |
| Series A | | |
| 5.00%, due 1/1/33 | 1,425,000 | 1,532,924 |
| Series A | | |
| 5.50%, due 1/1/40 | 4,650,000 | 5,026,911 |
| Series A | | |
| 5.50%, due 1/1/49 | 5,000,000 | 5,159,368 |
| Series A | | |
| 6.00%, due 1/1/38 | 39,050,000 | 40,691,436 |
| Series A, Insured: BAM | | |
| 6.00%, due 1/1/38 | 5,000,000 | 5,217,009 |
| City of Chicago, Waterworks, Revenue Bonds, Second Lien | | |
| 4.00%, due 11/1/37 | 265,000 | 260,545 |
| 5.00%, due 11/1/25 | 2,000,000 | 2,041,982 |
| 5.00%, due 11/1/28 | 3,750,000 | 3,875,688 |
| Series 2, Insured: AGM | | |
| 5.00%, due 11/1/32 | 4,000,000 | 4,208,704 |
| Series 2, Insured: AGM | | |
| 5.00%, due 11/1/33 | 8,550,000 | 8,998,399 |
| 5.00%, due 11/1/39 | 5,620,000 | 5,637,652 |
| | Principal
Amount | Value |
| |
| Illinois (continued) |
City of Chicago, Waterworks, Revenue Bonds, Second Lien
(continued) | | |
| Insured: AGM | | |
| 5.25%, due 11/1/33 | $ 4,000,000 | $ 4,242,491 |
| Insured: AGM | | |
| 5.25%, due 11/1/34 | 1,860,000 | 1,965,434 |
| Insured: AGM | | |
| 5.25%, due 11/1/35 | 2,275,000 | 2,407,738 |
| Series A, Insured: AGM | | |
| 5.25%, due 11/1/48 | 6,000,000 | 6,486,455 |
| Series A, Insured: AGM | | |
| 5.50%, due 11/1/62 | 4,320,000 | 4,669,115 |
| City of Chicago, Wastewater Transmission Project, Revenue Bonds, Second Lien | | |
| 5.00%, due 1/1/28 | 1,000,000 | 1,002,052 |
| Series B, Insured: AGM-CR | | |
| 5.00%, due 1/1/30 | 6,435,000 | 6,687,097 |
| Insured: BAM | | |
| 5.00%, due 1/1/44 | 11,240,000 | 11,263,068 |
| Series A, Insured: AGM | | |
| 5.25%, due 1/1/42 | 3,750,000 | 3,875,346 |
| Series A, Insured: AGM | | |
| 5.50%, due 1/1/62 | 5,280,000 | 5,716,930 |
| City of Chicago Heights, Unlimited General Obligation | | |
| Series B, Insured: BAM | | |
| 5.25%, due 12/1/34 | 1,865,000 | 1,983,579 |
| Cook County High School District No. 209, Proviso Township, Limited General Obligation | | |
| Series B, Insured: AGM | | |
| 4.00%, due 12/1/38 | 3,000,000 | 2,994,640 |
| County of Cook, Sales Tax, Revenue Bonds | | |
| 4.00%, due 11/15/37 | 4,250,000 | 4,291,891 |
| Grundy County School District No. 54, Unlimited General Obligation | | |
| Series C, Insured: BAM | | |
| 3.00%, due 12/1/25 | 2,960,000 | 2,909,375 |
| Illinois Finance Authority, Maine Township High School District No. 207, Revenue Bonds | | |
| 4.00%, due 12/1/37 | 3,500,000 | 3,539,164 |
The notes to the financial statements are an integral part of, and should be read in conjunction with, the financial statements.
23
Portfolio of Investments April 30, 2024†^(Unaudited) (continued)
| | Principal
Amount | Value |
| Long-Term Municipal Bonds (continued) |
| Illinois (continued) |
| Illinois Finance Authority, University of Chicago (The), Revenue Bonds | | |
| Series A | | |
| 4.00%, due 10/1/38 | $ 8,500,000 | $ 8,064,167 |
| Illinois Finance Authority, University of Chicago Medical Center Obligated Group, Revenue Bonds | | |
| Series B | | |
| 4.00%, due 8/15/41 | 3,500,000 | 3,387,603 |
| Illinois Finance Authority, Northwestern Memorial Healthcare, Revenue Bonds | | |
| Series A | | |
| 4.00%, due 7/15/47 | 16,660,000 | 15,879,276 |
| Illinois Finance Authority, Mercy Health Corp. Obligated Group, Revenue Bonds | | |
| 5.00%, due 12/1/40 | 4,500,000 | 4,560,654 |
| Illinois Finance Authority, Silver Cross Hospital Obligated Group, Revenue Bonds | | |
| Series C | | |
| 5.00%, due 8/15/44 | 16,500,000 | 16,581,266 |
| Illinois Housing Development Authority, Revenue Bonds | | |
| Series A, Insured: GNMA / FNMA / FHLMC | | |
| 6.00%, due 10/1/54 | 7,000,000 | 7,552,604 |
| Illinois Municipal Electric Agency, Revenue Bonds | | |
| Series A | | |
| 4.00%, due 2/1/33 | 8,750,000 | 8,689,180 |
| Series A | | |
| 4.00%, due 2/1/34 | 5,650,000 | 5,588,714 |
| Series A | | |
| 5.00%, due 2/1/32 | 5,000,000 | 5,052,683 |
| Illinois Sports Facilities Authority (The), Revenue Bonds | | |
| Insured: AGM | | |
| 5.25%, due 6/15/31 | 4,000,000 | 4,003,005 |
| Illinois State Toll Highway Authority, Revenue Bonds, Senior Lien | | |
| Series A | | |
| 5.00%, due 12/1/31 | 4,220,000 | 4,311,658 |
| Series B | | |
| 5.00%, due 1/1/41 | 6,000,000 | 6,099,353 |
| | Principal
Amount | Value |
| |
| Illinois (continued) |
| Illinois State Toll Highway Authority, Revenue Bonds | | |
| Series A | | |
| 5.00%, due 1/1/37 | $ 5,000,000 | $ 5,072,543 |
| Series C | | |
| 5.00%, due 1/1/38 | 5,000,000 | 5,037,085 |
| Series C | | |
| 5.00%, due 1/1/39 | 5,250,000 | 5,285,289 |
| Kane County Forest Preserve District, Unlimited General Obligation | | |
| Series C | | |
| 3.00%, due 12/15/26 | 2,880,000 | 2,826,986 |
| Lake County Community High School District No. 115, Lake Forest, Unlimited General Obligation | | |
| 4.25%, due 11/1/41 | 7,260,000 | 7,373,793 |
| 4.50%, due 11/1/42 | 7,585,000 | 7,813,367 |
| Metropolitan Pier & Exposition Authority, McCormick Place Expansion Project, Capital Appreciation, Revenue Bonds | | |
| Series A, Insured: NATL-RE | | |
| (zero coupon), due 6/15/35 | 17,500,000 | 11,249,105 |
| Series A, Insured: NATL-RE | | |
| (zero coupon), due 6/15/36 | 27,500,000 | 16,728,676 |
| Series B-1, Insured: AGM | | |
| (zero coupon), due 6/15/43 | 10,000,000 | 4,166,449 |
| Northern Illinois Municipal Power Agency, Revenue Bonds | | |
| Series A | | |
| 5.00%, due 12/1/41 | 5,125,000 | 5,163,954 |
| Rock Island County Public Building Commission, County of Rock Island, Revenue Bonds | | |
| Insured: AGM | | |
| 5.00%, due 12/1/36 | 2,145,000 | 2,213,379 |
| Sales Tax Securitization Corp., Revenue Bonds | | |
| Series A | | |
| 4.00%, due 1/1/48 | 10,000,000 | 8,859,776 |
| Series A, Insured: BAM | | |
| 4.00%, due 1/1/48 | 9,500,000 | 8,628,745 |
| Series C | | |
| 5.00%, due 1/1/25 | 4,000,000 | 4,032,103 |
| Series A | | |
| 5.00%, due 1/1/28 | 3,685,000 | 3,908,508 |
The notes to the financial statements are an integral part of, and should be read in conjunction with, the financial statements.
| 24 | MainStay MacKay Tax Free Bond Fund |
| | Principal
Amount | Value |
| Long-Term Municipal Bonds (continued) |
| Illinois (continued) |
| Sales Tax Securitization Corp., Revenue Bonds (continued) | | |
| Series C | | |
| 5.25%, due 1/1/34 | $ 7,500,000 | $ 8,072,387 |
| Series C, Insured: BAM | | |
| 5.25%, due 1/1/48 | 35,150,000 | 36,650,360 |
| Sangamon County School District No. 186, Springfield, Unlimited General Obligation | | |
| Insured: AGM | | |
| 5.50%, due 6/1/58 | 9,475,000 | 10,085,535 |
| Southern Illinois University, Housing & Auxiliary Facilities System, Revenue Bonds | | |
| Series B, Insured: BAM | | |
| 5.00%, due 4/1/29 | 1,620,000 | 1,632,721 |
| Series B, Insured: BAM | | |
| 5.00%, due 4/1/30 | 1,000,000 | 1,007,137 |
| State of Illinois, Unlimited General Obligation | | |
| Insured: BAM | | |
| 4.00%, due 6/1/41 | 6,450,000 | 6,182,348 |
| Series D | | |
| 5.00%, due 11/1/26 | 7,375,000 | 7,607,608 |
| 5.00%, due 2/1/27 | 3,980,000 | 4,117,379 |
| Series D | | |
| 5.00%, due 11/1/27 | 10,000,000 | 10,462,886 |
| 5.00%, due 1/1/28 | 5,155,000 | 5,256,231 |
| Series D | | |
| 5.00%, due 11/1/28 | 6,280,000 | 6,556,131 |
| 5.00%, due 5/1/29 | 2,660,000 | 2,662,334 |
| Series A | | |
| 5.00%, due 12/1/34 | 4,500,000 | 4,682,639 |
| 5.25%, due 2/1/32 | 8,550,000 | 8,559,273 |
| Series A | | |
| 5.50%, due 3/1/47 | 4,750,000 | 5,075,183 |
| Series A | | |
| 6.00%, due 5/1/27 | 8,190,000 | 8,743,446 |
| State of Illinois, Build America Bonds, Unlimited General Obligation | | |
| Series 4, Insured: AGM-CR | | |
| 6.875%, due 7/1/25 | 6,335,000 | 6,371,958 |
| United City of Yorkville, Special Tax | | |
| Insured: AGM | | |
| 5.00%, due 3/1/32 | 3,007,000 | 3,060,023 |
| | Principal
Amount | Value |
| |
| Illinois (continued) |
| Village of Bellwood, Unlimited General Obligation | | |
| Insured: AGM | | |
| 5.00%, due 12/1/29 | $ 1,500,000 | $ 1,532,746 |
| Village of Rosemont, Corporate Purpose, Unlimited General Obligation | | |
| Series A, Insured: AGM | | |
| 5.00%, due 12/1/40 | 6,790,000 | 6,940,937 |
| Village of Schaumburg, Unlimited General Obligation | | |
| Series A, Insured: BAM | | |
| 4.00%, due 12/1/41 | 32,050,000 | 31,815,782 |
| Will County School District No. 114, Manhattan, Unlimited General Obligation | | |
| Insured: BAM | | |
| 5.50%, due 1/1/49 | 6,210,000 | 6,752,517 |
| | | 740,431,963 |
| Indiana 1.1% |
| Crown Point Multi School Building Corp., Revenue Bonds | | |
| Insured: State Intercept | | |
| 5.00%, due 1/15/40 | 8,500,000 | 9,150,238 |
| Greater Clark Building Corp., Revenue Bonds | | |
| Insured: State Intercept | | |
| 6.00%, due 7/15/38 | 5,700,000 | 6,714,009 |
| Indiana Finance Authority, Indiana University Health, Revenue Bonds | | |
| Series L | | |
| 0.70%, due 12/1/46 (a) | 5,000,000 | 4,663,264 |
| Series A | | |
| 5.00%, due 10/1/41 | 7,750,000 | 8,423,504 |
| Series A | | |
| 5.00%, due 10/1/42 | 12,220,000 | 13,228,258 |
| Series A | | |
| 5.00%, due 10/1/46 | 4,000,000 | 4,269,658 |
| Indiana Finance Authority, State Revolving Fund, Revenue Bonds | | |
| Series E | | |
| 5.00%, due 2/1/25 | 6,000,000 | 6,065,387 |
| Indiana Finance Authority, CWA Authority, Inc., Revenue Bonds, First Lien | | |
| Series B | | |
| 5.25%, due 10/1/47 | 13,695,000 | 14,572,158 |
The notes to the financial statements are an integral part of, and should be read in conjunction with, the financial statements.
25
Portfolio of Investments April 30, 2024†^(Unaudited) (continued)
| | Principal
Amount | Value |
| Long-Term Municipal Bonds (continued) |
| Indiana (continued) |
| Indiana Housing & Community Development Authority, Revenue Bonds | | |
| Series A-1, Insured: GNMA / FNMA / FHLMC | | |
| 5.75%, due 7/1/53 | $ 2,725,000 | $ 2,859,368 |
| Indiana Municipal Power Agency, Revenue Bonds | | |
| Series A | | |
| 5.00%, due 1/1/42 | 15,425,000 | 15,635,216 |
| Indianapolis Local Public Improvement Bond Bank, Revenue Bonds | | |
| Series I | | |
| 5.00%, due 1/1/28 (b) | 4,350,000 | 4,375,424 |
| Series I | | |
| 5.00%, due 1/1/29 (b) | 3,500,000 | 3,522,433 |
| Series D | | |
| 6.00%, due 2/1/48 | 8,150,000 | 9,348,714 |
| | | 102,827,631 |
| Iowa 0.4% |
| Ames Community School District, Unlimited General Obligation | | |
| 1.875%, due 6/1/36 | 4,000,000 | 3,016,733 |
| 1.875%, due 6/1/37 | 4,000,000 | 2,909,492 |
| City of Des Moines, Unlimited General Obligation | | |
| Series F | | |
| 2.00%, due 6/1/37 | 4,450,000 | 3,237,817 |
| Iowa Finance Authority, Iowa Health System Obligated Group, Revenue Bonds | | |
| Series E | | |
| 5.00%, due 8/15/32 | 2,500,000 | 2,550,249 |
| PEFA, Inc., Revenue Bonds | | |
| 5.00%, due 9/1/49 (a) | 14,795,000 | 15,070,129 |
| Waukee Community School District, Unlimited General Obligation | | |
| Series B | | |
| 2.00%, due 6/1/35 | 4,000,000 | 3,140,437 |
| Series B | | |
| 2.00%, due 6/1/37 | 4,265,000 | 3,137,669 |
| Series B | | |
| 2.00%, due 6/1/38 | 5,370,000 | 3,831,598 |
| | | 36,894,124 |
| | Principal
Amount | Value |
| |
| Kansas 0.1% |
| City of Hutchinson, Hutchinson Regional Medical Center, Inc., Revenue Bonds | | |
| 5.00%, due 12/1/26 | $ 565,000 | $ 555,279 |
| 5.00%, due 12/1/28 | 410,000 | 399,691 |
| 5.00%, due 12/1/30 | 500,000 | 485,351 |
| City of Topeka, Combined Utility, Revenue Bonds | | |
| Series A | | |
| 4.00%, due 8/1/48 | 6,000,000 | 5,539,143 |
| | | 6,979,464 |
| Kentucky 0.9% |
| County of Warren, Bowling Green-Warren County Community Hospital Corp., Revenue Bonds | | |
| 5.25%, due 4/1/54 | 13,375,000 | 14,233,009 |
| Kentucky Public Energy Authority, Revenue Bonds (a) | | |
| Series C-1 | | |
| 4.00%, due 12/1/49 | 10,990,000 | 10,988,325 |
| Series A | | |
| 5.00%, due 5/1/55 | 6,500,000 | 6,761,149 |
| Kentucky Public Energy Authority, Gas Supply, Revenue Bonds | | |
| Series C | | |
| 4.00%, due 2/1/50 (a) | 8,640,000 | 8,618,336 |
| Series A-1 | | |
| 4.00%, due 8/1/52 (a) | 9,125,000 | 9,018,977 |
| Series A-2 | | |
| 4.764%, due 8/1/52 | 17,500,000 | 17,115,996 |
| Series C-2 | | |
| 4.943%, due 12/1/49 | 5,750,000 | 5,754,703 |
| Louisville/Jefferson County Metropolitan Government, UofL Health Project, Revenue Bonds | | |
| Series A, Insured: AGM | | |
| 5.00%, due 5/15/47 | 11,250,000 | 11,806,753 |
| | | 84,297,248 |
| Louisiana 0.3% |
| City of Shreveport, Unlimited General Obligation | | |
| Insured: BAM | | |
| 5.00%, due 8/1/30 | 4,355,000 | 4,519,681 |
| Ernest N Morial New Orleans Exhibition Hall Authority, Special Tax | | |
| 5.50%, due 7/15/53 | 15,945,000 | 17,395,070 |
The notes to the financial statements are an integral part of, and should be read in conjunction with, the financial statements.
| 26 | MainStay MacKay Tax Free Bond Fund |
| | Principal
Amount | Value |
| Long-Term Municipal Bonds (continued) |
| Louisiana (continued) |
| Louisiana Public Facilities Authority, Ochsner Clinic Foundation Obligated Group, Revenue Bonds | | |
| 4.00%, due 5/15/42 | $ 4,250,000 | $ 4,057,905 |
| | | 25,972,656 |
| Maine 0.0% ‡ |
| Maine Municipal Bond Bank, Revenue Bonds | | |
| Series B | | |
| 3.50%, due 11/1/29 | 3,700,000 | 3,694,444 |
| Maryland 0.5% |
| County of Baltimore, Unlimited General Obligation | | |
| 5.00%, due 3/1/25 | 3,195,000 | 3,234,316 |
| County of Frederick, Public Facilities Project, Unlimited General Obligation | | |
| Series A | | |
| 1.75%, due 10/1/36 | 5,630,000 | 4,141,952 |
| Maryland Community Development Administration, Revenue Bonds | | |
| Series E, Insured: GNMA / FNMA / FHLMC | | |
| 6.25%, due 3/1/54 | 6,125,000 | 6,611,523 |
| Maryland Health & Higher Educational Facilities Authority, MedStar Health Obligated Group, Revenue Bonds | | |
| 5.00%, due 8/15/42 | 6,350,000 | 6,386,055 |
| Maryland Stadium Authority, Baltimore City Public School Construction Financing Fund, Revenue Bonds | | |
| Series A, Insured: State Intercept | | |
| 5.00%, due 5/1/34 | 4,250,000 | 4,511,213 |
| State of Maryland, Revenue Bonds | | |
| 3.00%, due 11/1/30 | 10,750,000 | 10,381,461 |
| 3.00%, due 11/1/31 | 6,375,000 | 6,107,372 |
| | | 41,373,892 |
| Massachusetts 1.5% |
| Boston Water & Sewer Commission, Revenue Bonds | | |
| Series B | | |
| 3.00%, due 11/1/41 | 8,500,000 | 7,057,105 |
| | Principal
Amount | Value |
| |
| Massachusetts (continued) |
| City of Boston, Unlimited General Obligation | | |
| Series A | | |
| 5.00%, due 11/1/38 | $ 5,750,000 | $ 6,632,829 |
| City of Worcester, Limited General Obligation | | |
| Insured: AGM | | |
| 3.00%, due 2/1/37 | 2,750,000 | 2,477,344 |
| Commonwealth of Massachusetts, Consolidated Loan, Limited General Obligation | | |
| Series B | | |
| 3.00%, due 2/1/48 | 31,045,000 | 23,437,606 |
| Series C | | |
| 3.00%, due 3/1/49 | 13,250,000 | 9,887,015 |
| Series B | | |
| 3.00%, due 4/1/49 | 7,465,000 | 5,567,875 |
| Series D | | |
| 5.00%, due 7/1/25 | 9,500,000 | 9,673,684 |
| Series A | | |
| 5.00%, due 4/1/37 | 2,950,000 | 3,080,165 |
| Commonwealth of Massachusetts, Consolidated Loan, Unlimited General Obligation | | |
| Series C | | |
| 5.00%, due 10/1/52 | 5,500,000 | 5,840,003 |
| Massachusetts Bay Transportation Authority, Sales Tax, Revenue Bonds | | |
| Series A | | |
| (zero coupon), due 7/1/31 | 11,500,000 | 8,655,708 |
| Massachusetts Bay Transportation Authority, Sales Tax, Revenue Bonds, Senior Lien | | |
| Series B | | |
| 4.00%, due 7/1/35 | 10,250,000 | 10,281,066 |
| Massachusetts Development Finance Agency, Partners Healthcare System Issue, Revenue Bonds | | |
| Series O-2 | | |
| 5.00%, due 7/1/27 | 4,700,000 | 4,781,940 |
| Massachusetts Development Finance Agency, Harvard University Issue, Revenue Bonds | | |
| Series B | | |
| 5.00%, due 11/15/32 | 7,965,000 | 9,296,952 |
The notes to the financial statements are an integral part of, and should be read in conjunction with, the financial statements.
27
Portfolio of Investments April 30, 2024†^(Unaudited) (continued)
| | Principal
Amount | Value |
| Long-Term Municipal Bonds (continued) |
| Massachusetts (continued) |
| Massachusetts Development Finance Agency, Dana-Farber Cancer Institute, Revenue Bonds | | |
| Series N | | |
| 5.00%, due 12/1/41 | $ 13,015,000 | $ 13,301,916 |
| Massachusetts School Building Authority, Revenue Bonds, Senior Lien | | |
| Series B | | |
| 5.00%, due 11/15/33 | 8,500,000 | 8,871,431 |
| Town of Middleton, Limited General Obligation | | |
| 2.00%, due 12/15/39 | 2,675,000 | 1,919,292 |
| Town of Stoneham, Limited General Obligation | | |
| 2.25%, due 1/15/39 | 4,430,000 | 3,367,382 |
| | | 134,129,313 |
| Michigan 1.5% |
| Downriver Utility Wastewater Authority, Revenue Bonds | | |
| Insured: AGM | | |
| 5.00%, due 4/1/31 | 1,600,000 | 1,699,405 |
| Great Lakes Water Authority, Sewage Disposal System, Revenue Bonds, Second Lien | | |
| Series C | | |
| 5.00%, due 7/1/36 | 3,000,000 | 3,075,023 |
| Great Lakes Water Authority, Sewage Disposal System, Revenue Bonds, Senior Lien | | |
| Series A | | |
| 5.25%, due 7/1/52 | 5,000,000 | 5,364,433 |
| Great Lakes Water Authority, Water Supply System, Revenue Bonds, Senior Lien | | |
| Series C | | |
| 5.25%, due 7/1/33 | 7,175,000 | 7,444,234 |
| Series C | | |
| 5.25%, due 7/1/35 | 8,175,000 | 8,449,896 |
| Holly Area School District, Unlimited General Obligation | | |
| Series I, Insured: Q-SBLF | | |
| 5.25%, due 5/1/48 | 3,415,000 | 3,639,587 |
| | Principal
Amount | Value |
| |
| Michigan (continued) |
| Lapeer Community Schools, Unlimited General Obligation | | |
| Insured: AGM | | |
| 5.25%, due 5/1/46 | $ 9,000,000 | $ 9,668,491 |
| Michigan Finance Authority, McLaren Health Care Corp., Revenue Bonds | | |
| Series A | | |
| 4.00%, due 2/15/44 | 8,500,000 | 8,016,679 |
| Michigan Finance Authority, Trinity Health Corp. Obligated Group, Revenue Bonds | | |
| Series MI | | |
| 4.00%, due 12/1/45 | 7,725,000 | 7,337,184 |
| Michigan Finance Authority, BHSH System Obligated Group, Revenue Bonds | | |
| Series A | | |
| 5.00%, due 4/15/28 | 6,600,000 | 7,019,190 |
| Michigan Finance Authority, Great Lakes Water Authority Sewage Disposal System, Revenue Bonds, Second Lien | | |
| Series C-7, Insured: NATL-RE | | |
| 5.00%, due 7/1/32 | 2,000,000 | 2,004,048 |
| Michigan Finance Authority, Beaumont Health Obligated Group, Revenue Bonds | | |
| Series A | | |
| 5.00%, due 11/1/44 | 4,860,000 | 4,910,572 |
| Michigan Finance Authority, Bronson Health Care Group, Revenue Bonds | | |
| Series A | | |
| 5.00%, due 5/15/54 | 11,870,000 | 11,985,765 |
| Michigan Finance Authority, Provident Group - HFH Energy LLC, Revenue Bonds | | |
| 5.50%, due 2/28/49 | 2,375,000 | 2,564,297 |
| Michigan State Housing Development Authority, Revenue Bonds | | |
| Series A | | |
| 3.75%, due 4/1/27 | 8,500,000 | 8,470,069 |
The notes to the financial statements are an integral part of, and should be read in conjunction with, the financial statements.
| 28 | MainStay MacKay Tax Free Bond Fund |
| | Principal
Amount | Value |
| Long-Term Municipal Bonds (continued) |
| Michigan (continued) |
| Southgate Community School District, Unlimited General Obligation | | |
| Series II, Insured: Q-SBLF | | |
| 5.25%, due 5/1/49 | $ 9,440,000 | $ 10,174,856 |
| State of Michigan, Trunk Line, Revenue Bonds | | |
| Series A | | |
| 4.00%, due 11/15/44 | 31,625,000 | 31,331,975 |
| | | 133,155,704 |
| Minnesota 1.3% |
| City of Rochester, Mayo Clinic, Revenue Bonds | | |
| 4.00%, due 11/15/39 | 16,425,000 | 16,947,731 |
| Elk River Independent School District No. 728, Unlimited General Obligation | | |
| Series A, Insured: SD CRED PROG | | |
| 2.25%, due 2/1/36 | 5,250,000 | 4,305,098 |
| Series A, Insured: SD CRED PROG | | |
| 2.50%, due 2/1/38 | 9,000,000 | 7,112,438 |
| Metropolitan Council, Minneapolis-St.Paul Metropolitan Area, Unlimited General Obligation | | |
| Series A | | |
| 3.00%, due 3/1/29 | 3,300,000 | 3,217,015 |
| Minneapolis-St Paul Metropolitan Airports Commission, Revenue Bonds | | |
| Series B | | |
| 5.00%, due 1/1/28 (b) | 5,000,000 | 5,203,150 |
| Minnesota Agricultural & Economic Development Board, HealthPartners Obligated Group, Revenue Bonds | | |
| 5.25%, due 1/1/47 | 9,250,000 | 10,000,161 |
| 5.25%, due 1/1/54 | 24,185,000 | 25,756,594 |
| Minnesota Housing Finance Agency, Residential Housing Finance, Revenue Bonds | | |
| Series R, Insured: GNMA / FNMA / FHLMC | | |
| 6.25%, due 7/1/54 | 6,000,000 | 6,470,825 |
| | Principal
Amount | Value |
| |
| Minnesota (continued) |
| Moorhead Independent School District No. 152, Unlimited General Obligation | | |
| Series A, Insured: SD CRED PROG | | |
| 2.50%, due 2/1/38 | $ 8,000,000 | $ 6,326,771 |
| State of Minnesota, Unlimited General Obligation | | |
| Series B | | |
| 1.625%, due 8/1/37 | 4,000,000 | 2,808,554 |
| Series B | | |
| 5.00%, due 8/1/26 | 11,000,000 | 11,400,964 |
| White Bear Lake Independent School District No. 624, Unlimited General Obligation | | |
| Series A, Insured: SD CRED PROG | | |
| 2.50%, due 2/1/39 | 8,300,000 | 6,396,988 |
| Series A, Insured: SD CRED PROG | | |
| 2.50%, due 2/1/40 | 8,105,000 | 6,124,037 |
| Series A, Insured: SD CRED PROG | | |
| 3.00%, due 2/1/43 | 4,060,000 | 3,286,742 |
| | | 115,357,068 |
| Missouri 0.9% |
| Health & Educational Facilities Authority of the State of Missouri, Mercy Health, Revenue Bonds | | |
| 3.00%, due 6/1/53 | 5,760,000 | 4,191,102 |
| 4.00%, due 6/1/53 | 9,750,000 | 8,972,025 |
| 5.50%, due 12/1/48 | 16,245,000 | 17,803,475 |
| Health & Educational Facilities Authority of the State of Missouri, St Luke's Health System, Revenue Bonds | | |
| Series A | | |
| 4.00%, due 11/15/48 | 8,500,000 | 8,081,446 |
| Health & Educational Facilities Authority of the State of Missouri, CoxHealth, Revenue Bonds | | |
| Series A | | |
| 4.00%, due 11/15/49 | 6,750,000 | 6,281,383 |
| Health & Educational Facilities Authority of the State of Missouri, BJC Healthcare, Revenue Bonds | | |
| Series D | | |
| 4.00%, due 1/1/58 (a) | 13,000,000 | 12,054,458 |
The notes to the financial statements are an integral part of, and should be read in conjunction with, the financial statements.
29
Portfolio of Investments April 30, 2024†^(Unaudited) (continued)
| | Principal
Amount | Value |
| Long-Term Municipal Bonds (continued) |
| Missouri (continued) |
| Missouri Housing Development Commission, First Place Homeownership Loan Program, Revenue Bonds | | |
| Insured: GNMA / FNMA / FHLMC | | |
| 4.25%, due 5/1/47 | $ 1,805,000 | $ 1,793,640 |
| Missouri Joint Municipal Electric Utility Commission, Prairie State Project, Revenue Bonds | | |
| Series A | | |
| 5.00%, due 12/1/31 | 3,000,000 | 3,026,974 |
| Missouri State Environmental Improvement & Energy Resources Authority, Revenue Bonds | | |
| Series C | | |
| 2.75%, due 9/1/33 | 9,000,000 | 7,852,953 |
| Missouri State Environmental Improvement & Energy Resources Authority, Union Electric Co., Revenue Bonds | | |
| Series B | | |
| 2.90%, due 9/1/33 | 5,000,000 | 4,596,764 |
| St. Charles County School District No. R-IV, Wentzville, Unlimited General Obligation | | |
| Insured: State Aid Direct Deposit | | |
| 1.875%, due 3/1/40 | 11,145,000 | 7,470,997 |
| | | 82,125,217 |
| Montana 0.1% |
| Montana Facility Finance Authority, Benefis Health System Obligated Group, Revenue Bonds | | |
| 5.00%, due 2/15/33 | 1,320,000 | 1,355,753 |
| Montana State Board of Regents, University of Montana/Missoula, Revenue Bonds | | |
| Insured: AGM | | |
| 5.25%, due 11/15/52 | 7,370,000 | 7,934,792 |
| Yellowstone County K-12, School District No. 26 Lockwood, Unlimited General Obligation | | |
| 5.00%, due 7/1/32 | 2,550,000 | 2,720,636 |
| | | 12,011,181 |
| | Principal
Amount | Value |
| |
| Nebraska 0.9% |
| County of Sarpy, Highway Allocation Fund, Limited General Obligation | | |
| 1.875%, due 6/1/39 | $ 2,890,000 | $ 1,944,513 |
| Metropolitan Utilities District of Omaha, Revenue Bonds | | |
| 3.40%, due 12/1/30 | 7,000,000 | 6,931,633 |
| Nebraska Investment Finance Authority, Revenue Bonds (c) | | |
| Series C, Insured: GNMA / FNMA / FHLMC | | |
| 4.55%, due 9/1/44 | 5,175,000 | 5,177,465 |
| Series C, Insured: GNMA / FNMA / FHLMC | | |
| 4.70%, due 9/1/49 | 8,750,000 | 8,746,854 |
| Omaha Public Power District, Electric System, Revenue Bonds | | |
| Series A | | |
| 5.00%, due 2/1/47 | 17,500,000 | 18,630,866 |
| Omaha Public Power District, Revenue Bonds | | |
| Series A | | |
| 5.25%, due 2/1/52 | 25,930,000 | 27,859,205 |
| Omaha School District, Unlimited General Obligation | | |
| 1.75%, due 12/15/36 | 7,635,000 | 5,613,840 |
| 1.75%, due 12/15/37 | 6,755,000 | 4,798,802 |
| | | 79,703,178 |
| Nevada 1.4% |
| City of Reno, Capital Improvement, Revenue Bonds | | |
| Series A-1, Insured: AGM | | |
| 4.00%, due 6/1/46 | 1,600,000 | 1,524,940 |
| Clark County School District, Limited General Obligation | | |
| Series B, Insured: BAM | | |
| 3.00%, due 6/15/36 | 5,500,000 | 5,000,907 |
| County of Clark, Regional Transportation Commission of Southern Nevada Motor Fuel Tax, Revenue Bonds | | |
| Insured: AGM | | |
| 4.00%, due 7/1/40 | 16,500,000 | 16,419,681 |
| County of Clark, Limited General Obligation | | |
| 4.00%, due 7/1/44 | 4,900,000 | 4,741,390 |
The notes to the financial statements are an integral part of, and should be read in conjunction with, the financial statements.
| 30 | MainStay MacKay Tax Free Bond Fund |
| | Principal
Amount | Value |
| Long-Term Municipal Bonds (continued) |
| Nevada (continued) |
| Las Vegas Convention & Visitors Authority, Convention Center Expansion, Revenue Bonds | | |
| Series B | | |
| 4.00%, due 7/1/49 | $ 32,845,000 | $ 30,870,681 |
| Series B | | |
| 5.00%, due 7/1/34 | 2,500,000 | 2,809,342 |
| Series B | | |
| 5.00%, due 7/1/43 | 25,635,000 | 26,638,949 |
| Series A | | |
| 5.00%, due 7/1/49 | 8,150,000 | 8,608,233 |
| Series B | | |
| 5.25%, due 7/1/49 | 8,000,000 | 8,576,763 |
| Las Vegas Valley Water District, Limited General Obligation | | |
| 5.00%, due 6/1/33 | 7,600,000 | 7,659,416 |
| Las Vegas Valley Water District, Water Improvement, Limited General Obligation | | |
| Series A | | |
| 5.00%, due 6/1/41 | 6,500,000 | 6,630,632 |
| Series A | | |
| 5.00%, due 6/1/46 | 5,155,000 | 5,249,315 |
| | | 124,730,249 |
| New Hampshire 0.5% |
| New Hampshire Business Finance Authority, St. Luke's Hospital Obligated Group, Revenue Bonds | | |
| Series B, Insured: AGM | | |
| 3.00%, due 8/15/46 | 2,995,000 | 2,247,980 |
| New Hampshire Business Finance Authority, Revenue Bonds | | |
| Series 2 | | |
| 4.25%, due 7/20/41 | 6,500,000 | 6,327,558 |
| New Hampshire Business Finance Authority, Wheeling Power Co., Revenue Bonds | | |
| Series A | | |
| 6.89%, due 4/1/34 (e) | 25,000,000 | 25,011,315 |
| New Hampshire Housing Finance Authority, Revenue Bonds | | |
| Series D, Insured: GNMA / FNMA / FHLMC | | |
| 6.50%, due 7/1/55 | 7,500,000 | 8,173,889 |
| | | 41,760,742 |
| | Principal
Amount | Value |
| |
| New Jersey 3.0% |
| Garden State Preservation Trust, Revenue Bonds | | |
| Series A, Insured: AGM | | |
| 5.75%, due 11/1/28 | $ 3,500,000 | $ 3,700,785 |
| New Jersey Building Authority, Revenue Bonds | | |
| Series A, Insured: BAM | | |
| 5.00%, due 6/15/28 | 1,805,000 | 1,864,644 |
| New Jersey Economic Development Authority, New Jersey-American Water Co., Inc., Revenue Bonds (a)(b) | | |
| Series D | | |
| 1.10%, due 11/1/29 | 6,500,000 | 5,644,833 |
| Series A | | |
| 2.20%, due 10/1/39 | 12,000,000 | 10,407,442 |
| Series B | | |
| 3.75%, due 11/1/34 | 4,625,000 | 4,568,334 |
| New Jersey Economic Development Authority, The Goethals Bridge Replacement Project, Revenue Bonds (b) | | |
| 5.00%, due 1/1/28 | 1,000,000 | 1,000,465 |
| 5.50%, due 1/1/26 | 1,000,000 | 1,001,024 |
| New Jersey Economic Development Authority, New Jersey Transit Corp., Revenue Bonds | | |
| Series A | | |
| 5.00%, due 11/1/52 | 4,250,000 | 4,436,049 |
| New Jersey Health Care Facilities Financing Authority, RWJ Barnabas Health, Revenue Bonds | | |
| Series A | | |
| 4.00%, due 7/1/36 | 6,500,000 | 6,512,914 |
| New Jersey Health Care Facilities Financing Authority, Hackensack Meridian Health Obligated Group, Revenue Bonds | | |
| Series A | | |
| 5.00%, due 7/1/39 | 9,000,000 | 9,277,000 |
| New Jersey Health Care Facilities Financing Authority, RWJ Barnabas Health Obligated Group, Revenue Bonds | | |
| Series A | | |
| 5.00%, due 7/1/43 | 4,000,000 | 4,067,055 |
The notes to the financial statements are an integral part of, and should be read in conjunction with, the financial statements.
31
Portfolio of Investments April 30, 2024†^(Unaudited) (continued)
| | Principal
Amount | Value |
| Long-Term Municipal Bonds (continued) |
| New Jersey (continued) |
| New Jersey Transportation Trust Fund Authority, Transportation System, Revenue Bonds | | |
| Series C, Insured: NATL-RE | | |
| (zero coupon), due 12/15/27 | $ 7,960,000 | $ 6,966,989 |
| Series C, Insured: NATL-RE | | |
| (zero coupon), due 12/15/30 | 17,075,000 | 13,346,792 |
| Series C, Insured: AGM | | |
| (zero coupon), due 12/15/34 | 25,900,000 | 17,453,210 |
| Series A | | |
| (zero coupon), due 12/15/37 | 25,000,000 | 14,197,105 |
| Series A | | |
| 5.00%, due 12/15/26 | 3,500,000 | 3,630,931 |
| New Jersey Transportation Trust Fund Authority, Revenue Bonds | | |
| Series A | | |
| 4.25%, due 12/15/38 | 3,355,000 | 3,369,633 |
| Series BB | | |
| 5.25%, due 6/15/50 | 10,000,000 | 10,707,825 |
| New Jersey Transportation Trust Fund Authority, Transportation Program, Revenue Bonds | | |
| Series AA | | |
| 5.00%, due 6/15/46 | 6,115,000 | 6,259,689 |
| Series AA | | |
| 5.25%, due 6/15/43 | 10,525,000 | 10,934,891 |
| New Jersey Transportation Trust Fund Authority, Build America Bonds, Revenue Bonds | | |
| Series C | | |
| 5.754%, due 12/15/28 | 2,500,000 | 2,497,748 |
| New Jersey Turnpike Authority, Revenue Bonds | | |
| Series A | | |
| 5.00%, due 1/1/27 (c) | 3,000,000 | 3,118,460 |
| Series A | | |
| 5.00%, due 1/1/34 (c) | 4,500,000 | 5,146,082 |
| Series B | | |
| 5.25%, due 1/1/49 | 23,500,000 | 25,751,977 |
| Series B | | |
| 5.25%, due 1/1/52 | 35,000,000 | 37,839,637 |
| State of New Jersey, Various Purpose, Unlimited General Obligation | | |
| 2.00%, due 6/1/37 | 7,500,000 | 5,544,111 |
| 5.00%, due 6/1/38 | 3,685,000 | 3,951,707 |
| 5.00%, due 6/1/40 | 5,585,000 | 5,949,293 |
| | Principal
Amount | Value |
| |
| New Jersey (continued) |
| State of New Jersey, Various Purpose, Unlimited General Obligation (continued) | | |
| 5.00%, due 6/1/41 | $ 10,000,000 | $ 10,622,332 |
| Tobacco Settlement Financing Corp., Revenue Bonds | | |
| Series A | | |
| 5.00%, due 6/1/30 | 6,815,000 | 7,205,087 |
| Series A | | |
| 5.00%, due 6/1/33 | 6,500,000 | 6,862,509 |
| Series A | | |
| 5.00%, due 6/1/34 | 2,000,000 | 2,108,475 |
| Series A | | |
| 5.00%, due 6/1/36 | 4,950,000 | 5,189,397 |
| Series A | | |
| 5.25%, due 6/1/46 | 4,000,000 | 4,142,202 |
| Township of Edison, Unlimited General Obligation | | |
| 2.00%, due 3/15/36 | 4,545,000 | 3,488,187 |
| | | 268,764,814 |
| New Mexico 0.2% |
| Albuquerque Municipal School District No. 12, Unlimited General Obligation | | |
| Insured: State Aid Withholding | | |
| 5.00%, due 8/1/25 (c) | 7,250,000 | 7,375,315 |
| New Mexico Hospital Equipment Loan Council, Presbyterian Healthcare Services, Revenue Bonds | | |
| Series A | | |
| 4.00%, due 8/1/37 | 3,650,000 | 3,660,543 |
| Series A | | |
| 5.00%, due 8/1/44 | 6,835,000 | 7,084,350 |
| | | 18,120,208 |
| New York 14.4% |
| Battery Park City Authority, Revenue Bonds, Senior Lien | | |
| Series A | | |
| 5.00%, due 11/1/53 | 12,500,000 | 13,456,682 |
| City of New York, Unlimited General Obligation | | |
| Series A, Insured: BAM | | |
| 3.00%, due 8/1/36 | 12,320,000 | 11,217,425 |
| Series A-1 | | |
| 4.00%, due 8/1/37 | 2,000,000 | 2,023,048 |
The notes to the financial statements are an integral part of, and should be read in conjunction with, the financial statements.
| 32 | MainStay MacKay Tax Free Bond Fund |
| | Principal
Amount | Value |
| Long-Term Municipal Bonds (continued) |
| New York (continued) |
| City of New York, Unlimited General Obligation (continued) | | |
| Series E-1 | | |
| 4.00%, due 4/1/42 | $ 17,770,000 | $ 17,408,658 |
| Series B | | |
| 5.00%, due 12/1/33 | 4,750,000 | 4,926,323 |
| Series A-1 | | |
| 5.00%, due 9/1/37 | 4,250,000 | 4,728,060 |
| Series C | | |
| 5.00%, due 8/1/42 | 2,160,000 | 2,308,772 |
| Series F-1 | | |
| 5.00%, due 3/1/43 | 4,315,000 | 4,620,493 |
| Series B-1 | | |
| 5.25%, due 10/1/33 | 6,260,000 | 6,652,678 |
| Series D | | |
| 5.25%, due 4/1/47 | 4,165,000 | 4,575,395 |
| Series D | | |
| 5.50%, due 4/1/46 | 13,185,000 | 14,872,961 |
| Series D | | |
| 5.50%, due 4/1/48 | 17,025,000 | 19,022,937 |
| Series D | | |
| 5.50%, due 4/1/49 | 20,250,000 | 22,571,209 |
| Hudson Yards Infrastructure Corp., Second Indenture, Revenue Bonds | | |
| Series A | | |
| 4.00%, due 2/15/37 | 2,175,000 | 2,262,558 |
| Series A | | |
| 5.00%, due 2/15/39 | 4,700,000 | 4,860,299 |
| Long Island Power Authority, Electric System, Revenue Bonds | | |
| 5.00%, due 9/1/37 | 2,000,000 | 2,132,581 |
| Series A | | |
| 5.00%, due 9/1/44 | 5,250,000 | 5,256,833 |
| Metropolitan Transportation Authority, Revenue Bonds | | |
| Series B | | |
| 4.00%, due 11/15/36 | 3,500,000 | 3,420,700 |
| Series D-1 | | |
| 5.00%, due 11/15/26 | 2,285,000 | 2,337,264 |
| Series C-1, Insured: BAM | | |
| 5.00%, due 11/15/34 | 20,000,000 | 21,201,822 |
| Series C-1 | | |
| 5.00%, due 11/15/35 | 4,250,000 | 4,332,084 |
| Series A-1 | | |
| 5.00%, due 11/15/40 | 3,890,000 | 3,918,108 |
| | Principal
Amount | Value |
| |
| New York (continued) |
Metropolitan Transportation Authority, Revenue Bonds
(continued) | | |
| Series E | | |
| 5.00%, due 11/15/43 | $ 675,000 | $ 675,382 |
| Series C-1 | | |
| 5.25%, due 11/15/29 | 2,230,000 | 2,285,597 |
| Series B | | |
| 5.25%, due 11/15/35 | 2,370,000 | 2,374,005 |
| Series D-1 | | |
| 5.25%, due 11/15/44 | 5,355,000 | 5,400,307 |
| Series A | | |
| 5.50%, due 11/15/47 | 14,610,000 | 16,137,258 |
| Metropolitan Transportation Authority, Green Bond, Revenue Bonds | | |
| Series A-1 | | |
| 5.00%, due 11/15/41 | 2,815,000 | 2,851,473 |
| Series C, Insured: BAM | | |
| 5.00%, due 11/15/42 | 7,700,000 | 8,074,754 |
| Series D | | |
| 5.00%, due 11/15/44 | 10,450,000 | 10,965,194 |
| Metropolitan Transportation Authority, Metropolitan Transportation Authority Dedicated Tax Fund, Revenue Bonds | | |
| Series A | | |
| 5.00%, due 11/15/45 | 6,725,000 | 7,259,920 |
| New York City Housing Development Corp., Revenue Bonds | | |
| Series A-1 | | |
| 4.15%, due 11/1/38 | 15,130,000 | 14,728,401 |
| New York City Municipal Water Finance Authority, Water & Sewer System Second General Resolution, Revenue Bonds | | |
| Series BB-1 | | |
| 3.00%, due 6/15/44 | 33,510,000 | 26,895,324 |
| Series DD-1 | | |
| 3.00%, due 6/15/50 | 4,515,000 | 3,350,908 |
| Series FF-2 | | |
| 4.00%, due 6/15/41 | 6,000,000 | 5,988,585 |
| Series AA-2 | | |
| 4.00%, due 6/15/43 | 4,360,000 | 4,321,158 |
| Series BB-1 | | |
| 4.00%, due 6/15/45 | 7,250,000 | 7,065,342 |
The notes to the financial statements are an integral part of, and should be read in conjunction with, the financial statements.
33
Portfolio of Investments April 30, 2024†^(Unaudited) (continued)
| | Principal
Amount | Value |
| Long-Term Municipal Bonds (continued) |
| New York (continued) |
New York City Municipal Water Finance Authority, Water & Sewer System Second General Resolution, Revenue Bonds
(continued) | | |
| Series AA | | |
| 5.00%, due 6/15/37 | $ 7,250,000 | $ 7,565,935 |
| Series AA | | |
| 5.00%, due 6/15/38 | 3,750,000 | 3,902,289 |
| Series FF | | |
| 5.00%, due 6/15/38 | 4,565,000 | 4,818,150 |
| Series GG | | |
| 5.00%, due 6/15/39 | 17,500,000 | 17,694,145 |
| Series EE | | |
| 5.00%, due 6/15/40 | 6,905,000 | 7,204,003 |
| Series BB-1 | | |
| 5.00%, due 6/15/44 | 3,250,000 | 3,492,541 |
| Series CC-1 | | |
| 5.00%, due 6/15/51 | 5,385,000 | 5,666,092 |
| Series DD-2 | | |
| 5.25%, due 6/15/47 | 6,915,000 | 7,595,345 |
| Series AA-1 | | |
| 5.25%, due 6/15/52 | 11,190,000 | 12,139,200 |
| New York City Transitional Finance Authority, Building Aid, Revenue Bonds | | |
| Series S-1A, Insured: State Aid Withholding | | |
| 3.00%, due 7/15/39 | 5,000,000 | 4,288,130 |
| Series S-1B, Insured: State Aid Withholding | | |
| 3.00%, due 7/15/49 | 10,000,000 | 7,506,058 |
| Series S-1A, Insured: State Aid Withholding | | |
| 4.00%, due 7/15/36 | 5,750,000 | 5,969,508 |
| Series S-3, Insured: State Aid Withholding | | |
| 5.25%, due 7/15/45 | 6,000,000 | 6,313,703 |
| New York City Transitional Finance Authority, Future Tax Secured, Revenue Bonds | | |
| Series C-1 | | |
| 4.00%, due 11/1/36 | 3,520,000 | 3,586,802 |
| Series C-1 | | |
| 4.00%, due 11/1/42 | 8,540,000 | 8,341,013 |
| Series E-1 | | |
| 4.00%, due 2/1/46 | 16,085,000 | 15,543,838 |
| | Principal
Amount | Value |
| |
| New York (continued) |
| New York City Transitional Finance Authority, Future Tax Secured, Revenue Bonds (continued) | | |
| Series A-1 | | |
| 5.00%, due 5/1/33 | $ 8,475,000 | $ 8,704,346 |
| Series B-1 | | |
| 5.00%, due 11/1/33 | 11,265,000 | 11,270,342 |
| Series B-1 | | |
| 5.00%, due 11/1/36 | 17,000,000 | 18,453,882 |
| Series A-1 | | |
| 5.00%, due 8/1/40 | 4,400,000 | 4,587,213 |
| Series C-3 | | |
| 5.00%, due 5/1/41 | 5,400,000 | 5,606,045 |
| Series F-1 | | |
| 5.00%, due 2/1/42 | 5,000,000 | 5,424,024 |
| Series A-1 | | |
| 5.25%, due 8/1/42 | 6,350,000 | 7,033,285 |
| Series C | | |
| 5.50%, due 5/1/42 | 10,000,000 | 11,445,989 |
| Series C | | |
| 5.50%, due 5/1/43 | 5,000,000 | 5,692,855 |
| Series C | | |
| 5.50%, due 5/1/44 | 22,000,000 | 24,972,479 |
| Series D-1 | | |
| 5.50%, due 11/1/45 | 22,025,000 | 24,608,231 |
| New York Liberty Development Corp., Bank of America Tower at One Bryant Park Project, Revenue Bonds | | |
| 2.45%, due 9/15/69 | 11,125,000 | 10,041,359 |
| New York Liberty Development Corp., Revenue Bonds | | |
| Series A | | |
| 2.50%, due 11/15/36 | 3,500,000 | 2,876,561 |
| New York Liberty Development Corp., 1 World Trade Center, Revenue Bonds | | |
| Insured: BAM | | |
| 2.75%, due 2/15/44 | 18,000,000 | 13,222,093 |
| Insured: AGM-CR | | |
| 3.00%, due 2/15/42 | 22,150,000 | 18,406,101 |
| Insured: BAM | | |
| 4.00%, due 2/15/43 | 3,250,000 | 3,211,806 |
| Insured: AGM-CR | | |
| 4.00%, due 2/15/43 | 9,500,000 | 9,376,085 |
The notes to the financial statements are an integral part of, and should be read in conjunction with, the financial statements.
| 34 | MainStay MacKay Tax Free Bond Fund |
| | Principal
Amount | Value |
| Long-Term Municipal Bonds (continued) |
| New York (continued) |
| New York Liberty Development Corp., 4 World Trade Center LLC, Revenue Bonds | | |
| Series A | | |
| 2.875%, due 11/15/46 | $ 14,060,000 | $ 10,162,164 |
| New York Power Authority, Revenue Bonds | | |
| Series A | | |
| 4.00%, due 11/15/50 | 5,000,000 | 4,769,338 |
| New York State Dormitory Authority, State Personal Income Tax, Revenue Bonds | | |
| Series A | | |
| 3.00%, due 3/15/39 | 8,500,000 | 7,371,012 |
| Series A | | |
| 3.00%, due 3/15/42 | 6,315,000 | 5,192,007 |
| Series A | | |
| 4.00%, due 3/15/36 | 6,750,000 | 6,971,536 |
| Series A | | |
| 4.00%, due 3/15/37 | 4,000,000 | 4,082,205 |
| Series A | | |
| 4.00%, due 3/15/37 | 3,200,000 | 3,261,728 |
| Series A | | |
| 4.00%, due 3/15/39 | 17,200,000 | 17,329,544 |
| Series A | | |
| 4.00%, due 3/15/40 | 16,840,000 | 16,855,698 |
| Series A | | |
| 4.00%, due 3/15/41 | 3,180,000 | 3,160,660 |
| Series E | | |
| 4.00%, due 3/15/45 | 2,550,000 | 2,475,405 |
| Series E | | |
| 5.00%, due 2/15/35 | 2,905,000 | 3,202,225 |
| Series A | | |
| 5.00%, due 3/15/39 | 5,000,000 | 5,301,028 |
| Series A | | |
| 5.00%, due 3/15/45 | 11,715,000 | 12,704,476 |
| Series A | | |
| 5.00%, due 3/15/46 | 4,750,000 | 5,065,115 |
| Series A | | |
| 5.25%, due 3/15/48 | 10,800,000 | 11,808,006 |
| New York State Dormitory Authority, NYU Langone Hospitals Obligated Group, Revenue Bonds | | |
| Series A | | |
| 3.00%, due 7/1/48 | 9,000,000 | 6,776,095 |
| Series A | | |
| 4.00%, due 7/1/50 | 15,000,000 | 14,217,685 |
| | Principal
Amount | Value |
| |
| New York (continued) |
| New York State Dormitory Authority, School Districts Financing Program, Revenue Bonds | | |
| Series A, Insured: BAM | | |
| 5.00%, due 10/1/36 | $ 3,750,000 | $ 4,137,365 |
| New York State Dormitory Authority, Sales Tax, Revenue Bonds | | |
| Series A | | |
| 5.00%, due 3/15/38 | 5,000,000 | 5,172,938 |
| Series A | | |
| 5.00%, due 3/15/42 | 4,750,000 | 4,934,849 |
| New York State Dormitory Authority, St John's University, Revenue Bonds | | |
| 5.00%, due 7/1/40 | 7,835,000 | 8,625,935 |
| New York State Dormitory Authority, Northwell Health, Revenue Bonds | | |
| Series B-3 | | |
| 5.00%, due 5/1/48 (a) | 5,000,000 | 5,072,110 |
| New York State Dormitory Authority, Cornell University, Revenue Bonds | | |
| Series A | | |
| 5.50%, due 7/1/54 | 23,910,000 | 26,874,622 |
| New York State Dormitory Authority, New York University, Revenue Bonds | | |
| Series A, Insured: NATL-RE | | |
| 5.75%, due 7/1/27 | 2,625,000 | 2,728,762 |
| New York State Environmental Facilities Corp., Clean Water & Drinking Water, Revenue Bonds | | |
| Series B | | |
| 3.00%, due 6/15/38 | 8,100,000 | 7,172,525 |
| New York State Thruway Authority, Revenue Bonds | | |
| Series B, Insured: AGM-CR | | |
| 3.00%, due 1/1/46 | 9,715,000 | 7,466,854 |
| New York State Thruway Authority, Revenue Bonds, Junior Lien | | |
| Series A | | |
| 5.00%, due 1/1/46 | 5,440,000 | 5,481,973 |
| New York State Thruway Authority, State Personal Income Tax, Revenue Bonds | | |
| Series A-1 | | |
| 4.00%, due 3/15/43 | 7,500,000 | 7,311,893 |
The notes to the financial statements are an integral part of, and should be read in conjunction with, the financial statements.
35
Portfolio of Investments April 30, 2024†^(Unaudited) (continued)
| | Principal
Amount | Value |
| Long-Term Municipal Bonds (continued) |
| New York (continued) |
| New York State Thruway Authority, General Revenue Junior Indebtedness Obligation, Revenue Bonds, Junior Lien | | |
| Series B, Insured: BAM | | |
| 4.00%, due 1/1/45 | $ 4,650,000 | $ 4,520,600 |
| New York State Urban Development Corp., Sales Tax, Revenue Bonds | | |
| Series A | | |
| 3.00%, due 3/15/40 | 4,000,000 | 3,362,161 |
| Series A | | |
| 4.00%, due 3/15/37 | 14,250,000 | 14,738,464 |
| Series A | | |
| 4.00%, due 3/15/38 | 5,550,000 | 5,673,357 |
| New York State Urban Development Corp., Personal Income Tax, Revenue Bonds | | |
| Series A | | |
| 5.00%, due 3/15/42 | 15,250,000 | 16,605,624 |
| New York Transportation Development Corp., LaGuardia Airport Terminal B Redevelopment Project, Revenue Bonds (b) | | |
| Series A, Insured: AGM | | |
| 4.00%, due 7/1/35 | 10,730,000 | 10,607,764 |
| Series A, Insured: AGM | | |
| 4.00%, due 7/1/37 | 11,770,000 | 11,341,229 |
| New York Transportation Development Corp., Terminal 4 John F. Kennedy International Airport Project, Revenue Bonds (b) | | |
| Insured: AGM-CR | | |
| 5.00%, due 12/1/27 | 4,250,000 | 4,456,749 |
| Insured: AGM-CR | | |
| 5.00%, due 12/1/28 | 4,250,000 | 4,517,676 |
| Insured: AGM-CR | | |
| 5.00%, due 12/1/29 | 7,900,000 | 8,517,999 |
| 5.00%, due 12/1/30 | 9,390,000 | 10,053,621 |
| Insured: AGM | | |
| 5.50%, due 6/30/43 | 4,250,000 | 4,612,451 |
| Onondaga County Trust for Cultural Resources, Syracuse University Project, Revenue Bonds | | |
| 5.00%, due 12/1/43 | 10,210,000 | 10,807,029 |
| 5.00%, due 12/1/45 | 7,500,000 | 7,907,224 |
| | Principal
Amount | Value |
| |
| New York (continued) |
| Oswego City School District, Unlimited General Obligation | | |
| Insured: State Aid Withholding | | |
| 4.75%, due 7/19/24 | $ 7,500,000 | $ 7,506,470 |
| Port Authority of New York & New Jersey, Revenue Bonds | | |
| Series 207 | | |
| 4.00%, due 3/15/30 (b) | 16,000,000 | 16,159,258 |
| 4.00%, due 3/15/35 (b) | 9,560,000 | 9,568,165 |
| Series 183 | | |
| 4.00%, due 12/15/39 | 10,000,000 | 9,830,393 |
| Series 223 | | |
| 4.00%, due 7/15/46 (b) | 4,175,000 | 3,873,022 |
| Series 185 | | |
| 5.00%, due 9/1/27 (b) | 6,200,000 | 6,221,350 |
| Series 242 | | |
| 5.00%, due 12/1/30 (b) | 17,705,000 | 19,073,860 |
| Series 185 | | |
| 5.00%, due 9/1/31 (b) | 6,750,000 | 6,772,129 |
| Series 242 | | |
| 5.00%, due 12/1/31 (b) | 18,000,000 | 19,561,214 |
| Series 185 | | |
| 5.00%, due 9/1/32 (b) | 6,000,000 | 6,019,472 |
| Series 218 | | |
| 5.00%, due 11/1/44 (b) | 2,750,000 | 2,813,284 |
| Series 231 | | |
| 5.50%, due 8/1/40 (b) | 9,205,000 | 10,173,582 |
| Series 231 | | |
| 5.50%, due 8/1/42 (b) | 2,750,000 | 3,012,504 |
| Series 231 | | |
| 5.50%, due 8/1/47 (b) | 15,250,000 | 16,493,073 |
| Series 231 | | |
| 5.50%, due 8/1/52 (b) | 3,415,000 | 3,654,543 |
| Series 234 | | |
| 5.50%, due 8/1/52 (b) | 4,665,000 | 4,992,224 |
| Rensselaer City School District, Certificate of Participation | | |
| Insured: AGM State Aid Withholding | | |
| 5.00%, due 6/1/30 | 1,880,000 | 1,926,852 |
| Insured: AGM State Aid Withholding | | |
| 5.00%, due 6/1/32 | 2,000,000 | 2,048,633 |
| State of New York, Mortgage Agency, Revenue Bonds | | |
| Series 227 | | |
| 2.30%, due 10/1/40 | 6,250,000 | 4,523,458 |
The notes to the financial statements are an integral part of, and should be read in conjunction with, the financial statements.
| 36 | MainStay MacKay Tax Free Bond Fund |
| | Principal
Amount | Value |
| Long-Term Municipal Bonds (continued) |
| New York (continued) |
| Suffolk County Water Authority, Revenue Bonds | | |
| Series B | | |
| 3.00%, due 6/1/45 | $ 3,875,000 | $ 3,039,837 |
| Suffolk County Water Authority, Waterworks, Revenue Bonds | | |
| Series A | | |
| 3.75%, due 6/1/36 | 15,390,000 | 15,245,288 |
| Town of Hempstead, Limited General Obligation | | |
| 2.00%, due 6/15/36 | 6,070,000 | 4,713,810 |
| 2.125%, due 6/15/38 | 6,720,000 | 4,920,524 |
| Triborough Bridge & Tunnel Authority, MTA Bridges & Tunnels, Revenue Bonds, Senior Lien | | |
| Series C-3 | | |
| 3.00%, due 5/15/51 | 15,000,000 | 11,186,980 |
| Series C-3, Insured: AGM-CR | | |
| 3.00%, due 5/15/51 | 16,010,000 | 11,984,932 |
| Series D-2 | | |
| 4.50%, due 5/15/47 | 10,000,000 | 10,259,828 |
| Series C | | |
| 5.25%, due 11/15/40 | 5,000,000 | 5,678,476 |
| Series D-2 | | |
| 5.25%, due 5/15/47 | 22,750,000 | 24,816,762 |
| Series D-2 | | |
| 5.50%, due 5/15/52 | 25,000,000 | 27,456,527 |
| Triborough Bridge & Tunnel Authority, MTA Bridges & Tunnels, Revenue Bonds | | |
| Series C | | |
| 4.00%, due 11/15/41 | 10,250,000 | 10,251,119 |
| Series A | | |
| 4.00%, due 5/15/52 | 5,500,000 | 5,229,710 |
| Series B | | |
| 5.00%, due 3/15/27 | 15,000,000 | 15,719,229 |
| Series B | | |
| 5.00%, due 11/15/35 | 10,000,000 | 10,468,613 |
| Series B | | |
| 5.00%, due 11/15/37 | 2,850,000 | 2,973,856 |
| Series C-2 | | |
| 5.00%, due 11/15/42 | 15,745,000 | 16,358,135 |
| Series A | | |
| 5.00%, due 11/15/43 | 4,000,000 | 4,163,692 |
| Series A | | |
| 5.00%, due 5/15/53 | 5,250,000 | 5,566,089 |
| | Principal
Amount | Value |
| |
| New York (continued) |
| Triborough Bridge & Tunnel Authority, MTA Bridges & Tunnels, Revenue Bonds (continued) | | |
| Series A | | |
| 5.25%, due 5/15/52 | $ 3,750,000 | $ 4,043,199 |
| Series A | | |
| 5.50%, due 5/15/63 | 4,340,000 | 4,752,862 |
| TSASC, Inc., Tobacco Settlement Bonds, Revenue Bonds | | |
| Series A | | |
| 5.00%, due 6/1/33 | 5,890,000 | 6,110,825 |
| Series A | | |
| 5.00%, due 6/1/35 | 2,365,000 | 2,446,218 |
| | | 1,308,057,644 |
| North Carolina 0.6% |
| City of Fayetteville, Public Works Commission, Revenue Bonds | | |
| 2.00%, due 3/1/35 | 3,330,000 | 2,692,744 |
| 2.00%, due 3/1/37 | 3,465,000 | 2,650,240 |
| 2.00%, due 3/1/38 | 3,535,000 | 2,623,339 |
| 2.125%, due 3/1/39 | 3,605,000 | 2,651,120 |
| 2.125%, due 3/1/40 | 3,680,000 | 2,635,458 |
| County of Brunswick, School, Unlimited General Obligation | | |
| 2.85%, due 8/1/29 | 2,475,000 | 2,349,218 |
| 2.95%, due 8/1/30 | 2,500,000 | 2,378,790 |
| County of Durham, Unlimited General Obligation | | |
| 3.00%, due 10/1/29 | 3,750,000 | 3,657,897 |
| County of Union, Unlimited General Obligation | | |
| Series C | | |
| 2.50%, due 9/1/36 | 4,000,000 | 3,364,730 |
| North Carolina Housing Finance Agency, Revenue Bonds | | |
| Series 39-B, Insured: GNMA / FNMA / FHLMC | | |
| 4.00%, due 7/1/48 | 3,635,000 | 3,597,011 |
| Series 42, Insured: GNMA / FNMA / FHLMC | | |
| 4.00%, due 1/1/50 | 3,535,000 | 3,495,247 |
| Series 49, Insured: GNMA / FNMA / FHLMC | | |
| 6.00%, due 7/1/53 | 8,330,000 | 8,800,365 |
| Series 52-A, Insured: GNMA / FNMA / FHLMC | | |
| 6.25%, due 1/1/55 | 9,500,000 | 10,241,692 |
The notes to the financial statements are an integral part of, and should be read in conjunction with, the financial statements.
37
Portfolio of Investments April 30, 2024†^(Unaudited) (continued)
| | Principal
Amount | Value |
| Long-Term Municipal Bonds (continued) |
| North Carolina (continued) |
| North Carolina Turnpike Authority, Triangle Expressway System, Revenue Bonds, Senior Lien | | |
| Insured: AGM | | |
| 5.00%, due 1/1/27 | $ 3,250,000 | $ 3,372,773 |
| | | 54,510,624 |
| Ohio 0.9% |
| American Municipal Power, Inc., Prairie State Energy Campus Project, Revenue Bonds | | |
| Series A, Insured: BAM | | |
| 4.00%, due 2/15/34 | 10,000,000 | 10,414,132 |
| Buckeye Tobacco Settlement Financing Authority, Revenue Bonds, Senior Lien | | |
| Series A-2 | | |
| 3.00%, due 6/1/48 | 11,915,000 | 8,721,057 |
| Series A-2, Class 1 | | |
| 5.00%, due 6/1/36 | 4,250,000 | 4,514,678 |
| Clermont County Port Authority, West Clermont Local School District Project, Revenue Bonds | | |
| Insured: BAM | | |
| 5.00%, due 12/1/32 | 2,200,000 | 2,240,897 |
| Insured: BAM | | |
| 5.00%, due 12/1/33 | 1,335,000 | 1,359,406 |
| Cleveland-Cuyahoga County Port Authority, Annual Appropriation Bonds, Revenue Bonds | | |
| 6.00%, due 11/15/25 | 865,000 | 866,654 |
| County of Franklin, Ohio Hospital, Revenue Bonds | | |
| Series A | | |
| 4.00%, due 5/15/47 | 3,815,000 | 3,635,030 |
| 5.00%, due 5/15/40 | 5,750,000 | 5,804,102 |
| 5.00%, due 5/15/45 | 10,000,000 | 10,060,038 |
| Northeast Ohio Regional Sewer District, Revenue Bonds | | |
| 3.25%, due 11/15/40 | 2,000,000 | 1,710,708 |
| 4.00%, due 11/15/43 | 4,175,000 | 4,150,267 |
| Ohio Higher Educational Facility Commission, Ashtabula County Medical Center Obligated Group, Revenue Bonds | | |
| 5.00%, due 1/1/30 | 210,000 | 218,347 |
| 5.00%, due 1/1/34 | 360,000 | 380,554 |
| | Principal
Amount | Value |
| |
| Ohio (continued) |
| Ohio Higher Educational Facility Commission, Ashtabula County Medical Center Obligated Group, Revenue Bonds (continued) | | |
| 5.25%, due 1/1/36 | $ 495,000 | $ 528,907 |
| 5.25%, due 1/1/52 | 2,500,000 | 2,480,872 |
| Worthington City School District, Unlimited General Obligation | | |
| 5.50%, due 12/1/54 | 25,055,000 | 27,641,548 |
| | | 84,727,197 |
| Oklahoma 0.7% |
| Edmond Public Works Authority, Revenue Bonds | | |
| 5.00%, due 7/1/42 | 9,405,000 | 9,680,328 |
| Lincoln County Educational Facilities Authority, Stroud Public Schools Project, Revenue Bonds | | |
| 5.00%, due 9/1/28 | 2,450,000 | 2,511,705 |
| Oklahoma Housing Finance Agency, Revenue Bonds | | |
| Series A, Insured: GNMA / FNMA / FHLMC | | |
| 4.00%, due 9/1/49 | 3,110,000 | 3,074,057 |
| Oklahoma Turnpike Authority, Revenue Bonds | | |
| 5.50%, due 1/1/53 | 44,455,000 | 48,614,485 |
| Weatherford Industrial Trust, Custer County Independent School District No. 26 Weatherford, Revenue Bonds | | |
| 5.00%, due 3/1/33 | 2,000,000 | 2,135,579 |
| | | 66,016,154 |
| Oregon 0.6% |
| City of Portland, Limited General Obligation | | |
| Series A | | |
| 2.00%, due 10/1/38 | 2,535,000 | 1,823,661 |
| Series A | | |
| 2.00%, due 10/1/39 | 2,015,000 | 1,421,809 |
| Multnomah County School District No. 1, Portland Bidding Group 1, Unlimited General Obligation | | |
| Insured: School Bond Guaranty | | |
| 5.00%, due 6/15/25 | 17,500,000 | 17,798,818 |
The notes to the financial statements are an integral part of, and should be read in conjunction with, the financial statements.
| 38 | MainStay MacKay Tax Free Bond Fund |
| | Principal
Amount | Value |
| Long-Term Municipal Bonds (continued) |
| Oregon (continued) |
| Multnomah County School District No. 40, Unlimited General Obligation | | |
| Series B, Insured: School Bond Guaranty | | |
| 5.50%, due 6/15/53 | $ 7,750,000 | $ 8,560,522 |
| Port of Portland, Airport, Revenue Bonds (b) | | |
| Series A-27 | | |
| 5.00%, due 7/1/37 | 5,550,000 | 5,860,704 |
| Series 29-A | | |
| 5.00%, due 7/1/45 | 3,300,000 | 3,388,239 |
| Series 29 | | |
| 5.50%, due 7/1/48 | 5,750,000 | 6,222,204 |
| Seaside School District No. 10, Unlimited General Obligation | | |
| Series A, Insured: School Bond Guaranty | | |
| (zero coupon), due 6/15/44 | 6,000,000 | 2,318,399 |
| Washington Clackamas & Yamhill Counties School District No. 88J, Sherwood, Unlimited General Obligation | | |
| Series B, Insured: School Bond Guaranty | | |
| 5.00%, due 6/15/30 | 4,000,000 | 4,199,915 |
| | | 51,594,271 |
| Pennsylvania 2.9% |
| Allegheny County Airport Authority, Revenue Bonds (b) | | |
| Series A | | |
| 4.00%, due 1/1/38 | 4,665,000 | 4,576,637 |
| Series A | | |
| 4.00%, due 1/1/39 | 6,540,000 | 6,398,766 |
| Bethel Park School District, Limited General Obligation | | |
| Insured: State Aid Withholding | | |
| 5.00%, due 8/1/46 | 2,500,000 | 2,679,919 |
| Insured: State Aid Withholding | | |
| 5.50%, due 8/1/48 | 2,500,000 | 2,766,856 |
| City of Philadelphia, Water & Wastewater, Revenue Bonds | | |
| Series C | | |
| 5.50%, due 6/1/47 | 12,500,000 | 13,767,922 |
| Series B, Insured: AGM | | |
| 5.50%, due 9/1/53 | 8,865,000 | 9,833,818 |
| | Principal
Amount | Value |
| |
| Pennsylvania (continued) |
| Commonwealth Financing Authority, Tobacco Master Settlement Payment, Revenue Bonds | | |
| Insured: AGM | | |
| 4.00%, due 6/1/39 | $ 4,050,000 | $ 4,000,948 |
| Commonwealth Financing Authority, Revenue Bonds | | |
| Series C, Insured: AGM | | |
| 5.197%, due 6/1/26 | 6,140,000 | 6,090,012 |
| Commonwealth of Pennsylvania, Unlimited General Obligation | | |
| Series 2, Insured: AGM | | |
| 3.00%, due 9/15/33 | 13,000,000 | 12,456,931 |
| Series 1 | | |
| 3.50%, due 3/1/31 | 15,000,000 | 15,007,179 |
| County of Lehigh, Lehigh Valley Health Network, Revenue Bonds | | |
| Series A | | |
| 5.00%, due 7/1/44 | 3,500,000 | 3,595,845 |
| Lancaster County Hospital Authority, University of Pennsylvania Health System Obligated Group (The), Revenue Bonds | | |
| Series A | | |
| 5.00%, due 8/15/42 | 5,000,000 | 5,084,971 |
| Pennsylvania Economic Development Financing Authority, UPMC Obligated Group, Revenue Bonds | | |
| Series A-2 | | |
| 4.00%, due 5/15/48 | 6,090,000 | 5,652,337 |
| Pennsylvania Economic Development Financing Authority, Waste Management, Inc. Project, Revenue Bonds | | |
| Series A | | |
| 4.17%, due 6/1/41 (b) | 13,500,000 | 13,495,027 |
| Pennsylvania Economic Development Financing Authority, Penndot Major Bridges Project, Revenue Bonds | | |
| Insured: AGM | | |
| 5.75%, due 12/31/62 (b) | 25,000,000 | 27,616,365 |
| Pennsylvania Higher Education Assistance Agency, Revenue Bonds, Senior Lien | | |
| Series 1A | | |
| 4.125%, due 6/1/45 (b) | 5,500,000 | 5,294,232 |
The notes to the financial statements are an integral part of, and should be read in conjunction with, the financial statements.
39
Portfolio of Investments April 30, 2024†^(Unaudited) (continued)
| | Principal
Amount | Value |
| Long-Term Municipal Bonds (continued) |
| Pennsylvania (continued) |
| Pennsylvania Higher Educational Facilities Authority, University of Pennsylvania Health System, Revenue Bonds | | |
| Series A | | |
| 4.00%, due 8/15/36 | $ 3,875,000 | $ 3,901,776 |
| Series A | | |
| 4.00%, due 8/15/42 | 4,000,000 | 3,883,689 |
| 4.00%, due 8/15/49 | 19,540,000 | 18,552,173 |
| Series A | | |
| 5.00%, due 8/15/42 | 5,370,000 | 5,461,889 |
| Pennsylvania Housing Finance Agency, Revenue Bonds | | |
| Series 121 | | |
| 2.80%, due 10/1/31 | 6,000,000 | 5,473,547 |
| Series A-141 | | |
| 5.75%, due 10/1/53 | 6,335,000 | 6,665,828 |
| Pennsylvania Turnpike Commission, Revenue Bonds | | |
| Series B | | |
| 5.00%, due 12/1/30 | 6,355,000 | 6,399,854 |
| Series B | | |
| 5.25%, due 12/1/39 | 4,000,000 | 4,026,404 |
| Series B | | |
| 5.25%, due 12/1/44 | 4,085,000 | 4,501,095 |
| Pennsylvania Turnpike Commission, Revenue Bonds, Second Series | | |
| 5.00%, due 12/1/41 | 3,500,000 | 3,655,981 |
| Philadelphia Authority for Industrial Development, St. Joseph's University Project, Revenue Bonds | | |
| 5.25%, due 11/1/52 | 3,250,000 | 3,378,069 |
| Pittsburgh Water & Sewer Authority, Revenue Bonds | | |
| Series B, Insured: AGM | | |
| 4.00%, due 9/1/34 | 2,400,000 | 2,453,839 |
| School District of Philadelphia (The), Revenue Notes | | |
| Series A | | |
| 5.00%, due 6/28/24 | 30,000,000 | 30,034,746 |
| State Public School Building Authority, Philadelphia Community College, Revenue Bonds | | |
| Series A, Insured: BAM | | |
| 5.00%, due 6/15/28 | 4,505,000 | 4,553,007 |
| | Principal
Amount | Value |
| |
| Pennsylvania (continued) |
| State Public School Building Authority, School District of Philadelphia (The), Revenue Bonds | | |
| Series A, Insured: AGM State Aid Withholding | | |
| 5.00%, due 6/1/31 | $ 20,000,000 | $ 20,563,080 |
| | | 261,822,742 |
| Puerto Rico 0.3% |
| Puerto Rico Commonwealth Aqueduct & Sewer Authority, Revenue Bonds, Senior Lien | | |
| Series A, Insured: AGC-ICC | | |
| 6.125%, due 7/1/24 | 150,000 | 150,561 |
| Puerto Rico Electric Power Authority, Revenue Bonds | | |
| Series UU, Insured: AGC | | |
| 4.25%, due 7/1/27 | 2,345,000 | 2,292,053 |
| Series NN, Insured: NATL-RE | | |
| 4.75%, due 7/1/33 | 1,140,000 | 1,105,325 |
| Series PP, Insured: NATL-RE | | |
| 5.00%, due 7/1/24 | 2,415,000 | 2,415,272 |
| Series UU, Insured: AGM | | |
| 5.00%, due 7/1/24 | 3,915,000 | 3,915,090 |
| Series TT, Insured: AGM-CR | | |
| 5.00%, due 7/1/27 | 500,000 | 499,388 |
| Series SS, Insured: AGM | | |
| 5.00%, due 7/1/30 | 550,000 | 546,854 |
| Series VV, Insured: NATL-RE | | |
| 5.25%, due 7/1/26 | 1,575,000 | 1,559,846 |
| Series VV, Insured: NATL-RE | | |
| 5.25%, due 7/1/29 | 1,470,000 | 1,448,377 |
| Series VV, Insured: NATL-RE | | |
| 5.25%, due 7/1/32 | 1,225,000 | 1,211,825 |
| Series VV, Insured: NATL-RE | | |
| 5.25%, due 7/1/34 | 550,000 | 541,459 |
| Puerto Rico Housing Finance Authority, Puerto Rico Housing Administration, Revenue Bonds | | |
| 5.00%, due 12/1/24 | 6,500,000 | 6,535,452 |
| Puerto Rico Municipal Finance Agency, Revenue Bonds | | |
| Series A, Insured: AGM | | |
| 5.00%, due 8/1/27 | 195,000 | 196,295 |
| Series A, Insured: AGM | | |
| 5.00%, due 8/1/30 | 1,440,000 | 1,449,565 |
The notes to the financial statements are an integral part of, and should be read in conjunction with, the financial statements.
| 40 | MainStay MacKay Tax Free Bond Fund |
| | Principal
Amount | Value |
| Long-Term Municipal Bonds (continued) |
| Puerto Rico (continued) |
| Puerto Rico Sales Tax Financing Corp., Revenue Bonds | | |
| Insured: BHAC-CR | | |
| (zero coupon), due 8/1/54 | $ 98,098 | $ 19,008 |
| | | 23,886,370 |
| Rhode Island 0.0% ‡ |
| Providence Public Building Authority, Various Capital Projects, Revenue Bonds | | |
| Series A, Insured: AGM | | |
| 5.875%, due 6/15/26 | 990,000 | 991,536 |
| South Carolina 1.3% |
| Patriots Energy Group Financing Agency, Revenue Bonds | | |
| Series B-2 | | |
| 5.458%, due 2/1/54 | 15,000,000 | 15,419,532 |
| South Carolina Jobs-Economic Development Authority, AnMed Health, Revenue Bonds | | |
| 4.25%, due 2/1/48 | 12,580,000 | 12,355,000 |
| 5.25%, due 2/1/53 | 8,180,000 | 8,693,482 |
| South Carolina Ports Authority, Revenue Bonds | | |
| 5.00%, due 7/1/31 (b) | 3,260,000 | 3,416,134 |
| South Carolina Public Service Authority, Santee Cooper Project, Revenue Bonds | | |
| Series B, Insured: AGM-CR | | |
| 4.00%, due 12/1/29 | 4,167,000 | 4,293,769 |
| Series B, Insured: BAM | | |
| 4.00%, due 12/1/55 | 3,000 | 2,659 |
| Series A, Insured: AGM-CR | | |
| 5.00%, due 12/1/31 | 2,250,000 | 2,463,662 |
| Series A, Insured: AGM-CR | | |
| 5.00%, due 12/1/32 | 8,500,000 | 8,730,132 |
| Series A, Insured: AGM-CR | | |
| 5.00%, due 12/1/36 | 12,750,000 | 13,946,142 |
| Series E, Insured: AGM | | |
| 5.00%, due 12/1/52 | 14,550,000 | 14,966,015 |
| Series E, Insured: AGM | | |
| 5.50%, due 12/1/42 | 9,125,000 | 10,039,612 |
| | Principal
Amount | Value |
| |
| South Carolina (continued) |
| South Carolina Transportation Infrastructure Bank, Revenue Bonds | | |
| Series A | | |
| 5.00%, due 10/1/36 | $ 12,950,000 | $ 13,580,221 |
| Series A | | |
| 5.00%, due 10/1/40 | 9,000,000 | 9,328,077 |
| | | 117,234,437 |
| South Dakota 0.1% |
| South Dakota Housing Development Authority, Revenue Bonds | | |
| Series B | | |
| 3.00%, due 11/1/52 | 7,390,000 | 7,102,211 |
| Series A, Insured: GNMA / FNMA / FHLMC | | |
| 6.00%, due 5/1/54 | 5,000,000 | 5,274,555 |
| | | 12,376,766 |
| Tennessee 1.1% |
| County of Knox, Unlimited General Obligation | | |
| Series B | | |
| 3.00%, due 6/1/34 | 3,665,000 | 3,453,210 |
| County of Rutherford, Unlimited General Obligation | | |
| 1.625%, due 4/1/34 | 5,375,000 | 4,164,081 |
| 1.875%, due 4/1/39 | 4,120,000 | 2,846,032 |
| Metropolitan Government of Nashville & Davidson County, Electric, Revenue Bonds | | |
| Series A | | |
| 5.25%, due 5/15/49 | 5,000,000 | 5,494,178 |
| Metropolitan Nashville Airport Authority (The), Revenue Bonds | | |
| Series A | | |
| 4.00%, due 7/1/49 | 3,500,000 | 3,261,832 |
| Series B | | |
| 5.00%, due 7/1/44 (b) | 10,225,000 | 10,523,278 |
| Series B | | |
| 5.50%, due 7/1/40 (b) | 2,000,000 | 2,205,729 |
| Series B | | |
| 5.50%, due 7/1/41 (b) | 3,000,000 | 3,295,643 |
| Series B | | |
| 5.50%, due 7/1/52 (b) | 7,000,000 | 7,477,079 |
| State of Tennessee, Unlimited General Obligation | | |
| Series A | | |
| 5.00%, due 5/1/36 | 19,000,000 | 21,951,010 |
The notes to the financial statements are an integral part of, and should be read in conjunction with, the financial statements.
41
Portfolio of Investments April 30, 2024†^(Unaudited) (continued)
| | Principal
Amount | Value |
| Long-Term Municipal Bonds (continued) |
| Tennessee (continued) |
| State of Tennessee, Unlimited General Obligation (continued) | | |
| Series A | | |
| 5.00%, due 5/1/40 | $ 14,500,000 | $ 16,238,546 |
| Series A | | |
| 5.00%, due 5/1/42 | 10,000,000 | 11,106,864 |
| Series A | | |
| 5.00%, due 5/1/43 | 3,500,000 | 3,870,332 |
| Tennessee Energy Acquisition Corp., Revenue Bonds | | |
| 4.00%, due 11/1/49 (a) | 5,250,000 | 5,249,844 |
| Tennessee Housing Development Agency, Revenue Bonds | | |
| Series 2 | | |
| 2.50%, due 1/1/31 | 2,020,000 | 1,797,962 |
| | | 102,935,620 |
| Texas 11.3% |
| Aldine Independent School District, Unlimited General Obligation | | |
| Series A, Insured: PSF-GTD | | |
| 5.00%, due 2/15/28 | 8,585,000 | 8,984,008 |
| Bastrop Independent School District, Unlimited General Obligation | | |
| Insured: PSF-GTD | | |
| 5.00%, due 2/15/48 | 6,785,000 | 7,250,418 |
| Bexar County Hospital District, Certificates of Obligation, Limited General Obligation | | |
| 4.00%, due 2/15/37 | 3,450,000 | 3,459,187 |
| Central Texas Regional Mobility Authority, Revenue Bonds, Sub. Lien | | |
| Series F | | |
| 5.00%, due 1/1/25 | 5,130,000 | 5,137,394 |
| Central Texas Turnpike System, Revenue Bonds | | |
| Series B | | |
| (zero coupon), due 8/15/37 | 8,000,000 | 4,221,203 |
| Series C | | |
| 5.00%, due 8/15/28 | 2,070,000 | 2,075,019 |
| City of Austin, Water & Wastewater System, Revenue Bonds | | |
| Series A | | |
| 3.35%, due 5/15/29 | 4,250,000 | 4,126,850 |
| | Principal
Amount | Value |
| |
| Texas (continued) |
| City of Austin, Airport System, Revenue Bonds (b) | | |
| 5.00%, due 11/15/31 | $ 5,000,000 | $ 5,018,850 |
| 5.00%, due 11/15/39 | 7,000,000 | 7,005,779 |
| City of Celina, Limited General Obligation | | |
| 1.75%, due 9/1/36 | 3,395,000 | 2,480,285 |
| 1.875%, due 9/1/37 | 3,455,000 | 2,473,246 |
| 1.875%, due 9/1/39 | 3,585,000 | 2,411,051 |
| City of Dallas, Hotel Occupancy Tax, Revenue Bonds | | |
| 4.00%, due 8/15/36 | 1,150,000 | 1,115,581 |
| City of Dallas, Limited General Obligation | | |
| Series B | | |
| 5.00%, due 2/15/26 | 7,000,000 | 7,196,755 |
| Series B | | |
| 5.00%, due 2/15/26 | 19,000,000 | 19,534,050 |
| City of El Paso, Limited General Obligation | | |
| Insured: BAM | | |
| 4.00%, due 8/15/42 | 16,040,000 | 15,474,449 |
| City of El Paso, Water & Sewer, Revenue Bonds | | |
| 5.00%, due 3/1/52 | 15,000,000 | 15,742,359 |
| 5.25%, due 3/1/49 | 14,500,000 | 15,694,182 |
| City of Fort Worth, General purpose, Limited General Obligation | | |
| 2.00%, due 3/1/38 | 5,000,000 | 3,583,227 |
| 2.00%, due 3/1/41 | 5,470,000 | 3,541,491 |
| City of Fort Worth, Limited General Obligation | | |
| 5.00%, due 3/1/25 | 2,700,000 | 2,731,231 |
| City of Frisco, Limited General Obligation | | |
| 2.00%, due 2/15/38 | 4,740,000 | 3,396,762 |
| City of Georgetown, Utility System, Revenue Bonds | | |
| Insured: AGM | | |
| 5.25%, due 8/15/52 | 4,700,000 | 4,961,896 |
| City of Houston, Public Improvement, Limited General Obligation | | |
| Series A | | |
| 5.00%, due 3/1/28 | 3,445,000 | 3,596,425 |
| City of Houston, Hotel Occupancy Tax & Special Tax, Revenue Bonds | | |
| 5.00%, due 9/1/31 | 2,200,000 | 2,207,212 |
| 5.00%, due 9/1/34 | 1,550,000 | 1,554,468 |
The notes to the financial statements are an integral part of, and should be read in conjunction with, the financial statements.
| 42 | MainStay MacKay Tax Free Bond Fund |
| | Principal
Amount | Value |
| Long-Term Municipal Bonds (continued) |
| Texas (continued) |
| City of Houston, Combined Utility System, Revenue Bonds, First Lien | | |
| Series A | | |
| 5.00%, due 11/15/36 | $ 9,500,000 | $ 9,679,283 |
| Series B | | |
| 5.00%, due 11/15/36 | 18,280,000 | 18,844,320 |
| City of Houston, Airport System, Revenue Bonds, Sub. Lien (b) | | |
| Series A, Insured: AGM | | |
| 5.25%, due 7/1/43 | 4,000,000 | 4,315,866 |
| Series A, Insured: AGM | | |
| 5.25%, due 7/1/48 | 6,980,000 | 7,417,387 |
| City of Lubbock, Electric Light & Power System, Revenue Bonds | | |
| Insured: AGM-CR | | |
| 4.00%, due 4/15/46 | 8,150,000 | 7,853,629 |
| Insured: AGM-CR | | |
| 4.00%, due 4/15/51 | 6,290,000 | 5,921,847 |
| City of San Antonio, Electric & Gas Systems, Revenue Bonds | | |
| 4.00%, due 2/1/38 | 10,000,000 | 9,916,024 |
| 4.00%, due 2/1/47 | 7,735,000 | 7,140,039 |
| Series A | | |
| 5.50%, due 2/1/50 | 35,000,000 | 38,648,375 |
| Cleburne Independent School District, Unlimited General Obligation | | |
| Insured: PSF-GTD | | |
| 5.00%, due 2/15/35 | 6,000,000 | 6,112,228 |
| Collin County Community College District, Limited General Obligation | | |
| 3.50%, due 8/15/37 | 4,250,000 | 3,931,891 |
| Comal Independent School District, School Building, Unlimited General Obligation | | |
| Insured: PSF-GTD | | |
| 3.00%, due 2/1/39 | 7,670,000 | 6,661,724 |
| Insured: PSF-GTD | | |
| 3.00%, due 2/1/40 | 12,500,000 | 10,616,750 |
| Conroe Independent School District, Unlimited General Obligation | | |
| Insured: PSF-GTD | | |
| 2.50%, due 2/15/37 | 4,000,000 | 3,267,013 |
| | Principal
Amount | Value |
| |
| Texas (continued) |
| County of Collin, Limited General Obligation | | |
| 2.25%, due 2/15/41 | $ 4,740,000 | $ 3,255,764 |
| County of Harris, Unlimited General Obligation | | |
| Series A | | |
| 5.00%, due 10/1/31 | 4,000,000 | 4,078,448 |
| Cypress-Fairbanks Independent School District, Unlimited General Obligation | | |
| Series A, Insured: PSF-GTD | | |
| 3.30%, due 2/15/30 | 3,500,000 | 3,371,670 |
| Dallas Fort Worth International Airport, Revenue Bonds | | |
| Series A | | |
| 4.00%, due 11/1/34 | 18,000,000 | 18,499,689 |
| Denton Independent School District, Unlimited General Obligation | | |
| Insured: PSF-GTD | | |
| 1.80%, due 8/15/37 | 6,000,000 | 4,327,666 |
| Insured: PSF-GTD | | |
| 3.00%, due 8/15/28 | 3,000,000 | 2,893,290 |
| Harris County Cultural Education Facilities Finance Corp., Texas Children's Hospital, Revenue Bonds | | |
| Series A | | |
| 3.00%, due 10/1/51 | 3,400,000 | 2,509,654 |
| Humble Independent School District, Unlimited General Obligation | | |
| Series A, Insured: PSF-GTD | | |
| 4.00%, due 2/15/30 | 17,595,000 | 17,635,095 |
| Irving Independent School District, Unlimited General Obligation | | |
| Insured: PSF-GTD | | |
| 5.00%, due 2/15/40 | 4,500,000 | 4,944,060 |
| Lamar Consolidated Independent School District, Unlimited General Obligation | | |
| Insured: AGM | | |
| 5.50%, due 2/15/58 | 65,000,000 | 71,188,435 |
| Leander Independent School District, Unlimited General Obligation | | |
| Series A, Insured: PSF-GTD | | |
| (zero coupon), due 8/16/44 | 8,300,000 | 3,150,176 |
| Series A, Insured: PSF-GTD | | |
| 5.00%, due 8/15/39 | 5,080,000 | 5,135,334 |
The notes to the financial statements are an integral part of, and should be read in conjunction with, the financial statements.
43
Portfolio of Investments April 30, 2024†^(Unaudited) (continued)
| | Principal
Amount | Value |
| Long-Term Municipal Bonds (continued) |
| Texas (continued) |
| Lewisville Independent School District, Unlimited General Obligation | | |
| Insured: PSF-GTD | | |
| 5.00%, due 8/15/26 | $ 15,000,000 | $ 15,581,720 |
| Love Field Airport Modernization Corp., Revenue Bonds | | |
| Insured: AGM | | |
| 4.00%, due 11/1/40 (b) | 7,210,000 | 6,998,446 |
| Lower Colorado River Authority, LCRA Transmission Services Corp., Revenue Bonds | | |
| 5.00%, due 5/15/27 | 3,455,000 | 3,458,084 |
| 5.00%, due 5/15/28 | 3,745,000 | 3,748,343 |
| Series A | | |
| 5.25%, due 5/15/48 | 3,000,000 | 3,232,014 |
| Insured: AGM | | |
| 5.50%, due 5/15/48 | 7,500,000 | 8,216,977 |
| Insured: AGM | | |
| 5.50%, due 5/15/53 | 26,875,000 | 29,326,008 |
| Lower Colorado River Authority, Revenue Bonds | | |
| Series D | | |
| 5.00%, due 5/15/30 | 5,000,000 | 5,056,538 |
| Lubbock-Cooper Independent School District, Unlimited General Obligation | | |
| Insured: PSF-GTD | | |
| 5.00%, due 2/15/46 | 5,000,000 | 5,367,144 |
| Marshall Independent School District, Unlimited General Obligation | | |
| Insured: PSF-GTD | | |
| 4.00%, due 2/15/48 | 3,620,000 | 3,462,705 |
| Matagorda County Navigation District No. 1, Central Power and Light Company Project, Revenue Bonds | | |
| Series A | | |
| 2.60%, due 11/1/29 | 13,500,000 | 12,158,782 |
| New Caney Independent School District, Unlimited General Obligation | | |
| Insured: PSF-GTD | | |
| 5.00%, due 2/15/48 | 6,000,000 | 6,427,333 |
| | Principal
Amount | Value |
| |
| Texas (continued) |
| North Texas Municipal Water District, Sabine Creek Regional Wastewater System, Revenue Bonds | | |
| Insured: AGM | | |
| 4.375%, due 6/1/52 | $ 7,200,000 | $ 7,189,096 |
| North Texas Tollway Authority, Revenue Bonds, First Tier | | |
| Series A | | |
| 4.00%, due 1/1/43 | 6,250,000 | 6,127,034 |
| Series A | | |
| 4.125%, due 1/1/39 | 2,250,000 | 2,287,752 |
| Series A | | |
| 4.125%, due 1/1/40 | 4,750,000 | 4,794,100 |
| Series A | | |
| 5.25%, due 1/1/38 | 6,700,000 | 7,510,738 |
| North Texas Tollway Authority, Revenue Bonds | | |
| Series A | | |
| 5.00%, due 1/1/33 | 4,500,000 | 4,532,295 |
| Series A | | |
| 5.00%, due 1/1/35 | 2,450,000 | 2,466,034 |
| Series A, Insured: BAM | | |
| 5.00%, due 1/1/38 | 8,175,000 | 8,220,666 |
| North Texas Tollway Authority, Revenue Bonds, Second Tier | | |
| Series B | | |
| 5.00%, due 1/1/39 | 4,500,000 | 4,607,533 |
| Northside Independent School District, Unlimited General Obligation | | |
| Insured: PSF-GTD | | |
| 3.35%, due 8/15/36 | 3,250,000 | 3,049,248 |
| Insured: PSF-GTD | | |
| 3.45%, due 8/15/37 | 6,430,000 | 6,045,634 |
| Pearland Independent School District, Unlimited General Obligation | | |
| Insured: PSF-GTD | | |
| 5.25%, due 2/15/32 | 845,000 | 869,885 |
| Insured: PSF-GTD | | |
| 5.25%, due 2/15/32 | 4,155,000 | 4,280,904 |
| Port Authority of Houston of Harris County Texas, Revenue Bonds, First Lien | | |
| 5.00%, due 10/1/53 | 10,000,000 | 10,574,616 |
The notes to the financial statements are an integral part of, and should be read in conjunction with, the financial statements.
| 44 | MainStay MacKay Tax Free Bond Fund |
| | Principal
Amount | Value |
| Long-Term Municipal Bonds (continued) |
| Texas (continued) |
| Royse City Independent School District, Unlimited General Obligation | | |
| Insured: PSF-GTD | | |
| 5.00%, due 2/15/53 | $ 10,000,000 | $ 10,598,398 |
| San Antonio Independent School District, Unlimited General Obligation | | |
| Insured: PSF-GTD | | |
| 5.00%, due 8/15/52 | 8,715,000 | 9,186,658 |
| San Antonio Water System, Revenue Bonds, Junior Lien | | |
| Series B | | |
| 5.25%, due 5/15/52 | 40,000,000 | 43,027,068 |
| San Marcos Consolidated Independent School District, Unlimited General Obligation | | |
| Insured: PSF-GTD | | |
| 5.25%, due 8/15/47 | 9,000,000 | 9,854,802 |
| Spring Independent School District, Unlimited General Obligation | | |
| 5.00%, due 8/15/47 | 5,000,000 | 5,386,840 |
| State of Texas, Water Financial Assistance, Unlimited General Obligation | | |
| Series A | | |
| 3.00%, due 8/1/27 | 2,075,000 | 2,013,486 |
| Series B | | |
| 5.00%, due 8/1/39 | 10,490,000 | 10,592,261 |
| State of Texas, College Student Loan, Unlimited General Obligation (b) | | |
| Series B | | |
| 4.00%, due 8/1/26 | 10,000,000 | 9,914,855 |
| Series B | | |
| 4.00%, due 8/1/27 | 6,000,000 | 5,961,364 |
| 4.00%, due 8/1/28 | 6,800,000 | 6,759,907 |
| Series B | | |
| 4.00%, due 8/1/28 | 3,105,000 | 3,086,693 |
| 4.00%, due 8/1/29 | 6,940,000 | 6,900,478 |
| 4.00%, due 8/1/30 | 11,285,000 | 11,273,420 |
| 4.00%, due 8/1/32 | 11,000,000 | 10,936,369 |
| 5.00%, due 8/1/27 | 7,750,000 | 7,836,841 |
| 5.50%, due 8/1/32 | 3,500,000 | 3,612,759 |
| | Principal
Amount | Value |
| |
| Texas (continued) |
| State of Texas, Transportation Commission, Highway Improvement, Unlimited General Obligation | | |
| 5.00%, due 4/1/33 | $ 5,500,000 | $ 5,676,084 |
| Series A | | |
| 5.00%, due 4/1/37 | 4,525,000 | 4,646,978 |
| State of Texas, Mobility Fund, Unlimited General Obligation | | |
| Series B | | |
| 5.00%, due 10/1/36 | 33,665,000 | 34,167,063 |
| Tarrant County Cultural Education Facilities Finance Corp., Texas Health Resources Obligated Group, Revenue Bonds | | |
| Series A | | |
| 5.00%, due 2/15/41 | 10,500,000 | 10,683,755 |
| Tarrant County Cultural Education Facilities Finance Corp., Buckner Retirement Services, Inc. Project, Revenue Bonds | | |
| Series B | | |
| 5.00%, due 11/15/46 | 2,885,000 | 2,707,668 |
| Tarrant County Cultural Education Facilities Finance Corp., CHRISTUS Health Obligated Group, Revenue Bonds | | |
| Series A | | |
| 5.00%, due 7/1/53 (a) | 8,000,000 | 8,796,889 |
| Texas Department of Housing & Community Affairs, Revenue Bonds | | |
| Series A, Insured: GNMA | | |
| 3.50%, due 3/1/51 | 2,900,000 | 2,829,824 |
| Series A, Insured: GNMA / FNMA | | |
| 3.95%, due 1/1/50 | 3,270,000 | 2,964,571 |
| Series A, Insured: GNMA | | |
| 5.00%, due 1/1/49 | 4,000,000 | 4,024,333 |
| Series A, Insured: GNMA | | |
| 5.125%, due 1/1/54 | 3,250,000 | 3,325,434 |
| Series B, Insured: GNMA | | |
| 6.00%, due 3/1/53 | 11,525,000 | 12,430,433 |
| Texas Department of Housing & Community Affairs, Residential Mortgage, Revenue Bonds | | |
| Series A, Insured: GNMA / FNMA | | |
| 4.75%, due 1/1/49 | 15,000 | 15,026 |
The notes to the financial statements are an integral part of, and should be read in conjunction with, the financial statements.
45
Portfolio of Investments April 30, 2024†^(Unaudited) (continued)
| | Principal
Amount | Value |
| Long-Term Municipal Bonds (continued) |
| Texas (continued) |
| Texas Municipal Gas Acquisition & Supply Corp. II, Revenue Bonds | | |
| Series C | | |
| 4.38%, due 9/15/27 | $ 35,000,000 | $ 34,925,027 |
| Texas Municipal Gas Acquisition & Supply Corp. III, Gas Supply, Revenue Bonds | | |
| 5.00%, due 12/15/25 | 1,525,000 | 1,540,630 |
| 5.00%, due 12/15/26 | 4,925,000 | 5,015,688 |
| 5.00%, due 12/15/27 | 5,180,000 | 5,325,365 |
| 5.00%, due 12/15/28 | 3,000,000 | 3,091,238 |
| 5.00%, due 12/15/32 | 10,075,000 | 10,610,732 |
| Texas Municipal Gas Acquisition and Supply Corp. I, Revenue Bonds, Senior Lien | | |
| Series D | | |
| 6.25%, due 12/15/26 | 2,390,000 | 2,465,505 |
| Texas Private Activity Bond Surface Transportation Corp., LBJ Infrastructure Group LLC, Revenue Bonds, Senior Lien | | |
| Series A | | |
| 4.00%, due 6/30/35 | 2,300,000 | 2,339,257 |
| Texas Private Activity Bond Surface Transportation Corp., NTE Mobility Partners Segments 3 LLC, Revenue Bonds, Senior Lien (b) | | |
| 5.00%, due 12/31/33 | 2,740,000 | 2,945,536 |
| 5.00%, due 6/30/34 | 2,500,000 | 2,683,496 |
| 5.00%, due 12/31/34 | 3,125,000 | 3,348,076 |
| 5.125%, due 6/30/35 | 2,500,000 | 2,688,365 |
| 5.125%, due 12/31/35 | 2,500,000 | 2,683,332 |
| Texas Private Activity Bond Surface Transportation Corp., North Tarrant Express Managed Lanes Project, Revenue Bonds, Senior Lien | | |
| 5.50%, due 12/31/58 (b) | 14,900,000 | 15,992,946 |
| Texas State Technical College, Revenue Bonds | | |
| Series A, Insured: AGM | | |
| 5.50%, due 8/1/42 | 3,750,000 | 4,208,880 |
| Texas Transportation Commission, State Highway, Revenue Bonds, First Tier | | |
| 5.00%, due 10/1/25 | 9,000,000 | 9,197,677 |
| | Principal
Amount | Value |
| |
| Texas (continued) |
| Texas Water Development Board, State Water Implementation Fund, Revenue Bonds | | |
| 4.65%, due 10/15/40 | $ 3,505,000 | $ 3,728,777 |
| Series A | | |
| 4.75%, due 10/15/43 | 16,000,000 | 16,946,818 |
| 5.00%, due 10/15/47 | 4,385,000 | 4,680,361 |
| Series A | | |
| 5.25%, due 10/15/51 | 22,000,000 | 23,835,643 |
| Upper Brushy Creek Water Control and Improvement District, Unlimited General Obligation | | |
| 3.00%, due 8/15/47 | 2,885,000 | 2,150,176 |
| Waxahachie Independent School District, Unlimited General Obligation | | |
| Insured: PSF-GTD | | |
| 5.00%, due 2/15/48 | 3,035,000 | 3,251,159 |
| | | 1,024,743,605 |
| U.S. Virgin Islands 0.9% |
| Matching Fund Special Purpose Securitization Corp., Revenue Bonds | | |
| Series A | | |
| 5.00%, due 10/1/28 | 5,000,000 | 5,228,200 |
| Series A | | |
| 5.00%, due 10/1/30 | 11,805,000 | 12,550,853 |
| Series A | | |
| 5.00%, due 10/1/32 | 11,805,000 | 12,685,552 |
| Series A | | |
| 5.00%, due 10/1/39 | 35,670,000 | 37,235,613 |
| Virgin Islands Public Finance Authority, Revenue Bonds | | |
| 5.00%, due 9/1/30 (e) | 4,700,000 | 4,731,091 |
| Series C, Insured: AGM-CR | | |
| 5.00%, due 10/1/39 | 7,575,000 | 7,589,846 |
| | | 80,021,155 |
| Utah 2.5% |
| City of Salt Lake City, Airport, Revenue Bonds (b) | | |
| Series A | | |
| 4.00%, due 7/1/41 | 5,750,000 | 5,502,526 |
| Series A | | |
| 5.00%, due 7/1/30 | 3,250,000 | 3,490,405 |
| Series A | | |
| 5.00%, due 7/1/31 | 6,155,000 | 6,676,095 |
The notes to the financial statements are an integral part of, and should be read in conjunction with, the financial statements.
| 46 | MainStay MacKay Tax Free Bond Fund |
| | Principal
Amount | Value |
| Long-Term Municipal Bonds (continued) |
| Utah (continued) |
| City of Salt Lake City, Airport, Revenue Bonds (b) (continued) | | |
| Series A | | |
| 5.00%, due 7/1/32 | $ 3,750,000 | $ 4,070,892 |
| Series A | | |
| 5.00%, due 7/1/33 | 3,000,000 | 3,098,071 |
| Series A | | |
| 5.00%, due 7/1/34 | 3,705,000 | 3,825,113 |
| Series A | | |
| 5.00%, due 7/1/35 | 4,500,000 | 4,868,542 |
| Series A | | |
| 5.00%, due 7/1/36 | 4,250,000 | 4,569,887 |
| Series A | | |
| 5.00%, due 7/1/43 | 7,250,000 | 7,396,281 |
| Series A | | |
| 5.00%, due 7/1/47 | 30,040,000 | 30,261,686 |
| Series A | | |
| 5.50%, due 7/1/53 | 8,500,000 | 9,104,015 |
| County of Salt Lake, Option Sales & Use Tax, Revenue Bonds | | |
| Series B | | |
| 2.70%, due 2/1/28 | 2,625,000 | 2,536,153 |
| Series B | | |
| 2.85%, due 2/1/29 | 2,675,000 | 2,577,616 |
| Davis School District, Unlimited General Obligation | | |
| Insured: School Bond Guaranty | | |
| 3.35%, due 6/1/35 | 4,525,000 | 4,347,520 |
| Insured: School Bond Guaranty | | |
| 3.375%, due 6/1/36 | 4,675,000 | 4,452,032 |
| Intermountain Power Agency, Revenue Bonds | | |
| Series A | | |
| 4.00%, due 7/1/36 | 7,500,000 | 7,856,032 |
| Series A | | |
| 5.00%, due 7/1/33 | 5,950,000 | 6,723,317 |
| Series A | | |
| 5.00%, due 7/1/42 | 4,045,000 | 4,405,334 |
| Series A | | |
| 5.00%, due 7/1/45 | 12,500,000 | 13,396,585 |
| Series A | | |
| 5.25%, due 7/1/43 | 7,435,000 | 8,223,381 |
| Series A | | |
| 5.25%, due 7/1/44 | 8,155,000 | 9,006,935 |
| Series A | | |
| 5.25%, due 7/1/45 | 17,910,000 | 19,724,851 |
| | Principal
Amount | Value |
| |
| Utah (continued) |
| Jordan School District, School Building, Unlimited General Obligation | | |
| Insured: School Bond Guaranty | | |
| 2.25%, due 6/15/36 | $ 1,225,000 | $ 969,115 |
| University of Utah (The), Revenue Bonds | | |
| Series B | | |
| 5.25%, due 8/1/53 | 7,830,000 | 8,597,360 |
| Utah Board of Higher Education, Revenue Bonds | | |
| Series A, Insured: NATL-RE | | |
| 5.50%, due 4/1/29 | 8,000,000 | 8,553,295 |
| Utah Charter School Finance Authority, Spectrum Academy Project, Revenue Bonds | | |
| Insured: BAM UT CSCE | | |
| 4.00%, due 4/15/45 | 1,750,000 | 1,597,109 |
| Utah Housing Corp., Mortgage-Backed, Revenue Bonds | | |
| Series H-G2, Insured: GNMA | | |
| 4.50%, due 10/21/48 | 512,113 | 501,401 |
| Series J-G2, Insured: GNMA | | |
| 4.50%, due 12/21/48 | 448,980 | 438,823 |
| Series A, Insured: GNMA | | |
| 4.50%, due 1/21/49 | 1,107,705 | 1,084,498 |
| Series B-G2, Insured: GNMA | | |
| 4.50%, due 2/21/49 | 1,133,457 | 1,101,987 |
| Series G-2, Insured: GNMA | | |
| 5.00%, due 7/21/52 | 13,789,076 | 13,658,891 |
| Series H-G2, Insured: GNMA | | |
| 5.00%, due 8/21/52 | 20,310,727 | 20,130,092 |
| Series C-G2, Insured: GNMA | | |
| 5.50%, due 4/21/53 | 4,811,721 | 4,794,859 |
| | | 227,540,699 |
| Virginia 0.8% |
| Arlington County Industrial Development Authority, Virginia Hospital Center Arlington Health System Obligated Group, Revenue Bonds | | |
| 3.75%, due 7/1/50 | 4,500,000 | 4,064,163 |
| Arlington County Industrial Development Authority, Virginia Hospital Center, Revenue Bonds | | |
| 4.00%, due 7/1/45 | 4,750,000 | 4,487,214 |
The notes to the financial statements are an integral part of, and should be read in conjunction with, the financial statements.
47
Portfolio of Investments April 30, 2024†^(Unaudited) (continued)
| | Principal
Amount | Value |
| Long-Term Municipal Bonds (continued) |
| Virginia (continued) |
Arlington County Industrial Development Authority, Virginia Hospital Center, Revenue Bonds
(continued) | | |
| Series A | | |
| 5.00%, due 7/1/53 (a) | $ 10,000,000 | $ 10,774,039 |
| City of Alexandria, Unlimited General Obligation | | |
| Series A, Insured: State Aid Withholding | | |
| 2.00%, due 12/15/39 | 1,550,000 | 1,092,552 |
| Series D, Insured: State Aid Withholding | | |
| 5.00%, due 7/1/26 | 2,235,000 | 2,316,209 |
| City of Harrisonburg, Unlimited General Obligation | | |
| Series A, Insured: State Aid Withholding | | |
| 1.875%, due 7/15/37 | 3,200,000 | 2,317,891 |
| County of Fairfax, Unlimited General Obligation | | |
| Series B, Insured: State Aid Withholding | | |
| 3.00%, due 10/1/26 | 7,750,000 | 7,599,817 |
| County of Loudoun, Public Improvement, Unlimited General Obligation | | |
| Series A, Insured: State Aid Withholding | | |
| 4.00%, due 12/1/32 | 6,000,000 | 6,024,206 |
| Roanoke Economic Development Authority, Carilion Clinic Obligated Group, Revenue Bonds | | |
| Series A | | |
| 3.00%, due 7/1/45 | 7,500,000 | 5,946,001 |
| Virginia College Building Authority, 21st Century College & Equipment Programs, Revenue Bonds | | |
| Series D, Insured: State Intercept | | |
| 3.00%, due 2/1/26 | 6,000,000 | 5,916,557 |
| Series D, Insured: State Intercept | | |
| 3.15%, due 2/1/28 | 5,600,000 | 5,473,810 |
| Virginia Commonwealth Transportation Board, Revenue Bonds | | |
| 5.00%, due 3/15/25 | 4,040,000 | 4,092,510 |
| | Principal
Amount | Value |
| |
| Virginia (continued) |
| Virginia Public Building Authority, Revenue Bonds | | |
| Series A | | |
| 3.30%, due 8/1/28 | $ 6,260,000 | $ 6,139,580 |
| Virginia Public School Authority, Revenue Bonds | | |
| Series B, Insured: State Intercept | | |
| 3.00%, due 8/1/26 | 6,750,000 | 6,677,985 |
| Virginia Small Business Financing Authority, Capital Beltway Express LLC, Revenue Bonds, Senior Lien | | |
| 5.00%, due 12/31/47 (b) | 2,250,000 | 2,280,834 |
| | | 75,203,368 |
| Washington 2.2% |
| City of Seattle, Water System, Revenue Bonds | | |
| 5.00%, due 8/1/26 | 5,000,000 | 5,183,356 |
| City of Spokane, Water & Wastewater, Revenue Bonds | | |
| 4.00%, due 12/1/30 | 11,190,000 | 11,100,314 |
| County of King, Limited General Obligation | | |
| Series A | | |
| 2.00%, due 1/1/34 | 4,190,000 | 3,431,599 |
| County of King, Sewer, Revenue Bonds | | |
| Series A | | |
| 4.00%, due 7/1/41 | 4,000,000 | 3,875,325 |
| Douglas County Public Utility District No. 1, Wells Hydroelectric Project, Revenue Bonds | | |
| Series B | | |
| 5.00%, due 9/1/47 | 10,030,000 | 10,608,538 |
| Energy Northwest, Bonneville Power Administration, Revenue Bonds | | |
| Series A | | |
| 5.00%, due 7/1/35 | 4,250,000 | 4,707,384 |
| Series A | | |
| 5.00%, due 7/1/36 | 6,100,000 | 6,897,361 |
| North Thurston Public Schools, Unlimited General Obligation | | |
| Insured: School Bond Guaranty | | |
| 3.50%, due 12/1/29 | 4,360,000 | 4,281,888 |
| Port of Seattle, Revenue Bonds (b) | | |
| 5.00%, due 4/1/27 | 6,835,000 | 7,072,738 |
| 5.00%, due 7/1/28 | 8,500,000 | 8,504,859 |
The notes to the financial statements are an integral part of, and should be read in conjunction with, the financial statements.
| 48 | MainStay MacKay Tax Free Bond Fund |
| | Principal
Amount | Value |
| Long-Term Municipal Bonds (continued) |
| Washington (continued) |
Port of Seattle, Revenue Bonds (b)
(continued) | | |
| 5.00%, due 7/1/29 | $ 6,585,000 | $ 6,590,219 |
| Series C | | |
| 5.00%, due 4/1/30 | 2,000,000 | 2,004,383 |
| Series A | | |
| 5.00%, due 5/1/30 | 4,000,000 | 4,117,163 |
| Series C | | |
| 5.00%, due 8/1/30 | 5,000,000 | 5,351,307 |
| Series C | | |
| 5.00%, due 4/1/32 | 3,000,000 | 3,005,470 |
| Series C | | |
| 5.00%, due 4/1/34 | 4,400,000 | 4,405,866 |
| Port of Seattle, Intermediate Lien, Revenue Bonds | | |
| Series C | | |
| 5.00%, due 8/1/38 (b) | 8,965,000 | 9,432,834 |
| Southwest Suburban Sewer District, Revenue Bonds | | |
| Series A | | |
| 3.00%, due 5/1/29 | 2,050,000 | 1,978,826 |
| State of Washington, Unlimited General Obligation | | |
| Series R-2020A | | |
| 5.00%, due 1/1/25 | 6,710,000 | 6,773,544 |
| State of Washington, Various Purpose, Unlimited General Obligation | | |
| Series R-2023A | | |
| 5.00%, due 8/1/25 | 22,500,000 | 22,933,411 |
| Series C | | |
| 5.00%, due 2/1/29 | 5,900,000 | 6,416,039 |
| Series R-2015D | | |
| 5.00%, due 7/1/32 | 5,000,000 | 5,042,919 |
| Series A | | |
| 5.00%, due 8/1/35 | 4,000,000 | 4,551,296 |
| Series A | | |
| 5.00%, due 8/1/38 | 10,565,000 | 11,904,946 |
| Series C | | |
| 5.00%, due 2/1/41 | 4,250,000 | 4,591,823 |
| Series A | | |
| 5.00%, due 8/1/41 | 11,700,000 | 12,979,668 |
| State of Washington, Motor Vehicle Fuel Tax, Unlimited General Obligation | | |
| Series R-2022B | | |
| 5.00%, due 2/1/29 | 4,750,000 | 5,165,455 |
| | Principal
Amount | Value |
| |
| Washington (continued) |
| State of Washington, Motor Vehicle Fuel Tax, Unlimited General Obligation (continued) | | |
| Series B | | |
| 5.00%, due 6/1/37 | $ 5,540,000 | $ 6,289,062 |
| Washington State Housing Finance Commission, Revenue Bonds | | |
| Series 2N, Insured: GNMA / FNMA / FHLMC | | |
| 3.75%, due 12/1/49 | 3,035,000 | 2,985,421 |
| Series 1N, Insured: GNMA / FNMA / FHLMC | | |
| 5.00%, due 12/1/44 (c) | 5,000,000 | 5,284,817 |
| Washington State Housing Finance Commission, Single Family Program, Revenue Bonds | | |
| Series 1N | | |
| 4.00%, due 6/1/49 | 155,000 | 153,335 |
| | | 197,621,166 |
| West Virginia 0.3% |
| West Virginia Hospital Finance Authority, United Health System, Revenue Bonds | | |
| Series A | | |
| 5.00%, due 6/1/52 | 13,280,000 | 13,438,519 |
| West Virginia Hospital Finance Authority, Vandalia Health, Inc., Revenue Bonds | | |
| Series B, Insured: AGM | | |
| 5.50%, due 9/1/48 | 8,600,000 | 9,371,644 |
| West Virginia Hospital Finance Authority, Vandalia Health, Inc. Obligated Group, Revenue Bonds | | |
| Series B | | |
| 6.00%, due 9/1/48 | 5,200,000 | 5,847,462 |
| | | 28,657,625 |
| Wisconsin 0.6% |
| County of Milwaukee, Unlimited General Obligation | | |
| Series A | | |
| 3.00%, due 12/1/25 | 2,365,000 | 2,333,599 |
| Howard-Suamico School District, Unlimited General Obligation | | |
| 2.00%, due 3/1/36 | 4,825,000 | 3,770,958 |
| 2.00%, due 3/1/39 | 5,200,000 | 3,645,416 |
| 2.00%, due 3/1/40 | 3,245,000 | 2,218,381 |
| 2.00%, due 3/1/41 | 4,540,000 | 3,035,763 |
The notes to the financial statements are an integral part of, and should be read in conjunction with, the financial statements.
49
Portfolio of Investments April 30, 2024†^(Unaudited) (continued)
| | Principal
Amount | Value |
| Long-Term Municipal Bonds (continued) |
| Wisconsin (continued) |
| River Falls School District, Unlimited General Obligation | | |
| Series A | | |
| 3.35%, due 4/1/34 | $ 2,765,000 | $ 2,648,415 |
| Series A | | |
| 3.40%, due 4/1/35 | 2,595,000 | 2,485,034 |
| Series A | | |
| 3.45%, due 4/1/36 | 3,130,000 | 2,975,766 |
| Sun Prairie Area School District, Unlimited General Obligation | | |
| 2.00%, due 3/1/41 | 9,755,000 | 6,422,429 |
| Waunakee Community School District, Unlimited General Obligation | | |
| 3.25%, due 4/1/28 | 13,000,000 | 12,638,062 |
| Wisconsin Health & Educational Facilities Authority, Children's Hospital of Wisconsin, Revenue Bonds | | |
| 4.00%, due 8/15/42 | 6,350,000 | 6,087,174 |
| 4.00%, due 8/15/47 | 6,250,000 | 5,883,734 |
| Wisconsin Health & Educational Facilities Authority, Aspirus, Inc. Obligated Group, Revenue Bonds | | |
| 4.00%, due 8/15/48 | 4,015,000 | 3,681,293 |
| | | 57,826,024 |
| Wyoming 0.1% |
| Wyoming Community Development Authority, Revenue Bonds | | |
| Series 1 | | |
| 5.75%, due 6/1/53 | 5,000,000 | 5,246,547 |
Total Long-Term Municipal Bonds
(Cost $8,571,882,994) | | 8,713,626,025 |
| Short-Term Municipal Notes 1.8% |
| Alabama 0.1% |
| Walker County Economic & Industrial Development Authority, Alabama Power Co., Revenue Bonds, First Series | | |
| Series 1 | | |
| 4.10%, due 8/1/63 (b)(f) | 10,000,000 | 10,000,000 |
| | Principal
Amount | Value |
| |
| California 0.0% ‡ |
| Tender Option Bond Trust Receipts, Revenue Bonds | | |
| 4.05%, due 4/1/43 (e)(f) | $ 220,000 | $ 220,000 |
| Georgia 1.0% |
| Bartow County Development Authority, Georgia Power Company Plant Bowen Project, Revenue Bonds | | |
| Series 1 | | |
| 4.15%, due 11/1/62 (b)(f) | 24,000,000 | 24,000,000 |
| Development Authority of Burke County (The), Georgia Power Co. Vogtle Project, Revenue Bonds (f) | | |
| Series 1 | | |
| 4.15%, due 11/1/48 | 28,935,000 | 28,935,000 |
| Series 1 | | |
| 4.25%, due 11/1/52 | 41,775,000 | 41,775,000 |
| | | 94,710,000 |
| New York 0.3% |
| Long Island Power Authority, Electric System, Revenue Bonds | | |
| Series D | | |
| 3.78%, due 5/1/33 (f) | 15,500,000 | 15,500,000 |
| Nuveen New York AMT-Free Quality Municipal Income Fund | | |
| 4.22%, due 5/1/47 (e)(f) | 4,900,000 | 4,900,000 |
| Tender Option Bond Trust Receipts, Revenue Bonds | | |
| 3.85%, due 11/15/47 (e)(f) | 3,880,000 | 3,880,000 |
| | | 24,280,000 |
| Pennsylvania 0.2% |
| Delaware Valley Regional Finance Authority, Revenue Bonds | | |
| Series E | | |
| 4.526%, due 9/1/48 (f) | 16,250,000 | 16,250,000 |
The notes to the financial statements are an integral part of, and should be read in conjunction with, the financial statements.
| 50 | MainStay MacKay Tax Free Bond Fund |
| | Principal
Amount | | Value |
| Short-Term Municipal Notes (continued) |
| Wisconsin 0.2% |
| Nuveen AMT-Free Quality Municipal Income Fund | | | |
| Series D | | | |
| 4.22%, due 3/1/29 (f) | $ 18,150,000 | | $ 18,150,000 |
Total Short-Term Municipal Notes
(Cost $163,368,830) | | | 163,610,000 |
Total Municipal Bonds
(Cost $8,735,251,824) | | | 8,877,236,025 |
| |
| Long-Term Bonds 0.1% |
| Corporate Bond 0.1% |
| Electric 0.1% |
| Virginia Power Fuel Securitization LLC | | | |
| Series A-1 | | | |
| 5.088%, due 5/1/27 | 5,000,000 | | 4,960,207 |
Total Long-Term Bonds
(Cost $4,999,945) | | | 4,960,207 |
| |
| | Shares | | Value |
| Short-Term Investment 1.2% |
| Unaffiliated Investment Company 1.2% |
| BlackRock Liquidity Funds MuniCash, 3.427% (g) | 111,588,900 | | 111,599,958 |
Total Short-Term Investment
(Cost $111,599,958) | | | 111,599,958 |
Total Investments
(Cost $8,851,851,727) | 99.1% | | 8,993,796,190 |
| Other Assets, Less Liabilities | 0.9 | | 82,494,283 |
| Net Assets | 100.0% | | $ 9,076,290,473 |
| † | Percentages indicated are based on Fund net assets. |
| ^ | Industry classifications may be different than those used for compliance monitoring purposes. |
| ‡ | Less than one-tenth of a percent. |
| (a) | Coupon rate may change based on changes of the underlying collateral or prepayments of principal. Rate shown was the rate in effect as of April 30, 2024. |
| (b) | Interest on these securities was subject to alternative minimum tax . |
| (c) | Delayed delivery security. |
| (d) | Step coupon—Rate shown was the rate in effect as of April 30, 2024. |
| (e) | May be sold to institutional investors only under Rule 144A or securities offered pursuant to Section 4(a)(2) of the Securities Act of 1933, as amended. |
| (f) | Variable-rate demand notes (VRDNs)—Provide the right to sell the security at face value on either that day or within the rate-reset period. VRDNs will normally trade as if the maturity is the earlier put date, even though stated maturity is longer. The interest rate is reset on the put date at a stipulated daily, weekly, monthly, quarterly, or other specified time interval to reflect current market conditions. These securities do not indicate a reference rate and spread in their description. The maturity date shown is the final maturity. |
| (g) | Current yield as of April 30, 2024. |
| Abbreviation(s): |
| AGC—Assured Guaranty Corp. |
| AGM—Assured Guaranty Municipal Corp. |
| BAM—Build America Mutual Assurance Co. |
| BHAC—Berkshire Hathaway Assurance Corp. |
| CHF—Collegiate Housing Foundation |
| CR—Custodial Receipts |
| FHLMC—Federal Home Loan Mortgage Corp. |
| FNMA—Federal National Mortgage Association |
| GNMA—Government National Mortgage Association |
| ICC—Insured Custody Certificates |
| MTA—Metropolitan Transportation Authority |
| NATL-RE—National Public Finance Guarantee Corp. |
| PSF-GTD—Permanent School Fund Guaranteed |
| Q-SBLF—Qualified School Board Loan Fund |
| SD CRED PROG—School District Credit Enhancement Program |
| UT CSCE—Utah Charter School Credit Enhancement Program |
The notes to the financial statements are an integral part of, and should be read in conjunction with, the financial statements.
51
Portfolio of Investments April 30, 2024†^(Unaudited) (continued)
The following is a summary of the fair valuations according to the inputs used as of April 30, 2024, for valuing the Fund’s assets:
| Description | Quoted
Prices in
Active
Markets for
Identical
Assets
(Level 1) | | Significant
Other
Observable
Inputs
(Level 2) | | Significant
Unobservable
Inputs
(Level 3) | | Total |
| Asset Valuation Inputs | | | | | | | |
| Investments in Securities (a) | | | | | | | |
| Municipal Bonds | | | | | | | |
| Long-Term Municipal Bonds | $ — | | $ 8,713,626,025 | | $ — | | $ 8,713,626,025 |
| Short-Term Municipal Notes | — | | 163,610,000 | | — | | 163,610,000 |
| Total Municipal Bonds | — | | 8,877,236,025 | | — | | 8,877,236,025 |
| Long-Term Bonds | | | | | | | |
| Corporate Bond | — | | 4,960,207 | | — | | 4,960,207 |
| Short-Term Investment | | | | | | | |
| Unaffiliated Investment Company | 111,599,958 | | — | | — | | 111,599,958 |
| Total Investments in Securities | $ 111,599,958 | | $ 8,882,196,232 | | $ — | | $ 8,993,796,190 |
| (a) | For a complete listing of investments and their industries, see the Portfolio of Investments. |
The notes to the financial statements are an integral part of, and should be read in conjunction with, the financial statements.
| 52 | MainStay MacKay Tax Free Bond Fund |
Statement of Assets and Liabilities as of April 30, 2024 (Unaudited)
| Assets |
Investment in securities, at value
(identified cost $8,851,851,727) | $8,993,796,190 |
| Receivables: | |
| Interest | 112,707,563 |
| Investment securities sold | 45,358,308 |
| Fund shares sold | 19,952,197 |
| Other assets | 368,385 |
| Total assets | 9,172,182,643 |
| Liabilities |
| Payables: | |
| Investment securities purchased | 65,705,954 |
| Fund shares redeemed | 16,776,452 |
| Manager (See Note 3) | 3,039,467 |
| Transfer agent (See Note 3) | 799,671 |
| NYLIFE Distributors (See Note 3) | 302,751 |
| Professional fees | 136,744 |
| Custodian | 92,277 |
| Distributions payable | 9,038,854 |
| Total liabilities | 95,892,170 |
| Net assets | $9,076,290,473 |
| Composition of Net Assets |
| Shares of beneficial interest outstanding (par value of $.01 per share) unlimited number of shares authorized | $ 9,778,955 |
| Additional paid-in-capital | 9,940,482,901 |
| | 9,950,261,856 |
| Total distributable earnings (loss) | (873,971,383) |
| Net assets | $9,076,290,473 |
| Class A | |
| Net assets applicable to outstanding shares | $1,242,838,683 |
| Shares of beneficial interest outstanding | 133,942,081 |
| Net asset value per share outstanding | $ 9.28 |
| Maximum sales charge (3.00% of offering price) | 0.29 |
| Maximum offering price per share outstanding | $ 9.57 |
| Investor Class | |
| Net assets applicable to outstanding shares | $ 6,339,758 |
| Shares of beneficial interest outstanding | 680,140 |
| Net asset value per share outstanding | $ 9.32 |
| Maximum sales charge (2.50% of offering price) | 0.24 |
| Maximum offering price per share outstanding | $ 9.56 |
| Class B | |
| Net assets applicable to outstanding shares | $ 1,166,297 |
| Shares of beneficial interest outstanding | 125,726 |
| Net asset value and offering price per share outstanding | $ 9.28 |
| Class C | |
| Net assets applicable to outstanding shares | $ 97,140,911 |
| Shares of beneficial interest outstanding | 10,466,673 |
| Net asset value and offering price per share outstanding | $ 9.28 |
| Class C2 | |
| Net assets applicable to outstanding shares | $ 6,413,964 |
| Shares of beneficial interest outstanding | 691,548 |
| Net asset value and offering price per share outstanding | $ 9.27 |
| Class I | |
| Net assets applicable to outstanding shares | $6,969,762,544 |
| Shares of beneficial interest outstanding | 750,929,849 |
| Net asset value and offering price per share outstanding | $ 9.28 |
| Class R6 | |
| Net assets applicable to outstanding shares | $ 752,628,316 |
| Shares of beneficial interest outstanding | 81,059,436 |
| Net asset value and offering price per share outstanding | $ 9.28 |
The notes to the financial statements are an integral part of, and should be read in conjunction with, the financial statements.
53
Statement of Operations for the six months ended April 30, 2024 (Unaudited)
| Investment Income (Loss) |
| Income | |
| Interest | $176,398,006 |
| Expenses | |
| Manager (See Note 3) | 17,672,012 |
| Transfer agent (See Note 3) | 2,392,630 |
| Distribution/Service—Class A (See Note 3) | 1,575,271 |
| Distribution/Service—Investor Class (See Note 3) | 8,155 |
| Distribution/Service—Class B (See Note 3) | 3,953 |
| Distribution/Service—Class C (See Note 3) | 258,496 |
| Distribution/Service—Class C2 (See Note 3) | 19,149 |
| Professional fees | 267,879 |
| Registration | 194,895 |
| Trustees | 99,963 |
| Custodian | 93,499 |
| Shareholder communication | 80,989 |
| Miscellaneous | 153,406 |
| Total expenses | 22,820,297 |
| Net investment income (loss) | 153,577,709 |
| Realized and Unrealized Gain (Loss) |
| Net realized gain (loss) on investments | (20,572,054) |
| Net change in unrealized appreciation (depreciation) on investments | 462,273,780 |
| Net realized and unrealized gain (loss) | 441,701,726 |
| Net increase (decrease) in net assets resulting from operations | $595,279,435 |
The notes to the financial statements are an integral part of, and should be read in conjunction with, the financial statements.
| 54 | MainStay MacKay Tax Free Bond Fund |
Statements of Changes in Net Assets
for the six months ended April 30, 2024 (Unaudited) and the year ended October 31, 2023
| | Six months
ended
April 30,
2024 | Year
ended
October 31,
2023 |
| Increase (Decrease) in Net Assets |
| Operations: | | |
| Net investment income (loss) | $ 153,577,709 | $ 256,101,344 |
| Net realized gain (loss) | (20,572,054) | (204,148,258) |
| Net change in unrealized appreciation (depreciation) | 462,273,780 | 85,954,555 |
| Net increase (decrease) in net assets resulting from operations | 595,279,435 | 137,907,641 |
| Distributions to shareholders: | | |
| Class A | (22,501,416) | (46,644,991) |
| Investor Class | (114,693) | (234,139) |
| Class B | (26,008) | (88,640) |
| Class C | (1,696,597) | (3,895,641) |
| Class C2 | (92,241) | (160,027) |
| Class I | (125,076,221) | (216,236,340) |
| Class R6 | (13,838,615) | (18,378,828) |
| Total distributions to shareholders | (163,345,791) | (285,638,606) |
| Capital share transactions: | | |
| Net proceeds from sales of shares | 2,403,190,674 | 5,473,281,465 |
| Net asset value of shares issued to shareholders in reinvestment of distributions | 113,413,188 | 203,066,915 |
| Cost of shares redeemed | (1,665,115,780) | (3,880,913,107) |
| Redemptions in-kind | — | (373,829,325) |
| Increase (decrease) in net assets derived from capital share transactions | 851,488,082 | 1,421,605,948 |
| Net increase (decrease) in net assets | 1,283,421,726 | 1,273,874,983 |
| Net Assets |
| Beginning of period | 7,792,868,747 | 6,518,993,764 |
| End of period | $ 9,076,290,473 | $ 7,792,868,747 |
The notes to the financial statements are an integral part of, and should be read in conjunction with, the financial statements.
55
Financial Highlights selected per share data and ratios
| | Six months ended
April 30,
2024* | | Year Ended October 31, |
| Class A | 2023 | | 2022 | | 2021 | | 2020 | | 2019 |
| Net asset value at beginning of period | $ 8.77 | | $ 8.85 | | $ 10.60 | | $ 10.43 | | $ 10.33 | | $ 9.80 |
| Net investment income (loss) | 0.16(a) | | 0.29(a) | | 0.20(a) | | 0.17(a) | | 0.26 | | 0.30 |
| Net realized and unrealized gain (loss) | 0.52 | | (0.05) | | (1.66) | | 0.23 | | 0.11 | | 0.53 |
| Total from investment operations | 0.68 | | 0.24 | | (1.46) | | 0.40 | | 0.37 | | 0.83 |
| Less distributions: | | | | | | | | | | | |
| From net investment income | (0.17) | | (0.32) | | (0.26) | | (0.23) | | (0.27) | | (0.30) |
| From net realized gain on investments | — | | — | | (0.03) | | — | | — | | — |
| Total distributions | (0.17) | | (0.32) | | (0.29) | | (0.23) | | (0.27) | | (0.30) |
| Net asset value at end of period | $ 9.28 | | $ 8.77 | | $ 8.85 | | $ 10.60 | | $ 10.43 | | $ 10.33 |
| Total investment return (b) | 7.70% | | 2.62% | | (13.96)% | | 3.84% | | 3.66% | | 8.55% |
| Ratios (to average net assets)/Supplemental Data: | | | | | | | | | | | |
| Net investment income (loss) | 3.35%†† | | 3.10% | | 2.03% | | 1.63% | | 2.04% | | 2.93% |
| Net expenses (c) | 0.74%†† | | 0.74% | | 0.75% | | 0.73% | | 0.75% | | 0.78% |
| Portfolio turnover rate (d) | 20% | | 75%(e) | | 127%(e) | | 39% | | 72% | | 38% |
| Net assets at end of period (in 000’s) | $ 1,242,839 | | $ 1,200,333 | | $ 1,552,537 | | $ 3,134,090 | | $ 2,674,765 | | $ 1,728,643 |
| * | Unaudited. |
| †† | Annualized. |
| (a) | Per share data based on average shares outstanding during the period. |
| (b) | Total investment return is calculated exclusive of sales charges and assumes the reinvestment of dividends and distributions. For periods of less than one year, total return is not annualized. |
| (c) | In addition to the fees and expenses which the Fund bears directly, it also indirectly bears a pro-rata share of the fees and expenses of the underlying funds in which it invests. Such indirect expenses are not included in the above expense ratios. |
| (d) | The portfolio turnover rate includes variable rate demand notes. |
| (e) | The portfolio turnover rate excludes in-kind transactions. |
The notes to the financial statements are an integral part of, and should be read in conjunction with, the financial statements.
| 56 | MainStay MacKay Tax Free Bond Fund |
Financial Highlights selected per share data and ratios
| | Six months ended
April 30,
2024* | | Year Ended October 31, |
| Investor Class | 2023 | | 2022 | | 2021 | | 2020 | | 2019 |
| Net asset value at beginning of period | $ 8.81 | | $ 8.89 | | $ 10.65 | | $ 10.48 | | $ 10.38 | | $ 9.84 |
| Net investment income (loss) | 0.15(a) | | 0.28(a) | | 0.20(a) | | 0.17(a) | | 0.20 | | 0.30 |
| Net realized and unrealized gain (loss) | 0.52 | | (0.04) | | (1.67) | | 0.23 | | 0.17 | | 0.54 |
| Total from investment operations | 0.67 | | 0.24 | | (1.47) | | 0.40 | | 0.37 | | 0.84 |
| Less distributions: | | | | | | | | | | | |
| From net investment income | (0.16) | | (0.32) | | (0.26) | | (0.23) | | (0.27) | | (0.30) |
| From net realized gain on investments | — | | — | | (0.03) | | — | | — | | — |
| Total distributions | (0.16) | | (0.32) | | (0.29) | | (0.23) | | (0.27) | | (0.30) |
| Net asset value at end of period | $ 9.32 | | $ 8.81 | | $ 8.89 | | $ 10.65 | | $ 10.48 | | $ 10.38 |
| Total investment return (b) | 7.64% | | 2.57% | | (14.01)% | | 3.80% | | 3.64% | | 8.63% |
| Ratios (to average net assets)/Supplemental Data: | | | | | | | | | | | |
| Net investment income (loss) | 3.29%†† | | 3.05% | | 2.07% | | 1.61% | | 2.04% | | 2.95% |
| Net expenses (c) | 0.78%†† | | 0.78% | | 0.77% | | 0.76% | | 0.76% | | 0.77% |
| Portfolio turnover rate (d) | 20% | | 75%(e) | | 127%(e) | | 39% | | 72% | | 38% |
| Net assets at end of period (in 000's) | $ 6,340 | | $ 6,248 | | $ 6,622 | | $ 9,027 | | $ 9,334 | | $ 9,815 |
| * | Unaudited. |
| †† | Annualized. |
| (a) | Per share data based on average shares outstanding during the period. |
| (b) | Total investment return is calculated exclusive of sales charges and assumes the reinvestment of dividends and distributions. For periods of less than one year, total return is not annualized. |
| (c) | In addition to the fees and expenses which the Fund bears directly, it also indirectly bears a pro-rata share of the fees and expenses of the underlying funds in which it invests. Such indirect expenses are not included in the above expense ratios. |
| (d) | The portfolio turnover rate includes variable rate demand notes. |
| (e) | The portfolio turnover rate excludes in-kind transactions. |
The notes to the financial statements are an integral part of, and should be read in conjunction with, the financial statements.
57
Financial Highlights selected per share data and ratios
| | Six months ended
April 30,
2024* | | Year Ended October 31, |
| Class B | 2023 | | 2022 | | 2021 | | 2020 | | 2019 |
| Net asset value at beginning of period | $ 8.77 | | $ 8.85 | | $ 10.60 | | $ 10.43 | | $ 10.33 | | $ 9.80 |
| Net investment income (loss) | 0.14(a) | | 0.26(a) | | 0.18(a) | | 0.15(a) | | 0.12 | | 0.27 |
| Net realized and unrealized gain (loss) | 0.52 | | (0.04) | | (1.66) | | 0.22 | | 0.23 | | 0.53 |
| Total from investment operations | 0.66 | | 0.22 | | (1.48) | | 0.37 | | 0.35 | | 0.80 |
| Less distributions: | | | | | | | | | | | |
| From net investment income | (0.15) | | (0.30) | | (0.24) | | (0.20) | | (0.25) | | (0.27) |
| From net realized gain on investments | — | | — | | (0.03) | | — | | — | | — |
| Total distributions | (0.15) | | (0.30) | | (0.27) | | (0.20) | | (0.25) | | (0.27) |
| Net asset value at end of period | $ 9.28 | | $ 8.77 | | $ 8.85 | | $ 10.60 | | $ 10.43 | | $ 10.33 |
| Total investment return (b) | 7.55% | | 2.32% | | (14.19)% | | 3.56% | | 3.38% | | 8.28% |
| Ratios (to average net assets)/Supplemental Data: | | | | | | | | | | | |
| Net investment income (loss) | 3.07%†† | | 2.80% | | 1.80% | | 1.38% | | 1.80% | | 2.71% |
| Net expenses (c) | 1.03%†† | | 1.03% | | 1.02% | | 1.01% | | 1.01% | | 1.02% |
| Portfolio turnover rate (d) | 20% | | 75%(e) | | 127%(e) | | 39% | | 72% | | 38% |
| Net assets at end of period (in 000’s) | $ 1,166 | | $ 1,920 | | $ 3,959 | | $ 7,006 | | $ 9,286 | | $ 12,354 |
| * | Unaudited. |
| †† | Annualized. |
| (a) | Per share data based on average shares outstanding during the period. |
| (b) | Total investment return is calculated exclusive of sales charges and assumes the reinvestment of dividends and distributions. For periods of less than one year, total return is not annualized. |
| (c) | In addition to the fees and expenses which the Fund bears directly, it also indirectly bears a pro-rata share of the fees and expenses of the underlying funds in which it invests. Such indirect expenses are not included in the above expense ratios. |
| (d) | The portfolio turnover rate includes variable rate demand notes. |
| (e) | The portfolio turnover rate excludes in-kind transactions. |
The notes to the financial statements are an integral part of, and should be read in conjunction with, the financial statements.
| 58 | MainStay MacKay Tax Free Bond Fund |
Financial Highlights selected per share data and ratios
| | Six months ended
April 30,
2024* | | Year Ended October 31, |
| Class C | 2023 | | 2022 | | 2021 | | 2020 | | 2019 |
| Net asset value at beginning of period | $ 8.78 | | $ 8.85 | | $ 10.60 | | $ 10.44 | | $ 10.34 | | $ 9.80 |
| Net investment income (loss) | 0.14(a) | | 0.26(a) | | 0.18(a) | | 0.15(a) | | 0.18 | | 0.27 |
| Net realized and unrealized gain (loss) | 0.51 | | (0.03) | | (1.66) | | 0.21 | | 0.17 | | 0.54 |
| Total from investment operations | 0.65 | | 0.23 | | (1.48) | | 0.36 | | 0.35 | | 0.81 |
| Less distributions: | | | | | | | | | | | |
| From net investment income | (0.15) | | (0.30) | | (0.24) | | (0.20) | | (0.25) | | (0.27) |
| From net realized gain on investments | — | | — | | (0.03) | | — | | — | | — |
| Total distributions | (0.15) | | (0.30) | | (0.27) | | (0.20) | | (0.25) | | (0.27) |
| Net asset value at end of period | $ 9.28 | | $ 8.78 | | $ 8.85 | | $ 10.60 | | $ 10.44 | | $ 10.34 |
| Total investment return (b) | 7.42% | | 2.44% | | (14.19)% | | 3.46% | | 3.38% | | 8.39% |
| Ratios (to average net assets)/Supplemental Data: | | | | | | | | | | | |
| Net investment income (loss) | 3.06%†† | | 2.81% | | 1.81% | | 1.37% | | 1.79% | | 2.69% |
| Net expenses (c) | 1.03%†† | | 1.03% | | 1.02% | | 1.01% | | 1.01% | | 1.02% |
| Portfolio turnover rate (d) | 20% | | 75%(e) | | 127%(e) | | 39% | | 72% | | 38% |
| Net assets at end of period (in 000’s) | $ 97,141 | | $ 103,571 | | $ 125,521 | | $ 194,545 | | $ 220,146 | | $ 225,762 |
| * | Unaudited. |
| †† | Annualized. |
| (a) | Per share data based on average shares outstanding during the period. |
| (b) | Total investment return is calculated exclusive of sales charges and assumes the reinvestment of dividends and distributions. For periods of less than one year, total return is not annualized. |
| (c) | In addition to the fees and expenses which the Fund bears directly, it also indirectly bears a pro-rata share of the fees and expenses of the underlying funds in which it invests. Such indirect expenses are not included in the above expense ratios. |
| (d) | The portfolio turnover rate includes variable rate demand notes. |
| (e) | The portfolio turnover rate excludes in-kind transactions. |
The notes to the financial statements are an integral part of, and should be read in conjunction with, the financial statements.
59
Financial Highlights selected per share data and ratios
| | Six months ended
April 30,
2024* | | Year Ended October 31, | | August 31, 2020^ through
October 31, |
| Class C2 | 2023 | | 2022 | | 2021 | | 2020 |
| Net asset value at beginning of period | $ 8.77 | | $ 8.85 | | $ 10.60 | | $ 10.43 | | $ 10.52 |
| Net investment income (loss) | 0.14(a) | | 0.25(a) | | 0.17(a) | | 0.12(a) | | 0.03 |
| Net realized and unrealized gain (loss) | 0.51 | | (0.05) | | (1.67) | | 0.23 | | (0.09) |
| Total from investment operations | 0.65 | | 0.20 | | (1.50) | | 0.35 | | (0.06) |
| Less distributions: | | | | | | | | | |
| From net investment income | (0.15) | | (0.28) | | (0.22) | | (0.18) | | (0.03) |
| From net realized gain on investments | — | | — | | (0.03) | | — | | — |
| Total distributions | (0.15) | | (0.28) | | (0.25) | | (0.18) | | (0.03) |
| Net asset value at end of period | $ 9.27 | | $ 8.77 | | $ 8.85 | | $ 10.60 | | $ 10.43 |
| Total investment return (b) | 7.35% | | 2.17% | | (14.32)% | | 3.39% | | (0.54)% |
| Ratios (to average net assets)/Supplemental Data: | | | | | | | | | |
| Net investment income (loss) | 2.90%†† | | 2.67% | | 1.75% | | 1.12% | | 1.02%†† |
| Net expenses (c) | 1.18%†† | | 1.18% | | 1.17% | | 1.15% | | 1.15%†† |
| Portfolio turnover rate (d) | 20% | | 75%(e) | | 127%(e) | | 39% | | 72% |
| Net assets at end of period (in 000’s) | $ 6,414 | | $ 5,350 | | $ 3,920 | | $ 2,990 | | $ 251 |
| * | Unaudited. |
| ^ | Inception date. |
| †† | Annualized. |
| (a) | Per share data based on average shares outstanding during the period. |
| (b) | Total investment return is calculated exclusive of sales charges and assumes the reinvestment of dividends and distributions. For periods of less than one year, total return is not annualized. |
| (c) | In addition to the fees and expenses which the Fund bears directly, it also indirectly bears a pro-rata share of the fees and expenses of the underlying funds in which it invests. Such indirect expenses are not included in the above expense ratios. |
| (d) | The portfolio turnover rate includes variable rate demand notes. |
| (e) | The portfolio turnover rate excludes in-kind transactions. |
The notes to the financial statements are an integral part of, and should be read in conjunction with, the financial statements.
| 60 | MainStay MacKay Tax Free Bond Fund |
Financial Highlights selected per share data and ratios
| | Six months ended
April 30,
2024* | | Year Ended October 31, |
| Class I | 2023 | | 2022 | | 2021 | | 2020 | | 2019 |
| Net asset value at beginning of period | $ 8.78 | | $ 8.85 | | $ 10.60 | | $ 10.44 | | $ 10.34 | | $ 9.80 |
| Net investment income (loss) | 0.17(a) | | 0.31(a) | | 0.23(a) | | 0.20(a) | | 0.29 | | 0.32 |
| Net realized and unrealized gain (loss) | 0.51 | | (0.03) | | (1.66) | | 0.22 | | 0.11 | | 0.54 |
| Total from investment operations | 0.68 | | 0.28 | | (1.43) | | 0.42 | | 0.40 | | 0.86 |
| Less distributions: | | | | | | | | | | | |
| From net investment income | (0.18) | | (0.35) | | (0.29) | | (0.26) | | (0.30) | | (0.32) |
| From net realized gain on investments | — | | — | | (0.03) | | — | | — | | — |
| Total distributions | (0.18) | | (0.35) | | (0.32) | | (0.26) | | (0.30) | | (0.32) |
| Net asset value at end of period | $ 9.28 | | $ 8.78 | | $ 8.85 | | $ 10.60 | | $ 10.44 | | $ 10.34 |
| Total investment return (b) | 7.71% | | 2.99% | | (13.75)% | | 4.00% | | 3.91% | | 8.93% |
| Ratios (to average net assets)/Supplemental Data: | | | | | | | | | | | |
| Net investment income (loss) | 3.59%†† | | 3.35% | | 2.33% | | 1.87% | | 2.28% | | 3.14% |
| Net expenses (c) | 0.49%†† | | 0.49% | | 0.50% | | 0.48% | | 0.50% | | 0.52% |
| Portfolio turnover rate (d) | 20% | | 75%(e) | | 127%(e) | | 39% | | 72% | | 38% |
| Net assets at end of period (in 000’s) | $ 6,969,763 | | $ 5,868,539 | | $ 4,357,422 | | $ 5,709,408 | | $ 4,430,985 | | $ 2,866,903 |
| * | Unaudited. |
| †† | Annualized. |
| (a) | Per share data based on average shares outstanding during the period. |
| (b) | Total investment return is calculated exclusive of sales charges and assumes the reinvestment of dividends and distributions. Class I shares are not subject to sales charges. For periods of less than one year, total return is not annualized. |
| (c) | In addition to the fees and expenses which the Fund bears directly, it also indirectly bears a pro-rata share of the fees and expenses of the underlying funds in which it invests. Such indirect expenses are not included in the above expense ratios. |
| (d) | The portfolio turnover rate includes variable rate demand notes. |
| (e) | The portfolio turnover rate excludes in-kind transactions. |
The notes to the financial statements are an integral part of, and should be read in conjunction with, the financial statements.
61
Financial Highlights selected per share data and ratios
| | Six months ended
April 30,
2024* | | Year Ended October 31, | | November 1, 2019^ through
October 31, |
| Class R6 | 2023 | | 2022 | | 2021 | | 2020 |
| Net asset value at beginning of period | $ 8.78 | | $ 8.86 | | $ 10.61 | | $ 10.44 | | $ 10.34 |
| Net investment income (loss) | 0.17(a) | | 0.32(a) | | 0.24(a) | | 0.21(a) | | 0.27 |
| Net realized and unrealized gain (loss) | 0.51 | | (0.05) | | (1.66) | | 0.22 | | 0.13 |
| Total from investment operations | 0.68 | | 0.27 | | (1.42) | | 0.43 | | 0.40 |
| Less distributions: | | | | | | | | | |
| From net investment income | (0.18) | | (0.35) | | (0.30) | | (0.26) | | (0.30) |
| From net realized gain on investments | — | | — | | (0.03) | | — | | — |
| Total distributions | (0.18) | | (0.35) | | (0.33) | | (0.26) | | (0.30) |
| Net asset value at end of period | $ 9.28 | | $ 8.78 | | $ 8.86 | | $ 10.61 | | $ 10.44 |
| Total investment return (b) | 7.74% | | 2.93% | | (13.68)% | | 4.15% | | 3.95% |
| Ratios (to average net assets)/Supplemental Data: | | | | | | | | | |
| Net investment income (loss) | 3.64%†† | | 3.40% | | 2.51% | | 1.92% | | 2.27% |
| Net expenses (c) | 0.43%†† | | 0.43% | | 0.44% | | 0.43% | | 0.44% |
| Portfolio turnover rate (d) | 20% | | 75%(e) | | 127%(e) | | 39% | | 72% |
| Net assets at end of period (in 000’s) | $ 752,628 | | $ 606,909 | | $ 469,013 | | $ 276,280 | | $ 197,746 |
| * | Unaudited. |
| ^ | Inception date. |
| †† | Annualized. |
| (a) | Per share data based on average shares outstanding during the period. |
| (b) | Total investment return is calculated exclusive of sales charges and assumes the reinvestment of dividends and distributions. Class R6 shares are not subject to sales charges. For periods of less than one year, total return is not annualized. |
| (c) | In addition to the fees and expenses which the Fund bears directly, it also indirectly bears a pro-rata share of the fees and expenses of the underlying funds in which it invests. Such indirect expenses are not included in the above expense ratios. |
| (d) | The portfolio turnover rate includes variable rate demand notes. |
| (e) | The portfolio turnover rate excludes in-kind transactions. |
The notes to the financial statements are an integral part of, and should be read in conjunction with, the financial statements.
| 62 | MainStay MacKay Tax Free Bond Fund |
Notes to Financial Statements (Unaudited)
Note 1-Organization and Business
The MainStay Funds (the “Trust”) was organized on January 9, 1986, as a Massachusetts business trust. The Trust is registered under the Investment Company Act of 1940, as amended (the “1940 Act”), as an open-end management investment company, and is comprised of eleven funds (collectively referred to as the "Funds"). These financial statements and notes relate to the MainStay MacKay Tax Free Bond Fund (the "Fund"), a “diversified” fund, as that term is defined in the 1940 Act, as interpreted or modified by regulatory authorities having jurisdiction, from time to time.
The following table lists the Fund's share classes that have been registered and commenced operations:
| Class | Commenced Operations |
| Class A | January 3, 1995 |
| Investor Class | February 28, 2008 |
| Class B | May 1, 1986 |
| Class C | September 1, 1998 |
| Class C2 | August 31, 2020 |
| Class I | December 21, 2009 |
| Class R6 | November 1, 2019 |
Class B shares of the MainStay Group of Funds are closed to all new purchases as well as additional investments by existing Class B shareholders. Existing Class B shareholders may continue to reinvest dividends and capital gains distributions, as well as exchange their Class B shares for Class B shares of other funds in the MainStay Group of Funds as permitted by the current exchange privileges. Class B shareholders continue to be subject to any applicable contingent deferred sales charge ("CDSC") at the time of redemption. All other features of the Class B shares, including but not limited to the fees and expenses applicable to Class B shares, remain unchanged. Unless redeemed, Class B shareholders will remain in Class B shares of their respective fund until the Class B shares are converted to Class A or Investor Class shares pursuant to the applicable conversion schedule.
Class A and Investor Class shares are offered at net asset value (“NAV”) per share plus an initial sales charge. No initial sales charge applies to investments of $250,000 or more (and certain other qualified purchases) in Class A and Investor Class shares. However, a CDSC of 1.00% may be imposed on certain redemptions made within 18 months of the date of purchase on shares that were purchased without an initial sales charge. Class C and Class C2 shares are offered at NAV without an initial sales charge, although a 1.00% CDSC may be imposed on certain redemptions of such shares made within one year of the date of purchase of Class C and Class C2 shares. When Class B shares were offered, they were offered at NAV without an initial sales charge, although a CDSC that declines depending on the number of years a shareholder held its Class B shares may be imposed on certain redemptions of such shares made within six years of the date of purchase of such shares. Class I and Class R6 shares are offered at NAV without a sales charge. Depending upon eligibility, Class B shares convert to either Class A or Investor Class
shares at the end of the calendar quarter eight years after the date they were purchased. In addition, depending upon eligibility, Class C and Class C2 shares convert to either Class A or Investor Class shares at the end of the calendar quarter eight years after the date they were purchased. Additionally, Investor Class shares may convert automatically to Class A shares. Under certain circumstances and as may be permitted by the Trust’s multiple class plan pursuant to Rule 18f-3 under the 1940 Act, specified share classes of the Fund may be converted to one or more other share classes of the Fund as disclosed in the capital share transactions within these Notes. The classes of shares have the same voting (except for issues that relate solely to one class), dividend, liquidation and other rights, and the same terms and conditions, except that under distribution plans pursuant to Rule 12b-1 under the 1940 Act, Class B, Class C and Class C2 shares are subject to higher distribution and/or service fees than Class A and Investor Class shares. Class I and Class R6 shares are not subject to a distribution and/or service fee.
The Fund's investment objective is to seek current income exempt from regular federal income tax.
Note 2–Significant Accounting Policies
The Fund is an investment company and accordingly follows the investment company accounting and reporting guidance of the Financial Accounting Standards Board (“FASB”) Accounting Standards Codification Topic 946 Financial Services—Investment Companies. The Fund prepares its financial statements in accordance with generally accepted accounting principles (“GAAP”) in the United States of America and follows the significant accounting policies described below.
(A) Securities Valuation. Investments are usually valued as of the close of regular trading on the New York Stock Exchange (the "Exchange") (usually 4:00 p.m. Eastern time) on each day the Fund is open for business ("valuation date").
Pursuant to Rule 2a-5 under the 1940 Act, the Board of Trustees of the Trust (the "Board") has designated New York Life Investment Management LLC (“New York Life Investments” or the "Manager") as its Valuation Designee (the "Valuation Designee"). The Valuation Designee is responsible for performing fair valuations relating to all investments in the Fund’s portfolio for which market quotations are not readily available; periodically assessing and managing material valuation risks; establishing and applying fair value methodologies; testing fair valuation methodologies; evaluating and overseeing pricing services; ensuring appropriate segregation of valuation and portfolio management functions; providing quarterly, annual and prompt reporting to the Board, as appropriate; identifying potential conflicts of interest; and maintaining appropriate records. The Valuation Designee has established a valuation committee ("Valuation Committee") to assist in carrying out the Valuation Designee’s responsibilities and establish prices of securities for which market quotations are not readily available. The Fund's and the Valuation Designee's policies and procedures ("Valuation Procedures") govern the Valuation Designee’s selection and application of methodologies for determining and calculating the fair value of Fund investments. The
Notes to Financial Statements (Unaudited) (continued)
Valuation Designee may value the Fund's portfolio securities for which market quotations are not readily available and other Fund assets utilizing inputs from pricing services and other third-party sources. The Valuation Committee meets (in person, via electronic mail or via teleconference) on an ad-hoc basis to determine fair valuations and on a quarterly basis to review fair value events with respect to certain securities for which market quotations are not readily available, including valuation risks and back-testing results, and to preview reports to the Board.
The Valuation Committee establishes prices of securities for which market quotations are not readily available based on such methodologies and measurements on a regular basis after considering information that is reasonably available and deemed relevant by the Valuation Committee. The Board shall oversee the Valuation Designee and review fair valuation materials on a prompt, quarterly and annual basis and approve proposed revisions to the Valuation Procedures.
Investments for which market quotations are not readily available are valued at fair value as determined in good faith pursuant to the Valuation Procedures. A market quotation is readily available only when that quotation is a quoted price (unadjusted) in active markets for identical investments that the Fund can access at the measurement date, provided that a quotation will not be readily available if it is not reliable. "Fair value" is defined as the price the Fund would reasonably expect to receive upon selling an asset or liability in an orderly transaction to an independent buyer in the principal or most advantageous market for the asset or liability. Fair value measurements are determined within a framework that establishes a three-tier hierarchy that maximizes the use of observable market data and minimizes the use of unobservable inputs to establish a classification of fair value measurements for disclosure purposes. "Inputs" refer broadly to the assumptions that market participants would use in pricing the asset or liability, including assumptions about risk, such as the risk inherent in a particular valuation technique used to measure fair value using a pricing model and/or the risk inherent in the inputs for the valuation technique. Inputs may be observable or unobservable. Observable inputs reflect the assumptions market participants would use in pricing the asset or liability based on market data obtained from sources independent of the Fund. Unobservable inputs reflect the Fund’s own assumptions about the assumptions market participants would use in pricing the asset or liability based on the information available. The inputs or methodology used for valuing assets or liabilities may not be an indication of the risks associated with investing in those assets or liabilities. The three-tier hierarchy of inputs is summarized below.
| • | Level 1—quoted prices (unadjusted) in active markets for an identical asset or liability |
| • | Level 2—other significant observable inputs (including quoted prices for a similar asset or liability in active markets, interest rates and yield curves, prepayment speeds, credit risk, etc.) |
| • | Level 3—significant unobservable inputs (including the Fund's own assumptions about the assumptions that market participants would use in measuring fair value of an asset or liability) |
The level of an asset or liability within the fair value hierarchy is based on the lowest level of an input, both individually and in the aggregate, that is significant to the fair value measurement. The aggregate value by input level of the Fund’s assets and liabilities as of April 30, 2024, is included at the end of the Portfolio of Investments.
The Fund may use third-party vendor evaluations, whose prices may be derived from one or more of the following standard inputs, among others:
| • Benchmark yields | • Reported trades |
| • Broker/dealer quotes | • Issuer spreads |
| • Two-sided markets | • Benchmark securities |
| • Bids/offers | • Reference data (corporate actions or material event notices) |
| • Industry and economic events | • Comparable bonds |
| • Monthly payment information | |
An asset or liability for which a market quotation is not readily available is valued by methods deemed reasonable in good faith by the Valuation Committee, following the Valuation Procedures to represent fair value. Under these procedures, the Valuation Designee generally uses a market-based approach which may use related or comparable assets or liabilities, recent transactions, market multiples, book values and other relevant information. The Valuation Designee may also use an income-based valuation approach in which the anticipated future cash flows of the asset or liability are discounted to calculate fair value. Discounts may also be applied due to the nature and/or duration of any restrictions on the disposition of the asset or liability. Fair value represents a good faith approximation of the value of a security. Fair value determinations involve the consideration of a number of subjective factors, an analysis of applicable facts and circumstances and the exercise of judgment. As a result, it is possible that the fair value for a security determined in good faith in accordance with the Valuation Procedures may differ from valuations for the same security determined for other funds using their own valuation procedures. Although the Valuation Procedures are designed to value a security at the price the Fund may reasonably expect to receive upon the security's sale in an orderly transaction, there can be no assurance that any fair value determination thereunder would, in fact, approximate the amount that the Fund would actually realize upon the sale of the security or the price at which the security would trade if a reliable market price were readily available. During the six-month period ended April 30, 2024, there were no material changes to the fair value methodologies.
Securities which may be valued in this manner include, but are not limited to: (i) a security for which trading has been halted or suspended or otherwise does not have a readily available market quotation on a given day; (ii) a debt security that has recently gone into default and for which there is not a current market quotation; (iii) a security of an issuer that has entered into a restructuring; (iv) a security that has been delisted from a national exchange; (v) a security subject to trading collars for which no or limited trading takes place; and (vi) a security whose principal market has been temporarily closed at a time when, under normal
| 64 | MainStay MacKay Tax Free Bond Fund |
conditions, it would be open. Securities valued in this manner are generally categorized as Level 2 or 3 in the hierarchy.
Investments in mutual funds, including money market funds, are valued at their respective NAVs at the close of business each day on the valuation date. These securities are generally categorized as Level 1 in the hierarchy.
Municipal debt securities are valued at the evaluated mean prices supplied by a pricing agent or broker selected by the Valuation Designee, in consultation with the Subadvisor. The evaluations are market-based measurements processed through a pricing application and represents the pricing agent's good faith determination as to what a holder may receive in an orderly transaction under market conditions. The rules-based logic utilizes valuation techniques that reflect participants' assumptions and vary by asset class and per methodology, maximizing the use of relevant observable data including quoted prices for similar assets, benchmark yield curves and market corroborated inputs. The evaluated bid or mean prices are deemed by the Valuation Designee, in consultation with the Subadvisor, to be representative of market values, at the regular close of trading of the Exchange on each valuation date. Municipal debt securities purchased on a delayed delivery basis are marked to market daily until settlement at the forward settlement date. Municipal debt securities are generally categorized as Level 2 in the hierarchy.
Temporary cash investments acquired in excess of 60 days to maturity at the time of purchase are valued using the latest bid prices or using valuations based on a matrix system (which considers such factors as security prices, yields, maturities and ratings), both as furnished by independent pricing services. Temporary cash investments that mature in 60 days or less at the time of purchase ("Short-Term Investments") are valued using the amortized cost method of valuation, unless the use of such method would be inappropriate. The amortized cost method involves valuing a security at its cost on the date of purchase and thereafter assuming a constant amortization to maturity of the difference between such cost and the value on maturity date. Amortized cost approximates the current fair value of a security. Securities valued using the amortized cost method are not valued using quoted prices in an active market and are generally categorized as Level 2 in the hierarchy.
The information above is not intended to reflect an exhaustive list of the methodologies that may be used to value portfolio investments. The Valuation Procedures permit the use of a variety of valuation methodologies in connection with valuing portfolio investments. The methodology used for a specific type of investment may vary based on the market data available or other considerations. The methodologies summarized above may not represent the specific means by which portfolio investments are valued on any particular business day.
(B) Income Taxes. The Fund's policy is to comply with the requirements of the Internal Revenue Code of 1986, as amended (the “Internal Revenue Code”), applicable to regulated investment companies
and to distribute all of its taxable income to the shareholders of the Fund within the allowable time limits.
The Manager evaluates the Fund’s tax positions to determine if the tax positions taken meet the minimum recognition threshold in connection with accounting for uncertainties in income tax positions taken or expected to be taken for the purposes of measuring and recognizing tax liabilities in the financial statements. Recognition of tax benefits of an uncertain tax position is permitted only to the extent the position is “more likely than not” to be sustained assuming examination by taxing authorities. The Manager analyzed the Fund's tax positions taken on federal, state and local income tax returns for all open tax years (for up to three tax years) and has concluded that no provisions for federal, state and local income tax are required in the Fund's financial statements. The Fund's federal, state and local income tax and federal excise tax returns for tax years for which the applicable statutes of limitations have not expired are subject to examination by the Internal Revenue Service and state and local departments of revenue.
(C) Dividends and Distributions to Shareholders. Dividends and distributions are recorded on the ex-dividend date. The Fund intends to declare dividends from net investment income, if any, daily and intends to pay them at least monthly and declares and pays distributions from net realized capital gains, if any, at least annually. Unless a shareholder elects otherwise, all dividends and distributions are reinvested at NAV in the same class of shares of the Fund. Dividends and distributions to shareholders are determined in accordance with federal income tax regulations and may differ from determinations using GAAP.
(D) Security Transactions and Investment Income. The Fund records security transactions on the trade date. Realized gains and losses on security transactions are determined using the identified cost method. Discounts and premiums on securities purchased, other than temporary cash investments that mature in 60 days or less at the time of purchase, for the Fund are accreted and amortized, respectively, on the effective interest rate method.
Investment income and realized and unrealized gains and losses on investments of the Fund are allocated pro rata to the separate classes of shares based upon their relative net assets on the date the income is earned or realized and unrealized gains and losses are incurred.
The Fund may place a debt security on non-accrual status and reduce related interest income by ceasing current accruals and writing off all or a portion of any interest receivables when the collection of all or a portion of such interest has become doubtful. A debt security is removed from non-accrual status when the issuer resumes interest payments or when collectability of interest is reasonably assured.
(E) Expenses. Expenses of the Trust are allocated to the individual Funds in proportion to the net assets of the respective Funds when the expenses are incurred, except where direct allocations of expenses can be made. Expenses (other than transfer agent expenses and fees incurred under the shareholder services plans and/or the distribution plans further discussed in Note 3(B)) are allocated to separate classes of shares pro
Notes to Financial Statements (Unaudited) (continued)
rata based upon their relative net assets on the date the expenses are incurred. The expenses borne by the Fund, including those of related parties to the Fund, are shown in the Statement of Operations.
Additionally, the Fund may invest in mutual funds, which are subject to management fees and other fees that may cause the costs of investing in mutual funds to be greater than the costs of owning the underlying securities directly. These indirect expenses of mutual funds are not included in the amounts shown as expenses in the Statement of Operations or in the expense ratios included in the Financial Highlights.
(F) Use of Estimates. In preparing financial statements in conformity with GAAP, the Manager makes estimates and assumptions that affect the reported amounts and disclosures in the financial statements. Actual results could differ from those estimates and assumptions.
(G) Delayed Delivery Transactions. The Fund may purchase or sell securities on a delayed delivery basis. These transactions involve a commitment by the Fund to purchase or sell securities for a predetermined price or yield, with payment and delivery taking place beyond the customary settlement period. When delayed delivery purchases are outstanding, the Fund will designate liquid assets in an amount sufficient to meet the purchase price. When purchasing a security on a delayed delivery basis, the Fund assumes the rights and risks of ownership of the security, including the risk of price and yield fluctuations, and takes such fluctuations into account when determining its NAV. The Fund may dispose of or renegotiate a delayed delivery transaction after it is entered into, and may sell delayed delivery securities before they are delivered, which may result in a realized gain or loss. When the Fund has sold a security it owns on a delayed delivery basis, the Fund does not participate in future gains and losses with respect to the security.
(H) Municipal Bond Risk. The Fund may invest more heavily in municipal bonds from certain cities, states, territories or regions than others, which may increase the Fund’s exposure to losses resulting from economic, political, regulatory occurrences, or declines in tax revenue impacting these particular cities, states, territories or regions. In addition, many state and municipal governments that issue securities are under significant economic and financial stress and may not be able to satisfy their obligations, and these events may be made worse due to current economic challenges. The Fund may invest a substantial amount of its assets in municipal bonds whose interest is paid solely from revenues of similar projects, such as tobacco settlement bonds. If the Fund concentrates its investments in this manner, it assumes the legal and economic risks relating to such projects and this may have a significant impact on the Fund’s investment performance.
Certain of the issuers in which the Fund may invest have recently experienced, or may experience, significant financial difficulties and repeated credit rating downgrades. On May 3, 2017, the Commonwealth of Puerto Rico (the "Commonwealth") began proceedings pursuant to the Puerto Rico Oversight, Management, and Economic Stability Act (“PROMESA”) to seek bankruptcy-type protections from approximately $74 billion in debt and approximately $48 billion in unfunded pension
obligations. In addition, the current economic environment and the resulting pressure on Puerto Rico’s budget have further contributed to its financial challenges. Following the outbreak of COVID-19, the federal government passed certain relief packages, including the Coronavirus Aid, Relief, and Economic Security Act and the American Rescue Plan, which included an aggregate of more than $7 billion in disaster relief funds for the U.S. territories, including Puerto Rico. However, there can be no assurances that the federal funds allocated to the Commonwealth will be sufficient to address the long-term economic challenges that arose from COVID-19.
As of October 31, 2023, Puerto Rico Electric Power Authority ("PREPA") has remained in Title III Bankruptcy for over 6 years. A significant number of net revenue bond creditors, the Oversight Board, and the Commonwealth have been unable to reach a consensual resolution on PREPA’s debt restructuring following the termination of the previous 2019 PREPA Restructuring Support Agreement by the Commonwealth of Puerto Rico in March of 2022. On December 16, 2022, the Oversight Board filed a proposed plan of adjustment to restructure more than $10 billion of debt and other claims against PREPA. The plan of adjustment, amended in March, proposed to cut PREPA’s unsustainable debt to approximately $5.68 billion.
Bankruptcy litigation has ensued between the Oversight Board and a group of net revenue bond creditors over the security provisions of PREPA’s $8.3 billion of net revenue bonds resulting in a ruling in March that PREPA’s net revenue bonds are unsecured.
In June of 2023, a claims estimation hearing resulted in a ruling that PREPA’s now asserted unsecured net revenue bond claim was valued at approximately 2.383 billion, which is only 28.3% of the full prepetition claim asserted by net revenue bond holders. Due to the lower claims estimation ruling, at the end of August 2023 the Oversight Board filed a new proposed plan of adjustment to reflect the March lien ruling and June estimation hearing with lower recovery amounts afforded to net revenue bond holders. In conjunction with the new proposed plan of adjustment, a subset of the original litigating PREPA creditors entered into Planned Support Agreements (”PSAs”) supporting the new proposed plan of adjustment.
However, following the new proposed plan of adjustment, a significant amount of creditors not previously involved in the PREPA bankruptcy have objected to the revised plan of adjustment, including the MainStay MacKay Municipal Bond Funds.
Objecting creditors are appealing several rulings, including the March net revenue bond lien ruling, the June net revenue bond claims estimation ruling, and the November disclosure statement approval ruling that provides for a plan with disparate recoveries for the same creditors. Objecting creditors believe the PREPA bankruptcy plan of adjustment is unconfirmable and these rulings will be overturned on appeal, but there is no certainty that objecting creditors will be successful in appealing these rulings, or if overturned, these creditors will receive the relief sought. The proposed PREPA August plan of adjustment provides 3.5% of cash
| 66 | MainStay MacKay Tax Free Bond Fund |
recovery for objecting creditors to the plan as opposed to 12.5% of cash recovery for consenting creditors who have not previously settled.
Bankruptcy plan confirmation hearings were held in March of 2024 though at the end of May 2024 Judge Swain has not yet ruled on the confirmability of the plan. Furthermore, as of the end of May 2024, the First Circuit has yet to rule on the appeal of the lien and recourse challenges brought by objecting creditors. It is unclear what impact if any the 1st Circuit rulings will have on plan confirmation and/or whether any appellate rulings will occur prior to the approval of any plan confirmation by Judge Swain.
The Fund’s vulnerability to potential losses associated with such developments may be reduced through investing in municipal securities that feature credit enhancements (such as bond insurance). The bond insurance provider pays both principal and interest when due to the bond holder. The magnitude of Puerto Rico’s debt restructuring or other adverse economic developments could pose significant strains on the ability of municipal securities insurers to meet all future claims. As of April 30, 2024, the Fund's total Puerto Rico investments is 1.2% of total investments, with 100.0% of that amount insured.
(I) Indemnifications. Under the Trust’s organizational documents, its officers and trustees are indemnified against certain liabilities that may arise out of performance of their duties to the Trust. Additionally, in the normal course of business, the Fund enters into contracts with third-party service providers that contain a variety of representations and warranties and that may provide general indemnifications. The Fund's maximum exposure under these arrangements is unknown, as this would involve future claims that may be made against the Fund that have not yet occurred. The Manager believes that the risk of loss in connection with these potential indemnification obligations is remote. However, there can be no assurance that material liabilities related to such obligations will not arise in the future, which could adversely impact the Fund.
Note 3–Fees and Related Party Transactions
(A) Manager and Subadvisor. New York Life Investments, a registered investment adviser and an indirect, wholly-owned subsidiary of New York Life Insurance Company ("New York Life"), serves as the Fund's Manager, pursuant to an Amended and Restated Management Agreement ("Management Agreement"). The Manager provides offices, conducts clerical, recordkeeping and bookkeeping services and keeps most of the financial and accounting records required to be maintained by the Fund. Except for the portion of salaries and expenses that are the responsibility of the Fund, the Manager pays the salaries and expenses of all personnel affiliated with the Fund and certain operational expenses of the Fund. The Fund reimburses New York Life Investments in an amount equal to the portion of the compensation of the Chief Compliance Officer attributable to the Fund. MacKay Shields LLC ("MacKay Shields" or the "Subadvisor"), a registered investment adviser and an indirect, wholly-owned subsidiary of New York Life, serves as the Subadvisor to the Fund and is responsible for the day-to-day portfolio management of the Fund. Pursuant to the terms of an Amended and Restated Subadvisory Agreement
("Subadvisory Agreement") between New York Life Investments and MacKay Shields, New York Life Investments pays for the services of the Subadvisor.
Pursuant to the Management Agreement, the Fund pays the Manager a monthly fee for the services performed and the facilities furnished at an annual rate of the Fund’s average daily net assets as follows: 0.45% up to $500 million; 0.425% from $500 million to $1 billion; 0.40% from $1 billion to $5 billion; 0.39% from $5 billion to $7 billion; 0.38% from $7 billion to $9 billion; 0.37% from $9 billion to $11 billion; and 0.36% in excess of 11 billion, plus a fee for fund accounting services previously provided by New York Life Investments under a separate fund accounting agreement furnished at an annual rate of the Fund’s average daily net assets as follows: 0.05% up to $20 million; 0.0333% from $20 million to $100 million; and 0.01% in excess of $100 million. During the six-month period ended April 30, 2024, the effective management fee rate was 0.41%, inclusive of a fee for fund accounting services of 0.01% of the Fund's average daily net assets.
In addition, New York Life Investments waived fees and/or reimbursed expenses so that Total Annual Fund Operating Expenses (excluding taxes, interest, litigation, extraordinary expenses, brokerage and other transaction expenses relating to the purchase or sale of portfolio investments, and acquired (underlying) fund fees and expenses) for Class R6 shares did not exceed those of Class I.
During the six-month period ended April 30, 2024, New York Life Investments earned fees from the Fund in the amount of $17,672,012 and paid the Subadvisor in the amount of $8,613,009. There were no waived fees and/or reimbursed expenses.
JPMorgan Chase Bank, N.A. ("JPMorgan") provides sub-administration and sub-accounting services to the Fund pursuant to an agreement with New York Life Investments. These services include calculating the daily NAVs of the Fund, maintaining the general ledger and sub-ledger accounts for the calculation of the Fund's NAVs, and assisting New York Life Investments in conducting various aspects of the Fund's administrative operations. For providing these services to the Fund, JPMorgan is compensated by New York Life Investments.
Pursuant to an agreement between the Trust and New York Life Investments, New York Life Investments is responsible for providing or procuring certain regulatory reporting services for the Fund. The Fund will reimburse New York Life Investments for the actual costs incurred by New York Life Investments in connection with providing or procuring these services for the Fund.
(B) Distribution and Service Fees. The Trust, on behalf of the Fund, has entered into a distribution agreement with NYLIFE Distributors LLC (the “Distributor”), an affiliate of New York Life Investments. The Fund has adopted distribution plans (the “Plans”) in accordance with the provisions of Rule 12b-1 under the 1940 Act.
Pursuant to the Class A and Investor Class Plans, the Distributor receives a monthly fee from the Class A and Investor Class shares at an annual
Notes to Financial Statements (Unaudited) (continued)
rate of 0.25% of the average daily net assets of the Class A and Investor Class shares for distribution and/or service activities as designated by the Distributor. Pursuant to the Class B and Class C Plans, Class B and Class C shares pay the Distributor a monthly distribution fee at an annual rate of 0.25% of the average daily net assets of the Class B and Class C shares along with a service fee at an annual rate of 0.25% of the average daily net assets of the Class B and Class C shares, for a total 12b-1 fee of 0.50%. Pursuant to the Class C2 Plan, Class C2 shares pay the Distributor a monthly distribution fee at an annual rate of 0.40% of the average daily net assets of the Class C2 shares, along with a service fee at an annual rate of 0.25% of the average daily net assets of the Class C2 shares, for a total 12b-1 fee of 0.65%. Class I and Class R6 shares are not subject to a distribution and/or service fee.
The Plans provide that the distribution and service fees are payable to the Distributor regardless of the amounts actually expended by the Distributor for distribution of the Fund's shares and service activities.
(C) Sales Charges. The Fund was advised by the Distributor that the amount of initial sales charges retained on sales of Class A and Investor Class shares during the six-month period ended April 30, 2024, were $7,917 and $138, respectively.
The Fund was also advised that the Distributor retained CDSCs on redemptions of Class A, Class B and Class C shares during the six-month period ended April 30, 2024, of $74,666, $2,616 and $4,740, respectively.
(D) Transfer, Dividend Disbursing and Shareholder Servicing Agent. NYLIM Service Company LLC, an affiliate of New York Life Investments, is the Fund's transfer, dividend disbursing and shareholder servicing agent pursuant to an agreement between NYLIM Service Company LLC and the Trust. NYLIM Service Company LLC has entered into an agreement with SS&C Global Investor & Distribution Solutions, Inc. ("SS&C"), pursuant to which SS&C performs certain transfer agent services on behalf of NYLIM Service Company LLC. New York Life Investments has contractually agreed to limit the transfer agency expenses charged to the Fund’s share classes to a maximum of 0.35% of that share class’s average daily net assets on an annual basis after deducting any applicable Fund or class-level expense reimbursement or small account fees. This agreement will remain in effect until February 28, 2025, and shall renew automatically for one-year terms unless New York Life Investments provides written notice of termination prior to the start of the next term or upon approval of the Board. During the six-month period ended April 30, 2024, transfer agent expenses incurred by the Fund and any reimbursements, pursuant to the
aforementioned Transfer Agency expense limitation agreement, were as follows:
| Class | Expense | Waived |
| Class A | $ 375,195 | $— |
| Investor Class | 3,203 | — |
| Class B | 768 | — |
| Class C | 50,699 | — |
| Class C2 | 2,901 | — |
| Class I | 1,945,541 | — |
| Class R6 | 14,323 | — |
(E) Small Account Fee. Shareholders with small accounts adversely impact the cost of providing transfer agency services. In an effort to reduce total transfer agency expenses, the Fund has implemented a small account fee on certain types of accounts. As described in the Fund's prospectus, certain shareholders with an account balance of less than $1,000 ($5,000 for Class A share accounts) are charged an annual per account fee of $20 (assessed semi-annually), the proceeds from which offset transfer agent fees as reflected in the Statement of Operations. This small account fee will not apply to certain types of accounts as described further in the Fund’s prospectus.
(F) Capital. As of April 30, 2024, New York Life and its affiliates beneficially held shares of the Fund with the values and percentages of net assets as follows:
| Class C2 | $24,094 | 0.4% |
| Class R6 | 25,824 | 0.0‡ |
| ‡ | Less than one-tenth of a percent. |
Note 4-Federal Income Tax
As of April 30, 2024, the cost and unrealized appreciation (depreciation) of the Fund’s investment portfolio, including applicable derivative contracts and other financial instruments, as determined on a federal income tax basis, were as follows:
| | Federal Tax
Cost | Gross
Unrealized
Appreciation | Gross
Unrealized
(Depreciation) | Net
Unrealized
Appreciation/
(Depreciation) |
| Investments in Securities | $8,888,251,248 | $147,349,893 | $(41,804,951) | $105,544,942 |
As of October 31, 2023, for federal income tax purposes, capital loss carryforwards of $948,435,411, as shown in the table below, were available to the extent provided by the regulations to offset future realized gains of the Fund. Accordingly, no capital gains distributions are expected
| 68 | MainStay MacKay Tax Free Bond Fund |
to be paid to shareholders until net gains have been realized in excess of such amounts.
Capital Loss
Available Through | Short-Term
Capital Loss
Amounts (000’s) | Long-Term
Capital Loss
Amounts (000’s) |
| Unlimited | $565,664 | $382,771 |
During the year ended October 31, 2023, the tax character of distributions paid as reflected in the Statements of Changes in Net Assets was as follows:
| | 2023 |
| Distributions paid from: | |
| Ordinary Income | $ 6,696,558 |
| Exempt Interest Dividends | 278,942,048 |
| Total | $285,638,606 |
Note 5–Custodian
JPMorgan is the custodian of cash and securities held by the Fund. Custodial fees are charged to the Fund based on the Fund's net assets and/or the market value of securities held by the Fund and the number of certain transactions incurred by the Fund.
Note 6–Line of Credit
The Fund and certain other funds managed by New York Life Investments maintain a line of credit with a syndicate of banks in order to secure a source of funds for temporary purposes to meet unanticipated or excessive redemption requests.
Effective July 25, 2023, under the credit agreement (the “Credit Agreement”), the aggregate commitment amount is $600,000,000 with an additional uncommitted amount of $100,000,000. The commitment fee is an annual rate of 0.15% of the average commitment amount payable quarterly, regardless of usage, to JPMorgan, who serves as the agent to the syndicate. The commitment fee is allocated among the Fund and certain other funds managed by New York Life Investments based upon their respective net assets and other factors. Interest on any revolving credit loan is charged based upon the Federal Funds Rate, Daily Simple Secured Overnight Financing Rate ("SOFR") + 0.10%, or the Overnight Bank Funding Rate, whichever is higher. The Credit Agreement expires on July 23, 2024, although the Fund, certain other funds managed by New York Life Investments and the syndicate of banks may renew the Credit Agreement for an additional year on the same or different terms or enter into a credit agreement with a different syndicate of banks. Prior to July 25, 2023, the aggregate commitment amount and the commitment fee were the same as those under the current Credit Agreement. During the six-month period ended April 30, 2024, there were no borrowings made or outstanding with respect to the Fund under the Credit Agreement.
Note 7–Interfund Lending Program
Pursuant to an exemptive order issued by the SEC, the Fund, along with certain other funds managed by New York Life Investments, may participate in an interfund lending program. The interfund lending program provides an alternative credit facility that permits the Fund and certain other funds managed by New York Life Investments to lend or borrow money for temporary purposes directly to or from one another, subject to the conditions of the exemptive order. During the six-month period ended April 30, 2024, there were no interfund loans made or outstanding with respect to the Fund.
Note 8–Purchases and Sales of Securities (in 000’s)
During the six-month period ended April 30, 2024, purchases and sales of securities, other than short-term securities and in-kind transactions, were $2,501,007 and $1,678,451, respectively.
Note 9–Capital Share Transactions
Transactions in capital shares for the six-month period ended April 30, 2024 and the year ended October 31, 2023, were as follows:
| Class A | Shares | Amount |
| Six-month period ended April 30, 2024: | | |
| Shares sold | 17,709,273 | $ 165,546,977 |
| Shares issued to shareholders in reinvestment of distributions | 1,926,165 | 18,105,082 |
| Shares redeemed | (22,475,489) | (210,132,267) |
| Net increase (decrease) in shares outstanding before conversion | (2,840,051) | (26,480,208) |
| Shares converted into Class A (See Note 1) | 129,811 | 1,217,589 |
| Shares converted from Class A (See Note 1) | (155,195) | (1,448,545) |
| Net increase (decrease) | (2,865,435) | $ (26,711,164) |
| Year ended October 31, 2023: | | |
| Shares sold | 47,760,222 | $ 442,488,108 |
| Shares issued to shareholders in reinvestment of distributions | 4,007,599 | 37,098,862 |
| Shares redeemed | (50,435,605) | (465,236,589) |
| Shares redeemed in connection with in-kind transactions | (39,952,689) | (373,829,325) |
| Net increase (decrease) in shares outstanding before conversion | (38,620,473) | (359,478,944) |
| Shares converted into Class A (See Note 1) | 321,509 | 3,003,490 |
| Shares converted from Class A (See Note 1) | (311,175) | (2,883,763) |
| Net increase (decrease) | (38,610,139) | $ (359,359,217) |
| |
Notes to Financial Statements (Unaudited) (continued)
| Investor Class | Shares | Amount |
| Six-month period ended April 30, 2024: | | |
| Shares sold | 13,029 | $ 121,326 |
| Shares issued to shareholders in reinvestment of distributions | 11,520 | 108,783 |
| Shares redeemed | (46,830) | (440,721) |
| Net increase (decrease) in shares outstanding before conversion | (22,281) | (210,612) |
| Shares converted into Investor Class (See Note 1) | 21,977 | 207,144 |
| Shares converted from Investor Class (See Note 1) | (28,389) | (269,229) |
| Net increase (decrease) | (28,693) | $ (272,697) |
| Year ended October 31, 2023: | | |
| Shares sold | 21,923 | $ 205,436 |
| Shares issued to shareholders in reinvestment of distributions | 23,957 | 222,827 |
| Shares redeemed | (85,065) | (791,986) |
| Net increase (decrease) in shares outstanding before conversion | (39,185) | (363,723) |
| Shares converted into Investor Class (See Note 1) | 34,707 | 322,690 |
| Shares converted from Investor Class (See Note 1) | (31,523) | (294,482) |
| Net increase (decrease) | (36,001) | $ (335,515) |
| |
| Class B | Shares | Amount |
| Six-month period ended April 30, 2024: | | |
| Shares sold | 34 | $ 316 |
| Shares issued to shareholders in reinvestment of distributions | 2,659 | 25,003 |
| Shares redeemed | (82,864) | (778,490) |
| Net increase (decrease) in shares outstanding before conversion | (80,171) | (753,171) |
| Shares converted from Class B (See Note 1) | (12,939) | (121,304) |
| Net increase (decrease) | (93,110) | $ (874,475) |
| Year ended October 31, 2023: | | |
| Shares sold | 10,162 | $ 92,414 |
| Shares issued to shareholders in reinvestment of distributions | 9,094 | 84,378 |
| Shares redeemed | (225,573) | (2,110,439) |
| Net increase (decrease) in shares outstanding before conversion | (206,317) | (1,933,647) |
| Shares converted from Class B (See Note 1) | (22,298) | (206,802) |
| Net increase (decrease) | (228,615) | $ (2,140,449) |
| |
| Class C | Shares | Amount |
| Six-month period ended April 30, 2024: | | |
| Shares sold | 900,586 | $ 8,448,500 |
| Shares issued to shareholders in reinvestment of distributions | 145,859 | 1,371,273 |
| Shares redeemed | (2,284,667) | (21,372,373) |
| Net increase (decrease) in shares outstanding before conversion | (1,238,222) | (11,552,600) |
| Shares converted from Class C (See Note 1) | (96,820) | (907,857) |
| Net increase (decrease) | (1,335,042) | $ (12,460,457) |
| Year ended October 31, 2023: | | |
| Shares sold | 2,263,361 | $ 21,043,323 |
| Shares issued to shareholders in reinvestment of distributions | 335,827 | 3,111,757 |
| Shares redeemed | (4,817,895) | (44,653,513) |
| Net increase (decrease) in shares outstanding before conversion | (2,218,707) | (20,498,433) |
| Shares converted from Class C (See Note 1) | (158,785) | (1,474,192) |
| Net increase (decrease) | (2,377,492) | $ (21,972,625) |
| |
| Class C2 | Shares | Amount |
| Six-month period ended April 30, 2024: | | |
| Shares sold | 130,686 | $ 1,228,199 |
| Shares issued to shareholders in reinvestment of distributions | 9,820 | 92,241 |
| Shares redeemed | (58,953) | (547,219) |
| Net increase (decrease) | 81,553 | $ 773,221 |
| Year ended October 31, 2023: | | |
| Shares sold | 382,509 | $ 3,563,900 |
| Shares issued to shareholders in reinvestment of distributions | 17,308 | 160,027 |
| Shares redeemed | (232,963) | (2,161,230) |
| Net increase (decrease) | 166,854 | $ 1,562,697 |
| |
| 70 | MainStay MacKay Tax Free Bond Fund |
| Class I | Shares | Amount |
| Six-month period ended April 30, 2024: | | |
| Shares sold | 212,971,544 | $ 1,991,631,119 |
| Shares issued to shareholders in reinvestment of distributions | 9,859,909 | 92,688,007 |
| Shares redeemed | (139,179,582) | (1,291,493,784) |
| Net increase (decrease) in shares outstanding before conversion | 83,651,871 | 792,825,342 |
| Shares converted into Class I (See Note 1) | 165,017 | 1,540,739 |
| Shares converted from Class I (See Note 1) | (1,575,433) | (14,794,224) |
| Net increase (decrease) | 82,241,455 | $ 779,571,857 |
| Year ended October 31, 2023: | | |
| Shares sold | 463,833,414 | $ 4,298,291,795 |
| Shares issued to shareholders in reinvestment of distributions | 17,389,207 | 160,931,629 |
| Shares redeemed | (304,933,040) | (2,803,075,906) |
| Net increase (decrease) in shares outstanding before conversion | 176,289,581 | 1,656,147,518 |
| Shares converted into Class I (See Note 1) | 328,304 | 3,044,015 |
| Shares converted from Class I (See Note 1) | (136,968) | (1,281,488) |
| Net increase (decrease) | 176,480,917 | $ 1,657,910,045 |
| |
| Class R6 | Shares | Amount |
| Six-month period ended April 30, 2024: | | |
| Shares sold | 25,460,354 | $ 236,214,237 |
| Shares issued to shareholders in reinvestment of distributions | 108,735 | 1,022,799 |
| Shares redeemed | (15,189,567) | (140,350,926) |
| Net increase (decrease) in shares outstanding before conversion | 10,379,522 | 96,886,110 |
| Shares converted into Class R6 (See Note 1) | 1,551,941 | 14,575,687 |
| Net increase (decrease) | 11,931,463 | $ 111,461,797 |
| Year ended October 31, 2023: | | |
| Shares sold | 77,829,474 | $ 707,596,489 |
| Shares issued to shareholders in reinvestment of distributions | 157,438 | 1,457,435 |
| Shares redeemed | (61,792,901) | (562,883,444) |
| Net increase (decrease) in shares outstanding before conversion | 16,194,011 | 146,170,480 |
| Shares converted into Class R6 (See Note 1) | 116,991 | 1,096,842 |
| Shares converted from Class R6 (See Note 1) | (140,796) | (1,326,310) |
| Net increase (decrease) | 16,170,206 | $ 145,941,012 |
Note 10–Other Matters
As of the date of this report, the Fund faces a heightened level of risk associated with current uncertainty, volatility and state of economies, financial markets, a high interest rate environment, and labor and health conditions around the world. Events such as war, acts of terrorism,
recessions, rapid inflation, the imposition of economic sanctions, earthquakes, hurricanes, epidemics and pandemics and other unforeseen natural or human disasters may have broad adverse social, political and economic effects on the global economy, which could negatively impact the value of the Fund's investments. Developments that disrupt global economies and financial markets may magnify factors that affect the Fund's performance.
Note 11–Subsequent Events
In connection with the preparation of the financial statements of the Fund as of and for the six-month period ended April 30, 2024, events and transactions subsequent to April 30, 2024, through the date the financial statements were issued, have been evaluated by the Manager for possible adjustment and/or disclosure. No subsequent events requiring financial statement adjustment or disclosure have been identified.
Board Consideration and Approval of Management Agreement and Subadvisory Agreement (Unaudited)
The continuation of the Management Agreement with respect to the MainStay MacKay Tax Free Bond Fund (“Fund”) and New York Life Investment Management LLC (“New York Life Investments”) and the Subadvisory Agreement between New York Life Investments and MacKay Shields LLC (“MacKay”) with respect to the Fund (together, “Advisory Agreements”) is subject to annual review and approval by the Board of Trustees of The MainStay Funds (“Board” of the “Trust”) in accordance with Section 15 of the Investment Company Act of 1940, as amended (“1940 Act”). At its December 6–7, 2023 meeting, the Board, including the Trustees who are not an “interested person” (as such term is defined in the 1940 Act) of the Trust (“Independent Trustees”) voting separately, unanimously approved the continuation of each of the Advisory Agreements for a one-year period.
In reaching the decision to approve the continuation of each of the Advisory Agreements, the Board considered information and materials furnished by New York Life Investments and MacKay in connection with an annual contract review process undertaken by the Board that took place at meetings of the Board and its Contracts Committee from September 2023 through December 2023, including information and materials furnished by New York Life Investments and MacKay in response to requests prepared on behalf of the Board, and in consultation with the Independent Trustees, by independent legal counsel to the Independent Trustees, which encompassed a variety of topics, including those summarized below. Information and materials requested by and furnished to the Board for consideration in connection with the contract review process included, among other items, reports on the Fund and “peer funds” prepared by Institutional Shareholder Services Inc. (“ISS”), an independent third-party service provider engaged by the Board to report objectively on the Fund’s investment performance, management fee and total expenses. The Board also considered information on the fees charged to other investment advisory clients of New York Life Investments and/or MacKay that follow investment strategies similar to those of the Fund, if any, and, when applicable, the rationale for differences in the Fund’s management and subadvisory fees and the fees charged to those other investment advisory clients. In addition, the Board considered information regarding the legal standards and fiduciary obligations applicable to its consideration of the continuation of each of the Advisory Agreements. The contract review process, including the structure and format for information and materials provided to the Board, has been developed in consultation with the Board. The Independent Trustees also met in executive sessions with their independent legal counsel and, for portions thereof, with senior management of New York Life Investments.
The Board’s deliberations with respect to the continuation of each of the Advisory Agreements reflect a year-long process, and the Board also took into account information furnished to the Board and its Committees throughout the year, as deemed relevant and appropriate by the Trustees, including, among other items, reports on investment performance of the Fund and investment-related matters for the Fund as well as presentations from New York Life Investments and, generally annually, MacKay personnel. In addition, the Board took into account other
information provided by New York Life Investments throughout the year, including, among other items, periodic reports on legal and compliance matters, risk management, portfolio turnover, brokerage commissions and non-advisory services provided to the Fund by New York Life Investments, as deemed relevant and appropriate by the Trustees.
In addition to information provided to the Board throughout the year, the Board received information in connection with its June 2023 meeting provided specifically in response to requests prepared on behalf of the Board, and in consultation with the Independent Trustees, by independent legal counsel to the Independent Trustees regarding the Fund’s distribution arrangements. In addition, the Board received information regarding the Fund’s asset levels, share purchase and redemption activity and the payment of Rule 12b-1 and/or certain other fees by the applicable share classes of the Fund, among other information.
In considering the continuation of each of the Advisory Agreements, the Trustees reviewed and evaluated the information and factors they believed to reasonably be necessary and appropriate in light of legal advice furnished to them by independent legal counsel to the Independent Trustees and through the exercise of their own business judgment. Although individual Trustees may have weighed certain factors or information differently and the Board did not consider any single factor or information controlling in reaching its decision, the factors that figured prominently in the Board’s consideration of the continuation of each of the Advisory Agreements are summarized in more detail below and include, among other factors: (i) the nature, extent and quality of the services provided to the Fund by New York Life Investments and MacKay; (ii) the qualifications of the portfolio managers of the Fund and the historical investment performance of the Fund, New York Life Investments and MacKay; (iii) the costs of the services provided, and profits realized, by New York Life Investments and MacKay with respect to their relationships with the Fund; (iv) the extent to which economies of scale have been realized or may be realized if the Fund grows and the extent to which any economies of scale have been shared, have benefited or may benefit the Fund’s shareholders; and (v) the reasonableness of the Fund’s management and subadvisory fees and total ordinary operating expenses. Although the Board recognized that comparisons between the Fund’s fees and expenses and those of other funds are imprecise given different terms of agreements, variations in fund strategies and other factors, the Board considered the reasonableness of the Fund’s management fee and total ordinary operating expenses as compared to the peer funds identified by ISS. Throughout their considerations, the Trustees acknowledged the commitment of New York Life Investments and its affiliates to serve the MainStay Group of Funds, as well as their capacity, experience, resources, financial stability and reputations. The Trustees also acknowledged the entrepreneurial and other risks assumed by New York Life Investments in sponsoring and managing the Fund. With respect to the Subadvisory Agreement, the Board took into account New York Life Investments’ recommendation to approve the continuation of the Subadvisory Agreement.
| 72 | MainStay MacKay Tax Free Bond Fund |
The Trustees noted that, throughout the year, the Trustees are afforded an opportunity to ask questions of, and request additional information or materials from, New York Life Investments and MacKay. The Board’s decision with respect to each of the Advisory Agreements may have also been based, in part, on the Board’s knowledge of New York Life Investments and MacKay resulting from, among other things, the Board’s consideration of each of the Advisory Agreements in prior years, the advisory agreements for other funds in the MainStay Group of Funds, the Board’s review throughout the year of the performance and operations of other funds in the MainStay Group of Funds and each Trustee’s business judgment and industry experience. In addition to considering the above-referenced factors, the Board observed that in the marketplace there are a range of investment options available to investors and that the Fund’s shareholders, having had the opportunity to consider other investment options, have invested in the Fund.
The factors that figured prominently in the Board’s decision to approve the continuation of each of the Advisory Agreements during the Board’s December 6–7, 2023 meeting are summarized in more detail below.
Nature, Extent and Quality of Services Provided by New York Life Investments and MacKay
The Board examined the nature, extent and quality of the services that New York Life Investments provides to the Fund. The Board evaluated New York Life Investments’ experience and capabilities in serving as manager of the Fund and considered that the Fund operates in a “manager-of-managers” structure. The Board also considered New York Life Investments’ responsibilities and services provided pursuant to this structure, including overseeing the services provided by MacKay, evaluating the performance of MacKay, making recommendations to the Board as to whether the Subadvisory Agreement should be renewed, modified or terminated and periodically reporting to the Board regarding the results of New York Life Investments’ evaluation and monitoring functions. The Board noted that New York Life Investments manages other mutual funds, serves a variety of other investment advisory clients, including other pooled investment vehicles, and has experience overseeing mutual fund service providers, including subadvisors. The Board considered the experience of senior personnel at New York Life Investments providing management and administrative and other non-advisory services to the Fund. The Board observed that New York Life Investments devotes significant resources and time to providing management and administrative and other non-advisory services to the Fund, including New York Life Investments’ oversight and due diligence reviews of MacKay and ongoing analysis of, and interactions with, MacKay with respect to, among other things, the Fund’s investment performance and risks as well as MacKay’s investment capabilities and subadvisory services with respect to the Fund.
The Board also considered the range of services that New York Life Investments provides to the Fund under the terms of the Management Agreement, including: (i) fund accounting and ongoing supervisory services provided by New York Life Investments’ Fund Administration and Accounting Group; (ii) investment supervisory and analytical services
provided by New York Life Investments’ Investment Consulting Group; (iii) compliance services provided by the Trust’s Chief Compliance Officer as well as New York Life Investments’ compliance department, including supervision and implementation of the Fund’s compliance program; (iv) legal services provided by New York Life Investments’ Office of the General Counsel; and (v) risk management monitoring and analysis by compliance and investment personnel. In addition, the Board considered New York Life Investments’ willingness to invest in personnel and other resources, such as cyber security, information security and business continuity planning, that may benefit the Fund and noted that New York Life Investments is responsible for compensating the Trust’s officers, except for a portion of the salary of the Trust’s Chief Compliance Officer. The Board recognized that New York Life Investments provides certain other non-advisory services to the Fund and has over time provided an increasingly broad array of non-advisory services to the MainStay Group of Funds as a result of regulatory and other developments.
The Board also examined the range, and the nature, extent and quality, of the investment advisory services that MacKay provides to the Fund and considered the terms of each of the Advisory Agreements. The Board evaluated MacKay’s experience and performance in serving as subadvisor to the Fund and advising other portfolios and MacKay’s track record and experience in providing investment advisory services as well as the experience of investment advisory, senior management and/or administrative personnel at MacKay. The Board considered New York Life Investments’ and MacKay’s overall resources, legal and compliance environment, capabilities, reputation, financial condition and history. In addition to information provided in connection with quarterly meetings with the Trust’s Chief Compliance Officer, the Board considered information regarding the compliance policies and procedures of New York Life Investments and MacKay and acknowledged their commitment to further developing and strengthening compliance programs that may relate to the Fund. The Board also considered MacKay’s ability to recruit and retain qualified investment professionals and willingness to invest in personnel and other resources that may benefit the Fund. In this regard, the Board considered the qualifications and experience of the Fund’s portfolio managers, the number of accounts managed by the portfolio managers and the method for compensating the portfolio managers.
In addition, the Board considered information provided by New York Life Investments and MacKay regarding their respective business continuity and disaster recovery plans.
Based on these considerations, among others, the Board concluded that the Fund would likely continue to benefit from the nature, extent and quality of these services.
Investment Performance
In evaluating the Fund’s investment performance, the Board considered investment performance results over various periods in light of the Fund’s investment objective, strategies and risks. The Board considered investment reports on, and analysis of, the Fund’s performance provided to the Board throughout the year. These reports include, among other
Board Consideration and Approval of Management Agreement and Subadvisory Agreement (Unaudited) (continued)
items, information on the Fund’s gross and net returns, the Fund’s investment performance compared to a relevant investment category and the Fund’s benchmark, the Fund’s risk-adjusted investment performance and the Fund’s investment performance as compared to peer funds, as appropriate, as well as portfolio attribution information and commentary on the effect of market conditions. The Board also considered information provided by ISS showing the investment performance of the Fund as compared to peer funds. In addition, the Board reviewed the methodology used by ISS to construct the group of peer funds for comparative purposes.
The Board also took into account its discussions with senior management at New York Life Investments concerning the Fund’s investment performance over various periods as well as discussions between representatives of MacKay and the members of the Board’s Investment Committee, which generally occur on an annual basis.
Based on these considerations, among others, the Board concluded that its review of the Fund’s investment performance and related information supported a determination to approve the continuation of each of the Advisory Agreements.
Costs of the Services Provided, and Profits and Other Benefits Realized, by New York Life Investments and MacKay
The Board considered the costs of the services provided under each of the Advisory Agreements. The Board also considered the profitability of New York Life Investments and its affiliates, including MacKay, due to their relationships with the Fund as well as of New York Life Investments and its affiliates due to their relationships with the MainStay Group of Funds. Because MacKay is an affiliate of New York Life Investments whose subadvisory fee is paid by New York Life Investments, not the Fund, the Board considered cost and profitability information for New York Life Investments and MacKay in the aggregate.
In addition, the Board acknowledged the difficulty in obtaining reliable comparative data about mutual fund managers’ profitability because such information generally is not publicly available and may be impacted by numerous factors, including the structure of a fund manager’s organization, the types of funds it manages, the methodology used to allocate certain fixed costs to specific funds and the manager’s capital structure and costs of capital.
In evaluating the costs of the services provided by New York Life Investments and MacKay, and profitability of New York Life Investments and its affiliates, including MacKay, due to their relationships with the Fund, the Board considered, among other factors, New York Life Investments’ and its affiliates’, including MacKay’s, continuing investments in, or willingness to invest in, personnel and other resources that may support and further enhance the management of the Fund, and that New York Life Investments is responsible for paying the subadvisory fee for the Fund. The Board also considered the financial resources of New York Life Investments and MacKay and acknowledged that New York Life Investments and MacKay must be in a position to recruit and retain experienced professional personnel and to maintain a strong financial
position for New York Life Investments and MacKay to continue to provide high-quality services to the Fund. The Board recognized that the Fund benefits from the allocation of certain fixed costs among the funds in the MainStay Group of Funds, among other expected benefits resulting from its relationship with New York Life Investments.
The Board considered information regarding New York Life Investments’ methodology for calculating profitability and allocating costs provided by New York Life Investments in connection with the fund profitability analysis presented to the Board. The Board concluded that New York Life Investments’ methods for allocating costs and procedures for estimating overall profitability of the relationship with the funds in the MainStay Group of Funds were reasonable. The Board recognized the difficulty in calculating and evaluating a manager’s profitability with respect to the Fund and considered that other profitability methodologies may also be reasonable.
The Board also considered certain fall-out benefits that may be realized by New York Life Investments and its affiliates, including MacKay, due to their relationships with the Fund, including reputational and other indirect benefits. The Board recognized, for example, the benefits to MacKay from legally permitted “soft-dollar” arrangements by which brokers provide research and other services to MacKay in exchange for commissions paid by the Fund with respect to trades in the Fund’s portfolio securities. In addition, the Board considered its review of the management agreement for a money market fund advised by New York Life Investments and an affiliated subadvisor that serves as an investment option for the Fund, including the potential rationale for and costs associated with investments in this money market fund by the Fund, if any, and considered information from New York Life Investments that the nature and type of specific investment advisory services provided to this money market fund are distinct from, or in addition to, the investment advisory services provided to the Fund.
The Board observed that, in addition to fees earned by New York Life Investments under the Management Agreement for managing the Fund, New York Life Investments’ affiliates also earn revenues from serving the Fund in various other capacities, including as the Fund’s transfer agent and distributor. The Board considered information about these other revenues and their impact on the profitability of the relationship with the Fund to New York Life Investments and its affiliates. The Board noted that, although it assessed the overall profitability of the relationship with the Fund to New York Life Investments and its affiliates as part of the contract review process, when considering the reasonableness of the fee paid to New York Life Investments under the Management Agreement, the Board considered the profitability of New York Life Investments’ relationship with the Fund on a pre-tax basis and without regard to distribution expenses incurred by New York Life Investments from its own resources.
| 74 | MainStay MacKay Tax Free Bond Fund |
After evaluating the information deemed relevant by the Trustees, the Board concluded that any profits realized by New York Life Investments and its affiliates, including MacKay, due to their relationships with the Fund were not excessive and other expected benefits that may accrue to New York Life Investments and its affiliates, including MacKay, are reasonable.
Management and Subadvisory Fees and Total Ordinary Operating Expenses
The Board evaluated the reasonableness of the fee paid under each of the Advisory Agreements and the Fund’s total ordinary operating expenses. With respect to the management fee and subadvisory fee, the Board primarily considered the reasonableness of the management fee paid by the Fund to New York Life Investments because the subadvisory fee paid to MacKay is paid by New York Life Investments, not the Fund. The Board also considered the reasonableness of the subadvisory fee paid by New York Life Investments and the amount of the management fee retained by New York Life Investments.
In assessing the reasonableness of the Fund’s fees and expenses, the Board primarily considered comparative data provided by ISS on the fees and expenses of similar mutual funds managed by other investment advisers. The Board reviewed the methodology used by ISS to construct the group of peer funds for comparative purposes. In addition, the Board considered information provided by New York Life Investments and MacKay on fees charged to other investment advisory clients, including institutional separate accounts and/or other funds, that follow investment strategies similar to those of the Fund, if any. The Board considered the contractual management fee schedule for the Fund as compared to those for such other investment advisory clients, taking into account the rationale for differences in fee schedules. The Board also took into account information provided by New York Life Investments about the more extensive scope of services provided to registered investment companies, such as the Fund, as compared with other investment advisory clients. Additionally, the Board considered the impact of contractual breakpoints, voluntary waivers and expense limitation arrangements on the Fund’s net management fee and expenses. The Board also considered that in proposing fees for the Fund, New York Life Investments considers the competitive marketplace for mutual funds. The Board noted that New York Life Investments proposed an additional management fee and subadvisory fee breakpoint for the Fund, effective February 28, 2024.
The Board took into account information from New York Life Investments, as provided in connection with the Board’s June 2023 meeting, regarding the reasonableness of the Fund’s transfer agent fee schedule, including industry data demonstrating that the fees that NYLIM Service Company LLC, an affiliate of New York Life Investments and the Fund’s transfer agent, charges the Fund are within the range of fees charged by transfer agents to other mutual funds. In addition, the Board considered NYLIM Service Company LLC’s profitability in connection with the transfer agent services it provides to the Fund. The Board also took into account
information provided by NYLIM Service Company LLC regarding the sub-transfer agency payments it made to intermediaries in connection with the provision of sub-transfer agency services to the Fund.
The Board considered the extent to which transfer agent fees contributed to the total expenses of the Fund. The Board acknowledged the role that the MainStay Group of Funds historically has played in serving the investment needs of New York Life Insurance Company customers, who often maintain smaller account balances than other shareholders of funds, and the impact of small accounts on the expense ratios of Fund share classes. The Board also recognized measures that it and New York Life Investments have taken that are intended to mitigate the effect of small accounts on the expense ratios of Fund share classes, including through the imposition of an expense limitation on net transfer agency expenses. The Board also considered that NYLIM Service Company LLC had waived its contractual cost of living adjustments during certain years.
Based on the factors outlined above, among other considerations, the Board concluded that the Fund’s management fee and total ordinary operating expenses are within a range that is competitive and support a conclusion that these fees and expenses are reasonable.
Economies of Scale
The Board considered information regarding economies of scale, including whether economies of scale may exist with respect to the Fund and whether the Fund’s management fee and expense structure permits any economies of scale to be appropriately shared with the Fund’s shareholders. The Board also considered a report from New York Life Investments, previously prepared at the request of the Board, that addressed economies of scale, including with respect to the mutual fund business generally, and the various ways in which the benefits of economies of scale may be shared with the funds in the MainStay Group of Funds. Although the Board recognized the difficulty of determining economies of scale with precision, the Board acknowledged that economies of scale may be shared with the Fund in a number of ways, including, for example, through the imposition of fee breakpoints, initially setting management fee rates at scale or making additional investments to enhance the services provided to the Fund. The Board reviewed information from New York Life Investments showing how the Fund’s management fee schedule compared to fee schedules of other funds and accounts managed by New York Life Investments. The Board also reviewed information from ISS showing how the Fund’s management fee schedule compared with fees paid for similar services by peer funds at varying asset levels.
Based on this information, the Board concluded that economies of scale are appropriately shared for the benefit of the Fund’s shareholders through the Fund’s management fee and expense structure and other methods to share benefits from economies of scale.
Board Consideration and Approval of Management Agreement and Subadvisory Agreement (Unaudited) (continued)
Conclusion
On the basis of the information and factors summarized above, among other information and factors deemed relevant by the Trustees, and the evaluation thereof, the Board, including the Independent Trustees voting separately, unanimously voted to approve the continuation of each of the Advisory Agreements.
| 76 | MainStay MacKay Tax Free Bond Fund |
Discussion of the Operation and Effectiveness of the Fund's Liquidity Risk Management Program (Unaudited)
In compliance with Rule 22e-4 under the Investment Company Act of 1940, as amended (the “Liquidity Rule”), the Fund has adopted and implemented a liquidity risk management program (the “Program”), which New York Life Investment Management LLC believes is reasonably designed to assess and manage the Fund's liquidity risk. A Fund's liquidity risk is the risk that the Fund could not meet requests to redeem shares issued by the Fund without significant dilution of the remaining investors’ interests in the Fund. The Board of Trustees of The MainStay Funds (the "Board") previously approved the designation of New York Life Investment Management LLC as administrator of the Program (the “Administrator”). The Administrator has established a Liquidity Risk Management Committee to assist the Administrator in the implementation and day-to-day administration of the Program and to otherwise support the Administrator in fulfilling its responsibilities under the Program.
At a meeting of the Board held on February 27, 2024, the Administrator provided the Board with a written report addressing the Program’s operation and assessing the adequacy and effectiveness of its implementation for the period from January 1, 2023, through December 31, 2023 (the "Review Period"), as required under the Liquidity Rule. The report noted that the Administrator concluded that (i) the Program operated effectively to assess and manage the Fund's liquidity risk, (ii) the Program has been and continues to be adequately and effectively implemented to monitor and, as applicable, respond to the Fund's liquidity developments and (iii) the Fund's investment strategy continues to be appropriate for an open-end fund. In addition, the report summarized the operation of the Program and the information and factors considered by the Administrator in its assessment of the Program’s implementation, such as the liquidity risk assessment framework and the liquidity classification methodologies, and discussed notable geopolitical, market and other economic events that impacted liquidity risk during the Review Period.
In accordance with the Program, the Fund's liquidity risk is assessed no less frequently than annually taking into consideration certain factors, as applicable, such as (i) investment strategy and liquidity of portfolio investments, (ii) short-term and long-term cash flow projections, and (iii) holdings of cash and cash equivalents, as well as borrowing arrangements and other funding sources. Certain factors are considered under both normal and reasonably foreseeable stressed conditions.
Each Fund portfolio investment is classified into one of four liquidity categories. The classification is based on a determination of the number of days it is reasonably expected to take to convert the investment into cash, or sell or dispose of the investment, in current market conditions without significantly changing the market value of the investment. The Administrator has delegated liquidity classification determinations to the Fund’s subadvisor, subject to appropriate oversight by the Administrator, and liquidity classification determinations are made by taking into account the Fund's reasonably anticipated trade size, various market, trading and investment-specific considerations, as well as market depth, and, in certain cases, third-party vendor data.
The Liquidity Rule requires funds that do not primarily hold assets that are highly liquid investments to adopt a minimum amount of net assets that must be invested in highly liquid investments that are assets (an “HLIM”). In addition, the Liquidity Rule limits a fund's investments in illiquid investments. Specifically, the Liquidity Rule prohibits acquisition of illiquid investments if, immediately after acquisition, doing so would result in a fund holding more than 15% of its net assets in illiquid investments that are assets. The Program includes provisions reasonably designed to determine, periodically review and comply with the HLIM requirement, as applicable, and to comply with the 15% limit on illiquid investments.
There can be no assurance that the Program will achieve its objectives under all circumstances in the future. Please refer to the Fund's prospectus for more information regarding the Fund's exposure to liquidity risk and other risks to which it may be subject.
Proxy Voting Policies and Procedures and Proxy Voting Record
The Fund is required to file with the SEC its proxy voting record for the 12-month period ending June 30 on Form N-PX. A description of the policies and procedures that are used to vote proxies relating to portfolio securities of the Fund is available free of charge upon request by calling 800-624-6782 or visiting the SEC’s website at www.sec.gov. The most recent Form N-PX or proxy voting record is available free of charge upon request by calling 800-624-6782; visiting newyorklifeinvestments.com; or visiting the SEC’s website at www.sec.gov.
Shareholder Reports and Quarterly Portfolio Disclosure
The Fund is required to file its complete schedule of portfolio holdings with the SEC 60 days after its first and third fiscal quarter on Form N-PORT. The Fund's holdings report is available free of charge upon request by calling New York Life Investments at 800-624-6782.
| 78 | MainStay MacKay Tax Free Bond Fund |
Equity
U.S. Equity
MainStay Epoch U.S. Equity Yield Fund
MainStay Fiera SMID Growth Fund
MainStay PineStone U.S. Equity Fund
MainStay S&P 500 Index Fund
MainStay Winslow Large Cap Growth Fund
MainStay WMC Enduring Capital Fund
MainStay WMC Growth Fund
MainStay WMC Small Companies Fund
MainStay WMC Value Fund
International Equity
MainStay Epoch International Choice Fund
MainStay PineStone International Equity Fund
MainStay WMC International Research Equity Fund
Emerging Markets Equity
MainStay Candriam Emerging Markets Equity Fund
Global Equity
MainStay Epoch Capital Growth Fund
MainStay Epoch Global Equity Yield Fund
MainStay PineStone Global Equity Fund
Fixed Income
Taxable Income
MainStay Candriam Emerging Markets Debt Fund
MainStay Floating Rate Fund
MainStay MacKay High Yield Corporate Bond Fund
MainStay MacKay Short Duration High Income Fund
MainStay MacKay Strategic Bond Fund
MainStay MacKay Total Return Bond Fund
MainStay MacKay U.S. Infrastructure Bond Fund
MainStay Short Term Bond Fund
Tax-Exempt Income
MainStay MacKay Arizona Muni Fund
MainStay MacKay California Tax Free Opportunities Fund1
MainStay MacKay Colorado Muni Fund
MainStay MacKay High Yield Municipal Bond Fund
MainStay MacKay New York Tax Free Opportunities Fund2
MainStay MacKay Oregon Muni Fund
MainStay MacKay Short Term Municipal Fund
MainStay MacKay Strategic Municipal Allocation Fund
MainStay MacKay Tax Free Bond Fund
MainStay MacKay Utah Muni Fund
Money Market
MainStay Money Market Fund
Mixed Asset
MainStay Balanced Fund
MainStay Income Builder Fund
MainStay MacKay Convertible Fund
Speciality
MainStay CBRE Global Infrastructure Fund
MainStay CBRE Real Estate Fund
MainStay Cushing MLP Premier Fund
Asset Allocation
MainStay Conservative Allocation Fund
MainStay Conservative ETF Allocation Fund
MainStay Equity Allocation Fund
MainStay Equity ETF Allocation Fund
MainStay Growth Allocation Fund
MainStay Growth ETF Allocation Fund
MainStay Moderate Allocation Fund
MainStay Moderate ETF Allocation Fund
Manager
New York Life Investment Management LLC
New York, New York
Subadvisors
Candriam3
Strassen, Luxembourg
CBRE Investment Management Listed Real Assets LLC
Radnor, Pennsylvania
Cushing Asset Management, LP
Dallas, Texas
Epoch Investment Partners, Inc.
New York, New York
Fiera Capital Inc.
New York, New York
IndexIQ Advisors LLC3
New York, New York
MacKay Shields LLC3
New York, New York
NYL Investors LLC3
New York, New York
PineStone Asset Management Inc.
Montreal, Québec
Wellington Management Company LLP
Boston, Massachusetts
Winslow Capital Management, LLC
Minneapolis, Minnesota
Legal Counsel
Dechert LLP
Washington, District of Columbia
Independent Registered Public Accounting Firm
KPMG LLP
Philadelphia, Pennsylvania
Distributor
NYLIFE Distributors LLC3
Jersey City, New Jersey
Custodian
JPMorgan Chase Bank, N.A.
New York, New York
1.
This Fund is registered for sale in AZ, CA, NV, OR, TX, UT, WA (all share classes); and MI (Class A and Class I shares only); and CO, FL, GA, HI, ID, MA, MD, NH, NJ and NY (Class I and Class C2 shares only).
| 2. | This Fund is registered for sale in CA, CT, DE, FL, MA, NJ, NY, VT (all share classes) and SD (Class R6 shares only). |
| 3. | An affiliate of New York Life Investment Management LLC. |
Not part of the Semiannual Report
For more information
800-624-6782
newyorklifeinvestments.com
“New York Life Investments” is both a service mark, and the common trade name, of certain investment advisors affiliated with New York Life Insurance Company. The MainStay Funds® are managed by New York Life Investment Management LLC and distributed by NYLIFE Distributors LLC, 30 Hudson Street, Jersey City, NJ 07302, a wholly owned subsidiary of New York Life Insurance Company. NYLIFE Distributors LLC is a Member FINRA/SIPC.
©2024 NYLIFE Distributors LLC. All rights reserved.
| 5022141 MS081-24 | MST10-06/24 |
(NYLIM) NL215
MainStay MacKay U.S. Infrastructure Bond Fund
Message from the President and Semiannual Report
Unaudited | April 30, 2024
Special Notice:
Beginning in July 2024, new regulations issued by the Securities and Exchange Commission (SEC) will take effect requiring open-end mutual fund companies and ETFs to (1) overhaul the content of their shareholder reports and (2) mail paper copies of the new tailored shareholder reports to shareholders who have not opted to receive these documents electronically.
If you have not yet elected to receive your shareholder reports electronically, please contact your financial intermediary or visit newyorklifeinvestments.com/accounts.
| Not FDIC/NCUA Insured | Not a Deposit | May Lose Value | No Bank Guarantee | Not Insured by Any Government Agency |
This page intentionally left blank
Message from the President
Stock and bond markets gained broad ground during the six-month period ended April 30, 2024, bolstered by better-than-expected economic growth and the prospect of monetary easing in the face of a myriad of macroeconomic and geopolitical challenges.
Throughout the reporting period, interest rates remained at their highest levels in decades in most developed countries, with the U.S. federal funds rate in the 5.25%−5.50% range, as central banks struggled to bring inflation under control. Early in the reporting period, the U.S. Federal Reserve began to forecast interest rate cuts in 2024, but delayed action as inflation remained stubbornly high, fluctuating between 3.1% and 3.5%. Nevertheless, despite the increasing cost of capital and tighter lending environment that resulted from sustained high rates, economic growth remained surprisingly robust, supported by high levels of consumer spending, low unemployment and strong corporate earnings. Investors tended to shrug off concerns related to sticky inflation and high interest rates—not to mention the ongoing war in Ukraine, intensifying hostilities in the Middle East and simmering tensions between China and the United States—focusing instead on the positives of continued economic growth and surprisingly strong corporate profits.
The S&P 500® Index, a widely regarded benchmark of U.S. market performance, produced double-digit gains, reaching record levels in March 2024. Market strength, which had been narrowly focused on mega-cap, technology-related stocks during the previous six months broadened significantly during the reporting period. All industry sectors produced positive results, with the strongest returns in communication services, information technology and industrials, and more moderate gains in the lagging energy, real estate and consumer staples areas. Growth-oriented shares slightly outperformed value-oriented
issues, while large- and mid-cap stocks modestly outperformed their small-cap counterparts. Most overseas equity markets trailed the U.S. market, as developed international economies experienced relatively low growth rates, and weak economic conditions in China undermined emerging markets.
Bonds generally gained ground as well. The yield on the 10-year Treasury note ranged between approximately 4.7% and 3.8%, while the 2-year Treasury yield remained slightly higher, between approximately 5.0% and 4.1%, in an inverted curve pattern often viewed as indicative of an impending economic slowdown. Nevertheless, the prevailing environment of stable interest rates and attractive yields provided a favorable environment for fixed-income investors. Long-term Treasury bonds and investment-grade corporate bonds produced similar gains, while high yield bonds advanced by a slightly greater margin, despite the added risks implicit in an uptick in default rates. International bond markets modestly outperformed their U.S. counterparts, led by a rebound in the performance of emerging-markets debt.
The risks and uncertainties inherent in today’s markets call for the kind of insight and expertise that New York Life Investments offers through our one-on-one philosophy, long-lasting focus, and multi-boutique approach.
Thank you for trusting us to help you meet your investment needs.
Sincerely,
Kirk C. Lehneis
President
The opinions expressed are as of the date of this report and are subject to change. There is no guarantee that any forecast made will come to pass. This material does not constitute investment advice and is not intended as an endorsement of any specific investment. Past performance is no guarantee of future results.
Not part of the Semiannual Report
Investors should refer to the Fund’s Summary Prospectus and/or Prospectus and consider the Fund’s investment objectives, strategies, risks, charges and expenses carefully before investing. The Summary Prospectus and/or Prospectus contain this and other information about the Fund. You may obtain copies of the Fund’s Summary Prospectus, Prospectus and Statement of Additional Information, which includes information about The MainStay Funds' Trustees, free of charge, upon request, by calling toll-free 800-624-6782, by writing to NYLIFE Distributors LLC, Attn: MainStay Marketing Department, 30 Hudson Street, Jersey City, NJ 07302 or by sending an e-mail to MainStayShareholderServices@nylim.com. These documents are also available on dfinview.com/NYLIM. Please read the Fund’s Summary Prospectus and/or Prospectus carefully before investing.
Investment and Performance Comparison (Unaudited)
Performance data quoted represents past performance. Past performance is no guarantee of future results. Because of market volatility and other factors, current performance may be lower or higher than the figures shown. Investment return and principal value will fluctuate, and as a result, when shares are redeemed, they may be worth more or less than their original cost. The graph below depicts the historical performance of Class I shares of the Fund. Performance will vary from class to class based on differences in class-specific expenses and sales charges. For performance information current to the most recent month-end, please call 800-624-6782 or visit newyorklifeinvestments.com.
The performance table and graph do not reflect the deduction of taxes that a shareholder would pay on distributions or Fund share redemptions. Total returns reflect maximum applicable sales charges as indicated in the table below, if any, changes in share price, and reinvestment of dividend and capital gain distributions. The graph assumes the initial investment amount shown below and reflects the deduction of all sales charges that would have applied for the period of investment. Performance figures may reflect certain fee waivers and/or expense limitations, without which total returns may have been lower. For more information on share classes and current fee waivers and/or expense limitations (if any), please refer to the Notes to Financial Statements.
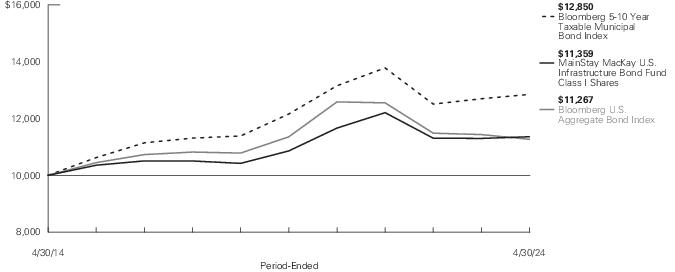
| Average Annual Total Returns for the Period-Ended April 30, 2024 |
| Class | Sales Charge | | Inception
Date1 | Six
Months2 | One
Year | Five
Years | Ten Years
or Since
Inception | Gross
Expense
Ratio3 |
| Class A Shares4 | Maximum 3.00% Initial Sales Charge | With sales charges | 1/3/1995 | 2.01% | -2.72% | -0.21% | 0.58% | 0.99% |
| | | Excluding sales charges | | 5.17 | 0.29 | 0.71 | 1.04 | 0.99 |
| Investor Class Shares5 | Maximum 2.50% Initial Sales Charge | With sales charges | 2/28/2008 | 2.39 | -2.48 | -0.53 | 0.28 | 1.37 |
| | | Excluding sales charges | | 5.01 | 0.02 | 0.39 | 0.74 | 1.37 |
| Class C Shares | Maximum 1.00% CDSC | With sales charges | 9/1/1998 | 3.50 | -1.69 | -0.36 | -0.01 | 2.13 |
| | if Redeemed Within One Year of Purchase | Excluding sales charges | | 4.50 | -0.73 | -0.36 | -0.01 | 2.13 |
| Class I Shares | No Sales Charge | | 1/2/2004 | 5.23 | 0.53 | 0.90 | 1.28 | 0.74 |
| Class R6 Shares | No Sales Charge | | 11/1/2019 | 5.12 | 0.46 | N/A | -0.43 | 0.56 |
| 1. | Effective August 31, 2020, February 28, 2019 and June 21, 2019, the Fund modified its principal investment strategies. The past performance in the graph and table prior to those dates reflects the Fund's prior principal investment strategies. |
| 2. | Not annualized. |
| 3. | The gross expense ratios presented reflect the Fund’s “Total Annual Fund Operating Expenses” from the most recent Prospectus, as supplemented, and may differ from other expense ratios disclosed in this report. |
| 4. | Prior to August 10, 2022, the maximum initial sales charge was 4.50%, which is reflected in the applicable average annual total return figures shown. |
| 5. | Prior to August 10, 2022, the maximum initial sales charge was 4.00%, which is reflected in the applicable average annual total return figures shown. |
The footnotes on the next page are an integral part of the table and graph and should be carefully read in conjunction with them.
| Benchmark Performance* | Six
Months1 | One
Year | Five
Years | Ten
Years |
| Bloomberg U.S. Aggregate Bond Index2 | 4.97% | -1.47% | -0.16% | 1.20% |
| Bloomberg 5-10 Year Taxable Municipal Bond Index3 | 5.76 | 1.21 | 1.11 | 2.54 |
| Morningstar Intermediate Core Bond Category Average4 | 5.13 | -1.01 | -0.14 | 1.10 |
| * | Returns for indices reflect no deductions for fees, expenses or taxes, except for foreign withholding taxes where applicable. Results assume reinvestment of all dividends and capital gains. An investment cannot be made directly in an index. |
| 1. | Not annualized. |
| 2. | In accordance with new regulatory requirements, the Fund has selected the Bloomberg U.S. Aggregate Bond Index, which represents a broad measure of market performance, as a replacement for the Bloomberg 5-10 Year Taxable Municipal Bond Index. The Bloomberg U.S. Aggregate Bond Index is a broad-based benchmark that measures the performance of the investment grade, U.S. dollar-denominated, fixed-rate taxable bond market, including Treasuries, government-related and corporate securities,mortgage-backed securities (agency fixed-rate and hybrid adjustable rate mortgage pass-throughs), asset-backed securities, and commercial mortgage-backed securities. |
| 3. | The Bloomberg 5-10 Year Taxable Municipal Bond Index, which is generally representative of the market sectors or types of investments in which the Fund invests, is the 5-10 year component of the Bloomberg Taxable Municipal Bond Index. |
| 4. | The Morningstar Intermediate Core Bond Category Average is representative of funds that invest primarily in investment-grade U.S. fixed-income issues including government, corporate, and securitized debt, and hold less than 5% in below-investment-grade exposures. Their durations (a measure of interest-rate sensitivity) typically range between 75% and 125% of the three-year average of the effective duration of the Morningstar Core Bond Index. Results are based on average total returns of similar funds with all dividends and capital gain distributions reinvested. |
The footnotes on the preceding page are an integral part of the table and graph and should be carefully read in conjunction with them.
| 6 | MainStay MacKay U.S. Infrastructure Bond Fund |
Cost in Dollars of a $1,000 Investment in MainStay MacKay U.S. Infrastructure Bond Fund (Unaudited)
The example below is intended to describe the fees and expenses borne by shareholders during the six-month period from November 1, 2023 to April 30, 2024, and the impact of those costs on your investment.
Example
As a shareholder of the Fund you incur two types of costs: (1) transaction costs, including exchange fees and sales charges (loads) on purchases (as applicable), and (2) ongoing costs, including management fees, distribution and/or service (12b-1) fees and other Fund expenses (as applicable). This example is intended to help you understand your ongoing costs (in dollars) of investing in the Fund and to compare these costs with the ongoing costs of investing in other mutual funds. The example is based on an investment of $1,000 made at the beginning of the six-month period and held for the entire period from November 1, 2023 to April 30, 2024.
This example illustrates your Fund’s ongoing costs in two ways:
Actual Expenses
The second and third data columns in the table below provide information about actual account values and actual expenses. You may use the information in these columns, together with the amount you invested, to estimate the expenses that you paid during the six months ended April 30, 2024. Simply divide your account value by $1,000 (for example, an $8,600 account value divided by $1,000 = 8.6), then multiply the
result by the number under the heading entitled “Expenses Paid During Period” to estimate the expenses you paid on your account during this period.
Hypothetical Example for Comparison Purposes
The fourth and fifth data columns in the table below provide information about hypothetical account values and hypothetical expenses based on the Fund’s actual expense ratio and an assumed rate of return of 5% per year before expenses, which is not the Fund’s actual return. The hypothetical account values and expenses may not be used to estimate the actual ending account balances or expenses you paid for the six-month period shown. You may use this information to compare the ongoing costs of investing in the Fund with the ongoing costs of investing in other mutual funds. To do so, compare this 5% hypothetical example with the 5% hypothetical examples that appear in the shareholder reports of the other mutual funds.
Please note that the expenses shown in the table are meant to highlight your ongoing costs only and do not reflect any transactional costs, such as exchange fees or sales charges (loads). Therefore, the fourth and fifth data columns of the table are useful in comparing ongoing costs only and will not help you determine the relative total costs of owning different funds. In addition, if these transactional costs were included, your costs would have been higher.
| Share Class | Beginning
Account
Value
11/1/23 | Ending Account
Value (Based
on Actual
Returns and
Expenses)
4/30/24 | Expenses
Paid
During
Period1 | Ending Account
Value (Based
on Hypothetical
5% Annualized
Return and
Actual Expenses)
4/30/24 | Expenses
Paid
During
Period1 | Net Expense
Ratio
During
Period2 |
| Class A Shares | $1,000.00 | $1,051.70 | $4.34 | $1,020.64 | $4.27 | 0.85% |
| Investor Class Shares | $1,000.00 | $1,050.10 | $5.61 | $1,019.39 | $5.52 | 1.10% |
| Class C Shares | $1,000.00 | $1,045.00 | $9.46 | $1,015.61 | $9.32 | 1.86% |
| Class I Shares | $1,000.00 | $1,052.30 | $3.06 | $1,021.88 | $3.02 | 0.60% |
| Class R6 Shares | $1,000.00 | $1,051.20 | $2.70 | $1,022.23 | $2.66 | 0.53% |
| 1. | Expenses are equal to the Fund’s annualized expense ratio of each class multiplied by the average account value over the period, divided by 366 and multiplied by 182 (to reflect the six-month period). The table above represents the actual expenses incurred during the six-month period. In addition to the fees and expenses which the Fund bears directly, it also indirectly bears a pro rata share of the fees and expenses of the underlying funds in which it invests. Such indirect expenses are not included in the above-reported expense figures. |
| 2. | Expenses are equal to the Fund's annualized expense ratio to reflect the six-month period. |
Portfolio Composition as of April 30, 2024 (Unaudited)
‡ Less than one-tenth of percent
See Portfolio of Investments beginning on page 9 for specific holdings within these categories. The Fund's holdings are subject to change.
Top Ten Holdings and/or Issuers Held as of April 30, 2024 (excluding short-term investments) (Unaudited)
| 1. | Commonwealth of Massachusetts, 3.769%-5.50%, due 7/15/29–10/1/31 |
| 2. | New York City Transitional Finance Authority, 3.00%-5.65%, due 2/1/29–11/1/35 |
| 3. | State of Illinois, 2.159%-7.35%, due 6/15/29–12/1/38 |
| 4. | State of Texas, 1.844%-4.90%, due 10/1/29–10/1/35 |
| 5. | City of New York, 1.623%-5.625%, due 8/1/28–3/1/35 |
| 6. | New York State Dormitory Authority, 2.219%-5.289%, due 7/1/30–7/1/35 |
| 7. | State of California, 3.00%-7.50%, due 9/1/29–10/1/41 |
| 8. | State of New York, 2.90%-6.25%, due 3/1/30–10/1/54 |
| 9. | Emory University, 2.143%, due 9/1/30 |
| 10. | District of Columbia, 3.759%-5.203%, due 7/1/29–5/1/32 |
| 8 | MainStay MacKay U.S. Infrastructure Bond Fund |
Portfolio of Investments April 30, 2024†^(Unaudited)
| | Principal
Amount | Value |
| Long-Term Bonds 94.5% |
| Corporate Bonds 8.6% |
| Commercial Services 4.7% |
| Chapman University | | |
| Series 2021 | | |
| 2.067%, due 4/1/31 | $ 2,616,000 | $ 2,075,741 |
| Cornell University | | |
| 4.835%, due 6/15/34 | 10,797,000 | 10,482,725 |
| Emory University | | |
| Series 2020 | | |
| 2.143%, due 9/1/30 | 24,940,000 | 20,877,494 |
| Johns Hopkins University | | |
| Series A | | |
| 4.705%, due 7/1/32 | 11,000,000 | 10,730,856 |
| President and Fellows of Harvard College | | |
| 4.609%, due 2/15/35 | 7,600,000 | 7,284,739 |
| Yale University | | |
| Series 2020 | | |
| 1.482%, due 4/15/30 | 2,819,000 | 2,285,465 |
| | | 53,737,020 |
| Electric 1.0% |
| Virginia Power Fuel Securitization LLC | | |
| Series A-2 | | |
| 4.877%, due 5/1/31 | 11,650,000 | 11,393,684 |
| Healthcare-Services 2.9% |
| Advocate Health & Hospitals Corp. | | |
| 3.829%, due 8/15/28 | 6,590,000 | 6,255,599 |
| CommonSpirit Health | | |
| 5.205%, due 12/1/31 | 10,750,000 | 10,410,498 |
| OhioHealth Corp. | | |
| 2.297%, due 11/15/31 | 6,520,000 | 5,287,882 |
| Toledo Hospital (The) | | |
| 5.75%, due 11/15/38 | 10,785,000 | 10,673,281 |
| | | 32,627,260 |
Total Corporate Bonds
(Cost $99,670,768) | | 97,757,964 |
| Municipal Bonds 85.9% |
| Alabama 2.1% |
Alabama Federal Aid Highway Finance Authority
Revenue Bonds | | |
| Series B | | |
| 1.727%, due 9/1/28 | 5,600,000 | 4,914,783 |
| | Principal
Amount | Value |
| |
| Alabama (continued) |
Alabama Federal Aid Highway Finance Authority
Revenue Bonds (continued) | | |
| Series B | | |
| 1.856%, due 9/1/29 | $ 2,160,000 | $ 1,853,642 |
| Series B | | |
| 2.156%, due 9/1/32 | 4,000,000 | 3,220,062 |
| Series B | | |
| 2.256%, due 9/1/33 | 7,400,000 | 5,854,902 |
Black Belt Energy Gas District, Gas Project
Revenue Bonds | | |
| Series A | | |
| 5.25%, due 5/1/55 (a) | 2,000,000 | 2,142,461 |
Energy Southeast A Cooperative District
Revenue Bonds | | |
| Series B | | |
| 5.25%, due 7/1/54 (a) | 5,700,000 | 6,032,111 |
| | | 24,017,961 |
| Arizona 0.7% |
Arizona Board of Regents, Arizona State University
Revenue Bonds | | |
| Series C | | |
| 4.531%, due 7/1/29 | 1,525,000 | 1,495,753 |
Arizona Industrial Development Authority, Voyager Foundation Inc., Project
Revenue Bonds | | |
| Series 2020 | | |
| 3.65%, due 10/1/29 | 1,115,000 | 999,034 |
| Series 2020 | | |
| 3.90%, due 10/1/34 | 1,900,000 | 1,522,971 |
City of Phoenix
Unlimited General Obligation | | |
| Series A | | |
| 5.269%, due 7/1/34 | 3,980,000 | 3,903,445 |
| | | 7,921,203 |
| Arkansas 0.9% |
City of Springdale, Sales & Use Tax
Revenue Bonds | | |
| Series A, Insured: BAM | | |
| 5.053%, due 8/1/29 | 3,345,000 | 3,334,745 |
| Series A, Insured: BAM | | |
| 5.103%, due 8/1/30 | 1,500,000 | 1,495,206 |
The notes to the financial statements are an integral part of, and should be read in conjunction with, the financial statements.
9
Portfolio of Investments April 30, 2024†^(Unaudited) (continued)
| | Principal
Amount | Value |
| Municipal Bonds (continued) |
| Arkansas (continued) |
City of Springdale, Sales & Use Tax
Revenue Bonds (continued) | | |
| Series A, Insured: BAM | | |
| 5.11%, due 8/1/31 | $ 2,100,000 | $ 2,086,680 |
| Series A, Insured: BAM | | |
| 5.16%, due 8/1/32 | 2,000,000 | 1,984,654 |
| Series A, Insured: BAM | | |
| 5.21%, due 8/1/33 | 1,150,000 | 1,141,071 |
| | | 10,042,356 |
| California 17.1% |
Alameda Corridor Transportation Authority
Revenue Bonds, Sub. Lien | | |
| Series B, Insured: BAM AMBAC | | |
| (zero coupon), due 10/1/32 | 4,000,000 | 2,525,395 |
Anaheim Public Financing Authority, Convention Center Expansion
Revenue Bonds | | |
| Series A, Insured: AGM | | |
| 2.971%, due 7/1/33 | 2,800,000 | 2,270,358 |
California Community Choice Financing Authority, Clean Energy Project (a)
Revenue Bonds | | |
| Series A-1 | | |
| 4.00%, due 5/1/53 | 5,405,000 | 5,387,513 |
| Series C | | |
| 5.25%, due 1/1/54 | 5,725,000 | 5,975,697 |
California Health Facilities Financing Authority
Revenue Bonds, Senior Lien | | |
| 1.829%, due 6/1/29 | 2,500,000 | 2,148,983 |
California Infrastructure & Economic Development Bank, Infrastructure State Revolving Fund
Revenue Bonds | | |
| Series A | | |
| 2.186%, due 10/1/34 | 1,900,000 | 1,445,748 |
California State Public Works Board, Department of General Services
Revenue Bonds | | |
| Series B | | |
| 5.05%, due 4/1/32 | 4,000,000 | 3,964,038 |
| | Principal
Amount | Value |
| |
| California (continued) |
California State University, Systemwide
Revenue Bonds | | |
| Series B | | |
| 1.674%, due 11/1/29 | $ 2,960,000 | $ 2,503,508 |
| Series B | | |
| 1.994%, due 11/1/32 | 1,000,000 | 790,087 |
| Series B | | |
| 4.90%, due 11/1/34 | 3,750,000 | 3,671,473 |
California Statewide Communities Development Authority, Buck Institute for Research on Aging
Revenue Bonds | | |
| Insured: AGM | | |
| 2.148%, due 11/15/30 | 2,035,000 | 1,851,375 |
Chaffey Joint Union High School District
Unlimited General Obligation | | |
| 2.865%, due 8/1/31 | 2,200,000 | 1,913,017 |
City of Los Angeles, Department of Airports Customer Facility Charge
Revenue Bonds | | |
| Series A, Insured: AGM | | |
| 3.258%, due 5/15/30 | 2,620,000 | 2,374,228 |
| Series A, Insured: AGM | | |
| 3.408%, due 5/15/32 | 5,410,000 | 4,780,903 |
City of Oakland
Unlimited General Obligation | | |
| Series A-2 | | |
| 5.50%, due 7/15/31 | 1,000,000 | 1,032,171 |
| Series A-2 | | |
| 5.60%, due 7/15/32 | 2,580,000 | 2,678,870 |
| Series A-2 | | |
| 5.75%, due 7/15/34 | 4,205,000 | 4,399,163 |
| Series A-2 | | |
| 5.85%, due 7/15/35 | 4,430,000 | 4,647,492 |
Contra Costa Community College District
Unlimited General Obligation | | |
| 1.75%, due 8/1/28 | 1,500,000 | 1,321,485 |
| Series B | | |
| 6.504%, due 8/1/34 | 2,270,000 | 2,394,202 |
Contra Costa Transportation Authority, Sales Tax
Revenue Bonds | | |
| Series B | | |
| 2.25%, due 3/1/34 | 1,580,000 | 1,234,826 |
The notes to the financial statements are an integral part of, and should be read in conjunction with, the financial statements.
| 10 | MainStay MacKay U.S. Infrastructure Bond Fund |
| | Principal
Amount | Value |
| Municipal Bonds (continued) |
| California (continued) |
County of Alameda
Unlimited General Obligation | | |
| Series B | | |
| 3.699%, due 8/1/31 | $ 3,050,000 | $ 2,818,869 |
Cupertino Union School District
Unlimited General Obligation | | |
| 2.65%, due 8/1/31 | 1,000,000 | 854,988 |
East Side Union High School District
Unlimited General Obligation | | |
| Series B, Insured: BAM | | |
| 2.027%, due 8/1/30 | 1,195,000 | 1,012,574 |
Foothill-De Anza Community College District, Election of 2006
Unlimited General Obligation | | |
| Series E | | |
| 2.896%, due 8/1/31 | 1,025,000 | 895,481 |
Glendale Community College District
Unlimited General Obligation | | |
| 2.268%, due 8/1/30 | 1,500,000 | 1,290,266 |
| 2.668%, due 8/1/34 | 2,545,000 | 2,056,351 |
Hemet Unified School District
Unlimited General Obligation | | |
| Insured: AGM | | |
| 1.70%, due 8/1/29 | 5,285,000 | 4,477,919 |
Kern County Water Agency Improvement, District No. 4
Revenue Bonds | | |
| Series B, Insured: AGM | | |
| 4.276%, due 5/1/36 | 4,000,000 | 3,738,809 |
Long Beach Community College District
Unlimited General Obligation | | |
| Series H | | |
| 2.387%, due 8/1/29 | 1,695,000 | 1,496,427 |
| Series H | | |
| 2.587%, due 8/1/31 | 4,870,000 | 4,150,712 |
Los Angeles Community College District, Election of 2008
Unlimited General Obligation | | |
| Series B | | |
| 7.53%, due 8/1/29 | 6,000,000 | 6,589,909 |
Marin Community College District
Unlimited General Obligation | | |
| Series B | | |
| 1.89%, due 8/1/32 | 2,400,000 | 1,892,842 |
| Series B-1 | | |
| 3.94%, due 8/1/34 | 1,835,000 | 1,660,338 |
| | Principal
Amount | Value |
| |
| California (continued) |
Oakland Unified School District, Alameda County
Unlimited General Obligation | | |
| Insured: BAM | | |
| 2.874%, due 8/1/35 | $ 7,405,000 | $ 5,867,977 |
Port of Oakland
Revenue Bonds, Senior Lien | | |
| Series R | | |
| 1.949%, due 5/1/28 | 4,000,000 | 3,548,646 |
| Series R | | |
| 2.099%, due 5/1/30 | 2,360,000 | 1,992,528 |
| Series R | | |
| 2.349%, due 5/1/33 | 2,590,000 | 2,047,912 |
Riverside Community College District
Unlimited General Obligation | | |
| 1.589%, due 8/1/28 | 2,500,000 | 2,187,210 |
| 1.785%, due 8/1/29 | 2,000,000 | 1,714,856 |
San Diego Community College District
Unlimited General Obligation | | |
| 2.113%, due 8/1/31 | 3,470,000 | 2,864,309 |
San Diego County Regional Transportation Commission
Revenue Bonds | | |
| Series A | | |
| 2.499%, due 4/1/30 | 1,570,000 | 1,380,455 |
San Diego Public Facilities Financing Authority, Water Utility
Revenue Bonds | | |
| Series B | | |
| 2.333%, due 8/1/32 | 1,000,000 | 815,284 |
San Francisco City & County Public Utilities Commission, Wastewater
Revenue Bonds | | |
| Series B | | |
| 5.60%, due 10/1/30 | 6,620,000 | 6,637,299 |
San Joaquin Hills Transportation Corridor Agency
Revenue Bonds, Senior Lien | | |
| Series B, Insured: AGM | | |
| 2.571%, due 1/15/30 | 1,250,000 | 1,085,752 |
San Jose Evergreen Community College District
Unlimited General Obligation | | |
| Series B | | |
| 6.586%, due 7/1/43 | 5,000,000 | 4,945,064 |
San Jose Unified School District
Unlimited General Obligation | | |
| 1.847%, due 8/1/33 | 1,685,000 | 1,290,499 |
The notes to the financial statements are an integral part of, and should be read in conjunction with, the financial statements.
11
Portfolio of Investments April 30, 2024†^(Unaudited) (continued)
| | Principal
Amount | Value |
| Municipal Bonds (continued) |
| California (continued) |
San Ramon Valley Unified School District
Unlimited General Obligation | | |
| Series 2021 | | |
| 2.014%, due 8/1/31 | $ 2,920,000 | $ 2,396,070 |
Santa Monica-Malibu Unified School District
Unlimited General Obligation | | |
| 1.51%, due 7/1/30 | 2,510,000 | 2,063,377 |
Silicon Valley Clean Water
Revenue Bonds | | |
| Series A | | |
| 1.962%, due 8/1/31 | 3,035,000 | 2,464,710 |
Southern California Public Power Authority, National Gas Project
Revenue Bonds | | |
| Series A, Insured: AGM | | |
| 5.93%, due 7/1/32 | 1,800,000 | 1,848,245 |
| Series A, Insured: AGM | | |
| 6.03%, due 7/1/32 | 7,030,000 | 7,247,388 |
State of California, Various Purpose
Unlimited General Obligation | | |
| 3.00%, due 11/1/30 | 3,225,000 | 2,853,756 |
| Series B | | |
| 5.125%, due 9/1/29 | 3,000,000 | 3,012,678 |
| 5.75%, due 10/1/31 | 8,000,000 | 8,289,347 |
| 5.875%, due 10/1/41 | 4,000,000 | 4,087,922 |
| 7.50%, due 4/1/34 | 4,000,000 | 4,562,984 |
State of California Department of Water Resources, Central Valley Project
Revenue Bonds | | |
| Series BC | | |
| 1.769%, due 12/1/34 | 2,425,000 | 1,763,230 |
| Series BE | | |
| 2.132%, due 12/1/33 | 7,500,000 | 5,833,288 |
University of California
Revenue Bonds | | |
| Series BI | | |
| 2.247%, due 5/15/34 | 2,480,000 | 1,910,689 |
| Series BD | | |
| 3.349%, due 7/1/29 | 8,660,000 | 8,006,561 |
| Series BU | | |
| 4.932%, due 5/15/34 | 9,000,000 | 8,803,686 |
| | Principal
Amount | Value |
| |
| California (continued) |
Vacaville Unified School District
Unlimited General Obligation | | |
| 1.639%, due 8/1/29 | $ 2,000,000 | $ 1,705,674 |
| | | 195,473,413 |
| Colorado 0.9% |
City & County of Denver, Airport System
Revenue Bonds | | |
| Series C | | |
| 2.237%, due 11/15/30 | 8,020,000 | 6,798,900 |
| Series C | | |
| 2.617%, due 11/15/33 | 3,000,000 | 2,433,050 |
Park Creek Metropolitan District
Revenue Bonds, Senior Lien | | |
| Series B, Insured: AGM | | |
| 3.344%, due 12/1/32 | 1,850,000 | 1,613,765 |
| | | 10,845,715 |
| Connecticut 1.3% |
State of Connecticut
Unlimited General Obligation | | |
| Series A | | |
| 2.677%, due 7/1/30 | 3,805,000 | 3,341,305 |
| Series A | | |
| 4.06%, due 6/15/30 | 4,600,000 | 4,375,184 |
| Series A | | |
| 4.657%, due 5/15/30 | 7,000,000 | 6,878,998 |
| | | 14,595,487 |
| Delaware 0.8% |
County of New Castle
Unlimited General Obligation | | |
| Series B | | |
| 1.67%, due 7/15/29 | 11,430,000 | 9,744,202 |
| District of Columbia 1.8% |
District of Columbia
Revenue Bonds | | |
| Series B | | |
| 3.759%, due 7/1/29 | 1,870,000 | 1,773,991 |
| Series B | | |
| 5.153%, due 5/1/31 | 10,000,000 | 10,102,206 |
| Series B | | |
| 5.203%, due 5/1/32 | 8,800,000 | 8,889,302 |
| | | 20,765,499 |
The notes to the financial statements are an integral part of, and should be read in conjunction with, the financial statements.
| 12 | MainStay MacKay U.S. Infrastructure Bond Fund |
| | Principal
Amount | Value |
| Municipal Bonds (continued) |
| Florida 3.8% |
Bay Laurel Center Community Development District, Water & Sewer
Revenue Bonds | | |
| Series B, Insured: AGM | | |
| 5.60%, due 9/1/42 | $ 1,000,000 | $ 992,310 |
Central Florida Tourism Oversight District
Limited General Obligation | | |
| Series A | | |
| 2.547%, due 6/1/35 | 1,605,000 | 1,227,423 |
City of Miami, Beach Parking
Unlimited General Obligation | | |
| Series B | | |
| 5.261%, due 5/1/38 | 2,010,000 | 1,991,791 |
City of Miramar
Revenue Bonds | | |
| 2.443%, due 10/1/34 | 1,970,000 | 1,524,474 |
| 2.543%, due 10/1/35 | 2,395,000 | 1,825,699 |
County of Broward, Airport System
Revenue Bonds | | |
| Series C | | |
| 2.504%, due 10/1/28 | 2,360,000 | 2,120,430 |
| Series C | | |
| 2.914%, due 10/1/32 | 9,255,000 | 7,787,422 |
County of Miami-Dade, Seaport Department
Revenue Bonds | | |
| Series A-3, Insured: AGM | | |
| 2.012%, due 10/1/31 | 6,940,000 | 5,594,562 |
| Series A-3, Insured: AGM | | |
| 2.162%, due 10/1/32 | 4,000,000 | 3,168,142 |
County of Miami-Dade, Aviation
Revenue Bonds | | |
| Series B | | |
| 2.287%, due 10/1/29 | 1,000,000 | 868,978 |
| Series B | | |
| 3.406%, due 10/1/32 | 1,500,000 | 1,315,509 |
County of Miami-Dade
Revenue Bonds | | |
| 5.499%, due 11/1/29 | 1,150,000 | 1,169,055 |
| 5.653%, due 11/1/32 | 2,725,000 | 2,789,260 |
Florida Development Finance Corp., UF Health Jacksonville Project
Revenue Bonds | | |
| Series B, Insured: AGM | | |
| 3.223%, due 2/1/32 | 8,500,000 | 7,008,258 |
| | Principal
Amount | Value |
| |
| Florida (continued) |
Tampa-Hillsborough County Expressway Authority
Revenue Bonds | | |
| Series B, Insured: BAM | | |
| 2.142%, due 7/1/31 | $ 4,375,000 | $ 3,578,705 |
| | | 42,962,018 |
| Georgia 1.4% |
City of Atlanta, Water & Wastewater
Revenue Bonds | | |
| 1.637%, due 11/1/29 | 7,250,000 | 6,103,445 |
| 2.257%, due 11/1/35 | 5,635,000 | 4,395,381 |
Municipal Electric Authority of Georgia
Revenue Bonds | | |
| Series A, Insured: AGM-CR AMBAC | | |
| 5.95%, due 1/1/35 | 3,165,000 | 3,235,571 |
Oglethorpe Power Corp.
Revenue Bonds | | |
| Insured: NATL-RE | | |
| 5.534%, due 1/1/35 (b) | 2,820,000 | 2,760,522 |
| | | 16,494,919 |
| Guam 0.1% |
Port Authority of Guam
Revenue Bonds | | |
| Series C | | |
| 4.582%, due 7/1/28 | 1,000,000 | 945,870 |
| Hawaii 2.2% |
City & County of Honolulu, Wastewater System
Revenue Bonds | | |
| Series A | | |
| 1.623%, due 7/1/31 | 3,080,000 | 2,452,115 |
City & County of Honolulu
Unlimited General Obligation | | |
| Series D | | |
| 3.068%, due 10/1/30 | 1,980,000 | 1,769,216 |
State of Hawaii
Unlimited General Obligation | | |
| Series GC | | |
| 1.718%, due 10/1/30 | 5,500,000 | 4,535,855 |
| Series GC | | |
| 1.868%, due 10/1/31 | 6,000,000 | 4,848,928 |
| Series GJ | | |
| 2.042%, due 8/1/31 | 4,255,000 | 3,500,994 |
| Series GM | | |
| 4.806%, due 10/1/30 | 4,000,000 | 3,970,674 |
The notes to the financial statements are an integral part of, and should be read in conjunction with, the financial statements.
13
Portfolio of Investments April 30, 2024†^(Unaudited) (continued)
| | Principal
Amount | Value |
| Municipal Bonds (continued) |
| Hawaii (continued) |
State of Hawaii
Unlimited General Obligation
(continued) | | |
| Series GM | | |
| 4.821%, due 10/1/32 | $ 2,000,000 | $ 1,968,658 |
State of Hawaii, Airports System
Revenue Bonds | | |
| Series E | | |
| 2.23%, due 7/1/29 | 2,200,000 | 1,922,361 |
| | | 24,968,801 |
| Illinois 5.9% |
Chicago Board of Education
Unlimited General Obligation | | |
| Series C, Insured: BAM | | |
| 6.319%, due 11/1/29 | 2,000,000 | 2,057,814 |
Chicago Transit Authority Sales Tax Receipts Fund
Revenue Bonds | | |
| Series B, Insured: BAM | | |
| 3.102%, due 12/1/30 | 2,100,000 | 1,865,916 |
City of Chicago
Unlimited General Obligation | | |
| Series B, Insured: AGM-CR | | |
| 7.375%, due 1/1/33 | 1,125,000 | 1,238,894 |
County of Cook
Unlimited General Obligation | | |
| Series C | | |
| 5.79%, due 11/15/29 | 1,290,000 | 1,294,532 |
Illinois Finance Authority, Ann & Robert H Lurie Children's Hospital
Revenue Bonds | | |
| 3.548%, due 8/15/29 | 2,525,000 | 2,346,347 |
| 3.598%, due 8/15/30 | 1,000,000 | 918,310 |
Illinois Housing Development Authority
Revenue Bonds | | |
| Series B, Insured: GNMA / FNMA / FHLMC | | |
| 5.628%, due 4/1/53 | 5,635,000 | 5,564,758 |
Metropolitan Pier & Exposition Authority
Revenue Bonds | | |
| Series B | | |
| 7.20%, due 6/15/33 | 11,880,000 | 12,205,982 |
| | Principal
Amount | Value |
| |
| Illinois (continued) |
Sales Tax Securitization Corp.
Revenue Bonds, Second Lien | | |
| Series B, Insured: BAM | | |
| 2.857%, due 1/1/31 | $ 8,500,000 | $ 7,455,029 |
| Series B | | |
| 3.107%, due 1/1/35 | 4,000,000 | 3,280,496 |
Sales Tax Securitization Corp.
Revenue Bonds | | |
| Series C | | |
| 3.23%, due 1/1/28 | 2,160,000 | 2,028,287 |
State of Illinois, Sales Tax
Revenue Bonds, Junior Lien | | |
| Series B | | |
| 2.159%, due 6/15/29 | 2,500,000 | 2,158,636 |
State of Illinois, Sales Tax
Revenue Bonds | | |
| 3.45%, due 6/15/29 | 3,170,000 | 2,918,830 |
State of Illinois
Unlimited General Obligation | | |
| Series B | | |
| 5.52%, due 4/1/38 | 6,950,000 | 6,610,279 |
| Insured: AGM-CR | | |
| 5.65%, due 12/1/38 | 1,666,667 | 1,648,049 |
| Series 3 | | |
| 6.725%, due 4/1/35 | 6,769,231 | 7,025,217 |
State of Illinois, Build America Bonds
Unlimited General Obligation | | |
| Series 5 | | |
| 7.35%, due 7/1/35 | 5,931,428 | 6,258,308 |
| | | 66,875,684 |
| Indiana 1.1% |
Indiana Housing & Community Development Authority
Revenue Bonds | | |
| Series B-3, Insured: GNMA / FNMA / FHLMC | | |
| 6.25%, due 7/1/54 (c) | 5,000,000 | 5,090,037 |
Indianapolis Local Public Improvement Bond Bank
Revenue Bonds | | |
| Series A-2 | | |
| 5.854%, due 1/15/30 | 4,830,000 | 4,868,184 |
St. Joseph County Redevelopment Authority, Commission
Revenue Bonds | | |
| Series B, Insured: AGM | | |
| 4.991%, due 2/1/31 | 1,085,000 | 1,068,751 |
The notes to the financial statements are an integral part of, and should be read in conjunction with, the financial statements.
| 14 | MainStay MacKay U.S. Infrastructure Bond Fund |
| | Principal
Amount | Value |
| Municipal Bonds (continued) |
| Indiana (continued) |
St. Joseph County Redevelopment Authority, Commission
Revenue Bonds (continued) | | |
| Series B, Insured: AGM | | |
| 5.033%, due 2/1/32 | $ 1,135,000 | $ 1,114,573 |
| Series B, Insured: AGM | | |
| 5.083%, due 2/1/33 | 1,000,000 | 980,462 |
| | | 13,122,007 |
| Kentucky 0.5% |
Kentucky Public Energy Authority
Revenue Bonds | | |
| Series A | | |
| 5.00%, due 5/1/55 (a) | 5,000,000 | 5,200,884 |
| Louisiana 0.7% |
Louisiana Local Government Environmental Facilities & Community Development Authority, Utilities Restoration Corp. Project
Revenue Bonds | | |
| 5.197%, due 9/1/39 | 4,929,198 | 4,831,875 |
State of Louisiana
Unlimited General Obligation | | |
| Series C-1 | | |
| 1.804%, due 6/1/31 | 3,710,000 | 3,005,562 |
| | | 7,837,437 |
| Maryland 0.3% |
County of Howard
Unlimited General Obligation | | |
| Series E | | |
| 1.55%, due 8/15/31 | 3,000,000 | 2,377,831 |
Maryland Stadium Authority, Baltimore City Public School Construction Financing Fund
Revenue Bonds | | |
| Series C, Insured: State Intercept | | |
| 2.207%, due 5/1/31 | 1,510,000 | 1,247,866 |
| | | 3,625,697 |
| Massachusetts 4.9% |
Commonwealth of Massachusetts, COVID-19 Recovery Assessment
Revenue Bonds | | |
| Series A | | |
| 3.769%, due 7/15/29 | 11,225,000 | 10,660,708 |
| | Principal
Amount | Value |
| |
| Massachusetts (continued) |
Commonwealth of Massachusetts, COVID-19 Recovery Assessment
Revenue Bonds (continued) | | |
| Series A | | |
| 3.881%, due 1/15/31 | $ 7,900,000 | $ 7,337,920 |
Commonwealth of Massachusetts
Limited General Obligation | | |
| Series E | | |
| 5.50%, due 10/1/29 | 9,000,000 | 9,246,954 |
| Series E | | |
| 5.50%, due 10/1/31 | 5,050,000 | 5,224,831 |
Massachusetts Bay Transportation Authority, Sales Tax
Revenue Bonds | | |
| Series B | | |
| 2.235%, due 7/1/31 | 7,795,000 | 6,298,779 |
Massachusetts Port Authority
Revenue Bonds | | |
| Series C | | |
| 1.679%, due 7/1/31 | 1,625,000 | 1,288,121 |
Massachusetts Water Resources Authority
Revenue Bonds | | |
| Series C | | |
| 1.94%, due 8/1/30 | 1,500,000 | 1,251,804 |
| Series C | | |
| 2.09%, due 8/1/31 | 1,055,000 | 863,728 |
| Series E | | |
| 2.323%, due 8/1/29 | 2,015,000 | 1,767,062 |
| Series C | | |
| 2.39%, due 8/1/33 | 9,380,000 | 7,454,292 |
University of Massachusetts, Building Authority
Revenue Bonds, Senior Lien | | |
| Series 4 | | |
| 2.008%, due 11/1/31 | 2,730,000 | 2,218,257 |
| Series 2 | | |
| 3.646%, due 11/1/34 | 2,495,000 | 2,186,061 |
| | | 55,798,517 |
| Michigan 0.4% |
Michigan Finance Authority, Local Government Loan Program
Revenue Bonds | | |
| Series E, Insured: State Aid Direct Deposit | | |
| 8.369%, due 11/1/35 | 680,000 | 800,518 |
The notes to the financial statements are an integral part of, and should be read in conjunction with, the financial statements.
15
Portfolio of Investments April 30, 2024†^(Unaudited) (continued)
| | Principal
Amount | Value |
| Municipal Bonds (continued) |
| Michigan (continued) |
Michigan State Building Authority
Revenue Bonds | | |
| Series II | | |
| 1.812%, due 10/15/31 | $ 3,100,000 | $ 2,486,520 |
| Series II | | |
| 1.912%, due 10/15/32 | 1,000,000 | 786,218 |
| | | 4,073,256 |
| Minnesota 0.1% |
Western Minnesota Municipal Power Agency
Revenue Bonds | | |
| Series A | | |
| 2.595%, due 1/1/29 | 1,000,000 | 907,733 |
| Mississippi 1.8% |
State of Mississippi
Unlimited General Obligation | | |
| Series A | | |
| 1.632%, due 11/1/31 | 7,000,000 | 5,578,455 |
| Series B | | |
| 1.699%, due 6/1/29 | 2,935,000 | 2,528,708 |
| Series B | | |
| 1.849%, due 6/1/30 | 2,135,000 | 1,803,676 |
| Series E | | |
| 1.987%, due 10/1/30 | 7,835,000 | 6,614,884 |
| Series F | | |
| 5.245%, due 11/1/34 | 4,075,000 | 3,990,514 |
| | | 20,516,237 |
| Missouri 1.0% |
Missouri Highway & Transportation Commission, Federal Reimbursement State Road
Revenue Bonds | | |
| Series B | | |
| 5.445%, due 5/1/33 | 12,120,000 | 12,007,438 |
| Nebraska 0.2% |
City of Lincoln, Electric System
Revenue Bonds | | |
| Series B | | |
| 1.499%, due 9/1/30 | 3,000,000 | 2,423,682 |
| | Principal
Amount | Value |
| |
| New Hampshire 1.7% |
New Hampshire Business Finance Authority, Wheeling Power Co.
Revenue Bonds | | |
| Series A | | |
| 6.89%, due 4/1/34 (b) | $ 20,000,000 | $ 20,009,052 |
| New Jersey 1.1% |
New Jersey Turnpike Authority
Revenue Bonds | | |
| Series B | | |
| 1.483%, due 1/1/28 | 2,000,000 | 1,766,903 |
| Series B | | |
| 1.713%, due 1/1/29 | 3,485,000 | 3,020,565 |
State of New Jersey
Unlimited General Obligation | | |
| Series A | | |
| 2.75%, due 6/1/31 | 3,900,000 | 3,341,237 |
| Series A, Insured: BAM | | |
| 2.90%, due 6/1/33 | 5,180,000 | 4,353,579 |
| | | 12,482,284 |
| New York 11.9% |
Brookhaven Local Development Corp., Long Island Community Hospital Health Care Services Foundation
Revenue Bonds | | |
| Series B, Insured: AGM-CR | | |
| 6.00%, due 10/1/30 | 1,855,000 | 1,873,223 |
City of New York
Unlimited General Obligation | | |
| Series D | | |
| 1.623%, due 8/1/28 | 1,210,000 | 1,057,676 |
| Series D | | |
| 1.623%, due 8/1/28 | 5,290,000 | 4,608,999 |
| Series D | | |
| 1.723%, due 8/1/29 | 230,000 | 196,174 |
| Series D | | |
| 1.723%, due 8/1/29 | 1,070,000 | 908,165 |
| Series D-2 | | |
| 1.75%, due 3/1/30 | 2,450,000 | 2,042,335 |
| Series D-3 | | |
| 1.97%, due 3/1/31 | 1,000,000 | 819,804 |
| Series D-3 | | |
| 2.22%, due 3/1/35 | 6,000,000 | 4,474,934 |
| Series A-3 | | |
| 2.80%, due 8/1/30 | 2,820,000 | 2,476,318 |
| Series E-2 | | |
| 4.90%, due 4/1/34 | 2,000,000 | 1,940,734 |
The notes to the financial statements are an integral part of, and should be read in conjunction with, the financial statements.
| 16 | MainStay MacKay U.S. Infrastructure Bond Fund |
| | Principal
Amount | Value |
| Municipal Bonds (continued) |
| New York (continued) |
City of New York
Unlimited General Obligation
(continued) | | |
| Series B-2 | | |
| 5.514%, due 10/1/30 | $ 3,880,000 | $ 3,968,878 |
| Series B-2 | | |
| 5.625%, due 10/1/31 | 2,110,000 | 2,171,546 |
Metropolitan Transportation Authority
Revenue Bonds | | |
| Series B-1 | | |
| 6.548%, due 11/15/31 | 11,220,000 | 11,608,616 |
New York City Transitional Finance Authority, Future Tax Secured
Revenue Bonds | | |
| Series B-3 | | |
| 3.00%, due 11/1/33 | 9,180,000 | 7,609,392 |
| Series C-3 | | |
| 3.35%, due 11/1/30 | 4,000,000 | 3,612,012 |
| Series F-2 | | |
| 4.43%, due 2/1/29 | 5,280,000 | 5,147,877 |
| Series A-2 | | |
| 4.60%, due 5/1/30 | 6,000,000 | 5,846,680 |
| Series D-3 | | |
| 5.65%, due 11/1/35 | 6,000,000 | 6,077,794 |
New York Power Authority
Revenue Bonds | | |
| Series A, Insured: AGM | | |
| 5.749%, due 11/15/33 | 6,530,000 | 6,761,752 |
New York State Dormitory Authority, New York University
Revenue Bonds | | |
| Series B | | |
| 2.219%, due 7/1/35 | 2,000,000 | 1,576,661 |
New York State Dormitory Authority, University Facilities
Revenue Bonds | | |
| Series A | | |
| 2.592%, due 7/1/35 | 1,000,000 | 772,567 |
| Series B | | |
| 2.746%, due 7/1/30 | 6,430,000 | 5,635,272 |
New York State Dormitory Authority, Workers' Compensation Board
Revenue Bonds | | |
| Series A | | |
| 4.802%, due 12/1/34 | 9,370,000 | 9,141,699 |
| | Principal
Amount | Value |
| |
| New York (continued) |
New York State Dormitory Authority, State Personal Income Tax
Revenue Bonds | | |
| Series H | | |
| 5.289%, due 3/15/33 | $ 6,935,000 | $ 6,837,300 |
New York State Urban Development Corp., Sales Tax
Revenue Bonds | | |
| Series B | | |
| 1.75%, due 3/15/28 | 3,580,000 | 3,186,581 |
New York State Urban Development Corp., Personal Income Tax
Revenue Bonds | | |
| Series B | | |
| 1.777%, due 3/15/28 | 3,500,000 | 3,120,949 |
| Series D | | |
| 3.32%, due 3/15/29 | 4,990,000 | 4,635,971 |
New York Transportation Development Corp., LaGuardia Airport Terminal B Redevelopment Project
Revenue Bonds | | |
| Series B, Insured: AGM-CR | | |
| 3.473%, due 7/1/28 | 5,860,000 | 5,464,025 |
State of New York
Unlimited General Obligation | | |
| Series B | | |
| 2.90%, due 2/15/33 | 6,000,000 | 5,110,194 |
| Series B | | |
| 2.95%, due 2/15/34 | 6,750,000 | 5,664,949 |
State of New York, Build America Bonds
Unlimited General Obligation | | |
| Series C | | |
| 5.54%, due 3/1/30 | 5,000,000 | 5,021,079 |
State of New York, Mortgage Agency
Revenue Bonds | | |
| Series 260, Insured: SONYMA | | |
| 6.25%, due 10/1/54 | 6,500,000 | 6,651,091 |
| | | 136,021,247 |
| North Carolina 0.3% |
University of North Carolina at Chapel Hill
Revenue Bonds | | |
| Series C | | |
| 3.327%, due 12/1/36 | 2,025,000 | 1,752,481 |
| 3.847%, due 12/1/34 | 1,530,000 | 1,387,500 |
| | | 3,139,981 |
The notes to the financial statements are an integral part of, and should be read in conjunction with, the financial statements.
17
Portfolio of Investments April 30, 2024†^(Unaudited) (continued)
| | Principal
Amount | Value |
| Municipal Bonds (continued) |
| Ohio 3.8% |
American Municipal Power, Inc., Combined Hydroelectric
Revenue Bonds | | |
| Series B | | |
| 6.424%, due 2/15/32 | $ 3,455,000 | $ 3,609,904 |
| Series A | | |
| 7.734%, due 2/15/33 | 6,000,000 | 6,826,563 |
City of Columbus
Limited General Obligation | | |
| Series D | | |
| 4.022%, due 4/1/35 | 1,135,000 | 1,022,421 |
County of Lucas
Revenue Notes | | |
| 6.25%, due 10/11/24 | 8,330,000 | 8,339,454 |
Franklin County Convention Facilities Authority
Revenue Bonds | | |
| Series B | | |
| 2.022%, due 12/1/30 | 4,795,000 | 3,919,931 |
JobsOhio Beverage System
Revenue Bonds, Senior Lien | | |
| 4.433%, due 1/1/33 | 6,410,000 | 6,232,475 |
JobsOhio Beverage System
Revenue Bonds | | |
| Series B | | |
| 4.532%, due 1/1/35 | 12,085,000 | 11,586,564 |
Ohio Higher Educational Facility Commission, Ashtabula County Medical Center Obligated Group
Revenue Bonds | | |
| 5.25%, due 1/1/42 | 2,000,000 | 2,034,943 |
| | | 43,572,255 |
| Oklahoma 0.2% |
Oklahoma Development Finance Authority, Public Service Co. of Oklahoma
Revenue Bonds | | |
| 4.135%, due 12/1/33 | 1,137,035 | 1,088,152 |
Oklahoma Municipal Power Authority, Power Supply System
Revenue Bonds | | |
| Series B, Insured: AGM | | |
| 2.251%, due 1/1/32 | 1,300,000 | 1,062,870 |
| | | 2,151,022 |
| | Principal
Amount | Value |
| |
| Oregon 1.8% |
City of Portland, Affordable Housing Project
Unlimited General Obligation | | |
| Series A | | |
| 4.43%, due 6/15/29 | $ 2,270,000 | $ 2,218,742 |
Oregon State Lottery
Revenue Bonds | | |
| Series B | | |
| 1.641%, due 4/1/28 | 9,500,000 | 8,399,227 |
| Series B | | |
| 1.875%, due 4/1/29 | 3,900,000 | 3,385,903 |
| Series B | | |
| 3.821%, due 4/1/31 | 3,000,000 | 2,792,929 |
State of Oregon, Department of Transportation
Revenue Bonds, Senior Lien | | |
| Series B | | |
| 1.66%, due 11/15/31 | 1,760,000 | 1,393,260 |
State of Oregon
Unlimited General Obligation | | |
| Series C | | |
| 1.975%, due 5/1/31 | 1,000,000 | 824,375 |
Tri-County Metropolitan Transportation, District of Oregon
Revenue Bonds, Senior Lien | | |
| Series B | | |
| 2.583%, due 9/1/36 | 2,100,000 | 1,587,899 |
| | | 20,602,335 |
| Pennsylvania 2.3% |
City of Philadelphia
Unlimited General Obligation | | |
| Series B, Insured: AGM | | |
| 1.618%, due 7/15/29 | 2,505,000 | 2,106,941 |
| Series B, Insured: AGM | | |
| 1.738%, due 7/15/30 | 2,250,000 | 1,843,553 |
City of Philadelphia, Water & Wastewater
Revenue Bonds | | |
| Series B | | |
| 2.034%, due 11/1/31 | 1,000,000 | 834,519 |
City of Pittsburgh
Unlimited General Obligation | | |
| Series B | | |
| 1.619%, due 9/1/29 | 1,570,000 | 1,322,793 |
The notes to the financial statements are an integral part of, and should be read in conjunction with, the financial statements.
| 18 | MainStay MacKay U.S. Infrastructure Bond Fund |
| | Principal
Amount | Value |
| Municipal Bonds (continued) |
| Pennsylvania (continued) |
Commonwealth of Pennsylvania
Unlimited General Obligation | | |
| Series 1 | | |
| 1.625%, due 8/1/28 | $ 9,175,000 | $ 8,033,137 |
| Series 1 | | |
| 2.05%, due 8/1/31 | 5,020,000 | 4,138,265 |
County of Allegheny
Unlimited General Obligation | | |
| Series C-79 | | |
| 1.786%, due 11/1/30 | 1,000,000 | 821,402 |
Erie City Water Authority
Revenue Bonds | | |
| Series D, Insured: AGM | | |
| 1.961%, due 12/1/30 | 2,945,000 | 2,415,011 |
Reading Area Water Authority
Revenue Bonds | | |
| Insured: BAM | | |
| 2.952%, due 12/1/36 | 3,600,000 | 2,850,704 |
University of Pittsburgh-of the Commonwealth System of Higher Education
Revenue Bonds | | |
| Series C | | |
| 2.629%, due 9/15/33 | 2,000,000 | 1,637,798 |
| | | 26,004,123 |
| Rhode Island 0.4% |
Rhode Island Student Loan Authority
Revenue Bonds, Senior Lien | | |
| Series 1 | | |
| 5.797%, due 12/1/33 | 1,400,000 | 1,379,664 |
State of Rhode Island
Unlimited General Obligation | | |
| Series B | | |
| 5.00%, due 8/1/29 | 3,145,000 | 3,157,916 |
| | | 4,537,580 |
| South Carolina 0.3% |
South Carolina Public Service Authority, Santee Cooper Project
Revenue Bonds | | |
| Series F, Insured: AGM-CR | | |
| 5.74%, due 1/1/30 | 3,690,000 | 3,731,234 |
| | Principal
Amount | Value |
| |
| Tennessee 0.7% |
Metropolitan Government Nashville & Davidson County Sports Authority, Stadium Project
Revenue Bonds | | |
| Series D | | |
| 4.98%, due 7/1/29 | $ 1,315,000 | $ 1,314,607 |
| Series D | | |
| 5.03%, due 7/1/30 | 1,000,000 | 1,000,039 |
| Series D | | |
| 5.068%, due 7/1/31 | 1,600,000 | 1,598,814 |
| Series D | | |
| 5.168%, due 7/1/33 | 1,550,000 | 1,548,286 |
State of Tennessee
Unlimited General Obligation | | |
| Series B | | |
| 1.925%, due 11/1/34 | 1,500,000 | 1,117,505 |
| Series B | | |
| 1.975%, due 11/1/35 | 1,500,000 | 1,090,925 |
| | | 7,670,176 |
| Texas 7.4% |
City of Corpus Christi, Utility System
Revenue Bonds, Junior Lien | | |
| Series B | | |
| 2.166%, due 7/15/32 | 2,500,000 | 1,985,155 |
City of Dallas, Waterworks & Sewer System
Revenue Bonds | | |
| Series B | | |
| 3.648%, due 10/1/30 | 2,000,000 | 1,859,361 |
City of Houston, Combined Utility System
Revenue Bonds, First Lien | | |
| Series D | | |
| 1.972%, due 11/15/34 | 1,000,000 | 733,711 |
| Series D | | |
| 2.022%, due 11/15/35 | 2,000,000 | 1,431,157 |
| Series B | | |
| 3.828%, due 5/15/28 | 3,025,000 | 2,935,664 |
City of Houston, Airport System
Revenue Bonds, Sub. Lien | | |
| Series C | | |
| 2.485%, due 7/1/32 | 1,470,000 | 1,207,931 |
City of Midland
Limited General Obligation | | |
| Series A | | |
| 3.601%, due 3/1/31 | 1,420,000 | 1,320,976 |
The notes to the financial statements are an integral part of, and should be read in conjunction with, the financial statements.
19
Portfolio of Investments April 30, 2024†^(Unaudited) (continued)
| | Principal
Amount | Value |
| Municipal Bonds (continued) |
| Texas (continued) |
City of San Antonio
Limited General Obligation | | |
| Series 2020 | | |
| 1.433%, due 2/1/28 | $ 2,000,000 | $ 1,757,255 |
Clint Independent School District
Unlimited General Obligation | | |
| Insured: PSF-GTD | | |
| 1.991%, due 2/15/36 | 1,820,000 | 1,300,552 |
County of Bexar, Combined Venue Tax
Revenue Bonds | | |
| Insured: AGM | | |
| 2.434%, due 8/15/33 | 1,000,000 | 773,858 |
Dallas Area Rapid Transit
Revenue Bonds | | |
| Series C | | |
| 1.846%, due 12/1/30 | 3,825,000 | 3,184,551 |
| Series C | | |
| 1.946%, due 12/1/31 | 4,230,000 | 3,444,960 |
| Series C | | |
| 2.046%, due 12/1/32 | 2,035,000 | 1,624,882 |
| Series C | | |
| 2.096%, due 12/1/33 | 1,250,000 | 976,165 |
Dallas Fort Worth International Airport
Revenue Bonds | | |
| Series C | | |
| 2.246%, due 11/1/31 | 2,585,000 | 2,122,754 |
| Series A | | |
| 2.454%, due 11/1/29 | 1,000,000 | 875,894 |
| Series C | | |
| 2.591%, due 11/1/33 | 4,300,000 | 3,454,060 |
Dallas Independent School District
Unlimited General Obligation | | |
| Series B, Insured: PSF-GTD | | |
| 1.935%, due 8/15/30 | 4,875,000 | 4,116,589 |
Manor Independent School District
Unlimited General Obligation | | |
| Series B, Insured: PSF-GTD | | |
| 5.00%, due 8/1/29 | 2,000,000 | 1,998,146 |
Prosper Independent School District
Unlimited General Obligation | | |
| Insured: PSF-GTD | | |
| 1.429%, due 2/15/30 | 3,380,000 | 2,770,725 |
State of Texas, Public Finance Authority
Unlimited General Obligation | | |
| Series B | | |
| 1.844%, due 10/1/30 | 4,000,000 | 3,336,034 |
| | Principal
Amount | Value |
| |
| Texas (continued) |
State of Texas, Public Finance Authority
Unlimited General Obligation
(continued) | | |
| 2.526%, due 10/1/31 | $ 7,500,000 | $ 6,384,309 |
| 2.746%, due 10/1/33 | 1,000,000 | 829,139 |
| Series B | | |
| 3.00%, due 10/1/29 | 3,000,000 | 2,739,020 |
| 4.68%, due 10/1/32 | 7,470,000 | 7,304,188 |
| 4.90%, due 10/1/35 | 5,100,000 | 4,989,569 |
Texas Natural Gas Securitization Finance Corp.
Revenue Bonds | | |
| Series A-1 | | |
| 5.102%, due 4/1/35 | 18,430,763 | 18,243,896 |
Texas Tech University System
Revenue Bonds | | |
| 1.653%, due 2/15/29 | 1,250,000 | 1,075,395 |
| | | 84,775,896 |
| U.S. Virgin Islands 0.5% |
Matching Fund Special Purpose Securitization Corp.
Revenue Bonds | | |
| Series B | | |
| 6.00%, due 10/1/25 | 5,875,000 | 5,795,509 |
| Utah 1.0% |
County of Salt Lake, Convention Hotel
Revenue Bonds | | |
| 5.25%, due 10/1/34 (b) | 3,610,000 | 3,232,611 |
Intermountain Power Agency
Revenue Bonds | | |
| Series B | | |
| 4.978%, due 7/1/31 | 1,020,000 | 1,007,770 |
| Series B | | |
| 5.228%, due 7/1/35 | 2,520,000 | 2,486,019 |
Utah Board of Higher Education
Revenue Bonds | | |
| Series B | | |
| 1.656%, due 8/1/31 | 1,000,000 | 794,276 |
Utah Transit Authority
Revenue Bonds | | |
| 2.289%, due 12/15/32 | 4,360,000 | 3,524,430 |
| | | 11,045,106 |
The notes to the financial statements are an integral part of, and should be read in conjunction with, the financial statements.
| 20 | MainStay MacKay U.S. Infrastructure Bond Fund |
| | Principal
Amount | Value |
| Municipal Bonds (continued) |
| Virginia 1.0% |
City of Norfolk
Unlimited General Obligation | | |
| Series B, Insured: State Aid Withholding | | |
| 2.854%, due 10/1/34 | $ 2,255,000 | $ 1,856,745 |
Farmville Industrial Development Authority, Longwood University Student Housing Project
Revenue Bonds | | |
| Series B | | |
| 5.00%, due 1/1/34 | 1,995,000 | 1,794,953 |
| Toll Road Investors Partnership II LP | | |
| Series A, Insured: AGM | | |
| (zero coupon), due 2/15/41 (b) | 10,000,000 | 2,580,671 |
Virginia College Building Authority, 21st Century College & Equipment Programs
Revenue Bonds | | |
| Series B | | |
| 1.865%, due 2/1/31 | 3,000,000 | 2,464,426 |
Virginia Public Building Authority
Revenue Bonds | | |
| Series C | | |
| 2.563%, due 8/1/29 | 2,700,000 | 2,401,947 |
| | | 11,098,742 |
| Washington 1.1% |
County of King, Sewer
Revenue Bonds | | |
| Series A | | |
| 2.091%, due 7/1/34 | 1,880,000 | 1,434,174 |
| Series B | | |
| 2.43%, due 1/1/39 | 1,235,000 | 872,961 |
County of King
Limited General Obligation | | |
| Series C | | |
| 4.932%, due 12/1/31 | 1,600,000 | 1,587,322 |
| Series C | | |
| 4.982%, due 12/1/32 | 1,650,000 | 1,635,023 |
| Series C | | |
| 5.112%, due 12/1/34 | 1,550,000 | 1,538,217 |
County of Pierce, Sewer
Revenue Bonds | | |
| Series B | | |
| 2.467%, due 8/1/37 | 1,000,000 | 735,334 |
| | Principal
Amount | Value |
| |
| Washington (continued) |
Energy Northwest, Bonneville Power Administration
Revenue Bonds | | |
| Series B | | |
| 2.166%, due 7/1/32 | $ 2,740,000 | $ 2,193,963 |
Spokane Public Facilities District, Sales & Lodging tax
Revenue Bonds | | |
| Series B | | |
| 1.996%, due 12/1/30 | 3,050,000 | 2,549,463 |
| | | 12,546,457 |
| West Virginia 0.1% |
County of Ohio, Special District Excise Tax
Revenue Bonds | | |
| Series A | | |
| 4.00%, due 3/1/40 | 2,200,000 | 1,605,234 |
| Wisconsin 0.3% |
State of Wisconsin
Unlimited General Obligation | | |
| Series 2 | | |
| 2.614%, due 5/1/32 | 4,250,000 | 3,592,106 |
Total Municipal Bonds
(Cost $983,264,016) | | 981,546,355 |
| U.S. Government & Federal Agencies 0.0% ‡ |
| Federal Home Loan Mortgage Corporation (Mortgage Pass-Through Securities) 0.0% ‡ |
| FHLMC Gold Pools, 30 Year | | |
| 4.00%, due 10/1/48 | 105,513 | 95,798 |
| 6.50%, due 4/1/37 | 21,649 | 22,373 |
| | | 118,171 |
| Government National Mortgage Association (Mortgage Pass-Through Security) 0.0% ‡ |
| GNMA I, 30 Year | | |
| 6.50%, due 4/15/31 | 59,351 | 60,159 |
Total U.S. Government & Federal Agencies
(Cost $187,912) | | 178,330 |
Total Long-Term Bonds
(Cost $1,083,122,696) | | 1,079,482,649 |
| |
The notes to the financial statements are an integral part of, and should be read in conjunction with, the financial statements.
21
Portfolio of Investments April 30, 2024†^(Unaudited) (continued)
| | Shares | | Value |
| |
| Short-Term Investments 3.6% |
| Affiliated Investment Company 0.5% |
| MainStay U.S. Government Liquidity Fund, 5.242% (d) | 5,983,275 | | $ 5,983,275 |
| |
| | Principal
Amount | | |
| |
| Commercial Paper 0.9% |
| City of Hope | | | |
| 5.883%, due 5/22/24 | $ 10,000,000 | | 9,964,357 |
| Short-Term Municipal Notes 2.2% |
| Mizuho Floater (b)(e) | | | |
| 5.72%, due 12/1/52 | 4,750,000 | | 4,750,000 |
| 5.72%, due 12/1/62 | 8,750,000 | | 8,750,000 |
| New Hampshire Business Finance Authority | | | |
| 5.58%, due 2/1/29 (b)(e) | 12,000,000 | | 12,000,000 |
Total Short-Term Municipal Notes
(Cost $25,500,000) | | | 25,500,000 |
Total Short-Term Investments
(Cost $41,449,150) | | | 41,447,632 |
Total Investments
(Cost $1,124,571,846) | 98.1% | | 1,120,930,281 |
| Other Assets, Less Liabilities | 1.9 | | 21,137,436 |
| Net Assets | 100.0% | | $ 1,142,067,717 |
| † | Percentages indicated are based on Fund net assets. |
| ^ | Industry classifications may be different than those used for compliance monitoring purposes. |
| ‡ | Less than one-tenth of a percent. |
| (a) | Coupon rate may change based on changes of the underlying collateral or prepayments of principal. Rate shown was the rate in effect as of April 30, 2024. |
| (b) | May be sold to institutional investors only under Rule 144A or securities offered pursuant to Section 4(a)(2) of the Securities Act of 1933, as amended. |
| (c) | Delayed delivery security. |
| (d) | Current yield as of April 30, 2024. |
| (e) | Variable-rate demand notes (VRDNs)—Provide the right to sell the security at face value on either that day or within the rate-reset period. VRDNs will normally trade as if the maturity is the earlier put date, even though stated maturity is longer. The interest rate is reset on the put date at a stipulated daily, weekly, monthly, quarterly, or other specified time interval to reflect current market conditions. These securities do not indicate a reference rate and spread in their description. The maturity date shown is the final maturity. |
The notes to the financial statements are an integral part of, and should be read in conjunction with, the financial statements.
| 22 | MainStay MacKay U.S. Infrastructure Bond Fund |
Investments in Affiliates (in 000's)
Investments in issuers considered to be affiliate(s) of the Fund during the six-month period ended April 30, 2024 for purposes of Section 2(a)(3) of the Investment Company Act of 1940, as amended, were as follows:
| Affiliated Investment Companies | Value,
Beginning
of Period | Purchases
at Cost | Proceeds
from
Sales | Net
Realized
Gain/(Loss)
on Sales | Change in
Unrealized
Appreciation/
(Depreciation) | Value,
End of
Period | Dividend
Income | Other
Distributions | Shares
End of
Period |
| MainStay U.S. Government Liquidity Fund | $ 826 | $ 374,180 | $ (369,023) | $ — | $ — | $ 5,983 | $ 505 | $ — | 5,983 |
| Abbreviation(s): |
| AGM—Assured Guaranty Municipal Corp. |
| AMBAC—Ambac Assurance Corp. |
| BAM—Build America Mutual Assurance Co. |
| CR—Custodial Receipts |
| FHLMC—Federal Home Loan Mortgage Corp. |
| FNMA—Federal National Mortgage Association |
| GNMA—Government National Mortgage Association |
| NATL-RE—National Public Finance Guarantee Corp. |
| PSF-GTD—Permanent School Fund Guaranteed |
| SONYMA—State of New York Mortgage Agency |
The following is a summary of the fair valuations according to the inputs used as of April 30, 2024, for valuing the Fund’s assets:
| Description | Quoted
Prices in
Active
Markets for
Identical
Assets
(Level 1) | | Significant
Other
Observable
Inputs
(Level 2) | | Significant
Unobservable
Inputs
(Level 3) | | Total |
| Asset Valuation Inputs | | | | | | | |
| Investments in Securities (a) | | | | | | | |
| Long-Term Bonds | | | | | | | |
| Corporate Bonds | $ — | | $ 97,757,964 | | $ — | | $ 97,757,964 |
| Municipal Bonds | — | | 981,546,355 | | — | | 981,546,355 |
| U.S. Government & Federal Agencies | — | | 178,330 | | — | | 178,330 |
| Total Long-Term Bonds | — | | 1,079,482,649 | | — | | 1,079,482,649 |
| Short-Term Investments | | | | | | | |
| Affiliated Investment Company | 5,983,275 | | — | | — | | 5,983,275 |
| Commercial Paper | — | | 9,964,357 | | — | | 9,964,357 |
| Short-Term Municipal Notes | — | | 25,500,000 | | — | | 25,500,000 |
| Total Short-Term Investments | 5,983,275 | | 35,464,357 | | — | | 41,447,632 |
| Total Investments in Securities | $ 5,983,275 | | $ 1,114,947,006 | | $ — | | $ 1,120,930,281 |
| (a) | For a complete listing of investments and their industries, see the Portfolio of Investments. |
The notes to the financial statements are an integral part of, and should be read in conjunction with, the financial statements.
23
Statement of Assets and Liabilities as of April 30, 2024 (Unaudited)
| Assets |
Investment in unaffiliated securities, at value
(identified cost $1,118,588,571) | $1,114,947,006 |
Investment in affiliated investment companies, at value
(identified cost $5,983,275) | 5,983,275 |
| Cash | 12,343,510 |
| Due from custodian | 2,694,916 |
| Receivables: | |
| Dividends and interest | 11,862,785 |
| Investment securities sold | 8,497,887 |
| Fund shares sold | 3,756,328 |
| Other assets | 152,596 |
| Total assets | 1,160,238,303 |
| Liabilities |
| Payables: | |
| Investment securities purchased | 13,166,190 |
| Fund shares redeemed | 3,472,046 |
| Manager (See Note 3) | 399,367 |
| Transfer agent (See Note 3) | 264,572 |
| Custodian | 33,854 |
| Professional fees | 30,762 |
| NYLIFE Distributors (See Note 3) | 25,036 |
| Accrued expenses | 50 |
| Distributions payable | 778,709 |
| Total liabilities | 18,170,586 |
| Net assets | $1,142,067,717 |
| Composition of Net Assets |
| Shares of beneficial interest outstanding (par value of $.01 per share) unlimited number of shares authorized | $ 1,553,182 |
| Additional paid-in-capital | 1,242,646,884 |
| | 1,244,200,066 |
| Total distributable earnings (loss) | (102,132,349) |
| Net assets | $1,142,067,717 |
| Class A | |
| Net assets applicable to outstanding shares | $ 85,403,328 |
| Shares of beneficial interest outstanding | 11,735,177 |
| Net asset value per share outstanding | $ 7.28 |
| Maximum sales charge (3.00% of offering price) | 0.23 |
| Maximum offering price per share outstanding | $ 7.51 |
| Investor Class | |
| Net assets applicable to outstanding shares | $ 13,002,403 |
| Shares of beneficial interest outstanding | 1,778,441 |
| Net asset value per share outstanding | $ 7.31 |
| Maximum sales charge (2.50% of offering price) | 0.19 |
| Maximum offering price per share outstanding | $ 7.50 |
| Class C | |
| Net assets applicable to outstanding shares | $ 5,640,389 |
| Shares of beneficial interest outstanding | 775,570 |
| Net asset value and offering price per share outstanding | $ 7.27 |
| Class I | |
| Net assets applicable to outstanding shares | $758,516,900 |
| Shares of beneficial interest outstanding | 103,066,628 |
| Net asset value and offering price per share outstanding | $ 7.36 |
| Class R6 | |
| Net assets applicable to outstanding shares | $279,504,697 |
| Shares of beneficial interest outstanding | 37,962,423 |
| Net asset value and offering price per share outstanding | $ 7.36 |
The notes to the financial statements are an integral part of, and should be read in conjunction with, the financial statements.
| 24 | MainStay MacKay U.S. Infrastructure Bond Fund |
Statement of Operations for the six months ended April 30, 2024 (Unaudited)
| Investment Income (Loss) |
| Income | |
| Interest | $25,878,443 |
| Dividends-affiliated | 504,887 |
| Total income | 26,383,330 |
| Expenses | |
| Manager (See Note 3) | 2,539,717 |
| Transfer agent (See Note 3) | 751,350 |
| Distribution/Service—Class A (See Note 3) | 104,692 |
| Distribution/Service—Investor Class (See Note 3) | 16,659 |
| Distribution/Service—Class B (See Note 3)(a) | 772 |
| Distribution/Service—Class C (See Note 3) | 28,120 |
| Registration | 88,324 |
| Professional fees | 61,678 |
| Custodian | 36,272 |
| Shareholder communication | 24,260 |
| Trustees | 12,125 |
| Miscellaneous | 17,317 |
| Total expenses before waiver/reimbursement | 3,681,286 |
| Expense waiver/reimbursement from Manager (See Note 3) | (445,687) |
| Net expenses | 3,235,599 |
| Net investment income (loss) | 23,147,731 |
| Realized and Unrealized Gain (Loss) |
| Net realized gain (loss) on unaffiliated investments | (6,467,436) |
| Net change in unrealized appreciation (depreciation) on unaffiliated investments | 29,513,600 |
| Net realized and unrealized gain (loss) | 23,046,164 |
| Net increase (decrease) in net assets resulting from operations | $46,193,895 |
| (a) | Class B shares converted into Class A or Investor Class shares pursuant to the applicable conversion schedule and are no longer offered for sale as of February 20, 2024. |
The notes to the financial statements are an integral part of, and should be read in conjunction with, the financial statements.
25
Statements of Changes in Net Assets
for the six months ended April 30, 2024 (Unaudited) and the year ended October 31, 2023
| | Six months
ended
April 30,
2024 | Year
ended
October 31,
2023 |
| Increase (Decrease) in Net Assets |
| Operations: | | |
| Net investment income (loss) | $ 23,147,731 | $ 29,156,942 |
| Net realized gain (loss) | (6,467,436) | (26,791,024) |
| Net change in unrealized appreciation (depreciation) | 29,513,600 | (2,641,992) |
| Net increase (decrease) in net assets resulting from operations | 46,193,895 | (276,074) |
| Distributions to shareholders: | | |
| Class A | (1,783,398) | (3,190,609) |
| Investor Class | (266,072) | (522,064) |
| Class B(a) | (2,580) | (14,468) |
| Class C | (91,287) | (171,500) |
| Class I | (15,983,298) | (20,530,573) |
| Class R6 | (5,057,763) | (4,837,944) |
| Total distributions to shareholders | (23,184,398) | (29,267,158) |
| Capital share transactions: | | |
| Net proceeds from sales of shares | 464,143,458 | 673,028,663 |
| Net asset value of shares issued to shareholders in reinvestment of distributions | 18,469,830 | 22,229,651 |
| Cost of shares redeemed | (269,920,017) | (264,606,267) |
| Increase (decrease) in net assets derived from capital share transactions | 212,693,271 | 430,652,047 |
| Net increase (decrease) in net assets | 235,702,768 | 401,108,815 |
| Net Assets |
| Beginning of period | 906,364,949 | 505,256,134 |
| End of period | $1,142,067,717 | $ 906,364,949 |
| (a) | Class B shares converted into Class A or Investor Class shares pursuant to the applicable conversion schedule and are no longer offered for sale as of February 20, 2024. |
The notes to the financial statements are an integral part of, and should be read in conjunction with, the financial statements.
| 26 | MainStay MacKay U.S. Infrastructure Bond Fund |
Financial Highlights selected per share data and ratios
| | Six months ended
April 30,
2024* | | Year Ended October 31, |
| Class A | 2023 | | 2022 | | 2021 | | 2020 | | 2019 |
| Net asset value at beginning of period | $ 7.07 | | $ 7.20 | | $ 8.74 | | $ 8.77 | | $ 8.64 | | $ 7.93 |
| Net investment income (loss) (a) | 0.16 | | 0.30 | | 0.18 | | 0.13 | | 0.16 | | 0.21 |
| Net realized and unrealized gain (loss) | 0.21 | | (0.13) | | (1.47) | | 0.07 | | 0.14 | | 0.71 |
| Total from investment operations | 0.37 | | 0.17 | | (1.29) | | 0.20 | | 0.30 | | 0.92 |
| Less distributions: | | | | | | | | | | | |
| From net investment income | (0.16) | | (0.30) | | (0.18) | | (0.13) | | (0.17) | | (0.21) |
| From net realized gain on investments | — | | — | | (0.07) | | (0.10) | | — | | — |
| Return of capital | — | | — | | — | | — | | — | | (0.00)‡ |
| Total distributions | (0.16) | | (0.30) | | (0.25) | | (0.23) | | (0.17) | | (0.21) |
| Net asset value at end of period | $ 7.28 | | $ 7.07 | | $ 7.20 | | $ 8.74 | | $ 8.77 | | $ 8.64 |
| Total investment return (b) | 5.17% | | 2.26% | | (14.98)% | | 2.36% | | 3.45% | | 11.76% |
| Ratios (to average net assets)/Supplemental Data: | | | | | | | | | | | |
| Net investment income (loss) | 4.25%†† | | 4.04% | | 2.20% | | 1.49% | | 1.84% | | 2.52% |
| Net expenses (c) | 0.85%†† | | 0.85% | | 0.85% | | 0.85% | | 0.85% | | 0.89% |
| Expenses (before waiver/reimbursement) (c) | 0.96%†† | | 0.99% | | 0.98% | | 0.96% | | 0.98% | | 1.02% |
| Portfolio turnover rate (d) | 47% | | 130% | | 170% | | 51% | | 89% | | 124% |
| Net assets at end of period (in 000’s) | $ 85,403 | | $ 78,068 | | $ 75,780 | | $ 111,626 | | $ 103,475 | | $ 84,513 |
| * | Unaudited. |
| ‡ | Less than one cent per share. |
| †† | Annualized. |
| (a) | Per share data based on average shares outstanding during the period. |
| (b) | Total investment return is calculated exclusive of sales charges and assumes the reinvestment of dividends and distributions. For periods of less than one year, total return is not annualized. |
| (c) | In addition to the fees and expenses which the Fund bears directly, it also indirectly bears a pro-rata share of the fees and expenses of the underlying funds in which it invests. Such indirect expenses are not included in the above expense ratios. |
| (d) | The portfolio turnover rate includes variable rate demand notes. |
The notes to the financial statements are an integral part of, and should be read in conjunction with, the financial statements.
27
Financial Highlights selected per share data and ratios
| | Six months ended
April 30,
2024* | | Year Ended October 31, |
| Investor Class | 2023 | | 2022 | | 2021 | | 2020 | | 2019 |
| Net asset value at beginning of period | $ 7.10 | | $ 7.24 | | $ 8.78 | | $ 8.81 | | $ 8.68 | | $ 7.97 |
| Net investment income (loss) (a) | 0.15 | | 0.28 | | 0.16 | | 0.10 | | 0.14 | | 0.19 |
| Net realized and unrealized gain (loss) | 0.21 | | (0.14) | | (1.47) | | 0.07 | | 0.13 | | 0.71 |
| Total from investment operations | 0.36 | | 0.14 | | (1.31) | | 0.17 | | 0.27 | | 0.90 |
| Less distributions: | | | | | | | | | | | |
| From net investment income | (0.15) | | (0.28) | | (0.16) | | (0.10) | | (0.14) | | (0.19) |
| From net realized gain on investments | — | | — | | (0.07) | | (0.10) | | — | | — |
| Return of capital | — | | — | | — | | — | | — | | (0.00)‡ |
| Total distributions | (0.15) | | (0.28) | | (0.23) | | (0.20) | | (0.14) | | (0.19) |
| Net asset value at end of period | $ 7.31 | | $ 7.10 | | $ 7.24 | | $ 8.78 | | $ 8.81 | | $ 8.68 |
| Total investment return (b) | 5.01% | | 1.80% | | (15.14)% | | 2.02% | | 3.14% | | 11.36% |
| Ratios (to average net assets)/Supplemental Data: | | | | | | | | | | | |
| Net investment income (loss) | 3.99%†† | | 3.72% | | 1.95% | | 1.16% | | 1.57% | | 2.21% |
| Net expenses (c) | 1.10%†† | | 1.15% | | 1.12% | | 1.17% | | 1.15% | | 1.21% |
| Expenses (before waiver/reimbursement) (c) | 1.33%†† | | 1.37% | | 1.25% | | 1.33% | | 1.28% | | 1.35% |
| Portfolio turnover rate (d) | 47% | | 130% | | 170% | | 51% | | 89% | | 124% |
| Net assets at end of period (in 000's) | $ 13,002 | | $ 13,066 | | $ 13,974 | | $ 17,994 | | $ 19,459 | | $ 20,520 |
| * | Unaudited. |
| ‡ | Less than one cent per share. |
| †† | Annualized. |
| (a) | Per share data based on average shares outstanding during the period. |
| (b) | Total investment return is calculated exclusive of sales charges and assumes the reinvestment of dividends and distributions. For periods of less than one year, total return is not annualized. |
| (c) | In addition to the fees and expenses which the Fund bears directly, it also indirectly bears a pro-rata share of the fees and expenses of the underlying funds in which it invests. Such indirect expenses are not included in the above expense ratios. |
| (d) | The portfolio turnover rate includes variable rate demand notes. |
The notes to the financial statements are an integral part of, and should be read in conjunction with, the financial statements.
| 28 | MainStay MacKay U.S. Infrastructure Bond Fund |
Financial Highlights selected per share data and ratios
| | Six months ended
April 30,
2024* | | Year Ended October 31, |
| Class C | 2023 | | 2022 | | 2021 | | 2020 | | 2019 |
| Net asset value at beginning of period | $ 7.07 | | $ 7.20 | | $ 8.74 | | $ 8.77 | | $ 8.64 | | $ 7.93 |
| Net investment income (loss) (a) | 0.12 | | 0.22 | | 0.11 | | 0.04 | | 0.08 | | 0.12 |
| Net realized and unrealized gain (loss) | 0.20 | | (0.13) | | (1.48) | | 0.07 | | 0.13 | | 0.71 |
| Total from investment operations | 0.32 | | 0.09 | | (1.37) | | 0.11 | | 0.21 | | 0.83 |
| Less distributions: | | | | | | | | | | | |
| From net investment income | (0.12) | | (0.22) | | (0.10) | | (0.04) | | (0.08) | | (0.12) |
| From net realized gain on investments | — | | — | | (0.07) | | (0.10) | | — | | — |
| Return of capital | — | | — | | — | | — | | — | | (0.00)‡ |
| Total distributions | (0.12) | | (0.22) | | (0.17) | | (0.14) | | (0.08) | | (0.12) |
| Net asset value at end of period | $ 7.27 | | $ 7.07 | | $ 7.20 | | $ 8.74 | | $ 8.77 | | $ 8.64 |
| Total investment return (b) | 4.50% | | 1.19% | | (15.84)% | | 1.27% | | 2.38% | | 10.59% |
| Ratios (to average net assets)/Supplemental Data: | | | | | | | | | | | |
| Net investment income (loss) | 3.24%†† | | 2.98% | | 1.38% | | 0.42% | | 0.88% | | 1.47% |
| Net expenses (c) | 1.86%†† | | 1.91% | | 1.87% | | 1.92% | | 1.90% | | 1.96% |
| Expenses (before waiver/reimbursement) (c) | 2.08%†† | | 2.13% | | 2.00% | | 2.08% | | 2.02% | | 2.10% |
| Portfolio turnover rate (d) | 47% | | 130% | | 170% | | 51% | | 89% | | 124% |
| Net assets at end of period (in 000’s) | $ 5,640 | | $ 4,734 | | $ 7,037 | | $ 6,481 | | $ 8,708 | | $ 14,152 |
| * | Unaudited. |
| ‡ | Less than one cent per share. |
| †† | Annualized. |
| (a) | Per share data based on average shares outstanding during the period. |
| (b) | Total investment return is calculated exclusive of sales charges and assumes the reinvestment of dividends and distributions. For periods of less than one year, total return is not annualized. |
| (c) | In addition to the fees and expenses which the Fund bears directly, it also indirectly bears a pro-rata share of the fees and expenses of the underlying funds in which it invests. Such indirect expenses are not included in the above expense ratios. |
| (d) | The portfolio turnover rate includes variable rate demand notes. |
The notes to the financial statements are an integral part of, and should be read in conjunction with, the financial statements.
29
Financial Highlights selected per share data and ratios
| | Six months ended
April 30,
2024* | | Year Ended October 31, |
| Class I | 2023 | | 2022 | | 2021 | | 2020 | | 2019 |
| Net asset value at beginning of period | $ 7.15 | | $ 7.28 | | $ 8.84 | | $ 8.87 | | $ 8.73 | | $ 8.02 |
| Net investment income (loss) (a) | 0.16 | | 0.32 | | 0.20 | | 0.15 | | 0.17 | | 0.24 |
| Net realized and unrealized gain (loss) | 0.22 | | (0.13) | | (1.49) | | 0.07 | | 0.16 | | 0.71 |
| Total from investment operations | 0.38 | | 0.19 | | (1.29) | | 0.22 | | 0.33 | | 0.95 |
| Less distributions: | | | | | | | | | | | |
| From net investment income | (0.17) | | (0.32) | | (0.20) | | (0.15) | | (0.19) | | (0.24) |
| From net realized gain on investments | — | | — | | (0.07) | | (0.10) | | — | | — |
| Return of capital | — | | — | | — | | — | | — | | (0.00)‡ |
| Total distributions | (0.17) | | (0.32) | | (0.27) | | (0.25) | | (0.19) | | (0.24) |
| Net asset value at end of period | $ 7.36 | | $ 7.15 | | $ 7.28 | | $ 8.84 | | $ 8.87 | | $ 8.73 |
| Total investment return (b) | 5.23% | | 2.48% | | (14.83)% | | 2.58% | | 3.78% | | 11.95% |
| Ratios (to average net assets)/Supplemental Data: | | | | | | | | | | | |
| Net investment income (loss) | 4.44%†† | | 4.24% | | 2.47% | | 1.71% | | 1.97% | | 2.64% |
| Net expenses (c) | 0.60%†† | | 0.60% | | 0.60% | | 0.60% | | 0.60% | | 0.60% |
| Expenses (before waiver/reimbursement) (c) | 0.71%†† | | 0.74% | | 0.73% | | 0.71% | | 0.72% | | 0.74% |
| Portfolio turnover rate (d) | 47% | | 130% | | 170% | | 51% | | 89% | | 124% |
| Net assets at end of period (in 000’s) | $ 758,517 | | $ 683,014 | | $ 297,386 | | $ 329,021 | | $ 292,000 | | $ 177,305 |
| * | Unaudited. |
| ‡ | Less than one cent per share. |
| †† | Annualized. |
| (a) | Per share data based on average shares outstanding during the period. |
| (b) | Total investment return is calculated exclusive of sales charges and assumes the reinvestment of dividends and distributions. Class I shares are not subject to sales charges. For periods of less than one year, total return is not annualized. |
| (c) | In addition to the fees and expenses which the Fund bears directly, it also indirectly bears a pro-rata share of the fees and expenses of the underlying funds in which it invests. Such indirect expenses are not included in the above expense ratios. |
| (d) | The portfolio turnover rate includes variable rate demand notes. |
The notes to the financial statements are an integral part of, and should be read in conjunction with, the financial statements.
| 30 | MainStay MacKay U.S. Infrastructure Bond Fund |
Financial Highlights selected per share data and ratios
| | Six months ended
April 30,
2024* | | Year Ended October 31, | | November 1, 2019^ through
October 31, |
| Class R6 | 2023 | | 2022 | | 2021 | | 2020 |
| Net asset value at beginning of period | $ 7.16 | | $ 7.29 | | $ 8.84 | | $ 8.87 | | $ 8.72 |
| Net investment income (loss) (a) | 0.17 | | 0.32 | | 0.20 | | 0.16 | | 0.19 |
| Net realized and unrealized gain (loss) | 0.20 | | (0.13) | | (1.47) | | 0.07 | | 0.15 |
| Total from investment operations | 0.37 | | 0.19 | | (1.27) | | 0.23 | | 0.34 |
| Less distributions: | | | | | | | | | |
| From net investment income | (0.17) | | (0.32) | | (0.21) | | (0.16) | | (0.19) |
| From net realized gain on investments | — | | — | | (0.07) | | (0.10) | | — |
| Total distributions | (0.17) | | (0.32) | | (0.28) | | (0.26) | | (0.19) |
| Net asset value at end of period | $ 7.36 | | $ 7.16 | | $ 7.29 | | $ 8.84 | | $ 8.87 |
| Total investment return (b) | 5.12% | | 2.55% | | (14.66)% | | 2.65% | | 3.85% |
| Ratios (to average net assets)/Supplemental Data: | | | | | | | | | |
| Net investment income (loss) | 4.50%†† | | 4.30% | | 2.50% | | 1.77% | | 2.16% |
| Net expenses (c) | 0.53%††(d) | | 0.53% | | 0.53% | | 0.53% | | 0.53% |
| Expenses (before waiver/reimbursement) (c) | 0.53%†† | | 0.56% | | 0.57% | | 0.56% | | 0.58% |
| Portfolio turnover rate (e) | 47% | | 130% | | 170% | | 51% | | 89% |
| Net assets at end of period (in 000’s) | $ 279,505 | | $ 127,190 | | $ 110,457 | | $ 149,500 | | $ 83,204 |
| * | Unaudited. |
| ^ | Inception date. |
| †† | Annualized. |
| (a) | Per share data based on average shares outstanding during the period. |
| (b) | Total investment return is calculated exclusive of sales charges and assumes the reinvestment of dividends and distributions. Class R6 shares are not subject to sales charges. For periods of less than one year, total return is not annualized. |
| (c) | In addition to the fees and expenses which the Fund bears directly, it also indirectly bears a pro-rata share of the fees and expenses of the underlying funds in which it invests. Such indirect expenses are not included in the above expense ratios. |
| (d) | Expense waiver/reimbursement less than 0.01%. |
| (e) | The portfolio turnover rate includes variable rate demand notes. |
The notes to the financial statements are an integral part of, and should be read in conjunction with, the financial statements.
31
Notes to Financial Statements (Unaudited)
Note 1-Organization and Business
The MainStay Funds (the “Trust”) was organized on January 9, 1986, as a Massachusetts business trust. The Trust is registered under the Investment Company Act of 1940, as amended (the “1940 Act”), as an open-end management investment company, and is comprised of eleven funds (collectively referred to as the "Funds"). These financial statements and notes relate to the MainStay MacKay U.S. Infrastructure Bond Fund (the "Fund"), a “diversified” fund, as that term is defined in the 1940 Act, as interpreted or modified by regulatory authorities having jurisdiction, from time to time.
The following table lists the Fund's share classes that have been registered and commenced operations:
| Class | Commenced Operations |
| Class A | January 3, 1995 |
| Investor Class | February 28, 2008 |
| Class C | September 1, 1998 |
| Class I | January 2, 2004 |
| Class R6 | November 1, 2019 |
Effective at the close of business on February 20, 2024, all outstanding Class B shares converted into Class A or Investor Class shares pursuant to the applicable conversion schedule.
Class A and Investor Class shares are offered at net asset value (“NAV”) per share plus an initial sales charge. No initial sales charge applies to investments of $250,000 or more (and certain other qualified purchases) in Class A and Investor Class shares. A CDSC of 1.00% may be imposed on certain redemptions of Class A and Investor Class shares made within 18 months of the date of purchase on shares that were purchased without an initial sales charge. Class C shares are offered at NAV without an initial sales charge, although a 1.00% CDSC may be imposed on certain redemptions of such shares made within one year of the date of purchase of Class C shares. Investments in Class C shares are subject to a purchase maximum of $250,000. Class I and Class R6 shares are offered at NAV without a sales charge. Depending upon eligibility, Class C shares convert to either Class A or Investor Class shares at the end of the calendar quarter eight years after the date they were purchased. Additionally, Investor Class shares may convert automatically to Class A shares. Under certain circumstances and as may be permitted by the Trust’s multiple class plan pursuant to Rule 18f-3 under the 1940 Act, specified share classes of the Fund may be converted to one or more other share classes of the Fund as disclosed in the capital share transactions within these Notes. The classes of shares have the same voting (except for issues that relate solely to one class), dividend, liquidation and other rights, and the same terms and conditions, except that under distribution plans pursuant to Rule 12b-1 under the 1940 Act, Class C shares are subject to higher distribution and/or service fees than Class A and Investor Class shares. Class I and Class R6 shares are not subject to a distribution and/or service fee.
The Fund's investment objective is to seek current income.
Note 2–Significant Accounting Policies
The Fund is an investment company and accordingly follows the investment company accounting and reporting guidance of the Financial Accounting Standards Board (“FASB”) Accounting Standards Codification Topic 946 Financial Services—Investment Companies. The Fund prepares its financial statements in accordance with generally accepted accounting principles (“GAAP”) in the United States of America and follows the significant accounting policies described below.
(A) Securities Valuation. Investments are usually valued as of the close of regular trading on the New York Stock Exchange (the "Exchange") (usually 4:00 p.m. Eastern time) on each day the Fund is open for business ("valuation date").
Pursuant to Rule 2a-5 under the 1940 Act, the Board of Trustees of the Trust (the "Board") has designated New York Life Investment Management LLC ("New York Life Investments" or the "Manager") as its Valuation Designee (the "Valuation Designee"). The Valuation Designee is responsible for performing fair valuations relating to all investments in the Fund’s portfolio for which market quotations are not readily available; periodically assessing and managing material valuation risks; establishing and applying fair value methodologies; testing fair valuation methodologies; evaluating and overseeing pricing services; ensuring appropriate segregation of valuation and portfolio management functions; providing quarterly, annual and prompt reporting to the Board, as appropriate; identifying potential conflicts of interest; and maintaining appropriate records. The Valuation Designee has established a valuation committee ("Valuation Committee") to assist in carrying out the Valuation Designee’s responsibilities and establish prices of securities for which market quotations are not readily available. The Fund's and the Valuation Designee's policies and procedures ("Valuation Procedures") govern the Valuation Designee’s selection and application of methodologies for determining and calculating the fair value of Fund investments. The Valuation Designee may value the Fund's portfolio securities for which market quotations are not readily available and other Fund assets utilizing inputs from pricing services and other third-party sources. The Valuation Committee meets (in person, via electronic mail or via teleconference) on an ad-hoc basis to determine fair valuations and on a quarterly basis to review fair value events with respect to certain securities for which market quotations are not readily available, including valuation risks and back-testing results, and to preview reports to the Board.
The Valuation Committee establishes prices of securities for which market quotations are not readily available based on such methodologies and measurements on a regular basis after considering information that is reasonably available and deemed relevant by the Valuation Committee. The Board shall oversee the Valuation Designee and review fair valuation materials on a prompt, quarterly and annual basis and approve proposed revisions to the Valuation Procedures.
Investments for which market quotations are not readily available are valued at fair value as determined in good faith pursuant to the Valuation Procedures. A market quotation is readily available only when that
| 32 | MainStay MacKay U.S. Infrastructure Bond Fund |
quotation is a quoted price (unadjusted) in active markets for identical investments that the Fund can access at the measurement date, provided that a quotation will not be readily available if it is not reliable. "Fair value" is defined as the price the Fund would reasonably expect to receive upon selling an asset or liability in an orderly transaction to an independent buyer in the principal or most advantageous market for the asset or liability. Fair value measurements are determined within a framework that establishes a three-tier hierarchy that maximizes the use of observable market data and minimizes the use of unobservable inputs to establish a classification of fair value measurements for disclosure purposes. "Inputs" refer broadly to the assumptions that market participants would use in pricing the asset or liability, including assumptions about risk, such as the risk inherent in a particular valuation technique used to measure fair value using a pricing model and/or the risk inherent in the inputs for the valuation technique. Inputs may be observable or unobservable. Observable inputs reflect the assumptions market participants would use in pricing the asset or liability based on market data obtained from sources independent of the Fund. Unobservable inputs reflect the Fund’s own assumptions about the assumptions market participants would use in pricing the asset or liability based on the information available. The inputs or methodology used for valuing assets or liabilities may not be an indication of the risks associated with investing in those assets or liabilities. The three-tier hierarchy of inputs is summarized below.
| • | Level 1—quoted prices (unadjusted) in active markets for an identical asset or liability |
| • | Level 2—other significant observable inputs (including quoted prices for a similar asset or liability in active markets, interest rates and yield curves, prepayment speeds, credit risk, etc.) |
| • | Level 3—significant unobservable inputs (including the Fund's own assumptions about the assumptions that market participants would use in measuring fair value of an asset or liability) |
The level of an asset or liability within the fair value hierarchy is based on the lowest level of an input, both individually and in the aggregate, that is significant to the fair value measurement. The aggregate value by input level of the Fund’s assets and liabilities as of April 30, 2024, is included at the end of the Portfolio of Investments.
The Fund may use third-party vendor evaluations, whose prices may be derived from one or more of the following standard inputs, among others:
| • Benchmark yields | • Reported trades |
| • Broker/dealer quotes | • Issuer spreads |
| • Two-sided markets | • Benchmark securities |
| • Bids/offers | • Reference data (corporate actions or material event notices) |
| • Industry and economic events | • Comparable bonds |
| • Monthly payment information | |
An asset or liability for which a market quotation is not readily available is valued by methods deemed reasonable in good faith by the Valuation Committee, following the Valuation Procedures to represent fair value.
Under these procedures, the Valuation Designee generally uses a market-based approach which may use related or comparable assets or liabilities, recent transactions, market multiples, book values and other relevant information. The Valuation Designee may also use an income-based valuation approach in which the anticipated future cash flows of the asset or liability are discounted to calculate fair value. Discounts may also be applied due to the nature and/or duration of any restrictions on the disposition of the asset or liability. Fair value represents a good faith approximation of the value of a security. Fair value determinations involve the consideration of a number of subjective factors, an analysis of applicable facts and circumstances and the exercise of judgment. As a result, it is possible that the fair value for a security determined in good faith in accordance with the Valuation Procedures may differ from valuations for the same security determined for other funds using their own valuation procedures. Although the Valuation Procedures are designed to value a security at the price the Fund may reasonably expect to receive upon the security's sale in an orderly transaction, there can be no assurance that any fair value determination thereunder would, in fact, approximate the amount that the Fund would actually realize upon the sale of the security or the price at which the security would trade if a reliable market price were readily available. During the six-month period ended April 30, 2024, there were no material changes to the fair value methodologies.
Securities which may be valued in this manner include, but are not limited to: (i) a security for which trading has been halted or suspended or otherwise does not have a readily available market quotation on a given day; (ii) a debt security that has recently gone into default and for which there is not a current market quotation; (iii) a security of an issuer that has entered into a restructuring; (iv) a security that has been delisted from a national exchange; (v) a security subject to trading collars for which no or limited trading takes place; and (vi) a security whose principal market has been temporarily closed at a time when, under normal conditions, it would be open. Securities valued in this manner are generally categorized as Level 2 or 3 in the hierarchy.
Investments in mutual funds, including money market funds, are valued at their respective NAVs at the close of business each day on the valuation date. These securities are generally categorized as Level 1 in the hierarchy.
Debt securities (other than convertible and municipal bonds) are valued at the evaluated bid prices (evaluated mean prices in the case of convertible and municipal bonds) supplied by a pricing agent or broker selected by the Valuation Designee, in consultation with the Subadvisor. The evaluations are market-based measurements processed through a pricing application and represents the pricing agent’s good faith determination as to what a holder may receive in an orderly transaction under market conditions. The rules-based logic utilizes valuation techniques that reflect participants’ assumptions and vary by asset class and per methodology, maximizing the use of relevant observable data including quoted prices for similar assets, benchmark yield curves and market corroborated inputs. The evaluated bid or mean prices are deemed by the Valuation Designee, in consultation with the Subadvisor, to be representative of
Notes to Financial Statements (Unaudited) (continued)
market values at the regular close of trading of the Exchange on each valuation date. Debt securities purchased on a delayed delivery basis are marked to market daily until settlement at the forward settlement date. Debt securities, including corporate bonds, U.S. government and federal agency bonds, municipal bonds, foreign bonds, convertible bonds, asset-backed securities and mortgage-backed securities are generally categorized as Level 2 in the hierarchy.
Temporary cash investments acquired in excess of 60 days to maturity at the time of purchase are valued using the latest bid prices or using valuations based on a matrix system (which considers such factors as security prices, yields, maturities and ratings), both as furnished by independent pricing services. Temporary cash investments that mature in 60 days or less at the time of purchase ("Short-Term Investments") are valued using the amortized cost method of valuation, unless the use of such method would be inappropriate. The amortized cost method involves valuing a security at its cost on the date of purchase and thereafter assuming a constant amortization to maturity of the difference between such cost and the value on maturity date. Amortized cost approximates the current fair value of a security. Securities valued using the amortized cost method are not valued using quoted prices in an active market and are generally categorized as Level 2 in the hierarchy.
The information above is not intended to reflect an exhaustive list of the methodologies that may be used to value portfolio investments. The Valuation Procedures permit the use of a variety of valuation methodologies in connection with valuing portfolio investments. The methodology used for a specific type of investment may vary based on the market data available or other considerations. The methodologies summarized above may not represent the specific means by which portfolio investments are valued on any particular business day.
(B) Income Taxes. The Fund's policy is to comply with the requirements of the Internal Revenue Code of 1986, as amended (the “Internal Revenue Code”), applicable to regulated investment companies and to distribute all of its taxable income to the shareholders of the Fund within the allowable time limits.
The Manager evaluates the Fund’s tax positions to determine if the tax positions taken meet the minimum recognition threshold in connection with accounting for uncertainties in income tax positions taken or expected to be taken for the purposes of measuring and recognizing tax liabilities in the financial statements. Recognition of tax benefits of an uncertain tax position is permitted only to the extent the position is “more likely than not” to be sustained assuming examination by taxing authorities. The Manager analyzed the Fund's tax positions taken on federal, state and local income tax returns for all open tax years (for up to three tax years) and has concluded that no provisions for federal, state and local income tax are required in the Fund's financial statements. The Fund's federal, state and local income tax and federal excise tax returns for tax years for which the applicable statutes of limitations have not expired are subject to examination by the Internal Revenue Service and state and local departments of revenue.
(C) Dividends and Distributions to Shareholders. Dividends and distributions are recorded on the ex-dividend date. The Fund intends to declare dividends from net investment income, if any, daily and intends to pay them at least monthly and pays distributions from net realized capital and currency gains, if any, at least annually. Unless a shareholder elects otherwise, all dividends and distributions are reinvested at NAV in the same class of shares of the Fund. Dividends and distributions to shareholders are determined in accordance with federal income tax regulations and may differ from determinations using GAAP.
(D) Security Transactions and Investment Income. The Fund records security transactions on the trade date. Realized gains and losses on security transactions are determined using the identified cost method. Interest income is accrued as earned using the effective interest rate method and includes any realized gains and losses from repayments of principal on mortgage-backed securities. Distributions received from real estate investment trusts may be classified as dividends, capital gains and/or return of capital. Discounts and premiums on securities purchased, other than temporary cash investments that mature in 60 days or less at the time of purchase, for the Fund are accreted and amortized, respectively, on the effective interest rate method.
Investment income and realized and unrealized gains and losses on investments of the Fund are allocated pro rata to the separate classes of shares based upon their relative net assets on the date the income is earned or realized and unrealized gains and losses are incurred.
The Fund may place a debt security on non-accrual status and reduce related interest income by ceasing current accruals and writing off all or a portion of any interest receivables when the collection of all or a portion of such interest has become doubtful. A debt security is removed from non-accrual status when the issuer resumes interest payments or when collectability of interest is reasonably assured.
(E) Expenses. Expenses of the Trust are allocated to the individual Funds in proportion to the net assets of the respective Funds when the expenses are incurred, except where direct allocations of expenses can be made. Expenses (other than transfer agent expenses and fees incurred under the shareholder services plans and/or the distribution plans further discussed in Note 3(B)) are allocated to separate classes of shares pro rata based upon their relative net assets on the date the expenses are incurred. The expenses borne by the Fund, including those of related parties to the Fund, are shown in the Statement of Operations.
Additionally, the Fund may invest in mutual funds, which are subject to management fees and other fees that may cause the costs of investing in mutual funds to be greater than the costs of owning the underlying securities directly. These indirect expenses of mutual funds are not included in the amounts shown as expenses in the Statement of Operations or in the expense ratios included in the Financial Highlights.
(F) Use of Estimates. In preparing financial statements in conformity with GAAP, the Manager makes estimates and assumptions that affect the reported amounts and disclosures in the financial statements. Actual results could differ from those estimates and assumptions.
| 34 | MainStay MacKay U.S. Infrastructure Bond Fund |
(G) Securities Lending. In order to realize additional income, the Fund may engage in securities lending, subject to the limitations set forth in the 1940 Act and relevant guidance by the staff of the Securities and Exchange Commission (“SEC”). If the Fund engages in securities lending, the Fund will lend through its custodian, JPMorgan Chase Bank, N.A., ("JPMorgan"), acting as securities lending agent on behalf of the Fund. Under the current arrangement, JPMorgan will manage the Fund's collateral in accordance with the securities lending agency agreement between the Fund and JPMorgan, and indemnify the Fund against counterparty risk. The loans will be collateralized by cash (which may be invested in a money market fund) and/or non-cash collateral (which may include U.S. Treasury securities and/or U.S. government agency securities issued or guaranteed by the United States government or its agencies or instrumentalities) at least equal at all times to the market value of the securities loaned. Non-cash collateral held at year end is segregated and cannot be transferred by the Fund. The Fund bears the risk of delay in recovery of, or loss of rights in, the securities loaned. The Fund may also record a realized gain or loss on securities deemed sold due to a borrower’s inability to return securities on loan. The Fund bears the risk of any loss on investment of cash collateral. The Fund will receive compensation for lending its securities in the form of fees or it will retain a portion of interest earned on the investment of any cash collateral. The Fund will also continue to receive interest and dividends on the securities loaned and any gain or loss in the market price of the securities loaned that may occur during the term of the loan will be for the account of the Fund. Income earned from securities lending activities, if any, is reflected in the Statement of Operations.
(H) Delayed Delivery Transactions. The Fund may purchase or sell securities on a delayed delivery basis. These transactions involve a commitment by the Fund to purchase or sell securities for a predetermined price or yield, with payment and delivery taking place beyond the customary settlement period. When delayed delivery purchases are outstanding, the Fund will designate liquid assets in an amount sufficient to meet the purchase price. When purchasing a security on a delayed delivery basis, the Fund assumes the rights and risks of ownership of the security, including the risk of price and yield fluctuations, and takes such fluctuations into account when determining its NAV. The Fund may dispose of or renegotiate a delayed delivery transaction after it is entered into, and may sell delayed delivery securities before they are delivered, which may result in a realized gain or loss. When the Fund has sold a security it owns on a delayed delivery basis, the Fund does not participate in future gains and losses with respect to the security.
(I) Government, Infrastructure Investment and Municipal Bond Risk. Investments in the Fund are not guaranteed, even though some of the Fund’s underlying investments are guaranteed by the U.S. government or its agencies or instrumentalities. The principal risk of mortgage-related and asset-backed securities is that the underlying debt may be prepaid ahead of schedule, if interest rates fall, thereby reducing the value of the Fund’s investment. If interest rates rise, less of the debt may be prepaid and the Fund may lose money because the Fund may be unable to invest in higher yielding assets. The Fund is subject to
interest-rate risk and can lose principal value when interest rates rise. Bonds are also subject to credit risk, in which the bond issuer may fail to pay interest and principal in a timely manner.
The Fund’s investments in infrastructure-related securities will expose the Fund to potential adverse economic, regulatory, political, legal and other changes affecting such investments. Issuers of securities in infrastructure-related businesses are subject to a variety of factors that may adversely affect their business or operations, including high interest costs in connection with capital construction programs, high leverage, costs associated with environmental or other regulations and the effects of economic slowdowns. Rising interest rates could lead to higher financing costs and reduced earnings for infrastructure companies.
Municipal bond risks include the inability of the issuer to repay the obligation, the relative lack of information about certain issuers, and the possibility of future tax and legislative changes, which could affect the market for and value of municipal securities.
Municipalities continue to experience political, economic and financial difficulties in the current economic environment. The ability of a municipal issuer to make payments and the value of municipal bonds can be affected by uncertainties in the municipal securities market. Such uncertainties could cause increased volatility in the municipal securities market and could negatively impact the Fund’s net asset value, and/or the distributions paid by the Fund.
(J) Indemnifications. Under the Trust’s organizational documents, its officers and trustees are indemnified against certain liabilities that may arise out of performance of their duties to the Trust. Additionally, in the normal course of business, the Fund enters into contracts with third-party service providers that contain a variety of representations and warranties and that may provide general indemnifications. The Fund's maximum exposure under these arrangements is unknown, as this would involve future claims that may be made against the Fund that have not yet occurred. The Manager believes that the risk of loss in connection with these potential indemnification obligations is remote. However, there can be no assurance that material liabilities related to such obligations will not arise in the future, which could adversely impact the Fund.
Note 3–Fees and Related Party Transactions
(A) Manager and Subadvisor. New York Life Investments, a registered investment adviser and an indirect, wholly-owned subsidiary of New York Life Insurance Company ("New York Life"), serves as the Fund's Manager, pursuant to an Amended and Restated Management Agreement ("Management Agreement"). The Manager provides offices, conducts clerical, recordkeeping and bookkeeping services and keeps most of the financial and accounting records required to be maintained by the Fund. Except for the portion of salaries and expenses that are the responsibility of the Fund, the Manager pays the salaries and expenses of all personnel affiliated with the Fund and certain operational expenses of the Fund. The Fund reimburses New York Life Investments in an amount equal to the portion of the compensation of the Chief Compliance Officer attributable
Notes to Financial Statements (Unaudited) (continued)
to the Fund. MacKay Shields LLC ("MacKay Shields" or the "Subadvisor"), a registered investment adviser and an indirect, wholly-owned subsidiary of New York Life, serves as the Subadvisor to the Fund and is responsible for the day-to-day portfolio management of the Fund. Pursuant to the terms of an Amended and Restated Subadvisory Agreement ("Subadvisory Agreement") between New York Life Investments and MacKay Shields, New York Life Investments pays for the services of the Subadvisor.
Pursuant to the Management Agreement, the Fund pays the Manager a monthly fee for the services performed and the facilities furnished at an annual rate of the Fund’s average daily net assets as follows: 0.50% up to $500 million; 0.475% from $500 million to $1 billion; and 0.45% in excess of $1 billion. During the six-month period ended April 30, 2024, the effective management fee rate was 0.49% of the Fund’s average daily net assets, exclusive of any applicable waivers/reimbursements.
New York Life Investments has contractually agreed to waive fees and/or reimburse expenses so that Total Annual Fund Operating Expenses (excluding taxes, interest, litigation, extraordinary expenses, brokerage and other transaction expenses relating to the purchase or sale of portfolio investments and acquired (underlying) fund fees and expenses) do not exceed the following percentages of daily net assets: Class A, 0.85% and Class R6, 0.53%. New York Life Investments will apply an equivalent waiver or reimbursement, in an equal number of basis points of basis points of the Class A shares waiver/ reimbursement to Investor Class, Class C and Class I shares. This agreement will remain in effect until February 28, 2025, and shall renew automatically for one-year terms unless New York Life Investments provides written notice of termination prior to the start of the next term or upon approval of the Board.
During the six-month period ended April 30, 2024, New York Life Investments earned fees from the Fund in the amount of $2,539,717 and waived fees and/or reimbursed expenses, including the waiver/reimbursement of certain class specific expenses in the amount of $445,687 and paid the Subadvisor fees in the amount of $1,047,015.
JPMorgan Chase Bank, N.A. ("JPMorgan") provides sub-administration and sub-accounting services to the Fund pursuant to an agreement with New York Life Investments. These services include calculating the daily NAVs of the Fund, maintaining the general ledger and sub-ledger accounts for the calculation of the Fund's NAVs, and assisting New York Life Investments in conducting various aspects of the Fund's administrative operations. For providing these services to the Fund, JPMorgan is compensated by New York Life Investments.
Pursuant to an agreement between the Trust and New York Life Investments, New York Life Investments is responsible for providing or procuring certain regulatory reporting services for the Fund. The Fund will reimburse New York Life Investments for the actual costs incurred by New York Life Investments in connection with providing or procuring these services for the Fund.
(B) Distribution and Service Fees. The Trust, on behalf of the Fund, has entered into a distribution agreement with NYLIFE Distributors LLC (the “Distributor”), an affiliate of New York Life Investments. The Fund has adopted distribution plans (the “Plans”) in accordance with the provisions of Rule 12b-1 under the 1940 Act.
Pursuant to the Class A and Investor Class Plans, the Distributor receives a monthly fee from the Class A and Investor Class shares at an annual rate of 0.25% of the average daily net assets of the Class A and Investor Class shares for distribution and/or service activities as designated by the Distributor. Pursuant to the Class B and Class C Plans, Class B and Class C shares pay the Distributor a monthly distribution fee at an annual rate of 0.75% of the average daily net assets of the Class B and Class C shares along with a service fee at an annual rate of 0.25% of the average daily net assets of the Class B and Class C shares, for a total 12b-1 fee of 1.00%. Class I and Class R6 shares are not subject to a distribution and/or service fee.
The Plans provide that the distribution and service fees are payable to the Distributor regardless of the amounts actually expended by the Distributor for distribution of the Fund's shares and service activities.
(C) Sales Charges. The Fund was advised by the Distributor that the amount of initial sales charges retained on sales of Class A and Investor Class shares during the six-month period ended April 30, 2024, were $2,747 and $191, respectively.
The Fund was also advised that the Distributor retained CDSCs on redemptions of Class A and Class C shares during the six-month period ended April 30, 2024, of $10,403 and $393, respectively.
(D) Transfer, Dividend Disbursing and Shareholder Servicing Agent. NYLIM Service Company LLC, an affiliate of New York Life Investments, is the Fund's transfer, dividend disbursing and shareholder servicing agent pursuant to an agreement between NYLIM Service Company LLC and the Trust. NYLIM Service Company LLC has entered into an agreement with SS&C Global Investor & Distribution Solutions, Inc. ("SS&C"), pursuant to which SS&C performs certain transfer agent services on behalf of NYLIM Service Company LLC. New York Life Investments has contractually agreed to limit the transfer agency expenses charged to the Fund’s share classes to a maximum of 0.35% of that share class’s average daily net assets on an annual basis after deducting any applicable Fund or class-level expense reimbursement or small account fees. This agreement will remain in effect until February 28, 2025, and shall renew automatically for one-year terms unless New York Life Investments provides written notice of termination prior to the start of the next term or upon approval of the Board. During the six-month period ended April 30, 2024, transfer agent expenses incurred by the Fund and any reimbursements, pursuant to the
| 36 | MainStay MacKay U.S. Infrastructure Bond Fund |
aforementioned Transfer Agency expense limitation agreement, were as follows:
| Class | Expense | Waived |
| Class A | $ 72,497 | $ — |
| Investor Class | 35,941 | (7,496) |
| Class B* | 386 | (72) |
| Class C | 15,323 | (3,257) |
| Class I | 622,715 | — |
| Class R6 | 4,488 | — |
| * | Effective at the close of business on February 20, 2024, all outstanding Class B shares converted into Class A or Investor Class shares pursuant to the applicable conversion schedule . |
(E) Small Account Fee. Shareholders with small accounts adversely impact the cost of providing transfer agency services. In an effort to reduce total transfer agency expenses, the Fund has implemented a small account fee on certain types of accounts. As described in the Fund's prospectus, certain shareholders with an account balance of less than $1,000 ($5,000 for Class A share accounts) are charged an annual per account fee of $20 (assessed semi-annually), the proceeds from which offset transfer agent fees as reflected in the Statement of Operations. This small account fee will not apply to certain types of accounts as described further in the Fund’s prospectus.
(F) Capital. As of April 30, 2024, New York Life and its affiliates beneficially held shares of the Fund with the values and percentages of net assets as follows:
| ‡ | Less than one-tenth of a percent. |
Note 4-Federal Income Tax
As of April 30, 2024, the cost and unrealized appreciation (depreciation) of the Fund’s investment portfolio, including applicable derivative contracts and other financial instruments, as determined on a federal income tax basis, were as follows:
| | Federal Tax
Cost | Gross
Unrealized
Appreciation | Gross
Unrealized
(Depreciation) | Net
Unrealized
Appreciation/
(Depreciation) |
| Investments in Securities | $1,126,205,861 | $5,973,476 | $(11,249,056) | $(5,275,580) |
As of October 31, 2023, for federal income tax purposes, capital loss carryforwards of $90,426,252, as shown in the table below, were available to the extent provided by the regulations to offset future realized gains of the Fund. Accordingly, no capital gains distributions are expected
to be paid to shareholders until net gains have been realized in excess of such amounts.
Capital Loss
Available Through | Short-Term
Capital Loss
Amounts (000’s) | Long-Term
Capital Loss
Amounts (000’s) |
| Unlimited | $53,934 | $36,492 |
During the year ended October 31, 2023, the tax character of distributions paid as reflected in the Statements of Changes in Net Assets was as follows:
| | 2023 |
| Distributions paid from: | |
| Ordinary Income | $29,267,158 |
Note 5–Custodian
JPMorgan is the custodian of cash and securities held by the Fund. Custodial fees are charged to the Fund based on the Fund's net assets and/or the market value of securities held by the Fund and the number of certain transactions incurred by the Fund.
Note 6–Line of Credit
The Fund and certain other funds managed by New York Life Investments maintain a line of credit with a syndicate of banks in order to secure a source of funds for temporary purposes to meet unanticipated or excessive redemption requests.
Effective July 25, 2023, under the credit agreement (the “Credit Agreement”), the aggregate commitment amount is $600,000,000 with an additional uncommitted amount of $100,000,000. The commitment fee is an annual rate of 0.15% of the average commitment amount payable quarterly, regardless of usage, to JPMorgan, who serves as the agent to the syndicate. The commitment fee is allocated among the Fund and certain other funds managed by New York Life Investments based upon their respective net assets and other factors. Interest on any revolving credit loan is charged based upon the Federal Funds Rate, Daily Simple Secured Overnight Financing Rate ("SOFR") + 0.10%, or the Overnight Bank Funding Rate, whichever is higher. The Credit Agreement expires on July 23, 2024, although the Fund, certain other funds managed by New York Life Investments and the syndicate of banks may renew the Credit Agreement for an additional year on the same or different terms or enter into a credit agreement with a different syndicate of banks. Prior to July 25, 2023, the aggregate commitment amount and the commitment fee were the same as those under the current Credit Agreement. During the six-month period ended April 30, 2024, there were no borrowings made or outstanding with respect to the Fund under the Credit Agreement.
Notes to Financial Statements (Unaudited) (continued)
Note 7–Interfund Lending Program
Pursuant to an exemptive order issued by the SEC, the Fund, along with certain other funds managed by New York Life Investments, may participate in an interfund lending program. The interfund lending program provides an alternative credit facility that permits the Fund and certain other funds managed by New York Life Investments to lend or borrow money for temporary purposes directly to or from one another, subject to the conditions of the exemptive order. During the six-month period ended April 30, 2024, there were no interfund loans made or outstanding with respect to the Fund.
Note 8–Purchases and Sales of Securities (in 000’s)
During the six-month period ended April 30, 2024, purchases and sales of securities, other than short-term securities, were $681,637 and $482,853, respectively.
Note 9–Capital Share Transactions
Transactions in capital shares for the six-month period ended April 30, 2024 and the year ended October 31, 2023, were as follows:
| Class A | Shares | Amount |
| Six-month period ended April 30, 2024: | | |
| Shares sold | 2,349,339 | $ 17,428,093 |
| Shares issued to shareholders in reinvestment of distributions | 219,408 | 1,626,732 |
| Shares redeemed | (1,941,683) | (14,355,840) |
| Net increase (decrease) in shares outstanding before conversion | 627,064 | 4,698,985 |
| Shares converted into Class A (See Note 1) | 80,391 | 597,208 |
| Shares converted from Class A (See Note 1) | (12,421) | (92,409) |
| Net increase (decrease) | 695,034 | $ 5,203,784 |
| Year ended October 31, 2023: | | |
| Shares sold | 3,242,640 | $ 24,038,951 |
| Shares issued to shareholders in reinvestment of distributions | 392,218 | 2,894,696 |
| Shares redeemed | (3,218,969) | (23,728,902) |
| Net increase (decrease) in shares outstanding before conversion | 415,889 | 3,204,745 |
| Shares converted into Class A (See Note 1) | 108,943 | 809,230 |
| Shares converted from Class A (See Note 1) | (6,067) | (46,047) |
| Net increase (decrease) | 518,765 | $ 3,967,928 |
| |
| Investor Class | Shares | Amount |
| Six-month period ended April 30, 2024: | | |
| Shares sold | 16,750 | $ 123,770 |
| Shares issued to shareholders in reinvestment of distributions | 34,594 | 257,577 |
| Shares redeemed | (92,907) | (690,361) |
| Net increase (decrease) in shares outstanding before conversion | (41,563) | (309,014) |
| Shares converted into Investor Class (See Note 1) | 18,656 | 138,737 |
| Shares converted from Investor Class (See Note 1) | (37,875) | (282,879) |
| Net increase (decrease) | (60,782) | $ (453,156) |
| Year ended October 31, 2023: | | |
| Shares sold | 58,734 | $ 439,185 |
| Shares issued to shareholders in reinvestment of distributions | 68,232 | 506,179 |
| Shares redeemed | (190,031) | (1,411,925) |
| Net increase (decrease) in shares outstanding before conversion | (63,065) | (466,561) |
| Shares converted into Investor Class (See Note 1) | 31,293 | 231,512 |
| Shares converted from Investor Class (See Note 1) | (60,321) | (451,493) |
| Net increase (decrease) | (92,093) | $ (686,542) |
| |
| Class B | Shares | Amount |
| Six-month period ended April 30, 2024: (a) | | |
| Shares sold | 8 | $ 117 |
| Shares issued to shareholders in reinvestment of distributions | 286 | 2,128 |
| Shares redeemed | (2,259) | (16,753) |
| Net increase (decrease) in shares outstanding before conversion | (1,965) | (14,508) |
| Shares converted from Class B (See Note 1) | (39,576) | (292,914) |
| Net increase (decrease) | (41,541) | $ (307,422) |
| Year ended October 31, 2023: | | |
| Shares sold | 48 | $ 459 |
| Shares issued to shareholders in reinvestment of distributions | 1,862 | 13,788 |
| Shares redeemed | (7,935) | (58,774) |
| Net increase (decrease) in shares outstanding before conversion | (6,025) | (44,527) |
| Shares converted from Class B (See Note 1) | (38,870) | (286,065) |
| Net increase (decrease) | (44,895) | $ (330,592) |
| |
| 38 | MainStay MacKay U.S. Infrastructure Bond Fund |
| Class C | Shares | Amount |
| Six-month period ended April 30, 2024: | | |
| Shares sold | 277,070 | $ 2,041,649 |
| Shares issued to shareholders in reinvestment of distributions | 11,488 | 85,125 |
| Shares redeemed | (161,302) | (1,184,059) |
| Net increase (decrease) in shares outstanding before conversion | 127,256 | 942,715 |
| Shares converted from Class C (See Note 1) | (21,507) | (160,152) |
| Net increase (decrease) | 105,749 | $ 782,563 |
| Year ended October 31, 2023: | | |
| Shares sold | 259,903 | $ 1,923,254 |
| Shares issued to shareholders in reinvestment of distributions | 22,463 | 165,942 |
| Shares redeemed | (568,869) | (4,205,610) |
| Net increase (decrease) in shares outstanding before conversion | (286,503) | (2,116,414) |
| Shares converted from Class C (See Note 1) | (21,091) | (155,454) |
| Net increase (decrease) | (307,594) | $ (2,271,868) |
| |
| Class I | Shares | Amount |
| Six-month period ended April 30, 2024: | | |
| Shares sold | 36,429,106 | $ 272,599,114 |
| Shares issued to shareholders in reinvestment of distributions | 1,933,924 | 14,493,297 |
| Shares redeemed | (30,821,880) | (230,389,691) |
| Net increase (decrease) in shares outstanding before conversion | 7,541,150 | 56,702,720 |
| Shares converted into Class I (See Note 1) | 12,288 | 92,409 |
| Net increase (decrease) | 7,553,438 | $ 56,795,129 |
| Year ended October 31, 2023: | | |
| Shares sold | 78,116,291 | $ 585,268,003 |
| Shares issued to shareholders in reinvestment of distributions | 2,482,267 | 18,466,059 |
| Shares redeemed | (25,920,656) | (193,052,091) |
| Net increase (decrease) in shares outstanding before conversion | 54,677,902 | 410,681,971 |
| Shares converted into Class I (See Note 1) | 5,996 | 46,047 |
| Net increase (decrease) | 54,683,898 | $ 410,728,018 |
| |
| Class R6 | Shares | Amount |
| Six-month period ended April 30, 2024: | | |
| Shares sold | 23,048,826 | $ 171,950,715 |
| Shares issued to shareholders in reinvestment of distributions | 267,252 | 2,004,971 |
| Shares redeemed | (3,126,790) | (23,283,313) |
| Net increase (decrease) | 20,189,288 | $ 150,672,373 |
| Year ended October 31, 2023: | | |
| Shares sold | 8,280,249 | $ 61,358,811 |
| Shares issued to shareholders in reinvestment of distributions | 24,490 | 182,987 |
| Shares redeemed | (5,666,639) | (42,148,965) |
| Net increase (decrease) in shares outstanding before conversion | 2,638,100 | 19,392,833 |
| Shares converted from Class R6 (See Note 1) | (19,584) | (147,730) |
| Net increase (decrease) | 2,618,516 | $ 19,245,103 |
| (a) | Class B shares converted into Class A or Investor Class shares pursuant to the applicable conversion schedule and are no longer offered for sale as of February 20, 2024. |
Note 10–Other Matters
As of the date of this report, the Fund faces a heightened level of risk associated with current uncertainty, volatility and state of economies, financial markets, a high interest rate environment, and labor and health conditions around the world. Events such as war, acts of terrorism, recessions, rapid inflation, the imposition of economic sanctions, earthquakes, hurricanes, epidemics and pandemics and other unforeseen natural or human disasters may have broad adverse social, political and economic effects on the global economy, which could negatively impact the value of the Fund's investments. Developments that disrupt global economies and financial markets may magnify factors that affect the Fund's performance.
Note 11–Subsequent Events
In connection with the preparation of the financial statements of the Fund as of and for the six-month period ended April 30, 2024, events and transactions subsequent to April 30, 2024, through the date the financial statements were issued, have been evaluated by the Manager for possible adjustment and/or disclosure. No subsequent events requiring financial statement adjustment or disclosure have been identified.
Board Consideration and Approval of Management Agreement and Subadvisory Agreement (Unaudited)
The continuation of the Management Agreement with respect to the MainStay MacKay U.S. Infrastructure Bond Fund (“Fund”) and New York Life Investment Management LLC (“New York Life Investments”) and the Subadvisory Agreement between New York Life Investments and MacKay Shields LLC (“MacKay”) with respect to the Fund (together, “Advisory Agreements”) is subject to annual review and approval by the Board of Trustees of The MainStay Funds (“Board” of the “Trust”) in accordance with Section 15 of the Investment Company Act of 1940, as amended (“1940 Act”). At its December 6–7, 2023 meeting, the Board, including the Trustees who are not an “interested person” (as such term is defined in the 1940 Act) of the Trust (“Independent Trustees”) voting separately, unanimously approved the continuation of each of the Advisory Agreements for a one-year period.
In reaching the decision to approve the continuation of each of the Advisory Agreements, the Board considered information and materials furnished by New York Life Investments and MacKay in connection with an annual contract review process undertaken by the Board that took place at meetings of the Board and its Contracts Committee from September 2023 through December 2023, including information and materials furnished by New York Life Investments and MacKay in response to requests prepared on behalf of the Board, and in consultation with the Independent Trustees, by independent legal counsel to the Independent Trustees, which encompassed a variety of topics, including those summarized below. Information and materials requested by and furnished to the Board for consideration in connection with the contract review process included, among other items, reports on the Fund and “peer funds” prepared by Institutional Shareholder Services Inc. (“ISS”), an independent third-party service provider engaged by the Board to report objectively on the Fund’s investment performance, management fee and total expenses. The Board also considered information on the fees charged to other investment advisory clients of New York Life Investments and/or MacKay that follow investment strategies similar to those of the Fund, if any, and, when applicable, the rationale for differences in the Fund’s management and subadvisory fees and the fees charged to those other investment advisory clients. In addition, the Board considered information regarding the legal standards and fiduciary obligations applicable to its consideration of the continuation of each of the Advisory Agreements. The contract review process, including the structure and format for information and materials provided to the Board, has been developed in consultation with the Board. The Independent Trustees also met in executive sessions with their independent legal counsel and, for portions thereof, with senior management of New York Life Investments.
The Board’s deliberations with respect to the continuation of each of the Advisory Agreements reflect a year-long process, and the Board also took into account information furnished to the Board and its Committees throughout the year, as deemed relevant and appropriate by the Trustees, including, among other items, reports on investment performance of the Fund and investment-related matters for the Fund as well as presentations from New York Life Investments and, generally annually, MacKay personnel. In addition, the Board took into account other
information provided by New York Life Investments throughout the year, including, among other items, periodic reports on legal and compliance matters, risk management, portfolio turnover, brokerage commissions and non-advisory services provided to the Fund by New York Life Investments, as deemed relevant and appropriate by the Trustees.
In addition to information provided to the Board throughout the year, the Board received information in connection with its June 2023 meeting provided specifically in response to requests prepared on behalf of the Board, and in consultation with the Independent Trustees, by independent legal counsel to the Independent Trustees regarding the Fund’s distribution arrangements. In addition, the Board received information regarding the Fund’s asset levels, share purchase and redemption activity and the payment of Rule 12b-1 and/or certain other fees by the applicable share classes of the Fund, among other information.
In considering the continuation of each of the Advisory Agreements, the Trustees reviewed and evaluated the information and factors they believed to reasonably be necessary and appropriate in light of legal advice furnished to them by independent legal counsel to the Independent Trustees and through the exercise of their own business judgment. Although individual Trustees may have weighed certain factors or information differently and the Board did not consider any single factor or information controlling in reaching its decision, the factors that figured prominently in the Board’s consideration of the continuation of each of the Advisory Agreements are summarized in more detail below and include, among other factors: (i) the nature, extent and quality of the services provided to the Fund by New York Life Investments and MacKay; (ii) the qualifications of the portfolio managers of the Fund and the historical investment performance of the Fund, New York Life Investments and MacKay; (iii) the costs of the services provided, and profits realized, by New York Life Investments and MacKay with respect to their relationships with the Fund; (iv) the extent to which economies of scale have been realized or may be realized if the Fund grows and the extent to which any economies of scale have been shared, have benefited or may benefit the Fund’s shareholders; and (v) the reasonableness of the Fund’s management and subadvisory fees and total ordinary operating expenses. Although the Board recognized that comparisons between the Fund’s fees and expenses and those of other funds are imprecise given different terms of agreements, variations in fund strategies and other factors, the Board considered the reasonableness of the Fund’s management fee and total ordinary operating expenses as compared to the peer funds identified by ISS. Throughout their considerations, the Trustees acknowledged the commitment of New York Life Investments and its affiliates to serve the MainStay Group of Funds, as well as their capacity, experience, resources, financial stability and reputations. The Trustees also acknowledged the entrepreneurial and other risks assumed by New York Life Investments in sponsoring and managing the Fund. With respect to the Subadvisory Agreement, the Board took into account New York Life Investments’ recommendation to approve the continuation of the Subadvisory Agreement.
| 40 | MainStay MacKay U.S. Infrastructure Bond Fund |
The Trustees noted that, throughout the year, the Trustees are afforded an opportunity to ask questions of, and request additional information or materials from, New York Life Investments and MacKay. The Board’s decision with respect to each of the Advisory Agreements may have also been based, in part, on the Board’s knowledge of New York Life Investments and MacKay resulting from, among other things, the Board’s consideration of each of the Advisory Agreements in prior years, the advisory agreements for other funds in the MainStay Group of Funds, the Board’s review throughout the year of the performance and operations of other funds in the MainStay Group of Funds and each Trustee’s business judgment and industry experience. In addition to considering the above-referenced factors, the Board observed that in the marketplace there are a range of investment options available to investors and that the Fund’s shareholders, having had the opportunity to consider other investment options, have invested in the Fund.
The factors that figured prominently in the Board’s decision to approve the continuation of each of the Advisory Agreements during the Board’s December 6–7, 2023 meeting are summarized in more detail below.
Nature, Extent and Quality of Services Provided by New York Life Investments and MacKay
The Board examined the nature, extent and quality of the services that New York Life Investments provides to the Fund. The Board evaluated New York Life Investments’ experience and capabilities in serving as manager of the Fund and considered that the Fund operates in a “manager-of-managers” structure. The Board also considered New York Life Investments’ responsibilities and services provided pursuant to this structure, including overseeing the services provided by MacKay, evaluating the performance of MacKay, making recommendations to the Board as to whether the Subadvisory Agreement should be renewed, modified or terminated and periodically reporting to the Board regarding the results of New York Life Investments’ evaluation and monitoring functions. The Board noted that New York Life Investments manages other mutual funds, serves a variety of other investment advisory clients, including other pooled investment vehicles, and has experience overseeing mutual fund service providers, including subadvisors. The Board considered the experience of senior personnel at New York Life Investments providing management and administrative and other non-advisory services to the Fund. The Board observed that New York Life Investments devotes significant resources and time to providing management and administrative and other non-advisory services to the Fund, including New York Life Investments’ oversight and due diligence reviews of MacKay and ongoing analysis of, and interactions with, MacKay with respect to, among other things, the Fund’s investment performance and risks as well as MacKay’s investment capabilities and subadvisory services with respect to the Fund.
The Board also considered the range of services that New York Life Investments provides to the Fund under the terms of the Management Agreement, including: (i) fund accounting and ongoing supervisory services provided by New York Life Investments’ Fund Administration and Accounting Group; (ii) investment supervisory and analytical services
provided by New York Life Investments’ Investment Consulting Group; (iii) compliance services provided by the Trust’s Chief Compliance Officer as well as New York Life Investments’ compliance department, including supervision and implementation of the Fund’s compliance program; (iv) legal services provided by New York Life Investments’ Office of the General Counsel; and (v) risk management monitoring and analysis by compliance and investment personnel. In addition, the Board considered New York Life Investments’ willingness to invest in personnel and other resources, such as cyber security, information security and business continuity planning, that may benefit the Fund and noted that New York Life Investments is responsible for compensating the Trust’s officers, except for a portion of the salary of the Trust’s Chief Compliance Officer. The Board recognized that New York Life Investments provides certain other non-advisory services to the Fund and has over time provided an increasingly broad array of non-advisory services to the MainStay Group of Funds as a result of regulatory and other developments.
The Board also examined the range, and the nature, extent and quality, of the investment advisory services that MacKay provides to the Fund and considered the terms of each of the Advisory Agreements. The Board evaluated MacKay’s experience and performance in serving as subadvisor to the Fund and advising other portfolios and MacKay’s track record and experience in providing investment advisory services as well as the experience of investment advisory, senior management and/or administrative personnel at MacKay. The Board considered New York Life Investments’ and MacKay’s overall resources, legal and compliance environment, capabilities, reputation, financial condition and history. In addition to information provided in connection with quarterly meetings with the Trust’s Chief Compliance Officer, the Board considered information regarding the compliance policies and procedures of New York Life Investments and MacKay and acknowledged their commitment to further developing and strengthening compliance programs that may relate to the Fund. The Board also considered MacKay’s ability to recruit and retain qualified investment professionals and willingness to invest in personnel and other resources that may benefit the Fund. In this regard, the Board considered the qualifications and experience of the Fund’s portfolio managers, the number of accounts managed by the portfolio managers and the method for compensating the portfolio managers.
In addition, the Board considered information provided by New York Life Investments and MacKay regarding their respective business continuity and disaster recovery plans.
Based on these considerations, among others, the Board concluded that the Fund would likely continue to benefit from the nature, extent and quality of these services.
Investment Performance
In evaluating the Fund’s investment performance, the Board considered investment performance results over various periods in light of the Fund’s investment objective, strategies and risks. The Board considered investment reports on, and analysis of, the Fund’s performance provided to the Board throughout the year. These reports include, among other
Board Consideration and Approval of Management Agreement and Subadvisory Agreement (Unaudited) (continued)
items, information on the Fund’s gross and net returns, the Fund’s investment performance compared to a relevant investment category and the Fund’s benchmarks, the Fund’s risk-adjusted investment performance and the Fund’s investment performance as compared to peer funds, as appropriate, as well as portfolio attribution information and commentary on the effect of market conditions. The Board also considered information provided by ISS showing the investment performance of the Fund as compared to peer funds. In addition, the Board reviewed the methodology used by ISS to construct the group of peer funds for comparative purposes.
The Board also took into account its discussions with senior management at New York Life Investments concerning the Fund’s investment performance over various periods as well as discussions between representatives of MacKay and the members of the Board’s Investment Committee, which generally occur on an annual basis.
Based on these considerations, among others, the Board concluded that its review of the Fund’s investment performance and related information supported a determination to approve the continuation of each of the Advisory Agreements.
Costs of the Services Provided, and Profits and Other Benefits Realized, by New York Life Investments and MacKay
The Board considered the costs of the services provided under each of the Advisory Agreements. The Board also considered the profitability of New York Life Investments and its affiliates, including MacKay, due to their relationships with the Fund as well as of New York Life Investments and its affiliates due to their relationships with the MainStay Group of Funds. Because MacKay is an affiliate of New York Life Investments whose subadvisory fee is paid by New York Life Investments, not the Fund, the Board considered cost and profitability information for New York Life Investments and MacKay in the aggregate.
In addition, the Board acknowledged the difficulty in obtaining reliable comparative data about mutual fund managers’ profitability because such information generally is not publicly available and may be impacted by numerous factors, including the structure of a fund manager’s organization, the types of funds it manages, the methodology used to allocate certain fixed costs to specific funds and the manager’s capital structure and costs of capital.
In evaluating the costs of the services provided by New York Life Investments and MacKay, and profitability of New York Life Investments and its affiliates, including MacKay, due to their relationships with the Fund, the Board considered, among other factors, New York Life Investments’ and its affiliates’, including MacKay’s, continuing investments in, or willingness to invest in, personnel and other resources that may support and further enhance the management of the Fund, and that New York Life Investments is responsible for paying the subadvisory fee for the Fund. The Board also considered the financial resources of New York Life Investments and MacKay and acknowledged that New York Life Investments and MacKay must be in a position to recruit and retain experienced professional personnel and to maintain a strong financial
position for New York Life Investments and MacKay to continue to provide high-quality services to the Fund. The Board recognized that the Fund benefits from the allocation of certain fixed costs among the funds in the MainStay Group of Funds, among other expected benefits resulting from its relationship with New York Life Investments.
The Board considered information regarding New York Life Investments’ methodology for calculating profitability and allocating costs provided by New York Life Investments in connection with the fund profitability analysis presented to the Board. The Board concluded that New York Life Investments’ methods for allocating costs and procedures for estimating overall profitability of the relationship with the funds in the MainStay Group of Funds were reasonable. The Board recognized the difficulty in calculating and evaluating a manager’s profitability with respect to the Fund and considered that other profitability methodologies may also be reasonable.
The Board also considered certain fall-out benefits that may be realized by New York Life Investments and its affiliates, including MacKay, due to their relationships with the Fund, including reputational and other indirect benefits. The Board recognized, for example, the benefits to MacKay from legally permitted “soft-dollar” arrangements by which brokers provide research and other services to MacKay in exchange for commissions paid by the Fund with respect to trades in the Fund’s portfolio securities.] In addition, the Board considered its review of the management agreement for a money market fund advised by New York Life Investments and an affiliated subadvisor that serves as an investment option for the Fund, including the potential rationale for and costs associated with investments in this money market fund by the Fund, if any, and considered information from New York Life Investments that the nature and type of specific investment advisory services provided to this money market fund are distinct from, or in addition to, the investment advisory services provided to the Fund.
The Board observed that, in addition to fees earned by New York Life Investments under the Management Agreement for managing the Fund, New York Life Investments’ affiliates also earn revenues from serving the Fund in various other capacities, including as the Fund’s transfer agent and distributor. The Board considered information about these other revenues and their impact on the profitability of the relationship with the Fund to New York Life Investments and its affiliates. The Board noted that, although it assessed the overall profitability of the relationship with the Fund to New York Life Investments and its affiliates as part of the contract review process, when considering the reasonableness of the fee paid to New York Life Investments under the Management Agreement, the Board considered the profitability of New York Life Investments’ relationship with the Fund on a pre-tax basis and without regard to distribution expenses incurred by New York Life Investments from its own resources.
| 42 | MainStay MacKay U.S. Infrastructure Bond Fund |
After evaluating the information deemed relevant by the Trustees, the Board concluded that any profits realized by New York Life Investments and its affiliates, including MacKay, due to their relationships with the Fund were not excessive and other expected benefits that may accrue to New York Life Investments and its affiliates, including MacKay, are reasonable.
Management and Subadvisory Fees and Total Ordinary Operating Expenses
The Board evaluated the reasonableness of the fee paid under each of the Advisory Agreements and the Fund’s total ordinary operating expenses. With respect to the management fee and subadvisory fee, the Board primarily considered the reasonableness of the management fee paid by the Fund to New York Life Investments because the subadvisory fee paid to MacKay is paid by New York Life Investments, not the Fund. The Board also considered the reasonableness of the subadvisory fee paid by New York Life Investments and the amount of the management fee retained by New York Life Investments.
In assessing the reasonableness of the Fund’s fees and expenses, the Board primarily considered comparative data provided by ISS on the fees and expenses of similar mutual funds managed by other investment advisers. The Board reviewed the methodology used by ISS to construct the group of peer funds for comparative purposes. In addition, the Board considered information provided by New York Life Investments and MacKay on fees charged to other investment advisory clients, including institutional separate accounts and/or other funds, that follow investment strategies similar to those of the Fund, if any. The Board considered the contractual management fee schedule for the Fund as compared to those for such other investment advisory clients, taking into account the rationale for differences in fee schedules. The Board also took into account information provided by New York Life Investments about the more extensive scope of services provided to registered investment companies, such as the Fund, as compared with other investment advisory clients. Additionally, the Board considered the impact of contractual breakpoints, and voluntary waivers and expense limitation arrangements on the Fund’s net management fee and expenses. The Board also considered that in proposing fees for the Fund, New York Life Investments considers the competitive marketplace for mutual funds.
The Board took into account information from New York Life Investments, as provided in connection with the Board’s June 2023 meeting, regarding the reasonableness of the Fund’s transfer agent fee schedule, including industry data demonstrating that the fees that NYLIM Service Company LLC, an affiliate of New York Life Investments and the Fund’s transfer agent, charges the Fund are within the range of fees charged by transfer agents to other mutual funds. In addition, the Board considered NYLIM Service Company LLC’s profitability in connection with the transfer agent services it provides to the Fund. The Board also took into account information provided by NYLIM Service Company LLC regarding the sub-transfer agency payments it made to intermediaries in connection with the provision of sub-transfer agency services to the Fund.
The Board considered the extent to which transfer agent fees contributed to the total expenses of the Fund. The Board acknowledged the role that the MainStay Group of Funds historically has played in serving the investment needs of New York Life Insurance Company customers, who often maintain smaller account balances than other shareholders of funds, and the impact of small accounts on the expense ratios of Fund share classes. The Board also recognized measures that it and New York Life Investments have taken that are intended to mitigate the effect of small accounts on the expense ratios of Fund share classes, including through the imposition of an expense limitation on net transfer agency expenses. The Board also considered that NYLIM Service Company LLC had waived its contractual cost of living adjustments during certain years.
Based on the factors outlined above, among other considerations, the Board concluded that the Fund’s management fee and total ordinary operating expenses are within a range that is competitive and support a conclusion that these fees and expenses are reasonable.
Economies of Scale
The Board considered information regarding economies of scale, including whether economies of scale may exist with respect to the Fund and whether the Fund’s management fee and expense structure permits any economies of scale to be appropriately shared with the Fund’s shareholders. The Board also considered a report from New York Life Investments, previously prepared at the request of the Board, that addressed economies of scale, including with respect to the mutual fund business generally, and the various ways in which the benefits of economies of scale may be shared with the funds in the MainStay Group of Funds. Although the Board recognized the difficulty of determining economies of scale with precision, the Board acknowledged that economies of scale may be shared with the Fund in a number of ways, including, for example, through the imposition of fee breakpoints, initially setting management fee rates at scale or making additional investments to enhance the services provided to the Fund. The Board reviewed information from New York Life Investments showing how the Fund’s management fee schedule compared to fee schedules of other funds and accounts managed by New York Life Investments. The Board also reviewed information from ISS showing how the Fund’s management fee schedule compared with fees paid for similar services by peer funds at varying asset levels.
Based on this information, the Board concluded that economies of scale are appropriately shared for the benefit of the Fund’s shareholders through the Fund’s management fee and expense structure and other methods to share benefits from economies of scale.
Conclusion
On the basis of the information and factors summarized above, among other information and factors deemed relevant by the Trustees, and the evaluation thereof, the Board, including the Independent Trustees voting separately, unanimously voted to approve the continuation of each of the Advisory Agreements.
Discussion of the Operation and Effectiveness of the Fund's Liquidity Risk Management Program (Unaudited)
In compliance with Rule 22e-4 under the Investment Company Act of 1940, as amended (the “Liquidity Rule”), the Fund has adopted and implemented a liquidity risk management program (the “Program”), which New York Life Investment Management LLC believes is reasonably designed to assess and manage the Fund's liquidity risk. A Fund's liquidity risk is the risk that the Fund could not meet requests to redeem shares issued by the Fund without significant dilution of the remaining investors’ interests in the Fund. The Board of Trustees of The MainStay Funds (the "Board") previously approved the designation of New York Life Investment Management LLC as administrator of the Program (the “Administrator”). The Administrator has established a Liquidity Risk Management Committee to assist the Administrator in the implementation and day-to-day administration of the Program and to otherwise support the Administrator in fulfilling its responsibilities under the Program.
At a meeting of the Board held on February 27, 2024, the Administrator provided the Board with a written report addressing the Program’s operation and assessing the adequacy and effectiveness of its implementation for the period from January 1, 2023, through December 31, 2023 (the "Review Period"), as required under the Liquidity Rule. The report noted that the Administrator concluded that (i) the Program operated effectively to assess and manage the Fund's liquidity risk, (ii) the Program has been and continues to be adequately and effectively implemented to monitor and, as applicable, respond to the Fund's liquidity developments and (iii) the Fund's investment strategy continues to be appropriate for an open-end fund. In addition, the report summarized the operation of the Program and the information and factors considered by the Administrator in its assessment of the Program’s implementation, such as the liquidity risk assessment framework and the liquidity classification methodologies, and discussed notable geopolitical, market and other economic events that impacted liquidity risk during the Review Period.
In accordance with the Program, the Fund's liquidity risk is assessed no less frequently than annually taking into consideration certain factors, as applicable, such as (i) investment strategy and liquidity of portfolio investments, (ii) short-term and long-term cash flow projections, and (iii) holdings of cash and cash equivalents, as well as borrowing arrangements and other funding sources. Certain factors are considered under both normal and reasonably foreseeable stressed conditions.
Each Fund portfolio investment is classified into one of four liquidity categories. The classification is based on a determination of the number of days it is reasonably expected to take to convert the investment into cash, or sell or dispose of the investment, in current market conditions without significantly changing the market value of the investment. The Administrator has delegated liquidity classification determinations to the Fund’s subadvisor, subject to appropriate oversight by the Administrator, and liquidity classification determinations are made by taking into account the Fund's reasonably anticipated trade size, various market, trading and investment-specific considerations, as well as market depth, and, in certain cases, third-party vendor data.
The Liquidity Rule requires funds that do not primarily hold assets that are highly liquid investments to adopt a minimum amount of net assets that must be invested in highly liquid investments that are assets (an “HLIM”). In addition, the Liquidity Rule limits a fund's investments in illiquid investments. Specifically, the Liquidity Rule prohibits acquisition of illiquid investments if, immediately after acquisition, doing so would result in a fund holding more than 15% of its net assets in illiquid investments that are assets. The Program includes provisions reasonably designed to determine, periodically review and comply with the HLIM requirement, as applicable, and to comply with the 15% limit on illiquid investments.
There can be no assurance that the Program will achieve its objectives under all circumstances in the future. Please refer to the Fund's prospectus for more information regarding the Fund's exposure to liquidity risk and other risks to which it may be subject.
| 44 | MainStay MacKay U.S. Infrastructure Bond Fund |
Proxy Voting Policies and Procedures and Proxy Voting Record
The Fund is required to file with the SEC its proxy voting record for the 12-month period ending June 30 on Form N-PX. A description of the policies and procedures that are used to vote proxies relating to portfolio securities of the Fund is available free of charge upon request by calling 800-624-6782 or visiting the SEC’s website at www.sec.gov. The most recent Form N-PX or proxy voting record is available free of charge upon request by calling 800-624-6782; visiting newyorklifeinvestments.com; or visiting the SEC’s website at www.sec.gov.
Shareholder Reports and Quarterly Portfolio Disclosure
The Fund is required to file its complete schedule of portfolio holdings with the SEC 60 days after its first and third fiscal quarter on Form N-PORT. The Fund's holdings report is available free of charge upon request by calling New York Life Investments at 800-624-6782.
This page intentionally left blank.
Equity
U.S. Equity
MainStay Epoch U.S. Equity Yield Fund
MainStay Fiera SMID Growth Fund
MainStay PineStone U.S. Equity Fund
MainStay S&P 500 Index Fund
MainStay Winslow Large Cap Growth Fund
MainStay WMC Enduring Capital Fund
MainStay WMC Growth Fund
MainStay WMC Small Companies Fund
MainStay WMC Value Fund
International Equity
MainStay Epoch International Choice Fund
MainStay PineStone International Equity Fund
MainStay WMC International Research Equity Fund
Emerging Markets Equity
MainStay Candriam Emerging Markets Equity Fund
Global Equity
MainStay Epoch Capital Growth Fund
MainStay Epoch Global Equity Yield Fund
MainStay PineStone Global Equity Fund
Fixed Income
Taxable Income
MainStay Candriam Emerging Markets Debt Fund
MainStay Floating Rate Fund
MainStay MacKay High Yield Corporate Bond Fund
MainStay MacKay Short Duration High Income Fund
MainStay MacKay Strategic Bond Fund
MainStay MacKay Total Return Bond Fund
MainStay MacKay U.S. Infrastructure Bond Fund
MainStay Short Term Bond Fund
Tax-Exempt Income
MainStay MacKay Arizona Muni Fund
MainStay MacKay California Tax Free Opportunities Fund1
MainStay MacKay Colorado Muni Fund
MainStay MacKay High Yield Municipal Bond Fund
MainStay MacKay New York Tax Free Opportunities Fund2
MainStay MacKay Oregon Muni Fund
MainStay MacKay Short Term Municipal Fund
MainStay MacKay Strategic Municipal Allocation Fund
MainStay MacKay Tax Free Bond Fund
MainStay MacKay Utah Muni Fund
Money Market
MainStay Money Market Fund
Mixed Asset
MainStay Balanced Fund
MainStay Income Builder Fund
MainStay MacKay Convertible Fund
Speciality
MainStay CBRE Global Infrastructure Fund
MainStay CBRE Real Estate Fund
MainStay Cushing MLP Premier Fund
Asset Allocation
MainStay Conservative Allocation Fund
MainStay Conservative ETF Allocation Fund
MainStay Equity Allocation Fund
MainStay Equity ETF Allocation Fund
MainStay Growth Allocation Fund
MainStay Growth ETF Allocation Fund
MainStay Moderate Allocation Fund
MainStay Moderate ETF Allocation Fund
Manager
New York Life Investment Management LLC
New York, New York
Subadvisors
Candriam3
Strassen, Luxembourg
CBRE Investment Management Listed Real Assets LLC
Radnor, Pennsylvania
Cushing Asset Management, LP
Dallas, Texas
Epoch Investment Partners, Inc.
New York, New York
Fiera Capital Inc.
New York, New York
IndexIQ Advisors LLC3
New York, New York
MacKay Shields LLC3
New York, New York
NYL Investors LLC3
New York, New York
PineStone Asset Management Inc.
Montreal, Québec
Wellington Management Company LLP
Boston, Massachusetts
Winslow Capital Management, LLC
Minneapolis, Minnesota
Legal Counsel
Dechert LLP
Washington, District of Columbia
Independent Registered Public Accounting Firm
KPMG LLP
Philadelphia, Pennsylvania
Distributor
NYLIFE Distributors LLC3
Jersey City, New Jersey
Custodian
JPMorgan Chase Bank, N.A.
New York, New York
1.
This Fund is registered for sale in AZ, CA, NV, OR, TX, UT, WA (all share classes); and MI (Class A and Class I shares only); and CO, FL, GA, HI, ID, MA, MD, NH, NJ and NY (Class I and Class C2 shares only).
| 2. | This Fund is registered for sale in CA, CT, DE, FL, MA, NJ, NY, VT (all share classes) and SD (Class R6 shares only). |
| 3. | An affiliate of New York Life Investment Management LLC. |
Not part of the Semiannual Report
For more information
800-624-6782
newyorklifeinvestments.com
“New York Life Investments” is both a service mark, and the common trade name, of certain investment advisors affiliated with New York Life Insurance Company. The MainStay Funds® are managed by New York Life Investment Management LLC and distributed by NYLIFE Distributors LLC, 30 Hudson Street, Jersey City, NJ 07302, a wholly owned subsidiary of New York Life Insurance Company. NYLIFE Distributors LLC is a Member FINRA/SIPC.
©2024 NYLIFE Distributors LLC. All rights reserved.
| 5022150 MS081-24 | MSINF10-06/24 |
(NYLIM) NL211
MainStay Money Market Fund
Message from the President and Semiannual Report
Unaudited | April 30, 2024
Special Notice:
Beginning in July 2024, new regulations issued by the Securities and Exchange Commission (SEC) will take effect requiring open-end mutual fund companies and ETFs to (1) overhaul the content of their shareholder reports and (2) mail paper copies of the new tailored shareholder reports to shareholders who have not opted to receive these documents electronically.
If you have not yet elected to receive your shareholder reports electronically, please contact your financial intermediary or visit newyorklifeinvestments.com/accounts.
| Not FDIC/NCUA Insured | Not a Deposit | May Lose Value | No Bank Guarantee | Not Insured by Any Government Agency |
This page intentionally left blank
Message from the President
Stock and bond markets gained broad ground during the six-month period ended April 30, 2024, bolstered by better-than-expected economic growth and the prospect of monetary easing in the face of a myriad of macroeconomic and geopolitical challenges.
Throughout the reporting period, interest rates remained at their highest levels in decades in most developed countries, with the U.S. federal funds rate in the 5.25%−5.50% range, as central banks struggled to bring inflation under control. Early in the reporting period, the U.S. Federal Reserve began to forecast interest rate cuts in 2024, but delayed action as inflation remained stubbornly high, fluctuating between 3.1% and 3.5%. Nevertheless, despite the increasing cost of capital and tighter lending environment that resulted from sustained high rates, economic growth remained surprisingly robust, supported by high levels of consumer spending, low unemployment and strong corporate earnings. Investors tended to shrug off concerns related to sticky inflation and high interest rates—not to mention the ongoing war in Ukraine, intensifying hostilities in the Middle East and simmering tensions between China and the United States—focusing instead on the positives of continued economic growth and surprisingly strong corporate profits.
The S&P 500® Index, a widely regarded benchmark of U.S. market performance, produced double-digit gains, reaching record levels in March 2024. Market strength, which had been narrowly focused on mega-cap, technology-related stocks during the previous six months broadened significantly during the reporting period. All industry sectors produced positive results, with the strongest returns in communication services, information technology and industrials, and more moderate gains in the lagging energy, real estate and consumer staples areas. Growth-oriented shares slightly outperformed value-oriented
issues, while large- and mid-cap stocks modestly outperformed their small-cap counterparts. Most overseas equity markets trailed the U.S. market, as developed international economies experienced relatively low growth rates, and weak economic conditions in China undermined emerging markets.
Bonds generally gained ground as well. The yield on the 10-year Treasury note ranged between approximately 4.7% and 3.8%, while the 2-year Treasury yield remained slightly higher, between approximately 5.0% and 4.1%, in an inverted curve pattern often viewed as indicative of an impending economic slowdown. Nevertheless, the prevailing environment of stable interest rates and attractive yields provided a favorable environment for fixed-income investors. Long-term Treasury bonds and investment-grade corporate bonds produced similar gains, while high yield bonds advanced by a slightly greater margin, despite the added risks implicit in an uptick in default rates. International bond markets modestly outperformed their U.S. counterparts, led by a rebound in the performance of emerging-markets debt.
The risks and uncertainties inherent in today’s markets call for the kind of insight and expertise that New York Life Investments offers through our one-on-one philosophy, long-lasting focus, and multi-boutique approach.
Thank you for trusting us to help you meet your investment needs.
Sincerely,
Kirk C. Lehneis
President
The opinions expressed are as of the date of this report and are subject to change. There is no guarantee that any forecast made will come to pass. This material does not constitute investment advice and is not intended as an endorsement of any specific investment. Past performance is no guarantee of future results.
Not part of the Semiannual Report
An investment in the Fund is not insured or guaranteed by the Federal Deposit Insurance Corporation or any other government agency. Although the Fund seeks to preserve the value of your investment at $1.00 per share, it is possible to lose money by investing in the Fund. The Fund’s sponsor has no legal obligation to provide financial support to the Fund, and you should not expect that the sponsor will provide financial support at any time. The Fund may impose a fee upon the sale of your shares or may temporarily suspend your ability to sell shares if the Fund’s liquidity falls below required minimums because of market conditions or other factors.
Investors should refer to the Fund’s Summary Prospectus and/or Prospectus and consider the Fund’s investment objectives, strategies, risks, charges and expenses carefully before investing. The Summary Prospectus and/or Prospectus contain this and other information about the Fund. You may obtain copies of the Fund’s Summary Prospectus, Prospectus and Statement of Additional Information, which includes information about The MainStay Funds' Trustees, free of charge, upon request, by calling toll-free 800-624-6782, by writing to NYLIFE Distributors LLC, Attn: MainStay Marketing Department, 30 Hudson Street, Jersey City, NJ 07302 or by sending an e-mail to MainStayShareholderServices@nylim.com. These documents are also available on dfinview.com/NYLIM. Please read the Fund’s Summary Prospectus and/or Prospectus carefully before investing.
Investment and Performance Comparison (Unaudited)
Performance data quoted represents past performance. Past performance is no guarantee of future results. Because of market volatility and other factors, current performance may be lower or higher than the figures shown. Investment return and principal value will fluctuate, and as a result, when shares are redeemed, they may be worth more or less than their original cost. The graph below depicts the historical performance of Class A2 shares of the Fund. Performance will vary from class to class based on differences in class-specific expenses.For performance information current to the most recent month-end, please call 800-624-6782 or visit newyorklifeinvestments.com.
The performance table and graph do not reflect the deduction of taxes that a shareholder would pay on distributions or Fund share redemptions. Total returns reflect changes in share price, and reinvestment of dividend and capital gain distributions. The graph assumes the initial investment amount shown below. Performance figures may reflect certain fee waivers and/or expense limitations, without which total returns may have been lower. For more information on share classes and current fee waivers and/or expense limitations (if any), please refer to the Notes to Financial Statements.
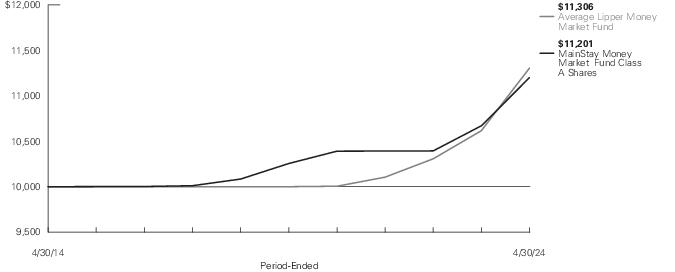
| Average Annual Total Returns for the Period-Ended April 30, 2024 |
| Class | Sales Charge | | Inception
Date | Six
Months1 | One
Year | Five
Years | Ten Years
or Since
Inception | Gross
Expense
Ratio2 |
| Class A Shares3 | No Sales Charge | | 1/3/1995 | 2.50% | 4.98% | 1.78% | 1.14% | 0.52% |
| Investor Class Shares3 | No Sales Charge | | 2/28/2008 | 2.35 | 4.69 | 1.62 | 1.01 | 0.87 |
| Class B Shares3, 4 | No Sales Charge | | 5/1/1986 | 2.35 | 4.69 | 1.62 | 1.01 | 0.87 |
| Class C Shares3 | No Sales Charge | | 9/1/1998 | 2.35 | 4.69 | 1.62 | 1.01 | 0.87 |
| SIMPLE Class Shares3 | No Sales Charge | | 8/31/2020 | 2.52 | 5.02 | N/A | 2.01 | 0.59 |
| 1. | Not annualized. |
| 2. | The gross expense ratios presented reflect the Fund’s “Total Annual Fund Operating Expenses” from the most recent Prospectus, as supplemented, and may differ from other expense ratios disclosed in this report. |
| 3. | As of April 30, 2024, MainStay Money Market Fund had an effective 7-day yield of 5.06% for Class A, 4.77% for Investor Class, 4.77% for Class B, 4.77% for Class C and 5.13% for SIMPLE Class shares. The 7-day current yield was 4.94% for Class A, 4.66% for Investor Class, 4.66% for Class B, 4.66% for Class C and 5.01% for SIMPLE Class shares. These yields reflect certain expense limitations. Had these expense limitations not been in effect, the effective 7-day yield would have been 5.06%, 4.63%, 4.62%, 4.62% and 5.13%, for Class A, Investor Class, Class B, Class C and SIMPLE Class shares, respectively, and the 7-day current yield would have been 4.94%, 4.52%, 4.52%, 4.52% and 5.01%, for Class A, Investor Class, Class B, Class C and SIMPLE Class shares, respectively. The current yield reflects the Fund’s earnings better than the Fund’s total return. |
| 4. | Class B shares are closed to all new purchases as well as additional investments by existing Class B shareholders. |
The footnotes on the next page are an integral part of the table and graph and should be carefully read in conjunction with them.
| Benchmark Performance* | Six
Months1 | One
Year | Five
Years | Ten
Years |
| Average Lipper Money Market Fund2 | 2.53% | 5.07% | 1.87% | 1.24% |
| * | Returns for indices reflect no deductions for fees, expenses or taxes, except for foreign withholding taxes where applicable. Results assume reinvestment of all dividends and capital gains. An investment cannot be made directly in an index. |
| 1. | Not annualized. |
| 2. | The Average Lipper Money Market Fund is an equally weighted performance average adjusted for capital gains distributions and income dividends of all of the money market funds in the Lipper Universe. Lipper Inc., a wholly-owned subsidiary of Reuters Group PLC, is an independent monitor of mutual fund performance. Lipper averages are not class specific. Lipper returns are unaudited. Results are based on average total returns of similar funds with all dividend and capital gain distributions reinvested. |
The footnotes on the preceding page are an integral part of the table and graph and should be carefully read in conjunction with them.
| 6 | MainStay Money Market Fund |
Cost in Dollars of a $1,000 Investment in MainStay Money Market Fund (Unaudited)
The example below is intended to describe the fees and expenses borne by shareholders during the six-month period from November 1, 2023 to April 30, 2024, and the impact of those costs on your investment.
Example
As a shareholder of the Fund you incur two types of costs: (1) transaction costs, including exchange fees and sales charges (loads) on purchases (as applicable), and (2) ongoing costs, including management fees, distribution and/or service (12b-1) fees and other Fund expenses (as applicable). This example is intended to help you understand your ongoing costs (in dollars) of investing in the Fund and to compare these costs with the ongoing costs of investing in other mutual funds. The example is based on an investment of $1,000 made at the beginning of the six-month period and held for the entire period from November 1, 2023 to April 30, 2024.
This example illustrates your Fund’s ongoing costs in two ways:
Actual Expenses
The second and third data columns in the table below provide information about actual account values and actual expenses. You may use the information in these columns, together with the amount you invested, to estimate the expenses that you paid during the six months ended April 30, 2024. Simply divide your account value by $1,000 (for example, an $8,600 account value divided by $1,000 = 8.6), then multiply the
result by the number under the heading entitled “Expenses Paid During Period” to estimate the expenses you paid on your account during this period.
Hypothetical Example for Comparison Purposes
The fourth and fifth data columns in the table below provide information about hypothetical account values and hypothetical expenses based on the Fund’s actual expense ratio and an assumed rate of return of 5% per year before expenses, which is not the Fund’s actual return. The hypothetical account values and expenses may not be used to estimate the actual ending account balances or expenses you paid for the six-month period shown. You may use this information to compare the ongoing costs of investing in the Fund with the ongoing costs of investing in other mutual funds. To do so, compare this 5% hypothetical example with the 5% hypothetical examples that appear in the shareholder reports of the other mutual funds.
Please note that the expenses shown in the table are meant to highlight your ongoing costs only and do not reflect any transactional costs, such as exchange fees or sales charges (loads). Therefore, the fourth and fifth data columns of the table are useful in comparing ongoing costs only and will not help you determine the relative total costs of owning different funds. In addition, if these transactional costs were included, your costs would have been higher.
| Share Class | Beginning
Account
Value
11/1/23 | Ending Account
Value (Based
on Actual
Returns and
Expenses)
4/30/24 | Expenses
Paid
During
Period1 | Ending Account
Value (Based
on Hypothetical
5% Annualized
Return and
Actual Expenses)
4/30/24 | Expenses
Paid
During
Period1 | Net Expense
Ratio
During
Period2 |
| Class A Shares | $1,000.00 | $1,025.00 | $2.62 | $1,022.28 | $2.61 | 0.52% |
| Investor Class Shares | $1,000.00 | $1,023.50 | $4.02 | $1,020.88 | $4.02 | 0.80% |
| Class B Shares | $1,000.00 | $1,023.50 | $4.02 | $1,020.88 | $4.02 | 0.80% |
| Class C Shares | $1,000.00 | $1,023.50 | $4.02 | $1,020.88 | $4.02 | 0.80% |
| SIMPLE Class Shares | $1,000.00 | $1,025.20 | $2.42 | $1,022.48 | $2.41 | 0.48% |
| 1. | Expenses are equal to the Fund’s annualized expense ratio of each class multiplied by the average account value over the period, divided by 366 and multiplied by 182 (to reflect the six-month period). The table above represents the actual expenses incurred during the six-month period. In addition to the fees and expenses which the Fund bears directly, it also indirectly bears a pro rata share of the fees and expenses of the underlying funds in which it invests. Such indirect expenses are not included in the above-reported expense figures. |
| 2. | Expenses are equal to the Fund's annualized expense ratio to reflect the six-month period. |
Portfolio Composition as of April 30, 2024 (Unaudited)
‡ Less than one-tenth of a percent.
See Portfolio of Investments beginning on page 9 for specific holdings within these categories. The Fund's holdings are subject to change.
| 8 | MainStay Money Market Fund |
Portfolio of Investments April 30, 2024†^(Unaudited)
| | Principal
Amount | Value |
| Short-Term Investments 100.0% |
| Commercial Paper 43.8% |
| Analog Devices, Inc. | | |
| 5.362%, due 5/2/24 | $ 20,000,000 | $ 19,997,034 |
| Australia & New Zealand Banking Group Ltd. | | |
| 5.631%, due 5/15/24 | 20,000,000 | 19,957,378 |
| Cummins, Inc. | | |
| 5.433%, due 6/4/24 | 20,000,000 | 19,898,000 |
| Equitable Short Term Funding LLC | | |
| 5.689%, due 5/22/24 | 20,000,000 | 19,935,483 |
| Henkel Corp. | | |
| 5.413%, due 6/3/24 | 20,000,000 | 19,902,100 |
| National Bank of Canada | | |
| 5.696%, due 5/24/24 | 20,000,000 | 19,929,339 |
| Natixis SA | | |
| 5.757%, due 8/22/24 | 20,000,000 | 19,653,467 |
| Northern Illinois Gas Co. | | |
| 5.454%, due 5/22/24 | 20,000,000 | 19,936,650 |
| Schlumberger Investment SA | | |
| 5.432%, due 5/28/24 | 20,000,000 | 19,919,000 |
| Toyota Motor Credit Corp. | | |
| 5.412%, due 5/29/24 | 20,000,000 | 19,916,933 |
| UnitedHealth Group, Inc. | | |
| 5.511%, due 9/3/24 | 20,000,000 | 19,625,000 |
| Wisconsin Public Service Corp. | | |
| 5.396%, due 5/7/24 | 20,000,000 | 19,982,033 |
Total Commercial Paper
(Cost $238,652,417) | | 238,652,417 |
| Repurchase Agreements 31.6% |
BMO Capital Markets
5.30%, dated 4/30/24
due 5/1/24
Proceeds at Maturity $55,000,089
(Collateralized by United States Treasury security with a rate of 5.57% and with maturity date of 01/31/26, with a Principal Amount of $55,229,900 and a Market Value of $56,100,091) | 55,000,000 | 55,000,000 |
BofA Securities, Inc.
5.30%, dated 4/30/24
due 5/1/24
Proceeds at Maturity $75,000,000
(Collateralized by United States Treasury securities with rates between 0.00% and 4.25% and maturity dates between 05/15/25 and 05/15/28, with a Principal Amount of $92,193,266 and a Market Value of $76,500,000) | 75,000,000 | 75,000,000 |
| | Principal
Amount | | Value |
| |
| Repurchase Agreements (continued) |
RBC Capital Markets LLC
5.30%, dated 4/30/24
due 5/1/24
Proceeds at Maturity $22,266,345
(Collateralized by United States Treasury securities with rates between 1.00% and 4.375% and maturity dates between 12/15/26 and 07/31/28, with a Principal Amount of $22,754,400 and a Market Value of $22,711,671) | $ 22,263,000 | | $ 22,263,000 |
TD Securities, Inc.
5.30%, dated 4/30/24
due 5/1/24
Proceeds at Maturity $20,000,000
(Collateralized by United States Treasury securities with rates between 0.50% and 3.75% and maturity dates between 10/31/27 and 12/31/28, with a Principal Amount of $23,279,900 and a Market Value of $20,400,000) | 20,000,000 | | 20,000,000 |
Total Repurchase Agreements
(Cost $172,263,000) | | | 172,263,000 |
| U.S. Treasury Debt 24.6% |
| U.S. Treasury Bills (a) | | | |
| 5.299%, due 5/14/24 | 3,821,000 | | 3,813,746 |
| 5.301%, due 5/28/24 | 7,000,000 | | 6,972,394 |
| 5.302%, due 5/21/24 | 5,000,000 | | 4,985,388 |
| 5.304%, due 6/4/24 | 20,000,000 | | 19,900,633 |
| 5.317%, due 6/11/24 | 10,000,000 | | 9,939,946 |
| 5.319%, due 6/18/24 | 89,310,000 | | 88,681,853 |
Total U.S. Treasury Debt
(Cost $134,293,960) | | | 134,293,960 |
Total Short-Term Investments
(Cost $545,209,377) | 100.0% | | 545,209,377 |
| Other Assets, Less Liabilities | 0.0‡ | | 29,560 |
| Net Assets | 100.0% | | $ 545,238,937 |
| † | Percentages indicated are based on Fund net assets. |
| ^ | Industry classifications may be different than those used for compliance monitoring purposes. |
| ‡ | Less than one-tenth of a percent. |
| (a) | Interest rate shown represents yield to maturity. |
The notes to the financial statements are an integral part of, and should be read in conjunction with, the financial statements.
9
Portfolio of Investments April 30, 2024†^(Unaudited) (continued)
The following is a summary of the fair valuations according to the inputs used as of April 30, 2024, for valuing the Fund’s assets:
| Description | Quoted
Prices in
Active
Markets for
Identical
Assets
(Level 1) | | Significant
Other
Observable
Inputs
(Level 2) | | Significant
Unobservable
Inputs
(Level 3) | | Total |
| Asset Valuation Inputs | | | | | | | |
| Investments in Securities (a) | | | | | | | |
| Short-Term Investments | | | | | | | |
| Commercial Paper | $ — | | $ 238,652,417 | | $ — | | $ 238,652,417 |
| Repurchase Agreements | — | | 172,263,000 | | — | | 172,263,000 |
| U.S. Treasury Debt | — | | 134,293,960 | | — | | 134,293,960 |
| Total Investments in Securities | $ — | | $ 545,209,377 | | $ — | | $ 545,209,377 |
| (a) | For a complete listing of investments and their industries, see the Portfolio of Investments. |
The notes to the financial statements are an integral part of, and should be read in conjunction with, the financial statements.
| 10 | MainStay Money Market Fund |
Statement of Assets and Liabilities as of April 30, 2024 (Unaudited)
| Assets |
Investment in securities, at value
(amortized cost $372,946,377) | $372,946,377 |
Repurchase agreements, at value
(amortized cost $172,263,000) | 172,263,000 |
| Cash | 750 |
| Receivables: | |
| Fund shares sold | 328,773 |
| Interest | 25,361 |
| Other assets | 77,134 |
| Total assets | 545,641,395 |
| Liabilities |
| Payables: | |
| Manager (See Note 3) | 170,244 |
| Transfer agent (See Note 3) | 93,583 |
| Fund shares redeemed | 60,236 |
| Professional fees | 32,954 |
| Custodian | 10,123 |
| Shareholder communication | 3,250 |
| Dividends payable | 32,068 |
| Total liabilities | 402,458 |
| Net assets | $545,238,937 |
| Composition of Net Assets |
| Shares of beneficial interest outstanding (par value of $.01 per share) unlimited number of shares authorized | $ 5,452,512 |
| Additional paid-in-capital | 539,758,266 |
| | 545,210,778 |
| Total distributable earnings (loss) | 28,159 |
| Net assets | $545,238,937 |
| Class A | |
| Net assets applicable to outstanding shares | $491,968,087 |
| Shares of beneficial interest outstanding | 491,967,515 |
| Net asset value and offering price per share outstanding | $ 1.00 |
| Investor Class | |
| Net assets applicable to outstanding shares | $ 16,192,037 |
| Shares of beneficial interest outstanding | 16,201,676 |
| Net asset value and offering price per share outstanding | $ 1.00 |
| Class B | |
| Net assets applicable to outstanding shares | $ 21,268,209 |
| Shares of beneficial interest outstanding | 21,271,513 |
| Net asset value and offering price per share outstanding | $ 1.00 |
| Class C | |
| Net assets applicable to outstanding shares | $ 14,600,701 |
| Shares of beneficial interest outstanding | 14,600,593 |
| Net asset value and offering price per share outstanding | $ 1.00 |
| SIMPLE Class | |
| Net assets applicable to outstanding shares | $ 1,209,903 |
| Shares of beneficial interest outstanding | 1,209,903 |
| Net asset value and offering price per share outstanding | $ 1.00 |
The notes to the financial statements are an integral part of, and should be read in conjunction with, the financial statements.
11
Statement of Operations for the six months ended April 30, 2024 (Unaudited)
| Investment Income (Loss) |
| Income | |
| Interest | $14,780,162 |
| Expenses | |
| Manager (See Note 3) | 1,067,726 |
| Transfer agent (See Note 3) | 275,985 |
| Registration | 58,615 |
| Professional fees | 48,066 |
| Custodian | 14,315 |
| Shareholder communication | 10,675 |
| Trustees | 6,739 |
| Miscellaneous | 6,595 |
| Total expenses before waiver/reimbursement | 1,488,716 |
| Expense waiver/reimbursement from Manager (See Note 3) | (21,867) |
| Net expenses | 1,466,849 |
| Net investment income (loss) | 13,313,313 |
| Realized Gain (Loss) |
| Net realized gain (loss) on investments | 642 |
| Net increase (decrease) in net assets resulting from operations | $13,313,955 |
The notes to the financial statements are an integral part of, and should be read in conjunction with, the financial statements.
| 12 | MainStay Money Market Fund |
Statements of Changes in Net Assets
for the six months ended April 30, 2024 (Unaudited) and the year ended October 31, 2023
| | Six months
ended
April 30,
2024 | Year
ended
October 31,
2023 |
| Increase (Decrease) in Net Assets |
| Operations: | | |
| Net investment income (loss) | $ 13,313,313 | $ 21,627,510 |
| Net realized gain (loss) | 642 | 3,598 |
| Net increase (decrease) in net assets resulting from operations | 13,313,955 | 21,631,108 |
| Distributions to shareholders: | | |
| Class A | (12,058,145) | (19,296,985) |
| Investor Class | (385,619) | (738,241) |
| Class B | (506,688) | (920,152) |
| Class C | (345,748) | (664,134) |
| SIMPLE Class | (17,113) | (7,996) |
| Total distributions to shareholders | (13,313,313) | (21,627,508) |
| Capital share transactions: | | |
| Net proceeds from sales of shares | 232,139,173 | 467,513,223 |
| Net asset value of shares issued to shareholders in reinvestment of distributions | 13,013,379 | 21,108,528 |
| Cost of shares redeemed | (241,466,731) | (436,011,790) |
| Increase (decrease) in net assets derived from capital share transactions | 3,685,821 | 52,609,961 |
| Net increase (decrease) in net assets | 3,686,463 | 52,613,561 |
| Net Assets |
| Beginning of period | 541,552,474 | 488,938,913 |
| End of period | $ 545,238,937 | $ 541,552,474 |
The notes to the financial statements are an integral part of, and should be read in conjunction with, the financial statements.
13
Financial Highlights selected per share data and ratios
| | Six months ended
April 30,
2024* | | Year Ended October 31, |
| Class A | 2023 | | 2022 | | 2021 | | 2020 | | 2019 |
| Net asset value at beginning of period | $ 1.00 | | $ 1.00 | | $ 1.00 | | $ 1.00 | | $ 1.00 | | $ 1.00 |
| Net investment income (loss) (a) | 0.02 | | 0.04 | | 0.01 | | 0.00‡ | | 0.00‡ | | 0.02 |
| Net realized and unrealized gain (loss) | 0.00‡ | | 0.00‡ | | 0.00‡ | | 0.00‡ | | 0.00‡ | | 0.00‡ |
| Total from investment operations | 0.02 | | 0.04 | | 0.01 | | 0.00‡ | | 0.00‡ | | 0.02 |
| Less distributions: | | | | | | | | | | | |
| From net investment income | (0.02) | | (0.04) | | (0.01) | | (0.00)‡ | | (0.00)‡ | | (0.02) |
| Net asset value at end of period | $ 1.00 | | $ 1.00 | | $ 1.00 | | $ 1.00 | | $ 1.00 | | $ 1.00 |
| Total investment return (b) | 2.50% | | 4.42% | | 0.70% | | 0.01% | | 0.45% | | 1.84% |
| Ratios (to average net assets)/Supplemental Data: | | | | | | | | | | | |
| Net investment income (loss) | 4.97%†† | | 4.35% | | 0.75% | | 0.01% | | 0.37% | | 1.82% |
| Net expenses | 0.52%†† | | 0.52% | | 0.37% | | 0.12% | | 0.39% | | 0.56% |
| Expenses (before waiver/reimbursement) | 0.52%†† | | 0.52% | | 0.52% | | 0.54% | | 0.55% | | 0.56% |
| Net assets at end of period (in 000’s) | $ 491,968 | | $ 487,114 | | $ 427,378 | | $ 354,743 | | $ 415,041 | | $ 290,421 |
| * | Unaudited. |
| ‡ | Less than one cent per share. |
| †† | Annualized. |
| (a) | Per share data based on average shares outstanding during the period. |
| (b) | Total investment return is calculated exclusive of sales charges and assumes the reinvestment of distributions. For periods of less than one year, total return is not annualized. |
| | Six months ended
April 30,
2024* | | Year Ended October 31, |
| Investor Class | 2023 | | 2022 | | 2021 | | 2020 | | 2019 |
| Net asset value at beginning of period | $ 1.00 | | $ 1.00 | | $ 1.00 | | $ 1.00 | | $ 1.00 | | $ 1.00 |
| Net investment income (loss) (a) | 0.02 | | 0.04 | | 0.01 | | 0.00‡ | | 0.00‡ | | 0.02 |
| Net realized and unrealized gain (loss) | 0.00‡ | | 0.00‡ | | 0.00‡ | | 0.00‡ | | 0.00‡ | | 0.00‡ |
| Total from investment operations | 0.02 | | 0.04 | | 0.01 | | 0.00‡ | | 0.00‡ | | 0.02 |
| Less distributions: | | | | | | | | | | | |
| From net investment income | (0.02) | | (0.04) | | (0.01) | | (0.00)‡ | | (0.00)‡ | | (0.02) |
| Net asset value at end of period | $ 1.00 | | $ 1.00 | | $ 1.00 | | $ 1.00 | | $ 1.00 | | $ 1.00 |
| Total investment return (b) | 2.35% | | 4.13% | | 0.56% | | 0.01% | | 0.35% | | 1.59% |
| Ratios (to average net assets)/Supplemental Data: | | | | | | | | | | | |
| Net investment income (loss) | 4.69%†† | | 4.04% | | 0.53% | | 0.01% | | 0.33% | | 1.58% |
| Net expenses | 0.80%†† | | 0.80% | | 0.49% | | 0.12% | | 0.51% | | 0.80% |
| Expenses (before waiver/reimbursement) | 0.88%†† | | 0.87% | | 0.84% | | 0.96% | | 0.91% | | 0.88% |
| Net assets at end of period (in 000's) | $ 16,192 | | $ 17,025 | | $ 19,327 | | $ 22,096 | | $ 28,427 | | $ 28,133 |
| * | Unaudited. |
| ‡ | Less than one cent per share. |
| †† | Annualized. |
| (a) | Per share data based on average shares outstanding during the period. |
| (b) | Total investment return is calculated exclusive of sales charges and assumes the reinvestment of distributions. For periods of less than one year, total return is not annualized. |
The notes to the financial statements are an integral part of, and should be read in conjunction with, the financial statements.
| 14 | MainStay Money Market Fund |
Financial Highlights selected per share data and ratios
| | Six months ended
April 30,
2024* | | Year Ended October 31, |
| Class B | 2023 | | 2022 | | 2021 | | 2020 | | 2019 |
| Net asset value at beginning of period | $ 1.00 | | $ 1.00 | | $ 1.00 | | $ 1.00 | | $ 1.00 | | $ 1.00 |
| Net investment income (loss) (a) | 0.02 | | 0.04 | | 0.01 | | 0.00‡ | | 0.00‡ | | 0.02 |
| Net realized and unrealized gain (loss) | 0.00‡ | | 0.00‡ | | 0.00‡ | | 0.00‡ | | 0.00‡ | | 0.00‡ |
| Total from investment operations | 0.02 | | 0.04 | | 0.01 | | 0.00‡ | | 0.00‡ | | 0.02 |
| Less distributions: | | | | | | | | | | | |
| From net investment income | (0.02) | | (0.04) | | (0.01) | | (0.00)‡ | | (0.00)‡ | | (0.02) |
| Net asset value at end of period | $ 1.00 | | $ 1.00 | | $ 1.00 | | $ 1.00 | | $ 1.00 | | $ 1.00 |
| Total investment return (b) | 2.35% | | 4.13% | | 0.56% | | 0.01% | | 0.35% | | 1.59% |
| Ratios (to average net assets)/Supplemental Data: | | | | | | | | | | | |
| Net investment income (loss) | 4.69%†† | | 4.05% | | 0.54% | | 0.01% | | 0.35% | | 1.59% |
| Net expenses | 0.80%†† | | 0.80% | | 0.49% | | 0.12% | | 0.52% | | 0.80% |
| Expenses (before waiver/reimbursement) | 0.88%†† | | 0.87% | | 0.84% | | 0.97% | | 0.90% | | 0.88% |
| Net assets at end of period (in 000’s) | $ 21,268 | | $ 22,152 | | $ 23,696 | | $ 25,709 | | $ 30,215 | | $ 32,981 |
| * | Unaudited. |
| ‡ | Less than one cent per share. |
| †† | Annualized. |
| (a) | Per share data based on average shares outstanding during the period. |
| (b) | Total investment return is calculated exclusive of sales charges and assumes the reinvestment of distributions. For periods of less than one year, total return is not annualized. |
| | Six months ended
April 30,
2024* | | Year Ended October 31, |
| Class C | 2023 | | 2022 | | 2021 | | 2020 | | 2019 |
| Net asset value at beginning of period | $ 1.00 | | $ 1.00 | | $ 1.00 | | $ 1.00 | | $ 1.00 | | $ 1.00 |
| Net investment income (loss) (a) | 0.02 | | 0.04 | | 0.01 | | 0.00‡ | | 0.00‡ | | 0.02 |
| Net realized and unrealized gain (loss) | 0.00‡ | | 0.00‡ | | 0.00‡ | | 0.00‡ | | 0.00‡ | | 0.00‡ |
| Total from investment operations | 0.02 | | 0.04 | | 0.01 | | 0.00‡ | | 0.00‡ | | 0.02 |
| Less distributions: | | | | | | | | | | | |
| From net investment income | (0.02) | | (0.04) | | (0.01) | | (0.00)‡ | | (0.00)‡ | | (0.02) |
| Net asset value at end of period | $ 1.00 | | $ 1.00 | | $ 1.00 | | $ 1.00 | | $ 1.00 | | $ 1.00 |
| Total investment return (b) | 2.35% | | 4.13% | | 0.56% | | 0.01% | | 0.35% | | 1.60% |
| Ratios (to average net assets)/Supplemental Data: | | | | | | | | | | | |
| Net investment income (loss) | 4.69%†† | | 4.02% | | 0.55% | | 0.01% | | 0.27% | | 1.59% |
| Net expenses | 0.80%†† | | 0.80% | | 0.52% | | 0.12% | | 0.50% | | 0.80% |
| Expenses (before waiver/reimbursement) | 0.88%†† | | 0.87% | | 0.84% | | 0.96% | | 0.90% | | 0.88% |
| Net assets at end of period (in 000’s) | $ 14,601 | | $ 15,087 | | $ 18,464 | | $ 17,941 | | $ 28,171 | | $ 20,308 |
| * | Unaudited. |
| ‡ | Less than one cent per share. |
| †† | Annualized. |
| (a) | Per share data based on average shares outstanding during the period. |
| (b) | Total investment return is calculated exclusive of sales charges and assumes the reinvestment of distributions. For periods of less than one year, total return is not annualized. |
The notes to the financial statements are an integral part of, and should be read in conjunction with, the financial statements.
15
Financial Highlights selected per share data and ratios
| | Six months ended
April 30,
2024* | | Year Ended October 31, | | August 31, 2020^ through
October 31, |
| SIMPLE Class | 2023 | | 2022 | | 2021 | | 2020 |
| Net asset value at beginning of period | $ 1.00 | | $ 1.00 | | $ 1.00 | | $ 1.00 | | $ 1.00 |
| Net investment income (loss) (a) | 0.02 | | 0.04 | | 0.01 | | 0.00‡ | | (0.00)‡ |
| Net realized and unrealized gain (loss) | 0.00‡ | | 0.00‡ | | 0.00‡ | | 0.00‡ | | 0.00‡ |
| Total from investment operations | 0.02 | | 0.04 | | 0.01 | | 0.00‡ | | 0.00‡ |
| Less distributions: | | | | | | | | | |
| From net investment income | (0.02) | | (0.04) | | (0.01) | | (0.00)‡ | | (0.00)‡ |
| Net asset value at end of period | $ 1.00 | | $ 1.00 | | $ 1.00 | | $ 1.00 | | $ 1.00 |
| Total investment return (b) | 2.52% | | 4.33% | | 0.56% | | 0.01% | | 0.00%‡‡ |
| Ratios (to average net assets)/Supplemental Data: | | | | | | | | | |
| Net investment income (loss) | 4.99%†† | | 4.32% | | 0.58% | | 0.01% | | (0.02)%†† |
| Net expenses | 0.48%†† | | 0.59% | | 0.51% | | 0.12% | | 0.19%†† |
| Expenses (before waiver/reimbursement) | 0.48%†† | | 0.59% | | 0.84% | | 0.97% | | 0.95%†† |
| Net assets at end of period (in 000’s) | $ 1,210 | | $ 175 | | $ 74 | | $ 25 | | $ 25 |
| * | Unaudited. |
| ^ | Inception date. |
| ‡ | Less than one cent per share. |
| ‡‡ | Less than one-tenth percent. |
| †† | Annualized. |
| (a) | Per share data based on average shares outstanding during the period. |
| (b) | Total investment return is calculated exclusive of sales charges and assumes the reinvestment of dividends and distributions. SIMPLE Class shares are not subject to sales charges. For periods of less than one year, total return is not annualized. |
The notes to the financial statements are an integral part of, and should be read in conjunction with, the financial statements.
| 16 | MainStay Money Market Fund |
Notes to Financial Statements (Unaudited)
Note 1-Organization and Business
The MainStay Funds (the “Trust”) was organized on January 9, 1986, as a Massachusetts business trust. The Trust is registered under the Investment Company Act of 1940, as amended (the “1940 Act”), as an open-end management investment company, and is comprised of eleven funds (collectively referred to as the "Funds"). These financial statements and notes relate to the MainStay Money Market Fund (the "Fund"), a “diversified” fund, as that term is defined in the 1940 Act, as interpreted or modified by regulatory authorities having jurisdiction, from time to time.
The following table lists the Fund's share classes that have been registered and commenced operations:
| Class | Commenced Operations |
| Class A | January 3, 1995 |
| Investor Class | February 28, 2008 |
| Class B | May 1, 1986 |
| Class C | September 1, 1998 |
| SIMPLE Class | August 31, 2020 |
Class A, Class C, Investor Class and SIMPLE Class shares are offered at net asset value (“NAV”) without an initial sales charge. Class B shares of the MainStay Group of Funds are closed to all new purchases as well as additional investments by existing Class B shareholders. Existing Class B shareholders may continue to reinvest dividends and capital gains distributions, as well as exchange their Class B shares for Class B shares of other funds in the MainStay Group of Funds as permitted by the current exchange privileges. All other features of the Class B shares, including but not limited to the fees and expenses applicable to Class B shares, remain unchanged. Unless redeemed, Class B shareholders will remain in Class B shares of their respective fund until the Class B shares are converted to Class A or Investor Class shares pursuant to the applicable conversion schedule. Depending upon eligibility, Class B shares convert to either Class A or Investor Class shares at the end of the calendar quarter eight years after the date they were purchased. Additionally, Investor Class shares may convert automatically to Class A shares. SIMPLE Class shares convert to Class A shares, or Investor Class shares if you are not eligible to hold Class A shares, at the end of the calendar quarter, ten years after the date they were purchased. Share class conversions are based on the relevant NAVs of the two classes at the time of the conversion, and no sales load or other charge is imposed. Under certain circumstances and as may be permitted by the Trust’s multiple class plan pursuant to Rule 18f-3 under the 1940 Act, specified share classes of the Fund may be converted to one or more other share classes of the Fund as disclosed in the capital share transactions within these Notes. The classes of shares have the same voting (except for issues that relate solely to one class), dividend, liquidation and other rights, and the same terms and conditions.
The Fund's investment objective is to seek a high level of current income while preserving capital and maintaining liquidity.
Note 2–Significant Accounting Policies
The Fund is an investment company and accordingly follows the investment company accounting and reporting guidance of the Financial Accounting Standards Board (“FASB”) Accounting Standards Codification Topic 946 Financial Services—Investment Companies. The Fund prepares its financial statements in accordance with generally accepted accounting principles (“GAAP”) in the United States of America and follows the significant accounting policies described below.
(A) Valuation of Shares. You could lose money by investing in the Fund. Although the Fund seeks to preserve the value of your investment at $1.00 per share by using the amortized cost method of valuation, it cannot guarantee it will do so. The Fund may impose a fee upon the sale of your shares. An investment in the Fund is not insured or guaranteed by the Federal Deposit Insurance Corporation or any other government agency. The Fund's sponsor has no legal obligation to provide financial support to the Fund, and you should not expect that the sponsor will provide financial support to the Fund at any time, including during periods of market stress.
(B) Securities Valuation. Securities are valued using the amortized cost method of valuation, unless the use of such method would be inappropriate per the requirements of Rule 2a-7 under the 1940 Act. The amortized cost method involves valuing a security at its cost on the date of purchase and thereafter assuming a constant amortization to maturity of the difference between such cost and the value on maturity date. Amortized cost approximates the current fair value of a security.
Pursuant to Rule 2a-5 under the 1940 Act, the Board of Trustees of the Trust (the "Board") has designated New York Life Investment Management LLC (“New York Life Investments” or the "Manager") as its Valuation Designee (the "Valuation Designee"). The Valuation Designee is responsible for performing fair valuations relating to all investments in the Fund’s portfolio for which market quotations are not readily available; periodically assessing and managing material valuation risks; establishing and applying fair value methodologies; testing fair valuation methodologies; evaluating and overseeing pricing services; ensuring appropriate segregation of valuation and portfolio management functions; providing quarterly, annual and prompt reporting to the Board, as appropriate; identifying potential conflicts of interest; and maintaining appropriate records. The Valuation Designee has established a valuation committee ("Valuation Committee") to assist in carrying out the Valuation Designee’s responsibilities and establish prices of securities for which market quotations are not readily available. The Fund's and the Valuation Designee's policies and procedures ("Valuation Procedures") govern the Valuation Designee’s selection and application of methodologies for determining and calculating the fair value of Fund investments. The Valuation Designee may value the Fund's portfolio securities for which market quotations are not readily available and other Fund assets utilizing inputs from pricing services and other third-party sources. The Valuation Committee meets (in person, via electronic mail or via teleconference) on an ad-hoc basis to determine fair valuations and on a quarterly basis to review fair value events with respect to certain securities for which
Notes to Financial Statements (Unaudited) (continued)
market quotations are not readily available, including valuation risks and back-testing results, and to preview reports to the Board.
The Valuation Committee establishes prices of securities for which market quotations are not readily available based on such methodologies and measurements on a regular basis after considering information that is reasonably available and deemed relevant by the Valuation Committee. The Board shall oversee the Valuation Designee and review fair valuation materials on a prompt, quarterly and annual basis and approve proposed revisions to the Valuation Procedures.
Investments for which market quotations are not readily available are valued at fair value as determined in good faith pursuant to the Valuation Procedures. A market quotation is readily available only when that quotation is a quoted price (unadjusted) in active markets for identical investments that the Fund can access at the measurement date, provided that a quotation will not be readily available if it is not reliable. "Fair value" is defined as the price the Fund would reasonably expect to receive upon selling an asset or liability in an orderly transaction to an independent buyer in the principal or most advantageous market for the asset or liability. Fair value measurements are determined within a framework that establishes a three-tier hierarchy that maximizes the use of observable market data and minimizes the use of unobservable inputs to establish a classification of fair value measurements for disclosure purposes. "Inputs" refer broadly to the assumptions that market participants would use in pricing the asset or liability, including assumptions about risk, such as the risk inherent in a particular valuation technique used to measure fair value using a pricing model and/or the risk inherent in the inputs for the valuation technique. Inputs may be observable or unobservable. Observable inputs reflect the assumptions market participants would use in pricing the asset or liability based on market data obtained from sources independent of the Fund. Unobservable inputs reflect the Fund’s own assumptions about the assumptions market participants would use in pricing the asset or liability based on the information available. The inputs or methodology used for valuing assets or liabilities may not be an indication of the risks associated with investing in those assets or liabilities. The three-tier hierarchy of inputs is summarized below.
| • | Level 1—quoted prices (unadjusted) in active markets for an identical asset or liability |
| • | Level 2—other significant observable inputs (including quoted prices for a similar asset or liability in active markets, interest rates and yield curves, prepayment speeds, credit risk, etc.) |
| • | Level 3—significant unobservable inputs (including the Fund's own assumptions about the assumptions that market participants would use in measuring fair value of an asset or liability) |
Securities valued at amortized cost are not obtained from a quoted price in an active market and are generally categorized as Level 2 in the hierarchy. The level of an asset or liability within the fair value hierarchy is based on the lowest level of an input, both individually and in the aggregate, that is significant to the fair value measurement. As of
April 30, 2024, the aggregate value by input level of the Fund’s assets and liabilities is included at the end of the Portfolio of Investments.
The Fund may use third-party vendor evaluations, whose prices may be derived from one or more of the following standard inputs, among others:
| • Benchmark yields | • Reported trades |
| • Broker/dealer quotes | • Issuer spreads |
| • Two-sided markets | • Benchmark securities |
| • Bids/offers | • Reference data (corporate actions or material event notices) |
| • Industry and economic events | • Comparable bonds |
| • Monthly payment information | |
An asset or liability for which a market quotation is not readily available is valued by methods deemed reasonable in good faith by the Valuation Committee, following the Valuation Procedures to represent fair value. Under these procedures, the Valuation Designee generally uses a market-based approach which may use related or comparable assets or liabilities, recent transactions, market multiples, book values and other relevant information. The Valuation Designee may also use an income-based valuation approach in which the anticipated future cash flows of the asset or liability are discounted to calculate fair value. Discounts may also be applied due to the nature and/or duration of any restrictions on the disposition of the asset or liability. Fair value represents a good faith approximation of the value of a security. Fair value determinations involve the consideration of a number of subjective factors, an analysis of applicable facts and circumstances and the exercise of judgment. As a result, it is possible that the fair value for a security determined in good faith in accordance with the Valuation Procedures may differ from valuations for the same security determined for other funds using their own valuation procedures. Although the Valuation Procedures are designed to value a security at the price the Fund may reasonably expect to receive upon the security's sale in an orderly transaction, there can be no assurance that any fair value determination thereunder would, in fact, approximate the amount that the Fund would actually realize upon the sale of the security or the price at which the security would trade if a reliable market price were readily available. During the six-month period ended April 30, 2024, there were no material changes to the fair value methodologies.
Securities which may be valued in this manner include, but are not limited to: (i) a security for which trading has been halted or suspended or otherwise does not have a readily available market quotation on a given day; (ii) a debt security that has recently gone into default and for which there is not a current market quotation; (iii) a security of an issuer that has entered into a restructuring; (iv) a security that has been delisted from a national exchange; (v) a security subject to trading collars for which no or limited trading takes place; and (vi) a security whose principal market has been temporarily closed at a time when, under normal conditions, it would be open. Securities valued in this manner are generally categorized as Level 2 or 3 in the hierarchy.
| 18 | MainStay Money Market Fund |
The information above is not intended to reflect an exhaustive list of the methodologies that may be used to value portfolio investments. The Valuation Procedures permit the use of a variety of valuation methodologies in connection with valuing portfolio investments. The methodology used for a specific type of investment may vary based on the market data available or other considerations. The methodologies summarized above may not represent the specific means by which portfolio investments are valued on any particular business day.
(C) Income Taxes. The Fund's policy is to comply with the requirements of the Internal Revenue Code of 1986, as amended (the “Internal Revenue Code”), applicable to regulated investment companies and to distribute all of its taxable income to the shareholders of the Fund within the allowable time limits.
The Manager evaluates the Fund’s tax positions to determine if the tax positions taken meet the minimum recognition threshold in connection with accounting for uncertainties in income tax positions taken or expected to be taken for the purposes of measuring and recognizing tax liabilities in the financial statements. Recognition of tax benefits of an uncertain tax position is permitted only to the extent the position is “more likely than not” to be sustained assuming examination by taxing authorities. The Manager analyzed the Fund's tax positions taken on federal, state and local income tax returns for all open tax years (for up to three tax years) and has concluded that no provisions for federal, state and local income tax are required in the Fund's financial statements. The Fund's federal, state and local income tax and federal excise tax returns for tax years for which the applicable statutes of limitations have not expired are subject to examination by the Internal Revenue Service and state and local departments of revenue.
(D) Dividends and Distributions to Shareholders. Dividends and distributions are recorded on the ex-dividend date. The Fund intends to declare dividends from net investment income, if any, daily and intends to pay them at least monthly and declares and pays distributions from net realized capital and currency gains, if any, at least annually. Unless a shareholder elects otherwise, all dividends and distributions are reinvested at NAV in the same class of shares of the Fund. Dividends and distributions to shareholders are determined in accordance with federal income tax regulations and may differ from determinations using GAAP.
(E) Security Transactions and Investment Income. The Fund records security transactions on the trade date. Realized gains and losses on security transactions are determined using the identified cost method. Interest income is accrued daily and discounts and premiums on securities purchased for the Fund are accreted and amortized, respectively, on the straight-line method. The straight-line method approximates the effective interest rate for short-term investments.
Investment income and realized and unrealized gains and losses on investments of the Fund are allocated pro rata to the separate classes of shares based upon their relative net assets on the date the income is earned or realized and unrealized gains and losses are incurred.
The Fund may place a debt security on non-accrual status and reduce related interest income by ceasing current accruals and writing off all or a portion of any interest receivables when the collection of all or a portion of such interest has become doubtful. A debt security is removed from non-accrual status when the issuer resumes interest payments or when collectability of interest is reasonably assured.
(F) Expenses. Expenses of the Trust are allocated to the individual Funds in proportion to the net assets of the respective Funds when the expenses are incurred, except where direct allocations of expenses can be made. Expenses (other than transfer agent expenses and fees incurred under the shareholder services plans and/or the distribution plans further discussed in Note 3(B)) are allocated to separate classes of shares pro rata based upon their relative net assets on the date the expenses are incurred. The expenses borne by the Fund, including those of related parties to the Fund, are shown in the Statement of Operations.
(G) Use of Estimates. In preparing financial statements in conformity with GAAP, the Manager makes estimates and assumptions that affect the reported amounts and disclosures in the financial statements. Actual results could differ from those estimates and assumptions.
(H) Repurchase Agreements. The Fund may enter into repurchase agreements (i.e., buy a security from another party with the agreement that it will be sold back in the future) to earn income. The Fund may enter into repurchase agreements only with counterparties, usually financial institutions, that are deemed by the Manager or the Subadvisor to be creditworthy, pursuant to guidelines established by the Board. During the term of any repurchase agreement, the Manager or the Subadvisor will continue to monitor the creditworthiness of the counterparty. Under the 1940 Act, repurchase agreements are considered to be collateralized loans by the Fund to the counterparty secured by the securities transferred to the Fund.
Repurchase agreements are subject to counterparty risk, meaning the Fund could lose money by the counterparty’s failure to perform under the terms of the agreement. The Fund mitigates this risk by ensuring the repurchase agreement is collateralized by cash, U.S. government securities, fixed income securities and/or other securities. The collateral is held by the Fund's custodian and valued daily on a mark to market basis to determine if the value, including accrued interest, exceeds the repurchase price. In the event of the counterparty’s default on the obligation to repurchase, the Fund has the right to liquidate the collateral and apply the proceeds in satisfaction of the obligation. Under certain circumstances, such as in the event of default or bankruptcy by the counterparty, realization and/or retention of the collateral may be limited or subject to delay, to legal proceedings and possible realized loss to the Fund.
(I) Debt Securities Risk. The Fund’s investments may include securities such as variable rate notes, floaters and mortgage-related and asset-backed securities. If expectations about changes in interest rates or
Notes to Financial Statements (Unaudited) (continued)
assessments of an issuer’s credit worthiness or market conditions are incorrect, investments in these types of securities could lose money for the Fund.
The Fund may also invest in U.S. dollar-denominated securities of foreign issuers, which carry certain risks in addition to the usual risks inherent in domestic instruments. Foreign regulatory regimes and securities markets can have less stringent investor protections and disclosure standards and less liquid trading markets than U.S. regulatory regimes and securities markets, and can experience political, social and economic developments that may affect the value of investments in foreign securities. These risks include those resulting from future adverse political or economic developments and possible imposition of foreign governmental laws or restrictions. Economic sanctions and other similar governmental actions or developments could, among other things, effectively restrict or eliminate the Fund’s ability to purchase or sell certain foreign securities or groups of foreign securities, and thus may make the Fund’s investments in such securities less liquid or more difficult to value. The ability of issuers of debt securities held by the Fund to meet their obligations may be affected by, among other things, economic or political developments in a specific country, industry or region.
(J) Indemnifications. Under the Trust’s organizational documents, its officers and trustees are indemnified against certain liabilities that may arise out of performance of their duties to the Trust. Additionally, in the normal course of business, the Fund enters into contracts with third-party service providers that contain a variety of representations and warranties and that may provide general indemnifications. The Fund's maximum exposure under these arrangements is unknown, as this would involve future claims that may be made against the Fund that have not yet occurred. The Manager believes that the risk of loss in connection with these potential indemnification obligations is remote. However, there can be no assurance that material liabilities related to such obligations will not arise in the future, which could adversely impact the Fund.
Note 3–Fees and Related Party Transactions
(A) Manager and Subadvisor. New York Life Investments, a registered investment adviser and an indirect, wholly-owned subsidiary of New York Life Insurance Company ("New York Life"), serves as the Fund's Manager pursuant to an Amended and Restated Management Agreement ("Management Agreement"). The Manager provides offices, conducts clerical, recordkeeping and bookkeeping services and keeps most of the financial and accounting records required to be maintained by the Fund. Except for the portion of salaries and expenses that are the responsibility of the Fund, the Manager pays the salaries and expenses of all personnel affiliated with the Fund and certain operational expenses of the Fund. The Fund reimburses New York Life Investments in an amount equal to the portion of the compensation of the Chief Compliance Officer attributable to the Fund. NYL Investors LLC ("NYL Investors" or ''Subadvisor''), a registered investment adviser and a direct, wholly-owned subsidiary of New York Life, serves as the Subadvisor to the Fund and is responsible for the day-to-day portfolio management of the Fund. Pursuant to the
terms of a Subadvisory Agreement ("Subadvisory Agreement") between New York Life Investments and NYL Investors, New York Life Investments pays for the services of the Subadvisor.
Pursuant to the Management Agreement, the Fund pays the Manager a monthly fee for the services performed and the facilities furnished at an annual rate of the Fund’s average daily net assets as follows: 0.40% up to $500 million; 0.35% from $500 million to $1 billion; and 0.30% in excess of $1 billion. During the six-month period ended April 30, 2024, the effective management fee rate was 0.40% of the Fund’s average daily net assets, exclusive of any applicable waivers/reimbursements.
New York Life Investments has contractually agreed to waive fees and/or reimburse expenses so that Total Annual Fund Operating Expenses (excluding taxes, interest, litigation, extraordinary expenses, brokerage and other transaction expenses relating to the purchase or sale of portfolio investments and acquired (underlying) fund fees and expenses) do not exceed the following percentages of average daily net assets: Class A, 0.70%; Investor Class, 0.80%; Class B, 0.80%; Class C, 0.80% and SIMPLE Class, 0.80%. This agreement will remain in effect until February 28, 2025, and shall renew automatically for one-year terms unless New York Life Investments provides written notice of termination prior to the start of the next term or upon approval of the Board.
New York Life Investments may voluntarily waive fees or reimburse expenses of the Fund to the extent it deems appropriate to enhance the yield of the Fund’s during periods when expenses have a significant impact on the yield of the Fund, as applicable, because of low interest rates. This expense limitation policy is voluntary and in addition to any contractual arrangements that may be in place with respect to the Fund and described in the Fund’s prospectus.
During the six-month period ended April 30, 2024, New York Life Investments earned fees from the Fund in the amount of $1,067,726 and paid the Subadvisor in the amount of $523,062. Additionally, New York Life Investments reimbursed expenses in the amount of $21,867, without which the Fund's total returns would have been lower.
JPMorgan Chase Bank, N.A. ("JPMorgan") provides sub-administration and sub-accounting services to the Fund pursuant to an agreement with New York Life Investments. These services include calculating the daily NAVs of the Fund, maintaining the general ledger and sub-ledger accounts for the calculation of the Fund's NAVs, and assisting New York Life Investments in conducting various aspects of the Fund's administrative operations. For providing these services to the Fund, JPMorgan is compensated by New York Life Investments.
Pursuant to an agreement between the Trust and New York Life Investments, New York Life Investments is responsible for providing or procuring certain regulatory reporting services for the Fund. The Fund will reimburse New York Life Investments for the actual costs incurred by New York Life Investments in connection with providing or procuring these services for the Fund.
| 20 | MainStay Money Market Fund |
(B) Sales Charges. Although the Fund does not assess a CDSC upon redemption of Class B or Class C shares of the Fund, the applicable CDSC will be assessed when shares are redeemed from the Fund if the shareholder previously exchanged his or her investment into the Fund from another fund within the MainStay Group of Funds. The Fund was advised that the Distributor received from shareholders the proceeds from CDSCs of Class A, Investor Class, Class B and Class C during the six-month period ended April 30, 2024, of $8,955, $10, $3,965 and $595, respectively.
(C) Transfer, Dividend Disbursing and Shareholder Servicing Agent. NYLIM Service Company LLC, an affiliate of New York Life Investments, is the Fund's transfer, dividend disbursing and shareholder servicing agent pursuant to an agreement between NYLIM Service Company LLC and the Trust. NYLIM Service Company LLC has entered into an agreement with SS&C Global Investor & Distribution Solutions, Inc. ("SS&C"), pursuant to which SS&C performs certain transfer agent services on behalf of NYLIM Service Company LLC. New York Life Investments has contractually agreed to limit the transfer agency expenses charged to the Fund’s share classes to a maximum of 0.35% of that share class’s average daily net assets on an annual basis after deducting any applicable Fund or class-level expense reimbursement or small account fees. This agreement will remain in effect until February 28, 2025, and shall renew automatically for one-year terms unless New York Life Investments provides written notice of termination prior to the start of the next term or upon approval of the Board. During the six-month period ended April 30, 2024, transfer agent expenses incurred by the Fund and any reimbursements, pursuant to the aforementioned Transfer Agency expense limitation agreement, were as follows:
| Class | Expense | Waived |
| Class A | $161,601 | $ — |
| Investor Class | 35,487 | (79) |
| Class B | 46,796 | (110) |
| Class C | 31,998 | (77) |
| SIMPLE Class | 103 | — |
(D) Small Account Fee. Shareholders with small accounts adversely impact the cost of providing transfer agency services. In an effort to reduce total transfer agency expenses, the Fund has implemented a small account fee on certain types of accounts. As described in the Fund's prospectus, certain shareholders with an account balance of less than $1,000 ($5,000 for Class A share accounts) are charged an annual per account fee of $20 (assessed semi-annually), the proceeds from which offset transfer agent fees as reflected in the Statement of Operations. This small account fee will not apply to certain types of accounts as described further in the Fund’s prospectus.
(E) Capital. As of April 30, 2024, New York Life and its affiliates beneficially held shares of the Fund with the values and percentages of net assets as follows:
Note 4-Federal Income Tax
The amortized cost also represents the aggregate cost for federal income tax purposes.
As of October 31, 2023, for federal income tax purposes, capital loss carryforwards of $5,448, as shown in the table below, were available to the extent provided by the regulations to offset future realized gains of the Fund. Accordingly, no capital gains distributions are expected to be paid to shareholders until net gains have been realized in excess of such amounts.
Capital Loss
Available Through | Short-Term
Capital Loss
Amounts (000’s) | Long-Term
Capital Loss
Amounts (000’s) |
| Unlimited | $5 | $— |
During the year ended October 31, 2023, the tax character of distributions paid as reflected in the Statements of Changes in Net Assets was as follows:
| | 2023 |
| Distributions paid from: | |
| Ordinary Income | $21,627,508 |
Note 5–Custodian
JPMorgan is the custodian of cash and securities held by the Fund. Custodial fees are charged to the Fund based on the Fund's net assets and/or the market value of securities held by the Fund and the number of certain transactions incurred by the Fund.
Note 6–Interfund Lending Program
Pursuant to an exemptive order issued by the SEC, the Fund, along with certain other funds managed by New York Life Investments, may participate in an interfund lending program. The interfund lending program provides an alternative credit facility that permits the Fund and certain other funds managed by New York Life Investments to lend or borrow money for temporary purposes directly to or from one another, subject to the conditions of the exemptive order. During the six-month period ended April 30, 2024, there were no interfund loans made or outstanding with respect to the Fund.
Notes to Financial Statements (Unaudited) (continued)
Note 7–Capital Share Transactions
Transactions in capital shares for the six-month period ended April 30, 2024 and the year ended October 31, 2023, were as follows:
| Class A (at $1 per share) | Shares |
| Six-month period ended April 30, 2024: | |
| Shares sold | 222,687,443 |
| Shares issued to shareholders in reinvestment of distributions | 11,780,956 |
| Shares redeemed | (231,434,076) |
| Net increase (decrease) in shares outstanding before conversion | 3,034,323 |
| Shares converted into Class A (See Note 1) | 1,845,236 |
| Shares converted from Class A (See Note 1) | (26,254) |
| Net increase (decrease) | 4,853,305 |
| Year ended October 31, 2023: | |
| Shares sold | 448,938,701 |
| Shares issued to shareholders in reinvestment of distributions | 18,818,104 |
| Shares redeemed | (414,117,186) |
| Net increase (decrease) in shares outstanding before conversion | 53,639,619 |
| Shares converted into Class A (See Note 1) | 6,170,381 |
| Shares converted from Class A (See Note 1) | (77,698) |
| Net increase (decrease) | 59,732,302 |
| |
| Investor Class (at $1 per share) | Shares |
| Six-month period ended April 30, 2024: | |
| Shares sold | 4,729,917 |
| Shares issued to shareholders in reinvestment of distributions | 374,931 |
| Shares redeemed | (4,197,898) |
| Net increase (decrease) in shares outstanding before conversion | 906,950 |
| Shares converted into Investor Class (See Note 1) | 69,596 |
| Shares converted from Investor Class (See Note 1) | (1,809,208) |
| Net increase (decrease) | (832,662) |
| Year ended October 31, 2023: | |
| Shares sold | 11,047,443 |
| Shares issued to shareholders in reinvestment of distributions | 717,723 |
| Shares redeemed | (8,087,178) |
| Net increase (decrease) in shares outstanding before conversion | 3,677,988 |
| Shares converted into Investor Class (See Note 1) | 82,400 |
| Shares converted from Investor Class (See Note 1) | (6,062,419) |
| Net increase (decrease) | (2,302,031) |
| |
| Class B (at $1 per share) | Shares |
| Six-month period ended April 30, 2024: | |
| Shares sold | 307,390 |
| Shares issued to shareholders in reinvestment of distributions | 499,553 |
| Shares redeemed | (1,635,951) |
| Net increase (decrease) in shares outstanding before conversion | (829,008) |
| Shares converted from Class B (See Note 1) | (54,914) |
| Net increase (decrease) | (883,922) |
| Year ended October 31, 2023: | |
| Shares sold | 817,072 |
| Shares issued to shareholders in reinvestment of distributions | 909,328 |
| Shares redeemed | (3,183,969) |
| Net increase (decrease) in shares outstanding before conversion | (1,457,569) |
| Shares converted into Class B (See Note 1) | 20,761 |
| Shares converted from Class B (See Note 1) | (107,393) |
| Net increase (decrease) | (1,544,201) |
| |
| Class C (at $1 per share) | Shares |
| Six-month period ended April 30, 2024: | |
| Shares sold | 2,391,472 |
| Shares issued to shareholders in reinvestment of distributions | 342,516 |
| Shares redeemed | (3,195,462) |
| Net increase (decrease) in shares outstanding before conversion | (461,474) |
| Shares converted from Class C (See Note 1) | (24,457) |
| Net increase (decrease) | (485,931) |
| Year ended October 31, 2023: | |
| Shares sold | 6,312,161 |
| Shares issued to shareholders in reinvestment of distributions | 655,669 |
| Shares redeemed | (10,319,185) |
| Net increase (decrease) in shares outstanding before conversion | (3,351,355) |
| Shares converted from Class C (See Note 1) | (26,031) |
| Net increase (decrease) | (3,377,386) |
| |
| SIMPLE Class (at $1 per share) | Shares |
| Six-month period ended April 30, 2024: | |
| Shares sold | 2,022,950 |
| Shares issued to shareholders in reinvestment of distributions | 15,423 |
| Shares redeemed | (1,003,343) |
| Net increase (decrease) | 1,035,030 |
| Year ended October 31, 2023: | |
| Shares sold | 397,607 |
| Shares issued to shareholders in reinvestment of distributions | 7,704 |
| Shares redeemed | (304,265) |
| Net increase (decrease) | 101,046 |
Note 8–Other Matters
As of the date of this report, the Fund faces a heightened level of risk associated with current uncertainty, volatility and state of economies, financial markets, a high interest rate environment, and labor and health
| 22 | MainStay Money Market Fund |
conditions around the world. Events such as war, acts of terrorism, recessions, rapid inflation, the imposition of economic sanctions, earthquakes, hurricanes, epidemics and pandemics and other unforeseen natural or human disasters may have broad adverse social, political and economic effects on the global economy, which could negatively impact the value of the Fund's investments. Developments that disrupt global economies and financial markets may magnify factors that affect the Fund's performance.
On July 12, 2023, the SEC adopted certain amendments to the regulatory requirements for money market funds, including the Fund. In particular, the SEC, among other things, amended Rule 2a-7 under the 1940 Act to remove the ability of a money market fund to impose a redemption gate (except as part of a liquidation), while preserving the discretion to impose liquidity fees for non-government money market funds, such as the Fund (without regard to weekly liquid asset levels). Prior to these amendments, the Fund was permitted to impose a liquidity fee and/or redemption gate if the Fund invested less than 30% of its total assets in weekly liquid assets. The Fund is no longer permitted to temporarily impose a redemption gate, except as part of its liquidation, and the Fund may subject redemptions to a liquidity fee of up to 2% without regard to the Fund’s level of weekly liquid assets if the Fund’s Board of Trustees believes such fee to be in the best interest of the Fund.
Note 9–Subsequent Events
In connection with the preparation of the financial statements of the Fund as of and for the six-month period ended April 30, 2024, events and transactions subsequent to April 30, 2024, through the date the financial statements were issued, have been evaluated by the Manager for possible adjustment and/or disclosure. No subsequent events requiring financial statement adjustment or disclosure have been identified.
Board Consideration and Approval of Management Agreement and Subadvisory Agreement (Unaudited)
The continuation of the Management Agreement with respect to the MainStay Money Market Fund (“Fund”) and New York Life Investment Management LLC (“New York Life Investments”) and the Subadvisory Agreement between New York Life Investments and NYL Investors LLC (“NYL Investors”) with respect to the Fund (together, “Advisory Agreements”) is subject to annual review and approval by the Board of Trustees of The MainStay Funds (“Board” of the “Trust”) in accordance with Section 15 of the Investment Company Act of 1940, as amended (“1940 Act”). At its December 6–7, 2023 meeting, the Board, including the Trustees who are not an “interested person” (as such term is defined in the 1940 Act) of the Trust (“Independent Trustees”) voting separately, unanimously approved the continuation of each of the Advisory Agreements for a one-year period.
In reaching the decision to approve the continuation of each of the Advisory Agreements, the Board considered information and materials furnished by New York Life Investments and NYL Investors in connection with an annual contract review process undertaken by the Board that took place at meetings of the Board and its Contracts Committee from September 2023 through December 2023, including information and materials furnished by New York Life Investments and NYL Investors in response to requests prepared on behalf of the Board, and in consultation with the Independent Trustees, by independent legal counsel to the Independent Trustees, which encompassed a variety of topics, including those summarized below. Information and materials requested by and furnished to the Board for consideration in connection with the contract review process included, among other items, reports on the Fund and “peer funds” prepared by Institutional Shareholder Services Inc. (“ISS”), an independent third-party service provider engaged by the Board to report objectively on the Fund’s investment performance, management fee and total expenses. The Board also considered information on the fees charged to other investment advisory clients of New York Life Investments and/or NYL Investors that follow investment strategies similar to those of the Fund, if any, and, when applicable, the rationale for differences in the Fund’s management and subadvisory fees and the fees charged to those other investment advisory clients. In addition, the Board considered information regarding the legal standards and fiduciary obligations applicable to its consideration of the continuation of each of the Advisory Agreements. The contract review process, including the structure and format for information and materials provided to the Board, has been developed in consultation with the Board. The Independent Trustees also met in executive sessions with their independent legal counsel and, for portions thereof, with senior management of New York Life Investments.
The Board’s deliberations with respect to the continuation of each of the Advisory Agreements reflect a year-long process, and the Board also took into account information furnished to the Board and its Committees throughout the year, as deemed relevant and appropriate by the Trustees, including, among other items, reports on investment performance of the Fund and investment-related matters for the Fund as well as presentations from New York Life Investments and, generally annually, NYL Investors personnel. In addition, the Board took into account other
information provided by New York Life Investments throughout the year, including, among other items, periodic reports on legal and compliance matters, risk management, portfolio turnover, brokerage commissions and non-advisory services provided to the Fund by New York Life Investments, as deemed relevant and appropriate by the Trustees.
In addition to information provided to the Board throughout the year, the Board received information in connection with its June 2023 meeting provided specifically in response to requests prepared on behalf of the Board, and in consultation with the Independent Trustees, by independent legal counsel to the Independent Trustees regarding the Fund’s distribution arrangements. In addition, the Board received information regarding the Fund’s asset levels, share purchase and redemption activity and the payment of Rule 12b-1 and/or certain other fees by the applicable share classes of the Fund, among other information.
In considering the continuation of each of the Advisory Agreements, the Trustees reviewed and evaluated the information and factors they believed to reasonably be necessary and appropriate in light of legal advice furnished to them by independent legal counsel to the Independent Trustees and through the exercise of their own business judgment. Although individual Trustees may have weighed certain factors or information differently and the Board did not consider any single factor or information controlling in reaching its decision, the factors that figured prominently in the Board’s consideration of the continuation of each of the Advisory Agreements are summarized in more detail below and include, among other factors: (i) the nature, extent and quality of the services provided to the Fund by New York Life Investments and NYL Investors; (ii) the qualifications of the portfolio managers of the Fund and the historical investment performance of the Fund, New York Life Investments and NYL Investors; (iii) the costs of the services provided, and profits realized, by New York Life Investments and NYL Investors with respect to their relationships with the Fund; (iv) the extent to which economies of scale have been realized or may be realized if the Fund grows and the extent to which any economies of scale have been shared, have benefited or may benefit the Fund’s shareholders; and (v) the reasonableness of the Fund’s management and subadvisory fees and total ordinary operating expenses. Although the Board recognized that comparisons between the Fund’s fees and expenses and those of other funds are imprecise given different terms of agreements, variations in fund strategies and other factors, the Board considered the reasonableness of the Fund’s management fee and total ordinary operating expenses as compared to the peer funds identified by ISS. Throughout their considerations, the Trustees acknowledged the commitment of New York Life Investments and its affiliates to serve the MainStay Group of Funds, as well as their capacity, experience, resources, financial stability and reputations. The Trustees also acknowledged the entrepreneurial and other risks assumed by New York Life Investments in sponsoring and managing the Fund. With respect to the Subadvisory Agreement, the Board took into account New York Life Investments’ recommendation to approve the continuation of the Subadvisory Agreement.
| 24 | MainStay Money Market Fund |
The Trustees noted that, throughout the year, the Trustees are afforded an opportunity to ask questions of, and request additional information or materials from, New York Life Investments and NYL Investors. The Board’s decision with respect to each of the Advisory Agreements may have also been based, in part, on the Board’s knowledge of New York Life Investments and NYL Investors resulting from, among other things, the Board’s consideration of each of the Advisory Agreements in prior years, the advisory agreements for other funds in the MainStay Group of Funds, the Board’s review throughout the year of the performance and operations of other funds in the MainStay Group of Funds and each Trustee’s business judgment and industry experience. In addition to considering the above-referenced factors, the Board observed that in the marketplace there are a range of investment options available to investors and that the Fund’s shareholders, having had the opportunity to consider other investment options, have invested in the Fund.
The factors that figured prominently in the Board’s decision to approve the continuation of each of the Advisory Agreements during the Board’s December 6–7, 2023 meeting are summarized in more detail below.
Nature, Extent and Quality of Services Provided by New York Life Investments and NYL Investors
The Board examined the nature, extent and quality of the services that New York Life Investments provides to the Fund. The Board evaluated New York Life Investments’ experience and capabilities in serving as manager of the Fund and considered that the Fund operates in a “manager-of-managers” structure. The Board also considered New York Life Investments’ responsibilities and services provided pursuant to this structure, including overseeing the services provided by NYL Investors, evaluating the performance of NYL Investors, making recommendations to the Board as to whether the Subadvisory Agreement should be renewed, modified or terminated and periodically reporting to the Board regarding the results of New York Life Investments’ evaluation and monitoring functions. The Board noted that New York Life Investments manages other mutual funds, serves a variety of other investment advisory clients, including other pooled investment vehicles, and has experience overseeing mutual fund service providers, including subadvisors. The Board considered the experience of senior personnel at New York Life Investments providing management and administrative and other non-advisory services to the Fund. The Board observed that New York Life Investments devotes significant resources and time to providing management and administrative and other non-advisory services to the Fund, including New York Life Investments’ oversight and due diligence reviews of NYL Investors and ongoing analysis of, and interactions with, NYL Investors with respect to, among other things, the Fund’s investment performance and risks as well as NYL Investors’ investment capabilities and subadvisory services with respect to the Fund.
The Board also considered the range of services that New York Life Investments provides to the Fund under the terms of the Management Agreement, including: (i) fund accounting and ongoing supervisory services provided by New York Life Investments’ Fund Administration and Accounting Group; (ii) investment supervisory and analytical services
provided by New York Life Investments’ Investment Consulting Group; (iii) compliance services provided by the Trust’s Chief Compliance Officer as well as New York Life Investments’ compliance department, including supervision and implementation of the Fund’s compliance program; (iv) legal services provided by New York Life Investments’ Office of the General Counsel; and (v) risk management monitoring and analysis by compliance and investment personnel. In addition, the Board considered New York Life Investments’ willingness to invest in personnel and other resources, such as cyber security, information security and business continuity planning, that may benefit the Fund and noted that New York Life Investments is responsible for compensating the Trust’s officers, except for a portion of the salary of the Trust’s Chief Compliance Officer. The Board recognized that New York Life Investments provides certain other non-advisory services to the Fund and has over time provided an increasingly broad array of non-advisory services to the MainStay Group of Funds as a result of regulatory and other developments.
The Board also examined the range, and the nature, extent and quality, of the investment advisory services that NYL Investors provides to the Fund and considered the terms of each of the Advisory Agreements. The Board evaluated NYL Investors’ experience and performance in serving as subadvisor to the Fund and advising other portfolios and NYL Investors’ track record and experience in providing investment advisory services as well as the experience of investment advisory, senior management and/or administrative personnel at NYL Investors. The Board considered New York Life Investments’ and NYL Investors’ overall resources, legal and compliance environment, capabilities, reputation, financial condition and history. In addition to information provided in connection with quarterly meetings with the Trust’s Chief Compliance Officer, the Board considered information regarding the compliance policies and procedures of New York Life Investments and NYL Investors and acknowledged their commitment to further developing and strengthening compliance programs that may relate to the Fund. The Board also considered NYL Investors’ ability to recruit and retain qualified investment professionals and willingness to invest in personnel and other resources that may benefit the Fund. In this regard, the Board considered the qualifications and experience of the Fund’s portfolio managers, the number of accounts managed by the portfolio managers and the method for compensating the portfolio managers.
In addition, the Board considered information provided by New York Life Investments and NYL Investors regarding their respective business continuity and disaster recovery plans.
Based on these considerations, among others, the Board concluded that the Fund would likely continue to benefit from the nature, extent and quality of these services.
Investment Performance
In evaluating the Fund’s investment performance, the Board considered investment performance results over various periods in light of the Fund’s investment objective, strategies and risks. The Board considered investment reports on, and analysis of, the Fund’s performance provided
Board Consideration and Approval of Management Agreement and Subadvisory Agreement (Unaudited) (continued)
to the Board throughout the year. These reports include, among other items, information on the Fund’s gross and net returns, the Fund’s investment performance compared to a relevant investment category and the Fund’s benchmarks, the Fund’s risk-adjusted investment performance and the Fund’s investment performance as compared to peer funds, as appropriate, as well as portfolio attribution information and commentary on the effect of market conditions. The Board also considered information provided by ISS showing the investment performance of the Fund as compared to peer funds. In addition, the Board reviewed the methodology used by ISS to construct the group of peer funds for comparative purposes.
The Board also took into account its discussions with senior management at New York Life Investments concerning the Fund’s investment performance over various periods as well as discussions between representatives of NYL Investors and the members of the Board’s Investment Committee, which generally occur on an annual basis.
Based on these considerations, among others, the Board concluded that its review of the Fund’s investment performance and related information supported a determination to approve the continuation of each of the Advisory Agreements.
Costs of the Services Provided, and Profits and Other Benefits Realized, by New York Life Investments and NYL Investors
The Board considered the costs of the services provided under each of the Advisory Agreements. The Board also considered the profitability of New York Life Investments and its affiliates, including NYL Investors, due to their relationships with the Fund as well as of New York Life Investments and its affiliates due to their relationships with the MainStay Group of Funds. Because NYL Investors is an affiliate of New York Life Investments whose subadvisory fee is paid by New York Life Investments, not the Fund, the Board considered cost and profitability information for New York Life Investments and NYL Investors in the aggregate.
In addition, the Board acknowledged the difficulty in obtaining reliable comparative data about mutual fund managers’ profitability because such information generally is not publicly available and may be impacted by numerous factors, including the structure of a fund manager’s organization, the types of funds it manages, the methodology used to allocate certain fixed costs to specific funds and the manager’s capital structure and costs of capital.
In evaluating the costs of the services provided by New York Life Investments and NYL Investors, and profitability of New York Life Investments and its affiliates, including NYL Investors, due to their relationships with the Fund, the Board considered, among other factors, New York Life Investments’ and its affiliates’, including NYL Investors’, continuing investments in, or willingness to invest in, personnel and other resources that may support and further enhance the management of the Fund, and that New York Life Investments is responsible for paying the subadvisory fee for the Fund. The Board also considered the financial resources of New York Life Investments and NYL Investors and
acknowledged that New York Life Investments and NYL Investors must be in a position to recruit and retain experienced professional personnel and to maintain a strong financial position for New York Life Investments and NYL Investors to continue to provide high-quality services to the Fund. The Board recognized that the Fund benefits from the allocation of certain fixed costs among the funds in the MainStay Group of Funds, among other expected benefits resulting from its relationship with New York Life Investments.
The Board considered information regarding New York Life Investments’ methodology for calculating profitability and allocating costs provided by New York Life Investments in connection with the fund profitability analysis presented to the Board. The Board concluded that New York Life Investments’ methods for allocating costs and procedures for estimating overall profitability of the relationship with the funds in the MainStay Group of Funds were reasonable. The Board recognized the difficulty in calculating and evaluating a manager’s profitability with respect to the Fund and considered that other profitability methodologies may also be reasonable.
The Board also considered certain fall-out benefits that may be realized by New York Life Investments and its affiliates, including NYL Investors, due to their relationships with the Fund, including reputational and other indirect benefits.
The Board observed that, in addition to fees earned by New York Life Investments under the Management Agreement for managing the Fund, New York Life Investments’ affiliates also earn revenues from serving the Fund in various other capacities, including as the Fund’s transfer agent and distributor. The Board considered information about these other revenues and their impact on the profitability of the relationship with the Fund to New York Life Investments and its affiliates. The Board noted that, although it assessed the overall profitability of the relationship with the Fund to New York Life Investments and its affiliates as part of the contract review process, when considering the reasonableness of the fee paid to New York Life Investments under the Management Agreement, the Board considered the profitability of New York Life Investments’ relationship with the Fund on a pre-tax basis and without regard to distribution expenses incurred by New York Life Investments from its own resources.
After evaluating the information deemed relevant by the Trustees, the Board concluded that any profits realized by New York Life Investments and its affiliates, including NYL Investors, due to their relationships with the Fund were not excessive and other expected benefits that may accrue to New York Life Investments and its affiliates, including NYL Investors, are reasonable.
Management and Subadvisory Fees and Total Ordinary Operating Expenses
The Board evaluated the reasonableness of the fee paid under each of the Advisory Agreements and the Fund’s total ordinary operating expenses. With respect to the management fee and subadvisory fee, the Board primarily considered the reasonableness of the management fee
| 26 | MainStay Money Market Fund |
paid by the Fund to New York Life Investments because the subadvisory fee paid to NYL Investors is paid by New York Life Investments, not the Fund. The Board also considered the reasonableness of the subadvisory fee paid by New York Life Investments and the amount of the management fee retained by New York Life Investments.
In assessing the reasonableness of the Fund’s fees and expenses, the Board primarily considered comparative data provided by ISS on the fees and expenses of similar mutual funds managed by other investment advisers. The Board reviewed the methodology used by ISS to construct the group of peer funds for comparative purposes. In addition, the Board considered information provided by New York Life Investments and NYL Investors on fees charged to other investment advisory clients, including institutional separate accounts and/or other funds, that follow investment strategies similar to those of the Fund, if any. The Board considered the contractual management fee schedule for the Fund as compared to those for such other investment advisory clients, taking into account the rationale for differences in fee schedules. The Board also took into account information provided by New York Life Investments about the more extensive scope of services provided to registered investment companies, such as the Fund, as compared with other investment advisory clients. Additionally, the Board considered the impact of contractual breakpoints, voluntary waivers and expense limitation arrangements on the Fund’s net management fee and expenses. The Board noted that New York Life Investments, in certain years, has provided support to the Fund in the form of voluntary waivers and/or reimbursements of fees and expenses in order to maintain a positive yield. The Board also considered that in proposing fees for the Fund, New York Life Investments considers the competitive marketplace for mutual funds. The Board considered its discussions with representatives from New York Life Investments regarding the management fee paid by the Fund.
The Board took into account information from New York Life Investments, as provided in connection with the Board’s June 2023 meeting, regarding the reasonableness of the Fund’s transfer agent fee schedule, including industry data demonstrating that the fees that NYLIM Service Company LLC, an affiliate of New York Life Investments and the Fund’s transfer agent, charges the Fund are within the range of fees charged by transfer agents to other mutual funds. In addition, the Board considered NYLIM Service Company LLC’s profitability in connection with the transfer agent services it provides to the Fund. The Board also took into account information provided by NYLIM Service Company LLC regarding the sub-transfer agency payments it made to intermediaries in connection with the provision of sub-transfer agency services to the Fund.
The Board considered the extent to which transfer agent fees contributed to the total expenses of the Fund. The Board acknowledged the role that the MainStay Group of Funds historically has played in serving the investment needs of New York Life Insurance Company customers, who often maintain smaller account balances than other shareholders of funds, and the impact of small accounts on the expense ratios of Fund share classes. The Board also recognized measures that it and New York Life Investments have taken that are intended to mitigate the effect of
small accounts on the expense ratios of Fund share classes, including through the imposition of an expense limitation on net transfer agency expenses. The Board also considered that NYLIM Service Company LLC had waived its contractual cost of living adjustments during certain years.
Based on the factors outlined above, among other considerations, the Board concluded that the Fund’s management fee and total ordinary operating expenses are within a range that is competitive and support a conclusion that these fees and expenses are reasonable.
Economies of Scale
The Board considered information regarding economies of scale, including whether economies of scale may exist with respect to the Fund and whether the Fund’s management fee and expense structure permits any economies of scale to be appropriately shared with the Fund’s shareholders. The Board also considered a report from New York Life Investments, previously prepared at the request of the Board, that addressed economies of scale, including with respect to the mutual fund business generally, and the various ways in which the benefits of economies of scale may be shared with the funds in the MainStay Group of Funds. Although the Board recognized the difficulty of determining economies of scale with precision, the Board acknowledged that economies of scale may be shared with the Fund in a number of ways, including, for example, through the imposition of fee breakpoints, initially setting management fee rates at scale or making additional investments to enhance the services provided to the Fund. The Board reviewed information from New York Life Investments showing how the Fund’s management fee schedule compared to fee schedules of other funds and accounts managed by New York Life Investments. The Board also reviewed information from ISS showing how the Fund’s management fee schedule compared with fees paid for similar services by peer funds at varying asset levels.
Based on this information, the Board concluded that economies of scale are appropriately shared for the benefit of the Fund’s shareholders through the Fund’s management fee and expense structure and other methods to share benefits from economies of scale.
Conclusion
On the basis of the information and factors summarized above, among other information and factors deemed relevant by the Trustees, and the evaluation thereof, the Board, including the Independent Trustees voting separately, unanimously voted to approve the continuation of each of the Advisory Agreements.
Proxy Voting Policies and Procedures and Proxy Voting Record
The Fund is required to file with the SEC its proxy voting record for the 12-month period ending June 30 on Form N-PX. A description of the policies and procedures that are used to vote proxies relating to portfolio securities of the Fund is available free of charge upon request by calling 800-624-6782 or visiting the SEC’s website at www.sec.gov. The most recent Form N-PX or proxy voting record is available free of charge upon request by calling 800-624-6782; visiting newyorklifeinvestments.com; or visiting the SEC’s website at www.sec.gov.
Shareholder Reports and Quarterly Portfolio Disclosure
The Fund is required to file a Form N-MFP every month disclosing its portfolio holdings. The Fund's Form N-MFP is available free of charge upon request by calling New York Life Investments at 800-624-6782.
This page intentionally left blank.
This page intentionally left blank.
Equity
U.S. Equity
MainStay Epoch U.S. Equity Yield Fund
MainStay Fiera SMID Growth Fund
MainStay PineStone U.S. Equity Fund
MainStay S&P 500 Index Fund
MainStay Winslow Large Cap Growth Fund
MainStay WMC Enduring Capital Fund
MainStay WMC Growth Fund
MainStay WMC Small Companies Fund
MainStay WMC Value Fund
International Equity
MainStay Epoch International Choice Fund
MainStay PineStone International Equity Fund
MainStay WMC International Research Equity Fund
Emerging Markets Equity
MainStay Candriam Emerging Markets Equity Fund
Global Equity
MainStay Epoch Capital Growth Fund
MainStay Epoch Global Equity Yield Fund
MainStay PineStone Global Equity Fund
Fixed Income
Taxable Income
MainStay Candriam Emerging Markets Debt Fund
MainStay Floating Rate Fund
MainStay MacKay High Yield Corporate Bond Fund
MainStay MacKay Short Duration High Income Fund
MainStay MacKay Strategic Bond Fund
MainStay MacKay Total Return Bond Fund
MainStay MacKay U.S. Infrastructure Bond Fund
MainStay Short Term Bond Fund
Tax-Exempt Income
MainStay MacKay Arizona Muni Fund
MainStay MacKay California Tax Free Opportunities Fund1
MainStay MacKay Colorado Muni Fund
MainStay MacKay High Yield Municipal Bond Fund
MainStay MacKay New York Tax Free Opportunities Fund2
MainStay MacKay Oregon Muni Fund
MainStay MacKay Short Term Municipal Fund
MainStay MacKay Strategic Municipal Allocation Fund
MainStay MacKay Tax Free Bond Fund
MainStay MacKay Utah Muni Fund
Money Market
MainStay Money Market Fund
Mixed Asset
MainStay Balanced Fund
MainStay Income Builder Fund
MainStay MacKay Convertible Fund
Speciality
MainStay CBRE Global Infrastructure Fund
MainStay CBRE Real Estate Fund
MainStay Cushing MLP Premier Fund
Asset Allocation
MainStay Conservative Allocation Fund
MainStay Conservative ETF Allocation Fund
MainStay Equity Allocation Fund
MainStay Equity ETF Allocation Fund
MainStay Growth Allocation Fund
MainStay Growth ETF Allocation Fund
MainStay Moderate Allocation Fund
MainStay Moderate ETF Allocation Fund
Manager
New York Life Investment Management LLC
New York, New York
Subadvisors
Candriam3
Strassen, Luxembourg
CBRE Investment Management Listed Real Assets LLC
Radnor, Pennsylvania
Cushing Asset Management, LP
Dallas, Texas
Epoch Investment Partners, Inc.
New York, New York
Fiera Capital Inc.
New York, New York
IndexIQ Advisors LLC3
New York, New York
MacKay Shields LLC3
New York, New York
NYL Investors LLC3
New York, New York
PineStone Asset Management Inc.
Montreal, Québec
Wellington Management Company LLP
Boston, Massachusetts
Winslow Capital Management, LLC
Minneapolis, Minnesota
Legal Counsel
Dechert LLP
Washington, District of Columbia
Independent Registered Public Accounting Firm
KPMG LLP
Philadelphia, Pennsylvania
Distributor
NYLIFE Distributors LLC3
Jersey City, New Jersey
Custodian
JPMorgan Chase Bank, N.A.
New York, New York
1.
This Fund is registered for sale in AZ, CA, NV, OR, TX, UT, WA (all share classes); and MI (Class A and Class I shares only); and CO, FL, GA, HI, ID, MA, MD, NH, NJ and NY (Class I and Class C2 shares only).
| 2. | This Fund is registered for sale in CA, CT, DE, FL, MA, NJ, NY, VT (all share classes) and SD (Class R6 shares only). |
| 3. | An affiliate of New York Life Investment Management LLC. |
Not part of the Semiannual Report
For more information
800-624-6782
newyorklifeinvestments.com
“New York Life Investments” is both a service mark, and the common trade name, of certain investment advisors affiliated with New York Life Insurance Company. The MainStay Funds® are managed by New York Life Investment Management LLC and distributed by NYLIFE Distributors LLC, 30 Hudson Street, Jersey City, NJ 07302, a wholly owned subsidiary of New York Life Insurance Company. NYLIFE Distributors LLC is a Member FINRA/SIPC.
©2024 NYLIFE Distributors LLC. All rights reserved.
| 5022273 MS081-24 | MSMM10-06/24 |
(NYLIM) NL214
MainStay Winslow Large Cap Growth Fund
Message from the President and Semiannual Report
Unaudited | April 30, 2024
Special Notice:
Beginning in July 2024, new regulations issued by the Securities and Exchange Commission (SEC) will take effect requiring open-end mutual fund companies and ETFs to (1) overhaul the content of their shareholder reports and (2) mail paper copies of the new tailored shareholder reports to shareholders who have not opted to receive these documents electronically.
If you have not yet elected to receive your shareholder reports electronically, please contact your financial intermediary or visit newyorklifeinvestments.com/accounts.
| Not FDIC/NCUA Insured | Not a Deposit | May Lose Value | No Bank Guarantee | Not Insured by Any Government Agency |
This page intentionally left blank
Message from the President
Stock and bond markets gained broad ground during the six-month period ended April 30, 2024, bolstered by better-than-expected economic growth and the prospect of monetary easing in the face of a myriad of macroeconomic and geopolitical challenges.
Throughout the reporting period, interest rates remained at their highest levels in decades in most developed countries, with the U.S. federal funds rate in the 5.25%−5.50% range, as central banks struggled to bring inflation under control. Early in the reporting period, the U.S. Federal Reserve began to forecast interest rate cuts in 2024, but delayed action as inflation remained stubbornly high, fluctuating between 3.1% and 3.5%. Nevertheless, despite the increasing cost of capital and tighter lending environment that resulted from sustained high rates, economic growth remained surprisingly robust, supported by high levels of consumer spending, low unemployment and strong corporate earnings. Investors tended to shrug off concerns related to sticky inflation and high interest rates—not to mention the ongoing war in Ukraine, intensifying hostilities in the Middle East and simmering tensions between China and the United States—focusing instead on the positives of continued economic growth and surprisingly strong corporate profits.
The S&P 500® Index, a widely regarded benchmark of U.S. market performance, produced double-digit gains, reaching record levels in March 2024. Market strength, which had been narrowly focused on mega-cap, technology-related stocks during the previous six months broadened significantly during the reporting period. All industry sectors produced positive results, with the strongest returns in communication services, information technology and industrials, and more moderate gains in the lagging energy, real estate and consumer staples areas. Growth-oriented shares slightly outperformed value-oriented
issues, while large- and mid-cap stocks modestly outperformed their small-cap counterparts. Most overseas equity markets trailed the U.S. market, as developed international economies experienced relatively low growth rates, and weak economic conditions in China undermined emerging markets.
Bonds generally gained ground as well. The yield on the 10-year Treasury note ranged between approximately 4.7% and 3.8%, while the 2-year Treasury yield remained slightly higher, between approximately 5.0% and 4.1%, in an inverted curve pattern often viewed as indicative of an impending economic slowdown. Nevertheless, the prevailing environment of stable interest rates and attractive yields provided a favorable environment for fixed-income investors. Long-term Treasury bonds and investment-grade corporate bonds produced similar gains, while high yield bonds advanced by a slightly greater margin, despite the added risks implicit in an uptick in default rates. International bond markets modestly outperformed their U.S. counterparts, led by a rebound in the performance of emerging-markets debt.
The risks and uncertainties inherent in today’s markets call for the kind of insight and expertise that New York Life Investments offers through our one-on-one philosophy, long-lasting focus, and multi-boutique approach.
Thank you for trusting us to help you meet your investment needs.
Sincerely,
Kirk C. Lehneis
President
The opinions expressed are as of the date of this report and are subject to change. There is no guarantee that any forecast made will come to pass. This material does not constitute investment advice and is not intended as an endorsement of any specific investment. Past performance is no guarantee of future results.
Not part of the Semiannual Report
Investors should refer to the Fund’s Summary Prospectus and/or Prospectus and consider the Fund’s investment objectives, strategies, risks, charges and expenses carefully before investing. The Summary Prospectus and/or Prospectus contain this and other information about the Fund. You may obtain copies of the Fund’s Summary Prospectus, Prospectus and Statement of Additional Information, which includes information about The MainStay Funds' Trustees, free of charge, upon request, by calling toll-free 800-624-6782, by writing to NYLIFE Distributors LLC, Attn: MainStay Marketing Department, 30 Hudson Street, Jersey City, NJ 07302 or by sending an e-mail to MainStayShareholderServices@nylim.com. These documents are also available on dfinview.com/NYLIM. Please read the Fund’s Summary Prospectus and/or Prospectus carefully before investing.
Investment and Performance Comparison (Unaudited)
Performance data quoted represents past performance. Past performance is no guarantee of future results. Because of market volatility and other factors, current performance may be lower or higher than the figures shown. Investment return and principal value will fluctuate, and as a result, when shares are redeemed, they may be worth more or less than their original cost. The graph below depicts the historical performance of Class I shares of the Fund. Performance will vary from class to class based on differences in class-specific expenses and sales charges. For performance information current to the most recent month-end, please call 800-624-6782 or visit newyorklifeinvestments.com.
The performance table and graph do not reflect the deduction of taxes that a shareholder would pay on distributions or Fund share redemptions. Total returns reflect maximum applicable sales charges as indicated in the table below, if any, changes in share price, and reinvestment of dividend and capital gain distributions. The graph assumes the initial investment amount shown below and reflects the deduction of all sales charges that would have applied for the period of investment. Performance figures may reflect certain fee waivers and/or expense limitations, without which total returns may have been lower. For more information on share classes and current fee waivers and/or expense limitations (if any), please refer to the Notes to Financial Statements.

| Average Annual Total Returns for the Period-Ended April 30, 2024 |
| Class | Sales Charge | | Inception
Date | Six
Months1 | One
Year | Five
Years | Ten Years
or Since
Inception | Gross
Expense
Ratio2 |
| Class A Shares | Maximum 5.50% Initial Sales Charge | With sales charges | 7/1/1995 | 20.78% | 28.43% | 13.13% | 13.84% | 0.98% |
| | | Excluding sales charges | | 27.81 | 35.91 | 14.42 | 14.48 | 0.98 |
| Investor Class Shares3 | Maximum 5.00% Initial Sales Charge | With sales charges | 2/28/2008 | 21.27 | 28.94 | 12.95 | 13.69 | 1.19 |
| | | Excluding sales charges | | 27.65 | 35.73 | 14.23 | 14.34 | 1.19 |
| Class B Shares4 | Maximum 5.00% CDSC | With sales charges | 4/1/2005 | 22.06 | 29.52 | 13.20 | 13.48 | 1.94 |
| | if Redeemed Within the First Six Years of Purchase | Excluding sales charges | | 27.06 | 34.52 | 13.38 | 13.48 | 1.94 |
| Class C Shares | Maximum 1.00% CDSC | With sales charges | 4/1/2005 | 26.24 | 33.47 | 13.36 | 13.48 | 1.94 |
| | if Redeemed Within One Year of Purchase | Excluding sales charges | | 27.24 | 34.47 | 13.36 | 13.48 | 1.94 |
| Class I Shares | No Sales Charge | | 4/1/2005 | 27.96 | 36.25 | 14.70 | 14.76 | 0.73 |
| Class R1 Shares | No Sales Charge | | 4/1/2005 | 27.92 | 36.10 | 14.58 | 14.64 | 0.83 |
| Class R2 Shares | No Sales Charge | | 4/1/2005 | 27.78 | 35.85 | 14.31 | 14.36 | 1.08 |
| Class R3 Shares | No Sales Charge | | 4/28/2006 | 27.75 | 35.61 | 14.05 | 14.09 | 1.33 |
| Class R6 Shares | No Sales Charge | | 6/17/2013 | 28.04 | 36.36 | 14.80 | 14.87 | 0.64 |
| SIMPLE Class Shares | No Sales Charge | | 8/31/2020 | 27.65 | 35.61 | N/A | 8.35 | 1.24 |
| 1. | Not annualized. |
| 2. | The gross expense ratios presented reflect the Fund’s “Total Annual Fund Operating Expenses” from the most recent Prospectus, as supplemented, and may differ from other expense ratios disclosed in this report. |
| 3. | Prior to June 30, 2020, the maximum initial sales charge was 5.50%, which is reflected in the applicable average annual total return figures shown. |
| 4. | Class B shares are closed to all new purchases as well as additional investments by existing Class B shareholders. |
The footnotes on the next page are an integral part of the table and graph and should be carefully read in conjunction with them.
| Benchmark Performance* | Six
Months1 | One
Year | Five
Years | Ten
Years |
| Russell 3000® Index2 | 21.09% | 22.30% | 12.43% | 11.81% |
| Russell 1000® Growth Index3 | 23.56 | 31.80 | 16.46 | 15.48 |
| S&P 500® Index4 | 20.98 | 22.66 | 13.19 | 12.41 |
| Morningstar Large Growth Category Average5 | 24.13 | 29.19 | 12.82 | 12.85 |
| * | Returns for indices reflect no deductions for fees, expenses or taxes, except for foreign withholding taxes where applicable. Results assume reinvestment of all dividends and capital gains. An investment cannot be made directly in an index. |
| 1. | Not annualized. |
| 2. | In accordance with new regulatory requirements, the Fund has selected the Russell 3000® Index, which represents a broad measure of market performance, as a replacement for the Russell 1000® Growth Index. The Russell 3000® Index measures the performance of the largest 3,000 U.S. companies representing approximately 98% of the investable U.S. equity market. |
| 3. | The Russell 1000® Growth Index, which is generally representative of the market sectors or types of investments in which the Fund invests, measures the performance of the large-cap growth segment of the U.S. equity universe. It includes those Russell 1000® Index companies with higher price-to-book ratios and higher forecasted growth values. |
| 4. | The S&P 500® Index, which represents a broad measure of market performance, is generally representative of the market sectors or types of investments in which the Fund invests. S&P® and S&P 500® are registered trademarks of Standard & Poor’s Financial Services LLC. The S&P 500® Index is widely regarded as the standard index for measuring large-cap U.S. stock market performance. |
| 5. | The Morningstar Large Growth Category Average is representative of funds that invest primarily in big U.S. companies that are projected to grow faster than other large-cap stocks. Stocks in the top 70% of the capitalization of the U.S. equity market are defined as large cap. Growth is defined based on fast growth and high valuations. Most of these funds focus on companies in rapidly expanding industries. Results are based on average total returns of similar funds with all dividends and capital gain distributions reinvested. |
The footnotes on the preceding page are an integral part of the table and graph and should be carefully read in conjunction with them.
| 6 | MainStay Winslow Large Cap Growth Fund |
Cost in Dollars of a $1,000 Investment in MainStay Winslow Large Cap Growth Fund (Unaudited)
The example below is intended to describe the fees and expenses borne by shareholders during the six-month period from November 1, 2023 to April 30, 2024, and the impact of those costs on your investment.
Example
As a shareholder of the Fund you incur two types of costs: (1) transaction costs, including exchange fees and sales charges (loads) on purchases (as applicable), and (2) ongoing costs, including management fees, distribution and/or service (12b-1) fees and other Fund expenses (as applicable). This example is intended to help you understand your ongoing costs (in dollars) of investing in the Fund and to compare these costs with the ongoing costs of investing in other mutual funds. The example is based on an investment of $1,000 made at the beginning of the six-month period and held for the entire period from November 1, 2023 to April 30, 2024.
This example illustrates your Fund’s ongoing costs in two ways:
Actual Expenses
The second and third data columns in the table below provide information about actual account values and actual expenses. You may use the information in these columns, together with the amount you invested, to estimate the expenses that you paid during the six months ended April 30, 2024. Simply divide your account value by $1,000 (for example, an $8,600 account value divided by $1,000 = 8.6), then multiply the
result by the number under the heading entitled “Expenses Paid During Period” to estimate the expenses you paid on your account during this period.
Hypothetical Example for Comparison Purposes
The fourth and fifth data columns in the table below provide information about hypothetical account values and hypothetical expenses based on the Fund’s actual expense ratio and an assumed rate of return of 5% per year before expenses, which is not the Fund’s actual return. The hypothetical account values and expenses may not be used to estimate the actual ending account balances or expenses you paid for the six-month period shown. You may use this information to compare the ongoing costs of investing in the Fund with the ongoing costs of investing in other mutual funds. To do so, compare this 5% hypothetical example with the 5% hypothetical examples that appear in the shareholder reports of the other mutual funds.
Please note that the expenses shown in the table are meant to highlight your ongoing costs only and do not reflect any transactional costs, such as exchange fees or sales charges (loads). Therefore, the fourth and fifth data columns of the table are useful in comparing ongoing costs only and will not help you determine the relative total costs of owning different funds. In addition, if these transactional costs were included, your costs would have been higher.
| Share Class | Beginning
Account
Value
11/1/23 | Ending Account
Value (Based
on Actual
Returns and
Expenses)
4/30/24 | Expenses
Paid
During
Period1 | Ending Account
Value (Based
on Hypothetical
5% Annualized
Return and
Actual Expenses)
4/30/24 | Expenses
Paid
During
Period1 | Net Expense
Ratio
During
Period2 |
| Class A Shares | $1,000.00 | $1,278.10 | $ 5.38 | $1,020.14 | $4.77 | 0.95% |
| Investor Class Shares | $1,000.00 | $1,276.50 | $ 6.45 | $1,019.19 | $5.72 | 1.14% |
| Class B Shares | $1,000.00 | $1,270.60 | $10.67 | $1,015.46 | $9.47 | 1.89% |
| Class C Shares | $1,000.00 | $1,272.40 | $10.68 | $1,015.46 | $9.47 | 1.89% |
| Class I Shares | $1,000.00 | $1,279.60 | $ 3.97 | $1,021.38 | $3.52 | 0.70% |
| Class R1 Shares | $1,000.00 | $1,279.20 | $ 4.53 | $1,020.88 | $4.02 | 0.80% |
| Class R2 Shares | $1,000.00 | $1,277.80 | $ 5.95 | $1,019.64 | $5.27 | 1.05% |
| Class R3 Shares | $1,000.00 | $1,277.50 | $ 7.36 | $1,018.40 | $6.52 | 1.30% |
| Class R6 Shares | $1,000.00 | $1,280.40 | $ 3.52 | $1,021.78 | $3.12 | 0.62% |
| SIMPLE Class Shares | $1,000.00 | $1,276.50 | $ 6.62 | $1,019.04 | $5.87 | 1.17% |
| 1. | Expenses are equal to the Fund’s annualized expense ratio of each class multiplied by the average account value over the period, divided by 366 and multiplied by 182 (to reflect the six-month period). The table above represents the actual expenses incurred during the six-month period. In addition to the fees and expenses which the Fund bears directly, it also indirectly bears a pro rata share of the fees and expenses of the underlying funds in which it invests. Such indirect expenses are not included in the above-reported expense figures. |
| 2. | Expenses are equal to the Fund's annualized expense ratio to reflect the six-month period. |
Industry Composition as of April 30, 2024 (Unaudited)
| Software | 22.1% |
| Semiconductors & Semiconductor Equipment | 15.9 |
| Interactive Media & Services | 9.3 |
| Health Care Equipment & Supplies | 8.1 |
| Broadline Retail | 7.4 |
| Technology Hardware, Storage & Peripherals | 5.2 |
| Hotels, Restaurants & Leisure | 4.4 |
| Financial Services | 3.1 |
| Entertainment | 2.9 |
| Ground Transportation | 2.6 |
| Chemicals | 2.3 |
| Electrical Equipment | 2.1 |
| Capital Markets | 2.0 |
| Pharmaceuticals | 1.9% |
| Building Products | 1.8 |
| Machinery | 1.7 |
| Specialty Retail | 1.7 |
| Health Care Providers & Services | 1.5 |
| Consumer Staples Distribution & Retail | 1.2 |
| Aerospace & Defense | 1.2 |
| IT Services | 1.0 |
| Short–Term Investments | 0.8 |
| Other Assets, Less Liabilities | –0.2 |
| | 100.0% |
See Portfolio of Investments beginning on page 9 for specific holdings within these categories. The Fund's holdings are subject to change.
Top Ten Holdings and/or Issuers Held as of April 30, 2024 (excluding short-term investments) (Unaudited)
| 1. | Microsoft Corp. |
| 2. | NVIDIA Corp. |
| 3. | Amazon.com, Inc. |
| 4. | Alphabet, Inc. |
| 5. | Apple, Inc. |
| 6. | Meta Platforms, Inc., Class A |
| 7. | Broadcom, Inc. |
| 8. | Intuitive Surgical, Inc. |
| 9. | Adobe, Inc. |
| 10. | Salesforce, Inc. |
| 8 | MainStay Winslow Large Cap Growth Fund |
Portfolio of Investments April 30, 2024†^(Unaudited)
| | Shares | Value |
| Common Stocks 99.4% |
| Aerospace & Defense 1.2% |
| General Electric Co. | 1,030,600 | $ 166,771,692 |
| Broadline Retail 7.4% |
| Amazon.com, Inc. (a) | 5,882,200 | 1,029,385,000 |
| Building Products 1.8% |
| Trane Technologies plc | 786,460 | 249,575,216 |
| Capital Markets 2.0% |
| KKR & Co., Inc. | 3,021,300 | 281,192,391 |
| Chemicals 2.3% |
| Ecolab, Inc. | 767,500 | 173,570,125 |
| Linde plc | 336,830 | 148,528,557 |
| | | 322,098,682 |
| Consumer Staples Distribution & Retail 1.2% |
| Costco Wholesale Corp. | 231,700 | 167,495,930 |
| Electrical Equipment 2.1% |
| AMETEK, Inc. | 870,200 | 151,989,132 |
| Vertiv Holdings Co., Class A | 1,553,600 | 144,484,800 |
| | | 296,473,932 |
| Entertainment 2.9% |
| Netflix, Inc. (a) | 350,400 | 192,944,256 |
| Spotify Technology SA (a) | 760,000 | 213,134,400 |
| | | 406,078,656 |
| Financial Services 3.1% |
| Mastercard, Inc., Class A | 466,200 | 210,349,440 |
| Visa, Inc., Class A | 833,200 | 223,805,852 |
| | | 434,155,292 |
| Ground Transportation 2.6% |
| Old Dominion Freight Line, Inc. | 772,800 | 140,425,488 |
| Uber Technologies, Inc. (a) | 3,365,100 | 223,005,177 |
| | | 363,430,665 |
| Health Care Equipment & Supplies 8.1% |
| Abbott Laboratories | 1,382,000 | 146,450,540 |
| Boston Scientific Corp. (a) | 2,797,100 | 201,027,577 |
| Edwards Lifesciences Corp. (a) | 2,751,700 | 232,986,439 |
| IDEXX Laboratories, Inc. (a) | 395,900 | 195,083,684 |
| Intuitive Surgical, Inc. (a) | 982,390 | 364,093,382 |
| | | 1,139,641,622 |
| | Shares | Value |
| |
| Health Care Providers & Services 1.5% |
| UnitedHealth Group, Inc. | 441,000 | $ 213,311,700 |
| Hotels, Restaurants & Leisure 4.4% |
| Booking Holdings, Inc. | 75,000 | 258,902,250 |
| Chipotle Mexican Grill, Inc. (a) | 65,870 | 208,122,852 |
| Hilton Worldwide Holdings, Inc. | 725,200 | 143,067,456 |
| | | 610,092,558 |
| Interactive Media & Services 9.3% |
| Alphabet, Inc. (a) | | |
| Class A | 2,463,220 | 400,962,952 |
| Class C | 2,252,920 | 370,920,749 |
| |
| Meta Platforms, Inc., Class A | 1,235,900 | 531,647,103 |
| | | 1,303,530,804 |
| IT Services 1.0% |
| Accenture plc, Class A | 479,100 | 144,165,981 |
| Machinery 1.7% |
| Parker-Hannifin Corp. | 426,500 | 232,404,115 |
| Pharmaceuticals 1.9% |
| Eli Lilly & Co. | 348,200 | 271,979,020 |
| Semiconductors & Semiconductor Equipment 15.9% |
| Advanced Micro Devices, Inc. (a) | 783,900 | 124,154,082 |
| ASML Holding NV (Registered) (b) | 258,170 | 225,245,580 |
| Broadcom, Inc. | 369,300 | 480,189,711 |
| Lam Research Corp. | 359,690 | 321,710,333 |
| NVIDIA Corp. | 1,239,850 | 1,071,255,197 |
| | | 2,222,554,903 |
| Software 22.1% |
| Adobe, Inc. (a) | 777,700 | 359,942,891 |
| Intuit, Inc. | 480,100 | 300,360,162 |
| Microsoft Corp. | 3,900,230 | 1,518,476,546 |
| Salesforce, Inc. | 1,330,400 | 357,797,776 |
| ServiceNow, Inc. (a) | 312,710 | 216,811,224 |
| Synopsys, Inc. (a) | 343,400 | 182,204,606 |
| Workday, Inc., Class A (a) | 644,200 | 157,655,066 |
| | | 3,093,248,271 |
| Specialty Retail 1.7% |
| O'Reilly Automotive, Inc. (a) | 228,520 | 231,550,175 |
The notes to the financial statements are an integral part of, and should be read in conjunction with, the financial statements.
9
Portfolio of Investments April 30, 2024†^(Unaudited) (continued)
| | Shares | | Value |
| Common Stocks (continued) |
| Technology Hardware, Storage & Peripherals 5.2% |
| Apple, Inc. | 4,257,180 | | $ 725,125,469 |
Total Common Stocks
(Cost $8,771,988,467) | | | 13,904,262,074 |
| Short-Term Investments 0.8% |
| Affiliated Investment Company 0.5% |
| MainStay U.S. Government Liquidity Fund, 5.242% (c)(d) | 71,866,969 | | 71,866,969 |
| Unaffiliated Investment Companies 0.3% |
| BlackRock Liquidity FedFund, 5.303% (d)(e) | 10,000,000 | | 10,000,000 |
| Fidelity Government Portfolio, 5.296% (d)(e) | 10,000,000 | | 10,000,000 |
| Goldman Sachs Financial Square Government Fund, 5.307% (d)(e) | 5,000,000 | | 5,000,000 |
| Invesco Government & Agency Portfolio, 5.309% (d)(e) | 10,750,400 | | 10,750,400 |
| RBC U.S. Government Money Market Fund, 5.297% (d)(e) | 5,000,000 | | 5,000,000 |
| Wells Fargo Government Money Market Fund, 5.30% (d)(e) | 5,000,000 | | 5,000,000 |
| | | | 45,750,400 |
Total Short-Term Investments
(Cost $117,617,369) | | | 117,617,369 |
Total Investments
(Cost $8,889,605,836) | 100.2% | | 14,021,879,443 |
| Other Assets, Less Liabilities | (0.2) | | (30,916,582) |
| Net Assets | 100.0% | | $ 13,990,962,861 |
| † | Percentages indicated are based on Fund net assets. |
| ^ | Industry classifications may be different than those used for compliance monitoring purposes. |
| (a) | Non-income producing security. |
| (b) | All or a portion of this security was held on loan. As of April 30, 2024, the aggregate market value of securities on loan was $43,012,771. The Fund received cash collateral with a value of $45,750,400. (See Note 2(G)) |
| (c) | As of April 30, 2024, the Fund's ownership exceeds 5% of the outstanding shares of the Underlying Fund's share class. |
| (d) | Current yield as of April 30, 2024. |
| (e) | Represents a security purchased with cash collateral received for securities on loan. |
The notes to the financial statements are an integral part of, and should be read in conjunction with, the financial statements.
| 10 | MainStay Winslow Large Cap Growth Fund |
Investments in Affiliates (in 000's)
Investments in issuers considered to be affiliate(s) of the Fund during the six-month period ended April 30, 2024 for purposes of Section 2(a)(3) of the Investment Company Act of 1940, as amended, were as follows:
| Affiliated Investment Companies | Value,
Beginning
of Period | Purchases
at Cost | Proceeds
from
Sales | Net
Realized
Gain/(Loss)
on Sales | Change in
Unrealized
Appreciation/
(Depreciation) | Value,
End of
Period | Dividend
Income | Other
Distributions | Shares
End of
Period |
| MainStay U.S. Government Liquidity Fund | $ 38,040 | $ 1,531,857 | $ (1,498,030) | $ — | $ — | $ 71,867 | $ 2,035 | $ — | 71,867 |
The following is a summary of the fair valuations according to the inputs used as of April 30, 2024, for valuing the Fund’s assets:
| Description | Quoted
Prices in
Active
Markets for
Identical
Assets
(Level 1) | | Significant
Other
Observable
Inputs
(Level 2) | | Significant
Unobservable
Inputs
(Level 3) | | Total |
| Asset Valuation Inputs | | | | | | | |
| Investments in Securities (a) | | | | | | | |
| Common Stocks | $ 13,904,262,074 | | $ — | | $ — | | $ 13,904,262,074 |
| Short-Term Investments | | | | | | | |
| Affiliated Investment Company | 71,866,969 | | — | | — | | 71,866,969 |
| Unaffiliated Investment Companies | 45,750,400 | | — | | — | | 45,750,400 |
| Total Short-Term Investments | 117,617,369 | | — | | — | | 117,617,369 |
| Total Investments in Securities | $ 14,021,879,443 | | $ — | | $ — | | $ 14,021,879,443 |
| (a) | For a complete listing of investments and their industries, see the Portfolio of Investments. |
The notes to the financial statements are an integral part of, and should be read in conjunction with, the financial statements.
11
Statement of Assets and Liabilities as of April 30, 2024 (Unaudited)
| Assets |
Investment in unaffiliated securities, at value
(identified cost $8,817,738,867) including securities on loan of $43,012,771 | $13,950,012,474 |
Investment in affiliated investment companies, at value
(identified cost $71,866,969) | 71,866,969 |
| Receivables: | |
| Fund shares sold | 28,170,142 |
| Dividends | 2,816,265 |
| Securities lending | 4,498 |
| Other assets | 319,847 |
| Total assets | 14,053,190,195 |
| Liabilities |
| Cash collateral received for securities on loan | 45,750,400 |
| Payables: | |
| Manager (See Note 3) | 7,183,891 |
| Fund shares redeemed | 7,098,581 |
| Transfer agent (See Note 3) | 1,418,041 |
| NYLIFE Distributors (See Note 3) | 516,963 |
| Professional fees | 184,803 |
| Custodian | 66,648 |
| Accrued expenses | 8,007 |
| Total liabilities | 62,227,334 |
| Net assets | $13,990,962,861 |
| Composition of Net Assets |
| Shares of beneficial interest outstanding (par value of $.01 per share) unlimited number of shares authorized | $ 12,495,261 |
| Additional paid-in-capital | 7,405,187,139 |
| | 7,417,682,400 |
| Total distributable earnings (loss) | 6,573,280,461 |
| Net assets | $13,990,962,861 |
| Class A | |
| Net assets applicable to outstanding shares | $1,484,062,593 |
| Shares of beneficial interest outstanding | 153,979,743 |
| Net asset value per share outstanding | $ 9.64 |
| Maximum sales charge (5.50% of offering price) | 0.56 |
| Maximum offering price per share outstanding | $ 10.20 |
| Investor Class | |
| Net assets applicable to outstanding shares | $ 66,159,522 |
| Shares of beneficial interest outstanding | 7,175,479 |
| Net asset value per share outstanding | $ 9.22 |
| Maximum sales charge (5.00% of offering price) | 0.49 |
| Maximum offering price per share outstanding | $ 9.71 |
| Class B | |
| Net assets applicable to outstanding shares | $ 4,626,871 |
| Shares of beneficial interest outstanding | 866,001 |
| Net asset value and offering price per share outstanding | $ 5.34 |
| Class C | |
| Net assets applicable to outstanding shares | $ 41,470,940 |
| Shares of beneficial interest outstanding | 7,803,143 |
| Net asset value and offering price per share outstanding | $ 5.31 |
| Class I | |
| Net assets applicable to outstanding shares | $7,243,586,558 |
| Shares of beneficial interest outstanding | 628,773,501 |
| Net asset value and offering price per share outstanding | $ 11.52 |
| Class R1 | |
| Net assets applicable to outstanding shares | $1,018,042,918 |
| Shares of beneficial interest outstanding | 93,915,657 |
| Net asset value and offering price per share outstanding | $ 10.84 |
| Class R2 | |
| Net assets applicable to outstanding shares | $ 134,902,549 |
| Shares of beneficial interest outstanding | 14,255,926 |
| Net asset value and offering price per share outstanding | $ 9.46 |
| Class R3 | |
| Net assets applicable to outstanding shares | $ 42,585,169 |
| Shares of beneficial interest outstanding | 5,208,985 |
| Net asset value and offering price per share outstanding | $ 8.18 |
| Class R6 | |
| Net assets applicable to outstanding shares | $3,954,846,010 |
| Shares of beneficial interest outstanding | 337,473,247 |
| Net asset value and offering price per share outstanding | $ 11.72 |
The notes to the financial statements are an integral part of, and should be read in conjunction with, the financial statements.
| 12 | MainStay Winslow Large Cap Growth Fund |
| SIMPLE Class | |
| Net assets applicable to outstanding shares | $679,731 |
| Shares of beneficial interest outstanding | 74,456 |
| Net asset value and offering price per share outstanding | $ 9.13 |
The notes to the financial statements are an integral part of, and should be read in conjunction with, the financial statements.
13
Statement of Operations for the six months ended April 30, 2024 (Unaudited)
| Investment Income (Loss) |
| Income | |
| Dividends-unaffiliated (net of foreign tax withholding of $274,276) | $ 38,235,730 |
| Dividends-affiliated | 2,035,323 |
| Securities lending, net | 6,592 |
| Total income | 40,277,645 |
| Expenses | |
| Manager (See Note 3) | 42,940,783 |
| Transfer agent (See Note 3) | 4,050,569 |
| Distribution/Service—Class A (See Note 3) | 1,764,946 |
| Distribution/Service—Investor Class (See Note 3) | 88,314 |
| Distribution/Service—Class B (See Note 3) | 30,330 |
| Distribution/Service—Class C (See Note 3) | 217,381 |
| Distribution/Service—Class R2 (See Note 3) | 165,458 |
| Distribution/Service—Class R3 (See Note 3) | 103,839 |
| Distribution/Service—SIMPLE Class (See Note 3) | 1,427 |
| Shareholder service (See Note 3) | 590,866 |
| Professional fees | 390,576 |
| Trustees | 159,359 |
| Registration | 120,603 |
| Shareholder communication | 90,188 |
| Custodian | 70,721 |
| Miscellaneous | 246,889 |
| Total expenses before waiver/reimbursement | 51,032,249 |
| Expense waiver/reimbursement from Manager (See Note 3) | (526,884) |
| Net expenses | 50,505,365 |
| Net investment income (loss) | (10,227,720) |
| Realized and Unrealized Gain (Loss) |
| Net realized gain (loss) on unaffiliated investments | 1,500,751,386 |
| Net change in unrealized appreciation (depreciation) on unaffiliated investments | 1,786,433,267 |
| Net realized and unrealized gain (loss) | 3,287,184,653 |
| Net increase (decrease) in net assets resulting from operations | $3,276,956,933 |
The notes to the financial statements are an integral part of, and should be read in conjunction with, the financial statements.
| 14 | MainStay Winslow Large Cap Growth Fund |
Statements of Changes in Net Assets
for the six months ended April 30, 2024 (Unaudited) and the year ended October 31, 2023
| | Six months
ended
April 30,
2024 | Year
ended
October 31,
2023 |
| Increase (Decrease) in Net Assets |
| Operations: | | |
| Net investment income (loss) | $ (10,227,720) | $ (19,046,995) |
| Net realized gain (loss) | 1,500,751,386 | 1,300,340,950 |
| Net change in unrealized appreciation (depreciation) | 1,786,433,267 | 841,465,661 |
| Net increase (decrease) in net assets resulting from operations | 3,276,956,933 | 2,122,759,616 |
| Distributions to shareholders: | | |
| Class A | (130,082,500) | (137,076,160) |
| Investor Class | (7,244,475) | (8,619,202) |
| Class B | (1,132,819) | (1,794,965) |
| Class C | (7,147,012) | (8,883,388) |
| Class I | (595,283,038) | (674,639,763) |
| Class R1 | (86,798,156) | (86,323,034) |
| Class R2 | (12,504,737) | (13,562,024) |
| Class R3 | (4,536,383) | (5,552,262) |
| Class R6 | (313,598,647) | (369,612,028) |
| SIMPLE Class | (46,846) | (30,895) |
| Total distributions to shareholders | (1,158,374,613) | (1,306,093,721) |
| Capital share transactions: | | |
| Net proceeds from sales of shares | 1,074,078,515 | 1,751,093,329 |
| Net asset value of shares issued to shareholders in reinvestment of distributions | 1,075,112,615 | 1,210,855,286 |
| Cost of shares redeemed | (2,205,593,960) | (3,204,378,874) |
| Increase (decrease) in net assets derived from capital share transactions | (56,402,830) | (242,430,259) |
| Net increase (decrease) in net assets | 2,062,179,490 | 574,235,636 |
| Net Assets |
| Beginning of period | 11,928,783,371 | 11,354,547,735 |
| End of period | $13,990,962,861 | $11,928,783,371 |
The notes to the financial statements are an integral part of, and should be read in conjunction with, the financial statements.
15
Financial Highlights selected per share data and ratios
| | Six months ended
April 30,
2024* | | Year Ended October 31, |
| Class A | 2023 | | 2022 | | 2021 | | 2020 | | 2019 |
| Net asset value at beginning of period | $ 8.39 | | $ 8.03 | | $ 14.92 | | $ 11.08 | | $ 9.59 | | $ 9.95 |
| Net investment income (loss) (a) | (0.02) | | (0.03) | | (0.04) | | (0.07) | | (0.03) | | (0.02) |
| Net realized and unrealized gain (loss) | 2.22 | | 1.44 | | (3.74) | | 4.55 | | 2.58 | | 1.48 |
| Total from investment operations | 2.20 | | 1.41 | | (3.78) | | 4.48 | | 2.55 | | 1.46 |
| Less distributions: | | | | | | | | | | | |
| From net realized gain on investments | (0.95) | | (1.05) | | (3.11) | | (0.64) | | (1.06) | | (1.82) |
| Net asset value at end of period | $ 9.64 | | $ 8.39 | | $ 8.03 | | $ 14.92 | | $ 11.08 | | $ 9.59 |
| Total investment return (b) | 27.81% | | 19.57% | | (31.71)% | | 42.16% | | 29.44% | | 17.05% |
| Ratios (to average net assets)/Supplemental Data: | | | | | | | | | | | |
| Net investment income (loss) | (0.38)%†† | | (0.39)% | | (0.37)% | | (0.53)% | | (0.31)% | | (0.20)% |
| Net expenses (c) | 0.95%†† | | 0.98% | | 0.96% | | 0.93% | | 0.97% | | 0.99% |
| Expenses (before waiver/reimbursement) (c) | 0.95%††(d) | | 0.98%(d) | | 0.96%(d) | | 0.94% | | 0.97% | | 0.99% |
| Portfolio turnover rate | 37% | | 81% | | 77% | | 66% | | 44% | | 54% |
| Net assets at end of period (in 000’s) | $ 1,484,063 | | $ 1,153,265 | | $ 1,065,870 | | $ 1,745,833 | | $ 1,341,381 | | $ 1,008,608 |
| * | Unaudited. |
| †† | Annualized. |
| (a) | Per share data based on average shares outstanding during the period. |
| (b) | Total investment return is calculated exclusive of sales charges and assumes the reinvestment of dividends and distributions. For periods of less than one year, total return is not annualized. |
| (c) | In addition to the fees and expenses which the Fund bears directly, it also indirectly bears a pro-rata share of the fees and expenses of the underlying funds in which it invests. Such indirect expenses are not included in the above expense ratios. |
| (d) | Expense waiver/reimbursement less than 0.01%. |
| | Six months ended
April 30,
2024* | | Year Ended October 31, |
| Investor Class | 2023 | | 2022 | | 2021 | | 2020 | | 2019 |
| Net asset value at beginning of period | $ 8.07 | | $ 7.78 | | $ 14.56 | | $ 10.84 | | $ 9.42 | | $ 9.81 |
| Net investment income (loss) (a) | (0.03) | | (0.05) | | (0.05) | | (0.08) | | (0.04) | | (0.03) |
| Net realized and unrealized gain (loss) | 2.13 | | 1.39 | | (3.62) | | 4.44 | | 2.52 | | 1.46 |
| Total from investment operations | 2.10 | | 1.34 | | (3.67) | | 4.36 | | 2.48 | | 1.43 |
| Less distributions: | | | | | | | | | | | |
| From net realized gain on investments | (0.95) | | (1.05) | | (3.11) | | (0.64) | | (1.06) | | (1.82) |
| Net asset value at end of period | $ 9.22 | | $ 8.07 | | $ 7.78 | | $ 14.56 | | $ 10.84 | | $ 9.42 |
| Total investment return (b) | 27.65% | | 19.26% | | (31.75)% | | 41.98% | | 29.19% | | 16.96% |
| Ratios (to average net assets)/Supplemental Data: | | | | | | | | | | | |
| Net investment income (loss) | (0.56)%†† | | (0.59)% | | (0.52)% | | (0.67)% | | (0.43)% | | (0.31)% |
| Net expenses (c) | 1.14%†† | | 1.19% | | 1.11% | | 1.08% | | 1.10% | | 1.09% |
| Expenses (before waiver/reimbursement) (c) | 1.14%††(d) | | 1.19%(d) | | 1.11%(d) | | 1.09% | | 1.10% | | 1.10% |
| Portfolio turnover rate | 37% | | 81% | | 77% | | 66% | | 44% | | 54% |
| Net assets at end of period (in 000's) | $ 66,160 | | $ 61,360 | | $ 64,065 | | $ 106,354 | | $ 110,831 | | $ 109,236 |
| * | Unaudited. |
| †† | Annualized. |
| (a) | Per share data based on average shares outstanding during the period. |
| (b) | Total investment return is calculated exclusive of sales charges and assumes the reinvestment of dividends and distributions. For periods of less than one year, total return is not annualized. |
| (c) | In addition to the fees and expenses which the Fund bears directly, it also indirectly bears a pro-rata share of the fees and expenses of the underlying funds in which it invests. Such indirect expenses are not included in the above expense ratios. |
| (d) | Expense waiver/reimbursement less than 0.01%. |
The notes to the financial statements are an integral part of, and should be read in conjunction with, the financial statements.
| 16 | MainStay Winslow Large Cap Growth Fund |
Financial Highlights selected per share data and ratios
| | Six months ended
April 30,
2024* | | Year Ended October 31, |
| Class B | 2023 | | 2022 | | 2021 | | 2020 | | 2019 |
| Net asset value at beginning of period | $ 5.05 | | $ 5.28 | | $ 10.96 | | $ 8.37 | | $ 7.55 | | $ 8.26 |
| Net investment income (loss) (a) | (0.03) | | (0.06) | | (0.08) | | (0.13) | | (0.09) | | (0.08) |
| Net realized and unrealized gain (loss) | 1.27 | | 0.88 | | (2.49) | | 3.36 | | 1.97 | | 1.19 |
| Total from investment operations | 1.24 | | 0.82 | | (2.57) | | 3.23 | | 1.88 | | 1.11 |
| Less distributions: | | | | | | | | | | | |
| From net realized gain on investments | (0.95) | | (1.05) | | (3.11) | | (0.64) | | (1.06) | | (1.82) |
| Net asset value at end of period | $ 5.34 | | $ 5.05 | | $ 5.28 | | $ 10.96 | | $ 8.37 | | $ 7.55 |
| Total investment return (b) | 27.06% | | 18.40% | | (32.29)% | | 40.80% | | 28.37% | | 15.96% |
| Ratios (to average net assets)/Supplemental Data: | | | | | | | | | | | |
| Net investment income (loss) | (1.28)%†† | | (1.32)% | | (1.27)% | | (1.42)% | | (1.17)% | | (1.05)% |
| Net expenses (c) | 1.89%†† | | 1.94% | | 1.86% | | 1.83% | | 1.85% | | 1.84% |
| Expenses (before waiver/reimbursement) (c) | 1.89%††(d) | | 1.94%(d) | | 1.86%(d) | | 1.84% | | 1.85% | | 1.85% |
| Portfolio turnover rate | 37% | | 81% | | 77% | | 66% | | 44% | | 54% |
| Net assets at end of period (in 000’s) | $ 4,627 | | $ 6,235 | | $ 9,408 | | $ 20,533 | | $ 20,172 | | $ 21,015 |
| * | Unaudited. |
| †† | Annualized. |
| (a) | Per share data based on average shares outstanding during the period. |
| (b) | Total investment return is calculated exclusive of sales charges and assumes the reinvestment of dividends and distributions. For periods of less than one year, total return is not annualized. |
| (c) | In addition to the fees and expenses which the Fund bears directly, it also indirectly bears a pro-rata share of the fees and expenses of the underlying funds in which it invests. Such indirect expenses are not included in the above expense ratios. |
| (d) | Expense waiver/reimbursement less than 0.01%. |
| | Six months ended
April 30,
2024* | | Year Ended October 31, |
| Class C | 2023 | | 2022 | | 2021 | | 2020 | | 2019 |
| Net asset value at beginning of period | $ 5.02 | | $ 5.26 | | $ 10.93 | | $ 8.35 | | $ 7.53 | | $ 8.25 |
| Net investment income (loss) (a) | (0.03) | | (0.07) | | (0.08) | | (0.13) | | (0.09) | | (0.07) |
| Net realized and unrealized gain (loss) | 1.27 | | 0.88 | | (2.48) | | 3.35 | | 1.97 | | 1.17 |
| Total from investment operations | 1.24 | | 0.81 | | (2.56) | | 3.22 | | 1.88 | | 1.10 |
| Less distributions: | | | | | | | | | | | |
| From net realized gain on investments | (0.95) | | (1.05) | | (3.11) | | (0.64) | | (1.06) | | (1.82) |
| Net asset value at end of period | $ 5.31 | | $ 5.02 | | $ 5.26 | | $ 10.93 | | $ 8.35 | | $ 7.53 |
| Total investment return (b) | 27.24% | | 18.24% | | (32.29)% | | 40.77% | | 28.46% | | 15.97% |
| Ratios (to average net assets)/Supplemental Data: | | | | | | | | | | | |
| Net investment income (loss) | (1.31)%†† | | (1.34)% | | (1.27)% | | (1.42)% | | (1.17)% | | (1.04)% |
| Net expenses (c) | 1.89%†† | | 1.94% | | 1.86% | | 1.83% | | 1.85% | | 1.84% |
| Expenses (before waiver/reimbursement) (c) | 1.89%††(d) | | 1.94%(d) | | 1.86%(d) | | 1.84% | | 1.85% | | 1.85% |
| Portfolio turnover rate | 37% | | 81% | | 77% | | 66% | | 44% | | 54% |
| Net assets at end of period (in 000’s) | $ 41,471 | | $ 38,923 | | $ 46,833 | | $ 90,377 | | $ 95,761 | | $ 131,945 |
| * | Unaudited. |
| †† | Annualized. |
| (a) | Per share data based on average shares outstanding during the period. |
| (b) | Total investment return is calculated exclusive of sales charges and assumes the reinvestment of dividends and distributions. For periods of less than one year, total return is not annualized. |
| (c) | In addition to the fees and expenses which the Fund bears directly, it also indirectly bears a pro-rata share of the fees and expenses of the underlying funds in which it invests. Such indirect expenses are not included in the above expense ratios. |
| (d) | Expense waiver/reimbursement less than 0.01%. |
The notes to the financial statements are an integral part of, and should be read in conjunction with, the financial statements.
17
Financial Highlights selected per share data and ratios
| | Six months ended
April 30,
2024* | | Year Ended October 31, |
| Class I | 2023 | | 2022 | | 2021 | | 2020 | | 2019 |
| Net asset value at beginning of period | $ 9.85 | | $ 9.24 | | $ 16.66 | | $ 12.28 | | $ 10.49 | | $ 10.69 |
| Net investment income (loss) (a) | (0.01) | | (0.01) | | (0.01) | | (0.04) | | (0.01) | | 0.00‡ |
| Net realized and unrealized gain (loss) | 2.63 | | 1.68 | | (4.30) | | 5.06 | | 2.86 | | 1.62 |
| Total from investment operations | 2.62 | | 1.67 | | (4.31) | | 5.02 | | 2.85 | | 1.62 |
| Less distributions: | | | | | | | | | | | |
| From net investment income | — | | (0.01) | | — | | — | | — | | — |
| From net realized gain on investments | (0.95) | | (1.05) | | (3.11) | | (0.64) | | (1.06) | | (1.82) |
| Total distributions | (0.95) | | (1.06) | | (3.11) | | (0.64) | | (1.06) | | (1.82) |
| Net asset value at end of period | $ 11.52 | | $ 9.85 | | $ 9.24 | | $ 16.66 | | $ 12.28 | | $ 10.49 |
| Total investment return (b) | 27.96% | | 19.89% | | (31.55)% | | 42.46% | | 29.80% | | 17.29% |
| Ratios (to average net assets)/Supplemental Data: | | | | | | | | | | | |
| Net investment income (loss) | (0.12)%†† | | (0.14)% | | (0.11)% | | (0.28)% | | (0.06)% | | 0.05% |
| Net expenses (c) | 0.70%†† | | 0.73% | | 0.71% | | 0.68% | | 0.72% | | 0.74% |
| Expenses (before waiver/reimbursement) (c) | 0.70%††(d) | | 0.73%(d) | | 0.71%(d) | | 0.69% | | 0.72% | | 0.74% |
| Portfolio turnover rate | 37% | | 81% | | 77% | | 66% | | 44% | | 54% |
| Net assets at end of period (in 000’s) | $ 7,243,587 | | $ 6,217,494 | | $ 6,016,574 | | $ 8,434,291 | | $ 6,824,224 | | $ 6,080,320 |
| * | Unaudited. |
| ‡ | Less than one cent per share. |
| †† | Annualized. |
| (a) | Per share data based on average shares outstanding during the period. |
| (b) | Total investment return is calculated exclusive of sales charges and assumes the reinvestment of dividends and distributions. Class I shares are not subject to sales charges. For periods of less than one year, total return is not annualized. |
| (c) | In addition to the fees and expenses which the Fund bears directly, it also indirectly bears a pro-rata share of the fees and expenses of the underlying funds in which it invests. Such indirect expenses are not included in the above expense ratios. |
| (d) | Expense waiver/reimbursement less than 0.01%. |
The notes to the financial statements are an integral part of, and should be read in conjunction with, the financial statements.
| 18 | MainStay Winslow Large Cap Growth Fund |
Financial Highlights selected per share data and ratios
| | Six months ended
April 30,
2024* | | Year Ended October 31, |
| Class R1 | 2023 | | 2022 | | 2021 | | 2020 | | 2019 |
| Net asset value at beginning of period | $ 9.32 | | $ 8.80 | | $ 16.03 | | $ 11.85 | | $ 10.17 | | $ 10.43 |
| Net investment income (loss) (a) | (0.01) | | (0.02) | | (0.02) | | (0.05) | | (0.02) | | (0.00)‡ |
| Net realized and unrealized gain (loss) | 2.48 | | 1.59 | | (4.10) | | 4.87 | | 2.76 | | 1.56 |
| Total from investment operations | 2.47 | | 1.57 | | (4.12) | | 4.82 | | 2.74 | | 1.56 |
| Less distributions: | | | | | | | | | | | |
| From net investment income | — | | (0.00)‡ | | — | | — | | — | | — |
| From net realized gain on investments | (0.95) | | (1.05) | | (3.11) | | (0.64) | | (1.06) | | (1.82) |
| Total distributions | (0.95) | | (1.05) | | (3.11) | | (0.64) | | (1.06) | | (1.82) |
| Net asset value at end of period | $ 10.84 | | $ 9.32 | | $ 8.80 | | $ 16.03 | | $ 11.85 | | $ 10.17 |
| Total investment return (b) | 27.92% | | 19.73% | | (31.62)% | | 42.30% | | 29.64% | | 17.25% |
| Ratios (to average net assets)/Supplemental Data: | | | | | | | | | | | |
| Net investment income (loss) | (0.22)%†† | | (0.25)% | | (0.22)% | | (0.38)% | | (0.15)% | | (0.04)% |
| Net expenses (c) | 0.80%†† | | 0.83% | | 0.81% | | 0.78% | | 0.82% | | 0.84% |
| Expenses (before waiver/reimbursement) (c) | 0.80%††(d) | | 0.83%(d) | | 0.81%(d) | | 0.79% | | 0.82% | | 0.84% |
| Portfolio turnover rate | 37% | | 81% | | 77% | | 66% | | 44% | | 54% |
| Net assets at end of period (in 000’s) | $ 1,018,043 | | $ 850,155 | | $ 721,142 | | $ 1,207,903 | | $ 914,359 | | $ 919,236 |
| * | Unaudited. |
| ‡ | Less than one cent per share. |
| †† | Annualized. |
| (a) | Per share data based on average shares outstanding during the period. |
| (b) | Total investment return is calculated exclusive of sales charges and assumes the reinvestment of dividends and distributions. Class R1 shares are not subject to sales charges. For periods of less than one year, total return is not annualized. |
| (c) | In addition to the fees and expenses which the Fund bears directly, it also indirectly bears a pro-rata share of the fees and expenses of the underlying funds in which it invests. Such indirect expenses are not included in the above expense ratios. |
| (d) | Expense waiver/reimbursement less than 0.01%. |
The notes to the financial statements are an integral part of, and should be read in conjunction with, the financial statements.
19
Financial Highlights selected per share data and ratios
| | Six months ended
April 30,
2024* | | Year Ended October 31, |
| Class R2 | 2023 | | 2022 | | 2021 | | 2020 | | 2019 |
| Net asset value at beginning of period | $ 8.25 | | $ 7.93 | | $ 14.78 | | $ 10.99 | | $ 9.53 | | $ 9.90 |
| Net investment income (loss) (a) | (0.02) | | (0.04) | | (0.04) | | (0.08) | | (0.04) | | (0.03) |
| Net realized and unrealized gain (loss) | 2.18 | | 1.41 | | (3.70) | | 4.51 | | 2.56 | | 1.48 |
| Total from investment operations | 2.16 | | 1.37 | | (3.74) | | 4.43 | | 2.52 | | 1.45 |
| Less distributions: | | | | | | | | | | | |
| From net realized gain on investments | (0.95) | | (1.05) | | (3.11) | | (0.64) | | (1.06) | | (1.82) |
| Net asset value at end of period | $ 9.46 | | $ 8.25 | | $ 7.93 | | $ 14.78 | | $ 10.99 | | $ 9.53 |
| Total investment return (b) | 27.78% | | 19.29% | | (31.74)% | | 42.04% | | 29.29% | | 16.89% |
| Ratios (to average net assets)/Supplemental Data: | | | | | | | | | | | |
| Net investment income (loss) | (0.47)%†† | | (0.49)% | | (0.47)% | | (0.63)% | | (0.40)% | | (0.29)% |
| Net expenses (c) | 1.05%†† | | 1.08% | | 1.06% | | 1.03% | | 1.07% | | 1.09% |
| Expenses (before waiver/reimbursement) (c) | 1.05%††(d) | | 1.08%(d) | | 1.06%(d) | | 1.04% | | 1.07% | | 1.09% |
| Portfolio turnover rate | 37% | | 81% | | 77% | | 66% | | 44% | | 54% |
| Net assets at end of period (in 000’s) | $ 134,903 | | $ 111,520 | | $ 106,414 | | $ 188,790 | | $ 159,297 | | $ 163,288 |
| * | Unaudited. |
| †† | Annualized. |
| (a) | Per share data based on average shares outstanding during the period. |
| (b) | Total investment return is calculated exclusive of sales charges and assumes the reinvestment of dividends and distributions. Class R2 shares are not subject to sales charges. For periods of less than one year, total return is not annualized. |
| (c) | In addition to the fees and expenses which the Fund bears directly, it also indirectly bears a pro-rata share of the fees and expenses of the underlying funds in which it invests. Such indirect expenses are not included in the above expense ratios. |
| (d) | Expense waiver/reimbursement less than 0.01%. |
| | Six months ended
April 30,
2024* | | Year Ended October 31, |
| Class R3 | 2023 | | 2022 | | 2021 | | 2020 | | 2019 |
| Net asset value at beginning of period | $ 7.25 | | $ 7.10 | | $ 13.60 | | $ 10.19 | | $ 8.93 | | $ 9.41 |
| Net investment income (loss) (a) | (0.03) | | (0.05) | | (0.06) | | (0.10) | | (0.06) | | (0.05) |
| Net realized and unrealized gain (loss) | 1.91 | | 1.25 | | (3.33) | | 4.15 | | 2.38 | | 1.39 |
| Total from investment operations | 1.88 | | 1.20 | | (3.39) | | 4.05 | | 2.32 | | 1.34 |
| Less distributions: | | | | | | | | | | | |
| From net realized gain on investments | (0.95) | | (1.05) | | (3.11) | | (0.64) | | (1.06) | | (1.82) |
| Net asset value at end of period | $ 8.18 | | $ 7.25 | | $ 7.10 | | $ 13.60 | | $ 10.19 | | $ 8.93 |
| Total investment return (b) | 27.75% | | 19.11% | | (31.98)% | | 41.60% | | 28.99% | | 16.69% |
| Ratios (to average net assets)/Supplemental Data: | | | | | | | | | | | |
| Net investment income (loss) | (0.73)%†† | | (0.73)% | | (0.72)% | | (0.88)% | | (0.65)% | | (0.55)% |
| Net expenses (c) | 1.30%†† | | 1.33% | | 1.31% | | 1.28% | | 1.32% | | 1.34% |
| Expenses (before waiver/reimbursement) (c) | 1.30%††(d) | | 1.33%(d) | | 1.31%(d) | | 1.29% | | 1.32% | | 1.34% |
| Portfolio turnover rate | 37% | | 81% | | 77% | | 66% | | 44% | | 54% |
| Net assets at end of period (in 000’s) | $ 42,585 | | $ 34,337 | | $ 38,027 | | $ 63,195 | | $ 56,657 | | $ 57,283 |
| * | Unaudited. |
| †† | Annualized. |
| (a) | Per share data based on average shares outstanding during the period. |
| (b) | Total investment return is calculated exclusive of sales charges and assumes the reinvestment of dividends and distributions. Class R3 shares are not subject to sales charges. For periods of less than one year, total return is not annualized. |
| (c) | In addition to the fees and expenses which the Fund bears directly, it also indirectly bears a pro-rata share of the fees and expenses of the underlying funds in which it invests. Such indirect expenses are not included in the above expense ratios. |
| (d) | Expense waiver/reimbursement less than 0.01%. |
The notes to the financial statements are an integral part of, and should be read in conjunction with, the financial statements.
| 20 | MainStay Winslow Large Cap Growth Fund |
Financial Highlights selected per share data and ratios
| | Six months ended
April 30,
2024* | | Year Ended October 31, |
| Class R6 | 2023 | | 2022 | | 2021 | | 2020 | | 2019 |
| Net asset value at beginning of period | $ 10.00 | | $ 9.37 | | $ 16.84 | | $ 12.39 | | $ 10.58 | | $ 10.76 |
| Net investment income (loss) (a) | (0.00)‡ | | (0.01) | | (0.00)‡ | | (0.03) | | 0.00‡ | | 0.01 |
| Net realized and unrealized gain (loss) | 2.67 | | 1.71 | | (4.36) | | 5.12 | | 2.88 | | 1.63 |
| Total from investment operations | 2.67 | | 1.70 | | (4.36) | | 5.09 | | 2.88 | | 1.64 |
| Less distributions: | | | | | | | | | | | |
| From net investment income | — | | (0.02) | | — | | — | | (0.01) | | — |
| From net realized gain on investments | (0.95) | | (1.05) | | (3.11) | | (0.64) | | (1.06) | | (1.82) |
| Total distributions | (0.95) | | (1.07) | | (3.11) | | (0.64) | | (1.07) | | (1.82) |
| Net asset value at end of period | $ 11.72 | | $ 10.00 | | $ 9.37 | | $ 16.84 | | $ 12.39 | | $ 10.58 |
| Total investment return (b) | 28.04% | | 19.95% | | (31.50)% | | 42.65% | | 29.83% | | 17.49% |
| Ratios (to average net assets)/Supplemental Data: | | | | | | | | | | | |
| Net investment income (loss) | (0.05)%†† | | (0.05)% | | (0.04)% | | (0.22)% | | 0.02% | | 0.13% |
| Net expenses (c) | 0.62%†† | | 0.64% | | 0.63% | | 0.62% | | 0.64% | | 0.64% |
| Expenses (before waiver/reimbursement) (c) | 0.63%†† | | 0.64%(d) | | 0.64%(d) | | 0.63% | | 0.64% | | 0.64% |
| Portfolio turnover rate | 37% | | 81% | | 77% | | 66% | | 44% | | 54% |
| Net assets at end of period (in 000’s) | $ 3,954,846 | | $ 3,455,134 | | $ 3,285,993 | | $ 4,782,798 | | $ 3,981,812 | | $ 3,148,459 |
| * | Unaudited. |
| ‡ | Less than one cent per share. |
| †† | Annualized. |
| (a) | Per share data based on average shares outstanding during the period. |
| (b) | Total investment return is calculated exclusive of sales charges and assumes the reinvestment of dividends and distributions. Class R6 shares are not subject to sales charges. For periods of less than one year, total return is not annualized. |
| (c) | In addition to the fees and expenses which the Fund bears directly, it also indirectly bears a pro-rata share of the fees and expenses of the underlying funds in which it invests. Such indirect expenses are not included in the above expense ratios. |
| (d) | Expense waiver/reimbursement less than 0.01%. |
The notes to the financial statements are an integral part of, and should be read in conjunction with, the financial statements.
21
Financial Highlights selected per share data and ratios
| | Six months ended
April 30,
2024* | | Year Ended October 31, | | August 31, 2020^ through
October 31, |
| SIMPLE Class | 2023 | | 2022 | | 2021 | | 2020 |
| Net asset value at beginning of period | $ 8.00 | | $ 7.72 | | $ 14.52 | | $ 10.84 | | $ 11.84** |
| Net investment income (loss) (a) | (0.03) | | (0.05) | | (0.07) | | (0.12) | | (0.02) |
| Net realized and unrealized gain (loss) | 2.11 | | 1.38 | | (3.62) | | 4.44 | | (0.98) |
| Total from investment operations | 2.08 | | 1.33 | | (3.69) | | 4.32 | | (1.00) |
| Less distributions: | | | | | | | | | |
| From net realized gain on investments | (0.95) | | (1.05) | | (3.11) | | (0.64) | | — |
| Net asset value at end of period | $ 9.13 | | $ 8.00 | | $ 7.72 | | $ 14.52 | | $ 10.84 |
| Total investment return (b) | 27.65% | | 19.28% | | (32.02)% | | 41.59% | | (8.45)% |
| Ratios (to average net assets)/Supplemental Data: | | | | | | | | | |
| Net investment income (loss) | (0.61)%†† | | (0.68)% | | (0.77)% | | (0.96)% | | (1.00)%†† |
| Net expenses (c) | 1.17%†† | | 1.24% | | 1.37% | | 1.33% | | 1.32%†† |
| Expenses (before waiver/reimbursement) (c) | 1.18%†† | | 1.24%(d) | | 1.38%(d) | | 1.34% | | 1.33%†† |
| Portfolio turnover rate | 37% | | 81% | | 77% | | 66% | | 44% |
| Net assets at end of period (in 000’s) | $ 680 | | $ 358 | | $ 220 | | $ 71 | | $ 23 |
| * | Unaudited. |
| ^ | Inception date. |
| ** | Based on the net asset value of Investor Class as of August 31, 2020. |
| †† | Annualized. |
| (a) | Per share data based on average shares outstanding during the period. |
| (b) | Total investment return is calculated exclusive of sales charges and assumes the reinvestment of dividends and distributions. SIMPLE Class shares are not subject to sales charges. For periods of less than one year, total return is not annualized. |
| (c) | In addition to the fees and expenses which the Fund bears directly, it also indirectly bears a pro-rata share of the fees and expenses of the underlying funds in which it invests. Such indirect expenses are not included in the above expense ratios. |
| (d) | Expense waiver/reimbursement less than 0.01%. |
The notes to the financial statements are an integral part of, and should be read in conjunction with, the financial statements.
| 22 | MainStay Winslow Large Cap Growth Fund |
Notes to Financial Statements (Unaudited)
Note 1-Organization and Business
The MainStay Funds (the “Trust”) was organized on January 9, 1986, as a Massachusetts business trust. The Trust is registered under the Investment Company Act of 1940, as amended (the “1940 Act”), as an open-end management investment company, and is comprised of eleven funds (collectively referred to as the "Funds"). These financial statements and notes relate to the MainStay Winslow Large Cap Growth Fund (the "Fund"), a “diversified” fund, as that term is defined in the 1940 Act, as interpreted or modified by regulatory authorities having jurisdiction, from time to time.
The following table lists the Fund's share classes that have been registered and commenced operations:
| Class | Commenced Operations |
| Class A | July 1, 1995 |
| Investor Class | February 28, 2008 |
| Class B | April 1, 2005 |
| Class C | April 1, 2005 |
| Class I | April 1, 2005 |
| Class R1 | April 1, 2005 |
| Class R2 | April 1, 2005 |
| Class R3 | April 28, 2006 |
| Class R6 | June 17, 2013 |
| SIMPLE Class | August 31, 2020 |
Class B shares of the MainStay Group of Funds are closed to all new purchases as well as additional investments by existing Class B shareholders. Existing Class B shareholders may continue to reinvest dividends and capital gains distributions, as well as exchange their Class B shares for Class B shares of other funds in the MainStay Group of Funds as permitted by the current exchange privileges. Class B shareholders continue to be subject to any applicable contingent deferred sales charge ("CDSC") at the time of redemption. All other features of the Class B shares, including but not limited to the fees and expenses applicable to Class B shares, remain unchanged. Unless redeemed, Class B shareholders will remain in Class B shares of their respective fund until the Class B shares are converted to Class A or Investor Class shares pursuant to the applicable conversion schedule.
Class A and Investor Class shares are offered at net asset value (“NAV”) per share plus an initial sales charge. No initial sales charge applies to investments of $1 million or more (and certain other qualified purchases) in Class A and Investor Class shares. However, a CDSC of 1.00% may be imposed on certain redemptions made within 18 months of the date of purchase on shares that were purchased without an initial sales charge. Class C shares are offered at NAV without an initial sales charge, although a 1.00% CDSC may be imposed on certain redemptions of such shares made within one year of the date of purchase of Class C shares. When Class B shares were offered, they were offered at NAV without an initial sales charge, although a CDSC that declines depending on the number of years a shareholder held its Class B shares may be imposed on certain redemptions of such shares made within six years of the date
of purchase of such shares. Class I, Class R1, Class R2, Class R3, Class R6 and SIMPLE Class shares are offered at NAV without a sales charge. Depending upon eligibility, Class B shares convert to either Class A or Investor Class shares at the end of the calendar quarter eight years after the date they were purchased. In addition, depending upon eligibility, Class C shares convert to either Class A or Investor Class shares at the end of the calendar quarter eight years after the date they were purchased. Additionally, Investor Class shares may convert automatically to Class A shares. SIMPLE Class shares convert to Class A shares, or Investor Class shares if you are not eligible to hold Class A shares, at the end of the calendar quarter, ten years after the date they were purchased. Share class conversions are based on the relevant NAVs of the two classes at the time of the conversion, and no sales load or other charge is imposed. Under certain circumstances and as may be permitted by the Trust’s multiple class plan pursuant to Rule 18f-3 under the 1940 Act, specified share classes of the Fund may be converted to one or more other share classes of the Fund as disclosed in the capital share trans-actions within these Notes. The classes of shares have the same voting (except for issues that relate solely to one class), dividend, liquidation and other rights, and the same terms and conditions, except that under distribution plans pursuant to Rule 12b-1 under the 1940 Act, Class B and Class C shares are subject to higher distribution and/or service fees than Class A, Investor Class, Class R2, Class R3 and SIMPLE Class shares. Class I, Class R1 and Class R6 shares are not subject to a distribution and/or service fee. Class R1, Class R2 and Class R3 shares are subject to a shareholder service fee, which is in addition to fees paid under the distribution plans for Class R2 and Class R3 shares.
The Fund's investment objective is to seek long-term growth of capital.
Note 2–Significant Accounting Policies
The Fund is an investment company and accordingly follows the investment company accounting and reporting guidance of the Financial Accounting Standards Board (“FASB”) Accounting Standards Codification Topic 946 Financial Services—Investment Companies. The Fund prepares its financial statements in accordance with generally accepted accounting principles (“GAAP”) in the United States of America and follows the significant accounting policies described below.
(A) Securities Valuation. Investments are usually valued as of the close of regular trading on the New York Stock Exchange (the "Exchange") (usually 4:00 p.m. Eastern time) on each day the Fund is open for business ("valuation date").
Pursuant to Rule 2a-5 under the 1940 Act, the Board of Trustees of the Trust (the "Board") has designated New York Life Investment Management LLC (“New York Life Investments” or the "Manager") as its Valuation Designee (the "Valuation Designee"). The Valuation Designee is responsible for performing fair valuations relating to all investments in the Fund’s portfolio for which market quotations are not readily available; periodically assessing and managing material valuation risks; establishing and applying fair value methodologies; testing fair valuation methodologies; evaluating and overseeing pricing services; ensuring
Notes to Financial Statements (Unaudited) (continued)
appropriate segregation of valuation and portfolio management functions; providing quarterly, annual and prompt reporting to the Board, as appropriate; identifying potential conflicts of interest; and maintaining appropriate records. The Valuation Designee has established a valuation committee ("Valuation Committee") to assist in carrying out the Valuation Designee’s responsibilities and establish prices of securities for which market quotations are not readily available. The Fund's and the Valuation Designee's policies and procedures ("Valuation Procedures") govern the Valuation Designee’s selection and application of methodologies for determining and calculating the fair value of Fund investments. The Valuation Designee may value the Fund's portfolio securities for which market quotations are not readily available and other Fund assets utilizing inputs from pricing services and other third-party sources. The Valuation Committee meets (in person, via electronic mail or via teleconference) on an ad-hoc basis to determine fair valuations and on a quarterly basis to review fair value events with respect to certain securities for which market quotations are not readily available, including valuation risks and back-testing results, and to preview reports to the Board.
The Valuation Committee establishes prices of securities for which market quotations are not readily available based on such methodologies and measurements on a regular basis after considering information that is reasonably available and deemed relevant by the Valuation Committee. The Board shall oversee the Valuation Designee and review fair valuation materials on a prompt, quarterly and annual basis and approve proposed revisions to the Valuation Procedures.
Investments for which market quotations are not readily available are valued at fair value as determined in good faith pursuant to the Valuation Procedures. A market quotation is readily available only when that quotation is a quoted price (unadjusted) in active markets for identical investments that the Fund can access at the measurement date, provided that a quotation will not be readily available if it is not reliable. "Fair value" is defined as the price the Fund would reasonably expect to receive upon selling an asset or liability in an orderly transaction to an independent buyer in the principal or most advantageous market for the asset or liability. Fair value measurements are determined within a framework that establishes a three-tier hierarchy that maximizes the use of observable market data and minimizes the use of unobservable inputs to establish a classification of fair value measurements for disclosure purposes. "Inputs" refer broadly to the assumptions that market participants would use in pricing the asset or liability, including assumptions about risk, such as the risk inherent in a particular valuation technique used to measure fair value using a pricing model and/or the risk inherent in the inputs for the valuation technique. Inputs may be observable or unobservable. Observable inputs reflect the assumptions market participants would use in pricing the asset or liability based on market data obtained from sources independent of the Fund. Unobservable inputs reflect the Fund’s own assumptions about the assumptions market participants would use in pricing the asset or liability based on the information available. The inputs or methodology used for valuing assets or liabilities may not be an indication of the risks associated with investing in those assets or liabilities. The three-tier hierarchy of inputs is summarized below.
| • | Level 1—quoted prices (unadjusted) in active markets for an identical asset or liability |
| • | Level 2—other significant observable inputs (including quoted prices for a similar asset or liability in active markets, interest rates and yield curves, prepayment speeds, credit risk, etc.) |
| • | Level 3—significant unobservable inputs (including the Fund's own assumptions about the assumptions that market participants would use in measuring fair value of an asset or liability) |
The level of an asset or liability within the fair value hierarchy is based on the lowest level of an input, both individually and in the aggregate, that is significant to the fair value measurement. The aggregate value by input level of the Fund’s assets and liabilities as of April 30, 2024, is included at the end of the Portfolio of Investments.
The Fund may use third-party vendor evaluations, whose prices may be derived from one or more of the following standard inputs, among others:
| • Broker/dealer quotes | • Benchmark securities |
| • Two-sided markets | • Reference data (corporate actions or material event notices) |
| • Bids/offers | • Monthly payment information |
| • Industry and economic events | • Reported trades |
An asset or liability for which a market quotation is not readily available is valued by methods deemed reasonable in good faith by the Valuation Committee, following the Valuation Procedures to represent fair value. Under these procedures, the Valuation Designee generally uses a market-based approach which may use related or comparable assets or liabilities, recent transactions, market multiples, book values and other relevant information. The Valuation Designee may also use an income-based valuation approach in which the anticipated future cash flows of the asset or liability are discounted to calculate fair value. Discounts may also be applied due to the nature and/or duration of any restrictions on the disposition of the asset or liability. Fair value represents a good faith approximation of the value of a security. Fair value determinations involve the consideration of a number of subjective factors, an analysis of applicable facts and circumstances and the exercise of judgment. As a result, it is possible that the fair value for a security determined in good faith in accordance with the Valuation Procedures may differ from valuations for the same security determined for other funds using their own valuation procedures. Although the Valuation Procedures are designed to value a security at the price the Fund may reasonably expect to receive upon the security's sale in an orderly transaction, there can be no assurance that any fair value determination thereunder would, in fact, approximate the amount that the Fund would actually realize upon the sale of the security or the price at which the security would trade if a reliable market price were readily available. During the six-month period ended April 30, 2024, there were no material changes to the fair value methodologies.
Securities which may be valued in this manner include, but are not limited to: (i) a security for which trading has been halted or suspended or
| 24 | MainStay Winslow Large Cap Growth Fund |
otherwise does not have a readily available market quotation on a given day; (ii) a debt security that has recently gone into default and for which there is not a current market quotation; (iii) a security of an issuer that has entered into a restructuring; (iv) a security that has been delisted from a national exchange; (v) a security subject to trading collars for which no or limited trading takes place; and (vi) a security whose principal market has been temporarily closed at a time when, under normal conditions, it would be open. Securities valued in this manner are generally categorized as Level 2 or 3 in the hierarchy.
Certain securities held by the Fund may principally trade in foreign markets. Events may occur between the time the foreign markets close and the time at which the Fund's NAVs are calculated. These events may include, but are not limited to, situations relating to a single issuer in a market sector, significant fluctuations in U.S. or foreign markets, natural disasters, armed conflicts, governmental actions or other developments not tied directly to the securities markets. Should the Valuation Designee conclude that such events may have affected the accuracy of the last price of such securities reported on the local foreign market, the Valuation Designee may, pursuant to the Valuation Procedures, adjust the value of the local price to reflect the estimated impact on the price of such securities as a result of such events. In this instance, securities are generally categorized as Level 3 in the hierarchy. Additionally, certain foreign equity securities are also fair valued whenever the movement of a particular index exceeds certain thresholds. In such cases, the securities are fair valued by applying factors provided by a third-party vendor in accordance with the Valuation Procedures and are generally categorized as Level 2 in the hierarchy.
Equity securities, rights and warrants, if applicable, are valued at the last quoted sales prices as of the close of regular trading on the relevant exchange on each valuation date. Securities that are not traded on the valuation date are valued at the mean of the last quoted bid and ask prices. Prices are normally taken from the principal market in which each security trades. These securities are generally categorized as Level 1 in the hierarchy.
Investments in mutual funds, including money market funds, are valued at their respective NAVs at the close of business each day on the valuation date. These securities are generally categorized as Level 1 in the hierarchy.
Temporary cash investments acquired in excess of 60 days to maturity at the time of purchase are valued using the latest bid prices or using valuations based on a matrix system (which considers such factors as security prices, yields, maturities and ratings), both as furnished by independent pricing services. Temporary cash investments that mature in 60 days or less at the time of purchase ("Short-Term Investments") are valued using the amortized cost method of valuation, unless the use of such method would be inappropriate. The amortized cost method involves valuing a security at its cost on the date of purchase and thereafter assuming a constant amortization to maturity of the difference between such cost and the value on maturity date. Amortized cost approximates the current fair value of a security. Securities valued using the amortized
cost method are not valued using quoted prices in an active market and are generally categorized as Level 2 in the hierarchy.
The information above is not intended to reflect an exhaustive list of the methodologies that may be used to value portfolio investments. The Valuation Procedures permit the use of a variety of valuation methodologies in connection with valuing portfolio investments. The methodology used for a specific type of investment may vary based on the market data available or other considerations. The methodologies summarized above may not represent the specific means by which portfolio investments are valued on any particular business day.
(B) Income Taxes. The Fund's policy is to comply with the requirements of the Internal Revenue Code of 1986, as amended (the “Internal Revenue Code”), applicable to regulated investment companies and to distribute all of its taxable income to the shareholders of the Fund within the allowable time limits.
The Manager evaluates the Fund’s tax positions to determine if the tax positions taken meet the minimum recognition threshold in connection with accounting for uncertainties in income tax positions taken or expected to be taken for the purposes of measuring and recognizing tax liabilities in the financial statements. Recognition of tax benefits of an uncertain tax position is permitted only to the extent the position is “more likely than not” to be sustained assuming examination by taxing authorities. The Manager analyzed the Fund's tax positions taken on federal, state and local income tax returns for all open tax years (for up to three tax years) and has concluded that no provisions for federal, state and local income tax are required in the Fund's financial statements. The Fund's federal, state and local income tax and federal excise tax returns for tax years for which the applicable statutes of limitations have not expired are subject to examination by the Internal Revenue Service and state and local departments of revenue.
(C) Dividends and Distributions to Shareholders. Dividends and distributions are recorded on the ex-dividend date. The Fund intends to declare and pay dividends from net investment income and distributions from net realized capital and currency gains, if any, at least annually. Unless a shareholder elects otherwise, all dividends and distributions are reinvested at NAV in the same class of shares of the Fund. Dividends and distributions to shareholders are determined in accordance with federal income tax regulations and may differ from determinations using GAAP.
(D) Security Transactions and Investment Income. The Fund records security transactions on the trade date. Realized gains and losses on security transactions are determined using the identified cost method. Dividend income is recognized on the ex-dividend date, net of any foreign tax withheld at the source, and interest income is accrued as earned using the effective interest rate method. Distributions received from real estate investment trusts may be classified as dividends, capital gains and/or return of capital.
Investment income and realized and unrealized gains and losses on investments of the Fund are allocated pro rata to the separate classes of
Notes to Financial Statements (Unaudited) (continued)
shares based upon their relative net assets on the date the income is earned or realized and unrealized gains and losses are incurred.
(E) Expenses. Expenses of the Trust are allocated to the individual Funds in proportion to the net assets of the respective Funds when the expenses are incurred, except where direct allocations of expenses can be made. Expenses (other than transfer agent expenses and fees incurred under the shareholder services plans and/or the distribution plans further discussed in Note 3(B)) are allocated to separate classes of shares pro rata based upon their relative net assets on the date the expenses are incurred. The expenses borne by the Fund, including those of related parties to the Fund, are shown in the Statement of Operations.
Additionally, the Fund may invest in mutual funds, which are subject to management fees and other fees that may cause the costs of investing in mutual funds to be greater than the costs of owning the underlying securities directly. These indirect expenses of mutual funds are not included in the amounts shown as expenses in the Statement of Operations or in the expense ratios included in the Financial Highlights.
(F) Use of Estimates. In preparing financial statements in conformity with GAAP, the Manager makes estimates and assumptions that affect the reported amounts and disclosures in the financial statements. Actual results could differ from those estimates and assumptions.
(G) Securities Lending. In order to realize additional income, the Fund may engage in securities lending, subject to the limitations set forth in the 1940 Act and relevant guidance by the staff of the Securities and Exchange Commission (“SEC”). If the Fund engages in securities lending, the Fund will lend through its custodian, JPMorgan Chase Bank, N.A., ("JPMorgan"), acting as securities lending agent on behalf of the Fund. Under the current arrangement, JPMorgan will manage the Fund's collateral in accordance with the securities lending agency agreement between the Fund and JPMorgan, and indemnify the Fund against counterparty risk. The loans will be collateralized by cash (which may be invested in a money market fund) and/or non-cash collateral (which may include U.S. Treasury securities and/or U.S. government agency securities issued or guaranteed by the United States government or its agencies or instrumentalities) at least equal at all times to the market value of the securities loaned. Non-cash collateral held at year end is segregated and cannot be transferred by the Fund. The Fund bears the risk of delay in recovery of, or loss of rights in, the securities loaned. The Fund may also record a realized gain or loss on securities deemed sold due to a borrower’s inability to return securities on loan. The Fund bears the risk of any loss on investment of cash collateral. The Fund will receive compensation for lending its securities in the form of fees or it will retain a portion of interest earned on the investment of any cash collateral. The Fund will also continue to receive interest and dividends on the securities loaned and any gain or loss in the market price of the securities loaned that may occur during the term of the loan will be for the account of the Fund. Income earned from securities lending activities, if any, is reflected in the Statement of Operations.
(H) Indemnifications. Under the Trust’s organizational documents, its officers and trustees are indemnified against certain liabilities that may arise out of performance of their duties to the Trust. Additionally, in the normal course of business, the Fund enters into contracts with third-party service providers that contain a variety of representations and warranties and that may provide general indemnifications. The Fund's maximum exposure under these arrangements is unknown, as this would involve future claims that may be made against the Fund that have not yet occurred. The Manager believes that the risk of loss in connection with these potential indemnification obligations is remote. However, there can be no assurance that material liabilities related to such obligations will not arise in the future, which could adversely impact the Fund.
Note 3–Fees and Related Party Transactions
(A) Manager and Subadvisor. New York Life Investments, a registered investment adviser and an indirect, wholly-owned subsidiary of New York Life Insurance Company ("New York Life"), serves as the Fund’s Manager, pursuant to an Amended and Restated Management Agreement (“Management Agreement”). The Manager provides offices, conducts clerical, recordkeeping and bookkeeping services and keeps most of the financial and accounting records required to be maintained by the Fund. Except for the portion of salaries and expenses that are the responsibility of the Fund, the Manager pays the salaries and expenses of all personnel affiliated with the Fund and certain operational expenses of the Fund. The Fund reimburses New York Life Investments in an amount equal to the portion of the compensation of the Chief Compliance Officer attributable to the Fund. Winslow Capital Management, LLC. (“Winslow” or the “Subadvisor”), a registered investment adviser, serves as the Subadvisor to the Fund and is responsible for the day-to-day portfolio management of the Fund. Pursuant to the terms of a Subadvisory Agreement ("Subadvisory Agreement") between New York Life Investments and Winslow, New York Life Investments pays for the services of the Subadvisor.
Pursuant to the Management Agreement, the Fund pays the Manager a monthly fee for the services performed and the facilities furnished at an annual rate of the Fund’s average daily net assets as follows: 0.75% up to $500 million; 0.725% from $500 million to $750 million; 0.71% from $750 million to $1 billion; 0.70% from $1 billion to $2 billion; 0.66% from $2 billion to $3 billion; 0.61% from $3 billion to $7 billion; 0.585% from $7 billion to $9 billion; and 0.575% on assets over $9 billion. During the six-month period ended April 30, 2024, the effective management fee rate was 0.61% of the Fund’s average daily net assets, exclusive of any applicable waivers/reimbursements.
New York Life Investments has contractually agreed to waive a portion of its management fee so that the management fee does not exceed 0.55% of the Fund’s average daily net assets from $11 billion to $13 billion; and 0.525% of the Fund’s average daily net assets over $13 billion. This agreement will remain in effect until February 28, 2025, and shall renew automatically for one-year terms unless New York Life Investments
| 26 | MainStay Winslow Large Cap Growth Fund |
provides written notice of termination prior to the start of the next term or upon approval of the Board.
New York Life Investments has also contractually agreed to waive fees and/or reimburse expenses so that Total Annual Fund Operating Expenses (excluding taxes, interest, litigation, extraordinary expenses, brokerage and other transaction expenses relating to the purchase and sale of portfolio investments, and acquired (underlying) fund fees and expenses) of Class I shares do not exceed 0.88% of the Fund’s average daily net assets. New York Life Investments has also contractually agreed to waive fees and/or reimburse expenses so that Total Annual Fund Operating Expenses (excluding taxes, interest, litigation, extraordinary expenses, brokerage and other transaction expenses relating to the purchase or sale of portfolio investments, and acquired (underlying) fund fees and expenses) of Class R6 do not exceed those of Class I. These agreements will remain in effect until February 28, 2025, and shall renew automatically for one-year terms unless New York Life Investments provides written notice of termination prior to the start of the next term or upon approval of the Board.
Additionally, New York Life Investments has agreed to further voluntarily waive fees and/or reimburse expenses of the appropriate class of the Fund so that Total Annual Fund Operating Expenses (excluding taxes, interest, litigation, extraordinary expenses, brokerage and other transaction expenses relating to the purchase and sale of portfolio investments, and acquired (underlying) fund fees and expenses) of Class R1 shares do not exceed 0.95%. These voluntary waivers or reimbursements may be discontinued at any time without notice.
During the six-month period ended April 30, 2024, New York Life Investments earned fees from the Fund in the amount of $42,940,783 and waived fees and/or reimbursed expenses in the amount of $526,884 and paid the Subadvisor fees in the amount of $16,847,575.
JPMorgan provides sub-administration and sub-accounting services to the Fund pursuant to an agreement with New York Life Investments. These services include calculating the daily NAVs of the Fund, maintaining the general ledger and sub-ledger accounts for the calculation of the Fund's NAVs, and assisting New York Life Investments in conducting various aspects of the Fund's administrative operations. For providing these services to the Fund, JPMorgan is compensated by New York Life Investments.
Pursuant to an agreement between the Trust and New York Life Investments, New York Life Investments is responsible for providing or procuring certain regulatory reporting services for the Fund. The Fund will reimburse New York Life Investments for the actual costs incurred by New York Life Investments in connection with providing or procuring these services for the Fund.
(B) Distribution and Service Fees. The Trust, on behalf of the Fund, has entered into a distribution agreement with NYLIFE Distributors LLC (the “Distributor”), an affiliate of New York Life Investments. The Fund has adopted distribution plans (the “Plans”) in accordance with the provisions of Rule 12b-1 under the 1940 Act.
Pursuant to the Class A, Investor Class and Class R2 Plans, the Distributor receives a monthly fee from the Class A, Investor Class and Class R2 shares at an annual rate of 0.25% of the average daily net assets of the Class A, Investor Class and Class R2 shares for distribution and/or service activities as designated by the Distributor. Pursuant to the Class B and Class C Plans, Class B and Class C shares pay the Distributor a monthly distribution fee at an annual rate of 0.75% of the average daily net assets of the Class B and Class C shares, along with a service fee at an annual rate of 0.25% of the average daily net assets of the Class B and Class C shares, for a total 12b-1 fee of 1.00%. Pursuant to the Class R3 and SIMPLE Class Plans, Class R3 and SIMPLE Class shares pay the Distributor a monthly distribution fee at an annual rate of 0.25% of the average daily net assets of the Class R3 and SIMPLE Class shares, along with a service fee at an annual rate of 0.25% of the average daily net assets of the Class R3 and SIMPLE Class shares, for a total 12b-1 fee of 0.50%. Class I, Class R1 and Class R6 shares are not subject to a distribution and/or service fee.
The Plans provide that the distribution and service fees are payable to the Distributor regardless of the amounts actually expended by the Distributor for distribution of the Fund's shares and service activities.
In accordance with the Shareholder Services Plans for the Class R1, Class R2 and Class R3 shares, the Manager has agreed to provide, through its affiliates or independent third parties, various shareholder and administrative support services to shareholders of the Class R1, Class R2 and Class R3 shares. For its services, the Manager, its affiliates or independent third-party service providers are entitled to a shareholder service fee accrued daily and paid monthly at an annual rate of 0.10% of the average daily net assets of the Class R1, Class R2 and Class R3 shares. This is in addition to any fees paid under the Class R2 and Class R3 Plans.
During the six-month period ended April 30, 2024, shareholder service fees incurred by the Fund were as follows:
| |
| Class R1 | $503,915 |
| Class R2 | 66,183 |
| Class R3 | 20,768 |
(C) Sales Charges. The Fund was advised by the Distributor that the amount of initial sales charges retained on sales of Class A and Investor Class shares during the six-month period ended April 30, 2024, were $98,289 and $8,341, respectively.
The Fund was also advised that the Distributor retained CDSCs on redemptions of Class A, Class B and Class C shares during the six-month period ended April 30, 2024, of $1,667, $15 and $2,293, respectively.
(D) Transfer, Dividend Disbursing and Shareholder Servicing Agent. NYLIM Service Company LLC, an affiliate of New York Life Investments, is the Fund's transfer, dividend disbursing and shareholder servicing agent pursuant to an agreement between NYLIM Service Company LLC and the Trust. NYLIM Service Company LLC has entered
Notes to Financial Statements (Unaudited) (continued)
into an agreement with SS&C Global Investor & Distribution Solutions, Inc. ("SS&C"), pursuant to which SS&C performs certain transfer agent services on behalf of NYLIM Service Company LLC. New York Life Investments has contractually agreed to limit the transfer agency expenses charged to the Fund’s share classes to a maximum of 0.35% of that share class’s average daily net assets on an annual basis after deducting any applicable Fund or class-level expense reimbursement or small account fees. This agreement will remain in effect until February 28, 2025, and shall renew automatically for one-year terms unless New York Life Investments provides written notice of termination prior to the start of the next term or upon approval of the Board. During the six-month period ended April 30, 2024, transfer agent expenses incurred by the Fund and any reimbursements, pursuant to the aforementioned Transfer Agency expense limitation agreement, were as follows:
| Class | Expense | Waived |
| Class A | $ 541,824 | $— |
| Investor Class | 93,910 | — |
| Class B | 7,992 | — |
| Class C | 57,685 | — |
| Class I | 2,814,706 | — |
| Class R1 | 387,634 | — |
| Class R2 | 50,877 | — |
| Class R3 | 15,961 | — |
| Class R6 | 79,837 | — |
| SIMPLE Class | 143 | — |
(E) Small Account Fee. Shareholders with small accounts adversely impact the cost of providing transfer agency services. In an effort to reduce total transfer agency expenses, the Fund has implemented a small account fee on certain types of accounts. As described in the Fund's prospectus, certain shareholders with an account balance of less than $1,000 ($5,000 for Class A share accounts) are charged an annual per account fee of $20 (assessed semi-annually), the proceeds from which offset transfer agent fees as reflected in the Statement of Operations. This small account fee will not apply to certain types of accounts as described further in the Fund’s prospectus.
(F) Capital. As of April 30, 2024, New York Life and its affiliates beneficially held shares of the Fund with the values and percentages of net assets as follows:
Note 4-Federal Income Tax
As of April 30, 2024, the cost and unrealized appreciation (depreciation) of the Fund’s investment portfolio, including applicable derivative contracts and other financial instruments, as determined on a federal income tax basis, were as follows:
| | Federal Tax
Cost | Gross
Unrealized
Appreciation | Gross
Unrealized
(Depreciation) | Net
Unrealized
Appreciation/
(Depreciation) |
| Investments in Securities | $8,939,109,931 | $5,281,923,309 | $(199,153,797) | $5,082,769,512 |
During the year ended October 31, 2023, the tax character of distributions paid as reflected in the Statements of Changes in Net Assets was as follows:
| | 2023 |
| Distributions paid from: | |
| Ordinary Income | $ 13,433,752 |
| Long-Term Capital Gains | 1,292,659,969 |
| Total | $1,306,093,721 |
Note 5–Custodian
JPMorgan is the custodian of cash and securities held by the Fund. Custodial fees are charged to the Fund based on the Fund's net assets and/or the market value of securities held by the Fund and the number of certain transactions incurred by the Fund.
Note 6–Line of Credit
The Fund and certain other funds managed by New York Life Investments maintain a line of credit with a syndicate of banks in order to secure a source of funds for temporary purposes to meet unanticipated or excessive redemption requests.
Effective July 25, 2023, under the credit agreement (the “Credit Agreement”), the aggregate commitment amount is $600,000,000 with an additional uncommitted amount of $100,000,000. The commitment fee is an annual rate of 0.15% of the average commitment amount payable quarterly, regardless of usage, to JPMorgan, who serves as the agent to the syndicate. The commitment fee is allocated among the Fund and certain other funds managed by New York Life Investments based upon their respective net assets and other factors. Interest on any revolving credit loan is charged based upon the Federal Funds Rate, Daily Simple Secured Overnight Financing Rate ("SOFR") + 0.10%, or the Overnight Bank Funding Rate, whichever is higher. The Credit Agreement expires on July 23, 2024, although the Fund, certain other funds managed by New York Life Investments and the syndicate of banks may renew the Credit Agreement for an additional year on the same or different terms or enter into a credit agreement with a different syndicate of banks. Prior to July 25, 2023, the aggregate commitment amount and
| 28 | MainStay Winslow Large Cap Growth Fund |
the commitment fee were the same as those under the current Credit Agreement. During the six-month period ended April 30, 2024, there were no borrowings made or outstanding with respect to the Fund under the Credit Agreement.
Note 7–Interfund Lending Program
Pursuant to an exemptive order issued by the SEC, the Fund, along with certain other funds managed by New York Life Investments, may participate in an interfund lending program. The interfund lending program provides an alternative credit facility that permits the Fund and certain other funds managed by New York Life Investments to lend or borrow money for temporary purposes directly to or from one another, subject to the conditions of the exemptive order. During the six-month period ended April 30, 2024, there were no interfund loans made or outstanding with respect to the Fund.
Note 8–Purchases and Sales of Securities (in 000’s)
During the six-month period ended April 30, 2024, purchases and sales of securities, other than short-term securities, were $5,041,274 and $6,248,649, respectively.
Note 9–Capital Share Transactions
Transactions in capital shares for the six-month period ended April 30, 2024 and the year ended October 31, 2023, were as follows:
| Class A | Shares | Amount |
| Six-month period ended April 30, 2024: | | |
| Shares sold | 14,954,758 | $ 144,785,247 |
| Shares issued to shareholders in reinvestment of distributions | 14,162,184 | 120,236,969 |
| Shares redeemed | (14,113,363) | (133,460,830) |
| Net increase (decrease) in shares outstanding before conversion | 15,003,579 | 131,561,386 |
| Shares converted into Class A (See Note 1) | 1,685,487 | 16,268,621 |
| Shares converted from Class A (See Note 1) | (212,237) | (2,069,506) |
| Net increase (decrease) | 16,476,829 | $ 145,760,501 |
| Year ended October 31, 2023: | | |
| Shares sold | 15,983,106 | $ 129,616,235 |
| Shares issued to shareholders in reinvestment of distributions | 17,289,578 | 125,347,772 |
| Shares redeemed | (29,604,181) | (235,655,363) |
| Net increase (decrease) in shares outstanding before conversion | 3,668,503 | 19,308,644 |
| Shares converted into Class A (See Note 1) | 1,268,493 | 10,288,730 |
| Shares converted from Class A (See Note 1) | (174,362) | (1,381,429) |
| Net increase (decrease) | 4,762,634 | $ 28,215,945 |
| |
| Investor Class | Shares | Amount |
| Six-month period ended April 30, 2024: | | |
| Shares sold | 300,116 | $ 2,728,910 |
| Shares issued to shareholders in reinvestment of distributions | 889,705 | 7,233,403 |
| Shares redeemed | (358,104) | (3,258,755) |
| Net increase (decrease) in shares outstanding before conversion | 831,717 | 6,703,558 |
| Shares converted into Investor Class (See Note 1) | 81,255 | 755,914 |
| Shares converted from Investor Class (See Note 1) | (1,343,462) | (12,478,843) |
| Net increase (decrease) | (430,490) | $ (5,019,371) |
| Year ended October 31, 2023: | | |
| Shares sold | 594,759 | $ 4,639,901 |
| Shares issued to shareholders in reinvestment of distributions | 1,231,575 | 8,608,707 |
| Shares redeemed | (2,052,819) | (15,881,811) |
| Net increase (decrease) in shares outstanding before conversion | (226,485) | (2,633,203) |
| Shares converted into Investor Class (See Note 1) | 193,762 | 1,546,555 |
| Shares converted from Investor Class (See Note 1) | (599,739) | (4,736,436) |
| Net increase (decrease) | (632,462) | $ (5,823,084) |
| |
| Class B | Shares | Amount |
| Six-month period ended April 30, 2024: | | |
| Shares sold | 26,733 | $ 143,465 |
| Shares issued to shareholders in reinvestment of distributions | 236,119 | 1,116,844 |
| Shares redeemed | (256,518) | (1,365,184) |
| Net increase (decrease) in shares outstanding before conversion | 6,334 | (104,875) |
| Shares converted from Class B (See Note 1) | (375,955) | (2,009,936) |
| Net increase (decrease) | (369,621) | $ (2,114,811) |
| Year ended October 31, 2023: | | |
| Shares sold | 13,930 | $ 64,994 |
| Shares issued to shareholders in reinvestment of distributions | 401,754 | 1,767,718 |
| Shares redeemed | (298,158) | (1,460,234) |
| Net increase (decrease) in shares outstanding before conversion | 117,526 | 372,478 |
| Shares converted from Class B (See Note 1) | (665,391) | (3,230,081) |
| Net increase (decrease) | (547,865) | $ (2,857,603) |
| |
Notes to Financial Statements (Unaudited) (continued)
| Class C | Shares | Amount |
| Six-month period ended April 30, 2024: | | |
| Shares sold | 605,839 | $ 3,172,941 |
| Shares issued to shareholders in reinvestment of distributions | 1,379,854 | 6,485,314 |
| Shares redeemed | (1,726,639) | (9,195,497) |
| Net increase (decrease) in shares outstanding before conversion | 259,054 | 462,758 |
| Shares converted from Class C (See Note 1) | (202,017) | (1,071,425) |
| Net increase (decrease) | 57,037 | $ (608,667) |
| Year ended October 31, 2023: | | |
| Shares sold | 907,854 | $ 4,372,020 |
| Shares issued to shareholders in reinvestment of distributions | 1,816,650 | 7,956,928 |
| Shares redeemed | (3,484,405) | (16,834,402) |
| Net increase (decrease) in shares outstanding before conversion | (759,900) | (4,505,454) |
| Shares converted from Class C (See Note 1) | (399,925) | (1,981,428) |
| Net increase (decrease) | (1,159,826) | $ (6,486,882) |
| |
| Class I | Shares | Amount |
| Six-month period ended April 30, 2024: | | |
| Shares sold | 45,270,507 | $ 512,190,156 |
| Shares issued to shareholders in reinvestment of distributions | 53,790,718 | 545,437,883 |
| Shares redeemed | (101,682,013) | (1,158,945,594) |
| Net increase (decrease) in shares outstanding before conversion | (2,620,788) | (101,317,555) |
| Shares converted into Class I (See Note 1) | 188,233 | 2,185,038 |
| Shares converted from Class I (See Note 1) | (131,604) | (1,491,139) |
| Net increase (decrease) | (2,564,159) | $ (100,623,656) |
| Year ended October 31, 2023: | | |
| Shares sold | 87,063,257 | $ 813,021,273 |
| Shares issued to shareholders in reinvestment of distributions | 72,242,661 | 614,062,619 |
| Shares redeemed | (178,838,638) | (1,685,015,501) |
| Net increase (decrease) in shares outstanding before conversion | (19,532,720) | (257,931,609) |
| Shares converted into Class I (See Note 1) | 157,330 | 1,466,305 |
| Shares converted from Class I (See Note 1) | (201,120) | (1,891,775) |
| Net increase (decrease) | (19,576,510) | $ (258,357,079) |
| |
| Class R1 | Shares | Amount |
| Six-month period ended April 30, 2024: | | |
| Shares sold | 6,954,886 | $ 74,465,044 |
| Shares issued to shareholders in reinvestment of distributions | 9,088,812 | 86,798,156 |
| Shares redeemed | (13,540,792) | (143,042,205) |
| Net increase (decrease) in shares outstanding before conversion | 2,502,906 | 18,220,995 |
| Shares converted into Class R1 (See Note 1) | 222,041 | 2,104,945 |
| Net increase (decrease) | 2,724,947 | $ 20,325,940 |
| Year ended October 31, 2023: | | |
| Shares sold | 18,440,679 | $ 167,960,802 |
| Shares issued to shareholders in reinvestment of distributions | 10,722,851 | 86,318,947 |
| Shares redeemed | (19,868,278) | (178,889,345) |
| Net increase (decrease) in shares outstanding before conversion | 9,295,252 | 75,390,404 |
| Shares converted into Class R1 (See Note 1) | 7,150 | 60,468 |
| Shares converted from Class R1 (See Note 1) | (23,920) | (240,876) |
| Net increase (decrease) | 9,278,482 | $ 75,209,996 |
| |
| Class R2 | Shares | Amount |
| Six-month period ended April 30, 2024: | | |
| Shares sold | 1,592,409 | $ 14,274,780 |
| Shares issued to shareholders in reinvestment of distributions | 1,108,636 | 9,246,020 |
| Shares redeemed | (1,705,636) | (15,967,888) |
| Net increase (decrease) in shares outstanding before conversion | 995,409 | 7,552,912 |
| Shares converted from Class R2 (See Note 1) | (250,589) | (2,104,945) |
| Net increase (decrease) | 744,820 | $ 5,447,967 |
| Year ended October 31, 2023: | | |
| Shares sold | 2,296,843 | $ 17,881,375 |
| Shares issued to shareholders in reinvestment of distributions | 1,391,973 | 9,938,687 |
| Shares redeemed | (3,601,858) | (28,456,267) |
| Net increase (decrease) in shares outstanding before conversion | 86,958 | (636,205) |
| Shares converted from Class R2 (See Note 1) | (2,389) | (17,227) |
| Net increase (decrease) | 84,569 | $ (653,432) |
| |
| 30 | MainStay Winslow Large Cap Growth Fund |
| Class R3 | Shares | Amount |
| Six-month period ended April 30, 2024: | | |
| Shares sold | 624,458 | $ 5,033,128 |
| Shares issued to shareholders in reinvestment of distributions | 618,158 | 4,456,920 |
| Shares redeemed | (756,474) | (5,999,961) |
| Net increase (decrease) in shares outstanding before conversion | 486,142 | 3,490,087 |
| Shares converted from Class R3 (See Note 1) | (10,401) | (88,724) |
| Net increase (decrease) | 475,741 | $ 3,401,363 |
| Year ended October 31, 2023: | | |
| Shares sold | 922,756 | $ 6,449,354 |
| Shares issued to shareholders in reinvestment of distributions | 870,215 | 5,473,601 |
| Shares redeemed | (2,412,610) | (16,649,602) |
| Net increase (decrease) | (619,639) | $ (4,726,647) |
| |
| Class R6 | Shares | Amount |
| Six-month period ended April 30, 2024: | | |
| Shares sold | 27,584,253 | $ 317,042,974 |
| Shares issued to shareholders in reinvestment of distributions | 28,521,267 | 294,054,260 |
| Shares redeemed | (64,144,431) | (734,327,946) |
| Net increase (decrease) | (8,038,911) | $ (123,230,712) |
| Year ended October 31, 2023: | | |
| Shares sold | 63,800,380 | $ 606,984,764 |
| Shares issued to shareholders in reinvestment of distributions | 40,759,793 | 351,349,412 |
| Shares redeemed | (109,697,203) | (1,025,523,675) |
| Net increase (decrease) in shares outstanding before conversion | (5,137,030) | (67,189,499) |
| Shares converted into Class R6 (See Note 1) | 11,946 | 117,194 |
| Net increase (decrease) | (5,125,084) | $ (67,072,305) |
| |
| SIMPLE Class | Shares | Amount |
| Six-month period ended April 30, 2024: | | |
| Shares sold | 27,005 | $ 241,870 |
| Shares issued to shareholders in reinvestment of distributions | 5,820 | 46,846 |
| Shares redeemed | (3,184) | (30,100) |
| Net increase (decrease) | 29,641 | $ 258,616 |
| Year ended October 31, 2023: | | |
| Shares sold | 13,600 | $ 102,611 |
| Shares issued to shareholders in reinvestment of distributions | 4,458 | 30,895 |
| Shares redeemed | (1,770) | (12,674) |
| Net increase (decrease) | 16,288 | $ 120,832 |
Note 10–Other Matters
As of the date of this report, the Fund faces a heightened level of risk associated with current uncertainty, volatility and state of economies, financial markets, a high interest rate environment, and labor and health conditions around the world. Events such as war, acts of terrorism, recessions, rapid inflation, the imposition of economic sanctions, earthquakes, hurricanes, epidemics and pandemics and other unforeseen natural or human disasters may have broad adverse social, political and economic effects on the global economy, which could negatively impact the value of the Fund's investments. Developments that disrupt global economies and financial markets may magnify factors that affect the Fund's performance.
Note 11–Subsequent Events
In connection with the preparation of the financial statements of the Fund as of and for the six-month period ended April 30, 2024, events and transactions subsequent to April 30, 2024, through the date the financial statements were issued, have been evaluated by the Manager for possible adjustment and/or disclosure. No subsequent events requiring financial statement adjustment or disclosure have been identified.
Board Consideration and Approval of Management Agreement and Subadvisory Agreement (Unaudited)
The continuation of the Management Agreement with respect to the MainStay Winslow Large Cap Growth Fund (“Fund”) and New York Life Investment Management LLC (“New York Life Investments”) and the Subadvisory Agreement between New York Life Investments and Winslow Capital Management, LLC (“Winslow Capital”) with respect to the Fund (together, “Advisory Agreements”) is subject to annual review and approval by the Board of Trustees of The MainStay Funds (“Board” of the “Trust”) in accordance with Section 15 of the Investment Company Act of 1940, as amended (“1940 Act”). At its December 6–7, 2023 meeting, the Board, including the Trustees who are not an “interested person” (as such term is defined in the 1940 Act) of the Trust (“Independent Trustees”) voting separately, unanimously approved the continuation of each of the Advisory Agreements for a one-year period.
In reaching the decision to approve the continuation of each of the Advisory Agreements, the Board considered information and materials furnished by New York Life Investments and Winslow Capital in connection with an annual contract review process undertaken by the Board that took place at meetings of the Board and its Contracts Committee from September 2023 through December 2023, including information and materials furnished by New York Life Investments and Winslow Capital in response to requests prepared on behalf of the Board, and in consultation with the Independent Trustees, by independent legal counsel to the Independent Trustees, which encompassed a variety of topics, including those summarized below. Information and materials requested by and furnished to the Board for consideration in connection with the contract review process included, among other items, reports on the Fund and “peer funds” prepared by Institutional Shareholder Services Inc. (“ISS”), an independent third-party service provider engaged by the Board to report objectively on the Fund’s investment performance, management fee and total expenses. The Board also considered information on the fees charged to other investment advisory clients of New York Life Investments and/or Winslow Capital that follow investment strategies similar to those of the Fund, if any, and, when applicable, the rationale for differences in the Fund’s management and subadvisory fees and the fees charged to those other investment advisory clients. In addition, the Board considered information regarding the legal standards and fiduciary obligations applicable to its consideration of the continuation of each of the Advisory Agreements. The contract review process, including the structure and format for information and materials provided to the Board, has been developed in consultation with the Board. The Independent Trustees also met in executive sessions with their independent legal counsel and, for portions thereof, with senior management of New York Life Investments.
The Board’s deliberations with respect to the continuation of each of the Advisory Agreements reflect a year-long process, and the Board also took into account information furnished to the Board and its Committees throughout the year, as deemed relevant and appropriate by the Trustees, including, among other items, reports on investment performance of the Fund and investment-related matters for the Fund as well as presentations from New York Life Investments and, generally annually, Winslow Capital personnel. In addition, the Board took into account other
information provided by New York Life Investments throughout the year, including, among other items, periodic reports on legal and compliance matters, risk management, portfolio turnover, brokerage commissions and non-advisory services provided to the Fund by New York Life Investments, as deemed relevant and appropriate by the Trustees.
In addition to information provided to the Board throughout the year, the Board received information in connection with its June 2023 meeting provided specifically in response to requests prepared on behalf of the Board, and in consultation with the Independent Trustees, by independent legal counsel to the Independent Trustees regarding the Fund’s distribution arrangements. In addition, the Board received information regarding the Fund’s asset levels, share purchase and redemption activity and the payment of Rule 12b-1 and/or certain other fees by the applicable share classes of the Fund, among other information.
In considering the continuation of each of the Advisory Agreements, the Trustees reviewed and evaluated the information and factors they believed to reasonably be necessary and appropriate in light of legal advice furnished to them by independent legal counsel to the Independent Trustees and through the exercise of their own business judgment. Although individual Trustees may have weighed certain factors or information differently and the Board did not consider any single factor or information controlling in reaching its decision, the factors that figured prominently in the Board’s consideration of the continuation of each of the Advisory Agreements are summarized in more detail below and include, among other factors: (i) the nature, extent and quality of the services provided to the Fund by New York Life Investments and Winslow Capital; (ii) the qualifications of the portfolio managers of the Fund and the historical investment performance of the Fund, New York Life Investments and Winslow Capital; (iii) the costs of the services provided, and profits realized, by New York Life Investments and Winslow Capital with respect to their relationships with the Fund; (iv) the extent to which economies of scale have been realized or may be realized if the Fund grows and the extent to which any economies of scale have been shared, have benefited or may benefit the Fund’s shareholders; and (v) the reasonableness of the Fund’s management and subadvisory fees and total ordinary operating expenses. Although the Board recognized that comparisons between the Fund’s fees and expenses and those of other funds are imprecise given different terms of agreements, variations in fund strategies and other factors, the Board considered the reasonableness of the Fund’s management fee and total ordinary operating expenses as compared to the peer funds identified by ISS. Throughout their considerations, the Trustees acknowledged the commitment of New York Life Investments and its affiliates to serve the MainStay Group of Funds, as well as their capacity, experience, resources, financial stability and reputations. The Trustees also acknowledged the entrepreneurial and other risks assumed by New York Life Investments in sponsoring and managing the Fund. With respect to the Subadvisory Agreement, the Board took into account New York Life Investments’ recommendation to approve the continuation of the Subadvisory Agreement.
| 32 | MainStay Winslow Large Cap Growth Fund |
The Trustees noted that, throughout the year, the Trustees are afforded an opportunity to ask questions of, and request additional information or materials from, New York Life Investments and Winslow Capital. The Board’s decision with respect to each of the Advisory Agreements may have also been based, in part, on the Board’s knowledge of New York Life Investments and Winslow Capital resulting from, among other things, the Board’s consideration of each of the Advisory Agreements in prior years, the advisory agreements for other funds in the MainStay Group of Funds, the Board’s review throughout the year of the performance and operations of other funds in the MainStay Group of Funds and each Trustee’s business judgment and industry experience. In addition to considering the above-referenced factors, the Board observed that in the marketplace there are a range of investment options available to investors and that the Fund’s shareholders, having had the opportunity to consider other investment options, have invested in the Fund.
The factors that figured prominently in the Board’s decision to approve the continuation of each of the Advisory Agreements during the Board’s December 6–7, 2023 meeting are summarized in more detail below.
Nature, Extent and Quality of Services Provided by New York Life Investments and Winslow Capital
The Board examined the nature, extent and quality of the services that New York Life Investments provides to the Fund. The Board evaluated New York Life Investments’ experience and capabilities in serving as manager of the Fund and considered that the Fund operates in a “manager-of-managers” structure. The Board also considered New York Life Investments’ responsibilities and services provided pursuant to this structure, including overseeing the services provided by Winslow Capital, evaluating the performance of Winslow Capital, making recommendations to the Board as to whether the Subadvisory Agreement should be renewed, modified or terminated and periodically reporting to the Board regarding the results of New York Life Investments’ evaluation and monitoring functions. The Board noted that New York Life Investments manages other mutual funds, serves a variety of other investment advisory clients, including other pooled investment vehicles, and has experience overseeing mutual fund service providers, including subadvisors. The Board considered the experience of senior personnel at New York Life Investments providing management and administrative and other non-advisory services to the Fund. The Board observed that New York Life Investments devotes significant resources and time to providing management and administrative and other non-advisory services to the Fund, including New York Life Investments’ oversight and due diligence reviews of Winslow Capital and ongoing analysis of, and interactions with, Winslow Capital with respect to, among other things, the Fund’s investment performance and risks as well as Winslow Capital’s investment capabilities and subadvisory services with respect to the Fund.
The Board also considered the range of services that New York Life Investments provides to the Fund under the terms of the Management Agreement, including: (i) fund accounting and ongoing supervisory services provided by New York Life Investments’ Fund Administration and
Accounting Group; (ii) investment supervisory and analytical services provided by New York Life Investments’ Investment Consulting Group; (iii) compliance services provided by the Trust’s Chief Compliance Officer as well as New York Life Investments’ compliance department, including supervision and implementation of the Fund’s compliance program; (iv) legal services provided by New York Life Investments’ Office of the General Counsel; and (v) risk management monitoring and analysis by compliance and investment personnel. In addition, the Board considered New York Life Investments’ willingness to invest in personnel and other resources, such as cyber security, information security and business continuity planning, that may benefit the Fund and noted that New York Life Investments is responsible for compensating the Trust’s officers, except for a portion of the salary of the Trust’s Chief Compliance Officer. The Board recognized that New York Life Investments provides certain other non-advisory services to the Fund and has over time provided an increasingly broad array of non-advisory services to the MainStay Group of Funds as a result of regulatory and other developments.
The Board also examined the range, and the nature, extent and quality, of the investment advisory services that Winslow Capital provides to the Fund and considered the terms of each of the Advisory Agreements. The Board evaluated Winslow Capital’s experience and performance in serving as subadvisor to the Fund and advising other portfolios and Winslow Capital’s track record and experience in providing investment advisory services as well as the experience of investment advisory, senior management and/or administrative personnel at Winslow Capital. The Board considered New York Life Investments’ and Winslow Capital’s overall resources, legal and compliance environment, capabilities, reputation, financial condition and history. In addition to information provided in connection with quarterly meetings with the Trust’s Chief Compliance Officer, the Board considered information regarding the compliance policies and procedures of New York Life Investments and Winslow Capital and acknowledged their commitment to further developing and strengthening compliance programs that may relate to the Fund. The Board also considered Winslow Capital’s ability to recruit and retain qualified investment professionals and willingness to invest in personnel and other resources that may benefit the Fund. In this regard, the Board considered the qualifications and experience of the Fund’s portfolio managers, the number of accounts managed by the portfolio managers and the method for compensating the portfolio managers.
In addition, the Board considered information provided by New York Life Investments and Winslow Capital regarding their respective business continuity and disaster recovery plans.
Based on these considerations, among others, the Board concluded that the Fund would likely continue to benefit from the nature, extent and quality of these services.
Investment Performance
In evaluating the Fund’s investment performance, the Board considered investment performance results over various periods in light of the Fund’s investment objective, strategies and risks. The Board considered
Board Consideration and Approval of Management Agreement and Subadvisory Agreement (Unaudited) (continued)
investment reports on, and analysis of, the Fund’s performance provided to the Board throughout the year. These reports include, among other items, information on the Fund’s gross and net returns, the Fund’s investment performance compared to a relevant investment category and the Fund’s benchmarks, the Fund’s risk-adjusted investment performance and the Fund’s investment performance as compared to peer funds, as appropriate, as well as portfolio attribution information and commentary on the effect of market conditions. The Board also considered information provided by ISS showing the investment performance of the Fund as compared to peer funds. In addition, the Board reviewed the methodology used by ISS to construct the group of peer funds for comparative purposes.
The Board also took into account its discussions with senior management at New York Life Investments concerning the Fund’s investment performance over various periods as well as discussions between representatives of Winslow Capital and the members of the Board’s Investment Committee, which generally occur on an annual basis.
Based on these considerations, among others, the Board concluded that its review of the Fund’s investment performance and related information supported a determination to approve the continuation of each of the Advisory Agreements.
Costs of the Services Provided, and Profits and Other Benefits Realized, by New York Life Investments and Winslow Capital
The Board considered the costs of the services provided under each of the Advisory Agreements. The Board also considered the profitability of New York Life Investments and its affiliates and Winslow Capital due to their relationships with the Fund as well as of New York Life Investments and its affiliates due to their relationships with the MainStay Group of Funds. With respect to the profitability of Winslow Capital’s relationship with the Fund, the Board considered information from New York Life Investments that Winslow Capital’s subadvisory fee reflected an arm’s-length negotiation and that this fee is paid by New York Life Investments, not the Fund, and the relevance of Winslow Capital’s profitability was considered by the Trustees in that context. On this basis, the Board primarily considered the costs and profitability for New York Life Investments and its affiliates with respect to the Fund.
In addition, the Board acknowledged the difficulty in obtaining reliable comparative data about mutual fund managers’ profitability because such information generally is not publicly available and may be impacted by numerous factors, including the structure of a fund manager’s organization, the types of funds it manages, the methodology used to allocate certain fixed costs to specific funds and the manager’s capital structure and costs of capital.
In evaluating the costs of the services provided by New York Life Investments and Winslow Capital, and profitability of New York Life Investments and its affiliates and Winslow Capital due to their relationships with the Fund, the Board considered, among other factors, New York Life Investments’ and its affiliates’ and Winslow Capital’s
continuing investments in, or willingness to invest in, personnel and other resources that may support and further enhance the management of the Fund, and that New York Life Investments is responsible for paying the subadvisory fee for the Fund. The Board also considered the financial resources of New York Life Investments and Winslow Capital and acknowledged that New York Life Investments and Winslow Capital must be in a position to recruit and retain experienced professional personnel and to maintain a strong financial position for New York Life Investments and Winslow Capital to continue to provide high-quality services to the Fund. The Board recognized that the Fund benefits from the allocation of certain fixed costs among the funds in the MainStay Group of Funds, among other expected benefits resulting from its relationship with New York Life Investments.
The Board considered information regarding New York Life Investments’ methodology for calculating profitability and allocating costs provided by New York Life Investments in connection with the fund profitability analysis presented to the Board. The Board concluded that New York Life Investments’ methods for allocating costs and procedures for estimating overall profitability of the relationship with the funds in the MainStay Group of Funds were reasonable. The Board recognized the difficulty in calculating and evaluating a manager’s profitability with respect to the Fund and considered that other profitability methodologies may also be reasonable.
The Board also considered certain fall-out benefits that may be realized by New York Life Investments and its affiliates and Winslow Capital and its affiliates due to their relationships with the Fund, including reputational and other indirect benefits. The Board recognized, for example, the benefits to Winslow Capital from legally permitted “soft-dollar” arrangements by which brokers provide research and other services to Winslow Capital in exchange for commissions paid by the Fund with respect to trades in the Fund’s portfolio securities. In this regard, the Board also requested and considered information from New York Life Investments concerning other material business relationships between Winslow Capital and its affiliates and New York Life Investments and its affiliates. In addition, the Board considered its review of the management agreement for a money market fund advised by New York Life Investments and an affiliated subadvisor that serves as an investment option for the Fund, including the potential rationale for and costs associated with investments in this money market fund by the Fund, if any, and considered information from New York Life Investments that the nature and type of specific investment advisory services provided to this money market fund are distinct from, or in addition to, the investment advisory services provided to the Fund.
The Board observed that, in addition to fees earned by New York Life Investments under the Management Agreement for managing the Fund, New York Life Investments’ affiliates also earn revenues from serving the Fund in various other capacities, including as the Fund’s transfer agent and distributor. The Board considered information about these other revenues and their impact on the profitability of the relationship with the Fund to New York Life Investments and its affiliates. The Board noted that, although it assessed the overall profitability of the relationship with
| 34 | MainStay Winslow Large Cap Growth Fund |
the Fund to New York Life Investments and its affiliates as part of the contract review process, when considering the reasonableness of the fee paid to New York Life Investments under the Management Agreement, the Board considered the profitability of New York Life Investments’ relationship with the Fund on a pre-tax basis and without regard to distribution expenses incurred by New York Life Investments from its own resources.
After evaluating the information deemed relevant by the Trustees, the Board concluded that any profits realized by New York Life Investments and its affiliates due to their relationships with the Fund were not excessive, other expected benefits that may accrue to New York Life Investments and its affiliates are reasonable and other expected benefits that may accrue to Winslow Capital and its affiliates are consistent with those expected for a subadvisor to a mutual fund. With respect to Winslow Capital, the Board considered that any profits realized by Winslow Capital due to its relationship with the Fund are the result of arm’s-length negotiations between New York Life Investments and Winslow Capital acknowledging that any such profits are based on the subadvisory fee paid to Winslow Capital by New York Life Investments, not the Fund.
Management and Subadvisory Fees and Total Ordinary Operating Expenses
The Board evaluated the reasonableness of the fee paid under each of the Advisory Agreements and the Fund’s total ordinary operating expenses. With respect to the management fee and subadvisory fee, the Board primarily considered the reasonableness of the management fee paid by the Fund to New York Life Investments because the subadvisory fee paid to Winslow Capital is paid by New York Life Investments, not the Fund. The Board also considered the reasonableness of the subadvisory fee paid by New York Life Investments and the amount of the management fee retained by New York Life Investments.
In assessing the reasonableness of the Fund’s fees and expenses, the Board primarily considered comparative data provided by ISS on the fees and expenses of similar mutual funds managed by other investment advisers. The Board reviewed the methodology used by ISS to construct the group of peer funds for comparative purposes. In addition, the Board considered information provided by New York Life Investments and Winslow Capital on fees charged to other investment advisory clients, including institutional separate accounts and/or other funds, that follow investment strategies similar to those of the Fund, if any. The Board considered the contractual management fee schedule for the Fund as compared to those for such other investment advisory clients, taking into account the rationale for differences in fee schedules. The Board also took into account information provided by New York Life Investments about the more extensive scope of services provided to registered investment companies, such as the Fund, as compared with other investment advisory clients. Additionally, the Board considered the impact of contractual breakpoints, voluntary waivers and expense limitation arrangements on the Fund’s net management fee and
expenses. The Board also considered that in proposing fees for the Fund, New York Life Investments considers the competitive marketplace for mutual funds.
The Board took into account information from New York Life Investments, as provided in connection with the Board’s June 2023 meeting, regarding the reasonableness of the Fund’s transfer agent fee schedule, including industry data demonstrating that the fees that NYLIM Service Company LLC, an affiliate of New York Life Investments and the Fund’s transfer agent, charges the Fund are within the range of fees charged by transfer agents to other mutual funds. In addition, the Board considered NYLIM Service Company LLC’s profitability in connection with the transfer agent services it provides to the Fund. The Board also took into account information provided by NYLIM Service Company LLC regarding the sub-transfer agency payments it made to intermediaries in connection with the provision of sub-transfer agency services to the Fund.
The Board considered the extent to which transfer agent fees contributed to the total expenses of the Fund. The Board acknowledged the role that the MainStay Group of Funds historically has played in serving the investment needs of New York Life Insurance Company customers, who often maintain smaller account balances than other shareholders of funds, and the impact of small accounts on the expense ratios of Fund share classes. The Board also recognized measures that it and New York Life Investments have taken that are intended to mitigate the effect of small accounts on the expense ratios of Fund share classes, including through the imposition of an expense limitation on net transfer agency expenses. The Board also considered that NYLIM Service Company LLC had waived its contractual cost of living adjustments during certain years.
Based on the factors outlined above, among other considerations, the Board concluded that the Fund’s management fee and total ordinary operating expenses are within a range that is competitive and support a conclusion that these fees and expenses are reasonable.
Economies of Scale
The Board considered information regarding economies of scale, including whether economies of scale may exist with respect to the Fund and whether the Fund’s management fee and expense structure permits any economies of scale to be appropriately shared with the Fund’s shareholders. The Board also considered a report from New York Life Investments, previously prepared at the request of the Board, that addressed economies of scale, including with respect to the mutual fund business generally, and the various ways in which the benefits of economies of scale may be shared with the funds in the MainStay Group of Funds. Although the Board recognized the difficulty of determining economies of scale with precision, the Board acknowledged that economies of scale may be shared with the Fund in a number of ways, including, for example, through the imposition of fee breakpoints, initially setting management fee rates at scale or making additional investments to enhance the services provided to the Fund. The Board reviewed information from New York Life Investments showing how the Fund’s management fee schedule compared to fee schedules of other funds and
Board Consideration and Approval of Management Agreement and Subadvisory Agreement (Unaudited) (continued)
accounts managed by New York Life Investments. The Board also reviewed information from ISS showing how the Fund’s management fee schedule compared with fees paid for similar services by peer funds at varying asset levels.
Based on this information, the Board concluded that economies of scale are appropriately shared for the benefit of the Fund’s shareholders through the Fund’s management fee and expense structure and other methods to share benefits from economies of scale.
Conclusion
On the basis of the information and factors summarized above, among other information and factors deemed relevant by the Trustees, and the evaluation thereof, the Board, including the Independent Trustees voting separately, unanimously voted to approve the continuation of each of the Advisory Agreements.
| 36 | MainStay Winslow Large Cap Growth Fund |
Discussion of the Operation and Effectiveness of the Fund's Liquidity Risk Management Program (Unaudited)
In compliance with Rule 22e-4 under the Investment Company Act of 1940, as amended (the “Liquidity Rule”), the Fund has adopted and implemented a liquidity risk management program (the “Program”), which New York Life Investment Management LLC believes is reasonably designed to assess and manage the Fund's liquidity risk. A Fund's liquidity risk is the risk that the Fund could not meet requests to redeem shares issued by the Fund without significant dilution of the remaining investors’ interests in the Fund. The Board of Trustees of The MainStay Funds (the "Board") previously approved the designation of New York Life Investment Management LLC as administrator of the Program (the “Administrator”). The Administrator has established a Liquidity Risk Management Committee to assist the Administrator in the implementation and day-to-day administration of the Program and to otherwise support the Administrator in fulfilling its responsibilities under the Program.
At a meeting of the Board held on February 27, 2024, the Administrator provided the Board with a written report addressing the Program’s operation and assessing the adequacy and effectiveness of its implementation for the period from January 1, 2023, through December 31, 2023 (the "Review Period"), as required under the Liquidity Rule. The report noted that the Administrator concluded that (i) the Program operated effectively to assess and manage the Fund's liquidity risk, (ii) the Program has been and continues to be adequately and effectively implemented to monitor and, as applicable, respond to the Fund's liquidity developments and (iii) the Fund's investment strategy continues to be appropriate for an open-end fund. In addition, the report summarized the operation of the Program and the information and factors considered by the Administrator in its assessment of the Program’s implementation, such as the liquidity risk assessment framework and the liquidity classification methodologies, and discussed notable geopolitical, market and other economic events that impacted liquidity risk during the Review Period.
In accordance with the Program, the Fund's liquidity risk is assessed no less frequently than annually taking into consideration certain factors, as applicable, such as (i) investment strategy and liquidity of portfolio investments, (ii) short-term and long-term cash flow projections, and (iii) holdings of cash and cash equivalents, as well as borrowing arrangements and other funding sources. Certain factors are considered under both normal and reasonably foreseeable stressed conditions.
Each Fund portfolio investment is classified into one of four liquidity categories. The classification is based on a determination of the number of days it is reasonably expected to take to convert the investment into cash, or sell or dispose of the investment, in current market conditions without significantly changing the market value of the investment. The Administrator has delegated liquidity classification determinations to the Fund’s subadvisor, subject to appropriate oversight by the Administrator, and liquidity classification determinations are made by taking into account the Fund's reasonably anticipated trade size, various market, trading and investment-specific considerations, as well as market depth, and, in certain cases, third-party vendor data.
The Liquidity Rule requires funds that do not primarily hold assets that are highly liquid investments to adopt a minimum amount of net assets that must be invested in highly liquid investments that are assets (an “HLIM”). In addition, the Liquidity Rule limits a fund's investments in illiquid investments. Specifically, the Liquidity Rule prohibits acquisition of illiquid investments if, immediately after acquisition, doing so would result in a fund holding more than 15% of its net assets in illiquid investments that are assets. The Program includes provisions reasonably designed to determine, periodically review and comply with the HLIM requirement, as applicable, and to comply with the 15% limit on illiquid investments.
There can be no assurance that the Program will achieve its objectives under all circumstances in the future. Please refer to the Fund's prospectus for more information regarding the Fund's exposure to liquidity risk and other risks to which it may be subject.
Proxy Voting Policies and Procedures and Proxy Voting Record
The Fund is required to file with the SEC its proxy voting record for the 12-month period ending June 30 on Form N-PX. A description of the policies and procedures that are used to vote proxies relating to portfolio securities of the Fund is available free of charge upon request by calling 800-624-6782 or visiting the SEC’s website at www.sec.gov. The most recent Form N-PX or proxy voting record is available free of charge upon request by calling 800-624-6782; visiting newyorklifeinvestments.com; or visiting the SEC’s website at www.sec.gov.
Shareholder Reports and Quarterly Portfolio Disclosure
The Fund is required to file its complete schedule of portfolio holdings with the SEC 60 days after its first and third fiscal quarter on Form N-PORT. The Fund's holdings report is available free of charge upon request by calling New York Life Investments at 800-624-6782.
| 38 | MainStay Winslow Large Cap Growth Fund |
Equity
U.S. Equity
MainStay Epoch U.S. Equity Yield Fund
MainStay Fiera SMID Growth Fund
MainStay PineStone U.S. Equity Fund
MainStay S&P 500 Index Fund
MainStay Winslow Large Cap Growth Fund
MainStay WMC Enduring Capital Fund
MainStay WMC Growth Fund
MainStay WMC Small Companies Fund
MainStay WMC Value Fund
International Equity
MainStay Epoch International Choice Fund
MainStay PineStone International Equity Fund
MainStay WMC International Research Equity Fund
Emerging Markets Equity
MainStay Candriam Emerging Markets Equity Fund
Global Equity
MainStay Epoch Capital Growth Fund
MainStay Epoch Global Equity Yield Fund
MainStay PineStone Global Equity Fund
Fixed Income
Taxable Income
MainStay Candriam Emerging Markets Debt Fund
MainStay Floating Rate Fund
MainStay MacKay High Yield Corporate Bond Fund
MainStay MacKay Short Duration High Income Fund
MainStay MacKay Strategic Bond Fund
MainStay MacKay Total Return Bond Fund
MainStay MacKay U.S. Infrastructure Bond Fund
MainStay Short Term Bond Fund
Tax-Exempt Income
MainStay MacKay Arizona Muni Fund
MainStay MacKay California Tax Free Opportunities Fund1
MainStay MacKay Colorado Muni Fund
MainStay MacKay High Yield Municipal Bond Fund
MainStay MacKay New York Tax Free Opportunities Fund2
MainStay MacKay Oregon Muni Fund
MainStay MacKay Short Term Municipal Fund
MainStay MacKay Strategic Municipal Allocation Fund
MainStay MacKay Tax Free Bond Fund
MainStay MacKay Utah Muni Fund
Money Market
MainStay Money Market Fund
Mixed Asset
MainStay Balanced Fund
MainStay Income Builder Fund
MainStay MacKay Convertible Fund
Speciality
MainStay CBRE Global Infrastructure Fund
MainStay CBRE Real Estate Fund
MainStay Cushing MLP Premier Fund
Asset Allocation
MainStay Conservative Allocation Fund
MainStay Conservative ETF Allocation Fund
MainStay Equity Allocation Fund
MainStay Equity ETF Allocation Fund
MainStay Growth Allocation Fund
MainStay Growth ETF Allocation Fund
MainStay Moderate Allocation Fund
MainStay Moderate ETF Allocation Fund
Manager
New York Life Investment Management LLC
New York, New York
Subadvisors
Candriam3
Strassen, Luxembourg
CBRE Investment Management Listed Real Assets LLC
Radnor, Pennsylvania
Cushing Asset Management, LP
Dallas, Texas
Epoch Investment Partners, Inc.
New York, New York
Fiera Capital Inc.
New York, New York
IndexIQ Advisors LLC3
New York, New York
MacKay Shields LLC3
New York, New York
NYL Investors LLC3
New York, New York
PineStone Asset Management Inc.
Montreal, Québec
Wellington Management Company LLP
Boston, Massachusetts
Winslow Capital Management, LLC
Minneapolis, Minnesota
Legal Counsel
Dechert LLP
Washington, District of Columbia
Independent Registered Public Accounting Firm
KPMG LLP
Philadelphia, Pennsylvania
Distributor
NYLIFE Distributors LLC3
Jersey City, New Jersey
Custodian
JPMorgan Chase Bank, N.A.
New York, New York
1.
This Fund is registered for sale in AZ, CA, NV, OR, TX, UT, WA (all share classes); and MI (Class A and Class I shares only); and CO, FL, GA, HI, ID, MA, MD, NH, NJ and NY (Class I and Class C2 shares only).
| 2. | This Fund is registered for sale in CA, CT, DE, FL, MA, NJ, NY, VT (all share classes) and SD (Class R6 shares only). |
| 3. | An affiliate of New York Life Investment Management LLC. |
Not part of the Semiannual Report
For more information
800-624-6782
newyorklifeinvestments.com
“New York Life Investments” is both a service mark, and the common trade name, of certain investment advisors affiliated with New York Life Insurance Company. The MainStay Funds® are managed by New York Life Investment Management LLC and distributed by NYLIFE Distributors LLC, 30 Hudson Street, Jersey City, NJ 07302, a wholly owned subsidiary of New York Life Insurance Company. NYLIFE Distributors LLC is a Member FINRA/SIPC.
©2024 NYLIFE Distributors LLC. All rights reserved.
| 5022118 MS081-24 | MSLG10-06/24 |
(NYLIM) NL221
MainStay WMC Enduring Capital Fund
Message from the President and Semiannual Report
Unaudited | April 30, 2024
Special Notice:
Beginning in July 2024, new regulations issued by the Securities and Exchange Commission (SEC) will take effect requiring open-end mutual fund companies and ETFs to (1) overhaul the content of their shareholder reports and (2) mail paper copies of the new tailored shareholder reports to shareholders who have not opted to receive these documents electronically.
If you have not yet elected to receive your shareholder reports electronically, please contact your financial intermediary or visit newyorklifeinvestments.com/accounts.
| Not FDIC/NCUA Insured | Not a Deposit | May Lose Value | No Bank Guarantee | Not Insured by Any Government Agency |
This page intentionally left blank
Message from the President
Stock and bond markets gained broad ground during the six-month period ended April 30, 2024, bolstered by better-than-expected economic growth and the prospect of monetary easing in the face of a myriad of macroeconomic and geopolitical challenges.
Throughout the reporting period, interest rates remained at their highest levels in decades in most developed countries, with the U.S. federal funds rate in the 5.25%−5.50% range, as central banks struggled to bring inflation under control. Early in the reporting period, the U.S. Federal Reserve began to forecast interest rate cuts in 2024, but delayed action as inflation remained stubbornly high, fluctuating between 3.1% and 3.5%. Nevertheless, despite the increasing cost of capital and tighter lending environment that resulted from sustained high rates, economic growth remained surprisingly robust, supported by high levels of consumer spending, low unemployment and strong corporate earnings. Investors tended to shrug off concerns related to sticky inflation and high interest rates—not to mention the ongoing war in Ukraine, intensifying hostilities in the Middle East and simmering tensions between China and the United States—focusing instead on the positives of continued economic growth and surprisingly strong corporate profits.
The S&P 500® Index, a widely regarded benchmark of U.S. market performance, produced double-digit gains, reaching record levels in March 2024. Market strength, which had been narrowly focused on mega-cap, technology-related stocks during the previous six months broadened significantly during the reporting period. All industry sectors produced positive results, with the strongest returns in communication services, information technology and industrials, and more moderate gains in the lagging energy, real estate and consumer staples areas. Growth-oriented shares slightly outperformed value-oriented
issues, while large- and mid-cap stocks modestly outperformed their small-cap counterparts. Most overseas equity markets trailed the U.S. market, as developed international economies experienced relatively low growth rates, and weak economic conditions in China undermined emerging markets.
Bonds generally gained ground as well. The yield on the 10-year Treasury note ranged between approximately 4.7% and 3.8%, while the 2-year Treasury yield remained slightly higher, between approximately 5.0% and 4.1%, in an inverted curve pattern often viewed as indicative of an impending economic slowdown. Nevertheless, the prevailing environment of stable interest rates and attractive yields provided a favorable environment for fixed-income investors. Long-term Treasury bonds and investment-grade corporate bonds produced similar gains, while high yield bonds advanced by a slightly greater margin, despite the added risks implicit in an uptick in default rates. International bond markets modestly outperformed their U.S. counterparts, led by a rebound in the performance of emerging-markets debt.
The risks and uncertainties inherent in today’s markets call for the kind of insight and expertise that New York Life Investments offers through our one-on-one philosophy, long-lasting focus, and multi-boutique approach.
Thank you for trusting us to help you meet your investment needs.
Sincerely,
Kirk C. Lehneis
President
The opinions expressed are as of the date of this report and are subject to change. There is no guarantee that any forecast made will come to pass. This material does not constitute investment advice and is not intended as an endorsement of any specific investment. Past performance is no guarantee of future results.
Not part of the Semiannual Report
Investors should refer to the Fund’s Summary Prospectus and/or Prospectus and consider the Fund’s investment objectives, strategies, risks, charges and expenses carefully before investing. The Summary Prospectus and/or Prospectus contain this and other information about the Fund. You may obtain copies of the Fund’s Summary Prospectus, Prospectus and Statement of Additional Information, which includes information about The MainStay Funds' Trustees, free of charge, upon request, by calling toll-free 800-624-6782, by writing to NYLIFE Distributors LLC, Attn: MainStay Marketing Department, 30 Hudson Street, Jersey City, NJ 07302 or by sending an e-mail to MainStayShareholderServices@nylim.com. These documents are also available on dfinview.com/NYLIM. Please read the Fund’s Summary Prospectus and/or Prospectus carefully before investing.
Investment and Performance Comparison (Unaudited)
Performance data quoted represents past performance. Past performance is no guarantee of future results. Because of market volatility and other factors, current performance may be lower or higher than the figures shown. Investment return and principal value will fluctuate, and as a result, when shares are redeemed, they may be worth more or less than their original cost. The graph below depicts the historical performance of Class I shares of the Fund. Performance will vary from class to class based on differences in class-specific expenses and sales charges. For performance information current to the most recent month-end, please call 800-624-6782 or visit newyorklifeinvestments.com.
The performance table and graph do not reflect the deduction of taxes that a shareholder would pay on distributions or Fund share redemptions. Total returns reflect maximum applicable sales charges as indicated in the table below, if any, changes in share price, and reinvestment of dividend and capital gain distributions. The graph assumes the initial investment amount shown below and reflects the deduction of all sales charges that would have applied for the period of investment. Performance figures may reflect certain fee waivers and/or expense limitations, without which total returns may have been lower. For more information on share classes and current fee waivers and/or expense limitations (if any), please refer to the Notes to Financial Statements.

| Average Annual Total Returns for the Period-Ended April 30, 2024 |
| Class | Sales Charge | | Inception
Date1 | Six
Months2 | One
Year | Five
Years | Ten Years
or Since
Inception | Gross
Expense
Ratio3 |
| Class A Shares | Maximum 5.50% Initial Sales Charge | With sales charges | 6/1/1998 | 13.26% | 12.02% | 10.86% | 10.36% | 0.94% |
| | | Excluding sales charges | | 19.85 | 18.54 | 12.12 | 10.99 | 0.94 |
| Investor Class Shares4 | Maximum 5.00% Initial Sales Charge | With sales charges | 2/28/2008 | 13.75 | 12.35 | 10.60 | 10.10 | 1.17 |
| | | Excluding sales charges | | 19.73 | 18.27 | 11.85 | 10.72 | 1.17 |
| Class B Shares5 | Maximum 5.00% CDSC | With sales charges | 6/1/1998 | 14.26 | 12.36 | 10.75 | 9.89 | 1.92 |
| | if Redeemed Within the First Six Years of Purchase | Excluding sales charges | | 19.26 | 17.36 | 11.01 | 9.89 | 1.92 |
| Class C Shares | Maximum 1.00% CDSC | With sales charges | 9/1/1998 | 18.24 | 16.38 | 11.01 | 9.89 | 1.92 |
| | if Redeemed Within One Year of Purchase | Excluding sales charges | | 19.24 | 17.38 | 11.01 | 9.89 | 1.92 |
| Class I Shares | No Sales Charge | | 12/28/2004 | 20.00 | 18.82 | 12.40 | 11.27 | 0.69 |
| Class R6 Shares | No Sales Charge | | 4/26/2021 | 20.03 | 18.92 | N/A | 7.61 | 0.61 |
| 1. | Effective March 5, 2021, the Fund replaced its subadvisor and modified its principal investment strategies. The past performance in the graph and table prior to March 5, 2021 reflects the Fund's prior subadvisor and principal investment strategies. |
| 2. | Not annualized. |
| 3. | The gross expense ratios presented reflect the Fund’s “Total Annual Fund Operating Expenses” from the most recent Prospectus, as supplemented, and may differ from other expense ratios disclosed in this report. |
| 4. | Prior to June 30, 2020, the maximum initial sales charge was 5.50%, which is reflected in the applicable average annual total return figures shown. |
| 5. | Class B shares are closed to all new purchases as well as additional investments by existing Class B shareholders. |
The footnotes on the next page are an integral part of the table and graph and should be carefully read in conjunction with them.
| Benchmark Performance* | Six
Months1 | One
Year | Five
Years | Ten
Years |
| Russell 3000® Index2 | 21.09% | 22.30% | 12.43% | 11.81% |
| S&P 500® Index3 | 20.98 | 22.66 | 13.19 | 12.41 |
| Morningstar Large Blend Category Average4 | 19.86 | 20.31 | 11.78 | 10.96 |
| * | Returns for indices reflect no deductions for fees, expenses or taxes, except for foreign withholding taxes where applicable. Results assume reinvestment of all dividends and capital gains. An investment cannot be made directly in an index. |
| 1. | Not annualized. |
| 2. | In accordance with new regulatory requirements, the Fund has selected the Russell 3000® Index, which represents a broad measure of market performance, as a replacement for the S&P 500® Index. The Russell 3000® Index measures the performance of the largest 3,000 U.S. companies representing approximately 98% of the investable U.S. equity market. |
| 3. | The S&P 500® Index, which represents a broad measure of market performance, is generally representative of the market sectors or types of investments in which the Fund invests. S&P® and S&P 500® are registered trademarks of Standard & Poor’s Financial Services LLC. The S&P 500® Index is widely regarded as the standard index for measuring large-cap U.S. stock market performance. |
| 4. | The Morningstar Large Blend Category Average is representative of funds that represent the overall U.S. stock market in size, growth rates and price. Stocks in the top 70% of the capitalization of the U.S. equity market are defined as large cap. The blend style is assigned to funds where neither growth nor value characteristics predominate. These funds tend to invest across the spectrum of U.S. industries, and owing to their broad exposure, the funds' returns are often similar to those of the S&P 500® Index. Results are based on average total returns of similar funds with all dividends and capital gain distributions reinvested. |
The footnotes on the preceding page are an integral part of the table and graph and should be carefully read in conjunction with them.
| 6 | MainStay WMC Enduring Capital Fund |
Cost in Dollars of a $1,000 Investment in MainStay WMC Enduring Capital Fund (Unaudited)
The example below is intended to describe the fees and expenses borne by shareholders during the six-month period from November 1, 2023 to April 30, 2024, and the impact of those costs on your investment.
Example
As a shareholder of the Fund you incur two types of costs: (1) transaction costs, including exchange fees and sales charges (loads) on purchases (as applicable), and (2) ongoing costs, including management fees, distribution and/or service (12b-1) fees and other Fund expenses (as applicable). This example is intended to help you understand your ongoing costs (in dollars) of investing in the Fund and to compare these costs with the ongoing costs of investing in other mutual funds. The example is based on an investment of $1,000 made at the beginning of the six-month period and held for the entire period from November 1, 2023 to April 30, 2024.
This example illustrates your Fund’s ongoing costs in two ways:
Actual Expenses
The second and third data columns in the table below provide information about actual account values and actual expenses. You may use the information in these columns, together with the amount you invested, to estimate the expenses that you paid during the six months ended April 30, 2024. Simply divide your account value by $1,000 (for example, an $8,600 account value divided by $1,000 = 8.6), then multiply the
result by the number under the heading entitled “Expenses Paid During Period” to estimate the expenses you paid on your account during this period.
Hypothetical Example for Comparison Purposes
The fourth and fifth data columns in the table below provide information about hypothetical account values and hypothetical expenses based on the Fund’s actual expense ratio and an assumed rate of return of 5% per year before expenses, which is not the Fund’s actual return. The hypothetical account values and expenses may not be used to estimate the actual ending account balances or expenses you paid for the six-month period shown. You may use this information to compare the ongoing costs of investing in the Fund with the ongoing costs of investing in other mutual funds. To do so, compare this 5% hypothetical example with the 5% hypothetical examples that appear in the shareholder reports of the other mutual funds.
Please note that the expenses shown in the table are meant to highlight your ongoing costs only and do not reflect any transactional costs, such as exchange fees or sales charges (loads). Therefore, the fourth and fifth data columns of the table are useful in comparing ongoing costs only and will not help you determine the relative total costs of owning different funds. In addition, if these transactional costs were included, your costs would have been higher.
| Share Class | Beginning
Account
Value
11/1/23 | Ending Account
Value (Based
on Actual
Returns and
Expenses)
4/30/24 | Expenses
Paid
During
Period1 | Ending Account
Value (Based
on Hypothetical
5% Annualized
Return and
Actual Expenses)
4/30/24 | Expenses
Paid
During
Period1 | Net Expense
Ratio
During
Period2 |
| Class A Shares | $1,000.00 | $1,198.50 | $ 5.08 | $1,020.24 | $4.67 | 0.93% |
| Investor Class Shares | $1,000.00 | $1,197.30 | $ 6.28 | $1,019.14 | $5.77 | 1.15% |
| Class B Shares | $1,000.00 | $1,192.60 | $10.36 | $1,015.41 | $9.52 | 1.90% |
| Class C Shares | $1,000.00 | $1,192.40 | $10.36 | $1,015.41 | $9.52 | 1.90% |
| Class I Shares | $1,000.00 | $1,200.00 | $ 3.72 | $1,021.48 | $3.42 | 0.68% |
| Class R6 Shares | $1,000.00 | $1,200.30 | $ 3.34 | $1,021.83 | $3.07 | 0.61% |
| 1. | Expenses are equal to the Fund’s annualized expense ratio of each class multiplied by the average account value over the period, divided by 366 and multiplied by 182 (to reflect the six-month period). The table above represents the actual expenses incurred during the six-month period. In addition to the fees and expenses which the Fund bears directly, it also indirectly bears a pro rata share of the fees and expenses of the underlying funds in which it invests. Such indirect expenses are not included in the above-reported expense figures. |
| 2. | Expenses are equal to the Fund's annualized expense ratio to reflect the six-month period. |
Industry Composition as of April 30, 2024 (Unaudited)
| Machinery | 11.9% |
| Commercial Services & Supplies | 11.2 |
| Insurance | 10.3 |
| Chemicals | 7.5 |
| Software | 7.5 |
| Ground Transportation | 5.7 |
| Capital Markets | 5.7 |
| Household Durables | 5.4 |
| Financial Services | 4.5 |
| Trading Companies & Distributors | 4.2 |
| Consumer Staples Distribution & Retail | 4.1 |
| Air Freight & Logistics | 3.4 |
| Specialized REITs | 3.1% |
| Consumer Finance | 2.8 |
| Containers & Packaging | 2.8 |
| Banks | 2.7 |
| Life Sciences Tools & Services | 2.4 |
| Health Care Providers & Services | 2.0 |
| Media | 1.2 |
| Short–Term Investments | 1.7 |
| Other Assets, Less Liabilities | –0.1 |
| | 100.0% |
See Portfolio of Investments beginning on page 9 for specific holdings within these categories. The Fund's holdings are subject to change.
Top Ten Holdings and/or Issuers Held as of April 30, 2024 (excluding short-term investments) (Unaudited)
| 1. | Constellation Software, Inc. |
| 2. | Progressive Corp. (The) |
| 3. | NVR, Inc. |
| 4. | PACCAR, Inc. |
| 5. | Copart, Inc. |
| 6. | Markel Group, Inc. |
| 7. | Berkshire Hathaway, Inc., Class B |
| 8. | Linde plc |
| 9. | Watsco, Inc. |
| 10. | Costco Wholesale Corp. |
| 8 | MainStay WMC Enduring Capital Fund |
Portfolio of Investments April 30, 2024†^(Unaudited)
| | Shares | Value |
| Common Stocks 98.4% |
| Air Freight & Logistics 3.4% |
| Expeditors International of Washington, Inc. | 161,170 | $ 17,939,833 |
| Banks 2.7% |
| M&T Bank Corp. | 96,430 | 13,923,528 |
| Capital Markets 5.7% |
| Brookfield Asset Management Ltd., Class A | 154,796 | 5,911,659 |
| Brookfield Corp. | 238,569 | 9,571,389 |
| Charles Schwab Corp. (The) | 192,677 | 14,248,464 |
| | | 29,731,512 |
| Chemicals 7.5% |
| Linde plc | 51,322 | 22,630,949 |
| Sherwin-Williams Co. (The) | 55,399 | 16,598,094 |
| | | 39,229,043 |
| Commercial Services & Supplies 11.2% |
| Cintas Corp. | 27,334 | 17,995,066 |
| Copart, Inc. (a) | 455,472 | 24,736,684 |
| Waste Connections, Inc. | 97,770 | 15,847,539 |
| | | 58,579,289 |
| Consumer Finance 2.8% |
| Credit Acceptance Corp. (a) | 28,830 | 14,810,548 |
| Consumer Staples Distribution & Retail 4.1% |
| Costco Wholesale Corp. | 29,187 | 21,099,282 |
| Containers & Packaging 2.8% |
| Ball Corp. | 207,422 | 14,430,349 |
| Financial Services 4.5% |
| Berkshire Hathaway, Inc., Class B (a) | 58,662 | 23,272,975 |
| Ground Transportation 5.7% |
| Canadian National Railway Co. | 118,293 | 14,357,736 |
| Old Dominion Freight Line, Inc. | 85,686 | 15,570,003 |
| | | 29,927,739 |
| Health Care Providers & Services 2.0% |
| UnitedHealth Group, Inc. | 21,419 | 10,360,370 |
| Household Durables 5.4% |
| NVR, Inc. (a) | 3,809 | 28,334,580 |
| | Shares | Value |
| |
| Insurance 10.3% |
| Brookfield Reinsurance Ltd. (b) | 3,730 | $ 149,834 |
| Markel Group, Inc. (a) | 16,511 | 24,079,643 |
| Progressive Corp. (The) | 141,537 | 29,475,080 |
| | | 53,704,557 |
| Life Sciences Tools & Services 2.4% |
| Danaher Corp. | 50,991 | 12,575,400 |
| Machinery 11.9% |
| Deere & Co. | 25,912 | 10,142,216 |
| Fortive Corp. | 157,868 | 11,882,724 |
| IDEX Corp. | 59,051 | 13,018,384 |
| PACCAR, Inc. | 252,730 | 26,817,180 |
| | | 61,860,504 |
| Media 1.2% |
| Cable One, Inc. | 16,091 | 6,337,440 |
| Software 7.5% |
| Constellation Software, Inc. | 14,513 | 37,364,715 |
| Lumine Group, Inc. (a) | 61,645 | 1,688,616 |
| | | 39,053,331 |
| Specialized REITs 3.1% |
| American Tower Corp. | 47,181 | 8,094,372 |
| Public Storage | 31,684 | 8,220,414 |
| | | 16,314,786 |
| Trading Companies & Distributors 4.2% |
| Watsco, Inc. | 48,837 | 21,865,302 |
Total Common Stocks
(Cost $366,731,034) | | 513,350,368 |
| |
| | Number of
Warrants | |
| |
| Warrants 0.0% ‡ |
| Software 0.0% ‡ |
| Constellation Software, Inc. | | |
| Expires 3/31/40 (a)(c)(d) | 16,496 | — |
Total Warrants
(Cost $0) | | — |
| |
The notes to the financial statements are an integral part of, and should be read in conjunction with, the financial statements.
9
Portfolio of Investments April 30, 2024†^(Unaudited) (continued)
| | Shares | | Value |
| |
| Short-Term Investments 1.7% |
| Affiliated Investment Company 1.7% |
| MainStay U.S. Government Liquidity Fund, 5.242% (e) | 8,847,982 | | $ 8,847,982 |
| Unaffiliated Investment Company 0.0% ‡ |
| Invesco Government & Agency Portfolio, 5.309% (e)(f) | 4,175 | | 4,175 |
Total Short-Term Investments
(Cost $8,852,157) | | | 8,852,157 |
Total Investments
(Cost $375,583,191) | 100.1% | | 522,202,525 |
| Other Assets, Less Liabilities | (0.1) | | (403,872) |
| Net Assets | 100.0% | | $ 521,798,653 |
| † | Percentages indicated are based on Fund net assets. |
| ^ | Industry classifications may be different than those used for compliance monitoring purposes. |
| ‡ | Less than one-tenth of a percent. |
| (a) | Non-income producing security. |
| (b) | All or a portion of this security was held on loan. As of April 30, 2024, the aggregate market value of securities on loan was $4,017. The Fund received cash collateral with a value of $4,175. (See Note 2(I)) |
| (c) | Illiquid security—As of April 30, 2024, the total market value deemed illiquid under procedures approved by the Board of Trustees was $0, which represented less than one-tenth of a percent of the Fund’s net assets. |
| (d) | Security in which significant unobservable inputs (Level 3) were used in determining fair value. |
| (e) | Current yield as of April 30, 2024. |
| (f) | Represents a security purchased with cash collateral received for securities on loan. |
Investments in Affiliates (in 000's)
Investments in issuers considered to be affiliate(s) of the Fund during the six-month period ended April 30, 2024 for purposes of Section 2(a)(3) of the Investment Company Act of 1940, as amended, were as follows:
| Affiliated Investment Companies | Value,
Beginning
of Period | Purchases
at Cost | Proceeds
from
Sales | Net
Realized
Gain/(Loss)
on Sales | Change in
Unrealized
Appreciation/
(Depreciation) | Value,
End of
Period | Dividend
Income | Other
Distributions | Shares
End of
Period |
| MainStay U.S. Government Liquidity Fund | $ 5,152 | $ 28,097 | $ (24,401) | $ — | $ — | $ 8,848 | $ 286 | $ — | 8,848 |
| Abbreviation(s): |
| REIT—Real Estate Investment Trust |
The notes to the financial statements are an integral part of, and should be read in conjunction with, the financial statements.
| 10 | MainStay WMC Enduring Capital Fund |
The following is a summary of the fair valuations according to the inputs used as of April 30, 2024, for valuing the Fund’s assets:
| Description | Quoted
Prices in
Active
Markets for
Identical
Assets
(Level 1) | | Significant
Other
Observable
Inputs
(Level 2) | | Significant
Unobservable
Inputs
(Level 3) | | Total |
| Asset Valuation Inputs | | | | | | | |
| Investments in Securities (a) | | | | | | | |
| Common Stocks | $ 513,350,368 | | $ — | | $ — | | $ 513,350,368 |
| Warrants | — | | — | | — | | — |
| Short-Term Investments | | | | | | | |
| Affiliated Investment Company | 8,847,982 | | — | | — | | 8,847,982 |
| Unaffiliated Investment Company | 4,175 | | — | | — | | 4,175 |
| Total Short-Term Investments | 8,852,157 | | — | | — | | 8,852,157 |
| Total Investments in Securities | $ 522,202,525 | | $ — | | $ — | | $ 522,202,525 |
| (a) | For a complete listing of investments and their industries, see the Portfolio of Investments. |
The notes to the financial statements are an integral part of, and should be read in conjunction with, the financial statements.
11
Statement of Assets and Liabilities as of April 30, 2024 (Unaudited)
| Assets |
Investment in unaffiliated securities, at value
(identified cost $366,735,209) including securities on loan of $4,017 | $513,354,543 |
Investment in affiliated investment companies, at value
(identified cost $8,847,982) | 8,847,982 |
| Cash | 53 |
| Receivables: | |
| Fund shares sold | 106,077 |
| Dividends | 105,171 |
| Other assets | 92,105 |
| Total assets | 522,505,931 |
| Liabilities |
| Cash collateral received for securities on loan | 4,175 |
| Payables: | |
| Manager (See Note 3) | 241,658 |
| Fund shares redeemed | 168,875 |
| Shareholder communication | 106,410 |
| NYLIFE Distributors (See Note 3) | 67,960 |
| Transfer agent (See Note 3) | 66,308 |
| Professional fees | 44,926 |
| Custodian | 4,736 |
| Trustees | 254 |
| Securities lending | 45 |
| Accrued expenses | 1,931 |
| Total liabilities | 707,278 |
| Net assets | $521,798,653 |
| Composition of Net Assets |
| Shares of beneficial interest outstanding (par value of $.01 per share) unlimited number of shares authorized | $ 146,996 |
| Additional paid-in-capital | 378,335,681 |
| | 378,482,677 |
| Total distributable earnings (loss) | 143,315,976 |
| Net assets | $521,798,653 |
| Class A | |
| Net assets applicable to outstanding shares | $236,932,944 |
| Shares of beneficial interest outstanding | 6,665,453 |
| Net asset value per share outstanding | $ 35.55 |
| Maximum sales charge (5.50% of offering price) | 2.07 |
| Maximum offering price per share outstanding | $ 37.62 |
| Investor Class | |
| Net assets applicable to outstanding shares | $ 21,904,721 |
| Shares of beneficial interest outstanding | 616,772 |
| Net asset value per share outstanding | $ 35.52 |
| Maximum sales charge (5.00% of offering price) | 1.87 |
| Maximum offering price per share outstanding | $ 37.39 |
| Class B | |
| Net assets applicable to outstanding shares | $ 1,241,765 |
| Shares of beneficial interest outstanding | 40,171 |
| Net asset value and offering price per share outstanding | $ 30.91 |
| Class C | |
| Net assets applicable to outstanding shares | $ 14,214,778 |
| Shares of beneficial interest outstanding | 460,307 |
| Net asset value and offering price per share outstanding | $ 30.88 |
| Class I | |
| Net assets applicable to outstanding shares | $ 81,293,835 |
| Shares of beneficial interest outstanding | 2,271,476 |
| Net asset value and offering price per share outstanding | $ 35.79 |
| Class R6 | |
| Net assets applicable to outstanding shares | $166,210,610 |
| Shares of beneficial interest outstanding | 4,645,442 |
| Net asset value and offering price per share outstanding | $ 35.78 |
The notes to the financial statements are an integral part of, and should be read in conjunction with, the financial statements.
| 12 | MainStay WMC Enduring Capital Fund |
Statement of Operations for the six months ended April 30, 2024 (Unaudited)
| Investment Income (Loss) |
| Income | |
| Dividends-unaffiliated (net of foreign tax withholding of $58,177) | $ 3,856,087 |
| Dividends-affiliated | 285,661 |
| Securities lending, net | 1,429 |
| Other | 106 |
| Total income | 4,143,283 |
| Expenses | |
| Manager (See Note 3) | 1,437,621 |
| Distribution/Service—Class A (See Note 3) | 287,292 |
| Distribution/Service—Investor Class (See Note 3) | 29,560 |
| Distribution/Service—Class B (See Note 3) | 7,298 |
| Distribution/Service—Class C (See Note 3) | 84,513 |
| Distribution/Service—Class R3 (See Note 3)(a) | 1,494 |
| Transfer agent (See Note 3) | 187,458 |
| Registration | 56,721 |
| Professional fees | 56,150 |
| Trustees | 6,248 |
| Custodian | 5,691 |
| Shareholder communication | 2,102 |
| Shareholder service (See Note 3) | 299 |
| Miscellaneous | 15,249 |
| Total expenses | 2,177,696 |
| Net investment income (loss) | 1,965,587 |
| Realized and Unrealized Gain (Loss) |
| Net realized gain (loss) on: | |
| Unaffiliated investment transactions | 3,716,070 |
| Foreign currency transactions | 584 |
| Net realized gain (loss) | 3,716,654 |
| Net change in unrealized appreciation (depreciation) on: | |
| Unaffiliated investments | 86,563,018 |
| Translation of other assets and liabilities in foreign currencies | (5) |
| Net change in unrealized appreciation (depreciation) | 86,563,013 |
| Net realized and unrealized gain (loss) | 90,279,667 |
| Net increase (decrease) in net assets resulting from operations | $92,245,254 |
| (a) | Class liquidated and is no longer offered for sale as of February 23, 2024. |
The notes to the financial statements are an integral part of, and should be read in conjunction with, the financial statements.
13
Statements of Changes in Net Assets
for the six months ended April 30, 2024 (Unaudited) and the year ended October 31, 2023
| | Six months
ended
April 30,
2024 | Year
ended
October 31,
2023 |
| Increase (Decrease) in Net Assets |
| Operations: | | |
| Net investment income (loss) | $ 1,965,587 | $ 2,848,806 |
| Net realized gain (loss) | 3,716,654 | (6,891,808) |
| Net change in unrealized appreciation (depreciation) | 86,563,013 | 28,352,462 |
| Net increase (decrease) in net assets resulting from operations | 92,245,254 | 24,309,460 |
| Distributions to shareholders: | | |
| Class A | (1,462,773) | (7,743,520) |
| Investor Class | (108,996) | (859,939) |
| Class B | (2,409) | (113,221) |
| Class C | (29,131) | (929,434) |
| Class I | (743,460) | (3,690,395) |
| Class R3(a) | (4,081) | (21,276) |
| Class R6 | (1,656,975) | (8,289,276) |
| Total distributions to shareholders | (4,007,825) | (21,647,061) |
| Capital share transactions: | | |
| Net proceeds from sales of shares | 24,616,258 | 125,928,585 |
| Net asset value of shares issued to shareholders in reinvestment of distributions | 3,958,976 | 21,396,272 |
| Cost of shares redeemed | (64,321,092) | (197,554,301) |
| Increase (decrease) in net assets derived from capital share transactions | (35,745,858) | (50,229,444) |
| Net increase (decrease) in net assets | 52,491,571 | (47,567,045) |
| Net Assets |
| Beginning of period | 469,307,082 | 516,874,127 |
| End of period | $521,798,653 | $ 469,307,082 |
| (a) | Class liquidated and is no longer offered for sale as of February 23, 2024. |
The notes to the financial statements are an integral part of, and should be read in conjunction with, the financial statements.
| 14 | MainStay WMC Enduring Capital Fund |
Financial Highlights selected per share data and ratios
| | Six months ended
April 30,
2024* | | Year Ended October 31, |
| Class A | 2023 | | 2022 | | 2021 | | 2020 | | 2019 |
| Net asset value at beginning of period | $ 29.86 | | $ 30.01 | | $ 36.76 | | $ 24.95 | | $ 24.92 | | $ 26.31 |
| Net investment income (loss) (a) | 0.11 | | 0.11 | | 0.06 | | 0.06 | | 0.16 | | 0.26 |
| Net realized and unrealized gain (loss) | 5.80 | | 0.92 | | (3.74) | | 11.99 | | 1.36 | | 1.28 |
| Total from investment operations | 5.91 | | 1.03 | | (3.68) | | 12.05 | | 1.52 | | 1.54 |
| Less distributions: | | | | | | | | | | | |
| From net investment income | (0.22) | | (0.08) | | (0.04) | | (0.24) | | (0.27) | | (0.22) |
| From net realized gain on investments | — | | (1.10) | | (3.03) | | — | | (1.22) | | (2.71) |
| Total distributions | (0.22) | | (1.18) | | (3.07) | | (0.24) | | (1.49) | | (2.93) |
| Net asset value at end of period | $ 35.55 | | $ 29.86 | | $ 30.01 | | $ 36.76 | | $ 24.95 | | $ 24.92 |
| Total investment return (b) | 19.85% | | 3.36% | | (10.96)% | | 48.53% | | 6.42% | | 6.80% |
| Ratios (to average net assets)/Supplemental Data: | | | | | | | | | | | |
| Net investment income (loss) | 0.64%†† | | 0.35% | | 0.18% | | 0.19% | | 0.64% | | 1.08% |
| Net expenses (c) | 0.93%†† | | 0.94% | | 0.94% | | 0.91% | | 0.99% | | 0.97% |
| Portfolio turnover rate | 0%‡‡ | | 17% | | 2% | | 24% | | 166% | | 164% |
| Net assets at end of period (in 000’s) | $ 236,933 | | $ 197,726 | | $ 196,218 | | $ 228,700 | | $ 62,611 | | $ 63,814 |
| * | Unaudited. |
| †† | Annualized. |
| ‡‡ | Less than one-tenth percent. |
| (a) | Per share data based on average shares outstanding during the period. |
| (b) | Total investment return is calculated exclusive of sales charges and assumes the reinvestment of dividends and distributions. For periods of less than one year, total return is not annualized. |
| (c) | In addition to the fees and expenses which the Fund bears directly, it also indirectly bears a pro-rata share of the fees and expenses of the underlying funds in which it invests. Such indirect expenses are not included in the above expense ratios. |
| | Six months ended
April 30,
2024* | | Year Ended October 31, |
| Investor Class | 2023 | | 2022 | | 2021 | | 2020 | | 2019 |
| Net asset value at beginning of period | $ 29.80 | | $ 29.97 | | $ 36.73 | | $ 24.92 | | $ 24.90 | | $ 26.29 |
| Net investment income (loss) (a) | 0.08 | | 0.04 | | 0.01 | | (0.01) | | 0.08 | | 0.20 |
| Net realized and unrealized gain (loss) | 5.79 | | 0.91 | | (3.74) | | 11.98 | | 1.37 | | 1.27 |
| Total from investment operations | 5.87 | | 0.95 | | (3.73) | | 11.97 | | 1.45 | | 1.47 |
| Less distributions: | | | | | | | | | | | |
| From net investment income | (0.15) | | (0.02) | | — | | (0.16) | | (0.21) | | (0.15) |
| From net realized gain on investments | — | | (1.10) | | (3.03) | | — | | (1.22) | | (2.71) |
| Total distributions | (0.15) | | (1.12) | | (3.03) | | (0.16) | | (1.43) | | (2.86) |
| Net asset value at end of period | $ 35.52 | | $ 29.80 | | $ 29.97 | | $ 36.73 | | $ 24.92 | | $ 24.90 |
| Total investment return (b) | 19.73% | | 3.13% | | (11.13)% | | 48.22% | | 6.05% | | 6.51% |
| Ratios (to average net assets)/Supplemental Data: | | | | | | | | | | | |
| Net investment income (loss) | 0.47%†† | | 0.13% | | 0.03% | | (0.02)% | | 0.35% | | 0.82% |
| Net expenses (c) | 1.15%†† | | 1.17% | | 1.11% | | 1.19% | | 1.30% | | 1.23% |
| Expenses (before waiver/reimbursement) (c) | 1.15%†† | | 1.17% | | 1.11% | | 1.19% | | 1.31% | | 1.27% |
| Portfolio turnover rate | 0%‡‡ | | 17% | | 2% | | 24% | | 166% | | 164% |
| Net assets at end of period (in 000's) | $ 21,905 | | $ 21,764 | | $ 22,977 | | $ 29,293 | | $ 15,544 | | $ 17,203 |
| * | Unaudited. |
| †† | Annualized. |
| ‡‡ | Less than one-tenth percent. |
| (a) | Per share data based on average shares outstanding during the period. |
| (b) | Total investment return is calculated exclusive of sales charges and assumes the reinvestment of dividends and distributions. For periods of less than one year, total return is not annualized. |
| (c) | In addition to the fees and expenses which the Fund bears directly, it also indirectly bears a pro-rata share of the fees and expenses of the underlying funds in which it invests. Such indirect expenses are not included in the above expense ratios. |
The notes to the financial statements are an integral part of, and should be read in conjunction with, the financial statements.
15
Financial Highlights selected per share data and ratios
| | Six months ended
April 30,
2024* | | Year Ended October 31, |
| Class B | 2023 | | 2022 | | 2021 | | 2020 | | 2019 |
| Net asset value at beginning of period | $ 25.96 | | $ 26.41 | | $ 32.96 | | $ 22.40 | | $ 22.50 | | $ 24.04 |
| Net investment income (loss) (a) | (0.04) | | (0.15) | | (0.21) | | (0.22) | | (0.08) | | 0.02 |
| Net realized and unrealized gain (loss) | 5.04 | | 0.80 | | (3.31) | | 10.78 | | 1.22 | | 1.15 |
| Total from investment operations | 5.00 | | 0.65 | | (3.52) | | 10.56 | | 1.14 | | 1.17 |
| Less distributions: | | | | | | | | | | | |
| From net investment income | (0.05) | | — | | — | | — | | (0.02) | | — |
| From net realized gain on investments | — | | (1.10) | | (3.03) | | — | | (1.22) | | (2.71) |
| Total distributions | (0.05) | | (1.10) | | (3.03) | | — | | (1.24) | | (2.71) |
| Net asset value at end of period | $ 30.91 | | $ 25.96 | | $ 26.41 | | $ 32.96 | | $ 22.40 | | $ 22.50 |
| Total investment return (b) | 19.26% | | 2.34% | | (11.79)% | | 47.14%(c) | | 5.28% | | 5.71% |
| Ratios (to average net assets)/Supplemental Data: | | | | | | | | | | | |
| Net investment income (loss) | (0.26)%†† | | (0.57)% | | (0.72)% | | (0.77)% | | (0.39)% | | 0.10% |
| Net expenses (d) | 1.90%†† | | 1.92% | | 1.86% | | 1.95% | | 2.05% | | 1.98% |
| Expenses (before waiver/reimbursement) (d) | 1.90%†† | | 1.92% | | 1.86% | | 1.95% | | 2.06% | | 2.02% |
| Portfolio turnover rate | 0%‡‡ | | 17% | | 2% | | 24% | | 166% | | 164% |
| Net assets at end of period (in 000’s) | $ 1,242 | | $ 1,527 | | $ 2,824 | | $ 5,007 | | $ 3,666 | | $ 4,718 |
| * | Unaudited. |
| †† | Annualized. |
| ‡‡ | Less than one-tenth percent. |
| (a) | Per share data based on average shares outstanding during the period. |
| (b) | Total investment return is calculated exclusive of sales charges and assumes the reinvestment of dividends and distributions. For periods of less than one year, total return is not annualized. |
| (c) | Total investment return may reflect adjustments to conform to generally accepted accounting principles. |
| (d) | In addition to the fees and expenses which the Fund bears directly, it also indirectly bears a pro-rata share of the fees and expenses of the underlying funds in which it invests. Such indirect expenses are not included in the above expense ratios. |
The notes to the financial statements are an integral part of, and should be read in conjunction with, the financial statements.
| 16 | MainStay WMC Enduring Capital Fund |
Financial Highlights selected per share data and ratios
| | Six months ended
April 30,
2024* | | Year Ended October 31, |
| Class C | 2023 | | 2022 | | 2021 | | 2020 | | 2019 |
| Net asset value at beginning of period | $ 25.94 | | $ 26.39 | | $ 32.93 | | $ 22.38 | | $ 22.48 | | $ 24.02 |
| Net investment income (loss) (a) | (0.04) | | (0.16) | | (0.21) | | (0.24) | | (0.08) | | 0.02 |
| Net realized and unrealized gain (loss) | 5.03 | | 0.81 | | (3.30) | | 10.79 | | 1.22 | | 1.15 |
| Total from investment operations | 4.99 | | 0.65 | | (3.51) | | 10.55 | | 1.14 | | 1.17 |
| Less distributions: | | | | | | | | | | | |
| From net investment income | (0.05) | | — | | — | | — | | (0.02) | | — |
| From net realized gain on investments | — | | (1.10) | | (3.03) | | — | | (1.22) | | (2.71) |
| Total distributions | (0.05) | | (1.10) | | (3.03) | | — | | (1.24) | | (2.71) |
| Net asset value at end of period | $ 30.88 | | $ 25.94 | | $ 26.39 | | $ 32.93 | | $ 22.38 | | $ 22.48 |
| Total investment return (b) | 19.24% | | 2.39% | | (11.80)% | | 47.14%(c) | | 5.29% | | 5.72% |
| Ratios (to average net assets)/Supplemental Data: | | | | | | | | | | | |
| Net investment income (loss) | (0.25)%†† | | (0.60)% | | (0.72)% | | (0.80)% | | (0.38)% | | 0.10% |
| Net expenses (d) | 1.90%†† | | 1.92% | | 1.86% | | 1.89% | | 2.05% | | 1.98% |
| Expenses (before waiver/reimbursement) (d) | 1.90%†† | | 1.92% | | 1.86% | | 1.89% | | 2.06% | | 2.02% |
| Portfolio turnover rate | 0%‡‡ | | 17% | | 2% | | 24% | | 166% | | 164% |
| Net assets at end of period (in 000’s) | $ 14,215 | | $ 16,624 | | $ 23,500 | | $ 37,234 | | $ 6,641 | | $ 10,946 |
| * | Unaudited. |
| †† | Annualized. |
| ‡‡ | Less than one-tenth percent. |
| (a) | Per share data based on average shares outstanding during the period. |
| (b) | Total investment return is calculated exclusive of sales charges and assumes the reinvestment of dividends and distributions. For periods of less than one year, total return is not annualized. |
| (c) | Total investment return may reflect adjustments to conform to generally accepted accounting principles. |
| (d) | In addition to the fees and expenses which the Fund bears directly, it also indirectly bears a pro-rata share of the fees and expenses of the underlying funds in which it invests. Such indirect expenses are not included in the above expense ratios. |
The notes to the financial statements are an integral part of, and should be read in conjunction with, the financial statements.
17
Financial Highlights selected per share data and ratios
| | Six months ended
April 30,
2024* | | Year Ended October 31, |
| Class I | 2023 | | 2022 | | 2021 | | 2020 | | 2019 |
| Net asset value at beginning of period | $ 30.09 | | $ 30.24 | | $ 36.99 | | $ 25.09 | | $ 25.05 | | $ 26.44 |
| Net investment income (loss) (a) | 0.16 | | 0.19 | | 0.15 | | 0.16 | | 0.23 | | 0.32 |
| Net realized and unrealized gain (loss) | 5.84 | | 0.92 | | (3.77) | | 12.03 | | 1.37 | | 1.28 |
| Total from investment operations | 6.00 | | 1.11 | | (3.62) | | 12.19 | | 1.60 | | 1.60 |
| Less distributions: | | | | | | | | | | | |
| From net investment income | (0.30) | | (0.16) | | (0.10) | | (0.29) | | (0.34) | | (0.28) |
| From net realized gain on investments | — | | (1.10) | | (3.03) | | — | | (1.22) | | (2.71) |
| Total distributions | (0.30) | | (1.26) | | (3.13) | | (0.29) | | (1.56) | | (2.99) |
| Net asset value at end of period | $ 35.79 | | $ 30.09 | | $ 30.24 | | $ 36.99 | | $ 25.09 | | $ 25.05 |
| Total investment return (b) | 20.00% | | 3.60% | | (10.72)% | | 48.97% | | 6.66% | | 7.06% |
| Ratios (to average net assets)/Supplemental Data: | | | | | | | | | | | |
| Net investment income (loss) | 0.92%†† | | 0.62% | | 0.45% | | 0.48% | | 0.96% | | 1.34% |
| Net expenses (c) | 0.68%†† | | 0.69% | | 0.69% | | 0.66% | | 0.74% | | 0.72% |
| Portfolio turnover rate | 0%‡‡ | | 17% | | 2% | | 24% | | 166% | | 164% |
| Net assets at end of period (in 000’s) | $ 81,294 | | $ 75,684 | | $ 73,935 | | $ 135,219 | | $ 37,491 | | $ 97,903 |
| * | Unaudited. |
| †† | Annualized. |
| ‡‡ | Less than one-tenth percent. |
| (a) | Per share data based on average shares outstanding during the period. |
| (b) | Total investment return is calculated exclusive of sales charges and assumes the reinvestment of dividends and distributions. Class I shares are not subject to sales charges. For periods of less than one year, total return is not annualized. |
| (c) | In addition to the fees and expenses which the Fund bears directly, it also indirectly bears a pro-rata share of the fees and expenses of the underlying funds in which it invests. Such indirect expenses are not included in the above expense ratios. |
The notes to the financial statements are an integral part of, and should be read in conjunction with, the financial statements.
| 18 | MainStay WMC Enduring Capital Fund |
Financial Highlights selected per share data and ratios
| | Six months ended
April 30,
2024* | | Year Ended October 31, | | April 26, 2021^ through
October 31, |
| Class R6 | 2023 | | 2022 | | 2021 |
| Net asset value at beginning of period | $ 30.10 | | $ 30.24 | | $ 37.00 | | $ 33.07 |
| Net investment income (loss) (a) | 0.17 | | 0.22 | | 0.16 | | 0.14 |
| Net realized and unrealized gain (loss) | 5.84 | | 0.92 | | (3.77) | | 3.79 |
| Total from investment operations | 6.01 | | 1.14 | | (3.61) | | 3.93 |
| Less distributions: | | | | | | | |
| From net investment income | (0.33) | | (0.18) | | (0.12) | | — |
| From net realized gain on investments | — | | (1.10) | | (3.03) | | — |
| Total distributions | (0.33) | | (1.28) | | (3.15) | | — |
| Net asset value at end of period | $ 35.78 | | $ 30.10 | | $ 30.24 | | $ 37.00 |
| Total investment return (b) | 20.03% | | 3.69% | | (10.69)% | | 11.88% |
| Ratios (to average net assets)/Supplemental Data: | | | | | | | |
| Net investment income (loss) | 0.97%†† | | 0.71% | | 0.50% | | 0.44%†† |
| Net expenses (c) | 0.61%†† | | 0.61% | | 0.63% | | 0.60%†† |
| Portfolio turnover rate | 0%‡‡ | | 17% | | 2% | | 24% |
| Net assets at end of period (in 000’s) | $ 166,211 | | $ 155,134 | | $ 196,860 | | $ 262,843 |
| * | Unaudited. |
| ^ | Inception date. |
| †† | Annualized. |
| ‡‡ | Less than one-tenth percent. |
| (a) | Per share data based on average shares outstanding during the period. |
| (b) | Total investment return is calculated exclusive of sales charges and assumes the reinvestment of dividends and distributions. Class R6 shares are not subject to sales charges. For periods of less than one year, total return is not annualized. |
| (c) | In addition to the fees and expenses which the Fund bears directly, it also indirectly bears a pro-rata share of the fees and expenses of the underlying funds in which it invests. Such indirect expenses are not included in the above expense ratios. |
The notes to the financial statements are an integral part of, and should be read in conjunction with, the financial statements.
19
Notes to Financial Statements (Unaudited)
Note 1-Organization and Business
The MainStay Funds (the “Trust”) was organized on January 9, 1986, as a Massachusetts business trust. The Trust is registered under the Investment Company Act of 1940, as amended (the “1940 Act”), as an open-end management investment company, and is comprised of eleven funds (collectively referred to as the "Funds"). These financial statements and notes relate to the MainStay WMC Enduring Capital Fund (the "Fund"), a “diversified” fund, as that term is defined in the 1940 Act, as interpreted or modified by regulatory authorities having jurisdiction, from time to time.
The following table lists the Fund's share classes that have been registered and commenced operations:
| Class | Commenced Operations |
| Class A | June 1, 1998 |
| Investor Class | February 28, 2008 |
| Class B | June 1, 1998 |
| Class C | September 1, 1998 |
| Class I | December 28, 2004 |
| Class R6 | April 26, 2021 |
Effective at the close of business on February 23, 2024, Class R3 shares were liquidated.
Class B shares of the MainStay Group of Funds are closed to all new purchases as well as additional investments by existing Class B shareholders. Existing Class B shareholders may continue to reinvest dividends and capital gains distributions, as well as exchange their Class B shares for Class B shares of other funds in the MainStay Group of Funds as permitted by the current exchange privileges. Class B shareholders continue to be subject to any applicable contingent deferred sales charge ("CDSC") at the time of redemption. All other features of the Class B shares, including but not limited to the fees and expenses applicable to Class B shares, remain unchanged. Unless redeemed, Class B shareholders will remain in Class B shares of their respective fund until the Class B shares are converted to Class A or Investor Class shares pursuant to the applicable conversion schedule.
Class A and Investor Class shares are offered at net asset value (“NAV”) per share plus an initial sales charge. No initial sales charge applies to investments of $1 million or more (and certain other qualified purchases) in Class A and Investor Class shares. However, a CDSC of 1.00% may be imposed on certain redemptions made within 18 months of the date of purchase on shares that were purchased without an initial sales charge. Class C shares are offered at NAV without an initial sales charge, although a 1.00% CDSC may be imposed on certain redemptions of such shares made within one year of the date of purchase of Class C shares. When Class B shares were offered, they were offered at NAV without an initial sales charge, although a CDSC that declines depending on the number of years a shareholder held its Class B shares may be imposed on certain redemptions of such shares made within six years of the date of purchase of such shares. Class I and Class R6 shares are offered at NAV without a sales charge. Depending upon eligibility, Class B shares
convert to either Class A or Investor Class shares at the end of the calendar quarter eight years after the date they were purchased. In addition, depending upon eligibility, Class C shares convert to either Class A or Investor Class shares at the end of the calendar quarter eight years after the date they were purchased. Additionally, Investor Class shares may convert automatically to Class A shares. Under certain circumstances and as may be permitted by the Trust’s multiple class plan pursuant to Rule 18f-3 under the 1940 Act, specified share classes of the Fund may be converted to one or more other share classes of the Fund as disclosed in the capital share transactions within these Notes. The classes of shares have the same voting (except for issues that relate solely to one class), dividend, liquidation and other rights, and the same terms and conditions, except that under distribution plans pursuant to Rule 12b-1 under the 1940 Act, Class B and Class C shares are subject to higher distribution and/or service fees than Class A and Investor Class shares. Class I and Class R6 shares are not subject to a distribution and/or service fee.
The Fund's investment objective is to seek long-term growth of capital.
Note 2–Significant Accounting Policies
The Fund is an investment company and accordingly follows the investment company accounting and reporting guidance of the Financial Accounting Standards Board (“FASB”) Accounting Standards Codification Topic 946 Financial Services—Investment Companies. The Fund prepares its financial statements in accordance with generally accepted accounting principles (“GAAP”) in the United States of America and follows the significant accounting policies described below.
(A) Securities Valuation. Investments are usually valued as of the close of regular trading on the New York Stock Exchange (the "Exchange") (usually 4:00 p.m. Eastern time) on each day the Fund is open for business ("valuation date").
Pursuant to Rule 2a-5 under the 1940 Act, the Board of Trustees of the Trust (the "Board") has designated New York Life Investment Management LLC ("New York Life Investments" or the "Manager") as its Valuation Designee (the "Valuation Designee"). The Valuation Designee is responsible for performing fair valuations relating to all investments in the Fund’s portfolio for which market quotations are not readily available; periodically assessing and managing material valuation risks; establishing and applying fair value methodologies; testing fair valuation methodologies; evaluating and overseeing pricing services; ensuring appropriate segregation of valuation and portfolio management functions; providing quarterly, annual and prompt reporting to the Board, as appropriate; identifying potential conflicts of interest; and maintaining appropriate records. The Valuation Designee has established a valuation committee ("Valuation Committee") to assist in carrying out the Valuation Designee’s responsibilities and establish prices of securities for which market quotations are not readily available. The Fund's and the Valuation Designee's policies and procedures ("Valuation Procedures") govern the Valuation Designee’s selection and application of methodologies for determining and calculating the fair value of Fund investments. The
| 20 | MainStay WMC Enduring Capital Fund |
Valuation Designee may value the Fund's portfolio securities for which market quotations are not readily available and other Fund assets utilizing inputs from pricing services and other third-party sources. The Valuation Committee meets (in person, via electronic mail or via teleconference) on an ad-hoc basis to determine fair valuations and on a quarterly basis to review fair value events with respect to certain securities for which market quotations are not readily available, including valuation risks and back-testing results, and to preview reports to the Board.
The Valuation Committee establishes prices of securities for which market quotations are not readily available based on such methodologies and measurements on a regular basis after considering information that is reasonably available and deemed relevant by the Valuation Committee. The Board shall oversee the Valuation Designee and review fair valuation materials on a prompt, quarterly and annual basis and approve proposed revisions to the Valuation Procedures.
Investments for which market quotations are not readily available are valued at fair value as determined in good faith pursuant to the Valuation Procedures. A market quotation is readily available only when that quotation is a quoted price (unadjusted) in active markets for identical investments that the Fund can access at the measurement date, provided that a quotation will not be readily available if it is not reliable. "Fair value" is defined as the price the Fund would reasonably expect to receive upon selling an asset or liability in an orderly transaction to an independent buyer in the principal or most advantageous market for the asset or liability. Fair value measurements are determined within a framework that establishes a three-tier hierarchy that maximizes the use of observable market data and minimizes the use of unobservable inputs to establish a classification of fair value measurements for disclosure purposes. "Inputs" refer broadly to the assumptions that market participants would use in pricing the asset or liability, including assumptions about risk, such as the risk inherent in a particular valuation technique used to measure fair value using a pricing model and/or the risk inherent in the inputs for the valuation technique. Inputs may be observable or unobservable. Observable inputs reflect the assumptions market participants would use in pricing the asset or liability based on market data obtained from sources independent of the Fund. Unobservable inputs reflect the Fund’s own assumptions about the assumptions market participants would use in pricing the asset or liability based on the information available. The inputs or methodology used for valuing assets or liabilities may not be an indication of the risks associated with investing in those assets or liabilities. The three-tier hierarchy of inputs is summarized below.
| • | Level 1—quoted prices (unadjusted) in active markets for an identical asset or liability |
| • | Level 2—other significant observable inputs (including quoted prices for a similar asset or liability in active markets, interest rates and yield curves, prepayment speeds, credit risk, etc.) |
| • | Level 3—significant unobservable inputs (including the Fund's own assumptions about the assumptions that market participants would use in measuring fair value of an asset or liability) |
The level of an asset or liability within the fair value hierarchy is based on the lowest level of an input, both individually and in the aggregate, that is significant to the fair value measurement. The aggregate value by input level of the Fund’s assets and liabilities as of April 30, 2024, is included at the end of the Portfolio of Investments.
The Fund may use third-party vendor evaluations, whose prices may be derived from one or more of the following standard inputs, among others:
| • Broker/dealer quotes | • Benchmark securities |
| • Two-sided markets | • Reference data (corporate actions or material event notices) |
| • Bids/offers | • Monthly payment information |
| • Industry and economic events | • Reported trades |
An asset or liability for which a market quotation is not readily available is valued by methods deemed reasonable in good faith by the Valuation Committee, following the Valuation Procedures to represent fair value. Under these procedures, the Valuation Designee generally uses a market-based approach which may use related or comparable assets or liabilities, recent transactions, market multiples, book values and other relevant information. The Valuation Designee may also use an income-based valuation approach in which the anticipated future cash flows of the asset or liability are discounted to calculate fair value. Discounts may also be applied due to the nature and/or duration of any restrictions on the disposition of the asset or liability. Fair value represents a good faith approximation of the value of a security. Fair value determinations involve the consideration of a number of subjective factors, an analysis of applicable facts and circumstances and the exercise of judgment. As a result, it is possible that the fair value for a security determined in good faith in accordance with the Valuation Procedures may differ from valuations for the same security determined for other funds using their own valuation procedures. Although the Valuation Procedures are designed to value a security at the price the Fund may reasonably expect to receive upon the security's sale in an orderly transaction, there can be no assurance that any fair value determination thereunder would, in fact, approximate the amount that the Fund would actually realize upon the sale of the security or the price at which the security would trade if a reliable market price were readily available. During the six-month period ended April 30, 2024, there were no material changes to the fair value methodologies.
Securities which may be valued in this manner include, but are not limited to: (i) a security for which trading has been halted or suspended or otherwise does not have a readily available market quotation on a given day; (ii) a debt security that has recently gone into default and for which there is not a current market quotation; (iii) a security of an issuer that has entered into a restructuring; (iv) a security that has been delisted from a national exchange; (v) a security subject to trading collars for which no or limited trading takes place; and (vi) a security whose principal market has been temporarily closed at a time when, under normal conditions, it would be open. Securities valued in this manner are generally categorized as Level 2 or 3 in the hierarchy.
Notes to Financial Statements (Unaudited) (continued)
Certain securities held by the Fund may principally trade in foreign markets. Events may occur between the time the foreign markets close and the time at which the Fund's NAVs are calculated. These events may include, but are not limited to, situations relating to a single issuer in a market sector, significant fluctuations in U.S. or foreign markets, natural disasters, armed conflicts, governmental actions or other developments not tied directly to the securities markets. Should the Valuation Designee conclude that such events may have affected the accuracy of the last price of such securities reported on the local foreign market, the Valuation Designee may, pursuant to the Valuation Procedures, adjust the value of the local price to reflect the estimated impact on the price of such securities as a result of such events. In this instance, securities are generally categorized as Level 3 in the hierarchy. Additionally, certain foreign equity securities are also fair valued whenever the movement of a particular index exceeds certain thresholds. In such cases, the securities are fair valued by applying factors provided by a third-party vendor in accordance with the Valuation Procedures and are generally categorized as Level 2 in the hierarchy.
If the principal market of certain foreign equity securities is closed in observance of a local foreign holiday, these securities are valued using the last closing price of regular trading on the relevant exchange and fair valued by applying factors provided by a third-party vendor in accordance with the Valuation Procedures. These securities are generally categorized as Level 2 in the hierarchy.
Equity securities, rights and warrants, if applicable, are valued at the last quoted sales prices as of the close of regular trading on the relevant exchange on each valuation date. Securities that are not traded on the valuation date are valued at the mean of the last quoted bid and ask prices. Prices are normally taken from the principal market in which each security trades. These securities are generally categorized as Level 1 in the hierarchy.
Investments in mutual funds, including money market funds, are valued at their respective NAVs at the close of business each day on the valuation date. These securities are generally categorized as Level 1 in the hierarchy.
Temporary cash investments acquired in excess of 60 days to maturity at the time of purchase are valued using the latest bid prices or using valuations based on a matrix system (which considers such factors as security prices, yields, maturities and ratings), both as furnished by independent pricing services. Temporary cash investments that mature in 60 days or less at the time of purchase ("Short-Term Investments") are valued using the amortized cost method of valuation, unless the use of such method would be inappropriate. The amortized cost method involves valuing a security at its cost on the date of purchase and thereafter assuming a constant amortization to maturity of the difference between such cost and the value on maturity date. Amortized cost approximates the current fair value of a security. Securities valued using the amortized cost method are not valued using quoted prices in an active market and are generally categorized as Level 2 in the hierarchy.
The information above is not intended to reflect an exhaustive list of the methodologies that may be used to value portfolio investments. The Valuation Procedures permit the use of a variety of valuation methodologies in connection with valuing portfolio investments. The methodology used for a specific type of investment may vary based on the market data available or other considerations. The methodologies summarized above may not represent the specific means by which portfolio investments are valued on any particular business day.
(B) Income Taxes. The Fund's policy is to comply with the requirements of the Internal Revenue Code of 1986, as amended (the “Internal Revenue Code”), applicable to regulated investment companies and to distribute all of its taxable income to the shareholders of the Fund within the allowable time limits.
The Manager evaluates the Fund’s tax positions to determine if the tax positions taken meet the minimum recognition threshold in connection with accounting for uncertainties in income tax positions taken or expected to be taken for the purposes of measuring and recognizing tax liabilities in the financial statements. Recognition of tax benefits of an uncertain tax position is permitted only to the extent the position is “more likely than not” to be sustained assuming examination by taxing authorities. The Manager analyzed the Fund's tax positions taken on federal, state and local income tax returns for all open tax years (for up to three tax years) and has concluded that no provisions for federal, state and local income tax are required in the Fund's financial statements. The Fund's federal, state and local income tax and federal excise tax returns for tax years for which the applicable statutes of limitations have not expired are subject to examination by the Internal Revenue Service and state and local departments of revenue.
(C) Foreign Taxes. The Fund may be subject to foreign taxes on income and other transaction-based taxes imposed by certain countries in which it invests. A portion of the taxes on gains on investments or currency purchases/repatriation may be reclaimable. The Fund will accrue such taxes and reclaims as applicable, based upon its current interpretation of tax rules and regulations that exist in the markets in which it invests.
The Fund may be subject to taxation on realized capital gains, repatriation proceeds and other transaction-based taxes imposed by certain countries in which it invests. The Fund will accrue such taxes as applicable based upon its current interpretation of tax rules and regulations that exist in the market in which it invests. Capital gains taxes relating to positions still held are reflected as a liability in the Statement of Assets and Liabilities, as well as an adjustment to the Fund's net unrealized appreciation (depreciation). Taxes related to capital gains realized, if any, are reflected as part of net realized gain (loss) in the Statement of Operations. Changes in tax liabilities related to capital gains taxes on unrealized investment gains, if any, are reflected as part of the change in net unrealized appreciation (depreciation) on investments in the Statement of Operations. Transaction-based charges are generally assessed as a percentage of the transaction amount.
| 22 | MainStay WMC Enduring Capital Fund |
(D) Dividends and Distributions to Shareholders. Dividends and distributions are recorded on the ex-dividend date. The Fund intends to declare and pay dividends from net investment income and distributions from net realized capital and currency gains, if any, at least annually. Unless a shareholder elects otherwise, all dividends and distributions are reinvested at NAV in the same class of shares of the Fund. Dividends and distributions to shareholders are determined in accordance with federal income tax regulations and may differ from determinations using GAAP.
(E) Security Transactions and Investment Income. The Fund records security transactions on the trade date. Realized gains and losses on security transactions are determined using the identified cost method. Dividend income is recognized on the ex-dividend date, net of any foreign tax withheld at the source, and interest income is accrued as earned using the effective interest rate method. Distributions received from real estate investment trusts may be classified as dividends, capital gains and/or return of capital.
Investment income and realized and unrealized gains and losses on investments of the Fund are allocated pro rata to the separate classes of shares based upon their relative net assets on the date the income is earned or realized and unrealized gains and losses are incurred.
(F) Expenses. Expenses of the Trust are allocated to the individual Funds in proportion to the net assets of the respective Funds when the expenses are incurred, except where direct allocations of expenses can be made. Expenses (other than transfer agent expenses and fees incurred under the shareholder services plans and/or the distribution plans further discussed in Note 3(B)) are allocated to separate classes of shares pro rata based upon their relative net assets on the date the expenses are incurred. The expenses borne by the Fund, including those of related parties to the Fund, are shown in the Statement of Operations.
Additionally, the Fund may invest in mutual funds, which are subject to management fees and other fees that may cause the costs of investing in mutual funds to be greater than the costs of owning the underlying securities directly. These indirect expenses of mutual funds are not included in the amounts shown as expenses in the Statement of Operations or in the expense ratios included in the Financial Highlights.
(G) Use of Estimates. In preparing financial statements in conformity with GAAP, the Manager makes estimates and assumptions that affect the reported amounts and disclosures in the financial statements. Actual results could differ from those estimates and assumptions.
(H) Foreign Currency Transactions. The Fund's books and records are maintained in U.S. dollars. Prices of securities denominated in foreign currency amounts are translated into U.S. dollars at the mean between the buying and selling rates last quoted by any major U.S. bank at the following dates:
(i) market value of investment securities, other assets and liabilities— at the valuation date; and
(ii) purchases and sales of investment securities, income and expenses—at the date of such transactions.
The assets and liabilities that are denominated in foreign currency amounts are presented at the exchange rates and market values at the close of the period. The realized and unrealized changes in net assets arising from fluctuations in exchange rates and market prices of securities are not separately presented.
Net realized gain (loss) on foreign currency transactions represents net currency gains or losses realized as a result of differences between the amounts of securities sale proceeds or purchase cost, dividends, interest and withholding taxes as recorded on the Fund's books, and the U.S. dollar equivalent amount actually received or paid. Net currency gains or losses from valuing such foreign currency denominated assets and liabilities, other than investments at valuation date exchange rates, are reflected in unrealized foreign exchange gains or losses.
(I) Securities Lending. In order to realize additional income, the Fund may engage in securities lending, subject to the limitations set forth in the 1940 Act and relevant guidance by the staff of the Securities and Exchange Commission (“SEC”). If the Fund engages in securities lending, the Fund will lend through its custodian, JPMorgan Chase Bank, N.A., ("JPMorgan"), acting as securities lending agent on behalf of the Fund. Under the current arrangement, JPMorgan will manage the Fund's collateral in accordance with the securities lending agency agreement between the Fund and JPMorgan, and indemnify the Fund against counterparty risk. The loans will be collateralized by cash (which may be invested in a money market fund) and/or non-cash collateral (which may include U.S. Treasury securities and/or U.S. government agency securities issued or guaranteed by the United States government or its agencies or instrumentalities) at least equal at all times to the market value of the securities loaned. Non-cash collateral held at year end is segregated and cannot be transferred by the Fund. The Fund bears the risk of delay in recovery of, or loss of rights in, the securities loaned. The Fund may also record a realized gain or loss on securities deemed sold due to a borrower’s inability to return securities on loan. The Fund bears the risk of any loss on investment of cash collateral. The Fund will receive compensation for lending its securities in the form of fees or it will retain a portion of interest earned on the investment of any cash collateral. The Fund will also continue to receive interest and dividends on the securities loaned and any gain or loss in the market price of the securities loaned that may occur during the term of the loan will be for the account of the Fund. Income earned from securities lending activities, if any, is reflected in the Statement of Operations.
(J) Rights and Warrants. Rights are certificates that permit the holder to purchase a certain number of shares, or a fractional share, of a new stock from the issuer at a specific price. Warrants are instruments that entitle the holder to buy an equity security at a specific price for a specific period of time. These investments can provide a greater potential for profit or loss than an equivalent investment in the underlying security. Prices of these investments do not necessarily move in tandem with the prices of the underlying securities.
There is risk involved in the purchase of rights and warrants in that these investments are speculative investments. The Fund could also lose the
Notes to Financial Statements (Unaudited) (continued)
entire value of its investment in warrants if such warrants are not exercised by the date of its expiration. The Fund is exposed to risk until the sale or exercise of each right or warrant is completed.
(K) Indemnifications. Under the Trust’s organizational documents, its officers and trustees are indemnified against certain liabilities that may arise out of performance of their duties to the Trust. Additionally, in the normal course of business, the Fund enters into contracts with third-party service providers that contain a variety of representations and warranties and that may provide general indemnifications. The Fund's maximum exposure under these arrangements is unknown, as this would involve future claims that may be made against the Fund that have not yet occurred. The Manager believes that the risk of loss in connection with these potential indemnification obligations is remote. However, there can be no assurance that material liabilities related to such obligations will not arise in the future, which could adversely impact the Fund.
Note 3–Fees and Related Party Transactions
(A) Manager and Subadvisor. New York Life Investments, a registered investment adviser and an indirect, wholly-owned subsidiary of New York Life Insurance Company ("New York Life"), serves as the Fund's Manager, pursuant to an Amended and Restated Management Agreement ("Management Agreement"). The Manager provides offices, conducts clerical, recordkeeping and bookkeeping services and keeps most of the financial and accounting records required to be maintained by the Fund. Except for the portion of salaries and expenses that are the responsibility of the Fund, the Manager pays the salaries and expenses of all personnel affiliated with the Fund and certain operational expenses of the Fund. The Fund reimburses New York Life Investments in an amount equal to the portion of the compensation of the Chief Compliance Officer attributable to the Fund. Wellington Management Company LLP ("Wellington" or the "Subadvisor"), a registered investment adviser, serves as the Subadvisor to the Fund and is responsible for the day-to-day portfolio management of the Fund. Pursuant to the terms of a Subadvisory Agreement ("Subadvisory Agreement") between New York Life Investments and Wellington, New York Life Investments pays for the services of the Subadvisor.
Pursuant to the Management Agreement, the Fund pays the Manager a monthly fee for the services performed and the facilities furnished at an annual rate of the Fund’s average daily net assets as follows: 0.55% up to $500 million; 0.525% from $500 million to $1 billion; and 0.50% on assets in excess of $1 billion. During the six-month period ended April 30, 2024, the effective management fee rate was 0.55%.
New York Life Investments has contractually agreed to waive fees and/or reimburse expenses so that Class R6 fees and expenses do not exceed those of Class I. This agreement will remain in effect until February 28, 2025, and shall renew automatically for one-year terms unless New York Life Investments provides written notice of termination prior to the start of the next term or upon approval of the Board.
During the six-month period ended April 30, 2024, New York Life Investments earned fees from the Fund in the amount of $1,437,621 and paid the Subadvisor fees in the amount of $620,550.
JPMorgan provides sub-administration and sub-accounting services to the Fund pursuant to an agreement with New York Life Investments. These services include calculating the daily NAVs of the Fund, maintaining the general ledger and sub-ledger accounts for the calculation of the Fund's NAVs, and assisting New York Life Investments in conducting various aspects of the Fund's administrative operations. For providing these services to the Fund, JPMorgan is compensated by New York Life Investments.
Pursuant to an agreement between the Trust and New York Life Investments, New York Life Investments is responsible for providing or procuring certain regulatory reporting services for the Fund. The Fund will reimburse New York Life Investments for the actual costs incurred by New York Life Investments in connection with providing or procuring these services for the Fund.
(B) Distribution and Service Fees. The Trust, on behalf of the Fund, has entered into a distribution agreement with NYLIFE Distributors LLC (the “Distributor”), an affiliate of New York Life Investments. The Fund has adopted distribution plans (the “Plans”) in accordance with the provisions of Rule 12b-1 under the 1940 Act.
Pursuant to the Class A and Investor Class Plans, the Distributor receives a monthly fee from the Class A and Investor Class shares at an annual rate of 0.25% of the average daily net assets of the Class A and Investor Class shares for distribution and/or service activities as designated by the Distributor. Pursuant to the Class B and Class C Plans, Class B and Class C shares pay the Distributor a monthly distribution fee at an annual rate of 0.75% of the average daily net assets of the Class B and Class C shares, along with a service fee at an annual rate of 0.25% of the average daily net assets of the Class B and Class C shares, for a total 12b-1 fee of 1.00%. Pursuant to the Class R3 Plan, Class R3 shares pay the Distributor a monthly distribution fee at an annual rate of 0.25% of the average daily net assets of the Class R3 shares, along with a service fee at an annual rate of 0.25% of the average daily net assets of the Class R3 shares, for a total 12b-1 fee of 0.50%. Class I and Class R6 shares are not subject to a distribution and/or service fee.
The Plans provide that the distribution and service fees are payable to the Distributor regardless of the amounts actually expended by the Distributor for distribution of the Fund's shares and service activities.
In accordance with the Shareholder Services Plans for the Class R3 shares, the Manager has agreed to provide, through its affiliates or independent third parties, various shareholder and administrative support services to shareholders of the Class R3 shares. For its services, the Manager, its affiliates or independent third-party service providers are entitled to a shareholder service fee accrued daily and paid monthly at an annual rate of 0.10% of the average daily net assets of the Class R3 shares. This is in addition to any fees paid under the Class R3 Plan.
| 24 | MainStay WMC Enduring Capital Fund |
During the period November 1, 2023 through February 28, 2024, shareholder service fees incurred by the Fund were as follows:
| * | Effective at the close of business on February 23, 2024, Class R3 shares were liquidated. |
(C) Sales Charges. The Fund was advised by the Distributor that the amount of initial sales charges retained on sales of Class A and Investor Class shares during the six-month period ended April 30, 2024, were $18,943 and $1,815, respectively.
The Fund was also advised that the Distributor retained CDSCs on redemptions of Class A and Class C shares during the six-month period ended April 30, 2024, of $539 and $142, respectively.
(D) Transfer, Dividend Disbursing and Shareholder Servicing Agent. NYLIM Service Company LLC, an affiliate of New York Life Investments, is the Fund's transfer, dividend disbursing and shareholder servicing agent pursuant to an agreement between NYLIM Service Company LLC and the Trust. NYLIM Service Company LLC has entered into an agreement with SS&C Global Investor & Distribution Solutions, Inc. ("SS&C"), pursuant to which SS&C performs certain transfer agent services on behalf of NYLIM Service Company LLC. New York Life Investments has contractually agreed to limit the transfer agency expenses charged to the Fund’s share classes to a maximum of 0.35% of that share class’s average daily net assets on an annual basis after deducting any applicable Fund or class-level expense reimbursement or small account fees. This agreement will remain in effect until February 28, 2025, and shall renew automatically for one-year terms unless New York Life Investments provides written notice of termination prior to the start of the next term or upon approval of the Board. During the six-month period ended April 30, 2024, transfer agent expenses incurred by the Fund and any reimbursements, pursuant to the aforementioned Transfer Agency expense limitation agreement, were as follows:
| Class | Expense | Waived |
| Class A | $89,151 | $— |
| Investor Class | 35,043 | — |
| Class B | 2,148 | — |
| Class C | 24,957 | — |
| Class I | 32,562 | — |
| Class R3* | 240 | — |
| Class R6 | 3,357 | — |
| * | Effective at the close of business on February 23, 2024, Class R3 shares were liquidated. |
(E) Small Account Fee. Shareholders with small accounts adversely impact the cost of providing transfer agency services. In an effort to reduce total transfer agency expenses, the Fund has implemented a small account fee on certain types of accounts. As described in the Fund's prospectus, certain shareholders with an account balance of less than
$1,000 ($5,000 for Class A share accounts) are charged an annual per account fee of $20 (assessed semi-annually), the proceeds from which offset transfer agent fees as reflected in the Statement of Operations. This small account fee will not apply to certain types of accounts as described further in the Fund’s prospectus.
(F) Capital. As of April 30, 2024, New York Life and its affiliates beneficially held shares of the Fund with the values and percentages of net assets as follows:
| ‡ | Less than one-tenth of a percent. |
Note 4-Federal Income Tax
As of April 30, 2024, the cost and unrealized appreciation (depreciation) of the Fund’s investment portfolio, including applicable derivative contracts and other financial instruments, as determined on a federal income tax basis, were as follows:
| | Federal Tax
Cost | Gross
Unrealized
Appreciation | Gross
Unrealized
(Depreciation) | Net
Unrealized
Appreciation/
(Depreciation) |
| Investments in Securities | $375,894,229 | $163,554,297 | $(17,246,001) | $146,308,296 |
As of October 31, 2023, for federal income tax purposes, capital loss carryforwards of $7,238,905, as shown in the table below, were available to the extent provided by the regulations to offset future realized gains of the Fund. Accordingly, no capital gains distributions are expected to be paid to shareholders until net gains have been realized in excess of such amounts.
Capital Loss
Available Through | Short-Term
Capital Loss
Amounts (000’s) | Long-Term
Capital Loss
Amounts (000’s) |
| Unlimited | $1,196 | $6,043 |
During the year ended October 31, 2023, the tax character of distributions paid as reflected in the Statements of Changes in Net Assets was as follows:
| | 2023 |
| Distributions paid from: | |
| Ordinary Income | $13,213,407 |
| Long-Term Capital Gains | 8,433,654 |
| Total | $21,647,061 |
Note 5–Custodian
JPMorgan is the custodian of cash and securities held by the Fund. Custodial fees are charged to the Fund based on the Fund's net assets and/or the market value of securities held by the Fund and the number of certain transactions incurred by the Fund.
Notes to Financial Statements (Unaudited) (continued)
Note 6–Line of Credit
The Fund and certain other funds managed by New York Life Investments maintain a line of credit with a syndicate of banks in order to secure a source of funds for temporary purposes to meet unanticipated or excessive redemption requests.
Effective July 25, 2023, under the credit agreement (the “Credit Agreement”), the aggregate commitment amount is $600,000,000 with an additional uncommitted amount of $100,000,000. The commitment fee is an annual rate of 0.15% of the average commitment amount payable quarterly, regardless of usage, to JPMorgan, who serves as the agent to the syndicate. The commitment fee is allocated among the Fund and certain other funds managed by New York Life Investments based upon their respective net assets and other factors. Interest on any revolving credit loan is charged based upon the Federal Funds Rate, Daily Simple Secured Overnight Financing Rate ("SOFR") + 0.10%, or the Overnight Bank Funding Rate, whichever is higher. The Credit Agreement expires on July 23, 2024, although the Fund, certain other funds managed by New York Life Investments and the syndicate of banks may renew the Credit Agreement for an additional year on the same or different terms or enter into a credit agreement with a different syndicate of banks. Prior to July 25, 2023, the aggregate commitment amount and the commitment fee were the same as those under the current Credit Agreement. During the six-month period ended April 30, 2024, there were no borrowings made or outstanding with respect to the Fund under the Credit Agreement.
Note 7–Interfund Lending Program
Pursuant to an exemptive order issued by the SEC, the Fund, along with certain other funds managed by New York Life Investments, may participate in an interfund lending program. The interfund lending program provides an alternative credit facility that permits the Fund and certain other funds managed by New York Life Investments to lend or borrow money for temporary purposes directly to or from one another, subject to the conditions of the exemptive order. During the six-month period ended April 30, 2024, there were no interfund loans made or outstanding with respect to the Fund.
Note 8–Purchases and Sales of Securities (in 000’s)
During the six-month period ended April 30, 2024, purchases and sales of securities, other than short-term securities, were $995 and $42,914, respectively.
Note 9–Capital Share Transactions
Transactions in capital shares for the six-month period ended April 30, 2024 and the year ended October 31, 2023, were as follows:
| Class A | Shares | Amount |
| Six-month period ended April 30, 2024: | | |
| Shares sold | 374,825 | $ 13,104,256 |
| Shares issued to shareholders in reinvestment of distributions | 42,440 | 1,417,788 |
| Shares redeemed | (493,826) | (17,135,043) |
| Net increase (decrease) in shares outstanding before conversion | (76,561) | (2,612,999) |
| Shares converted into Class A (See Note 1) | 122,201 | 4,370,001 |
| Shares converted from Class A (See Note 1) | (1,914) | (64,770) |
| Net increase (decrease) | 43,726 | $ 1,692,232 |
| Year ended October 31, 2023: | | |
| Shares sold | 777,331 | $ 23,810,633 |
| Shares issued to shareholders in reinvestment of distributions | 247,479 | 7,533,253 |
| Shares redeemed | (1,019,479) | (31,269,191) |
| Net increase (decrease) in shares outstanding before conversion | 5,331 | 74,695 |
| Shares converted into Class A (See Note 1) | 78,147 | 2,366,476 |
| Shares converted from Class A (See Note 1) | (151) | (4,661) |
| Net increase (decrease) | 83,327 | $ 2,436,510 |
| |
| Investor Class | Shares | Amount |
| Six-month period ended April 30, 2024: | | |
| Shares sold | 13,847 | $ 480,409 |
| Shares issued to shareholders in reinvestment of distributions | 3,238 | 108,536 |
| Shares redeemed | (34,616) | (1,199,089) |
| Net increase (decrease) in shares outstanding before conversion | (17,531) | (610,144) |
| Shares converted into Investor Class (See Note 1) | 9,265 | 317,970 |
| Shares converted from Investor Class (See Note 1) | (105,232) | (3,777,341) |
| Net increase (decrease) | (113,498) | $ (4,069,515) |
| Year ended October 31, 2023: | | |
| Shares sold | 29,849 | $ 915,511 |
| Shares issued to shareholders in reinvestment of distributions | 28,225 | 859,163 |
| Shares redeemed | (67,503) | (2,064,768) |
| Net increase (decrease) in shares outstanding before conversion | (9,429) | (290,094) |
| Shares converted into Investor Class (See Note 1) | 18,857 | 587,855 |
| Shares converted from Investor Class (See Note 1) | (45,909) | (1,390,486) |
| Net increase (decrease) | (36,481) | $ (1,092,725) |
| |
| 26 | MainStay WMC Enduring Capital Fund |
| Class B | Shares | Amount |
| Six-month period ended April 30, 2024: | | |
| Shares issued to shareholders in reinvestment of distributions | 80 | $ 2,409 |
| Shares redeemed | (3,395) | (102,237) |
| Net increase (decrease) in shares outstanding before conversion | (3,315) | (99,828) |
| Shares converted from Class B (See Note 1) | (15,340) | (467,598) |
| Net increase (decrease) | (18,655) | $ (567,426) |
| Year ended October 31, 2023: | | |
| Shares sold | 73 | $ 2,000 |
| Shares issued to shareholders in reinvestment of distributions | 4,112 | 109,752 |
| Shares redeemed | (16,415) | (431,503) |
| Net increase (decrease) in shares outstanding before conversion | (12,230) | (319,751) |
| Shares converted from Class B (See Note 1) | (35,872) | (966,410) |
| Net increase (decrease) | (48,102) | $ (1,286,161) |
| |
| Class C | Shares | Amount |
| Six-month period ended April 30, 2024: | | |
| Shares sold | 15,215 | $ 458,017 |
| Shares issued to shareholders in reinvestment of distributions | 961 | 28,907 |
| Shares redeemed | (187,335) | (5,823,534) |
| Net increase (decrease) in shares outstanding before conversion | (171,159) | (5,336,610) |
| Shares converted from Class C (See Note 1) | (9,494) | (286,027) |
| Net increase (decrease) | (180,653) | $ (5,622,637) |
| Year ended October 31, 2023: | | |
| Shares sold | 32,846 | $ 872,256 |
| Shares issued to shareholders in reinvestment of distributions | 34,072 | 908,718 |
| Shares redeemed | (294,528) | (7,872,021) |
| Net increase (decrease) in shares outstanding before conversion | (227,610) | (6,091,047) |
| Shares converted from Class C (See Note 1) | (22,080) | (583,195) |
| Net increase (decrease) | (249,690) | $ (6,674,242) |
| |
| Class I | Shares | Amount |
| Six-month period ended April 30, 2024: | | |
| Shares sold | 152,677 | $ 5,195,654 |
| Shares issued to shareholders in reinvestment of distributions | 22,091 | 740,522 |
| Shares redeemed | (418,930) | (14,633,091) |
| Net increase (decrease) in shares outstanding before conversion | (244,162) | (8,696,915) |
| Shares converted into Class I (See Note 1) | 673 | 23,824 |
| Net increase (decrease) | (243,489) | $ (8,673,091) |
| Year ended October 31, 2023: | | |
| Shares sold | 1,177,378 | $ 35,968,422 |
| Shares issued to shareholders in reinvestment of distributions | 120,167 | 3,678,308 |
| Shares redeemed | (1,227,165) | (37,749,795) |
| Net increase (decrease) in shares outstanding before conversion | 70,380 | 1,896,935 |
| Shares converted into Class I (See Note 1) | 150 | 4,661 |
| Shares converted from Class I (See Note 1) | (466) | (14,240) |
| Net increase (decrease) | 70,064 | $ 1,887,356 |
| |
| Class R3 | Shares | Amount |
| Six-month period ended April 30, 2024: (a) | | |
| Shares sold | 2,199 | $ 72,174 |
| Shares issued to shareholders in reinvestment of distributions | 115 | 3,839 |
| Shares redeemed | (27,601) | (989,709) |
| Net increase (decrease) in shares outstanding before conversion | (25,287) | (913,696) |
| Shares converted from Class R3 (See Note 1) | (3,438) | (116,059) |
| Net increase (decrease) | (28,725) | $ (1,029,755) |
| Year ended October 31, 2023: | | |
| Shares sold | 10,803 | $ 327,040 |
| Shares issued to shareholders in reinvestment of distributions | 590 | 17,802 |
| Shares redeemed | (1,533) | (48,413) |
| Net increase (decrease) | 9,860 | $ 296,429 |
| |
Notes to Financial Statements (Unaudited) (continued)
| Class R6 | Shares | Amount |
| Six-month period ended April 30, 2024: | | |
| Shares sold | 152,764 | $ 5,305,748 |
| Shares issued to shareholders in reinvestment of distributions | 49,496 | 1,656,975 |
| Shares redeemed | (710,729) | (24,438,389) |
| Net increase (decrease) | (508,469) | $ (17,475,666) |
| Year ended October 31, 2023: | | |
| Shares sold | 2,095,234 | $ 64,032,723 |
| Shares issued to shareholders in reinvestment of distributions | 270,980 | 8,289,276 |
| Shares redeemed | (3,722,309) | (118,118,610) |
| Net increase (decrease) | (1,356,095) | $ (45,796,611) |
| (a) | Class liquidated and is no longer offered for sale as of February 23, 2024. |
Note 10–Other Matters
As of the date of this report, the Fund faces a heightened level of risk associated with current uncertainty, volatility and state of economies, financial markets, a high interest rate environment, and labor and health conditions around the world. Events such as war, acts of terrorism, recessions, rapid inflation, the imposition of economic sanctions, earthquakes, hurricanes, epidemics and pandemics and other unforeseen natural or human disasters may have broad adverse social, political and economic effects on the global economy, which could negatively impact the value of the Fund's investments. Developments that disrupt global economies and financial markets may magnify factors that affect the Fund's performance.
Note 11–Subsequent Events
In connection with the preparation of the financial statements of the Fund as of and for the six-month period ended April 30, 2024, events and transactions subsequent to April 30, 2024, through the date the financial statements were issued, have been evaluated by the Manager for possible adjustment and/or disclosure. No subsequent events requiring financial statement adjustment or disclosure have been identified.
| 28 | MainStay WMC Enduring Capital Fund |
Board Consideration and Approval of Management Agreement and Subadvisory Agreement (Unaudited)
The continuation of the Management Agreement with respect to the MainStay WMC Enduring Capital Fund (“Fund”) and New York Life Investment Management LLC (“New York Life Investments”) and the Subadvisory Agreement between New York Life Investments and Wellington Management Company LLP (“WMC”) with respect to the Fund (together, “Advisory Agreements”) is subject to annual review and approval by the Board of Trustees of The MainStay Funds (“Board” of the “Trust”) in accordance with Section 15 of the Investment Company Act of 1940, as amended (“1940 Act”). At its December 6–7, 2023 meeting, the Board, including the Trustees who are not an “interested person” (as such term is defined in the 1940 Act) of the Trust (“Independent Trustees”) voting separately, unanimously approved the continuation of each of the Advisory Agreements for a one-year period.
In reaching the decision to approve the continuation of each of the Advisory Agreements, the Board considered information and materials furnished by New York Life Investments and WMC in connection with an annual contract review process undertaken by the Board that took place at meetings of the Board and its Contracts Committee from September 2023 through December 2023, including information and materials furnished by New York Life Investments and WMC in response to requests prepared on behalf of the Board, and in consultation with the Independent Trustees, by independent legal counsel to the Independent Trustees, which encompassed a variety of topics, including those summarized below. Information and materials requested by and furnished to the Board for consideration in connection with the contract review process included, among other items, reports on the Fund and “peer funds” prepared by Institutional Shareholder Services Inc. (“ISS”), an independent third-party service provider engaged by the Board to report objectively on the Fund’s investment performance, management fee and total expenses. The Board also considered information on the fees charged to other investment advisory clients of New York Life Investments and/or WMC that follow investment strategies similar to those of the Fund, if any, and, when applicable, the rationale for differences in the Fund’s management and subadvisory fees and the fees charged to those other investment advisory clients. In addition, the Board considered information regarding the legal standards and fiduciary obligations applicable to its consideration of the continuation of each of the Advisory Agreements. The contract review process, including the structure and format for information and materials provided to the Board, has been developed in consultation with the Board. The Independent Trustees also met in executive sessions with their independent legal counsel and, for portions thereof, with senior management of New York Life Investments.
The Board’s deliberations with respect to the continuation of each of the Advisory Agreements reflect a year-long process, and the Board also took into account information furnished to the Board and its Committees throughout the year, as deemed relevant and appropriate by the Trustees, including, among other items, reports on investment performance of the Fund and investment-related matters for the Fund as well as presentations from New York Life Investments and, generally annually, WMC personnel. In addition, the Board took into account other
information provided by New York Life Investments throughout the year, including, among other items, periodic reports on legal and compliance matters, risk management, portfolio turnover, brokerage commissions and non-advisory services provided to the Fund by New York Life Investments, as deemed relevant and appropriate by the Trustees.
In addition to information provided to the Board throughout the year, the Board received information in connection with its June 2023 meeting provided specifically in response to requests prepared on behalf of the Board, and in consultation with the Independent Trustees, by independent legal counsel to the Independent Trustees regarding the Fund’s distribution arrangements. In addition, the Board received information regarding the Fund’s asset levels, share purchase and redemption activity and the payment of Rule 12b-1 and/or certain other fees by the applicable share classes of the Fund, among other information.
In considering the continuation of each of the Advisory Agreements, the Trustees reviewed and evaluated the information and factors they believed to reasonably be necessary and appropriate in light of legal advice furnished to them by independent legal counsel to the Independent Trustees and through the exercise of their own business judgment. Although individual Trustees may have weighed certain factors or information differently and the Board did not consider any single factor or information controlling in reaching its decision, the factors that figured prominently in the Board’s consideration of the continuation of each of the Advisory Agreements are summarized in more detail below and include, among other factors: (i) the nature, extent and quality of the services provided to the Fund by New York Life Investments and WMC; (ii) the qualifications of the portfolio managers of the Fund and the historical investment performance of the Fund, New York Life Investments and WMC; (iii) the costs of the services provided, and profits realized, by New York Life Investments and WMC with respect to their relationships with the Fund; (iv) the extent to which economies of scale have been realized or may be realized if the Fund grows and the extent to which any economies of scale have been shared, have benefited or may benefit the Fund’s shareholders; and (v) the reasonableness of the Fund’s management and subadvisory fees and total ordinary operating expenses. Although the Board recognized that comparisons between the Fund’s fees and expenses and those of other funds are imprecise given different terms of agreements, variations in fund strategies and other factors, the Board considered the reasonableness of the Fund’s management fee and total ordinary operating expenses as compared to the peer funds identified by ISS. Throughout their considerations, the Trustees acknowledged the commitment of New York Life Investments and its affiliates to serve the MainStay Group of Funds, as well as their capacity, experience, resources, financial stability and reputations. The Trustees also acknowledged the entrepreneurial and other risks assumed by New York Life Investments in sponsoring and managing the Fund. With respect to the Subadvisory Agreement, the Board took into account New York Life Investments’ recommendation to approve the continuation of the Subadvisory Agreement.
Board Consideration and Approval of Management Agreement and Subadvisory Agreement (Unaudited) (continued)
The Trustees noted that, throughout the year, the Trustees are afforded an opportunity to ask questions of, and request additional information or materials from, New York Life Investments and WMC. The Board’s decision with respect to each of the Advisory Agreements may have also been based, in part, on the Board’s knowledge of New York Life Investments and WMC resulting from, among other things, the Board’s consideration of each of the Advisory Agreements in prior years, the advisory agreements for other funds in the MainStay Group of Funds, the Board’s review throughout the year of the performance and operations of other funds in the MainStay Group of Funds and each Trustee’s business judgment and industry experience. In addition to considering the above-referenced factors, the Board observed that in the marketplace there are a range of investment options available to investors and that the Fund’s shareholders, having had the opportunity to consider other investment options, have invested in the Fund.
The factors that figured prominently in the Board’s decision to approve the continuation of each of the Advisory Agreements during the Board’s December 6–7, 2023 meeting are summarized in more detail below.
Nature, Extent and Quality of Services Provided by New York Life Investments and WMC
The Board examined the nature, extent and quality of the services that New York Life Investments provides to the Fund. The Board evaluated New York Life Investments’ experience and capabilities in serving as manager of the Fund and considered that the Fund operates in a “manager-of-managers” structure. The Board also considered New York Life Investments’ responsibilities and services provided pursuant to this structure, including overseeing the services provided by WMC, evaluating the performance of WMC, making recommendations to the Board as to whether the Subadvisory Agreement should be renewed, modified or terminated and periodically reporting to the Board regarding the results of New York Life Investments’ evaluation and monitoring functions. The Board noted that New York Life Investments manages other mutual funds, serves a variety of other investment advisory clients, including other pooled investment vehicles, and has experience overseeing mutual fund service providers, including subadvisors. The Board considered the experience of senior personnel at New York Life Investments providing management and administrative and other non-advisory services to the Fund. The Board observed that New York Life Investments devotes significant resources and time to providing management and administrative and other non-advisory services to the Fund, including New York Life Investments’ oversight and due diligence reviews of WMC and ongoing analysis of, and interactions with, WMC with respect to, among other things, the Fund’s investment performance and risks as well as WMC’s investment capabilities and subadvisory services with respect to the Fund.
The Board also considered the range of services that New York Life Investments provides to the Fund under the terms of the Management Agreement, including: (i) fund accounting and ongoing supervisory services provided by New York Life Investments’ Fund Administration and Accounting Group; (ii) investment supervisory and analytical services
provided by New York Life Investments’ Investment Consulting Group; (iii) compliance services provided by the Trust’s Chief Compliance Officer as well as New York Life Investments’ compliance department, including supervision and implementation of the Fund’s compliance program; (iv) legal services provided by New York Life Investments’ Office of the General Counsel; and (v) risk management monitoring and analysis by compliance and investment personnel. In addition, the Board considered New York Life Investments’ willingness to invest in personnel and other resources, such as cyber security, information security and business continuity planning, that may benefit the Fund and noted that New York Life Investments is responsible for compensating the Trust’s officers, except for a portion of the salary of the Trust’s Chief Compliance Officer. The Board recognized that New York Life Investments provides certain other non-advisory services to the Fund and has over time provided an increasingly broad array of non-advisory services to the MainStay Group of Funds as a result of regulatory and other developments.
The Board also examined the range, and the nature, extent and quality, of the investment advisory services that WMC provides to the Fund and considered the terms of each of the Advisory Agreements. The Board evaluated WMC’s experience and performance in serving as subadvisor to the Fund and advising other portfolios and WMC’s track record and experience in providing investment advisory services as well as the experience of investment advisory, senior management and/or administrative personnel at WMC. The Board considered New York Life Investments’ and WMC’s overall resources, legal and compliance environment, capabilities, reputation, financial condition and history. In addition to information provided in connection with quarterly meetings with the Trust’s Chief Compliance Officer, the Board considered information regarding the compliance policies and procedures of New York Life Investments and WMC and acknowledged their commitment to further developing and strengthening compliance programs that may relate to the Fund. The Board also considered WMC’s ability to recruit and retain qualified investment professionals and willingness to invest in personnel and other resources that may benefit the Fund. In this regard, the Board considered the qualifications and experience of the Fund’s portfolio managers, the number of accounts managed by the portfolio managers and the method for compensating the portfolio managers.
In addition, the Board considered information provided by New York Life Investments and WMC regarding their respective business continuity and disaster recovery plans.
Based on these considerations, among others, the Board concluded that the Fund would likely continue to benefit from the nature, extent and quality of these services.
Investment Performance
In evaluating the Fund’s investment performance, the Board considered investment performance results over various periods in light of the Fund’s investment objective, strategies and risks. The Board considered investment reports on, and analysis of, the Fund’s performance provided to the Board throughout the year. These reports include, among other
| 30 | MainStay WMC Enduring Capital Fund |
items, information on the Fund’s gross and net returns, the Fund’s investment performance compared to a relevant investment category and the Fund’s benchmarks, the Fund’s risk-adjusted investment performance and the Fund’s investment performance as compared to peer funds, as appropriate, as well as portfolio attribution information and commentary on the effect of market conditions. The Board also considered information provided by ISS showing the investment performance of the Fund as compared to peer funds. In addition, the Board reviewed the methodology used by ISS to construct the group of peer funds for comparative purposes.
The Board also took into account its discussions with senior management at New York Life Investments concerning the Fund’s investment performance over various periods as well as discussions between representatives of WMC and the members of the Board’s Investment Committee, which generally occur on an annual basis. In considering the investment performance of the Fund, the Board noted that the Fund underperformed its peer funds for the one- and five-year periods ended July 31, 2023, performed in line with its peer funds for the ten-year period ended July 31, 2023, and performed favorably relative to its peer funds for the three-year period ended July 31, 2023. The Board considered its discussions with representatives from New York Life Investments and WMC regarding the Fund’s investment performance.
Based on these considerations, among others, the Board concluded that its review of the Fund’s investment performance and related information supported a determination to approve the continuation of each of the Advisory Agreements.
Costs of the Services Provided, and Profits and Other Benefits Realized, by New York Life Investments and WMC
The Board considered the costs of the services provided under each of the Advisory Agreements. The Board also considered the profitability of New York Life Investments and its affiliates and WMC due to their relationships with the Fund as well as of New York Life Investments and its affiliates due to their relationships with the MainStay Group of Funds. With respect to the profitability of WMC’s relationship with the Fund, the Board considered information from New York Life Investments that WMC’s subadvisory fee reflected an arm’s-length negotiation and that this fee is paid by New York Life Investments, not the Fund, and the relevance of WMC’s profitability was considered by the Trustees in that context. On this basis, the Board primarily considered the costs and profitability for New York Life Investments and its affiliates with respect to the Fund.
In addition, the Board acknowledged the difficulty in obtaining reliable comparative data about mutual fund managers’ profitability because such information generally is not publicly available and may be impacted by numerous factors, including the structure of a fund manager’s organization, the types of funds it manages, the methodology used to allocate certain fixed costs to specific funds and the manager’s capital structure and costs of capital.
In evaluating the costs of the services provided by New York Life Investments and WMC, and profitability of New York Life Investments and its affiliates and WMC due to their relationships with the Fund, the Board considered, among other factors, New York Life Investments’ and its affiliates’ and WMC’s continuing investments in, or willingness to invest in, personnel and other resources that may support and further enhance the management of the Fund, and that New York Life Investments is responsible for paying the subadvisory fee for the Fund. The Board also considered the financial resources of New York Life Investments and WMC and acknowledged that New York Life Investments and WMC must be in a position to recruit and retain experienced professional personnel and to maintain a strong financial position for New York Life Investments and WMC to continue to provide high-quality services to the Fund. The Board recognized that the Fund benefits from the allocation of certain fixed costs among the funds in the MainStay Group of Funds, among other expected benefits resulting from its relationship with New York Life Investments.
The Board considered information regarding New York Life Investments’ methodology for calculating profitability and allocating costs provided by New York Life Investments in connection with the fund profitability analysis presented to the Board. The Board concluded that New York Life Investments’ methods for allocating costs and procedures for estimating overall profitability of the relationship with the funds in the MainStay Group of Funds were reasonable. The Board recognized the difficulty in calculating and evaluating a manager’s profitability with respect to the Fund and considered that other profitability methodologies may also be reasonable.
The Board also considered certain fall-out benefits that may be realized by New York Life Investments and its affiliates and WMC and its affiliates due to their relationships with the Fund, including reputational and other indirect benefits. The Board recognized, for example, the benefits to WMC from legally permitted “soft-dollar” arrangements by which brokers provide research and other services to WMC in exchange for commissions paid by the Fund with respect to trades in the Fund’s portfolio securities. In this regard, the Board also requested and considered information from New York Life Investments concerning other material business relationships between WMC and its affiliates and New York Life Investments and its affiliates and considered the existence of a strategic partnership between New York Life Investments and WMC that relates to certain current and future products and represents a potential conflict of interest associated with New York Life Investments’ recommendation to approve the continuation of the Subadvisory Agreement. In addition, the Board considered its review of the management agreement for a money market fund advised by New York Life Investments and an affiliated subadvisor that serves as an investment option for the Fund, including the potential rationale for and costs associated with investments in this money market fund by the Fund, if any, and considered information from New York Life Investments that the nature and type of specific investment advisory services provided to this money market fund are distinct from, or in addition to, the investment advisory services provided to the Fund.
Board Consideration and Approval of Management Agreement and Subadvisory Agreement (Unaudited) (continued)
The Board observed that, in addition to fees earned by New York Life Investments under the Management Agreement for managing the Fund, New York Life Investments’ affiliates also earn revenues from serving the Fund in various other capacities, including as the Fund’s transfer agent and distributor. The Board considered information about these other revenues and their impact on the profitability of the relationship with the Fund to New York Life Investments and its affiliates. The Board noted that, although it assessed the overall profitability of the relationship with the Fund to New York Life Investments and its affiliates as part of the contract review process, when considering the reasonableness of the fee paid to New York Life Investments under the Management Agreement, the Board considered the profitability of New York Life Investments’ relationship with the Fund on a pre-tax basis and without regard to distribution expenses incurred by New York Life Investments from its own resources.
After evaluating the information deemed relevant by the Trustees, the Board concluded that any profits realized by New York Life Investments and its affiliates due to their relationships with the Fund were not excessive, other expected benefits that may accrue to New York Life Investments and its affiliates are reasonable and other expected benefits that may accrue to WMC and its affiliates are consistent with those expected for a subadvisor to a mutual fund. With respect to WMC, the Board considered that any profits realized by WMC due to its relationship with the Fund are the result of arm’s-length negotiations between New York Life Investments and WMC, acknowledging that any such profits are based on the subadvisory fee paid to WMC by New York Life Investments, not the Fund.
Management and Subadvisory Fees and Total Ordinary Operating Expenses
The Board evaluated the reasonableness of the fee paid under each of the Advisory Agreements and the Fund’s total ordinary operating expenses. With respect to the management fee and subadvisory fee, the Board primarily considered the reasonableness of the management fee paid by the Fund to New York Life Investments because the subadvisory fee paid to WMC is paid by New York Life Investments, not the Fund. The Board also considered the reasonableness of the subadvisory fee paid by New York Life Investments and the amount of the management fee retained by New York Life Investments.
In assessing the reasonableness of the Fund’s fees and expenses, the Board primarily considered comparative data provided by ISS on the fees and expenses of similar mutual funds managed by other investment advisers. The Board reviewed the methodology used by ISS to construct the group of peer funds for comparative purposes. In addition, the Board considered information provided by New York Life Investments and WMC on fees charged to other investment advisory clients, including institutional separate accounts and/or other funds, that follow investment strategies similar to those of the Fund, if any. The Board considered the contractual management fee schedule for the Fund as compared to those for such other investment advisory clients, taking into account the rationale for differences in fee schedules. The Board also took into
account information provided by New York Life Investments about the more extensive scope of services provided to registered investment companies, such as the Fund, as compared with other investment advisory clients. Additionally, the Board considered the impact of contractual breakpoints, voluntary waivers and expense limitation arrangements on the Fund’s net management fee and expenses. The Board also considered that in proposing fees for the Fund, New York Life Investments considers the competitive marketplace for mutual funds.
The Board took into account information from New York Life Investments, as provided in connection with the Board’s June 2023 meeting, regarding the reasonableness of the Fund’s transfer agent fee schedule, including industry data demonstrating that the fees that NYLIM Service Company LLC, an affiliate of New York Life Investments and the Fund’s transfer agent, charges the Fund are within the range of fees charged by transfer agents to other mutual funds. In addition, the Board considered NYLIM Service Company LLC’s profitability in connection with the transfer agent services it provides to the Fund. The Board also took into account information provided by NYLIM Service Company LLC regarding the sub-transfer agency payments it made to intermediaries in connection with the provision of sub-transfer agency services to the Fund.
The Board considered the extent to which transfer agent fees contributed to the total expenses of the Fund. The Board acknowledged the role that the MainStay Group of Funds historically has played in serving the investment needs of New York Life Insurance Company customers, who often maintain smaller account balances than other shareholders of funds, and the impact of small accounts on the expense ratios of Fund share classes. The Board also recognized measures that it and New York Life Investments have taken that are intended to mitigate the effect of small accounts on the expense ratios of Fund share classes, including through the imposition of an expense limitation on net transfer agency expenses. The Board also considered that NYLIM Service Company LLC had waived its contractual cost of living adjustments during certain years.
Based on the factors outlined above, among other considerations, the Board concluded that the Fund’s management fee and total ordinary operating expenses are within a range that is competitive and support a conclusion that these fees and expenses are reasonable.
Economies of Scale
The Board considered information regarding economies of scale, including whether economies of scale may exist with respect to the Fund and whether the Fund’s management fee and expense structure permits any economies of scale to be appropriately shared with the Fund’s shareholders. The Board also considered a report from New York Life Investments, previously prepared at the request of the Board, that addressed economies of scale, including with respect to the mutual fund business generally, and the various ways in which the benefits of economies of scale may be shared with the funds in the MainStay Group of Funds. Although the Board recognized the difficulty of determining economies of scale with precision, the Board acknowledged that economies of scale may be shared with the Fund in a number of ways,
| 32 | MainStay WMC Enduring Capital Fund |
including, for example, through the imposition of fee breakpoints, initially setting management fee rates at scale or making additional investments to enhance the services provided to the Fund. The Board reviewed information from New York Life Investments showing how the Fund’s management fee schedule compared to fee schedules of other funds and accounts managed by New York Life Investments. The Board also reviewed information from ISS showing how the Fund’s management fee schedule compared with fees paid for similar services by peer funds at varying asset levels.
Based on this information, the Board concluded that economies of scale are appropriately shared for the benefit of the Fund’s shareholders through the Fund’s management fee and expense structure and other methods to share benefits from economies of scale.
Conclusion
On the basis of the information and factors summarized above, among other information and factors deemed relevant by the Trustees, and the evaluation thereof, the Board, including the Independent Trustees voting separately, unanimously voted to approve the continuation of each of the Advisory Agreements.
Discussion of the Operation and Effectiveness of the Fund's Liquidity Risk Management Program (Unaudited)
In compliance with Rule 22e-4 under the Investment Company Act of 1940, as amended (the “Liquidity Rule”), the Fund has adopted and implemented a liquidity risk management program (the “Program”), which New York Life Investment Management LLC believes is reasonably designed to assess and manage the Fund's liquidity risk. A Fund's liquidity risk is the risk that the Fund could not meet requests to redeem shares issued by the Fund without significant dilution of the remaining investors’ interests in the Fund. The Board of Trustees of The MainStay Funds (the "Board") previously approved the designation of New York Life Investment Management LLC as administrator of the Program (the “Administrator”). The Administrator has established a Liquidity Risk Management Committee to assist the Administrator in the implementation and day-to-day administration of the Program and to otherwise support the Administrator in fulfilling its responsibilities under the Program.
At a meeting of the Board held on February 27, 2024, the Administrator provided the Board with a written report addressing the Program’s operation and assessing the adequacy and effectiveness of its implementation for the period from January 1, 2023, through December 31, 2023 (the "Review Period"), as required under the Liquidity Rule. The report noted that the Administrator concluded that (i) the Program operated effectively to assess and manage the Fund's liquidity risk, (ii) the Program has been and continues to be adequately and effectively implemented to monitor and, as applicable, respond to the Fund's liquidity developments and (iii) the Fund's investment strategy continues to be appropriate for an open-end fund. In addition, the report summarized the operation of the Program and the information and factors considered by the Administrator in its assessment of the Program’s implementation, such as the liquidity risk assessment framework and the liquidity classification methodologies, and discussed notable geopolitical, market and other economic events that impacted liquidity risk during the Review Period.
In accordance with the Program, the Fund's liquidity risk is assessed no less frequently than annually taking into consideration certain factors, as applicable, such as (i) investment strategy and liquidity of portfolio investments, (ii) short-term and long-term cash flow projections, and (iii) holdings of cash and cash equivalents, as well as borrowing arrangements and other funding sources. Certain factors are considered under both normal and reasonably foreseeable stressed conditions.
Each Fund portfolio investment is classified into one of four liquidity categories. The classification is based on a determination of the number of days it is reasonably expected to take to convert the investment into cash, or sell or dispose of the investment, in current market conditions without significantly changing the market value of the investment. The Administrator has delegated liquidity classification determinations to the Fund’s subadvisor, subject to appropriate oversight by the Administrator, and liquidity classification determinations are made by taking into account the Fund's reasonably anticipated trade size, various market, trading and investment-specific considerations, as well as market depth, and, in certain cases, third-party vendor data.
The Liquidity Rule requires funds that do not primarily hold assets that are highly liquid investments to adopt a minimum amount of net assets that must be invested in highly liquid investments that are assets (an “HLIM”). In addition, the Liquidity Rule limits a fund's investments in illiquid investments. Specifically, the Liquidity Rule prohibits acquisition of illiquid investments if, immediately after acquisition, doing so would result in a fund holding more than 15% of its net assets in illiquid investments that are assets. The Program includes provisions reasonably designed to determine, periodically review and comply with the HLIM requirement, as applicable, and to comply with the 15% limit on illiquid investments.
There can be no assurance that the Program will achieve its objectives under all circumstances in the future. Please refer to the Fund's prospectus for more information regarding the Fund's exposure to liquidity risk and other risks to which it may be subject.
| 34 | MainStay WMC Enduring Capital Fund |
Proxy Voting Policies and Procedures and Proxy Voting Record
The Fund is required to file with the SEC its proxy voting record for the 12-month period ending June 30 on Form N-PX. A description of the policies and procedures that are used to vote proxies relating to portfolio securities of the Fund is available free of charge upon request by calling 800-624-6782 or visiting the SEC’s website at www.sec.gov. The most recent Form N-PX or proxy voting record is available free of charge upon request by calling 800-624-6782; visiting newyorklifeinvestments.com; or visiting the SEC’s website at www.sec.gov.
Shareholder Reports and Quarterly Portfolio Disclosure
The Fund is required to file its complete schedule of portfolio holdings with the SEC 60 days after its first and third fiscal quarter on Form N-PORT. The Fund's holdings report is available free of charge upon request by calling New York Life Investments at 800-624-6782.
This page intentionally left blank.
This page intentionally left blank.
This page intentionally left blank.
Equity
U.S. Equity
MainStay Epoch U.S. Equity Yield Fund
MainStay Fiera SMID Growth Fund
MainStay PineStone U.S. Equity Fund
MainStay S&P 500 Index Fund
MainStay Winslow Large Cap Growth Fund
MainStay WMC Enduring Capital Fund
MainStay WMC Growth Fund
MainStay WMC Small Companies Fund
MainStay WMC Value Fund
International Equity
MainStay Epoch International Choice Fund
MainStay PineStone International Equity Fund
MainStay WMC International Research Equity Fund
Emerging Markets Equity
MainStay Candriam Emerging Markets Equity Fund
Global Equity
MainStay Epoch Capital Growth Fund
MainStay Epoch Global Equity Yield Fund
MainStay PineStone Global Equity Fund
Fixed Income
Taxable Income
MainStay Candriam Emerging Markets Debt Fund
MainStay Floating Rate Fund
MainStay MacKay High Yield Corporate Bond Fund
MainStay MacKay Short Duration High Income Fund
MainStay MacKay Strategic Bond Fund
MainStay MacKay Total Return Bond Fund
MainStay MacKay U.S. Infrastructure Bond Fund
MainStay Short Term Bond Fund
Tax-Exempt Income
MainStay MacKay Arizona Muni Fund
MainStay MacKay California Tax Free Opportunities Fund1
MainStay MacKay Colorado Muni Fund
MainStay MacKay High Yield Municipal Bond Fund
MainStay MacKay New York Tax Free Opportunities Fund2
MainStay MacKay Oregon Muni Fund
MainStay MacKay Short Term Municipal Fund
MainStay MacKay Strategic Municipal Allocation Fund
MainStay MacKay Tax Free Bond Fund
MainStay MacKay Utah Muni Fund
Money Market
MainStay Money Market Fund
Mixed Asset
MainStay Balanced Fund
MainStay Income Builder Fund
MainStay MacKay Convertible Fund
Speciality
MainStay CBRE Global Infrastructure Fund
MainStay CBRE Real Estate Fund
MainStay Cushing MLP Premier Fund
Asset Allocation
MainStay Conservative Allocation Fund
MainStay Conservative ETF Allocation Fund
MainStay Equity Allocation Fund
MainStay Equity ETF Allocation Fund
MainStay Growth Allocation Fund
MainStay Growth ETF Allocation Fund
MainStay Moderate Allocation Fund
MainStay Moderate ETF Allocation Fund
Manager
New York Life Investment Management LLC
New York, New York
Subadvisors
Candriam3
Strassen, Luxembourg
CBRE Investment Management Listed Real Assets LLC
Radnor, Pennsylvania
Cushing Asset Management, LP
Dallas, Texas
Epoch Investment Partners, Inc.
New York, New York
Fiera Capital Inc.
New York, New York
IndexIQ Advisors LLC3
New York, New York
MacKay Shields LLC3
New York, New York
NYL Investors LLC3
New York, New York
PineStone Asset Management Inc.
Montreal, Québec
Wellington Management Company LLP
Boston, Massachusetts
Winslow Capital Management, LLC
Minneapolis, Minnesota
Legal Counsel
Dechert LLP
Washington, District of Columbia
Independent Registered Public Accounting Firm
KPMG LLP
Philadelphia, Pennsylvania
Distributor
NYLIFE Distributors LLC3
Jersey City, New Jersey
Custodian
JPMorgan Chase Bank, N.A.
New York, New York
1.
This Fund is registered for sale in AZ, CA, NV, OR, TX, UT, WA (all share classes); and MI (Class A and Class I shares only); and CO, FL, GA, HI, ID, MA, MD, NH, NJ and NY (Class I and Class C2 shares only).
| 2. | This Fund is registered for sale in CA, CT, DE, FL, MA, NJ, NY, VT (all share classes) and SD (Class R6 shares only). |
| 3. | An affiliate of New York Life Investment Management LLC. |
Not part of the Semiannual Report
For more information
800-624-6782
newyorklifeinvestments.com
“New York Life Investments” is both a service mark, and the common trade name, of certain investment advisors affiliated with New York Life Insurance Company. The MainStay Funds® are managed by New York Life Investment Management LLC and distributed by NYLIFE Distributors LLC, 30 Hudson Street, Jersey City, NJ 07302, a wholly owned subsidiary of New York Life Insurance Company. NYLIFE Distributors LLC is a Member FINRA/SIPC.
©2024 NYLIFE Distributors LLC. All rights reserved.
| 5022305 MS081-24 | MSWEC10-06/24 |
(NYLIM) NL528
MainStay WMC Value Fund
Message from the President and Semiannual Report
Unaudited | April 30, 2024
Special Notice:
Beginning in July 2024, new regulations issued by the Securities and Exchange Commission (SEC) will take effect requiring open-end mutual fund companies and ETFs to (1) overhaul the content of their shareholder reports and (2) mail paper copies of the new tailored shareholder reports to shareholders who have not opted to receive these documents electronically.
If you have not yet elected to receive your shareholder reports electronically, please contact your financial intermediary or visit newyorklifeinvestments.com/accounts.
| Not FDIC/NCUA Insured | Not a Deposit | May Lose Value | No Bank Guarantee | Not Insured by Any Government Agency |
This page intentionally left blank
Message from the President
Stock and bond markets gained broad ground during the six-month period ended April 30, 2024, bolstered by better-than-expected economic growth and the prospect of monetary easing in the face of a myriad of macroeconomic and geopolitical challenges.
Throughout the reporting period, interest rates remained at their highest levels in decades in most developed countries, with the U.S. federal funds rate in the 5.25%−5.50% range, as central banks struggled to bring inflation under control. Early in the reporting period, the U.S. Federal Reserve began to forecast interest rate cuts in 2024, but delayed action as inflation remained stubbornly high, fluctuating between 3.1% and 3.5%. Nevertheless, despite the increasing cost of capital and tighter lending environment that resulted from sustained high rates, economic growth remained surprisingly robust, supported by high levels of consumer spending, low unemployment and strong corporate earnings. Investors tended to shrug off concerns related to sticky inflation and high interest rates—not to mention the ongoing war in Ukraine, intensifying hostilities in the Middle East and simmering tensions between China and the United States—focusing instead on the positives of continued economic growth and surprisingly strong corporate profits.
The S&P 500® Index, a widely regarded benchmark of U.S. market performance, produced double-digit gains, reaching record levels in March 2024. Market strength, which had been narrowly focused on mega-cap, technology-related stocks during the previous six months broadened significantly during the reporting period. All industry sectors produced positive results, with the strongest returns in communication services, information technology and industrials, and more moderate gains in the lagging energy, real estate and consumer staples areas. Growth-oriented shares slightly outperformed value-oriented
issues, while large- and mid-cap stocks modestly outperformed their small-cap counterparts. Most overseas equity markets trailed the U.S. market, as developed international economies experienced relatively low growth rates, and weak economic conditions in China undermined emerging markets.
Bonds generally gained ground as well. The yield on the 10-year Treasury note ranged between approximately 4.7% and 3.8%, while the 2-year Treasury yield remained slightly higher, between approximately 5.0% and 4.1%, in an inverted curve pattern often viewed as indicative of an impending economic slowdown. Nevertheless, the prevailing environment of stable interest rates and attractive yields provided a favorable environment for fixed-income investors. Long-term Treasury bonds and investment-grade corporate bonds produced similar gains, while high yield bonds advanced by a slightly greater margin, despite the added risks implicit in an uptick in default rates. International bond markets modestly outperformed their U.S. counterparts, led by a rebound in the performance of emerging-markets debt.
The risks and uncertainties inherent in today’s markets call for the kind of insight and expertise that New York Life Investments offers through our one-on-one philosophy, long-lasting focus, and multi-boutique approach.
Thank you for trusting us to help you meet your investment needs.
Sincerely,
Kirk C. Lehneis
President
The opinions expressed are as of the date of this report and are subject to change. There is no guarantee that any forecast made will come to pass. This material does not constitute investment advice and is not intended as an endorsement of any specific investment. Past performance is no guarantee of future results.
Not part of the Semiannual Report
Investors should refer to the Fund’s Summary Prospectus and/or Prospectus and consider the Fund’s investment objectives, strategies, risks, charges and expenses carefully before investing. The Summary Prospectus and/or Prospectus contain this and other information about the Fund. You may obtain copies of the Fund’s Summary Prospectus, Prospectus and Statement of Additional Information, which includes information about The MainStay Funds' Trustees, free of charge, upon request, by calling toll-free 800-624-6782, by writing to NYLIFE Distributors LLC, Attn: MainStay Marketing Department, 30 Hudson Street, Jersey City, NJ 07302 or by sending an e-mail to MainStayShareholderServices@nylim.com. These documents are also available on dfinview.com/NYLIM. Please read the Fund’s Summary Prospectus and/or Prospectus carefully before investing.
Investment and Performance Comparison (Unaudited)
Performance data quoted represents past performance. Past performance is no guarantee of future results. Because of market volatility and other factors, current performance may be lower or higher than the figures shown. Investment return and principal value will fluctuate, and as a result, when shares are redeemed, they may be worth more or less than their original cost. The graph below depicts the historical performance of Class I shares of the Fund. Performance will vary from class to class based on differences in class-specific expenses and sales charges. For performance information current to the most recent month-end, please call 800-624-6782 or visit newyorklifeinvestments.com.
The performance table and graph do not reflect the deduction of taxes that a shareholder would pay on distributions or Fund share redemptions. Total returns reflect maximum applicable sales charges as indicated in the table below, if any, changes in share price, and reinvestment of dividend and capital gain distributions. The graph assumes the initial investment amount shown below and reflects the deduction of all sales charges that would have applied for the period of investment. Performance figures may reflect certain fee waivers and/or expense limitations, without which total returns may have been lower. For more information on share classes and current fee waivers and/or expense limitations (if any), please refer to the Notes to Financial Statements.

| Average Annual Total Returns for the Period-Ended April 30, 2024 |
| Class | Sales Charge | | Inception
Date1 | Six
Months2 | One
Year | Five
Years | Ten Years
or Since
Inception | Gross
Expense
Ratio3 |
| Class A Shares | Maximum 5.50% Initial Sales Charge | With sales charges | 6/9/1999 | 7.65% | 4.28% | 9.50% | 9.09% | 1.04% |
| | | Excluding sales charges | | 13.91 | 10.35 | 10.75 | 9.71 | 1.04 |
| Investor Class Shares4 | Maximum 5.00% Initial Sales Charge | With sales charges | 2/28/2008 | 8.10 | 4.59 | 9.22 | 8.85 | 1.30 |
| | | Excluding sales charges | | 13.79 | 10.10 | 10.46 | 9.47 | 1.30 |
| Class B Shares5 | Maximum 5.00% CDSC | With sales charges | 6/9/1999 | 8.36 | 4.24 | 9.47 | 8.64 | 2.05 |
| | if Redeemed Within the First Six Years of Purchase | Excluding sales charges | | 13.36 | 9.24 | 9.62 | 8.64 | 2.05 |
| Class C Shares | Maximum 1.00% CDSC | With sales charges | 6/9/1999 | 12.41 | 8.29 | 9.64 | 8.65 | 2.05 |
| | if Redeemed Within One Year of Purchase | Excluding sales charges | | 13.41 | 9.29 | 9.64 | 8.65 | 2.05 |
| Class I Shares | No Sales Charge | | 1/21/1971 | 14.14 | 10.74 | 11.08 | 10.01 | 0.79 |
| Class R6 Shares | No Sales Charge | | 4/26/2021 | 14.12 | 10.72 | N/A | 5.24 | 0.71 |
| 1. | Effective April 26, 2021, the Fund replaced its subadvisor, changed its investment objective and modified its principal investment strategies. Therefore, the performance information shown in this report prior to April 26, 2021 reflects that of the Fund’s prior subadvisor, investment objective and principal investment strategies. |
| 2. | Not annualized. |
| 3. | The gross expense ratios presented reflect the Fund’s “Total Annual Fund Operating Expenses” from the most recent Prospectus, as supplemented, and may differ from other expense ratios disclosed in this report. |
| 4. | Prior to June 30, 2020, the maximum initial sales charge was 5.50%, which is reflected in the applicable average annual total return figures shown. |
| 5. | Class B shares are closed to all new purchases as well as additional investments by existing Class B shareholders. |
The footnotes on the next page are an integral part of the table and graph and should be carefully read in conjunction with them.
| Benchmark Performance* | Six
Months1 | One
Year | Five
Years | Ten
Years |
| Russell 3000® Index2 | 21.09% | 22.30% | 12.43% | 11.81% |
| Russell 1000® Value Index3 | 18.42 | 13.42 | 8.60 | 8.43 |
| Morningstar Large Value Category Average4 | 17.99 | 14.37 | 9.20 | 8.57 |
| * | Returns for indices reflect no deductions for fees, expenses or taxes, except for foreign withholding taxes where applicable. Results assume reinvestment of all dividends and capital gains. An investment cannot be made directly in an index. |
| 1. | Not annualized. |
| 2. | In accordance with new regulatory requirements, the Fund has selected the Russell 3000® Index, which represents a broad measure of market performance, as a replacement for the Russell 1000® Value Index. The Russell 3000® Index measures the performance of the largest 3,000 U.S. companies representing approximately 98% of the investable U.S. equity market. |
| 3. | The Russell 1000® Value Index, which is generally representative of the market sectors or types of investments in which the Fund invests, measures the performance of the large-cap value segment of the U.S. equity universe. It includes those Russell 1000® Index companies with lower price-to-book ratios and lower expected growth values. |
| 4. | The Morningstar Large Value Category Average is representative of funds that invest primarily in big U.S. companies that are less expensive or growing more slowly than other large-cap stocks. Results are based on average total returns of similar funds with all dividends and capital gain distributions reinvested. |
The footnotes on the preceding page are an integral part of the table and graph and should be carefully read in conjunction with them.
Cost in Dollars of a $1,000 Investment in MainStay WMC Value Fund (Unaudited)
The example below is intended to describe the fees and expenses borne by shareholders during the six-month period from November 1, 2023 to April 30, 2024, and the impact of those costs on your investment.
Example
As a shareholder of the Fund you incur two types of costs: (1) transaction costs, including exchange fees and sales charges (loads) on purchases (as applicable), and (2) ongoing costs, including management fees, distribution and/or service (12b-1) fees and other Fund expenses (as applicable). This example is intended to help you understand your ongoing costs (in dollars) of investing in the Fund and to compare these costs with the ongoing costs of investing in other mutual funds. The example is based on an investment of $1,000 made at the beginning of the six-month period and held for the entire period from November 1, 2023 to April 30, 2024.
This example illustrates your Fund’s ongoing costs in two ways:
Actual Expenses
The second and third data columns in the table below provide information about actual account values and actual expenses. You may use the information in these columns, together with the amount you invested, to estimate the expenses that you paid during the six months ended April 30, 2024. Simply divide your account value by $1,000 (for example, an $8,600 account value divided by $1,000 = 8.6), then multiply the
result by the number under the heading entitled “Expenses Paid During Period” to estimate the expenses you paid on your account during this period.
Hypothetical Example for Comparison Purposes
The fourth and fifth data columns in the table below provide information about hypothetical account values and hypothetical expenses based on the Fund’s actual expense ratio and an assumed rate of return of 5% per year before expenses, which is not the Fund’s actual return. The hypothetical account values and expenses may not be used to estimate the actual ending account balances or expenses you paid for the six-month period shown. You may use this information to compare the ongoing costs of investing in the Fund with the ongoing costs of investing in other mutual funds. To do so, compare this 5% hypothetical example with the 5% hypothetical examples that appear in the shareholder reports of the other mutual funds.
Please note that the expenses shown in the table are meant to highlight your ongoing costs only and do not reflect any transactional costs, such as exchange fees or sales charges (loads). Therefore, the fourth and fifth data columns of the table are useful in comparing ongoing costs only and will not help you determine the relative total costs of owning different funds. In addition, if these transactional costs were included, your costs would have been higher.
| Share Class | Beginning
Account
Value
11/1/23 | Ending Account
Value (Based
on Actual
Returns and
Expenses)
4/30/24 | Expenses
Paid
During
Period1 | Ending Account
Value (Based
on Hypothetical
5% Annualized
Return and
Actual Expenses)
4/30/24 | Expenses
Paid
During
Period1 | Net Expense
Ratio
During
Period2 |
| Class A Shares | $1,000.00 | $1,139.10 | $ 5.48 | $1,019.74 | $ 5.17 | 1.03% |
| Investor Class Shares | $1,000.00 | $1,137.90 | $ 6.86 | $1,018.45 | $ 6.47 | 1.29% |
| Class B Shares | $1,000.00 | $1,133.60 | $10.82 | $1,014.72 | $10.22 | 2.04% |
| Class C Shares | $1,000.00 | $1,134.10 | $10.82 | $1,014.72 | $10.22 | 2.04% |
| Class I Shares | $1,000.00 | $1,141.40 | $ 3.73 | $1,021.38 | $ 3.52 | 0.70% |
| Class R6 Shares | $1,000.00 | $1,141.20 | $ 3.73 | $1,021.38 | $ 3.52 | 0.70% |
| 1. | Expenses are equal to the Fund’s annualized expense ratio of each class multiplied by the average account value over the period, divided by 366 and multiplied by 182 (to reflect the six-month period). The table above represents the actual expenses incurred during the six-month period. In addition to the fees and expenses which the Fund bears directly, it also indirectly bears a pro rata share of the fees and expenses of the underlying funds in which it invests. Such indirect expenses are not included in the above-reported expense figures. |
| 2. | Expenses are equal to the Fund's annualized expense ratio to reflect the six-month period. |
Industry Composition as of April 30, 2024 (Unaudited)
| Pharmaceuticals | 10.4% |
| Oil, Gas & Consumable Fuels | 9.6 |
| Capital Markets | 8.8 |
| Banks | 7.7 |
| Health Care Providers & Services | 6.0 |
| Insurance | 5.0 |
| Semiconductors & Semiconductor Equipment | 4.1 |
| Communications Equipment | 3.8 |
| Aerospace & Defense | 3.2 |
| Specialized REITs | 2.7 |
| Building Products | 2.7 |
| Beverages | 2.6 |
| Personal Care Products | 2.5 |
| Air Freight & Logistics | 2.0 |
| Electronic Equipment, Instruments & Components | 1.7 |
| Electrical Equipment | 1.6 |
| Multi–Utilities | 1.5 |
| Health Care Equipment & Supplies | 1.5 |
| Automobile Components | 1.5 |
| Biotechnology | 1.5 |
| Media | 1.4 |
| Diversified Consumer Services | 1.4% |
| Gas Utilities | 1.3 |
| Entertainment | 1.3 |
| IT Services | 1.3 |
| Distributors | 1.2 |
| Real Estate Management & Development | 1.2 |
| Household Durables | 1.2 |
| Machinery | 1.1 |
| Hotels, Restaurants & Leisure | 1.1 |
| Financial Services | 1.1 |
| Food Products | 1.1 |
| Chemicals | 1.1 |
| Interactive Media & Services | 1.0 |
| Hotel & Resort REITs | 1.0 |
| Ground Transportation | 1.0 |
| Specialty Retail | 0.0‡ |
| Short–Term Investment | 1.1 |
| Other Assets, Less Liabilities | –0.3 |
| | 100.0% |
| ‡ | Less than one–tenth of a percent. |
See Portfolio of Investments beginning on page 9 for specific holdings within these categories. The Fund's holdings are subject to change.
Top Ten Holdings and/or Issuers Held as of April 30, 2024 (excluding short-term investments) (Unaudited)
| 1. | JPMorgan Chase & Co. |
| 2. | Merck & Co., Inc. |
| 3. | Johnson & Johnson |
| 4. | Cisco Systems, Inc. |
| 5. | Elevance Health, Inc. |
| 6. | Pfizer, Inc. |
| 7. | UnitedHealth Group, Inc. |
| 8. | United Parcel Service, Inc., Class B |
| 9. | M&T Bank Corp. |
| 10. | American International Group, Inc. |
Portfolio of Investments April 30, 2024†^(Unaudited)
| | Shares | Value |
| Common Stocks 99.2% |
| Aerospace & Defense 3.2% |
| General Dynamics Corp. | 53,973 | $ 15,495,109 |
| L3Harris Technologies, Inc. | 70,770 | 15,148,318 |
| | | 30,643,427 |
| Air Freight & Logistics 2.0% |
| United Parcel Service, Inc., Class B | 129,534 | 19,103,674 |
| Automobile Components 1.5% |
| Gentex Corp. | 412,186 | 14,137,980 |
| Banks 7.7% |
| JPMorgan Chase & Co. | 203,509 | 39,020,816 |
| M&T Bank Corp. | 130,857 | 18,894,442 |
| PNC Financial Services Group, Inc. (The) | 98,616 | 15,113,888 |
| | | 73,029,146 |
| Beverages 2.6% |
| Keurig Dr Pepper, Inc. | 415,944 | 14,017,313 |
| Pernod Ricard SA, Sponsored ADR | 371,520 | 11,253,341 |
| | | 25,270,654 |
| Biotechnology 1.5% |
| Gilead Sciences, Inc. | 215,607 | 14,057,576 |
| Building Products 2.7% |
| Fortune Brands Innovations, Inc. | 130,988 | 9,575,223 |
| Johnson Controls International plc | 246,509 | 16,040,341 |
| | | 25,615,564 |
| Capital Markets 8.8% |
| Ares Management Corp. | 104,775 | 13,944,505 |
| Intercontinental Exchange, Inc. | 95,540 | 12,301,730 |
| KKR & Co., Inc. | 124,159 | 11,555,478 |
| LPL Financial Holdings, Inc. | 39,172 | 10,542,360 |
| Morgan Stanley | 161,674 | 14,686,466 |
| Nasdaq, Inc. | 81,130 | 4,855,631 |
| Raymond James Financial, Inc. | 134,804 | 16,446,088 |
| | | 84,332,258 |
| Chemicals 1.1% |
| Axalta Coating Systems Ltd. (a) | 326,700 | 10,271,448 |
| Communications Equipment 3.8% |
| Cisco Systems, Inc. | 492,672 | 23,145,731 |
| F5, Inc. (a) | 76,905 | 12,713,165 |
| | | 35,858,896 |
| | Shares | Value |
| |
| Distributors 1.2% |
| LKQ Corp. | 278,365 | $ 12,005,883 |
| Diversified Consumer Services 1.4% |
| H&R Block, Inc. | 279,332 | 13,192,850 |
| Electrical Equipment 1.6% |
| Emerson Electric Co. | 138,757 | 14,955,230 |
| Electronic Equipment, Instruments & Components 1.7% |
| Corning, Inc. | 474,374 | 15,834,604 |
| Entertainment 1.3% |
| Electronic Arts, Inc. | 99,886 | 12,667,543 |
| Financial Services 1.1% |
| Global Payments, Inc. | 84,168 | 10,333,305 |
| Food Products 1.1% |
| Archer-Daniels-Midland Co. | 175,781 | 10,311,314 |
| Gas Utilities 1.3% |
| Atmos Energy Corp. | 108,671 | 12,812,311 |
| Ground Transportation 1.0% |
| Knight-Swift Transportation Holdings, Inc. | 199,384 | 9,217,522 |
| Health Care Equipment & Supplies 1.5% |
| Boston Scientific Corp. (a) | 199,553 | 14,341,874 |
| Health Care Providers & Services 6.0% |
| Centene Corp. (a) | 226,099 | 16,518,793 |
| Elevance Health, Inc. | 40,333 | 21,319,217 |
| UnitedHealth Group, Inc. | 40,253 | 19,470,376 |
| | | 57,308,386 |
| Hotel & Resort REITs 1.0% |
| Host Hotels & Resorts, Inc. | 525,905 | 9,923,827 |
| Hotels, Restaurants & Leisure 1.1% |
| Wyndham Hotels & Resorts, Inc. | 142,701 | 10,489,951 |
| Household Durables 1.2% |
| Lennar Corp., Class A | 73,087 | 11,081,451 |
The notes to the financial statements are an integral part of, and should be read in conjunction with, the financial statements.
9
Portfolio of Investments April 30, 2024†^(Unaudited) (continued)
| | Shares | Value |
| Common Stocks (continued) |
| Insurance 5.0% |
| American International Group, Inc. | 247,366 | $ 18,629,133 |
| Everest Group Ltd. | 29,631 | 10,857,095 |
| MetLife, Inc. | 251,096 | 17,847,904 |
| | | 47,334,132 |
| Interactive Media & Services 1.0% |
| Alphabet, Inc., Class C (a) | 60,480 | 9,957,427 |
| IT Services 1.3% |
| Amdocs Ltd. | 143,965 | 12,091,620 |
| Machinery 1.1% |
| Middleby Corp. (The) (a) | 77,489 | 10,768,646 |
| Media 1.4% |
| Omnicom Group, Inc. | 142,760 | 13,253,838 |
| Multi-Utilities 1.5% |
| Sempra | 202,486 | 14,504,072 |
| Oil, Gas & Consumable Fuels 9.6% |
| Antero Resources Corp. (a) | 314,555 | 10,698,016 |
| ConocoPhillips | 141,843 | 17,818,318 |
| Coterra Energy, Inc. | 399,077 | 10,918,747 |
| EOG Resources, Inc. | 108,460 | 14,330,820 |
| Hess Corp. | 66,812 | 10,522,222 |
| Phillips 66 | 108,574 | 15,548,882 |
| Targa Resources Corp. | 99,641 | 11,365,052 |
| | | 91,202,057 |
| Personal Care Products 2.5% |
| Kenvue, Inc. | 590,794 | 11,118,743 |
| Unilever plc, Sponsored ADR | 239,944 | 12,441,097 |
| | | 23,559,840 |
| Pharmaceuticals 10.4% |
| AstraZeneca plc, Sponsored ADR | 184,571 | 14,005,247 |
| Johnson & Johnson | 182,923 | 26,448,836 |
| Merck & Co., Inc. | 225,440 | 29,131,357 |
| Pfizer, Inc. | 783,103 | 20,063,098 |
| Roche Holding AG | 40,245 | 9,628,188 |
| | | 99,276,726 |
| | Shares | | Value |
| |
| Real Estate Management & Development 1.2% |
| CBRE Group, Inc., Class A (a) | 132,372 | | $ 11,501,803 |
| Semiconductors & Semiconductor Equipment 4.1% |
| Analog Devices, Inc. | 68,962 | | 13,834,467 |
| NXP Semiconductors NV | 57,722 | | 14,787,799 |
| QUALCOMM, Inc. | 64,444 | | 10,688,038 |
| | | | 39,310,304 |
| Specialized REITs 2.7% |
| Crown Castle, Inc. | 143,180 | | 13,427,420 |
| Gaming and Leisure Properties, Inc. | 295,963 | | 12,646,499 |
| | | | 26,073,919 |
| Specialty Retail 0.0% ‡ |
| GNC Holdings, Inc. (a)(b)(c) | 15,319 | | — |
Total Common Stocks
(Cost $827,958,031) | | | 945,631,058 |
| Short-Term Investment 1.1% |
| Affiliated Investment Company 1.1% |
| MainStay U.S. Government Liquidity Fund, 5.242% (d) | 10,540,804 | | 10,540,804 |
Total Short-Term Investment
(Cost $10,540,804) | | | 10,540,804 |
Total Investments
(Cost $838,498,835) | 100.3% | | 956,171,862 |
| Other Assets, Less Liabilities | (0.3) | | (2,735,304) |
| Net Assets | 100.0% | | $ 953,436,558 |
| † | Percentages indicated are based on Fund net assets. |
| ^ | Industry classifications may be different than those used for compliance monitoring purposes. |
| ‡ | Less than one-tenth of a percent. |
| (a) | Non-income producing security. |
| (b) | Illiquid security—As of April 30, 2024, the total market value deemed illiquid under procedures approved by the Board of Trustees was $0, which represented less than one-tenth of a percent of the Fund’s net assets. |
| (c) | Security in which significant unobservable inputs (Level 3) were used in determining fair value. |
| (d) | Current yield as of April 30, 2024. |
The notes to the financial statements are an integral part of, and should be read in conjunction with, the financial statements.
| 10 | MainStay WMC Value Fund |
Investments in Affiliates (in 000's)
Investments in issuers considered to be affiliate(s) of the Fund during the six-month period ended April 30, 2024 for purposes of Section 2(a)(3) of the Investment Company Act of 1940, as amended, were as follows:
| Affiliated Investment Companies | Value,
Beginning
of Period | Purchases
at Cost | Proceeds
from
Sales | Net
Realized
Gain/(Loss)
on Sales | Change in
Unrealized
Appreciation/
(Depreciation) | Value,
End of
Period | Dividend
Income | Other
Distributions | Shares
End of
Period |
| MainStay U.S. Government Liquidity Fund | $ 9,393 | $ 121,769 | $ (120,621) | $ — | $ — | $ 10,541 | $ 223 | $ — | 10,541 |
| Abbreviation(s): |
| ADR—American Depositary Receipt |
| REIT—Real Estate Investment Trust |
The following is a summary of the fair valuations according to the inputs used as of April 30, 2024, for valuing the Fund’s assets:
| Description | Quoted
Prices in
Active
Markets for
Identical
Assets
(Level 1) | | Significant
Other
Observable
Inputs
(Level 2) | | Significant
Unobservable
Inputs
(Level 3) | | Total |
| Asset Valuation Inputs | | | | | | | |
| Investments in Securities (a) | | | | | | | |
| Common Stocks | | | | | | | |
| Pharmaceuticals | $ 89,648,538 | | $ 9,628,188 | | $ — | | $ 99,276,726 |
| All Other Industries | 846,354,332 | | — | | — | | 846,354,332 |
| Total Common Stocks | 936,002,870 | | 9,628,188 | | — | | 945,631,058 |
| Short-Term Investment | | | | | | | |
| Affiliated Investment Company | 10,540,804 | | — | | — | | 10,540,804 |
| Total Investments in Securities | $ 946,543,674 | | $ 9,628,188 | | $ — | | $ 956,171,862 |
| (a) | For a complete listing of investments and their industries, see the Portfolio of Investments. |
The notes to the financial statements are an integral part of, and should be read in conjunction with, the financial statements.
11
Statement of Assets and Liabilities as of April 30, 2024 (Unaudited)
| Assets |
Investment in unaffiliated securities, at value
(identified cost $827,958,031) | $945,631,058 |
Investment in affiliated investment companies, at value
(identified cost $10,540,804) | 10,540,804 |
| Cash | 255 |
| Receivables: | |
| Investment securities sold | 12,328,992 |
| Dividends | 726,832 |
| Fund shares sold | 172,533 |
| Other assets | 93,395 |
| Total assets | 969,493,869 |
| Liabilities |
| Payables: | |
| Investment securities purchased | 12,029,744 |
| Fund shares redeemed | 3,131,835 |
| Manager (See Note 3) | 517,505 |
| Transfer agent (See Note 3) | 149,912 |
| NYLIFE Distributors (See Note 3) | 136,219 |
| Professional fees | 47,436 |
| Shareholder communication | 30,955 |
| Custodian | 9,073 |
| Securities lending | 389 |
| Trustees | 257 |
| Accrued expenses | 3,986 |
| Total liabilities | 16,057,311 |
| Net assets | $953,436,558 |
| Composition of Net Assets |
| Shares of beneficial interest outstanding (par value of $.01 per share) unlimited number of shares authorized | $ 331,089 |
| Additional paid-in-capital | 820,957,689 |
| | 821,288,778 |
| Total distributable earnings (loss) | 132,147,780 |
| Net assets | $953,436,558 |
| Class A | |
| Net assets applicable to outstanding shares | $522,084,413 |
| Shares of beneficial interest outstanding | 18,480,665 |
| Net asset value per share outstanding | $ 28.25 |
| Maximum sales charge (5.50% of offering price) | 1.64 |
| Maximum offering price per share outstanding | $ 29.89 |
| Investor Class | |
| Net assets applicable to outstanding shares | $ 50,948,091 |
| Shares of beneficial interest outstanding | 1,802,352 |
| Net asset value per share outstanding | $ 28.27 |
| Maximum sales charge (5.00% of offering price) | 1.49 |
| Maximum offering price per share outstanding | $ 29.76 |
| Class B | |
| Net assets applicable to outstanding shares | $ 3,191,275 |
| Shares of beneficial interest outstanding | 163,042 |
| Net asset value and offering price per share outstanding | $ 19.57 |
| Class C | |
| Net assets applicable to outstanding shares | $ 17,220,423 |
| Shares of beneficial interest outstanding | 879,187 |
| Net asset value and offering price per share outstanding | $ 19.59 |
| Class I | |
| Net assets applicable to outstanding shares | $132,731,287 |
| Shares of beneficial interest outstanding | 4,340,547 |
| Net asset value and offering price per share outstanding | $ 30.58 |
| Class R6 | |
| Net assets applicable to outstanding shares | $227,261,069 |
| Shares of beneficial interest outstanding | 7,443,092 |
| Net asset value and offering price per share outstanding | $ 30.53 |
The notes to the financial statements are an integral part of, and should be read in conjunction with, the financial statements.
| 12 | MainStay WMC Value Fund |
Statement of Operations for the six months ended April 30, 2024 (Unaudited)
| Investment Income (Loss) |
| Income | |
| Dividends-unaffiliated (net of foreign tax withholding of $100,534) | $ 12,476,412 |
| Dividends-affiliated | 222,561 |
| Securities lending, net | 7,342 |
| Total income | 12,706,315 |
| Expenses | |
| Manager (See Note 3) | 3,146,718 |
| Distribution/Service—Class A (See Note 3) | 650,720 |
| Distribution/Service—Investor Class (See Note 3) | 65,825 |
| Distribution/Service—Class B (See Note 3) | 20,096 |
| Distribution/Service—Class C (See Note 3) | 82,096 |
| Distribution/Service—Class R2 (See Note 3)(a) | 562 |
| Distribution/Service—Class R3 (See Note 3)(a) | 2,421 |
| Transfer agent (See Note 3) | 400,165 |
| Professional fees | 67,353 |
| Registration | 62,147 |
| Trustees | 11,851 |
| Custodian | 9,441 |
| Shareholder communication | 3,676 |
| Shareholder service (See Note 3) | 757 |
| Miscellaneous | 24,352 |
| Total expenses before waiver/reimbursement | 4,548,180 |
| Expense waiver/reimbursement from Manager (See Note 3) | (57,752) |
| Net expenses | 4,490,428 |
| Net investment income (loss) | 8,215,887 |
| Realized and Unrealized Gain (Loss) |
| Net realized gain (loss) on: | |
| Unaffiliated investment transactions | 12,821,217 |
| Foreign currency transactions | (1,253) |
| Net realized gain (loss) | 12,819,964 |
| Net change in unrealized appreciation (depreciation) on: | |
| Unaffiliated investments | 101,989,334 |
| Translation of other assets and liabilities in foreign currencies | (4,125) |
| Net change in unrealized appreciation (depreciation) | 101,985,209 |
| Net realized and unrealized gain (loss) | 114,805,173 |
| Net increase (decrease) in net assets resulting from operations | $123,021,060 |
| (a) | Class liquidated and is no longer offered for sale as of February 23, 2024. |
The notes to the financial statements are an integral part of, and should be read in conjunction with, the financial statements.
13
Statements of Changes in Net Assets
for the six months ended April 30, 2024 (Unaudited) and the year ended October 31, 2023
| | Six months
ended
April 30,
2024 | Year
ended
October 31,
2023 |
| Increase (Decrease) in Net Assets |
| Operations: | | |
| Net investment income (loss) | $ 8,215,887 | $ 15,393,259 |
| Net realized gain (loss) | 12,819,964 | 27,324,979 |
| Net change in unrealized appreciation (depreciation) | 101,985,209 | (58,736,095) |
| Net increase (decrease) in net assets resulting from operations | 123,021,060 | (16,017,857) |
| Distributions to shareholders: | | |
| Class A | (23,214,849) | (29,416,342) |
| Investor Class | (2,278,800) | (3,013,210) |
| Class B | (261,360) | (545,950) |
| Class C | (904,378) | (977,214) |
| Class I | (6,606,035) | (8,145,019) |
| Class R1(a) | (8,014) | (9,920) |
| Class R2(a) | (47,287) | (56,602) |
| Class R3(a) | (67,522) | (81,173) |
| Class R6 | (9,612,608) | (14,701,579) |
| Total distributions to shareholders | (43,000,853) | (56,947,009) |
| Capital share transactions: | | |
| Net proceeds from sales of shares | 46,949,727 | 126,738,662 |
| Net asset value of shares issued to shareholders in reinvestment of distributions | 42,053,608 | 55,819,279 |
| Cost of shares redeemed | (112,173,138) | (226,681,810) |
| Increase (decrease) in net assets derived from capital share transactions | (23,169,803) | (44,123,869) |
| Net increase (decrease) in net assets | 56,850,404 | (117,088,735) |
| Net Assets |
| Beginning of period | 896,586,154 | 1,013,674,889 |
| End of period | $ 953,436,558 | $ 896,586,154 |
| (a) | Class liquidated and is no longer offered for sale as of February 23, 2024. |
The notes to the financial statements are an integral part of, and should be read in conjunction with, the financial statements.
| 14 | MainStay WMC Value Fund |
Financial Highlights selected per share data and ratios
| | Six months ended
April 30,
2024* | | Year Ended October 31, |
| Class A | 2023 | | 2022 | | 2021 | | 2020 | | 2019 |
| Net asset value at beginning of period | $ 25.98 | | $ 28.11 | | $ 55.21 | | $ 39.49 | | $ 42.24 | | $ 41.20 |
| Net investment income (loss) (a) | 0.23 | | 0.39 | | 0.36 | | 0.30 | | 0.21 | | 0.26 |
| Net realized and unrealized gain (loss) | 3.31 | | (0.94) | | (1.68) | | 17.09 | | 0.55 | | 4.88 |
| Total from investment operations | 3.54 | | (0.55) | | (1.32) | | 17.39 | | 0.76 | | 5.14 |
| Less distributions: | | | | | | | | | | | |
| From net investment income | (0.40) | | (0.42) | | (0.38) | | (0.25) | | (0.31) | | (0.28) |
| From net realized gain on investments | (0.87) | | (1.16) | | (25.40) | | (1.42) | | (3.20) | | (3.82) |
| Total distributions | (1.27) | | (1.58) | | (25.78) | | (1.67) | | (3.51) | | (4.10) |
| Net asset value at end of period | $ 28.25 | | $ 25.98 | | $ 28.11 | | $ 55.21 | | $ 39.49 | | $ 42.24 |
| Total investment return (b) | 13.91% | | (2.17)% | | (2.68)% | | 45.14% | | 1.66% | | 13.54% |
| Ratios (to average net assets)/Supplemental Data: | | | | | | | | | | | |
| Net investment income (loss) | 1.63%†† | | 1.42% | | 1.21% | | 0.60% | | 0.55% | | 0.67% |
| Net expenses (c) | 1.03%†† | | 1.03%(d) | | 1.02%(d) | | 1.06% | | 1.10%(e) | | 1.11% |
| Portfolio turnover rate | 20% | | 29% | | 37% | | 23% | | 16% | | 20% |
| Net assets at end of period (in 000’s) | $ 522,084 | | $ 485,177 | | $ 522,937 | | $ 547,299 | | $ 389,530 | | $ 427,040 |
| * | Unaudited. |
| †† | Annualized. |
| (a) | Per share data based on average shares outstanding during the period. |
| (b) | Total investment return is calculated exclusive of sales charges and assumes the reinvestment of dividends and distributions. For periods of less than one year, total return is not annualized. |
| (c) | In addition to the fees and expenses which the Fund bears directly, it also indirectly bears a pro-rata share of the fees and expenses of the underlying funds in which it invests. Such indirect expenses are not included in the above expense ratios. |
| (d) | Expense waiver/reimbursement less than 0.01%. |
| (e) | Net of interest expense which is less than one-tenth of a percent. |
The notes to the financial statements are an integral part of, and should be read in conjunction with, the financial statements.
15
Financial Highlights selected per share data and ratios
| | Six months ended
April 30,
2024* | | Year Ended October 31, |
| Investor Class | 2023 | | 2022 | | 2021 | | 2020 | | 2019 |
| Net asset value at beginning of period | $ 25.96 | | $ 28.09 | | $ 55.08 | | $ 39.40 | | $ 42.17 | | $ 41.15 |
| Net investment income (loss) (a) | 0.19 | | 0.31 | | 0.29 | | 0.14 | | 0.10 | | 0.18 |
| Net realized and unrealized gain (loss) | 3.32 | | (0.93) | | (1.69) | | 17.09 | | 0.53 | | 4.86 |
| Total from investment operations | 3.51 | | (0.62) | | (1.40) | | 17.23 | | 0.63 | | 5.04 |
| Less distributions: | | | | | | | | | | | |
| From net investment income | (0.33) | | (0.35) | | (0.19) | | (0.13) | | (0.20) | | (0.20) |
| From net realized gain on investments | (0.87) | | (1.16) | | (25.40) | | (1.42) | | (3.20) | | (3.82) |
| Total distributions | (1.20) | | (1.51) | | (25.59) | | (1.55) | | (3.40) | | (4.02) |
| Net asset value at end of period | $ 28.27 | | $ 25.96 | | $ 28.09 | | $ 55.08 | | $ 39.40 | | $ 42.17 |
| Total investment return (b) | 13.79% | | (2.43)% | | (2.91)% | | 44.73% | | 1.35% | | 13.27% |
| Ratios (to average net assets)/Supplemental Data: | | | | | | | | | | | |
| Net investment income (loss) | 1.39%†† | | 1.16% | | 0.97% | | 0.28% | | 0.25% | | 0.46% |
| Net expenses (c) | 1.29%†† | | 1.30% | | 1.26% | | 1.36% | | 1.40%(d) | | 1.33% |
| Expenses (before waiver/reimbursement) (c) | 1.29%†† | | 1.30%(e) | | 1.26%(e) | | 1.36% | | 1.41% | | 1.38% |
| Portfolio turnover rate | 20% | | 29% | | 37% | | 23% | | 16% | | 20% |
| Net assets at end of period (in 000's) | $ 50,948 | | $ 50,024 | | $ 56,061 | | $ 66,193 | | $ 69,423 | | $ 80,733 |
| * | Unaudited. |
| †† | Annualized. |
| (a) | Per share data based on average shares outstanding during the period. |
| (b) | Total investment return is calculated exclusive of sales charges and assumes the reinvestment of dividends and distributions. For periods of less than one year, total return is not annualized. |
| (c) | In addition to the fees and expenses which the Fund bears directly, it also indirectly bears a pro-rata share of the fees and expenses of the underlying funds in which it invests. Such indirect expenses are not included in the above expense ratios. |
| (d) | Net of interest expense which is less than one-tenth of a percent. |
| (e) | Expense waiver/reimbursement less than 0.01%. |
The notes to the financial statements are an integral part of, and should be read in conjunction with, the financial statements.
| 16 | MainStay WMC Value Fund |
Financial Highlights selected per share data and ratios
| | Six months ended
April 30,
2024* | | Year Ended October 31, |
| Class B | 2023 | | 2022 | | 2021 | | 2020 | | 2019 |
| Net asset value at beginning of period | $ 18.30 | | $ 20.29 | | $ 47.03 | | $ 33.97 | | $ 36.88 | | $ 36.53 |
| Net investment income (loss) (a) | 0.06 | | 0.08 | | 0.05 | | (0.20) | | (0.16) | | (0.09) |
| Net realized and unrealized gain (loss) | 2.32 | | (0.66) | | (1.39) | | 14.68 | | 0.45 | | 4.26 |
| Total from investment operations | 2.38 | | (0.58) | | (1.34) | | 14.48 | | 0.29 | | 4.17 |
| Less distributions: | | | | | | | | | | | |
| From net investment income | (0.24) | | (0.25) | | — | | — | | — | | — |
| From net realized gain on investments | (0.87) | | (1.16) | | (25.40) | | (1.42) | | (3.20) | | (3.82) |
| Total distributions | (1.11) | | (1.41) | | (25.40) | | (1.42) | | (3.20) | | (3.82) |
| Net asset value at end of period | $ 19.57 | | $ 18.30 | | $ 20.29 | | $ 47.03 | | $ 33.97 | | $ 36.88 |
| Total investment return (b) | 13.36% | | (3.18)% | | (3.66)% | | 43.67% | | 0.57% | | 12.45% |
| Ratios (to average net assets)/Supplemental Data: | | | | | | | | | | | |
| Net investment income (loss) | 0.67%†† | | 0.43% | | 0.23% | | (0.47)% | | (0.48)% | | (0.27)% |
| Net expenses (c) | 2.04%†† | | 2.05% | | 2.01% | | 2.11% | | 2.15%(d) | | 2.08% |
| Expenses (before waiver/reimbursement) (c) | 2.04%†† | | 2.05%(e) | | 2.01%(e) | | 2.11% | | 2.16% | | 2.13% |
| Portfolio turnover rate | 20% | | 29% | | 37% | | 23% | | 16% | | 20% |
| Net assets at end of period (in 000’s) | $ 3,191 | | $ 4,503 | | $ 8,045 | | $ 13,100 | | $ 14,212 | | $ 21,088 |
| * | Unaudited. |
| †† | Annualized. |
| (a) | Per share data based on average shares outstanding during the period. |
| (b) | Total investment return is calculated exclusive of sales charges and assumes the reinvestment of dividends and distributions. For periods of less than one year, total return is not annualized. |
| (c) | In addition to the fees and expenses which the Fund bears directly, it also indirectly bears a pro-rata share of the fees and expenses of the underlying funds in which it invests. Such indirect expenses are not included in the above expense ratios. |
| (d) | Net of interest expense which is less than one-tenth of a percent. |
| (e) | Expense waiver/reimbursement less than 0.01%. |
The notes to the financial statements are an integral part of, and should be read in conjunction with, the financial statements.
17
Financial Highlights selected per share data and ratios
| | Six months ended
April 30,
2024* | | Year Ended October 31, |
| Class C | 2023 | | 2022 | | 2021 | | 2020 | | 2019 |
| Net asset value at beginning of period | $ 18.31 | | $ 20.30 | | $ 47.04 | | $ 33.98 | | $ 36.88 | | $ 36.53 |
| Net investment income (loss) (a) | 0.06 | | 0.08 | | 0.05 | | (0.21) | | (0.16) | | (0.07) |
| Net realized and unrealized gain (loss) | 2.33 | | (0.66) | | (1.39) | | 14.69 | | 0.46 | | 4.24 |
| Total from investment operations | 2.39 | | (0.58) | | (1.34) | | 14.48 | | 0.30 | | 4.17 |
| Less distributions: | | | | | | | | | | | |
| From net investment income | (0.24) | | (0.25) | | — | | — | | — | | — |
| From net realized gain on investments | (0.87) | | (1.16) | | (25.40) | | (1.42) | | (3.20) | | (3.82) |
| Total distributions | (1.11) | | (1.41) | | (25.40) | | (1.42) | | (3.20) | | (3.82) |
| Net asset value at end of period | $ 19.59 | | $ 18.31 | | $ 20.30 | | $ 47.04 | | $ 33.98 | | $ 36.88 |
| Total investment return (b) | 13.41% | | (3.18)% | | (3.66)% | | 43.65% | | 0.60% | | 12.45% |
| Ratios (to average net assets)/Supplemental Data: | | | | | | | | | | | |
| Net investment income (loss) | 0.61%†† | | 0.41% | | 0.22% | | (0.50)% | | (0.48)% | | (0.22)% |
| Net expenses (c) | 2.04%†† | | 2.05% | | 2.00% | | 2.11% | | 2.15%(d) | | 2.07% |
| Expenses (before waiver/reimbursement) (c) | 2.04%†† | | 2.05%(e) | | 2.01% | | 2.11% | | 2.16% | | 2.12% |
| Portfolio turnover rate | 20% | | 29% | | 37% | | 23% | | 16% | | 20% |
| Net assets at end of period (in 000’s) | $ 17,220 | | $ 14,603 | | $ 14,564 | | $ 11,119 | | $ 14,315 | | $ 22,933 |
| * | Unaudited. |
| †† | Annualized. |
| (a) | Per share data based on average shares outstanding during the period. |
| (b) | Total investment return is calculated exclusive of sales charges and assumes the reinvestment of dividends and distributions. For periods of less than one year, total return is not annualized. |
| (c) | In addition to the fees and expenses which the Fund bears directly, it also indirectly bears a pro-rata share of the fees and expenses of the underlying funds in which it invests. Such indirect expenses are not included in the above expense ratios. |
| (d) | Net of interest expense which is less than one-tenth of a percent. |
| (e) | Expense waiver/reimbursement less than 0.01%. |
The notes to the financial statements are an integral part of, and should be read in conjunction with, the financial statements.
| 18 | MainStay WMC Value Fund |
Financial Highlights selected per share data and ratios
| | Six months ended
April 30,
2024* | | Year Ended October 31, |
| Class I | 2023 | | 2022 | | 2021 | | 2020 | | 2019 |
| Net asset value at beginning of period | $ 28.06 | | $ 30.24 | | $ 57.43 | | $ 40.99 | | $ 43.71 | | $ 42.51 |
| Net investment income (loss) (a) | 0.30 | | 0.51 | | 0.48 | | 0.30 | | 0.32 | | 0.38 |
| Net realized and unrealized gain (loss) | 3.58 | | (1.02) | | (1.76) | | 17.91 | | 0.57 | | 5.02 |
| Total from investment operations | 3.88 | | (0.51) | | (1.28) | | 18.21 | | 0.89 | | 5.40 |
| Less distributions: | | | | | | | | | | | |
| From net investment income | (0.49) | | (0.51) | | (0.51) | | (0.35) | | (0.41) | | (0.38) |
| From net realized gain on investments | (0.87) | | (1.16) | | (25.40) | | (1.42) | | (3.20) | | (3.82) |
| Total distributions | (1.36) | | (1.67) | | (25.91) | | (1.77) | | (3.61) | | (4.20) |
| Net asset value at end of period | $ 30.58 | | $ 28.06 | | $ 30.24 | | $ 57.43 | | $ 40.99 | | $ 43.71 |
| Total investment return (b) | 14.14% | | (1.88)% | | (2.37)% | | 45.57% | | 1.92% | | 13.80% |
| Ratios (to average net assets)/Supplemental Data: | | | | | | | | | | | |
| Net investment income (loss) | 1.98%†† | | 1.76% | | 1.51% | | 0.61% | | 0.81% | | 0.93% |
| Net expenses (c) | 0.70%†† | | 0.70% | | 0.70% | | 0.82% | | 0.85%(d) | | 0.86% |
| Expenses (before waiver/reimbursement) (c) | 0.78%†† | | 0.79% | | 0.77% | | 0.83% | | 0.85% | | 0.86% |
| Portfolio turnover rate | 20% | | 29% | | 37% | | 23% | | 16% | | 20% |
| Net assets at end of period (in 000’s) | $ 132,731 | | $ 141,185 | | $ 137,117 | | $ 102,714 | | $ 417,329 | | $ 488,730 |
| * | Unaudited. |
| †† | Annualized. |
| (a) | Per share data based on average shares outstanding during the period. |
| (b) | Total investment return is calculated exclusive of sales charges and assumes the reinvestment of dividends and distributions. Class I shares are not subject to sales charges. For periods of less than one year, total return is not annualized. |
| (c) | In addition to the fees and expenses which the Fund bears directly, it also indirectly bears a pro-rata share of the fees and expenses of the underlying funds in which it invests. Such indirect expenses are not included in the above expense ratios. |
| (d) | Net of interest expense which is less than one-tenth of a percent. |
The notes to the financial statements are an integral part of, and should be read in conjunction with, the financial statements.
19
Financial Highlights selected per share data and ratios
| | Six months ended
April 30,
2024* | | Year Ended October 31, | | April 26, 2021^ through
October 31, |
| Class R6 | 2023 | | 2022 | | 2021 |
| Net asset value at beginning of period | $ 28.02 | | $ 30.20 | | $ 57.42 | | $ 53.83** |
| Net investment income (loss) (a) | 0.29 | | 0.52 | | 0.49 | | 0.65 |
| Net realized and unrealized gain (loss) | 3.58 | | (1.03) | | (1.77) | | 2.94 |
| Total from investment operations | 3.87 | | (0.51) | | (1.28) | | 3.59 |
| Less distributions: | | | | | | | |
| From net investment income | (0.49) | | (0.51) | | (0.54) | | — |
| From net realized gain on investments | (0.87) | | (1.16) | | (25.40) | | — |
| Total distributions | (1.36) | | (1.67) | | (25.94) | | — |
| Net asset value at end of period | $ 30.53 | | $ 28.02 | | $ 30.20 | | $ 57.42 |
| Total investment return (b) | 14.12% | | (1.88)% | | (2.37)% | | 6.67% |
| Ratios (to average net assets)/Supplemental Data: | | | | | | | |
| Net investment income (loss) | 1.96%†† | | 1.77% | | 1.52% | | 1.25%†† |
| Net expenses (c) | 0.70%††(d) | | 0.70% | | 0.70% | | 0.72%†† |
| Expenses (before waiver/reimbursement) (c) | 0.70%†† | | 0.71% | | 0.71% | | 0.72%†† |
| Portfolio turnover rate | 20% | | 29% | | 37% | | 23% |
| Net assets at end of period (in 000’s) | $ 227,261 | | $ 198,461 | | $ 272,274 | | $ 356,580 |
| * | Unaudited. |
| ** | Based on the net asset value of Class I as of April 26, 2021. |
| ^ | Inception date. |
| †† | Annualized. |
| (a) | Per share data based on average shares outstanding during the period. |
| (b) | Total investment return is calculated exclusive of sales charges and assumes the reinvestment of dividends and distributions. Class R6 shares are not subject to sales charges. For periods of less than one year, total return is not annualized. |
| (c) | In addition to the fees and expenses which the Fund bears directly, it also indirectly bears a pro-rata share of the fees and expenses of the underlying funds in which it invests. Such indirect expenses are not included in the above expense ratios. |
| (d) | Expense waiver/reimbursement less than 0.01%. |
The notes to the financial statements are an integral part of, and should be read in conjunction with, the financial statements.
| 20 | MainStay WMC Value Fund |
Notes to Financial Statements (Unaudited)
Note 1-Organization and Business
The MainStay Funds (the “Trust”) was organized on January 9, 1986, as a Massachusetts business trust. The Trust is registered under the Investment Company Act of 1940, as amended (the “1940 Act”), as an open-end management investment company, and is comprised of eleven funds (collectively referred to as the "Funds"). These financial statements and notes relate to the MainStay WMC Value Fund (the "Fund"), a “diversified” fund, as that term is defined in the 1940 Act, as interpreted or modified by regulatory authorities having jurisdiction, from time to time.
The following table lists the Fund's share classes that have been registered and commenced operations:
| Class | Commenced Operations |
| Class A | June 9, 1999 |
| Investor Class | February 28, 2008 |
| Class B | June 9, 1999 |
| Class C | June 9, 1999 |
| Class I | January 21, 1971 |
| Class R6 | April 26, 2021 |
Effective at the close of business on February 23, 2024, Class R1, R2 and R3 shares were liquidated.
Class B shares of the MainStay Group of Funds are closed to all new purchases as well as additional investments by existing Class B shareholders. Existing Class B shareholders may continue to reinvest dividends and capital gains distributions, as well as exchange their Class B shares for Class B shares of other funds in the MainStay Group of Funds as permitted by the current exchange privileges. Class B shareholders continue to be subject to any applicable contingent deferred sales charge ("CDSC") at the time of redemption. All other features of the Class B shares, including but not limited to the fees and expenses applicable to Class B shares, remain unchanged. Unless redeemed, Class B shareholders will remain in Class B shares of their respective fund until the Class B shares are converted to Class A or Investor Class shares pursuant to the applicable conversion schedule.
Class A and Investor Class shares are offered at net asset value (“NAV”) per share plus an initial sales charge. No initial sales charge applies to investments of $1 million or more (and certain other qualified purchases) in Class A and Investor Class shares. A CDSC of 1.00% may be imposed on certain redemptions of Class A and Investor Class shares made within 18 months of the date of purchase on shares that were purchased without an initial sales charge. Class C shares are offered at NAV without an initial sales charge, although a 1.00% CDSC may be imposed on certain redemptions of such shares made within one year of the date of purchase of Class C shares. Class I and Class R6 shares are offered at NAV without a sales charge. Depending upon eligibility, Class C shares convert to either Class A or Investor Class shares at the end of the calendar quarter eight years after the date they were purchased. Additionally, Investor Class shares may convert automatically to Class A shares. Under certain circumstances and as may be permitted by the Trust’s multiple class plan pursuant to Rule 18f-3 under the 1940 Act,
specified share classes of the Fund may be converted to one or more other share classes of the Fund as disclosed in the capital share transactions within these Notes. The classes of shares have the same voting (except for issues that relate solely to one class), dividend, liquidation and other rights, and the same terms and conditions, except that under distribution plans pursuant to Rule 12b-1 under the 1940 Act, Class C shares are subject to higher distribution and/or service fees than Class A and Investor Class shares. Class I and Class R6 shares are not subject to a distribution and/or service fee.
The Fund's investment objective is to seek long-term appreciation of capital.
Note 2–Significant Accounting Policies
The Fund is an investment company and accordingly follows the investment company accounting and reporting guidance of the Financial Accounting Standards Board (“FASB”) Accounting Standards Codification Topic 946 Financial Services—Investment Companies. The Fund prepares its financial statements in accordance with generally accepted accounting principles (“GAAP”) in the United States of America and follows the significant accounting policies described below.
(A) Securities Valuation. Investments are usually valued as of the close of regular trading on the New York Stock Exchange (the "Exchange") (usually 4:00 p.m. Eastern time) on each day the Fund is open for business ("valuation date").
Pursuant to Rule 2a-5 under the 1940 Act, the Board of Trustees of the Trust (the "Board") has designated New York Life Investment Management LLC ("New York Life Investments" or the "Manager") as its Valuation Designee (the "Valuation Designee"). The Valuation Designee is responsible for performing fair valuations relating to all investments in the Fund’s portfolio for which market quotations are not readily available; periodically assessing and managing material valuation risks; establishing and applying fair value methodologies; testing fair valuation methodologies; evaluating and overseeing pricing services; ensuring appropriate segregation of valuation and portfolio management functions; providing quarterly, annual and prompt reporting to the Board, as appropriate; identifying potential conflicts of interest; and maintaining appropriate records. The Valuation Designee has established a valuation committee ("Valuation Committee") to assist in carrying out the Valuation Designee’s responsibilities and establish prices of securities for which market quotations are not readily available. The Fund's and the Valuation Designee's policies and procedures ("Valuation Procedures") govern the Valuation Designee’s selection and application of methodologies for determining and calculating the fair value of Fund investments. The Valuation Designee may value the Fund's portfolio securities for which market quotations are not readily available and other Fund assets utilizing inputs from pricing services and other third-party sources. The Valuation Committee meets (in person, via electronic mail or via teleconference) on an ad-hoc basis to determine fair valuations and on a quarterly basis to review fair value events with respect to certain securities for which
Notes to Financial Statements (Unaudited) (continued)
market quotations are not readily available, including valuation risks and back-testing results, and to preview reports to the Board.
The Valuation Committee establishes prices of securities for which market quotations are not readily available based on such methodologies and measurements on a regular basis after considering information that is reasonably available and deemed relevant by the Valuation Committee. The Board shall oversee the Valuation Designee and review fair valuation materials on a prompt, quarterly and annual basis and approve proposed revisions to the Valuation Procedures.
Investments for which market quotations are not readily available are valued at fair value as determined in good faith pursuant to the Valuation Procedures. A market quotation is readily available only when that quotation is a quoted price (unadjusted) in active markets for identical investments that the Fund can access at the measurement date, provided that a quotation will not be readily available if it is not reliable. "Fair value" is defined as the price the Fund would reasonably expect to receive upon selling an asset or liability in an orderly transaction to an independent buyer in the principal or most advantageous market for the asset or liability. Fair value measurements are determined within a framework that establishes a three-tier hierarchy that maximizes the use of observable market data and minimizes the use of unobservable inputs to establish a classification of fair value measurements for disclosure purposes. "Inputs" refer broadly to the assumptions that market participants would use in pricing the asset or liability, including assumptions about risk, such as the risk inherent in a particular valuation technique used to measure fair value using a pricing model and/or the risk inherent in the inputs for the valuation technique. Inputs may be observable or unobservable. Observable inputs reflect the assumptions market participants would use in pricing the asset or liability based on market data obtained from sources independent of the Fund. Unobservable inputs reflect the Fund’s own assumptions about the assumptions market participants would use in pricing the asset or liability based on the information available. The inputs or methodology used for valuing assets or liabilities may not be an indication of the risks associated with investing in those assets or liabilities. The three-tier hierarchy of inputs is summarized below.
| • | Level 1—quoted prices (unadjusted) in active markets for an identical asset or liability |
| • | Level 2—other significant observable inputs (including quoted prices for a similar asset or liability in active markets, interest rates and yield curves, prepayment speeds, credit risk, etc.) |
| • | Level 3—significant unobservable inputs (including the Fund's own assumptions about the assumptions that market participants would use in measuring fair value of an asset or liability) |
The level of an asset or liability within the fair value hierarchy is based on the lowest level of an input, both individually and in the aggregate, that is significant to the fair value measurement. The aggregate value by input level of the Fund’s assets and liabilities as of April 30, 2024, is included at the end of the Portfolio of Investments.
The Fund may use third-party vendor evaluations, whose prices may be derived from one or more of the following standard inputs, among others:
| • Broker/dealer quotes | • Benchmark securities |
| • Two-sided markets | • Reference data (corporate actions or material event notices) |
| • Bids/offers | • Monthly payment information |
| • Industry and economic events | • Reported trades |
An asset or liability for which a market quotation is not readily available is valued by methods deemed reasonable in good faith by the Valuation Committee, following the Valuation Procedures to represent fair value. Under these procedures, the Valuation Designee generally uses a market-based approach which may use related or comparable assets or liabilities, recent transactions, market multiples, book values and other relevant information. The Valuation Designee may also use an income-based valuation approach in which the anticipated future cash flows of the asset or liability are discounted to calculate fair value. Discounts may also be applied due to the nature and/or duration of any restrictions on the disposition of the asset or liability. Fair value represents a good faith approximation of the value of a security. Fair value determinations involve the consideration of a number of subjective factors, an analysis of applicable facts and circumstances and the exercise of judgment. As a result, it is possible that the fair value for a security determined in good faith in accordance with the Valuation Procedures may differ from valuations for the same security determined for other funds using their own valuation procedures. Although the Valuation Procedures are designed to value a security at the price the Fund may reasonably expect to receive upon the security's sale in an orderly transaction, there can be no assurance that any fair value determination thereunder would, in fact, approximate the amount that the Fund would actually realize upon the sale of the security or the price at which the security would trade if a reliable market price were readily available. During the six-month period ended April 30, 2024, there were no material changes to the fair value methodologies.
Securities which may be valued in this manner include, but are not limited to: (i) a security for which trading has been halted or suspended or otherwise does not have a readily available market quotation on a given day; (ii) a debt security that has recently gone into default and for which there is not a current market quotation; (iii) a security of an issuer that has entered into a restructuring; (iv) a security that has been delisted from a national exchange; (v) a security subject to trading collars for which no or limited trading takes place; and (vi) a security whose principal market has been temporarily closed at a time when, under normal conditions, it would be open. Securities valued in this manner are generally categorized as Level 2 or 3 in the hierarchy.
Equity securities, rights and warrants, if applicable, are valued at the last quoted sales prices as of the close of regular trading on the relevant exchange on each valuation date. Securities that are not traded on the valuation date are valued at the mean of the last quoted bid and ask prices. Prices are normally taken from the principal market in which each
| 22 | MainStay WMC Value Fund |
security trades. These securities are generally categorized as Level 1 in the hierarchy.
Investments in mutual funds, including money market funds, are valued at their respective NAVs at the close of business each day on the valuation date. These securities are generally categorized as Level 1 in the hierarchy.
Temporary cash investments acquired in excess of 60 days to maturity at the time of purchase are valued using the latest bid prices or using valuations based on a matrix system (which considers such factors as security prices, yields, maturities and ratings), both as furnished by independent pricing services. Temporary cash investments that mature in 60 days or less at the time of purchase ("Short-Term Investments") are valued using the amortized cost method of valuation, unless the use of such method would be inappropriate. The amortized cost method involves valuing a security at its cost on the date of purchase and thereafter assuming a constant amortization to maturity of the difference between such cost and the value on maturity date. Amortized cost approximates the current fair value of a security. Securities valued using the amortized cost method are not valued using quoted prices in an active market and are generally categorized as Level 2 in the hierarchy.
The information above is not intended to reflect an exhaustive list of the methodologies that may be used to value portfolio investments. The Valuation Procedures permit the use of a variety of valuation methodologies in connection with valuing portfolio investments. The methodology used for a specific type of investment may vary based on the market data available or other considerations. The methodologies summarized above may not represent the specific means by which portfolio investments are valued on any particular business day.
(B) Income Taxes. The Fund's policy is to comply with the requirements of the Internal Revenue Code of 1986, as amended (the “Internal Revenue Code”), applicable to regulated investment companies and to distribute all of its taxable income to the shareholders of the Fund within the allowable time limits.
The Manager evaluates the Fund’s tax positions to determine if the tax positions taken meet the minimum recognition threshold in connection with accounting for uncertainties in income tax positions taken or expected to be taken for the purposes of measuring and recognizing tax liabilities in the financial statements. Recognition of tax benefits of an uncertain tax position is permitted only to the extent the position is “more likely than not” to be sustained assuming examination by taxing authorities. The Manager analyzed the Fund's tax positions taken on federal, state and local income tax returns for all open tax years (for up to three tax years) and has concluded that no provisions for federal, state and local income tax are required in the Fund's financial statements. The Fund's federal, state and local income tax and federal excise tax returns for tax years for which the applicable statutes of limitations have not expired are subject to examination by the Internal Revenue Service and state and local departments of revenue.
(C) Dividends and Distributions to Shareholders. Dividends and distributions are recorded on the ex-dividend date. The Fund intends to declare and pay dividends from net investment income and distributions from net realized capital and currency gains, if any, at least annually. Unless a shareholder elects otherwise, all dividends and distributions are reinvested at NAV in the same class of shares of the Fund. Dividends and distributions to shareholders are determined in accordance with federal income tax regulations and may differ from determinations using GAAP.
(D) Security Transactions and Investment Income. The Fund records security transactions on the trade date. Realized gains and losses on security transactions are determined using the identified cost method. Dividend income is recognized on the ex-dividend date, net of any foreign tax withheld at the source, and interest income is accrued as earned using the effective interest rate method. Distributions received from real estate investment trusts may be classified as dividends, capital gains and/or return of capital.
Investment income and realized and unrealized gains and losses on investments of the Fund are allocated pro rata to the separate classes of shares based upon their relative net assets on the date the income is earned or realized and unrealized gains and losses are incurred.
(E) Expenses. Expenses of the Trust are allocated to the individual Funds in proportion to the net assets of the respective Funds when the expenses are incurred, except where direct allocations of expenses can be made. Expenses (other than transfer agent expenses and fees incurred under the shareholder services plans and/or the distribution plans further discussed in Note 3(B)) are allocated to separate classes of shares pro rata based upon their relative net assets on the date the expenses are incurred. The expenses borne by the Fund, including those of related parties to the Fund, are shown in the Statement of Operations.
Additionally, the Fund may invest in mutual funds, which are subject to management fees and other fees that may cause the costs of investing in mutual funds to be greater than the costs of owning the underlying securities directly. These indirect expenses of mutual funds are not included in the amounts shown as expenses in the Statement of Operations or in the expense ratios included in the Financial Highlights.
(F) Use of Estimates. In preparing financial statements in conformity with GAAP, the Manager makes estimates and assumptions that affect the reported amounts and disclosures in the financial statements. Actual results could differ from those estimates and assumptions.
(G) Foreign Currency Transactions. The Fund's books and records are maintained in U.S. dollars. Prices of securities denominated in foreign currency amounts are translated into U.S. dollars at the mean between the buying and selling rates last quoted by any major U.S. bank at the following dates:
(i) market value of investment securities, other assets and liabilities— at the valuation date; and
(ii) purchases and sales of investment securities, income and expenses—at the date of such transactions.
Notes to Financial Statements (Unaudited) (continued)
The assets and liabilities that are denominated in foreign currency amounts are presented at the exchange rates and market values at the close of the period. The realized and unrealized changes in net assets arising from fluctuations in exchange rates and market prices of securities are not separately presented.
Net realized gain (loss) on foreign currency transactions represents net currency gains or losses realized as a result of differences between the amounts of securities sale proceeds or purchase cost, dividends, interest and withholding taxes as recorded on the Fund's books, and the U.S. dollar equivalent amount actually received or paid. Net currency gains or losses from valuing such foreign currency denominated assets and liabilities, other than investments at valuation date exchange rates, are reflected in unrealized foreign exchange gains or losses.
(H) Securities Lending. In order to realize additional income, the Fund may engage in securities lending, subject to the limitations set forth in the 1940 Act and relevant guidance by the staff of the Securities and Exchange Commission (“SEC”). If the Fund engages in securities lending, the Fund will lend through its custodian, JPMorgan Chase Bank, N.A., ("JPMorgan"), acting as securities lending agent on behalf of the Fund. Under the current arrangement, JPMorgan will manage the Fund's collateral in accordance with the securities lending agency agreement between the Fund and JPMorgan, and indemnify the Fund against counterparty risk. The loans will be collateralized by cash (which may be invested in a money market fund) and/or non-cash collateral (which may include U.S. Treasury securities and/or U.S. government agency securities issued or guaranteed by the United States government or its agencies or instrumentalities) at least equal at all times to the market value of the securities loaned. Non-cash collateral held at year end is segregated and cannot be transferred by the Fund. The Fund bears the risk of delay in recovery of, or loss of rights in, the securities loaned. The Fund may also record a realized gain or loss on securities deemed sold due to a borrower’s inability to return securities on loan. The Fund bears the risk of any loss on investment of cash collateral. The Fund will receive compensation for lending its securities in the form of fees or it will retain a portion of interest earned on the investment of any cash collateral. The Fund will also continue to receive interest and dividends on the securities loaned and any gain or loss in the market price of the securities loaned that may occur during the term of the loan will be for the account of the Fund. Income earned from securities lending activities, if any, is reflected in the Statement of Operations.
(I) Foreign Securities Risk. The Fund may invest in foreign securities, which carry certain risks that are in addition to the usual risks inherent in domestic securities. Foreign regulatory regimes and securities markets can have less stringent investor protections and disclosure standards and less liquid trading markets than U.S. regulatory regimes and securities markets, and can experience political, social and economic developments that may affect the value of investments in foreign securities. These risks include those resulting from currency fluctuations, future adverse political or economic developments and possible imposition of currency exchange blockages or other foreign governmental
laws or restrictions. Economic sanctions and other similar governmental actions or developments could, among other things, effectively restrict or eliminate the Fund's ability to purchase or sell certain foreign securities or groups of foreign securities, and thus may make the Fund's investments in such securities less liquid or more difficult to value. These risks are likely to be greater in emerging markets than in developed markets. The ability of issuers of debt securities held by the Fund to meet their obligations may be affected by, among other things, economic or political developments in a specific country, industry or region.
(J) Indemnifications. Under the Trust’s organizational documents, its officers and trustees are indemnified against certain liabilities that may arise out of performance of their duties to the Trust. Additionally, in the normal course of business, the Fund enters into contracts with third-party service providers that contain a variety of representations and warranties and that may provide general indemnifications. The Fund's maximum exposure under these arrangements is unknown, as this would involve future claims that may be made against the Fund that have not yet occurred. The Manager believes that the risk of loss in connection with these potential indemnification obligations is remote. However, there can be no assurance that material liabilities related to such obligations will not arise in the future, which could adversely impact the Fund.
Note 3–Fees and Related Party Transactions
(A) Manager and Subadvisor. New York Life Investments, a registered investment adviser and an indirect, wholly-owned subsidiary of New York Life Insurance Company ("New York Life"), serves as the Fund's Manager, pursuant to an Amended and Restated Management Agreement ("Management Agreement"). The Manager provides offices, conducts clerical, recordkeeping and bookkeeping services and keeps most of the financial and accounting records required to be maintained by the Fund. Except for the portion of salaries and expenses that are the responsibility of the Fund, the Manager pays the salaries and expenses of all personnel affiliated with the Fund and certain operational expenses of the Fund. The Fund reimburses New York Life Investments in an amount equal to the portion of the compensation of the Chief Compliance Officer attributable to the Fund. Wellington Management Company LLP ("Wellington" or the "Subadvisor"), a registered investment adviser, serves as the Subadvisor to the Fund and is responsible for the day-to-day portfolio management of the Fund. Pursuant to the terms of a Subadvisory Agreement ("Subadvisory Agreement") between New York Life Investments and Wellington, New York Life Investments pays for the services of the Subadvisor.
Under the Management Agreement, the Fund pays the Manager a monthly fee for the services performed and the facilities furnished at an annual rate of the Fund’s average daily net assets as follows: 0.66% on assets up to $1 billion; 0.64% on assets from $1 billion to $3 billion; and 0.62% on assets over $3 billion. During the six-month period ended April 30, 2024, the effective management fee rate was 0.66% of the Fund’s average daily net assets, exclusive of any applicable waivers/reimbursements.
| 24 | MainStay WMC Value Fund |
New York Life Investments has contractually agreed to waive fees and/or reimburse expenses so that Total Annual Fund Operating Expenses (excluding taxes, interest, litigation, extraordinary expenses, brokerage and other transaction expenses relating to the purchase or sale of portfolio investments, and acquired (underlying) fund fees and expenses) for Class I shares do not exceed 0.70% of its average daily net assets. In addition, New York Life Investments will waive fees and/or reimburse expenses so that Total Annual Fund Operating Expenses (excluding taxes, interest, litigation, extraordinary expenses, brokerage and other transaction expenses relating to the purchase or sale of portfolio investments, and acquired (underlying) fund fees and expenses) for Class R6 do not exceed those of Class I. This agreement will remain in effect until February 28, 2025, and shall renew automatically for one-year terms unless New York Life Investments provides written notice of termination prior to the start of the next term or upon approval of the Board.
During the six-month period ended April 30, 2024, New York Life Investments earned fees from the Fund in the amount of $3,146,718 and waived fees and/or reimbursed expenses in the amount of $57,752 and paid the Subadvisor fees in the amount of $1,285,365.
JPMorgan provides sub-administration and sub-accounting services to the Fund pursuant to an agreement with New York Life Investments. These services include calculating the daily NAVs of the Fund, maintaining the general ledger and sub-ledger accounts for the calculation of the Fund's NAVs, and assisting New York Life Investments in conducting various aspects of the Fund's administrative operations. For providing these services to the Fund, JPMorgan is compensated by New York Life Investments.
Pursuant to an agreement between the Trust and New York Life Investments, New York Life Investments is responsible for providing or procuring certain regulatory reporting services for the Fund. The Fund will reimburse New York Life Investments for the actual costs incurred by New York Life Investments in connection with providing or procuring these services for the Fund.
(B) Distribution and Service Fees. The Trust, on behalf of the Fund, has entered into a distribution agreement with NYLIFE Distributors LLC (the “Distributor”), an affiliate of New York Life Investments. The Fund has adopted distribution plans (the “Plans”) in accordance with the provisions of Rule 12b-1 under the 1940 Act.
Pursuant to the Class A, Investor Class and Class R2 Plans, the Distributor receives a monthly fee from the Class A, Investor Class and Class R2 shares at an annual rate of 0.25% of the average daily net assets of the Class A, Investor Class and Class R2 shares for distribution and/or service activities as designated by the Distributor. Pursuant to the Class B and Class C Plans, Class B and Class C shares pay the Distributor a monthly distribution fee at an annual rate of 0.75% of the average daily net assets of the Class B and Class C shares, along with a service fee at an annual rate of 0.25% of the average daily net assets of the Class B and Class C shares, for a total 12b-1 fee of 1.00%. Pursuant
to the Class R3 Plan, Class R3 shares pay the Distributor a monthly distribution fee at an annual rate of 0.25% of the average daily net assets of the Class R3 shares, along with a service fee at an annual rate of 0.25% of the average daily net assets of the Class R3 shares, for a total 12b-1 fee of 0.50%. Class I, Class R1 and Class R6 shares are not subject to a distribution and/or service fee.
The Plans provide that the distribution and service fees are payable to the Distributor regardless of the amounts actually expended by the Distributor for distribution of the Fund's shares and service activities.
In accordance with the Shareholder Services Plans for the Class R1, Class R2 and Class R3 shares, the Manager has agreed to provide, through its affiliates or independent third parties, various shareholder and administrative support services to shareholders of the Class R1, Class R2 and Class R3 shares. For its services, the Manager, its affiliates or independent third-party service providers are entitled to a shareholder service fee accrued daily and paid monthly at an annual rate of 0.10% of the average daily net assets of the Class R1, Class R2 and Class R3 shares. This is in addition to any fees paid under the Class R2 and Class R3 Plans.
During the period November 1, 2023 through February 23, 2024, shareholder service fees incurred by the Fund were as follows:
| |
| Class R1* | $ 48 |
| Class R2* | 225 |
| Class R3* | 484 |
| * | Effective at the close of business on February 23, 2024, Class R1, Class R2 and R3 shares were liquidated. |
(C) Sales Charges. The Fund was advised by the Distributor that the amount of initial sales charges retained on sales of Class A and Investor Class shares during the six-month period ended April 30, 2024, were $25,961 and $2,582, respectively.
The Fund was also advised that the Distributor retained CDSCs on redemptions of Class A, Class B and Class C shares during the six-month period ended April 30, 2024, of $956, $9 and $1,411, respectively.
(D) Transfer, Dividend Disbursing and Shareholder Servicing Agent. NYLIM Service Company LLC, an affiliate of New York Life Investments, is the Fund's transfer, dividend disbursing and shareholder servicing agent pursuant to an agreement between NYLIM Service Company LLC and the Trust. NYLIM Service Company LLC has entered into an agreement with SS&C Global Investor & Distribution Solutions, Inc. ("SS&C"), pursuant to which SS&C performs certain transfer agent services on behalf of NYLIM Service Company LLC. New York Life Investments has contractually agreed to limit the transfer agency expenses charged to the Fund’s share classes to a maximum of 0.35% of that share class’s average daily net assets on an annual basis after deducting any applicable Fund or class-level expense reimbursement or small account fees. This agreement will remain in effect until February 28, 2025, and shall renew automatically for one-year terms
Notes to Financial Statements (Unaudited) (continued)
unless New York Life Investments provides written notice of termination prior to the start of the next term or upon approval of the Board. During the six-month period ended April 30, 2024, transfer agent expenses incurred by the Fund and any reimbursements, pursuant to the aforementioned Transfer Agency expense limitation agreement, were as follows:
| Class | Expense | Waived |
| Class A | $212,582 | $— |
| Investor Class | 89,852 | — |
| Class B | 6,788 | — |
| Class C | 28,121 | — |
| Class I | 57,853 | — |
| Class R1* | 40 | — |
| Class R2* | 189 | — |
| Class R3* | 403 | — |
| Class R6 | 4,337 | — |
| * | Effective at the close of business on February 23, 2024, Class R1, Class R2 and R3 shares were liquidated. |
(E) Small Account Fee. Shareholders with small accounts adversely impact the cost of providing transfer agency services. In an effort to reduce total transfer agency expenses, the Fund has implemented a small account fee on certain types of accounts. As described in the Fund's prospectus, certain shareholders with an account balance of less than $1,000 ($5,000 for Class A share accounts) are charged an annual per account fee of $20 (assessed semi-annually), the proceeds from which offset transfer agent fees as reflected in the Statement of Operations. This small account fee will not apply to certain types of accounts as described further in the Fund’s prospectus.
(F) Capital. As of April 30, 2024, New York Life and its affiliates beneficially held shares of the Fund with the values and percentages of net assets as follows:
| ‡ | Less than one-tenth of a percent. |
Note 4-Federal Income Tax
As of April 30, 2024, the cost and unrealized appreciation (depreciation) of the Fund’s investment portfolio, including applicable derivative contracts and other financial instruments, as determined on a federal income tax basis, were as follows:
| | Federal Tax
Cost | Gross
Unrealized
Appreciation | Gross
Unrealized
(Depreciation) | Net
Unrealized
Appreciation/
(Depreciation) |
| Investments in Securities | $843,221,107 | $153,527,745 | $(40,576,990) | $112,950,755 |
During the year ended October 31, 2023, the tax character of distributions paid as reflected in the Statements of Changes in Net Assets was as follows:
| | 2023 |
| Distributions paid from: | |
| Ordinary Income | $17,709,162 |
| Long-Term Capital Gains | 39,237,847 |
| Total | $56,947,009 |
Note 5–Custodian
JPMorgan is the custodian of cash and securities held by the Fund. Custodial fees are charged to the Fund based on the Fund's net assets and/or the market value of securities held by the Fund and the number of certain transactions incurred by the Fund.
Note 6–Line of Credit
The Fund and certain other funds managed by New York Life Investments maintain a line of credit with a syndicate of banks in order to secure a source of funds for temporary purposes to meet unanticipated or excessive redemption requests.
Effective July 25, 2023, under the credit agreement (the “Credit Agreement”), the aggregate commitment amount is $600,000,000 with an additional uncommitted amount of $100,000,000. The commitment fee is an annual rate of 0.15% of the average commitment amount payable quarterly, regardless of usage, to JPMorgan, who serves as the agent to the syndicate. The commitment fee is allocated among the Fund and certain other funds managed by New York Life Investments based upon their respective net assets and other factors. Interest on any revolving credit loan is charged based upon the Federal Funds Rate, Daily Simple Secured Overnight Financing Rate ("SOFR") + 0.10%, or the Overnight Bank Funding Rate, whichever is higher. The Credit Agreement expires on July 23, 2024, although the Fund, certain other funds managed by New York Life Investments and the syndicate of banks may renew the Credit Agreement for an additional year on the same or different terms or enter into a credit agreement with a different syndicate of banks. Prior to July 25, 2023, the aggregate commitment amount and the commitment fee were the same as those under the current Credit Agreement. During the six-month period ended April 30, 2024, there were no borrowings made or outstanding with respect to the Fund under the Credit Agreement.
Note 7–Interfund Lending Program
Pursuant to an exemptive order issued by the SEC, the Fund, along with certain other funds managed by New York Life Investments, may participate in an interfund lending program. The interfund lending program provides an alternative credit facility that permits the Fund and certain other funds managed by New York Life Investments to lend or borrow money for temporary purposes directly to or from one another, subject to the conditions of the exemptive order. During the six-month
| 26 | MainStay WMC Value Fund |
period ended April 30, 2024, there were no interfund loans made or outstanding with respect to the Fund.
Note 8–Purchases and Sales of Securities (in 000’s)
During the six-month period ended April 30, 2024, purchases and sales of securities, other than short-term securities, were $191,627 and $248,348, respectively.
Note 9–Capital Share Transactions
Transactions in capital shares for the six-month period ended April 30, 2024 and the year ended October 31, 2023, were as follows:
| Class A | Shares | Amount |
| Six-month period ended April 30, 2024: | | |
| Shares sold | 459,660 | $ 12,797,128 |
| Shares issued to shareholders in reinvestment of distributions | 847,795 | 22,466,522 |
| Shares redeemed | (1,705,715) | (47,382,613) |
| Net increase (decrease) in shares outstanding before conversion | (398,260) | (12,118,963) |
| Shares converted into Class A (See Note 1) | 202,135 | 5,684,135 |
| Shares converted from Class A (See Note 1) | (974) | (26,865) |
| Net increase (decrease) | (197,099) | $ (6,461,693) |
| Year ended October 31, 2023: | | |
| Shares sold | 1,590,537 | $ 43,127,887 |
| Shares issued to shareholders in reinvestment of distributions | 1,052,417 | 28,541,623 |
| Shares redeemed | (2,737,252) | (74,286,857) |
| Net increase (decrease) in shares outstanding before conversion | (94,298) | (2,617,347) |
| Shares converted into Class A (See Note 1) | 179,908 | 4,832,388 |
| Shares converted from Class A (See Note 1) | (11,768) | (323,015) |
| Net increase (decrease) | 73,842 | $ 1,892,026 |
| |
| Investor Class | Shares | Amount |
| Six-month period ended April 30, 2024: | | |
| Shares sold | 19,524 | $ 545,482 |
| Shares issued to shareholders in reinvestment of distributions | 85,677 | 2,274,715 |
| Shares redeemed | (90,877) | (2,530,023) |
| Net increase (decrease) in shares outstanding before conversion | 14,324 | 290,174 |
| Shares converted into Investor Class (See Note 1) | 11,967 | 337,647 |
| Shares converted from Investor Class (See Note 1) | (151,077) | (4,265,275) |
| Net increase (decrease) | (124,786) | $ (3,637,454) |
| Year ended October 31, 2023: | | |
| Shares sold | 51,736 | $ 1,400,586 |
| Shares issued to shareholders in reinvestment of distributions | 110,738 | 3,007,651 |
| Shares redeemed | (174,718) | (4,739,165) |
| Net increase (decrease) in shares outstanding before conversion | (12,244) | (330,928) |
| Shares converted into Investor Class (See Note 1) | 31,998 | 887,420 |
| Shares converted from Investor Class (See Note 1) | (88,401) | (2,373,861) |
| Net increase (decrease) | (68,647) | $ (1,817,369) |
| |
| Class B | Shares | Amount |
| Six-month period ended April 30, 2024: | | |
| Shares sold | 97 | $ 1,929 |
| Shares issued to shareholders in reinvestment of distributions | 14,173 | 261,360 |
| Shares redeemed | (18,643) | (364,519) |
| Net increase (decrease) in shares outstanding before conversion | (4,373) | (101,230) |
| Shares converted from Class B (See Note 1) | (78,583) | (1,527,369) |
| Net increase (decrease) | (82,956) | $ (1,628,599) |
| Year ended October 31, 2023: | | |
| Shares sold | 1,127 | $ 22,150 |
| Shares issued to shareholders in reinvestment of distributions | 28,265 | 544,951 |
| Shares redeemed | (39,346) | (753,882) |
| Net increase (decrease) in shares outstanding before conversion | (9,954) | (186,781) |
| Shares converted from Class B (See Note 1) | (140,526) | (2,699,233) |
| Net increase (decrease) | (150,480) | $ (2,886,014) |
| |
Notes to Financial Statements (Unaudited) (continued)
| Class C | Shares | Amount |
| Six-month period ended April 30, 2024: | | |
| Shares sold | 156,648 | $ 3,049,857 |
| Shares issued to shareholders in reinvestment of distributions | 46,228 | 852,900 |
| Shares redeemed | (109,389) | (2,120,392) |
| Net increase (decrease) in shares outstanding before conversion | 93,487 | 1,782,365 |
| Shares converted from Class C (See Note 1) | (11,643) | (226,353) |
| Net increase (decrease) | 81,844 | $ 1,556,012 |
| Year ended October 31, 2023: | | |
| Shares sold | 296,509 | $ 5,705,628 |
| Shares issued to shareholders in reinvestment of distributions | 50,505 | 974,235 |
| Shares redeemed | (234,517) | (4,556,446) |
| Net increase (decrease) in shares outstanding before conversion | 112,497 | 2,123,417 |
| Shares converted from Class C (See Note 1) | (32,491) | (625,729) |
| Net increase (decrease) | 80,006 | $ 1,497,688 |
| |
| Class I | Shares | Amount |
| Six-month period ended April 30, 2024: | | |
| Shares sold | 360,630 | $ 10,798,781 |
| Shares issued to shareholders in reinvestment of distributions | 225,774 | 6,468,424 |
| Shares redeemed | (1,277,464) | (38,251,755) |
| Net increase (decrease) in shares outstanding before conversion | (691,060) | (20,984,550) |
| Shares converted into Class I (See Note 1) | 901 | 26,865 |
| Shares converted from Class I (See Note 1) | (93) | (2,785) |
| Net increase (decrease) | (690,252) | $(20,960,470) |
| Year ended October 31, 2023: | | |
| Shares sold | 2,437,113 | $ 71,634,987 |
| Shares issued to shareholders in reinvestment of distributions | 270,746 | 7,908,495 |
| Shares redeemed | (2,222,127) | (64,985,391) |
| Net increase (decrease) in shares outstanding before conversion | 485,732 | 14,558,091 |
| Shares converted into Class I (See Note 1) | 11,171 | 330,560 |
| Shares converted from Class I (See Note 1) | (970) | (28,530) |
| Net increase (decrease) | 495,933 | $ 14,860,121 |
| |
| Class R1 | Shares | Amount |
| Six-month period ended April 30, 2024: (a) | | |
| Shares sold | 69 | $ 1,917 |
| Shares issued to shareholders in reinvestment of distributions | 297 | 8,014 |
| Shares redeemed | (6,460) | (185,193) |
| Net increase (decrease) | (6,094) | $ (175,262) |
| Year ended October 31, 2023: | | |
| Shares sold | 197 | $ 5,380 |
| Shares issued to shareholders in reinvestment of distributions | 359 | 9,920 |
| Shares redeemed | (473) | (13,122) |
| Net increase (decrease) | 83 | $ 2,178 |
| |
| Class R2 | Shares | Amount |
| Six-month period ended April 30, 2024: (a) | | |
| Shares sold | 600 | $ 16,536 |
| Shares issued to shareholders in reinvestment of distributions | 1,671 | 44,945 |
| Shares redeemed | (40,494) | (1,144,325) |
| Net increase (decrease) | (38,223) | $ (1,082,844) |
| Year ended October 31, 2023: | | |
| Shares sold | 1,806 | $ 49,580 |
| Shares issued to shareholders in reinvestment of distributions | 1,923 | 52,887 |
| Shares redeemed | (1,834) | (50,187) |
| Net increase (decrease) | 1,895 | $ 52,280 |
| |
| Class R3 | Shares | Amount |
| Six-month period ended April 30, 2024: (a) | | |
| Shares sold | 3,978 | $ 109,290 |
| Shares issued to shareholders in reinvestment of distributions | 2,412 | 64,120 |
| Shares redeemed | (62,779) | (1,770,885) |
| Net increase (decrease) | (56,389) | $ (1,597,475) |
| Year ended October 31, 2023: | | |
| Shares sold | 18,812 | $ 507,413 |
| Shares issued to shareholders in reinvestment of distributions | 2,864 | 77,938 |
| Shares redeemed | (17,565) | (458,612) |
| Net increase (decrease) | 4,111 | $ 126,739 |
| |
| 28 | MainStay WMC Value Fund |
| Class R6 | Shares | Amount |
| Six-month period ended April 30, 2024: | | |
| Shares sold | 652,974 | $ 19,628,807 |
| Shares issued to shareholders in reinvestment of distributions | 336,105 | 9,612,608 |
| Shares redeemed | (627,915) | (18,423,433) |
| Net increase (decrease) | 361,164 | $ 10,817,982 |
| Year ended October 31, 2023: | | |
| Shares sold | 148,724 | $ 4,285,051 |
| Shares issued to shareholders in reinvestment of distributions | 503,997 | 14,701,579 |
| Shares redeemed | (2,587,712) | (76,838,148) |
| Net increase (decrease) | (1,934,991) | $(57,851,518) |
| (a) | Class liquidated and is no longer offered for sale as of February 23, 2024. |
Note 10–Other Matters
As of the date of this report, the Fund faces a heightened level of risk associated with current uncertainty, volatility and state of economies, financial markets, a high interest rate environment, and labor and health conditions around the world. Events such as war, acts of terrorism, recessions, rapid inflation, the imposition of economic sanctions, earthquakes, hurricanes, epidemics and pandemics and other unforeseen natural or human disasters may have broad adverse social, political and economic effects on the global economy, which could negatively impact the value of the Fund's investments. Developments that disrupt global economies and financial markets may magnify factors that affect the Fund's performance.
Note 11–Subsequent Events
In connection with the preparation of the financial statements of the Fund as of and for the six-month period ended April 30, 2024, events and transactions subsequent to April 30, 2024, through the date the financial statements were issued, have been evaluated by the Manager for possible adjustment and/or disclosure. No subsequent events requiring financial statement adjustment or disclosure have been identified.
Board Consideration and Approval of Management Agreement and Subadvisory Agreement (Unaudited)
The continuation of the Management Agreement with respect to the MainStay WMC Value Fund (“Fund”) and New York Life Investment Management LLC (“New York Life Investments”) and the Subadvisory Agreement between New York Life Investments and Wellington Management Company LLP (“WMC”) with respect to the Fund (together, “Advisory Agreements”) is subject to annual review and approval by the Board of Trustees of The MainStay Funds (“Board” of the “Trust”) in accordance with Section 15 of the Investment Company Act of 1940, as amended (“1940 Act”). At its December 6–7, 2023 meeting, the Board, including the Trustees who are not an “interested person” (as such term is defined in the 1940 Act) of the Trust (“Independent Trustees”) voting separately, unanimously approved the continuation of each of the Advisory Agreements for a one-year period.
In reaching the decision to approve the continuation of each of the Advisory Agreements, the Board considered information and materials furnished by New York Life Investments and WMC in connection with an annual contract review process undertaken by the Board that took place at meetings of the Board and its Contracts Committee from September 2023 through December 2023, including information and materials furnished by New York Life Investments and WMC in response to requests prepared on behalf of the Board, and in consultation with the Independent Trustees, by independent legal counsel to the Independent Trustees, which encompassed a variety of topics, including those summarized below. Information and materials requested by and furnished to the Board for consideration in connection with the contract review process included, among other items, reports on the Fund and “peer funds” prepared by Institutional Shareholder Services Inc. (“ISS”), an independent third-party service provider engaged by the Board to report objectively on the Fund’s investment performance, management fee and total expenses. The Board also considered information on the fees charged to other investment advisory clients of New York Life Investments and/or WMC that follow investment strategies similar to those of the Fund, if any, and, when applicable, the rationale for differences in the Fund’s management and subadvisory fees and the fees charged to those other investment advisory clients. In addition, the Board considered information regarding the legal standards and fiduciary obligations applicable to its consideration of the continuation of each of the Advisory Agreements. The contract review process, including the structure and format for information and materials provided to the Board, has been developed in consultation with the Board. The Independent Trustees also met in executive sessions with their independent legal counsel and, for portions thereof, with senior management of New York Life Investments.
The Board’s deliberations with respect to the continuation of each of the Advisory Agreements reflect a year-long process, and the Board also took into account information furnished to the Board and its Committees throughout the year, as deemed relevant and appropriate by the Trustees, including, among other items, reports on investment performance of the Fund and investment-related matters for the Fund as well as presentations from New York Life Investments and, generally annually, WMC personnel. In addition, the Board took into account other
information provided by New York Life Investments throughout the year, including, among other items, periodic reports on legal and compliance matters, risk management, portfolio turnover, brokerage commissions and non-advisory services provided to the Fund by New York Life Investments, as deemed relevant and appropriate by the Trustees.
In addition to information provided to the Board throughout the year, the Board received information in connection with its June 2023 meeting provided specifically in response to requests prepared on behalf of the Board, and in consultation with the Independent Trustees, by independent legal counsel to the Independent Trustees regarding the Fund’s distribution arrangements. In addition, the Board received information regarding the Fund’s asset levels, share purchase and redemption activity and the payment of Rule 12b-1 and/or certain other fees by the applicable share classes of the Fund, among other information.
In considering the continuation of each of the Advisory Agreements, the Trustees reviewed and evaluated the information and factors they believed to reasonably be necessary and appropriate in light of legal advice furnished to them by independent legal counsel to the Independent Trustees and through the exercise of their own business judgment. Although individual Trustees may have weighed certain factors or information differently and the Board did not consider any single factor or information controlling in reaching its decision, the factors that figured prominently in the Board’s consideration of the continuation of each of the Advisory Agreements are summarized in more detail below and include, among other factors: (i) the nature, extent and quality of the services provided to the Fund by New York Life Investments and WMC; (ii) the qualifications of the portfolio managers of the Fund and the historical investment performance of the Fund, New York Life Investments and WMC; (iii) the costs of the services provided, and profits realized, by New York Life Investments and WMC with respect to their relationships with the Fund; (iv) the extent to which economies of scale have been realized or may be realized if the Fund grows and the extent to which any economies of scale have been shared, have benefited or may benefit the Fund’s shareholders; and (v) the reasonableness of the Fund’s management and subadvisory fees and total ordinary operating expenses. Although the Board recognized that comparisons between the Fund’s fees and expenses and those of other funds are imprecise given different terms of agreements, variations in fund strategies and other factors, the Board considered the reasonableness of the Fund’s management fee and total ordinary operating expenses as compared to the peer funds identified by ISS. Throughout their considerations, the Trustees acknowledged the commitment of New York Life Investments and its affiliates to serve the MainStay Group of Funds, as well as their capacity, experience, resources, financial stability and reputations. The Trustees also acknowledged the entrepreneurial and other risks assumed by New York Life Investments in sponsoring and managing the Fund. With respect to the Subadvisory Agreement, the Board took into account New York Life Investments’ recommendation to approve the continuation of the Subadvisory Agreement.
| 30 | MainStay WMC Value Fund |
The Trustees noted that, throughout the year, the Trustees are afforded an opportunity to ask questions of, and request additional information or materials from, New York Life Investments and WMC. The Board’s decision with respect to each of the Advisory Agreements may have also been based, in part, on the Board’s knowledge of New York Life Investments and WMC resulting from, among other things, the Board’s consideration of each of the Advisory Agreements in prior years, the advisory agreements for other funds in the MainStay Group of Funds, the Board’s review throughout the year of the performance and operations of other funds in the MainStay Group of Funds and each Trustee’s business judgment and industry experience. In addition to considering the above-referenced factors, the Board observed that in the marketplace there are a range of investment options available to investors and that the Fund’s shareholders, having had the opportunity to consider other investment options, have invested in the Fund.
The factors that figured prominently in the Board’s decision to approve the continuation of each of the Advisory Agreements during the Board’s December 6–7, 2023 meeting are summarized in more detail below.
Nature, Extent and Quality of Services Provided by New York Life Investments and WMC
The Board examined the nature, extent and quality of the services that New York Life Investments provides to the Fund. The Board evaluated New York Life Investments’ experience and capabilities in serving as manager of the Fund and considered that the Fund operates in a “manager-of-managers” structure. The Board also considered New York Life Investments’ responsibilities and services provided pursuant to this structure, including overseeing the services provided by WMC, evaluating the performance of WMC, making recommendations to the Board as to whether the Subadvisory Agreement should be renewed, modified or terminated and periodically reporting to the Board regarding the results of New York Life Investments’ evaluation and monitoring functions. The Board noted that New York Life Investments manages other mutual funds, serves a variety of other investment advisory clients, including other pooled investment vehicles, and has experience overseeing mutual fund service providers, including subadvisors. The Board considered the experience of senior personnel at New York Life Investments providing management and administrative and other non-advisory services to the Fund. The Board observed that New York Life Investments devotes significant resources and time to providing management and administrative and other non-advisory services to the Fund, including New York Life Investments’ oversight and due diligence reviews of WMC and ongoing analysis of, and interactions with, WMC with respect to, among other things, the Fund’s investment performance and risks as well as WMC’s investment capabilities and subadvisory services with respect to the Fund.
The Board also considered the range of services that New York Life Investments provides to the Fund under the terms of the Management Agreement, including: (i) fund accounting and ongoing supervisory services provided by New York Life Investments’ Fund Administration and Accounting Group; (ii) investment supervisory and analytical services
provided by New York Life Investments’ Investment Consulting Group; (iii) compliance services provided by the Trust’s Chief Compliance Officer as well as New York Life Investments’ compliance department, including supervision and implementation of the Fund’s compliance program; (iv) legal services provided by New York Life Investments’ Office of the General Counsel; and (v) risk management monitoring and analysis by compliance and investment personnel. In addition, the Board considered New York Life Investments’ willingness to invest in personnel and other resources, such as cyber security, information security and business continuity planning, that may benefit the Fund and noted that New York Life Investments is responsible for compensating the Trust’s officers, except for a portion of the salary of the Trust’s Chief Compliance Officer. The Board recognized that New York Life Investments provides certain other non-advisory services to the Fund and has over time provided an increasingly broad array of non-advisory services to the MainStay Group of Funds as a result of regulatory and other developments.
The Board also examined the range, and the nature, extent and quality, of the investment advisory services that WMC provides to the Fund and considered the terms of each of the Advisory Agreements. The Board evaluated WMC’s experience and performance in serving as subadvisor to the Fund and advising other portfolios and WMC’s track record and experience in providing investment advisory services as well as the experience of investment advisory, senior management and/or administrative personnel at WMC. The Board considered New York Life Investments’ and WMC’s overall resources, legal and compliance environment, capabilities, reputation, financial condition and history. In addition to information provided in connection with quarterly meetings with the Trust’s Chief Compliance Officer, the Board considered information regarding the compliance policies and procedures of New York Life Investments and WMC and acknowledged their commitment to further developing and strengthening compliance programs that may relate to the Fund. The Board also considered WMC’s ability to recruit and retain qualified investment professionals and willingness to invest in personnel and other resources that may benefit the Fund. In this regard, the Board considered the qualifications and experience of the Fund’s portfolio managers, the number of accounts managed by the portfolio managers and the method for compensating the portfolio managers.
In addition, the Board considered information provided by New York Life Investments and WMC regarding their respective business continuity and disaster recovery plans.
Based on these considerations, among others, the Board concluded that the Fund would likely continue to benefit from the nature, extent and quality of these services.
Investment Performance
In evaluating the Fund’s investment performance, the Board considered investment performance results over various periods in light of the Fund’s investment objective, strategies and risks. The Board considered investment reports on, and analysis of, the Fund’s performance provided to the Board throughout the year. These reports include, among other
Board Consideration and Approval of Management Agreement and Subadvisory Agreement (Unaudited) (continued)
items, information on the Fund’s gross and net returns, the Fund’s investment performance compared to a relevant investment category and the Fund’s benchmarks, the Fund’s risk-adjusted investment performance and the Fund’s investment performance as compared to peer funds, as appropriate, as well as portfolio attribution information and commentary on the effect of market conditions. The Board also considered information provided by ISS showing the investment performance of the Fund as compared to peer funds. In addition, the Board reviewed the methodology used by ISS to construct the group of peer funds for comparative purposes.
The Board also took into account its discussions with senior management at New York Life Investments concerning the Fund’s investment performance over various periods as well as discussions between representatives of WMC and the members of the Board’s Investment Committee, which generally occur on an annual basis.
Based on these considerations, among others, the Board concluded that its review of the Fund’s investment performance and related information supported a determination to approve the continuation of each of the Advisory Agreements.
Costs of the Services Provided, and Profits and Other Benefits Realized, by New York Life Investments and WMC
The Board considered the costs of the services provided under each of the Advisory Agreements. The Board also considered the profitability of New York Life Investments and its affiliates and WMC due to their relationships with the Fund as well as of New York Life Investments and its affiliates due to their relationships with the MainStay Group of Funds. With respect to the profitability of WMC’s relationship with the Fund, the Board considered information from New York Life Investments that WMC’s subadvisory fee reflected an arm’s-length negotiation and that this fee is paid by New York Life Investments, not the Fund, and the relevance of WMC’s profitability was considered by the Trustees in that context. On this basis, the Board primarily considered the costs and profitability for New York Life Investments and its affiliates with respect to the Fund.
In addition, the Board acknowledged the difficulty in obtaining reliable comparative data about mutual fund managers’ profitability because such information generally is not publicly available and may be impacted by numerous factors, including the structure of a fund manager’s organization, the types of funds it manages, the methodology used to allocate certain fixed costs to specific funds and the manager’s capital structure and costs of capital.
In evaluating the costs of the services provided by New York Life Investments and WMC, and profitability of New York Life Investments and its affiliates and WMC due to their relationships with the Fund, the Board considered, among other factors, New York Life Investments’ and its affiliates’ and WMC’s continuing investments in, or willingness to invest in, personnel and other resources that may support and further enhance the management of the Fund, and that New York Life Investments is responsible for paying the subadvisory fee for the Fund. The Board also considered the financial resources of New York Life Investments and
WMC and acknowledged that New York Life Investments and WMC must be in a position to recruit and retain experienced professional personnel and to maintain a strong financial position for New York Life Investments and WMC to continue to provide high-quality services to the Fund. The Board recognized that the Fund benefits from the allocation of certain fixed costs among the funds in the MainStay Group of Funds, among other expected benefits resulting from its relationship with New York Life Investments.
The Board considered information regarding New York Life Investments’ methodology for calculating profitability and allocating costs provided by New York Life Investments in connection with the fund profitability analysis presented to the Board. The Board concluded that New York Life Investments’ methods for allocating costs and procedures for estimating overall profitability of the relationship with the funds in the MainStay Group of Funds were reasonable. The Board recognized the difficulty in calculating and evaluating a manager’s profitability with respect to the Fund and considered that other profitability methodologies may also be reasonable.
The Board also considered certain fall-out benefits that may be realized by New York Life Investments and its affiliates and WMC and its affiliates due to their relationships with the Fund, including reputational and other indirect benefits. The Board recognized, for example, the benefits to WMC from legally permitted “soft-dollar” arrangements by which brokers provide research and other services to WMC in exchange for commissions paid by the Fund with respect to trades in the Fund’s portfolio securities. In this regard, the Board also requested and considered information from New York Life Investments concerning other material business relationships between WMC and its affiliates and New York Life Investments and its affiliates and considered the existence of a strategic partnership between New York Life Investments and WMC that relates to certain current and future products and represents a potential conflict of interest associated with New York Life Investments’ recommendation to approve the continuation of the Subadvisory Agreement. In addition, the Board considered its review of the management agreement for a money market fund advised by New York Life Investments and an affiliated subadvisor that serves as an investment option for the Fund, including the potential rationale for and costs associated with investments in this money market fund by the Fund, if any, and considered information from New York Life Investments that the nature and type of specific investment advisory services provided to this money market fund are distinct from, or in addition to, the investment advisory services provided to the Fund.
The Board observed that, in addition to fees earned by New York Life Investments under the Management Agreement for managing the Fund, New York Life Investments’ affiliates also earn revenues from serving the Fund in various other capacities, including as the Fund’s transfer agent and distributor. The Board considered information about these other revenues and their impact on the profitability of the relationship with the Fund to New York Life Investments and its affiliates. The Board noted that, although it assessed the overall profitability of the relationship with the Fund to New York Life Investments and its affiliates as part of the
| 32 | MainStay WMC Value Fund |
contract review process, when considering the reasonableness of the fee paid to New York Life Investments under the Management Agreement, the Board considered the profitability of New York Life Investments’ relationship with the Fund on a pre-tax basis and without regard to distribution expenses incurred by New York Life Investments from its own resources.
After evaluating the information deemed relevant by the Trustees, the Board concluded that any profits realized by New York Life Investments and its affiliates due to their relationships with the Fund were not excessive, other expected benefits that may accrue to New York Life Investments and its affiliates are reasonable and other expected benefits that may accrue to WMC and its affiliates are consistent with those expected for a subadvisor to a mutual fund. With respect to WMC, the Board considered that any profits realized by WMC due to its relationship with the Fund are the result of arm’s-length negotiations between New York Life Investments and WMC, acknowledging that any such profits are based on the subadvisory fee paid to WMC by New York Life Investments, not the Fund.
Management and Subadvisory Fees and Total Ordinary Operating Expenses
The Board evaluated the reasonableness of the fee paid under each of the Advisory Agreements and the Fund’s total ordinary operating expenses. With respect to the management fee and subadvisory fee, the Board primarily considered the reasonableness of the management fee paid by the Fund to New York Life Investments because the subadvisory fee paid to WMC is paid by New York Life Investments, not the Fund. The Board also considered the reasonableness of the subadvisory fee paid by New York Life Investments and the amount of the management fee retained by New York Life Investments.
In assessing the reasonableness of the Fund’s fees and expenses, the Board primarily considered comparative data provided by ISS on the fees and expenses of similar mutual funds managed by other investment advisers. The Board reviewed the methodology used by ISS to construct the group of peer funds for comparative purposes. In addition, the Board considered information provided by New York Life Investments and WMC on fees charged to other investment advisory clients, including institutional separate accounts and/or other funds, that follow investment strategies similar to those of the Fund, if any. The Board considered the contractual management fee schedule for the Fund as compared to those for such other investment advisory clients, taking into account the rationale for differences in fee schedules. The Board also took into account information provided by New York Life Investments about the more extensive scope of services provided to registered investment companies, such as the Fund, as compared with other investment advisory clients. Additionally, the Board considered the impact of contractual breakpoints, voluntary waivers and expense limitation arrangements on the Fund’s net management fee and expenses. The Board also considered that in proposing fees for the Fund, New York Life Investments considers the competitive marketplace for mutual funds.
The Board took into account information from New York Life Investments, as provided in connection with the Board’s June 2023 meeting, regarding the reasonableness of the Fund’s transfer agent fee schedule, including industry data demonstrating that the fees that NYLIM Service Company LLC, an affiliate of New York Life Investments and the Fund’s transfer agent, charges the Fund are within the range of fees charged by transfer agents to other mutual funds. In addition, the Board considered NYLIM Service Company LLC’s profitability in connection with the transfer agent services it provides to the Fund. The Board also took into account information provided by NYLIM Service Company LLC regarding the sub-transfer agency payments it made to intermediaries in connection with the provision of sub-transfer agency services to the Fund.
The Board considered the extent to which transfer agent fees contributed to the total expenses of the Fund. The Board acknowledged the role that the MainStay Group of Funds historically has played in serving the investment needs of New York Life Insurance Company customers, who often maintain smaller account balances than other shareholders of funds, and the impact of small accounts on the expense ratios of Fund share classes. The Board also recognized measures that it and New York Life Investments have taken that are intended to mitigate the effect of small accounts on the expense ratios of Fund share classes, including through the imposition of an expense limitation on net transfer agency expenses. The Board also considered that NYLIM Service Company LLC had waived its contractual cost of living adjustments during certain years.
Based on the factors outlined above, among other considerations, the Board concluded that the Fund’s management fee and total ordinary operating expenses are within a range that is competitive and support a conclusion that these fees and expenses are reasonable.
Economies of Scale
The Board considered information regarding economies of scale, including whether economies of scale may exist with respect to the Fund and whether the Fund’s management fee and expense structure permits any economies of scale to be appropriately shared with the Fund’s shareholders. The Board also considered a report from New York Life Investments, previously prepared at the request of the Board, that addressed economies of scale, including with respect to the mutual fund business generally, and the various ways in which the benefits of economies of scale may be shared with the funds in the MainStay Group of Funds. Although the Board recognized the difficulty of determining economies of scale with precision, the Board acknowledged that economies of scale may be shared with the Fund in a number of ways, including, for example, through the imposition of fee breakpoints, initially setting management fee rates at scale or making additional investments to enhance the services provided to the Fund. The Board reviewed information from New York Life Investments showing how the Fund’s management fee schedule compared to fee schedules of other funds and accounts managed by New York Life Investments. The Board also reviewed information from ISS showing how the Fund’s management fee schedule compared with fees paid for similar services by peer funds at varying asset levels.
Board Consideration and Approval of Management Agreement and Subadvisory Agreement (Unaudited) (continued)
Based on this information, the Board concluded that economies of scale are appropriately shared for the benefit of the Fund’s shareholders through the Fund’s management fee and expense structure and other methods to share benefits from economies of scale.
Conclusion
On the basis of the information and factors summarized above, among other information and factors deemed relevant by the Trustees, and the evaluation thereof, the Board, including the Independent Trustees voting separately, unanimously voted to approve the continuation of each of the Advisory Agreements.
| 34 | MainStay WMC Value Fund |
Discussion of the Operation and Effectiveness of the Fund's Liquidity Risk Management Program (Unaudited)
In compliance with Rule 22e-4 under the Investment Company Act of 1940, as amended (the “Liquidity Rule”), the Fund has adopted and implemented a liquidity risk management program (the “Program”), which New York Life Investment Management LLC believes is reasonably designed to assess and manage the Fund's liquidity risk. A Fund's liquidity risk is the risk that the Fund could not meet requests to redeem shares issued by the Fund without significant dilution of the remaining investors’ interests in the Fund. The Board of Trustees of The MainStay Funds (the "Board") previously approved the designation of New York Life Investment Management LLC as administrator of the Program (the “Administrator”). The Administrator has established a Liquidity Risk Management Committee to assist the Administrator in the implementation and day-to-day administration of the Program and to otherwise support the Administrator in fulfilling its responsibilities under the Program.
At a meeting of the Board held on February 27, 2024, the Administrator provided the Board with a written report addressing the Program’s operation and assessing the adequacy and effectiveness of its implementation for the period from January 1, 2023, through December 31, 2023 (the "Review Period"), as required under the Liquidity Rule. The report noted that the Administrator concluded that (i) the Program operated effectively to assess and manage the Fund's liquidity risk, (ii) the Program has been and continues to be adequately and effectively implemented to monitor and, as applicable, respond to the Fund's liquidity developments and (iii) the Fund's investment strategy continues to be appropriate for an open-end fund. In addition, the report summarized the operation of the Program and the information and factors considered by the Administrator in its assessment of the Program’s implementation, such as the liquidity risk assessment framework and the liquidity classification methodologies, and discussed notable geopolitical, market and other economic events that impacted liquidity risk during the Review Period.
In accordance with the Program, the Fund's liquidity risk is assessed no less frequently than annually taking into consideration certain factors, as applicable, such as (i) investment strategy and liquidity of portfolio investments, (ii) short-term and long-term cash flow projections, and (iii) holdings of cash and cash equivalents, as well as borrowing arrangements and other funding sources. Certain factors are considered under both normal and reasonably foreseeable stressed conditions.
Each Fund portfolio investment is classified into one of four liquidity categories. The classification is based on a determination of the number of days it is reasonably expected to take to convert the investment into cash, or sell or dispose of the investment, in current market conditions without significantly changing the market value of the investment. The Administrator has delegated liquidity classification determinations to the Fund's subadvisors, subject to appropriate oversight by the Administrator, and liquidity classification determinations are made by taking into account the Fund's reasonably anticipated trade size, various market, trading and investment-specific considerations, as well as market depth, and, in certain cases, third-party vendor data.
The Liquidity Rule requires funds that do not primarily hold assets that are highly liquid investments to adopt a minimum amount of net assets that must be invested in highly liquid investments that are assets (an “HLIM”). In addition, the Liquidity Rule limits a fund's investments in illiquid investments. Specifically, the Liquidity Rule prohibits acquisition of illiquid investments if, immediately after acquisition, doing so would result in a fund holding more than 15% of its net assets in illiquid investments that are assets. The Program includes provisions reasonably designed to determine, periodically review and comply with the HLIM requirement, as applicable, and to comply with the 15% limit on illiquid investments.
There can be no assurance that the Program will achieve its objectives under all circumstances in the future. Please refer to the Fund's prospectus for more information regarding the Fund's exposure to liquidity risk and other risks to which it may be subject.
Proxy Voting Policies and Procedures and Proxy Voting Record
The Fund is required to file with the SEC its proxy voting record for the 12-month period ending June 30 on Form N-PX. A description of the policies and procedures that are used to vote proxies relating to portfolio securities of the Fund is available free of charge upon request by calling 800-624-6782 or visiting the SEC’s website at www.sec.gov. The most recent Form N-PX or proxy voting record is available free of charge upon request by calling 800-624-6782; visiting newyorklifeinvestments.com; or visiting the SEC’s website at www.sec.gov.
Shareholder Reports and Quarterly Portfolio Disclosure
The Fund is required to file its complete schedule of portfolio holdings with the SEC 60 days after its first and third fiscal quarter on Form N-PORT. The Fund's holdings report is available free of charge upon request by calling New York Life Investments at 800-624-6782.
| 36 | MainStay WMC Value Fund |
This page intentionally left blank.
This page intentionally left blank.
Equity
U.S. Equity
MainStay Epoch U.S. Equity Yield Fund
MainStay Fiera SMID Growth Fund
MainStay PineStone U.S. Equity Fund
MainStay S&P 500 Index Fund
MainStay Winslow Large Cap Growth Fund
MainStay WMC Enduring Capital Fund
MainStay WMC Growth Fund
MainStay WMC Small Companies Fund
MainStay WMC Value Fund
International Equity
MainStay Epoch International Choice Fund
MainStay PineStone International Equity Fund
MainStay WMC International Research Equity Fund
Emerging Markets Equity
MainStay Candriam Emerging Markets Equity Fund
Global Equity
MainStay Epoch Capital Growth Fund
MainStay Epoch Global Equity Yield Fund
MainStay PineStone Global Equity Fund
Fixed Income
Taxable Income
MainStay Candriam Emerging Markets Debt Fund
MainStay Floating Rate Fund
MainStay MacKay High Yield Corporate Bond Fund
MainStay MacKay Short Duration High Income Fund
MainStay MacKay Strategic Bond Fund
MainStay MacKay Total Return Bond Fund
MainStay MacKay U.S. Infrastructure Bond Fund
MainStay Short Term Bond Fund
Tax-Exempt Income
MainStay MacKay Arizona Muni Fund
MainStay MacKay California Tax Free Opportunities Fund1
MainStay MacKay Colorado Muni Fund
MainStay MacKay High Yield Municipal Bond Fund
MainStay MacKay New York Tax Free Opportunities Fund2
MainStay MacKay Oregon Muni Fund
MainStay MacKay Short Term Municipal Fund
MainStay MacKay Strategic Municipal Allocation Fund
MainStay MacKay Tax Free Bond Fund
MainStay MacKay Utah Muni Fund
Money Market
MainStay Money Market Fund
Mixed Asset
MainStay Balanced Fund
MainStay Income Builder Fund
MainStay MacKay Convertible Fund
Speciality
MainStay CBRE Global Infrastructure Fund
MainStay CBRE Real Estate Fund
MainStay Cushing MLP Premier Fund
Asset Allocation
MainStay Conservative Allocation Fund
MainStay Conservative ETF Allocation Fund
MainStay Equity Allocation Fund
MainStay Equity ETF Allocation Fund
MainStay Growth Allocation Fund
MainStay Growth ETF Allocation Fund
MainStay Moderate Allocation Fund
MainStay Moderate ETF Allocation Fund
Manager
New York Life Investment Management LLC
New York, New York
Subadvisors
Candriam3
Strassen, Luxembourg
CBRE Investment Management Listed Real Assets LLC
Radnor, Pennsylvania
Cushing Asset Management, LP
Dallas, Texas
Epoch Investment Partners, Inc.
New York, New York
Fiera Capital Inc.
New York, New York
IndexIQ Advisors LLC3
New York, New York
MacKay Shields LLC3
New York, New York
NYL Investors LLC3
New York, New York
PineStone Asset Management Inc.
Montreal, Québec
Wellington Management Company LLP
Boston, Massachusetts
Winslow Capital Management, LLC
Minneapolis, Minnesota
Legal Counsel
Dechert LLP
Washington, District of Columbia
Independent Registered Public Accounting Firm
KPMG LLP
Philadelphia, Pennsylvania
Distributor
NYLIFE Distributors LLC3
Jersey City, New Jersey
Custodian
JPMorgan Chase Bank, N.A.
New York, New York
1.
This Fund is registered for sale in AZ, CA, NV, OR, TX, UT, WA (all share classes); and MI (Class A and Class I shares only); and CO, FL, GA, HI, ID, MA, MD, NH, NJ and NY (Class I and Class C2 shares only).
| 2. | This Fund is registered for sale in CA, CT, DE, FL, MA, NJ, NY, VT (all share classes) and SD (Class R6 shares only). |
| 3. | An affiliate of New York Life Investment Management LLC. |
Not part of the Semiannual Report
For more information
800-624-6782
newyorklifeinvestments.com
“New York Life Investments” is both a service mark, and the common trade name, of certain investment advisors affiliated with New York Life Insurance Company. The MainStay Funds® are managed by New York Life Investment Management LLC and distributed by NYLIFE Distributors LLC, 30 Hudson Street, Jersey City, NJ 07302, a wholly owned subsidiary of New York Life Insurance Company. NYLIFE Distributors LLC is a Member FINRA/SIPC.
©2024 NYLIFE Distributors LLC. All rights reserved.
| 5022246 MS081-24 | MSWV10-06/24 |
(NYLIM) NL532
Not applicable.
| Item 3. | Audit Committee Financial Expert. |
Not applicable.
| Item 4. | Principal Accountant Fees and Services. |
Not applicable.
| Item 5. | Audit Committee of Listed Registrants. |
Not applicable.
The Schedule of Investments is included as part of Item 1 of this report.
| Item 7. | Disclosure of Proxy Voting Policies and Procedures for Closed-End Management Investment Companies. |
Not applicable.
| Item 8. | Portfolio Managers of Closed-End Management Investment Companies. |
Not applicable.
| Item 9. | Purchases of Equity Securities by Closed-End Management Investment Company and Affiliated Purchasers. |
Not applicable.
| Item 10. | Submission of Matters to a Vote of Security Holders. |
Since the Registrant’s last response to this Item, there have been no material changes to the procedures by which shareholders may recommend nominees to the Registrant’s Board of Trustees.
| Item 11. | Controls and Procedures. |
(a) Based on an evaluation of the Registrant’s Disclosure Controls and Procedures (as defined in Rule 30a-3(c) under the Investment Company Act of 1940) (the “Disclosure Controls”), as of a date within 90 days prior to the filing date (the “Filing Date”) of this Form N-CSR (the “Report”), the Registrant’s principal executive officer and principal financial officer have concluded that the Disclosure Controls are reasonably designed to ensure that information required to be disclosed by the Registrant in the Report is recorded, processed, summarized and reported by the Filing Date, including ensuring that information required to be disclosed in the Report is accumulated and communicated to the Registrant’s management, including the Registrant’s principal executive officer and principal financial officer, as appropriate to allow timely decisions regarding required disclosure.
(b) There were no changes in the Registrant’s internal control over financial reporting (as defined in Rule 30a-3(d)) under the Investment Company Act of 1940 that occurred during the period covered by this report that has materially affected, or is reasonably likely to materially affect, the Registrant’s internal control over financial reporting.
| Item 12. | Disclosure of Securities Lending Activities for Closed-End Management Investment Companies. |
Not applicable.
SIGNATURES
Pursuant to the requirements of the Securities Exchange Act of 1934 and the Investment Company Act of 1940, the Registrant has duly caused this Report to be signed on its behalf by the undersigned, thereunto duly authorized.
| | |
| THE MAINSTAY FUNDS |
| |
| By: | | /s/ Kirk C. Lehneis |
| | Kirk C. Lehneis President and Principal Executive Officer |
| |
| Date: | | July 5, 2024 |
Pursuant to the requirements of the Securities Exchange Act of 1934 and the Investment Company Act of 1940, this Report has been signed below by the following persons on behalf of the Registrant and in the capacities and on the dates indicated.
| | |
| By: | | /s/ Kirk C. Lehneis |
| | Kirk C. Lehneis President and Principal Executive Officer |
| |
| Date: | | July 5, 2024 |
| |
| By: | | /s/ Jack Benintende |
| | Jack R. Benintende Treasurer and Principal Financial and Accounting Officer |
| |
| Date: | | July 5, 2024 |