Item 1. Report to Stockholders:
The following is a copy of the report transmitted to stockholders pursuant to Rule 30e-1 under the Investment Company Act of 1940:

What makes Putnam different?

In 1830, Massachusetts Supreme Judicial Court Justice Samuel Putnam established The Prudent Man Rule, a legal foundation for responsible money management.
THE PRUDENT MAN RULE
All that can be required of a trustee to invest is that he shall conduct himself faithfully and exercise a sound discretion. He is to observe how men of prudence, discretion, and intelligence manage their own affairs, not in regard to speculation, but in regard to the permanent disposition of their funds, considering the probable income, as well as the probable safety of the capital to be invested.

A time-honored tradition in money management
Since 1937, our values have been rooted in a profound sense of responsibility for the money entrusted to us.
A prudent approach to investing
We use a research-driven team approach to seek consistent, dependable, superior investment results over time, although there is no guarantee a fund will meet its objectives.
Funds for every investment goal
We offer a broad range of mutual funds and other financial products so investors and their advisors can build diversified portfolios.
A commitment to doing what’s right for investors
We have below-average expenses and stringent investor protections, and provide a wealth of information about the Putnam funds.
Industry-leading service
We help investors, along with their financial advisors, make informed investment decisions with confidence.
Putnam
High Yield
Advantage Fund
11| 30| 05
Annual Report
|
| Message from the Trustees | 2 |
| About the fund | 4 |
| Report from the fund managers | 7 |
| Performance | 12 |
| Expenses | 15 |
| Portfolio turnover | 17 |
| Risk | 18 |
| Your fund’s management | 19 |
| Terms and definitions | 22 |
| Trustee approval of management contract | 24 |
| Other information for shareholders | 29 |
| Financial statements | 30 |
| Federal tax information | 68 |
| About the Trustees | 69 |
| Officers | 75 |
Cover photograph: © Richard H. Johnson
Message from the Trustees
|
Dear Fellow Shareholder
During the course of 2005, U.S. and global economies proved resilient in the face of some emerging challenges. Higher energy prices, mounting inflationary pressures, and damage caused by an unusually active hurricane season appeared at times to pose a risk to corporate earnings, raising investors’ concerns. The Federal Reserve Board’s program of interest-rate increases remained in effect throughout the year, as well. Nevertheless, in recent months the financial markets have demonstrated trends consistent with an expanding economy -- relative weakness for bonds and relative strength for stocks. With many companies appearing likely to deliver strong earnings, our teams are working to identify investment opportunities while remaining cognizant of the risks posed by higher energy prices in the winter months, as well as the possibility of continued increases in interest rates in 2006.
In our view, the professional research, diversification, and active management that mutual funds provide continue to make them an intelligent choice for investors. We want you to know that Putnam Investments’ management team, under the leadership of Chief Executive Officer Ed Haldeman, continues to focus on investment performance and remains committed to putting the interests of shareholders first. Also, in keeping with these goals, we have redesigned and expanded our shareholder reports to make it easier for you to learn more about your fund. Furthermore, on page 24 we provide information about the 2005 approval by the Trustees of your fund’s management contract with Putnam.
2
In the following pages, members of your fund’s management team discuss the fund’s performance and strategies, and their outlook for the months ahead. We thank you for your support of the Putnam funds throughout 2005 and wish you a happy and prosperous 2006.
Putnam High Yield Advantage Fund:
seeking high current income and capital growth
|
Unlike most types of fixed-income investments, high-yield bonds are more dependent on the performance of issuing companies than on interest rates. For this reason, distinguishing between opportunities and pitfalls requires a rigorous investment process. With Putnam High Yield Advantage Fund, this process is highlighted by exhaustive research, investment diversification, and timely portfolio adjustments.
Because of the risks of high-yield bond investing, in-depth credit research is essential. The fund’s research team -- more than 20 professionals, including analysts who specialize by industry -- visits with the management of issuing companies and analyzes each company’s prospects. The team then compares this information, along with each bond’s independent credit rating, to the bond’s stated yield before deciding whether it is an appropriate investment for the fund.
The fund’s portfolio typically consists of a broad range of industries and companies. Holdings are diversified across industry sectors and among bonds with differing credit ratings. While the fund invests primarily in the bonds of U.S. companies, its diversified approach allows it to include foreign bonds as well. Among these securities, investments in emerging-market bonds may be used to enhance the fund’s appreciation potential. Although diversification does not ensure a profit or protect against a loss and it is possible to lose money in a diversified portfolio, the fund’s diver-sification can help reduce the volatility that typically comes with higher-risk investments.
As the bond markets shift over time, the fund’s management looks for ways to capitalize on developments that affect fixed-income securities in general and high-yield bonds in particular. For example, when credit spreads
High-yield bonds have historically offered greater return potential
than investment-grade bonds.

are wide and expected to tighten, the fund may pursue the higher income potential offered by lower-quality issues. On the other hand, when credit spreads are narrow -- that is, when the difference in yield between higher- and lower-rated bonds of comparable maturities is small -- the fund may shift its emphasis to higher-quality high-yield bonds.
Lower-rated bonds may offer higher yields in return for more risk. Mutual funds that invest in bonds are subject to certain risks, including interest-rate risk, credit risk, and inflation risk. As interest rates rise, the prices of bonds fall. Long-term bonds are more exposed to interest-rate risk than short-term bonds. Unlike bonds, bond funds have ongoing fees and expenses.
What makes a bond
“high yield”?
|
High-yield bonds are fixed-income investments typically issued by companies that lack an established earnings track record or a solid credit history. In general, high-yield bonds offer higher interest rates than investment-grade bonds to compensate for their increased risk. Because of this added risk, these bonds are rated below investment grade by an independent rating agency (for example, the lowest Moody’s Investors Service rating of investment-grade bonds is Baa). The lower the rating, the greater the possibility that a bond’s issuer will be unable to make interest payments or repay the principal.
| Moody’s | Grade |
|
| Aaa | Investment |
|
| Aa | Investment |
|
| Baa | Investment |
|
| Ba, B | High yield |
|
| Caa/Ca | High yield |
|
| C | High yield |
|
In general, the performance of high-yield bonds tends to be less dependent on interest rates than that of higher-rated bonds. Over the past 10 years, the JP Morgan Developed High Yield Index (the fund’s benchmark) largely outperformed the Lehman Global Aggregate Bond Index (which is made up of a variety of investment-grade bonds), particularly when corporate stocks were rallying.
The JP Morgan Developed High Yield Index is an unmanaged index of high-yield fixed-income securities of developed markets. The Lehman Global Aggregate Bond Index is an unmanaged index of global investment-grade fixed-income securities. You cannot invest directly in an index.
During the period, the JP Morgan Developed High Yield Index replaced the JP Morgan Global High Yield Index as the fund’s primary benchmark.
5
Putnam High Yield Advantage Fund seeks high current income and, as a secondary objective, capital growth when consistent with achieving high current income by investing in a diversified portfolio of high-yield bonds that includes a broad range of industries and issuers. The fund is designed for investors who seek high income and capital growth and are willing to accept the added risks of investing in below-investment-grade bonds.
- For the 12 months ended November 30, 2005, Putnam High Yield Advantage Fund’s class A shares had a total return of 3.67% without sales charges.
- The fund’s benchmark, the JP Morgan Global High Yield Index, returned 3.74% for the period. During the period, the benchmark was changed to the JP Morgan Developed High Yield Index, which returned 3.28% for the period.
- The average return for the fund’s Lipper category, High Current Yield Funds, was 2.97%.
- Additional fund performance, comparative performance, and Lipper data can be found in the performance section beginning on page 12.
Total return for class A shares for periods ended 11/30/05
| Since the fund’s inception (3/25/86), average annual return is 7.68% at NAV and 7.42% at POP. | |
|
| | Average annual return | Cumulative return |
| | NAV | POP | NAV | POP |
|
| 10 years | 5.17% | 4.68% | 65.51% | 58.04% |
|
| 5 years | 8.55 | 7.55 | 50.73 | 43.88 |
|
| 3 years | 13.36 | 11.65 | 45.65 | 39.19 |
|
| 1 year | 3.67 | -0.99 | 3.67 | -0.99 |
|
Data is historical. Past performance does not guarantee future results. More recent returns may be less or more than those shown. Investment return and principal value will fluctuate, and you may have a gain or a loss when you sell your shares. Performance assumes reinvestment of distributions and does not account for taxes. Returns at NAV do not reflect a sales charge of 4.50% . For the most recent month-end performance, visit www.putnam.com. A short-term trading fee of up to 2% may apply.
6
Report from the fund managers
|
The year in review
During the 12 months ended November 30, 2005, Putnam High Yield Advantage Fund’s results at net asset value (NAV, or without sales charges) were in line with the JP Morgan Global High Yield Index, its benchmark for much of the year. In October, the fund’s benchmark was changed to the JP Morgan Developed High Yield Index, which Putnam Management believes more closely reflects the securities the fund holds. The fund outperformed this index for the period, and was also ahead of the average for its Lipper peer group. Fund performance was buoyed by successful security selection; in addition to positioning the fund to benefit from the strength of numerous issues, we were also able to add value by underweighting or entirely avoiding some of the period’s weakest performers. Your fund also benefited from a small position in emerging-market bonds; although this position was sold before the end of the period, we believe it contributed substantially to the fund’s relative outperformance.
High-yield bonds encountered some headwinds during your fund’s fiscal year, but several factors helped push them into positive territory for the period, including consistently solid corporate business fundamentals and steady consolidation activity. Several high-yield companies were acquired by investment-grade firms, resulting in credit upgrades for their bonds. After posting generally favorable returns during the first three months of the period, high-yield bonds struggled from mid-March to mid-May 2005, due to concerns that record-high energy prices might spark more broad-based inflation, forcing the Federal Reserve Board (the Fed) to abandon its measured tightening policy and raise short-term interest rates more aggressively. In addition, market participants sought to come to terms with the credit-rating downgrades of General Motors and Ford bonds, and the automakers’ subsequent entry into the high-yield market. However, these fears have subsided over the past six months. The high-yield bond
market has assimilated these large issuers smoothly.
The Fed continued to raise short-term interest rates steadily, boosting the federal funds target rate eight times, bringing it to 4.00% by period-end. These moves didn’t lead to meaningful increases in yields for longer-term bonds, but created some challenges for the high-yield market in the early fall. However, high-yield bonds enjoyed stronger performance in November due to solid inflows of assets into high-yield mutual funds. The default rate within the high-yield market remained near historical lows, and yield spreads, which are the yield advantages offered by high-yield bonds over Treasury bonds with comparable maturities -- ended the period below historical averages, indicating generally favorable sentiment toward the asset class, although spreads ended the period wider than they were at the beginning of 2005.
Strategy overview
We continued to upgrade the credit quality of the portfolio during the period, moving away from the lower-quality bonds we had emphasized during the past two years. This shift was based on our belief that the Fed’s continued tightening of short-term interest rates would start to curtail economic growth. We also felt that narrow yield spreads meant high-yield bond investors were not being compensated enough for the added risk of owning lower-quality bonds.
| Market sector performance | |
These indexes provide an overview of performance in different market sectors for the | |
| 12 months ended 11/30/05. | |
|
| |
| Bonds | |
| JP Morgan Developed High Yield Index (global high-yield corporate bonds) | 3.28% |
|
| Lehman Aggregate Bond Index (broad bond market) | 2.40% |
|
| Lehman GNMA Index (Government National Mortgage Association bonds) | 2.59% |
|
| Citigroup World Government Bond Index (global government bonds) | -6.33% |
|
| Equities | |
| S&P 500 Index (broad stock market) | 8.44% |
|
| Russell 2000 Index (small-company stocks) | 8.14% |
|
| MSCI EAFE Index (international stocks) | 13.25% |
|
8
In comparison to the benchmark, the fund carried an overweighted stake in energy, where we focused on small and midsize exploration and production companies that we considered positioned to profit from higher oil and gas prices. We underweighted transportation issues, avoiding bonds issued by Delta and Northwest, both of which declared bankruptcy during the period. We were very cautious within the automotive sector, particularly regarding auto suppliers whose fates are heavily dependent on the big three U.S. auto producers, and who were adversely affected by higher operating costs. In addition, we underweighted paper and forest products. Generally speaking, these bonds were unattractively priced, and we believed that some firms were facing weakening business prospects. We avoided some poorly performing securities within the packaging group, where companies encountered rising costs for the petroleum-based resins they use in manufacturing. As noted earlier, the fund carried a small stake in emerging-market debt for part of the period, and sold it when the bonds reached our price targets.
Your fund’s holdings
During your fund’s fiscal year, its performance was helped by several factors. The sector weighting decisions just described -- overweighting energy, underweighting transportation as well as paper and forest products, and taking
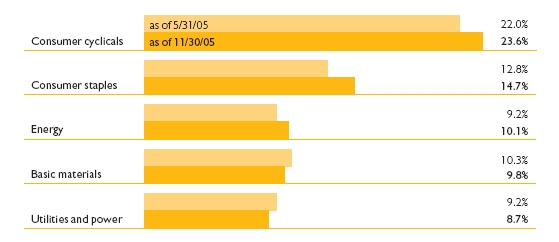
Comparison of top sector weightings
|
This chart shows how the fund’s top weightings have changed over the last six months.
Weightings are shown as a percentage of net assets. Holdings will vary over time.
9
advantage of emerging markets’ strength for part of the period -- all buoyed performance. The fund’s strong showing relative to its new benchmark is mainly due to our underweighting or not owning certain index components that suffered price declines during the period. For example, we avoided electric energy merchant Calpine, which appeared headed toward bankruptcy due to heavy indebtedness and rising prices for the natural gas the firm uses for power generation. The fund also benefited from underweighting Ford and General Motors, which, after enjoying a short rally upon entering the high-yield market, underperformed over the six-month period due to relatively weak business fundamentals. Pet food manufacturer Doane Pet Care, on the other hand, made a substantial, positive contribution to performance. This smaller, lower-rated company was acquired and its bonds and preferred stock obligations were redeemed, resulting in significant capital appreciation for the fund.
On the downside, the fund’s performance relative to its benchmark index was held back by our decision not to purchase bonds issued by electric energy merchant Mirant and rural/suburban wireless telecommunications services provider Dobson Communications. Both of these companies’ bonds recovered from depressed price levels during the period. Mirant’s bonds rallied as the company emerged from bankruptcy, but we chose to not purchase any
Top holdings
This table shows the fund’s top holdings, and the percentage of the fund’s net assets that each comprised, as of 11/30/05. The fund’s holdings will change over time.
| Holding (percent of fund’s net assets) | Coupon (%) and maturity date | Industry |
| CCH I LLC 144A (1.0%) | 11%, 2015 | Consumer staples |
|
| Neon Capital, Ltd. 144A | | |
| (Cayman Islands) (0.9%) | 1.105%, 2013 | Asset-backed securities |
|
| Qwest Corp. (0.9%) | 8.875%, 2012 | Communications services |
|
| General Motors Acceptance Corp. (0.8%) | 8%, 2031 | Consumer cyclicals |
|
| AT&T Corp. (0.8%) | 9.75%, 2031 | Communications services |
|
| Neon Capital, Ltd. 144A | | |
| (Cayman Islands) (0.7%) | 1.686%, 2013 | Asset-backed securities |
|
| Ford Motor Credit Corp. (0.6%) | 7.875%, 2010 | Consumer cyclicals |
|
| Arch Western Finance, LLC (0.6%) | 6.75%, 2013 | Energy |
|
| Legrand SA (France) (0.6%) | 8.5% 2025 | Capital goods |
|
| Equistar Chemicals LP/Equistar | | |
| Funding Corp. (0.5%) | 10.125%, 2008 | Basic materials |
|
10
because we found Mirant’s credit profile unappealing. Similarly, Dobson’s bonds rallied when the company posted better-than-expected revenues from roaming charges that bolstered its financial health, but we missed out on the rebound due to credit concerns. Fund holding Charter Communications, a cable TV operator, declined during the period. Charter fell along with most of its industry as cable TV providers encountered increasing competition for their packaged services from satellite and telephone companies.
Please note that the holdings discussed in this report may not have been held by the fund for the entire period discussed, are subject to review in accordance with the fund’s investment strategy, and may vary in the future.
The outlook for your fund
|
The following commentary reflects anticipated developments that could affect your fund over the next six months, as well as your management team’s plans for responding to them.
At this time, we believe corporate business fundamentals are generally positive, driven by a strong U.S. economy, healthy capital markets, merger-and-acquisitions activity, credit upgrades, and low default rates. Defaults may rise from current lows during the next 12 months, but we do not anticipate that any increase will be dramatic. In terms of valuations, yield spreads between high-yield bonds and Treasuries are currently narrower than the historical average, indicating that high-yield bond valuations may be relatively high -- although historically, spreads have been at similar levels during extended periods of low default rates. As for technicals (issues related to the supply of and demand for high-yield bonds that help drive the market), demand and new-issue supply have both waned, leading us to a neutral outlook in this area. Overall, we feel that, after such a run-up in the recent past, any positive returns for high-yield bonds will largely be generated by their regular interest payments. We intend to follow a relatively defensive approach, particularly regarding credit quality, as we believe it is the most prudent choice in this environment.
The views expressed in this report are exclusively those of Putnam Management. They are not meant as investment advice.
Mutual funds that invest in bonds are subject to certain risks, including interest-rate risk, credit risk, and inflation risk. As interest rates rise, the prices of bonds fall. Long-term bonds are more exposed to interest-rate risk than short-term bonds. Unlike bonds, bond funds have ongoing fees and expenses. Lower-rated bonds may offer higher yields in return for more risk. The fund is closed to new investors.
11
This section shows your fund’s performance during its fiscal year, which ended November 30, 2005. In accordance with regulatory requirements, we also include performance for the most current calendar quarter-end. Performance should always be considered in light of a fund’s investment strategy. Data represents past performance. Past performance does not guarantee future results. More recent returns may be less or more than those shown. Investment return and principal value will fluctuate, and you may have a gain or a loss when you sell your shares. For the most recent month-end performance, please visit www.putnam.com or call Putnam at 1-800-225-1581. Class Y shares are generally only available to corporate and institutional clients. See the Terms and Definitions section in this report for definitions of the share classes offered by your fund.
| Fund performance | | | | | | | |
Total return for periods ended 11/30/05 | | | | | | |
|
| |
| | Class A | | Class B | | Class M | | Class Y |
| (inception dates) | (3/25/86) | | (5/16/94) | | (12/1/94) | | (12/31/98) |
| | NAV | POP | NAV | CDSC | NAV | POP | NAV |
|
| Annual average | | | | | | | |
| (life of fund) | 7.68% | 7.42% | 6.74% | 6.74% | 7.38% | 7.20% | 7.83% |
|
| 10 years | 65.51 | 58.04 | 52.88 | 52.88 | 62.27 | 56.99 | 70.08 |
| Annual average | 5.17 | 4.68 | 4.34 | 4.34 | 4.96 | 4.61 | 5.45 |
|
| 5 years | 50.73 | 43.88 | 44.45 | 42.57 | 49.55 | 44.72 | 53.73 |
| Annual average | 8.55 | 7.55 | 7.63 | 7.35 | 8.38 | 7.67 | 8.98 |
|
| 3 years | 45.65 | 39.19 | 42.21 | 39.21 | 44.65 | 40.06 | 46.99 |
| Annual average | 13.36 | 11.65 | 12.45 | 11.66 | 13.10 | 11.88 | 13.70 |
|
| 1 year | 3.67 | -0.99 | 2.91 | -1.94 | 3.46 | 0.05 | 3.80 |
|
Performance assumes reinvestment of distributions and does not account for taxes. Returns at public offering price (POP) for class A and M shares reflect a sales charge of 4.50% and 3.25%, respectively (which for class A shares does not reflect a reduction in sales charges that went into effect on April 1, 2005; if this reduction had been in place for all periods indicated, returns would have been higher). Class B share returns reflect the applicable contingent deferred sales charge (CDSC), which is 5% in the first year, declining to 1% in the sixth year, and is eliminated thereafter. Class Y shares has no initial sales charge or CDSC. Performance for class B, M, and Y shares before their inception is derived from the historical performance of class A shares, adjusted for the applicable sales charge (or CDSC) and, except for class Y shares, the higher operating expenses for such shares.
A 2% short-term trading fee may be applied to shares exchanged or sold within 5 days of purchase. In addition, there is a 1% short-term trading fee for this fund on shares sold or exchanged between 6 and 90 days.
12
Change in the value of a $10,000 investment ($9,550 after sales charge)
Cumulative total return from 11/30/95 to 11/30/05
|
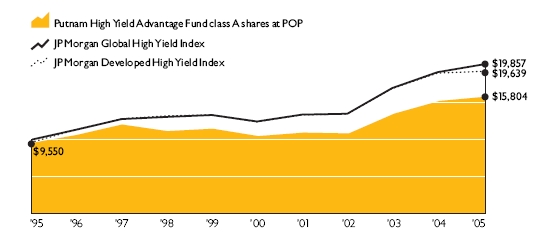
Past performance does not indicate future results. At the end of the same time period, a $10,000 investment in the
fund’s class B shares would have been valued at $15,288, and no contingent deferred sales charges would apply.
A $10,000 investment in the fund’s class M shares would have been valued at $16,227 ($15,699 at public offering
price). A $10,000 investment in the fund’s class Y shares would have been valued at $17,008. See first page of
performance section for performance calculation method.
Comparative index returns
For periods ended 11/30/05
|
| | | | Lipper High |
| | JP Morgan | JP Morgan | Current Yield |
| | Global High | Developed High | Funds category |
| | Yield Index | Yield Index | average* |
|
| Annual average | | | |
| (life of fund) | --† | --‡ | 7.11% |
|
| 10 years | 98.57% | 96.39% | 71.99 |
| Annual average | 7.10 | 6.98 | 5.43 |
|
| 5 years | 59.27 | 58.22 | 44.27 |
| Annual average | 9.76 | 9.61 | 7.51 |
|
| 3 years | 46.96 | 45.78 | 40.54 |
| Annual average | 13.69 | 13.39 | 11.96 |
|
| 1 year | 3.74 | 3.28 | 2.97 |
|
Index and Lipper results should be compared to fund performance at net asset value. During the period, the JP Morgan
Developed High Yield Index replaced the JP Morgan Global High Yield Index as the fund’s primary benchmark.
* Over the 1-, 3-, 5-, and 10-year periods ended 11/30/05, there were 426, 371, 303, and 102 funds, respectively, in this Lipper category.
† This index began operations on 12/31/93.
‡ This index began operations on 12/31/94.
|
13
| Fund price and distribution information | | | |
For the 12-month period ended 11/30/05 | | | | | |
|
| |
| | Class A | | Class B | Class M | | Class Y |
|
| Distributions (number) | 12 | | 12 | 12 | | 12 |
|
| Income1 | $0.408 | $0.361 | $0.396 | $0.420 |
|
| Capital gains1 | -- | | -- | -- | | -- |
|
| Total | $0.408 | $0.361 | $0.396 | $0.420 |
|
| Share value: | NAV | POP | NAV | NAV | POP | NAV |
|
| 11/30/04 | $6.16 | $6.45 | $6.08 | $6.17 | $6.38 | $6.27 |
|
| 11/30/05 | 5.97 | 6.20* | 5.89 | 5.98 | 6.18 | 6.08 |
|
| Current yield (end of period) | | | | | | |
| Current dividend rate1 | 6.83% | 6.58% | 6.11% | 6.62% | 6.41% | 6.91% |
|
| Current 30-day SEC yield2 | 7.17 | 6.90 | 6.41 | 6.85 | 6.69 | 7.35 |
|
| |
| * Reflects a reduction in sales charges that took effect on April 1, 2005. | | | | |
| 1 | Most recent distribution, excluding capital gains, annualized and divided by NAV or POP at end of period. |
| |
| 2 | Based only on investment income, calculated using SEC guidelines. |
| |
Fund performance for most recent calendar quarter
Total return for periods ended 12/31/05
|
| | Class A | | Class B | | Class M | | Class Y |
| (inception dates) | (3/25/86) | | (5/16/94) | | (12/1/94) | | (12/31/98) |
| | NAV | POP | NAV | CDSC | NAV | POP | NAV |
|
| Annual average | | | | | | | |
| (life of fund) | 7.69% | 7.43% | 6.76% | 6.76% | 7.40% | 7.22% | 7.84% |
|
| 10 years | 63.72 | 56.41 | 51.34 | 51.34 | 60.63 | 55.46 | 68.52 |
| Annual average | 5.05 | 4.57 | 4.23 | 4.23 | 4.85 | 4.51 | 5.36 |
|
| 5 years | 49.80 | 43.01 | 43.80 | 41.92 | 48.64 | 43.85 | 52.78 |
| Annual average | 8.42 | 7.42 | 7.54 | 7.25 | 8.25 | 7.54 | 8.85 |
|
| 3 years | 46.15 | 39.64 | 42.93 | 39.93 | 45.39 | 40.75 | 47.71 |
| Annual average | 13.48 | 11.77 | 12.64 | 11.85 | 13.29 | 12.07 | 13.89 |
|
| 1 year | 3.25 | -1.37 | 2.65 | -2.17 | 3.21 | -0.17 | 3.56 |
|
14
As a mutual fund investor, you pay ongoing expenses, such as management fees, distribution fees (12b-1 fees), and other expenses. Using the information below, you can estimate how these expenses affect your investment and compare them with the expenses of other funds. You may also pay one-time transaction expenses, including sales charges (loads) and redemption fees, which are not shown in this section and would have resulted in higher total expenses. For more information, see your fund’s prospectus or talk to your financial advisor.
Review your fund’s expenses
|
The table below shows the expenses you would have paid on a $1,000 investment in Putnam High Yield Advantage Fund from June 1, 2005, to November 30, 2005. It also shows how much a $1,000 investment would be worth at the close of the period, assuming actual returns and expenses.
| | Class A | Class B | Class M | Class Y |
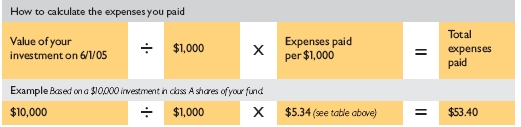
| Expenses paid per $1,000* | $ 5.34 | $ 9.14 | $ 6.61 | $ 4.07 |
|
| Ending value (after expenses) | $1,029.20 | $1,025.60 | $1,028.10 | $1,029.70 |
|
* Expenses for each share class are calculated using the fund’s annualized expense ratio for each class, which represents the ongoing expenses as a percentage of net assets for the six
months ended 11/30/05. The expense ratio may differ for each share class (see the table at the bottom of the next page). Expenses are calculated by multiplying the expense ratio by the
average account value for the period; then multiplying the result by the number of days in the period; and then dividing that result by the number of days in the year.
|
Estimate the expenses you paid
|
To estimate the ongoing expenses you paid for the six months ended November 30, 2005, use the calculation method below. To find the value of your investment on June 1, 2005, go to www.putnam.com and log on to your account. Click on the “Transaction History” tab in your Daily Statement and enter 06/01/2005 in both the “from” and “to” fields. Alternatively, call Putnam at 1-800-225-1581.
15
Compare expenses using the SEC’s method
The Securities and Exchange Commission (SEC) has established guidelines to help investors assess fund expenses. Per these guidelines, the table below shows your fund’s expenses based on a $1,000 investment, assuming a hypothetical 5% annualized return. You can use this information to compare the ongoing expenses (but not transaction expenses or total costs) of investing in the fund with those of other funds. All mutual fund shareholder reports will provide this information to help you make this comparison. Please note that you cannot use this information to estimate your actual ending account balance and expenses paid during the period.
| | Class A | Class B | Class M | Class Y |
| Expenses paid per $1,000* | $ 5.32 | $ 9.10 | $ 6.58 | $ 4.05 |
|
| Ending value (after expenses) | $1,019.80 | $1,016.04 | $1,018.55 | $1,021.06 |
|
| * | Expenses for each share class are calculated using the fund’s annualized expense ratio for each class, which represents the ongoing expenses as a percentage of net assets for the six months ended 11/30/05. The expense ratio may differ for each share class (see the table at the bottom of this page). Expenses are calculated by multiplying the expense ratio by the average account value for the period; then multiplying the result by the number of days in the period; and then dividing that result by the number of days in the year. |
| |
Compare expenses using industry averages
You can also compare your fund’s expenses with the average of its peer group, as defined by Lipper, an independent fund-rating agency that ranks funds relative to others that Lipper considers to have similar investment styles or objectives. The expense ratio for each share class shown below indicates how much of your fund’s net assets have been used to pay ongoing expenses during the period.
| | | Class A | Class B | Class M | Class Y |
| | Your fund’s annualized | | | | |
| | expense ratio† | 1.05% | 1.80% | 1.30% | 0.80% |
|
| | Average annualized expense | | | | |
| | ratio for Lipper peer group‡ | 1.11% | 1.86% | 1.36% | 0.86% |
|
| |
| † | For the fund’s most recent fiscal half year; may differ from expense ratios based on one-year data in the financial highlights. |
| |
| ‡ | Simple average of the expenses of all front-end load funds in the fund’s Lipper peer group, calculated in accordance with Lipper’s standard method for comparing fund expenses (excluding 12b-1 fees and without giving |
| effect to any expense offset and brokerage service arrangements that may reduce fund expenses). This average reflects each fund’s expenses for its most recent fiscal year available to Lipper as of 9/30/05. To facilitate comparison, |
| Putnam has adjusted this average to reflect the 12b-1 fees carried by each class of shares other than class Y shares, which do not incur 12b-1 fees. The peer group may include funds that are significantly smaller or larger than the fund, which |
| may limit the comparability of the fund’s expenses to the simple average, which typically is higher than the asset-weighted average. |
16
Your fund’s
portfolio turnover
|
Putnam funds are actively managed by teams of experts who buy and sell securities based on intensive analysis of companies, industries, economies, and markets. Portfolio turnover is a measure of how often a fund’s managers buy and sell securities for your fund. A portfolio turnover of 100%, for example, means that the managers sold and replaced securities valued at 100% of a fund’s assets within a one-year period. Funds with high turnover may be more likely to generate capital gains and dividends that must be distributed to shareholders as taxable income. High turnover may also cause a fund to pay more brokerage commissions and other transaction costs, which may detract from performance.
Funds that invest in bonds or other fixed-income instruments may have higher turnover than funds that invest only in stocks. Short-term bond funds tend to have higher turnover than longer-term bond funds, because shorter-term bonds will mature or be sold more frequently than longer-term bonds. You can use the table below to compare your fund’s turnover with the average turnover for funds in its Lipper category.
| Turnover comparisons | | | | | |
Percentage of holdings that change every year | | | |
|
| |
| | 2005 | 2004 | 2003 | 2002 | 2001 |
| Putnam High Yield | | | | | |
| Advantage Fund | 33% | 53% | 79% | 60% | 81% |
|
| Lipper High Current Yield | | | | | |
| Funds category average | 77% | 94% | 107% | 100% | 108% |
|
Turnover data for the fund is calculated based on the fund’s fiscal-year period, which ends on November 30. Turnover data for the fund’s Lipper category is calculated based on the average of the turnover of each fund in the category for its fiscal year ended during the indicated year. Fiscal years vary across funds in the Lipper category, which may limit the comparability of the fund’s portfolio turnover rate to the Lipper average. Comparative data for 2005 is based on information available as of 9/30/05.
17
This risk comparison is designed to help you understand how your fund compares with other funds. The comparison utilizes a risk measure developed by Morningstar, an independent fund-rating agency. This risk measure is referred to as the fund’s Overall Morningstar Risk.
Your fund’s Overall Morningstar® Risk
|
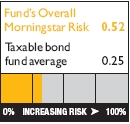
Your fund’s Overall Morningstar Risk is shown alongside that of the average fund in its broad asset class, as determined by Morningstar. The risk bar broadens the comparison by translating the fund’s Overall Morningstar Risk into a percentile, which is based on the fund’s ranking among all funds rated by Morningstar as of December 31, 2005. A higher Overall Morningstar Risk generally indicates that a fund’s monthly returns have varied more widely.
Morningstar determines a fund’s Overall Morningstar Risk by assessing variations in the fund’s monthly returns -- with an emphasis on downside variations -- over 3-, 5-, and 10-year periods, if available. Those measures are weighted and averaged to produce the fund’s Overall Morningstar Risk. The information shown is provided for the fund’s class A shares only; information for other classes may vary. Overall Morningstar Risk is based on historical data and does not indicate future results. Morningstar does not purport to measure the risk associated with a current investment in a fund, either on an absolute basis or on a relative basis. Low Overall Morningstar Risk does not mean that you cannot lose money on an investment in a fund. Copyright 2004 Morningstar, Inc. All Rights Reserved. The information contained herein (1) is proprietary to Morningstar and/or its content providers; (2) may not be copied or distributed; and (3) is not warranted to be accurate, complete, or timely. Neither Morningstar nor its content providers are responsible for any damages or losses arising from any use of this information.
18
Your fund is managed by the members of the Putnam Core Fixed-Income High-Yield Team. Paul Scanlon is the Portfolio Leader. Norman Boucher, Geoffrey Kelley, and Robert Salvin are Portfolio Members of your fund. The Portfolio Leader and Portfolio Members coordinate the team’s management of the fund.
For a complete listing of the members of the Putnam Core Fixed-Income High-Yield Team, including those who are not Portfolio Leaders or Portfolio Members of your fund, visit Putnam’s Individual Investor Web site at www.putnam.com.
Fund ownership by the Portfolio Leader and Portfolio Members
The table below shows how much the fund’s current Portfolio Leader and Portfolio Members have invested in the fund (in dollar ranges). Information shown is as of November 30, 2005, and November 30, 2004.
| | | | $1 - | $10,001 - | $50,001 - | $100,001 - | $500,001 - | $1,000,001 |
| | Year | $0 | $10,000 | $50,000 | $100,000 | $500,000 | $1,000,000 | and over |
|
| Paul Scanlon | 2005 | * | | | | | | |
| | | | | | | | |
|
|
| Portfolio Leader | 2004 | * | | | | | | |
|
| Norman Boucher | 2005 | * | | | | | | |
|
|
| Portfolio Member | N/A | | | | | | | |
|
| Geoffrey Kelley | 2005 | | | * | | | | |
|
|
| Portfolio Member | N/A | | | | | | | |
|
| Robert Salvin | 2005 | * | | | | | | |
|
|
| Portfolio Member | N/A | | | | | | | |
|
N/A indicates the individual was not a Portfolio Leader or Portfolio Member as of 11/30/04.
19
Fund manager compensation
|
The total 2004 fund manager compensation that is attributable to your fund is approximately $470,000. This amount includes a portion of 2004 compensation paid by Putnam Management to the fund managers listed in this section for their portfolio management responsibilities, calculated based on the fund assets they manage taken as a percentage of the total assets they manage. The compensation amount also includes a portion of the 2004 compensation paid to the Group Chief Investment Officer of the fund’s broader investment category for his oversight responsibilities, calculated based on the fund assets he oversees taken as a percentage of the total assets he oversees. This amount does not include compensation of other personnel involved in research, trading, administration, systems, compliance, or fund operations; nor does it include non-compensation costs. These percentages are determined as of the fund’s fiscal period-end. For personnel who joined Putnam Management during or after 2004, the calculation reflects annualized 2004 compensation or an estimate of 2005 compensation, as applicable.
Other Putnam funds managed by the Portfolio Leader and Portfolio Members
Paul Scanlon is also a Portfolio Leader of Putnam Floating Rate Income Fund, Putnam High Yield Trust, and Putnam Managed High Yield Trust. He is also a Portfolio Member of Putnam Diversified Income Trust, Putnam Master Intermediate Income Trust, and Putnam Premier Income Trust.
Norman Boucher is also a Portfolio Member of Putnam High Yield Trust and Putnam Managed High Yield Trust.
Geoffrey Kelley is also a Portfolio Member of Putnam High Yield Trust and Putnam Managed High Yield Trust.
Robert Salvin is also a Portfolio Member of Putnam High Income Securities Fund, Putnam High Yield Trust, and Putnam Managed High Yield Trust.
Paul Scanlon, Norman Boucher, Geoffrey Kelley, and Robert Salvin may also manage other accounts and variable trust funds advised by Putnam Management or an affiliate.
Changes in your fund’s Portfolio Leader and Portfolio Members
During the year ended November 30, 2005, Paul Scanlon became Portfolio Leader and Geoffrey Kelley and Robert Salvin became Portfolio Members of your fund, while Portfolio Member Norman Boucher rejoined your fund’s management team. These changes followed the departure of Portfolio Leader Stephen Peacher and Portfolio Member Rosemary Thomsen from your fund’s management team.
20
Fund ownership by Putnam’s Executive Board
The table below shows how much the members of Putnam’s Executive Board have invested in the fund (in dollar ranges). Information shown is as of November 30, 2005, and November 30, 2004.
| | | | | $1 - | $10,001 - | $50,001- | $100,001 |
| | Year | | $0 | $10,000 | $50,000 | $100,000 | and over |
|
| Philippe Bibi | 2005 | | * | | | | |
|
|
| Chief Technology Officer | 2004 | | * | | | | |
|
| Joshua Brooks | 2005 | | * | | | | |
|
|
| Deputy Head of Investments | N/A | | | | | | |
|
| William Connolly | 2005 | | * | | | | |
|
|
| Head of Retail Management | N/A | | | | | | |
|
| Kevin Cronin | 2005 | | * | | | | |
|
|
| Head of Investments | 2004 | | * | | | | |
|
| Charles Haldeman, Jr. | 2005 | | * | | | | |
|
|
| President and CEO | 2004 | | * | | | | |
|
| Amrit Kanwal | 2005 | | * | | | | |
|
|
| Chief Financial Officer | 2004 | | * | | | | |
|
| Steven Krichmar | 2005 | | * | | | | |
|
|
| Chief of Operations | 2004 | | * | | | | |
|
| Francis McNamara, III | 2005 | | | * | | | |
|
|
| General Counsel | 2004 | | | * | | | |
|
| Richard Robie, III | 2005 | | * | | | | |
|
|
| Chief Administrative Officer | 2004 | | * | | | | |
|
| Edward Shadek | 2005 | | * | | | | |
|
|
| Deputy Head of Investments | N/A | | | | | | |
|
| Sandra Whiston | 2005 | | * | | | | |
|
|
| Head of Institutional Management | N/A | | | | | | |
|
N/A indicates the individual was not a member of Putnam’s Executive Board as of 11/30/04.
21
Total return shows how the value of the fund’s shares changed over time, assuming you held the shares through the entire period and reinvested all distributions in the fund.
Net asset value (NAV) is the price, or value, of one share of a mutual fund, without a sales charge. NAVs fluctuate with market conditions. NAV is calculated by dividing the net assets of each class of shares by the number of outstanding shares in the class.
Public offering price (POP) is the price of a mutual fund share plus the maximum sales charge levied at the time of purchase. POP performance figures shown here assume the 4.50% maximum sales charge for class A shares (reduced to 3.75% on April 1, 2005) and 3.25% for class M shares.
Contingent deferred sales charge (CDSC) is a charge applied at the time of the redemption of class B shares and assumes redemption at the end of the period. Your fund’s class B CDSC declines from a 5% maximum during the first year to 1% during the sixth year. After the sixth year, the CDSC no longer applies.
Class A shares are generally subject to an initial sales charge and no sales charge on redemption (except on certain redemptions of shares bought without an initial sales charge).
Class B shares may be subject to a sales charge upon redemption.
Class M shares have a lower initial sales charge and a higher 12b-1 fee than class A shares and no sales charge on redemption.
Class Y shares are not subject to an initial sales charge or CDSC, and carry no 12b-1 fee. They are only available to eligible purchasers, including eligible defined contribution plans or corporate IRAs.
22
Citigroup World Government Bond Index is an unmanaged index of global investment-grade fixed-income securities.
JP Morgan Developed High Yield Index is an unmanaged index of high-yield fixed-income securities issued in developed countries.
JP Morgan Global High Yield Index is an unmanaged index of global high-yield fixed-income securities.
Lehman Aggregate Bond Index is an unmanaged index of U.S. investment-grade fixed-income securities.
Lehman GNMA Index is an unmanaged index of Government National Mortgage Association bonds.
Morgan Stanley Capital International (MSCI) EAFE Index is an unmanaged index of equity securities from developed countries in Western Europe, the Far East, and Australasia.
Russell 2000 Index is an unmanaged index of the 2,000 smallest companies in the Russell 3000 Index.
S&P 500 Index is an unmanaged index of common stock performance.
Indexes assume reinvestment of all distributions and do not account for fees. Securities and performance of a fund and an index will differ. You cannot invest directly in an index.
Lipper is a third-party industry-ranking entity that ranks mutual funds. Lipper rankings are based on total return at net asset value and do not reflect sales charges. Funds are ranked among other funds with similar current investment styles or objectives as determined by Lipper. Lipper may change a fund’s category assignment at its discretion. Lipper category averages reflect performance trends for funds within a category.
23
Trustee approval of
management contract
|
The Board of Trustees of the Putnam funds oversees the management of each fund and, as required by law, determines annually whether to approve the continuance of your fund’s management contract with Putnam Management and its sub-management contract with Putnam Management’s affiliate, Putnam Investments Limited (“PIL”). In this regard, the Board of Trustees, with the assistance of its Contract Committee consisting solely of Trustees who are not “interested persons” (as such term is defined in the Investment Company Act of 1940, as amended) of the Putnam funds (the “Independent Trustees”), requests and evaluates all information it deems reasonably necessary under the circumstances. Over the course of several months beginning in March and ending in June 2005, the Contract Committee met five times to consider the information provided by Putnam Management and other information developed with the assistance of the Board’s independent counsel and independent staff. The Contract Committee reviewed and discussed key aspects of this information with all of the Independent Trustees. Upon completion of this review, the Contract Committee recommended and the Independent Trustees approved the continuance of your fund’s management contract and sub-management contract, effective July 1, 2005. Because PIL is an affiliate of Putnam Management and Putnam Management remains fully responsible for all services provided by PIL, the Trustees have not evaluated PIL as a separate entity and all subsequent references to Putnam Management below should be deemed to include reference to PIL as necessary or appropriate in the context.
This approval was based on the following conclusions:
- That the fee schedule currently in effect for your fund represents reasonable compensation in light of the nature and quality of the services being provided to the fund, the fees paid by competitive funds and the costs incurred by Putnam Management in providing such services, and
- That such fee schedule represents an appropriate sharing between fund shareholders and Putnam Management of such economies of scale as may exist in the management of the fund at current asset levels.
These conclusions were based on a comprehensive consideration of all information provided to the Trustees and were not the result of any single factor. Some of the factors that figured particularly in the Trustees’ deliberations and how the Trustees considered these factors are described below, although individual Trustees may have evaluated the information presented differently, giving different weights to various factors. It is also important to recognize that the fee arrangements for your fund and the other Putnam funds are the result of many years of review and discussion between the Independent Trustees and Putnam Management, that certain aspects of such arrangements may receive greater scrutiny in some years than others, and that the Trustees’ conclusions may be based, in part, on their consideration of these same arrangements in prior years.
24
Model fee schedules and categories; total expenses
The Trustees’ review of the management fees and total expenses of the Putnam funds focused on three major themes:
- Consistency. The Trustees, working in cooperation with Putnam Management, have devel- oped and implemented a series of model fee schedules for the Putnam funds designed to ensure that each fund’s management fee is consistent with the fees for similar funds in the Putnam family of funds and compares favorably with fees paid by competitive funds spon- sored by other investment advisors. Under this approach, each Putnam fund is assigned to one of several fee categories based on a combination of factors, including competitive fees and perceived difficulty of management, and a common fee schedule is implemented for all funds in a given fee category. The Trustees reviewed the model fee schedule currently in effect for your fund, including fee levels and breakpoints, and the assignment of the fund to a particular fee category under this structure. (“Breakpoints” refer to reductions in fee rates that apply to additional assets once specified asset levels are reached.) The Trustees concluded that no changes should be made in the fund’s current fee schedule at this time.
- Competitiveness. The Trustees also reviewed comparative fee and expense information for competitive funds, which indicated that, in a custom peer group of competitive funds selected by Lipper Inc., your fund ranked in the 62nd percentile in management fees and in the 48th percentile in total expenses (less any applicable 12b-1 fees) as of December 31, 2004 (the first percentile being the least expensive funds and the 100th percentile being the most expensive funds). (Because the fund’s custom peer group is smaller than the fund’s broad Lipper Inc. peer group, this expense comparison may differ from the Lipper peer expense information found elsewhere in this report.) The Trustees noted that expense ratios for a number of Putnam funds, which show the percentage of fund assets used to pay for manage- ment and administrative services, distribution (12b-1) fees and other expenses, had been increasing recently as a result of declining net assets and the natural operation of fee break- points. They noted that such expense ratio increases were currently being controlled by expense limitations implemented in January 2004 and which Putnam Management, in consul- tation with the Contract Committee, has committed to maintain at least through 2006. The Trustees expressed their intention to monitor this information closely to ensure that fees and expenses of the Putnam funds continue to meet evolving competitive standards.
- Economies of scale. The Trustees concluded that the fee schedule currently in effect for your fund represents an appropriate sharing of economies of scale at current asset levels. Your fund currently has the benefit of breakpoints in its management fee that provide shareholders with significant economies of scale, which means that the effective management fee rate of a fund (as a percentage of fund assets) declines as a fund grows in size and crosses specified asset thresholds. The Trustees examined the existing breakpoint structure of the Putnam funds’ management fees in light of competitive industry practices. The Trustees considered
25
various possible modifications to the Putnam funds’ current breakpoint structure, but ultimately concluded that the current breakpoint structure continues to serve the interests of fund shareholders. Accordingly, the Trustees continue to believe that the fee schedules currently in effect for the funds represent an appropriate sharing of economies of scale at current asset levels. The Trustees noted that significant redemptions in many Putnam funds, together with significant changes in the cost structure of Putnam Management, have altered the economics of Putnam Management’s business in significant ways. In view of these changes, the Trustees intend to consider whether a greater sharing of the economies of scale by fund shareholders would be appropriate if and when aggregate assets in the Putnam funds begin to experience meaningful growth.
In connection with their review of the management fees and total expenses of the Putnam funds, the Trustees also reviewed the costs of the services to be provided and profits to be realized by Putnam Management and its affiliates from the relationship with the funds. This information included trends in revenues, expenses and profitability of Putnam Management and its affiliates relating to the investment management and distribution services provided to the funds. In this regard, the Trustees also reviewed an analysis of Putnam Management’s revenues, expenses and profitability with respect to the funds’ management contracts, allocated on a fund-by-fund basis.
The quality of the investment process provided by Putnam Management represented a major factor in the Trustees’ evaluation of the quality of services provided by Putnam Management under your fund’s management contract. The Trustees were assisted in their review of the funds’ investment process and performance by the work of the Investment Oversight Committees of the Trustees, which meet on a regular monthly basis with the funds’ portfolio teams throughout the year. The Trustees concluded that Putnam Management generally provides a high-quality investment process -- as measured by the experience and skills of the individuals assigned to the management of fund portfolios, the resources made available to such personnel, and in general the ability of Putnam Management to attract and retain high-quality personnel -- but also recognize that this does not guarantee favorable investment results for every fund in every time period. The Trustees considered the investment performance of each fund over multiple time periods and considered information comparing the fund’s performance with various benchmarks and with the performance of competitive funds. The Trustees noted the satisfactory investment performance of many Putnam funds. They also noted the disappointing investment performance of certain funds in recent years and continued to discuss with senior management of Putnam Management the factors contributing to such underperformance and actions being taken to improve performance. The Trustees recognized that, in recent years, Putnam Management has made significant changes in its investment personnel and processes and in the fund product line to address areas of underperformance. The Trustees indicated their intention to continue to
26
monitor performance trends to assess the effectiveness of these changes and to evaluate whether additional remedial changes are warranted.
In the case of your fund, the Trustees considered that your fund’s class A share performance at net asset value was in the following percentiles of its Lipper Inc. peer group for the one-, three-and five-year periods ended December 31, 2004 (the first percentile being the best-performing funds and the 100th percentile being the worst-performing funds):
| One-year period | Three-year period | Five-year period |
|
| 19th | 24th | 47th |
(Because of the passage of time, these performance results may differ from the performance results for more recent periods shown elsewhere in this report.)
As a general matter, the Trustees believe that cooperative efforts between the Trustees and Putnam Management represent the most effective way to address investment performance problems. The Trustees believe that investors in the Putnam funds have, in effect, placed their trust in the Putnam organization, under the oversight of the funds’ Trustees, to make appropriate decisions regarding the management of the funds. Based on the responsiveness of Putnam Management in the recent past to Trustee concerns about investment performance, the Trustees believe that it is preferable to seek change within Putnam Management to address performance shortcomings. In the Trustees’ view, the alternative of terminating a management contract and engaging a new investment advisor for an underperforming fund would entail significant disruptions and would not provide any greater assurance of improved investment performance.
Brokerage and soft-dollar allocations; other benefits
The Trustees considered various potential benefits that Putnam Management may receive in connection with the services it provides under the management contract with your fund. These include principally benefits related to brokerage and soft-dollar allocations, whereby a portion of the commissions paid by a fund for brokerage is earmarked to pay for research services that may be utilized by a fund’s investment advisor, subject to the obligation to seek best execution. The Trustees believe that soft-dollar credits and other potential benefits associated with the allocation of fund brokerage, which pertains mainly to funds investing in equity securities, represent assets of the funds that should be used for the benefit of fund shareholders. This area has been marked by significant change in recent years. In July 2003, acting upon the Contract Committee’s recommendation, the Trustees directed that allocations of brokerage to reward firms that sell fund shares be discontinued no later than December 31, 2003. In addition, commencing in 2004, the allocation of brokerage commissions by Putnam Management to acquire research services from third-party service providers has been significantly reduced, and continues at a modest level only to acquire research that is customarily not available for cash. The Trustees will continue to monitor the allocation of the funds’ brokerage to ensure that the principle of “best price and execution” remains paramount in the portfolio trading process.
27
The Trustees’ annual review of your fund’s management contract also included the review of its distributor’s contract and distribution plan with Putnam Retail Management Limited Partnership and the custodian agreement and investor servicing agreement with Putnam Fiduciary Trust Company, all of which provide benefits to affiliates of Putnam Management.
Comparison of retail and institutional fee schedules
The information examined by the Trustees as part of their annual contract review has included for many years information regarding fees charged by Putnam Management and its affiliates to institutional clients such as defined benefit pension plans, college endowments, etc. This information included comparison of such fees with fees charged to the funds, as well as a detailed assessment of the differences in the services provided to these two types of clients. The Trustees observed, in this regard, that the differences in fee rates between institutional clients and the mutual funds are by no means uniform when examined by individual asset sectors, suggesting that differences in the pricing of investment management services to these types of clients reflect to a substantial degree historical competitive forces operating in separate market places. The Trustees considered the fact that fee rates across all asset sectors are higher on average for mutual funds than for institutional clients, as well as the differences between the services that Putnam Management provides to the Putnam funds and those that it provides to institutional clients of the firm, but have not relied on such comparisons to any significant extent in concluding that the management fees paid by your fund are reasonable.
28
Other information
for shareholders
|
Putnam’s policy on confidentiality
|
In order to conduct business with our shareholders, we must obtain certain personal information such as account holders’ addresses, telephone numbers, Social Security numbers, and the names of their financial advisors. We use this information to assign an account number and to help us maintain accurate records of transactions and account balances. It is our policy to protect the confidentiality of your information, whether or not you currently own shares of our funds, and in particular, not to sell information about you or your accounts to outside marketing firms. We have safeguards in place designed to prevent unauthorized access to our computer systems and procedures to protect personal information from unauthorized use. Under certain circumstances, we share this information with outside vendors who provide services to us, such as mailing and proxy solicitation. In those cases, the service providers enter into confidentiality agreements with us, and we provide only the information necessary to process transactions and perform other services related to your account. We may also share this information with our Putnam affiliates to service your account or provide you with information about other Putnam products or services. It is also our policy to share account information with your financial advisor, if you’ve listed one on your Putnam account. If you would like clarification about our confidentiality policies or have any questions or concerns, please don’t hesitate to contact us at 1-800-225-1581, Monday through Friday, 8:30 a.m. to 7:00 p.m., or Saturdays from 9:00 a.m. to 5:00 p.m. Eastern Time.
Putnam is committed to managing our mutual funds in the best interests of our shareholders. The Putnam funds’ proxy voting guidelines and procedures, as well as information regarding how your fund voted proxies relating to portfolio securities during the 12-month period ended June 30, 2005, are available on the Putnam Individual Investor Web site, www.putnam.com/individual, and on the SEC’s Web site, www.sec.gov. If you have questions about finding forms on the SEC’s Web site, you may call the SEC at 1-800-SEC-0330. You may also obtain the Putnam funds’ proxy voting guidelines and procedures at no charge by calling Putnam’s Shareholder Services at 1-800-225-1581.
The fund will file a complete schedule of its portfolio holdings with the SEC for the first and third quarters of each fiscal year on Form N-Q. Shareholders may obtain the fund’s Forms N-Q on the SEC’s Web site at www.sec.gov. In addition, the fund’s Forms N-Q may be reviewed and copied at the SEC’s public reference room in Washington, D.C. You may call the SEC at 1-800-SEC-0330 for information about the SEC’s Web site or the operation of the public reference room.
29
A guide to financial statements
|
These sections of the report, as well as the accompanying Notes, preceded by the Report of Independent Registered Public Accounting Firm, constitute the fund’s financial statements.
The fund’s portfolio lists all the fund’s investments and their values as of the last day of the reporting period. Holdings are organized by asset type and industry sector, country, or state to show areas of concentration and diversification.
Statement of assets and liabilities shows how the fund’s net assets and share price are determined. All investment and noninvestment assets are added together. Any unpaid expenses and other liabilities are subtracted from this total. The result is divided by the number of shares to determine the net asset value per share, which is calculated separately for each class of shares. (For funds with preferred shares, the amount subtracted from total assets includes the liquidation preference of preferred shares.)
Statement of operations shows the fund’s net investment gain or loss. This is done by first adding up all the fund’s earnings -- from dividends and interest income - -- and subtracting its operating expenses to determine net investment income (or loss). Then, any net gain or loss the fund realized on the sales of its holdings - -- as well as any unrealized gains or losses over the period -- is added to or subtracted from the net investment result to determine the fund’s net gain or loss for the fiscal year.
Statement of changes in net assets shows how the fund’s net assets were affected by the fund’s net investment gain or loss, by distributions to shareholders, and by changes in the number of the fund’s shares. It lists distributions and their sources (net investment income or realized capital gains) over the current reporting period and the most recent fiscal year-end. The distributions listed here may not match the sources listed in the Statement of operations because the distributions are determined on a tax basis and may be paid in a different period from the one in which they were earned.
Financial highlights provide an overview of the fund’s investment results, per-share distributions, expense ratios, net investment income ratios, and portfolio turnover in one summary table, reflecting the five most recent reporting periods. In a semiannual report, the highlight table also includes the current reporting period. For open-end funds, a separate table is provided for each share class.
30
Report of Independent Registered
Public Accounting Firm
|
The Board of Trustees and Shareholders
Putnam High Yield Advantage Fund:
|
We have audited the accompanying statement of assets and liabilities of Putnam High Yield Advantage Fund, including the fund’s portfolio, as of November 30, 2005, and the related statement of operations for the year then ended, the statements of changes in net assets for each of the two years in the period then ended and the financial highlights for each of the five years in the period then ended. These financial statements and financial highlights are the responsibility of the Fund’s management. Our responsibility is to express an opinion on these financial statements and financial highlights based on our audits.
We conducted our audits in accordance with the standards of the Public Company Accounting Oversight Board (United States). Those standards require that we plan and perform our audit to obtain reasonable assurance about whether the financial statements and financial highlights are free of material misstatement. An audit includes examining, on a test basis, evidence supporting the amounts and disclosures in the financial statements. Our procedures included confirmation of securities owned as of November 30, 2005, by correspondence with the custodian and brokers or by other appropriate auditing procedures. An audit also includes assessing the accounting principles used and significant estimates made by management, as well as evaluating the overall financial statement presentation. We believe that our audits provide a reasonable basis for our opinion.
In our opinion, the financial statements and financial highlights referred to above present fairly, in all material respects, the financial position of Putnam High Yield Advantage Fund as of November 30, 2005, the results of its operations for the year then ended, the changes in its net assets for each of the two years in the period then ended, and the financial highlights for each of the five years in the period then ended in conformity with U.S. generally accepted accounting principles.

Boston, Massachusetts
January 11, 2006
|
31
| The fund’s portfolio 11/30/05 | | | | |
|
| |
| |
| |
| CORPORATE BONDS AND NOTES (90.6%)* | | | | |
|
| | Principal amount | | Value |
| |
| Advertising and Marketing Services (0.4%) | | | | |
| Affinion Group, Inc. 144A company guaranty 10 1/8s, 2013 | $ | 2,045,000 | $ | 1,937,638 |
| Lamar Media Corp. company guaranty 7 1/4s, 2013 | | 1,715,000 | | 1,766,450 |
| | | | | 3,704,088 |
|
| |
| Automotive (3.9%) | | | | |
| Dana Corp. notes 9s, 2011 | | 2,845,000 | | 2,332,900 |
| Dura Operating Corp. company guaranty Ser. B, 8 5/8s, 2012 | | 1,485,000 | | 1,232,550 |
| Ford Motor Co. notes 7.45s, 2031 | | 3,775,000 | | 2,661,375 |
| Ford Motor Credit Corp. bonds 7 3/8s, 2011 | | 4,100,000 | | 3,725,055 |
| Ford Motor Credit Corp. notes 7 7/8s, 2010 | | 6,205,000 | | 5,815,338 |
| Ford Motor Credit Corp. notes 7 3/8s, 2009 | | 2,130,000 | | 1,957,966 |
| General Motors Acceptance Corp. bonds 8s, 2031 | | 8,030,000 | | 7,874,459 |
| General Motors Acceptance Corp. notes 5 1/8s, 2008 | | 1,460,000 | | 1,308,971 |
| Meritor Automotive, Inc. notes 6.8s, 2009 | | 1,620,000 | | 1,482,300 |
| Tenneco Automotive, Inc. company guaranty 8 5/8s,2014 | | 1,705,000 | | 1,592,044 |
| Tenneco Automotive, Inc. sec. notes Ser. B, 10 1/4s, 2013 | | 2,770,000 | | 3,026,225 |
| TRW Automotive Inc. sr. sub. notes 11s, 2013 | | 3,375,000 | | 3,771,563 |
| | | | | 36,780,746 |
|
| |
| Basic Materials (9.1%) | | | | |
| ALROSA Finance SA 144A company guaranty 8 7/8s, | | | | |
| 2014 (Luxembourg) | | 1,920,000 | | 2,203,200 |
| BCP Crystal US Holdings Corp. sr. sub. notes 9 5/8s, 2014 | | 1,860,000 | | 2,062,275 |
| Century Aluminum Co. company guaranty 7 1/2s, 2014 | | 1,135,000 | | 1,095,275 |
| Chaparral Steel Co. 144A sr. unsecd. notes 10s, 2013 | | 3,170,000 | | 3,368,125 |
| Chesapeake Corp. sr. sub. notes 7s, 2014 | EUR | 705,000 | | 813,186 |
| Cognis Holding GmbH & Co. 144A | | | | |
| sr. notes 9 1/2s, 2014 (Germany) | EUR | 890,000 | | 1,126,768 |
| Compass Minerals Group, Inc. company guaranty 10s, 2011 | $ | 1,730,000 | | 1,868,400 |
| Compass Minerals International, Inc. | | | | |
| sr. notes stepped-coupon zero % (12 3/4s, 12/15/07), 2012 †† | | 4,315,000 | | 3,840,350 |
| Crystal US Holdings, LLC sr. disc. | | | | |
| notes stepped-coupon Ser. A, zero % (10s, 10/1/09), 2014 †† | | 2,345,000 | | 1,664,950 |
| Equistar Chemicals LP/Equistar Funding Corp. company | | | | |
| guaranty 10 1/8s, 2008 | | 4,685,000 | | 5,106,650 |
| Georgia-Pacific Corp. company guaranty 8 7/8s, 2010 | | 610,000 | | 686,250 |
| Georgia-Pacific Corp. debs. 9 1/2s, 2011 | | 715,000 | | 762,369 |
| Georgia-Pacific Corp. sr. notes 8s, 2024 | | 210,000 | | 202,125 |
| Gerdau Ameristeel Corp. sr. notes 10 3/8s, 2011 (Canada) | | 2,630,000 | | 2,893,000 |
| Gibraltar Industries, Inc. 144A sr. sub. notes 8s, 2015 | | 1,085,000 | | 1,093,138 |
| Hercules, Inc. company guaranty 6 3/4s, 2029 | | 2,610,000 | | 2,528,438 |
| Huntsman Advanced Materials, LLC sec. FRN 11.82s, 2008 | | 168,000 | | 176,400 |
| Huntsman Advanced Materials, LLC sec. notes 11s, 2010 | | 100,000 | | 114,250 |
32
| CORPORATE BONDS AND NOTES (90.6%)* continued | | | | |
|
| | Principal amount | | Value |
| |
| Basic Materials continued | | | | |
| Huntsman International, LLC company guaranty 10 1/8s, 2009 | $ | 2,719,000 | $ | 2,807,368 |
| Huntsman, LLC company guaranty 11 5/8s, 2010 | | 948,000 | | 1,077,165 |
| Huntsman, LLC company guaranty 11 1/2s, 2012 | | 732,000 | | 832,650 |
| Innophos, Inc. 144A sr. sub. notes 9 5/8s, 2014 | | 2,920,000 | | 2,934,600 |
| ISP Chemco, Inc. company guaranty Ser. B, 10 1/4s, 2011 | | 2,625,000 | | 2,795,625 |
| Ispat Inland ULC sec. notes 9 3/4s, 2014 | | 1,020,000 | | 1,150,050 |
| Jefferson Smurfit Corp. company guaranty 8 1/4s, 2012 | | 590,000 | | 572,300 |
| Jefferson Smurfit Corp. company guaranty 7 1/2s, 2013 | | 135,000 | | 124,538 |
| JSG Holding PLC 144A sr. notes 11 1/2s, | | | | |
| 2015 (Ireland) ‡‡ | EUR | 1,851,734 | | 1,964,542 |
| Lyondell Chemical Co. bonds 11 1/8s, 2012 | $ | 255,000 | | 286,875 |
| MDP Acquisitions PLC sr. notes 9 5/8s, 2012 (Ireland) | | 3,210,000 | | 3,177,900 |
| MDP Acquisitions PLC sr. notes Ser. EUR, | | | | |
| 10 1/8s, 2012 (Ireland) | EUR | 145,000 | | 182,378 |
| Metals USA, Inc. 144A sec. notes 11 1/8s, 2015 | $ | 1,235,000 | | 1,262,788 |
| Millennium America, Inc. company guaranty | | | | |
| 9 1/4s, 2008 | | 3,120,000 | | 3,369,600 |
| Nalco Co. sr. sub. notes 9s, 2013 | EUR | 1,200,000 | | 1,532,676 |
| Nalco Co. sr. sub. notes 8 7/8s, 2013 | $ | 2,450,000 | | 2,541,875 |
| Nell AF S.a.r.l. 144A sr. notes 8 3/8s, 2015 (Luxembourg) | | 1,910,000 | | 1,871,800 |
| Nell AF S.a.r.l. 144A sr. notes 8 3/8s, 2015 (Luxembourg) | EUR | 445,000 | | 525,877 |
| NewPage Corp. sec. notes 10s, 2012 | $ | 1,645,000 | | 1,620,325 |
| Norske Skog Canada, Ltd. sr. notes 7 3/8s, 2014 (Canada) | | 1,375,000 | | 1,244,375 |
| Novelis, Inc. 144A sr. notes 7 1/2s, 2015 | | 4,885,000 | | 4,567,475 |
| PCI Chemicals Canada sec. sr. notes 10s, 2008 (Canada) | | 476,488 | | 499,717 |
| PQ Corp. 144A company guaranty 7 1/2s, 2013 | | 765,000 | | 703,800 |
| Pregis Corp. 144A company guaranty 12 3/8s, 2013 | | 2,045,000 | | 1,993,875 |
| Rockwood Specialties Group, Inc. company | | | | |
| guaranty 7 5/8s, 2014 | EUR | 1,400,000 | | 1,696,529 |
| Rockwood Specialties Group, Inc. sub. notes 7 1/2s, 2014 | $ | 550,000 | | 539,000 |
| SGL Carbon Luxembourg SA 144A | | | | |
| sr. notes 8 1/2s, 2012 (Luxembourg) | EUR | 920,000 | | 1,185,896 |
| Steel Dynamics, Inc. company guaranty 9 1/2s, 2009 | $ | 1,370,000 | | 1,443,638 |
| Sterling Chemicals, Inc. sec. notes 10s, 2007 ‡‡ | | 644,388 | | 618,612 |
| Stone Container Corp. sr. notes 9 3/4s, 2011 | | 995,000 | | 1,014,900 |
| Stone Container Corp. sr. notes 8 3/8s, 2012 | | 3,810,000 | | 3,714,750 |
| Stone Container Finance company guaranty 7 3/8s, | | | | |
| 2014 (Canada) | | 585,000 | | 533,813 |
| Tembec Industries, Inc. company guaranty 7 3/4s, | | | | |
| 2012 (Canada) | | 230,000 | | 135,700 |
| Ucar Finance, Inc. company guaranty 10 1/4s, 2012 | | 1,560,000 | | 1,645,800 |
| United States Steel, LLC sr. notes 10 3/4s, 2008 | | 1,524,000 | | 1,682,115 |
| Wheeling-Pittsburgh Steel Corp. sr. notes 6s, 2010 ‡‡ | | 151,135 | | 120,908 |
| Wheeling-Pittsburgh Steel Corp. sr. notes 5s, 2011 ‡‡ | | 285,396 | | 231,884 |
| WHX Corp. sr. notes 10 1/2s, 2005 (In default) (F) † **** | | 930,000 | | 93 |
| | | | | 85,808,961 |
33
| CORPORATE BONDS AND NOTES (90.6%)* continued | | | | |
|
| | Principal amount | | Value |
| |
| Beverage (0.2%) | | | | |
| Constellation Brands, Inc. company guaranty Ser. B, | | | | |
| 8s, 2008 | $ | 1,640,000 | $ | 1,713,800 |
| Constellation Brands, Inc. sr. sub. notes Ser. B, | | | | |
| 8 1/8s, 2012 | | 145,000 | | 150,800 |
| | | | | 1,864,600 |
|
| |
| Broadcasting (3.2%) | | | | |
| DirecTV Holdings, LLC company guaranty 6 3/8s, 2015 | | 4,430,000 | | 4,346,938 |
| Diva Systems Corp. sr. disc. notes Ser. B, 12 5/8s, | | | | |
| 2008 (In default) † | | 12,449,000 | | 15,561 |
| Echostar DBS Corp. company guaranty 6 5/8s, 2014 | | 2,835,000 | | 2,735,775 |
| Echostar DBS Corp. sr. notes 6 3/8s, 2011 | | 5,085,000 | | 4,919,738 |
| Emmis Communications Corp. sr. notes FRN 9.745s, 2012 | | 1,450,000 | | 1,451,813 |
| Granite Broadcasting Corp. sec. notes 9 3/4s, 2010 | | 4,290,000 | | 3,989,700 |
| LIN Television Corp. sr. sub. notes 6 1/2s, 2013 | | 290,000 | | 277,675 |
| LIN Television Corp. 144A sr. sub. notes 6 1/2s, 2013 | | 705,000 | | 675,038 |
| Paxson Communications Corp. company guaranty | | | | |
| 10 3/4s, 2008 | | 2,060,000 | | 2,116,650 |
| Rainbow National Services, LLC 144A sr. notes 8 3/4s, 2012 | | 2,835,000 | | 2,990,925 |
| Rainbow National Services, LLC 144A | | | | |
| sr. sub. debs. 10 3/8s, 2014 | | 1,250,000 | | 1,362,500 |
| Sirius Satellite Radio, Inc. 144A sr. notes 9 5/8s, 2013 | | 2,060,000 | | 2,013,650 |
| Young Broadcasting, Inc. company guaranty 10s, 2011 | | 2,527,000 | | 2,375,380 |
| Young Broadcasting, Inc. sr. sub. notes 8 3/4s, 2014 | | 1,330,000 | | 1,167,075 |
| | | | | 30,438,418 |
|
| |
| Building Materials (1.2%) | | | | |
| Associated Materials, Inc. company guaranty 9 3/4s, 2012 | | 1,435,000 | | 1,348,900 |
| Building Materials Corp. company guaranty 8s, 2008 | | 1,450,000 | | 1,455,438 |
| Goodman Global Holding Co., Inc. 144A | | | | |
| sr. notes 6.41s, 2012 | | 1,285,000 | | 1,272,150 |
| Goodman Global Holding Co., Inc. 144A | | | | |
| sr. sub. notes 7 7/8s, 2012 | | 1,970,000 | | 1,851,800 |
| NTK Holdings, Inc. sr. disc. notes zero %, 2014 | | 1,435,000 | | 868,175 |
| Owens Corning notes 7 1/2s, 2005 (In default) † **** | | 2,245,000 | | 1,824,063 |
| Texas Industries, Inc. 144A sr. notes 7 1/4s, 2013 | | 700,000 | | 724,500 |
| THL Buildco, Inc. (Nortek Holdings, Inc.) | | | | |
| sr. sub. notes 8 1/2s, 2014 | | 2,340,000 | | 2,246,400 |
| | | | | 11,591,426 |
|
| |
| Cable Television (2.6%) | | | | |
| Atlantic Broadband Finance, LLC company | | | | |
| guaranty 9 3/8s, 2014 | | 1,530,000 | | 1,384,650 |
| CCH I Holdings, LLC 144A company guaranty 11 1/8s, 2014�� | | 2,936,000 | | 1,864,360 |
| CCH I Holdings, LLC 144A company guaranty 10s, 2014 | | 2,032,000 | | 1,249,680 |
| CCH I Holdings, LLC 144A company | | | | |
| guaranty stepped-coupon zero % (12 1/8s, 1/15/07), 2015 †† | | 135,000 | | 69,525 |
| CCH I, LLC 144A secd. notes 11s, 2015 | | 10,734,000 | | 9,204,405 |
| CSC Holdings, Inc. debs. 7 5/8s, 2018 | | 1,685,000 | | 1,600,750 |
34
| CORPORATE BONDS AND NOTES (90.6%)* continued | | | | |
|
| | Principal amount | | Value |
| |
| Cable Television continued | | | | |
| CSC Holdings, Inc. sr. notes Ser. B, 7 5/8s, 2011 | $ | 1,445,000 | $ | 1,437,775 |
| CSC Holdings, Inc. 144A sr. notes 6 3/4s, 2012 | | 2,635,000 | | 2,503,250 |
| Kabel Deutscheland GmbH 144A company | | | | |
| guaranty 10 5/8s, 2014 (Germany) | | 2,380,000 | | 2,558,500 |
| Quebecor Media, Inc. sr. notes 11 1/8s, 2011 (Canada) | | 2,480,000 | | 2,684,600 |
| | | | | 24,557,495 |
|
| |
| Capital Goods (7.0%) | | | | |
| AEP Industries, Inc. sr. unsub. 7 7/8s, 2013 | | 1,010,000 | | 983,329 |
| Allied Waste North America, Inc. company | | | | |
| guaranty Ser. B, 8 1/2s, 2008 | | 2,660,000 | | 2,793,000 |
| Allied Waste North America, Inc. sec. notes Ser. B, | | | | |
| 5 3/4s, 2011 | | 555,000 | | 528,638 |
| Amsted Industries, Inc. 144A sr. notes 10 1/4s, 2011 | | 2,740,000 | | 2,962,625 |
| Argo-Tech Corp. company guaranty 9 1/4s, 2011 | | 1,875,000 | | 1,935,938 |
| BE Aerospace, Inc. sr. notes 8 1/2s, 2010 | | 1,897,000 | | 2,029,790 |
| Blount, Inc. sr. sub. notes 8 7/8s, 2012 | | 2,495,000 | | 2,588,563 |
| Bombardier, Inc. 144A notes 6 3/4s, 2012 (Canada) | | 1,025,000 | | 943,000 |
| Browning-Ferris Industries, Inc. debs. 7.4s, 2035 | | 1,310,000 | | 1,152,800 |
| Browning-Ferris Industries, Inc. sr. notes 6 3/8s, 2008 | | 1,870,000 | | 1,862,942 |
| Crown Americas, LLC/Crown Americas Capital Corp. 144A | | | | |
| sr. notes 7 5/8s, 2013 | | 3,620,000 | | 3,710,500 |
| Decrane Aircraft Holdings Co. company | | | | |
| guaranty zero %, 2008 (acquired 7/23/04, | | | | |
| cost $3,250,000) ‡ | | 9,907,000 | | 4,755,360 |
| Earle M. Jorgensen Co. sec. notes 9 3/4s, 2012 | | 2,785,000 | | 2,966,025 |
| Hexcel Corp. sr. sub. notes 6 3/4s, 2015 | | 640,000 | | 617,600 |
| Invensys, PLC notes 9 7/8s, 2011 (United Kingdom) | | 1,040,000 | | 1,019,200 |
| Jacuzzi Brands, Inc. sec. notes 9 5/8s, 2010 | | 410,000 | | 436,650 |
| L-3 Communications Corp. company guaranty | | | | |
| 6 1/8s, 2013 | | 1,910,000 | | 1,867,025 |
| L-3 Communications Corp. 144A sr. sub. notes | | | | |
| 6 3/8s, 2015 | | 2,460,000 | | 2,423,100 |
| Legrand SA debs. 8 1/2s, 2025 (France) | | 4,360,000 | | 5,232,000 |
| Manitowoc Co., Inc. (The) company guaranty 10 1/2s, 2012 | | 188,000 | | 209,150 |
| Manitowoc Co., Inc. (The) company | | | | |
| guaranty 10 3/8s, 2011 | EUR | 670,000 | | 853,375 |
| Manitowoc Co., Inc. (The) sr. notes 7 1/8s, 2013 | $ | 865,000 | | 890,950 |
| Milacron Escrow Corp. sec. notes 11 1/2s, 2011 | | 1,020,000 | | 877,200 |
| Mueller Group, Inc. sr. sub. notes 10s, 2012 | | 900,000 | | 949,500 |
| Mueller Holdings, Inc. disc. notes stepped-coupon | | | | |
| zero % (14 3/4s, 4/15/09), 2014 †† | | 1,730,000 | | 1,301,825 |
| Owens-Brockway Glass company guaranty 8 1/4s, 2013 | | 2,725,000 | | 2,813,563 |
| Owens-Brockway Glass sr. sec. notes 8 3/4s, 2012 | | 3,035,000 | | 3,277,800 |
| Owens-Illinois, Inc. debs. 7.8s, 2018 | | 1,505,000 | | 1,482,425 |
| Polypore, Inc. notes 8 3/4s, 2012 | EUR | 465,000 | | 482,365 |
| Polypore, Inc. sr. sub. notes 8 3/4s, 2012 | $ | 390,000 | | 349,050 |
35
| CORPORATE BONDS AND NOTES (90.6%)* continued | | | | |
|
| | Principal amount | | Value |
| |
| Capital Goods continued | | | | |
| Ray Acquisition sr. notes 9 3/8s, 2015 (France) | EUR | 1,405,000 | $ | 1,719,978 |
| Siebe PLC 144A sr. unsub. 6 1/2s, 2010 | | | | |
| (United Kingdom) | $ | 1,580,000 | | 1,358,800 |
| Solo Cup Co. sr. sub. notes 8 1/2s, 2014 | | 1,945,000 | | 1,762,656 |
| TD Funding Corp. company guaranty 8 3/8s, 2011 | | 2,070,000 | | 2,142,450 |
| Tekni-Plex, Inc. 144A sec. notes 10 7/8s, 2012 | | 840,000 | | 915,600 |
| Terex Corp. company guaranty Ser. B, 10 3/8s, 2011 | | 3,155,000 | | 3,364,019 |
| | | | | 65,558,791 |
|
| |
| Commercial and Consumer Services (0.4%) | | | | |
| Ashtead Holdings PLC 144A sr. notes 8 5/8s, 2015 | | | | |
| (United Kingdom) | | 860,000 | | 896,550 |
| Coinmach Corp. sr. notes 9s, 2010 | | 3,182,000 | | 3,341,100 |
| | | | | 4,237,650 |
|
| |
| Communication Services (7.7%) | | | | |
| Alamosa Delaware, Inc. company guaranty 12s, 2009 | | 1,047,000 | | 1,149,083 |
| Alamosa Delaware, Inc. company guaranty 11s, 2010 | | 1,620,000 | | 1,838,700 |
| American Cellular Corp. company guaranty 9 1/2s, 2009 | | 785,000 | | 851,725 |
| American Cellular Corp. sr. notes Ser. B, 10s, 2011 | | 1,410,000 | | 1,526,325 |
| American Tower Corp. sr. notes 7 1/2s, 2012 | | 1,300,000 | | 1,355,250 |
| American Towers, Inc. company guaranty 7 1/4s, 2011 | | 2,965,000 | | 3,091,013 |
| Asia Global Crossing, Ltd. sr. notes 13 3/8s, 2010 | | | | |
| (Bermuda) (In default) † | | 2,241,629 | | 95,269 |
| AT&T Corp. sr. notes 9 3/4s, 2031 | | 6,155,000 | | 7,570,650 |
| Centennial Cellular Operating Co., LLC company | | | | |
| guaranty 10 1/8s, 2013 | | 845,000 | | 942,175 |
| Centennial Cellular Operating Co., LLC | | | | |
| sr. sub. notes 10 3/4s, 2008 | | 346,000 | | 352,920 |
| Cincinnati Bell Telephone Co. company guaranty | | | | |
| 6.3s, 2028 | | 520,000 | | 468,000 |
| Cincinnati Bell, Inc. company guaranty 7s, 2015 | | 885,000 | | 854,025 |
| Cincinnati Bell, Inc. sr. sub. notes 8 3/8s, 2014 | | 1,010,000 | | 989,800 |
| Cincinnati Bell, Inc. sr. sub. notes 7 1/4s, 2023 | | 1,575,000 | | 1,508,063 |
| Citizens Communications Co. notes 9 1/4s, 2011 | | 2,210,000 | | 2,414,425 |
| Citizens Communications Co. sr. notes 6 1/4s, 2013 | | 2,760,000 | | 2,656,500 |
| Digicel, Ltd. 144A sr. notes 9 1/4s, 2012 (Jamaica) | | 1,335,000 | | 1,375,050 |
| Dobson Cellular Systems sec. notes 9 7/8s, 2012 | | 940,000 | | 1,041,050 |
| Dobson Communications Corp. 144A sr. notes FRN | | | | |
| 8.4s, 2012 | | 855,000 | | 842,175 |
| Globix Corp. company guaranty 11s, 2008 ‡‡ | | 549,852 | | 520,985 |
| Horizon PCS, Inc. company guaranty 11 3/8s, 2012 | | 410,000 | | 472,525 |
| Inmarsat Finance PLC company guaranty 7 5/8s, 2012 | | | | |
| (United Kingdom) | | 1,969,000 | | 2,003,458 |
| Inmarsat Finance PLC company guaranty stepped-coupon | | | | |
| zero % (10 3/8s, 10/15/08), 2012 (United Kingdom) †† | | 3,060,000 | | 2,493,900 |
| Intelsat Bermuda, Ltd. 144A sr. notes 8 5/8s, | | | | |
| 2015 (Bermuda) | | 2,670,000 | | 2,676,675 |
36
| CORPORATE BONDS AND NOTES (90.6%)* continued | | | | |
|
| | Principal amount | | Value |
| |
| Communication Services continued | | | | |
| Intelsat Bermuda, Ltd. 144A sr. notes 8 1/4s, | | | | |
| 2013 (Bermuda) | $ | 1,265,000 | $ | 1,265,000 |
| iPCS, Inc. sr. notes 11 1/2s, 2012 | | 1,025,000 | | 1,181,313 |
| IWO Holdings, Inc. sec. FRN 7.9s, 2012 | | 340,000 | | 351,900 |
| Madison River Capital Corp. sr. notes 13 1/4s, 2010 | | 1,212,000 | | 1,290,780 |
| Nextel Partners, Inc. sr. notes 8 1/8s, 2011 | | 4,220,000 | | 4,494,300 |
| Qwest Communications International, Inc. company | | | | |
| guaranty 8s, 2014 | | 2,145,000 | | 2,166,450 |
| Qwest Corp. notes 8 7/8s, 2012 | | 7,170,000 | | 8,048,325 |
| Qwest Corp. 144A sr. notes 7 5/8s, 2015 | | 1,765,000 | | 1,877,519 |
| Rogers Cantel, Inc. debs. 9 3/4s, 2016 (Canada) | | 1,350,000 | | 1,621,688 |
| Rogers Wireless Communications, Inc. sec. | | | | |
| notes 7 1/2s, 2015 (Canada) | | 1,090,000 | | 1,154,038 |
| Rogers Wireless Communications, Inc. | | | | |
| sr. sub. notes 8s, 2012 (Canada) | | 1,360,000 | | 1,439,900 |
| Rural Cellular Corp. sr. notes 9 7/8s, 2010 | | 665,000 | | 695,756 |
| Rural Cellular Corp. sr. sub. notes 9 3/4s, 2010 | | 1,495,000 | | 1,495,000 |
| Rural Cellular Corp. 144A sr. sub. notes FRN | | | | |
| 10.041s, 2012 | | 545,000 | | 539,550 |
| SBA Communications Corp. sr. notes 8 1/2s, 2012 | | 617,000 | | 684,870 |
| SBA Telecommunications, Inc./SBA Communications Corp. | | | | |
| sr. disc. notes stepped-coupon zero % (9 3/4s, | | | | |
| 12/15/07), 2011 †† | | 1,610,000 | | 1,473,150 |
| Syniverse Technologies, Inc. 144A | | | | |
| sr. sub. notes 7 3/4s, 2013 | | 925,000 | | 940,031 |
| U S West, Inc. debs. 7 1/4s, 2025 | | 1,135,000 | | 1,126,488 |
| Valor Telecommunications | | | | |
| Enterprises LLC/Finance Corp. company | | | | |
| guaranty 7 3/4s, 2015 | | 965,000 | | 945,700 |
| | | | | 71,881,499 |
|
| |
| Consumer (0.9%) | | | | |
| Jostens IH Corp. company guaranty 7 5/8s, 2012 | | 4,540,000 | | 4,505,950 |
| Samsonite Corp. sr. sub. notes 8 7/8s, 2011 | | 3,940,000 | | 4,028,650 |
| | | | | 8,534,600 |
|
| |
| Consumer Goods (2.2%) | | | | |
| Church & Dwight Co., Inc. company guaranty 6s, 2012 | | 1,805,000 | | 1,777,925 |
| Elizabeth Arden, Inc. company guaranty 7 3/4s, 2014 | | 2,215,000 | | 2,220,538 |
| Playtex Products, Inc. company guaranty 9 3/8s, 2011 | | 3,090,000 | | 3,256,088 |
| Playtex Products, Inc. sec. notes 8s, 2011 | | 2,725,000 | | 2,888,500 |
| Prestige Brands, Inc. sr. sub. notes 9 1/4s, 2012 | | 2,313,000 | | 2,278,305 |
| Remington Arms Co., Inc. company guaranty 10 1/2s, 2011 | | 3,450,000 | | 3,001,500 |
| Scotts Co. (The) sr. sub. notes 6 5/8s, 2013 | | 1,030,000 | | 1,040,300 |
| Spectrum Brands, Inc. company guaranty 7 3/8s, 2015 | | 3,690,000 | | 3,191,850 |
| Spectrum Brands, Inc. sr. sub. notes 8 1/2s, 2013 | | 665,000 | | 602,656 |
| | | | | 20,257,662 |
37
| CORPORATE BONDS AND NOTES (90.6%)* continued | | | | |
|
| | Principal amount | | Value |
| |
| Consumer Services (0.5%) | | | | |
| Brand Services, Inc. company guaranty 12s, 2012 | $ | 2,525,000 | $ | 2,651,250 |
| United Rentals NA, Inc. company guaranty 6 1/2s, 2012 | | 1,925,000 | | 1,852,813 |
| | | | | 4,504,063 |
|
| |
| Energy (9.1%) | | | | |
| Arch Western Finance, LLC sr. notes 6 3/4s, 2013 | | 5,335,000 | | 5,388,350 |
| Bluewater Finance, Ltd. company guaranty 10 1/4s, | | | | |
| 2012 (Cayman Islands) | | 1,910,000 | | 2,038,925 |
| Chaparral Energy, Inc. 144A sr. notes 8 1/2s, 2015 | | 1,545,000 | | 1,575,900 |
| CHC Helicopter Corp. sr. sub. notes 7 3/8s, | | | | |
| 2014 (Canada) | | 3,325,000 | | 3,349,938 |
| Chesapeake Energy Corp. sr. notes 7 1/2s, 2013 | | 3,385,000 | | 3,571,175 |
| Chesapeake Energy Corp. sr. notes 7s, 2014 | | 1,125,000 | | 1,164,375 |
| Compton Petroleum Corp. 144A sr. notes 7 5/8s, 2013 (Canada) | | 2,065,000 | | 2,095,975 |
| Comstock Resources, Inc. sr. notes 6 7/8s, 2012 | | 1,775,000 | | 1,757,250 |
| Dresser, Inc. company guaranty 9 3/8s, 2011 | | 2,825,000 | | 2,966,250 |
| Dresser-Rand Group, Inc. 144A sr. sub. notes | | | | |
| 7 5/8s, 2014 | | 1,070,000 | | 1,094,075 |
| Encore Acquisition Co. sr. sub. notes 6 1/4s, 2014 | | 880,000 | | 838,200 |
| Encore Acquisition Co. sr. sub. notes 6s, 2015 | | 3,290,000 | | 3,026,800 |
| Exco Resources, Inc. company guaranty 7 1/4s, 2011 | | 3,265,000 | | 3,305,813 |
| Forest Oil Corp. company guaranty 7 3/4s, 2014 | | 745,000 | | 782,250 |
| Forest Oil Corp. sr. notes 8s, 2011 | | 2,365,000 | | 2,601,500 |
| Forest Oil Corp. sr. notes 8s, 2008 | | 855,000 | | 897,750 |
| Hanover Compressor Co. sr. notes 9s, 2014 | | 1,315,000 | | 1,426,775 |
| Hanover Compressor Co. sr. notes 8 5/8s, 2010 | | 905,000 | | 952,513 |
| Hanover Compressor Co. sub. notes zero %, 2007 | | 1,970,000 | | 1,753,300 |
| Hanover Equipment Trust sec. notes Ser. B, 8 3/4s, 2011 | | 645,000 | | 680,475 |
| Harvest Operations Corp. sr. notes 7 7/8s, | | | | |
| 2011 (Canada) | | 2,350,000 | | 2,338,250 |
| Hornbeck Offshore Services, Inc. sr. notes Ser. B, | | | | |
| 6 1/8s, 2014 | | 955,000 | | 940,675 |
| Inergy LP/Inergy Finance Corp. sr. notes 6 7/8s, 2014 | | 2,555,000 | | 2,414,475 |
| KCS Energy, Inc. sr. notes 7 1/8s, 2012 | | 1,260,000 | | 1,260,000 |
| Massey Energy Co. sr. notes 6 5/8s, 2010 | | 3,070,000 | | 3,081,512 |
| Newfield Exploration Co. sr. notes 7 5/8s, 2011 | | 3,120,000 | | 3,322,800 |
| Newfield Exploration Co. sr. sub. notes 6 5/8s, 2014 | | 2,095,000 | | 2,115,950 |
| Offshore Logistics, Inc. company guaranty | | | | |
| 6 1/8s, 2013 | | 1,860,000 | | 1,720,500 |
| Oslo Seismic Services, Inc. 1st mtge. 8.28s, 2011 | | 1,977,278 | | 2,050,916 |
| Pacific Energy Partners/Pacific Energy Finance Corp. | | | | |
| sr. notes 7 1/8s, 2014 | | 1,350,000 | | 1,404,000 |
| Peabody Energy Corp. sr. notes 5 7/8s, 2016 | | 2,610,000 | | 2,531,700 |
| Petroleum Geo-Services notes 10s, 2010 (Norway) | | 2,025,000 | | 2,293,313 |
| Plains Exploration & Production Co. sr. notes 7 1/8s, 2014 | | 1,855,000 | | 1,901,375 |
| Plains Exploration & Production Co. | | | | |
| sr. sub. notes 8 3/4s, 2012 | | 3,030,000 | | 3,249,675 |
38
| CORPORATE BONDS AND NOTES (90.6%)* continued | | | | |
|
| | Principal amount | | Value |
| |
| Energy continued | | | | |
| Pogo Producing Co. 144A sr. sub. notes 6 7/8s, 2017 | $ | 2,040,000 | $ | 1,989,000 |
| Pride International, Inc. sr. notes 7 3/8s, 2014 | | 3,300,000 | | 3,555,750 |
| Seabulk International, Inc. company guaranty 9 1/2s, 2013 | | 2,445,000 | | 2,744,513 |
| Star Gas Partners LP/Star Gas Finance Co. | | | | |
| sr. notes 10 1/4s, 2013 | | 590,000 | | 480,850 |
| Stone Energy Corp. sr. sub. notes 6 3/4s, 2014 | | 775,000 | | 722,688 |
| Vintage Petroleum, Inc. sr. notes 8 1/4s, 2012 | | 1,140,000 | | 1,225,500 |
| Vintage Petroleum, Inc. sr. sub. notes 7 7/8s, 2011 | | 595,000 | | 624,750 |
| Whiting Petroleum Corp. 144A sr. sub. notes 7s, 2014 | | 2,530,000 | | 2,548,975 |
| | | | | 85,784,756 |
|
| |
| Entertainment (1.3%) | | | | |
| AMC Entertainment, Inc. sr. sub. notes 9 7/8s, 2012 | | 915,000 | | 898,988 |
| AMC Entertainment, Inc. sr. sub. notes 8s, 2014 | | 676,000 | | 605,020 |
| Cinemark USA, Inc. sr. sub. notes 9s, 2013 | | 1,425,000 | | 1,499,813 |
| Cinemark, Inc. sr. disc. notes stepped-coupon zero % | | | | |
| (9 3/4s, 3/15/07), 2014 †† | | 3,565,000 | | 2,629,188 |
| Loews Cineplex Entertainment Corp. company | | | | |
| guaranty 9s, 2014 | | 1,930,000 | | 1,932,413 |
| Marquee Holdings, Inc. sr. disc. notes stepped-coupon | | | | |
| zero % (12s, 8/15/09), 2014 †† | | 2,440,000 | | 1,512,800 |
| Six Flags, Inc. sr. notes 9 5/8s, 2014 | | 1,515,000 | | 1,488,488 |
| Universal City Florida Holding Co. sr. notes 8 3/8s, 2010 | | 545,000 | | 536,825 |
| Universal City Florida Holding Co. sr. notes FRN 9s, 2010 | | 940,000 | | 951,750 |
| | | | | 12,055,285 |
|
| |
| Financial (1.2%) | | | | |
| Crescent Real Estate Equities LP notes 7 1/2s, 2007 (R) | | 1,205,000 | | 1,217,050 |
| E*Trade Finance Corp. sr. notes 8s, 2011 | | 3,350,000 | | 3,425,375 |
| Finova Group, Inc. notes 7 1/2s, 2009 | | 3,376,680 | | 1,215,605 |
| UBS AG/Jersey Branch sr. notes Ser. EMTN, 9.14s, | | | | |
| 2008 (Jersey) | | 1,910,000 | | 1,960,138 |
| Western Financial Bank sub. debs. 9 5/8s, 2012 | | 2,750,000 | | 3,080,000 |
| | | | | 10,898,168 |
|
| |
| Food (1.4%) | | | | |
| Archibald Candy Corp. company guaranty 10s, | | | | |
| 2007 (In default) (F) † ‡‡ | | 424,297 | | 22,170 |
| Dean Foods Co. sr. notes 6 5/8s, 2009 | | 2,570,000 | | 2,608,550 |
| Del Monte Corp. sr. sub. notes 8 5/8s, 2012 | | 2,625,000 | | 2,756,250 |
| Del Monte Corp. 144A sr. sub. notes 6 3/4s, 2015 | | 1,320,000 | | 1,260,600 |
| Doane Pet Care Co. 144A sr. sub. notes 10 5/8s, 2015 | | 1,920,000 | | 1,951,200 |
| Pinnacle Foods Holding Corp. sr. sub. notes 8 1/4s, 2013 | | 3,555,000 | | 3,430,575 |
| United Biscuits Finance company | | | | |
| guaranty 10 5/8s, 2011 (United Kingdom) | EUR | 840,000 | | 1,063,961 |
| | | | | 13,093,306 |
39
| CORPORATE BONDS AND NOTES (90.6%)* continued | | | | |
|
| | Principal amount | | Value |
| |
| Gaming & Lottery (3.6%) | | | | |
| Ameristar Casinos, Inc. company guaranty 10 3/4s, 2009 | $ | 1,430,000 | $ | 1,519,375 |
| Boyd Gaming Corp. sr. sub. notes 8 3/4s, 2012 | | 1,575,000 | | 1,697,062 |
| Boyd Gaming Corp. sr. sub. notes 7 3/4s, 2012 | | 545,000 | | 570,888 |
| Boyd Gaming Corp. sr. sub. notes 6 3/4s, 2014 | | 440,000 | | 436,700 |
| Harrah’s Operating Co., Inc. company guaranty 8s, 2011 | | 125,000 | | 137,780 |
| MGM Mirage, Inc. company guaranty 8 1/2s, 2010 | | 1,670,000 | | 1,807,775 |
| MGM Mirage, Inc. company guaranty 6s, 2009 | | 3,320,000 | | 3,295,100 |
| Mirage Resorts, Inc. debs. 7 1/4s, 2017 | | 715,000 | | 729,300 |
| Park Place Entertainment Corp. sr. notes 7 1/2s, 2009 | | 3,645,000 | | 3,900,150 |
| Park Place Entertainment Corp. sr. notes 7s, 2013 | | 830,000 | | 881,575 |
| Park Place Entertainment Corp. sr. sub. notes 8 7/8s, 2008 | | 1,575,000 | | 1,701,000 |
| Penn National Gaming, Inc. sr. sub. notes 8 7/8s, 2010 | | 510,000 | | 534,225 |
| Penn National Gaming, Inc. sr. sub. notes 6 3/4s, 2015 | | 825,000 | | 798,188 |
| Pinnacle Entertainment, Inc. sr. sub. notes 8 1/4s, 2012 | | 1,170,000 | | 1,193,400 |
| Resorts International Hotel and Casino, Inc. company | | | | |
| guaranty 11 1/2s, 2009 | | 1,940,000 | | 2,148,550 |
| Scientific Games Corp. company guaranty 6 1/4s, 2012 | | 2,215,000 | | 2,181,775 |
| Station Casinos, Inc. sr. notes 6s, 2012 | | 2,165,000 | | 2,159,588 |
| Station Casinos, Inc. sr. sub. notes 6 7/8s, 2016 | | 1,775,000 | | 1,801,625 |
| Trump Entertainment Resorts, Inc. sec. notes 8 1/2s, 2015 | | 4,000,000 | | 3,880,000 |
| Wynn Las Vegas, LLC/Wynn Las Vegas Capital Corp. 1st | | | | |
| mtge. 6 5/8s, 2014 | | 2,310,000 | | 2,232,038 |
| | | | | 33,606,094 |
|
| |
| Health Care (7.0%) | | | | |
| Alderwoods Group, Inc. company guaranty 7 3/4s, 2012 | | 1,065,000 | | 1,104,938 |
| Community Health Systems, Inc. sr. sub. notes 6 1/2s, 2012 | | 2,265,000 | | 2,233,856 |
| Coventry Health Care, Inc. sr. notes 5 7/8s, 2012 | | 1,315,000 | | 1,318,288 |
| DaVita, Inc. company guaranty 7 1/4s, 2015 | | 1,405,000 | | 1,434,856 |
| DaVita, Inc. company guaranty 6 5/8s, 2013 | | 700,000 | | 717,500 |
| Elan Finance PLC/Elan Finance Corp, company | | | | |
| guaranty 7 3/4s, 2011 (Ireland) | | 1,240,000 | | 1,137,700 |
| Extendicare Health Services, Inc. company | | | | |
| guaranty 9 1/2s, 2010 | | 1,500,000 | | 1,590,000 |
| HCA, Inc. debs. 7.19s, 2015 | | 3,090,000 | | 3,221,687 |
| HCA, Inc. notes 8.36s, 2024 | | 2,040,000 | | 2,170,448 |
| HCA, Inc. notes 7s, 2007 | | 165,000 | | 168,379 |
| HCA, Inc. sr. notes 7 7/8s, 2011 | | 930,000 | | 990,740 |
| Healthsouth Corp. notes 7 5/8s, 2012 | | 3,939,000 | | 3,653,423 |
| MedQuest, Inc. company guaranty Ser. B, 11 7/8s, 2012 | | 1,570,000 | | 1,573,925 |
| MQ Associates, Inc. sr. disc. notes stepped-coupon | | | | |
| zero % (12 1/4s, 8/15/08), 2012 †† | | 3,275,000 | | 1,834,000 |
| Omnicare, Inc. sr. sub. notes 6 1/8s, 2013 | | 3,040,000 | | 2,918,400 |
| PacifiCare Health Systems, Inc. company | | | | |
| guaranty 10 3/4s, 2009 | | 3,103,000 | | 3,335,725 |
| Psychiatric Solutions, Inc. company guaranty 7 3/4s, 2015 | | 2,080,000 | | 2,152,800 |
| Service Corp. International debs. 7 7/8s, 2013 | | 1,185,000 | | 1,244,250 |
40
| CORPORATE BONDS AND NOTES (90.6%)* continued | | | | |
|
| | Principal amount | | Value |
| |
| Health Care continued | | | | |
| Service Corp. International notes 6 1/2s, 2008 | $ | 435,000 | $ | 440,438 |
| Service Corp. International notes Ser. *, 7.7s, 2009 | | 1,045,000 | | 1,099,863 |
| Service Corp. International 144A sr. notes 7s, 2017 | | 740,000 | | 731,675 |
| Service Corp. International 144A sr. notes 6 3/4s, 2016 | | 2,650,000 | | 2,597,000 |
| Stewart Enterprises, Inc. 144A sr. notes 7 1/4s, 2013 | | 3,010,000 | | 2,882,075 |
| Tenet Healthcare Corp. notes 7 3/8s, 2013 | | 2,925,000 | | 2,661,750 |
| Tenet Healthcare Corp. sr. notes 9 7/8s, 2014 | | 3,325,000 | | 3,333,313 |
| Triad Hospitals, Inc. sr. notes 7s, 2012 | | 2,455,000 | | 2,485,688 |
| Triad Hospitals, Inc. sr. sub. notes 7s, 2013 | | 5,065,000 | | 5,065,000 |
| Universal Hospital Services, Inc. sr. notes 10 1/8s, | | | | |
| 2011 (Canada) | | 3,140,000 | | 3,218,500 |
| US Oncology, Inc. company guaranty 9s, 2012 | | 2,025,000 | | 2,161,688 |
| Vanguard Health Holding Co. II, LLC | | | | |
| sr. sub. notes 9s, 2014 | | 2,280,000 | | 2,405,400 |
| Ventas Realty LP/Capital Corp. company guaranty 9s, 2012 (R) | | 2,230,000 | | 2,519,900 |
| Ventas Realty LP/Capital Corp. company | | | | |
| guaranty 6 3/4s, 2010 (R) | | 865,000 | | 877,975 |
| Ventas Realty LP/Capital Corp. sr. notes 6 5/8s, 2014 (R) | | 690,000 | | 698,625 |
| | | | | 65,979,805 |
|
| |
| Homebuilding (2.5%) | | | | |
| D.R. Horton, Inc. company guaranty 8s, 2009 | | 415,000 | | 442,644 |
| D.R. Horton, Inc. sr. notes 7 7/8s, 2011 | | 1,070,000 | | 1,159,613 |
| D.R. Horton, Inc. sr. notes 5 7/8s, 2013 | | 3,075,000 | | 2,941,327 |
| K. Hovnanian Enterprises, Inc. company | | | | |
| guaranty 8 7/8s, 2012 | | 2,315,000 | | 2,378,663 |
| K. Hovnanian Enterprises, Inc. company | | | | |
| guaranty 6 3/8s, 2014 | | 1,330,000 | | 1,225,072 |
| K. Hovnanian Enterprises, Inc. sr. notes 6 1/2s, 2014 | | 940,000 | | 878,250 |
| KB Home company guaranty 5 7/8s, 2015 | | 2,595,000 | | 2,409,110 |
| Meritage Homes Corp. company guaranty 6 1/4s, 2015 | | 965,000 | | 873,325 |
| Schuler Homes, Inc. company guaranty 10 1/2s, 2011 | | 1,510,000 | | 1,627,025 |
| Standard Pacific Corp. sr. notes 7 3/4s, 2013 | | 2,885,000 | | 2,812,875 |
| Standard Pacific Corp. sr. notes 7s, 2015 | | 1,025,000 | | 937,875 |
| Standard Pacific Corp. sr. notes 6 7/8s, 2011 | | 185,000 | | 177,138 |
| Technical Olympic USA, Inc. company guaranty 10 3/8s, 2012 | | 1,295,000 | | 1,275,575 |
| Technical Olympic USA, Inc. sr. sub. notes 7 1/2s, 2015 | | 1,170,000 | | 976,950 |
| WCI Communities, Inc. company guaranty 10 5/8s, 2011 | | 625,000 | | 659,375 |
| WCI Communities, Inc. company guaranty 9 1/8s, 2012 | | 2,660,000 | | 2,660,000 |
| | | | | 23,434,817 |
|
| |
| Household Furniture and Appliances (0.4%) | | | | |
| Sealy Mattress Co. sr. sub. notes 8 1/4s, 2014 | | 3,770,000 | | 3,845,400 |
|
| |
| Lodging/Tourism (1.5%) | | | | |
| FelCor Lodging LP company guaranty 9s, 2008 (R) | | 955,000 | | 1,045,725 |
| Host Marriott LP company guaranty Ser. G, 9 1/4s, 2007 (R) | | 1,710,000 | | 1,812,600 |
| Host Marriott LP sr. notes Ser. M, 7s, 2012 (R) | | 2,955,000 | | 3,047,344 |
| MeriStar Hospitality Corp. company guaranty 9 1/8s, 2011 (R) | | 1,405,000 | | 1,559,550 |
41
| CORPORATE BONDS AND NOTES (90.6%)* continued | | | | |
|
| | Principal amount | | Value |
| |
| Lodging/Tourism continued | | | | |
| MeriStar Hospitality Corp. company guaranty 9s, 2008 (R) | $ | 2,250,000 | $ | 2,334,375 |
| Starwood Hotels & Resorts Worldwide, Inc. company | | | | |
| guaranty 7 7/8s, 2012 | | 1,055,000 | | 1,155,225 |
| Starwood Hotels & Resorts Worldwide, Inc. company | | | | |
| guaranty 7 3/8s, 2007 | | 1,270,000 | | 1,303,338 |
| Starwood Hotels & Resorts Worldwide, Inc. | | | | |
| debs. 7 3/8s, 2015 | | 1,655,000 | | 1,774,988 |
| | | | | 14,033,145 |
|
| |
| Media (0.5%) | | | | |
| Affinity Group, Inc. sr. sub. notes 9s, 2012 | | 2,435,000 | | 2,428,913 |
| Interpublic Group of Companies, Inc. notes 6 1/4s, 2014 | | 495,000 | | 422,606 |
| Warner Music Group sr. sub. notes 7 3/8s, 2014 | | 1,500,000 | | 1,455,000 |
| | | | | 4,306,519 |
|
| |
| Publishing (3.7%) | | | | |
| American Media, Inc. company guaranty Ser. B, | | | | |
| 10 1/4s, 2009 | | 2,425,000 | | 2,231,000 |
| CanWest Media, Inc. company guaranty 8s, 2012 (Canada) | | 4,266,600 | | 4,373,265 |
| Cenveo Corp, sr. sub. notes 7 7/8s, 2013 | | 1,330,000 | | 1,276,800 |
| Dex Media West, LLC/Dex Media Finance Co. | | | | |
| sr. notes Ser. B, 8 1/2s, 2010 | | 2,480,000 | | 2,616,400 |
| Dex Media, Inc. disc. notes stepped-coupon zero % | | | | |
| (9s, 11/15/08), 2013 †† | | 2,015,000 | | 1,596,888 |
| Dex Media, Inc. notes 8s, 2013 | | 2,375,000 | | 2,422,500 |
| Houghton Mifflin Co. sr. sub. notes 9 7/8s, 2013 | | 3,645,000 | | 3,872,813 |
| Mail-Well I Corp. company guaranty 9 5/8s, 2012 | | 1,020,000 | | 1,099,050 |
| PRIMEDIA, Inc. company guaranty 8 7/8s, 2011 | | 2,775,000 | | 2,657,063 |
| PRIMEDIA, Inc. sr. notes 8s, 2013 | | 2,860,000 | | 2,523,950 |
| R.H. Donnelley Corp. sr. notes 6 7/8s, 2013 | | 1,340,000 | | 1,226,100 |
| R.H. Donnelley Finance Corp. I 144A | | | | |
| sr. sub. notes 10 7/8s, 2012 | | 820,000 | | 928,650 |
| R.H. Donnelley, Inc. company guaranty 8 7/8s, 2010 | | 510,000 | | 548,250 |
| Reader’s Digest Association, Inc. (The) | | | | |
| sr. notes 6 1/2s, 2011 | | 1,435,000 | | 1,399,125 |
| Vertis, Inc. company guaranty Ser. B, 10 7/8s, 2009 | | 4,160,000 | | 4,045,600 |
| Vertis, Inc. 144A sub. notes 13 1/2s, 2009 | | 2,930,000 | | 2,285,400 |
| | | | | 35,102,854 |
|
| |
| Restaurants (0.5%) | | | | |
| Domino’s, Inc. sr. sub. notes 8 1/4s, 2011 | | 1,046,000 | | 1,082,610 |
| Sbarro, Inc. company guaranty 11s, 2009 | | 3,320,000 | | 3,286,800 |
| | | | | 4,369,410 |
|
| |
| Retail (3.5%) | | | | |
| Asbury Automotive Group, Inc. sr. sub. notes 8s, 2014 | | 1,925,000 | | 1,804,688 |
| Autonation, Inc. company guaranty 9s, 2008 | | 3,925,000 | | 4,209,563 |
| Bear Creek Corp. 144A sr. notes 9s, 2013 | | 970,000 | | 955,450 |
| GSC Holdings Corp. 144A company guaranty 8s, 2012 | | 2,040,000 | | 1,968,600 |
42
| CORPORATE BONDS AND NOTES (90.6%)* continued | | | | |
|
| | Principal amount | | Value |
| |
| Retail continued | | | | |
| JC Penney Co., Inc. debs. 7.95s, 2017 | $ | 3,080,000 | $ | 3,513,994 |
| JC Penney Co., Inc. debs. 7 1/8s, 2023 | | 2,230,000 | | 2,395,468 |
| JC Penney Co., Inc. notes 9s, 2012 | | 510,000 | | 594,788 |
| JC Penney Co., Inc. notes 8s, 2010 | | 100,000 | | 108,830 |
| Jean Coutu Group, Inc. sr. notes 7 5/8s, 2012 (Canada) | | 2,070,000 | | 2,028,600 |
| Jean Coutu Group, Inc. sr. sub. notes 8 1/2s, 2014 (Canada) | | 1,025,000 | | 950,688 |
| Movie Gallery, Inc. sr. unsecd. notes 11s, 2012 | | 2,100,000 | | 1,585,500 |
| Neiman-Marcus Group, Inc. 144A sr. notes 9s, 2015 | | 3,585,000 | | 3,647,738 |
| Rite Aid Corp. company guaranty 9 1/2s, 2011 | | 2,180,000 | | 2,256,300 |
| Rite Aid Corp. company guaranty 7 1/2s, 2015 | | 1,325,000 | | 1,225,625 |
| Rite Aid Corp. debs. 6 7/8s, 2013 | | 150,000 | | 120,000 |
| Rite Aid Corp. sr. notes 9 1/4s, 2013 | | 1,755,000 | | 1,592,663 |
| Toys R Us, Inc. notes 7 5/8s, 2011 | | 1,425,000 | | 1,175,625 |
| United Auto Group, Inc. company guaranty 9 5/8s, 2012 | | 2,440,000 | | 2,525,400 |
| | | | | 32,659,520 |
|
| |
| Technology (4.1%) | | | | |
| Advanced Micro Devices, Inc. sr. notes 7 3/4s, 2012 | | 3,470,000 | | 3,496,025 |
| Amkor Technologies, Inc. sr. notes 7 3/4s, 2013 | | 1,220,000 | | 1,049,200 |
| Celestica, Inc. sr. sub. notes 7 7/8s, 2011 (Canada) | | 750,000 | | 751,875 |
| Celestica, Inc. sr. sub. notes 7 5/8s, 2013 (Canada) | | 2,090,000 | | 2,037,750 |
| Freescale Semiconductor, Inc. sr. notes Ser. B, 7 1/8s, 2014 | | 2,820,000 | | 2,975,100 |
| Iron Mountain, Inc. company guaranty 8 5/8s, 2013 | | 4,170,000 | | 4,357,650 |
| Iron Mountain, Inc. sr. sub. notes 8 1/4s, 2011 | | 175,000 | | 176,313 |
| Lucent Technologies, Inc. debs. 6 1/2s, 2028 | | 310,000 | | 265,050 |
| Lucent Technologies, Inc. debs. 6.45s, 2029 | | 2,755,000 | | 2,376,188 |
| New ASAT Finance, Ltd. company guaranty 9 1/4s, 2011 | | | | |
| (Cayman Islands) | | 1,235,000 | | 855,238 |
| SCG Holding Corp. 144A notes zero %, 2011 | | 1,185,000 | | 1,185,000 |
| Seagate Technology Hdd Holdings company guaranty 8s, | | | | |
| 2009 (Cayman Islands) | | 935,000 | | 974,738 |
| SunGard Data Systems, Inc. 144A | | | | |
| sr. sub. notes 10 1/4s, 2015 | | 2,050,000 | | 2,070,500 |
| SunGard Data Systems, Inc. 144A sr. unsecd. notes 9 1/8s, 2013 | | 3,466,000 | | 3,587,310 |
| UGS Corp. company guaranty 10s, 2012 | | 3,005,000 | | 3,275,450 |
| Unisys Corp. sr. notes 8s, 2012 | | 2,055,000 | | 1,859,775 |
| Xerox Corp. notes Ser. MTN, 7.2s, 2016 | | 1,825,000 | | 1,920,813 |
| Xerox Corp. sr. notes 7 5/8s, 2013 | | 2,810,000 | | 2,957,525 |
| Xerox Corp. sr. notes 6 7/8s, 2011 | | 1,875,000 | | 1,942,969 |
| | | | | 38,114,469 |
|
| |
| Textiles (1.1%) | | | | |
| Levi Strauss & Co. sr. notes 12 1/4s, 2012 | | 3,050,000 | | 3,408,375 |
| Levi Strauss & Co. sr. notes 9 3/4s, 2015 | | 3,140,000 | | 3,249,900 |
| Oxford Industries, Inc. sr. notes 8 7/8s, 2011 | | 1,740,000 | | 1,774,800 |
| Russell Corp. company guaranty 9 1/4s, 2010 | | 1,765,000 | | 1,804,713 |
| | | | | 10,237,788 |
43
| CORPORATE BONDS AND NOTES (90.6%)* continued | | | | |
|
| | Principal amount | | Value |
| |
| Tire & Rubber (0.5%) | | | | |
| Goodyear Tire & Rubber Co. (The) notes 8 1/2s, 2007 | $ | 335,000 | $ | 345,888 |
| Goodyear Tire & Rubber Co. (The) notes 7.857s, 2011 | | 3,250,000 | | 3,136,250 |
| Goodyear Tire & Rubber Co. (The) 144A sr. notes 9s, 2015 | | 1,445,000 | | 1,412,488 |
| | | | | 4,894,626 |
|
| |
| Transportation (1.0%) | | | | |
| Calair, LLC/Calair Capital Corp. company | | | | |
| guaranty 8 1/8s, 2008 | | 3,085,000 | | 2,491,138 |
| Greenbrier Companies, Inc. 144A sr. notes 8 3/8s, 2015 | | 1,035,000 | | 1,049,231 |
| Kansas City Southern Railway Co. company | | | | |
| guaranty 9 1/2s, 2008 | | 3,170,000 | | 3,431,525 |
| Kansas City Southern Railway Co. company | | | | |
| guaranty 7 1/2s, 2009 | | 700,000 | | 724,500 |
| Navistar International Corp. company guaranty 6 1/4s, 2012 | | 1,380,000 | | 1,242,000 |
| United AirLines, Inc. debs. 9 1/8s, 2012 (In default) † | | 3,000 | | 518 |
| | | | | 8,938,912 |
|
| |
| Utilities & Power (8.4%) | | | | |
| AES Corp. (The) 144A sec. notes 9s, 2015 | | 2,960,000 | | 3,241,200 |
| AES Corp. (The) 144A sec. notes 8 3/4s, 2013 | | 3,055,000 | | 3,314,675 |
| ANR Pipeline Co. debs. 9 5/8s, 2021 | | 540,000 | | 648,212 |
| CMS Energy Corp. sr. notes 8.9s, 2008 | | 870,000 | | 922,200 |
| CMS Energy Corp. sr. notes 8 1/2s, 2011 | | 490,000 | | 527,975 |
| CMS Energy Corp. sr. notes 7 3/4s, 2010 | | 740,000 | | 769,600 |
| Colorado Interstate Gas Co. debs. 6.85s, 2037 | | 1,430,000 | | 1,455,437 |
| Colorado Interstate Gas Co. sr. notes 5.95s, 2015 | | 405,000 | | 388,309 |
| DPL, Inc. sr. notes 6 7/8s, 2011 | | 2,432,000 | | 2,577,920 |
| Dynegy Holdings, Inc. 144A sec. notes 10 1/8s, 2013 | | 3,610,000 | | 4,043,200 |
| Dynegy-Roseton Danskamme company guaranty Ser. A, | | | | |
| 7.27s, 2010 | | 1,460,000 | | 1,467,300 |
| Dynegy-Roseton Danskamme company guaranty Ser. B, | | | | |
| 7.67s, 2016 | | 2,180,000 | | 2,185,450 |
| Edison Mission Energy sr. notes 9 7/8s, 2011 | | 50,000 | | 58,188 |
| El Paso CGP Co. notes 7 3/4s, 2010 | | 745,000 | | 752,450 |
| El Paso Corp. sr. notes 8.05s, 2030 | | 1,990,000 | | 1,990,000 |
| El Paso Corp. sr. notes 7 3/8s, 2012 | | 1,600,000 | | 1,584,000 |
| El Paso Corp. sr. notes Ser. MTN, 7.8s, 2031 | | 1,380,000 | | 1,355,850 |
| El Paso Natural Gas Co. debs. 8 5/8s, 2022 | | 765,000 | | 852,104 |
| El Paso Production Holding Co. company | | | | |
| guaranty 7 3/4s, 2013 | | 4,150,000 | | 4,253,750 |
| Ferrellgas Partners LP/Ferrellgas Partners Finance | | | | |
| sr. notes 6 3/4s, 2014 | | 2,200,000 | | 2,062,500 |
| Midwest Generation, LLC sec. sr. notes 8 3/4s, 2034 | | 4,395,000 | | 4,845,488 |
| Mission Energy Holding Co. sec. notes 13 1/2s, 2008 | | 2,875,000 | | 3,342,188 |
| Monongahela Power Co. 1st mtge. 6.7s, 2014 | | 1,320,000 | | 1,443,580 |
| National Power Corp. 144A foreign government | | | | |
| guaranty FRN 8.63s, 2011 (Philippines) | | 950,000 | | 1,001,063 |
44
| CORPORATE BONDS AND NOTES (90.6%)* continued | | | | |
|
| | Principal amount | | Value |
| |
| Utilities & Power continued | | | | |
| Nevada Power Co. 2nd mtge. 9s, 2013 | $ | 1,366,000 | $ | 1,504,783 |
| Northwestern Corp. sec. notes 5 7/8s, 2014 | | 1,330,000 | | 1,323,274 |
| NRG Energy, Inc. company guaranty 8s, 2013 | | 2,444,000 | | 2,682,290 |
| Orion Power Holdings, Inc. sr. notes 12s, 2010 | | 2,285,000 | | 2,604,900 |
| PSEG Energy Holdings, Inc. notes 7 3/4s, 2007 | | 2,290,000 | | 2,335,800 |
| SEMCO Energy, Inc. sr. notes 7 3/4s, 2013 | | 1,990,000 | | 2,069,725 |
| Sierra Pacific Power Co. general ref. mtge. 6 1/4s, 2012 | | 515,000 | | 521,438 |
| Sierra Pacific Resources sr. notes 8 5/8s, 2014 | | 1,630,000 | | 1,780,775 |
| Teco Energy, Inc. notes 7.2s, 2011 | | 680,000 | | 715,700 |
| Teco Energy, Inc. notes 7s, 2012 | | 1,165,000 | | 1,220,338 |
| Teco Energy, Inc. sr. notes 6 3/4s, 2015 | | 140,000 | | 144,900 |
| Tennessee Gas Pipeline Co. debs. 7s, 2028 | | 305,000 | | 294,795 |
| Tennessee Gas Pipeline Co. unsecd. notes 7 1/2s, 2017 | | 610,000 | | 640,893 |
| Texas Genco LLC/Texas Genco Financing Corp. 144A | | | | |
| sr. notes 6 7/8s, 2014 | | 2,435,000 | | 2,605,450 |
| Transcontinental Gas Pipeline Corp. debs. 7 1/4s, 2026 | | 1,055,000 | | 1,131,488 |
| Utilicorp Canada Finance Corp. company | | | | |
| guaranty 7 3/4s, 2011 (Canada) | | 2,630,000 | | 2,695,750 |
| Utilicorp United, Inc. sr. notes 9.95s, 2011 | | 1,355,000 | | 1,497,275 |
| Williams Cos., Inc. (The) 144A notes 6 3/8s, 2010 | | 700,000 | | 693,000 |
| Williams Cos., Inc. (The) notes 8 3/4s, 2032 | | 2,150,000 | | 2,440,250 |
| Williams Cos., Inc. (The) notes 7 3/4s, 2031 | | 1,225,000 | | 1,264,813 |
| Williams Cos., Inc. (The) notes 7 5/8s, 2019 | | 3,075,000 | | 3,213,375 |
| York Power Funding 144A notes 12s, 2007 | | | | |
| (Cayman Islands) (In default) (F) † | | 1,732,251 | | 144,470 |
| | | | | 78,608,121 |
|
| |
| Total corporate bonds and notes (cost $860,864,884) | | | $ | 849,682,994 |
|
| |
| |
| ASSET-BACKED SECURITIES (2.7%)* | | | | |
|
| | Principal amount | | Value |
| |
| CDO Repackaging Trust Series 144A Ser. 03-3, Class A, | | | | |
| 9.49s, 2008 | $ | 1,805,000 | $ | 1,967,450 |
| Dryden Leveraged Loan CDO 144A FRN Ser. 03-4A, | | | | |
| Class D, 12.605s, 2015 (Cayman Islands) | | 615,000 | | 631,386 |
| Neon Capital, Ltd. 144A | | | | |
| limited recourse sec. notes Ser. 94, 1.105s, 2013 | | | | |
| (Cayman Islands) (F) (g) | | 6,684,836 | | 8,468,504 |
| limited recourse sec. notes Ser. 95, 2.319s, 2013 | | | | |
| (Cayman Islands) (F) (g) | | 3,901,050 | | 1,465,285 |
| limited recourse sec. notes Ser. 96, 1.686s, 2013 | | | | |
| (Cayman Islands) (F) (g) | | 6,271,893 | | 6,237,423 |
| limited recourse sec. notes Ser. 96, 1.458s, 2013 | | | | |
| (Cayman Islands) (F) (g) | | 14,668,569 | | 3,115,149 |
| limited recourse sec. notes Ser. 98, 1.637s, 2014 | | | | |
| (Cayman Islands) (F) (g) | | 2,382,544 | | 560,584 |
45
| ASSET-BACKED SECURITIES (2.7%)* continued | | | | |
|
| | Principal amount | | Value |
| |
| Octagon Investment Parties VI, Ltd. FRN Ser. 03-6A, | | | | |
| Class B2L, 12.38s, 2016 (Cayman Islands) | $ | 725,000 | $ | 759,438 |
| Providian Gateway Master Trust Ser. 02, Class B, | | | | |
| Principal Only (PO), zero %, 2006 | | 2,460,000 | | 2,444,613 |
|
| Total asset-backed securities (cost $23,863,510) | | | $ | 25,649,832 |
|
| |
| |
| SENIOR LOANS (2.4%)* (c) | | | | |
|
| | Principal amount | | Value |
| |
| Basic Materials (0.1%) | | | | |
| Graphic Packaging Corp. bank term loan FRN Ser. C, | | | | |
| 6.582s, 2010 | $ | 271,873 | $ | 274,932 |
| Hercules, Inc. bank term loan FRN Ser. B, 5.856s, 2010 | | 517,125 | | 522,426 |
| Nalco Co. bank term loan FRN Ser. B, 5.813s, 2010 | | 228,898 | | 231,823 |
| St. Mary’s Cement Corp. bank term loan FRN Ser. B, | | | | |
| 5.49s, 2009 | | 294,750 | | 298,434 |
| | | | | 1,327,615 |
|
| |
| Beverage (0.1%) | | | | |
| Constellation Brands, Inc. bank term loan FRN Ser. B, | | | | |
| 5.659s, 2011 | | 782,778 | | 786,007 |
|
| |
| Capital Goods (0.1%) | | | | |
| Amsted Industries, Inc. bank term loan FRN | | | | |
| 6.645s, 2010 | | 360,288 | | 364,641 |
| Invensys, PLC bank term loan FRN Ser. B-1, 7.791s, | | | | |
| 2009 (United Kingdom) | | 101,490 | | 102,632 |
| Solo Cup Co. bank term loan FRN 6.439s, 2011 | | 221,625 | | 222,733 |
| | | | | 690,006 |
|
| |
| Communication Services (0.1%) | | | | |
| Alaska Communications Systems Group, Inc. bank term | | | | |
| loan FRN Ser. B, 6.02s, 2012 | | 1,000,000 | | 1,011,250 |
| Consolidated Communications Holdings bank term loan | | | | |
| FRN Ser. D, 6.417s, 2011 | | 148,125 | | 149,051 |
| PanAmSat Corp. bank term loan FRN Ser. B1, | | | | |
| 5.857s, 2010 | | 128,700 | | 130,113 |
| Qwest Communications International, Inc. bank term | | | | |
| loan FRN Ser. A, 9.02s, 2007 | | 120,250 | | 123,173 |
| | | | | 1,413,587 |
|
| |
| Consumer Cyclicals (0.6%) | | | | |
| Federal Mogul Corp. bank term loan FRN Ser. A, | | | | |
| 6.33s, 2006 | | 1,165,000 | | 1,082,480 |
| Federal Mogul Corp. bank term loan FRN Ser. B, | | | | |
| 6.58s, 2006 | | 2,700,000 | | 2,515,501 |
| Hayes Lemmerz International, Inc. bank term loan FRN | | | | |
| 7.438s, 2009 | | 205,642 | | 203,182 |
| Landsource, Inc. bank term loan FRN Ser. B, 6 5/8s, 2010 | | 150,000 | | 151,219 |
46
| SENIOR LOANS (2.4%)* (c) continued | | | | |
|
| | Principal amount | | Value |
| |
| Consumer Cyclicals continued | | | | |
| Neiman Marcus Group, Inc. bank term loan FRN Ser. B, | | | | |
| 6.475s, 2013 | $ | 1,200,000 | $ | 1,204,363 |
| TRW Automotive, Inc. bank term loan FRN Ser. B, | | | | |
| 5 1/4s, 2010 | | 149,805 | | 150,180 |
| | | | | 5,306,925 |
|
| |
| Consumer Staples (0.6%) | | | | |
| AMF Bowling Worldwide bank term loan FRN Ser. B, | | | | |
| 6.847s, 2009 | | 156,730 | | 157,807 |
| Century Cable Holdings bank term loan FRN 9s, 2009 | | 2,290,000 | | 2,246,653 |
| Charter Communications PLC bank term loan FRN Ser. B, | | | | |
| 7 1/2s, 2011 (United Kingdom) | | 355,059 | | 355,530 |
| Mediacom Communications Corp. bank term loan FRN | | | | |
| Ser. B, 6.379s, 2012 | | 1,240,625 | | 1,255,746 |
| Olympus Cable Holdings, LLC bank term loan FRN | | | | |
| Ser. B, 9s, 2010 | | 1,670,000 | | 1,639,284 |
| | | | | 5,655,020 |
|
| |
| Energy (--%) | | | | |
| Dresser, Inc. bank term loan FRN 7.99s, 2010 | | 270,000 | | 273,713 |
|
| |
| Entertainment (--%) | | | | |
| Six Flags, Inc. bank term loan FRN Ser. B, 6.67s, 2009 | | 89,412 | | 90,275 |
|
| |
| Financial (0.1%) | | | | |
| General Growth Properties, Inc. bank term loan FRN | | | | |
| Ser. B, 6.09s, 2008 (R) | | 993,591 | | 999,056 |
|
| |
| Food (0.1%) | | | | |
| Pinnacle Foods Holding Corp. bank term loan FRN | | | | |
| 7.307s, 2010 | | 499,171 | | 504,538 |
|
| |
| Health Care (0.1%) | | | | |
| Beverly Enterprises, Inc. bank term loan FRN 6.477s, 2008 | | 245,000 | | 245,459 |
| Community Health Systems, Inc. bank term loan FRN | | | | |
| Ser. B, 5.61s, 2011 | | 178,200 | | 180,168 |
| Fisher Scientific International, Inc. bank term loan | | | | |
| FRN Ser. B, 5.52s, 2011 | | 177,750 | | 178,639 |
| Hanger Orthopedic Group, Inc. bank term loan FRN | | | | |
| 7 3/4s, 2009 | | 196,000 | | 197,960 |
| Kinetic Concepts, Inc. bank term loan FRN Ser. B, | | | | |
| 5.78s, 2011 | | 138,691 | | 139,847 |
| VWR International, Inc. bank term loan FRN Ser. B, | | | | |
| 6.69s, 2011 | | 32,380 | | 32,744 |
| | | | | 974,817 |
|
| |
| Household Furniture and Appliances (0.0%) | | | | |
| Sealy Mattress Co. bank term loan FRN Ser. D, 5.897s, 2012 | | 123,010 | | 124,202 |
47
| SENIOR LOANS (2.4%)* (c) continued | | | | |
|
| | Principal amount | | Value |
| Media (0.1%) | | | | |
| Warner Music Group bank term loan FRN Ser. B, 5.999s, 2011 | $ | 590,514 | $ | 596,208 |
|
| |
| Publishing (--%) | | | | |
| Dex Media West, LLC/Dex Media Finance Co. bank term | | | | |
| loan FRN Ser. B, 5.927s, 2010 | | 290,699 | | 291,789 |
|
| |
| Tire & Rubber (--%) | | | | |
| Goodyear Tire & Rubber Co. (The) bank term loan FRN 7.06s, 2010 | 405,000 | | 406,435 |
|
| |
| Utilities & Power (0.4%) | | | | |
| El Paso Corp. bank term loan FRN 3.764s, 2009 | | 870,000 | | 872,538 |
| El Paso Corp. bank term loan FRN Ser. B, 6.813s, 2009 | | 1,421,880 | | 1,428,396 |
| NRG Energy, Inc. bank term loan FRN 5.795s, 2011 | | 437,500 | | 438,958 |
| NRG Energy, Inc. bank term loan FRN Ser. B, 5.895s, 2011 | | 558,281 | | 560,142 |
| Williams Cos., Inc. (The) bank term loan FRN Ser. C, 6.37s, 2007 | | 180,854 | | 182,436 |
| | | | | 3,482,470 |
|
| |
| Total senior loans (cost $22,843,652) | | | $ | 22,922,663 |
|
| |
| |
| COLLATERALIZED MORTGAGE OBLIGATIONS (0.6%)* | | | | |
|
| | Principal amount | | Value |
| |
| DLJ Commercial Mortgage Corp. | | | | |
| Ser. 98-CF2, Class B4, 6.04s, 2031 | $ | 493,418 | $ | 481,830 |
| Ser. 98-CF2, Class B5, 5.95s, 2031 | | 1,581,791 | | 1,146,640 |
| GE Capital Commercial Mortgage Corp. 144A | | | | |
| Ser. 00-1, Class F, 7.784s, 2033 | | 257,000 | | 277,054 |
| Ser. 00-1, Class G, 6.131s, 2033 | | 1,025,000 | | 951,422 |
| GMAC Commercial Mortgage Securities, Inc. 144A | | | | |
| Ser. 99-C3, Class G, 6.974s, 2036 | | 912,750 | | 753,295 |
| LB Commercial Conduit Mortgage Trust 144A Ser. 99-C1, | | | | |
| Class G, 6.41s, 2031 | | 437,000 | | 411,996 |
| Mach One Commercial Mortgage Trust 144A | | | | |
| Ser. 04-1A, Class J, 5.45s, 2040 | | 1,000,000 | | 827,813 |
| Ser. 04-1A, Class K, 5.45s, 2040 | | 365,000 | | 295,436 |
| Ser. 04-1A, Class L, 5.45s, 2040 | | 165,000 | | 120,779 |
|
| Total collateralized mortgage obligations (cost $4,800,437) | | | $ | 5,266,265 |
|
| |
| |
| CONVERTIBLE BONDS AND NOTES (0.2%)* | | | | |
|
| | Principal amount | | Value |
| |
| Wabash National Corp. cv. sr. notes 3 1/4s, 2008 | $ | 880,000 | $ | 1,029,600 |
| WCI Communities, Inc. cv. sr. sub. notes 4s, 2023 | | 910,000 | | 990,763 |
|
| Total convertible bonds and notes (cost $1,998,840) | | | $ | 2,020,363 |
48
| FOREIGN GOVERNMENT BONDS AND NOTES (0.1%)* (cost $1,024,836) | | |
|
| | Principal amount | | Value |
| Philippines (Republic of ) bonds 9 1/2s, 2024 | $ | 945,000 | $ | 1,067,850 |
|
| |
| SHORT-TERM INVESTMENTS (2.4%)* (cost $22,510,695) | | | | |
|
| | | Shares | | Value |
| Putnam Prime Money Market Fund (e) | | 22,510,695 | $ | 22,510,695 |
|
| |
| TOTAL INVESTMENTS | | | | |
| Total investments (cost $937,906,854) | | | $ | 929,120,662 |
* Percentages indicated are based on net assets of $938,313,789.
**** Security is in default of principal and interest.
† Non-income-producing security.
++ The interest rate and date shown parenthetically represent the new interest rate to be paid and the date the fund will begin accruing interest at this rate.
‡ Restricted, excluding 144A securities, as to public resale. The total market value of restricted securities held at November 30, 2005 was $4,755,360 or 0.5% of net assets.
‡‡ Income may be received in cash or additional securities at the discretion of the issuer.
(R) Real Estate Investment Trust.
(c) Senior loans are exempt from registration under the Security Act of 1933, as amended, but contain certain restrictions on resale and cannot be sold publicly. These loans pay interest at
rates which adjust periodically. The interest rate shown for senior loans are the current interest rates at November 30, 2005. Senior loans are also subject to mandatory and/or optional
prepayment which cannot be predicted. As a result, the remaining maturity may be substantially less than the stated maturity shown (Notes 1 and 6).
(e) See Note 5 to the financial statements regarding investments in Putnam Prime Money Market Fund.
(F) Security is valued at fair value following procedures approved by the Trustees.
(g) The notes are secured by debt and equity securities and equity participation agreements held by Neon Capital, Ltd.
At November 30, 2005, liquid assets totaling $4,560,000 have been designated as collateral for open forward commitments and open swap contracts.
144A after the name of a security represents those exempt from registration under Rule 144A of the Securities Act of 1933.
These securities may be resold in transactions exempt from registration, normally to qualified institutional buyers.
The rates shown on Floating Rate Notes (FRN) are the current interest rates at November 30, 2005.
|
49
| FORWARD CURRENCY CONTRACTS TO BUY at 11/30/05 | | | |
|
| | | Aggregate | Delivery | Unrealized |
| | Value | face value | date | appreciation |
|
| Canadian Dollar | $516,893 | $512,812 | 1/18/06 | $4,081 |
|
| |
| |
| FORWARD CURRENCY CONTRACTS TO SELL at 11/30/05 | | | |
|
| | | Aggregate | Delivery | Unrealized |
| | Value | face value | date | appreciation |
|
| Euro | $12,801,043 | $13,659,893 | 12/21/05 | $858,850 |
|
| |
| |
| CREDIT DEFAULT CONTRACTS OUTSTANDING at 11/30/05 | | | |
|
| | | | Notional | Unrealized |
| | | | amount | appreciation |
|
| Agreement with Goldman Sachs International on September 2, 2004, | | |
| terminating on the date on which the notional amount is reduced to zero | | |
| or the date on which the assets securing the reference obligation are | | |
| liquidated, the fund receives a payment of the outstanding notional | | |
| amount times 2.461% and the fund pays in the event of a credit default | | |
| in one of the underlying securities in the basket of BB CMBS securities. | $1,485,000 | $20,794 |
Agreement with JPMorgan Chase Bank, N.A. on September 1, 2005, | | |
| maturing on September 20, 2010, to pay quarterly 460 basis points | | |
| times the notional amount. Upon a credit default event of General Motors | | |
| Acceptance Corp., the fund receives a payment of the proportional | | |
| notional amount times the difference between the par value and the then | | |
| market value of General Motors Acceptance Corp. | | 2,085,000 | 27,648 |
Agreement with JPMorgan Chase Bank, N.A. on April 25, 2005, | | |
| maturing on June 20, 2010, to receive a quarterly payment of 3.70% times | | |
| the notional amount. Upon a credit default event of Felcor Lodging L.P., | | |
| 8 1/2, 2011, the fund makes a payment of the proportional notional | | |
| amount times the difference between the par value and the then-market | | |
| value of Felcor Lodging L.P., 8 1/2, 2011. | | 990,000 | 44,847 |
|
| Total | | | | $93,289 |
The accompanying notes are an integral part of these financial statements.
50
| Statement of assets and liabilities 11/30/05 | | |
|
| |
| ASSETS | | |
| Investment in securities, at value (Note 1): | | |
| Unaffiliated issuers (identified cost $915,396,159) | $ | 906,609,967 |
| Affiliated issuers (identified cost $22,510,695) (Note 5) | | 22,510,695 |
|
| Cash | | 12,908 |
|
| Interest and other receivables | | 19,307,408 |
|
| Receivable for shares of the fund sold | | 95,694 |
|
| Receivable for securities sold | | 1,720,128 |
|
| Receivable for open forward currency contracts (Note 1) | | 862,931 |
|
| Receivable for closed forward currency contracts (Note 1) | | 32,686 |
|
| Unrealized appreciation on swap contracts (Note 1) | | 93,289 |
|
| Total assets | | 951,245,706 |
|
| |
| LIABILITIES | | |
| Payable for securities purchased | | 7,711,947 |
|
| Payable for shares of the fund repurchased | | 2,686,312 |
|
| Payable for compensation of Manager (Notes 2 and 5) | | 1,569,942 |
|
| Payable for investor servicing and custodian fees (Note 2) | | 170,387 |
|
| Payable for Trustee compensation and expenses (Note 2) | | 196,342 |
|
| Payable for administrative services (Note 2) | | 3,568 |
|
| Payable for distribution fees (Note 2) | | 403,244 |
|
| Other accrued expenses | | 190,175 |
|
| Total liabilities | | 12,931,917 |
|
| Net assets | $ | 938,313,789 |
|
| |
| REPRESENTED BY | | |
| Paid-in capital (Unlimited shares authorized) (Notes 1 and 4) | | $ 2,222,996,534 |
|
| Undistributed net investment income (Note 1) | | 1,675,847 |
|
| Accumulated net realized loss on investments | | |
| and foreign currency transactions (Note 1) | | (1,278,511,834) |
|
| Net unrealized depreciation of investments | | |
| and assets and liabilities in foreign currencies | | (7,846,758) |
|
| Total -- Representing net assets applicable to capital shares outstanding | $ | 938,313,789 |
| |
| (Continued on next page) | | |
51
| Statement of assets and liabilities (Continued) | |
|
| |
| COMPUTATION OF NET ASSET VALUE AND OFFERING PRICE | |
| Net asset value and redemption price per class A share | |
| ($440,780,196 divided by 73,878,653 shares) | $5.97 |
|
| Offering price per class A share | |
| (100/96.25 of $5.97)* | $6.20 |
|
| Net asset value and offering price per class B share | |
| ($46,601,570 divided by 7,913,937 shares)** | $5.89 |
|
| Net asset value and redemption price per class M share | |
| ($430,520,789 divided by 72,030,135 shares) | $5.98 |
|
| Offering price per class M share | |
| (100/96.75 of $5.98)*** | $6.18 |
|
| Net asset value, offering price and redemption price per class Y share | |
| ($20,411,234 divided by 3,356,902 shares) | $6.08 |
| * | On single retail sales of less than $100,000. On sales of $100,000 or more and on group sales, the offering price is reduced. |
| |
| ** | Redemption price per share is equal to net asset value less any applicable contingent deferred sales charge. |
| |
| *** | On single retail sales of less than $50,000. On sales of $50,000 or more and on group sales, the offering price is reduced. |
| |
The accompanying notes are an integral part of these financial statements.
52
| Statement of operations Year ended 11/30/05 | | |
|
| |
| INVESTMENT INCOME | | |
| Interest (including interest income of $638,251 | | |
| from investments in affiliated issuers) (Note 5) | $ | 86,511,638 |
|
| Dividends (net of foreign tax of $1,810) | | 12,672 |
|
| Total investment income | | 86,524,310 |
|
| |
| EXPENSES | | |
| Compensation of Manager (Note 2) | | 6,873,414 |
|
| Investor servicing fees (Note 2) | | 892,622 |
|
| Custodian fees (Note 2) | | 204,141 |
|
| Trustee compensation and expenses (Note 2) | | 48,339 |
|
| Administrative services (Note 2) | | 42,275 |
|
| Distribution fees -- Class A (Note 2) | | 1,149,415 |
|
| Distribution fees -- Class B (Note 2) | | 866,714 |
|
| Distribution fees -- Class M (Note 2) | | 2,486,955 |
|
| Other | | 421,222 |
|
| Non-recurring costs (Notes 2 and 7) | | 14,422 |
|
| Costs assumed by Manager (Notes 2 and 7) | | (14,422) |
|
| Fees waived and reimbursed by Manager (Note 5) | | (31,665) |
|
| Total expenses | | 12,953,432 |
|
| Expense reduction (Note 2) | | (59,306) |
|
| Net expenses | | 12,894,126 |
|
| Net investment income | | 73,630,184 |
|
| Net realized gain on investments (Notes 1, 3 and 6) | | 14,920,798 |
|
| Net realized gain on swap contracts (Note 1) | | 469,097 |
|
| Net realized gain on foreign currency transactions (Note 1) | | 929,525 |
|
| Net unrealized appreciation of assets and liabilities | | |
| in foreign currencies | | 837,863 |
|
| Net unrealized depreciation of investments | | |
| and swap contracts during the year | | (55,328,568) |
|
| Net loss on investments | | (38,171,285) |
|
| Net increase in net assets resulting from operations | $ | 35,458,899 |
The accompanying notes are an integral part of these financial statements.
53
| Statement of changes in net assets | |
|
| |
| DECREASE IN NET ASSETS | | |
|
| | Year ended | Year ended |
| | 11/30/05 | 11/30/04 |
|
| Operations: | | |
| Net investment income | $ 73,630,184 | $ 88,580,466 |
|
| Net realized gain (loss) on investments | | |
| and foreign currency transactions | 16,319,420 | (83,937,449) |
|
| Net unrealized appreciation (depreciation) of investments | | |
| and assets and liabilities in foreign currencies | (54,490,705) | 143,997,816 |
|
| Net increase in net assets resulting from operations | 35,458,899 | 148,640,833 |
|
| Distributions to shareholders: (Note 1) | | |
|
| From net investment income | | |
|
| Class A | (30,773,043) | (35,440,021) |
|
| Class B | (5,287,382) | (10,517,923) |
|
| Class M | (32,426,583) | (42,192,839) |
|
| Class Y | (1,641,972) | (1,781,949) |
|
| Redemption fees (Note 1) | 5,857 | 17,373 |
|
| Decrease from capital share transactions (Note 4) | (234,795,304) | (220,380,374) |
|
| Total decrease in net assets | (269,459,528) | (161,654,900) |
|
| |
| NET ASSETS | | |
| Beginning of year | 1,207,773,317 | 1,369,428,217 |
|
| End of year (including undistributed net investment | | |
| income of $1,675,847 and distributions in excess | | |
| of net investment income of $4,618,739, respectively) | $ 938,313,789 | $1,207,773,317 |
The accompanying notes are an integral part of these financial statements.
54
Financial highlights (For a common share outstanding throughout the period)
| CLASS A | | | | | |
|
| PER-SHARE OPERATING PERFORMANCE | | | | |
|
| | | | Year ended | | |
| | 11/30/05 | 11/30/04 | 11/30/03 | 11/30/02 | 11/30/01 |
|
| Net asset value, | | | | | |
| beginning of period | $6.16 | $5.88 | $5.17 | $5.84 | $6.30 |
|
| Investment operations: | | | | | |
| Net investment income (a) | .43(d) | .43(d) | .48 | .56 | .68 |
|
| Net realized and unrealized | | | | | |
| gain (loss) on investments | (.21) | .29 | .73 | (.62) | (.40) |
|
| Total from | | | | | |
| investment operations | .22 | .72 | 1.21 | (.06) | .28 |
|
| Less distributions: | | | | | |
| From net investment income | (.41) | (.44) | (.50) | (.58) | (.71) |
|
| From return of capital | -- | -- | -- | (.03) | (.03) |
|
| Total distributions | (.41) | (.44) | (.50) | (.61) | (.74) |
|
| Redemption fees | --(e) | --(e) | -- | -- | -- |
|
| Net asset value, | | | | | |
| end of period | $5.97 | $6.16 | $5.88 | $5.17 | $5.84 |
|
| Total return at | | | | | |
| net asset value (%)(b) | 3.67 | 12.72 | 24.65 | (0.93) | 4.46 |
|
| |
| RATIOS AND SUPPLEMENTAL DATA | | | | | |
| Net assets, end of period | | | | | |
| (in thousands) | $440,780 | $484,372 | $507,140 | $462,586 | $561,101 |
|
| Ratio of expenses to | | | | | |
| average net assets (%)(c) | 1.04(d) | 1.07(d) | 1.03 | 1.03 | 1.00 |
|
| Ratio of net investment income | | | | | |
| to average net assets (%) | 7.07(d) | 7.22(d) | 8.61 | 10.35 | 11.01 |
|
| Portfolio turnover (%) | 33.37 | 53.33 | 78.78 | 60.35 | 81.23 |
| (a) | Per share net investment income has been determined on the basis of the weighted average number of shares outstanding during the period. |
| |
| (b) | Total return assumes dividend reinvestment and does not reflect the effect of sales charges. |
| |
| (c) | Includes amounts paid through expense offset arrangements (Note 2). |
| |
| (d) | Reflects waivers of certain fund expenses in connection with investments in Putnam Prime Money Market Fund during the period. As a result of such waivers, the expenses of the fund for the periods ended November 30, 2005 and November 30, 2004 reflect a reduction of less than 0.01% of average net assets for class A shares (Note 5). |
| |
| (e) | Amount represents less than $0.01 per share. |
| |
The accompanying notes are an integral part of these financial statements.
55
Financial highlights (For a common share outstanding throughout the period)
| CLASS B | | | | | |
|
| PER-SHARE OPERATING PERFORMANCE | | | | |
|
| | | | Year ended | | |
| | 11/30/05 | 11/30/04 | 11/30/03 | 11/30/02 | 11/30/01 |
|
| Net asset value, | | | | | |
| beginning of period | $6.08 | $5.81 | $5.12 | $5.79 | $6.27 |
|
| Investment operations: | | | | | |
| Net investment income (a) | .38(d) | .38(d) | .43 | .52 | .63 |
|
| Net realized and unrealized | | | | | |
| gain (loss) on investments | (.21) | .28 | .72 | (.62) | (.42) |
|
| Total from | | | | | |
| investment operations | .17 | .66 | 1.15 | (.10) | .21 |
|
| Less distributions: | | | | | |
| From net investment income | (.36) | (.39) | (.46) | (.54) | (.66) |
|
| From return of capital | -- | -- | -- | (.03) | (.03) |
|
| Total distributions | (.36) | (.39) | (.46) | (.57) | (.69) |
|
| Redemption fees | --(e) | --(e) | -- | -- | -- |
|
| Net asset value, | | | | | |
| end of period | $5.89 | $6.08 | $5.81 | $5.12 | $5.79 |
|
| Total return at | | | | | |
| net asset value (%)(b) | 2.91 | 11.84 | 23.56 | (1.71) | 3.35 |
|
| |
| RATIOS AND SUPPLEMENTAL DATA | | | | | |
| Net assets, end of period | | | | | |
| (in thousands) | $46,602 | $123,263 | $199,990 | $258,113 | $372,989 |
|
| Ratio of expenses to | | | | | |
| average net assets (%)(c) | 1.79(d) | 1.82(d) | 1.78 | 1.78 | 1.75 |
|
| Ratio of net investment income | | | | | |
| to average net assets (%) | 6.30(d) | 6.50(d) | 7.94 | 9.58 | 10.27 |
|
| Portfolio turnover (%) | 33.37 | 53.33 | 78.78 | 60.35 | 81.23 |
| (a) | Per share net investment income has been determined on the basis of the weighted average number of shares outstanding during the period. |
| |
| (b) | Total return assumes dividend reinvestment and does not reflect the effect of sales charges. |
| |
| (c) | Includes amounts paid through expense offset arrangements (Note 2). |
| |
| (d) | Reflects waivers of certain fund expenses in connection with investments in Putnam Prime Money Market Fund during the period. As a result of such waivers, the expenses of the fund for the periods ended November 30, 2005 and November 30, 2004 reflect a reduction of less than 0.01% of average net assets for class B shares (Note 5). |
| |
| (e) | Amount represents less than $0.01 per share. |
| |
The accompanying notes are an integral part of these financial statements.
56
Financial highlights (For a common share outstanding throughout the period)
| CLASS M | | | | | |
|
| PER-SHARE OPERATING PERFORMANCE | | | | |
|
| | | | Year ended | | |
| | 11/30/05 | 11/30/04 | 11/30/03 | 11/30/02 | 11/30/01 |
|
| Net asset value, | | | | | |
| beginning of period | $6.17 | $5.89 | $5.18 | $5.85 | $6.29 |
|
| Investment operations: | | | | | |
| Net investment income (a) | .41(d) | .42(d) | .47 | .55 | .67 |
|
| Net realized and unrealized | | | | | |
| gain (loss) on investments | (.20) | .29 | .73 | (.62) | (.38) |
|
| Total from | | | | | |
| investment operations | .21 | .71 | 1.20 | (.07) | .29 |
|
| Less distributions: | | | | | |
| From net investment income | (.40) | (.43) | (.49) | (.57) | (.70) |
|
| From return of capital | -- | -- | -- | (.03) | (.03) |
|
| Total distributions | (.40) | (.43) | (.49) | (.60) | (.73) |
|
| Redemption fees | --(e) | --(e) | -- | -- | -- |
|
| Net asset value, | | | | | |
| end of period | $5.98 | $6.17 | $5.89 | $5.18 | $5.85 |
|
| Total return at | | | | | |
| net asset value (%)(b) | 3.46 | 12.47 | 24.32 | (1.15) | 4.59 |
|
| |
| RATIOS AND SUPPLEMENTAL DATA | | | | | |
| Net assets, end of period | | | | | |
| (in thousands) | $430,521 | $573,455 | $638,046 | $534,636 | $693,973 |
|
| Ratio of expenses to | | | | | |
| average net assets (%)(c) | 1.29(d) | 1.32(d) | 1.28 | 1.28 | 1.25 |
|
| Ratio of net investment income | | | | | |
| to average net assets (%) | 6.82(d) | 6.98(d) | 8.34 | 10.10 | 10.75 |
|
| Portfolio turnover (%) | 33.37 | 53.33 | 78.78 | 60.35 | 81.23 |
| (a) | Per share net investment income has been determined on the basis of the weighted average number of shares outstanding during the period. |
| |
| (b) | Total return assumes dividend reinvestment and does not reflect the effect of sales charges. |
| |
| (c) | Includes amounts paid through expense offset arrangements (Note 2). |
| |
| (d) | Reflects waivers of certain fund expenses in connection with investments in Putnam Prime Money Market Fund during the period. As a result of such waivers, the expenses of the fund for the periods ended November 30, 2005 and November 30, 2004 reflect a reduction of less than 0.01% of average net assets for class M shares (Note 5). |
| |
| (e) | Amount represents less than $0.01 per share. |
| |
The accompanying notes are an integral part of these financial statements.
57
Financial highlights (For a common share outstanding throughout the period)
| CLASS Y | | | | | |
|
| PER-SHARE OPERATING PERFORMANCE | | | | |
|
| | | | Year ended | | |
| | 11/30/05 | 11/30/04 | 11/30/03 | 11/30/02 | 11/30/01 |
|
| Net asset value, | | | | | |
| beginning of period | $6.27 | $5.97 | $5.23 | $5.88 | $6.32 |
|
| Investment operations: | | | | | |
| Net investment income (a) | .45(d) | .45(d) | .50 | .59 | .68 |
|
| Net realized and unrealized | | | | | |
| gain (loss) on investments | (.22) | .30 | .76 | (.62) | (.37) |
|
| Total from | | | | | |
| investment operations | .23 | .75 | 1.26 | (.03) | .31 |
|
| Less distributions: | | | | | |
| From net investment income | (.42) | (.45) | (.52) | (.59) | (.72) |
|
| From return of capital | -- | -- | -- | (.03) | (.03) |
|
| Total distributions | (.42) | (.45) | (.52) | (.62) | (.75) |
|
| Redemption fees | --(e) | --(e) | -- | -- | -- |
|
| Net asset value, | | | | | |
| end of period | $6.08 | $6.27 | $5.97 | $5.23 | $5.88 |
|
| Total return at | | | | | |
| net asset value (%)(b) | 3.80 | 13.09 | 25.21 | (0.36) | 4.97 |
|
| |
| RATIOS AND SUPPLEMENTAL DATA | | | | | |
| Net assets, end of period | | | | | |
| (in thousands) | $20,411 | $26,684 | $24,253 | $15,562 | $15,278 |
|
| Ratio of expenses to | | | | | |
| average net assets (%)(c) | .79(d) | .82(d) | .78 | .78 | .75 |
|
| Ratio of net investment income | | | | | |
| to average net assets (%) | 7.31(d) | 7.46(d) | 8.83 | 10.60 | 11.33 |
|
| Portfolio turnover (%) | 33.37 | 53.33 | 78.78 | 60.35 | 81.23 |
| (a) | Per share net investment income has been determined on the basis of the weighted average number of shares outstanding during the period. |
| |
| (b) | Total return assumes dividend reinvestment and does not reflect the effect of sales charges. |
| |
| (c) | Includes amounts paid through expense offset arrangements (Note 2). |
| |
| (d) | Reflects waivers of certain fund expenses in connection with investments in Putnam Prime Money Market Fund during the period. As a result of such waivers, the expenses of the fund for the periods ended November 30, 2005 and November 30, 2004 reflect a reduction of less than 0.01% of average net assets for class Y shares (Note 5). |
| |
| (e) | Amount represents less than $0.01 per share. |
| |
The accompanying notes are an integral part of these financial statements.
58
Notes to financial statements 11/30/05
Note 1: Significant accounting policies
Putnam High Yield Advantage Fund (the “fund”), a Massachusetts business trust, is registered under the Investment Company Act of 1940, as amended, as a diversified, open-end management investment company. The fund seeks high current income primarily through a diversified portfolio of higher yielding, lower rated bonds that may have a higher rate of default. Capital growth is a secondary objective when consistent with the objective of high current income.
The fund offers class A, class B, class M and class Y shares. Class A and class M shares are sold with a maximum front-end sales charge of 3.75% and 3.25%, respectively, and generally do not pay contingent deferred sales charges. Prior to April 1, 2005, the maximum front-end sales charge for class A shares was 4.50% . Class B shares, which convert to class A shares after approximately eight years, do not pay a front-end sales charge, and are subject to a contingent deferred sales charge, if those shares are redeemed within six years of purchase. The expenses for class A, Class B and class M shares may differ based on the distribution fee of each class, which is identified in Note 2. Class Y shares, which are sold at net asset value, are generally subject to the same expenses as class A, class B, and class M shares, but do not bear a distribution fee. Class Y shares are sold to certain eligible purchasers including certain defined contribution plans (including corporate IRAs), bank trust departments, and trust companies.
A 2.00% redemption fee may apply to any shares that are redeemed (either by selling or exchanging into another fund) within 5 days of purchase. A 1.00% redemption fee would apply to any shares that are redeemed (either by selling or exchanging into another fund) within 6-90 days of purchase. The redemption fee is accounted for as an addition to paid-in-capital.
Investment income, realized and unrealized gains and losses and expenses of the fund are borne pro-rata based on the relative net assets of each class to the total net assets of the fund, except that each class bears expenses unique to that class (including the distribution fees applicable to such classes). Each class votes as a class only with respect to its own distribution plan or other matters on which a class vote is required by law or determined by the Trustees. Shares of each class would receive their pro-rata share of the net assets of the fund, if the fund were liquidated. In addition, the Trustees declare separate dividends on each class of shares.
In the normal course of business, the fund enters into contracts that may include agreements to indemnify another party under given circumstances. The fund’s maximum exposure under these arrangements is unknown as this would involve future claims that may be, but have not yet been, made against the fund. However, the fund expects the risk of material loss to be remote.
The following is a summary of significant accounting policies consistently followed by the fund in the preparation of its financial statements. The preparation of financial statements is in conformity with accounting principles generally accepted in the United States of America and requires management to make estimates and assumptions that affect the reported amounts of assets and liabilities in the financial statements and the reported amounts of increases and decreases in net assets from operations during the reporting period. Actual results could differ from those estimates.
A) Security valuation Investments for which market quotations are readily available are valued at the last reported sales price on their principal exchange, or official closing price for certain markets. If no sales are reported -- as in the case of some securities traded over-the-counter -- a security is valued at its last reported bid price. Market quotations are not considered to be readily available for certain debt obligations; such investments are valued on the basis of valuations furnished by an independent pricing service approved by the Trustees or dealers selected by Putnam Management. Such services or dealers
59
determine valuations for normal institutional-size trading units of such securities using methods based on market transactions for comparable securities and various relationships, generally recognized by institutional traders, between securities. Many securities markets and exchanges outside the U.S. close prior to the close of the New York Stock Exchange and therefore the closing prices for securities in such markets or on such exchanges may not fully reflect events that occur after such close but before the close of the New York Stock Exchange. Accordingly, on certain days, the fund will fair value foreign securities taking into account multiple factors, including movements in the U.S. securities markets. The number of days on which fair value prices will be used will depend on market activity and it is possible that fair value prices will be used by the fund to a significant extent. Securities quoted in foreign currencies, if any, are translated into U.S. dollars at the current exchange rate. Short-term investments having remaining maturities of 60 days or less are valued at amortized cost, which approximates fair value. Other investments, including certain restricted securities, are valued at fair value following procedures approved by the Trustees. Such valuations and procedures are reviewed periodically by the Trustees.
B) Joint trading account Pursuant to an exemptive order from the Securities and Exchange Commission, the fund may transfer uninvested cash balances, including cash collateral received under security lending arrangements, into a joint trading account along with the cash of other registered investment companies and certain other accounts managed by Putnam Investment Management, LLC (“Putnam Management”), the fund’s manager, an indirect wholly-owned subsidiary of Putnam, LLC. These balances may be invested in issues of high-grade short-term investments having maturities of up to 397 days for collateral received under security lending arrangements and up to 90 days for other cash investments.
C) Repurchase agreements The fund, or any joint trading account, through its custodian, receives delivery of the underlying securities, the market value of which at the time of purchase is required to be in an amount at least equal to the resale price, including accrued interest. Collateral for certain tri-party repurchase agreements is held at the counterparty’s custodian in a segregated account for the benefit of the fund and the coun-terparty. Putnam Management is responsible for determining that the value of these underlying securities is at all times at least equal to the resale price, including accrued interest.
D) Security transactions and related investment income Security transactions are recorded on the trade date (the date the order to buy or sell is executed). Gains or losses on securities sold are determined on the identified cost basis. Interest income is recorded on the accrual basis. Dividend income, net of applicable withholding taxes, is recognized on the ex-dividend date except that certain dividends from foreign securities, if any, are recognized as soon as the fund is informed of the ex-dividend date. The fund earned certain fees in connection with its senior loan purchasing activities. These fees are treated as market discount and are recorded as income in the statement of operations.
E) Stripped mortgage-backed securities The fund may invest in stripped mortgage-backed securities which represent a participation in mortgage loans and may be structured in classes with rights to receive different portions of the interest and principal. Interest-only securities receive all of the interest and principal-only securities receive all of the principal. If the interest-only securities experience greater than anticipated prepayments of principal, the fund may fail to recoup fully its initial investment in these securities. Conversely, principal-only securities increase in value if prepayments are greater than anticipated and decline if prepayments are slower than anticipated. The market value of these securities is highly sensitive to changes in interest rates.
60
F) Foreign currency translation The accounting records of the fund are maintained in U.S. dollars. The market value of foreign securities, currency holdings, and other assets and liabilities are recorded in the books and records of the fund after translation to U.S. dollars based on the exchange rates on that day. The cost of each security is determined using historical exchange rates. Income and withholding taxes are translated at prevailing exchange rates when earned or incurred. The fund does not isolate that portion of realized or unrealized gains or losses resulting from changes in the foreign exchange rate on investments from fluctuations arising from changes in the market prices of the securities. Such gains and losses are included with the net realized and unrealized gain or loss on investments. Net realized gains and losses on foreign currency transactions represent net realized exchange gains or losses on closed forward currency contracts, disposition of foreign currencies, currency gains and losses realized between the trade and settlement dates on securities transactions and the difference between the amount of investment income and foreign withholding taxes recorded on the fund’s books and the U.S. dollar equivalent amounts actually received or paid. Net unrealized appreciation and depreciation of assets and liabilities in foreign currencies arise from changes in the value of open forward currency contracts and assets and liabilities other than investments at the period end, resulting from changes in the exchange rate. Investments in foreign securities involve certain risks, including those related to economic instability, unfavorable political developments, and currency fluctuations, not present with domestic investments.
G) Forward currency contracts The fund may buy and sell forward currency contracts, which are agreements between two parties to buy and sell currencies at a set price on a future date. These contracts are used to protect against a decline in value relative to the U.S. dollar of the currencies in which its portfolio securities are denominated or quoted (or an increase in the value of a currency in which securities a fund intends to buy are denominated, when a fund holds cash reserves and short term investments), or for other investment purposes. The U.S. dollar value of forward currency contracts is determined using current forward currency exchange rates supplied by a quotation service. The market value of the contract will fluctuate with changes in currency exchange rates. The contract is marked to market daily and the change in market value is recorded as an unrealized gain or loss. When the contract is closed, the fund records a realized gain or loss equal to the difference between the value of the contract at the time it was opened and the value at the time it was closed. The fund could be exposed to risk if the value of the currency changes unfavorably, if the counterparties to the contracts are unable to meet the terms of their contracts or if the fund is unable to enter into a closing position. Risks may exceed amounts recognized on the statement of assets and liabilities. Forward currency contracts outstanding at period end, if any, are listed after the fund’s portfolio.
H) Total return swap contracts The fund may enter into total return swap contracts, which are arrangements to exchange a market linked return for a periodic payment, both based on a notional principal amount. To the extent that the total return of the security, index or other financial measure underlying the transaction exceeds or falls short of the offsetting interest rate obligation, the fund will receive a payment from or make a payment to the counterparty. Total return swap contracts are marked to market daily based upon quotations from market makers and the change, if any, is recorded as unrealized gain or loss. Payments received or made are recorded as realized gains or loss. The fund could be exposed to credit or market risk due to unfavorable changes in the fluctuation of interest rates or in the price of the underlying security or index, the possibility that there is no liquid market for these agreements or that the counterparty may default on its obligation to perform. Risk of loss may exceed
61
amounts recognized on the statement of assets and liabilities. Total return swap contracts outstanding at period end, if any, are listed after the fund’s portfolio.
I) Credit default contracts The fund may enter into credit default contracts where one party, the protection buyer, makes an upfront or periodic payment to a counter party, the protection seller, in exchange for the right to receive a contingent payment. The maximum amount of the payment may equal the notional amount, at par, of the underlying index or security as a result of a related credit event. An upfront payment received by the fund, as the protection seller, is recorded as a liability on the fund’s books. An upfront payment made by the fund, as the protection buyer, is recorded as an asset on the fund’s books. Periodic payments received or paid by the fund are recorded as realized gains or losses. The credit default contracts are marked to market daily based upon quotations from market makers and the change, if any, is recorded as unrealized gain or loss. Payments received or made as a result of a credit event or termination of the contract are recognized, net of a proportional amount of the upfront payment, as realized gains or losses. In addition to bearing the risk that the credit event will occur, the fund could be exposed to market risk due to unfavorable changes in interest rates or in the price of the underlying security or index, the possibility that the fund may be unable to close out its position at the same time or at the same price as if it had purchased comparable publicly traded securities or that the counterparty may default on its obligation to perform. Risks of loss may exceed amounts recognized on the statement of assets and liabilities. Credit default contracts outstanding at period end, if any, are listed after the fund’s portfolio.
J) Federal taxes It is the policy of the fund to distribute all of its taxable income within the prescribed time and otherwise comply with the provisions of the Internal Revenue Code of 1986 (the “Code”) applicable to regulated investment companies. It is also the intention of the fund to distribute an amount sufficient to avoid imposition of any excise tax under Section 4982 of the Code, as amended. Therefore, no provision has been made for federal taxes on income, capital gains or unrealized appreciation on securities held nor for excise tax on income and capital gains.
At November 30, 2005, the fund had a capital loss carryover of $1,278,476,589 available to the extent allowed by the Code to offset future net capital gain, if any. The amount of the carryover and the expiration dates are:
| Loss Carryover | Expiration |
| $286,189,144 | November 30, 2007 |
|
| 217,396,296 | November 30, 2008 |
|
| 265,227,969 | November 30, 2009 |
|
| 309,407,794 | November 30, 2010 |
|
| 104,325,628 | November 30, 2011 |
|
| 95,929,758 | November 30, 2012 |
|
K) Distributions to shareholders Distributions to shareholders from net investment income are recorded by the fund on the ex-dividend date. Distributions from capital gains, if any, are recorded on the ex-dividend date and paid at least annually. The amount and character of income and gains to be distributed are determined in accordance with income tax regulations, which may differ from generally accepted accounting principles.
These differences include temporary and permanent differences of losses on wash sales transactions, foreign currency gains and losses, defaulted bond interest, interest on payment-in-kind securities and income on swap contracts. Reclassifications are made to the fund’s capital accounts to reflect income and gains available for distribution (or available capital loss carryovers) under income tax regulations. For the year ended November 30, 2005, the fund reclassified $2,793,382 to increase undistributed net investment income and $97,107 to decrease
62
paid-in-capital, with an increase to accumulated net realized losses of $2,696,275.
The tax basis components of distributable earnings and the federal tax cost as of November 30, 2005 were as follows:
| Unrealized appreciation | $ 27,874,159 |
| Unrealized depreciation | (39,744,482) |
| | ------------------------------ |
| Net unrealized depreciation | (11,870,323) |
| Undistributed ordinary income | 6,559,544 |
| Capital loss carryforward | (1,278,476,589) |
| Cost for federal income | |
| tax purposes | $ 940,990,985 |
Note 2: Management fee, administrative
services and other transactions
|
Putnam Management is paid for management and investment advisory services quarterly based on the average net assets of the fund. Such fee is based on the following annual rates: 0.70% of the first $500 million of average net assets, 0.60% of the next $500 million, 0.55% of the next $500 million, 0.50% of the next $5 billion, 0.475% of the next $5 billion, 0.455% of then next $5 billion, 0.44% of the next $5 billion, and 0.43% thereafter.
Putnam Management has agreed to waive fees and reimburse expenses of the fund through November 30, 2006 to the extent necessary to ensure that the fund’s expenses do not exceed the simple average of the expenses of all front-end load funds viewed by Lipper, Inc. as having the same investment classification or objective as the fund. The expense reimbursement is based on a comparison of the fund’s expenses with the average annualized operating expenses of the funds in its Lipper peer group for each calendar quarter during the fund’s last fiscal year, excluding 12b-1 fees and without giving effect to any expense offset and brokerage service arrangements that may reduce fund expenses. For the year ended November 30, 2005, Putnam Management did not waive any of its management fee from the fund.
For the year ended November 30, 2005, Putnam Management has assumed $14,422 of legal, shareholder servicing and communication, audit and Trustee fees incurred by the fund in connection with certain legal and regulatory matters (including those described in Note 7).
Effective September 13, 2004, Putnam Investments Limited (“PIL”), an affiliate of Putnam Management, is authorized by the Trustees to manage a separate portion of the assets of the fund as determined by Putnam Management from time to time. Putnam Management pays a quarterly sub-management fee to PIL for its services at an annual rate of 0.40% of the average net assets of the portion of the fund managed by PIL.
The fund reimburses Putnam Management an allocated amount for the compensation and related expenses of certain officers of the fund and their staff who provide administrative services to the fund. The aggregate amount of all such reimbursements is determined annually by the Trustees.
Custodial functions for the fund’s assets are provided by Putnam Fiduciary Trust Company (“PFTC”), a subsidiary of Putnam, LLC. PFTC receives fees for custody services based on the fund’s asset level, the number of its security holdings and transaction volumes. Putnam Investor Services, a division of PFTC, provides investor servicing agent functions to the fund. Putnam Investor Services receives fees for investor servicing based on the number of shareholder accounts in the fund and the level of defined contribution plan assets in the fund. During the year ended November 30, 2005, the fund incurred $1,092,217 for these services.
The fund has entered into an arrangement with PFTC whereby credits realized as a result of uninvested cash balances are used to reduce a portion of the fund’s expenses. For the year ended November 30, 2005, the fund’s expenses were reduced by $59,306 under these arrangements.
63
Each independent Trustee of the fund receives an annual Trustee fee, of which $397, as a quarterly retainer, has been allocated to the fund, and an additional fee for each Trustees meeting attended. Trustees receive additional fees for attendance at certain committee meetings, industry seminars and for certain compliance-related matters. Trustees also are reimbursed for expenses they incur relating to their services as Trustees. George Putnam III, who is not an independent Trustee, also receives the foregoing fees for his services as Trustee.
The fund has adopted a Trustee Fee Deferral Plan (the “Deferral Plan”) which allows the Trustees to defer the receipt of all or a portion of Trustees fees payable on or after July 1, 1995. The deferred fees remain invested in certain Putnam funds until distribution in accordance with the Deferral Plan.
The fund has adopted an unfunded noncontributory defined benefit pension plan (the “Pension Plan”) covering all Trustees of the fund who have served as a Trustee for at least five years and were first elected prior to 2004. Benefits under the Pension Plan are equal to 50% of the Trustee’s average total retainer and meeting fees for the three years preceding retirement. Pension expense for the fund is included in Trustee compensation and expenses in the statement of operations. Accrued pension liability is included in Payable for Trustee compensation and expenses in the statement of assets and liabilities. The Trustees have terminated the Pension Plan with respect to any Trustee first elected after 2003.
The fund has adopted distribution plans (the “Plans”) with respect to its class A, class B and class M shares pursuant to rule 12b-1 under the Investment Company Act of 1940. The purpose of the Plans is to compensate Putnam Retail Management, a wholly-owned subsidiary of Putnam, LLC and Putnam Retail Management GP, Inc., for services provided and expenses incurred in distributing shares of the fund. The Plans provide for payments by the fund to Putnam Retail Management at an annual rate of up to 0.35%, 1.00% and 1.00% of the average net assets attributable to class A, class B and class M shares, respectively. The Trustees have approved payment by the fund at an annual rate of 0.25%, 1.00% and 0.50% of the average net assets attributable to class A, class B and class M shares, respectively.
For the year ended November 30, 2005, Putnam Retail Management, acting as underwriter, received net commissions of $7,152 and $138 from the sale of class A and class M shares, respectively, and received $32,253 in contingent deferred sales charges from redemptions of class B shares. A deferred sales charge of up to 1.00% and 0.40% is assessed on certain redemptions of class A and class M shares, respectively. For the year ended November 30, 2005, Putnam Retail Management, acting as underwriter, received $53 and no monies on class A and class M redemptions, respectively.
Note 3: Purchases and sales of securities
During the year ended November 30, 2005, cost of purchases and proceeds from sales of investment securities other than short-term investments aggregated $342,396,949 and $561,087,119, respectively. There were no purchases or sales of U.S. government securities.
Note 4: Capital shares
At November 30, 2005, there was an unlimited number of shares of beneficial interest authorized. Transactions in capital shares were as follows:
64
| CLASS A | Shares | Amount |
| Year ended 11/30/05: | |
| Shares sold | 12,881,929 | $ 77,924,293 |
|
| Shares issued | | |
| in connection | | |
| with reinvestment | | |
| of distributions | 3,196,210 | 19,308,372 |
|
| | 16,078,139 | 97,232,665 |
|
| Shares | | |
| repurchased | (20,821,208) | (126,075,192) |
|
| Net decrease | (4,743,069) | $ (28,842,527) |
| |
| Year ended 11/30/04: | |
| Shares sold | 13,071,625 | $ 78,245,789 |
|
| Shares issued | | |
| in connection | | |
| with reinvestment | | |
| of distributions | 3,563,145 | 21,257,776 |
|
| | 16,634,770 | 99,503,565 |
|
| Shares | | |
| repurchased | (24,287,882) | (145,118,352) |
|
| Net decrease | (7,653,112) | $ (45,614,787) |
|
| |
| CLASS B | Shares | Amount |
| Year ended 11/30/05: | |
| Shares sold | 175,107 | $ 1,031,918 |
|
| Shares issued | | |
| in connection | | |
| with reinvestment | | |
| of distributions | 509,385 | 3,066,719 |
|
| | 684,492 | 4,098,637 |
|
| Shares | | |
| repurchased | (13,033,290) | (77,858,699) |
|
| Net decrease | (12,348,798) | $(73,760,062) |
| |
| Year ended 11/30/04: | |
| Shares sold | 576,367 | $ 3,408,521 |
|
| Shares issued | | |
| in connection | | |
| with reinvestment | | |
| of distributions | 1,045,000 | 6,159,850 |
|
| | 1,621,367 | 9,568,371 |
|
| Shares | | |
| repurchased | (15,788,856) | (93,303,830) |
|
| Net decrease | (14,167,489) | $(83,735,459) |
| CLASS M | Shares | Amount |
| Year ended 11/30/05: | |
| Shares sold | 4,504,839 | $ 27,430,895 |
|
| Shares issued | | |
| in connection | | |
| with reinvestment | | |
| of distributions | 80,748 | 489,012 |
|
| | 4,585,587 | 27,919,907 |
|
| Shares | | |
| repurchased | (25,432,861) | (154,584,057) |
|
| Net decrease | (20,847,274) | $(126,664,150) |
| |
| Year ended 11/30/04: | |
| Shares sold | 18,382,493 | $ 110,530,522 |
|
| Shares issued | | |
| in connection | | |
| with reinvestment | | |
| of distributions | 106,819 | 651,941 |
|
| | 18,489,312 | 111,182,463 |
|
| Shares | | |
| repurchased | (33,882,136) | (203,387,355) |
|
| Net decrease | (15,392,824) | $ (92,204,892) |
|
| |
| CLASS Y | Shares | Amount |
| Year ended 11/30/05: | |
| Shares sold | 938,356 | $ 5,832,772 |
|
| Shares issued | | |
| in connection | | |
| with reinvestment | | |
| of distributions | 266,800 | 1,641,972 |
|
| | 1,205,156 | 7,474,744 |
|
| Shares | | |
| repurchased | (2,105,532) | (13,003,309) |
|
| Net decrease | (900,376) | $ (5,528,565) |
| |
| Year ended 11/30/04: | |
| Shares sold | 1,672,438 | $ 10,245,546 |
|
| Shares issued | | |
| in connection | | |
| with reinvestment | | |
| of distributions | 293,816 | 1,781,949 |
|
| | 1,966,254 | 12,027,495 |
|
| Shares | | |
| repurchased | (1,771,485) | (10,852,731) |
|
| Net increase | 194,769 | $ 1,174,764 |
65
Note 5: Investment in Putnam Prime Money Market Fund
Pursuant to an exemptive order from the Securities and Exchange Commission, the fund invests in Putnam Prime Money Market Fund, an open-end management investment company managed by Putnam Management. Management fees paid by the fund are reduced by an amount equal to the management and administrative services fees paid by Putnam Prime Money Market Fund with respect to assets invested by the fund in Putnam Prime Money Market Fund. For the year ended November 30, 2005, management fees paid were reduced by $31,665 relating to the fund’s investment in Putnam Prime Money Market Fund. Income distributions earned by the fund are recorded as income in the statement of operations and totaled $638,251 for the year ended November 30, 2005. During the year ended November 30, 2005, cost of purchases and cost of sales of investments in Putnam Prime Money Market Fund aggregated $293,925,036 and $292,314,254, respectively.
Note 6: Senior loan commitments
Senior loans are purchased or sold on a when-issued or delayed delivery basis and may be settled a month or more after the trade date, which from time to time can delay the actual investment of available cash balances; interest income is accrued based on the terms of the securities. Senior loans can be acquired through an agent, by assignment from another holder of the loan, or as a participation interest in another holder’s portion of the loan. When the fund invests in a loan or participation, the fund is subject to the risk that an intermediate participant between the fund and the borrower will fail to meet its obligations to the fund, in addition to the risk that the borrower under the loan may default on its obligations.
Note 7: Regulatory matters and litigation
Putnam Management has entered into agreements with the Securities and Exchange Commission and the Massachusetts Securities Division settling charges connected with excessive short-term trading by Putnam employees and, in the case of the charges brought by the Massachusetts Securities Division, by participants in some Putnam-administered 401(k) plans. Pursuant to these settlement agreements, Putnam Management will pay a total of $193.5 million in penalties and restitution, with $153.5 million being paid to certain open-end funds and their shareholders. The amount will be allocated to shareholders and funds pursuant to a plan developed by an independent consultant, and will be paid following approval of the plan by the SEC and the Massachusetts Securities Division.
The Securities and Exchange Commission’s and Massachusetts Securities Division’s allegations and related matters also serve as the general basis for numerous lawsuits, including purported class action lawsuits filed against Putnam Management and certain related parties, including certain Putnam funds. Putnam Management will bear any costs incurred by Putnam funds in connection with these lawsuits. Putnam Management believes that the likelihood that the pending private lawsuits and purported class action lawsuits will have a material adverse financial impact on the fund is remote, and the pending actions are not likely to materially affect its ability to provide investment management services to its clients, including the Putnam funds.
Putnam Investments has recorded a charge of $30 million for the estimated cost, excluding interest, that it believes will be necessary to address issues relating to the calculation of certain amounts paid by the Putnam mutual funds in previous years. The previous payments were cost reimbursements by the Putnam funds to Putnam for transfer agent services relating to defined
66
contribution operations. Putnam currently anticipates that any payments made by Putnam related to this issue will be paid to the Putnam funds. Review of this issue is ongoing.
Putnam Management and Putnam Retail Management are named as defendants in a civil suit in which the plaintiffs allege that the management and distribution fees paid by certain Putnam funds were excessive and seek recovery under the Investment Company Act of 1940. Putnam Management and Putnam Retail Management have contested the plaintiffs’ claims and the matter is currently pending in the U.S. District Court for the District of Massachusetts. Based on currently available information, Putnam Management believes that this action is without merit and that it is unlikely to have a material effect on Putnam Management’s and Putnam Retail Management’s ability to provide services to their clients, including the fund.
67
Federal tax information
(Unaudited)
|
The Form 1099 you receive in January 2006 will show the tax status of all distributions paid to your account in calendar 2005.
68
Jameson A. Baxter (Born 1943), Trustee since 1994, Vice Chairman since 2005
Ms. Baxter is the President of Baxter Associates, Inc., a private investment firm that she founded in 1986.
Ms. Baxter serves as a Director of ASHTA Chemicals, Inc., Banta Corporation (a printing and digital imaging firm), Ryerson Tull, Inc. (a steel service corporation), the Mutual Fund Directors Forum, Advocate Health Care and BoardSource, formerly the National Center for Nonprofit Boards. She is Chairman Emeritus of the Board of Trustees, Mount Holyoke College, having served as Chairman for five years and as a board member for thirteen years. Until 2002, Ms. Baxter was a Director of Intermatic Corporation (a manufacturer of energy control products).
Ms. Baxter has held various positions in investment banking and corporate finance, including Vice President and Principal of the Regency Group, and Vice President of and Consultant to First Boston Corporation. She is a graduate of Mount Holyoke College.
Charles B. Curtis (Born 1940), Trustee since 2001
Mr. Curtis is President and Chief Operating Officer of the Nuclear Threat Initiative (a private foundation dealing with national security issues) and serves as Senior Advisor to the United Nations Foundation.
Mr. Curtis is a member of the Council on Foreign Relations and the Trustee Advisory Council of the Applied Physics Laboratory, Johns Hopkins University. Until 2003, Mr. Curtis was a member of the Electric Power Research Institute Advisory Council and the University of Chicago Board of Governors for Argonne National Laboratory. Prior to 2002, Mr. Curtis was a Member of the Board of Directors of the Gas Technology Institute and the Board of Directors of the Environment and Natural Resources Program Steering Committee, John F. Kennedy School of Government, Harvard University. Until 2001, Mr. Curtis was a member of the Department of Defense Policy Board and Director of EG&G Technical Services, Inc. (a fossil energy research and development support company).
From August 1997 to December 1999, Mr. Curtis was a Partner at Hogan & Hartson L.L.P., a Washington, D.C. law firm. Prior to May 1997, Mr. Curtis was Deputy Secretary of Energy. He served as Chairman of the Federal Energy Regulatory Commission from 1977 to 1981 and has held positions on the staff of the U.S. House of Representatives, the U.S. Treasury Department, and the SEC.
69
Myra R. Drucker (Born 1948), Trustee since 2004
Ms. Drucker is a Vice Chair of the Board of Trustees of Sarah Lawrence College, a Trustee of Commonfund (a not-for-profit firm specializing in asset management for educational endowments and foundations) and a member of the Investment Committee of the Kresge Foundation (a charitable trust).
Ms. Drucker is an ex-officio member of the New York Stock Exchange (NYSE) Pension Managers Advisory Committee, having served as Chair for seven years and a member of the Executive Committee of the Committee on Investment of Employee Benefit Assets. She is Chair of the Advisory Board of Hamilton Lane Advisors (an investment management firm) and a member of the Advisory Board of RCM (an investment management firm). Until August 31, 2004, Ms. Drucker was Managing Director and a member of the Board of Directors of General Motors Asset Management and Chief Investment Officer of General Motors Trust Bank. Ms. Drucker also served as a member of the NYSE Corporate Accountability and Listing Standards Committee and the NYSE/NASD IPO Advisory Committee.
Prior to joining General Motors Asset Management in 2001, Ms. Drucker held various executive positions in the investment management industry. Ms. Drucker served as Chief Investment Officer of Xerox Corporation (a technology and service company in the document industry), where she was responsible for the investment of the company’s pension assets. Ms. Drucker was also Staff Vice President and Director of Trust Investments for International Paper (a paper, paper distribution, packaging and forest products company) and previously served as Manager of Trust Investments for Xerox Corporation. Ms. Drucker received a B.A. degree in Literature and Psychology from Sarah Lawrence College and pursued graduate studies in economics, statistics and portfolio theory at Temple University.
John A. Hill (Born 1942), Trustee since 1985 and Chairman since 2000
Mr. Hill is Vice Chairman of First Reserve Corporation, a private equity buyout firm that specializes in energy investments in the diversified worldwide energy industry.
Mr. Hill is a Director of Devon Energy Corporation, TransMontaigne Oil Company and various private companies controlled by First Reserve Corporation, as well as Chairman of TH Lee, Putnam Investment Trust (a closed-end investment company advised by an affiliate of Putnam Management). He is also a Trustee of Sarah Lawrence College. Until 2005, he was a Director of Continuum Health Partners of New York.
Prior to acquiring First Reserve Corporation in 1983, Mr. Hill held executive positions in investment banking and investment management with several firms and with the federal government, including Deputy Associate Director of the Office of Management and Budget and Deputy
70
Director of the Federal Energy Administration. He is active in various business associations, including the Economic Club of New York, and lectures on energy issues in the United States and Europe. Mr. Hill holds a B.A. degree in Economics from Southern Methodist University and pursued graduate studies there as a Woodrow Wilson Fellow.
Paul L. Joskow (Born 1947), Trustee since 1997
|
Dr. Joskow is the Elizabeth and James Killian Professor of Economics and Management, and Director of the Center for Energy and Environmental Policy Research at the Massachusetts Institute of Technology.
Dr. Joskow serves as a Director of National Grid plc (a UK-based holding company with interests in electric and gas transmission and distribution and telecommunications infrastructure) and TransCanada Corporation (an energy company focused on natural gas transmission and power services). He also serves on the Board of Overseers of the Boston Symphony Orchestra. Prior to February 2005, he served on the board of the Whitehead Institute for Biomedical Research (a non-profit research institution) and has been President of the Yale University Council since 1993. Prior to February 2002, he was a Director of State Farm Indemnity Company (an automobile insurance company), and, prior to March 2000, he was a Director of New England Electric System (a public utility holding company).
Dr. Joskow has published five books and numerous articles on topics in industrial organization, government regulation of industry, and competition policy. He is active in industry restructuring, environmental, energy, competition and privatization policies -- serving as an advisor to governments and corporations worldwide. Dr. Joskow holds a Ph.D. and M. Phil from Yale University and a B.A. from Cornell University.
Elizabeth T. Kennan (Born 1938), Trustee since 1992
Dr. Kennan is a Partner of Cambus-Kenneth Farm (thoroughbred horse and cattle breeding). She is President Emeritus of Mount Holyoke College.
Dr. Kennan served as Chairman and is now Lead Director of Northeast Utilities. Until 2005, she was a Director of Talbots, Inc. She has served as Director on a number of other boards, including Bell Atlantic, Chastain Real Estate, Shawmut Bank, Berkshire Life Insurance and Kentucky Home Life Insurance. She is a Trustee of the National Trust for Historic Preservation, of Centre College and of Midway College in Midway, Kentucky. She is also a member of The Trustees of Reservations. Dr. Kennan has served on the oversight committee of the Folger Shakespeare Library, as President of Five Colleges Incorporated, as a Trustee of Notre Dame University and is active in various educational and civic associations.
71
As a member of the faculty of Catholic University for twelve years, until 1978, Dr. Kennan directed the post-doctoral program in Patristic and Medieval Studies, taught history and published numerous articles. Dr. Kennan holds a Ph.D. from the University of Washington in Seattle, an M.S. from St. Hilda’s College at Oxford University and an A.B. from Mount Holyoke College. She holds several honorary doctorates.
John H. Mullin, III (Born 1941), Trustee since 1997
Mr. Mullin is the Chairman and CEO of Ridgeway Farm (a limited liability company engaged in timber and farming).
Mr. Mullin serves as a Director of The Liberty Corporation (a broadcasting company), Progress Energy, Inc. (a utility company, formerly known as Carolina Power & Light) and Sonoco Products, Inc. (a packaging company). Mr. Mullin is Trustee Emeritus of The National Humanities Center and Washington & Lee University, where he served as Chairman of the Investment Committee. Prior to May 2001, he was a Director of Graphic Packaging International Corp. Prior to February 2004, he was a Director of Alex Brown Realty, Inc.
Mr. Mullin is also a past Director of Adolph Coors Company; ACX Technologies, Inc.; Crystal Brands, Inc.; Dillon, Read & Co., Inc.; Fisher-Price, Inc.; and The Ryland Group, Inc. Mr. Mullin is a graduate of Washington & Lee University and The Wharton Graduate School, University of Pennsylvania.
Robert E. Patterson (Born 1945), Trustee since 1984
Mr. Patterson is Senior Partner of Cabot Properties, L.P. and Chairman of Cabot Properties, Inc. (a private equity firm investing in commercial real estate).
Mr. Patterson serves as Chairman Emeritus and Trustee of the Joslin Diabetes Center and as a Director of Brandywine Trust Group, LLC. Prior to June 2003, he was a Trustee of Sea Education Association. Prior to December 2001, he was President and Trustee of Cabot Industrial Trust (a publicly traded real estate investment trust). Prior to February 1998, he was Executive Vice President and Director of Acquisitions of Cabot Partners Limited Partnership (a registered investment adviser involved in institutional real estate investments). Prior to 1990, he served as Executive Vice President of Cabot, Cabot & Forbes Realty Advisors, Inc. (the predecessor company of Cabot Partners).
Mr. Patterson practiced law and held various positions in state government and was the founding Executive Director of the Massachusetts Industrial Finance Agency. Mr. Patterson is a graduate of Harvard College and Harvard Law School.
72
W. Thomas Stephens (Born 1942), Trustee since 1997
Mr. Stephens is Chairman and Chief Executive Officer of Boise Cascade, L.L.C. (a paper, forest products and timberland assets company).
Until 2005, Mr. Stephens was a director of TransCanadaPipelines, Ltd. Until 2004, Mr. Stephens was a Director of Xcel Energy Incorporated (a public utility company), Qwest Communications, and Norske Canada, Inc. (a paper manufacturer). Until 2003, Mr. Stephens was a Director of Mail-Well, Inc. (a diversified printing company). He served as Chairman of Mail-Well until 2001 and as CEO of MacMillan-Bloedel, Ltd. (a forest products company) until 1999.
Prior to 1996, Mr. Stephens was Chairman and Chief Executive Officer of Johns Manville Corporation. He holds B.S. and M.S. degrees from the University of Arkansas.
Richard B. Worley (Born 1945), Trustee since 2004
Mr. Worley is Managing Partner of Permit Capital LLC, an investment management firm.
Mr. Worley serves on the Executive Committee of the University of Pennsylvania Medical Center, is a Trustee of The Robert Wood Johnson Foundation (a philanthropic organization devoted to health care issues) and is a Director of The Colonial Williamsburg Foundation (a historical preservation organization). Mr. Worley also serves on the investment committees of Mount Holyoke College and World Wildlife Fund (a wildlife conservation organization).
Prior to joining Permit Capital LLC in 2002, Mr. Worley served as Chief Strategic Officer of Morgan Stanley Investment Management. He previously served as President, Chief Executive Officer and Chief Investment Officer of Morgan Stanley Dean Witter Investment Management and as a Managing Director of Morgan Stanley, a financial services firm. Mr. Worley also was the Chairman of Miller Anderson & Sherrerd, an investment management firm.
Mr. Worley holds a B.S. degree from University of Tennessee and pursued graduate studies in economics at the University of Texas.
73
| | Charles E. Haldeman, Jr.* (Born 1948), Trustee since 2004 |
| |
| | Mr. Haldeman is President and Chief Executive Officer of Putnam, LLC (“Putnam Investments”). He is a member of Putnam Investments’ Executive Board of Directors and Advisory Council. Prior to November 2003, Mr. Haldeman served as Co-Head of Putnam Investments’ Investment Division. |
| |
| | Prior to joining Putnam Investments in 2002, Mr. Haldeman held executive positions in the invest- ment management industry. He previously served as Chief Executive Officer of Delaware Investments and President & Chief Operating Officer of United Asset Management. Mr. Haldeman was also a partner and director of Cooke & Bieler, Inc. (an investment management firm). |
| |
| | Mr. Haldeman currently serves on the Board of Governors of the Investment Company Institute and as a Trustee of Dartmouth College, and he is a member of the Partners HealthCare Systems Investment Committee. He is a graduate of Dartmouth College, Harvard Law School and Harvard Business School. Mr. Haldeman is also a Chartered Financial Analyst (CFA) charterholder. |
| |
| | George Putnam, III* (Born 1951), Trustee since 1984 and President since 2000 |
| |
| | Mr. Putnam is President of New Generation Research, Inc. (a publisher of financial advisory and other research services), and of New Generation Advisers, Inc. (a registered investment advisor to private funds). Mr. Putnam founded the New Generation companies in 1986. |
| |
| | Mr. Putnam is a Director of The Boston Family Office, LLC (a registered investment adviser). He is a Trustee of St. Mark’s School and Shore Country Day School, and until 2002 was a Trustee of the Sea Education Association. |
| |
| | Mr. Putnam previously worked as an attorney with the law firm of Dechert LLP (formerly known as Dechert Price & Rhoads) in Philadelphia. He is a graduate of Harvard College, Harvard Business School and Harvard Law School. |
| |
| | The address of each Trustee is One Post Office Square, Boston, MA 02109. |
| |
| | As of November 30, 2005, there were 108 Putnam Funds. All Trustees serve as Trustees of all Putnam funds. |
| |
| Each Trustee serves for an indefinite term, until his or her resignation, retirement at age 72, death, or removal. |
*
| Trustees who are or may be deemed to be “interested persons” (as defined in the Investment Company Act of 1940) of the fund, Putnam Management, Putnam Retail Management, or Marsh & McLennan Companies, Inc., the parent company of Putnam, LLC and its affiliated companies. Messrs. Haldeman and Putnam, III are deemed “interested persons” by virtue of their positions as officers of the fund, Putnam Management or Putnam Retail Management and as shareholders of Marsh & McLennan Companies, Inc. Mr. Putnam, III is the President of your fund and each of the other Putnam funds. Mr. Haldeman is President and Chief Executive Officer of Putnam Investments. |
| |
74
Officers
In addition to George Putnam, III, the other officers of the fund are shown below:
Charles E. Porter (Born 1938)
Executive Vice President, Associate Treasurer
and Principal Executive Officer
Since 1989
Jonathan S. Horwitz (Born 1955)
Senior Vice President and Treasurer
Since 2004
Prior to 2004, Managing Director,
Putnam Investments
Steven D. Krichmar (Born 1958)
Vice President and Principal Financial Officer
Since 2002
Senior Managing Director, Putnam
Investments. Prior to July 2001, Partner,
PricewaterhouseCoopers LLP
Michael T. Healy (Born 1958)
Assistant Treasurer and Principal
Accounting Officer
Since 2000
Managing Director, Putnam Investments
Beth S. Mazor (Born 1958)
Vice President
Since 2002
Senior Vice President, Putnam Investments
Daniel T. Gallagher (Born 1962)
Senior Vice President, Staff Counsel
and Compliance Liaison
Since 2004
Prior to 2004, Associate, Ropes & Gray LLP;
prior to 2000, Law Clerk, Massachusetts
Supreme Judicial Court
Francis J. McNamara, III (Born 1955)
Vice President and Chief Legal Officer
Since 2004
Senior Managing Director, Putnam
Investments, Putnam Management
and Putnam Retail Management. Prior
to 2004, General Counsel, State Street
Research & Management Company |
James P. Pappas (Born 1953)
Vice President
Since 2004
Managing Director, Putnam Investments
and Putnam Management. During 2002,
Chief Operating Officer, Atalanta/Sosnoff
Management Corporation; prior to 2001,
President and Chief Executive Officer,
UAM Investment Services, Inc.
Richard S. Robie, III (Born 1960)
Vice President
Since 2004
Senior Managing Director, Putnam
Investments, Putnam Management
and Putnam Retail Management. Prior
to 2003, Senior Vice President, United
Asset Management Corporation
Charles A. Ruys de Perez (Born 1957)
Vice President and Chief Compliance Officer
Since 2004
Managing Director, Putnam Investments
Mark C. Trenchard (Born 1962)
Vice President and BSA Compliance Officer
Since 2002
Senior Vice President, Putnam Investments
Judith Cohen (Born 1945)
Vice President, Clerk and Assistant Treasurer
Since 1993
Wanda M. McManus (Born 1947)
Vice President, Senior Associate Treasurer
and Assistant Clerk
Since 2005
Nancy T. Florek (Born 1957)
Vice President, Assistant Clerk,
Assistant Treasurer and Proxy Manager
Since 2005
|
The address of each Officer is One Post Office Square, Boston, MA 02109.
75
Founded over 65 years ago, Putnam Investments was built around the concept that a balance between risk and reward is the hallmark of a well-rounded financial program. We manage over 100 mutual funds in growth, value, blend, fixed income, and international.
Investment Manager
Putnam Investment
Management, LLC
One Post Office Square
Boston, MA 02109
Investment Sub-Manager
Putnam Investments Limited
57-59 St. James Street
London, England SW1A 1LD
Marketing Services
Putnam Retail Management
One Post Office Square
Boston, MA 02109
Custodian
Putnam Fiduciary
Trust Company
Legal Counsel
Ropes & Gray LLP
Independent Registered
Public Accounting Firm
KPMG LLP
Trustees
John A. Hill, Chairman
Jameson Adkins Baxter,
Vice Chairman
Charles B. Curtis
Myra R. Drucker
Charles E. Haldeman, Jr
Paul L. Joskow
Elizabeth T. Kennan
John H. Mullin, III
Robert E. Patterson
George Putnam, III
W. Thomas Stephens
Richard B. Worley
|
Officers
George Putnam, III
President
Charles E. Porter
Executive Vice President,
Associate Treasurer and
Principal Executive Officer
Jonathan S. Horwitz
Senior Vice President
and Treasurer
Steven D. Krichmar
Vice President and
Principal Financial Officer
Michael T. Healy
Assistant Treasurer and
Principal Accounting Officer
Daniel T. Gallagher
Senior Vice President,
Staff Counsel and
Compliance Liaison |
Beth S. Mazor
Vice President
James P. Pappas
Vice President
Richard S. Robie, III
Vice President
Mark C. Trenchard
Vice President and
BSA Compliance Officer
Francis J. McNamara, III
Vice President and
Chief Legal Officer
Charles A. Ruys de Perez
Vice President and
Chief Compliance Officer
Judith Cohen
Vice President, Clerk and
Assistant Treasurer
Wanda M. McManus
Vice President, Senior Associate
Treasurer and Assistant Clerk
Nancy T. Florek
Vice President, Assistant Clerk,
Assistant Treasurer
and Proxy Manager
|
This report is for the information of shareholders of Putnam High Yield Advantage Fund. It may also be used as sales literature when preceded or accompanied by the current prospectus, the most recent copy of Putnam’s Quarterly Performance Summary, and Putnam’s Quarterly Ranking Summary. For more recent performance, please visit www.putnam.com. Investors should carefully consider the investment objective, risks, charges, and expenses of a fund, which are described in its prospectus. For this and other information or to request a prospectus, call 1-800-225-1581 toll free. Please read the prospectus carefully before investing. The fund’s Statement of Additional Information contains additional information about the fund’s Trustees and is available without charge upon request by calling 1-800-225-1581.
76

(a) All officers of the Fund, including its principal executive, financial and accounting officers, are employees of Putnam Investment Management, LLC, the Fund's investment manager. As such they are subject to a comprehensive Code of Ethics adopted and administered by Putnam Investments which is designed to protect the interests of the firm and its clients. The Fund has adopted a Code of Ethics which incorporates the Code of Ethics of Putnam Investments with respect to all of its officers and Trustees who are employees of Putnam Investment Management, LLC. For this reason, the Fund has not adopted a separate code of ethics governing its principal executive, financial and accounting officers.
(c) In December 2004, Putnam Investment Management, LLC, the Fund's investment manager, Putnam Retail Management Limited Partnership, the Fund's principal underwriter, and Putnam Investments Limited, the sub-manager for a portion of the assets of certain funds as determined by Putnam Management from time to time, adopted several amendments to their Code of Ethics. Insofar as such Code of Ethics applies to the Fund's principal executive officer, principal financial officer and principal accounting officer, the amendments provided for the following: (i) implementation of minimum monetary sanctions for violations of the Code; (ii) expansion of the definition of "access person" under the Code to include all Putnam employees with access to non-public information regarding Putnam-managed mutual fund portfolio holdings; (iii) lengthening the period during which access persons are required to complete quarterly reports; (iv) reducing the maximum number of trades than can be made by Putnam employees in their personal accounts in any calendar quarter from 25 trades to 10 trades; and (v) lengthening the required holding period for securities by access persons from 60 days to 90 days.
In March 2005, additional amendments to the Code of Ethics were adopted, to go into effect on April 1, 2005. Insofar as such Code of Ethics applies to the Fund’s principal executive officer, principal financial officer and principal accounting officer, the amendments (i) prohibit Putnam employees from using Putnam funds, letterhead or other resources in making political or campaign contributions and (ii) require pre-clearance of personal political or campaign contributions or other gifts to government officials or political candidates in certain jurisdictions and to officials or candidates with whom Putnam has or is seeking to establish a business relationship.
In July 2005, additional amendments to the Code of Ethics were adopted. Insofar as such Code of Ethics applies to the Fund's principal executive officer, principal financial officer and principal accounting officer, the amendments provided for an exception to the standard 90-day holding period (one year, in the case of employees deemed to be “access persons” under the Code) for shares of Putnam mutual funds in the case of redemptions from an employee’s account in a college savings plan qualified under Section 529 of the Internal Revenue Code. Under this exception, an employee may, without penalty under the Code, make “qualified redemptions” of shares from such an account less than 90 days (or one year, as applicable) after purchase. “Qualified redemptions” include redemptions for higher education purposes for the account beneficiary and redemptions made upon death or disability. The July 2005 amendments also provide that an employee may, for purposes of the rule limiting the number of trades per calendar quarter in an employee’s personal account to a maximum of 10, count all trades of the same security in the same direction (all buys or all sells) over a period of five consecutive business days as a single trade.
Item 3. Audit Committee Financial Expert:
|
The Funds' Audit and Compliance Committee is comprised solely of Trustees who are "independent" (as such term has been defined by the Securities and Exchange Commission ("SEC") in regulations implementing Section 407 of the Sarbanes-Oxley Act (the "Regulations")). The Trustees believe that each of the members of the Audit and Compliance Committee also possess a combination of knowledge and experience with respect to financial accounting matters, as well as other attributes, that qualify them for service on the Committee. In addition, the Trustees have determined that all members of the Funds' Audit and Compliance Committee meet the financial literacy requirements of the New York Stock Exchange's rules and that Mr. Patterson, Mr. Stephens and Mr. Hill qualify as "audit committee financial experts" (as such term has been defined by the Regulations) based on their review of their pertinent experience and education. Certain other Trustees, although not on the Audit and Compliance Committee, would also qualify as "audit committee financial
experts." The SEC has stated that the designation or identification of a person as an audit committee financial expert pursuant to this Item 3 of Form N-CSR does not impose on such person any duties, obligations or liability that are greater than the duties, obligations and liability imposed on such person as a member of the Audit and Compliance Committee and the Board of Trustees in the absence of such designation or identification.
Item 4. Principal Accountant Fees and Services:
The following table presents fees billed in each of the last two fiscal years for services rendered to the fund by the fund’s independent auditors:
| Fiscal year ended | Audit Fees | Audit-Related Fees | Tax Fees | All Other Fees |
| |
| November 30, 2005 | $ 47,936 | $ -- | $ 3,636 | $ -- |
| November 30, 2004 | $ 41,361* | $ -- | $ 3,600 | $ 5,786 |
* Includes fees of $ 1,661 by the fund’s independent auditor to the fund for audit procedures necessitated by regulatory and litigation matters for the fiscal year ended November 30, 2004. These fees were reimbursed to the fund by Putnam.
For the fiscal years ended November 30, 2005 and November 30, 2004, the fund’s independent auditors billed aggregate non-audit fees in the amounts of $3,636 and $9,386 respectively, to the fund, Putnam Management and any entity controlling, controlled by or under common control with Putnam Management that provides ongoing services to the fund.
Audit Fees represents fees billed for the fund’s last two fiscal years.
Audit-Related Fees represents fees billed in the fund’s last two fiscal years for services traditionally performed by the fund’s auditor, including accounting consultation for proposed transactions or concerning financial accounting and reporting standards and other audit or attest services not required by statute or regulation.
Tax Fees represent fees billed in the fund’s last two fiscal years for tax compliance, tax planning and tax advice services. Tax planning and tax advice services include assistance with tax audits, employee benefit plans and requests for rulings or technical advice from taxing authorities.
All Other Fees Fees represent fees billed for services relating to interfund trading.
Pre-Approval Policies of the Audit and Compliance Committee. The Audit and Compliance Committee of the Putnam funds has determined that, as a matter of policy, all work performed for the funds by the funds’ independent auditors will be pre-approved by the Committee and will generally not be subject to pre-approval procedures.
Under certain circumstances, the Audit and Compliance Committee believes that it may be appropriate for Putnam Investment Management, LLC (“Putnam Management”) and certain of its affiliates to engage the services of the funds’ independent auditors, but only after prior approval by the Committee. Such requests are required to be submitted in writing to the Committee and explain, among other things, the nature of the proposed engagement, the estimated fees, and why this work must be performed by that particular audit firm. The Committee will review the proposed engagement at its next meeting.
Since May 6, 2003, all work performed by the independent auditors for the funds, Putnam Management and any entity controlling, controlled by or under common control with Putnam Management that provides ongoing services to the fund was pre-approved by the Committee or a member of the Committee pursuant to the pre-approval policies discussed above. Prior to that date, the Committee had a general policy to pre-approve the independent auditor’s engagements for non-audit services with the funds, Putnam Management
and any entity controlling, controlled by or under common control with Putnam Management that provides ongoing services to the fund.
The following table presents fees billed by the fund’s principal auditor for services required to be approved pursuant to paragraph (c)(7)(ii) of Rule 2-01 of Regulation S-X.
| Fiscal year ended | Audit-Related Fees | Tax Fees | All Other Fees | Total Non-Audit Fees |
| |
| November 30, 2005 | $ -- | $ -- | $ -- | $ -- |
| November 30, 2004 | $ -- | $ -- | $ -- | $ - -- |
Item 5. Audit Committee
Not applicable
Item 6. Schedule of Investments:
Not applicable
Item 7. Disclosure of Proxy Voting Policies and Procedures For Closed-End Management
Investment Companies:
Not applicable
Item 8. Portfolio Managers of Closed-End Investment Companies
Not Applicable
Item 9. Purchases of Equity Securities by Closed-End Management Investment Companies and
Affiliated Purchasers:
Not applicable
Item 10. Submission of Matters to a Vote of Security Holders:
Not applicable
Item 11. Controls and Procedures:
(a) The registrant's principal executive officer and principal financial officer have concluded, based on their evaluation of the effectiveness of the design and operation of the registrant's disclosure controls and procedures as of a date within 90 days of the filing date of this report, that the design and operation of such procedures are generally effective to provide reasonable assurance that information required to be disclosed by the registrant in this report is recorded, processed, summarized and reported within the time periods specified in the Commission's rules and forms.
(b) Changes in internal control over financial reporting:
Not applicable
Item 12. Exhibits:
(a) The Code of Ethics of The Putnam Funds, which incorporates the Code of Ethics of Putnam Investments, is filed herewith.
(b) A separate certification for each principal executive officer and principal financial officer of the registrant as required by Rule 30a-2 under the Investment Company Act of 1940, as amended, and the officer certifications as required by Section 906 of the Sarbanes-Oxley Act of 2002 are filed herewith.
SIGNATURES
Pursuant to the requirements of the Securities Exchange Act of 1934 and the Investment Company Act of 1940, the registrant has duly caused this report to be signed on its behalf by the undersigned, thereunto duly authorized.
NAME OF REGISTRANT
By (Signature and Title):
/s/Michael T. Healy
Michael T. Healy
Principal Accounting Officer
Date: January 27, 2006
Pursuant to the requirements of the Securities Exchange Act of 1934 and the Investment Company Act of 1940, this report has been signed below by the following persons on behalf of the registrant and in the capacities and on the dates indicated.
By (Signature and Title):
/s/Charles E. Porter
Charles E. Porter
Principal Executive Officer
Date: January 27, 2006
By (Signature and Title):
/s/Steven D. Krichmar
Steven D. Krichmar
Principal Financial Officer
Date: January 27, 2006