UNITED STATES
SECURITIES AND EXCHANGE COMMISSION
Washington, D.C. 20549
|
FORM N-CSR
CERTIFIED SHAREHOLDER REPORT OF REGISTERED
MANAGEMENT INVESTMENT COMPANIES
|
Investment Company Act file number: (811- 04616 )
Exact name of registrant as specified in charter: Putnam High Yield Advantage Fund
Address of principal executive offices: One Post Office Square, Boston, Massachusetts 02109
| Name and address of agent for service: | Beth S. Mazor, Vice President |
| | One Post Office Square |
| | Boston, Massachusetts 02109 |
| |
| Copy to: | John W. Gerstmayr, Esq. |
| | Ropes & Gray LLP |
| | One International Place |
| | Boston, Massachusetts 02110 |
Registrant’s telephone number, including area code: (617) 292-1000
Date of fiscal year end: November 30, 2006
Date of reporting period: December 1, 2005— May 31, 2006
Item 1. Report to Stockholders:
The following is a copy of the report transmitted to stockholders pursuant to Rule 30e-1 under the Investment Company Act of 1940:

What makes Putnam different?

In 1830, Massachusetts Supreme Judicial Court Justice Samuel Putnam established The Prudent Man Rule, a legal foundation for responsible money management.
THE PRUDENT MAN RULE
All that can be required of a trustee to invest is that he shall conduct himself faithfully and exercise a sound discretion. He is to observe how men of prudence, discretion, and intelligence manage their own affairs, not in regard to speculation, but in regard to the permanent disposition of their funds, considering the probable income, as well as the probable safety of the capital to be invested.

A time-honored tradition
in money management
Since 1937, our values have been rooted
in a profound sense of responsibility for the
money entrusted to us.
A prudent approach to investing
We use a research-driven team approach to seek
consistent, dependable, superior investment
results over time, although there is no guarantee
a fund will meet its objectives.
Funds for every investment goal
We offer a broad range of mutual funds and other
financial products so investors and their financial
representatives can build diversified portfolios.
A commitment to doing
what’s right for investors
We have below-average expenses and stringent
investor protections, and provide a wealth of
information about the Putnam funds.
Industry-leading service
We help investors, along with their financial
representatives, make informed investment
decisions with confidence.
|
Putnam
High Yield
Advantage Fund
|
5| 31| 06
Semiannual Report
|
| Message from the Trustees | 2 |
| About the fund | 4 |
| Report from the fund managers | 7 |
| Performance | 13 |
| Expenses | 16 |
| Portfolio turnover | 18 |
| Risk | 19 |
| Your fund’s management | 20 |
| Terms and definitions | 23 |
| Trustee approval of management contract | 25 |
| Other information for shareholders | 30 |
| Financial statements | 31 |
Cover photograph: * Richard H. Johnson
Message from the Trustees
|
Dear Fellow Shareholder
Investors continue to keep a close watch on the course of the economy. Globally, it appears that, assuming economic growth exceeds 4% in 2006, we will have seen the strongest economic performance over a four-year period in over thirty years. Corporate profits have boomed around the world, business capacity utilization rates have moved up, and unemployment rates have come down. Given such a sustained period of robust growth, it is not surprising that prices have begun to rise, inflation rates have crept up, and central banks in many countries, particularly the Federal Reserve (the Fed) in the United States, have pushed interest rates higher.
In recent weeks, investors have worried that these higher rates could threaten the fundamentals of the global economy, prompting a widespread sell-off. However, we believe that today’s higher interest rates, far from being a threat to global economic fundamentals, are in fact an integral part of them. Higher interest rates are bringing business borrowing costs closer to the rate of return available from investments. In our view, this should help provide the basis for a longer and more durable business expansion and a continued healthy investment environment.
You can be assured that the investment professionals managing your fund are closely monitoring the factors that influence the performance of the securities in which your fund invests. Moreover, Putnam Investments’ management team, under the leadership of Chief Executive Officer Ed Haldeman, continues to focus on investment performance and remains committed to putting the interests of shareholders first.
2
In the following pages, members of your fund’s management team discuss the fund’s performance and strategies for the fiscal period ended May 31, 2006, and provide their outlook for the months ahead. As always, we thank you for your support of the Putnam funds.

Putnam High Yield Advantage Fund:
seeking high current income and capital growth
|
Unlike most types of fixed-income investments, high-yield bonds are more dependent on the performance of issuing companies than on interest rates. For this reason, distinguishing between opportunities and pitfalls requires a rigorous investment process. With Putnam High Yield Advantage Fund, this process is highlighted by exhaustive research, investment diversification, and timely portfolio adjustments.
Because of the risks of high-yield bond investing, in-depth credit research is essential. The fund’s research team — more than 20 professionals, including analysts who specialize by industry — visits with the management of issuing companies and analyzes each company’s prospects. The team then compares this information to the bond’s potential upside or downside before deciding whether it is an appropriate investment for the fund.
The fund’s portfolio typically consists of a broad range of industries and companies. Holdings are diversified across industry sectors and among bonds with differing credit ratings. While the fund invests primarily in the bonds of U.S. companies, its diversified approach allows it to include foreign bonds as well. Among these securities, investments in emerging-market bonds may be used to enhance the fund’s appreciation potential. Although diversification does not ensure a profit or protect against a loss and it is possible to lose money in a diversified portfolio, the fund’s diversification can help reduce the volatility that typically comes with higher-risk investments.
As the bond markets shift over time, the fund’s management looks for ways to capitalize on developments that affect fixed-income securities in general and high-yield bonds in particular. For example, when credit spreads are wide and expected to tighten, the fund
High-yield bonds have historically offered greater
return potential than investment-grade bonds.
|

may pursue the higher income potential offered by lower-quality issues. On the other hand, when credit spreads are narrow — that is, when the difference in yield between higher- and lower-rated bonds of comparable maturities is small — the fund may shift its emphasis to higher-quality high-yield bonds.
Lower-rated bonds may offer higher yields in return for more risk. Mutual funds that invest in bonds are subject to certain risks, including interest-rate risk, credit risk, and inflation risk. As interest rates rise, the prices of bonds fall. Long-term bonds are more exposed to interest-rate risk than short-term bonds. Unlike bonds, bond funds have ongoing fees and expenses.
What makes a bond
“high yield”?
|
High-yield bonds are fixed-income investments typically issued by companies that lack an established earnings track record or a solid credit history. In general, high-yield bonds offer higher interest rates than investment-grade bonds to compensate for their increased risk. Because of this added risk, these bonds are rated below investment grade by an independent rating agency (for example, the lowest Moody’s Investors Service rating of investment-grade bonds is Baa). The lower the rating, the greater the possibility that a bond’s issuer will be unable to make interest payments or repay the principal.
| BOND RATINGS | |
| Moody’s | Grade |
|
| Aaa | Investment |
|
| Aa, A | Investment |
|
| Baa | Investment |
|
| Ba, B | High yield |
|
| Caa/Ca�� | High yield |
|
| C | High yield |
|
Putnam High Yield Advantage Fund seeks high current income and, as a secondary objective, capital growth, by investing in a diversified portfolio of high-yield bonds that includes a broad range of industries and issuers. The fund is designed for investors who seek high income and are willing to accept the added risks of investing in below-investment-grade bonds.
| Highlights |
* | For the six months ended May 31, 2006, Putnam High Yield Advantage Fund’s class A shares |
| had a total return of 4.38% without sales charges. |
* | The fund’s benchmark, the JP Morgan Developed High Yield Index, returned 4.71%. |
* | The average return for the fund’s Lipper category, High Current Yield Funds, was 3.84%. |
* | Additional fund performance, comparative performance, and Lipper data can be found in the |
| performance section beginning on page 13. |
Performance
Total return for class A shares for periods ended 5/31/06
|
| Since the fund’s inception (3/25/86), average annual return is 7.71% at NAV and 7.50% at POP. | |
|
| | Average annual return | Cumulative return |
| | NAV | POP | NAV | POP |
|
| 10 years | 5.08% | 4.69% | 64.20% | 58.08% |
|
| 5 years | 8.39 | 7.58 | 49.61 | 44.07 |
|
| 3 years | 10.29 | 8.88 | 34.17 | 29.08 |
|
| 1 year | 7.43 | 3.47 | 7.43 | 3.47 |
|
| 6 months | — | — | 4.38 | 0.51 |
|
Data is historical. Past performance does not guarantee future results. More recent returns may be less or more than those shown. Investment return and principal value will fluctuate, and you may have a gain or a loss when you sell your shares. Performance assumes reinvestment of distributions and does not account for taxes. Returns at NAV do not reflect a sales charge of 3.75% . For the most recent month-end performance, visit www.putnam.com. A short-term trading fee of up to 2% may apply.
6
Report from the fund managers
|
The period in review
During the six months ended May 31, 2006, Putnam High Yield Advantage Fund slightly underperformed its benchmark, the JP Morgan Developed High Yield Index, based on results at net asset value (NAV). We attribute this under-performance primarily to the fund’s underweight position in many lower-quality areas of the high-yield market, such as defaulted bonds and securities issued by companies that were dealing with bankruptcy or other special situations, as many such issues rallied during the period. On the plus side, our decision to overweight bonds from the strong-performing energy industry buoyed performance, as did the fund’s holdings in bonds issued by diversified media companies. The fund’s results at NAV outperformed the average for its Lipper peer group, largely, we believe, due to successful security selection.
Market overview
At the beginning of its 2006 fiscal year, the high-yield market was still digesting the negative effects of several developments that had held it back in the preceding three months. These events included the high-profile bankruptcies of airlines Delta and Northwest and auto parts supplier Delphi. The market also absorbed the significant influx of debt that accompanied the credit-rating downgrades of Ford and General Motors in 2005. When electric utility Calpine defaulted on its bonds in December 2005, investor sentiment concerning high-yield bonds was further dampened. However, the tide turned for the high-yield market in January, thanks to positive influences that included continued healthy business fundamentals, large deals that came to the market, consolidation activity, strong liquidity, and General Motors’ plan to sell its financing arm. In addition, even with the bankruptcies cited earlier, the overall default rate remained below historical averages, indicating the relative financial health of high-yield companies.
While the Fed continued to raise short-term interest rates at each of its Open Market Committee meetings during the period, these moves did not have as much impact on the high-yield market as the relative health of corporate business
7
fundamentals. Against that backdrop, there was a rally among the lower-quality segments of the high-yield market from January through the end of April. May brought with it increasing volatility due to concerns about inflation that made investors more risk-averse. A sharp sell-off in the emerging markets spilled into the broader markets, leading to lower prices for high-yield bonds in May.
Strategy overview
We maintained a bias toward the higher-quality tiers of the high-yield bond market. Until May, the last month of the semiannual period, high-yield bond spreads — the yield advantage offered by high-yield bonds over comparable Treasuries — remained narrow, meaning investors were not being compensated for taking on the additional risk carried by lower-quality bonds. In addition, we believed that the Fed’s continued tightening of short-term interest rates would start to soften economic growth, a backdrop that would favor bonds carrying higher credit ratings. Overall, we sought to maintain a diversified portfolio, investing in companies that appear to have a sustainable competitive advantage, a viable capital structure, sufficient cash-flow generation, and a feature of adequate downside protection. We continued to be quite selective in adding new names to the fund, relying on our rigorous fundamental credit research to evaluate potential investments.
| Market sector performance | |
| These indexes provide an overview of performance in different market sectors for the | |
| six months ended 5/31/06. | |
|
|
| Bonds | |
|
| JP Morgan Developed High Yield Index (high-yield corporate bonds) | 4.71% |
|
| Lehman Aggregate Bond Index (broad bond market) | 0.01% |
|
| Lehman GNMA Index (Government National Mortgage Association bonds) | 0.61% |
|
| Citigroup World Government Bond Index (global government bonds) | 5.01% |
|
| Equities | |
|
| S&P 500 Index (broad stock market) | 2.60% |
|
| Russell 2000 Index (small-company stocks) | 7.03% |
|
| MSCI EAFE Index (international stocks) | 15.30% |
|
8
With regard to industry and sector weightings, we maintained an overweight position in energy, particularly exploration and production companies, which continued to benefit from strong global demand and restricted supply. We also favored media, where valuations remained attractive and solid economic growth sustained advertising spending. The portfolio also had exposure to bonds issued by building materials companies, which benefited from demand growth, and by utilities, due to the stable cash-flow characteristics offered by regulated utilities and pipeline companies.
Areas we chose to underweight, relative to the benchmark, included bonds issued by auto manufacturers and parts suppliers. Several such companies filed for bankruptcy protection, due in part to high costs and a lack of pricing power. We also underweighted bonds issued by paper and forest products companies because we felt their valuations were not compelling.
Your fund’s holdings
Overall, during the course of the six-month period, it appears that our diversified approach helped stabilize returns. Although our high-quality bias held back returns during the low-quality rally at the beginning of 2006, it helped bolster relative returns during December 2005 and again when the market struggled in May.
Bonds issued by Decrane Aircraft Holdings were another key contributor to

9
fund performance. The bonds recovered from previously depressed prices as Decrane enjoyed a surge in demand for its products from its customers in the burgeoning corporate aircraft industry. The results of broadcaster Paxson Communications, another large portfolio position, stabilized, as the company demonstrated success at refinancing its debt in order to significantly improve its financial profile. Securities issued by Irish packaging company Jefferson-Smurfit (JSG and MDP bonds) rallied following the company’s merger with Kappa Packaging, a move that many investors felt would help improve the European containerboard market.
Although we have felt rewarded by generally steering clear of the air transportation industry in recent years, due to the tide of company bankruptcies during the period, the fund held an overweight position in Continental Airlines (CalAir bonds) that bolstered returns. These bonds appreciated due to a more favorable supply/demand backdrop for domestic airlines. Lastly, bonds issued by Brand Services, which provides scaffolding to construction companies, also rose in price in response to the company’s filing for an initial public offering (IPO) of common stock.
In terms of disappointments, sometimes what a fund doesn’t own can influence its performance relative to its benchmark as much as or more than what it does own. That was the case during this semiannual period. As noted
Top holdings
This table shows the fund’s top holdings, and the percentage of the fund’s net assets that each comprised, as of 5/31/06. The fund’s holdings will change over time.
| Holding (percent of fund’s net assets) | Coupon (%) and maturity date | Industry |
|
| Neon Capital, Ltd. 144A | | |
| (Cayman Islands) (1.5%) | 1.105%, 2013 | Asset-backed securities |
|
| CCH I LLC (1.1%) | 11%, 2015 | Consumer staples |
|
| Neon Capital, Ltd. 144A | | |
| (Cayman Islands) (0.8%) | 1.686%, 2013 | Asset-backed securities |
|
| Ford Motor Credit Corp. (0.7%) | 7.875 %, 2010 | Consumer cyclicals |
|
| Qwest Corp. (0.7%) | 8.875%, 2012 | Communication services |
|
| Novelis, Inc. 144A (0.6%) | 7.75%, 2015 | Basic materials |
|
| General Motors Acceptance Corp. (0.6%) | 7.75%, 2010 | Consumer cyclicals |
|
| Legrand SA (France) (0.6%) | 8.5%, 2025 | Capital goods |
|
| General Motors Acceptance Corp. (0.6%) | 6.875%, 2012 | Consumer cyclicals |
|
| Equistar Chemicals LP/Equistar | | |
| Funding Corp. (0.6%) | 10.125%, 2008 | Basic materials |
|
10
earlier, our conservative outlook led us to underweight the transportation sector. This decision dampened relative performance, as the fund did not own several bonds that posted relatively strong returns. For example, distressed securities issued by now-bankrupt auto parts manufacturer Delphi recovered during the lower-quality rally that occurred during the first four months of 2006, and the fund did not benefit. Fund performance also was held back by our not owning AMR, the holding company for American Airlines, and Delta Airlines, which is in bankruptcy. As mentioned above, airline bonds performed relatively well in the period and helped the results of bonds issued by these companies. Outside of transportation, bonds issued by bankrupt electric utility Calpine rebounded from distressed levels to post strong performance, but your fund did not participate because we chose not to own the company’s bonds.
One fund holding that underper-formed was MQ Associates (MedQuest bonds), which provides imaging services, including MRIs, for hospitals. These bonds declined when a change in the reimbursement formula offered by health plans to the company reduced the firm’s future revenue stream. However, we have maintained the fund’s position because we believe the firm’s prospects remain healthy.
Please note that the holdings discussed in this report may not have been held by the fund for the entire period. Portfolio composition is subject to review in accordance with the fund’s investment strategy and may vary in the future.
11
The outlook for your fund
|
The following commentary reflects anticipated developments that could affect your fund over the next six months, as well as your management team’s plans for responding to them.
As we look to the remainder of your fund’s fiscal year, we will, as always, focus on three main factors to determine our outlook. First, we consider company fundamentals. While some industries currently are facing challenges, the overall fundamental backdrop for corporations remains positive, although higher interest rates, fuel costs, and slowing growth expected in 2007 will provide some headwind in certain sectors. We also examine technical factors, or the supply of and demand for high-yield bonds. Recently, these indicators have become less favorable. New issuance is currently running well ahead of last year’s levels, and the quality of some new deals has deteriorated. One redeeming feature is that many bonds are being removed from the market by tender offers, upgrades, and refinancing through the bank loan market. At this point, the technical outlook is difficult to predict, and we are remaining neutral. Finally, we consider valuations. While high-yield spreads are tighter than the long-term average — indicating that high-yield bonds are selling at relatively high valuations — spreads remain above their historically tightest levels, suggesting that high-yield bonds are not at peak valuations. Ordinarily, this would be of significant concern. However, defaults remain at low levels and show no sign of spiking. Therefore, we find valuations to be reasonable, as long as defaults don’t increase.
When we put this all together, we believe returns in the foreseeable future will be generated mainly through interest income rather than capital appreciation or depreciation. Therefore, we intend to continue to build and maintain a diversified portfolio of relatively high-quality bonds.
The views expressed in this report are exclusively those of Putnam Management. They are not meant as investment advice.
Mutual funds that invest in bonds are subject to certain risks, including interest-rate risk, credit risk, and inflation risk. As interest rates rise, the prices of bonds fall. Long-term bonds are more exposed to interest-rate risk than short-term bonds. Unlike bonds, bond funds have ongoing fees and expenses. Lower-rated bonds may offer higher yields in return for more risk. The fund is closed to new investors.
12
This section shows your fund’s performance for periods ended May 31, 2006, the end of the first half of its current fiscal year. In accordance with regulatory requirements for mutual funds, we also include performance as of the most recent calendar quarter-end. Performance should always be considered in light of a fund’s investment strategy. Data represents past performance. Past performance does not guarantee future results. More recent returns may be less or more than those shown. Investment return and principal value will fluctuate, and you may have a gain or a loss when you sell your shares. For the most recent month-end performance, please visit www.putnam.com or call Putnam at 1-800-225-1581. Class Y shares are generally only available to corporate and institutional clients. See the Terms and Definitions section in this report for definitions of the share classes offered by your fund.
| Fund performance | | | | | | | |
| Total return for periods ended 5/31/06 | | | | | | | |
|
| |
| | Class A | | Class B | | Class M | | Class Y |
| (inception dates) | (3/25/86) | | (5/16/94) | | (12/1/94) | | (12/31/98) |
| | NAV | POP | NAV | CDSC | NAV | POP | NAV |
|
| Annual average | | | | | | | |
| (life of fund) | 7.71% | 7.50% | 6.78% | 6.78% | 7.41% | 7.23% | 7.86% |
|
| 10 years | 64.20 | 58.08 | 51.66 | 51.66 | 61.01 | 55.78 | 69.04 |
| Annual average | 5.08 | 4.69 | 4.25 | 4.25 | 4.88 | 4.53 | 5.39 |
|
| 5 years | 49.61 | 44.07 | 43.60 | 41.69 | 47.95 | 43.14 | 52.27 |
| Annual average | 8.39 | 7.58 | 7.51 | 7.22 | 8.15 | 7.44 | 8.77 |
|
| 3 years | 34.17 | 29.08 | 31.09 | 28.09 | 33.05 | 28.68 | 35.21 |
| Annual average | 10.29 | 8.88 | 9.44 | 8.60 | 9.99 | 8.77 | 10.58 |
|
| 1 year | 7.43 | 3.47 | 6.69 | 1.68 | 7.20 | 3.75 | 7.67 |
|
| 6 months | 4.38 | 0.51 | 4.02 | –0.98 | 4.27 | 0.89 | 4.57 |
|
Performance assumes reinvestment of distributions and does not account for taxes. Returns at public offering price (POP) for class A and M shares reflect a sales charge of 3.75% and 3.25%, respectively. Class B share returns reflect the applicable contingent deferred sales charge (CDSC), which is 5% in the first year, declining to 1% in the sixth year, and is eliminated thereafter. Class Y shares have no initial sales charge or CDSC. Performance for class B, M, and Y shares before their inception is derived from the historical performance of class A shares, adjusted for the applicable sales charge (or CDSC) and, except for class Y shares, the higher operating expenses for such shares.
A 2% short-term trading fee may be applied to shares exchanged or sold within 5 days of purchase. In addition, there is a 1% short-term trading fee for this fund on shares sold or exchanged between 6 and 90 days.
13
Comparative index returns
For periods ended 5/31/06
|
| | | Lipper High |
| | JP Morgan Developed | Current Yield Funds |
| | High Yield Index | category average* |
|
| Annual average | | |
| (life of fund) | —† | 7.13% |
|
| 10 years | 95.26% | 69.60 |
| Annual average | 6.92 | 5.28 |
|
| 5 years | 53.12 | 40.40 |
| Annual average | 8.89 | 6.95 |
|
| 3 years | 33.21 | 29.04 |
| Annual average | 10.03 | 8.84 |
|
| 1 year | 7.36 | 6.88 |
|
| 6 months | 4.71 | 3.84 |
|
Index and Lipper results should be compared to fund performance at net asset value.
† This index began operations on 12/31/94.
* Over the 6-month and 1-, 3-, 5-, and 10-year periods ended 5/31/06, there were 458, 444, 387, 313, and 113 funds, respectively, in this Lipper category.
14
Fund price and distribution information
For the six-month period ended 5/31/06
|
| Distributions | Class A | | Class B | Class M | | Class Y |
|
| Number | 6 | | 6 | 6 | | 6 |
|
| Income | $0.217 | $0.193 | $0.211 | $0.223 |
|
| Capital gains | — | | — | — | | — |
|
| Total | $0.217 | $0.193 | $0.211 | $0.223 |
|
| Share value: | NAV | POP | NAV | NAV | POP | NAV |
|
| 11/30/05 | $5.97 | $6.20 | $5.89 | $5.98 | $6.18 | $6.08 |
|
| 5/31/06 | 6.01 | 6.24 | 5.93 | 6.02 | 6.22 | 6.13 |
|
| Current yield (end of period) | | | | | | |
| Current dividend rate1 | 6.79% | 6.54% | 6.07% | 6.58% | 6.37% | 6.85% |
|
| Current 30-day SEC yield2 | 6.85 | 6.60 | 6.09 | 6.53 | 6.38 | 7.04 |
|
1 Most recent distribution, excluding capital gains, annualized and divided by NAV or POP at end of period.
2 Based only on investment income, calculated using SEC guidelines.
Fund performance for most recent calendar quarter
Total return for periods ended 6/30/06
| | Class A | | Class B | | Class M | | Class Y |
| (inception dates) | (3/25/86) | | (5/16/94) | | (12/1/94) | | (12/31/98) |
| | NAV | POP | NAV | CDSC | NAV | POP | NAV |
|
| Annual average | | | | | | | |
| (life of fund) | 7.71% | 7.50% | 6.78% | 6.78% | 7.41% | 7.23% | 7.86% |
|
| 10 years | 65.44 | 59.20 | 52.80 | 52.80 | 62.22 | 56.90 | 70.31 |
| Annual average | 5.16 | 4.76 | 4.33 | 4.33 | 4.96 | 4.61 | 5.47 |
|
| 5 years | 52.71 | 46.92 | 46.84 | 44.87 | 51.00 | 46.21 | 55.39 |
| Annual average | 8.84 | 8.00 | 7.99 | 7.70 | 8.59 | 7.89 | 9.22 |
|
| 3 years | 31.11 | 26.23 | 28.05 | 25.05 | 30.02 | 25.84 | 31.94 |
| Annual average | 9.45 | 8.07 | 8.59 | 7.74 | 9.14 | 7.96 | 9.68 |
|
| 1 year | 6.55 | 2.49 | 5.80 | 0.83 | 6.33 | 2.93 | 6.81 |
|
| 6 months | 4.16 | 0.29 | 3.62 | -1.39 | 3.87 | 0.51 | 4.18 |
|
15
Your fund’s expenses
As a mutual fund investor, you pay ongoing expenses, such as management fees, distribution fees (12b-1 fees), and other expenses. In the most recent six-month period, your fund limited these expenses; had it not done so, expenses would have been higher. Using the information below, you can estimate how these expenses affect your investment and compare them with the expenses of other funds. You may also pay one-time transaction expenses, including sales charges (loads) and redemption fees, which are not shown in this section and would have resulted in higher total expenses. For more information, see your fund’s prospectus or talk to your financial advisor.
Review your fund’s expenses
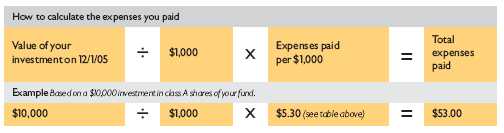
The table below shows the expenses you would have paid on a $1,000 investment in Putnam High Yield Advantage Fund from December 1, 2005, to May 31, 2006. It also shows how much a $1,000 investment would be worth at the close of the period, assuming actual returns and expenses.
| | Class A | Class B | Class M | Class Y |
|
| Expenses paid per $1,000* | $ 5.30 | $ 9.10 | $ 6.57 | $ 4.03 |
|
| Ending value (after expenses) | $1,043.80 | $1,040.20 | $1,042.70 | $1,045.70 |
|
* Expenses for each share class are calculated using the fund’s annualized expense ratio for each class, which represents the ongoing expenses as a percentage of net assets for the six months ended 5/31/06. The expense ratio may differ for each share class (see the table at the bottom of the next page). Expenses are calculated by multiplying the expense ratio by the average account value for the period; then multiplying the result by the number of days in the period; and then dividing that result by the number of days in the year. Does not reflect the effect of a non-recurring reimbursement by Putnam. If this amount had been reflected in the table above, expenses for each share class would have been lower.
Estimate the expenses you paid
To estimate the ongoing expenses you paid for the six months ended May 31, 2006, use the calculation method below. To find the value of your investment on December 1, 2005, go to www.putnam.com and log on to your account. Click on the “Transaction History” tab in your Daily Statement and enter 12/01/2005 in both the “from” and “to” fields. Alternatively, call Putnam at 1-800-225-1581.
16
Compare expenses using the SEC’s method
The Securities and Exchange Commission (SEC) has established guidelines to help investors assess fund expenses. Per these guidelines, the table below shows your fund’s expenses based on a $1,000 investment, assuming a hypothetical 5% annualized return. You can use this information to compare the ongoing expenses (but not transaction expenses or total costs) of investing in the fund with those of other funds. All mutual fund shareholder reports will provide this information to help you make this comparison. Please note that you cannot use this information to estimate your actual ending account balance and expenses paid during the period.
| | Class A | Class B | Class M | Class Y |
|
| Expenses paid per $1,000* | $ 5.24 | $ 9.00 | $ 6.49 | $ 3.98 |
|
| Ending value (after expenses) | $1,019.75 | $1,016.01 | $1,018.50 | $1,020.99 |
|
* Expenses for each share class are calculated using the fund’s annualized expense ratio for each class, which represents the ongoing expenses as a percentage of net assets for the six months ended 5/31/06. The expense ratio may differ for each share class (see the table at the bottom of this page). Expenses are calculated by multiplying the expense ratio by the average account value for the period; then multiplying the result by the number of days in the period; and then dividing that result by the number of days in the year. Does not reflect the effect of a non-recurring reimbursement by Putnam. If this amount had been reflected in the table above, expenses for each share class would have been lower.
Compare expenses using industry averages
You can also compare your fund’s expenses with the average of its peer group, as defined by Lipper, an independent fund-rating agency that ranks funds relative to others that Lipper considers to have similar investment styles or objectives. The expense ratio for each share class shown below indicates how much of your fund’s net assets have been used to pay ongoing expenses during the period.
| | Class A | Class B | Class M | Class Y |
|
| Your fund’s annualized expense ratio* | 1.04% | 1.79% | 1.29% | 0.79% |
|
| Average annualized expense | | | | |
| ratio for Lipper peer group† | 1.10% | 1.85% | 1.35% | 0.85% |
|
* Does not reflect the effect of a non-recurring reimbursement by Putnam. If this amount had been reflected in the table above, the expense ratio for each share class would have been lower.
† Simple average of the expenses of all front-end load funds in the fund’s Lipper peer group, calculated in accordance with Lipper’s standard method for comparing fund expenses (excluding 12b-1 fees and without giving effect to any expense offset and brokerage service arrangements that may reduce fund expenses). This average reflects each fund’s expenses for its most recent fiscal year available to Lipper as of 3/31/06. To facilitate comparison, Putnam has adjusted this average to reflect the 12b-1 fees carried by each class of shares other than class Y shares, which do not incur 12b-1 fees. The peer group may include funds that are significantly smaller or larger than the fund, which may limit the comparability of the fund’s expenses to the simple average, which typically is higher than the asset-weighted average.
17
Your fund’s
portfolio turnover
|
Putnam funds are actively managed by teams of experts who buy and sell securities based on intensive analysis of companies, industries, economies, and markets. Portfolio turnover is a measure of how often a fund’s managers buy and sell securities for your fund. A portfolio turnover of 100%, for example, means that the managers sold and replaced securities valued at 100% of a fund’s assets within a one-year period. Funds with high turnover may be more likely to generate capital gains and dividends that must be distributed to shareholders as taxable income. High turnover may also cause a fund to pay more brokerage commissions and other transaction costs, which may detract from performance.
Funds that invest in bonds or other fixed-income instruments may have higher turnover than funds that invest only in stocks. Short-term bond funds tend to have higher turnover than longer-term bond funds, because shorter-term bonds will mature or be sold more frequently than longer-term bonds. You can use the table below to compare your fund’s turnover with the average turnover for funds in its Lipper category.
| Turnover comparisons | | | | | |
| Percentage of holdings that change every year | | | |
| |
| | 2005 | 2004 | 2003 | 2002 | 2001 |
|
| Putnam High Yield | | | | | |
| Advantage Fund | 33% | 53% | 79% | 60% | 81% |
|
| Lipper High Current Yield | | | | | |
| Funds category average | 73% | 95% | 98% | 99% | 109% |
|
Turnover data for the fund is calculated based on the fund’s fiscal-year period, which ends on November 30. Turnover data for the fund’s Lipper category is calculated based on the average of the turnover of each fund in the category for its fiscal year ended during the indicated year. Fiscal years vary across funds in the Lipper category, which may limit the comparability of the fund’s portfolio turnover rate to the Lipper average. Comparative data for 2005 is based on information available as of 12/31/05.
18
Your fund’s risk
This risk comparison is designed to help you understand how your fund compares with other funds. The comparison utilizes a risk measure developed by Morningstar, an independent fund-rating agency. This risk measure is referred to as the fund’s Overall Morningstar Risk.
Your fund’s Overall Morningstar® Risk

Your fund’s Overall Morningstar Risk is shown alongside that of the average fund in its broad asset class, as determined by Morningstar. The risk bar broadens the comparison by translating the fund’s Overall Morningstar Risk into a percentile, which is based on the fund’s ranking among all funds rated by Morningstar as of June 30, 2006. A higher Overall Morningstar Risk generally indicates that a fund’s monthly returns have varied more widely.
Morningstar determines a fund’s Overall Morningstar Risk by assessing variations in the fund’s monthly returns — with an emphasis on downside variations — over 3-, 5-, and 10-year periods, if available. Those measures are weighted and averaged to produce the fund’s Overall Morningstar Risk. The information shown is provided for the fund’s class A shares only; information for other classes may vary. Overall Morningstar Risk is based on historical data and does not indicate future results. Morningstar does not purport to measure the risk associated with a current investment in a fund, either on an absolute basis or on a relative basis. Low Overall Morningstar Risk does not mean that you cannot lose money on an investment in a fund. Copyright 2006 Morningstar, Inc. All Rights Reserved. The information contained herein (1) is proprietary to Morningstar and/or its content providers; (2) may not be copied or distributed; and (3) is not warranted to be accurate, complete, or timely. Neither Morningstar nor its content providers are responsible for any damages or losses arising from any use of this information.
19
Your fund’s management
Your fund is managed by the members of the Putnam Core Fixed-Income High-Yield Team. Paul Scanlon is the Portfolio Leader. Norman Boucher and Robert Salvin are Portfolio Members of your fund. The Portfolio Leader and Portfolio Members coordinate the team’s management of the fund.
For a complete listing of the members of the Putnam Core Fixed-Income High-Yield Team, including those who are not Portfolio Leaders or Portfolio Members of your fund, visit Putnam’s Individual Investor Web site at www.putnam.com.
Fund ownership by the Portfolio Leader and Portfolio Members
The table below shows how much the fund’s current Portfolio Leader and Portfolio Members have invested in the fund (in dollar ranges). Information shown is as of May 31, 2006, and May 31, 2005.
| | | | $1 – | $10,001 – | $50,001 – | $100,001 – | $500,001 – | $1,000,001 |
| | Year | $0 | $10,000 | $50,000 | $100,000 | $500,000 | $1,000,000 | and over |
|
| Paul Scanlon | 2006 | * | | | | | | |
|
|
| Portfolio Leader | 2005 | * | | | | | | |
|
| Norman Boucher | 2006 | | * | | | | | |
|
|
| Portfolio Member | N/A | | | | | | | |
|
| Robert Salvin | 2006 | * | | | | | | |
|
|
| Portfolio Member | 2005 | * | | | | | | |
|
N/A indicates the individual was not a Portfolio Leader or Portfolio Member as of 5/31/05.
20
Fund manager compensation
|
The total 2005 fund manager compensation that is attributable to your fund is approximately $650,000. This amount includes a portion of 2005 compensation paid by Putnam Management to the fund managers listed in this section for their portfolio management responsibilities, calculated based on the fund assets they manage taken as a percentage of the total assets they manage. The compensation amount also includes a portion of the 2005 compensation paid to the Group Chief Investment Officer of the fund’s broader investment category for his oversight responsibilities, calculated based on the fund assets he oversees taken as a percentage of the total assets he oversees. This amount does not include compensation of other personnel involved in research, trading, administration, systems, compliance, or fund operations; nor does it include non-compensation costs. These percentages are determined as of the fund’s fiscal period-end. For personnel who joined Putnam Management during or after 2005, the calculation reflects annualized 2005 compensation or an estimate of 2006 compensation, as applicable.
Other Putnam funds managed by the Portfolio Leader
and Portfolio Members
Paul Scanlon is also a Portfolio Leader of Putnam Floating Rate Income Fund, Putnam High Yield Trust, and Putnam Managed High Yield Trust. He is also a Portfolio Member of Putnam Diversified Income Trust, Putnam Master Intermediate Income Trust, and Putnam Premier Income Trust.
Norman Boucher is also a Portfolio Member of Putnam High Yield Trust and Putnam Managed High Yield Trust.
Robert Salvin is also a Portfolio Leader of Putnam High Income Securities Fund, and a Portfolio Member of Putnam Convertible Income-Growth Trust, Putnam High Yield Trust, and Putnam Managed High Yield Trust.
Paul Scanlon, Norman Boucher, and Robert Salvin may also manage other accounts and variable trust funds advised by Putnam Management or an affiliate.
Changes in your fund’s Portfolio Leader and Portfolio Members
During the year ended May 31, 2006, Portfolio Member Norman Boucher joined your fund’s management team and Portfolio Member Geoffrey Kelley left your fund’s management team.
21
Fund ownership by Putnam’s Executive Board
The table below shows how much the members of Putnam’s Executive Board have invested in the fund (in dollar ranges). Information shown is as of May 31, 2006, and May 31, 2005.
| | | | $1 – | $10,001 – | $50,001– | $100,001 |
| | Year | $0 | $10,000 | $50,000 | $100,000 | and over |
|
| Philippe Bibi | 2006 | * | | | | |
|
|
| Chief Technology Officer | 2005 | * | | | | |
|
| Joshua Brooks | 2006 | * | | | | |
|
|
| Deputy Head of Investments | 2005 | * | | | | |
|
| William Connolly | 2006 | * | | | | |
|
|
| Head of Retail Management | N/A | | | | | |
|
| Kevin Cronin | 2006 | * | | | | |
|
|
| Head of Investments | 2005 | * | | | | |
|
| Charles Haldeman, Jr. | 2006 | | * | | | |
|
|
| President and CEO | 2005 | * | | | | |
|
| Amrit Kanwal | 2006 | * | | | | |
|
|
| Chief Financial Officer | 2005 | * | | | | |
|
| Steven Krichmar | 2006 | * | | | | |
|
|
| Chief of Operations | 2005 | * | | | | |
|
| Francis McNamara, III | 2006 | | * | | | |
|
|
| General Counsel | 2005 | | * | | | |
|
| Richard Robie, III | 2006 | * | | | | |
|
|
| Chief Administrative Officer | 2005 | * | | | | |
|
| Edward Shadek | 2006 | * | | | | |
|
|
| Deputy Head of Investments | 2005 | * | | | | |
|
| Sandra Whiston | 2006 | * | | | | |
|
|
| Head of Institutional Management | N/A | | | | | |
|
| |
| N/A indicates the individual was not a member of Putnam’s Executive Board as of 5/31/05. | | |
22
Total return shows how the value of the fund’s shares changed over time, assuming you held the shares through the entire period and reinvested all distributions in the fund.Net asset value (NAV) is the price, or value, of one share of a mutual fund, without a sales charge. NAVs fluctuate with market conditions. NAV is calculated by dividing the net assets of each class of shares by the number of outstanding shares in the class.
Public offering price (POP) is the price of a mutual fund share plus the maximum sales charge levied at the time of purchase. POP performance figures shown here assume the 3.75% maximum sales charge for class A shares and 3.25% for class M shares.
Contingent deferred sales charge (CDSC) is generally a charge applied at the time of the redemption of class B shares and assumes redemption at the end of the period. Your fund’s class B CDSC declines from a 5% maximum during the first year to 1% during the sixth year. After the sixth year, the CDSC no longer applies.
Class A shares are generally subject to an initial sales charge and no CDSC (except on certain redemptions of shares bought without an initial sales charge).Class B shares are not subject to an initial sales charge. They may be subject to a CDSC.
Class M shares have a lower initial sales charge and a higher 12b-1 fee than class A shares and no CDSC (except on certain redemptions of shares bought without an initial sales charge).
Class Y shares are not subject to an initial sales charge or CDSC, and carry no 12b-1 fee. They are only available to eligible purchasers, including eligible defined contribution plans or corporate IRAs.
23
Comparative indexes
Citigroup World Government Bond Index is an unmanaged index of global investment-grade fixed-income securities.
JP Morgan Developed High Yield Index is an unmanaged index of high-yield fixed-income securities issued in developed countries.
Lehman Aggregate Bond Index is an unmanaged index of U.S. investment-grade fixed-income securities.
Lehman GNMA Index is an unmanaged index of Government National Mortgage Association bonds.
Morgan Stanley Capital International (MSCI) EAFE Index is an unmanaged index of equity securities from developed countries in Western Europe, the Far East, and Australasia.
Russell 2000 Index is an unmanaged index of the 2,000 smallest companies in the Russell 3000 Index.
S&P 500 Index is an unmanaged index of common stock performance.
Indexes assume reinvestment of all distributions and do not account for fees. Securities and performance of a fund and an index will differ. You cannot invest directly in an index.
Lipper is a third-party industry-ranking entity that ranks mutual funds. Its rankings do not reflect sales charges. Lipper rankings are based on total return at net asset value relative to other funds that have similar current investment styles or objectives as determined by Lipper. Lipper may change a fund’s category assignment at its discretion. Lipper category averages reflect performance trends for funds within a category.
24
Trustee approval of
management contract
|
General conclusions
The Board of Trustees of the Putnam funds oversees the management of each fund and, as required by law, determines annually whether to approve the continuance of your fund’s management contract with Putnam Management and its sub-management contract with Putnam Management’s affiliate, Putnam Investments Limited (“PIL”). In this regard, the Board of Trustees, with the assistance of its Contract Committee consisting solely of Trustees who are not “interested persons” (as such term is defined in the Investment Company Act of 1940, as amended) of the Putnam funds (the “Independent Trustees”), requests and evaluates all information it deems reasonably necessary under the circumstances. Over the course of several months beginning in March and ending in June 2005, the Contract Committee met five times to consider the information provided by Putnam Management and other information developed with the assistance of the Board’s independent counsel and independent staff. The Contract Committee reviewed and discussed key aspects of this information with all of the Independent Trustees. Upon completion of this review, the Contract Committee recommended and the Independent Trustees approved the continuance of your fund’s management contract and sub-management contract, effective July 1, 2005. Because PIL is an affiliate of Putnam Management and Putnam Management remains fully responsible for all services provided by PIL, the Trustees have not evaluated PIL as a separate entity and all subsequent references to Putnam Management below should be deemed to include reference to PIL as necessary or appropriate in the context.
This approval was based on the following conclusions:
| * | That the fee schedule currently in effect for your fund represents reasonable compensation |
| in light of the nature and quality of the services being provided to the fund, the fees paid |
| by competitive funds and the costs incurred by Putnam Management in providing such |
| services, and |
* | That such fee schedule represents an appropriate sharing between fund shareholders and |
| Putnam Management of such economies of scale as may exist in the management of the fund |
| at current asset levels. |
These conclusions were based on a comprehensive consideration of all information provided to the Trustees and were not the result of any single factor. Some of the factors that figured particularly in the Trustees’ deliberations and how the Trustees considered these factors are described below, although individual Trustees may have evaluated the information presented differently, giving different weights to various factors. It is also important to recognize that the fee arrangements for your fund and the other Putnam funds are the result of many years of review and discussion between the Independent Trustees and Putnam Management, that certain aspects of such arrangements may receive greater scrutiny in some years than others, and that the Trustees’ conclusions may be based, in part, on their consideration of these same arrangements in prior years.
25
Model fee schedules and categories; total expenses
The Trustees’ review of the management fees and total expenses of the Putnam funds focused on three major themes:
* Consistency. The Trustees, working in cooperation with Putnam Management, have developed and implemented a series of model fee schedules for the Putnam funds designed to ensure that each fund’s management fee is consistent with the fees for similar funds in the Putnam family of funds and compares favorably with fees paid by competitive funds sponsored by other investment advisors. Under this approach, each Putnam fund is assigned to one of several fee categories based on a combination of factors, including competitive fees and perceived difficulty of management, and a common fee schedule is implemented for all funds in a given fee category. The Trustees reviewed the model fee schedule currently in effect for your fund, including fee levels and breakpoints, and the assignment of the fund to a particular fee category under this structure. (“Breakpoints” refer to reductions in fee rates that apply to additional assets once specified asset levels are reached.) The Trustees concluded that no changes should be made in the fund’s current fee schedule at this time.
* Competitiveness. The Trustees also reviewed comparative fee and expense information for competitive funds, which indicated that, in a custom peer group of competitive funds selected by Lipper Inc., your fund ranked in the 62nd percentile in management fees and in the 48th percentile in total expenses (less any applicable 12b-1 fees) as of December 31, 2004 (the first percentile being the least expensive funds and the 100th percentile being the most expensive funds). (Because the fund’s custom peer group is smaller than the fund’s broad Lipper Inc. peer group, this expense comparison may differ from the Lipper peer expense information found elsewhere in this report.) The Trustees noted that expense ratios for a number of Putnam funds, which show the percentage of fund assets used to pay for management and administrative services, distribution (12b-1) fees and other expenses, had been increasing recently as a result of declining net assets and the natural operation of fee breakpoints. They noted that such expense ratio increases were currently being controlled by expense limitations implemented in January 2004 and which Putnam Management, in consultation with the Contract Committee, had committed to maintain at least through 2006. The Trustees expressed their intention to monitor this information closely to ensure that fees and expenses of the Putnam funds continue to meet evolving competitive standards.
* Economies of scale. The Trustees concluded that the fee schedule currently in effect for your fund represents an appropriate sharing of economies of scale at current asset levels. Your fund currently has the benefit of breakpoints in its management fee that provide shareholders with significant economies of scale, which means that the effective management fee rate of a fund (as a percentage of fund assets) declines as a fund grows in size and crosses specified asset thresholds. The Trustees examined the existing breakpoint structure of the Putnam funds’ management fees in light of competitive industry practices. The Trustees considered
26
various possible modifications to the Putnam funds’ current breakpoint structure, but ultimately concluded that the current breakpoint structure continues to serve the interests of fund shareholders. Accordingly, the Trustees continue to believe that the fee schedules currently in effect for the funds represent an appropriate sharing of economies of scale at current asset levels. The Trustees noted that significant redemptions in many Putnam funds, together with significant changes in the cost structure of Putnam Management, have altered the economics of Putnam Management’s business in significant ways. In view of these changes, the Trustees intend to consider whether a greater sharing of the economies of scale by fund shareholders would be appropriate if and when aggregate assets in the Putnam funds begin to experience meaningful growth.
In connection with their review of the management fees and total expenses of the Putnam funds, the Trustees also reviewed the costs of the services to be provided and profits to be realized by Putnam Management and its affiliates from the relationship with the funds. This information included trends in revenues, expenses and profitability of Putnam Management and its affiliates relating to the investment management and distribution services provided to the funds. In this regard, the Trustees also reviewed an analysis of Putnam Management’s revenues, expenses and profitability with respect to the funds’ management contracts, allocated on a fund-by-fund basis.
The quality of the investment process provided by Putnam Management represented a major factor in the Trustees’ evaluation of the quality of services provided by Putnam Management under your fund’s management contract. The Trustees were assisted in their review of the funds’ investment process and performance by the work of the Investment Oversight Committees of the Trustees, which meet on a regular monthly basis with the funds’ portfolio teams throughout the year. The Trustees concluded that Putnam Management generally provides a high-quality investment process — as measured by the experience and skills of the individuals assigned to the management of fund portfolios, the resources made available to such personnel, and in general the ability of Putnam Management to attract and retain high-quality personnel — but also recognize that this does not guarantee favorable investment results for every fund in every time period. The Trustees considered the investment performance of each fund over multiple time periods and considered information comparing the fund’s performance with various benchmarks and with the performance of competitive funds. The Trustees noted the satisfactory investment performance of many Putnam funds. They also noted the disappointing investment performance of certain funds in recent years and continued to discuss with senior management of Putnam Management the factors contributing to such underperformance and actions being taken to improve performance. The Trustees recognized that, in recent years, Putnam Management has made significant changes in its investment personnel and processes and in the fund product line to address areas of underperformance. The Trustees indicated their intention to continue to
27
monitor performance trends to assess the effectiveness of these changes and to evaluate whether additional remedial changes are warranted.
In the case of your fund, the Trustees considered that your fund’s class A share cumulative total return performance at net asset value was in the following percentiles of its Lipper Inc. peer group (Lipper High Current Yield Funds) for the one-, three-, and five-year periods ended December 31, 2004 (the first percentile being the best-performing funds and the 100th percentile being the worst-performing funds):
| One-year period | Three-year period | Five-year period |
|
| 19th | 24th | 47th |
(Because of the passage of time, these performance results may differ from the performance results for more recent periods shown elsewhere in this report. Over the one-, three-, and five-year periods ended December 31, 2004, there were 416, 346, and 275 funds, respectively, in your fund’s Lipper peer group.* Past performance is no guarantee of future performance.)
As a general matter, the Trustees believe that cooperative efforts between the Trustees and Putnam Management represent the most effective way to address investment performance problems. The Trustees believe that investors in the Putnam funds have, in effect, placed their trust in the Putnam organization, under the oversight of the funds’ Trustees, to make appropriate decisions regarding the management of the funds. Based on the responsiveness of Putnam Management in the recent past to Trustee concerns about investment performance, the Trustees believe that it is preferable to seek change within Putnam Management to address performance shortcomings. In the Trustees’ view, the alternative of terminating a management contract and engaging a new investment advisor for an underperforming fund would entail significant disruptions and would not provide any greater assurance of improved investment performance.
Brokerage and soft-dollar allocations; other benefits
The Trustees considered various potential benefits that Putnam Management may receive in connection with the services it provides under the management contract with your fund. These include principally benefits related to brokerage and soft-dollar allocations, whereby a portion of the commissions paid by a fund for brokerage is earmarked to pay for research services that may be utilized by a fund’s investment advisor, subject to the obligation to seek best execution. The Trustees believe that soft-dollar credits and other potential benefits associated with the allocation of fund brokerage, which pertains mainly to funds investing in equity securities, represent assets of the funds that should be used for the benefit of fund shareholders. This
* The percentile rankings for your fund’s class A share annualized total return performance in the Lipper High Current Yield Funds category for the one-, five-, and ten-year periods ended June 30, 2006, were 13%, 20%, and 54%, respectively. Over the one-, five-, and ten-year periods ended June 30, 2006, the fund ranked 55th out of 444, 62nd out of 313 , and 61st out of 114 funds, respectively. Note that this more recent information was not available when the Trustees approved the continuance of your fund’s management contract.
28
area has been marked by significant change in recent years. In July 2003, acting upon the Contract Committee’s recommendation, the Trustees directed that allocations of brokerage to reward firms that sell fund shares be discontinued no later than December 31, 2003. In addition, commencing in 2004, the allocation of brokerage commissions by Putnam Management to acquire research services from third-party service providers has been significantly reduced, and continues at a modest level only to acquire research that is customarily not available for cash. The Trustees will continue to monitor the allocation of the funds’ brokerage to ensure that the principle of “best price and execution” remains paramount in the portfolio trading process.
The Trustees’ annual review of your fund’s management contract also included the review of its distributor’s contract and distribution plan with Putnam Retail Management Limited Partnership and the custodian agreement and investor servicing agreement with Putnam Fiduciary Trust Company, all of which provide benefits to affiliates of Putnam Management.
Comparison of retail and institutional fee schedules
The information examined by the Trustees as part of their annual contract review has included for many years information regarding fees charged by Putnam Management and its affiliates to institutional clients such as defined benefit pension plans, college endowments, etc. This information included comparison of such fees with fees charged to the funds, as well as a detailed assessment of the differences in the services provided to these two types of clients. The Trustees observed, in this regard, that the differences in fee rates between institutional clients and the mutual funds are by no means uniform when examined by individual asset sectors, suggesting that differences in the pricing of investment management services to these types of clients reflect to a substantial degree historical competitive forces operating in separate market places. The Trustees considered the fact that fee rates across all asset sectors are higher on average for mutual funds than for institutional clients, as well as the differences between the services that Putnam Management provides to the Putnam funds and those that it provides to institutional clients of the firm, but have not relied on such comparisons to any significant extent in concluding that the management fees paid by your fund are reasonable.
29
Other information
for shareholders
|
Important notice regarding delivery of shareholder documents
In accordance with SEC regulations, Putnam sends a single copy of annual and semiannual shareholder reports, prospectuses, and proxy statements to Putnam shareholders who share the same address, unless a shareholder requests otherwise. If you prefer to receive your own copy of these documents, please call Putnam at 1-800-225-1581, and Putnam will begin sending individual copies within 30 days.
Putnam is committed to managing our mutual funds in the best interests of our shareholders. The Putnam funds’ proxy voting guidelines and procedures, as well as information regarding how your fund voted proxies relating to portfolio securities during the 12-month period ended June 30, 2005, are available on the Putnam Individual Investor Web site, www.putnam.com/individual, and on the SEC’s Web site, www.sec.gov. If you have questions about finding forms on the SEC’s Web site, you may call the SEC at 1-800-SEC-0330. You may also obtain the Putnam funds’ proxy voting guidelines and procedures at no charge by calling Putnam’s Shareholder Services at 1-800-225-1581.
The fund will file a complete schedule of its portfolio holdings with the SEC for the first and third quarters of each fiscal year on Form N-Q. Shareholders may obtain the fund’s Forms N-Q on the SEC’s Web site at www.sec.gov. In addition, the fund’s Forms N-Q may be reviewed and copied at the SEC’s Public Reference Room in Washington, D.C. You may call the SEC at 1-800-SEC-0330 for information about the SEC’s Web site or the operation of the Public Reference Room.
30
A guide to financial statements
|
These sections of the report, as well as the accompanying Notes, constitute the fund’s financial statements.
The fund’s portfolio lists all the fund’s investments and their values as of the last day of the reporting period. Holdings are organized by asset type and industry sector, country, or state to show areas of concentration and diversification.
Statement of assets and liabilities shows how the fund’s net assets and share price are determined. All investment and noninvestment assets are added together. Any unpaid expenses and other liabilities are subtracted from this total. The result is divided by the number of shares to determine the net asset value per share, which is calculated separately for each class of shares. (For funds with preferred shares, the amount subtracted from total assets includes the liquidation preference of preferred shares.)
Statement of operations shows the fund’s net investment gain or loss. This is done by first adding up all the fund’s earnings — from dividends and interest income — and subtracting its operating expenses to determine net investment income (or loss). Then, any net gain or loss the fund realized on the sales of its holdings — as well as any unrealized gains or losses over the period — is added to or subtracted from the net investment result to determine the fund’s net gain or loss for the fiscal period.
Statement of changes in net assets shows how the fund’s net assets were affected by the fund’s net investment gain or loss, by distributions to shareholders, and by changes in the number of the fund’s shares. It lists distributions and their sources (net investment income or realized capital gains) over the current reporting period and the most recent fiscal year-end. The distributions listed here may not match the sources listed in the Statement of operations because the distributions are determined on a tax basis and may be paid in a different period from the one in which they were earned. Dividend sources are estimated at the time of declaration. Actual results may vary. Any non-taxable return of capital cannot be determined until final tax calculations are completed after the end of the fund’s fiscal year.
Financial highlights provide an overview of the fund’s investment results, per-share distributions, expense ratios, net investment income ratios, and portfolio turnover in one summary table, reflecting the five most recent reporting periods. In a semiannual report, the highlight table also includes the current reporting period.
31
| The fund’s portfolio 5/31/06 (Unaudited) | | | | |
|
| |
| |
| |
| CORPORATE BONDS AND NOTES (88.5%)* | | | | |
|
| | | Principal amount | | Value |
|
| Advertising and Marketing Services (0.6%) | | | | |
| Affinion Group, Inc. bonds 11 1/2s, 2015 | $ | 1,340,000 | $ | 1,363,450 |
| Affinion Group, Inc. 144A company guaranty 10 1/8s, 2013 | | 2,210,000 | | 2,287,350 |
| Lamar Media Corp. company guaranty 7 1/4s, 2013 | | 1,715,000 | | 1,699,994 |
| | | | | 5,350,794 |
|
| |
| Automotive (5.7%) | | | | |
| ArvinMeritor, Inc. notes 8 3/4s, 2012 | | 240,000 | | 241,200 |
| ArvinMeritor, Inc. sr. unsecd. notes 8 1/8s, 2015 | | 740,000 | | 712,250 |
| Avis Budget Care Rental LLC 144A sr. notes 7 3/4s, 2016 | | 1,475,000 | | 1,486,063 |
| Ford Motor Co. notes 7.45s, 2031 | | 3,775,000 | | 2,736,875 |
| Ford Motor Credit Corp. notes 7 7/8s, 2010 | | 6,425,000 | | 5,927,872 |
| Ford Motor Credit Corp. notes 7 3/8s, 2009 | | 4,015,000 | | 3,698,160 |
| Ford Motor Credit Corp. notes 6 1/2s, 2007 | | 2,910,000 | | 2,908,338 |
| General Motors Acceptance Corp. notes 7 3/4s, 2010 | | 5,565,000 | | 5,452,186 |
| General Motors Acceptance Corp. notes 6 7/8s, 2012 | | 5,420,000 | | 5,038,069 |
| General Motors Acceptance Corp. notes 6 3/4s, 2014 | | 3,795,000 | | 3,444,953 |
| General Motors Acceptance Corp. notes 5 1/8s, 2008 | | 1,460,000 | | 1,382,855 |
| General Motors Acceptance Corp. sr. unsub. notes 5.85s, 2009 | 2,835,000 | | 2,675,560 |
| Hertz Corp. 144A sr. notes 8 7/8s, 2014 | | 1,940,000 | | 2,017,600 |
| Lear Corp. company guaranty Ser. B, 8.11s, 2009 | | 975,000 | | 950,625 |
| Lear Corp. sr. notes 8 1/8s, 2008 | EUR | 320,000 | | 419,607 |
| Meritor Automotive, Inc. notes 6.8s, 2009 | $ | 282,000 | | 274,950 |
| Tenneco Automotive, Inc. company guaranty 8 5/8s, 2014 | | 1,930,000 | | 1,939,650 |
| Tenneco Automotive, Inc. sec. notes Ser. B, 10 1/4s, 2013 | | 2,770,000 | | 3,047,000 |
| TRW Automotive Inc. sr. notes 9 3/8s, 2013 | | 820,000 | | 883,550 |
| TRW Automotive Inc. sr. sub. notes 11s, 2013 | | 3,375,000 | | 3,737,813 |
| | | | | 48,975,176 |
|
| |
| Basic Materials (8.4%) | | | | |
| Abitibi-Consolidated, Inc. debs. 8.85s, 2030 (Canada) | | 590,000 | | 511,825 |
| Abitibi-Consolidated, Inc. notes 7 3/4s, 2011 (Canada) | | 560,000 | | 527,800 |
| Abitibi-Consolidated, Inc. notes 6s, 2013 (Canada) | | 1,175,000 | | 992,875 |
| AK Steel Corp. company guaranty 7 3/4s, 2012 | | 3,785,000 | | 3,728,225 |
| Builders FirstSource Inc. company guaranty FRB 9.42s, 2012 | | 230,000 | | 236,900 |
| Century Aluminum Co. company guaranty 7 1/2s, 2014 | | 1,135,000 | | 1,169,050 |
| Chaparral Steel Co. company guaranty 10s, 2013 | | 2,545,000 | | 2,831,313 |
| Chesapeake Corp. sr. sub. notes 7s, 2014 | EUR | 300,000 | | 342,715 |
| Cognis Holding GMBH & Co. 144A sr. notes 11.644s, | | | | |
| 2015 (Germany) | EUR | 1,005,000 | | 1,330,734 |
| Cognis Holding GmbH & Co. 144A sr. notes 9 1/2s, | | | | |
| 2014 (Germany) | EUR | 890,000 | | 1,281,905 |
| Compass Minerals International, Inc. | | | | |
| sr. notes stepped-coupon zero % (12 3/4s, | | | | |
| 12/15/07), 2012 †† | $ | 4,315,000 | | 4,142,400 |
| Covalence Specialty Materials Corp. 144A | | | | |
| sr. sub. notes 10 1/4s, 2016 | | 3,630,000 | | 3,666,300 |
32
| CORPORATE BONDS AND NOTES (88.5%)* continued | | | | |
|
| | | Principal amount | | Value |
|
| Basic Materials continued | | | | |
| Crystal US Holdings, LLC sr. disc. notes stepped-coupon | | | | |
| Ser. A, zero % (10s, 10/1/09), 2014 †† | $ | 2,785,000 | $ | 2,221,038 |
| Equistar Chemicals LP/Equistar Funding Corp. company | | | | |
| guaranty 10 1/8s, 2008 | | 4,685,000 | | 5,024,663 |
| Georgia-Pacific Corp. debs. 9 1/2s, 2011 | | 715,000 | | 765,050 |
| Gerdau Ameristeel Corp. sr. notes 10 3/8s, 2011 (Canada) | | 2,630,000 | | 2,846,975 |
| Graphic Packaging International Corp sr. notes 8 1/2s, 2011 | | 545,000 | | 549,088 |
| Huntsman, LLC company guaranty 11 5/8s, 2010 | | 948,000 | | 1,052,280 |
| Huntsman, LLC company guaranty 11 1/2s, 2012 | | 732,000 | | 832,650 |
| Ineos Group Holdings PLC 144A bonds 7 7/8s, 2016 | | | | |
| (United Kingdom) | EUR | 1,560,000 | | 1,919,361 |
| Innophos, Inc. company guaranty 8 7/8s, 2014 | $ | 1,420,000 | | 1,444,850 |
| Ispat Inland ULC sec. notes 9 3/4s, 2014 | | 1,020,000 | | 1,141,125 |
| JSG Holding PLC 144A sr. notes 11 1/2s, 2015(Ireland) ‡‡ | EUR | 699,783 | | 927,940 |
| MDP Acquisitions PLC sr. notes 9 5/8s, 2012 (Ireland) | $ | 3,210,000 | | 3,346,425 |
| MDP Acquisitions PLC sr. notes Ser. EUR, 10 1/8s, | | | | |
| 2012 (Ireland) | EUR | 145,000 | | 205,125 |
| Metals USA, Inc. 144A sec. notes 11 1/8s, 2015 | $ | 1,635,000 | | 1,823,025 |
| Nalco Co. sr. sub. notes 8 7/8s, 2013 | | 2,000,000 | | 2,057,500 |
| Nell AF S.a.r.l. 144A sr. notes 8 3/8s, 2015 (Luxembourg) | | 1,910,000 | | 1,886,125 |
| Nell AF S.a.r.l. 144A sr. notes 8 3/8s, 2015 (Luxembourg) | EUR | 445,000 | | 581,515 |
| NewPage Corp. sec. notes 10s, 2012 | $ | 1,935,000 | | 2,046,263 |
| Norske Skog Canada, Ltd. sr. notes 7 3/8s, 2014 (Canada) | | 1,000,000 | | 920,000 |
| Novelis, Inc. 144A sr. notes 7 3/4s, 2015 | | 5,715,000 | | 5,457,825 |
| PCI Chemicals Canada sec. sr. notes 10s, 2008 (Canada) | | 316,054 | | 329,881 |
| PQ Corp. 144A company guaranty 7 3/4s, 2013 | | 2,395,000 | | 2,308,181 |
| Rockwood Specialties Group, Inc. company | | | | |
| guaranty 7 5/8s, 2014 | EUR | 1,400,000 | | 1,842,071 |
| Smurfit Capital Funding PLC debs. 7 1/2s, 2025 (Ireland) | $ | 870,000 | | 804,750 |
| Steel Dynamics, Inc. company guaranty 9 1/2s, 2009 | | 1,370,000 | | 1,428,225 |
| Sterling Chemicals, Inc. sec. notes 10s, 2007 ‡‡ | | 644,388 | | 615,391 |
| Stone Container Corp. sr. notes 8 3/8s, 2012 | | 3,810,000 | | 3,600,450 |
| Stone Container Finance company guaranty 7 3/8s, | | | | |
| 2014 (Canada) | | 585,000 | | 523,575 |
| Ucar Finance, Inc. company guaranty 10 1/4s, 2012 | | 1,560,000 | | 1,661,400 |
| United States Steel, LLC sr. notes 10 3/4s, 2008 | | 1,524,000 | | 1,653,540 |
| Wheeling-Pittsburgh Steel Corp. sr. notes 6s, 2010 ‡‡ | | 155,165 | | 122,580 |
| Wheeling-Pittsburgh Steel Corp. sr. notes 5s, 2011 ‡‡ | | 280,632 | | 221,699 |
| | | | | 72,922,608 |
|
| |
| Beverage (0.2%) | | | | |
| Constellation Brands, Inc. company guaranty Ser. B, 8s, 2008 | | 1,640,000 | | 1,681,000 |
| Constellation Brands, Inc. sr. sub. notes Ser. B, 8 1/8s, 2012 | | 145,000 | | 150,075 |
| | | | | 1,831,075 |
|
| |
| Broadcasting (2.7%) | | | | |
| DirecTV Holdings, LLC company guaranty 6 3/8s, 2015 | | 3,980,000 | | 3,741,200 |
| Echostar DBS Corp. company guaranty 6 5/8s, 2014 | | 2,335,000 | | 2,206,575 |
| Echostar DBS Corp. sr. notes 6 3/8s, 2011 | | 4,585,000 | | 4,401,600 |
33
| CORPORATE BONDS AND NOTES (88.5%)* continued | | | | |
|
| | | Principal amount | | Value |
|
| Broadcasting continued | | | | |
| LIN Television Corp. company guaranty Ser. B, | | | | |
| 6 1/2s, 2013 | $ | 705,000 | $ | 653,888 |
| LIN Television Corp. sr. sub. notes 6 1/2s, 2013 | | 290,000 | | 268,975 |
| Paxson Communications Corp. 144A sec. FRN 11.318s, 2013 | | 995,000 | | 1,006,194 |
| Paxson Communications Corp. 144A sec. FRN 8.318s, 2012 | | 1,200,000 | | 1,224,000 |
| Rainbow National Services, LLC 144A sr. notes 8 3/4s, 2012 | | 2,835,000 | | 3,005,100 |
| Rainbow National Services, LLC 144A sr. sub. debs. 10 3/8s, 2014 | 1,250,000 | | 1,396,875 |
| Sirius Satellite Radio, Inc. sr. unsecd. notes 9 5/8s, 2013 | | 2,060,000 | | 1,946,700 |
| Young Broadcasting, Inc. company guaranty 10s, 2011 | | 2,322,000 | | 2,101,410 |
| Young Broadcasting, Inc. sr. sub. notes 8 3/4s, 2014 | | 1,330,000 | | 1,117,200 |
| | | | | 23,069,717 |
|
| |
| Building Materials (1.7%) | | | | |
| Associated Materials, Inc. company guaranty 9 3/4s, 2012 | | 2,520,000 | | 2,608,200 |
| Building Materials Corp. company guaranty 8s, 2008 | | 1,300,000 | | 1,316,250 |
| Goodman Global Holding Co., Inc. sr. sub. notes 7 7/8s, 2012 | | 1,200,000 | | 1,176,000 |
| NTK Holdings, Inc. sr. disc. notes zero %, 2014 | | 3,450,000 | | 2,604,750 |
| Owens Corning notes 7 1/2s, 2005 (In default) † **** | | 2,245,000 | | 2,447,050 |
| Ply Gem Industries, Inc. sr. sub. notes 9s, 2012 | | 385,000 | | 362,863 |
| Texas Industries, Inc. sr. unsecd. notes 7 1/4s, 2013 | | 1,230,000 | | 1,254,600 |
| THL Buildco, Inc. (Nortek Holdings, Inc.) | | | | |
| sr. sub. notes 8 1/2s, 2014 | | 3,355,000 | | 3,371,775 |
| | | | | 15,141,488 |
|
| |
| Cable Television (2.2%) | | | | |
| Atlantic Broadband Finance, LLC company guaranty 9 3/8s, 2014 | | 1,530,000 | | 1,461,150 |
| CCH I Holdings LLC company guaranty stepped-coupon | | | | |
| zero % (12 1/8s, 11/15/07), 2015 †† | | 135,000 | | 72,225 |
| CCH I LLC secd. notes 11s, 2015 | | 10,734,000 | | 9,150,735 |
| CCH II 144A sr. notes 10 1/4s, 2010 | | 2,545,000 | | 2,532,275 |
| CCH, LLC/Capital Corp. sr. notes 10 1/4s, 2010 | | 515,000 | | 513,713 |
| CSC Holdings, Inc. debs. 7 5/8s, 2018 | | 1,335,000 | | 1,328,325 |
| CSC Holdings, Inc. sr. notes Ser. B, 7 5/8s, 2011 | | 1,445,000 | | 1,452,225 |
| CSC Holdings, Inc. 144A sr. notes 7 1/4s, 2012 | | 2,635,000 | | 2,579,006 |
| | | | | 19,089,654 |
|
| |
| Capital Goods (8.3%) | | | | |
| Aero Invest 1 SA company guaranty 11.269s, 2015 | | | | |
| (Luxembourg) | EUR | 759,355 | | 1,007,520 |
| Alliant Techsystems, Inc. sr. sub. notes 6 3/4s, 2016 | $ | 3,085,000 | | 3,027,156 |
| Allied Waste North America, Inc. company | | | | |
| guaranty Ser. B, 8 1/2s, 2008 | | 3,050,000 | | 3,210,125 |
| Allied Waste North America, Inc. sec. notes Ser. B, | | | | |
| 5 3/4s, 2011 | | 555,000 | | 524,475 |
| Amsted Industries, Inc. 144A sr. notes 10 1/4s, 2011 | | 3,290,000 | | 3,553,200 |
| ASPropulsion Capital B.V. sr. notes Ser. REGS, | | | | |
| 9 5/8s, 2013 (Netherlands) | EUR | 600,000 | | 879,232 |
34
| CORPORATE BONDS AND NOTES (88.5%)* continued | | | | |
|
| | | Principal amount | | Value |
|
| Capital Goods continued | | | | |
| Blount, Inc. sr. sub. notes 8 7/8s, 2012 | $ | 2,890,000 | $ | 2,976,700 |
| Browning-Ferris Industries, Inc. debs. 7.4s, 2035 | | 1,310,000 | | 1,192,100 |
| Browning-Ferris Industries, Inc. sr. notes 6 3/8s, 2008 | | 1,870,000 | | 1,870,000 |
| Crown Americas, LLC/Crown Americas Capital Corp. | | | | |
| 144A sr. notes 7 5/8s, 2013 | | 3,620,000 | | 3,638,100 |
| Crown Cork & Seal Co. Inc. debs. 8s, 2023 | | 1,635,000 | | 1,561,425 |
| Decrane Aircraft Holdings Co. company guaranty zero %, | | | | |
| 2008 (acquired 7/23/04, cost $1,590,063) ‡ | | 4,847,000 | | 3,392,900 |
| Dresser-Rand Group, Inc. company guaranty 7 3/8s, 2014 | | 1,070,000 | | 1,075,350 |
| Earle M. Jorgensen Co. sec. notes 9 3/4s, 2012 | | 2,280,000 | | 2,439,600 |
| Graham Packaging Co. Inc. company guaranty 8 1/2s, 2012 | | 355,000 | | 358,550 |
| Graham Packaging Co. Inc. sub. notes 9 7/8s, 2014 | | 1,910,000 | | 1,948,200 |
| Greenbrier Cos., Inc. company guaranty 8 3/8s, 2015 | | 2,120,000 | | 2,183,600 |
| Invensys, PLC notes 9 7/8s, 2011 (United Kingdom) | | 1,040,000 | | 1,128,400 |
| L-3 Communications Corp. company guaranty 6 1/8s, 2013 | | 1,910,000 | | 1,800,175 |
| L-3 Communications Corp. sr. sub. notes Class B, 6 3/8s, 2015 | | 2,460,000 | | 2,324,700 |
| Legrand SA debs. 8 1/2s, 2025 (France) | | 4,360,000 | | 5,123,000 |
| Manitowoc Co., Inc. (The) company guaranty 10 1/2s, 2012 | | 1,023,000 | | 1,112,513 |
| Manitowoc Co., Inc. (The) sr. notes 7 1/8s, 2013 | | 1,415,000 | | 1,443,300 |
| Milacron Escrow Corp. sec. notes 11 1/2s, 2011 | | 1,470,000 | | 1,385,475 |
| Mueller Group, Inc. sr. sub. notes 10s, 2012 | | 1,840,000 | | 2,010,200 |
| Owens Brockway Glass Container Inc company | | | | |
| guaranty 6 3/4s, 2014 | EUR | 1,750,000 | | 2,256,515 |
| Owens-Brockway Glass company guaranty 8 1/4s, 2013 | $ | 2,725,000 | | 2,752,250 |
| Owens-Brockway Glass sr. sec. notes 8 3/4s, 2012 | | 1,740,000 | | 1,840,050 |
| Ray Acquisition SCA sr. notes 9 3/8s, 2015 (France) | EUR | 1,405,000 | | 1,919,024 |
| Siebe PLC 144A sr. unsub. 6 1/2s, 2010 (United Kingdom) | $ | 1,125,000 | | 1,156,680 |
| Solo Cup Co. sr. sub. notes 8 1/2s, 2014 | | 1,945,000 | | 1,750,500 |
| TD Funding Corp. company guaranty 8 3/8s, 2011 | | 3,195,000 | | 3,394,688 |
| Tekni-Plex, Inc. 144A sec. notes 10 7/8s, 2012 | | 2,140,000 | | 2,386,100 |
| Terex Corp. company guaranty Ser. B, 10 3/8s, 2011 | | 3,155,000 | | 3,328,525 |
| | | | | 71,950,328 |
|
| |
| Communication Services (6.6%) | | | | |
| American Cellular Corp. company guaranty 9 1/2s, 2009 | | 785,000 | | 807,569 |
| American Cellular Corp. sr. notes Ser. B, 10s, 2011 | | 1,410,000 | | 1,513,988 |
| American Tower Corp. sr. notes 7 1/2s, 2012 | | 1,300,000 | | 1,326,000 |
| American Towers, Inc. company guaranty 7 1/4s, 2011 | | 2,965,000 | | 3,031,713 |
| Centennial Cellular Operating Co., LLC company | | | | |
| guaranty 10 1/8s, 2013 | | 845,000 | | 910,488 |
| Centennial Cellular Operating Co., LLC | | | | |
| sr. sub. notes 10 3/4s, 2008 | | 346,000 | | 349,460 |
| Centennial Communications Corp. sr. notes 10s, 2013 | | 1,275,000 | | 1,319,625 |
| Centennial Communications Corp. sr. notes FRN 10.74s, 2013 | | 420,000 | | 437,850 |
| Cincinnati Bell Telephone company guaranty 6.3s, 2028 | | 520,000 | | 449,800 |
| Cincinnati Bell, Inc. company guaranty 7s, 2015 | | 885,000 | | 856,238 |
| Cincinnati Bell, Inc. sr. sub. notes 8 3/8s, 2014 | | 370,000 | | 373,700 |
| Cincinnati Bell, Inc. unsub. notes 7 1/4s, 2023 | | 1,575,000 | | 1,500,188 |
| Citizens Communications Co. notes 9 1/4s, 2011 | | 2,210,000 | | 2,400,613 |
35
| CORPORATE BONDS AND NOTES (88.5%)* continued | | | | |
|
| | | Principal amount | | Value |
|
| Communication Services continued | | | | |
| Citizens Communications Co. sr. notes 6 1/4s, 2013 | $ | 2,760,000 | $ | 2,635,800 |
| Digicel, Ltd. 144A sr. notes 9 1/4s, 2012 (Jamaica) | | 1,335,000 | | 1,401,750 |
| Dobson Cellular Systems sec. notes 9 7/8s, 2012 | | 1,625,000 | | 1,755,000 |
| Dobson Communications Corp. sr. notes FRN 9.318s, 2012 | | 855,000 | | 863,550 |
| Horizon PCS, Inc. company guaranty 11 3/8s, 2012 | | 410,000 | | 465,350 |
| Inmarsat Finance PLC company guaranty 7 5/8s, 2012 | | | | |
| (United Kingdom) | | 1,519,000 | | 1,549,380 |
| Inmarsat Finance PLC company guaranty stepped-coupon | | | | |
| zero % (10 3/8s, 10/15/08), 2012 (United Kingdom) †† | | 3,060,000 | | 2,608,650 |
| Intelsat Subsidiary Holding Co Ltd company | | | | |
| guaranty 8 7/8s, 2015 (Bermuda) | | 2,670,000 | | 2,703,375 |
| Intelsat Subsidiary Holding Co Ltd sr. notes 8 1/2s, | | | | |
| 2013 (Bermuda) | | 1,265,000 | | 1,269,744 |
| iPCS, Inc. sr. notes 11 1/2s, 2012 | | 1,025,000 | | 1,168,500 |
| IWO Holdings, Inc. sec. FRN 8.818s, 2012 | | 340,000 | | 352,750 |
| Madison River Capital Corp. sr. notes 13 1/4s, 2010 | | 721,000 | | 753,445 |
| Nordic Telephone Co Holdings ApS 144A | | | | |
| sr. notes 8 7/8s, 2016 (Denmark) | | 380,000 | | 392,350 |
| PanAmSat Corp. company guaranty 9s, 2014 | | 1,025,000 | | 1,063,438 |
| Qwest Communications International, Inc. company | | | | |
| guaranty 7 1/2s, 2014 | | 4,680,000 | | 4,656,600 |
| Qwest Corp. notes 8 7/8s, 2012 | | 5,405,000 | | 5,796,863 |
| Qwest Corp. sr. notes 7 5/8s, 2015 | | 1,765,000 | | 1,795,888 |
| Qwest, Inc. debs. 7 1/4s, 2025 | | 1,135,000 | | 1,086,763 |
| Rogers Cantel, Inc. debs. 9 3/4s, 2016 (Canada) | | 1,350,000 | | 1,572,750 |
| Rogers Wireless, Inc. sec. notes 7 1/2s, 2015 (Canada) | | 1,090,000 | | 1,121,338 |
| Rogers Wireless, Inc. sr. sub. notes 8s, 2012 (Canada) | | 1,360,000 | | 1,399,100 |
| Rural Cellular Corp. sr. notes 9 7/8s, 2010 | | 665,000 | | 699,913 |
| Rural Cellular Corp. sr. sub. notes 9 3/4s, 2010 | | 1,495,000 | | 1,509,950 |
| Rural Cellular Corp. 144A sr. sub. notes FRN10.899s, 2012 | | 545,000 | | 568,163 |
| Syniverse Technologies, Inc. sr. sub. notes Ser. B, 7 3/4s, 2013 | | 1,330,000 | | 1,326,675 |
| Valor Telecommunications Enterprises LLC/Finance Corp. | | | | |
| company guaranty 7 3/4s, 2015 | | 965,000 | | 993,950 |
| | | | | 56,788,267 |
|
| |
| Consumer (1.0%) | | | | |
| Jostens IH Corp. company guaranty 7 5/8s, 2012 | | 4,540,000 | | 4,460,550 |
| Samsonite Corp. sr. sub. notes 8 7/8s, 2011 | | 3,940,000 | | 4,107,450 |
| | | | | 8,568,000 |
|
| |
| Consumer Goods (2.3%) | | | | |
| Church & Dwight Co., Inc. company guaranty 6s, 2012 | | 1,805,000 | | 1,714,750 |
| Elizabeth Arden, Inc. company guaranty 7 3/4s, 2014 | | 2,215,000 | | 2,215,000 |
| Nutro Products, Inc. 144A sr. notes FRN 9.23s, 2013 | | 780,000 | | 789,750 |
| Playtex Products, Inc. company guaranty 9 3/8s, 2011 | | 3,090,000 | | 3,221,325 |
| Playtex Products, Inc. sec. notes 8s, 2011 | | 2,725,000 | | 2,854,438 |
| Prestige Brands, Inc. sr. sub. notes 9 1/4s, 2012 | | 2,313,000 | | 2,324,565 |
| Remington Arms Co., Inc. company guaranty 10 1/2s, 2011 | | 2,520,000 | | 2,142,000 |
| Scotts Co. (The) sr. sub. notes 6 5/8s, 2013 | | 1,030,000 | | 1,009,400 |
36
| CORPORATE BONDS AND NOTES (88.5%)* continued | | | | |
|
| | | Principal amount | | Value |
|
| Consumer Goods continued | | | | |
| Spectrum Brands, Inc. company guaranty 7 3/8s, 2015 | $ | 3,690,000 | $ | 2,998,125 |
| Spectrum Brands, Inc. sr. sub. notes 8 1/2s, 2013 | | 985,000 | | 856,950 |
| | | | | 20,126,303 |
|
| |
| Consumer Services (0.9%) | | | | |
| Brand Services, Inc. company guaranty 12s, 2012 | | 2,745,000 | | 3,129,300 |
| iPayment, Inc. 144A sr. sub. notes 9 3/4s, 2014 | | 735,000 | | 736,838 |
| United Rentals NA, Inc. company guaranty 6 1/2s, 2012 | | 920,000 | | 883,200 |
| United Rentals NA, Inc. sr. sub. notes 7s, 2014 | | 2,910,000 | | 2,735,400 |
| | | | | 7,484,738 |
|
| |
| Energy (9.0%) | | | | |
| Arch Western Finance, LLC sr. notes 6 3/4s, 2013 | | 3,910,000 | | 3,792,700 |
| Bluewater Finance, Ltd. company guaranty 10 1/4s, | | | | |
| 2012 (Cayman Islands) | | 1,910,000 | | 1,976,850 |
| Chaparral Energy, Inc. 144A sr. notes 8 1/2s, 2015 | | 1,545,000 | | 1,564,313 |
| CHC Helicopter Corp. sr. sub. notes 7 3/8s, 2014 (Canada) | | 3,325,000 | | 3,258,500 |
| Chesapeake Energy Corp. sr. notes 7 1/2s, 2013 | | 3,385,000 | | 3,461,163 |
| Chesapeake Energy Corp. sr. notes 7s, 2014 | | 1,125,000 | | 1,120,781 |
| Compton Petroleum Corp. company guaranty 7 5/8s, | | | | |
| 2013 (Canada) | | 2,065,000 | | 2,013,375 |
| Comstock Resources, Inc. sr. notes 6 7/8s, 2012 | | 1,775,000 | | 1,708,438 |
| Denbury Resources, Inc. sr. sub. notes 7 1/2s, 2015 | | 1,065,000 | | 1,078,313 |
| Dresser, Inc. company guaranty 9 3/8s, 2011 | | 2,825,000 | | 2,965,431 |
| Encore Acquisition Co. sr. sub. notes 6 1/4s, 2014 | | 880,000 | | 807,400 |
| Encore Acquisition Co. sr. sub. notes 6s, 2015 | | 3,290,000 | | 2,936,325 |
| EXCO Resources, Inc. company guaranty 7 1/4s, 2011 | | 3,265,000 | | 3,183,375 |
| Forest Oil Corp. company guaranty 7 3/4s, 2014 | | 745,000 | | 759,900 |
| Forest Oil Corp. sr. notes 8s, 2011 | | 2,365,000 | | 2,453,688 |
| Forest Oil Corp. sr. notes 8s, 2008 | | 855,000 | | 872,100 |
| Hanover Compressor Co. sr. notes 9s, 2014 | | 1,315,000 | | 1,397,188 |
| Hanover Compressor Co. sr. notes 8 5/8s, 2010 | | 905,000 | | 932,150 |
| Hanover Equipment Trust sec. notes Ser. B, 8 3/4s, 2011 | | 645,000 | | 670,800 |
| Harvest Operations Corp. sr. notes 7 7/8s, 2011 (Canada) | | 2,350,000 | | 2,297,125 |
| Hornbeck Offshore Services, Inc. sr. notes Ser. B, | | | | |
| 6 1/8s, 2014 | | 955,000 | | 890,538 |
| Inergy LP/Inergy Finance Corp. sr. notes 6 7/8s, 2014 | | 3,750,000 | | 3,534,375 |
| KCS Energy, Inc. sr. notes 7 1/8s, 2012 | | 1,260,000 | | 1,263,150 |
| Massey Energy Co. sr. notes 6 5/8s, 2010 | | 3,070,000 | | 3,070,000 |
| Newfield Exploration Co. sr. notes 7 5/8s, 2011 | | 3,120,000 | | 3,198,000 |
| Newfield Exploration Co. sr. sub. notes 6 5/8s, 2014 | | 2,095,000 | | 2,005,963 |
| Offshore Logistics, Inc. company guaranty 6 1/8s, 2013 | | 1,860,000 | | 1,720,500 |
| Oslo Seismic Services, Inc. 1st mtge. 8.28s, 2011 | | 1,857,302 | | 1,886,087 |
| Pacific Energy Partners/Pacific Energy Finance Corp. | | | | |
| sr. notes 7 1/8s, 2014 | | 1,350,000 | | 1,346,625 |
| Peabody Energy Corp. sr. notes 5 7/8s, 2016 | | 2,610,000 | | 2,446,875 |
| Plains Exploration & Production Co. sr. notes 7 1/8s, 2014 | | 1,855,000 | | 1,831,813 |
| Plains Exploration & Production Co. sr. sub. notes 8 3/4s, 2012 | | 3,030,000 | | 3,166,350 |
| Pogo Producing Co. sr. sub. notes 6 7/8s, 2017 | | 2,040,000 | | 1,927,800 |
37
| CORPORATE BONDS AND NOTES (88.5%)* continued | | | | |
|
| | | Principal amount | | Value |
|
| Energy continued | | | | |
| Pride International, Inc. sr. notes 7 3/8s, 2014 | $ | 3,300,000 | $ | 3,374,250 |
| Quicksilver Resources, Inc. company guaranty 7 1/8s, 2016 | | 1,370,000 | | 1,308,350 |
| Seabulk International, Inc. company guaranty 9 1/2s, 2013 | | 2,445,000 | | 2,713,950 |
| Stone Energy Corp. sr. sub. notes 6 3/4s, 2014 | | 775,000 | | 776,938 |
| Whiting Petroleum Corp. company guaranty 7s, 2014 | | 2,530,000 | | 2,441,450 |
| | | | | 78,152,929 |
|
| |
| Entertainment (1.2%) | | | | |
| AMC Entertainment, Inc. sr. sub. notes 8s, 2014 | | 676,000 | | 630,370 |
| AMC Entertainment, Inc. 144A company guaranty 11s, 2016 | | 1,275,000 | | 1,377,000 |
| Cinemark USA, Inc. sr. sub. notes 9s, 2013 | | 805,000 | | 857,325 |
| Cinemark, Inc. sr. disc. notes stepped-coupon zero % | | | | |
| (9 3/4s, 3/15/09), 2014 †† | | 3,565,000 | | 2,794,069 |
| Marquee Holdings, Inc. sr. disc.notes stepped-coupon zero % | | | | |
| (12s, 8/15/09), 2014 †† | | 1,840,000 | | 1,311,000 |
| Six Flags, Inc. sr. notes 9 5/8s, 2014 | | 1,515,000 | | 1,496,063 |
| Universal City Florida Holding Co. sr. notes 8 3/8s, 2010 | | 545,000 | | 555,900 |
| Universal City Florida Holding Co. sr. notes FRN 9.899s, 2010 | | 940,000 | | 970,550 |
| | | | | 9,992,277 |
|
| |
| Financial (0.7%) | | | | |
| Crescent Real Estate Equities LP notes 7 1/2s, 2007 (R) | | 1,205,000 | | 1,217,050 |
| E*Trade Finance Corp. sr. notes 8s, 2011 | | 3,350,000 | | 3,467,250 |
| Finova Group, Inc. notes 7 1/2s, 2009 | | 3,139,720 | | 1,012,560 |
| | | | | 5,696,860 |
|
| |
| Food (1.4%) | | | | |
| Archibald Candy Corp. company guaranty 10s, | | | | |
| 2007 (In default) (F) † | | 424,297 | | 22,170 |
| Dean Foods Co. company guaranty 7s, 2016 | | 2,365,000 | | 2,317,700 |
| Dean Foods Co. sr. notes 6 5/8s, 2009 | | 1,245,000 | | 1,245,000 |
| Del Monte Corp. company guaranty 6 3/4s, 2015 | | 1,320,000 | | 1,250,700 |
| Del Monte Corp. sr. sub. notes 8 5/8s, 2012 | | 2,625,000 | | 2,736,563 |
| Pinnacle Foods Holding Corp. sr. sub. notes 8 1/4s, 2013 | | 3,555,000 | | 3,492,788 |
| United Biscuits Finance company guaranty 10 5/8s, | | | | |
| 2011 (United Kingdom) | EUR | 840,000 | | 1,135,989 |
| | | | | 12,200,910 |
|
| |
| Gaming & Lottery (3.6%) | | | | |
| Boyd Gaming Corp. sr. sub. notes 8 3/4s, 2012 | $ | 1,575,000 | | 1,665,563 |
| Boyd Gaming Corp. sr. sub. notes 7 3/4s, 2012 | | 545,000 | | 557,263 |
| Boyd Gaming Corp. sr. sub. notes 7 1/8s, 2016 | | 1,990,000 | | 1,955,175 |
| Boyd Gaming Corp. sr. sub. notes 6 3/4s, 2014 | | 440,000 | | 424,600 |
| Harrah’s Operating Co., Inc. company guaranty 8s, 2011 | | 125,000 | | 134,171 |
| MGM Mirage, Inc. company guaranty 8 1/2s, 2010 | | 1,670,000 | | 1,761,850 |
| MGM Mirage, Inc. company guaranty 6s, 2009 | | 3,320,000 | | 3,274,350 |
| Mirage Resorts, Inc. debs. 7 1/4s, 2017 | | 715,000 | | 704,275 |
| Park Place Entertainment Corp. sr. notes 7s, 2013 | | 830,000 | | 855,072 |
| Park Place Entertainment Corp. sr. sub. notes 7 7/8s, 2010 | | 1,575,000 | | 1,649,813 |
38
| CORPORATE BONDS AND NOTES (88.5%)* continued | | | | |
|
| | | Principal amount | | Value |
|
| Gaming & Lottery continued | | | | |
| Penn National Gaming, Inc. sr. sub. notes 6 3/4s, 2015 | $ | 825,000 | $ | 788,906 |
| Pinnacle Entertainment, Inc. sr. sub. notes 8 1/4s, 2012 | | 1,170,000 | | 1,187,550 |
| Resorts International Hotel and Casino, Inc. company | | | | |
| guaranty 11 1/2s, 2009 | | 1,940,000 | | 2,114,600 |
| Scientific Games Corp. company guaranty 6 1/4s, 2012 | | 2,215,000 | | 2,131,938 |
| Station Casinos, Inc. sr. notes 6s, 2012 | | 4,070,000 | | 3,897,025 |
| Station Casinos, Inc. sr. sub. notes 6 7/8s, 2016 | | 1,775,000 | | 1,715,094 |
| Trump Entertainment Resorts, Inc. sec. notes 8 1/2s, 2015 | | 4,000,000 | | 3,920,000 |
| Wynn Las Vegas, LLC/Wynn Las Vegas Capital Corp. | | | | |
| 1st mtge. 6 5/8s, 2014 | | 2,310,000 | | 2,191,613 |
| | | | | 30,928,858 |
|
| |
| Health Care (6.5%) | | | | |
| Alderwoods Group, Inc. company guaranty 7 3/4s, 2012 | | 1,065,000 | | 1,126,238 |
| Community Health Systems, Inc. | | | | |
| sr. sub. notes 6 1/2s, 2012 | | 2,265,000 | | 2,171,569 |
| DaVita, Inc. company guaranty 6 5/8s, 2013 | | 700,000 | | 672,875 |
| Elan Finance PLC/Elan Finance Corp, company | | | | |
| guaranty 7 3/4s, 2011 (Ireland) | | 1,240,000 | | 1,218,300 |
| Extendicare Health Services, Inc. company | | | | |
| guaranty 9 1/2s, 2010 | | 1,500,000 | | 1,567,500 |
| Fresenius Finance BV 144A company guaranty | | | | |
| 5 1/2s, 2016 (Netherlands) | EUR | 630,000 | | 800,613 |
| HCA, Inc. debs. 7.19s, 2015 | $ | 2,110,000 | | 2,092,103 |
| HCA, Inc. notes 8.36s, 2024 | | 2,040,000 | | 2,062,150 |
| HCA, Inc. sr. notes 7 7/8s, 2011 | | 930,000 | | 963,513 |
| IASIS Healthcare/IASIS Capital Corp. | | | | |
| sr. sub. notes 8 3/4s, 2014 | | 1,030,000 | | 1,041,588 |
| Insight Health Services Corp. company guaranty FRB | | | | |
| 10.4s, 2011 | | 1,070,000 | | 964,338 |
| MedQuest, Inc. company guaranty Ser. B, 11 7/8s, 2012 | | 1,570,000 | | 1,420,850 |
| Omnicare, Inc. sr. sub. notes 6 7/8s, 2015 | | 995,000 | | 965,150 |
| Omnicare, Inc. sr. sub. notes 6 1/8s, 2013 | | 3,040,000 | | 2,872,800 |
| Psychiatric Solutions, Inc. company guaranty 7 3/4s, 2015 | | 2,080,000 | | 2,095,600 |
| Select Medical Corp. company guaranty 7 5/8s, 2015 | | 1,955,000 | | 1,744,838 |
| Service Corporation International notes 6 1/2s, 2008 | | 435,000 | | 433,913 |
| Service Corporation International 144A sr. notes 7 1/4s, 2017 | | 740,000 | | 703,000 |
| Service Corporation International debs. 7 7/8s, 2013 | | 1,185,000 | | 1,196,850 |
| Service Corporation International notes Ser. *, 7.7s, 2009 | | 1,045,000 | | 1,058,063 |
| Service Corporation International 144A | | | | |
| sr. notes 6 3/4s, 2016 | | 2,650,000 | | 2,484,375 |
| Stewart Enterprises, Inc. 144A sr. notes 7 3/4s, 2013 | | 3,010,000 | | 2,814,350 |
| Tenet Healthcare Corp. notes 7 3/8s, 2013 | | 2,925,000 | | 2,705,625 |
| Tenet Healthcare Corp. sr. notes 9 7/8s, 2014 | | 2,455,000 | | 2,497,963 |
| Triad Hospitals, Inc. sr. notes 7s, 2012 | | 2,455,000 | | 2,433,519 |
| Triad Hospitals, Inc. sr. sub. notes 7s, 2013 | | 4,450,000 | | 4,310,938 |
| Universal Hospital Services, Inc. sr. notes 10 1/8s, | | | | |
| 2011 (Canada) | | 1,620,000 | | 1,701,000 |
| US Oncology, Inc. company guaranty 9s, 2012 | | 2,025,000 | | 2,121,188 |
| Vanguard Health Holding Co. II, LLC sr. sub. notes 9s, 2014 | | 3,040,000 | | 3,116,000 |
39
| CORPORATE BONDS AND NOTES (88.5%)* continued | | | | |
|
| | | Principal amount | | Value |
|
| Health Care continued | | | | |
| Ventas Realty LP/Capital Corp. company guaranty 9s, 2012 (R) | $ | 2,230,000 | $ | 2,464,150 |
| Ventas Realty LP/Capital Corp. company | | | | |
| guaranty 6 3/4s, 2010 (R) | | 865,000 | | 868,244 |
| Ventas Realty LP/Capital Corp. sr. notes 6 5/8s, 2014 (R) | | 690,000 | | 674,475 |
| Ventas Realty LP/Capital Corp. sr. notes 6 1/2s, 2016 (R) | | 850,000 | | 822,375 |
| | | | | 56,186,053 |
|
| |
| Homebuilding (1.2%) | | | | |
| Ashton Woods USA LLC/Ashton Woods Finance Co. | | | | |
| sr. sub. notes 9 1/2s, 2015 | | 1,075,000 | | 991,688 |
| K. Hovnanian Enterprises, Inc. company guaranty 8 7/8s, 2012 | | 2,315,000 | | 2,384,450 |
| Meritage Homes Corp. company guaranty 6 1/4s, 2015 | | 965,000 | | 854,025 |
| Schuler Homes, Inc. company guaranty 10 1/2s, 2011 | | 1,510,000 | | 1,594,933 |
| Standard Pacific Corp. sr. notes 7 3/4s, 2013 | | 2,700,000 | | 2,608,875 |
| Technical Olympic USA, Inc. company guaranty 10 3/8s, 2012 | | 1,295,000 | | 1,314,425 |
| WCI Communities, Inc. company guaranty 9 1/8s, 2012 | | 410,000 | | 400,263 |
| | | | | 10,148,659 |
|
| |
| Household Furniture and Appliances (0.5%) | | | | |
| Sealy Corp. sr. sub. notes 8 1/4s, 2014 | | 3,770,000 | | 3,920,800 |
|
| |
| Lodging/Tourism (0.8%) | | | | |
| FelCor Lodging LP company guaranty 8 1/2s, 2008 (R) | | 955,000 | | 1,021,850 |
| Host Marriott LP sr. notes Ser. M, 7s, 2012 (R) | | 2,955,000 | | 2,962,388 |
| Starwood Hotels & Resorts Worldwide, Inc. company | | | | |
| guaranty 7 7/8s, 2012 | | 1,055,000 | | 1,115,663 |
| Starwood Hotels & Resorts Worldwide, Inc. debs. 7 3/8s, 2015 | | 1,655,000 | | 1,700,513 |
| | | | | 6,800,414 |
|
| |
| Media (0.6%) | | | | |
| Affinity Group, Inc. sr. sub. notes 9s, 2012 | | 2,435,000 | | 2,410,650 |
| Interpublic Group of Companies, Inc. notes 6 1/4s, 2014 | | 495,000 | | 409,613 |
| Warner Music Group sr. sub. notes 7 3/8s, 2014 | | 1,500,000 | | 1,485,000 |
| Time Warner Telecom, Inc. company guaranty 9 1/4s, 2014 | | 1,220,000 | | 1,300,825 |
| | | | | 5,606,088 |
|
| |
| Publishing (3.8%) | | | | |
| American Media, Inc. company guaranty Ser. B, 10 1/4s, 2009 | | 2,425,000 | | 2,237,063 |
| CanWest Media, Inc. company guaranty 8s, 2012 (Canada) | | 2,386,600 | | 2,404,500 |
| Cenveo Corp, sr. sub. notes 7 7/8s, 2013 | | 1,185,000 | | 1,143,525 |
| Dex Media West, LLC sr. notes Ser. B, 8 1/2s, 2010 | | 2,480,000 | | 2,566,800 |
| Dex Media, Inc. disc. notes stepped-coupon zero % | | | | |
| (9s, 11/15/08), 2013 †† | | 2,015,000 | | 1,692,600 |
| Dex Media, Inc. notes 8s, 2013 | | 895,000 | | 906,188 |
| Houghton Mifflin Co. sr. sub. notes 9 7/8s, 2013 | | 2,875,000 | | 3,033,125 |
| Mail-Well I Corp. company guaranty 9 5/8s, 2012 | | 1,020,000 | | 1,088,850 |
| PRIMEDIA, Inc. company guaranty 8 7/8s, 2011 | | 2,085,000 | | 1,996,388 |
| PRIMEDIA, Inc. sr. notes 8s, 2013 | | 3,550,000 | | 3,195,000 |
| R.H. Donnelley Corp. sr. notes 6 7/8s, 2013 | | 1,075,000 | | 986,313 |
40
| CORPORATE BONDS AND NOTES (88.5%)* continued | | | | |
|
| | | Principal amount | | Value |
|
| Publishing continued | | | | |
| R.H. Donnelley Corp. 144A sr. disc. notes | | | | |
| Ser. A-2, 6 7/8s, 2013 | $ | 1,545,000 | $ | 1,413,675 |
| R.H. Donnelley Corp. 144A sr. notes Ser. A-3, 8 7/8s, 2016 | | 2,000,000 | | 2,015,000 |
| R.H. Donnelley Corp. 144A sr. disc. notes 6 7/8s, 2013 | | 720,000 | | 658,800 |
| Reader’s Digest Association, Inc. (The) sr. notes 6 1/2s, 2011 | | 1,435,000 | | 1,395,538 |
| Vertis, Inc. company guaranty Ser. B, 10 7/8s, 2009 | | 4,160,000 | | 4,082,000 |
| Vertis, Inc. 144A sub. notes 13 1/2s, 2009 | | 2,930,000 | | 2,373,300 |
| | | | | 33,188,665 |
|
| |
| Restaurants (0.5%) | | | | |
| Domino’s, Inc. sr. sub. notes 8 1/4s, 2011 | | 1,046,000 | | 1,077,380 |
| Sbarro, Inc. company guaranty 11s, 2009 | | 3,320,000 | | 3,353,200 |
| | | | | 4,430,580 |
|
| |
| Retail (2.8%) | | | | |
| Asbury Automotive Group, Inc. sr. sub. notes 8s, 2014 | | 1,925,000 | | 1,915,375 |
| Autonation, Inc. 144A company guaranty 7s, 2014 | | 390,000 | | 388,050 |
| Autonation, Inc. 144A company guaranty FRB 7.045s, 2013 | | 535,000 | | 540,350 |
| Bon-Ton Department Stores Inc/The 144A sr. notes 10 1/4s, 2014 | 2,865,000 | | 2,678,775 |
| Burlington Coat Factory Warehouse Corp. 144A | | | | |
| sr. notes 11 1/8s, 2014 | | 1,945,000 | | 1,908,531 |
| Harry & David Holdings Inc. company guaranty 9s, 2013 | | 970,000 | | 892,400 |
| Jean Coutu Group, Inc. sr. notes 7 5/8s, 2012 (Canada) | | 2,070,000 | | 2,013,075 |
| Jean Coutu Group, Inc. sr. sub. notes 8 1/2s, 2014 (Canada) | | 1,025,000 | | 953,250 |
| Movie Gallery, Inc. sr. unsecd. notes 11s, 2012 | | 840,000 | | 638,400 |
| Neiman-Marcus Group, Inc. 144A sr. notes 9s, 2015 | | 3,585,000 | | 3,732,881 |
| Rite Aid Corp. company guaranty 9 1/2s, 2011 | | 2,180,000 | | 2,278,100 |
| Rite Aid Corp. company guaranty 7 1/2s, 2015 | | 1,325,000 | | 1,291,875 |
| Rite Aid Corp. sr. notes 9 1/4s, 2013 | | 1,755,000 | | 1,711,125 |
| United Auto Group, Inc. company guaranty 9 5/8s, 2012 | | 2,440,000 | | 2,577,250 |
| Victoria ACQ II 144A sr. unsecd. notes 10.879s, 2015 | | | | |
| (Netherlands) ‡‡ | EUR | 465,000 | | 590,511 |
| | | | | 24,109,948 |
|
| |
| Technology (4.4%) | | | | |
| Advanced Micro Devices, Inc. sr. notes 7 3/4s, 2012 | $ | 2,253,000 | | 2,326,223 |
| Amkor Technologies, Inc. sr. notes 7 3/4s, 2013 | | 1,910,000 | | 1,738,100 |
| Avago Technologies Finance 144A sr. notes 10 1/8s, | | | | |
| 2013 (Singapore) | | 395,000 | | 422,650 |
| Amkor Technologies, Inc. sr. unsecd. notes 9 1/4s, 2016 | | 955,000 | | 916,800 |
| Celestica, Inc. sr. sub. notes 7 7/8s, 2011 (Canada) | | 750,000 | | 751,875 |
| Celestica, Inc. sr. sub. notes 7 5/8s, 2013 (Canada) | | 1,370,000 | | 1,359,725 |
| Freescale Semiconductor, Inc. sr. notes Ser. B, 7 1/8s, 2014 | | 2,820,000 | | 2,876,400 |
| Iron Mountain, Inc. company guaranty 8 5/8s, 2013 | | 4,170,000 | | 4,284,675 |
| Iron Mountain, Inc. sr. sub. notes 8 1/4s, 2011 | | 175,000 | | 176,969 |
| Lucent Technologies, Inc. debs. 6 1/2s, 2028 | | 310,000 | | 268,150 |
| Lucent Technologies, Inc. debs. 6.45s, 2029 | | 2,755,000 | | 2,400,294 |
| Lucent Technologies, Inc. notes 5 1/2s, 2008 | | 520,000 | | 507,000 |
41
| CORPORATE BONDS AND NOTES (88.5%)* continued | | | | |
|
| | | Principal amount | | Value |
|
| Technology continued | | | | |
| New ASAT Finance, Ltd. company guaranty 9 1/4s, 2011 | | | | |
| (Cayman Islands) | $ | 1,235,000 | $ | 1,086,800 |
| Seagate Technology Hdd Holdings company guaranty 8s, | | | | |
| 2009 (Cayman Islands) | | 935,000 | | 963,050 |
| Sensata Technologies BV 144A 8s, 2014 (Netherlands) | | 955,000 | | 940,675 |
| Serena Software, Inc. 144a sr. sub. notes 10 3/8s, 2016 | | 395,000 | | 412,775 |
| Solectron Corp. 144A sr. sub. notes 8s, 2016 | | 1,195,000 | | 1,200,975 |
| SunGard Data Systems, Inc. 144A sr. sub. notes 10 1/4s, 2015 | | 2,620,000 | | 2,737,900 |
| SunGard Data Systems, Inc. 144A sr. unsecd. notes 9 1/8s, 2013 | | 3,466,000 | | 3,634,968 |
| UGS Corp. company guaranty 10s, 2012 | | 3,005,000 | | 3,260,425 |
| Unisys Corp. sr. notes 8s, 2012 | | 1,395,000 | | 1,309,556 |
| Xerox Corp. sr. notes 7 5/8s, 2013 | | 2,810,000 | | 2,880,250 |
| Xerox Corp. sr. notes 6 7/8s, 2011 | | 1,875,000 | | 1,893,750 |
| Xerox Corp. sr. notes 6.4s, 2016 | | 63,000 | | 60,165 |
| | | | | 38,410,150 |
|
| |
| Textiles (0.8%) | | | | |
| Invista 144A notes 9 1/4s, 2012 | | 590,000 | | 625,400 |
| Levi Strauss & Co. sr. notes 9 3/4s, 2015 | | 3,140,000 | | 3,242,050 |
| Levi Strauss & Co. 144A sr. notes 8 7/8s, 2016 | | 1,490,000 | | 1,463,925 |
| Oxford Industries, Inc. sr. notes 8 7/8s, 2011 | | 1,740,000 | | 1,783,500 |
| | | | | 7,114,875 |
|
| |
| Tire & Rubber (0.6%) | | | | |
| Goodyear Tire & Rubber Co. (The) notes 8 1/2s, 2007 | | 335,000 | | 337,513 |
| Goodyear Tire & Rubber Co. (The) notes 7.857s, 2011 | | 235,000 | | 227,363 |
| Goodyear Tire & Rubber Co. (The) sr. notes 9s, 2015 | | 4,235,000 | | 4,309,113 |
| | | | | 4,873,989 |
|
| |
| Transportation (0.8%) | | | | |
| CalAir, LLC/CalAir Capital Corp. company | | | | |
| guaranty 8 1/8s, 2008 | | 3,085,000 | | 2,946,175 |
| Kansas City Southern Railway Co. company | | | | |
| guaranty 9 1/2s, 2008 | | 3,170,000 | | 3,320,575 |
| Kansas City Southern Railway Co. company | | | | |
| guaranty 7 1/2s, 2009 | | 700,000 | | 703,500 |
| | | | | 6,970,250 |
|
| |
| Utilities & Power (8.7%) | | | | |
| AES Corp. (The) 144A sec. notes 9s, 2015 | | 2,960,000 | | 3,189,400 |
| AES Corp. (The) 144A sec. notes 8 3/4s, 2013 | | 3,055,000 | | 3,291,763 |
| ANR Pipeline Co. debs. 9 5/8s, 2021 | | 540,000 | | 643,105 |
| CMS Energy Corp. sr. notes 8.9s, 2008 | | 870,000 | | 906,975 |
| CMS Energy Corp. sr. notes 8 1/2s, 2011 | | 490,000 | | 516,950 |
| CMS Energy Corp. sr. notes 7 3/4s, 2010 | | 740,000 | | 758,500 |
| Colorado Interstate Gas Co. debs. 6.85s, 2037 | | 1,430,000 | | 1,442,498 |
| Colorado Interstate Gas Co. sr. notes 5.95s, 2015 | | 405,000 | | 378,289 |
| Copano Energy, LLC. 144A sr. notes 8 1/8s, 2016 | | 805,000 | | 825,125 |
| Dynegy Holdings, Inc. 144A sr. unsecd. notes 8 3/8s, 2016 | | 1,940,000 | | 1,930,300 |
42
| CORPORATE BONDS AND NOTES (88.5%)* continued | | | | |
|
| | | Principal amount | | Value |
|
| Utilities & Power continued | | | | |
| Dynegy-Roseton Danskamme company guaranty Ser. A, | | | | |
| 7.27s, 2010 | $ | 1,460,000 | $ | 1,487,375 |
| Dynegy-Roseton Danskamme company guaranty Ser. B, | | | | |
| 7.67s, 2016 | | 2,180,000 | | 2,242,675 |
| Edison Mission Energy sr. notes 9 7/8s, 2011 | | 50,000 | | 58,688 |
| Edison Mission Energy 144A sr. notes 7 3/4s, 2016 | | 735,000 | | 727,650 |
| Edison Mission Energy 144A sr. notes 7 1/2s, 2013 | | 885,000 | | 876,150 |
| El Paso Corp. notes 7 3/4s, 2010 | | 745,000 | | 763,625 |
| El Paso Corp. sr. notes 8.05s, 2030 | | 1,990,000 | | 1,985,025 |
| El Paso Corp. sr. notes 7 3/8s, 2012 | | 1,600,000 | | 1,608,000 |
| El Paso Corp. sr. notes Ser. MTN, 7.8s, 2031 | | 1,380,000 | | 1,347,225 |
| El Paso Natural Gas Co. debs. 8 5/8s, 2022 | | 765,000 | | 842,468 |
| El Paso Production Holding Co. company | | | | |
| guaranty 7 3/4s, 2013 | | 4,150,000 | | 4,233,000 |
| Ferrellgas LP/Finance sr. notes 6 3/4s, 2014 | | 2,200,000 | | 2,106,500 |
| Midwest Generation, LLC sec. sr. notes 8 3/4s, 2034 | | 4,395,000 | | 4,702,650 |
| Mirant North America LLC 144A sr. notes 7 3/8s, 2013 | | 2,390,000 | | 2,360,125 |
| Mission Energy Holding Co. sec. notes 13 1/2s, 2008 | | 2,875,000 | | 3,245,156 |
| Monongahela Power Co. 1st mtge. 6.7s, 2014 | | 1,320,000 | | 1,367,404 |
| Nevada Power Co. 2nd mtge. 9s, 2013 | | 1,366,000 | | 1,493,060 |
| Northwestern Corp. sec. notes 5 7/8s, 2014 | | 2,380,000 | | 2,327,473 |
| NRG Energy, Inc. sr. notes 7 3/8s, 2016 | | 4,970,000 | | 4,976,213 |
| Orion Power Holdings, Inc. sr. notes 12s, 2010 | | 2,285,000 | | 2,576,338 |
| SEMCO Energy, Inc. sr. notes 7 3/4s, 2013 | | 1,990,000 | | 2,021,486 |
| Sierra Pacific Power Co. general ref. mtge. 6 1/4s, 2012 | | 515,000 | | 510,926 |
| Sierra Pacific Resources sr. notes 8 5/8s, 2014 | | 1,630,000 | | 1,755,802 |
| Teco Energy, Inc. notes 7.2s, 2011 | | 680,000 | | 699,550 |
| Teco Energy, Inc. notes 7s, 2012 | | 1,165,000 | | 1,188,300 |
| Teco Energy, Inc. sr. notes 6 3/4s, 2015 | | 140,000 | | 140,000 |
| Tennessee Gas Pipeline Co. debs. 7s, 2028 | | 305,000 | | 290,413 |
| Tennessee Gas Pipeline Co. unsecd. notes 7 1/2s, 2017 | | 610,000 | | 629,751 |
| Transcontinental Gas Pipeline Corp. debs. 7 1/4s, 2026 | | 1,055,000 | | 1,072,144 |
| Utilicorp Canada Finance Corp. company | | | | |
| guaranty 7 3/4s, 2011 (Canada) | | 2,630,000 | | 2,741,775 |
| Utilicorp United, Inc. sr. notes 9.95s, 2011 | | 1,355,000 | | 1,514,213 |
| Williams Cos., Inc. (The) notes 8 3/4s, 2032 | | 2,150,000 | | 2,408,000 |
| Williams Cos., Inc. (The) notes 7 3/4s, 2031 | | 1,225,000 | | 1,246,438 |
| Williams Cos., Inc. (The) notes 7 5/8s, 2019 | | 3,075,000 | | 3,174,938 |
| Williams Cos., Inc. (The) 144A notes 6 3/8s, 2010 | | 700,000 | | 691,250 |
| York Power Funding 144A notes 12s, 2007 | | | | |
| (Cayman Islands) (In default) (F) † | | 1,732,251 | | 144,470 |
| | | | | 75,439,161 |
|
| |
| Total corporate bonds and notes (cost $769,432,908) | | | $ | 765,469,614 |
43
| ASSET-BACKED SECURITIES (3.1%)* | | | | |
|
| | | Principal amount | | Value |
|
| Asset Backed Securities Corp. Home Equity Loan Trust | | | | |
| 144A FRB Ser. 06-HE2, Class M11, 7.581s, 2036 | $ | 205,000 | $ | 168,436 |
| CDO Repackaging Trust Series 144A Ser. 03-3, | | | | |
| Class A, 9.49s, 2008 | | 1,805,000 | | 1,958,425 |
| Neon Capital, Ltd. 144A | | | | |
| limited recourse sec. notes Ser. 94, 1.686s, 2013 | | | | |
| (Cayman Islands) (F) (g) | | 6,271,893 | | 6,662,419 |
| limited recourse sec. notes Ser. 95, 2.319s, 2013 | | | | |
| (Cayman Islands) (F) (g) | | 3,901,050 | | 1,437,225 |
| limited recourse sec. notes Ser. 96, 1.458s, 2013 | | | | |
| (Cayman Islands) (F) (g) | | 14,668,569 | | 3,017,559 |
| limited recourse sec. notes Ser. 97, 1.105s, 2013 | | | | |
| (Cayman Islands) (F) (g) | | 6,684,836 | | 12,625,275 |
| limited recourse sec. notes Ser. 98, 1.637s, 2014 | | | | |
| (Cayman Islands) (F) (g) | | 2,382,544 | | 551,118 |
|
| Total asset-backed securities (cost $21,100,983) | | | $ | 26,420,457 |
|
| |
| |
| SENIOR LOANS (2.8%)* (c) | | | | |
|
| | | Principal amount | | Value |
|
| Burlington Coat Factory Warehouse Corp. bank term loan | | | | |
| FRN Ser. B, 7.53s, 2013 | $ | 448,875 | $ | 443,825 |
| Century Cable Holdings bank term loan FRN 10s, 2009 | | 2,290,000 | | 2,221,776 |
| Charter Communications bank term loan FRN Ser. B, | | | | |
| 7.755s, 2013 | | 353,261 | | 354,741 |
| Community Health Systems, Inc. bank term loan FRN | | | | |
| Ser. B, 6.97s, 2011 | | 177,300 | | 178,223 |
| Consolidated Communications Holdings bank term loan | | | | |
| FRN Ser. D, 6.78s, 2011 | | 148,125 | | 148,495 |
| Constellation Brands, Inc. bank term loan FRN | | | | |
| Ser. B, 6.361s, 2011 | | 782,778 | | 784,441 |
| Dana Corporation bank term loan FRN 7.22s, 2008 | | 450,000 | | 450,844 |
| Dex Media West, LLC bank term loan FRN Ser. B, 6.619s, 2010 | | 278,109 | | 277,666 |
| Dresser, Inc. bank term loan FRN 8.65s, 2010 | | 270,000 | | 274,725 |
| El Paso Corp. bank term loan FRN 4.729s, 2009 | | 870,000 | | 874,108 |
| El Paso Corp. bank term loan FRN Ser. B, 7 3/4s, 2009 | | 1,121,320 | | 1,127,082 |
| Federal Mogul Corp. bank term loan FRN Ser. A, 7 1/4s, 2007 | | 1,165,000 | | 1,140,972 |
| Federal Mogul Corp. bank term loan FRN Ser. B, 7 1/2s, 2007 | | 2,700,000 | | 2,648,249 |
| Goodyear Tire & Rubber Co. (The) bank term loan FRN | | | | |
| 7.954s, 2010 | | 405,000 | | 407,734 |
| Graphic Packaging Corp. bank term loan FRN Ser. C, | | | | |
| 7.498s, 2010 | | 262,187 | | 264,388 |
| Healthsouth Corp. bank term loan FRN Ser. B, 8.15s, 2013 | | 2,300,000 | | 2,300,412 |
| Invensys, PLC bank term loan FRN 9.431s, 2009 | | | | |
| (United Kingdom) | | 1,800,000 | | 1,818,000 |
| Invensys, PLC bank term loan FRN Ser. B-1, 8.501s, | | | | |
| 2009 (United Kingdom) | | 50,070 | | 50,070 |
| Kinetic Concepts, Inc. bank term loan FRN Ser. B, 6.73s, 2011 | | 115,566 | | 116,433 |
44
| SENIOR LOANS (2.8%)* (c) continued | | | | |
|
| | | Principal amount | | Value |
|
| Landsource, Inc. bank term loan FRN Ser. B, 7 5/8s, 2010 | $ | 150,000 | $ | 150,281 |
| Leap Wireless International, Inc. bank term loan FRN | | | | |
| Ser. B, 7 3/4s, 2013 | | 200,000 | | 201,125 |
| Mediacom Communications Corp. bank term loan FRN | | | | |
| Ser. B, 7.067s, 2012 | | 1,234,375 | | 1,230,408 |
| Nalco Co. bank term loan FRN Ser. B, 6.636s, 2010 | | 226,780 | | 227,319 |
| Neiman Marcus Group, Inc. bank term loan FRN Ser. B, | | | | |
| 7.34s, 2013 | | 1,139,241 | | 1,147,480 |
| NRG Energy, Inc. bank term loan FRN Ser. B, 6.82s, 2013 | | 915,000 | | 918,224 |
| Olympus Cable Holdings, LLC bank term loan FRN | | | | |
| Ser. B, 10s, 2010 | | 1,670,000 | | 1,622,584 |
| PanAmSat Corp. bank term loan FRN Ser. B1, 6.9s, 2010 | | 128,050 | | 128,850 |
| Pinnacle Foods Holding Corp. bank term loan FRN 8.237s, 2010 | | 459,096 | | 461,048 |
| Sealy Corp. bank term loan FRN Ser. D, 6.739s, 2012 | | 119,042 | | 119,414 |
| Six Flags, Inc. bank term loan FRN Ser. B, 7.317s, 2009 | | 88,960 | | 89,420 |
| Solo Cup Co. bank term loan FRN 9.66s, 2012 | | 150,000 | | 151,688 |
| Solo Cup Co. bank term loan FRN 7.532s, 2011 | | 220,500 | | 221,924 |
| St. Mary’s Cement Corp. bank term loan FRN 6.979s, 2009 | | 293,250 | | 296,916 |
| TRW Automotive, Inc. bank term loan FRN Ser. B, 6 1/4s, 2010 | | 149,051 | | 149,072 |
| United Airlines bank term loan FRN Ser. B, 8 5/8s, 2012 | | 393,750 | | 399,066 |
| United Airlines bank term loan FRN Ser. DD, 8 7/8s, 2012 | | 56,250 | | 57,009 |
| VWR International, Inc. bank term loan FRN Ser. B, 7.34s, 2011 | | 29,712 | | 29,910 |
| Warner Music Group bank term loan FRN Ser. B, 7.222s, 2011 | | 585,284 | | 586,930 |
| Young Broadcasting, Inc. bank term loan FRN Ser. B, 7.344s, 2012 | | 99,749 | | 99,406 |
|
| Total senior loans (cost $24,081,736) | | | $ | 24,170,258 |
|
| |
| |
| CONVERTIBLE BONDS AND NOTES (0.8%)* | | | | |
|
| | | Principal amount | | Value |
|
| ArvinMeritor, Inc. 144A cv. unsec. stepped-coupon | | | | |
| 4 5/8s (zero %, 3/1/16) 2026 †† | $ | 860,000 | $ | 905,150 |
| DRS Technologies, Inc. 144A cv. unsec. notes 2s, 2026 | | 2,520,000 | | 2,611,350 |
| LIN Television Corp. cv. sr. sub. notes 2 1/2s, 2033 | | 640,000 | | 580,000 |
| Sinclair Broadcast Group, Inc. cv. sr. sub. notes stepped-coupon | | | | |
| 4 7/8s (2s, 1/15/11) 2018 †† | | 1,060,000 | | 928,825 |
| Wabash National Corp. cv. sr. notes 3 1/4s, 2008 | | 880,000 | | 920,700 |
| WCI Communities, Inc. cv. sr. sub. notes 4s, 2023 | | 910,000 | | 924,788 |
|
| Total convertible bonds and notes (cost $6,867,643) | | | $ | 6,870,813 |
|
| |
| |
| COLLATERALIZED MORTGAGE OBLIGATIONS (0.6%)* | | | | |
|
| | | Principal amount | | Value |
|
| DLJ Commercial Mortgage Corp. | | | | |
| Ser. 98-CF2, Class B4, 6.04s, 2031 | $ | 493,418 | $ | 482,035 |
| Ser. 98-CF2, Class B5, 5.95s, 2031 | | 1,581,791 | | 1,402,366 |
| GE Capital Commercial Mortgage Corp. 144A | | | | |
| Ser. 00-1, Class F, 7.513s, 2033 | | 257,000 | | 268,146 |
| Ser. 00-1, Class G, 6.131s, 2033 | | 1,025,000 | | 935,467 |
45
| COLLATERALIZED MORTGAGE OBLIGATIONS (0.6%)* continued | | | | |
|
| | | Principal amount | | Value |
|
| GMAC Commercial Mortgage Securities, Inc. 144A | | | | |
| Ser. 99-C3, Class G, 6.974s, 2036 | $ | 912,750 | $ | 892,411 |
| LB Commercial Conduit Mortgage Trust 144A | | | | |
| Ser. 99-C1, Class G, 6.41s, 2031 | | 437,000 | | 399,593 |
| Mach One Commercial Mortgage Trust 144A | | | | |
| Ser. 04-1A, Class J, 5.45s, 2040 | | 1,000,000 | | 796,094 |
| Ser. 04-1A, Class K, 5.45s, 2040 | | 365,000 | | 282,661 |
| Ser. 04-1A, Class L, 5.45s, 2040 | | 165,000 | | 116,899 |
|
| Total collateralized mortgage obligations (cost $4,800,437) | | | $ | 5,575,672 |
|
| |
| FOREIGN GOVERNMENT BONDS AND NOTES (0.2%)* | | | | |
|
| | | Principal amount | | Value |
|
| Argentina (Republic of ) FRB 4.889s, 2012 | $ | 1,981,875 | $ | 1,820,344 |
| Philippines (Republic of ) bonds 9 1/2s, 2024 | | 255,000 | | 292,995 |
|
| Total foreign government bonds and notes (cost $2,096,572) | | | $ | 2,113,339 |
|
| |
| SHORT-TERM INVESTMENTS (2.4%)* (cost $20,482,411) | | | | |
|
| | | Shares | | Value |
|
| Putnam Prime Money Market Fund (e) | | 20,482,411 | $ | 20,482,411 |
|
| |
| TOTAL INVESTMENTS | | | | |
| Total investments (cost $848,862,690) | | | $ | 851,102,564 |
* Percentages indicated are based on net assets of $865,329,175.
**** Security is in default of principal and interest.
† Non-income-producing security.
† † The interest rate and date shown parenthetically represent the new interest rate to be paid and the date the fund will begin accruing interest at this rate.
‡ Restricted, excluding 144A securities, as to public resale. The total market value of restricted securities held at May 31, 2006 was $3,392,900 or 0.4% of net assets.
‡‡ Income may be received in cash or additional securities at the discretion of the issuer.
(R) Real Estate Investment Trust.
(c) Senior loans are exempt from registration under the Security Act of 1933, as amended, but contain certain restrictions on resale and cannot be sold publicly. These loans pay interest at rates which adjust periodically. The interest rate shown for senior loans are the current interest rates at May 31, 2006. Senior loans are also subject to mandatory and/or optional prepayment which cannot be predicted. As a result, the remaining maturity may be substantially less than the stated maturity shown (Notes 1 and 6).
(e) See Note 5 to the financial statements regarding investments in Putnam Prime Money Market Fund.
(F) Security is valued at fair value following procedures approved by the Trustees.
(g) The notes are secured by debt and equity securities and equity participation agreements held by Neon Capital, Ltd. At May 31, 2006, liquid assets totaling $18,749,642 have been designated as collateral for open swap contracts and forward contracts.
144A after the name of an issuer represents securities exempt from registration under Rule 144A of the Securities Act of 1933. These securities may be resold in transactions exempt from registration, normally to qualified institutional buyers.
The rates shown on Floating Rate Bonds (FRB) and Floating Rate Notes (FRN) are the current interest rates at May 31, 2006.
46
| FORWARD CURRENCY CONTRACTS TO BUY at 5/31/06 (Unaudited) | | |
|
| | | | Aggregate | Delivery | Unrealized |
| | | Value | face value | date | appreciation |
|
| Canadian Dollar | | $548,510 | $526,550 | 7/19/06 | $21,960 |
|
| |
| FORWARD CURRENCY CONTRACTS TO SELL at 5/31/06 (Unaudited) | | |
|
| |
| | | | Aggregate | Delivery | Unrealized |
| | | Value | face value | date | depreciation |
|
| Euro | | $17,882,621 | $16,872,077 | 6/21/06 | $(1,010,544) |
|
| |
| |
| CREDIT DEFAULT CONTRACTS OUTSTANDING at 5/31/06 (Unaudited) | | |
|
| | Upfront | | | Fixed payments | Unrealized |
| Swap counterparty / | premium | Notional | Termination | received (paid) | by appreciation/ |
| Referenced debt* | received (paid)** | amount | date | fund per annum | (depreciation) |
|
| Bank of America, N.A. | | | | | |
| Abitibi-Consolidated, Inc., | | | | | |
| 8.375%, 4/1/2015 | — | $1,005,000 | 6/20/11 | 365 bp | $ (28,713) |
|
| Citibank, N.A. | | | | | |
| Ford Motor Co., 7.45%, | | | | | |
| 7/16/2031 | — | 770,000 | 6/20/07 | 620 bp | 14,241 |
|
| Lear Corp., 8.11%, | | | | | |
| 5/15/09 | — | 612,000 | 6/20/08 | 845 bp | 59,049 |
|
| Visteon Corp., 7%, | | | | | |
| 3/10/14 | — | 1,000,000 | 6/20/09 | 535 bp | (2,659) |
|
| Deutsche Bank AG | | | | | |
| Ford Motor Co., 7.45%, | | | | | |
| 7/16/2031 | — | 1,078,000 | 6/20/07 | 595 bp | 16,701 |
|
| Lear Corp., 8.11%, | | | | | |
| 5/15/09 | — | 1,020,000 | 6/20/08 | 860 bp | 101,470 |
|
| Visteon Corp., 7%, | | | | | |
| 3/10/14 | — | 375,000 | 6/20/09 | 535 bp | (997) |
|
| Goldman Sachs Capital Markets, L.P. | | | | |
| Ford Motor Co., 7.45%, | | | | | |
| 7/16/2031 | — | 770,000 | 6/20/07 | 630 bp | 15,604 |
|
| Visteon Corp., 7%, | | | | | |
| 3/10/14 | — | 605,000 | 6/20/09 | 545 bp | (128) |
|
| Goldman Sachs International | | | | | |
| One of the underlying | | | | | |
| securities in the basket | | | | | |
| of BB CMBS securities | — | 1,485,000 | (a) | 2.461% | 72,229 |
| JPMorgan Chase Bank, N.A. | | | | | |
| Abitibi-Consolidated, Inc., | | | | | |
| 8.375%, 4/1/2015 | — | 603,000 | 6/20/11 | 365 bp | (17,289) |
|
| Felcor Lodging L.P., | | | | | |
| 8 1/2%, 6/1/11 | — | 990,000 | 6/20/10 | 370 bp | 90,420 |
|
| Ford Motor Co., 7.45%, | | | | | |
| 7/16/2031 | — | 770,000 | 6/20/07 | 635 bp | 16,017 |
|
| Ford Motor Co., 7.45%, | | | | | |
| 7/16/2031 | — | 1,005,000 | 6/20/07 | 665 bp | 24,352 |
|
| Visteon Corp., 7%, | | | | | |
| 3/10/14 | — | 400,000 | 6/20/09 | 530 bp | (1,551) |
|
47
| CREDIT DEFAULT CONTRACTS OUTSTANDING at 5/31/06 (Unaudited) continued | |
|
| | Upfront | | | Fixed payments | Unrealized |
| Swap counterparty / | premium | Notional | Termination | received (paid) by | appreciation/ |
| Referenced debt* | received (paid)** | amount | date | fund per annum | (depreciation) |
|
| Lehman Brothers Special Financing, Inc. | | | | |
| General Motors, | | | | | |
| 7 1/8%,7/15/2013 | — | $2,005,000 | 12/20/06 | 750 bp | $ (8,552) |
|
| Morgan Stanley Capital Services, Inc. | | | | |
| Bombardier, Inc, | | | | | |
| 6 3/4%, 5/1/12 | — | 1,085,000 | 3/20/11 | 355 bp | 48,026 |
|
| Lear Corp., 8.11%, | | | | | |
| 5/15/09 | — | 1,070,000 | 6/20/08 | 660 bp | 59,421 |
|
| Lear Corp., 8.11%, | | | | | |
| 5/15/09 | — | 1,020,000 | 6/20/08 | 860 bp | 101,470 |
|
| Visteon Corp., 7%, | | | | | |
| 3/10/14 | — | 639,932 | 6/20/09 | 535 bp | (1,702) |
|
| Total | | | | | $557,409 |
* Payments related to the reference debt are made upon a credit default event.
** Upfront premium is based on the difference between the original spread on issue and the market spread on day of execution.
(a) Terminating on the date on which the notional amount is reduced to zero or the date on which the assets securing the reference entity are liquidated.
The accompanying notes are an integral part of these financial statements.
48
| Statement of assets and liabilities 5/31/06 (Unaudited) | | |
|
| |
| ASSETS | | |
|
| Investment in securities, at value (Note 1): | | |
| Unaffiliated issuers (identified cost $828,380,279) | $ | 830,620,153 |
| Affiliated issuers (identified cost $20,482,411) (Note 5) | | 20,482,411 |
|
| Cash | | 207,253 |
|
| Interest and other receivables | | 17,653,265 |
|
| Receivable for shares of the fund sold | | 305,592 |
|
| Receivable for securities sold | | 5,885,517 |
|
| Unrealized appreciation on swap contracts (Note 1) | | 619,000 |
|
| Receivable for open forward currency contracts (Note 1) | | 21,960 |
|
| Receivable for closed swap contracts (Note 1) | | 95,901 |
|
| Total assets | | 875,891,052 |
|
| |
| LIABILITIES | | |
|
| Payable for securities purchased | | 5,510,377 |
|
| Payable for shares of the fund repurchased | | 1,708,314 |
|
| Payable for compensation of Manager (Notes 2 and 5) | | 1,458,039 |
|
| Payable for investor servicing and custodian fees (Note 2) | | 126,690 |
|
| Payable for Trustee compensation and expenses (Note 2) | | 209,267 |
|
| Payable for administrative services (Note 2) | | 5,869 |
|
| Payable for distribution fees (Note 2) | | 374,037 |
|
| Unrealized depreciation on swap contracts (Note 1) | | 61,591 |
|
| Payable for open forward currency contracts (Note 1) | | 1,010,544 |
|
| Other accrued expenses | | 97,149 |
|
| Total liabilities | | 10,561,877 |
|
| Net assets | $ | 865,329,175 |
|
| |
| REPRESENTED BY | | |
|
| Paid-in capital (Unlimited shares authorized) (Notes 1 and 4) | $ | 2,142,833,733 |
|
| Undistributed net investment income (Note 1) | | 4,192,816 |
|
| Accumulated net realized loss on investments | | |
| and foreign currency transactions (Note 1) | | (1,283,496,653) |
|
| Net unrealized appreciation of investments | | |
| and assets and liabilities in foreign currencies | | 1,799,279 |
|
| Total — Representing net assets applicable to capital shares outstanding | $ | 865,329,175 |
| |
| (Continued on next page) | | |
49
| Statement of assets and liabilities (Continued) | |
|
| |
| COMPUTATION OF NET ASSET VALUE AND OFFERING PRICE | |
|
| Net asset value and redemption price per class A share | |
| ($442,209,024 divided by 73,543,365 shares) | $6.01 |
|
| Offering price per class A share | |
| (100/96.25 of $6.01)* | $6.24 |
|
| Net asset value and offering price per class B share | |
| ($21,967,396 divided by 3,701,955 shares)** | $5.93 |
|
| Net asset value and redemption price per class M share | |
| ($392,251,131 divided by 65,127,105 shares) | $6.02 |
|
| Offering price per class M share | |
| (100/96.75 of $6.02)*** | $6.22 |
|
| Net asset value, offering price and redemption price per class Y share | |
| ($8,901,624 divided by 1,451,269 shares) | $6.13 |
* On single retail sales of less than $100,000. On sales of $100,000 or more and on group sales, the offering price is reduced.
** Redemption price per share is equal to net asset value less any applicable contingent deferred sales charge.
*** On single retail sales of less than $50,000. On sales of $50,000 or more and on group sales, the offering price is reduced.
The accompanying notes are an integral part of these financial statements.
50
| Statement of operations Six months ended 5/31/06 (Unaudited) | |
|
| |
| INVESTMENT INCOME | |
|
| Interest (including interest income of $354,019 | |
| from investments in affiliated issuers) (Note 5) | $39,791,308 |
|
| EXPENSES | |
|
| Compensation of Manager (Note 2) | 2,948,874 |
|
| Investor servicing fees (Note 2) | 360,379 |
|
| Custodian fees (Note 2) | 95,238 |
|
| Trustee compensation and expenses (Note 2) | 36,618 |
|
| Administrative services (Note 2) | 18,197 |
|
| Distribution fees — Class A (Note 2) | 559,454 |
|
| Distribution fees — Class B (Note 2) | 150,631 |
|
| Distribution fees — Class M (Note 2) | 1,030,630 |
|
| Other | 108,292 |
|
| Non-recurring costs (Notes 2 and 7) | 6,280 |
|
| Costs assumed by Manager (Notes 2 and 7) | (6,280) |
|
| Fees waived and reimbursed by Manager or affiliate (Notes 5 and 7) | (80,576) |
|
| Total expenses | 5,227,737 |
|
| Expense reduction (Note 2) | (45,518) |
|
| Net expenses | 5,182,219 |
|
| Net investment income | 34,609,089 |
|
| Net realized loss on investments (Notes 1 and 3) | (6,033,570) |
|
| Net realized gain on swap contracts (Note 1) | 232,209 |
|
| Net realized gain on foreign currency transactions (Note 1) | 816,542 |
|
| Net unrealized depreciation of assets and liabilities | |
| in foreign currencies during the period | (1,844,149) |
|
| Net unrealized appreciation of investments | |
| and swap contracts during the period | 11,490,186 |
|
| Net gain on investments | 4,661,218 |
|
| Net increase in net assets resulting from operations | $39,270,307 |
The accompanying notes are an integral part of these financial statements.
51
| Statement of changes in net assets | |
|
| DECREASE IN NET ASSETS | | |
|
| | Six months ended | Year ended |
| | 5/31/06* | 11/30/05 |
|
| Operations: | | |
| Net investment income | $ 34,609,089 | $ 73,630,184 |
|
| Net realized gain (loss) on investments | | |
| and foreign currency transactions | (4,984,819) | 16,319,420 |
|
| Net unrealized appreciation (depreciation) of investments | | |
| and assets and liabilities in foreign currencies | 9,646,037 | (54,490,705) |
|
| Net increase in net assets resulting from operations | 39,270,307 | 35,458,899 |
|
| Distributions to shareholders: (Note 1) | | |
|
| From net investment income | | |
|
| Class A | (16,176,407) | (30,773,043) |
|
| Class B | (1,047,297) | (5,287,382) |
|
| Class M | (14,527,577) | (32,426,583) |
|
| Class Y | (340,839) | (1,641,972) |
|
| Redemption fees (Note 1) | 8,016 | 5,857 |
|
| Decrease from capital share transactions (Note 4) | (80,170,817) | (234,795,304) |
|
| Total decrease in net assets | (72,984,614) | (269,459,528) |
|
| |
| NET ASSETS | | |
|
| Beginning of period | 938,313,789 | 1,207,773,317 |
|
| End of period (including undistributed net investment | | |
| income of $4,192,816 and $1,675,847, respectively) | $865,329,175 | $ 938,313,789 |
| | |
| * Unaudited | | |
The accompanying notes are an integral part of these financial statements.
52
This page left blank intentionally.
53
| Financial highlights | (For a common share outstanding throughout the period) | | | | | | | | | |
|
| |
| INVESTMENT OPERATIONS: | | | | LESS DISTRIBUTIONS: | | | | | RATIOS AND SUPPLEMENTAL DATA: | |
|
| | | | Net | | | | | | | Total | | | Ratio of net | |
| | Net asset | | realized and | Total | From | | | | Net asset | return | Net | Ratio of | investment | |
| | value, | Net | unrealized | from | net | From | | | value, | at net | assets, | expenses to | income (loss) | Portfolio |
| | beginning | investment | gain (loss) on | investment | investment | return of | Total | Redemption | end | asset | end of period | average net | to average | turnover |
| Period ended | of period | income (loss)(a) | investments | operations | income | capital | distributions | fees | of period | value (%)(b) | (in thousands) | assets (%)(c) | net assets (%) | (%) |
|
| CLASS A | | | | | | | | | | | | | | |
| May 31, 2006** | $5.97 | .23(d,e) | .03 | .26 | (.22) | — | (.22) | —(f ) | $6.01 | 4.38* | $442,209 | .51*(d,e) | 3.91*(d,e) | 22.39* |
| November 30, 2005 | 6.16 | .43(d) | (.21) | .22 | (.41) | — | (.41) | —(f ) | 5.97 | 3.67 | 440,780 | 1.04(d) | 7.07(d) | 33.37 |
| November 30, 2004 | 5.88 | .43(d) | .29 | .72 | (.44) | — | (.44) | —(f ) | 6.16 | 12.72 | 484,372 | 1.07(d) | 7.22(d) | 53.33 |
| November 30, 2003 | 5.17 | .48 | .73 | 1.21 | (.50) | — | (.50) | — | 5.88 | 24.65 | 507,140 | 1.03 | 8.61 | 78.78 |
| November 30, 2002 | 5.84 | .56 | (.62) | (.06) | (.58) | (.03) | (.61) | — | 5.17 | (.93) | 462,586 | 1.03 | 10.35 | 60.35 |
| November 30, 2001 | 6.30 | .68 | (.40) | .28 | (.71) | (.03) | (.74) | — | 5.84 | 4.46 | 561,101 | 1.00 | 11.01 | 81.23 |
|
| |
| CLASS B | | | | | | | | | | | | | | |
| May 31, 2006** | $5.89 | .20(d,e) | .03 | .23 | (.19) | — | (.19) | —(f ) | $5.93 | 4.02* | $21,967 | .89*(d,e) | 3.47*(d,e) | 22.39* |
| November 30, 2005 | 6.08 | .38(d) | (.21) | .17 | (.36) | — | (.36) | —(f ) | 5.89 | 2.91 | 46,602 | 1.79(d) | 6.30(d) | 33.37 |
| November 30, 2004 | 5.81 | .38(d) | .28 | .66 | (.39) | — | (.39) | —(f) | 6.08 | 11.84 | 123,263 | 1.82(d) | 6.50(d) | 53.33 |
| November 30, 2003 | 5.12 | .43 | .72 | 1.15 | (.46) | — | (.46) | — | 5.81 | 23.56 | 199,990 | 1.78 | 7.94 | 78.78 |
| November 30, 2002 | 5.79 | .52 | (.62) | (.10) | (.54) | (.03) | (.57) | — | 5.12 | (1.71) | 258,113 | 1.78 | 9.58 | 60.35 |
| November 30, 2001 | 6.27 | .63 | (.42) | .21 | (.66) | (.03) | (.69) | — | 5.79 | 3.35 | 372,989 | 1.75 | 10.27 | 81.23 |
|
| |
| CLASS M | | | | | | | | | | | | | | |
| May 31, 2006** | $5.98 | .23(d,e) | .02 | .25 | (.21) | — | (.21) | —(f) | $6.02 | 4.27* | $392,251 | .64*(d,e) | 3.78*(d,e) | 22.39* |
| November 30, 2005 | 6.17 | .41(d) | (.20) | .21 | (.40) | — | (.40) | —(f) | 5.98 | 3.46 | 430,521 | 1.29(d) | 6.82(d) | 33.37 |
| November 30, 2004 | 5.89 | .42(d) | .29 | .71 | (.43) | — | (.43) | —(f ) | 6.17 | 12.47 | 573,455 | 1.32(d) | 6.98(d) | 53.33 |
| November 30, 2003 | 5.18 | .47 | .73 | 1.20 | (.49) | — | (.49) | — | 5.89 | 24.32 | 638,046 | 1.28 | 8.34 | 78.78 |
| November 30, 2002 | 5.85 | .55 | (.62) | (.07) | (.57) | (.03) | (.60) | — | 5.18 | (1.15) | 534,636 | 1.28 | 10.10 | 60.35 |
| November 30, 2001 | 6.29 | .67 | (.38) | .29 | (.70) | (.03) | (.73) | — | 5.85 | 4.59 | 693,973 | 1.25 | 10.75 | 81.23 |
|
| |
| CLASS Y | | | | | | | | | | | | | | |
| May 31, 2006** | $6.08 | .25(d,e) | .02 | .27 | (.22) | — | (.22) | —(f) | $6.13 | 4.57* | $8,902 | .39*(d,e) | 4.01*(d,e) | 22.39* |
| November 30, 2005 | 6.27 | .45(d) | (.22) | .23 | (.42) | — | (.42) | —(f) | 6.08 | 3.80 | 20,411 | .79(d) | 7.31(d) | 33.37 |
| November 30, 2004 | 5.97 | .45(d) | .30 | .75 | (.45) | — | (.45) | —(f) | 6.27 | 13.09 | 26,684 | .82(d) | 7.46(d) | 53.33 |
| November 30, 2003 | 5.23 | .50 | .76 | 1.26 | (.52) | — | (.52) | — | 5.97 | 25.21 | 24,253 | .78 | 8.83 | 78.78 |
| November 30, 2002 | 5.88 | .59 | (.62) | (.03) | (.59) | (.03) | (.62) | — | 5.23 | (.36) | 15,562 | .78 | 10.60 | 60.35 |
| November 30, 2001 | 6.32 | .68 | (.37) | .31 | (.72) | (.03) | (.75) | — | 5.88 | 4.97 | 15,278 | .75 | 11.33 | 81.23 |
|
| |
| |
| See notes to financial highlights at the end of this section. | | | | | | | | | | | | |
The accompanying notes are an integral part of these financial statements.
|
Financial highlights (Continued)
* Not annualized.
** Unaudited.
(a) Per share net investment income (loss) has been determined on the basis of the weighted average number of shares outstanding during the period.
(b) Total return assumes dividend reinvestment and does not reflect the effect of sales charges.
(c) Includes amounts paid through expense offset arrangements (Note 2).
(d) Reflects waivers of certain fund expenses in connection with investments in Putnam Prime Market Fund during the period. As a result of such waivers, the expenses of each class, as a percentage of its net assets, reflect a reduction of the following amounts (Note 5):
| | 5/31/06 | 11/30/05 | 11/30/04 |
|
| Class A | <0.01% | <0.01% | <0.01% |
|
| Class B | <0.01 | <0.01 | <0.01 |
|
| Class M | <0.01 | <0.01 | <0.01 |
|
| Class Y | <0.01 | <0.01 | <0.01 |
|
(e) Reflects a non-recurring accrual related to a reimbursement to the fund from Putnam Investments relating to the calculation of certain amounts paid by the fund to Putnam in previous years for transfer agent services, which amounted to less than $0.01 per share and 0.01% of average net assets for the period ended May 31, 2006 (Note 7).
(f) Amount represents less than $0.01 per share.
The accompanying notes are an integral part of these financial statements.
56
Notes to financial statements 5/31/06 (Unaudited)
Note 1: Significant accounting policies
Putnam High Yield Advantage Fund (the “fund”), a Massachusetts business trust, is registered under the Investment Company Act of 1940, as amended, as a diversified, open-end management investment company. The fund seeks high current income primarily through a diversified portfolio of higher yielding, lower rated bonds that may have a higher rate of default. Capital growth is a secondary objective when consistent with the objective of high current income.
The fund offers class A, class B, class M and class Y shares. Class A and class M shares are sold with a maximum front-end sales charge of 3.75% and 3.25%, respectively, and generally do not pay a contingent deferred sales charge. Class B shares, which convert to class A shares after approximately eight years, do not pay a front-end sales charge and are subject to a contingent deferred sales charge, if those shares are redeemed within six years of purchase. The expenses for class A, class B and class M shares may differ based on the distribution fee of each class, which is identified in Note 2. Class Y shares, which are sold at net asset value, are generally subject to the same expenses as class A, class B, class C, and class M shares, but do not bear a distribution fee. Class Y shares are sold to certain eligible purchasers including certain defined contribution plans (including corporate IRAs), bank trust departments and trust companies.
A 2.00% redemption fee may apply to any shares that are redeemed (either by selling or exchanging into another fund) within 5 days of purchase. A 1.00% redemption fee would apply to any shares that are redeemed (either by selling or exchanging into another fund) within 6-90 days of purchase. The redemption fee is accounted for as an addition to paid-in-capital.
Investment income, realized and unrealized gains and losses and expenses of the fund are borne pro-rata based on the relative net assets of each class to the total net assets of the fund, except that each class bears expenses unique to that class (including the distribution fees applicable to such classes). Each class votes as a class only with respect to its own distribution plan or other matters on which a class vote is required by law or determined by the Trustees. Shares of each class would receive their pro-rata share of the net assets of the fund, if the fund were liquidated. In addition, the Trustees declare separate dividends on each class of shares.
In the normal course of business, the fund enters into contracts that may include agreements to indemnify another party under given circumstances. The fund’s maximum exposure under these arrangements is unknown as this would involve future claims that may be, but have not yet been, made against the fund. However, the fund expects the risk of material loss to be remote.
The following is a summary of significant accounting policies consistently followed by the fund in the preparation of its financial statements. The preparation of financial statements is in conformity with accounting principles generally accepted in the United States of America and requires management to make estimates and assumptions that affect the reported amounts of assets and liabilities in the financial statements and the reported amounts of increases and decreases in net assets from operations during the reporting period. Actual results could differ from those estimates.
A) Security valuation Market quotations are not considered to be readily available for certain debt obligations; such investments are valued on the basis of valuations furnished by an independent pricing service approved by the Trustees or dealers selected by Putnam Investment Management, LLC (“Putnam Management”), the fund’s manager, an indirect wholly-owned subsidiary of Putnam, LLC. Such services or dealers determine valuations for normal institutional-size trading units of such securities using methods based on market transactions for comparable securities and various relationships, generally recognized by institutional traders, between securities. Securities quoted in foreign currencies, if any, are translated into U.S. dollars at the current exchange rate. Other investments,
57
including certain restricted securities, are valued at fair value following procedures approved by the Trustees. Such valuations and procedures are reviewed periodically by the Trustees.
B) Joint trading account Pursuant to an exemptive order from the Securities and Exchange Commission, the fund may transfer uninvested cash balances, including cash collateral received under security lending arrangements, into a joint trading account along with the cash of other registered investment companies and certain other accounts managed by Putnam Management. These balances may be invested in issues of high-grade short-term investments having maturities of up to 397 days for collateral received under security lending arrangements and up to 90 days for other cash investments.
C) Repurchase agreements The fund, or any joint trading account, through its custodian, receives delivery of the underlying securities, the market value of which at the time of purchase is required to be in an amount at least equal to the resale price, including accrued interest. Collateral for certain tri-party repurchase agreements is held at the counterparty’s custodian in a segregated account for the benefit of the fund and the coun-terparty. Putnam Management is responsible for determining that the value of these underlying securities is at all times at least equal to the resale price, including accrued interest.
D) Security transactions and related investment income Security transactions are recorded on the trade date (the date the order to buy or sell is executed). Gains or losses on securities sold are determined on the identified cost basis. Interest income is recorded on the accrual basis. All premiums/discounts are amortized/accreted on a yield-to-maturity basis.
The fund earned certain fees in connection with its senior loan purchasing activities. These fees are treated as market discount and are recorded as income in the statement of operations.
E) Stripped mortgage-backed securities The fund may invest in stripped mortgage-backed securities which represent a participation in mortgage loans and may be structured in classes with rights to receive different portions of the interest and principal. Interest-only securities receive all of the interest and principal-only securities receive all of the principal. If the interest-only securities experience greater than anticipated prepayments of principal, the fund may fail to recoup fully its initial investment in these securities. Conversely, principal-only securities increase in value if prepayments are greater than anticipated and decline if prepayments are slower than anticipated. The market value of these securities is highly sensitive to changes in interest rates.
F) Foreign currency translation The accounting records of the fund are maintained in U.S. dollars. The market value of foreign securities, currency holdings, and other assets and liabilities are recorded in the books and records of the fund after translation to U.S. dollars based on the exchange rates on that day. The cost of each security is determined using historical exchange rates. Income and withholding taxes are translated at prevailing exchange rates when earned or incurred. The fund does not isolate that portion of realized or unrealized gains or losses resulting from changes in the foreign exchange rate on investments from fluctuations arising from changes in the market prices of the securities. Such gains and losses are included with the net realized and unrealized gain or loss on investments. Net realized gains and losses on foreign currency transactions represent net realized exchange gains or losses on closed forward currency contracts, disposition of foreign currencies, currency gains and losses realized between the trade and settlement dates on securities transactions and the difference between the amount of investment income and foreign withholding taxes recorded on the fund’s books and the U.S. dollar equivalent amounts actually received or paid. Net unrealized appreciation and depreciation of assets and liabilities in foreign currencies arise from
58
changes in the value of open forward currency contracts and assets and liabilities other than investments at the period end, resulting from changes in the exchange rate. Investments in foreign securities involve certain risks, including those related to economic instability, unfavorable political developments, and currency fluctuations, not present with domestic investments.
G) Forward currency contracts The fund may buy and sell forward currency contracts, which are agreements between two parties to buy and sell currencies at a set price on a future date. These contracts are used to protect against a decline in value relative to the U.S. dollar of the currencies in which its portfolio securities are denominated or quoted (or an increase in the value of a currency in which securities a fund intends to buy are denominated, when a fund holds cash reserves and short term investments), or for other investment purposes. The U.S. dollar value of forward currency contracts is determined using current forward currency exchange rates supplied by a quotation service. The market value of the contract will fluctuate with changes in currency exchange rates. The contract is marked to market daily and the change in market value is recorded as an unrealized gain or loss. When the contract is closed, the fund records a realized gain or loss equal to the difference between the value of the contract at the time it was opened and the value at the time it was closed. The fund could be exposed to risk if the value of the currency changes unfavorably, if the counterparties to the contracts are unable to meet the terms of their contracts or if the fund is unable to enter into a closing position. Risks may exceed amounts recognized on the statement of assets and liabilities. Forward currency contracts outstanding at period end, if any, are listed after the fund’s portfolio.
H) Credit default contracts The fund may enter into credit default contracts where one party, the protection buyer, makes an upfront or periodic payment to a counter party, the protection seller, in exchange for the right to receive a contingent payment. The maximum amount of the payment may equal the notional amount, at par, of the underlying index or security as a result of a related credit event. An upfront payment received by the fund, as the protection seller, is recorded as a liability on the fund’s books. An upfront payment made by the fund, as the protection buyer, is recorded as an asset on the fund’s books. Periodic payments received or paid by the fund are recorded as realized gains or losses. The credit default contracts are marked to market daily based upon quotations from an independent pricing service or market makers and the change, if any, is recorded as unrealized gain or loss. Payments received or made as a result of a credit event or termination of the contract are recognized, net of a proportional amount of the upfront payment, as realized gains or losses. In addition to bearing the risk that the credit event will occur, the fund could be exposed to market risk due to unfavorable changes in interest rates or in the price of the underlying security or index, the possibility that the fund may be unable to close out its position at the same time or at the same price as if it had purchased comparable publicly traded securities or that the counterparty may default on its obligation to perform. Risks of loss may exceed amounts recognized on the statement of assets and liabilities. Credit default contracts outstanding at period end, if any, are listed after the fund’s portfolio.
I) Federal taxes It is the policy of the fund to distribute all of its taxable income within the prescribed time and otherwise comply with the provisions of the Internal Revenue Code of 1986 (the “Code”) applicable to regulated investment companies. It is also the intention of the fund to distribute an amount sufficient to avoid imposition of any excise tax under Section 4982 of the Code, as amended. Therefore, no provision has been made for federal taxes on income, capital gains or unrealized appreciation on securities held nor for excise tax on income and capital gains.
At November 30, 2005, the fund had a capital loss carryover of $1,278,476,589 available to the extent allowed by the Code to offset future net capital
59
gain, if any. The amount of the carryover and the expiration dates are:
| Loss Carryover | Expiration |
|
| $286,189,144 | November 30, 2007 |
|
| 217,396,296 | November 30, 2008 |
|
| 265,227,969 | November 30, 2009 |
|
| 309,407,794 | November 30, 2010 |
|
| 104,325,628 | November 30, 2011 |
|
| 95,929,758 | November 30, 2012 |
|
The aggregate identified cost on a tax basis is $851,946,821, resulting in gross unrealized appreciation and depreciation of $23,453,845 and $24,298,102, respectively, or net unrealized depreciation of $844,257.
J) Distributions to shareholders Distributions to shareholders from net investment income are recorded by the fund on the ex-dividend date. Distributions from capital gains, if any, are recorded on the ex-dividend date and paid at least annually. The amount and character of income and gains to be distributed are determined in accordance with income tax regulations, which may differ from generally accepted accounting principles. Dividend sources are estimated at the time of declaration. Actual results may vary. Any non-taxable return of capital cannot be determined until final tax calculations are completed after the end of the fund’s fiscal year. Reclassifications are made to the fund’s capital accounts to reflect income and gains available for distribution (or available capital loss carryovers) under income tax regulations.
Note 2: Management fee, administrative
services and other transactions
Putnam Management is paid for management and investment advisory services quarterly based on the average net assets of the fund. Such fee is based on the following annual rates: 0.70% of the first $500 million of average net assets, 0.60% of the next $500 million, 0.55% of the next $500 million, 0.50% of the next $5 billion, 0.475% of the next $5 billion, 0.455% of then next $5 billion, 0.44% of the next $5 billion, and 0.43% thereafter.
Putnam Management has agreed to waive fees and reimburse expenses of the fund through November 30, 2006 to the extent necessary to ensure that the fund’s expenses do not exceed the simple average of the expenses of all front-end load funds viewed by Lipper Inc. as having the same investment classification or objective as the fund. The expense reimbursement is based on a comparison of the fund’s expenses with the average annualized operating expenses of the funds in its Lipper peer group for each calendar quarter during the fund’s last fiscal year, excluding 12b-1 fees and without giving effect to any expense offset and brokerage service arrangements that may reduce fund expenses. For the period ended May 31, 2006, Putnam Management did not waive any of its management fee from the fund.
For the period ended May 31, 2006, Putnam Management has assumed $6,280 of legal, shareholder servicing and communication, audit and Trustee fees incurred by the fund in connection with certain legal and regulatory matters (including those described in Note 7).
Putnam Investments Limited (“PIL”), an affiliate of Putnam Management, is authorized by the Trustees to manage a separate portion of the assets of the fund as determined by Putnam Management from time to time. Putnam Management pays a quarterly sub-management fee to PIL for its services at an annual rate of 0.40% of the average net assets of the portion of the fund managed by PIL.
The fund reimburses Putnam Management an allocated amount for the compensation and related expenses of certain officers of the fund and their staff who provide administrative services to the fund. The aggregate amount of all such reimbursements is determined annually by the Trustees.
Custodial functions for the fund’s assets are provided by Putnam Fiduciary Trust Company (“PFTC”), a subsidiary of Putnam, LLC. PFTC
60
receives fees for custody services based on the fund’s asset level, the number of its security holdings and transaction volumes. Putnam Investor Services, a division of PFTC, provides investor servicing agent functions to the fund. Putnam Investor Services receives fees for investor servicing based on the number of shareholder accounts in the fund and the level of defined contribution plan assets in the fund. During the period ended May 31, 2006, the fund incurred $455,617 for these services.
The fund has entered into an arrangement with PFTC whereby credits realized as a result of uninvested cash balances are used to reduce a portion of the fund’s expenses. For the six months ended May 31, 2006, the fund’s expenses were reduced by $45,518 under these arrangements.
Each independent Trustee of the fund receives an annual Trustee fee, of which $410, as a quarterly retainer, has been allocated to the fund, and an additional fee for each Trustees meeting attended. Trustees receive additional fees for attendance at certain committee meetings, industry seminars and for certain compliance-related matters. Trustees also are reimbursed for expenses they incur relating to their services as Trustees. George Putnam, III, who is not an independent Trustee, also receives the foregoing fees for his services as Trustee.
The fund has adopted a Trustee Fee Deferral Plan (the “Deferral Plan”) which allows the Trustees to defer the receipt of all or a portion of Trustees fees payable on or after July 1, 1995. The deferred fees remain invested in certain Putnam funds until distribution in accordance with the Deferral Plan.
The fund has adopted an unfunded noncontributory defined benefit pension plan (the “Pension Plan”) covering all Trustees of the fund who have served as a Trustee for at least five years and were first elected prior to 2004. Benefits under the Pension Plan are equal to 50% of the Trustee’s average annual attendance and retainer fees for the three years ended December 31, 2005. Pension expense for the fund is included in Trustee compensation and expenses in the statement of operations. Accrued pension liability is included in Payable for Trustee compensation and expenses in the statement of assets and liabilities. The Trustees have terminated the Pension Plan with respect to any Trustee first elected after 2003.
The fund has adopted distribution plans (the “Plans”) with respect to its class A, class B and class M shares pursuant to rule 12b-1 under the Investment Company Act of 1940. The purpose of the Plans is to compensate Putnam Retail Management, a wholly-owned subsidiary of Putnam, LLC and Putnam Retail Management GP, Inc., for services provided and expenses incurred in distributing shares of the fund. The Plans provide for payments by the fund to Putnam Retail Management at an annual rate of up to 0.35%, 1.00% and 1.00% of the average net assets attributable to class A, class B and class M shares, respectively.
The Trustees have approved payment by the fund at an annual rate of 0.25%, 1.00% and 0.50% of the average net assets attributable to class A, class B and class M shares, respectively. For the six months ended May 31, 2006, Putnam Retail Management, acting as underwriter, received net commissions of $1,517 and $16 from the sale of class A and class M shares, respectively, and received $15,589 in contingent deferred sales charges from redemptions of class B shares. A deferred sales charge of up to 1.00% and 0.40% is assessed on certain redemptions of class A and class M shares, respectively. For the six months ended May 31, 2006, Putnam Retail Management, acting as underwriter, received no monies on class A and class M redemptions.
Note 3: Purchases and sales of securities
During the six months ended May 31, 2006, cost of purchases and proceeds from sales of investment securities other than short-term investments aggregated $193,946,156 and $278,772,669, respectively. There were no purchases or sales of U.S. government securities.
61
Note 4: Capital shares
At May 31, 2006, there was an unlimited number of shares of beneficial interest authorized. Transactions in capital shares were as follows:
| CLASS A | Shares | Amount |
|
| Six months ended 5/31/06: | |
| Shares sold | 6,271,527 | $ 38,919,019 |
|
| Shares issued | | |
| in connection | | |
| with reinvestment | | |
| of distributions | 1,747,441 | 9,075,061 |
|
| | 8,018,968 | 47,994,080 |
|
| Shares | | |
| repurchased | (8,354,256) | (50,152,681) |
|
| Net decrease | (335,288) | $ (2,158,601) |
| |
| Year ended 11/30/05: | |
| Shares sold | 12,881,929 | $77,924,293 |
|
| Shares issued | | |
| in connection | | |
| with reinvestment | | |
| of distributions | 3,196,210 | 19,308,372 |
|
| | 16,078,139 | 97,232,665 |
|
| Shares | | |
| repurchased | (20,821,208) | (126,075,192) |
|
| Net decrease | (4,743,069) | (28,842,527) |
| CLASS B | Shares | Amount |
|
| Six months ended 5/31/06: | |
| Shares sold | 41,848 | $ 247,806 |
|
| Shares issued | | |
| in connection | | |
| with reinvestment | | |
| of distributions | 98,210 | 578,966 |
|
| | 140,058 | 826,772 |
|
| Shares | | |
| repurchased | (4,352,040) | (25,711,048) |
|
| Net decrease | (4,211,982) | $(24,884,276) |
| |
| Year ended 11/30/05: | |
| Shares sold | 175,107 | $ 1,031,918 |
|
| Shares issued | | |
| in connection | | |
| with reinvestment | | |
| of distributions | 509,385 | 3,066,719 |
|
| | 684,492 | 4,098,637 |
|
| Shares | | |
| repurchased | (13,033,290) | (77,858,699) |
|
| Net decrease | (12,348,798) | $(73,760,062) |
|
| |
| CLASS M | Shares | Amount |
|
| Six months ended 5/31/06: | |
| Shares sold | 406,837 | $ 2,415,999 |
|
| Shares issued | | |
| in connection | | |
| with reinvestment | | |
| of distributions | 31,603 | 220,244 |
|
| | 438,440 | 2,636,243 |
|
| Shares | | |
| repurchased | (7,341,470) | (44,154,688) |
|
| Net decrease | (6,903,030) | $ (41,518,445) |
| |
| Year ended 11/30/05: | |
| Shares sold | 4,504,839 | $ 27,430,895 |
|
| Shares issued | | |
| in connection | | |
| with reinvestment | | |
| of distributions | 80,748 | 489,012 |
|
| | 4,585,587 | 27,919,907 |
|
| Shares | | |
| repurchased | (25,432,861) | (154,584,057) |
|
| Net decrease | (20,847,274) | $(126,664,150) |
62
| CLASS Y | Shares | Amount |
|
| Six months ended 5/31/06: | |
| Shares sold | 122,098 | $ 747,403 |
|
| Shares issued | | |
| in connection | | |
| with reinvestment | | |
| of distributions | 48,565 | 295,817 |
|
| | 170,663 | 1,043,220 |
|
| Shares | | |
| repurchased | (2,076,296) | (12,652,715) |
|
| Net decrease | (1,905,633) | $(11,609,495) |
| |
| Year ended 11/30/05: | | |
| Shares sold | 938,356 | $ 5,832,772 |
|
| Shares issued | | |
| in connection | | |
| with reinvestment | | |
| of distributions | 266,800 | 1,641,972 |
|
| | 1,205,156 | 7,474,744 |
|
| Shares | | |
| repurchased | (2,105,532) | (13,003,309) |
|
| Net decrease | (900,376) | $ (5,528,565) |
Note 5: Investment in Putnam Prime
Money Market Fund
Pursuant to an exemptive order from the Securities and Exchange Commission, the fund invests in Putnam Prime Money Market Fund, an open-end management investment company managed by Putnam Management. Management fees paid by the fund are reduced by an amount equal to the management and administrative services fees paid by Putnam Prime Money Market Fund with respect to assets invested by the fund in Putnam Prime Money Market Fund. For the period ended May 31, 2006, management fees paid were reduced by $9,610 relating to the fund’s investment in Putnam Prime Money Market Fund. Income distributions earned by the fund are recorded as income in the statement of operations and totaled $354,019 for the period ended May 31, 2006. During the period ended May 31, 2006, cost of purchases and cost of sales of investments in Putnam Prime Money Market Fund aggregated $146,585,833 and $148,614,117, respectively.
Note 6: Senior loan commitments
Senior loans are purchased or sold on a when-issued or delayed delivery basis and may be settled a month or more after the trade date, which from time to time can delay the actual investment of available cash balances; interest income is accrued based on the terms of the securities. Senior loans can be acquired through an agent, by assignment from another holder of the loan, or as a participation interest in another holder’s portion of the loan. When the fund invests in a loan or participation, the fund is subject to the risk that an intermediate participant between the fund and the borrower will fail to meet its obligations to the fund, in addition to the risk that the borrower under the loan may default on its obligations.
Note 7: Regulatory matters and litigation
Putnam Management has entered into agreements with the Securities and Exchange Commission and the Massachusetts Securities Division settling charges connected with excessive short-term trading by Putnam employees and, in the case of the charges brought by the Massachusetts Securities Division, by participants in some Putnam-administered 401(k) plans. Pursuant to these settlement agreements, Putnam Management will pay a total of $193.5 million in penalties and restitution, with $153.5 million being paid to certain open-end funds and their shareholders. The amount will be allocated to shareholders and funds pursuant to a plan developed by an independent consultant, and will be paid following approval of the plan by the SEC and the Massachusetts Securities Division.
The Securities and Exchange Commission’s and Massachusetts Securities Division’s allegations and related matters also serve as the general basis for numerous lawsuits, including purported class action lawsuits filed against Putnam Management and certain related parties, including certain Putnam funds. Putnam Management will bear any costs incurred by Putnam funds in connection
63
with these lawsuits. Putnam Management believes that the likelihood that the pending private lawsuits and purported class action lawsuits will have a material adverse financial impact on the fund is remote, and the pending actions are not likely to materially affect its ability to provide investment management services to its clients, including the Putnam funds.
In March 2006, the fund received $70,966 from Putnam to address issues relating to the calculation of certain amounts paid by the Putnam mutual funds to Putnam for transfer agent services. This amount is included in Fees waived and reimbursed by Manager or affiliate on the Statement of operations. Review of this matter is ongoing and the amount received by the fund may be adjusted in the future. Such adjustment is not expected to be material.
Putnam Management and Putnam Retail Management are named as defendants in a civil suit in which the plaintiffs allege that the management and distribution fees paid by certain Putnam funds were excessive and seek recovery under the Investment Company Act of 1940. Putnam Management and Putnam Retail Management have contested the plaintiffs’ claims and the matter is currently pending in the U.S. District Court for the District of Massachusetts. Based on currently available information, Putnam Management believes that this action is without merit and that it is unlikely to have a material effect on Putnam Management’s and Putnam Retail Management’s ability to provide services to their clients, including the fund.
64
Putnam puts your
interests first
|
In January 2004, Putnam began introducing a number of voluntary initiatives designed to reduce fund expenses, provide investors with more useful information, and help safeguard the interests of all Putnam investors. Visit www.putnam.com for details.
Cost-cutting initiatives
Reduced sales charges The maximum sales charge for class A shares has been reduced to 5.25% for equity funds (formerly 5.75%) and 3.75% for most income funds (formerly 4.50%) . The maximum sales charge for class M shares has been reduced to 3.25% for equity funds (formerly 3.50%) .*
Lower class B purchase limit To help ensure that investors are in the most cost-effective share class, the maximum amount that can be invested in class B shares has been reduced to $100,000. (Larger trades or accumulated amounts will be refused.)
Ongoing expenses will be limited Through calendar 2006, total ongoing expenses, including management fees for all funds, will be maintained at or below the average of each fund’s industry peers in its Lipper load-fund universe. For more information, please see the Statement of Additional information.
Improved disclosure
Putnam fund prospectuses and shareholder reports have been revised to disclose additional information that will help shareholders compare funds and weigh their costs and risks along with their potential benefits. Shareholders will find easy-to-understand information about fund expense ratios, portfolio manager compensation, risk comparisons, turnover comparisons, brokerage commissions, and employee and trustee ownership of Putnam funds. Disclosure of breakpoint discounts has also been enhanced to alert investors to potential cost savings.
Protecting investors’ interests
Short-term trading fee introduced To discourage short-term trading, which can interfere with a fund’s long-term strategy, a 2% short-term trading fee may be imposed on any Putnam fund shares (other than money market funds) redeemed or exchanged within five calendar days of purchase.
* The maximum sales charge for class A shares of Putnam Limited Duration Government Income Fund (formerly Putnam Intermediate U.S. Government Income Fund) and Putnam Floating Rate Income Fund remains 3.25% .
65
The Putnam
family of funds
|
The following is a complete list of Putnam’s open-end mutual funds. Investors should carefully consider the investment objective, risks, charges, and expenses of a fund before investing. For a prospectus containing this and other information for any Putnam fund or product, call your financial advisor at 1-800-225-1581 and ask for a prospectus. Please read the prospectus carefully before investing.
| Growth funds | Value funds |
| Discovery Growth Fund | Classic Equity Fund |
| Growth Opportunities Fund | Convertible Income-Growth Trust |
| Health Sciences Trust | Equity Income Fund |
| International New Opportunities Fund* | The George Putnam Fund of Boston |
| New Opportunities Fund | The Putnam Fund for Growth |
| OTC & Emerging Growth Fund | and Income |
| Small Cap Growth Fund | International Growth and Income Fund* |
| Vista Fund | Mid Cap Value Fund |
| Voyager Fund | New Value Fund |
| | Small Cap Value Fund† |
| |
| Blend funds | Income funds |
| Capital Appreciation Fund | American Government Income Fund |
| Capital Opportunities Fund | Diversified Income Trust |
| Europe Equity Fund* | Floating Rate Income Fund |
| Global Equity Fund* | Global Income Trust* |
| Global Natural Resources Fund* | High Yield Advantage Fund*† |
| International Capital | High Yield Trust* |
| Opportunities Fund* | Income Fund |
| International Equity Fund* | Limited Duration Government |
| Investors Fund | Income Fund‡ |
| Research Fund | Money Market Fund§ |
| Tax Smart Equity Fund® | U.S. Government Income Trust |
| Utilities Growth and Income Fund | |
* A 1% redemption fee on total assets redeemed or exchanged between 6 and 90 days of purchase may be imposed for all share classes of these funds.
† Closed to new investors.
‡ Formerly Putnam Intermediate U.S. Government Income Fund.
§ An investment in a money market fund is not insured or guaranteed by the Federal Deposit Insurance Corporation or any other government agency. Although the fund seeks to preserve your investment at $1.00 per share, it is possible to lose money by investing in the fund.
66
Tax-free income funds
AMT-Free Insured Municipal Fund**
Tax Exempt Income Fund
Tax Exempt Money Market Fund§
Tax-Free High Yield Fund
State tax-free income funds:
Arizona, California, Florida, Massachusetts,
Michigan, Minnesota, New Jersey, New York,
Ohio, and Pennsylvania
Asset allocation funds
Income Strategies Fund
Putnam Asset Allocation Funds — three
investment portfolios that spread your
money across a variety of stocks, bonds,
and money market investments.
The three portfolios:
Asset Allocation: Balanced Portfolio
Asset Allocation: Conservative Portfolio
Asset Allocation: Growth Portfolio
|
Putnam RetirementReady® Funds
Putnam RetirementReady Funds — ten
investment portfolios that offer diversifica-
tion among stocks, bonds, and money
market instruments and adjust to become
more conservative over time based on a
target date for withdrawing assets.
The ten funds:
Putnam RetirementReady 2050 Fund
Putnam RetirementReady 2045 Fund
Putnam RetirementReady 2040 Fund
Putnam RetirementReady 2035 Fund
Putnam RetirementReady 2030 Fund
Putnam RetirementReady 2025 Fund
Putnam RetirementReady 2020 Fund
Putnam RetirementReady 2015 Fund
Putnam RetirementReady 2010 Fund
Putnam RetirementReady Maturity Fund
|
** Formerly Putnam Tax-Free Insured Fund.
With the exception of money market funds, a 2% redemption fee may be applied to shares exchanged or sold within 5 days
of purchase.
Check your account balances and the most recent month-end performance at www.putnam.com.
|
67
Fund information
Founded over 65 years ago, Putnam Investments was built around the concept that a balance between risk and reward is the hallmark of a well-rounded financial program. We manage over 100 mutual funds in growth, value, blend, fixed income, and international.
| Investment Manager | Paul L. Joskow | James P. Pappas |
| Putnam Investment | Elizabeth T. Kennan | Vice President |
| Management, LLC | Robert E. Patterson | Richard S. Robie, III |
| One Post Office Square | George Putnam, III | Vice President |
| Boston, MA 02109 | W. Thomas Stephens | |
| Richard B. Worley | Francis J. McNamara, III |
| Investment Sub-Manager | | Vice President and |
| Putnam Investments Limited | Officers | Chief Legal Officer |
| 57–59 St. James Street | George Putnam, III | |
| London, England SW1A 1LD | President | Charles A. Ruys de Perez |
| | | Vice President and |
| Marketing Services | Charles E. Porter | Chief Compliance Officer |
| Putnam Retail Management | Executive Vice President, | |
| One Post Office Square | Associate Treasurer and | Mark C. Trenchard |
| Boston, MA 02109 | Principal Executive Officer | Vice President and |
| | BSA Compliance Officer |
| Custodian | Jonathan S. Horwitz | |
| Putnam Fiduciary | Senior Vice President | Judith Cohen |
| Trust Company | and Treasurer | Vice President, Clerk and |
| | Assistant Treasurer |
| Legal Counsel | Steven D. Krichmar | |
| Ropes & Gray LLP | Vice President and | Wanda M. McManus |
| Trustees | Principal Financial Officer | Vice President, Senior Associate |
| | | Treasurer and Assistant Clerk |
| John A. Hill, Chairman | Michael T. Healy | |
| Jameson Adkins Baxter, | Assistant Treasurer and | Nancy E. Florek |
| Vice Chairman | Principal Accounting Officer | Vice President, Assistant Clerk, |
| Charles B. Curtis | | Assistant Treasurer |
| Myra R. Drucker | Beth S. Mazor | and Proxy Manager |
| Charles E. Haldeman, Jr. | Vice President | |
| | |
This report is for the information of shareholders of Putnam High Yield Advantage Fund. It may also be used as sales literature when preceded or accompanied by the current prospectus, the most recent copy of Putnam’s Quarterly Performance Summary, and Putnam’s Quarterly Ranking Summary. For more recent performance, please visit www.putnam.com. Investors should carefully consider the investment objective, risks, charges, and expenses of a fund, which are described in its prospectus. For this and other information or to request a prospectus, call 1-800-225-1581 toll free. Please read the prospectus carefully before investing. The fund’s Statement of Additional Information contains additional information about the fund’s Trustees and is available without charge upon request by calling 1-800-225-1581.
68

Item 2. Code of Ethics:
Not applicable
Item 3. Audit Committee Financial Expert:
|
Item 4. Principal Accountant Fees and Services:
|
Item 5. Audit Committee of Listed Registrants
|
Item 6. Schedule of Investments:
|
The registrant’s schedule of investments in unaffiliated issuers is included in the report to shareholders in Item 1 above.
Item 7. Disclosure of Proxy Voting Policies and Procedures For Closed-End Management Investment Companies:
Item 8. Portfolio Managers of Closed-End Investment Companies
Item 9. Purchases of Equity Securities by Closed-End Management Investment Companies and Affiliated Purchasers:
Item 10. Submission of Matters to a Vote of Security Holders:
Item 11. Controls and Procedures:
|
(a) The registrant's principal executive officer and principal financial officer have concluded, based on their evaluation of the effectiveness of the design and operation of the registrant's disclosure controls and procedures as of a date within 90 days of the filing date of this report, that the design and operation of such procedures are generally effective to provide reasonable assurance that information required to be disclosed by the registrant in this report is recorded, processed, summarized and reported within the time periods specified in the Commission's rules and forms.
(b) Changes in internal control over financial reporting: Not applicable
Item 12. Exhibits:
(a)(1) Not applicable
|
(a)(2) Separate certifications for the principal executive officer and principal financial officer of the registrant as required by Rule 30a-2(a) under the Investment Company Act of 1940, as amended, are filed herewith.
(b) The certifications required by Rule 30a-2(b) under the Investment Company Act of 1940, as amended, are filed herewith.
Pursuant to the requirements of the Securities Exchange Act of 1934 and the Investment Company Act of 1940, the registrant has duly caused this report to be signed on its behalf by the undersigned, thereunto duly authorized.
Putnam High Yield Advantage Fund
By (Signature and Title):
/s/Michael T. Healy
Michael T. Healy
Principal Accounting Officer
Date: July 27, 2006
|
Pursuant to the requirements of the Securities Exchange Act of 1934 and the Investment Company Act of 1940, this report has been signed below by the following persons on behalf of the registrant and in the capacities and on the dates indicated.
By (Signature and Title):
/s/Charles E. Porter
Charles E. Porter
Principal Executive Officer
Date: July 27, 2006
By (Signature and Title):
/s/Steven D. Krichmar
Steven D. Krichmar
Principal Financial Officer
Date: July 27, 2006
|