| |
| UNITED STATES |
| SECURITIES AND EXCHANGE COMMISSION |
| Washington, D.C. 20549 |
| |
| FORM N-CSR |
| |
| CERTIFIED SHAREHOLDER REPORT OF REGISTERED |
| MANAGEMENT INVESTMENT COMPANIES |
| |
| Investment Company Act file number: (811- 04616) |
| |
| Exact name of registrant as specified in charter: Putnam High Yield Advantage Fund |
| |
| Address of principal executive offices: One Post Office Square, Boston, Massachusetts 02109 |
| | |
| Name and address of agent for service: | Beth S. Mazor, Vice President |
| | One Post Office Square |
| | Boston, Massachusetts 02109 |
| | |
| Copy to: | John W. Gerstmayr, Esq. |
| | Ropes & Gray LLP |
| | One International Place |
| | Boston, Massachusetts 02110 |
| | |
| Registrant’s telephone number, including area code: | (617) 292-1000 |
| | |
| Date of fiscal year end: November 30, 2007 | |
| |
| Date of reporting period: December 1, 2006 — November 30, 2007 |
Item 1. Report to Stockholders:
The following is a copy of the report transmitted to stockholders pursuant to Rule 30e-1 under the Investment Company Act of 1940:

What makes Putnam different?
A time-honored tradition in
money management
Since 1937, our values have been rooted in a profound sense of responsibility for the money entrusted to us.
A prudent approach to investing
We use a research-driven team approach to seek consistent, dependable, superior investment results over time, although there is no guarantee a fund will meet its objectives.
Funds for every investment goal
We offer a broad range of mutual funds and other financial products so investors and their financial representatives can build diversified portfolios.
A commitment to doing what’s right
for investors
With a focus on investment performance, below-average expenses, and in-depth information about our funds, we put the interests of investors first and seek to set the standard for integrity and service.
Industry-leading service
We help investors, along with their financial representatives, make informed investment decisions with confidence.

In 1830, Massachusetts Supreme Judicial Court Justice Samuel Putnam established The Prudent Man Rule, a legal foundation for responsible money management.
THE PRUDENT MAN RULE
All that can be required of a trustee to invest is that he shall conduct himself faithfully and exercise a sound discretion. He is to observe how men of prudence, discretion, and intelligence manage their own affairs, not in regard to speculation, but in regard to the permanent disposition of their funds, considering the probable income, as well as the probable safety of the capital to be invested.

Putnam
High Yield
Advantage Fund
11| 30| 07
Annual Report
| |
| Message from the Trustees | 1 |
| About the fund | 2 |
| Performance and portfolio snapshots | 4 |
| Report from the fund managers | 5 |
| Performance in depth | 9 |
| Expenses | 12 |
| Portfolio turnover | 14 |
| Risk | 14 |
| Your fund’s management | 15 |
| Terms and definitions | 16 |
| Trustee approval of management contract | 17 |
| Other information for shareholders | 21 |
| Financial statements | 22 |
| Shareholder meeting results | 50 |
| Federal tax information | 51 |
| About the Trustees | 52 |
| Officers | 56 |
Cover photograph: © Richard H. Johnson
Message from the Trustees
Dear Fellow Shareholder:
As we look toward the new year, we note that 2007 was marked by heightened market turbulence. Stock market indexes in the United States reached new highs in July and again in October, but volatility was the norm rather than the exception. Business losses related to the subprime mortgage sector were farther-reaching and more acute than many observers had predicted, and the market’s daily fluctuations were understandably unsettling. Putnam’s bond funds generally provided sources of stability and income to investors’ portfolios in spite of these difficulties, while international funds posted continued strong gains. Importantly, the U.S. economy registered some of the strongest growth of this business expansion in the spring and summer months, creating a cushion that, along with timely action by the Federal Reserve, should help to support moderate economic growth in 2008. Although the events of the past year have tested the mettle of long-term investors, they also help us to understand the importance of certain time-tested principles: the wisdom of a long-term perspective, the power of stocks to achieve capital growth over long periods, and the benefits of diversification across asset classes.
We are pleased to announce that a new independent Trustee, Robert J. Darretta, has joined your fund’s Board of Trustees. Mr. Darretta brings extensive leadership experience in corporate finance and accounting. He is a former Vice Chairman of the Board of Directors of Johnson & Johnson, one of the leading U.S. health-care and consumer products companies, where he also served as Chief Financial Officer, Executive Vice President, and Treasurer.
Putnam Investments celebrated its 70th anniversary in November. From modest beginnings in Boston, Massachusetts, the firm has grown into a global asset manager that serves millions of investors worldwide. Although the mutual fund industry has undergone many changes since George Putnam introduced his innovative balanced fund in 1937, Putnam’s guiding principles have not. As we celebrate this 70-year milestone, we look forward to Putnam continuing its long tradition of prudent money management. Thank you for your support of the Putnam funds.

Putnam High Yield Advantage Fund:
Seeking high current income and capital growth
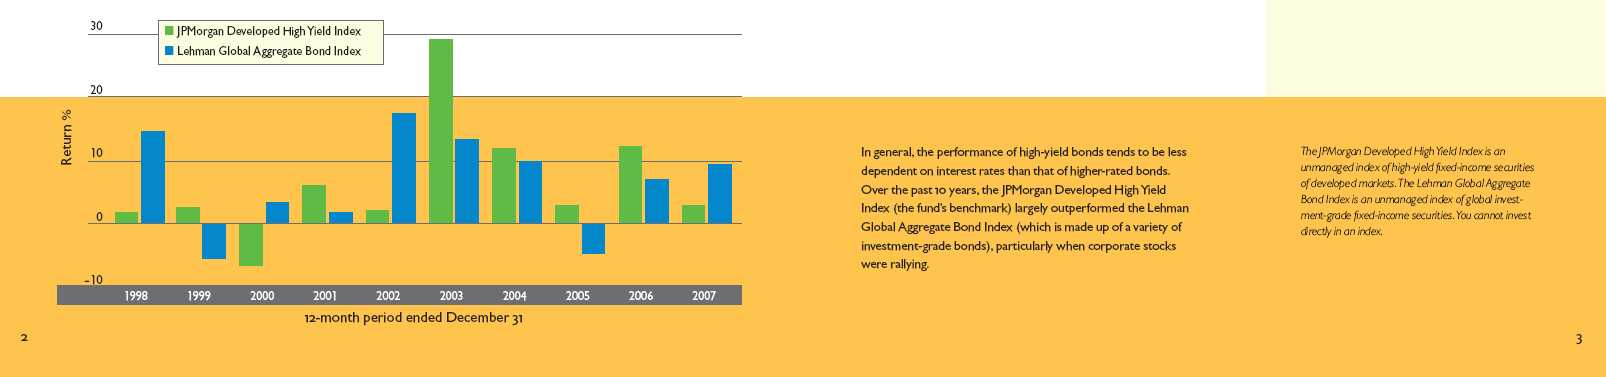
Unlike most types of fixed-income investments, high-yield bond performance is more dependent on the performance of the companies that issue the bonds than on interest rates. For this reason, distinguishing between opportunities and potential pitfalls requires a rigorous investment process. With Putnam High Yield Advantage Fund, this process is highlighted by intensive research, investment diversification, and carefully timed portfolio adjustments.
Because of the risks of high-yield bond investing, in-depth credit research is essential. The fund’s research team — more than 20 professionals, including analysts who specialize by industry — visits with the management of issuing companies and analyzes each company’s prospects. The team then compares this information to the bond’s potential upside or downside before deciding whether it is an appropriate investment for the fund.
The fund’s portfolio typically consists of bonds from a broad range of industries and companies. Holdings are diversified across industry sectors and among bonds with differing credit ratings. While the fund invests primarily in the bonds of U.S. companies, its diversified approach allows it to include foreign bonds as well. Among these securities, investments in emerging-market bonds may be used to enhance the fund’s appreciation potential. Although diversification does not ensure a profit or protect against a loss and it is possible to lose money in a diversified portfolio, the fund’s diversification can help reduce the volatility that typically comes with higher-risk investments.
As the bond markets shift over time, the fund’s management looks for ways to capitalize on developments that affect fixed-income securities in general and high-yield bonds in particular. For example, when credit spreads are wide and expected to tighten, the fund may pursue the higher income potential offered by lower-quality issues. On the other hand, when credit spreads are narrow — that is, when the difference in yield between higher- and lower-rated bonds of comparable maturities is small — the fund may shift its emphasis to higher-quality high-yield bonds.
Lower-rated bonds may offer higher yields in return for more risk. Mutual funds that invest in bonds are subject to certain risks, including interest-rate risk, credit risk, and inflation risk. As interest rates rise, the prices of bonds fall. Long-term bonds are more exposed to interest-rate risk than short-term bonds. Unlike bonds, bond funds have ongoing fees and expenses.
What makes a bond
“high yield”?
High-yield bonds are fixed-income investments typically issued by companies that lack an established earnings track record or a solid credit history. In general, high-yield bonds offer higher interest rates than investment-grade bonds to compensate for their increased risk. Because of this added risk, these bonds are rated below investment grade by an independent rating agency (for example, the lowest Moody’s Investors Service rating of investment-grade bonds is Baa). The lower the rating, the greater the possibility that a bond’s issuer will be unable to make interest payments or repay the principal.
| |
| BOND RATINGS | |
|
| Moody’s | Grade |
|
| Aaa | Investment |
|
| Aa | Investment |
|
| Baa | Investment |
|
| Ba, B | High yield |
|
| Caa/Ca | High yield |
|
| C | High yield |
|
High-yield bonds historically have offered greater return
potential than investment-grade bonds.
Performance and portfolio snapshots
Putnam High Yield Advantage Fund
Current performance may be lower or higher than the quoted past performance, which cannot guarantee future results. Share price, principal value, and return will fluctuate, and you may have a gain or a loss when you sell your shares. Performance of class A shares assumes reinvestment of distributions and does not account for taxes. Fund returns in the bar chart do not reflect a sales charge; had they, returns would have been lower. See pages 9–11 for additional performance information. For a portion of the periods, this fund may have limited expenses, without which returns would have been lower. A 1% short-term trading fee may apply. To obtain the most recent month-end performance, visit www.putnam.com.
* The inception date of the fund’s benchmark, the JPMorgan Developed High Yield Index, was 12/31/94, which post-dates the 3/25/86 inception date of the fund’s class A shares.
“During the period we continued to emphasize
relatively high-quality issues and maintained
our rigorous fundamental credit research,
which benefited the fund during the second
half of the year, in particular.”
Paul Scanlon, Portfolio Leader, Putnam High Yield Advantage Fund

Credit qualities shown as a percentage of portfolio value as of 11/30/07. A bond rated Baa or higher (MIG3/VMIG3 or higher, for short-term debt) is considered investment grade. The chart reflects Moody’s ratings; percentages may include bonds not rated by Moody’s but considered by Putnam Management to be of comparable quality. Ratings will vary over time.
4
Report from the fund managers
The year in review

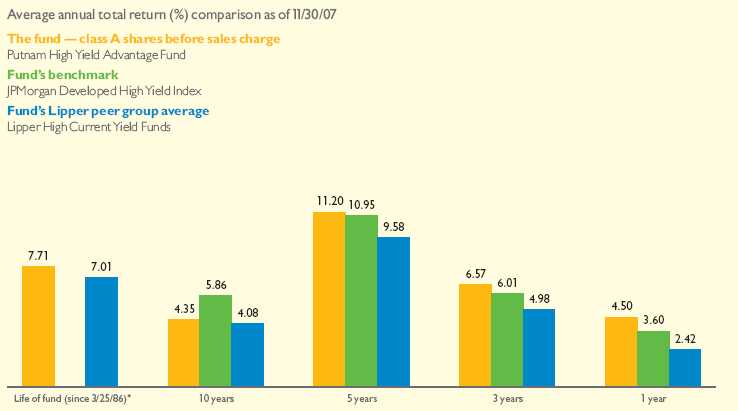
We are pleased to report that your fund’s class A shares posted a 4.50% total return during the fiscal year that ended November 30, 2007, based on results before sales charges. The year was marked by a sharp change in the tone of the market, as robust growth in the high-yield market was replaced in the summer by significant volatility related to the burgeoning mortgage crisis.
Favorable security selection was the main driver of your fund’s outperformance of its benchmark and Lipper peer group. While our decision not to emphasize the lower-quality segments of the market may have been a drag on performance earlier in the year, that decision proved sound in the face of market turmoil from the summer through the end of the fiscal year.
Market overview
Solid corporate business fundamentals coupled with sustained demand helped high-yield bonds post positive performance during the first half of your fund’s fiscal year. However, that backdrop changed dramatically as problems in the subprime mortgage and associated structured credit markets dampened investor sentiment and stunted market activity. This shift occurred just when the debt markets faced an unprecedented backlog of new issuance, much of which had been generated by firms seeking to raise capital for leveraged buyouts. In some cases, this new bond issuance was of lower quality, coming primarily from companies with significant debt leverage. This merger of too much supply and shrinking demand caused prices of high-yield bonds to decline dramatically during the summer, even though default rates remained at historically low levels.
The market staged a bit of a rebound in September, as some large deals successfully came to market. Nevertheless, access to credit continued to contract through the end of the fiscal year. In the face of uncertainty about the extent of their subprime and associated losses, financial institutions tightened their lending practices and sought to preserve assets to ensure liquidity. The Federal Reserve attempted to
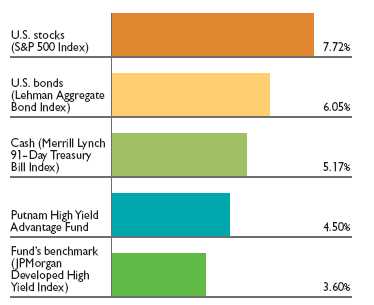
Market sector and fund performance
This comparison shows your fund’s performance in the context of different market sectors for the 12 months ended 11/30/07. See the previous page and pages 9–11 for additional fund performance information. Index descriptions can be found on page 16.
5
alleviate this credit crunch by lowering short-term interest rates on three separate occasions, but evidence of widening losses were already afoot. In the final months of the fiscal year, corporate earnings in the financial, homebuilding, and consumer-related industries showed signs of deterioration.
Strategy overview
Our basic investment approach of maintaining a broadly diversified portfolio of bonds from a variety of sectors and industries remained the same during the year.
In terms of credit quality, we continued to emphasize the higher-quality segment of the market. As mentioned, this strategy may have held back the fund’s relative performance during the first half of its fiscal year — when lower-quality bonds outperformed — but was of benefit during the downturn in the second half. As the market fell into turmoil, we maintained our rigorous fundamental credit research, carefully reviewing each holding to make sure its balance of risk and reward had not changed.
Additionally, as the market regained some stability in the latter stages of the period, we were able to find opportunities to make new investments at very attractive yields. Given that defaults remained very low, some of these bonds appeared to have a fair amount of bad news already reflected in their yields, which should ultimately accrue more income to the fund.
Further, we continued to add to the fund’s investments in floating-rate bank loans. These loans are issued by banks to companies with below-investment-grade ratings, and are subsequently traded on the open market. This asset class suffered sharp declines in the summer, as investor demand for structured credit programs, including collateralized loan obligations (CLOs), plunged. As a result, the loans began to offer yields that became attractive when compared with some high-yield bonds. An added benefit is that floating-rate loans generally are senior to high-yield bonds in many corporate capital structures, meaning that holders of a company’s bank loans generally would be paid before investors who hold the firm’s unsecured bonds, should the company default on its debt obligations.
Your fund’s holdings
The fund’s overweight exposure to the energy sector provided an important boost to performance during the year. Business fundamentals for energy companies remained robust because global demand for energy continued to outpace supply. Among bond holdings that helped your fund during the fiscal year were natural gas companies El Paso and Williams, both of which benefited as natural gas prices rose. El Paso is one of North America’s largest independent
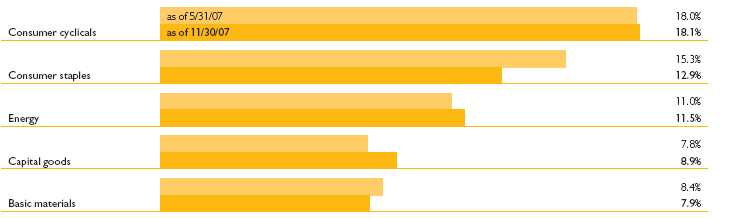
Comparison of top sector weightings
This chart shows how the fund’s top weightings have changed over the past six months. Weightings are shown as a percentage of net assets. Holdings will vary over time.
6
natural gas producers. Its bond prices rose when the company sold a pipeline subsidiary to pay down debt. Williams also used to engage in electricity and power generation, but sold this portion of its business to Bear Stearns’ energy-trading subsidiary. By doing so, the company looked to refocus on its core business of producing, processing, and transporting natural gas. Another energy company, XCL, a Louisiana-based oil and natural gas company, was acquired during the year, which bolstered the value of its securities, which we held in the fund.
Other holdings that helped performance came from a diverse set of industries. Bonds issued by Chaparral Steel rose when that company was purchased, and metals and mining firm Freeport-McMoRan offered very strong returns. Our holdings in this company’s convertible securities appreciated in concert with the underlying equity price in an environment of heightened global demand for copper, and after Freeport announced its acquisition of competitor Phelps Dodge.
When measuring the fund’s performance against its benchmarks, relative performance is sometimes aided by what we do not own or what we chose to sell. For example, the fund’s relative performance benefited from our decision not to own auto parts manufacturer Delphi, an index component whose valuation declined as the company worked its way through bankruptcy. Additionally, our decision to underweight the homebuilder and forest products sectors bolstered relative performance. For example, selling homebuilder Technical Olympic before its bond prices collapsed proved helpful.
Within a difficult investing environment, however, the fund was not immune to declines due to problems encountered by some of its holdings. The main detractor during the year was casino operator Tropicana. Its bond prices declined due to poor execution by management, as well as concerns about licensing renewals. Elsewhere, diversified media company Vertis called off a proposed acquisition of one of its chief competitors, causing its bonds to sell off; and Buffets, a restaurant chain, suffered from weak operating results.
Please note that the holdings discussed in this report may not have been held by the fund for the entire period. Portfolio composition is subject to review in accordance with the fund’s investment strategy and may vary in the future.
Of special interest
Fund’s dividend increased
We are pleased to announce an increase in the fund’s dividend from $0.0340 per share to $0.0350 per share, which occurred in October 2007. This dividend increase was possible because of the fund’s overall increase in net asset value and the amount of income flowing from the portfolio holdings.
Top holdings
This table shows the fund’s top holdings, and the percentage of the fund’s net assets that each represented, as of 11/30/07. The fund’s holdings will change over time.
| | | | |
| Holding (percent of fund’s net assets) | Coupon (%) and maturity date | | Sector/Industry |
|
| CCH I, LLC/Capital Corp. (1.0%) | | 11%, 2015 | | Consumer staples/Cable television |
|
| General Motors Corp. (0.9%) | | 7.2%, 2011 | | Consumer cyclicals/Automotive |
|
| Ford Motor Credit Corp. (0.8%) | | 9.875%, 2011 | | Consumer cyclicals/Automotive |
|
| General Motors Acceptance Corp. (GMAC LLC) (0.7%) | | 7.75%, 2010 | | Financial/Financial |
|
| General Motors Acceptance Corp. (GMAC LLC) (0.7%) | | 6.875%, 2012 | | Financial/Financial |
|
| NRG Energy, Inc. (0.7%) | | 7.375%, 2016 | | Utilities & power/Power producers |
|
| SunGard Data Systems, Inc. (0.7%) | | 9.125%, 2013 | | Technology/Computers |
|
| Echostar DBS Corp. (0.7%) | | 6.375%, 2011 | | Consumer staples/Broadcasting |
|
| Legrand SA (0.6%) | | 8.5%, 2025 | | Capital goods/Manufacturing |
|
| Freeport-McMoRan Copper & Gold, Inc. (0.6%) | | 8.375%, 2017 | | Basic materials/Metals |
|
7
The outlook for your fund
The following commentary reflects anticipated developments that could affect your fund over the next six months, as well as your management team’s plans for responding to them.
By the close of the fiscal year, many high-yield bond prices had declined from their highs in keeping with the turn in investor sentiment. Corporate business fundamentals are not as strong as they appeared at the start of the year, and it is unclear whether the economy is entering a period of slower growth or outright recession. Against this backdrop, it is widely expected that default rates on high-yield bonds will start rising from their historically low levels. Although there is currently a lack of liquidity in the markets, we believe valuations are becoming attractive.
For our part, we are neither overly bullish nor bearish. Going forward, we will aim to avoid being too aggressive or defensive, instead maintaining a consistent investment approach, selecting securities one at a time with a focus on diversification, as well as taking care to choose investments for the fund that offer an attractive balance of risk and potential reward.
The views expressed in this report are exclusively those of Putnam Management. They are not meant as investment advice.
Lower-rated bonds may offer higher yields in return for more risk. Mutual funds that invest in bonds are subject to certain risks, including interest-rate risk, credit risk, and inflation risk. As interest rates rise, the prices of bonds fall. Long-term bonds are more exposed to interest-rate risk than short-term bonds. Unlike bonds, bond funds have ongoing fees and expenses.
8
Your fund’s performance
This section shows your fund’s performance, price, and distribution information periods ended November 30, 2007, the end of its most recent fiscal year. In accordance with regulatory requirements for mutual funds, we also include performance as of the most recent calendar quarter-end and expense information taken from the fund’s current prospectus. Performance should always be considered in light of a fund’s investment strategy. Data represents past performance. Past performance does not guarantee future results. More recent returns may be less or more than those shown. Investment return and principal value will fluctuate, and you may have a gain or a loss when you sell your shares. Performance information does not reflect any deduction for taxes a shareholder may owe on fund distributions or on the redemption of fund shares. For the most recent month-end performance, please visit www.putnam.com or call Putnam at 1-800-225-1581. Class Y shares are generally only available to corporate and institutional clients and clients in other approved programs. See the Terms and Definitions section in this report for definitions of the share classes offered by your fund.
Fund performance Total return for periods ended 11/30/07
| | | | | | | | | | | | | | | | | |
| | | | | | | | | | | |
| | | | Class A | | | Class B | | | Class C | | | Class M | | | Class R | | Class Y |
| (inception dates) | | | (3/25/86) | | | (5/16/94) | | | (3/30/07) | | | (12/1/94) | | | (3/30/07) | | (12/31/98) |
| | | NAV | POP | NAV | CDSC | NAV | CDSC | NAV | POP | NAV | NAV |
|
| Annual average | | | | | | | | | | | |
| (life of fund) | | 7.71% | 7.51% | 6.79% | 6.79% | 6.89% | 6.89% | 7.41% | 7.25% | 7.44% | 7.88% |
|
| 10 years | | 53.12 | 46.92 | 41.33 | 41.33 | 41.70 | 41.70 | 49.87 | 45.06 | 49.38 | 58.23 |
| Annual average | | 4.35 | 3.92 | 3.52 | 3.52 | 3.55 | 3.55 | 4.13 | 3.79 | 4.09 | 4.70 |
|
| 5 years | | 70.04 | 63.10 | 63.47 | 61.47 | 63.32 | 63.32 | 67.87 | 62.53 | 68.07 | 72.58 |
| Annual average | | 11.20 | 10.28 | 10.33 | 10.06 | 10.31 | 10.31 | 10.92 | 10.20 | 10.94 | 11.53 |
|
| 3 years | | 21.03 | 16.13 | 18.29 | 15.35 | 18.01 | 18.01 | 20.06 | 16.11 | 20.23 | 21.87 |
| Annual average | | 6.57 | 5.11 | 5.76 | 4.88 | 5.68 | 5.68 | 6.28 | 5.10 | 6.33 | 6.82 |
|
| 1 year | | 4.50 | 0.31 | 3.58 | –1.27 | 3.46 | 2.50 | 4.11 | 0.71 | 4.35 | 4.78 |
|
Current performance may be lower or higher than the quoted past performance, which cannot guarantee future results. After sales charge returns (public offering price, or POP) for class A and M shares reflect a maximum 4.00% and 3.25% load, respectively as of 1/2/08. Class B share returns reflect the applicable contingent deferred sales charge (CDSC), which is 5% in the first year, declining to 1% in the sixth year, and is eliminated thereafter. Class C shares reflect a 1% CDSC for the first year and is eliminated thereafter. Class R and Y shares have no initial sales charge or CDSC. Performance for class B, C, M, R, and Y shares before their inception is derived from the historical performance of class A shares, adjusted for the applicable sales charge (or CDSC) and, except for class Y shares, the higher operating expenses for such shares.
For a portion of the periods, this fund limited expenses, without which returns would have been lower.
A 1% short-term trading fee may be applied to shares exchanged or sold within 7 days of purchase.
Change in the value of a $10,000 investment ($9,600 after sales charge)
Cumulative total return from 11/30/97 to 11/30/07
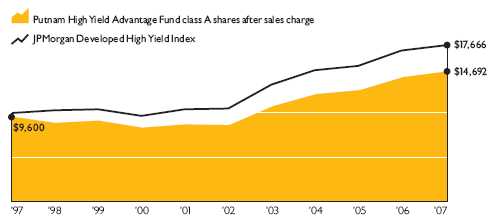
Past performance does not indicate future results. At the end of the same time period, a $10,000 investment in the fund’s class B and class C shares would have been valued at $14,133 and $14,170, respectively, and no contingent deferred sales charges would apply. A $10,000 investment in the fund’s class M shares ($9,675 after sales charge) would have been valued at $14,506 at public offering price. A $10,000 investment in the fund’s class R and class Y shares would have been valued at $14,938 and $15,823, respectively.
9
Comparative index returns For periods ended 11/30/07
| | | |
| | | | Lipper High |
| | JPMorgan Developed | | Current Yield Funds |
| | High Yield Index | | category average* |
|
| Annual average | | | |
| (life of fund) | —† | | 7.01% |
|
| 10 years | 76.66% | | 51.61 |
| Annual average | 5.86 | | 4.08 |
|
| 5 years | 68.14 | | 58.75 |
| Annual average | 10.95 | | 9.58 |
|
| 3 years | 19.12 | | 15.88 |
| Annual average | 6.01 | | 4.98 |
|
| 1 year | 3.60 | | 2.42 |
|
Index and Lipper results should be compared to fund performance at net asset value.
* Over the 1-, 3-, 5-, 10-year, and life of fund periods ended 11/30/07, there were 447, 381, 326, 148, and 28 funds, respectively, in this Lipper category.
† This index began operations on 12/31/94.
Fund price and distribution information For the 12-month period ended 11/30/07
| | | | | | | | |
| Distributions | Class A | | Class B | Class C | Class M | | Class R | Class Y |
|
| Number | 12 | 12 | 8 | 12 | 8 | 12 |
|
| Income | $0.447 | $0.399 | $0.252 | $0.434 | $0.265 | $0.460 |
|
| Capital gains | — | — | — | — | — | — |
|
| Total | $0.447 | $0.399 | $0.252 | $0.434 | $0.265 | $0.460 |
|
| Share value: | NAV | POP† | NAV | NAV | NAV | POP | NAV | NAV |
|
| 11/30/06 | $6.22 | $6.48 | $6.14 | — | $6.23 | $6.44 | — | $6.35 |
|
| 3/30/07* | — | — | — | $6.27 | — | — | $6.35 | — |
|
| 11/30/07 | 6.05 | 6.30 | 5.96 | 5.95 | 6.05 | 6.25 | 6.05 | 6.19 |
|
| Current yield (end of period) | | | | | | | | |
|
| Current dividend rate1 | 6.94% | 6.67% | 6.24% | 6.25% | 6.74% | 6.53% | 6.74% | 6.98% |
|
| Current 30-day SEC yield2,3 | | | | | | | | |
| (with expense limitation) | N/A | 7.37 | 6.91 | 6.90 | N/A | 7.18 | 7.48 | 7.86 |
|
| Current 30-day SEC yield3 | | | | | | | | |
| (without expense limitation) | N/A | 7.37 | 6.90 | 6.90 | N/A | 7.18 | 7.48 | 7.86 |
|
* Inception date of class C and class R shares.
† Reflects an increase in sales charges that took effect on 1/2/08.
1 Most recent distribution, excluding capital gains, annualized and divided by NAV or POP at end of period.
2 For a portion of the period, this fund may have limited expenses, without which yields would have been lower.
3 Based only on investment income and calculated using the maximum offering price for each share class, in accordance with SEC guidelines.
10
Fund performance as of most recent calendar quarter Total return for periods ended 12/31/07
| | | | | | | | | | | |
| | | Class A | | Class B | | Class C | | Class M | | Class R | Class Y |
| (inception dates) | | (3/25/86) | | (5/16/94) | | (3/30/07) | | (12/1/94) | | (3/30/07) | (12/31/98) |
| | | NAV | POP | NAV | CDSC | NAV | CDSC | NAV | POP | NAV | NAV |
|
| Annual average | | | | | | | | | | | |
| (life of fund) | | 7.69% | 7.48% | 6.76% | 6.76% | 6.87% | 6.87% | 7.39% | 7.22% | 7.43% | 7.85% |
|
| 10 years | | 51.43 | 45.32 | 39.75 | 39.75 | 40.09 | 40.09 | 48.23 | 43.35 | 47.97 | 56.51 |
| Annual average | | 4.24 | 3.81 | 3.40 | 3.40 | 3.43 | 3.43 | 4.01 | 3.67 | 4.00 | 4.58 |
|
| 5 years | | 69.48 | 62.84 | 62.92 | 60.92 | 62.98 | 62.98 | 67.32 | 61.98 | 67.76 | 72.01 |
| Annual average | | 11.13 | 10.24 | 10.25 | 9.98 | 10.26 | 10.26 | 10.84 | 10.13 | 10.90 | 11.46 |
|
| 3 years | | 19.73 | 14.91 | 17.01 | 14.11 | 16.86 | 16.86 | 18.77 | 14.89 | 19.12 | 20.59 |
| Annual average | | 6.19 | 4.74 | 5.38 | 4.50 | 5.33 | 5.33 | 5.90 | 4.74 | 6.01 | 6.44 |
|
| 1 year | | 3.44 | –0.71 | 2.68 | –2.14 | 2.51 | 1.55 | 3.05 | –0.31 | 3.44 | 3.74 |
|
Fund’s annual operating expenses For the fiscal year ended 11/30/06
| | | | | | | |
| | | Class A | Class B | Class C | Class M | Class R | Class Y |
|
| Total annual fund operating expenses | | 1.05% | 1.80% | 1.80% | 1.30% | 1.30% | 0.80% |
|
Expense information in this table is taken from the most recent prospectus, is subject to change, and may differ from that shown in the next section and in the financial highlights of this report. Expenses are shown as a percentage of average net assets. Please refer to the fund’s prospectus for more detail.
11
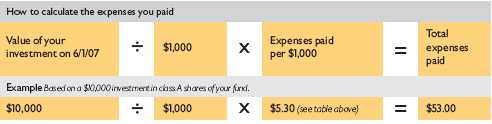
Your fund’s expenses
As a mutual fund investor, you pay ongoing expenses, such as management fees, distribution fees (12b-1 fees), and other expenses. In the most recent six-month period, your fund limited these expenses; had it not done so, expenses would have been higher. Using the information below, you can estimate how these expenses affect your investment and compare them with the expenses of other funds. You may also pay one-time transaction expenses, including sales charges (loads) and redemption fees, which are not shown in this section and would have resulted in higher total expenses. For more information, see your fund’s prospectus or talk to your financial representative.
Review your fund’s expenses
The table below shows the expenses you would have paid on a $1,000 investment in Putnam High Yield Advantage Fund from June 1, 2007, to November 30, 2007. It also shows how much a $1,000 investment would be worth at the close of the period, assuming actual returns and expenses.
| | | | | | | |
| | | Class A | Class B | Class C | Class M | Class R | Class Y |
|
| Expenses paid per $1,000* | | $ 5.30 | $ 9.00 | $ 9.00 | $ 6.54 | $ 6.54 | $ 4.07 |
|
| Ending value (after expenses) | | $977.60 | $973.30 | $972.70 | $976.40 | $976.40 | $979.10 |
|
* Expenses for each share class are calculated using the fund’s annualized expense ratio for each class, which represents the ongoing expenses as a percentage of average net assets for the six months ended 11/30/07. The expense ratio may differ for each share class (see the last table in this section). Expenses are calculated by multiplying the expense ratio by the average account value for the period; then multiplying the result by the number of days in the period; and then dividing that result by the number of days in the year.
Estimate the expenses you paid
To estimate the ongoing expenses you paid for the six months ended November 30, 2007, use the calculation method below. To find the value of your investment on June 1, 2007, call Putnam at 1-800-225-1581.
Compare expenses using the SEC’s method
The Securities and Exchange Commission (SEC) has established guidelines to help investors assess fund expenses. Per these guidelines, the table below shows your fund’s expenses based on a $1,000 investment, assuming a hypothetical 5% annualized return. You can use this information to compare the ongoing expenses (but not transaction expenses or total costs) of investing in the fund with those of other funds. All mutual fund shareholder reports will provide this information to help you make this comparison. Please note that you cannot use this information to estimate your actual ending account balance and expenses paid during the period.
| | | | | | | |
| | | Class A | Class B | Class C | Class M | Class R | Class Y |
|
| Expenses paid per $1,000* | | $ 5.42 | $ 9.20 | $ 9.20 | $ 6.68 | $ 6.68 | $ 4.15 |
|
| Ending value (after expenses) | | $1,019.70 | $1,015.94 | $1,015.94 | $1,018.45 | $1,018.45 | $1,020.96 |
|
* Expenses for each share class are calculated using the fund’s annualized expense ratio for each class, which represents the ongoing expenses as a percentage of average net assets for the six months ended 11/30/07. The expense ratio may differ for each share class (see the last table in this section). Expenses are calculated by multiplying the expense ratio by the average account value for the period; then multiplying the result by the number of days in the period; and then dividing that result by the number of days in the year.
12
Compare expenses using industry averages
You can also compare your fund’s expenses with the average of its peer group, as defined by Lipper, an independent fund-rating agency that ranks funds relative to others that Lipper considers to have similar investment styles or objectives. The expense ratio for each share class shown below indicates how much of your fund’s average net assets have been used to pay ongoing expenses during the period.
| | | | | | | |
| | | Class A | Class B | Class C | Class M | Class R | Class Y |
|
| Your fund’s annualized expense ratio* | | 1.07% | 1.82% | 1.82% | 1.32% | 1.32% | 0.82% |
|
| Average annualized expense ratio for Lipper peer group† | | 1.13% | 1.88% | 1.88% | 1.38% | 1.38% | 0.88% |
|
* For the fund’s most recent fiscal half year; may differ from expense ratios based on one-year data in the financial highlights.
† Putnam is committed to keeping fund expenses below the Lipper peer group average expense ratio and will limit fund expenses if they exceed the Lipper average. The Lipper average is a simple average of front-end load funds in the peer group that excludes 12b-1 fees as well as any expense offset and brokerage service arrangements that may reduce fund expenses. To facilitate the comparison in this presentation, Putnam has adjusted the Lipper average to reflect the 12b-1 fees carried by each class of shares other than class Y shares, which do not incur 12b-1 fees. Investors should note that the other funds in the peer group may be significantly smaller or larger than the fund, and that an asset-weighted average would likely be lower than the simple average. Also, the fund and Lipper report expense data at different times and for different periods. The fund’s expense ratio shown here is annualized data for the most recent six-month period, while the quarte rly updated Lipper average is based on the most recent fiscal year-end data available for the peer group funds as of 9/30/07.
13
Your fund’s portfolio turnover
and Morningstar® Risk
Putnam funds are actively managed by teams of experts who buy and sell securities based on intensive analysis of companies, industries, economies, and markets. Portfolio turnover is a measure of how often a fund’s managers buy and sell securities for your fund. A portfolio turnover of 100%, for example, means that the managers sold and replaced securities valued at 100% of a fund’s average portfolio value within a given period. Funds with high turnover may be more likely to generate capital gains that must be distributed to shareholders as taxable income. High turnover may also cause a fund to pay more brokerage commissions and other transaction costs, which may detract from performance.
Funds that invest in bonds or other fixed-income instruments may have higher turnover than funds that invest only in stocks. Short-term bond funds tend to have higher turnover than longer-term bond funds, because shorter-term bonds will mature or be sold more frequently than longer-term bonds. You can use the table below to compare your fund’s turnover with the average turnover for funds in its Lipper category.
Turnover comparisons
Percentage of holdings that change every year
| | | | | | |
| | | 2007 | 2006 | 2005 | 2004 | 2003 |
|
| Putnam High Yield Advantage Fund | | 48% | 46% | 33% | 53% | 79% |
|
| Lipper High Current Yield Funds category average | | 83% | 83% | 73% | 95% | 98% |
|
Turnover data for the fund is calculated based on the fund’s fiscal-year period, which ends on November 30. Turnover data for the fund’s Lipper category is calculated based on the average of the turnover of each fund in the category for its fiscal year ended during the indicated year. Fiscal years vary across funds in the Lipper category, which may limit the comparability of the fund’s portfolio turnover rate to the Lipper average. Comparative data for 2007 is based on information available as of 11/30/07.
Your fund’s Morningstar® Risk
This risk comparison is designed to help you understand how your fund compares with other funds. The comparison utilizes a risk measure developed by Morningstar, an independent fund-rating agency. This risk measure is referred to as the fund’s Morningstar Risk.

Your fund’s Morningstar Risk is shown alongside that of the average fund in its Morningstar category. The risk bar broadens the comparison by translating the fund’s Morningstar Risk into a percentile, which is based on the fund’s ranking among all funds rated by Morningstar as of December 31, 2007. A higher Morningstar Risk generally indicates that a fund’s monthly returns have varied more widely.
Morningstar determines a fund’s Morningstar Risk by assessing variations in the fund’s monthly returns — with an emphasis on downside variations — over a 3-year period, if available. Those measures are weighted and averaged to produce the fund’s Morningstar Risk. The information shown is provided for the fund’s class A shares only; information for other classes may vary. Morningstar Risk is based on historical data and does not indicate future results. Morningstar does not purport to measure the risk associated with a current investment in a fund, either on an absolute basis or on a relative basis. Low Morningstar Risk does not mean that you cannot lose money on an investment in a fund. Copyright 2007 Morningstar, Inc. All Rights Reserved. The information contained herein (1) is proprietary to Morningstar and/or its content providers; (2) may not be copied or distributed; and (3) is not warranted to be accurate, complete, or timely. Nei ther Morningstar nor its content providers are responsible for any damages or losses arising from any use of this information.
14
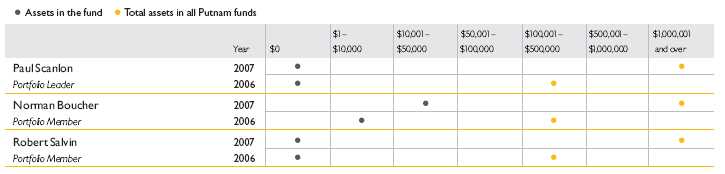
Your fund’s management
Your fund is managed by the members of the Putnam Core Fixed-Income High-Yield Team. Paul Scanlon is the Portfolio Leader. Norman Boucher and Robert Salvin are Portfolio Members of your fund. The Portfolio Leader and Portfolio Members coordinate the team’s management of the fund.
For a complete listing of the members of the Putnam Core Fixed-Income High-Yield Team, including those who are not Portfolio Leaders or Portfolio Members of your fund, visit Putnam’s Individual Investor Web site at www.putnam.com.
Investment team fund ownership
The table below shows how much the fund’s current Portfolio Leader and Portfolio Members have invested in the fund and in all Putnam mutual funds (in dollar ranges). Information shown is as of November 30, 2007, and November 30, 2006.
Trustee and Putnam employee fund ownership
As of November 30, 2007, all of the Trustees of the Putnam funds owned fund shares. The table below shows the approximate value of investments in the fund and all Putnam funds as of that date by the Trustees and Putnam employees. These amounts include investments by the Trustees’ and employees’ immediate family members and investments through retirement and deferred compensation plans.
| | |
| | | Total assets in |
| | Assets in the fund | all Putnam funds |
|
| Trustees | $ 233,000 | $ 92,000,000 |
|
| Putnam employees | $2,071,000 | $770,000,000 |
|
Other Putnam funds managed by the Portfolio Leader and Portfolio Members
Paul Scanlon is also a Portfolio Leader of Putnam Floating Rate Income Fund and Putnam High Yield Trust. He is also a Portfolio Member of Putnam Diversified Income Trust, Putnam Master Intermediate Income Trust, and Putnam Premier Income Trust.
Norman Boucher is also a Portfolio Member of Putnam High Yield Trust.
Robert Salvin is also a Portfolio Leader of Putnam High Income Securities Fund and a Portfolio Member of Putnam Convertible Income-Growth Trust and Putnam High Yield Trust.
Paul Scanlon, Norman Boucher, and Robert Salvin may also manage other accounts and variable trust funds advised by Putnam Management or an affiliate.
Changes in your fund’s Portfolio Leader and Portfolio Members
Your fund’s Portfolio Leader and Portfolio Members did not change during the year ended November 30, 2007.
15
Terms and definitions
Important terms
Total return shows how the value of the fund’s shares changed over time, assuming you held the shares through the entire period and reinvested all distributions in the fund.
Net asset value (NAV) is the price, or value, of one share of a mutual fund, without a sales charge. NAVs fluctuate with market conditions. NAV is calculated by dividing the net assets of each class of shares by the number of outstanding shares in the class. Public offering price (POP) is the price of a mutual fund share plus the maximum sales charge levied at the time of purchase. POP performance figures shown here assume the 4.00% maximum sales charge for class A shares and 3.25% for class M shares.
Contingent deferred sales charge (CDSC) is generally a charge applied at the time of the redemption of class B or C shares and assumes redemption at the end of the period. Your fund’s class B CDSC declines from a 5% maximum during the first year to 1% during the sixth year. After the sixth year, the CDSC no longer applies. The CDSC for class C shares is 1% for one year after purchase.
Current yield is the annual rate of return earned from dividends or interest of an investment. Current yield is expressed as a percentage of the price of a security, fund share, or principal investment.
Share classes
Class A shares are generally subject to an initial sales charge and no CDSC (except on certain redemptions of shares bought without an initial sales charge).
Class B shares are not subject to an initial sales charge. They may be subject to a CDSC.
Class C shares are not subject to an initial sales charge and are subject to a CDSC only if the shares are redeemed during the first year.
Class M shares have a lower initial sales charge and a higher 12b-1 fee than class A shares and no CDSC.
Class R shares are not subject to an initial sales charge or CDSC and are available only to certain defined contribution plans.
Class Y shares are not subject to an initial sales charge or CDSC, and carry no 12b-1 fee. They are generally only available to corporate and institutional clients and clients in other approved programs.
Comparative indexes
JPMorgan Developed High Yield Index is an unmanaged index of high-yield fixed-income securities issued in developed countries.
Lehman Aggregate Bond Index is an unmanaged index of U.S. investment-grade fixed-income securities.
Merrill Lynch 91-Day Treasury Bill Index is an unmanaged index that seeks to measure the performance of U.S. Treasury bills available in the marketplace.
S&P 500 Index is an unmanaged index of common stock performance.
Indexes assume reinvestment of all distributions and do not account for fees. Securities and performance of a fund and an index will differ. You cannot invest directly in an index.
Lipper is a third-party industry-ranking entity that ranks mutual funds. Its rankings do not reflect sales charges. Lipper rankings are based on total return at net asset value relative to other funds that have similar current investment styles or objectives as determined by Lipper. Lipper may change a fund’s category assignment at its discretion. Lipper category averages reflect performance trends for funds within a category.
16
Trustee approval
of management contract
General conclusions
The Board of Trustees of the Putnam funds oversees the management of each fund and, as required by law, determines annually whether to approve the continuance of your fund’s management contract with Putnam Investment Management (“Putnam Management”) and the sub-management contract between Putnam Management’s affiliate, Putnam Investments Limited (“PIL”), and Putnam Management. In this regard, the Board of Trustees, with the assistance of its Contract Committee consisting solely of Trustees who are not “interested persons” (as such term is defined in the Investment Company Act of 1940, as amended) of the Putnam funds (the “Independent Trustees”), requests and evaluates all information it deems reasonably necessary under the circumstances. Over the course of several months ending in June 2007, the Contract Committee met several times to consider the information provided by Putnam Management and other information develo ped with the assistance of the Board’s independent counsel and independent staff. The Contract Committee reviewed and discussed key aspects of this information with all of the Independent Trustees. The Contract Committee recommended, and the Independent Trustees approved, the continuance of your fund’s management contract and sub-management contract, effective July 1, 2007. (Because PIL is an affiliate of Putnam Management and Putnam Management remains fully responsible for all services provided by PIL, the Trustees have not evaluated PIL as a separate entity, and all subsequent references to Putnam Management below should be deemed to include reference to PIL as necessary or appropriate in the context.)
In addition, in anticipation of the sale of Putnam Investments to Great-West Lifeco, at a series of meetings ending in March 2007, the Trustees reviewed and approved new management and distribution arrangements to take effect upon the change of control. Shareholders of all funds approved the management contracts in May 2007, and the change of control transaction was completed on August 3, 2007. Upon the change of control, the management contracts that were approved by the Trustees in June 2007 automatically terminated and were replaced by new contracts that had been approved by shareholders. In connection with their review for the June 2007 continuance of the Putnam funds’ management contracts, the Trustees did not identify any facts or circumstances that would alter the substance of the conclusions and recommendations they made in their review of the contracts to take effect upon the change of control.
The Independent Trustees’ approval was based on the following conclusions:
• That the fee schedule in effect for your fund represented reasonable compensation in light of the nature and quality of the services being provided to the fund, the fees paid by competitive funds and the costs incurred by Putnam Management in providing such services, and
• That this fee schedule represented an appropriate sharing between fund shareholders and Putnam Management of such economies of scale as may exist in the management of the fund at current asset levels.
These conclusions were based on a comprehensive consideration of all information provided to the Trustees and were not the result of any single factor. Some of the factors that figured particularly in the Trustees’ deliberations and how the Trustees considered these factors are described below, although individual Trustees may have evaluated the information presented differently, giving different weights to various factors. It is also important to recognize that the fee arrangements for your fund and the other Putnam funds are the result of many years of review and discussion between the Independent Trustees and Putnam Management, that certain aspects of such arrangements may receive greater scrutiny in some years than others, and that the Trustees’ conclusions may be based, in part, on their consideration of these same arrangements in prior years.
Management fee schedules and categories; total expenses
The Trustees reviewed the management fee schedules in effect for all Putnam funds, including fee levels and breakpoints, and the assignment of funds to particular fee categories. In reviewing fees and expenses, the Trustees generally focused their attention on material changes in circumstances — for example, changes in a fund’s size or investment style, changes in Putnam Management’s operating costs or responsibilities, or changes in competitive practices in the mutual fund industry — that suggest that consideration of fee changes might be warranted. The Trustees concluded that the circumstances did not warrant changes to the management fee structure of your fund, which had been carefully developed over the years, re-examined on many occasions and adjusted where appropriate. The Trustees focused on two areas of particular interest, as discussed further below:
• Competitiveness. The Trustees reviewed comparative fee and expense information for competitive funds, which indicated that,
17
in a custom peer group of competitive funds selected by Lipper Inc., your fund ranked in the 69th percentile in management fees and in the 34th percentile in total expenses (less any applicable 12b-1 fees) as of December 31, 2006 (the first percentile being the least expensive funds and the 100th percentile being the most expensive funds). (Because the fund’s custom peer group is smaller than the fund’s broad Lipper Inc. peer group, this expense information may differ from the Lipper peer expense information found elsewhere in this report.) The Trustees noted that expense ratios for a number of Putnam funds, which show the percentage of fund assets used to pay for management and administrative services, distribution (12b-1) fees and other expenses, had been increasing recently as a result of declining net assets and the natural operation of fee breakpoints.
The Trustees noted that the expense ratio increases described above were currently being controlled by expense limitations implemented in January 2004 and which Putnam Management had committed to maintain at least through 2007. In anticipation of the change of control of Putnam Investments, the Trustees requested, and received a commitment from Putnam Management and Great-West Lifeco, to extend this program through at least June 30, 2009. These expense limitations give effect to a commitment by Putnam Management that the expense ratio of each open-end fund would be no higher than the average expense ratio of the competitive funds included in the fund’s relevant Lipper universe (exclusive of any applicable 12b-1 charges in each case). The Trustees observed that this commitment to limit fund expenses has served shareholders well since its inception.
In order to ensure that the expenses of the Putnam funds continue to meet evolving competitive standards, the Trustees requested, and Putnam Management agreed, to extend for the twelve months beginning July 1, 2007, an additional expense limitation for certain funds at an amount equal to the average expense ratio (exclusive of 12b-1 charges) of a custom peer group of competitive funds selected by Lipper to correspond to the size of the fund. This additional expense limitation will be applied to those open-end funds that had above-average expense ratios (exclusive of 12b-1 charges) based on the custom peer group data for the period ended December 31, 2006. This additional expense limitation will not be applied to your fund because it had a below-average expense ratio relative to its custom peer group.
• Economies of scale. Your fund currently has the benefit of breakpoints in its management fee that provide shareholders with significant economies of scale, which means that the effective management fee rate of a fund (as a percentage of fund assets) declines as a fund grows in size and crosses specified asset thresholds. Conversely, as a fund shrinks in size — as has been the case for many Putnam funds in recent years — these breakpoints result in increasing fee levels. In recent years, the Trustees have examined the operation of the existing breakpoint structure during periods of both growth and decline in asset levels. The Trustees concluded that the fee schedules in effect for the funds represented an appropriate sharing of economies of scale at current asset levels. In reaching this conclusion, the Trustees considered the Contract Committee’s stated intent to con tinue to work with Putnam Management to plan for an eventual resumption in the growth of assets, and to consider the potential economies that might be produced under various growth assumptions.
In connection with their review of the management fees and total expenses of the Putnam funds, the Trustees also reviewed the costs of the services to be provided and profits to be realized by Putnam Management and its affiliates from the relationship with the funds. This information included trends in revenues, expenses and profitability of Putnam Management and its affiliates relating to the investment management and distribution services provided to the funds. In this regard, the Trustees also reviewed an analysis of Putnam Management’s revenues, expenses and profitability with respect to the funds’ management contracts, allocated on a fund-by-fund basis.
Investment performance during the Trustees’ review period
The quality of the investment process provided by Putnam Management represented a major factor in the Trustees’ evaluation of the quality of services provided by Putnam Management under your fund’s management contract. The Trustees were assisted in their review of the Putnam funds’ investment process and performance by the work of the Investment Process Committee of the Trustees and the Investment Oversight Committees of the Trustees, which had met on a regular monthly basis with the funds’ portfolio teams throughout the year. The Trustees concluded that Putnam Management generally provides a high-quality investment process — as measured by the experience and skills of the individuals assigned to the management of fund portfolios, the resources made available to such personnel, and in general the ability of Putnam Management to attract and
18
retain high-quality personnel — but also recognized that this does not guarantee favorable investment results for every fund in every time period. The Trustees considered the investment performance of each fund over multiple time periods and considered information comparing each fund’s performance with various benchmarks and with the performance of competitive funds.
The Trustees noted the satisfactory investment performance of many Putnam funds. They also noted the disappointing investment performance of certain funds in recent years and discussed with senior management of Putnam Management the factors contributing to such underperformance and actions being taken to improve performance. The Trustees recognized that, in recent years, Putnam Management has made significant changes in its investment personnel and processes and in the fund product line to address areas of underperformance. In particular, they noted the important contributions of Putnam Management’s leadership in attracting, retaining and supporting high-quality investment professionals and in systematically implementing an investment process that seeks to merge the best features of fundamental and quantitative analysis. The Trustees indicated their intention to continue to monitor performance trends to assess the effectiveness of these changes and to evaluate whether additional changes to address areas of underperformance are warranted.
In the case of your fund, the Trustees considered that your fund’s class A share cumulative total return performance at net asset value was in the following percentiles of its Lipper Inc. peer group (Lipper High Current Yield Funds) for the one-, three- and five-year periods ended March 31, 2007 (the first percentile being the best-performing funds and the 100th percentile being the worst-performing funds):
| | |
| One-year period | Three-year period | Five-year period |
|
| 4th | 13th | 19th |
(Because of the passage of time, these performance results may differ from the performance results for more recent periods shown elsewhere in this report. Over the one-, three- and five-year periods ended March 31, 2007, there were 445, 382, and 315 funds, respectively, in your fund’s Lipper peer group.* Past performance is no guarantee of future returns.)
As a general matter, the Trustees concluded that cooperative efforts between the Trustees and Putnam Management represent the most effective way to address investment performance problems. The Trustees noted that investors in the Putnam funds have, in effect, placed their trust in the Putnam organization, under the oversight of the funds’ Trustees, to make appropriate decisions regarding the management of the funds. Based on the responsiveness of Putnam Management in the recent past to Trustee concerns about investment performance, the Trustees concluded that it is preferable to seek change within Putnam Management to address performance shortcomings. In the Trustees’ view, the alternative of terminating a management contract and engaging a new investment adviser for an underperforming fund would entail significant disruptions and would not provide any greater assurance of improved investment performance.
Brokerage and soft-dollar allocations; other benefits
The Trustees considered various potential benefits that Putnam Management may receive in connection with the services it provides under the management contract with your fund. These include benefits related to brokerage and soft-dollar allocations, whereby a portion of the commissions paid by a fund for brokerage may be used to acquire research services that may be useful to Putnam Management in managing the assets of the fund and of other clients. The Trustees indicated their continued intent to monitor the potential benefits associated with the allocation of fund brokerage to ensure that the principle of seeking “best price and execution” remains paramount in the portfolio trading process.
The Trustees’ annual review of your fund’s management contract also included the review of its distributor’s contract and distribution plan with Putnam Retail Management Limited Partnership and the custodian agreement and investor servicing agreement with Putnam Fiduciary Trust Company (“PFTC”), each of which provides benefits to affiliates of Putnam Management. In the case of the custodian agreement, the Trustees considered that, effective January 1, 2007, the Putnam funds had engaged State Street Bank and Trust Company as custodian and began to transition the responsibility for providing custody services away from PFTC.
* The percentile rankings for your fund’s class A share annualized total return performance in the Lipper High Current Yield Funds category for the one-, five- and ten-year periods ended December 31, 2007 were 11%, 15%, and 53%, respectively. Over the one-, five- and ten-year periods ended December 31, 2007, the fund ranked 50 out of 455, 47 out of 334, and 80 out of 151 funds, respectively. Note that this more recent information was not available when the Trustees approved the continuance of your fund’s management contract.
19
Comparison of retail and institutional fee schedules
The information examined by the Trustees as part of their annual contract review has included for many years information regarding fees charged by Putnam Management and its affiliates to institutional clients such as defined benefit pension plans, college endowments, etc. This information included comparison of such fees with fees charged to the funds, as well as a detailed assessment of the differences in the services provided to these two types of clients. The Trustees observed, in this regard, that the differences in fee rates between institutional clients and the funds are by no means uniform when examined by individual asset sectors, suggesting that differences in the pricing of investment management services to these types of clients reflect to a substantial degree historical competitive forces operating in separate market places. The Trustees considered the fact that fee rates across all asset sectors are higher on average for funds than for institutional clients, as well as the differences between the services that Putnam Management provides to the Putnam funds and those that it provides to institutional clients of the firm, but did not rely on such comparisons to any significant extent in concluding that the management fees paid by your fund are reasonable.
20
Other information for shareholders
Putnam’s policy on confidentiality
In order to conduct business with our shareholders, we must obtain certain personal information such as account holders’ addresses, telephone numbers, Social Security numbers, and the names of their financial representatives. We use this information to assign an account number and to help us maintain accurate records of transactions and account balances. It is our policy to protect the confidentiality of your information, whether or not you currently own shares of our funds, and, in particular, not to sell information about you or your accounts to outside marketing firms. We have safeguards in place designed to prevent unauthorized access to our computer systems and procedures to protect personal information from unauthorized use. Under certain circumstances, we share this information with outside vendors who provide services to us, such as mailing and proxy solicitation. In those cases, the service providers enter into confi dentiality agreements with us, and we provide only the information necessary to process transactions and perform other services related to your account. We may also share this information with our Putnam affiliates to service your account or provide you with information about other Putnam products or services. It is also our policy to share account information with your financial representative, if you’ve listed one on your Putnam account. If you would like clarification about our confidentiality policies or have any questions or concerns, please don’t hesitate to contact us at 1-800-225-1581, Monday through Friday, 8:30 a.m. to 7:00 p.m., or Saturdays from 9:00 a.m. to 5:00 p.m. Eastern Time.
Proxy voting
Putnam is committed to managing our mutual funds in the best interests of our shareholders. The Putnam funds’ proxy voting guidelines and procedures, as well as information regarding how your fund voted proxies relating to portfolio securities during the 12-month period ended June 30, 2007, are available on the Putnam Individual Investor Web site, www.putnam.com/individual, and on the SEC’s Web site, www.sec.gov. If you have questions about finding forms on the SEC’s Web site, you may call the SEC at 1-800-SEC-0330. You may also obtain the Putnam funds’ proxy voting guidelines and procedures at no charge by calling Putnam’s Shareholder Services at 1-800-225-1581.
Fund portfolio holdings
The fund will file a complete schedule of its portfolio holdings with the SEC for the first and third quarters of each fiscal year on Form N-Q. Shareholders may obtain the fund’s Forms N-Q on the SEC’s Web site at www.sec.gov. In addition, the fund’s Forms N-Q may be reviewed and copied at the SEC’s Public Reference Room in Washington, D.C. You may call the SEC at 1-800-SEC-0330 for information about the SEC’s Web site or the operation of the Public Reference Room.
21
Financial statements
These sections of the report, as well as the accompanying Notes, preceded by the Report of Independent Registered Public Accounting Firm, constitute the fund’s financial statements.
The fund’s portfolio lists all the fund’s investments and their values as of the last day of the reporting period. Holdings are organized by asset type and industry sector, country, or state to show areas of concentration and diversification.
Statement of assets and liabilities shows how the fund’s net assets and share price are determined. All investment and non-investment assets are added together. Any unpaid expenses and other liabilities are subtracted from this total. The result is divided by the number of shares to determine the net asset value per share, which is calculated separately for each class of shares. (For funds with preferred shares, the amount subtracted from total assets includes the liquidation preference of preferred shares.)
Statement of operations shows the fund’s net investment gain or loss. This is done by first adding up all the fund’s earnings — from dividends and interest income — and subtracting its operating expenses to determine net investment income (or loss). Then, any net gain or loss the fund realized on the sales of its holdings — as well as any unrealized gains or losses over the period — is added to or subtracted from the net investment result to determine the fund’s net gain or loss for the fiscal year.
Statement of changes in net assets shows how the fund’s net assets were affected by the fund’s net investment gain or loss, by distributions to shareholders, and by changes in the number of the fund’s shares. It lists distributions and their sources (net investment income or realized capital gains) over the current reporting period and the most recent fiscal year-end. The distributions listed here may not match the sources listed in the Statement of operations because the distributions are determined on a tax basis and may be paid in a different period from the one in which they were earned.
Financial highlights provide an overview of the fund’s investment results, per-share distributions, expense ratios, net investment income ratios, and portfolio turnover in one summary table, reflecting the five most recent reporting periods. In a semiannual report, the highlight table also includes the current reporting period.
22
Report of Independent Registered Public Accounting Firm
The Board of Trustees and Shareholders of
Putnam High Yield Advantage Fund:
We have audited the accompanying statement of assets and liabilities of Putnam High Yield Advantage Fund, including the fund’s portfolio, as of November 30, 2007, and the related statement of operations for the year then ended, the statements of changes in net assets for each of the two years in the period then ended, and the financial highlights for each of the five years or periods in the period then ended. These financial statements and financial highlights are the responsibility of the fund’s management. Our responsibility is to express an opinion on these financial statements and financial highlights based on our audits.
We conducted our audits in accordance with the standards of the Public Company Accounting Oversight Board (United States). Those standards require that we plan and perform our audit to obtain reasonable assurance about whether the financial statements and financial highlights are free of material misstatement. An audit includes examining, on a test basis, evidence supporting the amounts and disclosures in the financial statements. Our procedures included confirmation of securities owned as of November 30, 2007 by correspondence with the custodian and brokers or by other appropriate auditing procedures. An audit also includes assessing the accounting principles used and significant estimates made by management, as well as evaluating the overall financial statement presentation. We believe that our audits provide a reasonable basis for our opinion.
In our opinion, the financial statements and financial highlights referred to above present fairly, in all material respects, the financial position of Putnam High Yield Advantage Fund as of November 30, 2007, the results of its operations for the year then ended, the changes in its net assets for each of the two years in the period then ended, and the financial highlights for each of the five years or periods in the period then ended, in conformity with U.S. generally accepted accounting principles.

Boston, Massachusetts
January 15, 2008
23
The fund’s portfolio 11/30/07
| | | | |
| CORPORATE BONDS AND NOTES (81.5%)* | | |
|
| | | Principal amount | | Value |
|
| Advertising and Marketing | | | | |
| Services (0.3%) | | | | |
| Lamar Media Corp. company | | | | |
| guaranty 7 1/4s, 2013 | $ | 1,450,000 | $ | 1,431,875 |
| Lamar Media Corp. 144A | | | | |
| sr. sub. notes 6 5/8s, 2015 | | 565,000 | | 536,750 |
| | | | | 1,968,625 |
|
| |
| Automotive (4.0%) | | | | |
| Allison Transmission 144A | | | | |
| company guaranty 11s, 2015 | | 405,000 | | 389,813 |
| ArvinMeritor, Inc. sr. unsec. | | | | |
| notes 8 1/8s, 2015 | | 380,000 | | 332,500 |
| Dana Corp. notes 5.85s, 2015 | | 2,135,000 | | 1,601,250 |
| Ford Motor Co. notes | | | | |
| 7.45s, 2031 | | 1,445,000 | | 1,090,975 |
| Ford Motor Credit Corp. | | | | |
| notes 7 7/8s, 2010 | | 3,200,000 | | 2,970,224 |
| Ford Motor Credit Corp. | | | | |
| notes 7.8s, 2012 | | 405,000 | | 360,946 |
| Ford Motor Credit Corp. | | | | |
| notes 7 3/8s, 2009 | | 1,345,000 | | 1,273,445 |
| Ford Motor Credit Corp. | | | | |
| sr. notes 9 7/8s, 2011 | | 5,600,000 | | 5,418,616 |
| Ford Motor Credit Corp. sr. | | | | |
| unsec. 9 3/4s, 2010 | | 1,970,000 | | 1,915,840 |
| Ford Motor Credit Corp. sr. | | | | |
| unsec. FRN 7.993s, 2012 | | 625,000 | | 549,966 |
| General Motors Corp. debs. | | | | |
| 9.4s, 2021 | | 425,000 | | 378,250 |
| General Motors Corp. notes | | | | |
| 7.2s, 2011 | | 7,195,000 | | 6,691,350 |
| Lear Corp. company | | | | |
| guaranty 8 3/4s, 2016 | | 860,000 | | 791,200 |
| Lear Corp. company | | | | |
| guaranty 8 1/2s, 2013 | | 265,000 | | 250,425 |
| Meritor Automotive, Inc. | | | | |
| notes 6.8s, 2009 | | 282,000 | | 277,770 |
| Tenneco Automotive, Inc. | | | | |
| company guaranty 8 5/8s, | | | | |
| 2014 (S) | | 1,810,000 | | 1,803,213 |
| Tenneco Automotive, Inc. sec. | | | | |
| notes Ser. B, 10 1/4s, 2013 | | 205,000 | | 220,888 |
| Tenneco, Inc. 144A sr. unsec. | | | | |
| 8 1/8s, 2015 | | 170,000 | | 169,575 |
| UCI Holdco, Inc. 144A | | | | |
| sr. notes FRN 12.694s, 2013 ‡‡ | | 2,098,001 | | 2,045,551 |
| United Components, Inc. | | | | |
| sr. sub. notes 9 3/8s, 2013 | | 45,000 | | 44,325 |
| | | | | 28,576,122 |
|
| |
| Basic Materials (7.3%) | | | | |
| AK Steel Corp. company | | | | |
| guaranty 7 3/4s, 2012 | | 3,295,000 | | 3,286,763 |
| Aleris International, Inc. | | | | |
| company guaranty 10s, 2016 | | 1,660,000 | | 1,394,400 |
| Aleris International, Inc. | | | | |
| company guaranty 9s, 2014 ‡‡ | | 1,620,000 | | 1,393,200 |
| | | | |
| CORPORATE BONDS AND NOTES (81.5%)* continued | | |
|
| | Principal amount | | Value |
|
| Basic Materials continued | | | | |
| Algoma Acquisition Corp. 144A | | | | |
| unsec. notes 9 7/8s, | | | | |
| 2015 (Canada) | $ | 675,000 | $ | 540,000 |
| Builders FirstSource, Inc. company | | | | |
| guaranty FRN 9.119s, 2012 | | 1,675,000 | | 1,474,000 |
| Century Aluminum Co. company | | | | |
| guaranty 7 1/2s, 2014 | | 1,135,000 | | 1,113,719 |
| Clondalkin Acquisition BV 144A | | | | |
| sec. FRN 7.694s, | | | | |
| 2013 (Netherlands) | | 1,165,000 | | 1,121,313 |
| Domtar Corp. company | | | | |
| guaranty 7 7/8s, 2011 (Canada) | | 580,000 | | 590,150 |
| Freeport-McMoRan Copper & | | | | |
| Gold, Inc. sr. unsec. | | | | |
| bonds 8 3/8s, 2017 | | 4,070,000 | | 4,405,775 |
| Freeport-McMoRan Copper & | | | | |
| Gold, Inc. sr. unsec. FRN | | | | |
| 8.394s, 2015 | | 715,000 | | 729,300 |
| Freeport-McMoRan Copper & | | | | |
| Gold, Inc. sr. unsec. | | | | |
| notes 8 1/4s, 2015 | | 2,030,000 | | 2,169,563 |
| Georgia-Pacific Corp. | | | | |
| debs. 9 1/2s, 2011 | | 1,435,000 | | 1,485,225 |
| Georgia-Pacific Corp. | | | | |
| 144A company | | | | |
| guaranty 7 1/8s, 2017 | | 140,000 | | 134,050 |
| Gerdau Ameristeel Corp. | | | | |
| sr. notes 10 3/8s, 2011 (Canada) | | 1,922,000 | | 2,008,490 |
| Hercules, Inc. company | | | | |
| guaranty 6 3/4s, 2029 | | 1,630,000 | | 1,568,875 |
| Hexion U.S. Finance | | | | |
| Corp./Hexion | | | | |
| Nova Scotia Finance, | | | | |
| ULC company guaranty | | | | |
| 9 3/4s, 2014 | | 2,270,000 | | 2,440,250 |
| Huntsman, LLC company | | | | |
| guaranty 11 5/8s, 2010 | | 3,000 | | 3,180 |
| Jefferson Smurfit Corp. company | | | | |
| guaranty 8 1/4s, 2012 | | 540,000 | | 534,600 |
| Lyondell Chemical Co. company | | | | |
| guaranty 8 1/4s, 2016 | | 3,575,000 | | 4,191,688 |
| Lyondell Chemical Co. company | | | | |
| guaranty 8s, 2014 | | 1,505,000 | | 1,704,413 |
| Lyondell Chemical Co. company | | | | |
| guaranty 6 7/8s, 2017 | | 60,000 | | 68,100 |
| MacDermid, Inc. 144A | | | | |
| sr. sub. notes 9 1/2s, 2017 | | 870,000 | | 789,525 |
| Metals USA, Inc. sec. | | | | |
| notes 11 1/8s, 2015 | | 1,085,000 | | 1,122,975 |
| Momentive Performance | | | | |
| Materials, Inc. 144A | | | | |
| sr. notes 9 3/4s, 2014 | | 3,805,000 | | 3,529,138 |
| Mosaic Co. (The) 144A | | | | |
| sr. notes 7 5/8s, 2016 | | 1,115,000 | | 1,193,050 |
| Mosaic Co. (The) 144A | | | | |
| sr. notes 7 3/8s, 2014 | | 670,000 | | 706,850 |
24
| | | | | |
| CORPORATE BONDS AND NOTES (81.5%)* continued | | |
| |
| | | Principal amount | | Value |
|
| Basic Materials continued | | | | | |
| NewPage Corp. company | | | | | |
| guaranty 10s, 2012 | | $ | 840,000 | $ | 856,800 |
| NewPage Holding Corp. | | | | | |
| sr. notes FRN 11.818s, 2013 ‡‡ | | 534,266 | | 512,895 |
| Norske Skog Canada, Ltd. | | | | | |
| company guaranty Ser. D, 8 5/8s, | | | | |
| 2011 (Canada) | | | 735,000 | | 610,050 |
| Novelis, Inc. company | | | | | |
| guaranty 7 1/4s, 2015 | | | 2,520,000 | | 2,349,900 |
| Rockwood Specialties | | | | | |
| Group, Inc. company | | | | | |
| guaranty 7 5/8s, 2014 | EUR | | 965,000 | | 1,386,857 |
| Smurfit-Stone Container | | | | | |
| Enterprises, Inc. sr. unsec. | | | | | |
| 8s, 2017 | | $ | 1,240,000 | | 1,190,400 |
| Steel Dynamics, Inc. 144A | | | | | |
| sr. notes 7 3/8s, 2012 | | | 50,000 | | 49,625 |
| Steel Dynamics, Inc. 144A | | | | | |
| sr. notes 6 3/4s, 2015 | | | 2,900,000 | | 2,769,500 |
| Stone Container Finance | | | | | |
| company guaranty 7 3/8s, | | | | | |
| 2014 (Canada) | | | 415,000 | | 385,950 |
| Tube City IMS Corp. company | | | | |
| guaranty 9 3/4s, 2015 | | | 1,530,000 | | 1,453,500 |
| Ucar Finance, Inc. company | | | | | |
| guaranty 10 1/4s, 2012 | | | 102,000 | | 105,060 |
| Verso Paper Holdings, | | | | | |
| LLC/ Verso Paper, Inc. company | | | | |
| guaranty 11 3/8s, 2016 | | | 685,000 | | 695,275 |
| | | | | | 52,064,404 |
|
| |
| Broadcasting (2.3%) | | | | | |
| DirecTV Holdings, LLC company | | | | |
| guaranty 6 3/8s, 2015 | | | 3,180,000 | | 3,076,650 |
| Echostar DBS Corp. company | | | | |
| guaranty 7 1/8s, 2016 | | | 125,000 | | 130,156 |
| Echostar DBS Corp. company | | | | |
| guaranty 7s, 2013 | | | 1,495,000 | | 1,547,325 |
| Echostar DBS Corp. company | | | | |
| guaranty 6 5/8s, 2014 | | | 270,000 | | 273,375 |
| Echostar DBS Corp. | | | | | |
| sr. notes 6 3/8s, 2011 | | | 4,585,000 | | 4,653,775 |
| Ion Media Networks, Inc. 144A | | | | |
| sr. sec. notes 11.493s, 2013 | | | 995,000 | | 987,538 |
| Ion Media Networks, Inc. 144A | | | | |
| sr. sec. notes 8.493s, 2012 | | | 1,175,000 | | 1,154,438 |
| Sinclair Broadcast Group, Inc. | | | | |
| company guaranty 8s, 2012 | | | 60,000 | | 61,200 |
| Sirius Satellite Radio, Inc. | | | | | |
| sr. unsec. notes 9 5/8s, 2013 | | 2,060,000 | | 1,993,050 |
| Univision Communications, Inc. | | | | |
| 144A sr. notes 9 3/4s, 2015 ‡‡ | | 1,080,000 | | 1,004,400 |
| Young Broadcasting, Inc. | | | | | |
| company guaranty 10s, 2011 | | 1,142,000 | | 913,600 |
| Young Broadcasting, Inc. | | | | | |
| sr. sub. notes 8 3/4s, 2014 | | | 395,000 | | 290,325 |
| | | | | | 16,085,832 |
|
| | | | |
| CORPORATE BONDS AND NOTES (81.5%)* continued | | |
|
| | Principal amount | | Value |
|
| Building Materials (1.0%) | | | | |
| Associated Materials, Inc. | | | | |
| company guaranty 9 3/4s, 2012 | $ | 610,000 | $ | 622,200 |
| Goodman Global Holding Co., | | | | |
| Inc. sr. notes FRN Ser. B, | | | | |
| 8.36s, 2012 | | 1,645,000 | | 1,642,944 |
| NTK Holdings, Inc. sr. disc. | | | | |
| notes zero %, 2014 | | 1,765,000 | | 1,041,350 |
| Texas Industries, Inc. sr. unsec. | | | | |
| notes 7 1/4s, 2013 | | 1,410,000 | | 1,367,700 |
| THL Buildco, Inc. (Nortek | | | | |
| Holdings, Inc.) sr. sub. notes | | | | |
| 8 1/2s, 2014 | | 2,955,000 | | 2,393,550 |
| | | | | 7,067,744 |
|
| |
| Cable Television (2.7%) | | | | |
| Atlantic Broadband Finance, LLC | | | | |
| company guaranty 9 3/8s, 2014 | | 1,530,000 | | 1,430,550 |
| Cablevision Systems Corp. | | | | |
| sr. notes Ser. B, 8s, 2012 | | 655,000 | | 623,888 |
| CCH I Holdings, LLC company | | | | |
| guaranty 12 1/8s, 2015 | | 25,000 | | 17,125 |
| CCH I, LLC/Capital Corp. sec. | | | | |
| notes 11s, 2015 | | 7,954,000 | | 6,919,980 |
| CCH II, LLC/Capital Corp. | | | | |
| sr. unsec. notes Ser. B, | | | | |
| 10 1/4s, 2010 | | 3,565,000 | | 3,511,525 |
| CCH, LLC/Capital Corp. sr. | | | | |
| unsec. notes 10 1/4s, 2010 | | 515,000 | | 508,563 |
| CSC Holdings, Inc. sr. notes | | | | |
| 6 3/4s, 2012 | | 2,210,000 | | 2,071,875 |
| CSC Holdings, Inc. sr. notes | | | | |
| Ser. B, 7 5/8s, 2011 | | 1,445,000 | | 1,416,100 |
| NTL Cable PLC sr. notes 9 1/8s, | | | | |
| 2016 (United Kingdom) | | 820,000 | | 815,900 |
| Rainbow National Services, LLC | | | | |
| 144A sr. notes 8 3/4s, 2012 | | 1,730,000 | | 1,764,600 |
| | | | | 19,080,106 |
|
| |
| Capital Goods (7.7%) | | | | |
| Alliant Techsystems, Inc. | | | | |
| sr. sub. notes 6 3/4s, 2016 | | 3,830,000 | | 3,791,700 |
| Allied Waste North America, Inc. | | | | |
| company guaranty 6 7/8s, 2017 | | 2,145,000 | | 2,110,144 |
| American Railcar Industries, Inc. | | | | |
| sr. unsec. 7 1/2s, 2014 | | 285,000 | | 270,750 |
| Baldor Electric Co. company | | | | |
| guaranty 8 5/8s, 2017 | | 1,830,000 | | 1,880,325 |
| Berry Plastics Holding Corp. | | | | |
| company guaranty 10 1/4s, 2016 | | 955,000 | | 845,175 |
| Berry Plastics Holding Corp. sec. | | | | |
| notes 8 7/8s, 2014 | | 2,040,000 | | 1,968,600 |
| Blount, Inc. | | | | |
| sr. sub. notes 8 7/8s, 2012 | | 1,125,000 | | 1,125,000 |
| Bombardier, Inc. 144A | | | | |
| sr. notes 8s, 2014 (Canada) | | 1,525,000 | | 1,578,375 |
| Bombardier, Inc. 144A sr. unsec. | | | | |
| FRN 7.631s, 2013 (Canada) EUR | | 930,000 | | 1,350,847 |
25
| | | | |
| CORPORATE BONDS AND NOTES (81.5%)* continued | | |
|
| | | Principal amount | | Value |
|
| Capital Goods continued | | | | |
| Crown Americas, LLC/Crown | | | | |
| Americas Capital Corp. sr. notes | | | | |
| 7 5/8s, 2013 | $ | 1,880,000 | $ | 1,917,600 |
| General Cable Corp. company | | | | |
| guaranty 7 1/8s, 2017 | | 1,250,000 | | 1,231,250 |
| General Cable Corp. company | | | | |
| guaranty FRN 7.606s, 2015 | | 470,000 | | 453,550 |
| Greenbrier Cos., Inc. company | | | | |
| guaranty 8 3/8s, 2015 | | 1,990,000 | | 1,895,475 |
| Hawker Beechcraft | | | | |
| Acquisition Co., LLC 144A | | | | |
| sr. notes 8 7/8s, 2015 ‡‡ | | 1,070,000 | | 1,056,625 |
| Hawker Beechcraft | | | | |
| Acquisition Co., LLC 144A | | | | |
| sr. notes 8 1/2s, 2015 | | 1,675,000 | | 1,683,375 |
| Hawker Beechcraft | | | | |
| Acquisition Co., LLC 144A | | | | |
| sr. sub. notes 9 3/4s, 2017 | | 290,000 | | 292,900 |
| Hexcel Corp. | | | | |
| sr. sub. notes 6 3/4s, 2015 | | 2,375,000 | | 2,327,500 |
| L-3 Communications Corp. | | | | |
| company guaranty 6 1/8s, 2013 | | 1,570,000 | | 1,538,600 |
| L-3 Communications Corp. | | | | |
| company guaranty Ser. B, | | | | |
| 6 3/8s, 2015 | | 2,460,000 | | 2,435,400 |
| L-3 Communications Corp. | | | | |
| sr. sub. notes 5 7/8s, 2015 | | 575,000 | | 552,000 |
| Legrand SA debs. 8 1/2s, | | | | |
| 2025 (France) | | 3,850,000 | | 4,569,103 |
| Manitowoc Co., Inc. (The) | | | | |
| sr. notes 7 1/8s, 2013 | | 1,855,000 | | 1,831,813 |
| Milacron Escrow Corp. sec. | | | | |
| notes 11 1/2s, 2011 | | 1,350,000 | | 1,262,250 |
| Mueller Water Products, Inc. | | | | |
| company guaranty 7 3/8s, 2017 | | 770,000 | | 683,375 |
| Owens-Brockway Glass | | | | |
| company guaranty 8 7/8s, 2009 | | 105,000 | | 105,919 |
| Owens-Brockway Glass | | | | |
| Container, Inc. company | | | | |
| guaranty 6 3/4s, 2014 | EUR | 995,000 | | 1,404,488 |
| RBS Global, Inc. / Rexnord Corp. | | | |
| company guaranty 9 1/2s, 2014 | $ | 3,635,000 | | 3,598,650 |
| Ryerson Tull, Inc. 144A sec. | | | | |
| notes 12s, 2015 | | 570,000 | | 559,313 |
| TD Funding Corp. company | | | | |
| guaranty 7 3/4s, 2014 | | 2,190,000 | | 2,211,900 |
| Tekni-Plex, Inc. sec. | | | | |
| notes 10 7/8s, 2012 | | 2,525,000 | | 2,708,063 |
| Terex Corp. company | | | | |
| guaranty 7 3/8s, 2014 | | 1,095,000 | | 1,100,475 |
| Terex Corp. sr. sub. notes | | | | |
| 8s, 2017 | | 390,000 | | 391,950 |
| Titan International, Inc. company | | | |
| guaranty 8s, 2012 | | 2,890,000 | | 2,890,000 |
| WCA Waste Corp. company | | | | |
| guaranty 9 1/4s, 2014 | | 1,230,000 | | 1,266,900 |
| | | | | 54,889,390 |
|
| | | | | |
| CORPORATE BONDS AND NOTES (81.5%)* continued | | |
|
| | | | Principal amount | | Value |
|
| Coal (1.4%) | | | | | |
| Arch Western Finance, LLC | | | | | |
| sr. notes 6 3/4s, 2013 | | $ | 4,420,000 | $ | 4,276,350 |
| Massey Energy Co. | | | | | |
| sr. notes 6 5/8s, 2010 | | | 2,545,000 | | 2,475,013 |
| Peabody Energy Corp. company | | | | | |
| guaranty 7 3/8s, 2016 | | | 930,000 | | 953,250 |
| Peabody Energy Corp. | | | | | |
| sr. notes 5 7/8s, 2016 | | | 2,610,000 | | 2,453,400 |
| | | | | | 10,158,013 |
|
| |
| Commercial and Consumer Services (0.1%) | | |
| iPayment, Inc. company | | | | | |
| guaranty 9 3/4s, 2014 | | | 735,000 | | 701,925 |
|
| |
| Communication Services (7.0%) | | | |
| American Cellular Corp. | | | | | |
| company guaranty 9 1/2s, 2009 | | | 785,000 | | 797,427 |
| American Tower Corp. | | | | | |
| sr. notes 7 1/2s, 2012 | | | 1,020,000 | | 1,042,950 |
| American Tower Corp. 144A | | | | | |
| sr. notes 7s, 2017 | | | 705,000 | | 717,338 |
| BCM Ireland Finance Ltd. 144A | | | | | |
| FRN 9.506s, 2016 | | | | | |
| (Cayman Islands) | EUR | | 630,000 | | 908,175 |
| Centennial Cellular | | | | | |
| Operating Co., LLC company | | | | | |
| guaranty 10 1/8s, 2013 | | $ | 845,000 | | 883,025 |
| Centennial Communications | | | | | |
| Corp. sr. notes 10s, 2013 | | | 685,000 | | 712,400 |
| Centennial Communications | | | | | |
| Corp. sr. notes FRN | | | | | |
| 10.981s, 2013 | | | 420,000 | | 429,450 |
| Cincinnati Bell, Inc. company | | | | | |
| guaranty 7s, 2015 | | | 885,000 | | 834,113 |
| Citizens Communications Co. | | | | | |
| notes 9 1/4s, 2011 | | | 1,465,000 | | 1,585,863 |
| Cricket Communications, Inc. | | | | | |
| company guaranty 9 3/8s, 2014 | | | 2,565,000 | | 2,385,450 |
| Cricket Communications, | | | | | |
| Inc. 144A | | | | | |
| company guaranty 9 3/8s, 2014 | | | 245,000 | | 227,850 |
| Digicel Group, Ltd. 144A | | | | | |
| sr. notes 8 7/8s, 2015 (Bermuda) | 1,650,000 | | 1,476,750 |
| Digicel, Ltd. 144A | | | | | |
| sr. notes 9 1/4s, 2012 (Jamaica) | | | 1,375,000 | | 1,381,875 |
| Dobson Cellular Systems sec. | | | | | |
| notes 9 7/8s, 2012 | | | 1,625,000 | | 1,775,313 |
| Hawaiian Telcom | | | | | |
| Communications, Inc. company | | | | | |
| guaranty Ser. B, 9 3/4s, 2013 | | | 10,000 | | 9,738 |
| Inmarsat Finance PLC company | | | | | |
| guaranty stepped-coupon zero % | | | |
| (10 3/8s, 11/15/08), 2012 | | | | | |
| (United Kingdom) †† | | | 2,646,000 | | 2,546,775 |
| Intelsat Bermuda, Ltd. company | | | | | |
| guaranty FRN 8.886s, | | | | | |
| 2015 (Bermuda) | | | 660,000 | | 660,825 |
26
| | | | |
| CORPORATE BONDS AND NOTES (81.5%)* continued | | |
| |
| | | Principal amount | | Value |
|
| Communication Services continued | | | |
| Intelsat Bermuda, Ltd. sr. unsec. | | | | |
| 11 1/4s, 2016 (Bermuda) | $ | 3,955,000 | $ | 4,073,650 |
| Intelsat Intermediate Holding Co., | | | | |
| Ltd. company guaranty stepped- | | | | |
| coupon zero % (9 1/4s, 2/1/10), | | | | |
| 2015 (Bermuda) †† | | 690,000 | | 565,800 |
| iPCS, Inc. sec. FRN 7.036s, 2013 | | 680,000 | | 632,400 |
| Level 3 Financing, Inc. company | | | | |
| guaranty 12 1/4s, 2013 | | 380,000 | | 379,050 |
| Level 3 Financing, Inc. company | | | | |
| guaranty 9 1/4s, 2014 | | 1,995,000 | | 1,790,513 |
| Level 3 Financing, Inc. company | | | | |
| guaranty 8 3/4s, 2017 | | 1,070,000 | | 917,525 |
| MetroPCS Wireless, Inc. sr. unsec. | | | | |
| 9 1/4s, 2014 | | 3,035,000 | | 2,875,663 |
| Nordic Telephone Co. Holdings | | | | |
| ApS 144A sr. notes 8 7/8s, | | | | |
| 2016 (Denmark) | | 380,000 | | 385,700 |
| PAETEC Holding Corp. 144A | | | | |
| sr. notes 9 1/2s, 2015 | | 695,000 | | 689,788 |
| PanAmSat Corp. company | | | | |
| guaranty 9s, 2014 | | 735,000 | | 746,025 |
| Qwest Communications | | | | |
| International, Inc. company | | | | |
| guaranty 7 1/2s, 2014 | | 3,885,000 | | 3,855,863 |
| Qwest Corp. debs. 7 1/4s, 2025 | | 1,135,000 | | 1,089,600 |
| Qwest Corp. notes 8 7/8s, 2012 | | 2,720,000 | | 2,920,600 |
| Rural Cellular Corp. | | | | |
| sr. notes 9 7/8s, 2010 | | 665,000 | | 689,938 |
| Rural Cellular Corp. sr. sub. FRN | | | | |
| 10.661s, 2012 | | 545,000 | | 555,900 |
| Rural Cellular Corp. 144A | | | | |
| sr. sub. notes FRN 8.58s, 2013 | | 935,000 | | 949,025 |
| Syniverse Technologies, Inc. | | | | |
| sr. sub. notes Ser. B, 7 3/4s, 2013 | | 1,330,000 | | 1,283,450 |
| Time Warner Telecom, Inc. | | | | |
| company guaranty 9 1/4s, 2014 | | 1,050,000 | | 1,073,625 |
| West Corp. company guaranty | | | | |
| 11s, 2016 | | 520,000 | | 520,000 |
| West Corp. company | | | | |
| guaranty 9 1/2s, 2014 | | 960,000 | | 945,600 |
| Windstream Corp. company | | | | |
| guaranty 8 5/8s, 2016 | | 2,880,000 | | 2,988,000 |
| Windstream Corp. company | | | | |
| guaranty 8 1/8s, 2013 | | 1,530,000 | | 1,573,988 |
| | | | | 49,877,020 |
|
| |
| Consumer (0.8%) | | | | |
| Jostens IH Corp. company | | | | |
| guaranty 7 5/8s, 2012 | | 3,790,000 | | 3,790,000 |
| Yankee Acquisition Corp. | | | | |
| company guaranty 9 3/4s, 2017 | | 325,000 | | 299,813 |
| Yankee Acquisition Corp. | | | | |
| company guaranty Ser. B, | | | | |
| 8 1/2s, 2015 | | 1,525,000 | | 1,410,625 |
| | | | | 5,500,438 |
|
| | | | |
| CORPORATE BONDS AND NOTES (81.5%)* continued | | |
|
| | | Principal amount | | Value |
|
| Consumer Goods (1.5%) | | | | |
| Church & Dwight Co., Inc. | | | | |
| company guaranty 6s, 2012 | $ | 1,805,000 | $ | 1,759,875 |
| Elizabeth Arden, Inc. company | | | | |
| guaranty 7 3/4s, 2014 | | 2,385,000 | | 2,331,338 |
| Jarden Corp. company | | | | |
| guaranty 7 1/2s, 2017 | | 1,430,000 | | 1,287,000 |
| Prestige Brands, Inc. | | | | |
| sr. sub. notes 9 1/4s, 2012 | | 2,233,000 | | 2,210,670 |
| Spectrum Brands, Inc. company | | | | |
| guaranty 11 1/2s, 2013 ‡‡ | | 1,370,000 | | 1,181,625 |
| Spectrum Brands, Inc. company | | | | |
| guaranty 7 3/8s, 2015 | | 2,490,000 | | 1,805,250 |
| | | | | 10,575,758 |
|
| |
| Consumer Services (0.4%) | | | | |
| Rental Services Corp. company | | | | |
| guaranty 9 1/2s, 2014 | | 865,000 | | 802,288 |
| United Rentals NA, Inc. | | | | |
| sr. sub. notes 7s, 2014 | | 2,345,000 | | 2,087,050 |
| | | | | 2,889,338 |
|
| |
| Energy (3.1%) | | | | |
| CHC Helicopter Corp. | | | | |
| sr. sub. notes 7 3/8s, 2014 | | | | |
| (Canada) | | 3,325,000 | | 3,158,750 |
| Complete Production Services, | | | | |
| Inc. company guaranty 8s, 2016 | | 2,535,000 | | 2,408,250 |
| Dresser-Rand Group, Inc. | | | | |
| company guaranty 7 3/8s, 2014 | | 1,070,000 | | 1,056,625 |
| Hornbeck Offshore Services, Inc. | | | | |
| sr. notes Ser. B, 6 1/8s, 2014 | | 955,000 | | 904,863 |
| Inergy LP/Inergy Finance Corp. | | | | |
| sr. notes 6 7/8s, 2014 | | 3,750,000 | | 3,618,750 |
| Key Energy Services, Inc. 144A | | | | |
| sr. notes 8 3/8s, 2014 | | 925,000 | | 927,313 |
| Offshore Logistics, Inc. company | | | | |
| guaranty 6 1/8s, 2013 | | 2,160,000 | | 2,057,400 |
| Oslo Seismic Services, Inc. 1st | | | | |
| mtge. 8.28s, 2011 | | 1,473,718 | | 1,544,200 |
| Pacific Energy Partners/Pacific | | | | |
| Energy Finance Corp. | | | | |
| sr. notes 7 1/8s, 2014 | | 1,350,000 | | 1,407,706 |
| Pride International, Inc. | | | | |
| sr. notes 7 3/8s, 2014 | | 3,300,000 | | 3,382,500 |
| Stallion Oilfield | | | | |
| Services/Stallion Oilfield | | | | |
| Finance Corp. 144A sr. unsec. | | | | |
| notes 9 3/4s, 2015 | | 1,820,000 | | 1,669,850 |
| | | | | 22,136,207 |
|
| |
| Entertainment (1.4%) | | | | |
| AMC Entertainment, Inc. | | | | |
| company guaranty 11s, 2016 | | 1,061,000 | | 1,111,398 |
| Avis Budget Car Rental, LLC | | | | |
| company guaranty 7 3/4s, 2016 | | 1,475,000 | | 1,392,031 |
| Avis Budget Car Rental, LLC | | | | |
| company guaranty 7 5/8s, 2014 | | 965,000 | | 926,400 |
27
| | | | |
| CORPORATE BONDS AND NOTES (81.5%)* continued | | |
| |
| | | Principal amount | | Value |
|
| Entertainment continued | | | | |
| Cinemark, Inc. sr. disc. | | | | |
| notes stepped-coupon zero % | | | | |
| (9 3/4s, 3/15/09), 2014 †† | $ | 1,755,000 | $ | 1,632,150 |
| Hertz Corp. company | | | | |
| guaranty 8 7/8s, 2014 | | 1,940,000 | | 1,940,000 |
| Marquee Holdings, Inc. sr. disc. | | | | |
| notes zero %, 2014 | | 1,840,000 | | 1,527,200 |
| Universal City Florida Holding | | | | |
| Co. sr. notes 8 3/8s, 2010 | | 245,000 | | 245,000 |
| Universal City Florida Holding | | | | |
| Co. sr. notes FRN 9.661s, 2010 | | 950,000 | | 959,500 |
| | | | | 9,733,679 |
|
| |
| Financial (4.3%) | | | | |
| E*Trade Financial Corp. sr. unsec. | | | | |
| notes 8s, 2011 | | 1,465,000 | | 1,120,725 |
| Finova Group, Inc. notes | | | | |
| 7 1/2s, 2009 | | 2,843,484 | | 476,284 |
| GMAC LLC notes 7 3/4s, 2010 | | 5,565,000 | | 5,282,988 |
| GMAC LLC notes 7s, 2012 | | 605,000 | | 524,817 |
| GMAC LLC notes 6 7/8s, 2012 | | 5,980,000 | | 5,083,849 |
| GMAC LLC notes 6 3/4s, 2014 | | 4,524,000 | | 3,721,619 |
| GMAC LLC notes FRN | | | | |
| 7.82s, 2014 | | 1,206,000 | | 988,948 |
| GMAC LLC unsub. notes | | | | |
| 6 5/8s, 2012 | | 1,600,000 | | 1,380,128 |
| HUB International Holdings, Inc. | | | | |
| 144A sr. notes 9s, 2014 | | 320,000 | | 288,000 |
| HUB International Holdings, Inc. | | | | |
| 144A sr. sub. notes 10 1/4s, 2015 | | 445,000 | | 381,588 |
| Leucadia National Corp. sr. | | | | |
| unsec. 8 1/8s, 2015 | | 510,000 | | 507,450 |
| Leucadia National Corp. sr. | | | | |
| unsec. 7 1/8s, 2017 | | 1,230,000 | | 1,134,675 |
| Nuveen Investments, Inc. 144A | | | | |
| sr. notes 10 1/2s, 2015 | | 1,000,000 | | 987,500 |
| Petroplus Finance, Ltd. company | | | | |
| guaranty 6 3/4s, 2014 (Bermuda) | | 1,695,000 | | 1,576,350 |
| Realogy Corp. 144A | | | | |
| sr. notes 10 1/2s, 2014 | | 4,515,000 | | 3,397,538 |
| Tropicana Entertainment, LLC | | | | |
| sr. sub. notes 9 5/8s, 2014 | | 5,480,000 | | 3,808,600 |
| USI Holdings Corp. 144A | | | | |
| sr. notes FRN 8.744s, 2014 | | 290,000 | | 259,550 |
| | | | | 30,920,609 |
|
| |
| Food (0.9%) | | | | |
| Archibald Candy Corp. company | | | | |
| guaranty 10s, 2008 (In default) (F) † | | 424,297 | | 6,233 |
| Chiquita Brands International, Inc. | | | | |
| sr. notes 8 7/8s, 2015 | | 290,000 | | 266,800 |
| Chiquita Brands International, Inc. | | | | |
| sr. notes 7 1/2s, 2014 | | 1,665,000 | | 1,444,388 |
| Dean Foods Co. company | | | | |
| guaranty 7s, 2016 | | 1,220,000 | | 1,079,700 |
| | | | |
| CORPORATE BONDS AND NOTES (81.5%)* continued | | |
|
| | | Principal amount | | Value |
|
| Food continued | | | | |
| Del Monte Corp. | | | | |
| sr. sub. notes 8 5/8s, 2012 | $ | 2,625,000 | $ | 2,651,250 |
| Pinnacle Foods Finance LLC | | | | |
| 144A sr. sub. notes 10 5/8s, 2017 | | 885,000 | | 778,800 |
| | | | | 6,227,171 |
|
| |
| Gaming & Lottery (3.4%) | | | | |
| Boyd Gaming Corp. | | | | |
| sr. sub. notes 7 3/4s, 2012 | | 545,000 | | 554,538 |
| Boyd Gaming Corp. | | | | |
| sr. sub. notes 7 1/8s, 2016 | | 2,110,000 | | 2,009,775 |
| Boyd Gaming Corp. | | | | |
| sr. sub. notes 6 3/4s, 2014 | | 1,020,000 | | 971,550 |
| Isle of Capri Casinos, Inc. | | | | |
| company guaranty 7s, 2014 | | 25,000 | | 21,375 |
| Mashantucket Western Pequot | | | | |
| Tribe 144A bonds 8 1/2s, 2015 | | 1,995,000 | | 1,995,000 |
| MGM Mirage, Inc. company | | | | |
| guaranty 8 1/2s, 2010 | | 1,670,000 | | 1,732,625 |
| MGM Mirage, Inc. company | | | | |
| guaranty 6s, 2009 | | 3,320,000 | | 3,286,800 |
| Pinnacle Entertainment, Inc. | | | | |
| sr. sub. notes 8 3/4s, 2013 | | 50,000 | | 51,000 |
| Pinnacle Entertainment, Inc. | | | | |
| sr. sub. notes 8 1/4s, 2012 | | 1,667,000 | | 1,683,670 |
| Pinnacle Entertainment, Inc. | | | | |
| 144A sr. sub. notes 7 1/2s, | | | | |
| 2015 (S) | | 1,890,000 | | 1,748,250 |
| Scientific Games Corp. company | | | | |
| guaranty 6 1/4s, 2012 | | 2,215,000 | | 2,115,325 |
| Station Casinos, Inc. | | | | |
| sr. notes 6s, 2012 | | 2,740,000 | | 2,486,550 |
| Trump Entertainment Resorts, Inc. | | | | |
| sec. notes 8 1/2s, 2015 | | 4,500,000 | | 3,566,250 |
| Wynn Las Vegas, LLC/Wynn | | | | |
| Las Vegas Capital Corp. 1st mtge. | | | | |
| 6 5/8s, 2014 (S) | | 2,310,000 | | 2,240,700 |
| | | | | 24,463,408 |
|
| |
| Health Care (6.9%) | | | | |
| Accellent, Inc. company | | | | |
| guaranty 10 1/2s, 2013 | | 1,810,000 | | 1,601,850 |
| Bausch & Lomb, Inc. 144A | | | | |
| sr. unsec. 9 7/8s, 2015 | | 1,065,000 | | 1,078,313 |
| Community Health Systems, Inc. | | | | |
| company guaranty 8 7/8s, 2015 | | 3,195,000 | | 3,226,950 |
| DaVita, Inc. company | | | | |
| guaranty 6 5/8s, 2013 | | 1,605,000 | | 1,556,850 |
| Elan Finance PLC/Elan | | | | |
| Finance Corp. company | | | | |
| guaranty 7 3/4s, 2011 (Ireland) | | 1,185,000 | | 1,152,413 |
| HCA, Inc. sec. notes | | | | |
| 9 5/8s, 2016 ‡‡ | | 2,730,000 | | 2,839,200 |
| HCA, Inc. sec. notes | | | | |
| 9 1/4s, 2016 | | 3,860,000 | | 3,995,100 |
| HCA, Inc. sec. notes | | | | |
| 9 1/8s, 2014 | | 2,120,000 | | 2,167,700 |
| HCA, Inc. sr. notes 7 7/8s, 2011 | | 930,000 | | 904,425 |
28
| | | | |
| CORPORATE BONDS AND NOTES (81.5%)* continued | | |
|
| | | Principal amount | | Value |
|
| Health Care continued | | | | |
| Health Management Associates, | | | | |
| Inc. sr. notes 6 1/8s, 2016 | $ | 2,065,000 | $ | 1,792,375 |
| IASIS Healthcare/IASIS | | | | |
| Capital Corp. | | | | |
| sr. sub. notes 8 3/4s, 2014 | | 205,000 | | 198,850 |
| Omnicare, Inc. company | | | | |
| guaranty 6 3/4s, 2013 | | 185,000 | | 170,200 |
| Omnicare, Inc. | | | | |
| sr. sub. notes 6 1/8s, 2013 | | 514,000 | | 470,310 |
| Psychiatric Solutions, Inc. | | | | |
| company guaranty 7 3/4s, 2015 | | 1,790,000 | | 1,745,250 |
| Select Medical Corp. company | | | | |
| guaranty 7 5/8s, 2015 | | 2,070,000 | | 1,759,500 |
| Service Corporation International | | | | |
| debs. 7 7/8s, 2013 | | 1,185,000 | | 1,206,003 |
| Service Corporation International | | | | |
| sr. notes 7s, 2017 | | 740,000 | | 697,450 |
| Service Corporation International | | | | |
| sr. notes 6 3/4s, 2016 | | 2,650,000 | | 2,504,250 |
| Stewart Enterprises, Inc. | | | | |
| sr. notes 6 1/4s, 2013 | | 3,010,000 | | 2,859,500 |
| Sun Healthcare Group, Inc. | | | | |
| company guaranty FRN | | | | |
| 9 1/8s, 2015 | | 1,325,000 | | 1,328,313 |
| Surgical Care Affiliates, Inc. | | | | |
| 144A sr. notes 8 7/8s, 2015 ‡‡ | | 535,000 | | 489,525 |
| Surgical Care Affiliates, Inc. | | | | |
| 144A sr. sub. notes 10s, 2017 | | 1,355,000 | | 1,233,050 |
| Tenet Healthcare Corp. | | | | |
| notes 7 3/8s, 2013 | | 2,560,000 | | 2,252,800 |
| Tenet Healthcare Corp. | | | | |
| sr. notes 6 3/8s, 2011 | | 2,565,000 | | 2,308,500 |
| US Oncology, Inc. company | | | | |
| guaranty 9s, 2012 | | 2,335,000 | | 2,299,975 |
| Vanguard Health Holding Co. | | | | |
| II, LLC sr. sub. notes 9s, 2014 | | 2,551,000 | | 2,417,073 |
| Ventas Realty LP/Capital Corp. | | | | |
| company guaranty 9s, 2012 (R) | | 2,230,000 | | 2,408,400 |
| Ventas Realty LP/Capital Corp. | | | | |
| company guaranty 6 3/4s, | | | | |
| 2010 (R) | | 865,000 | | 860,675 |
| Ventas Realty LP/Capital Corp. | | | | |
| sr. notes 6 5/8s, 2014 (R) | | 690,000 | | 681,375 |
| Ventas Realty LP/Capital Corp. | | | | |
| sr. notes 6 1/2s, 2016 (R) | | 850,000 | | 828,750 |
| | | | | 49,034,925 |
|
| |
| Homebuilding (0.4%) | | | | |
| K. Hovnanian Enterprises, Inc. | | | | |
| sr. notes 8 5/8s, 2017 | | 165,000 | | 121,275 |
| Meritage Homes Corp. company | | | | |
| guaranty 6 1/4s, 2015 (S) | | 1,955,000 | | 1,368,500 |
| Meritage Homes Corp. sr. notes | | | | |
| 7s, 2014 | | 245,000 | | 187,425 |
| | | | |
| CORPORATE BONDS AND NOTES (81.5%)* continued | | |
|
| | | Principal amount | | Value |
|
| Homebuilding continued | | | | |
| Standard Pacific Corp. | | | | |
| sr. notes 6 1/2s, 2008 | $ | 1,475,000 | $ | 1,283,250 |
| Standard Pacific Corp. sr. unsec. | | | | |
| 5 1/8s, 2009 | | 285,000 | | 213,750 |
| | | | | 3,174,200 |
|
| |
| Household Furniture and Appliances (0.1%) | | |
| Sealy Mattress Co. | | | | |
| sr. sub. notes 8 1/4s, 2014 | | 945,000 | | 928,463 |
|
| |
| Lodging/Tourism (0.8%) | | | | |
| FelCor Lodging LP company | | | | |
| guaranty 8 1/2s, 2008 (R) | | 955,000 | | 1,005,138 |
| Host Marriott LP company | | | | |
| guaranty Ser. Q, 6 3/4s, 2016 (R) | | 450,000 | | 446,625 |
| Host Marriott LP sr. notes Ser. M, | | | | |
| 7s, 2012 (R) | | 2,955,000 | | 2,955,000 |
| Seminole Hard Rock | | | | |
| Entertainment, Inc. 144A sec. | | | | |
| FRN 8.194s, 2014 | | 1,100,000 | | 1,039,500 |
| | | | | 5,446,263 |
|
| |
| Media (1.9%) | | | | |
| Affinion Group, Inc. company | | | | |
| guaranty 11 1/2s, 2015 | | 1,490,000 | | 1,486,275 |
| Affinion Group, Inc. company | | | | |
| guaranty 10 1/8s, 2013 | | 2,225,000 | | 2,230,563 |
| Affinity Group, Inc. | | | | |
| sr. sub. notes 9s, 2012 | | 2,000,000 | | 1,890,000 |
| Idearc, Inc. company guaranty | | | | |
| 8s, 2016 | | 4,145,000 | | 3,875,575 |
| Nielsen Finance LLC/Nielsen | | | | |
| Finance Co. company guaranty | | | | |
| 10s, 2014 | | 1,700,000 | | 1,729,750 |
| Nielsen Finance LLC/Nielsen | | | | |
| Finance Co. company | | | | |
| guaranty stepped-coupon zero % | | | | |
| (12 1/2s, 8/1/11), 2016 †† | | 3,670,000 | | 2,541,475 |
| | | | | 13,753,638 |
|
| |
| Oil & Gas (5.8%) | | | | |
| Chaparral Energy, Inc. company | | | | |
| guaranty 8 1/2s, 2015 | | 444,000 | | 392,940 |
| Chaparral Energy, Inc. 144A | | | | |
| sr. notes 8 7/8s, 2017 | | 1,980,000 | | 1,762,200 |
| Chesapeake Energy Corp. | | | | |
| company guaranty 6 1/2s, 2017 | | 220,000 | | 211,200 |
| Chesapeake Energy Corp. | | | | |
| sr. notes 7 1/2s, 2013 | | 3,385,000 | | 3,461,163 |
| Chesapeake Energy Corp. | | | | |
| sr. notes 7s, 2014 | | 1,125,000 | | 1,125,000 |
| Compton Petroleum Corp. | | | | |
| company guaranty 7 5/8s, | | | | |
| 2013 (Canada) | | 3,215,000 | | 3,006,025 |
| Comstock Resources, Inc. | | | | |
| sr. notes 6 7/8s, 2012 | | 1,775,000 | | 1,677,375 |
29
| | | | |
| CORPORATE BONDS AND NOTES (81.5%)* continued | | |
|
| | | Principal amount | | Value |
|
| Oil & Gas continued | | | | |
| Connacher Oil and Gas, Ltd. | | | | |
| 144A sec. notes 10 1/4s, | | | | |
| 2015 (Canada) | $ | 1,055,000 | $ | 1,055,000 |
| Denbury Resources, Inc. | | | | |
| sr. sub. notes 7 1/2s, 2015 | | 1,525,000 | | 1,544,063 |
| Encore Acquisition Co. | | | | |
| sr. sub. notes 6 1/4s, 2014 | | 880,000 | | 814,000 |
| Encore Acquisition Co. | | | | |
| sr. sub. notes 6s, 2015 | | 3,290,000 | | 2,961,000 |
| EXCO Resources, Inc. company | | | | |
| guaranty 7 1/4s, 2011 | | 1,920,000 | | 1,867,200 |
| Forest Oil Corp. sr. notes | | | | |
| 8s, 2011 | | 2,365,000 | | 2,447,775 |
| Harvest Operations Corp. | | | | |
| sr. notes 7 7/8s, 2011 (Canada) | | 2,350,000 | | 2,197,250 |
| Hilcorp Energy I LP/Hilcorp | | | | |
| Finance Co. 144A sr. notes | | | | |
| 9s, 2016 | | 770,000 | | 785,400 |
| Newfield Exploration Co. | | | | |
| sr. sub. notes 6 5/8s, 2016 | | 300,000 | | 294,750 |
| Newfield Exploration Co. | | | | |
| sr. sub. notes 6 5/8s, 2014 | | 2,095,000 | | 2,053,100 |
| PetroHawk Energy Corp. | | | | |
| company guaranty 9 1/8s, 2013 | | 3,855,000 | | 4,047,750 |
| Plains Exploration & | | | | |
| Production Co. company | | | | |
| guaranty 7 3/4s, 2015 | | 365,000 | | 361,350 |
| Plains Exploration & | | | | |
| Production Co. company | | | | |
| guaranty 7s, 2017 | | 1,910,000 | | 1,814,500 |
| Quicksilver Resources, Inc. | | | | |
| company guaranty 7 1/8s, 2016 | | 1,370,000 | | 1,322,050 |
| Sabine Pass LNG LP sec. | | | | |
| notes 7 1/2s, 2016 | | 1,290,000 | | 1,219,050 |
| Targa Resources, Inc. 144A | | | | |
| company guaranty 8 1/2s, 2013 | | 2,705,000 | | 2,650,900 |
| Whiting Petroleum Corp. | | | | |
| company guaranty 7s, 2014 | | 2,530,000 | | 2,454,100 |
| | | | | 41,525,141 |
|
| |
| Publishing (1.8%) | | | | |
| American Media, Inc. company | | | | |
| guaranty 8 7/8s, 2011 | | 305,000 | | 271,450 |
| American Media, Inc. company | | | | |
| guaranty Ser. B, 10 1/4s, 2009 | | 2,120,000 | | 1,894,750 |
| CanWest Media, Inc. company | | | | |
| guaranty 8s, 2012 (Canada) | | 1,196,600 | | 1,109,847 |
| Cenveo Corp., | | | | |
| sr. sub. notes 7 7/8s, 2013 | | 700,000 | | 623,000 |
| Dex Media, Inc. disc. | | | | |
| notes stepped-coupon zero % | | | | |
| (9s,11/15/08), 2013 †† | | 935,000 | | 857,863 |
| Dex Media, Inc. notes 8s, 2013 | | 545,000 | | 520,475 |
| Quebecor Media notes 7 3/4s, | | | | |
| 2016 (Canada) | | 360,000 | | 335,700 |
| R.H. Donnelley Corp. sr. disc. | | | | |
| notes Ser. A-1, 6 7/8s, 2013 | | 205,000 | | 187,063 |
| | | | |
| CORPORATE BONDS AND NOTES (81.5%)* continued | | |
|
| | | Principal amount | | Value |
|
| Publishing continued | | | | |
| R.H. Donnelley Corp. sr. disc. | | | | |
| notes Ser. A-2, 6 7/8s, 2013 | $ | 1,545,000 | $ | 1,409,813 |
| R.H. Donnelley Corp. | | | | |
| sr. notes 8 7/8s, 2017 | | 1,045,000 | | 984,913 |
| R.H. Donnelley Corp. | | | | |
| sr. notes 6 7/8s, 2013 | | 620,000 | | 565,750 |
| Reader’s Digest Association, Inc. | | | | |
| (The) 144A sr. sub. notes | | | | |
| 9s, 2017 | | 1,750,000 | | 1,435,000 |
| Vertis, Inc. company | | | | |
| guaranty 9 3/4s, 2009 | | 500,000 | | 465,000 |
| Vertis, Inc. company | | | | |
| guaranty Ser. B, 10 7/8s, 2009 | | 2,575,000 | | 1,686,625 |
| Vertis, Inc. 144A | | | | |
| sub. notes 13 1/2s, 2009 | | 880,000 | | 281,600 |
| | | | | 12,628,849 |
|
|
| |
| Restaurants (0.1%) | | | | |
| Buffets, Inc. company | | | | |
| guaranty 12 1/2s, 2014 | | 660,000 | | 315,150 |
| OSI Restaurant Partners, Inc. | | | | |
| 144A sr. notes 10s, 2015 | | 720,000 | | 574,200 |
| | | | | 889,350 |
|
| |
| Retail (1.8%) | | | | |
| Asbury Automotive Group, Inc. | | | | |
| sr. sub. notes 8s, 2014 | | 1,925,000 | | 1,848,000 |
| Autonation, Inc. company | | | | |
| guaranty 7s, 2014 | | 380,000 | | 359,100 |
| Autonation, Inc. company | | | | |
| guaranty FRN 7.243s, 2013 | | 590,000 | | 554,600 |
| Claire’s Stores, Inc. 144A | | | | |
| company guaranty | | | | |
| 9 5/8s, 2015 ‡‡ | | 55,000 | | 40,150 |
| Harry & David Holdings, Inc. | | | | |
| company guaranty 9s, 2013 | | 1,355,000 | | 1,243,213 |
| Harry & David Holdings, Inc. | | | | |
| company guaranty FRN | | | | |
| 10.62s, 2012 | | 385,000 | | 365,750 |
| Michaels Stores, Inc. company | | | | |
| guaranty 11 3/8s, 2016 | | 2,095,000 | | 1,995,488 |
| Michaels Stores, Inc. company | | | | |
| guaranty 10s, 2014 | | 470,000 | | 462,950 |
| Neiman-Marcus Group, Inc. | | | | |
| company guaranty 9s, 2015 | | 1,280,000 | | 1,331,200 |
| Rite Aid Corp. company | | | | |
| guaranty 9 3/8s, 2015 | | 1,570,000 | | 1,358,050 |
| Rite Aid Corp. company | | | | |
| guaranty 7 1/2s, 2015 | | 1,325,000 | | 1,212,375 |
| Rite Aid Corp. sec. notes | | | | |
| 7 1/2s, 2017 | | 180,000 | | 162,000 |
| Rite Aid Corp. 144A company | | | | |
| guaranty 9 1/2s, 2017 | | 125,000 | | 107,500 |
| United Auto Group, Inc. | | | | |
| company guaranty 7 3/4s, 2016 | | 1,690,000 | | 1,605,500 |
| | | | | 12,645,876 |
|
30
| | | | |
| CORPORATE BONDS AND NOTES (81.5%)* continued | | |
|
| | Principal amount | | Value |
|
| Technology (5.5%) | | | | |
| Activant Solutions, Inc. company | | | | |
| guaranty 9 1/2s, 2016 | $ | 985,000 | $ | 844,638 |
| Advanced Micro Devices, Inc. | | | | |
| sr. notes 7 3/4s, 2012 | | 1,498,000 | | 1,381,905 |
| Amkor Technologies, Inc. | | | | |
| sr. notes 7 3/4s, 2013 | | 2,245,000 | | 2,110,300 |
| Avago Technologies Finance | | | | |
| company guaranty 11 7/8s, | | | | |
| 2015 (Singapore) | | 390,000 | | 419,250 |
| Avago Technologies Finance | | | | |
| company guaranty 10 1/8s, | | | | |
| 2013 (Singapore) | | 395,000 | | 415,738 |
| Avago Technologies Finance | | | | |
| company guaranty FRN 11.12s, | | | | |
| 2013 (Singapore) | | 35,000 | | 35,569 |
| Celestica, Inc. | | | | |
| sr. sub. notes 7 7/8s, | | | | |
| 2011 (Canada) | | 750,000 | | 725,625 |
| Celestica, Inc. | | | | |
| sr. sub. notes 7 5/8s, | | | | |
| 2013(Canada) | | 905,000 | | 850,700 |
| Ceridian Corp. 144A sr. unsec. | | | | |
| 11 1/4s, 2015 | | 1,045,000 | | 975,769 |
| Compucom Systems, Inc. | | | | |
| sr. sub. notes 12 1/2s, 2015 | | 570,000 | | 558,600 |
| Freescale Semiconductor, Inc. | | | | |
| sr. sec. notes 10 1/8s, 2016 (S) | | 1,970,000 | | 1,689,275 |
| Freescale Semiconductor, Inc. | | | | |
| sr. unsec. 9 1/8s, 2014 ‡‡ | | 1,970,000 | | 1,718,825 |
| Freescale Semiconductor, Inc. | | | | |
| sr. unsec. 8 7/8s, 2014 (S) | | 3,305,000 | | 3,019,944 |
| Iron Mountain, Inc. company | | | | |
| guaranty 8 3/4s, 2018 | | 670,000 | | 700,150 |
| Iron Mountain, Inc. company | | | | |
| guaranty 8 5/8s, 2013 | | 1,930,000 | | 1,944,475 |
| Iron Mountain, Inc. | | | | |
| sr. sub. notes 8 1/4s, 2011 | | 175,000 | | 175,875 |
| Lucent Technologies, Inc. | | | | |
| debs. 6.45s, 2029 | | 2,345,000 | | 1,887,725 |
| Lucent Technologies, Inc. | | | | |
| notes 5 1/2s, 2008 | | 520,000 | | 512,200 |
| New ASAT Finance, Ltd. company | | | | |
| guaranty 9 1/4s, 2011 | | | | |
| (Cayman Islands) | | 1,235,000 | | 950,950 |
| Nortel Networks, Ltd. 144A | | | | |
| company guaranty 10 3/4s, | | | | |
| 2016 (Canada) | | 575,000 | | 599,438 |
| Nortel Networks, Ltd. 144A | | | | |
| company guaranty FRN 9.493s, | | | | |
| 2011(Canada) | | 1,770,000 | | 1,721,325 |
| NXP BV/NXP Funding, LLC sec. | | | | |
| FRN 7.993s, 2013 (acquired | | | | |
| 10/5/06, cost $1,660,000) | | | | |
| (Netherlands) ‡ | | 1,660,000 | | 1,568,700 |
| NXP BV/NXP Funding, LLC sec. | | | | |
| notes 7 7/8s, 2014 (Netherlands) | | 2,772,000 | | 2,661,120 |
| Open Solutions, Inc. 144A | | | | |
| sr. sub. notes 9 3/4s, 2015 | | 1,140,000 | | 1,060,200 |
| | | | |
| CORPORATE BONDS AND NOTES (81.5%)* continued | | |
|
| | Principal amount | | Value |
|
| Technology continued | | | | |
| Seagate Technology Hdd | | | | |
| Holdings company guaranty | | | | |
| 6.8s, 2016 (Cayman Islands) | $ | 940,000 | $ | 946,803 |
| SunGard Data Systems, Inc. | | | | |
| company guaranty 10 1/4s, 2015 | | 1,646,000 | | 1,695,380 |
| SunGard Data Systems, Inc. | | | | |
| company guaranty 9 1/8s, 2013 | | 4,762,000 | | 4,845,335 |
| Travelport LLC company | | | | |
| guaranty 11 7/8s, 2016 | | 495,000 | | 524,700 |
| Travelport LLC company | | | | |
| guaranty 9 7/8s, 2014 | | 1,360,000 | | 1,373,600 |
| Unisys Corp. sr. notes 8s, 2012 | | 1,395,000 | | 1,252,013 |
| | | | | 39,166,127 |
|
| |
| Textiles (1.3%) | | | | |
| Hanesbrands, Inc. company | | | | |
| guaranty FRN Ser. B, | | | | |
| 8.784s, 2014 | | 2,630,000 | | 2,590,550 |
| Levi Strauss & Co. | | | | |
| sr. notes 9 3/4s, 2015 | | 3,140,000 | | 3,151,775 |
| Levi Strauss & Co. | | | | |
| sr. notes 8 7/8s, 2016 | | 1,490,000 | | 1,452,750 |
| Oxford Industries, Inc. | | | | |
| sr. notes 8 7/8s, 2011 | | 1,740,000 | | 1,726,950 |
| | | | | 8,922,025 |
|
| |
| Tire & Rubber (0.1%) | | | | |
| Goodyear Tire & Rubber Co. | | | | |
| (The) sr. notes 9s, 2015 | | 100,000 | | 106,500 |
| Goodyear Tire & Rubber Co. | | | | |
| (The) sr. notes 8 5/8s, 2011 | | 579,000 | | 605,055 |
| | | | | 711,555 |
|
| |
| Utilities & Power (5.4%) | | | | |
| AES Corp. (The) 144A sec. | | | | |
| notes 8 3/4s, 2013 | | 1,904,000 | | 1,994,440 |
| AES Corp. (The) 144A sr. notes | | | | |
| 8s, 2017 | | 670,000 | | 666,650 |
| CMS Energy Corp. sr. notes | | | | |
| 8 1/2s, 2011 | | 490,000 | | 527,501 |
| CMS Energy Corp. sr. notes | | | | |
| 7 3/4s, 2010 | | 740,000 | | 774,366 |
| Colorado Interstate Gas Co. | | | | |
| debs. 6.85s, 2037 | | 1,430,000 | | 1,455,914 |
| Colorado Interstate Gas Co. | | | | |
| sr. notes 5.95s, 2015 | | 405,000 | | 406,901 |
| Dynegy-Roseton Danskamme | | | | |
| company guaranty Ser. A, | | | | |
| 7.27s, 2010 | | 1,184,784 | | 1,183,303 |
| Dynegy-Roseton Danskamme | | | | |
| company guaranty Ser. B, | | | | |
| 7.67s, 2016 | | 2,180,000 | | 2,147,300 |
| Edison Mission Energy sr. unsec. | | | | |
| 7.2s, 2019 | | 1,370,000 | | 1,308,350 |
| Edison Mission Energy sr. unsec. | | | | |
| 7s, 2017 | | 1,015,000 | | 971,863 |
| Edison Mission Energy sr. unsec. | | | | |
| notes 7 3/4s, 2016 | | 755,000 | | 762,550 |
31
| | | | |
| CORPORATE BONDS AND NOTES (81.5%)* continued | | |
|
| | Principal amount | | Value |
|
| Utilities & Power continued | | | | |
| Edison Mission Energy sr. unsec. | | | | |
| notes 7 1/2s, 2013 | $ | 885,000 | $ | 885,000 |
| El Paso Natural Gas Co. debs. | | | | |
| 8 5/8s, 2022 | | 765,000 | | 901,224 |
| Ferrellgas LP/Finance | | | | |
| sr. notes 6 3/4s, 2014 | | 2,200,000 | | 2,134,000 |
| Mirant Americas Generation, Inc. | | | | |
| sr. notes 8.3s, 2011 | | 1,440,000 | | 1,432,800 |
| Mirant North America, LLC | | | | |
| company guaranty 7 3/8s, 2013 | | 2,440,000 | | 2,446,100 |
| NRG Energy, Inc. company | | | | |
| guaranty 7 3/8s, 2017 | | 935,000 | | 918,638 |
| NRG Energy, Inc. sr. notes | | | | |
| 7 3/8s, 2016 | | 5,065,000 | | 4,963,700 |
| Orion Power Holdings, Inc. | | | | |
| sr. notes 12s, 2010 | | 940,000 | | 1,024,600 |
| Sierra Pacific Power Co. general | | | | |
| ref. mtge. 6 1/4s, 2012 | | 485,000 | | 505,276 |
| Sierra Pacific Resources | | | | |
| sr. notes 8 5/8s, 2014 | | 1,630,000 | | 1,735,953 |
| Teco Energy, Inc. notes 7.2s, 2011 | | 680,000 | | 715,086 |
| Teco Energy, Inc. notes 7s, 2012 | | 1,165,000 | | 1,220,192 |
| Teco Energy, Inc. | | | | |
| sr. notes 6 3/4s, 2015 | | 140,000 | | 144,440 |
| Tennessee Gas Pipeline Co. | | | | |
| debs. 7s, 2028 | | 305,000 | | 313,156 |
| Tennessee Gas Pipeline Co. unsec. | | | | |
| notes 7 1/2s, 2017 | | 610,000 | | 676,006 |
| Transcontinental Gas | | | | |
| Pipeline Corp. debs. 7 1/4s, 2026 | | 1,055,000 | | 1,153,906 |
| Utilicorp United, Inc. | | | | |
| sr. notes 9.95s, 2011 | | 68,000 | | 74,151 |
| Williams Cos., Inc. (The) | | | | |
| notes 7 3/4s, 2031 | | 1,225,000 | | 1,353,625 |
| Williams Cos., Inc. (The) | | | | |
| notes 7 5/8s, 2019 | | 2,170,000 | | 2,403,275 |
| Williams Cos., Inc. (The) 144A | | | | |
| notes 6 3/8s, 2010 | | 700,000 | | 709,625 |
| Williams Partners LP/ Williams | | | | |
| Partners Finance Corp. company | | | | |
| guaranty 7 1/4s, 2017 | | 705,000 | | 722,625 |
| | | | | 38,632,516 |
|
| |
| Total corporate bonds and notes (cost $607,295,882) | $ | 580,374,717 |
|
| |
| |
| SENIOR LOANS (8.6%)* (c) | | | | |
| |
| | Principal amount | | Value |
|
| Automotive (0.3%) | | | | |
| Allison Transmission bank term | | | | |
| loan FRN Ser. B, 8.17s, 2014 | $ | 1,250,000 | $ | 1,164,584 |
| Dana Corp. bank term loan FRN | | | | |
| 7.98s, 2008 | | 450,000 | | 446,384 |
| United Components, Inc. bank term | | | | |
| loan FRN Ser. D, 6.868s, 2012 | | 214,667 | | 206,080 |
| | | | | 1,817,048 |
|
| | | | |
| SENIOR LOANS (8.6%)* (c) continued | | | | |
| |
| | | Principal amount | | Value |
|
| Basic Materials (0.6%) | | | | |
| Domtar Corp. bank term loan | | | | |
| FRN 6.027s, 2014 (Canada) | $ | 1,590,104 | $ | 1,520,822 |
| Georgia-Pacific Corp. bank term | | | | |
| loan FRN Ser. B, 7.412s, 2013 | | 1,067,284 | | 1,012,300 |
| Huntsman International, LLC | | | | |
| bank term loan FRN Ser. B, | | | | |
| 6.533s, 2012 | | 361,524 | | 354,043 |
| Ineos Holdings, Ltd. bank term | | | | |
| loan FRN Ser. B2, 7.58s, 2014 | | | | |
| (United Kingdom) | | 220,000 | | 212,896 |
| Ineos Holdings, Ltd. bank term | | | | |
| loan FRN Ser. C2, 8.08s, 2015 | | | | |
| (United Kingdom) | | 220,000 | | 212,896 |
| Rockwood Specialties Group, Inc. | | | | |
| bank term loan FRN Ser. E, | | | | |
| 6.46s, 2012 | | 760,000 | | 729,073 |
| | | | | 4,042,030 |
|
| |
| Broadcasting (0.2%) | | | | |
| Univision Communications, Inc. | | | | |
| bank term loan FRN Ser. B, | | | | |
| 7.204s, 2014 | | 1,546,309 | | 1,416,161 |
| Univision Communications, Inc. | | | | |
| bank term loan FRN Ser. DD, | | | | |
| 7.61s, 2014 (U) | | 53,691 | | 49,172 |
| Young Broadcasting, Inc. bank | | | | |
| term loan FRN Ser. B, | | | | |
| 7.252s, 2012 | | 79,434 | | 75,065 |
| | | | | 1,540,398 |
|
| |
| Cable Television (0.1%) | | | | |
| Cablevision Systems Corp. bank | | | | |
| term loan FRN 6.415s, 2013 | | 837,873 | | 793,062 |
|
| |
| Capital Goods (0.3%) | | | | |
| Sequa Corp. bank term loan FRN | | | | |
| 8.479s, 2014 | | 850,000 | | 819,542 |
| Wesco Aircraft Hardware Corp. | | | | |
| bank term loan FRN 10.95s, 2014 | | 1,275,000 | | 1,262,250 |
| Wesco Aircraft Hardware Corp. | | | | |
| bank term loan FRN 7.45s, 2013 | | 389,000 | | 380,247 |
| | | | | 2,462,039 |
|
| |
| Communication Services (0.2%) | | | | |
| Hawaiian Telcom | | | | |
| Communications, Inc. bank term | | | | |
| loan FRN Ser. C, 7.45s, 2014 | | 1,062,338 | | 1,003,688 |
| Leap Wireless International, Inc. | | | | |
| bank term loan FRN Ser. B, | | | | |
| 7.448s, 2013 | | 197,500 | | 192,915 |
| | | | | 1,196,603 |
|
| |
| Consumer Cyclicals (1.6%) | | | | |
| Adesa, Inc. bank term loan FRN | | | | |
| 7.45s, 2013 | | 648,375 | | 612,135 |
| CCM Merger, Inc. bank term | | | | |
| loan FRN Ser. B, 7.3s, 2012 | | 660,000 | | 636,900 |
32
| | | | |
| SENIOR LOANS (8.6%)* (c) continued | | | | |
| |
| | | Principal amount | | Value |
|
| Consumer Cyclicals continued | | | | |
| Federal Mogul Corp. bank term | | | | |
| loan FRN Ser. A, 7.003s, 2008 | $ | 1,165,000 | $ | 1,148,495 |
| Federal Mogul Corp. bank term | | | | |
| loan FRN Ser. B, 7.253s, 2008 | | 2,700,000 | | 2,661,749 |
| GateHouse Media, Inc. bank | | | | |
| term loan FRN Ser. B, | | | | |
| 7.07s, 2014 | | 822,935 | | 730,061 |
| GateHouse Media, Inc. bank | | | | |
| term loan FRN Ser. DD, | | | | |
| 7.236s, 2014 | | 307,065 | | 272,411 |
| Golden Nugget, Inc. bank term | | | | |
| loan FRN Ser. B, 6.742s, 2014 | | 238,636 | | 226,108 |
| Golden Nugget, Inc. bank term | | | | |
| loan FRN Ser. DD, 7 1/2s, | | | | |
| 2014 (U) | | 136,364 | | 129,205 |
| Landsource, Inc. bank term loan | | | | |
| FRN 7.697s, 2013 | | 409,351 | | 339,762 |
| Lear Corp bank term loan FRN | | | | |
| 7.604s, 2013 | | 1,548,000 | | 1,501,560 |
| Neiman Marcus Group, Inc. bank | | | | |
| term loan FRN Ser. B, | | | | |
| 7.448s, 2013 | | 315,675 | | 303,127 |
| Tribune Co. bank term loan FRN | | | | |
| Ser. B, 8.244s, 2014 | | 3,057,338 | | 2,650,712 |
| Trump Hotel & Casino Resort, Inc. | | | | |
| bank term loan FRN 7.35s, 2012 | | 207,349 | | 202,165 |
| Trump Hotel & Casino Resort, Inc. | | | | |
| bank term loan FRN Ser. B-1, | | | | |
| 7.9s, 2012 | | 207,348 | | 202,165 |
| | | | | 11,616,555 |
|
| |
| Consumer Staples (0.8%) | | | | |
| Charter Communications, Inc. | | | | |
| bank term loan FRN 6.99s, 2014 | | 290,910 | | 270,714 |
| Citadel Communications bank | | | | |
| term loan FRN Ser. B, | | | | |
| 6.632s, 2014 | | 760,000 | | 689,700 |
| Mediacom Communications | | | | |
| Corp. bank term loan FRN | | | | |
| Ser. C, 6.61s, 2015 | | 1,629,100 | | 1,526,118 |
| Pinnacle Foods Holding Corp. | | | | |
| bank term loan FRN Ser. B, | | | | |
| 7.948s, 2014 | | 357,350 | | 337,696 |
| Rental Service Corp. bank term | | | | |
| loan FRN 8 3/4s, 2013 | | 2,010,000 | | 1,887,726 |
| Six Flags Theme Parks bank term | | | | |
| loan FRN 7.249s, 2015 | | 783,038 | | 723,087 |
| | | | | 5,435,041 |
|
| |
| Energy (0.6%) | | | | |
| Enterprise GP Holdings, LP bank | | | | |
| term loan FRN 7.494s, 2014 | | 280,000 | | 277,900 |
| Key Energy Services, Inc. bank | | | | |
| term loan FRN 8s, 2010 | | 310,000 | | 308,838 |
| Sandridge Energy bank term loan | | | | |
| FRN 8.854s, 2014 | | 675,000 | | 671,625 |
| Sandridge Energy bank term loan | | | | |
| FRN 8 5/8s, 2015 | | 2,825,000 | | 2,817,938 |
| | | | | 4,076,301 |
|
| | | | |
| SENIOR LOANS (8.6%)* (c) continued | | | | |
|
| | Principal amount | | Value |
|
| Financial (0.2%) | | | | |
| Nuveen Investments, Inc. bank | | | | |
| term loan FRN Ser. B, | | | | |
| 7.724s, 2014 | $ | 460,000 | $ | 453,428 |
| Realogy Corp. bank term loan | | | | |
| FRN 5.32s, 2013 | | 256,667 | | 223,557 |
| Realogy Corp. bank term loan | | | | |
| FRN Ser. B, 8.24s, 2013 | | 950,950 | | 828,277 |
| | | | | 1,505,262 |
|
| |
| Gaming & Lottery (0.1%) | | | | |
| Isle of Capri Casinos, Inc. bank | | | | |
| term loan FRN 6.741s, 2014 | | 475,279 | | 445,277 |
| Isle of Capri Casinos, Inc. bank | | | | |
| term loan FRN Ser. A, 7.11s, | | | | |
| 2014 (U) | | 142,941 | | 133,918 |
| Isle of Capri Casinos, Inc. bank | | | | |
| term loan FRN Ser. B, | | | | |
| 6.643s, 2014 | | 190,112 | | 178,111 |
| | | | | 757,306 |
|
| |
| Health Care (1.3%) | | | | |
| Community Health Systems, Inc. | | | | |
| bank term loan FRN Ser. B, | | | | |
| 7.756s, 2014 | | 1,399,428 | | 1,336,931 |
| Community Health Systems, Inc. | | | | |
| bank term loan FRN Ser. DD, | | | | |
| 7 3/4s, 2014 (U) | | 94,410 | | 90,194 |
| Fenwal Controls of Japan, LTD. | | | | |
| bank term loan FRN 7.791s, | | | | |
| 2014 (Japan) | | 1,577,786 | | 1,467,341 |
| Fenwal Controls of Japan, LTD. | | | | |
| bank term loan FRN Ser. DD, | | | | |
| 7 3/4s, 2014 (Japan) (U) | | 264,286 | | 245,786 |
| Health Management Associates, | | | | |
| Inc. bank term loan FRN | | | | |
| 6.942s, 2014 | | 1,835,775 | | 1,718,489 |
| Healthsouth Corp. bank term | | | | |
| loan FRN Ser. B, 7.171s, 2013 | | 970,479 | | 927,910 |
| Hologic, Inc. bank term loan | | | | |
| FRN Ser. B1, 7.268s, 2013 | | 943,333 | | 933,900 |
| Hologic, Inc. bank term loan | | | | |
| FRN Ser. B2, 7.268s, 2013 | | 471,667 | | 468,129 |
| IASIS Healthcare, LLC/IASIS | | | | |
| Capital Corp. bank term loan | | | | |
| FRN 10.61s, 2014 | | 1,871,470 | | 1,740,467 |
| Psychiatric Solutions, Inc. bank | | | | |
| term loan FRN Ser. B, | | | | |
| 7.003s, 2012 | | 214,509 | | 205,929 |
| | | | | 9,135,076 |
|
| |
| Media (0.1%) | | | | |
| Idearc, Inc. bank term loan | | | | |
| FRN Ser. B, 7.2s, 2014 | | 1,077,286 | | 1,030,155 |
|
33
| | | | |
| SENIOR LOANS (8.6%)* (c) continued | | | | |
| |
| | Principal amount | | Value |
|
| Retail (0.4%) | | | | |
| Claire’s Stores, Inc. bank term | | | | |
| loan FRN 7.948s, 2014 | $ | 2,104,725 | $ | 1,846,240 |
| Michaels Stores, Inc. bank term | | | | |
| loan FRN Ser. B, 7.607s, 2013 | | 786,030 | | 720,111 |
| | | | | 2,566,351 |
|
| |
| Technology (0.5%) | | | | |
| CompuCom Systems, Inc. bank | | | | |
| term loan FRN 8.26s, 2014 | | 975,000 | | 965,250 |
| First Data Corp. bank term loan | | | | |
| FRN Ser. B1, 7.96s, 2014 | | 925,000 | | 875,166 |
| First Data Corp. bank term loan | | | | |
| FRN Ser. B3, 7.96s, 2014 | | 925,000 | | 880,369 |
| Flextronics International, Ltd. | | | | |
| bank term loan FRN Ser. B, | | | | |
| 7.455s, 2014 (Singapore) | | 228,795 | | 223,289 |
| Flextronics International, Ltd. | | | | |
| bank term loan FRN Ser. B, | | | | |
| 7.394s, 2014 (Singapore) | | 796,205 | | 777,047 |
| | | | | 3,721,121 |
|
| |
| Tire & Rubber (0.3%) | | | | |
| Goodyear Tire & Rubber Co. | | | | |
| (The) bank term loan FRN | | | | |
| 6.85s, 2010 | | 2,460,000 | | 2,304,713 |
|
| |
| Transportation (0.2%) | | | | |
| Navistar Financial Corp. bank | | | | |
| term loan FRN 6.953s, 2012 | | 385,333 | | 372,810 |
| Navistar International Corp. bank | | | | |
| term loan FRN 8.234s, 2012 | | 1,059,667 | | 1,025,228 |
| United Airlines Corp. bank term | | | | |
| loan FRN Ser. B, 6.907s, 2014 | | 422,875 | | 401,496 |
| | | | | 1,799,534 |
|
| |
| Utilities & Power (0.8%) | | | | |
| Energy Future Holdings bank term | | | | |
| loan FRN Ser. B2, 8.396s, 2014 | | 2,480,000 | | 2,433,500 |
| Energy Future Holdings bank term | | | | |
| loan FRN Ser. B3, 8.396s, 2014 | | 3,310,000 | | 3,252,787 |
| | | | | 5,686,287 |
|
| |
| Total senior loans (cost $64,083,414) | | | $ | 61,484,882 |
|
| |
| |
| CONVERTIBLE BONDS AND NOTES (1.4%)* | | |
|
| | Principal amount | | Value |
|
| Acquicor Technology, Inc. | | | | |
| 144A cv. notes 8s, 2011 | $ | 822,000 | $ | 715,140 |
| DRS Technologies, Inc. | | | | |
| 144A cv. unsec. notes 2s, 2026 | | 3,085,000 | | 3,513,044 |
| International Coal Group, Inc. | | | | |
| 144A cv. company guaranty | | | | |
| 9s, 2012 | | 1,480,000 | | 1,699,117 |
| Jazz Technologies, Inc. cv. | | | | |
| company guaranty 8s, 2011 | | 20,000 | | 17,400 |
| | | | |
| CONVERTIBLE BONDS AND NOTES (1.4%)* continued | | |
|
| | Principal amount | | Value |
|
| Level 3 Communications, Inc. cv. | | | | |
| sr. notes 3 1/2s, 2012 | $ | 995,000 | $ | 902,963 |
| NII Holdings, Inc. | | | | |
| 144A cv. sr. unsec. notes | | | | |
| 3 1/8s, 2012 | | 1,298,000 | | 1,145,485 |
| Sinclair Broadcast | | | | |
| Group, Inc. cv. sr. sub. notes | | | | |
| stepped-coupon 4 7/8s | | | | |
| (2s, 1/15/11) 2018 †† | | 1,060,000 | | 985,800 |
| Trinity Industries, Inc. cv. sub. | | | | |
| notes 3 7/8s, 2036 | | 1,310,000 | | 1,141,338 |
|
| |
| Total convertible bonds and notes (cost $9,741,046) | $ | 10,120,287 |
|
| |
| |
| COLLATERALIZED MORTGAGE OBLIGATIONS (0.5%)* | | |
|
| | Principal amount | | Value |
| |
| DLJ Commercial Mortgage Corp. | | | | |
| 144A Ser. 98-CF2, Class B5, | | | | |
| 5.95s, 2031 | $ | 1,581,791 | $ | 1,388,022 |
| GE Capital Commercial | | | | |
| Mortgage Corp. 144A Ser. 00-1, | | | | |
| Class G, 6.131s, 2033 | | 1,025,000 | | 912,476 |
| Mach One Commercial | | | | |
| Mortgage Trust 144A | | | | |
| Ser. 04-1A, Class J, 5.45s, | | | | |
| 2040 (Canada) | | 1,000,000 | | 734,050 |
| Ser. 04-1A, Class K, 5.45s, | | | | |
| 2040 (Canada) | | 365,000 | | 277,181 |
| Ser. 04-1A, Class L, 5.45s, | | | | |
| 2040 (Canada) | | 165,000 | | 97,495 |
|
| |
| Total collateralized mortgage obligations | | |
| (cost $3,123,108) | | | $ | 3,409,224 |
|
| |
| |
| ASSET-BACKED SECURITIES (0.5%)* | | | | |
|
| | Principal amount | | Value |
| |
| Neon Capital, Ltd. 144A | | | | |
| limited recourse sec. | | | | |
| notes Ser. 95, 2.319s, 2013 | | | | |
| (Cayman Islands) (F) (g) | $ | 3,901,050 | $ | 1,385,470 |
| limited recourse sec. | | | | |
| notes Ser. 97, 1.105s, 2013 | | | | |
| (Cayman Islands) (F) (g) | | 6,684,836 | | 1,974,433 |
|
| |
| Total asset-backed securities (cost $4,065,552) | $ | 3,359,903 |
|
| |
| |
| FOREIGN GOVERNMENT BONDS AND NOTES (0.2%)* (cost $225,142) |
| |
| | Principal amount | | Value |
|
| Argentina (Republic of ) FRB | | | | |
| 5.389s, 2012 | $ | 1,415,625 | $ | 1,243,615 |
|
34
| | | | |
| SHORT-TERM INVESTMENTS (6.8%)* | | | |
|
| | Principal amount/shares | | Value |
| Short-term investments held as | | | | |
| collateral for loaned securities | | | | |
| with yields ranging from 4.40% | | | | |
| to 5.44% and due dates ranging | | | | |
| from December 3, 2007 to | | | | |
| January 29, 2008 (d) | $ | 8,813,642 | $ | 8,789,680 |
| Putnam Prime Money Market | | | | |
| Fund (e) | | 39,980,499 | | 39,980,499 |
|
| |
| Total short-term investments (cost $48,770,179) | $ | 48,770,179 |
|
| |
| |
| TOTAL INVESTMENTS | | | | |
| Total investments (cost $737,304,323) | | $ | 708,762,807 |
* Percentages indicated are based on net assets of $712,179,926.
† Non-income-producing security.
† † The interest rate and date shown parenthetically represent the new interest rate to be paid and the date the fund will begin accruing interest at this rate.
‡ Restricted, excluding 144A securities, as to public resale. The total market value of restricted securities held at November 30, 2007 was $1,568,700 or 0.2% of net assets.
‡‡ Income may be received in cash or additional securities at the discretion of the issuer.
(c) Senior loans are exempt from registration under the Securities Act of 1933, as amended, but contain certain restrictions on resale and cannot be sold publicly. These loans pay interest at rates which adjust periodically. The interest rates shown for senior loans are the current interest rates at November 30, 2007. Senior loans are also subject to mandatory and/or optional prepayment which cannot be predicted. As a result, the remaining maturity may be substantially less than the stated maturity shown (Notes 1 and 6).
(d) See Note 1 to the financial statements.
(e) See Note 5 to the financial statements regarding investments in Putnam Prime Money Market Fund.
(F) Security is valued at fair value following procedures approved by the Trustees.
(g) The notes are secured by debt and equity securities and equity participation agreements held by Neon Capital, Ltd.
(R) Real Estate Investment Trust.
(S) Securities on loan, in part or in entirety, at November 30, 2007.
(U) A portion of the position represents unfunded loan commitments (Note 7).
At November 30, 2007, liquid assets totaling $14,806,362 have been designated as collateral for open forward commitments and swap contracts.
144A after the name of an issuer represents securities exempt from registration under Rule 144A under the Securities Act of 1933, as amended. These securities may be resold in transactions exempt from registration, normally to qualified institutional buyers.
The rates shown on Floating Rate Bonds (FRB) and Floating Rate Notes (FRN) are the current interest rates at November 30, 2007.
The dates shown on debt obligations are the original maturity dates.
| | | | | | | |
| FORWARD CURRENCY CONTRACTS TO BUY at 11/30/07 (aggregate face value $4,235,414) | | | | |
|
| | | | | | | | Unrealized |
| | | | | Aggregate | | Delivery | appreciation/ |
| | | | Value | face value | | date | (depreciation) |
|
| Canadian Dollar | | | $602,787 | $604,214 | | 1/16/08 | $(1,427) |
| Euro | | | 3,874,330 | 3,631,200 | | 12/19/07 | 243,130 |
|
| Total | | | | | | | $241,703 |
|
| |
| FORWARD CURRENCY CONTRACTS TO SELL at 11/30/07 | | | | | |
|
| |
| | | | | Aggregate | | Delivery | Unrealized |
| | | | Value | face value | | date | depreciation |
|
| Euro | | | $9,154,099 | $8,514,563 | | 12/19/07 | $(639,536) |
| |
| INTEREST RATE SWAP CONTRACTS OUTSTANDING at 11/30/07 | | | | |
|
| | | | Payments | Payments | | | |
| Swap counterparty / | | Termination | made by | received by | | | Unrealized |
| Notional amount | | date | fund per annum | fund per annum | | | appreciation |
|
| Lehman Brothers Special Financing, Inc. | | | | | | | |
| $141,110,000 | | 9/14/09 | 3 month USD-LIBOR-BBA | 4.715% | | | $1,495,495 |
| | | | | | |
| CREDIT DEFAULT CONTRACTS OUTSTANDING at 11/30/07 | | | | | | |
|
| | | | Fixed payments | | Unrealized | |
| Swap counterparty / | Notional | | Termination | | received (paid) by | appreciation/ |
| Referenced debt* | amount | | date | | fund per annum | (depreciation) |
|
| Bank of America, N.A. | | | | | | |
| Abitibibowater Inc., | | | | | | |
| 6 1/2%, 6/15/13 | $ 440,000 | | 12/20/08 | | 550 bp | $ (17,477) |
|
| Nalco, Co. | | | | | | |
| 7.75%,11/15/11 | 400,000 | | 9/20/12 | | 350 bp | (648) |
|
| Bear Stearns Credit Products, Inc. | | | | | | |
| Claire’s Stores, | | | | | | |
| 9 5/8%, 6/1/15 | 255,000 | | 6/20/12 | | 230 bp | (19,349) |
|
| Citibank, N.A. | | | | | | |
| Abitibibowater Inc., | | | | | | |
| 6 1/2%, 6/15/13 | 440,000 | | 12/20/08 | | 725 bp | (8,584) |
|
| Abitibibowater Inc., | | | | | | |
| 6 1/2%, 6/15/13 | 440,000 | | 12/20/08 | | 800 bp | (7,728) |
|
| Freescale | | | | | | |
| Semiconductor, 8 7/8%, | | | | | | |
| 12/15/14 | 1,105,000 | | 9/20/12 | | 495 bp | (50,222) |
|
| Credit Suisse International | | | | | | |
| Advanced Micro Devices, | | | | | | |
| 7 3/4%, 11/1/12 | 495,000 | | 6/20/09 | | (165 bp) | (18,765) |
|
| Dynegy Holdings Inc., | | | | | | |
| 6 7/8%, 4/1/11 | 720,000 | | 6/20/17 | | 297 bp | (87,995) |
|
| Deutsche Bank AG | | | | | | |
| Nalco, Co. 7.75%, 11/15/11 | 370,000 | | 12/20/12 | | 363 bp | (113) |
|
| Goldman Sachs International | | | | | | |
| Any one of the | | | | | | |
| underlying securities | | | | | | |
| in the basket of BB | | | | | | |
| CMBS securities | 1,485,000 | | (a) | | 2.461% | (3,938) |
|
| General Motors Corp., | | | | | | |
| 7 1/8%, 7/15/13 | 1,725,000 | | 9/20/08 | | 620 bp | 52,785 |
|
| General Motors Corp., | | | | | | |
| 7 1/8%, 7/15/13 | 365,000 | | 9/20/08 | | 620 bp | 11,169 |
|
| Lehman Brothers Special Financing, Inc. | | | | | | |
| Community Health | | | | | | |
| Systems, 8 7/8%, 7/15/15 | 960,000 | | 12/20/12 | | 360 bp | (29,030) |
|
| Solectron Global | | | | | | |
| Finance Ltd, 8%, 3/15/16 | 317,000 | | 3/20/12 | | 390 bp | 45,264 |
|
| Sungard Data Systems, | | | | | | |
| Inc., 9 1/8%, 8/15/13 | 930,000 | | 9/20/12 | | 395 bp | 2,074 |
|
| Merrill Lynch Capital Services, Inc. | | | | | | |
| General Motors Corp., | | | | | | |
| 7 1/8%, 7/15/13 | 1,205,000 | | 9/20/08 | | 500 bp | 22,654 |
|
| Merrill Lynch International | | | | | | |
| Dynegy Holdings Inc., | | | | | | |
| 6 7/8%, 4/1/11 | 720,000 | | 6/20/17 | | 295 bp | (76,774) |
|
| Morgan Stanley Capital Services, Inc. | | | | | | |
| Advanced Micro Devices, | | | | | | |
| 7 3/4%, 11/1/12 | 50,000 | | 6/20/09 | | 190 bp | (1,689) |
|
| Aramark Services, Inc., | | | | | | |
| 8.5%, 2/1/15 | 780,000 | | 12/20/12 | | 355 bp | (18,233) |
|
36
| | | | | |
| CREDIT DEFAULT CONTRACTS OUTSTANDING at 11/30/07 continued | | | | |
| |
| | | | | Fixed payments | Unrealized |
| Swap counterparty / | Notional | | Termination | received (paid) by | appreciation/ |
| Referenced debt* | amount | | date | fund per annum | (depreciation) |
|
| Morgan Stanley Capital Services, Inc. continued | | | | | |
| Dynegy Holdings Inc., | | | | | |
| 6 7/8%, 4/1/11 | $ 720,000 | | 6/20/12 | 225 bp | $ (45,539) |
|
| Jefferson Smurfit Corp, | | | | | |
| 7.5%, 6/1/13 | 660,000 | | 9/20/12 | 445 bp | 23,148 |
|
| Nalco, Co. 7.75%, 11/15/11 | 405,000 | | 9/20/12 | 330 bp | (4,042) |
|
| Oshkosh Truck Corp, T/L B L | 1,075,000 | | 6/20/12 | 114 bp | (59,007) |
|
| Total | | | | | $(292,039) |
* Payments related to the reference debt are made upon a credit default event.
** Upfront premium is based on the difference between the original spread on issue and the market spread on day of execution.
(a) Terminating on the date on which the notional amount is reduced to zero or the date on which the assets securing the reference entity are liquidated.
The accompanying notes are an integral part of these financial statements.
37
Statement of assets and liabilities 11/30/07
| |
| ASSETS | |
|
| Investment in securities, at value, including $8,610,835 of securities on loan (Note 1): | |
| Unaffiliated issuers (identified cost $697,323,824) | $ 668,782,308 |
| Affiliated issuers (identified cost $39,980,499) (Note 5) | 39,980,499 |
|
| Cash | 2,339,434 |
|
| Foreign currency (cost $44) (Note 1) | 44 |
|
| Interest and other receivables | 14,222,199 |
|
| Receivable for shares of the fund sold | 222,131 |
|
| Receivable for securities sold | 1,925,698 |
|
| Receivable for sales of delayed delivery securities (Notes 1, 6 and 7) | 165,718 |
|
| Receivable from Manager (Note 2) | 132,424 |
|
| Unrealized appreciation on swap contracts (Note 1) | 1,652,589 |
|
| Receivable for open forward currency contracts (Note 1) | 243,130 |
|
| Receivable for closed forward currency contracts (Note 1) | 13,099 |
|
| Receivable for closed swap contracts (Note 1) | 743,179 |
|
| Total assets | 730,422,452 |
|
| |
| LIABILITIES | |
|
| Payable for securities purchased | 4,658,855 |
|
| Payable for purchases of delayed delivery securities (Notes 1, 6 and 7) | 815,833 |
|
| Payable for shares of the fund repurchased | 720,941 |
|
| Payable for compensation of Manager (Notes 2 and 5) | 1,205,476 |
|
| Payable for investor servicing (Note 2) | 158,907 |
|
| Payable for Trustee compensation and expenses (Note 2) | 241,158 |
|
| Payable for administrative services (Note 2) | 1,760 |
|
| Payable for distribution fees (Note 2) | 285,785 |
|
| Payable for closed forward currency contracts (Note 1) | 130,146 |
|
| Payable for open forward currency contracts (Note 1) | 640,963 |
|
| Payable for closed swap contracts (Note 1) | 19,050 |
|
| Unrealized depreciation on swap contracts (Note 1) | 449,133 |
|
| Collateral on securities loaned, at value (Note 1) | 8,789,680 |
|
| Other accrued expenses | 124,839 |
|
| Total liabilities | 18,242,526 |
|
| Net assets | $ 712,179,926 |
|
| |
| REPRESENTED BY | |
|
| Paid-in capital (Unlimited shares authorized) (Notes 1 and 4) | $1,732,729,783 |
|
| Undistributed net investment income (Note 1) | 8,202,215 |
|
| Accumulated net realized loss on investments (Note 1) | (1,001,018,439) |
|
| Net unrealized depreciation of investments and assets and liabilities in foreign currencies | (27,733,633) |
|
| Total — Representing net assets applicable to capital shares outstanding | $ 712,179,926 |
(Continued on next page)
38
Statement of assets and liabilities (Continued)
| |
| COMPUTATION OF NET ASSET VALUE AND OFFERING PRICE | |
|
| Net asset value and redemption price per class A share ($373,890,229 divided by 61,846,948 shares) | $6.05 |
|
| Offering price per class A share (100/96.00 of $6.05)*† | $6.30 |
|
| Net asset value and offering price per class B share ($11,407,248 divided by 1,913,737 shares)** | $5.96 |
|
| Net asset value and offering price per class C share ($776,007 divided by 130,390 shares)** | $5.95 |
|
| Net asset value and redemption price per class M share ($275,959,121 divided by 45,600,240 shares) | $6.05 |
|
| Offering price per class M share (100/96.75 of $6.05)*** | $6.25 |
|
| Net asset value, offering price and redemption price per class R share ($1,465 divided by 242 shares) | $6.05 |
|
| Net asset value, offering price and redemption price per class Y share ($50,145,856 divided by 8,107,260 shares) | $6.19 |
|
* On single retail sales of less than $100,000. On sales of $100,000 or more the offering price is reduced.
** Redemption price per share is equal to net asset value less any applicable contingent deferred sales charge.
*** On single retail sales of less than $50,000. On sales of $50,000 or more the offering price is reduced.
† Reflects a maximum front-end sales charge for class A shares of 4.00% which became effective on January 2, 2008.
The accompanying notes are an integral part of these financial statements.
39
Statement of operations Year ended 11/30/07
| |
| INVESTMENT INCOME | |
|
| Interest (including interest income of $2,140,592 from investments in affiliated issuers) (Note 5) | $ 61,713,443 |
|
| Dividends | 2,707 |
|
| Securities lending | 35,313 |
|
| Total investment income | 61,751,463 |
| |
| |
| EXPENSES | |
|
| Compensation of Manager (Note 2) | 5,084,330 |
|
| Investor servicing fees (Note 2) | 765,999 |
|
| Custodian fees (Note 2) | 70,747 |
|
| Trustee compensation and expenses (Note 2) | 54,836 |
|
| Administrative services (Note 2) | 27,001 |
|
| Distribution fees — Class A (Note 2) | 1,038,782 |
|
| Distribution fees — Class B (Note 2) | 137,723 |
|
| Distribution fees — Class C (Note 2) | 1,746 |
|
| Distribution fees — Class M (Note 2) | 1,573,071 |
|
| Distribution fees — Class R (Note 2) | 4 |
|
| Other | 355,550 |
|
| Non-recurring cost (Notes 2 and 8) | 773 |
|
| Cost assumed by Manager (Notes 2 and 8) | (773) |
|
| Fees waived and reimbursed by Manager (Note 5) | (27,504) |
|
| Total expenses | 9,082,285 |
|
| Expense reduction (Note 2) | (229,587) |
|
| Net expenses | 8,852,698 |
|
| Net investment income | 52,898,765 |
|
| Net realized gain on investments (Notes 1 and 3) | 36,646,525 |
|
| Net increase from payments by affiliate (Note 2) | 68,401 |
|
| Net realized gain on swap contracts (Note 1) | 803,869 |
|
| Net realized loss on foreign currency transactions (Note 1) | (770,672) |
|
| Net unrealized appreciation of assets and liabilities in foreign currencies during the year | 318,228 |
|
| Net unrealized depreciation of investments and swap contracts during the year | (56,142,428) |
|
| Net loss on investments | (19,076,077) |
|
| Net increase in net assets resulting from operations | $ 33,822,688 |
The accompanying notes are an integral part of these financial statements.
40
Statement of changes in net assets
| | |
| DECREASE IN NET ASSETS | | |
| |
| | Year ended | Year ended |
| | 11/30/07 | 11/30/06 |
|
| Operations: | | |
| Net investment income | $ 52,898,765 | $ 63,055,692 |
|
| Net realized gain (loss) on investments and foreign currency transactions | 36,748,123 | (4,750,603) |
|
| Net unrealized appreciation (depreciation) of investments | (55,824,200) | 35,937,325 |
|
| Net increase in net assets resulting from operations | 33,822,688 | 94,242,414 |
|
| Distributions to shareholders (Note 1): | | |
|
| From ordinary income | | |
|
| Net investment income | | |
|
| Class A | (29,750,825) | (30,716,391) |
|
| Class B | (909,127) | (1,640,684) |
|
| Class C | (10,650) | — |
|
| Class M | (22,018,330) | (26,501,892) |
|
| Class R | (47) | — |
|
| Class Y | (1,415,231) | (657,482) |
|
| Redemption fees (Note 1) | 26,436 | 10,834 |
|
| Decrease from capital share transactions (Note 4) | (77,684,006) | (162,931,570) |
|
| Total decrease in net assets | (97,939,092) | (128,194,771) |
|
| |
| NET ASSETS | | |
|
| Beginning of year | 810,119,018 | 938,313,789 |
|
| End of year (including undistributed net investment income of $8,202,215 and $8,928,869, respectively) | $712,179,926 | $ 810,119,018 |
The accompanying notes are an integral part of these financial statements.
41
Financial highlights (For a common share outstanding throughout the period)
| | | | | | | | | | | | | |
| INVESTMENT OPERATIONS: | | | | | LESS DISTRIBUTIONS | | | | RATIOS AND SUPPLEMENTAL DATA: | |
| |
| | | | Net | | | | | | Total | | | Ratio of net | |
| | Net asset | | realized and | Total | From | | | Net asset | return | Net | Ratio of | investment | |
| | value, | Net | unrealized | from | net | | | value, | at net | assets, | expenses to | income (loss) | Portfolio |
| | beginning | investment | gain (loss) on | investment | investment | Total | Redemption | end | asset | end of period | average net | to average | turnover |
| Period ended | of period | income (loss)(a) | investments | operations | income | distributions | fees | of period | value (%)(b) | (in thousands) | assets (%)(c) | net assets (%) | (%) |
| |
| CLASS A | | | | | | | | | | | | | |
| November 30, 2007 | $6.22 | .44(d) | (.16) | .28 | (.45) | (.45) | —(f) | $6.05 | 4.50 | $373,890 | 1.08(d) | 7.04(d) | 47.50 |
| November 30, 2006 | 5.97 | .45(d,e) | .22 | .67 | (.42) | (.42) | —(f) | 6.22 | 11.71 | 433,782 | 1.04(d,e) | 7.41(d,e) | 45.62 |
| November 30, 2005 | 6.16 | .43(d) | (.21) | .22 | (.41) | (.41) | —(f) | 5.97 | 3.67 | 440,780 | 1.04(d) | 7.07(d) | 33.37 |
| November 30, 2004 | 5.88 | .43(d) | .29 | .72 | (.44) | (.44) | —(f) | 6.16 | 12.72 | 484,372 | 1.07(d) | 7.22(d) | 53.33 |
| November 30, 2003 | 5.17 | .48 | .73 | 1.21 | (.50) | (.50) | — | 5.88 | 24.65 | 507,140 | 1.03 | 8.61 | 78.78 |
|
| |
| CLASS B | | | | | | | | | | | | | |
| November 30, 2007 | $6.14 | .39(d) | (.17) | .22 | (.40) | (.40) | —(f) | $5.96 | 3.58 | $11,407 | 1.83(d) | 6.29(d) | 47.50 |
| November 30, 2006 | 5.89 | .39(d,e) | .23 | .62 | (.37) | (.37) | —(f) | 6.14 | 10.98 | 16,530 | 1.79(d,e) | 6.69(d,e) | 45.62 |
| November 30, 2005 | 6.08 | .38(d) | (.21) | .17 | (.36) | (.36) | —(f) | 5.89 | 2.91 | 46,602 | 1.79(d) | 6.30(d) | 33.37 |
| November 30, 2004 | 5.81 | .38(d) | .28 | .66 | (.39) | (.39) | —(f) | 6.08 | 11.84 | 123,263 | 1.82(d) | 6.50(d) | 53.33 |
| November 30, 2003 | 5.12 | .43 | .72 | 1.15 | (.46) | (.46) | — | 5.81 | 23.56 | 199,990 | 1.78 | 7.94 | 78.78 |
|
| |
| CLASS C | | | | | | | | | | | | | |
| November 30, 2007† | $6.27 | .26(d) | (.33) | (.07) | (.25) | (.25) | —(f) | $5.95 | (1.11) | $776 | 1.23*(d) | 4.29*(d) | 47.50 |
|
| |
| CLASS M | | | | | | | | | | | | | |
| November 30, 2007 | $6.23 | .42(d) | (.17) | .25 | (.43) | (.43) | —(f) | $6.05 | 4.11 | $275,959 | 1.33(d) | 6.79(d) | 47.50 |
| November 30, 2006 | 5.98 | .43(d,e) | .23 | .66 | (.41) | (.41) | —(f) | 6.23 | 11.47 | 349,881 | 1.29(d,e) | 7.17(d,e) | 45.62 |
| November 30, 2005 | 6.17 | .41(d) | (.20) | .21 | (.40) | (.40) | —(f) | 5.98 | 3.46 | 430,521 | 1.29(d) | 6.82(d) | 33.37 |
| November 30, 2004 | 5.89 | .42(d) | .29 | .71 | (.43) | (.43) | —(f) | 6.17 | 12.47 | 573,455 | 1.32(d) | 6.98(d) | 53.33 |
| November 30, 2003 | 5.18 | .47 | .73 | 1.20 | (.49) | (.49) | — | 5.89 | 24.32 | 638,046 | 1.28 | 8.34 | 78.78 |
|
| |
| CLASS R | | | | | | | | | | | | | |
| November 30, 2007† | $6.35 | .29(d) | (.32) | (.03) | (.27) | (.27) | —(f) | $6.05 | (.57) | $1 | .89*(d) | 4.62*(d) | 47.50 |
|
| |
| CLASS Y | | | | | | | | | | | | | |
| November 30, 2007 | $6.35 | .47(d) | (.17) | .30 | (.46) | (.46) | —(f) | $6.19 | 4.78 | $50,146 | .83(d) | 7.27(d) | 47.50 |
| November 30, 2006 | 6.08 | .47(d,e) | .23 | .70 | (.43) | (.43) | —(f) | 6.35 | 12.05 | 9,925 | .79(d,e) | 7.63(d,e) | 45.62 |
| November 30, 2005 | 6.27 | .45(d) | (.22) | .23 | (.42) | (.42) | —(f) | 6.08 | 3.80 | 20,411 | .79(d) | 7.31(d) | 33.37 |
| November 30, 2004 | 5.97 | .45(d) | .30 | .75 | (.45) | (.45) | —(f) | 6.27 | 13.09 | 26,684 | .82(d) | 7.46(d) | 53.33 |
| November 30, 2003 | 5.23 | .50 | .76 | 1.26 | (.52) | (.52) | — | 5.97 | 25.21 | 24,253 | .78 | 8.83 | 78.78 |
|
* Not annualized.
† For the period March 30, 2007 (commencement of operations) to November 30, 2007.
(a) Per share net investment income (loss) has been determined on the basis of the weighted average number of shares outstanding during the period.
(b) Total return assumes dividend reinvestment and does not reflect the effect of sales charges.
(c) Includes amounts paid through expense offset arrangements (Note 2).
(d) Reflects waivers of certain fund expenses in connection with investments in Putnam Prime Money Market Fund during the period. As a result of such waivers, the expenses of each class reflect a reduction of the following amounts (Note 5):
| |
| | Percentage |
| | of average |
| | net assets |
|
| November 30, 2007 | <0.01% |
|
| November 30, 2006 | <0.01 |
|
| November 30, 2005 | <0.01 |
|
| November 30, 2004 | <0.01 |
|
(e) Reflects a non-recurring accrual related to a reimbursement to the fund from Putnam Investments relating to the calculation of certain amounts paid by the fund to Putnam in previous years for transfer agent services, which amounted to less than $0.01 per share and 0.01% of average net assets for the period ended November 30, 2006.
(f) Amount represents less than $0.01 per share.
The accompanying notes are an integral part of these financial statements.
42
Notes to financial statements 11/30/07
Note 1: Significant accounting policies
Putnam High Yield Advantage Fund (the “fund”), a Massachusetts business trust, is registered under the Investment Company Act of 1940, as amended, as a diversified, open-end management investment company. The fund seeks high current income primarily through a diversified portfolio of higher yielding, lower rated bonds that may have a higher rate of default. Capital growth is a secondary objective when consistent with the objective of high current income.
The fund offers class A, class B, class C, class M, class R and class Y shares. The fund began offering class C and class R shares on March 30, 2007. Class A and class M shares are sold with a maximum front-end sales charge of 4.00% and 3.25%, respectively, and generally do not pay a contingent deferred sales charge. Prior to January 2, 2008, the class A maximum front-end sales charge was 3.75% . Class B shares, which convert to class A shares after approximately eight years, do not pay a front-end sales charge and are subject to a contingent deferred sales charge, if those shares are redeemed within six years of purchase. Class C shares have a one-year 1.00% contingent deferred sales charge and do not convert to class A shares. Class R shares, which are offered to qualified employee-benefit plans, are sold without a front-end sales charge or a contingent deferred sales charge. The expenses for class A, class B, class C, class M and class R shares may differ based o n the distribution fee of each class, which is identified in Note 2. Class Y shares, which are sold at net asset value, are generally subject to the same expenses as class A, class B, class C, class M and class R shares, but do not bear a distribution fee. Class Y shares are sold to certain eligible purchasers including certain defined contribution plans (including corporate IRAs), bank trust departments and trust companies.
A 1.00% redemption fee may apply on any shares that are redeemed (either by selling or exchanging into another fund) within 90 days of purchase. The redemption fee is accounted for as an addition to paid-in-capital.
Investment income, realized and unrealized gains and losses and expenses of the fund are borne pro-rata based on the relative net assets of each class to the total net assets of the fund, except that each class bears expenses unique to that class (including the distribution fees applicable to such classes). Each class votes as a class only with respect to its own distribution plan or other matters on which a class vote is required by law or determined by the Trustees. If the fund were liquidated, shares of each class would receive their pro-rata share of the net assets of the fund. In addition, the Trustees declare separate dividends on each class of shares.
In the normal course of business, the fund enters into contracts that may include agreements to indemnify another party under given circumstances. The fund’s maximum exposure under these arrangements is unknown as this would involve future claims that may be, but have not yet been, made against the fund. However, the fund expects the risk of material loss to be remote.
The following is a summary of significant accounting policies consistently followed by the fund in the preparation of its financial statements. The preparation of financial statements is in conformity with accounting principles generally accepted in the United States of America and requires management to make estimates and assumptions that affect the reported amounts of assets and liabilities in the financial statements and the reported amounts of increases and decreases in net assets from operations during the reporting period. Actual results could differ from those estimates.
A) Security valuation Market quotations are not considered to be readily available for certain debt obligations; such investments are valued on the basis of valuations furnished by an independent pricing service approved by the Trustees or dealers selected by Putnam Investment Management, LLC (“Putnam Management”), the fund’s manager, a wholly-owned subsidiary of Putnam, LLC. Such services or dealers determine valuations for normal institutional-size trading units of such securities using methods based on market transactions for comparable securities and various relationships, generally recognized by institutional traders, between securities. Securities quoted in foreign currencies, if any, are translated into U.S. dollars at the current exchange rate. Certain investments, including certain restricted securities and derivatives, are also valued at fair value following procedures approved by the Trustees. Such valuations and procedures are reviewed periodically by the Trustees. The fair value of securities is generally determined as the amount that the fund could reasonably expect to realize from an orderly disposition of such securities over a reasonable period of time. By its nature, a fair value price is a good faith estimate of the value of a security at a given point in time and does not reflect an actual market price, which may be different by a material amount.
B) Joint trading account Pursuant to an exemptive order from the Securities and Exchange Commission (the “SEC”), the fund may transfer uninvested cash balances, including cash collateral received under security lending arrangements, into a joint trading account along with the cash of other registered investment companies and certain other accounts managed by Putnam Management. These balances may be invested in issues of high-grade short-term investments having maturities of up to 397 days for collateral received under security lending arrangements and up to 90 days for other cash investments.
C) Repurchase agreements The fund, or any joint trading account, through its custodian, receives delivery of the underlying securities, the market value of which at the time of purchase is required to be in an amount at least equal to the resale price, including accrued interest. Collateral for certain tri-party repurchase agreements is held at the counterparty’s custodian in a segregated account for the benefit of the fund and the counterparty. Putnam Management is responsible for determining that the value of these underlying securities is at all times at least equal to the resale price, including accrued interest.
D) Security transactions and related investment income Security transactions are recorded on the trade date (the date the order to buy or sell is executed). Gains or losses on securities sold are determined on the identified cost basis. Interest income is recorded on the accrual basis. All premiums/discounts are amortized/accreted on a yield-to-maturity basis. Securities purchased or sold on a delayed delivery basis may be settled a month or more after the trade date; interest income is accrued based on the terms of the securities. Losses may arise due to changes in the market value of the underlying securities or if the counterparty does not perform under the contract. The fund earned certain fees in connection with its senior loan purchasing activities. These fees are treated as market discount and are recorded as income in the statement of operations.
E) Foreign currency translation The accounting records of the fund are maintained in U.S. dollars. The market value of foreign securities, currency holdings, and other assets and liabilities is recorded in the books and records of the fund after translation to U.S. dollars based on the exchange rates on that day. The cost of each security is determined using historical exchange rates. Income and withholding taxes are translated at
44
prevailing exchange rates when earned or incurred. The fund does not isolate that portion of realized or unrealized gains or losses resulting from changes in the foreign exchange rate on investments from fluctuations arising from changes in the market prices of the securities. Such gains and losses are included with the net realized and unrealized gain or loss on investments. Net realized gains and losses on foreign currency transactions represent net realized exchange gains or losses on closed forward currency contracts, disposition of foreign currencies, currency gains and losses realized between the trade and settlement dates on securities transactions and the difference between the amount of investment income and foreign withholding taxes recorded on the fund’s books and the U.S. dollar equivalent amounts actually received or paid. Net unrealized appreciation and depreciation of assets and liabilities in foreign currencies arise from changes in the value of open forward currency contracts and assets and liabilities other than investments at the period end, resulting from changes in the exchange rate. Investments in foreign securities involve certain risks, including those related to economic instability, unfavorable political developments, and currency fluctuations, not present with domestic investments.
F) Forward currency contracts The fund may buy and sell forward currency contracts, which are agreements between two parties to buy and sell currencies at a set price on a future date. These contracts are used to protect against a decline in value relative to the U.S. dollar of the currencies in which its portfolio securities are denominated or quoted (or an increase in the value of a currency in which securities a fund intends to buy are denominated, when a fund holds cash reserves and short term investments), or for other investment purposes. The U.S. dollar value of forward currency contracts is determined using current forward currency exchange rates supplied by a quotation service. The market value of the contract will fluctuate with changes in currency exchange rates. The contract is marked to market daily and the change in market value is recorded as an unrealized gain or loss. When the contract is closed, the fund r ecords a realized gain or loss equal to the difference between the value of the contract at the time it was opened and the value at the time it was closed. The fund could be exposed to risk if the value of the currency changes unfavorably, if the coun-terparties to the contracts are unable to meet the terms of their contracts or if the fund is unable to enter into a closing position. Risks may exceed amounts recognized on the Statement of assets and liabilities. Forward currency contracts outstanding at period end, if any, are listed after the fund’s portfolio.
G) Interest rate swap contracts The fund may enter into interest rate swap contracts, which are arrangements between two parties to exchange cash flows based on a notional principal amount, to manage the fund’s exposure to interest rates. Interest rate swap contracts are marked to market daily based upon quotations from an independent pricing service or market makers and the change, if any, is recorded as unrealized gain or loss. Payments received or made are recorded as realized gains or losses. Certain interest rate swap contracts may include extended effective dates. Income related to these swap contracts is accrued based on the terms of the contract. The fund could be exposed to credit or market risk due to unfavorable changes in the fluctuation of interest rates or if the counterparty defaults on its obligation to perform. Risk of loss may exceed amounts recognized on the Statement of assets and liabilities. Inter est rate swap contracts outstanding at period end, if any, are listed after the fund’s portfolio.
H) Credit default contracts The fund may enter into credit default contracts where one party, the protection buyer, makes an upfront or periodic payment to a counterparty, the protection seller, in exchange for the right to receive a contingent payment. The maximum amount of the payment may equal the notional amount, at par, of the underlying index or security as a result of a related credit event. Payments are made upon a credit default event of the disclosed primary referenced obligation or all other equally ranked obligations of the reference entity. An upfront payment received by the fund, as the protection seller, is recorded as a liability on the fund’s books. An upfront payment made by the fund, as the protection buyer, is recorded as an asset on the fund’s books. Periodic payments received or paid by the fund are recorded as realized gains or losses. The credit default contracts are marked to market daily based upon quotations from an independent pricing service or market makers and the change, if any, is recorded as unrealized gain or loss. Payments received or made as a result of a credit event or termination of the contract are recognized, net of a proportional amount of the upfront payment, as realized gains or losses. In addition to bearing the risk that the credit event will occur, the fund could be exposed to market risk due to unfavorable changes in interest rates or in the price of the underlying security or index, the possibility that the fund may be unable to close out its position at the same time or at the same price as if it had purchased comparable publicly traded securities or that the counterparty may default on its obligation to perform. Risks of loss may exceed amounts recognized on the Statement of assets and liabilities. Credit default contracts outstanding at period end, if any, are listed after the fund’s portfolio.
I) Securities lending The fund may lend securities, through its agents, to qualified borrowers in order to earn additional income. The loans are collateralized by cash and/or securities in an amount at least equal to the market value of the securities loaned. The market value of securities loaned is determined daily and any additional required collateral is allocated to the fund on the next business day. The risk of borrower default will be borne by the fund’s agents; the fund will bear the risk of loss with respect to the investment of the cash collateral. Income from securities lending is included in investment income on the Statement of operations. At November 30, 2007, the value of securities loaned amounted to $8,610,835. The fund received cash collateral of $8,789,680 which is pooled with collateral of other Putnam funds into 54 issues of short-term investments.
J) Federal taxes It is the policy of the fund to distribute all of its taxable income within the prescribed time and otherwise comply with the provisions of the Internal Revenue Code of 1986 (the “Code”), as amended, applicable to regulated investment companies. It is also the intention of the fund to distribute an amount sufficient to avoid imposition of any excise tax under Section 4982 of the Code, as amended. Therefore, no provision has been made for federal taxes on income, capital gains or unrealized appreciation on securities held nor for excise tax on income and capital gains.
At November 30, 2007, the fund had a capital loss carryover of $1,001,007,717 available to the extent allowed by the Code to offset future net capital gain, if any. The amount of the carryover and the expiration dates are:
45
| | |
| Loss Carryover | Expiration |
|
| $217,396,296 | November 30, 2008 |
|
| 265,227,969 | November 30, 2009 |
|
| 309,407,794 | November 30, 2010 |
|
| 104,325,628 | November 30, 2011 |
|
| 95,929,758 | November 30, 2012 |
|
| 8,720,272 | November 30, 2014 |
|
K) Distributions to shareholders Distributions to shareholders from net investment income are recorded by the fund on the ex-dividend date. Distributions from capital gains, if any, are recorded on the ex-dividend date and paid at least annually. The amount and character of income and gains to be distributed are determined in accordance with income tax regulations, which may differ from generally accepted accounting principles. These differences include temporary and/or permanent differences of foreign currency gains and losses, the expiration of a capital loss carryover and income on swap contracts. Reclassifications are made to the fund’s capital accounts to reflect income and gains available for distribution (or available capital loss carryovers) under income tax regulations. For the year ended November 30, 2007, the fund reclassified $478,791 to increase undistributed net investment income and $249,938,311 to decre ase paid-in-capital, with a decrease to accumulated net realized losses of $249,459,520.
The tax basis components of distributable earnings and the federal tax cost as of November 30, 2007 were as follows:
| |
| Unrealized appreciation | $ 8,602,612 |
| Unrealized depreciation | (37,154,850) |
| | –——————————————— |
| Net unrealized depreciation | (28,552,238) |
| Undistributed ordinary income | 7,191,752 |
| Capital loss carryforward | (1,001,007,717) |
| Cost for federal income tax purposes | $ 737,315,045 |
Note 2: Management fee, administrative services
and other transactions
Putnam Management is paid for management and investment advisory services quarterly based on the average net assets of the fund. Such fee is based on the following annual rates: 0.70% of the first $500 million of average net assets, 0.60% of the next $500 million, 0.55% of the next $500 million, 0.50% of the next $5 billion, 0.475% of the next $5 billion, 0.455% of then next $5 billion, 0.44% of the next $5 billion, and 0.43% thereafter.
Putnam Management has agreed to waive fees and reimburse expenses of the fund through June 30, 2009 to the extent necessary to ensure that the fund’s expenses do not exceed the simple average of the expenses of all front-end load funds viewed by Lipper Inc. as having the same investment classification or objective as the fund. The expense reimbursement is based on a comparison of the fund’s expenses with the average annualized operating expenses of the funds in its Lipper peer group for each calendar quarter during the fund’s last fiscal year, excluding 12b-1 fees and without giving effect to any expense offset and brokerage service arrangements that may reduce fund expenses. For the year ended November 30, 2007, Putnam Management did not waive any of its management fee from the fund.
Effective August 3, 2007, Marsh & McLennan Companies, Inc. sold its ownership interest in Putnam Management, its parent companies and affiliates to a wholly-owned subsidiary of Great-West Lifeco, Inc. The fund’s shareholders have approved a new management contract for the fund that became effective upon the sale.
Putnam Investments Limited (“PIL”), an affiliate of Putnam Management, is authorized by the Trustees to manage a separate portion of the assets of the fund as determined by Putnam Management from time to time. Putnam Management pays a quarterly sub-management fee to PIL for its services at an annual rate of 0.40% of the average net assets of the portion of the fund managed by PIL. A new sub-management contract between Putnam Management and PIL was approved effective upon the change of control of Putnam Management described in the previous paragraph.
For the year ended November 30, 2007, Putnam Management has assumed $773 of legal, shareholder servicing and communication, audit and Trustee fees incurred by the fund in connection with certain legal and regulatory matters (including those described in Note 8).
Putnam Management voluntarily reimbursed the fund $68,401 for a trading error which occurred during the period. The effect of the losses incurred and the reimbursement by Putnam Management of such losses had no impact on total return.
The fund reimburses Putnam Management an allocated amount for the compensation and related expenses of certain officers of the fund and their staff who provide administrative services to the fund. The aggregate amount of all such reimbursements is determined annually by the Trustees.
Custodial services for the fund’s assets were provided by Putnam Fiduciary Trust Company (“PFTC”), an affiliate of Putnam Management, and by State Street Bank and Trust Company (“State Street”). Custody fees are based on the fund’s asset level, the number of its security holdings, transaction volumes and with respect to PFTC, certain fees related to the transition of assets to State Street. Putnam Investor Services, a division of PFTC, provided investor servicing agent functions to the fund. Putnam Investor Services received fees for investor servicing, subject to certain limitations, based on the number of shareholder accounts in the fund and the level of defined contribution plan assets in the fund.
During the year ended November 30, 2007, the fund incurred $819,085 for custody and investor servicing agent functions provided by PFTC.
The fund has entered into arrangements with PFTC and State Street whereby PFTC’s and State Street’s fees are reduced by credits allowed on cash balances. For the year ended November 30, 2007, the fund’s expenses were reduced by $229,587 under these arrangements.
Each independent Trustee of the fund receives an annual Trustee fee, of which $399, as a quarterly retainer, has been allocated to the fund, and an additional fee for each Trustees meeting attended. Trustees receive additional fees for attendance at certain committee meetings and industry seminars and for certain compliance-related matters. Trustees also are reimbursed for expenses they incur relating to their services as Trustees. The fund has adopted a Trustee Fee Deferral Plan (the “Deferral Plan”) which allows the Trustees to defer the receipt of all or a portion of Trustees fees payable on or after July 1, 1995. The deferred fees remain invested in certain Putnam funds until distribution in accordance with the Deferral Plan.
46
The fund has adopted an unfunded noncontributory defined benefit pension plan (the “Pension Plan”) covering all Trustees of the fund who have served as a Trustee for at least five years and were first elected prior to 2004. Benefits under the Pension Plan are equal to 50% of the Trustee’s average annual attendance and retainer fees for the three years ended December 31, 2005. The retirement benefit is payable during a Trustee’s lifetime, beginning the year following retirement, for the number of years of service through December 31, 2006. Pension expense for the fund is included in Trustee compensation and expenses in the Statement of operations. Accrued pension liability is included in Payable for Trustee compensation and expenses in the Statement of assets and liabilities. The Trustees have terminated the Pension Plan with respect to any Trustee first elected after 2003.
The fund has adopted distribution plans (the “Plans”) with respect to its class A, class B, class C, class M and class R shares pursuant to Rule 12b-1 under the Investment Company Act of 1940. The purpose of the Plans is to compensate Putnam Retail Management, a wholly-owned subsidiary of Putnam, LLC and Putnam Retail Management GP, Inc., for services provided and expenses incurred in distributing shares of the fund. The Plans provide for payments by the fund to Putnam Retail Management at an annual rate of up to 0.35%, 1.00%, 1.00% , 1.00% and 1.00% of the average net assets attributable to class A, class B, class C, class M and class R shares, respectively. The Trustees have approved payment by the fund at an annual rate of 0.25%, 1.00%, 1.00%, 0.50% and 0.50% of the average net assets attributable to class A, class B, class C, class M and class R shares, respectively.
For the year ended November 30, 2007, Putnam Retail Management, acting as underwriter, received net commissions of $13,331 and $244 from the sale of class A and class M shares, respectively, and received $10,017 and $8 in contingent deferred sales charges from redemptions of class B and class C shares, respectively.
A deferred sales charge of up to 1.00% and 0.40% is assessed on certain redemptions of class A and class M shares, respectively. For the year ended November 30, 2007, Putnam Retail Management, acting as underwriter, received no monies on class A and class M redemptions, respectively.
Note 3: Purchases and sales of securities
During the year ended November 30, 2007, cost of purchases and proceeds from sales of investment securities other than short-term investments aggregated $338,785,534 and $438,074,265, respectively. There were no purchases or sales of U.S. government securities.
Note 4: Capital shares
At November 30, 2007, there was an unlimited number of shares of beneficial interest authorized. Transactions in capital shares were as follows:
| | | |
| CLASS A | Shares | | Amount |
|
| Year ended 11/30/07: | | | |
| Shares sold | 6,657,394 | $ 41,691,671 |
|
| Shares issued in connection with | | | |
| reinvestment of distributions | 3,264,887 | | 20,282,418 |
|
| | 9,922,281 | | 61,974,089 |
|
| Shares repurchased | (17,826,794) | (111,094,320) |
|
| Net decrease | (7,904,513) | $ (49,120,231) |
| |
| Year ended 11/30/06: | | | |
| Shares sold | 9,407,143 | $ 56,566,960 |
|
| Shares issued in connection with | | | |
| reinvestment of distributions | 3,340,140 | | 20,100,869 |
|
| | 12,747,283 | | 76,667,829 |
|
| Shares repurchased | (16,874,475) | (101,829,737) |
|
| Net decrease | (4,127,192) | $ (25,161,908) |
|
| |
| CLASS B | Shares | | Amount |
|
| Year ended 11/30/07: | | | |
| Shares sold | 623,777 | | $ 3,860,080 |
|
| Shares issued in connection with | | | |
| reinvestment of distributions | 87,650 | | 537,459 |
|
| | 711,427 | | 4,397,539 |
|
| Shares repurchased | (1,491,696) | | (9,176,467) |
|
| Net decrease | (780,269) | | $ (4,778,928) |
| |
| Year ended 11/30/06: | | | |
| Shares sold | 60,277 | | $ 358,109 |
|
| Shares issued in connection with | | | |
| reinvestment of distributions | 154,421 | | 915,469 |
|
| | 214,698 | | 1,273,578 |
|
| Shares repurchased | (5,434,629) | | (32,208,035) |
|
| Net decrease | (5,219,931) | $ (30,934,457) |
| |
| |
| CLASS C | Shares | | Amount |
|
| For the period 3/30/07 (commencement of operations) to 11/30/07: | |
| Shares sold | 129,629 | | $788,774 |
|
| Shares issued in connection with | | | |
| reinvestment of distributions | 1,572 | | 9,443 |
|
| | 131,201 | | 798,217 |
|
| Shares repurchased | (811) | | (4,921) |
|
| Net increase | 130,390 | | $793,296 |
47
| | | |
| CLASS M | Shares | | Amount |
|
| Year ended 11/30/07: | | | |
| Shares sold | 157,121 | | $ 982,853 |
|
| Shares issued in connection with | | | |
| reinvestment of distributions | 60,425 | | 375,908 |
|
| | 217,546 | | 1,358,761 |
|
| Shares repurchased | (10,798,558) | | (67,709,447) |
|
| Net decrease | (10,581,012) | | $(66,350,686) |
| |
| Year ended 11/30/06: | | | |
| Shares sold | 728,276 | | $ 4,413,472 |
|
| Shares issued in connection with | | | |
| reinvestment of distributions | 68,756 | | 414,512 |
|
| | 797,032 | | 4,827,984 |
|
| Shares repurchased | (16,645,915) | | (100,744,961) |
|
| Net decrease | (15,848,883) | | $ (95,916,977) |
| |
| |
| CLASS R | Shares | | Amount |
|
| For the period 3/30/07 (commencement of operations) to 11/30/07: |
| Shares sold | 234 | | $1,477 |
|
| Shares issued in connection with | | | |
| reinvestment of distributions | 8 | | 42 |
|
| | 242 | | 1,519 |
|
| Shares repurchased | — | | — |
|
| Net increase | 242 | | $1,519 |
| |
| |
| CLASS Y | Shares | | Amount |
|
| Year ended 11/30/07: | | | |
| Shares sold | 7,462,360 | | $ 47,563,901 |
|
| Shares issued in connection with | | | |
| reinvestment of distributions | 223,019 | | 1,406,702 |
|
| | 7,685,379 | | 48,970,603 |
|
| Shares repurchased | (1,141,109) | | (7,199,579) |
|
| Net increase | 6,544,270 | | $ 41,771,024 |
| |
| Year ended 11/30/06: | | | |
| Shares sold | 215,290 | | $ 1,325,604 |
|
| Shares issued in connection with | | | |
| reinvestment of distributions | 99,097 | | 608,551 |
|
| | 314,387 | | 1,934,155 |
|
| Shares repurchased | (2,108,299) | | (12,852,383) |
|
| Net decrease | (1,793,912) | | $(10,918,228) |
At November 30, 2007 Putnam, LLC. owned 166 and 164 class C and class R shares, (less than .01% and 68% of class C and class R shares outstanding), valued at $988 and $992, respectively.
Note 5: Investment in Putnam Prime Money Market Fund
The fund invests in Putnam Prime Money Market Fund, an open-end management investment company managed by Putnam Management. Investments in Putnam Prime Money Market Fund are valued at its closing net asset value each business day. Management fees paid by the fund are reduced by an amount equal to the management fees paid by Putnam Prime Money Market Fund with respect to assets invested by the fund in Putnam Prime Money Market Fund. For the year ended November 30, 2007, management fees paid were reduced by $27,504 relating to the fund’s investment in Putnam Prime Money Market Fund. Income distributions earned by the fund are recorded as income in the Statement of operations and totaled $2,140,592 for the year ended November 30, 2007. During the year ended November 30, 2007, cost of purchases and proceeds of sales of investments in Putnam Prime Money Market Fund aggregated $262,093,142 and $241,410,230, respectively.
Note 6: Senior loan commitments
Senior loans are purchased or sold on a when-issued or delayed delivery basis and may be settled a month or more after the trade date, which from time to time can delay the actual investment of available cash balances; interest income is accrued based on the terms of the securities. Senior loans can be acquired through an agent, by assignment from another holder of the loan, or as a participation interest in another holder’s portion of the loan. When the fund invests in a loan or participation, the fund is subject to the risk that an intermediate participant between the fund and the borrower will fail to meet its obligations to the fund, in addition to the risk that the borrower under the loan may default on its obligations.
Note 7: Unfunded loan commitments
As of November 30, 2007, the fund had unfunded loan commitments of $691,691, which could be extended at the option of the borrower, pursuant to the following loan agreements with the following borrowers:
| |
| Borrower | Unfunded Commitments |
|
| Community Health Systems, Inc. | $ 94,410 |
|
| Fenwal Controls of Japan, LTD. (Japan) | 264,286 |
|
| Golden Nugget, Inc. | 136,363 |
|
| Isle of Capri Casinos, Inc. | 142,941 |
|
| Univision Communications, Inc. | 53,691 |
|
Note 8: Regulatory matters and litigation
In late 2003 and 2004, Putnam Management settled charges brought by the Securities and Exchange Commission (the “SEC”) and the Massachusetts Securities Division in connection with excessive short-term trading in Putnam funds. Payments from Putnam Management will be distributed to certain open-end Putnam funds and their shareholders. These allegations and related matters have served as the general basis for certain lawsuits, including purported class action lawsuits against Putnam Management and, in a limited number of cases, some Putnam funds. Putnam Management believes that these lawsuits will have no material adverse effect on the funds or on Putnam Management’s ability to provide investment management services. In addition, Putnam Management has agreed to bear any costs incurred by the Putnam funds as a result of these matters.
Putnam Management and Putnam Retail Management are named as defendants in a civil suit in which the plaintiffs allege that the management
48
and distribution fees paid by certain Putnam funds were excessive and seek recovery under the Investment Company Act of 1940. Putnam Management and Putnam Retail Management have contested the plaintiffs’ claims and the matter is currently pending in the U.S. District Court for the District of Massachusetts. Based on currently available information, Putnam Management believes that this action is without merit and that it is unlikely to have a material effect on Putnam Management’s and Putnam Retail Management’s ability to provide services to their clients, including the fund.
Note 9: New accounting pronouncements
In June 2006, the Financial Accounting Standards Board (“FASB”) issued Interpretation No. 48, Accounting for Uncertainty in Income Taxes (the “Interpretation”). The Interpretation prescribes a minimum threshold for financial statement recognition of the benefit of a tax position taken or expected to be taken by a filer in the filer’s tax return. The Interpretation is not expected to have a material effect on the fund’s financial statements. However, the conclusions regarding the Interpretation may be subject to review and adjustment at a later date based on factors including, but not limited to, further implementation guidance expected from the FASB, and on-going analysis of tax laws, regulations and interpretations thereof.
In September 2006, the FASB issued Statement of Financial Accounting Standards No. 157, Fair Value Measurements (the “Standard”). The Standard defines fair value, sets out a framework for measuring fair value and requires additional disclosures about fair value measurements. The Standard applies to fair value measurements already required or permitted by existing standards. The Standard is effective for financial statements issued for fiscal years beginning after November 15, 2007 and interim periods within those fiscal years. Putnam Management is currently evaluating what impact the adoption of the Standard will have on the fund’s financial statements.
49
Shareholder meeting
results (unaudited)
May 15, 2007 meeting
A proposal to approve a new management contract between the fund and Putnam Investment Management, LLC was approved as follows:
| | |
| Votes for | Votes against | Abstentions |
|
| 97,888,469 | 1,800,377 | 2,245,360 |
|
All tabulations rounded to the nearest whole number.
50
Federal tax information
(unaudited)
The Form 1099 you receive in January 2008 will show the tax status of all distributions paid to your account in calendar 2007.
51
About the Trustees
Jameson A. Baxter (Born 1943), Trustee since 1994, Vice Chairman since 2005
Ms. Baxter is the President of Baxter Associates, Inc., a private investment firm.
Ms. Baxter serves as a Director of ASHTA Chemicals, Inc., Ryerson, Inc. (a metals service corporation), the Mutual Fund Directors Forum, and Advocate Health Care. She is Chairman Emeritus of the Board of Trustees, Mount Holyoke College, having served as Chairman for five years. Until 2007, she was a Director of Banta Corporation (a printing and supply chain management company). Until 2004, she was a Director of BoardSource (formerly the National Center for Nonprofit Boards), and until 2002, she was a Director of Intermatic Corporation (a manufacturer of energy control products).
Ms. Baxter has held various positions in investment banking and corporate finance, including Vice President and Principal of the Regency Group, and Vice President of and Consultant to First Boston Corporation. She is a graduate of Mount Holyoke College.
Charles B. Curtis (Born 1940), Trustee since 2001
Mr. Curtis is President and Chief Operating Officer of the Nuclear Threat Initiative (a private foundation dealing with national security issues) and serves as Senior Advisor to the United Nations Foundation.
Mr. Curtis is a member of the Council on Foreign Relations and serves as a Director of Edison International and Southern California Edison. Until 2006, Mr. Curtis served as a member of the Trustee Advisory Council of the Applied Physics Laboratory, Johns Hopkins University. Until 2003, Mr. Curtis was a member of the Electric Power Research Institute Advisory Council and the University of Chicago Board of Governors for Argonne National Laboratory. Prior to 2002, Mr. Curtis was a Member of the Board of Directors of the Gas Technology Institute and the Board of Directors of the Environment and Natural Resources Program Steering Committee, John F. Kennedy School of Government, Harvard University. Until 2001, Mr. Curtis was a member of the Department of Defense Policy Board and Director of EG&G Technical Services, Inc. (a fossil energy research and development support company).
From August 1997 to December 1999, Mr. Curtis was a Partner at Hogan & Hartson L.L.P., a Washington, D.C. law firm. Prior to May 1997, Mr. Curtis was Deputy Secretary of Energy and Under Secretary of the U.S. Department of Energy. He served as Chairman of the Federal Energy Regulatory Commission from 1977 to 1981 and has held positions on the staff of the U.S. House of Representatives, the U.S. Treasury Department, and the SEC.
Robert J. Darretta (Born 1946), Trustee since 2007
Mr. Darretta serves as Director of UnitedHealth Group, a diversified health-care conglomerate.
Until April 2007, Mr. Darretta was Vice Chairman of the Board of Directors of Johnson & Johnson, a diversified health-care conglomerate. Prior to 2007, Mr. Darretta held several accounting and finance positions with Johnson & Johnson, including Chief Financial Officer, Executive Vice President, and Treasurer.
Mr. Darretta received a B.S. in Economics from Villanova University.
Myra R. Drucker (Born 1948), Trustee since 2004
Ms. Drucker is Chair of the Board of Trustees of Commonfund (a not-for-profit firm specializing in asset management for educational endowments and foundations), Vice Chair of the Board of Trustees of Sarah Lawrence College, and a member of the Investment Committee of the Kresge Foundation (a charitable trust). She is also a director of New York Stock Exchange LLC, a wholly-owned subsidiary of the publicly-traded NYSE Group, Inc., a director of Interactive Data Corporation (a provider of financial market data, analytics, and related services to financial institutions and individual investors), and an advisor to RCM Capital Management (an investment management firm).
Ms. Drucker is an ex-officio member of the New York Stock Exchange (NYSE) Pension Managers Advisory Committee, having served as Chair for seven years.
Until August 31, 2004, Ms. Drucker was Managing Director and a member of the Board of Directors of General Motors Asset Management and Chief Investment Officer of General Motors Trust Bank. Ms. Drucker also served as a member of the NYSE Corporate Accountability and Listing Standards Committee and the NYSE/NASD IPO Advisory Committee.
Prior to joining General Motors Asset Management in 2001, Ms. Drucker held various executive positions in the investment management industry. Ms. Drucker served as Chief Investment Officer of Xerox Corporation (a technology and service company in the document industry), where she was responsible for the investment of the company’s pension assets. Ms. Drucker was also Staff Vice President and Director of Trust Investments for International Paper (a paper products, paper distribution, packaging and forest products company) and previously served as Manager of Trust Investments for Xerox Corporation. Ms. Drucker received a B.A. degree in Literature and Psychology from Sarah Lawrence College and pursued graduate studies in economics, statistics and portfolio theory at Temple University.
52
John A. Hill (Born 1942), Trustee since 1985 and Chairman since 2000
Mr. Hill is Vice Chairman of First Reserve Corporation, a private equity buyout firm that specializes in energy investments in the diversified worldwide energy industry.
Mr. Hill is a Director of Devon Energy Corporation and various private companies controlled by First Reserve Corporation, as well as Chairman of TH Lee, Putnam Investment Trust (a closed-end investment company advised by an affiliate of Putnam Management). He is also a Trustee of Sarah Lawrence College. Until 2005, he was a Director of Continuum Health Partners of New York.
Prior to acquiring First Reserve Corporation in 1983, Mr. Hill held executive positions in investment banking and investment management with several firms and with the federal government, including Deputy Associate Director of the Office of Management and Budget and Deputy Director of the Federal Energy Administration. He is active in various business associations, including the Economic Club of New York, and lectures on energy issues in the United States and Europe. Mr. Hill holds a B.A. degree in Economics from Southern Methodist University and pursued graduate studies there as a Woodrow Wilson Fellow.
Paul L. Joskow (Born 1947), Trustee since 1997
Dr. Joskow is an economist and President of the Alfred P. Sloan Foundation (a philanthropic institution focused primarily on research and education on issues related to science, technology, and economic performance). He is on leave from his position as the Elizabeth and James Killian Professor of Economics and Management at the Massachusetts Institute of Technology (MIT), where he has been on the faculty since 1972. Dr. Joskow was the Director of the Center for Energy and Environmental Policy Research at MIT from 1999 through 2007.
Dr. Joskow serves as a Director of TransCanada Corporation (an energy company focused on natural gas transmission and power services) and Exelon Corporation (an energy company focused on power services) and as a Member of the Board of Overseers of the Boston Symphony Orchestra. Prior to August 2007, he served as a Director of National Grid (a UK-based holding company with interests in electric and gas transmission and distribution and telecommunications infrastructure). Prior to July, 2006, he served as President of the Yale University Council and continues to serve as a Member of the Council. Prior to February 2005, he served on the board of the Whitehead Institute for Biomedical Research (a non-profit research institution). Prior to February 2002, he was a Director of State Farm Indemnity Company (an automobile insurance company), and prior to March 2000, he was a Director of New England Electric System (a public utility holding company).
Dr. Joskow has published six books and numerous articles on topics in industrial organization, government regulation of industry, and competition policy. He is active in industry restructuring, environmental, energy, competition and privatization policies — serving as an advisor to governments and corporations worldwide. Dr. Joskow holds a Ph.D. and M. Phil from Yale University and a B.A. from Cornell University.
Elizabeth T. Kennan (Born 1938), Trustee since 1992
Dr. Kennan is a Partner of Cambus-Kenneth Farm (thoroughbred horse and cattle breeding). She is President Emeritus of Mount Holyoke College.
Dr. Kennan served as Chairman and is now Lead Director of Northeast Utilities, which operates New England’s largest energy delivery system. She is a Trustee of the National Trust for Historic Preservation, of Centre College and of Midway College in Midway, Kentucky. Until 2006, she was a member of The Trustees of Reservations. Prior to 2001, Dr. Kennan served on the oversight committee of the Folger Shakespeare Library. Prior to June 2005, she was a Director of Talbots, Inc., and she has served as Director on a number of other boards, including Bell Atlantic, Chastain Real Estate, Shawmut Bank, Berkshire Life Insurance, and Kentucky Home Life Insurance. Dr. Kennan has also served as President of Five Colleges Incorporated and as a Trustee of Notre Dame University, and is active in various educational and civic associations.
As a member of the faculty of Catholic University for twelve years, until 1978, Dr. Kennan directed the post-doctoral program in Patristic and Medieval Studies, taught history and published numerous articles. Dr. Kennan holds a Ph.D. from the University of Washington in Seattle, an M.S. from St. Hilda’s College at Oxford University and an A.B. from Mount Holyoke College. She holds several honorary doctorates.
Kenneth R. Leibler (Born 1949), Trustee since 2006
Mr. Leibler is a founding partner and former Chairman of the Boston Options Exchange, an electronic marketplace for the trading of listed derivative securities.
Mr. Leibler currently serves as a Trustee of Beth Israel Deaconess Hospital in Boston. He is also lead director of Ruder Finn Group, a global communications and advertising firm, and a director of Northeast Utilities, which operates New England’s largest energy
53
delivery system. Prior to December 2006, he served as a director of the Optimum Funds group. Prior to October 2006, he served as a director of ISO New England, the organization responsible for the operation of the electric generation system in the New England states. Prior to 2000, Mr. Leibler was a director of the Investment Company Institute in Washington, D.C.
Prior to January 2005, Mr. Leibler served as Chairman and Chief Executive Officer of the Boston Stock Exchange. Prior to January 2000, he served as President and Chief Executive Officer of Liberty Financial Companies, a publicly traded diversified asset management organization. Prior to June 1990, he served as President and Chief Operating Officer of the American Stock Exchange (AMEX), and at the time was the youngest person in AMEX history to hold the title of President. Prior to serving as AMEX President, he held the position of Chief Financial Officer and headed its management and marketing operations. Mr. Leibler graduated magna cum laude with a degree in economics from Syracuse University, where he was elected Phi Beta Kappa.
Robert E. Patterson (Born 1945), Trustee since 1984
Mr. Patterson is Senior Partner of Cabot Properties, L.P. and Chairman of Cabot Properties, Inc. (a private equity firm investing in commercial real estate).
Mr. Patterson serves as Chairman Emeritus and Trustee of the Joslin Diabetes Center. Prior to June 2003, he was a Trustee of Sea Education Association. Prior to December 2001, he was President and Trustee of Cabot Industrial Trust (a publicly traded real estate investment trust). Prior to February 1998, he was Executive Vice President and Director of Acquisitions of Cabot Partners Limited Partnership (a registered investment adviser involved in institutional real estate investments). Prior to 1990, he served as Executive Vice President of Cabot, Cabot & Forbes Realty Advisors, Inc. (the predecessor company of Cabot Partners).
Mr. Patterson practiced law and held various positions in state government and was the founding Executive Director of the Massachusetts Industrial Finance Agency. Mr. Patterson is a graduate of Harvard College and Harvard Law School.
George Putnam, III (Born 1951), Trustee since 1984
Mr. Putnam is Chairman of New Generation Research, Inc. (a publisher of financial advisory and other research services), and President of New Generation Advisers, Inc. (a registered investment advisor to private funds). Mr. Putnam founded the New Generation companies in 1986.
Mr. Putnam is a Director of The Boston Family Office, LLC (a registered investment adviser). He is a Trustee of St. Mark’s School. Until 2006, he was a Trustee of Shore Country Day School, and until 2002 was a Trustee of the Sea Education Association.
Mr. Putnam previously worked as an attorney with the law firm of Dechert LLP (formerly known as Dechert Price & Rhoads) in Philadelphia. He is a graduate of Harvard College, Harvard Business School and Harvard Law School.
W. Thomas Stephens (Born 1942), Trustee since 1997
Mr. Stephens is Chairman and Chief Executive Officer of Boise Cascade, L.L.C. (a paper, forest products and timberland assets company).
Mr. Stephens is a Director of TransCanadaPipelines, Ltd. (an energy infrastructure company). Until 2004, Mr. Stephens was a Director of Xcel Energy Incorporated (a public utility company), Qwest Communications, and Norske Canada, Inc. (a paper manufacturer). Until 2003, Mr. Stephens was a Director of Mail-Well, Inc. (a diversified printing company). He served as Chairman of Mail-Well until 2001 and as CEO of MacMillan-Bloedel, Ltd. (a forest products company) until 1999.
Prior to 1996, Mr. Stephens was Chairman and Chief Executive Officer of Johns Manville Corporation. He holds B.S. and M.S. degrees from the University of Arkansas.
Richard B. Worley (Born 1945), Trustee since 2004
Mr. Worley is Managing Partner of Permit Capital LLC, an investment management firm.
Mr. Worley serves as a Trustee of the University of Pennsylvania Medical Center, The Robert Wood Johnson Foundation (a philanthropic organization devoted to health care issues), and the National Constitution Center. He is also a Director of The Colonial Williamsburg Foundation (a historical preservation organization) and the Philadelphia Orchestra Association. Mr. Worley also serves on the investment committees of Mount Holyoke College and World Wildlife Fund (a wildlife conservation organization).
Prior to joining Permit Capital LLC in 2002, Mr. Worley served as Chief Strategic Officer of Morgan Stanley Investment Management. He previously served as President, Chief Executive Officer and Chief Investment Officer of Morgan Stanley Dean Witter Investment Management and as a Managing Director of Morgan Stanley, a financial services firm. Mr. Worley also was the Chairman of Miller Anderson & Sherrerd, an investment management firm.
54
Mr. Worley holds a B.S. degree from the University of Tennessee and pursued graduate studies in economics at the University of Texas.
Charles E. Haldeman, Jr.* (Born 1948), Trustee since 2004 and President of the Funds since 2007
Mr. Haldeman is President and Chief Executive Officer of Putnam, LLC (“Putnam Investments”) and President of the Putnam Funds. He is a member of Putnam Investments’ Executive Board of Directors and Advisory Council. Prior to November 2003, Mr. Haldeman served as Co-Head of Putnam Investments’ Investment Division.
Prior to joining Putnam Investments in 2002, Mr. Haldeman held executive positions in the investment management industry. He previously served as Chief Executive Officer of Delaware Investments and President and Chief Operating Officer of United Asset Management. Mr. Haldeman was also a partner and director of Cooke & Bieler, Inc. (an investment management firm).
Mr. Haldeman currently serves on the Board of Governors of the Investment Company Institute and as Chair of the Board of Trustees of Dartmouth College. He also serves on the Partners HealthCare Investment Committee, the Tuck School of Business and Dartmouth College Board of Overseers, and the Harvard Business School Board of Dean’s Advisors. He is a graduate of Dartmouth College, Harvard Law School and Harvard Business School. Mr. Haldeman is also a Chartered Financial Analyst (CFA) charterholder.
The address of each Trustee is One Post Office Square, Boston, MA 02109.
As of November 30, 2007, there were 102 Putnam funds. All Trustees serve as Trustees of all Putnam funds.
Each Trustee serves for an indefinite term, until his or her resignation, retirement at age 72, death, or removal.
* Trustee who is an “interested person” (as defined in the Investment Company Act of 1940) of the fund, Putnam Management, and/or Putnam Retail Management. Mr. Haldeman is the President of your fund and each of the other Putnam funds, and is President and Chief Executive Officer of Putnam Investments.
55
Officers
In addition to Charles E. Haldeman, Jr., the other officers of the fund are shown below:
| |
| Charles E. Porter (Born 1938) | Richard S. Robie, III (Born 1960) |
| Executive Vice President, Principal Executive Officer, Associate | Vice President |
| Treasurer, and Compliance Liaison | Since 2004 |
| Since 1989 | |
| Senior Managing Director, Putnam Investments, Putnam Management |
| Jonathan S. Horwitz (Born 1955) | and Putnam Retail Management. Prior to 2003, Senior Vice President, |
| Senior Vice President and Treasurer | United Asset Management Corporation |
| Since 2004 | |
| Francis J. McNamara, III (Born 1955) |
| Prior to 2004, Managing Director, | Vice President and Chief Legal Officer |
| Putnam Investments | Since 2004 |
| |
| Steven D. Krichmar (Born 1958) | Senior Managing Director, Putnam Investments, Putnam Management |
| Vice President and Principal Financial Officer | and Putnam Retail Management. Prior to 2004, General Counsel, |
| Since 2002 | State Street Research & Management Company |
| |
| Senior Managing Director, Putnam Investments | Robert R. Leveille (Born 1969) |
| Vice President and Chief Compliance Officer |
| Janet C. Smith (Born 1965) | Since 2007 |
| Vice President, Principal Accounting Officer and Assistant Treasurer | |
| Since 2007 | Managing Director, Putnam Investments, Putnam Management, |
| and Putnam Retail Management. Prior to 2004, member of Bell |
| Managing Director, Putnam Investments and Putnam Management | Boyd & Lloyd LLC. Prior to 2003, Vice President and Senior Counsel, |
| Liberty Funds Group LLC |
| Susan G. Malloy (Born 1957) | |
| Vice President and Assistant Treasurer | Mark C. Trenchard (Born 1962) |
| Since 2007 | Vice President and BSA Compliance Officer |
| Since 2002 |
| Managing Director, Putnam Investments | |
| Managing Director, Putnam Investments |
| Beth S. Mazor (Born 1958) | |
| Vice President | Judith Cohen (Born 1945) |
| Since 2002 | Vice President, Clerk and Assistant Treasurer |
| Since 1993 |
| Managing Director, Putnam Investments | |
| Wanda M. McManus (Born 1947) |
| James P. Pappas (Born 1953) | Vice President, Senior Associate Treasurer and Assistant Clerk |
| Vice President | Since 2005 |
| Since 2004 | |
| Nancy E. Florek (Born 1957) |
| Managing Director, Putnam Investments and Putnam Management. | Vice President, Assistant Clerk, Assistant Treasurer |
| During 2002, Chief Operating Officer, Atalanta/Sosnoff | and Proxy Manager |
| Management Corporation | Since 2005 |
The address of each Officer is One Post Office Square, Boston, MA 02109.
56
Fund information
Founded 70 years ago, Putnam Investments was built around the concept that a balance between risk and reward is the hallmark of a well-rounded financial program. We manage over 100 mutual funds in growth, value, blend, fixed income, and international.
| | |
| Investment Manager | Officers | Wanda M. McManus |
| Putnam Investment | Charles E. Haldeman, Jr. | Vice President, Senior Associate Treasurer |
| Management, LLC | President | and Assistant Clerk |
| One Post Office Square | | |
| Boston, MA 02109 | Charles E. Porter | Nancy E. Florek |
| Executive Vice President, Principal | Vice President, Assistant Clerk, |
| Investment Sub-Manager | Executive Officer, Associate Treasurer | Assistant Treasurer and Proxy Manager |
| Putnam Investments Limited | and Compliance Liaison | |
| 57–59 St. James’s Street | | |
| London, England SW1A 1LD | Jonathan S. Horwitz | |
| Senior Vice President and Treasurer | |
| Marketing Services | | |
| Putnam Retail Management | Steven D. Krichmar | |
| One Post Office Square | Vice President and Principal Financial Officer | |
| Boston, MA 02109 | | |
| Janet C. Smith | |
| Custodian | Vice President, Principal Accounting Officer | |
| State Street Bank and Trust Company | and Assistant Treasurer | |
| | |
| Legal Counsel | Susan G. Malloy | |
| Ropes & Gray LLP | Vice President and Assistant Treasurer | |
| | |
| Independent Registered Public | Beth S. Mazor | |
| Accounting Firm | Vice President | |
| KPMG LLP | | |
| James P. Pappas | |
| Trustees | Vice President | |
| John A. Hill, Chairman | | |
| Jameson Adkins Baxter, Vice Chairman | Richard S. Robie, III | |
| Charles B. Curtis | Vice President | |
| Robert J. Darretta | | |
| Myra R. Drucker | Francis J. McNamara, III | |
| Charles E. Haldeman, Jr. | Vice President and Chief Legal Officer | |
| Paul L. Joskow | | |
| Elizabeth T. Kennan | Robert R. Leveille | |
| Kenneth R. Leibler | Vice President and Chief Compliance Officer | |
| Robert E. Patterson | | |
| George Putnam, III | Mark C. Trenchard | |
| W. Thomas Stephens | Vice President and BSA Compliance Officer | |
| Richard B. Worley | | |
| Judith Cohen | |
| Vice President, Clerk and Assistant Treasurer | |
| | |
This report is for the information of shareholders of Putnam High Yield Advantage Fund. It may also be used as sales literature when preceded or accompanied by the current prospectus, the most recent copy of Putnam’s Quarterly Performance Summary, and Putnam’s Quarterly Ranking Summary. For more recent performance, please visit www.putnam.com. Investors should carefully consider the investment objective, risks, charges, and expenses of a fund, which are described in its prospectus. For this and other information or to request a prospectus, call 1-800-225-1581 toll free. Please read the prospectus carefully before investing. The fund’s Statement of Additional Information contains additional information about the fund’s Trustees and is available without charge upon request by calling 1-800-225-1581.

Item 2. Code of Ethics:
(a) The fund’s principal executive, financial and accounting officers are employees of Putnam Investment Management, LLC, the Fund's investment manager. As such they are subject to a comprehensive Code of Ethics adopted and administered by Putnam Investments which is designed to protect the interests of the firm and its clients. The Fund has adopted a Code of Ethics which incorporates the Code of Ethics of Putnam Investments with respect to all of its officers and Trustees who are employees of Putnam Investment Management, LLC. For this reason, the Fund has not adopted a separate code of ethics governing its principal executive, financial and accounting officers.
(c) In August 2007, the Code of Ethics of Putnam Investment Management, LLC was amended to reflect the change in ownership of Putnam Investments Trust, the parent company of Putnam Investment Management, LLC, from Marsh & McLennan Companies, Inc. (“MMC”) to Great-West Lifeco Inc., a subsidiary of Power Financial Corporation. In addition to administrative and non-substantive changes, the Code of Ethics was amended to remove a prohibition, which applied to members of Putnam Investments’ Executive Board and senior members of the staff of the Chief Financial Officer of Putnam Investments, on transactions in MMC securities during the period between the end of a calendar quarter and the public announcement of MMC’s earnings for that quarter.
Item 3. Audit Committee Financial Expert:
The Funds' Audit and Compliance Committee is comprised solely of Trustees who are "independent" (as such term has been defined by the Securities and Exchange Commission ("SEC") in regulations implementing Section 407 of the Sarbanes-Oxley Act (the "Regulations")). The Trustees believe that each of the members of the Audit and Compliance Committee also possess a combination of knowledge and experience with respect to financial accounting matters, as well as other attributes, that qualify them for service on the Committee. In addition, the Trustees have determined that each of Mr. Patterson, Mr. Stephens, Mr. Leibler, Mr. Hill and Mr. Darretta meets the financial literacy requirements of the New York Stock Exchange's rules and qualifies as an "audit committee financial expert" (as such term has been defined by the Regulations) based on their review of his pertinent experience and education. Certain other Trustees, although not on the Audit and Compliance Committee, would also qualify as "audit committee financial experts." The SEC has stated that the designation or identification of a person as an audit committee financial expert pursuant to this Item 3 of Form N-CSR does not impose on such person any duties, obligations or liability that are greater than the duties, obligations and liability imposed on such person as a member of the Audit and Compliance Committee and the Board of Trustees in the absence of such designation or identification.
Item 4. Principal Accountant Fees and Services:
The following table presents fees billed in each of the last two fiscal years for services rendered to the fund by the fund’s independent auditor:
| | | | |
| Fiscal | | Audit- | | |
| year | Audit | Related | Tax | All Other |
| ended | Fees | Fees | Fees | Fees |
| |
| November 30, 2007 | $69,650 | $-- | $3,800 | $- |
| November 30, 2006 | $68,709* | $-- | $3,265 | $ 566 |
* Includes fees of $8,344 billed by the fund’s independent auditor to the fund for procedures necessitated by regulatory and litigation matters for the fiscal year ended November 30, 2006,
respectively. These fees were reimbursed to the fund by Putnam Investment Management, LLC (“Putnam Management”).
For the fiscal years ended November 30, 2007and November 30, 2006, the fund’s independent auditor billed aggregate non-audit fees in the amounts of $3,800 and $3,831 respectively, to the fund, Putnam Management and any entity controlling, controlled by or under common control with Putnam Management that provides ongoing services to the fund.
Audit Fees represent fees billed for the fund’s last two fiscal years.
Audit-Related Fees represent fees billed in the fund’s last two fiscal years for services traditionally performed by the fund’s auditor, including accounting consultation for proposed transactions or concerning financial accounting and reporting standards and other audit or attest services not required by statute or regulation.
Tax Fees represent fees billed in the fund’s last two fiscal years for tax compliance, tax planning and tax advice services. Tax planning and tax advice services include assistance with tax audits, employee benefit plans and requests for rulings or technical advice from taxing authorities.
All Other Fees represent fees billed for services relating to expense allocation methodology.
Pre-Approval Policies of the Audit and Compliance Committee. The Audit and Compliance Committee of the Putnam funds has determined that, as a matter of policy, all work performed for the funds by the funds’ independent auditors will be pre-approved by the Committee itself and thus will generally not be subject to pre-approval procedures.
The Audit and Compliance Committee also has adopted a policy to pre-approve the engagement by Putnam Management and certain of its affiliates of the funds’ independent auditors, even in circumstances where pre-approval is not required by applicable law. Any such requests by Putnam Management or certain of its affiliates are typically submitted in writing to the Committee and explain, among other things, the nature of the proposed engagement, the estimated fees, and why this work should be performed by that particular audit firm as opposed to another one. In reviewing such requests, the Committee considers, among other things, whether the provision of such services by the audit firm are compatible with the independence of the audit firm.
The following table presents fees billed by the fund’s independent auditor for services required to be approved pursuant to paragraph (c)(7)(ii) of Rule 2-01 of Regulation S-X.
| | | | |
| Fiscal | Audit- | | All | Total |
| year | Related | Tax | Other | Non-Audit |
| ended | Fees | Fees | Fees | Fees |
| November 30, | | | | |
| 2007 | $ - | $ - | $ - | $ - |
| November 30, | | | | |
| 2006 | $ - | $ - | $ - | $ - |
Item 5. Audit Committee of Listed Registrants
Not applicable
Item 6. Schedule of Investments:
The registrant’s schedule of investments in unaffiliated issuers is included in the report to shareholders in Item 1 above.
Item 7. Disclosure of Proxy Voting Policies and Procedures For Closed-End Management
Investment Companies:
Not applicable
Item 8. Portfolio Managers of Closed-End Investment Companies
Not Applicable
Item 9. Purchases of Equity Securities by Closed-End Management Investment Companies and
Affiliated Purchasers:
Not applicable
Item 10. Submission of Matters to a Vote of Security Holders:
Not applicable
Item 11. Controls and Procedures:
(a) The registrant's principal executive officer and principal financial officer have concluded, based on their evaluation of the effectiveness of the design and operation of the registrant's disclosure controls and procedures as of a date within 90 days of the filing date of this report, that the design and operation of such procedures are generally effective to provide reasonable assurance that information required to be disclosed by the registrant in this report is recorded, processed, summarized and reported within the time periods specified in the Commission's rules and forms.
(b) Changes in internal control over financial reporting: Not applicable
Item 12. Exhibits:
(a)(1) The Code of Ethics of The Putnam Funds, which incorporates the Code of Ethics of Putnam Investments, is filed herewith.
(a)(2) Separate certifications for the principal executive officer and principal financial officer of the registrant as required by Rule 30a-2(a) under the Investment Company Act of 1940, as amended, are filed herewith.
(b) The certifications required by Rule 30a-2(b) under the Investment Company Act of 1940, as amended, are filed herewith.
SIGNATURES
Pursuant to the requirements of the Securities Exchange Act of 1934 and the Investment Company Act of 1940, the registrant has duly caused this report to be signed on its behalf by the undersigned, thereunto duly authorized.
Putnam High Yield Advantage Fund
By (Signature and Title):
/s/Janet C. Smith
Janet C. Smith
Principal Accounting Officer
Date: January 28, 2008
Pursuant to the requirements of the Securities Exchange Act of 1934 and the Investment Company Act of 1940, this report has been signed below by the following persons on behalf of the registrant and in the capacities and on the dates indicated.
By (Signature and Title):
/s/Charles E. Porter
Charles E. Porter
Principal Executive Officer
Date: January 28, 2008
By (Signature and Title):
/s/Steven D. Krichmar
Steven D. Krichmar
Principal Financial Officer
Date: January 28, 2008