| | |
| UNITED STATES
SECURITIES AND EXCHANGE COMMISSION |
| | |
| CERTIFIED SHAREHOLDER REPORT OF REGISTERED
MANAGEMENT INVESTMENT COMPANIES
|
| | |
| Investment Company Act file number: | (811-04616) |
| | |
| Exact name of registrant as specified in charter: | Putnam High Yield Advantage Fund |
| | |
| Address of principal executive offices: | One Post Office Square, Boston, Massachusetts 02109 |
| | |
| Name and address of agent for service: | Robert T. Burns, Vice President
One Post Office Square
Boston, Massachusetts 02109 |
| | |
| Copy to: | John W. Gerstmayr, Esq.
Ropes & Gray LLP
800 Boylston Street
Boston, Massachusetts 02199-3600 |
| | |
| Registrant’s telephone number, including area code: | (617) 292-1000 |
| | |
| Date of fiscal year end: | November 30, 2011 |
| | |
| Date of reporting period: | December 1, 2010 — November 30, 2011 |
| | |
|
Item 1. Report to Stockholders: | |
| | |
| The following is a copy of the report transmitted to stockholders pursuant to Rule 30e-1 under the Investment Company Act of 1940: | |
Putnam
High Yield
Advantage Fund
Annual report
11 | 30 | 11
| | | |
| Message from the Trustees | 1 | | |
| | |
| About the fund | 2 | | |
| | |
| Performance snapshot | 4 | | |
| | |
| Interview with your fund’s portfolio manager | 5 | | |
| | |
| Your fund’s performance | 10 | | |
| | |
| Your fund’s expenses | 13 | | |
| | |
| Terms and definitions | 15 | | |
| | |
| Other information for shareholders | 16 | | |
| | |
| Trustee approval of management contract | 17 | | |
| | |
| Financial statements | 21 | | |
| | |
| Federal tax information | 64 | | |
| | |
| About the Trustees | 65 | | |
| | |
| Officers | 67 | | |
| | |
Message from the Trustees
Dear Fellow Shareholder:
For all the volatility and economic uncertainty investors experienced in recent months, U.S. equity markets ended the year more or less where they started; some fixed-income sectors posted modest gains, while others struggled. This period of heightened volatility is likely to persist, given the unresolved European debt crisis and tepid growth here in the United States. However, not all the news is bad. Corporate earnings and balance sheets remain solid, unemployment has trended down, inflation pressures have eased globally, and state budgets show early signs of improvement.
The counsel of your financial advisor can be an invaluable resource during periods of market uncertainty, as can a long-term focus and a balanced investment approach. Moreover, Putnam’s portfolio managers and analysts are trained to uncover the opportunities that often emerge in this kind of environment, while also seeking to guard against downside risk.
We would like to thank John A. Hill, who has served as Chairman of the Trustees since 2000 and who continues on as a Trustee, for his service. We are pleased to announce that Jameson A. Baxter is the new Chair, having served as Vice Chair since 2005 and a Trustee since 1994.
Ms. Baxter is President of Baxter Associates, Inc., a private investment firm, and Chair of the Mutual Fund Directors Forum. In addition, she serves as Chair Emeritus of the Board of Trustees of Mount Holyoke College, Director of the Adirondack Land Trust, and Trustee of the Nature Conservancy’s Adirondack Chapter.
We would also like to take this opportunity to welcome new shareholders to the fund and to thank all of our investors for your continued confidence in Putnam.

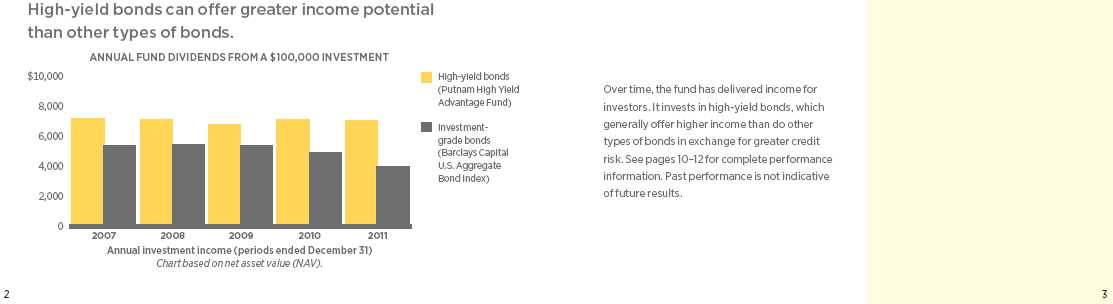
About the fund
Seeking a high level of current income for investors since 1986
Unlike most types of fixed-income investments, high-yield bond performance is more dependent on the performance of the companies that issue the bonds than on interest rates. For this reason, distinguishing between opportunities and potential pitfalls requires a rigorous investment process that includes analyzing companies. With Putnam High Yield Advantage Fund, this process is highlighted by intensive research, investment diversification, and carefully timed portfolio adjustments.
Because of the risks of high-yield bond investing, in-depth credit research is essential. The fund’s research team — which includes analysts who specialize by industry — visits with the management of issuing companies and analyzes each company’s prospects. The team then compares this information to the bond’s upside or downside potential before deciding whether it is an appropriate investment for the fund.
The fund’s portfolio typically consists of bonds from a broad range of industries and companies. Holdings are diversified across industry sectors and among bonds with differing credit ratings. While the fund invests primarily in the bonds of U.S. companies, its diversified approach allows it to include foreign bonds as well.
As the bond markets shift over time, the fund’s managers look for ways to capitalize on developments that affect fixed-income securities in general and high-yield bonds in particular. For example, when credit spreads are wide and are expected to tighten, the fund may pursue the higher income potential offered by lower-quality issues. On the other hand, when credit spreads are narrow — that is, when the diff erence in yield between higher- and lower-rated bonds of comparable maturities is small — the fund may shift its emphasis to higher-quality high-yield bonds.
Consider these risks before investing: Lower-rated bonds may offer higher yields in return for more risk. The use of derivatives involves additional risks, such as the potential inability to terminate or sell derivatives positions and the potential failure of the other party to the instrument to meet its obligations. Funds that invest in bonds are subject to certain risks including interest-rate risk, credit risk, and inflation risk. As interest rates rise, the prices of bonds fall. Long-term bonds are more exposed to interest-rate risk than short-term bonds. Unlike bonds, bond funds have ongoing fees and expenses.
What makes a bond “high yield”?
High-yield bonds are fixed-income investments typically issued by companies that lack an established earnings track record or a solid credit history. In general, high-yield bonds offer higher interest rates than investment-grade bonds to compensate for their increased risk. Because of this added risk, these bonds are typically rated below investment grade by an independent rating agency (for example, the lowest Moody’s Investors Service rating of investment-grade bonds is Baa). The lower the rating, the greater the possibility that a bond’s issuer will be unable to make interest payments or repay the principal.

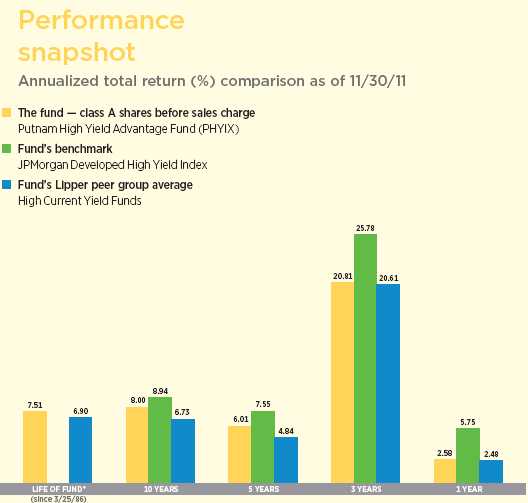
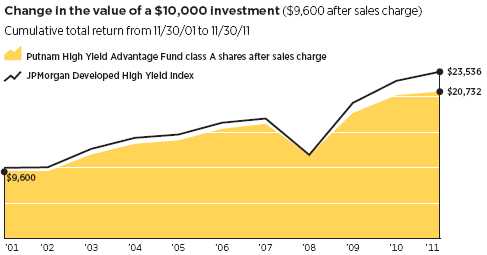
Current performance may be lower or higher than the quoted past performance, which cannot guarantee future results. Share price, principal value, and return will fluctuate, and you may have a gain or a loss when you sell your shares. Performance of class A shares assumes reinvestment of distributions and does not account for taxes. Fund returns in the bar chart do not reflect a sales charge of 4.00%; had they, returns would have been lower. See pages 5 and 10–12 for additional performance information. For a portion of the periods, the fund had expense limitations, without which returns would have been lower. A short-term trading fee of 1% may apply to redemptions or exchanges from certain funds within the time period specified in the fund’s prospectus. To obtain the most recent month-end performance, visit putnam.com.
* The fund’s benchmark, the JPMorgan Developed High Yield Index, was introduced on 12/31/94, which post-dates the inception of the fund’s class A shares.
4
Interview with your fund’s portfolio manager

How would you characterize the environment in the high-yield bond market during the 12 months ended November 30, 2011?
Despite significant turbulence caused by various macroeconomic and political developments, high-yield bonds posted reasonably solid performance over the past year. During the first half of the period, high-yield bonds were among the best-performing fixed-income categories, thanks to a generally supportive economic environment, strong corporate fundamentals, and solid demand for high-yield debt. As we moved into the summer, however, growing unease about a potentially expanding sovereign debt crisis in Europe, Standard & Poor’s downgrade of the U.S. long-term credit rating, and concern about a global economic slowdown created volatility, and investors fled from risk. As a result, high-yield bonds, as well as other asset classes with greater perceived risk, substantially underperformed.
High-yield bonds rallied in October, as hopes for a deal to end Europe’s debt crisis and modestly positive economic data fueled a short-lived resurgence in investor risk appetite. But, in the final month of the period, investors again turned cautious, as European policymakers continued to struggle to craft an acceptable solution to the continent’s debt problem. Additionally, the “super committee” — created through August’s debt ceiling legislation and tasked with reducing the deficit by at least $1.2 trillion — failed to reach an agreement
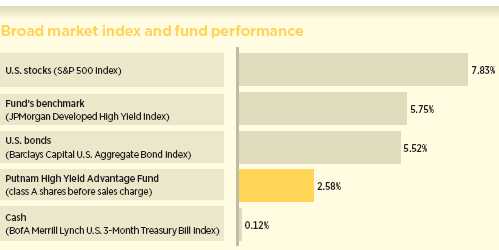
This comparison shows your fund’s performance in the context of broad market indexes for the 12 months ended 11/30/11. See pages 4 and 10–12 for additional fund performance information. Index descriptions can be found on page 15.
5
before its November 23, 2011 deadline, further deepening investors’ risk aversion.
Following a relatively robust pace of new issuance during the period’s first half, new issuance of high-yield bonds weakened during the second half, as market volatility caused a number of issuers to postpone or cancel planned transactions. In a similar reversal from the first half of the period, as investors became more cautious, higher-rated [BB] bonds generally outperformed their lower-rated [CCC] counterparts during the period’s second half.
High-yield defaults slightly increased during the latter months of the period, but remained below the historical average for the period as a whole. Credit trends remained positive overall, but were negative in August, September, and November when the number of downgrades outpaced the number of upgrades.
Against this backdrop, the fund lagged its benchmark but slightly outperformed the average return of its Lipper peer group.
What factors detracted from the fund’s relative return?
The fund trailed its benchmark primarily due to overweight exposure to the mid- and lower-quality tiers of the market. In terms of individual holdings, an overweight position in Harry and David, a specialty retailer of gourmet fruit and food gift baskets, hurt performance, as the company filed for Chapter 11 bankruptcy in March 2011. This position was eliminated from the fund during the period. Additional detractors included Travelport, which provides computerized
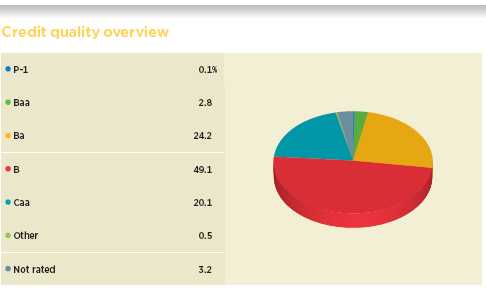
Credit qualities are shown as a percentage of net assets as of 11/30/11. A bond rated Baa or higher (Prime-3 or higher, for short-term debt) is considered investment grade. The chart reflects Moody’s ratings; percentages may include bonds or derivatives not rated by Moody’s but rated by Standard & Poor’s (S&P) or, if unrated by S&P, by Fitch, and then included in the closest equivalent Moody’s rating. Ratings will vary over time.
Credit quality includes bonds and represents only the fixed-income portion of the portfolio. Derivative instruments, including currency forwards, are only included to the extent of any unrealized gain or loss on such instruments and are shown in the not-rated category. Cash is also shown in the not-rated category. The fund itself has not been rated by an independent rating agency.
6
registration systems and other services to the travel industry; Clearwire, which controls wireless spectrum — or the “rails” on which wireless data ride; wireless carrier Sprint Nextel; and HBOS, a banking and insurance company based in the United Kingdom.
Which holdings helped versus the index?
Top individual relative contributors included First Data, a provider of merchant processing services; telecommunication services companies Windstream and PAETEC; and satellite radio operator XM Satellite Radio.
What is your outlook for the high-yield market over the coming months?
Data releases continue to portray a U.S. economy that is growing, albeit slowly. While we don’t expect a particularly robust recovery, we believe the basic requirements for continued moderate expansion are in place.
U.S. corporate strength has been a major bright spot for the economy. Company balance sheets remain solid, with healthy cash levels and profit margins that are still wide. While the outlook for earnings growth has diminished with the slowing global economy — in particular, the likelihood of recession in Europe — we believe
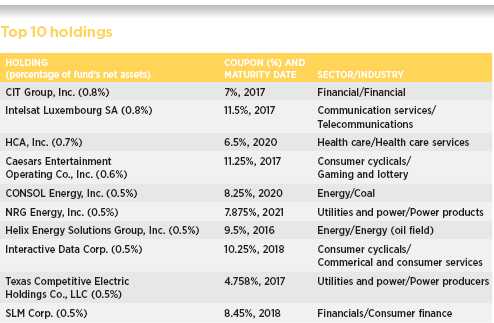
This table shows the fund’s top 10 holdings and the percentage of the fund’s net assets that each represented as of 11/30/11. Short-term holdings are excluded. Holdings will vary over time.
7
corporations remain well positioned to weather difficult conditions.
At the global macroeconomic level, we are concerned about the continuing uncertainty regarding Europe’s debt crisis. While policymakers are working to come up with a solution, European Union leaders remain deeply divided over key elements of their strategy. Meanwhile, with the European economy possibly already in a recession, pressures on European banks raise the risk of contagion for the United States.
In terms of the high-yield market specifically, the trauma of the financial crisis of 2008 and 2009, severe as it was, had the beneficial effect of purging the market of its least-creditworthy companies. Put differently, the bulk of today’s high-yield issuers are stronger for having weathered the recession. Most of them have better balance sheets, with substantial amounts of cash and sturdier capital structures. Moreover, many corporations today are managing their balance sheets far more conservatively than they did in the years leading up to the 2008–2009 debacle. In our view, such conservative financial management bodes well for default rates, and we believe that high-yield defaults
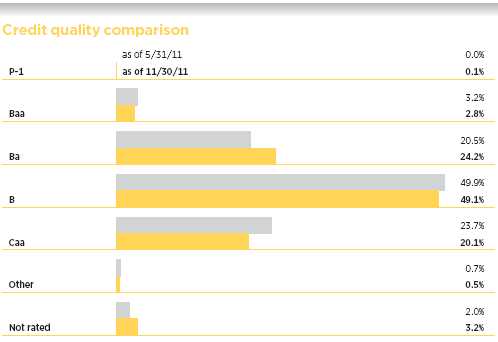
This chart shows how the fund’s credit quality has changed over the past six months. Credit qualities are shown as a percentage of net assets as of 11/30/11. A bond rated Baa or higher (Prime-3 or higher, for short-term debt) is considered investment grade. The chart reflects Moody’s ratings; percentages may include bonds or derivatives not rated by Moody’s but rated by Standard & Poor’s (S&P) or, if unrated by S&P, by Fitch, and then included in the closest equivalent Moody’s rating. Ratings will vary over time.
Credit quality includes bonds and represents only the fixed-income portion of the portfolio. Derivative instruments, including currency forwards, are only included to the extent of any unrealized gain or loss on such instruments and are shown in the not-rated category. Cash is also shown in the not-rated category. The fund itself has not been rated by an independent rating agency.
8
are likely to remain below the historical average for an extended period.
As for market “technicals” [the supply/demand balance], our outlook is neutral. Retail fund flows turned positive in October but pulled back in November, with demand for high-yield bonds hampered by volatility and strained market liquidity. Concerning valuation, at period-end, yield spreads were at attractive levels relative to their risk-adjusted return potential.
Given this outlook, how have you positioned the fund?
We modestly reduced the fund’s risk by, among other measures, moderately raising its cash allocation. Tactically increasing cash enables us to manage volatility more effectively and have “dry powder” available for new investment opportunities.
High-yield bonds experienced equity-like volatility during the period’s second half, but their yield component provided a cushion for investors amid shifting market expectations. While past performance is no guarantee of future results, it is worth noting that over the past 25 years, high-yield bonds have generated their strongest total returns during periods of relatively slow GDP growth of 2% or less.
Thanks for your time and for bringing us up to date, Paul.
The views expressed in this report are exclusively those of Putnam Management and are subject to change. They are not meant as investment advice.
Please note that the holdings discussed in this report may not have been held by the fund for the entire period. Portfolio composition is subject to review in accordance with the fund’s investment strategy and may vary in the future. Current and future portfolio holdings are subject to risk.
Portfolio Manager Paul D. Scanlon is Co-Head of Fixed Income at Putnam. He has an M.B.A. from The University of Chicago Booth School of Business and a B.A. from Colgate University. A CFA charterholder, Paul joined Putnam in 1999 and has been in the investment industry since 1986.
In addition to Paul, your fund’s portfolio managers are Norm Boucher and Rob Salvin.
IN THE NEWS
Despite persistent market volatility, corporate financials improved to near-peak levels in 2011. Economic growth may have slowed, but many U.S. companies that implemented cost-cutting measures since 2008 began to see the results of those efforts reflected in resilient profit margins. Companies in the S&P 500 Index are on track to generate record earnings per share in 2011. In lean economic times, companies have remained vigilant about controlling costs and managing inventories effectively. Even in the face of heightened market volatility and consequent investor risk aversion, strong earnings performance has supported both equities and high-yield bonds on a fundamental basis.
9
Your fund’s performance
This section shows your fund’s performance, price, and distribution information for periods ended November 30, 2011, the end of its most recent fiscal year. In accordance with regulatory requirements for mutual funds, we also include performance as of the most recent calendar quarter-end and expense information taken from the fund’s current prospectus. Performance should always be considered in light of a fund’s investment strategy. Data represent past performance. Past performance does not guarantee future results. More recent returns may be less or more than those shown. Investment return and principal value will fluctuate, and you may have a gain or a loss when you sell your shares. Performance information does not reflect any deduction for taxes a shareholder may owe on fund distributions or on the redemption of fund shares. For the most recent month-end performance, please visit the Individual Investors section at putnam.com or call Putnam at 1-800-225-1581. Class R and class Y shares are not available to all investors. See the Terms and Definitions section in this report for definitions of the share classes offered by your fund.
Fund performance Total return for periods ended 11/30/11
| | | | | | | | | | |
| | Class A | Class B | Class C | Class M | Class R | Class Y |
| (inception dates) | (3/25/86) | (5/16/94) | (3/30/07) | (12/1/94) | (3/30/07) | (12/31/98) |
|
| | Before | After | | | | | Before | After | Net | Net |
| | sales | sales | Before | After | Before | After | sales | sales | asset | asset |
| | charge | charge | CDSC | CDSC | CDSC | CDSC | charge | charge | value | value |
|
| Annual average | | | | | | | | | | |
| (life of fund) | 7.51% | 7.33% | 6.61% | 6.61% | 6.70% | 6.70% | 7.21% | 7.08% | 7.25% | 7.69% |
|
| 10 years | 115.84 | 107.32 | 100.12 | 100.12 | 100.21 | 100.21 | 110.70 | 103.74 | 111.11 | 122.58 |
| Annual average | 8.00 | 7.56 | 7.18 | 7.18 | 7.19 | 7.19 | 7.74 | 7.38 | 7.76 | 8.33 |
|
| 5 years | 33.90 | 28.53 | 29.02 | 27.22 | 28.88 | 28.88 | 32.19 | 27.88 | 32.62 | 35.63 |
| Annual average | 6.01 | 5.15 | 5.23 | 4.93 | 5.21 | 5.21 | 5.74 | 5.04 | 5.81 | 6.28 |
|
| 3 years | 76.31 | 69.21 | 72.60 | 69.60 | 72.69 | 72.69 | 75.13 | 69.28 | 75.21 | 77.83 |
| Annual average | 20.81 | 19.16 | 19.95 | 19.25 | 19.97 | 19.97 | 20.54 | 19.18 | 20.56 | 21.15 |
|
| 1 year | 2.58 | –1.59 | 1.84 | –2.92 | 1.90 | 0.94 | 2.37 | –0.98 | 2.37 | 2.88 |
|
Current performance may be lower or higher than the quoted past performance, which cannot guarantee future results. After-sales-charge returns for class A and M shares reflect the deduction of the maximum 4.00% and 3.25% sales charge, respectively, levied at the time of purchase. Class B share returns after contingent deferred sales charge (CDSC) reflect the applicable CDSC, which is 5% in the first year, declining over time to 1% in the sixth year, and is eliminated thereafter. Class C share returns after CDSC reflect a 1% CDSC for the first year that is eliminated thereafter. Class R and Y shares have no initial sales charge or CDSC. Performance for class B, C, M, R, and Y shares before their inception is derived from the historical performance of class A shares, adjusted for the applicable sales charge (or CDSC) and the higher operating expenses for such shares, except for class Y shares, for which 12b-1 fees are not applicable.
For a portion of the periods, the fund had expense limitations, without which returns would have been lower.
Class B share performance does not reflect conversion to class A shares.
A short-term trading fee of 1% may apply to redemptions or exchanges from certain funds within the time period specified in the fund’s prospectus.
10
Comparative index returns For periods ended 11/30/11
| | |
| | JPMorgan Developed | Lipper High Current Yield Funds |
| | High Yield Index | category average* |
|
| Annual average (life of fund) | —† | 6.90% |
|
| 10 years | 135.36% | 95.18 |
| Annual average | 8.94 | 6.73 |
|
| 5 years | 43.92 | 27.82 |
| Annual average | 7.55 | 4.84 |
|
| 3 years | 98.99 | 75.80 |
| Annual average | 25.78 | 20.61 |
|
| 1 year | 5.75 | 2.48 |
|
Index and Lipper results should be compared with fund performance before sales charge, before CDSC, or at net asset value.
* Over the 1-year, 3-year, 5-year, 10-year, and life-of-fund periods ended 11/30/11, there were 489, 423, 349, 236, and 24 funds, respectively, in this Lipper category.
† The fund’s benchmark, the JPMorgan Developed High Yield Index, was introduced on 12/31/94, which post-dates the inception of the fund’s class A shares.
Fund price and distribution information For the 12-month period ended 11/30/11
| | | | | | | | |
| Distributions | Class A | Class B | Class C | Class M | Class R | Class Y |
|
| Number | 12 | 12 | 12 | 12 | 12 | 12 |
|
| Income | $0.439 | $0.394 | $0.397 | $0.427 | $0.427 | $0.451 |
|
| Capital gains | — | — | — | — | — | — |
|
| Total | $0.439 | $0.394 | $0.397 | $0.427 | $0.427 | $0.451 |
|
| | Before | After | Net | Net | Before | After | Net | Net |
| | sales | sales | asset | asset | sales | sales | asset | asset |
| Share value | charge | charge | value | value | charge | charge | value | value |
|
| 11/30/10 | $5.90 | $6.15 | $5.80 | $5.78 | $5.90 | $6.10 | $5.90 | $6.08 |
|
| 11/30/11 | 5.62 | 5.85 | 5.52 | 5.50 | 5.62 | 5.81 | 5.62 | 5.81 |
|
| | Before | After | Net | Net | Before | After | Net | Net |
| | sales | sales | asset | asset | sales | sales | asset | asset |
| Current yield (end of period) | charge | charge | value | value | charge | charge | value | value |
|
| Current dividend rate 1 | 7.47% | 7.18% | 6.96% | 6.98% | 7.26% | 7.02% | 7.26% | 7.44% |
|
| Current 30-day SEC yield 2 | N/A | 7.32 | 6.85 | 6.86 | N/A | 7.12 | 7.37 | 7.88 |
|
The classification of distributions, if any, is an estimate. Before-sales-charge share value and current dividend rate for class A and M shares, if applicable, do not take into account any sales charge levied at the time of purchase. After-sales-charge share value, current dividend rate, and current 30-day SEC yield, if applicable, are calculated assuming that the maximum sales charge (4.00% for class A shares and 3.25% for class M shares) was levied at the time of purchase. Final distribution information will appear on your year-end tax forms.
1 Most recent distribution, excluding capital gains, annualized and divided by share price before or after sales charge at period-end.
2 Based only on investment income and calculated using the maximum offering price for each share class, in accordance with SEC guidelines.
11
Past performance does not indicate future results. At the end of the same time period, a $10,000 investment in the fund’s class B and class C shares would have been valued at $20,012 and $20,021, respectively, and no contingent deferred sales charges would apply. A $10,000 investment in the fund’s class M shares ($9,675 after sales charge) would have been valued at $20,374. A $10,000 investment in the fund’s class R and class Y shares would have been valued at $21,111 and $22,258, respectively.
Fund performance as of most recent calendar quarter
Total return for periods ended 12/31/11
| | | | | | | | | | |
| | Class A | Class B | Class C | Class M | Class R | Class Y |
| (inception dates) | (3/25/86) | (5/16/94) | (3/30/07) | (12/1/94) | (3/30/07) | (12/31/98) |
|
| | Before | After | | | | | Before | After | Net | Net |
| | sales | sales | Before | After | Before | After | sales | sales | asset | asset |
| | charge | charge | CDSC | CDSC | CDSC | CDSC | charge | charge | value | value |
|
| Annual average | | | | | | | | | | |
| (life of fund) | 7.59% | 7.42% | 6.69% | 6.69% | 6.78% | 6.78% | 7.30% | 7.16% | 7.33% | 7.77% |
|
| 10 years | 121.43 | 112.61 | 105.39 | 105.39 | 105.36 | 105.36 | 116.15 | 109.30 | 116.52 | 128.14 |
| Annual average | 8.27 | 7.83 | 7.46 | 7.46 | 7.46 | 7.46 | 8.01 | 7.67 | 8.03 | 8.60 |
|
| 5 years | 35.92 | 30.47 | 31.21 | 29.38 | 31.05 | 31.05 | 34.19 | 29.81 | 34.60 | 37.60 |
| Annual average | 6.33 | 5.46 | 5.58 | 5.29 | 5.56 | 5.56 | 6.06 | 5.36 | 6.12 | 6.59 |
|
| 3 years | 73.41 | 66.62 | 70.11 | 67.11 | 69.81 | 69.81 | 72.26 | 66.67 | 72.34 | 74.92 |
| Annual average | 20.14 | 18.55 | 19.37 | 18.67 | 19.30 | 19.30 | 19.87 | 18.56 | 19.89 | 20.49 |
|
| 1 year | 3.15 | –1.00 | 2.59 | –2.20 | 2.49 | 1.53 | 2.94 | –0.39 | 2.94 | 3.42 |
|
12
Your fund’s expenses
As a mutual fund investor, you pay ongoing expenses, such as management fees, distribution fees (12b-1 fees), and other expenses. Using the following information, you can estimate how these expenses affect your investment and compare them with the expenses of other funds. You may also pay one-time transaction expenses, including sales charges (loads) and redemption fees, which are not shown in this section and would have resulted in higher total expenses. For more information, see your fund’s prospectus or talk to your financial representative.
Expense ratios
| | | | | | |
| | Class A | Class B | Class C | Class M | Class R | Class Y |
|
| Total annual operating expenses for the fiscal year | | | | | | |
| ended 11/30/10* | 1.04% | 1.79% | 1.79% | 1.29% | 1.29% | 0.79% |
|
| Annualized expense ratio for the six-month period | | | | | | |
| ended 11/30/11† | 1.04% | 1.79% | 1.79% | 1.29% | 1.29% | 0.79% |
|
Fiscal-year expense information in this table is taken from the most recent prospectus, is subject to change, and may differ from that shown for the annualized expense ratio and in the financial highlights of this report. Expenses are shown as a percentage of average net assets.
* Restated to reflect projected expenses under a management contract effective 1/1/10.
† For the fund’s most recent fiscal half year; may differ from expense ratios based on one-year data in the financial highlights.
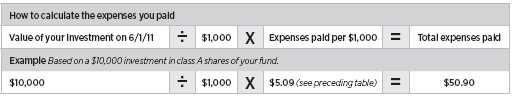
Expenses per $1,000
The following table shows the expenses you would have paid on a $1,000 investment in the fund from June 1, 2011, to November 30, 2011. It also shows how much a $1,000 investment would be worth at the close of the period, assuming actual returns and expenses.
| | | | | | |
| | Class A | Class B | Class C | Class M | Class R | Class Y |
|
| Expenses paid per $1,000*† | $5.09 | $8.76 | $8.75 | $6.32 | $6.32 | $3.87 |
|
| Ending value (after expenses) | $953.80 | $951.10 | $949.70 | $952.80 | $952.80 | $956.20 |
|
* Expenses for each share class are calculated using the fund’s annualized expense ratio for each class, which represents the ongoing expenses as a percentage of average net assets for the six months ended 11/30/11. The expense ratio may differ for each share class.
† Expenses are calculated by multiplying the expense ratio by the average account value for the period; then multiplying the result by the number of days in the period; and then dividing that result by the number of days in the year.
13
Estimate the expenses you paid
To estimate the ongoing expenses you paid for the six months ended November 30, 2011, use the following calculation method. To find the value of your investment on June 1, 2011, call Putnam at 1-800-225-1581.
Compare expenses using the SEC’s method
The Securities and Exchange Commission (SEC) has established guidelines to help investors assess fund expenses. Per these guidelines, the following table shows your fund’s expenses based on a $1,000 investment, assuming a hypothetical 5% annualized return. You can use this information to compare the ongoing expenses (but not transaction expenses or total costs) of investing in the fund with those of other funds. All mutual fund shareholder reports will provide this information to help you make this comparison. Please note that you cannot use this information to estimate your actual ending account balance and expenses paid during the period.
| | | | | | |
| | Class A | Class B | Class C | Class M | Class R | Class Y |
|
| Expenses paid per $1,000*† | $5.27 | $9.05 | $9.05 | $6.53 | $6.53 | $4.00 |
|
| Ending value (after expenses) | $1,019.85 | $1,016.09 | $1,016.09 | $1,018.60 | $1,018.60 | $1,021.11 |
|
* Expenses for each share class are calculated using the fund’s annualized expense ratio for each class, which represents the ongoing expenses as a percentage of average net assets for the six months ended 11/30/11. The expense ratio may differ for each share class.
† Expenses are calculated by multiplying the expense ratio by the average account value for the period; then multiplying the result by the number of days in the period; and then dividing that result by the number of days in the year.
14
Terms and definitions
Important terms
Total return shows how the value of the fund’s shares changed over time, assuming you held the shares through the entire period and reinvested all distributions in the fund.
Before sales charge, or net asset value, is the price, or value, of one share of a mutual fund, without a sales charge. Before-sales-charge figures fluctuate with market conditions, and are calculated by dividing the net assets of each class of shares by the number of outstanding shares in the class.
After sales charge is the price of a mutual fund share plus the maximum sales charge levied at the time of purchase. After-sales-charge performance figures shown here assume the 4.00% maximum sales charge for class A shares and 3.25% for class M shares.
Contingent deferred sales charge (CDSC) is generally a charge applied at the time of the redemption of class B or C shares and assumes redemption at the end of the period. Your fund’s class B CDSC declines over time from a 5% maximum during the first year to 1% during the sixth year. After the sixth year, the CDSC no longer applies. The CDSC for class C shares is 1% for one year after purchase.
Current yield is the annual rate of return earned from dividends or interest of an investment. Current yield is expressed as a percentage of the price of a security, fund share, or principal investment.
Share classes
Class A shares are generally subject to an initial sales charge and no CDSC (except on certain redemptions of shares bought without an initial sales charge).
Class B shares are not subject to an initial sales charge. They may be subject to a CDSC.
Class C shares are not subject to an initial sales charge and are subject to a CDSC only if the shares are redeemed during the first year.
Class M shares have a lower initial sales charge and a higher 12b-1 fee than class A shares and no CDSC (except on certain redemptions of shares bought without an initial sales charge).
Class R shares are not subject to an initial sales charge or CDSC and are available only to certain defined contribution plans.
Class Y shares are not subject to an initial sales charge or CDSC, and carry no 12b-1 fee. They are generally only available to corporate and institutional clients and clients in other approved programs.
Comparative indexes
Barclays Capital U.S. Aggregate Bond Index is an unmanaged index of U.S. investment-grade fixed-income securities.
BofA (Bank of America) Merrill Lynch U.S. 3-Month Treasury Bill Index is an unmanaged index that seeks to measure the performance of U.S. Treasury bills available in the marketplace.
JPMorgan Developed High Yield Index is an unmanaged index of high-yield fixed-income securities issued in developed countries.
S&P 500 Index is an unmanaged index of common stock performance.
Indexes assume reinvestment of all distributions and do not account for fees. Securities and performance of a fund and an index will differ. You cannot invest directly in an index.
Lipper is a third-party industry-ranking entity that ranks mutual funds. Its rankings do not reflect sales charges. Lipper rankings are based on total return at net asset value relative to other funds that have similar current investment styles or objectives as determined by Lipper. Lipper may change a fund’s category assignment at its discretion. Lipper category averages reflect performance trends for funds within a category.
15
Other information for shareholders
Important notice regarding Putnam’s privacy policy
In order to conduct business with our shareholders, we must obtain certain personal information such as account holders’ names, addresses, Social Security numbers, and dates of birth. Using this information, we are able to maintain accurate records of accounts and transactions.
It is our policy to protect the confidentiality of our shareholder information, whether or not a shareholder currently owns shares of our funds. In particular, it is our policy not to sell information about you or your accounts to outside marketing firms. We have safeguards in place designed to prevent unauthorized access to our computer systems and procedures to protect personal information from unauthorized use.
Under certain circumstances, we must share account information with outside vendors who provide services to us, such as mailings and proxy solicitations. In these cases, the service providers enter into confidentiality agreements with us, and we provide only the information necessary to process transactions and perform other services related to your account. Finally, it is our policy to share account information with your financial representative, if you’ve listed one on your Putnam account.
Proxy voting
Putnam is committed to managing our mutual funds in the best interests of our shareholders. The Putnam funds’ proxy voting guidelines and procedures, as well as information regarding how your fund voted proxies relating to portfolio securities during the 12-month period ended June 30, 2011, are available in the Individual Investors section at putnam.com, and on the SEC’s website, www.sec.gov. If you have questions about finding forms on the SEC’s website, you may call the SEC at 1-800-SEC-0330. You may also obtain the Putnam funds’ proxy voting guidelines and procedures at no charge by calling Putnam’s Shareholder Services at 1-800-225-1581.
Fund portfolio holdings
The fund will file a complete schedule of its portfolio holdings with the SEC for the first and third quarters of each fiscal year on Form N-Q. Shareholders may obtain the fund’s Forms N-Q on the SEC’s website at www.sec.gov. In addition, the fund’s Forms N-Q may be reviewed and copied at the SEC’s Public Reference Room in Washington, D.C. You may call the SEC at 1-800-SEC-0330 for information about the SEC’s website or the operation of the Public Reference Room.
Trustee and employee fund ownership
Putnam employees and members of the Board of Trustees place their faith, confidence, and, most importantly, investment dollars in Putnam mutual funds. As of November 30, 2011, Putnam employees had approximately $322,000,000 and the Trustees had approximately $70,000,000 invested in Putnam mutual funds. These amounts include investments by the Trustees’ and employees’ immediate family members as well as investments through retirement and deferred compensation plans.
16
Trustee approval of management contract
General conclusions
The Board of Trustees of the Putnam funds oversees the management of each fund and, as required by law, determines annually whether to approve the continuance of your fund’s management contract with Putnam Investment Management (“Putnam Management”) and the sub-management contract with respect to your fund between Putnam Management and its affiliate, Putnam Investments Limited (“PIL”).
The Board of Trustees, with the assistance of its Contract Committee, which consists solely of Trustees who are not “interested persons” (as this term is defined in the Investment Company Act of 1940, as amended) of the Putnam funds (“Independent Trustees”), requests and evaluates all information it deems reasonably necessary under the circumstances in connection with its annual contract review. Over the course of several months ending in June 2011, the Contract Committee met on a number of occasions with representatives of Putnam Management, and separately in executive session, to consider the information that Putnam Management provided and other information developed with the assistance of the Board’s independent counsel and independent staff. The Contract Committee reviewed and discussed key aspects of this information with all of the Independent Trustees on a number of occasions. At the Trustees’ June 17, 2011 meeting, the Contract Committee recommended, and the Independent Trustees approved, the continuance of your fund’s management and sub-management contracts, effective July 1, 2011. (Because PIL is an affiliate of Putnam Management and Putnam Management remains fully responsible for all services provided by PIL, the Trustees have not evaluated PIL as a separate entity, and all subsequent references to Putnam Management below should be deemed to include reference to PIL as necessary or appropriate in the context.)
The Independent Trustees’ approval was based on the following conclusions:
• That the fee schedule in effect for your fund represented reasonable compensation in light of the nature and quality of the services being provided to the fund, the fees paid by competitive funds, and the costs incurred by Putnam Management in providing services, and
• That the fee schedule represented an appropriate sharing between fund shareholders and Putnam Management of such economies of scale as may exist in the management of the fund at current asset levels.
These conclusions were based on a comprehensive consideration of all information provided to the Trustees and were not the result of any single factor. Some of the factors that figured particularly in the Trustees’ deliberations and how the Trustees considered these factors are described below, although individual Trustees may have evaluated the information presented differently, giving different weights to various factors. It is also important to recognize that the management arrangements for your fund and the other Putnam funds are the result of many years of review and discussion between the Independent Trustees and Putnam Management, that some aspects of the arrangements may receive greater scrutiny in some years than others, and that the Trustees’ conclusions may be based, in part, on their consideration of fee arrangements in previous years.
Management fee schedules and total expenses
The Trustees reviewed the management fee schedules in effect for all Putnam funds, including fee levels and breakpoints. In reviewing management fees, the Trustees
17
generally focus their attention on material changes in circumstances — for example, changes in assets under management or investment style, changes in Putnam Management’s operating costs, or changes in competitive practices in the mutual fund industry — that suggest that consideration of fee changes might be warranted. The Trustees concluded that the circumstances did not warrant changes to the management fee structure of your fund.
Most of the open-end Putnam funds have new management contracts, with new fee schedules reflecting the implementation of more competitive fee levels for many funds, complex-wide breakpoints for the open-end funds, and performance fees for some funds. These new management contracts have been in effect for a little over a year — since January or, for a few funds, February, 2010. The Trustees approved the new management contracts on July 10, 2009, and fund shareholders subsequently approved the contracts by overwhelming majorities of the shares voted.
Because these management contracts had been implemented only recently, the Contract Committee had limited practical experience with the operation of the new fee structures. Under its new management contract, your fund has the benefit of breakpoints in its management fee that provide shareholders with significant economies of scale in the form of reduced fee levels as assets under management in the Putnam family of funds increase. The Contract Committee observed that the complex-wide breakpoints of the open-end funds had only been in place for a short while, and the Trustees will examine the operation of this new breakpoint structure in future years in light of further experience.
As in the past, the Trustees also focused on the competitiveness of each fund’s total expense ratio. In order to ensure that expenses of the Putnam funds continue to meet evolving competitive standards, the Trustees and Putnam Management agreed in 2009 to implement certain expense limitations. These expense limitations serve in particular to maintain competitive expense levels for funds with large numbers of small shareholder accounts and funds with relatively small net assets. Most funds, including your fund, had sufficiently low expenses that these expense limitations did not apply. The expense limitations were: (i) a contractual expense limitation applicable to all retail open-end funds of 37.5 basis points on investor servicing fees and expenses and (ii) a contractual expense limitation applicable to all open-end funds of 20 basis points on so-called “other expenses” (i.e., all expenses exclusive of management fees, investor servicing fees, distribution fees, investment-related expenses, interest, taxes, brokerage commissions and extraordinary expenses). Putnam Management’s support for these expense limitations was an important factor in the Trustees’ decision to approve the continuance of your fund’s management and sub-management contracts.
The Trustees reviewed comparative fee and expense information for a custom group of competitive funds selected by Lipper Inc. This comparative information included your fund’s percentile ranking for effective management fees and total expenses (excluding any applicable 12b-1 fee), which provides a general indication of your fund’s relative standing. In the custom peer group, your fund ranked in the 3rd quintile in effective management fees (determined for your fund and the other funds in the custom peer group based on fund asset size and the applicable contractual management fee schedule) and in the 3rd quintile in total expenses (excluding any applicable 12b-1 fees) as of December 31, 2010 (the first quintile representing the least expensive funds and the fifth quintile the most expensive funds). The fee and expense data reported by Lipper as of December 31, 2010 reflected the most
18
recent fiscal year-end data available in Lipper’s database at that time.
In connection with their review of the management fees and total expenses of the Putnam funds, the Trustees also reviewed the costs of the services provided and the profits realized by Putnam Management and its affiliates from their contractual relationships with the funds. This information included trends in revenues, expenses and profitability of Putnam Management and its affiliates relating to the investment management, investor servicing and distribution services provided to the funds. In this regard, the Trustees also reviewed an analysis of Putnam Management’s revenues, expenses and profitability, allocated on a fund-by-fund basis, with respect to the funds’ management, distribution, and investor servicing contracts. For each fund, the analysis presented information about revenues, expenses and profitability for each of the agreements separately and for the agreements taken together on a combined basis. The Trustees concluded that, at current asset levels, the fee schedules in place represented reasonable compensation for the services being provided and represented an appropriate sharing of such economies of scale as may exist in the management of the funds at that time.
The information examined by the Trustees as part of their annual contract review for the Putnam funds has included for many years information regarding fees charged by Putnam Management and its affiliates to institutional clients such as defined benefit pension plans, college endowments, and the like. This information included comparisons of those fees with fees charged to the funds, as well as an assessment of the differences in the services provided to these different types of clients. The Trustees observed that the differences in fee rates between institutional clients and mutual funds are by no means uniform when examined by individual asset sectors, suggesting that differences in the pricing of investment management services to these types of clients may reflect historical competitive forces operating in separate markets. The Trustees considered the fact that in many cases fee rates across different asset classes are higher on average for mutual funds than for institutional clients, as well as the differences between the services that Putnam Management provides to the Putnam funds and those that it provides to its institutional clients. The Trustees did not rely on these comparisons to any significant extent in concluding that the management fees paid by your fund are reasonable.
Investment performance
The quality of the investment process provided by Putnam Management represented a major factor in the Trustees’ evaluation of the quality of services provided by Putnam Management under your fund’s management contract. The Trustees were assisted in their review of the Putnam funds’ investment process and performance by the work of several investment oversight committees of the Trustees, which met on a regular basis with the funds’ portfolio teams and with the Chief Investment Officer and other members of Putnam Management’s Investment Division throughout the year. The Trustees concluded that Putnam Management generally provides a high-quality investment process — based on the experience and skills of the individuals assigned to the management of fund portfolios, the resources made available to them, and in general Putnam Management’s ability to attract and retain high-quality personnel — but also recognized that this does not guarantee favorable investment results for every fund in every time period. The Trustees considered the investment performance of each fund over multiple time periods and considered information comparing each fund’s performance with various benchmarks and with the performance of competitive funds.
19
The Committee noted the substantial improvement in the performance of most Putnam funds during the 2009–2010 period and Putnam Management’s ongoing efforts to strengthen its investment personnel and processes. The Committee also noted the disappointing investment performance of some funds for periods ended December 31, 2010 and considered information provided by Putnam Management regarding the factors contributing to the underperformance and actions being taken to improve the performance of these particular funds. The Trustees indicated their intention to continue to monitor performance trends to assess the effectiveness of these efforts and to evaluate whether additional actions to address areas of underperformance are warranted.
In the case of your fund, the Trustees considered that its class A share cumulative total return performance at net asset value was in the following quartiles of its Lipper Inc. peer group (Lipper High Current Yield Funds) for the one-year, three-year and five-year periods ended December 31, 2010 (the first quartile representing the best-performing funds and the fourth quartile the worst-performing funds):
| | | |
| One-year period | 3rd | | |
| | |
| Three-year period | 2nd | | |
| | |
| Five-year period | 1st | | |
| | |
Over the one-year, three-year and five-year periods ended December 31, 2010, there were 485, 424 and 361 funds, respectively, in your fund’s Lipper peer group. (When considering performance information, shareholders should be mindful that past performance is not a guarantee of future results.)
Brokerage and soft-dollar allocations; investor servicing
The Trustees considered various potential benefits that Putnam Management may receive in connection with the services it provides under the management contract with your fund. These include benefits related to brokerage allocation and the use of soft dollars, whereby a portion of the commissions paid by a fund for brokerage may be used to acquire research services that are expected to be useful to Putnam Management in managing the assets of the fund and of other clients. Subject to policies established by the Trustees, soft-dollar credits acquired through these means are used primarily to supplement Putnam Management’s internal research efforts. However, the Trustees noted that a portion of available soft-dollar credits continues to be allocated to the payment of fund expenses. The Trustees indicated their continued intent to monitor regulatory developments in this area with the assistance of their Brokerage Committee and also indicated their continued intent to monitor the potential benefits associated with fund brokerage and soft-dollar allocations and trends in industry practices to ensure that the principle of seeking best price and execution remains paramount in the portfolio trading process.
Putnam Management may also receive benefits from payments that the funds make to Putnam Management’s affiliates for investor or distribution services. In conjunction with the annual review of your fund’s management contract, the Trustees reviewed your fund’s investor servicing agreement with Putnam Investor Services, Inc. (“PSERV”) and its distributor’s contracts and distribution plans with Putnam Retail Management Limited Partnership (“PRM”), both of which are affiliates of Putnam Management. The Trustees concluded that the fees payable by the funds to PSERV and PRM, as applicable, for such services are reasonable in relation to the nature and quality of such services.
20
Financial statements
These sections of the report, as well as the accompanying Notes, preceded by the Report of Independent Registered Public Accounting Firm, constitute the fund’s financial statements.
The fund’s portfolio lists all the fund’s investments and their values as of the last day of the reporting period. Holdings are organized by asset type and industry sector, country, or state to show areas of concentration and diversification.
Statement of assets and liabilities shows how the fund’s net assets and share price are determined. All investment and non-investment assets are added together. Any unpaid expenses and other liabilities are subtracted from this total. The result is divided by the number of shares to determine the net asset value per share, which is calculated separately for each class of shares. (For funds with preferred shares, the amount subtracted from total assets includes the liquidation preference of preferred shares.)
Statement of operations shows the fund’s net investment gain or loss. This is done by first adding up all the fund’s earnings — from dividends and interest income — and subtracting its operating expenses to determine net investment income (or loss). Then, any net gain or loss the fund realized on the sales of its holdings — as well as any unrealized gains or losses over the period — is added to or subtracted from the net investment result to determine the fund’s net gain or loss for the fiscal year.
Statement of changes in net assets shows how the fund’s net assets were affected by the fund’s net investment gain or loss, by distributions to shareholders, and by changes in the number of the fund’s shares. It lists distributions and their sources (net investment income or realized capital gains) over the current reporting period and the most recent fiscal year-end. The distributions listed here may not match the sources listed in the Statement of operations because the distributions are determined on a tax basis and may be paid in a different period from the one in which they were earned.
Financial highlights provide an overview of the fund’s investment results, per-share distributions, expense ratios, net investment income ratios, and portfolio turnover in one summary table, reflecting the five most recent reporting periods. In a semiannual report, the highlights table also includes the current reporting period.
21
Report of Independent Registered Public Accounting Firm
The Board of Trustees and Shareholders
Putnam High Yield Advantage Fund:
We have audited the accompanying statement of assets and liabilities of Putnam High Yield Advantage Fund (the fund), including the fund’s portfolio, as of November 30, 2011, and the related statement of operations for the year then ended, the statements of changes in net assets for each of the years in the two-year period then ended, and the financial highlights for each of the years in the five-year period then ended. These financial statements and financial highlights are the responsibility of the fund’s management. Our responsibility is to express an opinion on these financial statements and financial highlights based on our audits.
We conducted our audits in accordance with the standards of the Public Company Accounting Oversight Board (United States). Those standards require that we plan and perform our audit to obtain reasonable assurance about whether the financial statements and financial highlights are free of material misstatement. An audit includes examining, on a test basis, evidence supporting the amounts and disclosures in the financial statements. Our procedures included confirmation of securities owned as of November 30, 2011 by correspondence with the custodian and brokers or by other appropriate auditing procedures. An audit also includes assessing the accounting principles used and significant estimates made by management, as well as evaluating the overall financial statement presentation. We believe that our audits provide a reasonable basis for our opinion.
In our opinion, the financial statements and financial highlights referred to above present fairly, in all material respects, the financial position of Putnam High Yield Advantage Fund as of November 30, 2011, the results of its operations for the year then ended, the changes in its net assets for each of the years in the two-year period then ended, and the financial highlights for each of the years in the five-year period then ended, in conformity with U.S. generally accepted accounting principles.
Boston, Massachusetts
January 9, 2012
22
The fund’s portfolio 11/30/11
| | | |
| CORPORATE BONDS AND NOTES (92.3%)* | | Principal amount | Value |
|
| Advertising and marketing services (0.4%) | | | |
| Affinion Group, Inc. company guaranty sr. unsec. notes | | | |
| 7 7/8s, 2018 | | $1,430,000 | $1,190,475 |
|
| Affinion Group, Inc. company guaranty sr. unsec. sub. notes | | | |
| 11 1/2s, 2015 | | 1,785,000 | 1,552,950 |
|
| Lamar Media Corp. company guaranty sr. sub. notes 7 7/8s, 2018 | | 775,000 | 800,188 |
|
| | | | 3,543,613 |
| Automotive (2.0%) | | | |
| Chrysler Group, LLC/CG Co-Issuer, Inc. 144A company guaranty | | | |
| sr. notes 8 1/4s, 2021 | | 2,020,000 | 1,711,950 |
|
| Ford Motor Credit Co., LLC sr. unsec. notes 8 1/8s, 2020 | | 3,055,000 | 3,604,900 |
|
| Ford Motor Credit Co., LLC sr. unsec. notes 5s, 2018 | | 1,810,000 | 1,779,655 |
|
| Ford Motor Credit Co., LLC sr. unsec. unsub. notes 5 7/8s, 2021 | | 2,230,000 | 2,274,600 |
|
| Ford Motor Credit Co., LLC sr. unsec. unsub. notes 5 3/4s, 2021 | | 615,000 | 627,222 |
|
| Navistar International Corp. sr. notes 8 1/4s, 2021 | | 2,919,000 | 3,035,750 |
|
| TRW Automotive, Inc. company guaranty sr. unsec. unsub. notes | | | |
| Ser. REGS, 6 3/8s, 2014 | EUR | 1,000,000 | 1,358,773 |
|
| TRW Automotive, Inc. 144A company guaranty sr. notes | | | |
| 7 1/4s, 2017 | | $1,080,000 | 1,128,600 |
|
| | | | 15,521,450 |
| Basic materials (7.2%) | | | |
| AbitibiBowater, Inc. 144A company guaranty sr. notes 10 1/4s, | | | |
| 2018 (Canada) | | 365,000 | 396,938 |
|
| Ardagh Glass Finance PLC sr. sec. unsub. notes Ser. REGS, | | | |
| 9 1/4s, 2016 (Ireland) | EUR | 760,000 | 1,030,663 |
|
| Associated Materials, LLC company guaranty sr. notes | | | |
| 9 1/8s, 2017 | | $1,915,000 | 1,620,559 |
|
| Atkore International, Inc. company guaranty sr. notes | | | |
| 9 7/8s, 2018 Δ | | 2,310,000 | 2,246,465 |
|
| Celanese US Holdings, LLC company guaranty sr. unsec. notes | | | |
| 6 5/8s, 2018 (Germany) | | 710,000 | 741,950 |
|
| Celanese US Holdings, LLC sr. notes 5 7/8s, 2021 (Germany) | | 1,895,000 | 1,928,163 |
|
| Cemex Finance, LLC 144A company guaranty sr. bonds | | | |
| 9 1/2s, 2016 | | 475,000 | 381,188 |
|
| Clondalkin Acquisition BV 144A company guaranty sr. notes FRN | | | |
| 2.347s, 2013 (Netherlands) | | 590,000 | 554,600 |
|
| Compass Minerals International, Inc. company guaranty sr. unsec. | | | |
| notes 8s, 2019 | | 1,515,000 | 1,598,325 |
|
| Dynacast International, LLC/Dynacast Finance, Inc. 144A notes | | | |
| 9 1/4s, 2019 | | 430,000 | 400,975 |
|
| Edgen Murray Corp. company guaranty sr. notes 12 1/4s, 2015 | | 630,000 | 559,125 |
|
| Exopack Holding Corp. 144A sr. notes 10s, 2018 | | 1,065,000 | 1,054,350 |
|
| Ferro Corp. sr. unsec. notes 7 7/8s, 2018 | | 2,265,000 | 2,259,338 |
|
| FMG Resources August 2006 Pty, Ltd. 144A company guaranty | | | |
| sr. unsec notes 6 3/8s, 2016 (Australia) | | 375,000 | 352,500 |
|
| FMG Resources August 2006 Pty, Ltd. 144A sr. notes 8 1/4s, | | | |
| 2019 (Australia) | | 1,330,000 | 1,293,425 |
|
| FMG Resources August 2006 Pty, Ltd. 144A sr. notes 7s, | | | |
| 2015 (Australia) | | 1,485,000 | 1,433,025 |
|
23
| | | |
| CORPORATE BONDS AND NOTES (92.3%)* cont. | | Principal amount | Value |
|
| Basic materials cont. | | | |
| FMG Resources August 2006 Pty, Ltd. 144A sr. notes 6 7/8s, | | | |
| 2018 (Australia) | | $2,020,000 | $1,848,192 |
|
| Hexion U.S. Finance Corp./Hexion Nova Scotia Finance, ULC | | | |
| company guaranty notes 9s, 2020 | | 745,000 | 584,825 |
|
| Hexion U.S. Finance Corp./Hexion Nova Scotia Finance, ULC | | | |
| company guaranty sr. notes 8 7/8s, 2018 | | 1,180,000 | 1,064,950 |
|
| Huntsman International, LLC company guaranty sr. unsec. sub. | | | |
| notes 8 5/8s, 2021 | | 1,165,000 | 1,182,475 |
|
| Huntsman International, LLC company guaranty sr. unsec. sub. | | | |
| notes 8 5/8s, 2020 | | 2,010,000 | 2,040,150 |
|
| INEOS Finance PLC sr. sec. notes company guaranty Ser. REGS, | | | |
| 9 1/4s, 2015 (United Kingdom) | EUR | 100,000 | 129,840 |
|
| INEOS Finance PLC 144A company guaranty sr. notes 9s, 2015 | | | |
| (United Kingdom) | | $1,310,000 | 1,300,175 |
|
| INEOS Group Holdings, Ltd. company guaranty sr. unsec. notes | | | |
| Ser. REGS, 7 7/8s, 2016 (United Kingdom) | EUR | 810,000 | 766,109 |
|
| Lyondell Chemical Co. company guaranty sr. sec. loans 8s, 2017 | | $606,000 | 657,510 |
|
| Lyondell Chemical Co. sr. notes 11s, 2018 | | 3,174,116 | 3,420,110 |
|
| LyondellBasell Industries NV 144A company guaranty sr. notes | | | |
| 6s, 2021 (Netherlands) | | 2,135,000 | 2,177,700 |
|
| Momentive Performance Materials, Inc. notes 9s, 2021 | | 2,510,000 | 1,788,375 |
|
| NewPage Corp. company guaranty sr. notes 11 3/8s, 2014 | | | |
| (In default) † | | 1,000,000 | 697,500 |
|
| Nexeo Solutions, LLC/Nexeo Solutions Finance Corp. 144A | | | |
| company guaranty sr. sub. notes 8 3/8s, 2018 | | 470,000 | 459,425 |
|
| Norbord, Inc. sr. unsub. plants equip. 7 1/4s, 2012 (Canada) | | 630,000 | 626,850 |
|
| Novelis, Inc. company guaranty sr. unsec. notes 8 3/4s, 2020 | | 2,610,000 | 2,753,550 |
|
| Novelis, Inc. company guaranty sr. unsec. notes 7 1/4s, 2015 | | 1,600,000 | 1,576,000 |
|
| Old All, Inc. company guaranty sr. unsec. notes 9s, 2014 | | | |
| (In default) † F | | 1,905,000 | 2 |
|
| PE Paper Escrow GmbH sr. notes Ser. REGS, 11 3/4s, 2014 | | | |
| (Austria) | EUR | 495,000 | 695,031 |
|
| Pregis Corp. company guaranty FRN 6.572s, 2013 | EUR | 190,000 | 247,023 |
|
| Pregis Corp. company guaranty notes FRN 6.572s, 2013 | EUR | 240,000 | 312,029 |
|
| Pregis Corp. company guaranty sr. sub. notes 12 3/8s, 2013 | | $945,000 | 878,850 |
|
| Rhodia SA 144A sr. notes 6 7/8s, 2020 (France) | | 635,000 | 709,613 |
|
| Sealed Air Corp. 144A sr. unsec. notes 8 3/8s, 2021 | | 360,000 | 384,300 |
|
| Smurfit Kappa Acquisition company guaranty sr. bonds 7 1/4s, | | | |
| 2017 (Ireland) | EUR | 150,000 | 205,101 |
|
| Smurfit Kappa Funding PLC sr. unsec. sub. notes 7 3/4s, 2015 | | | |
| (Ireland) | | $942,000 | 946,710 |
|
| Smurfit Kappa Treasury company guaranty sr. unsec. unsub. | | | |
| debs 7 1/2s, 2025 (Ireland) | | 380,000 | 347,700 |
|
| Solo Cup Co. company guaranty notes 10 1/2s, 2013 | | 410,000 | 414,100 |
|
| Solutia, Inc. company guaranty sr. unsec. notes 8 3/4s, 2017 | | 935,000 | 1,009,800 |
|
| Solutia, Inc. company guaranty sr. unsec. notes 7 7/8s, 2020 | | 2,470,000 | 2,636,725 |
|
| Steel Dynamics, Inc. company guaranty sr. unsec. unsub. notes | | | |
| 6 3/4s, 2015 | | 80,000 | 80,800 |
|
| Steel Dynamics, Inc. sr. unsec. unsub. notes 7 3/4s, 2016 | | 1,835,000 | 1,890,050 |
|
24
| | |
| CORPORATE BONDS AND NOTES (92.3%)* cont. | Principal amount | Value |
|
| Basic materials cont. | | |
| Thompson Creek Metals Co., Inc. 144A company guaranty | | |
| sr. notes 7 3/8s, 2018 (Canada) | $735,000 | $617,400 |
|
| TPC Group, LLC company guaranty sr. notes 8 1/4s, 2017 | 1,530,000 | 1,526,175 |
|
| Tube City IMS Corp. company guaranty sr. unsec. sub. notes | | |
| 9 3/4s, 2015 | 1,985,000 | 1,999,888 |
|
| Verso Paper Holdings, LLC/Verso Paper, Inc. company guaranty | | |
| sr. notes 8 3/4s, 2019 | 945,000 | 614,250 |
|
| Verso Paper Holdings, LLC/Verso Paper, Inc. sr. notes | | |
| 11 1/2s, 2014 | 537,000 | 547,740 |
|
| | | 56,988,612 |
| Broadcasting (2.5%) | | |
| Clear Channel Communications, Inc. company guaranty sr. notes | | |
| 9s, 2021 | 805,000 | 664,125 |
|
| Clear Channel Communications, Inc. company guaranty unsec. | | |
| unsub. notes 10 3/4s, 2016 | 1,345,000 | 847,350 |
|
| Clear Channel Communications, Inc. sr. unsec. notes 5 1/2s, 2014 | 705,000 | 475,875 |
|
| Clear Channel Worldwide Holdings, Inc. company guaranty | | |
| sr. unsec. unsub. notes 9 1/4s, 2017 | 275,000 | 288,063 |
|
| Clear Channel Worldwide Holdings, Inc. company guaranty | | |
| sr. unsec. unsub. notes Ser. B, 9 1/4s, 2017 | 2,370,000 | 2,494,425 |
|
| Cumulus Media, Inc. 144A sr. notes 7 3/4s, 2019 | 1,645,000 | 1,422,925 |
|
| DIRECTV Holdings, LLC/DIRECTV Financing Co., Inc. company | | |
| guaranty sr. unsec. notes 7 5/8s, 2016 | 840,000 | 895,650 |
|
| DISH DBS Corp. company guaranty 7 1/8s, 2016 | 760,000 | 780,900 |
|
| DISH DBS Corp. company guaranty sr. unsec. notes 7 7/8s, 2019 | 1,820,000 | 1,929,200 |
|
| DISH DBS Corp. company guaranty sr. unsec. notes 6 3/4s, 2021 | 1,350,000 | 1,316,250 |
|
| Entercom Radio, LLC 144A company guaranty sr. sub. notes | | |
| 10 1/2s, 2019 | 1,590,000 | 1,534,350 |
|
| Gray Television, Inc. company guaranty sr. notes 10 1/2s, 2015 | 1,740,000 | 1,618,200 |
|
| Nexstar Broadcasting, Inc./Mission Broadcasting, Inc. company | | |
| guaranty sr. notes 8 7/8s, 2017 | 1,350,000 | 1,363,500 |
|
| Univision Communications, Inc. 144A company guaranty sr. unsec. | | |
| notes 8 1/2s, 2021 | 1,385,000 | 1,142,625 |
|
| Univision Communications, Inc. 144A sr. notes 7 7/8s, 2020 | 435,000 | 411,075 |
|
| XM Satellite Radio, Inc. 144A company guaranty sr. unsec. notes | | |
| 13s, 2013 | 1,030,000 | 1,163,900 |
|
| XM Satellite Radio, Inc. 144A sr. unsec. notes 7 5/8s, 2018 | 1,580,000 | 1,627,400 |
|
| | | 19,975,813 |
| Building materials (1.7%) | | |
| Building Materials Corp. 144A company guaranty sr. notes | | |
| 7 1/2s, 2020 | 1,360,000 | 1,441,600 |
|
| Building Materials Corp. 144A sr. notes 7s, 2020 | 640,000 | 662,400 |
|
| Building Materials Corp. 144A sr. notes 6 7/8s, 2018 | 800,000 | 804,000 |
|
| Building Materials Corp. 144A sr. notes 6 3/4s, 2021 | 530,000 | 527,350 |
|
| Jeld-Wen Escrow Corp. 144A sr. notes 12 1/4s, 2017 | 1,530,000 | 1,591,200 |
|
| Masonite International Corp. 144A company guaranty sr. notes | | |
| 8 1/4s, 2021 (Canada) | 1,750,000 | 1,645,000 |
|
| Nortek, Inc. 144A company guaranty sr. notes 8 1/2s, 2021 | 780,000 | 641,550 |
|
| Nortek, Inc. 144A company guaranty sr. unsec. notes 10s, 2018 | 1,070,000 | 995,100 |
|
25
| | | |
| CORPORATE BONDS AND NOTES (92.3%)* cont. | Principal amount | Value |
|
| Building materials cont. | | | |
| Owens Corning company guaranty sr. unsec. notes 9s, 2019 | | $2,925,000 | $3,451,500 |
|
| Roofing Supply Group, LLC/Roofing Supply Finance, Inc. 144A | | | |
| sr. notes 8 5/8s, 2017 | | 2,065,000 | 2,039,188 |
|
| | | | 13,798,888 |
| Cable television (2.6%) | | | |
| AMC Networks, Inc. 144A company guaranty sr. unsec notes | | | |
| 7 3/4s, 2021 | | 140,000 | 148,050 |
|
| Atlantic Broadband Finance, LLC company guaranty 9 3/8s, 2014 | | 855,000 | 848,588 |
|
| Bresnan Broadband Holdings, LLC 144A company guaranty | | | |
| sr. unsec. unsub. notes 8s, 2018 | | 1,190,000 | 1,201,900 |
|
| Cablevision Systems Corp. sr. unsec. unsub. notes 8 5/8s, 2017 | | 2,665,000 | 2,784,925 |
|
| Cablevision Systems Corp. sr. unsec. unsub. notes 8s, 2020 | | 470,000 | 477,050 |
|
| CCH II, LLC/CCH II Capital company guaranty sr. unsec. notes | | | |
| 13 1/2s, 2016 | | 964,581 | 1,111,680 |
|
| CCO Holdings, LLC/CCO Holdings Capital Corp. company | | | |
| guaranty sr. unsec. notes 7 7/8s, 2018 | | 1,375,000 | 1,424,844 |
|
| CCO Holdings, LLC/CCO Holdings Capital Corp. company | | | |
| guaranty sr. unsec. notes 6 1/2s, 2021 | | 1,285,000 | 1,240,025 |
|
| CCO Holdings, LLC/CCO Holdings Capital Corp. company | | | |
| guaranty sr. unsec. unsub. notes 7 3/8s, 2020 | | 975,000 | 975,000 |
|
| CCO Holdings, LLC/CCO Holdings Capital Corp. company | | | |
| guaranty sr. unsub. notes 7s, 2019 | | 1,190,000 | 1,201,900 |
|
| Cequel Communications Holdings I, LLC/Cequel Capital Corp. | | | |
| 144A sr. notes 8 5/8s, 2017 | | 3,375,000 | 3,434,063 |
|
| CSC Holdings, LLC sr. unsec. unsub. notes 8 1/2s, 2014 | | 250,000 | 277,188 |
|
| CSC Holdings, LLC 144A sr. unsec. unsub. notes 6 3/4s, 2021 | | 950,000 | 954,750 |
|
| Kabel BW Erste Beteiligungs GmbH/Kabel Baden-Wurttemberg | | | |
| GmbH & Co. KG 144A company guaranty sr. notes 7 1/2s, 2019 | | | |
| (Germany) | | 735,000 | 735,000 |
|
| Mediacom Broadband, LLC/Mediacom Broadband Corp. | | | |
| sr. unsec. unsub. notes 8 1/2s, 2015 | | 115,000 | 117,875 |
|
| Mediacom, LLC/Mediacom Capital Corp. sr. unsec. notes | | | |
| 9 1/8s, 2019 | | 775,000 | 807,938 |
|
| Quebecor Media, Inc. 144A sr. unsec. notes 7 3/8s, 2021 | | | |
| (Canada) | CAD | 995,000 | 958,500 |
|
| Videotron Ltee sr. notes 6 7/8s, 2021 (Canada) | CAD | 940,000 | 909,075 |
|
| Virgin Media Finance PLC company guaranty sr. notes Ser. 1, | | | |
| 9 1/2s, 2016 (United Kingdom) | | $980,000 | 1,073,100 |
|
| | | | 20,681,451 |
| Capital goods (6.3%) | | | |
| Allison Transmission 144A company guaranty 11s, 2015 | | 385,000 | 404,250 |
|
| Altra Holdings, Inc. company guaranty sr. notes 8 1/8s, 2016 | | 2,420,000 | 2,510,750 |
|
| American Axle & Manufacturing, Inc. company guaranty sr. unsec. | | | |
| notes 7 3/4s, 2019 | | 680,000 | 651,100 |
|
| American Axle & Manufacturing, Inc. company guaranty sr. unsec. | | | |
| notes 5 1/4s, 2014 | | 755,000 | 732,350 |
|
| American Axle & Manufacturing, Inc. company guaranty sr. unsec. | | | |
| unsub. notes 7 7/8s, 2017 | | 95,000 | 91,675 |
|
| American Axle & Manufacturing, Inc. 144A company guaranty | | | |
| sr. notes 9 1/4s, 2017 | | 1,635,000 | 1,724,925 |
|
| ARD Finance SA 144A sr. notes 11 1/8s, 2018 (Luxembourg) ‡‡ | | 420,000 | 369,600 |
|
26
| | | |
| CORPORATE BONDS AND NOTES (92.3%)* cont. | | Principal amount | Value |
|
| Capital goods cont. | | | |
| Ardagh Packaging Finance PLC sr. notes Ser. REGS, 7 3/8s, | | | |
| 2017 (Ireland) | EUR | 130,000 | $168,251 |
|
| Ardagh Packaging Finance PLC 144A company | | | |
| guaranty sr. notes 7 3/8s, 2017 (Ireland) | EUR | 480,000 | 621,233 |
|
| BE Aerospace, Inc. sr. unsec. unsub. notes 6 7/8s, 2020 | | $410,000 | 436,650 |
|
| Berry Plastics Corp. company guaranty notes FRN 4.222s, 2014 | | 645,000 | 593,400 |
|
| Berry Plastics Corp. company guaranty sr. notes 9 1/2s, 2018 | | 1,460,000 | 1,396,125 |
|
| Berry Plastics Corp. notes 9 3/4s, 2021 | | 1,115,000 | 1,064,825 |
|
| Berry Plastics Holding Corp. company guaranty sr. unsec. sub. | | | |
| notes 10 1/4s, 2016 | | 630,000 | 579,600 |
|
| Briggs & Stratton Corp. company guaranty sr. unsec. notes | | | |
| 6 7/8s, 2020 | | 1,910,000 | 1,929,100 |
|
| Crown Americas, LLC/Crown Americas Capital Corp. III | | | |
| company guaranty sr. unsec. notes 6 1/4s, 2021 | | 310,000 | 321,625 |
|
| Crown Euro Holdings SA 144A sr. notes 7 1/8s, 2018 (France) | EUR | 370,000 | 494,095 |
|
| Exide Technologies sr. notes 8 5/8s, 2018 | | $2,620,000 | 2,096,000 |
|
| JM Huber Corp. 144A sr. unsec. notes 9 7/8s, 2019 | | 1,775,000 | 1,797,188 |
|
| Kratos Defense & Security Solutions, Inc. company guaranty | | | |
| sr. notes 10s, 2017 | | 2,809,000 | 2,830,068 |
|
| Kratos Defense & Security Solutions, Inc. 144A company guaranty | | | |
| sr. notes 10s, 2017 | | 130,000 | 130,975 |
|
| Legrand SA unsec. unsub. debs. 8 1/2s, 2025 (France) | | 3,065,000 | 3,750,518 |
|
| Meritor, Inc. company guaranty sr. unsec. notes 8 1/8s, 2015 | | 500,000 | 442,500 |
|
| Mueller Water Products, Inc. company guaranty sr. unsec. unsub. | | | |
| notes 8 3/4s, 2020 | | 200,000 | 212,250 |
|
| Pittsburgh Glass Works, LLC 144A sr. notes 8 1/2s, 2016 | | 3,845,000 | 3,720,038 |
|
| Polypore International, Inc. company guaranty sr. unsec. notes | | | |
| 7 1/2s, 2017 | | 990,000 | 1,014,750 |
|
| Reynolds Group DL Escrew, Inc./Reynolds Group Escrew, LLC | | | |
| 144A company guaranty sr. notes 8 3/4s, 2016 | | 780,000 | 805,350 |
|
| Reynolds Group Issuer, Inc. 144A company guaranty sr. notes | | | |
| 7 1/8s, 2019 | | 1,135,000 | 1,109,463 |
|
| Reynolds Group Issuer, Inc. 144A company guaranty sr. unsec. | | | |
| notes 9s, 2019 | | 635,000 | 571,500 |
|
| Reynolds Group Issuer, Inc. 144A sr. notes 6 7/8s, 2021 | | | |
| (New Zealand) | | 305,000 | 291,275 |
|
| Reynolds Group Issuer, Inc. 144A sr. unsec. notes 8 1/4s, 2021 | | | |
| (New Zealand) | | 440,000 | 374,000 |
|
| Reynolds Group Issuer, Inc./Reynolds Group Issuer, LLC/Reynolds | | | |
| Group Issuer Lu 144A sr. notes 7 7/8s, 2019 | | 985,000 | 989,925 |
|
| Reynolds Group Issuer, Inc./Reynolds Group Issuer, LLC/Reynolds | | | |
| Group Issuer Lu 144A sr. unsec. notes 9 7/8s, 2019 | | 940,000 | 860,100 |
|
| Ryerson Holding Corp. sr. disc. notes zero %, 2015 | | 600,000 | 267,000 |
|
| Ryerson, Inc. company guaranty sr. notes 12s, 2015 | | 3,185,000 | 3,192,963 |
|
| Tenneco, Inc. company guaranty sr. unsec. unsub. notes | | | |
| 7 3/4s, 2018 | | 625,000 | 634,375 |
|
| Tenneco, Inc. company guaranty sr. unsub. notes 6 7/8s, 2020 | | 1,240,000 | 1,246,200 |
|
| Terex Corp. company guaranty sr. unsec. notes 10 7/8s, 2016 | | 775,000 | 860,250 |
|
| Terex Corp. sr. unsec. sub. notes 8s, 2017 | | 2,834,000 | 2,756,065 |
|
27
| | | |
| CORPORATE BONDS AND NOTES (92.3%)* cont. | | Principal amount | Value |
|
| Capital goods cont. | | | |
| Thermadyne Holdings Corp. company guaranty sr. notes 9s, 2017 | | $2,240,000 | $2,240,000 |
|
| Thermon Industries, Inc. company guaranty sr. notes 9 1/2s, 2017 | | 1,879,000 | 1,991,740 |
|
| TransDigm, Inc. company guaranty unsec. sub. notes 7 3/4s, 2018 | | 1,900,000 | 1,957,000 |
|
| | | | 50,231,047 |
| Coal (2.4%) | | | |
| Alpha Natural Resources, Inc. company guaranty sr. unsec. notes | | | |
| 6 1/4s, 2021 | | 1,045,000 | 992,750 |
|
| Alpha Natural Resources, Inc. company guaranty sr. unsec. notes | | | |
| 6s, 2019 | | 1,370,000 | 1,308,350 |
|
| Arch Coal, Inc. company guaranty sr. unsec. notes 7 1/4s, 2020 | | 1,370,000 | 1,342,600 |
|
| Arch Coal, Inc. 144A company guaranty sr. unsec. notes 7s, 2019 | | 1,420,000 | 1,384,500 |
|
| Arch Western Finance, LLC company guaranty sr. notes | | | |
| 6 3/4s, 2013 | | 606,000 | 606,000 |
|
| CONSOL Energy, Inc. company guaranty sr. unsec. notes | | | |
| 8 1/4s, 2020 | | 4,055,000 | 4,359,125 |
|
| CONSOL Energy, Inc. company guaranty sr. unsec. notes 8s, 2017 | | 1,835,000 | 1,954,275 |
|
| CONSOL Energy, Inc. 144A company guaranty sr. unsec. notes | | | |
| 6 3/8s, 2021 | | 230,000 | 226,550 |
|
| James River Coal Co. company guaranty sr. unsec. unsub. notes | | | |
| 7 7/8s, 2019 | | 575,000 | 437,000 |
|
| Peabody Energy Corp. company guaranty 7 3/8s, 2016 | | 2,635,000 | 2,852,388 |
|
| Peabody Energy Corp. company guaranty sr. unsec. unsub. notes | | | |
| 6 1/2s, 2020 | | 150,000 | 151,500 |
|
| Peabody Energy Corp. 144A sr. unsec. notes 6s, 2018 | | 3,445,000 | 3,440,694 |
|
| | | | 19,055,732 |
| Commercial and consumer services (1.6%) | | | |
| ARAMARK Holdings Corp. 144A sr. unsec. notes 8 5/8s, 2016 ‡‡ | | 605,000 | 614,075 |
|
| Brickman Group Holdings, Inc. 144A sr. notes 9 1/8s, 2018 | | 600,000 | 528,000 |
|
| Compucom Systems, Inc. 144A sr. sub. notes 12 1/2s, 2015 | | 570,000 | 581,400 |
|
| Interactive Data Corp. company guaranty sr. unsec. notes | | | |
| 10 1/4s, 2018 | | 3,685,000 | 3,942,950 |
|
| Lender Processing Services, Inc. company guaranty sr. unsec. | | | |
| unsub. notes 8 1/8s, 2016 | | 2,258,000 | 2,201,550 |
|
| PHH Corp. sr. unsec. unsub. notes 9 1/4s, 2016 | | 805,000 | 829,150 |
|
| Sabre Holdings Corp. sr. unsec. unsub. notes 8.35s, 2016 | | 2,430,000 | 1,895,400 |
|
| Travelport, LLC company guaranty 11 7/8s, 2016 | | 840,000 | 273,000 |
|
| Travelport, LLC company guaranty 9 7/8s, 2014 | | 780,000 | 471,900 |
|
| Travelport, LLC/Travelport, Inc. company guaranty sr. unsec. | | | |
| notes 9s, 2016 | | 2,230,000 | 1,273,888 |
|
| | | | 12,611,313 |
| Consumer (1.2%) | | | |
| Jarden Corp. company guaranty sr. unsec. notes 8s, 2016 | | 605,000 | 653,400 |
|
| Jarden Corp. company guaranty sr. unsec. sub. notes 7 1/2s, 2017 | | 2,905,000 | 3,079,300 |
|
| Jarden Corp. company guaranty sr. unsec. sub. notes Ser. 1, | | | |
| 7 1/2s, 2020 | EUR | 250,000 | 326,834 |
|
| Scotts Miracle-Gro Co. (The) 144A sr. notes 6 5/8s, 2020 | | $1,240,000 | 1,252,400 |
|
| Yankee Candle Co. company guaranty sr. notes Ser. B, | | | |
| 8 1/2s, 2015 | | 2,545,000 | 2,538,638 |
|
| YCC Holdings, LLC/Yankee Finance, Inc. sr. unsec. notes | | | |
| 10 1/4s, 2016 ‡‡ | | 1,590,000 | 1,391,250 |
|
| | | | 9,241,822 |
28
| | | |
| CORPORATE BONDS AND NOTES (92.3%)* cont. | | Principal amount | Value |
|
| Consumer staples (8.0%) | | | |
| ACCO Brands Corp. company guaranty sr. notes 10 5/8s, 2015 | | $1,120,000 | $1,240,400 |
|
| AE Escrow Corp. 144A sr. unsec. notes 9 3/4s, 2020 | | 470,000 | 470,000 |
|
| Archibald Candy Corp. company guaranty sub. notes 10s, 2012 | | | |
| (In default) † F | | 415,457 | 13,295 |
|
| Avis Budget Car Rental, LLC company guaranty sr. unsec. unsub. | | | |
| notes 9 5/8s, 2018 | | 1,530,000 | 1,541,475 |
|
| Avis Budget Car Rental, LLC company guaranty sr. unsec. unsub. | | | |
| notes 7 3/4s, 2016 | | 1,475,000 | 1,467,625 |
|
| Burger King Corp. company guaranty sr. unsec. notes 9 7/8s, 2018 | | 550,000 | 600,188 |
|
| Central Garden & Pet Co. company guaranty sr. sub. notes | | | |
| 8 1/4s, 2018 | | 837,000 | 811,890 |
|
| CKE Holdings, Inc. 144A sr. notes 10 1/2s, 2016 ‡‡ | | 850,532 | 790,995 |
|
| Claire’s Stores, Inc. company guaranty sr. notes 8 7/8s, 2019 | | 1,040,000 | 759,200 |
|
| Claire’s Stores, Inc. 144A company guaranty sr. unsec. notes | | | |
| 9 5/8s, 2015 | | 74,494 | 55,312 |
|
| Constellation Brands, Inc. company guaranty sr. unsec. unsub. | | | |
| notes 7 1/4s, 2016 | | 1,935,000 | 2,118,825 |
|
| Corrections Corporation of America company guaranty sr. notes | | | |
| 7 3/4s, 2017 | | 2,270,000 | 2,457,275 |
|
| Dave & Buster’s, Inc. company guaranty sr. unsec. unsub. notes | | | |
| 11s, 2018 | | 1,730,000 | 1,773,250 |
|
| Dean Foods Co. company guaranty sr. unsec. unsub. notes | | | |
| 9 3/4s, 2018 | | 365,000 | 383,250 |
|
| Dean Foods Co. company guaranty sr. unsec. unsub. notes | | | |
| 7s, 2016 | | 1,830,000 | 1,775,100 |
|
| DineEquity, Inc. company guaranty sr. unsec. notes 9 1/2s, 2018 | | 3,436,000 | 3,556,260 |
|
| Dole Food Co. sr. notes 13 7/8s, 2014 | | 441,000 | 510,458 |
|
| Dole Food Co. 144A sr. notes 8s, 2016 | | 841,000 | 866,230 |
|
| Elizabeth Arden, Inc. sr. unsec. unsub. notes 7 3/8s, 2021 | | 1,415,000 | 1,475,138 |
|
| Hertz Corp. company guaranty sr. unsec. notes 7 1/2s, 2018 | | 570,000 | 571,425 |
|
| Hertz Holdings Netherlands BV 144A sr. bonds 8 1/2s, 2015 | | | |
| (Netherlands) | EUR | 1,450,000 | 1,961,799 |
|
| JBS USA LLC/JBS USA Finance, Inc. 144A sr. unsec. notes | | | |
| 7 1/4s, 2021 | | $3,590,000 | 3,266,900 |
|
| JBS USA, LLC/JBS USA Finance, Inc. company guaranty sr. unsec. | | | |
| notes 11 5/8s, 2014 | | 585,000 | 650,813 |
|
| Landry’s Acquisition Co. 144A company guaranty notes | | | |
| 11 5/8s, 2015 | | 420,000 | 430,500 |
|
| Landry’s Restaurants, Inc. company guaranty sr. notes | | | |
| 11 5/8s, 2015 | | 515,000 | 536,888 |
|
| Landry’s Restaurants, Inc. 144A company guaranty sr. notes | | | |
| 11 5/8s, 2015 | | 625,000 | 651,563 |
|
| Libbey Glass, Inc. sr. notes 10s, 2015 | | 832,000 | 886,080 |
|
| Michael Foods, Inc. company guaranty sr. unsec notes 9 3/4s, 2018 | | 715,000 | 736,450 |
|
| Pinnacle Foods Finance, LLC/Pinnacle Foods Finance Corp. | | | |
| company guaranty sr. unsec. notes 9 1/4s, 2015 | | 1,285,000 | 1,313,913 |
|
| Prestige Brands, Inc. company guaranty sr. unsec. notes | | | |
| 8 1/4s, 2018 | | 1,840,000 | 1,867,600 |
|
| Reddy Ice Corp. company guaranty sr. notes 11 1/4s, 2015 | | 1,700,000 | 1,564,000 |
|
29
| | |
| CORPORATE BONDS AND NOTES (92.3%)* cont. | Principal amount | Value |
|
| Consumer staples cont. | | |
| Revlon Consumer Products Corp. company guaranty notes | | |
| 9 3/4s, 2015 | $1,400,000 | $1,491,000 |
|
| Rite Aid Corp. company guaranty sr. notes 10 1/4s, 2019 | 515,000 | 556,200 |
|
| Rite Aid Corp. company guaranty sr. notes 7 1/2s, 2017 | 1,340,000 | 1,313,200 |
|
| Rite Aid Corp. company guaranty sr. unsec. unsub. notes | | |
| 9 1/2s, 2017 | 2,370,000 | 2,073,750 |
|
| Rite Aid Corp. company guaranty sr. unsub. notes 8s, 2020 | 445,000 | 480,600 |
|
| Roadhouse Financing, Inc. notes 10 3/4s, 2017 | 455,000 | 450,450 |
|
| Service Corporation International sr. notes 7s, 2019 | 660,000 | 684,750 |
|
| Service Corporation International sr. notes 7s, 2017 | 205,000 | 219,350 |
|
| Service Corporation International sr. unsec. unsub. notes | | |
| 6 3/4s, 2016 | 2,005,000 | 2,130,313 |
|
| Smithfield Foods, Inc. company guaranty sr. notes 10s, 2014 | 2,325,000 | 2,662,125 |
|
| Spectrum Brands, Inc. sr. notes 9 1/2s, 2018 | 1,415,000 | 1,538,813 |
|
| Spectrum Brands, Inc. sr. unsec. sub. bonds 12s, 2019 | 2,056,466 | 2,228,695 |
|
| Spectrum Brands, Inc. 144A company guaranty notes 9 1/2s, 2018 | 690,000 | 750,375 |
|
| Stewart Enterprises, Inc. company guaranty sr. unsec. notes | | |
| 6 1/2s, 2019 | 1,125,000 | 1,094,063 |
|
| Tyson Foods, Inc. sr. unsec. unsub. notes 10 1/2s, 2014 | 1,510,000 | 1,740,275 |
|
| United Rentals North America, Inc. company guaranty sr. unsec. | | |
| sub. notes 8 3/8s, 2020 | 620,000 | 604,500 |
|
| United Rentals North America, Inc. company guaranty sr. unsec. | | |
| unsub. notes 9 1/4s, 2019 | 1,130,000 | 1,220,400 |
|
| Wendy’s Co. (The) company guaranty sr. unsec. unsub. notes | | |
| 10s, 2016 | 2,480,000 | 2,715,600 |
|
| West Corp. company guaranty sr. unsec. notes 8 5/8s, 2018 | 1,000,000 | 997,500 |
|
| West Corp. company guaranty sr. unsec. notes 7 7/8s, 2019 | 1,240,000 | 1,240,000 |
|
| | | 63,296,056 |
| Energy (oil field) (1.4%) | | |
| Complete Production Services, Inc. company guaranty 8s, 2016 | 1,255,000 | 1,305,200 |
|
| Frac Tech Services, LLC/Frac Tech Finance, Inc. 144A company | | |
| guaranty sr. notes 7 5/8s, 2018 | 1,550,000 | 1,561,625 |
|
| Helix Energy Solutions Group, Inc. 144A sr. unsec. notes | | |
| 9 1/2s, 2016 | 3,795,000 | 3,946,800 |
|
| Key Energy Services, Inc. company guaranty unsec. unsub. notes | | |
| 6 3/4s, 2021 | 1,020,000 | 1,007,250 |
|
| Offshore Group Investments, Ltd. company guaranty sr. notes | | |
| 11 1/2s, 2015 (Cayman Islands) | 2,285,000 | 2,450,663 |
|
| SESI, LLC 144A sr. unsec. notes 7 1/8s, 2021 | 760,000 | 773,300 |
|
| Trinidad Drilling, Ltd. 144A sr. unsec. notes 7 7/8s, 2019 (Canada) | 325,000 | 331,500 |
|
| | | 11,376,338 |
| Entertainment (0.7%) | | |
| AMC Entertainment, Inc. company guaranty sr. sub. notes | | |
| 9 3/4s, 2020 | 2,110,000 | 1,920,100 |
|
| Cedar Fair LP/Canada’s Wonderland Co./Magnum | | |
| Management Corp. company guaranty sr. unsec. notes | | |
| 9 1/8s, 2018 | 255,000 | 277,313 |
|
| Cinemark USA, Inc. company guaranty sr. unsec. notes | | |
| 8 5/8s, 2019 | 655,000 | 704,125 |
|
30
| | |
| CORPORATE BONDS AND NOTES (92.3%)* cont. | Principal amount | Value |
|
| Entertainment cont. | | |
| Cinemark USA, Inc. company guaranty sr. unsec. sub. notes | | |
| 7 3/8s, 2021 | $310,000 | $309,225 |
|
| Regal Entertainment Group company guaranty sr. unsec. notes | | |
| 9 1/8s, 2018 | 2,090,000 | 2,184,050 |
|
| | | 5,394,813 |
| Financials (9.0%) | | |
| ABN Amro North American Holding Preferred Capital Repackage | | |
| Trust I 144A jr. sub. bonds FRB 6.523s, perpetual maturity | 2,605,000 | 1,914,675 |
|
| ACE Cash Express, Inc. 144A sr. notes 11s, 2019 | 1,745,000 | 1,587,950 |
|
| Ally Financial, Inc. company guaranty sr. notes 6 1/4s, 2017 | 1,235,000 | 1,134,824 |
|
| Ally Financial, Inc. company guaranty sr. unsec. unsub. notes | | |
| 8.3s, 2015 | 2,825,000 | 2,860,313 |
|
| Ally Financial, Inc. company guaranty sr. unsec. unsub. notes | | |
| 8s, 2020 | 795,000 | 784,069 |
|
| Ally Financial, Inc. company guaranty sr. unsec. unsub. notes | | |
| 7 1/2s, 2020 | 2,620,000 | 2,531,575 |
|
| Ally Financial, Inc. company guaranty sr. unsec. unsub. notes FRN | | |
| 2.526s, 2014 | 821,000 | 714,652 |
|
| Ally Financial, Inc. unsec. sub. notes 8s, 2018 | 905,000 | 839,388 |
|
| American International Group, Inc. jr. sub. bonds FRB | | |
| 8.175s, 2058 | 1,900,000 | 1,676,750 |
|
| BAC Capital Trust VI bank guaranty jr. unsec. sub. notes | | |
| 5 5/8s, 2035 | 1,130,000 | 914,138 |
|
| BankAmerica Capital II bank guaranty jr. unsec. sub. notes 8s, 2026 | 425,000 | 395,250 |
|
| Capital One Capital IV company guaranty jr. unsec. sub. notes | | |
| FRN 6.745s, 2037 | 1,365,000 | 1,346,231 |
|
| CB Richard Ellis Services, Inc. company guaranty sr. unsec. notes | | |
| 6 5/8s, 2020 | 885,000 | 891,638 |
|
| CB Richard Ellis Services, Inc. company guaranty sr. unsec. sub. | | |
| notes 11 5/8s, 2017 | 1,040,000 | 1,188,200 |
|
| CIT Group, Inc. sr. bonds 7s, 2017 | 172 | 170 |
|
| CIT Group, Inc. sr. bonds 7s, 2016 | 978 | 968 |
|
| CIT Group, Inc. 144A bonds 7s, 2017 | 6,354,000 | 6,258,690 |
|
| CIT Group, Inc. 144A bonds 7s, 2016 | 2,392,000 | 2,362,100 |
|
| CIT Group, Inc. 144A company guaranty notes 6 5/8s, 2018 | 1,290,000 | 1,306,125 |
|
| CNO Financial Group, Inc. 144A company guaranty sr. notes | | |
| 9s, 2018 | 1,015,000 | 1,065,750 |
|
| Community Choice Financial, Inc. 144A sr. notes 10 3/4s, 2019 | 1,675,000 | 1,645,688 |
|
| Dresdner Funding Trust I 144A bonds 8.151s, 2031 | 2,075,000 | 1,328,000 |
|
| E*Trade Financial Corp. sr. notes 6 3/4s, 2016 | 1,040,000 | 1,014,000 |
|
| E*Trade Financial Corp. sr. unsec. unsub. notes 12 1/2s, 2017 | 1,365,000 | 1,542,450 |
|
| HBOS Capital Funding LP 144A bank guaranty jr. unsec. sub. | | |
| FRB 6.071s, perpetual maturity (Jersey) | 2,085,000 | 1,271,850 |
|
| HBOS PLC 144A sr. unsec. sub. notes 6 3/4s, 2018 | | |
| (United Kingdom) | 1,650,000 | 1,317,515 |
|
| HBOS PLC 144A unsec. sub. bonds 6s, 2033 (United Kingdom) | 650,000 | 404,083 |
|
| HUB International Holdings, Inc. 144A sr. sub. notes 10 1/4s, 2015 | 555,000 | 536,963 |
|
| Icahn Enterprises LP/Icahn Enterprises Finance Corp. company | | |
| guaranty sr. unsec. notes 8s, 2018 | 3,215,000 | 3,279,300 |
|
31
| | |
| CORPORATE BONDS AND NOTES (92.3%)* cont. | Principal amount | Value |
|
| Financials cont. | | |
| ING Groep NV jr. unsec. sub. notes 5.775s, 2015 perpetual | | |
| maturity (Netherlands) | $545,000 | $365,150 |
|
| International Lease Finance Corp. sr. unsec. notes 6 1/4s, 2019 | 155,000 | 138,725 |
|
| Leucadia National Corp. sr. unsec. notes 8 1/8s, 2015 | 200,000 | 211,000 |
|
| Leucadia National Corp. sr. unsec. notes 7 1/8s, 2017 | 1,362,000 | 1,375,620 |
|
| Liberty Mutual Group, Inc. 144A company guaranty jr. sub. notes | | |
| FRB 10 3/4s, 2058 | 300,000 | 361,500 |
|
| Liberty Mutual Group, Inc. 144A company guaranty jr. unsec. sub. | | |
| bonds 7.8s, 2037 | 670,000 | 579,550 |
|
| Liberty Mutual Group, Inc. 144A company guaranty jr. unsec. sub. | | |
| notes FRN 7s, 2037 | 195,000 | 161,850 |
|
| MPT Operating Partnership LP/MPT Finance Corp. company | | |
| guaranty sr. unsec notes 6 7/8s, 2021 R | 640,000 | 633,600 |
|
| National Money Mart Co. company guaranty sr. unsec. unsub. | | |
| notes 10 3/8s, 2016 (Canada) | 1,825,000 | 1,939,063 |
|
| NB Capital Trust IV jr. unsec. sub. notes 8 1/4s, 2027 | 400,000 | 372,000 |
|
| Nuveen Investments, Inc. company guaranty sr. unsec. unsub. | | |
| notes 10 1/2s, 2015 | 1,620,000 | 1,547,100 |
|
| Omega Healthcare Investors, Inc. company guaranty sr. unsec. | | |
| notes 6 3/4s, 2022 R | 1,645,000 | 1,620,325 |
|
| Provident Funding Associates LP/PFG Finance Corp. 144A | | |
| sr. notes 10 1/4s, 2017 | 1,920,000 | 1,824,000 |
|
| Provident Funding Associates LP/PFG Finance Corp. 144A | | |
| sr. notes 10 1/8s, 2019 | 790,000 | 639,900 |
|
| Regions Financing Trust II company guaranty jr. unsec. sub. bonds | | |
| FRB 6 5/8s, 2047 | 2,800,000 | 2,240,000 |
|
| Residential Capital LLC company guaranty jr. notes 9 5/8s, 2015 | 2,870,000 | 1,729,175 |
|
| Royal Bank of Scotland Group PLC jr. unsec. sub. bonds FRB | | |
| 7.648s, perpetual maturity (United Kingdom) | 3,450,000 | 2,371,875 |
|
| SLM Corp. sr. notes Ser. MTN, 8s, 2020 | 885,000 | 865,088 |
|
| SLM Corp. sr. unsec. unsub. notes Ser. MTN, 8.45s, 2018 | 3,885,000 | 3,873,275 |
|
| Springleaf Finance Corp. sr. unsec. notes Ser. MTN, 6.9s, 2017 | 4,655,000 | 3,130,488 |
|
| Springleaf Finance Corp. sr. unsec. notes Ser. MTNI, 5.85s, 2013 | 885,000 | 750,038 |
|
| Springleaf Finance Corp. sr. unsec. notes Ser. MTNI, | | |
| 4 7/8s, 2012 | 815,000 | 770,680 |
|
| USI Holdings Corp. 144A company guaranty sr. unsec. notes FRN | | |
| 4.332s, 2014 | 330,000 | 298,650 |
|
| Ventas Realty LP/Capital Corp. company guaranty 9s, 2012 R | 1,305,000 | 1,336,218 |
|
| Ventas Realty LP/Capital Corp. sr. notes 6 3/4s, 2017 R | 125,000 | 129,853 |
|
| | | 71,378,028 |
| Gaming and lottery (3.2%) | | |
| American Casino & Entertainment Properties LLC sr. notes | | |
| 11s, 2014 | 1,949,000 | 1,949,000 |
|
| Caesars Entertainment Operating Co., Inc. company guaranty | | |
| sr. notes 10s, 2018 | 4,682,000 | 2,996,480 |
|
| Caesars Entertainment Operating Co., Inc. company guaranty | | |
| sr. notes 10s, 2015 | 435,000 | 387,150 |
|
| Caesars Entertainment Operating Co., Inc. sr. notes 11 1/4s, 2017 | 4,865,000 | 5,059,600 |
|
| Isle of Capri Casinos, Inc. company guaranty 7s, 2014 | 2,639,000 | 2,441,075 |
|
32
| | | |
| CORPORATE BONDS AND NOTES (92.3%)* cont. | Principal amount | Value |
|
| Gaming and lottery cont. | | | |
| Isle of Capri Casinos, Inc. company guaranty sr. unsec. unsub. | | | |
| notes 7 3/4s, 2019 | | $1,145,000 | $1,053,400 |
|
| Mashantucket Western Pequot Tribe 144A bonds Ser. A, 8 1/2s, | | | |
| 2015 (In default) † | | 1,995,000 | 89,775 |
|
| MTR Gaming Group, Inc. 144A notes 11 1/2s, 2019 | | 3,840,000 | 3,196,800 |
|
| Penn National Gaming, Inc. sr. unsec. sub. notes 8 3/4s, 2019 | | 385,000 | 413,875 |
|
| Pinnacle Entertainment, Inc. company guaranty sr. unsec. notes | | | |
| 8 5/8s, 2017 | | 410,000 | 430,500 |
|
| Pinnacle Entertainment, Inc. company guaranty sr. unsec. sub. | | | |
| notes 7 1/2s, 2015 | | 1,550,000 | 1,503,500 |
|
| ROC Finance, LLC/ROC Finance 1 Corp. 144A notes 12 1/8s, 2018 | | 1,420,000 | 1,491,000 |
|
| Wynn Las Vegas, LLC/Wynn Las Vegas Capital Corp. company | | | |
| guaranty 1st mtge. notes 7 3/4s, 2020 | | 885,000 | 953,588 |
|
| Yonkers Racing Corp. 144A sr. notes 11 3/8s, 2016 | | 3,086,000 | 3,124,575 |
|
| | | | 25,090,318 |
| Health care (6.4%) | | | |
| Aviv Healthcare Properties LP company guaranty sr. unsec. notes | | | |
| 7 3/4s, 2019 | | 1,200,000 | 1,134,000 |
|
| Biomet, Inc. company guaranty sr. unsec. notes 10s, 2017 | | 2,205,000 | 2,375,888 |
|
| Biomet, Inc. company guaranty sr. unsec. sub. notes 11 5/8s, 2017 | | 200,000 | 214,000 |
|
| Capella Healthcare, Inc. company guaranty sr. unsec. notes | | | |
| 9 1/4s, 2017 | | 1,785,000 | 1,764,919 |
|
| Capsugel FinanceCo SCA 144A company guaranty sr. unsec. | | | |
| notes 9 7/8s, 2019 | | 1,690,000 | 2,281,584 |
|
| CHS/Community Health Systems, Inc. 144A company guaranty | | | |
| sr. unsec. notes 8s, 2019 | | 600,000 | 582,000 |
|
| ConvaTec Healthcare E SA 144A sr. notes 7 3/8s, 2017 | | | |
| (Luxembourg) | EUR | 610,000 | 778,075 |
|
| ConvaTec Healthcare E SA 144A sr. unsec. notes 10 1/2s, 2018 | | | |
| (Luxembourg) | | $3,110,000 | 2,806,775 |
|
| DaVita, Inc. company guaranty sr. unsec. notes 6 5/8s, 2020 | | 415,000 | 407,738 |
|
| DaVita, Inc. company guaranty sr. unsec. notes 6 3/8s, 2018 | | 1,240,000 | 1,218,300 |
|
| Elan Finance PLC/Elan Finance Corp. company guaranty sr. unsec. | | | |
| notes 8 3/4s, 2016 (Ireland) | | 2,070,000 | 2,204,550 |
|
| Emergency Medical Services Corp. company guaranty sr. unsec. | | | |
| notes 8 1/8s, 2019 | | 1,285,000 | 1,262,513 |
|
| Endo Pharmaceuticals Holdings, Inc. 144A company guaranty | | | |
| sr. unsec. notes 7s, 2019 | | 895,000 | 917,375 |
|
| Giant Funding Corp. 144A sr. notes 8 1/4s, 2018 | | 1,505,000 | 1,550,150 |
|
| HCA, Inc. company guaranty sr. notes 9 7/8s, 2017 | | 335,000 | 361,800 |
|
| HCA, Inc. company guaranty sr. notes 8 1/2s, 2019 | | 2,865,000 | 3,094,200 |
|
| HCA, Inc. sr. notes 6 1/2s, 2020 | | 5,315,000 | 5,275,138 |
|
| HCA, Inc. sr. unsec. notes 7 1/2s, 2022 | | 1,450,000 | 1,421,000 |
|
| Health Management Associates, Inc. sr. notes 6 1/8s, 2016 | | 1,765,000 | 1,795,888 |
|
| IASIS Healthcare, LLC/IASIS Capital Corp. 144A sr. notes | | | |
| 8 3/8s, 2019 | | 2,990,000 | 2,489,175 |
|
| Jaguar Holding Co. II/Jaguar Merger Sub, Inc. 144A sr. unsec. | | | |
| notes 9 1/2s, 2019 Δ | | 1,675,000 | 1,683,375 |
|
| Kinetics Concept/KCI USA 144A company guaranty notes | | | |
| 10 1/2s, 2018 | | 2,535,000 | 2,433,600 |
|
33
| | |
| CORPORATE BONDS AND NOTES (92.3%)* cont. | Principal amount | Value |
|
| Health care cont. | | |
| Multiplan, Inc. 144A company guaranty sr. notes 9 7/8s, 2018 | $1,515,000 | $1,511,213 |
|
| Select Medical Corp. company guaranty 7 5/8s, 2015 | 441,000 | 409,028 |
|
| Surgical Care Affiliates, Inc. 144A sr. sub. notes 10s, 2017 | 2,220,000 | 2,131,200 |
|
| Surgical Care Affiliates, Inc. 144A sr. unsec. notes 8 7/8s, 2015 ‡‡ | 577,149 | 571,378 |
|
| Teleflex, Inc. company guaranty sr. unsec. sub. notes 6 7/8s, 2019 | 1,135,000 | 1,147,769 |
|
| Tenet Healthcare Corp. company guaranty sr. notes 10s, 2018 | 560,000 | 630,000 |
|
| Tenet Healthcare Corp. sr. notes 8 7/8s, 2019 | 775,000 | 844,750 |
|
| Tenet Healthcare Corp. 144A company guaranty notes | | |
| 6 1/4s, 2018 | 1,940,000 | 1,910,900 |
|
| United Surgical Partners International, Inc. company guaranty | | |
| sr. unsec. sub. notes 8 7/8s, 2017 | 655,000 | 650,088 |
|
| Valeant Pharmaceuticals International 144A company guaranty | | |
| sr. notes 7s, 2020 | 250,000 | 235,313 |
|
| Valeant Pharmaceuticals International 144A company guaranty | | |
| sr. unsec. notes 6 7/8s, 2018 | 1,480,000 | 1,428,200 |
|
| Valeant Pharmaceuticals International 144A company guaranty | | |
| sr. unsec. notes 6 1/2s, 2016 | 1,185,000 | 1,146,488 |
|
| Valeant Pharmaceuticals International 144A sr. notes 6 3/4s, 2017 | 580,000 | 558,250 |
|
| Vanguard Health Systems, Inc. sr. unsec. notes zero %, 2016 | 59,000 | 37,760 |
|
| | | 51,264,380 |
| Homebuilding (1.0%) | | |
| Beazer Homes USA, Inc. company guaranty sr. unsec. notes | | |
| 6 7/8s, 2015 | 870,000 | 626,400 |
|
| Beazer Homes USA, Inc. company guaranty sr. unsec. unsub. | | |
| notes 9 1/8s, 2018 | 850,000 | 561,000 |
|
| Beazer Homes USA, Inc. sr. unsec. notes 9 1/8s, 2019 | 540,000 | 352,350 |
|
| M/I Homes, Inc. company guaranty sr. unsec. notes 8 5/8s, 2018 | 2,450,000 | 2,149,875 |
|
| Pulte Group, Inc. company guaranty sr. unsec. notes 7 5/8s, 2017 | 1,850,000 | 1,780,625 |
|
| Pulte Group, Inc. company guaranty sr. unsec. unsub. notes | | |
| 7 7/8s, 2032 | 995,000 | 803,463 |
|
| Realogy Corp. company guaranty sr. unsec. unsub. notes | | |
| 11 1/2s, 2017 | 2,110,000 | 1,608,875 |
|
| Standard Pacific Corp. company guaranty sr. unsec. unsub. notes | | |
| 7s, 2015 | 270,000 | 256,500 |
|
| | | 8,139,088 |
| Household furniture and appliances (0.3%) | | |
| Sealy Mattress Co. sr. sub. notes 8 1/4s, 2014 | 945,000 | 928,463 |
|
| Sealy Mattress Co. 144A company guaranty sr. sec. notes | | |
| 10 7/8s, 2016 | 1,302,000 | 1,419,180 |
|
| | | 2,347,643 |
| Lodging/Tourism (1.1%) | | |
| CityCenter Holdings LLC/CityCenter Finance Corp. 144A | | |
| company guaranty sr. notes 10 3/4s, 2017 ‡‡ | 2,084,777 | 2,063,929 |
|
| FelCor Lodging LP company guaranty sr. notes 10s, 2014 R | 2,324,000 | 2,486,680 |
|
| FelCor Lodging LP company guaranty sr. notes 6 3/4s, 2019 R | 2,115,000 | 1,966,950 |
|
| MGM Resorts International company guaranty sr. notes 9s, 2020 | 330,000 | 359,700 |
|
| MGM Resorts International company guaranty sr. unsec. notes | | |
| 6 7/8s, 2016 | 535,000 | 488,188 |
|
| MGM Resorts International company guaranty sr. unsec. notes | | |
| 6 5/8s, 2015 | 710,000 | 670,950 |
|
34
| | |
| CORPORATE BONDS AND NOTES (92.3%)* cont. | Principal amount | Value |
|
| Lodging/Tourism cont. | | |
| MGM Resorts International sr. notes 10 3/8s, 2014 | $260,000 | $291,200 |
|
| SugarHouse HSP Gaming Prop. Mezz LP/SugarHouse HSP | | |
| Gaming Finance Corp. 144A notes 8 5/8s, 2016 | 745,000 | 763,625 |
|
| | | 9,091,222 |
| Media (0.5%) | | |
| Affinion Group Holdings, Inc. company guaranty sr. unsec. notes | | |
| 11 5/8s, 2015 | 1,405,000 | 1,173,175 |
|
| Nielsen Finance, LLC/Nielsen Finance Co. company guaranty | | |
| sr. unsec. notes 7 3/4s, 2018 | 2,154,000 | 2,277,855 |
|
| Nielsen Finance, LLC/Nielsen Finance Co. sr. notes 11 5/8s, 2014 | 235,000 | 267,900 |
|
| | | 3,718,930 |
| Oil and gas (9.8%) | | |
| Anadarko Finance Co. company guaranty sr. unsec. unsub. notes | | |
| Ser. B, 7 1/2s, 2031 | 2,720,000 | 3,274,948 |
|
| Anadarko Petroleum Corp. sr. notes 5.95s, 2016 | 1,035,000 | 1,153,889 |
|
| Anadarko Petroleum Corp. sr. unsec. notes 6 3/8s, 2017 | 220,000 | 252,144 |
|
| Anadarko Petroleum Corp. sr. unsec. notes 6.2s, 2040 | 690,000 | 754,391 |
|
| ATP Oil & Gas Corp. company guaranty sr. notes 11 7/8s, 2015 | 670,000 | 442,200 |
|
| Brigham Exploration Co. company guaranty sr. unsec. notes | | |
| 8 3/4s, 2018 | 796,000 | 967,140 |
|
| Carrizo Oil & Gas, Inc. company guaranty sr. unsec. notes | | |
| 8 5/8s, 2018 | 3,314,000 | 3,289,145 |
|
| Carrizo Oil & Gas, Inc. 144A company guaranty sr. unsec notes | | |
| 8 5/8s, 2018 | 415,000 | 408,775 |
|
| Chaparral Energy, Inc. company guaranty sr. unsec. notes | | |
| 9 7/8s, 2020 | 1,140,000 | 1,219,800 |
|
| Chaparral Energy, Inc. company guaranty sr. unsec. notes | | |
| 8 7/8s, 2017 | 1,790,000 | 1,825,800 |
|
| Chaparral Energy, Inc. company guaranty sr. unsec. notes | | |
| 8 1/4s, 2021 | 585,000 | 576,225 |
|
| Chesapeake Energy Corp. company guaranty 6 1/2s, 2017 | 220,000 | 229,900 |
|
| Chesapeake Energy Corp. company guaranty sr. unsec. notes | | |
| 9 1/2s, 2015 | 1,025,000 | 1,153,125 |
|
| Chesapeake Midstream Partners LP/CHKM Finance Corp. 144A | | |
| company guaranty sr. unsec. notes 5 7/8s, 2021 | 580,000 | 562,600 |
|
| Chesapeake Oilfield Operating, LLC/Chesapeake Oilfield | | |
| Finance, Inc. 144A company guaranty sr. unsec. unsub. notes | | |
| 6 5/8s, 2019 | 1,650,000 | 1,627,313 |
|
| Comstock Resources, Inc. company guaranty sr. unsub. notes | | |
| 8 3/8s, 2017 | 1,090,000 | 1,068,200 |
|
| Concho Resources, Inc. company guaranty sr. unsec. notes | | |
| 6 1/2s, 2022 | 1,570,000 | 1,589,625 |
|
| Connacher Oil and Gas, Ltd. 144A notes 8 1/2s, 2019 (Canada) | 390,000 | 300,300 |
|
| Crosstex Energy LP/Crosstex Energy Finance Corp. company | | |
| guaranty sr. unsec. notes 8 7/8s, 2018 | 3,130,000 | 3,333,450 |
|
| Denbury Resources, Inc. company guaranty sr. sub. notes | | |
| 9 3/4s, 2016 | 330,000 | 363,825 |
|
| Denbury Resources, Inc. company guaranty sr. unsec. sub. notes | | |
| 8 1/4s, 2020 | 1,240,000 | 1,339,200 |
|
| Denbury Resources, Inc. company guaranty sr. unsec. sub. notes | | |
| 6 3/8s, 2021 | 825,000 | 833,250 |
|
35
| | |
| CORPORATE BONDS AND NOTES (92.3%)* cont. | Principal amount | Value |
|
| Oil and gas cont. | | |
| Encore Acquisition Co. company guaranty sr. sub. notes | | |
| 9 1/2s, 2016 | $285,000 | $314,213 |
|
| EXCO Resources, Inc. company guaranty sr. unsec. notes | | |
| 7 1/2s, 2018 | 3,565,000 | 3,279,800 |
|
| Ferrellgas LP/Ferrellgas Finance Corp. sr. unsec. notes | | |
| 9 1/8s, 2017 | 1,370,000 | 1,411,100 |
|
| Ferrellgas LP/Ferrellgas Finance Corp. sr. unsec. notes | | |
| 6 1/2s, 2021 | 860,000 | 737,450 |
|
| Forbes Energy Services Ltd. company guaranty sr. unsec notes | | |
| 9s, 2019 | 1,045,000 | 971,850 |
|
| Goodrich Petroleum Corp. 144A sr. notes 8 7/8s, 2019 | 2,380,000 | 2,332,400 |
|
| Hercules Offshore, Inc. 144A sr. notes 10 1/2s, 2017 | 790,000 | 758,400 |
|
| Inergy LP/Inergy Finance Corp. company guaranty sr. unsec. | | |
| notes 6 7/8s, 2021 | 1,835,000 | 1,743,250 |
|
| Kodiak Oil & Gas Corp. 144A sr. notes 8 1/8s, 2019 | 1,750,000 | 1,776,250 |
|
| Laredo Petroleum, Inc. 144A sr. notes 9 1/2s, 2019 | 2,130,000 | 2,207,212 |
|
| MEG Energy Corp. 144A company guaranty sr. unsec. notes | | |
| 6 1/2s, 2021 (Canada) | 1,350,000 | 1,356,750 |
|
| Milagro Oil & Gas 144A notes 10 1/2s, 2016 | 1,980,000 | 1,405,800 |
|
| Newfield Exploration Co. sr. sub. notes 6 5/8s, 2016 | 300,000 | 308,250 |
|
| Newfield Exploration Co. sr. unsec. notes 5 3/4s, 2022 | 695,000 | 729,750 |
|
| Newfield Exploration Co. sr. unsec. sub. notes 7 1/8s, 2018 | 360,000 | 378,000 |
|
| Newfield Exploration Co. sr. unsec. sub. notes 6 5/8s, 2014 | 3,230,000 | 3,262,300 |
|
| OPTI Canada, Inc. company guaranty sr. sec. notes 8 1/4s, 2014 | | |
| (Canada) (In default) † | 440,000 | 295,350 |
|
| OPTI Canada, Inc. company guaranty sr. sec. notes 7 7/8s, 2014 | | |
| (Canada) (In default) † | 1,185,000 | 793,950 |
|
| Petrohawk Energy Corp. company guaranty sr. unsec. notes | | |
| 10 1/2s, 2014 | 455,000 | 506,756 |
|
| Petroleum Development Corp. company guaranty sr. unsec. notes | | |
| 12s, 2018 | 2,555,000 | 2,733,850 |
|
| Plains Exploration & Production Co. company guaranty sr. unsec. | | |
| notes 7 5/8s, 2018 | 300,000 | 315,000 |
|
| Plains Exploration & Production Co. company guaranty sr. unsec. | | |
| notes 6 3/4s, 2022 | 2,525,000 | 2,575,500 |
|
| Quicksilver Resources, Inc. company guaranty sr. unsec. notes | | |
| 8 1/4s, 2015 | 565,000 | 576,300 |
|
| Quicksilver Resources, Inc. sr. notes 11 3/4s, 2016 | 1,265,000 | 1,423,125 |
|
| Range Resources Corp. company guaranty sr. sub. notes | | |
| 6 3/4s, 2020 | 640,000 | 700,800 |
|
| Rosetta Resources, Inc. company guaranty sr. unsec. notes | | |
| 9 1/2s, 2018 | 2,400,000 | 2,574,000 |
|
| Sabine Pass LNG LP sec. notes 7 1/2s, 2016 | 2,625,000 | 2,602,031 |
|
| SandRidge Energy, Inc. company guaranty sr. unsec. unsub. | | |
| notes 7 1/2s, 2021 | 345,000 | 315,675 |
|
| SandRidge Energy, Inc. 144A company guaranty sr. unsec. unsub. | | |
| notes 8s, 2018 | 3,285,000 | 3,153,600 |
|
| SandRidge Energy, Inc. 144A sr. unsec. notes 9 7/8s, 2016 | 570,000 | 587,100 |
|
| SM Energy Co. 144A sr. unsec. notes 6 5/8s, 2019 | 715,000 | 722,150 |
|
36
| | |
| CORPORATE BONDS AND NOTES (92.3%)* cont. | Principal amount | Value |
|
| Oil and gas cont. | | |
| SM Energy Co. 144A sr. unsec. notes 6 1/2s, 2021 | $690,000 | $690,000 |
|
| Unit Corp. company guaranty sr. sub. notes 6 5/8s, 2021 | 415,000 | 409,184 |
|
| Whiting Petroleum Corp. company guaranty 7s, 2014 | 1,245,000 | 1,319,700 |
|
| Williams Cos., Inc. (The) notes 7 3/4s, 2031 | 1,800,000 | 2,245,570 |
|
| Williams Cos., Inc. (The) sr. unsec. notes 7 7/8s, 2021 | 541,000 | 682,662 |
|
| WPX Energy, Inc. 144A sr. unsec. notes 6s, 2022 | 965,000 | 948,113 |
|
| WPX Energy, Inc. 144A sr. unsec. notes 5 1/4s, 2017 | 2,070,000 | 2,033,775 |
|
| | | 77,742,211 |
| Publishing (0.4%) | | |
| Cengage Learning Acquisitions, Inc. 144A sr. notes 10 1/2s, 2015 | 1,115,000 | 808,375 |
|
| Cenveo Corp. company guaranty sr. notes 8 7/8s, 2018 | 1,820,000 | 1,551,550 |
|
| Cenveo Corp. 144A company guaranty sr. unsec. notes | | |
| 10 1/2s, 2016 | 490,000 | 414,050 |
|
| Vertis, Inc. company guaranty sr. sec. notes Ser. A, 8 1/2s, 2012 † ‡‡ F | 706,925 | 34,215 |
|
| | | 2,808,190 |
| Regional Bells (0.9%) | | |
| Cincinnati Bell, Inc. company guaranty sr. unsec. notes 7s, 2015 | 700,000 | 686,000 |
|
| Cincinnati Bell, Inc. company guaranty sr. unsec. sub. notes | | |
| 8 3/4s, 2018 | 3,305,000 | 2,941,450 |
|
| Frontier Communications Corp. sr. unsec. notes 8 1/2s, 2020 | 1,685,000 | 1,600,750 |
|
| Frontier Communications Corp. sr. unsec. notes 8 1/4s, 2017 | 905,000 | 881,244 |
|
| Frontier Communications Corp. sr. unsec. notes 8 1/4s, 2014 | 570,000 | 588,525 |
|
| Frontier Communications Corp. sr. unsec. notes 8 1/8s, 2018 | 605,000 | 575,506 |
|
| Qwest Communications International, Inc. company guaranty | | |
| 7 1/2s, 2014 | 70,000 | 70,438 |
|
| | | 7,343,913 |
| Retail (2.9%) | | |
| Academy Ltd./Academy Finance Corp. 144A company guaranty | | |
| sr. unsec. notes 9 1/4s, 2019 | 995,000 | 965,150 |
|
| Autonation, Inc. company guaranty sr. unsec. notes 6 3/4s, 2018 | 505,000 | 523,938 |
|
| Bon-Ton Department Stores, Inc. (The) company guaranty | | |
| 10 1/4s, 2014 | 2,520,000 | 1,619,100 |
|
| Burlington Coat Factory Warehouse Corp. 144A company | | |
| guaranty sr. unsec. notes 10s, 2019 | 1,475,000 | 1,419,688 |
|
| J Crew Group, Inc. company guaranty sr. unsec. notes | | |
| 8 1/8s, 2019 | 780,000 | 716,625 |
|
| Limited Brands, Inc. company guaranty sr. unsec. notes | | |
| 6 5/8s, 2021 | 1,300,000 | 1,348,750 |
|
| Macy’s Retail Holdings, Inc. company guaranty sr. unsec. notes | | |
| 5.9s, 2016 | 1,455,000 | 1,608,090 |
|
| Macy’s Retail Holdings, Inc. company guaranty sr. unsec. unsub. | | |
| notes 8 1/8s, 2015 | 545,000 | 628,697 |
|
| Michaels Stores, Inc. company guaranty 11 3/8s, 2016 | 2,205,000 | 2,315,250 |
|
| Needle Merger Sub Corp. 144A sr. unsec. notes 8 1/8s, 2019 | 1,665,000 | 1,531,800 |
|
| Neiman-Marcus Group, Inc. company guaranty sr. unsec. sub. | | |
| notes 10 3/8s, 2015 | 345,000 | 356,930 |
|
| Penske Automotive Group, Inc. company guaranty sr. unsec. sub. | | |
| notes 7 3/4s, 2016 | 2,240,000 | 2,273,600 |
|
| PETCO Animal Supplies, Inc. 144A company guaranty sr. notes | | |
| 9 1/4s, 2018 | 870,000 | 913,500 |
|
37
| | |
| CORPORATE BONDS AND NOTES (92.3%)* cont. | Principal amount | Value |
|
| Retail cont. | | |
| QVC Inc. 144A sr. notes 7 1/2s, 2019 | $1,280,000 | $1,360,000 |
|
| QVC Inc. 144A sr. notes 7 3/8s, 2020 | 885,000 | 940,313 |
|
| Sears Holdings Corp. company guaranty 6 5/8s, 2018 | 1,180,000 | 933,675 |
|
| Toys R Us - Delaware, Inc. 144A company guaranty sr. notes | | |
| 7 3/8s, 2016 | 365,000 | 361,350 |
|
| Toys R Us Property Co., LLC company guaranty sr. notes | | |
| 8 1/2s, 2017 | 1,420,000 | 1,451,950 |
|
| Toys R Us Property Co., LLC company guaranty sr. unsec. notes | | |
| 10 3/4s, 2017 | 2,040,000 | 2,198,100 |
|
| | | 23,466,506 |
| Technology (4.7%) | | |
| Advanced Micro Devices, Inc. sr. unsec. notes 8 1/8s, 2017 | 200,000 | 203,500 |
|
| Advanced Micro Devices, Inc. sr. unsec. notes 7 3/4s, 2020 | 2,535,000 | 2,547,675 |
|
| Alcatel-Lucent USA, Inc. unsec. debs. 6.45s, 2029 | 950,000 | 684,000 |
|
| Avaya, Inc. company guaranty sr. unsec. notes 10 1/8s, 2015 ‡‡ | 905,000 | 714,950 |
|
| Avaya, Inc. company guaranty sr. unsec. notes 9 3/4s, 2015 | 3,245,000 | 2,539,213 |
|
| Avaya, Inc. 144A company guaranty sr. notes 7s, 2019 | 790,000 | 707,050 |
|
| Ceridian Corp. company guaranty sr. unsec. notes 12 1/4s, 2015 ‡‡ | 2,461,350 | 1,926,006 |
|
| Ceridian Corp. sr. unsec. notes 11 1/4s, 2015 | 1,905,000 | 1,452,563 |
|
| Eagle Parent Inc. 144A sr. notes 8 5/8s, 2019 | 1,670,000 | 1,548,925 |
|
| Fidelity National Information Services, Inc. company guaranty | | |
| sr. unsec. notes 7 7/8s, 2020 | 455,000 | 482,300 |
|
| Fidelity National Information Services, Inc. company guaranty | | |
| sr. unsec. notes 7 5/8s, 2017 | 895,000 | 948,700 |
|
| First Data Corp. company guaranty sr. unsec. notes 10.55s, 2015 | 1,888,138 | 1,718,206 |
|
| First Data Corp. company guaranty sr. unsec. sub. notes | | |
| 11 1/4s, 2016 | 2,160,000 | 1,760,400 |
|
| First Data Corp. 144A company guaranty notes 8 1/4s, 2021 | 2,210,000 | 1,911,650 |
|
| First Data Corp. 144A company guaranty sr. notes 7 3/8s, 2019 | 735,000 | 690,900 |
|
| First Data Corp. 144A sr. bonds 12 5/8s, 2021 | 2,345,000 | 1,934,625 |
|
| Freescale Semiconductor, Inc. company guaranty sr. unsec. notes | | |
| 10 3/4s, 2020 | 1,844,000 | 1,890,100 |
|
| Freescale Semiconductor, Inc. 144A company guaranty sr. notes | | |
| 10 1/8s, 2018 | 654,000 | 696,510 |
|
| Freescale Semiconductor, Inc. 144A company guaranty sr. notes | | |
| 9 1/4s, 2018 | 2,135,000 | 2,225,738 |
|
| Iron Mountain, Inc. company guaranty 8 3/4s, 2018 | 155,000 | 159,650 |
|
| Iron Mountain, Inc. company guaranty sr. sub. notes 7 3/4s, 2019 | 630,000 | 650,475 |
|
| Iron Mountain, Inc. company guaranty sr. unsec. sub. notes | | |
| 8s, 2020 | 75,000 | 77,250 |
|
| Iron Mountain, Inc. sr. sub. notes 8 3/8s, 2021 | 540,000 | 567,000 |
|
| Jazz Technologies, Inc. company guaranty sr. unsec. notes | | |
| 8s, 2015 F | 899,000 | 885,515 |
|
| NXP BV/NXP Funding, LLC 144A company guaranty sr. notes | | |
| 9 3/4s, 2018 (Netherlands) | 2,230,000 | 2,425,125 |
|
| Seagate HDD Cayman 144A company guaranty sr. unsec. notes | | |
| 7 3/4s, 2018 (Cayman Islands) | 905,000 | 932,150 |
|
| SunGard Data Systems, Inc. company guaranty 10 1/4s, 2015 | 1,817,000 | 1,871,510 |
|
38
| | |
| CORPORATE BONDS AND NOTES (92.3%)* cont. | Principal amount | Value |
|
| Technology cont. | | |
| SunGard Data Systems, Inc. 144A sr. unsec. notes 7 5/8s, 2020 | $960,000 | $950,400 |
|
| Syniverse Holdings, Inc. company guaranty sr. unsec. notes | | |
| 9 1/8s, 2019 | 1,930,000 | 1,978,250 |
|
| Unisys Corp. sr. unsec. unsub. notes 12 1/2s, 2016 | 485,000 | 516,525 |
|
| | | 37,596,861 |
| Telecommunications (7.6%) | | |
| Clearwire Communications, LLC/Clearwire Finance, Inc. 144A | | |
| company guaranty sr. notes 12s, 2017 | 760,000 | 440,800 |
|
| Clearwire Communications, LLC/Clearwire Finance, Inc. 144A | | |
| company guaranty sr. notes 12s, 2015 | 1,205,000 | 1,018,225 |
|
| Clearwire Communications, LLC/Clearwire Finance, Inc. 144A | | |
| company guaranty sr. notes 12s, 2015 | 1,145,000 | 967,525 |
|
| Crown Castle International Corp. sr. unsec. notes 7 1/8s, 2019 | 570,000 | 611,325 |
|
| Digicel Group, Ltd. 144A sr. notes 10 1/2s, 2018 (Jamaica) | 925,000 | 920,375 |
|
| Digicel, Ltd. 144A sr. unsec. notes 8 1/4s, 2017 (Jamaica) | 1,620,000 | 1,595,700 |
|
| EH Holding Corp. 144A sr. notes 6 1/2s, 2019 | 1,810,000 | 1,769,275 |
|
| EH Holding Corp. 144A sr. unsec. notes 7 5/8s, 2021 | 2,005,000 | 1,969,913 |
|
| Equinix, Inc. sr. unsec. notes 7s, 2021 | 940,000 | 958,800 |
|
| Intelsat Jackson Holdings SA 144A company guaranty sr. notes | | |
| 7 1/2s, 2021 (Bermuda) | 1,775,000 | 1,686,250 |
|
| Intelsat Luxembourg SA company guaranty sr. unsec. notes | | |
| 11 1/2s, 2017 (Luxembourg) ‡‡ | 6,671,093 | 6,120,728 |
|
| Intelsat Luxembourg SA company guaranty sr. unsec. notes | | |
| 11 1/4s, 2017 (Luxembourg) | 3,165,000 | 2,911,800 |
|
| Intelsat Luxembourg SA 144A company guaranty sr. unsec. notes | | |
| 11 1/2s, 2017 (Luxembourg) ‡‡ | 1,130,000 | 1,036,775 |
|
| Level 3 Financing, Inc. 144A company guaranty sr. unsec. notes | | |
| 8 1/8s, 2019 | 270,000 | 255,150 |
|
| Level 3 Financing, Inc. company guaranty sr. unsec. unsub. notes | | |
| 9 3/8s, 2019 | 1,035,000 | 1,045,350 |
|
| Level 3 Financing, Inc. company guaranty sr. unsec. unsub. notes | | |
| 9 1/4s, 2014 | 1,779,000 | 1,812,356 |
|
| MetroPCS Wireless, Inc. company guaranty sr. unsec. notes | | |
| 7 7/8s, 2018 | 2,655,000 | 2,535,525 |
|
| Nextel Communications, Inc. company guaranty sr. unsec. notes | | |
| Ser. D, 7 3/8s, 2015 | 1,105,000 | 972,400 |
|
| Nextel Communications, Inc. company guaranty sr. unsec. unsub. | | |
| notes 5.95s, 2014 | 1,316,000 | 1,204,140 |
|
| NII Capital Corp. company guaranty sr. unsec. unsub. notes | | |
| 10s, 2016 | 1,475,000 | 1,674,125 |
|
| NII Capital Corp. company guaranty sr. unsec. unsub. notes | | |
| 7 5/8s, 2021 | 1,430,000 | 1,444,300 |
|
| PAETEC Holding Corp. company guaranty sr. notes 8 7/8s, 2017 | 915,000 | 988,200 |
|
| PAETEC Holding Corp. company guaranty sr. unsec. notes | | |
| 9 7/8s, 2018 | 2,320,000 | 2,511,400 |
|
| Qwest Corp. notes 6 3/4s, 2021 | 1,735,000 | 1,809,041 |
|
| Qwest Corp. sr. unsec. unsub. notes 8 3/8s, 2016 | 645,000 | 731,269 |
|
| Qwest Corp. sr. unsec. unsub. notes 7 1/4s, 2025 | 1,135,000 | 1,163,375 |
|
| SBA Telecommunications, Inc. company guaranty sr. unsec. notes | | |
| 8 1/4s, 2019 | 1,230,000 | 1,323,788 |
|
39
| | | |
| CORPORATE BONDS AND NOTES (92.3%)* cont. | | Principal amount | Value |
|
| Telecommunications cont. | | | |
| SBA Telecommunications, Inc. company guaranty sr. unsec. | | | |
| notes 8s, 2016 | | $1,365,000 | $1,460,550 |
|
| Sprint Capital Corp. company guaranty 6 7/8s, 2028 | | 3,150,000 | 2,197,125 |
|
| Sprint Nextel Corp. sr. notes 8 3/8s, 2017 | | 4,510,000 | 3,867,325 |
|
| Sprint Nextel Corp. sr. unsec. notes 6s, 2016 | | 1,575,000 | 1,256,063 |
|
| Sprint Nextel Corp. 144A company guaranty sr. unsec. notes | | | |
| 9s, 2018 | | 1,625,000 | 1,641,250 |
|
| Wind Acquisition Finance SA company guaranty sr. sec. notes | | | |
| Ser. REGS, 7 3/8s, 2018 (Netherlands) | EUR | 795,000 | 885,699 |
|
| Wind Acquisition Finance SA 144A company guaranty sr. notes | | | |
| 7 1/4s, 2018 (Netherlands) | | $1,415,000 | 1,234,588 |
|
| Wind Acquisition Finance SA 144A sr. notes 11 3/4s, 2017 | | | |
| (Netherlands) | | 1,400,000 | 1,207,500 |
|
| Wind Acquisition Holding company guaranty sr. notes Ser. REGS, | | | |
| 12 1/4s, 2017 (Luxembourg) ‡‡ | EUR | 100,000 | 98,826 |
|
| Wind Acquisition Holdings Finance SA 144A company guaranty | | | |
| sr. notes 12 1/4s, 2017 (Italy) ‡‡ | | $989,127 | 761,628 |
|
| Windstream Corp. company guaranty sr. unsec. unsub. notes | | | |
| 8 1/8s, 2018 | | 505,000 | 515,100 |
|
| Windstream Corp. company guaranty sr. unsec. unsub. notes | | | |
| 8 1/8s, 2013 | | 795,000 | 840,713 |
|
| Windstream Corp. company guaranty sr. unsec. unsub. notes | | | |
| 7 7/8s, 2017 | | 2,290,000 | 2,393,050 |
|
| Windstream Corp. company guaranty sr. unsec. unsub. notes | | | |
| 7 3/4s, 2021 | | 925,000 | 911,125 |
|
| | | | 60,748,452 |
| Telephone (0.4%) | | | |
| Cricket Communications, Inc. company guaranty sr. unsec. notes | | | |
| 7 3/4s, 2020 | | 2,575,000 | 2,021,375 |
|
| Cricket Communications, Inc. company guaranty sr. unsub. notes | | | |
| 7 3/4s, 2016 | | 1,460,000 | 1,456,350 |
|
| | | | 3,477,725 |
| Textiles (0.4%) | | | |
| Hanesbrands, Inc. company guaranty sr. unsec. notes 6 3/8s, 2020 | | 1,110,000 | 1,097,513 |
|
| Hanesbrands, Inc. sr. unsec. notes 8s, 2016 | | 980,000 | 1,055,950 |
|
| Levi Strauss & Co. sr. unsec. notes 8 7/8s, 2016 | | 1,135,000 | 1,169,050 |
|
| | | | 3,322,513 |
| Transportation (1.1%) | | | |
| Aguila 3 SA 144A company guaranty sr. notes 7 7/8s, 2018 | | | |
| (Luxembourg) | | 2,810,000 | 2,669,500 |
|
| AMGH Merger Sub, Inc. 144A company | | | |
| guaranty sr. notes 9 1/4s, 2018 | | 2,265,000 | 2,242,350 |
|
| CHC Helicopter SA 144A company guaranty sr. notes 9 1/4s, | | | |
| 2020 (Luxembourg) | | 650,000 | 559,000 |
|
| Kansas City Southern de Mexico SA de CV sr. unsec. unsub. notes | | | |
| 8s, 2018 (Mexico) | | 180,000 | 196,650 |
|
| Kansas City Southern de Mexico SA de CV sr. unsec. unsub. notes | | | |
| 6 1/8s, 2021 (Mexico) | | 315,000 | 326,849 |
|
| Swift Services Holdings, Inc. company guaranty sr. notes 10s, 2018 | | 1,880,000 | 1,955,200 |
|
| Western Express, Inc. 144A sr. notes 12 1/2s, 2015 | | 1,685,000 | 623,450 |
|
| | | | 8,572,999 |
40
| | |
| CORPORATE BONDS AND NOTES (92.3%)* cont. | Principal amount | Value |
|
| Utilities and power (4.5%) | | |
| AES Corp. (The) sr. unsec. notes 8s, 2020 | $520,000 | $562,250 |
|
| AES Corp. (The) sr. unsec. unsub. notes 8s, 2017 | 1,855,000 | 1,994,125 |
|
| AES Corp. (The) 144A sr. notes 7 3/8s, 2021 | 935,000 | 974,738 |
|
| Calpine Corp. 144A company guaranty sr. notes 7 7/8s, 2020 | 1,340,000 | 1,393,600 |
|
| Calpine Corp. 144A sr. notes 7 1/4s, 2017 | 2,707,000 | 2,761,140 |
|
| Colorado Interstate Gas Co., LLC debs. 6.85s, 2037 (Canada) | 1,430,000 | 1,540,244 |
|
| Dolphin Subsidiary II, Inc. 144A sr. unsec. notes 7 1/4s, 2021 | 975,000 | 1,026,188 |
|
| Dolphin Subsidiary II, Inc. 144A sr. unsec. notes 6 1/2s, 2016 | 2,090,000 | 2,168,375 |
|
| Dynegy Holdings, LLC sr. unsec. notes 7 3/4s, 2019 (In default) † | 3,000,000 | 2,085,000 |
|
| Edison Mission Energy sr. unsec. notes 7 3/4s, 2016 | 755,000 | 524,725 |
|
| Edison Mission Energy sr. unsec. notes 7 1/2s, 2013 | 830,000 | 780,200 |
|
| Edison Mission Energy sr. unsec. notes 7.2s, 2019 | 1,035,000 | 610,650 |
|
| Edison Mission Energy sr. unsec. notes 7s, 2017 | 45,000 | 28,238 |
|
| El Paso Corp. sr. unsec. notes 7s, 2017 | 1,160,000 | 1,260,915 |
|
| El Paso Corp. sr. unsec. notes Ser. GMTN, 7.8s, 2031 | 705,000 | 810,750 |
|
| El Paso Natural Gas Co. debs. 8 5/8s, 2022 | 765,000 | 953,866 |
|
| Energy Future Holdings Corp. company guaranty sr. notes | | |
| 10s, 2020 | 560,000 | 574,000 |
|
| Energy Future Intermediate Holding Co., LLC/EFIH Finance, Inc. | | |
| sr. notes 10s, 2020 | 1,870,000 | 1,926,100 |
|
| Energy Transfer Equity LP company guaranty sr. unsec. notes | | |
| 7 1/2s, 2020 | 1,995,000 | 2,064,825 |
|
| GenOn Americas Generation, Inc. sr. unsec. notes 9 1/8s, 2031 | 405,000 | 360,450 |
|
| GenOn Energy, Inc. sr. unsec. notes 9 7/8s, 2020 | 2,475,000 | 2,456,438 |
|
| GenOn Energy, Inc. sr. unsec. notes 9 1/2s, 2018 | 380,000 | 383,800 |
|
| Ipalco Enterprises, Inc. 144A sr. notes 7 1/4s, 2016 | 230,000 | 241,500 |
|
| NRG Energy, Inc. company guaranty sr. unsec. notes 7 5/8s, 2018 | 260,000 | 256,100 |
|
| NRG Energy, Inc. 144A company guaranty sr. unsec. notes | | |
| 7 7/8s, 2021 | 4,195,000 | 3,985,250 |
|
| NV Energy, Inc. sr. unsec. notes 6 1/4s, 2020 | 935,000 | 958,375 |
|
| PNM Resources, Inc. unsec. unsub. notes 9 1/4s, 2015 | 166,000 | 183,845 |
|
| Tennessee Gas Pipeline Co. sr. unsec. unsub. debs. 7s, 2028 | 305,000 | 347,853 |
|
| Texas Competitive/Texas Competitive Electric Holdings Co., LLC | | |
| company guaranty notes 15s, 2021 | 1,660,000 | 979,400 |
|
| Texas Competitive/Texas Competitive Electric Holdings Co., LLC | | |
| company guaranty sr. unsec. notes 10 1/2s, 2016 ‡‡ | 2,657,447 | 1,036,404 |
|
| Texas Competitive/Texas Competitive Electric Holdings Co., LLC | | |
| 144A company guaranty sr. notes 11 1/2s, 2020 | 1,130,000 | 937,900 |
|
| | | 36,167,244 |
| | | |
| Total corporate bonds and notes (cost $759,384,124) | | $733,993,171 |
| |
| |
| SENIOR LOANS (5.6%)* c | Principal amount | Value |
|
| Basic materials (0.2%) | | |
| Exopack, LLC bank term loan FRN Ser. B, 6 1/2s, 2017 | $623,438 | $595,383 |
|
| INEOS Group Holdings, Ltd. bank term loan FRN Ser. C2, | | |
| 8.001s, 2014 | 558,845 | 560,940 |
|
| INEOS U.S. Finance, LLC bank term loan FRN Ser. B2, 7.501s, 2013 | 580,802 | 582,980 |
|
| | | 1,739,303 |
41
| | |
| SENIOR LOANS (5.6%)* c cont. | Principal amount | Value |
|
| Broadcasting (0.6%) | | |
| Clear Channel Communications, Inc. bank term loan FRN Ser. A, | | |
| 3.639s, 2014 | $695,000 | $596,541 |
|
| Clear Channel Communications, Inc. bank term loan FRN Ser. B, | | |
| 3.889s, 2016 | 2,051,361 | 1,525,699 |
|
| Cumulus Media, Inc. bank term loan FRN 7 1/2s, 2019 | 1,000,000 | 942,500 |
|
| Univision Communications, Inc. bank term loan FRN 4.489s, 2017 | 1,725,281 | 1,543,588 |
|
| | | 4,608,328 |
| Building materials (—%) | | |
| Nortek, Inc. bank term loan FRN Ser. B, 5 1/4s, 2017 | 277,975 | 269,983 |
|
| | | 269,983 |
| Capital goods (0.1%) | | |
| SRAM Corp. bank term loan FRN 8 1/2s, 2018 | 780,000 | 780,000 |
|
| | | 780,000 |
| Commercial and consumer services (0.1%) | | |
| Compucom Systems, Inc. bank term loan FRN 3.74s, 2014 | 503,240 | 478,078 |
|
| | | 478,078 |
| Consumer cyclicals (1.2%) | | |
| Caesars Entertainment Corp. bank term loan FRN Ser. B, | | |
| 9 1/4s, 2017 Δ | 500,000 | 470,834 |
|
| CCM Merger, Inc. bank term loan FRN Ser. B, 7s, 2017 | 2,127,080 | 2,108,468 |
|
| Ceasars Entertainment Operating Co., Inc. bank term loan FRN | | |
| Ser. B, 9 1/2s, 2016 | 486,338 | 478,232 |
|
| Chrysler Group, LLC bank term loan FRN Ser. B, 6s, 2017 | 75,000 | 68,775 |
|
| GateHouse Media, Inc. bank term loan FRN Ser. B, 2.24s, 2014 | 650,300 | 143,472 |
|
| GateHouse Media, Inc. bank term loan FRN Ser. DD, 2.24s, 2014 | 242,649 | 53,534 |
|
| Golden Nugget, Inc. bank term loan FRN Ser. B, 3.24s, 2014 ‡‡ | 747,102 | 597,682 |
|
| Golden Nugget, Inc. bank term loan FRN Ser. DD, 3.24s, 2014 ‡‡ | 425,279 | 340,223 |
|
| Goodman Global, Inc. bank term loan FRN 9s, 2017 | 1,988,182 | 1,991,911 |
|
| Neiman Marcus Group, Inc. (The) bank term loan FRN 4 3/4s, 2018 | 1,130,000 | 1,086,213 |
|
| Six Flags Theme Parks bank term loan FRN Ser. B, 5 1/4s, 2016 | 1,770,584 | 1,765,420 |
|
| Tribune Co. bank term loan FRN Ser. B, 5 1/4s, 2014 (In default) † | 1,239,169 | 759,379 |
|
| | | 9,864,143 |
| Consumer staples (0.5%) | | |
| Claire’s Stores, Inc. bank term loan FRN 2.991s, 2014 | 1,862,072 | 1,600,053 |
|
| Del Monte Corp. bank term loan FRN Ser. B, 4 1/2s, 2018 | 488,775 | 463,114 |
|
| Huish Detergents, Inc. bank term loan FRN 4.49s, 2014 | 455,000 | 386,181 |
|
| Revlon Consumer Products bank term loan FRN Ser. B, 4 3/4s, 2017 | 1,720,688 | 1,700,254 |
|
| Rite Aid Corp. bank term loan FRN Ser. B, 1.99s, 2014 | 113,423 | 106,759 |
|
| | | 4,256,361 |
| Energy (0.2%) | | |
| Frac Tech International, LLC bank term loan FRN Ser. B, 6 1/4s, 2016 | 1,376,586 | 1,353,643 |
|
| | | 1,353,643 |
| Financials (0.5%) | | |
| AGFS Funding Co. bank term loan FRN Ser. B, 5 1/2s, 2017 | 1,210,000 | 1,053,708 |
|
| CNO Financial Group, Inc. bank term loan FRN 6 1/4s, 2016 | 509,919 | 508,963 |
|
| HUB International Holdings, Inc. bank term loan FRN 6 3/4s, 2014 | 793,800 | 785,862 |
|
| iStar Financial, Inc. bank term loan FRN Ser. A2, 7s, 2014 | 1,265,000 | 1,214,400 |
|
| Nuveen Investments, Inc. bank term loan FRN Ser. B, 5.819s, 2017 | 423,476 | 401,508 |
|
| | | 3,964,441 |
42
| | |
| SENIOR LOANS (5.6%)* c cont. | Principal amount | Value |
|
| Gaming and lottery (0.1%) | | |
| Caesars Entertainment Operating Co., Inc. bank term loan FRN | | |
| Ser. B2, 3.247s, 2015 | $760,000 | $644,371 |
|
| | | 644,371 |
| Health care (1.0%) | | |
| Ardent Medical Services, Inc. bank term loan FRN 6 1/2s, 2015 | 1,774,875 | 1,730,503 |
|
| Emergency Medical Services Corp. bank term loan FRN Ser. B, | | |
| 5 1/4s, 2018 | 1,678,575 | 1,621,923 |
|
| Grifols SA bank term loan FRN Ser. B, 6s, 2016 (Spain) | 857,850 | 855,705 |
|
| IASIS Healthcare, LLC bank term loan FRN Ser. B, 5s, 2018 | 1,044,750 | 1,007,748 |
|
| Kinetic Concepts, Inc. bank term loan FRN Ser. B, 7s, 2018 | 1,630,000 | 1,636,877 |
|
| Pharmaceutical Product Development, Inc. bank term loan FRN | | |
| Ser. B, 6 1/4s, 2018 | 1,135,000 | 1,117,975 |
|
| | | 7,970,731 |
| Homebuilding (0.3%) | | |
| Realogy Corp. bank term loan FRN Ser. A, 13 1/2s, 2017 | 2,600,000 | 2,541,500 |
|
| | | 2,541,500 |
| Publishing (0.2%) | | |
| Cengage Learning Acquisitions, Inc. bank term loan FRN Ser. B, | | |
| 2.49s, 2014 | 1,525,361 | 1,282,734 |
|
| | | 1,282,734 |
| Retail (0.1%) | | |
| Burlington Coat Factory Warehouse Corp. bank term loan FRN | | |
| Ser. B, 6 1/4s, 2017 | 429,563 | 417,951 |
|
| | | 417,951 |
| Utilities and power (0.6%) | | |
| Dynegy, Inc. bank term loan FRN 9 1/4s, 2016 | 445,000 | 446,335 |
|
| Dynegy, Inc. bank term loan FRN 9 1/4s, 2016 | 110,000 | 109,588 |
|
| Texas Competitive Electric Holdings Co., LLC bank term loan | | |
| FRN 4.758s, 2017 | 5,958,299 | 3,880,342 |
|
| | | 4,436,265 |
| | | |
| Total senior loans (cost $48,834,403) | | $44,607,832 |
| |
| |
| CONVERTIBLE BONDS AND NOTES (0.7%)* | Principal amount | Value |
|
| Altra Holdings, Inc. 144A cv. company guaranty sr. unsec. notes | | |
| 2 3/4s, 2031 | $758,000 | $691,675 |
|
| Ford Motor Co. cv. sr. unsec. notes 4 1/4s, 2016 | 700,000 | 992,250 |
|
| Meritor, Inc. cv. company guaranty sr. unsec. notes | | |
| stepped-coupon 4 5/8s (0s, 3/1/16) 2026 †† | 1,450,000 | 1,078,438 |
|
| Steel Dynamics, Inc. cv. sr. notes 5 1/8s, 2014 | 773,000 | 836,773 |
|
| TRW Automotive, Inc. cv. company guaranty sr. unsec. notes | | |
| 3 1/2s, 2015 | 550,000 | 735,240 |
|
| Virgin Media, Inc. cv. sr. unsec. notes 6 1/2s, 2016 | | |
| (United Kingdom) | 705,000 | 992,288 |
|
| XM Satellite Radio, Inc. 144A cv. company guaranty sr. unsec. | | |
| sub. notes 7s, 2014 | 489,000 | 632,033 |
|
| Total convertible bonds and notes (cost $4,994,822) | | $5,958,697 |
| |
| |
| ASSET-BACKED SECURITIES (0.2%)* | Principal amount | Value |
|
| Neon Capital, Ltd. 144A limited recourse sec. notes Ser. 97, 1.105s, | | |
| 2013 (Cayman Islands) F | $6,684,836 | $1,799,129 |
|
| Total asset-backed securities (cost $519,956) | | $1,799,129 |
43
| | |
| SHORT-TERM INVESTMENTS (4.9%)* | Principal amount/shares | Value |
|
| Putnam Money Market Liquidity Fund 0.10% e | 38,065,843 | $38,065,843 |
|
| SSgA Prime Money Market Fund 0.11% P | 120,000 | 120,000 |
|
| U.S. Treasury Bills with an effective yield of 0.068%, | | |
| July 26, 2012 ## | $1,083,000 | 1,082,388 |
|
| Total short-term investments (cost $39,268,231) | | $39,268,231 |
|
| |
| TOTAL INVESTMENTS | | |
|
| Total investments (cost $853,001,536) | | $825,627,060 |
| |
| Key to holding’s currency abbreviations |
| | |
| CAD | Canadian Dollar |
| EUR | Euro |
| |
| Key to holding’s abbreviations |
| | |
| FRB | Floating Rate Bonds |
| FRN | Floating Rate Notes |
| GMTN | Global Medium Term Notes |
| MTN | Medium Term Notes |
| MTNI | Medium Term Notes Class I |
Notes to the fund’s portfolio
Unless noted otherwise, the notes to the fund’s portfolio are for the close of the fund’s reporting period, which ran from December 1, 2010 through November 30, 2011 (reporting period).
* Percentages indicated are based on net assets of $795,652,488.
† Non-income-producing security.
†† The interest rate and date shown parenthetically represent the new interest rate to be paid and the date the fund will begin accruing interest at this rate.
‡‡ Income may be received in cash or additional securities at the discretion of the issuer.
## This security, in part or in entirety, was pledged and segregated with the custodian for collateral on certain derivative contracts at the close of the reporting period.
Δ Forward commitment, in part or in entirety (Note 1).
c Senior loans are exempt from registration under the Securities Act of 1933, as amended, but contain certain restrictions on resale and cannot be sold publicly. These loans pay interest at rates which adjust periodically. The interest rates shown for senior loans are the current interest rates at the close of the reporting period. Senior loans are also subject to mandatory and/or optional prepayment which cannot be predicted. As a result, the remaining maturity may be substantially less than the stated maturity shown (Notes 1 and 7).
e See Note 6 to the financial statements regarding investments in Putnam Money Market Liquidity Fund. The rate quoted in the security description is the annualized 7-day yield of the fund at the close of the reporting period.
F Is valued at fair value following procedures approved by the Trustees. Securities may be classified as Level 2 or Level 3 for Accounting Standards Codification ASC 820 Fair Value Measurements and Disclosures (ASC 820) based on the securities’ valuation inputs.
P Security purchased with cash or security received, that was pledged to the fund for collateral on certain derivatives contracts. The rate quoted in the security description is the annualized 7-day yield of the fund at the close of the reporting period (Note 1).
R Real Estate Investment Trust.
At the close of the reporting period, the fund maintained liquid assets totaling $10,096,543 to cover certain derivatives contracts.
Debt obligations are considered secured unless otherwise indicated.
44
144A after the name of an issuer represents securities exempt from registration under Rule 144A under the Securities Act of 1933, as amended. These securities may be resold in transactions exempt from registration, normally to qualified institutional buyers.
The rates shown on FRB and FRN are the current interest rates at the close of the reporting period.
The dates shown on debt obligations are the original maturity dates.
FORWARD CURRENCY CONTRACTS at 11/30/11 (aggregate face value $16,657,901)
| | | | | | |
| | | | | | Unrealized |
| | Contract | Delivery | | Aggregate | appreciation/ |
| Counterparty | Currency | type | date | Value | face value | (depreciation) |
|
| Bank of America, N.A. | | | | | |
|
| Canadian Dollar | Sell | 12/21/11 | $490,048 | $492,213 | $2,165 |
|
| Euro | Sell | 12/21/11 | 4,175,665 | 4,248,785 | 73,120 |
|
| Barclays Bank PLC | | | | | |
|
| Euro | Sell | 12/21/11 | 1,038,944 | 1,057,578 | 18,634 |
|
| Citibank, N.A. | | | | | |
|
| Euro | Buy | 12/21/11 | 318,228 | 323,606 | (5,378) |
|
| Credit Suisse AG | | | | | |
|
| Euro | Sell | 12/21/11 | 1,392,112 | 1,416,842 | 24,730 |
|
| Deutsche Bank AG | | | | | |
|
| Euro | Buy | 12/21/11 | 55,367 | 56,362 | (995) |
|
| Goldman Sachs International | | | | | |
|
| Euro | Sell | 12/21/11 | 1,630,246 | 1,659,594 | 29,348 |
|
| HSBC Bank USA, National Association | | | | |
|
| Euro | Sell | 12/21/11 | 337,579 | 343,586 | 6,007 |
|
| JPMorgan Chase Bank, N.A. | | | | | |
|
| Canadian Dollar | Sell | 12/21/11 | 517,000 | 519,012 | 2,012 |
|
| Euro | Sell | 12/21/11 | 1,581,732 | 1,621,081 | 39,349 |
|
| Royal Bank of Scotland PLC (The) | | | | | |
|
| Euro | Buy | 12/21/11 | 378,164 | 379,714 | (1,550) |
|
| State Street Bank and Trust Co. | | | | | |
|
| Euro | Sell | 12/21/11 | 2,179,081 | 2,216,736 | 37,655 |
|
| UBS AG | | | | | |
|
| Euro | Sell | 12/21/11 | 1,210,556 | 1,232,042 | 21,486 |
|
| Westpac Banking Corp. | | | | | |
|
| Canadian Dollar | Sell | 12/21/11 | 886,104 | 890,476 | 4,372 |
|
| Euro | Sell | 12/21/11 | 196,742 | 200,274 | 3,532 |
|
| Total | | | | | $254,487 |
45
CREDIT DEFAULT CONTRACTS OUTSTANDING at 11/30/11
| | | | | | | |
| | | Upfront | | | | Fixed payments | |
| | | premium | | | Termi- | received | Unrealized |
| Swap counterparty / | | received | Notional | | nation | (paid) by fund | appreciation/ |
| Referenced debt* | Rating*** | (paid)** | amount | | date | per annum | (depreciation) |
|
| Barclays Bank PLC | | | | | | | |
| DJ CDX NA HY Series | | | | | | | |
| 17 Version 2 Index | B+/P | $229,688 | $3,712,500 | | 12/20/16 | 500 bp | $(85,646) |
|
| Goldman Sachs International | | | | | | |
| DJ CDX NA HY Series | | | | | | | |
| 17 Version 2 Index | B+/P | 600,000 | 5,940,000 | | 12/20/16 | 500 bp | 123,502 |
|
| Total | | | | | | | $37,856 |
* Payments related to the referenced debt are made upon a credit default event.
** Upfront premium is based on the difference between the original spread on issue and the market spread on day of execution.
*** Ratings are presented for credit default contracts in which the fund has sold protection on the underlying referenced debt. Ratings for an underlying index represent the average of the ratings of all the securities included in that index. The Moody’s, Standard & Poor’s or Fitch ratings are believed to be the most recent ratings available at November 30, 2011. Securities rated by Putnam are indicated by “/P.” Securities rated by Fitch are indicated by “/F.”
ASC 820 establishes a three-level hierarchy for disclosure of fair value measurements. The valuation hierarchy is based upon the transparency of inputs to the valuation of the fund’s investments. The three levels are defined as follows:
Level 1 — Valuations based on quoted prices for identical securities in active markets.
Level 2 — Valuations based on quoted prices in markets that are not active or for which all significant inputs are observable, either directly or indirectly.
Level 3 — Valuations based on inputs that are unobservable and significant to the fair value measurement.
The following is a summary of the inputs used to value the fund’s net assets as of the close of the reporting period:
| | | | |
| | | | | Valuation inputs | |
|
| Investments in securities: | | Level 1 | Level 2 | Level 3 |
|
| Asset-backed securities | | $— | $— | $1,799,129 |
|
| Convertible bonds and notes | | — | 5,958,697 | — |
|
| Corporate bonds and notes | | — | 733,060,144 | 933,027 |
|
| Senior loans | | — | 44,607,832 | — |
|
| Short-term investments | | 38,185,843 | 1,082,388 | — |
|
| Totals by level | | $38,185,843 | $784,709,061 | $2,732,156 |
| | | | | | |
| | | | | Valuation inputs | |
|
| Other financial instruments: | | Level 1 | Level 2 | Level 3 |
|
| Forward currency contracts | | $— | 254,487 | $— |
|
| Credit default contracts | | — | (791,832) | — |
|
| Totals by level | | $— | $(537,345) | $— |
At the start and/or close of the reporting period, Level 3 investments in securities and other financial instruments were not considered a significant portion of the fund’s portfolio.
The accompanying notes are an integral part of these financial statements.
46
Statement of assets and liabilities 11/30/11
| |
| ASSETS | |
|
| Investment in securities, at value, (Note 1): | |
| Unaffiliated issuers (identified cost $814,935,693) | $787,561,217 |
| Affiliated issuers (identified cost $38,065,843) (Notes 1 and 6) | 38,065,843 |
|
| Cash | 1,938,474 |
|
| Dividends, interest and other receivables | 18,060,189 |
|
| Receivable for shares of the fund sold | 1,087,845 |
|
| Receivable for investments sold | 4,917,397 |
|
| Receivable for sales of delayed delivery securities (Notes 1 and 7) | 540,893 |
|
| Unrealized appreciation on swap contracts (Note 1) | 123,502 |
|
| Unrealized appreciation on forward currency contracts (Note 1) | 262,410 |
|
| Total assets | 852,557,770 |
| |
| LIABILITIES | |
|
| Payable for investments purchased | 9,905,253 |
|
| Payable for purchases of delayed delivery securities (Notes 1 and 7) | 2,185,527 |
|
| Payable for shares of the fund repurchased | 42,498,894 |
|
| Payable for compensation of Manager (Note 2) | 402,637 |
|
| Payable for investor servicing fees (Note 2) | 113,270 |
|
| Payable for custodian fees (Note 2) | 9,821 |
|
| Payable for Trustee compensation and expenses (Note 2) | 225,042 |
|
| Payable for administrative services (Note 2) | 4,266 |
|
| Payable for distribution fees (Note 2) | 317,235 |
|
| Unrealized depreciation on forward currency contracts (Note 1) | 7,923 |
|
| Unrealized depreciation on swap contracts (Note 1) | 85,646 |
|
| Premium received on swap contracts (Note 1) | 829,688 |
|
| Collateral on certain derivative contracts, at value (Note 1) | 120,000 |
|
| Other accrued expenses | 200,080 |
|
| Total liabilities | 56,905,282 |
| | |
| Net assets | $795,652,488 |
|
| |
| REPRESENTED BY | |
|
| Paid-in capital (Unlimited shares authorized) (Notes 1, 4 and 8) | $1,002,161,769 |
|
| Undistributed net investment income (Note 1) | 5,779,524 |
|
| Accumulated net realized loss on investments and foreign currency transactions (Note 1) | (185,194,802) |
|
| Net unrealized depreciation of investments and assets and liabilities in foreign currencies | (27,094,003) |
|
| Total — Representing net assets applicable to capital shares outstanding | $795,652,488 |
(Continued on next page)
47
Statement of assets and liabilities (Continued)
| |
| COMPUTATION OF NET ASSET VALUE AND OFFERING PRICE | |
|
| Net asset value and redemption price per class A share | |
| ($510,879,613 divided by 90,870,250 shares) | $5.62 |
|
| Offering price per class A share (100/96.00 of $5.62)* | $5.85 |
|
| Net asset value and offering price per class B share ($8,076,041 divided by 1,463,738 shares)** | $5.52 |
|
| Net asset value and offering price per class C share ($15,915,000 divided by 2,892,889 shares)** | $5.50 |
|
| Net asset value and redemption price per class M share | |
| ($130,757,932 divided by 23,258,272 shares) | $5.62 |
|
| Offering price per class M share (100/96.75 of $5.62)† | $5.81 |
|
| Net asset value, offering price and redemption price per class R share | |
| ($16,209,297 divided by 2,883,750 shares) | $5.62 |
|
| Net asset value, offering price and redemption price per class Y share | |
| ($113,814,605 divided by 19,597,726 shares) | $5.81 |
|
* On single retail sales of less than $100,000. On sales of $100,000 or more the offering price is reduced.
** Redemption price per share is equal to net asset value less any applicable contingent deferred sales charge.
† On single retail sales of less than $50,000. On sales of $50,000 or more the offering price is reduced.
The accompanying notes are an integral part of these financial statements.
48
Statement of operations Year ended 11/30/11
| |
| INVESTMENT INCOME | |
|
| Interest (net of foreign tax of $2,851) (including interest income of $18,762 from investments | |
| in affiliated issuers) (Note 6) | $67,938,035 |
|
| Total investment income | 67,938,035 |
| |
| EXPENSES | |
|
| Compensation of Manager (Note 2) | 4,689,158 |
|
| Investor servicing fees (Note 2) | 1,256,562 |
|
| Custodian fees (Note 2) | 24,391 |
|
| Trustee compensation and expenses (Note 2) | 76,589 |
|
| Administrative services (Note 2) | 24,657 |
|
| Distribution fees — Class A (Note 2) | 1,327,858 |
|
| Distribution fees — Class B (Note 2) | 77,253 |
|
| Distribution fees — Class C (Note 2) | 114,122 |
|
| Distribution fees — Class M (Note 2) | 761,888 |
|
| Distribution fees — Class R (Note 2) | 76,544 |
|
| Other | 418,922 |
|
| Total expenses | 8,847,944 |
| | |
| Expense reduction (Note 2) | (4,047) |
|
| Net expenses | 8,843,897 |
| | |
| Net investment income | 59,094,138 |
|
| |
| Net realized gain on investments (Notes 1 and 3) | 16,067,127 |
|
| Net realized loss on swap contracts (Note 1) | (708,681) |
|
| Net realized gain on foreign currency transactions (Note 1) | 344,279 |
|
| Net unrealized depreciation of assets and liabilities in foreign currencies during the year | (540,793) |
|
| Net unrealized depreciation of investments and swap contracts during the year | (52,975,367) |
|
| Net loss on investments | (37,813,434) |
| | |
| Net increase in net assets resulting from operations | $21,280,703 |
|
The accompanying notes are an integral part of these financial statements.
49
Statement of changes in net assets
| | |
| INCREASE (DECREASE) IN NET ASSETS | Year ended 11/30/11 | Year ended 11/30/10 |
|
| Operations: | | |
| Net investment income | $59,094,138 | $60,038,389 |
|
| Net realized gain on investments | | |
| and foreign currency transactions | 15,702,725 | 23,470,033 |
|
| Net unrealized appreciation (depreciation) of investments | | |
| and assets and liabilities in foreign currencies | (53,516,160) | 19,530,821 |
|
| Net increase in net assets resulting from operations | 21,280,703 | 103,039,243 |
|
| Distributions to shareholders (Note 1): | | |
| From ordinary income | | |
| Net investment income | | |
|
| Class A | (39,484,973) | (37,424,414) |
|
| Class B | (520,121) | (525,453) |
|
| Class C | (779,513) | (604,759) |
|
| Class M | (10,977,830) | (12,160,237) |
|
| Class R | (1,090,288) | (560,409) |
|
| Class Y | (7,412,853) | (5,600,967) |
|
| Increase in capital from settlement payments (Note 8) | 423,611 | — |
|
| Redemption fees (Note 1) | 90,811 | 47,162 |
|
| Increase from capital share transactions (Note 4) | 9,237,077 | 30,559,597 |
|
| Total increase (decrease) in net assets | (29,233,376) | 76,769,763 |
| |
| NET ASSETS | | |
|
| Beginning of year | 824,885,864 | 748,116,101 |
|
| End of year (including undistributed net investment | | |
| income of $5,779,524 and $5,850,100, respectively) | $795,652,488 | $824,885,864 |
|
The accompanying notes are an integral part of these financial statements.
50
|
| This page left blank intentionally. |
51
Financial highlights (For a common share outstanding throughout the period)
| | | | | | | | | | | | | | |
| INVESTMENT OPERATIONS: | | | | LESS DISTRIBUTIONS: | | | | | RATIOS AND SUPPLEMENTAL DATA: | |
|
| | | | | | | | | | | | | Ratio | Ratio | |
| | | | Net realized | | | | | | | | | of expenses | of net investment | |
| | Net asset value, | | and unrealized | Total from | From | | | | | Total return | Net assets, | to average | income (loss) | Portfolio |
| | beginning | Net investment | gain (loss) | investment | net investment | Total | Redemption | Non-recurring | Net asset value, | at net asset | end of period | net assets | to average | turnover |
| Period ended | of period | income (loss) a | on investments | operations | income | distributions | fees b | reimbursements | end of period | value (%) c | (in thousands) | (%) d | net assets (%) | (%) |
|
| Class A | | | | | | | | | | | | | | |
| November 30, 2011 | $5.90 | .43 | (.27) | .16 | (.44) | (.44) | — | — f | $5.62 | 2.58 | $510,880 | 1.04 | 7.25 | 57 |
| November 30, 2010 | 5.56 | .44 | .32 | .76 | (.42) | (.42) | — | — | 5.90 | 14.10 | 535,054 | 1.05 e | 7.66 e | 71 |
| November 30, 2009 | 4.05 | .40 | 1.55 | 1.95 | (.44) | (.44) | — | — | 5.56 | 50.64 | 479,094 | 1.13 e | 8.13 e | 59 |
| November 30, 2008 | 6.05 | .42 | (1.97) | (1.55) | (.45) | (.45) | — | — | 4.05 | (27.33) | 292,694 | 1.10 e | 7.63 e | 34 |
| November 30, 2007 | 6.22 | .44 | (.16) | .28 | (.45) | (.45) | — | — | 6.05 | 4.50 | 373,890 | 1.08 e | 7.04 e | 48 |
|
| Class B | | | | | | | | | | | | | | |
| November 30, 2011 | $5.80 | .38 | (.27) | .11 | (.39) | (.39) | — | — f | $5.52 | 1.84 | $8,076 | 1.79 | 6.50 | 57 |
| November 30, 2010 | 5.47 | .39 | .32 | .71 | (.38) | (.38) | — | — | 5.80 | 13.28 | 7,520 | 1.80 e | 6.93 e | 71 |
| November 30, 2009 | 3.99 | .35 | 1.54 | 1.89 | (.41) | (.41) | — | — | 5.47 | 49.61 | 9,033 | 1.88 e | 7.41 e | 59 |
| November 30, 2008 | 5.96 | .38 | (1.94) | (1.56) | (.41) | (.41) | — | — | 3.99 | (27.84) | 6,036 | 1.85 e | 6.86 e | 34 |
| November 30, 2007 | 6.14 | .39 | (.17) | .22 | (.40) | (.40) | — | — | 5.96 | 3.58 | 11,407 | 1.83 e | 6.29 e | 48 |
|
| Class C | | | | | | | | | | | | | | |
| November 30, 2011 | $5.78 | .37 | (.25) | .12 | (.40) | (.40) | — | — f | $5.50 | 1.90 | $15,915 | 1.79 | 6.49 | 57 |
| November 30, 2010 | 5.46 | .39 | .31 | .70 | (.38) | (.38) | — | — | 5.78 | 13.13 | 9,464 | 1.80 e | 6.92 e | 71 |
| November 30, 2009 | 3.98 | .35 | 1.54 | 1.89 | (.41) | (.41) | — | — | 5.46 | 49.80 | 10,020 | 1.88 e | 7.16 e | 59 |
| November 30, 2008 | 5.95 | .37 | (1.93) | (1.56) | (.41) | (.41) | — | — | 3.98 | (27.87) | 684 | 1.85 e | 6.78 e | 34 |
| November 30, 2007† | 6.27 | .26 | (.33) | (.07) | (.25) | (.25) | — | — | 5.95 | (1.11) * | 776 | 1.23 *e | 4.29 *e | 48 |
|
| Class M | | | | | | | | | | | | | | |
| November 30, 2011 | $5.90 | .42 | (.27) | .15 | (.43) | (.43) | — | — f | $5.62 | 2.37 | $130,758 | 1.29 | 7.00 | 57 |
| November 30, 2010 | 5.57 | .43 | .31 | .74 | (.41) | (.41) | — | — | 5.90 | 13.65 | 164,632 | 1.30 e | 7.42 e | 71 |
| November 30, 2009 | 4.05 | .39 | 1.56 | 1.95 | (.43) | (.43) | — | — | 5.57 | 50.52 | 178,550 | 1.38 e | 7.97 e | 59 |
| November 30, 2008 | 6.05 | .41 | (1.97) | (1.56) | (.44) | (.44) | — | — | 4.05 | (27.50) | 155,249 | 1.35 e | 7.36 e | 34 |
| November 30, 2007 | 6.23 | .42 | (.17) | .25 | (.43) | (.43) | — | — | 6.05 | 4.11 | 275,959 | 1.33 e | 6.79 e | 48 |
|
| Class R | | | | | | | | | | | | | | |
| November 30, 2011 | $5.90 | .41 | (.26) | .15 | (.43) | (.43) | — | — f | $5.62 | 2.37 | $16,209 | 1.29 | 6.98 | 57 |
| November 30, 2010 | 5.56 | .43 | .32 | .75 | (.41) | (.41) | — | — | 5.90 | 13.86 | 11,085 | 1.30 e | 7.34 e | 71 |
| November 30, 2009 | 4.05 | .38 | 1.56 | 1.94 | (.43) | (.43) | — | — | 5.56 | 50.32 | 4,728 | 1.38 e | 7.63 e | 59 |
| November 30, 2008 | 6.05 | .41 | (1.97) | (1.56) | (.44) | (.44) | — | — | 4.05 | (27.46) | 680 | 1.35 e | 8.31 e | 34 |
| November 30, 2007† | 6.35 | .29 | (.32) | (.03) | (.27) | (.27) | — | — | 6.05 | (.57) * | 1 | .89 *e | 4.62 *e | 48 |
|
| Class Y | | | | | | | | | | | | | | |
| November 30, 2011 | $6.08 | .46 | (.28) | .18 | (.45) | (.45) | — | — f | $5.81 | 2.88 | $113,815 | .79 | 7.49 | 57 |
| November 30, 2010 | 5.71 | .47 | .33 | .80 | (.43) | (.43) | — | — | 6.08 | 14.49 | 97,130 | .80 e | 7.87 e | 71 |
| November 30, 2009 | 4.15 | .43 | 1.58 | 2.01 | (.45) | (.45) | — | — | 5.71 | 50.98 | 66,691 | .88 e | 8.35 e | 59 |
| November 30, 2008 | 6.19 | .45 | (2.03) | (1.58) | (.46) | (.46) | — | — | 4.15 | (27.21) | 33,660 | .85 e | 7.94 e | 34 |
| November 30, 2007 | 6.35 | .47 | (.17) | .30 | (.46) | (.46) | — | — | 6.19 | 4.78 | 50,146 | .83 e | 7.27 e | 48 |
|
See notes to financial highlights at the end of this section.
The accompanying notes are an integral part of these financial statements.
Financial highlights (Continued)
* Not annualized
† For the period March 30, 2007 (commencement of operations) to November 30, 2007.
a Per share net investment income (loss) has been determined on the basis of the weighted average number of shares outstanding during the period.
b Amount represents less than $0.01 per share.
c Total return assumes dividend reinvestment and does not reflect the effect of sales charges.
d Includes amounts paid through expense offset arrangements (Note 2).
e Reflects an involuntary contractual expense limitation in effect during the period. For periods prior to November 30, 2009, certain fund expenses were waived in connection with the fund’s investment in Putnam Prime Money Market Fund. As a result of such limitation and/or waivers, the expenses of each class reflect a reduction of the following amounts:
| |
| | Percentage of |
| | average net assets |
|
| November 30, 2010 | 0.01% |
|
| November 30, 2009 | 0.09 |
|
| November 30, 2008 | 0.02 |
|
| November 30, 2007 | <0.01 |
|
f Reflects a non-recurring reimbursement related to restitution amounts in connection with a distribution plan approved by the Securities and Exchange Commission (the SEC) which amounted to less than $0.01 per share outstanding on July 21, 2011. Also reflects a non-recurring reimbursement related to short-term trading related lawsuits, which amounted to less than $0.01 per share outstanding on May 11, 2011 (Note 8).
The accompanying notes are an integral part of these financial statements.
54
Notes to financial statements 11/30/11
Note 1: Significant accounting policies
Putnam High Yield Advantage Fund (the fund), a Massachusetts business trust, is registered under the Investment Company Act of 1940, as amended, as a diversified, open-end management investment company. The fund seeks high current income with capital growth as a secondary objective when consistent with achieving high current income. The fund invests mainly in bonds that are obligations of U.S. companies, are below investment-grade in quality (sometimes referred to as “junk bonds”), and have intermediate- to long term maturities (three years or longer). The fund may consider, among other factors, credit, interest rate and prepayment risks, as well as general market conditions, when deciding whether to buy or sell investments. The fund may invest in higher yielding, lower rated bonds that may have a higher rate of default.
The fund offers class A, class B, class C, class M, class R and class Y shares. Class A and class M shares are sold with a maximum front-end sales charge of 4.00% and 3.25%, respectively, and generally do not pay a contingent deferred sales charge. Class B shares, which convert to class A shares after approximately eight years, do not pay a front-end sales charge and are subject to a contingent deferred sales charge if those shares are redeemed within six years of purchase. Class C shares have a one-year 1.00% contingent deferred sales charge and do not convert to class A shares. Class R shares, which are not available to all investors, are sold at net asset value. The expenses for class A, class B, class C, class M and class R shares may differ based on the distribution fee of each class, which is identified in Note 2. Class Y shares, which are sold at net asset value, are generally subject to the same expenses as class A, class B, class C, class M and class R shares, but do not bear a distribution fee. Class Y shares are not available to all investors.
A 1.00% redemption fee may apply on any shares that are redeemed (either by selling or exchanging into another fund) within 30 days of purchase. Prior to August 2, 2010, a 1.00% redemption fee applied on any shares that were redeemed (either by selling or exchanging into another fund) within 90 days of purchase. The redemption fee is accounted for as an addition to paid-in-capital.
Investment income, realized and unrealized gains and losses and expenses of the fund are borne pro-rata based on the relative net assets of each class to the total net assets of the fund, except that each class bears expenses unique to that class (including the distribution fees applicable to such classes). Each class votes as a class only with respect to its own distribution plan or other matters on which a class vote is required by law or determined by the Trustees. If the fund were liquidated, shares of each class would receive their pro-rata share of the net assets of the fund. In addition, the Trustees declare separate dividends on each class of shares.
In the normal course of business, the fund enters into contracts that may include agreements to indemnify another party under given circumstances. The fund’s maximum exposure under these arrangements is unknown as this would involve future claims that may be, but have not yet been, made against the fund. However, the fund’s management team expects the risk of material loss to be remote.
The following is a summary of significant accounting policies consistently followed by the fund in the preparation of its financial statements. The preparation of financial statements is in conformity with accounting principles generally accepted in the United States of America and requires management to make estimates and assumptions that affect the reported amounts of assets and liabilities in the financial statements and the reported amounts of increases and decreases in net assets from operations. Actual results could differ from those estimates. Subsequent events after the Statement of assets and liabilities date through the date that the financial statements were issued have been evaluated in the preparation of the financial statements. Unless otherwise noted, the “reporting period” represents the period from December 1, 2010 through November 30, 2011.
A) Security valuation Investments for which market quotations are readily available are valued at the last reported sales price on their principal exchange, or official closing price for certain markets, and are classified as Level 1 securities. If no sales are reported, as in the case of some securities traded over-the-counter, a security is valued at its last reported bid price and is generally categorized as a Level 2 security.
Market quotations are not considered to be readily available for certain debt obligations and other investments; such investments are valued on the basis of valuations furnished by an independent pricing service approved by the Trustees or dealers selected by Putnam Investment Management, LLC (Putnam Management), the fund’s manager, an indirect wholly-owned subsidiary of Putnam Investments, LLC. Such services or dealers determine valuations for normal institutional-size trading units of such securities using methods based on market transactions for comparable securities and various relationships, generally recognized by institutional traders, between securities
55
(which considers such factors as security prices, yields, maturities and ratings). These securities will generally be categorized as Level 2.
Many securities markets and exchanges outside the U.S. close prior to the close of the New York Stock Exchange and therefore the closing prices for securities in such markets or on such exchanges may not fully reflect events that occur after such close but before the close of the New York Stock Exchange. Accordingly, on certain days, the fund will fair value foreign equity securities taking into account multiple factors including movements in the U.S. securities markets, currency valuations and comparisons to the valuation of American Depository Receipts, exchange-traded funds and futures contracts. These securities, which will generally represent a transfer from a Level 1 to a Level 2 security, will be classified as Level 2. The number of days on which fair value prices will be used will depend on market activity and it is possible that fair value prices will be used by the fund to a significant extent. Securities quoted in foreign currencies, if any, are translated into U.S. dollars at the current exchange rate.
To the extent a pricing service or dealer is unable to value a security or provides a valuation that Putnam Management does not believe accurately reflects the security’s fair value, the security will be valued at fair value by Putnam Management. Certain investments, including certain restricted and illiquid securities and derivatives, are also valued at fair value following procedures approved by the Trustees. These valuations consider such factors as significant market or specific security events such as interest rate or credit quality changes, various relationships with other securities, discount rates, U.S. Treasury, U.S. swap and credit yields, index levels, convexity exposures and recovery rates. These securities are classified as Level 2 or as Level 3 depending on the priority of the significant inputs.
Such valuations and procedures are reviewed periodically by the Trustees. Certain securities may be valued on the basis of a price provided by a single source. The fair value of securities is generally determined as the amount that the fund could reasonably expect to realize from an orderly disposition of such securities over a reasonable period of time. By its nature, a fair value price is a good faith estimate of the value of a security in a current sale and does not reflect an actual market price, which may be different by a material amount.
B) Security transactions and related investment income Security transactions are recorded on the trade date (the date the order to buy or sell is executed). Gains or losses on securities sold are determined on the identified cost basis. Interest income is recorded on the accrual basis. Dividend income, net of applicable withholding taxes, is recognized on the ex-dividend date except that certain dividends from foreign securities, if any, are recognized as soon as the fund is informed of the ex-dividend date. Non-cash dividends, if any, are recorded at the fair market value of the securities received. Dividends representing a return of capital or capital gains, if any, are reflected as a reduction of cost and/or as a realized gain. These fees are treated as market discount and are amortized into income in the Statement of operations. Securities purchased or sold on a delayed delivery basis may be settled a month or more after the trade date; interest income is accrued based on the terms of the securities. Losses may arise due to changes in the market value of the underlying securities or if the counterparty does not perform under the contract. The fund earned certain fees in connection with its senior loan purchasing activities.
C) Foreign currency translation The accounting records of the fund are maintained in U.S. dollars. The market value of foreign securities, currency holdings, and other assets and liabilities is recorded in the books and records of the fund after translation to U.S. dollars based on the exchange rates on that day. The cost of each security is determined using historical exchange rates. Income and withholding taxes are translated at prevailing exchange rates when earned or incurred. The fund does not isolate that portion of realized or unrealized gains or losses resulting from changes in the foreign exchange rate on investments from fluctuations arising from changes in the market prices of the securities. Such gains and losses are included with the net realized and unrealized gain or loss on investments. Net realized gains and losses on foreign currency transactions represent net realized exchange gains or losses on closed forward currency contracts, disposition of foreign currencies, currency gains and losses realized between the trade and settlement dates on securities transactions and the difference between the amount of investment income and foreign withholding taxes recorded on the fund’s books and the U.S. dollar equivalent amounts actually received or paid. Net unrealized appreciation and depreciation of assets and liabilities in foreign currencies arise from changes in the value of open forward currency contracts and assets and liabilities other than investments at the period end, resulting from changes in the exchange rate. Investments in foreign securities involve certain risks, including those related to economic instability, unfavorable political developments, and currency fluctuations, not present with domestic investments. The fund may be subject to taxes imposed by governments of countries in which it invests. Such taxes are generally based on either income or gains earned or repatriated. The fund accrues and applies such taxes to net investment income, net realized gains and net unrealized gains as income and/or capital gains are earned. In some cases, the fund may be entitled to reclaim all or a portion of such taxes, and such
56
reclaim amounts, if any, are reflected as an asset on the fund’s books. In many cases, however, the fund may not receive such amounts for an extended period of time, depending on the country of investment.
D) Forward currency contracts The fund buys and sells forward currency contracts, which are agreements between two parties to buy and sell currencies at a set price on a future date. These contracts are used to hedge foreign exchange risk. The U.S. dollar value of forward currency contracts is determined using current forward currency exchange rates supplied by a quotation service. The market value of the contract will fluctuate with changes in currency exchange rates. The contract is marked to market daily and the change in market value is recorded as an unrealized gain or loss. The fund records a realized gain or loss equal to the difference between the value of the contract at the time it was opened and the value at the time it was closed when the contract matures or by delivery of the currency. The fund could be exposed to risk if the value of the currency changes unfavorably, if the counterparties to the contracts are unable to meet the terms of their contracts or if the fund is unable to enter into a closing position. Risks may exceed amounts recognized on the Statement of assets and liabilities. Forward currency contracts outstanding at period end, if any, are listed after the fund’s portfolio. Outstanding forward currency contracts at the close of the reporting period are indicative of the volume of activity during the period.
E) Credit default contracts The fund entered into credit default contracts to hedge market risk. In a credit default contract, the protection buyer typically makes an up front payment and a periodic stream of payments to a counterparty, the protection seller, in exchange for the right to receive a contingent payment upon the occurrence of a credit event on the reference obligation or all other equally ranked obligations of the reference entity. Credit events are contract specific but may include bankruptcy, failure to pay, restructuring and obligation acceleration. An upfront payment received by the fund, as the protection seller, is recorded as a liability on the fund’s books. An upfront payment made by the fund, as the protection buyer, is recorded as an asset on the fund’s books. Periodic payments received or paid by the fund are recorded as realized gains or losses. The credit default contracts are marked to market daily based upon quotations from an independent pricing service or market makers and the change, if any, is recorded as an unrealized gain or loss. Upon the occurrence of a credit event, the difference between the par value and market value of the reference obligation, net of any proportional amount of the upfront payment, is recorded as a realized gain or loss.
In addition to bearing the risk that the credit event will occur, the fund could be exposed to market risk due to unfavorable changes in interest rates or in the price of the underlying security or index or the possibility that the fund may be unable to close out its position at the same time or at the same price as if it had purchased the underlying reference obligations. In certain circumstances, the fund may enter into offsetting credit default contracts which would mitigate its risk of loss. Risks of loss may exceed amounts recognized on the Statement of assets and liabilities. The fund’s maximum risk of loss from counterparty risk, either as the protection seller or as the protection buyer, is the fair value of the contract. This risk may be mitigated by having a master netting arrangement between the fund and the counterparty. Where the fund is a seller of protection, the maximum potential amount of future payments the fund may be required to make is equal to the notional amount of the relevant credit default contract. Credit default contracts outstanding, including their respective notional amounts at period end, if any, are listed after the fund’s portfolio. The fund had an average notional amount of approximately $3,600,000 on credit default swap contracts for the reporting period.
F) Master agreements The fund is a party to ISDA (International Swap and Derivatives Association, Inc.) Master Agreements (Master Agreements) with certain counterparties that govern over-the-counter derivative and foreign exchange contracts entered into from time to time. The Master Agreements may contain provisions regarding, among other things, the parties’ general obligations, representations, agreements, collateral requirements, events of default and early termination. With respect to certain counterparties, in accordance with the terms of the Master Agreements, collateral posted to the fund is held in a segregated account by the fund’s custodian and with respect to those amounts which can be sold or repledged, are presented in the fund’s portfolio. Collateral pledged by the fund is segregated by the fund’s custodian and identified in the fund’s portfolio. Collateral can be in the form of cash or debt securities issued by the U.S. Government or related agencies or other securities as agreed to by the fund and the applicable counterparty. Collateral requirements are determined based on the fund’s net position with each counterparty. Termination events applicable to the fund may occur upon a decline in the fund’s net assets below a specified threshold over a certain period of time. Termination events applicable to counterparties may occur upon a decline in the counterparty’s long-term and short-term credit ratings below a specified level. In each case, upon occurrence, the other party may elect to terminate early and cause settlement of all derivative and foreign exchange contracts outstanding, including the payment of any losses and costs resulting from such early termination, as reasonably determined by the terminating party. Any decision by one or more of the fund’s counterparties to elect early termination could impact the fund’s future derivative activity.
57
At the close of the reporting period, the fund had a net liability position of $751,773 on derivative contracts subject to the Master Agreements Collateral posted by the fund totaled $1,001,499.
G) Interfund lending The fund, along with other Putnam funds, may participate in an interfund lending program pursuant to an exemptive order issued by the Securities and Exchange Commission (the SEC). This program allows the fund to borrow from or lend to other Putnam funds that permit such transactions. Interfund lending transactions are subject to each fund’s investment policies and borrowing and lending limits. Interest earned or paid on the interfund lending transaction will be based on the average of certain current market rates. During the reporting period, the fund did not utilize the program.
H) Line of credit The fund participates, along with other Putnam funds, in a $325 million unsecured committed line of credit and a $185 million unsecured uncommitted line of credit, both provided by State Street Bank and Trust Company (State Street). Borrowings may be made for temporary or emergency purposes, including the funding of shareholder redemption requests and trade settlements. Interest is charged to the fund based on the fund’s borrowing at a rate equal to the Federal Funds rate plus 1.25% for the committed line of credit and the Federal Funds rate plus 1.30% for the uncommitted line of credit. A closing fee equal to 0.02% of the committed line of credit and $50,000 for the uncommitted line of credit has been paid by the participating funds. In addition, a commitment fee of 0.13% per annum on any unutilized portion of the committed line of credit is allocated to the participating funds based on their relative net assets and paid quarterly. During the reporting period, the fund had no borrowings against these arrangements.
I) Federal taxes It is the policy of the fund to distribute all of its taxable income within the prescribed time period and otherwise comply with the provisions of the Internal Revenue Code of 1986, as amended (the Code), applicable to regulated investment companies. It is also the intention of the fund to distribute an amount sufficient to avoid imposition of any excise tax under Section 4982 of the Code. The fund is subject to the provisions of Accounting Standards Codification ASC 740 Income Taxes (ASC 740). ASC 740 sets forth a minimum threshold for financial statement recognition of the benefit of a tax position taken or expected to be taken in a tax return. The fund did not have a liability to record for any unrecognized tax benefits in the accompanying financial statements. No provision has been made for federal taxes on income, capital gains or unrealized appreciation on securities held nor for excise tax on income and capital gains. Each of the fund’s federal tax returns for the prior three fiscal years remains subject to examination by the Internal Revenue Service.
At November 30, 2011, the fund had a capital loss carryover of $185,184,027 available to the extent allowed by the Code to offset future net capital gain, if any. The amounts of the carryovers and the expiration dates are:
| | |
| Loss carryover | Expiration |
|
| $95,929,758 | | November 30, 2012 |
|
| 8,720,272 | | November 30, 2014 |
|
| 21,153,748 | | November 30, 2016 |
|
| 59,380,249 | | November 30, 2017 |
|
Under the recently enacted Regulated Investment Company Modernization Act of 2010, the fund will be permitted to carry forward capital losses incurred in taxable years beginning after December 22, 2010 for an unlimited period. However, any losses incurred during those future years will be required to be utilized prior to the losses incurred in pre-enactment tax years. As a result of this ordering rule, pre-enactment capital loss carryforwards may be more likely to expire unused. Additionally, post-enactment capital losses that are carried forward will retain their character as either short-term or long-term capital losses rather than being considered all short-term as under previous law.
J) Distributions to shareholders Distributions to shareholders from net investment income are recorded by the fund on the ex-dividend date. Distributions from capital gains, if any, are recorded on the ex-dividend date and paid at least annually. The amount and character of income and gains to be distributed are determined in accordance with income tax regulations, which may differ from generally accepted accounting principles. These differences include temporary and/or permanent differences of the expiration of a capital loss carryover, defaulted bond interest, and interest on payment in-in-kind securities. Reclassifications are made to the fund’s capital accounts to reflect income and gains available for distribution (or available capital loss carryovers) under income tax regulations. For the reporting period ended, the fund reclassified $1,100,864 to increase undistributed net investment income and $89,801,134 to decrease paid-in-capital, with a decrease to accumulated net realized losses of $88,700,270.
58
The tax basis components of distributable earnings and the federal tax cost as of the close of the reporting period were as follows:
| |
| Unrealized appreciation | $21,632,605 |
| Unrealized depreciation | (49,017,856) |
|
| Net unrealized depreciation | (27,385,251) |
| Undistributed ordinary income | 6,790,053 |
| Capital loss carryforward | (185,184,027) |
| Cost for federal income tax purposes | $853,012,311 |
Note 2: Management fee, administrative services and other transactions
The fund pays Putnam Management a management fee (based on the fund’s average net assets and computed and paid monthly) at annual rates that may vary based on the average of the aggregate net assets of most open-end funds, as defined in the fund’s management contract, sponsored by Putnam Management. Such annual rates may vary as follows:
| |
| 0.720% | of the first $5 billion, |
| 0.670% | of the next $5 billion, |
| 0.620% | of the next $10 billion, |
| 0.570% | of the next $10 billion, |
| 0.520% | of the next $50 billion, |
| 0.500% | of the next $50 billion, |
| 0.490% | of the next $100 billion, |
| 0.485% | of any excess thereafter. |
Putnam Management has contractually agreed, through June 30, 2012, to waive fees or reimburse the fund’s expenses to the extent necessary to limit the cumulative expenses of the fund, exclusive of brokerage, interest, taxes, investment-related expenses, extraordinary expenses and payments under the fund’s investor servicing contract, investment management contract and distribution plans, on a fiscal year-to-date basis to an annual rate of 0.20% of the fund’s average net assets over such fiscal year-to-date period. During the reporting period, the fund’s expenses were not reduced as a result of this limit.
Putnam Investments Limited (PIL), an affiliate of Putnam Management, is authorized by the Trustees to manage a separate portion of the assets of the fund as determined by Putnam Management from time to time. Putnam Management pays a quarterly sub-management fee to PIL for its services at an annual rate of 0.40% of the average net assets of the portion of the fund managed by PIL.
The fund reimburses Putnam Management an allocated amount for the compensation and related expenses of certain officers of the fund and their staff who provide administrative services to the fund. The aggregate amount of all such reimbursements is determined annually by the Trustees.
Custodial functions for the fund’s assets are provided by State Street. Custody fees are based on the fund’s asset level, the number of its security holdings and transaction volumes.
Putnam Investor Services, Inc., an affiliate of Putnam Management, provides investor servicing agent functions to the fund. Putnam Investor Services, Inc. received fees for investor servicing based on the fund’s retail asset level, the number of shareholder accounts in the fund and the level of defined contribution plan assets in the fund. Investor servicing fees will not exceed an annual rate of 0.375% of the fund’s average net assets. The amounts incurred for investor servicing agent functions during the reporting period are included in Investor servicing fees in the Statement of operations.
The fund has entered into expense offset arrangements with Putnam Investor Services, Inc. and State Street whereby Putnam Investor Services, Inc.’s and State Street’s fees are reduced by credits allowed on cash balances. For the reporting period, the fund’s expenses were reduced by $4,047 under the expense offset arrangements.
Each independent Trustee of the fund receives an annual Trustee fee, of which $617, as a quarterly retainer, has been allocated to the fund, and an additional fee for each Trustees meeting attended. Trustees also are reimbursed for expenses they incur relating to their services as Trustees.
The fund has adopted a Trustee Fee Deferral Plan (the Deferral Plan) which allows the Trustees to defer the receipt of all or a portion of Trustees fees payable on or after July 1, 1995. The deferred fees remain invested in certain Putnam funds until distribution in accordance with the Deferral Plan.
59
The fund has adopted an unfunded noncontributory defined benefit pension plan (the Pension Plan) covering all Trustees of the fund who have served as a Trustee for at least five years and were first elected prior to 2004. Benefits under the Pension Plan are equal to 50% of the Trustee’s average annual attendance and retainer fees for the three years ended December 31, 2005. The retirement benefit is payable during a Trustee’s lifetime, beginning the year following retirement, for the number of years of service through December 31, 2006. Pension expense for the fund is included in Trustee compensation and expenses in the Statement of operations. Accrued pension liability is included in Payable for Trustee compensation and expenses in the Statement of assets and liabilities. The Trustees have terminated the Pension Plan with respect to any Trustee first elected after 2003.
The fund has adopted distribution plans (the Plans) with respect to its class A, class B, class C, class M and class R shares pursuant to Rule 12b–1 under the Investment Company Act of 1940. The purpose of the Plans is to compensate Putnam Retail Management Limited Partnership, a wholly-owned subsidiary of Putnam Investments, LLC and Putnam Retail Management GP, Inc., for services provided and expenses incurred in distributing shares of the fund. The Plans provide for payments by the fund to Putnam Retail Management Limited Partnership at an annual rate of up to 0.35%, 1.00%, 1.00%, 1.00% and 1.00% of the average net assets attributable to class A, class B, class C, class M and class R shares, respectively. The Trustees have approved payment by the fund at an annual rate of 0.25%, 1.00%, 1.00%, 0.50% and 0.50% of the average net assets attributable to class A, class B, class C, class M and class R shares, respectively.
For the reporting period, Putnam Retail Management Limited Partnership, acting as underwriter, received net commissions of $47,760 and $372 from the sale of class A and class M shares, respectively, and received $14,213 and $509 in contingent deferred sales charges from redemptions of class B and class C shares, respectively.
A deferred sales charge of up to 1.00% and 0.40% is assessed on certain redemptions of class A and class M shares, respectively. For the reporting period, Putnam Retail Management Limited Partnership, acting as underwriter, received $66 and no monies on class A and class M redemptions, respectively.
Note 3: Purchases and sales of securities
During the reporting period, cost of purchases and proceeds from sales of investment securities other than short-term investments aggregated $479,657,511 and $446,983,912, respectively. There were no purchases or proceeds from sales of long-term U.S. government securities.
Note 4: Capital shares
At the close of the reporting period, there was an unlimited number of shares of beneficial interest authorized. Transactions in capital shares were as follows:
| | | | |
| | Year ended 11/30/11 | Year ended 11/30/10 |
|
| Class A | Shares | Amount | Shares | Amount |
|
| Shares sold | 31,716,690 | $186,377,117 | 27,873,455 | $160,278,466 |
|
| Shares issued in connection with | | | | |
| reinvestment of distributions | 5,518,193 | 32,561,824 | 5,314,861 | 30,678,210 |
|
| | 37,234,883 | 218,938,941 | 33,188,316 | 190,956,676 |
|
| Shares repurchased | (37,041,355) | (217,782,415) | (28,675,629) | (164,877,506) |
|
| Net increase | 193,528 | $1,156,526 | 4,512,687 | $26,079,170 |
|
60
| | | | |
| | Year ended 11/30/11 | Year ended 11/30/10 |
|
| Class B | Shares | Amount | Shares | Amount |
|
| Shares sold | 733,560 | $4,262,414 | 380,271 | $2,177,101 |
|
| Shares issued in connection with | | | | |
| reinvestment of distributions | 59,583 | 344,477 | 57,500 | 326,017 |
|
| | 793,143 | 4,606,891 | 437,771 | 2,503,118 |
|
| Shares repurchased | (626,545) | (3,666,745) | (792,324) | (4,483,156) |
|
| Net increase (decrease) | 166,598 | $940,146 | (354,553) | $(1,980,038) |
|
| |
| | Year ended 11/30/11 | Year ended 11/30/10 |
|
| Class C | Shares | Amount | Shares | Amount |
|
| Shares sold | 1,927,302 | $11,121,958 | 540,341 | $3,104,055 |
|
| Shares issued in connection with | | | | |
| reinvestment of distributions | 103,310 | 593,405 | 84,808 | 479,741 |
|
| | 2,030,612 | 11,715,363 | 625,149 | 3,583,796 |
|
| Shares repurchased | (773,873) | (4,450,044) | (824,678) | (4,645,076) |
|
| Net increase (decrease) | 1,256,739 | $7,265,319 | (199,529) | $(1,061,280) |
|
| |
| | Year ended 11/30/11 | Year ended 11/30/10 |
|
| Class M | Shares | Amount | Shares | Amount |
|
| Shares sold | 300,112 | $1,767,025 | 551,808 | $3,182,572 |
|
| Shares issued in connection with | | | | |
| reinvestment of distributions | 51,102 | 301,599 | 48,731 | 281,540 |
|
| | 351,214 | 2,068,624 | 600,539 | 3,464,112 |
|
| Shares repurchased | (4,979,524) | (29,615,987) | (4,796,623) | (27,688,079) |
|
| Net decrease | (4,628,310) | $(27,547,363) | (4,196,084) | $(24,223,967) |
|
| |
| | Year ended 11/30/11 | Year ended 11/30/10 |
|
| Class R | Shares | Amount | Shares | Amount |
|
| Shares sold | 2,150,158 | $12,830,531 | 1,758,600 | $10,154,279 |
|
| Shares issued in connection with | | | | |
| reinvestment of distributions | 184,638 | 1,088,241 | 95,831 | 555,232 |
|
| | 2,334,796 | 13,918,772 | 1,854,431 | 10,709,511 |
|
| Shares repurchased | (1,328,919) | (7,830,007) | (826,199) | (4,756,957) |
|
| Net increase | 1,005,877 | $6,088,765 | 1,028,232 | $5,952,554 |
|
| |
| | Year ended 11/30/11 | Year ended 11/30/10 |
|
| Class Y | Shares | Amount | Shares | Amount |
|
| Shares sold | 11,775,479 | $71,189,142 | 6,763,327 | $40,267,309 |
|
| Shares issued in connection with | | | | |
| reinvestment of distributions | 1,016,265 | 6,188,538 | 804,548 | 4,785,491 |
|
| | 12,791,744 | 77,377,680 | 7,567,875 | 45,052,800 |
|
| Shares repurchased | (9,171,417) | (56,043,996) | (3,260,677) | (19,259,642) |
|
| Net increase | 3,620,327 | $21,333,684 | 4,307,198 | $25,793,158 |
|
At the close of the reporting period, a shareholder of record owned 6.1% of the outstanding shares of the fund.
61
Note 5: Summary of derivative activity
The following is a summary of the market values of derivative instruments as of the close of the reporting period.
Market values of derivative instruments as of the close of the reporting period
| | | | |
| | Asset derivatives | Liability derivatives |
|
| Derivatives not | | | | |
| accounted for as | Statement of | | Statement of | |
| hedging instruments | assets and | | assets and | |
| under ASC 815 | liabilities location | Market value | liabilities location | Market value |
|
| Credit contracts | Receivables | $— | Payables | $791,832 |
|
| Foreign exchange | | | | |
| contracts | Receivables | 262,410 | Payables | 7,923 |
|
| Total | | $262,410 | | $799,755 |
|
The following is a summary of realized and change in unrealized gains or losses of derivative instruments on the Statement of operations for the reporting period (see Note 1):
Amount of realized gain or (loss) on derivatives recognized in net gain or (loss) on investments
| | | |
| Derivatives not accounted for as hedging | Forward currency | | |
| instruments under ASC 815 | contracts | Swaps | Total |
|
| Credit contracts | $— | $(708,681) | $(708,681) |
|
| Foreign exchange contracts | 406,629 | — | $406,629 |
|
| Total | $406,629 | $(708,681) | $(302,052) |
|
Change in unrealized appreciation or (depreciation) on derivatives recognized in income
| | | |
| Derivatives not accounted for as hedging | Forward currency | | |
| instruments under ASC 815 | contracts | Swaps | Total |
|
| Credit contracts | $— | $37,856 | $37,856 |
|
| Foreign exchange contracts | (537,562) | — | (537,562) |
|
| Total | $(537,562) | $37,856 | $(499,706) |
|
Note 6: Investment in Putnam Money Market Liquidity Fund
The fund invested in Putnam Money Market Liquidity Fund, an open-end management investment company managed by Putnam Management. Investments in Putnam Money Market Liquidity Fund are valued at its closing net asset value each business day. Income distributions earned by the fund are recorded as interest income in the Statement of operations and totaled $18,762 for the reporting period. During the reporting period, cost of purchases and proceeds of sales of investments in Putnam Money Market Liquidity Fund aggregated $258,967,535 and $242,889,463, respectively. Management fees charged to Putnam Money Market Liquidity Fund have been waived by Putnam Management.
Note 7: Senior loan commitments
Senior loans are purchased or sold on a when-issued or delayed delivery basis and may be settled a month or more after the trade date, which from time to time can delay the actual investment of available cash balances; interest income is accrued based on the terms of the securities. Senior loans can be acquired through an agent, by assignment from another holder of the loan, or as a participation interest in another holder’s portion of the loan. When the fund invests in a loan or participation, the fund is subject to the risk that an intermediate participant between the fund and the borrower will fail to meet its obligations to the fund, in addition to the risk that the borrower under the loan may default on its obligations.
62
Note 8: Regulatory matters and litigation
In late 2003 and 2004, Putnam Management settled charges brought by the SEC and the Massachusetts Securities Division in connection with excessive short-term trading in Putnam funds. In July 2011, the fund recorded a receivable of $417,577 related to restitution amounts in connection with a distribution plan approved by the SEC. This amount, which was received by the fund in December 2011, is reported in the Increase in capital from settlement payments line on the Statement of changes in net assets. These allegations and related matters have served as the general basis for certain lawsuits, including purported class action lawsuits against Putnam Management and, in a limited number of cases, some Putnam funds. In May 2011, the fund received a payment of $6,034 related to settlement of those lawsuits. This amount is reported in the Increase in capital from settlement payments line on the Statement of changes in net assets. Putnam Management has agreed to bear any costs incurred by the Putnam funds as a result of these matters.
Note 9: Market and credit risk
In the normal course of business, the fund trades financial instruments and enters into financial transactions where risk of potential loss exists due to changes in the market (market risk) or failure of the contracting party to the transaction to perform (credit risk). The fund may be exposed to additional credit risk that an institution or other entity with which the fund has unsettled or open transactions will default.
Note 10: New accounting pronouncement
In May 2011, the Financial Accounting Standards Board (FASB) issued Accounting Standards Update (ASU) 2011–04 “Fair Value Measurements and Disclosures (Topic 820) — Amendments to Achieve Common Fair Value Measurement and Disclosure Requirements in U.S. GAAP and IFRS”. ASU 2011–04 amends FASB Topic 820 “Fair Value Measurement” and seeks to develop common requirements for measuring fair value and for disclosing information about fair value measurements in accordance with GAAP. ASU 2011–04 is effective for fiscal years and interim periods beginning after December 15, 2011. Putnam Management is currently evaluating the application of ASU 2011–04 and its impact, if any, on the fund’s financial statements.
63
Federal tax information (Unaudited)
For the tax year ended November 30, 2011, pursuant to §871(k) of the Internal Revenue Code, the fund hereby designates $55,228,863 of distributions paid as qualifying to be taxed as interest-related dividends.
The Form 1099 that will be mailed to you in January 2012 will show the tax status of all distributions paid to your account in calendar 2011.
64
About the Trustees
Independent Trustees

Ravi Akhoury
Born 1947, Trustee since 2009
Principal occupations during past five years: Advisor to New York Life Insurance Company. Trustee of American India Foundation and of the Rubin Museum. From 1992 to 2007, was Chairman and CEO of MacKay Shields, a multi-product investment management firm with over $40 billion in assets under management.
Other directorships: Jacob Ballas Capital India, a non-banking finance company focused on private equity advisory services; RAGE Frameworks, Inc., a private software company

Barbara M. Baumann
Born 1955, Trustee since 2010
Principal occupations during past five years: President and Owner of Cross Creek Energy Corporation, a strategic consultant to domestic energy firms and direct investor in energy projects. Trustee of Mount Holyoke College and member of the Investment Committee for the college’s endowment. Former Chair and current board member of Girls Incorporated of Metro Denver. Member of the Finance Committee, The Children’s Hospital of Denver.
Other directorships: SM Energy Company, a domestic exploration and production company; UniSource Energy Corporation, an Arizona utility; CVR Energy, a petroleum refiner and fertilizer manufacturer

Jameson A. Baxter
Born 1943, Trustee since 1994, Vice Chair from 2005 to 2011, and Chair since 2011
Principal occupations during past five years: President of Baxter Associates, Inc., a private investment firm. Chair of Mutual Fund Directors Forum. Chair Emeritus of the Board of Trustees of Mount Holyoke College. Director of the Adirondack Land Trust and Trustee of the Nature Conservancy’s Adirondack Chapter.

Charles B. Curtis
Born 1940, Trustee since 2001
Principal occupations during past five years: Former President and Chief Operating Officer of the Nuclear Threat Initiative, a private foundation dealing with national security issues. Senior Advisor to the Center for Strategic and International Studies. Member of the Council on Foreign Relations.
Other directorships: Edison International; Southern California Edison

Robert J. Darretta
Born 1946, Trustee since 2007
Principal occupations during past five years: Health Care Industry Advisor to Permira, a global private equity firm. Until April 2007, was Vice Chairman of the Board of Directors of Johnson & Johnson. Served as Johnson & Johnson’s Chief Financial Officer for a decade.
Other directorships: UnitedHealth Group, a diversified health-care company

John A. Hill
Born 1942, Trustee since 1985 and Chairman from 2000 to 2011
Principal occupations during past five years: Founder and Vice-Chairman of First Reserve Corporation, the leading private equity buyout firm focused on the worldwide energy industry. Serves as a Trustee and Chairman of the Board of Trustees of Sarah Lawrence College. Also a member of the Advisory Board of the Millstein Center for Corporate Governance and Performance at the Yale School of Management.
Other directorships: Devon Energy Corporation, a leading independent natural gas and oil exploration and production company
65

Paul L. Joskow
Born 1947, Trustee since 1997
Principal occupations during past five years: Economist and President of the Alfred P. Sloan Foundation, a philanthropic institution focused primarily on research and education on issues related to science, technology, and economic performance. Elizabeth and James Killian Professor of Economics, Emeritus at the Massachusetts Institute of Technology (MIT). Prior to 2007, served as the Director of the Center for Energy and Environmental Policy Research at MIT.
Other directorships: TransCanada Corporation, an energy company focused on natural gas transmission and power services; Exelon Corporation, an energy company focused on power services

Kenneth R. Leibler
Born 1949, Trustee since 2006
Principal occupations during past five years: Founder and former Chairman of Boston Options Exchange, an electronic marketplace for the trading of derivative securities. Vice Chairman of the Board of Trustees of Beth Israel Deaconess Hospital in Boston, Massachusetts. Until November 2010, director of Ruder Finn Group, a global communications and advertising firm.
Other directorships: Northeast Utilities, which operates New England’s largest energy delivery system

Robert E. Patterson
Born 1945, Trustee since 1984
Principal occupations during past five years: Senior Partner of Cabot Properties, LP and Co-Chairman of Cabot Properties, Inc., a private equity firm investing in commercial real estate. Past Chairman and Trustee of the Joslin Diabetes Center.

George Putnam, III
Born 1951, Trustee since 1984
Principal occupations during past five years: Chairman of New Generation Research, Inc., a publisher of financial advisory and other research services, and founder and President of New Generation Advisors, LLC, a registered investment advisor to private funds. Director of The Boston Family Office, LLC, a registered investment advisor.

W. Thomas Stephens
Born 1942, Trustee from 1997 to 2008 and since 2009
Principal occupations during past five years: Retired as Chairman and Chief Executive Officer of Boise Cascade, LLC, a paper, forest products, and timberland assets company, in December 2008. Prior to 2010, Director of Boise Inc., a manufacturer of paper and packaging products.
Other directorships: TransCanadaPipelines Ltd., an energy infrastructure company
Interested Trustee

Robert L. Reynolds
Born 1952, Trustee since 2008 and President of the Putnam Funds since July 2009
Principal occupations during past five years: President and Chief Executive Officer of Putnam Investments since 2008. Prior to joining Putnam Investments, served as Vice Chairman and Chief Operating Officer of Fidelity Investments from 2000 to 2007.
The address of each Trustee is One Post Office Square, Boston, MA 02109.
As of November 30, 2011, there were 108 Putnam funds. All Trustees serve as Trustees of all Putnam funds.
Each Trustee serves for an indefinite term, until his or her resignation, retirement at age 75, removal, or death.
* Mr. Reynolds is an “interested person” (as defined in the Investment Company Act of 1940) of the fund, Putnam Management, and/or Putnam Retail Management. He is President and Chief Executive Officer of Putnam Investments, as well as the President of your fund and each of the other Putnam funds.
66
Officers
In addition to Robert L. Reynolds, the other officers of the fund are shown below:
| |
| Jonathan S. Horwitz (Born 1955) | Robert T. Burns (Born 1961) |
| Executive Vice President, Principal Executive | Vice President and Chief Legal Officer |
| Officer, Treasurer and Compliance Liaison | Since 2011 |
| Since 2004 | General Counsel, Putnam Investments and |
| | Putnam Management |
| Steven D. Krichmar (Born 1958) | |
| Vice President and Principal Financial Officer | James P. Pappas (Born 1953) |
| Since 2002 | Vice President |
| Chief of Operations, Putnam Investments and | Since 2004 |
| Putnam Management | Director of Trustee Relations, |
| | Putnam Investments and Putnam Management |
| Janet C. Smith (Born 1965) | |
| Vice President, Assistant Treasurer and | Judith Cohen (Born 1945) |
| Principal Accounting Officer | Vice President, Clerk and Assistant Treasurer |
| Since 2007 | Since 1993 |
| Director of Fund Administration Services, | |
| Putnam Investments and Putnam Management | Michael Higgins (Born 1976) |
| | Vice President, Senior Associate Treasurer and |
| Beth S. Mazor (Born 1958) | Assistant Clerk |
| Vice President | Since 2010 |
| Since 2002 | Manager of Finance, Dunkin’ Brands (2008– |
| Manager of Trustee Relations, Putnam | 2010); Senior Financial Analyst, Old Mutual Asset |
| Investments and Putnam Management | Management (2007–2008); Senior Financial |
| | Analyst, Putnam Investments (1999–2007) |
| Robert R. Leveille (Born 1969) | |
| Vice President and Chief Compliance Officer | Nancy E. Florek (Born 1957) |
| Since 2007 | Vice President, Assistant Clerk, Assistant |
| Chief Compliance Officer, Putnam Investments, | Treasurer and Proxy Manager |
| Putnam Management, and Putnam Retail | Since 2000 |
| Management | |
| | Susan G. Malloy (Born 1957) |
| Mark C. Trenchard (Born 1962) | Vice President and Assistant Treasurer |
| Vice President and BSA Compliance Officer | Since 2007 |
| Since 2002 | Director of Accounting & Control Services, |
| Director of Operational Compliance, | Putnam Management |
| Putnam Investments and Putnam | |
| Retail Management | |
The principal occupations of the officers for the past five years have been with the employers as shown above although in some cases, they have held different positions with such employers. The address of each Officer is One Post Office Square, Boston, MA 02109.
67
Services for shareholders
Investor services
Systematic investment plan Tell us how much you wish to invest regularly — weekly, semimonthly, or monthly — and the amount you choose will be transferred automatically from your checking or savings account. There’s no additional fee for this service, and you can suspend it at any time. This plan may be a great way to save for college expenses or to plan for your retirement.
Please note that regular investing does not guarantee a profit or protect against loss in a declining market. Before arranging a systematic investment plan, consider your financial ability to continue making purchases in periods when prices are low.
Systematic exchange You can make regular transfers from one Putnam fund to another Putnam fund. There are no additional fees for this service, and you can cancel or change your options at any time.
Dividends PLUS You can choose to have the dividend distributions from one of your Putnam funds automatically reinvested in another Putnam fund at no additional charge.
Free exchange privilege You can exchange money between Putnam funds free of charge, as long as they are the same class of shares. A signature guarantee is required if you are exchanging more than $500,000. The fund reserves the right to revise or terminate the exchange privilege.
Reinstatement privilege If you’ve sold Putnam shares or received a check for a dividend or capital gain, you may reinvest the proceeds with Putnam within 90 days of the transaction and they will be reinvested at the fund’s current net asset value — with no sales charge. However, reinstatement of class B shares may have special tax consequences. Ask your financial or tax representative for details.
Check-writing service You have ready access to many Putnam accounts. It’s as simple as writing a check, and there are no special fees or service charges. For more information about the check-writing service, call Putnam or visit our website.
Dollar cost averaging When you’re investing for long-term goals, it’s time, not timing, that counts. Investing on a systematic basis is a better strategy than trying to figure out when the markets will go up or down. This means investing the same amount of money regularly over a long period. This method of investing is called dollar cost averaging. When a fund’s share price declines, your investment dollars buy more shares at lower prices. When it increases, they buy fewer shares. Over time, you will pay a lower average price per share.
For more information
Visit the Individual Investors section at putnam.com A secure section of our website contains complete information on your account, including balances and transactions, updated daily. You may also conduct transactions, such as exchanges, additional investments, and address changes. Log on today to get your password.
Call us toll free at 1-800-225-1581 Ask a helpful Putnam representative or your financial advisor for details about any of these or other services, or see your prospectus.
68
Fund information
Founded over 70 years ago, Putnam Investments was built around the concept that a balance between risk and reward is the hallmark of a well-rounded financial program. We manage over 100 funds across income, value, blend, growth, asset allocation, absolute return, and global sector categories.
| | |
| Investment Manager | Paul L. Joskow | Mark C. Trenchard |
| Putnam Investment | Kenneth R. Leibler | Vice President and |
| Management, LLC | Robert E. Patterson | BSA Compliance Officer |
| One Post Office Square | George Putnam, III | |
| Boston, MA 02109 | Robert L. Reynolds | Robert T. Burns |
| | W. Thomas Stephens | Vice President and |
| Investment Sub-Manager | | Chief Legal Officer |
| Putnam Investments Limited | Officers | |
| 57–59 St James’s Street | Robert L. Reynolds | James P. Pappas |
| London, England SW1A 1LD | President | Vice President |
| | | |
| Marketing Services | Jonathan S. Horwitz | Judith Cohen |
| Putnam Retail Management | Executive Vice President, | Vice President, Clerk and |
| One Post Office Square | Principal Executive | Assistant Treasurer |
| Boston, MA 02109 | Officer, Treasurer and | |
| | Compliance Liaison | Michael Higgins |
| Custodian | | Vice President, Senior Associate |
| State Street Bank | Steven D. Krichmar | Treasurer and Assistant Clerk |
| and Trust Company | Vice President and | |
| | Principal Financial Officer | Nancy E. Florek |
| Legal Counsel | | Vice President, Assistant Clerk, |
| Ropes & Gray LLP | Janet C. Smith | Assistant Treasurer and |
| | Vice President, Assistant | Proxy Manager |
| Independent Registered | Treasurer and Principal | |
| Public Accounting Firm | Accounting Officer | Susan G. Malloy |
| KPMG LLP | | Vice President and |
| | Beth S. Mazor | Assistant Treasurer |
| Trustees | Vice President | |
| Jameson A. Baxter, Chair | | |
| Ravi Akhoury | Robert R. Leveille | |
| Barbara M. Baumann | Vice President and | |
| Charles B. Curtis | Chief Compliance Officer | |
| Robert J. Darretta | | |
| John A. Hill | | |
This report is for the information of shareholders of Putnam High Yield Advantage Fund. It may also be used as sales literature when preceded or accompanied by the current prospectus, the most recent copy of Putnam’s Quarterly Performance Summary, and Putnam’s Quarterly Ranking Summary. For more recent performance, please visit putnam.com. Investors should carefully consider the investment objectives, risks, charges, and expenses of a fund, which are described in its prospectus. For this and other information or to request a prospectus or summary prospectus, call 1-800-225-1581 toll free. Please read the prospectus carefully before investing. The fund’s Statement of Additional Information contains additional information about the fund’s Trustees and is available without charge upon request by calling 1-800-225-1581.
| |
| (a) The fund’s principal executive, financial and accounting officers are employees of Putnam Investment Management, LLC, the Fund’s investment manager. As such they are subject to a comprehensive Code of Ethics adopted and administered by Putnam Investments which is designed to protect the interests of the firm and its clients. The Fund has adopted a Code of Ethics which incorporates the Code of Ethics of Putnam Investments with respect to all of its officers and Trustees who are employees of Putnam Investment Management, LLC. For this reason, the Fund has not adopted a separate code of ethics governing its principal executive, financial and accounting officers. |
| |
| (c) In May 2008, the Code of Ethics of Putnam Investment Management, LLC was updated in its entirety to include the amendments adopted in August 2007 as well as a several additional technical, administrative and non-substantive changes. In May of 2009, the Code of Ethics of Putnam Investment Management, LLC was amended to reflect that all employees will now be subject to a 90-day blackout restriction on holding Putnam open-end funds, except for portfolio managers and their supervisors (and each of their immediate family members), who will be subject to a one-year blackout restriction on the funds that they manage or supervise. In June 2010, the Code of Ethics of Putnam Investments was updated in its entirety to include the amendments adopted in May of 2009 and to change certain rules and limits contained in the Code of Ethics. In addition, the updated Code of Ethics included numerous technical, administrative and non-substantive changes, which were intended primarily to make the document easier to navigate and understand. In July 2011, the Code of Ethics of Putnam Investments was updated to reflect several technical, administrative and non-substantive changes resulting from changes in employee titles. |
| |
| Item 3. Audit Committee Financial Expert: |
| |
| The Funds’ Audit and Compliance Committee is comprised solely of Trustees who are “independent” (as such term has been defined by the Securities and Exchange Commission (“SEC”) in regulations implementing Section 407 of the Sarbanes-Oxley Act (the “Regulations”)). The Trustees believe that each of the members of the Audit and Compliance Committee also possess a combination of knowledge and experience with respect to financial accounting matters, as well as other attributes, that qualify them for service on the Committee. In addition, the Trustees have determined that each of Mr. Leibler, Mr. Hill, Mr. Darretta and Ms. Baumann qualifies as an “audit committee financial expert” (as such term has been defined by the Regulations) based on their review of his or her pertinent experience and education. The SEC has stated that the designation or identification of a person as an audit committee financial expert pursuant to this Item 3 of Form N-CSR does not impose on such person any duties, obligations or liability that are greater than the duties, obligations and liability imposed on such person as a member of the Audit and Compliance Committee and the Board of Trustees in the absence of such designation or identification. |
| |
| Item 4. Principal Accountant Fees and Services: |
| |
| The following table presents fees billed in each of the last two fiscal years for services rendered to the fund by the fund’s independent auditor: |
| | | | | |
| Fiscal year ended | Audit Fees | Audit-Related Fees | Tax Fees | All Other Fees |
|
|
| | | | | |
| November 30, 2011 | $82,325 | $-- | $4,350 | $ — |
| November 30, 2010 | $70,498 | $-- | $4,100 | $ — |
| |
| For the fiscal years ended November 30, 2011and November 30, 2010, the fund’s independent auditor billed aggregate non-audit fees in the amounts of $4,350 and $4,100 respectively, to the fund, Putnam Management and any entity controlling, controlled by or under common control with Putnam Management that provides ongoing services to the fund. |
| |
| Audit Fees represent fees billed for the fund’s last two fiscal years relating to the audit and review of the financial statements included in annual reports and registration statements, and other services that are normally provided in connection with statutory and regulatory filings or engagements. |
| |
| Audit-Related Fees represent fees billed in the fund’s last two fiscal years for services traditionally performed by the fund’s auditor, including accounting consultation for proposed transactions or concerning financial accounting and reporting standards and other audit or attest services not required by statute or regulation. |
| |
| Tax Fees represent fees billed in the fund’s last two fiscal years for tax compliance, tax planning and tax advice services. Tax planning and tax advice services include assistance with tax audits, employee benefit plans and requests for rulings or technical advice from taxing authorities. |
| |
| Pre-Approval Policies of the Audit and Compliance Committee. The Audit and Compliance Committee of the Putnam funds has determined that, as a matter of policy, all work performed for the funds by the funds’ independent auditors will be pre-approved by the Committee itself and thus will generally not be subject to pre-approval procedures. |
| |
| The Audit and Compliance Committee also has adopted a policy to pre-approve the engagement by Putnam Management and certain of its affiliates of the funds’ independent auditors, even in circumstances where pre-approval is not required by applicable law. Any such requests by Putnam Management or certain of its affiliates are typically submitted in writing to the Committee and explain, among other things, the nature of the proposed engagement, the estimated fees, and why this work should be performed by that particular audit firm as opposed to another one. In reviewing such requests, the Committee considers, among other things, whether the provision of such services by the audit firm are compatible with the independence of the audit firm. |
| |
| The following table presents fees billed by the fund’s independent auditor for services required to be approved pursuant to paragraph (c)(7)(ii) of Rule 2-01 of Regulation S-X. |
| | | | | |
| Fiscal year ended | Audit-Related Fees | Tax Fees | All Other Fees | Total Non-Audit Fees |
|
|
| | | | | |
| November 30, 2011 | $ — | $ — | $ — | $ — |
| | | | | |
| November 30, 2010 | $ — | $ — | $ — | $ — |
| |
| Item 5. Audit Committee of Listed Registrants |
| |
| Item 6. Schedule of Investments: |
| |
| The registrant’s schedule of investments in unaffiliated issuers is included in the report to shareholders in Item 1 above. |
| |
| Item 7. Disclosure of Proxy Voting Policies and Procedures For Closed-End Management Investment Companies: |
| |
| Item 8. Portfolio Managers of Closed-End Investment Companies |
| |
| Item 9. Purchases of Equity Securities by Closed-End Management Investment Companies and Affiliated Purchasers: |
| |
| Item 10. Submission of Matters to a Vote of Security Holders: |
| |
| Item 11. Controls and Procedures: |
| |
| (a) The registrant’s principal executive officer and principal financial officer have concluded, based on their evaluation of the effectiveness of the design and operation of the registrant’s disclosure controls and procedures as of a date within 90 days of the filing date of this report, that the design and operation of such procedures are generally effective to provide reasonable assurance that information required to be disclosed by the registrant in this report is recorded, processed, summarized and reported within the time periods specified in the Commission’s rules and forms. |
| |
| (b) Changes in internal control over financial reporting: During the period, State Street Bank and Trust Company, which provides certain administrative, pricing and bookkeeping services for the Putnam funds pursuant to an agreement with Putnam Investment Management, LLC, began utilizing different accounting systems and systems support in providing services for the fund. |
| |
| (a)(1) The Code of Ethics of The Putnam Funds, which incorporates the Code of Ethics of Putnam Investments, is filed herewith. |
| |
| (a)(2) Separate certifications for the principal executive officer and principal financial officer of the registrant as required by Rule 30a-2(a) under the Investment Company Act of 1940, as amended, are filed herewith. |
| |
| (b) The certifications required by Rule 30a-2(b) under the Investment Company Act of 1940, as amended, are filed herewith. |
| |
| Pursuant to the requirements of the Securities Exchange Act of 1934 and the Investment Company Act of 1940, the registrant has duly caused this report to be signed on its behalf by the undersigned, thereunto duly authorized. |
| |
| Putnam High Yield Advantage Fund |
| |
| By (Signature and Title): |
| |
| /s/Janet C. Smith
Janet C. Smith
Principal Accounting Officer
|
| |
| Pursuant to the requirements of the Securities Exchange Act of 1934 and the Investment Company Act of 1940, this report has been signed below by the following persons on behalf of the registrant and in the capacities and on the dates indicated. |
| |
| By (Signature and Title): |
| |
| /s/Jonathan S. Horwitz
Jonathan S. Horwitz
Principal Executive Officer
|
| |
| By (Signature and Title): |
| |
| /s/Steven D. Krichmar
Steven D. Krichmar
Principal Financial Officer
|