| | |
| UNITED STATES
SECURITIES AND EXCHANGE COMMISSION |
| | |
| CERTIFIED SHAREHOLDER REPORT OF REGISTERED
MANAGEMENT INVESTMENT COMPANIES
|
| | |
| Investment Company Act file number: | (811-04616) |
| | |
| Exact name of registrant as specified in charter: | Putnam High Yield Advantage Fund |
| | |
| Address of principal executive offices: | One Post Office Square, Boston, Massachusetts 02109 |
| | |
| Name and address of agent for service: | Robert T. Burns, Vice President
One Post Office Square
Boston, Massachusetts 02109 |
| | |
| Copy to: | John W. Gerstmayr, Esq.
Ropes & Gray LLP
800 Boylston Street
Boston, Massachusetts 02199-3600 |
| | |
| Registrant’s telephone number, including area code: | (617) 292-1000 |
| | |
| Date of fiscal year end: | November 30, 2012 |
| | |
| Date of reporting period: | December 1, 2011 — November 30, 2012 |
| | |
|
Item 1. Report to Stockholders: | |
| | |
| The following is a copy of the report transmitted to stockholders pursuant to Rule 30e-1 under the Investment Company Act of 1940: | |

Putnam
High Yield
Advantage Fund
Annual report
11 | 30 | 12
| | |
| Message from the Trustees | 1 | |
| |
| About the fund | 2 | |
| |
| Performance snapshot | 4 | |
| |
| Interview with your fund’s portfolio manager | 5 | |
| |
| Your fund’s performance | 11 | |
| |
| Your fund’s expenses | 14 | |
| |
| Terms and definitions | 16 | |
| |
| Other information for shareholders | 17 | |
| |
| Trustee approval of management contract | 18 | |
| |
| Financial statements | 22 | |
| |
| Federal tax information | 65 | |
| |
| About the Trustees | 66 | |
| |
| Officers | 68 | |
| |
Consider these risks before investing: Lower-rated bonds may offer higher yields in return for more risk. Derivatives also involve the risk, in the case of many over-the-counter instruments, of the potential inability to terminate or sell derivatives positions and the potential failure of the other party to the instrument to meet its obligations. Bond investments are subject to interest-rate risk, which means the prices of the fund’s bond investments are likely to fall if interest rates rise. Bond investments also are subject to credit risk, which is the risk that the issuer of the bond may default on payment of interest or principal. Interest-rate risk is generally greater for longer-term bonds, and credit risk is generally greater for below-investment-grade bonds, which may be considered speculative. Unlike bonds, funds that invest in bonds have ongoing fees and expenses. The prices of bonds in the fund’s portfolio may fall or fail to rise over extended periods of time for a variety of reasons, including both general financial market conditions and factors related to a specific issuer.
Message from the Trustees
Dear Fellow Shareholder:
In recent months, Europe’s sovereign debt crisis and the threat of the “fiscal cliff” in the United States have contributed to heightened market volatility and have curtailed economic growth.
Even with these challenges, the U.S. economy has exhibited resiliency, with employment, housing, and GDP data all improving. While most of Europe is mired in recession, slow but steady progress is being made to resolve the eurozone’s years-long debt crisis. Meanwhile, China, the world’s second-largest economy, is showing strength in its important manufacturing sector.
Putnam’s portfolio managers and analysts are trained to look for opportunities and manage downside risk in volatile market environments. We also believe in the importance of relying on the expertise of a financial advisor as you work toward your long-term financial goals.
We would like to take this opportunity to announce the arrival of two new Trustees, Liaquat Ahamed and Katinka Domotorffy, CFA, to your fund’s Board of Trustees. Mr. Ahamed, who in 2010 won the Pulitzer Prize for History with his book, Lords of Finance: The Bankers Who Broke the World, also serves on the Board of Aspen Insurance and the Board of the Rohatyn Group, an emerging-market fund complex that manages money for institutional investors.
Ms. Domotorffy, who until year-end 2011 was a Partner, Chief Investment Officer, and Global Head of Quantitative Investment Strategies at Goldman Sachs Asset Management, currently serves as a member of the Anne Ray Charitable Trust’s Investment Committee, Margaret A. Cargill Philanthropies, and director for Reach Out and Read of Greater New York, an organization dedicated to promoting early childhood literacy.
We would also like to extend a welcome to new shareholders of the fund and to thank all of our investors for your continued confidence in Putnam.

About the fund
Seeking a high level of current income for investors since 1986
Unlike most types of fixed-income investments, high-yield bond performance is more dependent on the performance of the companies that issue the bonds than on interest rates. For this reason, distinguishing between opportunities and potential pitfalls requires a rigorous investment process that includes analyzing companies. With Putnam High Yield Advantage Fund, this process is highlighted by intensive research, investment diversification, and carefully timed portfolio adjustments.
Because of the risks of high-yield bond investing, in-depth credit research is essential. The fund’s research team — which includes analysts who specialize by industry — visits with the management of issuing companies and analyzes each company’s prospects. The team then compares this information to the bond’s upside or downside potential before deciding whether it is an appropriate investment for the fund.
The fund’s portfolio typically consists of bonds from a broad range of industries and companies. Holdings are diversified across industry sectors and among bonds with differing credit ratings. While the fund invests primarily in the bonds of U.S. companies, its diversified approach allows it to include foreign bonds as well.
As the bond markets shift over time, the fund’s managers look for ways to capitalize on developments that aff ect fixed-income securities in general and high-yield bonds in particular. For example, when credit spreads are wide and are expected to tighten, the fund may pursue the higher income potential offered by lower-quality issues. On the other hand, when credit spreads are narrow — that is, when the diff erence in yield between higher- and lower-rated bonds of comparable maturities is small — the fund may shift its emphasis to higher-quality high-yield bonds.
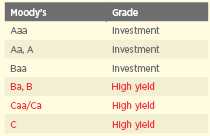
What makes a bond “high yield”?
High-yield bonds are fixed-income investments typically issued by companies that lack an established earnings track record or a solid credit history. In general, high-yield bonds offer higher interest rates than investment-grade bonds to compensate for their increased risk. Because of this added risk, these bonds are typically rated below investment grade by an independent rating agency (for example, the lowest Moody’s Investors Service rating of investment-grade bonds is Baa). The lower the rating, the greater the possibility that a bond’s issuer will be unable to make interest payments or repay the principal.
Bond ratings
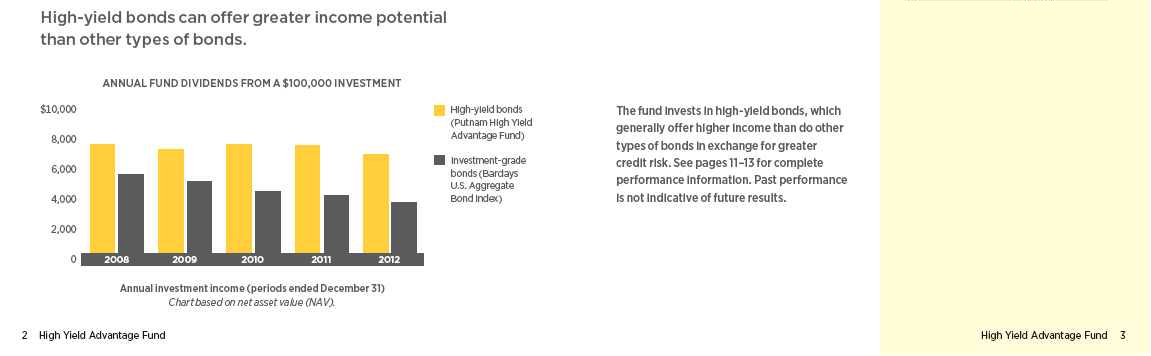
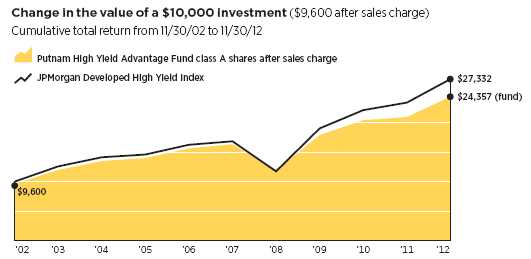
Current performance may be lower or higher than the quoted past performance, which cannot guarantee future results. Share price, principal value, and return will fluctuate, and you may have a gain or a loss when you sell your shares. Performance of class A shares assumes reinvestment of distributions and does not account for taxes. Fund returns in the bar chart do not reflect a sales charge of 4.00%; had they, returns would have been lower. See pages 5 and 11–13 for additional performance information. For a portion of the periods, the fund had expense limitations, without which returns would have been lower. A short-term trading fee of 1% may apply to redemptions or exchanges from certain funds within the time period specified in the fund’s prospectus. To obtain the most recent month-end performance, visit putnam.com.
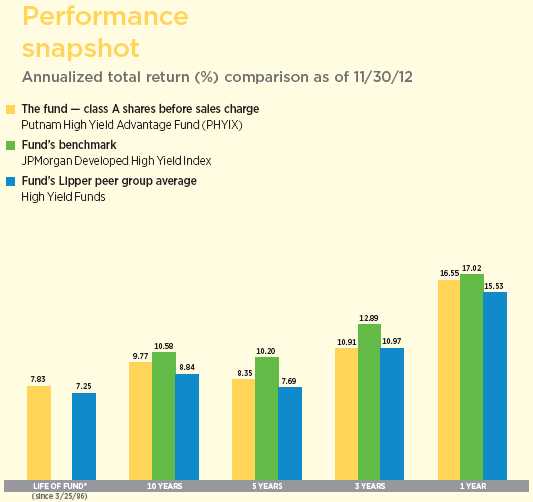
* The fund’s benchmark, the JPMorgan Developed High Yield Index, was introduced on 12/31/94, which post-dates the inception of the fund’s class A shares.
| |
| 4 | High Yield Advantage Fund |
Interview with your fund’s portfolio manager

Paul, what was the market environment like for high-yield bonds during the 12 months ended November 30, 2012?
The period began on a positive note, as investors grew more optimistic about U.S. economic growth and less pessimistic about Europe’s sovereign debt crisis. Investor confidence was buoyed by the European Central Bank’s [ECB] Long-Term Refinancing Operation, which provided much-needed stability to global credit markets by injecting liquidity into the European banking system, thereby reducing banks’ short-term funding risk. Against this backdrop, high-yield bonds rallied strongly from December through February.
As winter turned to spring, disappointing U.S. economic data, concern about slowing global economic growth, and renewed fear about eurozone debt prompted investors to reduce risk and shift back toward more-defensive asset classes and market sectors. As a result, after posting moderately positive returns in March and April, high-yield bonds, as well as other asset classes entailing greater credit or market risk, sold off in May.
The high-yield market bottomed at the beginning of June, then staged an impressive rally into mid September, fueled by encouraging comments from the ECB and robust demand from investors seeking yield. Additionally, investors concluded that U.S.
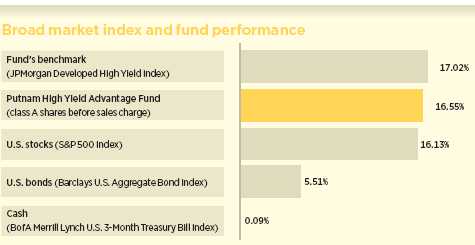
This comparison shows your fund’s performance in the context of broad market indexes for the 12 months ended 11/30/12. See pages 4 and 11–13 for additional fund performance information. Index descriptions can be found on pages 16–17.
| |
| High Yield Advantage Fund | 5 |
economic growth, while anemic by historical standards, would likely remain steady.
High-yield bonds were choppy during the period’s latter months, due to uncertainty about the U.S. presidential election and the effect it could have on the so-called “fiscal cliff” of automatic tax increases and spending cuts that were scheduled to kick in on January 1, 2013. However, the market advanced during the period’s final weeks in part due to investors’ anticipation that President Obama and Congress could possibly reach a compromise. Investors were also relieved that with President Obama’s reelection, Ben Bernanke likely would remain Federal Reserve chairman and the central bank’s accommodative monetary policy would continue.
For the period as a whole, high-yield bonds were one of the top-performing fixed-income categories. As for the fund, it slightly under-performed its benchmark but outpaced the average return of its Lipper peer group.
What factors influenced the fund’s relative performance during the period?
At the sector/industry level, overweighting financials, telecommunications, gaming and leisure, and retail aided the fund’s results versus the index. Conversely, adverse security selection in utilities hampered relative performance, as did holding
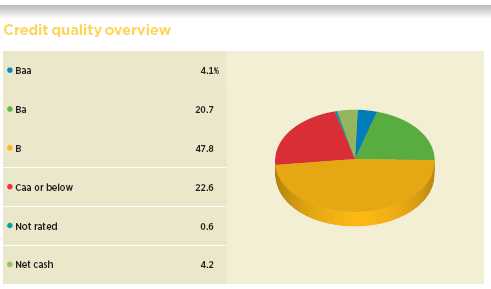
Credit qualities are shown as a percentage of the fund’s net assets as of 11/30/12. A bond rated Baa or higher (Prime-3 or higher, for short-term debt) is considered investment grade. The chart reflects Moody’s ratings; percentages may include bonds or derivatives not rated by Moody’s but rated by Standard & Poor’s (S&P) or, if unrated by S&P, by Fitch Ratings, and then included in the closest equivalent Moody’s rating. Ratings will vary over time.
Credit quality includes bonds and represents only the fixed-income portion of the portfolio. Derivative instruments, including forward currency contracts, are only included to the extent of any unrealized gain or loss on such instruments and are shown in the net-cash category. The fund itself has not been rated by an independent rating agency.
| |
| 6 | High Yield Advantage Fund |
lighter-than-benchmark stakes in paper/packaging, diversified media, and industrials.

From a credit-quality standpoint, modestly overweighting CCC-rated securities helped the fund’s relative performance, as they outperformed BB- and B-rated bonds. Underweighting BB-rated and “crossover” securities provided a further boost to results, because bonds in these ratings tiers lagged the index. Crossover bonds are those that straddle the gap between investment grade and high yield, often receiving an investment-grade rating from one rating agency and a below-investment-grade rating from another.
Which holdings helped versus the index?
Wireless carrier Sprint Nextel was the top individual contributor, as the company posted better-than-expected results on stronger wireless margins resulting from lower expenses and reduced roaming costs. In addition, the firm added more than one million subscribers to its network.
Satellite services provider Intelsat also helped the fund’s performance, thanks to stronger operating margins and continued steady growth.
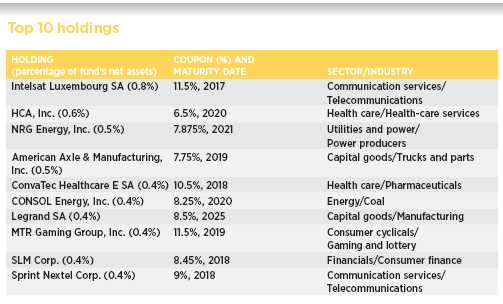
This table shows the fund’s top 10 holdings and the percentage of the fund’s net assets that each represented as of 11/30/12. Short-term holdings, derivatives, and TBA commitments are excluded. Holdings will vary over time.
| |
| High Yield Advantage Fund | 7 |
Our position in automotive finance provider Ally Financial [formerly GMAC] proved beneficial, as investors became more confident in the firm’s ability to extricate itself from mortgage liabilities at its ResCap subsidiary.
Real estate and relocation services company Realogy was another contributor. Prices for the firm’s bonds and bank debt rose in anticipation of an initial public stock offering, along with continued modest improvement in transaction volumes and pricing. Realogy’s securities were also helped by signs of recovery in the U.S. housing market.
Hospitality and gaming company MTR Gaming Group rounded out the group of top contributors. MTR’s securities received a boost when the Ohio Gaming Commission licensed the firm to operate video lottery terminals at its Scioto Downs racetrack in Columbus, Ohio.
Which investments weren’t as productive?
NII Capital, the financing subsidiary of NII Holdings, which provides mobile communications for business customers in Latin America under the Nextel brand, was a disappointment. The firm missed revenue and earnings expectations due to lower-than-forecast average revenue per user and margin pressure from its expansion and rebranding initiative. NII also indicated that it expects earnings and net subscriber additions to be markedly lower compared with the same period last year.
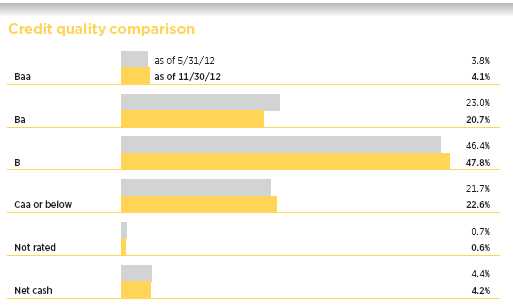
This chart shows how the fund’s credit quality has changed over the past six months. Credit qualities are shown as a percentage of net assets as of 11/30/12. A bond rated Baa or higher (Prime-3 or higher, for short-term debt) is considered investment grade. The chart reflects Moody’s ratings; percentages may include bonds or derivatives not rated by Moody’s but rated by Standard & Poor’s (S&P) or, if unrated by S&P, by Fitch Ratings, and then included in the closest equivalent Moody’s rating. Ratings will vary over time.
Credit quality includes bonds and represents only the fixed-income portion of the portfolio. Derivative instruments, including currency forwards, are only included to the extent of any unrealized gain or loss on such instruments and are shown in the net-cash category. The fund itself has not been rated by an independent rating agency.
| |
| 8 | High Yield Advantage Fund |
The fund had underweight exposure to automaker Chrysler Group, and its bonds outperformed the index. Chrysler benefited from stronger U.S. sales across all of its brands.
The fund reduced its distribution rate during the period. What led to that decision?
The fund’s distribution rate per class A share was lowered to $0.031 from $0.035 in April due to a decline in the amount of income earned because of lower overall yields across the market. Similar reductions were made to other share classes.
What is your outlook for the high-yield market over the coming months?
We evaluate the high-yield market by looking at three key factors: fundamentals, valuation, and “technicals,” or the balance of supply and demand. As of now, we are neutral on all three.
Looking first at fundamentals, we see an economic landscape marked by countervailing trends. Third-quarter gross domestic product came in at a better-than-expected annualized rate of 2%, indicating that the U.S. economy continued to grow, albeit at a sluggish pace compared with past post-recession recoveries. With the Japanese and German economies slowing sharply, recession in other parts of Europe, and China growing at a rate that is slow by its own standards, the areas of the U.S. economy that are heavily dependent on global trade have weakened. In our view, corporate fundamentals still appear to be reasonably solid, although earnings in various early-cycle industries are showing signs of softening. At the same time, the housing market appears to be recovering in many parts of the country, which could provide a nice boost to certain sectors of the economy. That said, the possibility of fiscal austerity in the form of spending cuts and tax increases in 2013 could dampen the positive effects of a housing recovery.
As for valuation, the yield advantage high-yield bonds offered versus Treasuries compressed during the period to 597 basis points at period-end. [A basis point is 1/100 of one percent.] The high-yield default rate ended the period at 1.3%, which is well below the long-term average of 4.2%. All told, while yield spreads on high-yield bonds have tightened, their absolute yields remain attractive against the backdrop of lower-yielding alternatives, particularly given relatively low default risk at the present time. Consequently, in our view, high-yield bonds appear to be fairly valued, barring some unforeseen market event.
Looking at market technicals, high-yield mutual funds experienced positive flows in nine out of the past twelve months, although recent flows turned negative, particularly among exchange-traded funds [ETFs]. New issuance reached record levels, with corporations seeking to lock in attractive long-term rates.
High-yield market liquidity, or ease of trading, has diminished, partly due to new regulations designed to limit risk in financial institutions. These regulatory changes have made broker/dealers more reluctant to commit risk capital to support bond inventories at the same level as in the past. As market-makers have drawn down their inventories of corporate bonds, marketplace liquidity has declined.
Given this outlook, how have you positioned the fund?
The amount of refinancing that has occurred during the past two-and-a-half years has extended the maturity profile of many high-yield issuers, which helps reduce their current debt load. As a result, we believe the prospects for the default rate to remain below the historical average for some time are quite good. That said, given the continuing uncertainty surrounding potential macroeconomic, U.S. fiscal policy, and geopolitical developments, we have modestly reduced
| |
| High Yield Advantage Fund | 9 |
the fund’s overall market risk by, among other measures, moderately increasing cash. In our view, holding a cash cushion may also help the fund should marketplace liquidity remain constrained.
Thanks for your time and for bringing us up to date, Paul.
The views expressed in this report are exclusively those of Putnam Management and are subject to change. They are not meant as investment advice.
Please note that the holdings discussed in this report may not have been held by the fund for the entire period. Portfolio composition is subject to review in accordance with the fund’s investment strategy and may vary in the future. Current and future portfolio holdings are subject to risk.
Portfolio Manager Paul D. Scanlon is Co-Head of Fixed Income at Putnam. He has an M.B.A. from The University of Chicago Booth School of Business and a B.A. from Colgate University. A CFA charterholder, Paul joined Putnam in 1999 and has been in the investment industry since 1986.
In addition to Paul, your fund’s portfolio managers are Norman P. Boucher and Robert L. Salvin.
IN THE NEWS
While the U.S. economy continues to gather strength in several key areas, estimates for overall global economic growth in 2012 and 2013 have been downgraded. The Organisation for Economic Co-operation and Development (OECD) revised its global GDP projections from 3.4% to 2.9% for 2012 and from 4.2% to 3.4% for 2013. The primary barriers to growth include the eurozone’s debt crisis and, to a lesser degree, the impending U.S. “fiscal cliff.” For the eurozone, the Paris-based think tank predicts negative growth of –0.4% in 2012 and –0.1% in 2013, before climbing to a tepid 1.3% in 2014. U.S. GDP growth may be significantly better, however: 2.2% for 2012, slowing to 2% in 2013, before increasing to 2.8% in 2014, according to the OECD.
| |
| 10 | High Yield Advantage Fund |
Your fund’s performance
This section shows your fund’s performance, price, and distribution information for periods ended November 30, 2012, the end of its most recent fiscal year. In accordance with regulatory requirements for mutual funds, we also include performance as of the most recent calendar quarter-end and expense information taken from the fund’s current prospectus. Performance should always be considered in light of a fund’s investment strategy. Data represent past performance. Past performance does not guarantee future results. More recent returns may be less or more than those shown. Investment return and principal value will fluctuate, and you may have a gain or a loss when you sell your shares. Performance information does not reflect any deduction for taxes a shareholder may owe on fund distributions or on the redemption of fund shares. For the most recent month-end performance, please visit the Individual Investors section at putnam.com or call Putnam at 1-800-225-1581. Class R and class Y shares are not available to all investors. See the Terms and Definitions section in this report for definitions of the share classes offered by your fund.
Fund performance Total return for periods ended 11/30/12
| | | | | | | | | | |
| | Class A | Class B | Class C | Class M | Class R | Class Y |
|
| (inception dates) | (3/25/86) | (5/16/94) | (3/30/07) | (12/1/94) | (3/30/07) | (12/31/98) |
|
| | Before | After | | | | | Before | After | Net | Net |
| | sales | sales | Before | After | Before | After | sales | sales | asset | asset |
| charge | charge | CDSC | CDSC | CDSC | CDSC | charge | charge | value | value |
|
| Annual average | | | | | | | | | | |
| (life of fund) | 7.83% | 7.67% | 6.93% | 6.93% | 7.02% | 7.02% | 7.54% | 7.40% | 7.57% | 8.01% |
|
| 10 years | 153.94 | 143.57 | 135.13 | 135.13 | 135.01 | 135.01 | 147.53 | 139.66 | 148.08 | 160.82 |
| Annual average | 9.77 | 9.31 | 8.93 | 8.93 | 8.92 | 8.92 | 9.49 | 9.13 | 9.51 | 10.06 |
|
| 5 years | 49.34 | 43.41 | 43.84 | 41.84 | 43.90 | 43.90 | 47.46 | 42.74 | 47.60 | 51.13 |
| Annual average | 8.35 | 7.48 | 7.54 | 7.24 | 7.55 | 7.55 | 8.08 | 7.38 | 8.10 | 8.61 |
|
| 3 years | 36.42 | 31.00 | 33.22 | 30.22 | 33.17 | 33.17 | 35.12 | 30.66 | 35.36 | 37.51 |
| Annual average | 10.91 | 9.42 | 10.03 | 9.20 | 10.02 | 10.02 | 10.55 | 9.32 | 10.62 | 11.20 |
|
| 1 year | 16.55 | 11.97 | 15.48 | 10.48 | 15.52 | 14.52 | 16.13 | 12.33 | 16.13 | 16.76 |
|
Current performance may be lower or higher than the quoted past performance, which cannot guarantee future results. After-sales-charge returns for class A and M shares reflect the deduction of the maximum 4.00% and 3.25% sales charge, respectively, levied at the time of purchase. Class B share returns after contingent deferred sales charge (CDSC) reflect the applicable CDSC, which is 5% in the first year, declining over time to 1% in the sixth year, and is eliminated thereafter. Class C share returns after CDSC reflect a 1% CDSC for the first year that is eliminated thereafter. Class R and Y shares have no initial sales charge or CDSC. Performance for class B, C, M, R, and Y shares before their inception is derived from the historical performance of class A shares, adjusted for the applicable sales charge (or CDSC) and the higher operating expenses for such shares, except for class Y shares, for which 12b-1 fees are not applicable.
For a portion of the periods, the fund had expense limitations, without which returns would have been lower.
Class B share performance does not reflect conversion to class A shares.
A short-term trading fee of 1% may apply to redemptions or exchanges from certain funds within the time period specified in the fund’s prospectus.
| |
| High Yield Advantage Fund | 11 |
Comparative index returns For periods ended 11/30/12
| | |
| | JPMorgan Developed | Lipper High Yield Funds |
| | High Yield Index | category average* |
|
| Annual average (life of fund) | —† | 7.25% |
|
| 10 years | 173.32% | 134.55 |
| Annual average | 10.58 | 8.84 |
|
| 5 years | 62.55 | 45.13 |
| Annual average | 10.20 | 7.69 |
|
| 3 years | 43.87 | 36.70 |
| Annual average | 12.89 | 10.97 |
|
| 1 year | 17.02 | 15.53 |
|
Index and Lipper results should be compared with fund performance before sales charge, before CDSC, or at net asset value.
* Over the 1-year, 3-year, 5-year, 10-year, and life-of-fund periods ended 11/30/12, there were 504, 440, 377, 257 and 24 funds, respectively, in this Lipper category.
† The fund’s benchmark, the JPMorgan Developed High Yield Index, was introduced on 12/31/94, which post-dates the inception of the fund’s class A shares.
Past performance does not indicate future results. At the end of the same time period, a $10,000 investment in the fund’s class B and class C shares would have been valued at $23,513 and $23,501, respectively, and no contingent deferred sales charges would apply. A $10,000 investment in the fund’s class M shares ($9,675 after sales charge) would have been valued at $23,966. A $10,000 investment in the fund’s class R and class Y shares would have been valued at $24,808 and $26,082, respectively.
| |
| 12 | High Yield Advantage Fund |
Fund price and distribution information For the 12-month period ended 11/30/12
| | | | | | | | |
| Distributions | Class A | Class B | Class C | Class M | Class R | Class Y |
|
| Number | 12 | 12 | 12 | 12 | 12 | 12 |
|
| Income | $0.403 | $0.362 | $0.361 | $0.391 | $0.391 | $0.415 |
|
| Total | $0.403 | $0.362 | $0.361 | $0.391 | $0.391 | $0.415 |
|
| | Before | After | Net | Net | Before | After | Net | Net |
| | sales | sales | asset | asset | sales | sales | asset | asset |
| Share value | charge | charge | value | value | charge | charge | value | value |
|
| 11/30/11 | $5.62 | $5.85 | $5.52 | $5.50 | $5.62 | $5.81 | $5.62 | $5.81 |
|
| 11/30/12 | 6.12 | 6.38 | 5.99 | 5.97 | 6.11 | 6.32 | 6.11 | 6.34 |
|
| | Before | After | Net | Net | Before | After | Net | Net |
| Current yield | sales | sales | asset | asset | sales | sales | asset | asset |
| (end of period) | charge | charge | value | value | charge | charge | value | value |
|
| Current dividend rate 1 | 6.08% | 5.83% | 5.61% | 5.43% | 5.89% | 5.70% | 5.89% | 6.06% |
|
| Current 30-day SEC yield 2 | N/A | 5.02 | 4.49 | 4.49 | N/A | 4.82 | 4.99 | 5.48 |
|
The classification of distributions, if any, is an estimate. Before-sales-charge share value and current dividend rate for class A and M shares, if applicable, do not take into account any sales charge levied at the time of purchase. After-sales-charge share value, current dividend rate, and current 30-day SEC yield, if applicable, are calculated assuming that the maximum sales charge (4.00% for class A shares and 3.25% for class M shares) was levied at the time of purchase. Final distribution information will appear on your year-end tax forms.
1 Most recent distribution, excluding capital gains, annualized and divided by share price before or after sales charge at period-end.
2 Based only on investment income and calculated using the maximum offering price for each share class, in accordance with SEC guidelines.
Fund performance as of most recent calendar quarter
Total return for periods ended 12/31/12
| | | | | | | | | | |
| | Class A | Class B | Class C | Class M | Class R | Class Y |
|
| (inception dates) | (3/25/86) | (5/16/94) | (3/30/07) | (12/1/94) | (3/30/07) | (12/31/98) |
|
| | Before | After | | | | | Before | After | Net | Net |
| | sales | sales | Before | After | Before | After | sales | sales | asset | asset |
| | charge | charge | CDSC | CDSC | CDSC | CDSC | charge | charge | value | value |
|
| Annual average | | | | | | | | | | |
| (life of fund) | 7.86% | 7.70% | 6.97% | 6.97% | 7.05% | 7.05% | 7.57% | 7.44% | 7.60% | 8.04% |
|
| 10 years | 156.35 | 146.31 | 137.81 | 137.81 | 138.01 | 138.01 | 150.30 | 142.32 | 150.81 | 163.18 |
| Annual average | 9.87 | 9.43 | 9.05 | 9.05 | 9.06 | 9.06 | 9.61 | 9.25 | 9.63 | 10.16 |
|
| 5 years | 51.26 | 45.20 | 45.97 | 43.97 | 46.04 | 46.04 | 49.60 | 44.77 | 49.50 | 53.01 |
| Annual average | 8.63 | 7.74 | 7.86 | 7.56 | 7.87 | 7.87 | 8.39 | 7.68 | 8.37 | 8.88 |
|
| 3 years | 34.58 | 29.12 | 31.61 | 28.61 | 31.55 | 31.55 | 33.52 | 29.21 | 33.53 | 35.46 |
| Annual average | 10.41 | 8.89 | 9.59 | 8.75 | 9.57 | 9.57 | 10.12 | 8.92 | 10.12 | 10.65 |
|
| 1 year | 15.11 | 10.47 | 14.23 | 9.23 | 14.24 | 13.24 | 14.88 | 11.19 | 14.88 | 15.35 |
|
| 6 months | 7.36 | 3.02 | 6.95 | 1.95 | 6.96 | 5.96 | 7.26 | 3.76 | 7.26 | 7.37 |
|
| |
| High Yield Advantage Fund | 13 |
Your fund’s expenses
As a mutual fund investor, you pay ongoing expenses, such as management fees, distribution fees (12b-1 fees), and other expenses. Using the following information, you can estimate how these expenses affect your investment and compare them with the expenses of other funds. You may also pay one-time transaction expenses, including sales charges (loads) and redemption fees, which are not shown in this section and would have resulted in higher total expenses. For more information, see your fund’s prospectus or talk to your financial representative.
Expense ratios
| | | | | | |
| | Class A | Class B | Class C | Class M | Class R | Class Y |
|
| Total annual operating expenses | | | | | | |
| for the fiscal year ended | | | | | | |
| 11/30/11 | 1.04% | 1.79% | 1.79% | 1.29% | 1.29% | 0.79% |
|
| Annualized expense ratio for | | | | | | |
| the six-month period ended | | | | | | |
| 11/30/12* | 1.03% | 1.78% | 1.78% | 1.28% | 1.28% | 0.78% |
|
Fiscal-year expense information in this table is taken from the most recent prospectus, is subject to change, and may differ from that shown for the annualized expense ratio and in the financial highlights of this report. Expenses are shown as a percentage of average net assets.
* For the fund’s most recent fiscal half year; may differ from expense ratios based on one-year data in the financial highlights.
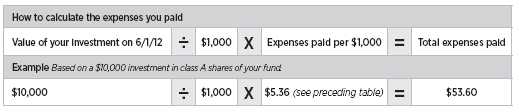
Expenses per $1,000
The following table shows the expenses you would have paid on a $1,000 investment in the fund from June 1, 2012, to November 30, 2012. It also shows how much a $1,000 investment would be worth at the close of the period, assuming actual returns and expenses.
| | | | | | |
| | Class A | Class B | Class C | Class M | Class R | Class Y |
|
| Expenses paid per $1,000*† | $5.36 | $9.23 | $9.23 | $6.65 | $6.65 | $4.06 |
|
| Ending value (after expenses) | $1,080.70 | $1,074.90 | $1,075.00 | $1,077.90 | $1,077.90 | $1,082.40 |
|
* Expenses for each share class are calculated using the fund’s annualized expense ratio for each class, which represents the ongoing expenses as a percentage of average net assets for the six months ended 11/30/12. The expense ratio may differ for each share class.
† Expenses are calculated by multiplying the expense ratio by the average account value for the period; then multiplying the result by the number of days in the period; and then dividing that result by the number of days in the year.
| |
| 14 | High Yield Advantage Fund |
Estimate the expenses you paid
To estimate the ongoing expenses you paid for the six months ended November 30, 2012, use the following calculation method. To find the value of your investment on June 1, 2012, call Putnam at 1-800-225-1581.
Compare expenses using the SEC’s method
The Securities and Exchange Commission (SEC) has established guidelines to help investors assess fund expenses. Per these guidelines, the following table shows your fund’s expenses based on a $1,000 investment, assuming a hypothetical 5% annualized return. You can use this information to compare the ongoing expenses (but not transaction expenses or total costs) of investing in the fund with those of other funds. All mutual fund shareholder reports will provide this information to help you make this comparison. Please note that you cannot use this information to estimate your actual ending account balance and expenses paid during the period.
| | | | | | |
| | Class A | Class B | Class C | Class M | Class R | Class Y |
|
| Expenses paid per $1,000*† | $5.20 | $8.97 | $8.97 | $6.46 | $6.46 | $3.94 |
|
| Ending value (after expenses) | $1,019.85 | $1,016.10 | $1,016.10 | $1,018.60 | $1,018.60 | $1,021.10 |
|
* Expenses for each share class are calculated using the fund’s annualized expense ratio for each class, which represents the ongoing expenses as a percentage of average net assets for the six months ended 11/30/12. The expense ratio may differ for each share class.
† Expenses are calculated by multiplying the expense ratio by the average account value for the period; then multiplying the result by the number of days in the period; and then dividing that result by the number of days in the year.
| |
| High Yield Advantage Fund | 15 |
Terms and definitions
Important terms
Total return shows how the value of the fund’s shares changed over time, assuming you held the shares through the entire period and reinvested all distributions in the fund.
Before sales charge, or net asset value, is the price, or value, of one share of a mutual fund, without a sales charge. Before-sales-charge figures fluctuate with market conditions, and are calculated by dividing the net assets of each class of shares by the number of outstanding shares in the class.
After sales charge is the price of a mutual fund share plus the maximum sales charge levied at the time of purchase. After-sales-charge performance figures shown here assume the 4.00% maximum sales charge for class A shares and 3.25% for class M shares.
Contingent deferred sales charge (CDSC) is generally a charge applied at the time of the redemption of class B or C shares and assumes redemption at the end of the period. Your fund’s class B CDSC declines over time from a 5% maximum during the first year to 1% during the sixth year. After the sixth year, the CDSC no longer applies. The CDSC for class C shares is 1% for one year after purchase.
Share classes
Class A shares are generally subject to an initial sales charge and no CDSC (except on certain redemptions of shares bought without an initial sales charge).
Class B shares are not subject to an initial sales charge. They may be subject to a CDSC.
Class C shares are not subject to an initial sales charge and are subject to a CDSC only if the shares are redeemed during the first year.
Class M shares have a lower initial sales charge and a higher 12b-1 fee than class A shares and no CDSC (except on certain redemptions of shares bought without an initial sales charge).
Class R shares are not subject to an initial sales charge or CDSC and are available only to certain defined contribution plans.
Class Y shares are not subject to an initial sales charge or CDSC, and carry no 12b-1 fee. They are generally only available to corporate and institutional clients and clients in other approved programs.
Fixed-income terms
Current yield is the annual rate of return earned from dividends or interest of an investment. Current yield is expressed as a percentage of the price of a security, fund share, or principal investment.
Yield curve is a graph that plots the yields of bonds with equal credit quality against their differing maturity dates, ranging from shortest to longest. It is used as a benchmark for other debt, such as mortgage or bank lending rates.
Comparative indexes
Barclays U.S. Aggregate Bond Index is an unmanaged index of U.S. investment-grade fixed-income securities.
BofA (Bank of America) Merrill Lynch U.S. 3-Month Treasury Bill Index is an unmanaged index that seeks to measure the performance of U.S. Treasury bills available in the marketplace.
JPMorgan Developed High Yield Index is an unmanaged index of high-yield fixed-income securities issued in developed countries.
S&P 500 Index is an unmanaged index of common stock performance.
Indexes assume reinvestment of all distributions and do not account for fees. Securities and performance of a fund and an index will differ. You cannot invest directly in an index.
| |
| 16 | High Yield Advantage Fund |
Lipper is a third-party industry-ranking entity that ranks mutual funds. Its rankings do not reflect sales charges. Lipper rankings are based on total return at net asset value relative to other funds that have similar current investment styles or objectives as determined by Lipper. Lipper may change a fund’s category assignment at its discretion. Lipper category averages reflect performance trends for funds within a category.
Other information for shareholders
Important notice regarding Putnam’s privacy policy
In order to conduct business with our shareholders, we must obtain certain personal information such as account holders’ names, addresses, Social Security numbers, and dates of birth. Using this information, we are able to maintain accurate records of accounts and transactions.
It is our policy to protect the confidentiality of our shareholder information, whether or not a shareholder currently owns shares of our funds. In particular, it is our policy not to sell information about you or your accounts to outside marketing firms. We have safeguards in place designed to prevent unauthorized access to our computer systems and procedures to protect personal information from unauthorized use.
Under certain circumstances, we must share account information with outside vendors who provide services to us, such as mailings and proxy solicitations. In these cases, the service providers enter into confidentiality agreements with us, and we provide only the information necessary to process transactions and perform other services related to your account. Finally, it is our policy to share account information with your financial representative, if you’ve listed one on your Putnam account.
Proxy voting
Putnam is committed to managing our mutual funds in the best interests of our shareholders. The Putnam funds’ proxy voting guidelines and procedures, as well as information regarding how your fund voted proxies relating to portfolio securities during the 12-month period ended June 30, 2012, are available in the Individual Investors section at putnam.com, and on the Securities and Exchange Commission (SEC) website, www.sec.gov. If you have questions about finding forms on the SEC’s website, you may call the SEC at 1-800-SEC-0330. You may also obtain the Putnam funds’ proxy voting guidelines and procedures at no charge by calling Putnam’s Shareholder Services at 1-800-225-1581.
Fund portfolio holdings
The fund will file a complete schedule of its portfolio holdings with the SEC for the first and third quarters of each fiscal year on Form N-Q. Shareholders may obtain the fund’s Forms N-Q on the SEC’s website at www.sec.gov. In addition, the fund’s Forms N-Q may be reviewed and copied at the SEC’s Public Reference Room in Washington, D.C. You may call the SEC at 1-800-SEC-0330 for information about the SEC’s website or the operation of the Public Reference Room.
Trustee and employee fund ownership
Putnam employees and members of the Board of Trustees place their faith, confidence, and, most importantly, investment dollars in Putnam mutual funds. As of November 30, 2012, Putnam employees had approximately $340,000,000 and the Trustees had approximately $83,000,000 invested in Putnam mutual funds. These amounts include investments by the Trustees’ and employees’ immediate family members as well as investments through retirement and deferred compensation plans.
| |
| High Yield Advantage Fund | 17 |
Trustee approval of management contract
General conclusions
The Board of Trustees of the Putnam funds oversees the management of each fund and, as required by law, determines annually whether to approve the continuance of your fund’s management contract with Putnam Investment Management (“Putnam Management”) and the sub-management contract with respect to your fund between Putnam Management and its affiliate, Putnam Investments Limited (“PIL”).
The Board of Trustees, with the assistance of its Contract Committee, requests and evaluates all information it deems reasonably necessary under the circumstances in connection with its annual contract review. The Contract Committee consists solely of Trustees who are not “interested persons” (as this term is defined in the Investment Company Act of 1940, as amended (the “1940 Act”)) of the Putnam funds (“Independent Trustees”).
At the outset of the review process, members of the Board’s independent staff and independent legal counsel met with representatives of Putnam Management to review the annual contract review materials furnished to the Contract Committee during the course of the previous year’s review and to discuss possible changes in these materials that might be necessary or desirable for the coming year. Following these discussions and in consultation with the Contract Committee, the Independent Trustees’ independent legal counsel requested that Putnam Management furnish specified information, together with any additional information that Putnam Management considered relevant, to the Contract Committee. Over the course of several months ending in June 2012, the Contract Committee met on a number of occasions with representatives of Putnam Management, and separately in executive session, to consider the information that Putnam Management provided. Throughout this process, the Contract Committee was assisted by the members of the Board’s independent staff and by independent legal counsel for the Putnam funds and the Independent Trustees.
In May 2012, the Contract Committee met in executive session with the other Independent Trustees to discuss the Contract Committee’s preliminary recommendations with respect to the continuance of the contracts. At the Trustees’ June 22, 2012 meeting, the Contract Committee met in executive session with the other Independent Trustees to review a summary of the key financial data that the Contract Committee considered in the course of its review. The Contract Committee then presented its written report, which summarized the key factors that the Committee had considered and set forth its final recommendations. The Contract Committee then recommended, and the Independent Trustees approved, the continuance of your fund’s management and sub-management contracts, effective July 1, 2012. (Because PIL is an affiliate of Putnam Management and Putnam Management remains fully responsible for all services provided by PIL, the Trustees have not evaluated PIL as a separate entity, and all subsequent references to Putnam Management below should be deemed to include reference to PIL as necessary or appropriate in the context.)
The Independent Trustees’ approval was based on the following conclusions:
• That the fee schedule in effect for your fund represented reasonable compensation in light of the nature and quality of the services being provided to the fund, the fees paid by competitive funds, and the costs incurred by Putnam Management in providing services, and
• That the fee schedule represented an appropriate sharing between fund shareholders and Putnam Management of such economies of scale as may exist in the management of the fund at current asset levels.
These conclusions were based on a comprehensive consideration of all information provided to the Trustees and were not the result of any single factor. Some of the factors that figured
| |
| 18 | High Yield Advantage Fund |
particularly in the Trustees’ deliberations and how the Trustees considered these factors are described below, although individual Trustees may have evaluated the information presented differently, giving different weights to various factors. It is also important to recognize that the management arrangements for your fund and the other Putnam funds are the result of many years of review and discussion between the Independent Trustees and Putnam Management, that some aspects of the arrangements may receive greater scrutiny in some years than others, and that the Trustees’ conclusions may be based, in part, on their consideration of fee arrangements in previous years.
Management fee schedules and total expenses
The Trustees reviewed the management fee schedules in effect for all Putnam funds, including fee levels and breakpoints. In reviewing management fees, the Trustees generally focus their attention on material changes in circumstances — for example, changes in assets under management, changes in a fund’s investment style, changes in Putnam Management’s operating costs, or changes in competitive practices in the mutual fund industry — that suggest that consideration of fee changes might be warranted. The Trustees concluded that the circumstances did not warrant changes to the management fee structure of your fund.
Most of the open-end Putnam funds, including your fund, have relatively new management contracts, which introduced fee schedules that reflect more competitive fee levels for many funds, complex-wide breakpoints for the open-end funds, and performance fees for some funds. These new management contracts have been in effect for two years — since January or, for a few funds, February 2010. The Trustees approved the new management contracts on July 10, 2009, and fund shareholders subsequently approved the contracts by overwhelming majorities of the shares voted.
Under its management contract, your fund has the benefit of breakpoints in its management fee that provide shareholders with significant economies of scale in the form of reduced fee levels as assets under management in the Putnam family of funds increase. The Contract Committee observed that the complex-wide breakpoints of the open-end funds had only been in place for two years, and the Trustees will continue to examine the operation of this new breakpoint structure in future years in light of further experience.
As in the past, the Trustees also focused on the competitiveness of each fund’s total expense ratio. In order to ensure that expenses of the Putnam funds continue to meet evolving competitive standards, the Trustees and Putnam Management agreed in 2009 to implement certain expense limitations. These expense limitations serve in particular to maintain competitive expense levels for funds with large numbers of small shareholder accounts and funds with relatively small net assets. Most funds, including your fund, had sufficiently low expenses that these expense limitations did not apply. The expense limitations were: (i) a contractual expense limitation applicable to all retail open-end funds of 37.5 basis points (effective March 1, 2012, this expense limitation was reduced to 32 basis points) on investor servicing fees and expenses and (ii) a contractual expense limitation applicable to all open-end funds of 20 basis points on so-called “other expenses” (i.e., all expenses exclusive of management fees, investor servicing fees, distribution fees, investment-related expenses, interest, taxes, brokerage commissions, extraordinary expenses and acquired fund fees and expenses). Putnam Management’s support for these expense limitations, including its agreement to reduce the expense limitation applicable to the open-end funds’ investor servicing fees and expenses as noted above, was an important factor in the Trustees’ decision to approve the continuance of your fund’s management and sub-management contracts.
The Trustees reviewed comparative fee and expense information for a custom group of competitive funds selected by Lipper Inc. This comparative information included your fund’s percentile ranking for effective management
| |
| High Yield Advantage Fund | 19 |
fees and total expenses (excluding any applicable 12b-1 fee), which provides a general indication of your fund’s relative standing. In the custom peer group, your fund ranked in the 2nd quintile in effective management fees (determined for your fund and the other funds in the custom peer group based on fund asset size and the applicable contractual management fee schedule) and in the 2nd quintile in total expenses (excluding any applicable 12b-1 fees) as of December 31, 2011 (the first quintile representing the least expensive funds and the fifth quintile the most expensive funds). The fee and expense data reported by Lipper as of December 31, 2011 reflected the most recent fiscal year-end data available in Lipper’s database at that time.
In connection with their review of the management fees and total expenses of the Putnam funds, the Trustees also reviewed the costs of the services provided and the profits realized by Putnam Management and its affiliates from their contractual relationships with the funds. This information included trends in revenues, expenses and profitability of Putnam Management and its affiliates relating to the investment management, investor servicing and distribution services provided to the funds. In this regard, the Trustees also reviewed an analysis of Putnam Management’s revenues, expenses and profitability, allocated on a fund-by-fund basis, with respect to the funds’ management, distribution, and investor servicing contracts. For each fund, the analysis presented information about revenues, expenses and profitability for each of the agreements separately and for the agreements taken together on a combined basis. The Trustees concluded that, at current asset levels, the fee schedules in place represented reasonable compensation for the services being provided and represented an appropriate sharing of such economies of scale as may exist in the management of the funds at that time.
The information examined by the Trustees as part of their annual contract review for the Putnam funds has included for many years information regarding fees charged by Putnam Management and its affiliates to institutional clients such as defined benefit pension plans, college endowments, and the like. This information included comparisons of those fees with fees charged to the funds, as well as an assessment of the differences in the services provided to these different types of clients. The Trustees observed that the differences in fee rates between institutional clients and mutual funds are by no means uniform when examined by individual asset sectors, suggesting that differences in the pricing of investment management services to these types of clients may reflect historical competitive forces operating in separate markets. The Trustees considered the fact that in many cases fee rates across different asset classes are higher on average for mutual funds than for institutional clients, as well as the differences between the services that Putnam Management provides to the Putnam funds and those that it provides to its institutional clients. The Trustees did not rely on these comparisons to any significant extent in concluding that the management fees paid by your fund are reasonable.
Investment performance
The quality of the investment process provided by Putnam Management represented a major factor in the Trustees’ evaluation of the quality of services provided by Putnam Management under your fund’s management contract. The Trustees were assisted in their review of the Putnam funds’ investment process and performance by the work of the investment oversight committees of the Trustees, which meet on a regular basis with the funds’ portfolio teams and with the Chief Investment Officer and other members of Putnam Management’s Investment Division throughout the year. The Trustees concluded that Putnam Management generally provides a high-quality investment process — based on the experience and skills of the individuals assigned to the management of fund portfolios, the resources made available to them, and in general Putnam Management’s ability to attract and retain high-quality personnel — but also recognized that this does
|
| 20 High Yield Advantage Fund |
not guarantee favorable investment results for every fund in every time period.
The Trustees considered the investment performance of each fund over multiple time periods and considered information comparing each fund’s performance with various benchmarks and, where applicable, with the performance of competitive funds or targeted annualized return. They noted that since 2009, when Putnam Management began implementing major changes to strengthen its investment personnel and processes, there has been a steady improvement in the number of Putnam funds showing above-median three-year performance results. They also noted the disappointing investment performance of some funds for periods ended December 31, 2011 and considered information provided by Putnam Management regarding the factors contributing to the underperformance and actions being taken to improve the performance of these particular funds. The Trustees indicated their intention to continue to monitor performance trends to assess the effectiveness of these efforts and to evaluate whether additional actions to address areas of underperformance are warranted.
In the case of your fund, the Trustees considered that its class A share cumulative total return performance at net asset value was in the following quartiles of its Lipper Inc. peer group (Lipper High Yield Current Funds) for the one-year, three-year and five-year periods ended December 31, 2011 (the first quartile representing the best-performing funds and the fourth quartile the worst-performing funds):
| | | |
| One-year period | 3rd | | |
| | |
| Three-year period | 3rd | | |
| | |
| Five-year period | 2nd | | |
| | |
Over the one-year, three-year and five-year periods ended December 31, 2011, there were 491, 424 and 356 funds, respectively, in your fund’s Lipper peer group. (When considering performance information, shareholders should be mindful that past performance is not a guarantee of future results.)
Brokerage and soft-dollar allocations; investor servicing
The Trustees considered various potential benefits that Putnam Management may receive in connection with the services it provides under the management contract with your fund. These include benefits related to brokerage allocation and the use of soft dollars, whereby a portion of the commissions paid by a fund for brokerage may be used to acquire research services that are expected to be useful to Putnam Management in managing the assets of the fund and of other clients. Subject to policies established by the Trustees, soft-dollar credits acquired through these means are used primarily to acquire research services that supplement Putnam Management’s internal research efforts. However, the Trustees noted that a portion of available soft-dollar credits continues to be allocated to the payment of fund expenses. The Trustees indicated their continued intent to monitor regulatory developments in this area with the assistance of their Brokerage Committee and also indicated their continued intent to monitor the potential benefits associated with fund brokerage and soft-dollar allocations and trends in industry practices to ensure that the principle of seeking best price and execution remains paramount in the portfolio trading process.
Putnam Management may also receive benefits from payments that the funds make to Putnam Management’s affiliates for investor or distribution services. In conjunction with the annual review of your fund’s management and sub-management contracts, the Trustees reviewed your fund’s investor servicing agreement with Putnam Investor Services, Inc. (“PSERV”) and its distributor’s contracts and distribution plans with Putnam Retail Management Limited Partnership (“PRM”), both of which are affiliates of Putnam Management. The Trustees concluded that the fees payable by the funds to PSERV and PRM, as applicable, for such services are reasonable in relation to the nature and quality of such services.
| |
| High Yield Advantage Fund | 21 |
Financial statements
These sections of the report, as well as the accompanying Notes, preceded by the Report of Independent Registered Public Accounting Firm, constitute the fund’s financial statements.
The fund’s portfolio lists all the fund’s investments and their values as of the last day of the reporting period. Holdings are organized by asset type and industry sector, country, or state to show areas of concentration and diversification.
Statement of assets and liabilities shows how the fund’s net assets and share price are determined. All investment and non-investment assets are added together. Any unpaid expenses and other liabilities are subtracted from this total. The result is divided by the number of shares to determine the net asset value per share, which is calculated separately for each class of shares. (For funds with preferred shares, the amount subtracted from total assets includes the liquidation preference of preferred shares.)
Statement of operations shows the fund’s net investment gain or loss. This is done by first adding up all the fund’s earnings — from dividends and interest income — and subtracting its operating expenses to determine net invest ment income (or loss). Then, any net gain or loss the fund realized on the sales of its holdings —well as any unrealized gains or losses over the period — is added to or subtracted from the investment result to determine the fund’s net gain or loss for the fiscal year.
Statement of changes in net assets shows how the fund’s net assets were affected by the fund’s net investment gain or loss, by distributions to shareholders, and by changes in the number of the fund’s shares. It lists distributions and their sources (net investment income or realized capital gains) over the current reporting period and the most recent fiscal year-end. The distributions listed here may not match the sources listed in the Statement of operations because the distributions are determined on a tax basis and may be paid in a different period from the one in which they were earned.
Financial highlights provide an overview of the fund’s investment results, per-share distributions, expense ratios, net investment income ratios, and portfolio turnover in one summary table, reflecting the five most recent reporting periods. In a semiannual report, the highlights table also includes the current reporting period.
|
| 22 High Yield Advantage Fund |
Report of Independent Registered Public Accounting Firm
The Board of Trustees and Shareholders
Putnam High Yield Advantage Fund:
We have audited the accompanying statement of assets and liabilities of Putnam High Yield Advantage Fund (the fund), including the fund’s portfolio, as of November 30, 2012, and the related statement of operations for the year then ended, the statements of changes in net assets for each of the years in the two-year period then ended, and the financial highlights for each of the years in the five-year period then ended. These financial statements and financial highlights are the responsibility of the fund’s management. Our responsibility is to express an opinion on these financial statements and financial highlights based on our audits.
We conducted our audits in accordance with the standards of the Public Company Accounting Oversight Board (United States). Those standards require that we plan and perform the audit to obtain reasonable assurance about whether the financial statements and financial highlights are free of material misstatement. An audit includes examining, on a test basis, evidence supporting the amounts and disclosures in the financial statements. Our procedures included confirmation of securities owned as of November 30, 2012, by correspondence with the custodian and brokers or by other appropriate auditing procedures. An audit also includes assessing the accounting principles used and significant estimates made by management, as well as evaluating the overall financial statement presentation. We believe that our audits provide a reasonable basis for our opinion.
In our opinion, the financial statements and financial highlights referred to above present fairly, in all material respects, the financial position of Putnam High Yield Advantage Fund as of November 30, 2012, the results of its operations for the year then ended, the changes in its net assets for each of the years in the two-year period then ended, and the financial highlights for each of the years in the five-year period then ended, in conformity with U.S. generally accepted accounting principles.

Boston, Massachusetts
January 15, 2013
| |
| High Yield Advantage Fund | 23 |
The fund’s portfolio 11/30/12
| | | |
| CORPORATE BONDS AND NOTES (87.4%)* | Principal amount | Value |
|
| Advertising and marketing services (0.6%) | | | |
| Affinion Group, Inc. company guaranty sr. unsec. | | | |
| notes 7 7/8s, 2018 | | $1,430,000 | $1,144,000 |
|
| Affinion Group, Inc. company guaranty sr. unsec. | | | |
| sub. notes 11 1/2s, 2015 | | 1,385,000 | 1,121,850 |
|
| Griffey Intermediate, Inc./Griffey Finance Sub LLC 144A | | | |
| sr. notes 7s, 2020 | | 1,570,000 | 1,581,774 |
|
| Lamar Media Corp. company guaranty sr. sub. notes | | | |
| 7 7/8s, 2018 | | 560,000 | 618,100 |
|
| Lamar Media Corp. company guaranty sr. sub. notes | | | |
| 5 7/8s, 2022 | | 1,340,000 | 1,425,425 |
|
| | | | 5,891,149 |
| Automotive (1.4%) | | | |
| Chrysler Group, LLC/CG Co-Issuer, Inc. company | | | |
| guaranty notes 8 1/4s, 2021 | | 2,135,000 | 2,351,168 |
|
| Ford Motor Credit Co., LLC sr. unsec. unsub. notes | | | |
| 5 7/8s, 2021 | | 3,340,000 | 3,831,707 |
|
| Ford Motor Credit Co., LLC sr. unsec. unsub. notes | | | |
| 5 3/4s, 2021 | | 615,000 | 698,579 |
|
| Navistar International Corp. sr. notes 8 1/4s, 2021 | | 2,604,000 | 2,473,800 |
|
| Schaeffler Finance BV sr. sec. notes Ser. REGS, 8 3/4s, | | | |
| 2019 (Germany) | EUR | 310,000 | 439,888 |
|
| Schaeffler Finance BV 144A company | | | |
| guaranty sr. notes 8 1/2s, 2019 (Germany) | | $2,080,000 | 2,308,799 |
|
| Schaeffler Finance BV 144A company | | | |
| guaranty sr. notes 7 3/4s, 2017 (Germany) | | 565,000 | 618,675 |
|
| TRW Automotive, Inc. 144A company | | | |
| guaranty sr. notes 7 1/4s, 2017 | | 1,080,000 | 1,225,800 |
|
| | | | 13,948,416 |
| Basic materials (7.2%) | | | |
| Ainsworth Lumber Co., Ltd. 144A sr. notes 7 1/2s, 2017 | | | |
| (Canada) | | 610,000 | 616,100 |
|
| Ardagh Glass Finance PLC sr. unsub. notes Ser. REGS, | | | |
| 9 1/4s, 2016 (Ireland) | EUR | 280,000 | 393,705 |
|
| Ashland, Inc. 144A sr. unsec. notes 4 3/4s, 2022 | | $410,000 | 421,275 |
|
| Atkore International, Inc. company | | | |
| guaranty sr. notes 9 7/8s, 2018 | | 3,530,000 | 3,596,187 |
|
| Boise Cascade LLC/Boise Cascade Finance Corp. 144A | | | |
| sr. unsec. notes 6 3/8s, 2020 (United Kingdom) | | 270,000 | 274,050 |
|
| Celanese US Holdings, LLC company guaranty sr. unsec. | | | |
| unsub. notes 4 5/8s, 2022 (Germany) | | 965,000 | 993,950 |
|
| Celanese US Holdings, LLC sr. notes 5 7/8s, 2021 (Germany) | | 1,895,000 | 2,117,663 |
|
| Cemex Finance, LLC 144A company guaranty sr. bonds | | | |
| 9 1/2s, 2016 | | 2,390,000 | 2,569,250 |
|
| Cemex Finance, LLC 144A company guaranty sr. notes | | | |
| 9 3/8s, 2022 | | 745,000 | 802,738 |
|
| Compass Minerals International, Inc. company | | | |
| guaranty sr. unsec. notes 8s, 2019 | | 1,865,000 | 2,004,874 |
|
| Edgen Murray Corp. 144A company guaranty sr. notes | | | |
| 8 3/4s, 2020 | | 920,000 | 920,000 |
|
| Ferro Corp. sr. unsec. notes 7 7/8s, 2018 | | 1,905,000 | 1,719,263 |
|
|
| 24 High Yield Advantage Fund |
| | | |
| CORPORATE BONDS AND NOTES (87.4%)* cont. | Principal amount | Value |
|
| Basic materials cont. | | | |
| FMG Resources August 2006 Pty, Ltd. 144A company | | | |
| guaranty sr. unsec. notes 6 3/8s, 2016 (Australia) | | $860,000 | $866,450 |
|
| FMG Resources August 2006 Pty, Ltd. 144A sr. notes 8 1/4s, | | | |
| 2019 (Australia) | | 930,000 | 950,925 |
|
| FMG Resources August 2006 Pty, Ltd. 144A sr. notes 7s, 2015 | | | |
| (Australia) | | 15,000 | 15,263 |
|
| FMG Resources August 2006 Pty, Ltd. 144A sr. notes 6 7/8s, | | | |
| 2018 (Australia) | | 2,020,000 | 1,987,882 |
|
| FMG Resources August 2006 Pty, Ltd. 144A sr. unsec. | | | |
| notes 6 7/8s, 2022 (Australia) | | 920,000 | 890,100 |
|
| Hexion U.S. Finance Corp./Hexion Nova Scotia Finance, ULC | | | |
| company guaranty sr. notes 8 7/8s, 2018 | | 1,180,000 | 1,191,800 |
|
| Hexion U.S. Finance Corp./Hexion Nova Scotia Finance, ULC | | | |
| company guaranty sr. notes 6 5/8s, 2020 | | 570,000 | 568,575 |
|
| Hexion U.S. Finance Corp./Hexion Nova Scotia Finance, ULC | | | |
| company guaranty sr. notes FRN 4.81s, 2014 | | 610,000 | 561,200 |
|
| Huntsman International, LLC company guaranty sr. unsec. | | | |
| sub. notes 8 5/8s, 2021 | | 1,165,000 | 1,319,363 |
|
| Huntsman International, LLC company guaranty sr. unsec. | | | |
| sub. notes 8 5/8s, 2020 | | 2,510,000 | 2,811,200 |
|
| Huntsman International, LLC 144A company | | | |
| guaranty sr. unsec. unsub. notes 4 7/8s, 2020 | | 965,000 | 955,350 |
|
| IAMGOLD Corp. 144A company guaranty sr. unsec. | | | |
| notes 6 3/4s, 2020 (Canada) | | 1,815,000 | 1,778,700 |
|
| INEOS Finance PLC 144A company guaranty sr. notes 9s, 2015 | | | |
| (United Kingdom) | | 1,710,000 | 1,823,202 |
|
| INEOS Finance PLC 144A company guaranty sr. notes 8 3/8s, | | | |
| 2019 (United Kingdom) | | 830,000 | 884,988 |
|
| INEOS Finance PLC 144A company guaranty sr. notes 7 1/2s, | | | |
| 2020 (United Kingdom) | | 375,000 | 387,188 |
|
| INEOS Group Holdings, Ltd. company guaranty sr. unsec. | | | |
| notes Ser. REGS, 7 7/8s, 2016 (Luxembourg) | EUR | 1,250,000 | 1,575,162 |
|
| JM Huber Corp. 144A sr. unsec. notes 9 7/8s, 2019 | | $1,905,000 | 2,128,838 |
|
| Louisiana-Pacific Corp. company guaranty sr. unsec. | | | |
| unsub. notes 7 1/2s, 2020 | | 805,000 | 897,575 |
|
| LyondellBasell Industries NV sr. unsec. notes 6s, 2021 | | | |
| (Netherlands) | | 2,790,000 | 3,330,563 |
|
| LyondellBasell Industries NV sr. unsec. | | | |
| unsub. notes 5 3/4s, 2024 (Netherlands) | | 1,915,000 | 2,298,000 |
|
| LyondellBasell Industries NV sr. unsec. unsub. notes 5s, | | | |
| 2019 (Netherlands) | | 3,455,000 | 3,839,368 |
|
| Momentive Performance Materials, Inc. company | | | |
| guaranty notes 9 1/2s, 2021 | EUR | 465,000 | 429,976 |
|
| Momentive Performance Materials, Inc. 144A company | | | |
| guaranty sr. notes 10s, 2020 | | $560,000 | 537,600 |
|
| MPM Escrow LLC /MPM Finance Escrow Corp. 144A | | | |
| sr. notes 8 7/8s, 2020 | | 730,000 | 724,525 |
|
| New Gold, Inc. 144A company guaranty sr. unsec. | | | |
| unsub. notes 7s, 2020 (Canada) | | 920,000 | 977,500 |
|
| New Gold, Inc. 144A sr. unsec. notes 6 1/4s, 2022 (Canada) | | 485,000 | 491,548 |
|
| |
| High Yield Advantage Fund | 25 |
| | | |
| CORPORATE BONDS AND NOTES (87.4%)* cont. | Principal amount | Value |
|
| Basic materials cont. | | | |
| Novelis, Inc. company guaranty sr. unsec. notes 8 3/4s, 2020 | | $1,030,000 | $1,153,600 |
|
| Novelis, Inc. sr. unsec. notes company guaranty 8 3/8s, 2017 | | 25,000 | 27,500 |
|
| Nufarm Australia Ltd. 144A company | | | |
| guaranty sr. notes 6 3/8s, 2019 (Australia) | | 1,140,000 | 1,183,367 |
|
| Perstorp Holding AB 144A company guaranty sub. notes 11s, | | | |
| 2017 (Sweden) | | 605,000 | 571,725 |
|
| Perstorp Holding AB 144A company guaranty sr. notes 8 3/4s, | | | |
| 2017 (Sweden) | | 1,525,000 | 1,532,625 |
|
| PQ Corp. 144A sr. notes 8 3/4s, 2018 | | 1,215,000 | 1,248,413 |
|
| Rockwood Specialties Group, Inc. company | | | |
| guaranty sr. unsec. notes 4 5/8s, 2020 | | 370,000 | 378,325 |
|
| Roofing Supply Group, LLC/Roofing Supply Finance, Inc. 144A | | | |
| company guaranty sr. unsec. notes 10s, 2020 | | 1,360,000 | 1,502,800 |
|
| Ryerson, Inc./Joseph T Ryerson & Son, Inc. 144A company | | | |
| guaranty sr. notes 9s, 2017 | | 1,250,000 | 1,237,500 |
|
| Sealed Air Corp. 144A sr. unsec. notes 6 1/2s, 2020 | | 300,000 | 312,000 |
|
| Smurfit Kappa Acquisition company | | | |
| guaranty sr. bonds 7 1/4s, 2017 (Ireland) | EUR | 100,000 | 139,709 |
|
| Smurfit Kappa Acquisitions 144A company | | | |
| guaranty sr. notes 4 7/8s, 2018 (Ireland) | | $1,210,000 | 1,225,125 |
|
| Smurfit Kappa Treasury company guaranty sr. unsec. | | | |
| unsub. debs 7 1/2s, 2025 (Ireland) | | 840,000 | 865,200 |
|
| Steel Dynamics, Inc. company guaranty sr. unsec. | | | |
| unsub. notes 6 3/4s, 2015 | | 80,000 | 81,400 |
|
| Steel Dynamics, Inc. sr. unsec. notes company | | | |
| guaranty 7 5/8s, 2020 | | 115,000 | 126,788 |
|
| Steel Dynamics, Inc. 144A company guaranty sr. unsec. | | | |
| notes 6 3/8s, 2022 | | 270,000 | 282,150 |
|
| Steel Dynamics, Inc. 144A company guaranty sr. unsec. | | | |
| notes 6 1/8s, 2019 | | 610,000 | 637,450 |
|
| Taminco Global Chemical Corp. 144A sr. notes 9 3/4s, 2020 | | | |
| (Belgium) | | 2,215,000 | 2,392,200 |
|
| TPC Group, LLC company guaranty sr. notes 8 1/4s, 2017 | | 1,530,000 | 1,698,300 |
|
| Tronox Finance, LLC 144A company guaranty sr. unsec. | | | |
| notes 6 3/8s, 2020 | | 2,200,000 | 2,167,000 |
|
| Verso Paper Holdings, LLC/Verso Paper, Inc. company | | | |
| guaranty sr. notes 8 3/4s, 2019 | | 345,000 | 103,500 |
|
| Verso Paper Holdings, LLC/Verso Paper, Inc. 144A company | | | |
| guaranty sr. notes 11 3/4s, 2019 | | 90,000 | 57,600 |
|
| | | | 69,576,173 |
| Broadcasting (2.0%) | | | |
| Clear Channel Communications, Inc. company | | | |
| guaranty sr. notes 9s, 2021 | | 805,000 | 710,413 |
|
| Clear Channel Communications, Inc. 144A company | | | |
| guaranty sr. notes 9s, 2019 | | 2,025,000 | 1,832,625 |
|
| Clear Channel Worldwide Holdings, Inc. company | | | |
| guaranty sr. unsec. notes 7 5/8s, 2020 | | 3,335,000 | 3,284,974 |
|
| Clear Channel Worldwide Holdings, Inc. 144A company | | | |
| guaranty sr. unsec. unsub. notes 6 1/2s, 2022 | | 1,545,000 | 1,552,725 |
|
| Cumulus Media Holdings, Inc. company guaranty sr. unsec. | | | |
| unsub. notes 7 3/4s, 2019 | | 1,685,000 | 1,630,238 |
|
|
| 26 High Yield Advantage Fund |
| | |
| CORPORATE BONDS AND NOTES (87.4%)* cont. | Principal amount | Value |
|
| Broadcasting cont. | | |
| Entercom Radio, LLC company guaranty sr. unsec. | | |
| sub. notes 10 1/2s, 2019 | $1,590,000 | $1,745,025 |
|
| Gray Television, Inc. 144A company guaranty sr. unsec. | | |
| notes 7 1/2s, 2020 | 1,155,000 | 1,155,000 |
|
| LIN Television Corp. 144A company guaranty sr. unsec. | | |
| notes 6 3/8s, 2021 | 625,000 | 639,063 |
|
| Nexstar Broadcasting, Inc. 144A company guaranty sr. unsec. | | |
| unsub. notes 6 7/8s, 2020 | 1,495,000 | 1,502,474 |
|
| Nexstar Broadcasting, Inc./Mission Broadcasting, Inc. | | |
| company guaranty sr. notes 8 7/8s, 2017 | 1,350,000 | 1,474,875 |
|
| Sinclair Television Group, Inc. 144A sr. notes 6 1/8s, 2022 | 650,000 | 677,625 |
|
| Sirius XM Radio, Inc. 144A sr. unsec. notes 5 1/4s, 2022 | 190,000 | 189,525 |
|
| Univision Communications, Inc. 144A company | | |
| guaranty sr. unsec. notes 8 1/2s, 2021 | 930,000 | 957,900 |
|
| Univision Communications, Inc. 144A sr. notes 7 7/8s, 2020 | 1,265,000 | 1,350,388 |
|
| XM Satellite Radio, Inc. 144A sr. unsec. notes 7 5/8s, 2018 | 870,000 | 961,350 |
|
| | | 19,664,200 |
| Building materials (1.2%) | | |
| Building Materials Corp. 144A company | | |
| guaranty sr. notes 7 1/2s, 2020 | 1,360,000 | 1,489,199 |
|
| Building Materials Corp. 144A sr. notes 7s, 2020 | 640,000 | 697,600 |
|
| Building Materials Corp. 144A sr. notes 6 7/8s, 2018 | 1,150,000 | 1,233,375 |
|
| Building Materials Corp. 144A sr. notes 6 3/4s, 2021 | 530,000 | 580,350 |
|
| Jeld-Wen Escrow Corp. 144A sr. notes 12 1/4s, 2017 | 2,645,000 | 3,061,587 |
|
| Masonite International Corp., 144A company | | |
| guaranty sr. notes 8 1/4s, 2021 (Canada) | 1,915,000 | 2,049,050 |
|
| Nortek, Inc. company guaranty sr. unsec. notes 10s, 2018 | 1,745,000 | 1,941,313 |
|
| Owens Corning company guaranty sr. unsec. notes 9s, 2019 | 424,000 | 534,240 |
|
| | | 11,586,714 |
| Cable television (3.4%) | | |
| Bresnan Broadband Holdings, LLC 144A company | | |
| guaranty sr. unsec. unsub. notes 8s, 2018 | 1,070,000 | 1,150,250 |
|
| Cablevision Systems Corp. sr. unsec. unsub. notes 8 5/8s, 2017 | 1,825,000 | 2,094,187 |
|
| Cablevision Systems Corp. sr. unsec. unsub. notes 8s, 2020 | 470,000 | 519,350 |
|
| Cablevision Systems Corp. sr. unsec. unsub. notes 7 3/4s, 2018 | 525,000 | 573,563 |
|
| CCO Holdings, LLC/CCO Holdings Capital Corp. company | | |
| guaranty sr. unsec. notes 7 7/8s, 2018 | 1,020,000 | 1,101,600 |
|
| CCO Holdings, LLC/CCO Holdings Capital Corp. company | | |
| guaranty sr. unsec. notes 6 1/2s, 2021 | 1,655,000 | 1,787,399 |
|
| CCO Holdings, LLC/CCO Holdings Capital Corp. company | | |
| guaranty sr. unsec. notes 5 1/4s, 2022 | 1,620,000 | 1,636,200 |
|
| CCO Holdings, LLC/CCO Holdings Capital Corp. company | | |
| guaranty sr. unsec. unsub. notes 7 3/8s, 2020 | 975,000 | 1,087,125 |
|
| CCO Holdings, LLC/CCO Holdings Capital Corp. company | | |
| guaranty sr. unsec. unsub. notes 6 5/8s, 2022 | 500,000 | 543,750 |
|
| CCO Holdings, LLC/CCO Holdings Capital Corp. company | | |
| guaranty sr. unsub. notes 7s, 2019 | 1,545,000 | 1,672,463 |
|
| Cequel Communications Holdings I, LLC/Cequel Capital Corp. | | |
| 144A sr. notes 8 5/8s, 2017 | 3,375,000 | 3,602,812 |
|
| |
| High Yield Advantage Fund | 27 |
| | | |
| CORPORATE BONDS AND NOTES (87.4%)* cont. | Principal amount | Value |
|
| Cable television cont. | | | |
| Cequel Communications Escrow Capital Corp. 144A sr. unsec. | | | |
| notes 6 3/8s, 2020 | | $365,000 | $375,038 |
|
| CSC Holdings, LLC 144A sr. unsec. unsub. notes 6 3/4s, 2021 | | 1,250,000 | 1,375,000 |
|
| DISH DBS Corp. company guaranty 7 1/8s, 2016 | | 155,000 | 173,794 |
|
| DISH DBS Corp. company guaranty sr. unsec. notes | | | |
| 7 7/8s, 2019 | | 1,820,000 | 2,152,150 |
|
| DISH DBS Corp. company guaranty sr. unsec. notes | | | |
| 6 3/4s, 2021 | | 3,210,000 | 3,627,299 |
|
| Mediacom, LLC/Mediacom Capital Corp. sr. unsec. | | | |
| notes 9 1/8s, 2019 | | 775,000 | 856,375 |
|
| Mediacom, LLC/Mediacom Capital Corp. sr. unsec. | | | |
| unsub. notes 7 1/4s, 2022 | | 1,465,000 | 1,571,213 |
|
| Quebecor Media, Inc. 144A sr. unsec. notes 7 3/8s, 2021 | | | |
| (Canada) | | 995,000 | 1,072,348 |
|
| Quebecor Media, Inc. 144A sr. unsec. notes 5 3/4s, 2023 | | | |
| (Canada) | | 1,170,000 | 1,213,875 |
|
| Unitymedia Hessen GmbH & Co. KG/Unitymedia NRW GmbH | | | |
| 144A company guaranty sr. notes 7 1/2s, 2019 (Germany) | | 735,000 | 805,231 |
|
| Videotron Ltee company guaranty sr. unsec. unsub. notes 5s, | | | |
| 2022 (Canada) | | 1,610,000 | 1,658,300 |
|
| Videotron Ltee sr. notes 6 7/8s, 2021 (Canada) | | 340,000 | 375,018 |
|
| Virgin Media Finance PLC company guaranty sr. unsec. | | | |
| unsub. notes 5 1/4s, 2022 (United Kingdom) | | 600,000 | 630,428 |
|
| Virgin Media Finance PLC company guaranty sr. unsec. | | | |
| unsub. notes 4 7/8s, 2022 (United Kingdom) | | 1,025,000 | 1,048,574 |
|
| | | | 32,703,342 |
| Capital goods (5.6%) | | | |
| ADS Waste Holdings, Inc. 144A sr. notes 8 1/4s, 2020 | | 280,000 | 292,600 |
|
| Altra Holdings, Inc. company guaranty sr. notes 8 1/8s, 2016 | | 1,098,000 | 1,167,394 |
|
| American Axle & Manufacturing, Inc. company | | | |
| guaranty sr. unsec. notes 7 3/4s, 2019 | | 4,225,000 | 4,573,562 |
|
| ARD Finance SA sr. notes Ser. REGS, 11 1/8s, 2018 | | | |
| (Luxembourg) ‡‡ | EUR | 211,125 | 280,076 |
|
| ARD Finance SA 144A sr. notes 11 1/8s, 2018 (Luxembourg) ‡‡ | | $469,804 | 488,596 |
|
| Ardagh Packaging Finance PLC sr. notes Ser. REGS, 7 3/8s, | | | |
| 2017 (Ireland) | EUR | 710,000 | 989,210 |
|
| Ardagh Packaging Finance PLC 144A company | | | |
| guaranty sr. notes 7 3/8s, 2017 (Ireland) | EUR | 480,000 | 668,762 |
|
| Ardagh Packaging Finance PLC 144A company | | | |
| guaranty sr. unsec. unsub. notes 9 1/8s, 2020 (Ireland) | | $225,000 | 243,000 |
|
| Ardagh Packaging Finance PLC/Ardagh MP Holdings USA, Inc. | | | |
| 144A company guaranty sr. notes 7 3/8s, 2017 (Ireland) | | 225,000 | 243,563 |
|
| B/E Aerospace, Inc. sr. unsec. unsub. notes 6 7/8s, 2020 | | 410,000 | 457,663 |
|
| B/E Aerospace, Inc. sr. unsec. unsub. notes 5 1/4s, 2022 | | 525,000 | 551,250 |
|
| Ball Corp. company guaranty sr. unsec. notes 5s, 2022 | | 455,000 | 482,300 |
|
| Berry Plastics Corp. company guaranty notes 9 1/2s, 2018 | | 1,295,000 | 1,418,024 |
|
| Berry Plastics Corp. company guaranty unsub. notes | | | |
| 9 3/4s, 2021 | | 705,000 | 801,938 |
|
| Berry Plastics Holding Corp. company guaranty sr. unsec. | | | |
| sub. notes 10 1/4s, 2016 | | 880,000 | 909,700 |
|
|
| 28 High Yield Advantage Fund |
| | | |
| CORPORATE BONDS AND NOTES (87.4%)* cont. | Principal amount | Value |
|
| Capital goods cont. | | | |
| BOE Merger Corp. 144A sr. unsec. notes 9 1/2s, 2017 ‡‡ | | $625,000 | $612,500 |
|
| Bombardier, Inc. 144A sr. unsec. notes 7 3/4s, 2020 (Canada) | | 755,000 | 842,769 |
|
| Bombardier, Inc. 144A sr. unsec. notes 5 3/4s, 2022 (Canada) | | 485,000 | 494,700 |
|
| Briggs & Stratton Corp. company guaranty sr. unsec. | | | |
| notes 6 7/8s, 2020 | | 2,135,000 | 2,364,512 |
|
| Consolidated Container Co. LLC/Consolidated Container | | | |
| Capital, Inc. 144A company guaranty sr. unsec. | | | |
| notes 10 1/8s, 2020 | | 645,000 | 685,313 |
|
| Continental Rubber of America Corp. 144A notes 4 1/2s, 2019 | | 765,000 | 770,738 |
|
| Crown Euro Holdings SA 144A sr. notes 7 1/8s, 2018 (France) | EUR | 370,000 | 528,189 |
|
| Exide Technologies sr. notes 8 5/8s, 2018 | | $1,445,000 | 1,170,450 |
|
| GrafTech International, Ltd. 144A company | | | |
| guaranty sr. unsec. notes 6 3/8s, 2020 | | 365,000 | 375,950 |
|
| Kratos Defense & Security Solutions, Inc. company | | | |
| guaranty sr. notes 10s, 2017 | | 1,749,000 | 1,906,410 |
|
| Legrand SA unsec. unsub. debs. 8 1/2s, 2025 (France) | | 3,235,000 | 4,327,210 |
|
| Manitowoc Co., Inc. (The) company guaranty sr. unsec. | | | |
| notes 5 7/8s, 2022 | | 455,000 | 456,138 |
|
| Meritor, Inc. company guaranty sr. unsec. notes 8 1/8s, 2015 | | 330,000 | 349,800 |
|
| Mueller Water Products, Inc. company guaranty sr. unsec. | | | |
| unsub. notes 8 3/4s, 2020 | | 180,000 | 205,200 |
|
| Pittsburgh Glass Works, LLC 144A sr. notes 8 1/2s, 2016 | | 2,871,000 | 2,619,788 |
|
| Polypore International, Inc. company guaranty sr. unsec. | | | |
| notes 7 1/2s, 2017 | | 2,750,000 | 2,980,312 |
|
| Rexel SA 144A company guaranty sr. unsec. | | | |
| unsub. notes 6 1/8s, 2019 (France) | | 2,115,000 | 2,199,196 |
|
| Reynolds Group Issuer, Inc. company | | | |
| guaranty sr. notes 7 7/8s, 2019 | | 985,000 | 1,081,038 |
|
| Reynolds Group Issuer, Inc. company | | | |
| guaranty sr. notes 7 1/8s, 2019 | | 580,000 | 626,400 |
|
| Reynolds Group Issuer, Inc. company guaranty sr. unsec. | | | |
| unsub. notes 9 7/8s, 2019 | | 2,465,000 | 2,600,574 |
|
| Reynolds Group Issuer, Inc. company guaranty sr. unsec. | | | |
| unsub. notes 9s, 2019 | | 635,000 | 654,050 |
|
| Reynolds Group Issuer, Inc. company guaranty sr. unsec. | | | |
| unsub. notes 8 1/4s, 2021 (New Zealand) | | 440,000 | 436,700 |
|
| Reynolds Group Issuer, Inc. 144A company | | | |
| guaranty sr. notes 5 3/4s, 2020 | | 925,000 | 945,813 |
|
| Tenneco, Inc. company guaranty sr. unsec. | | | |
| unsub. notes 7 3/4s, 2018 | | 625,000 | 678,125 |
|
| Tenneco, Inc. company guaranty sr. unsub. notes 6 7/8s, 2020 | | 1,620,000 | 1,743,525 |
|
| Terex Corp. company guaranty sr. unsec. unsub. notes 6s, 2021 | | 1,930,000 | 1,997,550 |
|
| Thermadyne Holdings Corp. company guaranty sr. notes 9s, 2017 | | 2,790,000 | 2,957,400 |
|
| Thermon Industries, Inc. company guaranty sr. notes | | | |
| 9 1/2s, 2017 | | 1,595,000 | 1,780,419 |
|
| TransDigm, Inc. company guaranty unsec. sub. notes | | | |
| 7 3/4s, 2018 | | 1,900,000 | 2,099,500 |
|
| | | | 54,057,907 |
|
| High Yield Advantage Fund 29 |
| | | |
| CORPORATE BONDS AND NOTES (87.4%)* cont. | Principal amount | Value |
|
| Coal (1.1%) | | | |
| Alpha Natural Resources, Inc. company guaranty sr. unsec. | | | |
| notes 6 1/4s, 2021 | | $460,000 | $407,100 |
|
| Alpha Natural Resources, Inc. company guaranty sr. unsec. | | | |
| notes 6s, 2019 | | 1,175,000 | 1,036,937 |
|
| Arch Coal, Inc. company guaranty sr. unsec. notes 7 1/4s, 2020 | | 540,000 | 484,650 |
|
| Arch Coal, Inc. company guaranty sr. unsec. | | | |
| unsub. notes 7s, 2019 | | 1,215,000 | 1,090,463 |
|
| CONSOL Energy, Inc. company guaranty sr. unsec. | | | |
| notes 8 1/4s, 2020 | | 4,055,000 | 4,328,712 |
|
| CONSOL Energy, Inc. company guaranty sr. unsec. notes 8s, 2017 | | 1,835,000 | 1,963,449 |
|
| Peabody Energy Corp. company guaranty sr. unsec. | | | |
| notes 7 3/8s, 2016 | | 550,000 | 632,500 |
|
| Peabody Energy Corp. company guaranty sr. unsec. | | | |
| unsub. notes 6 1/2s, 2020 | | 150,000 | 159,750 |
|
| Peabody Energy Corp. company guaranty sr. unsec. | | | |
| unsub. notes 6s, 2018 | | 225,000 | 235,125 |
|
| | | | 10,338,686 |
| Commercial and consumer services (1.8%) | | | |
| ARAMARK Holdings Corp. 144A sr. unsec. notes 8 5/8s, 2016 ‡‡ | | 360,000 | 369,004 |
|
| Ashtead Capital, Inc. 144A company | | | |
| guaranty sr. notes 6 1/2s, 2022 | | 700,000 | 745,500 |
|
| Interactive Data Corp. company guaranty sr. unsec. | | | |
| notes 10 1/4s, 2018 | | 3,460,000 | 3,875,199 |
|
| Lender Processing Services, Inc. company | | | |
| guaranty sr. unsec. unsub. notes 5 3/4s, 2023 | | 1,830,000 | 1,905,488 |
|
| Rural/Metro Corp. 144A sr. unsec. notes 10 1/8s, 2019 | | 2,155,000 | 2,036,475 |
|
| Rural/Metro Corp. 144A sr. unsec. notes 10 1/8s, 2019 | | 585,000 | 549,900 |
|
| Sabre Holdings Corp. sr. unsec. unsub. notes 8.35s, 2016 | | 2,680,000 | 2,787,199 |
|
| Sabre, Inc. 144A sr. notes 8 1/2s, 2019 | | 1,900,000 | 2,014,000 |
|
| Travelport, LLC company guaranty sr. unsec. | | | |
| sub. notes 11 7/8s, 2016 | | 840,000 | 310,800 |
|
| Travelport, LLC company guaranty sr. unsec. | | | |
| unsub. notes 9 7/8s, 2014 | | 65,000 | 51,025 |
|
| Travelport, LLC 144A sr. notes Ser B, 6.362s, 2016 ‡‡ | | 2,412,286 | 1,785,091 |
|
| Travelport, LLC/Travelport, Inc. company | | | |
| guaranty sr. unsec. notes 9s, 2016 | | 775,000 | 546,375 |
|
| | | | 16,976,056 |
| Consumer (0.7%) | | | |
| Jarden Corp. company guaranty sr. unsec. notes 8s, 2016 | | 605,000 | 644,325 |
|
| Jarden Corp. company guaranty sr. unsec. sub. notes Ser. 1, | | | |
| 7 1/2s, 2020 | EUR | 250,000 | 353,571 |
|
| Scotts Miracle-Gro Co. (The) company guaranty sr. unsec. | | | |
| unsub. notes 6 5/8s, 2020 | | $1,240,000 | 1,342,300 |
|
| Spectrum Brands Escrow Corp. 144A sr. unsec. notes | | | |
| 6 5/8s, 2022 | | 90,000 | 92,700 |
|
| Spectrum Brands Escrow Corp. 144A sr. unsec. notes | | | |
| 6 3/8s, 2020 | | 110,000 | 113,163 |
|
| Spectrum Brands Holdings, Inc. Company | | | |
| guaranty sr. notes 9 1/2s, 2018 | | 2,255,000 | 2,567,880 |
|
| Spectrum Brands Holdings, Inc. 144A sr. notes 6 3/4s, 2020 | | 1,330,000 | 1,386,525 |
|
| | | | 6,500,464 |
|
| 30 High Yield Advantage Fund |
| | | |
| CORPORATE BONDS AND NOTES (87.4%)* cont. | Principal amount | Value |
|
| Consumer staples (6.1%) | | | |
| Avis Budget Car Rental, LLC company guaranty sr. unsec. | | | |
| unsub. notes 9 3/4s, 2020 | | $470,000 | $540,500 |
|
| Avis Budget Car Rental, LLC company guaranty sr. unsec. | | | |
| unsub. notes 9 5/8s, 2018 | | 1,005,000 | 1,118,063 |
|
| Avis Budget Car Rental, LLC company guaranty sr. unsec. | | | |
| unsub. notes 8 1/4s, 2019 | | 430,000 | 475,688 |
|
| Avis Budget Car Rental, LLC company guaranty sr. unsec. | | | |
| unsub. notes 7 3/4s, 2016 | | 703,000 | 721,461 |
|
| Burger King Corp. company guaranty sr. unsec. notes | | | |
| 9 7/8s, 2018 | | 550,000 | 633,875 |
|
| Carrols Restaurant Group, Inc. 144A company | | | |
| guaranty sr. notes 11 1/4s, 2018 | | 990,000 | 1,086,525 |
|
| CKE Holdings, Inc. 144A sr. unsec. notes 10 1/2s, 2016 ‡‡ | | 948,907 | 1,012,958 |
|
| Claire’s Stores, Inc. company guaranty sr. notes 8 7/8s, 2019 | | 1,205,000 | 1,123,663 |
|
| Claire’s Stores, Inc. 144A company guaranty sr. unsec. | | | |
| notes 9 5/8s, 2015 | | 74,494 | 68,162 |
|
| Claire’s Stores, Inc. 144A sr. notes 9s, 2019 | | 2,530,000 | 2,662,824 |
|
| Constellation Brands, Inc. company guaranty sr. unsec. | | | |
| unsub. notes 7 1/4s, 2016 | | 1,935,000 | 2,234,924 |
|
| Constellation Brands, Inc. company guaranty sr. unsec. | | | |
| unsub. notes 6s, 2022 | | 735,000 | 840,656 |
|
| Constellation Brands, Inc. company guaranty sr. unsec. | | | |
| unsub. notes 4 5/8s, 2023 | | 360,000 | 370,800 |
|
| Corrections Corporation of America company | | | |
| guaranty sr. notes 7 3/4s, 2017 | | 2,270,000 | 2,417,550 |
|
| Dave & Buster’s, Inc. company guaranty sr. unsec. | | | |
| unsub. notes 11s, 2018 | | 1,730,000 | 1,933,275 |
|
| Dean Foods Co. company guaranty sr. unsec. | | | |
| unsub. notes 9 3/4s, 2018 | | 445,000 | 501,738 |
|
| Dean Foods Co. company guaranty sr. unsec. unsub. | | | |
| notes 7s, 2016 | | 1,830,000 | 1,962,675 |
|
| Del Monte Corp. company guaranty sr. unsec. notes | | | |
| 7 5/8s, 2019 | | 1,640,000 | 1,681,000 |
|
| DineEquity, Inc. company guaranty sr. unsec. notes | | | |
| 9 1/2s, 2018 | | 3,436,000 | 3,886,974 |
|
| Dole Food Co. sr. notes 13 7/8s, 2014 | | 441,000 | 489,510 |
|
| Dole Food Co. 144A sr. notes 8s, 2016 | | 841,000 | 876,743 |
|
| Elizabeth Arden, Inc. sr. unsec. unsub. notes 7 3/8s, 2021 | | 1,415,000 | 1,574,188 |
|
| HDTFS, Inc. 144A company guaranty sr. notes 6 1/4s, 2022 | | 870,000 | 901,538 |
|
| HDTFS, Inc. 144A company guaranty sr. notes 5 7/8s, 2020 | | 745,000 | 769,213 |
|
| Hertz Corp. (The) company guaranty sr. unsec. notes | | | |
| 7 1/2s, 2018 | | 570,000 | 624,150 |
|
| Hertz Holdings Netherlands BV 144A sr. bonds 8 1/2s, 2015 | | | |
| (Netherlands) | EUR | 1,450,000 | 2,039,586 |
|
| JBS USA, LLC/JBS USA Finance, Inc. company | | | |
| guaranty sr. unsec. notes 11 5/8s, 2014 | | $585,000 | 658,856 |
|
| JBS USA, LLC/JBS USA Finance, Inc. 144A sr. unsec. | | | |
| notes 8 1/4s, 2020 | | 540,000 | 560,250 |
|
| JBS USA, LLC/JBS USA Finance, Inc. 144A sr. unsec. | | | |
| notes 7 1/4s, 2021 | | 2,265,000 | 2,225,363 |
|
| |
| High Yield Advantage Fund | 31 |
| | |
| CORPORATE BONDS AND NOTES (87.4%)* cont. | Principal amount | Value |
|
| Consumer staples cont. | | |
| Landry’s Acquisition Co. 144A sr. unsec. notes 9 3/8s, 2020 | $1,125,000 | $1,192,500 |
|
| Libbey Glass, Inc. 144A company guaranty sr. notes | | |
| 6 7/8s, 2020 | 960,000 | 1,027,200 |
|
| Michael Foods, Inc. company guaranty sr. unsec. | | |
| notes 9 3/4s, 2018 | 715,000 | 793,650 |
|
| Post Holdings, Inc. 144A sr. unsec. notes 7 3/8s, 2022 | 1,300,000 | 1,389,375 |
|
| Prestige Brands, Inc. company guaranty sr. unsec. | | |
| notes 8 1/4s, 2018 | 1,840,000 | 2,023,999 |
|
| Revlon Consumer Products Corp. company | | |
| guaranty notes 9 3/4s, 2015 | 1,400,000 | 1,473,500 |
|
| Rite Aid Corp. company guaranty sr. notes 10 1/4s, 2019 | 515,000 | 581,950 |
|
| Rite Aid Corp. company guaranty sr. notes 7 1/2s, 2017 | 1,340,000 | 1,370,150 |
|
| Rite Aid Corp. company guaranty sr. unsec. | | |
| unsub. notes 9 1/2s, 2017 | 2,370,000 | 2,441,099 |
|
| Rite Aid Corp. company guaranty sr. unsec. | | |
| unsub. notes 9 1/4s, 2020 | 2,280,000 | 2,325,600 |
|
| Rite Aid Corp. company guaranty sr. unsub. notes 8s, 2020 | 445,000 | 499,513 |
|
| Smithfield Foods, Inc. sr. unsec. unsub. notes 6 5/8s, 2022 | 1,245,000 | 1,319,700 |
|
| UR Financing Escrow Corp. 144A company | | |
| guaranty notes 5 3/4s, 2018 | 460,000 | 495,650 |
|
| UR Financing Escrow Corp. 144A sr. unsec. notes 7 5/8s, 2022 | 685,000 | 758,638 |
|
| United Rentals North America, Inc. company | | |
| guaranty sr. unsec. unsub. notes 9 1/4s, 2019 | 2,235,000 | 2,542,313 |
|
| United Rentals North America, Inc. company | | |
| guaranty sr. unsec. unsub. notes 6 1/8s, 2023 | 355,000 | 366,538 |
|
| West Corp. company guaranty sr. unsec. notes 8 5/8s, 2018 | 725,000 | 748,563 |
|
| West Corp. company guaranty sr. unsec. notes 7 7/8s, 2019 | 1,240,000 | 1,255,500 |
|
| Wok Acquisition Corp. 144A sr. unsec. notes 10 1/4s, 2020 | 435,000 | 462,188 |
|
| | | 59,060,334 |
| Distributors (0.3%) | | |
| HD Supply, Inc. 144A company guaranty sr. notes 8 1/8s, 2019 | 1,120,000 | 1,254,400 |
|
| HD Supply, Inc. 144A company guaranty sr. unsec. | | |
| notes 11 1/2s, 2020 | 1,590,000 | 1,737,075 |
|
| | | 2,991,475 |
| Energy (oil field) (0.9%) | | |
| FTS International Services, LLC/FTS International Bonds, Inc. | | |
| 144A company guaranty sr. unsec. unsub. notes 8 1/8s, 2018 | 1,127,000 | 1,160,810 |
|
| Hiland Partners LP /Hiland Partners Finance Corp. 144A | | |
| company guaranty sr. notes 7 1/4s, 2020 | 720,000 | 753,300 |
|
| Key Energy Services, Inc. company guaranty unsec. | | |
| unsub. notes 6 3/4s, 2021 | 1,420,000 | 1,423,550 |
|
| Key Energy Services, Inc. 144A company guaranty sr. unsec. | | |
| notes 6 3/4s, 2021 | 365,000 | 364,088 |
|
| Offshore Group Investment, Ltd. company | | |
| guaranty sr. notes 11 1/2s, 2015 (Cayman Islands) | 1,966,000 | 2,162,599 |
|
| Offshore Group Investment, Ltd. 144A company | | |
| guaranty sr. notes 7 1/2s, 2019 (Cayman Islands) | 1,805,000 | 1,814,025 |
|
| SESI, LLC company guaranty sr. unsec. notes 7 1/8s, 2021 | 760,000 | 845,500 |
|
| Trinidad Drilling, Ltd. 144A sr. unsec. notes 7 7/8s, 2019 | | |
| (Canada) | 325,000 | 343,688 |
|
| | | 8,867,560 |
|
| 32 High Yield Advantage Fund |
| | | |
| CORPORATE BONDS AND NOTES (87.4%)* cont. | Principal amount | Value |
|
| Entertainment (0.7%) | | | |
| AMC Entertainment, Inc. company | | | |
| guaranty sr. sub. notes 9 3/4s, 2020 | | $1,860,000 | $2,092,499 |
|
| Carmike Cinemas, Inc. company guaranty notes 7 3/8s, 2019 | | 820,000 | 877,400 |
|
| Cedar Fair LP/Canada’s Wonderland Co./Magnum | | | |
| Management Corp. company guaranty sr. unsec. notes | | | |
| 9 1/8s, 2018 | | 255,000 | 288,788 |
|
| Cinemark USA, Inc. company guaranty sr. unsec. | | | |
| notes 8 5/8s, 2019 | | 160,000 | 176,800 |
|
| Cinemark USA, Inc. company guaranty sr. unsec. | | | |
| sub. notes 7 3/8s, 2021 | | 805,000 | 881,475 |
|
| Regal Entertainment Group company guaranty sr. unsec. | | | |
| notes 9 1/8s, 2018 | | 2,015,000 | 2,231,612 |
|
| | | | 6,548,574 |
| Financials (8.9%) | | | |
| ABN AMRO North American Holding Preferred Capital | | | |
| Repackage Trust I 144A jr. unsec. sub. bonds FRB 3.40675s, | | | |
| perpetual maturity | | 2,605,000 | 2,611,513 |
|
| ACE Cash Express, Inc. 144A sr. notes 11s, 2019 | | 975,000 | 923,813 |
|
| Air Lease Corp. sr. unsec. notes 5 5/8s, 2017 | | 1,385,000 | 1,447,325 |
|
| Ally Financial, Inc. company guaranty sr. notes 6 1/4s, 2017 | | 1,235,000 | 1,364,101 |
|
| Ally Financial, Inc. company guaranty sr. unsec. | | | |
| unsub. notes 8.3s, 2015 | | 1,825,000 | 2,039,438 |
|
| Ally Financial, Inc. company guaranty sr. unsec. | | | |
| unsub. notes 8s, 2020 | | 795,000 | 977,850 |
|
| Ally Financial, Inc. company guaranty sr. unsec. | | | |
| unsub. notes 7 1/2s, 2020 | | 2,620,000 | 3,157,099 |
|
| Ally Financial, Inc. company guaranty sr. unsec. | | | |
| unsub. notes 5 1/2s, 2017 | | 575,000 | 612,375 |
|
| Ally Financial, Inc. unsec. sub. notes 8s, 2018 | | 1,331,000 | 1,535,641 |
|
| American International Group, Inc. jr. sub. bonds FRB | | | |
| 8.175s, 2068 | | 1,755,000 | 2,193,750 |
|
| Capital One Capital IV company guaranty jr. unsec. | | | |
| sub. notes FRN 6.745s, 2037 | | 1,365,000 | 1,371,825 |
|
| CB Richard Ellis Services, Inc. company guaranty sr. unsec. | | | |
| notes 6 5/8s, 2020 | | 885,000 | 966,863 |
|
| CB Richard Ellis Services, Inc. company guaranty sr. unsec. | | | |
| sub. notes 11 5/8s, 2017 | | 990,000 | 1,092,713 |
|
| CIT Group, Inc. sr. unsec. notes 5s, 2022 | | 1,435,000 | 1,504,549 |
|
| CIT Group, Inc. sr. unsec. unsub. notes 5 3/8s, 2020 | | 1,145,000 | 1,222,288 |
|
| CIT Group, Inc. sr. unsec. unsub. notes 5 1/4s, 2018 | | 1,505,000 | 1,597,181 |
|
| CIT Group, Inc. sr. unsec. unsub. notes 5s, 2017 | | 915,000 | 958,463 |
|
| CIT Group, Inc. 144A company guaranty notes 6 5/8s, 2018 | | 1,290,000 | 1,444,800 |
|
| CIT Group, Inc. 144A company guaranty notes 5 1/2s, 2019 | | 1,975,000 | 2,103,374 |
|
| Citigroup, Inc. unsec. sub. notes 4 3/4s, 2019 | EUR | 565,000 | 703,626 |
|
| CNG Holdings, Inc./OH 144A sr. notes 9 3/8s, 2020 | | $680,000 | 691,900 |
|
| CNO Financial Group, Inc. 144A company | | | |
| guaranty sr. notes 6 3/8s, 2020 | | 965,000 | 1,010,838 |
|
| Community Choice Financial, Inc. company | | | |
| guaranty sr. notes 10 3/4s, 2019 | | 1,675,000 | 1,624,750 |
|
| Dresdner Funding Trust I 144A bonds 8.151s, 2031 | | 2,550,000 | 2,409,749 |
|
| |
| High Yield Advantage Fund | 33 |
| | |
| CORPORATE BONDS AND NOTES (87.4%)* cont. | Principal amount | Value |
|
| Financials cont. | | |
| E*Trade Financial Corp. sr. notes 6 3/4s, 2016 | $740,000 | $777,000 |
|
| E*Trade Financial Corp. sr. unsec. unsub. notes 6 3/8s, 2019 | 1,545,000 | 1,558,519 |
|
| HBOS Capital Funding LP 144A bank guaranty jr. unsec. | | |
| sub. FRB 6.071s, perpetual maturity (Jersey) | 1,595,000 | 1,299,925 |
|
| HBOS PLC 144A sr. unsec. sub. notes 6 3/4s, 2018 | | |
| (United Kingdom) | 1,650,000 | 1,753,125 |
|
| HBOS PLC 144A unsec. sub. bonds 6s, 2033 (United Kingdom) | 650,000 | 586,619 |
|
| Hub International Ltd. 144A company | | |
| guaranty sr. notes 8 1/8s, 2018 | 580,000 | 603,200 |
|
| Icahn Enterprises LP/Icahn Enterprises Finance Corp. | | |
| company guaranty sr. unsec. notes 8s, 2018 | 3,215,000 | 3,415,937 |
|
| International Lease Finance Corp. sr. unsec. notes 6 1/4s, 2019 | 1,440,000 | 1,526,400 |
|
| International Lease Finance Corp. sr. unsec. | | |
| unsub. notes 5 7/8s, 2022 | 1,695,000 | 1,741,613 |
|
| International Lease Finance Corp. sr. unsec. | | |
| unsub. notes 4 7/8s, 2015 | 630,000 | 644,175 |
|
| iStar Financial, Inc. sr. unsec. notes 7 1/8s, 2018 R | 1,025,000 | 1,036,531 |
|
| iStar Financial, Inc. sr. unsec. unsub. notes Ser. B, 9s, 2017 R | 1,255,000 | 1,352,263 |
|
| Liberty Mutual Group, Inc. 144A company guaranty jr. unsec. | | |
| sub. bonds 7.8s, 2037 | 970,000 | 1,076,700 |
|
| Liberty Mutual Group, Inc. 144A company guaranty jr. unsec. | | |
| sub. notes FRN 7s, 2037 | 195,000 | 193,050 |
|
| MPT Operating Partnership LP/MPT Finance Corp. company | | |
| guaranty sr. unsec. notes 6 7/8s, 2021 R | 640,000 | 694,400 |
|
| MPT Operating Partnership LP/MPT Finance Corp. company | | |
| guaranty sr. unsec. unsub. notes 6 3/8s, 2022 R | 915,000 | 953,888 |
|
| National Money Mart Co. company guaranty sr. unsec. | | |
| unsub. notes 10 3/8s, 2016 (Canada) | 810,000 | 897,075 |
|
| Nationstar Mortgage, LLC/Nationstar Capital Corp. 144A | | |
| company guaranty sr. unsec. notes 9 5/8s, 2019 | 410,000 | 456,125 |
|
| Nationstar Mortgage, LLC/Nationstar Capital Corp. 144A | | |
| company guaranty sr. unsec. notes 7 7/8s, 2020 | 960,000 | 994,800 |
|
| Nationstar Mortgage, LLC/Nationstar Capital Corp. 144A | | |
| company guaranty sr. unsec. unsub. notes 9 5/8s, 2019 | 270,000 | 299,025 |
|
| Neuberger Berman Group LLC/Neuberger Berman Finance Corp. | | |
| 144A sr. notes 5 7/8s, 2022 | 1,365,000 | 1,426,424 |
|
| Neuberger Berman Group LLC/Neuberger Berman Finance Corp. | | |
| 144A sr. notes 5 5/8s, 2020 | 685,000 | 714,113 |
|
| Nuveen Investments, Inc. 144A sr. unsec. notes 9 1/2s, 2020 | 400,000 | 404,000 |
|
| Nuveen Investments, Inc. 144A sr. unsec. notes 9 1/8s, 2017 | 910,000 | 903,175 |
|
| PHH Corp. sr. unsec. unsub. notes 9 1/4s, 2016 | 1,360,000 | 1,582,700 |
|
| PHH Corp. sr. unsec. unsub. notes 7 3/8s, 2019 | 1,115,000 | 1,209,775 |
|
| Provident Funding Associates LP/PFG Finance Corp. 144A | | |
| sr. notes 10 1/4s, 2017 | 2,270,000 | 2,497,000 |
|
| Provident Funding Associates LP/PFG Finance Corp. 144A | | |
| sr. notes 10 1/8s, 2019 | 790,000 | 829,500 |
|
| Regions Bank unsec. sub. notes 7 1/2s, 2018 | 850,000 | 1,020,000 |
|
| Regions Financing Trust II company guaranty jr. unsec. | | |
| sub. bonds FRB 6 5/8s, 2047 | 1,150,000 | 1,148,352 |
|
|
| 34 High Yield Advantage Fund |
| | | |
| CORPORATE BONDS AND NOTES (87.4%)* cont. | Principal amount | Value |
|
| Financials cont. | | | |
| Residential Capital LLC company guaranty jr. notes 9 5/8s, | | | |
| 2015 (In default) † | | $2,855,000 | $2,969,200 |
|
| Royal Bank of Scotland Group PLC jr. unsec. sub. bonds FRB | | | |
| 7.648s, perpetual maturity (United Kingdom) | | 3,450,000 | 3,415,499 |
|
| Royal Bank of Scotland Group PLC (The) sr. sub. notes FRN | | | |
| 9 1/2s,2022 (United Kingdom) | | 430,000 | 499,574 |
|
| SLM Corp. sr. notes Ser. MTN, 8s, 2020 | | 1,585,000 | 1,810,863 |
|
| SLM Corp. sr. unsec. unsub. notes Ser. MTN, 8.45s, 2018 | | 3,495,000 | 4,062,938 |
|
| Springleaf Finance Corp. sr. unsec. notes Ser. MTN, 6.9s, 2017 | | 4,215,000 | 3,740,813 |
|
| | | | 85,660,120 |
| Gaming and lottery (2.5%) | | | |
| American Casino & Entertainment Properties LLC | | | |
| sr. notes 11s, 2014 | | 1,960,000 | 2,015,125 |
|
| Caesars Entertainment Operating Co., Inc. company | | | |
| guaranty sr. notes 10s, 2018 | | 1,517,000 | 967,088 |
|
| Caesars Entertainment Operating Co., Inc. | | | |
| sr. notes 11 1/4s, 2017 | | 3,725,000 | 4,002,046 |
|
| CCM Merger, Inc. 144A company guaranty sr. unsec. | | | |
| notes 9 1/8s, 2019 | | 1,150,000 | 1,150,000 |
|
| Great Canadian Gaming Corp. 144A company | | | |
| guaranty sr. unsec. notes 6 5/8s, 2022 (Canada) | CAD | 2,210,000 | 2,300,238 |
|
| Isle of Capri Casinos, Inc. company guaranty sr. unsec. | | | |
| sub. notes 8 7/8s, 2020 | | $1,100,000 | 1,164,625 |
|
| Isle of Capri Casinos, Inc. company guaranty sr. unsec. | | | |
| unsub. notes 7 3/4s, 2019 | | 1,145,000 | 1,225,150 |
|
| Mashantucket Western Pequot Tribe 144A bonds Ser. A, | | | |
| 8 1/2s, 2015 (In default) † | | 1,995,000 | 159,600 |
|
| MTR Gaming Group, Inc. company guaranty notes | | | |
| 11 1/2s, 2019 ‡‡ | | 3,878,496 | 4,072,420 |
|
| Pinnacle Entertainment, Inc. company guaranty sr. unsec. | | | |
| notes 8 5/8s, 2017 | | 410,000 | 442,288 |
|
| Rivers Pittsburgh Borrower LP/Rivers Pittsburgh | | | |
| Finance Corp. 144A sr. notes 9 1/2s, 2019 | | 1,295,000 | 1,388,888 |
|
| ROC Finance, LLC/ROC Finance 1 Corp. 144A notes | | | |
| 12 1/8s, 2018 | | 2,055,000 | 2,342,700 |
|
| Yonkers Racing Corp. 144A sr. notes 11 3/8s, 2016 | | 3,086,000 | 3,325,165 |
|
| | | | 24,555,333 |
| Health care (7.2%) | | | |
| AmSurg Corp. 144A company guaranty sr. unsec. | | | |
| unsub. notes 5 5/8s, 2020 | | 1,370,000 | 1,383,700 |
|
| Aviv Healthcare Properties LP company guaranty sr. unsec. | | | |
| notes 7 3/4s, 2019 | | 1,200,000 | 1,260,000 |
|
| Biomet, Inc. 144A sr. unsec. notes 6 1/2s, 2020 | | 1,925,000 | 2,011,625 |
|
| Capella Healthcare, Inc. company guaranty sr. unsec. | | | |
| notes 9 1/4s, 2017 | | 1,785,000 | 1,905,488 |
|
| Capsugel FinanceCo SCA 144A company guaranty sr. unsec. | | | |
| notes 9 7/8s, 2019 | EUR | 1,690,000 | 2,482,739 |
|
| CDRT Holding Corp. 144A sr. unsec. notes 9 1/4s, 2017 ‡‡ | | $1,860,000 | 1,850,700 |
|
| CHS/Community Health Systems, Inc. company | | | |
| guaranty sr. notes 5 1/8s, 2018 | | 1,570,000 | 1,652,425 |
|
| |
| High Yield Advantage Fund | 35 |
| | | |
| CORPORATE BONDS AND NOTES (87.4%)* cont. | Principal amount | Value |
|
| Health care cont. | | | |
| CHS/Community Health Systems, Inc. company | | | |
| guaranty sr. unsec. unsub. notes 8s, 2019 | | $625,000 | $680,469 |
|
| ConvaTec Healthcare E SA 144A sr. notes 7 3/8s, 2017 | | | |
| (Luxembourg) | EUR | 610,000 | 853,225 |
|
| ConvaTec Healthcare E SA 144A sr. unsec. notes 10 1/2s, | | | |
| 2018 (Luxembourg) | | $3,983,000 | 4,341,469 |
|
| Emergency Medical Services Corp. company | | | |
| guaranty sr. unsec. notes 8 1/8s, 2019 | | 1,065,000 | 1,136,888 |
|
| Endo Health Solutions, Inc. company guaranty sr. unsec. | | | |
| notes 7s, 2019 | | 895,000 | 955,413 |
|
| Fresenius Medical Care US Finance II, Inc. 144A company | | | |
| guaranty sr. unsec. notes 5 5/8s, 2019 | | 1,315,000 | 1,403,763 |
|
| Grifols, Inc. company guaranty sr. unsec. notes 8 1/4s, 2018 | | 1,505,000 | 1,664,906 |
|
| HCA, Inc. company guaranty sr. notes 9 7/8s, 2017 | | 335,000 | 356,356 |
|
| HCA, Inc. company guaranty sr. notes 8 1/2s, 2019 | | 2,865,000 | 3,215,963 |
|
| HCA, Inc. sr. notes 6 1/2s, 2020 | | 4,890,000 | 5,489,024 |
|
| HCA, Inc. sr. unsec. notes 7 1/2s, 2022 | | 410,000 | 465,863 |
|
| Health Net, Inc. sr. unsec. bonds 6 3/8s, 2017 | | 2,730,000 | 2,846,025 |
|
| Hologic, Inc. 144A company guaranty sr. unsec. | | | |
| notes 6 1/4s, 2020 | | 405,000 | 430,313 |
|
| IASIS Healthcare, LLC/IASIS Capital Corp. company | | | |
| guaranty sr. unsec. notes 8 3/8s, 2019 | | 3,165,000 | 2,990,925 |
|
| IMS Health, Inc. 144A sr. unsec. notes 6s, 2020 | | 795,000 | 820,838 |
|
| Jaguar Holding Co. I 144A sr. unsec. notes 9 3/8s, 2017 ‡‡ | | 760,000 | 779,000 |
|
| Jaguar Holding Co. II/Jaguar Merger Sub, Inc. 144A | | | |
| sr. unsec. notes 9 1/2s, 2019 | | 1,675,000 | 1,884,375 |
|
| Kinetics Concept/KCI USA 144A company | | | |
| guaranty notes 10 1/2s, 2018 | | 3,310,000 | 3,442,399 |
|
| Kinetics Concept/KCI USA 144A company guaranty sr. unsec. | | | |
| notes 12 1/2s, 2019 | | 955,000 | 897,700 |
|
| Multiplan, Inc. 144A company guaranty sr. notes 9 7/8s, 2018 | | 1,515,000 | 1,677,863 |
|
| Omega Healthcare Investors, Inc. company | | | |
| guaranty sr. unsec. notes 6 3/4s, 2022 R | | 975,000 | 1,073,719 |
|
| Service Corporation International sr. notes 7s, 2019 | | 660,000 | 722,700 |
|
| Service Corporation International sr. notes 7s, 2017 | | 205,000 | 235,750 |
|
| Service Corporation International sr. unsec. | | | |
| unsub. notes 6 3/4s, 2016 | | 2,005,000 | 2,230,563 |
|
| Sky Growth Acquisition Corp. 144A company | | | |
| guaranty sr. unsec. notes 7 3/8s, 2020 | | 2,635,000 | 2,598,769 |
|
| Stewart Enterprises, Inc. company guaranty sr. unsec. | | | |
| notes 6 1/2s, 2019 | | 1,125,000 | 1,209,375 |
|
| Surgical Care Affiliates, Inc. 144A sr. sub. notes 10s, 2017 | | 2,220,000 | 2,303,250 |
|
| Surgical Care Affiliates, Inc. 144A sr. unsec. | | | |
| notes 8 7/8s, 2015 | | 577,149 | 587,249 |
|
| Teleflex, Inc. company guaranty sr. unsec. | | | |
| sub. notes 6 7/8s, 2019 | | 1,135,000 | 1,222,963 |
|
| Tenet Healthcare Corp. company guaranty sr. notes 10s, 2018 | | 560,000 | 638,400 |
|
| Tenet Healthcare Corp. company guaranty sr. notes 6 1/4s, 2018 | | 2,070,000 | 2,276,999 |
|
| Tenet Healthcare Corp. sr. notes 8 7/8s, 2019 | | 775,000 | 868,000 |
|
|
| 36 High Yield Advantage Fund |
| | |
| CORPORATE BONDS AND NOTES (87.4%)* cont. | Principal amount | Value |
|
| Health care cont. | | |
| United Surgical Partners International, Inc. company | | |
| guaranty sr. unsec. unsub. notes 9s, 2020 | $1,140,000 | $1,256,850 |
|
| Valeant Pharmaceuticals International 144A company | | |
| guaranty sr. notes 7s, 2020 | 250,000 | 271,875 |
|
| Valeant Pharmaceuticals International 144A company | | |
| guaranty sr. unsec. notes 6 7/8s, 2018 | 1,480,000 | 1,600,250 |
|
| Valeant Pharmaceuticals International 144A company | | |
| guaranty sr. unsec. notes 6 1/2s, 2016 | 1,185,000 | 1,250,175 |
|
| Valeant Pharmaceuticals International 144A | | |
| sr. notes 6 3/4s, 2017 | 580,000 | 627,850 |
|
| Vanguard Health Systems, Inc. sr. unsec. notes zero %, 2016 | 59,000 | 41,890 |
|
| VPI Escrow Corp. 144A sr. unsec. notes 6 3/8s, 2020 (Canada) | 280,000 | 296,800 |
|
| | | 70,192,881 |
| Homebuilding (2.1%) | | |
| Beazer Homes USA, Inc. company guaranty sr. unsec. | | |
| notes 6 7/8s, 2015 | 1,325,000 | 1,326,656 |
|
| Beazer Homes USA, Inc. company guaranty sr. unsec. | | |
| unsub. notes 9 1/8s, 2018 | 190,000 | 196,175 |
|
| Beazer Homes USA, Inc. sr. unsec. notes company | | |
| guaranty 8 1/8s, 2016 | 1,025,000 | 1,081,375 |
|
| Beazer Homes USA, Inc. 144A company | | |
| guaranty sr. notes 6 5/8s, 2018 | 750,000 | 798,750 |
|
| K Hovnanian Enterprises, Inc. 144A company | | |
| guaranty notes 9 1/8s, 2020 | 465,000 | 491,738 |
|
| K Hovnanian Enterprises, Inc. 144A sr. notes 7 1/4s, 2020 | 1,020,000 | 1,099,050 |
|
| Lennar Corp. 144A company guaranty sr. notes 4 3/4s, 2017 | 460,000 | 476,100 |
|
| Lennar Corp. 144A company guaranty sr. unsec. notes | | |
| 4 3/4s, 2022 | 630,000 | 609,525 |
|
| M/I Homes, Inc. company guaranty sr. unsec. notes | | |
| 8 5/8s, 2018 | 2,850,000 | 3,085,124 |
|
| Pulte Group, Inc. company guaranty sr. unsec. notes | | |
| 7 5/8s, 2017 | 2,070,000 | 2,416,725 |
|
| Pulte Group, Inc. company guaranty sr. unsec. | | |
| unsub. notes 7 7/8s, 2032 | 995,000 | 1,064,650 |
|
| Realogy Group, LLC company guaranty sr. unsec. | | |
| sub. notes 12 3/8s, 2015 | 880,000 | 906,400 |
|
| Realogy Group, LLC company guaranty sr. unsec. | | |
| unsub. notes 11 1/2s, 2017 | 2,240,000 | 2,424,799 |
|
| Realogy Group, LLC 144A company guaranty sr. notes 9s, 2020 | 350,000 | 388,500 |
|
| Realogy Group, LLC 144A company guaranty sr. notes 7 7/8s, 2019 | 615,000 | 651,900 |
|
| Realogy Group, LLC 144A company guaranty sr. notes 7 5/8s, 2020 | 525,000 | 585,375 |
|
| Taylor Morrison Communities, Inc./Monarch Communities, Inc. | | |
| 144A company guaranty sr. unsec. notes 7 3/4s, 2020 | 440,000 | 464,200 |
|
| Taylor Morrison Communities, Inc./Monarch Communities, Inc. | | |
| 144A sr. notes 7 3/4s, 2020 | 2,310,000 | 2,425,500 |
|
| | | 20,492,542 |
| Household furniture and appliances (0.1%) | | |
| Sealy Mattress Co. 144A company guaranty sr. notes 10 7/8s, 2016 | 699,000 | 760,163 |
|
| | | 760,163 |
| |
| High Yield Advantage Fund | 37 |
| | |
| CORPORATE BONDS AND NOTES (87.4%)* cont. | Principal amount | Value |
|
| Lodging/Tourism (1.7%) | | |
| Choice Hotels International, Inc. company | | |
| guaranty sr. unsec. unsub. notes 5 3/4s, 2022 | $650,000 | $710,125 |
|
| CityCenter Holdings LLC/CityCenter Finance Corp. company | | |
| guaranty 10 3/4s, 2017 ‡‡ | 2,691,418 | 2,900,003 |
|
| CityCenter Holdings LLC/CityCenter Finance Corp. company | | |
| guaranty sr. notes 7 5/8s, 2016 | 800,000 | 852,000 |
|
| FelCor Lodging LP company guaranty sr. notes 10s, 2014 R | 2,324,000 | 2,629,025 |
|
| FelCor Lodging LP company guaranty sr. notes 6 3/4s, 2019 R | 2,115,000 | 2,226,037 |
|
| Host Hotels & Resorts LP company guaranty sr. unsec. | | |
| unsub. notes 4 3/4s, 2023 R | 445,000 | 471,700 |
|
| MGM Resorts International company guaranty sr. notes 9s, 2020 | 140,000 | 155,750 |
|
| MGM Resorts International company guaranty sr. unsec. | | |
| notes 6 7/8s, 2016 | 535,000 | 560,413 |
|
| MGM Resorts International company guaranty sr. unsec. | | |
| notes 6 5/8s, 2015 | 1,985,000 | 2,114,025 |
|
| MGM Resorts International company guaranty sr. unsec. | | |
| unsub. notes 7 3/4s, 2022 | 915,000 | 960,750 |
|
| MGM Resorts International 144A company guaranty sr. unsec. | | |
| notes 8 5/8s, 2019 | 1,440,000 | 1,576,800 |
|
| MGM Resorts International 144A company guaranty sr. unsec. | | |
| notes 6 3/4s, 2020 | 1,110,000 | 1,118,325 |
|
| SugarHouse HSP Gaming Prop. Mezz LP/SugarHouse HSP Gaming | | |
| Finance Corp. 144A notes 8 5/8s, 2016 | 315,000 | 337,050 |
|
| | | 16,612,003 |
| Media (0.2%) | | |
| Affinion Group Holdings, Inc. company guaranty sr. unsec. | | |
| notes 11 5/8s, 2015 | 1,405,000 | 969,450 |
|
| Nielsen Finance, LLC/Nielsen Finance Co. company | | |
| guaranty sr. unsec. notes 7 3/4s, 2018 (Netherlands) | 438,000 | 488,370 |
|
| Nielsen Finance, LLC/Nielsen Finance Co. 144A sr. unsec. | | |
| notes 4 1/2s, 2020 (Netherlands) | 865,000 | 862,838 |
|
| | | 2,320,658 |
| Oil and gas (10.3%) | | |
| Access Midstream Partners, LP/ACMP Finance Corp. company | | |
| guaranty sr. unsec. notes 5 7/8s, 2021 | 580,000 | 606,100 |
|
| Access Midstream Partners, LP/ACMP Finance Corp. company | | |
| guaranty sr. unsec. unsub. notes 6 1/8s, 2022 | 500,000 | 530,000 |
|
| AmeriGas Finance, LLC/AmeriGas Finance Corp. company | | |
| guaranty sr. unsec. notes 7s, 2022 | 1,155,000 | 1,253,175 |
|
| Anadarko Finance Co. company guaranty sr. unsec. | | |
| unsub. notes Ser. B, 7 1/2s, 2031 | 230,000 | 307,364 |
|
| Anadarko Petroleum Corp. sr. unsec. notes 6.2s, 2040 | 690,000 | 853,061 |
|
| Atlas Pipeline Partners LP/Atlas Pipeline Finance Corp. | | |
| 144A company guaranty sr. notes 6 5/8s, 2020 | 555,000 | 577,200 |
|
| Atwood Oceanics, Inc. sr. unsec. unsub. notes 6 1/2s, 2020 | 1,020,000 | 1,088,850 |
|
| Aurora USA Oil & Gas Inc., 144A sr. notes 9 7/8s, 2017 | 1,290,000 | 1,364,175 |
|
| Carrizo Oil & Gas, Inc. company guaranty sr. unsec. | | |
| notes 8 5/8s, 2018 | 3,179,000 | 3,377,688 |
|
| Chaparral Energy, Inc. company guaranty sr. unsec. | | |
| notes 9 7/8s, 2020 | 1,235,000 | 1,392,463 |
|
|
| 38 High Yield Advantage Fund |
| | | |
| CORPORATE BONDS AND NOTES (87.4%)* cont. | Principal amount | Value |
|
| Oil and gas cont. | | | |
| Chaparral Energy, Inc. company guaranty sr. unsec. | | | |
| notes 8 1/4s, 2021 | | $1,700,000 | $1,827,500 |
|
| Chesapeake Energy Corp. company guaranty 6 1/2s, 2017 | | 220,000 | 231,550 |
|
| Chesapeake Energy Corp. company guaranty sr. unsec. | | | |
| bonds 6 1/4s, 2017 | EUR | 485,000 | 665,661 |
|
| Chesapeake Energy Corp. company guaranty sr. unsec. | | | |
| notes 9 1/2s, 2015 | | $1,625,000 | 1,824,063 |
|
| Chesapeake Energy Corp. company guaranty sr. unsec. | | | |
| unsub. notes 6.775s, 2019 | | 335,000 | 335,838 |
|
| Chesapeake Oilfield Operating, LLC/Chesapeake Oilfield | | | |
| Finance, Inc. 144A company guaranty sr. unsec. | | | |
| unsub. notes 6 5/8s, 2019 | | 1,650,000 | 1,551,000 |
|
| Comstock Resources, Inc. company | | | |
| guaranty sr. unsub. notes 8 3/8s, 2017 | | 1,090,000 | 1,130,875 |
|
| Concho Resources, Inc. company guaranty sr. unsec. | | | |
| notes 6 1/2s, 2022 | | 1,570,000 | 1,719,150 |
|
| Concho Resources, Inc. company guaranty sr. unsec. | | | |
| unsub. notes 5 1/2s, 2023 | | 450,000 | 464,625 |
|
| Concho Resources, Inc. company guaranty sr. unsec. | | | |
| unsub. notes 5 1/2s, 2022 | | 1,280,000 | 1,321,600 |
|
| Connacher Oil and Gas, Ltd. 144A notes 8 1/2s, 2019 (Canada) | | 1,410,000 | 1,046,925 |
|
| Continental Resources, Inc. company guaranty sr. unsec. | | | |
| notes 5s, 2022 | | 2,900,000 | 3,074,000 |
|
| Crosstex Energy LP/Crosstex Energy Finance Corp. company | | | |
| guaranty sr. unsec. notes 8 7/8s, 2018 | | 3,130,000 | 3,396,049 |
|
| Crosstex Energy LP/Crosstex Energy Finance Corp. 144A | | | |
| company guaranty sr. unsec. notes 7 1/8s, 2022 | | 555,000 | 566,100 |
|
| Denbury Resources, Inc. company | | | |
| guaranty sr. sub. notes 9 3/4s, 2016 | | 330,000 | 351,450 |
|
| Denbury Resources, Inc. company guaranty sr. unsec. | | | |
| sub. notes 8 1/4s, 2020 | | 1,240,000 | 1,401,200 |
|
| Denbury Resources, Inc. company guaranty sr. unsec. | | | |
| sub. notes 6 3/8s, 2021 | | 825,000 | 905,438 |
|
| Encore Acquisition Co. company | | | |
| guaranty sr. sub. notes 9 1/2s, 2016 | | 285,000 | 305,663 |
|
| EXCO Resources, Inc. company guaranty sr. unsec. | | | |
| notes 7 1/2s, 2018 | | 2,890,000 | 2,716,600 |
|
| Ferrellgas LP/Ferrellgas Finance Corp. sr. unsec. | | | |
| notes 9 1/8s, 2017 | | 1,370,000 | 1,472,749 |
|
| Ferrellgas LP/Ferrellgas Finance Corp. sr. unsec. | | | |
| notes 6 1/2s, 2021 | | 860,000 | 834,200 |
|
| Forbes Energy Services Ltd. company guaranty sr. unsec. | | | |
| notes 9s, 2019 | | 1,045,000 | 943,113 |
|
| Goodrich Petroleum Corp. company guaranty sr. unsec. | | | |
| unsub. notes 8 7/8s, 2019 | | 2,380,000 | 2,243,150 |
|
| Gulfport Energy Corp. 144A company guaranty sr. unsec. | | | |
| notes 7 3/4s, 2020 | | 1,045,000 | 1,034,550 |
|
| Halcon Resources Corp. 144A sr. unsec. notes 8 7/8s, 2021 | | 1,875,000 | 1,940,625 |
|
| Hercules Offshore, Inc. 144A company | | | |
| guaranty sr. notes 7 1/8s, 2017 | | 140,000 | 143,500 |
|
|
| High Yield Advantage Fund 39 |
| | |
| CORPORATE BONDS AND NOTES (87.4%)* cont. | Principal amount | Value |
|
| Oil and gas cont. | | |
| Hercules Offshore, Inc. 144A sr. notes 10 1/2s, 2017 | $1,820,000 | $1,933,750 |
|
| Kodiak Oil & Gas Corp. company guaranty sr. unsec. | | |
| unsub. notes 8 1/8s, 2019 | 3,130,000 | 3,411,700 |
|
| Laredo Petroleum, Inc. company guaranty sr. unsec. | | |
| notes 7 3/8s, 2022 | 555,000 | 600,788 |
|
| Laredo Petroleum, Inc. company guaranty sr. unsec. | | |
| unsub. notes 9 1/2s, 2019 | 2,130,000 | 2,385,600 |
|
| Lone Pine Resources Canada, Ltd. company | | |
| guaranty sr. unsec. notes 10 3/8s, 2017 (Canada) | 650,000 | 604,500 |
|
| MEG Energy Corp. 144A company guaranty sr. unsec. | | |
| notes 6 1/2s, 2021 (Canada) | 2,150,000 | 2,244,063 |
|
| MEG Energy Corp. 144A company guaranty sr. unsec. | | |
| notes 6 3/8s, 2023 (Canada) | 685,000 | 708,975 |
|
| Milagro Oil & Gas, Inc. company guaranty notes 10 1/2s, 2016 | 1,980,000 | 1,485,000 |
|
| Newfield Exploration Co. sr. unsec. notes 5 3/4s, 2022 | 1,350,000 | 1,464,750 |
|
| Newfield Exploration Co. sr. unsec. sub. notes 7 1/8s, 2018 | 360,000 | 379,350 |
|
| Newfield Exploration Co. sr. unsec. unsub. notes 5 5/8s, 2024 | 1,088,000 | 1,164,160 |
|
| Northern Oil and Gas, Inc. company guaranty sr. unsec. | | |
| notes 8s, 2020 | 1,390,000 | 1,431,700 |
|
| Oasis Petroleum, Inc. company guaranty sr. unsec. | | |
| notes 6 7/8s, 2023 | 930,000 | 985,800 |
|
| PetroBakken Energy, Ltd. 144A sr. unsec. notes 8 5/8s, 2020 | | |
| (Canada) | 3,410,000 | 3,410,000 |
|
| Plains Exploration & Production Co. company | | |
| guaranty sr. unsec. notes 7 5/8s, 2018 | 300,000 | 318,000 |
|
| Plains Exploration & Production Co. company | | |
| guaranty sr. unsec. notes 6 3/4s, 2022 | 2,525,000 | 2,600,750 |
|
| Quicksilver Resources, Inc. company guaranty sr. unsec. | | |
| notes 8 1/4s, 2015 | 565,000 | 519,800 |
|
| Quicksilver Resources, Inc. sr. notes 11 3/4s, 2016 | 1,265,000 | 1,255,513 |
|
| Range Resources Corp. company | | |
| guaranty sr. sub. notes 6 3/4s, 2020 | 640,000 | 700,800 |
|
| Range Resources Corp. company guaranty sr. unsec. | | |
| sub. notes 5s, 2022 | 640,000 | 667,200 |
|
| Rosetta Resources, Inc. company guaranty sr. unsec. | | |
| notes 9 1/2s, 2018 | 2,400,000 | 2,646,000 |
|
| Sabine Pass LNG LP company guaranty sr. notes 7 1/2s, 2016 | 2,625,000 | 2,835,000 |
|
| Sabine Pass LNG LP 144A sr. notes 6 1/2s, 2020 | 690,000 | 690,000 |
|
| Samson Investment Co. 144A sr. unsec. notes 9 3/4s, 2020 | 3,415,000 | 3,611,363 |
|
| SandRidge Energy, Inc. company guaranty sr. unsec. | | |
| notes 9 7/8s, 2016 | 570,000 | 615,600 |
|
| SandRidge Energy, Inc. company guaranty sr. unsec. | | |
| unsub. notes 7 1/2s, 2021 | 40,000 | 41,700 |
|
| SandRidge Energy, Inc. 144A company guaranty sr. unsec. | | |
| unsub. notes 8s, 2018 | 3,285,000 | 3,473,887 |
|
| Shelf Drilling Holdings Ltd. 144A sr. notes 8 5/8s, 2018 | 1,510,000 | 1,517,550 |
|
| SM Energy Co. sr. unsec. notes 6 5/8s, 2019 | 715,000 | 756,113 |
|
| SM Energy Co. sr. unsec. notes 6 1/2s, 2021 | 690,000 | 727,950 |
|
| SM Energy Co. sr. unsec. unsub. notes 6 1/2s, 2023 | 280,000 | 294,000 |
|
|
| 40 High Yield Advantage Fund |
| | |
| CORPORATE BONDS AND NOTES (87.4%)* cont. | Principal amount | Value |
|
| Oil and gas cont. | | |
| Suburban Propane Partners LP/Suburban Energy Finance Corp. | | |
| 144A sr. unsec. notes 7 3/8s, 2021 | $1,135,000 | $1,214,450 |
|
| Unit Corp. company guaranty sr. sub. notes 6 5/8s, 2021 | 415,000 | 423,300 |
|
| Unit Corp. 144A company guaranty sr. sub. notes 6 5/8s, 2021 | 1,430,000 | 1,455,025 |
|
| Whiting Petroleum Corp. company guaranty 7s, 2014 | 1,245,000 | 1,316,588 |
|
| Williams Cos., Inc. (The) notes 7 3/4s, 2031 | 1,113,000 | 1,403,174 |
|
| Williams Cos., Inc. (The) sr. unsec. notes 7 7/8s, 2021 | 335,000 | 432,610 |
|
| WPX Energy, Inc. sr. unsec. unsub. notes 6s, 2022 | 555,000 | 593,850 |
|
| WPX Energy, Inc. sr. unsec. unsub. notes 5 1/4s, 2017 | 2,070,000 | 2,189,025 |
|
| | | 99,306,634 |
| Publishing (0.2%) | | |
| Cenveo Corp. company guaranty sr. notes 8 7/8s, 2018 | 1,820,000 | 1,656,200 |
|
| | | 1,656,200 |
| Regional Bells (0.8%) | | |
| Cincinnati Bell, Inc. company guaranty sr. unsec. | | |
| sub. notes 8 3/4s, 2018 | 1,250,000 | 1,257,813 |
|
| Cincinnati Bell, Inc. company guaranty sr. unsec. | | |
| sub. notes 8 1/4s, 2017 | 655,000 | 699,213 |
|
| Frontier Communications Corp. sr. unsec. notes 9 1/4s, 2021 | 535,000 | 624,613 |
|
| Frontier Communications Corp. sr. unsec. notes 8 1/2s, 2020 | 2,295,000 | 2,622,037 |
|
| Frontier Communications Corp. sr. unsec. notes 8 1/4s, 2017 | 905,000 | 1,040,750 |
|
| Frontier Communications Corp. sr. unsec. notes 8 1/8s, 2018 | 1,160,000 | 1,322,400 |
|
| | | 7,566,826 |
| Retail (3.0%) | | |
| Academy, Ltd./Academy Finance Corp. 144A company | | |
| guaranty sr. unsec. notes 9 1/4s, 2019 | 995,000 | 1,094,500 |
|
| Autonation, Inc. company guaranty sr. unsec. notes 6 3/4s, 2018 | 505,000 | 571,281 |
|
| Autonation, Inc. company guaranty sr. unsec. | | |
| unsub. notes 5 1/2s, 2020 | 450,000 | 480,375 |
|
| Bon-Ton Department Stores, Inc. (The) 144A company | | |
| guaranty sr. notes 10 5/8s, 2017 | 2,205,000 | 2,116,800 |
|
| Burlington Coat Factory Warehouse Corp. company | | |
| guaranty sr. unsec. notes 10s, 2019 | 1,475,000 | 1,615,125 |
|
| J Crew Group, Inc. company guaranty sr. unsec. | | |
| notes 8 1/8s, 2019 | 1,800,000 | 1,890,000 |
|
| Jo-Ann Stores Holdings, Inc. 144A sr. notes 9 3/4s, 2019 ‡‡ | 920,000 | 899,300 |
|
| Limited Brands, Inc. company guaranty sr. unsec. | | |
| notes 6 5/8s, 2021 | 1,300,000 | 1,488,499 |
|
| Limited Brands, Inc. sr. notes 5 5/8s, 2022 | 685,000 | 739,800 |
|
| Macy’s Retail Holdings, Inc. company guaranty sr. unsec. | | |
| notes 5.9s, 2016 | 1,455,000 | 1,711,594 |
|
| Macy’s Retail Holdings, Inc. company guaranty sr. unsec. | | |
| unsub. notes 7 7/8s, 2015 | 545,000 | 638,507 |
|
| Michaels Stores, Inc. company guaranty 11 3/8s, 2016 | 2,205,000 | 2,306,981 |
|
| Needle Merger Sub Corp. 144A sr. unsec. notes 8 1/8s, 2019 | 1,890,000 | 1,899,450 |
|
| Neiman-Marcus Group, Inc. company guaranty sr. unsec. | | |
| sub. notes 10 3/8s, 2015 | 345,000 | 352,766 |
|
| Penske Automotive Group, Inc. 144A company | | |
| guaranty sr. sub. notes 5 3/4s, 2022 | 1,350,000 | 1,373,625 |
|
| |
| High Yield Advantage Fund | 41 |
| | |
| CORPORATE BONDS AND NOTES (87.4%)* cont. | Principal amount | Value |
|
| Retail cont. | | |
| PETCO Animal Supplies, Inc. 144A company | | |
| guaranty sr. notes 9 1/4s, 2018 | $870,000 | $965,700 |
|
| PETCO Holdings, Inc. 144A sr. unsec. notes 8 1/2s, 2017 ‡‡ | 925,000 | 943,500 |
|
| QVC Inc. 144A sr. notes 7 1/2s, 2019 | 1,280,000 | 1,409,718 |
|
| QVC Inc. 144A sr. notes 7 3/8s, 2020 | 885,000 | 981,107 |
|
| Toys R Us Property Co., LLC company | | |
| guaranty sr. notes 8 1/2s, 2017 | 1,420,000 | 1,515,850 |
|
| Toys R Us Property Co., LLC company guaranty sr. unsec. | | |
| notes 10 3/4s, 2017 | 2,040,000 | 2,223,600 |
|
| YCC Holdings, LLC/Yankee Finance, Inc. sr. unsec. | | |
| notes 10 1/4s, 2016 ‡‡ | 1,590,000 | 1,645,650 |
|
| | | 28,863,728 |
| Technology (3.9%) | | |
| Advanced Micro Devices, Inc. sr. unsec. notes 7 3/4s, 2020 | 315,000 | 270,506 |
|
| Alcatel-Lucent USA, Inc. unsec. debs. 6.45s, 2029 | 1,670,000 | 1,102,200 |
|
| Avaya, Inc. company guaranty sr. unsec. notes 9 3/4s, 2015 | 695,000 | 550,788 |
|
| Avaya, Inc. 144A company guaranty sr. notes 7s, 2019 | 2,075,000 | 1,862,313 |
|
| Ceridian Corp. company guaranty sr. unsec. notes 12 1/4s, 2015 ‡‡ | 2,016,350 | 1,976,023 |
|
| Ceridian Corp. sr. unsec. notes 11 1/4s, 2015 | 1,260,000 | 1,228,500 |
|
| Ceridian Corp. 144A sr. notes 8 7/8s, 2019 | 935,000 | 1,000,450 |
|
| CyrusOne LP/CyrusOne Finance Corp. 144A company | | |
| guaranty sr. unsec. unsub. notes 6 3/8s, 2022 | 385,000 | 398,475 |
|
| Epicor Software Corp. company guaranty sr. unsec. | | |
| notes 8 5/8s, 2019 | 1,565,000 | 1,631,513 |
|
| Fidelity National Information Services, Inc. company | | |
| guaranty sr. unsec. notes 7 7/8s, 2020 | 880,000 | 990,000 |
|
| Fidelity National Information Services, Inc. company | | |
| guaranty sr. unsec. notes 7 5/8s, 2017 | 590,000 | 643,100 |
|
| First Data Corp. company guaranty sr. unsec. notes 12 5/8s, 2021 | 2,625,000 | 2,762,813 |
|
| First Data Corp. company guaranty sr. unsec. notes 10.55s, 2015 | 968,138 | 994,762 |
|
| First Data Corp. company guaranty sr. unsec. | | |
| sub. notes 11 1/4s, 2016 | 955,000 | 943,063 |
|
| First Data Corp. 144A company guaranty notes 8 1/4s, 2021 | 3,070,000 | 3,062,324 |
|
| First Data Corp. 144A company guaranty sr. notes 7 3/8s, 2019 | 1,790,000 | 1,839,225 |
|
| Freescale Semiconductor, Inc. company guaranty sr. unsec. | | |
| notes 10 3/4s, 2020 | 1,409,000 | 1,477,689 |
|
| Freescale Semiconductor, Inc. 144A company | | |
| guaranty sr. notes 10 1/8s, 2018 | 654,000 | 712,860 |
|
| Freescale Semiconductor, Inc. 144A company | | |
| guaranty sr. notes 9 1/4s, 2018 | 2,692,000 | 2,897,265 |
|
| Infor US, Inc. company guaranty sr. unsec. notes 9 3/8s, 2019 | 870,000 | 970,050 |
|
| Infor US, Inc. company guaranty sr. unsec. | | |
| unsub. notes 11 1/2s, 2018 | 1,160,000 | 1,345,600 |
|
| Iron Mountain, Inc. company guaranty sr. sub. notes 7 3/4s, 2019 | 630,000 | 707,175 |
|
| Iron Mountain, Inc. company guaranty sr. unsec. | | |
| sub. notes 8s, 2020 | 75,000 | 79,125 |
|
| Iron Mountain, Inc. sr. sub. notes 8 3/8s, 2021 | 540,000 | 596,700 |
|
| Jazz Technologies, Inc. company guaranty sr. unsec. | | |
| notes 8s, 2015 | 899,000 | 746,170 |
|
|
| 42 High Yield Advantage Fund |
| | |
| CORPORATE BONDS AND NOTES (87.4%)* cont. | Principal amount | Value |
|
| Technology cont. | | |
| NXP BV/NXP Funding, LLC 144A company | | |
| guaranty sr. notes 9 3/4s, 2018 (Netherlands) | $1,265,000 | $1,464,238 |
|
| Seagate HDD Cayman company guaranty sr. unsec. | | |
| unsub. notes 7 3/4s, 2018 (Cayman Islands) | 865,000 | 940,688 |
|
| SunGard Data Systems, Inc. 144A company | | |
| guaranty sr. sub. notes 6 5/8s, 2019 | 1,040,000 | 1,060,800 |
|
| SunGard Data Systems, Inc. 144A sr. unsec. notes 7 5/8s, 2020 | 1,415,000 | 1,549,425 |
|
| Syniverse Holdings, Inc. company guaranty sr. unsec. | | |
| notes 9 1/8s, 2019 | 1,930,000 | 2,060,275 |
|
| | | 37,864,115 |
| Telecommunications (7.2%) | | |
| Clearwire Communications, LLC/Clearwire Finance, Inc. 144A | | |
| company guaranty sr. notes 12s, 2017 | 710,000 | 781,000 |
|
| Clearwire Communications, LLC/Clearwire Finance, Inc. 144A | | |
| company guaranty sr. notes 12s, 2015 | 1,205,000 | 1,271,275 |
|
| Clearwire Communications, LLC/Clearwire Finance, Inc. 144A | | |
| company guaranty sr. notes 12s, 2015 | 525,000 | 551,250 |
|
| Crown Castle International Corp. sr. unsec. notes 7 1/8s, 2019 | 570,000 | 628,425 |
|
| Crown Castle International Corp. 144A sr. unsec. | | |
| notes 5 1/4s, 2023 | 1,225,000 | 1,280,125 |
|
| Digicel Group, Ltd. 144A sr. notes 10 1/2s, 2018 (Jamaica) | 925,000 | 1,017,500 |
|
| Digicel Group, Ltd. 144A sr. unsec. notes 8 1/4s, 2020 (Jamaica) | 1,995,000 | 2,119,688 |
|
| Digicel, Ltd. 144A sr. unsec. notes 8 1/4s, 2017 (Jamaica) | 1,195,000 | 1,281,638 |
|
| Equinix, Inc. sr. unsec. notes 7s, 2021 | 940,000 | 1,035,175 |
|
| Hughes Satellite Systems Corp. company | | |
| guaranty sr. notes 6 1/2s, 2019 | 1,750,000 | 1,881,250 |
|
| Hughes Satellite Systems Corp. company guaranty sr. unsec. | | |
| notes 7 5/8s, 2021 | 2,005,000 | 2,235,575 |
|
| Intelsat Jackson Holdings SA company guaranty sr. unsec. | | |
| notes 7 1/2s, 2021 (Bermuda) | 1,170,000 | 1,251,900 |
|
| Intelsat Jackson Holdings SA 144A company | | |
| guaranty sr. unsec. notes 7 1/4s, 2020 (Bermuda) | 1,150,000 | 1,224,750 |
|
| Intelsat Jackson Holdings SA 144A sr. unsec. notes 6 5/8s, | | |
| 2022 (Bermuda) | 740,000 | 740,000 |
|
| Intelsat Luxembourg SA company guaranty sr. unsec. | | |
| notes 11 1/2s, 2017 (Luxembourg) ‡‡ | 6,971,093 | 7,398,072 |
|
| Intelsat Luxembourg SA company guaranty sr. unsec. | | |
| notes 11 1/4s, 2017 (Luxembourg) | 3,165,000 | 3,354,900 |
|
| Level 3 Financing, Inc. company guaranty sr. unsec. | | |
| unsub. notes 9 3/8s, 2019 | 1,035,000 | 1,156,613 |
|
| Level 3 Financing, Inc. company guaranty sr. unsec. | | |
| unsub. notes 8 5/8s, 2020 | 1,210,000 | 1,315,875 |
|
| Level 3 Financing, Inc. company guaranty sr. unsec. | | |
| unsub. notes 8 1/8s, 2019 | 270,000 | 288,900 |
|
| Level 3 Financing, Inc. 144A company guaranty sr. unsec. | | |
| unsub. notes 7s, 2020 | 835,000 | 849,613 |
|
| MetroPCS Wireless, Inc. company guaranty sr. unsec. | | |
| notes 7 7/8s, 2018 | 2,325,000 | 2,511,000 |
|
| NII Capital Corp. company guaranty sr. unsec. | | |
| unsub. notes 10s, 2016 | 685,000 | 582,250 |
|
|
| High Yield Advantage Fund 43 |
| | | |
| CORPORATE BONDS AND NOTES (87.4%)* cont. | Principal amount | Value |
|
| Telecommunications cont. | | | |
| NII Capital Corp. company guaranty sr. unsec. | | | |
| unsub. notes 8 7/8s, 2019 | | $835,000 | $597,025 |
|
| NII Capital Corp. company guaranty sr. unsec. | | | |
| unsub. notes 7 5/8s, 2021 | | 2,450,000 | 1,702,750 |
|
| PAETEC Holding Corp. company guaranty sr. notes 8 7/8s, 2017 | | 915,000 | 985,913 |
|
| PAETEC Holding Corp. company guaranty sr. unsec. | | | |
| notes 9 7/8s, 2018 | | 2,320,000 | 2,615,800 |
|
| Qwest Corp. sr. unsec. notes 6 3/4s, 2021 | | 1,735,000 | 2,031,154 |
|
| Qwest Corp. sr. unsec. unsub. notes 7 1/4s, 2025 | | 1,135,000 | 1,337,737 |
|
| SBA Telecommunications, Inc. company guaranty sr. unsec. | | | |
| notes 8 1/4s, 2019 | | 800,000 | 898,000 |
|
| SBA Telecommunications, Inc. 144A company | | | |
| guaranty sr. unsec. unsub. notes 5 3/4s, 2020 | | 465,000 | 485,925 |
|
| Sprint Capital Corp. company guaranty 6 7/8s, 2028 | | 3,615,000 | 3,723,450 |
|
| Sprint Nextel Corp. sr. notes 8 3/8s, 2017 | | 2,065,000 | 2,395,400 |
|
| Sprint Nextel Corp. sr. unsec. notes 6s, 2016 | | 3,125,000 | 3,390,625 |
|
| Sprint Nextel Corp. sr. unsec. unsub. notes 9 1/8s, 2017 | | 1,315,000 | 1,545,125 |
|
| Sprint Nextel Corp. sr. unsec. unsub. notes 7s, 2020 | | 1,035,000 | 1,120,388 |
|
| Sprint Nextel Corp. 144A company guaranty sr. unsec. | | | |
| notes 9s, 2018 | | 3,275,000 | 4,028,250 |
|
| Wind Acquisition Finance SA company | | | |
| guaranty sr. notes Ser. REGS, 7 3/8s, 2018 (Luxembourg) | EUR | 795,000 | 1,018,315 |
|
| Wind Acquisition Finance SA 144A company | | | |
| guaranty sr. notes 7 1/4s, 2018 (Luxembourg) | | $1,415,000 | 1,400,850 |
|
| Wind Acquisition Finance SA 144A sr. notes 11 3/4s, 2017 | | | |
| (Luxembourg) | | 550,000 | 562,375 |
|
| Wind Acquisition Holdings Finance SA 144A company | | | |
| guaranty sr. notes 12 1/4s, 2017 (Luxembourg) ‡‡ | | 588,687 | 581,328 |
|
| Windstream Corp. company guaranty sr. unsec. | | | |
| unsub. notes 8 1/8s, 2018 | | 505,000 | 547,925 |
|
| Windstream Corp. company guaranty sr. unsec. | | | |
| unsub. notes 7 7/8s, 2017 | | 2,290,000 | 2,536,174 |
|
| Windstream Corp. company guaranty sr. unsec. | | | |
| unsub. notes 7 3/4s, 2021 | | 925,000 | 975,875 |
|
| | | | 69,237,158 |
| Telephone (0.5%) | | | |
| Cricket Communications, Inc. company guaranty sr. unsec. | | | |
| notes 7 3/4s, 2020 | | 2,575,000 | 2,658,688 |
|
| Cricket Communications, Inc. company | | | |
| guaranty sr. unsub. notes 7 3/4s, 2016 | | 1,460,000 | 1,543,950 |
|
| TW Telecom Holdings, Inc. 144A company guaranty sr. unsec. | | | |
| notes 5 3/8s, 2022 | | 460,000 | 476,100 |
|
| | | | 4,678,738 |
| Textiles (0.2%) | | | |
| Hanesbrands, Inc. company guaranty sr. unsec. notes 6 3/8s, 2020 | | 1,110,000 | 1,219,613 |
|
| Hanesbrands, Inc. sr. unsec. notes 8s, 2016 | | 980,000 | 1,087,810 |
|
| | | | 2,307,423 |
|
| 44 High Yield Advantage Fund |
| | |
| CORPORATE BONDS AND NOTES (87.4%)* cont. | Principal amount | Value |
|
| Transportation (1.2%) | | |
| Aguila 3 SA 144A company guaranty sr. notes 7 7/8s, 2018 | | |
| (Luxembourg) | $3,445,000 | $3,651,699 |
|
| Air Medical Group Holdings, Inc. company | | |
| guaranty sr. notes 9 1/4s, 2018 | 2,265,000 | 2,440,538 |
|
| CHC Helicopter SA company guaranty sr. notes 9 1/4s, 2020 | | |
| (Canada) | 2,450,000 | 2,486,750 |
|
| Swift Services Holdings, Inc. company | | |
| guaranty sr. notes 10s, 2018 | 2,475,000 | 2,722,500 |
|
| Western Express, Inc. 144A sr. notes 12 1/2s, 2015 | 420,000 | 256,200 |
|
| | | 11,557,687 |
| Utilities and power (4.4%) | | |
| AES Corp. (The) sr. unsec. notes 8s, 2020 | 520,000 | 600,600 |
|
| AES Corp. (The) sr. unsec. unsub. notes 8s, 2017 | 1,855,000 | 2,128,612 |
|
| AES Corp. (The) sr. unsec. unsub. notes 7 3/8s, 2021 | 1,977,000 | 2,189,527 |
|
| Calpine Corp. 144A company guaranty sr. notes 7 7/8s, 2020 | 1,296,000 | 1,438,560 |
|
| Calpine Corp. 144A sr. notes 7 1/4s, 2017 | 2,436,000 | 2,606,520 |
|
| Colorado Interstate Gas Co., LLC debs. 6.85s, 2037 (Canada) | 1,430,000 | 1,768,694 |
|
| DPL, Inc. sr. unsec. notes 6 1/2s, 2016 | 2,090,000 | 2,199,725 |
|
| Edison Mission Energy sr. unsec. notes 7 3/4s, | | |
| 2016 (In default) † | 755,000 | 381,275 |
|
| Edison Mission Energy sr. unsec. notes 7 1/2s, | | |
| 2013 (In default) † | 1,105,000 | 558,025 |
|
| Edison Mission Energy sr. unsec. notes 7.2s, | | |
| 2019 (In default) † | 1,035,000 | 521,381 |
|
| Edison Mission Energy sr. unsec. notes 7s, | | |
| 2017 (In default) † | 45,000 | 22,613 |
|
| El Paso Corp. sr. unsec. notes 7s, 2017 | 1,160,000 | 1,325,859 |
|
| El Paso Corp. sr. unsec. notes Ser. GMTN, 7.8s, 2031 | 705,000 | 812,160 |
|
| El Paso Natural Gas Co. debs. 8 5/8s, 2022 | 765,000 | 1,050,103 |
|
| Energy Future Holdings Corp. company | | |
| guaranty sr. notes 10s, 2020 | 560,000 | 595,000 |
|
| Energy Future Intermediate Holding Co., LLC/EFIH | | |
| Finance, Inc. sr. notes 10s, 2020 | 1,870,000 | 2,085,049 |
|
| Energy Future Intermediate Holding Co., LLC/EFIH | | |
| Finance, Inc. 144A notes 11 3/4s, 2022 | 740,000 | 752,950 |
|
| Energy Transfer Equity LP company guaranty sr. unsec. | | |
| notes 7 1/2s, 2020 | 1,995,000 | 2,264,325 |
|
| EP Energy LLC /Everest Acquisition Finance, Inc. company | | |
| guaranty sr. notes 6 7/8s, 2019 | 625,000 | 676,563 |
|
| EP Energy/EP Finance, Inc. sr. unsec. notes 9 3/8s, 2020 | 2,985,000 | 3,305,887 |
|
| EP Energy, LLC/Everest Acquisition Finance, Inc. company | | |
| guaranty sr. unsec. notes 7 3/4s, 2022 | 430,000 | 446,125 |
|
| GenOn Americas Generation, Inc. sr. unsec. notes 9 1/8s, 2031 | 705,000 | 743,775 |
|
| GenOn Energy, Inc. sr. unsec. notes 9 7/8s, 2020 | 2,330,000 | 2,638,725 |
|
| GenOn Energy, Inc. sr. unsec. notes 9 1/2s, 2018 | 380,000 | 439,850 |
|
| Ipalco Enterprises, Inc. 144A sr. notes 7 1/4s, 2016 | 230,000 | 254,725 |
|
| NGPL PipeCo, LLC 144A sr. notes 9 5/8s, 2019 | 655,000 | 749,975 |
|
| NRG Energy, Inc. company guaranty sr. unsec. notes 7 7/8s, 2021 | 4,195,000 | 4,635,474 |
|
|
| High Yield Advantage Fund 45 |
| | |
| CORPORATE BONDS AND NOTES (87.4%)* cont. | Principal amount | Value |
|
| Utilities and power cont. | | |
| NRG Energy, Inc. company guaranty sr. unsec. notes 7 5/8s, 2018 | $260,000 | $287,300 |
|
| NRG Energy, Inc. 144A company guaranty sr. unsec. | | |
| notes 6 5/8s, 2023 | 450,000 | 470,250 |
|
| NV Energy, Inc. sr. unsec. notes 6 1/4s, 2020 | 935,000 | 1,083,429 |
|
| PNM Resources, Inc. unsec. unsub. notes 9 1/4s, 2015 | 166,000 | 190,070 |
|
| Regency Energy Partners company guaranty sr. unsec. | | |
| unsub. notes 5 1/2s, 2023 | 1,110,000 | 1,165,500 |
|
| Tennessee Gas Pipeline Co., LLC sr. unsec. unsub. debs. 7s, 2028 | 305,000 | 423,130 |
|
| Texas Competitive/Texas Competitive Electric | | |
| Holdings Co., LLC company guaranty notes 15s, 2021 | 1,660,000 | 466,875 |
|
| Texas Competitive/Texas Competitive Electric | | |
| Holdings Co., LLC company guaranty sr. unsec. | | |
| notes 10 1/2s, 2016 ‡‡ | 2,964,817 | 459,547 |
|
| Texas Competitive/Texas Competitive Electric Holdings Co., | | |
| LLC 144A company guaranty sr. notes 11 1/2s, 2020 | 745,000 | 551,300 |
|
| | | 42,289,478 |
| | | |
| Total corporate bonds and notes (cost $806,415,756) | | $844,632,737 |
| |
| SENIOR LOANS (5.7%)* c | Principal amount | Value |
|
| Broadcasting (0.5%) | | |
| Clear Channel Communications, Inc. bank term loan FRN | | |
| Ser. A, 3.612s, 2014 | $545,563 | $531,469 |
|
| Clear Channel Communications, Inc. bank term loan FRN | | |
| Ser. B, 3.862s, 2016 | 2,519,084 | 2,037,309 |
|
| Cumulus Media Holdings, Inc. bank term loan FRN 7 1/2s, 2019 | 1,000,000 | 1,017,500 |
|
| Univision Communications, Inc. bank term loan FRN 4.462s, 2017 | 915,599 | 892,709 |
|
| | | 4,478,987 |
| Capital goods (0.3%) | | |
| SRAM Corp. bank term loan FRN 8 1/2s, 2018 | 1,565,000 | 1,580,649 |
|
| Tomkins Air Distribution bank term loan FRN 9 1/4s, 2020 | 550,000 | 558,938 |
|
| Tomkins Air Distribution bank term loan FRN 5 1/4s, 2018 | 655,000 | 656,364 |
|
| | | 2,795,951 |
| Commercial and consumer services (0.2%) | | |
| Travelport, LLC bank term loan FRN 11s, 2015 | 835,000 | 850,655 |
|
| Travelport, LLC bank term loan FRN Ser. B, 4.855s, 2015 | 661,585 | 625,749 |
|
| Travelport, LLC bank term loan FRN Ser. S, 4.862s, 2015 | 208,415 | 197,126 |
|
| | | 1,673,530 |
| Communication services (0.4%) | | |
| Asurion Corp. bank term loan FRN 11s, 2019 | 1,255,000 | 1,327,163 |
|
| Asurion, LLC bank term loan FRN 9s, 2019 | 267,516 | 275,319 |
|
| Wide Open West Finance, LLC bank term loan FRN 6 1/4s, 2018 | 2,603,475 | 2,628,918 |
|
| | | 4,231,400 |
| Consumer cyclicals (1.1%) | | |
| Academy, Ltd. bank term loan FRN Ser. B, 4 3/4s, 2018 | 345,000 | 345,949 |
|
| Aot Bedding Super Holings, LLC bank term loan FRN 5s, 2019 | 885,000 | 884,004 |
|
| Chrysler Group, LLC bank term loan FRN Ser. B, 6s, 2017 | 74,248 | 75,883 |
|
| Compucom Systems, Inc. bank term loan FRN 6 1/2s, 2018 | 1,045,000 | 1,046,958 |
|
| Golden Nugget, Inc. bank term loan FRN Ser. B, 3.27s, 2014 ‡‡ | 747,021 | 715,895 |
|
| Golden Nugget, Inc. bank term loan FRN Ser. DD, 3.27s, 2014 ‡‡ | 425,217 | 407,500 |
|
| Harrah’s bank term loan FRN Ser. B, 9 1/2s, 2016 | 481,388 | 489,992 |
|
|
| 46 High Yield Advantage Fund |
| | |
| SENIOR LOANS (5.7%)* c cont. | Principal amount | Value |
|
| Consumer cyclicals cont. | | |
| Motor City bank term loan FRN 6s, 2017 | $1,989,988 | $1,991,232 |
|
| Navistar, Inc. bank term loan FRN Ser. B, 7s, 2017 | 995,000 | 997,073 |
|
| Neiman Marcus Group, Inc. (The) bank term loan FRN | | |
| 4 3/4s, 2018 | 1,130,000 | 1,130,418 |
|
| Neiman Marcus Group, Inc. (The) bank term loan FRN | | |
| 4 3/4s, 2018 | 995,000 | 995,368 |
|
| Tempur-Pedic International, Inc. bank term loan FRN Ser. B, | | |
| 5s, 2019 | 1,130,000 | 1,133,885 |
|
| Thomson Learning bank term loan FRN Ser. B, 2.72s, 2014 | 651,592 | 490,975 |
|
| | | 10,705,132 |
| Consumer staples (0.4%) | | |
| Del Monte Corp. bank term loan FRN Ser. B, 4 1/2s, 2018 | 469,792 | 469,596 |
|
| Landry’s, Inc. bank term loan FRN Ser. B, 6 1/2s, 2017 | 1,885,525 | 1,902,495 |
|
| Revlon Consumer Products Corp. bank term loan FRN | | |
| 4 3/4s, 2017 | 1,703,438 | 1,709,579 |
|
| Rite Aid Corp. bank term loan FRN Ser. B, 1.963s, 2014 | 112,832 | 111,647 |
|
| | | 4,193,317 |
| Energy (0.1%) | | |
| Frac Tech International, LLC bank term loan FRN Ser. B, | | |
| 8 1/2s, 2016 | 1,166,317 | 994,286 |
|
| | | 994,286 |
| Financials (0.6%) | | |
| iStar Financial, Inc. bank term loan FRN 5 3/4s, 2017 | 1,170,454 | 1,170,089 |
|
| iStar Financial, Inc. bank term loan FRN Ser. A2, 7s, 2017 | 365,000 | 377,775 |
|
| Nuveen Investments, Inc. bank term loan FRN 8 1/4s, 2019 | 2,365,000 | 2,400,474 |
|
| Nuveen Investments, Inc. bank term loan FRN Ser. B, | | |
| 5.846s, 2017 | 423,476 | 423,740 |
|
| Springleaf Financial Funding Co. bank term loan FRN Ser. B, | | |
| 5 1/2s, 2017 | 1,165,000 | 1,148,739 |
|
| | | 5,520,817 |
| Gaming and lottery (0.4%) | | |
| Caesars Entertainment Operating Co., Inc. bank term loan | | |
| FRN Ser. B6, 5.458s, 2018 | 4,381,000 | 3,909,434 |
|
| | | 3,909,434 |
| Health care (0.8%) | | |
| Ardent Health Services bank term loan FRN Ser. B, 6 1/2s, 2015 | 1,737,514 | 1,736,428 |
|
| Ardent Medical Services, Inc. bank term loan FRN 6 3/4s, 2018 | 1,230,000 | 1,239,225 |
|
| Emergency Medical Services Corp. bank term loan FRN Ser. B, | | |
| 5 1/4s, 2018 | 1,369,857 | 1,383,127 |
|
| Kinetic Concepts, Inc. bank term loan FRN Ser. C1, 5 1/2s, 2018 | 440,000 | 442,888 |
|
| Par Pharmaceutical Cos., Inc. bank term loan FRN Ser. B, | | |
| 5s, 2019 | 935,000 | 932,429 |
|
| Pharmaceutical Product Development, Inc. bank term loan FRN | | |
| Ser. B, 6 1/4s, 2018 | 1,126,488 | 1,143,151 |
|
| Quintiles Transnational Holdings, Inc. bank term loan FRN | | |
| 7 1/2s, 2017 | 500,000 | 503,750 |
|
| | | 7,380,998 |
| Oil and gas (0.1%) | | |
| Plains Exploration & Production Co. bank term loan FRN | | |
| Class B, 4s, 2019 | 1,490,000 | 1,495,588 |
|
| | | 1,495,588 |
|
| High Yield Advantage Fund 47 |
| | |
| SENIOR LOANS (5.7%)* c cont. | Principal amount | Value |
|
| Retail (—%) | | |
| Burlington Coat Factory Warehouse Corp. bank term loan | | |
| FRN Ser. B1, 5 1/2s, 2017 | $229,118 | $230,631 |
|
| | | 230,631 |
| Technology (0.2%) | | |
| First Data Corp. bank term loan FRN 5.208s, 2017 | 655,000 | 638,625 |
|
| Lawson Software bank term loan FRN Class B2, 5 1/4s, 2018 | 1,122,188 | 1,130,369 |
|
| | | 1,768,994 |
| Telecommunications (0.1%) | | |
| Level 3 Financing, Inc. bank term loan FRN 5 1/4s, 2019 | 1,085,000 | 1,090,424 |
|
| | | 1,090,424 |
| Telephone (0.1%) | | |
| Cricket Communications, Inc. bank term loan FRN Ser. B, | | |
| 4 3/4s, 2019 | 535,000 | 537,341 |
|
| | | 537,341 |
| Utilities and power (0.4%) | | |
| Dynegy Power, LLC bank term loan FRN 9 1/4s, 2016 | 423,314 | 439,717 |
|
| Texas Competitive Electric Holdings Co., LLC bank term loan | | |
| FRN 4.743s, 2017 | 5,958,299 | 3,857,998 |
|
| | | 4,297,715 |
| | | |
| Total senior loans (cost $56,858,083) | | $55,304,545 |
|
| |
| CONVERTIBLE BONDS AND NOTES (0.9%)* | Principal amount | Value |
|
| Altra Holdings, Inc. cv. company guaranty sr. unsec. | | |
| notes 2 3/4s, 2031 | $1,058,000 | $1,098,998 |
|
| DFC Global Corp. 144A cv. sr. unsec. unsub. notes | | |
| 3 1/4s, 2017 | 860,000 | 918,652 |
|
| Exide Technologies cv. sr. sub. notes FRN zero %, 2013 | 1,386,000 | 1,261,260 |
|
| Ford Motor Co. cv. sr. unsec. notes 4 1/4s, 2016 | 700,000 | 1,036,910 |
|
| Navistar International Corp. cv. sr. unsec. sub. notes 3s, 2014 | 1,538,000 | 1,407,269 |
|
| Steel Dynamics, Inc. cv. sr. notes 5 1/8s, 2014 | 373,000 | 396,546 |
|
| TRW Automotive, Inc. cv. company guaranty sr. unsec. | | |
| notes 3 1/2s, 2015 | 550,000 | 1,008,219 |
|
| XM Satellite Radio, Inc. 144A cv. company | | |
| guaranty sr. unsec. sub. notes 7s, 2014 | 889,000 | 1,460,738 |
|
| Total convertible bonds and notes (cost $7,299,823) | | $8,588,592 |
|
| |
| ASSET-BACKED SECURITIES (0.1%)* | Principal amount | Value |
|
| Neon Capital, Ltd. 144A limited recourse notes Ser. 97, | | |
| 1.105s, 2013 (Cayman Islands) F | $6,684,836 | $756,596 |
|
| Total asset-backed securities (cost $—) | | $756,596 |
|
| |
| SHORT-TERM INVESTMENTS (4.2%)* | Principal amount/shares | Value |
|
| Putnam Money Market Liquidity Fund 0.16% L | 40,591,647 | $40,591,647 |
|
| U.S. Treasury Bills with an effective yield of 0.156%, | | |
| July 25, 2013 | $372,000 | 371,668 |
|
| Total short-term investments (cost $40,963,263) | | $40,963,315 |
|
| |
| TOTAL INVESTMENTS | | |
|
| Total investments (cost $911,536,925) | | $950,245,785 |
|
| 48 High Yield Advantage Fund |
| |
| Key to holding’s currency abbreviations |
| |
| CAD | Canadian Dollar |
| EUR | Euro |
| | |
| Key to holding’s abbreviations |
| |
| FRB | Floating Rate Bonds: the rate shown is the current interest rate at the close of the reporting period |
| FRN | Floating Rate Notes: the rate shown is the current interest rate at the close of the reporting period |
| GMTN | Global Medium Term Notes |
| MTN | Medium Term Notes |
Notes to the fund’s portfolio
Unless noted otherwise, the notes to the fund’s portfolio are for the close of the fund’s reporting period, which ran from December 1, 2011 through November 30, 2012 (the reporting period). Within the following notes to the portfolio, references to “ASC 820” represent Accounting Standards Codification ASC 820 Fair Value Measurements and Disclosures.
* Percentages indicated are based on net assets of $966,211,080.
† Non-income-producing security.
‡‡ Income may be received in cash or additional securities at the discretion of the issuer.
c Senior loans are exempt from registration under the Securities Act of 1933, as amended, but contain certain restrictions on resale and cannot be sold publicly. These loans pay interest at rates which adjust periodically. The interest rates shown for senior loans are the current interest rates at the close of the reporting period. Senior loans are also subject to mandatory and/or optional prepayment which cannot be predicted. As a result, the remaining maturity may be substantially less than the stated maturity shown (Notes 1 and 7).
F Is valued at fair value following procedures approved by the Trustees. Securities may be classified as Level 2 or Level 3 for ASC 820 based on the securities’ valuation inputs. At the close of the reporting period, fair value pricing was also used for certain foreign securities in the portfolio (Note 1).
L Affiliated company (Note 6). The rate quoted in the security description is the annualized 7-day yield of the fund at the close of the reporting period.
R Real Estate Investment Trust.
At the close of the reporting period, the fund maintained liquid assets totaling $21,321 to cover certain derivatives contracts.
Debt obligations are considered secured unless otherwise indicated.
144A after the name of an issuer represents securities exempt from registration under Rule 144A under the Securities Act of 1933, as amended. These securities may be resold in transactions exempt from registration, normally to qualified institutional buyers.
The dates shown on debt obligations are the original maturity dates.
| | | | | | |
| FORWARD CURRENCY CONTRACTS at 11/30/12 (aggregate face value $17,219,242) | | |
| |
| | | | | | Unrealized |
| | Contract | Delivery | | Aggregate | appreciation/ |
| Counterparty | Currency | type | date | Value | face value | (depreciation) |
|
| Bank of America N.A. | | | | | |
|
| Canadian Dollar | Sell | 12/20/12 | $503,176 | $500,526 | $(2,650) |
|
| Euro | Sell | 12/20/12 | 3,776,158 | 3,768,730 | (7,428) |
|
| Barclays Bank PLC | | | | | |
|
| Euro | Sell | 12/20/12 | 1,439,831 | 1,437,155 | (2,676) |
|
| Credit Suisse AG | | | | | |
|
| Euro | Sell | 12/20/12 | 1,347,476 | 1,344,671 | (2,805) |
|
| Deutsche Bank AG | | | | | |
|
| Euro | Sell | 12/20/12 | 229,197 | 228,796 | (401) |
|
| Goldman Sachs International | | | | | |
|
| Euro | Sell | 12/20/12 | 1,577,974 | 1,574,774 | (3,200) |
|
|
| High Yield Advantage Fund 49 |
| | | | | | |
| FORWARD CURRENCY CONTRACTS at 11/30/12 (aggregate face value $17,219,242) cont. | |
| | |
| | | | | | Unrealized |
| | Contract | Delivery | | Aggregate | appreciation/ |
| Counterparty | Currency | type | date | Value | face value | (depreciation) |
|
| JPMorgan Chase Bank N.A. | | | | | |
|
| Canadian Dollar | Sell | 12/20/12 | $530,850 | $528,568 | $(2,282) |
|
| Euro | Sell | 12/20/12 | 1,668,768 | 1,665,243 | (3,525) |
|
| State Street Bank and Trust Co. | | | | | |
|
| Canadian Dollar | Sell | 12/20/12 | 2,224,034 | 2,214,229 | (9,805) |
|
| Euro | Sell | 12/20/12 | 2,544,191 | 2,538,621 | (5,570) |
|
| UBS AG | | | | | |
|
| Euro | Sell | 12/20/12 | 1,171,741 | 1,169,306 | (2,435) |
|
| WestPac Banking Corp. | | | | | |
|
| Canadian Dollar | Sell | 12/20/12 | 249,675 | 248,623 | (1,052) |
|
| Total | | | | | $(43,829) |
ASC 820 establishes a three-level hierarchy for disclosure of fair value measurements. The valuation hierarchy is based upon the transparency of inputs to the valuation of the fund’s investments. The three levels are defined as follows:
Level 1: Valuations based on quoted prices for identical securities in active markets.
Level 2: Valuations based on quoted prices in markets that are not active or for which all significant inputs are observable, either directly or indirectly.
Level 3: Valuations based on inputs that are unobservable and significant to the fair value measurement.
The following is a summary of the inputs used to value the fund’s net assets as of the close of the reporting period:
| | | |
| | | Valuation inputs | |
|
| Investments in securities: | Level 1 | Level 2 | Level 3 |
|
| Asset-backed securities | $— | $— | $756,596 |
|
| Convertible bonds and notes | — | 8,588,592 | — |
|
| Corporate bonds and notes | — | 844,632,737 | — |
|
| Senior loans | — | 55,304,545 | — |
|
| Short-term investments | 40,591,647 | 371,668 | — |
|
| Totals by level | $40,591,647 | $908,897,542 | $756,596 |
| | | | |
| | | Valuation inputs | |
|
| Other financial instruments: | Level 1 | Level 2 | Level 3 |
|
| Forward currency contracts | $— | $(43,829) | $— |
|
| Totals by level | $— | $(43,829) | $— |
At the start and close of the reporting period, Level 3 investments in securities were not considered a significant portion of the fund’s portfolio.
The accompanying notes are an integral part of these financial statements.
|
| 50 High Yield Advantage Fund |
Statement of assets and liabilities 11/30/12
| |
| ASSETS | |
|
| Investment in securities, at value (Note 1): | |
| Unaffiliated issuers (identified cost $870,945,278) | $909,654,138 |
| Affiliated issuers (identified cost $40,591,647) (Notes 1 and 6) | 40,591,647 |
|
| Cash | 1,073,443 |
|
| Interest and other receivables | 17,356,712 |
|
| Receivable for shares of the fund sold | 1,388,443 |
|
| Receivable for investments sold | 6,261,331 |
|
| Total assets | 976,325,714 |
| |
| LIABILITIES | |
|
| Payable for investments purchased | 6,919,310 |
|
| Payable for shares of the fund repurchased | 1,556,107 |
|
| Payable for compensation of Manager (Note 2) | 453,790 |
|
| Payable for custodian fees (Note 2) | 9,532 |
|
| Payable for investor servicing fees (Note 2) | 254,827 |
|
| Payable for Trustee compensation and expenses (Note 2) | 254,121 |
|
| Payable for administrative services (Note 2) | 1,913 |
|
| Unrealized depreciation on forward currency contracts (Note 1) | 43,829 |
|
| Payable for distribution fees (Note 2) | 378,877 |
|
| Other accrued expenses | 242,328 |
|
| Total liabilities | 10,114,634 |
| | |
| Net assets | $966,211,080 |
|
| |
| REPRESENTED BY | |
|
| Paid-in capital (Unlimited shares authorized) (Notes 1 and 4) | $1,010,432,205 |
|
| Undistributed net investment income (Note 1) | 6,418,575 |
|
| Accumulated net realized loss on investments and foreign currency transactions (Note 1) | (89,311,538) |
|
| Net unrealized appreciation of investments and assets and liabilities in foreign currencies | 38,671,838 |
|
| Total — Representing net assets applicable to capital shares outstanding | $966,211,080 |
| |
| COMPUTATION OF NET ASSET VALUE AND OFFERING PRICE | |
|
| Net asset value and redemption price per class A share | |
| ($652,557,130 divided by 106,688,333 shares) | $6.12 |
|
| Offering price per class A share (100/96.00 of $6.12)* | $6.38 |
|
| Net asset value and offering price per class B share ($15,256,984 divided by 2,546,347 shares)** | $5.99 |
|
| Net asset value and offering price per class C share ($29,271,041 divided by 4,899,755 shares)** | $5.97 |
|
| Net asset value and redemption price per class M share | |
| ($123,202,635 divided by 20,154,087 shares) | $6.11 |
|
| Offering price per class M share (100/96.75 of $6.11)† | $6.32 |
|
| Net asset value, offering price and redemption price per class R share | |
| ($26,120,461 divided by 4,273,263 shares) | $6.11 |
|
| Net asset value, offering price and redemption price per class Y share | |
| ($119,802,829 divided by 18,909,508 shares) | $6.34 |
|
* On single retail sales of less than $100,000. On sales of $100,000 or more the offering price is reduced.
** Redemption price per share is equal to net asset value less any applicable contingent deferred sales charge.
† On single retail sales of less than $50,000. On sales of $50,000 or more the offering price is reduced.
The accompanying notes are an integral part of these financial statements.
| |
| High Yield Advantage Fund | 51 |
Statement of operations Year ended 11/30/12
| |
| INVESTMENT INCOME | |
|
| Interest (net of foreign tax of $12,853) (including interest income of $45,321 | |
| from investments in affiliated issuers) (Note 6) | $70,417,150 |
|
| Total investment income | 70,417,150 |
| |
| EXPENSES | |
|
| Compensation of Manager (Note 2) | 5,206,491 |
|
| Investor servicing fees (Note 2) | 1,418,455 |
|
| Custodian fees (Note 2) | 27,319 |
|
| Trustee compensation and expenses (Note 2) | 83,481 |
|
| Distribution fees (Note 2) | 2,591,252 |
|
| Administrative services (Note 2) | 25,902 |
|
| Other | 391,313 |
|
| Total expenses | 9,744,213 |
| | |
| Expense reduction (Note 2) | (1,947) |
|
| Net expenses | 9,742,266 |
| | |
| Net investment income | 60,674,884 |
|
| Net realized gain on investments (Notes 1 and 3) | 6,759,369 |
|
| Net realized gain on swap contracts (Note 1) | 37,325 |
|
| Net realized gain on foreign currency transactions (Note 1) | 537,458 |
|
| Net unrealized depreciation of assets and liabilities in foreign currencies during the year | (279,639) |
|
| Net unrealized appreciation of investments and swap contracts during the year | 66,045,480 |
|
| Net gain on investments | 73,099,993 |
| |
| Net increase in net assets resulting from operations | $133,774,877 |
|
The accompanying notes are an integral part of these financial statements.
|
| 52 High Yield Advantage Fund |
Statement of changes in net assets
| | |
| INCREASE IN NET ASSETS | Year ended 11/30/12 | Year ended 11/30/11 |
|
| Operations: | | |
| Net investment income | $60,674,884 | $59,094,138 |
|
| Net realized gain on investments | | |
| and foreign currency transactions | 7,334,152 | 15,702,725 |
|
| Net unrealized appreciation (depreciation) of investments | | |
| and assets and liabilities in foreign currencies | 65,765,841 | (53,516,160) |
|
| Net increase in net assets resulting from operations | 133,774,877 | 21,280,703 |
|
| Distributions to shareholders (Note 1): | | |
| From ordinary income | | |
| Net investment income | | |
|
| Class A | (39,862,201) | (39,484,973) |
|
| Class B | (722,360) | (520,121) |
|
| Class C | (1,457,020) | (779,513) |
|
| Class M | (8,496,166) | (10,977,830) |
|
| Class R | (1,442,102) | (1,090,288) |
|
| Class Y | (8,559,900) | (7,412,853) |
|
| Increase in capital from settlement payments (Note 8) | — | 423,611 |
|
| Redemption fees (Note 1) | 17,085 | 90,811 |
|
| Increase from capital share transactions (Note 4) | 97,306,379 | 9,237,077 |
|
| Total increase (decrease) in net assets | 170,558,592 | (29,233,376) |
| |
| NET ASSETS | | |
|
| Beginning of year | 795,652,488 | 824,885,864 |
|
| End of year (including undistributed net investment income | | |
| of $6,418,575 and $5,779,524, respectively) | $966,211,080 | $795,652,488 |
|
The accompanying notes are an integral part of these financial statements.
| |
| High Yield Advantage Fund | 53 |
Financial highlights (For a common share outstanding throughout the period)
| | | | | | | | | | | | | | |
| INVESTMENT OPERATIONS: | | | | LESS DISTRIBUTIONS: | | | | | RATIOS AND SUPPLEMENTAL DATA: | |
|
| | | | | | | | | | | | | Ratio | Ratio | |
| | | | Net realized | | | | | | | | | of expenses | of net investment | |
| | Net asset value, | | and unrealized | Total from | From | | | | | Total return | Net assets, | to average | income (loss) | Portfolio |
| | beginning | Net investment | gain (loss) | investment | net investment | Total | Redemption | Non-recurring | Net asset value, | at net asset | end of period | net assets | to average | turnover |
| Period ended | of period | income (loss) a | on investments | operations | income | distributions | fees b | reimbursements | end of period | value (%) c | (in thousands) | (%) d | net assets (%) | (%) |
|
| Class A | | | | | | | | | | | | | | |
| November 30, 2012 | $5.62 | .40 | .50 | .90 | (.40) | (.40) | — | — | $6.12 | 16.55 | $652,557 | 1.04 | 6.74 | 40 |
| November 30, 2011 | 5.90 | .43 | (.27) | .16 | (.44) | (.44) | — | — f | 5.62 | 2.58 | 510,880 | 1.04 | 7.25 | 57 |
| November 30, 2010 | 5.56 | .44 | .32 | .76 | (.42) | (.42) | — | — | 5.90 | 14.10 | 535,054 | 1.05 e | 7.66 e | 71 |
| November 30, 2009 | 4.05 | .40 | 1.55 | 1.95 | (.44) | (.44) | — | — | 5.56 | 50.64 | 479,094 | 1.13 e | 8.13 e | 59 |
| November 30, 2008 | 6.05 | .42 | (1.97) | (1.55) | (.45) | (.45) | — | — | 4.05 | (27.33) | 292,694 | 1.10 e | 7.63 e | 34 |
|
| Class B | | | | | | | | | | | | | | |
| November 30, 2012 | $5.52 | .35 | .48 | .83 | (.36) | (.36) | — | — | $5.99 | 15.48 | $15,257 | 1.79 | 5.94 | 40 |
| November 30, 2011 | 5.80 | .38 | (.27) | .11 | (.39) | (.39) | — | — f | 5.52 | 1.84 | 8,076 | 1.79 | 6.50 | 57 |
| November 30, 2010 | 5.47 | .39 | .32 | .71 | (.38) | (.38) | — | — | 5.80 | 13.28 | 7,520 | 1.80 e | 6.93 e | 71 |
| November 30, 2009 | 3.99 | .35 | 1.54 | 1.89 | (.41) | (.41) | — | — | 5.47 | 49.61 | 9,033 | 1.88 e | 7.41 e | 59 |
| November 30, 2008 | 5.96 | .38 | (1.94) | (1.56) | (.41) | (.41) | — | — | 3.99 | (27.84) | 6,036 | 1.85 e | 6.86 e | 34 |
|
| Class C | | | | | | | | | | | | | | |
| November 30, 2012 | $5.50 | .35 | .48 | .83 | (.36) | (.36) | — | — | $5.97 | 15.52 | $29,271 | 1.79 | 5.95 | 40 |
| November 30, 2011 | 5.78 | .37 | (.25) | .12 | (.40) | (.40) | — | — f | 5.50 | 1.90 | 15,915 | 1.79 | 6.49 | 57 |
| November 30, 2010 | 5.46 | .39 | .31 | .70 | (.38) | (.38) | — | — | 5.78 | 13.13 | 9,464 | 1.80 e | 6.92 e | 71 |
| November 30, 2009 | 3.98 | .35 | 1.54 | 1.89 | (.41) | (.41) | — | — | 5.46 | 49.80 | 10,020 | 1.88 e | 7.16 e | 59 |
| November 30, 2008 | 5.95 | .37 | (1.93) | (1.56) | (.41) | (.41) | — | — | 3.98 | (27.87) | 684 | 1.85 e | 6.78 e | 34 |
|
| Class M | | | | | | | | | | | | | | |
| November 30, 2012 | $5.62 | .39 | .49 | .88 | (.39) | (.39) | — | — | $6.11 | 16.13 | $123,203 | 1.29 | 6.51 | 40 |
| November 30, 2011 | 5.90 | .42 | (.27) | .15 | (.43) | (.43) | — | — f | 5.62 | 2.37 | 130,758 | 1.29 | 7.00 | 57 |
| November 30, 2010 | 5.57 | .43 | .31 | .74 | (.41) | (.41) | — | — | 5.90 | 13.65 | 164,632 | 1.30 e | 7.42 e | 71 |
| November 30, 2009 | 4.05 | .39 | 1.56 | 1.95 | (.43) | (.43) | — | — | 5.57 | 50.52 | 178,550 | 1.38 e | 7.97 e | 59 |
| November 30, 2008 | 6.05 | .41 | (1.97) | (1.56) | (.44) | (.44) | — | — | 4.05 | (27.50) | 155,249 | 1.35 e | 7.36 e | 34 |
|
| Class R | | | | | | | | | | | | | | |
| November 30, 2012 | $5.62 | .39 | .49 | .88 | (.39) | (.39) | — | — | $6.11 | 16.13 | $26,120 | 1.29 | 6.46 | 40 |
| November 30, 2011 | 5.90 | .41 | (.26) | .15 | (.43) | (.43) | — | — f | 5.62 | 2.37 | 16,209 | 1.29 | 6.98 | 57 |
| November 30, 2010 | 5.56 | .43 | .32 | .75 | (.41) | (.41) | — | — | 5.90 | 13.86 | 11,085 | 1.30 e | 7.34 e | 71 |
| November 30, 2009 | 4.05 | .38 | 1.56 | 1.94 | (.43) | (.43) | — | — | 5.56 | 50.32 | 4,728 | 1.38 e | 7.63 e | 59 |
| November 30, 2008 | 6.05 | .41 | (1.97) | (1.56) | (.44) | (.44) | — | — | 4.05 | (27.46) | 680 | 1.35 e | 8.31 e | 34 |
|
| Class Y | | | | | | | | | | | | | | |
| November 30, 2012 | $5.81 | .43 | .52 | .95 | (.42) | (.42) | — | — | $6.34 | 16.76 | $119,803 | .79 | 6.99 | 40 |
| November 30, 2011 | 6.08 | .46 | (.28) | .18 | (.45) | (.45) | — | — f | 5.81 | 2.88 | 113,815 | .79 | 7.49 | 57 |
| November 30, 2010 | 5.71 | .47 | .33 | .80 | (.43) | (.43) | — | — | 6.08 | 14.49 | 97,130 | .80 e | 7.87 e | 71 |
| November 30, 2009 | 4.15 | .43 | 1.58 | 2.01 | (.45) | (.45) | — | — | 5.71 | 50.98 | 66,691 | .88 e | 8.35 e | 59 |
| November 30, 2008 | 6.19 | .45 | (2.03) | (1.58) | (.46) | (.46) | — | — | 4.15 | (27.21) | 33,660 | .85 e | 7.94 e | 34 |
|
See notes to financial highlights at the end of this section.
The accompanying notes are an integral part of these financial statements.
| | |
| 54 High Yield Advantage Fund | High Yield Advantage Fund | 55 |
Financial highlights (Continued)
a Per share net investment income (loss) has been determined on the basis of the weighted average number of shares outstanding during the period.
b Amount represents less than $0.01 per share.
c Total return assumes dividend reinvestment and does not reflect the effect of sales charges.
d Includes amounts paid through expense offset arrangements (Note 2).
e Reflects an involuntary contractual expense limitation in effect during the period. For periods prior to November 30, 2009, certain fund expenses were waived in connection with the fund’s investment in Putnam Prime Money Market Fund. As a result of such limitation and/or waivers, the expenses of each class reflect a reduction of the following amounts:
| |
| | Percentage of |
| | average net assets |
|
| November 30, 2010 | 0.01% |
|
| November 30, 2009 | 0.09 |
|
| November 30, 2008 | 0.02 |
|
f Reflects a non-recurring reimbursement related to restitution amounts in connection with a distribution plan approved by the Securities and Exchange Commission (the SEC) which amounted to less than $0.01 per share outstanding on July 21, 2011. Also reflects a non-recurring reimbursement related to short-term trading related lawsuits, which amounted to less than $0.01 per share outstanding on May 11, 2011 (Note 8).
The accompanying notes are an integral part of these financial statements.
|
| 56 High Yield Advantage Fund |
Notes to financial statements 11/30/12
Within the following Notes to financial statements, references to “State Street” represent State Street Bank and Trust Company, references to “the SEC” represent the Securities and Exchange Commission and references to “Putnam Management” represent Putnam Investment Management, LLC, the fund’s manager, an indirect wholly-owned subsidiary of Putnam Investments, LLC. Unless otherwise noted, the “reporting period” represents the period from December 1, 2011 through November 30, 2012.
Putnam High Yield Advantage Fund (the fund) is a Massachusetts business trust, which is registered under the Investment Company Act of 1940, as amended, as a diversified open-end management investment company. The investment objective of the fund is to seek high current income with capital growth as a secondary objective when consistent with the objective of high current income. The fund invests mainly in bonds that are obligations of U.S. companies, are below investment-grade in quality (sometimes referred to as “junk bonds”), and have intermediate- to long-term maturities (three years or longer). The fund may consider, among other factors, credit, interest rate and prepayment risks, as well as general market conditions, when deciding whether to buy or sell investments.
The fund offers class A, class B, class C, class M, class R, and class Y shares. Class A and class M shares are sold with a maximum front-end sales charge of 4.00% and 3.25%, respectively, and generally do not pay a contingent deferred sales charge. Class B shares, which convert to class A shares after approximately eight years, do not pay a front-end sales charge and are subject to a contingent deferred sales charge if those shares are redeemed within six years of purchase. Class C shares have a one-year 1.00% contingent deferred sales charge and do not convert to class A shares. Class R shares, which are not available to all investors, are sold at net asset value. The expenses for class A, class B, class C, class M and class R shares may differ based on the distribution fee of each class, which is identified in Note 2. Class Y shares, which are sold at net asset value, are generally subject to the same expenses as class A, class B, class C, class M and class R shares, but do not bear a distribution fee. Class Y shares are not available to all investors.
In the normal course of business, the fund enters into contracts that may include agreements to indemnify another party under given circumstances. The fund’s maximum exposure under these arrangements is unknown as this would involve future claims that may be, but have not yet been, made against the fund. However, the fund’s management team expects the risk of material loss to be remote.
Note 1: Significant accounting policies
The following is a summary of significant accounting policies consistently followed by the fund in the preparation of its financial statements. The preparation of financial statements is in conformity with accounting principles generally accepted in the United States of America and requires management to make estimates and assumptions that affect the reported amounts of assets and liabilities in the financial statements and the reported amounts of increases and decreases in net assets from operations. Actual results could differ from those estimates. Subsequent events after the Statement of assets and liabilities date through the date that the financial statements were issued have been evaluated in the preparation of the financial statements.
A 1.00% redemption fee may apply on shares that are redeemed (either by selling or exchanging into another fund) within 30 days of purchase. The redemption fee is accounted for as an addition to paid-in-capital.
Investment income, realized and unrealized gains and losses and expenses of the fund are borne pro-rata based on the relative net assets of each class to the total net assets of the fund, except that each class bears expenses unique to that class (including the distribution fees applicable to such classes). Each class votes as a class only with respect to its own distribution plan or other matters on which a class vote is required by law or determined by the Trustees. If the fund were liquidated, shares of each class would receive their pro-rata share of the net assets of the fund. In addition, the Trustees declare separate dividends on each class of shares.
Security valuation Market quotations are not considered to be readily available for certain debt obligations and other investments; such investments are valued on the basis of valuations furnished by an independent pricing service approved by the Trustees or dealers selected by Putnam Management. Such services or dealers determine valuations for normal institutional-size trading units of such securities using methods based on market transactions for comparable securities and various relationships, generally recognized by institutional traders, between securities (which considers such factors as security prices, yields, maturities and ratings). These securities will generally be categorized as Level 2. Securities quoted in foreign currencies, if any, are translated into U.S. dollars at the current exchange rate.
| |
| High Yield Advantage Fund | 57 |
Investments in open-end investment companies (excluding exchange traded funds), if any, which can be classified as Level 1 or Level 2 securities, are based on their net asset value. The net asset value of such investment companies equals the total value of their assets less their liabilities and divided by the number of their outstanding shares.
To the extent a pricing service or dealer is unable to value a security or provides a valuation that Putnam Management does not believe accurately reflects the security’s fair value, the security will be valued at fair value by Putnam Management. Certain investments, including certain restricted and illiquid securities and derivatives, are also valued at fair value following procedures approved by the Trustees. These valuations consider such factors as significant market or specific security events such as interest rate or credit quality changes, various relationships with other securities, discount rates, U.S. Treasury, U.S. swap and credit yields, index levels, convexity exposures and recovery rates. These securities are classified as Level 2 or as Level 3 depending on the priority of the significant inputs.
Such valuations and procedures are reviewed periodically by the Trustees. Certain securities may be valued on the basis of a price provided by a single source. The fair value of securities is generally determined as the amount that the fund could reasonably expect to realize from an orderly disposition of such securities over a reasonable period of time. By its nature, a fair value price is a good faith estimate of the value of a security in a current sale and does not reflect an actual market price, which may be different by a material amount.
Security transactions and related investment income Security transactions are recorded on the trade date (the date the order to buy or sell is executed). Gains or losses on securities sold are determined on the identified cost basis. Interest income is recorded on the accrual basis. All premiums/discounts are amortized/accreted on a yield-to-maturity basis. The fund earned certain fees in connection with its senior loan purchasing activities. These fees are treated as market discount and are amortized into income in the Statement of operations.
Foreign currency translation The accounting records of the fund are maintained in U.S. dollars. The market value of foreign securities, currency holdings, and other assets and liabilities is recorded in the books and records of the fund after translation to U.S. dollars based on the exchange rates on that day. The cost of each security is determined using historical exchange rates. Income and withholding taxes are translated at prevailing exchange rates when earned or incurred. The fund does not isolate that portion of realized or unrealized gains or losses resulting from changes in the foreign exchange rate on investments from fluctuations arising from changes in the market prices of the securities. Such gains and losses are included with the net realized and unrealized gain or loss on investments. Net realized gains and losses on foreign currency transactions represent net realized exchange gains or losses on closed forward currency contracts, disposition of foreign currencies, currency gains and losses realized between the trade and settlement dates on securities transactions and the difference between the amount of investment income and foreign withholding taxes recorded on the fund’s books and the U.S. dollar equivalent amounts actually received or paid. Net unrealized appreciation and depreciation of assets and liabilities in foreign currencies arise from changes in the value of open forward currency contracts and assets and liabilities other than investments at the period end, resulting from changes in the exchange rate.
Forward currency contracts The fund buys and sells forward currency contracts, which are agreements between two parties to buy and sell currencies at a set price on a future date. These contracts are used to hedge foreign exchange risk. The U.S. dollar value of forward currency contracts is determined using current forward currency exchange rates supplied by a quotation service. The market value of the contract will fluctuate with changes in currency exchange rates. The contract is marked to market daily and the change in market value is recorded as an unrealized gain or loss. The fund records a realized gain or loss equal to the difference between the value of the contract at the time it was opened and the value at the time it was closed when the contract matures or by delivery of the currency. The fund could be exposed to risk if the value of the currency changes unfavorably, if the counterparties to the contracts are unable to meet the terms of their contracts or if the fund is unable to enter into a closing position. Risks may exceed amounts recognized on the Statement of assets and liabilities.
Forward currency contracts outstanding at period end, if any, are listed after the fund’s portfolio. Outstanding forward currency contracts at the close of the reporting period are indicative of the volume of activity during the reporting period.
Credit default contracts The fund entered into credit default contracts to hedge credit risk, to hedge market risk and to gain exposure on individual names and/or baskets of securities.
In a credit default contract, the protection buyer typically makes an up front payment and a periodic stream of payments to a counterparty, the protection seller, in exchange for the right to receive a contingent payment upon
|
| 58 High Yield Advantage Fund |
the occurrence of a credit event on the reference obligation or all other equally ranked obligations of the ref erence entity. Credit events are contract specific but may include bankruptcy, failure to pay, restructuring and obligation acceleration. An upfront payment received by the fund is recorded as a liability on the fund’s books An upfront payment made by the fund is recorded as an asset on the fund’s books. Periodic payments received paid by the fund are recorded as realized gains or losses. The credit default contracts are marked to market daily based upon quotations from an independent pricing service or market makers and the change, if any, is recorded as an unrealized gain or loss. Upon the occurrence of a credit event, the difference between the par value and market value of the reference obligation, net of any proportional amount of the upfront payment, is recorded as realized gain or loss.
In addition to bearing the risk that the credit event will occur, the fund could be exposed to market risk due to unfavorable changes in interest rates or in the price of the underlying security or index or the possibility that the fund may be unable to close out its position at the same time or at the same price as if it had purchased the underlying reference obligations. In certain circumstances, the fund may enter into offsetting credit default contracts which would mitigate its risk of loss. Risks of loss may exceed amounts recognized on the Statement of assets and liabilities. The fund’s maximum risk of loss from counterparty risk, either as the protection seller or as the protection buyer, is the fair value of the contract. This risk may be mitigated by having a master netting arrangement between the fund and the counterparty. Where the fund is a seller of protection, the maximum potential amount of future payments the fund may be required to make is equal to the notional amount of the relevant credit default contract.
Credit default contracts outstanding, including their respective notional amounts at period end, if any, are listed after the fund’s portfolio. The fund had an average notional amount of approximately $700,000 on credit default swap contracts for the reporting period.
Master agreements The fund is a party to ISDA (International Swaps and Derivatives Association, Inc.) Master Agreements (Master Agreements) with certain counterparties that govern over-the-counter derivative and foreign exchange contracts entered into from time to time. The Master Agreements may contain provisions regarding, among other things, the parties’ general obligations, representations, agreements, collateral requirements, events of default and early termination. With respect to certain counterparties, in accordance with the terms of the Master Agreements, collateral posted to the fund is held in a segregated account by the fund’s custodian and with respect to those amounts which can be sold or repledged, are presented in the fund’s portfolio.
Collateral pledged by the fund is segregated by the fund’s custodian and identified in the fund’s portfolio. Collateral can be in the form of cash or debt securities issued by the U.S. Government or related agencies or other securities as agreed to by the fund and the applicable counterparty. Collateral requirements are determined based on the fund’s net position with each counterparty.
Termination events applicable to the fund may occur upon a decline in the fund’s net assets below a specified threshold over a certain period of time. Termination events applicable to counterparties may occur upon a decline in the counterparty’s long-term and short-term credit ratings below a specified level. In each case, upon occurrence, the other party may elect to terminate early and cause settlement of all derivative and foreign exchange contracts outstanding, including the payment of any losses and costs resulting from such early termination, as reasonably determined by the terminating party. Any decision by one or more of the fund’s counterparties to elect early termination could impact the fund’s future derivative activity.
At the close of the reporting period, the fund had a net liability position of $43,829 on open derivative contracts subject to the Master Agreements. There was no collateral posted by the fund.
Interfund lending The fund, along with other Putnam funds, may participate in an interfund lending program pursuant to an exemptive order issued by the SEC. This program allows the fund to borrow from or lend to other Putnam funds that permit such transactions. Interfund lending transactions are subject to each fund’s investment policies and borrowing and lending limits. Interest earned or paid on the interfund lending transaction will be based on the average of certain current market rates. During the reporting period, the fund did not utilize the program.
Line of credit The fund participates, along with other Putnam funds, in a $315 million unsecured committed line of credit and a $185 million unsecured uncommitted line of credit, both provided by State Street. Borrowings may be made for temporary or emergency purposes, including the funding of shareholder redemption requests and trade settlements. Interest is charged to the fund based on the fund’s borrowing at a rate equal to the Federal Funds rate plus 1.25% for the committed line of credit and the Federal Funds rate plus 1.30% for the uncommitted line of credit. A closing fee equal to 0.02% of the committed line of credit and $50,000 for the uncommitted line of credit has been paid by the participating funds. In addition, a commitment fee of 0.11% per annum on any unutilized portion
|
| High Yield Advantage Fund 59 |
of the committed line of credit is allocated to the participating funds based on their relative net assets and paid quarterly. During the reporting period, the fund had no borrowings against these arrangements.
Federal taxes It is the policy of the fund to distribute all of its taxable income within the prescribed time period and otherwise comply with the provisions of the Internal Revenue Code of 1986, as amended (the Code), applicable to regulated investment companies. It is also the intention of the fund to distribute an amount sufficient to avoid imposition of any excise tax under Section 4982 of the Code.
The fund is subject to the provisions of Accounting Standards Codification ASC 740 Income Taxes (ASC 740). ASC 740 sets forth a minimum threshold for financial statement recognition of the benefit of a tax position taken or expected to be taken in a tax return. The fund did not have a liability to record for any unrecognized tax benefits in the accompanying financial statements. No provision has been made for federal taxes on income, capital gains or unrealized appreciation on securities held nor for excise tax on income and capital gains. Each of the fund’s federal tax returns for the prior three fiscal years remains subject to examination by the Internal Revenue Service.
The fund may also be subject to taxes imposed by governments of countries in which it invests. Such taxes are generally based on either income or gains earned or repatriated. The fund accrues and applies such taxes to net investment income, net realized gains and net unrealized gains as income and/or capital gains are earned. In some cases, the fund may be entitled to reclaim all or a portion of such taxes, and such reclaim amounts, if any, are reflected as an asset on the fund’s books. In many cases, however, the fund may not receive such amounts for an extended period of time, depending on the country of investment.
At November 30, 2012, the fund had a capital loss carryover of $89,254,269 available to the extent allowed by the Code to offset future net capital gain, if any. The amounts of the carryovers and the expiration dates are:
| | | |
| | Loss carryover | |
|
| Short-term | Long-term | Total | Expiration |
|
| $8,720,272 | — | $8,720,272 | November 30, 2014 |
|
| 21,153,748 | — | 21,153,748 | November 30, 2016 |
|
| 59,380,249 | — | 59,380,249 | November 30, 2017 |
|
Under the Regulated Investment Company Modernization Act of 2010, the fund will be permitted to carry forward capital losses incurred in taxable years beginning after December 22, 2010 for an unlimited period. However, any losses incurred will be required to be utilized prior to the losses incurred in pre-enactment tax years. As a result of this ordering rule, pre-enactment capital loss carryforwards may be more likely to expire unused. Additionally, post-enactment capital losses that are carried forward will retain their character as either short-term or long-term capital losses rather than being considered all short-term as under previous law.
Distributions to shareholders Distributions to shareholders from net investment income are recorded by the fund on the ex-dividend date. Distributions from capital gains, if any, are recorded on the ex-dividend date and paid at least annually. The amount and character of income and gains to be distributed are determined in accordance with income tax regulations, which may differ from generally accepted accounting principles. These differences include temporary and/or permanent differences of the expiration of a capital loss carryover and interest on payment-in-kind securities. Reclassifications are made to the fund’s capital accounts to reflect income and gains available for distribution (or available capital loss carryovers) under income tax regulations. For the reporting period ended, the fund reclassified $503,916 to increase undistributed net investment income, $89,053,028 to decrease paid-in-capital and $88,549,112 to decrease accumulated net realized losses.
The tax basis components of distributable earnings and the federal tax cost as of the close of the reporting period were as follows:
| |
| Unrealized appreciation | $56,412,699 |
| Unrealized depreciation | (17,761,108) |
|
| Net unrealized appreciation | 38,651,591 |
| Undistributed ordinary income | 6,972,766 |
| Capital loss carryforward | (89,254,269) |
| Cost for federal income tax purposes | $911,594,194 |
|
| 60 High Yield Advantage Fund |
Note 2: Management fee, administrative services and other transactions
The fund pays Putnam Management a management fee (based on the fund’s average net assets and computed and paid monthly) at annual rates that may vary based on the average of the aggregate net assets of most open-end funds, as defined in the fund’s management contract, sponsored by Putnam Management. Such annual rates may vary as follows:
| | | | |
| 0.720% | of the first $5 billion, | | 0.520% | of the next $50 billion, |
| |
|
| 0.670% | of the next $5 billion, | | 0.500% | of the next $50 billion, |
| |
|
| 0.620% | of the next $10 billion, | | 0.490% | of the next $100 billion, and |
| |
|
| 0.570% | of the next $10 billion, | | 0.485% | of any excess thereafter. |
| |
|
Putnam Management has contractually agreed, through June 30, 2013, to waive fees or reimburse the fund’s expenses to the extent necessary to limit the cumulative expenses of the fund, exclusive of brokerage, interest, taxes, investment-related expenses, extraordinary expenses, acquired fund fees and expenses and payments under the fund’s investor servicing contract, investment management contract and distribution plans, on a fiscal year-to-date basis to an annual rate of 0.20% of the fund’s average net assets over such fiscal year-to-date period. During the reporting period, the fund’s expenses were not reduced as a result of this limit.
Putnam Investments Limited (PIL), an affiliate of Putnam Management, is authorized by the Trustees to manage a separate portion of the assets of the fund as determined by Putnam Management from time to time. Putnam Management pays a quarterly sub-management fee to PIL for its services at an annual rate of 0.40% of the average net assets of the portion of the fund managed by PIL.
The fund reimburses Putnam Management an allocated amount for the compensation and related expenses of certain officers of the fund and their staff who provide administrative services to the fund. The aggregate amount of all such reimbursements is determined annually by the Trustees.
Custodial functions for the fund’s assets are provided by State Street. Custody fees are based on the fund’s asset level, the number of its security holdings and transaction volumes.
Putnam Investor Services, Inc., an affiliate of Putnam Management, provides investor servicing agent functions to the fund. Putnam Investor Services, Inc. received fees for investor servicing based on the fund’s retail asset level, the number of shareholder accounts in the fund and the level of defined contribution plan assets in the fund. Investor servicing fees will not exceed an annual rate of 0.32% of the fund’s average net assets. Prior to March 1, 2012, investor servicing fees could not exceed an annual rate of 0.375% of the fund’s average net assets. During the reporting period, the class specific expenses related to investor servicing fees were as follows:
| | | | |
| Class A | $926,282 | | Class R | 34,834 |
| |
|
| Class B | 18,555 | | Class Y | 199,317 |
| |
|
| Class C | 37,436 | | Total | $1,418,455 |
| |
|
| Class M | 202,031 | | | |
| | |
The fund has entered into expense offset arrangements with Putnam Investor Services, Inc. and State Street whereby Putnam Investor Services, Inc.’s and State Street’s fees are reduced by credits allowed on cash balances. For the reporting period, the fund’s expenses were reduced by $1,947 under the expense offset arrangements.
Each independent Trustee of the fund receives an annual Trustee fee, of which $761, as a quarterly retainer, has been allocated to the fund, and an additional fee for each Trustees meeting attended. Trustees also are reimbursed for expenses they incur relating to their services as Trustees.
The fund has adopted a Trustee Fee Deferral Plan (the Deferral Plan) which allows the Trustees to defer the receipt of all or a portion of Trustees fees payable on or after July 1, 1995. The deferred fees remain invested in certain Putnam funds until distribution in accordance with the Deferral Plan.
The fund has adopted an unfunded noncontributory defined benefit pension plan (the Pension Plan) covering all Trustees of the fund who have served as a Trustee for at least five years and were first elected prior to 2004. Benefits under the Pension Plan are equal to 50% of the Trustee’s average annual attendance and retainer fees for the three years ended December 31, 2005. The retirement benefit is payable during a Trustee’s lifetime, beginning the year following retirement, for the number of years of service through December 31, 2006. Pension expense for the fund is included in Trustee compensation and expenses in the Statement of operations. Accrued pension
| |
| High Yield Advantage Fund | 61 |
liability is included in Payable for Trustee compensation and expenses in the Statement of assets and liabilities. The Trustees have terminated the Pension Plan with respect to any Trustee first elected after 2003.
The fund has adopted distribution plans (the Plans) with respect to its class A, class B, class C, class M and class R shares pursuant to Rule 12b–1 under the Investment Company Act of 1940. The purpose of the Plans is to compensate Putnam Retail Management Limited Partnership, an indirect wholly-owned subsidiary of Putnam Investments, LLC, for services provided and expenses incurred in distributing shares of the fund. The Plans provide for payments by the fund to Putnam Retail Management Limited Partnership at an annual rate of up to 0.35%, 1.00%, 1.00%, 1.00% and 1.00% of the average net assets attributable to class A, class B, class C, class M and class R shares, respectively. The Trustees have approved payment by the fund at an annual rate of 0.25%, 1.00%, 1.00%, 0.50% and 0.50% of the average net assets attributable to class A, class B, class C, class M and class R shares, respectively. During the reporting period, the class specific expenses related to distribution fees were as follows:
| | | | |
| Class A | $1,478,474 | | Class M | 643,547 |
| |
|
| Class B | 118,671 | | Class R | 111,207 |
| |
|
| Class C | 239,353 | | Total | $2,591,252 |
| |
|
For the reporting period, Putnam Retail Management Limited Partnership, acting as underwriter, received net commissions of $85,859 and $349 from the sale of class A and class M shares, respectively, and received $15,684 and $977 in contingent deferred sales charges from redemptions of class B and class C shares, respectively.
A deferred sales charge of up to 1.00% and 0.40% is assessed on certain redemptions of class A and class M shares, respectively. For the reporting period, Putnam Retail Management Limited Partnership, acting as underwriter, received $74 and no monies on class A and class M redemptions, respectively.
Note 3: Purchases and sales of securities
During the reporting period, cost of purchases and proceeds from sales of investment securities other than short-term investments aggregated $441,190,903 and $341,348,104, respectively. There were no purchases or proceeds from sales of long-term U.S. government securities.
Note 4: Capital shares
At the close of the reporting period, there was an unlimited number of shares of beneficial interest authorized. Transactions in capital shares were as follows:
| | | | |
| | Year ended 11/30/12 | Year ended 11/30/11 |
|
| Class A | Shares | Amount | Shares | Amount |
|
| Shares sold | 34,034,672 | $202,599,367 | 31,716,690 | $186,377,117 |
|
| Shares issued in connection with | | | | |
| reinvestment of distributions | 5,670,687 | 33,574,614 | 5,518,193 | 32,561,824 |
|
| | 39,705,359 | 236,173,981 | 37,234,883 | 218,938,941 |
|
| Shares repurchased | (23,887,276) | (141,992,891) | (37,041,355) | (217,782,415) |
|
| Net increase | 15,818,083 | $94,181,090 | 193,528 | $1,156,526 |
|
| |
| | Year ended 11/30/12 | Year ended 11/30/11 |
|
| Class B | Shares | Amount | Shares | Amount |
|
| Shares sold | 1,506,951 | $8,803,078 | 733,560 | $4,262,414 |
|
| Shares issued in connection with | | | | |
| reinvestment of distributions | 93,908 | 547,236 | 59,583 | 344,477 |
|
| | 1,600,859 | 9,350,314 | 793,143 | 4,606,891 |
|
| Shares repurchased | (518,250) | (3,027,472) | (626,545) | (3,666,745) |
|
| Net increase | 1,082,609 | $6,322,842 | 166,598 | $940,146 |
|
|
| 62 High Yield Advantage Fund |
| | | | |
| | Year ended 11/30/12 | Year ended 11/30/11 |
|
| Class C | Shares | Amount | Shares | Amount |
|
| Shares sold | 2,684,363 | $15,569,195 | 1,927,302 | $11,121,958 |
|
| Shares issued in connection with | | | | |
| reinvestment of distributions | 200,002 | 1,160,670 | 103,310 | 593,405 |
|
| | 2,884,365 | 16,729,865 | 2,030,612 | 11,715,363 |
|
| Shares repurchased | (877,499) | (5,107,018) | (773,873) | (4,450,044) |
|
| Net increase | 2,006,866 | $11,622,847 | 1,256,739 | $7,265,319 |
|
| |
| | Year ended 11/30/12 | Year ended 11/30/11 |
|
| Class M | Shares | Amount | Shares | Amount |
|
| Shares sold | 468,594 | $2,800,522 | 300,112 | $1,767,025 |
|
| Shares issued in connection with | | | | |
| reinvestment of distributions | 49,298 | 291,693 | 51,102 | 301,599 |
|
| | 517,892 | 3,092,215 | 351,214 | 2,068,624 |
|
| Shares repurchased | (3,622,077) | (21,541,253) | (4,979,524) | (29,615,987) |
|
| Net decrease | (3,104,185) | $(18,449,038) | (4,628,310) | $(27,547,363) |
|
| |
| | Year ended 11/30/12 | Year ended 11/30/11 |
|
| Class R | Shares | Amount | Shares | Amount |
|
| Shares sold | 1,958,340 | $11,604,867 | 2,150,158 | $12,830,531 |
|
| Shares issued in connection with | | | | |
| reinvestment of distributions | 243,330 | 1,442,102 | 184,638 | 1,088,241 |
|
| | 2,201,670 | 13,046,969 | 2,334,796 | 13,918,772 |
|
| Shares repurchased | (812,157) | (4,830,060) | (1,328,919) | (7,830,007) |
|
| Net increase | 1,389,513 | $8,216,909 | 1,005,877 | $6,088,765 |
|
| |
| | Year ended 11/30/12 | Year ended 11/30/11 |
|
| Class Y | Shares | Amount | Shares | Amount |
|
| Shares sold | 7,870,709 | $48,345,465 | 11,775,479 | $71,189,142 |
|
| Shares issued in connection with | | | | |
| reinvestment of distributions | 1,102,272 | 6,764,955 | 1,016,265 | 6,188,538 |
|
| | 8,972,981 | 55,110,420 | 12,791,744 | 77,377,680 |
|
| Shares repurchased | (9,661,199) | (59,698,691) | (9,171,417) | (56,043,996) |
|
| Net increase (decrease) | (688,218) | $(4,588,271) | 3,620,327 | $21,333,684 |
|
At the close of the period, a shareholder of record owned 6.6% of the outstanding shares of the fund.
|
| High Yield Advantage Fund 63 |
Note 5: Summary of derivative activity
The following is a summary of the market values of derivative instruments as of the close of the reporting period:
Market values of derivative instruments as of the close of the reporting period
| | | | |
| | Asset derivatives | Liability derivatives |
|
| Derivatives not | | | | |
| accounted for as | Statement of | | Statement of | |
| hedging instruments | assets and | | assets and | |
| under ASC 815 | liabilities location | Market value | liabilities location | Market value |
|
| Foreign exchange | | | | |
| contracts | Receivables | $— | Payables | $43,829 |
|
| Total | | $— | | $43,829 |
|
The following is a summary of realized and change in unrealized gains or losses of derivative instruments on the Statement of operations for the reporting period (see Note 1):
Amount of realized gain or (loss) on derivatives recognized in net gain or (loss) on investments
| | | |
| Derivatives not accounted for as hedging | Forward currency | | |
| instruments under ASC 815 | contracts | Swaps | Total |
|
| Credit contracts | $— | $37,325 | $37,325 |
|
| Foreign exchange contracts | 596,654 | — | 596,654 |
|
| Total | $596,654 | $37,325 | $633,979 |
|
Change in unrealized appreciation or (depreciation) on derivatives recognized in net gain or (loss) on investments
| | | |
| Derivatives not accounted for as hedging | Forward currency | | |
| instruments under ASC 815 | contracts | Swaps | Total |
|
| Credit contracts | $— | $(37,856) | $(37,856) |
|
| Foreign exchange contracts | (298,316) | — | (298,316) |
|
| Total | $(298,316) | $(37,856) | $(336,172) |
|
Note 6: Transactions with affiliated issuer
Transactions during the reporting period with Putnam Money Market Liquidity Fund, which is under common ownership and control, were as follows:
| | | | | |
| | Market value at | | | | Market value |
| | the beginning | | | | at the end of |
| | of the reporting | Purchase | Sale | Investment | the reporting |
| Name of affiliate | period | cost | proceeds | income | period |
|
| Putnam Money Market | | | | | |
| Liquidity Fund* | $38,065,843 | $269,435,459 | $266,909,655 | $45,321 | $40,591,647 |
|
* Management fees charged to Putnam Money Market Liquidity Fund have been waived by Putnam Management.
Note 7: Senior loan commitments
Senior loans are purchased or sold on a when-issued or delayed delivery basis and may be settled a month or more after the trade date, which from time to time can delay the actual investment of available cash balances; interest income is accrued based on the terms of the securities. Senior loans can be acquired through an agent, by assignment from another holder of the loan, or as a participation interest in another holder’s portion of the loan. When the fund invests in a loan or participation, the fund is subject to the risk that an intermediate participant between the fund and the borrower will fail to meet its obligations to the fund, in addition to the risk that the borrower under the loan may default on its obligations.
|
| 64 High Yield Advantage Fund |
Note 8: Regulatory matters and litigation
In late 2003 and 2004, Putnam Management settled charges brought by the SEC and the Massachusetts Securities Division in connection with excessive short-term trading in Putnam funds. In July 2011, the fund recorded a receivable of $417,577 related to restitution amounts in connection with a distribution plan approved by the SEC. This amount, which was received by the fund in December 2011, is reported as part of Increase in capital from settlement payments on the Statement of changes in net assets. These allegations and related matters have served as the general basis for certain lawsuits, including purported class action lawsuits against Putnam Management and, in a limited number of cases, some Putnam funds. In May 2011, the fund received a payment of $6,034 related to settlement of those lawsuits. This amount is reported as a part of Increase in capital from settlement payments on the Statement of changes in net assets. Putnam Management has agreed to bear any costs incurred by the Putnam funds as a result of these matters.
Note 9: Market, credit and other risks
In the normal course of business, the fund trades financial instruments and enters into financial transactions where risk of potential loss exists due to changes in the market (market risk) or failure of the contracting party to the transaction to perform (credit risk). The fund may be exposed to additional credit risk that an institution or other entity with which the fund has unsettled or open transactions will default.
Note 10: New accounting pronouncements
In May 2011, the Financial Accounting Standards Board (FASB) issued Accounting Standards Update (ASU) 2011-04 “Fair Value Measurements and Disclosures (Topic 820) — Amendments to Achieve Common Fair Value Measurement and Disclosure Requirements in U.S. GAAP and IFRS”. ASU 2011-04 amends FASB Topic 820 “Fair Value Measurement” and seeks to develop common requirements for measuring fair value and for disclosing information about fair value measurements in accordance with GAAP. ASU 2011-04 is effective for fiscal years and interim periods beginning after December 15, 2011. The application of ASU 2011-04 did not have a material impact on the fund’s financial statements.
In December 2011, the FASB issued ASU No. 2011–11 “Disclosures about Offsetting Assets and Liabilities”. The update creates new disclosure requirements requiring entities to disclose both gross and net information for derivatives and other financial instruments that are either offset in the Statement of assets and liabilities or subject to an enforceable master netting arrangement or similar agreement. The disclosure requirements are effective for annual reporting periods beginning on or after January 1, 2013 and interim periods within those annual periods. Putnam Management is currently evaluating the application of ASU 2011–11 and its impact, if any, on the fund’s financial statements.
Federal tax information (Unaudited)
For the reporting period ended, pursuant to §871(k) of the Internal Revenue Code, the fund hereby designates $48,889,788 of distributions paid as qualifying to be taxed as interest-related dividends.
The Form 1099 that will be mailed to you in January 2013 will show the tax status of all distributions paid to your account in calendar 2012.
|
| High Yield Advantage Fund 65 |
About the Trustees
Independent Trustees

|
| 66 High Yield Advantage Fund |
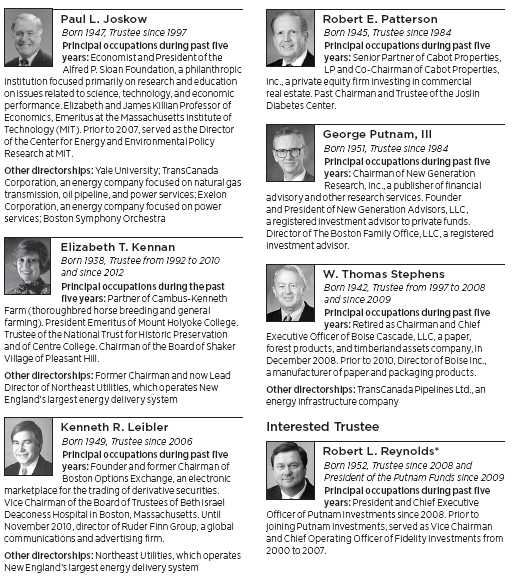
* Mr. Reynolds is an “interested person” (as defined in the Investment Company Act of 1940) of the fund, Putnam Management, and Putnam Retail Management. He is President and Chief Executive Officer of Putnam Investments, as well as the President of your fund and each of the other Putnam funds.
The address of each Trustee is One Post Office Square, Boston, MA 02109.
As of November 30, 2012, there were 109 Putnam funds. All Trustees serve as Trustees of all Putnam funds.
Each Trustee serves for an indefinite term, until his or her resignation, retirement at age 75, removal, or death.
| |
| High Yield Advantage Fund | 67 |
Officers
In addition to Robert L. Reynolds, the other officers of the fund are shown below:
| |
| Jonathan S. Horwitz (Born 1955) | Janet C. Smith (Born 1965) |
| Executive Vice President, Principal Executive | Vice President, Principal Accounting Officer, |
| Officer, and Compliance Liaison | and Assistant Treasurer |
| Since 2004 | Since 2007 |
| | Director of Fund Administration Services, |
| Steven D. Krichmar (Born 1958) | Putnam Investments and Putnam Management |
| Vice President and Principal Financial Officer | |
| Since 2002 | Susan G. Malloy (Born 1957) |
| Chief of Operations, Putnam Investments and | Vice President and Assistant Treasurer |
| Putnam Management | Since 2007 |
| | Director of Accounting & Control Services, |
| Robert T. Burns (Born 1961) | Putnam Management |
| Vice President and Chief Legal Officer | |
| Since 2011 | James P. Pappas (Born 1953) |
| General Counsel, Putnam Investments and | Vice President |
| Putnam Management | Since 2004 |
| | Director of Trustee Relations, |
| Robert R. Leveille (Born 1969) | Putnam Investments and Putnam Management |
| Vice President and Chief Compliance Officer | |
| Since 2007 | Mark C. Trenchard (Born 1962) |
| Chief Compliance Officer, Putnam Investments, | Vice President and BSA Compliance Officer |
| Putnam Management, and Putnam Retail | Since 2002 |
| Management | Director of Operational Compliance, |
| | Putnam Investments and Putnam |
| Michael J. Higgins (Born 1976) | Retail Management |
| Vice President and Treasurer | |
| Since 2010 | Judith Cohen (Born 1945) |
| Manager of Finance, Dunkin’ Brands (2008– | Vice President, Clerk, and Associate Treasurer |
| 2010); Senior Financial Analyst, Old Mutual Asset | Since 1993 |
| Management (2007–2008); Senior Financial | |
| Analyst, Putnam Investments (1999–2007) | Nancy E. Florek (Born 1957) |
| Vice President, Proxy Manager, Assistant Clerk, |
| | and Associate Treasurer |
| | Since 2000 |
The principal occupations of the officers for the past five years have been with the employers as shown above although in some cases, they have held different positions with such employers. The address of each Officer is One Post Office Square, Boston, MA 02109.
|
| 68 High Yield Advantage Fund |
Fund information
Founded 75 years ago, Putnam Investments was built around the concept that a balance between risk and reward is the hallmark of a well-rounded financial program. We manage over 100 funds across income, value, blend, growth, asset allocation, absolute return, and global sector categories.
| | |
| Investment Manager | Trustees | Robert R. Leveille |
| Putnam Investment | Jameson A. Baxter, Chair | Vice President and |
| Management, LLC | Liaquat Ahamed | Chief Compliance Officer |
| One Post Office Square | Ravi Akhoury | |
| Boston, MA 02109 | Barbara M. Baumann | Michael J. Higgins |
| | Charles B. Curtis | Vice President and Treasurer |
| Investment Sub-Manager | Robert J. Darretta | |
| Putnam Investments Limited | Katinka Domotorffy | Janet C. Smith |
| 57–59 St James’s Street | John A. Hill | Vice President, |
| London, England SW1A 1LD | Paul L. Joskow | Principal Accounting Officer, |
| | Elizabeth T. Kennan | and Assistant Treasurer |
| Marketing Services | Kenneth R. Leibler | |
| Putnam Retail Management | Robert E. Patterson | Susan G. Malloy |
| One Post Office Square | George Putnam, III | Vice President and |
| Boston, MA 02109 | Robert L. Reynolds | Assistant Treasurer |
| | W. Thomas Stephens | |
| Custodian | | James P. Pappas |
| State Street Bank | Officers | Vice President |
| and Trust Company | Robert L. Reynolds | |
| | President | Mark C. Trenchard |
| Legal Counsel | | Vice President and |
| Ropes & Gray LLP | Jonathan S. Horwitz | BSA Compliance Officer |
| | Executive Vice President, | |
| Independent Registered | Principal Executive Officer, and | Judith Cohen |
| Public Accounting Firm | Compliance Liaison | Vice President, Clerk, and |
| KPMG LLP | | Associate Treasurer |
| | Steven D. Krichmar | |
| | Vice President and | Nancy E. Florek |
| | Principal Financial Officer | Vice President, Proxy |
| | | Manager, Assistant Clerk, and |
| | Robert T. Burns | Associate Treasurer |
| | Vice President and | |
| | Chief Legal Officer | |
| | | |
This report is for the information of shareholders of Putnam High Yield Advantage Fund. It may also be used as sales literature when preceded or accompanied by the current prospectus, the most recent copy of Putnam’s Quarterly Performance Summary, and Putnam’s Quarterly Ranking Summary. For more recent performance, please visit putnam.com. Investors should carefully consider the investment objectives, risks, charges, and expenses of a fund, which are described in its prospectus. For this and other information or to request a prospectus or summary prospectus, call 1-800-225-1581 toll free. Please read the prospectus carefully before investing. The fund’s Statement of Additional Information contains additional information about the fund’s Trustees and is available without charge upon request by calling 1-800-225-1581.
| |
| (a) The fund’s principal executive, financial and accounting officers are employees of Putnam Investment Management, LLC, the Fund’s investment manager. As such they are subject to a comprehensive Code of Ethics adopted and administered by Putnam Investments which is designed to protect the interests of the firm and its clients. The Fund has adopted a Code of Ethics which incorporates the Code of Ethics of Putnam Investments with respect to all of its officers and Trustees who are employees of Putnam Investment Management, LLC. For this reason, the Fund has not adopted a separate code of ethics governing its principal executive, financial and accounting officers. |
| |
| (c) In May 2008, the Code of Ethics of Putnam Investment Management, LLC was updated in its entirety to include the amendments adopted in August 2007 as well as a several additional technical, administrative and non-substantive changes. In May of 2009, the Code of Ethics of Putnam Investment Management, LLC was amended to reflect that all employees will now be subject to a 90-day blackout restriction on holding Putnam open-end funds, except for portfolio managers and their supervisors (and each of their immediate family members), who will be subject to a one-year blackout restriction on the funds that they manage or supervise. In June 2010, the Code of Ethics of Putnam Investments was updated in its entirety to include the amendments adopted in May of 2009 and to change certain rules and limits contained in the Code of Ethics. In addition, the updated Code of Ethics included numerous technical, administrative and non-substantive changes, which were intended primarily to make the document easier to navigate and understand. In July 2011, the Code of Ethics of Putnam Investments was updated to reflect several technical, administrative and non-substantive changes resulting from changes in employee titles. |
| |
| Item 3. Audit Committee Financial Expert: |
| |
| The Funds’ Audit and Compliance Committee is comprised solely of Trustees who are “independent” (as such term has been defined by the Securities and Exchange Commission (“SEC”) in regulations implementing Section 407 of the Sarbanes-Oxley Act (the “Regulations”)). The Trustees believe that each of the members of the Audit and Compliance Committee also possess a combination of knowledge and experience with respect to financial accounting matters, as well as other attributes, that qualify them for service on the Committee. In addition, the Trustees have determined that each of Mr. Leibler, Mr. Hill, Mr. Darretta and Ms. Baumann qualifies as an “audit committee financial expert” (as such term has been defined by the Regulations) based on their review of his or her pertinent experience and education. The SEC has stated that the designation or identification of a person as an audit committee financial expert pursuant to this Item 3 of Form N-CSR does not impose on such person any duties, obligations or liability that are greater than the duties, obligations and liability imposed on such person as a member of the Audit and Compliance Committee and the Board of Trustees in the absence of such designation or identification. |
| |
| Item 4. Principal Accountant Fees and Services: |
| |
| The following table presents fees billed in each of the last two fiscal years for services rendered to the fund by the fund’s independent auditor: |
| | | | | |
| Fiscal year ended | Audit Fees | Audit-Related Fees | Tax Fees | All Other Fees |
|
|
| | | | | |
| November 30, 2012 | $80,880 | $-- | $4,450 | $ — |
| November 30, 2011 | $82,325 | $-- | $4,350 | $ — |
| |
| For the fiscal years ended November 30, 2012 and November 30, 2011, the fund’s independent auditor billed aggregate non-audit fees in the amounts of $4,450 and $4,350 respectively, to the fund, Putnam Management and any entity controlling, controlled by or under common control with Putnam Management that provides ongoing services to the fund. |
| |
| Audit Fees represent fees billed for the fund’s last two fiscal years relating to the audit and review of the financial statements included in annual reports and registration statements, and other services that are normally provided in connection with statutory and regulatory filings or engagements. |
| |
| Audit-Related Fees represent fees billed in the fund’s last two fiscal years for services traditionally performed by the fund’s auditor, including accounting consultation for proposed transactions or concerning financial accounting and reporting standards and other audit or attest services not required by statute or regulation. |
| |
| Tax Fees represent fees billed in the fund’s last two fiscal years for tax compliance, tax planning and tax advice services. Tax planning and tax advice services include assistance with tax audits, employee benefit plans and requests for rulings or technical advice from taxing authorities. |
| |
| Pre-Approval Policies of the Audit and Compliance Committee. The Audit and Compliance Committee of the Putnam funds has determined that, as a matter of policy, all work performed for the funds by the funds’ independent auditors will be pre-approved by the Committee itself and thus will generally not be subject to pre-approval procedures. |
| |
| The Audit and Compliance Committee also has adopted a policy to pre-approve the engagement by Putnam Management and certain of its affiliates of the funds’ independent auditors, even in circumstances where pre-approval is not required by applicable law. Any such requests by Putnam Management or certain of its affiliates are typically submitted in writing to the Committee and explain, among other things, the nature of the proposed engagement, the estimated fees, and why this work should be performed by that particular audit firm as opposed to another one. In reviewing such requests, the Committee considers, among other things, whether the provision of such services by the audit firm are compatible with the independence of the audit firm. |
| |
| The following table presents fees billed by the fund’s independent auditor for services required to be approved pursuant to paragraph (c)(7)(ii) of Rule 2-01 of Regulation S-X. |
| | | | | |
| Fiscal year ended | Audit-Related Fees | Tax Fees | All Other Fees | Total Non-Audit Fees |
|
|
| | | | | |
| November 30, 2012 | $ — | $ — | $ — | $ — |
| | | | | |
| November 30, 2011 | $ — | $ — | $ — | $ — |
| |
| Item 5. Audit Committee of Listed Registrants |
| |
| Item 6. Schedule of Investments: |
| |
| The registrant’s schedule of investments in unaffiliated issuers is included in the report to shareholders in Item 1 above. |
| |
| Item 7. Disclosure of Proxy Voting Policies and Procedures For Closed-End Management Investment Companies: |
| |
| Item 8. Portfolio Managers of Closed-End Investment Companies |
| |
| Item 9. Purchases of Equity Securities by Closed-End Management Investment Companies and Affiliated Purchasers: |
| |
| Item 10. Submission of Matters to a Vote of Security Holders: |
| |
| Item 11. Controls and Procedures: |
| |
| (a) The registrant’s principal executive officer and principal financial officer have concluded, based on their evaluation of the effectiveness of the design and operation of the registrant’s disclosure controls and procedures as of a date within 90 days of the filing date of this report, that the design and operation of such procedures are generally effective to provide reasonable assurance that information required to be disclosed by the registrant in this report is recorded, processed, summarized and reported within the time periods specified in the Commission’s rules and forms. |
| |
| (b) Changes in internal control over financial reporting: Not applicable |
| |
| (a)(1) The Code of Ethics of The Putnam Funds, which incorporates the Code of Ethics of Putnam Investments, is filed herewith. |
| |
| (a)(2) Separate certifications for the principal executive officer and principal financial officer of the registrant as required by Rule 30a-2(a) under the Investment Company Act of 1940, as amended, are filed herewith. |
| |
| (b) The certifications required by Rule 30a-2(b) under the Investment Company Act of 1940, as amended, are filed herewith. |
| |
| Pursuant to the requirements of the Securities Exchange Act of 1934 and the Investment Company Act of 1940, the registrant has duly caused this report to be signed on its behalf by the undersigned, thereunto duly authorized. |
| |
| Putnam High Yield Advantage Fund |
| |
| By (Signature and Title): |
| |
| /s/Janet C. Smith
Janet C. Smith
Principal Accounting Officer
|
| |
| Pursuant to the requirements of the Securities Exchange Act of 1934 and the Investment Company Act of 1940, this report has been signed below by the following persons on behalf of the registrant and in the capacities and on the dates indicated. |
| |
| By (Signature and Title): |
| |
| /s/Jonathan S. Horwitz
Jonathan S. Horwitz
Principal Executive Officer
|
| |
| By (Signature and Title): |
| |
| /s/Steven D. Krichmar
Steven D. Krichmar
Principal Financial Officer
|