CERTIFIED SHAREHOLDER REPORT OF REGISTERED MANAGEMENT INVESTMENT COMPANIES
Investment Company Act file number:
(811-04616)
Exact name of registrant as specified in charter:
Putnam High Yield Advantage Fund
Address of principal executive offices:
One Post Office Square, Boston, Massachusetts 02109
Name and address of agent for service:
Robert T. Burns, Vice President One Post Office Square Boston, Massachusetts 02109
Copy to:
Bryan Chegwidden, Esq. Ropes & Gray LLP 1211 Avenue of the Americas New York, New York 10036
Registrant’s telephone number, including area code:
(617) 292-1000
Date of fiscal year end:
November 30, 2014
Date of reporting period :
December 1, 2013 — November 30, 2014
Item 1. Report to Stockholders:
The following is a copy of the report transmitted to stockholders pursuant to Rule 30e-1 under the Investment Company Act of 1940:
Putnam High Yield Advantage Fund
Annual report 11 | 30 | 14
Message from the Trustees
1
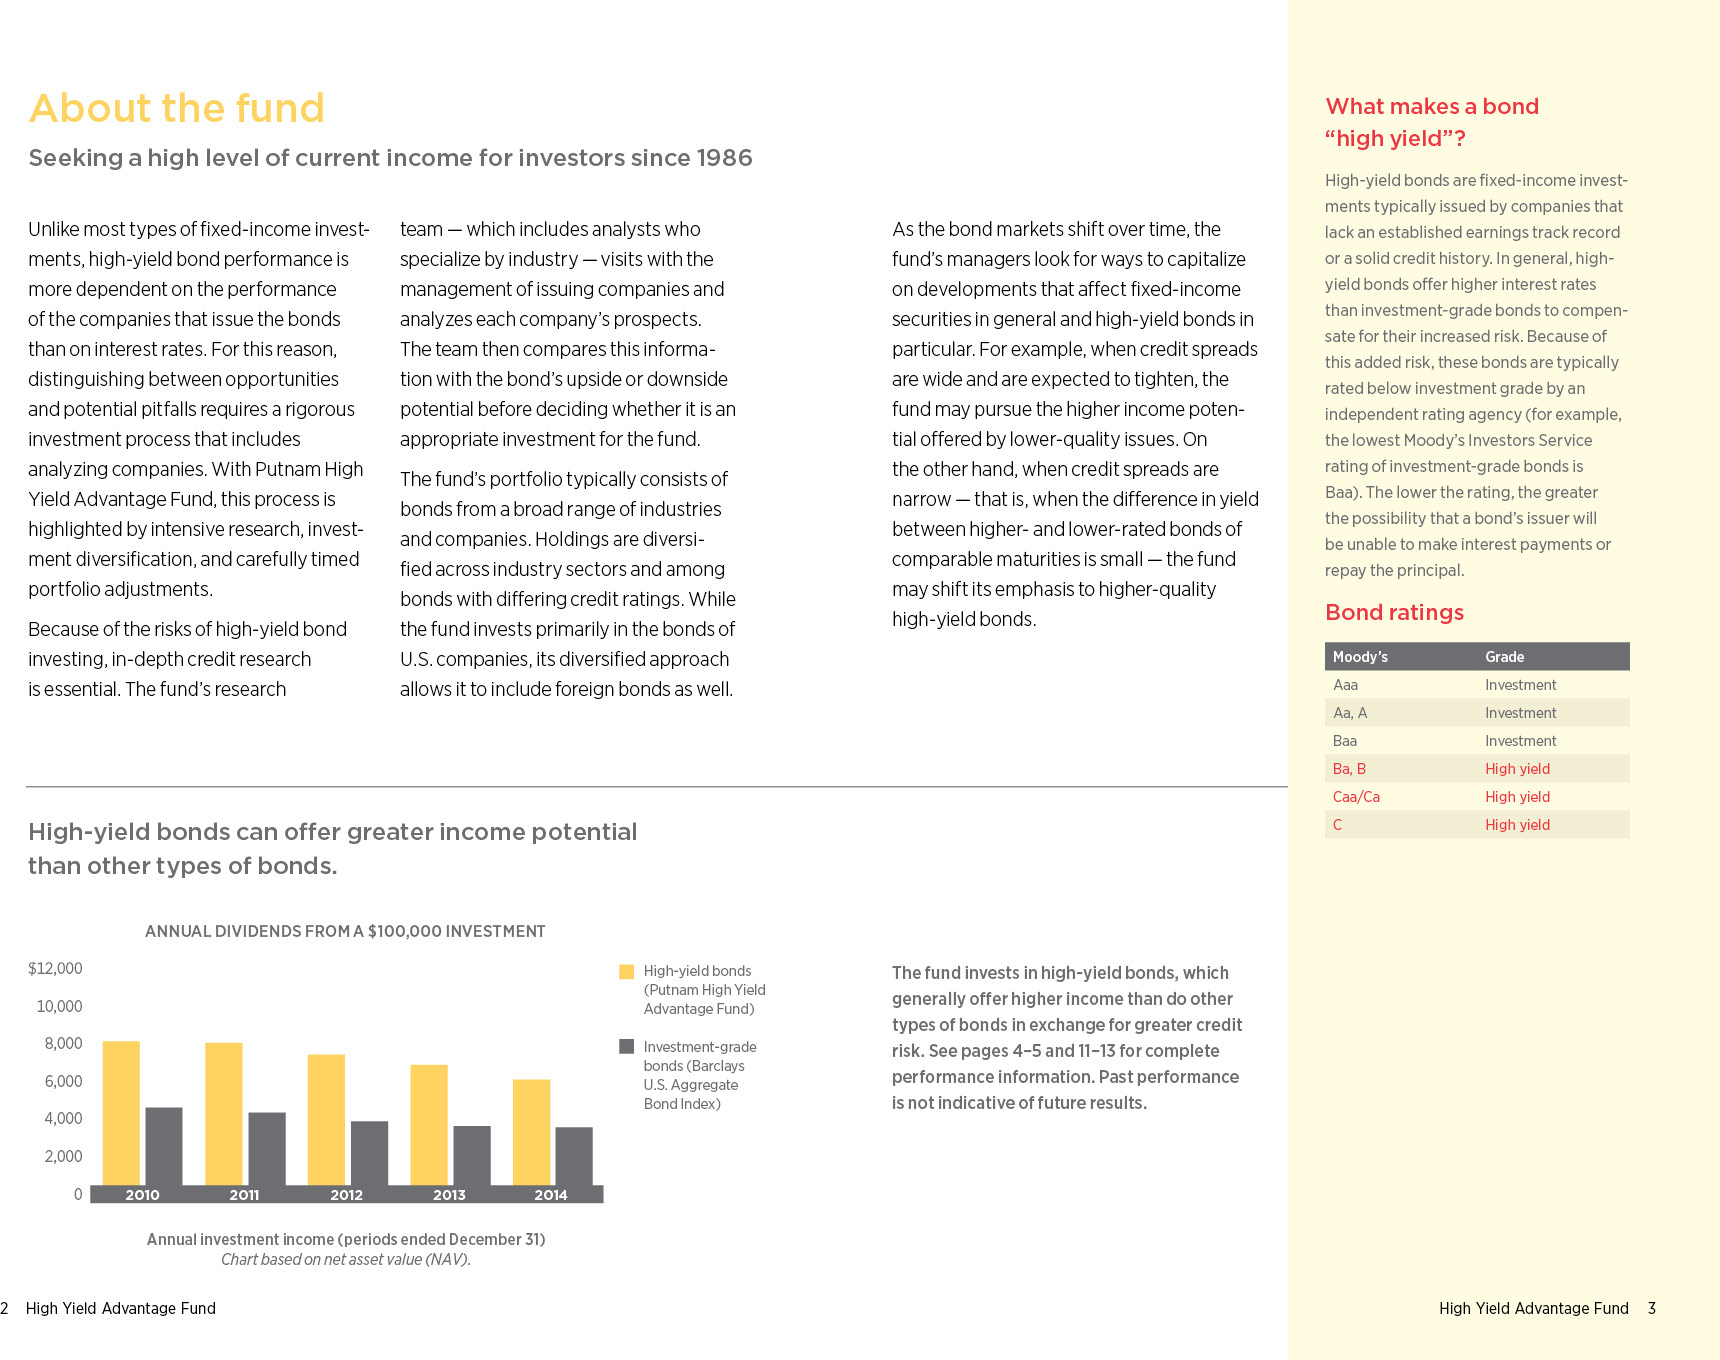
About the fund
2
Performance snapshot
4
Interview with your fund’s portfolio manager
5
Your fund’s performance
11
Your fund’s expenses
14
Terms and definitions
16
Other information for shareholders
17
Important notice regarding Putnam’s privacy policy
18
Trustee approval of management contract
19
Financial statements
24
Federal tax information
68
Shareholder meeting results
69
About the Trustees
70
Officers
72
Consider these risks before investing: The value of bonds in the fund’s portfolio may fall or fail to rise over extended periods of time for a variety of reasons, including general financial market conditions, changing market perceptions of the risk of default, changes in government intervention, and factors related to a specific issuer or industry. These factors may also lead to periods of high volatility and reduced liquidity in the bond markets. Lower-rated bonds may offer higher yields in return for more risk. Bond investments are subject to interest-rate risk (the risk of bond prices falling if interest rates rise) and credit risk (the risk of an issuer defaulting on interest or principal payments). Interest-rate risk is generally greater for longer-term bonds, and credit risk is generally greater for below-investment-grade bonds. Risks associated with derivatives include increased investment exposure (which may be considered leverage) and, in the case of over-the-counter instruments, the potential inability to terminate or sell derivatives positions and the potential failure of the other party to the instrument to meet its obligations. Unlike bonds, funds that invest in bonds have fees and expenses. You can lose money by investing in the fund.
Message from the Trustees
Dear Fellow Shareholder:
At the start of 2015, the U.S. economy appears to be on firm footing. The nation’s unemployment rate has fallen substantially, while gross domestic product expanded in the second and third quarters of 2014. Over the course of 2014, U.S. stocks advanced, and many areas of the bond markets delivered positive results, including tax-exempt bonds, which benefited from solid investor demand.
U.S. consumers are also seeing an unexpected increase in disposable income thanks to the drop in energy prices over the past several months. While supportive of U.S. growth, lower energy prices unfortunately pose economic difficulties to a number of oil-exporting countries. In addition, Europe, China, and Japan are attending to policy measures to help restore economic vigor.
Since the Federal Reserve concluded its quantitative easing program in the fall of 2014, the major policy question for the United States is when the central bank will raise short-term interest rates. A move in mid-2015 appears likely, according to comments from Fed officials. Rising rates could generate a potential headwind for fixed-income securities and markets more broadly.
The first months of the new year may be a good time to meet with your financial advisor to ensure that your portfolio is properly diversified and aligned with your objectives and risk tolerance. Putnam offers a wide range of strategies for all environments, as well as new ways of thinking about building portfolios for both the opportunities and the risks in today’s markets.
As always, thank you for investing with Putnam.
Respectfully yours,
Robert L. Reynolds President and Chief Executive Officer Putnam Investments
Jameson A. Baxter Chair, Board of Trustees
January 9, 2015
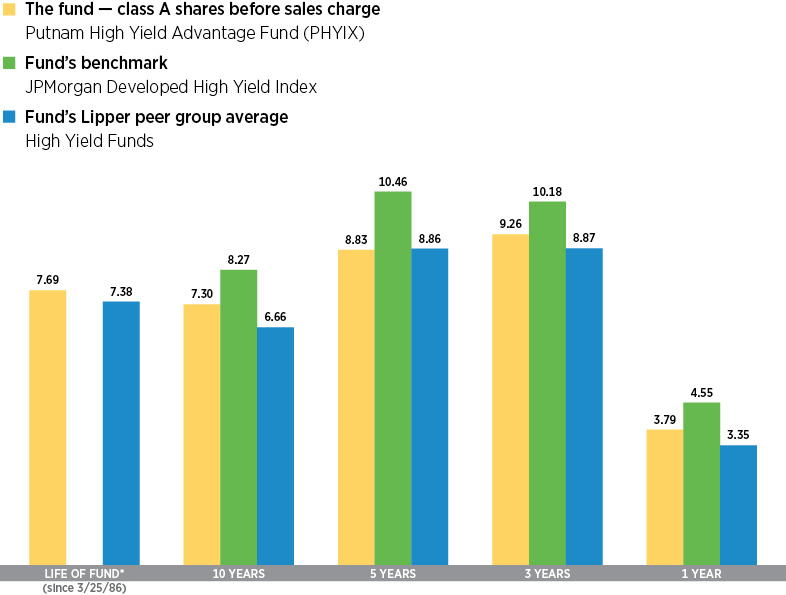
Performance snapshot
Annualized total return (%) comparison as of 11/30/14
Current performance may be lower or higher than the quoted past performance, which cannot guarantee future results. Share price, principal value, and return will fluctuate, and you may have a gain or a loss when you sell your shares. Performance of class A shares assumes reinvestment of distributions and does not account for taxes. Fund returns in the bar chart do not reflect a sales charge of 4.00%; had they, returns would have been lower. See pages 5 and 11–13 for additional performance information. For a portion of the periods, the fund had expense limitations, without which returns would have been lower. To obtain the most recent month-end performance, visit putnam.com.
* The fund’s benchmark, the JPMorgan Developed High Yield Index, was introduced on 12/31/94, which post-dates the inception of the fund’s class A shares.
4 High Yield Advantage Fund
Interview with your fund’s portfolio manager
Paul D. Scanlon, CFA
Paul, what was the market environment like for high-yield bonds during the 12 months ended November 30, 2014?
The market environment was generally supportive during the period’s first half, but became considerably more volatile in the second half. The major event marking the early months of the period was the Federal Reserve beginning the process of winding down its bond-buying program, which was announced in December 2013, launched in January 2014, and concluded in October 2014.
The U.S. economy shrank early in the new year — its first quarterly contraction since 2011 — partly due to severe weather in some of the nation’s most densely populated regions that suppressed consumer and business spending. By February, however, market participants were encouraged by the resiliency of U.S. stocks as well as lower U.S. Treasury yields. High-yield demand also received a boost in June when the European Central Bank [ECB] implemented a negative deposit rate of -0.10% in the hope of stimulating bank lending to help stave off deflation and bolster eurozone economic growth.
In July, U.S. high-yield bonds registered their first negative return since August 2013 due to what many observers characterized as a technical sell-off, fueled partly by significant outflows from high-yield exchange-traded funds and mutual funds. During August, the asset class recovered, buoyed by improving investor sentiment. Investors were
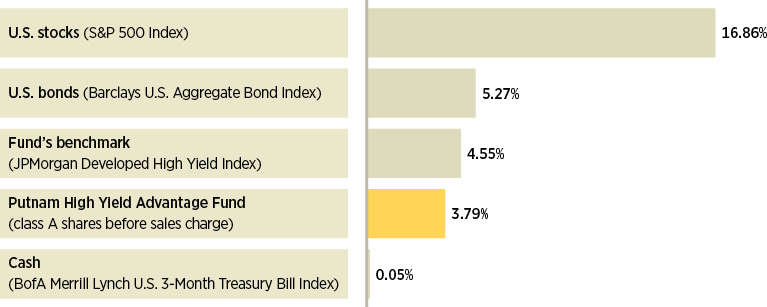
Broad market index and fund performance
This comparison shows your fund’s performance in the context of broad market indexes for the 12 months ended 11/30/14. See pages 4 and 11–13 for additional fund performance information. Index descriptions can be found on page 16.
High Yield Advantage Fund 5
encouraged by greater clarity from the Fed on interest-rate policy, easing geopolitical tensions, increasing odds that the ECB would implement quantitative easing, ongoing merger-and-acquisition activity, and a solid quarterly earnings season. In September, however, selling pressure resumed, as an abundance of high-yield issuance, volatile equity and commodity markets, renewed concern about rising interest rates, heightened geopolitical uncertainty, and weak economic data overseas reduced investors’ appetite for risk.
Fragile investor sentiment persisted until mid-October, when a number of stabilizing factors helped high-yield bonds sharply rebound. These positive developments included a solid reading on third-quarter U.S. gross domestic product, better-than-expected third-quarter U.S. corporate earnings, indications by both the ECB and the Bank of Japan that they were preparing to ease their respective monetary policies, long-term interest rates that remained low, and reduced concern about inflation.
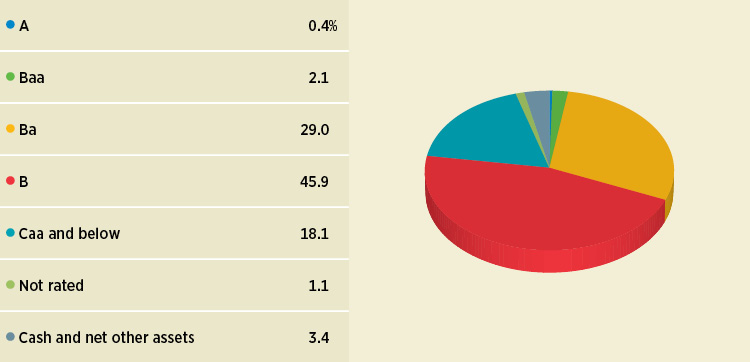
Credit quality overview
Credit qualities are shown as a percentage of the fund’s net assets as of 11/30/14. A bond rated Baa or higher (Prime-3 or higher, for short-term debt) is considered investment grade. The chart reflects Moody’s ratings; percentages may include bonds or derivatives not rated by Moody’s but rated by Standard & Poor’s (S&P) or, if unrated by S&P, by Fitch ratings, and then included in the closest equivalent Moody’s rating based on analysis of these agencies’ respective ratings criteria. Moody’s ratings are used in recognition of its prominence among rating agencies and breadth of coverage of rated securities. Ratings may vary over time.
Cash and net other assets, if any, represent the market value weights of cash, derivatives, short-term securities, and other unclassified assets in the portfolio. The fund itself has not been rated by an independent rating agency.
6 High Yield Advantage Fund
“Despite the challenges presented by the energy sector, we believe the fund has held up relatively well amid the recent market selloff.”
Paul Scanlon
Oil prices fell steadily from midsummer through period-end on concerns that the global market was oversupplied. Much of the new U.S. supply has resulted from the proliferation of shale oil fields in various parts of the country during the past six years. Meanwhile, widespread deceleration of global economic growth, particularly in Europe and China, sapped demand, as did signs that the Organization of Petroleum Exporting Countries [OPEC] wasn’t likely to cut output. A stronger U.S. dollar also put pressure on oil, because oil is priced in dollars and becomes more expensive for buyers in other countries when the dollar strengthens, dampening their interest in the market. In our view, the November 27 announcement by OPEC that it would leave its oil production levels unchanged confirmed the near-term downward trend in oil prices. With energy comprising anywhere from 15% to 20% of the
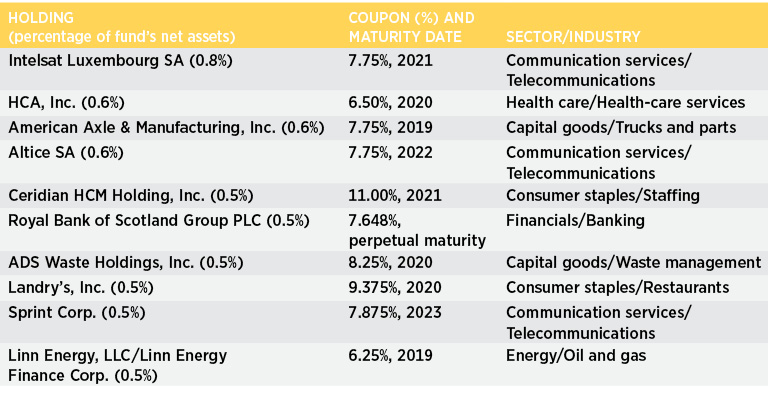
Top 10 holdings
This table shows the fund’s top 10 holdings and the percentage of the fund’s net assets that each represented as of 11/30/14. Short-term holdings, TBA commitments, and derivatives, if any, are excluded. Holdings may vary over time.
High Yield Advantage Fund 7
high-yield market, depending on which index is consulted, it is not surprising that falling oil prices weighed on high-yield bonds as the period came to a close.
During the past 12 months, higher-quality Ba-rated securities outperformed lower-quality B-rated and Caa-rated bonds. From an industry perspective, utilities, diversified media, and transportation were the best performers versus the fund’s benchmark. On the downside, energy, metals/mining, and gaming/lodging/leisure were the worst relative performers.
The fund outpaced the average return of its Lipper peer group but trailed its benchmark. What factors influenced its relative performance?
At the sector/industry level, favorable overall positioning in gaming/lodging/ leisure, along with overweights in financials and housing, contributed the most versus the benchmark. Conversely, not having enough exposure to utilities, adverse positioning in health care, and an underweight in paper/packaging hampered the fund’s relative performance. Additionally, having
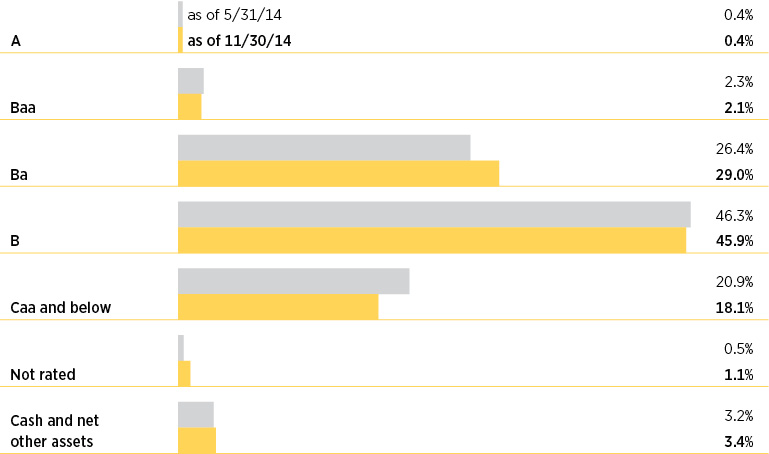
Credit quality comparison
This chart shows how the fund’s credit quality has changed over the past six months. Credit qualities are shown as a percentage of the fund’s net assets. A bond rated Baa or higher (Prime-3 or higher, for short-term debt) is considered investment grade. The chart reflects Moody’s ratings; percentages may include bonds or derivatives not rated by Moody’s but rated by Standard & Poor’s (S&P) or, if unrated by S&P, by Fitch ratings, and then included in the closest equivalent Moody’s rating based on analysis of these agencies’ respective ratings criteria. Moody’s ratings are used in recognition of its prominence among rating agencies and breadth of coverage of rated securities. Ratings may vary over time.
Cash and net other assets, if any, represent the market value weights of cash, derivatives, short-term securities, and other unclassified assets in the portfolio. The fund itself has not been rated by an independent rating agency.
8 High Yield Advantage Fund
a lighter-than-benchmark allocation in Ba-rated bonds worked against the fund’s relative result.
Which holdings helped performance versus the fund’s benchmark?
The top individual contributors included overweights in global payments processing company First Data, resort and casino operator Caesars Entertainment, German banking and financial services provider Commerzbank, and an underweight in coal producer Arch Coal. We did not hold Arch Coal at period-end.
Which investments weren’t as productive during the past 12 months?
An overweight in offshore drilling company Paragon Offshore — which was spun off from Noble Corporation in August 2014 — was the biggest individual detractor. Additionally, underweighting several strong-performing index components dampened relative performance. These included municipal bond insurer Ambac Financial Group, automaker General Motors [GM], and Ohio-based utility FirstEnergy. We sold our positions in Ambac and FirstEnergy during the period.
The fund reduced its dividend rate in December 2013. What factors led to that decision?
Reflecting the debt refinancing that occurred during the period, the fund’s monthly distribution rate per class A share was lowered from $0.031 to $0.027. The refinancing of existing high-yield bonds resulted in higher-coupon older bonds being replaced with lower-coupon securities. Similar reductions were made to other share classes.
What is your outlook for the high-yield market over the coming months, and how are you positioning the fund?
In our view, domestic corporate fundamentals are likely to remain strong. Corporate earnings have continued to trend higher, and we believe revenue growth could become a more meaningful driver of earnings growth in 2015.
High-yield issuers appear to be in reasonably good financial shape. Corporations have continued to take a conservative approach toward managing their assets and liabilities. Most have refinanced debt and lowered their overall borrowing costs, with refinancing accounting for 54% of high-yield new issuance for the year-to-date through November 30, 2014.
We believe the default rate, which stood at 1.9% at period-end — well below the long-term average of 3.8% — could remain low. That said, sustained weakness in energy prices would likely elevate defaults among energy-related issuers. All told, excluding the energy sector, we continue to have a reasonably positive outlook for the asset class. Despite the challenges presented by the energy sector, we believe the fund has held up relatively well amid the recent market selloff. With valuations improved after the selloff, we believe the yield advantage that high-yield bonds provide over Treasuries offers the potential for attractive loss-adjusted returns versus other fixed-income alternatives.
As for portfolio positioning, historically, overweighting lower-quality Caa-rated securities had helped the fund’s relative performance. However, more recently, as we have progressed further into the credit cycle, higher-quality Ba-rated bonds have outperformed. Consequently, we have been selectively adding Ba-rated holdings to bring the fund’s allocation closer to neutral versus the benchmark. Additionally, to compensate for heightened market unease, we have increased the fund’s cash allocation and are keeping the portfolio’s interest-rate sensitivity below that of the benchmark. From an industry perspective, at period-end we favored telecommunication services, gaming/lodging/leisure, financials, cable
High Yield Advantage Fund 9
television, and broadcasting. Conversely, we were generally underweight in technology, energy, metals/mining, transportation, food/beverage, consumer products, and industrials.
Thanks for bringing us up to date, Paul.
The views expressed in this report are exclusively those of Putnam Management and are subject to change. They are not meant as investment advice.
Please note that the holdings discussed in this report may not have been held by the fund for the entire period. Portfolio composition is subject to review in accordance with the fund’s investment strategy and may vary in the future. Current and future portfolio holdings are subject to risk.
Portfolio Manager Paul D. Scanlon is Co-Head of Fixed Income at Putnam. He has an M.B.A. from The University of Chicago Booth School of Business and a B.A. from Colgate University. Paul joined Putnam in 1999 and has been in the investment industry since 1986.
In addition to Paul, your fund’s portfolio managers are Norman P. Boucher and Robert L. Salvin.
IN THE NEWS
The plummeting price of oil, which dropped at least 40% to under $60 per barrel from June to November, has put more money into American consumers’ pockets and is likely to accelerate the pace of the nation’s economic recovery. Savings gained from lower heating and gasoline costs have helped boost consumer confidence across the United States. Prices fell in response to greater oil supplies, combined with reduced energy demand. Domestic oil production has increased due to advanced extraction techniques, like hydraulic fracturing. Overseas, the 12-nation Organization of Petroleum Exporting Countries (OPEC) has been slow to reduce output, instead opting to sell excess reserves at a deep discount to struggling economies in Asia and Europe. Competing on price, however, may put OPEC-member countries at risk of stalling their own economic progress. In Russia and Venezuela, for example, shrinking oil revenue has contributed to weakened local currencies and increased inflationary concerns. In regard to demand, the International Energy Agency revised its global oil consumption outlook downward by 230,000 barrels per day, to 900,000, for 2015.
10 High Yield Advantage Fund
Your fund’s performance
This section shows your fund’s performance, price, and distribution information for periods ended November 30, 2014, the end of its most recent fiscal year. In accordance with regulatory requirements for mutual funds, we also include performance information as of the most recent calendar quarter-end and expense information taken from the fund’s current prospectus. Performance should always be considered in light of a fund’s investment strategy. Data represent past performance. Past performance does not guarantee future results. More recent returns may be less or more than those shown. Investment return and principal value will fluctuate, and you may have a gain or a loss when you sell your shares. Performance information does not reflect any deduction for taxes a shareholder may owe on fund distributions or on the redemption of fund shares. For the most recent month-end performance, please visit the Individual Investors section at putnam.com or call Putnam at 1-800-225-1581. Class R and Y shares are not available to all investors. See the Terms and Definitions section in this report for definitions of the share classes offered by your fund.
Fund performance Total return for periods ended 11/30/14
Class A
Class B
Class C
Class M
Class R
Class Y
(inception dates)
(3/25/86)
(5/16/94)
(3/30/07)
(12/1/94)
(3/30/07)
(12/31/98)
Before sales charge
After sales charge
Before CDSC
After CDSC
Before CDSC
After CDSC
Before sales charge
After sales charge
Net asset value
Net asset value
Annual average
(life of fund)
7.69%
7.53%
7.42%
7.42%
6.88%
6.88%
7.40%
7.28%
7.43%
7.88%
10 years
102.28
94.19
90.43
90.43
87.74
87.74
97.40
90.98
97.74
107.38
Annual average
7.30
6.86
6.65
6.65
6.50
6.50
7.04
6.68
7.06
7.57
5 years
52.68
46.57
47.14
45.14
47.11
47.11
50.66
45.77
50.94
54.83
Annual average
8.83
7.95
8.03
7.73
8.03
8.03
8.54
7.83
8.58
9.14
3 years
30.44
25.23
27.54
24.54
27.62
27.62
29.49
25.28
29.49
31.46
Annual average
9.26
7.79
8.45
7.59
8.47
8.47
9.00
7.80
9.00
9.55
1 year
3.79
–0.36
3.23
–1.70
3.24
2.26
3.59
0.23
3.59
4.16
Current performance may be lower or higher than the quoted past performance, which cannot guarantee future results. After-sales-charge returns for class A and M shares reflect the deduction of the maximum 4.00% and 3.25% sales charge, respectively, levied at the time of purchase. Class B share returns after contingent deferred sales charge (CDSC) reflect the applicable CDSC, which is 5% in the first year, declining over time to 1% in the sixth year, and is eliminated thereafter. Class C share returns after CDSC reflect a 1% CDSC for the first year that is eliminated thereafter. Class R and Y shares have no initial sales charge or CDSC. Performance for class B, C, M, R, and Y shares before their inception is derived from the historical performance of class A shares, adjusted for the applicable sales charge (or CDSC) and the higher operating expenses for such shares, except for class Y shares, for which 12b-1 fees are not applicable.
For a portion of the periods, the fund had expense limitations, without which returns would have been lower.
Class B share performance reflects conversion to class A shares after eight years.
High Yield Advantage Fund 11
Comparative index returns For periods ended 11/30/14
JPMorgan Developed High Yield Index
Lipper High Yield Funds category average*
Annual average (life of fund)
—†
7.38%
10 years
121.34%
91.23
Annual average
8.27
6.66
5 years
64.45
53.03
Annual average
10.46
8.86
3 years
33.76
29.11
Annual average
10.18
8.87
1 year
4.55
3.35
Index and Lipper results should be compared with fund performance before sales charge, before CDSC, or at net asset value.
* Over the 1-year, 3-year, 5-year, 10-year, and life-of-fund periods ended 11/30/14, there were 618, 479, 418, 281, and 21 funds, respectively, in this Lipper category.
† The fund’s benchmark, the JPMorgan Developed High Yield Index, was introduced on 12/31/94, which post-dates the inception of the fund’s class A shares.
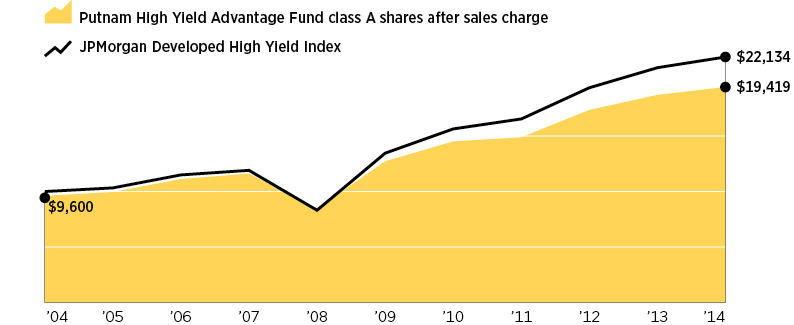
Change in the value of a $10,000 investment ($9,600 after sales charge)
Cumulative total return from 11/30/04 to 11/30/14
Past performance does not indicate future results. At the end of the same time period, a $10,000 investment in the fund’s class B and class C shares would have been valued at $19,043 and $18,774, respectively, and no contingent deferred sales charges would apply. A $10,000 investment in the fund’s class M shares ($9,675 after sales charge) would have been valued at $19,098. A $10,000 investment in the fund’s class R and Y shares would have been valued at $19,774 and $20,738, respectively.
12 High Yield Advantage Fund
Fund price and distribution information For the 12-month period ended 11/30/14
Distributions
Class A
Class B
Class C
Class M
Class R
Class Y
Number
12
12
12
12
12
12
Income
$0.324
$0.276
$0.276
$0.312
$0.312
$0.336
Capital gains
—
—
—
—
—
—
Total
$0.324
$0.276
$0.276
$0.312
$0.312
$0.336
Share value
Before sales charge
After sales charge
Net asset value
Net asset value
Before sales charge
After sales charge
Net asset value
Net asset value
11/30/13
$6.20
$6.46
$6.06
$6.04
$6.19
$6.40
$6.19
$6.44
11/30/14
6.11
6.36
5.98
5.96
6.10
6.30
6.10
6.37
Current rate (end of period)
Before sales charge
After sales charge
Net asset value
Net asset value
Before sales charge
After sales charge
Net asset value
Net asset value
Current dividend rate 1
5.30%
5.09%
4.62%
4.63%
5.11%
4.95%
5.11%
5.27%
Current 30-day SEC yield 2
N/A
4.50
3.93
3.93
N/A
4.29
4.44
4.94
The classification of distributions, if any, is an estimate. Before-sales-charge share value and current dividend rate for class A and M shares, if applicable, do not take into account any sales charge levied at the time of purchase. After-sales-charge share value, current dividend rate, and current 30-day SEC yield, if applicable, are calculated assuming that the maximum sales charge (4.00% for class A shares and 3.25% for class M shares) was levied at the time of purchase. Final distribution information will appear on your year-end tax forms.
1 Most recent distribution, including any return of capital and excluding capital gains, annualized and divided by share price before or after sales charge at period-end.
2 Based only on investment income and calculated using the maximum offering price for each share class, in accordance with SEC guidelines.
Fund performance as of most recent calendar quarter Total return for periods ended 12/31/14
Class A
Class B
Class C
Class M
Class R
Class Y
(inception dates)
(3/25/86)
(5/16/94)
(3/30/07)
(12/1/94)
(3/30/07)
(12/31/98)
Before sales charge
After sales charge
Before CDSC
After CDSC
Before CDSC
After CDSC
Before sales charge
After sales charge
Net asset value
Net asset value
Annual average
(life of fund)
7.61%
7.46%
7.35%
7.35%
6.81%
6.81%
7.32%
7.20%
7.35%
7.80%
10 years
97.17
89.28
85.95
85.95
82.92
82.92
92.41
86.16
92.74
101.98
Annual average
7.02
6.59
6.40
6.40
6.23
6.23
6.76
6.41
6.78
7.28
5 years
46.52
40.66
41.07
39.07
41.04
41.04
44.59
39.89
44.59
48.28
Annual average
7.94
7.06
7.12
6.82
7.12
7.12
7.65
6.94
7.65
8.20
3 years
25.32
20.31
22.44
19.44
22.48
22.48
24.40
20.36
24.40
26.27
Annual average
7.81
6.36
6.98
6.10
6.99
6.99
7.55
6.37
7.55
8.09
1 year
1.94
–2.14
1.18
–3.65
1.18
0.22
1.74
–1.56
1.74
2.21
See the discussion following the fund performance table on page 11 for information about the calculation of fund performance.
High Yield Advantage Fund 13
Your fund’s expenses
As a mutual fund investor, you pay ongoing expenses, such as management fees, distribution fees (12b-1 fees), and other expenses. Using the following information, you can estimate how these expenses affect your investment and compare them with the expenses of other funds. You may also pay one-time transaction expenses, including sales charges (loads) and redemption fees, which are not shown in this section and would have resulted in higher total expenses. For more information, see your fund’s prospectus or talk to your financial representative.
Expense ratios
Class A
Class B
Class C
Class M
Class R
Class Y
Total annual operating expenses for the fiscal year ended 11/30/13
1.04%
1.79%
1.79%
1.29%
1.29%
0.79%
Annualized expense ratio for the six-month period ended 11/30/14*
1.02%
1.77%
1.77%
1.27%
1.27%
0.77%
Fiscal-year expense information in this table is taken from the most recent prospectus, is subject to change, and may differ from that shown for the annualized expense ratio and in the financial highlights of this report.
Expenses are shown as a percentage of average net assets.
* For the fund’s most recent fiscal half year; may differ from expense ratios based on one-year data in the financial highlights.
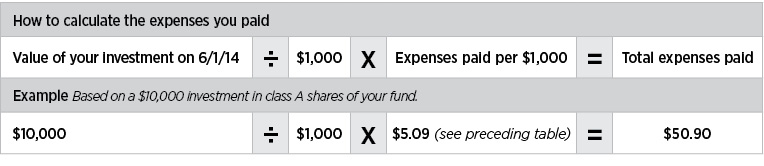
Expenses per $1,000
The following table shows the expenses you would have paid on a $1,000 investment in the fund from June 1, 2014, to November 30, 2014. It also shows how much a $1,000 investment would be worth at the close of the period, assuming actual returns and expenses.
Class A
Class B
Class C
Class M
Class R
Class Y
Expenses paid per $1,000*†
$5.09
$8.82
$8.82
$6.33
$6.34
$3.85
Ending value (after expenses)
$992.20
$988.10
$988.10
$989.70
$991.20
$993.40
* Expenses for each share class are calculated using the fund’s annualized expense ratio for each class, which represents the ongoing expenses as a percentage of average net assets for the six months ended 11/30/14. The expense ratio may differ for each share class.
† Expenses are calculated by multiplying the expense ratio by the average account value for the period; then multiplying the result by the number of days in the period; and then dividing that result by the number of days in the year.
14 High Yield Advantage Fund
Estimate the expenses you paid
To estimate the ongoing expenses you paid for the six months ended November 30, 2014, use the following calculation method. To find the value of your investment on June 1, 2014, call Putnam at 1-800-225-1581.
Compare expenses using the SEC’s method
The Securities and Exchange Commission (SEC) has established guidelines to help investors assess fund expenses. Per these guidelines, the following table shows your fund’s expenses based on a $1,000 investment, assuming a hypothetical 5% annualized return. You can use this information to compare the ongoing expenses (but not transaction expenses or total costs) of investing in the fund with those of other funds. All mutual fund shareholder reports will provide this information to help you make this comparison. Please note that you cannot use this information to estimate your actual ending account balance and expenses paid during the period.
Class A
Class B
Class C
Class M
Class R
Class Y
Expenses paid per $1,000*†
$5.16
$8.95
$8.95
$6.43
$6.43
$3.90
Ending value (after expenses)
$1,019.95
$1,016.19
$1,016.19
$1,018.70
$1,018.70
$1,021.21
* Expenses for each share class are calculated using the fund’s annualized expense ratio for each class, which represents the ongoing expenses as a percentage of average net assets for the six months ended 11/30/14. The expense ratio may differ for each share class.
† Expenses are calculated by multiplying the expense ratio by the average account value for the six-month period; then multiplying the result by the number of days in the six-month period; and then dividing that result by the number of days in the year.
High Yield Advantage Fund 15
Terms and definitions
Important terms
Total return shows how the value of the fund’s shares changed over time, assuming you held the shares through the entire period and reinvested all distributions in the fund.
Before sales charge, or net asset value, is the price, or value, of one share of a mutual fund, without a sales charge. Before-sales-charge figures fluctuate with market conditions, and are calculated by dividing the net assets of each class of shares by the number of outstanding shares in the class.
After sales charge is the price of a mutual fund share plus the maximum sales charge levied at the time of purchase. After-sales-charge performance figures shown here assume the 4.00% maximum sales charge for class A shares and 3.25% for class M shares.
Contingent deferred sales charge (CDSC) is generally a charge applied at the time of the redemption of class B or C shares and assumes redemption at the end of the period. Your fund’s class B CDSC declines over time from a 5% maximum during the first year to 1% during the sixth year. After the sixth year, the CDSC no longer applies. The CDSC for class C shares is 1% for one year after purchase.
Share classes
Class A shares are generally subject to an initial sales charge and no CDSC (except on certain redemptions of shares bought without an initial sales charge).
Class B shares are not subject to an initial sales charge and may be subject to a CDSC.
Class C shares are not subject to an initial sales charge and are subject to a CDSC only if the shares are redeemed during the first year.
Class M shares have a lower initial sales charge and a higher 12b-1 fee than class A shares and no CDSC (except on certain redemptions of shares bought without an initial sales charge).
Class R shares are not subject to an initial sales charge or CDSC and are available only to certain employer-sponsored retirement plans.
Class Y shares are not subject to an initial sales charge or CDSC, and carry no 12b-1 fee. They are generally only available to corporate and institutional clients and clients in other approved programs.
Fixed-income terms
Current rate is the annual rate of return earned from dividends or interest of an investment. Current rate is expressed as a percentage of the price of a security, fund share, or principal investment.
Yield curve is a graph that plots the yields of bonds with equal credit quality against their differing maturity dates, ranging from shortest to longest. It is used as a benchmark for other debt, such as mortgage or bank lending rates.
Comparative indexes
Barclays U.S. Aggregate Bond Index is an unmanaged index of U.S. investment-grade fixed-income securities.
BofA Merrill Lynch U.S. 3-Month Treasury Bill Index is an unmanaged index that seeks to measure the performance of U.S. Treasury bills available in the marketplace.
JPMorgan Developed High Yield Index is an unmanaged index of high-yield fixed-income securities issued in developed countries.
S&P 500 Index is an unmanaged index of common stock performance.
Indexes assume reinvestment of all distributions and do not account for fees. Securities and performance of a fund and an index will differ. You cannot invest directly in an index.
16 High Yield Advantage Fund
Lipper is a third-party industry-ranking entity that ranks mutual funds. Its rankings do not reflect sales charges. Lipper rankings are based on total return at net asset value relative to other funds that have similar current investment styles or objectives as determined by Lipper. Lipper may change a fund’s category assignment at its discretion. Lipper category averages reflect performance trends for funds within a category.
Other information for shareholders
Proxy voting
Putnam is committed to managing our mutual funds in the best interests of our shareholders. The Putnam funds’ proxy voting guidelines and procedures, as well as information regarding how your fund voted proxies relating to portfolio securities during the 12-month period ended June 30, 2014, are available in the Individual Investors section of putnam.com, and on the Securities and Exchange Commission (SEC) website, www.sec.gov. If you have questions about finding forms on the SEC’s website, you may call the SEC at 1-800-SEC-0330. You may also obtain the Putnam funds’ proxy voting guidelines and procedures at no charge by calling Putnam’s Shareholder Services at 1-800-225-1581.
Fund portfolio holdings
The fund will file a complete schedule of its portfolio holdings with the SEC for the first and third quarters of each fiscal year on Form N-Q. Shareholders may obtain the fund’s Form N-Q on the SEC’s website at www.sec.gov. In addition, the fund’s Form N-Q may be reviewed and copied at the SEC’s Public Reference Room in Washington, D.C. You may call the SEC at 1-800-SEC-0330 for information about the SEC’s website or the operation of the Public Reference Room.
Trustee and employee fund ownership
Putnam employees and members of the Board of Trustees place their faith, confidence, and, most importantly, investment dollars in Putnam mutual funds. As of November 30, 2014, Putnam employees had approximately $501,000,000 and the Trustees had approximately $141,000,000 invested in Putnam mutual funds. These amounts include investments by the Trustees’ and employees’ immediate family members as well as investments through retirement and deferred compensation plans.
High Yield Advantage Fund 17
Important notice regarding Putnam’s privacy policy
In order to conduct business with our shareholders, we must obtain certain personal information such as account holders’ names, addresses, Social Security numbers, and dates of birth. Using this information, we are able to maintain accurate records of accounts and transactions.
It is our policy to protect the confidentiality of our shareholder information, whether or not a shareholder currently owns shares of our funds. In particular, it is our policy not to sell information about you or your accounts to outside marketing firms. We have safeguards in place designed to prevent unauthorized access to our computer systems and procedures to protect personal information from unauthorized use.
Under certain circumstances, we must share account information with outside vendors who provide services to us, such as mailings and proxy solicitations. In these cases, the service providers enter into confidentiality agreements with us, and we provide only the information necessary to process transactions and perform other services related to your account. Finally, it is our policy to share account information with your financial representative, if you’ve listed one on your Putnam account.
18 High Yield Advantage Fund
Trustee approval of management contract
General conclusions
The Board of Trustees of the Putnam funds oversees the management of each fund and, as required by law, determines annually whether to approve the continuance of your fund’s management contract with Putnam Investment Management, LLC (“Putnam Management”) and the sub-management contract with respect to your fund between Putnam Management and its affiliate, Putnam Investments Limited (“PIL”). The Board of Trustees, with the assistance of its Contract Committee, requests and evaluates all information it deems reasonably necessary under the circumstances in connection with its annual contract review. The Contract Committee consists solely of Trustees who are not “interested persons” (as this term is defined in the Investment Company Act of 1940, as amended (the “1940 Act”)) of the Putnam funds (“Independent Trustees”).
At the outset of the review process, members of the Board’s independent staff and independent legal counsel met with representatives of Putnam Management to review the annual contract review materials furnished to the Contract Committee during the course of the previous year’s review and to discuss possible changes in these materials that might be necessary or desirable for the coming year. Following these discussions and in consultation with the Contract Committee, the Independent Trustees’ independent legal counsel requested that Putnam Management furnish specified information, together with any additional information that Putnam Management considered relevant, to the Contract Committee. Over the course of several months ending in June 2014, the Contract Committee met on a number of occasions with representatives of Putnam Management, and separately in executive session, to consider the information that Putnam Management provided, as well as supplemental information provided in response to additional requests made by the Contract Committee. Throughout this process, the Contract Committee was assisted by the members of the Board’s independent staff and by independent legal counsel for the Putnam funds and the Independent Trustees.
In May 2014, the Contract Committee met in executive session to discuss and consider its preliminary recommendations with respect to the continuance of the contracts. At the Trustees’ June 20, 2014 meeting, the Contract Committee met in executive session with the other Independent Trustees to review a summary of the key financial, performance and other data that the Contract Committee considered in the course of its review. The Contract Committee then presented its written report, which summarized the key factors that the Committee had considered and set forth its final recommendations. The Contract Committee then recommended, and the Independent Trustees approved, the continuance of your fund’s management and sub-management contracts, effective July 1, 2014. (Because PIL is an affiliate of Putnam Management and Putnam Management remains fully responsible for all services provided by PIL, the Trustees have not attempted to evaluate PIL as a separate entity, and all subsequent references to Putnam Management below should be deemed to include reference to PIL as necessary or appropriate in the context.)
The Independent Trustees’ approval was based on the following conclusions:
• That the fee schedule in effect for your fund represented reasonable compensation in light of the nature and quality of the services being provided to the fund, the fees paid by competitive funds, and the costs incurred by Putnam Management in providing services to the fund; and
High Yield Advantage Fund 19
• That the fee schedule in effect for your fund represented an appropriate sharing between fund shareholders and Putnam Management of such economies of scale as may exist in the management of the fund at current asset levels.
These conclusions were based on a comprehensive consideration of all information provided to the Trustees and were not the result of any single factor. Some of the factors that figured particularly in the Trustees’ deliberations and how the Trustees considered these factors are described below, although individual Trustees may have evaluated the information presented differently, giving different weights to various factors. It is also important to recognize that the management arrangements for your fund and the other Putnam funds are the result of many years of review and discussion between the Independent Trustees and Putnam Management, that some aspects of the arrangements may receive greater scrutiny in some years than others, and that the Trustees’ conclusions may be based, in part, on their consideration of fee arrangements in previous years. For example, with some minor exceptions, the current fee arrangements under the management contracts for the Putnam funds were implemented at the beginning of 2010 following extensive review by the Contract Committee and discussions with representatives of Putnam Management, as well as approval by shareholders. Shareholders also voted overwhelmingly to approve these fee arrangements in early 2014, when they were asked to approve new management contracts (with the same fees and substantially identical other provisions) following the possible termination of the previous management contracts as a result of the death of the Honorable Paul G. Desmarais. (Mr. Desmarais, both directly and through holding companies, controlled a majority of the voting shares of Power Corporation of Canada, which (directly and indirectly) is the majority owner of Putnam Management. Mr. Desmarais’ voting control of shares of Power Corporation of Canada was transferred to The Desmarais Family Residuary Trust upon his death and this transfer, as a technical matter, may have constituted an “assignment” within the meaning of the 1940 Act, causing the Putnam funds’ management contracts to terminate automatically.)
Management fee schedules and total expenses
The Trustees reviewed the management fee schedules in effect for all Putnam funds, including fee levels and breakpoints. The Trustees also reviewed the total expenses of each Putnam fund, recognizing that in most cases management fees represented the major, but not the sole, determinant of total costs to shareholders.
In reviewing fees and expenses, the Trustees generally focus their attention on material changes in circumstances — for example, changes in assets under management, changes in a fund’s investment style, changes in Putnam Management’s operating costs or profitability, or changes in competitive practices in the mutual fund industry — that suggest that consideration of fee changes might be warranted. The Trustees concluded that the circumstances did not warrant changes to the management fee structure of your fund.
Under its management contract, your fund has the benefit of breakpoints in its management fee schedule that provide shareholders with economies of scale in the form of reduced fee levels as assets under management in the Putnam family of funds increase. The Trustees concluded that the fee schedule in effect for your fund represented an appropriate sharing of economies of scale between fund shareholders and Putnam Management.
As in the past, the Trustees also focused on the competitiveness of each fund’s total expense ratio. In order to ensure that expenses of the Putnam funds continue to meet competitive standards, the Trustees and Putnam
20 High Yield Advantage Fund
Management have implemented certain expense limitations. These expense limitations were: (i) a contractual expense limitation applicable to all retail open-end funds of 32 basis points on investor servicing fees and expenses and (ii) a contractual expense limitation applicable to all open-end funds of 20 basis points on so-called “other expenses” (i.e., all expenses exclusive of management fees, investor servicing fees, distribution fees, investment-related expenses, interest, taxes, brokerage commissions, extraordinary expenses and acquired fund fees and expenses). These expense limitations serve in particular to maintain competitive expense levels for funds with large numbers of small shareholder accounts and funds with relatively small net assets. Most funds, including your fund, had sufficiently low expenses that these expense limitations did not apply. Putnam Management’s support for these expense limitation arrangements was an important factor in the Trustees’ decision to approve the continuance of your fund’s management and sub-management contracts.
The Trustees reviewed comparative fee and expense information for a custom group of competitive funds selected by Lipper Inc. (“Lipper”). This comparative information included your fund’s percentile ranking for effective management fees and total expenses (excluding any applicable 12b-1 fee), which provides a general indication of your fund’s relative standing. In the custom peer group, your fund ranked in the second quintile in effective management fees (determined for your fund and the other funds in the custom peer group based on fund asset size and the applicable contractual management fee schedule) and in the third quintile in total expenses (excluding any applicable 12b-1 fees) as of December 31, 2013 (the first quintile representing the least expensive funds and the fifth quintile the most expensive funds). The fee and expense data reported by Lipper as of December 31, 2013 reflected the most recent fiscal year-end data available in Lipper’s database at that time.
In connection with their review of the management fees and total expenses of the Putnam funds, the Trustees also reviewed the costs of the services provided and the profits realized by Putnam Management and its affiliates from their contractual relationships with the funds. This information included trends in revenues, expenses and profitability of Putnam Management and its affiliates relating to the investment management, investor servicing and distribution services provided to the funds. In this regard, the Trustees also reviewed an analysis of Putnam Management’s revenues, expenses and profitability, allocated on a fund-by-fund basis, with respect to the funds’ management, distribution, and investor servicing contracts. For each fund, the analysis presented information about revenues, expenses and profitability for each of the agreements separately and for the agreements taken together on a combined basis. The Trustees concluded that, at current asset levels, the fee schedules in place represented reasonable compensation for the services being provided and represented an appropriate sharing of such economies of scale as may exist in the management of the Putnam funds at that time.
The information examined by the Trustees as part of their annual contract review for the Putnam funds has included for many years information regarding fees charged by Putnam Management and its affiliates to institutional clients such as defined benefit pension plans, college endowments, and the like. This information included comparisons of those fees with fees charged to the Putnam funds, as well as an assessment of the differences in the services provided to these different types of clients. The Trustees observed that the differences in fee rates between institutional clients and mutual funds are by no means uniform when examined by individual asset sectors, suggesting that
High Yield Advantage Fund 21
differences in the pricing of investment management services to these types of clients may reflect historical competitive forces operating in separate markets. The Trustees considered the fact that in many cases fee rates across different asset classes are higher on average for mutual funds than for institutional clients, as well as the differences between the services that Putnam Management provides to the Putnam funds and those that it provides to its institutional clients. The Trustees did not rely on these comparisons to any significant extent in concluding that the management fees paid by your fund are reasonable.
Investment performance
The quality of the investment process provided by Putnam Management represented a major factor in the Trustees’ evaluation of the quality of services provided by Putnam Management under your fund’s management contract. The Trustees were assisted in their review of the Putnam funds’ investment process and performance by the work of the investment oversight committees of the Trustees, which meet on a regular basis with the funds’ portfolio teams and with the Chief Investment Officer and other senior members of Putnam Management’s Investment Division throughout the year. The Trustees concluded that Putnam Management generally provides a high-quality investment process — based on the experience and skills of the individuals assigned to the management of fund portfolios, the resources made available to them, and in general Putnam Management’s ability to attract and retain high-quality personnel — but also recognized that this does not guarantee favorable investment results for every fund in every time period.
The Trustees considered that 2013 was a year of strong competitive performance for many of the Putnam funds, with only a relatively small number of exceptions. They noted that this strong performance was exemplified by the fact that the Putnam funds were recognized by Barron’s as the second-best performing mutual fund complex for both 2013 and the five-year period ended December 31, 2013. They also noted, however, the disappointing investment performance of some funds for periods ended December 31, 2013 and considered information provided by Putnam Management regarding the factors contributing to the underperformance and actions being taken to improve the performance of these particular funds. The Trustees indicated their intention to continue to monitor performance trends to assess the effectiveness of these efforts and to evaluate whether additional actions to address areas of underperformance are warranted. For purposes of evaluating investment performance, the Trustees generally focus on competitive industry rankings for the one-year, three-year and five-year periods. For a number of Putnam funds with relatively unique investment mandates for which meaningful competitive performance rankings are not considered available, the Trustees evaluated performance based on comparisons of fund returns with the returns of selected investment benchmarks. In the case of your fund, the Trustees considered that its class A share cumulative total return performance at net asset value was in the following quartiles of its Lipper peer group (Lipper High Yield Funds) for the one-year, three-year and five-year periods ended December 31, 2013 (the first quartile representing the best-performing funds and the fourth quartile the worst-performing funds):
One-year period
2nd
Three-year period
2nd
Five-year period
2nd
Over the one-year, three-year and five-year periods ended December 31, 2013, there were 565, 458 and 394 funds, respectively, in your fund’s Lipper peer group. (When considering performance information, shareholders should be mindful that past performance is not a guarantee of future results.)
22 High Yield Advantage Fund
Brokerage and soft-dollar allocations; investor servicing
The Trustees considered various potential benefits that Putnam Management may receive in connection with the services it provides under the management contract with your fund. These include benefits related to brokerage allocation and the use of soft dollars, whereby a portion of the commissions paid by a fund for brokerage may be used to acquire research services that are expected to be useful to Putnam Management in managing the assets of the fund and of other clients. Subject to policies established by the Trustees, soft dollars generated by these means are used primarily to acquire brokerage and research services that enhance Putnam Management’s investment capabilities and supplement Putnam Management’s internal research efforts. However, the Trustees noted that a portion of available soft dollars continues to be used to pay fund expenses. The Trustees indicated their continued intent to monitor regulatory and industry developments in this area with the assistance of their Brokerage Committee and also indicated their continued intent to monitor the allocation of the Putnam funds’ brokerage in order to ensure that the principle of seeking best price and execution remains paramount in the portfolio trading process.
Putnam Management may also receive benefits from payments that the funds make to Putnam Management’s affiliates for investor or distribution services. In conjunction with the annual review of your fund’s management and sub-management contracts, the Trustees reviewed your fund’s investor servicing agreement with Putnam Investor Services, Inc. (“PSERV”) and its distributor’s contracts and distribution plans with Putnam Retail Management Limited Partnership (“PRM”), both of which are affiliates of Putnam Management. The Trustees concluded that the fees payable by the funds to PSERV and PRM, as applicable, for such services are reasonable in relation to the nature and quality of such services, the fees paid by competitive funds, and the costs incurred by PSERV and PRM, as applicable, in providing such services.
High Yield Advantage Fund 23
Financial statements
These sections of the report, as well as the accompanying Notes, preceded by the Report of Independent Registered Public Accounting Firm, constitute the fund’s financial statements.
The fund’s portfolio lists all the fund’s investments and their values as of the last day of the reporting period. Holdings are organized by asset type and industry sector, country, or state to show areas of concentration and diversification.
Statement of assets and liabilities shows how the fund’s net assets and share price are determined. All investment and non-investment assets are added together. Any unpaid expenses and other liabilities are subtracted from this total. The result is divided by the number of shares to determine the net asset value per share, which is calculated separately for each class of shares. (For funds with preferred shares, the amount subtracted from total assets includes the liquidation preference of preferred shares.)
Statement of operations shows the fund’s net investment gain or loss. This is done by first adding up all the fund’s earnings — from dividends and interest income — and subtracting its operating expenses to determine net investment income (or loss). Then, any net gain or loss the fund realized on the sales of its holdings — as well as any unrealized gains or losses over the period — is added to or subtracted from the net investment result to determine the fund’s net gain or loss for the fiscal year.
Statement of changes in net assets shows how the fund’s net assets were affected by the fund’s net investment gain or loss, by distributions to shareholders, and by changes in the number of the fund’s shares. It lists distributions and their sources (net investment income or realized capital gains) over the current reporting period and the most recent fiscal year-end. The distributions listed here may not match the sources listed in the Statement of operations because the distributions are determined on a tax basis and may be paid in a different period from the one in which they were earned.
Financial highlights provide an overview of the fund’s investment results, per-share distributions, expense ratios, net investment income ratios, and portfolio turnover in one summary table, reflecting the five most recent reporting periods. In a semiannual report, the highlights table also includes the current reporting period.
24 High Yield Advantage Fund
Report of Independent Registered Public Accounting Firm
The Board of Trustees and Shareholders Putnam High Yield Advantage Fund:
We have audited the accompanying statement of assets and liabilities of Putnam High Yield Advantage Fund (the fund), including the fund’s portfolio, as of November 30, 2014, and the related statement of operations for the year then ended, the statements of changes in net assets for each of the years in the two-year period then ended, and the financial highlights for each of the years in the five-year period then ended. These financial statements and financial highlights are the responsibility of the fund’s management. Our responsibility is to express an opinion on these financial statements and financial highlights based on our audits.
We conducted our audits in accordance with the standards of the Public Company Accounting Oversight Board (United States). Those standards require that we plan and perform the audit to obtain reasonable assurance about whether the financial statements and financial highlights are free of material misstatement. An audit includes examining, on a test basis, evidence supporting the amounts and disclosures in the financial statements. Our procedures included confirmation of securities owned as of November 30, 2014, by correspondence with the custodian and brokers or by other appropriate auditing procedures. An audit also includes assessing the accounting principles used and significant estimates made by management, as well as evaluating the overall financial statement presentation. We believe that our audits provide a reasonable basis for our opinion.
In our opinion, the financial statements and financial highlights referred to above present fairly, in all material respects, the financial position of Putnam High Yield Advantage Fund as of November 30, 2014, the results of its operations for the year then ended, the changes in its net assets for each of the years in the two-year period then ended, and the financial highlights for each of the years in the five-year period then ended, in conformity with U.S. generally accepted accounting principles.
Boston, Massachusetts January 9, 2015
High Yield Advantage Fund 25
The fund’s portfolio 11/30/14
CORPORATE BONDS AND NOTES (89.5%)*
Principal amount
Value
Advertising and marketing services (0.9%)
Alliance Data Systems Corp. 144A company guaranty sr. unsec. notes 5 3/8s, 2022
$2,645,000
$2,651,613
CBS Outdoor Americas Capital, LLC/CBS Outdoor Americas Capital Corp. 144A company guaranty sr. unsec. notes 5 7/8s, 2025
945,000
978,075
CBS Outdoor Americas Capital, LLC/CBS Outdoor Americas Capital Corp. 144A company guaranty sr. unsec. notes 5 5/8s, 2024
1,865,000
1,925,612
Lamar Media Corp. company guaranty sr. sub. notes 5 7/8s, 2022
1,935,000
2,022,075
Lamar Media Corp. company guaranty sr. unsec. notes 5 3/8s, 2024
540,000
557,550
8,134,925
Automotive (1.2%)
Chrysler Group, LLC/CG Co-Issuer, Inc. company guaranty notes 8 1/4s, 2021
3,045,000
3,395,174
Chrysler Group, LLC/CG Co-Issuer, Inc. company guaranty notes 8s, 2019
665,000
706,563
Dana Holding Corp. sr. unsec. unsub. notes 6s, 2023
2,785,000
2,917,287
General Motors Co. sr. unsec. unsub. notes 5.2s, 2045
800,000
822,320
Navistar International Corp. sr. notes 8 1/4s, 2021
Texas Competitive Electric Holdings Co., LLC/TCEH Finance, Inc. 144A company guaranty sr. notes 11 1/2s, 2020 (In default) †
745,000
594,138
42,087,337
Total corporate bonds and notes (cost $802,818,398)
$811,144,536
SENIOR LOANS (5.3%)*c
Principal amount
Value
Basic materials (0.1%)
Oxea Sarl bank term loan FRN 8 1/4s, 2020 (Germany)
$475,000
$461,938
461,938
Capital goods (0.2%)
Gates Global, LLC/Gates Global Co. bank term loan FRN 4 1/4s, 2021
1,410,000
1,395,144
1,395,144
Communication services (0.3%)
Asurion, LLC bank term loan FRN 8 1/2s, 2021
2,635,000
2,651,469
2,651,469
Consumer cyclicals (2.6%)
Caesars Entertainment Operating Co., Inc. bank term loan FRN Ser. B6, 6.985s, 2017
3,913,849
3,555,732
Caesars Entertainment Operating Co., Inc. bank term loan FRN Ser. B7, 9 3/4s, 2017
693,263
638,379
Caesars Growth Properties Holdings, LLC bank term loan FRN 6 1/4s, 2021
2,548,613
2,374,033
CCM Merger, Inc. bank term loan FRN Ser. B, 4 1/2s, 2021
445,000
444,444
CPG International, Inc. bank term loan FRN Ser. B, 4 3/4s, 2020
495,000
494,381
Delta 2 (Lux) Sarl bank term loan FRN 4 3/4s, 2021 (Luxembourg)
1,340,000
1,329,113
Getty Images, Inc. bank term loan FRN Ser. B, 4 3/4s, 2019
1,054,798
997,444
iHeartCommunications, Inc. bank term loan FRN Ser. D, 6.906s, 2019
2,584,000
2,424,808
JC Penney Corp., Inc. bank term loan FRN 5s, 2019
2,517,538
2,434,932
Navistar, Inc. bank term loan FRN Ser. B, 5 3/4s, 2017
500,000
505,313
Neiman Marcus Group, Ltd., Inc. bank term loan FRN 4 1/4s, 2020
2,556,198
2,539,156
ROC Finance, LLC bank term loan FRN 5s, 2019
1,215,789
1,156,520
Travelport Finance Sarl bank term loan FRN Ser. B, 6s, 2021 (Luxembourg)
2,065,000
2,070,591
Univision Communications, Inc. bank term loan FRN 4s, 2020
2,106,554
2,084,500
Yonkers Racing Corp. bank term loan FRN 4 1/4s, 2019
921,074
821,291
23,870,637
46 High Yield Advantage Fund
SENIOR LOANS (5.3%)*c cont.
Principal amount
Value
Consumer staples (0.5%)
BC ULC bank term loan FRN Ser. B, 4 1/2s, 2021 (Canada)
$1,815,000
$1,819,213
CEC Entertainment, Inc. bank term loan FRN Ser. B, 4s, 2021
1,417,875
1,393,506
Del Monte Foods, Inc. bank term loan FRN 8 1/4s, 2021
990,000
851,400
Rite Aid Corp. bank term loan FRN 4 7/8s, 2021
815,000
814,491
4,878,610
Energy (0.6%)
Fieldwood Energy, LLC bank term loan FRN 8 3/8s, 2020
1,750,000
1,573,906
Offshore Group Investment, Ltd. bank term loan FRN Ser. B, 5 3/4s, 2019 (Cayman Islands)
600,850
492,697
Shelf Drilling Holdings, Ltd. bank term loan FRN 10s, 2018 ‡‡
2,180,000
2,114,600
Tervita Corp. bank term loan FRN Ser. B, 6 1/4s, 2018 (Canada)
1,572,000
1,436,022
5,617,225
Financials (—%)
iStar Financial, Inc. bank term loan FRN Ser. A2, 7s, 2017 R
281,880
288,575
288,575
Health care (0.4%)
CHS/Community Health Systems, Inc. bank term loan FRN Ser. D, 4 1/4s, 2021
1,045,392
1,047,515
Par Pharmaceutical Cos., Inc. bank term loan FRN Ser. B, 4s, 2019
1,455,911
1,431,646
Patheon, Inc. bank term loan FRN Ser. B, 4 1/4s, 2021 (Canada)
995,000
971,369
3,450,530
Technology (0.1%)
Avaya, Inc. bank term loan FRN Ser. B3, 4.654s, 2017
505,497
490,613
490,613
Transportation (0.2%)
Air Medical Group Holdings, Inc. bank term loan FRN 7 5/8s, 2018 ‡‡
1,950,000
1,930,500
1,930,500
Utilities and power (0.3%)
Energy Future Intermediate Holding Co., LLC bank term loan FRN 4 1/4s, 2016
730,000
729,818
Texas Competitive Electric Holdings Co., LLC bank term loan FRN 4.65s, 2017
3,273,299
2,369,050
Texas Competitive Electric Holdings Co., LLC bank term loan FRN 4.65s, 2017
33,594
24,314
3,123,182
Total senior loans (cost $50,187,858)
$48,158,423
CONVERTIBLE BONDS AND NOTES (0.3%)*
Principal amount
Value
iStar Financial, Inc. cv. sr. unsec. unsub. notes 3s, 2016 R
$1,563,000
$2,035,808
Jazz Technologies, Inc. 144A cv. company guaranty sr. unsec. notes 8s, 2018
449,000
619,901
Total convertible bonds and notes (cost $2,196,096)
$2,655,709
U.S. TREASURY OBLIGATIONS (—%)*
Principal amount
Value
U.S. Treasury Notes 0.625%, November 30, 2017 i
$124,000
$123,283
Total U.S. treasury obligations (cost $123,283)
$123,283
High Yield Advantage Fund 47
SHORT-TERM INVESTMENTS (4.5%)*
Shares
Value
Putnam Short Term Investment Fund 0.09% L
40,611,944
$40,611,944
SSgA Prime Money Market Fund Class N zero % P
110,000
110,000
Total short-term investments (cost $40,721,944)
$40,721,944
TOTAL INVESTMENTS
Total investments (cost $896,047,579)
$902,803,895
Key to holding’s currency abbreviations
CAD
Canadian Dollar
EUR
Euro
GBP
British Pound
Key to holding’s abbreviations
EMTN
Euro Medium Term Notes
FRB
Floating Rate Bonds: the rate shown is the current interest rate at the close of the reporting period
FRN
Floating Rate Notes: the rate shown is the current interest rate at the close of the reporting period
GMTN
Global Medium Term Notes
MTN
Medium Term Notes
Notes to the fund’s portfolio
Unless noted otherwise, the notes to the fund’s portfolio are for the close of the fund’s reporting period, which ran from December 1, 2013 through November 30, 2014 (the reporting period). Within the following notes to the portfolio, references to “ASC 820” represent Accounting Standards Codification 820 Fair Value Measurements and Disclosures and references to “OTC”, if any, represent over-the-counter.
*
Percentages indicated are based on net assets of $905,987,938.
†
Non-income-producing security.
‡‡
Income may be received in cash or additional securities at the discretion of the issuer.
c
Senior loans are exempt from registration under the Securities Act of 1933, as amended, but contain certain restrictions on resale and cannot be sold publicly. These loans pay interest at rates which adjust periodically. The interest rates shown for senior loans are the current interest rates at the close of the reporting period. Senior loans are also subject to mandatory and/or optional prepayment which cannot be predicted. As a result, the remaining maturity may be substantially less than the stated maturity shown (Notes 1 and 6).
F
Security is valued at fair value following procedures approved by the Trustees. Securities may be classified as Level 2 or Level 3 for ASC 820 based on the securities’ valuation inputs (Note 1).
i
Security was pledged, or purchased with cash that was pledged, to the fund for collateral on certain derivative contracts (Note 1).
L
Affiliated company (Note 5). The rate quoted in the security description is the annualized 7-day yield of the fund at the close of the reporting period.
P
Security was pledged, or purchased with cash that was pledged, to the fund for collateral on certain derivative contracts. The rate quoted in the security description is the annualized 7-day yield of the fund at the close of the reporting period (Note 1).
R
Real Estate Investment Trust.
Debt obligations are considered secured unless otherwise indicated.
144A after the name of an issuer represents securities exempt from registration under Rule 144A under the Securities Act of 1933, as amended. These securities may be resold in transactions exempt from registration, normally to qualified institutional buyers.
The dates shown on debt obligations are the original maturity dates.
48 High Yield Advantage Fund
FORWARD CURRENCY CONTRACTS at 11/30/14 (aggregate face value $12,933,803)
Counterparty
Currency
Contract type
Delivery date
Value
Aggregate face value
Unrealized appreciation/ (depreciation)
Bank of America N.A.
Canadian Dollar
Sell
1/21/15
$436,743
$446,014
$9,271
Euro
Sell
12/17/14
3,610,017
3,812,379
202,362
Barclays Bank PLC
British Pound
Sell
12/17/14
2,952,723
3,119,325
166,602
Credit Suisse International
Euro
Buy
12/17/14
1,086,737
1,113,419
(26,682)
Euro
Sell
12/17/14
1,086,736
1,115,517
28,781
JPMorgan Chase Bank N.A.
Canadian Dollar
Sell
1/21/15
735,737
750,540
14,803
State Street Bank and Trust Co.
Canadian Dollar
Sell
1/21/15
1,893,891
1,920,281
26,390
Euro
Sell
12/17/14
507,491
568,172
60,681
WestPac Banking Corp.
Canadian Dollar
Sell
1/21/15
86,300
88,156
1,856
Total
$484,064
ASC 820 establishes a three-level hierarchy for disclosure of fair value measurements. The valuation hierarchy is based upon the transparency of inputs to the valuation of the fund’s investments. The three levels are defined as follows:
Level 1: Valuations based on quoted prices for identical securities in active markets.
Level 2: Valuations based on quoted prices in markets that are not active or for which all significant inputs are observable, either directly or indirectly.
Level 3: Valuations based on inputs that are unobservable and significant to the fair value measurement.
The following is a summary of the inputs used to value the fund’s net assets as of the close of the reporting period:
Valuation inputs
Investments in securities:
Level 1
Level 2
Level 3
Convertible bonds and notes
$—
$2,655,709
$—
Corporate bonds and notes
—
811,144,514
22
Senior loans
—
48,158,423
—
U.S. treasury obligations
—
123,283
—
Short-term investments
40,721,944
—
—
Totals by level
$40,721,944
$862,081,929
$22
Valuation inputs
Other financial instruments:
Level 1
Level 2
Level 3
Forward currency contracts
$—
$484,064
$—
Totals by level
$—
$484,064
$—
During the reporting period, transfers within the fair value hierarchy, if any, (other than certain transfers involving non-U.S. equity securities as described in Note 1) did not represent, in the aggregate, more than 1% of the fund’s net assets measured as of the end of the period.
At the start and close of the reporting period, Level 3 investments in securities represented less than 1% of the fund’s net assets and were not considered a significant portion of the fund’s portfolio.
The accompanying notes are an integral part of these financial statements.
Affiliated issuers (identified cost $40,611,944) (Notes 1 and 5)
40,611,944
Cash
322,216
Interest and other receivables
13,910,212
Receivable for shares of the fund sold
518,916
Receivable for investments sold
6,046,580
Unrealized appreciation on forward currency contracts (Note 1)
510,746
Prepaid assets
40,497
Total assets
924,153,062
LIABILITIES
Payable for investments purchased
15,082,988
Payable for shares of the fund repurchased
1,272,695
Payable for compensation of Manager (Note 2)
418,379
Payable for custodian fees (Note 2)
12,114
Payable for investor servicing fees (Note 2)
219,738
Payable for Trustee compensation and expenses (Note 2)
317,680
Payable for administrative services (Note 2)
2,938
Payable for distribution fees (Note 2)
323,766
Unrealized depreciation on forward currency contracts (Note 1)
26,682
Collateral on certain derivative contracts, at value (Note 1)
233,283
Other accrued expenses
254,861
Total liabilities
18,165,124
Net assets
$905,987,938
REPRESENTED BY
Paid-in capital (Unlimited shares authorized) (Notes 1 and 4)
$955,456,569
Undistributed net investment income (Note 1)
4,121,365
Accumulated net realized loss on investments and foreign currency transactions (Note 1)
(60,822,743)
Net unrealized appreciation of investments and assets and liabilities in foreign currencies
7,232,747
Total — Representing net assets applicable to capital shares outstanding
$905,987,938
(Continued on next page)
The accompanying notes are an integral part of these financial statements.
50 High Yield Advantage Fund
Statement of assets and liabilities (Continued)
COMPUTATION OF NET ASSET VALUE AND OFFERING PRICE
Net asset value and redemption price per class A share ($529,990,169 divided by 86,677,298 shares)
$6.11
Offering price per class A share (100/96.00 of $6.11)*
$6.36
Net asset value and offering price per class B share ($16,893,348 divided by 2,825,145 shares)**
$5.98
Net asset value and offering price per class C share ($25,229,005 divided by 4,233,485 shares)**
$5.96
Net asset value and redemption price per class M share ($112,526,344 divided by 18,436,628 shares)
$6.10
Offering price per class M share (100/96.75 of $6.10)†
$6.30
Net asset value, offering price and redemption price per class R share ($28,806,942 divided by 4,720,495 shares)
$6.10
Net asset value, offering price and redemption price per class Y share ($192,542,130 divided by 30,235,854 shares)
$6.37
*
On single retail sales of less than $100,000. On sales of $100,000 or more the offering price is reduced.
**
Redemption price per share is equal to net asset value less any applicable contingent deferred sales charge.
†
On single retail sales of less than $50,000. On sales of $50,000 or more the offering price is reduced.
The accompanying notes are an integral part of these financial statements.
High Yield Advantage Fund 51
Statement of operations Year ended 11/30/14
INVESTMENT INCOME
Interest (including interest income of $25,929 from investments in affiliated issuers) (Note 5)
$61,237,935
Total investment income
61,237,935
EXPENSES
Compensation of Manager (Note 2)
5,388,856
Investor servicing fees (Note 2)
1,449,066
Custodian fees (Note 2)
30,707
Trustee compensation and expenses (Note 2)
47,402
Distribution fees (Note 2)
2,629,750
Administrative services (Note 2)
22,464
Other
546,389
Total expenses
10,114,634
Expense reduction (Note 2)
(1,519)
Net expenses
10,113,115
Net investment income
51,124,820
Net realized gain on investments (Notes 1 and 3)
15,134,390
Net realized loss on foreign currency transactions (Note 1)
(230,706)
Net unrealized appreciation of assets and liabilities in foreign currencies during the year
965,921
Net unrealized depreciation of investments during the year
(29,039,650)
Net loss on investments
(13,170,045)
Net increase in net assets resulting from operations
$37,954,775
The accompanying notes are an integral part of these financial statements.
52 High Yield Advantage Fund
Statement of changes in net assets
INCREASE (DECREASE) IN NET ASSETS
Year ended 11/30/14
Year ended 11/30/13
Operations:
Net investment income
$51,124,820
$58,367,402
Net realized gain on investments and foreign currency transactions
14,903,684
19,884,608
Net unrealized depreciation of investments and assets and liabilities in foreign currencies
(28,073,729)
(3,365,362)
Net increase in net assets resulting from operations
37,954,775
74,886,648
Distributions to shareholders (Note 1):
From ordinary income
Net investment income
Class A
(28,598,028)
(41,244,151)
Class B
(782,318)
(933,561)
Class C
(1,256,380)
(1,623,946)
Class M
(6,523,775)
(7,399,731)
Class R
(1,410,153)
(1,563,283)
Class Y
(10,441,420)
(9,935,475)
Redemption fees (Note 1)
—
9,696
Increase (decrease) from capital share transactions (Note 4)
(86,847,468)
25,485,428
Total increase (decrease) in net assets
(97,904,767)
37,681,625
NET ASSETS
Beginning of year
1,003,892,705
966,211,080
End of year (including undistributed net investment income of $4,121,365 and $2,432,401, respectively)
$905,987,938
$1,003,892,705
The accompanying notes are an integral part of these financial statements.
High Yield Advantage Fund 53
Financial highlights (For a common share outstanding throughout the period)
INVESTMENT OPERATIONS:
LESS DISTRIBUTIONS:
RATIOS AND SUPPLEMENTAL DATA:
Period ended
Net asset value, beginning of period
Net investment income (loss)a
Net realized and unrealized gain (loss) on investments
Total from investment operations
From net investment income
Total distributions
Redemption fees
Non-recurring reimbursements
Net asset value, end of period
Total return at net asset value (%)b
Net assets, end of period (in thousands)
Ratio of expenses to average net assets (%)c
Ratio of net investment income (loss) to average net assets (%)
Portfolio turnover (%)
Class A
November 30, 2014
$6.20
.33
(.10)
.23
(.32)
(.32)
—
—
$6.11
3.79
$529,990
1.03
5.34
43
November 30, 2013
6.12
.36
.11
.47
(.39)
(.39)
—d
—
6.20
7.84
565,904
1.04
5.85
49
November 30, 2012
5.62
.40
.50
.90
(.40)
(.40)
—d
—
6.12
16.55
652,557
1.04
6.74
40
November 30, 2011
5.90
.43
(.27)
.16
(.44)
(.44)
—d
—e
5.62
2.58
510,880
1.04
7.25
57
November 30, 2010
5.56
.44
.32
.76
(.42)
(.42)
—d
—
5.90
14.10
535,054
1.05f
7.66f
71
Class B
November 30, 2014
$6.06
.28
(.08)
.20
(.28)
(.28)
—
—
$5.98
3.23
$16,893
1.78
4.59
43
November 30, 2013
5.99
.31
.10
.41
(.34)
(.34)
—d
—
6.06
6.98
17,154
1.79
5.07
49
November 30, 2012
5.52
.35
.48
.83
(.36)
(.36)
—d
—
5.99
15.48
15,257
1.79
5.94
40
November 30, 2011
5.80
.38
(.27)
.11
(.39)
(.39)
—d
—e
5.52
1.84
8,076
1.79
6.50
57
November 30, 2010
5.47
.39
.32
.71
(.38)
(.38)
—d
—
5.80
13.28
7,520
1.80f
6.93f
71
Class C
November 30, 2014
$6.04
.28
(.08)
.20
(.28)
(.28)
—
—
$5.96
3.24
$25,229
1.78
4.59
43
November 30, 2013
5.97
.31
.10
.41
(.34)
(.34)
—d
—
6.04
7.01
28,949
1.79
5.08
49
November 30, 2012
5.50
.35
.48
.83
(.36)
(.36)
—d
—
5.97
15.52
29,271
1.79
5.95
40
November 30, 2011
5.78
.37
(.25)
.12
(.40)
(.40)
—d
—e
5.50
1.90
15,915
1.79
6.49
57
November 30, 2010
5.46
.39
.31
.70
(.38)
(.38)
—d
—
5.78
13.13
9,464
1.80f
6.92f
71
Class M
November 30, 2014
$6.19
.32
(.10)
.22
(.31)
(.31)
—
—
$6.10
3.59
$112,526
1.28
5.10
43
November 30, 2013
6.11
.34
.12
.46
(.38)
(.38)
—d
—
6.19
7.64
134,948
1.29
5.58
49
November 30, 2012
5.62
.39
.49
.88
(.39)
(.39)
—d
—
6.11
16.13
123,203
1.29
6.51
40
November 30, 2011
5.90
.42
(.27)
.15
(.43)
(.43)
—d
—e
5.62
2.37
130,758
1.29
7.00
57
November 30, 2010
5.57
.43
.31
.74
(.41)
(.41)
—d
—
5.90
13.65
164,632
1.30f
7.42f
71
Class R
November 30, 2014
$6.19
.32
(.10)
.22
(.31)
(.31)
—
—
$6.10
3.59
$28,807
1.28
5.08
43
November 30, 2013
6.11
.35
.11
.46
(.38)
(.38)
—d
—
6.19
7.64
24,687
1.29
5.59
49
November 30, 2012
5.62
.39
.49
.88
(.39)
(.39)
—d
—
6.11
16.13
26,120
1.29
6.46
40
November 30, 2011
5.90
.41
(.26)
.15
(.43)
(.43)
—d
—e
5.62
2.37
16,209
1.29
6.98
57
November 30, 2010
5.56
.43
.32
.75
(.41)
(.41)
—d
—
5.90
13.86
11,085
1.30f
7.34f
71
Class Y
November 30, 2014
$6.44
.36
(.09)
.27
(.34)
(.34)
—
—
$6.37
4.16
$192,542
.78
5.61
43
November 30, 2013
6.34
.38
.12
.50
(.40)
(.40)
—d
—
6.44
8.10
232,251
.79
6.00
49
November 30, 2012
5.81
.43
.52
.95
(.42)
(.42)
—d
—
6.34
16.76
119,803
.79
6.99
40
November 30, 2011
6.08
.46
(.28)
.18
(.45)
(.45)
—d
—e
5.81
2.88
113,815
.79
7.49
57
November 30, 2010
5.71
.47
.33
.80
(.43)
(.43)
—d
—
6.08
14.49
97,130
.80f
7.87f
71
See notes to financial highlights at the end of this section.
The accompanying notes are an integral part of these financial statements.
54
High Yield Advantage Fund
High Yield Advantage Fund
55
Financial highlights (Continued)
a Per share net investment income (loss) has been determined on the basis of the weighted average number of shares outstanding during the period.
b Total return assumes dividend reinvestment and does not reflect the effect of sales charges.
c Includes amounts paid through expense offset and/or brokerage service arrangements, if any (Note 2). Also excludes acquired fund fees and expenses, if any.
d Amount represents less than $0.01 per share.
e Reflects a non-recurring reimbursement related to restitution amounts in connection with a distribution plan approved by the Securities and Exchange Commission (the SEC) which amounted to less than $0.01 per share outstanding on July 21, 2011. Also reflects a non-recurring reimbursement related to short-term trading related lawsuits, which amounted to less than $0.01 per share outstanding on May 11, 2011.
f Reflects an involuntary contractual expense limitation in effect during the period. As a result of such limitation, the expenses of each class reflect a reduction of the following amount:
Percentage of average net assets
November 30, 2010
0.01%
The accompanying notes are an integral part of these financial statements.
56 High Yield Advantage Fund
Notes to financial statements 11/30/14
Within the following Notes to financial statements, references to “State Street” represent State Street Bank and Trust Company, references to “the SEC” represent the Securities and Exchange Commission, references to “Putnam Management” represent Putnam Investment Management, LLC, the fund’s manager, an indirect wholly-owned subsidiary of Putnam Investments, LLC and references to “OTC”, if any, represent over-the-counter. Unless otherwise noted, the “reporting period” represents the period from December 1, 2013 through November 30, 2014.
Putnam High Yield Advantage Fund (the fund) is a Massachusetts business trust, which is registered under the Investment Company Act of 1940, as amended, as a diversified open-end management investment company. The goal of the fund is to seek high current income. Capital growth is a secondary goal when consistent with achieving high current income. The fund invests mainly in bonds that are obligations of U.S. companies, are below-investment-grade in quality (sometimes referred to as “junk bonds”), and have intermediate- to long-term maturities (three years or longer). The fund may also invest in other debt instruments, including loans. Putnam Management may consider, among other factors, credit, interest rate and prepayment risks, as well as general market conditions, when deciding whether to buy or sell investments. Putnam Management may also use derivatives, such as futures, options, certain foreign currency transactions and swap contracts, for both hedging and non-hedging purposes.
The fund offers class A, class B, class C, class M, class R and class Y shares. Class A and class M shares are sold with a maximum front-end sales charge of 4.00% and 3.25%, respectively, and generally do not pay a contingent deferred sales charge. Class B shares, which convert to class A shares after approximately eight years, do not pay a front-end sales charge and are subject to a contingent deferred sales charge if those shares are redeemed within six years of purchase. Class C shares have a one-year 1.00% contingent deferred sales charge and do not convert to class A shares. Class R shares, which are not available to all investors, are sold at net asset value. The expenses for class A, class B, class C, class M and class R shares may differ based on the distribution fee of each class, which is identified in Note 2. Class Y shares, which are sold at net asset value, are generally subject to the same expenses as class A, class B, class C, class M and class R shares, but do not bear a distribution fee. Class Y shares are not available to all investors.
In the normal course of business, the fund enters into contracts that may include agreements to indemnify another party under given circumstances. The fund’s maximum exposure under these arrangements is unknown as this would involve future claims that may be, but have not yet been, made against the fund. However, the fund’s management team expects the risk of material loss to be remote.
Note 1: Significant accounting policies
The following is a summary of significant accounting policies consistently followed by the fund in the preparation of its financial statements. The preparation of financial statements is in conformity with accounting principles generally accepted in the United States of America and requires management to make estimates and assumptions that affect the reported amounts of assets and liabilities in the financial statements and the reported amounts of increases and decreases in net assets from operations. Actual results could differ from those estimates. Subsequent events after the Statement of assets and liabilities date through the date that the financial statements were issued have been evaluated in the preparation of the financial statements.
A short-term trading fee of 1.00% may have applied to redemptions (including exchanges into another fund) of shares purchased before June 24, 2013 and held for 30 days or less. The short-term trading fee was accounted for as an addition to paid-in-capital. No short-term trading fee applies to shares purchased on or after June 24, 2013.
Investment income, realized and unrealized gains and losses and expenses of the fund are borne pro-rata based on the relative net assets of each class to the total net assets of the fund, except that each class bears expenses unique to that class (including the distribution fees applicable to such classes). Each class votes as a class only with respect to its own distribution plan or other matters on which a class vote is required by law or determined by the Trustees. If the fund were liquidated, shares of each class would receive their pro-rata share of the net assets of the fund. In addition, the Trustees declare separate dividends on each class of shares.
Security valuation Portfolio securities and other investments are valued using policies and procedures adopted by the Board of Trustees. The Board has formed a Pricing Committee to oversee the implementation of these procedures and has delegated responsibility for valuing the fund’s assets in accordance with these procedures to Putnam Management. Putnam Management has established an internal Valuation Committee that is responsible for making fair value determinations, evaluating the effectiveness of the pricing policies of the fund and reporting to the Pricing Committee.
High Yield Advantage Fund 57
Market quotations are not considered to be readily available for certain debt obligations and other investments; such investments are valued on the basis of valuations furnished by an independent pricing service approved by the Trustees or dealers selected by Putnam Management. Such services or dealers determine valuations for normal institutional-size trading units of such securities using methods based on market transactions for comparable securities and various relationships, generally recognized by institutional traders, between securities (which consider such factors as security prices, yields, maturities and ratings). These securities will generally be categorized as Level 2. Securities quoted in foreign currencies, if any, are translated into U.S. dollars at the current exchange rate. Short-term securities with remaining maturities of 60 days or less may be valued at amortized cost, which approximates fair value and are classified as Level 2 securities.
Investments in open-end investment companies (excluding exchange traded funds), if any, which can be classified as Level 1 or Level 2 securities, are valued based on their net asset value. The net asset value of such investment companies equals the total value of their assets less their liabilities and divided by the number of their outstanding shares.
To the extent a pricing service or dealer is unable to value a security or provides a valuation that Putnam Management does not believe accurately reflects the security’s fair value, the security will be valued at fair value by Putnam Management in accordance with policies and procedures approved by the Trustees. Certain investments, including certain restricted and illiquid securities and derivatives, are also valued at fair value following procedures approved by the Trustees. These valuations consider such factors as significant market or specific security events such as interest rate or credit quality changes, various relationships with other securities, discount rates, U.S. Treasury, U.S. swap and credit yields, index levels, convexity exposures and recovery rates, sales and other multiples and resale restrictions. These securities are classified as Level 2 or as Level 3 depending on the priority of the significant inputs.
To assess the continuing appropriateness of fair valuations, the Valuation Committee reviews and affirms the reasonableness of such valuations on a regular basis after considering all relevant information that is reasonably available. Such valuations and procedures are reviewed periodically by the Trustees. The fair value of securities is generally determined as the amount that the fund could reasonably expect to realize from an orderly disposition of such securities over a reasonable period of time. By its nature, a fair value price is a good faith estimate of the value of a security in a current sale and does not reflect an actual market price, which may be different by a material amount.
Security transactions and related investment income Security transactions are recorded on the trade date (the date the order to buy or sell is executed). Gains or losses on securities sold are determined on the identified cost basis. Interest income, net of any applicable withholding taxes, is recorded on the accrual basis. All premiums/discounts are amortized/accreted on a yield-to-maturity basis.
The fund earned certain fees in connection with its senior loan purchasing activities. These fees are treated as market discount and are amortized into income in the Statement of operations.
Foreign currency translation The accounting records of the fund are maintained in U.S. dollars. The fair value of foreign securities, currency holdings, and other assets and liabilities is recorded in the books and records of the fund after translation to U.S. dollars based on the exchange rates on that day. The cost of each security is determined using historical exchange rates. Income and withholding taxes are translated at prevailing exchange rates when earned or incurred. The fund does not isolate that portion of realized or unrealized gains or losses resulting from changes in the foreign exchange rate on investments from fluctuations arising from changes in the market prices of the securities. Such gains and losses are included with the net realized and unrealized gain or loss on investments. Net realized gains and losses on foreign currency transactions represent net realized exchange gains or losses on closed forward currency contracts, disposition of foreign currencies, currency gains and losses realized between the trade and settlement dates on securities transactions and the difference between the amount of investment income and foreign withholding taxes recorded on the fund’s books and the U.S. dollar equivalent amounts actually received or paid. Net unrealized appreciation and depreciation of assets and liabilities in foreign currencies arise from changes in the value of open forward currency contracts and assets and liabilities other than investments at the period end, resulting from changes in the exchange rate.
Forward currency contracts The fund buys and sells forward currency contracts, which are agreements between two parties to buy and sell currencies at a set price on a future date. These contracts are used to hedge foreign exchange risk and to gain exposure on currency.
The U.S. dollar value of forward currency contracts is determined using current forward currency exchange rates supplied by a quotation service. The fair value of the contract will fluctuate with changes in currency exchange
58 High Yield Advantage Fund
rates. The contract is marked to market daily and the change in fair value is recorded as an unrealized gain or loss. The fund records a realized gain or loss equal to the difference between the value of the contract at the time it was opened and the value at the time it was closed when the contract matures or by delivery of the currency. The fund could be exposed to risk if the value of the currency changes unfavorably, if the counterparties to the contracts are unable to meet the terms of their contracts or if the fund is unable to enter into a closing position. Risks may exceed amounts recognized on the Statement of assets and liabilities.
Forward currency contracts outstanding at period end, if any, are listed after the fund’s portfolio.
Master agreements The fund is a party to ISDA (International Swaps and Derivatives Association, Inc.) Master Agreements (Master Agreements) with certain counterparties that govern OTC derivative and foreign exchange contracts entered into from time to time. The Master Agreements may contain provisions regarding, among other things, the parties’ general obligations, representations, agreements, collateral requirements, events of default and early termination. With respect to certain counterparties, in accordance with the terms of the Master Agreements, collateral posted to the fund is held in a segregated account by the fund’s custodian and with respect to those amounts which can be sold or repledged, is presented in the fund’s portfolio.
Collateral pledged by the fund is segregated by the fund’s custodian and identified in the fund’s portfolio. Collateral can be in the form of cash or debt securities issued by the U.S. Government or related agencies or other securities as agreed to by the fund and the applicable counterparty. Collateral requirements are determined based on the fund’s net position with each counterparty.
Termination events applicable to the fund may occur upon a decline in the fund’s net assets below a specified threshold over a certain period of time. Termination events applicable to counterparties may occur upon a decline in the counterparty’s long-term and short-term credit ratings below a specified level. In each case, upon occurrence, the other party may elect to terminate early and cause settlement of all derivative and foreign exchange contracts outstanding, including the payment of any losses and costs resulting from such early termination, as reasonably determined by the terminating party. Any decision by one or more of the fund’s counterparties to elect early termination could impact the fund’s future derivative activity.
At the close of the reporting period, the fund did not have a net liability position on open derivative contracts subject to the Master Agreements.
Interfund lending The fund, along with other Putnam funds, may participate in an interfund lending program pursuant to an exemptive order issued by the SEC. This program allows the fund to borrow from or lend to other Putnam funds that permit such transactions. Interfund lending transactions are subject to each fund’s investment policies and borrowing and lending limits. Interest earned or paid on the interfund lending transaction will be based on the average of certain current market rates. During the reporting period, the fund did not utilize the program.
Lines of credit The fund participates, along with other Putnam funds, in a $392.5 million unsecured committed line of credit and a $235.5 million unsecured uncommitted line of credit, both provided by State Street. Borrowings may be made for temporary or emergency purposes, including the funding of shareholder redemption requests and trade settlements. Interest is charged to the fund based on the fund’s borrowing at a rate equal to the Federal Funds rate plus 1.25% for the committed line of credit and the Federal Funds rate plus 1.30% for the uncommitted line of credit. A closing fee equal to 0.04% of the committed line of credit and 0.04% of the uncommitted line of credit has been paid by the participating funds. In addition, a commitment fee of 0.11% per annum on any unutilized portion of the committed line of credit is allocated to the participating funds based on their relative net assets and paid quarterly. During the reporting period, the fund had no borrowings against these arrangements.
Federal taxes It is the policy of the fund to distribute all of its taxable income within the prescribed time period and otherwise comply with the provisions of the Internal Revenue Code of 1986, as amended (the Code), applicable to regulated investment companies. It is also the intention of the fund to distribute an amount sufficient to avoid imposition of any excise tax under Section 4982 of the Code.
The fund is subject to the provisions of Accounting Standards Codification 740 Income Taxes (ASC 740). ASC 740 sets forth a minimum threshold for financial statement recognition of the benefit of a tax position taken or expected to be taken in a tax return. The fund did not have a liability to record for any unrecognized tax benefits in the accompanying financial statements. No provision has been made for federal taxes on income, capital gains or unrealized appreciation on securities held nor for excise tax on income and capital gains. Each of the fund’s federal tax returns for the prior three fiscal years remains subject to examination by the Internal Revenue Service.
The fund may also be subject to taxes imposed by governments of countries in which it invests. Such taxes are generally based on either income or gains earned or repatriated. The fund accrues and applies such taxes to net
High Yield Advantage Fund 59
investment income, net realized gains and net unrealized gains as income and/or capital gains are earned. In some cases, the fund may be entitled to reclaim all or a portion of such taxes, and such reclaim amounts, if any, are reflected as an asset on the fund’s books. In many cases, however, the fund may not receive such amounts for an extended period of time, depending on the country of investment.
At November 30, 2014, the fund had a capital loss carryover of $59,325,817 available to the extent allowed by the Code to offset future net capital gain, if any. The amounts of the carryovers and the expiration dates are:
Loss carryover
Short-term
Long-term
Total
Expiration
$59,325,817
$—
$59,325,817
November 30, 2017
Under the Regulated Investment Company Modernization Act of 2010, the fund will be permitted to carry forward capital losses incurred in taxable years beginning after December 22, 2010 for an unlimited period. However, any losses incurred will be required to be utilized prior to the losses incurred in pre-enactment tax years. As a result of this ordering rule, pre-enactment capital loss carryforwards may be more likely to expire unused. Additionally, post-enactment capital losses that are carried forward will retain their character as either short-term or long-term capital losses rather than being considered all short-term as under previous law.
Distributions to shareholders Distributions to shareholders from net investment income are recorded by the fund on the ex-dividend date. Distributions from capital gains, if any, are recorded on the ex-dividend date and paid at least annually. The amount and character of income and gains to be distributed are determined in accordance with income tax regulations, which may differ from generally accepted accounting principles. These differences include temporary and/or permanent differences from interest on payment-in-kind securities. Reclassifications are made to the fund’s capital accounts to reflect income and gains available for distribution (or available capital loss carryovers) under income tax regulations. At the close of the reporting period, the fund reclassified $423,782 to decrease undistributed net investment income, $1,046,870 to increase paid-in-capital and $623,088 to increase accumulated net realized loss.
The tax basis components of distributable earnings and the federal tax cost as of the close of the reporting period were as follows:
Unrealized appreciation
$25,984,609
Unrealized depreciation
(20,725,218)
Net unrealized appreciation
5,259,391
Undistributed ordinary income
4,789,669
Capital loss carryforward
(59,325,817)
Cost for federal income tax purposes
$897,544,504
Note 2: Management fee, administrative services and other transactions
The fund pays Putnam Management a management fee (based on the fund’s average net assets and computed and paid monthly) at annual rates that may vary based on the average of the aggregate net assets of most open-end funds, as defined in the fund’s management contract, sponsored by Putnam Management. Such annual rates may vary as follows:
0.720%
of the first $5 billion,
0.670%
of the next $5 billion,
0.620%
of the next $10 billion,
0.570%
of the next $10 billion,
0.520%
of the next $50 billion,
0.500%
of the next $50 billion,
0.490%
of the next $100 billion and
0.485%
of any excess thereafter.
The fund’s shareholders approved the fund’s current management contract with Putnam Management effective February 27, 2014. Shareholders were asked to approve the fund’s management contract following the death on October 8, 2013 of The Honourable Paul G. Desmarais, who had controlled directly and indirectly a majority of the voting shares of Power Corporation of Canada, the ultimate parent company of Putnam Management. The substantive terms of the management contract, including terms relating to fees, are identical to the terms of the fund’s previous management contract and reflect the rates provided in the table above.
60 High Yield Advantage Fund
Putnam Management has contractually agreed, through June 30, 2015, to waive fees or reimburse the fund’s expenses to the extent necessary to limit the cumulative expenses of the fund, exclusive of brokerage, interest, taxes, investment-related expenses, extraordinary expenses, acquired fund fees and expenses and payments under the fund’s investor servicing contract, investment management contract and distribution plans, on a fiscal year-to-date basis to an annual rate of 0.20% of the fund’s average net assets over such fiscal year-to-date period. During the reporting period, the fund’s expenses were not reduced as a result of this limit.
Putnam Investments Limited (PIL), an affiliate of Putnam Management, is authorized by the Trustees to manage a separate portion of the assets of the fund as determined by Putnam Management from time to time. Putnam Management pays a quarterly sub-management fee to PIL for its services at an annual rate of 0.40% of the average net assets of the portion of the fund managed by PIL.
The fund reimburses Putnam Management an allocated amount for the compensation and related expenses of certain officers of the fund and their staff who provide administrative services to the fund. The aggregate amount of all such reimbursements is determined annually by the Trustees.
Custodial functions for the fund’s assets are provided by State Street. Custody fees are based on the fund’s asset level, the number of its security holdings and transaction volumes.
Putnam Investor Services, Inc., an affiliate of Putnam Management, provides investor servicing agent functions to the fund. Putnam Investor Services, Inc. received fees for investor servicing based on the fund’s retail asset level, the number of shareholder accounts in the fund and the level of defined contribution plan assets in the fund. Investor servicing fees will not exceed an annual rate of 0.32% of the fund’s average net assets. During the reporting period, the expenses for each class of shares related to investor servicing fees were as follows:
Class A
$834,627
Class B
26,164
Class C
41,890
Class M
197,211
Class R
42,593
Class Y
306,581
Total
$1,449,066
The fund has entered into expense offset arrangements with Putnam Investor Services, Inc. and State Street whereby Putnam Investor Services, Inc.’s and State Street’s fees are reduced by credits allowed on cash balances. For the reporting period, the fund’s expenses were reduced by $1,519 under the expense offset arrangements.
Each Independent Trustee of the fund receives an annual Trustee fee, of which $508, as a quarterly retainer, has been allocated to the fund, and an additional fee for each Trustees meeting attended. Trustees also are reimbursed for expenses they incur relating to their services as Trustees.
The fund has adopted a Trustee Fee Deferral Plan (the Deferral Plan) which allows the Trustees to defer the receipt of all or a portion of Trustees fees payable on or after July 1, 1995. The deferred fees remain invested in certain Putnam funds until distribution in accordance with the Deferral Plan.
The fund has adopted an unfunded noncontributory defined benefit pension plan (the Pension Plan) covering all Trustees of the fund who have served as a Trustee for at least five years and were first elected prior to 2004. Benefits under the Pension Plan are equal to 50% of the Trustee’s average annual attendance and retainer fees for the three years ended December 31, 2005. The retirement benefit is payable during a Trustee’s lifetime, beginning the year following retirement, for the number of years of service through December 31, 2006. Pension expense for the fund is included in Trustee compensation and expenses in the Statement of operations. Accrued pension liability is included in Payable for Trustee compensation and expenses in the Statement of assets and liabilities. The Trustees have terminated the Pension Plan with respect to any Trustee first elected after 2003.
The fund has adopted distribution plans (the Plans) with respect to its class A, class B, class C, class M and class R shares pursuant to Rule 12b–1 under the Investment Company Act of 1940. The purpose of the Plans is to compensate Putnam Retail Management Limited Partnership, an indirect wholly-owned subsidiary of Putnam Investments, LLC, for services provided and expenses incurred in distributing shares of the fund. The Plans provide for payments by the fund to Putnam Retail Management Limited Partnership at an annual rate of up to 0.35%, 1.00%, 1.00%, 1.00% and 1.00% of the average net assets attributable to class A, class B, class C, class M and class R shares, respectively. The Trustees have approved payment by the fund at an annual rate of 0.25%, 1.00%, 1.00%, 0.50%
High Yield Advantage Fund 61
and 0.50% of the average net assets attributable to class A, class B, class C, class M and class R shares, respectively. During the reporting period, the class specific expenses related to distribution fees were as follows:
Class A
$1,383,696
Class B
173,608
Class C
277,733
Class M
653,283
Class R
141,430
Total
$2,629,750
For the reporting period, Putnam Retail Management Limited Partnership, acting as underwriter, received net commissions of $24,502 and $574 from the sale of class A and class M shares, respectively, and received $7,116 and $128 in contingent deferred sales charges from redemptions of class B and class C shares, respectively.
A deferred sales charge of up to 1.00% and 0.65% is assessed on certain redemptions of class A and class M shares, respectively. For the reporting period, Putnam Retail Management Limited Partnership, acting as underwriter, received $80 and no monies on class A and class M redemptions, respectively.
Note 3: Purchases and sales of securities
During the reporting period, cost of purchases and proceeds from sales, excluding short-term investments were as follows:
Cost of purchases
Proceeds from sales
Investments in securities, including TBA commitments (Long-term)
$392,936,020
$437,184,942
U.S. government securities (Long-term)
—
—
Total
$392,936,020
$437,184,942
Note 4: Capital shares
At the close of the reporting period, there was an unlimited number of shares of beneficial interest authorized. Transactions in capital shares were as follows:
Year ended 11/30/14
Year ended 11/30/13
Class A
Shares
Amount
Shares
Amount
Shares sold
18,300,291
$114,009,653
35,692,145
$220,700,326
Shares issued in connection with reinvestment of distributions
4,131,890
25,790,153
5,316,813
32,865,975
22,432,181
139,799,806
41,008,958
253,566,301
Shares repurchased
(27,099,569)
(168,516,498)
(56,352,605)
(347,271,086)
Net decrease
(4,667,388)
$(28,716,692)
(15,343,647)
$(93,704,785)
Year ended 11/30/14
Year ended 11/30/13
Class B
Shares
Amount
Shares
Amount
Shares sold
327,257
$2,002,756
790,180
$4,801,049
Shares issued in connection with reinvestment of distributions
101,124
617,645
125,022
756,558
428,381
2,620,401
915,202
5,557,607
Shares repurchased
(432,334)
(2,641,510)
(632,451)
(3,821,312)
Net increase (decrease)
(3,953)
$(21,109)
282,751
$1,736,295
62 High Yield Advantage Fund
Year ended 11/30/14
Year ended 11/30/13
Class C
Shares
Amount
Shares
Amount
Shares sold
709,466
$4,337,622
1,271,289
$7,693,913
Shares issued in connection with reinvestment of distributions
160,458
977,396
217,229
1,311,055
869,924
5,315,018
1,488,518
9,004,968
Shares repurchased
(1,425,733)
(8,673,962)
(1,598,979)
(9,640,955)
Net decrease
(555,809)
$(3,358,944)
(110,461)
$(635,987)
Year ended 11/30/14
Year ended 11/30/13
Class M
Shares
Amount
Shares
Amount
Shares sold
2,240,042
$13,953,057
4,116,672
$25,455,503
Shares issued in connection with reinvestment of distributions
38,045
237,156
46,023
284,205
2,278,087
14,190,213
4,162,695
25,739,708
Shares repurchased
(5,649,389)
(35,255,433)
(2,508,852)
(15,549,907)
Net increase (decrease)
(3,371,302)
$(21,065,220)
1,653,843
$10,189,801
Year ended 11/30/14
Year ended 11/30/13
Class R
Shares
Amount
Shares
Amount
Shares sold
2,099,781
$13,096,553
1,606,793
$9,943,796
Shares issued in connection with reinvestment of distributions
225,514
1,405,351
253,163
1,563,232
2,325,295
14,501,904
1,859,956
11,507,028
Shares repurchased
(1,594,812)
(9,956,933)
(2,143,207)
(13,216,731)
Net increase (decrease)
730,483
$4,544,971
(283,251)
$(1,709,703)
Year ended 11/30/14
Year ended 11/30/13
Class Y
Shares
Amount
Shares
Amount
Shares sold
14,913,793
$96,672,745
36,859,091
$235,384,394
Shares issued in connection with reinvestment of distributions
1,034,027
6,699,715
1,170,541
7,502,533
15,947,820
103,372,460
38,029,632
242,886,927
Shares repurchased
(21,800,762)
(141,602,934)
(20,850,344)
(133,277,120)
Net increase (decrease)
(5,852,942)
$(38,230,474)
17,179,288
$109,609,807
At the close of the reporting period, a shareholder of record owned 5.7% of the outstanding shares of the fund.
Note 5: Affiliated transactions
Transactions during the reporting period with Putnam Short Term Investment Fund, which is under common ownership and control, were as follows:
Name of affiliate
Fair value at the beginning of the reporting period
Purchase cost
Sale proceeds
Investment income
Fair value at the end of the reporting period
Putnam Short Term Investment Fund*
$43,646,708
$302,832,955
$305,867,719
$25,929
$40,611,944
* Management fees charged to Putnam Short Term Investment Fund have been waived by Putnam Management.
High Yield Advantage Fund 63
Note 6: Senior loan commitments
Senior loans are purchased or sold on a when-issued or delayed delivery basis and may be settled a month or more after the trade date, which from time to time can delay the actual investment of available cash balances; interest income is accrued based on the terms of the securities. Senior loans can be acquired through an agent, by assignment from another holder of the loan, or as a participation interest in another holder’s portion of the loan. When the fund invests in a loan or participation, the fund is subject to the risk that an intermediate participant between the fund and the borrower will fail to meet its obligations to the fund, in addition to the risk that the borrower under the loan may default on its obligations.
Note 7: Market, credit and other risks
In the normal course of business, the fund trades financial instruments and enters into financial transactions where risk of potential loss exists due to changes in the market (market risk) or failure of the contracting party to the transaction to perform (credit risk). The fund may be exposed to additional credit risk that an institution or other entity with which the fund has unsettled or open transactions will default. Investments in foreign securities involve certain risks, including those related to economic instability, unfavorable political developments, and currency fluctuations.
Note 8: Summary of derivative activity
The volume of activity for the reporting period for any derivative type that was held during the period is listed below and was as follows based on an average of the holdings at the end of each fiscal quarter:
Forward currency contracts (contract amount)
$19,300,000
The following is a summary of the fair value of derivative instruments as of the close of the reporting period:
Fair value of derivative instruments as of the close of the reporting period
Asset derivatives
Liability derivatives
Derivatives not accounted for as hedging instruments under ASC 815
Statement of assets and liabilities location
Fair value
Statement of assets and liabilities location
Fair value
Foreign exchange contracts
Receivables
$510,746
Payables
$26,682
Total
$510,746
$26,682
The following is a summary of realized and change in unrealized gains or losses of derivative instruments on the Statement of operations for the reporting period (see Note 1):
Amount of realized gain or (loss) on derivatives recognized in net gain or (loss) on investments
Derivatives not accounted for as hedging instruments under ASC 815
Forward currency contracts
Total
Foreign exchange contracts
$(230,403)
$(230,403)
Total
$(230,403)
$(230,403)
Change in unrealized appreciation or (depreciation) on derivatives recognized in net gain or (loss) on investments
Derivatives not accounted for as hedging instruments under ASC 815
Forward currency contracts
Total
Foreign exchange contracts
$978,670
$978,670
Total
$978,670
$978,670
64 High Yield Advantage Fund
This page left blank intentionally.
High Yield Advantage Fund 65
Note 9: Offsetting of financial and derivative assets and liabilities
The following table summarizes any derivatives, repurchase agreements and reverse repurchase agreements, at the end of the reporting period, that are subject to an enforceable master netting agreement or similar agreement. For securities lending transactions or borrowing transactions associated with securities sold short, if any, see Note 1. For financial reporting purposes, the fund does not offset financial assets and financial liabilities that are subject to the master netting agreements in the Statement of assets and liabilities.
Bank of America N.A.
Barclays Bank PLC
Credit Suisse International
JPMorgan Chase Bank N.A.
State Street Bank and Trust Co.
WestPac Banking Corp.
Total
Assets:
Forward currency contracts#
$211,633
$166,602
$28,781
$14,803
$87,071
$1,856
$510,746
Total Assets
$211,633
$166,602
$28,781
$14,803
$87,071
$1,856
$510,746
Liabilities:
Forward currency contracts#
—
—
26,682
—
—
—
26,682
Total Liabilities
$—
$—
$26,682
$—
$—
$—
$26,682
Total Financial and Derivative Net Assets
$211,633
$166,602
$2,099
$14,803
$87,071
$1,856
$484,064
Total collateral received (pledged)†##
$110,000
$123,283
$—
$—
$—
$—
Net amount
$101,633
$43,319
$2,099
$14,803
$87,071
$1,856
†
Additional collateral may be required from certain brokers based on individual agreements.
#
Covered by master netting agreement (Note 1).
##
Any over-collateralization of total financial and derivative net assets is not shown. Collateral may include amounts related to unsettled agreements.
66
High Yield Advantage Fund
High Yield Advantage Fund
67
Federal tax information (Unaudited)
For the reporting period, pursuant to §871(k) of the Internal Revenue Code, the fund hereby designates $38,760,808 of distributions paid as qualifying to be taxed as interest-related dividends.
The Form 1099 that will be mailed to you in January 2015 will show the tax status of all distributions paid to your account in calendar 2014.
68 High Yield Advantage Fund
Shareholder meeting results (Unaudited)
February 27, 2014 special meeting
At the meeting, each of the nominees for Trustees was elected as follows:
Votes for
Votes withheld
Liaquat Ahamed
104,524,129
6,192,663
Ravi Akhoury
104,530,248
6,186,544
Barbara M. Baumann
104,624,367
6,092,425
Jameson A. Baxter
104,660,794
6,055,998
Charles B. Curtis
104,594,399
6,122,393
Robert J. Darretta
104,621,409
6,095,383
Katinka Domotorffy
104,601,019
6,115,773
John A. Hill
104,626,639
6,090,153
Paul L. Joskow
104,636,179
6,080,613
Kenneth R. Leibler
104,664,565
6,052,227
Robert E. Patterson
104,690,630
6,026,162
George Putnam, III
104,615,046
6,101,746
Robert L. Reynolds
104,646,098
6,070,694
W. Thomas Stephens
104,626,798
6,089,994
A proposal to approve a new management contract between the fund and Putnam Management was approved as follows:
Votes for
Votes against
Abstentions
Broker non-votes
89,581,582
1,465,543
6,386,596
13,283,071
A proposal to adopt an Amended and Restated Declaration of Trust was approved as follows:
Votes for
Votes against
Abstentions
Broker non-votes
89,401,088
1,672,427
6,360,211
13,283,066
All tabulations are rounded to the nearest whole number.
High Yield Advantage Fund 69
About the Trustees
Independent Trustees
Liaquat Ahamed
Born 1952, Trustee since 2012
Principal occupations during past five years: Pulitzer Prize-winning author of Lords of Finance: The Bankers Who Broke the World, whose articles on economics have appeared in such publications as the New York Times, Foreign Affairs, and the Financial Times. Director of Aspen Insurance Co., a New York Stock Exchange company, and Chair of the Aspen Board’s Investment Committee. Trustee of the Brookings Institution and Chair of its Investment Committee.
Other directorships: The Rohatyn Group, an emerging-market fund complex that manages money for institutions
Ravi Akhoury
Born 1947, Trustee since 2009
Principal occupations during past five years: Trustee of American India Foundation and of the Rubin Museum. From 1992 to 2007, was Chairman and CEO of MacKay Shields, a multi-product investment management firm.
Other directorships: RAGE Frameworks, Inc., a private software company; English Helper, Inc., a private software company
Barbara M. Baumann
Born 1955, Trustee since 2010
Principal occupations during past five years: President and Owner of Cross Creek Energy Corporation, a strategic consultant to domestic energy firms and direct investor in energy projects. Current Board member of The Denver Foundation. Former Chair and current Board member of Girls Incorporated of Metro Denver. Member of the Finance Committee, the Children’s Hospital of Colorado.
Other directorships: Buckeye Partners, L.P., a publicly traded master limited partnership focused on pipeline transport, storage, and distribution of petroleum products; Devon Energy Corporation, a leading independent natural gas and oil exploration and production company
Jameson A. Baxter
Born 1943, Trustee since 1994, Vice Chair from 2005 to 2011, and Chair since 2011
Principal occupations during past five years: President of Baxter Associates, Inc., a private investment firm. Chair of Mutual Fund Directors Forum. Chair Emeritus of the Board of Trustees of Mount Holyoke College. Director of the Adirondack Land Trust and Trustee of the Nature Conservancy’s Adirondack Chapter.
Charles B. Curtis
Born 1940, Trustee since 2001
Principal occupations during past five years: Senior Advisor to the Center for Strategic and International Studies. President Emeritus and former President and Chief Operating Officer of the Nuclear Threat Initiative, a private foundation dealing with national security issues. Member of the Council on Foreign Relations and U.S. State Department International Security Advisory Board.
Robert J. Darretta
Born 1946, Trustee since 2007
Principal occupations during past five years: From 2009 until 2012, served as Health Care Industry Advisor to Permira, a global private equity firm. Until April 2007, was Vice Chairman of the Board of Directors of Johnson & Johnson. Served as Johnson & Johnson’s Chief Financial Officer for a decade.
Other directorships: UnitedHealth Group, a diversified health-care company
Katinka Domotorffy
Born 1975, Trustee since 2012
Principal occupations during past five years: Voting member of the Investment Committees of the Anne Ray Charitable Trust and Margaret A. Cargill Foundation, part of the Margaret A. Cargill Philanthropies. Until 2011, Partner, Chief Investment Officer, and Global Head of Quantitative Investment Strategies at Goldman Sachs Asset Management.
Other directorships: Reach Out and Read of Greater New York, an organization dedicated to promoting childhood literacy
John A. Hill
Born 1942, Trustee since 1985 and Chairman from 2000 to 2011
Principal occupations during past five years: Founder and Vice-Chairman of First Reserve Corporation, the leading private equity buyout firm focused on the worldwide energy industry. Trustee and Chairman of the Board of Trustees of Sarah Lawrence College. Member of the Advisory Board of the Millstein Center for Global Markets and Corporate Ownership at The Columbia University Law School.
Other directorships: Devon Energy Corporation, a leading independent natural gas and oil exploration and production company
70 High Yield Advantage Fund
Paul L. Joskow
Born 1947, Trustee since 1997
Principal occupations during past five years: Economist and President of the Alfred P. Sloan Foundation, a philanthropic institution focused primarily on research and education on issues related to science, technology, and economic performance. Elizabeth and James Killian Professor of Economics, Emeritus at the Massachusetts Institute of Technology (MIT). Prior to 2007, served as the Director of the Center for Energy and Environmental Policy Research at MIT.
Other directorships: Yale University; Exelon Corporation, an energy company focused on power services; Boston Symphony Orchestra; Prior to April 2013, served as Director of TransCanada Corporation and TransCanada Pipelines Ltd., energy companies focused on natural gas transmission, oil pipelines and power services
Kenneth R. Leibler
Born 1949, Trustee since 2006
Principal occupations during past five years: Founder and former Chairman of Boston Options Exchange, an electronic marketplace for the trading of derivative securities. Serves on the Board of Trustees of Beth Israel Deaconess Hospital in Boston, Massachusetts. Director of Beth Israel Deaconess Care Organization. Until November 2010, director of Ruder Finn Group, a global communications and advertising firm.
Other directorships: Northeast Utilities, which operates New England’s largest energy delivery system
Robert E. Patterson
Born 1945, Trustee since 1984
Principal occupations during past five years: Co-Chairman of Cabot Properties, Inc., a private equity firm investing in commercial real estate, and Chairman of its Investment Committee. Past Chairman and Trustee of the Joslin Diabetes Center.
George Putnam, III
Born 1951, Trustee since 1984
Principal occupations during past five years: Chairman of New Generation Research, Inc., a publisher of financial advisory and other research services. Founder and President of New Generation Advisors, LLC, a registered investment advisor to private funds. Director of The Boston Family Office, LLC, a registered investment advisor.
W. Thomas Stephens
Born 1942, Trustee from 1997 to 2008 and since 2009
Principal occupations during past five years: Retired as Chairman and Chief Executive Officer of Boise Cascade, LLC, a paper, forest products, and timberland assets company, in December 2008. Prior to 2010, Director of Boise Inc., a manufacturer of paper and packaging products.
Other directorships: TransCanada Pipelines Ltd., an energy infrastructure company
Interested Trustee
Robert L. Reynolds*
Born 1952, Trustee since 2008 and President of the Putnam Funds since 2009
Principal occupations during past five years: President and Chief Executive Officer of Putnam Investments since 2008 and, since 2014, President and Chief Executive Officer of Great-West Financial, a financial services company that provides retirement savings plans, life insurance, and annuity and executive benefits products, and of Great-West Lifeco U.S. Inc., a holding company that owns Putnam Investments and Great-West Financial. Prior to joining Putnam Investments, served as Vice Chairman and Chief Operating Officer of Fidelity Investments from 2000 to 2007.
* Mr. Reynolds is an “interested person” (as defined in the Investment Company Act of 1940) of the fund and Putnam Investments. He is President and Chief Executive Officer of Putnam Investments, as well as the President of your fund and each of the other Putnam funds.
The address of each Trustee is One Post Office Square, Boston, MA 02109.
As of November 30, 2014, there were 116 Putnam funds. All Trustees serve as Trustees of all Putnam funds.
Each Trustee serves for an indefinite term, until his or her resignation, retirement at age 75, removal, or death.
High Yield Advantage Fund 71
Officers
In addition to Robert L. Reynolds, the other officers of the fund are shown below:
Jonathan S. Horwitz (Born 1955)
Executive Vice President, Principal Executive Officer, and Compliance Liaison
Since 2004
Steven D. Krichmar (Born 1958)
Vice President and Principal Financial Officer
Since 2002
Chief of Operations, Putnam Investments and Putnam Management
Robert T. Burns (Born 1961)
Vice President and Chief Legal Officer
Since 2011
General Counsel, Putnam Investments, Putnam Management, and Putnam Retail Management
Manager of Finance, Dunkin’ Brands (2008–2010); Senior Financial Analyst, Old Mutual Asset Management (2007–2008); Senior Financial Analyst, Putnam Investments (1999–2007)
Janet C. Smith (Born 1965)
Vice President, Principal Accounting Officer, and Assistant Treasurer
Since 2007
Director of Fund Administration Services, Putnam Investments and Putnam Management
Susan G. Malloy (Born 1957)
Vice President and Assistant Treasurer
Since 2007
Director of Accounting & Control Services, Putnam Investments and Putnam Management
James P. Pappas (Born 1953)
Vice President
Since 2004
Director of Trustee Relations, Putnam Investments and Putnam Management
Mark C. Trenchard (Born 1962)
Vice President and BSA Compliance Officer
Since 2002
Director of Operational Compliance, Putnam Investments and Putnam Retail Management
Nancy E. Florek (Born 1957)
Vice President, Director of Proxy Voting and Corporate Governance, Assistant Clerk, and Associate Treasurer
Since 2000
The principal occupations of the officers for the past five years have been with the employers as shown above, although in some cases they have held different positions with such employers. The address of each officer is One Post Office Square, Boston, MA 02109.
72 High Yield Advantage Fund
Services for shareholders
Investor services
Systematic investment plan Tell us how much you wish to invest regularly — weekly, semimonthly, or monthly — and the amount you choose will be transferred automatically from your checking or savings account. There’s no additional fee for this service, and you can suspend it at any time. This plan may be a great way to save for college expenses or to plan for your retirement.
Please note that regular investing does not guarantee a profit or protect against loss in a declining market. Before arranging a systematic investment plan, consider your financial ability to continue making purchases in periods when prices are low.
Systematic exchange You can make regular transfers from one Putnam fund to another Putnam fund. There are no additional fees for this service, and you can cancel or change your options at any time.
Dividends PLUS You can choose to have the dividend distributions from one of your Putnam funds automatically reinvested in another Putnam fund at no additional charge.
Free exchange privilege You can exchange money between Putnam funds free of charge, as long as they are the same class of shares. A signature guarantee is required if you are exchanging more than $500,000. The fund reserves the right to revise or terminate the exchange privilege.
Reinstatement privilege If you’ve sold Putnam shares or received a check for a dividend or capital gain, you may reinvest the proceeds with Putnam within 90 days of the transaction and they will be reinvested at the fund’s current net asset value — with no sales charge. However, reinstatement of class B shares may have special tax consequences. Ask your financial or tax representative for details.
Check-writing service You have ready access to many Putnam accounts. It’s as simple as writing a check, and there are no special fees or service charges. For more information about the check-writing service, call Putnam or visit our website.
Dollar cost averaging When you’re investing for long-term goals, it’s time, not timing, that counts. Investing on a systematic basis is a better strategy than trying to figure out when the markets will go up or down. This means investing the same amount of money regularly over a long period. This method of investing is called dollar cost averaging. When a fund’s share price declines, your investment dollars buy more shares at lower prices. When it increases, they buy fewer shares. Over time, you will pay a lower average price per share.
For more information
Visit the Individual Investors section at putnam.com A secure section of our website contains complete information on your account, including balances and transactions, updated daily. You may also conduct transactions, such as exchanges, additional investments, and address changes. Log on today to get your password.
Call us toll free at 1-800-225-1581 Ask a helpful Putnam representative or your financial advisor for details about any of these or other services, or see your prospectus.
High Yield Advantage Fund 73
Putnam family of funds
The following is a list of Putnam’s open-end mutual funds offered to the public. Investors should carefully consider the investment objective, risks, charges, and expenses of a fund before investing. For a prospectus, or a summary prospectus if available, containing this and other information for any Putnam fund or product, contact your financial advisor or call Putnam Investor Services at 1-800-225-1581. Please read the prospectus carefully before investing.
Growth
Growth Opportunities Fund
International Growth Fund
Multi-Cap Growth Fund
Small Cap Growth Fund
Voyager Fund
Blend
Asia Pacific Equity Fund
Capital Opportunities Fund
Capital Spectrum Fund
Emerging Markets Equity Fund
Equity Spectrum Fund
Europe Equity Fund
Global Equity Fund
International Capital Opportunities Fund
International Equity Fund
Investors Fund
Low Volatility Equity Fund
Multi-Cap Core Fund
Research Fund
Strategic Volatility Equity Fund
Value
Convertible Securities Fund
Equity Income Fund
Global Dividend Fund
The Putnam Fund for Growth and Income
International Value Fund
Multi-Cap Value Fund
Small Cap Value Fund
Income
American Government Income Fund
Diversified Income Trust
Emerging Markets Income Fund
Floating Rate Income Fund
Global Income Trust
High Yield Advantage Fund
High Yield Trust
Income Fund
Money Market Fund*
Short Duration Income Fund
U.S. Government Income Trust
Tax-free Income
AMT-Free Municipal Fund
Intermediate-Term Municipal Income Fund
Short-Term Municipal Income Fund
Tax Exempt Income Fund
Tax Exempt Money Market Fund*
Tax-Free High Yield Fund
State tax-free income funds†:
Arizona, California, Massachusetts, Michigan, Minnesota, New Jersey, New York, Ohio, and Pennsylvania.
* An investment in a money market fund is not insured or guaranteed by the Federal Deposit Insurance Corporation or any other government agency. Although the fund seeks to preserve the value of your investment at $1.00 per share, it is possible to lose money by investing in the fund.
† Not available in all states.
74 High Yield Advantage Fund
Absolute Return
Absolute Return 100 Fund®
Absolute Return 300 Fund®
Absolute Return 500 Fund®
Absolute Return 700 Fund®
Global Sector
Global Consumer Fund
Global Energy Fund
Global Financials Fund
Global Health Care Fund
Global Industrials Fund
Global Natural Resources Fund
Global Sector Fund
Global Technology Fund
Global Telecommunications Fund
Global Utilities Fund
Asset Allocation
George Putnam Balanced Fund
Global Asset Allocation Funds — four investment portfolios that spread your money across a variety of stocks, bonds, and money market instruments.
Dynamic Asset Allocation Balanced Fund
Dynamic Asset Allocation Conservative Fund
Dynamic Asset Allocation Growth Fund
Dynamic Risk Allocation Fund
Retirement Income Lifestyle Funds — portfolios with managed allocations to stocks, bonds, and money market investments to generate retirement income.
Retirement Income Fund Lifestyle 1
Retirement Income Fund Lifestyle 2
Retirement Income Fund Lifestyle 3
RetirementReady® Funds — portfolios with adjusting allocations to stocks, bonds, and money market instruments, becoming more conservative over time.
RetirementReady® 2055 Fund
RetirementReady® 2050 Fund
RetirementReady® 2045 Fund
RetirementReady® 2040 Fund
RetirementReady® 2035 Fund
RetirementReady® 2030 Fund
RetirementReady® 2025 Fund
RetirementReady® 2020 Fund
RetirementReady® 2015 Fund
Check your account balances and the most recent month-end performance in the Individual Investors section at putnam.com.
High Yield Advantage Fund 75
Fund information
Founded over 75 years ago, Putnam Investments was built around the concept that a balance between risk and reward is the hallmark of a well-rounded financial program. We manage over 100 funds across income, value, blend, growth, asset allocation, absolute return, and global sector categories.
Investment Manager
Putnam Investment Management, LLC One Post Office Square Boston, MA 02109
Investment Sub-Manager
Putnam Investments Limited 57–59 St James’s Street London, England SW1A 1LD
Marketing Services
Putnam Retail Management One Post Office Square Boston, MA 02109
Custodian
State Street Bank and Trust Company
Legal Counsel
Ropes & Gray LLP
Independent Registered Public Accounting Firm
KPMG LLP
Trustees
Jameson A. Baxter, Chair Liaquat Ahamed Ravi Akhoury Barbara M. Baumann Charles B. Curtis Robert J. Darretta Katinka Domotorffy John A. Hill Paul L. Joskow Kenneth R. Leibler Robert E. Patterson George Putnam, III Robert L. Reynolds W. Thomas Stephens
Officers
Robert L. Reynolds President
Jonathan S. Horwitz Executive Vice President, Principal Executive Officer, and Compliance Liaison
Steven D. Krichmar Vice President and Principal Financial Officer
Robert T. Burns Vice President and Chief Legal Officer
Robert R. Leveille Vice President and Chief Compliance Officer
Michael J. Higgins Vice President, Treasurer, and Clerk
Janet C. Smith Vice President, Principal Accounting Officer, and Assistant Treasurer
Susan G. Malloy Vice President and Assistant Treasurer
James P. Pappas Vice President
Mark C. Trenchard Vice President and BSA Compliance Officer
Nancy E. Florek Vice President, Director of Proxy Voting and Corporate Governance, Assistant Clerk, and Associate Treasurer
This report is for the information of shareholders of Putnam High Yield Advantage Fund. It may also be used as sales literature when preceded or accompanied by the current prospectus, the most recent copy of Putnam’s Quarterly Performance Summary, and Putnam’s Quarterly Ranking Summary. For more recent performance, please visit putnam.com. Investors should carefully consider the investment objectives, risks, charges, and expenses of a fund, which are described in its prospectus. For this and other information or to request a prospectus or summary prospectus, call 1-800-225-1581 toll free. Please read the prospectus carefully before investing. The fund’s Statement of Additional Information contains additional information about the fund’s Trustees and is available without charge upon request by calling 1-800-225-1581.
76 High Yield Advantage Fund
Item 2. Code of Ethics:
(a) The fund’s principal executive, financial and accounting officers are employees of Putnam Investment Management, LLC, the Fund’s investment manager. As such they are subject to a comprehensive Code of Ethics adopted and administered by Putnam Investments which is designed to protect the interests of the firm and its clients. The Fund has adopted a Code of Ethics which incorporates the Code of Ethics of Putnam Investments with respect to all of its officers and Trustees who are employees of Putnam Investment Management, LLC. For this reason, the Fund has not adopted a separate code of ethics governing its principal executive, financial and accounting officers.
(c) In July 2013, the Code of Ethics of Putnam Investment Management, LLC was amended. The changes to the Code of Ethics were as follows: (i) eliminating the requirement for employees to hold their shares of Putnam mutual funds for specified periods of time, (ii) removing the requirement to preclear transactions in certain kinds of exchange-traded funds and exchange-traded notes, although reporting of all such instruments remains required; (iii) eliminating the excessive trading rule related to employee transactions in securities requiring preclearance under the Code; (iv) adding provisions related to monitoring of employee trading; (v) changing from a set number of shares to a set dollar value of stock of mid- and large-cap companies on the Restricted List that can be purchased or sold; (vi) adding a requirement starting in March 2014 for employees to generally use certain approved brokers that provide Putnam with an electronic feed of transactions and statements for their personal brokerage accounts; and (vii) certain other changes.
Item 3. Audit Committee Financial Expert:
The Funds’ Audit and Compliance Committee is comprised solely of Trustees who are “independent” (as such term has been defined by the Securities and Exchange Commission (“SEC”) in regulations implementing Section 407 of the Sarbanes-Oxley Act (the “Regulations”)). The Trustees believe that each of the members of the Audit and Compliance Committee also possess a combination of knowledge and experience with respect to financial accounting matters, as well as other attributes, that qualify them for service on the Committee. In addition, the Trustees have determined that each of Mr. Leibler, Mr. Hill, Mr. Darretta, and Ms. Baumann qualifies as an “audit committee financial expert” (as such term has been defined by the Regulations) based on their review of his or her pertinent experience and education. The SEC has stated, and the funds’ amended and restated agreement and Declaration of Trust provides, that the designation or identification of a person as an audit committee financial expert pursuant to this Item 3 of Form N-CSR does not impose on such person any duties, obligations or liability that are greater than the duties, obligations and liability imposed on such person as a member of the Audit and Compliance Committee and the Board of Trustees in the absence of such designation or identification.
Item 4. Principal Accountant Fees and Services:
The following table presents fees billed in each of the last two fiscal years for services rendered to the fund by the fund’s independent auditor:
Fiscal year ended
Audit Fees
Audit-Related Fees
Tax Fees
All Other Fees
November 30, 2014
$85,331
$ —
$4,655
$ —
November 30, 2013
$83,156
$ —
$4,563
$ —
For the fiscal years ended November 30, 2014 and November 30, 2013, the fund’s independent auditor billed aggregate non-audit fees in the amounts of $4,655 and $4,563 respectively, to the fund, Putnam Management and any entity controlling, controlled by or under common control with Putnam Management that provides ongoing services to the fund.
Audit Fees represent fees billed for the fund’s last two fiscal years relating to the audit and review of the financial statements included in annual reports and registration statements, and other services that are normally provided in connection with statutory and regulatory filings or engagements.
Audit-Related Fees represent fees billed in the fund’s last two fiscal years for services traditionally performed by the fund’s auditor, including accounting consultation for proposed transactions or concerning financial accounting and reporting standards and other audit or attest services not required by statute or regulation.
Tax Fees represent fees billed in the fund’s last two fiscal years for tax compliance, tax planning and tax advice services. Tax planning and tax advice services include assistance with tax audits, employee benefit plans and requests for rulings or technical advice from taxing authorities.
Pre-Approval Policies of the Audit and Compliance Committee. The Audit and Compliance Committee of the Putnam funds has determined that, as a matter of policy, all work performed for the funds by the funds’ independent auditors will be pre-approved by the Committee itself and thus will generally not be subject to pre-approval procedures.
The Audit and Compliance Committee also has adopted a policy to pre-approve the engagement by Putnam Management and certain of its affiliates of the funds’ independent auditors, even in circumstances where pre-approval is not required by applicable law. Any such requests by Putnam Management or certain of its affiliates are typically submitted in writing to the Committee and explain, among other things, the nature of the proposed engagement, the estimated fees, and why this work should be performed by that particular audit firm as opposed to another one. In reviewing such requests, the Committee considers, among other things, whether the provision of such services by the audit firm are compatible with the independence of the audit firm.
The following table presents fees billed by the fund’s independent auditor for services required to be approved pursuant to paragraph (c)(7)(ii) of Rule 2-01 of Regulation S-X.
Fiscal year ended
Audit-Related Fees
Tax Fees
All Other Fees
Total Non-Audit Fees
November 30, 2014
$ —
$ —
$ —
$ —
November 30, 2013
$ —
$ —
$ —
$ —
Item 5. Audit Committee of Listed Registrants
Not applicable
Item 6. Schedule of Investments:
The registrant’s schedule of investments in unaffiliated issuers is included in the report to shareholders in Item 1 above.
Item 7. Disclosure of Proxy Voting Policies and Procedures For Closed-End Management Investment Companies:
Not applicable
Item 8. Portfolio Managers of Closed-End Investment Companies
Not Applicable
Item 9. Purchases of Equity Securities by Closed-End Management Investment Companies and Affiliated Purchasers:
Not applicable
Item 10. Submission of Matters to a Vote of Security Holders:
Not applicable
Item 11. Controls and Procedures:
(a) The registrant’s principal executive officer and principal financial officer have concluded, based on their evaluation of the effectiveness of the design and operation of the registrant’s disclosure controls and procedures as of a date within 90 days of the filing date of this report, that the design and operation of such procedures are generally effective to provide reasonable assurance that information required to be disclosed by the registrant in this report is recorded, processed, summarized and reported within the time periods specified in the Commission’s rules and forms.
(b) Changes in internal control over financial reporting: Not applicable
Item 12. Exhibits:
(a)(1) The Code of Ethics of The Putnam Funds, which incorporates the Code of Ethics of Putnam Investments, is filed herewith.
(a)(2) Separate certifications for the principal executive officer and principal financial officer of the registrant as required by Rule 30a-2(a) under the Investment Company Act of 1940, as amended, are filed herewith.
(b) The certifications required by Rule 30a-2(b) under the Investment Company Act of 1940, as amended, are filed herewith.
SIGNATURES
Pursuant to the requirements of the Securities Exchange Act of 1934 and the Investment Company Act of 1940, the registrant has duly caused this report to be signed on its behalf by the undersigned, thereunto duly authorized.
Putnam High Yield Advantage Fund
By (Signature and Title):
/s/ Janet C. Smith Janet C. Smith Principal Accounting Officer
Date: January 28, 2015
Pursuant to the requirements of the Securities Exchange Act of 1934 and the Investment Company Act of 1940, this report has been signed below by the following persons on behalf of the registrant and in the capacities and on the dates indicated.
By (Signature and Title):
/s/ Jonathan S. Horwitz Jonathan S. Horwitz Principal Executive Officer
Date: January 28, 2015
By (Signature and Title):
/s/ Steven D. Krichmar Steven D. Krichmar Principal Financial Officer
Date: January 28, 2015
We use cookies on this site to provide a more responsive and personalized service. Continuing to browse, clicking I Agree, or closing this banner indicates agreement. See our Cookie Policy for more information.