UNITED STATES
SECURITIES AND EXCHANGE COMMISSION
Washington, D.C. 20549
FORM N-CSR
CERTIFIED SHAREHOLDER REPORT OF REGISTERED MANAGEMENT
INVESTMENT COMPANIES
Investment Company Act file number: 811- 4603
Thrivent Series Fund, Inc.
(Exact name of registrant as specified in charter)
625 Fourth Avenue South
Minneapolis, Minnesota 55415
(Address of principal executive offices) (Zip code)
David S. Royal, Secretary
625 Fourth Avenue South
Minneapolis, Minnesota 55415
(Name and address of agent for service)
Registrant's telephone number, including area code: (612) 340-4249
Date of fiscal year end: December 31
Date of reporting period: June 29, 2007
Item 1. Report to Stockholders
Table of Contents
| President’s Letter | 1 |
| Economic and Market Overview | 2 |
| Portfolio Perspectives | |
| Thrivent Aggressive Allocation Portfolio | 4 |
| Thrivent Moderately Aggressive Allocation Portfolio . | 6 |
| Thrivent Moderate Allocation Portfolio | 8 |
| Thrivent Moderately Conservative Allocation Portfolio | 10 |
| Thrivent Technology Portfolio | 12 |
| Thrivent Partner Small Cap Growth Portfolio | 14 |
| Thrivent Partner Small Cap Value Portfolio | 16 |
| Thrivent Small Cap Stock Portfolio | 18 |
| Thrivent Small Cap Index Portfolio | 20 |
| Thrivent Mid Cap Growth Portfolio | 22 |
| Thrivent Mid Cap Growth Portfolio II | 24 |
| Thrivent Partner Mid Cap Value Portfolio | 26 |
| Thrivent Mid Cap Stock Portfolio | 28 |
| Thrivent Mid Cap Index Portfolio | 30 |
| Thrivent Partner International Stock Portfolio | 32 |
| Thrivent Partner All Cap Portfolio | 34 |
| Thrivent Large Cap Growth Portfolio | 36 |
| Thrivent Large Cap Growth Portfolio II | 38 |
| Thrivent Partner Growth Stock Portfolio | 40 |
| Thrivent Large Cap Value Portfolio | 42 |
| Thrivent Large Cap Stock Portfolio | 44 |
| Thrivent Large Cap Index Portfolio | 46 |
| Thrivent Real Estate Securities Portfolio | 48 |
| Thrivent Balanced Portfolio | 50 |
| Thrivent High Yield Portfolio | 52 |
| Thrivent Diversified Income Plus Portfolio | 54 |
| Thrivent Income Portfolio | 56 |
| Thrivent Bond Index Portfolio | 58 |
| Thrivent Limited Maturity Bond Portfolio | 60 |
| Thrivent Mortgage Securities Portfolio | 62 |
| Thrivent Money Market Portfolio | 64 |
| Shareholder Expense Example | 66 |
| Schedules of Investments | |
| Thrivent Aggressive Allocation Portfolio | 69 |
| Thrivent Moderately Aggressive Allocation Portfolio . | 70 |
| Thrivent Moderate Allocation Portfolio | 71 |
| Thrivent Moderately Conservative Allocation Portfolio | 72 |
| Thrivent Technology Portfolio | 73 |
| Thrivent Partner Small Cap Growth Portfolio | 75 |
| Thrivent Partner Small Cap Value Portfolio | 78 |
| Thrivent Small Cap Stock Portfolio | 81 |
| Thrivent Small Cap Index Portfolio | 85 |
| Thrivent Mid Cap Growth Portfolio | 94 |
| Thrivent Mid Cap Growth Portfolio II | 98 |
| Thrivent Partner Mid Cap Value Portfolio | 102 |
| Thrivent Mid Cap Stock Portfolio | 105 |
| Thrivent Mid Cap Index Portfolio | 108 |
| Thrivent Partner International Stock Portfolio | 114 |
| Thrivent Partner All Cap Portfolio | 119 |
| Thrivent Large Cap Growth Portfolio | 122 |
| Thrivent Large Cap Growth Portfolio II | 126 |
| Thrivent Partner Growth Stock Portfolio | 130 |
| Thrivent Large Cap Value Portfolio | 133 |
| Thrivent Large Cap Stock Portfolio | 136 |
| Thrivent Large Cap Index Portfolio | 140 |
| Thrivent Real Estate Securities Portfolio | 148 |
| Thrivent Balanced Portfolio | 151 |
| Thrivent High Yield Portfolio | 171 |
| Thrivent Diversified Income Plus Portfolio | 179 |
| Thrivent Income Portfolio | 190 |
| Thrivent Bond Index Portfolio | 199 |
| Thrivent Limited Maturity Bond Portfolio | 211 |
| Thrivent Mortgage Securities Portfolio | 220 |
| Thrivent Money Market Portfolio | 223 |
| Statement of Assets and Liabilities | 228 |
| Statement of Operations | 234 |
| Statement of Changes in Net Assets | 240 |
| Notes to Financial Statements | 246 |
| Financial Highlights | |
| Thrivent Aggressive Allocation Portfolio | 264 |
| Thrivent Moderately Aggressive Allocation Portfolio | . 264 |
| Thrivent Moderate Allocation Portfolio | 264 |
| Thrivent Moderately Conservative Allocation Portfolio | 264 |
| Thrivent Technology Portfolio | 264 |
| Thrivent Partner Small Cap Growth Portfolio | 264 |
| Thrivent Partner Small Cap Value Portfolio | 264 |
| Thrivent Small Cap Stock Portfolio | 266 |
| Thrivent Small Cap Index Portfolio | 266 |
| Thrivent Mid Cap Growth Portfolio | 266 |
| Thrivent Mid Cap Growth Portfolio II | 266 |
| Thrivent Partner Mid Cap Value Portfolio | 266 |
| Thrivent Mid Cap Stock Portfolio | 266 |
| Thrivent Mid Cap Index Portfolio | 268 |
| Thrivent Partner International Stock Portfolio | 268 |
| Thrivent Partner All Cap Portfolio | 268 |
| Thrivent Large Cap Growth Portfolio | 268 |
| Thrivent Large Cap Growth Portfolio II | 268 |
| Thrivent Partner Growth Stock Portfolio | 268 |
| Thrivent Large Cap Value Portfolio | 270 |
| Thrivent Large Cap Stock Portfolio | 270 |
| Thrivent Large Cap Index Portfolio | 270 |
| Thrivent Real Estate Securities Portfolio | 270 |
| Thrivent Balanced Portfolio | 270 |
| Thrivent High Yield Portfolio | 270 |
| Thrivent Diversified Income Plus Portfolio | 272 |
| Thrivent Income Portfolio | 272 |
| Thrivent Bond Index Portfolio | 272 |
| Thrivent Limited Maturity Bond Portfolio | 272 |
| Thrivent Mortgage Securities Portfolio | 272 |
| Thrivent Money Market Portfolio | 272 |
| Additional Information | 274 |
| Supplements to the Prospectus | 275 |

Dear Member:
We are pleased to provide you with the semiannual report for the six months ended June 29, 2007, for the Thrivent Series Fund, Inc. In this report, you will find detailed information about each of the Thrivent Series Fund, Inc. portfolios, including performance highlights, overall market conditions and management strategies during the six-month period. In addition, Thrivent Financial’s Chief Investment Officer Russ Swansen reviews the larger economic environment in his Economic and Market Review.
The six-month period proved a rewarding one. Bolstered by relatively low interest rates, stronger than expected corporate profits and surging economic growth overseas, stocks — both domestic and international — posted excellent results. Bonds garnered more modest returns consistent with their lower risk profiles but still performed well.
But within the larger story of strong market performance is a sub-plot involving changing leadership among asset classes. For example, for the first time in many years, large-company stocks appear to be wrestling leadership from smaller-company stocks. Also, real estate equities, after spectacular performance for several years, appear to be cooling. How can a busy person keep up with all these financial market “moving parts” so that his or her portfolio is well positioned? The Thrivent Investment Strategy Committee can help you achieve this goal with its ongoing asset allocation strategies that are embedded in the Thrivent Asset Allocation Portfolios and Thrivent’s tactical model portfolios called Tilts. We aim for simple, honest, transparent investment guidance to help you better navigate ever-changing markets and reach your most important financial goals.
Good advice, a well thought out long-term plan and a disciplined approach can make all the difference. Be sure to contact your Thrivent Financial representative if you have any questions or concerns with your overall portfolio or your insurance needs.
Supporting your most important financial goal: The future
Whether saving for retirement or structuring accumulated assets for income generation, proper advice and guidance for this important goal is critical. At Thrivent Financial for Lutherans, we seek to provide you, the member, with the financial confidence and security you need to live the life you want. Our asset management capabilities position us well to structure and monitor an investment course that can help you reach your goals. Whether you seek an aggressive approach for long-term growth or a conservative plan for near-term income, Thrivent Financial has the resources to help. Relevant, honest financial advice with the products and services that can help you achieve what you’ve worked so hard for — that’s our goal.
A strategy that fits your needs
We have the investment solutions and a money management philosophy uniquely tailored to support our members. Critical among these solutions is our strong belief in asset allocation and overall portfolio balance. Studies have shown that strategic asset allocation (the mix of investments in an overall portfolio) can be the major determinant of how well your assets will fare over the long term. Furthermore, success in managing assets or making retirement assets last longer is often dependent on achieving growth by investing in stocks. A sound asset allocation strategy can reduce the risk of volatile stocks by diversifying among different types of stocks (large and small, international and domestic, value style and growth style, etc.) as well as bonds and real estate securities.
Consider the following:
• Thrivent Financial associates are equipped with leading-edge tools and advice to build and support ongoing asset allocation strategies.
• Each portfolio is strictly managed to its individual investment objective to best support asset allocation.
• Finally, our Thrivent Asset Allocation Portfolios are customized to risk tolerance levels to provide a simple and smart method of managing your assets.
Thrivent Diversified Income Plus Portfolio
Thrivent is proud to offer a dividend-oriented Portfolio to our valued members. The Thrivent Diversified Income Plus Portfolio seeks a high current yield for income and, secondarily, potential growth in the form of capital appreciation through an optimized asset allocation mix of high yield bonds, real estate equities, dividend producing stocks and high-quality fixed income investments.
With life spans growing ever longer and the specter of inflation taking a bite out of fixed income portfolios, the Thrivent Diversified Income Plus Portfolio can provide valuable equity exposure and the potential growth your portfolio needs in retirement without the level of volatility that comes with many stock funds. Generating total return primarily from reinvesting dividends can provide a smoother growth track for your assets than sole reliance on more volatile security price gains. Contact your Thrivent Financial representative for more information.
Our commitment to you
We remain committed to providing our members with the guidance and solutions they need to prepare for retirement and to achieve their goals. Thank you for continuing to turn to us for your financial solutions. We very much value you and your business.
Sincerely,

Pamela J. Moret
President and Director
Thrivent Series Fund, Inc.
Investing in a variable product involves risks, including the possible loss of principal. The prospectus contains more complete information on the investment objectives, risks, charges and expenses of the investment company which investors should read and consider carefully before investing. To obtain a prospectus contact a registered representative or visit www.thrivent.com.
1

Stocks and bonds generally posted positive returns during the six-month period ended June 29, 2007, as investors mulled conflicting signals on the direction of the markets and the economy. These signs not only included shifts in the economy’s growth rate, a spike in interest rates and a continued slump in housing, but also a strong labor market, brisk consumer spending and impressive corporate profits.
U.S. Economy
The nation’s gross domestic product (GDP) fell from a 2.5% annual growth rate in the fourth quarter of 2006 to a 0.6% annual rate in the first quarter of 2007, the weakest rate of expansion in four years. Preliminary indications for the second quarter suggest a rebound in activity from the depressed first quarter level but expectations are for GDP growth to remain below trend, weighed down by more modest increases in consumer spending. Stable employment and reasonable income gains are being offset by stubbornly high energy prices and ongoing softness in housing.
The housing market showed few signs of recovery. Annualized sales of existing homes declined 2.6% in April, and in May they fell more than 10% from the previous–year level, the lowest since 2003. Annualized sales of new homes increased 16.2% in April, with the largest increase in the South, but they declined 1.6% in May. The May new home sales total was down nearly 16% from the total a year earlier.
Higher levels of business spending have offset much of the negative impact of the housing slowdown and a lower dollar is improving export sales as other economies pick up some growth momentum. Inventories are also a bit low and restocking should lead to better domestic growth.
Inflation and monetary policy
Excluding the volatile prices of food and energy, the core Consumer Price Index (CPI) advanced at a 2.1% annual rate during the first five months of 2007, following a 2.6% rise in all of 2006. “Headline” inflation accelerated during the period. The CPI rose at a 5.5% annual rate for the first five months of 2007, compared with a 2.5% rate for all of 2006, primarily as the result of a rebound in energy prices. The Federal Reserve has opted to maintain its policy stance, with indication of lowering the Fed Funds rate from its present level of 5.25% . After the Fed’s June meeting, policymakers said “a sustained moderation in inflation pressures has yet to be convincingly demonstrated.” Under current circumstances, they noted, the Fed’s main concern remains the risk that inflation will fail to moderate as expected.
Equity performance
Stocks gained steadily through late February, spurred by strong corporate profits, a flurry of merger and acquisition activity, and diminishing worries about higher commodities costs, inflation and interest rates. But on February 27, a 9% slide in Chinese stocks prompted most U.S. stock indexes to fall between 3% and 4% — the worst single-day decline in nearly four years. The Chinese market plunge was a reaction to Chinese authorities’ moves to limit speculative investment activity in Chinese stocks.
Unexpectedly strong earnings reports for the first quarter helped stocks regain their upward momentum in April and May, with many indexes at or approaching record highs. An abrupt rise in bond yields in June caused the rally to stall, though the market consolidated at a high level through the end of June.
Large-company stocks narrowly outperformed small-company issues during the period. The S&P 500 Index of large-company stocks posted a 6.96% total return, while the Russell 2000® Index of small-company stocks recorded a 6.45% return. Growth stocks outperformed value stocks. During the period, the Russell 1000® Growth Index returned 8.13%, while the Russell 1000® Value Index posted a return of 6.23% .
Sectors that performed best within the S&P 500 during the period included energy, materials, information technology, telecommunications services, and industrials, while consumer discretionary, consumer staples, and health care advanced at a more moderate rate. Financials, hurt by the rise in interest rates and the continuing troubles in the sub-prime mortgage sector, was the only S&P 500 sector to register a negative return.
2
Real estate investment trusts (REITs) had a particularly difficult period due to rising rates and extended valuations, with the FTSE NAREIT Equity REIT Index posting a –5.89% return for the six months. Foreign stocks generally continued to outperform most domestic issues. The Morgan Stanley Capital International Europe, Australasia, Far East (EAFE) Index posted an 11.09% total return in dollar terms.
Fixed income performance
Treasury yields were relatively stable during the period until early June, when they spiked as bond investors began to worry about a reacceleration in economic growth and, consequently, started to suspect that the Federal Reserve would not begin cutting rates as early as they expected. The rise in yields — which occurred in all but the shortest maturity lengths — eliminated the yield curve inversion (an abnormal situation in which shorter-term bonds actually pay higher yields than longer-term bonds) that had persisted for much of the last year. The six-month Treasury yield fell from 5.09% to 4.93% during the period, the 10-year yield increased from 4.70% to 5.03%, and the 30-year Treasury yield rose from 4.81% to 5.12% .
Increasing yields, with a corresponding drop in prices, generally limited bonds’ total returns for the six months ended June 29, 2007. The Lehman Brothers Aggregate Bond Index of the broad U.S. bond market posted a 0.97% total return and the Lehman Brothers Municipal Bond Index registered a total return of 0.14% . The Lehman Brothers Government/Corporate 1–3 Year Bond Index registered a 2.42% total return.
Below-investment-grade corporate bonds were stronger U.S. market performers during the period. The Lehman Brothers U.S. Corporate High Yield Bond Index registered a 2.87% total return.
Outlook
We expect economic growth to remain below average over the next few months, with inflation moderating. Gross domestic product growth should continue at around a 2% annual rate. Energy and commodities prices should moderate, and the housing market should begin to stabilize. These factors suggest consumer spending, while not robust, will be sufficient to maintain growth. We expect business spending on new plant and equipment to continue, after a number of years of below average investing in productive resources.
With policymakers concerned about the potential for higher inflation, we do not expect the Federal Reserve to ease interest rates any time soon. With uncertainty in the housing market, there is a possibility that the economy could slow more than we expect or even enter a recession.
As always, your best strategy is to work with your Thrivent Financial registered representative to create a plan based on your goals, diversify your portfolio and remain focused on the long term.
3

The Portfolio’s performance depends upon how its assets are allocated across broad asset categories and applicable sub-classes within such categories. Some broad asset categories and sub-classes may perform below expectations or below the securities markets generally over short or extended periods. In particular, underperformance in the equity markets would have material adverse effect on the Portfolio’s total return given its significant allocation to equity securities. Therefore a principal risk of investing in the Portfolio is that the allocation strategies used, and the allocation decisions made will not produce the desired results. In addition, the performance of the Portfolio is heavily dependent upon the performance of the underlying portfolios in which the Portfolio invests. As a result, the Portfolio is subject to the same risks as those faced by the underlying portfolios. Those risks include, but are not limited to, market risk, issuer risk, volatility risk, investment adviser risk, as well as credit risk and interest rate risk. These and other risks are described in the Portfolio’s prospectus.
How did the Portfolio perform during the six-month period ended June 29, 2007?
Thrivent Aggressive Allocation Portfolio returned 8.79% during the six-month period ended June 29, 2007. The Portfolio peer group, as represented by the Lipper Multi Cap Core category, reported a median return of 7.53% . The Portfolio’s market benchmarks, the S&P 500 Index and the Lehman Brothers Aggregate Bond Index, returned 6.96% and 0.98%, respectively.
What factors affected the Portfolio’s performance?
The Portfolio’s asset allocation within equities was the primary factor in superior returns versus the benchmarks, with good performance within particular Portfolio segments being an additional factor positively affecting returns. Aggressive Allocation Portfolio maintained an average exposure of greater than 90% of Portfolio assets in equity based accounts, with stocks providing a significant return premium versus bonds over the reporting period. Yields on fixed income securities had a modest upward bias since the beginning of the year, which resulted in total returns from fixed income in the low single digit area. Stocks experienced relatively stronger returns, generally in the mid- to high- single digits, following above expectations earnings’ reports from certain market segments early in the second calendar quarter. International stocks provided a better return than most U.S. stock categories and the Portfolio has a good exposure to that segment. Additionally, the Portfolio leans toward growth within the U.S. equity segments, and that group of stocks achieved better performance than core or value sectors over the period. The managed growth accounts within the Portfolio also performed better than their respective indexes, adding incremental performance.
The Portfolio has limited exposure to real estate investments trusts (REITs) due to valuation concerns; that lack of exposure benefited results during the period. Fixed income accounts are less than 10% of Portfolio assets and provide a modest reduction in Portfolio volatility as well as some stability, should equity markets come under pressure. High yield has been a modest component within the account and its returns have been better than higher-quality segments over the last few years, adding value when compared to our fixed income benchmark. We also have exposure to investment grade fixed income securities. All of these segments provided returns approximately in line with their respective sub-indexes.
What is your outlook?
As the reporting period draws to a close, we have become concerned with the back-up in the general level of interest rates, particularly in the highest-quality segments of government

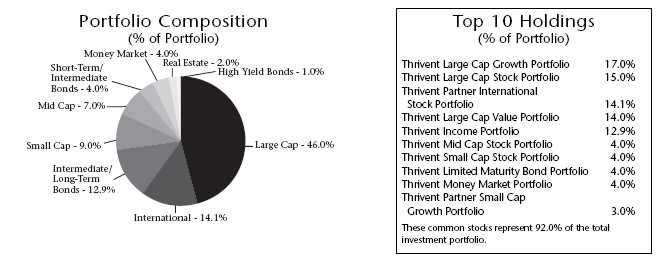
| Quoted Portfolio Composition and Top 10 Holdings are subject to change. |
| 4 |
obligations, as well as the continued narrowing of risk or yield premiums offered in lower rated fixed income securities. This is occurring in an environment that we believe carries heightened inflation risk, the deterioration of credit standings in light of an aggressive merger and acquisition market, and the continued reduction of equity shares outstanding funded by using cash on the balance sheet or the issuance of debt, neither of which is favorable for bond investors. Additionally, stocks have continued to move ahead despite the increase in interest rates, causing valuation ratings to deteriorate. Based on that, we began late in the period to upgrade the quality of our holdings in both the fixed income and equity segments of the Portfolio. We did not alter the bond/stock allocations, as it is still an even bet that the economic cycle will continue to support exposure to financial assets; however, we believe there are sufficient risks to justify a meaningful upgrade in the quality of holdings. As such, we modestly reduced exposure to the mid- and small-cap segments of the equity Portfolio and reinvested those proceeds in large-cap stocks. We maintain our bias to the growth oriented equity investment styles. In fixed income, we have reduced our exposure to high yield and reinvested those assets in higher-quality securities within fixed income categories.
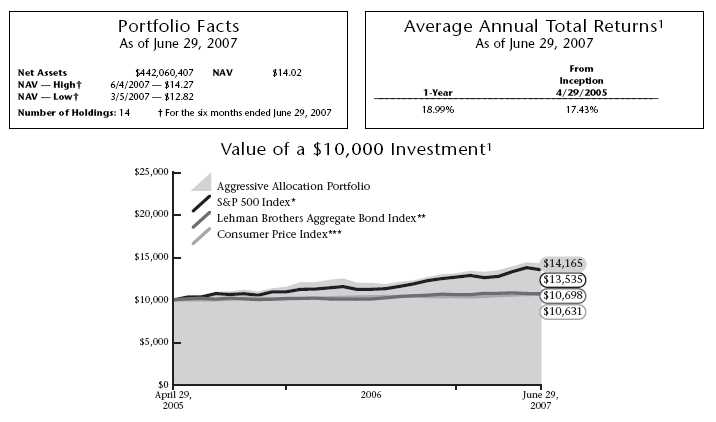
* The S&P 500 Index is an index that represents the average performance of a group of 500 large-capitalization stocks. It is not possible to invest directly in the Index. The performance of the Index does not reflect deductions for fees, expenses or taxes.
** The Lehman Brothers Aggregate Bond Index is an index that measures the performance of U.S. investment grade bonds. It is not possible to invest directly in the Index. The performance of the Index does not reflect deductions for fees, expenses or taxes.
*** The Consumer Price Index is an inflationary indicator that measures the change in the cost of a fixed basket of products and services, including housing, electricity, food and transportation. It is not possible to invest directly in the Index.
Past performance is not an indication of future results. Total investment return and principal value will fluctuate and units, when redeemed, may be worth more or less than their original cost. Current performance may be higher or lower than the performance data quoted. Market volatility can significantly affect short-term performance, and more recent returns may be different from those shown. Call 800-THRIVENT or visit www.thrivent.com for performance results current to the most recent month-end.
1 Annualized total returns represent past performance and reflect changes in share prices, the reinvestment of all dividends and capital gains, and the effects of compounding. Periods of less than one year are not annualized. At various times, the Portfolio’s adviser reimbursed and/or paid non-advisory Portfolio expenses. Had the adviser not done so, the Portfolio’s total returns would have been lower. The returns shown do not reflect charges and expenses imposed on contract holders by the variable accounts. Those charges and expenses reduce the returns received by contract holders as compared to the returns presented.
Investing in a variable product involves risks, including the possible loss of principal. The prospectus contains more complete information on the investment objectives, risks, charges and expenses of the investment company, which investors should read and consider carefully before investing. To obtain a prospectus, contact a registered representative or visit www.thrivent.com. Please read your prospectus carefully.
5

The Portfolio’s performance depends upon how its assets are allocated across broad asset categories and applicable sub-classes within such categories. Some broad asset categories and sub-classes may perform below expectations or below the securities markets generally over short or extended periods. In particular, underperformance in the equity markets would have material adverse effect on the Portfolio’s total return given its significant allocation to equity securities. Therefore a principal risk of investing in the Portfolio is that the allocation strategies used, and the allocation decisions made will not produce the desired results. In addition, the performance of the Portfolio is heavily dependent upon the performance of the underlying portfolios in which the Portfolio invests. As a result, the Portfolio is subject to the same risks as those faced by the underlying portfolios. Those risks include, but are not limited to, market risk, issuer risk, volatility risk, investment adviser risk, as well as credit risk and interest rate risk. These and other risks are described in the Portfolio’s prospectus.
How did the Portfolio perform during the six-month period ended June 29, 2007?
Thrivent Moderately Aggressive Allocation Portfolio returned 7.02% for the six-month period ended June 29, 2007. The Portfolio peer group, as represented by the Lipper Mixed Asset Target Allocation Growth category, reported a median return of 6.10% . The Portfolio’s benchmark indexes, the S&P 500 Index and the Lehman Brothers Aggregate Bond Index, returned 6.96% and 0.98%, respectively.
What factors affected the Portfolio’s performance?
The Portfolio’s asset allocation within equities was the primary factor in superior returns versus the benchmarks, with good performance within particular Portfolio segments being an additional factor positively affecting returns. The Portfolio maintained an average exposure of approximately 75% of assets in equity based accounts, and stocks provided a significant return premium versus bonds over the reporting period. Yields on fixed income securities had a modest upward bias since the beginning of the year, which resulted in total returns from fixed income in the low single digit area. Stocks experienced relatively stronger returns, generally in the mid- to high-single digits, following above expectations earnings’ reports from certain market segments early in the second calendar quarter. International stocks provided a better return than most U.S. stock catego ries, and the Portfolio has a good exposure to that segment. Additionally, the Portfolio leans toward growth within the U.S. equity segments, and that group of stocks achieved better performance than core or value sectors over the period. The managed growth accounts within the Portfolio also performed better than their respective indexes, adding incremental performance.
The Portfolio has limited exposure to real estate investments trusts (REITs) due to valuation concerns; that lack of exposure benefited results during the period. Fixed income accounts are approximately 25% of Portfolio assets and provide a reduction in Portfolio volatility as well as some stability, should equity markets come under pressure. High yield has been a component within the fixed accounts and its returns have been better than higher-quality segments over the last few years, adding value when compared to our fixed income benchmark. We also have exposure to investment grade fixed income securities. All of these segments provided returns approximately in line with their respective sub-indexes.
What is your outlook?
As the reporting period draws to a close, we have become concerned with the back-up in the general level of interest rates, particularly in the highest-quality segments of
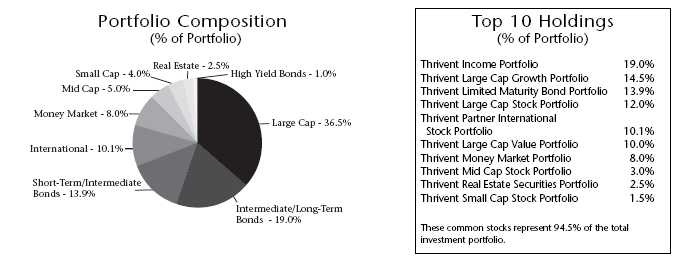
| Quoted Portfolio Composition and Top 10 Holdings are subject to change. |
| 6 |
government obligations, as well as the continued narrowing of risk or yield premiums offered in lower rated fixed income securities. This is occurring in an environment that we believe carries heightened inflation risk, the deterioration of credit standings in light of an aggressive merger and acquisition market, and the continued reduction of equity shares outstanding funded by using cash on the balance sheet or the issuance of debt, neither of which is favorable for bond investors. Additionally, stocks have continued to move ahead despite the increase in interest rates, causing valuation ratings to deteriorate. Based on that, we began late in the period to upgrade the quality of our holdings in both the fixed income and equity segments of the Portfolio. We did not alter the bond/stock allocations, as it is still an even bet that the economic cycle will continue to suppo rt exposure to financial assets; however, we believe there are sufficient risks to justify a meaningful upgrade in the quality of holdings. As such, we modestly reduced exposure to the mid- and small-cap segments of the equity Portfolio and reinvested those proceeds in large-cap stocks. We maintain our bias to the growth oriented equity investment styles. In fixed income, we have reduced our exposure to high yield and reinvested those assets in higher-quality securities within fixed income categories.

* The S&P 500 Index is an index that represents the average performance of a group of 500 large-capitalization stocks. It is not possible to invest directly in the Index. The performance of the Index does not reflect deductions for fees, expenses or taxes.
** The Lehman Brothers Aggregate Bond Index is an index that measures the performance of U.S. investment grade bonds. It is not possible to invest directly in the Index. The performance of the Index does not reflect deductions for fees, expenses or taxes.
*** The Consumer Price Index is an inflationary indicator that measures the change in the cost of a fixed basket of products and services, including housing, electricity, food and transportation. It is not possible to invest directly in the Index.
Past performance is not an indication of future results. Total investment return and principal value will fluctuate and units, when redeemed, may be worth more or less than their original cost. Current performance may be higher or lower than the performance data quoted. Market volatility can significantly affect short-term performance, and more recent returns may be different from those shown. Call 800-THRIVENT or visit www.thrivent.com for performance results current to the most recent month-end.
1 Annualized total returns represent past performance and reflect changes in share prices, the reinvestment of all dividends and capital gains, and the effects of compounding. Periods of less than one year are not annualized. At various times, the Portfolio’s adviser reimbursed and/or paid non-advisory Portfolio expenses. Had the adviser not done so, the Portfolio’s total returns would have been lower. The returns shown do not reflect charges and expenses imposed on contract holders by the variable accounts. Those charges and expenses reduce the returns received by contract holders as compared to the returns presented.
Investing in a variable product involves risks, including the possible loss of principal. The prospectus contains more complete information on the investment objectives, risks, charges and expenses of the investment company, which investors should read and consider carefully before investing. To obtain a prospectus, contact a registered representative or visit www.thrivent.com. Please read your prospectus carefully.
7

The Portfolio’s performance depends upon how its assets are allocated across broad asset categories and applicable sub-classes within such categories. Some broad asset categories and sub-classes may perform below expectations or below the securities markets generally over short or extended periods. In particular, underperformance in the equity markets would have material adverse effect on the Portfolio’s total return given its significant allocation to equity securities. Therefore a principal risk of investing in the Portfolio is that the allocation strategies used, and the allocation decisions made will not produce the desired results. In addition, the performance of the Portfolio is heavily dependent upon the performance of the underlying portfolios in which the Portfolio invests. As a result, the Portfolio is subject to the same risks as those faced by the underlying portfolios. Those risks include, but are not limited to, market risk, issuer risk, volatility risk, investment adviser risk, as well as credit risk and interest rate risk. These and other risks are described in the Portfolio’s prospectus.
How did the Portfolio perform during the six-month period ended June 29, 2007?
Thrivent Moderate Allocation Portfolio returned 5.47% for the six-month period ended June 29, 2007. The Portfolio peer group, as represented by the Lipper Mixed Asset Target Allocation Moderate category, reported a median return of 5.33% . The Portfolio’s benchmark indexes, the S&P 500 Index and the Lehman Brothers Aggregate Bond Index, returned 6.96% and 0.98%, respectively.
What factors affected the Portfolio’s performance?
The Portfolio’s asset allocation within equities was the primary factor in positive returns versus the benchmarks, with solid performance within particular Portfolio segments being an additional factor positively affecting returns. Moderate Allocation Portfolio maintained an average exposure of approximately 57% of assets in equity based accounts, and stocks provided a significant return premium versus bonds during this period. Yields on fixed income securities had a modest upward bias since the beginning of the year, resulting in total returns from fixed income in the low single digit area. Stocks experienced relatively stronger returns, generally in the mid- to high-single digits, following above expectations earnings’ reports from certain market segments early in the second calendar quarter. International stocks provided a better return than most U.S. stock categories; the Portfolio has some exposure to that segment. Additionally, the Portfolio leans toward growth within the U.S. equity segments, and that group of stocks achieved better performance than core or value sectors over the period. The managed growth accounts within the Portfolio also performed better than their respective indexes, adding incremental performance.
The Portfolio has limited exposure to real estate investments trusts (REITs) due to valuation concerns; that lack of exposure benefited results during the period. Fixed income accounts are approximately 43% of Portfolio assets and provide a reduction in Portfolio volatility as well as some stability, should equity markets come under pressure. High yield has been a component within the fixed accounts and its returns have been better than higher-quality segments over the last few years, adding value when compared to our fixed income benchmark. We also have high exposure to investment grade fixed income securities, which have provided superior returns to treasury obligations. All of these segments provided returns approximately in line with their respective sub-indexes.
What is your outlook?
As the reporting period draws to a close, we have become concerned with the back-up in the general level of interest rates, particularly in the highest-quality segments of government obligations, as well as the continued narrowing of risk or
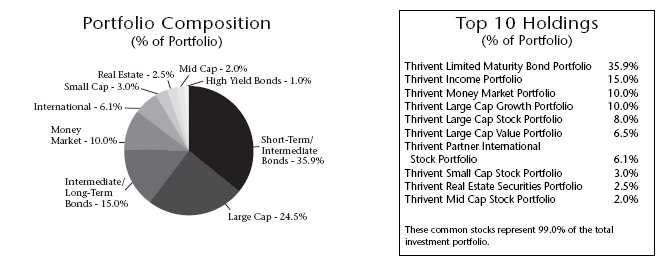
| Quoted Portfolio Composition and Top 10 Holdings are subject to change. |
| 8 |
yield premiums offered in lower-rated fixed income securities. This is occurring in an environment that we believe carries heightened inflation risk, the deterioration of credit standings in light of an aggressive merger and acquisition market, and the continued reduction of equity shares outstanding funded by using cash on the balance sheet or the issuance of debt, neither of which is favorable for bond investors. Additionally, stocks have continued to move ahead despite the increase in interest rates, causing valuation ratings to deteriorate.
Based on that, we began late in the period to upgrade the quality of our holdings in both the fixed income and equity segments of the Portfolio. We did not alter the bond/stock allocations, as it is still an even bet that the economic cycle will continue to support exposure to financial assets; however, we believe there are sufficient risks to justify a meaningful upgrade in the quality of holdings. As such, we modestly reduced exposure to the mid- and small-cap segments of the equity Portfolio and reinvested those proceeds in large-cap stocks. We maintain our bias to the growth oriented equity investment styles. In fixed income, we have reduced our exposure to high yield and reinvested those assets in higher-quality securities within fixed income categories.
* The S&P 500 Index is an index that represents the average performance of a group of 500 large-capitalization stocks. It is not possible to invest directly in the Index. The performance of the Index does not reflect deductions for fees, expenses or taxes.
** The Lehman Brothers Aggregate Bond Index is an index that measures the performance of U.S. investment grade bonds. It is not possible to invest directly in the Index. The performance of the Index does not reflect deductions for fees, expenses or taxes.
*** The Consumer Price Index is an inflationary indicator that measures the change in the cost of a fixed basket of products and services, including housing, electricity, food and transportation. It is not possible to invest directly in the Index.
Past performance is not an indication of future results. Total investment return and principal value will fluctuate and units, when redeemed, may be worth more or less than their original cost. Current performance may be higher or lower than the performance data quoted. Market volatility can significantly affect short-term performance, and more recent returns may be different from those shown. Call 800-THRIVENT or visit www.thrivent.com for performance results current to the most recent month-end.
1 Annualized total returns represent past performance and reflect changes in share prices, the reinvestment of all dividends and capital gains, and the effects of compounding. Periods of less than one year are not annualized. At various times, the Portfolio’s adviser reimbursed and/or paid non-advisory Portfolio expenses. Had the adviser not done so, the Portfolio’s total returns would have been lower. The returns shown do not reflect charges and expenses imposed on contract holders by the variable accounts. Those charges and expenses reduce the returns received by contract holders as compared to the returns presented.
Investing in a variable product involves risks, including the possible loss of principal. The prospectus contains more complete information on the investment objectives, risks, charges and expenses of the investment company, which investors should read and consider carefully before investing. To obtain a prospectus, contact a registered representative or visit www.thrivent.com. Please read your prospectus carefully.
9

The Portfolio’s performance depends upon how its assets are allocated across broad asset categories and applicable sub-classes within such categories. Some broad asset categories and sub-classes may perform below expectations or below the securities markets generally over short or extended periods. In particular, underperformance in the equity markets would have material adverse effect on the Portfolio’s total return given its significant allocation to equity securities. Therefore a principal risk of investing in the Portfolio is that the allocation strategies used, and the allocation decisions made will not produce the desired results. In addition, the performance of the Portfolio is heavily dependent upon the performance of the underlying portfolios in which the Portfolio invests. As a result, the Portfolio is subject to the same risks as those faced by the underlying portfolios. Those risks include, but are not limited to, market risk, issuer risk, volatility risk, investment adviser risk, as well as credit risk and interest rate risk. These and other risks are described in the Portfolio’s prospectus.
How did the Portfolio perform during the six-month period ended June 29, 2007?
Thrivent Moderately Conservative Allocation Portfolio returned 4.10% for the six-month period ended June 29, 2007. The Portfolio peer group, as represented by the Lipper Mixed Asset Target Allocation Conservative category, reported a median return of 3.48% . The Portfolio’s benchmark indexes, the S&P 500 Index and the Lehman Brothers Aggregate Bond Index, returned 6.96% and 0.98%, respectively.
What factors affected the Portfolio’s performance?
The Portfolio’s asset allocation within equities was the primary factor in good returns versus the benchmarks, with solid performance within particular Portfolio segments also positively affecting returns. Moderately Conservative Allocation Portfolio maintained an average exposure of approximately 38% of Portfolio assets in equity based accounts and stocks provided a significant return premium versus bonds over the reporting period. Yields on fixed income securities had a modest upward bias since the beginning of the year, which resulted in total returns from fixed income in the low single digit area. Stocks experienced relatively stronger returns, generally in the mid- to high-single digits, following above expectations earnings’ reports from certain market segments early in the second calendar quarter. International stocks provided a better return than most U. S. stock categories and the Portfolio has some exposure to that segment. Additionally, the Portfolio leans toward growth within the U.S. equity segments, and that group of stocks achieved better performance than core or value sectors over the period. The managed growth accounts within the Portfolio also performed better than their respective indexes, adding incremental performance.
The Portfolio has limited exposure to real estate investments trusts (REITs) due to valuation concerns; that lack of exposure benefited results during the period. Fixed income accounts are approximately 62% of Portfolio assets and provide a reduction in Portfolio volatility as well as some stability, should equity markets come under pressure. High yield has been a component within the fixed accounts and its returns have been better than higher-quality segments over the last few years, adding value when compared to our fixed income benchmark. We also have high exposure to investment grade fixed income securities, which have provided superior returns to treasury obligations. All of these segments provided returns approximately in line with their respective sub-indexes.
What is your outlook?
As the reporting period draws to a close, we have become concerned with the back-up in the general level of interest rates, particularly in the highest-quality segments of government
| Quoted Portfolio Composition and Top 10 Holdings are subject to change. |
| 10 |
obligations, as well as the continued narrowing of risk or yield premiums offered in lower-rated fixed income securities. This is occurring in an environment that we believe carries heightened inflation risk, the deterioration of credit standings in light of an aggressive merger and acquisition market, and the continued reduction of equity shares outstanding funded by using cash on the balance sheet or the issuance of debt, neither of which is favorable for bond investors. Additionally, stocks have continued to move ahead despite the increase in interest rates, causing valuation ratings to deteriorate.
Based on that, we began late in the period to upgrade the quality of our holdings in both the fixed income and equity segments of the Portfolio. We did not alter the bond/stock allocations, as it is still an even bet that the economic cycle will continue to support exposure to financial assets; however, we believe there are sufficient risks to justify a meaningful upgrade in the quality of holdings. As such, we modestly reduced exposure to the mid- and small-cap segments of the equity Portfolio and reinvested those proceeds in large-cap stocks. We maintain our bias to the growth oriented equity investment styles. In fixed income, we have reduced our exposure to high yield and reinvested those assets in higher-quality securities within fixed income categories.

* The S&P 500 Index is an index that represents the average performance of a group of 500 large-capitalization stocks. It is not possible to invest directly in the Index. The performance of the Index does not reflect deductions for fees, expenses or taxes.
** The Lehman Brothers Aggregate Bond Index is an index that measures the performance of U.S. investment grade bonds. It is not possible to invest directly in the Index. The performance of the Index does not reflect deductions for fees, expenses or taxes.
*** The Consumer Price Index is an inflationary indicator that measures the change in the cost of a fixed basket of products and services, including housing, electricity, food and transportation. It is not possible to invest directly in the Index.
Past performance is not an indication of future results. Total investment return and principal value will fluctuate and units, when redeemed, may be worth more or less than their original cost. Current performance may be higher or lower than the performance data quoted. Market volatility can significantly affect short-term performance, and more recent returns may be different from those shown. Call 800-THRIVENT or visit www.thrivent.com for performance results current to the most recent month-end.
1 Annualized total returns represent past performance and reflect changes in share prices, the reinvestment of all dividends and capital gains, and the effects of compounding. Periods of less than one year are not annualized. At various times, the Portfolio’s adviser reimbursed and/or paid non-advisory Portfolio expenses. Had the adviser not done so, the Portfolio’s total returns would have been lower. The returns shown do not reflect charges and expenses imposed on contract holders by the variable accounts. Those charges and expenses reduce the returns received by contract holders as compared to the returns presented.
Investing in a variable product involves risks, including the possible loss of principal. The prospectus contains more complete information on the investment objectives, risks, charges and expenses of the investment company, which investors should read and consider carefully before investing. To obtain a prospectus, contact a registered representative or visit www.thrivent.com. Please read your prospectus carefully.
11

How did the Portfolio perform during the six-month period ended June 29, 2007?
Thrivent Technology Portfolio returned 10.15% during the six-month period ended June 29, 2007. The Portfolio’s peer group, as represented by the Lipper Science & Technology category, reported a median return of 7.49% . The Portfolio’s market benchmark, the Goldman Sachs Technology Industry Composite, now known as CBOE GSTI Composite Index returned 9.25% .
What factors affected the Portfolio’s performance?
Encouragingly, the Portfolio has outperformed its public benchmark and peer group since the start of 2007 as a result of a significant repositioning in application software, technology services and hardware. In software, where we focused on niche application and middleware providers, strong gains in Hyperion and Nuance outweighed underperforming positions BEA Systems, Adobe Systems and TIBCO, and complemented our avoidance of underperformers Microsoft and Symantec. In Internet software and services we emphasized names with exposure to digital marketing like aQuantive, which was an especially strong performance contributor, along with VeriSign.
Technology hardware was a negative influence on total period performance due to security selection within semiconductors, but a significant overweighting in Apple and our meaningful exposure to strong-performing storage plays EMC Corp. and Emulex minimized its impact. Other negative contributors to performance included an underweighted position in the Internet retail sector and an overweighted position in the lagging biotechnology arena of the heath care sector.
What is your outlook?
Solid, though not spectacular, domestic capital spending sustains our optimism regarding technology expenditure growth at the enterprise level of 5% or more, with even stronger trends within the networking and video communications industries. Stronger international markets and a weak dollar provide additional reasons for optimism in a sector with disproportionate exposure to foreign demand.
We remain enthusiastic about dominant consumer and advertising names like Apple, Google and Yahoo!; storage companies; networking/bandwidth suppliers; and service-oriented architecture companies. Regulatory concerns and pipeline issues have created opportunities within the drug, biotechnology and medical device sectors, and we maintain above-benchmark exposure in these areas.

Quoted Major Market Sectors, Portfolio Composition and Top 10 Holdings are subject to change.
The lists of Major Market Sectors and Top 10 Holdings exclude short-term investments and collateral held for securities loaned.
The Portfolio Composition chart excludes collateral held for securities loaned.
12
Companies continue to enjoy unprecedented levels of cash and liquidity, and have the ability and motivation to upgrade their technology infrastructure in a global environment in which productivity gains are crucial to competitiveness. Manifestation of this trend should have a positive impact on the Portfolio.
We believe interest rate fears will abate as moderate economic growth persists in the second half of 2007, putting a greater premium on the growth profile of technology-focused sectors and allowing multiples to expand, especially for larger-cap names where operating and return metrics have caught up with their small- and mid-cap brethren, even if their valuations haven’t.

* The Consumer Price Index is an inflationary indicator that measures the change in the cost of a fixed basket of products and services, including housing, electricity, food and transportation. It is not possible to invest directly in the Index.
** The CBOE GSTI Composite Index is a modified capitalization-weighted index of selected technology stocks. It is not possible to invest directly in the Index. The performance of the Index does not reflect deductions for fees, expenses or taxes.
Past performance is not an indication of future results. Total investment return and principal value will fluctuate and units, when redeemed, may be worth more or less than their original cost. Current performance may be higher or lower than the performance data quoted. Market volatility can significantly affect short-term performance, and more recent returns may be different from those shown. Call 800-THRIVENT or visit www.thrivent.com for performance results current to the most recent month-end.
1 Annualized total returns represent past performance and reflect changes in share prices, the reinvestment of all dividends and capital gains, and the effects of compounding. At various times, the Portfolio’s adviser reimbursed and/or paid non-advisory Portfolio expenses. Had the adviser not done so, the Portfolio’s total returns would have been lower. The returns shown do not reflect charges and expenses imposed on contract holders by the variable accounts. Those charges and expenses reduce the returns received by contract holders as compared to the returns presented.
Investing in a variable product involves risks, including the possible loss of principal. The prospectus contains more complete information on the investment objectives, risks, charges and expenses of the investment company, which investors should read and consider carefully before investing. To obtain a prospectus, contact a registered representative or visit www.thrivent.com. Please read your prospectus carefully.
13

How did the Portfolio perform during the six-month period ended June 29, 2007?
Thrivent Partner Small Cap Growth Portfolio returned 9.59% during the six-month period ended June 29, 2007. The Portfolio’s peer group, as represented by the Lipper Small Cap Growth category, reported a median return of 10.94% . The Portfolio’s market benchmark, the Russell 2000® Growth Index, returned 9.33% .
What factors affected the Portfolio’s performance?
Returns for the period were in line with the good level of absolute returns realized by the benchmark Index. Areas of strong returns in the Portfolio were counterbalanced by segments that exhibited more mixed results. In total, the Portfolio realized a rewarding absolute return but achieved little incremental value versus the benchmark Index. Financials, energy and health care were segments of the Portfolio that achieved better than market results. In the financial segment, strong stock selection in the real estate investment trust (REIT) industry was led by our position in Highland Hospitality Corp. International Securities Exchange Holdings Inc. also performed well in the diversified financial services group, as did other select positions with an exposure to the continued strength in the fin ancial markets. We did not have significant holdings in those companies with exposure to ongoing deterioration in the sub-prime lending industry. Holdings in the energy equipment and services industries performed well, given the renewed strength in energy prices and continued expansion of capital spending focused on finding new sources of energy. Health care stocks underperformed the broader market. Our modest underweighting in the group, as well as our stock selection, aided the Portfolio’s overall results. Our holdings in the pharmaceutical industry lifted our results as stocks like K-V Pharmaceuticals performed well in the period.
The consumer discretionary segment of the Portfolio detracted from returns as our holding in Shuffle Master Inc. performed poorly in the period. Under Armor Inc. in the apparel group also did not perform up to expectations and was a drag on Portfolio performance. Arbitron Inc. in the media group performed well but was not of sufficient size to offset the returns in the more poorly performing segments. Our holdings in information technology stocks performed well during the period, with both the sec tor and our holdings outperforming the benchmark Index. We also held a modest amount of cash in the period for liquidity and transaction purposes and with the strong advance in the benchmark Index, there was a modest reduction in return due to those holdings.
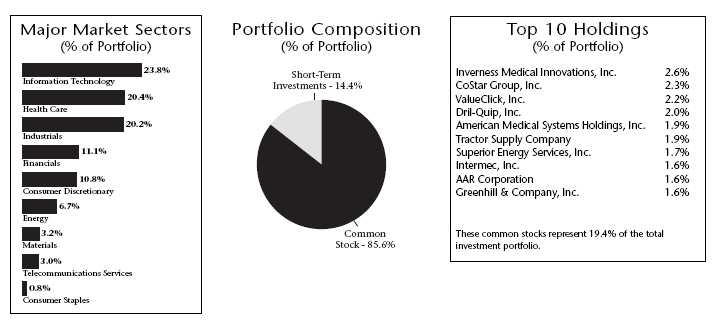
Quoted Major Market Sectors, Portfolio Composition and Top 10 Holdings are subject to change.
The lists of Major Market Sectors and Top 10 Holdings exclude short-term investments and collateral held for securities loaned.
The Portfolio Composition chart excludes collateral held for securities loaned.
14
What is your outlook?
We continue to anticipate that 2007 will prove a year in which price/earnings ratios expand — a circumstance that typically bodes well for growth stocks. We think any multiple expansion (which would be the first since 2003) could help offset the decelerating rate of corporate earnings growth. Although we think the stock market should be higher at the end of the year than it is now, a number of risks could confound that outlook: consumer spending, which accounts for about 70% of the gross domestic product, is softening; petroleum prices threaten to spike sharply higher; and a large loss in the suddenly unsteady Chinese stock market could have an adverse impact on the U.S. market. But we don’t assign a high probability to any of those risks. We expect the economy to move into the second half of the cycle, where solid but more moderate expansion will increasingly f avor secularly driven growth stocks.
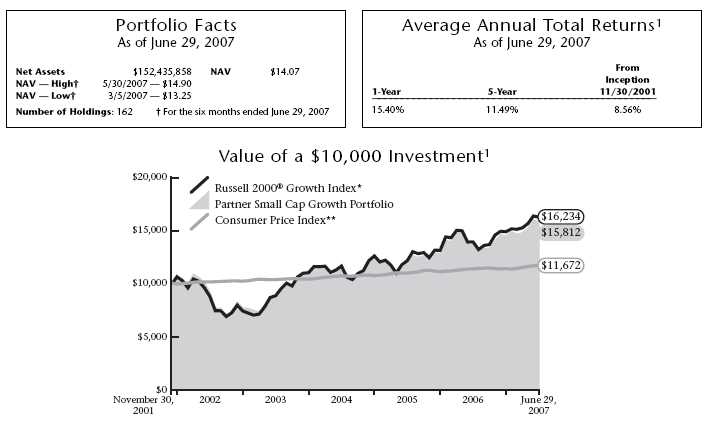
* The Russell 2000® Growth Index is an unmanaged index comprised of companies with a greater than average growth orientation within the Russell 2000® Index. The Russell 2000® Index is comprised of the 2,000 smaller companies in the Russell 3000® Index, which represents the 3,000 largest companies based on market capitalization and is designed to represent the performance of about 98% of the U.S. equity market. It is not possible to invest directly in the Index. The performance of the Index does not reflect deductions for fees, expenses or taxes.
** The Consumer Price Index is an inflationary indicator that measures the change in the cost of a fixed basket of products and services, including housing, electricity, food and transportation. It is not possible to invest directly in the Index.
Past performance is not an indication of future results. Total investment return and principal value will fluctuate and units, when redeemed, may be worth more or less than their original cost. Current performance may be higher or lower than the performance data quoted. Market volatility can significantly affect short-term performance, and more recent returns may be different from those shown. Call 800-THRIVENT or visit www.thrivent.com for performance results current to the most recent month-end.
1 Annualized total returns represent past performance and reflect changes in share prices, the reinvestment of all dividends and capital gains, and the effects of compounding. At various times, the Portfolio’s adviser reimbursed and/or paid non-advisory Portfolio expenses. Had the adviser not done so, the Portfolio’s total returns would have been lower. The returns shown do not reflect charges and expenses imposed on contract holders by the variable accounts. Those charges and expenses reduce the returns received by contract holders as compared to the returns presented.
Investing in a variable product involves risks, including the possible loss of principal. The prospectus contains more complete information on the investment objectives, risks, charges and expenses of the investment company, which investors should read and consider carefully before investing. To obtain a prospectus, contact a registered representative or visit www.thrivent.com. Please read your prospectus carefully.
15

The Portfolio is exposed to the risks of investing in equity securities of smaller companies, which may include, but are not limited to, lower trading volume and less liquidity than larger, more established companies. Small company stock prices are generally more volatile than large company stock prices. These and other risks are described in the Portfolio’s prospectus.
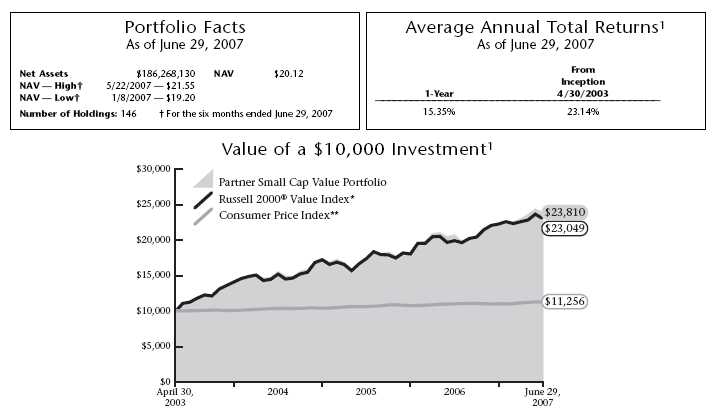
How did the Portfolio perform during the six-month period ended June 29, 2007?
Thrivent Partner Small Cap Value Portfolio returned 7.98% during the six-month period ended June 29, 2007. The Portfolio’s peer group, as represented by the Lipper Small Cap Value category, reported a median return of 6.86% . The Portfolio’s market benchmark, the Russell 2000® Value Index, returned 3.80% .
What factors affected the Portfolio’s performance?
The financials sector was the dominant contributor to our above-market return, followed by energy and consumer staples. The main detractors were consumer discretionary and health care. In the financials sector, the Portfolio benefited from being underweighted in commercial banks and real estate investment trusts (REITs). REIT stocks declined on valuation concerns, as this was one of the worst performing industries in the sector. Although in general the flat yield curve has put pressure on commercial banks, the Portfolio’s selection of companies did relatively well, aided by merger and acquisition activity. First Republic Bank, a commercial bank that focuses on high net worth individuals and their businesses, agreed to be acquired at a premium by Merrill Lynch. In addition, Ohio Casualty, a property and casualty insurer, agreed to be acquired by Liberty Mutual. Bristol West Holdings, an auto insurer, was purchased by Farmers Insurance Group.
An overweighted position in energy, one of the strongest performing sectors of the Index, contributed to results, as did stock selection, which included companies like Todco, W-H Energy Services and Atwood Oceanics.
Two food retailers — Nash Finch and Winn-Dixie — drove results in the consumer staples sector. The Portfolio is underweighted in this sector due to concerns over consumer spending as high energy costs, rising interest rates and the housing slowdown squeeze disposable income. Decreasing disposable income and housing market weakness impeded results in the consumer discretionary sector. Companies affected by these factors included Rare Hospitality International, an operator of chain restaurants, Building Material Holding, a manufacturer of pre-fabricated housing components, and M/I Homes, a builder of single-family homes.
The health care sector detracted primarily due to negative results in the life sciences tools and services industry and relatively weak performance in the health care equipment and supplies industry. The Portfolio’s position in the biotechnology industry is being increased given improving valuations and attractive long-term growth prospects.

Quoted Major Market Sectors, Portfolio Composition and Top 10 Holdings are subject to change.
The lists of Major Market Sectors and Top 10 Holdings exclude short-term investments and collateral held for securities loaned.
The Portfolio Composition chart excludes collateral held for securities loaned.
16
What is your outlook?
A slowing economy should favor the stocks of larger growth companies, as they are not as reliant on good economic growth as more cyclical companies. Overall, stocks appear attractive relative to bonds, barring any unexpected increase in interest rates. Within the small-cap universe, energy, materials, and industrials and business services stocks are expected to continue to benefit from the growing global economy. Valuations within the financials sector should decrease given the sector’s weakness in the United States. This should provide opportunities to invest in companies that appear well-positioned to weather the storm.
* The Russell 2000® Value Index is an index comprised of companies with a greater than average value orientation within the Russell 2000® Index. It is not possible to invest directly in the Index. The performance of the Index does not reflect deductions for fees, expenses or taxes.
** The Consumer Price Index is an inflationary indicator that measures the change in the cost of a fixed basket of products and services, including housing, electricity, food and transportation. It is not possible to invest directly in the Index.
Past performance is not an indication of future results. Total investment return and principal value will fluctuate and units, when redeemed, may be worth more or less than their original cost. Current performance may be higher or lower than the performance data quoted. Market volatility can significantly affect short-term performance, and more recent returns may be different from those shown. Call 800-THRIVENT or visit www.thrivent.com for performance results current to the most recent month-end.
1 Annualized total returns represent past performance and reflect changes in share prices, the reinvestment of all dividends and capital gains, and the effects of compounding. At various times, the Portfolio’s adviser reimbursed and/or paid non-advisory Portfolio expenses. Had the adviser not done so, the Portfolio’s total returns would have been lower. The returns shown do not reflect charges and expenses imposed on contract holders by the variable accounts. Those charges and expenses reduce the returns received by contract holders as compared to the returns presented.
Investing in a variable product involves risks, including the possible loss of principal. The prospectus contains more complete information on the investment objectives, risks, charges and expenses of the investment company, which investors should read and consider carefully before investing. To obtain a prospectus, contact a registered representative or visit www.thrivent.com. Please read your prospectus carefully.
17

How did the Portfolio perform during the six-month period ending June 29, 2007?
Thrivent Small Cap Stock Portfolio returned 8.47% during the six-month period ended June 29, 2007. The Portfolio’s peer group, as represented by the Lipper Small Cap Core category, reported a median return of 8.22% . The Portfolio’s market benchmark, the Russell 2000® Index, returned 6.45% .
What factors affected the Portfolio’s performance?
The greatest impact on Portfolio performance during the period on both an absolute and relative basis was the underweighted position of the financials sector. Given our concerns regarding the mortgage and housing markets, along with credit quality and interest rate concerns, the Portfolio has been very discriminate in holding financials stocks. During the period, elevated defaults within the sub-prime mortgage market caused the majority of stocks within the financials sector to perform poorly. While the financials stocks within the Russell 2000® Index had a negative return of almost 5%, the financials stocks within the Portfolio had a negative return of less than 1%. The Portfolio’s best performing stocks within this sector were Portfolio Recovery Associates Inc., a receivables collection company, and Affiliated Managers Group Inc., an asset management company. Performance was limited within the financials sector by our modest holdings in the banking industry, as almost all banking stocks had negative returns during the period.
Outside of financials, individual stock selection had a significantly positive impact on performance during the period. In particular, we had solid performance in the energy and industrials sectors. Within the energy sector, several stocks in the oil and gas equipment and services industry had large gains, including Global Industries, Inc., while Tesco Corp. and Dresser-Rand Group Inc. each appreciated considerably during the period. Given ou r positive economic outlook, we continued to maintain an overweighted position in the industrials sector, which paid handsome dividends. Within that sector, our investment in marine (barge) companies showed solid performance due to strong global demand, with Ultrapetrol appreciating significantly. Other strong performers include Huron Consulting Group Inc., a provider of financial and operating consulting services, and Baldor Electric Co., a manufacturer of electrical equipment.
Strong corporate earnings and ample market liquidity provided an ideal environment for merger and acquisition activity. The Portfolio participated in many deals announced during the period; more than a dozen of our holdings were targeted. In the health care sector, two diagnostic companies, Cytyc Corp. and Ventana Medical Systems, Inc., were targets of corporate takeovers and appreciated considerably; three of our health care services holdings were taken private through buyouts. The technology sector was also fertile ground for deal-making, with two software holdings, Hyperio n Solutions and Kronos Inc., appreciating due to takeover offers.
What is your outlook?
Superior stock selection will continue to be the major driver of Portfolio performance going forward. Given the very strong returns of the small-cap market over the past several years, and especially over the past 12 months, valuations have become compressed, with limited differentiation between growth

Quoted Major Market Sectors, Portfolio Composition and Top 10 Holdings are subject to change.
The lists of Major Market Sectors and Top 10 Holdings exclude short-term investments and collateral held for securities loaned.
The Portfolio Composition chart excludes collateral held for securities loaned.
18
stocks and value stocks or between high-quality stocks and low-quality stocks. We believe in this environment continued focus on attractively valued quality companies with a distinct competitive advantage or defensible niche will provide the best opportunity for success.
We remain diligent in monitoring the impact a deteriorating mortgage market and tighter credit standards will have on consumer spending. We are still concerned about how these factors will impact the financials sector and believe there is more downside ahead. Thus, the Portfolio will continue to hold minimal positions in this sector.
Industrials stocks remain attractive as corporations continue to invest in plant and equipment, while strong global economic growth drives demand for infrastructure projects worldwide. The Portfolio remains overweighted in health care due to improving fundamentals, attractive valuations and the strong competitive advantages many companies possess. Information technology also continues to be an attractive area for investment as companies increasingly use technology to gain efficiencies, while the strong growth in Internet use is fueling demand for infrastructure and capital equipment spending.
* The Russell 2000® Index is an index comprised of the 2,000 smaller companies in the Russell 3000® Index. It is not possible to invest directly in the Index. The performance of the Index does not reflect deductions for fees, expenses or taxes.
** The Consumer Price Index is an inflationary indicator that measures the change in the cost of a fixed basket of products and services, including housing, electricity, food and transportation. It is not possible to invest directly in the Index.
Past performance is not an indication of future results. Total investment return and principal value will fluctuate and units, when redeemed, may be worth more or less than their original cost. Current performance may be higher or lower than the performance data quoted. Market volatility can significantly affect short-term performance, and more recent returns may be different from those shown. Call 800-THRIVENT or visit www.thrivent.com for performance results current to the most recent month-end.
1 Annualized total returns represent past performance and reflect changes in share prices, the reinvestment of all dividends and capital gains, and the effects of compounding. At various times, the Portfolio’s adviser reimbursed and/or paid non-advisory Portfolio expenses. Had the adviser not done so, the Portfolio’s total returns would have been lower. The returns shown do not reflect charges and expenses imposed on contract holders by the variable accounts. Those charges and expenses reduce the returns received by contract holders as compared to the returns presented.
Investing in a variable product involves risks, including the possible loss of principal. The prospectus contains more complete information on the investment objectives, risks, charges and expenses of the investment company, which investors should read and consider carefully before investing. To obtain a prospectus, contact a registered representative or visit www.thrivent.com. Please read your prospectus carefully.
19
How did the Portfolio perform during the six-month period ended June 29, 2007?
Thrivent Small Cap Index Portfolio returned 8.35% during the six-month period ended June 29, 2007. The Portfolio’s peer group, as represented by the Lipper Small Cap Core category, reported a median return of 8.22% . The Portfolio’s market benchmark, the S&P SmallCap 600 Index, returned 8.56% .
What factors affected the Portfolio’s performance?
The Portfolio is managed to virtually replicate the performance of the S&P SmallCap 600 Index. We seek to maintain a fully invested position with limited transactions to minimize costs. As typically occurs with an index fund, the difference in performance between the benchmark index and the fund itself can be largely attributed to expenses and minor differences in Portfolio composition.
Three sectors drove the Portfolio’s performance, led by materials stocks, benefiting from a continued spike in steel and other commodities. Industrial companies also enjoyed solid growth. Energy companies performed well, in particular those energy companies involved in offshore drilling. By contrast, stocks of companies that are affected by rising interest rates struggled. Utilities and financial stocks also were out of favor in the first half of 2007, with financials posting the lone negative return among small-cap sectors.
What is your outlook?
The Portfolio will be fully invested to track the performance of the S&P SmallCap 600 Index. This offers individuals an attractive way to take advantage of the growth potential of the broad, diversified marketplace of small-cap stocks.

Quoted Major Market Sectors, Portfolio Composition and Top 10 Holdings are subject to change.
The lists of Major Market Sectors and Top 10 Holdings exclude short-term investments and collateral held for securities loaned.
The Portfolio Composition chart excludes collateral held for securities loaned.
20
With uncertainty growing over the strength of the U.S. economy and an ongoing inflation threat, investors backed away from riskier segments of the equity markets. Small-cap stocks outperformed large-cap stocks, but underperformed relative to mid-cap issues. Whether this marks a period of rotation in the markets and a shift to more blue chip names remains to be seen. Typically, the longer an economic cycle continues, the more investors tend to favor large-cap stocks in the equity marketplace. We still believe there is solid opportunity in the small-cap arena, but the premium return for small stocks is likely to be limited in the future as the cycle continues to mature.
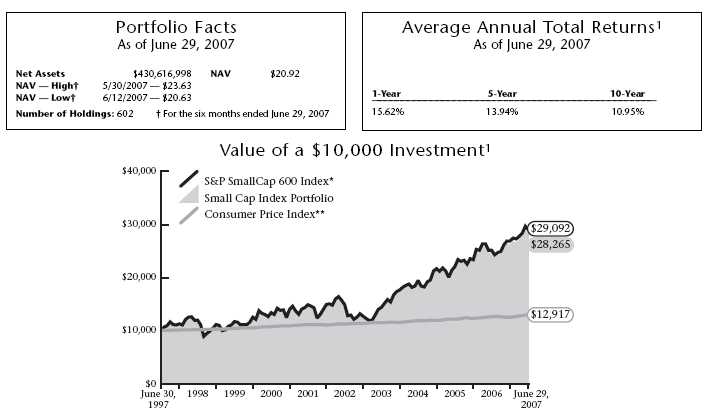
* The S&P SmallCap 600 Index is an unmanaged index that represents the average performance of a group of 600 small capitalization stocks. “S&P SmallCap 600 Index” is a trademark of The McGraw-Hill Companies, Inc. and has been licensed for use by Thrivent Financial for Lutherans. The product is not sponsored, endorsed or promoted by Standard & Poor’s, and Standard & Poor’s makes no representation regarding the advisability of investing in the product. It is not possible to invest directly in the Index. Index funds are subject to the same market risks associated with the stocks in their respective indexes. The performance of the Index does not reflect deductions for fees, expenses or taxes.
** The Consumer Price Index is an inflationary indicator that measures the change in the cost of a fixed basket of products and services, including housing, electricity, food and transportation. It is not possible to invest directly in the Index.
Past performance is not an indication of future results. Total investment return and principal value will fluctuate and units, when redeemed, may be worth more or less than their original cost. Current performance may be higher or lower than the performance data quoted. Market volatility can significantly affect short-term performance, and more recent returns may be different from those shown. Call 800-THRIVENT or visit www.thrivent.com for performance results current to the most recent month-end.
1 Annualized total returns represent past performance and reflect changes in share prices, the reinvestment of all dividends and capital gains, and the effects of compounding. At various times, the Portfolio’s adviser reimbursed and/or paid non-advisory Portfolio expenses. Had the adviser not done so, the Portfolio’s total returns would have been lower. The returns shown do not reflect charges and expenses imposed on contract holders by the variable accounts. Those charges and expenses reduce the returns received by contract holders as compared to the returns presented.
Investing in a variable product involves risks, including the possible loss of principal. The prospectus contains more complete information on the investment objectives, risks, charges and expenses of the investment company, which investors should read and consider carefully before investing. To obtain a prospectus, contact a registered representative or visit www.thrivent.com. Please read your prospectus carefully.
21

How did the Portfolio perform during the six-month period ended June 29, 2007?
Thrivent Mid Cap Growth Portfolio returned 14.65% during the six-month period ended June 29, 2007. The Portfolio’s peer group, as represented by the Lipper Mid Cap Growth category, reported a median return of 12.32% . The Portfolio’s market benchmark, the Russell Midcap® Growth Index, returned 10.97%.
What factors affected the Portfolio’s performance?
The Portfolio outperformed its benchmark by a healthy margin. Stock selection was strong across many sectors, including technology, industrials, financials and the consumer area.
In the technology sector, a large contributor to performance was our holding in Aquantive Inc., which was purchased by Microsoft for a substantial premium. In the industrial segment, Foster Wheeler Ltd., a maker of manufacturing and engineering equipment, contributed significantly to performance. The Portfolio also benefited from price appreciation in the education services stocks that have seen an improvement in their fundamentals over the course of the past year.
The largest factor mitigating the Portfolio’s performance during the period was its underweighted position in the energy sector, which was particularly strong in the first six months of 2007. In addition, not owning Amazon.com and Medimmune Inc., which both performed strongly, detracted from performance.
What is your outlook?
We believe the fallout from the deterioration in the residential housing market has yet to be fully discounted in many sectors. We believe the oversupply of housing inventory will continue to depress prices for U.S. homes throughout 2007. This will ultimately affect consumer spending and thus the economy. We have already begun to see signs that credit is tightening, which is also a precursor to slower consumer spending. This slowdown will be a drag on economic growth for the balance of 2007 and possibly into 2008.
As such, we remain overweighted in growth names in the technology, telecommunication services and health care sectors that have specific demand drivers or product cycles that will be less affected by a potential slowdown in the economy. We are

Quoted Major Market Sectors, Portfolio Composition and Top 10 Holdings are subject to change.
The lists of Major Market Sectors and Top 10 Holdings exclude short-term investments and collateral held for securities loaned.
The Portfolio Composition chart excludes collateral held for securities loaned.
22
also emphasizing companies that sell at valuations that provide downside cushion should the economy continue to weaken. We continue to favor companies that will benefit from the increase in Internet traffic and the resulting build-out of infrastructure that must take place to service that traffic. Health care also remains a target area for us. We are focusing on stocks that have either defensive characteristics or specific product cycles that will withstand a slowdown in the economy.
We are not as exposed to those segments of the market that are more cyclical in nature, with particular caution towards companies in or related to the home building and industrial equipment sectors. We continue to maintain an underweighted exposure to the consumer discretionary area as we see several headwinds affecting these stocks over the course of the summer and into the latter half of 2007.

* The Russell Midcap® Growth Index is an index comprised of companies with higher than average price-to-book ratios and higher forecasted growth values within the Russell Midcap® Index. It is not possible to invest directly in the Index. The performance of the Index does not reflect deductions for fees, expenses or taxes.
** The Consumer Price Index is an inflationary indicator that measures the change in the cost of a fixed basket of products and services, including housing, electricity, food and transportation. It is not possible to invest directly in the Index.
Past performance is not an indication of future results. Total investment return and principal value will fluctuate and units, when redeemed, may be worth more or less than their original cost. Current performance may be higher or lower than the performance data quoted. Market volatility can significantly affect short-term performance, and more recent returns may be different from those shown. Call 800-THRIVENT or visit www.thrivent.com for performance results current to the most recent month-end.
1 Annualized total returns represent past performance and reflect changes in share prices, the reinvestment of all dividends and capital gains, and the effects of compounding. At various times, the Portfolio’s adviser reimbursed and/or paid non-advisory Portfolio expenses. Had the adviser not done so, the Portfolio’s total returns would have been lower. The returns shown do not reflect charges and expenses imposed on contract holders by the variable accounts. Those charges and expenses reduce the returns received by contract holders as compared to the returns presented.
Investing in a variable product involves risks, including the possible loss of principal. The prospectus contains more complete information on the investment objectives, risks, charges and expenses of the investment company, which investors should read and consider carefully before investing. To obtain a prospectus, contact a registered representative or visit www.thrivent.com. Please read your prospectus carefully.
23

How did the Portfolio perform during the six-month period ended June 29, 2007?
Thrivent Mid Cap Growth Portfolio II returned 14.66% during the six-month period ended June 29, 2007. The Portfolio’s peer group, as represented by the Lipper Mid Cap Growth category, reported a median return of 12.32% . The Portfolio’s market benchmark, the Russell Midcap® Growth Index, returned 10.97% .
What factors affected the Portfolio’s performance?
The Portfolio outperformed its benchmark by a healthy margin. Stock selection was strong across many sectors, including technology, industrials, financials and the consumer area.
In the technology sector, a large contributor to performance was our holding in Aquantive Inc., which was purchased by Microsoft for a substantial premium. In the industrial segment, Foster Wheeler Ltd., a maker of manufacturing and engineering equipment, contributed significantly to performance. The Portfolio also benefited from price appreciation in the education services stocks that have seen an improvement in their fundamentals over the course of the past year.
The largest factor mitigating the Portfolio’s performance during the period was its underweighted position in the energy sector, which was particularly strong in the first six months of 2007. In addition, not owning Amazon.com and Medimmune Inc., which both performed strongly, detracted from performance.
What is your outlook?
We believe the fallout from the deterioration in the residential housing market has yet to be fully discounted in many sectors. We believe the over supply of housing inventory will continue to depress prices for U.S. homes throughout 2007. This will ultimately affect consumer spending and thus the economy. We have already begun to see signs that credit is tightening, which is also a precursor to slower consumer spending. This slowdown will be a drag on economic growth for the balance of 2007 and possibly into 2008.
As such, we remain overweighted in growth names in the technology, telecommunication services and health care sectors that have specific demand drivers or product cycles that will be less affected by a potential slowdown in the economy. We are

Quoted Major Market Sectors, Portfolio Composition and Top 10 Holdings are subject to change.
The lists of Major Market Sectors and Top 10 Holdings exclude short-term investments and collateral held for securities loaned.
The Portfolio Composition chart excludes collateral held for securities loaned.
24
also emphasizing companies that sell at valuations that provide downside cushion should the economy continue to weaken. We continue to favor companies that will benefit from the increase in Internet traffic and the resulting build-out of infrastructure that must take place to service that traffic. Health care also remains a target area for us. We are focusing on stocks that have either defensive characteristics or specific product cycles that will withstand a slowdown in the economy.
We are not as exposed to those segments of the market that are more cyclical in nature, with particular caution towards companies in or related to the home building and industrial equipment sectors. We continue to maintain an underweighted exposure to the consumer discretionary area as we see several headwinds affecting these stocks over the course of the summer and into the latter half of 2007.
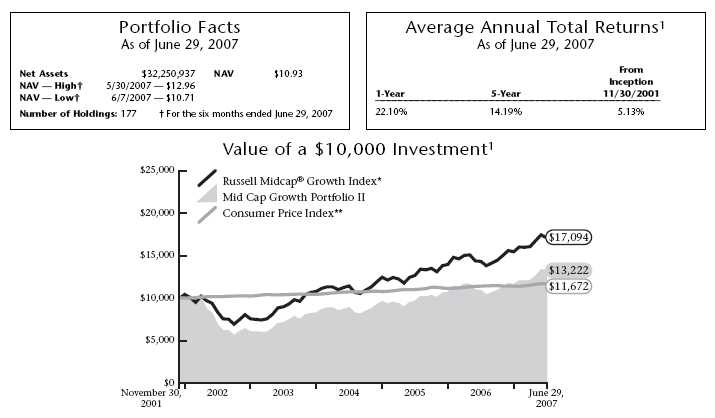
* The Russell Midcap® Growth Index is an index comprised of companies with higher than average price-to-book ratios and higher forecasted growth values within the Russell Midcap® Index. It is not possible to invest directly in the Index. The performance of the Index does not reflect deductions for fees, expenses or taxes.
** The Consumer Price Index is an inflationary indicator that measures the change in the cost of a fixed basket of products and services, including housing, electricity, food and transportation. It is not possible to invest directly in the Index.
Past performance is not an indication of future results. Total investment return and principal value will fluctuate and units, when redeemed, may be worth more or less than their original cost. Current performance may be higher or lower than the performance data quoted. Market volatility can significantly affect short-term performance, and more recent returns may be different from those shown. Call 800-THRIVENT or visit www.thrivent.com for performance results current to the most recent month-end.
1 Annualized total returns represent past performance and reflect changes in share prices, the reinvestment of all dividends and capital gains, and the effects of compounding. At various times, the Portfolio’s adviser reimbursed and/or paid non-advisory Portfolio expenses. Had the adviser not done so, the Portfolio’s total returns would have been lower. The returns shown do not reflect charges and expenses imposed on contract holders by the variable accounts. Those charges and expenses reduce the returns received by contract holders as compared to the returns presented.
Investing in a variable product involves risks, including the possible loss of principal. The prospectus contains more complete information on the investment objectives, risks, charges and expenses of the investment company, which investors should read and consider carefully before investing. To obtain a prospectus, contact a registered representative or visit www.thrivent.com. Please read your prospectus carefully.
25

How did the Portfolio perform during the six-month period ended June 29, 2007?
Thrivent Partner Mid Cap Value Portfolio returned 9.78% during the six-month period ended June 29, 2007. The Portfolio’s peer group, as represented by the Lipper Mid Cap Value category, reported a median return of 11.22% . The Portfolio’s market benchmark, the Russell Midcap® Value Index, returned 8.69% .
What factors affected the Portfolio’s performance?
Returns in the Portfolio were modestly ahead of the benchmark Index for the period. Energy, health care and utilities were all segments of the Portfolio that outperformed the benchmark. Our holdings in information technology stocks were the main detractor to performance; the group performed well, but our stocks did not achieve good results. In the energy sector, Range Resources Inc. — one of the Portfolio’s larger holdings — achieved excellent returns. Another significant holding, Williams Cos., also performed well. Smith International and W-H Energy Services in the energy equipment and services segment added to overall Portfolio results. Within health care, Medimmune Inc. was the subject of a takeover bid, which substantially lifted the stock. Health care technology providers achieved good returns in the period and our holdings in IMS Health Inc. and Perkin Elmer Inc. did well. Within the utility group, holdings in PPL Corp., Entergy Corp. and Edison International all performed well in the period.
Within the information technology sector, our holding in computer peripheral manufacturer Seagate Technology did not perform well. Additionally, in the IT services group, we did not own the stocks that advanced within the group and realized disappointing results from our holdings in companies like BearingPoint Inc. and CheckFree Corp. Within the software industry, our holding in Activision did not advance in line with the industry. A modest position in cash for liquidity and transaction purposes was a limiting factor given the good returns achieved by the benchmark.
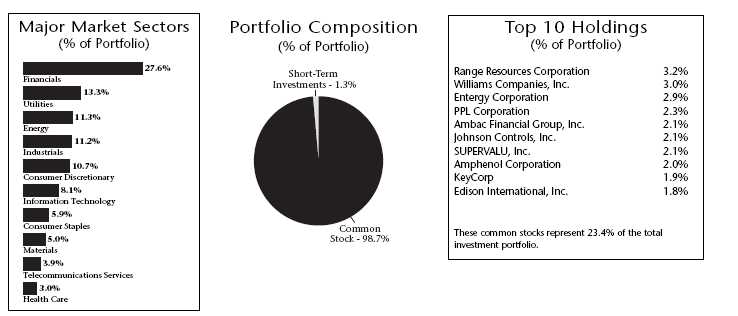
Quoted Major Market Sectors, Portfolio Composition and Top 10 Holdings are subject to change.
The lists of Major Market Sectors and Top 10 Holdings exclude short-term investments and collateral held for securities loaned.
The Portfolio Composition chart excludes collateral held for securities loaned.
26
What is your outlook?
Many of our best performing stocks in 2007 have been companies engaged in efforts to rationalize their cost structures, divest non-strategic assets and generally improve returns on capital. As we move through 2007, we will continue to seek similar opportunities, as these programs of internal change can show positive results in an uncertain market environment. We believe the market will see an active flow of private equity investment into mid-cap companies, particularly those with the cash flow characteristics we tend to favor.
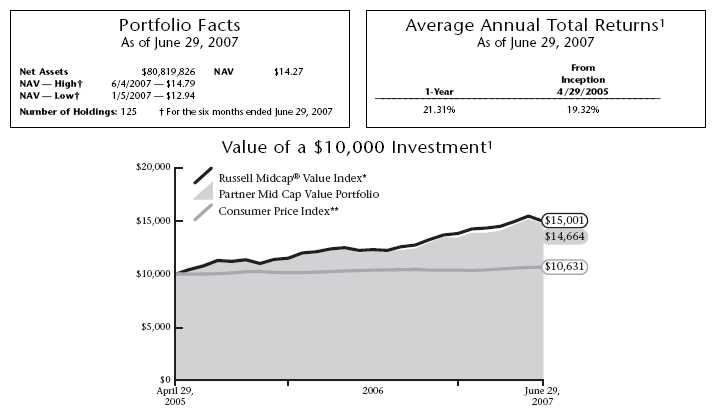
* The Russell Midcap® Value Index is an index comprised of companies with lower than average price-to-book ratios and lower forecasted growth values within the Russell Midcap® Index. It is not possible to invest directly in the Index. The performance of the Index does not reflect deductions for fees, expenses or taxes.
** The Consumer Price Index is an inflationary indicator that measures the change in the cost of a fixed basket of products and services, including housing, electricity, food and transportation. It is not possible to invest directly in the Index.
Past performance is not an indication of future results. Total investment return and principal value will fluctuate and units, when redeemed, may be worth more or less than their original cost. Current performance may be higher or lower than the performance data quoted. Market volatility can significantly affect short-term performance, and more recent returns may be different from those shown. Call 800-THRIVENT or visit www.thrivent.com for performance results current to the most recent month-end.
1 Annualized total returns represent past performance and reflect changes in share prices, the reinvestment of all dividends and capital gains, and the effects of compounding. Periods of less than one year are not annualized. At various times, the Portfolio’s adviser reimbursed and/or paid non-advisory Portfolio expenses. Had the adviser not done so, the Portfolio’s total returns would have been lower. The returns shown do not reflect charges and expenses imposed on contract holders by the variable accounts. Those charges and expenses reduce the returns received by contract holders as compared to the returns presented.
Investing in a variable product involves risks, including the possible loss of principal. The prospectus contains more complete information on the investment objectives, risks, charges and expenses of the investment company, which investors should read and consider carefully before investing. To obtain a prospectus, contact a registered representative or visit www.thrivent.com. Please read your prospectus carefully.
27

How did the Portfolio perform during the six-month period ended June 29, 2007?
Thrivent Mid Cap Stock Portfolio returned 10.68% during the six-month period ended June 29, 2007. The Portfolio’s peer group, as represented by the Lipper Mid Cap Core category, reported a median return of 11.01% . The Portfolio’s market benchmark, the Russell Midcap® Index, returned 9.90% .
What factors affected the Portfolio’s performance?
The Portfolio had strong relative and absolute performance for the first six months of the year. The Portfolio had success in the materials, consumer discretionary and information technology sectors. Both the materials and information technology sectors were overweighted and had better than average stock selection within the group. The strong performance in the materials sector was led by Owens-Illinois while the information technology group excess return was driven by a broad diversity of holdings across a number of industries. Solid stock selection benefited the consumer discretionary sector as Goodyear Tire & Rubber Co., one of the P ortfolio’s top holdings, had a particularly strong performance for the period. Negative factors included an underweighted position in the energy and industrial sectors, two of the top performing sectors for the first six months of the year. Stock selection within the industrial sector and underweighting the two best performing groups during the quarter, energy and industrials, led the underperformance. The poor contribution from stock selection was not the result of a significant decline in any of the Portfolio’s holdings but rather due to not having significant exposure to stocks in companies that advanced strongly during the quarter.
What is your outlook?
The Portfolio remains underweighted in cyclical industries. Policymakers worldwide continue to increase interest rates attempting to slow economic growth and bring inflation down to their long-term targets. Industrials and energy are the Portfolio’s largest underweighted sectors. The industrial sector currently trades at high valuations, while at the same time, profit margins are well above previous peak levels. Historically, in a cyclical industry, the combination of high current valuations and high profit margins are not sustainable, with valuations most often adjusting as profit margins come under pressure. The energy sector is seeing slowing demand growth at the same time inventories are increasing, production is rising and OPEC excess capacity is

Quoted Major Market Sectors, Portfolio Composition and Top 10 Holdings are subject to change.
The lists of Major Market Sectors and Top 10 Holdings exclude short-term investments and collateral held for securities loaned.
The Portfolio Composition chart excludes collateral held for securities loaned.
28
approaching 4 million barrels per day. Coincidentally, capital expenditures are increasing off of an already high base. Once again, these typically are not attractive investment characteristics for a cyclical industry. The Portfolio maintains an overweighted stance in the information technology sector as cable, telecommunication and Internet companies increase infrastructure spending in order to compete to increase their share of consumer and enterprise spending. As more information traverses IP networks, demand for networking equipment, storage and software will also expand.
* The Russell Midcap® Index is an unmanaged index that measures the performance of the smallest 800 securities in the Russell 1000® Index, as ranked by total market capitalization. It is not possible to invest directly in the index. The performance of the Index does not reflect deductions for fees, expenses or taxes. The composition of the Russell Midcap® Index serves as a better reflection of the Fund’s current strategy than does the S&P MidCap 400 Index.
** The S&P MidCap 400 Index is an unmanaged index that represents the average performance of a group of 400 medium capitalization stocks. It is not possible to invest directly in the Index. The performance of the Index does not reflect deductions for fees, expenses or taxes.
*** The Consumer Price Index is an inflationary indicator that measures the change in the cost of a fixed basket of products and services, including housing, electricity, food and transportation. It is not possible to invest directly in the Index.
Past performance is not an indication of future results. Total investment return and principal value will fluctuate and units, when redeemed, may be worth more or less than their original cost. Current performance may be higher or lower than the performance data quoted. Market volatility can significantly affect short-term performance, and more recent returns may be different from those shown. Call 800-THRIVENT or visit www.thrivent.com for performance results current to the most recent month-end.
1 Annualized total returns represent past performance and reflect changes in share prices, the reinvestment of all dividends and capital gains, and the effects of compounding. At various times, the Portfolio’s adviser reimbursed and/or paid non-advisory Portfolio expenses. Had the adviser not done so, the Portfolio’s total returns would have been lower. The returns shown do not reflect charges and expenses imposed on contract holders by the variable accounts. Those charges and expenses reduce the returns received by contract holders as compared to the returns presented.
Investing in a variable product involves risks, including the possible loss of principal. The prospectus contains more complete information on the investment objectives, risks, charges and expenses of the investment company, which investors should read and consider carefully before investing. To obtain a prospectus, contact a registered representative or visit www.thrivent.com. Please read your prospectus carefully.
29

How did the Portfolio perform during the six-month period ended June 29, 2007?
Thrivent Mid Cap Index Portfolio returned 11.70% during the six-month period ended June 29, 2007. The Portfolio’s peer group, as represented by the Lipper Mid Cap Core category, reported a median return of 11.01% . The Portfolio’s market benchmark, the S&P MidCap 400 Index, returned 11.97% .
What factors affected the Portfolio’s performance?
The Portfolio is managed to virtually replicate the performance of the S&P MidCap 400 Index. We seek to maintain a fully invested position with limited transactions to minimize costs. As typically occurs with an index fund, the difference in performance between the benchmark index and the fund itself can be largely attributed to expenses and minor differences in Portfolio composition.
Energy and materials sectors were the best performing groups in the market over the six-month period. Energy stocks clearly benefited from the continued rise in oil and gas prices, and energy equipment and services stocks represented the strongest industry within the sector. Materials stocks also performed well, due to increased spending on construction materials by businesses. Utilities and financials, two other prominent sectors in the Index, delivered positive but below-Index returns for the six-month period. Both utilities and financial stocks’ returns were limited as interest rates rose during the first half of 2007. Financial stocks were also affected by the weakening of the sub-prime lending markets in the second quarter.
What is your outlook?
Mid-cap stocks outperformed both large- and small-cap stocks for the six-month period. Large-cap stocks showed signs of overcoming their extended period of lagging the performance of smaller stocks toward the end of the period. If past economic cycles are any indication, the market may begin to favor large-cap issues in the months ahead. Typically, investors look for higher-quality stocks as economic growth moves past its peak in a given cycle — a factor that could help the Portfolio.
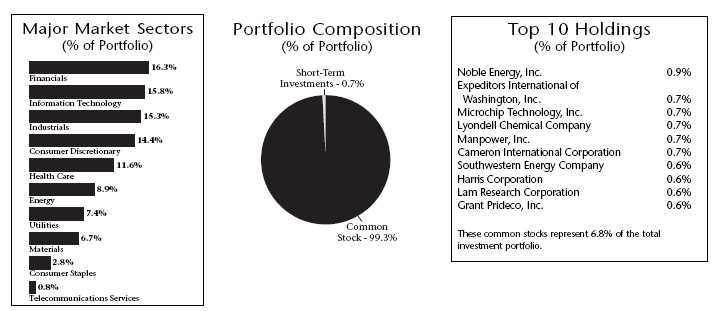
Quoted Major Market Sectors, Portfolio Composition and Top 10 Holdings are subject to change.
The lists of Major Market Sectors and Top 10 Holdings exclude short-term investments and collateral held for securities loaned.
The Portfolio Composition chart excludes collateral held for securities loaned.
30
In an environment where investors are faced with greater uncertainty about the direction of interest rates and the strength of the domestic economy, mid-cap stocks may offer a relatively safe haven in the equity markets compared to small-cap stocks. While we can anticipate continued volatility from stocks as a whole, those represented in this Index continue to offer a generally positive outlook.

* The S&P MidCap 400 Index is an unmanaged index that represents the average performance of a group of 400 medium capitalization stocks. “S&P MidCap 400 Index” is a trademark of The McGraw-Hill Companies, Inc. and has been licensed for use by Thrivent Financial for Lutherans. The product is not sponsored, endorsed or promoted by Standard & Poor’s, and Standard & Poor’s makes no representation regarding the advisability of investing in the product. Index funds are subject to the same market risks associated with the stocks in their respective indexes. It is not possible to invest directly in the Index. The performance of the Index does not reflect deductions for fees, expenses or taxes.
** The Consumer Price Index is an inflationary indicator that measures the change in the cost of a fixed basket of products and services, including housing, electricity, food and transportation. It is not possible to invest directly in the Index.
Past performance is not an indication of future results. Total investment return and principal value will fluctuate and units, when redeemed, may be worth more or less than their original cost. Current performance may be higher or lower than the performance data quoted. Market volatility can significantly affect short-term performance, and more recent returns may be different from those shown. Call 800-THRIVENT or visit www.thrivent.com for performance results current to the most recent month-end.
1 Annualized total returns represent past performance and reflect changes in share prices, the reinvestment of all dividends and capital gains, and the effects of compounding. At various times, the Portfolio’s adviser reimbursed and/or paid non-advisory Portfolio expenses. Had the adviser not done so, the Portfolio’s total returns would have been lower. The returns shown do not reflect charges and expenses imposed on contract holders by the variable accounts. Those charges and expenses reduce the returns received by contract holders as compared to the returns presented.
Investing in a variable product involves risks, including the possible loss of principal. The prospectus contains more complete information on the investment objectives, risks, charges and expenses of the investment company, which investors should read and consider carefully before investing. To obtain a prospectus, contact a registered representative or visit www.thrivent.com. Please read your prospectus carefully.
31

How did the Portfolio perform during the six-month period ended June 29, 2007?
Thrivent Partner International Stock Portfolio returned 10.70% during the six-month period ended June 29, 2007. The Portfolio’s peer group, as represented by the Lipper International Large Cap Core category, reported a median return of 10.64% . The Portfolio’s market benchmark, the MSCI EAFE Index, returned 11.09% .
What factors affected the Portfolio’s performance?
An underweighting of the materials and energy sectors and sub-par stock selection within the energy segment were the primary factors limiting returns versus the benchmark Index. Stock selection within the information technology group also limited Portfolio results. These factors were mitigated by stock selection within the consumer group and a moderate overweighting and stock selection within the industrial and utility sectors; however, those factors did not fully offset the drags on Portfolio results versus the benchmark. Both benchmark and Portfolio returns were quite good on an absolute basis as markets were generally strong in the reporting period. Stock selection within the materials group was better than the benchmark but our underweighting in this strongly performing group was a limiting factor. In energy shares, an underweighting of the group versus benchmark as w ell as disappointing stock selection combined to limit our advance.
Disappointing results on the part of Taiwan Semiconductor and Samsung Electronics, as well as less than adequate exposure to the strong performance in Nokia, all contributed to our lagging performance in the information technology group. Within the software segment, we did hold a position in Nintendo, which gained on the strength of its recent success in video gaming.
Within the consumer group, the Portfolio was the beneficiary of increased merger and acquisition anticipation and activity, particularly in the consumer retail and products segments. Within the industrial groups, holdings in Siemans AG and Schneider Electric both performed well. In the consumer staples group, holdings in both Unilever PLC and Carrefour S.A. provided good returns.
What is your outlook?
Europe has continued to benefit from stronger than expected economic growth driven by both exports and domestic demand. Low interest rates are facilitating a wave of merger and acquisition activity, which has been very
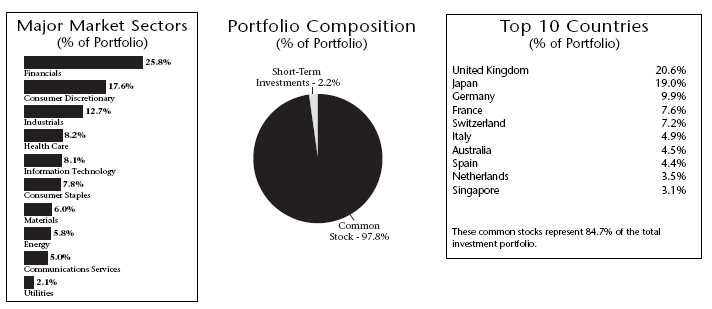
Quoted Major Market Sectors, Portfolio Composition and Top 10 Countries are subject to change.
The lists of Major Market Sectors and Top 10 Countries exclude short-term investments and collateral held for securities loaned.
The Portfolio Composition chart excludes collateral held for securities loaned.
32
supportive for stock prices. While there is concern that the euro’s rise over the past several years will hamper competitiveness, corporate cost cutting and strong demand have thus far been positive offsets.
Asian trade imbalances, currency concerns and inflation will be a key area of focus for central bankers as well as politicians. As China continues on its impressive growth path, many of the other Asian economies will benefit. However, as China broadens its reach and influence, there is a growing risk of a protectionist backlash in Europe and the United States. In Japan, the nascent merger and acquisition activity has focused management attention on shareholder value, a welcome change for investors.
The robust global economy of the past few years has helped companies deliver strong earnings’ growth, thus supporting positive equity market performance. Although we expect a moderation in global economic growth, and consequently a slowdown in earnings growth, we believe the markets should continue to provide solid, but modest equity gains.
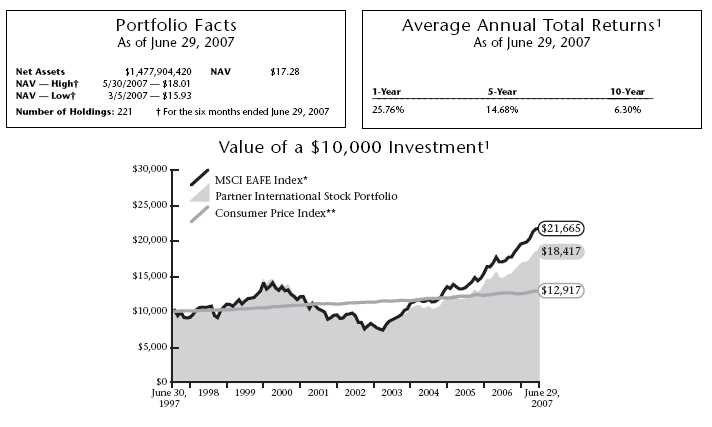
* The Morgan Stanley Capital International Europe, Australasia, Far East Index (MSCI EAFE Index) is a stock index designed to measure the equity performance of developed countries outside of North America. It is not possible to invest directly in the Index. The performance of the Index does not reflect deductions for fees, expenses or taxes.
** The Consumer Price Index is an inflationary indicator that measures the change in the cost of a fixed basket of products and services, including housing, electricity, food and transportation. It is not possible to invest directly in the Index.
Past performance is not an indication of future results. Total investment return and principal value will fluctuate and units, when redeemed, may be worth more or less than their original cost. Current performance may be higher or lower than the performance data quoted. Market volatility can significantly affect short-term performance, and more recent returns may be different from those shown. Call 800-THRIVENT or visit www.thrivent.com for performance results current to the most recent month-end.
1 Annualized total returns represent past performance and reflect changes in share prices, the reinvestment of all dividends and capital gains, and the effects of compounding. At various times, the Portfolio’s adviser reimbursed and/or paid non-advisory Portfolio expenses. Had the adviser not done so, the Portfolio’s total returns would have been lower. The returns shown do not reflect charges and expenses imposed on contract holders by the variable accounts. Those charges and expenses reduce the returns received by contract holders as compared to the returns presented.
Investing in a variable product involves risks, including the possible loss of principal. The prospectus contains more complete information on the investment objectives, risks, charges and expenses of the investment company, which investors should read and consider carefully before investing. To obtain a prospectus, contact a registered representative or visit www.thrivent.com. Please read your prospectus carefully.
33

How did the Portfolio perform during the six-month period ended June 29, 2007?
Thrivent Partner All Cap Portfolio returned 11.37% during the six-month period ended June 29, 2007. The Portfolio’s peer group, as represented by the Lipper Multi Cap Core category, reported a median return of 7.53% . The Portfolio’s market benchmark, the Russell 3000® Index, returned 7.11% .
What factors affected the Portfolio’s performance?
Superior returns for the six months were a function of strong stock selection as Portfolio sectors are generally kept in close alignment with those of the Portfolio’s benchmark. Energy stocks provided the largest contribution, with good returns across the board from the Portfolio’s holdings in the energy equipment group, such as Schlumberger Ltd., Transocean Inc. and GlobalSantaFe Inc. Energy production companies and integrated producers also added meaningfully to Portfolio results. Within the financial sector, we avoided many of the issues that were affected by continuing weakness in both the housing and sub-prime lending industr ies, while having exposure to generally higher quality or recovering financial service companies like Fannie Mae. Holdings in the insurance and brokerage/capital markets industries also added to returns. Health care holdings Medco Health Solutions in the pharmacy benefit industry and Baxter International, a diversified medial products and services company, performed well during the period. Shaw Group Inc. was a beneficiary of the strength in engineering and construction and industrial services industries. Precision Castparts Corp. also provided excellent returns, benefiting from its strong operating position in the aerospace, power generation and general industrial markets.
Segments of the Portfolio exposed to the consumer generally did not perform as well as those groups more exposed to the industrial or energy cycle that continues to unfold. Retailers did not keep pace with the overall market nor with the stronger segments of the Portfolio, but were generally not held in sufficient concentration or breadth to restrain the overall Portfolio return.

Quoted Major Market Sectors, Portfolio Composition and Top 10 Holdings are subject to change.
The lists of Major Market Sectors and Top 10 Holdings exclude short-term investments and collateral held for securities loaned.
The Portfolio Composition chart excludes collateral held for securities loaned.
34
What is your outlook?
The Portfolio is positioned to gain from active stock selection by identifying the best ideas from each of our industry-focused fundamental analysts. We continue to favor the biotechnology industry, with positions in biopharmaceutical companies engaged in the development of human therapeutics. We believe these businesses will benefit from successful drug launches, global market penetration, and solid franchises offering competitive advantages. Additionally, we are overweighted in the energy, equipment and services industry, focusing on companies exposed to the strong growth and demand within the deepwater drilling rig business. Within the health care sector, we are underweighted in the pharmaceuticals industry due to limited upside from patent expirations, eroding sales, and pipeline setbacks.

* The Russell 3000® Index is an unmanaged index comprised of the 3,000 largest companies based on market capitalization and is designed to represent the performance of about 98% of the U.S. equity market. It is not possible to invest directly in the Index. The performance of the Index does not reflect deductions for fees, expenses or taxes.
** The Consumer Price Index is an inflationary indicator that measures the change in the cost of a fixed basket of products and services, including housing, electricity, food and transportation. It is not possible to invest directly in the Index.
Past performance is not an indication of future results. Total investment return and principal value will fluctuate and units, when redeemed, may be worth more or less than their original cost. Current performance may be higher or lower than the performance data quoted. Market volatility can significantly affect short-term performance, and more recent returns may be different from those shown. Call 800-THRIVENT or visit www.thrivent.com for performance results current to the most recent month-end.
1 Annualized total returns represent past performance and reflect changes in share prices, the reinvestment of all dividends and capital gains, and the effects of compounding. At various times, the Portfolio’s adviser reimbursed and/or paid non-advisory Portfolio expenses. Had the adviser not done so, the Portfolio’s total returns would have been lower. The returns shown do not reflect charges and expenses imposed on contract holders by the variable accounts. Those charges and expenses reduce the returns received by contract holders as compared to the returns presented.
Investing in a variable product involves risks, including the possible loss of principal. The prospectus contains more complete information on the investment objectives, risks, charges and expenses of the investment company, which investors should read and consider carefully before investing. To obtain a prospectus, contact a registered representative or visit www.thrivent.com. Please read your prospectus carefully.
35

How did the Portfolio perform during the six-month period ended June 29, 2007?
Thrivent Large Cap Growth Portfolio returned 8.99% during the six-month period ended June 29, 2007. The Portfolio’s peer group, as represented by the Lipper Large Cap Growth category, reported a median return of 7.82% . The Portfolio’s market benchmark, the Russell 1000® Growth Index, returned 8.13% .
What factors affected the Portfolio’s performance?
Large-cap growth stocks exhibited comparable if not better returns when compared to value and small- and mid-capitalization stocks. Despite the continued strong returns in more cyclical industries such as energy, materials, and industrials, the key large-cap growth sectors, health care and information technology, posted respectable returns and lifted the overall growth category’s returns.
On a sector-based analysis, the outperformance versus our benchmark was broad-based with stock selection positively contributing in most sectors. Information technology and the energy sectors contributed the most, highlighted by our ownership in aQuantive Inc. and Apple for technology and Schlumberger and Diamond Offshore for energy. The telecommunications sector continued its strong performance, both in terms of sector allocation and security selection, due to large positions in emerging wireless telecommunication companies such as America Movil and NII Holdings. The financial, health care and material sectors also positively affected performance. Brokerage and exchange companies such as Goldman Sachs and Chicago Mercantile Exchange boosted the financial sector while health care was aided by positions in Gilead Sciences and Teva Pharmaceuticals. The materials sector posted superior returns through ownership in names such as Freeport McMoran Copper & Gold.
Sectors detracting most from performance for the six-month period included consumer discretionary, where not owning Amazon.com and poor performance in owned names such as Starbucks and Toll Brothers negatively affected Portfolio performance. Our underweighted stances in the utilities and industrials sectors also hurt Portfolio performance as these sectors posted above average returns. However, our stock selection in the industrials sector helped, highlighted by shares of Foster Wheeler. On a sub-sector basis, the strongest groups included Internet software and services, wireless telecommunications and communications equipment; the weakest groups were led by semiconductors, construction and farm machinery and industrial conglomerates.

Quoted Major Market Sectors, Portfolio Composition and Top 10 Holdings are subject to change.
The lists of Major Market Sectors and Top 10 Holdings exclude short-term investments and collateral held for securities loaned.
The Portfolio Composition chart excludes collateral held for securities loaned.
36
What is your outlook?
The equity market has been very strong in the first half of 2007 and our performance has also been good. We feel a lot of the positive news is already priced into the market; thus, we are not making large sector bets. Our most overweighted sector remains telecommunications services, with an emphasis on Latin American wireless companies. We have upped the weighting in consumer staples by adding Costco and Safeway to the Portfolio. At the industry level, we like engineering and construction (Fluor); biotechnology (Gilead); energy equipment and services (Diamond Offshore); and brokerage/asset managers (Morgan Stanley).
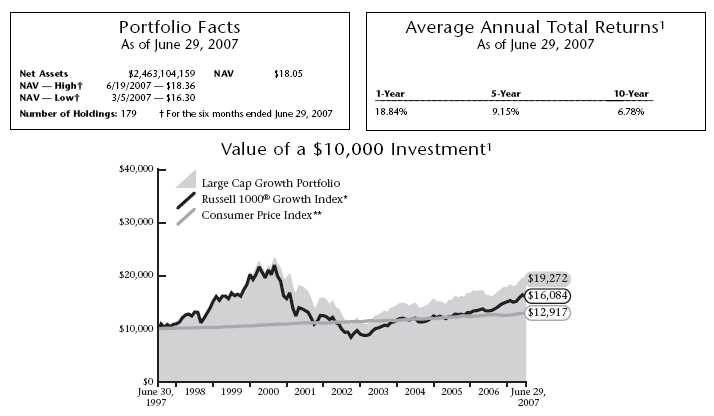
* The Russell 1000® Growth Index is an index comprised of those Russell 1000 companies with higher than average price-to-book ratios and higher forecasted growth values. It is not possible to invest directly in the Index. The performance of the Index does not reflect deductions for fees, expenses or taxes.
** The Consumer Price Index is an inflationary indicator that measures the change in the cost of a fixed basket of products and services, including housing, electricity, food and transportation. It is not possible to invest directly in the Index.
Past performance is not an indication of future results. Total investment return and principal value will fluctuate and units, when redeemed, may be worth more or less than their original cost. Current performance may be higher or lower than the performance data quoted. Market volatility can significantly affect short-term performance, and more recent returns may be different from those shown. Call 800-THRIVENT or visit www.thrivent.com for performance results current to the most recent month-end.
1 Annualized total returns represent past performance and reflect changes in share prices, the reinvestment of all dividends and capital gains, and the effects of compounding. At various times, the Portfolio’s adviser reimbursed and/or paid non-advisory Portfolio expenses. Had the adviser not done so, the Portfolio’s total returns would have been lower. The returns shown do not reflect charges and expenses imposed on contract holders by the variable accounts. Those charges and expenses reduce the returns received by contract holders as compared to the returns presented.
Investing in a variable product involves risks, including the possible loss of principal. The prospectus contains more complete information on the investment objectives, risks, charges and expenses of the investment company, which investors should read and consider carefully before investing. To obtain a prospectus, contact a registered representative or visit www.thrivent.com. Please read your prospectus carefully.
37

How did the Portfolio perform during the six-month period ended June 29, 2007?
Thrivent Large Cap Growth Portfolio II returned 8.93% during the six-month period ended June 29, 2007. The Portfolio’s peer group, as represented by the Lipper Large Cap Growth category, reported a median return of 7.82% . The Portfolio’s market benchmark, the Russell 1000® Growth Index, returned 8.13% .
What factors affected the Portfolio’s performance?
Large-cap growth stocks exhibited comparable if not better returns when compared to value and small- and mid-capitalization stocks. Despite the continued strong returns in more cyclical industries such as energy, materials, and industrials, the key large-cap growth sectors, health care and information technology, posted respectable returns and lifted the overall growth category’s returns.
On a sector-based analysis, the outperformance versus our benchmark was broad-based, with stock selection positively contributing in most sectors. Information technology and the energy sectors contributed the most, highlighted by our ownership in aQuantive Inc. and Apple for technology and Schlumberger and Diamond Offshore for energy. The telecommunications sector continued its strong performance, both in terms of sector allocation and security selection, due to large positions in emerging wireless telecommunication companies such as America Movil and NII Holdings. The financial, health care and material sectors also positively affected performance. Brokerage and exchange companies such as Goldman Sachs and Chicago Mercantile Exchange boosted the financial sector while health care was aided by positions in Gilead Sciences and Teva Pharmaceuticals. The materials sector posted superior returns through ownership in names such as Freeport McMoran Copper & Gold.
Sectors detracting most from performance for the six-month period include consumer discretionary, where a lack of ownership in shares of Amazon and poor performance in owned names such as Starbucks and Toll Brothers negatively affected Portfolio performance. Our underweighted stances in the utilities and industrials sectors also hurt Portfolio performance as these sectors posted above average returns. However, our stock selection in the industrials sector was excellent, highlighted by shares of Foster Wheeler. On a sub-sector basis, the strongest groups included Internet software and services, wireless telecommunications and communications equipment; the weakest groups were led by semiconductors, construction and farm machinery and industrial conglomerates.
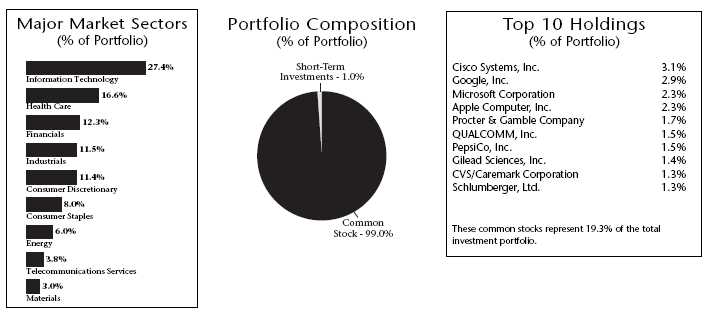
Quoted Major Market Sectors, Portfolio Composition and Top 10 Holdings are subject to change.
The lists of Major Market Sectors and Top 10 Holdings exclude short-term investments and collateral held for securities loaned.
The Portfolio Composition chart excludes collateral held for securities loaned.
38
What is your outlook?
The equity market has been very strong in the first half of 2007 and our performance has also been good. We feel a lot of the positive news is already priced into the market; thus, we are not making large sector bets. Our most overweighted sector remains telecommunications services, with an emphasis on Latin American wireless companies. We have upped the weighting in consumer staples by adding Costco and Safeway to the Portfolio. At the industry level, we like engineering and construction (Fluor); biotechnology (Gilead); energy equipment and services (Diamond Offshore); and brokerage/asset managers (Morgan Stanley).
* The Russell 1000® Growth Index is an index comprised of those Russell 1000 companies with higher than average price-to-book ratios and higher forecasted growth values. It is not possible to invest directly in the Index. The performance of the Index does not reflect deductions for fees, expenses or taxes.
** The Consumer Price Index is an inflationary indicator that measures the change in the cost of a fixed basket of products and services, including housing, electricity, food and transportation. It is not possible to invest directly in the Index.
Past performance is not an indication of future results. Total investment return and principal value will fluctuate and units, when redeemed, may be worth more or less than their original cost. Current performance may be higher or lower than the performance data quoted. Market volatility can significantly affect short-term performance, and more recent returns may be different from those shown. Call 800-THRIVENT or visit www.thrivent.com for performance results current to the most recent month-end.
1 Annualized total returns represent past performance and reflect changes in share prices, the reinvestment of all dividends and capital gains, and the effects of compounding. At various times, the Portfolio’s adviser reimbursed and/or paid non-advisory Portfolio expenses. Had the adviser not done so, the Portfolio’s total returns would have been lower. The returns shown do not reflect charges and expenses imposed on contract holders by the variable accounts. Those charges and expenses reduce the returns received by contract holders as compared to the returns presented.
Investing in a variable product involves risks, including the possible loss of principal. The prospectus contains more complete information on the investment objectives, risks, charges and expenses of the investment company, which investors should read and consider carefully before investing. To obtain a prospectus, contact a registered representative or visit www.thrivent.com. Please read your prospectus carefully.
39

How did the Portfolio perform during the six-month period ended June 29, 2007?
Thrivent Partner Growth Stock Portfolio returned 8.49% during the six-month period ended June 29, 2007. The Portfolio’s peer group, as represented by the Lipper Large Cap Growth category, reported a median return of 7.82% . The Portfolio’s market benchmark, the S&P 500/Citigroup Growth Index, returned 6.55% .
What factors affected the Portfolio’s performance?
The financials sector was the leading relative outperformer, helped by stock selection and a beneficial underweighting against the benchmark. Capital markets holdings, in particular asset managers Franklin Resources, State Street, and UBS, benefited from strong global markets and a positive macroeconomic environment. European financials were also notable contributors, led by German exchange operator Deutsche Bourse and Italian commercial bank Unicredito Italiano. While concerns about sub-prime lending rattled the sector and caused it to lag, the Portfolio benefited from avoiding real estate stocks and underweighting diversified financial services.
Stock selection, led by the wireless telecommunication services industry, resulted in the telecommunication services sector’s relative outperformance. Non-U.S. providers America Movil (Mexico) and Rogers Communications (Canada) were major contributors, boosted by strong earnings and expansion outlook reports. MetroPCS, a low-cost U.S. wireless provider, went public in April, and the stock has risen sharply.
The consumer discretionary sector benefited from stock selection, with concentrated strength in media and the Internet and catalog retail industries. Liberty Capital gained as the value of its extensive interests in media and telecommunication companies appreciated. Amazon.com shares rose dramatically after solidly beating analysts’ earnings estimates, with improved expense controls and increased operating leverage. MGM Mirage, the casino giant, rose on gaming strength in Las Vegas and high expectation s for its Macau operations and CenterCity, an ambitious multipurpose development in the heart of the Las Vegas Strip.
The Portfolio’s stock selection in the communications equipment industry was a primary driver of information technology’s outperformance. Among the best performers was Juniper Networks, which rose on encouraging launches of its new service-provider and enterprise products. Hon Hai Precision traded higher as the component supplier to Apple for its eagerly awaited iPhone.
Stock selection was negative in industrials and business services, while an underweighting in the aerospace and defense industry also hurt performance. Machinery company Danaher slumped on lower growth, and Southwest Airlines declined on softer traffic numbers.
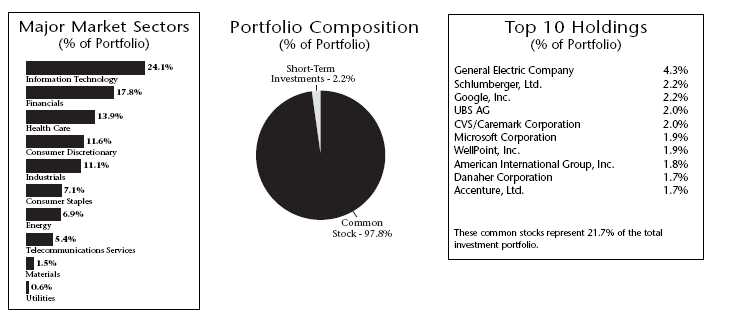
Quoted Major Market Sectors, Portfolio Composition and Top 10 Holdings are subject to change.
The lists of Major Market Sectors and Top 10 Holdings exclude short-term investments and collateral held for securities loaned.
The Portfolio Composition chart excludes collateral held for securities loaned.
40
Stock selection in health care, primarily in biotechnology and pharmaceuticals, had a negative impact. Biotech concern Genentech traded lower as its key cancer drugs fell short of estimates, and the growth outlook dimmed for its leading cancer drug Avastin.
What is your outlook?
While economic growth may moderate, we believe that companies producing stable earnings growth will be afforded higher prices by the market. We believe the market is currently underpriced considering the strength in the U.S. and global economies and the resilience of corporate earnings. The Portfolio is positioned to outperform in this environment.
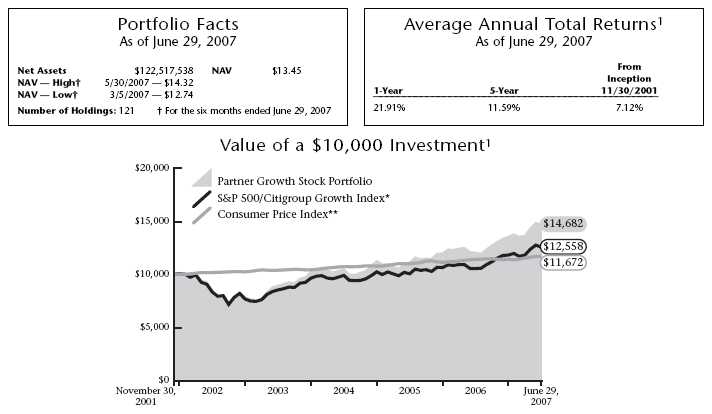
* The S&P 500/Citigroup Growth Index is an unmanaged capitalization-weighted index comprised of securities with higher price-to-book ratios in the S&P 500 Index. The S&P 500/Citigroup Growth Index is designed so that approximately one-half of the S&P 500 Index market capitalization is characterized as “value” and the other half as “growth.” It is not possible to invest directly in the Index. The performance of the Index does not reflect deductions for fees, expenses or taxes.
** The Consumer Price Index is an inflationary indicator that measures the change in the cost of a fixed basket of products and services, including housing, electricity, food and transportation. It is not possible to invest directly in the Index.
Past performance is not an indication of future results. Total investment return and principal value will fluctuate and units, when redeemed, may be worth more or less than their original cost. Current performance may be higher or lower than the performance data quoted. Market volatility can significantly affect short-term performance, and more recent returns may be different from those shown. Call 800-THRIVENT or visit www.thrivent.com for performance results current to the most recent month-end.
1 Annualized total returns represent past performance and reflect changes in share prices, the reinvestment of all dividends and capital gains, and the effects of compounding. At various times, the Portfolio’s adviser reimbursed and/or paid non-advisory Portfolio expenses. Had the adviser not done so, the Portfolio’s total returns would have been lower. The returns shown do not reflect charges and expenses imposed on contract holders by the variable accounts. Those charges and expenses reduce the returns received by contract holders as compared to the returns presented.
Investing in a variable product involves risks, including the possible loss of principal. The prospectus contains more complete information on the investment objectives, risks, charges and expenses of the investment company, which investors should read and consider carefully before investing. To obtain a prospectus, contact a registered representative or visit www.thrivent.com. Please read your prospectus carefully.
41

How did the Portfolio perform during the six-month period ended June 29, 2007?
Thrivent Large Cap Value Portfolio returned 7.48% during the six-month period ended June 29, 2007. The Portfolio’s peer group, as represented by the Lipper Large Cap Value category, reported a median return of 7.26% . The Portfolio’s market benchmark, the Russell 1000® Value Index, returned 6.25% .
What factors affected the Portfolio’s performance?
The majority of the strong relative performance was due to stock selection, particularly in the financials, industrials, and consumer staples sectors. In addition, an overweighted position in the technology and industrials sectors helped performance, as did underweighting in financials, especially in real estate investment trusts (REITs) and banks. An underweighted position in energy hurt relative performance.
In financials, emphasizing shares of JP Morgan versus Banc of America and Citigroup was a significant positive contributor. An emphasis on capital market sensitive financials versus spread sensitive (i.e., banks) benefited the Portfolio and remains an emphasis.
Highlights in the industrial sector included American Airlines and railroads CSX Corp. and Union Pacific. American Airlines was sold in January based upon valuation and has recently been repurchased at a lower price as recent strength in jet fuel prices has pushed the shares down to an attractive price level. Shares of Union Pacific have been s old due to valuation and consensus earnings’ estimates getting ahead of the company’s fundamentals. Other major contributors were positions in Flowserve, a manufacturer of pumps, valves and seals to industrial end markets, and Parker Hannifin, a diversified industrial company. Parker Hannifin has been sold due to valuation and the best case scenario reflected in consensus earnings’ expectations.
In consumer staples, not owning Proctor and Gamble helped meaningfully as the price of this stock declined during the period.
Areas that limited performance included health care, telecommunications services and materials. Stock selection was the primary source of sub-par performance in these areas.
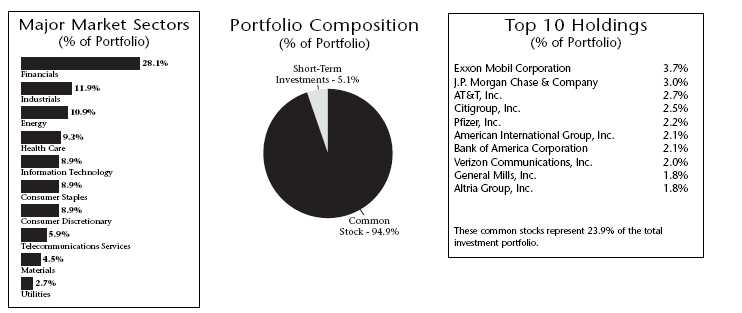
Quoted Major Market Sectors, Portfolio Composition and Top 10 Holdings are subject to change.
The lists of Major Market Sectors and Top 10 Holdings exclude short-term investments and collateral held for securities loaned.
The Portfolio Composition chart excludes collateral held for securities loaned.
42
In health care and particularly within the pharmaceuticals group, our largest overweighted holding, Sanofi-Aventis, declined because its new drug, Accompli, was not approved by the FDA. The Portfolio still retains Sanofi-Aventis but our expectations have been revised downward accordingly.
An underweighted position in AT&T hurt relative performance in telecommunications. In the materials sector, steel stocks performed well over the period, and we did not have a position in that segment of the materials industry.
What is your outlook?
We continue to find selected companies that offer both attractive relative valuations and expected improvement in operating performance in excess of consensus expectations. We have emphasized the shares of these companies in the Portfolio.

* The Russell 1000® Value Index is an index comprised of companies with lower price-to-book ratios and lower forecasted growth rates within the Russell 1000® Index. It is not possible to invest directly in the Index. The performance of the Index does not reflect deductions for fees, expenses or taxes.
** The Consumer Price Index is an inflationary indicator that measures the change in the cost of a fixed basket of products and services, including housing, electricity, food and transportation. It is not possible to invest directly in the Index.
Past performance is not an indication of future results. Total investment return and principal value will fluctuate and units, when redeemed, may be worth more or less than their original cost. Current performance may be higher or lower than the performance data quoted. Market volatility can significantly affect short-term performance, and more recent returns may be different from those shown. Call 800-THRIVENT or visit www.thrivent.com for performance results current to the most recent month-end.
1 Annualized total returns represent past performance and reflect changes in share prices, the reinvestment of all dividends and capital gains, and the effects of compounding. At various times, the Portfolio’s adviser reimbursed and/or paid non-advisory Portfolio expenses. Had the adviser not done so, the Portfolio’s total returns would have been lower. The returns shown do not reflect charges and expenses imposed on contract holders by the variable accounts. Those charges and expenses reduce the returns received by contract holders as compared to the returns presented.
Investing in a variable product involves risks, including the possible loss of principal. The prospectus contains more complete information on the investment objectives, risks, charges and expenses of the investment company, which investors should read and consider carefully before investing. To obtain a prospectus, contact a registered representative or visit www.thrivent.com. Please read your prospectus carefully.
43

How did the Portfolio perform during the six-month period ended June 29, 2007?
Thrivent Large Cap Stock Portfolio returned 6.77% during the six-month period ended June 29, 2007. The Portfolio’s peer group, as represented by the Lipper Large Cap Core category, reported a median return of 7.04% . The Portfolio’s market benchmark, the S&P 500, returned 6.96% .
What factors affected the Portfolio’s performance?
Returns were approximately just below both the Portfolio’s Index benchmark and median for its competitive universe as better than benchmark returns in certain segments of the Portfolio were fully offset by below benchmark results in other portions. Our modest position in cash for liquidity and transaction purposes was the most significant factor accounting for the modest performance lag versus the Index.
Stock selection was better than average in the financial, materials and consumer staples segments of the Portfolio. In the financial segment, we generally avoided holdings that were exposed to the difficulties being experienced in real estate and sub-prime lending while emphasizing those financial companies that would benefit from a continued positive environment for financial assets, such as mutual fund company Franklin Resources, Inc. and Ameriprise Financial. Holdings in brokerage firms Morgan Stanley, Goldman Sachs and UBS, Ag. aided results as they also provided better returns than the broader financial services companies.
Companies in the insurance industry in the Portfolio showed more mixed results with sub-par returns to our holding in American International Group, Inc. We had exposure in the strongly performing materials sector with positions in the chemical industry like Monsanto, Praxair Inc., and Air Products & Chemicals earning good returns for the Portfolio. Within the container segment, both Ball Corp. and Temple-Inland Industries achieved excellent returns for the Portfolio, as did Alcoa Inc. In the consumer staples sector, our holdings in food retailer Kroger Co. and drugstore chain CVS Caremark Corp also lifted our returns.
The consumer discretionary segment of the Portfolio was the source of disappointing results that offset the better performing sectors of the Portfolio. Hotels and restaurant stocks, particularly those exposed to the gaming and travel segments of the industry, came under pressure with investors’ concerns about the slowdown of consumer spending for leisure activities because of high oil prices. Select holdings in the media industry, especially those related to the traditional newspaper industry, did not perform as well as the broader market. Concerns about the business model in traditional channels in the era of continued challenges brought on by the emergence of Internet-based alternatives caused the group to be revalued.
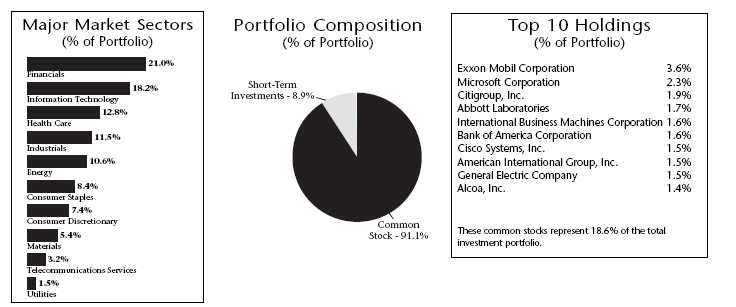
Quoted Major Market Sectors, Portfolio Composition and Top 10 Holdings are subject to change.
The lists of Major Market Sectors and Top 10 Holdings exclude short-term investments and collateral held for securities loaned.
The Portfolio Composition chart excludes collateral held for securities loaned.
44
What is your outlook?
We remain cautiously constructive on financial assets. We are concerned that more risky or volatile asset groups are richly priced following an extended period of above average performance. This doesn’t suggest necessarily that those groups will decline but indicates that an emphasis on higher-quality segments is appropriate within asset classes. This type of environment is favorable for large-cap portfolios as they appear to offer the best relative values while at the same time possessing characteristics of better quality financials and greater business diversity within the equity markets.
Additionally, large-cap companies tend to have greater exposure to the better near term growth that is evident outside the United States, either through export sales or directly from operations based overseas. The weak dollar of the last twelve months has made U.S. goods more competitive overseas and will also result in favorable currency translation benefits for earnings.
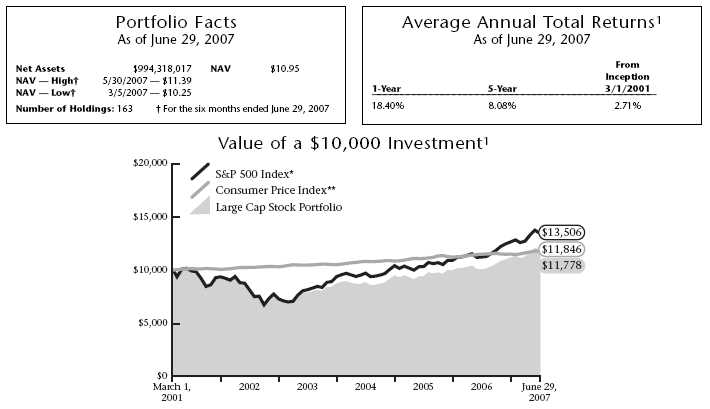
* The S&P 500 Index is an unmanaged index that represents the average performance of a group of 500 large-capitalization stocks. It is not possible to invest directly in the Index. The performance of the Index does not reflect deductions for fees, expenses or taxes.
** The Consumer Price Index is an inflationary indicator that measures the change in the cost of a fixed basket of products and services, including housing, electricity, food and transportation. It is not possible to invest directly in the Index.
Past performance is not an indication of future results. Total investment return and principal value will fluctuate and units, when redeemed, may be worth more or less than their original cost. Current performance may be higher or lower than the performance data quoted. Market volatility can significantly affect short-term performance, and more recent returns may be different from those shown. Call 800-THRIVENT or visit www.thrivent.com for performance results current to the most recent month-end.
1 Annualized total returns represent past performance and reflect changes in share prices, the reinvestment of all dividends and capital gains, and the effects of compounding. At various times, the Portfolio’s adviser reimbursed and/or paid non-advisory Portfolio expenses. Had the adviser not done so, the Portfolio’s total returns would have been lower. The returns shown do not reflect charges and expenses imposed on contract holders by the variable accounts. Those charges and expenses reduce the returns received by contract holders as compared to the returns presented.
Investing in a variable product involves risks, including the possible loss of principal. The prospectus contains more complete information on the investment objectives, risks, charges and expenses of the investment company, which investors should read and consider carefully before investing. To obtain a prospectus, contact a registered representative or visit www.thrivent.com. Please read your prospectus carefully.
45

How did the Portfolio perform during the six-month period ended June 29, 2007?
Thrivent Large Cap Index Portfolio returned 6.76% during the six-month period ended June 29, 2007. The Portfolio’s peer group, as represented by the S&P 500 Index Objective category, reported a median return of 6.77% . The Portfolio’s market benchmark, the S&P 500 Index, returned 6.96% .
What factors affected the Portfolio’s performance?
The Portfolio is managed to virtually replicate the performance of the S&P 500 Index. We seek to maintain a fully invested position with limited transactions to minimize costs. As typically occurs with an index fund, the difference in performance between the benchmark index and the fund itself can be largely attributed to expenses and minor differences in Portfolio composition.
Energy, materials, and telecommunication services sectors were the best performing groups in the market over the six-month period. Energy stocks clearly benefited from the continued rise in oil and gas prices, and energy equipment and services stocks represented the strongest industry within the sector. Industrial stocks also performed well, due to increased spending on capital investments by businesses. The biggest sector represented in the Index, financial stocks, was the only sector that delivered negative returns for the six-month period. Financial stocks such as thrifts, banks, and real estate investment trusts (REITs) suffered as interest rates rose during the first half of 2007. An additional factor impacting segments of the financial sector was ongoing deterioration in the sub-prime mortgage lending industry.

Quoted Major Market Sectors, Portfolio Composition and Top 10 Holdings are subject to change.
The lists of Major Market Sectors and Top 10 Holdings exclude short-term investments and collateral held for securities loaned.
The Portfolio Composition chart excludes collateral held for securities loaned.
46
What is your outlook?
Large-cap stocks lagged mid- and small-cap stocks for the six-month period. If past economic cycles are any indication, the market may begin to favor large-cap issues in the months ahead. Typically, investors look for higher-quality stocks as economic growth moves past its peak in a given cycle, a factor that could help the Portfolio.
In an environment where investors are faced with greater uncertainty about the direction of interest rates and the strength of the domestic economy, large stocks may offer a relatively safe haven in the equity markets. While we can anticipate continued volatility from stocks as a whole, those represented in this Index continue to offer a generally positive outlook.

* The S&P 500 Index is an index that represents the average performance of a group of 500 large-capitalization stocks. “S&P 500®” is a trademark of The McGraw-Hill Companies, Inc. and has been licensed for use by Thrivent Financial for Lutherans. The product is not sponsored, endorsed or promoted by Standard & Poor’s, and Standard & Poor’s makes no representation regarding the advisability of investing in the product. It is not possible to invest directly in the Index. Index funds are subject to the same market risks associated with the stocks in their respective indexes. The performance of these Indexes does not reflect deductions for fees, expenses or taxes.
** The Consumer Price Index is an inflationary indicator that measures the change in the cost of a fixed basket of products and services, including housing, electricity, food and transportation. It is not possible to invest directly in the Index.
Past performance is not an indication of future results. Total investment return and principal value will fluctuate and units, when redeemed, may be worth more or less than their original cost. Current performance may be higher or lower than the performance data quoted. Market volatility can significantly affect short-term performance, and more recent returns may be different from those shown. Call 800-THRIVENT or visit www.thrivent.com for performance results current to the most recent month-end.
1 Annualized total returns represent past performance and reflect changes in share prices, the reinvestment of all dividends and capital gains, and the effects of compounding. At various times, the Portfolio’s adviser reimbursed and/or paid non-advisory Portfolio expenses. Had the adviser not done so, the Portfolio’s total returns would have been lower. The returns shown do not reflect charges and expenses imposed on contract holders by the variable accounts. Those charges and expenses reduce the returns received by contract holders as compared to the returns presented.
Investing in a variable product involves risks, including the possible loss of principal. The prospectus contains more complete information on the investment objectives, risks, charges and expenses of the investment company, which investors should read and consider carefully before investing. To obtain a prospectus, contact a registered representative or visit www.thrivent.com. Please read your prospectus carefully.
47

How did the Portfolio perform for the six-month period ended June 29, 2007?
Thrivent Real Estate Securities Portfolio returned –6.14%, net of expenses, during the six-month period ended June 29, 2007. The Portfolio’s peer group, as represented by the Lipper Real Estate category, reported a median return of –5.82% . The Portfolio’s market benchmark, the FTSE NAREIT Equity REIT Index, which is without expenses, returned –5.89% .
What factors affected the Portfolio’s performance?
Subsequent to attaining an all-time high on February 7, 2007 (the day the $39 billion Equity Office Properties transaction was approved by shareholders), the FTSE NAREIT Equity REIT Index registered a decline of 16.60% through June 29, 2007. Many reasons have been offered to explain the negative performance of the sector during this period, including 1) real estate investment trust (REIT) stocks became overvalued, 2) dividend yields were too low, 3) rising interest rates made bonds and money market funds more competitive, 4) the overall equity market had been performing well, and 5) real estate mutual fund redemptions escalated. All of these factors contributed to the weak performance during the first half of 2007.
The best performing sectors in our Portfolio were multifamily apartments, regional malls, lodging/resort properties, and international real estate companies. Property sectors that detracted from performance were health care properties, retail shopping centers and self storage facilities. We benefited by having virtually no exposure in home building stocks, which have been devastated by overbuilding, rising interest rates, and a dramatic increase in foreclosures. Our two largest positive contributors to performance were Archstone-Smith Trust, one of the largest multifamily apartment REITs in the U.S., which agreed to be acquired by a private real estate company, and Starwood Hotels & Resorts, one of the premier lodging/resort companies.
The Portfolio’s performance was positively influenced by its recently established exposure in international real estate companies, which helped mitigate the generally weak performance of large-capitalization U.S. REITs during the first half of 2007.
What is your outlook?
Despite the weak performance of REIT stocks during the first half of 2007, the underlying fundamental factors have not changed materially. Demand for office and industrial property remains strong, particularly in gateway cities and coastal locations which benefit from global trade and high barriers to development of new properties. Regional malls are enjoying high occupancy rates and steadily increasing rents, particularly in dominant centers located in major metropolitan markets. Rental demand for retail shopping centers is also buoyant, especially in affluent and densely populated communities and
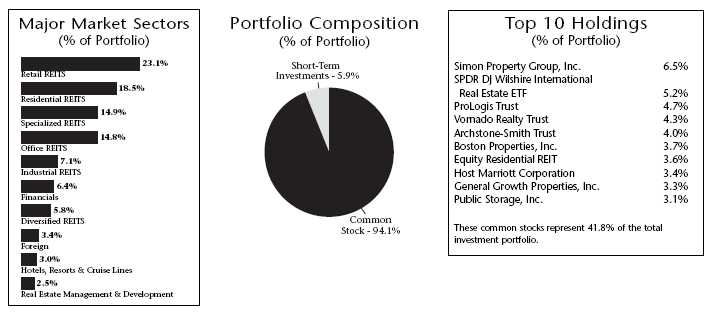
Quoted Major Market Sectors, Portfolio Composition and Top 10 Holdings are subject to change.
The lists of Major Market Sectors and Top 10 Holdings exclude short-term investments and collateral held for securities loaned.
The Portfolio Composition chart excludes collateral held for securities loaned.
48
neighborhoods. Multifamily apartment owners may face more competition from the single family market as a result of the oversupply of new and existing homes, although affordability-constrained markets such as California, New York, and Washington D.C. enjoy exceptionally strong apartment demand. Investment demand continues to be strong for real estate across all property types, with most of the recent merger and acquisition activity occurring in the office, apartment, and lodging/resort sectors.
The REIT market may continue to experience selling pressure if interest rates remain above 5% as measured by the ten-year U.S. Treasury Note. We will closely monitor interest rate levels and trends to determine whether any detrimental impact is occurring in the private real estate market, which directly affects REIT stock valuations. As a result of the increased level of risk in the REIT sector, we have positioned the Portfolio more defensively by broadening exposure within the U.S. real estate market, while continuing to selectively increase our international real estate exposure. We believe that U.S. REIT stocks will continue to be a rewarding long-term investment, and encourage shareholders to maintain their asset allocation commitment to the real estate sector despite the recent more challenging environment.
* The FTSE NAREIT Equity REIT Index is an unmanaged capitalization-weighted index of all equity real estate investment trusts. It is not possible to invest directly in this Index. The performance of this Index does not reflect deductions for fees, expenses or taxes.
** The Consumer Price Index is an inflationary indicator that measures the change in the cost of a fixed basket of products and services, including housing, electricity, food and transportation. It is not possible to invest directly in the Index.
Past performance is not an indication of future results. Total investment return and principal value will fluctuate and units, when redeemed, may be worth more or less than their original cost. Current performance may be higher or lower than the performance data quoted. Market volatility can significantly affect short-term performance, and more recent returns may be different from those shown. Call 800-THRIVENT or visit www.thrivent.com for performance results current to the most recent month-end.
1 Annualized total returns represent past performance and reflect changes in share prices, the reinvestment of all dividends and capital gains, and the effects of compounding. At various times, the Portfolio’s adviser reimbursed and/or paid non-advisory Portfolio expenses. Had the adviser not done so, the Portfolio’s total returns would have been lower. The returns shown do not reflect charges and expenses imposed on contract holders by the variable accounts. Those charges and expenses reduce the returns received by contract holders as compared to the returns presented.
Investing in a variable product involves risks, including the possible loss of principal. The prospectus contains more complete information on the investment objectives, risks, charges and expenses of the investment company, which investors should read and consider carefully before investing. To obtain a prospectus, contact a registered representative or visit www.thrivent.com. Please read your prospectus carefully.
49

How did the Portfolio perform during the six-month period ended June 29, 2007?
Thrivent Balanced Portfolio returned 4.78% during the six-month period ended June 29, 2007. The Portfolio’s market benchmarks, the S&P 500 Index, and the Lehman Brothers Aggregate Bond Index, returned 6.96% and 0.98%, respectively.
What factors affected the Portfolio’s performance?
Segment allocations tend to have the most significant impact on performance since both the equity and fixed income subcomponents of the Portfolio are managed to perform in line with their respective benchmark indexes. Stock returns were meaningfully better than bond returns in the period and we maintained an allocation of approximately two-thirds of assets invested in the equity segment, causing the return to be more in line with that earned in equity assets.
In the equity piece, energy, materials, and telecommunication services sectors were the best performing groups in the market over the six-month period. Energy stocks clearly benefited from the continued rise in oil and gas prices. Energy equipment and services stocks represented the strongest industry within the sector. Industrial stocks also performed well, due to increased spending on capital investments by businesses. The biggest sector represented in the Index, financial stocks, was the only sector that delivered negative returns for the six-month period. Financial stocks, such as thrifts, banks, and real estate investment trusts (REITs), suffered as interest rates rose during the first half of 2007.
Over the past six months, the bond market experienced rising interest rates and a reshaping of the Treasury yield curve from inverted to positive. Ten-year Treasury yields increased 0.33% from 4.70% to 5.03% over the period. Two-year Treasuries started the period at 4.81% and ended at 4.88%, up 0.07% . This resulted from improved economic growth, an elevated concern about inflation and less concern about adverse economic spillover from sub-prime mortgage loans. The best performing sectors in the investment grade bond market were shorter maturity Treasuries and Baa-rated corporate bonds. Residential mortgage-backed loans and commercial mortgage-backed loans were the worst performing sectors.
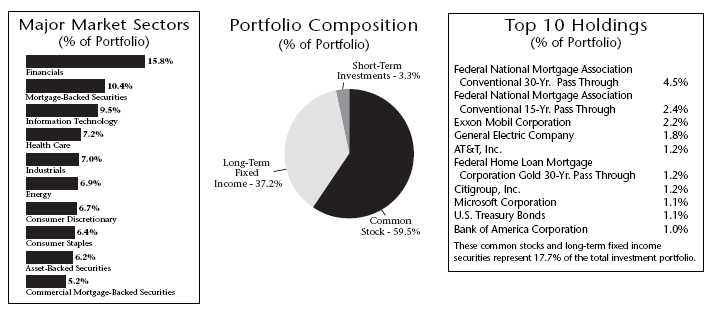
Quoted Major Market Sectors, Portfolio Composition and Top 10 Countries are subject to change. Major Market Sectors represent long-term non-government holdings.
The lists of Top 10 Holdings exclude short-term investments and collateral held for securities loaned.
The Portfolio Composition chart excludes collateral held for securities loaned.
50
What is your outlook?
We think the Federal Reserve Bank will be on hold the remainder of the year. This should keep U.S. Treasury rates fluctuating around current levels, which are at or near five-year highs. Of course there naturally will be some volatility around the level of interest rates as new economic information comes forth.
Large-cap stocks lagged mid- and small-cap stocks for the six-month period. If past economic cycles are any indication, the market may begin to favor large-cap issues in the months ahead. Typically, investors look for higher-quality stocks as economic growth moves past its peak in a given cycle, a factor that could help the Portfolio.
A balanced portfolio can offer a relatively safe haven in this investment arena. While we can anticipate continued volatility from stocks as a whole, those represented in this Index continue to offer a generally positive outlook.

* The S&P 500 Index is an unmanaged index that represents the average performance of a group of 500 large-capitalization stocks. It is not possible to invest directly in the Index. The performance of the Index does not reflect deductions for fees, expenses or taxes.
** The Lehman Brothers Aggregate Bond Index is an unmanaged index that measures the performance of U.S. investment grade bonds. It is not possible to invest directly in the Index. The performance of the Index does not reflect deductions for fees, expenses or taxes.
*** The Consumer Price Index is an inflationary indicator that measures the change in the cost of a fixed basket of products and services, including housing, electricity, food and transportation. It is not possible to invest directly in the Index.
Past performance is not an indication of future results. Total investment return and principal value will fluctuate and units, when redeemed, may be worth more or less than their original cost. Current performance may be higher or lower than the performance data quoted. Market volatility can significantly affect short-term performance, and more recent returns may be different from those shown. Call 800-THRIVENT or visit www.thrivent.com for performance results current to the most recent month-end.
1 Annualized total returns represent past performance and reflect changes in share prices, the reinvestment of all dividends and capital gains, and the effects of compounding. At various times, the Portfolio’s adviser reimbursed and/or paid non-advisory Portfolio expenses. Had the adviser not done so, the Portfolio’s total returns would have been lower. The returns shown do not reflect charges and expenses imposed on contract holders by the variable accounts. Those charges and expenses reduce the returns received by contract holders as compared to the returns presented.
Investing in a variable product involves risks, including the possible loss of principal. The prospectus contains more complete information on the investment objectives, risks, charges and expenses of the investment company, which investors should read and consider carefully before investing. To obtain a prospectus, contact a registered representative or visit www.thrivent.com. Please read your prospectus carefully.
51

How did the Portfolio perform during the six-month period ended June 29, 2007?
Thrivent High Yield Portfolio returned 2.80% during the six-month period ended June 29, 2007. The Portfolio’s peer group, as represented by the Lipper U.S. High Current Yield category, reported a median return of 2.99% . The Portfolio’s market benchmark, the Lehman Brothers U.S. Corporate High Yield Bond Index, returned 2.87% .
What factors affected the Portfolio’s performance?
Our underweighting of higher-risk, lower-quality securities generally detracted from the Portfolio’s performance during the period. Although the Portfolio underperformed its peers when lower-quality securities rallied the market, it outperformed them when riskier securities led the market lower. High yield bond prices were somewhat volatile, with the yield margin between the bonds and safer Treasury securities tightening until mid-period and then widening as the market sold off.
Other factors detracting from our performance included our underweighted position in auto-related bonds, which outperformed during the six-month period, and our overweighted stance in the home building sector, which was hit hard by the nation’s housing market decline. Our home construction industry bonds were generally of a higher quality, but unfortunately they were affected more than lower-quality names by the housing slump. We sold many of these securities later in the reporting period. Finally, our holdings of electric utility bonds underperformed the market and hurt our relative performance.
Positive contributors to performance included our higher allocation to cash and other defensive strategies when the market began to sell off later in the period. Our overweighted positions in the metals and mining, chemicals, and cable and media sectors also benefited our results. Good credit selection within each of these industries helped the Portfolio’s holdings outperform each sector’s average return during the period. Some of the securities that helped our performance included FMG Mining, Freeport-McMoRan and Charter Cable.
Also boosting the performance of the high yield sector overall during the period was an increase in leveraged buyouts. Unlike many investment grade bonds, high yield bonds often have covenants that protect the bondholder; this caused numerous bonds to be taken out at large premiums.
What is your outlook?
Our outlook for high yield bonds is generally cautious, given the high yield market’s rich valuations and historically thin yield margins over Treasury bonds. Even after the market
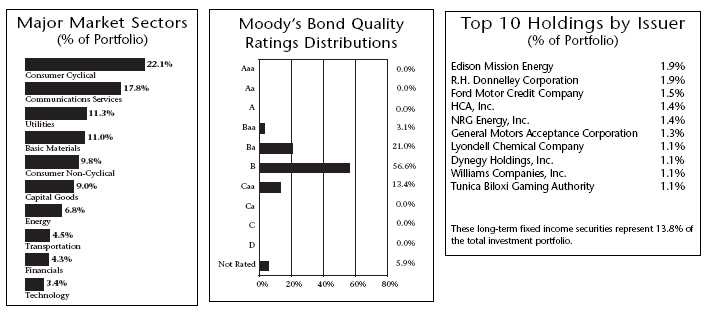
*High-yield bonds carry greater volatility and risk than investment-grade bonds.
Quoted Major Market Sectors, Moody’s Bond Quality Ratings Distributions and Top 10 Holdings by Issuer are subject to change.
The lists of Major Market Sectors and Top 10 Holdings by Issuer exclude short-term investments and collateral held for securities loaned.
52
sell off late in the period, further corrections could occur. Continued worries about the housing market slump and sub-prime mortgage troubles may depress high yield bond prices. Also, the amount of leverage used in leveraged buyouts has increased significantly, and that could pose problems for the market several years from now.
Despite our concerns, reasonable economic fundamentals should provide support for the high yield market. We expect a mild slowdown in U.S. economic growth as opposed to an outright recession, which we believe is unlikely given the strength of current economic fundamentals. The combination of steady but slower growth and low default rates should enable high yield bonds to continue providing a reasonable total return compared to other risk asset classes.
All in all, we are convinced that the Portfolio’s current composition and structure position it well for the macro environment we expect over the months ahead.

** The Lehman Brothers U.S. Corporate High Yield Bond Index is an index which measures the performance of fixed-rate non-investment grade bonds. It is not possible to invest directly in the Index. The performance of the Index does not reflect deductions for fees, expenses or taxes.
*** The Consumer Price Index is an inflationary indicator that measures the change in the cost of a fixed basket of products and services, including housing, electricity, food and transportation. It is not possible to invest directly in the Index.
Past performance is not an indication of future results. Total investment return and principal value will fluctuate and units, when redeemed, may be worth more or less than their original cost. Current performance may be higher or lower than the performance data quoted. Market volatility can significantly affect short-term performance, and more recent returns may be different from those shown. Call 800-THRIVENT or visit www.thrivent.com for performance results current to the most recent month-end.
1 Annualized total returns represent past performance and reflect changes in share prices, the reinvestment of all dividends and capital gains, and the effects of compounding. At various times, the Portfolio’s adviser reimbursed and/or paid non-advisory Portfolio expenses. Had the adviser not done so, the Portfolio’s total returns would have been lower. The returns shown do not reflect charges and expenses imposed on contract holders by the variable accounts. Those charges and expenses reduce the returns received by contract holders as compared to the returns presented.
Investing in a variable product involves risks, including the possible loss of principal. The prospectus contains more complete information on the investment objectives, risks, charges and expenses of the investment company, which investors should read and consider carefully before investing. To obtain a prospectus, contact a registered representative or visit www.thrivent.com. Please read your prospectus carefully.
53

Thrivent Diversified Income Plus Portfolio seeks to maximize income while maintaining prospects for capital appreciation by investing primarily in a diversified portfolio of income producing securities.
How did the Portfolio perform during the six-month period ended June 29, 2007?
Thrivent Diversified Income Plus Portfolio returned 1.01% for the period. This compares with the Portfolio’s primary benchmarks, the S&P 500 Dividend Aristocrats Index, which returned 5.76%; the Lehman Brothers Aggregate Bond Index, which returned 0.98%; and the Lehman Brothers U.S. Corporate High Yield Bond Index, which returned 2.87%; for the same six-month time frame.
What factors affected the Portfolio’s performance?
Late in the six-month period, the market began to see economic growth and consumer prices heating up. Worries about inflation, along with the realization that the Federal Reserve wouldn’t begin easing rates as soon as investors had expected, drove interest rates sharply higher in June.
In the equity portion, our large relative allocation to real estate investment trusts (REITs) was a substantial detractor from the Portfolio’s performance. REIT share prices fell sharply during the period because of rising interest rates and a correction in the very high valuations reached due to the Equity Office Property acquisition in the first quarter. Thus REITs dramatically underperformed the rest of the equity market, after several years of above average returns.
Also hurting the Portfolio’s performance was our relatively high allocation to financial stocks, which underperformed relative to the market due to rising interest rates and ongoing troubles in the sub-prime loan sector. The Portfolio focuses on these traditionally high-dividend stocks in pursuing its objective of maximizing income.
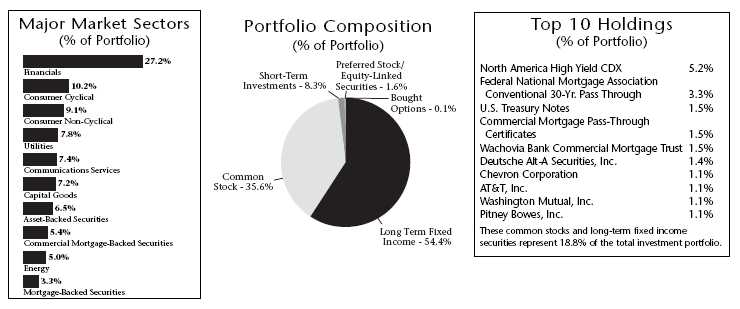
Quoted Major Market Sectors, Portfolio Composition and Top 10 Holdings are subject to change.
Major Market Sectors represent long-term non-government holdings.
The list of Top 10 Holdings excludes short-term investments and collateral held for securities loaned.
The Portfolio Composition chart excludes collateral held for securities loaned.
54
Rising rates also detracted from the returns of our bond holdings as well. Bond prices move in the opposite direction of interest rates, and the losses detracted from our holdings’ total return. High yield bonds, the main bond component in the Portfolio, fared best among bond sectors during the six-month period, though they lost much of their gains in June.
What is your outlook?
Although economic growth appeared to resurge in the second quarter, it’s unclear whether stronger growth will continue for the remainder of the year. We will be watching to see how the sub-prime mortgage situation, the housing market slump, interest and inflation rates, and other factors impact the economy. We think the Federal Reserve will abstain from changing interest rates for the rest of 2007, with the earliest possibility of a move in January 2008.
The worst may be over for REITs, but their performance over the short term may not be overly positive. For that reason, we will continue to underweight this sector. High yield bonds began to falter late in the period, as their yield margins over safer Treasury securities became extremely tight. We’ll continue to be cautious in this sector by upgrading quality and assuming a generally defensive posture.
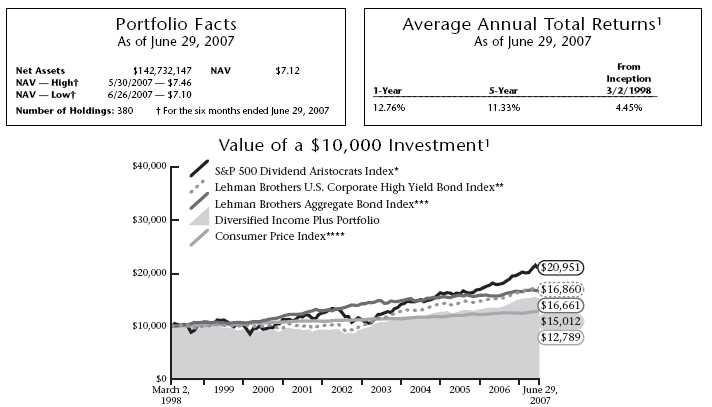
* The S&P 500 Dividend Aristocrats Index is an index which measures the performance of large-capitalization companies within the S&P 500 that have followed a managed dividends policy of consistently increasing dividends every year for at least 25 years. The index portfolio has both capital growth and dividend income characteristics, is equal-weighted and is broadly diversified across sectors. It is not possible to invest directly in the Index. The performance of the Index does not reflect deductions for fees, expenses or taxes. The composition of the S&P 500 Dividend Aristocrats Index serves as a better reflection of the Portfolios’ newly adopted strategy than does the Lehman Brothers U.S. Corporate High Yield Bond Index.
** The Lehman Brothers U.S. Corporate High Yield Bond Index is an index which measures the performance of fixed-rate non-investment grade bonds. It is not possible to invest directly in the Index. The performance of the Index does not reflect deductions for fees, expenses or taxes.
*** The Lehman Brothers Aggregate Bond Index is an index that measures the performance of U.S. investment grade bonds. It is not possible to invest directly in the Index. The performance of the Index does not reflect deductions for fees, expenses or taxes. The composition of the Lehman Brothers Aggregate Bond Index serves as a better reflection of the Portfolio’s current strategy than does the Lehman Brothers U.S. Corporate High Yield Bond Index.
****The Consumer Price Index is an inflationary indicator that measures the change in the cost of a fixed basket of products and services, including housing, electricity, food and transportation. It is not possible to invest directly in the Index.
Past performance is not an indication of future results. Total investment return and principal value will fluctuate and units, when redeemed, may be worth more or less than their original cost. Current performance may be higher or lower than the performance data quoted. Market volatility can significantly affect short-term performance, and more recent returns may be different from those shown. Call 800-THRIVENT or visit www.thrivent.com for performance results current to the most recent month-end.
1 Annualized total returns represent past performance and reflect changes in share prices, the reinvestment of all dividends and capital gains, and the effects of compounding. At various times, the Portfolio’s adviser reimbursed and/or paid non-advisory Portfolio expenses. Had the adviser not done so, the Portfolio’s total returns would have been lower. The returns shown do not reflect charges and expenses imposed on contract holders by the variable accounts. Those charges and expenses reduce the returns received by contract holders as compared to the returns presented.
Investing in a variable product involves risks, including the possible loss of principal. The prospectus contains more complete information on the investment objectives, risks, charges and expenses of the investment company, which investors should read and consider carefully before investing. To obtain a prospectus, contact a registered representative or visit www.thrivent.com. Please read your prospectus carefully.
55

How did the Portfolio perform during the six-month period ended June 29, 2007?
Thrivent Income Portfolio returned 0.91% during the six-month period ended June 29, 2007. The Portfolio’s peer group, as represented by the Lipper Corporate Debt Funds BBB-Rated Funds category, reported a median return of 1.01% . The Portfolio’s market benchmark, the Lehman Brothers Aggregate Bond Index, posted a return of 0.98% .
What factors affected the Portfolio’s performance?
Interest rates, and consequently bond prices, were volatile during the first half of 2007. After rising in the first weeks of the year, bond yields fell sharply in February as sub-prime mortgage troubles debuted and indicators of slower economic growth became more apparent. In the second quarter, the market began to see economic growth and consumer prices heating up. Worries about inflation, along with the realization that the Federal Reserve wouldn’t begin easing rates as soon as investors had expected, drove bond yields sharply higher in June.
The spike in yields — which occurred in all but the shortest maturity lengths — eliminated the yield curve inversion (an abnormal situation in which shorter-term bonds actually pay higher yields than longer-term bonds) that had persisted for much of the last year. The six-month Treasury yield fell from 5.09% to 4.93% during the period, the 10-year yield increased from 4.70% to 5.03%, and the 30-year Treasury yield rose from 4.81% to 5.12% .
High yield bonds fared best during the six-month period, though they lost much of their gains in June. Otherwise, securities that offer a yield margin, or “spread,” over safer Treasury securities — including investment grade corporate, agency, and mortgage backed bonds — underperformed Treasury securities. These bonds did well for the first five months of the year but, like high yield securities, struggled in June.
The Portfolio’s performance was hurt by our underweighting of high yield bonds early in the period, which was when the sector did well. We moved to a neutral weighting in high yield by June, but by then the bonds had begun to falter. Also detracting from our performance was our overweighting of mortgage backed bonds, a strategy that was most detrimental in June as selling pressure in this sector accelerated with rising rates.
A factor that boosted the Portfolio’s relative performance was our short duration (a measure of the Portfolio’s price sensitivity to interest rate movements; the greater the duration, the greater the price volatility of the Portfolio) versus our peer group. We used this strategy in a successful effort to take advantage of the yield curve’s movement back to a normal shape.
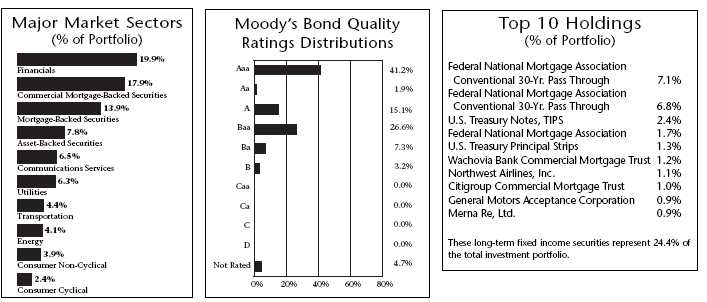
Quoted Major Market Sectors, Moody’s Bond Quality Ratings Distributions and Top 10 Holdings are subject to change.
Major Market Sectors represent long-term non-government holdings.
Moody’s Bond Quality Ratings Distributions and the list of Top 10 Holdings exclude short-term investments and collateral held for securities loaned.
56
What is your outlook?
Although economic growth appeared to resurge in the second quarter, it’s unclear whether stronger growth will continue for the remainder of the year. We will be watching to see how the sub-prime mortgage situation, the housing market slump, interest and inflation rates, and other factors impact the economy. We think the Federal Reserve will abstain from changing interest rates for the rest of 2007, with the earliest possibility of a move in January 2008.
We intend to keep the Portfolio’s duration short relative to our peers, clustered around the five-year maturity area to continue benefiting from the yield curve’s reversion to a normal shape. We will be slightly reducing our holdings of corporate bonds to an underweighted position, and maintain our modest overweighting in mortgage backed securities.
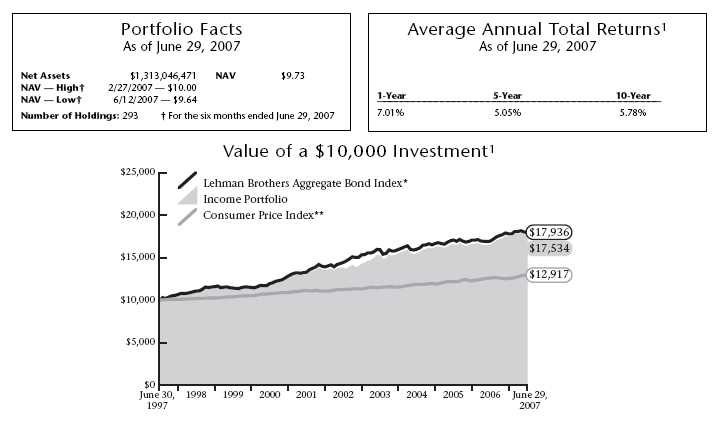
* The Lehman Brothers Aggregate Bond Index is an unmanaged index that measures the performance of U.S. investment grade bonds. It is not possible to invest directly in the Index. The performance of the Index does not reflect deductions for fees, expenses or taxes.
** The Consumer Price Index is an inflationary indicator that measures the change in the cost of a fixed basket of products and services, including housing, electricity, food and transportation. It is not possible to invest directly in the Index.
Past performance is not an indication of future results. Total investment return and principal value will fluctuate and units, when redeemed, may be worth more or less than their original cost. Current performance may be higher or lower than the performance data quoted. Market volatility can significantly affect short-term performance, and more recent returns may be different from those shown. Call 800-THRIVENT or visit www.thrivent.com for performance results current to the most recent month-end.
1 Annualized total returns represent past performance and reflect changes in share prices, the reinvestment of all dividends and capital gains, and the effects of compounding. At various times, the Portfolio’s adviser reimbursed and/or paid non-advisory Portfolio expenses. Had the adviser not done so, the Portfolio’s total returns would have been lower. The returns shown do not reflect charges and expenses imposed on contract holders by the variable accounts. Those charges and expenses reduce the returns received by contract holders as compared to the returns presented.
Investing in a variable product involves risks, including the possible loss of principal. The prospectus contains more complete information on the investment objectives, risks, charges and expenses of the investment company, which investors should read and consider carefully before investing. To obtain a prospectus, contact a registered representative or visit www.thrivent.com. Please read your prospectus carefully.
57

How did the Portfolio perform during the six-month period ended June 29, 2007?
Thrivent Bond Index Portfolio returned 0.78% during the six-month period ended June 29, 2007. The Portfolio’s peer group, as represented by Lipper General Bond category, reported a median return of 1.70% . The Portfolio’s market benchmark, the Lehman Brothers Aggregate Bond Index, returned 0.98% .
What factors affected the Portfolio’s performance?
Since the Portfolio’s objective is to track the performance of the Lehman Index, its allocations to various sectors of the broad U.S. fixed income markets generally mirror those of the Index. The reason the Portfolio underperformed the Lehman Index is that it incurred operating expenses, whereas none were incurred by the Index.
Interest rates, and consequently bond prices, were volatile during the first half of 2007. After rising in the first weeks of the year, bond yields fell sharply in February as sub-prime mortgage troubles debuted and indicators of slower economic growth became more apparent. In the second quarter, the market began to see economic growth and consumer prices heating up. Worries about inflation, along with the realization that the Federal Reserve wouldn’t begin easing rates as soon as investors had expected, drove bond yields sharply higher in June.
The spike in yields — which occurred in all but the shortest maturity lengths — eliminated the yield curve inversion (an abnormal situation in which shorter-term bonds actually pay higher yields than longer-term bonds) that had persisted for much of the last year. The six-month Treasury yield fell from 5.09% to 4.93% during the period, the 10-year yield increased from 4.70% to 5.03%, and the 30-year Treasury yield rose from 4.81% to 5.12% .
During the six-month period, securities that offer a yield margin, or “spread,” over safer Treasury securities — including investment grade corporate, agency, and mortgage backed bonds — underperformed Treasury securities. These bonds did well for the first five months of the year but struggled in June.
What is your outlook?
Although economic growth appeared to resurge in the second quarter, it’s unclear whether stronger growth will
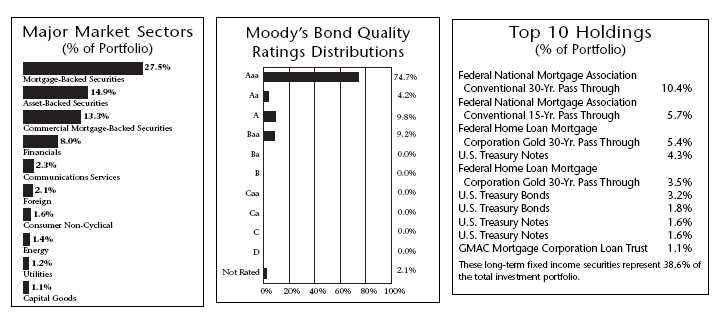
Quoted Major Market Sectors, Moody’s Bond Quality Ratings Distributions and Top 10 Holdings are subject to change.
Major Market Sectors represent long-term non-government holdings.
Moody’s Bond Quality Ratings Distributions and the list of Top 10 Holdings exclude short-term investments and collateral held for securities loaned.
58
continue for the remainder of the year. We will be watching to see how the sub-prime mortgage situation, the housing market slump, interest and inflation rates, and other factors impact the economy. We think the Federal Reserve will abstain from changing interest rates for the rest of 2007, with the earliest possibility of a move in January 2008.
With interest rates up over the last two years, we believe yield will play a more prominent role in the total return of the Portfolio going forward. As always, we intend to maintain a well diversified mix of debt securities in our efforts to track the performance of the Lehman Index.
* The Lehman Brothers Aggregate Bond Index is an unmanaged index that measures the performance of U.S. investment grade bonds. It is not possible to invest directly in the Index. The performance of the Index does not reflect deductions for fees, expenses or taxes.
** The Consumer Price Index is an inflationary indicator that measures the change in the cost of a fixed basket of products and services, including housing, electricity, food and transportation. It is not possible to invest directly in the Index.
Past performance is not an indication of future results. Total investment return and principal value will fluctuate and units, when redeemed, may be worth more or less than their original cost. Current performance may be higher or lower than the performance data quoted. Market volatility can significantly affect short-term performance, and more recent returns may be different from those shown. Call 800-THRIVENT or visit www.thrivent.com for performance results current to the most recent month-end.
1 Annualized total returns represent past performance and reflect changes in share prices, the reinvestment of all dividends and capital gains, and the effects of compounding. At various times, the Portfolio’s adviser reimbursed and/or paid non-advisory Portfolio expenses. Had the adviser not done so, the Portfolio’s total returns would have been lower. The returns shown do not reflect charges and expenses imposed on contract holders by the variable accounts. Those charges and expenses reduce the returns received by contract holders as compared to the returns presented.
Investing in a variable product involves risks, including the possible loss of principal. The prospectus contains more complete information on the investment objectives, risks, charges and expenses of the investment company, which investors should read and consider carefully before investing. To obtain a prospectus, contact a registered representative or visit www.thrivent.com. Please read your prospectus carefully.
59

How did the Portfolio perform during the six-month period ended June 29, 2007?
Thrivent Limited Maturity Bond Portfolio returned 2.01% during the six-month period ended June 29, 2007. The Portfolio’s peer group, as represented by the Lipper Short Investment Grade Debt category, reported a median return of 1.96% . The Portfolio’s market benchmark, the Lehman Brothers Government/Credit 1-3 Year Bond Index, returned 2.16% .
What factors affected the Portfolio’s performance?
Interest rates, and consequently bond prices, were volatile during the first half of 2007. After rising in the first weeks of the year, bond yields fell sharply in February as sub-prime mortgage troubles debuted and indicators of slower economic growth became more apparent. In the second quarter, the market began to see economic growth and consumer prices heating up. Worries about inflation, along with the realization that the Federal Reserve wouldn’t begin easing rates as soon as investors had expected, drove bond yields sharply higher in June.
The spike in yields — which occurred in all but the shortest maturity lengths — eliminated the yield curve inversion (an abnormal situation in which shorter-term bonds actually pay higher yields than longer-term bonds) that had persisted for much of the last year. The six-month Treasury yield fell from 5.09% to 4.93% during the period, the two-year yield increased from 4.82% to 4.87%, and the 10-year Treasury yield rose from 4.71% to 5.03% .
The Portfolio’s performance benefited from a higher allocation to cash equivalent and floating rate securities, which — due to an inverted yield curve — generated higher yields than most longer maturity securities. A modest short duration positioning due to the outlook for steady Federal Reserve interest rate policy and higher interest rates also contributed positively to performance during the period.
The Portfolio’s overweighting in the high-quality spread sectors of the bond market and an underweighted position in government securities negatively affected performance during the six-month period. Concerns about sub-prime mortgage lending and higher interest rates caused spreads versus U.S. Treasuries to widen in the second quarter.
What is your outlook?
Although economic growth appeared to resurge in the second quarter, it’s unclear whether stronger growth will
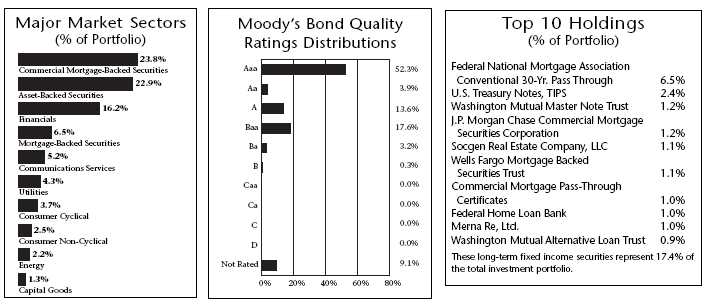
Quoted Major Market Sectors, Moody’s Bond Quality Ratings Distributions and Top 10 Holdings are subject to change.
Major Market Sectors represent long-term non-government holdings.
Moody’s Bond Quality Ratings Distributions and the list of Top 10 Holdings exclude short-term investments and collateral held for securities loaned.
60
continue for the remainder of the year. We will be watching to see how the sub-prime mortgage situation, the housing market slump, interest and inflation rates, and other factors affect the economy.
We think the Federal Reserve will abstain from changing interest rates for the rest of 2007, with the earliest possibility of a move in January 2008. As for when the Fed does step off of the sidelines, there now appears to be an equal chance that the next change will be an increase or a decrease.
Given the outlook for steady Fed rate policy, we plan to hold our overweighted position in cash equivalent and floating rate securities given the yield advantage and limited price risk. We also expect that the yield curve will gradually become steeper and plan to increase the Portfolio’s weighting in two- to three-year maturity securities. We plan to reduce the Portfolio’s overweighting in the spread related sectors of the market by lowering the weighting in the AAA securitized asset sectors (mortgage-backed, asset-backed, and commercial mortgage-backed securities). We will also increase our weighting to Treasury securities as part of a defensive strategy.
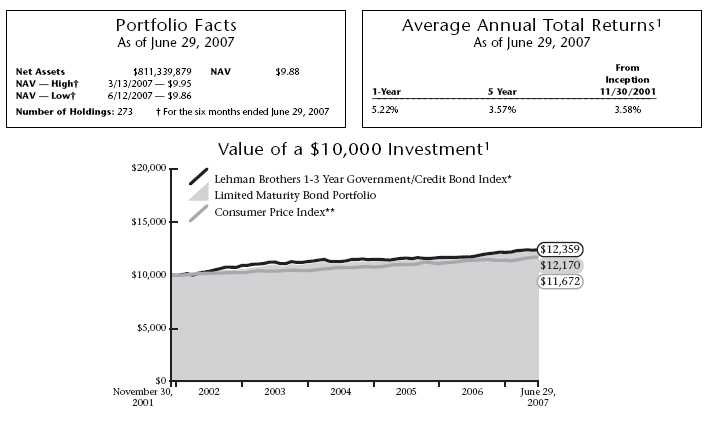
* The Lehman Brothers 1-3 Year Government/Credit Bond Index is an unmanaged market value weighted performance benchmark for government and corporate fixed-rate debt issues with maturities between one and three years. It is not possible to invest directly in the Index. The performance of the Index does not reflect deductions for fees, expenses or taxes.
** The Consumer Price Index is an inflationary indicator that measures the change in the cost of a fixed basket of products and services, including housing, electricity, food and transportation. It is not possible to invest directly in the Index.
Past performance is not an indication of future results. Total investment return and principal value will fluctuate and units, when redeemed, may be worth more or less than their original cost. Current performance may be higher or lower than the performance data quoted. Market volatility can significantly affect short-term performance, and more recent returns may be different from those shown. Call 800-THRIVENT or visit www.thrivent.com for performance results current to the most recent month-end.
1 Annualized total returns represent past performance and reflect changes in share prices, the reinvestment of all dividends and capital gains, and the effects of compounding. At various times, the Portfolio’s adviser reimbursed and/or paid non-advisory Portfolio expenses. Had the adviser not done so, the Portfolio’s total returns would have been lower. The returns shown do not reflect charges and expenses imposed on contract holders by the variable accounts. Those charges and expenses reduce the returns received by contract holders as compared to the returns presented.
Investing in a variable product involves risks, including the possible loss of principal. The prospectus contains more complete information on the investment objectives, risks, charges and expenses of the investment company, which investors should read and consider carefully before investing. To obtain a prospectus, contact a registered representative or visit www.thrivent.com. Please read your prospectus carefully.
61

The risks presented by mortgage securities include, but are not limited to, reinvestment of repaid principal at lower rates of return. The real estate industry — and therefore, the performance of the portfolio — is highly sensitive to economic conditions. In addition, the value of mortgage securities may fluctuate in response to changes in interest rates. These and other risks are described in the Portfolio’s prospectus.
How did the Portfolio perform during the six-month period ended June 29, 2007?
Thrivent Mortgage Securities Portfolio returned 0.56% during the six-month period ended June 29, 2007. The Portfolio peer group, as represented by the Lipper U.S. Mortgage Funds category, returned 0.65% . The Portfolio’s market benchmark, the Lehman Brothers Mortgage-Backed Securities Index, returned 1.05% .
What factors affected the Portfolio’s performance?
Interest rates, and consequently bond prices, were volatile during the first half of 2007. After rising in the first weeks of the year, bond yields fell sharply in February as sub-prime mortgage troubles debuted and indicators of slower economic growth became more apparent. Then in the second quarter, the market began to see economic growth and consumer prices heating up. Worries about inflation, along with the realization that the Federal Reserve wouldn’t begin easing rates as soon as investors had expected, drove bond yields sharply higher in June. The six-month Treasury yield fell from 5.09% to 4.93% during the period, the two-year yield increased from 4.82% to 4.87%, and the 10-year Treasury yield rose from 4.71% to 5.03% .
The period also was marked by higher wider spreads versus Treasuries due to concerns over sub-prime contagion in other sectors of the bond market. Agency-backed and mortgage-backed securities lagged behind other sectors of the bond market due to the higher interest rate volatility (mortgage-backed securities perform best in stable interest rate environments) and less demand from investors as a result of concerns over association with sub-prime mortgage exposure. Cash equivalent and AAA-rated floating rate mortgage securities provided the best returns over the period.
The Portfolio’s performance was hurt by its allocation to current coupon agency mortgage-backed securities and AAA-rated commercial mortgage-backed securities. The Portfolio benefited from a higher allocation to cash and floating rate securities in addition to an allocation to Treasury securities during the period.
What is your outlook?
Although economic growth appeared to resurge in the second quarter, it’s uncertain whether stronger growth will continue for the remainder of the year. We will be monitoring the sub-prime mortgage situation, the housing market slump, and interest and inflation rates for their impact on the economy.
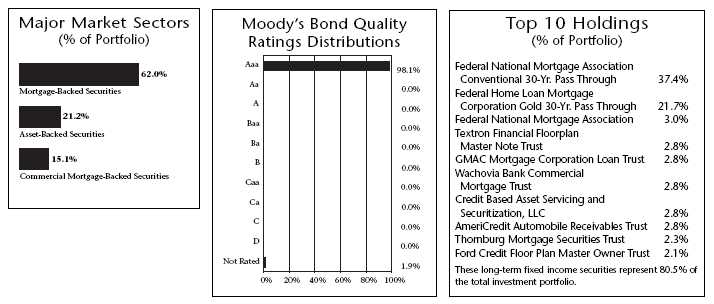
Quoted Major Market Sectors, Moody’s Bond Quality Ratings Distributions and Top 10 Holdings are subject to change.
Major Market Sectors represent long-term non-government holdings.
Moody’s Bond Quality Ratings Distributions and the list of Top 10 Holdings exclude short-term investments and collateral held for securities loaned.
62
We think the Federal Reserve will keep the Fed Funds rate unchanged for the rest of 2007, with the earliest possibility of a move in January 2008. There now appears to be an equal chance that the next move by the Fed will be an increase or a decrease. We expect interest rate volatility to remain at higher levels. Given this outlook, we plan to position the Portfolio with a similar duration to its benchmark and increase our emphasis on cash equivalents and Treasury securities versus mortgage-backed securities.

* The Lehman Brothers Mortgage-Backed Securities Index (MBS) is formed by grouping the universe of over 600,000 individual fixed rate U.S. government agency MBS pools into approximately 3,500 generic types of securities. It is not possible to invest directly in this Index. The performance of the Index does not reflect deductions for fees, expenses or taxes.
** The Consumer Price Index is an inflationary indicator that measures the change in the cost of a fixed basket of products and services, including housing, electricity, food and transportation. It is not possible to invest directly in the Index.
Past performance is not an indication of future results. Total investment return and principal value will fluctuate and units, when redeemed, may be worth more or less than their original cost. Current performance may be higher or lower than the performance data quoted. Market volatility can significantly affect short-term performance, and more recent returns may be different from those shown. Call 800-THRIVENT or visit www.thrivent.com for performance results current to the most recent month-end.
1 Annualized total returns represent past performance and reflect changes in share prices, the reinvestment of all dividends and capital gains, and the effects of compounding. At various times, the Portfolio’s adviser reimbursed and/or paid non-advisory Portfolio expenses. Had the adviser not done so, the Portfolio’s total returns would have been lower. The returns shown do not reflect charges and expenses imposed on contract holders by the variable accounts. Those charges and expenses reduce the returns received by contract holders as compared to the returns presented.
Investing in a variable product involves risks, including the possible loss of principal. The prospectus contains more complete information on the investment objectives, risks, charges and expenses of the investment company, which investors should read and consider carefully before investing. To obtain a prospectus, contact a registered representative or visit www.thrivent.com. Please read your prospectus carefully.
63

How did the Portfolio perform during the six-month period ended June 29, 2007?
Thrivent Money Market Portfolio produced a 2.53% return, while its peer group, the Lipper Money Market Portfolios category, reported a median net return of 2.41% .
What factors affected the Portfolio’s performance?
The Federal Reserve held short-term interest rates steady during the latest six-month period. Contributing to the Portfolio’s solid performance was our decision to not extend the Portfolio’s weighted-average maturity in early March when many market watchers expected the Federal Reserve to begin cutting interest rates. We maintained a slightly longer weighted-average maturity than the peer group during the first calendar quarter of 2007 and a slightly shorter weighted-average maturity during the second quarter.
Weighted-average maturity is the average maturity of all the securities that comprise a portfolio, typically expressed in days or years. Extending the weighted-average maturity of a portfolio requires adding longer-dated securities that will ultimately make the yield on the portfolio less sensitive to interest rate changes. Higher exposure to longer-dated securities in the portfolio will result in less impact to the yield on the portfolio when interest rates change. This is beneficial when rates decline faster than expectations, but detrimental when interest rates rise faster than expectations.
In addition, the Portfolio held a greater proportion of extendible floating rate securities than the peer group. These securities generally provide a higher yield than commercial paper and fixed maturity floating rate securities.
One factor that detracted from our performance during the period was that we didn’t extend the Portfolio’s average maturity more in January and February of 2007. As a result, we missed some opportunities. Maintaining our preference for high-quality, liquid investments also detracted from performance. Generally, higher-quality investments and/or more liquid investments offer less yield.
We are pleased to have achieved solid performance during the period while still maintaining a conservative Portfolio designed to meet shareholder’s objectives of safety and liquidity.
What is your outlook?
The Federal Reserve has kept interest rates steady since June of 2006, and we expect policymakers to continue to keep interest rates on hold as long as inflation remains elevated. While the housing industry remains weak, economic growth has accelerated from the first quarter and the Federal Reserve is unlikely to cut interest rates with inflation remaining above its stated comfort zone. In June the Fed

*To the extent practicable, the Portfolio intends to maintain a stable net asset value of $1.00 per share. An investment in Thrivent Money Market Portfolio is
not insured or guaranteed by the FDIC or any other government agency. Although the Portfolio seeks to preserve the value of your investment at $1.00
per share, it is possible to lose money by investing in the Portfolio.
Quoted Portfolio Composition is subject to change.
64
reiterated its forecast calling for moderating inflation, but it also acknowledged the risk that inflation remains elevated.
There are several factors that contribute to concern over the inflation trend, including high commodity prices and the low unemployment rate. Our strategy going forward is to maintain a slightly longer weighted average maturity in the Portfolio, but without adding significant exposure to long-dated securities. Doing so will keep the Portfolio flexible in case signs of economic growth or inflation grow and the market begins to anticipate higher interest rates. As in any interest rate environment, we will continue to focus on our primary objectives of safety and liquidity, while pursuing the optimum risk-adjusted yield.
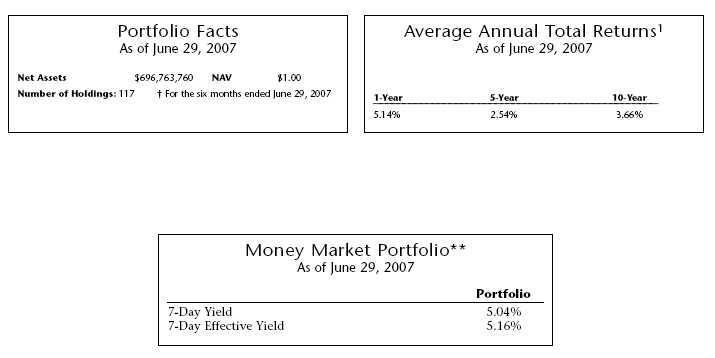
** Seven-day yields of Money Market Portfolio refer to the income generated by an investment in the Portfolio over a specified seven-day period, though they are expressed as annual percentage rates. Effective yields reflect the reinvestment of income. Yields are subject to daily fluctuation and should not be considered an indication of future results.
Past performance is not an indication of future results. Total investment return and principal value will fluctuate and units, when redeemed, may be worth more or less than their original cost. Current performance may be higher or lower than the performance data quoted. Market volatility can significantly affect short-term performance, and more recent returns may be different from those shown. Call 800-THRIVENT or visit www.thrivent.com for performance results current to the most recent month-end.
1 Annualized total returns represent past performance and reflect changes in share prices, the reinvestment of all dividends and capital gains, and the effects of compounding. At various times, the Portfolio’s adviser reimbursed and/or paid non-advisory Portfolio expenses. Had the adviser not done so, the Portfolio’s total returns would have been lower. The returns shown do not reflect charges and expenses imposed on contract holders by the variable accounts. Those charges and expenses reduce the returns received by contract holders as compared to the returns presented.
Investing in a variable product involves risks, including the possible loss of principal. The prospectus contains more complete information on the investment objectives, risks, charges and expenses of the investment company, which investors should read and consider carefully before investing. To obtain a prospectus, contact a registered representative or visit www.thrivent.com. Please read your prospectus carefully.
65
Shareholder Expense Example
(Unaudited)
As a shareholder of the Thrivent Series Fund, Inc., you incur ongoing costs, including management fees and other Portfolio expenses. This Example is intended to help you understand your ongoing costs (in dollars) of investing in a Portfolio and to compare these costs with the ongoing costs of investing in other mutual funds. The Example is based on an investment of $1,000 invested at the beginning of the period and held for the entire period from January 1, 2007 through June 29, 2007. Shares in a Portfolio are currently sold, without sales charges, only to separate accounts of Thrivent Financial for Lutherans and Thrivent Life Insurance Company, which are used to fund benefits of variable life insurance and variable annuity contracts issued by Thrivent Financial for Lutherans and Thrivent Life Insurance Company, and retirement plans sponsored by Thrivent Financial for Lutherans. Expenses associated with these variable contracts and reti rement plans are not included in these examples and had these costs been included, your costs would have been higher.
Actual Expenses
In the table below, the first line entitled Actual provides information about actual account values and actual expenses. You may use the information in this line, together with the amount you invested, to estimate the expenses that you paid over the period. Simply divide your account value by $1,000 (for example, an $8,600 account value divided by $1,000 = 8.6), then multiply the result by the number in the first line under the heading entitled Expenses Paid During Period to estimate the expenses you paid during the period.
Hypothetical Example for Comparison Purposes
In the table below, the second line entitled Hypothetical provides information about hypothetical account values and hypothetical expenses based on the Portfolio’s actual expense ratio and an assumed rate of return of 5% per year before expenses, which is not the Portfolio’s actual return. The hypothetical account values and expenses may not be used to estimate the actual ending account balance or expenses you paid for the period. You may use this information to compare the ongoing costs of investing in the Portfolio and other funds. To do so, compare this 5% hypothetical example with the 5% hypothetical examples that appear in the shareholder reports of the other funds.
| Beginning | Ending | Expenses | ||
| Account | Account | Paid During | Annualized | |
| Value | Value | Period * | Expense | |
| 1/1/2007 | 6/29/2007 | 1/1/2007 — 6/29/2007 | Ratio | |
| Thrivent Aggressive Allocation Portfolio | ||||
| Actual | $1,000 | $1,088 | $0.46 | 0.09% |
| Hypothetical ** | $1,000 | $1,024 | $0.45 | 0.09% |
| Thrivent Moderately Aggressive Allocation Portfolio | ||||
| Actual | $1,000 | $1,070 | $0.46 | 0.09% |
| Hypothetical ** | $1,000 | $1,024 | $0.45 | 0.09% |
| Thrivent Moderate Allocation Portfolio | ||||
| Actual | $1,000 | $1,055 | $0.56 | 0.11% |
| Hypothetical ** | $1,000 | $1,024 | $0.55 | 0.11% |
| Thrivent Moderately Conservative Allocation Portfolio | ||||
| Actual | $1,000 | $1,041 | $0.81 | 0.16% |
| Hypothetical ** | $1,000 | $1,024 | $0.80 | 0.16% |
| Thrivent Technology Portfolio | ||||
| Actual | $1,000 | $1,102 | $4.46 | 0.86% |
| Hypothetical ** | $1,000 | $1,020 | $4.28 | 0.86% |
| Thrivent Partner Small Cap Growth Portfolio | ||||
| Actual | $1,000 | $1,096 | $5.17 | 1.00% |
| Hypothetical ** | $1,000 | $1,020 | $4.98 | 1.00% |
| Thrivent Partner Small Cap Value Portfolio | ||||
| Actual | $1,000 | $1,080 | $4.41 | 0.86% |
| Hypothetical ** | $1,000 | $1,020 | $4.28 | 0.86% |
| Thrivent Small Cap Stock Portfolio | ||||
| Actual | $1,000 | $1,085 | $3.70 | 0.72% |
| Hypothetical ** | $1,000 | $1,021 | $3.59 | 0.72% |
66
| Beginning | Ending | Expenses | ||
| Account | Account | Paid During | Annualized | |
| Value | Value | Period * | Expense | |
| 1/1/2007 | 6/29/2007 | 1/1/2007 — 6/29/2007 | Ratio | |
| Thrivent Small Cap Index Portfolio | ||||
| Actual | $1,000 | $1,084 | $2.00 | 0.39% |
| Hypothetical ** | $1,000 | $1,023 | $1.95 | 0.39% |
| Thrivent Mid Cap Growth Portfolio | ||||
| Actual | $1,000 | $1,147 | $2.38 | 0.45% |
| Hypothetical ** | $1,000 | $1,022 | $2.24 | 0.45% |
| Thrivent Mid Cap Growth Portfolio II | ||||
| Actual | $1,000 | $1,147 | $3.23 | 0.61% |
| Hypothetical ** | $1,000 | $1,022 | $3.04 | 0.61% |
| Thrivent Mid Cap Value Portfolio | ||||
| Actual | $1,000 | $1,098 | $4.66 | 0.90% |
| Hypothetical ** | $1,000 | $1,020 | $4.48 | 0.90% |
| Thrivent Mid Cap Stock Portfolio | ||||
| Actual | $1,000 | $1,107 | $3.74 | 0.72% |
| Hypothetical ** | $1,000 | $1,021 | $3.59 | 0.72% |
| Thrivent Mid Cap Index Portfolio | ||||
| Actual | $1,000 | $1,117 | $2.19 | 0.42% |
| Hypothetical ** | $1,000 | $1,023 | $2.09 | 0.42% |
| Thrivent Partner International Stock Portfolio | ||||
| Actual | $1,000 | $1,107 | $4.26 | 0.82% |
| Hypothetical ** | $1,000 | $1,021 | $4.09 | 0.82% |
| Thrivent Partner All Cap Portfolio | ||||
| Actual | $1,000 | $1,114 | $4.38 | 0.84% |
| Hypothetical ** | $1,000 | $1,021 | $4.18 | 0.84% |
| Thrivent Large Cap Growth Portfolio | ||||
| Actual | $1,000 | $1,090 | $2.32 | 0.45% |
| Hypothetical ** | $1,000 | $1,022 | $2.24 | 0.45% |
| Thrivent Large Cap Growth Portfolio II | ||||
| Actual | $1,000 | $1,089 | $3.35 | 0.65% |
| Hypothetical ** | $1,000 | $1,021 | $3.24 | 0.65% |
| Thrivent Partner Growth Stock Portfolio | ||||
| Actual | $1,000 | $1,085 | $4.06 | 0.79% |
| Hypothetical ** | $1,000 | $1,021 | $3.94 | 0.79% |
| Thrivent Large Cap Value Portfolio | ||||
| Actual | $1,000 | $1,075 | $3.27 | 0.64% |
| Hypothetical ** | $1,000 | $1,022 | $3.19 | 0.64% |
| Thrivent Large Cap Stock Portfolio | ||||
| Actual | $1,000 | $1,068 | $3.36 | 0.66% |
| Hypothetical ** | $1,000 | $1,021 | $3.29 | 0.66% |
| Thrivent Large Cap Index Portfolio | ||||
| Actual | $1,000 | $1,068 | $1.84 | 0.36% |
| Hypothetical ** | $1,000 | $1,023 | $1.80 | 0.36% |
| Thrivent Real Estate Securities Portfolio | ||||
| Actual | $1,000 | $939 | $4.06 | 0.85% |
| Hypothetical ** | $1,000 | $1,020 | $4.23 | 0.85% |
| Thrivent Balanced Portfolio | ||||
| Actual | $1,000 | $1,048 | $1.92 | 0.38% |
| Hypothetical ** | $1,000 | $1,023 | $1.90 | 0.38% |
67
| Beginning | Ending | Expenses | ||
| Account | Account | Paid During | Annualized | |
| Value | Value | Period * | Expense | |
| 1/1/2007 | 6/29/2007 | 1/1/2007 — 6/29/2007 | Ratio | |
| Thrivent High Yield Portfolio | ||||
| Actual | $1,000 | $1,028 | $2.25 | 0.45% |
| Hypothetical ** | $1,000 | $1,022 | $2.24 | 0.45% |
| Thrivent Diversified Income Plus Portfolio | ||||
| Actual | $1,000 | $1,010 | $2.43 | 0.49% |
| Hypothetical ** | $1,000 | $1,022 | $2.44 | 0.49% |
| Thrivent Income Portfolio | ||||
| Actual | $1,000 | $1,009 | $2.18 | 0.44% |
| Hypothetical ** | $1,000 | $1,022 | $2.19 | 0.44% |
| Thrivent Bond Index Portfolio | ||||
| Actual | $1,000 | $1,008 | $2.03 | 0.41% |
| Hypothetical ** | $1,000 | $1,023 | $2.04 | 0.41% |
| Thrivent Limited Maturity Bond Portfolio | ||||
| Actual | $1,000 | $1,020 | $2.19 | 0.44% |
| Hypothetical ** | $1,000 | $1,022 | $2.19 | 0.44% |
| Thrivent Mortgage Securities Portfolio | ||||
| Actual | $1,000 | $1,006 | $3.17 | 0.64% |
| Hypothetical ** | $1,000 | $1,022 | $3.19 | 0.64% |
| Thrivent Money Market Portfolio | ||||
| Actual | $1,000 | $1,025 | $1.75 | 0.35% |
| Hypothetical ** | $1,000 | $1,023 | $1.75 | 0.35% |
*Expenses are equal to the Portfolio’s annualized expense ratio, multiplied by the average account value over the period, multiplied by 180 /365 to reflect the one-half year period.
**Assuming 5% total return before expenses.
68
| Aggressive Allocation Portfolio | |||
| Schedule of Investments as of June 29, 2007 (unaudited) | |||
| Shares | Value | Percentage | |
| Equity Portfolios (91.0%) | |||
| 1,889,233 | Thrivent Partner Small Cap Growth Portfolio # | $26,598,317 | 6.0% |
| 986,566 | Thrivent Partner Small Cap Value Portfolio | 19,852,955 | 4.5 |
| 2,099,026 | Thrivent Small Cap Stock Portfolio | 33,212,887 | 7.5 |
| 802,038 | Thrivent Mid Cap Growth Portfolio | 15,476,532 | 3.5 |
| 1,079,720 | Thrivent Partner Mid Cap Value Portfolio | 15,409,332 | 3.5 |
| 2,411,839 | Thrivent Mid Cap Stock Portfolio | 33,223,328 | 7.5 |
| 5,398,487 | Thrivent Partner International Stock Portfolio | 93,278,833 | 21.1 |
| 5,132,666 | Thrivent Large Cap Growth Portfolio | 92,624,093 | 20.9 |
| 2,246,031 | Thrivent Large Cap Value Portfolio | 30,917,964 | 7.0 |
| 3,830,849 | Thrivent Large Cap Stock Portfolio | 41,961,586 | 9.5 |
| Total Equity Portfolios | |||
| (cost $360,517,270) | 402,555,827 | ||
| Debt Portfolios (7.0%) | |||
| 866,567 | Thrivent High Yield Portfolio | 4,369,406 | 1.0 |
| 2,263,411 | Thrivent Income Portfolio | 22,012,800 | 5.0 |
| 446,120 | Thrivent Limited Maturity Bond Portfolio | 4,407,667 | 1.0 |
| Total Debt Portfolios | |||
| (cost $30,849,234) | 30,789,873 | ||
| Short-Term Investments (2.0%) | |||
| 8,787,014 | Thrivent Money Market Portfolio | 8,787,014 | 2.0 |
| Total Short-Term Investments | |||
| (cost $8,787,014) | 8,787,014 | ||
| Total Investments | |||
| (cost $400,153,518) 100.0% | $442,132,714 | ||
| Other Assets and Liabilities, | |||
| Net (0.0%) | (72,307) | ||
| Total Net Assets 100.0% | $442,060,407 | ||
# Non-income producing security.
Gross unrealized appreciation and depreciation of investments were as follows:
| Gross unrealized appreciation | $42,064,343 |
| Gross unrealized depreciation | (85,147) |
| Net unrealized appreciation (depreciation) | $41,979,196 |
| Cost for federal income tax purposes | $400,153,518 |
| The accompanying Notes to Financial Statements are an integral part of this schedule. |
| 69 |
| Moderately Aggressive Allocation Portfolio | |||
| Schedule of Investments as of June 29, 2007 (unaudited) | |||
| Shares | Value | Percentage | |
| Equity Portfolios (78.1%) | |||
| 3,204,629 | Thrivent Partner Small Cap Growth Portfolio # | $45,117,651 | 3.0% |
| 1,487,935 | Thrivent Partner Small Cap Value Portfolio | 29,942,163 | 2.0 |
| 3,794,943 | Thrivent Small Cap Stock Portfolio | 60,047,381 | 4.0 |
| 1,166,752 | Thrivent Mid Cap Growth Portfolio | 22,514,235 | 1.5 |
| 1,571,766 | Thrivent Partner Mid Cap Value Portfolio | 22,431,621 | 1.5 |
| 4,365,989 | Thrivent Mid Cap Stock Portfolio | 60,141,940 | 4.0 |
| 12,204,964 | Thrivent Partner International Stock Portfolio | 210,885,913 | 14.1 |
| 14,091,188 | Thrivent Large Cap Growth Portfolio | 254,289,573 | 17.0 |
| 15,236,507 | Thrivent Large Cap Value Portfolio | 209,739,665 | 14.0 |
| 20,508,497 | Thrivent Large Cap Stock Portfolio | 224,641,872 | 15.0 |
| 1,501,036 | Thrivent Real Estate Securities Portfolio | 30,039,173 | 2.0 |
| Total Equity Portfolios | |||
| (cost $1,063,005,855) | 1,169,791,187 | ||
| Debt Portfolios (17.9%) | |||
| 2,935,303 | Thrivent High Yield Portfolio | 14,800,387 | 1.0 |
| 19,957,063 | Thrivent Income Portfolio | 194,092,418 | 12.9 |
| 6,039,503 | Thrivent Limited Maturity Bond Portfolio | 59,670,291 | 4.0 |
| Total Debt Portfolios | |||
| (cost $270,034,174) | 268,563,096 | ||
| Short-Term Investments (4.0%) | |||
| 59,559,431 | Thrivent Money Market Portfolio | 59,559,431 | 4.0 |
| Total Short-Term Investments | |||
| (cost $59,559,431) | 59,559,431 | ||
| Total Investments | |||
| (cost $1,392,599,460) 100.0% | $1,497,913,714 | ||
| Other Assets and Liabilities, | |||
| Net (0.0%) | (202,180) | ||
| Total Net Assets 100.0% | $1,497,711,534 | ||
# Non-income producing security.
Gross unrealized appreciation and depreciation of investments were as follows:
| Gross unrealized appreciation | $106,785,333 |
| Gross unrealized depreciation | (1,471,079) |
| Net unrealized appreciation (depreciation) | $105,314,254 |
| Cost for federal income tax purposes | $1,392,599,460 |
| The accompanying Notes to Financial Statements are an integral part of this schedule. |
| 70 |
| Moderate Allocation Portfolio | |||
| Schedule of Investments as of June 29, 2007 (unaudited) | |||
| Shares | Value | Percentage | |
| Equity Portfolios (58.1%) | |||
| 1,880,280 | Thrivent Partner Small Cap Growth Portfolio # | $26,472,280 | 1.5% |
| 873,593 | Thrivent Partner Small Cap Value Portfolio | 17,579,579 | 1.0 |
| 1,689,375 | Thrivent Small Cap Stock Portfolio | 26,730,976 | 1.5 |
| 916,808 | Thrivent Mid Cap Growth Portfolio | 17,691,180 | 1.0 |
| 1,235,093 | Thrivent Partner Mid Cap Value Portfolio | 17,626,747 | 1.0 |
| 3,859,267 | Thrivent Mid Cap Stock Portfolio | 53,161,785 | 3.0 |
| 10,274,690 | Thrivent Partner International Stock Portfolio | 177,533,281 | 10.1 |
| 14,162,964 | Thrivent Large Cap Growth Portfolio | 255,584,855 | 14.5 |
| 12,826,958 | Thrivent Large Cap Value Portfolio | 176,570,769 | 10.0 |
| 19,337,192 | Thrivent Large Cap Stock Portfolio | 211,811,872 | 12.0 |
| 2,211,318 | Thrivent Real Estate Securities Portfolio | 44,253,551 | 2.5 |
| Total Equity Portfolios | |||
| (cost $928,858,106) | 1,025,016,875 | ||
| Debt Portfolios (33.9%) | |||
| 3,455,801 | Thrivent High Yield Portfolio | 17,424,840 | 1.0 |
| 34,375,847 | Thrivent Income Portfolio | 334,322,301 | 19.0 |
| 24,874,407 | Thrivent Limited Maturity Bond Portfolio | 245,759,144 | 13.9 |
| Total Debt Portfolios | |||
| (cost $601,529,115) | 597,506,285 | ||
| Short-Term Investments (8.0%) | |||
| 140,866,683 | Thrivent Money Market Portfolio | 140,866,683 | 8.0 |
| Total Short-Term Investments | |||
| (cost $140,866,683) | 140,866,683 | ||
| Total Investments | |||
| (cost $1,671,253,904) 100.0% | $1,763,389,843 | ||
| Other Assets and Liabilities, | |||
| Net (0.0%) | (234,225) | ||
| Total Net Assets 100.0% | $1,763,155,618 | ||
# Non income producing security.
Gross unrealized appreciation and depreciation of investments were as follows:
| Gross unrealized appreciation | $96,158,768 |
| Gross unrealized depreciation | (4,022,829) |
| Net unrealized appreciation (depreciation) | $92,135,939 |
| Cost for federal income tax purposes | $1,671,253,904 |
| The accompanying Notes to Financial Statements are an integral part of this schedule. |
| 71 |
| Moderately Conservative Allocation Portfolio | |||
| Schedule of Investments as of June 29, 2007 (unaudited) | |||
| Shares | Value | Percentage | |
| Equity Portfolios (38.1%) | |||
| 1,131,043 | Thrivent Small Cap Stock Portfolio | $17,896,497 | 3.0% |
| 867,229 | Thrivent Mid Cap Stock Portfolio | 11,946,161 | 2.0 |
| 2,077,300 | Thrivent Partner International Stock Portfolio | 35,893,038 | 6.1 |
| 3,290,742 | Thrivent Large Cap Growth Portfolio | 59,384,733 | 10.0 |
| 2,809,040 | Thrivent Large Cap Value Portfolio | 38,668,116 | 6.5 |
| 4,344,798 | Thrivent Large Cap Stock Portfolio | 47,591,183 | 8.0 |
| 745,051 | Thrivent Real Estate Securities Portfolio | 14,910,186 | 2.5 |
| Total Equity Portfolios | |||
| (cost $203,652,840) | 226,289,914 | ||
| Debt Portfolios (51.9%) | |||
| 1,164,606 | Thrivent High Yield Portfolio | 5,872,179 | 1.0 |
| 9,142,065 | Thrivent Income Portfolio | 88,911,153 | 15.0 |
| 21,553,196 | Thrivent Limited Maturity Bond Portfolio | 212,945,576 | 35.9 |
| Total Debt Portfolios | |||
| (cost $309,290,645) | 307,728,908 | ||
| Short-Term Investments (10.0%) | |||
| 59,438,974 | Thrivent Money Market Portfolio | 59,438,974 | 10.0 |
| Total Short-Term Investments | |||
| (cost $59,438,974) | 59,438,974 | ||
| Total Investments | |||
| (cost $572,382,459) 100.0% | $593,457,796 | ||
| Other Assets and Liabilities, | |||
| Net (0.0%) | (91,449) | ||
| Total Net Assets 100.000 | $593,366,347 | ||
Gross unrealized appreciation and depreciation of investments were as follows:
| Gross unrealized appreciation | $22,637,073 |
| Gross unrealized depreciation | (1,561,736) |
| Net unrealized appreciation (depreciation) | $21,075,337 |
| Cost for federal income tax purposes | $572,382,459 |
| The accompanying Notes to Financial Statements are an integral part of this schedule. |
| 72 |
| Technology Portfolio | ||||||
| Schedule of Investments as of June 29, 2007 (unaudited) | ||||||
| Shares | Common Stock (96.5%) | Value | Shares | Common Stock (96.5%) | Value | |
| Communications Equipment (26.0%) | 9,200 | Shire Pharmaceuticals | ||||
| 18,700 | ADTRAN, Inc. * | $485,639 | Group plc ADR * | $681,996 | ||
| 84,200 | Alcatel-Lucent ADR * | 1,178,800 | 1,100 | UnitedHealth Group, Inc. | 56,254 | |
| 17,900 | CIENA Corporation #* | 646,727 | 18,100 | Vertex Pharmaceuticals, Inc. # | 516,936 | |
| 123,500 | Cisco Systems, Inc. # | 3,439,475 | 700 | WellPoint, Inc. # | 55,881 | |
| 50,900 | Corning, Inc. # | 1,300,495 | Total Health Care | 5,034,495 | ||
| 7,400 | F5 Networks, Inc. # | 596,440 | ||||
| 39,500 | Foundry Networks, Inc. # | 658,070 | Industrials (0.9%) | |||
| 88,800 | Juniper Networks, Inc. #* | 2,235,096 | 11,300 | Monster Worldwide, Inc. # | 464,430 | |
| 35,750 | OpNext, Inc. # | 473,330 | Total Industrials | 464,430 | ||
| 49,800 | QUALCOMM, Inc. | 2,160,822 | ||||
| 14,000 | Telefonaktiebolaget LM | Internet Software & Services (10.6%) | ||||
| Ericsson ADR * | 558,460 | 22,500 | eBay, Inc. # | 724,050 | ||
| Total Communications | 5,100 | Google, Inc. # | 2,669,238 | |||
| Equipment | 13,733,354 | 27,800 | VeriSign, Inc. # | 882,094 | ||
| 48,700 | Yahoo!, Inc. # | 1,321,231 | ||||
| Computers & Peripherals (10.6%) | Total Internet | |||||
| 16,100 | Apple Computer, Inc. # | 1,964,844 | Software & Services | 5,596,613 | ||
| 103,500 | EMC Corporation #* | 1,873,350 | ||||
| 30,400 | Emulex Corporation # | 663,936 | IT Consulting & Services (2.7%) | |||
| 38,600 | Network Appliance, Inc. # | 1,127,120 | 13,300 | Accenture, Ltd. | 570,437 | |
| Total Computers & | 18,300 | MoneyGram International, Inc. | 511,485 | |||
| Peripherals | 5,629,250 | 19,800 | Perot Systems Corporation # | 337,392 | ||
| Total IT Consulting & | ||||||
| Consumer Discretionary (3.4%) | Services | 1,419,314 | ||||
| 2,300 | Best Buy Company, Inc. | 107,341 | ||||
| 20,700 | Scientific Games Corporation #* | 723,465 | Semiconductors & | |||
| 27,800 | TiVo, Inc. #* | 160,962 | Semiconductor Equipment (16.3%) | |||
| 8,500 | Viacom, Inc. # | 353,855 | 35,100 | Broadcom Corporation # | 1,026,675 | |
| 15,750 | WMS Industries, Inc. # | 454,545 | 17,100 | FormFactor, Inc. # | 654,930 | |
| Total Consumer | 52,400 | Integrated Device | ||||
| Discretionary | 1,800,168 | Technology, Inc. # | 800,148 | |||
| 69,300 | Intel Corporation | 1,646,568 | ||||
| Health Care (9.5%) | 29,500 | Intersil Corporation | 928,070 | |||
| 1,300 | Aetna, Inc. | 64,220 | 18,100 | MEMC Electronic Materials, Inc. # | 1,106,272 | |
| 31,700 | BioMarin Pharmaceutical, Inc. #* | 568,698 | 40,700 | Qimonda AG ADR #* | 628,815 | |
| 1,500 | CIGNA Corporation | 78,330 | 28,900 | Teradyne, Inc. # | 508,062 | |
| 9,900 | Cooper Companies, Inc. | 527,868 | 34,400 | Texas Instruments, Inc. | 1,294,472 | |
| 12,600 | Cubist Pharmaceuticals, Inc. # | 248,346 | Total Semiconductors & | |||
| 1,400 | Express Scripts, Inc. # | 70,014 | Semiconductor Equipment | 8,594,012 | ||
| 23,200 | Hologic, Inc. #* | 1,283,192 | ||||
| 8,400 | ImClone Systems, Inc. # | 297,024 | Software (14.1%) | |||
| 2,000 | IMS Health, Inc. | 64,260 | 39,500 | Adobe Systems, Inc. # | 1,585,925 | |
| 1,000 | McKesson Corporation | 59,640 | 23,900 | Cadence Design Systems, Inc. # | 524,844 | |
| 900 | Medco Health Solutions, Inc. # | 70,191 | 30,000 | Commvault Systems, Inc. # | 518,100 | |
| 14,500 | NuVasive, Inc. # | 391,645 | 59,200 | Microsoft Corporation | 1,744,624 | |
| 50,200 | Nuance Communications, Inc. #* | 839,846 | ||||
| The accompanying Notes to Financial Statements are an integral part of this schedule. |
| 73 |
| Technology Portfolio | |||||||
| Schedule of Investments as of June 29, 2007 (unaudited) | |||||||
| Shares | Common Stock (96.5%) | Value | Shares | Common Stock (96.5%) | Value | ||
| Software — continued | Telecommunications Services (2.4%) | ||||||
| 48,300 | Oracle Corporation # | $951,993 | 12,900 | America Movil SA de CV ADR | $798,897 | ||
| 33,900 | Red Hat, Inc. #* | 755,292 | 5,900 | NII Holdings, Inc. # | 476,366 | ||
| 61,100 | TIBCO Software, Inc. # | 552,955 | Total Telecommunications | ||||
| Total Software | 7,473,579 | Services | 1,275,263 | ||||
| Total Common Stock | |||||||
| (cost $43,738,222) | 51,020,478 | ||||||
| Interest | Maturity | ||||||
| Shares | Collateral Held for Securities Loaned (22.5%) | Rate (+) | Date | Value | |||
| 11,926,925 | Thrivent Financial Securities Lending Trust | 5.360% | N/A | $11,926,925 | |||
| Total Collateral Held for Securities Loaned | |||||||
| (cost $11,926,925) | 11,926,925 | ||||||
| Interest | Maturity | ||||||
| Shares | Short-Term Investments (3.6%) | Rate (+) | Date | Value | |||
| 1,887,300 | Thrivent Money Market Portfolio | 5.050% | N/A | $1,887,300 | |||
| Total Short-Term Investments (at amortized cost) | 1,887,300 | ||||||
| Total Investments (cost $57,552,447) 122.6% | $64,834,703 | ||||||
| Other Assets and Liabilities, Net (22.6%) | (11,965,278) | ||||||
| Total Net Assets 100.0% | $52,869,425 | ||||||
# Non-income producing security.
* All or a portion of the security is on loan as discussed in item 2(M) of the Notes to Financial Statements.
+ The interest rate shown reflects the yield, coupon rate or, for securities purchased at a discount, the discount rate at the date of purchase.
Definitions:
ADR — American Depository Receipts, which are certificates for shares of an underlying foreign security’s shares held by an issuing U.S. depository bank.
Gross unrealized appreciation and depreciation of investments were as follows:
| Gross unrealized appreciation | $8,055,861 |
| Gross unrealized depreciation | (773,605) |
| Net unrealized appreciation (depreciation) | $7,282,256 |
| Cost for federal income tax purposes | $57,552,447 |
| The accompanying Notes to Financial Statements are an integral part of this schedule. |
| 74 |
| Partner Small Cap Growth Portfolio | ||||||
| Schedule of Investments as of June 29, 2007 (unaudited) | ||||||
| Shares | Common Stock (98.1%) | Value | Shares | Common Stock (98.1%) | Value | |
| Consumer Discretionary (10.6%) | 24,878 | GFI Group, Inc. # | $1,803,157 | |||
| 14,260 | Arbitron, Inc. | $734,818 | 34,094 | Greenhill & Company, Inc. * | 2,342,599 | |
| 18,320 | ArvinMeritor, Inc. | 406,704 | 11,950 | Investment Technology | ||
| 12,900 | Citi Trends, Inc. #* | 489,684 | Group, Inc. # | 517,794 | ||
| 27,660 | Cooper Tire & Rubber Company | 763,969 | 33,123 | KBW, Inc. #* | 973,154 | |
| 13,100 | DSW, Inc. #* | 456,142 | 31,200 | Knight Capital Group, Inc. # | 517,920 | |
| 30,300 | GSI Commerce, Inc. #* | 688,113 | 38,380 | MarketAxess Holdings, Inc. #* | 690,456 | |
| 13,420 | Guess ?, Inc. | 644,697 | 26,490 | Penson Worldwide, Inc. # | 649,800 | |
| 33,760 | Iconix Brand Group, Inc. #* | 750,147 | 44,522 | Signature Bank # | 1,518,200 | |
| 16,560 | Life Time Fitness, Inc. #* | 881,489 | 10,680 | SVB Financial Group # | 567,215 | |
| 22,230 | McCormick & Schmick’s | 56,199 | Texas Capital Bancshares, Inc. # | 1,256,048 | ||
| Seafood Restaurants, Inc. # | 576,646 | 52,022 | Thomas Weisel Partners | |||
| 12,190 | Phillips-Van Heusen Corporation | 738,348 | Group, Inc. # | 866,166 | ||
| 12,590 | Priceline.com, Inc. #* | 865,437 | 29,070 | Waddell & Reed Financial, Inc. | 756,111 | |
| 134,650 | Shuffle Master, Inc. #* | 2,235,190 | Total Financials | 16,599,855 | ||
| 54,583 | Tractor Supply Company #* | 2,841,045 | ||||
| 16,550 | Under Armour, Inc. #* | 755,508 | Health Care (20.0%) | |||
| 10,920 | Volcom, Inc. # | 547,420 | 19,570 | Alexion Pharmaceuticals, Inc. # | 881,824 | |
| 36,350 | WMS Industries, Inc. # | 1,049,061 | 157,840 | American Medical Systems | ||
| 19,030 | Zumiez, Inc. #* | 718,953 | Holdings, Inc. #* | 2,847,434 | ||
| Total Consumer | 27,900 | Array Biopharma, Inc. # | 325,593 | |||
| Discretionary | 16,143,371 | 28,726 | ArthroCare Corporation # | 1,261,359 | ||
| 24,760 | BioMarin Pharmaceutical, Inc. # | 444,194 | ||||
| Consumer Staples (0.8%) | 2,860 | Chemed Corporation | 189,589 | |||
| 9,160 | Chattem, Inc. #* | 580,561 | 32,254 | HealthExtras, Inc. # | 954,073 | |
| 17,460 | Flowers Foods, Inc. | 582,466 | 9,750 | Healthways, Inc. #* | 461,858 | |
| Total Consumer Staples | 1,163,027 | 15,090 | Hologic, Inc. #* | 834,628 | ||
| 11,150 | ICON plc ADR # | 487,701 | ||||
| Energy (6.6%) | 55,369 | Illumina, Inc. #* | 2,247,428 | |||
| 14,680 | Alon USA Energy, Inc. | 646,067 | 24,910 | Immucor, Inc. # | 696,733 | |
| 12,020 | Arena Resources, Inc. #* | 698,482 | 23,234 | Integra LifeSciences Holdings | ||
| 7,080 | Core Laboratories NV # | 719,965 | Corporation #* | 1,148,224 | ||
| 18,920 | Delta Petroleum Corporation #* | 379,914 | 14,670 | InterMune, Inc. #* | 380,540 | |
| 66,854 | Dril-Quip, Inc. # | 3,005,087 | 16,560 | inVentiv Health, Inc. # | 606,262 | |
| 16,950 | Goodrich Petroleum | 74,848 | Inverness Medical | |||
| Corporation #* | 586,978 | Innovations, Inc. #* | 3,818,745 | |||
| 20,076 | Oil States International, Inc. # | 829,942 | 21,330 | K-V Pharmaceutical Company # | 581,029 | |
| 63,236 | Superior Energy Services, Inc. # | 2,524,381 | 12,410 | Kyphon, Inc. #* | 597,542 | |
| 10,970 | W-H Energy Services, Inc. # | 679,153 | 11,670 | Medicis Pharmaceutical | ||
| Total Energy | 10,069,969 | Corporation * | 356,402 | |||
| 49,675 | Mentor Corporation | 2,020,779 | ||||
| Financials (10.9%) | 37,024 | Meridian Bioscience, Inc. | 801,929 | |||
| 43,888 | Cohen & Steers, Inc. * | 1,906,934 | 48,559 | NuVasive, Inc. # | 1,311,579 | |
| 10,120 | Corporate Office Properties Trust | 415,021 | 20,780 | PAREXEL International | ||
| 43,550 | DiamondRock Hospitality | Corporation # | 874,007 | |||
| Company | 830,934 | 36,980 | Perrigo Company | 724,068 | ||
| 26,230 | Digital Realty Trust, Inc. * | 988,346 | 13,430 | Progenics Pharmaceuticals, Inc. # | 289,685 | |
| The accompanying Notes to Financial Statements are an integral part of this schedule. |
| 75 |
| Partner Small Cap Growth Portfolio | ||||||
| Schedule of Investments as of June 29, 2007 (unaudited) | ||||||
| Shares | Common Stock (98.1%) | Value | Shares | Common Stock (98.1%) | Value | |
| Health Care — continued | Information Technology (23.3%) | |||||
| 15,760 | Psychiatric Solutions, Inc. # | $571,458 | 16,730 | Advent Software, Inc. # | $544,562 | |
| 15,070 | Sunrise Senior Living, Inc. # | 602,649 | 47,460 | Anadigics, Inc. #* | 654,473 | |
| 106,164 | Trizetto Group, Inc. # | 2,055,335 | 8,330 | aQuantive, Inc. # | 531,454 | |
| 9,800 | United Therapeutics | 34,890 | Atheros Communications, Inc. # | 1,076,008 | ||
| Corporation #* | 624,848 | 70,726 | Avocent Corporation # | 2,051,761 | ||
| 23,690 | West Pharmaceutical | 17,150 | Blackboard, Inc. #* | 722,358 | ||
| Services, Inc. * | 1,116,984 | 40,730 | Brightpoint, Inc. # | 561,667 | ||
| 9,280 | Xenoport, Inc. # | 412,218 | 31,310 | Brooks Automation, Inc. # | 568,276 | |
| Total Health Care | 30,526,697 | 9,380 | C-COR, Inc. # | 131,883 | ||
| 61,233 | Coherent, Inc. # | 1,868,219 | ||||
| Industrials (19.8%) | 42,790 | Comtech Group, Inc. # | 706,463 | |||
| 71,532 | AAR Corporation # | 2,361,271 | 9,490 | Equinix, Inc. #* | 868,050 | |
| 17,190 | Actuant Corporation * | 1,084,001 | 53,126 | Euronet Worldwide, Inc. # | 1,549,154 | |
| 9,910 | Acuity Brands, Inc. | 597,375 | 14,420 | FLIR Systems, Inc. #* | 666,925 | |
| 15,710 | Aecom Technology Corporation # | 389,765 | 17,300 | FormFactor, Inc. # | 662,590 | |
| 45,880 | AirTran Holdings, Inc. #* | 501,010 | 33,520 | Foundry Networks, Inc. # | 558,443 | |
| 18,960 | Baldor Electric Company | 934,349 | 124,409 | Informatica Corporation # | 1,837,521 | |
| 23,410 | BE Aerospace, Inc. # | 966,833 | 93,713 | Intermec, Inc. #* | 2,371,876 | |
| 40,360 | Cenveo, Inc. # | 935,948 | 18,610 | Limelight Networks, Inc. #* | 368,106 | |
| 63,794 | CoStar Group, Inc. # | 3,373,427 | 17,130 | MICROS Systems, Inc. # | 931,872 | |
| 37,047 | CRA International, Inc. # | 1,785,665 | 23,150 | Net 1 UEPS Technology, Inc. #* | 559,072 | |
| 60,392 | Forward Air Corporation | 2,058,763 | 10,080 | Nice Systems, Ltd. ADR # | 350,179 | |
| 19,350 | FTI Consulting, Inc. # | 735,880 | 27,770 | Omniture, Inc. #* | 636,488 | |
| 45,782 | Gardner Denver, Inc. # | 1,948,024 | 49,280 | ON Semiconductor Corporation # | 528,282 | |
| 11,700 | GATX Corporation | 576,225 | 26,890 | Polycom, Inc. # | 903,504 | |
| 6,140 | General Cable Corporation # | 465,105 | 12,650 | Quality Systems, Inc. * | 480,320 | |
| 15,560 | Horizon Lines, Inc. | 509,746 | 19,080 | Riverbed Technology, Inc. #* | 836,086 | |
| 17,930 | Hub Group, Inc. # | 630,419 | 36,032 | Rogers Corporation # | 1,333,184 | |
| 11,590 | Huron Consulting Group, Inc. #* | 846,186 | 14,810 | SAVVIS, Inc. # | 733,243 | |
| 20,275 | IDEX Corporation | 781,398 | 39,570 | Semtech Corporation # | 685,748 | |
| 21,210 | Infrasource Services, Inc. # | 786,891 | 109,920 | Sonus Networks, Inc. # | 936,518 | |
| 24,600 | JA Solar Holdings Company, | 24,130 | Tessera Technologies, Inc. # | 978,472 | ||
| Ltd. ADR #* | 829,758 | 9,490 | The9, Ltd. ADR #* | 439,007 | ||
| 18,180 | Kenexa Corporation # | 685,568 | 13,290 | THQ, Inc. #* | 405,611 | |
| 9,293 | Kennametal, Inc. | 762,305 | 25,240 | Trimble Navigation, Ltd. # | 812,728 | |
| 36,870 | Knoll, Inc. | 825,888 | 112,956 | ValueClick, Inc. #* | 3,327,684 | |
| 35,052 | Ladish Company, Inc. # | 1,507,236 | 19,200 | Verigy, Ltd. # | 549,312 | |
| 36,725 | Orbital Sciences Corporation # | 771,592 | 35,602 | ViaSat, Inc. # | 1,142,824 | |
| 33,213 | Shaw Group, Inc. # | 1,537,430 | 17,410 | VistaPrint, Ltd. # | 665,932 | |
| 31,580 | The Geo Group Inc. # | 918,978 | Total Information | |||
| Total Industrials | 30,107,036 | Technology | 35,535,855 | |||
| The accompanying Notes to Financial Statements are an integral part of this schedule. |
| 76 |
| Partner Small Cap Growth Portfolio | |||||||
| Schedule of Investments as of June 29, 2007 (unaudited) | |||||||
| Shares | Common Stock (98.1%) | Value | Shares | Common Stock (98.1%) | Value | ||
| Materials (3.2%) | Telecommunications Services (2.9%) | ||||||
| 13,110 | Century Aluminum Company # | $716,199 | 33,920 | Cogent Communications | |||
| 25,520 | H.B. Fuller Company | 762,793 | Group, Inc. #* | $1,013,190 | |||
| 34,590 | Hercules, Inc. # | 679,694 | 45,780 | Dobson Communications | |||
| 22,110 | Pan American Silver Corporation # | 582,156 | Corporation # | 508,616 | |||
| 32,660 | Polypore International, Inc. # | 573,836 | 77,591 | NeuStar, Inc. # | 2,247,811 | ||
| 5,370 | RTI International Metals, Inc. # | 404,737 | 36,120 | Time Warner Telecom, Inc. # | 726,012 | ||
| 11,730 | Ryerson, Inc. * | 441,634 | Total Telecommunications | ||||
| 12,120 | Silgan Holdings, Inc. | 669,994 | Services | 4,495,629 | |||
| Total Materials | 4,831,043 | ||||||
| Total Common Stock | |||||||
| (cost $131,945,182) | 149,472,482 | ||||||
| Interest | Maturity | ||||||
| Shares | Collateral Held for Securities Loaned (28.9%) | Rate (+) | Date | Value | |||
| 44,049,755 | Thrivent Financial Securities Lending Trust | 5.360% | N/A | $44,049,755 | |||
| Total Collateral Held for Securities Loaned | |||||||
| (cost $44,049,755) | 44,049,755 | ||||||
| Shares or | |||||||
| Principal | Interest | Maturity | |||||
| Amount | Short-Term Investments (16.6%) | Rate (+) | Date | Value | |||
| $5,000,000 | Charta, LLC | 5.360% | 7/2/2007 | $4,998,511 | |||
| 2,900,000 | Corporate Receivables Corporation Funding, LLC | 5.360 | 7/2/2007 | 2,899,136 | |||
| 4,915,000 | Galaxy Funding, Inc. | 5.360 | 7/2/2007 | 4,913,536 | |||
| 5,000,000 | Jupiter Securitization Company, LLC | 5.350 | 7/2/2007 | 4,998,514 | |||
| 7,571,124 | Thrivent Money Market Portfolio | 5.050 | N/A | 7,571,124 | |||
| Total Short-Term Investments (at amortized cost) | 25,380,821 | ||||||
| Total Investments (cost $201,375,758) 143.6% | $218,903,058 | ||||||
| Other Assets and Liabilities, Net (43.6%) | (66,467,200) | ||||||
| Total Net Assets 100.0% | $152,435,858 | ||||||
# Non-income producing security.
* All or a portion of the security is on loan as discussed in item 2(M) of the Notes to Financial Statements.
+ The interest rate shown reflects the yield, coupon rate or, for securities purchased at a discount, the discount rate at the date of purchase.
Definitions:
ADR — American Depository Receipts, which are certificates for shares of an underlying foreign security’s shares held by an issuing U.S. depository bank.
Gross unrealized appreciation and depreciation of investments were as follows:
| Gross unrealized appreciation | $20,342,580 |
| Gross unrealized depreciation | (2,815,280) |
| Net unrealized appreciation (depreciation) | $17,527,300 |
| Cost for federal income tax purposes | $201,375,758 |
| The accompanying Notes to Financial Statements are an integral part of this schedule. |
| 77 |
| Partner Small Cap Value Portfolio | ||||||
| Schedule of Investments as of June 29, 2007 (unaudited) | ||||||
| Shares | Common Stock (96.1%) | Value | Shares | Common Stock (96.1%) | Value | |
| Consumer Discretionary (11.6%) | 40,500 | W-H Energy Services, Inc. # | $2,507,355 | |||
| 84,100 | Aaron Rents, Inc. | $2,455,720 | 46,000 | Whiting Petroleum | ||
| 58,500 | Building Materials Holding | Corporation #§ | 1,863,920 | |||
| Corporation | 830,115 | Total Energy | 15,318,688 | |||
| 33,200 | Cavco Industries, Inc. # | 1,245,664 | ||||
| 21,500 | Courier Corporation | 860,000 | Financials (20.0%) | |||
| 34,500 | CSS Industries, Inc. | 1,366,545 | 68,000 | Ares Capital Corporation | 1,145,800 | |
| 63,200 | Dixie Group, Inc. # | 790,000 | 30,600 | Boston Private Financial | ||
| 36,000 | Dorman Products, Inc. # | 497,520 | Holdings, Inc. | 822,222 | ||
| 12,600 | Drew Industries, Inc. # | 417,564 | 36,400 | Bristol West Holdings, Inc. | 814,268 | |
| 46,900 | Fred’s, Inc. | 627,522 | 115,100 | Cedar Shopping Centers, Inc. | 1,651,685 | |
| 21,500 | Fuel Systems Solutions, Inc. # | 356,470 | 43,600 | Compass Diversified Trust | 777,388 | |
| 84,300 | Haverty Furniture Companies, Inc. | 983,781 | 39,600 | East West Bancorp, Inc. | 1,539,648 | |
| 64,200 | Journal Register Company | 287,616 | 9,600 | Employers Holdings, Inc. | 203,904 | |
| 34,100 | M/I Homes, Inc. | 907,060 | 71,600 | First Financial Fund, Inc. | 985,216 | |
| 30,200 | Matthews International | 43,000 | First Republic Bank | 2,307,380 | ||
| Corporation | 1,317,022 | 63,200 | Hercules Technology Growth | |||
| 10,100 | Orient Express Hotels, Ltd. | 539,340 | Capital, Inc. | 853,832 | ||
| 40,200 | RARE Hospitality | 25,300 | Home Bancshares, Inc. | 570,515 | ||
| International, Inc. # | 1,076,154 | 66,400 | Kohlberg Capital Corporation | 1,231,720 | ||
| 95,000 | Regent Communications, Inc. # | 318,250 | 53,400 | LaSalle Hotel Properties | 2,318,628 | |
| 31,500 | Ruby Tuesday, Inc. | 829,395 | 2,700 | Markel Corporation # | 1,308,312 | |
| 61,400 | Saga Communications, Inc. # | 601,720 | 61,300 | Max Re Capital, Ltd. | 1,734,790 | |
| 63,200 | Shiloh Industries, Inc. | 769,776 | 32,600 | Midland Company | 1,530,244 | |
| 44,500 | Stanley Furniture Company, Inc. | 914,030 | 46,000 | National Health Realty, Inc. | 1,083,760 | |
| 50,800 | Steak n Shake Company # | 847,852 | 3,700 | National Interstate Corporation | 96,496 | |
| 103,400 | Stein Mart, Inc. | 1,267,684 | 39,300 | Ohio Casualty Corporation | 1,702,083 | |
| 49,800 | Winnebago Industries, Inc. | 1,470,096 | 31,700 | Parkway Properties, Inc. | 1,522,551 | |
| Total Consumer | 13,800 | Piper Jaffray Companies # | 769,074 | |||
| Discretionary | 21,576,896 | 41,700 | Potlatch Corporation | 1,795,185 | ||
| 55,100 | ProAssurance Corporation # | 3,067,417 | ||||
| Consumer Staples (2.6%) | 60,000 | ProCentury Corporation | 1,005,600 | |||
| 127,400 | Alliance One International, Inc. # | 1,280,370 | 37,800 | Sandy Spring Bancorp, Inc. | 1,188,432 | |
| 31,600 | Casey’s General Stores, Inc. | 861,416 | 40,200 | Seabright Insurance Holdings # | 702,696 | |
| 39,700 | Nash Finch Company | 1,965,150 | 34,500 | Strategic Hotel Capital, Inc. | 775,905 | |
| 25,200 | Winn-Dixie Stores, Inc. # | 738,360 | 33,000 | SVB Financial Group # | 1,752,630 | |
| Total Consumer Staples | 4,845,296 | 29,700 | Washington Real Estate | |||
| Investment Trust | 1,009,800 | |||||
| Energy (8.2%) | 21,400 | Wintrust Financial Corporation | 938,390 | |||
| 20,700 | Atwood Oceanics, Inc. # | 1,420,434 | Total Financials | 37,205,571 | ||
| 20,700 | Carbo Ceramics, Inc. | 906,867 | ||||
| 51,400 | Forest Oil Corporation # | 2,172,164 | Health Care (5.5%) | |||
| 67,200 | Geomet, Inc. # | 514,752 | 12,800 | Analogic Corporation | 940,928 | |
| 92,400 | Mariner Energy, Inc. # | 2,240,700 | 22,400 | Arrow International, Inc. | 857,472 | |
| 54,600 | TETRA Technologies, Inc. # | 1,539,720 | 58,400 | Capital Senior Living Corporation # | 550,128 | |
| 45,600 | Todco # | 2,152,776 | 86,500 | Momenta Pharmaceuticals, Inc. # | 871,920 | |
| The accompanying Notes to Financial Statements are an integral part of this schedule. |
| 78 |
| Partner Small Cap Value Portfolio | ||||||
| Schedule of Investments as of June 29, 2007 (unaudited) | ||||||
| Shares | Common Stock (96.1%) | Value | Shares | Common Stock (96.1%) | Value | |
| Health Care — continued | Information Technology (9.3%) | |||||
| 23,500 | Myriad Genetics, Inc. # | $873,965 | 47,900 | Advanced Energy | ||
| 26,300 | National Healthcare Corporation | 1,357,080 | Industries, Inc. # | $1,085,414 | ||
| 61,600 | Owens & Minor, Inc. | 2,152,304 | 21,900 | ATMI, Inc. #± | 657,000 | |
| 143,600 | Panacos Pharmaceuticals, Inc. # | 463,828 | 77,709 | Brooks Automation, Inc. # | 1,410,418 | |
| 30,800 | Pharmion Corporation # | 891,660 | 63,200 | Catapult Communications | ||
| 28,600 | West Pharmaceutical | Corporation # | 626,944 | |||
| Services, Inc. | 1,348,490 | 95,800 | GSI Group, Inc. # | 937,882 | ||
| Total Health Care | 10,307,775 | 183,900 | LookSmart, Ltd. # | 717,210 | ||
| 32,500 | Methode Electronics, Inc. | 508,625 | ||||
| Industrials (23.4%) | 117,300 | MPS Group, Inc. # | 1,568,301 | |||
| 56,000 | Accuride Corporation # | 862,960 | 55,500 | Nextest Systems Corporation # | 758,685 | |
| 21,700 | Ameron International | 55,500 | Progress Software Corporation # | 1,764,345 | ||
| Corporation | 1,957,123 | 260,000 | Safeguard Scientifics, Inc. # | 730,600 | ||
| 52,200 | Beacon Roofing Supply, Inc. # | 886,878 | 40,200 | SPSS, Inc. # | 1,774,428 | |
| 42,800 | Belden, Inc. | 2,368,980 | 44,000 | StarTek, Inc. | 474,760 | |
| 72,800 | Builders Firstsource, Inc. # | 1,169,168 | 85,200 | TNS, Inc. | 1,227,732 | |
| 50,800 | C&D Technologies, Inc. # | 284,480 | 81,700 | Wind River Systems, Inc. # | 898,700 | |
| 36,800 | Circor International, Inc. | 1,487,824 | 41,200 | Xyratex, Ltd. # | 915,876 | |
| 44,600 | Dollar Thrifty Automotive | 359,100 | Zarlink Semiconductor, Inc. # | 646,380 | ||
| Group, Inc. # | 1,821,464 | 48,800 | Zygo Corporation # | 697,352 | ||
| 20,100 | EDO Corporation | 660,687 | Total Information | |||
| 72,000 | Electro Rent Corporation | 1,046,880 | Technology | 17,400,652 | ||
| 32,700 | Franklin Electric Company, Inc. | 1,542,786 | ||||
| 41,600 | FTI Consulting, Inc. # | 1,582,048 | Materials (9.9%) | |||
| 37,700 | G & K Services, Inc. | 1,489,527 | 37,300 | Airgas, Inc. | 1,786,670 | |
| 63,600 | Genesee & Wyoming, Inc. # | 1,897,824 | 57,000 | American Vanguard Corporation | 816,240 | |
| 22,500 | Genlyte Group, Inc. # | 1,767,150 | 62,000 | AptarGroup, Inc. | 2,204,720 | |
| 60,700 | Gibraltar Industries, Inc. | 1,344,505 | 34,700 | Arch Chemicals, Inc. | 1,219,358 | |
| 67,200 | Hub Group, Inc. # | 2,362,752 | 19,900 | Carpenter Technology | ||
| 45,850 | IDEX Corporation | 1,767,059 | Corporation | 2,593,169 | ||
| 55,700 | Insituform Technologies, Inc. # | 1,214,817 | 26,300 | Chesapeake Corporation | 330,591 | |
| 59,400 | Kirby Corporation # | 2,280,366 | 10,500 | Deltic Timber Corporation | 575,610 | |
| 20,500 | LSI Industries, Inc. | 366,950 | 28,000 | Florida Rock Industries, Inc. | 1,890,000 | |
| 21,100 | Macquarie Infrastructure | 19,400 | Innospec, Inc. | 1,148,674 | ||
| Company, LLC | 875,228 | 55,500 | Metal Management, Inc. | 2,445,885 | ||
| 63,700 | McGrath Rentcorp | 2,146,053 | 18,200 | Minerals Technologies, Inc. | 1,218,490 | |
| 41,300 | Nordson Corporation | 2,071,608 | 67,000 | Myers Industries, Inc. | 1,481,370 | |
| 55,000 | Sterling Construction | 57,900 | Wausau-Mosinee | |||
| Company, Inc. # | 1,163,250 | Paper Corporation | 775,860 | |||
| 26,900 | Universal Forest Products, Inc. | 1,136,794 | Total Materials | 18,486,637 | ||
| 107,300 | Vitran Corporation, Inc. # | 2,289,782 | ||||
| 44,400 | Waste Connections, Inc. # | 1,342,656 | Telecommunications Services (0.8%) | |||
| 44,000 | Woodward Governor Company | 2,361,480 | 114,900 | Premiere Global Services, Inc. # | 1,495,998 | |
| Total Industrials | 43,549,079 | Total Telecommunications | ||||
| Services | 1,495,998 | |||||
| The accompanying Notes to Financial Statements are an integral part of this schedule. |
| 79 |
| Partner Small Cap Value Portfolio | |||||||
| Schedule of Investments as of June 29, 2007 (unaudited) | |||||||
| Shares | Common Stock (96.1%) | Value | Shares | Common Stock (96.1%) | Value | ||
| Utilities (4.8%) | 38,300 | UniSource Energy Corporation | $1,259,687 | ||||
| 42,600 | Black Hills Corporation | $1,693,350 | 37,500 | Vectren Corporation | 1,009,875 | ||
| 67,000 | Cleco Corporation | 1,641,500 | Total Utilities | 8,880,343 | |||
| 49,800 | El Paso Electric Company # | 1,223,088 | |||||
| 16,500 | Empire District Electric Company | 369,105 | Total Common Stock | ||||
| 49,800 | Southwest Gas Corporation | 1,683,738 | (cost $144,139,475) | 179,066,935 | |||
| Interest | Maturity | ||||||
| Shares | Short-Term Investments (3.6%) | Rate (+) | Date | Value | |||
| 6,694,041 | Thrivent Money Market Portfolio | 5.050% | N/A | $6,694,041 | |||
| Total Short-Term Investments (at amortized cost) | 6,694,041 | ||||||
| Total Investments (cost $150,833,516) 99.7% | $185,760,976 | ||||||
| Other Assets and Liabilities, Net 0.3% | 507,154 | ||||||
| Total Net Assets 100.0% | $186,268,130 | ||||||
# Non-income producing security.
+ The interest rate shown reflects the yield, coupon rate or, for securities purchased at a discount, the discount rate at the date of purchase.
§ Denotes investments purchased on a when-issued or delayed delivery basis.
± Designated as cover for long settling trades as discussed in the Notes to Financial Statements.
Gross unrealized appreciation and depreciation of investments were as follows:
| Gross unrealized appreciation | $42,070,372 |
| Gross unrealized depreciation | (7,142,912) |
| Net unrealized appreciation (depreciation) | $34,927,460 |
| Cost for federal income tax purposes | $150,833,516 |
| The accompanying Notes to Financial Statements are an integral part of this schedule. |
| 80 |
| Small Cap Stock Portfolio | ||||||
| Schedule of Investments as of June 29, 2007 (unaudited) | ||||||
| Shares | Common Stock (97.9%) | Value | Shares | Common Stock (97.9%) | Value | |
| Consumer Discretionary (13.0%) | 70,050 | Reddy Ice Holdings, Inc. | $1,997,826 | |||
| 19,200 | Aftermarket Technology | 6,600 | Universal Corporation | 402,072 | ||
| Corporation # | $569,856 | Total Consumer Staples | 13,896,751 | |||
| 59,300 | ArvinMeritor, Inc. | 1,316,460 | ||||
| 22,800 | Children’s Place Retail | Energy (6.8%) | ||||
| Stores, Inc. # | 1,177,392 | 99,200 | Alpha Natural Resources, Inc. # | 2,062,368 | ||
| 51,800 | Coldwater Creek, Inc. # | 1,203,314 | 36,100 | Arena Resources, Inc. # | 2,097,771 | |
| 50,800 | Crocs, Inc. # | 2,185,924 | 29,200 | Denbury Resources, Inc. # | 1,095,000 | |
| 20,400 | Desarrolladora Homex ADR # | 1,236,036 | 31,900 | Dresser-Rand Group, Inc. # | 1,260,050 | |
| 62,000 | Domino’s Pizza, Inc. | 1,132,740 | 27,300 | Frontier Oil Corporation | 1,194,921 | |
| 50,900 | DreamWorks Animation | 43,800 | Global Industries, Ltd. # | 1,174,716 | ||
| SKG, Inc. # | 1,467,956 | 42,100 | Horizon Offshore, Inc. # | 808,320 | ||
| 86,800 | GameStop Corporation # | 3,393,880 | 94,200 | Input/Output, Inc. # | 1,470,462 | |
| 110,600 | Gentex Corporation | 2,177,714 | 26,500 | Lufkin Industries, Inc. | 1,710,575 | |
| 51,100 | Hearst-Argyle Television, Inc. | 1,231,510 | 46,800 | Oil States International, Inc. # | 1,934,712 | |
| 18,100 | Jack in the Box, Inc. # | 1,284,014 | 37,700 | Parallel Petroleum Corporation # | 825,630 | |
| 38,325 | Joseph A. Bank Clothiers, Inc. # | 1,589,338 | 38,600 | Penn Virginia Corporation | 1,551,720 | |
| 28,600 | Laureate Education, Inc. # | 1,763,476 | 105,497 | Petrohawk Energy Corporation # | 1,673,182 | |
| 44,300 | Life Time Fitness, Inc. # | 2,358,089 | 36,300 | Petroleum Development | ||
| 40,200 | Men’s Wearhouse, Inc. | 2,053,014 | Corporation # | 1,723,524 | ||
| 40,000 | Meredith Corporation | 2,464,000 | 45,654 | Range Resources Corporation | 1,707,916 | |
| 8,800 | Oxford Industries, Inc. | 390,192 | 36,700 | Southwestern Energy Company # | 1,633,150 | |
| 30,200 | Pool Corporation | 1,178,706 | 37,900 | Superior Energy Services, Inc. # | 1,512,968 | |
| 103,600 | Quiksilver, Inc. # | 1,463,868 | 33,100 | Tesco Corporation # | 1,044,305 | |
| 37,600 | R.H. Donnelley Corporation # | 2,849,328 | 22,500 | Willbros Group, Inc. # | 667,800 | |
| 60,500 | RARE Hospitality | Total Energy | 27,149,090 | |||
| International, Inc. # | 1,619,585 | |||||
| 71,400 | Scientific Games Corporation # | 2,495,430 | Financials (15.8%) | |||
| 43,825 | Shuffle Master, Inc. # | 727,495 | 49,100 | Acadia Realty Trust | 1,274,145 | |
| 76,700 | Sonic Corporation # | 1,696,604 | 33,350 | Affiliated Managers Group, Inc. # | 4,294,145 | |
| 51,200 | Steiner Leisure, Ltd. # | 2,514,944 | 6,400 | Alabama National | ||
| 108,900 | Texas Roadhouse, Inc. # | 1,392,831 | BanCorporation | 395,776 | ||
| 30,800 | Tractor Supply Company # | 1,603,140 | 25,150 | Argonaut Group, Inc. | 784,932 | |
| 19,100 | Tween Brands, Inc. # | 851,860 | 79,900 | Assured Guaranty, Ltd. | 2,361,844 | |
| 95,100 | WMS Industries, Inc. # | 2,744,586 | 51,850 | BioMed Realty Trust, Inc. | 1,302,472 | |
| 62,900 | Wolverine World Wide, Inc. | 1,742,959 | 26,018 | BOK Financial Corporation | 1,389,882 | |
| Total Consumer | 73,200 | CastlePoint Holdings, Ltd. | 1,075,308 | |||
| Discretionary | 51,876,241 | 58,900 | Center Financial Corporation | 996,588 | ||
| 54,500 | Delphi Financial Group, Inc. | 2,279,190 | ||||
| Consumer Staples (3.5%) | 47,700 | Digital Realty Trust, Inc. | 1,797,336 | |||
| 121,200 | Casey’s General Stores, Inc. | 3,303,912 | 72,400 | Dollar Financial Corporation # | 2,063,400 | |
| 31,600 | Corn Products International, Inc. | 1,436,220 | 47,500 | Endurance Specialty | ||
| 80,400 | Elizabeth Arden, Inc. # | 1,950,504 | Holdings, Ltd. | 1,901,900 | ||
| 52,200 | Flowers Foods, Inc. | 1,741,392 | 80,500 | FelCor Lodging Trust, Inc. | 2,095,415 | |
| 56,000 | Performance Food | 66,500 | First Cash Financial | |||
| Group Company # | 1,819,440 | Services, Inc. # | 1,558,760 | |||
| 23,300 | Ralcorp Holdings, Inc. # | 1,245,385 | 43,500 | First Midwest Bancorp, Inc. | 1,544,685 | |
| The accompanying Notes to Financial Statements are an integral part of this schedule. |
| 81 |
| Small Cap Stock Portfolio | ||||||
| Schedule of Investments as of June 29, 2007 (unaudited) | ||||||
| Shares | Common Stock (97.9%) | Value | Shares | Common Stock (97.9%) | Value | |
| Financials — continued | 15,600 | Integra LifeSciences Holdings | ||||
| 52,500 | First State Bancorporation | $1,117,725 | Corporation # | $770,952 | ||
| 34,100 | Glimcher Realty Trust | 852,500 | 35,900 | inVentiv Health, Inc. # | 1,314,299 | |
| 28,000 | Greenhill & Company, Inc. | 1,923,880 | 31,400 | Kindred Healthcare, Inc. # | 964,608 | |
| 58,950 | HCC Insurance Holdings, Inc. | 1,969,520 | 57,900 | K-V Pharmaceutical Company # | 1,577,196 | |
| 36,100 | iShares Russell Microcap | 36,900 | Kyphon, Inc. # | 1,776,735 | ||
| Index Fund | 2,184,050 | 33,900 | LCA-Vision, Inc. | 1,602,114 | ||
| 17,758 | Mercantile Bank Corporation | 481,242 | 32,400 | LHC Group, Inc. # | 848,880 | |
| 61,700 | Nationwide Health | 47,700 | LifePoint Hospitals, Inc. # | 1,845,036 | ||
| Properties, Inc. | 1,678,240 | 62,000 | Medarex, Inc. # | 885,980 | ||
| 109,833 | Nexity Financial Corporation # | 1,129,083 | 61,400 | NuVasive, Inc. # | 1,658,414 | |
| 57,400 | Philadelphia Consolidated | 66,900 | Omnicell, Inc. # | 1,390,182 | ||
| Holding Corporation # | 2,399,320 | 24,800 | Orthofix International NV # | 1,115,256 | ||
| 80,200 | Platinum Underwriters | 46,200 | Owens & Minor, Inc. | 1,614,228 | ||
| Holdings, Ltd. | 2,786,950 | 16,500 | PDL BioPharma, Inc. # | 384,450 | ||
| 34,400 | Portfolio Recovery Associates, Inc. | 2,064,688 | 36,600 | Pediatrix Medical Group, Inc. # | 2,018,490 | |
| 24,100 | Potlatch Corporation | 1,037,505 | 31,200 | Pharmaceutical Product | ||
| 122,200 | PowerShares Zacks | Development, Inc. | 1,194,024 | |||
| Micro Cap Portfolio | 2,304,692 | 58,500 | PSS World Medical, Inc. # | 1,065,870 | ||
| 51,800 | ProAssurance Corporation # | 2,883,706 | 13,000 | Respironics, Inc. # | 553,670 | |
| 56,400 | Security Capital Assurance Ltd. | 1,741,068 | 39,000 | STERIS Corporation | 1,193,400 | |
| 20,000 | Senior Housing Property Trust | 407,000 | 97,400 | Sun Healthcare Group, Inc. # | 1,411,326 | |
| 3,100 | SL Green Realty Corporation | 384,059 | 34,400 | Syneron Medical, Ltd. # | 858,280 | |
| 23,300 | Stifel Financial Corporation # | 1,372,137 | 92,500 | Tercica, Inc. # | 471,750 | |
| 80,500 | Strategic Hotel Capital, Inc. | 1,810,445 | 47,000 | Thoratec Corporation # | 864,330 | |
| 17,000 | SVB Financial Group # | 902,870 | 65,700 | Trizetto Group, Inc. # | 1,271,952 | |
| 24,000 | UCBH Holdings, Inc. | 438,480 | 23,000 | Universal Health Services, Inc. | 1,414,500 | |
| 31,900 | United Community Banks, Inc. | 825,891 | 32,700 | Varian, Inc. # | 1,792,941 | |
| 53,200 | Universal American Financial | 65,600 | VCA Antech, Inc. # | 2,472,464 | ||
| Corporation # | 1,132,096 | 21,400 | Ventana Medical Systems, Inc. # | 1,653,578 | ||
| 62,503 | Washington Federal, Inc. | 1,519,448 | 12,500 | Wellcare Health Plans, Inc. # | 1,131,375 | |
| 17,600 | Westamerica Bancorporation | 778,624 | 41,700 | West Pharmaceutical | ||
| Total Financials | 63,240,997 | Services, Inc. | 1,966,155 | |||
| Total Health Care | 50,459,523 | |||||
| Health Care (12.6%) | ||||||
| 31,500 | Affymetrix, Inc. # | 784,035 | Industrials (18.4%) | |||
| 43,300 | BioMarin Pharmaceutical, Inc. # | 776,802 | 53,700 | Baldor Electric Company | 2,646,336 | |
| 9,500 | Bio-Rad Laboratories, Inc. # | 717,915 | 67,500 | BE Aerospace, Inc. # | 2,787,750 | |
| 29,800 | Cooper Companies, Inc. | 1,588,936 | 78,900 | CAI International, Inc. # | 1,039,902 | |
| 37,800 | Cubist Pharmaceuticals, Inc. # | 745,038 | 72,000 | CLARCOR, Inc. | 2,694,960 | |
| 24,700 | Cytyc Corporation # | 1,064,817 | 30,400 | Consolidated Graphics, Inc. # | 2,106,112 | |
| 22,800 | Dade Behring Holdings, Inc. | 1,211,136 | 79,700 | Dayton Superior Corporation # | 1,075,950 | |
| 114,800 | Dexcom, Inc. #* | 940,212 | 32,100 | Deluxe Corporation | 1,303,581 | |
| 24,000 | Endo Pharmaceutical | 64,700 | DRS Technologies, Inc. | 3,705,369 | ||
| Holdings, Inc. # | 821,520 | 91,500 | Euroseas, Ltd. | 1,304,790 | ||
| 53,100 | HealthExtras, Inc. # | 1,570,698 | 25,800 | Flowserve Corporation | 1,847,280 | |
| 20,900 | Hologic, Inc. # | 1,155,979 | 66,400 | FTI Consulting, Inc. # | 2,525,192 | |
| The accompanying Notes to Financial Statements are an integral part of this schedule. |
| 82 |
| Small Cap Stock Portfolio | ||||||
| Schedule of Investments as of June 29, 2007 (unaudited) | ||||||
| Shares | Common Stock (97.9%) | Value | Shares | Common Stock (97.9%) | Value | |
| Industrials — continued | 60,026 | FLIR Systems, Inc. # | $2,776,202 | |||
| 18,300 | Gardner Denver, Inc. # | $778,665 | 65,200 | Foundry Networks, Inc. # | 1,086,232 | |
| 37,900 | Genlyte Group, Inc. # | 2,976,666 | 102,600 | Informatica Corporation # | 1,515,402 | |
| 66,900 | Hub Group, Inc. # | 2,352,204 | 112,400 | Insight Enterprises, Inc. # | 2,536,868 | |
| 30,900 | Huron Consulting Group, Inc. # | 2,256,009 | 74,000 | Integrated Device | ||
| 53,800 | IDEX Corporation | 2,073,452 | Technology, Inc. # | 1,129,980 | ||
| 63,500 | Innerworkings, Inc. # | 1,017,270 | 170,800 | Ixia # | 1,581,608 | |
| 123,800 | Interface, Inc. | 2,334,868 | 101,700 | J2 Global Communication, Inc. # | 3,549,330 | |
| 90,600 | Interline Brands, Inc. # | 2,362,848 | 92,600 | Lawson Software, Inc. # | 915,814 | |
| 37,100 | Jacobs Engineering Group, Inc. # | 2,133,621 | 134,000 | Micrel, Inc. | 1,704,480 | |
| 68,600 | JB Hunt Transport Services, Inc. | 2,011,352 | 160,700 | MPS Group, Inc. # | 2,148,559 | |
| 38,700 | Kaydon Corporation | 2,017,044 | 85,000 | Nanometrics, Inc. # | 583,100 | |
| 86,800 | Kforce, Inc. # | 1,387,064 | 98,100 | Packeteer, Inc. # | 766,161 | |
| 61,000 | Kirby Corporation # | 2,341,790 | 105,700 | Parametric Technology | ||
| 41,500 | Landstar System, Inc. | 2,002,375 | Corporation # | 2,284,177 | ||
| 40,600 | Manitowoc Company, Inc. | 3,263,428 | 77,900 | Photronics, Inc. # | 1,159,152 | |
| 63,000 | Pall Corporation | 2,897,370 | 35,200 | Polycom, Inc. # | 1,182,720 | |
| 46,000 | Roper Industries, Inc. | 2,626,600 | 187,300 | Powerwave Technologies, Inc. # | 1,254,910 | |
| 66,513 | Standard Parking Corporation # | 2,336,602 | 68,500 | Progress Software Corporation # | 2,177,615 | |
| 74,900 | Ultrapetrol Bahamas, Ltd. # | 1,775,130 | 73,400 | QLogic Corporation # | 1,222,110 | |
| 37,500 | URS Corporation # | 1,820,625 | 158,100 | Sapient Corporation # | 1,222,113 | |
| 16,100 | Washington Group | 56,100 | ScanSource, Inc. # | 1,794,639 | ||
| International, Inc. # | 1,288,161 | 92,600 | Silicon Image, Inc. # | 794,508 | ||
| 112,550 | Waste Connections, Inc. # | 3,403,512 | 18,400 | SPSS, Inc. # | 812,176 | |
| 55,300 | Watson Wyatt Worldwide, Inc. | 2,791,544 | 40,000 | Sybase, Inc. # | 955,600 | |
| Total Industrials | 73,285,422 | 192,700 | TIBCO Software, Inc. # | 1,743,935 | ||
| 120,600 | Trimble Navigation, Ltd. # | 3,883,320 | ||||
| Information Technology (18.0%) | 69,500 | Varian Semiconductor | ||||
| 41,300 | ADTRAN, Inc. | 1,072,561 | Equipment Associates, Inc. # | 2,784,170 | ||
| 48,394 | Avnet, Inc. # | 1,918,338 | 60,500 | ViaSat, Inc. # | 1,942,050 | |
| 53,100 | Avocent Corporation # | 1,540,431 | 151,400 | Wind River Systems, Inc. # | 1,665,400 | |
| 125,100 | BEA Systems, Inc. # | 1,712,619 | 46,900 | Wright Express Corporation # | 1,607,263 | |
| 58,400 | Benchmark Electronics, Inc. # | 1,321,008 | 57,900 | Zebra Technologies Corporation # | 2,243,046 | |
| 265,000 | Brocade Communications # | 2,072,300 | Total Information | |||
| 35,600 | Business Objects SA ADR # | 1,382,704 | Technology | 71,923,777 | ||
| 27,600 | CACI International, Inc. # | 1,348,260 | ||||
| 154,000 | CNET Networks, Inc. # | 1,261,260 | Materials (6.3%) | |||
| 52,100 | Cypress Semiconductor | 50,100 | Airgas, Inc. | 2,399,790 | ||
| Corporation # | 1,213,409 | 38,600 | Albemarle Corporation | 1,487,258 | ||
| 27,750 | Diodes, Inc. # | 1,159,118 | 75,200 | AptarGroup, Inc. | 2,674,112 | |
| 173,100 | ECI Telecom, Ltd. # | 1,583,865 | 29,043 | Century Aluminum Company # | 1,586,619 | |
| 37,900 | Electronics for Imaging, Inc. # | 1,069,538 | 68,700 | Commercial Metals Company | 2,319,999 | |
| 49,500 | Emulex Corporation # | 1,081,080 | 32,000 | Eagle Materials, Inc. | 1,569,600 | |
| 116,500 | Entrust, Inc. # | 472,990 | 23,000 | Lubrizol Corporation | 1,484,650 | |
| 35,800 | Fairchild Semiconductor | 114,200 | RPM International, Inc. | 2,639,162 | ||
| International, Inc. # | 691,656 | 20,200 | RTI International Metals, Inc. # | 1,522,474 | ||
| The accompanying Notes to Financial Statements are an integral part of this schedule. |
| 83 |
| Small Cap Stock Portfolio | |||||||
| Schedule of Investments as of June 29, 2007 (unaudited) | |||||||
| Shares | Common Stock (97.9%) | Value | Shares | Common Stock (97.9%) | Value | ||
| Materials — continued | Utilities (2.6%) | ||||||
| 50,900 | Silgan Holdings, Inc. | $2,813,752 | 39,800 | AGL Resources, Inc. | $1,611,104 | ||
| 71,000 | Steel Dynamics, Inc. | 2,975,610 | 56,400 | Cleco Corporation | 1,381,800 | ||
| 22,800 | Texas Industries, Inc. | 1,787,748 | 35,200 | Piedmont Natural Gas | |||
| Total Materials | 25,260,774 | Company, Inc. | 867,680 | ||||
| 52,900 | PNM Resources, Inc. | 1,470,091 | |||||
| Telecommunications Services (0.9%) | 39,100 | UniSource Energy Corporation | 1,285,999 | ||||
| 127,750 | Iowa Telecommunications | 73,500 | Vectren Corporation | 1,979,355 | |||
| Services, Inc. | 2,903,758 | 76,500 | Westar Energy, Inc. | 1,857,420 | |||
| 39,900 | Time Warner Telecom, Inc. # | 801,990 | Total Utilities | 10,453,449 | |||
| Total Telecommunications | |||||||
| Services | 3,705,748 | Total Common Stock | |||||
| (cost $315,474,243) | 391,251,772 | ||||||
| Interest | Maturity | ||||||
| Shares | Collateral Held for Securities Loaned (<0.1%) | Rate (+) | Date | Value | |||
| 117,802 | Thrivent Financial Securities Lending Trust | 5.360% | N/A | $117,802 | |||
| Total Collateral Held for Securities Loaned | |||||||
| (cost $117,802) | 117,802 | ||||||
| Shares or | |||||||
| Principal | Interest | Maturity | |||||
| Amount | Short-Term Investments (1.4%) | Rate (+) | Date | Value | |||
| $900,000 | Federal National Mortgage Association | 5.090% | 7/16/2007 | $897,968 | |||
| 3,000,000 | Old Line Funding Corporation | 5.320 | 7/5/2007 | 2,997,783 | |||
| 1,665,478 | Thrivent Money Market Portfolio | 5.050 | N/A | 1,665,478 | |||
| Total Short-Term Investments (at amortized cost) | 5,561,229 | ||||||
| Total Investments (cost $321,153,274) 99.3% | $396,930,803 | ||||||
| Other Assets and Liabilities, Net 0.7% | 2,626,656 | ||||||
| Total Net Assets 100.0% | $399,557,460 | ||||||
# Non-income producing security.
* All or a portion of the security is on loan as discussed in item 2(M) of the Notes to Financial Statements.
+ The interest rate shown reflects the yield, coupon rate or, for securities purchased at a discount, the discount rate at the date of purchase.
Definitions:
ADR — American Depository Receipts, which are certificates for shares of an underlying foreign security’s shares held by an issuing U.S. depository bank.
Gross unrealized appreciation and depreciation of investments were as follows:
| Gross unrealized appreciation | $81,720,091 |
| Gross unrealized depreciation | (5,942,562) |
| Net unrealized appreciation (depreciation) | $75,777,529 |
| Cost for federal income tax purposes | $321,153,274 |
| The accompanying Notes to Financial Statements are an integral part of this schedule. |
| 84 |
| Small Cap Index Portfolio | ||||||
| Schedule of Investments as of June 29, 2007 (unaudited) | ||||||
| Shares | Common Stock (96.5%) | Value | Shares | Common Stock (96.5%) | Value | |
| Consumer Discretionary (14.9%) | 19,300 | JAKKS Pacific, Inc. # | $543,102 | |||
| 9,200 | 4Kids Entertainment, Inc. # | $138,000 | 16,830 | Jo-Ann Stores, Inc. # | 478,477 | |
| 33,575 | Aaron Rents, Inc. | 980,390 | 12,375 | Joseph A. Bank Clothiers, Inc. # | 513,191 | |
| 20,600 | Arbitron, Inc. | 1,061,518 | 34,000 | K2, Inc. # | 516,460 | |
| 8,400 | Arctic Cat, Inc. | 166,320 | 17,800 | Kellwood Company | 500,536 | |
| 10,200 | Ashworth, Inc. # | 71,400 | 11,300 | Keystone Automotive | ||
| 12,800 | Audiovox Corporation # | 166,016 | Industries, Inc. # | 467,481 | ||
| 8,300 | Bassett Furniture Industries, Inc. | 113,295 | 18,200 | K-Swiss, Inc. | 515,606 | |
| 15,600 | Big 5 Sporting Goods Corporation | 397,800 | 11,700 | Landry’s Restaurants, Inc. | 354,042 | |
| 9,400 | Blue Nile, Inc. # | 567,760 | 35,500 | La-Z-Boy, Inc. | 406,830 | |
| 18,100 | Bright Horizons Family | 9,900 | Libbey, Inc. | 213,543 | ||
| Solutions, Inc. # | 704,271 | 11,100 | Lithia Motors, Inc. | 281,274 | ||
| 30,425 | Brown Shoe Company, Inc. | 739,936 | 45,200 | Live Nation, Inc. # | 1,011,576 | |
| 20,200 | Building Materials Holding | 31,300 | LKQ Corporation # | 771,858 | ||
| Corporation | 286,638 | 8,400 | M/I Homes, Inc. | 223,440 | ||
| 20,100 | California Pizza Kitchen, Inc. # | 431,748 | 14,900 | Marcus Corporation | 354,024 | |
| 21,800 | Cato Corporation | 478,292 | 12,800 | MarineMax, Inc. # | 256,256 | |
| 22,325 | CEC Entertainment, Inc. # | 785,840 | 36,500 | Men’s Wearhouse, Inc. | 1,864,055 | |
| 52,900 | Champion Enterprises, Inc. # | 520,007 | 15,100 | Meritage Homes Corporation # | 403,925 | |
| 17,400 | Charlotte Russe Holding, Inc. # | 467,538 | 8,000 | Midas, Inc. # | 181,360 | |
| 16,100 | Children’s Place Retail | 18,500 | Monaco Coach Corporation | 265,475 | ||
| Stores, Inc. # | 831,404 | 7,400 | Monarch Casino & Resort, Inc. # | 198,690 | ||
| 24,925 | Christopher & Banks Corporation | 427,464 | 14,100 | Movado Group, Inc. | 475,734 | |
| 45,200 | CKE Restaurants, Inc. | 907,164 | 19,100 | Multimedia Games, Inc. # | 243,716 | |
| 11,000 | Coachmen Industries, Inc. | 106,260 | 3,400 | National Presto Industries, Inc. | 211,956 | |
| 19,100 | Coinstar, Inc. # | 601,268 | 21,800 | Nautilus Group, Inc. | 262,472 | |
| 15,400 | Cost Plus, Inc. # | 130,592 | 16,400 | O’Charley’s, Inc. | 330,624 | |
| 3,600 | CPI Corporation | 250,200 | 10,600 | Oxford Industries, Inc. | 470,004 | |
| 46,200 | Crocs, Inc. # | 1,987,986 | 17,700 | P.F. Chang’s China Bistro, Inc. # | 623,040 | |
| 7,600 | Deckers Outdoor Corporation # | 766,840 | 21,900 | Panera Bread Company # | 1,008,714 | |
| 31,900 | Dress Barn, Inc. # | 654,588 | 15,500 | Papa John’s International, Inc. # | 445,780 | |
| 13,000 | Drew Industries, Inc. # | 430,820 | 9,400 | Peet’s Coffee & Tea, Inc. # | 231,522 | |
| 21,550 | Ethan Allen Interiors, Inc. | 738,088 | 37,500 | Pep Boys — Manny, Moe & Jack | 756,000 | |
| 28,800 | Finish Line, Inc. | 262,368 | 16,800 | PetMed Express, Inc. # | 215,712 | |
| 44,200 | Fleetwood Enterprises, Inc. # | 400,010 | 41,200 | Pinnacle Entertainment, Inc. # | 1,159,780 | |
| 31,137 | Fossil, Inc. # | 918,230 | 24,600 | Polaris Industries, Inc. | 1,332,336 | |
| 27,650 | Fred’s, Inc. | 369,957 | 33,912 | Pool Corporation | 1,323,585 | |
| 15,500 | Genesco, Inc. # | 810,805 | 6,000 | Pre-Paid Legal Services, Inc. # | 385,860 | |
| 16,700 | Group 1 Automotive, Inc. | 673,678 | 84,300 | Quiksilver, Inc. # | 1,191,159 | |
| 20,300 | Guitar Center, Inc. # | 1,214,143 | 53,000 | Radio One, Inc. # | 374,180 | |
| 21,600 | Gymboree Corporation # | 851,256 | 21,250 | RARE Hospitality | ||
| 15,800 | Haverty Furniture Companies, Inc. | 184,386 | International, Inc. # | 568,862 | ||
| 21,850 | Hibbett Sports, Inc. # | 598,253 | 14,600 | RC2 Corporation # | 584,146 | |
| 30,475 | Hot Topic, Inc. # | 331,263 | 11,500 | Red Robin Gourmet Burgers, Inc. # | 464,255 | |
| 38,800 | Iconix Brand Group, Inc. # | 862,136 | 8,100 | Russ Berrie and Company, Inc. # | 150,903 | |
| 10,600 | IHOP Corporation | 576,958 | 12,000 | Ruth’s Chris Steak House, Inc. # | 203,880 | |
| 21,500 | Jack in the Box, Inc. # | 1,525,210 | 34,450 | Select Comfort Corporation # | 558,779 | |
| The accompanying Notes to Financial Statements are an integral part of this schedule. |
| 85 |
| Small Cap Index Portfolio | ||||||
| Schedule of Investments as of June 29, 2007 (unaudited) | ||||||
| Shares | Common Stock (96.5%) | Value | Shares | Common Stock (96.5%) | Value | |
| Consumer Discretionary — continued | 9,300 | Nash Finch Company | $460,350 | |||
| 24,225 | Shuffle Master, Inc. # | $402,135 | 24,300 | Performance Food | ||
| 18,800 | Skechers USA, Inc. # | 548,960 | Group Company # | 789,507 | ||
| 4,800 | Skyline Corporation | 144,048 | 38,500 | Playtex Products, Inc. # | 570,185 | |
| 21,000 | Sonic Automotive, Inc. | 608,370 | 18,600 | Ralcorp Holdings, Inc. # | 994,170 | |
| 47,952 | Sonic Corporation # | 1,060,698 | 11,000 | Sanderson Farms, Inc. | 495,220 | |
| 29,700 | Stage Stores, Inc. | 622,512 | 14,900 | Spartan Stores, Inc. | 490,359 | |
| 12,600 | Stamps.com, Inc. # | 173,628 | 26,800 | Spectrum Brands, Inc. # | 181,436 | |
| 8,400 | Standard Motor Products, Inc. | 126,252 | 21,500 | TreeHouse Foods, Inc. # | 572,115 | |
| 44,700 | Standard Pacific Corporation | 783,591 | 29,500 | United Natural Foods, Inc. # | 784,110 | |
| 19,717 | Steak n Shake Company # | 329,077 | 6,000 | USANA Health Sciences, Inc. # | 268,440 | |
| 18,700 | Stein Mart, Inc. | 229,262 | 12,170 | WD-40 Company | 400,028 | |
| 25,200 | Stride Rite Corporation | 510,552 | Total Consumer Staples | 15,772,896 | ||
| 12,700 | Sturm, Ruger & Company, Inc. # | 197,104 | ||||
| 15,800 | Superior Industries | Energy (6.0%) | ||||
| International, Inc. | 343,808 | 18,800 | Atwood Oceanics, Inc. # | 1,290,056 | ||
| 36,700 | Texas Roadhouse, Inc. # | 469,393 | 16,300 | Bristow Group, Inc. # | 807,665 | |
| 23,500 | Tractor Supply Company # | 1,223,175 | 66,800 | Cabot Oil & Gas Corporation ‡ | 2,463,584 | |
| 44,600 | Triarc Companies, Inc. | 700,220 | 14,100 | Carbo Ceramics, Inc. | 617,721 | |
| 20,700 | Tuesday Morning Corporation | 255,852 | 16,800 | Dril-Quip, Inc. # | 755,160 | |
| 22,000 | Tween Brands, Inc. # | 981,200 | 62,914 | Helix Energy Solutions | ||
| 9,900 | UniFirst Corporation | 436,095 | Group, Inc. # | 2,510,898 | ||
| 16,000 | Universal Technical | 16,000 | Hornbeck Offshore Services, Inc. # | 620,160 | ||
| Institute, Inc. # | 406,240 | 48,600 | Input/Output, Inc. # | 758,646 | ||
| 6,700 | Vertrue, Inc. # | 326,826 | 10,400 | Lufkin Industries, Inc. | 671,320 | |
| 10,000 | Volcom, Inc. # | 501,300 | 55,900 | Massey Energy Company | 1,489,735 | |
| 21,700 | Winnebago Industries, Inc. | 640,584 | 16,700 | Matrix Service Company # | 414,995 | |
| 24,800 | WMS Industries, Inc. # | 715,728 | 38,200 | Oceaneering International, Inc. # | 2,010,848 | |
| 38,300 | Wolverine World Wide, Inc. | 1,061,293 | 26,000 | Penn Virginia Corporation | 1,045,200 | |
| 33,800 | Zale Corporation # | 804,778 | 10,100 | Petroleum Development | ||
| Total Consumer | Corporation # | 479,548 | ||||
| Discretionary | 63,984,977 | 14,450 | SEACOR Holdings, Inc. # | 1,349,052 | ||
| 43,200 | St. Mary Land & | |||||
| Consumer Staples (3.7%) | Exploration Company | 1,581,984 | ||||
| 60,600 | Alliance One International, Inc. # | 609,030 | 19,300 | Stone Energy Corporation # | 661,218 | |
| 34,900 | Casey’s General Stores, Inc. ‡ | 951,374 | 20,300 | Swift Energy Company # | 868,028 | |
| 49,300 | Central Garden & Pet Company # | 578,289 | 50,050 | TETRA Technologies, Inc. # | 1,411,410 | |
| 13,000 | Chattem, Inc. # | 823,940 | 32,000 | Unit Corporation # | 2,013,120 | |
| 51,300 | Corn Products International, Inc. | 2,331,585 | 20,900 | W-H Energy Services, Inc. # | 1,293,919 | |
| 35,750 | Flowers Foods, Inc. | 1,192,620 | 19,600 | World Fuel Services Corporation | 824,376 | |
| 13,500 | Great Atlantic & Pacific Tea | Total Energy | 25,938,643 | |||
| Company, Inc. # | 452,790 | |||||
| 27,300 | Hain Celestial Group, Inc. # | 740,922 | Financials (15.2%) | |||
| 9,600 | J & J Snack Foods Corporation | 362,304 | 22,300 | Acadia Realty Trust ‡ | 578,685 | |
| 21,400 | Lance, Inc. | 504,184 | 11,800 | Alabama National BanCorporation | 729,712 | |
| 19,900 | Longs Drug Stores Corporation | 1,045,148 | 12,400 | Anchor BanCorp Wisconsin, Inc. | 324,756 | |
| 11,000 | Mannatech, Inc. | 174,790 | 38,200 | Bank Mutual Corporation | 440,446 | |
| The accompanying Notes to Financial Statements are an integral part of this schedule. |
| 86 |
| Small Cap Index Portfolio | ||||||
| Schedule of Investments as of June 29, 2007 (unaudited) | ||||||
| Shares | Common Stock (96.5%) | Value | Shares | Common Stock (96.5%) | Value | |
| Financials — continued | 20,000 | Kite Realty Group Trust | $380,400 | |||
| 31,000 | BankAtlantic Bancorp, Inc. | $266,910 | 36,800 | LaBranche & Company, Inc. # | 271,584 | |
| 22,100 | BankUnited Financial Corporation | 443,547 | 11,700 | LandAmerica Financial | ||
| 25,600 | Boston Private Financial | Group, Inc. | 1,128,933 | |||
| Holdings, Inc. | 687,872 | 45,700 | Lexington Corporate | |||
| 42,500 | Brookline Bancorp, Inc. | 489,175 | Properties Trust | 950,560 | ||
| 19,700 | Cascade Bancorp | 455,858 | 14,500 | LTC Properties, Inc. | 329,875 | |
| 20,500 | Cash America International, Inc. | 812,825 | 19,400 | MAF Bancorp, Inc. | 1,052,644 | |
| 21,200 | Central Pacific Financial | 33,800 | Medical Properties Trust, Inc. | 447,174 | ||
| Corporation | 699,812 | 17,500 | Mid-America Apartment | |||
| 30,818 | Chittenden Corporation | 1,077,089 | Communities, Inc. | 918,400 | ||
| 32,000 | Colonial Properties Trust | 1,166,400 | 14,600 | Nara Bancorp, Inc. | 232,578 | |
| 20,800 | Community Bank System, Inc. | 416,416 | 46,100 | National Retail Properties, Inc. | 1,007,746 | |
| 22,800 | Corus Bankshares, Inc. | 393,528 | 11,100 | Parkway Properties, Inc. | 533,133 | |
| 29,965 | Delphi Financial Group, Inc. | 1,253,136 | 39,600 | Philadelphia Consolidated | ||
| 18,675 | Dime Community Bancshares | 246,323 | Holding Corporation # | 1,655,280 | ||
| 13,465 | Downey Financial Corporation | 888,421 | 12,700 | Piper Jaffray Companies # | 707,771 | |
| 42,000 | East West Bancorp, Inc. | 1,632,960 | 11,000 | Portfolio Recovery Associates, Inc. | 660,220 | |
| 16,500 | EastGroup Properties, Inc. | 723,030 | 15,000 | Presidential Life Corporation | 294,900 | |
| 18,300 | Entertainment Properties Trust | 984,174 | 12,900 | PrivateBancorp, Inc. | 371,520 | |
| 17,800 | Essex Property Trust, Inc. | 2,070,140 | 23,000 | ProAssurance Corporation # | 1,280,410 | |
| 17,850 | Financial Federal Corporation | 532,287 | 23,900 | Prosperity Bancshares, Inc. | 782,964 | |
| 57,400 | First BanCorp | 630,826 | 22,364 | Provident Bankshares Corporation | 733,092 | |
| 19,400 | First Cash Financial | 11,200 | PS Business Parks, Inc. | 709,744 | ||
| Services, Inc. # | 454,736 | 18,700 | Rewards Network, Inc. # | 76,109 | ||
| 43,400 | First Commonwealth | 13,800 | RLI Corporation | 772,110 | ||
| Financial Corporation * | 473,928 | 10,000 | Safety Insurance Group, Inc. | 414,000 | ||
| 22,100 | First Financial Bancorp | 331,279 | 7,100 | SCPIE Holdings, Inc. # | 177,500 | |
| 9,000 | First Indiana Corporation | 199,080 | 39,500 | Selective Insurance Group, Inc. | 1,061,760 | |
| 34,312 | First Midwest Bancorp, Inc. | 1,218,419 | 51,400 | Senior Housing Property Trust | 1,045,990 | |
| 21,300 | First Republic Bank | 1,142,958 | 20,500 | Signature Bank # | 699,050 | |
| 11,500 | FirstFed Financial Corporation # | 652,395 | 51,100 | South Financial Group, Inc. | 1,156,904 | |
| 26,800 | Flagstar Bancorp, Inc. | 322,940 | 14,300 | Sovran Self Storage, Inc. | 688,688 | |
| 16,400 | Franklin Bank Corporation # | 244,360 | 12,900 | Sterling Bancorp | 206,787 | |
| 46,700 | Fremont General Corporation | 502,492 | 51,400 | Sterling Bancshares, Inc. | 581,334 | |
| 27,100 | Frontier Financial Corporation | 610,563 | 35,115 | Sterling Financial Corporation | 1,016,228 | |
| 36,400 | Glacier Bancorp, Inc. | 740,740 | 12,700 | Stewart Information | ||
| 28,200 | Hanmi Financial Corporation | 481,092 | Services Corporation | 505,841 | ||
| 25,100 | Hilb, Rogal and Hobbs Company | 1,075,786 | 36,100 | Susquehanna Bancshares, Inc. | 807,557 | |
| 13,865 | Independent Bank Corporation | 238,617 | 17,027 | SWS Group, Inc. | 368,113 | |
| 13,300 | Infinity Property & | 21,700 | Tanger Factory Outlet Centers, Inc. | 812,665 | ||
| Casualty Corporation | 674,709 | 17,500 | Tradestation Group, Inc. # | 203,875 | ||
| 45,100 | Inland Real Estate Corporation | 765,798 | 8,500 | Triad Guaranty, Inc. # | 339,405 | |
| 30,500 | Investment Technology | 51,882 | TrustCo Bank Corporation NY | 512,594 | ||
| Group, Inc. # | 1,321,565 | 68,800 | UCBH Holdings, Inc. | 1,256,976 | ||
| 12,900 | Irwin Financial Corporation | 193,113 | 43,600 | Umpqua Holdings Corporation | 1,025,036 | |
| 22,600 | Kilroy Realty Corporation | 1,600,984 | 25,000 | United Bankshares, Inc. | 795,000 | |
| The accompanying Notes to Financial Statements are an integral part of this schedule. |
| 87 |
| Small Cap Index Portfolio | ||||||
| Schedule of Investments as of June 29, 2007 (unaudited) | ||||||
| Shares | Common Stock (96.5%) | Value | Shares | Common Stock (96.5%) | Value | |
| Financials — continued | 47,200 | Hooper Holmes, Inc. # | $158,120 | |||
| 28,300 | United Community Banks, Inc. | $732,687 | 9,900 | ICU Medical, Inc. # | 425,106 | |
| 14,500 | United Fire & Casual Company | 513,010 | 21,300 | IDEXX Laboratories, Inc. # | 2,015,619 | |
| 46,600 | Whitney Holding Corporation ‡ | 1,402,660 | 47,475 | Immucor, Inc. # | 1,327,876 | |
| 10,800 | Wilshire Bancorp, Inc. | 131,544 | 13,400 | Integra LifeSciences Holdings | ||
| 16,700 | Wintrust Financial Corporation | 732,295 | Corporation # | 662,228 | ||
| 12,112 | World Acceptance Corporation # | 517,546 | 22,100 | Invacare Corporation | 405,093 | |
| 25,600 | Zenith National Insurance | 20,800 | inVentiv Health, Inc. # | 761,488 | ||
| Corporation | 1,205,504 | 8,500 | Kendle International, Inc. # | 312,545 | ||
| Total Financials | 65,397,578 | 8,200 | Kensey Nash Corporation # | 219,842 | ||
| 13,650 | LCA-Vision, Inc. | 645,099 | ||||
| Health Care (11.4%) | 22,200 | Martek Biosciences Corporation # | 576,534 | |||
| 33,600 | Allscripts Healthcare | 14,800 | Matria Healthcare, Inc. # | 448,144 | ||
| Solutions, Inc. # | 856,128 | 27,300 | Mentor Corporation | 1,110,564 | ||
| 23,300 | Alpharma, Inc. | 606,033 | 22,400 | Meridian Bioscience, Inc. | 485,184 | |
| 17,833 | Amedisys, Inc. # | 647,885 | 18,800 | Merit Medical Systems, Inc. # | 224,848 | |
| 49,600 | American Medical Systems | 55,000 | MGI Pharma, Inc. # | 1,230,350 | ||
| Holdings, Inc. # | 894,784 | 17,000 | Noven Pharmaceuticals, Inc. # | 398,650 | ||
| 36,100 | AMERIGROUP Corporation # | 859,180 | 23,300 | Odyssey Healthcare, Inc. # | 276,338 | |
| 23,900 | AMN Healthcare Services, Inc. # | 525,800 | 18,400 | Option Care, Inc. | 283,360 | |
| 20,550 | AmSurg Corporation # | 496,077 | 12,100 | Osteotech, Inc. # | 87,120 | |
| 9,700 | Analogic Corporation | 713,047 | 27,900 | Owens & Minor, Inc. | 974,826 | |
| 19,500 | ArQule, Inc. # | 137,475 | 12,500 | Palomar Medical | ||
| 18,900 | ArthroCare Corporation # | 829,899 | Technologies, Inc. # | 433,875 | ||
| 16,400 | BioLase Technology, Inc. # | 99,548 | 18,800 | PAREXEL International | ||
| 11,400 | Bradley Pharmaceuticals, Inc. # | 247,494 | Corporation # | 790,728 | ||
| 19,700 | Cambrex Corporation | 261,419 | 33,400 | Pediatrix Medical Group, Inc. #‡ | 1,842,010 | |
| 30,000 | Centene Corporation # | 642,600 | 12,800 | Pharmnet Development Group # | 408,064 | |
| 17,400 | Chemed Corporation | 1,153,446 | 15,500 | PolyMedica Corporation | 633,175 | |
| 19,450 | CONMED Corporation # | 569,496 | 12,000 | Possis Medical, Inc. # | 130,560 | |
| 30,700 | Cooper Companies, Inc. | 1,636,924 | 46,500 | PSS World Medical, Inc. # | 847,230 | |
| 15,100 | Cross Country Healthcare, Inc. # | 251,868 | 45,400 | Regeneron Pharmaceuticals, Inc. # | 813,568 | |
| 15,550 | CryoLife, Inc. # | 202,306 | 12,100 | RehabCare Group, Inc. # | 172,304 | |
| 15,200 | Cyberonics, Inc. # | 255,664 | 13,900 | Res-Care, Inc. # | 293,846 | |
| 8,900 | Datascope Corporation | 340,692 | 50,700 | Respironics, Inc. # | 2,159,313 | |
| 16,800 | Digene Corporation # | 1,008,840 | 32,400 | Savient Pharmaceuticals, Inc. # | 402,408 | |
| 13,200 | Dionex Corporation # | 937,068 | 20,400 | Sciele Pharma, Inc. # | 480,624 | |
| 16,200 | DJO, Inc. # | 668,574 | 38,500 | Sierra Health Services, Inc. # | 1,600,830 | |
| 21,397 | Enzo Biochem, Inc. # | 319,885 | 30,900 | Sunrise Senior Living, Inc. # | 1,235,691 | |
| 13,600 | Genesis Healthcare Corporation # | 930,512 | 10,500 | SurModics, Inc. # | 525,000 | |
| 19,000 | Gentiva Health Services, Inc. # | 381,140 | 24,300 | Symmetry Medical, Inc. # | 389,043 | |
| 15,300 | Greatbatch Technologies, Inc. # | 495,720 | 23,000 | Theragenics Corporation # | 95,910 | |
| 18,300 | Haemonetics Corporation # | 962,763 | 48,100 | ViroPharma, Inc. # | 663,780 | |
| 20,600 | HealthExtras, Inc. # | 609,348 | 5,500 | Vital Signs, Inc. | 305,525 | |
| 24,100 | Healthways, Inc. # | 1,141,617 | Total Health Care | 48,987,651 | ||
| 37,100 | Hologic, Inc. # | 2,052,001 | ||||
| The accompanying Notes to Financial Statements are an integral part of this schedule. |
| 88 |
| Small Cap Index Portfolio | ||||||
| Schedule of Investments as of June 29, 2007 (unaudited) | ||||||
| Shares | Common Stock (96.5%) | Value | Shares | Common Stock (96.5%) | Value | |
| Industrials (18.5%) | 27,100 | Hub Group, Inc. # | $952,836 | |||
| 15,700 | A.O. Smith Corporation | $626,273 | 55,900 | IDEX Corporation | 2,154,386 | |
| 14,200 | A.S.V., Inc. # | 245,376 | 18,900 | Insituform Technologies, Inc. # | 412,209 | |
| 25,700 | AAR Corporation # | 848,357 | 36,700 | Interface, Inc. | 692,162 | |
| 30,500 | ABM Industries, Inc. ‡ | 787,205 | 16,700 | Kaman Corporation | 520,873 | |
| 29,900 | Acuity Brands, Inc. ‡ | 1,802,372 | 52,900 | Kansas City Southern, Inc. # | 1,985,866 | |
| 16,700 | Administaff, Inc. ‡ | 559,283 | 19,500 | Kaydon Corporation | 1,016,340 | |
| 20,200 | Albany International Corporation | 816,888 | 36,700 | Kirby Corporation # | 1,408,913 | |
| 6,700 | Angelica Corporation | 141,236 | 39,950 | Knight Transportation, Inc. | 774,231 | |
| 19,600 | Apogee Enterprises, Inc. | 545,272 | 32,000 | Labor Ready, Inc. # | 739,520 | |
| 25,450 | Applied Industrial | 38,300 | Landstar System, Inc. | 1,847,975 | ||
| Technologies, Inc. | 750,775 | 3,000 | Lawson Products, Inc. | 116,100 | ||
| 8,500 | Applied Signal Technology, Inc. | 132,685 | 39,936 | Lennox International, Inc. | 1,367,009 | |
| 17,200 | Arkansas Best Corporation | 670,284 | 8,050 | Lindsay Manufacturing Company | 356,534 | |
| 20,800 | Armor Holdings, Inc. #‡ | 1,806,896 | 11,400 | Lydall, Inc. # | 166,554 | |
| 13,100 | Astec Industries, Inc. # | 553,082 | 20,600 | MagneTek, Inc. # | 106,090 | |
| 28,500 | Baldor Electric Company | 1,404,480 | 42,900 | Manitowoc Company, Inc. | 3,448,301 | |
| 27,700 | Barnes Group, Inc. | 877,536 | 21,700 | Mesa Air Group, Inc. # | 143,437 | |
| 29,925 | Belden, Inc. | 1,656,349 | 24,700 | Mobile Mini, Inc. # | 721,240 | |
| 19,000 | Bowne & Company, Inc. | 370,690 | 29,250 | Moog, Inc. # | 1,290,218 | |
| 37,200 | Brady Corporation ‡ | 1,381,608 | 25,500 | Mueller Industries, Inc. | 878,220 | |
| 34,100 | Briggs & Stratton Corporation | 1,076,196 | 13,900 | NCI Building Systems, Inc. # | 685,687 | |
| 17,700 | C&D Technologies, Inc. # | 99,120 | 19,250 | Old Dominion Freight Line # | 580,388 | |
| 6,900 | Cascade Corporation | 541,236 | 24,300 | On Assignment, Inc. # | 260,496 | |
| 9,000 | CDI Corporation | 289,800 | 22,000 | Regal-Beloit Corporation | 1,023,880 | |
| 18,750 | Ceradyne, Inc. # | 1,386,750 | 11,700 | Robbins & Myers, Inc. | 621,621 | |
| 35,300 | CLARCOR, Inc. | 1,321,279 | 13,000 | School Specialty, Inc. # | 460,720 | |
| 8,200 | Consolidated Graphics, Inc. # | 568,096 | 55,700 | Shaw Group, Inc. # | 2,578,353 | |
| 10,700 | Cubic Corporation | 322,926 | 25,300 | Simpson Manufacturing | ||
| 30,500 | Curtiss-Wright Corporation | 1,421,605 | Company, Inc. | 853,622 | ||
| 11,400 | EDO Corporation | 374,718 | 44,400 | SkyWest, Inc. | 1,058,052 | |
| 21,900 | EGL, Inc. # | 1,017,912 | 38,800 | Spherion Corporation # | 364,332 | |
| 21,900 | EMCOR Group, Inc. # | 1,596,510 | 8,600 | Standard Register Company | 98,040 | |
| 14,700 | EnPro Industries, Inc. # | 629,013 | 8,700 | Standex International Corporation | 247,428 | |
| 17,700 | Esterline Technologies | 24,100 | Teledyne Technologies, Inc. # | 1,107,395 | ||
| Corporation # | 855,087 | 40,006 | Tetra Tech, Inc. # | 862,129 | ||
| 20,900 | Forward Air Corporation | 712,481 | 27,800 | Toro Company | 1,637,142 | |
| 25,400 | Frontier Airlines Holdings, Inc. # | 142,240 | 19,600 | Tredegar Corporation | 417,480 | |
| 14,900 | G & K Services, Inc. | 588,699 | 11,400 | Triumph Group, Inc. | 746,358 | |
| 36,400 | Gardner Denver, Inc. # | 1,548,820 | 19,200 | United Stationers, Inc. # | 1,279,488 | |
| 38,700 | GenCorp, Inc. # | 505,809 | 13,100 | Universal Forest Products, Inc. | 553,606 | |
| 20,500 | Gibraltar Industries, Inc. | 454,075 | 36,500 | URS Corporation # | 1,772,075 | |
| 18,030 | Griffon Corporation # | 392,693 | 11,900 | Valmont Industries, Inc. | 865,844 | |
| 19,150 | Healthcare Services Group, Inc. | 564,925 | 14,700 | Viad Corporation | 619,899 | |
| 40,548 | Heartland Express, Inc. | 660,932 | 13,500 | Vicor Corporation | 178,605 | |
| 12,400 | Heidrick & Struggles | 9,100 | Volt Information Sciences, Inc. # | 167,804 | ||
| International, Inc. # | 635,376 | 21,100 | Wabash National Corporation | 308,693 | ||
| The accompanying Notes to Financial Statements are an integral part of this schedule. |
| 89 |
| Small Cap Index Portfolio | ||||||
| Schedule of Investments as of June 29, 2007 (unaudited) | ||||||
| Shares | Common Stock (96.5%) | Value | Shares | Common Stock (96.5%) | Value | |
| Industrials — continued | 24,800 | CTS Corporation | $313,968 | |||
| 47,300 | Waste Connections, Inc. # | $1,430,352 | 24,800 | Cymer, Inc. # | 996,960 | |
| 16,950 | Watsco, Inc. | 922,080 | 22,000 | Daktronics, Inc. | 472,560 | |
| 29,400 | Watson Wyatt Worldwide, Inc. | 1,484,112 | 17,400 | Digi International, Inc. # | 256,476 | |
| 20,500 | Watts Water Technologies, Inc. | 768,135 | 13,900 | Diodes, Inc. # | 580,603 | |
| 20,300 | Woodward Governor Company | 1,089,501 | 22,800 | Ditech Networks, Inc. # | 186,732 | |
| Total Industrials | 79,825,276 | 19,600 | DSP Group, Inc. # | 401,212 | ||
| 32,500 | eFunds Corporation # | 1,146,925 | ||||
| Information Technology (16.6%) | 20,200 | Electro Scientific | ||||
| 18,100 | Actel Corporation # | 251,771 | Industries, Inc. # | 420,160 | ||
| 82,000 | Adaptec, Inc. # | 312,420 | 40,000 | Epicor Software Corporation # | 594,800 | |
| 24,600 | Advanced Energy Industries, Inc. # | 557,436 | 15,000 | EPIQ Systems, Inc. # | 242,400 | |
| 51,350 | Aeroflex, Inc. # | 727,630 | 25,200 | Exar Corporation #‡ | 337,680 | |
| 21,200 | Agilysys, Inc. | 477,000 | 25,950 | FactSet Research Systems, Inc. | 1,773,682 | |
| 44,600 | AMIS Holdings, Inc. # | 558,392 | 17,900 | FEI Company # | 581,034 | |
| 21,700 | Anixter International, Inc. # | 1,632,057 | 45,700 | FLIR Systems, Inc. # | 2,113,625 | |
| 12,000 | Ansoft Corporation # | 353,880 | 16,000 | Gerber Scientific, Inc. # | 185,920 | |
| 53,400 | ANSYS, Inc. #‡ | 1,415,100 | 16,800 | Gevity HR, Inc. | 324,744 | |
| 75,100 | Arris Group, Inc. # | 1,321,009 | 54,500 | Harmonic, Inc. # | 483,415 | |
| 23,700 | ATMI, Inc. # | 711,000 | 18,000 | Hutchinson Technology, Inc. # | 338,580 | |
| 18,900 | Authorize.Net Holdings, Inc. # | 338,121 | 60,200 | Informatica Corporation # | 889,154 | |
| 28,413 | Avid Technology, Inc. # | 1,004,400 | 22,700 | InfoSpace, Inc. | 526,867 | |
| 70,000 | Axcelis Technologies, Inc. # | 454,300 | 33,375 | Insight Enterprises, Inc. # | 753,274 | |
| 7,900 | Bankrate, Inc. # | 378,568 | 15,000 | Inter-Tel, Inc. | 358,950 | |
| 8,200 | Bel Fuse, Inc. | 279,046 | 14,700 | Intevac, Inc. # | 312,522 | |
| 21,100 | Bell Microproducts, Inc. # | 137,572 | 20,600 | Itron, Inc. # | 1,605,564 | |
| 50,050 | Benchmark Electronics, Inc. # | 1,132,131 | 34,000 | J2 Global Communication, Inc. # | 1,186,600 | |
| 12,000 | Black Box Corporation | 496,560 | 20,400 | JDA Software Group, Inc. # | 400,452 | |
| 30,600 | Blackbaud, Inc. | 675,648 | 9,900 | Keithley Instruments, Inc. | 124,245 | |
| 10,200 | Blue Coat Systems, Inc. # | 505,104 | 21,200 | Komag, Inc. # | 676,068 | |
| 35,000 | Brightpoint, Inc. # | 482,650 | 47,000 | Kopin Corporation # | 183,300 | |
| 52,207 | Brooks Automation, Inc. # | 947,557 | 39,600 | Kulicke and Soffa | ||
| 16,400 | Cabot Microelectronics | Industries, Inc. # | 414,612 | |||
| Corporation # | 582,036 | 15,500 | Littelfuse, Inc. # | 523,435 | ||
| 21,300 | CACI International, Inc. # | 1,040,505 | 13,000 | LoJack Corporation # | 289,770 | |
| 19,000 | Captaris, Inc. # | 97,280 | 18,500 | Manhattan Associates, Inc. # | 516,335 | |
| 7,000 | Catapult Communications | 12,700 | ManTech International | |||
| Corporation # | 69,440 | Corporation # | 391,541 | |||
| 34,100 | C-COR, Inc. # | 479,446 | 15,000 | MAXIMUS, Inc. | 650,700 | |
| 27,100 | Checkpoint Systems, Inc. # | 684,275 | 15,500 | Mercury Computer Systems, Inc. # | 189,100 | |
| 37,200 | CIBER, Inc. # | 304,296 | 25,700 | Methode Electronics, Inc. | 402,205 | |
| 30,600 | Cognex Corporation | 688,806 | 28,000 | MICROS Systems, Inc. # | 1,523,200 | |
| 21,600 | Coherent, Inc. # | 659,016 | 52,500 | Microsemi Corporation # | 1,257,375 | |
| 15,800 | Cohu, Inc. | 351,550 | 20,200 | MIVA, Inc. # | 131,300 | |
| 16,000 | Comtech Telecommunications | 25,600 | MKS Instruments, Inc. # | 709,120 | ||
| Corporation # | 742,720 | 12,500 | MTS Systems Corporation | 558,375 | ||
| 20,000 | Concur Technologies, Inc. # | 457,000 | 31,900 | Napster, Inc. # | 108,460 | |
| The accompanying Notes to Financial Statements are an integral part of this schedule. |
| 90 |
| Small Cap Index Portfolio | ||||||
| Schedule of Investments as of June 29, 2007 (unaudited) | ||||||
| Shares | Common Stock (96.5%) | Value | Shares | Common Stock (96.5%) | Value | |
| Information Technology — continued | 21,400 | Veeco Instruments, Inc. # | $443,836 | |||
| 13,700 | Neoware Systems, Inc. # | $185,498 | 17,600 | ViaSat, Inc. # | 564,960 | |
| 23,800 | NETGEAR, Inc. # | 862,750 | 31,000 | Websense, Inc. # | 658,750 | |
| 17,500 | Network Equipment | 20,000 | X-Rite, Inc. | 295,400 | ||
| Technologies, Inc. # | 166,950 | Total Information | ||||
| 26,800 | Newport Corporation # | 414,864 | Technology | 71,440,790 | ||
| 20,900 | Novatel Wireless, Inc. # | 543,818 | ||||
| 13,950 | Park Electrochemical Corporation | 393,111 | Materials (5.2%) | |||
| 15,600 | PC TEL, Inc. # | 136,500 | 16,900 | A. Schulman, Inc. | 411,177 | |
| 18,000 | Pericom Semiconductor | 10,900 | A.M. Castle & Company | 391,419 | ||
| Corporation # | 200,880 | 15,100 | AMCOL International | |||
| 17,900 | Phoenix Technologies, Ltd. # | 150,897 | Corporation | 412,381 | ||
| 11,600 | Photon Dynamics, Inc. # | 126,440 | 47,900 | AptarGroup, Inc. ‡ | 1,703,324 | |
| 28,900 | Photronics, Inc. # | 430,032 | 16,800 | Arch Chemicals, Inc. | 590,352 | |
| 12,100 | Planar Systems, Inc. # | 90,629 | 13,900 | Brush Engineered Materials, Inc. # | 583,661 | |
| 31,900 | Plexus Corporation # | 733,381 | 26,200 | Buckeye Technologies, Inc. # | 405,314 | |
| 28,200 | Progress Software Corporation # | 896,478 | 20,200 | Caraustar Industries, Inc. # | 106,050 | |
| 11,800 | Quality Systems, Inc. | 448,046 | 19,500 | Century Aluminum Company # | 1,065,285 | |
| 18,000 | Radiant Systems, Inc. # | 238,320 | 32,200 | Chaparral Steel Company | 2,314,214 | |
| 15,200 | RadiSys Corporation # | 188,480 | 13,900 | Chesapeake Corporation | 174,723 | |
| 12,100 | Rogers Corporation # | 447,700 | 28,200 | Cleveland-Cliffs, Inc. | 2,190,294 | |
| 17,300 | Rudolph Technologies, Inc. # | 287,353 | 7,200 | Deltic Timber Corporation | 394,704 | |
| 17,800 | ScanSource, Inc. # | 569,422 | 23,700 | Georgia Gulf Corporation | 429,207 | |
| 46,300 | Secure Computing Corporation # | 351,417 | 41,800 | H.B. Fuller Company | 1,249,402 | |
| 8,900 | SI International, Inc. # | 293,878 | 29,200 | Headwaters, Inc. # | 504,284 | |
| 112,500 | Skyworks Solutions, Inc. # | 826,875 | 8,900 | Material Sciences Corporation # | 104,931 | |
| 18,000 | Sonic Solutions, Inc. # | 226,980 | 18,663 | Myers Industries, Inc. | 412,639 | |
| 12,600 | SPSS, Inc. # | 556,164 | 10,300 | Neenah Paper, Inc. | 424,978 | |
| 15,500 | Standard Microsystems | 20,500 | OM Group, Inc. # | 1,084,860 | ||
| Corporation # | 532,270 | 29,000 | OMNOVA Solutions, Inc. # | 175,450 | ||
| 8,000 | StarTek, Inc. | 86,320 | 6,300 | Penford Corporation | 171,927 | |
| 7,000 | Stratasys, Inc. # | 328,860 | 64,100 | PolyOne Corporation # | 460,879 | |
| 9,600 | Supertex, Inc. # | 300,864 | 11,400 | Pope & Talbot, Inc. # | 45,258 | |
| 20,400 | Sykes Enterprises, Inc. # | 387,396 | 7,100 | Quaker Chemical Corporation | 167,560 | |
| 31,950 | Symmetricom, Inc. # | 268,380 | 25,575 | Quanex Corporation | 1,245,502 | |
| 17,900 | Synaptics, Inc. # | 640,641 | 24,000 | Rock-Tenn Company | 761,280 | |
| 50,350 | Take-Two Interactive | 15,900 | RTI International Metals, Inc. # | 1,198,383 | ||
| Software, Inc. # | 1,005,490 | 18,200 | Ryerson, Inc. | 685,230 | ||
| 28,100 | Technitrol, Inc. | 805,627 | 10,900 | Schweitzer-Mauduit | ||
| 45,237 | THQ, Inc. # | 1,380,633 | International, Inc. | 337,900 | ||
| 9,300 | Tollgrade Communications, Inc. # | 98,115 | 18,800 | Texas Industries, Inc. | 1,474,108 | |
| 82,300 | Trimble Navigation, Ltd. # | 2,650,060 | 28,500 | Tronox, Inc. | 400,425 | |
| 26,400 | TTM Technologies, Inc. # | 343,200 | 30,800 | Wausau-Mosinee | ||
| 16,100 | Ultratech, Inc. # | 214,613 | Paper Corporation | 412,720 | ||
| 46,000 | United Online, Inc. | 758,540 | Total Materials | 22,489,821 | ||
| 54,175 | Varian Semiconductor Equipment | |||||
| Associates, Inc. # | 2,170,250 | |||||
| The accompanying Notes to Financial Statements are an integral part of this schedule. |
| 91 |
| Small Cap Index Portfolio | |||||||
| Schedule of Investments as of June 29, 2007 (unaudited) | |||||||
| Shares | Common Stock (96.5%) | Value | Shares | Common Stock (96.5%) | Value | ||
| Telecommunications Services (0.2%) | 49,500 | Energen Corporation | $2,719,530 | ||||
| 14,000 | CT Communications, Inc. | $427,140 | 15,000 | Laclede Group, Inc. | 478,200 | ||
| 31,000 | General Communication, Inc. # | 397,110 | 19,400 | New Jersey Resources Corporation | 989,788 | ||
| Total Telecommunications | 18,700 | Northwest Natural Gas Company | 863,753 | ||||
| Services | 824,250 | 51,000 | Piedmont Natural Gas | ||||
| Company, Inc. | 1,257,150 | ||||||
| Utilities (4.8%) | 20,400 | South Jersey Industries, Inc. | 721,752 | ||||
| 21,133 | ALLETE, Inc. | 994,308 | 74,432 | Southern Union Company | 2,425,739 | ||
| 11,750 | American States Water Company | 417,948 | 29,200 | Southwest Gas Corporation | 987,252 | ||
| 61,200 | Atmos Energy Corporation | 1,839,672 | 73,300 | UGI Corporation | 1,999,624 | ||
| 36,400 | Avista Corporation | 784,420 | 17,366 | UIL Holdings Corporation | 574,815 | ||
| 8,100 | Cascade Natural Gas Corporation | 213,921 | 24,300 | UniSource Energy Corporation | 799,227 | ||
| 7,100 | Central Vermont Public | Total Utilities | 20,508,132 | ||||
| Service Corporation | 267,528 | ||||||
| 9,500 | CH Energy Group, Inc. | 427,215 | Total Common Stock | ||||
| 39,700 | Cleco Corporation | 972,650 | (cost $261,856,497) | 415,170,014 | |||
| 31,500 | El Paso Electric Company # | 773,640 | |||||
| Interest | Maturity | ||||||
| Shares | Collateral Held for Securities Loaned (<0.1%) | Rate (+) | Date | Value | |||
| 179,231 | Thrivent Financial Securities Lending Trust | 5.360% | N/A | $179,231 | |||
| Total Collateral Held for Securities Loaned | |||||||
| (cost $179,231) | 179,231 | ||||||
| The accompanying Notes to Financial Statements are an integral part of this schedule. |
| 92 |
| Small Cap Index Portfolio | ||||
| Schedule of Investments as of June 29, 2007 (unaudited) | ||||
| Shares or | ||||
| Principal | Interest | Maturity | ||
| Amount | Short-Term Investments (3.6%) | Rate (+) | Date | Value |
| $650,000 | Federal National Mortgage Association | 5.090% | 7/16/2007 | $648,532 |
| 14,903,246 | Thrivent Money Market Portfolio | 5.050 | N/A | 14,903,246 |
| Total Short-Term Investments (at amortized cost) | 15,551,778 | |||
| Total Investments (cost $277,587,506) 100.1% | $430,901,023 | |||
| Other Assets and Liabilities, Net (0.1%) | (284,025) | |||
| Total Net Assets 100.0% | $430,616,998 | |||
| Number of | Notional | ||||
| Contracts | Expiration | Principal | Unrealized | ||
| Futures | Long/(Short) | Date | Amount | Value | Gain/(Loss) |
| Russell 2000 Futures | 36 | September 2007 | $15,439,480 | $15,157,800 | ($281,680) |
# Non-income producing security.
* All or a portion of the security is on loan as discussed in item 2(M) of the Notes to Financial Statements.
+ The interest rate shown reflects the yield, coupon rate or, for securities purchased at a discount, the discount rate at the date of purchase.
‡ At June 29, 2007, $648,532 of investments were held on deposit with the counterparty and pledged as the initial margin deposit for open financial futures contracts. In addition, $16,864,981 of investments were earmarked as collateral to cover open financial futures contracts.
Gross unrealized appreciation and depreciation of investments were as follows:
| Gross unrealized appreciation | $176,481,575 |
| Gross unrealized depreciation | (23,168,058) |
| Net unrealized appreciation (depreciation) | $153,313,517 |
| Cost for federal income tax purposes | $277,587,506 |
| The accompanying Notes to Financial Statements are an integral part of this schedule. |
| 93 |
| Mid Cap Growth Portfolio | ||||||
| Schedule of Investments as of June 29, 2007 (unaudited) | ||||||
| Shares | Common Stock (97.7%) | Value | Shares | Common Stock (97.7%) | Value | |
| Consumer Discretionary (15.2%) | Energy (6.0%) | |||||
| 34,400 | Abercrombie & Fitch Company | $2,510,512 | 15,700 | Baker Hughes, Inc. | $1,320,841 | |
| 48,900 | Cheesecake Factory, Inc. # | 1,199,028 | 95,000 | Cameron International | ||
| 59,800 | Chipotle Mexican Grill, Inc. # | 5,099,744 | Corporation # | 6,789,650 | ||
| 201,300 | Circuit City Stores, Inc. | 3,035,604 | 53,000 | Devon Energy Corporation | 4,149,370 | |
| 55,100 | Clear Channel Outdoor | 68,000 | Diamond Offshore Drilling, Inc. | 6,906,080 | ||
| Holdings, Inc. # | 1,561,534 | 36,500 | GlobalSantaFe Corporation | 2,637,125 | ||
| 301,300 | Coldwater Creek, Inc. # | 6,999,199 | 25,900 | National Oilwell Varco, Inc. # | 2,699,816 | |
| 248,500 | Corinthian Colleges, Inc. # | 4,048,065 | 82,800 | Peabody Energy Corporation | 4,005,864 | |
| 85,400 | Crocs, Inc. # | 3,674,762 | 86,300 | Southwestern Energy | ||
| 112,700 | DeVry, Inc. | 3,834,054 | Company # | 3,840,350 | ||
| 118,000 | DreamWorks Animation | 86,300 | Ultra Petroleum Corporation # | 4,767,212 | ||
| SKG, Inc. # | 3,403,120 | 65,100 | VeraSun Energy Corporation # | 942,648 | ||
| 52,400 | Focus Media Holding, | 39,988 | XTO Energy, Inc. | 2,403,279 | ||
| Ltd. ADR # | 2,646,200 | Total Energy | 40,462,235 | |||
| 80,400 | GameStop Corporation # | 3,143,640 | ||||
| 138,000 | Hilton Hotels Corporation | 4,618,860 | Financials (8.6%) | |||
| 126,100 | Iconix Brand Group, Inc. # | 2,801,942 | 31,750 | Affiliated Managers | ||
| 167,600 | International Game Technology | 6,653,720 | Group, Inc. # | 4,088,130 | ||
| 60,200 | ITT Educational Services, Inc. # | 7,066,276 | 28,300 | AllianceBernstein Holding, LP | 2,464,647 | |
| 189,300 | Leapfrog Enterprises, Inc. # | 1,940,325 | 141,500 | Annaly Capital | ||
| 108,100 | Newell Rubbermaid, Inc. | 3,181,383 | Management, Inc. | 2,040,430 | ||
| 335,600 | Quiksilver, Inc. # | 4,742,028 | 102,100 | Assurant, Inc. | 6,015,732 | |
| 102,700 | Scientific Games Corporation # | 3,589,365 | 4,600 | Chicago Mercantile Exchange | ||
| 110,500 | Shuffle Master, Inc. # | 1,834,300 | Holdings, Inc. | 2,458,056 | ||
| 198,900 | Staples, Inc. | 4,719,897 | 117,400 | E*TRADE Financial | ||
| 53,900 | Starwood Hotels & Resorts | Corporation # | 2,593,366 | |||
| Worldwide, Inc. | 3,615,073 | 42,500 | Greenhill & Company, Inc. | 2,920,175 | ||
| 54,600 | Texas Roadhouse, Inc. # | 698,334 | 65,200 | Highland Distressed | ||
| 84,400 | Tween Brands, Inc. # | 3,764,240 | Opportunities, Inc. | 929,100 | ||
| 51,100 | Under Armour, Inc. # | 2,332,715 | 18,200 | IntercontinentalExchange, | ||
| 125,400 | Urban Outfitters, Inc. # | 3,013,362 | Inc. # | 2,690,870 | ||
| 73,400 | Volcom, Inc. # | 3,679,542 | 91,400 | Lazard, Ltd. | 4,115,742 | |
| 189,400 | XM Satellite Radio | 22,150 | Legg Mason, Inc. | 2,179,117 | ||
| Holdings, Inc. # | 2,229,238 | 58,000 | Nasdaq Stock Market, Inc. # | 1,723,180 | ||
| Total Consumer | 83,300 | Northern Trust Corporation | 5,351,192 | |||
| Discretionary | 101,636,062 | 16,200 | Nymex Holdings, Inc. | 2,035,206 | ||
| 75,800 | PartnerRe, Ltd. | 5,874,500 | ||||
| Consumer Staples (2.1%) | 52,000 | Portfolio Recovery Associates, Inc. | 3,121,040 | |||
| 61,400 | Andersons, Inc. | 2,783,262 | 135,900 | T. Rowe Price Group, Inc. | 7,051,851 | |
| 148,000 | Coca-Cola Enterprises, Inc. | 3,552,000 | Total Financials | 57,652,334 | ||
| 134,100 | Pepsi Bottling Group, Inc. | 4,516,488 | ||||
| 80,100 | Whole Foods Market, Inc. | 3,067,830 | ||||
| Total Consumer Staples | 13,919,580 | |||||
| The accompanying Notes to Financial Statements are an integral part of this schedule. |
| 94 |
Mid Cap Growth Portfolio
Schedule of Investments as of June 29, 2007 (unaudited)
| Shares | Common Stock (97.7%) | Value | Shares | Common Stock (97.7%) | Value | |
| Health Care (17.7%) | 29,500 | Corporate Executive Board | ||||
| 156,000 | Advanced Medical Optics, Inc. # | $5,441,280 | Company | $1,914,845 | ||
| 107,400 | Affymetrix, Inc. # | 2,673,186 | 66,020 | Expeditors International of | ||
| 158,200 | Alkermes, Inc. # | 2,309,720 | Washington, Inc. | 2,726,626 | ||
| 78,800 | Allscripts Healthcare | 82,400 | Flowserve Corporation | 5,899,840 | ||
| Solutions, Inc. # | 2,007,824 | 80,700 | Foster Wheeler, Ltd. # | 8,634,093 | ||
| 143,300 | Amylin Pharmaceuticals, Inc. # | 5,898,228 | 75,000 | FTI Consulting, Inc. # | 2,852,250 | |
| 127,900 | Biogen Idec, Inc. # | 6,842,650 | 34,700 | Huron Consulting Group, Inc. # | 2,533,447 | |
| 90,600 | BioMarin Pharmaceutical, Inc. # | 1,625,364 | 29,600 | ITT Corporation | 2,021,088 | |
| 87,800 | C.R. Bard, Inc. | 7,254,914 | 66,000 | Jacobs Engineering Group, Inc. # | 3,795,660 | |
| 22,000 | Cephalon, Inc. # | 1,768,580 | 107,050 | Joy Global, Inc. | 6,244,226 | |
| 75,950 | Coventry Health Care, Inc. # | 4,378,518 | 74,500 | KBR, Inc. # | 1,954,135 | |
| 141,600 | Cubist Pharmaceuticals, Inc. # | 2,790,936 | 15,200 | Manitowoc Company, Inc. | 1,221,776 | |
| 30,250 | DaVita, Inc. # | 1,629,870 | 90,000 | Monster Worldwide, Inc. # | 3,699,000 | |
| 104,600 | Endo Pharmaceutical | 94,300 | Precision Castparts Corporation | 11,444,247 | ||
| Holdings, Inc. # | 3,580,458 | 30,100 | Rockwell Automation, Inc. | 2,090,144 | ||
| 86,000 | Foxhollow Technologies, Inc. # | 1,826,640 | 50,300 | Rockwell Collins, Inc. | 3,553,192 | |
| 135,400 | Gen-Probe, Inc. # | 8,180,868 | 54,200 | Roper Industries, Inc. | 3,094,820 | |
| 82,400 | Genzyme Corporation # | 5,306,560 | 103,800 | Spirit Aerosystems | ||
| 83,700 | Hologic, Inc. # | 4,629,447 | Holdings, Inc. # | 3,741,990 | ||
| 29,000 | Intuitive Surgical, Inc. # | 4,024,330 | 118,100 | Stericycle, Inc. # | 5,250,726 | |
| 110,000 | Kyphon, Inc. # | 5,296,500 | 29,700 | Textron, Inc. | 3,270,267 | |
| 119,700 | Mannkind Corporation # | 1,475,901 | 77,600 | US Airways Group, Inc. # | 2,348,952 | |
| 59,800 | Manor Care, Inc. | 3,904,342 | Total Industrials | 86,597,464 | ||
| 36,400 | Millipore Corporation # | 2,733,276 | ||||
| 130,800 | NuVasive, Inc. # | 3,532,908 | Information Technology (24.9%) | |||
| 103,500 | Patterson Companies, Inc. # | 3,857,445 | 256,166 | Activision, Inc. # | 4,782,619 | |
| 114,000 | Pharmaceutical Product | 178,964 | Adobe Systems, Inc. # | 7,185,405 | ||
| Development, Inc. | 4,362,780 | 73,300 | Akamai Technologies, Inc. # | 3,565,312 | ||
| 61,000 | Sepracor, Inc. # | 2,502,220 | 39,300 | Alliance Data Systems | ||
| 38,100 | Shire Pharmaceuticals Group | Corporation # | 3,037,104 | |||
| plc ADR | 2,824,353 | 50,400 | Amphenol Corporation | 1,796,760 | ||
| 125,800 | St. Jude Medical, Inc. # | 5,219,442 | 431,900 | BEA Systems, Inc. # | 5,912,711 | |
| 89,700 | Thermo Electron Corporation # | 4,639,284 | 162,600 | Broadcom Corporation # | 4,756,050 | |
| 128,100 | Thoratec Corporation # | 2,355,759 | 216,900 | Cadence Design Systems, Inc. # | 4,763,124 | |
| 49,700 | VCA Antech, Inc. # | 1,873,193 | 64,900 | China GrenTech Corporation, | ||
| 43,400 | Vertex Pharmaceuticals, Inc. # | 1,239,504 | Ltd. ADR # | 868,362 | ||
| Total Health Care | 117,986,280 | 100,500 | CIENA Corporation # | 3,631,065 | ||
| 307,100 | CNET Networks, Inc. # | 2,515,149 | ||||
| Industrials (13.0%) | 91,700 | Cogent, Inc. # | 1,347,073 | |||
| 84,450 | Aecom Technology | 27,550 | Cognizant Technology Solutions | |||
| Corporation # | 2,095,204 | Corporation # | 2,068,730 | |||
| 89,600 | BE Aerospace, Inc. # | 3,700,480 | 194,900 | Corning, Inc. # | 4,979,695 | |
| 47,800 | C.H. Robinson Worldwide, Inc. | 2,510,456 | 140,800 | Cree, Inc. #* | 3,639,680 | |
| The accompanying Notes to Financial Statements are an integral part of this schedule. |
| 95 |
Mid Cap Growth Portfolio
Schedule of Investments as of June 29, 2007 (unaudited)
| Shares | Common Stock (97.7%) | Value | Shares | Common Stock (97.7%) | Value | |
| Information Technology — continued | 150,600 | VeriSign, Inc. # | $4,778,538 | |||
| 63,000 | Electronic Arts, Inc. # | $2,981,160 | 50,800 | VistaPrint, Ltd. # | 1,943,100 | |
| 246,500 | Emulex Corporation # | 5,383,560 | 205,700 | Western Digital Corporation # | 3,980,295 | |
| 81,400 | F5 Networks, Inc. # | 6,560,840 | 76,000 | Xilinx, Inc. | 2,034,520 | |
| 68,900 | Fiserv, Inc. # | 3,913,520 | Total Information | |||
| 76,800 | FormFactor, Inc. # | 2,941,440 | Technology | 166,123,589 | ||
| 182,700 | Foundry Networks, Inc. # | 3,043,782 | ||||
| 333,200 | Integrated Device | Materials (4.0%) | ||||
| Technology, Inc. # | 5,087,964 | 69,400 | Air Products and Chemicals, Inc. 5,577,678 | |||
| 204,000 | Intersil Corporation | 6,417,840 | 18,300 | Allegheny Technologies, Inc. | 1,919,304 | |
| 262,862 | JDS Uniphase Corporation # | 3,530,237 | 172,300 | Bemis Company, Inc. | 5,716,914 | |
| 30,240 | KLA-Tencor Corporation | 1,661,688 | 67,400 | Celanese Corporation | 2,613,772 | |
| 85,100 | L-1 Identity Solutions, Inc. # | 1,740,295 | 60,800 | Newmont Mining Corporation | 2,374,848 | |
| 8,400 | Macrovision Corporation # | 252,504 | 123,700 | Praxair, Inc. | 8,905,163 | |
| 250,400 | Marvell Technology | Total Materials | 27,107,679 | |||
| Group, Ltd. # | 4,559,784 | |||||
| 85,300 | McAfee, Inc. # | 3,002,560 | Telecommunications Services (6.2%) | |||
| 140,000 | NAVTEQ Corporation # | 5,927,600 | 86,742 | American Tower Corporation # | 3,643,164 | |
| 202,600 | Network Appliance, Inc. # | 5,915,920 | 762,521 | Level 3 Communications, Inc. # | 4,460,748 | |
| 156,100 | Nuance Communications, Inc. # | 2,611,553 | 155,100 | NeuStar, Inc. # | 4,493,247 | |
| 150,400 | NVIDIA Corporation # | 6,213,024 | 123,900 | NII Holdings, Inc. # | 10,003,686 | |
| 66,600 | OpNext, Inc. # | 881,784 | 161,200 | Rogers Communications, Inc. | 6,849,388 | |
| 189,400 | Opsware, Inc. # | 1,801,194 | 167,200 | SBA Communications | ||
| 429,300 | Powerwave Technologies, Inc. # | 2,876,310 | Corporation # | 5,616,248 | ||
| 136,900 | SanDisk Corporation # | 6,699,886 | 311,400 | Time Warner Telecom, Inc. # | 6,259,140 | |
| 136,100 | STEC, Inc. # | 875,123 | Total Telecommunications | |||
| 159,700 | Symantec Corporation # | 3,225,940 | Services | 41,325,621 | ||
| 149,800 | Synopsys, Inc. # | 3,959,214 | ||||
| 222,800 | Tellabs, Inc. # | 2,397,328 | Total Common Stock | |||
| 66,100 | THQ, Inc. # | 2,017,372 | (cost $557,967,531) | 652,810,844 | ||
| 227,500 | TIBCO Software, Inc. # | 2,058,875 | ||||
| The accompanying Notes to Financial Statements are an integral part of this schedule. |
| 96 |
Mid Cap Growth Portfolio
Schedule of Investments as of June 29, 2007 (unaudited)
| Interest | Maturity | |||
| Shares | Collateral Held for Securities Loaned (0.6%) | Rate (+) | Date | Value |
| 3,726,929 | Thrivent Financial Securities Lending Trust | 5.360% | N/A | $3,726,929 |
| Total Collateral Held for Securities Loaned | ||||
| (cost $3,726,929) | 3,726,929 | |||
| Shares or | ||||
| Principal | Interest | Maturity | ||
| Amount | Short-Term Investments (0.7%) | Rate (+) | Date | Value |
| $2,000,000 | Barclays US Funding Corporation | 5.235% | 7/27/2007 | $1,992,147 |
| 2,928,509 | Thrivent Money Market Portfolio | 5.050 | N/A | 2,928,509 |
| Total Short-Term Investments (at amortized cost) | 4,920,656 | |||
| Total Investments (cost $566,615,116) 99.0% | $661,458,429 | |||
| Other Assets and Liabilities, Net 1.0% | 6,505,534 | |||
| Total Net Assets 100.0% | $667,963,963 | |||
# Non-income producing security.
* All or a portion of the security is on loan as discussed in item 2(M) of the Notes to Financial Statements.
+ The interest rate shown reflects the yield, coupon rate or, for securities purchased at a discount, the discount rate at the date of purchase.
Definitions:
ADR — American Depository Receipts, which are certificates for shares of an underlying foreign security’s shares held by an issuing U.S. depository bank.
Gross unrealized appreciation and depreciation of investments were as follows:
| Gross unrealized appreciation | $115,062,602 |
| Gross unrealized depreciation | (20,219,289) |
| Net unrealized appreciation (depreciation) | $94,843,313 |
| Cost for federal income tax purposes | $566,615,116 |
| The accompanying Notes to Financial Statements are an integral part of this schedule. |
| 97 |
| Mid Cap Growth Portfolio II Schedule of Investments as of June 29, 2007 (unaudited) | ||||||
| Shares | Common Stock (96.7%) | Value | Shares | Common Stock (96.7%) | Value | |
| Consumer Discretionary (15.1%) | Energy (6.0%) | |||||
| 1,600 | Abercrombie & Fitch Company | $116,768 | 700 | Baker Hughes, Inc. | $58,891 | |
| 2,300 | Cheesecake Factory, Inc. # | 56,396 |
| 4,500 | Cameron International | |
| 2,900 | Chipotle Mexican Grill, Inc. #* | 247,312 | Corporation # | 321,615 | ||
| 9,800 | Circuit City Stores, Inc. * | 147,784 | 2,500 | Devon Energy Corporation | 195,725 | |
| 2,700 | Clear Channel Outdoor | 3,300 | Diamond Offshore Drilling, Inc. | 335,148 | ||
| Holdings, Inc. # | 76,518 | 1,800 | GlobalSantaFe Corporation | 130,050 | ||
| 14,300 | Coldwater Creek, Inc. #* | 332,189 | 1,200 | National Oilwell Varco, Inc. # | 125,088 | |
| 11,900 | Corinthian Colleges, Inc. # | 193,851 | 4,000 | Peabody Energy Corporation | 193,520 | |
| 4,000 | Crocs, Inc. #* | 172,120 | 4,100 | Southwestern Energy Company # | 182,450 | |
| 5,400 | DeVry, Inc. | 183,708 | 4,100 | Ultra Petroleum Corporation # | 226,484 | |
| 5,600 | DreamWorks Animation | 3,150 | VeraSun Energy Corporation #* | 45,612 | ||
| SKG, Inc. # | 161,504 | 1,933 | XTO Energy, Inc. | 116,173 | ||
| 2,600 | Focus Media Holding, Ltd. ADR # | 131,300 | Total Energy | 1,930,756 | ||
| 3,800 | GameStop Corporation # | 148,580 | ||||
| 6,600 | Hilton Hotels Corporation | 220,902 | Financials (8.6%) | |||
| 6,100 | Iconix Brand Group, Inc. # | 135,542 | 1,490 | Affiliated Managers Group, Inc. # | 191,852 | |
| 7,990 | International Game Technology | 317,203 | 1,400 | AllianceBernstein Holding, LP | 121,926 | |
| 2,900 | ITT Educational Services, Inc. # | 340,402 | 6,800 | Annaly Capital Management, Inc. | 98,056 | |
| 9,100 | Leapfrog Enterprises, Inc. #* | 93,275 | 4,900 | Assurant, Inc. | 288,708 | |
| 5,100 | Newell Rubbermaid, Inc. | 150,093 | 200 | Chicago Mercantile Exchange | ||
| 16,000 | Quiksilver, Inc. # | 226,080 | Holdings, Inc. | 106,872 | ||
| 4,900 | Scientific Games Corporation #* | 171,255 | 5,600 | E*TRADE Financial Corporation # | 123,704 | |
| 5,400 | Shuffle Master, Inc. #* | 89,640 | 2,000 | Greenhill & Company, Inc. * | 137,420 | |
| 9,700 | Staples, Inc. | 230,181 | 3,200 | Highland Distressed | ||
| 2,600 | Starwood Hotels & Resorts | Opportunities, Inc. * | 45,600 | |||
| Worldwide, Inc. | 174,382 | 900 | IntercontinentalExchange, Inc. # | 133,065 | ||
| 2,500 | Texas Roadhouse, Inc. # | 31,975 | 4,400 | Lazard, Ltd. | 198,132 | |
| 4,000 | Tween Brands, Inc. # | 178,400 | 1,095 | Legg Mason, Inc. | 107,726 | |
| 2,400 | Under Armour, Inc. # | 109,560 | 2,800 | Nasdaq Stock Market, Inc. # | 83,188 | |
| 6,000 | Urban Outfitters, Inc. # | 144,180 | 4,000 | Northern Trust Corporation | 256,960 | |
| 3,500 | Volcom, Inc. # | 175,455 | 800 | Nymex Holdings, Inc. | 100,504 | |
| 9,200 | XM Satellite Radio | 3,600 | PartnerRe, Ltd. | 279,000 | ||
| Holdings, Inc. #* | 108,284 | 2,500 | Portfolio Recovery | |||
| Total Consumer | Associates, Inc. * | 150,050 | ||||
| Discretionary | 4,864,839 | 6,500 | T. Rowe Price Group, Inc. | 337,285 | ||
| Total Financials | 2,760,048 | |||||
| Consumer Staples (2.0%) | ||||||
| 2,900 | Andersons, Inc. * | 131,457 | Health Care (17.5%) | |||
| 7,000 | Coca-Cola Enterprises, Inc. | 168,000 | 7,400 | Advanced Medical Optics, Inc. #* | 258,112 | |
| 6,400 | Pepsi Bottling Group, Inc. | 215,552 | 5,100 | Affymetrix, Inc. # | 126,939 | |
| 3,800 | Whole Foods Market, Inc. * | 145,540 | 7,500 | Alkermes, Inc. # | 109,500 | |
| Total Consumer Staples | 660,549 | |||||
| The accompanying Notes to Financial Statements are an integral part of this schedule. |
| 98 |
Mid Cap Growth Portfolio II
Schedule of Investments as of June 29, 2007 (unaudited)
| Shares | Common Stock (96.7%) | Value | Shares | Common Stock (96.7%) | Value | |
| Health Care — continued | 3,900 | Flowserve Corporation | $279,240 | |||
| 3,700 | Allscripts Healthcare | 3,800 | Foster Wheeler, Ltd. # | 406,562 | ||
| Solutions, Inc. #* | $94,276 | 3,600 | FTI Consulting, Inc. # | 136,908 | ||
| 6,800 | Amylin Pharmaceuticals, Inc. #* | 279,888 | 1,700 | Huron Consulting Group, Inc. # | 124,117 | |
| 6,100 | Biogen Idec, Inc. # | 326,350 | 1,400 | ITT Corporation | 95,592 | |
| 4,300 | BioMarin Pharmaceutical, Inc. # | 77,142 | 3,200 | Jacobs Engineering Group, Inc. # | 184,032 | |
| 4,200 | C.R. Bard, Inc. | 347,046 | 5,150 | Joy Global, Inc. | 300,400 | |
| 1,000 | Cephalon, Inc. #* | 80,390 | 3,500 | KBR, Inc. # | 91,805 | |
| 3,650 | Coventry Health Care, Inc. # | 210,422 | 700 | Manitowoc Company, Inc. | 56,266 | |
| 6,700 | Cubist Pharmaceuticals, Inc. # | 132,057 | 4,260 | Monster Worldwide, Inc. # | 175,086 | |
| 1,450 | DaVita, Inc. # | 78,126 | 4,500 | Precision Castparts Corporation | 546,121 | |
| 5,000 | Endo Pharmaceutical | 1,400 | Rockwell Automation, Inc. | 97,216 | ||
| Holdings, Inc. # | 171,150 | 2,400 | Rockwell Collins, Inc. | 169,536 | ||
| 4,100 | Foxhollow Technologies, Inc. # | 87,084 | 2,600 | Roper Industries, Inc. | 148,460 | |
| 6,500 | Gen-Probe, Inc. # | 392,730 | 5,000 | Spirit Aerosystems Holdings, | ||
| 3,940 | Genzyme Corporation # | 253,736 | Inc. # | 180,250 | ||
| 4,000 | Hologic, Inc. #* | 221,240 | 5,700 | Stericycle, Inc. # | 253,422 | |
| 1,400 | Intuitive Surgical, Inc. # | 194,278 | 1,400 | Textron, Inc. | 154,154 | |
| 5,300 | Kyphon, Inc. # | 255,195 | 3,700 | US Airways Group, Inc. # | 111,999 | |
| 5,800 | Mannkind Corporation #* | 71,514 | Total Industrials | 4,132,064 | ||
| 2,900 | Manor Care, Inc. | 189,341 | ||||
| 1,700 | Millipore Corporation # | 127,653 | Information Technology (24.6%) | |||
| 6,300 | NuVasive, Inc. # | 170,163 | 12,266 | Activision, Inc. # | 229,006 | |
| 4,900 | Patterson Companies, Inc. # | 182,623 | 8,546 | Adobe Systems, Inc. # | 343,122 | |
| 5,400 | Pharmaceutical Product | 3,500 | Akamai Technologies, Inc. # | 170,240 | ||
| Development, Inc. | 206,658 | 1,920 | Alliance Data Systems | |||
| 2,900 | Sepracor, Inc. # | 118,958 | Corporation # | 148,378 | ||
| 1,800 | Shire Pharmaceuticals Group | 2,360 | Amphenol Corporation | 84,134 | ||
| plc ADR | 133,434 | 20,600 | BEA Systems, Inc. # | 282,014 | ||
| 6,000 | St. Jude Medical, Inc. # | 248,940 | 7,700 | Broadcom Corporation # | 225,225 | |
| 4,360 | Thermo Electron Corporation # | 225,499 | 10,300 | Cadence Design Systems, Inc. # | 226,188 | |
| 6,100 | Thoratec Corporation # | 112,179 | 3,100 | China GrenTech Corporation, | ||
| 2,400 | VCA Antech, Inc. # | 90,456 | Ltd. ADR #* | 41,478 | ||
| 2,100 | Vertex Pharmaceuticals, Inc. # | 59,976 | 4,800 | CIENA Corporation # | 173,424 | |
| Total Health Care | 5,633,055 | 14,700 | CNET Networks, Inc. # | 120,393 | ||
| 4,500 | Cogent, Inc. # | 66,105 | ||||
| Industrials (12.8%) | 1,300 | Cognizant Technology Solutions | ||||
| 4,000 | Aecom Technology Corporation # | 99,240 | Corporation # | 97,617 | ||
| 4,200 | BE Aerospace, Inc. # | 173,460 | 9,300 | Corning, Inc. # | 237,615 | |
| 2,400 | C.H. Robinson Worldwide, Inc. | 126,048 | 6,800 | Cree, Inc. #* | 175,780 | |
| 1,450 | Corporate Executive Board | 3,000 | Electronic Arts, Inc. # | 141,960 | ||
| Company | 94,120 | 11,800 | Emulex Corporation # | 257,712 | ||
| 3,100 | Expeditors International of | 3,900 | F5 Networks, Inc. # | 314,340 | ||
| Washington, Inc. | 128,030 | 3,300 | Fiserv, Inc. # | 187,440 | ||
| The accompanying Notes to Financial Statements are an integral part of this schedule. |
| 99 |
Mid Cap Growth Portfolio II
Schedule of Investments as of June 29, 2007 (unaudited)
| Shares | Common Stock (96.7%) | Value | Shares | Common Stock (96.7%) | Value | |
| Information Technology — continued | 9,900 | Western Digital Corporation # | $191,565 | |||
| 3,800 | FormFactor, Inc. # | $145,540 | 3,600 | Xilinx, Inc. | 96,372 | |
| 8,700 | Foundry Networks, Inc. # | 144,942 | Total Information | |||
| 15,900 | Integrated Device | Technology | 7,946,323 | |||
| Technology, Inc. # | 242,793 | |||||
| 9,700 | Intersil Corporation | 305,162 | Materials (4.0%) | |||
| 12,587 | JDS Uniphase Corporation #* | 169,043 | 3,300 | Air Products and Chemicals, Inc. | 265,221 | |
| 1,400 | KLA-Tencor Corporation | 76,930 | 900 | Allegheny Technologies, Inc. | 94,392 | |
| 4,100 | L-1 Identity Solutions, Inc. #* | 83,845 | 8,200 | Bemis Company, Inc. | 272,076 | |
| 400 | Macrovision Corporation # | 12,024 | 3,200 | Celanese Corporation | 124,096 | |
| 11,940 | Marvell Technology Group, Ltd. # | 217,427 | 2,900 | Newmont Mining Corporation | 113,274 | |
| 4,100 | McAfee, Inc. # | 144,320 | 6,000 | Praxair, Inc. | 431,940 | |
| 6,700 | NAVTEQ Corporation # | 283,678 | Total Materials | 1,300,999 | ||
| 9,600 | Network Appliance, Inc. # | 280,320 | ||||
| 7,400 | Nuance Communications, Inc. #* | 123,802 | Telecommunications Services (6.1%) | |||
| 7,200 | NVIDIA Corporation # | 297,432 | 4,080 | American Tower Corporation # | 171,360 | |
| 3,200 | OpNext, Inc. # | 42,368 | 36,597 | Level 3 Communications, Inc. # | 214,092 | |
| 9,000 | Opsware, Inc. # | 85,590 | 7,500 | NeuStar, Inc. # | 217,275 | |
| 21,100 | Powerwave Technologies, Inc. # | 141,370 | 5,900 | NII Holdings, Inc. # | 476,366 | |
| 6,500 | SanDisk Corporation #* | 318,110 | 7,700 | Rogers Communications, Inc. | 327,173 | |
| 6,500 | STEC, Inc. # | 41,795 | 8,000 | SBA Communications | ||
| 7,800 | Symantec Corporation # | 157,560 | Corporation # | 268,720 | ||
| 7,200 | Synopsys, Inc. # | 190,296 | 14,800 | Time Warner Telecom, Inc. # | 297,480 | |
| 10,800 | Tellabs, Inc. # | 116,208 | Total Telecommunications | |||
| 3,200 | THQ, Inc. #* | 97,664 | Services | 1,972,466 | ||
| 10,800 | TIBCO Software, Inc. # | 97,740 | ||||
| 7,200 | VeriSign, Inc. # | 228,456 | Total Common Stock | |||
| 2,400 | VistaPrint, Ltd. # | 91,800 | (cost $25,452,757) | 31,201,099 | ||
| The accompanying Notes to Financial Statements are an integral part of this schedule. |
| 100 |
Mid Cap Growth Portfolio II
Schedule of Investments as of June 29, 2007 (unaudited)
| Interest | Maturity | |||
| Shares | Collateral Held for Securities Loaned (12.8%) | Rate (+) | Date | Value |
| 4,125,807 | Thrivent Financial Securities Lending Trust | 5.360% | N/A | $4,125,807 |
| Total Collateral Held for Securities Loaned | ||||
| (cost $4,125,807) | 4,125,807 | |||
| Interest | Maturity | |||
| Shares | Short-Term Investments (1.5%) | Rate (+) | Date | Value |
| 482,634 | Thrivent Money Market Portfolio | 5.050% | N/A | $482,634 |
| Total Short-Term Investments (at amortized cost) | 482,634 | |||
| Total Investments (cost $30,061,198) 111.0% | $35,809,540 | |||
| Other Assets and Liabilities, Net (11.0%) | (3,558,603) | |||
| Total Net Assets 100.0% | $32,250,937 | |||
# Non-income producing security.
* All or a portion of the security is on loan as discussed in item 2(M) of the Notes to Financial Statements.
+ The interest rate shown reflects the yield, coupon rate or, for securities purchased at a discount, the discount rate at the date of purchase.
Definitions:
ADR — American Depository Receipts, which are certificates for shares of an underlying foreign security’s shares held by an issuing U.S. depository bank.
Gross unrealized appreciation and depreciation of investments were as follows:
| Gross unrealized appreciation | $6,643,264 |
| Gross unrealized depreciation | (894,922) |
| Net unrealized appreciation (depreciation) | $5,748,342 |
| Cost for federal income tax purposes | $30,061,198 |
| The accompanying Notes to Financial Statements are an integral part of this schedule. |
| 101 |
| Partner Mid Cap Value Portfolio Schedule of Investments as of June 29, 2007 (unaudited) | ||||||
| Shares | Common Stock (97.7%) | Value | Shares | Common Stock (97.7%) | Value | |
| Consumer Discretionary (10.4%) | Financials (27.0%) | |||||
| 510 | Autoliv, Inc. | $29,004 | 19,272 | Ambac Financial Group, Inc. | $1,680,326 | |
| 7,406 | Boyd Gaming Corporation | 364,301 | 23,818 | Apartment Investment & | ||
| 151,784 | Charter Communications, Inc. #* | 614,725 | Management Company * | 1,200,904 | ||
| 55,290 | Ford Motor Company * | 520,832 | 10,251 | Assurant, Inc. | 603,989 | |
| 8,330 | Fortune Brands, Inc. | 686,142 | 4,620 | Astoria Financial Corporation | 115,685 | |
| 12,737 | Goodyear Tire & | 7,487 | Bear Stearns Companies, Inc. | 1,048,180 | ||
| Rubber Company #* | 442,738 | 17,615 | Brandywine Realty Trust | 503,437 | ||
| 45,101 | H&R Block, Inc. | 1,054,010 | 15,805 | CIT Group, Inc. | 866,588 | |
| 7,400 | J.C. Penney Company, Inc. | 14,120 | Commerce Bancorp, Inc. | 522,299 | ||
| (Holding Company) | 535,612 | 10,178 | Commerce Bancshares, Inc. | 461,063 | ||
| 14,498 | Johnson Controls, Inc. | 1,678,433 | 36,700 | DCT Industrial Trust, Inc. | 394,892 | |
| 12,607 | Lennar Corporation | 460,912 | 7,059 | Developers Diversified | ||
| 36,211 | Newell Rubbermaid, Inc. | 1,065,690 | Realty Corporation | 372,080 | ||
| 10,585 | Ross Stores, Inc. | 326,018 | 9,389 | E*TRADE Financial Corporation # | 207,403 | |
| 11,506 | Tenneco, Inc. # | 403,170 | 6,655 | Equity Residential REIT | 303,668 | |
| 7,154 | Williams-Sonoma, Inc. * | 225,923 | 9,562 | Everest Re Group, Ltd. | 1,038,816 | |
| Total Consumer | 9,759 | First Horizon National | ||||
| Discretionary | 8,407,510 | Corporation | 380,601 | |||
| 21,718 | Highwoods Properties, Inc. | 814,425 | ||||
| Consumer Staples (5.8%) | 26,995 | Hudson City Bancorp, Inc. | 329,879 | |||
| 18,477 | Clorox Company | 1,147,422 | 43,798 | KeyCorp | 1,503,585 | |
| 12,475 | Coca-Cola Enterprises, Inc. | 299,400 | 5,412 | Lazard, Ltd. | 243,702 | |
| 3,632 | Loews Corporation — | 19,037 | Liberty Property Trust * | 836,295 | ||
| Carolina Group | 280,645 | 5,839 | M&T Bank Corporation | 624,189 | ||
| 5,781 | Pepsi Bottling Group, Inc. | 194,704 | 13,534 | Mack-Cali Realty Corporation | 588,594 | |
| 6,178 | Reynolds American, Inc. | 402,806 | 5,612 | MGIC Investment Corporation | 319,098 | |
| 14,852 | Safeway, Inc. | 505,414 | 17,077 | Northern Trust Corporation | 1,097,026 | |
| 5,250 | Smithfield Foods, Inc. # | 161,648 | 3,193 | Nuveen Investments | 198,445 | |
| 35,896 | SUPERVALU, Inc. | 1,662,703 | 9,578 | PartnerRe, Ltd. | 742,295 | |
| Total Consumer Staples | 4,654,742 | 18,977 | Pennsylvania Real Estate | |||
| Investment Trust | 841,250 | |||||
| Energy (11.0%) | 3,893 | Philadelphia Consolidated | ||||
| 15,812 | EOG Resources, Inc. | 1,155,225 | Holding Corporation # | 162,727 | ||
| 9,791 | Hess Corporation | 577,277 | 7,118 | PMI Group, Inc. | 317,961 | |
| 66,804 | Range Resources Corporation | 2,499,141 | 3,163 | Radian Group, Inc. | 170,802 | |
| 9,058 | Smith International, Inc. | 531,161 | 6,071 | RenaissanceRe Holdings, Ltd. | 376,341 | |
| 2,063 | Teekay Shipping Corporation | 119,468 | 15,379 | UnumProvident Corporation | 401,546 | |
| 14,393 | Ultra Petroleum Corporation # | 795,069 | 7,585 | Vornado Realty Trust * | 833,136 | |
| 8,784 | Weatherford International, Ltd. # | 485,228 | 22,583 | Webster Financial Corporation * | 963,617 | |
| 6,246 | W-H Energy Services, Inc. # | 386,690 | 4,423 | XL Capital, Ltd. | 372,815 | |
| 75,436 | Williams Companies, Inc. | 2,385,286 | 5,169 | Zions Bancorporation | 397,548 | |
| Total Energy | 8,934,545 | Total Financials | 21,835,207 | |||
| The accompanying Notes to Financial Statements are an integral part of this schedule. |
| 102 |
Partner Mid Cap Value Portfolio
Schedule of Investments as of June 29, 2007 (unaudited)
| Shares | Common Stock (97.7%) | Value | Shares | Common Stock (97.7%) | Value | |
| Health Care (2.9%) | Materials (4.9%) | |||||
| 4,874 | Coventry Health Care, Inc. # | $280,986 | 4,856 | Air Products and Chemicals, Inc. | $390,277 | |
| 8,282 | Health Net, Inc. # | 437,290 | 13,914 | Airgas, Inc. | 666,481 | |
| 32,033 | IMS Health, Inc. | 1,029,220 | 5,170 | Albemarle Corporation | 199,200 | |
| 24,647 | PerkinElmer, Inc. | 642,301 | 9,353 | Celanese Corporation | 362,709 | |
| Total Health Care | 2,389,797 | 47,771 | Chemtura Corporation | 530,736 | ||
| 17,342 | Commercial Metals Company | 585,639 | ||||
| Industrials (11.0%) | 37,490 | Domtar Corporation # | 418,388 | |||
| 4,138 | Alliant Techsystems, Inc. # | 410,283 | 7,526 | United States Steel Corporation | 818,452 | |
| 87,915 | Allied Waste Industries, Inc. #* | 1,183,336 | Total Materials | 3,971,882 | ||
| 9,059 | American Standard | |||||
| Companies, Inc. | 534,300 | Telecommunications Services (3.8%) | ||||
| 6,637 | Avis Budget Group, Inc. # | 188,690 | 54,668 | Cincinnati Bell, Inc. # | 315,981 | |
| 9,471 | ChoicePoint, Inc. # | 402,044 | 20,627 | Embarq Corporation | 1,307,133 | |
| 19,504 | Cooper Industries, Ltd. * | 1,113,483 | 18,108 | Metropcs Communications, Inc. # | 598,288 | |
| 6,487 | Eaton Corporation | 603,291 | 86,640 | Qwest Communications | ||
| 8,156 | Joy Global, Inc. | 475,739 | International, Inc. #* | 840,408 | ||
| 6,904 | Landstar System, Inc. | 333,118 | Total Telecommunications | |||
| 10,564 | Lennox International, Inc. | 361,606 | Services | 3,061,810 | ||
| 10,090 | Monster Worldwide, Inc. # | 414,699 | ||||
| 9,010 | Norfolk Southern Corporation | 473,656 | Utilities (13.0%) | |||
| 3,465 | Pitney Bowes, Inc. | 162,231 | 4,090 | AGL Resources, Inc. | 165,563 | |
| 20,199 | Republic Services, Inc. | 618,897 | 10,740 | American Electric Power | ||
| 14,824 | Rockwell Collins, Inc. | 1,047,167 | Company, Inc. | 483,730 | ||
| 3,792 | Ryder System, Inc. | 204,010 | 13,206 | CMS Energy Corporation | 227,143 | |
| 22,442 | Southwest Airlines Company | 334,610 | 2,500 | Constellation Energy Group, Inc. | 217,925 | |
| Total Industrials | 8,861,160 | 42,514 | DPL, Inc. * | 1,204,847 | ||
| 25,362 | Edison International, Inc. | 1,423,315 | ||||
| Information Technology (7.9%) | 21,450 | Entergy Corporation | 2,302,658 | |||
| 71,589 | Activision, Inc. # | 1,336,567 | 13,945 | FirstEnergy Corporation | 902,660 | |
| 43,826 | Amphenol Corporation | 1,562,397 | 23,634 | PG&E Corporation * | 1,070,620 | |
| 62,862 | BearingPoint, Inc. # | 459,521 | 39,531 | PPL Corporation | 1,849,655 | |
| 15,376 | CheckFree Corporation #* | 618,115 | 2,385 | SCANA Corporation | 91,322 | |
| 29,824 | LSI Corporation # | 223,978 | 12,980 | Wisconsin Energy Corporation | 574,105 | |
| 7,431 | National Semiconductor | Total Utilities | 10,513,543 | |||
| Corporation | 210,074 | |||||
| 3,630 | SanDisk Corporation # | 177,652 | Total Common Stock | |||
| 40,398 | Seagate Technology | 879,464 | (cost $70,461,694) | 79,036,500 | ||
| 13,356 | Tessera Technologies, Inc. # | 541,586 | ||||
| 21,480 | Xerox Corporation # | 396,950 | ||||
| Total Information | ||||||
| Technology | 6,406,304 | |||||
| The accompanying Notes to Financial Statements are an integral part of this schedule. |
| 103 |
Partner Mid Cap Value Portfolio
Schedule of Investments as of June 29, 2007 (unaudited)
| Interest | Maturity | |||
| Shares | Collateral Held for Securities Loaned (11.7%) | Rate (+) | Date | Value |
| 9,421,800 | Thrivent Financial Securities Lending Trust | 5.360% | N/A | $9,421,800 |
| Total Collateral Held for Securities Loaned | ||||
| (cost $9,421,800) | 9,421,800 | |||
| Interest | Maturity | |||
| Shares | Short-Term Investments (1.3%) | Rate(+) | Date | Value |
| 1,041,334 | Thrivent Money Market Portfolio | 5.050% | N/A | $1,041,334 |
| Total Short-Term Investments (at amortized cost) | 1,041,334 | |||
| Total Investments (cost $80,924,828) 110.7% | $89,499,634 | |||
| Other Assets and Liabilities, Net (10.7%) | (8,679,808) | |||
| Total Net Assets 100.0% | $80,819,826 | |||
# Non-income producing security.
* All or a portion of the security is on loan as discussed in item 2(M) of the Notes to Financial Statements.
+ The interest rate shown reflects the yield, coupon rate or, for securities purchased at a discount, the discount rate at the date of purchase.
Definitions:
REIT — Real Estate Investment Trust, is a company that buys, develops, manages and/or sells real estate assets.
Gross unrealized appreciation and depreciation of investments were as follows:
| Gross unrealized appreciation | $9,759,449 |
| Gross unrealized depreciation | (1,184,643) |
| Net unrealized appreciation (depreciation) | $8,574,806 |
| Cost for federal income tax purposes | $80,924,828 |
| The accompanying Notes to Financial Statements are an integral part of this schedule. |
| 104 |
Mid Cap Stock Portfolio Schedule of Investments as of June 29, 2007 (unaudited) | ||||||
| Shares | Common Stock (97.9%) | Value | Shares | Common Stock (97.9%) | Value | |
| Consumer Discretionary (12.7%) | 168,500 | New York Community | ||||
| 59,500 | Advance Auto Parts, Inc. | $2,411,535 | Bancorp, Inc. | $2,867,870 | ||
| 422,900 | Goodyear Tire & Rubber | 15,300 | NYSE Euronext | 1,126,386 | ||
| Company # | 14,700,004 | 67,400 | Old Republic International | |||
| 11,800 | Harman International | Corporation | 1,432,924 | |||
| Industries, Inc. | 1,378,240 | 30,600 | PartnerRe, Ltd. | 2,371,500 | ||
| 448,700 | Newell Rubbermaid, Inc. | 13,205,241 | 45,000 | Philadelphia Consolidated | ||
| 138,600 | Sally Beauty Company, Inc. # | 1,247,400 | Holding Corporation # | 1,881,000 | ||
| 715,200 | Service Corporation International | 9,140,256 | 174,100 | PMI Group, Inc. | 7,777,047 | |
| 240,000 | Tupperware Corporation | 6,897,600 | 24,900 | Protective Life Corporation | 1,190,469 | |
| Total Consumer | 48,900 | Rayonier, Inc. REIT | 2,207,346 | |||
| Discretionary | 48,980,276 | 37,100 | SEI Investments Company | 1,077,384 | ||
| 229,100 | U-Store-It Trust | 3,754,949 | ||||
| Consumer Staples (6.8%) | 65,600 | W.R. Berkley Corporation | 2,134,624 | |||
| 178,300 | Avon Products, Inc. | 6,552,525 | 39,000 | Westamerica Bancorporation | 1,725,360 | |
| 178,400 | Clorox Company | 11,078,640 | 36,700 | Whitney Holding Corporation | 1,104,670 | |
| 65,400 | Hershey Company | 3,310,548 | 18,300 | Zions Bancorporation | 1,407,453 | |
| 109,533 | Hormel Foods Corporation | 4,091,058 | Total Financials | 66,685,930 | ||
| 22,100 | William Wrigley Jr. Company | 1,222,351 | ||||
| Total Consumer Staples | 26,255,122 | Health Care (10.3%) | ||||
| 43,800 | Affymetrix, Inc. # | 1,090,182 | ||||
| Energy (0.6%) | 75,300 | Applera Corporation | ||||
| 12,100 | Devon Energy Corporation | 947,309 | (Celera Group) # | 933,720 | ||
| 32,600 | Dresser-Rand Group, Inc. # | 1,287,700 | 29,500 | Beckman Coulter, Inc. | 1,908,060 | |
| Total Energy | 2,235,009 | 26,400 | Cephalon, Inc. # | 2,122,296 | ||
| 34,500 | Coventry Health Care, Inc. # | 1,988,925 | ||||
| Financials (17.2%) | 56,800 | Cytyc Corporation # | 2,448,648 | |||
| 15,950 | Affiliated Managers Group, Inc. # | 2,053,722 | 39,806 | Dade Behring Holdings, Inc. | 2,114,495 | |
| 32,000 | American Capital Strategies, Ltd. | 1,360,640 | 20,500 | DaVita, Inc. # | 1,104,540 | |
| 37,000 | AmeriCredit Corporation # | 982,350 | 35,600 | Hologic, Inc. # | 1,969,036 | |
| 34,000 | Associated Banc-Corp | 1,111,800 | 46,100 | Hospira, Inc. # | 1,799,744 | |
| 35,900 | Assurant, Inc. | 2,115,228 | 119,800 | Human Genome Sciences, Inc. # | 1,068,616 | |
| 19,300 | Bear Stearns Companies, Inc. | 2,702,000 | 37,600 | ImClone Systems, Inc. # | 1,329,536 | |
| 59,100 | Brown & Brown, Inc. | 1,485,774 | 15,900 | Intuitive Surgical, Inc. # | 2,206,443 | |
| 14,000 | City National Corporation | 1,065,260 | 19,300 | Invitrogen Corporation # | 1,423,375 | |
| 27,700 | Commerce Bancshares, Inc. | 1,254,810 | 26,700 | LifePoint Hospitals, Inc. # | 1,032,756 | |
| 127,300 | E*TRADE Financial | 53,300 | Lincare Holdings, Inc. # | 2,124,005 | ||
| Corporation # | 2,812,057 | 33,000 | Patterson Companies, Inc. # | 1,229,910 | ||
| 43,500 | Eaton Vance Corporation | 1,921,830 | 33,300 | Quest Diagnostics, Inc. | 1,719,945 | |
| 53,600 | Endurance Specialty | 23,800 | ResMed, Inc. # | 981,988 | ||
| Holdings, Ltd. | 2,146,144 | 21,400 | Shire Pharmaceuticals | |||
| 74,100 | Equity One, Inc. | 1,893,255 | Group plc ADR | 1,586,382 | ||
| 46,233 | Fidelity National Financial, Inc. | 1,095,722 | 68,800 | St. Jude Medical, Inc. # | 2,854,512 | |
| 45,900 | General Growth Properties, Inc. | 2,430,405 | 22,400 | Universal Health Services, Inc. | 1,377,600 | |
| 154,000 | HCC Insurance Holdings, Inc. | 5,145,140 | 28,600 | Ventana Medical Systems, Inc. # | 2,209,922 | |
| 31,300 | Leucadia National Corporation | 1,103,325 | 49,400 | Vertex Pharmaceuticals, Inc. # | 1,410,864 | |
| 31,300 | MBIA, Inc. | 1,947,486 | Total Health Care | 40,035,500 | ||
| The accompanying Notes to Financial Statements are an integral part of this schedule. |
| 105 |
Mid Cap Stock Portfolio
Schedule of Investments as of June 29, 2007 (unaudited)
| Shares | Common Stock (97.9%) | Value | Shares | Common Stock (97.9%) | Value | |
| Industrials (4.1%) | 193,100 | Tellabs, Inc. # | $2,077,756 | |||
| 26,500 | Avery Dennison Corporation | $1,761,720 | 118,700 | Teradyne, Inc. # | 2,086,746 | |
| 19,800 | ChoicePoint, Inc. # | 840,510 | 233,200 | TIBCO Software, Inc. # | 2,110,460 | |
| 31,900 | Expeditors International of | 33,700 | ValueClick, Inc. # | 992,802 | ||
| Washington, Inc. | 1,317,470 | 46,250 | Varian Semiconductor | |||
| 165,100 | FTI Consulting, Inc. # | 6,278,753 | Equipment Associates, Inc. # | 1,852,775 | ||
| 28,400 | Pitney Bowes, Inc. | 1,329,688 | 118,000 | VeriSign, Inc. # | 3,744,140 | |
| 57,600 | Republic Services, Inc. | 1,764,864 | 97,000 | Vishay Intertechnology, Inc. # | 1,534,540 | |
| 36,400 | Stericycle, Inc. # | 1,618,344 | 138,500 | Wind River Systems, Inc. # | 1,523,500 | |
| 18,800 | WESCO International, Inc. # | 1,136,460 | 76,200 | Xilinx, Inc. | 2,039,874 | |
| Total Industrials | 16,047,809 | Total Information | ||||
| Technology | 77,308,562 | |||||
| Information Technology (20.0%) | ||||||
| 94,700 | ADC Telecommunications, Inc. # | 1,735,851 | Materials (19.2%) | |||
| 30,600 | Amphenol Corporation | 1,090,890 | 385,200 | Bemis Company, Inc. | 12,780,936 | |
| 55,300 | Arrow Electronics, Inc. # | 2,125,179 | 620,900 | Crown Holdings, Inc. # | 15,503,872 | |
| 396,900 | Brocade Communications # | 3,103,758 | 123,800 | Lubrizol Corporation | 7,991,290 | |
| 130,800 | Cadence Design Systems, Inc. # | 2,872,368 | 54,400 | NewMarket Corporation | 2,631,328 | |
| 39,900 | CheckFree Corporation # | 1,603,980 | 436,900 | Owens-Illinois, Inc. # | 15,291,500 | |
| 53,300 | Cognos, Inc. # | 2,114,411 | 295,500 | Sealed Air Corporation | 9,166,410 | |
| 52,300 | Cree, Inc. # | 1,351,955 | 191,300 | Silgan Holdings, Inc. | 10,575,064 | |
| 42,000 | Electronic Arts, Inc. # | 1,987,440 | 19,200 | Valspar Corporation | 545,472 | |
| 112,500 | Emulex Corporation # | 2,457,000 | Total Materials | 74,485,872 | ||
| 87,700 | Fair Isaac Corporation | 3,518,524 | ||||
| 38,045 | Fidelity National Information | Telecommunications Services (1.9%) | ||||
| Services, Inc. | 2,065,083 | 350,600 | Cincinnati Bell, Inc. # | 2,026,468 | ||
| 36,500 | FormFactor, Inc. # | 1,397,950 | 15,700 | Leap Wireless International, Inc. # | 1,326,650 | |
| 92,600 | Foundry Networks, Inc. # | 1,542,716 | 51,800 | NII Holdings, Inc. # | 4,182,332 | |
| 28,500 | Harris Corporation | 1,554,675 | Total Telecommunications | |||
| 146,900 | Informatica Corporation # | 2,169,713 | Services | 7,535,450 | ||
| 86,100 | Integrated Device | |||||
| Technology, Inc. # | 1,314,747 | Utilities (5.1%) | ||||
| 50,100 | International Rectifier | 20,300 | AGL Resources, Inc. | 821,744 | ||
| Corporation # | 1,866,726 | 21,200 | Alliant Energy Corporation | 823,620 | ||
| 93,700 | Intersil Corporation | 2,947,802 | 470,000 | CMS Energy Corporation | 8,084,000 | |
| 124,600 | Juniper Networks, Inc. # | 3,136,182 | 42,900 | Pepco Holdings, Inc. | 1,209,780 | |
| 88,400 | McAfee, Inc. # | 3,111,680 | 36,600 | SCANA Corporation | 1,401,414 | |
| 9,700 | NDS Group plc ADR # | 455,415 | 36,500 | Vectren Corporation | 982,945 | |
| 103,200 | Network Appliance, Inc. # | 3,013,440 | 25,100 | WGL Holdings, Inc. | 819,264 | |
| 74,100 | NVIDIA Corporation # | 3,061,071 | 124,300 | Wisconsin Energy Corporation | 5,497,789 | |
| 50,200 | Paychex, Inc. | 1,963,824 | Total Utilities | 19,640,556 | ||
| 100,300 | Qimonda AG ADR # | 1,549,635 | ||||
| 29,700 | SanDisk Corporation # | 1,453,518 | Total Common Stock | |||
| 105,200 | Synopsys, Inc. # | 2,780,436 | (cost $338,029,356) | 379,210,086 | ||
| The accompanying Notes to Financial Statements are an integral part of this schedule. |
| 106 |
Mid Cap Stock Portfolio
Schedule of Investments as of June 29, 2007 (unaudited)
| Shares or | ||||
| Principal | Interest | Maturity | ||
| Amount | Short-Term Investments (1.4%) | Rate (+) | Date | Value |
| $3,000,000 | Falcon Asset Securitization Corporation | 5.300% | 7/12/2007 | $2,994,700 |
| 2,423,827 | Thrivent Money Market Portfolio | 5.050 | N/A | 2,423,827 |
| Total Short-Term Investments (at amortized cost) | 5,418,527 | |||
| Total Investments (cost $343,447,883) 99.3% | $384,628,613 | |||
| Other Assets and Liabilities, Net 0.7% | 2,673,693 | |||
| Total Net Assets 100.0% | $387,302,306 | |||
# Non-income producing security.
+ The interest rate shown reflects the yield, coupon rate or, for securities purchased at a discount, the discount rate at the date of purchase.
Definitions:
ADR — American Depository Receipts, which are certificates for shares of an underlying foreign security’s shares held by an issuing U.S. depository bank.
REIT — Real Estate Investment Trust, is a company that buys, develops, manages and/or sells real estate assets.
Gross unrealized appreciation and depreciation of investments were as follows:
| Gross unrealized appreciation | $46,179,519 |
| Gross unrealized depreciation | (4,998,789) |
| Net unrealized appreciation (depreciation) | $41,180,730 |
| Cost for federal income tax purposes | $343,447,883 |
| The accompanying Notes to Financial Statements are an integral part of this schedule. |
| 107 |
| Mid Cap Index Portfolio Schedule of Investments as of June 29, 2007 (unaudited) | ||||||
| Shares | Common Stock (99.3%) | Value | Shares | Common Stock (99.3%) | Value | |
| Consumer Discretionary (14.3%) | 6,390 | Lee Enterprises, Inc. | $133,295 | |||
| 6,433 | 99 Cents Only Stores # | $84,337 | 4,800 | M.D.C. Holdings, Inc. | 232,128 | |
| 14,600 | Advance Auto Parts, Inc. | 591,738 | 4,400 | Matthews International | ||
| 7,000 | Aeropostale, Inc. # | 291,760 | Corporation | 191,884 | ||
| 26,980 | American Eagle Outfitters, Inc. ‡ | 692,307 | 3,200 | Media General, Inc. | 106,464 | |
| 8,000 | American Greetings Corporation | 226,640 | 4,560 | Modine Manufacturing Company | 103,056 | |
| 8,850 | AnnTaylor Stores Corporation # | 313,467 | 7,470 | Mohawk Industries, Inc. # | 752,901 | |
| 10,300 | Applebee’s International, Inc. | 248,230 | 8,300 | Netflix, Inc. # | 160,937 | |
| 9,730 | ArvinMeritor, Inc. | 216,006 | 700 | NVR, Inc. # | 475,825 | |
| 6,970 | Barnes & Noble, Inc. | 268,136 | 15,600 | O’Reilly Automotive, Inc. # | 570,180 | |
| 5,300 | Beazer Homes USA, Inc. | 130,751 | 9,600 | Pacific Sunwear of | ||
| 12,010 | Belo Corporation | 247,286 | California, Inc. # | 211,200 | ||
| 3,430 | Blyth, Inc. | 91,169 | 9,000 | Payless ShoeSource, Inc. # | 283,950 | |
| 5,110 | Bob Evans Farms, Inc. | 188,304 | 18,700 | PETsMART, Inc. | 606,815 | |
| 8,100 | Borders Group, Inc. | 154,386 | 7,600 | Phillips-Van Heusen Corporation | 460,332 | |
| 7,960 | BorgWarner, Inc. | 684,878 | 6,100 | Regis Corporation | 233,325 | |
| 5,800 | Boyd Gaming Corporation | 285,302 | 9,600 | Rent-A-Center, Inc. # | 251,808 | |
| 15,555 | Brinker International, Inc. | 455,295 | 19,260 | Ross Stores, Inc. | 593,208 | |
| 8,460 | Callaway Golf Company | 150,673 | 7,500 | Ruby Tuesday, Inc. | 197,475 | |
| 13,000 | Career Education Corporation # | 439,010 | 5,700 | Ryland Group, Inc. | 213,009 | |
| 29,500 | CarMax, Inc. # | 752,250 | 19,550 | Saks, Inc. | 417,392 | |
| 5,190 | Catalina Marketing Corporation | 163,485 | 3,610 | Scholastic Corporation # | 129,743 | |
| 3,400 | CBRL Group, Inc. | 144,432 | 9,300 | Scientific Games Corporation # | 325,035 | |
| 17,600 | Charming Shoppes, Inc. # | 190,608 | 7,820 | Sotheby’s Holdings, Inc. | 359,876 | |
| 9,800 | Cheesecake Factory, Inc. # | 240,296 | 2,000 | Strayer Education, Inc. | 263,420 | |
| 24,200 | Chico’s FAS, Inc. # | 589,028 | 4,900 | Thor Industries, Inc. | 221,186 | |
| 8,400 | Coldwater Creek, Inc. # | 195,132 | 6,900 | Timberland Company # | 173,811 | |
| 11,900 | Corinthian Colleges, Inc. # | 193,851 | 17,400 | Toll Brothers, Inc. # | 434,652 | |
| 8,120 | DeVry, Inc. | 276,242 | 8,400 | Tupperware Corporation | 241,416 | |
| 5,400 | Dick’s Sporting Goods, Inc. # | 314,118 | 15,400 | Urban Outfitters, Inc. # | 370,062 | |
| 14,060 | Dollar Tree Stores, Inc. # | 612,313 | 6,480 | Valassis Communications, Inc. # | 111,391 | |
| 3,900 | Entercom Communications | 770 | Washington Post Company | 597,589 | ||
| Corporation | 97,071 | 9,870 | Westwood One, Inc. | 70,965 | ||
| 21,200 | Foot Locker, Inc. | 462,160 | 15,180 | Williams-Sonoma, Inc. | 479,384 | |
| 6,840 | Furniture Brands | Total Consumer | ||||
| International, Inc. | 97,128 | Discretionary | 23,773,826 | |||
| 20,900 | GameStop Corporation # | 817,190 | ||||
| 19,520 | Gentex Corporation | 384,349 | Consumer Staples (2.8%) | |||
| 13,200 | Hanesbrands, Inc. # | 356,796 | 11,200 | Alberto-Culver Company | 265,664 | |
| 6,600 | Harte-Hanks, Inc. | 169,488 | 8,840 | BJ’s Wholesale Club, Inc. # | 318,505 | |
| 5,000 | Hovnanian Enterprises, Inc. # | 82,650 | 9,010 | Church & Dwight Company, Inc. | 436,625 | |
| 4,970 | International Speedway | 7,750 | Energizer Holdings, Inc. # | 771,900 | ||
| Corporation | 261,969 | 8,300 | Hansen Natural Corporation # | 356,734 | ||
| 4,500 | ITT Educational Services, Inc. # | 528,210 | 10,030 | Hormel Foods Corporation | 374,620 | |
| 6,100 | John Wiley and Sons, Inc. | 294,569 | 7,776 | J.M. Smucker Company | 495,020 | |
| 7,130 | Laureate Education, Inc. # | 439,636 | 3,340 | Lancaster Colony Corporation | 139,913 | |
| 10,600 | Lear Corporation # | 377,466 | 7,700 | NBTY, Inc. # | 332,640 | |
| The accompanying Notes to Financial Statements are an integral part of this schedule. |
| 108 |
Mid Cap Index Portfolio
Schedule of Investments as of June 29, 2007 (unaudited)
| Shares | Common Stock (99.3%) | Value | Shares | Common Stock (99.3%) | Value | ||
| Consumer Staples — continued | 7,100 | Cathay General Bancorp | $238,134 | ||||
| 8,310 | PepsiAmericas, Inc. | $204,094 | 5,720 | City National Corporation | 435,235 | ||
| 5,010 | Ruddick Corporation | 150,901 | 21,100 | Colonial BancGroup, Inc. | 526,867 | ||
| 16,300 | Smithfield Foods, Inc. # | 501,877 | 6,600 | Commerce Group, Inc. | 229,152 | ||
| 3,842 | Tootsie Roll Industries, Inc. | 106,459 | 6,200 | Cousins Properties, Inc. | 179,862 | ||
| 3,640 | Universal Corporation | 221,749 | 8,300 | Cullen/Frost Bankers, Inc. | 443,801 | ||
| Total Consumer Staples | 4,676,701 | 17,300 | Eaton Vance Corporation | 764,314 | |||
| 5,100 | Equity One, Inc. | 130,305 | |||||
| Energy (8.8%) | 8,610 | Everest Re Group, Ltd. | 935,390 | ||||
| 19,500 | Arch Coal, Inc. | 678,600 | 30,405 | Fidelity National Financial, Inc. | 720,598 | ||
| 15,060 | Cameron International | 13,300 | First American Corporation | 658,350 | |||
| Corporation #‡ | 1,076,338 | 3,200 | First Community Bancorp, Inc. | 183,072 | |||
| 11,500 | Cimarex Energy Company | 453,215 | 15,300 | First Niagara Financial Group, Inc. | 200,430 | ||
| 16,600 | Denbury Resources, Inc. # | 622,500 | 11,080 | FirstMerit Corporation | 231,904 | ||
| 7,400 | Encore Acquisition Company # | 205,720 | 7,060 | Greater Bay Bancorp | 196,550 | ||
| 8,900 | FMC Technologies, Inc. # | 705,058 | 7,070 | Hanover Insurance Group, Inc. | 344,945 | ||
| 10,400 | Forest Oil Corporation # | 439,504 | 15,350 | HCC Insurance Holdings, Inc. | 512,844 | ||
| 15,100 | Frontier Oil Corporation | 660,927 | 8,000 | Highwoods Properties, Inc. | 300,000 | ||
| 17,560 | Grant Prideco, Inc. # | 945,255 | 5,960 | Horace Mann Educators | |||
| 14,120 | Hanover Compressor Company # | 336,762 | Corporation | 126,590 | |||
| 14,180 | Helmerich & Payne, Inc. | 502,256 | 12,900 | Hospitality Properties Trust | 535,221 | ||
| 17,800 | Newfield Exploration Company # | 810,790 | 9,900 | IndyMac Bancorp, Inc. | 288,783 | ||
| 23,400 | Noble Energy, Inc. | 1,459,930 | 14,600 | Jefferies Group, Inc. | 393,908 | ||
| 3,400 | Overseas Shipholding Group, Inc. | 276,760 | 22,270 | Leucadia National Corporation | 785,018 | ||
| 21,500 | Patterson-UTI Energy, Inc. | 563,515 | 12,700 | Liberty Property Trust | 557,911 | ||
| 16,900 | Pioneer Natural Resources | 9,900 | Macerich Company | 815,958 | |||
| Company | 823,199 | 9,400 | Mack-Cali Realty Corporation | 408,806 | |||
| 9,900 | Plains Exploration & Production | 4,900 | Mercury General Corporation | 270,039 | |||
| Company # | 473,319 | 12,200 | Nationwide Health Properties, Inc. | 331,840 | |||
| 8,100 | Pogo Producing Company | 411,399 | 37,811 | New York Community | |||
| 22,720 | Pride International, Inc. # | 851,091 | Bancorp, Inc. | 643,543 | |||
| 7,600 | Quicksilver Resources, Inc. # | 338,808 | 10,900 | Nuveen Investments | 677,435 | ||
| 23,200 | Southwestern Energy Company # | 1,032,400 | 8,330 | Ohio Casualty Corporation | 360,772 | ||
| 11,000 | Superior Energy Services, Inc. # | 439,120 | 31,750 | Old Republic International | |||
| 7,900 | Tidewater, Inc. | 559,952 | Corporation | 675,005 | |||
| Total Energy | 14,666,418 | 11,980 | PMI Group, Inc. | 535,147 | |||
| 5,407 | Potlatch Corporation | 232,771 | |||||
| Financials (16.2%) | 9,670 | Protective Life Corporation | 462,323 | ||||
| 10,420 | A.G. Edwards, Inc. | 881,011 | 11,020 | Radian Group, Inc. | 595,080 | ||
| 13,600 | AMB Property Corporation ‡ | 723,792 | 12,725 | Raymond James Financial, Inc. | 393,202 | ||
| 9,835 | American Financial Group, Inc. | 335,865 | 10,808 | Rayonier, Inc. REIT | 487,873 | ||
| 16,190 | AmeriCredit Corporation # | 429,844 | 9,500 | Regency Centers Corporation | 669,750 | ||
| 13,600 | Arthur J. Gallagher & Company | 379,168 | 17,340 | SEI Investments Company | 503,554 | ||
| 17,593 | Associated Banc-Corp | 575,291 | 7,500 | StanCorp Financial Group, Inc. | 393,600 | ||
| 11,570 | Astoria Financial Corporation | 289,713 | 4,930 | SVB Financial Group # | 261,832 | ||
| 6,900 | Bank of Hawaii Corporation | 356,316 | 15,320 | TCF Financial Corporation | 425,896 | ||
| 15,800 | Brown & Brown, Inc. | 397,212 | 18,600 | UDR, Inc. | 489,180 | ||
| The accompanying Notes to Financial Statements are an integral part of this schedule. |
| 109 |
Mid Cap Index Portfolio
Schedule of Investments as of June 29, 2007 (unaudited)
| Shares | Common Stock (99.3%) | Value | Shares | Common Stock (99.3%) | Value | |
| Financials — continued | 10,450 | Perrigo Company | $204,611 | |||
| 5,500 | Unitrin, Inc. | $270,490 | 14,200 | Pharmaceutical Product | ||
| 23,375 | W.R. Berkley Corporation | 760,622 | Development, Inc. | 543,434 | ||
| 11,540 | Waddell & Reed Financial, Inc. | 300,155 | 7,400 | Psychiatric Solutions, Inc. # | 268,324 | |
| 12,027 | Washington Federal, Inc. | 292,376 | 10,600 | ResMed, Inc. # | 437,356 | |
| 7,830 | Webster Financial Corporation | 334,106 | 14,550 | Sepracor, Inc. # | 596,841 | |
| 10,500 | Weingarten Realty Investors | 431,550 | 9,000 | STERIS Corporation | 275,400 | |
| 4,320 | Westamerica Bancorporation | 191,117 | 5,400 | Techne Corporation # | 308,934 | |
| 9,480 | Wilmington Trust Corporation | 393,515 | 12,200 | Triad Hospitals, Inc. # | 655,872 | |
| Total Financials | 26,894,933 | 7,400 | Universal Health Services, Inc. | 455,100 | ||
| 12,910 | Valeant Pharmaceuticals | |||||
| Health Care (11.6%) | International | 215,468 | ||||
| 8,206 | Advanced Medical Optics, Inc. # | 286,225 | 4,200 | Varian, Inc. # | 230,286 | |
| 9,400 | Affymetrix, Inc. # | 233,966 | 11,500 | VCA Antech, Inc. # | 433,435 | |
| 5,970 | Apria Healthcare Group, Inc. # | 171,757 | 4,500 | Ventana Medical Systems, Inc. # | 347,715 | |
| 8,530 | Beckman Coulter, Inc. | 551,720 | 17,920 | Vertex Pharmaceuticals, Inc. # | 511,795 | |
| 9,000 | Cephalon, Inc. # | 723,510 | 4,600 | Wellcare Health Plans, Inc. # | 416,346 | |
| 8,900 | Cerner Corporation # | 493,683 | Total Health Care | 19,171,734 | ||
| 9,300 | Charles River Laboratories | |||||
| International, Inc. # | 480,066 | Industrials (15.2%) | ||||
| 12,900 | Community Health | 12,530 | AGCO Corporation # | 543,927 | ||
| Systems, Inc. # | 521,805 | 12,500 | AirTran Holdings, Inc. # | 136,500 | ||
| 8,710 | Covance, Inc. # | 597,158 | 5,540 | Alaska Air Group, Inc. # | 154,344 | |
| 15,800 | Cytyc Corporation # | 681,138 | 5,860 | Alexander & Baldwin, Inc. | 311,225 | |
| 20,880 | Dentsply International, Inc. | 798,869 | 4,500 | Alliant Techsystems, Inc. # | 446,175 | |
| 7,920 | Edwards Lifesciences | 14,570 | AMETEK, Inc. | 578,138 | ||
| Corporation # | 390,773 | 13,920 | Avis Budget Group, Inc. # | 395,746 | ||
| 18,300 | Endo Pharmaceutical | 6,660 | Brink’s Company | 412,187 | ||
| Holdings, Inc. # | 626,409 | 8,540 | Carlisle Companies, Inc. | 397,195 | ||
| 7,200 | Gen-Probe, Inc. # | 435,024 | 10,486 | ChoicePoint, Inc. # | 445,131 | |
| 33,300 | Health Management | 6,230 | Con-way, Inc. | 312,995 | ||
| Associates, Inc. | 378,288 | 9,700 | Copart, Inc. # | 296,723 | ||
| 15,380 | Health Net, Inc. # | 812,064 | 5,200 | Corporate Executive | ||
| 12,200 | Henry Schein, Inc. # | 651,846 | Board Company | 337,532 | ||
| 8,450 | Hillenbrand Industries, Inc. | 549,250 | 6,800 | Crane Company | 309,060 | |
| 5,100 | Intuitive Surgical, Inc. # | 707,727 | 7,100 | Deluxe Corporation | 288,331 | |
| 6,400 | Invitrogen Corporation # | 472,000 | 9,400 | Donaldson Company, Inc. | 334,170 | |
| 4,300 | Kindred Healthcare, Inc. # | 132,096 | 5,500 | DRS Technologies, Inc. | 314,985 | |
| 7,900 | LifePoint Hospitals, Inc. # | 305,572 | 8,220 | Dun & Bradstreet Corporation | 846,496 | |
| 11,520 | Lincare Holdings, Inc. # | 459,072 | 29,240 | Expeditors International of | ||
| 7,600 | Medicis Pharmaceutical | Washington, Inc. | 1,207,612 | |||
| Corporation | 232,104 | 17,260 | Fastenal Company | 722,504 | ||
| 44,047 | Millennium Pharmaceuticals, Inc. # | 465,577 | 6,600 | Federal Signal Corporation | 104,676 | |
| 16,720 | Omnicare, Inc. | 602,923 | 7,830 | Flowserve Corporation | 560,628 | |
| 4,900 | Par Pharmaceutical | 7,020 | GATX Corporation | 345,735 | ||
| Companies, Inc. # | 138,327 | 9,100 | Graco, Inc. | 366,548 | ||
| 15,960 | PDL BioPharma, Inc. # | 371,868 | 4,760 | Granite Construction, Inc. | 305,497 | |
| The accompanying Notes to Financial Statements are an integral part of this schedule. |
| 110 |
Mid Cap Index Portfolio
Schedule of Investments as of June 29, 2007 (unaudited)
| Shares | Common Stock (99.3%) | Value | Shares | Common Stock (99.3%) | Value | |
| Industrials — continued | 24,500 | Amphenol Corporation | $873,425 | |||
| 11,500 | Harsco Corporation | $598,000 | 21,300 | Andrew Corporation # | 307,572 | |
| 8,690 | Herman Miller, Inc. | 274,604 | 16,870 | Arrow Electronics, Inc. # | 648,314 | |
| 6,530 | HNI Corporation | 267,730 | 58,820 | Atmel Corporation # | 327,039 | |
| 8,230 | Hubbell, Inc. | 446,231 | 17,820 | Avnet, Inc. # | 706,385 | |
| 16,220 | Jacobs Engineering Group, Inc. # | 932,812 | 6,880 | Avocent Corporation # | 199,589 | |
| 13,940 | JB Hunt Transport Services, Inc. | 408,721 | 16,600 | BISYS Group, Inc. # | 196,378 | |
| 24,475 | JetBlue Airways Corporation # | 287,581 | 19,100 | Broadridge Financial Solutions, LLC | 365,192 | |
| 14,850 | Joy Global, Inc. | 866,200 | 38,180 | Cadence Design Systems, Inc. #‡ | 838,433 | |
| 23,000 | KBR, Inc. # | 603,290 | 8,370 | CDW Corporation # | 711,199 | |
| 3,020 | Kelly Services, Inc. | 82,929 | 19,700 | Ceridian Corporation # | 689,500 | |
| 5,370 | Kennametal, Inc. | 440,501 | 12,080 | CheckFree Corporation # | 485,616 | |
| 6,540 | Korn/Ferry International # | 171,740 | 8,350 | CommScope, Inc. # | 487,222 | |
| 5,800 | Lincoln Electric Holdings, Inc. | 430,592 | 11,500 | Cree, Inc. # | 297,275 | |
| 11,670 | Manpower, Inc. | 1,076,441 | 5,870 | CSG Systems International, Inc. # | 155,614 | |
| 4,100 | Mine Safety Appliances Company | 179,416 | 20,760 | Cypress Semiconductor | ||
| 7,400 | MSC Industrial Direct | Corporation # | 483,500 | |||
| Company, Inc. | 407,000 | 9,030 | Diebold, Inc. | 471,366 | ||
| 6,000 | Navigant Consulting, Inc. # | 111,360 | 5,500 | Digital River, Inc. # | 248,875 | |
| 4,590 | Nordson Corporation | 230,234 | 7,410 | DST Systems, Inc. # | 586,946 | |
| 10,100 | Oshkosh Truck Corporation | 635,492 | 5,570 | Dycom Industries, Inc. # | 166,989 | |
| 13,660 | Pentair, Inc. | 526,866 | 5,700 | F5 Networks, Inc. # | 459,420 | |
| 16,410 | Quanta Services, Inc. # | 503,295 | 7,850 | Fair Isaac Corporation | 314,942 | |
| 23,100 | Republic Services, Inc. | 707,784 | 17,000 | Fairchild Semiconductor | ||
| 4,132 | Rollins, Inc. | 94,086 | International, Inc. # | 328,440 | ||
| 12,100 | Roper Industries, Inc. | 690,910 | 7,100 | Gartner Group, Inc. # | 174,589 | |
| 1,100 | Sequa Corporation # | 123,200 | 9,400 | Global Payments, Inc. | 372,710 | |
| 7,760 | SPX Corporation | 681,406 | 18,400 | Harris Corporation ‡ | 1,003,720 | |
| 12,000 | Stericycle, Inc. # | 533,520 | 4,910 | Imation Corporation | 180,983 | |
| 5,440 | Teleflex, Inc. | 444,883 | 19,600 | Ingram Micro, Inc. # | 425,516 | |
| 6,900 | Thomas & Betts Corporation # | 400,200 | 27,150 | Integrated Device | ||
| 12,900 | Timken Company | 465,819 | Technology, Inc. # | 414,580 | ||
| 10,995 | Trinity Industries, Inc. | 478,722 | 9,950 | International Rectifier | ||
| 9,120 | United Rentals, Inc. # | 296,765 | Corporation # | 370,737 | ||
| 6,700 | Werner Enterprises, Inc. | 135,005 | 18,600 | Intersil Corporation | 585,156 | |
| 7,900 | YRC Worldwide, Inc. # | 290,720 | 10,560 | Jack Henry & Associates, Inc. | 271,920 | |
| Total Industrials | 25,298,115 | 11,480 | KEMET Corporation # | 80,934 | ||
| 18,500 | Lam Research Corporation # | 950,900 | ||||
| Information Technology (15.7%) | 15,950 | Lattice Semiconductor Corporation # | 91,234 | |||
| 54,700 | 3Com Corporation # | 225,911 | 7,240 | Macrovision Corporation # | 217,634 | |
| 34,588 | Activision, Inc. #‡ | 645,758 | 21,920 | McAfee, Inc. # | 771,584 | |
| 9,390 | Acxiom Corporation | 248,366 | 11,670 | Mentor Graphics Corporation # | 153,694 | |
| 15,500 | ADC Telecommunications, Inc. # | 284,115 | 7,850 | Micrel, Inc. | 99,852 | |
| 8,380 | ADTRAN, Inc. | 217,629 | 29,660 | Microchip Technology, Inc. | 1,098,606 | |
| 2,700 | Advent Software, Inc. # | 87,885 | 11,500 | MoneyGram International, Inc. | 321,425 | |
| 9,100 | Alliance Data Systems | 14,060 | MPS Group, Inc. # | 187,982 | ||
| Corporation # | 703,248 | 7,875 | National Instruments Corporation | 256,489 | ||
| The accompanying Notes to Financial Statements are an integral part of this schedule. |
| 111 |
Mid Cap Index Portfolio
Schedule of Investments as of June 29, 2007 (unaudited)
| Shares | Common Stock (99.3%) | Value | Shares | Common Stock (99.3%) | Value | |
| Information Technology — continued | 16,600 | RPM International, Inc. | $383,626 | |||
| 14,200 | Palm, Inc. # | $227,342 | 6,100 | Scotts Company | 261,934 | |
| 15,700 | Parametric Technology | 6,530 | Sensient Technologies Corporation | 165,797 | ||
| Corporation # | 339,277 | 13,780 | Sonoco Products Company | 589,922 | ||
| 6,640 | Plantronics, Inc. | 174,101 | 11,600 | Steel Dynamics, Inc. | 486,156 | |
| 12,520 | Polycom, Inc. # | 420,672 | 13,760 | Valspar Corporation | 390,922 | |
| 17,860 | Powerwave Technologies, Inc. # | 119,662 | 9,600 | Worthington Industries, Inc. | 207,840 | |
| 26,540 | RF Micro Devices, Inc. # | 165,610 | Total Materials | 10,951,404 | ||
| 8,690 | Semtech Corporation # | 150,598 | ||||
| 7,600 | Silicon Laboratories, Inc. # | 263,036 | Telecommunications Services (0.8%) | |||
| 5,700 | SRA International, Inc. # | 143,982 | 34,010 | Cincinnati Bell, Inc. # | 196,578 | |
| 12,580 | Sybase, Inc. # | 300,536 | 8,900 | NeuStar, Inc. # | 257,833 | |
| 19,680 | Synopsys, Inc. #‡ | 520,142 | 14,320 | Telephone and Data Systems, Inc. | 896,002 | |
| 7,580 | Tech Data Corporation # | 291,527 | Total Telecommunications | |||
| 5,020 | Transaction Systems | Services | 1,350,413 | |||
| Architects, Inc. # | 168,973 | |||||
| 19,152 | TriQuint Semiconductor, Inc. # | 96,909 | Utilities (7.3%) | |||
| 14,600 | UTStarcom, Inc. # | 81,906 | 10,780 | AGL Resources, Inc. | 436,374 | |
| 13,700 | ValueClick, Inc. # | 403,602 | 15,900 | Alliant Energy Corporation ‡ | 617,715 | |
| 25,420 | Vishay Intertechnology, Inc. # | 402,144 | 18,366 | Aqua America, Inc. | 413,051 | |
| 30,400 | Western Digital Corporation # | 588,240 | 51,380 | Aquila, Inc. #‡ | 210,144 | |
| 10,350 | Wind River Systems, Inc. # | 113,850 | 5,200 | Black Hills Corporation | 206,700 | |
| 9,400 | Zebra Technologies Corporation # | 364,156 | 15,530 | DPL, Inc. | 440,120 | |
| Total Information | 21,750 | Energy East Corporation | 567,458 | |||
| Technology | 26,128,653 | 16,700 | Equitable Resources, Inc. | 827,652 | ||
| 11,950 | Great Plains Energy, Inc. | 347,984 | ||||
| Materials (6.6%) | 11,180 | Hawaiian Electric Industries, Inc. | 264,854 | |||
| 10,790 | Airgas, Inc. | 516,841 | 6,130 | IDACORP, Inc. | 196,405 | |
| 10,920 | Albemarle Corporation | 420,748 | 24,925 | MDU Resources Group, Inc. | 698,897 | |
| 7,640 | Bowater, Inc. | 190,618 | 11,500 | National Fuel Gas Company | 498,065 | |
| 8,790 | Cabot Corporation | 419,107 | 21,170 | Northeast Utilities Service Company | 600,381 | |
| 3,500 | Carpenter Technology Corporation | 456,085 | 14,740 | NSTAR | 478,313 | |
| 33,100 | Chemtura Corporation | 367,741 | 12,590 | OGE Energy Corporation | 461,424 | |
| 16,200 | Commercial Metals Company | 547,074 | 15,200 | ONEOK, Inc. | 766,232 | |
| 5,860 | Cytec Industries, Inc. | 373,692 | 26,443 | Pepco Holdings, Inc. | 745,693 | |
| 6,100 | Ferro Corporation | 152,073 | 10,475 | PNM Resources, Inc. | 291,100 | |
| 6,700 | Florida Rock Industries, Inc. | 452,250 | 16,060 | Puget Energy, Inc. | 388,331 | |
| 5,300 | FMC Corporation | 473,767 | 16,230 | SCANA Corporation | 621,447 | |
| 14,300 | Louisiana-Pacific Corporation | 270,556 | 30,400 | Sierra Pacific Resources # | 533,824 | |
| 9,460 | Lubrizol Corporation | 610,643 | 10,590 | Vectren Corporation | 285,189 | |
| 29,440 | Lyondell Chemical Company | 1,092,813 | 12,020 | Westar Energy, Inc. | 291,846 | |
| 5,820 | Martin Marietta Materials, Inc. | 942,956 | 6,810 | WGL Holdings, Inc. | 222,278 | |
| 2,680 | Minerals Technologies, Inc. | 179,426 | 16,170 | Wisconsin Energy Corporation | 715,199 | |
| 10,100 | Olin Corporation | 212,100 | Total Utilities | 12,126,676 | ||
| 11,300 | Packaging Corporation of America | 286,003 | ||||
| 8,900 | Reliance Steel & Aluminum | Total Common Stock | ||||
| Company | 500,714 | (cost $115,441,008) | 165,038,873 | |||
| The accompanying Notes to Financial Statements are an integral part of this schedule. |
| 112 |
Mid Cap Index Portfolio
Schedule of Investments as of June 29, 2007 (unaudited)
| Shares or | ||||
| Principal | Interest | Maturity | ||
| Amount | Short-Term Investments (0.6%) | Rate (+) | Date | Value |
| $300,000 | Federal National Mortgage Association | 5.090% | 7/16/2007 | $299,322 |
| 780,712 | Thrivent Money Market Portfolio | 5.050 | N/A | 780,712 |
| Total Short-Term Investments (at amortized cost) | 1,080,034 | |||
| Total Investments (cost $116,521,042) 99.9% | $166,118,907 | |||
| Other Assets and Liabilities, Net 0.1% | 102,674 | |||
| Total Net Assets 100.0% | $166,221,581 | |||
| Number of | Notional | ||||
| Contracts | Expiration | Principal | Unrealized | ||
| Futures | Long/(Short) | Date | Amount | Value | Gain/(Loss) |
| S&P 400 Index Mini-Futures | 11 | September 2007 | $1,018,336 | $994,620 | ($23,716) |
# Non-income producing security.
+ The interest rate shown reflects the yield, coupon rate or, for securities purchased at a discount, the discount rate at the date of purchase.
‡ At June 29, 2007, $299,322 of investments were held on deposit with the counterparty and pledged as the initial margin deposit for open financial futures contracts. In addition, $5,634,863 of investments were earmarked as collateral to cover open financial futures contracts.
Definitions:
REIT — Real Estate Investment Trust, is a company that buys, develops, manages and/or sells real estate assets.
Gross unrealized appreciation and depreciation of investments were as follows:
| Gross unrealized appreciation | $53,554,640 |
| Gross unrealized depreciation | (3,956,775) |
| Net unrealized appreciation (depreciation) | $49,597,865 |
| Cost for federal income tax purposes | $116,521,042 |
| The accompanying Notes to Financial Statements are an integral part of this schedule. |
| 113 |
Partner International Stock Portfolio | ||||||
| Shares | Common Stock (98.6%) | Value (^) | Shares | Common Stock (98.6%) | Value (^) | |
| Australia (4.5%) | Denmark (0.3%) | |||||
| 124,260 | Babcock & Brown, Ltd. | $3,368,568 | 41,358 | Novo Nordisk AS | $4,498,724 | |
| 247,445 | BHP Billiton, Ltd. | 7,393,959 | Total Denmark | 4,498,724 | ||
| 99,203 | Caltex Australia, Ltd. | 1,986,507 | ||||
| 62,315 | Cochlear, Ltd. | 3,217,689 | Finland (0.7%) | |||
| 321,662 | Computershare, Ltd. | 3,069,247 | 348,178 | Nokia Oyj | 9,778,011 | |
| 57,442 | CSL, Ltd. | 4,275,910 | Total Finland | 9,778,011 | ||
| 66,228 | Macquarie Bank Limited | 4,756,922 | ||||
| 186,929 | QBE Insurance Group, Ltd. | 4,932,200 | France (7.5%) | |||
| 21,127 | Rio Tinto, Ltd. * | 1,762,395 | 57,153 | Air France — KLM | 2,659,119 | |
| 428,030 | Seek, Ltd. | 2,672,366 | 484,800 | Axa SA | 20,838,002 | |
| 921,345 | Westpac Banking Corporation | 20,007,130 | 49,353 | BNP Paribas SA | 5,861,926 | |
| 203,682 | Woolworths, Ltd. | 4,654,794 | 34,989 | Bouygues SA | 2,931,362 | |
| 135,218 | WorleyParsons, Ltd. | 3,889,624 | 59,200 | Carrefour SA | 4,157,556 | |
| Total Australia | 65,987,311 | 22,842 | CNP Assurances | 2,918,533 | ||
| 11,570 | Compagnie Generale de | |||||
| Austria (0.3%) | Geophysique-Veritas # | 2,887,117 | ||||
| 46,017 | Voestalpine AG | 3,867,950 | 37,208 | Kaufman & Broad SA | 2,878,758 | |
| Total Austria | 3,867,950 | 18,279 | Lafarge SA | 3,331,174 | ||
| 23,571 | Michelin Class B | 3,293,684 | ||||
| Belgium (0.5%) | 14,326 | Nexans SA | 2,377,856 | |||
| 55,629 | InBev NV | 4,405,833 | 31,230 | Nexity | 2,604,064 | |
| 26,009 | KBC Groep NV | 3,504,953 | 49,638 | Sanofi-Aventis | 4,009,842 | |
| Total Belgium | 7,910,786 | 138,200 | Schneider Electric SA | 19,361,635 | ||
| 118,214 | Total SA | 9,583,925 | ||||
| Bermuda (0.2%) | 77,385 | Vinci SA | 5,775,399 | |||
| 125,271 | Jardine Matheson Holdings, Ltd. | 2,983,755 | 361,875 | Vivendi Universal SA | 15,565,963 | |
| Total Bermuda | 2,983,755 | Total France | 111,035,915 | |||
| Canada (2.7%) | Germany (9.7%) | |||||
| 79,400 | AGF Management, Ltd. | 2,707,038 | 267,300 | Adidas AG | 16,893,403 | |
| 53,000 | Agrium, Inc. # | 2,322,886 | 18,892 | Allianz AG | 4,430,533 | |
| 80,909 | Biovail Corporation # | 2,062,029 | 51,436 | BASF AG | 6,755,359 | |
| 87,600 | EnCana Corporation # | 5,387,733 | 48,450 | Bayerische Motoren Werke AG | 3,140,824 | |
| 64,900 | Fortis, Inc. | 1,583,967 | 192,063 | Celesio AG | 12,479,858 | |
| 36,900 | Husky Energy, Inc. | 3,037,764 | 28,956 | Deutsche Bank AG | 4,214,295 | |
| 82,700 | Imperial Oil, Ltd. # | 3,849,707 | 40,741 | Deutsche Boerse AG | 4,615,417 | |
| 29,200 | Inmet Mining Corporation | 2,258,594 | 451,400 | Deutsche Post AG-REG | 14,666,193 | |
| 72,000 | Metro, Inc. | 2,522,332 | 54,849 | E.ON AG | 9,208,976 | |
| 54,800 | Potash Corporation of | 54,381 | Fresenius Medical Care | |||
| Saskatchewan # | 4,283,999 | AG & Company | 2,506,678 | |||
| 73,100 | Suncor Energy, Inc. # | 6,584,695 | 26,793 | MAN AG | 3,855,759 | |
| 216,400 | Talisman Energy, Inc. # | 4,184,587 | 193,200 | Metro AG | 16,040,228 | |
| Total Canada | 40,785,331 | 2,573 | Porsche AG | 4,588,643 | ||
| 15,664 | RWE AG | 1,671,685 | ||||
| The accompanying Notes to Financial Statements are an integral part of this schedule. |
| 114 |
Partner International Stock Portfolio
Schedule of Investments as of June 29, 2007 (unaudited)
| Shares | Common Stock (98.6%) | Value (^) | Shares | Common Stock (98.6%) | Value (^) |
| Germany — continued | 44,082 | Hikari Tsushin, Inc. | $1,851,484 | ||
| 21,259 | Salzgitter AG | $4,113,874 | 90,900 | Hitachi Construction | |
| 56,472 | SGL Carbon AG # | 2,340,076 | Machinery Company, Ltd. | 3,158,406 | |
| 224,626 | Siemens AG | 32,322,345 | 637 | Japan Tobacco, Inc. | 3,139,930 |
| Total Germany | 143,844,146 | 57,900 | Joint Corporation | 1,817,592 | |
| 225,000 | Kawasaki Kisen Kaisha, Ltd. | 2,744,042 | |||
| Greece (0.5%) | 353 | KDDI Corporation | 2,615,037 | ||
| 59,790 | National Bank of Greece SA | 3,404,178 | 141,000 | Komatsu, Ltd. | 4,086,616 |
| 103,146 | Piraeus Bank SA | 3,758,429 | 95,700 | Kyocera Corporation | 10,166,863 |
| Total Greece | 7,162,607 | 93,600 | Makita Corporation | 4,169,807 | |
| 88,400 | Matsuda Sangyo Company, Ltd. | 1,961,144 | |||
| Hong Kong (1.3%) | 1,970 | Mitsubishi UFJ Financial | |||
| 315,600 | Esprit Holdings, Ltd. | 4,009,842 | Group, Inc. | 21,710,755 | |
| 854,000 | Hengan International Group | 319,000 | Mitsui Osk Lines, Ltd. | 4,325,295 | |
| Company, Ltd. | 3,036,685 | 1,256 | Mizuho Financial Group, Inc. | 8,677,119 | |
| 798,100 | Swire Pacific, Ltd. | 8,883,251 | 1,535,000 | Mizuho Trust and Banking | |
| 352,889 | Vtech Holdings, Ltd. | 2,977,090 | Company, Ltd. | 3,109,881 | |
| Total Hong Kong | 18,906,868 | 73,800 | Mori Seiki Company, Ltd. | 2,288,676 | |
| 607,900 | Nikon Corporation | 16,929,568 | |||
| Ireland (0.8%) | 14,000 | Nintendo Company, Ltd. | 5,107,808 | ||
| 90,037 | Allied Irish Banks plc | 2,459,366 | 85,652 | Nippon Seiki Company, Ltd. | 1,912,679 |
| 177,045 | Anglo Irish Bank Corporation plc 3,633,316 | 710,000 | Nippon Steel Corporation | 4,994,499 | |
| 190,416 | C&C Group plc | 2,563,156 | 373,200 | Nippon Suisan Kaisha, Ltd. | 2,391,073 |
| 110,047 | Kingspan Group plc | 3,086,410 | 456 | NTT Data Corp. | 2,163,499 |
| Total Ireland | 11,742,248 | 89,000 | Olympus Corporation | 3,472,280 | |
| 12,730 | ORIX Corporation | 3,355,466 | |||
| Italy (4.9%) | 192,000 | Pacific Metals Company, Ltd. | 3,206,133 | ||
| 380,338 | Enel SPA | 4,087,977 | 111,000 | Ricoh Company, Ltd. | 2,568,137 |
| 603,973 | Eni SPA | 21,896,943 | 264,000 | Shimadzu Corporation | 2,775,412 |
| 548,800 | Finmeccanica SPA | 16,860,096 | 50,600 | Sumco Corporation | 2,535,324 |
| 58,639 | Fondiaria-Sai SPA | 2,834,766 | 944,200 | Sumitomo Corporation | 17,214,222 |
| 29,641 | Geox SPA | 545,893 | 172,000 | Sumitomo Metal Mining | |
| 133,797 | Indesit Company SPA | 3,117,059 | Company, Ltd. | 3,728,738 | |
| 2,525,257 | UniCredito Italiano SPA | 22,553,016 | 427 | Sumitomo Mitsui Financial | |
| Total Italy | 71,895,750 | Group, Inc. | 3,980,668 | ||
| 87,000 | Sumitomo Realty & | ||||
| Japan (18.7%) | Development Co., Ltd. | 2,833,280 | |||
| 67,900 | Aisin Seiki Company, Ltd. | 2,491,257 | 1,565,100 | Sumitomo Trust and Banking | |
| 5,673 | Ardepro Company, Ltd. | 1,767,984 | Company, Ltd. | 14,906,826 | |
| 244,000 | Asahi Glass Company, Ltd. | 3,289,956 | 334,500 | Takeda Pharmaceutical | |
| 697,500 | Bridgestone Corporation | 14,952,350 | Company, Ltd. | 21,609,184 | |
| 140,900 | Canon, Inc. * | 8,262,803 | 186,000 | Tanabe Seiyaku Company, Ltd. | 2,211,492 |
| 239,000 | Chiba Bank, Ltd. | 2,118,464 | 187,037 | The Sumitomo Warehouse | |
| 300,400 | Daito Trust Construction | Company, Ltd. | 1,290,146 | ||
| Company, Ltd. | 14,304,322 | 104,400 | Tokai Rika Company, Ltd. | 2,852,977 | |
| 958 | Geo Corporation | 1,623,655 | 398,400 | Toyota Motor Corporation | 25,125,651 |
| The accompanying Notes to Financial Statements are an integral part of this schedule. |
| 115 |
Partner International Stock Portfolio
Schedule of Investments as of June 29, 2007 (unaudited)
| Shares | Common Stock (98.6%) | Value (^) | Shares | Common Stock (98.6%) | Value (^) | |
| Japan — continued | Spain (4.3%) | |||||
| 140,900 | Urban Corporation | $2,559,283 | 795,869 | Banco Bilbao Vizcaya | ||
| 71,900 | Zenrin Company, Ltd. | 1,883,590 | Argentaria SA | $19,461,577 | ||
| Total Japan | 276,241,373 | 184,000 | Iberdrola SA | 10,273,221 | ||
| 67,205 | Industria de Diseno | |||||
| Netherlands (3.5%) | Textil SA (Inditex) | 3,955,354 | ||||
| 197,400 | ABN AMRO Holding NV | 9,050,639 | 1,206,341 | Telefonica SA | 26,844,148 | |
| 74,501 | Apothekers Cooperatie OPG U.A. | 2,713,746 | 54,064 | Union Fenosa SA | 2,886,186 | |
| 121,700 | Arcelor Mittal | 7,599,967 | Total Spain | 63,420,486 | ||
| 140,616 | ASML Holding NV # | 3,863,201 | ||||
| 65,663 | Furgo NV | 4,159,599 | Sweden (2.6%) | |||
| 61,633 | Heineken NV | 3,612,791 | 61,000 | Alfa Laval AB | 3,675,265 | |
| 363,500 | ING Groep NV | 15,997,936 | 98,500 | Hennes & Mauritz AB | 5,823,915 | |
| 63,089 | Sligro Food Group NV | 2,616,721 | 190,100 | Meda AB | 2,985,964 | |
| 64,610 | Unilever NV | 2,004,956 | 126,827 | Peab AB | 3,942,417 | |
| Total Netherlands | 51,619,556 | 96,600 | Skandinaviska Enskilda Banken | 3,110,195 | ||
| 4,674,300 | Telefonaktiebolaget LM Ericsson 18,645,257 | |||||
| Norway (0.7%) | Total Sweden | 38,183,013 | ||||
| 302,600 | Ementor ASA # | 2,803,984 | ||||
| 218,100 | Orkla ASA | 4,112,215 | Switzerland (7.1%) | |||
| 99,550 | Yara International ASA | 2,985,085 | 160,413 | ABB, Ltd. | 3,616,955 | |
| Total Norway | 9,901,284 | 56,592 | Actelion, Ltd. # | 2,520,440 | ||
| 14,900 | Givaudan SA | 14,692,955 | ||||
| Singapore (3.0%) | 32,478 | Holcim, Ltd. | 3,507,544 | |||
| 240,000 | City Developments, Ltd. | 2,712,997 | 61,934 | Nestle SA | 23,533,277 | |
| 558,000 | Keppel Land, Ltd. | 3,197,856 | 123,946 | Novartis AG | 6,958,398 | |
| 486,000 | Oversea-Chinese Banking | 50,757 | Roche Holding AG | 8,993,455 | ||
| Corporation | 2,905,206 | 62,703 | Swatch Group AG | 17,811,995 | ||
| 7,654,250 | Singapore | 177,500 | Swiss Reinsurance Company | 16,188,015 | ||
| Telecommunications, Ltd. | 17,022,556 | 50,580 | UBS AG | 3,024,899 | ||
| 1,320,400 | United Overseas Bank, Ltd. | 18,980,793 | 14,471 | Zurich Financial Services AG | 4,473,426 | |
| Total Singapore | 44,819,408 | Total Switzerland | 105,321,359 | |||
| South Korea (2.8%) | Taiwan (1.0%) | |||||
| 8,834 | Hyundai Heavy Industries | 3,291,436 | 1,388,004 | Taiwan Semiconductor | ||
| 21,271 | Korea Zinc Company, Ltd. | 3,610,912 | Manufacturing Company, | |||
| 39,701 | KT&G Corporation | 2,792,872 | Ltd. ADR | 15,448,488 | ||
| 141,600 | LG Electronics, Inc. | 11,690,273 | Total Taiwan | 15,448,488 | ||
| 62,600 | LG. Philips LCD Company, Ltd. # | 2,778,232 | ||||
| 19,270 | Samsung Electronics | United Kingdom (20.3%) | ||||
| Company, Ltd. | 11,780,763 | 156,440 | 3i Group plc | 3,641,377 | ||
| 68,693 | STX Shipbuilding Company, Ltd. | 3,272,625 | 331,966 | AstraZeneca plc | 17,789,578 | |
| 101,420 | Woori Finance Holdings | 297,178 | Barclays plc | 4,134,414 | ||
| Company, Ltd. | 2,565,754 | 223,203 | BHP Billiton plc | 6,200,068 | ||
| Total South Korea | 41,782,867 | 158,665 | BP Amoco plc | 1,909,014 | ||
| 131,160 | British Land Company plc | 3,509,583 | ||||
| The accompanying Notes to Financial Statements are an integral part of this schedule. |
| 116 |
Partner International Stock Portfolio
Schedule of Investments as of June 29, 2007 (unaudited)
| Shares | Common Stock (98.6%) | Value (^) | Shares | Common Stock (98.6%) | Value (^) | |
| United Kingdom — continued | 482,918 | Premier Foods plc | $2,792,585 | |||
| 1,407,300 | British Sky Broadcasting | 133,278 | Punch Taverns plc | 3,269,620 | ||
| Group plc | $18,042,264 | 97,553 | Reckitt Benckiser plc | 5,340,361 | ||
| 907,313 | BT Group plc | 6,038,368 | 36,704 | Rio Tinto plc | 2,807,878 | |
| 729,094 | Centricia plc | 5,664,241 | 1,424,221 | Royal Bank of Scotland | ||
| 175,210 | Charter plc # | 3,866,019 | Group plc | 18,020,399 | ||
| 79,983 | Chemring Group plc | 3,145,243 | 140,698 | Royal Dutch Shell plc | 5,727,708 | |
| 642,147 | GAME GROUP plc | 2,145,261 | 127,380 | Royal Dutch Shell plc | 5,309,725 | |
| 938,046 | GlaxoSmithKline plc | 24,434,968 | 917,551 | Tesco plc | 7,676,475 | |
| 51,562 | Go-Ahead Group plc | 2,698,598 | 545,360 | Unilever plc | 17,608,886 | |
| 380,117 | HBOS plc | 7,476,321 | 140,770 | United Business Media plc | 2,226,682 | |
| 122,213 | Imperial Tobacco Group plc | 5,634,510 | 5,657,187 | Vodafone Group plc | 18,954,984 | |
| 489,524 | International Power plc | 4,207,547 | 1,274,612 | WPP Group plc | 19,062,872 | |
| 120,656 | Keller Group plc | 2,604,086 | 77,558 | Xstrata plc | 4,617,068 | |
| 3,180,000 | Kingfisher plc | 14,402,590 | Total United Kingdom | 299,574,564 | ||
| 90,449 | Land Securities Group plc | 3,149,805 | ||||
| 1,305,200 | Lloyds TSB Group plc | 14,508,425 | United States (0.7%) | |||
| 334,846 | Man Group plc | 4,072,817 | 121,650 | iShares MSCI EAFE Index Fund 9,808,640 | ||
| 286,728 | Michael Page International plc | 3,012,199 | Total United States | 9,808,640 | ||
| 353,230 | National Grid plc | 5,211,774 | ||||
| 935,000 | Pearson plc | 15,749,493 | Total Common Stock | |||
| 325,363 | Petrofac, Ltd. | 2,910,758 | (cost $1,191,999,389) | 1,456,520,440 | ||
| Interest | Maturity | |||
| Shares | Collateral Held for Securities Loaned (0.6%) | Rate (+) | Date | Value |
| 8,996,919 | Thrivent Financial Securities Lending Trust | 5.360% | N/A | $8,996,919 |
| Total Collateral Held for Securities Loaned | ||||
| (cost $8,996,919) | 8,996,919 | |||
| The accompanying Notes to Financial Statements are an integral part of this schedule. |
| 117 |
Partner International Stock Portfolio
Schedule of Investments as of June 29, 2007 (unaudited)
| Shares or | ||||
| Principal | Interest | Maturity | ||
| Amount | Short-Term Investments (2.2%) | Rate (+) | Date | Value |
| $14,935,000 | ED&F Man Treasury Management plc | 5.420% | 7/2/2007 | $14,930,503 |
| 18,249,452 | Thrivent Money Market Portfolio | 5.050 | N/A | 18,249,452 |
| Total Short-Term Investments (at amortized cost) | 33,179,955 | |||
| Total Investments (cost $1,234,176,263) 101.4% | $1,498,697,314 | |||
| Other Assets and Liabilities, Net (1.4%) | (20,792,894) | |||
| Total Net Assets 100.0% | $1,477,904,420 | |||
# Non-income producing security.
* All or a portion of the security is on loan as discussed in item 2(M) of the Notes to Financial Statements.
+ The interest rate shown reflects the yield, coupon rate or, for securities purchased at a discount, the discount rate at the date of purchase.
^ Security is fair valued as discussed in item 2(A) of the Notes to Financial Statements.
Definitions:
ADR — American Depository Receipts, which are certificates for shares of an underlying foreign security’s shares held by an issuing U.S. depository bank.
Gross unrealized appreciation and depreciation of investments were as follows:
| Gross unrealized appreciation | $279,328,146 |
| Gross unrealized depreciation | (14,807,095) |
| Net unrealized appreciation (depreciation) | $264,521,051 |
| Cost for federal income tax purposes | $1,234,176,263 |
| The accompanying Notes to Financial Statements are an integral part of this schedule. |
| 118 |
Partner All Cap Portfolio | ||||||
| Shares | Common Stock (98.8%) | Value | Shares | Common Stock (98.8%) | Value | |
| Consumer Discretionary (9.9%) | 22,900 | Transocean, Inc. # | $2,426,942 | |||
| 19,200 | American Eagle Outfitters, Inc. * | $492,672 | 9,700 | Valero Energy Corporation | 716,442 | |
| 28,800 | Applebee’s International, Inc. | 694,080 | Total Energy | 10,913,032 | ||
| 13,400 | Best Buy Company, Inc. | 625,378 | ||||
| 18,500 | Comcast Corporation # | 520,220 | Financials (20.5%) | |||
| 33,800 | Discovery Holding Company # | 777,062 | 20,500 | ACE, Ltd. | 1,281,660 | |
| 24,000 | EchoStar Communications | 17,200 | American Express Company | 1,052,296 | ||
| Corporation # | 1,040,880 | 6,500 | Ameriprise Financial, Inc. | 413,205 | ||
| 353 | Gemstar-TV Guide | 59,000 | Bank of America Corporation | 2,884,510 | ||
| International, Inc. # | 1,737 | 25,500 | Bank of New York | |||
| 11,500 | J.C. Penney Company, Inc. | Company, Inc. # | 1,056,720 | |||
| (Holding Company) | 832,370 | 440 | Berkshire Hathaway, Inc. # | 1,586,200 | ||
| 10,300 | KB Home | 405,511 | 3,400 | Chicago Mercantile Exchange | ||
| 16,800 | Macy’s Group, Inc | 668,304 | Holdings, Inc. | 1,816,824 | ||
| 15,200 | NIKE, Inc. | 886,008 | 25,800 | Chubb Corporation | 1,396,812 | |
| 11,900 | OfficeMax, Inc. | 467,670 | 7,600 | Citigroup, Inc. | 389,804 | |
| 11,700 | Penn National Gaming, Inc. # | 703,053 | 9,700 | Endurance Specialty Holdings, Ltd. | 388,388 | |
| 58,200 | Time Warner, Inc. | 1,224,528 | 41,700 | Federal National Mortgage | ||
| 23,300 | TJX Companies, Inc. | 640,750 | Association | 2,724,261 | ||
| 5,600 | Wynn Resorts, Ltd. * | 502,264 | 8,100 | GFI Group, Inc. # | 587,088 | |
| Total Consumer | 6,400 | HCC Insurance Holdings, Inc. | 213,824 | |||
| Discretionary | 10,482,487 | 36,700 | Hudson City Bancorp, Inc. | 448,474 | ||
| 10,100 | KBW, Inc. #* | 296,738 | ||||
| Consumer Staples (9.2%) | 15,100 | Merrill Lynch & Company, Inc. | 1,262,058 | |||
| 5,000 | Altria Group, Inc. | 350,700 | 7,000 | PartnerRe, Ltd. | 542,500 | |
| 13,100 | Bunge, Ltd. * | 1,106,950 | 21,200 | People’s United Financial, Inc. | 375,876 | |
| 23,100 | ConAgra Foods, Inc. | 620,466 | 13,600 | PNC Financial Services Group, Inc. | 973,488 | |
| 16,000 | Corn Products International, Inc. | 727,200 | 16,400 | Prudential Financial, Inc. | 1,594,572 | |
| 52,500 | CVS/Caremark Corporation | 1,913,625 | 9,600 | Willis Group Holdings, Ltd. | 422,976 | |
| 16,600 | Kimberly-Clark Corporation | 1,110,374 | Total Financials | 21,708,274 | ||
| 80,400 | Playtex Products, Inc. # | 1,190,724 | ||||
| 44,000 | Procter & Gamble Company | 2,692,360 | Health Care (11.4%) | |||
| Total Consumer Staples | 9,712,399 | 13,900 | Adams Respiratory | |||
| Therapeutics, Inc. #* | 547,521 | |||||
| Energy (10.3%) | 3,100 | Advanced Magnetics, Inc. #* | 180,296 | |||
| 13,200 | Cameron International | 52,914 | Auxilium Pharmaceuticals, Inc. #* | 843,449 | ||
| Corporation # | 943,404 | 19,500 | Baxter International, Inc. | 1,098,630 | ||
| 49,500 | Continental Resources, Inc. # | 792,000 | 6,200 | C.R. Bard, Inc. | 512,306 | |
| 27,000 | Exxon Mobil Corporation | 2,264,760 | 7,600 | Cardinal Health, Inc. | 536,864 | |
| 7,000 | GlobalSantaFe Corporation | 505,750 | 12,000 | Express Scripts, Inc. # | 600,120 | |
| 3,600 | Holly Corporation | 267,084 | 31,300 | Gilead Sciences, Inc. # | 1,213,501 | |
| 19,800 | Pioneer Natural | 133,900 | Inyx, Inc. # | 326,716 | ||
| Resources Company | 964,458 | 8,350 | Medco Health Solutions, Inc. # | 651,216 | ||
| 15,000 | Plains Exploration & | 28,100 | Merck & Company, Inc. | 1,399,380 | ||
| Production Company # | 717,150 | 54,900 | Panacos Pharmaceuticals, Inc. # | 177,327 | ||
| 9,300 | Schlumberger, Ltd. | 789,942 | 15,100 | Pharmaceutical Product | ||
| 11,800 | Southwestern Energy Company # | 525,100 | Development, Inc. | 577,877 | ||
| The accompanying Notes to Financial Statements are an integral part of this schedule. |
| 119 |
Partner All Cap Portfolio
Schedule of Investments as of June 29, 2007 (unaudited)
| Shares | Common Stock (98.8%) | Value | Shares | Common Stock (98.8%) | Value | |
| Health Care — continued | 69,500 | Hewlett-Packard Company | $3,101,090 | |||
| 21,500 | Schering-Plough Corporation | $654,460 | 45,000 | Marvell Technology Group, Ltd. # | 819,450 | |
| 51,000 | Theravance, Inc. # | 1,632,000 | 19,900 | Microsoft Corporation | 586,453 | |
| 21,450 | Thermo Electron Corporation # | 1,109,394 | 28,900 | QUALCOMM, Inc. | 1,253,971 | |
| Total Health Care | 12,061,057 | 23,900 | SanDisk Corporation #* | 1,169,666 | ||
| 29,600 | Seagate Technology | 644,392 | ||||
| Industrials (11.7%) | 202,200 | Sun Microsystems, Inc. # | 1,063,572 | |||
| 11,600 | Alaska Air Group, Inc. # | 323,176 | Total Information | |||
| 39,400 | AMR Corporation # | 1,038,190 | Technology | 16,462,229 | ||
| 6,100 | Deere & Company | 736,514 | ||||
| 5,600 | Fluor Corporation | 623,672 | Materials (3.1%) | |||
| 9,300 | General Dynamics Corporation | 727,446 | 11,700 | Albemarle Corporation | 450,801 | |
| 36,500 | General Electric Company | 1,397,220 | 12,500 | Monsanto Company | 844,250 | |
| 10,400 | Jacobs Engineering Group, Inc. # | 598,104 | 12,200 | Nucor Corporation | 715,530 | |
| 5,200 | Manitowoc Company, Inc. | 417,976 | 17,100 | Praxair, Inc. | 1,231,029 | |
| 9,800 | Precision Castparts Corporation | 1,189,328 | Total Materials | 3,241,610 | ||
| 24,200 | Shaw Group, Inc. # | 1,120,218 | ||||
| 18,500 | Spirit Aerosystems Holdings, Inc. # | 666,925 | Telecommunications Services (3.7%) | |||
| 5,100 | Terex Corporation # | 414,630 | 19,700 | American Tower Corporation # | 827,400 | |
| 7,100 | Textron, Inc. | 781,781 | 75,412 | AT&T, Inc. | 3,129,598 | |
| 20,400 | UAL Corporation # | 828,036 | Total Telecommunications | |||
| 26,100 | UAP Holding Corporation | 786,654 | Services | 3,956,998 | ||
| 27,100 | UTI Worldwide, Inc. | 726,009 | ||||
| Total Industrials | 12,375,879 | Utilities (3.4%) | ||||
| 14,400 | Constellation Energy Group, Inc. 1,255,248 | |||||
| Information Technology (15.6%) | 12,500 | ITC Holdings Corporation | 507,875 | |||
| 38,100 | Activision, Inc. # | 711,327 | 39,800 | PPL Corporation | 1,862,242 | |
| 12,900 | Apple Computer, Inc. # | 1,574,316 | Total Utilities | 3,625,365 | ||
| 17,300 | Autodesk, Inc. # | 814,484 | ||||
| 46,000 | Cisco Systems, Inc. # | 1,281,100 | Total Common Stock | |||
| 22,400 | eBay, Inc. # | 720,832 | (cost $87,590,232) | 104,539,330 | ||
| 5,200 | Google, Inc. # | 2,721,576 | ||||
| The accompanying Notes to Financial Statements are an integral part of this schedule. |
| 120 |
Partner All Cap Portfolio
Schedule of Investments as of June 29, 2007 (unaudited)
| Interest | Maturity | |||
| Shares | Collateral Held for Securities Loaned (4.6%) | Rate (+) | Date | Value |
| 4,905,975 | Thrivent Financial Securities Lending Trust | 5.360% | N/A | $4,905,975 |
| Total Collateral Held for Securities Loaned | ||||
| (cost $4,905,975) | 4,905,975 | |||
| Interest | Maturity | |||
| Shares | Short-Term Investments (0.6%) | Rate (+) | Date | Value |
| 649,182 | Thrivent Money Market Portfolio | 5.050% | N/A | $649,182 |
| Total Short-Term Investments (at amortized cost) | 649,182 | |||
| Total Investments (cost $93,145,389) 104.0% | $110,094,487 | |||
| Other Assets and Liabilities, Net (4.0%) | (4,228,850) | |||
| Total Net Assets 100.0% | $105,865,637 | |||
# Non-income producing security.
* All or a portion of the security is on loan as discussed in item 2(M) of the Notes to Financial Statements.
+ The interest rate shown reflects the yield, coupon rate or, for securities purchased at a discount, the discount rate at the date of purchase. Gross unrealized appreciation and depreciation of investments were as follows:
| Gross unrealized appreciation | $17,862,390 |
| Gross unrealized depreciation | (913,292) |
| Net unrealized appreciation (depreciation) | $16,949,098 |
| Cost for federal income tax purposes | $93,145,389 |
| The accompanying Notes to Financial Statements are an integral part of this schedule. |
| 121 |
Large Cap Growth Portfolio
Schedule of Investments as of June 29, 2007 (unaudited)
| Shares | Common Stock (98.0%) | Value | Shares | Common Stock (98.0%) | Value | |
| Consumer Discretionary (11.2%) | Energy (5.9%) | |||||
| 99,800 | Abercrombie & Fitch Company | $7,283,404 | 95,150 | Cameron International | ||
| 139,400 | Brunswick Corporation * | 4,548,622 | Corporation # | $6,800,370 | ||
| 223,200 | Cheesecake Factory, Inc. # | 5,472,864 | 169,100 | Devon Energy Corporation | 13,238,839 | |
| 261,000 | Coach, Inc. # | 12,368,790 | 137,300 | Diamond Offshore | ||
| 978,700 | Comcast Corporation # | 27,364,452 | Drilling, Inc. * | 13,944,188 | ||
| 155,200 | DreamWorks Animation | 172,500 | Exxon Mobil Corporation | 14,469,300 | ||
| SKG, Inc. # | 4,475,968 | 66,500 | FMC Technologies, Inc. # | 5,268,130 | ||
| 369,700 | Gap, Inc. | 7,061,270 | 154,500 | GlobalSantaFe Corporation | 11,162,625 | |
| 581,700 | Home Depot, Inc. | 22,889,895 | 226,200 | Halliburton Company | 7,803,900 | |
| 337,350 | International Game | 81,500 | Marathon Oil Corporation | 4,886,740 | ||
| Technology * | 13,392,795 | 42,100 | National Oilwell Varco, Inc. # | 4,388,504 | ||
| 192,950 | J.C. Penney Company, Inc. | 100,900 | Oceaneering | |||
| (Holding Company) * | 13,965,721 | International, Inc. # | 5,311,376 | |||
| 404,132 | Kohl’s Corporation # | 28,705,496 | 378,050 | Schlumberger, Ltd. * | 32,111,567 | |
| 66,300 | Las Vegas Sands Corporation # | 5,064,657 | 75,000 | Suncor Energy, Inc. | 6,744,000 | |
| 338,250 | Marriott International, Inc. | 14,625,930 | 134,300 | Ultra Petroleum Corporation # | 7,418,732 | |
| 192,700 | McDonald’s Corporation | 9,781,452 | 184,383 | XTO Energy, Inc. | 11,081,418 | |
| 257,400 | McGraw-Hill Companies, Inc. | 17,523,792 | Total Energy | 144,629,689 | ||
| 730,400 | News Corporation * | 16,755,376 | ||||
| 226,300 | OfficeMax, Inc. | 8,893,590 | Financials (12.1%) | |||
| 151,250 | Royal Caribbean Cruises, Ltd. * | 6,500,725 | 95,100 | AFLAC, Inc. * | 4,888,140 | |
| 232,850 | Starbucks Corporation # | 6,109,984 | 66,600 | AllianceBernstein Holding, LP | 5,800,194 | |
| 103,100 | Starwood Hotels & Resorts | 265,600 | American Express Company | 16,249,408 | ||
| Worldwide, Inc. | 6,914,917 | 245,100 | American International | |||
| 328,100 | Toll Brothers, Inc. #* | 8,195,938 | Group, Inc. | 17,164,353 | ||
| 239,200 | Viacom, Inc. # | 9,957,896 | 379,800 | CB Richard Ellis Group, Inc. # | 13,862,700 | |
| 299,500 | Walt Disney Company * | 10,224,930 | 725,500 | Charles Schwab Corporation | 14,887,260 | |
| 92,900 | Wynn Resorts, Ltd. * | 8,332,201 | 40,300 | Chicago Mercantile Exchange | ||
| Total Consumer | Holdings, Inc. * | 21,534,708 | ||||
| Discretionary | 276,410,665 | 438,500 | Citigroup, Inc. | 22,490,665 | ||
| 89,100 | Franklin Resources, Inc. | 11,803,077 | ||||
| Consumer Staples (7.9%) | 145,000 | Goldman Sachs Group, Inc. | 31,428,750 | |||
| 179,850 | Altria Group, Inc. | 12,614,679 | 94,200 | IntercontinentalExchange, | ||
| 350,600 | Avon Products, Inc. | 12,884,550 | Inc. #* | 13,927,470 | ||
| 223,600 | Campbell Soup Company | 8,677,916 | 199,600 | Jefferies Group, Inc. | 5,385,208 | |
| 283,500 | Costco Wholesale Corporation | 16,590,420 | 97,950 | Legg Mason, Inc. | 9,636,321 | |
| 894,500 | CVS/Caremark Corporation | 32,604,525 | 298,450 | Lehman Brothers | ||
| 555,050 | PepsiCo, Inc. | 35,994,992 | Holdings, Inc. * | 22,240,494 | ||
| 674,900 | Procter & Gamble Company | 41,297,131 | 294,500 | Morgan Stanley | 24,702,660 | |
| 378,900 | Safeway, Inc. * | 12,893,967 | 57,900 | Nymex Holdings, Inc. | 7,273,977 | |
| 416,700 | Wal-Mart Stores, Inc. | 20,047,437 | 83,600 | NYSE Euronext * | 6,154,632 | |
| Total Consumer Staples | 193,605,617 | 234,100 | optionsXpress Holdings, Inc. * | 6,007,006 | ||
| The accompanying Notes to Financial Statements are an integral part of this schedule. |
| 122 |
Large Cap Growth Portfolio
Schedule of Investments as of June 29, 2007 (unaudited)
| Shares | Common Stock (98.0%) | Value | Shares | Common Stock (98.0%) | Value | |
| Financials — continued | 239,650 | Danaher Corporation * | $18,093,575 | |||
| 122,100 | Prudential Financial, Inc. | $11,871,783 | 117,000 | Deere & Company | 14,126,580 | |
| 266,100 | State Street Corporation | 18,201,240 | 407,200 | Emerson Electric Company | 19,056,960 | |
| 234,000 | T. Rowe Price Group, Inc. | 12,142,260 | 264,000 | Expeditors International of | ||
| Total Financials | 297,652,306 | Washington, Inc. * | 10,903,200 | |||
| 83,000 | FedEx Corporation | 9,210,510 | ||||
| Health Care (16.2%) | 89,600 | Fluor Corporation * | 9,978,752 | |||
| 388,550 | Abbott Laboratories | 20,806,852 | 97,450 | Foster Wheeler, Ltd. # | 10,426,176 | |
| 257,700 | Allergan, Inc. | 14,853,828 | 224,650 | General Dynamics | ||
| 291,900 | Amgen, Inc. #* | 16,139,151 | Corporation | 17,572,123 | ||
| 126,600 | Amylin Pharmaceuticals, | 807,350 | General Electric Company | 30,905,358 | ||
| Inc. #* | 5,210,856 | 157,700 | Illinois Tool Works, Inc. | 8,545,763 | ||
| 352,200 | Baxter International, Inc. | 19,842,948 | 223,650 | Monster Worldwide, Inc. # | 9,192,015 | |
| 260,100 | Bristol-Myers Squibb | 88,000 | Norfolk Southern Corporation | 4,626,160 | ||
| Company | 8,208,756 | 158,850 | Precision Castparts | |||
| 344,750 | Celgene Corporation # | 19,764,518 | Corporation | 19,278,036 | ||
| 320,400 | Express Scripts, Inc. # | 16,023,204 | 116,100 | Rockwell Collins, Inc. | 8,201,304 | |
| 313,750 | Genentech, Inc. # | 23,738,325 | 120,800 | Thomas & Betts Corporation # | 7,006,400 | |
| 278,415 | Genzyme Corporation # | 17,929,926 | 248,800 | UAL Corporation #* | 10,098,792 | |
| 884,400 | Gilead Sciences, Inc. # | 34,288,188 | 61,900 | Union Pacific Corporation | 7,127,785 | |
| 125,500 | Hologic, Inc. #* | 6,941,405 | 313,150 | United Technologies | ||
| 187,550 | Johnson & Johnson | 11,556,831 | Corporation | 22,211,730 | ||
| 214,300 | McKesson Corporation | 12,780,852 | Total Industrials | 279,326,789 | ||
| 384,950 | Medtronic, Inc. | 19,963,507 | ||||
| 320,400 | Merck & Company, Inc. | 15,955,920 | Information Technology (26.7%) | |||
| 438,600 | Schering-Plough Corporation | 13,350,984 | 355,128 | Accenture, Ltd. * | 15,231,440 | |
| 153,600 | Shire Pharmaceuticals Group | 624,700 | Adobe Systems, Inc. # | 25,081,705 | ||
| plc ADR * | 11,386,368 | 102,450 | Akamai Technologies, Inc. #* | 4,983,168 | ||
| 249,600 | St. Jude Medical, Inc. # | 10,355,904 | 306,300 | Alcatel-Lucent ADR * | 4,288,200 | |
| 369,250 | Teva Pharmaceutical Industries, | 449,250 | Apple Computer, Inc. # | 54,826,470 | ||
| Ltd. ADR * | 15,231,562 | 382,400 | Broadcom Corporation # | 11,185,200 | ||
| 382,808 | Thermo Electron | 2,611,950 | Cisco Systems, Inc. # | 72,742,810 | ||
| Corporation # | 19,798,830 | 175,250 | Citrix Systems, Inc. # | 5,900,668 | ||
| 504,900 | UnitedHealth Group, Inc. | 25,820,586 | 233,650 | Cognizant Technology | ||
| 227,400 | WellPoint, Inc. # | 18,153,342 | Solutions Corporation # | 17,544,778 | ||
| 181,600 | Wyeth | 10,412,944 | 607,750 | Corning, Inc. # | 15,528,012 | |
| 123,700 | Zimmer Holdings, Inc. # | 10,500,893 | 543,850 | eBay, Inc. # | 17,501,093 | |
| Total Health Care | 399,016,480 | 281,070 | Electronic Arts, Inc. # | 13,300,232 | ||
| 628,950 | EMC Corporation # | 11,383,995 | ||||
| Industrials (11.3%) | 357,100 | Emulex Corporation # | 7,799,064 | |||
| 304,850 | Boeing Company | 29,314,376 | 88,300 | F5 Networks, Inc. # | 7,116,980 | |
| 74,900 | C.H. Robinson | 126,300 | FormFactor, Inc. # | 4,837,290 | ||
| Worldwide, Inc. * | 3,933,748 | 280,300 | Foundry Networks, Inc. # | 4,669,798 | ||
| 73,400 | Caterpillar, Inc. | 5,747,220 | 137,102 | Google, Inc. # | 71,756,445 | |
| 99,900 | Chicago Bridge and | 545,800 | Hewlett-Packard Company | 24,353,596 | ||
| Iron Company | 3,770,226 | 207,500 | Informatica Corporation # | 3,064,775 | ||
| The accompanying Notes to Financial Statements are an integral part of this schedule. |
| 123 |
Large Cap Growth Portfolio
Schedule of Investments as of June 29, 2007 (unaudited)
| Shares | Common Stock (98.0%) | Value | Shares | Common Stock (98.0%) | Value | |
| Information Technology — continued | Materials (2.9%) | |||||
| 621,550 | Intel Corporation | $14,768,028 | 182,300 | Air Products and | ||
| 158,500 | International Rectifier | Chemicals, Inc. | $14,651,451 | |||
| Corporation # | 5,905,710 | 57,700 | Allegheny Technologies, Inc. | 6,051,576 | ||
| 604,800 | Marvell Technology | 170,600 | Ecolab, Inc. | 7,284,620 | ||
| Group, Ltd. # | 11,013,408 | 174,600 | Freeport-McMoRan Copper & | |||
| 285,300 | Maxim Integrated | Gold, Inc. | 14,460,372 | |||
| Products, Inc. | 9,531,873 | 447,900 | Monsanto Company | 30,251,166 | ||
| 1,856,950 | Microsoft Corporation | 54,724,316 | Total Materials | 72,699,185 | ||
| 302,800 | Motorola, Inc. | 5,359,560 | ||||
| 434,050 | Network Appliance, Inc. # | 12,674,260 | Telecommunications Services (3.8%) | |||
| 245,800 | NVIDIA Corporation # | 10,153,998 | 445,850 | America Movil SA de CV ADR | 27,611,490 | |
| 675,900 | ON Semiconductor | 306,100 | American Tower Corporation # | 12,856,200 | ||
| Corporation # | 7,245,648 | 293,100 | AT&T, Inc. | 12,163,650 | ||
| 938,400 | Oracle Corporation # | 18,495,864 | 574,400 | Level 3 Communications, | ||
| 394,900 | Qimonda AG ADR #* | 6,101,205 | Inc. #* | 3,360,240 | ||
| 849,100 | QUALCOMM, Inc. | 36,842,449 | 293,650 | NII Holdings, Inc. #* | 23,709,301 | |
| 58,500 | Research in Motion, Ltd. #* | 11,699,415 | 174,650 | Tim Participacoes SA ADR * | 6,020,186 | |
| 108,900 | SanDisk Corporation #* | 5,329,566 | 440,300 | Time Warner Telecom, Inc. #* | 8,850,030 | |
| 1,682,000 | Sun Microsystems, Inc. # | 8,847,320 | Total Telecommunications | |||
| 537,200 | Texas Instruments, Inc. * | 20,214,836 | Services | 94,571,097 | ||
| 242,500 | ValueClick, Inc. #* | 7,144,050 | ||||
| 333,700 | Western Union Company | 6,950,971 | Total Common Stock | |||
| 433,850 | Yahoo!, Inc. # | 11,770,350 | (cost $2,095,617,505) | 2,415,780,374 | ||
| Total Information | ||||||
| Technology | 657,868,546 | |||||
| The accompanying Notes to Financial Statements are an integral part of this schedule. |
| 124 |
Large Cap Growth Portfolio
Schedule of Investments as of June 29, 2007 (unaudited)
| Interest | Maturity | |||
| Shares | Collateral Held for Securities Loaned (11.2%) | Rate (+) | Date | Value |
| 275,420,330 | Thrivent Financial Securities Lending Trust | 5.360% | N/A | $275,420,330 |
| Total Collateral Held for Securities Loaned | ||||
| (cost $275,420,330) | 275,420,330 | |||
| Shares or | ||||
| Principal | Interest | Maturity | ||
| Amount | Short-Term Investments (2.9%) | Rate (+) | Date | Value |
| $2,000,000 | Barclays US Funding Corporation | 5.235% | 7/27/2007 | $1,992,147 |
| 13,025,000 | Galaxy Funding, Inc. | 5.360 | 7/2/2007 | 13,021,121 |
| 1,320,000 | Greyhawk Funding, LLC | 5.320 | 7/2/2007 | 1,319,610 |
| 6,000,000 | Old Line Funding Corporation | 5.350 | 7/12/2007 | 5,989,300 |
| 7,000,000 | Regency Markets No.1, LLC | 5.380 | 7/6/2007 | 6,993,723 |
| 5,000,000 | Sheffield Receivables Corporation | 5.330 | 7/5/2007 | 4,996,299 |
| 22,000,000 | Tempo Finance Corporation | 5.370 | 7/2/2007 | 21,993,437 |
| 8,126,554 | Thrivent Money Market Portfolio | 5.050 | N/A | 8,126,554 |
| 6,000,000 | Victory Receivables Corporation | 5.410 | 7/5/2007 | 5,995,492 |
| Total Short-Term Investments (at amortized cost) | 70,427,683 | |||
| Total Investments (cost $2,441,465,518) 112.1% | $2,761,628,387 | |||
| Other Assets and Liabilities, Net (12.1%) | (298,524,228) | |||
| Total Net Assets 100.0% | $2,463,104,159 | |||
# Non-income producing security.
* All or a portion of the security is on loan as discussed in item 2(M) of the Notes to Financial Statements.
+ The interest rate shown reflects the yield, coupon rate or, for securities purchased at a discount, the discount rate at the date of purchase.
Definitions:
ADR — American Depository Receipts, which are certificates for shares of an underlying foreign security’s shares held by an issuing U.S. depository bank.
Gross unrealized appreciation and depreciation of investments were as follows:
| Gross unrealized appreciation | $392,951,115 |
| Gross unrealized depreciation | (72,788,246) |
| Net unrealized appreciation (depreciation) | $320,162,869 |
| Cost for federal income tax purposes | $2,441,465,518 |
| The accompanying Notes to Financial Statements are an integral part of this schedule. |
| 125 |
Large Cap Growth Portfolio II | ||||||
| Shares | Common Stock (99.4%) | Value | Shares | Common Stock (99.4%) | Value | |
| Consumer Discretionary (11.3%) | Energy (6.0%) | |||||
| 1,400 | Abercrombie & Fitch Company | $102,172 | 1,200 | Cameron International | ||
| 2,000 | Brunswick Corporation | 65,260 | Corporation # | $85,764 | ||
| 3,200 | Cheesecake Factory, Inc. # | 78,464 | 2,350 | Devon Energy Corporation | 183,982 | |
| 3,650 | Coach, Inc. # | 172,974 | 2,000 | Diamond Offshore Drilling, Inc. | 203,120 | |
| 13,600 | Comcast Corporation # | 380,256 | 2,400 | Exxon Mobil Corporation | 201,312 | |
| 2,200 | DreamWorks Animation | 1,000 | FMC Technologies, Inc. # | 79,220 | ||
| SKG, Inc. # | 63,448 | 2,200 | GlobalSantaFe Corporation | 158,950 | ||
| 5,000 | Gap, Inc. | 95,500 | 3,200 | Halliburton Company | 110,400 | |
| 8,100 | Home Depot, Inc. | 318,735 | 1,100 | Marathon Oil Corporation | 65,956 | |
| 4,700 | International Game Technology | 186,590 | 600 | National Oilwell Varco, Inc. # | 62,544 | |
| 2,700 | J.C. Penney Company, Inc. | 1,400 | Oceaneering International, Inc. # | 73,696 | ||
| (Holding Company) | 195,426 | 5,300 | Schlumberger, Ltd. | 450,182 | ||
| 5,605 | Kohl’s Corporation # | 398,123 | 1,100 | Suncor Energy, Inc. | 98,912 | |
| 900 | Las Vegas Sands Corporation # | 68,751 | 1,900 | Ultra Petroleum Corporation # | 104,956 | |
| 4,700 | Marriott International, Inc. | 203,228 | 2,566 | XTO Energy, Inc. | 154,217 | |
| 2,700 | McDonald’s Corporation | 137,052 | Total Energy | 2,033,211 | ||
| 3,600 | McGraw-Hill Companies, Inc. | 245,088 | ||||
| 10,100 | News Corporation | 231,694 | Financials (12.2%) | |||
| 3,100 | OfficeMax, Inc. | 121,830 | 1,400 | AFLAC, Inc. | 71,960 | |
| 2,100 | Royal Caribbean Cruises, Ltd. * | 90,258 | 900 | AllianceBernstein Holding, LP | 78,381 | |
| 3,300 | Starbucks Corporation # | 86,592 | 3,700 | American Express Company | 226,366 | |
| 1,410 | Starwood Hotels & Resorts | 3,500 | American International | |||
| Worldwide, Inc. | 94,569 | Group, Inc. | 245,105 | |||
| 4,700 | Toll Brothers, Inc. # | 117,406 | 5,400 | CB Richard Ellis Group, Inc. # | 197,100 | |
| 3,300 | Viacom, Inc. # | 137,379 | 10,150 | Charles Schwab Corporation | 208,278 | |
| 4,200 | Walt Disney Company | 143,388 | 600 | Chicago Mercantile Exchange | ||
| 1,300 | Wynn Resorts, Ltd. * | 116,597 | Holdings, Inc. | 320,616 | ||
| Total Consumer | 6,100 | Citigroup, Inc. | 312,869 | |||
| Discretionary | 3,850,780 | 1,300 | Franklin Resources, Inc. | 172,211 | ||
| 2,000 | Goldman Sachs Group, Inc. | 433,500 | ||||
| Consumer Staples (8.0%) | 1,300 | IntercontinentalExchange, Inc. # | 192,205 | |||
| 2,500 | Altria Group, Inc. | 175,350 | 2,800 | Jefferies Group, Inc. | 75,544 | |
| 5,000 | Avon Products, Inc. | 183,750 | 1,350 | Legg Mason, Inc. | 132,813 | |
| 3,200 | Campbell Soup Company | 124,192 | 4,200 | Lehman Brothers Holdings, Inc. | 312,984 | |
| 3,900 | Costco Wholesale Corporation | 228,228 | 4,100 | Morgan Stanley | 343,908 | |
| 12,400 | CVS/Caremark Corporation | 451,980 | 800 | Nymex Holdings, Inc. | 100,504 | |
| 7,820 | PepsiCo, Inc. | 507,127 | 1,200 | NYSE Euronext | 88,344 | |
| 9,600 | Procter & Gamble Company | 587,424 | 3,300 | optionsXpress Holdings, Inc. | 84,678 | |
| 5,300 | Safeway, Inc. | 180,359 | 1,700 | Prudential Financial, Inc. | 165,291 | |
| 5,800 | Wal-Mart Stores, Inc. | 279,038 | 3,650 | State Street Corporation | 249,660 | |
| Total Consumer Staples | 2,717,448 | 3,200 | T. Rowe Price Group, Inc. | 166,048 | ||
| Total Financials | 4,178,365 | |||||
| The accompanying Notes to Financial Statements are an integral part of this schedule. |
| 126 |
Large Cap Growth Portfolio II
Schedule of Investments as of June 29, 2007 (unaudited)
| Shares | Common Stock (99.4%) | Value | Shares | Common Stock (99.4%) | Value | |
| Health Care (16.5%) | 2,200 | Illinois Tool Works, Inc. | $119,218 | |||
| 5,500 | Abbott Laboratories | $294,525 | 3,100 | Monster Worldwide, Inc. # | 127,410 | |
| 3,600 | Allergan, Inc. | 207,504 | 1,200 | Norfolk Southern Corporation | 63,084 | |
| 4,110 | Amgen, Inc. # | 227,242 | 2,300 | Precision Castparts Corporation | 279,128 | |
| 1,800 | Amylin Pharmaceuticals, Inc. #* | 74,088 | 1,600 | Rockwell Collins, Inc. | 113,024 | |
| 5,000 | Baxter International, Inc. | 281,700 | 1,700 | Thomas & Betts Corporation # | 98,600 | |
| 3,700 | Bristol-Myers Squibb Company | 116,772 | 3,400 | UAL Corporation #* | 138,006 | |
| 4,900 | Celgene Corporation # | 280,917 | 900 | Union Pacific Corporation | 103,635 | |
| 4,400 | Express Scripts, Inc. # | 220,044 | 4,450 | United Technologies Corporation | 315,638 | |
| 4,450 | Genentech, Inc. # | 336,687 | Total Industrials | 3,907,301 | ||
| 3,969 | Genzyme Corporation # | 255,604 | ||||
| 12,400 | Gilead Sciences, Inc. # | 480,748 | Information Technology (27.2%) | |||
| 1,800 | Hologic, Inc. #* | 99,558 | 5,072 | Accenture, Ltd. | 217,538 | |
| 2,630 | Johnson & Johnson | 162,061 | 9,000 | Adobe Systems, Inc. # | 361,350 | |
| 3,000 | McKesson Corporation | 178,920 | 1,500 | Akamai Technologies, Inc. # | 72,960 | |
| 5,470 | Medtronic, Inc. | 283,674 | 4,350 | Alcatel-Lucent ADR | 60,900 | |
| 4,400 | Merck & Company, Inc. | 219,120 | 6,300 | Apple Computer, Inc. # | 768,852 | |
| 6,200 | Schering-Plough Corporation | 188,728 | 5,350 | Broadcom Corporation # | 156,488 | |
| 2,200 | Shire Pharmaceuticals Group | 37,170 | Cisco Systems, Inc. # | 1,035,181 | ||
| plc ADR | 163,086 | 2,450 | Citrix Systems, Inc. # | 82,492 | ||
| 3,600 | St. Jude Medical, Inc. # | 149,364 | 3,250 | Cognizant Technology Solutions | ||
| 5,200 | Teva Pharmaceutical Industries, | Corporation # | 244,042 | |||
| Ltd. ADR | 214,500 | 8,580 | Corning, Inc. # | 219,219 | ||
| 5,448 | Thermo Electron Corporation # | 281,771 | 7,660 | eBay, Inc. # | 246,499 | |
| 7,100 | UnitedHealth Group, Inc. | 363,094 | 3,900 | Electronic Arts, Inc. # | 184,548 | |
| 3,200 | WellPoint, Inc. # | 255,456 | 9,300 | EMC Corporation # | 168,330 | |
| 2,580 | Wyeth | 147,937 | 5,000 | Emulex Corporation # | 109,200 | |
| 1,700 | Zimmer Holdings, Inc. # | 144,313 | 1,200 | F5 Networks, Inc. # | 96,720 | |
| Total Health Care | 5,627,413 | 1,800 | FormFactor, Inc. # | 68,940 | ||
| 3,950 | Foundry Networks, Inc. # | 65,807 | ||||
| Industrials (11.4%) | 1,900 | Google, Inc. # | 994,422 | |||
| 4,200 | Boeing Company | 403,872 | 7,600 | Hewlett-Packard Company | 339,112 | |
| 1,000 | C.H. Robinson Worldwide, Inc. | 52,520 | 3,100 | Informatica Corporation # | 45,787 | |
| 1,000 | Caterpillar, Inc. | 78,300 | 8,800 | Intel Corporation | 209,088 | |
| 1,400 | Chicago Bridge and Iron Company | 52,836 | 2,200 | International Rectifier | ||
| 3,300 | Danaher Corporation | 249,150 | Corporation # | 81,972 | ||
| 1,650 | Deere & Company | 199,221 | 8,800 | Marvell Technology Group, Ltd. # | 160,248 | |
| 5,700 | Emerson Electric Company | 266,760 | 4,000 | Maxim Integrated Products, Inc. | 133,640 | |
| 3,700 | Expeditors International of | 26,270 | Microsoft Corporation | 774,177 | ||
| Washington, Inc. | 152,810 | 4,300 | Motorola, Inc. | 76,110 | ||
| 1,170 | FedEx Corporation | 129,835 | 6,000 | Network Appliance, Inc. # | 175,200 | |
| 1,300 | Fluor Corporation | 144,781 | 3,600 | NVIDIA Corporation # | 148,716 | |
| 1,400 | Foster Wheeler, Ltd. # | 149,786 | 9,600 | ON Semiconductor Corporation # | 102,912 | |
| 3,100 | General Dynamics Corporation | 242,482 | 13,200 | Oracle Corporation # | 260,172 | |
| 11,160 | General Electric Company | 427,205 | 5,600 | Qimonda AG ADR # | 86,520 | |
| The accompanying Notes to Financial Statements are an integral part of this schedule. |
| 127 |
Large Cap Growth Portfolio II
Schedule of Investments as of June 29, 2007 (unaudited)
| Shares | Common Stock (99.4%) | Value | Shares | Common Stock (99.4%) | Value | |
| Information Technology — continued | Telecommunications Services (3.8%) | |||||
| 12,050 | QUALCOMM, Inc. | $522,850 | 6,200 | America Movil SA de CV ADR | $383,966 | |
| 800 | Research in Motion, Ltd. # | 159,992 | 4,200 | American Tower Corporation # | 176,400 | |
| 1,500 | SanDisk Corporation # | 73,410 | 3,900 | AT&T, Inc. | 161,850 | |
| 23,300 | Sun Microsystems, Inc. # | 122,558 | 8,100 | Level 3 Communications, Inc. # | 47,385 | |
| 7,600 | Texas Instruments, Inc. | 285,988 | 4,100 | NII Holdings, Inc. # | 331,034 | |
| 3,400 | ValueClick, Inc. # | 100,164 | 2,300 | Tim Participacoes SA ADR * | 79,281 | |
| 4,600 | Western Union Company | 95,818 | 6,200 | Time Warner Telecom, Inc. # | 124,620 | |
| 6,200 | Yahoo!, Inc. # | 168,206 | Total Telecommunications | |||
| Total Information | Services | 1,304,536 | ||||
| Technology | 9,276,128 | |||||
| Total Common Stock | ||||||
| Materials (3.0%) | (cost $28,823,803) | 33,910,902 | ||||
| 2,500 | Air Products and Chemicals, Inc. | 200,925 | ||||
| 800 | Allegheny Technologies, Inc. | 83,904 | ||||
| 2,400 | Ecolab, Inc. | 102,480 | ||||
| 2,450 | Freeport-McMoRan Copper & | |||||
| Gold, Inc. | 202,909 | |||||
| 6,300 | Monsanto Company | 425,502 | ||||
| Total Materials | 1,015,720 | |||||
| The accompanying Notes to Financial Statements are an integral part of this schedule. |
| 128 |
Large Cap Growth Portfolio II
Schedule of Investments as of June 29, 2007 (unaudited)
| Interest | Maturity | |||
| Shares | Collateral Held for Securities Loaned (1.6%) | Rate (+) | Date | Value |
| 560,250 | Thrivent Financial Securities Lending Trust | 5.360% | N/A | $560,250 |
| Total Collateral Held for Securities Loaned | ||||
| (cost $560,250) | 560,250 | |||
| Interest | Maturity | |||
| Shares | Short-Term Investments (1.1%) | Rate (+) | Date | Value |
| 358,208 | Thrivent Money Market Portfolio | 5.050% | N/A | $358,208 |
| Total Short-Term Investments (at amortized cost) | 358,208 | |||
| Total Investments (cost $29,742,261) 102.1% | $34,829,360 | |||
| Other Assets and Liabilities, Net (2.1%) | (716,858) | |||
| Total Net Assets 100.0% | $34,112,502 | |||
# Non-income producing security.
* All or a portion of the security is on loan as discussed in item 2(M) of the Notes to Financial Statements.
+ The interest rate shown reflects the yield, coupon rate or, for securities purchased at a discount, the discount rate at the date of purchase.
Definitions:
ADR — American Depository Receipts, which are certificates for shares of an underlying foreign security’s shares held by an issuing U.S. depository bank.
Gross unrealized appreciation and depreciation of investments were as follows:
| Gross unrealized appreciation | $5,772,114 |
| Gross unrealized depreciation | (685,015) |
| Net unrealized appreciation (depreciation) | $5,087,099 |
| Cost for federal income tax purposes | $29,742,261 |
| The accompanying Notes to Financial Statements are an integral part of this schedule. |
| 129 |
| Partner Growth Stock Portfolio Schedule of Investments as of June 29, 2007 (unaudited) | ||||||
| Shares | Common Stock (97.8%) | Value | Shares | Common Stock (97.8%) | Value | |
| Consumer Discretionary (11.4%) | Financials (17.4%) | |||||
| 17,500 | Amazon.com, Inc. # | $1,197,175 | 27,300 | American Express Company | $1,670,214 | |
| 15,000 | Bed Bath & Beyond, Inc. #* | 539,850 | 30,100 | American International | ||
| 15,900 | Clear Channel | Group, Inc. | 2,107,903 | |||
| Communications, Inc. | 601,338 | 44,618 | Anglo Irish Bank Corporation plc | 915,650 | ||
| 19,100 | Coach, Inc. # | 905,149 | 45,400 | Charles Schwab Corporation | 931,608 | |
| 18,100 | Grupo Televisia SA ADR | 499,741 | 600 | Chicago Mercantile | ||
| 8,100 | Harman International | Exchange Holdings, Inc. | 320,616 | |||
| Industries, Inc. | 946,080 | 26,400 | Citigroup, Inc. | 1,354,056 | ||
| 16,700 | International Game Technology | 662,990 | 27,700 | Countrywide Financial | ||
| 20,800 | Kohl’s Corporation # | 1,477,424 | Corporation * | 1,006,895 | ||
| 17,500 | Lennar Corporation | 639,800 | 44,600 | E*TRADE Financial Corporation # | 985,214 | |
| 5,225 | Liberty Media Corporation — | 16,921 | Erste Bank der oesterreichischen | |||
| Capital # | 614,878 | Sparkassen AG | 1,318,748 | |||
| 21,833 | Liberty Media Corporation — | 10,200 | Franklin Resources, Inc. | 1,351,194 | ||
| Interactive # | 487,531 | 5,000 | Goldman Sachs Group, Inc. | 1,083,750 | ||
| 30,600 | Lowe’s Companies, Inc. | 939,114 | 5,200 | ICICI Bank, Ltd. ADR § | 255,580 | |
| 19,100 | Marriott International, Inc. | 825,884 | 7,700 | Legg Mason, Inc. | 757,526 | |
| 4,700 | MGM MIRAGE # | 387,656 | 12,300 | Morgan Stanley | 1,031,724 | |
| 22,300 | PETsMART, Inc. * | 723,635 | 12,100 | Northern Trust Corporation | 777,304 | |
| 26,400 | Target Corporation | 1,679,040 | 12,100 | Prudential Financial, Inc. | 1,176,483 | |
| 14,400 | Viacom, Inc. # | 599,472 | 26,400 | State Street Corporation | 1,805,760 | |
| 3,200 | Wynn Resorts, Ltd. * | 287,008 | 40,800 | UBS AG | 2,440,014 | |
| Total Consumer | Total Financials | 21,290,239 | ||||
| Discretionary | 14,013,765 | |||||
| Health Care (13.6%) | ||||||
| Consumer Staples (6.9%) | 22,600 | Aetna, Inc. | 1,116,440 | |||
| 64,537 | CVS/Caremark Corporation | 2,352,374 | 2,000 | Alcon, Inc. | 269,820 | |
| 8,097 | InBev NV | 641,285 | 6,500 | Allergan, Inc. | 374,660 | |
| 14,500 | PepsiCo, Inc. | 940,325 | 10,400 | Amgen, Inc. # | 575,016 | |
| 21,937 | Procter & Gamble Company | 1,342,325 | 9,300 | Celgene Corporation # | 533,169 | |
| 8,919 | Reckitt Benckiser plc | 488,254 | 9,300 | Eli Lilly and Company | 519,684 | |
| 12,000 | SYSCO Corporation | 395,880 | 19,200 | Genentech, Inc. # | 1,452,672 | |
| 12,100 | Walgreen Company * | 526,834 | 33,000 | Gilead Sciences, Inc. # | 1,279,410 | |
| 10,000 | Wal-Mart de Mexico ADR | 379,913 | 7,500 | Humana, Inc. # | 456,825 | |
| 17,100 | Wal-Mart Stores, Inc. | 822,681 | 10,200 | Medco Health Solutions, Inc. # | 795,498 | |
| 15,300 | Whole Foods Market, Inc. * | 585,990 | 30,400 | Medtronic, Inc. | 1,576,544 | |
| Total Consumer Staples | 8,475,861 | 598 | Nobel Biocare Holding AG | 195,206 | ||
| 12,330 | Novartis AG | 692,213 | ||||
| Energy (6.7%) | 6,468 | Roche Holding AG | 1,146,042 | |||
| 17,000 | Baker Hughes, Inc. | 1,430,210 | 5,300 | St. Jude Medical, Inc. # | 219,897 | |
| 9,900 | EOG Resources, Inc. | 723,294 | 11,300 | Stryker Corporation | 712,917 | |
| 13,200 | Exxon Mobil Corporation | 1,107,216 | 19,800 | UnitedHealth Group, Inc. | 1,012,572 | |
| 8,900 | Murphy Oil Corporation | 529,016 | 27,900 | WellPoint, Inc. # | 2,227,257 | |
| 31,700 | Schlumberger, Ltd. | 2,692,598 | 18,800 | Wyeth | 1,077,992 | |
| 21,626 | Total SA | 1,753,278 | 4,700 | Zimmer Holdings, Inc. # | 398,983 | |
| Total Energy | 8,235,612 | Total Health Care | 16,632,817 | |||
| The accompanying Notes to Financial Statements are an integral part of this schedule. |
| 130 |
Partner Growth Stock Portfolio
Schedule of Investments as of June 29, 2007 (unaudited)
| Shares | Common Stock (97.8%) | Value | Shares | Common Stock (97.8%) | Value | |
| Industrials (10.8%) | 22,500 | Intel Corporation | $534,600 | |||
| 27,700 | Danaher Corporation | $2,091,350 | 14,600 | Intuit, Inc. # | 439,168 | |
| 3,300 | Deere & Company | 398,442 | 34,000 | Juniper Networks, Inc. #* | 855,780 | |
| 16,300 | Expeditors International of | 65,400 | Marvell Technology Group, Ltd. # | 1,190,934 | ||
| Washington, Inc. | 673,190 | 26,700 | Maxim Integrated Products, Inc. | 892,047 | ||
| 9,000 | Fastenal Company * | 376,740 | 77,375 | Microsoft Corporation | 2,280,241 | |
| 3,300 | Foster Wheeler, Ltd. # | 353,067 | 23,400 | QUALCOMM, Inc. | 1,015,326 | |
| 11,400 | General Dynamics Corporation | 891,708 | 245,100 | Telefonaktiebolaget LM Ericsson | 977,676 | |
| 135,300 | General Electric Company | 5,179,284 | 29,900 | Xilinx, Inc. * | 800,423 | |
| 7,600 | Joy Global, Inc. * | 443,308 | 27,900 | Yahoo!, Inc. # | 756,927 | |
| 5,687 | Schneider Electric SA | 796,741 | Total Information | |||
| 80,000 | Southwest Airlines Company | 1,192,800 | Technology | 28,940,316 | ||
| 26,000 | Tyco International, Ltd. # | 878,540 | ||||
| Total Industrials | 13,275,170 | Materials (1.5%) | ||||
| 36,287 | BHP Billiton, Ltd. | 1,084,300 | ||||
| Information Technology (23.6%) | 11,200 | Monsanto Company | 756,448 | |||
| 46,500 | Accenture, Ltd. | 1,994,385 | Total Materials | 1,840,748 | ||
| 18,000 | Adobe Systems, Inc. # | 722,700 | ||||
| 29,100 | Amdocs, Ltd. # | 1,158,762 | Telecommunications Services (5.3%) | |||
| 21,800 | Analog Devices, Inc. | 820,552 | 30,600 | America Movil SA de CV ADR | 1,895,058 | |
| 7,000 | Apple Computer, Inc. # | 854,280 | 26,300 | American Tower Corporation # | 1,104,600 | |
| 19,800 | Applied Materials, Inc. | 393,426 | 36,600 | Crown Castle International | ||
| 29,800 | ASML Holding NV ADR # | 818,010 | Corporation #*§ | 1,327,482 | ||
| 20,500 | Autodesk, Inc. # | 965,140 | 3,400 | Leap Wireless International, Inc. # | 287,300 | |
| 31,300 | Automatic Data Processing, Inc. | 1,517,111 | 11,400 | Metropcs Communications, Inc. # | 376,656 | |
| 65,400 | Cisco Systems, Inc. # | 1,821,390 | 35,000 | Rogers Communications, Inc. | 1,487,150 | |
| 42,000 | Corning, Inc. # | 1,073,100 | Total Telecommunications | |||
| 18,000 | Dell, Inc. # | 513,900 | Services | 6,478,246 | ||
| 33,700 | eBay, Inc. # | 1,084,466 | ||||
| 10,400 | Electronic Arts, Inc. # | 492,128 | Utilities (0.6%) | |||
| 40,600 | EMC Corporation #* | 734,860 | 31,300 | AES Corporation #± | 684,844 | |
| 5,000 | Google, Inc. # | 2,616,900 | Total Utilities | 684,844 | ||
| 43,000 | Hon Hai Precision Industry | |||||
| Company, Ltd. | 769,700 | Total Common Stock | ||||
| 16,800 | Infosys Technologies, Ltd. ADR | 846,384 | (cost $89,297,806) | 119,867,618 | ||
| The accompanying Notes to Financial Statements are an integral part of this schedule. |
| 131 |
Partner Growth Stock Portfolio
Schedule of Investments as of June 29, 2007 (unaudited)
| Interest | Maturity | |||
| Shares | Collateral Held for Securities Loaned (6.4%) | Rate (+) | Date | Value |
| 7,802,130 | Thrivent Financial Securities Lending Trust | 5.360% | N/A | $7,802,130 |
| Total Collateral Held for Securities Loaned | ||||
| (cost $7,802,130) | 7,802,130 | |||
| Interest | Maturity | |||
| Shares | Short-Term Investments (2.2%) | Rate(+) | Date | Value |
| 2,701,362 | Thrivent Money Market Portfolio | 5.050% | N/A | $2,701,362 |
| Total Short-Term Investments (at amortized cost) | 2,701,362 | |||
| Total Investments (cost $99,801,298) 106.4% | $130,371,110 | |||
| Other Assets and Liabilities, Net (6.4%) | (7,853,572) | |||
| Total Net Assets 100.0% | $122,517,538 | |||
# Non-income producing security.
* All or a portion of the security is on loan as discussed in item 2(M) of the Notes to Financial Statements.
+ The interest rate shown reflects the yield, coupon rate or, for securities purchased at a discount, the discount rate at the date of purchase.
§ Denotes investments purchased on a when-issued or delayed delivery basis.
± Designated as cover for long settling trades as discussed in the Notes to Financial Statements.
Definitions:
ADR — American Depository Receipts, which are certificates for shares of an underlying foreign security’s shares held by an issuing depository bank from more than one country.
Gross unrealized appreciation and depreciation of investments were as follows:
| Gross unrealized appreciation | $31,528,172 |
| Gross unrealized depreciation | (958,360) |
| Net unrealized appreciation (depreciation) | $30,569,812 |
| Cost for federal income tax purposes | $99,801,298 |
| The accompanying Notes to Financial Statements are an integral part of this schedule. |
| 132 |
| Large Cap Value Portfolio Schedule of Investments as of June 29, 2007 (unaudited) | ||||||
| Shares | Common Stock (97.8%) | Value | Shares | Common Stock (97.8%) | Value | |
| Consumer Discretionary (8.7%) | 99,400 | Schlumberger, Ltd. | $8,443,036 | |||
| 37,300 | BorgWarner, Inc. | $3,209,292 | 176,400 | Total SA ADR | 14,284,872 | |
| 70,850 | CBS Corporation * | 2,360,722 | Total Energy | 99,404,035 | ||
| 1 | Citadel Broadcasting Company | 2 | ||||
| 352,550 | Comcast Corporation #* | 9,913,706 | Financials (27.5%) | |||
| 56,800 | Darden Restaurants, Inc. | 2,498,632 | 48,800 | ACE, Ltd. | 3,050,976 | |
| 36,600 | Gannett Company, Inc. | 2,011,170 | 269,700 | American International | ||
| 67,900 | J.C. Penney Company, Inc. | Group, Inc. | 18,887,091 | |||
| (Holding Company) * | 4,914,602 | 385,950 | Bank of America Corporation | 18,869,096 | ||
| 102,760 | Liberty Media Corporation — | 201,700 | Bank of New York | |||
| Capital # | 12,092,797 | Company, Inc. # | 8,358,448 | |||
| 57,400 | Macy’s Group, Inc | 2,283,372 | 111,900 | Chubb Corporation | 6,058,266 | |
| 99,900 | McDonald’s Corporation | 5,070,924 | 450,545 | Citigroup, Inc. | 23,108,453 | |
| 384,000 | News Corporation | 8,144,640 | 61,100 | City National Corporation | 4,649,099 | |
| 44,600 | NIKE, Inc. | 2,599,734 | 82,200 | Countrywide Financial | ||
| 79,900 | Office Depot, Inc. # | 2,420,970 | Corporation * | 2,987,970 | ||
| 71,000 | Sherwin-Williams Company | 4,719,370 | 22,600 | Everest Re Group, Ltd. | 2,455,264 | |
| 37,800 | Target Corporation | 2,404,080 | 111,775 | Federal Home Loan Mortgage | ||
| 296,000 | Time Warner, Inc. | 6,227,840 | Corporation | 6,784,742 | ||
| 159,700 | TJX Companies, Inc. | 4,391,750 | 74,900 | Federal National Mortgage | ||
| 168,100 | Walt Disney Company * | 5,738,934 | Association | 4,893,217 | ||
| Total Consumer | 28,200 | Goldman Sachs Group, Inc. | 6,112,350 | |||
| Discretionary | 81,002,537 | 28,115 | Hartford Financial Services | |||
| Group, Inc. | 2,769,609 | |||||
| Consumer Staples (8.7%) | 384,100 | Hudson City Bancorp, Inc. | 4,693,702 | |||
| 233,200 | Altria Group, Inc. | 16,356,648 | 565,952 | J.P. Morgan Chase & Company | 27,420,374 | |
| 105,600 | Anheuser-Busch Companies, Inc. | 5,508,096 | 42,500 | Lehman Brothers Holdings, Inc. | 3,167,100 | |
| 271,600 | ConAgra Foods, Inc. | 7,295,176 | 149,600 | Mellon Financial Corporation | 6,582,400 | |
| 162,400 | Estee Lauder Companies, Inc. | 7,390,824 | 152,100 | Merrill Lynch & Company, Inc. | 12,712,518 | |
| 283,300 | General Mills, Inc. | 16,550,386 | 128,400 | Morgan Stanley | 10,770,192 | |
| 95,445 | Kimberly-Clark Corporation | 6,384,316 | 40,200 | PMI Group, Inc. | 1,795,734 | |
| 161,439 | Kraft Foods, Inc. | 5,690,725 | 94,400 | PNC Financial Services | ||
| 160,600 | Kroger Company | 4,517,678 | Group, Inc. | 6,757,152 | ||
| 65,400 | Safeway, Inc. | 2,225,562 | 171,400 | Principal Financial Group, Inc. | 9,990,906 | |
| 82,600 | Unilever NV ADR | 2,562,252 | 51,700 | Prudential Financial, Inc. | 5,026,791 | |
| 137,100 | Wal-Mart Stores, Inc. | 6,595,881 | 22,500 | Simon Property Group, Inc. | 2,093,400 | |
| Total Consumer Staples | 81,077,544 | 204,100 | State Street Corporation | 13,960,440 | ||
| 183,900 | Travelers Companies, Inc. | 9,838,650 | ||||
| Energy (10.6%) | 151,300 | U.S. Bancorp | 4,985,335 | |||
| 102,640 | Apache Corporation | 8,374,398 | 185,833 | Wachovia Corporation | 9,523,941 | |
| 155,866 | Chevron Corporation * | 13,130,152 | 163,300 | Washington Federal, Inc. | 3,969,823 | |
| 147,558 | ConocoPhillips | 11,583,303 | 116,713 | Washington Mutual, Inc. | 4,976,642 | |
| 408,900 | Exxon Mobil Corporation | 34,298,534 | 282,390 | Wells Fargo & Company | 9,931,656 | |
| 160,500 | Occidental Petroleum | Total Financials | 257,181,337 | |||
| Corporation | 9,289,740 | |||||
| The accompanying Notes to Financial Statements are an integral part of this schedule. |
| 133 |
Large Cap Value Portfolio
Schedule of Investments as of June 29, 2007 (unaudited)
| Shares | Common Stock (97.8%) | Value | Shares | Common Stock (97.8%) | Value | |
| Health Care (9.1%) | 225,500 | Hewlett-Packard Company | $10,061,810 | |||
| 216,400 | Abbott Laboratories | $11,588,220 | 607,700 | Intel Corporation | 14,438,952 | |
| 53,200 | Aetna, Inc. | 2,628,080 | 131,500 | International Business | ||
| 37,100 | Amgen, Inc. # | 2,051,259 | Machines Corporation | 13,840,375 | ||
| 113,200 | Baxter International, Inc. | 6,377,688 | 224,200 | Microsoft Corporation | 6,607,174 | |
| 90,525 | Johnson & Johnson | 5,578,150 | 113,900 | Motorola, Inc. | 2,016,030 | |
| 140,300 | McKesson Corporation | 8,367,492 | 113,190 | Nokia Oyj ADR | 3,181,771 | |
| 99,400 | Merck & Company, Inc. | 4,950,120 | 152,200 | Oracle Corporation # | 2,999,862 | |
| 53,300 | Novartis AG ADR | 2,988,531 | 198,500 | Sybase, Inc. # | 4,742,165 | |
| 802,400 | Pfizer, Inc. | 20,517,368 | 100,900 | Symantec Corporation # | 2,038,180 | |
| 255,600 | Sanofi-Aventis ADR | 10,293,012 | 209,900 | Tellabs, Inc. # | 2,258,524 | |
| 55,100 | WellPoint, Inc. # | 4,398,633 | Total Information | |||
| 100,900 | Wyeth | 5,785,606 | Technology | 81,744,010 | ||
| Total Health Care | 85,524,159 | |||||
| Materials (4.4%) | ||||||
| Industrials (11.6%) | 148,495 | Alcoa, Inc. | 6,018,502 | |||
| 266,600 | AMR Corporation # | 7,024,910 | 82,600 | Dow Chemical Company * | 3,652,572 | |
| 47,800 | Armstrong World Industries, Inc. # | 2,397,170 | 187,000 | E.I. du Pont de Nemours | ||
| 65,600 | Avery Dennison Corporation | 4,361,088 | and Company | 9,507,080 | ||
| 118,200 | CSX Corporation | 5,328,456 | 94,040 | International Paper Company * | 3,672,262 | |
| 47,700 | Deere & Company | 5,759,298 | 303,200 | MeadWestvaco Corporation | 10,709,024 | |
| 132,200 | Emerson Electric Company | 6,186,960 | 73,400 | Praxair, Inc. | 5,284,066 | |
| 178,800 | Flowserve Corporation | 12,802,080 | 42,900 | Rohm and Haas Company | 2,345,772 | |
| 27,800 | General Dynamics Corporation | 2,174,516 | Total Materials | 41,189,278 | ||
| 408,500 | General Electric Company | 15,637,380 | ||||
| 150,800 | Honeywell International, Inc. | 8,487,024 | Telecommunications Services (5.8%) | |||
| 116,800 | Lockheed Martin Corporation | 10,994,384 | 600,623 | AT&T, Inc. | 24,925,854 | |
| 32,300 | Northrop Grumman | 295,002 | Sprint Nextel Corporation | 6,109,491 | ||
| Corporation | 2,515,201 | 235,700 | Time Warner Telecom, Inc. #* | 4,737,570 | ||
| 179,700 | Republic Services, Inc. | 5,506,008 | 440,555 | Verizon Communications, Inc. | 18,137,649 | |
| 141,200 | Tyco International, Ltd. # | 4,771,148 | Total Telecommunications | |||
| 104,600 | United Technologies | Services | 53,910,564 | |||
| Corporation | 7,419,278 | |||||
| 193,000 | Waste Management, Inc. | 7,536,650 | Utilities (2.7%) | |||
| Total Industrials | 108,901,551 | 63,000 | Entergy Corporation | 6,763,050 | ||
| 149,200 | Exelon Corporation * | 10,831,920 | ||||
| Information Technology (8.7%) | 111,200 | FirstEnergy Corporation | 7,197,976 | |||
| 170,900 | Accenture, Ltd. | 7,329,901 | Total Utilities | 24,792,946 | ||
| 393,000 | AMIS Holdings, Inc. # | 4,920,360 | ||||
| 98,340 | Applied Materials, Inc. | 1,954,016 | Total Common Stock | |||
| 107,600 | Cisco Systems, Inc. # | 2,996,660 | (cost $761,911,391) | 914,727,961 | ||
| 82,600 | Dell, Inc. # | 2,358,230 | ||||
| The accompanying Notes to Financial Statements are an integral part of this schedule. |
| 134 |
Large Cap Value Portfolio
Schedule of Investments as of June 29, 2007 (unaudited)
| Interest | Maturity | |||
| Shares | Collateral Held for Securities Loaned (4.7%) | Rate (+) | Date | Value |
| 44,034,950 | Thrivent Financial Securities Lending Trust | 5.360% | N/A | $44,034,950 |
| Total Collateral Held for Securities Loaned | ||||
| (cost $44,034,950) | 44,034,950 | |||
| Shares or | ||||
| Principal | Interest | Maturity | ||
| Amount | Short-Term Investments (5.3%) | Rate (+) | Date | Value |
| $4,000,000 | DNB NOR ASA | 5.360% | 7/2/2007 | $3,998,809 |
| 15,000,000 | Solitaire Funding, LLC | 5.360 | 7/2/2007 | 14,995,533 |
| 13,955,358 | Thrivent Money Market Portfolio | 5.050 | N/A | 13,955,358 |
| 13,465,000 | UBS Americas, Inc. | 5.350 | 7/2/2007 | 13,460,998 |
| 3,000,000 | Victory Receivables Corporation | 5.410 | 7/5/2007 | 2,997,746 |
| Total Short-Term Investments (at amortized cost) | 49,408,444 | |||
| Total Investments (cost $855,354,785) 107.8% | $1,008,171,355 | |||
| Other Assets and Liabilities, Net (7.8%) | (72,664,439) | |||
| Total Net Assets 100.0% | $935,506,916 | |||
# Non-income producing security.
* All or a portion of the security is on loan as discussed in item 2(M) of the Notes to Financial Statements.
+ The interest rate shown reflects the yield, coupon rate or, for securities purchased at a discount, the discount rate at the date of purchase.
Definitions:
ADR — American Depository Receipts, which are certificates for shares of an underlying foreign security’s shares held by an issuing U.S. depository bank.
Gross unrealized appreciation and depreciation of investments were as follows:
| Gross unrealized appreciation | $158,091,575 |
| Gross unrealized depreciation | (5,275,005) |
| Net unrealized appreciation (depreciation) | $152,816,570 |
| Cost for federal income tax purposes | $855,354,785 |
| The accompanying Notes to Financial Statements are an integral part of this schedule. |
| 135 |
| Large Cap Stock Portfolio Schedule of Investments as of June 29, 2007 (unaudited) | ||||||
| Shares | Common Stock (95.9%) | Value | Shares | Common Stock (95.9%) | Value | |
| Consumer Discretionary (7.1%) | 18,200 | National Oilwell Varco, Inc. # | $1,897,168 | |||
| 409,985 | Comcast Corporation # | $11,496,410 | 74,289 | Occidental Petroleum | ||
| 54,590 | Darden Restaurants, Inc. | 2,401,414 | Corporation | 4,299,847 | ||
| 119,000 | Home Depot, Inc. | 4,682,650 | 126,383 | Schlumberger, Ltd. * | 10,734,972 | |
| 92,869 | International Game Technology | 3,686,899 | 25,016 | Suncor Energy, Inc. | 2,249,439 | |
| 31,069 | J.C. Penney Company, Inc. | 161,029 | Total SA ADR | 13,040,128 | ||
| (Holding Company) * | 2,248,774 | 73,312 | XTO Energy, Inc. | 4,406,051 | ||
| 146,677 | Kohl’s Corporation # | 10,418,467 | Total Energy | 100,855,214 | ||
| 39,200 | Liberty Media Corporation — | |||||
| Capital # | 4,613,056 | Financials (20.2%) | ||||
| 149,935 | Marriott International, Inc. | 6,483,189 | 78,500 | American Express Company | 4,802,630 | |
| 213,326 | News Corporation * | 4,893,698 | 207,587 | American International | ||
| 264,624 | News Corporation | 5,612,675 | Group, Inc. | 14,537,318 | ||
| 36,800 | Nordstrom, Inc. | 1,881,216 | 40,020 | Ameriprise Financial, Inc. | 2,544,071 | |
| 76,250 | Office Depot, Inc. # | 2,310,375 | 321,100 | Bank of America Corporation | 15,698,579 | |
| 32,050 | Sherwin-Williams Company | 2,130,364 | 92,800 | Bank of New York | ||
| 94,287 | Time Warner, Inc. | 1,983,798 | Company, Inc. # | 3,845,632 | ||
| 145,935 | TJX Companies, Inc. | 4,013,212 | 12,032 | Chicago Mercantile Exchange | ||
| 81,550 | Toll Brothers, Inc. # | 2,037,119 | Holdings, Inc. | 6,429,420 | ||
| Total Consumer | 80,074 | Chubb Corporation | 4,335,206 | |||
| Discretionary | 70,893,316 | 350,799 | Citigroup, Inc. | 17,992,481 | ||
| 74,289 | City National Corporation | 5,652,650 | ||||
| Consumer Staples (8.0%) | 38,716 | Countrywide Financial | ||||
| 152,996 | Altria Group, Inc. | 10,731,139 | Corporation * | 1,407,327 | ||
| 99,872 | Anheuser-Busch Companies, Inc. | 5,209,324 | 66,842 | Federal National Mortgage | ||
| 101,100 | Avon Products, Inc. | 3,715,425 | Association | 4,366,788 | ||
| 256,197 | ConAgra Foods, Inc. | 6,881,451 | 145,612 | Fifth Third Bancorp | 5,790,989 | |
| 91,300 | Costco Wholesale Corporation | 5,342,876 | 22,700 | Franklin Resources, Inc. | 3,007,069 | |
| 173,496 | CVS/Caremark Corporation | 6,323,929 | 42,565 | Goldman Sachs Group, Inc. | 9,225,964 | |
| 133,784 | Estee Lauder Companies, Inc. | 6,088,510 | 175,000 | Hudson City Bancorp, Inc. | 2,138,500 | |
| 180,827 | General Mills, Inc. | 10,563,913 | 19,150 | IntercontinentalExchange, | ||
| 99,826 | Kraft Foods, Inc. | 3,518,866 | Inc. #* | 2,831,328 | ||
| 157,750 | Procter & Gamble Company | 9,652,722 | 223,508 | J.P. Morgan Chase & Company | 10,828,963 | |
| 73,500 | Safeway, Inc. | 2,501,205 | 25,989 | Legg Mason, Inc. * | 2,556,798 | |
| 194,181 | Wal-Mart Stores, Inc. | 9,342,048 | 114,048 | Lehman Brothers Holdings, Inc. * | 8,498,857 | |
| Total Consumer Staples | 79,871,408 | |||||
| 41,400 | Loews Corporation | 2,110,572 | ||||
| Energy (10.1%) | 130,941 | Mellon Financial Corporation * | 5,761,404 | |||
| 63,218 | Apache Corporation | 5,157,957 | 133,784 | Merrill Lynch & Company, Inc. | 11,181,667 | |
| 30,315 | Chevron Corporation | 2,553,736 | 79,400 | MetLife, Inc. | 5,119,712 | |
| 138,730 | ConocoPhillips | 10,890,305 | 88,973 | Morgan Stanley * | 7,463,055 | |
| 45,100 | Devon Energy Corporation | 3,530,879 | 27,600 | NYSE Euronext * | 2,031,912 | |
| 33,500 | Diamond Offshore Drilling, Inc. | 3,402,260 | 91,344 | Principal Financial Group, Inc. | 5,324,442 | |
| 405,165 | Exxon Mobil Corporation ‡ | 33,985,240 | 57,580 | Prudential Financial, Inc. | 5,598,503 | |
| 65,152 | GlobalSantaFe Corporation | 4,707,232 | 120,551 | State Street Corporation | 8,245,688 | |
| The accompanying Notes to Financial Statements are an integral part of this schedule. |
| 136 |
Large Cap Stock Portfolio
Schedule of Investments as of June 29, 2007 (unaudited)
| Shares | Common Stock (95.9%) | Value | Shares | Common Stock (95.9%) | Value |
| Financials — continued | 59,195 | Lockheed Martin Corporation | $5,572,025 | ||
| 125,356 | Travelers Companies, Inc. | $6,706,546 | 59,850 | Monster Worldwide, Inc. # | 2,459,835 |
| 134,899 | Wachovia Corporation | 6,913,574 | 60,987 | Precision Castparts Corporation | 7,401,382 |
| 75,100 | Washington Federal, Inc. | 1,825,681 | 105,274 | UAL Corporation #* | 4,273,072 |
| 172,399 | Wells Fargo & Company | 6,063,273 | 32,796 | Union Pacific Corporation | 3,776,459 |
| Total Financials | 200,836,599 | 104,648 | United Technologies | ||
| Corporation | 7,422,683 | ||||
| Health Care (12.3%) | 188,374 | Waste Management, Inc. | 7,356,005 | ||
| 296,859 | Abbott Laboratories | 15,896,799 | Total Industrials | 110,120,052 | |
| 72,160 | Allergan, Inc. * | 4,159,302 | |||
| 20,200 | Amgen, Inc. # | 1,116,858 | Information Technology (17.5%) | ||
| 85,183 | Baxter International, Inc. | 4,799,210 | 290,087 | Accenture, Ltd. | 12,441,831 |
| 123,226 | Express Scripts, Inc. # | 6,162,532 | 108,953 | Adobe Systems, Inc. # | 4,374,463 |
| 91,094 | Genzyme Corporation # | 5,866,454 | 95,350 | Alcatel-Lucent ADR * | 1,334,900 |
| 298,440 | Gilead Sciences, Inc. # | 11,570,519 | 133,004 | AMIS Holdings, Inc. # | 1,665,210 |
| 204,375 | Johnson & Johnson | 12,593,588 | 84,074 | Apple Computer, Inc. # | 10,260,391 |
| 199,244 | McKesson Corporation | 11,882,912 | 123,071 | Broadcom Corporation # | 3,599,827 |
| 68,824 | Medtronic, Inc. | 3,569,213 | 531,764 | Cisco Systems, Inc. # | 14,809,627 |
| 95,050 | Merck & Company, Inc. | 4,733,490 | 132,313 | Citrix Systems, Inc. # | 4,454,979 |
| 427,615 | Pfizer, Inc. | 10,934,116 | 56,857 | Cognizant Technology Solutions | |
| 138,388 | Sanofi-Aventis ADR | 5,572,885 | Corporation # | 4,269,392 | |
| 188,322 | Thermo Electron Corporation # | 9,740,014 | 134,045 | Corning, Inc. # | 3,424,850 |
| 86,777 | UnitedHealth Group, Inc. | 4,437,776 | 94,417 | eBay, Inc. # | 3,038,339 |
| 55,164 | WellPoint, Inc. # | 4,403,742 | 121,874 | Emulex Corporation # | 2,661,728 |
| 89,744 | Wyeth | 5,145,921 | 21,400 | F5 Networks, Inc. # | 1,724,840 |
| Total Health Care | 122,585,331 | 25,621 | Google, Inc. # | 13,409,519 | |
| 296,460 | Hewlett-Packard Company | 13,228,045 | |||
| Industrials (11.1%) | 473,126 | Intel Corporation | 11,241,474 | ||
| 163,300 | AMR Corporation #‡ | 4,302,955 | 149,758 | International Business Machines | |
| 45,282 | Armstrong World | Corporation | 15,762,030 | ||
| Industries, Inc. # | 2,270,892 | 86,000 | Maxim Integrated | ||
| 62,137 | Avery Dennison Corporation | 4,130,868 | Products, Inc. | 2,873,260 | |
| 72,222 | Boeing Company | 6,944,868 | 750,399 | Microsoft Corporation | 22,114,259 |
| 11,741 | Caterpillar, Inc. | 919,320 | 67,900 | Network Appliance, Inc. # | 1,982,680 |
| 106,338 | CSX Corporation | 4,793,717 | 163,138 | Oracle Corporation # | 3,215,450 |
| 59,182 | Danaher Corporation | 4,468,241 | 233,219 | QUALCOMM, Inc. | 10,119,372 |
| 32,119 | Deere & Company | 3,878,048 | 589,600 | Sun Microsystems, Inc. #* | 3,101,296 |
| 88,800 | Emerson Electric Company | 4,155,840 | 91,700 | Sybase, Inc. # | 2,190,713 |
| 124,375 | Flowserve Corporation | 8,905,250 | 202,173 | Tellabs, Inc. # | 2,175,381 |
| 28,400 | Fluor Corporation | 3,162,908 | 105,387 | Texas Instruments, Inc. | 3,965,713 |
| 39,550 | General Dynamics Corporation | 3,093,601 | Total Information | ||
| 372,440 | General Electric Company | 14,257,003 | Technology | 173,439,569 | |
| 116,828 | Honeywell International, Inc. | 6,575,080 | |||
| The accompanying Notes to Financial Statements are an integral part of this schedule. |
| 137 |
Large Cap Stock Portfolio
Schedule of Investments as of June 29, 2007 (unaudited)
| Shares | Common Stock (95.9%) | Value | Shares | Common Stock (95.9%) | Value | |
| Materials (5.1%) | 79,809 | NII Holdings, Inc. #* | $6,443,779 | |||
| 54,427 | Air Products and Chemicals, Inc. | $4,374,298 | 50,343 | Tim Participacoes SA ADR * | 1,735,323 | |
| 341,075 | Alcoa, Inc. | 13,823,770 | 212,876 | Time Warner Telecom, Inc. #* | 4,278,808 | |
| 23,078 | Allegheny Technologies, Inc. | 2,420,421 | Total Telecommunications | |||
| 105,557 | E.I. du Pont de Nemours | Services | 30,464,077 | |||
| and Company | 5,366,518 | |||||
| 50,714 | Freeport-McMoRan Copper & | Utilities (1.4%) | ||||
| Gold, Inc. | 4,200,133 | 279,682 | Southern Company | 9,590,296 | ||
| 211,896 | MeadWestvaco Corporation | 7,484,167 | 63,551 | TXU Corporation | 4,276,982 | |
| 107,113 | Monsanto Company | 7,234,412 | Total Utilities | 13,867,278 | ||
| 85,759 | Praxair, Inc. | 6,173,790 | ||||
| Total Materials | 51,077,509 | Total Common Stock | ||||
| (cost $843,982,846) | 954,010,353 | |||||
| Telecommunications Services (3.1%) | ||||||
| 147,061 | America Movil SA de CV ADR | 9,107,488 | ||||
| 214,426 | AT&T, Inc. ‡ | 8,898,679 | ||||
| Interest | Maturity | |||
| Shares | Collateral Held for Securities Loaned (6.3%) | Rate (+) | Date | Value |
| 62,311,825 | Thrivent Financial Securities Lending Trust | 5.360% | N/A | $62,311,825 |
| Total Collateral Held for Securities Loaned | ||||
| (cost $62,311,825) | 62,311,825 | |||
| The accompanying Notes to Financial Statements are an integral part of this schedule. |
| 138 |
Large Cap Stock Portfolio
Schedule of Investments as of June 29, 2007 (unaudited)
| Shares or | ||||
| Principal | Interest | Maturity | ||
| Amount | Short-Term Investments (9.4%) | Rate (+) | Date | Value |
| $15,645,000 | Charta, LLC | 5.360% | 7/2/2007 | $15,640,341 |
| 1,500,000 | Federal Home Loan Bank | 5.187 | 7/18/2007 | 1,496,160 |
| 2,180,000 | Federal National Mortgage Association ‡ | 5.080 | 7/16/2007 | 2,175,078 |
| 12,000,000 | Kitty Hawk Funding Corporation | 5.330 | 7/9/2007 | 11,984,010 |
| 20,000,000 | Tempo Finance Corporation | 5.390 | 7/2/2007 | 19,994,011 |
| 5,000,000 | Tempo Finance Corporation | 5.265 | 8/13/2007 | 4,967,825 |
| 16,756,868 | Thrivent Money Market Portfolio | 5.050 | N/A | 16,756,868 |
| 15,150,000 | UBS Finance Corporation | 5.350 | 7/2/2007 | 15,145,497 |
| 5,500,000 | Victory Receivables Corporation | 5.330 | 7/5/2007 | 5,495,928 |
| Total Short-Term Investments (at amortized cost) | 93,655,718 | |||
| Total Investments (cost $999,950,389) 111.6% | $1,109,977,896 | |||
| Other Assets and Liabilities, Net (11.6%) | (115,659,879) | |||
| Total Net Assets 100.0% | $994,318,017 | |||
| Number of | Notional | ||||
| Contracts | Expiration | Principal | Unrealized | ||
| Futures | Long/(Short) | Date | Amount | Value | Gain/(Loss) |
| S&P 500 Index Futures | 53 | September 2007 | $20,225,065 | $20,079,050 | ($146,015) |
# Non-income producing security.
* All or a portion of the security is on loan as discussed in item 2(M) of the Notes to Financial Statements.
+ The interest rate shown reflects the yield, coupon rate or, for securities purchased at a discount, the discount rate at the date of purchase.
‡ At June 29, 2007, $2,175,078 of investments were held on deposit with the counterparty and pledged as the initial margin deposit for open financial futures contracts. In addition, $26,744,013 of investments were earmarked as collateral to cover open financial futures contracts.
Definitions:
ADR — American Depository Receipts, which are certificates for shares of an underlying foreign security’s shares held by an issuing U.S. depository bank.
Gross unrealized appreciation and depreciation of investments were as follows:
| Gross unrealized appreciation | $118,904,347 |
| Gross unrealized depreciation | (8,876,840) |
| Net unrealized appreciation (depreciation) | $110,027,507 |
| Cost for federal income tax purposes | $999,950,389 |
| The accompanying Notes to Financial Statements are an integral part of this schedule. |
| 139 |
Large Cap Index Portfolio
Schedule of Investments as of June 29, 2007 (unaudited)
| Shares | Common Stock (99.7%) | Value | Shares | Common Stock (99.7%) | Value | |
| Consumer Discretionary (10.2%) | 11,500 | IAC InterActiveCorp # | $398,015 | |||
| 4,600 | Abercrombie & Fitch Company | $335,708 | 17,400 | International Game Technology | 690,780 | |
| 16,300 | Amazon.com, Inc. # | 1,115,083 | 24,667 | Interpublic Group of | ||
| 7,400 | Apollo Group, Inc. # | 432,382 | Companies, Inc. # | 281,204 | ||
| 8,000 | AutoNation, Inc. # | 179,520 | 11,800 | J.C. Penney Company, Inc. | ||
| 2,600 | AutoZone, Inc. # | 355,212 | (Holding Company) | 854,084 | ||
| 14,400 | Bed Bath & Beyond, Inc. # | 518,256 | 10,300 | Johnson Controls, Inc. | 1,192,431 | |
| 21,225 | Best Buy Company, Inc. * | 990,571 | 5,800 | Jones Apparel Group, Inc. | 163,850 | |
| 5,800 | Big Lots, Inc. #* | 170,636 | 4,200 | KB Home | 165,354 | |
| 3,600 | Black & Decker Corporation | 317,916 | 16,900 | Kohl’s Corporation # | 1,200,407 | |
| 4,900 | Brunswick Corporation | 159,887 | 9,400 | Leggett & Platt, Inc. | 207,270 | |
| 23,200 | Carnival Corporation | 1,131,464 | 7,300 | Lennar Corporation | 266,888 | |
| 38,472 | CBS Corporation * | 1,281,887 | 18,004 | Limited Brands, Inc. | 494,210 | |
| 6,200 | Centex Corporation * | 248,620 | 5,600 | Liz Claiborne, Inc. | 208,880 | |
| 7,200 | Circuit City Stores, Inc. * | 108,576 | 79,100 | Lowe’s Companies, Inc. | 2,427,579 | |
| 1 | Citadel Broadcasting Company | 3 | 24,168 | Macy’s Group, Inc | 961,403 | |
| 26,100 | Clear Channel | 17,200 | Marriott International, Inc. | 743,728 | ||
| Communications, Inc. | 987,102 | 20,650 | Mattel, Inc. | 522,238 | ||
| 19,500 | Coach, Inc. # | 924,105 | 62,800 | McDonald’s Corporation | 3,187,728 | |
| 163,716 | Comcast Corporation # | 4,603,681 | 18,000 | McGraw-Hill Companies, Inc. | 1,225,440 | |
| 14,300 | D.R. Horton, Inc. | 284,999 | 2,200 | Meredith Corporation | 135,520 | |
| 7,450 | Darden Restaurants, Inc. | 327,726 | 7,700 | New York Times Company * | 195,580 | |
| 3,300 | Dillard’s, Inc. | 118,569 | 14,673 | Newell Rubbermaid, Inc. | 431,826 | |
| 40,500 | DIRECTV Group, Inc. # | 935,955 | 122,500 | News Corporation | 2,598,225 | |
| 16,515 | Dollar General Corporation | 362,009 | 19,900 | NIKE, Inc. | 1,159,971 | |
| 3,500 | Dow Jones & Company, Inc. | 201,075 | 11,900 | Nordstrom, Inc. | 608,328 | |
| 4,500 | E.W. Scripps Company | 205,605 | 14,500 | Office Depot, Inc. # | 439,350 | |
| 15,100 | Eastman Kodak Company * | 420,233 | 4,000 | OfficeMax, Inc. | 157,200 | |
| 8,000 | Family Dollar Stores, Inc. | 274,560 | 17,600 | Omnicom Group, Inc. | 931,392 | |
| 99,000 | Ford Motor Company * | 932,580 | 3,400 | Polo Ralph Lauren Corporation | 333,574 | |
| 8,000 | Fortune Brands, Inc. | 658,960 | 11,200 | Pulte Homes, Inc. * | 251,440 | |
| 12,400 | Gannett Company, Inc. | 681,380 | 7,100 | RadioShack Corporation * | 235,294 | |
| 27,862 | Gap, Inc. | 532,164 | 4,332 | Sears Holdings Corporation # | 734,274 | |
| 29,700 | General Motors Corporation * | 1,122,660 | 5,800 | Sherwin-Williams Company | 385,526 | |
| 9,100 | Genuine Parts Company | 451,360 | 3,200 | Snap-On, Inc. | 161,632 | |
| 10,800 | Goodyear Tire & | 4,500 | Stanley Works | 273,150 | ||
| Rubber Company #* | 375,408 | 37,575 | Staples, Inc. | 891,655 | ||
| 16,900 | H&R Block, Inc. | 394,953 | 38,900 | Starbucks Corporation # | 1,020,736 | |
| 13,500 | Harley-Davidson, Inc. * | 804,735 | 11,300 | Starwood Hotels & Resorts | ||
| 3,500 | Harman International | Worldwide, Inc. | 757,891 | |||
| Industries, Inc. | 408,800 | 44,900 | Target Corporation | 2,855,640 | ||
| 9,800 | Harrah’s Entertainment, Inc. | 835,548 | 7,100 | Tiffany & Company | 376,726 | |
| 8,550 | Hasbro, Inc. | 268,556 | 199,150 | Time Warner, Inc. | 4,190,116 | |
| 20,500 | Hilton Hotels Corporation | 686,135 | 23,900 | TJX Companies, Inc. | 657,250 | |
| 103,800 | Home Depot, Inc. | 4,084,530 | 6,538 | Tribune Company | 192,217 | |
| The accompanying Notes to Financial Statements are an integral part of this schedule. |
| 140 |
Large Cap Index Portfolio
Schedule of Investments as of June 29, 2007 (unaudited)
| Shares | Common Stock (99.7%) | Value | Shares | Common Stock (99.7%) | Value | |
| Consumer Discretionary — continued | 10,881 | SUPERVALU, Inc. | $504,008 | |||
| 4,700 | VF Corporation | $430,426 | 32,500 | SYSCO Corporation | 1,072,175 | |
| 36,172 | Viacom, Inc. # | 1,505,840 | 13,300 | Tyson Foods, Inc. | 306,432 | |
| 104,247 | Walt Disney Company * | 3,558,993 | 8,600 | UST, Inc. | 461,906 | |
| 4,700 | Wendy’s International, Inc. | 172,725 | 52,600 | Walgreen Company | 2,290,204 | |
| 4,058 | Whirlpool Corporation | 451,227 | 127,500 | Wal-Mart Stores, Inc. | 6,134,025 | |
| 9,572 | Wyndham Worldwide | 7,400 | Whole Foods Market, Inc. * | 283,420 | ||
| Corporation # | 347,081 | 11,275 | William Wrigley Jr. Company | 623,620 | ||
| 27,680 | Yum! Brands, Inc. | 905,690 | Total Consumer Staples | 65,317,087 | ||
| Total Consumer | ||||||
| Discretionary | 71,767,093 | Energy (10.7%) | ||||
| 24,372 | Anadarko Petroleum | |||||
| Consumer Staples (9.3%) | Corporation | 1,267,100 | ||||
| 110,600 | Altria Group, Inc. | 7,757,484 | 17,420 | Apache Corporation | 1,421,298 | |
| 39,900 | Anheuser-Busch | 16,800 | Baker Hughes, Inc. | 1,413,384 | ||
| Companies, Inc. | 2,081,184 | 15,400 | BJ Services Company | 437,976 | ||
| 34,268 | Archer-Daniels-Midland | 21,500 | Chesapeake Energy Corporation | 743,900 | ||
| Company | 1,133,928 | 113,096 | Chevron Corporation | 9,527,207 | ||
| 23,000 | Avon Products, Inc. | 845,250 | 86,049 | ConocoPhillips | 6,754,846 | |
| 4,300 | Brown-Forman Corporation | 314,244 | 9,500 | CONSOL Energy, Inc. | 438,045 | |
| 11,600 | Campbell Soup Company | 450,196 | 23,400 | Devon Energy Corporation | 1,831,986 | |
| 8,100 | Clorox Company | 503,010 | 36,818 | El Paso Corporation | 634,374 | |
| 105,700 | Coca-Cola Company | 5,529,167 | 8,000 | ENSCO International, Inc. | 488,080 | |
| 14,700 | Coca-Cola Enterprises, Inc. | 352,800 | 12,800 | EOG Resources, Inc. | 935,168 | |
| 26,900 | Colgate-Palmolive Company | 1,744,465 | 296,408 | Exxon Mobil Corporation | 24,862,704 | |
| 26,200 | ConAgra Foods, Inc. | 703,732 | 48,000 | Halliburton Company | 1,656,000 | |
| 10,100 | Constellation Brands, Inc. # | 245,228 | 14,300 | Hess Corporation | 843,128 | |
| 23,600 | Costco Wholesale Corporation | 1,381,072 | 36,068 | Marathon Oil Corporation * | 2,162,637 | |
| 81,144 | CVS/Caremark Corporation | 2,957,699 | 9,900 | Murphy Oil Corporation | 588,456 | |
| 6,900 | Dean Foods Company | 219,903 | 14,800 | Nabors Industries, Ltd. # | 494,024 | |
| 6,300 | Estee Lauder Companies, Inc. | 286,713 | 9,300 | National Oilwell Varco, Inc. # | 969,432 | |
| 18,200 | General Mills, Inc. | 1,063,244 | 7,100 | Noble Corporation | 692,392 | |
| 17,100 | H.J. Heinz Company | 811,737 | 43,800 | Occidental Petroleum | ||
| 9,200 | Hershey Company | 465,704 | Corporation | 2,535,144 | ||
| 13,300 | Kellogg Company | 688,807 | 13,900 | Peabody Energy Corporation | 672,482 | |
| 23,992 | Kimberly-Clark Corporation | 1,604,825 | 5,900 | Rowan Companies, Inc. | 241,782 | |
| 84,352 | Kraft Foods, Inc. | 2,973,408 | 62,000 | Schlumberger, Ltd. | 5,266,280 | |
| 37,200 | Kroger Company | 1,046,436 | 10,500 | Smith International, Inc. | 615,720 | |
| 7,000 | McCormick & Company, Inc. | 267,260 | 33,204 | Spectra Energy Corporation | 861,976 | |
| 2,500 | Molson Coors Brewing Company | 231,150 | 6,300 | Sunoco, Inc. | 501,984 | |
| 7,000 | Pepsi Bottling Group, Inc. | 235,760 | 15,111 | Transocean, Inc. # | 1,601,464 | |
| 85,670 | PepsiCo, Inc. | 5,555,700 | 28,800 | Valero Energy Corporation | 2,127,168 | |
| 165,660 | Procter & Gamble Company | 10,136,735 | 17,700 | Weatherford International, Ltd. # | 977,748 | |
| 9,100 | Reynolds American, Inc. * | 593,320 | 31,500 | Williams Companies, Inc. | 996,030 | |
| 23,200 | Safeway, Inc. | 789,496 | 20,100 | XTO Energy, Inc. | 1,208,010 | |
| 38,600 | Sara Lee Corporation | 671,640 | Total Energy | 75,767,925 | ||
| The accompanying Notes to Financial Statements are an integral part of this schedule. |
| 141 |
Large Cap Index Portfolio
Schedule of Investments as of June 29, 2007 (unaudited)
| Shares | Common Stock (99.7%) | Value | Shares | Common Stock (99.7%) | Value | |
| Financials (20.9%) | 51,200 | Federal National Mortgage | ||||
| 17,200 | ACE, Ltd. | $1,075,344 | Association | $3,344,896 | ||
| 25,800 | AFLAC, Inc. | 1,326,120 | 4,800 | Federated Investors, Inc. | 183,984 | |
| 31,882 | Allstate Corporation | 1,961,062 | 28,894 | Fifth Third Bancorp | 1,149,114 | |
| 5,500 | Ambac Financial Group, Inc. | 479,545 | 6,700 | First Horizon National | ||
| 62,500 | American Express Company ‡ | 3,823,750 | Corporation | 261,300 | ||
| 136,440 | American International | 8,700 | Franklin Resources, Inc. | 1,152,489 | ||
| Group, Inc. | 9,554,893 | 12,300 | General Growth Properties, Inc. | 651,285 | ||
| 12,300 | Ameriprise Financial, Inc. | 781,911 | 22,100 | Genworth Financial, Inc. | 760,240 | |
| 15,425 | Aon Corporation | 657,259 | 21,500 | Goldman Sachs Group, Inc. | 4,660,125 | |
| 5,300 | Apartment Investment & | 16,700 | Hartford Financial Services | |||
| Management Company * | 267,226 | Group, Inc. | 1,645,117 | |||
| 11,700 | Archstone-Smith Trust | 691,587 | 27,400 | Host Marriott Corporation | 633,488 | |
| 5,400 | Assurant, Inc. | 318,168 | 25,500 | Hudson City Bancorp, Inc. | 311,610 | |
| 4,300 | Avalonbay Communities, Inc. | 511,184 | 18,871 | Huntington Bancshares, Inc. * | 429,127 | |
| 233,518 | Bank of America Corporation | 11,416,695 | 179,693 | J.P. Morgan Chase & Company | 8,706,126 | |
| 39,700 | Bank of New York | 9,700 | Janus Capital Group, Inc. | 270,048 | ||
| Company, Inc. # | 1,645,168 | 20,700 | KeyCorp | 710,631 | ||
| 28,500 | BB&T Corporation | 1,159,380 | 12,000 | Kimco Realty Corporation | 456,840 | |
| 6,331 | Bear Stearns Companies, Inc. | 886,340 | 6,900 | Legg Mason, Inc. | 678,822 | |
| 6,400 | Boston Properties, Inc. * | 653,632 | 28,000 | Lehman Brothers Holdings, Inc. | 2,086,560 | |
| 21,673 | Capital One Financial | 14,294 | Lincoln National Corporation | 1,014,166 | ||
| Corporation | 1,700,030 | 23,400 | Loews Corporation | 1,192,932 | ||
| 9,800 | CB Richard Ellis Group, Inc. # | 357,700 | 4,000 | M&T Bank Corporation | 427,600 | |
| 53,225 | Charles Schwab Corporation | 1,092,177 | 29,200 | Marsh & McLennan | ||
| 1,900 | Chicago Mercantile Exchange | Companies, Inc. | 901,696 | |||
| Holdings, Inc. | 1,015,284 | 13,700 | Marshall & Ilsley Corporation | 652,531 | ||
| 21,100 | Chubb Corporation | 1,142,354 | 6,950 | MBIA, Inc. | 432,429 | |
| 9,038 | Cincinnati Financial | 22,000 | Mellon Financial Corporation | 968,000 | ||
| Corporation | 392,249 | 45,800 | Merrill Lynch & Company, Inc. | 3,827,964 | ||
| 10,100 | CIT Group, Inc. | 553,783 | 39,000 | MetLife, Inc. | 2,514,720 | |
| 260,239 | Citigroup, Inc. | 13,347,658 | 4,500 | MGIC Investment Corporation | 255,870 | |
| 8,250 | Comerica, Inc. | 490,628 | 12,200 | Moody’s Corporation | 758,840 | |
| 10,100 | Commerce Bancorp, Inc. | 373,599 | 55,450 | Morgan Stanley | 4,651,146 | |
| 7,000 | Compass Bancshares, Inc. | 482,860 | 30,300 | National City Corporation * | 1,009,596 | |
| 31,200 | Countrywide Financial | 10,000 | Northern Trust Corporation | 642,400 | ||
| Corporation * | 1,134,120 | 9,400 | Plum Creek Timber | |||
| 6,600 | Developers Diversified Realty | Company, Inc. * | 391,604 | |||
| Corporation | 347,886 | 18,200 | PNC Financial Services | |||
| 22,400 | E*TRADE Financial Corporation # | 494,816 | Group, Inc. | 1,302,756 | ||
| 15,400 | Equity Residential REIT | 702,702 | 14,100 | Principal Financial Group, Inc. | 821,889 | |
| 34,800 | Federal Home Loan Mortgage | 38,700 | Progressive Corporation | 926,091 | ||
| Corporation | 2,112,360 | 13,500 | ProLogis Trust * | 768,150 | ||
| The accompanying Notes to Financial Statements are an integral part of this schedule. |
| 142 |
Large Cap Index Portfolio
Schedule of Investments as of June 29, 2007 (unaudited)
| Shares | Common Stock (99.7%) | Value | Shares | Common Stock (99.7%) | Value | |
| Financials — continued | 51,900 | Eli Lilly and Company * | $2,900,172 | |||
| 24,600 | Prudential Financial, Inc. | $2,391,858 | 14,400 | Express Scripts, Inc. # | 720,144 | |
| 6,600 | Public Storage, Inc. | 507,012 | 16,700 | Forest Laboratories, Inc. # | 762,355 | |
| 37,077 | Regions Financial Corporation | 1,227,249 | 13,800 | Genzyme Corporation # | 888,720 | |
| 5,700 | SAFECO Corporation | 354,882 | 49,000 | Gilead Sciences, Inc. # | 1,899,730 | |
| 11,700 | Simon Property Group, Inc. | 1,088,568 | 8,180 | Hospira, Inc. # | 319,347 | |
| 21,600 | SLM Corporation | 1,243,728 | 8,800 | Humana, Inc. # | 536,008 | |
| 19,010 | Sovereign Bancorp, Inc. | 401,871 | 10,400 | IMS Health, Inc. | 334,152 | |
| 20,800 | State Street Corporation | 1,422,720 | 152,340 | Johnson & Johnson | 9,387,191 | |
| 18,700 | SunTrust Banks, Inc. | 1,603,338 | 12,800 | King Pharmaceuticals, Inc. # | 261,888 | |
| 17,300 | Synovus Financial Corporation | 531,110 | 6,100 | Laboratory Corporation of | ||
| 13,968 | T. Rowe Price Group, Inc. | 724,800 | America Holdings # | 477,386 | ||
| 5,100 | Torchmark Corporation | 341,700 | 4,000 | Manor Care, Inc. | 261,160 | |
| 34,881 | Travelers Companies, Inc. | 1,866,134 | 15,542 | McKesson Corporation | 926,925 | |
| 91,485 | U.S. Bancorp | 3,014,431 | 14,743 | Medco Health Solutions, Inc. # | 1,149,807 | |
| 18,024 | UnumProvident Corporation | 470,607 | 60,500 | Medtronic, Inc. | 3,137,530 | |
| 6,900 | Vornado Realty Trust * | 757,896 | 114,000 | Merck & Company, Inc. | 5,677,200 | |
| 100,593 | Wachovia Corporation | 5,155,391 | 3,000 | Millipore Corporation # | 225,270 | |
| 46,753 | Washington Mutual, Inc. | 1,993,548 | 13,000 | Mylan Laboratories, Inc. | 236,470 | |
| 175,700 | Wells Fargo & Company | 6,179,369 | 7,400 | Patterson Companies, Inc. # | 275,798 | |
| 9,700 | XL Capital, Ltd. | 817,613 | 6,500 | PerkinElmer, Inc. | 169,390 | |
| 5,900 | Zions Bancorporation | 453,769 | 369,253 | Pfizer, Inc. | 9,441,799 | |
| Total Financials | 147,049,246 | 8,400 | Quest Diagnostics, Inc. | 433,860 | ||
| 78,300 | Schering-Plough Corporation | 2,383,452 | ||||
| Health Care (11.6%) | 17,784 | St. Jude Medical, Inc. # | 737,858 | |||
| 81,000 | Abbott Laboratories | 4,337,550 | 15,700 | Stryker Corporation | 990,513 | |
| 27,096 | Aetna, Inc. | 1,338,542 | 24,800 | Tenet Healthcare Corporation # | 161,448 | |
| 16,000 | Allergan, Inc. | 922,240 | 22,200 | Thermo Electron Corporation # | 1,148,184 | |
| 10,000 | AmerisourceBergen Corporation | 494,700 | 70,500 | UnitedHealth Group, Inc. | 3,605,370 | |
| 61,040 | Amgen, Inc. #‡ | 3,374,902 | 6,800 | Varian Medical Systems, Inc. # | 289,068 | |
| 9,700 | Applera Corporation (Applied | 5,400 | Waters Corporation # | 320,544 | ||
| Biosystems Group) | 296,238 | 5,500 | Watson Pharmaceuticals, Inc. # | 178,915 | ||
| 5,700 | Barr Pharmaceuticals, Inc. # | 286,311 | 32,200 | WellPoint, Inc. # | 2,570,526 | |
| 3,000 | Bausch & Lomb, Inc. | 208,320 | 70,700 | Wyeth | 4,053,938 | |
| 34,200 | Baxter International, Inc. | 1,926,828 | 12,450 | Zimmer Holdings, Inc. # | 1,056,880 | |
| 12,800 | Becton, Dickinson and Company 953,600 | Total Health Care | 81,962,683 | |||
| 15,000 | Biogen Idec, Inc. # | 802,500 | ||||
| 12,850 | Biomet, Inc. | 587,502 | Industrials (11.4%) | |||
| 62,450 | Boston Scientific Corporation # | 957,983 | 37,900 | 3M Company | 3,289,341 | |
| 103,500 | Bristol-Myers Squibb Company | 3,266,460 | 13,500 | Allied Waste Industries, Inc. #* | 181,710 | |
| 5,600 | C.R. Bard, Inc. | 462,728 | 9,200 | American Standard | ||
| 20,175 | Cardinal Health, Inc. | 1,425,162 | Companies, Inc. | 542,616 | ||
| 19,900 | Celgene Corporation # | 1,140,867 | 4,900 | Avery Dennison Corporation | 325,752 | |
| 15,100 | CIGNA Corporation | 788,522 | 41,360 | Boeing Company | 3,977,178 | |
| 8,200 | Coventry Health Care, Inc. # | 472,730 | ||||
| The accompanying Notes to Financial Statements are an integral part of this schedule. |
| 143 |
Large Cap Index Portfolio
Schedule of Investments as of June 29, 2007 (unaudited)
| Shares | Common Stock (99.7%) | Value | Shares | Common Stock (99.7%) | Value | |
| Industrials — continued | 5,400 | Terex Corporation # | $439,020 | |||
| 18,692 | Burlington Northern Santa Fe | 6,600 | Textron, Inc. | 726,726 | ||
| Corporation | $1,591,437 | 104,307 | Tyco International, Ltd. # | 3,524,534 | ||
| 9,000 | C.H. Robinson Worldwide, Inc. | 472,680 | 14,200 | Union Pacific Corporation | 1,635,130 | |
| 33,600 | Caterpillar, Inc. | 2,630,880 | 55,800 | United Parcel Service, Inc. | 4,073,400 | |
| 7,100 | Cintas Corporation | 279,953 | 52,300 | United Technologies | ||
| 9,700 | Cooper Industries, Ltd. | 553,773 | Corporation | 3,709,639 | ||
| 23,000 | CSX Corporation | 1,036,840 | 3,900�� | W.W. Grainger, Inc. | 362,895 | |
| 5,400 | Cummins, Inc. | 546,534 | 27,199 | Waste Management, Inc. | 1,062,121 | |
| 12,500 | Danaher Corporation | 943,750 | Total Industrials | 80,283,830 | ||
| 11,800 | Deere & Company | 1,424,732 | ||||
| 10,900 | Dover Corporation | 557,535 | Information Technology (15.3%) | |||
| 7,700 | Eaton Corporation | 716,100 | 30,900 | Adobe Systems, Inc. # | 1,240,635 | |
| 41,800 | Emerson Electric Company | 1,956,240 | 29,000 | Advanced Micro Devices, Inc. #* | 414,700 | |
| 7,800 | Equifax, Inc. | 346,476 | 5,200 | Affiliated Computer | ||
| 16,160 | FedEx Corporation | 1,793,275 | Services, Inc. # | 294,944 | ||
| 4,700 | Fluor Corporation | 523,439 | 20,815 | Agilent Technologies, Inc. # | 800,129 | |
| 21,300 | General Dynamics Corporation | 1,666,086 | 18,700 | Altera Corporation | 413,831 | |
| 541,400 | General Electric Company | 20,724,792 | 17,200 | Analog Devices, Inc. | 647,408 | |
| 6,700 | Goodrich Corporation | 399,052 | 45,500 | Apple Computer, Inc. # | 5,552,820 | |
| 40,975 | Honeywell International, Inc. | 2,306,073 | 72,700 | Applied Materials, Inc. | 1,444,549 | |
| 21,600 | Illinois Tool Works, Inc. | 1,170,504 | 12,100 | Autodesk, Inc. # | 569,668 | |
| 15,800 | Ingersoll-Rand Company | 866,156 | 29,100 | Automatic Data Processing, Inc. | 1,410,477 | |
| 9,700 | ITT Corporation | 662,316 | 23,676 | Avaya, Inc. # | 398,704 | |
| 6,600 | L-3 Communications | 10,700 | BMC Software, Inc. # | 324,210 | ||
| Holdings, Inc. | 642,774 | 24,400 | Broadcom Corporation # | 713,700 | ||
| 18,600 | Lockheed Martin Corporation | 1,750,818 | 21,612 | CA, Inc. | 558,238 | |
| 19,800 | Masco Corporation | 563,706 | 4,457 | CIENA Corporation # | 161,031 | |
| 6,800 | Monster Worldwide, Inc. # | 279,480 | 319,500 | Cisco Systems, Inc. # | 8,898,075 | |
| 20,700 | Norfolk Southern Corporation | 1,088,199 | 9,500 | Citrix Systems, Inc. # | 319,865 | |
| 18,098 | Northrop Grumman | 7,500 | Cognizant Technology Solutions | |||
| Corporation | 1,409,291 | Corporation # | 563,175 | |||
| 13,025 | PACCAR, Inc. | 1,133,696 | 9,100 | Computer Sciences | ||
| 6,500 | Pall Corporation | 298,935 | Corporation # | 538,265 | ||
| 6,150 | Parker-Hannifin Corporation | 602,146 | 15,800 | Compuware Corporation # | 187,388 | |
| 11,700 | Pitney Bowes, Inc. | 547,794 | 7,300 | Convergys Corporation # | 176,952 | |
| 7,200 | Precision Castparts Corporation | 873,792 | 82,700 | Corning, Inc. # | 2,112,985 | |
| 11,500 | R.R. Donnelley & Sons Company | 500,365 | 119,500 | Dell, Inc. # | 3,411,725 | |
| 23,300 | Raytheon Company | 1,255,637 | 59,500 | eBay, Inc. # | 1,914,710 | |
| 8,700 | Robert Half International, Inc. | 317,550 | 16,300 | Electronic Arts, Inc. # | 771,316 | |
| 8,300 | Rockwell Automation, Inc. | 576,352 | 26,700 | Electronic Data Systems | ||
| 9,000 | Rockwell Collins, Inc. | 635,760 | Corporation | 740,391 | ||
| 3,300 | Ryder System, Inc. | 177,540 | 110,386 | EMC Corporation # | 1,997,987 | |
| 41,000 | Southwest Airlines Company | 611,310 | ||||
| The accompanying Notes to Financial Statements are an integral part of this schedule. |
| 144 |
Large Cap Index Portfolio
Schedule of Investments as of June 29, 2007 (unaudited)
| Shares | Common Stock (99.7%) | Value | Shares | Common Stock (99.7%) | Value | |
| Information Technology — continued | 4,400 | Tektronix, Inc. | $148,456 | |||
| 8,600 | Fidelity National Information | 23,000 | Tellabs, Inc. # | 247,480 | ||
| Services, Inc. | $466,808 | 10,100 | Teradyne, Inc. # | 177,558 | ||
| 39,680 | First Data Corporation | 1,296,346 | 75,500 | Texas Instruments, Inc. | 2,841,065 | |
| 8,800 | Fiserv, Inc. # | 499,840 | 18,300 | Unisys Corporation # | 167,262 | |
| 11,400 | Google, Inc. # | 5,966,532 | 12,900 | VeriSign, Inc. # | 409,317 | |
| 137,786 | Hewlett-Packard Company | 6,148,011 | 40,580 | Western Union Company | 845,281 | |
| 305,700 | Intel Corporation | 7,263,432 | 49,300 | Xerox Corporation # | 911,064 | |
| 71,800 | International Business Machines | 15,600 | Xilinx, Inc. * | 417,612 | ||
| Corporation | 7,556,950 | 63,600 | Yahoo!, Inc. # | 1,725,468 | ||
| 18,000 | Intuit, Inc. # | 541,440 | Total Information | |||
| 9,400 | Jabil Circuit, Inc. | 207,458 | Technology | 108,163,914 | ||
| 11,062 | JDS Uniphase Corporation #* | 148,563 | ||||
| 29,800 | Juniper Networks, Inc. #* | 750,066 | Materials (3.1%) | |||
| 10,000 | KLA-Tencor Corporation | 549,500 | 11,500 | Air Products and Chemicals, Inc. | 924,255 | |
| 4,900 | Lexmark International, Inc. # | 241,619 | 45,764 | Alcoa, Inc. | 1,854,815 | |
| 13,300 | Linear Technology Corporation * | 481,194 | 5,369 | Allegheny Technologies, Inc. | 563,101 | |
| 40,500 | LSI Corporation # | 304,155 | 3,100 | Ashland, Inc. | 198,245 | |
| 16,800 | Maxim Integrated Products, Inc. | 561,288 | 5,500 | Ball Corporation | 292,435 | |
| 11,900 | MEMC Electronic | 5,600 | Bemis Company, Inc. | 185,808 | ||
| Materials, Inc. # | 727,328 | 50,193 | Dow Chemical Company | 2,219,534 | ||
| 39,800 | Micron Technology, Inc. # | 498,694 | 48,611 | E.I. du Pont de Nemours | ||
| 443,000 | Microsoft Corporation | 13,055,210 | and Company | 2,471,383 | ||
| 7,600 | Molex, Inc. | 228,076 | 4,500 | Eastman Chemical Company | 289,485 | |
| 121,790 | Motorola, Inc. | 2,155,683 | 9,300 | Ecolab, Inc. | 397,110 | |
| 14,600 | National Semiconductor | 19,696 | Freeport-McMoRan Copper & | |||
| Corporation | 412,742 | Gold, Inc. | 1,631,223 | |||
| 9,400 | NCR Corporation # | 493,876 | 6,200 | Hercules, Inc. # | 121,830 | |
| 19,500 | Network Appliance, Inc. # | 569,400 | 4,200 | International Flavors & | ||
| 18,300 | Novell, Inc. # | 142,557 | Fragrances, Inc. | 218,988 | ||
| 6,700 | Novellus Systems, Inc. # | 190,079 | 22,871 | International Paper Company | 893,113 | |
| 19,000 | NVIDIA Corporation # | 784,890 | 9,781 | MeadWestvaco Corporation | 345,465 | |
| 208,237 | Oracle Corporation # | 4,104,351 | 28,578 | Monsanto Company | 1,930,158 | |
| 17,800 | Paychex, Inc. | 696,336 | 23,648 | Newmont Mining Corporation | 923,691 | |
| 8,500 | QLogic Corporation # | 141,525 | 15,800 | Nucor Corporation | 926,670 | |
| 87,700 | QUALCOMM, Inc. | 3,805,303 | 6,900 | Pactiv Corporation # | 220,041 | |
| 12,000 | SanDisk Corporation #* | 587,280 | 8,700 | PPG Industries, Inc. | 662,157 | |
| 47,600 | Solectron Corporation # | 175,168 | 16,800 | Praxair, Inc. | 1,209,432 | |
| 187,800 | Sun Microsystems, Inc. # | 987,828 | 7,613 | Rohm and Haas Company | 416,279 | |
| 47,324 | Symantec Corporation #* | 955,945 | 8,452 | Sealed Air Corporation | 262,181 | |
| The accompanying Notes to Financial Statements are an integral part of this schedule. |
| 145 |
Large Cap Index Portfolio
Schedule of Investments as of June 29, 2007 (unaudited)
| Shares | Common Stock (99.7%) | Value | Shares | Common Stock (99.7%) | Value | |
| Materials — continued | 14,300 | Consolidated Edison, Inc. | $645,216 | |||
| 7,100 | Sigma-Aldrich Corporation | $302,957 | 9,500 | Constellation Energy Group, Inc. | 828,115 | |
| 5,600 | Temple-Inland, Inc. | 344,568 | 18,347 | Dominion Resources, Inc. | 1,583,530 | |
| 6,200 | United States Steel Corporation | 674,250 | 9,400 | DTE Energy Company | 453,268 | |
| 5,000 | Vulcan Materials Company | 572,700 | 66,208 | Duke Energy Corporation | 1,211,606 | |
| 11,300 | Weyerhaeuser Company | 891,909 | 21,104 | Dynegy, Inc. # | 199,222 | |
| Total Materials | 21,943,783 | 17,100 | Edison International, Inc. | 959,652 | ||
| 10,400 | Entergy Corporation | 1,116,440 | ||||
| Telecommunications Services (3.7%) | 35,324 | Exelon Corporation | 2,564,522 | |||
| 18,100 | ALLTEL Corporation | 1,222,655 | 16,100 | FirstEnergy Corporation | 1,042,153 | |
| 324,439 | AT&T, Inc. | 13,464,218 | 21,300 | FPL Group, Inc. | 1,208,562 | |
| 5,800 | CenturyTel, Inc. | 284,490 | 4,115 | Integrys Energy Group, Inc. | 208,754 | |
| 18,100 | Citizens Communications | 9,300 | KeySpan Corporation | 390,414 | ||
| Company | 276,387 | 2,500 | Nicor, Inc. | 107,300 | ||
| 8,001 | Embarq Corporation | 507,023 | 14,509 | NiSource, Inc. | 300,481 | |
| 81,672 | Qwest Communications | 18,500 | PG&E Corporation * | 838,050 | ||
| International, Inc. #* | 792,218 | 5,400 | Pinnacle West Capital Corporation | 215,190 | ||
| 152,220 | Sprint Nextel Corporation | 3,152,476 | 20,200 | PPL Corporation | 945,158 | |
| 152,696 | Verizon Communications, Inc. | 6,286,494 | 13,420 | Progress Energy, Inc. | 611,818 | |
| 25,007 | Windstream Corporation | 369,103 | 13,200 | Public Service Enterprise | ||
| Total Telecommunications | Group, Inc. | 1,158,696 | ||||
| Services | 26,355,064 | 9,200 | Questar Corporation | 486,220 | ||
| 13,975 | Sempra Energy | 827,739 | ||||
| Utilities (3.5%) | 39,500 | Southern Company | 1,354,455 | |||
| 35,100 | AES Corporation #* | 767,988 | 11,100 | TECO Energy, Inc. | 190,698 | |
| 8,700 | Allegheny Energy, Inc. # | 450,138 | 24,134 | TXU Corporation | 1,624,218 | |
| 11,000 | Ameren Corporation | 539,110 | 21,505 | Xcel Energy, Inc. | 440,207 | |
| 20,960 | American Electric Power | Total Utilities | 24,711,228 | |||
| Company, Inc. | 944,038 | |||||
| 16,873 | CenterPoint Energy, Inc. | 293,590 | Total Common Stock | |||
| 11,900 | CMS Energy Corporation * | 204,680 | (cost $509,075,448) | 703,321,853 | ||
| Interest | Maturity | |||
| Shares | Collateral Held for Securities Loaned (4.0%) | Rate (+) | Date | Value |
| 27,998,850 | Thrivent Financial Securities Lending Trust | 5.360% | N/A | $27,998,850 |
| Total Collateral Held for Securities Loaned | ||||
| (cost $27,998,850) | 27,998,850 | |||
| The accompanying Notes to Financial Statements are an integral part of this schedule. |
| 146 |
Large Cap Index Portfolio
Schedule of Investments as of June 29, 2007 (unaudited)
| Shares or | ||||
| Principal | Interest | Maturity | ||
| Amount | Short-Term Investments (0.3%) | Rate (+) | Date | Value |
| $1,100,000 | Federal National Mortgage Association ‡ | 5.080% | 7/16/2007 | $1,097,516 |
| 1,338,557 | Thrivent Money Market Portfolio | 5.050 | N/A | 1,338,557 |
| Total Short-Term Investments (at amortized cost) | 2,436,073 | |||
| Total Investments (cost $539,510,371) 104.0% | $733,756,776 | |||
| Other Assets and Liabilities, Net (4.0%) | (28,329,900) | |||
| Total Net Assets 100.0% | $705,426,876 | |||
| Number of | Notional | ||||
| Contracts | Expiration | Principal | Unrealized | ||
| Futures | Long/(Short) | Date | Amount | Value | Gain/(Loss) |
| S&P 500 Index Futures | 6 | September 2007 | $2,316,630 | $2,273,100 | ($43,530) |
# Non-income producing security.
* All or a portion of the security is on loan as discussed in item 2(M) of the Notes to Financial Statements.
+ The interest rate shown reflects the yield, coupon rate or, for securities purchased at a discount, the discount rate at the date of purchase.
‡ At June 29, 2007, $1,097,516 of investments were held on deposit with the counterparty and pledged as the initial margin deposit for open financial futures contracts. In addition, $7,192,534 of investments were earmarked as collateral to cover open financial futures contracts.
Definitions:
REIT — Real Estate Investment Trust, is a company that buys, develops, manages and/or sells real estate assets.
Gross unrealized appreciation and depreciation of investments were as follows:
| Gross unrealized appreciation | $240,667,988 |
| Gross unrealized depreciation | (46,421,583) |
| Net unrealized appreciation (depreciation) | $194,246,405 |
| Cost for federal income tax purposes | $539,510,371 |
| The accompanying Notes to Financial Statements are an integral part of this schedule. |
| 147 |
Real Estate Securities Portfolio Schedule of Investments as of June 29, 2007 (unaudited) | ||||||
| Shares | Common Stock (95.4%) | Value | Shares | Common Stock (95.4%) | Value | |
| Diversified REITS (5.5%) | Mortgage REITS (0.4%) | |||||
| 24,900 | Colonial Properties Trust * | $907,605 | 24,900 | iStar Financial, Inc. | $1,103,817 | |
| 41,000 | Crescent Real Estate | 15,500 | RAIT Financial Trust | 403,310 | ||
| Equities Company | 920,040 | Total Mortgage REITS | 1,507,127 | |||
| 52,000 | Liberty Property Trust * | 2,284,360 | ||||
| 6,700 | PS Business Parks, Inc. | 424,579 | Office REITS (14.2%) | |||
| 123,500 | Vornado Realty Trust * | 13,565,240 | 43,000 | Alexandria Real Estate | ||
| 8,700 | Washington Real Estate | Equities, Inc. | 4,163,260 | |||
| Investment Trust | 295,800 | 61,500 | BioMed Realty Trust, Inc. * | 1,544,880 | ||
| Total Diversified REITS | 18,397,624 | 116,400 | Boston Properties, Inc. * | 11,887,932 | ||
| 104,300 | Brandywine Realty Trust | 2,980,894 | ||||
| Financials (6.1%) | 77,500 | Corporate Office Properties Trust * | 3,178,275 | |||
| 20,000 | S&P 500 Large Index | 52,500 | Digital Realty Trust, Inc. * | 1,978,200 | ||
| Depository Receipts | 3,006,000 | 82,500 | Douglas Emmett, Inc. * | 2,041,050 | ||
| 256,187 | SPDR DJ Wilshire International | 69,000 | Duke Realty Corporation | 2,461,230 | ||
| Real Estate ETF | 16,649,593 | 60,000 | Highwoods Properties, Inc. * | 2,250,000 | ||
| 12,000 | WisdomTree International | 28,000 | Kilroy Realty Corporation | 1,983,520 | ||
| Real Estate Fund # | 597,120 | 50,000 | Mack-Cali Realty Corporation | 2,174,500 | ||
| Total Financials | 20,252,713 | 47,200 | Maguire Properties, Inc. | 1,620,376 | ||
| 71,294 | SL Green Realty Corporation * | 8,832,552 | ||||
| Foreign (3.2%) | Total Office REITS | 47,096,669 | ||||
| 44,500 | British Land Company plc | 1,190,732 | ||||
| 178,000 | GPT Group | 701,632 | Real Estate Management & Development (2.4%) | |||
| 43,000 | Land Securities Group plc | 1,497,436 | 238,750 | Brookfield Properties | ||
| 67,000 | Mitsubishi Estate Company, Ltd. | 1,817,753 | Corporation * | 5,804,012 | ||
| 63,000 | Mitsui Fudosan Company, Ltd. | 1,765,784 | 35,000 | Forest City Enterprises * | 2,151,800 | |
| 7,100 | Rodamco Europe NV | 944,100 | Total Real Estate | |||
| 44,000 | Stockland | 303,124 | Management & | |||
| 54,000 | Sun Hung Kai Properties, Ltd. | 649,763 | Development | 7,955,812 | ||
| 108,695 | Westfield Group | 1,834,066 | ||||
| Total Foreign | 10,704,390 | Residential REITS (17.7%) | ||||
| 57,500 | Apartment Investment & | |||||
| Hotels, Resorts & Cruise Lines (2.9%) | Management Company * | 2,899,150 | ||||
| 79,100 | Hilton Hotels Corporation | 2,647,477 | 213,307 | Archstone-Smith Trust | 12,608,577 | |
| 4,300 | Orient Express Hotels, Ltd. | 229,620 | 82,000 | Avalonbay Communities, Inc. | 9,748,160 | |
| 100,800 | Starwood Hotels & Resorts | 52,300 | BRE Properties, Inc. | 3,100,867 | ||
| Worldwide, Inc. | 6,760,656 | 65,300 | Camden Property Trust | 4,373,141 | ||
| Total Hotels, Resorts & | 32,500 | Equity Lifestyle Properties, Inc. | 1,696,175 | |||
| Cruise Lines | 9,637,753 | 250,000 | Equity Residential REIT | 11,407,500 | ||
| 33,800 | Essex Property Trust, Inc. | 3,930,940 | ||||
| Industrial REITS (6.8%) | 38,000 | Home Properties, Inc. * | 1,973,340 | |||
| 90,000 | AMB Property Corporation * | 4,789,800 | 34,900 | Mid-America Apartment | ||
| 158,500 | DCT Industrial Trust, Inc. * | 1,705,460 | Communities, Inc. | 1,831,552 | ||
| 25,000 | EastGroup Properties, Inc. | 1,095,500 | 45,000 | Post Properties, Inc. * | 2,345,850 | |
| 262,400 | ProLogis Trust * | 14,930,560 | 109,500 | UDR, Inc. * | 2,879,850 | |
| Total Industrial REITS | 22,521,320 | Total Residential REITS | 58,795,102 | |||
| The accompanying Notes to Financial Statements are an integral part of this schedule. |
| 148 |
Real Estate Securities Portfolio
Schedule of Investments as of June 29, 2007 (unaudited)
| Shares | Common Stock (95.4%) | Value | Shares | Common Stock (95.4%) | Value | |
| Retail REITS (22.0%) | 12,300 | Entertainment Properties Trust * | $661,494 | |||
| 21,500 | Acadia Realty Trust | $557,925 | 45,000 | Equity Inns, Inc. | 1,008,000 | |
| 45,000 | CBL & Associates Properties, Inc. * | 1,622,250 | 70,000 | Extra Space Storage, Inc. * | 1,155,000 | |
| 800 | Cedar Shopping Centers, Inc. | 11,480 | 27,500 | FelCor Lodging Trust, Inc. | 715,825 | |
| 106,000 | Developers Diversified Realty | 87,300 | Health Care Property | |||
| Corporation | 5,587,260 | Investors, Inc. | 2,525,589 | |||
| 65,900 | Federal Realty Investment Trust | 5,091,434 | 38,600 | Health Care REIT, Inc. | 1,557,896 | |
| 197,500 | General Growth Properties, Inc. * | 10,457,625 | 28,875 | Healthcare Realty Trust, Inc. | 802,148 | |
| 26,000 | Glimcher Realty Trust * | 650,000 | 29,500 | Hersha Hospitality Trust | 348,690 | |
| 28,500 | Inland Real Estate Corporation * | 483,930 | 29,900 | Hospitality Properties Trust | 1,240,551 | |
| 205,328 | Kimco Realty Corporation | 7,816,837 | 461,656 | Host Marriott Corporation * | 10,673,487 | |
| 78,000 | Macerich Company * | 6,428,760 | 52,138 | LaSalle Hotel Properties * | 2,263,832 | |
| 18,500 | National Retail Properties, Inc. | 404,410 | 75,300 | Nationwide Health | ||
| 15,700 | Pennsylvania Real Estate | Properties, Inc. * | 2,048,160 | |||
| Investment Trust * | 695,981 | 20,400 | Plum Creek Timber | |||
| 13,300 | Ramco-Gershenson Properties Trust | 477,869 | Company, Inc. | 849,864 | ||
| 93,600 | Regency Centers Corporation | 6,598,800 | 127,360 | Public Storage, Inc. | 9,783,795 | |
| 221,500 | Simon Property Group, Inc. * | 20,608,361 | 9,000 | Rayonier, Inc. REIT | 406,260 | |
| 28,200 | Tanger Factory Outlet | 67,000 | Senior Housing Property Trust | 1,363,450 | ||
| Centers, Inc. | 1,056,090 | 77,500 | Strategic Hotel Capital, Inc. | 1,742,975 | ||
| 57,100 | Taubman Centers, Inc. | 2,832,731 | 57,800 | Sunstone Hotel Investors, Inc. * | 1,640,942 | |
| 45,000 | Weingarten Realty Investors | 1,849,500 | 41,200 | U-Store-It Trust | 675,268 | |
| Total Retail REITS | 73,231,243 | 106,500 | Ventas, Inc. | 3,860,625 | ||
| Total Specialized REITS | 47,396,251 | |||||
| Specialized REITS (14.2%) | ||||||
| 80,500 | Ashford Hospitality Trust | 946,680 | Total Common Stock | |||
| 59,000 | DiamondRock Hospitality | (cost $245,654,630) | 317,496,004 | |||
| Company * | 1,125,720 | |||||
| Interest | Maturity | |||
| Shares | Collateral Held for Securities Loaned (29.4%) | Rate (+) | Date | Value |
| 97,694,770 | Thrivent Financial Securities Lending Trust | 5.360% | N/A | $97,694,770 |
| Total Collateral Held for Securities Loaned | ||||
| (cost $97,694,770) | 97,694,770 | |||
| The accompanying Notes to Financial Statements are an integral part of this schedule. |
| 149 |
Real Estate Securities Portfolio
Schedule of Investments as of June 29, 2007 (unaudited)
| Shares or | ||||
| Principal | Interest | Maturity | ||
| Amount | Short-Term Investments (6.0%) | Rate (+) | Date | Value |
| $3,710,000 | Tempo Finance Corporation | 5.370% | 7/2/2007 | $3,708,893 |
| 16,318,150 | Thrivent Money Market Portfolio | 5.050 | N/A | 16,318,150 |
| Total Short-Term Investments (at amortized cost) | 20,027,043 | |||
| Total Investments (cost $363,376,443) 130.8% | $435,217,817 | |||
| Other Assets and Liabilities, Net (30.8%) | (102,597,911) | |||
| Total Net Assets 100.0% | $332,619,906 | |||
# Non-income producing security.
* All or a portion of the security is on loan as discussed in item 2(M) of the Notes to Financial Statements.
+ The interest rate shown reflects the yield, coupon rate or, for securities purchased at a discount, the discount rate at the date of purchase.
Definitions:
REIT — Real Estate Investment Trust, is a company that buys, develops, manages, and/or sells real estate assets. ETF — Exchange Traded Fund.
Gross unrealized appreciation and depreciation of investments were as follows:
| Gross unrealized appreciation | $74,435,603 |
| Gross unrealized depreciation | (2,594,229) |
| Net unrealized appreciation (depreciation) | $71,841,374 |
| Cost for federal income tax purposes | $363,376,443 |
| The accompanying Notes to Financial Statements are an integral part of this schedule. |
| 150 |
| Balanced Portfolio Schedule of Investments as of June 29, 2007 (unaudited) | ||||||
| Shares | Common Stock (64.9%) | Value | Shares | Common Stock (64.9%) | Value | |
| Consumer Discretionary (6.6%) | 11,989 | Interpublic Group of | ||||
| 2,300 | Abercrombie & Fitch Company | $167,854 | Companies, Inc. # | $136,675 | ||
| 7,900 | Amazon.com, Inc. # | 540,439 | 5,800 | J.C. Penney Company, Inc. | ||
| 3,500 | Apollo Group, Inc. # | 204,505 | (Holding Company) | 419,804 | ||
| 3,900 | AutoNation, Inc. # | 87,516 | 5,000 | Johnson Controls, Inc. | 578,850 | |
| 1,400 | AutoZone, Inc. # | 191,268 | 2,800 | Jones Apparel Group, Inc. | 79,100 | |
| 7,100 | Bed Bath & Beyond, Inc. # | 255,529 | 2,000 | KB Home | 78,740 | |
| 10,375 | Best Buy Company, Inc. | 484,201 | 8,200 | Kohl’s Corporation #± | 582,446 | |
| 2,900 | Big Lots, Inc. # | 85,318 | 4,600 | Leggett & Platt, Inc. | 101,430 | |
| 1,700 | Black & Decker Corporation | 150,127 | 3,600 | Lennar Corporation | 131,616 | |
| 2,500 | Brunswick Corporation | 81,575 | 8,762 | Limited Brands, Inc. | 240,517 | |
| 11,300 | Carnival Corporation | 551,101 | 2,700 | Liz Claiborne, Inc. | 100,710 | |
| 18,862 | CBS Corporation * | 628,482 | 38,600 | Lowe’s Companies, Inc. | 1,184,634 | |
| 3,000 | Centex Corporation | 120,300 | 11,700 | Macy’s Group, Inc | 465,426 | |
| 3,600 | Circuit City Stores, Inc. * | 54,288 | 8,500 | Marriott International, Inc. | 367,540 | |
| 1 | Citadel Broadcasting Company | 2 | 10,025 | Mattel, Inc. | 253,532 | |
| 12,700 | Clear Channel | 30,600 | McDonald’s Corporation | 1,553,256 | ||
| Communications, Inc. | 480,314 | 8,900 | McGraw-Hill Companies, Inc. | 605,912 | ||
| 9,500 | Coach, Inc. #± | 450,205 | 1,000 | Meredith Corporation | 61,600 | |
| 79,765 | Comcast Corporation # | 2,242,992 | 3,700 | New York Times Company * | 93,980 | |
| 7,100 | D.R. Horton, Inc. ± | 141,503 | 7,226 | Newell Rubbermaid, Inc. | 212,661 | |
| 3,700 | Darden Restaurants, Inc. | 162,763 | 59,700 | News Corporation | 1,266,237 | |
| 1,600 | Dillard’s, Inc. | 57,488 | 9,700 | NIKE, Inc. | 565,413 | |
| 19,700 | DIRECTV Group, Inc. # | 455,267 | 5,700 | Nordstrom, Inc. | 291,384 | |
| 8,022 | Dollar General Corporation | 175,842 | 7,000 | Office Depot, Inc. # | 212,100 | |
| 1,700 | Dow Jones & Company, Inc. | 97,665 | 2,000 | OfficeMax, Inc. | 78,600 | |
| 2,200 | E.W. Scripps Company | 100,518 | 8,400 | Omnicom Group, Inc. | 444,528 | |
| 7,300 | Eastman Kodak Company * | 203,159 | 1,600 | Polo Ralph Lauren Corporation | 156,976 | |
| 4,000 | Family Dollar Stores, Inc. | 137,280 | 5,500 | Pulte Homes, Inc. | 123,475 | |
| 48,200 | Ford Motor Company * | 454,044 | 3,500 | RadioShack Corporation | 115,990 | |
| 4,000 | Fortune Brands, Inc. | 329,480 | 2,080 | Sears Holdings Corporation # | 352,560 | |
| 6,100 | Gannett Company, Inc. | 335,195 | 3,000 | Sherwin-Williams Company | 199,410 | |
| 13,600 | Gap, Inc. | 259,760 | 1,500 | Snap-On, Inc. | 75,765 | |
| 14,500 | General Motors Corporation * | 548,100 | 2,300 | Stanley Works | 139,610 | |
| 4,400 | Genuine Parts Company | 218,240 | 18,300 | Staples, Inc. | 434,259 | |
| 5,200 | Goodyear Tire & | 19,000 | Starbucks Corporation # | 498,560 | ||
| Rubber Company # | 180,752 | 5,600 | Starwood Hotels & Resorts | |||
| 8,300 | H&R Block, Inc. | 193,971 | Worldwide, Inc. | 375,592 | ||
| 6,700 | Harley-Davidson, Inc. | 399,387 | 21,800 | Target Corporation | 1,386,480 | |
| 1,600 | Harman International | 3,600 | Tiffany & Company | 191,016 | ||
| Industries, Inc. | 186,880 | 97,050 | Time Warner, Inc. | 2,041,932 | ||
| 4,800 | Harrah’s Entertainment, Inc. | 409,248 | 11,600 | TJX Companies, Inc. | 319,000 | |
| 4,100 | Hasbro, Inc. ± | 128,781 | 3,215 | Tribune Company | 94,521 | |
| 10,000 | Hilton Hotels Corporation | 334,700 | 2,300 | VF Corporation | 210,634 | |
| 50,600 | Home Depot, Inc. | 1,991,110 | 17,662 | Viacom, Inc. # | 735,269 | |
| 5,700 | IAC InterActiveCorp # | 197,277 | 50,787 | Walt Disney Company ± | 1,733,868 | |
| 8,600 | International Game Technology | 341,420 | 2,400 | Wendy’s International, Inc. | 88,200 | |
| The accompanying Notes to Financial Statements are an integral part of this schedule. |
| 151 |
Balanced Portfolio
Schedule of Investments as of June 29, 2007 (unaudited)
| Shares | Common Stock (64.9%) | Value | Shares | Common Stock (64.9%) | Value | |
| Consumer Discretionary — continued | 3,700 | Whole Foods Market, Inc. * | $141,710 | |||
| 2,059 | Whirlpool Corporation | $228,939 | 5,525 | William Wrigley Jr. Company | 305,588 | |
| 4,632 | Wyndham Worldwide | Total Consumer Staples | 31,862,941 | |||
| Corporation # | 167,956 | |||||
| 13,320 | Yum! Brands, Inc. | 435,830 | Energy (7.0%) | |||
| Total Consumer | 11,836 | Anadarko Petroleum Corporation | 615,354 | |||
| Discretionary | 35,028,379 | 8,468 | Apache Corporation ± | 690,904 | ||
| 8,320 | Baker Hughes, Inc. | 699,962 | ||||
| Consumer Staples (6.0%) | 7,600 | BJ Services Company | 216,144 | |||
| 53,900 | Altria Group, Inc. | 3,780,546 | 10,500 | Chesapeake Energy Corporation | 363,300 | |
| 19,400 | Anheuser-Busch Companies, Inc. | 1,011,904 | 55,074 | Chevron Corporation ± | 4,639,434 | |
| 16,741 | Archer-Daniels-Midland Company | 553,960 | 41,882 | ConocoPhillips | 3,287,737 | |
| 11,200 | Avon Products, Inc. ± | 411,600 | 4,700 | CONSOL Energy, Inc. | 216,717 | |
| 2,200 | Brown-Forman Corporation | 160,776 | 11,400 | Devon Energy Corporation ± | 892,506 | |
| 5,600 | Campbell Soup Company | 217,336 | 17,886 | El Paso Corporation | 308,176 | |
| 3,900 | Clorox Company | 242,190 | 3,900 | ENSCO International, Inc. | 237,939 | |
| 51,500 | Coca-Cola Company ± | 2,693,965 | 6,200 | EOG Resources, Inc. | 452,972 | |
| 7,200 | Coca-Cola Enterprises, Inc. | 172,800 | 144,472 | Exxon Mobil Corporation | 12,118,311 | |
| 13,100 | Colgate-Palmolive Company | 849,535 | 23,400 | Halliburton Company | 807,300 | |
| 12,700 | ConAgra Foods, Inc. | 341,122 | 7,100 | Hess Corporation | 418,616 | |
| 4,900 | Constellation Brands, Inc. # | 118,972 | 17,522 | Marathon Oil Corporation | 1,050,619 | |
| 11,400 | Costco Wholesale Corporation | 667,128 | 4,900 | Murphy Oil Corporation | 291,256 | |
| 39,605 | CVS/Caremark Corporation | 1,443,602 | 7,300 | Nabors Industries, Ltd. # | 243,674 | |
| 3,400 | Dean Foods Company | 108,358 | 4,600 | National Oilwell Varco, Inc. # | 479,504 | |
| 3,200 | Estee Lauder Companies, Inc. | 145,632 | 3,400 | Noble Corporation | 331,568 | |
| 8,900 | General Mills, Inc. | 519,938 | 21,300 | Occidental Petroleum | ||
| 8,350 | H.J. Heinz Company | 396,374 | Corporation | 1,232,844 | ||
| 4,400 | Hershey Company | 222,728 | 6,700 | Peabody Energy Corporation | 324,146 | |
| 6,500 | Kellogg Company | 336,635 | 2,900 | Rowan Companies, Inc. | 118,842 | |
| 11,680 | Kimberly-Clark Corporation | 781,275 | 30,200 | Schlumberger, Ltd. | 2,565,188 | |
| 41,160 | Kraft Foods, Inc. | 1,450,890 | 5,200 | Smith International, Inc. | 304,928 | |
| 18,100 | Kroger Company | 509,153 | 16,121 | Spectra Energy Corporation | 418,501 | |
| 3,400 | McCormick & Company, Inc. | 129,812 | 3,100 | Sunoco, Inc. | 247,008 | |
| 1,400 | Molson Coors Brewing Company | 129,444 | 7,336 | Transocean, Inc. # | 777,469 | |
| 3,400 | Pepsi Bottling Group, Inc. | 114,512 | 14,000 | Valero Energy Corporation | 1,034,040 | |
| 41,720 | PepsiCo, Inc. | 2,705,542 | 8,600 | Weatherford International, Ltd. # | 475,064 | |
| 80,792 | Procter & Gamble Company | 4,943,662 | 15,300 | Williams Companies, Inc. | 483,786 | |
| 4,400 | Reynolds American, Inc. | 286,880 | 9,800 | XTO Energy, Inc. | 588,980 | |
| 11,300 | Safeway, Inc. | 384,539 | Total Energy | 36,932,789 | ||
| 18,800 | Sara Lee Corporation | 327,120 | ||||
| 5,369 | SUPERVALU, Inc. | 248,692 | Financials (13.6%) | |||
| 15,800 | SYSCO Corporation | 521,242 | 8,300 | ACE, Ltd. | 518,916 | |
| 6,500 | Tyson Foods, Inc. | 149,760 | 12,500 | AFLAC, Inc. ± | 642,500 | |
| 4,300 | UST, Inc. | 230,953 | 15,496 | Allstate Corporation ± | 953,159 | |
| 25,600 | Walgreen Company | 1,114,624 | 2,650 | Ambac Financial Group, Inc. | 231,054 | |
| 62,200 | Wal-Mart Stores, Inc. ± | 2,992,442 | 30,500 | American Express Company ± | 1,865,990 | |
| The accompanying Notes to Financial Statements are an integral part of this schedule. |
| 152 |
Balanced Portfolio
Schedule of Investments as of June 29, 2007 (unaudited)
| Shares | Common Stock (64.9%) | Value | Shares | Common Stock (64.9%) | Value | |
| Financials — continued | 13,300 | Host Marriott Corporation | $307,496 | |||
| 66,502 | American International | 12,500 | Hudson City Bancorp, Inc. | 152,750 | ||
| Group, Inc. ± | $4,657,135 | 9,316 | Huntington Bancshares, Inc. * | 211,846 | ||
| 5,940 | Ameriprise Financial, Inc. | 377,606 | 87,598 | J.P. Morgan Chase & Company | 4,244,123 | |
| 7,450 | Aon Corporation | 317,444 | 4,700 | Janus Capital Group, Inc. | 130,848 | |
| 2,500 | Apartment Investment & | 10,100 | KeyCorp | 346,733 | ||
| Management Company | 126,050 | 5,900 | Kimco Realty Corporation | 224,613 | ||
| 5,800 | Archstone-Smith Trust | 342,838 | 3,400 | Legg Mason, Inc. | 334,492 | |
| 2,700 | Assurant, Inc. | 159,084 | 13,600 | Lehman Brothers Holdings, Inc. | 1,013,472 | |
| 2,100 | Avalonbay Communities, Inc. | 249,648 | 7,011 | Lincoln National Corporation | 497,440 | |
| 113,807 | Bank of America Corporation | 5,564,024 | 11,400 | Loews Corporation | 581,172 | |
| 19,400 | Bank of New York | 2,000 | M&T Bank Corporation | 213,800 | ||
| Company, Inc. # | 803,936 | 14,200 | Marsh & McLennan | |||
| 14,000 | BB&T Corporation | 569,520 | Companies, Inc. | 438,496 | ||
| 2,978 | Bear Stearns Companies, Inc. | 416,920 | 6,700 | Marshall & Ilsley Corporation | 319,121 | |
| 3,100 | Boston Properties, Inc. | 316,603 | 3,400 | MBIA, Inc. | 211,548 | |
| 10,565 | Capital One Financial Corporation | 828,719 | 10,700 | Mellon Financial Corporation | 470,800 | |
| 4,900 | CB Richard Ellis Group, Inc. # | 178,850 | 22,300 | Merrill Lynch & Company, Inc. | 1,863,834 | |
| 25,925 | Charles Schwab Corporation | 531,981 | 19,000 | MetLife, Inc. | 1,225,120 | |
| 900 | Chicago Mercantile Exchange | 2,200 | MGIC Investment Corporation | 125,092 | ||
| Holdings, Inc. | 480,924 | 6,000 | Moody’s Corporation | 373,200 | ||
| 10,400 | Chubb Corporation ± | 563,056 | 26,990 | Morgan Stanley | 2,263,921 | |
| 4,451 | Cincinnati Financial Corporation | 193,173 | 14,800 | National City Corporation * | 493,136 | |
| 4,900 | CIT Group, Inc. | 268,667 | 4,900 | Northern Trust Corporation ± | 314,776 | |
| 126,889 | Citigroup, Inc. ± | 6,508,137 | 4,600 | Plum Creek Timber Company, Inc. | 191,636 | |
| 4,200 | Comerica, Inc. | 249,774 | 8,800 | PNC Financial Services Group, Inc. | 629,904 | |
| 5,000 | Commerce Bancorp, Inc. | 184,950 | 6,900 | Principal Financial Group, Inc. | 402,201 | |
| 3,400 | Compass Bancshares, Inc. | 234,532 | 18,800 | Progressive Corporation | 449,884 | |
| 15,198 | Countrywide Financial | 6,500 | ProLogis Trust | 369,850 | ||
| Corporation | 552,447 | 12,000 | Prudential Financial, Inc. | 1,166,760 | ||
| 3,400 | Developers Diversified | 3,200 | Public Storage, Inc. | 245,824 | ||
| Realty Corporation | 179,214 | 18,000 | Regions Financial Corporation | 595,800 | ||
| 10,900 | E*TRADE Financial Corporation # | 240,781 | 2,900 | SAFECO Corporation | 180,554 | |
| 7,400 | Equity Residential REIT ± | 337,662 | 5,800 | Simon Property Group, Inc. | 539,632 | |
| 16,900 | Federal Home Loan Mortgage | 10,500 | SLM Corporation | 604,590 | ||
| Corporation | 1,025,830 | 9,280 | Sovereign Bancorp, Inc. | 196,179 | ||
| 24,900 | Federal National Mortgage | 10,300 | State Street Corporation | 704,520 | ||
| Association | 1,626,717 | 9,100 | SunTrust Banks, Inc. | 780,234 | ||
| 2,300 | Federated Investors, Inc. | 88,159 | 8,450 | Synovus Financial Corporation | 259,415 | |
| 14,216 | Fifth Third Bancorp | 565,370 | 6,900 | T. Rowe Price Group, Inc. | 358,041 | |
| 3,300 | First Horizon National Corporation | 128,700 | 2,500 | Torchmark Corporation | 167,500 | |
| 4,200 | Franklin Resources, Inc. | 556,374 | 17,025 | Travelers Companies, Inc. | 910,838 | |
| 6,100 | General Growth Properties, Inc. | 322,995 | 44,521 | U.S. Bancorp ± | 1,466,967 | |
| 10,800 | Genworth Financial, Inc. | 371,520 | 8,758 | UnumProvident Corporation | 228,671 | |
| 10,400 | Goldman Sachs Group, Inc. | 2,254,200 | 3,500 | Vornado Realty Trust * | 384,440 | |
| 8,200 | Hartford Financial Services | 49,023 | Wachovia Corporation | 2,512,429 | ||
| Group, Inc. | 807,782 | 22,781 | Washington Mutual, Inc. | 971,382 | ||
| The accompanying Notes to Financial Statements are an integral part of this schedule. |
| 153 |
Balanced Portfolio
Schedule of Investments as of June 29, 2007 (unaudited)
| Shares | Common Stock (64.9%) | Value | Shares | Common Stock (64.9%) | Value | |
| Financials — continued | 3,100 | PerkinElmer, Inc. | $80,786 | |||
| 85,620 | Wells Fargo & Company | $3,011,255 | 180,051 | Pfizer, Inc. | 4,603,904 | |
| 4,800 | XL Capital, Ltd. | 404,592 | 4,100 | Quest Diagnostics, Inc. | 211,765 | |
| 2,900 | Zions Bancorporation | 223,039 | 38,200 | Schering-Plough Corporation | 1,162,808 | |
| Total Financials | 71,706,907 | 8,680 | St. Jude Medical, Inc. # | 360,133 | ||
| 7,600 | Stryker Corporation | 479,484 | ||||
| Health Care (7.6%) | 12,150 | Tenet Healthcare Corporation # | 79,096 | |||
| 39,500 | Abbott Laboratories ± | 2,115,225 | 10,800 | Thermo Electron Corporation # | 558,576 | |
| 13,156 | Aetna, Inc. | 649,906 | 34,300 | UnitedHealth Group, Inc. | 1,754,102 | |
| 7,800 | Allergan, Inc. | 449,592 | 3,200 | Varian Medical Systems, Inc. # | 136,032 | |
| 5,000 | AmerisourceBergen Corporation | 247,350 | 2,700 | Waters Corporation # | 160,272 | |
| 29,752 | Amgen, Inc. # | 1,644,988 | 2,800 | Watson Pharmaceuticals, Inc. # | 91,084 | |
| 4,900 | Applera Corporation (Applied | 15,700 | WellPoint, Inc. # | 1,253,331 | ||
| Biosystems Group) | 149,646 | 34,500 | Wyeth | 1,978,230 | ||
| 2,800 | Barr Pharmaceuticals, Inc. # | 140,644 | 5,990 | Zimmer Holdings, Inc. # | 508,491 | |
| 1,400 | Bausch & Lomb, Inc. | 97,216 | Total Health Care | 39,975,160 | ||
| 16,700 | Baxter International, Inc. | 940,878 | ||||
| 6,200 | Becton, Dickinson and Company | 461,900 | Industrials (7.4%) | |||
| 7,430 | Biogen Idec, Inc. # | 397,505 | 18,400 | 3M Company | 1,596,936 | |
| 6,450 | Biomet, Inc. | 294,894 | 6,600 | Allied Waste Industries, Inc. # | 88,836 | |
| 30,450 | Boston Scientific Corporation # | 467,103 | 4,600 | American Standard Companies, Inc. | 271,308 | |
| 50,500 | Bristol-Myers Squibb Company ± | 1,593,780 | 2,400 | Avery Dennison Corporation | 159,552 | |
| 2,700 | C.R. Bard, Inc. | 223,101 | 20,128 | Boeing Company ± | 1,935,508 | |
| 9,775 | Cardinal Health, Inc. ± | 690,506 | 9,092 | Burlington Northern Santa Fe | ||
| 9,700 | Celgene Corporation # | 556,101 | Corporation | 774,093 | ||
| 7,300 | CIGNA Corporation ± | 381,206 | 4,400 | C.H. Robinson Worldwide, Inc. | 231,088 | |
| 4,150 | Coventry Health Care, Inc. # | 239,248 | 16,400 | Caterpillar, Inc. | 1,284,120 | |
| 25,300 | Eli Lilly and Company * | 1,413,764 | 3,500 | Cintas Corporation | 138,005 | |
| 6,800 | Express Scripts, Inc. # | 340,068 | 4,700 | Cooper Industries, Ltd. | 268,323 | |
| 8,100 | Forest Laboratories, Inc. # | 369,765 | 11,200 | CSX Corporation | 504,896 | |
| 6,700 | Genzyme Corporation # | 431,480 | 2,600 | Cummins, Inc. | 263,146 | |
| 23,800 | Gilead Sciences, Inc. # | 922,726 | 6,300 | Danaher Corporation | 475,650 | |
| 4,130 | Hospira, Inc. # | 161,235 | 5,800 | Deere & Company | 700,292 | |
| 4,300 | Humana, Inc. # | 261,913 | 5,300 | Dover Corporation | 271,095 | |
| 5,100 | IMS Health, Inc. | 163,863 | 3,800 | Eaton Corporation | 353,400 | |
| 74,306 | Johnson & Johnson | 4,578,736 | 20,400 | Emerson Electric Company | 954,720 | |
| 6,333 | King Pharmaceuticals, Inc. # | 129,573 | 3,800 | Equifax, Inc. ± | 168,796 | |
| 3,100 | Laboratory Corporation of America | 7,840 | FedEx Corporation | 870,005 | ||
| Holdings # | 242,606 | 2,300 | Fluor Corporation | 256,151 | ||
| 1,900 | Manor Care, Inc. | 124,051 | 10,300 | General Dynamics Corporation | 805,666 | |
| 7,680 | McKesson Corporation | 458,035 | 264,000 | General Electric Company ‡ | 10,105,920 | |
| 7,255 | Medco Health Solutions, Inc. # | 565,817 | 3,400 | Goodrich Corporation | 202,504 | |
| 29,500 | Medtronic, Inc. | 1,529,870 | 19,937 | Honeywell International, Inc. | 1,122,054 | |
| 55,600 | Merck & Company, Inc. | 2,768,880 | 10,500 | Illinois Tool Works, Inc. | 568,995 | |
| 1,400 | Millipore Corporation # | 105,126 | 7,800 | Ingersoll-Rand Company | 427,596 | |
| 6,300 | Mylan Laboratories, Inc. | 114,597 | 4,700 | ITT Corporation | 320,916 | |
| 3,600 | Patterson Companies, Inc. # | 134,172 | 3,300 | L-3 Communications Holdings, Inc. | 321,387 | |
| The accompanying Notes to Financial Statements are an integral part of this schedule. |
| 154 |
Balanced Portfolio
Schedule of Investments as of June 29, 2007 (unaudited)
| Shares | Common Stock (64.9%) | Value | Shares | Common Stock (64.9%) | Value | |
| Industrials — continued | 3,600 | Cognizant Technology | ||||
| 9,100 | Lockheed Martin Corporation | $856,583 | Solutions Corporation # | $270,324 | ||
| 9,600 | Masco Corporation | 273,312 | 4,500 | Computer Sciences Corporation # | 266,175 | |
| 3,400 | Monster Worldwide, Inc. # | 139,740 | 7,900 | Compuware Corporation # | 93,694 | |
| 10,000 | Norfolk Southern Corporation | 525,700 | 3,700 | Convergys Corporation # | 89,688 | |
| 8,806 | Northrop Grumman Corporation | 685,723 | 40,300 | Corning, Inc. # | 1,029,665 | |
| 6,400 | PACCAR, Inc. | 557,056 | 58,200 | Dell, Inc. #± | 1,661,610 | |
| 3,300 | Pall Corporation | 151,767 | 29,000 | eBay, Inc. # | 933,220 | |
| 3,100 | Parker-Hannifin Corporation | 303,521 | 7,900 | Electronic Arts, Inc. # | 373,828 | |
| 5,700 | Pitney Bowes, Inc. | 266,874 | 13,000 | Electronic Data Systems | ||
| 3,600 | Precision Castparts Corporation | 436,896 | Corporation | 360,490 | ||
| 5,700 | R.R. Donnelley & Sons Company | 248,007 | 53,824 | EMC Corporation # | 974,214 | |
| 11,300 | Raytheon Company | 608,957 | 4,100 | Fidelity National Information | ||
| 4,300 | Robert Half International, Inc. | 156,950 | Services, Inc. | 222,548 | ||
| 4,100 | Rockwell Automation, Inc. | 284,704 | 19,262 | First Data Corporation | 629,290 | |
| 4,300 | Rockwell Collins, Inc. | 303,752 | 4,450 | Fiserv, Inc. # | 252,760 | |
| 1,600 | Ryder System, Inc. | 86,080 | 5,500 | Google, Inc. # | 2,878,590 | |
| 19,980 | Southwest Airlines Company | 297,902 | 67,161 | Hewlett-Packard Company | 2,996,724 | |
| 2,600 | Terex Corporation # | 211,380 | 149,100 | Intel Corporation | 3,542,616 | |
| 3,200 | Textron, Inc. | 352,352 | 35,000 | International Business | ||
| 50,863 | Tyco International, Ltd. # | 1,718,661 | Machines Corporation | 3,683,750 | ||
| 6,900 | Union Pacific Corporation | 794,535 | 8,700 | Intuit, Inc. # | 261,696 | |
| 27,100 | United Parcel Service, Inc. | 1,978,300 | 4,600 | Jabil Circuit, Inc. | 101,522 | |
| 25,500 | United Technologies Corporation | 1,808,715 | 5,500 | JDS Uniphase Corporation #* | 73,865 | |
| 2,000 | W.W. Grainger, Inc. | 186,100 | 14,500 | Juniper Networks, Inc. #* | 364,965 | |
| 13,230 | Waste Management, Inc. | 516,632 | 5,000�� | KLA-Tencor Corporation | 274,750 | |
| Total Industrials | 39,191,157 | 2,400 | Lexmark International, Inc. # | 118,344 | ||
| 6,600 | Linear Technology Corporation * | 238,788 | ||||
| Information Technology (10.0%) | 19,700 | LSI Corporation # | 147,947 | |||
| 15,000 | Adobe Systems, Inc. #± | 602,250 | 8,300 | Maxim Integrated Products, Inc. | 277,303 | |
| 14,100 | Advanced Micro Devices, Inc. #* | 201,630 | 5,800 | MEMC Electronic Materials, Inc. # | 354,496 | |
| 2,500 | Affiliated Computer | 19,400 | Micron Technology, Inc. # | 243,082 | ||
| Services, Inc. # | 141,800 | 216,000 | Microsoft Corporation ± | 6,365,520 | ||
| 10,063 | Agilent Technologies, Inc. # | 386,822 | 3,650 | Molex, Inc. | 109,536 | |
| 9,300 | Altera Corporation | 205,809 | 59,321 | Motorola, Inc. | 1,049,982 | |
| 8,300 | Analog Devices, Inc. | 312,412 | 7,100 | National Semiconductor | ||
| 22,100 | Apple Computer, Inc. # | 2,697,084 | Corporation | 200,717 | ||
| 35,400 | Applied Materials, Inc. | 703,398 | 4,700 | NCR Corporation # | 246,938 | |
| 6,000 | Autodesk, Inc. #± | 282,480 | 9,500 | Network Appliance, Inc. # | 277,400 | |
| 14,100 | Automatic Data Processing, Inc. | 683,427 | 9,000 | Novell, Inc. # | 70,110 | |
| 11,539 | Avaya, Inc. # | 194,317 | 3,300 | Novellus Systems, Inc. # | 93,621 | |
| 5,200 | BMC Software, Inc. #± | 157,560 | 9,400 | NVIDIA Corporation # | 388,314 | |
| 11,850 | Broadcom Corporation # | 346,612 | 101,559 | Oracle Corporation # | 2,001,728 | |
| 10,475 | CA, Inc. | 270,569 | 8,650 | Paychex, Inc. | 338,388 | |
| 2,114 | CIENA Corporation # | 76,379 | 4,100 | QLogic Corporation # | 68,265 | |
| 155,800 | Cisco Systems, Inc. #± | 4,339,030 | 42,700 | QUALCOMM, Inc. | 1,852,753 | |
| 4,600 | Citrix Systems, Inc. # | 154,882 | 5,900 | SanDisk Corporation #* | 288,746 | |
| The accompanying Notes to Financial Statements are an integral part of this schedule. |
| 155 |
Balanced Portfolio
Schedule of Investments as of June 29, 2007 (unaudited)
| Shares | Common Stock (64.9%) | Value | Shares | Common Stock (64.9%) | Value | |
| Information Technology — continued | 2,400 | Vulcan Materials Company | $274,896 | |||
| 23,100 | Solectron Corporation # | $85,008 | 5,600 | Weyerhaeuser Company | 442,008 | |
| 91,600 | Sun Microsystems, Inc. # | 481,816 | Total Materials | 10,689,109 | ||
| 23,072 | Symantec Corporation #* | 466,054 | ||||
| 2,100 | Tektronix, Inc. | 70,854 | Telecommunications Services (2.4%) | |||
| 11,200 | Tellabs, Inc. # | 120,512 | 8,800 | ALLTEL Corporation | 594,440 | |
| 4,900 | Teradyne, Inc. # | 86,142 | 158,179 | AT&T, Inc. ± | 6,564,428 | |
| 36,700 | Texas Instruments, Inc. | 1,381,021 | 2,850 | CenturyTel, Inc. | 139,792 | |
| 9,000 | Unisys Corporation # | 82,260 | 8,800 | Citizens Communications | ||
| 6,200 | VeriSign, Inc. # | 196,726 | Company | 134,376 | ||
| 19,762 | Western Union Company | 411,642 | 3,898 | Embarq Corporation | 247,016 | |
| 24,000 | Xerox Corporation # | 443,520 | 39,818 | Qwest Communications | ||
| 7,700 | Xilinx, Inc. | 206,129 | International, Inc. #* | 386,235 | ||
| 31,000 | Yahoo!, Inc. # | 841,030 | 74,169 | Sprint Nextel Corporation | 1,536,040 | |
| Total Information | 74,470 | Verizon Communications, Inc. | 3,065,930 | |||
| Technology | 52,697,137 | 12,317 | Windstream Corporation | 181,799 | ||
| Total Telecommunications | ||||||
| Materials (2.0%) | Services | 12,850,056 | ||||
| 5,600 | Air Products and Chemicals, Inc. | 450,072 | ||||
| 22,264 | Alcoa, Inc. | 902,360 | Utilities (2.3%) | |||
| 2,681 | Allegheny Technologies, Inc. | 281,183 | 17,100 | AES Corporation # | 374,148 | |
| 1,500 | Ashland, Inc. | 95,925 | 4,300 | Allegheny Energy, Inc. # | 222,482 | |
| 2,700 | Ball Corporation | 143,559 | 5,300 | Ameren Corporation | 259,753 | |
| 2,700 | Bemis Company, Inc. | 89,586 | 10,140 | American Electric Power | ||
| 24,377 | Dow Chemical Company ± | 1,077,951 | Company, Inc. | 456,706 | ||
| 23,619 | E.I. du Pont de Nemours | 8,324 | CenterPoint Energy, Inc. | 144,838 | ||
| and Company | 1,200,790 | 5,800 | CMS Energy Corporation * | 99,760 | ||
| 2,200 | Eastman Chemical Company | 141,526 | 7,000 | Consolidated Edison, Inc. | 315,840 | |
| 4,500 | Ecolab, Inc. | 192,150 | 4,600 | Constellation Energy Group, Inc. | 400,982 | |
| 9,544 | Freeport-McMoRan Copper & | 8,915 | Dominion Resources, Inc. | 769,454 | ||
| Gold, Inc. | 790,434 | 4,600 | DTE Energy Company | 221,812 | ||
| 3,000 | Hercules, Inc. #± | 58,950 | 32,242 | Duke Energy Corporation | 590,029 | |
| 2,000 | International Flavors & | 10,309 | Dynegy, Inc. # | 97,317 | ||
| Fragrances, Inc. | 104,280 | 8,300 | Edison International, Inc. | 465,796 | ||
| 11,121 | International Paper Company | 434,275 | 5,100 | Entergy Corporation ± | 547,485 | |
| 4,780 | MeadWestvaco Corporation | 168,830 | 17,174 | Exelon Corporation ± | 1,246,832 | |
| 13,866 | Monsanto Company | 936,510 | 7,900 | FirstEnergy Corporation | 511,367 | |
| 11,517 | Newmont Mining Corporation | 449,854 | 10,400 | FPL Group, Inc. | 590,096 | |
| 7,800 | Nucor Corporation | 457,470 | 2,107 | Integrys Energy Group, Inc. | 106,888 | |
| 3,400 | Pactiv Corporation # | 108,426 | 4,600 | KeySpan Corporation | 193,108 | |
| 4,300 | PPG Industries, Inc. | 327,273 | 1,300 | Nicor, Inc. | 55,796 | |
| 8,100 | Praxair, Inc. | 583,119 | 7,034 | NiSource, Inc. | 145,674 | |
| 3,711 | Rohm and Haas Company | 202,917 | 9,100 | PG&E Corporation * | 412,230 | |
| 4,228 | Sealed Air Corporation | 131,153 | 2,600 | Pinnacle West Capital Corporation | 103,610 | |
| 3,400 | Sigma-Aldrich Corporation | 145,078 | 9,800 | PPL Corporation | 458,542 | |
| 2,800 | Temple-Inland, Inc. | 172,284 | 6,591 | Progress Energy, Inc. | 300,484 | |
| 3,000 | United States Steel Corporation | 326,250 | ||||
| The accompanying Notes to Financial Statements are an integral part of this schedule. |
| 156 |
Balanced Portfolio
Schedule of Investments as of June 29, 2007 (unaudited)
| Shares | Common Stock (64.9%) | Value | Shares | Common Stock 64.9%) | Value | |
| Utilities — continued | 5,400 | TECO Energy, Inc. | $92,772 | |||
| 6,400 | Public Service Enterprise | 11,740 | TXU Corporation | 790,102 | ||
| Group, Inc. | $561,792 | 10,510 | Xcel Energy, Inc. | 215,140 | ||
| 4,800 | Questar Corporation | 253,680 | Total Utilities | 12,064,877 | ||
| 6,787 | Sempra Energy | 401,994 | ||||
| 19,200 | Southern Company | 658,368 | Total Common Stock | |||
| (cost $233,631,445) | 342,998,512 | |||||
| Principal | Interest | Maturity | ||
| Amount | Long-Term Fixed Income (40.7%) | Rate | Date | Value |
| Asset-Backed Securities (6.5%) | ||||
| $2,000,000 | AmeriCredit Automobile Receivables Trust ±† | 5.400% | 7/6/2007 | $1,999,710 |
| 1,934,366 | Bear Stearns Asset-Backed Securities, Inc. ±† | 5.560 | 7/25/2007 | 1,935,397 |
| 1,002,984 | Bear Stearns Mortgage Funding Trust † | 5.460 | 7/25/2007 | 1,002,574 |
| 366,889 | California Infrastructure PG&E Company | 6.480 | 12/26/2009 | 368,461 |
| 235,661 | Countrywide Asset-Backed Certificates † | 5.400 | 7/25/2007 | 235,655 |
| 2,000,000 | Countrywide Asset-Backed Certificates ± | 5.549 | 4/25/2036 | 1,991,114 |
| 750,000 | Countrywide Home Loans Asset-Backed Securities | 6.085 | 6/25/2021 | 751,829 |
| 2,000,000 | Credit Based Asset Servicing and Securitization, LLC † | 5.430 | 7/25/2007 | 1,999,768 |
| 1,000,000 | Credit Based Asset Servicing and Securitization, LLC | 5.501 | 12/25/2036 | 995,704 |
| 2,500,000 | DaimlerChrysler Master Owner Trust † | 5.370 | 7/15/2007 | 2,500,582 |
| 1,000,000 | First Franklin Mortgage Loan Asset-Backed Certificates † | 5.430 | 7/25/2007 | 999,997 |
| 854,990 | First Horizon ABS Trust † | 5.450 | 7/25/2007 | 854,709 |
| 1,410,572 | First Horizon ABS Trust † | 5.480 | 7/25/2007 | 1,410,116 |
| 1,500,000 | Ford Credit Floor Plan Master Owner Trust † | 5.500 | 7/15/2007 | 1,500,344 |
| 2,000,000 | GE Dealer Floorplan Master Note Trust † | 5.360 | 7/20/2007 | 2,000,636 |
| 1,500,000 | GMAC Mortgage Corporation Loan Trust † | 5.390 | 7/25/2007 | 1,499,132 |
| 2,500,000 | GMAC Mortgage Corporation Loan Trust † | 5.410 | 7/25/2007 | 2,500,178 |
| 1,313,090 | IndyMac Seconds Asset-Backed Trust † | 5.490 | 7/25/2007 | 1,312,682 |
| 245,756 | Massachusetts RRB Special Purpose Trust | 3.780 | 9/15/2010 | 243,627 |
| 487,541 | Master Asset-Backed Securities Trust † | 5.400 | 7/25/2007 | 487,617 |
| 1,320,945 | National Collegiate Student Loan Trust † | 5.380 | 7/25/2007 | 1,321,726 |
| 525,443 | Popular ABS Mortgage Pass-Through Trust † | 5.450 | 7/25/2007 | 525,537 |
| 363,952 | Residential Asset Securities Corporation † | 5.400 | 7/25/2007 | 363,931 |
| 1,381,834 | Residential Funding Mortgage Securities II † | 5.450 | 7/25/2007 | 1,381,936 |
| 662,758 | SLM Student Loan Trust † | 5.365 | 7/25/2007 | 662,910 |
| 2,000,000 | Textron Financial Floorplan Master Note Trust † | 5.440 | 7/13/2007 | 2,002,410 |
| 1,473,012 | Wachovia Asset Securitization, Inc. † | 5.460 | 7/25/2007 | 1,473,007 |
| Total Asset-Backed Securities | 34,321,289 | |||
| Basic Materials (0.2%) | ||||
| 250,000 | Alcan, Inc. | 5.000 | 6/1/2015 | 232,562 |
| 225,000 | Alcan, Inc. | 6.125 | 12/15/2033 | 209,059 |
| 550,000 | Weyerhaeuser Company | 6.750 | 3/15/2012 | 569,061 |
| Total Basic Materials | 1,010,682 | |||
| The accompanying Notes to Financial Statements are an integral part of this schedule. |
| 157 |
Balanced Portfolio
Schedule of Investments as of June 29, 2007 (unaudited)
| Principal | Interest | Maturity | ||
| Amount | Long-Term Fixed Income (40.7%) | Rate | Date | Value |
| Capital Goods (0.4%) | ||||
| $350,000 | Boeing Capital Corporation | 6.100% | 3/1/2011 | $357,601 |
| 225,000 | Caterpillar, Inc. | 4.500 | 6/15/2009 | 221,536 |
| 800,000 | General Electric Company | 5.000 | 2/1/2013 | 775,630 |
| 300,000 | John Deere Capital Corporation | 7.000 | 3/15/2012 | 317,187 |
| 225,000 | Northrop Grumman Corporation | 7.125 | 2/15/2011 | 236,005 |
| 225,000 | United Technologies Corporation | 6.050 | 6/1/2036 | 222,861 |
| Total Capital Goods | 2,130,820 | |||
| Commercial Mortgage-Backed Securities (5.5%) | ||||
| 1,000,000 | Banc of America Commercial Mortgage, Inc. | 5.118 | 7/11/2043 | 979,571 |
| 2,500,000 | Bear Stearns Commercial Mortgage Securities, Inc. † | 5.470 | 7/15/2007 | 2,500,000 |
| 400,000 | Bear Stearns Commercial Mortgage Securities, Inc. | 3.869 | 2/11/2041 | 390,581 |
| 1,908,640 | Chase Mortgage Finance Corporation | 4.577 | 2/25/2037 | 1,865,327 |
| 633,068 | Citigroup Commercial Mortgage Trust † | 5.390 | 7/15/2007 | 633,443 |
| 83,774 | Commercial Mortgage Pass-Through Certificates † | 5.420 | 7/15/2007 | 83,778 |
| 2,000,000 | Commercial Mortgage Pass-Through Certificates † | 5.450 | 7/15/2007 | 2,001,656 |
| 500,000 | Credit Suisse First Boston Mortgage Securities Corporation | 4.829 | 11/15/2037 | 471,964 |
| 2,000,000 | Credit Suisse Mortgage Capital Certificates † | 5.490 | 7/15/2007 | 2,001,614 |
| 2,000,000 | Crown Castle International Corporation | 5.245 | 11/15/2036 | 1,965,022 |
| 200,000 | General Electric Commercial Mortgage Corporation | 4.641 | 9/10/2013 | 191,592 |
| 1,500,000 | GMAC Commercial Mortgage Securities, Inc. | 4.547 | 12/10/2041 | 1,437,936 |
| 1,000,000 | Greenwich Capital Commercial Funding Corporation | 5.317 | 6/10/2036 | 976,884 |
| 1,000,000 | GS Mortgage Securities Corporation II † | 5.450 | 7/6/2007 | 1,000,000 |
| 400,000 | J.P. Morgan Chase Commercial Mortgage | |||
| Securities Corporation | 4.654 | 1/12/2037 | 382,674 | |
| 1,500,000 | J.P. Morgan Chase Commercial Mortgage | |||
| Securities Corporation | 5.336 | 5/15/2047 | 1,437,748 | |
| 1,887,520 | J.P. Morgan Mortgage Trust | 5.008 | 7/25/2035 | 1,863,075 |
| 1,000,000 | LB-UBS Commercial Mortgage Trust | 3.086 | 5/15/2027 | 980,803 |
| 1,495,755 | Merrill Lynch Mortgage Investors, Inc. | 4.874 | 6/25/2035 | 1,478,295 |
| 1,558,758 | Nationslink Funding Corporation | 6.316 | 1/20/2031 | 1,568,893 |
| 1,657,150 | Thornburg Mortgage Securities Trust † | 5.410 | 7/25/2007 | 1,653,955 |
| 851,670 | Thornburg Mortgage Securities Trust † | 5.430 | 7/25/2007 | 851,143 |
| 900,192 | Washington Mutual Asset Securities Corporation | 3.830 | 1/25/2035 | 870,714 |
| 1,240,450 | Zuni Mortgage Loan Trust † | 5.450 | 7/25/2007 | 1,239,819 |
| Total Commercial Mortgage-Backed Securities | 28,826,487 | |||
| Communications Services (1.3%) | ||||
| 225,000 | British Telecom plc | 8.625 | 12/15/2010 | 245,873 |
| 225,000 | British Telecom plc | 9.125 | 12/15/2030 | 294,477 |
| 450,000 | Cingular Wireless, Inc. | 6.500 | 12/15/2011 | 465,365 |
| 200,000 | Comcast Corporation | 5.500 | 3/15/2011 | 198,994 |
| 500,000 | Cox Communications, Inc. | 7.750 | 11/1/2010 | 531,742 |
| 115,000 | Cox Communications, Inc. | 6.450 | 12 /1/2036 | 110,605 |
| 225,000 | Deutsche Telekom International Finance BV ± | 8.000 | 6/15/2010 | 239,818 |
| 225,000 | France Telecom SA | 7.750 | 3/1/2011 | 240,384 |
| The accompanying Notes to Financial Statements are an integral part of this schedule. |
| 158 |
Balanced Portfolio
Schedule of Investments as of June 29, 2007 (unaudited)
| Principal | Interest | Maturity | ||
| Amount | Long-Term Fixed Income (40.7%) | Rate | Date | Value |
| Communications Services — continued | ||||
| $450,000 | New Cingular Wireless Services, Inc. | 7.875% | 3/1/2011 | $483,831 |
| 500,000 | News America, Inc. | 4.750 | 3/15/2010 | 490,058 |
| 225,000 | News America, Inc. | 6.400 | 12/15/2035 | 214,270 |
| 225,000 | SBC Communications, Inc. | 5.875 | 2/1/2012 | 226,914 |
| 600,000 | Sprint Capital Corporation | 7.625 | 1/30/2011 | 631,266 |
| 450,000 | Sprint Capital Corporation | 6.900 | 5/1/2019 | 445,471 |
| 550,000 | Telecom Italia Capital SA | 5.250 | 11/15/2013 | 524,080 |
| 425,000 | Tele-Communications, Inc. (TCI Group) | 7.875 | 8/1/2013 | 465,703 |
| 1,000,000 | Verizon Global Funding Corporation | 7.250 | 12/1/2010 | 1,054,144 |
| Total Communications Services | 6,862,995 | |||
| Consumer Cyclical (0.4%) | ||||
| 650,000 | AOL Time Warner, Inc. | 6.875 | 5/1/2012 | 678,126 |
| 500,000 | Johnson Controls, Inc. | 7.125 | 7/15/2017 | 533,373 |
| 450,000 | Wal-Mart Stores, Inc. | 7.550 | 2/15/2030 | 522,815 |
| 500,000 | Walt Disney Company | 5.625 | 9/15/2016 | 496,240 |
| Total Consumer Cyclical | 2,230,554 | |||
| Consumer Non-Cyclical (0.7%) | ||||
| 225,000 | Boston Scientific Corporation | 7.000 | 11/15/2035 | 212,583 |
| 800,000 | Bunge Limited Finance Corporation | 5.350 | 4/15/2014 | 759,965 |
| 425,000 | Coca-Cola HBC Finance BV | 5.125 | 9/17/2013 | 412,064 |
| 482,000 | General Mills, Inc. | 6.000 | 2/15/2012 | 487,173 |
| 500,000 | Kraft Foods, Inc. | 6.250 | 6/1/2012 | 508,176 |
| 500,000 | Kroger Company | 4.950 | 1/15/2015 | 461,629 |
| 500,000 | WellPoint, Inc. | 5.000 | 12/15/2014 | 472,096 |
| 450,000 | Wyeth | 6.000 | 2/15/2036 | 433,899 |
| Total Consumer Non-Cyclical | 3,747,585 | |||
| Energy (0.3%) | ||||
| 500,000 | Burlington Resources, Inc. | 6.500 | 12/1/2011 | 518,702 |
| 800,000 | Conoco Funding Company | 6.350 | 10/15/2011 | 824,910 |
| 250,000 | PennzEnergy Company | 10.125 | 11/15/2009 | 273,577 |
| Total Energy | 1,617,189 | |||
| Financials (3.1%) | ||||
| 450,000 | Allstate Corporation | 5.000 | 8/15/2014 | 430,344 |
| 250,000 | Associates Corporation of North America ± | 6.250 | 11/1/2008 | 252,738 |
| 225,000 | BAC Capital Trust XI | 6.625 | 5/23/2036 | 229,423 |
| 675,000 | Bank of America Corporation | 4.750 | 8/15/2013 | 643,714 |
| 1,350,000 | Bank One Corporation ± | 5.900 | 11/15/2011 | 1,369,337 |
| 700,000 | BB&T Corporation | 6.500 | 8/1/2011 | 722,555 |
| 900,000 | BNP Paribas SA ± | 5.186 | 6/29/2015 | 839,173 |
| 900,000 | Capital One Financial Corporation | 5.250 | 2/21/2017 | 834,138 |
| 650,000 | CIT Group, Inc. | 4.750 | 12/15/2010 | 630,417 |
| 650,000 | Credit Suisse First Boston USA, Inc. | 3.875 | 1/15/2009 | 636,356 |
| The accompanying Notes to Financial Statements are an integral part of this schedule. |
| 159 |
Balanced Portfolio
Schedule of Investments as of June 29, 2007 (unaudited)
| Principal | Interest | Maturity | ||
| Amount | Long-Term Fixed Income (40.7%) | Rate | Date | Value |
| Financials — continued | ||||
| $675,000 | Goldman Sachs Group, Inc. | 6.600% | 1/15/2012 | $698,975 |
| 425,000 | Household Finance Corporation | 4.750 | 5/15/2009 | 420,269 |
| 500,000 | HSBC Finance Corporation | 5.000 | 6/30/2015 | 468,318 |
| 650,000 | Lehman Brothers Holdings, Inc. | 3.950 | 11/10/2009 | 630,322 |
| 450,000 | Merrill Lynch & Company, Inc. | 5.000 | 2/3/2014 | 430,092 |
| 350,000 | MetLife, Inc. | 5.000 | 6/15/2015 | 330,448 |
| 1,100,000 | Morgan Stanley Dean Witter & Company * | 6.750 | 4/15/2011 | 1,140,509 |
| 1,487,137 | Preferred Term Securities XXIII, Ltd. † | 5.560 | 9/24/2007 | 1,487,137 |
| 425,000 | ProLogis Trust | 5.500 | 3/1/2013 | 420,079 |
| 500,000 | Prudential Financial, Inc. | 4.750 | 6/13/2015 | 464,653 |
| 225,000 | Prudential Financial, Inc. | 5.700 | 12/14/2036 | 206,172 |
| 400,000 | Residential Capital Corporation | 6.500 | 4/17/2013 | 386,632 |
| 450,000 | Student Loan Marketing Corporation | 4.000 | 1/15/2010 | 418,783 |
| 450,000 | Union Planters Corporation | 4.375 | 12/1/2010 | 436,036 |
| 425,000 | Wachovia Bank NA | 4.875 | 2/1/2015 | 401,473 |
| 500,000 | Washington Mutual Bank FA | 5.500 | 1/15/2013 | 488,626 |
| 900,000 | Wells Fargo & Company | 4.200 | 1/15/2010 | 877,208 |
| Total Financials | 16,293,927 | |||
| Foreign (1.6%) | ||||
| 1,500,000 | Canadian Government | 5.250 | 11/5/2008 | 1,503,138 |
| 300,000 | Codelco, Inc. | 6.375 | 11/30/2012 | 310,691 |
| 625,000 | European Investment Bank | 3.000 | 6/16/2008 | 612,287 |
| 450,000 | Export-Import Bank of Korea ± | 4.125 | 2/10/2009 | 440,307 |
| 1,200,000 | Inter-American Development Bank | 5.375 | 11/18/2008 | 1,204,723 |
| 1,000,000 | Ontario Electricity Financial Corporation | 7.450 | 3/31/2013 | 1,100,576 |
| 425,000 | Pemex Project Funding Master Trust | 9.125 | 10/13/2010 | 467,500 |
| 250,000 | Petro-Canada, Ltd. | 8.600 | 1/15/2010 | 271,364 |
| 500,000 | Province of Newfoundland | 8.650 | 10/22/2022 | 650,198 |
| 600,000 | Province of Quebec | 4.875 | 5/5/2014 | 580,325 |
| 750,000 | Republic of Italy | 4.375 | 6/15/2013 | 711,147 |
| 900,000 | United Mexican States | 5.625 | 1/15/2017 | 881,100 |
| Total Foreign | 8,733,356 | |||
| Mortgage-Backed Securities (11.0%) | ||||
| 8,610 | Federal Home Loan Mortgage Corporation Gold | |||
| 15-Yr. Pass Through | 6.500 | 4/1/2009 | 8,658 | |
| 11,270 | Federal Home Loan Mortgage Corporation Gold | |||
| 15-Yr. Pass Through | 7.500 | 8/1/2010 | 11,523 | |
| 1,190 | Federal Home Loan Mortgage Corporation Gold | |||
| 15-Yr. Pass Through | 7.000 | 11/1/2010 | 1,216 | |
| 41,836 | Federal Home Loan Mortgage Corporation Gold | |||
| 15-Yr. Pass Through | 7.000 | 2/1/2011 | 42,741 | |
| 30,442 | Federal Home Loan Mortgage Corporation Gold | |||
| 15-Yr. Pass Through | 6.000 | 5/1/2012 | 30,754 | |
| The accompanying Notes to Financial Statements are an integral part of this schedule. |
| 160 |
Balanced Portfolio
Schedule of Investments as of June 29, 2007 (unaudited)
| Principal | Interest | Maturity | ||
| Amount | Long-Term Fixed Income (40.7%) | Rate | Date | Value |
| Mortgage-Backed Securities — continued | ||||
| $4,411 | Federal Home Loan Mortgage Corporation Gold | |||
| 15-Yr. Pass Through | 8.000% | 6/1/2012 | $4,599 | |
| 10,569 | Federal Home Loan Mortgage Corporation Gold | |||
| 15-Yr. Pass Through | 7.000 | 8/1/2012 | 10,892 | |
| 20,366 | Federal Home Loan Mortgage Corporation Gold | |||
| 15-Yr. Pass Through | 6.500 | 11/1/2012 | 20,830 | |
| 15,227 | Federal Home Loan Mortgage Corporation Gold | |||
| 15-Yr. Pass Through | 6.500 | 8/1/2013 | 15,575 | |
| 76,037 | Federal Home Loan Mortgage Corporation Gold | |||
| 15-Yr. Pass Through | 6.000 | 2/1/2014 | 76,467 | |
| 126,838 | Federal Home Loan Mortgage Corporation Gold | |||
| 15-Yr. Pass Through | 5.500 | 4/1/2014 | 125,960 | |
| 132,681 | Federal Home Loan Mortgage Corporation Gold | |||
| 15-Yr. Pass Through | 6.000 | 4/1/2014 | 133,666 | |
| 54,770 | Federal Home Loan Mortgage Corporation Gold | |||
| 15-Yr. Pass Through | 6.500 | 6/1/2014 | 56,019 | |
| 46,422 | Federal Home Loan Mortgage Corporation Gold | |||
| 15-Yr. Pass Through | 7.500 | 9/1/2014 | 48,010 | |
| 1,311,349 | Federal Home Loan Mortgage Corporation Gold | |||
| 15-Yr. Pass Through | 5.500 | 12/1/2017 | 1,296,279 | |
| 22,406 | Federal Home Loan Mortgage Corporation Gold | |||
| 30-Yr. Pass Through | 6.500 | 4/1/2024 | 22,810 | |
| 58,047 | Federal Home Loan Mortgage Corporation Gold | |||
| 30-Yr. Pass Through | 9.000 | 11/1/2024 | 62,745 | |
| 2,837 | Federal Home Loan Mortgage Corporation Gold | |||
| 30-Yr. Pass Through | 9.000 | 4/1/2025 | 3,065 | |
| 4,636 | Federal Home Loan Mortgage Corporation Gold | |||
| 30-Yr. Pass Through | 7.000 | 9/1/2025 | 4,792 | |
| 5,729 | Federal Home Loan Mortgage Corporation Gold | |||
| 30-Yr. Pass Through | 8.500 | 9/1/2025 | 6,135 | |
| 13,954 | Federal Home Loan Mortgage Corporation Gold | |||
| 30-Yr. Pass Through | 8.000 | 1/1/2026 | 14,697 | |
| 4,149 | Federal Home Loan Mortgage Corporation Gold | |||
| 30-Yr. Pass Through | 6.500 | 5/1/2026 | 4,224 | |
| 11,580 | Federal Home Loan Mortgage Corporation Gold | |||
| 30-Yr. Pass Through | 7.000 | 5/1/2026 | 11,969 | |
| 26,133 | Federal Home Loan Mortgage Corporation Gold | |||
| 30-Yr. Pass Through | 6.000 | 7/1/2026 | 26,097 | |
| 1,365 | Federal Home Loan Mortgage Corporation Gold | |||
| 30-Yr. Pass Through | 7.500 | 7/1/2026 | 1,428 | |
| 1,362 | Federal Home Loan Mortgage Corporation Gold | |||
| 30-Yr. Pass Through | 7.500 | 8/1/2026 | 1,425 | |
| 7,379 | Federal Home Loan Mortgage Corporation Gold | |||
| 30-Yr. Pass Through | 8.000 | 11/1/2026 | 7,766 | |
| The accompanying Notes to Financial Statements are an integral part of this schedule. |
| 161 |
Balanced Portfolio
Schedule of Investments as of June 29, 2007 (unaudited)
| Principal | Interest | Maturity | ||
| Amount | Long-Term Fixed Income (40.7%) | Rate | Date | Value |
| Mortgage-Backed Securities — continued | ||||
| $4,655 | Federal Home Loan Mortgage Corporation Gold | |||
| 30-Yr. Pass Through | 7.500% | 1/1/2027 | $4,872 | |
| 12,039 | Federal Home Loan Mortgage Corporation Gold | |||
| 30-Yr. Pass Through | 6.500 | 2/1/2027 | 12,291 | |
| 12,385 | Federal Home Loan Mortgage Corporation Gold | |||
| 30-Yr. Pass Through | 7.000 | 2/1/2027 | 12,801 | |
| 19,821 | Federal Home Loan Mortgage Corporation Gold | |||
| 30-Yr. Pass Through | 8.000 | 3/1/2027 | 20,859 | |
| 8,621 | Federal Home Loan Mortgage Corporation Gold | |||
| 30-Yr. Pass Through | 7.500 | 4/1/2027 | 9,021 | |
| 4,799 | Federal Home Loan Mortgage Corporation Gold | |||
| 30-Yr. Pass Through | 7.000 | 5/1/2027 | 4,960 | |
| 22,558 | Federal Home Loan Mortgage Corporation Gold | |||
| 30-Yr. Pass Through | 8.000 | 6/1/2027 | 23,750 | |
| 8,628 | Federal Home Loan Mortgage Corporation Gold | |||
| 30-Yr. Pass Through | 8.500 | 7/1/2027 | 9,249 | |
| 9,995 | Federal Home Loan Mortgage Corporation Gold | |||
| 30-Yr. Pass Through | 7.000 | 9/1/2027 | 10,331 | |
| 14,377 | Federal Home Loan Mortgage Corporation Gold | |||
| 30-Yr. Pass Through | 8.000 | 10/1/2027 | 15,137 | |
| 12,845 | Federal Home Loan Mortgage Corporation Gold | |||
| 30-Yr. Pass Through | 7.500 | 11/1/2027 | 13,441 | |
| 6,330 | Federal Home Loan Mortgage Corporation Gold | |||
| 30-Yr. Pass Through | 6.500 | 12/1/2027 | 6,463 | |
| 6,432 | Federal Home Loan Mortgage Corporation Gold | |||
| 30-Yr. Pass Through | 7.500 | 12/1/2027 | 6,731 | |
| 51,754 | Federal Home Loan Mortgage Corporation Gold | |||
| 30-Yr. Pass Through | 6.500 | 6/1/2028 | 52,871 | |
| 21,740 | Federal Home Loan Mortgage Corporation Gold | |||
| 30-Yr. Pass Through | 7.000 | 10/1/2028 | 22,474 | |
| 65,528 | Federal Home Loan Mortgage Corporation Gold | |||
| 30-Yr. Pass Through | 6.500 | 11/1/2028 | 66,943 | |
| 4,927 | Federal Home Loan Mortgage Corporation Gold | |||
| 30-Yr. Pass Through | 6.500 | 1/1/2029 | 5,034 | |
| 92,324 | Federal Home Loan Mortgage Corporation Gold | |||
| 30-Yr. Pass Through | 6.000 | 3/1/2029 | 92,149 | |
| 46,502 | Federal Home Loan Mortgage Corporation Gold | |||
| 30-Yr. Pass Through | 6.500 | 4/1/2029 | 47,504 | |
| 84,570 | Federal Home Loan Mortgage Corporation Gold | |||
| 30-Yr. Pass Through | 6.000 | 5/1/2029 | 84,410 | |
| 83,763 | Federal Home Loan Mortgage Corporation Gold | |||
| 30-Yr. Pass Through | 7.000 | 5/1/2029 | 86,602 | |
| 34,146 | Federal Home Loan Mortgage Corporation Gold | |||
| 30-Yr. Pass Through | 6.500 | 7/1/2029 | 34,882 | |
| 58,813 | Federal Home Loan Mortgage Corporation Gold | |||
| 30-Yr. Pass Through | 6.500 | 8/1/2029 | 60,081 | |
| The accompanying Notes to Financial Statements are an integral part of this schedule. |
| 162 |
Balanced Portfolio
Schedule of Investments as of June 29, 2007 (unaudited)
| Principal | Interest | Maturity | ||
| Amount | Long-Term Fixed Income (40.7%) | Rate | Date | Value |
| Mortgage-Backed Securities — continued | ||||
| $14,747 | Federal Home Loan Mortgage Corporation Gold | |||
| 30-Yr. Pass Through | 7.000% | 9/1/2029 | $15,247 | |
| 20,864 | Federal Home Loan Mortgage Corporation Gold | |||
| 30-Yr. Pass Through | 7.000 | 10/1/2029 | 21,571 | |
| 9,989 | Federal Home Loan Mortgage Corporation Gold | |||
| 30-Yr. Pass Through | 7.500 | 11/1/2029 | 10,445 | |
| 9,467 | Federal Home Loan Mortgage Corporation Gold | |||
| 30-Yr. Pass Through | 7.000 | 1/1/2030 | 9,788 | |
| 64,301 | Federal Home Loan Mortgage Corporation Gold | |||
| 30-Yr. Pass Through | 7.500 | 1/1/2030 | 67,122 | |
| 12,643 | Federal Home Loan Mortgage Corporation Gold | |||
| 30-Yr. Pass Through | 8.000 | 8/1/2030 | 13,325 | |
| 65,040 | Federal Home Loan Mortgage Corporation Gold | |||
| 30-Yr. Pass Through | 6.000 | 3/1/2031 | 64,886 | |
| 245,097 | Federal Home Loan Mortgage Corporation Gold | |||
| 30-Yr. Pass Through | 6.000 | 6/1/2031 | 244,517 | |
| 192,664 | Federal Home Loan Mortgage Corporation Gold | |||
| 30-Yr. Pass Through | 6.000 | 1/1/2032 | 192,209 | |
| 814,408 | Federal Home Loan Mortgage Corporation Gold | |||
| 30-Yr. Pass Through | 6.000 | 10/1/2032 | 811,952 | |
| 7,000,000 | Federal Home Loan Mortgage Corporation Gold | |||
| 30-Yr. Pass Through § | 5.000 | 7/1/2037 | 6,560,316 | |
| 4,050,000 | Federal Home Loan Mortgage Corporation Gold | |||
| 30-Yr. Pass Through § | 6.000 | 7/1/2037 | 4,012,031 | |
| 5,119 | Federal National Mortgage Association Conventional | |||
| 15-Yr. Pass Through | 9.000 | 4/1/2010 | 5,375 | |
| 3,893 | Federal National Mortgage Association Conventional | |||
| 15-Yr. Pass Through | 6.000 | 2/1/2011 | 3,929 | |
| 8,019 | Federal National Mortgage Association Conventional | |||
| 15-Yr. Pass Through | 8.000 | 5/1/2011 | 8,294 | |
| 10,869 | Federal National Mortgage Association Conventional | |||
| 15-Yr. Pass Through | 7.000 | 6/1/2011 | 11,167 | |
| 4,824 | Federal National Mortgage Association Conventional | |||
| 15-Yr. Pass Through | 6.500 | 7/1/2011 | 4,922 | |
| 4,419 | Federal National Mortgage Association Conventional | |||
| 15-Yr. Pass Through | 7.500 | 7/1/2011 | 4,524 | |
| 35,455 | Federal National Mortgage Association Conventional | |||
| 15-Yr. Pass Through | 6.500 | 5/1/2012 | 36,281 | |
| 13,275 | Federal National Mortgage Association Conventional | |||
| 15-Yr. Pass Through | 6.500 | 7/1/2012 | 13,584 | |
| 34,100 | Federal National Mortgage Association Conventional | |||
| 15-Yr. Pass Through | 7.000 | 10/1/2012 | 35,166 | |
| 6,295 | Federal National Mortgage Association Conventional | |||
| 15-Yr. Pass Through | 7.000 | 12/1/2012 | 6,492 | |
| 24,328 | Federal National Mortgage Association Conventional | |||
| 15-Yr. Pass Through | 6.500 | 6/1/2013 | 24,893 | |
| The accompanying Notes to Financial Statements are an integral part of this schedule. |
| 163 |
Balanced Portfolio
Schedule of Investments as of June 29, 2007 (unaudited)
| Principal | Interest | Maturity | ||
| Amount | Long-Term Fixed Income (40.7%) | Rate | Date | Value |
| Mortgage-Backed Securities — continued | ||||
| $69,060 | Federal National Mortgage Association Conventional | |||
| 15-Yr. Pass Through | 6.000% | 11/1/2013 | $69,683 | |
| 118,014 | Federal National Mortgage Association Conventional | |||
| 15-Yr. Pass Through | 5.500 | 12/1/2013 | 117,219 | |
| 42,026 | Federal National Mortgage Association Conventional | |||
| 15-Yr. Pass Through | 6.000 | 12/1/2013 | 42,466 | |
| 26,700 | Federal National Mortgage Association Conventional | |||
| 15-Yr. Pass Through | 7.500 | 4/1/2015 | 27,519 | |
| 13,950,000 | Federal National Mortgage Association Conventional | |||
| 15-Yr. Pass Through § | 5.000 | 7/1/2022 | 13,479,188 | |
| 7,265 | Federal National Mortgage Association Conventional | |||
| 30-Yr. Pass Through | 10.500 | 8/1/2020 | 8,016 | |
| 6,202 | Federal National Mortgage Association Conventional | |||
| 30-Yr. Pass Through | 9.500 | 4/1/2025 | 6,818 | |
| 1,436 | Federal National Mortgage Association Conventional | |||
| 30-Yr. Pass Through | 7.500 | 9/1/2025 | 1,504 | |
| 5,050 | Federal National Mortgage Association Conventional | |||
| 30-Yr. Pass Through | 8.500 | 11/1/2025 | 5,414 | |
| 3,548 | Federal National Mortgage Association Conventional | |||
| 30-Yr. Pass Through | 7.000 | 1/1/2026 | 3,675 | |
| 16,006 | Federal National Mortgage Association Conventional | |||
| 30-Yr. Pass Through | 6.500 | 2/1/2026 | 16,279 | |
| 6,135 | Federal National Mortgage Association Conventional | |||
| 30-Yr. Pass Through | 7.000 | 3/1/2026 | 6,357 | |
| 9,284 | Federal National Mortgage Association Conventional | |||
| 30-Yr. Pass Through | 6.500 | 4/1/2026 | 9,443 | |
| 1,651 | Federal National Mortgage Association Conventional | |||
| 30-Yr. Pass Through | 8.500 | 5/1/2026 | 1,772 | |
| 4,086 | Federal National Mortgage Association Conventional | |||
| 30-Yr. Pass Through | 7.500 | 7/1/2026 | 4,278 | |
| 22,380 | Federal National Mortgage Association Conventional | |||
| 30-Yr. Pass Through | 7.500 | 8/1/2026 | 23,431 | |
| 2,190 | Federal National Mortgage Association Conventional | |||
| 30-Yr. Pass Through | 8.000 | 8/1/2026 | 2,315 | |
| 10,670 | Federal National Mortgage Association Conventional | |||
| 30-Yr. Pass Through | 7.000 | 11/1/2026 | 11,056 | |
| 3,758 | Federal National Mortgage Association Conventional | |||
| 30-Yr. Pass Through | 8.000 | 11/1/2026 | 3,973 | |
| 1,511 | Federal National Mortgage Association Conventional | |||
| 30-Yr. Pass Through | 7.500 | 12/1/2026 | 1,582 | |
| 2,234 | Federal National Mortgage Association Conventional | |||
| 30-Yr. Pass Through | 7.500 | 2/1/2027 | 2,339 | |
| 8,395 | Federal National Mortgage Association Conventional | |||
| 30-Yr. Pass Through | 7.000 | 3/1/2027 | 8,699 | |
| 9,503 | Federal National Mortgage Association Conventional | |||
| 30-Yr. Pass Through | 7.500 | 5/1/2027 | 9,948 | |
| The accompanying Notes to Financial Statements are an integral part of this schedule. |
| 164 |
Balanced Portfolio
Schedule of Investments as of June 29, 2007 (unaudited)
| Principal | Interest | Maturity | ||
| Amount | Long-Term Fixed Income (40.7%) | Rate | Date | Value |
| Mortgage-Backed Securities — continued | ||||
| $15,372 | Federal National Mortgage Association Conventional | |||
| 30-Yr. Pass Through | 6.500% | 7/1/2027 | $15,682 | |
| 10,601 | Federal National Mortgage Association Conventional | |||
| 30-Yr. Pass Through | 7.000 | 7/1/2027 | 10,988 | |
| 5,047 | Federal National Mortgage Association Conventional | |||
| 30-Yr. Pass Through | 8.000 | 7/1/2027 | 5,339 | |
| 8,070 | Federal National Mortgage Association Conventional | |||
| 30-Yr. Pass Through | 7.500 | 8/1/2027 | 8,447 | |
| 48,776 | Federal National Mortgage Association Conventional | |||
| 30-Yr. Pass Through | 8.000 | 9/1/2027 | 51,594 | |
| 12,697 | Federal National Mortgage Association Conventional | |||
| 30-Yr. Pass Through | 7.000 | 10/1/2027 | 13,161 | |
| 39,242 | Federal National Mortgage Association Conventional | |||
| 30-Yr. Pass Through | 7.500 | 12/1/2027 | 41,080 | |
| 7,085 | Federal National Mortgage Association Conventional | |||
| 30-Yr. Pass Through | 8.000 | 12/1/2027 | 7,494 | |
| 19,669 | Federal National Mortgage Association Conventional | |||
| 30-Yr. Pass Through | 6.500 | 2/1/2028 | 20,065 | |
| 14,075 | Federal National Mortgage Association Conventional | |||
| 30-Yr. Pass Through | 7.000 | 2/1/2028 | 14,589 | |
| 139,584 | Federal National Mortgage Association Conventional | |||
| 30-Yr. Pass Through | 6.500 | 7/1/2028 | 142,464 | |
| 35,496 | Federal National Mortgage Association Conventional | |||
| 30-Yr. Pass Through | 7.000 | 8/1/2028 | 36,800 | |
| 81,634 | Federal National Mortgage Association Conventional | |||
| 30-Yr. Pass Through | 6.500 | 11/1/2028 | 83,319 | |
| 3,130 | Federal National Mortgage Association Conventional | |||
| 30-Yr. Pass Through | 7.000 | 11/1/2028 | 3,245 | |
| 138,362 | Federal National Mortgage Association Conventional | |||
| 30-Yr. Pass Through | 6.000 | 12/1/2028 | 137,916 | |
| 44,335 | Federal National Mortgage Association Conventional | |||
| 30-Yr. Pass Through | 7.000 | 12/1/2028 | 45,963 | |
| 53,336 | Federal National Mortgage Association Conventional | |||
| 30-Yr. Pass Through | 6.000 | 3/1/2029 | 53,145 | |
| 76,825 | Federal National Mortgage Association Conventional | |||
| 30-Yr. Pass Through | 6.500 | 6/1/2029 | 78,405 | |
| 97,080 | Federal National Mortgage Association Conventional | |||
| 30-Yr. Pass Through | 6.000 | 7/1/2029 | 96,732 | |
| 29,358 | Federal National Mortgage Association Conventional | |||
| 30-Yr. Pass Through | 6.500 | 7/1/2029 | 29,962 | |
| 82,041 | Federal National Mortgage Association Conventional | |||
| 30-Yr. Pass Through | 7.500 | 8/1/2029 | 85,821 | |
| 103,941 | Federal National Mortgage Association Conventional | |||
| 30-Yr. Pass Through | 6.000 | 11/1/2029 | 103,568 | |
| 86,898 | Federal National Mortgage Association Conventional | |||
| 30-Yr. Pass Through | 7.000 | 11/1/2029 | 90,109 | |
| The accompanying Notes to Financial Statements are an integral part of this schedule. |
| 165 |
Balanced Portfolio
Schedule of Investments as of June 29, 2007 (unaudited)
| Principal | Interest | Maturity | ||
| Amount | Long-Term Fixed Income (40.7%) | Rate | Date | Value |
| Mortgage-Backed Securities — continued | ||||
| $26,522 | Federal National Mortgage Association Conventional | |||
| 30-Yr. Pass Through | 8.500% | 4/1/2030 | $28,456 | |
| 12,469 | Federal National Mortgage Association Conventional | |||
| 30-Yr. Pass Through | 7.500 | 8/1/2030 | 13,023 | |
| 155,660 | Federal National Mortgage Association Conventional | |||
| 30-Yr. Pass Through | 6.500 | 7/1/2031 | 158,687 | |
| 69,033 | Federal National Mortgage Association Conventional | |||
| 30-Yr. Pass Through | 6.500 | 10/1/2031 | 70,376 | |
| 80,471 | Federal National Mortgage Association Conventional | |||
| 30-Yr. Pass Through | 6.500 | 12/1/2031 | 82,036 | |
| 101,086 | Federal National Mortgage Association Conventional | |||
| 30-Yr. Pass Through | 6.500 | 5/1/2032 | 102,876 | |
| 565,189 | Federal National Mortgage Association Conventional | |||
| 30-Yr. Pass Through | 6.500 | 7/1/2032 | 575,199 | |
| 25,900,000 | Federal National Mortgage Association Conventional | |||
| 30-Yr. Pass Through § | 5.500 | 7/1/2037 | 24,977,312 | |
| 2,685 | Government National Mortgage Association | |||
| 15-Yr. Pass Through | 6.500 | 5/15/2009 | 2,717 | |
| 14,680 | Government National Mortgage Association | |||
| 15-Yr. Pass Through | 6.000 | 4/15/2011 | 14,848 | |
| 3,398 | Government National Mortgage Association | |||
| 5-Yr. Pass Through | 6.500 | 6/15/2011 | 3,473 | |
| 7,524 | Government National Mortgage Association | |||
| 15-Yr. Pass Through | 7.500 | 7/15/2011 | 7,748 | |
| 16,684 | Government National Mortgage Association | |||
| 15-Yr. Pass Through | 7.000 | 4/15/2012 | 17,232 | |
| 115,288 | Government National Mortgage Association | |||
| 15-Yr. Pass Through | 6.000 | 7/15/2014 | 115,988 | |
| 4,245 | Government National Mortgage Association | |||
| 30-Yr. Pass Through | 9.500 | 12/15/2024 | 4,657 | |
| 13,471 | Government National Mortgage Association | |||
| 30-Yr. Pass Through | 9.500 | 1/15/2025 | 14,793 | |
| 35,985 | Government National Mortgage Association | |||
| 30-Yr. Pass Through | 9.000 | 3/15/2025 | 38,904 | |
| 2,980 | Government National Mortgage Association | |||
| 30-Yr. Pass Through | 7.500 | 8/15/2025 | 3,123 | |
| 36,711 | Government National Mortgage Association | |||
| 30-Yr. Pass Through | 7.000 | 1/15/2026 | 38,289 | |
| 4,623 | Government National Mortgage Association | |||
| 30-Yr. Pass Through | 6.500 | 3/15/2026 | 4,715 | |
| 26,339 | Government National Mortgage Association | |||
| 30-Yr. Pass Through | 7.000 | 4/15/2026 | 27,471 | |
| 6,928 | Government National Mortgage Association | |||
| 30-Yr. Pass Through | 8.000 | 4/15/2026 | 7,349 | |
| 25,126 | Government National Mortgage Association | |||
| 30-Yr. Pass Through | 6.000 | 5/15/2026 | 25,094 | |
| The accompanying Notes to Financial Statements are an integral part of this schedule. |
| 166 |
Balanced Portfolio
Schedule of Investments as of June 29, 2007 (unaudited)
| Principal | Interest | Maturity | ||
| Amount | Long-Term Fixed Income (40.7%) | Rate | Date | Value |
| Mortgage-Backed Securities — continued | ||||
| $22,900 | Government National Mortgage Association | |||
| 30-Yr. Pass Through | 7.000% | 5/15/2026 | $23,884 | |
| 8,176 | Government National Mortgage Association | |||
| 30-Yr. Pass Through | 7.500 | 5/15/2026 | 8,569 | |
| 32,429 | Government National Mortgage Association | |||
| 30-Yr. Pass Through | 7.000 | 6/15/2026 | 33,823 | |
| 7,549 | Government National Mortgage Association | |||
| 30-Yr. Pass Through | 8.500 | 6/15/2026 | 8,118 | |
| 3,298 | Government National Mortgage Association | |||
| 30-Yr. Pass Through | 8.500 | 7/15/2026 | 3,546 | |
| 23,162 | Government National Mortgage Association | |||
| 30-Yr. Pass Through | 8.000 | 9/15/2026 | 24,568 | |
| 9,648 | Government National Mortgage Association | |||
| 30-Yr. Pass Through | 7.500 | 10/15/2026 | 10,112 | |
| 7,548 | Government National Mortgage Association | |||
| 30-Yr. Pass Through | 8.000 | 11/15/2026 | 8,006 | |
| 3,135 | Government National Mortgage Association | |||
| 30-Yr. Pass Through | 8.500 | 11/15/2026 | 3,371 | |
| 4,570 | Government National Mortgage Association | |||
| 30-Yr. Pass Through | 9.000 | 12/15/2026 | 4,944 | |
| 2,630 | Government National Mortgage Association | |||
| 30-Yr. Pass Through | 7.500 | 1/15/2027 | 2,756 | |
| 34,022 | Government National Mortgage Association | |||
| 30-Yr. Pass Through | 7.500 | 4/15/2027 | 35,658 | |
| 9,083 | Government National Mortgage Association | |||
| 30-Yr. Pass Through | 8.000 | 6/20/2027 | 9,597 | |
| 3,277 | Government National Mortgage Association | |||
| 30-Yr. Pass Through | 8.000 | 8/15/2027 | 3,476 | |
| 94,495 | Government National Mortgage Association | |||
| 30-Yr. Pass Through�� | 6.500 | 10/15/2027 | 96,506 | |
| 37,223 | Government National Mortgage Association | |||
| 30-Yr. Pass Through | 7.000 | 10/15/2027 | 38,821 | |
| 43,427 | Government National Mortgage Association | |||
| 30-Yr. Pass Through | 7.000 | 11/15/2027 | 45,291 | |
| 109,046 | Government National Mortgage Association | |||
| 30-Yr. Pass Through | 7.000 | 7/15/2028 | 113,677 | |
| 17,757 | Government National Mortgage Association | |||
| 30-Yr. Pass Through | 7.500 | 7/15/2028 | 18,607 | |
| 111,444 | Government National Mortgage Association | |||
| 30-Yr. Pass Through | 6.500 | 9/15/2028 | 113,851 | |
| 96,122 | Government National Mortgage Association | |||
| 30-Yr. Pass Through | 6.000 | 12/15/2028 | 95,988 | |
| 81,527 | Government National Mortgage Association | |||
| 30-Yr. Pass Through | 6.500 | 1/15/2029 | 83,294 | |
| 241,847 | Government National Mortgage Association | |||
| 30-Yr. Pass Through | 6.500 | 3/15/2029 | 247,087 | |
| The accompanying Notes to Financial Statements are an integral part of this schedule. |
| 167 |
Balanced Portfolio
Schedule of Investments as of June 29, 2007 (unaudited)
| Principal | Interest | Maturity | ||
| Amount | Long-Term Fixed Income (40.7%) | Rate | Date | Value |
| Mortgage-Backed Securities — continued | ||||
| $51,933 | Government National Mortgage Association | |||
| 30-Yr. Pass Through | 6.500% | 4/15/2029 | $53,059 | |
| 36,661 | Government National Mortgage Association | |||
| 30-Yr. Pass Through | 7.000 | 4/15/2029 | 38,218 | |
| 161,663 | Government National Mortgage Association | |||
| 30-Yr. Pass Through | 6.000 | 6/15/2029 | 161,415 | |
| 65,477 | Government National Mortgage Association | |||
| 30-Yr. Pass Through | 7.000 | 6/15/2029 | 68,258 | |
| 4,896 | Government National Mortgage Association | |||
| 30-Yr. Pass Through | 7.500 | 8/15/2029 | 5,129 | |
| 24,639 | Government National Mortgage Association | |||
| 30-Yr. Pass Through | 8.000 | 5/15/2030 | 26,164 | |
| 53,286 | Government National Mortgage Association | |||
| 30-Yr. Pass Through | 7.000 | 9/15/2031 | 55,520 | |
| 102,723 | Government National Mortgage Association | |||
| 30-Yr. Pass Through | 6.500 | 2/15/2032 | 104,782 | |
| Total Mortgage-Backed Securities | 57,850,557 | |||
| Technology (0.1%) | ||||
| 500,000 | International Business Machines Corporation | 7.500 | 6/15/2013 | 545,062 |
| Total Technology | 545,062 | |||
| Transportation (0.3%) | ||||
| 425,000 | CSX Corporation | 5.500 | 8/1/2013 | 416,715 |
| 450,000 | FedEx Corporation | 3.500 | 4/1/2009 | 434,992 |
| 500,000 | Union Pacific Corporation | 6.500 | 4/15/2012 | 514,659 |
| Total Transportation | 1,366,366 | |||
| U.S. Government (8.7%) | ||||
| 2,000,000 | Federal Home Loan Bank | 4.100 | 6/13/2008 | 1,978,058 |
| 2,000,000 | Federal Home Loan Bank | 4.500 | 10/14/2008 | 1,981,218 |
| 2,500,000 | Federal Home Loan Bank | 4.625 | 11/21/2008 | 2,479,238 |
| 1,000,000 | Federal Home Loan Bank | 3.750 | 8/18/2009 | 971,970 |
| 3,000,000 | Federal Home Loan Mortgage Corporation | 5.750 | 4/15/2008 | 3,009,096 |
| 1,000,000 | Federal National Mortgage Association | 5.250 | 1/15/2009 | 1,000,078 |
| 1,300,000 | Federal National Mortgage Association * | 5.000 | 2/13/2017 | 1,257,645 |
| 1,500,000 | Federal National Mortgage Association | 5.625 | 4/17/2028 | 1,486,611 |
| 1,000,000 | Federal National Mortgage Association | 7.125 | 1/15/2030 | 1,190,033 |
| 1,000,000 | Resolution Funding Corporation | 8.625 | 1/15/2021 | 1,293,185 |
| 5,400,000 | U.S. Treasury Bonds * | 7.250 | 5/15/2016 | 6,240,796 |
| 925,000 | U.S. Treasury Bonds * | 8.875 | 2/15/2019 | 1,223,312 |
| 650,000 | U.S. Treasury Bonds * | 7.875 | 2/15/2021 | 817,933 |
| 600,000 | U.S. Treasury Bonds | 8.000 | 11/15/2021 | 767,672 |
| 400,000 | U.S. Treasury Bonds | 7.250 | 8/15/2022 | 484,219 |
| 250,000 | U.S. Treasury Bonds * | 7.625 | 11/15/2022 | 313,125 |
| 625,000 | U.S. Treasury Bonds * | 7.125 | 2/15/2023 | 750,293 |
| The accompanying Notes to Financial Statements are an integral part of this schedule. |
| 168 |
Balanced Portfolio
Schedule of Investments as of June 29, 2007 (unaudited)
| Principal | Interest | Maturity | ||
| Amount | Long-Term Fixed Income (40.7%) | Rate | Date | Value |
| U.S. Government — continued | ||||
| $750,000 | U.S. Treasury Bonds * | 6.250% | 8/15/2023 | $832,793 |
| 1,100,000 | U.S. Treasury Bonds ‡ | 7.500 | 11/15/2024 | 1,383,766 |
| 500,000 | U.S. Treasury Bonds | 6.875 | 8/15/2025 | 595,664 |
| 1,450,000 | U.S. Treasury Bonds * | 6.125 | 8/15/2029 | 1,626,493 |
| 500,000 | U.S. Treasury Bonds * | 4.500 | 2/15/2036 | 452,734 |
| 1,000,000 | U.S. Treasury Notes | 3.375 | 2/15/2008 | 989,922 |
| 3,700,000 | U.S. Treasury Notes * | 6.000 | 8/15/2009 | 3,780,072 |
| 3,000,000 | U.S. Treasury Notes * | 3.625 | 1/15/2010 | 2,910,000 |
| 3,500,000 | U.S. Treasury Notes * | 4.500 | 11/30/2011 | 3,440,392 |
| 750,000 | U.S. Treasury Notes | 4.750 | 5/15/2014 | 740,625 |
| 1,700,000 | U.S. Treasury Notes * | 4.500 | 2/15/2016 | 1,638,508 |
| 275,000 | U.S. Treasury Notes * | 4.625 | 2/15/2017 | 266,320 |
| Total U.S. Government | 45,901,771 | |||
| Utilities (0.6%) | ||||
| 225,000 | Commonwealth Edison Company | 5.900 | 3/15/2036 | 207,984 |
| 450,000 | Duke Capital Corporation | 7.500 | 10/1/2009 | 467,823 |
| 450,000 | FirstEnergy Corporation | 6.450 | 11/15/2011 | 461,436 |
| 425,000 | Oncor Electric Delivery Company | 6.375 | 1/15/2015 | 431,066 |
| 225,000 | Oneok Partners, LP | 6.650 | 10/1/2036 | 223,164 |
| 300,000 | Progress Energy, Inc. | 7.000 | 10/30/2031 | 320,734 |
| 700,000 | Public Service Company of Colorado | 7.875 | 10/1/2012 | 768,029 |
| 225,000 | Southern California Edison Company | 5.000 | 1/15/2014 | 215,152 |
| 225,000 | Xcel Energy, Inc. | 6.500 | 7/1/2036 | 227,560 |
| Total Utilities | 3,322,948 | |||
| Total Long-Term Fixed Income (cost $216,061,371) | 214,761,588 | |||
| Interest | Maturity | |||
| Shares | Collateral Held for Securities Loaned (6.5%) | Rate (+) | Date | Value |
| 34,577,994 | Thrivent Financial Securities Lending Trust | 5.360% | N/A | $34,577,994 |
| Total Collateral Held for Securities Loaned | ||||
| (cost $34,577,994) | 34,577,994 | |||
| The accompanying Notes to Financial Statements are an integral part of this schedule. |
| 169 |
Balanced Portfolio
Schedule of Investments as of June 29, 2007 (unaudited)
| Shares or | ||||
| Principal | Interest | Maturity | ||
| Amount | Short-Term Investments (3.6%) | Rate (+) | Date | Value |
| $2,000,000 | Barclays US Funding Corporation ± | 5.235% | 7/27/2007 | $1,992,147 |
| 500,000 | Federal National Mortgage Association ‡ | 5.080 | 7/16/2007 | 498,872 |
| 16,501,487 | Thrivent Money Market Portfolio | 5.050 | N/A | 16,501,487 |
| Total Short-Term Investments (at amortized cost) | 18,992,506 | |||
| Total Investments (cost $503,263,316) 115.7% | $611,330,600 | |||
| Other Assets and Liabilities, Net (15.7%) | (83,123,799) | |||
| Total Net Assets 100.0% | $528,206,801 | |||
| Number of | Notional | ||||
| Contracts | Expiration | Principal | Unrealized | ||
| Futures | Long/(Short) | Date | Amount | Value | Gain/(Loss) |
| S&P 500 Index Futures | 17 | September 2007 | $6,595,448 | $6,440,450 | ($154,998) |
# Non-income producing security.
* All or a portion of the security is on loan as discussed in item 2(M) of the Notes to Financial Statements.
+ The interest rate shown reflects the yield, coupon rate or, for securities purchased at a discount, the discount rate at the date of purchase.
† Denotes variable rate obligations for which the current yield and next scheduled reset date are shown.
§ Denotes investments purchased on a when-issued or delayed delivery basis.
± Designated as cover for long settling trades as discussed in the Notes to Financial Statements.
‡ At June 29, 2007, $1,127,857 of investments were held on deposit with the counterparty and pledged as the initial margin deposit for open financial futures contracts. In addition, $7,656,000 of investments were earmarked as collateral to cover open financial futures contracts.
Definitions:
REIT — Real Estate Investment Trust, is a company that buys, develops, manages and/or sells real estate assets.
Gross unrealized appreciation and depreciation of investments were as follows:
| Gross unrealized appreciation | $137,288,644 |
| Gross unrealized depreciation | (29,221,360) |
| Net unrealized appreciation (depreciation) | $108,067,284 |
| Cost for federal income tax purposes | $503,263,316 |
| The accompanying Notes to Financial Statements are an integral part of this schedule. |
| 170 |
| High Yield Portfolio Schedule of Investments as of June 29, 2007 (unaudited) | ||||
| Principal | Interest | Maturity | ||
| Amount | Long-Term Fixed Income (94.1%) | Rate | Date | Value |
| Basic Materials (10.5%) | ||||
| $2,130,000 | Aleris International, Inc. ±‡ | 9.000% | 12/15/2014 | $2,148,638 |
| 2,740,000 | Aleris International, Inc. | 10.000 | 12/15/2016 | 2,719,450 |
| 3,035,000 | Arch Western Finance, LLC | 6.750 | 7/1/2013 | 2,913,600 |
| 2,250,000 | Buckeye Technologies, Inc. ‡ | 8.000 | 10/15/2010 | 2,250,000 |
| 2,770,000 | Domtar, Inc. | 7.125 | 8/1/2015 | 2,683,438 |
| 2,525,000 | Drummond Company, Inc. ‡ | 7.375 | 2/15/2016 | 2,398,750 |
| 1,414,000 | Equistar Chemicals, LP | 10.625 | 5/1/2011 | 1,488,235 |
| 3,485,000 | FMG Finance, Pty. Ltd. | 10.625 | 9/1/2016 | 4,147,150 |
| 3,545,000 | Freeport-McMoRan Copper & Gold, Inc. | 8.375 | 4/1/2017 | 3,784,288 |
| 1,640,000 | Georgia-Pacific Corporation | 8.125 | 5/15/2011 | 1,674,850 |
| 2,115,000 | Georgia-Pacific Corporation | 7.125 | 1/15/2017 | 2,030,400 |
| 4,160,000 | Graphic Packaging International Corporation | 9.500 | 8/15/2013 | 4,321,200 |
| 3,475,000 | Griffin Coal Mining Company, Pty., Ltd. | 9.500 | 12/1/2016 | 3,574,906 |
| 3,490,000 | Huntsman International, LLC | 7.875 | 11/13/2014 | 3,738,662 |
| 5,100,000 | Ineos Group Holdings plc | 8.500 | 2/15/2016 | 4,985,250 |
| 1,520,000 | Jefferson Smurfit Corporation | 8.250 | 10/1/2012 | 1,508,600 |
| 3,520,000 | Lyondell Chemical Company | 10.500 | 6/1/2013 | 3,801,600 |
| 1,600,000 | Lyondell Chemical Company | 8.250 | 9/15/2016 | 1,672,000 |
| 1,590,000 | Lyondell Chemical Company | 6.875 | 6/15/2017 | 1,534,350 |
| 2,270,000 | Mosaic Global Holdings, Inc., Convertible | 7.375 | 12/1/2014 | 2,292,700 |
| 1,620,000 | PNA Group, Inc. | 10.750 | 9/1/2016 | 1,765,800 |
| 1,140,000 | PNA Intermediate Holdings Corporation † | 12.360 | 8/15/2007 | 1,151,400 |
| 3,800,000 | Ryerson, Inc. | 8.250 | 12/15/2011 | 3,819,000 |
| 2,160,000 | Smurfit-Stone Container Enterprises, Inc. | 8.000 | 3/15/2017 | 2,095,200 |
| 1,970,000 | Southern Copper Corporation | 7.500 | 7/27/2035 | 2,114,868 |
| 4,210,000 | Terra Capital, Inc. | 7.000 | 2/1/2017 | 4,062,650 |
| Total Basic Materials | 70,676,985 | |||
| Capital Goods (8.6%) | ||||
| 2,600,000 | Ahern Rentals, Inc. | 9.250 | 8/15/2013 | 2,632,500 |
| 4,830,000 | Allied Waste North America, Inc. ±‡ | 7.875 | 4/15/2013 | 4,884,338 |
| 1,530,000 | Ashtead Capital, Inc. ‡ | 9.000 | 8/15/2016 | 1,602,675 |
| 2,525,000 | Ball Corporation ± | 6.625 | 3/15/2018 | 2,424,000 |
| 2,505,000 | Berry Plastics Holding Corporation ‡ | 8.875 | 9/15/2014 | 2,536,312 |
| 1,570,000 | Case New Holland, Inc. ‡ | 7.125 | 3/1/2014 | 1,589,625 |
| 2,150,000 | Crown Americas, Inc. | 7.625 | 11/15/2013 | 2,171,500 |
| 2,150,000 | Crown Americas, Inc. ± | 7.750 | 11/15/2015 | 2,160,750 |
| 3,400,000 | Da-Lite Screen Company, Inc. | 9.500 | 5/15/2011 | 3,570,000 |
| 1,140,000 | General Cable Corporation | 7.125 | 4/1/2017 | 1,128,600 |
| 1,915,000 | Graham Packaging Company, Inc. | 9.875 | 10/15/2014 | 1,936,544 |
| 1,090,000 | K&F Acquisition, Inc. | 7.750 | 11/15/2014 | 1,155,400 |
| 1,150,000 | Legrand SA | 8.500 | 2/15/2025 | 1,342,625 |
| 2,660,000 | Mueller Water Products, Inc. | 7.375 | 6/1/2017 | 2,637,683 |
| 2,340,000 | Norcraft Companies, LP/Norcraft Finance Corporation | 9.000 | 11/1/2011 | 2,416,050 |
| 1,630,000 | Owens-Brockway Glass Container, Inc. | 8.250 | 5/15/2013 | 1,687,050 |
| 4,150,000 | Owens-Illinois, Inc. | 7.500 | 5/15/2010 | 4,186,312 |
| The accompanying Notes to Financial Statements are an integral part of this schedule. |
| 171 |
High Yield Portfolio
Schedule of Investments as of June 29, 2007 (unaudited)
| Principal | Interest | Maturity | ||
| Amount | Long-Term Fixed Income (94.1%) | Rate | Date | Value |
| Capital Goods — continued | ||||
| $3,585,000 | Plastipak Holdings, Inc. | 8.500% | 12/15/2015 | $3,710,475 |
| 2,975,000 | RBS Global, Inc./Rexnord Corporation | 9.500 | 8/1/2014 | 3,049,375 |
| 1,110,000 | RBS Global, Inc./Rexnord Corporation | 11.750 | 8/1/2016 | 1,193,250 |
| 1,755,000 | Rental Services Corporation | 9.500 | 12/1/2014 | 1,790,100 |
| 1,840,000 | TransDigm, Inc. | 7.750 | 7/15/2014 | 1,858,400 |
| 2,295,000 | United Rentals North America, Inc. | 6.500 | 2/15/2012 | 2,254,838 |
| 3,620,000 | United Rentals North America, Inc. | 7.000 | 2/15/2014 | 3,529,500 |
| Total Capital Goods | 57,447,902 | |||
| Communications Services (17.0%) | ||||
| 2,840,000 | Block Communications, Inc. ‡ | 8.250 | 12/15/2015 | 2,868,400 |
| 2,410,000 | CCH I, LLC | 11.000 | 10/1/2015 | 2,515,438 |
| 2,900,000 | CCH II, LLC/ CCH II Capital Corporation | 10.250 | 10/1/2013 | 3,103,000 |
| 2,540,000 | Centennial Communications Corporation ± | 8.125 | 2/1/2014 | 2,597,150 |
| 3,060,000 | Charter Communications Holdings, LLC | 8.750 | 11/15/2013 | 3,113,550 |
| 3,420,000 | Citizens Communications Company ± | 9.250 | 5/15/2011 | 3,693,600 |
| 1,310,000 | Dex Media West, LLC/Dex Media West | |||
| Finance Company | 9.875 | 8/15/2013 | 1,401,700 | |
| 3,425,000 | Dobson Cellular Systems ‡ | 9.875 | 11/1/2012 | 3,690,438 |
| 2,505,000 | Idearc, Inc. | 8.000 | 11/15/2016 | 2,530,050 |
| 2,280,000 | Intelsat Bermuda, Ltd. † | 8.872 | 7/15/2007 | 2,328,450 |
| 1,640,000 | Intelsat Bermuda, Ltd. | 9.250 | 6/15/2016 | 1,742,500 |
| 3,520,000 | Intelsat Intermediate, Inc. > | Zero Coupon | 2/1/2010 | 2,895,200 |
| 2,510,000 | Intelsat Subsidiary Holding Company, Ltd. | 8.625 | 1/15/2015 | 2,572,750 |
| 1,785,000 | Lamar Media Corporation | 6.625 | 8/15/2015 | 1,691,288 |
| 3,970,000 | Level 3 Financing, Inc. | 9.250 | 11/1/2014 | 4,009,700 |
| 2,270,000 | Level 3 Financing, Inc. | 8.750 | 2/15/2017 | 2,244,462 |
| 6,430,000 | MetroPCS Wireless, Inc. | 9.250 | 11/1/2014 | 6,638,975 |
| 2,650,000 | Morris Publishing Group, LLC | 7.000 | 8/1/2013 | 2,318,750 |
| 5,330,000 | NTL Cable plc | 9.125 | 8/15/2016 | 5,583,175 |
| 2,510,000 | PRIMEDIA, Inc. † | 10.735 | 8/15/2007 | 2,588,438 |
| 3,110,000 | Quebecor World, Inc. | 9.750 | 1/15/2015 | 3,148,875 |
| 1,270,000 | Qwest Communications International, Inc. | 7.500 | 2/15/2014 | 1,285,875 |
| 4,530,000 | Qwest Corporation | 7.875 | 9/1/2011 | 4,722,525 |
| 1,650,000 | Qwest Corporation | 7.625 | 6/15/2015 | 1,703,625 |
| 9,925,000 | R.H. Donnelley Corporation | 6.875 | 1/15/2013 | 9,403,938 |
| 2,555,000 | R.H. Donnelley Corporation | 8.875 | 1/15/2016 | 2,657,200 |
| 4,590,000 | Readers Digest Association, Inc. | 9.000 | 2/15/2017 | 4,291,650 |
| 1,890,000 | Rural Cellular Corporation † | 8.360 | 9/4/2007 | 1,880,550 |
| 1,780,000 | Rural Cellular Corporation | 9.875 | 2/1/2010 | 1,860,100 |
| 3,385,000 | Time Warner Telecom Holdings, Inc. | 9.250 | 2/15/2014 | 3,588,100 |
| 3,510,000 | TL Acquisitions, Inc. >§ | Zero Coupon | 7/15/2009 | 2,636,888 |
| 3,780,000 | TL Acquisitions, Inc. § | 10.500 | 1/15/2015 | 3,666,600 |
| The accompanying Notes to Financial Statements are an integral part of this schedule. |
| 172 |
High Yield Portfolio
Schedule of Investments as of June 29, 2007 (unaudited)
| Principal | Interest | Maturity | ||
| Amount | Long-Term Fixed Income (94.1%) | Rate | Date | Value |
| Communications Services — continued | ||||
| $4,590,000 | Umbrella Acquisition | 9.750% | 3/15/2015 | $4,532,625 |
| 5,360,000 | Videotron Ltee | 6.875 | 1/15/2014 | 5,252,800 |
| 1,270,000 | Windstream Corporation | 8.625 | 8/1/2016 | 1,343,025 |
| 2,100,000 | Windstream Corporation | 7.000 | 3/15/2019 | 2,005,500 |
| Total Communications Services | 114,106,890 | |||
| Consumer Cyclical (21.1%) | ||||
| 1,980,000 | Allied Security Escrow Corporation ‡ | 11.375 | 7/15/2011 | 1,989,900 |
| 3,720,000 | ArvinMeritor, Inc. | 8.125 | 9/15/2015 | 3,603,750 |
| 2,755,000 | Beazer Homes USA, Inc. | 8.625 | 5/15/2011 | 2,644,800 |
| 3,350,000 | Bon-Ton Stores, Inc. | 10.250 | 3/15/2014 | 3,391,875 |
| 970,000 | Boyd Gaming Corporation | 7.125 | 2/1/2016 | 940,900 |
| 4,600,000 | Buffalo Thunder Development Authority ‡ | 9.375 | 12/15/2014 | 4,600,000 |
| 1,710,000 | Buffets, Inc. ±‡ | 12.500 | 11/1/2014 | 1,637,325 |
| 3,390,000 | Buhrmann U.S., Inc. ‡ | 7.875 | 3/1/2015 | 3,339,150 |
| 2,960,000 | Burlington Coat Factory Warehouse Corporation | 11.125 | 4/15/2014 | 2,886,000 |
| 3,590,000 | Circus & Eldorado Joint Venture/Silver Legacy | |||
| Capital Corporation | 10.125 | 3/1/2012 | 3,756,038 | |
| 3,240,000 | Claire’s Stores, Inc. | 10.500 | 6/1/2017 | 2,956,500 |
| 2,130,000 | Dollarama Group, LP †‡ | 11.160 | 12/17/2007 | 2,108,700 |
| 5,335,000 | Dollarama Group, LP | 8.875 | 8/15/2012 | 5,468,375 |
| 5,110,000 | Fontainebleau Las Vegas Holdings, LLC | 10.250 | 6/15/2015 | 5,033,350 |
| 4,050,000 | Ford Motor Credit Company † | 9.806 | 7/16/2007 | 4,340,430 |
| 1,350,000 | Ford Motor Credit Company | 9.750 | 9/15/2010 | 1,409,650 |
| 2,680,000 | Ford Motor Credit Company | 7.000 | 10/1/2013 | 2,483,009 |
| 1,590,000 | Ford Motor Credit Company | 8.000 | 12/15/2016 | 1,522,978 |
| 3,890,000 | Gaylord Entertainment Company | 6.750 | 11/15/2014 | 3,821,925 |
| 4,050,000 | General Motors Corporation | 8.250 | 7/15/2023 | 3,690,562 |
| 5,040,000 | Group 1 Automotive, Inc. | 8.250 | 8/15/2013 | 5,203,800 |
| 1,700,000 | Group 1 Automotive, Inc., Convertible | 2.250 | 6/15/2016 | 1,464,125 |
| 2,460,000 | Hanesbrands, Inc. † | 8.784 | 12/17/2007 | 2,496,900 |
| 1,965,000 | Harrah’s Operating Company, Inc. | 6.500 | 6/1/2016 | 1,640,775 |
| 3,650,000 | K. Hovnanian Enterprises, Inc. | 7.500 | 5/15/2016 | 3,321,500 |
| 1,535,000 | KB Home | 6.250 | 6/15/2015 | 1,350,800 |
| 3,140,000 | Majestic Star Casino, LLC | 9.500 | 10/15/2010 | 3,265,600 |
| 4,190,000 | MGM MIRAGE | 5.875 | 2/27/2014 | 3,791,950 |
| 3,510,000 | Mohegan Tribal Gaming Authority | 6.375 | 7/15/2009 | 3,474,900 |
| 3,180,000 | NCL Corporation | 10.625 | 7/15/2014 | 3,068,700 |
| 1,655,000 | Norcraft Holdings, LP/Norcraft | |||
| Capital Corporation | Zero Coupon | 9/1/2008 | 1,514,325 | |
| 2,800,000 | Perry Ellis International, Inc. | 8.875 | 9/15/2013 | 2,842,000 |
| 3,600,000 | Pokagon Gaming Authority | 10.375 | 6/15/2014 | 3,969,000 |
| 2,840,000 | Realogy Corporation | 10.500 | 4/15/2014 | 2,705,100 |
| 1,350,000 | Realogy Corporation | 12.375 | 4/15/2015 | 1,231,875 |
| 2,555,000 | Rite Aid Corporation | 8.625 | 3/1/2015 | 2,388,925 |
| The accompanying Notes to Financial Statements are an integral part of this schedule. |
| 173 |
High Yield Portfolio
Schedule of Investments as of June 29, 2007 (unaudited)
| Principal | Interest | Maturity | ||
| Amount | Long-Term Fixed Income (94.1%) | Rate | Date | Value |
| Consumer Cyclical — continued | ||||
| $3,325,000 | Sally Holdings, LLC * | 10.500% | 11/15/2016 | $3,341,625 |
| 2,835,000 | Seminole Hard Rock Entertainment † | 7.860 | 9/17/2007 | 2,856,262 |
| 2,100,000 | Service Corporation International | 6.750 | 4/1/2015 | 2,023,875 |
| 2,160,000 | Shingle Springs Tribal Gaming Authority | 9.375 | 6/15/2015 | 2,178,900 |
| 5,525,000 | Station Casinos, Inc. | 6.875 | 3/1/2016 | 4,875,812 |
| 6,510,000 | Tunica Biloxi Gaming Authority | 9.000 | 11/15/2015 | 6,802,950 |
| 2,000,000 | Turning Stone Resort Casino Enterprise | 9.125 | 12/15/2010 | 2,035,000 |
| 2,960,000 | Turning Stone Resort Casino Enterprise | 9.125 | 9/15/2014 | 3,011,800 |
| 3,515,000 | Universal City Florida Holding Company I/II † | 10.106 | 8/1/2007 | 3,585,300 |
| 3,045,000 | Warnaco, Inc. | 8.875 | 6/15/2013 | 3,220,088 |
| 3,103,000 | WMG Holdings Corporation > | Zero Coupon | 12/15/2009 | 2,358,280 |
| Total Consumer Cyclical | 141,645,384 | |||
| Consumer Non-Cyclical (9.4%) | ||||
| 3,950,000 | Community Health Systems, Inc. § | 8.875 | 7/15/2015 | 4,004,312 |
| 4,420,000 | Constellation Brands, Inc.�� | 7.250 | 9/1/2016 | 4,309,500 |
| 2,170,000 | Elan Finance plc/Elan Finance Corporation † | 9.360 | 8/15/2007 | 2,180,850 |
| 3,140,000 | HCA, Inc. | 6.750 | 7/15/2013 | 2,857,400 |
| 5,870,000 | HCA, Inc. | 9.250 | 11/15/2016 | 6,251,550 |
| 2,880,000 | IASIS Healthcare, LLC (IASIS Capital Corporation) | 8.750 | 6/15/2014 | 2,880,000 |
| 3,730,000 | Jarden Corporation | 7.500 | 5/1/2017 | 3,683,375 |
| 4,185,000 | Jostens Holding Corporation > | Zero Coupon | 12/1/2008 | 3,839,738 |
| 3,240,000 | Michael Foods, Inc. | 8.000 | 11/15/2013 | 3,272,400 |
| 3,710,000 | Omnicare, Inc. | 6.750 | 12/15/2013 | 3,543,050 |
| 2,125,000 | Smithfield Foods, Inc. | 8.000 | 10/15/2009 | 2,188,750 |
| 2,150,000 | Stater Brothers Holdings, Inc. | 8.125 | 6/15/2012 | 2,166,125 |
| 3,410,000 | Sun Healthcare Group, Inc. | 9.125 | 4/15/2015 | 3,546,400 |
| 2,680,000 | SUPERVALU, Inc. | 7.500 | 11/15/2014 | 2,747,000 |
| 3,780,000 | Surgical Care Affiliates, Inc. | 8.875 | 7/15/2015 | 3,761,100 |
| 2,680,000 | Triad Hospitals, Inc. | 7.000 | 11/15/2013 | 2,817,213 |
| 3,810,000 | Vanguard Health Holding Company II, LLC | 9.000 | 10/1/2014 | 3,771,900 |
| 3,740,000 | Ventas Realty, LP/Ventas Capital Corporation | 6.500 | 6/1/2016 | 3,646,500 |
| 1,508,000 | Warner Chilcott Corporation | 8.750 | 2/1/2015 | 1,549,470 |
| Total Consumer Non-Cyclical | 63,016,633 | |||
| Energy (6.5%) | ||||
| 3,230,000 | CHC Helicopter Corporation | 7.375 | 5/1/2014 | 3,076,575 |
| 1,585,000 | Chesapeake Energy Corporation ‡ | 6.375 | 6/15/2015 | 1,511,694 |
| 2,710,000 | Chesapeake Energy Corporation ‡ | 6.250 | 1/15/2018 | 2,530,462 |
| 3,035,000 | Denbury Resources, Inc. | 7.500 | 12/15/2015 | 3,027,412 |
| 2,700,000 | Energy Partners, Ltd. | 9.750 | 4/15/2014 | 2,679,750 |
| 2,980,000 | Forest Oil Corporation | 7.250 | 6/15/2019 | 2,890,600 |
| 2,135,000 | Hornbeck Offshore Services, Inc. | 6.125 | 12/1/2014 | 1,953,525 |
| 2,700,000 | Mariner Energy, Inc. | 8.000 | 5/15/2017 | 2,679,750 |
| 4,525,000 | Ocean Rig Norway AS | 8.375 | 7/1/2013 | 4,660,750 |
| 4,270,000 | OPTI Canada, Inc. | 8.250 | 12/15/2014 | 4,334,050 |
| The accompanying Notes to Financial Statements are an integral part of this schedule. |
| 174 |
High Yield Portfolio
Schedule of Investments as of June 29, 2007 (unaudited)
| Principal | Interest | Maturity | ||
| Amount | Long-Term Fixed Income (94.1%) | Rate | Date | Value |
| Energy — continued | ||||
| $3,140,000 | PetroHawk Energy Corporation | 9.125% | 7/15/2013 | $3,320,550 |
| 3,030,000 | Petroplus Finance, Ltd. | 7.000 | 5/1/2017 | 2,916,375 |
| 3,630,000 | Plains Exploration & Production Company | 7.750 | 6/15/2015 | 3,602,775 |
| 3,800,000 | Western Oil Sands, Inc. | 8.375 | 5/1/2012 | 4,156,250 |
| Total Energy | 43,340,518 | |||
| Financials (3.0%) | ||||
| 2,150,000 | ACE Cash Express, Inc. | 10.250 | 10/1/2014 | 2,198,375 |
| 1,425,000 | Deluxe Corporation | 7.375 | 6/1/2015 | 1,417,875 |
| 2,050,000 | FTI Consulting, Inc. | 7.625 | 6/15/2013 | 2,075,625 |
| 8,285,000 | General Motors Acceptance Corporation | 6.875 | 9/15/2011 | 8,149,573 |
| 6,600,000 | Leucadia National Corporation | 7.125 | 3/15/2017 | 6,402,000 |
| Total Financials | 20,243,448 | |||
| Technology (3.2%) | ||||
| 3,250,000 | Avago Technologies Finance Pte †‡ | 10.860 | 9/3/2007 | 3,339,375 |
| 2,100,000 | Avago Technologies Finance Pte ‡ | 10.125 | 12/1/2013 | 2,236,500 |
| 2,290,000 | Nortel Networks, Ltd. † | 9.606 | 7/15/2007 | 2,435,988 |
| 1,600,000 | NXP BV/NXP Funding, LLC † | 8.105 | 7/15/2007 | 1,602,000 |
| 4,780,000 | NXP BV/NXP Funding, LLC | 9.500 | 10/15/2015 | 4,708,300 |
| 5,205,000 | Seagate Technology HDD Holdings | 6.800 | 10/1/2016 | 4,996,800 |
| 2,180,000 | SunGard Data Systems, Inc. | 10.250 | 8/15/2015 | 2,305,350 |
| Total Technology | 21,624,313 | |||
| Transportation (4.3%) | ||||
| 3,359,836 | Continental Airlines, Inc. | 7.875 | 7/2/2018 | 3,435,432 |
| 2,670,000 | Delta Air Lines, Inc. ± | 7.920 | 11/18/2010 | 2,696,700 |
| 1,825,000 | Hertz Corporation | 8.875 | 1/1/2014 | 1,902,562 |
| 2,955,000 | Hertz Corporation | 10.500 | 1/1/2016 | 3,265,275 |
| 1,287,000 | H-Lines Finance Holding Corporation > | Zero Coupon | 4/1/2008 | 1,261,260 |
| 2,443,000 | Horizon Lines, LLC | 9.000 | 11/1/2012 | 2,583,472 |
| 3,220,000 | Kansas City Southern de Mexico SA de CV | 7.625 | 12/1/2013 | 3,211,950 |
| 3,000,000 | Navios Maritime Holdings, Inc. | 9.500 | 12/15/2014 | 3,180,000 |
| 2,112,915 | Northwest Airlines, Inc. | 7.691 | 4/1/2017 | 2,152,532 |
| 1,890,000 | Saint Acquisition Corporation | 12.500 | 5/15/2017 | 1,786,050 |
| 3,500,000 | Windsor Petroleum Transport Corporation | 7.840 | 1/15/2021 | 3,698,964 |
| Total Transportation | 29,174,197 | |||
| Utilities (10.5%) | ||||
| 1,700,000 | AES Corporation | 8.875 | 2/15/2011 | 1,791,375 |
| 3,170,000 | AES Corporation ‡ | 8.750 | 5/15/2013 | 3,344,350 |
| 2,950,000 | Colorado Interstate Gas Company | 6.800 | 11/15/2015 | 3,033,824 |
| 1,445,000 | Consumers Energy Company | 6.300 | 2/1/2012 | 1,428,930 |
| 2,870,000 | Copano Energy, LLC | 8.125 | 3/1/2016 | 2,913,050 |
| 2,020,000 | Dynegy Holdings, Inc. | 6.875 | 4/1/2011 | 1,984,650 |
| The accompanying Notes to Financial Statements are an integral part of this schedule. |
| 175 |
High Yield Portfolio
Schedule of Investments as of June 29, 2007 (unaudited)
| Principal | Interest | Maturity | ||
| Amount | Long-Term Fixed Income (94.1%) | Rate | Date | Value |
| Utilities — continued | ||||
| $1,860,000 | Dynegy Holdings, Inc. | 7.500% | 6/1/2015 | $1,750,725 |
| 2,005,000 | Dynegy Holdings, Inc. | 8.375 | 5/1/2016 | 1,959,888 |
| 1,370,000 | Dynegy Holdings, Inc. | 7.750 | 6/1/2019 | 1,274,100 |
| 2,230,000 | Edison Mission Energy | 7.500 | 6/15/2013 | 2,207,700 |
| 3,710,000 | Edison Mission Energy ‡ | 7.000 | 5/15/2017 | 3,496,675 |
| 3,710,000 | Edison Mission Energy | 7.200 | 5/15/2019 | 3,487,400 |
| 3,180,000 | Edison Mission Energy | 7.625 | 5/15/2027 | 3,005,100 |
| 2,530,000 | El Paso Corporation | 6.875 | 6/15/2014 | 2,517,345 |
| 2,530,000 | El Paso Corporation | 7.000 | 6/15/2017 | 2,502,281 |
| 1,530,000 | Mirant North America, LLC | 7.375 | 12/31/2013 | 1,564,425 |
| 6,880,000 | NRG Energy, Inc. | 7.375 | 2/1/2016 | 6,897,200 |
| 2,250,000 | Pacific Energy Partners, LP/Pacific Energy | |||
| Finance Corporation | 7.125 | 6/15/2014 | 2,327,895 | |
| 2,160,000 | Reliant Energy Resources Corporation | 6.750 | 12/15/2014 | 2,203,200 |
| 4,890,000 | SemGroup, LP | 8.750 | 11/15/2015 | 4,914,450 |
| 4,190,000 | Southern Natural Gas Company | 7.350 | 2/15/2031 | 4,441,693 |
| 2,503,000 | Southern Star Central Corporation | 6.750 | 3/1/2016 | 2,465,455 |
| 3,780,000 | Williams Companies, Inc. | 8.125 | 3/15/2012 | 4,011,525 |
| 2,470,000 | Williams Companies, Inc. | 8.750 | 3/15/2032 | 2,859,025 |
| 2,400,000 | Williams Partners, LP | 7.250 | 2/1/2017 | 2,412,000 |
| Total Utilities | 70,794,261 | |||
| Total Long-Term Fixed Income (cost $630,588,872) | 632,070,531 | |||
| Shares | Preferred Stock/Equity-Linked Securities (1.4%) | Value |
| 105,000 | Chevy Chase Preferred Capital Corporation, Convertible # | $5,622,750 |
| 1,700 | Morgan Stanley Dean Witter & Company, Convertible ¿ | 1,700,000 |
| 5,040 | NRG Energy, Inc., Convertible # | 1,861,423 |
| Total Preferred Stock (cost $8,216,250) | 9,184,173 | |
| The accompanying Notes to Financial Statements are an integral part of this schedule. |
| 176 |
High Yield Portfolio
Schedule of Investments as of June 29, 2007 (unaudited)
| Shares | Common Stock (<0.1%) | Value |
| 30 | Pliant Corporation #^ | $0 |
| 121,520 | TVMAX Holdings, Inc. # | 18,228 |
| 9,243 | XO Communications, Inc., Stock Warrants # | 6,470 |
| 6,932 | XO Communications, Inc., Stock Warrants # | 2,703 |
| 6,932 | XO Communications, Inc., Stock Warrants # | 1,109 |
| 4,621 | XO Holdings, Inc., Stock Warrants # | 20,610 |
| 80,000 | ZSC Specialty Chemical plc, Preferred Stock Warrants #^ƒ | 0 |
| 80,000 | ZSC Specialty Chemical plc, Stock Warrants #^ƒ | 0 |
| Total Common Stock (cost $6,566,208) | 49,120 | |
| Interest | Maturity | |||
| Shares | Collateral Held for Securities Loaned (0.6%) | Rate (+) | Date | Value |
| 4,363,365 | Thrivent Financial Securities Lending Trust | 5.360% | N/A | $4,363,365 |
| Total Collateral Held for Securities Loaned | ||||
| (cost $4,363,365) | 4,363,365 | |||
| Shares or | ||||
| Principal | Interest | Maturity | ||
| Amount | Short-Term Investments (3.8%) | Rate (+) | Date | Value |
| $8,000,000 | Air Products and Chemicals, Inc. ‡ | 5.290% | 7/3/2007 | $7,996,473 |
| 7,391,000 | Falcon Asset Securitization Corporation | 5.300 | 7/17/2007 | 7,372,502 |
| 600,000 | Federal National Mortgage Association ‡ | 5.090 | 7/16/2007 | 598,644 |
| 2,680,000 | Greyhawk Funding, LLC | 5.320 | 7/2/2007 | 2,679,208 |
| 6,000,000 | Old Line Funding Corporation | 5.320 | 7/5/2007 | 5,995,567 |
| 808,722 | Thrivent Money Market Portfolio | 5.050 | N/A | 808,722 |
| Total Short-Term Investments (at amortized cost) | 25,451,116 | |||
| Total Investments (cost $675,185,811) 99.9% | $671,118,305 | |||
| Other Assets and Liabilities, Net 0.1% | 430,308 | |||
| Total Net Assets 100.0% | $671,548,613 | |||
| The accompanying Notes to Financial Statements are an integral part of this schedule. |
| 177 |
High Yield Portfolio
Schedule of Investments as of June 29, 2007 (unaudited)
| Notional | |||||
| Buy/Sell | Termination | Principal | Unrealized | ||
| Swaps and Counterparty | Protection | Date | Amount | Gain/(Loss) | |
| Credit Default Swaps | |||||
| Beazer Homes USA, Inc., 5 Year, at 3.28%; | Sell | June | 2012 | $5,300,000 | ($327,525) |
| Bank of America, N.A. | |||||
| Beazer Homes USA, Inc., 5 Year, at 3.25%; | Sell | June | 2012 | $5,300,000 | ($333,377) |
| Bank of America, N.A. | |||||
| Beazer Homes USA, Inc., 10 Year, at 3.77%; | Buy | June | 2017 | ($3,450,000) | $292,514 |
| Bank of America, N.A. | |||||
| Beazer Homes USA, Inc., 10 Year, at 3.75%; | Buy | June | 2017 | ($3,450,000) | $296,235 |
| Bank of America, N.A. | |||||
| Dow Jones Unfunded CDX High Yield | |||||
| Series 8, at 2.75%; | Buy | June | 2014 | ($5,700,000) | $61,239 |
| Bank of America, N.A. | |||||
| Dow Jones Unfunded CDX High Yield | |||||
| Series 8, at 2.75%; | Buy | June | 2014 | ($17,000,000) | $155,147 |
| J.P. Morgan Chase and Co. | |||||
# Non-income producing security.
* All or a portion of the security is on loan as discussed in item 2(M) of the Notes to Financial Statements.
+ The interest rate shown reflects the yield, coupon rate or, for securities purchased at a discount, the discount rate at the date of purchase.
^ Security is fair valued as discussed in item 2(A) of the Notes to Financial Statements.
> Denotes step coupon bonds for which the current interest rate and next scheduled reset date are shown.
† Denotes variable rate obligations for which the current yield and next scheduled reset date are shown.
§ Denotes investments purchased on a when-issued or delayed delivery basis.
± Designated as cover for long settling trades as discussed in the Notes to Financial Statements.
‡ At June 29, 2007, $44,800,114 and $12,273,103 of investments were earmarked as collateral to cover open swap contracts and an unfunded loan commitment, respectively.
ƒ Denotes restricted securities. Restricted securities are investment securities which cannot be offered for public sale without first being registered under the Securities Act of 1933. The following table indicates the acquisition date and cost of restricted securities High Yield Portfolio owned as of June 29, 2007.
| Security | Acquisition Date | Cost |
| ZSC Specialty Chemical plc, Preferred Warrants | 6/24/1999 | $47,568 |
| ZSC Specialty Chemical plc, Stock Warrants | 6/24/1999 | $111,712 |
¿ These securities are Equity-Linked Structured Securities as discussed in item 2(Q) of the Notes to Financial Statements. Gross unrealized appreciation and depreciation of investments were as follows:
| Gross unrealized appreciation | $12,950,089 |
| Gross unrealized depreciation | (17,017,595) |
| Net unrealized appreciation (depreciation) | ($4,067,506) |
| Cost for federal income tax purposes | $675,185,811 |
| The accompanying Notes to Financial Statements are an integral part of this schedule. |
| 178 |
Diversified Income Plus Portfolio
Schedule of Investments as of June 29, 2007 (unaudited)
| Shares | Common Stock (36.6%) | Value | Shares | Common Stock (36.6%) | Value | |
| Consumer Discretionary (3.0%) | 4,000 | Developers Diversified | ||||
| 11,500 | Genuine Parts Company | $570,400 | Realty Corporation | $210,840 | ||
| 13,500 | Leggett & Platt, Inc. | 297,675 | 3,500 | DiamondRock Hospitality | ||
| 18,300 | Polaris Industries, Inc. * | 991,128 | Company | 66,780 | ||
| 15,900 | Stanley Works | 965,130 | 1,600 | Digital Realty Trust, Inc. | 60,288 | |
| 15,400 | VF Corporation | 1,410,332 | 2,700 | Douglas Emmett, Inc. | 66,798 | |
| Total Consumer | 5,800 | Duke Realty Corporation | 206,886 | |||
| Discretionary | 4,234,665 | 3,300 | Education Realty Trust, Inc. | 46,299 | ||
| 2,300 | Entertainment Properties Trust | 123,694 | ||||
| Consumer Staples (3.9%) | 2,900 | Equity One, Inc. | 74,095 | |||
| 20,600 | Altria Group, Inc. ‡ | 1,444,884 | 6,500 | Equity Residential REIT | 296,595 | |
| 9,500 | Clorox Company | 589,950 | 3,600 | Extra Space Storage, Inc. | 59,400 | |
| 10,100 | Kimberly-Clark Corporation | 675,589 | 85,800 | F.N.B. Corporation * | 1,436,292 | |
| 22,900 | Procter & Gamble Company | 1,401,251 | 7,400 | Feldman Mall Properties, Inc. | 84,360 | |
| 11,100 | SUPERVALU, Inc. | 514,152 | 46,693 | Fiduciary/Claymore MLP | ||
| 14,900 | Universal Corporation | 907,708 | Opportunity Fund | 1,137,441 | ||
| Total Consumer Staples | 5,533,534 | 104,400 | First Commonwealth Financial | |||
| Corporation * | 1,140,048 | |||||
| Energy (2.1%) | 8,100 | First Industrial Realty | ||||
| 17,900 | Chevron Corporation ± | 1,507,896 | Trust, Inc. * | 313,956 | ||
| 8,400 | Energy Income and | 5,100 | First Potomac Realty Trust | 118,779 | ||
| Growth Fund # | 234,360 | 8,900 | Franklin Street Properties | |||
| 5,900 | Exxon Mobil Corporation | 494,892 | Corporation * | 147,206 | ||
| 22,870 | Kayne Anderson MLP | 10,100 | General Growth Properties, Inc. | 534,795 | ||
| Investment Company | 759,513 | 5,200 | Getty Realty Corporation | 136,656 | ||
| Total Energy | 2,996,661 | 9,800 | Glimcher Realty Trust * | 245,000 | ||
| 8,600 | Health Care Property | |||||
| Financials (18.5%) | Investors, Inc. | 248,798 | ||||
| 32,600 | American Financial Realty Trust | 336,432 | 11,700 | Health Care REIT, Inc. | 472,212 | |
| 6,700 | Apartment Investment & | 13,000 | Healthcare Realty Trust, Inc. * | 361,140 | ||
| Management Company * | 337,814 | 15,600 | Hersha Hospitality Trust | 184,392 | ||
| 3,000 | Archstone-Smith Trust | 177,330 | 800 | Highland Hospitality Corporation | 15,360 | |
| 50,200 | Arthur J. Gallagher & Company * | 1,399,576 | 2,400 | Highwoods Properties, Inc. | 90,000 | |
| 37,500 | Ashford Hospitality Trust | 441,000 | 1,700 | Home Properties, Inc. | 88,281 | |
| 400 | Avalonbay Communities, Inc. | 47,552 | 14,200 | Hospitality Properties Trust | 589,158 | |
| 28,800 | Bank of America Corporation ‡ | 1,408,032 | 14,500 | Host Marriott Corporation * | 335,240 | |
| 1,600 | Boston Properties, Inc. | 163,408 | 33,800 | HRPT Properties Trust * | 351,520 | |
| 4,000 | Brandywine Realty Trust | 114,320 | 3,600 | Inland Real Estate Corporation | 61,128 | |
| 100 | Camden Property Trust | 6,697 | 7,100 | iStar Financial, Inc. | 314,743 | |
| 1,100 | CBL & Associates Properties, Inc. | 39,655 | 3,122 | Kimco Realty Corporation | 118,855 | |
| 14,600 | Citigroup, Inc. ± | 748,834 | 18,900 | Lexington Corporate | ||
| 5,700 | Colonial Properties Trust ± | 207,765 | Properties Trust * | 393,120 | ||
| 11,000 | Commerce Group, Inc. | 381,920 | 5,800 | Liberty Property Trust | 254,794 | |
| 40,200 | Corus Bankshares, Inc. * | 693,852 | 300 | Macerich Company | 24,726 | |
| 1,200 | Cousins Properties, Inc. | 34,812 | 3,800 | Mack-Cali Realty Corporation | 165,262 | |
| 3,000 | Crescent Real Estate | 1,100 | Maguire Properties, Inc. | 37,763 | ||
| Equities Company | 67,320 | 27,200 | Medical Properties Trust, Inc. * | 359,856 | ||
| The accompanying Notes to Financial Statements are an integral part of this schedule. |
| 179 |
Diversified Income Plus Portfolio
Schedule of Investments as of June 29, 2007 (unaudited)
| Shares | Common Stock (36.6%) | Value | Shares | Common Stock (36.6%) | Value | |
| Financials — continued | Health Care (3.0%) | |||||
| 20,900 | Mercury General Corporation | $1,151,799 | 25,300 | Eli Lilly and Company | $1,413,764 | |
| 6,400 | National Retail Properties, Inc. | 139,904 | 11,000 | Merck & Company, Inc. | 547,800 | |
| 7,500 | Nationwide Health | 41,550 | Meridian Bioscience, Inc. | 899,973 | ||
| Properties, Inc. * | 204,000 | 54,500 | Pfizer, Inc. | 1,393,565 | ||
| 24,500 | Omega Healthcare Investors, Inc. | 387,835 | Total Health Care | 4,255,102 | ||
| 4,000 | Pennsylvania Real Estate | |||||
| Investment Trust | 177,320 | Industrials (3.0%) | ||||
| 3,700 | ProLogis Trust | 210,530 | 4,600 | Avery Dennison Corporation | 305,808 | |
| 556 | Public Storage, Inc. | 42,712 | 15,100 | Brady Corporation | 560,814 | |
| 3,000 | Rayonier, Inc. REIT | 135,420 | 31,200 | Masco Corporation | 888,264 | |
| 9,300 | Realty Income Corporation * | 234,267 | 30,800 | McGrath Rentcorp | 1,037,652 | |
| 25,329 | Regions Financial Corporation | 838,390 | 30,900 | Pitney Bowes, Inc. | 1,446,738 | |
| 7,800 | Senior Housing Property Trust | 158,730 | Total Industrials | 4,239,276 | ||
| 5,600 | Simon Property Group, Inc. | 521,024 | ||||
| 335 | SL Green Realty Corporation | 41,503 | Information Technology (0.2%) | |||
| 25,500 | Spirit Finance Corporation | 371,280 | 4,700 | Diebold, Inc. | 245,340 | |
| 500 | Strategic Hotel Capital, Inc. | 11,245 | Total Information Technology 245,340 | |||
| 15,600 | Sun Communities, Inc. * | 464,412 | ||||
| 12,288 | Tortoise Energy Infrastructure | Materials (0.4%) | ||||
| Corporation | 514,130 | 6,400 | PPG Industries, Inc. | 487,104 | ||
| 8,400 | Tortoise North American | 2,800 | Sonoco Products Company | 119,868 | ||
| Energy Corporation | 218,904 | Total Materials | 606,972 | |||
| 9,700 | U.S. Bancorp | 319,615 | ||||
| 3,800 | UDR, Inc. | 99,940 | Telecommunications Services (1.0%) | |||
| 4,000 | U-Store-It Trust | 65,560 | 36,000 | AT&T, Inc. ‡ | 1,494,000 | |
| 2,900 | Ventas, Inc. | 105,125 | Total Telecommunications | |||
| 4,400 | Vornado Realty Trust * | 483,296 | Services | 1,494,000 | ||
| 34,000 | Washington Mutual, Inc. | 1,449,760 | ||||
| 900 | Washington Real Estate | Utilities (1.5%) | ||||
| Investment Trust | 30,600 | 22,500 | Atmos Energy Corporation | 676,350 | ||
| 100 | Weingarten Realty Investors | 4,110 | 11,000 | Black Hills Corporation | 437,250 | |
| 14,000 | XL Capital, Ltd., Convertible # | 411,320 | 20,900 | MDU Resources Group, Inc. | 586,036 | |
| Total Financials | 26,371,606 | 11,800 | Progress Energy, Inc. | 537,962 | ||
| Total Utilities | 2,237,598 | |||||
| Total Common Stock | ||||||
| (cost $51,800,886) | 52,214,754 | |||||
| The accompanying Notes to Financial Statements are an integral part of this schedule. |
| 180 |
Diversified Income Plus Portfolio
Schedule of Investments as of June 29, 2007 (unaudited)
| Shares | Preferred Stock/Equity-Linked Securities (1.6%) | Value |
| Energy (0.1%) | ||
| 7,500 | Goldman Sachs Group, Inc.,Convertible #¿ | $214,748 |
| Total Consumer Cyclical | 214,748 | |
| Financials (1.1%) | ||
| 10,150 | Goldman Sachs Group, Inc.,Convertible #¿ | 370,160 |
| 7,200 | Lehman Brothers Holdings, Inc.,Convertible # | 194,832 |
| 210 | Morgan Stanley, Convertible #¿ | 200,829 |
| 220 | Morgan Stanley Dean Witter & Company, Convertible ¿ | 220,000 |
| 8,505 | Simon Property Group, Inc.,Convertible # | 646,295 |
| Total Financials | 1,632,116 | |
| Utilities (0.4%) | ||
| 10,400 | CenterPoint Energy, Inc.,Convertible ± | 390,416 |
| 520 | NRG Energy, Inc., Convertible # | 192,052 |
| Total Utilities | 582,468 | |
| Total Preferred Stock | ||
| (cost $2,439,383) | 2,429,332 | |
| Principal | Interest | Maturity | ||
| Amount | Long-Term Fixed Income (55.7%) | Rate | Date | Value |
| Asset-Backed Securities (6.2%) | ||||
| $650,000 | GAMUT Reinsurance, Ltd. † | 12.360% | 7/31/2007 | $650,065 |
| 250,000 | GAMUT Reinsurance, Ltd. † | 20.360 | 7/31/2007 | 246,250 |
| 400,000 | Merna Re, Ltd. | 7.110 | 7/3/2007 | 400,000 |
| 400,000 | Merna Re, Ltd. | 8.110 | 7/3/2007 | 400,000 |
| 7,490,000 | North America High Yield CDX | 7.625 | 6/29/2012 | 7,082,544 |
| Total Asset-Backed Securities | 8,778,859 | |||
| Basic Materials (2.9%) | ||||
| 110,000 | Aleris International, Inc. ‡ | 9.000 | 12/15/2014 | 110,962 |
| 80,000 | Aleris International, Inc. ‡ | 10.000 | 12/15/2016 | 79,400 |
| 90,000 | Appleton Papers, Inc. ‡ | 8.125 | 6/15/2011 | 92,700 |
| 160,000 | Arch Western Finance, LLC | 6.750 | 7/1/2013 | 153,600 |
| 90,000 | Buckeye Technologies, Inc. | 8.000 | 10/15/2010 | 90,000 |
| 130,000 | Domtar, Inc. | 7.125 | 8/1/2015 | 125,938 |
| 130,000 | Drummond Company, Inc. | 7.375 | 2/15/2016 | 123,500 |
| 57,000 | Equistar Chemicals, LP | 10.625 | 5/1/2011 | 59,992 |
| 450,000 | FMG Finance, Pty. Ltd. | 10.625 | 9/1/2016 | 535,500 |
| 510,000 | Freeport-McMoRan Copper & Gold, Inc. | 8.375 | 4/1/2017 | 544,425 |
| 90,000 | Georgia-Pacific Corporation | 8.125 | 5/15/2011 | 91,912 |
| 140,000 | Georgia-Pacific Corporation | 7.125 | 1/15/2017 | 134,400 |
| 200,000 | Glencore Funding, LLC | 6.000 | 4/15/2014 | 196,285 |
| 210,000 | Graphic Packaging International Corporation | 9.500 | 8/15/2013 | 218,138 |
| 240,000 | Griffin Coal Mining Company, Pty. Ltd. | 9.500 | 12/1/2016 | 246,900 |
| 170,000 | Huntsman International, LLC | 7.875 | 11/13/2014 | 182,112 |
| The accompanying Notes to Financial Statements are an integral part of this schedule. |
| 181 |
Diversified Income Plus Portfolio
Schedule of Investments as of June 29, 2007 (unaudited)
| Principal | Interest | Maturity | ||
| Amount | Long-Term Fixed Income (55.7%) | Rate | Date | Value |
| Basic Materials — continued | ||||
| $80,000 | Jefferson Smurfit Corporation | 8.250% | 10/1/2012 | $79,400 |
| 140,000 | Lyondell Chemical Company | 10.500 | 6/1/2013 | 151,200 |
| 80,000 | Lyondell Chemical Company | 8.250 | 9/15/2016 | 83,600 |
| 90,000 | Lyondell Chemical Company | 6.875 | 6/15/2017 | 86,850 |
| 320,000 | Mosaic Global Holdings, Inc., Convertible | 7.375 | 12/1/2014 | 323,200 |
| 150,000 | Ryerson, Inc. | 8.250 | 12/15/2011 | 150,750 |
| 250,000 | Terra Capital, Inc. | 7.000 | 2/1/2017 | 241,250 |
| Total Basic Materials | 4,102,014 | |||
| Capital Goods (3.4%) | ||||
| 180,000 | Ahern Rentals, Inc. ‡ | 9.250 | 8/15/2013 | 182,250 |
| 440,000 | Allied Waste North America, Inc. ‡ | 7.875 | 4/15/2013 | 444,950 |
| 70,000 | Ashtead Capital, Inc. | 9.000 | 8/15/2016 | 73,325 |
| 130,000 | Ball Corporation | 6.625 | 3/15/2018 | 124,800 |
| 150,000 | Berry Plastics Holding Corporation ‡ | 8.875 | 9/15/2014 | 151,875 |
| 140,000 | Case New Holland, Inc. | 9.250 | 8/1/2011 | 146,748 |
| 380,000 | Case New Holland, Inc. | 7.125 | 3/1/2014 | 384,750 |
| 100,000 | Crown Americas, Inc. | 7.625 | 11/15/2013 | 101,000 |
| 100,000 | Crown Americas, Inc. | 7.750 | 11/15/2015 | 100,500 |
| 480,000 | Da-Lite Screen Company, Inc. ‡ | 9.500 | 5/15/2011 | 504,000 |
| 64,000 | Invensys plc | 9.875 | 3/15/2011 | 68,480 |
| 40,000 | K&F Acquisition, Inc. | 7.750 | 11/15/2014 | 42,400 |
| 860,000 | L-3 Communications Corporation | 5.875 | 1/15/2015 | 797,650 |
| 400,000 | L-3 Communications Corporation, Convertible | 3.000 | 8/1/2035 | 451,000 |
| 100,000 | Legrand SA | 8.500 | 2/15/2025 | 116,750 |
| 140,000 | Mueller Water Products, Inc. | 7.375 | 6/1/2017 | 138,825 |
| 70,000 | Owens-Brockway Glass Container, Inc. | 8.250 | 5/15/2013 | 72,450 |
| 210,000 | Owens-Illinois, Inc. | 7.500 | 5/15/2010 | 211,838 |
| 190,000 | Plastipak Holdings, Inc. | 8.500 | 12/15/2015 | 196,650 |
| 110,000 | Rental Services Corporation | 9.500 | 12/1/2014 | 112,200 |
| 110,000 | TransDigm, Inc. | 7.750 | 7/15/2014 | 111,100 |
| 90,000 | United Rentals North America, Inc. | 6.500 | 2/15/2012 | 88,425 |
| 270,000 | United Rentals North America, Inc. | 7.000 | 2/15/2014 | 263,250 |
| Total Capital Goods | 4,885,216 | |||
| Commercial Mortgage-Backed Securities (5.1%) | ||||
| 2,000,000 | Commercial Mortgage Pass-Through Certificates ±† | 5.500 | 7/15/2007 | 2,000,000 |
| 1,893,274 | Deutsche Alt-A Securities, Inc. †‡ | 5.799 | 7/25/2007 | 1,893,274 |
| 2,000,000 | Wachovia Bank Commercial Mortgage Trust † | 5.440 | 7/15/2007 | 1,999,882 |
| 1,418,420 | Washington Mutual Alternative Loan Trust † | 5.772 | 7/25/2007 | 1,418,309 |
| Total Commercial Mortgage-Backed Securities | 7,311,465 | |||
| Communications Services (5.7%) | ||||
| 18,000 | American Cellular Corporation | 10.000 | 8/1/2011 | 18,855 |
| 460,000 | American Tower Corporation ± | 7.125 | 10/15/2012 | 470,350 |
| 120,000 | Centennial Communications Corporation ± | 8.125 | 2/1/2014 | 122,700 |
| The accompanying Notes to Financial Statements are an integral part of this schedule. |
| 182 |
Diversified Income Plus Portfolio
Schedule of Investments as of June 29, 2007 (unaudited)
| Principal | Interest | Maturity | ||
| Amount | Long-Term Fixed Income (55.7%) | Rate | Date | Value |
| Communications Services — continued | ||||
| $175,000 | Citizens Communications Company | 9.250% | 5/15/2011 | $189,000 |
| 430,000 | Citizens Communications Company | 6.250 | 1/15/2013 | 412,262 |
| 70,000 | Dex Media West, LLC/Dex Media West | |||
| Finance Company | 9.875 | 8/15/2013 | 74,900 | |
| 170,000 | Dobson Cellular Systems | 9.875 | 11/1/2012 | 183,175 |
| 860,000 | Echostar DBS Corporation | 6.625 | 10/1/2014 | 821,300 |
| 150,000 | Idearc, Inc. | 8.000 | 11/15/2016 | 151,500 |
| 60,000 | Intelsat Bermuda, Ltd. | 9.250 | 6/15/2016 | 63,750 |
| 410,000 | Intelsat Intermediate, Inc. >‡ | Zero Coupon | 2/1/2010 | 337,225 |
| 150,000 | Intelsat Subsidiary Holding Company, Ltd. | 8.625 | 1/15/2015 | 153,750 |
| 90,000 | Lamar Media Corporation | 6.625 | 8/15/2015 | 85,275 |
| 185,000 | Morris Publishing Group, LLC | 7.000 | 8/1/2013 | 161,875 |
| 280,000 | NTL Cable plc | 9.125 | 8/15/2016 | 293,300 |
| 135,000 | PRIMEDIA, Inc. † | 10.735 | 8/15/2007 | 139,219 |
| 210,000 | Quebecor World, Inc. | 9.750 | 1/15/2015 | 212,625 |
| 200,000 | Qwest Communications International, Inc. | 7.250 | 2/15/2011 | 201,500 |
| 60,000 | Qwest Communications International, Inc. | 7.500 | 2/15/2014 | 60,750 |
| 470,000 | Qwest Corporation | 7.875 | 9/1/2011 | 489,975 |
| 50,000 | Qwest Corporation | 7.625 | 6/15/2015 | 51,625 |
| 5100,000 | R.H. Donnelley Corporation | 6.875 | 1/15/2013 | 483,225 |
| 110,000 | R.H. Donnelley Corporation | 8.875 | 1/15/2016 | 114,400 |
| 400,000 | Rogers Cable, Inc. | 6.750 | 3/15/2015 | 412,390 |
| 575,000 | Rogers Wireless Communications, Inc. | 7.500 | 3/15/2015 | 615,945 |
| 85,000 | Rural Cellular Corporation | 9.875 | 2/1/2010 | 88,825 |
| 200,000 | Time Warner Cable, Inc. | 5.850 | 5/1/2017 | 194,530 |
| 200,000 | Time Warner Telecom Holdings, Inc. | 9.250 | 2/15/2014 | 212,000 |
| 140,000 | Valor Telecommunications Enterprises, LLC | 7.750 | 2/15/2015 | 147,283 |
| 690,000 | Videotron Ltee | 6.875 | 1/15/2014 | 676,200 |
| 300,000 | Windstream Corporation | 8.625 | 8/1/2016 | 317,250 |
| 130,000 | Windstream Corporation | 7.000 | 3/15/2019 | 124,150 |
| Total Communications Services | 8,081,109 | |||
| Consumer Cyclical (6.4%) | ||||
| 180,000 | American Casino & Entertainment Properties, LLC ‡ | 7.850 | 2/1/2012 | 184,950 |
| 200,000 | ArvinMeritor, Inc. | 8.125 | 9/15/2015 | 193,750 |
| 330,000 | Beazer Homes USA, Inc. | 8.625 | 5/15/2011 | 316,800 |
| 90,000 | Boyd Gaming Corporation | 7.125 | 2/1/2016 | 87,300 |
| 360,000 | Buhrmann U.S., Inc. ‡ | 7.875 | 3/1/2015 | 354,600 |
| 400,000 | Carnival Corporation, Convertible >‡ | 1.132 | 4/29/2008 | 274,000 |
| 180,000 | Circus & Eldorado Joint Venture/Silver Legacy | |||
| Capital Corporation ± | 10.125 | 3/1/2012 | 188,325 | |
| 430,000 | Corrections Corporation of America | 6.250 | 3/15/2013 | 412,800 |
| 110,000 | Dollarama Group, LP † | 11.160 | 12/17/2007 | 108,900 |
| 260,000 | Dollarama Group, LP | 8.875 | 8/15/2012 | 266,500 |
| 160,000 | Ford Motor Credit Company † | 9.806 | 7/16/2007 | 171,474 |
| 70,000 | Ford Motor Credit Company | 9.750 | 9/15/2010 | 73,093 |
| The accompanying Notes to Financial Statements are an integral part of this schedule. |
| 183 |
Diversified Income Plus Portfolio
Schedule of Investments as of June 29, 2007 (unaudited)
| Principal | Interest | Maturity | ||
| Amount | Long-Term Fixed Income (55.7%) | Rate | Date | Value |
| Consumer Cyclical — continued | ||||
| $130,000 | Ford Motor Credit Company | 7.000% | 10/1/2013 | $120,444 |
| 90,000 | Ford Motor Credit Company | 8.000 | 12/15/2016 | 86,206 |
| 220,000 | Gaylord Entertainment Company | 6.750 | 11/15/2014 | 216,150 |
| 280,000 | Group 1 Automotive, Inc. ‡ | 8.250 | 8/15/2013 | 289,100 |
| 400,000 | Group 1 Automotive, Inc., Convertible >‡ | 2.250 | 6/15/2016 | 344,500 |
| 190,000 | Hanesbrands, Inc. † | 8.784 | 12/17/2007 | 192,850 |
| 260,000 | Harrah’s Operating Company, Inc. | 6.500 | 6/1/2016 | 217,100 |
| 860,000 | Host Marriott, LP ‡ | 6.375 | 3/15/2015 | 825,600 |
| 400,000 | International Game Technology, Convertible ‡ | 2.600 | 12/15/2036 | 389,500 |
| 190,000 | K. Hovnanian Enterprises, Inc. | 7.500 | 5/15/2016 | 172,900 |
| 580,000 | KB Home | 6.250 | 6/15/2015 | 510,400 |
| 180,000 | Majestic Star Casino, LLC | 9.500 | 10/15/2010 | 187,200 |
| 300,000 | MGM MIRAGE | 5.875 | 2/27/2014 | 271,500 |
| 210,000 | Pokagon Gaming Authority | 10.375 | 6/15/2014 | 231,525 |
| 650,000 | Royal Caribbean Cruises, Ltd. | 7.250 | 6/15/2016 | 642,203 |
| 220,000 | Seminole Hard Rock Entertainment † | 7.860 | 9/17/2007 | 221,650 |
| 130,000 | Service Corporation International | 6.750 | 4/1/2015 | 125,288 |
| 330,000 | Station Casinos, Inc. | 6.875 | 3/1/2016 | 291,225 |
| 260,000 | Tunica Biloxi Gaming Authority | 9.000 | 11/15/2015 | 271,700 |
| 200,000 | Turning Stone Resort Casino Enterprise | 9.125 | 12/15/2010 | 203,500 |
| 130,000 | Turning Stone Resort Casino Enterprise | 9.125 | 9/15/2014 | 132,275 |
| 180,000 | Universal City Florida Holding Company I/II † | 10.106 | 8/1/2007 | 183,600 |
| 150,000 | Warnaco, Inc. | 8.875 | 6/15/2013 | 158,625 |
| 235,000 | WMG Holdings Corporation > | Zero Coupon | 12/15/2009 | 178,600 |
| Total Consumer Cyclical | 9,096,133 | |||
| Consumer Non-Cyclical (4.8%) | ||||
| 400,000 | Archer-Daniels-Midland Company, Convertible | 0.875 | 2/15/2014 | 380,000 |
| 300,000 | Community Health Systems, Inc. § | 8.875 | 7/15/2015 | 304,125 |
| 520,000 | Constellation Brands, Inc. | 7.250 | 9/1/2016 | 507,000 |
| 200,000 | Coventry Health Care, Inc. | 5.950 | 3/15/2017 | 195,100 |
| 90,000 | Elan Finance Corporation, Ltd. | 7.750 | 11/15/2011 | 90,112 |
| 90,000 | Elan Finance plc/Elan Finance Corporation † | 9.360 | 8/15/2007 | 90,450 |
| 200,000 | Fisher Scientific International, Inc., Convertible | 3.250 | 3/1/2024 | 285,500 |
| 190,000 | Genzyme Corporation, Convertible | 1.250 | 12/1/2023 | 199,500 |
| 300,000 | HCA, Inc. ‡ | 9.250 | 11/15/2016 | 319,500 |
| 190,000 | Jarden Corporation | 7.500 | 5/1/2017 | 187,625 |
| 200,000 | Medtronic, Inc., Convertible | 1.500 | 4/15/2011 | 212,000 |
| 160,000 | Michael Foods, Inc. | 8.000 | 11/15/2013 | 161,600 |
| 195,000 | Millipore Corporation, Convertible | 3.750 | 6/1/2026 | 208,894 |
| 200,000 | Omnicare, Inc. | 6.750 | 12/15/2013 | 191,000 |
| 230,000 | Omnicare, Inc., Convertible | 3.250 | 12/15/2035 | 192,338 |
| 430,000 | Reynolds America, Inc. | 7.625 | 6/1/2016 | 455,280 |
| 460,000 | Smithfield Foods, Inc. | 8.000 | 10/15/2009 | 473,800 |
| 320,000 | Stater Brothers Holdings, Inc. | 8.125 | 6/15/2012 | 322,400 |
| 560,000 | SUPERVALU, Inc. | 7.500 | 11/15/2014 | 574,000 |
| The accompanying Notes to Financial Statements are an integral part of this schedule. |
| 184 |
Diversified Income Plus Portfolio
Schedule of Investments as of June 29, 2007 (unaudited)
| Principal | Interest | Maturity | ||
| Amount | Long-Term Fixed Income (55.7%) | Rate | Date | Value |
| Consumer Non-Cyclical — continued | ||||
| $210,000 | Teva Pharmaceutical Finance Company, Convertible | 1.750% | 2/1/2026 | $209,212 |
| 190,000 | Triad Hospitals, Inc. | 7.000 | 5/15/2012 | 198,549 |
| 130,000 | Triad Hospitals, Inc. | 7.000 | 11/15/2013 | 136,656 |
| 470,000 | Ventas Realty, LP/Ventas Capital Corporation | 6.500 | 6/1/2016 | 458,250 |
| 380,000 | Wyeth, Convertible † | 4.877 | 7/15/2007 | 429,856 |
| Total Consumer Non-Cyclical | 6,782,747 | |||
| Energy (2.6%) | ||||
| 160,000 | CHC Helicopter Corporation ‡ | 7.375 | 5/1/2014 | 152,400 |
| 510,000 | Chesapeake Energy Corporation | 6.375 | 6/15/2015 | 486,412 |
| 140,000 | Chesapeake Energy Corporation | 6.250 | 1/15/2018 | 130,725 |
| 400,000 | Chesapeake Energy Corporation, Convertible ‡ | 2.750 | 11/15/2035 | 433,500 |
| 155,000 | Denbury Resources, Inc. | 7.500 | 12/15/2015 | 154,612 |
| 210,000 | Forest Oil Corporation | 7.250 | 6/15/2019 | 203,700 |
| 130,000 | Hornbeck Offshore Services, Inc. | 6.125 | 12/1/2014 | 118,950 |
| 400,000 | Nabors Industries, Inc., Convertible | 0.940 | 5/15/2011 | 390,000 |
| 460,000 | Ocean Rig Norway AS | 8.375 | 7/1/2013 | 473,800 |
| 220,000 | OPTI Canada, Inc. | 8.250 | 12/15/2014 | 223,300 |
| 200,000 | PetroHawk Energy Corporation | 9.125 | 7/15/2013 | 211,500 |
| 420,000 | Petroplus Finance, Ltd. | 7.000 | 5/1/2017 | 404,250 |
| 220,000 | Plains Exploration & Production Company | 7.750 | 6/15/2015 | 218,350 |
| 150,000 | Western Oil Sands, Inc. | 8.375 | 5/1/2012 | 164,062 |
| Total Energy | 3,765,561 | |||
| Financials (6.0%) | ||||
| 400,000 | American International Group, Inc. | 6.250 | 3/15/2037 | 378,206 |
| 244,000 | Archstone-Smith Operating Trust, Convertible ‡ | 4.000 | 7/15/2036 | 255,590 |
| 200,000 | AXA SA | 6.463 | 12/14/2018 | 185,921 |
| 200,000 | BBVA Bancomer SA | 6.008 | 5/17/2022 | 194,952 |
| 200,000 | BRE Properties, Inc., Convertible | 4.125 | 8/15/2026 | 206,750 |
| 210,000 | Capital One Capital III ‡ | 7.686 | 8/15/2036 | 216,277 |
| 210,000 | Capital One Capital IV ‡ | 6.745 | 2/17/2037 | 193,222 |
| 300,000 | FTI Consulting, Inc. | 7.625 | 6/15/2013 | 303,750 |
| 670,000 | General Motors Acceptance Corporation ‡ | 6.875 | 9/15/2011 | 659,048 |
| 220,000 | Goldman Sachs Group, Inc., Convertible | 1.000 | 3/7/2012 | 219,512 |
| 840,000 | J.P. Morgan Chase Capital XX | 6.550 | 9/29/2036 | 808,959 |
| 580,000 | Leucadia National Corporation | 7.125 | 3/15/2017 | 562,600 |
| 630,000 | Lincoln National Corporation | 7.000 | 5/17/2016 | 646,430 |
| 200,000 | Mitsubishi UFG Capital Finance, Ltd. | 6.346 | 7/25/2016 | 196,515 |
| 210,000 | ProLogis Trust | 5.625 | 11/15/2016 | 204,417 |
| 420,000 | Rabobank Capital Funding Trust | 5.254 | 10/24/2016 | 393,251 |
| 420,000 | RBS Capital Trust I | 5.512 | 9/30/2014 | 403,666 |
| 400,000 | Residential Capital Corporation | 6.500 | 4/17/2013 | 386,632 |
| 200,000 | Resona Bank, Ltd. | 5.850 | 4/15/2016 | 191,224 |
| 420,000 | Student Loan Marketing Corporation | 4.500 | 7/26/2010 | 388,338 |
| 420,000 | Swiss RE Capital I, LP | 6.854 | 5/25/2016 | 422,480 |
| The accompanying Notes to Financial Statements are an integral part of this schedule. |
| 185 |
Diversified Income Plus Portfolio
Schedule of Investments as of June 29, 2007 (unaudited)
| Principal | Interest | Maturity | ||
| Amount | Long-Term Fixed Income (55.7%) | Rate | Date | Value |
| Financials — continued | ||||
| $420,000 | Wachovia Capital Trust III | 5.800% | 3/15/2011 | $418,170 |
| 695,000 | Washington Mutual Preferred Funding | 6.665 | 12/15/2016 | 663,471 |
| Total Financials | 8,499,381 | |||
| Mortgage-Backed Securities (3.1%) | ||||
| 4,500,000 | Federal National Mortgage Association Conventional | |||
| 30-Yr. Pass Through §~ | 6.000 | 7/1/2037 | 4,450,780 | |
| Total Mortgage-Backed Securities | 4,450,780 | |||
| Technology (1.2%) | ||||
| 130,000 | Avago Technologies Finance Pte † | 10.860 | 9/3/2007 | 133,575 |
| 130,000 | Avago Technologies Finance Pte | 10.125 | 12/1/2013 | 138,450 |
| 475,000 | Electronic Data Systems Corporation, Convertible ‡ | 3.875 | 7/15/2023 | 480,938 |
| 220,000 | Intel Corporation, Convertible | 2.950 | 12/15/2035 | 209,825 |
| 80,000 | NXP BV/NXP Funding, LLC † | 8.105 | 7/15/2007 | 80,100 |
| 250,000 | NXP BV/NXP Funding, LLC | 9.500 | 10/15/2015 | 246,250 |
| 370,000 | Seagate Technology HDD Holdings | 6.800 | 10/1/2016 | 355,200 |
| 110,000 | Unisys Corporation | 6.875 | 3/15/2010 | 107,112 |
| Total Technology | 1,751,450 | |||
| Transportation (1.3%) | ||||
| 217,023 | Continental Airlines, Inc. | 7.875 | 7/2/2018 | 221,906 |
| 400,000 | Continental Airlines, Inc. ‡ | 6.903 | 4/19/2022 | 392,000 |
| 140,000 | Delta Air Lines, Inc. | 7.920 | 11/18/2010 | 141,400 |
| 60,000 | Hertz Corporation | 8.875 | 1/1/2014 | 62,550 |
| 100,000 | Hertz Corporation | 10.500 | 1/1/2016 | 110,500 |
| 150,000 | H-Lines Finance Holding Corporation > | Zero Coupon | 4/1/2008 | 147,000 |
| 150,000 | Kansas City Southern de Mexico SA de CV | 7.625 | 12/1/2013 | 149,625 |
| 266,438 | Northwest Airlines, Inc. | 7.691 | 4/1/2017 | 271,434 |
| 344,118 | Piper Jaffray Equipment Trust Securities | 6.750 | 4/1/2011 | 342,397 |
| Total Transportation | 1,838,812 | |||
| U.S. Government (1.5%) | ||||
| 2,100,000 | U.S. Treasury Notes | 4.750 | 5/31/2012 | 2,083,595 |
| Total U.S. Government | 2,083,595 | |||
| Utilities (5.6%) | ||||
| 70,000 | AES Corporation ‡ | 8.875 | 2/15/2011 | 73,762 |
| 470,000 | AES Corporation ~‡ | 8.750 | 5/15/2013 | 495,850 |
| 350,000 | Colorado Interstate Gas Company ‡ | 6.800 | 11/15/2015 | 359,945 |
| 70,000 | Consumers Energy Company | 6.300 | 2/1/2012 | 69,222 |
| 210,000 | Copano Energy, LLC | 8.125 | 3/1/2016 | 213,150 |
| 110,000 | Dynegy Holdings, Inc. | 6.875 | 4/1/2011 | 108,075 |
| 100,000 | Dynegy Holdings, Inc. | 7.500 | 6/1/2015 | 94,125 |
| 120,000 | Dynegy Holdings, Inc. | 8.375 | 5/1/2016 | 117,300 |
| 40,000 | Dynegy Holdings, Inc. | 7.750 | 6/1/2019 | 37,200 |
| The accompanying Notes to Financial Statements are an integral part of this schedule. |
| 186 |
Diversified Income Plus Portfolio
Schedule of Investments as of June 29, 2007 (unaudited)
| Principal | Interest | Maturity | ||
| Amount | Long-Term Fixed Income (55.7%) | Rate | Date | Value |
| Utilities — continued | ||||
| $120,000 | Edison Mission Energy | 7.500% | 6/15/2013 | $118,800 |
| 130,000 | Edison Mission Energy ‡ | 7.750 | 6/15/2016 | 129,350 |
| 200,000 | Edison Mission Energy ‡�� | 7.000 | 5/15/2017 | 188,500 |
| 200,000 | Edison Mission Energy | 7.200 | 5/15/2019 | 188,000 |
| 170,000 | Edison Mission Energy | 7.625 | 5/15/2027 | 160,650 |
| 250,000 | El Paso Corporation | 6.875 | 6/15/2014 | 248,750 |
| 250,000 | El Paso Corporation | 7.000 | 6/15/2017 | 247,261 |
| 620,000 | Enterprise Products Operating, LP | 8.375 | 8/1/2016 | 661,697 |
| 70,000 | Mirant North America, LLC | 7.375 | 12/31/2013 | 71,575 |
| 540,000 | NRG Energy, Inc. | 7.375 | 2/1/2016 | 541,350 |
| 110,000 | Pacific Energy Partners, LP/Pacific Energy | |||
| Finance Corporation | 7.125 | 6/15/2014 | 113,808 | |
| 150,000 | Pacific Energy Partners, LP/Pacific Energy | |||
| Finance Corporation | 6.250 | 9/15/2015 | 147,349 | |
| 105,000 | Reliant Energy Resources Corporation | 6.750 | 12/15/2014 | 107,100 |
| 860,000 | Sabine Pass LNG LP | 7.500 | 11/30/2016 | 855,700 |
| 360,000 | SemGroup, LP | 8.750 | 11/15/2015 | 361,800 |
| 160,000 | Southern Natural Gas Company | 7.350 | 2/15/2031 | 169,611 |
| 110,000 | Southern Star Central Corporation | 6.750 | 3/1/2016 | 108,350 |
| 1,100,000 | TXU Energy Company, LLC † | 5.860 | 9/17/2007 | 1,100,426 |
| 430,000 | Williams Companies, Inc. | 8.125 | 3/15/2012 | 456,338 |
| 290,000 | Williams Companies, Inc. | 8.750 | 3/15/2032 | 335,675 |
| 120,000 | Williams Partners, LP | 7.250 | 2/1/2017 | 120,600 |
| Total Utilities | 8,001,319 | |||
| Total Long-Term Fixed Income (cost $80,598,497) | 79,428,441 | |||
| Exercise | Expiration | |||
| Contracts | Options Purchased (0.1%) | Price | Date | Value |
| 91 | Put on S&P 500 Mini Futures | $1,495 | 8/17/2007 | $118,755 |
| | ||||
| Total Options Purchased (cost $129,903) | 118,755 | |||
| Interest | Maturity | |||
| Shares | Collateral Held for Securities Loaned (6.8%) | Rate (+) | Date | Value |
| 9,700,875 | Thrivent Financial Securities Lending Trust | 5.360% | N/A | $9,700,875 |
| Total Collateral Held for Securities Loaned | ||||
| (cost $9,700,875) | 9,700,875 | |||
| The accompanying Notes to Financial Statements are an integral part of this schedule. |
| 187 |
Diversified Income Plus Portfolio
Schedule of Investments as of June 29, 2007 (unaudited)
| Shares or | ||||
| Principal | Interest | Maturity | ||
| Amount | Short-Term Investments (8.6%) | Rate (+) | Date | Value |
| $2,085,000 | Ciesco, LLC | 5.370% | 7/2/2007 | $2,084,378 |
| 200,000 | Federal National Mortgage Association | 5.090 | 7/16/2007 | 199,548 |
| 1,655,000 | Galaxy Funding, Inc. | 5.360 | 7/2/2007 | 1,654,507 |
| 830,000 | International Bank for Reconstruction and Development | 4.973 | 7/2/2007 | 829,774 |
| 1,500,000 | Regency Markets No.1, LLC | 5.350 | 7/9/2007 | 1,497,994 |
| 5,929,478 | Thrivent Money Market Portfolio | 5.050 | N/A | 5,929,478 |
| Total Short-Term Investments (at amortized cost) | 12,195,679 | |||
| Total Investments (cost $156,865,223) 109.4% | $156,087,836 | |||
| Other Assets and Liabilities, Net (9.4%) | (13,355,689) | |||
| Total Net Assets 100.0% | $142,732,147 | |||
| Number of | Notional | ||||
| Contracts | Expiration | Principal | Unrealized | ||
| Futures | Long/(Short) | Date | Amount | Value | Gain/(Loss) |
| Dow Jones U.S. Real Estate Index | 5 | September 2007 | $155,564 | $151,650 | ($3,914) |
| S&P 500 Index Mini-Futures | 10 | September 2007 | 767,352 | 757,700 | (9,652) |
| Number of | Exercise | Expiration | Unrealized | ||
| Call Options Written | Contracts | Price | Date | Value | Gain/(Loss) |
| Federal National Mortgage Association | 5 | $98.95 | July 2007 | ($5,739) | $2,698 |
| Conventional 30-Yr. Pass Through | |||||
| The accompanying Notes to Financial Statements are an integral part of this schedule. |
| 188 |
Diversified Income Plus Portfolio
Schedule of Investments as of June 29, 2007 (unaudited)
| Notional | ||||||
| Fund | Fund | Buy/Sell | Termination | Principal | Unrealized | |
| Swaps and Counterparty | Receives | Pays | Protection | Date | Amount | Gain/(Loss) |
| Credit Default Swaps | ||||||
| Beazer Homes USA, Inc., | ||||||
| 5 Year, at 3.25%; | N/A | N/A | Sell | June 2012 | $300,000 | ($18,870) |
| Bank of America, N.A. | ||||||
| Beazer Homes USA, Inc., | ||||||
| 5 Year, at 3.28%; | N/A | N/A | Sell | June 2012 | $300,000 | ($18,539) |
| Bank of America, N.A. | ||||||
| Beazer Homes USA, Inc., | ||||||
| 10 Year, at 3.75%; | N/A | N/A | Buy | June 2017 | ($200,000) | $17,173 |
| Bank of America, N.A. | ||||||
| Beazer Homes USA, Inc., | ||||||
| 10 Year, at 3.77%; | N/A | N/A | Buy | June 2017 | ($200,000) | $16,957 |
| Bank of America, N.A. | ||||||
| LCDX, N.A. Index Series 8, | ||||||
| 5 Year, at 1.20%; | N/A | N/A | Sell | June 2012 | $300,000 | ($7,513) |
| Bank of America, N.A. | ||||||
| LCDX, N.A. Index Series 8, | ||||||
| 5 Year, at 1.20%; | N/A | N/A | Sell | June 2012 | $1,500,000 | ($36,191) |
| J.P. Morgan Chase and Co. | ||||||
| Total Rate of Return Swap | ||||||
| Wachovia Bank, N.A. | Lehman Brothers | 1 Month LIBOR | N/A | August 2007 | $4,000,000 | ($52,191) |
| 3 Month | CMBS Aaa 8.5+ | Less 0.45% | ||||
| Yr Index | ||||||
# Non-income producing security.
* All or a portion of the security is on loan as discussed in item 2(M) of the Notes to Financial Statements.
+ The interest rate shown reflects the yield, coupon rate or, for securities purchased at a discount, the discount rate at the date of purchase.
> Denotes step coupon bonds for which the current interest rate and next scheduled reset date are shown.
† Denotes variable rate obligations for which the current yield and next scheduled reset date are shown.
§ Denotes investments purchased on a when-issued or delayed delivery basis.
± Designated as cover for long settling trades as discussed in the Notes to Financial Statements.
‡ At June 29, 2007, $378,898 of investments were held on deposit with the counterparty and pledged as the initial margin deposit for open financial futures contracts. In addition, $3,325,038, $10,545,354 and $243,755 of investments were earmarked as collateral to cover open financial futures, swap contracts and an unfunded loan commitment, respectively.
~ All or a portion of the security was earmarked as collateral to cover options.
¿ These securities are Equity-Linked Structured Securities as discussed in item 2(Q) of the Notes to Financial Statements.
Definitions:
REIT — Real Estate Investment Trust, is a company that busy, develops, manages and/or sells real estate assets.
Gross unrealized appreciation and depreciation of investments were as follows:
| Gross unrealized appreciation | $3,028,029 |
| Gross unrealized depreciation | (3,805,416) |
| Net unrealized appreciation (depreciation) | ($777,387) |
| Cost for federal income tax purposes | $156,865,223 |
| The accompanying Notes to Financial Statements are an integral part of this schedule. |
| 189 |
| Income Portfolio Schedule of Investments as of June 29, 2007 (unaudited) | ||||
| Principal | Interest | Maturity | ||
| Amount | Long-Term Fixed Income (98.9%) | Rate | Date | Value |
| Asset-Backed Securities (7.7%) | ||||
| $4,680,593 | Bear Stearns Mortgage Funding Trust †‡ | 5.460% | 7/25/2007 | $4,678,679 |
| 7,172,340 | Capitalsource Commercial Loan Trust †‡ | 5.450 | 7/20/2007 | 7,172,340 |
| 5,000,000 | Credit Based Asset Servicing and Securitization, LLC †‡ | 5.430 | 7/25/2007 | 4,999,420 |
| 10,000,000 | DaimlerChrysler Master Owner Trust ±† | 5.370 | 7/15/2007 | 10,002,330 |
| 4,500,000 | First Franklin Mortgage Loan Asset-Backed Certificates ±† | 5.410 | 7/25/2007 | 4,499,564 |
| 8,500,000 | Ford Credit Floor Plan Master Owner Trust †‡ | 5.500 | 7/15/2007 | 8,501,946 |
| 1,322,128 | GE Commercial Loan Trust †‡ | 5.420 | 7/19/2007 | 1,322,088 |
| 10,000,000 | GE Dealer Floorplan Master Note Trust ±† | 5.360 | 7/20/2007 | 10,003,180 |
| 11,500,000 | GMAC Mortgage Corporation Loan Trust †‡ | 5.390 | 7/25/2007 | 11,493,342 |
| 10,000,000 | GMAC Mortgage Corporation Loan Trust ±† | 5.410 | 7/25/2007 | 10,000,710 |
| 1,183,041 | GMAC Mortgage Corporation Loan Trust ±† | 5.420 | 7/25/2007 | 1,183,092 |
| 2,626,180 | IndyMac Seconds Asset-Backed Trust † | 5.490 | 7/25/2007 | 2,625,363 |
| 12,250,000 | Merna Re, Ltd. | Zero Coupon | 7/1/2010 | 12,250,000 |
| 2,375,003 | Popular ABS Mortgage Pass-Through Trust †~ | 5.450 | 7/25/2007 | 2,375,425 |
| 1,419,223 | Residential Asset Mortgage Products, Inc. †~ | 5.430 | 7/25/2007 | 1,419,306 |
| 8,291,005 | Residential Funding Mortgage Securities II † | 5.450 | 7/25/2007 | 8,291,618 |
| Total Asset-Backed Securities | 100,818,403 | |||
| Basic Materials (2.1%) | ||||
| 4,710,000 | Alcan, Inc. ‡ | 5.000 | 6/1/2015 | 4,381,463 |
| 4,500,000 | BHP Billiton Finance, Ltd. ± | 5.400 | 3/29/2017 | 4,325,900 |
| 2,725,000 | Dow Chemical Company ‡ | 7.375 | 11/1/2029 | 2,949,398 |
| 1,500,000 | Freeport-McMoRan Copper & Gold, Inc. † | 8.564 | 10/1/2007 | 1,571,250 |
| 7,300,000 | Glencore Funding, LLC ± | 6.000 | 4/15/2014 | 7,164,388 |
| 4,400,000 | Lubrizol Corporation ‡ | 5.500 | 10/1/2014 | 4,215,768 |
| 3,500,000 | Precision Castparts Corporation | 5.600 | 12/15/2013 | 3,451,994 |
| Total Basic Materials | 28,060,161 | |||
| Capital Goods (1.6%) | ||||
| 2,400,000 | CRH America, Inc. ‡ | 6.000 | 9/30/2016 | 2,372,986 |
| 3,429,000 | Goodrich Corporation ± | 6.800 | 7/1/2036 | 3,548,730 |
| 1,805,000 | Lockheed Martin Corporation ± | 6.150 | 9/1/2036 | 1,799,962 |
| 5,250,000 | Oakmont Asset Trust | 4.514 | 12/22/2008 | 5,178,290 |
| 1,800,000 | Owens Corning, Inc. | 7.000 | 12/1/2036 | 1,753,934 |
| 2,935,000 | Sealed Air Corporation ~ | 6.875 | 7/15/2033 | 2,853,642 |
| 3,980,463 | Systems 2001 Asset Trust, LLC ~ | 6.664 | 9/15/2013 | 4,126,188 |
| Total Capital Goods | 21,633,732 | |||
| Commercial Mortgage-Backed Securities (17.7%) | ||||
| 4,451,565 | Banc of America Commercial Mortgage, Inc. ‡ | 4.037 | 11/10/2039 | 4,356,016 |
| 3,000,000 | Banc of America Commercial Mortgage, Inc. ‡ | 5.118 | 7/11/2043 | 2,938,713 |
| 10,000,000 | Banc of America Large Loan Trust †‡ | 5.430 | 7/15/2007 | 10,007,720 |
| 5,000,000 | Banc of America Large Loan Trust †‡ | 5.530 | 7/15/2007 | 5,001,210 |
| 9,932,723 | Banc of America Mortgage Securities, Inc. ‡ | 4.803 | 9/25/2035 | 9,751,848 |
| 3,000,000 | Bear Stearns Commercial Mortgage Securities, Inc. †‡ | 5.470 | 7/15/2007 | 3,000,000 |
| The accompanying Notes to Financial Statements are an integral part of this schedule. |
| 190 |
Income Portfolio
Schedule of Investments as of June 29, 2007 (unaudited)
| Principal | Interest | Maturity | ||||||
| Amount | Long-Term Fixed Income (98.9%) | Rate | Date | Value | ||||
| Commercial Mortgage-Backed Securities — continued | ||||||||
| $1,582,670 | Citigroup Commercial Mortgage Trust † | 5.390% | 7/15/2007 | $1,583,609 | ||||
| 12,500,000 | Citigroup Commercial Mortgage Trust ±† | 5.460 | 7/15/2007 | 12,500,000 | ||||
| 5,000,000 | Citigroup Mortgage Loan Trust, Inc. ±‡ | 5.536 | 3/25/2036 | 4,978,150 | ||||
| 335,095 | Commercial Mortgage Pass-Through Certificates † | 5.420 | 7/15/2007 | 335,110 | ||||
| 2,000,000 | Commercial Mortgage Pass-Through Certificates ±† | 5.450 | 7/15/2007 | 2,001,656 | ||||
| 10,000,000 | Commercial Mortgage Pass-Through Certificates †‡ | 5.500 | 7/15/2007 | 10,000,000 | ||||
| 7,500,000 | Credit Suisse Mortgage Capital Certificates † | 5.490 | 7/15/2007 | 7,506,052 | ||||
| 10,000,000 | Crown Castle International Corporation | 5.245 | 11/15/2036 | 9,825,110 | ||||
| 4,733,186 | Deutsche Alt-A Securities, Inc. † | 5.799 | 7/25/2007 | 4,733,186 | ||||
| 9,000,000 | Greenwich Capital Commercial Funding Corporation | 5.915 | 7/10/2038 | 9,083,142 | ||||
| 4,493,232 | HomeBanc Mortgage Trust | 6.009 | 4/25/2037 | 4,516,413 | ||||
| 5,500,000 | J.P. Morgan Chase Commercial Mortgage | |||||||
| Securities Corporation ‡ | 4.302 | 1/15/2038 | 5,257,241 | |||||
| 11,500,000 | J.P. Morgan Chase Commercial Mortgage | |||||||
| Securities Corporation §^ | 6.007 | 7/15/2045 | 11,475,742 | |||||
| 9,978,455 | J.P. Morgan Chase Commercial Mortgage | |||||||
| Securities Corporation | 5.284 | 5/15/2047 | 9,834,545 | |||||
| 10,000,000 | J.P. Morgan Chase Commercial Mortgage | |||||||
| Securities Corporation ‡ | 5.336 | 5/15/2047 | 9,584,990 | |||||
| 9,437,601 | J.P. Morgan Mortgage Trust | 5.008 | 7/25/2035 | 9,315,375 | ||||
| 5,427,153 | Lehman Brothers “CALSTRS” Mortgage Trust ‡ | 3.988 | 11/20/2012 | 5,395,339 | ||||
| 7,478,774 | Merrill Lynch Mortgage Investors, Inc. | 4.874 | 6/25/2035 | 7,391,474 | ||||
| 6,000,000 | Merrill Lynch Mortgage Trust ‡ | 4.747 | 5/12/2043 | 5,599,620 | ||||
| 8,625,000 | Merrill Lynch Mortgage Trust ‡ | 5.441 | 1/12/2044 | 8,330,810 | ||||
| 6,628,601 | Thornburg Mortgage Securities Trust †~ | 5.410 | 7/25/2007 | 6,615,821 | ||||
| 15,000,000 | Wachovia Bank Commercial Mortgage Trust †~ | 5.440 | 7/15/2007 | 14,999,115 | ||||
| 7,700,000 | Wachovia Bank Commercial Mortgage Trust ~ | 4.390 | 2/15/2036 | 7,340,649 | ||||
| 6,396,068 | Wachovia Mortgage Loan Trust, LLC ~ | 5.580 | 5/20/2036 | 6,395,729 | ||||
| 8,510,521 | Washington Mutual Alternative Loan Trust † | 5.772 | 7/25/2007 | 8,509,856 | ||||
| 3,600,769 | Washington Mutual Asset Securities Corporation | 3.830 | 1/25/2035 | 3,482,854 | ||||
| 1,633,221 | Washington Mutual Mortgage Pass-Through Certificates †~ | 5.610 | 7/25/2007 | 1,636,042 | ||||
| 3,519,355 | Washington Mutual Mortgage Pass-Through Certificates ~ | 4.835 | 9/25/2035 | 3,470,194 | ||||
| 5,582,023 | Zuni Mortgage Loan Trust † | 5.450 | 7/25/2007 | 5,579,187 | ||||
| Total Commercial Mortgage-Backed Securities | 232,332,518 | |||||||
| Communications Services (6.4%) | ||||||||
| 1,225,000 | AT&T Corporation | 8.000 | 11/15/2031 | 1,456,010 | ||||
| 3,075,000 | British Telecom plc ±‡ | 9.125 | 12/15/2030 | 4,024,514 | ||||
| 1,700,000 | Comcast Corporation ‡ | 5.900 | 3/15/2016 | 1,669,847 | ||||
| 5,400,000 | Comcast Corporation ‡ | 5.875 | 2/15/2018 | 5,229,992 | ||||
| 6,000,000 | Cox Communications, Inc. | 4.625 | 6/1/2013 | 5,619,576 | ||||
| 1,230,000 | Cox Communications, Inc. ± | 5.450 | 12/15/2014 | 1,189,966 | ||||
| 1,800,000 | Embarq Corporation ‡ | 7.082 | 6/1/2016 | 1,810,084 | ||||
| 5,000,000 | Intelsat Intermediate, Inc. >‡ | Zero Coupon | 2/1/2010 | 4,112,500 | ||||
| 3,850,000 | New Cingular Wireless Services, Inc. ‡ | 8.125 | 5/1/2012 | 4,233,244 | ||||
| 1,350,000 | New Cingular Wireless Services, Inc. | 8.750 | 3/1/2031 | 1,682,937 | ||||
| The accompanying Notes to Financial Statements are an integral part of this schedule. |
| 191 |
Income Portfolio
Schedule of Investments as of June 29, 2007 (unaudited)
| Principal | Interest | Maturity | ||||||
| Amount | Long-Term Fixed Income (98.9%) | Rate | Date | Value | ||||
| Communications Services — continued | ||||||||
| $2,140,000 | News America, Inc. ‡ | 6.400% | 12/15/2035 | $2,037,948 | ||||
| 2,750,000 | Nextel Partners, Inc. ‡ | 8.125 | 7/1/2011 | 2,868,330 | ||||
| 4,800,000 | Qwest Corporation | 8.875 | 3/15/2012 | 5,172,000 | ||||
| 4,815,000 | Rogers Cable, Inc. ~ | 5.500 | 3/15/2014 | 4,669,226 | ||||
| 3,555,000 | Rogers Cable, Inc. ~ | 6.750 | 3/15/2015 | 3,665,120 | ||||
| 510,000 | Rogers Cable, Inc. ~ | 8.750 | 5/1/2032 | 618,257 | ||||
| 3,000,000 | Rogers Wireless Communications, Inc. ~ | 6.375 | 3/1/2014 | 3,032,031 | ||||
| 4,600,000 | Sprint Capital Corporation ~ | 6.900 | 5/1/2019 | 4,553,706 | ||||
| 3,000,000 | Sprint Capital Corporation | 6.875 | 11/15/2028 | 2,855,589 | ||||
| 5,450,000 | Telecom Italia Capital SA ~ | 5.250 | 11/15/2013 | 5,193,158 | ||||
| 2,750,000 | Telecom Italia Capital SA ~ | 5.250 | 10/1/2015 | 2,557,132 | ||||
| 4,400,000 | Telefonica Emisones SAU | 6.221 | 7/3/2017 | 4,388,982 | ||||
| 3,500,000 | Time Warner Cable, Inc. ‡ | 5.850 | 5/1/2017 | 3,404,268 | ||||
| 1,850,000 | Time Warner Entertainment Company, LP ~ | 8.375 | 3/15/2023 | 2,123,682 | ||||
| 4,555,000 | Verizon Communications, Inc. ~ | 5.550 | 2/15/2016 | 4,437,768 | ||||
| 1,835,000 | Verizon Communications, Inc. ~ | 5.500 | 4/1/2017 | 1,768,534 | ||||
| Total Communications Services | 84,374,401 | |||||||
| Consumer Cyclical (2.4%) | ||||||||
| 1,200,000 | Beazer Homes USA, Inc. ± | 8.375 | 4/15/2012 | 1,134,000 | ||||
| 6,500,000 | D.R. Horton, Inc. ‡ | 6.500 | 4/15/2016 | 6,218,972 | ||||
| 2,300,000 | Federated Retail Holdings, Inc. ‡ | 5.350 | 3/15/2012 | 2,259,621 | ||||
| 1,545,000 | Federated Retail Holdings, Inc. ‡ | 5.900 | 12/1/2016 | 1,505,802 | ||||
| 3,150,000 | Ford Motor Credit Company ± | 6.625 | 6/16/2008 | 3,147,874 | ||||
| 1,200,000 | JC Penney & Company, Inc. ~ | 7.950 | 4/1/2017 | 1,330,326 | ||||
| 490,000 | JC Penney Corporation, Inc. ~ | 5.750 | 2/15/2018 | 473,042 | ||||
| 2,140,000 | JC Penney Corporation, Inc. | 6.375 | 10/15/2036 | 2,037,937 | ||||
| 3,000,000 | Marriott International, Inc. | 7.000 | 1/15/2008 | 3,017,133 | ||||
| 4,100,000 | Nissan Motor Acceptance Corporation ‡ | 5.625 | 3/14/2011 | 4,075,420 | ||||
| 3,000,000 | Royal Caribbean Cruises, Ltd. ~ | 7.250 | 6/15/2016 | 2,964,012 | ||||
| 3,025,000 | Walmart Stores, Inc. ± | 5.875 | 4/5/2027 | 2,923,587 | ||||
| Total Consumer Cyclical | 31,087,726 | |||||||
| Consumer Non-Cyclical (3.8%) | ||||||||
| 5,600,000 | Abbott Laboratories ‡ | 5.600 | 5/15/2011 | 5,622,652 | ||||
| 1,200,000 | AmerisourceBergen Corporation ‡ | 5.625 | 9/15/2012 | 1,175,869 | ||||
| 3,000,000 | AmerisourceBergen Corporation ‡ | 5.875 | 9/15/2015 | 2,884,746 | ||||
| 3,325,000 | Baxter International, Inc. ‡ | 5.900 | 9/1/2016 | 3,324,694 | ||||
| 6,000,000 | Bunge Limited Finance Corporation ‡ | 5.350 | 4/15/2014 | 5,699,736 | ||||
| 4,300,000 | Cardinal Health, Inc. ~ | 6.000 | 6/15/2017 | 4,249,079 | ||||
| 3,600,000 | Community Health Systems, Inc. § | 8.875 | 7/15/2015 | 3,649,500 | ||||
| 6,050,000 | Constellation Brands, Inc. ±‡ | 7.250 | 5/15/2017 | 5,898,750 | ||||
| 2,070,000 | Procter & Gamble Company ~ | 5.550 | 3/5/2037 | 1,946,881 | ||||
| 3,000,000 | Qwest Diagnostic, Inc. | 6.400 | 7/1/2017 | 3,021,816 | ||||
| 4,200,000 | Triad Hospitals, Inc. | 7.000 | 5/15/2012 | 4,388,987 | ||||
| The accompanying Notes to Financial Statements are an integral part of this schedule. |
| 192 |
Income Portfolio
Schedule of Investments as of June 29, 2007 (unaudited)
| Principal | Interest | Maturity | ||||||
| Amount | Long-Term Fixed Income (98.9%) | Rate | Date | Value | ||||
| Consumer Non-Cyclical — continued | ||||||||
| $6,750,000 | Wyeth ‡ | 6.950% | 3/15/2011 | $7,064,044 | ||||
| 1,425,000 | Wyeth | 5.950 | 4/1/2037 | 1,361,848 | ||||
| Total Consumer Non-Cyclical | 50,288,602 | |||||||
| Energy (4.1%) | ||||||||
| 4,145,000 | Apache Corporation ~ | 5.250 | 4/15/2013 | 4,063,049 | ||||
| 6,700,000 | Canadian Natural Resources, Ltd. ‡ | 5.700 | 5/15/2017 | 6,481,352 | ||||
| 1,550,000 | Consolidated Natural Gas Company ‡ | 5.000 | 12/1/2014 | 1,464,077 | ||||
| 4,800,000 | Enterprise Products Operating, LP ± | 5.600 | 10/15/2014 | 4,666,224 | ||||
| 2,700,000 | Magellan Midstream Partners, LP ‡ | 6.450 | 6/1/2014 | 2,772,976 | ||||
| 1,100,000 | Nexen, Inc. ~ | 5.650 | 5/15/2017 | 1,057,724 | ||||
| 3,075,000 | Nexen, Inc. ~ | 6.400 | 5/15/2037 | 2,939,845 | ||||
| 3,250,000 | Plains All American Pipeline, LP/PAA Finance Corporation | 6.650 | 1/15/2037 | 3,204,364 | ||||
| 2,500,000 | Premcor Refining Group, Inc. | 6.125 | 5/1/2011 | 2,536,842 | ||||
| 2,800,000 | Premcor Refining Group, Inc. | 6.750 | 5/1/2014 | 2,860,939 | ||||
| 5,150,000 | Ras Laffan Liquefied Natural Gas Company, Ltd. II ~ | 5.298 | 9/30/2020 | 4,812,212 | ||||
| 1,650,000 | Southern California Gas Company ‡ | 5.750 | 11/15/2035 | 1,567,513 | ||||
| 3,000,000 | Southern Natural Gas Company ~ | 5.900 | 4/1/2017 | 2,901,654 | ||||
| 3,600,000 | Southern Star Central Corporation ~ | 6.750 | 3/1/2016 | 3,546,000 | ||||
| 3,000,000 | Transcontinental Gas Pipe Corporation ~ | 8.875 | 7/15/2012 | 3,360,000 | ||||
| 900,000 | Transcontinental Gas Pipe Corporation ~ | 6.400 | 4/15/2016 | 902,250 | ||||
| 3,500,000 | Valero Energy Corporation ~ | 6.125 | 6/15/2017 | 3,488,720 | ||||
| 1,200,000 | Valero Energy Corporation ~ | 6.625 | 6/15/2037 | 1,194,472 | ||||
| Total Energy | 53,820,213 | |||||||
| Financials (19.7%) | ||||||||
| 3,800,000 | American International Group, Inc. ‡ | 6.250 | 3/15/2037 | 3,592,953 | ||||
| 3,100,000 | Archstone-Smith Operating Trust ± | 5.625 | 8/15/2014 | 3,083,657 | ||||
| 3,900,000 | AXA SA ± | 6.463 | 12/14/2018 | 3,625,467 | ||||
| 1,030,000 | BAC Capital Trust XI ~ | 6.625 | 5/23/2036 | 1,050,249 | ||||
| 3,800,000 | BAC Capital Trust XIV ~ | 5.630 | 3/15/2012 | 3,715,564 | ||||
| 3,350,000 | BNP Paribas SA ± | 5.186 | 6/29/2015 | 3,123,587 | ||||
| 1,115,000 | Capital One Capital III ‡ | 7.686 | 8/15/2036 | 1,148,328 | ||||
| 2,460,000 | Capital One Financial Corporation ± | 5.250 | 2/21/2017 | 2,279,977 | ||||
| 6,000,000 | Capmark Financial Group, Inc. ‡ | 6.300 | 5/10/2017 | 5,904,318 | ||||
| 3,000,000 | Corestates Capital Trust I ± | 8.000 | 12/15/2026 | 3,107,214 | ||||
| 7,250,000 | Countrywide Financial Corporation ~ | 5.800 | 6/7/2012 | 7,198,931 | ||||
| 1,800,000 | Coventry Health Care, Inc. ‡ | 5.875 | 1/15/2012 | 1,804,559 | ||||
| 1,500,000 | Coventry Health Care, Inc. ~ | 6.125 | 1/15/2015 | 1,496,580 | ||||
| 1,500,000 | Coventry Health Care, Inc. | 5.950 | 3/15/2017 | 1,463,250 | ||||
| 4,800,000 | Credit Agricole SA ~ | 6.637 | 5/31/2017 | 4,665,922 | ||||
| 3,300,000 | Deluxe Corporation ± | 7.375 | 6/1/2015 | 3,283,500 | ||||
| 4,200,000 | Endurance Specialty Holdings, Ltd. ‡ | 6.150 | 10/15/2015 | 4,068,019 | ||||
| 2,500,000 | ERP Operating, LP ±~ | 5.125 | 3/15/2016 | 2,360,432 | ||||
| 2,375,000 | General Electric Capital Corporation ‡ | 5.720 | 8/22/2011 | 2,374,449 | ||||
| 5,000,000 | General Electric Capital Corporation ± | 4.375 | 3/3/2012 | 4,784,415 | ||||
| The accompanying Notes to Financial Statements are an integral part of this schedule. |
| 193 |
Income Portfolio
Schedule of Investments as of June 29, 2007 (unaudited)
| Principal | Interest | Maturity | ||||||
| Amount | Long-Term Fixed Income (98.9%) | Rate | Date | Value | ||||
| Financials — continued | ||||||||
| $12,470,000 | General Motors Acceptance Corporation ± | 6.875% | 9/15/2011 | $12,266,165 | ||||
| 7,200,000 | General Motors Acceptance Corporation, LLC ± | 6.000 | 12/15/2011 | 6,845,054 | ||||
| 5,500,000 | Goldman Sachs Group, Inc. ‡ | 5.125 | 1/15/2015 | 5,226,314 | ||||
| 4,000,000 | HSBC Capital Funding, LP/Jersey Channel Islands ± | 9.547 | 6/30/2010 | 4,417,024 | ||||
| 1,220,000 | HSBC Holdings plc ± | 6.500 | 5/2/2036 | 1,253,759 | ||||
| 3,250,000 | International Lease Finance Corporation | 5.750 | 6/15/2011 | 3,263,588 | ||||
| 5,185,000 | iStar Financial, Inc. | 5.850 | 3/15/2017 | 4,973,499 | ||||
| 2,800,000 | J.P. Morgan Chase & Company | 6.125 | 6/27/2017 | 2,821,770 | ||||
| 4,410,000 | J.P. Morgan Chase Bank NA ‡ | 5.875 | 6/13/2016 | 4,417,391 | ||||
| 2,840,000 | Liberty Property, LP ~ | 5.500 | 12/15/2016 | 2,729,166 | ||||
| 5,980,000 | Lincoln National Corporation | 7.000 | 5/17/2016 | 6,135,958 | ||||
| 685,000 | Marsh & McLennan Companies, Inc. ± | 5.750 | 9/15/2015 | 647,280 | ||||
| 2,370,000 | Merrill Lynch & Company, Inc. ‡ | 6.050 | 5/16/2016 | 2,344,231 | ||||
| 1,350,000 | Merrill Lynch & Company, Inc. ‡ | 6.110 | 1/29/2037 | 1,266,736 | ||||
| 6,730,000 | Mitsubishi UFG Capital Finance, Ltd. | 6.346 | 7/25/2016 | 6,612,736 | ||||
| 2,400,000 | Morgan Stanley ~ | 4.000 | 1/15/2010 | 2,317,001 | ||||
| 3,630,000 | Morgan Stanley | 6.250 | 8/9/2026 | 3,615,908 | ||||
| 6,939,972 | Preferred Term Securities XXIII, Ltd. † | 5.560 | 9/24/2007 | 6,939,972 | ||||
| 2,670,000 | ProLogis | 5.500 | 4/1/2012 | 2,647,692 | ||||
| 2,600,000 | ProLogis | 5.625 | 11/15/2015 | 2,543,804 | ||||
| 1,095,000 | Prudential Financial, Inc. | 5.900 | 3/17/2036 | 1,034,313 | ||||
| 1,120,000 | Prudential Financial, Inc. | 5.700 | 12/14/2036 | 1,026,276 | ||||
| 2,400,000 | QBE Capital Funding II, LP ~ | 6.797 | 6/1/2017 | 2,343,506 | ||||
| 3,750,000 | RBS Capital Trust I ~ | 5.512 | 9/30/2014 | 3,604,162 | ||||
| 2,500,000 | Regency Centers, LP ~ | 5.875 | 6/15/2017 | 2,458,505 | ||||
| 4,785,000 | Reinsurance Group of America, Inc. ~ | 5.625 | 3/15/2017 | 4,567,589 | ||||
| 5,040,000 | Residential Capital Corporation †~ | 6.457 | 7/17/2007 | 5,031,634 | ||||
| 3,300,000 | Residential Capital Corporation †~ | 7.187 | 7/17/2007 | 3,285,256 | ||||
| 6,800,000 | Residential Capital Corporation ~ | 6.500 | 4/17/2013 | 6,572,737 | ||||
| 7,775,000 | Residential Capital, LLC ~ | 6.500 | 6/1/2012 | 7,586,791 | ||||
| 6,000,000 | Resona Bank, Ltd. ~ | 5.850 | 4/15/2016 | 5,736,732 | ||||
| 3,500,000 | Simon Property Group, LP ~ | 4.600 | 6/15/2010 | 3,408,002 | ||||
| 2,100,000 | Simon Property Group, LP ~ | 5.375 | 6/1/2011 | 2,084,252 | ||||
| 2,280,000 | Simon Property Group, LP ~ | 5.750 | 12/1/2015 | 2,255,960 | ||||
| 6,300,000 | SLM Corporation ~ | 5.400 | 10/25/2011 | 5,770,202 | ||||
| 3,660,000 | SMFG Preferred Capital GBP 1, Ltd. ~ | 6.078 | 1/25/2017 | 3,520,957 | ||||
| 6,630,000 | Student Loan Marketing Corporation ~ | 4.500 | 7/26/2010 | 6,130,191 | ||||
| 4,200,000 | Swiss RE Capital I, LP ‡ | 6.854 | 5/25/2016 | 4,224,797 | ||||
| 995,000 | Travelers Companies, Inc. ~ | 6.250 | 6/15/2037 | 963,513 | ||||
| 3,000,000 | Travelers Property Casualty Corporation ~ | 5.000 | 3/15/2013 | 2,889,351 | ||||
| 2,500,000 | United Health Group | 6.500 | 6/15/2037 | 2,506,522 | ||||
| 3,825,000 | Wachovia Bank NA ~ | 4.875 | 2/1/2015 | 3,613,256 | ||||
| 3,585,000 | Wachovia Capital Trust III ~ | 5.800 | 3/15/2011 | 3,569,377 | ||||
| 3,650,000 | Wachovia Corporation ± | 5.300 | 10/15/2011 | 3,612,212 | ||||
| 1,720,000 | Washington Mutual Bank FA | 5.125 | 1/15/2015 | 1,621,628 | ||||
| 1,340,000 | Washington Mutual Preferred Funding | 6.665 | 12/15/2016 | 1,279,211 | ||||
| The accompanying Notes to Financial Statements are an integral part of this schedule. |
| 194 |
Income Portfolio
Schedule of Investments as of June 29, 2007 (unaudited)
| Principal | Interest | Maturity | ||||||
| Amount | Long-Term Fixed Income (98.9%) | Rate | Date | Value | ||||
| Financials — continued | ||||||||
| $7,400,000 | Washington Mutual Preferred Funding II | 6.895% | 6/15/2012 | $7,297,747 | ||||
| 6,000,000 | WellPoint, Inc. ± | 5.000 | 12/15/2014 | 5,665,152 | ||||
| 4,600,000 | Willis North America, Inc. ± | 6.200 | 3/28/2017 | 4,504,297 | ||||
| 3,075,000 | XL Capital, Ltd. ~ | 6.250 | 5/15/2027 | 2,969,601 | ||||
| Total Financials | 258,550,148 | |||||||
| Foreign (0.4%) | ||||||||
| 4,500,000 | Pemex Finance, Ltd. ~ | 9.030 | 2/15/2011 | 4,796,955 | ||||
| Total Foreign | 4,796,955 | |||||||
| Mortgage-Backed Securities (13.8%) | ||||||||
| 95,500,000 | Federal National Mortgage Association Conventional | |||||||
| 30-Yr. Pass Through §~ | 5.500 | 7/1/2037 | 92,097,817 | |||||
| 90,000,000 | Federal National Mortgage Association Conventional | |||||||
| 30-Yr. Pass Through § | 6.000 | 7/1/2037 | 89,015,580 | |||||
| Total Mortgage-Backed Securities | 181,113,397 | |||||||
| Transportation (4.3%) | ||||||||
| 2,800,000 | Burlington Northern Santa Fe Corporation ‡ | 7.000 | 12/15/2025 | 2,955,235 | ||||
| 3,303,571 | Continental Airlines, Inc. ‡ | 7.875 | 7/2/2018 | 3,377,901 | ||||
| 3,250,000 | Continental Airlines, Inc. ‡ | 5.983 | 4/19/2022 | 3,159,032 | ||||
| 6,500,000 | Delta Air Lines, Inc. ‡ | 7.111 | 9/18/2011 | 6,669,000 | ||||
| 2,000,000 | FedEx Corporation ± | 3.500 | 4/1/2009 | 1,933,296 | ||||
| 3,729,029 | FedEx Corporation ‡ | 6.845 | 1/15/2019 | 3,931,776 | ||||
| 3,439,051 | FedEx Corporation | 6.720 | 1/15/2022 | 3,617,537 | ||||
| 2,750,000 | Hertz Corporation | 8.875 | 1/1/2014 | 2,866,875 | ||||
| 5,850,000 | Kansas City Southern de Mexico SA de CV | 7.375 | 6/1/2014 | 5,806,125 | ||||
| 3,740,000 | Norfolk Southern Corporation ~ | 5.640 | 5/17/2029 | 3,379,580 | ||||
| 14,750,000 | Northwest Airlines, Inc. ‡ | 6.841 | 4/1/2011 | 14,952,812 | ||||
| 4,645,593 | Piper Jaffray Equipment Trust Securities | 6.750 | 4/1/2011 | 4,622,365 | ||||
| Total Transportation | 57,271,534 | |||||||
| U.S. Government (8.6%) | ||||||||
| 5,000,000 | Federal Home Loan Bank ± | 5.625 | 6/13/2016 | 4,981,310 | ||||
| 12,000,000 | Federal Home Loan Mortgage Corporation ± | 5.500 | 8/20/2012 | 12,108,732 | ||||
| 22,500,000 | Federal National Mortgage Association ‡ | 5.300 | 2/22/2011 | 22,381,312 | ||||
| 8,350,000 | U.S. Treasury Bonds * | 6.250 | 8/15/2023 | 9,271,765 | ||||
| 1,900,000 | U.S. Treasury Bonds * | 6.125 | 8/15/2029 | 2,131,266 | ||||
| 4,365,000 | U.S. Treasury Notes * | 4.500 | 5/15/2017 | 4,184,944 | ||||
| 32,880,600 | U.S. Treasury Notes, TIPS * | 2.000 | 7/15/2014 | 31,562,811 | ||||
| 38,000,000 | U.S. Treasury Principal Strips | Zero Coupon | 11/15/2022 | 17,006,786 | ||||
| 12,750,000 | U.S. Treasury Strips * | Zero Coupon | 2/15/2013 | 9,707,990 | ||||
| Total U.S. Government | 113,336,916 | |||||||
| The accompanying Notes to Financial Statements are an integral part of this schedule. |
| 195 |
Income Portfolio
Schedule of Investments as of June 29, 2007 (unaudited)
| Principal | Interest | Maturity | ||||||
| Amount | Long-Term Fixed Income (98.9%) | Rate | Date | Value | ||||
| Utilities (6.3%) | ||||||||
| $3,000,000 | Baltimore Gas & Electric Company ‡ | 5.900% | 10/1/2016 | $2,960,883 | ||||
| 2,500,000 | Carolina Power & Light, Inc. ‡~ | 5.150 | 4/1/2015 | 2,397,340 | ||||
| 3,950,000 | Cleveland Electric Illuminating Company ± | 7.430 | 11/1/2009 | 4,100,562 | ||||
| 1,775,000 | Cleveland Electric Illuminating Company | 5.700 | 4/1/2017 | 1,712,527 | ||||
| 2,930,000 | Commonwealth Edison Company | 5.400 | 12/15/2011 | 2,869,988 | ||||
| 2,500,000 | DTE Energy Company | 6.375 | 4/15/2033 | 2,472,252 | ||||
| 4,200,000 | Dynegy Holdings, Inc. ‡ | 7.500 | 6/1/2015 | 3,953,250 | ||||
| 1,800,000 | Dynegy Holdings, Inc. ± | 8.375 | 5/1/2016 | 1,759,500 | ||||
| 4,800,000 | Edison Mission Energy ± | 7.200 | 5/15/2019 | 4,512,000 | ||||
| 2,400,000 | Edison Mission Energy ‡ | 7.625 | 5/15/2027 | 2,268,000 | ||||
| 1,500,000 | Exelon Corporation ± | 6.750 | 5/1/2011 | 1,545,478 | ||||
| 3,500,000 | Exelon Corporation ± | 4.900 | 6/15/2015 | 3,220,906 | ||||
| 1,800,000 | Florida Power & Light Company ± | 6.200 | 6/1/2036 | 1,820,995 | ||||
| 3,000,000 | ITC Holdings Corporation ‡ | 5.875 | 9/30/2016 | 2,924,691 | ||||
| 2,400,000 | MidAmerican Energy Holdings Company ~ | 6.125 | 4/1/2036 | 2,318,647 | ||||
| 850,000 | MidAmerican Energy Holdings Company ‡ | 5.950 | 5/15/2037 | 801,091 | ||||
| 2,800,000 | Nevada Power Company | 6.750 | 7/1/2037 | 2,842,378 | ||||
| 6,450,000 | NiSource Finance Corporation ‡ | 7.875 | 11/15/2010 | 6,867,850 | ||||
| 2,000,000 | NRG Energy, Inc. ‡ | 7.250 | 2/1/2014 | 2,005,000 | ||||
| 1,500,000 | NRG Energy, Inc. ‡ | 7.375 | 2/1/2016 | 1,503,750 | ||||
| 1,550,000 | Ohio Edison Company | 6.875 | 7/15/2036 | 1,618,541 | ||||
| 1,959,395 | Power Contract Financing, LLC ~ | 6.256 | 2/1/2010 | 1,971,661 | ||||
| 3,282,121 | Power Receivables Finance, LLC ~ | 6.290 | 1/1/2012 | 3,316,452 | ||||
| 1,075,000 | Progress Energy, Inc. ~ | 7.000 | 10/30/2031 | 1,149,296 | ||||
| 4,800,000 | PSEG Power, LLC | 5.000 | 4/1/2014 | 4,540,498 | ||||
| 2,270,000 | PSI Energy, Inc. | 5.000 | 9/15/2013 | 2,176,426 | ||||
| 2,770,000 | Southwestern Public Service Company ~ | 6.000 | 10/1/2036 | 2,629,938 | ||||
| 4,600,000 | TXU Energy Company, LLC †~ | 5.860 | 9/17/2007 | 4,601,780 | ||||
| 2,900,000 | Union Electric Company ± | 6.400 | 6/15/2017 | 2,958,606 | ||||
| 2,580,000 | Virginia Electric & Power Company ~ | 6.000 | 1/15/2036 | 2,470,458 | ||||
| Total Utilities | 82,290,744 | |||||||
| Total Long-Term Fixed Income | ||||||||
| (cost $1,315,169,291) | 1,299,775,450 | |||||||
| Exercise | Expiration | |||||||
| Contracts | Options Purchased (0.1%) | Price | Date | Value | ||||
| 214 | Put on S&P 500 Mini Futures | $1,495 | 8/17/2007 | $279,270 | ||||
| 1,380 | Call on U.S. Treasury Bond Futures | 106 | 7/27/2007 | 539,062 | ||||
| 1,160 | Call on U.S. Treasury Bond Futures | 107 | 7/27/2007 | 145,000 | ||||
| Total Options Purchased (cost $822,180) | 963,332 | |||||||
| The accompanying Notes to Financial Statements are an integral part of this schedule. |
| 196 |
Income Portfolio
Schedule of Investments as of June 29, 2007 (unaudited)
| Interest | Maturity | ||||||
| Shares | Collateral Held for Securities Loaned (4.2%) | Rate (+) | Date | Value | |||
| 54,624,063 | Thrivent Financial Securities Lending Trust | 5.360% | N/A | $54,624,063 | |||
| Total Collateral Held for Securities Loaned | |||||||
| (cost $54,624,063) | 54,624,063 | ||||||
| Shares or | |||||||
| Principal | Interest | Maturity | |||||
| Amount | Short-Term Investments (15.4%) | Rate (+) | Date | Value | |||
| $10,000,000 | Air Products and Chemicals, Inc. ~ | 5.290% | 7/3/2007 | $9,995,592 | |||
| 7,000,000 | Barclays US Funding Corporation ‡ | 5.235 | 7/27/2007 | 6,972,516 | |||
| 5,085,000 | Charta, LLC ~ | 5.310 | 7/6/2007 | 5,080,500 | |||
| 13,748,000 | Cooperative Centrale Raiffeisen Boerenleen Bank | 5.300 | 7/6/2007 | 13,735,856 | |||
| 10,000,000 | DNB NOR ASA | 5.360 | 7/2/2007 | 9,997,022 | |||
| 10,000,000 | Falcon Asset Securitization Corporation ‡ | 5.300 | 7/18/2007 | 9,973,500 | |||
| 17,380,000 | Jupiter Securitization Company, LLC | 5.400 | 7/2/2007 | 17,374,786 | |||
| 7,500,000 | Jupiter Securitization Company, LLC ± | 5.290 | 7/18/2007 | 7,480,162 | |||
| 1,585,000 | Nieuw Amsterdam Receivables Corporation | 5.330 | 7/30/2007 | 1,577,960 | |||
| 6,000,000 | Old Line Funding Corporation | 5.320 | 7/5/2007 | 5,995,567 | |||
| 14,000,000 | Old Line Funding Corporation ‡ | 5.350 | 7/12/2007 | 13,975,033 | |||
| 10,000,000 | Regency Markets No.1, LLC | 5.350 | 7/9/2007 | 9,986,625 | |||
| 13,759,000 | Society of New York | 5.280 | 8/21/2007 | 13,654,065 | |||
| 12,000,000 | Solitaire Funding, LLC | 5.290 | 7/13/2007 | 11,977,077 | |||
| 11,489,000 | Swiss RE Financial Products | 5.250 | 7/2/2007 | 11,485,649 | |||
| 13,179,392 | Thrivent Money Market Portfolio | 5.050 | N/A | 13,179,392 | |||
| 9,320,000 | Thunder Bay Funding, Inc. | 5.330 | 7/16/2007 | 9,298,005 | |||
| 20,000,000 | Victory Receivables Corporation | 5.410 | 7/5/2007 | 19,985,083 | |||
| 10,300,000 | Windmill Funding Corporation ± | 5.290 | 7/13/2007 | 10,280,324 | |||
| Total Short-Term Investments (at amortized cost) | 202,004,714 | ||||||
| Total Investments (cost $1,572,620,248) 118.6% | $1,557,367,559 | ||||||
| Other Assets and Liabilities, Net (18.6%) | (244,321,088)�� | ||||||
| Total Net Assets 100.0% | $1,313,046,471 | ||||||
| Number of | Notional | ||||
| Contracts | Expiration | Principal | Unrealized | ||
| Futures | Long/(Short) | Date | Amount | Value | Gain/(Loss) |
| 5-Yr. U.S. Treasury Bond Futures | 1,080 | September 2007 | $112,546,114 | $112,404,380 | ($141,734) |
| 10-Yr. Euro-Bund Futures | (90) | September 2007 | (10,038,420) | (9,942,439) | 95,981 |
| 10-Yr. Japanese Treasury Bond Futures | 12 | September 2007 | 13,060,673 | 13,053,704 | (6,969) |
| 10-Yr. U.S. Treasury Bond Futures | (725) | September 2007 | (77,100,292) | (76,634,769) | 465,523 |
| 20-Yr. U.S. Treasury Bond Futures | 30 | September 2007 | 3,252,279 | 3,232,500 | (19,779) |
| Number of | Exercise | Expiration | Unrealized | ||
| Call Options Written | Contracts | Price | Date | Value | Gain/(Loss) |
| Federal National Mortgage Association | 55 | $96.48 | July 2007 | ($77,991) | $46,618 |
| Conventional 30-Yr. Pass Through | |||||
| The accompanying Notes to Financial Statements are an integral part of this schedule. |
| 197 |
Income Portfolio
Schedule of Investments as of June 29, 2007 (unaudited)
| Notional | ||||||
| Fund | Fund | Buy/Sell | Termination | Principal | Unrealized | |
| Swaps and Counterparty | Receives | Pays | Protection | Date | Amount | Gain/(Loss) |
| Credit Default Swaps | ||||||
| CDX, N.A. High Yield Index | ||||||
| Series 8, 5 Year, at 2.75%; | N/A | N/A | Sell | June 2012 | $14,250,000 | ($109,109) |
| Bank of America, N.A. | ||||||
| LCDX, N.A. Index | ||||||
| Series 8, 5 Year, at 1.20%; | N/A | N/A | Sell | June 2012 | $14,800,000 | ($363,869) |
| Bank of America, N.A. | ||||||
| Total Rate of Return Swap | ||||||
| Wachovia Bank, N.A. | Lehman Brothers | 1 Month LIBOR | N/A | August 2007 | $55,000,000 | ($717,629) |
| 3 Month | CMBS Aaa 8.5+ | Less 0.45% | ||||
| Yr Index | ||||||
* All or a portion of the security is on loan as discussed in item 2(M) of the Notes to Financial Statements.
+ The interest rate shown reflects the yield, coupon rate or, for securities purchased at a discount, the discount rate at the date of purchase.
> Denotes step coupon bonds for which the current interest rate and next scheduled reset date are shown.
† Denotes variable rate obligations for which the current yield and next scheduled reset date are shown.
§ Denotes investments purchased on a when-issued or delayed delivery basis.
± Designated as cover for long settling trades as discussed in the Notes to Financial Statements.
‡ At June 29, 2007, $1,745,433 of investments were held on deposit with the counterparty and pledged as the initial margin deposit for open financial futures contracts. In addition, $242,427,240, $99,754,375 and $4,991,083 of investments were earmarked as collateral to cover open financial futures, swap contracts and an unfunded loan commitment, respectively.
~ All or a portion of the security was earmarked as collateral to cover options.
^ Security is fair valued as discussed in item 2(A) of the Notes to Financial Statements.
Definitions:
TIPS — Treasury Inflation Protected Security
Gross unrealized appreciation and depreciation of investments were as follows:
| Gross unrealized appreciation | $3,704,834 |
| Gross unrealized depreciation | (18,957,523) |
| Net unrealized appreciation (depreciation) | ($15,252,689) |
| Cost for federal income tax purposes | $1,572,620,248 |
| The accompanying Notes to Financial Statements are an integral part of this schedule. |
| 198 |
Bond Index Portfolio
Schedule of Investments as of June 29, 2007 (unaudited)
| Principal | Interest | Maturity | |||||
| Amount | Long-Term Fixed Income (122.3%) | Rate | Date | Value | |||
| Asset-Backed Securities (18.3%) | |||||||
| $2,000,000 | AmeriCredit Automobile Receivables Trust ±† | 5.400% | 7/6/2007 | $1,999,710 | |||
| 1,934,366 | Bear Stearns Asset-Backed Securities, Inc. ±† | 5.560 | 7/25/2007 | 1,935,397 | |||
| 1,002,984 | Bear Stearns Mortgage Funding Trust † | 5.460 | 7/25/2007 | 1,002,574 | |||
| 235,661 | Countrywide Asset-Backed Certificates ±† | 5.400 | 7/25/2007 | 235,655 | |||
| 2,500,000 | Countrywide Asset-Backed Certificates ± | 5.549 | 4/25/2036 | 2,488,892 | |||
| 750,000 | Countrywide Home Loans Asset-Backed Securities | 6.085 | 6/25/2021 | 751,829 | |||
| 2,500,000 | Credit Based Asset Servicing and Securitization, LLC ±† | 5.430 | 7/25/2007 | 2,499,710 | |||
| 1,250,000 | Credit Based Asset Servicing and Securitization, LLC ± | 5.501 | 12/25/2036 | 1,244,630 | |||
| 2,500,000 | DaimlerChrysler Master Owner Trust ±† | 5.370 | 7/15/2007 | 2,500,582 | |||
| 1,500,000 | First Franklin Mortgage Loan Asset-Backed Certificates † | 5.430 | 7/25/2007 | 1,499,996 | |||
| 2,137,475 | First Horizon ABS Trust † | 5.450 | 7/25/2007 | 2,136,772 | |||
| 1,763,214 | First Horizon ABS Trust ±† | 5.480 | 7/25/2007 | 1,762,645 | |||
| 1,500,000 | Ford Credit Floor Plan Master Owner Trust † | 5.500 | 7/15/2007 | 1,500,344 | |||
| 2,000,000 | GE Dealer Floorplan Master Note Trust ±† | 5.360 | 7/20/2007 | 2,000,636 | |||
| 3,000,000 | GMAC Mortgage Corporation Loan Trust ±† | 5.390 | 7/25/2007 | 2,998,263 | |||
| 2,500,000 | GMAC Mortgage Corporation Loan Trust ±† | 5.410 | 7/25/2007 | 2,500,178 | |||
| 47,360 | Green Tree Financial Corporation ± | 6.330 | 11/1/2029 | 47,682 | |||
| 1,750,787 | IndyMac Seconds Asset-Backed Trust † | 5.490 | 7/25/2007 | 1,750,242 | |||
| 491,511 | Massachusetts RRB Special Purpose Trust ± | 3.780 | 9/15/2010 | 487,254 | |||
| 487,541 | Master Asset-Backed Securities Trust † | 5.400 | 7/25/2007 | 487,617 | |||
| 1,320,945 | National Collegiate Student Loan Trust † | 5.380 | 7/25/2007 | 1,321,726 | |||
| 525,443 | Popular ABS Mortgage Pass-Through Trust † | 5.450 | 7/25/2007 | 525,537 | |||
| 363,952 | Residential Asset Securities Corporation † | 5.400 | 7/25/2007 | 363,931 | |||
| 1,842,445 | Residential Funding Mortgage Securities II † | 5.450 | 7/25/2007 | 1,842,582 | |||
| 662,758 | SLM Student Loan Trust † | 5.365 | 7/25/2007 | 662,910 | |||
| 2,000,000 | Textron Financial Floorplan Master Note Trust ±† | 5.440 | 7/13/2007 | 2,002,410 | |||
| 1,964,017 | Wachovia Asset Securitization, Inc. † | 5.460 | 7/25/2007 | 1,964,009 | |||
| Total Asset-Backed Securities | 40,513,713 | ||||||
| Basic Materials (0.5%) | |||||||
| 500,000 | Alcan, Inc. ± | 5.200 | 1/15/2014 | 475,462 | |||
| 275,000 | Alcan, Inc. | 6.125 | 12/15/2033 | 255,517 | |||
| 27,000 | Dow Chemical Company | 7.375 | 11/1/2029 | 29,223 | |||
| 300,000 | Potash Corporation of Saskatchewan, Inc. ± | 7.750 | 5/31/2011 | 321,658 | |||
| Total Basic Materials | 1,081,860 | ||||||
| Capital Goods (1.3%) | |||||||
| 975,000 | Boeing Capital Corporation ± | 6.100 | 3/1/2011 | 996,173 | |||
| 275,000 | Caterpillar, Inc. ± | 4.500 | 6/15/2009 | 270,766 | |||
| 800,000 | General Electric Company ± | 5.000 | 2/1/2013 | 775,630 | |||
| 350,000 | John Deere Capital Corporation ± | 7.000 | 3/15/2012 | 370,052 | |||
| 27,000 | Lockheed Martin Corporation | 6.150 | 9/1/2036 | 26,925 | |||
| 200,000 | Northrop Grumman Corporation ± | 7.125 | 2/15/2011 | 209,782 | |||
| 275,000 | United Technologies Corporation | 6.050 | 6/1/2036 | 272,386 | |||
| Total Capital Goods | 2,921,714 | ||||||
| The accompanying Notes to Financial Statements are an integral part of this schedule. |
| 199 |
Bond Index Portfolio
Schedule of Investments as of June 29, 2007 (unaudited)
| Principal | Interest | Maturity | |||||
| Amount | Long-Term Fixed Income (122.3%) | Rate | Date | Value | |||
| Commercial Mortgage-Backed Securities (16.3%) | |||||||
| $700,000 | Banc of America Commercial Mortgage, Inc. ± | 5.118% | 7/11/2043 | $685,700 | |||
| 2,500,000 | Bear Stearns Commercial Mortgage Securities, Inc. ±† | 5.470 | 7/15/2007 | 2,500,000 | |||
| 400,000 | Bear Stearns Commercial Mortgage Securities, Inc. ± | 3.869 | 2/11/2041 | 390,581 | |||
| 2,385,800 | Chase Mortgage Finance Corporation | 4.577 | 2/25/2037 | 2,331,659 | |||
| 791,335 | Citigroup Commercial Mortgage Trust † | 5.390 | 7/15/2007 | 791,804 | |||
| 83,774 | Commercial Mortgage Pass-Through Certificates ±† | 5.420 | 7/15/2007 | 83,778 | |||
| 2,500,000 | Commercial Mortgage Pass-Through Certificates ±† | 5.450 | 7/15/2007 | 2,502,070 | |||
| 1,353,413 | Credit Suisse First Boston Mortgage | ||||||
| Securities Corporation ± | 3.861 | 3/15/2036 | 1,331,741 | ||||
| 500,000 | Credit Suisse First Boston Mortgage | ||||||
| Securities Corporation | 4.829 | 11/15/2037 | 471,964 | ||||
| 2,500,000 | Credit Suisse Mortgage Capital Certificates † | 5.490 | 7/15/2007 | 2,502,018 | |||
| 2,000,000 | Crown Castle International Corporation ± | 5.245 | 11/15/2036 | 1,965,022 | |||
| 800,000 | General Electric Commercial Mortgage Corporation | 4.641 | 9/10/2013 | 766,368 | |||
| 500,000 | GMAC Commercial Mortgage Securities, Inc. | 4.547 | 12/10/2041 | 479,312 | |||
| 1,000,000 | Goldman Sachs Mortgage Securities Corporation | 5.560 | 11/10/2039 | 978,166 | |||
| 1,000,000 | Greenwich Capital Commercial Funding Corporation | 5.317 | 6/10/2036 | 976,884 | |||
| 2,000,000 | GS Mortgage Securities Corporation II † | 5.450 | 7/6/2007 | 2,000,000 | |||
| 500,000 | J.P. Morgan Chase Commercial Mortgage | ||||||
| Securities Corporation ± | 4.654 | 1/12/2037 | 478,342 | ||||
| 1,500,000 | J.P. Morgan Chase Commercial Mortgage | ||||||
| Securities Corporation | 5.336 | 5/15/2047 | 1,437,748 | ||||
| 2,359,400 | J.P. Morgan Mortgage Trust | 5.008 | 7/25/2035 | 2,328,844 | |||
| 1,000,000 | LB-UBS Commercial Mortgage Trust ± | 3.086 | 5/15/2027 | 980,803 | |||
| 700,000 | LB-UBS Commercial Mortgage Trust | 4.786 | 10/15/2029 | 661,044 | |||
| 750,000 | LB-UBS Commercial Mortgage Trust | 4.553 | 7/15/2030 | 732,783 | |||
| 1,869,693 | Merrill Lynch Mortgage Investors, Inc. | 4.874 | 6/25/2035 | 1,847,868 | |||
| 369,180 | Nationslink Funding Corporation ± | 6.316 | 1/20/2031 | 371,580 | |||
| 1,657,150 | Thornburg Mortgage Securities Trust † | 5.410 | 7/25/2007 | 1,653,955 | |||
| 2,129,174 | Thornburg Mortgage Securities Trust † | 5.430 | 7/25/2007 | 2,127,858 | |||
| 1,575,336 | Washington Mutual Asset Securities Corporation | 3.830 | 1/25/2035 | 1,523,749 | |||
| 1,240,450 | Zuni Mortgage Loan Trust † | 5.450 | 7/25/2007 | 1,239,819 | |||
| Total Commercial Mortgage-Backed Securities | 36,141,460 | ||||||
| Communications Services (2.8%) | |||||||
| 27,000 | BellSouth Corporation | 6.875 | 10/15/2031 | 27,779 | |||
| 200,000 | British Telecom plc ± | 8.625 | 12/15/2010 | 218,554 | |||
| 302,000 | British Telecom plc | 9.125 | 12/15/2030 | 395,253 | |||
| 400,000 | Cingular Wireless, Inc. ± | 6.500 | 12/15/2011 | 413,658 | |||
| 225,000 | Comcast Corporation ± | 5.500 | 3/15/2011 | 223,868 | |||
| 500,000 | Cox Communications, Inc. ± | 7.750 | 11/1/2010 | 531,742 | |||
| 135,000 | Cox Communications, Inc. | 6.450 | 12/1/2036 | 129,841 | |||
| 200,000 | Deutsche Telekom International Finance BV | 8.000 | 6/15/2010 | 213,172 | |||
| 200,000 | France Telecom SA ± | 7.750 | 3/1/2011 | 213,675 | |||
| 700,000 | New Cingular Wireless Services, Inc. ± | 7.875 | 3/1/2011 | 752,625 | |||
| 275,000 | News America, Inc. | 6.400 | 12/15/2035 | 261,886 | |||
| The accompanying Notes to Financial Statements are an integral part of this schedule. |
| 200 |
Bond Index Portfolio
Schedule of Investments as of June 29, 2007 (unaudited)
| Principal | Interest | Maturity | |||||
| Amount | Long-Term Fixed Income (122.3%) | Rate | Date | Value | |||
| Communications Services — continued | |||||||
| $275,000 | SBC Communications, Inc. | 5.875% | 2/1/2012 | $277,339 | |||
| 700,000 | Sprint Capital Corporation ± | 7.625 | 1/30/2011 | 736,477 | |||
| 550,000 | Sprint Capital Corporation ± | 6.900 | 5/1/2019 | 544,465 | |||
| 800,000 | Telecom Italia Capital SA ± | 5.250 | 10/1/2015 | 743,893 | |||
| 425,000 | Tele-Communications, Inc. (TCI Group) ± | 7.875 | 8/1/2013 | 465,703 | |||
| 27,000 | Verizon Global Funding Corporation | 7.750 | 12/1/2030 | 30,244 | |||
| Total Communications Services | 6,180,174 | ||||||
| Consumer Cyclical (0.9%) | |||||||
| 850,000 | AOL Time Warner, Inc. ± | 6.875 | 5/1/2012 | 886,780 | |||
| 27,000 | AOL Time Warner, Inc. | 7.625 | 4/15/2031 | 28,927 | |||
| 27,000 | DaimlerChrysler North American Holdings Corporation | 8.500 | 1/18/2031 | 34,120 | |||
| 27,000 | Target Corporation | 7.000 | 7/15/2031 | 29,428 | |||
| 527,000 | Wal-Mart Stores, Inc. | 7.550 | 2/15/2030 | 612,274 | |||
| 500,000 | Walt Disney Company ± | 5.625 | 9/15/2016 | 496,240 | |||
| Total Consumer Cyclical | 2,087,769 | ||||||
| Consumer Non-Cyclical (1.9%) | |||||||
| 275,000 | Boston Scientific Corporation | 7.000 | 11/15/2035 | 259,824 | |||
| 600,000 | Bunge Limited Finance Corporation | 5.350 | 4/15/2014 | 569,974 | |||
| 475,000 | Coca-Cola HBC Finance BV ± | 5.125 | 9/17/2013 | 460,542 | |||
| 400,000 | Genentech, Inc. ± | 4.400 | 7/15/2010 | 389,066 | |||
| 482,000 | General Mills, Inc. ± | 6.000 | 2/15/2012 | 487,173 | |||
| 27,000 | Kellogg Company | 7.450 | 4/1/2031 | 30,613 | |||
| 650,000 | Kraft Foods, Inc. ± | 6.250 | 6/1/2012 | 660,629 | |||
| 27,000 | Kraft Foods, Inc. | 6.500 | 11/1/2031 | 26,102 | |||
| 500,000 | Kroger Company ± | 4.950 | 1/15/2015 | 461,629 | |||
| 475,000 | Safeway, Inc. ± | 4.125 | 11/1/2008 | 467,636 | |||
| 550,000 | Wyeth | 6.000 | 2/15/2036 | 530,320 | |||
| Total Consumer Non-Cyclical | 4,343,508 | ||||||
| Energy (1.8%) | |||||||
| 500,000 | Anadarko Finance Company ± | 6.750 | 5/1/2011 | 516,244 | |||
| 27,000 | Anadarko Finance Company | 7.500 | 5/1/2031 | 29,010 | |||
| 500,000 | Burlington Resources, Inc. ± | 6.500 | 12/1/2011 | 518,702 | |||
| 1,000,000 | Conoco Funding Company ± | 6.350 | 10/15/2011 | 1,031,137 | |||
| 27,000 | Conoco, Inc. | 6.950 | 4/15/2029 | 29,467 | |||
| 500,000 | Consolidated Natural Gas Company | 6.850 | 4/15/2011 | 525,119 | |||
| 27,000 | Devon Financing Corporation, ULC | 7.875 | 9/30/2031 | 31,276 | |||
| 475,000 | Duke Capital Corporation ± | 7.500 | 10/1/2009 | 493,813 | |||
| 275,000 | Oneok Partners, LP | 6.650 | 10/1/2036 | 272,756 | |||
| 500,000 | Valero Energy Corporation ± | 4.750 | 6/15/2013 | 474,214 | |||
| Total Energy | 3,921,738 | ||||||
| The accompanying Notes to Financial Statements are an integral part of this schedule. |
| 201 |
Bond Index Portfolio
Schedule of Investments as of June 29, 2007 (unaudited)
| Principal | Interest | Maturity | |||||
| Amount | Long-Term Fixed Income (122.3%) | Rate | Date | Value | |||
| Financials (9.7%) | |||||||
| $27,000 | Abbey National plc | 7.950% | 10/26/2029 | $32,431 | |||
| 500,000 | AIG SunAmerica Global Financing VI ± | 6.300 | 5/10/2011 | 512,086 | |||
| 500,000 | Allstate Corporation ± | 5.000 | 8/15/2014 | 478,160 | |||
| 250,000 | Associates Corporation of North America ± | 6.250 | 11/1/2008 | 252,738 | |||
| 27,000 | AXA SA | 8.600 | 12/15/2030 | 32,900 | |||
| 275,000 | BAC Capital Trust XI | 6.625 | 5/23/2036 | 280,406 | |||
| 650,000 | Bank of America Corporation ± | 4.750 | 8/15/2013 | 619,873 | |||
| 1,800,000 | Bank One Corporation ± | 5.900 | 11/15/2011 | 1,825,783 | |||
| 600,000 | BB&T Corporation ± | 6.500 | 8/1/2011 | 619,333 | |||
| 1,100,000 | BNP Paribas SA ± | 5.186 | 6/29/2015 | 1,025,655 | |||
| 1,100,000 | Capital One Financial Corporation ± | 5.250 | 2/21/2017 | 1,019,502 | |||
| 725,000 | CIT Group, Inc. ± | 4.750 | 12/15/2010 | 703,157 | |||
| 590,000 | Citigroup, Inc. ± | 5.000 | 9/15/2014 | 561,245 | |||
| 250,000 | Citigroup, Inc. ± | 4.700 | 5/29/2015 | 233,343 | |||
| 725,000 | Credit Suisse First Boston USA, Inc. ± | 3.875 | 1/15/2009 | 709,782 | |||
| 950,000 | Goldman Sachs Group, Inc. ± | 6.600 | 1/15/2012 | 983,742 | |||
| 500,000 | Household Finance Corporation ± | 4.750 | 5/15/2009 | 494,434 | |||
| 650,000 | Household Finance Corporation ± | 6.375 | 11/27/2012 | 667,336 | |||
| 350,000 | HSBC Finance Corporation ± | 5.000 | 6/30/2015 | 327,823 | |||
| 850,000 | International Lease Finance Corporation ± | 5.875 | 5/1/2013 | 855,699 | |||
| 775,000 | Lehman Brothers Holdings, Inc. ± | 3.950 | 11/10/2009 | 751,538 | |||
| 200,000 | Marsh & McLennan Companies, Inc. ± | 5.750 | 9/15/2015 | 188,987 | |||
| 475,000 | Merrill Lynch & Company, Inc. ± | 5.000 | 2/3/2014 | 453,986 | |||
| 500,000 | MetLife, Inc. ± | 5.000 | 6/15/2015 | 472,069 | |||
| 1,250,000 | Morgan Stanley Dean Witter & Company ± | 6.750 | 4/15/2011 | 1,296,032 | |||
| 1,487,137 | Preferred Term Securities XXIII, Ltd. † | 5.560 | 9/24/2007 | 1,487,137 | |||
| 500,000 | ProLogis Trust ± | 5.500 | 3/1/2013 | 494,210 | |||
| 275,000 | Prudential Financial, Inc. | 5.700 | 12/14/2036 | 251,987 | |||
| 500,000 | Residential Capital Corporation | 6.500 | 4/17/2013 | 483,290 | |||
| 500,000 | Student Loan Marketing Corporation ± | 4.000 | 1/15/2010 | 465,314 | |||
| 550,000 | Union Planters Corporation ± | 4.375 | 12/1/2010 | 532,933 | |||
| 500,000 | Wachovia Bank NA ± | 4.875 | 2/1/2015 | 472,321 | |||
| 500,000 | Washington Mutual Bank FA | 5.500 | 1/15/2013 | 488,626 | |||
| 500,000 | WellPoint, Inc. ± | 5.000 | 12/15/2014 | 472,096 | |||
| 1,100,000 | Wells Fargo & Company ± | 4.200 | 1/15/2010 | 1,072,144 | |||
| Total Financials | 21,618,098 | ||||||
| Foreign (2.7%) | |||||||
| 250,000 | African Development Bank ± | 6.875 | 10/15/2015 | 268,545 | |||
| 350,000 | Canadian Government ± | 5.250 | 11/5/2008 | 350,732 | |||
| 300,000 | Codelco, Inc. ± | 6.375 | 11/30/2012 | 310,691 | |||
| 800,000 | European Investment Bank ± | 3.000 | 6/16/2008 | 783,727 | |||
| 550,000 | Export-Import Bank of Korea ± | 4.125 | 2/10/2009 | 538,152 | |||
| 27,000 | Hydro-Quebec | 8.400 | 1/15/2022 | 34,189 | |||
| 350,000 | Inter-American Development Bank | 5.375 | 11/18/2008 | 351,378 | |||
| 425,000 | Pemex Project Funding Master Trust ± | 9.125 | 10/13/2010 | 467,500 | |||
| The accompanying Notes to Financial Statements are an integral part of this schedule. |
| 202 |
Bond Index Portfolio
Schedule of Investments as of June 29, 2007 (unaudited)
| Principal | Interest | Maturity | ||||||
| Amount | Long-Term Fixed Income (122.3%) | Rate | Date | Value | ||||
| Foreign — continued | ||||||||
| $250,000 | Province of Nova Scotia ± | 7.250% | 7/27/2013 | $273,154 | ||||
| 400,000 | Province of Quebec | 4.875 | 5/5/2014 | 386,884 | ||||
| 400,000 | Province of Quebec | 7.500 | 7/15/2023 | 473,448 | ||||
| 600,000 | Republic of Italy ± | 6.000 | 2/22/2011 | 613,900 | ||||
| 200,000 | Republic of Italy | 4.375 | 6/15/2013 | 189,639 | ||||
| 1,100,000 | United Mexican States ± | 5.625 | 1/15/2017 | 1,076,900 | ||||
| Total Foreign | 6,118,839 | |||||||
| Mortgage-Backed Securities (33.7%) | ||||||||
| 7,903 | Federal Home Loan Mortgage Corporation Gold | |||||||
| 15-Yr. Pass Through | 7.500 | 12/1/2009 | 8,039 | |||||
| 10,387 | Federal Home Loan Mortgage Corporation Gold | |||||||
| 15-Yr. Pass Through | 7.000 | 1/1/2011 | 10,611 | |||||
| 8,129 | Federal Home Loan Mortgage Corporation Gold | |||||||
| 15-Yr. Pass Through | 6.500 | 10/1/2012 | 8,314 | |||||
| 8,310 | Federal Home Loan Mortgage Corporation Gold | |||||||
| 15-Yr. Pass Through | 6.500 | 1/1/2013 | 8,499 | |||||
| 12,175 | Federal Home Loan Mortgage Corporation Gold | |||||||
| 15-Yr. Pass Through | 6.000 | 9/1/2013 | 12,281 | |||||
| 30,373 | Federal Home Loan Mortgage Corporation Gold | |||||||
| 15-Yr. Pass Through | 5.500 | 3/1/2014 | 30,163 | |||||
| 38,810 | Federal Home Loan Mortgage Corporation Gold | |||||||
| 15-Yr. Pass Through | 6.000 | 4/1/2014 | 39,150 | |||||
| 11,630 | Federal Home Loan Mortgage Corporation Gold | |||||||
| 15-Yr. Pass Through | 7.000 | 10/1/2014 | 11,993 | |||||
| 21,968 | Federal Home Loan Mortgage Corporation Gold | |||||||
| 15-Yr. Pass Through | 6.500 | 3/1/2016 | 22,451 | |||||
| 34,789 | Federal Home Loan Mortgage Corporation Gold | |||||||
| 15-Yr. Pass Through | 6.000 | 6/1/2016 | 34,984 | |||||
| 45,469 | Federal Home Loan Mortgage Corporation Gold | |||||||
| 15-Yr. Pass Through | 6.000 | 9/1/2016 | 45,724 | |||||
| 383,867 | Federal Home Loan Mortgage Corporation Gold | |||||||
| 15-Yr. Pass Through | 7.000 | 6/1/2017 | 394,995 | |||||
| 655,674 | Federal Home Loan Mortgage Corporation Gold | |||||||
| 15-Yr. Pass Through | 5.500 | 12/1/2017 | 648,139 | |||||
| 12,698 | Federal Home Loan Mortgage Corporation Gold | |||||||
| 30-Yr. Pass Through | 6.500 | 4/1/2024 | 12,928 | |||||
| 9,104 | Federal Home Loan Mortgage Corporation Gold | |||||||
| 30-Yr. Pass Through | 7.000 | 5/1/2024 | 9,404 | |||||
| 1,407 | Federal Home Loan Mortgage Corporation Gold | |||||||
| 30-Yr. Pass Through | 7.500 | 8/1/2025 | 1,473 | |||||
| 16,375 | Federal Home Loan Mortgage Corporation Gold | |||||||
| 30-Yr. Pass Through | 8.500 | 11/1/2025 | 17,535 | |||||
| 2,822 | Federal Home Loan Mortgage Corporation Gold | |||||||
| 30-Yr. Pass Through | 8.000 | 1/1/2026 | 2,972 | |||||
| The accompanying Notes to Financial Statements are an integral part of this schedule. |
| 203 |
Bond Index Portfolio
Schedule of Investments as of June 29, 2007 (unaudited)
| Principal | Interest | Maturity | ||||||
| Amount | Long-Term Fixed Income (122.3%) | Rate | Date | Value | ||||
| Mortgage-Backed Securities — continued | ||||||||
| $5,055 | Federal Home Loan Mortgage Corporation Gold | |||||||
| 30-Yr. Pass Through | 7.000% | 4/1/2027 | $5,225 | |||||
| 5,486 | Federal Home Loan Mortgage Corporation Gold | |||||||
| 30-Yr. Pass Through | 7.500 | 7/1/2027 | 5,742 | |||||
| 9,369 | Federal Home Loan Mortgage Corporation Gold | |||||||
| 30-Yr. Pass Through | 7.000 | 8/1/2027 | 9,684 | |||||
| 5,426 | Federal Home Loan Mortgage Corporation Gold | |||||||
| 30-Yr. Pass Through | 7.500 | 10/1/2027 | 5,678 | |||||
| 7,010 | Federal Home Loan Mortgage Corporation Gold | |||||||
| 30-Yr. Pass Through | 7.000 | 5/1/2028 | 7,246 | |||||
| 28,090 | Federal Home Loan Mortgage Corporation Gold | |||||||
| 30-Yr. Pass Through | 6.000 | 8/1/2028 | 28,044 | |||||
| 11,080 | Federal Home Loan Mortgage Corporation Gold | |||||||
| 30-Yr. Pass Through | 6.500 | 10/1/2028 | 11,319 | |||||
| 14,562 | Federal Home Loan Mortgage Corporation Gold | |||||||
| 30-Yr. Pass Through | 6.500 | 2/1/2029 | 14,876 | |||||
| 27,241 | Federal Home Loan Mortgage Corporation Gold | |||||||
| 30-Yr. Pass Through | 6.000 | 3/1/2029 | 27,189 | |||||
| 11,228 | Federal Home Loan Mortgage Corporation Gold | |||||||
| 30-Yr. Pass Through | 7.000 | 7/1/2029 | 11,609 | |||||
| 21,332 | Federal Home Loan Mortgage Corporation Gold | |||||||
| 30-Yr. Pass Through | 7.500 | 10/1/2029 | 22,306 | |||||
| 12,254 | Federal Home Loan Mortgage Corporation Gold | |||||||
| 30-Yr. Pass Through | 7.500 | 11/1/2029 | 12,814 | |||||
| 21,770 | Federal Home Loan Mortgage Corporation Gold | |||||||
| 30-Yr. Pass Through | 6.500 | 5/1/2031 | 22,212 | |||||
| 83,333 | Federal Home Loan Mortgage Corporation Gold | |||||||
| 30-Yr. Pass Through | 6.000 | 6/1/2031 | 83,136 | |||||
| 36,827 | Federal Home Loan Mortgage Corporation Gold | |||||||
| 30-Yr. Pass Through | 7.000 | 6/1/2031 | 38,011 | |||||
| 79,746 | Federal Home Loan Mortgage Corporation Gold | |||||||
| 30-Yr. Pass Through | 6.000 | 7/1/2031 | 79,557 | |||||
| 19,048 | Federal Home Loan Mortgage Corporation Gold | |||||||
| 30-Yr. Pass Through | 7.000 | 9/1/2031 | 19,660 | |||||
| 55,339 | Federal Home Loan Mortgage Corporation Gold | |||||||
| 30-Yr. Pass Through | 6.500 | 10/1/2031 | 56,461 | |||||
| 414,910 | Federal Home Loan Mortgage Corporation Gold | |||||||
| 30-Yr. Pass Through | 6.000 | 1/1/2032 | 413,929 | |||||
| 36,164 | Federal Home Loan Mortgage Corporation Gold | |||||||
| 30-Yr. Pass Through | 7.000 | 5/1/2032 | 37,275 | |||||
| 410,213 | Federal Home Loan Mortgage Corporation Gold | |||||||
| 30-Yr. Pass Through | 6.500 | 7/1/2032 | 417,784 | |||||
| 285,374 | Federal Home Loan Mortgage Corporation Gold | |||||||
| 30-Yr. Pass Through | 6.500 | 10/1/2032 | 290,641 | |||||
| 550,303 | Federal Home Loan Mortgage Corporation Gold | |||||||
| 30-Yr. Pass Through | 6.000 | 11/1/2032 | 548,644 | |||||
| The accompanying Notes to Financial Statements are an integral part of this schedule. |
| 204 |
Bond Index Portfolio
Schedule of Investments as of June 29, 2007 (unaudited)
| Principal | Interest | Maturity | ||||||
| Amount | Long-Term Fixed Income (122.3%) | Rate | Date | Value | ||||
| Mortgage-Backed Securities — continued | ||||||||
| $10,000,000 | Federal Home Loan Mortgage Corporation Gold | |||||||
| 30-Yr. Pass Through § | 5.000% | 7/1/2037 | $9,371,880 | |||||
| 14,700,000 | Federal Home Loan Mortgage Corporation Gold | |||||||
| 30-Yr. Pass Through § | 6.000 | 7/1/2037 | 14,562,188 | |||||
| 4,455 | Federal National Mortgage Association Conventional | |||||||
| 15-Yr. Pass Through | 6.000 | 4/1/2011 | 4,497 | |||||
| 1,377 | Federal National Mortgage Association Conventional | |||||||
| 15-Yr. Pass Through | 7.500 | 7/1/2011 | 1,417 | |||||
| 4,601 | Federal National Mortgage Association Conventional | |||||||
| 15-Yr. Pass Through | 8.000 | 7/1/2012 | 4,784 | |||||
| 8,144 | Federal National Mortgage Association Conventional | |||||||
| 15-Yr. Pass Through | 6.500 | 12/1/2012 | 8,334 | |||||
| 22,175 | Federal National Mortgage Association Conventional | |||||||
| 15-Yr. Pass Through | 6.500 | 6/1/2013 | 22,691 | |||||
| 30,679 | Federal National Mortgage Association Conventional | |||||||
| 15-Yr. Pass Through | 6.000 | 12/1/2013 | 30,956 | |||||
| 16,100,000 | Federal National Mortgage Association Conventional | |||||||
| 15-Yr. Pass Through § | 5.000 | 7/1/2022 | 15,556,625 | |||||
| 7,265 | Federal National Mortgage Association Conventional | |||||||
| 30-Yr. Pass Through | 10.500 | 8/1/2020 | 8,016 | |||||
| 7,433 | Federal National Mortgage Association Conventional | |||||||
| 30-Yr. Pass Through | 8.000 | 12/1/2024 | 7,841 | |||||
| 10,665 | Federal National Mortgage Association Conventional | |||||||
| 30-Yr. Pass Through | 7.000 | 10/1/2025 | 11,049 | |||||
| 35,491 | Federal National Mortgage Association Conventional | |||||||
| 30-Yr. Pass Through | 6.500 | 11/1/2025 | 36,096 | |||||
| 1,973 | Federal National Mortgage Association Conventional | |||||||
| 30-Yr. Pass Through | 8.500 | 12/1/2025 | 2,116 | |||||
| 7,544 | Federal National Mortgage Association Conventional | |||||||
| 30-Yr. Pass Through | 7.500 | 1/1/2026 | 7,899 | |||||
| 9,733 | Federal National Mortgage Association Conventional | |||||||
| 30-Yr. Pass Through | 6.500 | 5/1/2026 | 9,899 | |||||
| 6,090 | Federal National Mortgage Association Conventional | |||||||
| 30-Yr. Pass Through | 8.000 | 9/1/2026 | 6,438 | |||||
| 5,449 | Federal National Mortgage Association Conventional | |||||||
| 30-Yr. Pass Through | 7.500 | 2/1/2027 | 5,705 | |||||
| 3,913 | Federal National Mortgage Association Conventional | |||||||
| 30-Yr. Pass Through | 7.000 | 3/1/2027 | 4,055 | |||||
| 16,773 | Federal National Mortgage Association Conventional | |||||||
| 30-Yr. Pass Through | 6.500 | 8/1/2027 | 17,111 | |||||
| 2,098 | Federal National Mortgage Association Conventional | |||||||
| 30-Yr. Pass Through | 7.500 | 11/1/2027 | 2,196 | |||||
| 14,719 | Federal National Mortgage Association Conventional | |||||||
| 30-Yr. Pass Through | 9.000 | 11/1/2027 | 15,978 | |||||
| 4,428 | Federal National Mortgage Association Conventional | |||||||
| 30-Yr. Pass Through | 7.000 | 1/1/2028 | 4,590 | |||||
| The accompanying Notes to Financial Statements are an integral part of this schedule. |
| 205 |
Bond Index Portfolio
Schedule of Investments as of June 29, 2007 (unaudited)
| Principal | Interest | Maturity | ||||||
| Amount | Long-Term Fixed Income (122.3%) | Rate | Date | Value | ||||
| Mortgage-Backed Securities — continued | ||||||||
| $81,782 | Federal National Mortgage Association Conventional | |||||||
| 30-Yr. Pass Through | 7.500% | 2/1/2028 | $85,612 | |||||
| 13,495 | Federal National Mortgage Association Conventional | |||||||
| 30-Yr. Pass Through | 6.000 | 5/1/2028 | 13,452 | |||||
| 6,950 | Federal National Mortgage Association Conventional | |||||||
| 30-Yr. Pass Through | 6.500 | 9/1/2028 | 7,093 | |||||
| 19,582 | Federal National Mortgage Association Conventional | |||||||
| 30-Yr. Pass Through | 7.000 | 10/1/2028 | 20,301 | |||||
| 50,696 | Federal National Mortgage Association Conventional | |||||||
| 30-Yr. Pass Through | 7.500 | 11/1/2028 | 53,079 | |||||
| 98,018 | Federal National Mortgage Association Conventional | |||||||
| 30-Yr. Pass Through | 6.000 | 12/1/2028 | 97,702 | |||||
| 11,061 | Federal National Mortgage Association Conventional | |||||||
| 30-Yr. Pass Through | 7.000 | 12/1/2028 | 11,467 | |||||
| 15,553 | Federal National Mortgage Association Conventional | |||||||
| 30-Yr. Pass Through | 6.500 | 2/1/2029 | 15,874 | |||||
| 54,589 | Federal National Mortgage Association Conventional | |||||||
| 30-Yr. Pass Through | 6.000 | 3/1/2029 | 54,413 | |||||
| 23,832 | Federal National Mortgage Association Conventional | |||||||
| 30-Yr. Pass Through | 7.000 | 3/1/2029 | 24,713 | |||||
| 67,739 | Federal National Mortgage Association Conventional | |||||||
| 30-Yr. Pass Through | 6.500 | 4/1/2029 | 69,132 | |||||
| 12,483 | Federal National Mortgage Association Conventional | |||||||
| 30-Yr. Pass Through | 6.500 | 8/1/2029 | 12,740 | |||||
| 16,408 | Federal National Mortgage Association Conventional | |||||||
| 30-Yr. Pass Through | 7.500 | 8/1/2029 | 17,164 | |||||
| 22,271 | Federal National Mortgage Association Conventional | |||||||
| 30-Yr. Pass Through | 7.000 | 10/1/2029 | 23,094 | |||||
| 12,806 | Federal National Mortgage Association Conventional | |||||||
| 30-Yr. Pass Through | 7.500 | 12/1/2029 | 13,396 | |||||
| 9,827 | Federal National Mortgage Association Conventional | |||||||
| 30-Yr. Pass Through | 8.000 | 4/1/2030 | 10,352 | |||||
| 7,036 | Federal National Mortgage Association Conventional | |||||||
| 30-Yr. Pass Through | 7.500 | 12/1/2030 | 7,349 | |||||
| 133,348 | Federal National Mortgage Association Conventional | |||||||
| 30-Yr. Pass Through | 6.000 | 5/1/2031 | 132,818 | |||||
| 222,541 | Federal National Mortgage Association Conventional | |||||||
| 30-Yr. Pass Through | 6.500 | 4/1/2032 | 226,482 | |||||
| 202,172 | Federal National Mortgage Association Conventional | |||||||
| 30-Yr. Pass Through | 6.500 | 5/1/2032 | 205,753 | |||||
| 114,768 | Federal National Mortgage Association Conventional | |||||||
| 30-Yr. Pass Through | 7.000 | 5/1/2032 | 118,880 | |||||
| 678,085 | Federal National Mortgage Association Conventional | |||||||
| 30-Yr. Pass Through | 6.500 | 7/1/2032 | 690,095 | |||||
| 328,132 | Federal National Mortgage Association Conventional | |||||||
| 30-Yr. Pass Through | 6.500 | 8/1/2032 | 333,943 | |||||
| The accompanying Notes to Financial Statements are an integral part of this schedule. |
| 206 |
Bond Index Portfolio
Schedule of Investments as of June 29, 2007 (unaudited)
| Principal | Interest | Maturity | ||||||
| Amount | Long-Term Fixed Income (122.3%) | Rate | Date | Value | ||||
| Mortgage-Backed Securities — continued | ||||||||
| $29,400,000 | Federal National Mortgage Association Conventional | |||||||
| 30-Yr. Pass Through § | 5.500% | 7/1/2037 | $28,352,624 | |||||
| 6,633 | Government National Mortgage Association | |||||||
| 15-Yr. Pass Through | 6.500 | 6/15/2009 | 6,711 | |||||
| 28,121 | Government National Mortgage Association | |||||||
| 15-Yr. Pass Through | 7.000 | 9/15/2013 | 29,030 | |||||
| 5,998 | Government National Mortgage Association | |||||||
| 30-Yr. Pass Through | 7.500 | 3/15/2023 | 6,277 | |||||
| 9,722 | Government National Mortgage Association | |||||||
| 30-Yr. Pass Through | 7.000 | 1/15/2024 | 10,132 | |||||
| 4,434 | Government National Mortgage Association | |||||||
| 30-Yr. Pass Through | 9.000 | 9/15/2024 | 4,790 | |||||
| 6,805 | Government National Mortgage Association | |||||||
| 30-Yr. Pass Through | 8.000 | 6/15/2025 | 7,214 | |||||
| 2,030 | Government National Mortgage Association | |||||||
| 30-Yr. Pass Through | 8.000 | 9/15/2026 | 2,154 | |||||
| 24,433 | Government National Mortgage Association | |||||||
| 30-Yr. Pass Through | 7.500 | 3/15/2027 | 25,608 | |||||
| 8,638 | Government National Mortgage Association | |||||||
| 30-Yr. Pass Through | 7.500 | 10/15/2027 | 9,054 | |||||
| 8,644 | Government National Mortgage Association | |||||||
| 30-Yr. Pass Through | 7.000 | 11/15/2027 | 9,015 | |||||
| 14,850 | Government National Mortgage Association | |||||||
| 30-Yr. Pass Through | 7.000 | 1/15/2028 | 15,480 | |||||
| 15,923 | Government National Mortgage Association | |||||||
| 30-Yr. Pass Through | 6.500 | 7/15/2028 | 16,267 | |||||
| 17,722 | Government National Mortgage Association | |||||||
| 30-Yr. Pass Through | 7.000 | 8/15/2028 | 18,475 | |||||
| 52,330 | Government National Mortgage Association | |||||||
| 30-Yr. Pass Through | 7.500 | 11/15/2028 | 54,834 | |||||
| 12,590 | Government National Mortgage Association | |||||||
| 30-Yr. Pass Through | 6.500 | 12/15/2028 | 12,862 | |||||
| 62,391 | Government National Mortgage Association | |||||||
| 30-Yr. Pass Through | 6.500 | 3/15/2029 | 63,742 | |||||
| 17,040 | Government National Mortgage Association | |||||||
| 30-Yr. Pass Through | 6.500 | 4/15/2029 | 17,409 | |||||
| 14,818 | Government National Mortgage Association | |||||||
| 30-Yr. Pass Through | 8.000 | 10/15/2030 | 15,735 | |||||
| 19,133 | Government National Mortgage Association | |||||||
| 30-Yr. Pass Through | 7.500 | 1/15/2031 | 20,034 | |||||
| 7,510 | Government National Mortgage Association | |||||||
| 30-Yr. Pass Through | 7.000 | 4/15/2031 | 7,825 | |||||
| 36,192 | Government National Mortgage Association | |||||||
| 30-Yr. Pass Through | 6.500 | 6/15/2031 | 36,950 | |||||
| 28,692 | Government National Mortgage Association | |||||||
| 30-Yr. Pass Through | 7.000 | 9/15/2031 | 29,895 | |||||
| The accompanying Notes to Financial Statements are an integral part of this schedule. |
| 207 |
Bond Index Portfolio
Schedule of Investments as of June 29, 2007 (unaudited)
| Principal | Interest | Maturity | |||||
| Amount | Long-Term Fixed Income (122.3%) | Rate | Date | Value | |||
| Mortgage-Backed Securities — continued | |||||||
| $399,041 | Government National Mortgage Association | ||||||
| 30-Yr. Pass Through | 6.500% | 1/15/2032 | $407,038 | ||||
| 50,616 | Government National Mortgage Association | ||||||
| 30-Yr. Pass Through | 6.500 | 4/15/2032 | 51,631 | ||||
| Total Mortgage-Backed Securities | 74,666,748 | ||||||
| Technology (0.2%) | |||||||
| 500,000 | International Business Machines Corporation ± | 4.250 | 9/15/2009 | 488,979 | |||
| Total Technology | 488,979 | ||||||
| Transportation (0.7%) | |||||||
| 500,000 | CSX Corporation ± | 5.500 | 8/1/2013 | 490,252 | |||
| 475,000 | FedEx Corporation ± | 3.500 | 4/1/2009 | 459,158 | |||
| 500,000 | Union Pacific Corporation ± | 7.000 | 2/1/2016 | 525,010 | |||
| Total Transportation | 1,474,420 | ||||||
| U.S. Government (30.0%) | |||||||
| 2,000,000 | Federal Home Loan Bank ± | 3.375 | 2/15/2008 | 1,975,470 | |||
| 3,000,000 | Federal Home Loan Bank | 4.100 | 6/13/2008 | 2,967,087 | |||
| 500,000 | Federal Home Loan Bank | 4.500 | 10/14/2008 | 495,304 | |||
| 1,500,000 | Federal Home Loan Bank | 4.625 | 11/21/2008 | 1,487,542 | |||
| 3,000,000 | Federal Home Loan Bank | 4.875 | 2/9/2010 | 2,976,396 | |||
| 500,000 | Federal Home Loan Bank | 4.500 | 11/15/2012 | 481,390 | |||
| 850,000 | Federal Home Loan Bank | 4.500 | 9/16/2013 | 811,158 | |||
| 1,000,000 | Federal Home Loan Bank | 5.625 | 6/13/2016 | 996,262 | |||
| 1,050,000 | Federal Home Loan Mortgage Corporation | 6.000 | 6/15/2011 | 1,077,893 | |||
| 1,000,000 | Federal Home Loan Mortgage Corporation | 5.125 | 7/15/2012 | 994,348 | |||
| 700,000 | Federal Home Loan Mortgage Corporation | 6.750 | 3/15/2031 | 801,114 | |||
| 1,600,000 | Federal National Mortgage Association | 5.250 | 1/15/2009 | 1,600,125 | |||
| 2,000,000 | Federal National Mortgage Association | 6.125 | 3/15/2012 | 2,068,312 | |||
| 1,700,000 | Federal National Mortgage Association * | 5.000 | 2/13/2017 | 1,644,612 | |||
| 500,000 | Federal National Mortgage Association | 5.960 | 9/11/2028 | 521,358 | |||
| 100,000 | Federal National Mortgage Association | 6.250 | 5/15/2029 | 108,146 | |||
| 200,000 | Resolution Funding Corporation | 8.125 | 10/15/2019 | 246,500 | |||
| 250,000 | Tennessee Valley Authority ± | 6.000 | 3/15/2013 | 258,235 | |||
| 4,200,000 | U.S. Treasury Bonds * | 7.250 | 5/15/2016 | 4,853,953 | |||
| 400,000 | U.S. Treasury Bonds * | 8.875 | 2/15/2019 | 529,000 | |||
| 290,000 | U.S. Treasury Bonds * | 7.625 | 11/15/2022 | 363,225 | |||
| 1,000,000 | U.S. Treasury Bonds * | 6.250 | 8/15/2023 | 1,110,391 | |||
| 260,000 | U.S. Treasury Bonds | 7.500 | 11/15/2024 | 327,072 | |||
| 350,000 | U.S. Treasury Bonds | 6.875 | 8/15/2025 | 416,965 | |||
| 8,675,000 | U.S. Treasury Bonds * | 5.250 | 11/15/2028 | 8,734,641 | |||
| 2,000,000 | U.S. Treasury Notes * | 5.500 | 5/15/2009 | 2,021,250 | |||
| 11,500,000 | U.S. Treasury Notes * | 6.000 | 8/15/2009 | 11,748,872 | |||
| 2,000,000 | U.S. Treasury Notes * | 3.625 | 1/15/2010 | 1,940,000 | |||
| 2,945,000 | U.S. Treasury Notes * | 5.000 | 2/15/2011 | 2,958,344 | |||
| The accompanying Notes to Financial Statements are an integral part of this schedule. |
| 208 |
Bond Index Portfolio
Schedule of Investments as of June 29, 2007 (unaudited)
| Principal | Interest | Maturity | ||
| Amount | Long-Term Fixed Income (122.3%) | Rate | Date | Value |
| U.S. Government — continued | ||||
| $4,500,000 | U.S. Treasury Notes * | 4.500% | 11/30/2011 | $4,423,360 |
| 500,000 | U.S. Treasury Notes | 4.375 | 8/15/2012 | 488,711 |
| 4,375,000 | U.S. Treasury Notes * | 4.500 | 2/15/2016 | 4,216,748 |
| 400,000 | U.S. Treasury Notes * | 4.625 | 2/15/2017 | 387,375 |
| 600,000 | U.S. Treasury Notes | 4.500 | 5/15/2017 | 575,250 |
| Total U.S. Government | 66,606,409 | |||
| Utilities (1.5%) | ||||
| 400,000 | CenterPoint Energy Houston Electric, LLC ± | 5.600 | 7/1/2023 | 371,543 |
| 275,000 | Commonwealth Edison Company | 5.900 | 3/15/2036 | 254,203 |
| 475,000 | FirstEnergy Corporation ± | 6.450 | 11/15/2011 | 487,071 |
| 27,000 | FirstEnergy Corporation | 7.375 | 11/15/2031 | 29,229 |
| 27,000 | National Rural Utilities Cooperative Finance | 8.000 | 3/1/2032 | 33,242 |
| 475,000 | Oncor Electric Delivery Company ± | 6.375 | 1/15/2015 | 481,779 |
| 400,000 | Progress Energy, Inc. ± | 7.000 | 10/30/2031 | 427,645 |
| 600,000 | Public Service Company of Colorado | 7.875 | 10/1/2012 | 658,310 |
| 225,000 | Southern California Edison Company ± | 5.000 | 1/15/2014 | 215,152 |
| 275,000 | Xcel Energy, Inc. | 6.500 | 7/1/2036 | 278,129 |
| Total Utilities | 3,236,303 | |||
| Total Long-Term Fixed Income (cost $274,619,080) | 271,401,732 | |||
| Interest | Maturity | |||
| Shares | Collateral Held for Securities Loaned (20.8%) | Rate (+) | Date | Value |
| 46,054,281 | Thrivent Financial Securities Lending Trust | 5.360% | N/A | $46,054,281 |
| Total Collateral Held for Securities Loaned | ||||
| (cost $46,054,281) | 46,054,281 | |||
| The accompanying Notes to Financial Statements are an integral part of this schedule. |
| 209 |
Bond Index Portfolio
Schedule of Investments as of June 29, 2007 (unaudited)
| Shares or | |||||||
| Principal | Interest | Maturity | |||||
| Amount | Short-Term Investments (7.7%) | Rate (+) | Date | Value | |||
| $2,500,000 | DNB NOR ASA | 5.360% | 7/2/2007 | $2,499,256 | |||
| 3,500,000 | Greyhawk Funding, LLC | 5.320 | 7/2/2007 | 3,498,966 | |||
| 2,427,000 | MLTC Funding, Inc. | 5.310 | 7/24/2007 | 2,418,408 | |||
| 8,554,946 | Thrivent Money Market Portfolio | 5.050 | N/A | 8,554,946 | |||
| Total Short-Term Investments (at amortized cost) | 16,971,576 | ||||||
| Total Investments (cost $337,644,937) 150.8% | $334,427,589 | ||||||
| Other Assets and Liabilities, Net (50.8%) | (112,706,865) | ||||||
| Total Net Assets 100.0% | $221,720,724 | ||||||
* All or a portion of the security is on loan as discussed in item 2(M) of the Notes to Financial Statements.
+ The interest rate shown reflects the yield, coupon rate or, for securities purchased at a discount, the discount rate at the date of purchase.
† Denotes variable rate obligations for which the current yield and next scheduled reset date are shown.
§ Denotes investments purchased on a when-issued or delayed delivery basis.
± Designated as cover for long settling trades as discussed in the Notes to Financial Statements. Gross unrealized appreciation and depreciation of investments were as follows:
| Gross unrealized appreciation | $726,260 |
| Gross unrealized depreciation | (3,943,608) |
| Net unrealized appreciation (depreciation) | ($3,217,348) |
| Cost for federal income tax purposes | $337,644,937 |
| The accompanying Notes to Financial Statements are an integral part of this schedule. |
| 210 |
Limited Maturity Bond Portfolio
Schedule of Investments as of June 29, 2007 (unaudited)
| Principal | Interest | Maturity | |||||
| Amount | Long-Term Fixed Income (95.4%) | Rate | Date | Value | |||
| Asset-Backed Securities (21.8%) | |||||||
| $3,000,000 | AmeriCredit Automobile Receivables Trust †‡ | 5.400% | 7/6/2007 | $2,999,565 | |||
| 3,000,000 | AmeriCredit Automobile Receivables Trust ‡ | 3.430 | 7/6/2011 | 2,940,537 | |||
| 2,901,550 | Bear Stearns Asset-Backed Securities, Inc. †‡ | 5.560 | 7/25/2007 | 2,903,096 | |||
| 7,000,000 | Capital Auto Receivables Asset Trust ~ | 5.380 | 7/15/2010 | 6,999,895 | |||
| 1,251,926 | Caterpillar Financial Asset Trust ± | 3.900 | 2/25/2009 | 1,247,348 | |||
| 3,126,145 | Chase Manhattan Auto Owner Trust ‡ | 4.840 | 7/15/2009 | 3,119,617 | |||
| 1,976,721 | CIT Equipment Collateral ‡ | 4.420 | 5/20/2009 | 1,968,500 | |||
| 5,000,000 | Countrywide Asset-Backed Certificates ‡ | 5.549 | 4/25/2036 | 4,977,785 | |||
| 5,000,000 | Countrywide Asset-Backed Certificates ‡ | 5.683 | 10/25/2036 | 4,984,920 | |||
| 4,500,000 | Countrywide Home Loans Asset-Backed Securities ‡ | 6.085 | 6/25/2021 | 4,510,976 | |||
| 833,774 | CPS Auto Trust ‡ | 4.520 | 3/15/2010 | 831,481 | |||
| 5,500,000 | Credit Acceptance Auto Dealer Loan Trust | 5.320 | 10/15/2012 | 5,479,155 | |||
| 5,000,000 | Credit Based Asset Servicing and Securitization, LLC ‡ | 5.501 | 12/25/2036 | 4,978,520 | |||
| 7,000,000 | DaimlerChrysler Auto Trust ‡ | 5.330 | 8/8/2010 | 7,000,854 | |||
| 3,000,000 | DaimlerChrysler Master Owner Trust †‡ | 5.370 | 7/15/2007 | 3,000,699 | |||
| 6,000,000 | Drive Auto Receivables Trust ‡ | 5.300 | 7/15/2011 | 5,996,694 | |||
| 265,059 | First Franklin Mortgage Loan Asset-Backed Certificates | 5.500 | 3/25/2036 | 265,030 | |||
| 2,203,547 | GE Commercial Loan Trust † | 5.420 | 7/19/2007 | 2,203,480 | |||
| 3,000,000 | GE Dealer Floorplan Master Note Trust † | 5.360 | 7/20/2007 | 3,000,954 | |||
| 2,546,270 | GE Equipment Small Ticket, LLC | 4.380 | 7/22/2009 | 2,531,690 | |||
| 7,000,000 | GMAC Mortgage Corporation Loan Trust † | 5.390 | 7/25/2007 | 6,995,947 | |||
| 3,000,000 | GMAC Mortgage Corporation Loan Trust ±† | 5.410 | 7/25/2007 | 3,000,213 | |||
| 3,253,362 | GMAC Mortgage Corporation Loan Trust † | 5.420 | 7/25/2007 | 3,253,502 | |||
| 5,500,000 | GMAC Mortgage Corporation Loan Trust | 5.750 | 10/25/2036 | 5,488,994 | |||
| 3,500,000 | Harley Davidson Motorcycle Trust ‡ | 5.240 | 1/15/2012 | 3,496,574 | |||
| 2,528,230 | Harley Davidson Motorcycle Trust ± | 3.200 | 5/15/2012 | 2,470,839 | |||
| 646,792 | Honda Auto Receivables Owner Trust | 2.910 | 10/20/2008 | 643,825 | |||
| 764,455 | Honda Auto Receivables Owner Trust | 2.960 | 4/20/2009 | 762,520 | |||
| 1,129,702 | Household Automotive Trust ± | 5.400 | 6/17/2009 | 1,130,320 | |||
| 6,500,000 | Household Home Equity Loan Trust ‡ | 5.320 | 3/20/2036 | 6,469,684 | |||
| 3,500,000 | Household Home Equity Loan Trust ‡ | 5.660 | 3/20/2036 | 3,492,748 | |||
| 1,021,528 | John Deere Owner Trust ‡ | 3.980 | 6/15/2009 | 1,015,972 | |||
| 7,500,000 | Merna Re, Ltd. † | 7.110 | 7/3/2007 | 7,500,000 | |||
| 7,000,000 | Mortgage Equity Conversion Asset Trust † | 5.430 | 7/25/2007 | 6,982,500 | |||
| 7,000,000 | Mortgage Equity Conversion Asset Trust † | 5.450 | 7/25/2007 | 6,989,062 | |||
| 751,327 | Nissan Auto Lease Trust | 3.180 | 6/15/2010 | 749,482 | |||
| 3,000,000 | Nissan Auto Receivables Owner Trust | 4.740 | 9/15/2009 | 2,987,769 | |||
| 986,799 | Nomura Asset Acceptance Corporation † | 5.460 | 7/25/2007 | 986,875 | |||
| 1,726,017 | PG&E Energy Recovery Funding, LLC | 3.870 | 6/25/2011 | 1,700,674 | |||
| 826,912 | Popular ABS Mortgage Pass-Through Trust | 4.000 | 12/25/2034 | 822,486 | |||
| 4,665,000 | Renaissance Home Equity Loan Trust | 5.608 | 5/25/2036 | 4,649,326 | |||
| 1,737,036 | Residential Asset Securities Corporation | 5.010 | 4/25/2033 | 1,637,373 | |||
| 7,000,000 | Santander Drive Auto Receivables Trust | 5.050 | 9/15/2011 | 6,960,331 | |||
| 994,137 | SLM Student Loan Trust † | 5.365 | 7/25/2007 | 994,365 | |||
| 3,000,000 | Textron Financial Floorplan Master Note Trust † | 5.440 | 7/13/2007 | 3,003,615 | |||
| 3,705,775 | USAA Auto Owner Trust | 4.830 | 4/15/2010 | 3,696,199 | |||
| The accompanying Notes to Financial Statements are an integral part of this schedule. |
| 211 |
Limited Maturity Bond Portfolio
Schedule of Investments as of June 29, 2007 (unaudited)
| Principal | Interest | Maturity | |||||
| Amount | Long-Term Fixed Income (95.4%) | Rate | Date | Value | |||
| Asset-Backed Securities — continued | |||||||
| $2,455,021 | Wachovia Asset Securitization, Inc. † | 5.460% | 7/25/2007 | $2,455,011 | |||
| 6,000,000 | Wachovia Auto Loan Owner Trust | 5.230 | 8/22/2011 | 5,990,418 | |||
| 9,000,000 | Washington Mutual Master Note Trust † | 5.350 | 7/15/2007 | 9,000,000 | |||
| Total Asset-Backed Securities | 177,267,420 | ||||||
| Basic Materials (0.8%) | |||||||
| 1,400,000 | BHP Billiton Finance, Ltd. ‡ | 5.125 | 3/29/2012 | 1,371,705 | |||
| 1,028,000 | Equistar Chemicals, LP ‡ | 10.125 | 9/1/2008 | 1,069,120 | |||
| 2,400,000 | Lubrizol Corporation | 4.625 | 10/1/2009 | 2,352,922 | |||
| 1,500,000 | Monsanto Company ~ | 4.000 | 5/15/2008 | 1,481,301 | |||
| Total Basic Materials | 6,275,048 | ||||||
| Capital Goods (1.3%) | |||||||
| 3,400,000 | Goodrich Corporation | 7.500 | 4/15/2008 | 3,445,482 | |||
| 2,500,000 | John Deere Capital Corporation ± | 4.400 | 7/15/2009 | 2,451,398 | |||
| 2,500,000 | Oakmont Asset Trust | 4.514 | 12/22/2008 | 2,465,852 | |||
| 2,050,000 | Raytheon Company | 6.750 | 8/15/2007 | 2,055,468 | |||
| Total Capital Goods | 10,418,200 | ||||||
| Commercial Mortgage-Backed Securities (22.7%) | |||||||
| 5,134,483 | American Home Mortgage Assets †‡ | 5.949 | 7/25/2007 | 5,139,297 | |||
| 3,535,000 | Banc of America Commercial Mortgage, Inc. ‡ | 5.001 | 9/10/2010 | 3,481,158 | |||
| 1,237,692 | Banc of America Commercial Mortgage, Inc. ‡ | 4.037 | 11/10/2039 | 1,211,126 | |||
| 6,000,000 | Banc of America Large Loan Trust †‡ | 5.430 | 7/15/2007 | 6,004,632 | |||
| 7,000,000 | Banc of America Large Loan Trust †‡ | 5.530 | 7/15/2007 | 7,001,694 | |||
| 2,897,044 | Banc of America Mortgage Securities, Inc. ‡ | 4.803 | 9/25/2035 | 2,844,289 | |||
| 3,486,590 | Bear Stearns Adjustable Rate Mortgage Trust ‡ | 4.625 | 8/25/2010 | 3,427,779 | |||
| 4,000,000 | Bear Stearns Commercial Mortgage Securities, Inc. †‡ | 5.470 | 7/15/2007 | 4,000,000 | |||
| 1,300,000 | Bear Stearns Commercial Mortgage Securities, Inc. ±‡ | 3.869 | 2/11/2041 | 1,269,388 | |||
| 4,771,601 | Chase Mortgage Finance Corporation ‡ | 4.577 | 2/25/2037 | 4,663,319 | |||
| 633,068 | Citigroup Commercial Mortgage Trust † | 5.390 | 7/15/2007 | 633,443 | |||
| 626,440 | Citigroup Mortgage Loan Trust, Inc. | 4.922 | 8/25/2035 | 623,372 | |||
| 5,000,000 | Citigroup Mortgage Loan Trust, Inc. ‡ | 5.536 | 3/25/2036 | 4,978,150 | |||
| 100,529 | Commercial Mortgage Pass-Through Certificates † | 5.420 | 7/15/2007 | 100,533 | |||
| 8,000,000 | Commercial Mortgage Pass-Through Certificates †‡ | 5.500 | 7/15/2007 | 8,000,000 | |||
| 4,386,942 | Countrywide Home Loans, Inc. ‡ | 5.363 | 3/20/2036 | 4,345,516 | |||
| 4,419,391 | Countrywide Home Loans, Inc. ‡ | 5.867 | 9/20/2036 | 4,433,405 | |||
| 6,500,000 | Crown Castle International Corporation ‡ | 5.245 | 11/15/2036 | 6,386,322 | |||
| 6,626,460 | Deutsche Alt-A Securities, Inc. †‡ | 5.799 | 7/25/2007 | 6,626,460 | |||
| 3,691,455 | Federal Home Loan Mortgage Corporation | ||||||
| Multifamily Structured Pass Through ~ | 5.487 | 4/25/2010 | 3,678,948 | ||||
| 2,842,966 | General Electric Commercial Mortgage Corporation | 4.591 | 7/10/2045 | 2,795,077 | |||
| 3,125,727 | HomeBanc Mortgage Trust ± | 6.009 | 4/25/2037 | 3,141,852 | |||
| 2,205,830 | Impac CMB Trust †~ | 5.580 | 7/25/2007 | 2,206,726 | |||
| 1,610,038 | Impac CMB Trust † | 5.640 | 7/25/2007 | 1,611,337 | |||
| 4,026,943 | J.P. Morgan Alternative Loan Trust | 5.794 | 3/25/2036 | 4,022,602 | |||
| The accompanying Notes to Financial Statements are an integral part of this schedule. |
| 212 |
Limited Maturity Bond Portfolio
Schedule of Investments as of June 29, 2007 (unaudited)
| Principal | Interest | Maturity | |||||
| Amount | Long-Term Fixed Income (95.4%) | Rate | Date | Value | |||
| Commercial Mortgage-Backed Securities — continued | |||||||
| $2,261,281 | J.P. Morgan Chase Commercial Mortgage | ||||||
| Securities Corporation ~ | 2.790% | 1/12/2039 | $2,189,223 | ||||
| 9,100,000 | J.P. Morgan Chase Commercial Mortgage | ||||||
| Securities Corporation ‡ | 5.198 | 12/15/2044 | 8,996,451 | ||||
| 5,662,561 | J.P. Morgan Mortgage Trust | 5.008 | 7/25/2035 | 5,589,225 | |||
| 1,000,000 | LB-UBS Commercial Mortgage Trust | 3.323 | 3/15/2027 | 985,577 | |||
| 2,727,604 | LB-UBS Commercial Mortgage Trust | 4.741 | 9/15/2040 | 2,700,247 | |||
| 814,073 | Lehman Brothers “CALSTRS” Mortgage Trust | 3.988 | 11/20/2012 | 809,301 | |||
| 4,113,326 | Merrill Lynch Mortgage Investors, Inc. ~ | 4.874 | 6/25/2035 | 4,065,311 | |||
| 1,250,000 | Merrill Lynch Mortgage Trust ~ | 4.099 | 11/15/2010 | 1,243,376 | |||
| 2,933,661 | Residential Accredit Loans, Inc. | 5.609 | 9/25/2035 | 2,925,866 | |||
| 2,980,844 | Thornburg Mortgage Securities Trust † | 5.430 | 7/25/2007 | 2,979,001 | |||
| 5,730,000 | Wachovia Bank Commercial Mortgage Trust | 3.958 | 12/15/2035 | 5,614,053 | |||
| 3,876,405 | Wachovia Mortgage Loan Trust, LLC | 5.580 | 5/20/2036 | 3,876,199 | |||
| 7,281,223 | Washington Mutual Alternative Loan Trust † | 5.772 | 7/25/2007 | 7,280,655 | |||
| 5,522,236 | Washington Mutual Alternative Loan Trust † | 5.949 | 7/25/2007 | 5,525,903 | |||
| 3,690,788 | Washington Mutual Asset Securities Corporation | 3.830 | 1/25/2035 | 3,569,926 | |||
| 2,333,173 | Washington Mutual Mortgage Pass-Through Certificates † | 5.610 | 7/25/2007 | 2,337,202 | |||
| 6,108,387 | Washington Mutual Mortgage Pass-Through Certificates † | 5.909 | 7/25/2007 | 6,111,250 | |||
| 2,463,549 | Washington Mutual Mortgage Pass-Through Certificates | 4.835 | 9/25/2035 | 2,429,135 | |||
| 5,971,613 | Washington Mutual, Inc. † | 5.769 | 7/25/2007 | 5,963,682 | |||
| 5,468,742 | Washington Mutual, Inc. † | 5.849 | 7/25/2007 | 5,468,528 | |||
| 8,500,000 | Wells Fargo Mortgage Backed Securities Trust | 3.539 | 9/25/2034 | 8,231,859 | |||
| 1,061,483 | Wells Fargo Mortgage Backed Securities Trust | 4.950 | 3/25/2036 | 1,046,673 | |||
| 1,847,183 | Wells Fargo Mortgage Backed Securities Trust | 5.095 | 3/25/2036 | 1,825,930 | |||
| Total Commercial Mortgage-Backed Securities | 184,390,998 | ||||||
| Communications Services (5.0%) | |||||||
| 2,800,000 | Ameritech Capital Funding Corporation | 6.250 | 5/18/2009 | 2,825,287 | |||
| 2,000,000 | British Telecom plc ‡~ | 8.625 | 12/15/2010 | 2,185,538 | |||
| 3,100,000 | Comcast Cable Communications, Inc. ‡ | 6.200 | 11/15/2008 | 3,124,595 | |||
| 2,100,000 | Comcast Cable Communications, LLC ± | 6.875 | 6/15/2009 | 2,150,140 | |||
| 1,760,000 | Cox Communications, Inc. ‡ | 7.875 | 8/15/2009 | 1,839,501 | |||
| 1,400,000 | Cox Communications, Inc. ± | 4.625 | 1/15/2010 | 1,367,440 | |||
| 2,450,000 | GTE Corporation ± | 7.510 | 4/1/2009 | 2,528,660 | |||
| 1,954,000 | News America Holdings, Inc. ~ | 7.375 | 10/17/2008 | 1,992,965 | |||
| 2,500,000 | Nextel Partners, Inc. ± | 8.125 | 7/1/2011 | 2,607,572 | |||
| 1,000,000 | Qwest Corporation | 5.625 | 11/15/2008 | 996,250 | |||
| 2,620,000 | Rogers Cable, Inc. | 7.875 | 5/1/2012 | 2,832,967 | |||
| 2,500,000 | SBC Communications, Inc. ± | 4.125 | 9/15/2009 | 2,431,032 | |||
| 2,400,000 | Sprint Capital Corporation | 6.125 | 11/15/2008 | 2,413,596 | |||
| 2,400,000 | Telecom Italia Capital SA | 4.000 | 11/15/2008 | 2,348,986 | |||
| 1,400,000 | Telecom Italia Capital SA | 6.200 | 7/18/2011 | 1,417,349 | |||
| 1,000,000 | Telefonos de Mexico SA de CV | 4.500 | 11/19/2008 | 983,283 | |||
| The accompanying Notes to Financial Statements are an integral part of this schedule. |
| 213 |
Limited Maturity Bond Portfolio
Schedule of Investments as of June 29, 2007 (unaudited)
| Principal | Interest | Maturity | |||||
| Amount | Long-Term Fixed Income (95.4%) | Rate | Date | Value | |||
| Communications Services — continued | |||||||
| $2,400,000 | Time Warner Cable, Inc. | 5.400% | 7/2/2012 | $2,356,858 | |||
| 2,500,000 | Time Warner Entertainment Company, LP | 7.250 | 9/1/2008 | 2,545,555 | |||
| 1,700,000 | Vodafone Group plc | 5.350 | 2/27/2012 | 1,670,459 | |||
| Total Communications Services | 40,618,033 | ||||||
| Consumer Cyclical (3.6%) | |||||||
| 1,250,000 | Carnival Corporation ± | 3.750 | 11/15/2007 | 1,242,545 | |||
| 3,100,000 | Centex Corporation ‡ | 4.750 | 1/15/2008 | 3,090,712 | |||
| 2,700,000 | CVS Caremark Corporation †‡ | 5.660 | 9/4/2007 | 2,700,540 | |||
| 2,800,000 | CVS Corporation ~ | 4.000 | 9/15/2009 | 2,709,941 | |||
| 2,100,000 | D.R. Horton, Inc. ± | 8.000 | 2/1/2009 | 2,158,991 | |||
| 2,500,000 | DaimlerChrysler North American | ||||||
| Holdings Corporation †‡ | 5.886 | 8/1/2007 | 2,513,732 | ||||
| 1,750,000 | Ford Motor Credit Company | 6.625 | 6/16/2008 | 1,748,819 | |||
| 2,100,000 | May Department Stores Company ~ | 4.800 | 7/15/2009 | 2,059,900 | |||
| 4,100,000 | Ryland Group, Inc. | 5.375 | 6/1/2008 | 4,090,304 | |||
| 4,568,732 | SLM Private Credit Student Loan Trust † | 5.370 | 9/15/2007 | 4,569,577 | |||
| 2,000,000 | Walmart Stores, Inc. | 5.000 | 4/5/2012 | 1,958,210 | |||
| Total Consumer Cyclical | 28,843,271 | ||||||
| Consumer Non-Cyclical (2.4%) | |||||||
| 2,500,000 | Baxter International, Inc. ‡ | 5.196 | 2/16/2008 | 2,496,342 | |||
| 3,500,000 | Cadbury Schweppes plc ‡ | 3.875 | 10/1/2008 | 3,426,612 | |||
| 2,000,000 | Fortune Brands, Inc. | 5.125 | 1/15/2011 | 1,951,620 | |||
| 3,500,000 | General Mills, Inc. | 6.378 | 10/15/2008 | 3,523,058 | |||
| 1,950,000 | Kroger Company ± | 6.375 | 3/1/2008 | 1,960,150 | |||
| 2,800,000 | Miller Brewing Company ± | 4.250 | 8/15/2008 | 2,757,717 | |||
| 1,100,000 | Safeway, Inc. | 6.500 | 11/15/2008 | 1,114,105 | |||
| 2,000,000 | Wyeth | 4.375 | 3/1/2008 | 1,984,176 | |||
| Total Consumer Non-Cyclical | 19,213,780 | ||||||
| Energy (2.1%) | |||||||
| 2,350,000 | Enterprise Products Operating, LP ± | 4.000 | 10/15/2007 | 2,340,264 | |||
| 1,000,000 | Enterprise Products Operating, LP ‡ | 4.625 | 10/15/2009 | 979,424 | |||
| 2,430,000 | KeySpan Corporation ± | 4.900 | 5/16/2008 | 2,417,933 | |||
| 2,900,000 | Kinder Morgan Energy Partners, LP ‡ | 5.350 | 8/15/2007 | 2,899,204 | |||
| 2,500,000 | Oneok, Inc. | 5.510 | 2/16/2008 | 2,499,942 | |||
| 2,100,000 | Premcor Refining Group, Inc. | 6.125 | 5/1/2011 | 2,130,948 | |||
| 3,400,000 | Sempra Energy | 7.950 | 3/1/2010 | 3,594,840 | |||
| Total Energy | 16,862,555 | ||||||
| The accompanying Notes to Financial Statements are an integral part of this schedule. |
| 214 |
Limited Maturity Bond Portfolio
Schedule of Investments as of June 29, 2007 (unaudited)
| Principal | Interest | Maturity | |||||
| Amount | Long-Term Fixed Income (95.4%) | Rate | Date | Value | |||
| Financials (15.4%) | |||||||
| $2,000,000 | Abbey National plc >‡ | 6.700% | 6/15/2008 | $2,019,270 | |||
| 2,000,000 | American General Finance Corporation †‡ | 5.479 | 7/18/2007 | 2,001,300 | |||
| 1,400,000 | BAC Capital Trust XIV ‡~ | 5.630 | 3/15/2012 | 1,368,892 | |||
| 3,500,000 | Bank of New York Co., Inc. ‡ | 4.250 | 9/4/2012 | 3,492,506 | |||
| 2,000,000 | Capital One Bank ±‡ | 4.875 | 5/15/2008 | 1,990,804 | |||
| 1,650,000 | Capmark Financial Group, Inc. ‡ | 5.875 | 5/10/2012 | 1,628,377 | |||
| 2,250,000 | Chubb Corporation ± | 4.934 | 11/16/2007 | 2,244,672 | |||
| 2,400,000 | CIT Group, Inc. ‡ | 5.200 | 11/3/2010 | 2,363,090 | |||
| 700,000 | Corestates Capital Trust I | 8.000 | 12/15/2026 | 725,017 | |||
| 2,400,000 | Countrywide Home Loans, Inc. ± | 4.125 | 9/15/2009 | 2,327,822 | |||
| 2,100,000 | Credit Suisse First Boston USA, Inc. †‡ | 5.490 | 9/10/2007 | 2,104,998 | |||
| 2,000,000 | Deluxe Corporation ‡ | 3.500 | 10/1/2007 | 1,980,000 | |||
| 1,400,000 | Developers Diversified Realty Corporation ‡ | 4.625 | 8/1/2010 | 1,358,594 | |||
| 2,500,000 | Donaldson, Lufkin & Jenrette, Inc. ± | 6.500 | 4/1/2008 | 2,516,308 | |||
| 1,000,000 | First Chicago Corporation | 6.375 | 1/30/2009 | 1,014,336 | |||
| 3,600,000 | First Union Corporation | 6.300 | 4/15/2008 | 3,622,892 | |||
| 2,100,000 | General Electric Capital Corporation | 5.200 | 2/1/2011 | 2,079,943 | |||
| 2,800,000 | General Motors Acceptance Corporation | 6.875 | 8/28/2012 | 2,736,504 | |||
| 2,100,000 | Goldman Sachs Group, Inc. | 4.500 | 6/15/2010 | 2,047,479 | |||
| 2,100,000 | Hartford Financial Services Group, Inc. ‡ | 5.550 | 8/16/2008 | 2,101,800 | |||
| 2,800,000 | International Lease Finance Corporation | 3.300 | 1/23/2008 | 2,767,512 | |||
| 2,050,000 | International Lease Finance Corporation | 5.750 | 6/15/2011 | 2,058,571 | |||
| 1,500,000 | iSTAR Financial, Inc. ‡ | 4.875 | 1/15/2009 | 1,480,821 | |||
| 1,400,000 | iStar Financial, Inc. ‡ | 5.125 | 4/1/2011 | 1,370,326 | |||
| 1,600,000 | J.P. Morgan Chase & Company | 5.600 | 6/1/2011 | 1,603,749 | |||
| 2,100,000 | John Hancock Global Funding II ‡ | 3.750 | 9/30/2008 | 2,054,867 | |||
| 2,500,000 | KeyCorp ‡ | 4.700 | 5/21/2009 | 2,469,875 | |||
| 3,500,000 | Lehman Brothers Holdings E-Capital Trust I †~ | 6.140 | 8/20/2007 | 3,533,271 | |||
| 2,000,000 | Lehman Brothers Holdings, Inc. | 3.500 | 8/7/2008 | 1,958,326 | |||
| 2,000,000 | MBNA Europe Funding plc †~ | 5.460 | 9/7/2007 | 2,000,530 | |||
| 1,500,000 | Merrill Lynch & Company, Inc. †~ | 5.685 | 7/23/2007 | 1,500,036 | |||
| 2,800,000 | Merrill Lynch & Company, Inc. ~ | 4.000 | 11/15/2007 | 2,784,373 | |||
| 3,500,000 | Mizuho Preferred Capital Company, LLC ‡ | 8.790 | 6/30/2008 | 3,602,574 | |||
| 1,000,000 | Monumental Global Funding II ~ | 3.850 | 3/3/2008 | 989,172 | |||
| 1,400,000 | Morgan Stanley Dean Witter & Company ~ | 6.750 | 4/15/2011 | 1,451,556 | |||
| 6,300,000 | Nations Bank Capital Trust IV ~ | 8.250 | 4/15/2027 | 6,553,903 | |||
| 2,370,000 | Pacific Life Global Funding | 3.750 | 1/15/2009 | 2,317,244 | |||
| 2,100,000 | Popular North America, Inc. | 5.200 | 12/12/2007 | 2,096,453 | |||
| 2,500,000 | Premium Asset Trust † | 5.506 | 7/16/2007 | 2,503,108 | |||
| 1,400,000 | Pricoa Global Funding I | 4.350 | 6/15/2008 | 1,378,916 | |||
| 2,000,000 | Protective Life Secured Trust | 4.000 | 10/7/2009 | 1,940,034 | |||
| 2,800,000 | Residential Capital Corporation † | 7.187 | 7/17/2007 | 2,787,490 | |||
| 2,400,000 | Residential Capital Corporation | 6.125 | 11/21/2008 | 2,378,095 | |||
| 1,050,000 | Residential Capital Corporation | 6.000 | 2/22/2011 | 1,016,018 | |||
| 3,900,000 | Simon Property Group, LP | 6.375 | 11/15/2007 | 3,910,912 | |||
| 2,400,000 | SLM Corporation | 4.000 | 1/15/2009 | 2,305,985 | |||
| The accompanying Notes to Financial Statements are an integral part of this schedule. |
| 215 |
Limited Maturity Bond Portfolio
Schedule of Investments as of June 29, 2007 (unaudited)
| Principal | Interest | Maturity | |||||
| Amount | Long-Term Fixed Income (95.4%) | Rate | Date | Value | |||
| Financials — continued | |||||||
| $1,900,000 | SLM Corporation | 5.400% | 10/25/2011 | $1,740,220 | |||
| 8,200,000 | Societe Generale Real Estate Company, LLC | 7.640 | 9/30/2007 | 8,239,803 | |||
| 1,725,000 | Tokai Preferred Capital Company, LLC | 9.980 | 6/30/2008 | 1,794,128 | |||
| 1,400,000 | UnumProvident Corporation | 5.997 | 5/15/2008 | 1,402,723 | |||
| 700,000 | Wachovia Capital Trust III | 5.800 | 3/15/2011 | 696,949 | |||
| 1,400,000 | Wachovia Corporation | 6.375 | 2/1/2009 | 1,422,135 | |||
| 1,605,000 | Wachovia Corporation | 6.150 | 3/15/2009 | 1,625,384 | |||
| 1,400,000 | Washington Mutual Preferred Funding II | 6.895 | 6/15/2012 | 1,380,655 | |||
| 2,500,000 | Washington Mutual, Inc. | 4.000 | 1/15/2009 | 2,445,832 | |||
| 2,000,000 | Wells Fargo & Company † | 5.460 | 9/17/2007 | 2,004,236 | |||
| Total Financials | 125,290,386 | ||||||
| Industrials (0.4%) | |||||||
| 3,500,000 | Precision Castparts Corporation | 6.750 | 12/15/2007 | 3,516,744 | |||
| Total Industrials | 3,516,744 | ||||||
| Mortgage-Backed Securities (6.2%) | |||||||
| 51,000,000 | Federal National Mortgage Association Conventional | ||||||
| 30-Yr. Pass Through §~ | 6.000 | 7/1/2037 | 50,442,162 | ||||
| Total Mortgage-Backed Securities | 50,442,162 | ||||||
| Technology (0.6%) | |||||||
| 2,000,000 | International Business Machines Corporation ± | 4.950 | 3/22/2011 | 1,966,732 | |||
| 700,000 | Sun Microsystems, Inc. | 7.650 | 8/15/2009 | 724,928 | |||
| 2,100,000 | Xerox Corporation | 5.500 | 5/15/2012 | 2,063,922 | |||
| Total Technology | 4,755,582 | ||||||
| Transportation (1.2%) | |||||||
| 1,375,000 | Delta Air Lines, Inc. ‡ | 7.111 | 9/18/2011 | 1,410,750 | |||
| 1,300,000 | FedEx Corporation ± | 3.500 | 4/1/2009 | 1,256,642 | |||
| 3,125,000 | Norfolk Southern Corporation ‡ | 6.200 | 4/15/2009 | 3,160,075 | |||
| 2,400,000 | Northwest Airlines, Inc. | 6.841 | 4/1/2011 | 2,433,000 | |||
| 1,150,000 | Union Pacific Corporation | 6.125 | 1/15/2012 | 1,164,964 | |||
| Total Transportation | 9,425,431 | ||||||
| U.S. Government (7.7%) | |||||||
| 8,000,000 | Federal Home Loan Bank ‡ | 4.100 | 6/13/2008 | 7,912,232 | |||
| 7,000,000 | Federal Home Loan Bank * | 4.875 | 2/9/2010 | 6,944,924 | |||
| 5,500,000 | Federal Home Loan Mortgage Corporation ~ | 3.875 | 6/15/2008 | 5,428,049 | |||
| 2,000,000 | Federal Home Loan Mortgage Corporation ‡ | 4.625 | 8/15/2008 | 1,985,840 | |||
| 5,000,000 | Federal Home Loan Mortgage Corporation ~ | 4.750 | 11/3/2009 | 4,951,090 | |||
| The accompanying Notes to Financial Statements are an integral part of this schedule. |
| 216 |
Limited Maturity Bond Portfolio
Schedule of Investments as of June 29, 2007 (unaudited)
| Principal | Interest | Maturity | |||||
| Amount | Long-Term Fixed Income (95.4%) | Rate | Date | Value | |||
| U.S. Government — continued | |||||||
| $2,800,000 | Federal National Mortgage Association ‡ | 5.400% | 2/1/2008 | $2,800,062 | |||
| 4,000,000 | Federal National Mortgage Association ‡ | 4.000 | 9/2/2008 | 3,942,760 | |||
| 5,000,000 | Federal National Mortgage Association ‡ | 5.300 | 2/22/2011 | 4,973,625 | |||
| 5,000,000 | Federal National Mortgage Association ~ | 5.125 | 4/15/2011 | 4,981,865 | |||
| 19,728,360 | U.S. Treasury Notes, TIPS * | 2.000 | 7/15/2014 | 18,937,686 | |||
| Total U.S. Government | 62,858,133 | ||||||
| U.S. Municipals (0.1%) | |||||||
| 750,000 | Washington State Office of the State Treasurer | 4.500 | 7/1/2007 | 750,000 | |||
| Total U.S. Municipals | 750,000 | ||||||
| Utilities (4.1%) | |||||||
| 2,000,000 | Carolina Power & Light, Inc. ± | 5.950 | 3/1/2009 | 2,016,400 | |||
| 2,500,000 | CenterPoint Energy, Inc. ± | 5.875 | 6/1/2008 | 2,503,215 | |||
| 900,000 | Cleveland Electric Illuminating Company ± | 7.430 | 11/1/2009 | 934,305 | |||
| 3,500,000 | Commonwealth Edison Company ‡ | 3.700 | 2/1/2008 | 3,459,288 | |||
| 1,750,000 | Dominion Resources, Inc. ±† | 5.660 | 9/28/2007 | 1,750,402 | |||
| 3,100,000 | Dominion Resources, Inc. ± | 4.125 | 2/15/2008 | 3,074,757 | |||
| 675,000 | DPL, Inc. | 6.250 | 5/15/2008 | 678,919 | |||
| 1,500,000 | DTE Energy Company ± | 5.630 | 8/16/2007 | 1,501,600 | |||
| 2,100,000 | Niagara Mohawk Power Corporation ~ | 7.750 | 10/1/2008 | 2,153,294 | |||
| 1,000,000 | Pacific Gas & Electric Company ‡ | 3.600 | 3/1/2009 | 970,423 | |||
| 518,230 | Power Receivables Finance, LLC | 6.290 | 1/1/2012 | 523,650 | |||
| 3,000,000 | PSEG Funding Trust | 5.381 | 11/16/2007 | 2,997,327 | |||
| 359,000 | Texas-New Mexico Power Company | 6.125 | 6/1/2008 | 359,615 | |||
| 3,500,000 | TXU Energy Company, LLC † | 5.860 | 9/17/2007 | 3,501,354 | |||
| 2,000,000 | Virginia Electric & Power Company | 4.500 | 12/15/2010 | 1,935,340 | |||
| 5,000,000 | Yorkshire Power Finance, Ltd. | 6.496 | 2/25/2008 | 5,032,280 | |||
| Total Utilities | 33,392,169 | ||||||
| Total Long-Term Fixed Income (cost $778,940,799) | 774,319,912 | ||||||
| Exercise | Expiration | ||||||
| Contracts | Options Purchased (<0.1%) | Price | Date | Value | |||
| 138 | Put on S&P 500 Mini Futures | $1,495 | 8/17/2007 | $180,090 | |||
| 360 | Call on U.S. Treasury Bond Futures | 106 | 7/27/2007 | 140,625 | |||
| 250 | Call on U.S. Treasury Bond Futures | 107 | 7/27/2007 | 31,250 | |||
| Total Options Purchased (cost $319,297) | 351,965 | ||||||
| Interest | Maturity | ||||||
| Shares | Collateral Held for Securities Loaned (3.2%) | Rate (+) | Date | Value | |||
| 26,222,500 | Thrivent Financial Securities Lending Trust | 5.360% | N/A | $26,222,500 | |||
| Total Collateral Held for Securities Loaned | |||||||
| (cost $26,222,500) | 26,222,500 | ||||||
| The accompanying Notes to Financial Statements are an integral part of this schedule. |
| 217 |
Limited Maturity Bond Portfolio
Schedule of Investments as of June 29, 2007 (unaudited)
| Shares or | ||||||
| Principal | Interest | Maturity | ||||
| Amount | Short-Term Investments (9.4%) | Rate (+) | Date | Value | ||
| $3,500,000 | Barclays US Funding Corporation ‡ | 5.235% | 7/27/2007 | $3,486,258 | ||
| 6,500,000 | DNB NOR ASA | 5.360 | 7/2/2007 | 6,498,064 | ||
| 10,075,000 | Galaxy Funding, Inc. | 5.360 | 7/2/2007 | 10,072,000 | ||
| 5,000,000 | Kitty Hawk Funding Corporation | 5.330 | 7/9/2007 | 4,993,338 | ||
| 5,000,000 | Old Line Funding Corporation | 5.350 | 7/12/2007 | 4,991,083 | ||
| 11,000,000 | Park Avenue Receivables Corporation | 5.380 | 7/3/2007 | 10,995,068 | ||
| 3,500,000 | Ranger Funding Company, LLC | 5.340 | 7/17/2007 | 3,491,191 | ||
| 6,000,000 | Regency Markets No.1, LLC | 5.350 | 7/9/2007 | 5,991,975 | ||
| 8,000,000 | Society of New York | 5.280 | 8/21/2007 | 7,938,987 | ||
| 13,194,889 | Thrivent Money Market Portfolio | 5.050 | N/A | 13,194,889 | ||
| 4,527,000 | Victory Receivables Corporation | 5.410 | 7/5/2007 | 4,523,598 | ||
| Total Short-Term Investments (at amortized cost) | 76,176,451 | |||||
| Total Investments (cost $881,659,047) 108.1% | $877,070,828 | |||||
| Other Assets and Liabilities, Net (8.1%) | (65,730,949) | |||||
| Total Net Assets 100.0% | $811,339,879 | |||||
| Number of | Notional | |||||
| Contracts | Expiration | Principal | Unrealized | |||
| Futures | Long/(Short) | Date | Amount | Value | Gain/(Loss) | |
| 2-Yr. U.S. Treasury Bond Futures | 210 | September 2007 | $42,827,516 | $42,794,065 | ($33,451) | |
| 5-Yr. U.S. Treasury Bond Futures | 150 | September 2007 | 15,684,833 | 15,611,720 | (73,113) | |
| 10-Yr. Euro-Bund Futures | (33) | September 2007 | (3,680,754) | (3,645,561) | 35,193 | |
| 10-Yr. Japanese Treasury Bond Futures | 5 | September 2007 | 5,441,947 | 5,439,043 | (2,904) | |
| 10-Yr. U.S. Treasury Bond Futures | (600) | September 2007 | (63,935,045) | (63,421,878) | 513,167 | |
| Number of | Exercise | Expiration | Unrealized | |||
| Call Options Written | Contracts | Price | Date | Value | Gain/(Loss) | |
| Federal National Mortgage Association | 35 | $98.95 | July 2007 | ($44,637) | $20,988 | |
| Conventional 30-Yr. Pass Through | ||||||
| The accompanying Notes to Financial Statements are an integral part of this schedule. |
| 218 |
Limited Maturity Bond Portfolio
Schedule of Investments as of June 29, 2007 (unaudited)
| Notional | |||||||
| Fund | Fund | Buy/Sell | Termination | Principal | Unrealized | ||
| Swaps and Counterparty | Receives | Pays | Protection | Date | Amount | Gain/(Loss) | |
| Credit Default Swaps | |||||||
| LCDX, N.A. Index Series 8, | |||||||
| 5 Year, at 1.20%; | N/A | N/A | Sell | June 2012 | $5,200,000 | ($130,232) | |
| Bank of America, N.A. | |||||||
| LCDX, N.A. Index Series 8, | |||||||
| 5 Year, at 1.20%; | N/A | N/A | Sell | June 2012 | $5,200,000 | ($125,458) | |
| J.P. Morgan Chase and Co. | |||||||
| Interest Rate Swaps | |||||||
| Bank of America, N.A. 2 Year | 5.275% | 3 Month LIBOR | N/A | May 2009 | $24,000,000 | ($37,306) | |
| Bank of America, N.A. 2 Year | 5.306% | 3 Month LIBOR | N/A | June 2009 | $30,000,000 | ($24,336) | |
| Total Rate of Return Swap | |||||||
| Wachovia Bank, N.A. | Lehman Brothers | 1 Month LIBOR | N/A | August 2007 | $21,000,000 | ($274,004) | |
| 3 Month | CMBS Aaa 8.5+ | Less 0.45% | |||||
| Yr Index | |||||||
* All or a portion of the security is on loan as discussed in item 2(M) of the Notes to Financial Statements.
+ The interest rate shown reflects the yield, coupon rate or, for securities purchased at a discount, the discount rate at the date of purchase.
> Denotes step coupon bonds for which the current interest rate and next scheduled reset date are shown.
† Denotes variable rate obligations for which the current yield and next scheduled reset date are shown.
§ Denotes investments purchased on a when-issued or delayed delivery basis.
± Designated as cover for long settling trades as discussed in the Notes to Financial Statements.
‡ At June 29, 2007, $970,423 of investments were held on deposit with the counterparty and pledged as the initial margin deposit for open financial futures contracts. In addition, $138,954,423 and $99,892,282 of investments were earmarked as collateral to cover open financial futures and swap contracts, respectively.
~ All or a portion of the security was earmarked as collateral to cover options.
Definitions:
TIPS — Treasury Inflation Protected Security.
Gross unrealized appreciation and depreciation of investments were as follows:
| Gross unrealized appreciation | $405,859 |
| Gross unrealized depreciation | (4,994,078) |
| Net unrealized appreciation (depreciation) | ($4,588,219) |
| Cost for federal income tax purposes | $881,659,047 |
| The accompanying Notes to Financial Statements are an integral part of this schedule. |
| 219 |
Mortgage Securities Portfolio
Schedule of Investments as of June 29, 2007 (unaudited)
| Principal | Interest | Maturity | |||||
| Amount | Long-Term Fixed Income (132.7%) | Rate | Date | Value | |||
| Asset-Backed Securities (28.2%) | |||||||
| $2,000,000 | AmeriCredit Automobile Receivables Trust ±† | 5.400% | 7/6/2007 | $1,999,710 | |||
| 188,529 | Countrywide Asset-Backed Certificates ±† | 5.400 | 7/25/2007 | 188,524 | |||
| 2,000,000 | Credit Based Asset Servicing and Securitization, LLC ±†‡~ | 5.430 | 7/25/2007 | 1,999,768 | |||
| 1,410,572 | First Horizon ABS Trust ±† | 5.480 | 7/25/2007 | 1,410,116 | |||
| 1,500,000 | Ford Credit Floor Plan Master Owner Trust ±† | 5.500 | 7/15/2007 | 1,500,344 | |||
| 2,000,000 | GMAC Mortgage Corporation Loan Trust ±† | 5.410 | 7/25/2007 | 2,000,142 | |||
| 390,033 | Master Asset-Backed Securities Trust ±† | 5.400 | 7/25/2007 | 390,094 | |||
| 1,000,000 | MBNA Credit Card Master Note Trust ±† | 5.430 | 7/15/2007 | 1,001,991 | |||
| 921,223 | Residential Funding Mortgage Securities II ±† | 5.450 | 7/25/2007 | 921,291 | |||
| 662,758 | SLM Student Loan Trust ±† | 5.365 | 7/25/2007 | 662,910 | |||
| 2,000,000 | Textron Financial Floorplan Master Note Trust ±† | 5.440 | 7/13/2007 | 2,002,410 | |||
| 982,008 | Wachovia Asset Securitization, Inc. ±† | 5.460 | 7/25/2007 | 982,004 | |||
| Total Asset-Backed Securities | 15,059,304 | ||||||
| Commercial Mortgage-Backed Securities (20.0%) | |||||||
| 827,727 | Banc of America Mortgage Securities, Inc. ± | 4.803 | 9/25/2035 | 812,654 | |||
| 67,019 | Commercial Mortgage Pass-Through Certificates ±† | 5.420 | 7/15/2007 | 67,022 | |||
| 124,490 | Credit Suisse First Boston Mortgage | ||||||
| Securities Corporation ±† | 5.690 | 7/25/2007 | 124,508 | ||||
| 735,276 | Impac CMB Trust ±† | 5.580 | 7/25/2007 | 735,575 | |||
| 1,000,000 | J.P. Morgan Chase Commercial Mortgage | ||||||
| Securities Corporation §^ | 6.007 | 7/15/2045 | 997,891 | ||||
| 1,000,000 | LB-UBS Commercial Mortgage Trust ± | 4.553 | 7/15/2030 | 977,044 | |||
| 1,177,907 | Merrill Lynch Mortgage Investors, Inc. ± | 4.874 | 6/25/2035 | 1,164,157 | |||
| 445,593 | MLCC Mortgage Investors, Inc. ±† | 5.650 | 7/25/2007 | 445,945 | |||
| 979,707 | National Collegiate Student Loan Trust ±† | 5.390 | 7/25/2007 | 980,080 | |||
| 1,657,150 | Thornburg Mortgage Securities Trust ±† | 5.410 | 7/25/2007 | 1,653,955 | |||
| 2,000,000 | Wachovia Bank Commercial Mortgage Trust ±† | 5.440 | 7/15/2007 | 1,999,882 | |||
| 764,268 | Wells Fargo Mortgage Backed Securities Trust ‡ | 4.950 | 3/25/2036 | 753,605 | |||
| Total Commercial Mortgage-Backed Securities | 10,712,318 | ||||||
| Mortgage-Backed Securities (82.3%) | |||||||
| 15,500,000 | Federal Home Loan Mortgage Corporation Gold | ||||||
| 30-Yr. Pass Through § | 6.000 | 7/1/2037 | 15,354,688 | ||||
| 2,103,014 | Federal National Mortgage Association ± | 6.000 | 8/1/2024 | 2,105,084 | |||
| 27,500,000 | Federal National Mortgage Association Conventional | ||||||
| 30-Yr. Pass Through §~ | 5.500 | 7/1/2037 | 26,520,310 | ||||
| Total Mortgage-Backed Securities | 43,980,082 | ||||||
| U.S. Government (2.2%) | |||||||
| 100,000 | U.S. Treasury Notes | 4.875 | 4/30/2011 | 99,852 | |||
| 1,096,020 | U.S. Treasury Notes, TIPS ± | 2.000 | 7/15/2014 | 1,052,094 | |||
| Total U.S. Government | 1,151,946 | ||||||
| Total Long-Term Fixed Income (cost $71,645,137) | 70,903,650 | ||||||
| The accompanying Notes to Financial Statements are an integral part of this schedule. |
| 220 |
Mortgage Securities Portfolio
Schedule of Investments as of June 29, 2007 (unaudited)
| Exercise | Expiration | ||||||
| Contracts | Options Purchased (<0.1%) | Price | Date | Value | |||
| 20 | Call on U.S. Treasury Bond Futures | $105 | 8/24/2007 | $23,438 | |||
| Total Options Purchased (cost $12,863) | 23,438 | ||||||
| Shares or | |||||||
| Principal | Interest | Maturity | |||||
| Amount | Short-Term Investments (48.3%) | Rate (+) | Date | Value | |||
| $2,500,000 | Aspen Funding Corporation ±~ | 5.310% | 7/12/2007 | $2,495,575 | |||
| 2,250,000 | Barton Capital Corporation ± | 5.300 | 7/12/2007 | 2,246,025 | |||
| 2,200,000 | Chariot Funding, LLC ±~ | 5.290 | 7/16/2007 | 2,194,828 | |||
| 1,000,000 | Fountain Square Commercial Funding ± | 5.320 | 7/3/2007 | 999,557 | |||
| 2,515,000 | Galaxy Funding, Inc. | 5.360 | 7/2/2007 | 2,514,251 | |||
| 1,000,000 | HBOS Treasury Services plc ± | 5.300 | 7/12/2007 | 998,233 | |||
| 2,500,000 | Jupiter Securitization Company, LLC ± | 5.290 | 7/18/2007 | 2,493,387 | |||
| 1,015,000 | Louis Dreyfus Corporation ± | 5.290 | 7/19/2007 | 1,012,166 | |||
| 2,570,000 | MLTC Funding, Inc. ± | 5.310 | 7/24/2007 | 2,560,902 | |||
| 2,310,000 | Mont Blanc Capital Corporation ± | 5.300 | 7/23/2007 | 2,302,178 | |||
| 2,000,000 | Old Line Funding Corporation ± | 5.320 | 7/5/2007 | 1,998,522 | |||
| 1,500,000 | Regency Markets No.1, LLC ± | 5.350 | 7/9/2007 | 1,497,994 | |||
| 848 | Thrivent Money Market Portfolio | 5.050 | N/A | 848 | |||
| 2,500,000 | Victory Receivables Corporation ‡ | 5.310 | 7/23/2007 | 2,491,519 | |||
| Total Short-Term Investments (at amortized cost) | 25,805,985 | ||||||
| Total Investments (cost $97,463,985) 181.0% | $96,733,073 | ||||||
| Other Assets and Liabilities, Net (81.0%) | (43,285,923) | ||||||
| Total Net Assets 100.0% | $53,447,150 | ||||||
| Number of | Notional | ||||
| Contracts | Expiration | Principal | Unrealized | ||
| Futures | Long/(Short) | Date | Amount | Value | Gain/(Loss) |
| 5-Yr. U.S. Treasury Bond Futures | 25 | September 2007 | $2,614,139 | $2,601,953 | ($12,186) |
| The accompanying Notes to Financial Statements are an integral part of this schedule. |
| 221 |
Mortgage Securities Portfolio
Schedule of Investments as of June 29, 2007 (unaudited)
| Number of | Exercise | Expiration | Unrealized | |||
| Call Options Written | Contracts | Price | Date | Value | Gain/(Loss) | |
| FNMA Conventional 30-Yr. Pass Through | 1.5 | $96.34 | July 2007 | ($3,633) | $117 | |
| FNMA Conventional 30-Yr. Pass Through | 2 | 96.42 | July 2007 | (4,219) | 0 | |
| FNMA Conventional 30-Yr. Pass Through | 1.5 | 96.56 | July 2007 | (2,050) | 1,934 | |
+ The interest rate shown reflects the yield, coupon rate or, for securities purchased at a discount, the discount rate at the date of purchase.
^ Security is fair valued as discussed in item 2(A) of the Notes to Financial Statements.
† Denotes variable rate obligations for which the current yield and next scheduled reset date are shown.
§ Denotes investments purchased on a when-issued or delayed delivery basis.
‡ At June 29, 2007, $99,852 of investments were held on deposit with the counterparty and pledged as the initial margin deposit for open financial futures contracts. In addition, $3,445,100 of investments were earmarked as collateral to cover open financial futures contracts.
~ All or a portion of the security was earmarked as collateral to cover options.
Definitions:
TIPS — Treasury Inflation Protected Security
Gross unrealized appreciation and depreciation of investments were as follows:
| Gross unrealized appreciation | $32,161 |
| Gross unrealized depreciation | (763,073) |
| Net unrealized appreciation (depreciation) | ($730,912) |
| Cost for federal income tax purposes | $97,463,985 |
| The accompanying Notes to Financial Statements are an integral part of this schedule. |
| 222 |
Money Market Portfolio | |||||||
| Schedule of Investments as of June 29, 2007 (unaudited) | |||||||
| Principal | Interest | Maturity | |||||
| Amount | Certificates of Deposit (2.2%) | Rate (+) | Date | Value | |||
| $9,450,000 | Depfa Bank plc NY | 5.330% | 7/23/2007 | $9,450,000 | |||
| 3,150,000 | Depfa Bank plc NY | 5.330 | 8/20/2007 | 3,150,000 | |||
| 2,500,000 | Deutsche Bank AG | 5.410 | 6/9/2008 | 2,500,000 | |||
| Total Certificates of Deposit | 15,100,000 | ||||||
| Principal | Interest | Maturity | |||||
| Amount | Commercial Paper (70.3%) | Rate (+) | Date | Value | |||
| Asset-Backed Commercial Paper (5.1%) | |||||||
| $9,400,000 | Axon Financial Funding, LLC | 5.295% | 9/13/2007 | $9,296,306 | |||
| 7,815,000 | Axon Financial Funding, LLC | 5.270 | 10/22/2007 | 7,684,581 | |||
| 1,560,000 | GOVCO, Inc. | 5.220 | 12/20/2007 | 1,520,867 | |||
| 17,135,000 | Tempus Fund, LLC | 5.290 | 9/12/2007 | 16,948,682 | |||
| Total Asset-Backed Commercial Paper | 35,450,436 | ||||||
| Banking — Domestic (5.5%) | |||||||
| 7,626,000 | Barclays Bank plc | 5.205 | 10/29/2007 | 7,492,586 | |||
| 10,055,000 | River Fuel Company No. 2, Inc. | 5.230 | 7/31/2007 | 10,009,716 | |||
| 2,800,000 | River Fuel Funding Company No. 3 | 5.250 | 7/31/2007 | 2,787,341 | |||
| 2,210,000 | Societe Generale NA | 5.155 | 8/13/2007 | 2,196,076 | |||
| 2,000,000 | Societe Generale NA | 5.240 | 11/26/2007 | 1,956,624 | |||
| 6,651,000 | UBS Finance Corporation | 5.180 | 8/15/2007 | 6,606,977 | |||
| 6,220,000 | UBS Finance Corporation | 5.210 | 8/30/2007 | 6,165,089 | |||
| 1,100,000 | UBS Finance Corporation | 5.230 | 10/23/2007 | 1,081,622 | |||
| Total Banking — Domestic | 38,296,031 | ||||||
| Banking — Foreign (1.6%) | |||||||
| 3,140,000 | Bank of Ireland | 5.260 | 8/17/2007 | 3,117,978 | |||
| 4,710,000 | Bank of Ireland | 5.180 | 8/28/2007 | 4,670,015 | |||
| 3,000,000 | DNB NOR ASA | 5.330 | 7/25/2007 | 2,988,896 | |||
| Total Banking — Foreign | 10,776,889 | ||||||
| Consumer Cyclical (1.3%) | |||||||
| 9,360,000 | Wal-Mart Funding Corporation | 5.250 | 8/22/2007 | 9,287,655 | |||
| Total Consumer Cyclical | 9,287,655 | ||||||
| Consumer Non-Cyclical (2.7%) | |||||||
| 7,880,000 | Catholic Health Initiatives | 5.330 | 7/10/2007 | 7,880,000 | |||
| 5,300,000 | Catholic Health Initiatives | 5.310 | 8/9/2007 | 5,300,000 | |||
| 4,725,000 | Nestle Capital Corporation | 5.275 | 7/18/2007 | 4,712,537 | |||
| 930,000 | Nestle Capital Corporation | 5.225 | 8/10/2007 | 924,466 | |||
| Total Consumer Non-Cyclical | 18,817,003 | ||||||
| The accompanying Notes to Financial Statements are an integral part of this schedule. |
| 223 |
Money Market Portfolio
Schedule of Investments as of June 29, 2007 (unaudited)
| Principal | Interest | Maturity | ||
| Amount | Commercial Paper (70.3%) | Rate (+) | Date | Value |
| Education (9.4%) | ||||
| $10,213,000 | Duke University | 5.280% | 7/9/2007 | $10,199,519 |
| 4,670,000 | Duke University | 5.280 | 7/10/2007 | 4,663,150 |
| 7,740,000 | Northwestern University | 5.250 | 7/9/2007 | 7,729,841 |
| 14,385,000 | Northwestern University | 5.280 | 8/8/2007 | 14,302,718 |
| 4,800,000 | University of Washington | 5.340 | 8/15/2007 | 4,800,000 |
| 1,580,000 | Yale University | 5.250 | 7/9/2007 | 1,577,927 |
| 9,430,000 | Yale University | 5.280 | 8/3/2007 | 9,382,976 |
| 12,575,000 | Yale University | 5.280 | 8/8/2007 | 12,503,071 |
| Total Education | 65,159,202 | |||
| Finance (32.6%) | ||||
| 4,991,000 | Barton Capital Corporation | 5.330 | 8/10/2007 | 4,960,703 |
| 5,022,000 | Bryant Park Funding, LLC | 5.240 | 7/20/2007 | 5,007,380 |
| 3,665,000 | Bryant Park Funding, LLC | 5.240 | 7/25/2007 | 3,651,663 |
| 3,130,000 | BTM Capital Corporation | 5.275 | 7/19/2007 | 3,121,286 |
| 9,370,000 | BTM Capital Corporation | 5.280 | 7/24/2007 | 9,337,018 |
| 9,380,000 | BTM Capital Corporation | 5.290 | 9/20/2007 | 9,266,976 |
| 3,150,000 | Charta, LLC | 5.440 | 7/5/2007 | 3,147,620 |
| 9,740,000 | Corporate Receivables Corporation | 5.300 | 9/7/2007 | 9,641,058 |
| 6,270,000 | Corporate Receivables Corporation | 5.270 | 9/25/2007 | 6,190,146 |
| 1,000,000 | Fountain Square Commercial Funding | 5.240 | 8/7/2007 | 994,469 |
| 2,900,000 | Fountain Square Commercial Funding | 5.250 | 10/19/2007 | 2,853,056 |
| 3,100,000 | Galaxy Funding, Inc. | 5.240 | 7/24/2007 | 3,089,171 |
| 3,120,000 | Galaxy Funding, Inc. | 5.240 | 7/25/2007 | 3,108,646 |
| 8,190,000 | Galaxy Funding, Inc. | 5.240 | 8/28/2007 | 8,119,666 |
| 6,315,000 | General Electric Capital Corporation | 5.200 | 8/13/2007 | 6,274,865 |
| 6,200,000 | Grampian Funding, LLC | 5.185 | 11/19/2007 | 6,073,198 |
| 8,115,000 | Greyhawk Funding, LLC | 5.275 | 9/27/2007 | 8,009,172 |
| 9,500,000 | Greyhawk Funding, LLC | 5.285 | 10/2/2007 | 9,368,903 |
| 3,100,000 | HSBC Finance Corporation | 5.000 | 8/31/2007 | 3,073,306 |
| 9,460,000 | Liberty Harbour CDO, Inc. | 5.265 | 7/26/2007 | 9,424,029 |
| 5,600,000 | Liberty Harbour II CDO, LLC | 5.265 | 7/11/2007 | 5,590,991 |
| 9,400,000 | Liberty Harbour II CDO, LLC | 5.270 | 8/20/2007 | 9,329,821 |
| 9,350,000 | Liberty Harbour II CDO, LLC | 5.260 | 8/21/2007 | 9,278,961 |
| 6,000,000 | NATC California, LLC | 5.250 | 7/13/2007 | 5,988,625 |
| 8,247,000 | Nieuw Amsterdam Receivables Corporation | 5.280 | 7/20/2007 | 8,222,809 |
| 1,334,000 | Nieuw Amsterdam Receivables Corporation | 5.250 | 8/21/2007 | 1,323,884 |
| 2,800,000 | Nieuw Amsterdam Receivables Corporation | 5.250 | 8/28/2007 | 2,775,908 |
| 6,933,000 | North Sea Funding, LLC | 5.235 | 7/31/2007 | 6,901,746 |
| 5,710,000 | North Sea Funding, LLC | 5.210 | 8/22/2007 | 5,666,202 |
| 1,620,000 | North Sea Funding, LLC | 5.250 | 11/15/2007 | 1,587,398 |
| 1,063,000 | Park Avenue Receivables Corporation | 5.330 | 8/20/2007 | 1,054,973 |
| 7,900,000 | Ranger Funding Company, LLC | 5.250 | 7/25/2007 | 7,871,198 |
| 12,390,000 | Solitaire Funding, LLC | 5.450 | 7/2/2007 | 12,386,249 |
| 4,170,000 | Surrey Funding Corporation | 5.270 | 9/25/2007 | 4,116,892 |
| 7,875,000 | Tempo Finance Corporation | 5.265 | 8/13/2007 | 7,824,565 |
| The accompanying Notes to Financial Statements are an integral part of this schedule. |
| 224 |
Money Market Portfolio
Schedule of Investments as of June 29, 2007 (unaudited)
| Principal | Interest | Maturity | |||||
| Amount | Commercial Paper (70.3%) | Rate (+) | Date | Value | |||
| Finance — continued | |||||||
| $6,260,000 | Tempo Finance Corporation | 5.250% | 8/20/2007 | $6,213,441 | |||
| 3,960,000 | Tempo Finance Corporation | 5.260 | 9/4/2007 | 3,921,812 | |||
| 4,429,000 | Thames Asset Global Securitization, Inc. | 5.250 | 7/16/2007 | 4,418,666 | |||
| 7,322,000 | Thames Asset Global Securitization, Inc. | 5.230 | 8/28/2007 | 7,259,240 | |||
| 1,011,000 | Yorktown Capital, LLC | 5.380 | 7/20/2007 | 1,007,978 | |||
| Total Finance | 227,453,690 | ||||||
| Insurance (7.7%) | |||||||
| 3,150,000 | Aquinas Funding, LLC | 5.195 | 7/6/2007 | 3,147,272 | |||
| 9,400,000 | Aquinas Funding, LLC | 5.210 | 7/9/2007 | 9,387,757 | |||
| 9,500,000 | Aquinas Funding, LLC | 5.300 | 8/28/2007 | 9,417,482 | |||
| 3,140,000 | Aquinas Funding, LLC | 5.250 | 8/30/2007 | 3,112,067 | |||
| 2,190,000 | Curzon Funding, LLC | 5.190 | 11/9/2007 | 2,148,324 | |||
| 11,050,000 | Nyala Funding, LLC | 5.260 | 7/16/2007 | 11,024,200 | |||
| 9,490,000 | Nyala Funding, LLC | 5.200 | 8/15/2007 | 9,426,945 | |||
| 6,285,000 | Nyala Funding, LLC | 5.185 | 11/15/2007 | 6,160,141 | |||
| Total Insurance | 53,824,188 | ||||||
| U.S. Municipal (4.4%) | |||||||
| 8,400,000 | Alaska Housing Finance Corporation | 5.280 | 7/30/2007 | 8,363,040 | |||
| 9,350,000 | Alaska Housing Finance Corporation | 5.280 | 7/31/2007 | 9,307,488 | |||
| 6,100,000 | Alaska Housing Finance Corporation | 5.280 | 8/2/2007 | 6,070,476 | |||
| 4,000,000 | Alaska Housing Finance Corporation | 5.290 | 8/30/2007 | 3,964,146 | |||
| 3,140,000 | State of Michigan Industry Regional Authority | ||||||
| General Obligation Bonds | 5.410 | 10/4/2007 | 3,140,000 | ||||
| Total U.S. Municipal | 30,845,150 | ||||||
| Total Commercial Paper | 489,910,244 | ||||||
| Interest | Maturity | ||||||
| Shares | Other (<0.1%) | Rate (+) | Date | Value | |||
| 5,000 | Barclays Prime Money Market Fund | 5.290% | N/A | $5,000 | |||
| Total Other | 5,000 | ||||||
| The accompanying Notes to Financial Statements are an integral part of this schedule. |
| 225 |
Money Market Portfolio
Schedule of Investments as of June 29, 2007 (unaudited)
| Principal | Interest | Maturity | |||
| Amount | Variable Rate Notes (27.1%) † | Rate (+) | Date | Value | |
| Banking — Domestic (7.3%) | |||||
| $3,250,000 | Bank of New York Company, Inc. | 5.320% | 7/10/2007 | $3,250,000 | |
| 2,600,000 | Bank of New York Company, Inc. | 5.380 | 7/27/2007 | 2,600,367 | |
| 6,500,000 | Fifth Third Bancorp | 5.320 | 7/23/2007 | 6,500,000 | |
| 3,250,000 | HSBC USA, Inc. | 5.320 | 7/16/2007 | 3,250,000 | |
| 6,310,000 | Rabobank Nederland NV/NY | 5.320 | 8/15/2007 | 6,310,000 | |
| 6,700,000 | Royal Bank of Canada NY | 5.310 | 7/2/2007 | 6,700,000 | |
| 6,200,000 | Svenska Handelsbanken AB | 5.290 | 7/23/2007 | 6,200,000 | |
| 6,320,000 | US Trust Company of New York | 5.310 | 7/13/2007 | 6,320,000 | |
| 4,136,000 | Wells Fargo & Company | 5.310 | 7/3/2007 | 4,140,990 | |
| 5,775,000 | Wells Fargo & Company | 5.330 | 7/16/2007 | 5,775,000 | |
| Total Banking — Domestic | 51,046,357 | ||||
| Banking — Foreign (6.4%) | |||||
| 3,440,000 | Bank of Ireland | 5.320 | 7/20/2007 | 3,440,000 | |
| 4,050,000 | BNP Paribas SA | 5.310 | 7/26/2007 | 4,050,000 | |
| 7,810,000 | BNP Paribas SA | 5.326 | 8/7/2007 | 7,810,000 | |
| 6,000,000 | DNB NOR ASA | 5.320 | 7/25/2007 | 6,000,000 | |
| 9,520,000 | HBOS Treasury Services plc | 5.290 | 7/9/2007 | 9,520,000 | |
| 3,140,000 | Royal Bank of Canada | 5.290 | 7/6/2007 | 3,140,000 | |
| 4,000,000 | Royal Bank of Scotland plc | 5.330 | 7/23/2007 | 4,000,000 | |
| 6,320,000 | Svenska Handelsbanken AB | 5.290 | 7/13/2007 | 6,320,000 | |
| Total Banking — Foreign | 44,280,000 | ||||
| Basic Industry (1.3%) | |||||
| 9,380,000 | BASF Finance Europe NV | 5.354 | 10/22/2007 | 9,380,000 | |
| Total Basic Industry | 9,380,000 | ||||
| Brokerage (2.0%) | |||||
| 4,000,000 | Merrill Lynch & Company, Inc. | 5.570 | 7/11/2007 | 4,000,000 | |
| 5,000,000 | Merrill Lynch & Company, Inc. | 5.330 | 7/16/2007 | 5,001,238 | |
| 5,000,000 | Merrill Lynch & Company, Inc. | 5.300 | 7/24/2007 | 5,000,000 | |
| Total Brokerage | 14,001,238 | ||||
| Consumer Cyclical (0.9%) | |||||
| 6,240,000 | American Honda Finance Corporation | 5.330 | 9/11/2007 | 6,240,000 | |
| Total Consumer Cyclical | 6,240,000 | ||||
| Finance (4.9%) | |||||
| 2,730,000 | Kordsa, Inc. | 5.350 | 7/5/2007 | 2,730,000 | |
| 15,500,000 | Union Hamilton Special Funding, LLC | 5.360 | 9/21/2007 | 15,500,000 | |
| 15,720,000 | Union Hamilton Special Funding, LLC | 5.360 | 9/28/2007 | 15,720,000 | |
| Total Finance | 33,950,000 | ||||
| The accompanying Notes to Financial Statements are an integral part of this schedule. |
| 226 |
Money Market Portfolio
Schedule of Investments as of June 29, 2007 (unaudited)
| Principal | Interest | Maturity | ||
| Amount | Variable Rate Notes (27.1%) † | Rate (+) | Date | Value |
| Insurance (3.0%) | ||||
| $5,675,000 | Allstate Life Global Funding II | 5.390% | 7/9/2007 | $5,675,000 |
| 5,775,000 | Allstate Life Global Funding II | 5.360 | 7/16/2007 | 5,775,000 |
| 9,440,000 | ING Verzekeringen NV | 5.290 | 7/5/2007 | 9,440,000 |
| Total Insurance | 20,890,000 | |||
| U.S. Municipal (1.3%) | ||||
| 2,300,000 | Illinois Student Assistance Commission | |||
| Student Loan Revenue Bonds | 5.350 | 7/4/2007 | 2,300,000 | |
| 3,000,000 | Ohio State Air Quality Development Authority | |||
| Revenue Bonds (Columbus and Southern) (Series B) | 5.350 | 7/4/2007 | 3,000,000 | |
| 3,900,000 | Michigan State Housing Development | |||
| Authority Revenue Bonds (Series D) | 5.350 | 7/5/2007 | 3,900,000 | |
| Total U.S. Municipal | 9,200,000 | |||
| Total Variable Rate Notes | 188,987,595 | |||
| Total Investments (at amortized cost) 99.6% | $694,002,839 | |||
| Other Assets and Liabilities, Net 0.4% | 2,760,921 | |||
| Total Net Assets 100.0% | $696,763,760 | |||
+ The interest rate shown reflects the yield, coupon rate or, for securities purchased at a discount, the discount rate at the date of purchase.
† Denotes variable rate obligations for which the current yield and next scheduled reset date are shown.
| Cost for federal income tax purposes | $694,002,839 |
| The accompanying Notes to Financial Statements are an integral part of this schedule. |
| 227 |
| Thrivent Series Fund, Inc. | Thrivent Series Fund, Inc. | ||||||||||
| Statement of Assets and Liabilities | Statement of Assets and Liabilities – continued | ||||||||||
| Moderately | Moderately | Partner | Partner | ||||||||
| Aggressive | Aggressive | Moderate | Conservative | Small Cap | Small Cap | Small Cap | Small Cap | Mid Cap | Mid Cap | ||
| Allocation | Allocation | Allocation | Allocation | Technology | Growth | Value | Stock | Index | Growth | Growth | |
| As of June 29, 2007 (unaudited) | Portfolio | Portfolio | Portfolio | Portfolio | Portfolio | Portfolio | Portfolio | Portfolio | Portfolio | Portfolio | Portfolio II |
| Assets | |||||||||||
| Investments at cost | $400,153,518 | $1,392,599,460 | $1,671,253,904 | $572,382,459 | $57,552,447 | $201,375,758 | $150,833,516 | $321,153,274 | $277,587,506 | $566,615,116 | $30,061,198 |
| Investments in securities at market value | — | — | — | — | 51,020,478 | 167,282,179 | 179,066,935 | 395,147,523 | 415,818,546 | 654,802,991 | 31,201,099 |
| Investments in affiliates at market value | 442,132,714 | 1,497,913,714 | 1,763,389,843 | 593,457,796 | 13,814,225 | 51,620,879 | 6,694,041 | 1,783,280 | 15,082,477 | 6,655,438 | 4,608,441 |
| Investments at Market Value | 442,132,714 | 1,497,913,714 | 1,763,389,843 | 593,457,796 | 64,834,703 | 218,903,058 | 185,760,976 | 396,930,803 | 430,901,023 | 661,458,429 | 35,809,540 |
| Cash | — | — | — | — | 337 | 8,588 | — | — | 9,720 | — | — |
| Dividends and interest receivable | — | — | — | — | 3,947 | 29,722 | 85,088 | 370,368 | 357,961 | 232,233 | 11,393 |
| Prepaid expenses | 4,592 | 8,773 | 9,906 | 5,160 | 3,014 | 3,319 | 3,616 | 4,811 | 4,795 | 5,812 | 2,917 |
| Receivable for investments sold | — | — | — | — | — | 1,406,674 | 531,276 | 7,285,806 | — | 10,544,206 | 516,275 |
| Receivable for fund shares sold | 614,694 | 2,254,782 | 2,488,178 | 504,291 | 29,001 | 113,220 | 135,442 | 226,701 | 40,544 | 89,185 | 64,050 |
| Total Assets | 442,752,000 | 1,500,177,269 | 1,765,887,927 | 593,967,247 | 64,871,002 | 220,464,581 | 186,516,398 | 404,818,489 | 431,314,043 | 672,329,865 | 36,404,175 |
| Liabilities | |||||||||||
| Accrued expenses | 14,246 | 19,205 | 20,730 | 14,870 | 14,285 | 17,931 | 19,305 | 35,106 | 47,990 | 45,494 | 13,670 |
| Payable for investments purchased | 577,059 | 2,017,410 | 2,368,971 | 422,994 | — | 23,844,010 | 57,458 | 4,696,598 | — | — | — |
| Payable upon return of collateral for securities loaned | — | — | — | — | 11,926,925 | 44,049,755 | — | 117,802 | 179,231 | 3,726,929 | 4,125,807 |
| Payable for fund shares redeemed | 37,635 | 237,372 | 119,207 | 81,297 | 28,134 | 21,511 | 46,476 | 164,837 | 290,907 | 364,484 | 2,890 |
| Payable for variation margin | — | — | — | — | — | — | — | — | 57,600 | — | — |
| Payable to affiliate | 62,653 | 191,748 | 223,401 | 81,739 | 32,233 | 95,516 | 125,029 | 246,686 | 121,317 | 228,995 | 10,871 |
| Total Liabilities | 691,593 | 2,465,735 | 2,732,309 | 600,900 | 12,001,577 | 68,028,723 | 248,268 | 5,261,029 | 697,045 | 4,365,902 | 4,153,238 |
| Net Assets | |||||||||||
| Capital stock (beneficial interest) | 383,103,530 | 1,336,345,689 | 1,609,595,453 | 554,911,229 | 40,466,177 | 129,611,209 | 145,734,242 | 301,384,978 | 245,565,116 | 548,249,162 | 23,438,846 |
| Accumulated undistributed net investment income/(loss) | 3,704,247 | 17,265,297 | 25,213,001 | 9,658,912 | (59,161) | (254,701) | 810,257 | 1,669,026 | 2,630,151 | 874,189 | 10,180 |
| Accumulated undistributed net realized gain/(loss) | 13,273,434 | 38,786,294 | 36,211,225 | 7,720,869 | 5,180,153 | 5,552,050 | 4,796,171 | 20,725,927 | 29,389,894 | 23,997,299 | 3,053,569 |
| Net unrealized appreciation/(depreciation) on: | |||||||||||
| Investments | — | — | — | — | 7,282,256 | 17,527,300 | 34,927,460 | 75,777,529 | 153,313,517 | 94,843,313 | 5,748,342 |
| Affiliated investments | 41,979,196 | 105,314,254 | 92,135,939 | 21,075,337 | — | — | — | — | — | — | — |
| Futures contracts | — | — | — | — | — | — | — | — | (281,680) | — | — |
| Total Net Assets | $442,060,407 | $1,497,711,534 | $1,763,155,618 | $593,366,347 | $52,869,425 | $152,435,858 | $186,268,130 | $399,557,460 | $430,616,998 | $667,963,963 | $32,250,937 |
| Shares of beneficial interest outstanding | 31,526,792 | 111,855,815 | 139,184,793 | 49,856,931 | 6,467,336 | 10,830,551 | 9,256,271 | 25,251,679 | 20,580,257 | 34,615,856 | 2,949,952 |
| Net asset value per share | $14.02 | $13.39 | $12.67 | $11.90 | $8.17 | $14.07 | $20.12 | $15.82 | $20.92 | $19.30 | $10.93 |
| The accompanying Notes to Financial Statements are an integral part of this statement. | The accompanying Notes to Financial Statements are an integral part of this statement. | |
| 228 | 229 |
| Thrivent Series Fund, Inc. | Thrivent Series Fund, Inc. | ||||||||||
| Statement of Assets and Liabilities – continued | Statement of Assets and Liabilities – continued | ||||||||||
| Partner | Partner | Partner | |||||||||
| Mid Cap | Mid Cap | Mid Cap | International | Partner | Large Cap | Large Cap | Growth | Large Cap | Large Cap | Large Cap | |
| Value | Stock | Index | Stock | All Cap | Growth | Growth | Stock | Value | Stock | Index | |
| As of June 29, 2007 (unaudited) | Portfolio | Portfolio | Portfolio | Portfolio | Portfolio | Portfolio | Portfolio II | Portfolio | Portfolio | Portfolio | Portfolio |
| Assets | |||||||||||
| Investments at cost | $80,924,828 | $343,447,883 | $116,521,042 | $1,234,176,263 | $93,145,389 | $2,441,465,518 | $29,742,261 | $99,801,298 | $855,354,785 | $999,950,389 | $539,510,371 |
| Investments in securities at market value | 79,036,500 | 382,204,786 | 165,338,195 | 1,471,450,943 | 104,539,330 | 2,478,081,503 | 33,910,902 | 119,867,618 | 950,181,047 | 1,030,909,203 | 704,419,369 |
| Investments in affiliates at market value | 10,463,134 | 2,423,827 | 780,712 | 27,246,371 | 5,555,157 | 283,546,884 | 918,458 | 10,503,492 | 57,990,308 | 79,068,693 | 29,337,407 |
| Investments at Market Value | 89,499,634 | 384,628,613 | 166,118,907 | 1,498,697,314 | 110,094,487 | 2,761,628,387 | 34,829,360 | 130,371,110 | 1,008,171,355 | 1,109,977,896 | 733,756,776 |
| Cash | — | — | — | 767,898(a) | — | 6,307 | 17 | 1(b) | 5,925 | 4,656 | — |
| Dividends and interest receivable | 96,688 | 222,417 | 83,597 | 3,726,257 | 103,272 | 1,661,893 | 23,314 | 80,037 | 1,069,680 | 803,474 | 760,782 |
| Prepaid expenses | 3,098 | 4,662 | 3,538 | 9,488 | 3,239 | 13,668 | 2,934 | 3,317 | 6,649 | 6,860 | 6,047 |
| Receivable for investments sold | 2,659,598 | 3,043,492 | 650,358 | 6,444,411 | 1,833,964 | 63,759,568 | 918,275 | 1,074,103 | 4,514,509 | 24,995,162 | 450,898 |
| Receivable for fund shares sold | 129,380 | 212,253 | 2,205 | 797,792 | 103,974 | 918,003 | 2,065 | 15,227 | 606,290 | 688,657 | 44,811 |
| Receivable for forward contracts | — | — | — | 6,596,549 | — | — | — | 42,986 | — | — | — |
| Total Assets | 92,388,398 | 388,111,437 | 166,858,605 | 1,517,039,709 | 112,138,936 | 2,827,987,826 | 35,775,965 | 131,586,781 | 1,014,374,408 | 1,136,476,705 | 735,019,314 |
| Liabilities | |||||||||||
| Accrued expenses | 17,995 | 29,734 | 22,399 | 126,704 | 14,763 | 175,529 | 16,374 | 17,849 | 40,929 | 51,760 | 73,349 |
| Payable for investments purchased | 2,033,744 | 398,119 | 467,187 | 21,911,674 | 1,265,042 | 87,794,752 | 1,046,385 | 928,049 | 33,947,004 | 78,803,953 | 1,014,031 |
| Payable upon return of collateral for securities loaned | 9,421,800 | — | — | 8,996,919 | 4,905,975 | 275,420,330 | 560,250 | 7,802,130 | 44,034,950 | 62,311,825 | 27,998,850 |
| Payable for fund shares redeemed | 44,282 | 141,095 | 95,242 | 527,811 | 22,306 | 660,378 | 28,764 | 207,761 | 394,529 | 482,689 | 317,034 |
| Payable for forward contracts | — | — | — | 6,661,833 | — | — | — | 42,881 | — | — | — |
| Payable for variation margin | — | — | 1,673 | — | — | — | — | — | — | 23,850 | 1,580 |
| Payable to affiliate | 50,751 | 240,183 | 50,523 | 910,348 | 65,213 | 832,678 | 11,690 | 70,573 | 450,080 | 484,611 | 187,594 |
| Total Liabilities | 11,568,572 | 809,131 | 637,024 | 39,135,289 | 6,273,299 | 364,883,667 | 1,663,463 | 9,069,243 | 78,867,492 | 142,158,688 | 29,592,438 |
| Net Assets | |||||||||||
| Capital stock (beneficial interest) | 68,646,050 | 320,349,915 | 110,186,631 | 1,076,245,910 | 82,813,032 | 3,131,127,930 | 25,975,881 | 85,967,055 | 751,912,105 | 819,599,997 | 488,639,505 |
| Accumulated undistributed net investment income/(loss) | 357,225 | 1,732,048 | 1,273,120 | 10,269,272 | 277,374 | 6,938,023 | 60,963 | 395,753 | 6,708,322 | 6,519,837 | 5,713,385 |
| Accumulated undistributed net realized gain/(loss) | 3,241,745 | 24,039,613 | 5,187,681 | 126,872,168 | 5,826,133 | (995,124,663) | 2,988,559 | 5,585,693 | 24,069,919 | 58,316,691 | 16,871,111 |
| Net unrealized appreciation/(depreciation) on: | |||||||||||
| Investments | 8,574,806 | 41,180,730 | 49,597,865 | 264,521,051 | 16,949,098 | 320,162,869 | 5,087,099 | 30,569,812 | 152,816,570 | 110,027,507 | 194,246,405 |
| Futures contracts | — | — | (23,716) | — | — | — | — | — | — | (146,015) | (43,530) |
| Foreign currency forward contracts | — | — | — | (65,284) | — | — | — | 105 | — | — | — |
| Foreign currency transactions | — | — | — | 61,303 | — | — | — | (880) | — | — | — |
| Total Net Assets | $80,819,826 | $387,302,306 | $166,221,581 | $1,477,904,420 | $105,865,637 | $2,463,104,159 | $34,112,502 | $122,517,538 | $935,506,916 | $994,318,017 | $705,426,876 |
| Shares of beneficial interest outstanding | 5,662,716 | 28,116,133 | 10,536,882 | 85,538,341 | 8,799,126 | 136,489,644 | 3,049,352 | 9,106,139 | 67,959,427 | 90,775,238 | 27,603,028 |
| Net asset value per share | $14.27 | $13.78 | $15.78 | $17.28 | $12.03 | $18.05 | $11.19 | $13.45 | $13.77 | $10.95 | $25.56 |
| (a) Includes foreign currency holdings of $763,128 (cost $767,242) | |||||||||||
| (b) Includes foreign currency holdings of $1 (cost $1) | |||||||||||
| The accompanying Notes to Financial Statements are an integral part of this statement. | The accompanying Notes to Financial Statements are an integral part of this statement. | |
| 230 | 231 |
| Thrivent Series Fund, Inc. | Thrivent Series Fund, Inc. | ||||||||
| Statement of Assets and Liabilities – continued | Statement of Assets and Liabilities – continued | ||||||||
| Real Estate | Diversified | Limited | Mortgage | Money | |||||
| Securities | Balanced | High Yield | Income Plus | Income | Bond Index | Maturity | Securities | Market | |
| As of June 29, 2007 (unaudited) | Portfolio | Portfolio | Portfolio | Portfolio | Portfolio | Portfolio | Bond Portfolio | Portfolio | Portfolio |
| Assets | |||||||||
| Investments at cost | $363,376,443 | $503,263,316 | $675,185,811 | $156,865,223 | $1,572,620,248 | $337,644,937 | $881,659,047 | $97,463,985 | $694,002,839 |
| Investments in securities at market value | 321,204,897 | 560,251,119 | 665,946,218 | 140,457,483 | 1,489,564,104 | 279,818,362 | 837,653,439 | 96,732,225 | 694,002,839 |
| Investments in affiliates at market value | 114,012,920 | 51,079,481 | 5,172,087 | 15,630,353 | 67,803,455 | 54,609,227 | 39,417,389 | 848 | — |
| Investments at Market Value | 435,217,817 | 611,330,600 | 671,118,305 | 156,087,836 | 1,557,367,559 | 334,427,589 | 877,070,828 | 96,733,073 | 694,002,839 |
| Cash | — | — | — | 8,754 | — | — | 1,216 | 3,149 | 5,592 |
| Dividends and interest receivable | 975,658 | 1,863,580 | 12,080,121 | 1,135,508 | 10,908,171 | 1,883,824 | 5,568,917 | 73,653 | 1,008,919 |
| Prepaid expenses | 4,488 | 5,299 | 6,779 | 3,393 | 8,136 | 3,852 | 6,170 | 3,036 | 5,632 |
| Receivable for investments sold | 393,261 | 24,880 | 4,070,930 | 67,004 | 3,671,952 | 329,459 | 10,984,784 | 1,320,117 | — |
| Receivable for fund shares sold | 110,322 | 5,483 | 66,285 | 145,319 | 963,632 | 389,184 | 599,286 | 754 | 16,913,893 |
| Swap agreements, at value | — | — | 1,258,715 | 34,130 | — | — | — | — | — |
| Receivable for forward contracts | 300,367 | — | — | — | — | — | — | — | — |
| Receivable for variation margin | — | — | — | — | 71,063 | — | — | 7,813 | — |
| Total Assets | 437,001,913 | 613,229,842 | 688,601,135 | 157,481,944 | 1,572,990,513 | 337,033,908 | 894,231,201 | 98,141,595 | 711,936,875 |
| Liabilities | |||||||||
| Accrued expenses | 24,570 | 71,509 | 50,489 | 19,951 | 59,686 | 31,738 | 36,890 | 14,135 | 35,291 |
| Notes payable and other debt | — | 13,732 | — | — | 62,636 | 14,021 | — | — | — |
| Payable for investments purchased | 5,578,192 | 49,885,453 | 11,379,011 | 4,847,046 | 203,037,851 | 68,880,691 | 55,529,474 | 44,551,200 | — |
| Payable upon return of collateral for securities loaned | 97,694,770 | 34,577,994 | 4,363,365 | 9,700,875 | 54,624,063 | 46,054,281 | 26,222,500 | — | — |
| Payable for fund shares redeemed | 566,502 | 313,698 | 332,195 | 5,576 | 329,979 | 257,833 | 104,250 | 88,788 | 14,964,567 |
| Payable for forward contracts | 297,243 | — | — | — | — | — | — | — | — |
| Open options written, at value | — | — | — | 5,739 | 77,991 | — | 44,637 | 9,902 | — |
| Swap agreements, at value | — | — | 660,902 | 121,465 | 1,320,038 | — | 519,748 | — | — |
| Payable for variation margin | — | 7,650 | — | 2,180 | — | — | 164,021 | — | — |
| Payable to affiliate | 220,730 | 146,728 | 266,560 | 46,965 | 410,509 | 64,809 | 258,513 | 22,592 | 173,257 |
| Mortgage dollar roll deferred revenue | — | 6,277 | — | — | 21,289 | 9,811 | 11,289 | 7,828 | — |
| Total Liabilities | 104,382,007 | 85,023,041 | 17,052,522 | 14,749,797 | 259,944,042 | 115,313,184 | 82,891,322 | 44,694,445 | 15,173,115 |
| Net Assets | |||||||||
| Capital stock (beneficial interest) | 242,531,517 | 418,955,429 | 1,559,854,467 | 147,226,695 | 1,338,727,112 | 230,674,438 | 819,957,781 | 56,203,744 | 696,763,760 |
| Accumulated undistributed net investment income/(loss) | 3,679,978 | 7,475,695 | 2,561,728 | 3,494,014 | 1,574,059 | 8,075 | 448,908 | 50,562 | — |
| Accumulated undistributed net realized gain/(loss) | 14,568,639 | (6,136,609) | (886,944,309) | (7,101,133) | (11,250,558) | (5,744,441) | (4,346,960) | (2,066,109) | — |
| Net unrealized appreciation/(depreciation) on: | |||||||||
| Investments | 71,841,374 | 108,067,284 | (4,067,506) | (777,387) | (15,252,689) | (3,217,348) | (4,588,219) | (730,912) | — |
| Written option contracts | — | — | — | 2,698 | 46,618 | — | 20,988 | 2,051 | — |
| Futures contracts | — | (154,998) | — | (13,566) | 393,022 | — | 438,892 | (12,186) | — |
| Swap agreements | — | — | 144,233 | (99,174) | (1,190,607) | — | (591,335) | — | — |
| Foreign currency forward contracts | 3,124 | — | — | — | — | — | — | — | — |
| Foreign currency transactions | (4,726) | — | — | — | (486) | — | (176) | — | — |
| Total Net Assets | $332,619,906 | $528,206,801 | $671,548,613 | $142,732,147 | $1,313,046,471 | $221,720,724 | $811,339,879 | $53,447,150 | $696,763,760 |
| Shares of beneficial interest outstanding | 16,620,721 | 30,984,475 | 133,176,771 | 20,036,289 | 135,010,638 | 22,047,993 | 82,119,277 | 5,608,820 | 696,763,760 |
| Net asset value per share | $20.01 | $17.05 | $5.04 | $7.12 | $9.73 | $10.06 | $9.88 | $9.53 | $1.00 |
| The accompanying Notes to Financial Statements are an integral part of this statement. | The accompanying Notes to Financial Statements are an integral part of this statement. | |
| 232 | 233 |
| Thrivent Series Fund, Inc. | Thrivent Series Fund, Inc. | ||||||||||
| Statement of Operations | Statement of Operations – continued | ||||||||||
| Moderately | Moderately | Partner | Partner | ||||||||
| Aggressive | Aggressive | Moderate | Conservative | Small Cap | Small Cap | Small Cap | Small Cap | Mid Cap | Mid Cap | ||
| For the six months ended | Allocation | Allocation | Allocation | Allocation | Technology | Growth | Value | Stock | Index | Growth | Growth |
| June 29, 2007 (unaudited) | Portfolio | Portfolio | Portfolio | Portfolio | Portfolio | Portfolio | Portfolio | Portfolio | Portfolio | Portfolio | Portfolio II |
| Investment Income | |||||||||||
| Dividends | $— | $— | $— | $— | $126,307 | $201,598 | $1,209,468 | $2,327,210 | $2,783,831 | $1,634,598 | $78,886 |
| Taxable interest | — | — | — | — | 6,363 | 62,753 | 1,904 | 480,708 | 59,784 | 201,905 | — |
| Income from securities loaned | — | — | — | — | 8,433 | 46,704 | 41,965 | 130,537 | 193,125 | 276,174 | 13,357 |
| Income from affiliated investments | 3,881,922 | 17,831,337 | 26,022,214 | 10,065,597 | 32,859 | 47,744 | 166,507 | 305,634 | 138,977 | 280,689 | 17,335 |
| Foreign dividend tax withholding | — | — | — | — | (5,886) | — | — | — | (811) | (3,701) | (177) |
| Total Investment Income | 3,881,922 | 17,831,337 | 26,022,214 | 10,065,597 | 168,076 | 358,799 | 1,419,844 | 3,244,089 | 3,174,906 | 2,389,665 | 109,401 |
| Expenses | |||||||||||
| Adviser fees | 289,918 | 856,954 | 1,003,668 | 375,906 | 194,847 | 247,879 | 178,222 | 1,443,513 | 706,202 | 1,309,573 | 140,987 |
| Sub-Adviser fees | — | — | — | — | — | 337,151 | 534,666 | — | — | — | — |
| Accounting and pricing fees | 13,998 | 16,002 | 30,498 | 26,502 | 9,558 | 13,424 | 13,893 | 19,978 | 24,284 | 28,535 | 9,534 |
| Administrative service fees | 57,984 | 190,874 | 226,086 | 75,872 | 7,794 | 17,551 | 26,733 | 64,348 | 64,456 | 98,218 | 4,700 |
| Audit and legal fees | 8,194 | 13,171 | 14,679 | 8,885 | 6,280 | 6,650 | 7,033 | 8,657 | 8,862 | 10,301 | 6,132 |
| Custody fees | 1,973 | 1,973 | 1,973 | 1,973 | 389 | 16,828 | 8,165 | 21,067 | 22,761 | 13,423 | 5,346 |
| Insurance expenses | 2,864 | 5,228 | 5,938 | 3,210 | 1,960 | 2,140 | 2,329 | 3,163 | 3,248 | 3,986 | 1,893 |
| Printing and postage expenses | 591 | 1,947 | 2,291 | 763 | 76 | 175 | 264 | 640 | 612 | 921 | 42 |
| Directors’ fees | 1,863 | 1,863 | 1,863 | 1,863 | 1,736 | 1,923 | 4,305 | 8,121 | 9,252 | 11,716 | 1,912 |
| Other expenses | 3,790 | 4,488 | 4,670 | 3,954 | 3,544 | 4,051 | 4,167 | 4,892 | 5,290 | 5,940 | 4,044 |
| Total Expenses Before Reimbursement | 381,175 | 1,092,500 | 1,291,666 | 498,928 | 226,184 | 647,772 | 779,777 | 1,574,379 | 844,967 | 1,482,613 | 174,590 |
| Less: | |||||||||||
| Reimbursement from adviser | (205,346) | (528,306) | (484,299) | (94,089) | (2,597) | (62,231) | (13,358) | (24,228) | (8,723) | (22,666) | (79,722) |
| Custody earnings credit | — | — | — | — | (9) | (466) | (1,473) | (1,175) | (4,272) | (310) | (3) |
| Total Net Expenses | 175,829 | 564,194 | 807,367 | 404,839 | 223,578 | 585,075 | 764,946 | 1,548,976 | 831,972 | 1,459,637 | 94,865 |
| Net Investment Income/(Loss) | 3,706,093 | 17,267,143 | 25,214,847 | 9,660,758 | (55,502) | (226,276) | 654,898 | 1,695,113 | 2,342,934 | 930,028 | 14,536 |
| Realized and Unrealized Gains/(Losses) | |||||||||||
| Net realized gains/(losses) on: | |||||||||||
| Investments | — | — | — | — | 5,885,791 | 6,248,083 | 5,040,780 | 22,239,816 | 32,663,269 | 69,354,605 | 3,133,638 |
| Affiliated investments | 1,573,522 | 5,030,759 | 8,146,582 | 1,150,565 | — | — | — | — | — | — | — |
| Distributions of realized capital gains from | |||||||||||
| affiliated investments | 11,700,014 | 33,763,662 | 28,074,498 | 6,572,702 | — | — | — | — | — | — | — |
| Futures contracts | — | — | — | — | — | — | — | 393,428 | 180,125 | — | — |
| Change in net unrealized appreciation/(depreciation) on: | |||||||||||
| Investments | — | — | — | — | (745,825) | 5,100,120 | 7,861,215 | 10,936,648 | (14,295) | 20,367,935 | 1,197,928 |
| Affiliated investments | 15,714,022 | 29,819,227 | 17,877,719 | 2,503,161 | — | — | — | — | — | — | — |
| Futures contracts | — | — | — | — | — | — | — | — | (267,720) | — | — |
| Net Realized and Unrealized Gains/(Losses) | 28,987,558 | 68,613,648 | 54,098,799 | 10,226,428 | 5,139,966 | 11,348,203 | 12,901,995 | 33,569,892 | 32,561,379 | 89,722,540 | 4,331,566 |
| Net Increase/(Decrease) in Net Assets Resulting | |||||||||||
| From Operations | $32,693,651 | $85,880,791 | $79,313,646 | $19,887,186 | $5,084,464 | $11,121,927 | $13,556,893 | $35,265,005 | $34,904,313 | $90,652,568 | $4,346,102 |
| The accompanying Notes to Financial Statements are an integral part of this statement. | The accompanying Notes to Financial Statements are an integral part of this statement. | |
| 234 | 235 |
| Thrivent Series Fund, Inc. | Thrivent Series Fund, Inc. | ||||||||||
| Statement of Operations – continued | Statement of Operations – continued | ||||||||||
| Partner | Partner | Partner | |||||||||
| Mid Cap | Mid Cap | Mid Cap | International | Partner | Large Cap | Large Cap | Growth | Large Cap | Large Cap | Large Cap | |
| For the six months ended | Value | Stock | Index | Stock | All Cap | Growth | Growth | Stock | Value | Stock | Index |
| June 29, 2007 (unaudited) | Portfolio | Portfolio | Portfolio | Portfolio | Portfolio | Portfolio | Portfolio II | Portfolio | Portfolio | Portfolio | Portfolio |
| Investment Income | |||||||||||
| Dividends | $590,410 | $2,228,799 | $1,365,467 | $23,370,121 | $657,680 | $11,131,689 | $164,955 | $812,748 | $8,730,095 | $7,930,760 | $6,658,802 |
| Taxable interest | 9,274 | 333,896 | 7,773 | 1,014,110 | — | 919,773 | — | 1 | 409,604 | 1,210,535 | 59,779 |
| Income from securities loaned | 6,089 | 50,924 | 27,683 | 674,106 | 8,436 | 121,296 | 3,413 | 10,717 | 61,492 | 13,027 | 23,515 |
| Income from affiliated investments | 65,062 | 328,955 | 65,095 | 178,073 | 32,785 | 276,180 | 9,249 | 72,116 | 256,243 | 314,322 | 140,884 |
| Foreign dividend tax withholding | (66) | — | — | (2,297,930) | — | (151,021) | (2,214) | (32,883) | (101,024) | (68,353) | — |
| Total Investment Income | 670,769 | 2,942,574 | 1,466,018 | 22,938,480 | 698,901 | 12,297,917 | 175,403 | 862,699 | 9,356,410 | 9,400,291 | 6,882,980 |
| Expenses | |||||||||||
| Adviser fees | 86,977 | 1,353,821 | 285,325 | 3,114,679 | 175,132 | 4,699,231 | 138,382 | 235,770 | 2,491,051 | 2,691,821 | 1,066,431 |
| Sub-Adviser fees | 173,954 | — | — | 2,593,315 | 298,773 | — | — | 235,770 | — | — | — |
| Accounting and pricing fees | 10,680 | 16,885 | 14,729 | 65,044 | 10,690 | 73,545 | 9,549 | 12,488 | 26,305 | 28,613 | 30,759 |
| Administrative service fees | 10,437 | 60,208 | 24,456 | 213,605 | 14,965 | 352,442 | 5,189 | 17,683 | 124,553 | 131,696 | 105,780 |
| Audit and legal fees | 6,911 | 8,400 | 7,007 | 15,571 | 6,575 | 21,553 | 6,161 | 6,713 | 11,123 | 11,505 | 10,788 |
| Custody fees | 20,097 | 17,043 | 5,120 | 194,458 | 7,122 | 46,767 | 14,504 | 10,377 | 16,095 | 27,202 | 25,550 |
| Insurance expenses | 1,976 | 2,996 | 2,329 | 6,236 | 2,105 | 9,441 | 1,905 | 2,169 | 4,302 | 4,499 | 4,165 |
| Printing and postage expenses | 107 | 588 | 224 | 2,076 | 144 | 3,337 | 49 | 168 | 1,217 | 1,280 | 996 |
| Directors’ fees | 1,863 | 7,361 | 4,369 | 21,595 | 1,928 | 39,322 | 1,916 | 2,096 | 13,184 | 14,260 | 14,573 |
| Other expenses | 3,931 | 4,719 | 4,365 | 6,802 | 4,062 | 10,445 | 4,052 | 4,130 | 5,644 | 5,883 | 6,082 |
| Total Expenses Before Reimbursement | 316,933 | 1,472,021 | 347,924 | 6,233,381 | 521,496 | 5,256,083 | 181,707 | 527,364 | 2,693,474 | 2,916,759 | 1,265,124 |
| Less: | |||||||||||
| Reimbursement from adviser | (5,150) | (26,135) | (4,585) | (381,743) | (102,370) | (22,104) | (69,953) | (64,574) | (20,340) | (24,900) | (8,692) |
| Custody earnings credit | (85) | (68) | (463) | (1,094) | (75) | (137) | (17) | (146) | (1,631) | (829) | (995) |
| Total Net Expenses | 311,698 | 1,445,818 | 342,876 | 5,850,544 | 419,051 | 5,233,842 | 111,737 | 462,644 | 2,671,503 | 2,891,030 | 1,255,437 |
| Net Investment Income/(Loss) | 359,071 | 1,496,756 | 1,123,142 | 17,087,936 | 279,850 | 7,064,075 | 63,666 | 400,055 | 6,684,907 | 6,509,261 | 5,627,543 |
| Realized and Unrealized Gains/(Losses) | |||||||||||
| Net realized gains/(losses) on: | |||||||||||
| Investments | 3,439,621 | 25,036,027 | 7,117,462 | 147,585,648 | 5,913,656 | 197,007,105 | 3,102,562 | 6,162,474 | 25,532,302 | 59,488,246 | 22,273,527 |
| Written option contracts | — | — | — | — | — | 854,936 | 13,427 | — | — | — | — |
| Futures contracts | — | — | 208,593 | — | — | — | — | — | — | 3,124,023 | 462,030 |
| Foreign currency transactions | — | — | — | (487,501) | — | — | — | (5,710) | — | — | — |
| Change in net unrealized appreciation/(depreciation) on: | |||||||||||
| Investments | 2,286,695 | 13,457,519 | 9,750,865 | (18,167,029) | 4,734,755 | 17,373 | (159,000) | 3,160,319 | 28,690,053 | (10,487,997) | 18,401,805 |
| Futures contracts | — | — | 30,744 | — | — | — | — | — | — | (107,955) | (66,875) |
| Foreign currency forward contracts | — | — | — | (64,900) | — | — | — | 573 | — | — | — |
| Foreign currency transactions | — | — | — | 37,260 | — | — | — | (1,045) | — | — | — |
| Net Realized and Unrealized Gains/(Losses) | 5,726,316 | 38,493,546 | 17,107,664 | 128,903,478 | 10,648,411 | 197,879,414 | 2,956,989 | 9,316,611 | 54,222,355 | 52,016,317 | 41,070,487 |
| Net Increase/(Decrease) in Net Assets Resulting | |||||||||||
| From Operations | $6,085,387 | $39,990,302 | $18,230,806 | $145,991,414 | $10,928,261 | $204,943,489 | $3,020,655 | $9,716,666 | $60,907,262 | $58,525,578 | $46,698,030 |
| The accompanying Notes to Financial Statements are an integral part of this statement. | The accompanying Notes to Financial Statements are an integral part of this statement. | |
| 236 | 237 |
| Thrivent Series Fund, Inc. | Thrivent Series Fund, Inc. | ||||||||
| Statement of Operations – continued | Statement of Operations – continued | ||||||||
| Real Estate | Diversified | Limited | Mortgage | Money | |||||
| For the six months ended | Securities | Balanced | High Yield | Income Plus | Income | Bond Index | Maturity | Securities | Market |
| June 29, 2007 (unaudited) | Portfolio | Portfolio | Portfolio | Portfolio | Portfolio | Portfolio | Bond Portfolio | Portfolio | Portfolio |
| Investment Income | |||||||||
| Dividends | $4,735,204 | $3,303,400 | $364,316 | $1,229,957 | $— | $— | $— | $— | $— |
| Taxable interest | 10,878 | 4,769,753 | 34,300,982 | 2,439,205 | 32,817,298 | 5,595,041 | 18,558,774 | 1,498,503 | 16,348,936 |
| Income from mortgage dollar rolls | — | 70,915 | — | 2,031 | 296,016 | 113,994 | 126,758 | 84,740 | — |
| Income from securities loaned | 27,050 | 18,671 | 148,836 | 40,782 | 36,330 | 23,667 | 7,966 | — | — |
| Income from affiliated investments | 229,435 | 321,017 | 312,963 | 133,592 | 362,293 | 217,007 | 287,883 | 21 | — |
| Foreign dividend tax withholding | (15,578) | — | — | — | — | — | — | — | — |
| Total Investment Income | 4,986,989 | 8,483,756 | 35,127,097 | 3,845,567 | 33,511,937 | 5,949,709 | 18,981,381 | 1,583,264 | 16,348,936 |
| Expenses | |||||||||
| Adviser fees | 1,433,570 | 870,873 | 1,665,355 | 256,754 | 2,261,068 | 396,829 | 1,425,267 | 137,720 | 1,214,148 |
| Accounting and pricing fees | 17,558 | 36,305 | 39,770 | 20,048 | 45,135 | 23,389 | 30,168 | 12,153 | 25,582 |
| Administrative service fees | 53,759 | 80,923 | 124,902 | 19,257 | 169,580 | 34,014 | 106,895 | 8,263 | 91,061 |
| Audit and legal fees | 8,496 | 9,701 | 11,604 | 6,653 | 13,196 | 7,507 | 10,403 | 6,310 | 9,684 |
| Custody fees | 11,459 | 38,232 | 13,398 | 14,387 | 17,654 | 9,415 | 13,808 | 4,443 | 11,318 |
| Insurance expenses | 2,951 | 3,667 | 4,633 | 2,153 | 5,406 | 2,586 | 3,965 | 1,982 | 3,681 |
| Printing and postage expenses | 546 | 745 | 1,173 | 189 | 1,569 | 310 | 1,018 | 78 | 883 |
| Directors’ fees | 7,089 | 12,289 | 14,238 | 2,245 | 17,860 | 5,826 | 11,366 | 1,951 | 10,302 |
| Other expenses | 6,762 | 5,701 | 5,524 | 4,277 | 5,690 | 3,631 | 4,440 | 3,167 | 4,307 |
| Total Expenses Before Reimbursement | 1,542,190 | 1,058,436 | 1,880,597 | 325,963 | 2,537,158 | 483,507 | 1,607,330 | 176,067 | 1,370,966 |
| Less: | |||||||||
| Reimbursement from adviser | (18,092) | (20,753) | (24,950) | (10,520) | (28,866) | (15,236) | (22,922) | (2) | (303,537) |
| Custody earnings credit | (2,138) | (2,020) | (7,989) | (2,572) | (5,052) | (1,121) | (3,841) | (469) | (737) |
| Total Net Expenses | 1,521,960 | 1,035,663 | 1,847,658 | 312,871 | 2,503,240 | 467,150 | 1,580,567 | 175,596 | 1,066,692 |
| Net Investment Income/(Loss) | 3,465,029 | 7,448,093 | 33,279,439 | 3,532,696 | 31,008,697 | 5,482,559 | 17,400,814 | 1,407,668 | 15,282,244 |
| Realized and Unrealized Gains/(Losses) | |||||||||
| Net realized gains/(losses) on: | |||||||||
| Investments | 15,346,421 | 11,496,267 | 12,182,635 | 3,288,135 | 571,032 | (39,001) | (691,711) | (110,706) | — |
| Written option contracts | — | — | — | — | 197,266 | — | 80,664 | 29,219 | — |
| Futures contracts | — | 712,141 | 108,659 | 160,581 | 1,371,787 | — | 306,700 | (31,402) | — |
| Foreign currency transactions | (10,675) | — | — | — | (1,655) | — | (513) | — | — |
| Swap agreements | — | — | (87,942) | (100,405) | (458,958) | — | (399,535) | (50,488) | — |
| Change in net unrealized appreciation/(depreciation) on: | |||||||||
| Investments | (40,273,194) | 6,060,552 | (20,852,702) | (5,951,003) | (21,720,784) | (3,628,115) | (2,459,779) | (907,615) | — |
| Written option contracts | — | — | — | 2,698 | 46,618 | — | 20,988 | 2,051 | — |
| Futures contracts | — | (189,508) | — | (44,435) | 214,464 | — | 380,167 | (12,186) | — |
| Foreign currency forward contracts | 3,124 | — | — | — | — | — | — | — | — |
| Foreign currency transactions | (4,726) | — | — | — | 185 | — | 227 | — | — |
| Swap agreements | — | — | 144,233 | (99,174) | (1,218,937) | — | (601,645) | — | — |
| Net Realized and Unrealized Gains/(Losses) | (24,939,050) | 18,079,452 | (8,505,117) | (2,743,603) | (20,998,982) | (3,667,116) | (3,364,437) | (1,081,127) | — |
| Net Increase/(Decrease) in Net Assets Resulting | |||||||||
| From Operations | $(21,474,021) | $25,527,545 | $24,774,322 | $789,093 | $10,009,715 | $1,815,443 | $14,036,377 | $326,541 | $15,282,244 |
| The accompanying Notes to Financial Statements are an integral part of this statement. | The accompanying Notes to Financial Statements are an integral part of this statement. | |
| 238 | 239 |
| Thrivent Series Fund, Inc. | Thrivent Series Fund, Inc. | |||||||||||
| Statement of Changes in Net Assets | Statement of Changes in Net Assets – continued | |||||||||||
| Aggressive Allocation | Moderately Aggressive | Moderate Allocation | Moderately Conservative | Technology | Partner Small Cap | |||||||
| Portfolio | Allocation Portfolio | Portfolio | Allocation Portfolio | Portfolio | Growth Portfolio | |||||||
| 6/29/2007 | 12/31/2006 | 6/29/2007 | 12/31/2006 | 6/29/2007 | 12/31/2006 | 6/29/2007 | 12/31/2006 | 6/29/2007 | 12/31/2006 | 6/29/2007 | 12/31/2006 | |
| For the periods ended | (unaudited) | (unaudited) | (unaudited) | (unaudited) | (unaudited) | (unaudited) | ||||||
| Operations | ||||||||||||
| Net investment income/(loss) | $3,706,093 | $1,876,282 | $17,267,143 | $10,290,713 | $25,214,847 | $18,313,918 | $9,660,758 | $8,576,523 | $(55,502) | $(125,845) | $(226,276) | $(385,962) |
| Net realized gains/(losses) on: | ||||||||||||
| Investments | — | — | — | — | — | — | — | — | 5,885,791 | 1,226,671 | 6,248,083 | 6,930,764 |
| Affiliated investments | 1,573,522 | 472,927 | 5,030,759 | 2,107,242 | 8,146,582 | 4,194,101 | 1,150,565 | 2,072,132 | — | — | — | — |
| Distributions of realized capital gains from affiliated investments | 11,700,014 | 1,885,375 | 33,763,662 | 5,090,802 | 28,074,498 | 7,157,572 | 6,572,702 | 2,072,722 | — | — | — | — |
| Change in net unrealized appreciation/(depreciation) on: | ||||||||||||
| Investments | — | — | — | — | — | — | — | — | (745,825) | 548,896 | 5,100,120 | 3,145,234 |
| Affiliated investments | 15,714,022 | 23,353,619 | 29,819,227 | 67,274,310 | 17,877,719 | 63,964,841 | 2,503,161 | 15,565,217 | — | — | — | — |
| Net Change in Net Assets Resulting | ||||||||||||
| From Operations | 32,693,651 | 27,588,203 | 85,880,791 | 84,763,067 | 79,313,646 | 93,630,432 | 19,887,186 | 28,286,594 | 5,084,464 | 1,649,722 | 11,121,927 | 9,690,036 |
| Distributions to Shareholders | ||||||||||||
| From net investment income | (2,527,875) | (254) | (11,999,419) | (8,356) | (20,474,750) | (10,934) | (9,226,416) | (9,026) | — | — | — | — |
| From net realized gains | (1,708,150) | (451) | (5,496,139) | — | (9,193,702) | — | (3,496,569) | — | (1,732,497) | (804,350) | (6,970,287) | (306,119) |
| Total Distributions to Shareholders | (4,236,025) | (705) | (17,495,558) | (8,356) | (29,668,452) | (10,934) | (12,722,985) | (9,026) | (1,732,497) | (804,350) | (6,970,287) | (306,119) |
| Capital Stock Transactions | 79,982,366 | 234,228,998 | 365,505,829 | 740,970,279 | 439,474,915 | 849,257,149 | 151,267,910 | 259,923,468 | (3,836,658) | (7,318,944) | 40,839,197 | 33,314,554 |
| Net Increase/(Decrease) in Net Assets | 108,439,992 | 261,816,496 | 433,891,062 | 825,724,990 | 489,120,109 | 942,876,647 | 158,432,111 | 288,201,036 | (484,691) | (6,473,572) | 44,990,837 | 42,698,471 |
| Net Assets, Beginning of Period | 333,620,415 | 71,803,919 | 1,063,820,472 | 238,095,482 | 1,274,035,509 | 331,158,862 | 434,934,236 | 146,733,200 | 53,354,116 | 59,827,688 | 107,445,021 | 64,746,550 |
| Net Assets, End of Period | $442,060,407 | $333,620,415 | $1,497,711,534 | $1,063,820,472 | $1,763,155,618 | $1,274,035,509 | $593,366,347 | $434,934,236 | $52,869,425 | $53,354,116 | $152,435,858 | $107,445,021 |
| Partner Small Cap | Small Cap Stock | Small Cap Index | Mid Cap Growth | Mid Cap Growth | Partner Mid Cap | |||||||
| Value Portfolio | Portfolio | Portfolio | Portfolio | Portfolio II | Value Portfolio | |||||||
| 6/29/2007 | 12/31/2006 | 6/29/2007 | 12/31/2006 | 6/29/2007 | 12/31/2006 | 6/29/2007 | 12/31/2006 | 6/29/2007 | 12/31/2006 | 6/29/2007 | 12/31/2006 | |
| For the periods ended | (unaudited) | (unaudited) | (unaudited) | (unaudited) | (unaudited) | (unaudited) | ||||||
| Operations | ||||||||||||
| Net investment income/(loss) | $654,898 | $731,308 | $1,695,113 | $1,240,608 | $2,342,934 | $3,287,951 | $930,028 | $2,845,528 | $14,536 | $152,804 | $359,071 | $433,414 |
| Net realized gains/(losses) on: | ||||||||||||
| Investments | 5,040,780 | 8,563,335 | 22,239,816 | 21,926,259 | 32,663,269 | 42,948,546 | 69,354,605 | 118,155,298 | 3,133,638 | 5,085,536 | 3,439,621 | 658,908 |
| Written option contracts | — | — | — | — | — | — | — | 148,119 | — | 6,492 | — | — |
| Futures contracts | — | — | 393,428 | 1,127,068 | 180,125 | (25,970) | — | — | — | — | — | — |
| Change in net unrealized appreciation/(depreciation) on: | ||||||||||||
| Investments | 7,861,215 | 16,810,900 | 10,936,648 | 17,873,645 | (14,295) | 17,537,840 | 20,367,935 | (63,202,347) | 1,197,928 | (2,323,447) | 2,286,695 | 5,148,722 |
| Futures contracts | — | — | — | — | (267,720) | 49,285 | — | — | — | — | — | — |
| Net Change in Net Assets Resulting | ||||||||||||
| From Operations | 13,556,893 | 26,105,543 | 35,265,005 | 42,167,580 | 34,904,313 | 63,797,652 | 90,652,568 | 57,946,598 | 4,346,102 | 2,921,385 | 6,085,387 | 6,241,044 |
| Distributions to Shareholders | ||||||||||||
| From net investment income | (615,484) | (245,502) | (1,255,527) | (393,228) | (2,602,454) | (3,387,052) | (2,797,022) | (776,730) | (151,556) | (63,381) | — | (412,610) |
| From net realized gains | (8,696,064) | (4,957,416) | (24,156,432) | (21,622,774) | (43,516,538) | (12,406,769) | (26,785,497) | — | (5,117,206) | (398,560) | (371,536) | (496,498) |
| Total Distributions to Shareholders | (9,311,548) | (5,202,918) | (25,411,959) | (22,016,002) | (46,118,992) | (15,793,821) | (29,582,519) | (776,730) | (5,268,762) | (461,941) | (371,536) | (909,108) |
| Capital Stock Transactions | 18,400,902 | 36,478,829 | (16,964,792) | 96,341,517 | 2,081,589 | (81,904,164) | (47,986,982) | (149,761,729) | 1,469,399 | (8,985,118) | 20,160,641 | 28,366,726 |
| Net Increase/(Decrease) in Net Assets | 22,646,247 | 57,381,454 | (7,111,746) | 116,493,095 | (9,133,090) | (33,900,333) | 13,083,067 | (92,591,861) | 546,739 | (6,525,674) | 25,874,492 | 33,698,662 |
| Net Assets, Beginning of Period | 163,621,883 | 106,240,429 | 406,669,206 | 290,176,111 | 439,750,088 | 473,650,421 | 654,880,896 | 747,472,757 | 31,704,198 | 38,229,872 | 54,945,334 | 21,246,672 |
| Net Assets, End of Period | $186,268,130 | $163,621,883 | $399,557,460 | $406,669,206 | $430,616,998 | $439,750,088 | $667,963,963 | $654,880,896 | $32,250,937 | $31,704,198 | $80,819,826 | $54,945,334 |
| The accompanying Notes to Financial Statements are an integral part of this statement. | The accompanying Notes to Financial Statements are an integral part of this statement. | |
| 240 | 241 |
| Thrivent Series Fund, Inc. | Thrivent Series Fund, Inc. | |||||||||||
| Statement of Changes in Net Assets – continued | Statement of Changes in Net Assets – continued | |||||||||||
| Mid Cap Stock | Mid Cap Index | Partner International | Partner All Cap | Large Cap Growth | Large Cap Growth | |||||||
| Portfolio | Portfolio | Stock Portfolio | Portfolio | Portfolio | Portfolio II | |||||||
| 6/29/2007 | 12/31/2006 | 6/29/2007 | 12/31/2006 | 6/29/2007 | 12/31/2006 | 6/29/2007 | 12/31/2006 | 6/29/2007 | 12/31/2006 | 6/29/2007 | 12/31/2006 | |
| For the periods ended | (unaudited) | (unaudited) | (unaudited) | (unaudited) | (unaudited) | (unaudited) | ||||||
| Operations | ||||||||||||
| Net investment income/(loss) | $1,496,756 | $3,788,354 | $1,123,142 | $1,845,424 | $17,087,936 | $17,813,775 | $279,850 | $467,578 | $7,064,075 | $12,364,942 | $63,666 | $218,087 |
| Net realized gains/(losses) on: | ||||||||||||
| Investments | 25,036,027 | 27,891,869 | 7,117,462 | 8,814,852 | 147,585,648 | 101,356,430 | 5,913,656 | 13,995,068 | 197,007,105 | 129,262,855 | 3,102,562 | 2,239,445 |
| Written option contracts | — | — | — | — | — | — | — | — | 854,936 | 1,538,579 | 13,427 | 27,736 |
| Futures contracts | — | — | 208,593 | 80,501 | — | — | — | — | — | — | — | — |
| Foreign currency transactions | — | — | — | — | (487,501) | (175,402) | — | — | — | — | — | — |
| Change in net unrealized appreciation/(depreciation) on: | ||||||||||||
| Investments | 13,457,519 | 5,640,390 | 9,750,865 | 4,866,436 | (18,167,029) | 111,812,792 | 4,734,755 | (1,545,231) | 17,373 | 4,895,989 | (159,000) | (66,913) |
| Written option contracts | — | — | — | — | — | — | — | — | — | (40,721) | — | (905) |
| Futures contracts | — | — | 30,744 | (44,436) | — | — | — | — | — | — | — | — |
| Foreign currency forward contracts | — | — | — | — | (64,900) | 836 | — | — | — | — | — | — |
| Foreign currency transactions | — | — | — | — | 37,260 | 5,157 | — | — | — | — | — | — |
| Net Change in Net Assets Resulting | ||||||||||||
| From Operations | 39,990,302 | 37,320,613 | 18,230,806 | 15,562,777 | 145,991,414 | 230,813,588 | 10,928,261 | 12,917,415 | 204,943,489 | 148,021,644 | 3,020,655 | 2,417,450 |
| Distributions to Shareholders | ||||||||||||
| From net investment income | (3,442,513) | (928,850) | (1,542,576) | (1,645,094) | (20,042,187) | (15,477,487) | (469,104) | (388,596) | (12,284,570) | (11,608,717) | (217,804) | (231,923) |
| From net realized gains | (28,823,966) | (19,188,784) | (9,057,618) | (7,254,836) | (47,186,402) | — | (10,483,224) | — | — | — | (2,106,701) | (52,741) |
| Total Distributions to Shareholders | (32,266,479) | (20,117,634) | (10,600,194) | (8,899,930) | (67,228,589) | (15,477,487) | (10,952,328) | (388,596) | (12,284,570) | (11,608,717) | (2,324,505) | (284,664) |
| Capital Stock Transactions | 15,736,390 | 122,411,425 | (1,163,714) | (18,440,951) | 57,341,372 | 70,562,243 | 9,345,837 | 1,813,945 | (61,208,676) | (179,786,394) | (2,514,744) | (8,801,805) |
| Net Increase/(Decrease) in Net Assets | 23,460,213 | 139,614,404 | 6,466,898 | (11,778,104) | 136,104,197 | 285,898,344 | 9,321,770 | 14,342,764 | 131,450,243 | (43,373,467) | (1,818,594) | (6,669,019) |
| Net Assets, Beginning of Period | 363,842,093 | 224,227,689 | 159,754,683 | 171,532,787 | 1,341,800,223 | 1,055,901,879 | 96,543,867 | 82,201,103 | 2,331,653,916 | 2,375,027,383 | 35,931,096 | 42,600,115 |
| Net Assets, End of Period | $387,302,306 | $363,842,093 | $166,221,581 | $159,754,683 | $1,477,904,420 | $1,341,800,223 | $105,865,637 | $2,463,104,159 | $96,543,867 | $2,331,653,916 | $34,112,502 | $35,931,096 |
| Partner Growth Stock | Large Cap Value | Large Cap Stock | Large Cap Index | Real Estate Securities | Balanced | |||||||
| Portfolio | Portfolio | Portfolio | Portfolio | Portfolio | Portfolio | |||||||
| 6/29/2007 | 12/31/2006 | 6/29/2007 | 12/31/2006 | 6/29/2007 | 12/31/2006 | 6/29/2007 | 12/31/2006 | 6/29/2007 | 12/31/2006 | 6/29/2007 | 12/31/2006 | |
| For the periods ended | (unaudited) | (unaudited) | (unaudited) | (unaudited) | (unaudited) | (unaudited) | ||||||
| Operations | ||||||||||||
| Net investment income/(loss) | $400,055 | $627,996 | $6,684,907 | $10,542,905 | $6,509,261 | $10,374,268 | $5,627,543 | $11,845,066 | $3,465,029 | $4,394,985 | $7,448,093 | $16,421,891 |
| Net realized gains/(losses) on: | ||||||||||||
| Investments | 6,162,474 | 6,111,401 | 25,532,302 | 36,325,437 | 59,488,246 | 13,803,001 | 22,273,527 | 59,003,051 | 15,346,421 | 20,725,128 | 11,496,267 | 25,712,548 |
| Futures contracts | — | — | — | — | 3,124,023 | 977,405 | 462,030 | 1,270,813 | — | — | 712,141 | 820,342 |
| Foreign currency transactions | (5,710) | (9,056) | — | — | — | — | — | — | (10,675) | (32,185) | — | — |
| Change in net unrealized appreciation/(depreciation) on: | ||||||||||||
| Investments | 3,160,319 | 7,398,126 | 28,690,053 | 63,646,425 | (10,487,997) | 58,967,851 | 18,401,805 | 33,168,863 | (40,273,194) | 66,655,948 | 6,060,552 | 20,606,275 |
| Futures contracts | — | — | — | — | (107,955) | (38,060) | (66,875) | 41,640 | — | — | (189,508) | 119,410 |
| Foreign currency forward contracts | 573 | (97) | — | — | — | — | — | — | 3,124 | — | — | — |
| Foreign currency transactions | (1,045) | (22) | — | — | — | — | — | — | (4,726) | — | — | — |
| Net Change in Net Assets Resulting | ||||||||||||
| From Operations | 9,716,666 | 14,128,348 | 60,907,262 | 110,514,767 | 58,525,578 | 84,084,465 | 46,698,030 | 105,329,433 | (21,474,021) | 91,743,876 | 25,527,545 | 63,680,466 |
| Distributions to Shareholders | ||||||||||||
| From net investment income | (621,984) | (237,101) | (10,416,269) | (6,466,754) | (10,350,750) | (4,877,166) | (11,629,702) | (12,463,075) | (4,518,187) | (4,184,991) | (16,298,675) | (17,844,453) |
| From net realized gains | (5,894,305) | (2,713,317) | (36,284,324) | (13,282,920) | (15,366,693) | (8,534,756) | (28,177,160) | — | (20,759,334) | (12,678,039) | — | — |
| Total Distributions to Shareholders | (6,516,289) | (2,950,418) | (46,700,593) | (19,749,674) | (25,717,443) | (13,411,922) | (39,806,862) | (12,463,075) | (25,277,521) | (16,863,030) | (16,298,675) | (17,844,453) |
| Capital Stock Transactions | 2,647,070 | (14,871,673) | 149,606,120 | 166,400,530 | 132,245,815 | 156,175,673 | (28,765,211) | (160,828,999) | 11,483,032 | 18,396,156 | (47,151,314) | (143,240,068) |
| Net Increase/(Decrease) in Net Assets | 5,847,447 | (3,693,743) | 163,812,789 | 257,165,623 | 165,053,950 | 226,848,216 | (21,874,043) | (67,962,641) | (35,268,510) | 93,277,002 | (37,922,444) | (97,404,055) |
| Net Assets, Beginning of Period | 116,670,091 | 120,363,834 | 771,694,127 | 514,528,504 | 829,264,067 | 602,415,851 | 727,300,919 | 795,263,560 | 367,888,416 | 274,611,414 | 566,129,245 | 663,533,300 |
| Net Assets, End of Period | $122,517,538 | $116,670,091 | $935,506,916 | $771,694,127 | $994,318,017 | $829,264,067 | $705,426,876 | $727,300,919 | $332,619,906 | $367,888,416 | $528,206,801 | $566,129,245 |
| The accompanying Notes to Financial Statements are an integral part of this statement. | The accompanying Notes to Financial Statements are an integral part of this statement. | |
| 242 | 243 |
| Thrivent Series Fund, Inc. | Thrivent Series Fund, Inc. | |||||||||||
| Statement of Changes in Net Assets – continued | Statement of Changes in Net Assets – continued | |||||||||||
| High Yield | Diversified Income Plus | Income | Bond Index | Limited Maturity | Mortgage Securities | |||||||
| Portfolio | Portfolio | Portfolio | Portfolio | Bond Portfolio | Portfolio | |||||||
| 6/29/2007 | 12/31/2006 | 6/29/2007 | 12/31/2006 | 6/29/2007 | 12/31/2006 | 6/29/2007 | 12/31/2006 | 6/29/2007 | 12/31/2006 | 6/29/2007 | 12/31/2006 | |
| For the periods ended | (unaudited) | (unaudited) | (unaudited) | (unaudited) | (unaudited) | (unaudited) | ||||||
| Operations | ||||||||||||
| Net investment income/(loss) | $33,279,439 | $67,400,467 | $3,532,696 | $6,000,473 | $31,008,697 | $51,314,501 | $5,482,559 | $11,754,959 | $17,400,814 | $24,151,658 | $1,407,668 | $3,083,874 |
| Net realized gains/(losses) on: | ||||||||||||
| Investments | 12,182,635 | 11,497,803 | 3,288,135 | 1,721,189 | 571,032 | (9,882,895) | (39,001) | (3,992,644) | (691,711) | (1,514,323) | (110,706) | (1,628,788) |
| Written option contracts | — | — | — | — | 197,266 | 341,467 | — | — | 80,664 | 49,500 | 29,219 | 65,313 |
| Futures contracts | 108,659 | 85,830 | 160,581 | 41,698 | 1,371,787 | 2,254,846 | — | — | 306,700 | (142,359) | (31,402) | 50,737 |
| Foreign currency transactions | — | — | — | — | (1,655) | (234) | — | — | (513) | 21 | — | — |
| Swap agreements | (87,942) | — | (100,405) | — | (458,958) | 15,253 | — | — | (399,535) | 2,174 | (50,488) | — |
| Change in net unrealized appreciation/(depreciation) on: | ||||||||||||
| Investments | (20,852,702) | 3,621,368 | (5,951,003) | 4,432,420 | (21,720,784) | 9,129,401 | (3,628,115) | 1,636,347 | (2,459,779) | 1,965,503 | (907,615) | 1,180,031 |
| Written option contracts | — | — | 2,698 | — | 46,618 | — | — | — | 20,988 | — | 2,051 | 6,328 |
| Futures contracts | — | 66,785 | (44,435) | 38,992 | 214,464 | 430,129 | — | — | 380,167 | 131,435 | (12,186) | — |
| Foreign currency transactions | — | — | — | — | 185 | (671) | — | — | 227 | (403) | — | — |
| Swap agreements | 144,233 | — | (99,174) | — | (1,218,937) | 28,330 | — | — | (601,645) | 10,310 | — | — |
| Net Change in Net Assets Resulting | ||||||||||||
| From Operations | 24,774,322 | 82,672,253 | 789,093 | 12,234,772 | 10,009,715 | 53,630,127 | 1,815,443 | 9,398,662 | 14,036,377 | 24,653,516 | 326,541 | 2,757,495 |
| Distributions to Shareholders | ||||||||||||
| From net investment income | (33,545,319) | (67,173,264) | (2,651,827) | (3,423,713) | (30,089,130) | (51,060,201) | (5,515,090) | (11,775,809) | (17,144,040) | (23,958,814) | (1,371,802) | (3,061,441) |
| From net realized gains | — | — | — | — | — | (5,778,101) | — | — | — | — | — | — |
| Total Distributions to Shareholders | (33,545,319) | (67,173,264) | (2,651,827) | (3,423,713) | (30,089,130) | (56,838,302) | (5,515,090) | (11,775,809) | (17,144,040) | (23,958,814) | (1,371,802) | (3,061,441) |
| Capital Stock Transactions | (166,701,412) | 28,876,444 | 36,522,591 | 5,309,199 | 251,363,441 | 160,636,788 | (12,392,918) | (32,167,929) | 148,819,779 | 210,857,949 | (3,347,481) | (8,782,181) |
| Net Increase/(Decrease) in Net Assets | (175,472,409) | 44,375,433 | 34,659,857 | 14,120,258 | 231,284,026 | 157,428,613 | (16,092,565) | (34,545,076) | 145,712,116 | 211,552,651 | (4,392,742) | (9,086,127) |
| Net Assets, Beginning of Period | 847,021,022 | 802,645,589 | 108,072,290 | 93,952,032 | 1,081,762,445 | 924,333,832 | 237,813,289 | 272,358,365 | 665,627,763 | 454,075,112 | 57,839,892 | 66,926,019 |
| Net Assets, End of Period | $671,548,613 | $847,021,022 | $142,732,147 | $108,072,290 | $1,313,046,471 | $1,081,762,445 | $221,720,724 | $237,813,289 | $811,339,879 | $665,627,763 | $53,447,150 | $57,839,892 |
| Money Market Portfolio | ||||||||||||
| 6/29/2007 | 12/31/2006 | |||||||||||
| For the periods ended | (unaudited) | |||||||||||
| Operations | ||||||||||||
| Net investment income/(loss) | $15,282,244 | $23,138,704 | ||||||||||
| Net Change in Net Assets Resulting | ||||||||||||
| From Operations | 15,282,244 | 23,138,704 | ||||||||||
| Distributions to Shareholders | ||||||||||||
| From net investment income | (15,445,507) | (23,015,583) | ||||||||||
| Total Distributions to Shareholders | (15,445,507) | (23,015,583) | ||||||||||
| Capital Stock Transactions | 106,344,050 | 216,771,334 | ||||||||||
| Net Increase/(Decrease) in Net Assets | 106,180,787 | 216,894,455 | ||||||||||
| Net Assets, Beginning of Period | 590,582,973 | 373,688,518 | ||||||||||
| Net Assets, End of Period | $696,763,760 | $590,582,973 | ||||||||||
| The accompanying Notes to Financial Statements are an integral part of this statement. | The accompanying Notes to Financial Statements are an integral part of this statement. | |
| 244 | 245 |
THRIVENT SERIES FUND, INC.
NOTES TO FINANCIAL STATEMENTS
June 29, 2007 (unaudited)
(1) ORGANIZATION
Thrivent Series Fund, Inc. (the “Fund”), a Minnesota based company, is registered under the Investment Company Act of 1940. The Fund is divided into thirty-one separate series (each a “Portfolio” and, collectively, the “Portfolios”), each with its own investment objective and policies. The Fund consists of four asset allocation portfolios, nineteen equity portfolios, two hybrid portfolios, five fixed-income portfolios, and one money market portfolio. The assets of each Portfolio are segregated and each has a separate class of capital stock.
Shares in the Fund are currently sold, without sales charges, only to separate accounts of Thrivent Financial for Lutherans (“Thrivent Financial”) and Thrivent Life Insurance Company (“Thrivent Life”), which are used to fund benefits of variable life insurance and variable annuity contracts issued by Thrivent Financial and Thrivent Life; and retirement plans sponsored by Thrivent Financial.
Under the Fund’s organizational documents, its officers and directors are indemnified against certain liabilities arising out of the performance of their duties to the Fund. In addition, in the normal course of business, the Fund enters into contracts with service providers and others that provide general damage clauses. The Fund’s maximum exposure under these contracts is unknown, as this would involve future claims that may be made against the Fund. However, based on experience, the Fund expects the risk of loss to be remote.
(2) SIGNIFICANT ACCOUNTING POLICIES
(A) Valuation of Investments — Securities traded on U.S. or foreign securities exchanges or included in a national market system are valued at the official closing price at the close of each business day unless otherwise stated below. Over-the-counter securities and listed securities for which no price is readily available are valued at the current bid price considered best to represent the value at that time. Security prices are based on quotes that are obtained from an independent pricing service approved by the Board of Directors. The pricing service, in determining values of fixed-income securities, takes into consideration such factors as current quotations by broker/dealers, coupon, maturity, quality, type of issue, trading characteristics, and other yield and risk factors it deems relevant in determining valuations. Securities which cannot be value d by the approved pricing service are valued using valuations obtained from dealers that make markets in the securities. Exchange listed options and futures contracts are valued at the last quoted sales price. Mutual funds are valued at their net asset value at the close of each business day.
For all Portfolios, other than Money Market Portfolio, short-term securities with maturities of 60 days or less are valued at amortized cost. Securities held by Money Market Portfolio are valued on the basis of amortized cost (which approximates market value), whereby a portfolio security is valued at its cost initially and, thereafter, valued to reflect a constant amortization to maturity of any discount or premium. Money Market Portfolio and the Fund’s investment adviser follow procedures necessary to maintain a constant net asset value of $1.00 per share.
All securities for which market values are not readily available or deemed unreliable are appraised at fair value as determined in good faith under the direction of the Board of Directors. As of June 29, 2007, three securities in High Yield Portfolio, one security in Income Portfolio and one security in Mortgage Securities Portfolio were valued in good faith by or under the direction of the Board of Directors. These securities represented 0.00%, 0.87% and 1.87%, respectively, of each Portfolio’s net assets.
Fair Valuation of International Securities — Because many foreign markets close before the U.S. markets, events may occur between the close of the foreign market and the close of the U.S. markets that could have a material impact on the valuation of foreign securities. The Portfolios, under the supervision of the Board of Directors, evaluates the impacts of these events and may adjust the valuation of foreign securities to reflect the fair value as of the close of the U.S. markets. The Board of Directors has authorized the Fund’s investment adviser to make fair valuation determinations pursuant to policies approved by the Board of Directors.
(B) Foreign Currency Translation — The accounting records of each Portfolio are maintained in U.S. dollars. Securities and other assets and liabilities that are denominated in foreign currencies are translated into U.S. dollars at the daily closing rates of exchange.
Foreign currency amounts related to the purchase or sale of securities and income and expenses are translated at the exchange rate on the transaction date. Net realized and unrealized currency gains and losses are recorded from sales of foreign currency, exchange gains or losses between the trade date and settlement dates on securities transactions, and other translation gains or losses on dividends, interest income and foreign withholding taxes. The Portfolios do not separately report the effect of changes in foreign exchange
| 246 |
THRIVENT SERIES FUND, INC.
Notes to Financial Statements
As of June 29, 2007 (unaudited)
rates from changes in market prices on securities held. Such changes are included in net realized and unrealized gain or loss from investments.
For federal income tax purposes, the Portfolios treat the effect of changes in foreign exchange rates arising from actual foreign currency transactions and the changes in foreign exchange rates between the trade date and settlement date as ordinary income.
(C) Foreign Currency Contracts — In connection with purchases and sales of securities denominated in foreign currencies, all Portfolios except Money Market Portfolio may enter into forward currency contracts. Additionally, the Portfolios may enter into such contracts to hedge certain other foreign currency denominated investments. These contracts are recorded at market value and the related realized and unrealized foreign exchange gains and losses are included in the Statement of Operations. In the event that counter-parties fail to settle these forward contracts, the Portfolios could be exposed to foreign currency fluctuations. Foreign currency contracts are valued daily and unrealized appreciation or depreciation is recorded daily as the difference between the contract exchange rate and the closing forward rate applied to the face amount of the contract . A realized gain or loss is recorded at the time a forward contract is closed. During the six months ended June 29, 2007, Partner International Stock Portfolio, Partner Growth Stock Portfolio, Real Estate Securities Portfolio, Income Portfolio and Limited Maturity Bond Portfolio engaged in this type of investment.
(D) Foreign Denominated Investments — Foreign denominated assets and currency contracts may involve more risks than domestic transactions including currency risk, political and economic risk, regulatory risk, and market risk. Certain Portfolios may also invest in securities of companies located in emerging markets. Future economic or political developments could adversely affect the liquidity or value, or both, of such securities.
(E) Federal Income Taxes — No provision has been made for income taxes because each Portfolios’ policy is to qualify as regulated investment companies under the Internal Revenue Code and distribute substantially all taxable income on a timely basis. It is also the intention of the Portfolios to distribute an amount sufficient to avoid imposition of any federal excise tax. The Portfolios, accordingly, anticipate paying no federal taxes and no federal tax provision was recorded. Each Portfolio is treated as a separate taxable entity for federal income tax purposes.
(F) Income and Expenses — Estimated expenses are accrued daily. The Portfolios are charged for those expenses that are directly attributable to them. Expenses that are not directly attributable to a Portfolio are allocated among all appropriate Portfolios in proportion to their respective net assets, number of shareholder accounts or other reasonable basis.
Interest income is accrued daily and is determined on the basis of interest or discount earned on all debt securities, including accretion of market discount and original issue discount and amortization of premium. Paydown gains and losses on mortgage- and asset-backed securities are recorded as components of interest income. Dividend income is recorded on the ex-dividend date. For preferred stock payment-in-kind securities, income is recorded on the ex-dividend date in the amount of the value received.
(G) Custody Earnings Credit — The Portfolios have a deposit arrangement with the custodian whereby interest earned on uninvested cash balances is used to pay a portion of custodian fees. This deposit arrangement is an alternative to overnight investments.
(H) Distributions to Shareholders — Dividends from net investment income, if available, are declared and paid to each shareholder as a dividend. Dividend and capital gain distributions are recorded on the ex-dividend date. With the exception of Money Market Portfolio, net realized gains from securities transactions, if any, are paid at least annually for all Portfolios after the close of the Portfolios’ fiscal year. Any Portfolio subject to excise taxes would require an additional distribution prior to the close of the fiscal year.
Dividends are declared and reinvested daily for High Yield Portfolio, Income Portfolio, Bond Index Portfolio, Limited Maturity Bond Portfolio and Mortgage Securities Portfolio; declared daily and reinvested monthly for Money Market Portfolio; and declared and reinvested at least annually for all other Portfolios.
(I) Options — All Portfolios, with the exception of Money Market Portfolio, may buy put and call options and write put and covered call options. The Portfolios intend to use such derivative instruments as hedges to facilitate buying or selling securities or to provide protection against adverse movements in security prices or interest rates. The Portfolios may also enter into options contracts to protect against adverse foreign exchange rate fluctuations.
| 247 |
THRIVENT SERIES FUND, INC.
Notes to Financial Statements
As of June 29, 2007 (unaudited)
(2) SIGNIFICANT ACCOUNTING POLICIES — continued
Option contracts are valued daily and unrealized appreciation or depreciation is recorded. A Portfolio will realize a gain or loss upon expiration or closing of the option transaction. When an option is exercised, the proceeds upon sale for a written call option or the cost of a security for purchased put and call options is adjusted by the amount of premium received or paid. The writer of an option bears the market risk of an unfavorable change in the price of the security underlying the written option. During the six months ended June 29, 2007, Large Cap Growth Portfolio, Large Cap Growth Portfolio II, Diversified Income Plus Portfolio, Income Portfolio, Limited Maturity Bond Portfolio and Mortgage Securities Portfolio engaged in this type of investment.
(J) Financial Futures Contracts — Certain Portfolios may use futures contracts to manage the exposure to interest rate and market fluctuations. Gains or losses on futures contracts can offset changes in the yield of securities. When a futures contract is opened, cash or other investments equal to the required “initial margin deposit” are held on deposit with and pledged to the broker. Additional securities held by the Portfolios may be earmarked as collateral for open futures contracts. The futures contract’s daily change in value (“variation margin”) is either paid to or received from the broker, and is recorded as an unrealized gain or loss. When the contract is closed, the realized gain or loss is recorded equal to the difference between the value of the contract when opened and the value of the contract when closed. Futures co ntracts involve, to varying degrees, risk of loss in excess of the variation margin disclosed in the Statement of Assets and Liabilities. During the six months ended June 29, 2007, Small Cap Stock Portfolio, Small Cap Index Portfolio, Mid Cap Index Portfolio, Large Cap Stock Portfolio, Large Cap Index Portfolio, Balanced Portfolio, High Yield Portfolio, Diversified Income Plus Portfolio, Income Portfolio, Limited Maturity Bond Portfolio and Mortgage Securities Portfolio engaged in this type of investment.
(K) Swap Agreements — Certain Portfolios enter into swap transactions, which involve swapping one or more investment characteristics of a security or a basket of securities with another party. Such transactions include market risk, risk of default by the other party to the transaction, risk of imperfect correlation and manager risk and may involve commissions or other costs. Swaps generally do not involve delivery of securities, other underlying assets or principal. Accordingly, the risk of loss with respect to swaps is generally limited to the net amount of payments that the Portfolio is contractually obligated to make, or in the case of the counterparty defaulting, the net amount of payments that the Portfolio is contractually entitled to receive. Risks of loss may exceed amounts recogniz ed on the Statement of Assets and Liabilities. If there is a default by the counterparty, the Portfolio may have contractual remedies pursuant to the agreements related to the transaction. Periodic payments are recorded as realized gains or losses on the Statement of Operations. The contracts are valued daily and unrealized appreciation or depreciation is recorded. Payments received or made as a result of a credit event or termination of the contract are recognized as realized gains or losses on the Statement of Operations. Collateral, in the form of cash or securities, may be required to be held with the Fund’s custodian, or third party, in connection with these agreements.
Credit Default Swaps — A credit default swap is an agreement between two parties to exchange the credit risk of a particular issuer or reference entity. In a credit default swap transaction, a buyer pays periodic fees in return for payment by the seller which is contingent upon an adverse credit event occurring in the underlying issuer or reference entity. The seller collects periodic fees from the buyer and profits if the credit of the underlying issuer or reference entity remains stable or improves while the swap is outstanding, but the seller in a credit default swap contract would be required to pay an agreed upon amount to the buyer in the event of an adverse credit event in the reference entity. A buyer of a credit default swap is said to buy protection whereas a seller of a credit default swap is said to sell protection. The Portfolios may be eithe r the protection seller or the protection buyer. During the six months ended June 29, 2007, High Yield Portfolio, Diversified Income Plus Portfolio, Income Portfolio and Limited Maturity Bond Portfolio engaged in this type of investment.
Total Rate of Return Swaps — A total return swap is an agreement in which one party makes payments based on a set rate, either fixed or variable, while the other party makes payments based on the return of an underlying asset plus any capital gains and losses over the payment period. The underlying asset is typically an index, loan or a basket of assets. Total return swaps provide the Portfolios with the additional flexibility of gaining exposure to a market or securities index by using the most cost-effective vehicle available. During the six months ended June 29, 2007, Diversified Income Plus Portfolio, Income Portfolio, Limited Maturity Bond Portfolio and Mortgage Securities Portfolio engaged in this type of investment.
Interest Rate Swaps — An interest rate swap is an agreement between two parties to exchange cash flows based on the difference between two interest rates. Typically, one
| 248 |
THRIVENT SERIES FUND, INC.
Notes to Financial Statements
As of June 29, 2007 (unaudited)
party pays a fixed-rate for a specific period while the other pays a variable-rate based on an underlying index for the same period. Interest rate swaps allow the Portfolios to manage exposure to interest rate fluctuations. During the six months ended June 29, 2007, Limited Maturity Bond Portfolio engaged in this type of investment.
(L) Mortgage Dollar Roll Transactions — Certain Portfolios enter into dollar roll transactions on securities issued or to be issued by the Government National Mortgage Association, Federal National Mortgage Association and Federal Home Loan Mortgage Corporation, in which the Portfolios sell mortgage securities and simultaneously agree to repurchase similar (same type, coupon, and maturity) securities at a later date at an agreed upon price. During the period between the sale and repurchase, the Portfolios forgo principal and interest paid on the mortgage securities sold. The Portfolios are compensated from negotiated fees paid by brokers offered as an inducement to the Portfolios to “roll over” their purchase commitments. These fees are recognized over the roll period and are included in Income from mortgage dollar rolls in the Statement of Oper ations.
(M) Securities Lending — The Fund had previously entered into a Securities Lending Agreement with State Street Bank and Trust Company (“State Street Bank”) and, as of April 27, 2007, entered into a similar agreement with Dresdner Bank AG (each, an “Agreement”). Each Agreement authorizes the applicable lender to lend securities to authorized borrowers on behalf of the Portfolios. Pursuant to each Agreement, all loaned securities are collateralized by cash equal to at least 102% of the value of the loaned securities. All cash collateral received is invested in Thrivent Financial Securities Lending Trust. Amounts earned on investments in Thrivent Financial Securities Lending Trust, net of rebates and other securities lending expenses, are included in Income from securities loaned on the Statement of Operations. As payment for its services , each lender receives a portion of the fee income and earnings on the collateral. By investing any cash collateral it receives in these transactions, a Portfolio could realize additional gains or losses. If the borrower fails to return the securities and the invested collateral has declined in value, the Portfolio could lose money. The Agreement with State Street Bank grants and transfers to State Street Bank a lien upon collateralized assets in the possession of State Street Bank.
As of June 15, 2007, the Fund began transitioning the securities lending business from State Street Bank to Dresdner. As of June 29, 2007, all Portfolios except Aggressive Allocation
Portfolio, Moderately Aggressive Allocation Portfolio, Moderate Allocation Portfolio, Moderately Conservative Allocation Portfolio, Partner Small Cap Value Portfolio, Mid Cap Stock Portfolio, Mid Cap Index Portfolio, Mortgage Securities Portfolio and Money Market Portfolio had securities on loan. The value of securities on loan are as follows:
| Securities | |
| Portfolio | on Loan |
| Technology | $ 11,467,972 |
| Partner Small Cap Growth | 42,654,542 |
| Small Cap Stock | 116,945 |
| Small Cap Index | 170,286 |
| Mid Cap Growth | 3,638,879 |
| Mid Cap Growth II | 3,996,720 |
| Partner Mid Cap Value | 9,120,977 |
| Partner International Stock | 8,557,844 |
| Partner All Cap | 4,797,563 |
| Large Cap Growth | 260,652,122 |
| Large Cap Growth II | 544,326 |
| Partner Growth Stock | 7,558,568 |
| Large Cap Value | 40,544,891 |
| Large Cap Stock | 57,839,543 |
| Large Cap Index | 27,100,839 |
| Real Estate Securities | 94,733,368 |
| Balanced | 33,484,126 |
| High Yield | 1,445,190 |
| Diversified Income Plus | 9,296,498 |
| Income | 50,431,228 |
| Bond Index | 44,836,466 |
| Limited Maturity Bond | 23,839,551 |
(N) When-Issued and Delayed Delivery Transactions
— Certain Portfolios may purchase or sell securities on a when-issued or delayed delivery basis. These transactions involve a commitment by a Portfolio to purchase or sell securities for a predetermined price or yield, with payment and delivery taking place beyond the customary settlement period. When delayed delivery purchases are outstanding, a Portfolio will designate liquid assets in an amount sufficient to meet the purchase price. When purchasing a security on a delayed delivery basis, a Portfolio assumes the rights and risks of ownership of the security, including the risk of price and yield fluctua-tions, and takes such fluctuations into account when determining its net asset value. A Portfolio may dispose of a delayed delivery transaction after it is entered into, and may sell when-issued securities before they are delivered, which may result in a capital gain or loss. When a Portfolio has sold a security on a delayed deliv ery basis, a Portfolio does not participate in future gains and losses with respect to the security.
| 249 |
THRIVENT SERIES FUND, INC.
Notes to Financial Statements
As of June 29, 2007 (unaudited)
(2) SIGNIFICANT ACCOUNTING POLICIES — continued
(O) Treasury Inflation Protected Securities — Certain Portfolios may invest in treasury inflation protected securities (TIPS). These securities are fixed income securities whose principal value is periodically adjusted to the rate of inflation. The interest rate is generally fixed at issuance. Interest is paid based on the principal value, which is adjusted for inflation. Any increase in the principal amount will be included as taxable interest in the Statement of Operations and received upon maturity or sale of the security.
(P) Repurchase Agreements — Each Portfolio may engage in repurchase agreement transactions in pursuit of its investment objective. A repurchase agreement consists of a purchase and a simultaneous agreement to resell an investment for later delivery at an agreed upon price and rate of interest. The Portfolio must take possession of collateral either directly or through a third-party custodian. If the original seller of a security subject to a repurchase agreement fails to repurchase the security at the agreed upon time, the Portfolio could incur a loss due to a drop in the market value of the security during the time it takes the Portfolio to either sell the security or take action to enforce the Portfolio seller’s agreement to repurchase the security. Also, if a defaulting original seller filed for bankruptcy or became insolvent, disposition of such security might be delayed by pending court action. The Portfolio may only enter into repurchase agreements with banks and other recognized financial institutions such as broker/dealers that are found by the Portfolios’ investment adviser (or a subadviser) to be creditworthy.
(Q) Equity-Linked Structured Securities — Certain Portfolios may invest in equity-linked structured notes. Equity-linked structured notes are debt securities which combine the characteristics of common stock and the sale of an option. The return component is based upon the performance of a single equity security, a basket of equity securities, or an equity index and the sale of an option which is recognized as income. There is no guaranteed return of principal with these securities. The appreciation potential of these securities may be limited by a maximum payment or call right and can be influenced by many unpredictable factors.
(R) Credit Risk — The Portfolios may be susceptible to credit risk to the extent the issuer or counterparty defaults on its payment obligation. The Portfolios’ policy is to monitor the creditworthiness of the issuers. Interest receivables on defaulted securities are monitored for the ability to collect payments in default and adjusted accordingly.
(S) Accounting Estimates — The preparation of financial statements in conformity with accounting principles generally accepted in the United States of America require management to make estimates and assumptions that affect the reported amounts of assets and liabilities and disclosure of contingent assets and liabilities at the date of the financial statements and the reported amounts of income and expenses during the reporting period. Actual results could differ from those estimates.
(T) Loss Contingencies — High Yield Portfolio received a dividend in the amount of $59,063 from Global Crossings within 90 days of Global Crossings’ filing for bankruptcy. A preference action has been filed and it is possible that the Portfolio will be required to surrender the dividend back to the bankruptcy estate. This loss contingency has not been accrued as a liability because the amount to be surrendered can not be reasonably estimated.
(U) Unfunded Loan Commitment — The following Portfolios entered into a loan commitment with Lear Corporation on June 5, 2007. The loan has a maturity date of seven years from trade date and a coupon rate of LIBOR plus 275 basis points. The Portfolios are obligated to fund these loan commitments at the borrower’s discretion upon shareholders’ approval of the merger between Lear Corporation and American Real Estate Partners, LP (AREP).
| Principal | |
| Portfolio | Amount |
| High Yield | $3,970,000 |
| Diversified Income Plus | 220,000 |
Subsequent to June 29, 2007, the shareholders voted against the merger proposal with AREP. As such, the Portfolios will not be obligated to fund these loan commitments.
The following Portfolios entered into a loan commitment with Community Health Systems, Inc. Initial maturity of the bridge loan is one year from closing. After initial maturity, the bridge loan may be converted into exchange notes. The coupon rate will be determined at time of settlement. The Portfolios are obligated to fund these loan commitments at the borrower’s discretion upon shareholders’ approval of the merger between Community Health Systems, Inc. and Triad Hospitals, Inc. A commitment fee is paid to the funds at the close of the loan commitment.
| Principal | |
| Portfolio | Amount |
| High Yield | $6,800,000 |
| Income | 4,800,000 |
| 250 |
THRIVENT SERIES FUND, INC.
Notes to Financial Statements
As of June 29, 2007 (unaudited)
Subsequent to June 29, 2007, the Portfolios were released from their obligation to fund these loan commitments.
(V) Recent Accounting Pronouncements — In June 2006, the Financial Accounting Standards Board (FASB) issued FASB Interpretation No. 48 — Accounting for Uncertainty in Income Taxes (FIN 48), an interpretation of FASB Statement 109 that requires additional tax disclosures and the tax effects of certain income tax positions, whether on previously filed tax returns or those expected to be taken on future returns. These positions must meet a “more likely than not” standard that, based on the technical merits, would have a more than 50 percent likelihood of being sustained upon examination. In evaluating whether a tax position has met the more-likely-than-not recognition threshold, management of the Fund must presume that the position will be examined by the appropriate taxing authority that has full knowledge of all relevant information. The Por tfolios adopted the provisions of FIN 48 on June 29, 2007, the extended required implementation date set by the U.S. Securities and Exchange Commission for mutual funds.
FIN 48 requires management of the Fund to analyze all open tax years, as defined by statute of limitations, for all major jurisdictions. Open tax years are those that are open for exam by taxing authorities. Major jurisdictions for the Portfolios include Federal, Minnesota, Wisconsin as well as certain foreign countries. As of June 29, 2007, open Federal and Minnesota tax years include the tax years ended December 31, 2003 through 2006. Additionally, as of June 29, 2007, the December 31, 2002 tax year is open for Wisconsin.
The Portfolios have no examinations in progress and none are expected at this time.
As of June 29, 2007, management of the Fund has reviewed all open tax years and major jurisdictions and concluded that the adoption of FIN 48 resulted in no effect to the Portfolio’s tax liability, financial position or results of operations. There is no tax liability resulting from unrecognized tax benefits related to uncertain income tax positions taken or expected to be taken in future tax returns. The Portfolios are also not aware of any tax positions for which it is reasonably possible that the total amounts of unrecognized tax benefits will significantly change in the next 12 months.
Additionally, in September 2006, the FASB issued FASB statement No. 157 — Fair Value Measurements (FAS 157). The objective of the statement is to improve the consistency and comparability of fair value measurements used in finan-cial reporting. FAS 157 defines fair value, establishes a framework for measuring fair value in generally accepted accounting principles, and expands disclosures about fair value measurements. FAS 157 is effective for fiscal years beginning after November 15, 2007. Management of the Fund is currently evaluating the impact that FAS 157 will have on the Fund’s financial statements.
(W) Other — For financial statement purposes, investment security transactions are accounted for on the trade date. Realized gains and losses from investment transactions are determined on a specific cost identification basis, which is the same basis used for federal income tax purposes.
(3) FEES AND COMPENSATION PAID TO AFFILIATES
(A) Investment Advisory Fees — Each Portfolio pays Thrivent Financial, the Fund’s investment adviser, a fee for its advisory services. The fees are accrued daily and paid monthly. The annual rates of fees as a percent of average daily net assets were as follows:
| $0 to | $200 to | $250 to | $500 to | $750 to | $1,000 to | $1,500 to | $2,000 to | $2,500 to | Over | |
| Portfolio (M - Millions) | $200M | $250M | $500M | $750M | $1,000M | $1,500M | $2,000M | $2,500M | $5,000M | $5,000M |
| Aggressive Allocation | 0.15% | 0.15% | 0.15% | 0.125% | 0.125% | 0.125% | 0.125% | 0.125% | 0.125% | 0.125% |
| Moderately Aggressive | ||||||||||
| Allocation | 0.15% | 0.15% | 0.15% | 0.125% | 0.125% | 0.125% | 0.125% | 0.125% | 0.125% | 0.125% |
| Moderate Allocation | 0.15% | 0.15% | 0.15% | 0.125% | 0.125% | 0.125% | 0.125% | 0.125% | 0.125% | 0.125% |
| Moderately Conservative | ||||||||||
| Allocation | 0.15% | 0.15% | 0.15% | 0.125% | 0.125% | 0.125% | 0.125% | 0.125% | 0.125% | 0.125% |
| Technology | 0.75% | 0.75% | 0.75% | 0.75% | 0.75% | 0.75% | 0.75% | 0.75% | 0.75% | 0.75% |
| Partner Small Cap | ||||||||||
| Growth | 1.00% | 1.00% | 1.00% | 0.90% | 0.90% | 0.90% | 0.90% | 0.90% | 0.90% | 0.90% |
| Partner Small Cap | ||||||||||
| Value | 0.80% | 0.80% | 0.80% | 0.80% | 0.80% | 0.80% | 0.80% | 0.80% | 0.80% | 0.80% |
| 251 |
THRIVENT SERIES FUND, INC.
Notes to Financial Statements
As of June 29, 2007 (unaudited)
(3) FEES AND COMPENSATION PAID TO AFFILIATES — continued
| $0 to | $200 to | $250 to | $500 to | $750 to | $1,000 to | $1,500 to | $2,000 to | $2,500 to | Over | |
| Portfolio (M - Millions) | $200M | $250M | $500M | $750M | $1,000M | $1,500M | $2,000M | $2,500M | $5,000M | $5,000M |
| Small Cap Stock | 0.70% | 0.65% | 0.65% | 0.65% | 0.65% | 0.60% | 0.60% | 0.60% | 0.55% | 0.525% |
| Small Cap Index | 0.35% | 0.35% | 0.30% | 0.25% | 0.25% | 0.20% | 0.15% | 0.10% | 0.10% | 0.10% |
| Mid Cap Growth | 0.40% | 0.40% | 0.40% | 0.40% | 0.40% | 0.40% | 0.40% | 0.40% | 0.40% | 0.40% |
| Mid Cap Growth II | 0.90% | 0.90% | 0.90% | 0.80% | 0.80% | 0.80% | 0.80% | 0.80% | 0.80% | 0.80% |
| Partner Mid Cap Value | 0.75% | 0.75% | 0.70% | 0.70% | 0.70% | 0.70% | 0.70% | 0.70% | 0.70% | 0.70% |
| Mid Cap Stock | 0.70% | 0.65% | 0.65% | 0.65% | 0.65% | 0.60% | 0.60% | 0.60% | 0.55% | 0.525% |
| Mid Cap Index | 0.35% | 0.35% | 0.30% | 0.25% | 0.25% | 0.20% | 0.15% | 0.10% | 0.10% | 0.10% |
| Partner International | ||||||||||
| Stock | 0.85% | 0.85% | 0.85% | 0.80% | 0.80% | 0.75% | 0.70% | 0.70% | 0.70% | 0.70% |
| Partner All Cap | 0.95% | 0.95% | 0.95% | 0.90% | 0.90% | 0.90% | 0.90% | 0.90% | 0.90% | 0.90% |
| Large Cap Growth | 0.40% | 0.40% | 0.40% | 0.40% | 0.40% | 0.40% | 0.40% | 0.40% | 0.40% | 0.40% |
| Large Cap Growth II | 0.80% | 0.80% | 0.80% | 0.70% | 0.70% | 0.70% | 0.70% | 0.70% | 0.70% | 0.70% |
| Partner Growth Stock | 0.80% | 0.80% | 0.80% | 0.70% | 0.70% | 0.70% | 0.70% | 0.70% | 0.70% | 0.70% |
| Large Cap Value | 0.60% | 0.60% | 0.60% | 0.60% | 0.60% | 0.60% | 0.60% | 0.60% | 0.60% | 0.60% |
| Large Cap Stock | 0.65% | 0.65% | 0.65% | 0.575% | 0.55% | 0.475% | 0.475% | 0.475% | 0.45% | 0.425% |
| Large Cap Index | 0.35% | 0.35% | 0.30% | 0.25% | 0.25% | 0.20% | 0.15% | 0.10% | 0.10% | 0.10% |
| Real Estate Securities | 0.80% | 0.80% | 0.80% | 0.75% | 0.75% | 0.75% | 0.75% | 0.75% | 0.75% | 0.75% |
| Balanced | 0.35% | 0.35% | 0.30% | 0.30% | 0.30% | 0.30% | 0.30% | 0.30% | 0.30% | 0.30% |
| High Yield | 0.40% | 0.40% | 0.40% | 0.40% | 0.40% | 0.40% | 0.40% | 0.40% | 0.40% | 0.40% |
| Diversified Income Plus | 0.40% | 0.40% | 0.40% | 0.40% | 0.40% | 0.40% | 0.40% | 0.40% | 0.40% | 0.40% |
| Income | 0.40% | 0.40% | 0.40% | 0.40% | 0.40% | 0.40% | 0.40% | 0.40% | 0.40% | 0.40% |
| Bond Index | 0.35% | 0.35% | 0.30% | 0.25% | 0.25% | 0.20% | 0.15% | 0.10% | 0.10% | 0.10% |
| Limited Maturity Bond | 0.40% | 0.40% | 0.40% | 0.40% | 0.40% | 0.40% | 0.40% | 0.40% | 0.40% | 0.40% |
| Mortgage Securities | 0.50% | 0.50% | 0.50% | 0.50% | 0.50% | 0.50% | 0.50% | 0.50% | 0.50% | 0.50% |
| Money Market | 0.40% | 0.40% | 0.40% | 0.40% | 0.40% | 0.40% | 0.40% | 0.40% | 0.40% | 0.40% |
The following subadvisory fees are charged as part of the total investment advisory fees stated in the table above. The subadvisory fees are borne directly by the Adviser and do not increase the overall fees paid by the Portfolio.
The Adviser has entered into subadvisory agreements with Turner Investment Partners, Inc. (“Turner”) and Transamerica Investment Management, LLC (“Transamerica”) for the performance of subadvisory services for the Partner Small Cap Growth Portfolio. The fee payable is equal to 0.65% and 0.50% of average daily net assets subadvised by Turner and Transamerica, respectively.
The Adviser has entered into a subadvisory agreement with T. Rowe Price Associates, Inc. for the performance of subadvisory services for the Partner Small Cap Value Portfolio. The fee payable is equal to 0.60% of average daily net assets.
The Adviser has entered into a subadvisory agreement with Goldman Sachs Asset Management, LP (“Goldman Sachs”) for the performance of subadvisory services for the Partner Mid Cap Value Portfolio. The fee payable is equal to 0.50% of average daily net assets for the first $250 million and 0.45% for assets over $250 million. Thrivent Partner Mid Cap Value Fund will be included in determining breakpoints for the assets managed by Goldman Sachs.
The Adviser paid T. Rowe Price International, Inc. (“Price International”) an annual subadvisory fee for the performance of subadvisory services for Partner International Stock Portfolio until the termination of the subadvisory agreement on February 28, 2007. The fee payable was equal to 0.75% of the first $20 million, 0.60% of the next $30 million, and 0.50% of the next $150 million of average daily net assets, with the fee for all of the assets subadvised by Price International 0.50% and 0.45% when assets exceed $200 million and $500 million, respectively. Thrivent Partner International Stock Fund was included in determining breakpoints for the assets managed by Price International.
Effective February 28, 2007, the Adviser entered into a subadvisory agreement with Principal Global Investors, LLC (“Principal”) in addition to the existing subadvisory agreement with Mercator Asset Management, LP (“Mercator”) for the performance of subadvisory services for the Partner
| 252 |
THRIVENT SERIES FUND, INC.
Notes to Financial Statements
As of June 29, 2007 (unaudited)
International Stock Portfolio. For average daily net assets subadvised by Principal, the fee payable is equal to 0.35% of the first $500 million, 0.30% of the next $500 million and 0.25% when assets exceed $1 billion. For average daily net assets subadvised by Mercator, the fee payable 0.75% of the first $25 million, 0.60% of the next $25 million, 0.55% of the next $25 million, 0.50% of the next $225 million, 0.40% of the next $200 million and 0.20% when assets exceed $500 million. Thrivent Partner International Stock Fund is included in determining breakpoints for the assets managed by Principal and Mercator.
The Adviser has entered into a subadvisory agreement with Pyramis Global Advisors, LLC (“Pyramis Advisors”) for the performance of subadvisory services for the Partner All Cap Portfolio. Pyramis Advisors is a wholly owned subsidiary of Fidelity Management & Research Corporation (“FMR Corp”). The fee payable is equal to 0.60% of average daily net assets for the first $100 million, 0.55% for the next $400 million, 0.50% for the next $250 million and 0.45% for assets over $750 million.
The Adviser has entered into a subadvisory agreement with T. Rowe Price Associates, Inc. for the performance of subadvi-sory services for the Partner Growth Stock Portfolio. The fee payable is equal to 0.40% of average daily net assets for the first $500 million and 0.35% for assets over $500 million.
Each equity, hybrid and fixed income Portfolio may invest in Money Market Portfolio, subject to certain limitations. During the six months ended June 29, 2007, all the Portfolios invested in Money Market Portfolio. These related-party transactions are subject to the same terms as non-related party transactions except that, to avoid duplicate investment advisory fees, Thrivent Financial reimburses an amount equal to the smaller of the amount of the advisory fee for that Portfolio or the amount of the advisory fee which is charged to the Portfolio for its investment in Money Market Portfolio.
The Adviser has agreed to the following voluntary expense reimbursements of average daily net assets: Partner Small Cap Growth Portfolio, 0.10%; Mid Cap Growth Portfolio II, 0.50%; Partner All Cap Portfolio, 0.20%; Large Cap Growth Portfolio II, 0.40%; Partner Growth Stock Portfolio, 0.10%; and Money Market Portfolio, 0.10% . These voluntary waivers of expenses to any Portfolio may be modified or discontinued at any time by the Adviser.
(B) Other Expenses — The Fund has entered into an agreement with the Adviser to provide accounting personnel and services. For the six months ended June 29, 2007, Thrivent Financial received aggregate fees for accounting personnel and services of $673,500 from the Fund.
The Fund has entered into an agreement with the adviser to provide certain administrative personnel and services. For the six months ended June 29, 2007, Thrivent Financial received aggregate fees for administrative personnel and services of $2,584,283 from the Fund.
Each Director is eligible to participate in a deferred compensation plan with respect to fees received from the Fund. Participants in the plan may designate their deferred Director’s fees as if invested in any one of the Thrivent Mutual Funds. The value of each Director’s deferred compensation account will increase or decrease as if it were invested in shares of the selected Thrivent Mutual Funds. The deferred fees remain in the appropriate fund until distribution in accordance with the plan. The deferred fee liability is an unsecured liability.
Those Directors not participating in the above plan received $101,768 in fees from the Fund for the six months ended June 29, 2007. No remuneration has been paid by the Fund to any of the officers or affiliated Directors of the Fund. In addition, the Fund reimbursed unaffiliated Directors for reasonable expenses incurred in relation to attendance at the meetings and industry conferences.
Certain officers and non-independent directors of the Fund are officers and directors of Thrivent Financial and Thrivent Life; however, they receive no compensation from the Fund.
(4) TAX INFORMATION
Distributions are based on amounts calculated in accordance with the applicable federal income tax regulations, which may differ from accounting principles generally accepted in the United States of America. To the extent that these differences are permanent in nature, such amounts are reclassified within the capital accounts based on their federal tax-basis treatment; temporary differences do not require reclassifications. At fiscal year-end, the character and amount of distributions, on a tax-basis, and components of distributable earnings, are finalized. Therefore, as of June 29, 2007, tax-basis balances have not been determined.
| 253 |
THRIVENT SERIES FUND, INC.
Notes to Financial Statements
As of June 29, 2007 (unaudited)
(4) TAX INFORMATION — continued
At December 31, 2006, the following Portfolios had accumulated net realized capital loss carryovers expiring as follows:
| Capital Loss | Expiration | ||
| Portfolio | Carryover | Year | |
| Mid Cap Growth | $ 34,237,192 | 2009 | |
| 10,809,135 | 2010 | ||
| ————————— | |||
| $ 45,046,327 | |||
| =============== | |||
| Partner International Stock | $ 14,818,217 | 2009 | |
| 2,858,197 | 2010 | ||
| ————————— | |||
| $ 17,676,414 | |||
| =============== | |||
| Large Cap Growth | $ 79,477,038 | 2009 | |
| 893,502,496 | 2010 | ||
| 198,356,425 | 2011 | ||
| ————————— | |||
| $ 1,171,335,959 | |||
| =============== | |||
| Balanced | $ 5,789,747 | 2011 | |
| =============== | |||
| High Yield | $ 597,597 | 2007 | |
| 14,056,111 | 2008 | ||
| 288,927,133 | 2009 | ||
| 184,350,285 | 2010 | ||
| 364,926,135 | 2011 | ||
| 30,516,064 | 2012 | ||
| 10,993,224 | 2013 | ||
| 560,014 | 2014 | ||
| ————————— | |||
| $ 894,926,563 | |||
| =============== | |||
| Diversified Income Plus | $ 4,098,981 | 2008 | |
| 3,470,883 | 2009 | ||
| 2,850,377 | 2010 | ||
| ————————— | |||
| $ 10,420,241 | |||
| =============== | |||
| Income | $ 9,528,235 | 2014 | |
| =============== | |||
| Bond Index | $ 440,902 | 2012 | |
| 800,730 | 2013 | ||
| 4,157,673 | 2014 | ||
| ————————— | |||
| $ 5,399,305 | |||
| =============== | |||
| Limited Maturity Bond | $ 2,108,299 | 2013 | |
| 1,181,750 | 2014 | ||
| ————————— | |||
| 3,290,049 | |||
| =============== | |||
| Mortgage Securities | $ 91,230 | 2012 | |
| 192,822 | 2013 | ||
| 1,618,680 | 2014 | ||
| ————————— | |||
| $ 1,902,732 | |||
| =============== | |||
To the extent that these Portfolios realize future net capital gains, taxable distributions will be reduced by any unused capital loss carryovers as permitted by the Internal Revenue Code.
The following Portfolios deferred, on a tax basis, the following post-October 2006 losses:
| Post-October | |
| Portfolio | Loss |
| Technology | $ 172,060 |
| Partner International Stock | 25,934 |
| Real Estate Securities | 23,053 |
| Partner Growth Stock | 630 |
| High Yield | 4,066,109 |
| Bond Index | 194,702 |
| Limited Maturity Bond | 320,237 |
These amounts are deferred for tax purposes and deemed to occur in the fiscal year ended December 31, 2007.
(5) SECURITY TRANSACTIONS
(A) Purchases and Sales of Investment Securities —
For the six months ended June 29, 2007, the cost of purchases and the proceeds from sales of investment securities other than U.S. Government and short-term securities were as follows:
| In thousands | |||
| Portfolio | Purchases | Sales | |
| Aggressive Allocation | $ 133,255 | $ 47,468 | |
| Moderately Aggressive Allocation | 546,962 | 185,908 | |
| Moderate Allocation | 639,305 | 220,955 | |
| Moderately Conservative Allocation | 185,181 | 39,605 | |
| Technology | 32,333 | 39,198 | |
| Partner Small Cap Growth | 85,369 | 51,482 | |
| Partner Small Cap Value | 37,085 | 29,837 | |
| Small Cap Stock | 186,305 | 221,735 | |
| Small Cap Index | 30,721 | 78,394 | |
| Mid Cap Growth | 271,543 | 341,156 | |
| Mid Cap Growth II | 12,850 | 16,768 | |
| Partner Mid Cap Value | 47,786 | 26,267 | |
| Mid Cap Stock | 390,764 | 392,265 | |
| Mid Cap Index | 11,944 | 20,302 | |
| Partner International Stock | 1,038,987 | 1,020,844 | |
| Partner All Cap | 62,989 | 64,049 | |
| Large Cap Growth | 2,158,542 | 2,200,014 | |
| Large Cap Growth II | 30,378 | 34,511 | |
| Partner Growth Stock | 24,240 | 27,436 | |
| Large Cap Value | 303,062 | 184,787 | |
| Large Cap Stock | 779,347 | 664,173 | |
| Large Cap Index | 15,553 | 65,111 | |
| Real Estate Securities | 104,983 | 113,359 | |
| 254 |
THRIVENT SERIES FUND, INC.
Notes to Financial Statements
As of June 29, 2007 (unaudited)
| In thousands | |||
| Portfolio | Purchases | Sales | |
| Balanced | $ 23,093 | $ 67,916 | |
| High Yield | 274,770 | 440,180 | |
| Diversified Income Plus | 117,820 | 89,647 | |
| Income | 541,015 | 333,845 | |
| Bond Index | 19,688 | 21,329 | |
| Limited Maturity Bond | 328,092 | 189,867 | |
| Mortgage Securities | 5,798 | 10,284 | |
Purchases and Sales of U.S. Government Securities were:
| In thousands | |||
| Portfolio | Purchases | Sales | |
| Balanced | $ 331,049 | $ 340,434 | |
| Diversified Income Plus | 16,814 | 11,356 | |
| Income | 1,205,022 | 1,192,849 | |
| Bond Index | 454,972 | 463,014 | |
| Limited Maturity Bond | 377,170 | 355,641 | |
| Mortgage Securities | 292,263 | 297,457 | |
(B) Investments in Restricted Securities — High Yield Portfolio owns restricted securities that were purchased in private placement transactions without registration under the Securities Act of 1933. Unless such securities subsequently become registered, they generally may be resold only in privately negotiated transactions with a limited number of purchasers. For High Yield Portfolio, the aggregate value of restricted securities was $0 at June 29, 2007, which represented 0.00% of net assets. The Portfolio has no right to require registration of unregistered securities.
(C) Investments in High-Yielding Securities — High Yield Portfolio invests primarily in high-yielding fixed-income securities. Each of the other Portfolios, except Money Market Portfolio, may also invest in high-yielding securities. These securities will typically be in the lower rating categories or will be non-rated and generally will involve more risk than securities in the higher rating categories. Lower rated or unrated securities are more likely to react to developments affecting market risk and credit risk than are more highly rated securities, which react primarily to movements in the general level of interest rates.
(D) Investments in Options and Futures Contracts —The movement in the price of the security underlying an option or futures contract may not correlate perfectly with the movement in the prices of the portfolio securities being hedged. A lack of correlation could render the Portfolio’s hedging strategy unsuccessful and could result in a loss to the Portfolio. In the event that a liquid secondary market would not exist, the Portfolio could be prevented from entering into a closing transaction which could result in additional losses to the Portfolio.
(E) Written Option Contracts — The number of contracts and premium amounts associated with call option contracts written during the six months ended June 29, 2007, were as follows:
| Large Cap Growth | |||
| Number of | Premium | ||
| Contracts | Amount | ||
| ————————— | ————————— | ||
| Balance at January 1, 2007 | — | $ | — |
| Opened | 11,640 | 1,942,372 | |
| Closed | (7,917) | (1,532,753) | |
| Expired | (3,044) | (337,172) | |
| Exercised | (679) | (72,447) | |
| ————————— | ————————— | ||
| Balance at June 29, 2007 | — | $ | — |
| =============== | =============== | ||
| Large Cap Growth II | |||
| – | |||
| Number of | Premium | ||
| Contracts | Amount | ||
| ————————— | ————————— | ||
| Balance at January 1, 2007 | — | $ | — |
| Opened | 184 | 30,487 | |
| Closed | (123) | (23,906) | |
| Expired | (49) | (5,325) | |
| Exercised | (12) | (1,256) | |
| ————————— | ————————— | ||
| Balance at June 29, 2007 | — | $ | — |
| =============== | =============== | ||
| 255 |
THRIVENT SERIES FUND, INC.
Notes to Financial Statements
As of June 29, 2007 (unaudited)
(5) SECURITY TRANSACTIONS — continued
| Diversified Income Plus | |||
| Number of | Premium | ||
| Contracts | Amount | ||
| —————–———— | ————————— | ||
| Balance at January 1, 2007 | — | $ — | |
| Opened | 5 | 8,437 | |
| Closed | — | — | |
| Expired | — | — | |
| Exercised | — | — | |
| ————————— | ————————— | ||
| Balance at June 29, 2007 | 5 | $ 8,437 | |
| =============== | =============== | ||
| Income | |||
| Number of | Premium | ||
| Contracts | Amount | ||
| —————–———— | ————————— | ||
| Balance at January 1, 2007 | — | $ — | |
| Opened | 155 | 327,734 | |
| Closed | (50) | (101,563) | |
| Expired | (50) | (101,563) | |
| Exercised | — | — | |
| ————————— | ————————— | ||
| Balance at June 29, 2007 | 55 | $ 124,609 | |
| =============== | =============== | ||
| Limited Maturity Bond | |||
| Number of | Premium | ||
| Contracts | Amount | ||
| —————–———— | ————————— | ||
| Balance at January 1, 2007 | — | $ | — |
| Opened | 105 | 150,391 | |
| Closed | (35) | (39,648) | |
| Expired | (35) | (45,117) | |
| Exercised | — | — | |
| ————————— | ————————— | ||
| Balance at June 29, 2007 | 35 | $ 65,625 | |
| =============== | =============== | ||
| Mortgage Securities | |||
| – | |||
| Number of | Premium | ||
| Contracts | Amount | ||
| —————–———— | ————————— | ||
| Balance at January 1, 2007 | — | $ | — |
| Opened | 21 | 61,563 | |
| Closed | — | — | |
| Expired | (11) | (29,219) | |
| Exercised | (5) | (20,391) | |
| ————————— | ————————— | ||
| Balance at June 29, 2007 | 5 | $ 11,953 | |
| =============== | =============== | ||
(6) INVESTMENTS IN AFFILIATES
Affiliated issuers, as defined under the Investment Company Act of 1940, include those in which the Portfolio’s holdings of an issuer represent 5% or more of the outstanding voting securities of an issuer, or any affiliated mutual fund. A summary of transactions for the six months ended June 29, 2007, in Money Market Portfolio, is as follows:
| Gross | Gross | Balance of | Dividend Income | ||
| Purchases and | Sales and | Shares Held at | Value | Six Months ended | |
| Portfolio | Additions | Reductions | June 29, 2007 | June 29, 2007 | June 29, 2007 |
| Aggressive Allocation | $ 5,429,840 | $ 3,593 | $ 8,787,014 | $ 8,787,014 | $ 96,515 |
| Moderately Aggressive Allocation | 38,156,496 | — | 59,559,431 | 59,559,431 | 639,788 |
| Moderate Allocation | 44,929,022 | — | 140,866,683 | 140,866,683 | 2,804,125 |
| Moderately Conservative Allocation | 17,234,198 | 7,980,679 | 59,438,974 | 59,438,974 | 1,446,383 |
| Technology | 11,877,054 | 10,660,032 | 1,887,300 | 1,887,300 | 32,859 |
| Partner Small Cap Growth | 18,747,412 | 13,158,626 | 7,571,124 | 7,571,124 | 47,744 |
| Partner Small Cap Value | 17,407,817 | 15,564,750 | 6,694,041 | 6,694,041 | 166,507 |
| Small Cap Stock | 28,428,389 | 33,521,259 | 1,665,478 | 1,665,478 | 305,634 |
| Small Cap Index | 52,371,743 | 37,806,286 | 14,903,246 | 14,903,246 | 138,977 |
| Mid Cap Growth | 59,592,151 | 72,279,504 | 2,928,509 | 2,928,509 | 280,689 |
| Mid Cap Growth II | 5,134,588 | 5,567,737 | 482,634 | 482,634 | 17,335 |
| Partner Mid Cap Value | 18,898,057 | 19,722,017 | 1,041,334 | 1,041,334 | 65,062 |
| Mid Cap Stock | 40,213,767 | 50,694,874 | 2,423,827 | 2,423,827 | 328,955 |
| Mid Cap Index | 12,975,447 | 15,402,271 | 780,712 | 780,712 | 65,095 |
| Partner International Stock | 104,618,593 | 98,211,445 | 18,249,452 | 18,249,452 | 178,073 |
| Partner All Cap | 17,112,610 | 17,467,339 | 649,182 | 649,182 | 32,785 |
| Large Cap Growth | 54,646,518 | 61,190,409 | 8,126,554 | 8,126,554 | 276,180 |
| Large Cap Growth II | 5,229,884 | 5,574,545 | 358,208 | 358,208 | 9,249 |
| Partner Growth Stock | 13,132,508 | 12,972,560 | 2,701,362 | 2,701,362 | 72,116 |
| Large Cap Value | 53,485,164 | 50,200,442 | 13,955,358 | 13,955,358 | 256,243 |
| Large Cap Stock | 35,128,064 | 29,213,936 | 16,756,868 | 16,756,868 | 314,322 |
| 256 |
THRIVENT SERIES FUND, INC.
Notes to Financial Statements
As of June 29, 2007 (unaudited)
| Gross | Gross | Balance of | Dividend Income | ||
| Purchases and | Sales and | Shares Held at | Value | Six Months ended | |
| Portfolio | Additions | Reductions | June 29, 2007 | June 29, 2007 | June 29, 2007 |
| Large Cap Index | $44,877,405 | $53,050,425 | $1,338,557 | $ 1,338,557 | $ 140,884 |
| Real Estate Securities | 58,139,136 | 56,497,947 | 16,318,150 | 16,318,150 | 229,435 |
| Balanced | 45,395,076 | 44,569,681 | 16,501,487 | 16,501,487 | 321,017 |
| High Yield | 15,585,135 | 29,259,498 | 808,722 | 808,722 | 312,963 |
| Diversified Income Plus | 8,731,330 | 4,958,307 | 5,929,478 | 5,929,478 | 133,592 |
| Income | 25,219,488 | 26,291,892 | 13,179,392 | 13,179,392 | 362,293 |
| Bond Index | 8,528,688 | 8,650,756 | 8,554,946 | 8,554,946 | 217,007 |
| Limited Maturity Bond | 55,880,535 | 58,126,422 | 13,194,889 | 13,194,889 | 287,883 |
| Mortgage Securities | 21 | — | 848 | 848 | 21 |
| Total Value and Dividend Income | $445,653,760 | $9,579,731 | |||
A summary of transactions for the six months ended June 29, 2007, in Thrivent Financial Securities Lending Trust, is as follows:
| Gross | Gross | Balance of | |||
| Purchases and | Sales and | Shares Held at | Value | ||
| Portfolio | Additions | Reductions | June 29, 2007 | June 29, 2007 | |
| Technology | $ 56,822,005 | $ 55,732,686 | $ 11,926,925 | $ 11,926,925 | |
| Partner Small Cap Growth | 71,083,965 | 54,776,805 | 44,049,755 | 44,049,755 | |
| Partner Small Cap Value | 46,358,905 | 88,659,310 | — | — | |
| Small Cap Stock | 124,903,677 | 226,272,952 | 117,802 | 117,802 | |
| Small Cap Index | 47,320,734 | 160,992,540 | 179,231 | 179,231 | |
| Mid Cap Growth | 198,920,795 | 362,437,700 | 3,726,929 | 3,726,929 | |
| Mid Cap Growth II | 12,069,298 | 15,930,332 | 4,125,807 | 4,125,807 | |
| Partner Mid Cap Value | 65,600,613 | 64,563,717 | 9,421,800 | 9,421,800 | |
| Mid Cap Stock | 274,744,106 | 328,785,284 | — | — | |
| Mid Cap Index | 58,078,051 | 94,536,666 | — | — | |
| Partner International Stock | 698,928,645 | 969,382,127 | 8,996,919 | 8,996,919 | |
| Partner All Cap Growth | 62,712,738 | 73,463,664 | 4,905,975 | 4,905,975 | |
| Large Cap Growth | 1,263,478,334 | 1,109,487,088 | 275,420,330 | 275,420,330 | |
| Large Cap Growth II | 31,112,637 | 35,465,286 | 560,250 | 560,250 | |
| Partner Growth Stock | 72,551,112 | 70,328,314 | 7,802,130 | 7,802,130 | |
| Large Cap Value | 375,911,963 | 351,268,283 | 44,034,950 | 44,034,950 | |
| Large Cap Stock | 97,602,652 | 67,577,100 | 62,311,825 | 62,311,825 | |
| Large Cap Index | 138,794,385 | 121,544,670 | 27,998,850 | 27,998,850 | |
| Real Estate Securities | 358,619,999 | 295,526,195 | 97,694,770 | 97,694,770 | |
| Balanced | 119,793,551 | 131,383,281 | 34,577,994 | 34,577,994 | |
| High Yield | 200,766,313 | 345,878,023 | 4,363,365 | 4,363,365 | |
| Diversified Income Plus | 51,897,453 | 69,658,288 | 9,700,875 | 9,700,875 | |
| Income | 243,105,821 | 323,471,366 | 54,624,063 | 54,624,063 | |
| Bond Index | 123,919,924 | 131,389,256 | 46,054,281 | 46,054,281 | |
| Limited Maturity Bond | 145,001,263 | 177,365,408 | 26,222,500 | 26,222,500 | |
| Total Value | $778,817,326 | ||||
| 257 |
THRIVENT SERIES FUND, INC.
Notes to Financial Statements
As of June 29, 2007 (unaudited)
(6) INVESTMENTS IN AFFILIATES — continued
A summary of transactions for the Thrivent Allocation Portfolios for the six months ended June 29, 2007, in the following Thrivent Portfolios, is as follows:
| Gross | Gross | Balance of | Dividend Income | ||||
| Purchases and | Sales and | Shares Held at | Value | January 1, 2007 – | |||
| Portfolio | Additions | Reductions | June 29, 2007 | June 29, 2007 | June 29, 2007 | ||
| Aggressive Allocation | |||||||
| Partner Small Cap Growth | $ 6,464,756 | $ 2,425,783 | 1,889,233 | $ | 26,598,317 | $ | — |
| Partner Small Cap Value | 6,226,462 | 8,806,741 | 986,566 | 19,852,955 | 90,388 | ||
| Small Cap Stock | 13,481,140 | 4,266,684 | 2,099,026 | 33,212,887 | 82,363 | ||
| Mid Cap Growth | 4,258,946 | 5,154,329 | 802,038 | 15,476,532 | 83,152 | ||
| Partner Mid Cap Value | 3,468,634 | 4,443,896 | 1,079,720 | 15,409,332 | — | ||
| Mid Cap Stock | 14,418,250 | 19,760 | 2,411,839 | 33,223,328 | 190,372 | ||
| Partner International Stock | 21,265,911 | 7,995,486 | 5,398,487 | 93,278,833 | 1,293,701 | ||
| Large Cap Growth | 22,073,010 | 70,059 | 5,132,666 | 92,624,093 | 422,732 | ||
| Large Cap Value | 7,186,941 | 25,150 | 2,246,031 | 30,917,964 | 347,990 | ||
| Large Cap Stock | 14,262,264 | 28,742 | 3,830,849 | 41,961,586 | 372,423 | ||
| Real Estate Securities | — | 276,727 | — | — | — | ||
| High Yield | 2,876,251 | 10,169,332 | 866,567 | 4,369,406 | 507,154 | ||
| Income | 15,588,868 | 7,186 | 2,263,411 | 22,012,800 | 220,067 | ||
| Limited Maturity Bond | 1,683,489 | 3,778,153 | 446,120 | 4,407,667 | 175,065 | ||
| Money Market | 5,429,840 | 3,593 | 8,787,014 | 8,787,014 | 96,515 | ||
| Total Value and Dividend Income | $442,132,714 | $3,881,922 | |||||
| Moderately Aggressive Allocation | |||||||
| Partner Small Cap Growth | 12,921,586 | 1,041,712 | 3,204,629 | 45,117,651 | — | ||
| Partner Small Cap Value | 12,465,816 | 15,503,657 | 1,487,935 | 29,942,163 | 142,142 | ||
| Small Cap Stock | 31,841,857 | 15,503,885 | 3,794,943 | 60,047,381 | 160,356 | ||
| Mid Cap Growth | 6,099,447 | 11,568,508 | 1,166,752 | 22,514,235 | 90,083 | ||
| Partner Mid Cap Value | 5,881,494 | 11,424,542 | 1,571,766 | 22,431,621 | — | ||
| Mid Cap Stock | 47,962,796 | 25,773,261 | 4,365,989 | 60,141,940 | 660,888 | ||
| Partner International Stock | 63,662,074 | 28,548,622 | 12,204,964 | 210,885,913 | 3,035,007 | ||
| Large Cap Growth | 74,717,794 | — | 14,091,188 | 254,289,573 | 1,145,487 | ||
| Large Cap Value | 69,147,440 | — | 15,236,507 | 209,739,665 | 2,202,976 | ||
| Large Cap Stock | 69,856,822 | — | 20,508,497 | 224,641,872 | 2,222,978 | ||
| Real Estate Securities | 12,217,681 | 3,020,845 | 1,501,036 | 30,039,173 | 353,181 | ||
| High Yield | 19,483,954 | 63,086,249 | 2,935,303 | 14,800,387 | 2,630,089 | ||
| Income | 101,920,167 | — | 19,957,063 | 194,092,418 | 3,100,412 | ||
| Limited Maturity Bond | 18,782,931 | 10,436,343 | 6,039,503 | 59,670,291 | 1,447,950 | ||
| Money Market | 38,156,496 | — | 59,559,431 | 59,559,431 | 639,788 | ||
| Total Value and Dividend Income | $1,497,913,714 | $17,831,337 | |||||
| 258 |
THRIVENT SERIES FUND, INC.
Notes to Financial Statements
As of June 29, 2007 (unaudited)
| Gross | Gross | Balance of | Dividend Income | |||
| Purchases and | Sales and | Shares Held at | Value | January 1, 2007 – | ||
| Portfolio | Additions | Reductions | June 29, 2007 | June 29, 2007 | June 29, 2007 | |
| Moderate Allocation | ||||||
| Partner Small Cap Growth | $ 26,181,589 | $ — | 1,880,280 | $ 26,472,280 | $ — | |
| Partner Small Cap Value | 17,454,393 | — | 873,593 | 17,579,579 | — | |
| Small Cap Stock | 24,908,745 | 62,981,828 | 1,689,375 | 26,730,976 | 238,681 | |
| Mid Cap Growth | 16,476,056 | — | 916,808 | 17,691,180 | 69,392 | |
| Partner Mid Cap Value | 16,394,029 | — | 1,235,093 | 17,626,747 | — | |
| Mid Cap Stock | 21,389,862 | 45,669,154 | 3,859,267 | 53,161,785 | 584,170 | |
| Partner International Stock | 53,177,230 | 24,956,472 | 10,274,690 | 177,533,281 | 2,562,547 | |
| Large Cap Growth | 68,484,004 | — | 14,162,964 | 255,584,855 | 1,187,045 | |
| Large Cap Value | 60,041,432 | — | 12,826,958 | 176,570,769 | 1,814,426 | |
| Large Cap Stock | 66,233,033 | — | 19,337,192 | 211,811,872 | 2,077,697 | |
| Real Estate Securities | 17,468,112 | 12,109,641 | 2,211,318 | 44,253,551 | 525,383 | |
| High Yield | 22,746,957 | 75,237,628 | 3,455,801 | 17,424,840 | 3,134,293 | |
| Income | 140,916,408 | — | 34,375,847 | 334,322,301 | 6,549,506 | |
| Limited Maturity Bond | 87,433,464 | — | 24,874,407 | 245,759,144 | 4,474,948 | |
| Money Market | 44,929,022 | — | 140,866,683 | 140,866,683 | 2,804,125 | |
| Total Value and Dividend Income | $1,763,389,843 | $26,022,214 | ||||
| Moderately Conservative Allocation | ||||||
| Small Cap Stock | 5,276,426 | 726,507 | 1,131,043 | 17,896,497 | 48,722 | |
| Mid Cap Stock | 7,146,473 | 12,780,126 | 867,229 | 11,946,161 | 190,681 | |
| Partner International Stock | 9,824,345 | 1,719,227 | 2,077,300 | 35,893,038 | 475,344 | |
| Large Cap Growth | 14,520,034 | 8,231 | 3,290,742 | 59,384,733 | 284,155 | |
| Large Cap Value | 12,198,611 | 5,198 | 2,809,040 | 38,668,116 | 411,398 | |
| Large Cap Stock | 15,965,110 | 6,065 | 4,344,798 | 47,591,183 | 449,804 | |
| Real Estate Securities | 5,872,878 | 4,393,585 | 745,051 | 14,910,186 | 178,197 | |
| High Yield | 6,285,014 | 19,926,305 | 1,164,606 | 5,872,179 | 866,573 | |
| Income | 39,950,581 | 10,397 | 9,142,065 | 88,911,153 | 1,680,799 | |
| Limited Maturity Bond | 68,141,360 | 29,457 | 21,553,196 | 212,945,576 | 4,033,541 | |
| Money Market | 17,234,198 | 7,980,679 | 59,438,974 | 59,438,974 | 1,446,383 | |
| Total Value and Dividend Income | $593,457,796 | $10,065,597 | ||||
(7) SECURITY TRANSACTIONS WITH AFFILIATED FUNDS
The Portfolios are permitted to purchase or sell securities from or to certain other Portfolios under specified conditions outlined in procedures adopted by the Board of Directors. The procedures have been designed to ensure that any purchase or sale of securities by the Portfolio from or to another portfolio or fund that is or could be considered an affiliate by virtue of having a common investment adviser (or affiliated investment advisers), common Directors and/or common officers complies with Rule 17a-7 of the 1940 Act. Further, as defined under the procedures, each transaction is effected at the current market price. Pursuant to these procedures, during the six months ended June 29, 2007, the Portfolios engaged in purchases and sales of securities of $22,498,293 and $32,782,858, respectively.
(8) SHARES OF BENEFICIAL INTEREST
The shares of each Portfolio have equal rights and privileges with all shares of that Portfolio. Shares in the Portfolio are currently sold only to separate accounts of Thrivent Financial, Thrivent Life Insurance Company and retirement plans sponsored by Thrivent Financial.
Authorized capital stock consists of ten billion shares as follows:
| Shares | Par | |
| Portfolio | Authorized | Value |
| Aggressive Allocation | 125,000,000 | $0.01 |
| Moderately Aggressive Allocation | 125,000,000 | 0.01 |
| Moderate Allocation | 125,000,000 | 0.01 |
| Moderately Conservative Allocation | 125,000,000 | 0.01 |
| Technology | 125,000,000 | 0.01 |
| Partner Small Cap Growth | 125,000,000 | 0.01 |
| 259 |
THRIVENT SERIES FUND, INC.
Notes to Financial Statements
As of June 29, 2007 (unaudited)
(8) SHARES OF BENEFICIAL INTEREST — continued
| Shares | Par | |||
| Portfolio | Authorized | Value | ||
| Partner Small Cap Value | 125,000,000 | 0.01 | ||
| Small Cap Stock | 150,000,000 | 0.01 | ||
| Small Cap Index | 200,000,000 | 0.01 | ||
| Mid Cap Growth | 400,000,000 | 0.01 | ||
| Mid Cap Growth II | 125,000,000 | 0.01 | ||
| Partner Mid Cap Value | 125,000,000 | 0.01 | ||
| Mid Cap Stock | 125,000,000 | 0.01 | ||
| Mid Cap Index | 150,000,000 | 0.01 | ||
| Partner International Stock | 400,000,000 | 0.01 | ||
| Partner All Cap | 125,000,000 | 0.01 | ||
| Large Cap Growth | 1,000,000,000 | 0.01 | ||
| Large Cap Growth II | 125,000,000 | 0.01 | ||
| Shares | Par | |||
| Portfolio | Authorized | Value | ||
| Partner Growth Stock | 125,000,000 | 0.01 | ||
| Large Cap Value | 200,000,000 | 0.01 | ||
| Large Cap Stock | 400,000,000 | 0.01 | ||
| Large Cap Index | 200,000,000 | 0.01 | ||
| Real Estate Securities | 150,000,000 | 0.01 | ||
| Balanced | 400,000,000 | 0.01 | ||
| High Yield | 1,000,000,000 | 0.01 | ||
| Diversified Income Plus | 200,000,000 | 0.01 | ||
| Income | 1,000,000,000 | 0.01 | ||
| Bond Index | 200,000,000 | 0.01 | ||
| Limited Maturity Bond | 200,000,000 | 0.01 | ||
| Mortgage Securities | 125,000,000 | 0.01 | ||
| Money Market | 2,000,000,000 | 0.01 | ||
Transactions in shares of beneficial interest were as follows:
| Portfolios | ||||||||
| Moderately Aggressive | ||||||||
| Aggressive Allocation | Allocation | Moderate Allocation | ||||||
| ———————————————————— | ———————————————————— | ———————————————————— | ||||||
| Six Months Ended June 29, 2007 | Shares | Amount | Shares | Amount | Shares | Amount | ||
| ————————————————————————— | ————————— | ————————— | ————————— | ————————— | ————————— | ————————— | ||
| Sold | 6,398,345 | $ 86,739,544 | 27,157,260 | $ 355,955,540 | 33,243,366 | $ 417,623,359 | ||
| Dividends and distributions reinvested | 298,960 | 4,236,025 | 1,291,185 | 17,495,558 | 2,318,790 | 29,668,452 | ||
| Redeemed | (804,897) | (10,993,203) | (606,393) | (7,945,269) | (617,139) | (7,816,896) | ||
| ————————— | ————————— | ————————— | ————————— | ————————— | ————————— | |||
| Net Change | 5,892,408 | $ 79,982,366 | 27,842,052 | $ 365,505,829 | 34,945,017 | $ 439,474,915 | ||
| =============== | =============== | =============== | =============== | =============== | =============== | |||
| Year Ended December 31, 2006 | ||||||||
| ————————————————————————— | ||||||||
| Sold | 20,190,642 | $ 244,344,760 | 63,267,853 | $ 747,345,075 | 74,388,680 | $ 853,499,160 | ||
| Dividends and distributions reinvested | 59 | 705 | 719 | 8,356 | 967 | 10,934 | ||
| Redeemed | (833,039) | (10,116,467) | (528,072) | (6,383,152) | (364,081) | (4,252,945) | ||
| ————————— | ————————— | ————————— | ————————— | ————————— | ————————— | |||
| Net Change | 19,357,662 | $ 234,228,998 | 62,740,500 | $ 740,970,279 | 74,025,566 | $ 849,257,149 | ||
| =============== | =============== | =============== | =============== | =============== | =============== | |||
| Portfolios | ||||||||
| Moderately Conservative | ||||||||
| Allocation | Technology | Partner Small Cap Growth | ||||||
| ———————————————————— | ———————————————————— | ———————————————————— | ||||||
| Six Months Ended June 29, 2007 | Shares | Amount | Shares | Amount | Shares | Amount | ||
| ————————————————————————— | ————————— | ————————— | ————————— | ————————— | ————————— | ————————— | ||
| Sold | 12,397,072 | $ 148,083,543 | 522,580 | $ 4,117,307 | 3,153,974 | $ 44,041,852 | ||
| Dividends and distributions reinvested | 1,061,717 | 12,722,985 | 212,077 | 1,732,497 | 491,415 | 6,970,287 | ||
| Redeemed | (799,352) | (9,538,618) | (1,223,387) | (9,686,462) | (726,102) | (10,172,942) | ||
| ————————— | ————————— | ————————— | ————————— | ————————— | ————————— | |||
| Net Change | 12,659,437 | $ 151,267,910 | (488,730) | $ (3,836,658) | 2,919,287 | $ 40,839,197 | ||
| =============== | =============== | =============== | =============== | =============== | =============== | |||
| Year Ended December 31, 2006 | ||||||||
| ————————————————————————— | ||||||||
| Sold | 24,414,181 | $ 270,558,250 | 1,225,212 | $ 9,229,797 | 3,878,555 | $ 50,503,375 | ||
| Dividends and distributions reinvested | 826 | 9,026 | 104,196 | 804,350 | 23,363 | 306,119 | ||
| Redeemed | (959,956) | (10,643,808) | (2,321,126) | (17,353,091) | (1,337,444) | (17,494,940) | ||
| ————————— | ————————— | ————————— | ————————— | ————————— | ————————— | |||
| Net Change | 23,455,051 | $ 259,923,468 | (991,718) | $ (7,318,944) | 2,564,474 | $ 33,314,554 | ||
| =============== | =============== | =============== | =============== | =============== | =============== | |||
| 260 |
THRIVENT SERIES FUND, INC.
Notes to Financial Statements
As of June 29, 2007 (unaudited)
| Portfolios | ||||||||
| Partner Small Cap Value | Small Cap Stock | Small Cap Index | ||||||
| Six Months Ended June 29, 2007 | Shares | Amount | Shares | Amount | Shares | Amount | ||
| ————————————————————————— | ————————— | ————————— | ————————— | ————————— | ————————— | ————————— | ||
| Sold | 2,111,203 | $ 42,636,755 | 4,462,282 | $ 70,760,685 | 318,746 | $ 7,006,718 | ||
| Dividends and distributions reinvested | 453,569 | 9,311,548 | 1,588,635 | 25,411,959 | 2,167,755 | 46,118,992 | ||
| Redeemed | (1,670,658) | (33,547,401) | (7,155,483) | (113,137,436) | (2,312,396) | (51,044,121) | ||
| ————————— | ————————— | ————————— | ————————— | ————————— | ————————— | |||
| Net Change | 894,114 | $ 18,400,902 | (1,104,566) | $ (16,964,792) | 174,105 | $ 2,081,589 | ||
| =============== | =============== | =============== | =============== | =============== | =============== | |||
| Year Ended December 31, 2006 | ||||||||
| ————————————————————————— | ||||||||
| Sold | 3,193,245 | $ 57,784,031 | 9,926,411 | $ 148,338,462 | 654,454 | $ 13,348,254 | ||
| Dividends and distributions reinvested | 297,485 | 5,202,918 | 1,492,155 | 22,016,002 | 782,147 | 15,793,821 | ||
| Redeemed | (1,445,158) | (26,508,120) | (4,904,777) | (74,012,947) | (5,432,410) | (111,046,239) | ||
| ————————— | ————————— | ————————— | ————————— | ————————— | ————————— | |||
| Net Change | 2,045,572 | $ 36,478,829 | 6,513,789 | $ 96,341,517 | (3,995,809) | $ (81,904,164) | ||
| =============== | =============== | =============== | =============== | =============== | =============== | |||
| Portfolios | ||||||||
| Mid Cap Growth | Mid Cap Growth II | Partner Mid Cap Value | ||||||
| Six Months Ended June 29, 2007 | Shares | Amount | Shares | Amount | Shares | Amount | ||
| ————————————————————————— | ————————— | ————————— | ————————— | ————————— | ————————— | ————————— | ||
| Sold | 1,679,520 | $ 30,701,506 | 70,835 | $ 810,198 | 2,696,146 | $ 36,707,515 | ||
| Dividends and distributions reinvested | 1,527,928 | 29,582,519 | 480,201 | 5,268,762 | 25,317 | 371,536 | ||
| Redeemed | (5,819,392) | (108,271,007) | (389,221) | (4,609,561) | (1,266,423) | (16,918,410) | ||
| ————————— | ————————— | ————————— | ————————— | ————————— | ————————— | |||
| Net Change | (2,611,944) | $ (47,986,982) | 161,815 | $ 1,469,399 | 1,455,040 | $ 20,160,641 | ||
| =============== | =============== | =============== | =============== | =============== | =============== | |||
| Year Ended December 31, 2006 | ||||||||
| ————————————————————————— | ||||||||
| Sold | 2,773,532 | $ 46,954,507 | 153,375 | $ 1,678,406 | 3,420,179 | $ 41,671,095 | ||
| Dividends and distributions reinvested | 45,302 | 776,730 | 41,646 | 461,941 | 69,785 | 909,108 | ||
| Redeemed | (11,702,626) | (197,492,966) | (1,014,358) | (11,125,465) | (1,133,233) | (14,213,477) | ||
| ————————— | ————————— | ————————— | ————————— | ————————— | ————————— | |||
| Net Change | (8,883,792) | $ (149,761,729) | (819,337) | $ (8,985,118) | 2,356,731 | $ 28,366,726 | ||
| =============== | =============== | =============== | =============== | =============== | =============== | |||
| Portfolios | ||||||||
| Mid Cap Stock | Mid Cap Index | Partner International Stock | ||||||
| Six Months Ended June 29, 2007 | Shares | Amount | Shares | Amount | Shares | Amount | ||
| ————————————————————————— | ————————— | ————————— | ————————— | ————————— | ————————— | ————————— | ||
| Sold | 6,138,989 | $ 85,296,262 | 399,661 | $ 6,370,295 | 8,393,529 | $ 142,770,402 | ||
| Dividends and distributions reinvested | 2,289,881 | 32,266,479 | 657,018 | 10,600,194 | 3,889,418 | 67,228,589 | ||
| Redeemed | (7,437,278) | (101,826,351) | (1,135,305) | (18,134,203) | (8,954,164) | (152,657,619) | ||
| ————————— | ————————— | ————————— | ————————— | ————————— | ————————— | |||
| Net Change | 991,592 | $ 15,736,390 | (78,626) | $ (1,163,714) | 3,328,783 | $ 57,341,372 | ||
| =============== | =============== | =============== | =============== | =============== | =============== | |||
| Year Ended December 31, 2006 | ||||||||
| ————————————————————————— | ||||||||
| Sold | 10,789,241 | $ 137,707,129 | 618,940 | $ 8,977,573 | 21,187,302 | $ 310,963,553 | ||
| Dividends and distributions reinvested | 1,605,404 | 20,117,634 | 619,039 | 8,899,930 | 1,092,819 | 15,477,487 | ||
| Redeemed | (2,765,542) | (35,413,338) | (2,508,212) | (36,318,454) | (17,548,113) | (255,878,797) | ||
| ————————— | ————————— | ————————— | ————————— | ————————— | ————————— | |||
| Net Change | 9,629,103 | $ 122,411,425 | (1,270,233) | $ (18,440,951) | 4,732,008 | $ 70,562,243 | ||
| =============== | =============== | =============== | =============== | =============== | =============== | |||
| 261 |
THRIVENT SERIES FUND, INC.
Notes to Financial Statements
As of June 29, 2007 (unaudited)
(8) SHARES OF BENEFICIAL INTEREST — continued
| Portfolios | ||||||||
| Partner All Cap | Large Cap Growth | Large Cap Growth II | ||||||
| ———————————————————— | ———————————————————— | ———————————————————— | ||||||
| Six Months Ended June 29, 2007 | Shares | Amount | Shares | Amount | Shares | Amount | ||
| ————————————————————————— | ————————— | ————————— | ————————— | ————————— | ————————— | ————————— | ||
| Sold | 544,814 | $ 6,739,088 | 10,773,638 | $ 188,443,524 | 74,380 | $ 839,623 | ||
| Dividends and distributions reinvested | 901,886 | 10,952,328 | 673,024 | 12,284,570 | 205,416 | 2,324,505 | ||
| Redeemed | (670,364) | (8,345,579) | (15,077,527) | (261,936,770) | (497,430) | (5,678,872) | ||
| ————————— | ————————— | ————————— | ————————— | ————————— | ————————— | |||
| Net Change | 776,336 | $ 9,345,837 | (3,630,865) | $ (61,208,676) | (217,634) | $ (2,514,744) | ||
| =============== | =============== | =============== | =============== | =============== | =============== | |||
| Year Ended December 31, 2006 | ||||||||
| ————————————————————————— | ||||||||
| Sold | 1,426,305 | $ 15,744,226 | 21,811,334 | $ 345,605,039 | 197,124 | $ 2,068,620 | ||
| Dividends and distributions reinvested | 35,776 | 388,596 | 729,424 | 11,608,717 | 27,075 | 284,664 | ||
| Redeemed | (1,292,889) | (14,318,877) | (34,005,785) | (537,000,150) | (1,064,904) | (11,155,089) | ||
| ————————— | ————————— | ————————— | ————————— | ————————— | ————————— | |||
| Net Change | 169,192 | $ 1,813,945 | (11,465,027) | $ (179,786,394) | (840,705) | $ (8,801,805) | ||
| =============== | =============== | =============== | =============== | =============== | =============== | |||
| Portfolios | ||||||||
| Partner Growth Stock | Large Cap Value | Large Cap Stock | ||||||
| ———————————————————— | ———————————————————— | ———————————————————— | ||||||
| Six Months Ended June 29, 2007 | Shares | Amount | Shares | Amount | Shares | Amount | ||
| ————————————————————————— | ————————— | ————————— | ————————— | ————————— | ————————— | ————————— | ||
| Sold | 503,227 | $ 6,814,571 | 10,165,442 | $ 140,600,271 | 14,675,891 | $ 159,233,664 | ||
| Dividends and distributions reinvested | 479,590 | 6,516,289 | 3,332,852 | 46,700,593 | 2,318,056 | 25,717,443 | ||
| Redeemed | (793,056) | (10,683,790) | (2,711,848) | (37,694,744) | (4,873,395) | (52,705,292) | ||
| ————————— | ————————— | ————————— | ————————— | ————————— | ————————— | |||
| Net Change | 189,761 | $ 2,647,070 | 10,786,446 | $ 149,606,120 | 12,120,552 | $ 132,245,815 | ||
| =============== | =============== | =============== | =============== | =============== | =============== | |||
| Year Ended December 31, 2006 | ||||||||
| ————————————————————————— | ||||||||
| Sold | 687,371 | $ 8,364,117 | 18,999,023 | $ 235,883,469 | 27,772,140 | $ 273,325,925 | ||
| Dividends and distributions reinvested | 248,097 | 2,950,418 | 1,658,271 | 19,749,674 | 1,394,664 | 13,411,922 | ||
| Redeemed | (2,171,642) | (26,186,208) | (7,147,503) | (89,232,613) | (13,152,828) | (130,562,174) | ||
| ————————— | ————————— | ————————— | ————————— | ————————— | ————————— | |||
| Net Change | (1,236,174) | $ (14,871,673) | 13,509,791 | $ 166,400,530 | 16,013,976 | $ 156,175,673 | ||
| =============== | =============== | =============== | =============== | =============== | =============== | |||
| Portfolios | ||||||||
| Large Cap Index | Real Estate Securities | Balanced | ||||||
| ———————————————————— | ———————————————————— | ———————————————————— | ||||||
| Six Months Ended June 29, 2007 | Shares | Amount | Shares | Amount | Shares | Amount | ||
| ————————————————————————— | ————————— | ————————— | ————————— | ————————— | ————————— | ————————— | ||
| Sold | 368,127 | $ 9,543,592 | 1,880,930 | $ 42,600,443 | 288,366 | $ 4,944,903 | ||
| Dividends and distributions reinvested | 1,531,434 | 39,806,862 | 1,146,586 | 25,277,521 | 944,517 | 16,298,675 | ||
| Redeemed | (3,018,393) | (78,115,665) | (2,448,879) | (56,394,932) | (4,001,323) | (68,394,892) | ||
| ————————— | ————————— | ————————— | ————————— | ————————— | ————————— | |||
| Net Change | (1,118,832) | $ (28,765,211) | 578,637 | $ 11,483,032 | (2,768,440) | $ (47,151,314) | ||
| =============== | =============== | =============== | =============== | =============== | =============== | |||
| Year Ended December 31, 2006 | ||||||||
| ————————————————————————— | ||||||||
| Sold | 691,346 | $ 16,066,541 | 4,268,377 | $ 87,573,901 | 620,704 | $ 9,756,199 | ||
| Dividends and distributions reinvested | 551,969 | 12,463,075 | 907,776 | 16,863,030 | 1,162,263 | 17,844,453 | ||
| Capital contribution from adviser | — | — | — | 180,068 | — | — | ||
| Redeemed | (8,173,756) | (189,358,615) | (4,253,297) | (86,220,843) | (10,892,307) | (170,840,720) | ||
| ————————— | ————————— | ————————— | ————————— | ————————— | ————————— | |||
| Net Change | (6,930,441) | $ (160,828,999) | 922,856 | $ 18,396,156 | (9,109,340) | $ (143,240,068) | ||
| =============== | =============== | =============== | =============== | =============== | =============== | |||
| 262 |
THRIVENT SERIES FUND, INC.
Notes to Financial Statements
As of June 29, 2007 (unaudited)
| Portfolios | ||||||||
| High Yield | Diversified Income Plus | Income | ||||||
| ———————————————————— | ———————————————————— | ———————————————————— | ||||||
| Six Months Ended June 29, 2007 | Shares | Amount | Shares | Amount | Shares | Amount | ||
| ————————————————————————— | ————————— | ————————— | ————————— | ————————— | ————————— | ————————— | ||
| Sold | 10,327,210 | $ 53,135,379 | 5,467,103 | $ 39,937,305 | 30,686,344 | $ 300,539,381 | ||
| Dividends and distributions reinvested | 6,516,250 | 33,489,702 | 362,450 | 2,651,827 | 3,044,512 | 30,089,130 | ||
| Redeemed | (49,562,603) | (253,326,493) | (833,387) | (6,066,541) | (8,018,524) | (79,265,070) | ||
| ————————— | ————————— | ————————— | ————————— | ————————— | ————————— | |||
| Net Change | (32,719,143) | $ (166,701,412) | 4,996,166 | $ 36,522,591 | 25,712,332 | $ 251,363,441 | ||
| =============== | =============== | =============== | =============== | =============== | =============== | |||
| Year Ended December 31, 2006 | ||||||||
| ————————————————————————— | ||||||||
| Sold | 38,855,737 | $ 194,598,413 | 3,545,527 | $ 24,172,724 | 33,046,392 | $ 323,375,361 | ||
| Dividends and distributions reinvested | 13,430,063 | 67,173,264 | 524,198 | 3,423,713 | 5,811,528 | 56,838,302 | ||
| Redeemed | (46,522,259) | (232,895,233) | (3,397,543) | (22,287,238) | (22,458,305) | (219,576,875) | ||
| ————————— | ————————— | ————————— | ————————— | ————————— | ————————— | |||
| Net Change | 5,763,541 | $ 28,876,444 | 672,182 | $ 5,309,199 | 16,399,615 | $ 160,636,788 | ||
| =============== | =============== | =============== | =============== | =============== | =============== | |||
| Portfolios | ||||||||
| Bond Index | Limited Maturity Bond | Mortgage Securities | ||||||
| ———————————————————— | ———————————————————— | ———————————————————— | ||||||
| Six Months Ended June 29, 2007 | Shares | Amount | Shares | Amount | Shares | Amount | ||
| ————————————————————————— | ————————— | ————————— | ————————— | ————————— | ————————— | ————————— | ||
| Sold | 665,562 | $ 6,786,378 | 18,004,738 | $ 178,344,653 | 217,591 | $ 2,107,957 | ||
| Dividends and distributions reinvested | 540,891 | 5,515,090 | 1,729,414 | 17,144,041 | 141,715 | 1,371,802 | ||
| Redeemed | (2,422,622) | (24,694,386) | (4,712,415) | (46,668,915) | (704,921) | (6,827,240) | ||
| ————————— | ————————— | ————————— | ————————— | ————————— | ————————— | |||
| Net Change | (1,216,169) | $ (12,392,918) | 15,021,737 | $ 148,819,779 | (345,615) | $ (3,347,481) | ||
| =============== | =============== | =============== | =============== | =============== | =============== | |||
| Year Ended December 31, 2006 | ||||||||
| ————————————————————————— | ||||||||
| Sold | 1,222,750 | $ 12,433,116 | 29,524,176 | $ 292,189,829 | 462,329 | $ 4,461,916 | ||
| Dividends and distributions reinvested | 1,160,306 | 11,775,809 | 2,422,268 | 23,958,814 | 317,173 | 3,061,441 | ||
| Redeemed | (5,558,654) | (56,376,854) | (10,631,303) | (105,290,694) | (1,689,128) | (16,305,538) | ||
| ————————— | ————————— | ————————— | ————————— | ————————— | ————————— | |||
| Net Change | (3,175,598) | $ (32,167,929) | 21,315,141 | $ 210,857,949 | (909,626) | $ (8,782,181) | ||
| =============== | =============== | =============== | =============== | =============== | =============== | |||
| Portfolio | ||||||||
| Money Market | ||||||||
| ———————————————————— | ||||||||
| Six Months Ended June 29, 2007 | Shares | Amount | ||||||
| ————————————————————————— | ————————— | ————————— | ||||||
| Sold | 998,714,890 | $ 998,714,890 | ||||||
| Dividends and distributions reinvested | 15,445,507 | 15,445,507 | ||||||
| Redeemed | (907,816,347) | (907,816,347) | ||||||
| ————————— | ————————— | |||||||
| Net Change | 106,344,050 | $ 106,344,050 | ||||||
| =============== | =============== | |||||||
| Year Ended December 31, 2006 | ||||||||
| ————————————————————————— | ||||||||
| Sold | 1,054,405,961 | $1,054,405,961 | ||||||
| Dividends and distributions reinvested | 23,015,583 | 23,015,583 | ||||||
| Redeemed | (860,650,210) | (860,650,210) | ||||||
| ————————— | ————————— | |||||||
| Net Change | 216,771,334 | $ 216,771,334 | ||||||
| =============== | =============== | |||||||
| 263 |
| Thrivent Series Fund, Inc. | Thrivent Series Fund, Inc. | |||||||||||||||
| Financial Highlights | Financial Highlights — continued | |||||||||||||||
| F O R A S H A R E O U T S T A N D I N G T H R O U G H O U T E A C H P E R I O D(a) | R A T I O S / | S U P P L E M E N T A L | D A T A | |||||||||||||
| Ratios to Average | ||||||||||||||||
| Net Assets Before Expenses | ||||||||||||||||
| Less Distributions | Ratios to Average Net | Waived, Credited or Paid | ||||||||||||||
| Income from Investment Operations | from | Assets(d) | Indirectly(d) | |||||||||||||
| Net Asset | Net Realized | Net | Net Asset | |||||||||||||
| Value, | Net | and Unrealized | Total from | Net | Realized | Value, | Net Assets | Net | Net | Portfolio | ||||||
| Beginning | Investment | Gain (Loss) on | Investment | Investment | Gain on | Total | End of | Total | End of Period | Investment | Investment | Turnover | ||||
| of Period | Income (Loss) | Investments(b) | Operations | Income | Investments | Distributions | Period | Return(c) | (in millions) | Expenses | Income (Loss) | Expenses | Income (Loss) | Rate | ||
| AGGRESSIVE ALLOCATION PORTFOLIO | ||||||||||||||||
| Six Months Ended 6/29/2007 (unaudited) | $13.01 | $0.10 | $1.05 | $1.15 | $(0.08) | $(0.06) | $(0.14) | $14.02 | 8.79% | $442.1 | 0.09% | 1.92% | 0.20% | 1.81% | 12% | |
| Year Ended 12/31/2006 | 11.44 | 0.07 | 1.50 | 1.57 | — | — | — | 13.01 | 13.77% | 333.6 | 0.04% | 0.88% | 0.20% | 0.72% | 8% | |
| Year Ended 12/31/2005 (e) | 10.00 | — | 1.44 | 1.44 | — | — | — | 11.44 | 14.45% | 71.8 | 0.10% | 0.11% | 0.37% | (0.16)% | 7% | |
| MODERATELY AGGRESSIVE ALLOCATION PORTFOLIO | ||||||||||||||||
| Six Months Ended 6/29/2007 (unaudited) | 12.66 | 0.12 | 0.77 | 0.89 | (0.11) | (0.05) | (0.16) | 13.39 | 7.02% | 1,497.7 | 0.09% | 2.71% | 0.17% | 2.63% | 15% | |
| Year Ended 12/31/2006 | 11.19 | 0.12 | 1.35 | 1.47 | — | — | — | 12.66 | 13.15% | 1,063.8 | 0.05% | 1.58% | 0.18% | 1.44% | 14% | |
| Year Ended 12/31/2005 (e) | 10.00 | 0.02 | 1.19 | 1.21 | (0.02) | — | (0.02) | 11.19 | 12.12% | 238.1 | 0.10% | 0.69% | 0.24% | 0.55% | 4% | |
| MODERATE ALLOCATION PORTFOLIO | ||||||||||||||||
| Six Months Ended 6/29/2007 (unaudited) | 12.22 | 0.14 | 0.53 | 0.67 | (0.15) | (0.07) | (0.22) | 12.67 | 5.47% | 1,763.2 | 0.11% | 3.35% | 0.17% | 3.28% | 16% | |
| Year Ended 12/31/2006 | 10.96 | 0.18 | 1.08 | 1.26 | — | — | — | 12.22 | 11.52% | 1,274.0 | 0.08% | 2.29% | 0.18% | 2.19% | 19% | |
| Year Ended 12/31/2005 (e) | 10.00 | 0.04 | 0.96 | 1.00 | (0.04) | — | (0.04) | 10.96 | 9.98% | 331.2 | 0.12% | 1.29% | 0.22% | 1.19% | 4% | |
| MODERATELY CONSERVATIVE ALLOCATION PORTFOLIO | ||||||||||||||||
| Six Months Ended 6/29/2007 (unaudited) | 11.69 | 0.14 | 0.34 | 0.48 | (0.20) | (0.07) | (0.27) | 11.90 | 4.10% | 593.4 | 0.16% | 3.82% | 0.20% | 3.78% | 9% | |
| Year Ended 12/31/2006 | 10.68 | 0.23 | 0.78 | 1.01 | — | — | — | 11.69 | 9.53% | 434.9 | 0.15% | 2.94% | 0.20% | 2.89% | 19% | |
| Year Ended 12/31/2005 (e) | 10.00 | 0.06 | 0.68 | 0.74 | (0.06) | — | (0.06) | 10.68 | 7.40% | 146.7 | 0.17% | 2.12% | 0.27% | 2.02% | 5% | |
| TECHNOLOGY PORTFOLIO | ||||||||||||||||
| Six Months Ended 6/29/2007 (unaudited) | 7.67 | (0.01) | 0.78 | 0.77 | — | (0.27) | (0.27) | 8.17 | 10.15% | 52.9 | 0.86% | (0.21)% | 0.87% | (0.22)% | 63% | |
| Year Ended 12/31/2006 | 7.53 | (0.02) | 0.26 | 0.24 | — | (0.10) | (0.10) | 7.67 | 3.26% | 53.4 | 0.88% | (0.23)% | 0.89% | (0.24)% | 133% | |
| Year Ended 12/31/2005 | 7.28 | (0.02) | 0.29 | 0.27 | (0.02) | — | (0.02) | 7.53 | 3.72% | 59.8 | 0.86% | (0.33)% | 0.88% | (0.34)% | 47% | |
| Year Ended 12/31/2004 | 6.94 | 0.02 | 0.32 | 0.34 | — | — | — | 7.28 | 4.85% | 56.6 | 0.73% | 0.35% | 0.90% | 0.18% | 59% | |
| Year Ended 12/31/2003 | 4.59 | (0.01) | 2.36 | 2.35 | — | — | — | 6.94 | 51.36% | 41.2 | 0.73% | (0.36)% | 1.17% | (0.80)% | 68% | |
| Year Ended 12/31/2002 | 7.87 | (0.01) | (3.27) | (3.28) | — | — | — | 4.59 | (41.71)% | 13.3 | 0.74% | (0.50)% | 1.59% | (1.35)% | 57% | |
| PARTNER SMALL CAP GROWTH PORTFOLIO | ||||||||||||||||
| Six Months Ended 6/29/2007 (unaudited) | 13.58 | (0.02) | 1.32 | 1.30 | — | (0.81) | (0.81) | 14.07 | 9.55% | 152.4 | 1.00% | (0.39)% | 1.11% | (0.49)% | 44% | |
| Year Ended 12/31/2006 | 12.11 | (0.05) | 1.57 | 1.52 | — | (0.05) | (0.05) | 13.58 | 12.59% | 107.4 | 0.99% | (0.42)% | 1.12% | (0.55)% | 113% | |
| Year Ended 12/31/2005 | 12.33 | (0.06) | 0.50 | 0.44 | — | (0.66) | (0.66) | 12.11 | 3.96% | 64.7 | 0.99% | (0.60)% | 1.17% | (0.78)% | 104% | |
| Year Ended 12/31/2004 | 11.07 | (0.07) | 1.33 | 1.26 | — | — | — | 12.33 | 11.32% | 53.9 | 1.00% | (0.69)% | 1.19% | (0.88)% | 255% | |
| Year Ended 12/31/2003 | 7.70 | (0.04) | 3.41 | 3.37 | — | — | — | 11.07 | 43.83% | 40.1 | 1.00% | (0.57)% | 1.28% | (0.85)% | 52% | |
| Year Ended 12/31/2002 | 10.55 | (0.04) | (2.81) | (2.85) | — | — | — | 7.70 | (27.02)% | 20.3 | 1.00% | (0.52)% | 1.11% | (0.63)% | 29% | |
| PARTNER SMALL CAP VALUE PORTFOLIO | ||||||||||||||||
| Six Months Ended 6/29/2007 (unaudited) | 19.57 | 0.06 | 1.52 | 1.58 | (0.07) | (0.96) | (1.03) | 20.12 | 7.98% | 186.3 | 0.86% | 0.73% | 0.88% | 0.72% | 17% | |
| Year Ended 12/31/2006 | 16.82 | 0.08 | 3.45 | 3.53 | (0.04) | (0.74) | (0.78) | 19.57 | 21.50% | 163.6 | 0.86% | 0.52% | 0.88% | 0.51% | 25% | |
| Year Ended 12/31/2005 | 16.56 | 0.07 | 0.71 | 0.78 | (0.04) | (0.48) | (0.52) | 16.82 | 4.89% | 106.2 | 0.88% | 0.51% | 0.89% | 0.49% | 37% | |
| Year Ended 12/31/2004 | 13.73 | 0.07 | 2.95 | 3.02 | — | (0.19) | (0.19) | 16.56 | 22.26% | 77.5 | 0.80% | 0.51% | 0.99% | 0.32% | 106% | |
| Year Ended 12/31/2003 (f) | 10.00 | 0.01 | 4.15 | 4.16 | (0.01) | (0.42) | (0.43) | 13.73 | 41.55% | 19.8 | 0.80% | 0.12% | 1.69% | (0.77)% | 54% | |
| (a) All per share amounts have been rounded to the nearest cent. | ||||||||||||||||
| (b) The amount shown may not correlate with the change in aggregate gains and losses of portfolio securities due to the timing of sales and redemptions of | (d) Computed on an annualized basis for periods less than one year. | |||||||||||||||
| fund shares. | (e) Since inception, April 29, 2005. | |||||||||||||||
| (c) Total investment return assumes dividend reinvestment and does not reflect any deduction for sales charges. Not annualized for periods less than one year. | (f) Since inception, April 30, 2003. | |||||||||||||||
| The accompanying Notes to Financial Statements are an integral part of this schedule. | The accompanying Notes to Financial Statements are an integral part of this schedule. | |||||||||||||||
| 264 | 265 | |||||||||||||||
| Thrivent Series Fund, Inc. | Thrivent Series Fund, Inc. | |||||||||||||||
| Financial Highlights — continued | Financial Highlights — continued | |||||||||||||||
| F O R A S H A R E O U T S T A N D I N G T H R O U G H O U T E A C H P E R I O D(a) | R A T I O S / S U P P L E M E N T A L D A T A | |||||||||||||||
| Ratios to Average | ||||||||||||||||
| Net Assets Before Expenses | ||||||||||||||||
| Less Distributions | Ratios to Average Net | Waived, Credited or Paid | ||||||||||||||
| Income from Investment Operations | from | Assets(d) | Indirectly(d) | |||||||||||||
| Net Asset | Net Realized | Net | Net Asset | |||||||||||||
| Value, | Net | and Unrealized | Total from | Net | Realized | Value, | Net Assets | Net | Net | Portfolio | ||||||
| Beginning | Investment | Gain (Loss) on | Investment | Investment | Gain on | Total | End of | Total | End of Period | Investment | Investment | Turnover | ||||
| of Period | Income (Loss) | Investments(b) | Operations | Income | Investments | Distributions | Period | Return(c) | (in millions) | Expenses | Income (Loss) | Expenses | Income (Loss) | Rate | ||
| SMALL CAP STOCK PORTFOLIO | ||||||||||||||||
| Six Months Ended 6/29/2007 (unaudited) | $15.43 | $0.07 | $1.25 | $1.32 | $(0.05) | $(0.88) | $(0.93) | $15.82 | 8.47% | $399.6 | 0.72% | 0.79% | 0.73% | 0.78% | 46% | |
| Year Ended 12/31/2006 | 14.62 | 0.05 | 1.78 | 1.83 | (0.02) | (1.00) | (1.02) | 15.43 | 12.79% | 406.7 | 0.73% | 0.33% | 0.74% | 0.32% | 94% | |
| Year Ended 12/31/2005 | 14.74 | 0.02 | 1.16 | 1.18 | (0.01) | (1.29) | (1.30) | 14.62 | 8.81% | 290.2 | 0.74% | 0.20% | 0.76% | 0.19% | 113% | |
| Year Ended 12/31/2004 | 12.34 | 0.01 | 2.56 | 2.57 | — | (0.17) | (0.17) | 14.74 | 20.94% | 216.8 | 0.76% | 0.06% | 0.78% | 0.04% | 93% | |
| Year Ended 12/31/2003 | 8.81 | — | 3.53 | 3.53 | — | — | — | 12.34 | 40.19% | 156.9 | 0.69% | 0.00% | 0.82% | (0.13)% | 122% | |
| Year Ended 12/31/2002 | 11.09 | — | (2.26) | (2.26) | — | (0.02) | (0.02) | 8.81 | (20.41)% | 87.9 | 0.69% | 0.04% | 0.96% | (0.23)% | 92% | |
| SMALL CAP INDEX PORTFOLIO | ||||||||||||||||
| Six Months Ended 6/29/2007 (unaudited) | 21.55 | 0.13 | 1.71 | 1.84 | (0.14) | (2.33) | (2.47) | 20.92 | 8.35% | 430.6 | 0.39% | 1.09% | 0.39% | 1.08% | 7% | |
| Year Ended 12/31/2006 | 19.41 | 0.17 | 2.64 | 2.81 | (0.14) | (0.53) | (0.67) | 21.55 | 14.72% | 439.8 | 0.39% | 0.71% | 0.39% | 0.71% | 14% | |
| Year Ended 12/31/2005 | 19.26 | 0.15 | 1.18 | 1.33 | (0.13) | (1.05) | (1.18) | 19.41 | 7.32% | 473.7 | 0.39% | 0.75% | 0.39% | 0.75% | 14% | |
| Year Ended 12/31/2004 | 15.83 | 0.13 | 3.36 | 3.49 | (0.06) | — | (0.06) | 19.26 | 22.10% | 485.9 | 0.34% | 0.80% | 0.39% | 0.75% | 21% | |
| Year Ended 12/31/2003 | 11.52 | 0.07 | 4.29 | 4.36 | (0.05) | — | (0.05) | 15.83 | 38.16% | 394.8 | 0.40% | 0.52% | 0.40% | 0.52% | 15% | |
| Year Ended 12/31/2002 | 13.59 | 0.05 | (2.07) | (2.02) | — | (0.05) | (0.05) | 11.52 | (14.87)% | 273.4 | 0.40% | 0.40% | 0.40% | 0.40% | 17% | |
| MID CAP GROWTH PORTFOLIO | ||||||||||||||||
| Six Months Ended 6/29/2007 (unaudited) | 17.59 | 0.03 | 2.55 | 2.58 | (0.08) | (0.79) | (0.87) | 19.30 | 14.65% | 668.0 | 0.45% | 0.28% | 0.45% | 0.28% | 42% | |
| Year Ended 12/31/2006 | 16.21 | 0.08 | 1.32 | 1.40 | (0.02) | — | (0.02) | 17.59 | 8.63% | 654.9 | 0.45% | 0.40% | 0.45% | 0.40% | 149% | |
| Year Ended 12/31/2005 | 14.57 | 0.02 | 1.62 | 1.64 | — | — | — | 16.21 | 11.27% | 747.5 | 0.45% | 0.11% | 0.45% | 0.11% | 135% | |
| Year Ended 12/31/2004 | 13.08 | — | 1.49 | 1.49 | — | — | — | 14.57 | 11.36% | 784.9 | 0.45% | 0.00% | 0.46% | (0.01)% | 150% | |
| Year Ended 12/31/2003 | 9.63 | — | 3.45 | 3.45 | — | — | — | 13.08 | 35.92% | 478.8 | 0.40% | (0.03)% | 0.44% | (0.07)% | 79% | |
| Year Ended 12/31/2002 | 13.04 | — | (3.39) | (3.39) | (0.02) | — | (0.02) | 9.63 | (26.09)% | 348.8 | 0.40% | (0.06)% | 0.45% | (0.11)% | 51% | |
| MID CAP GROWTH PORTFOLIO II | ||||||||||||||||
| Six Months Ended 6/29/2007 (unaudited) | 11.37 | 0.01 | 1.66 | 1.67 | (0.06) | (2.05) | (2.11) | 10.93 | 14.66% | 32.3 | 0.61% | 0.09% | 1.11% | (0.42)% | 42% | |
| Year Ended 12/31/2006 | 10.60 | 0.06 | 0.85 | 0.91 | (0.02) | (0.12) | (0.14) | 11.37 | 8.60% | 31.7 | 0.39% | 0.44% | 1.11% | (0.28)% | 147% | |
| Year Ended 12/31/2005 | 9.53 | 0.02 | 1.05 | 1.07 | — | — | — | 10.60 | 11.22% | 38.2 | 0.39% | 0.17% | 1.10% | (0.54)% | 136% | |
| Year Ended 12/31/2004 | 8.19 | — | 1.34 | 1.34 | — | — | — | 9.53 | 16.41% | 38.4 | 0.47% | (0.04)% | 1.16% | (0.73)% | 227% | |
| Year Ended 12/31/2003 | 5.96 | (0.03) | 2.26 | 2.23 | — | — | — | 8.19 | 37.34% | 30.5 | 0.90% | (0.47)% | 1.34% | (0.91)% | 105% | |
| Year Ended 12/31/2002 | 10.60 | (0.02) | (4.60) | (4.62) | — | (0.02) | (0.02) | 5.96 | (43.66)% | 17.6 | 0.90% | (0.36)% | 1.02% | (0.48)% | 171% | |
| PARTNER MID CAP VALUE PORTFOLIO | ||||||||||||||||
| Six Months Ended 6/29/2007 (unaudited) | 13.06 | 0.06 | 1.22 | 1.28 | — | (0.07) | (0.07) | 14.27 | 9.78% | 80.8 | 0.90% | 1.03% | 0.91% | 1.02% | 38% | |
| Year Ended 12/31/2006 | 11.48 | 0.10 | 1.70 | 1.80 | (0.10) | (0.12) | (0.22) | 13.06 | 15.72% | 54.9 | 0.96% | 1.07% | 0.98% | 1.05% | 57% | |
| Year Ended 12/31/2005 (e) | 10.00 | 0.04 | 1.51 | 1.55 | (0.04) | (0.03) | (0.07) | 11.48 | 15.44% | 21.2 | 1.25% | 0.88% | 1.49% | 0.63% | 30% | |
| MID CAP STOCK PORTFOLIO | ||||||||||||||||
| Six Months Ended 6/29/2007 (unaudited) | 13.41 | 0.04 | 1.43 | 1.47 | (0.12) | (0.98) | (1.10) | 13.78 | 10.68% | 387.3 | 0.72% | 0.75% | 0.73% | 0.73% | 104% | |
| Year Ended 12/31/2006 | 12.82 | 0.13 | 1.51 | 1.64 | (0.05) | (1.00) | (1.05) | 13.41 | 13.41% | 363.8 | 0.73% | 1.26% | 0.75% | 1.24% | 184% | |
| Year Ended 12/31/2005 | 11.66 | 0.05 | 1.76 | 1.81 | (0.02) | (0.63) | (0.65) | 12.82 | 16.37% | 224.2 | 0.76% | 0.62% | 0.78% | 0.60% | 124% | |
| Year Ended 12/31/2004 | 10.04 | 0.02 | 1.70 | 1.72 | — | (0.10) | (0.10) | 11.66 | 17.24% | 111.7 | 0.68% | 0.26% | 0.82% | 0.12% | 126% | |
| Year Ended 12/31/2003 | 7.60 | 0.02 | 2.44 | 2.46 | (0.02) | — | (0.02) | 10.04 | 32.28% | 73.4 | 0.68% | 0.31% | 1.01% | (0.02)% | 85% | |
| Year Ended 12/31/2002 | 9.02 | 0.02 | (1.42) | (1.40) | (0.02) | — | (0.02) | 7.60 | (15.46)% | 31.3 | 0.68% | 0.36% | 1.05% | (0.01)% | 59% | |
| (a) All per share amounts have been rounded to the nearest cent. | (c) Total investment return assumes dividend reinvestment and does not reflect any deduction for sales charges. Not annualized for periods less than one year. | |||||||||||||||
| (b)The amount shown may not correlate with the change in aggregate gains and losses of portfolio securities due to the timing of sales and redemptions of | (d)Computed on an annualized basis for periods less than one year. | |||||||||||||||
| fund shares. | (e) Since inception, April 29, 2005. | |||||||||||||||
| The accompanying Notes to Financial Statements are an integral part of this schedule. | The accompanying Notes to Financial Statements are an integral part of this schedule. | |||||||||||||||
| 266 | 267 | |||||||||||||||
| Thrivent Series Fund, Inc. | Thrivent Series Fund, Inc. | |||||||||||||||
| Financial Highlights — continued | Financial Highlights — continued | |||||||||||||||
| F O R A S H A R E O U T S T A N D I N G T H R O U G H O U T E A C H P E R I O D(a) | R A T I O S / S U P P L E M E N T A L D A T A | |||||||||||||||
| Less Distributions | Ratios to Average Net | Waived, Credited or Paid | ||||||||||||||
| Income from Investment Operations | from | Assets(d) | Indirectly(d) | |||||||||||||
| Net Asset | Net Realized | Net | Net Asset | |||||||||||||
| Value, | Net | and Unrealized | Total from | Net | Realized | Value, | Net Assets | Net | Net | Portfolio | ||||||
| Beginning | Investment | Gain (Loss) on | Investment | Investment | Gain on | Total | End of | Total | End of Period | Investment | Investment | Turnover | ||||
| of Period | Income (Loss) | Investments(b) | Operations | Income | Investments | Distributions | Period | Return(c) | (in millions) | Expenses | Income (Loss) | Expenses | Income (Loss) | Rate | ||
| MID CAP INDEX PORTFOLIO | ||||||||||||||||
| Six Months Ended 6/29/2007 (unaudited) | $15.05 | $0.12 | $1.66 | $1.78 | $(0.15) | $(0.90) | $(1.05) | $15.78 | 11.70% | $166.2 | 0.42% | 1.38% | 0.43% | 1.37% | 7% | |
| Year Ended 12/31/2006 | 14.43 | 0.18 | 1.20 | 1.38 | (0.14) | (0.62) | (0.76) | 15.05 | 9.81% | 159.8 | 0.43% | 1.10% | 0.43% | 1.10% | 11% | |
| Year Ended 12/31/2005 | 13.34 | 0.14 | 1.44 | 1.58 | (0.07) | (0.42) | (0.49) | 14.43 | 12.34% | 171.5 | 0.43% | 1.08% | 0.44% | 1.07% | 19% | |
| Year Ended 12/31/2004 | 11.53 | 0.08 | 1.74 | 1.82 | — | (0.01) | (0.01) | 13.34 | 15.75% | 135.4 | 0.45% | 0.77% | 0.46% | 0.76% | 23% | |
| Year Ended 12/31/2003 | 8.65 | 0.06 | 2.95 | 3.01 | (0.06) | (0.07) | (0.13) | 11.53 | 34.80% | 76.2 | 0.36% | 0.88% | 0.64% | 0.60% | 25% | |
| Year Ended 12/31/2002 | 10.23 | 0.05 | (1.54) | (1.49) | (0.05) | (0.04) | (0.09) | 8.65 | (14.65)% | 30.6 | 0.34% | 0.79% | 0.83% | 0.30% | 14% | |
| PARTNER INTERNATIONAL STOCK PORTFOLIO | ||||||||||||||||
| Six Months Ended 6/29/2007 (unaudited) | 16.32 | 0.19 | 1.56 | 1.75 | (0.24) | (0.55) | (0.79) | 17.28 | 10.70% | 1,477.9 | 0.82% | 2.40% | 0.88% | 2.35% | 74% | |
| Year Ended 12/31/2006 | 13.63 | 0.23 | 2.67 | 2.90 | (0.21) | — | (0.21) | 16.32 | 21.50% | 1,341.8 | 0.89% | 1.51% | 0.89% | 1.51% | 50% | |
| Year Ended 12/31/2005 | 12.12 | 0.17 | 1.48 | 1.65 | (0.14) | — | (0.14) | 13.63 | 13.71% | 1,055.9 | 0.94% | 1.58% | 0.94% | 1.58% | 46% | |
| Year Ended 12/31/2004 | 10.62 | 0.13 | 1.52 | 1.65 | (0.15) | — | (0.15) | 12.12 | 15.65% | 721.0 | 0.94% | 1.18% | 0.94% | 1.18% | 63% | |
| Year Ended 12/31/2003 | 8.23 | 0.11 | 2.41 | 2.52 | (0.13) | — | (0.13) | 10.62 | 31.27% | 420.7 | 0.85% | 1.28% | 0.96% | 1.17% | 26% | |
| Year Ended 12/31/2002 | 10.02 | 0.10 | (1.85) | (1.75) | (0.04) | — | (0.04) | 8.23 | (17.43)% | 323.3 | 0.85% | 1.08% | 0.95% | 0.98% | 20% | |
| PARTNER ALL CAP PORTFOLIO | ||||||||||||||||
| Six Months Ended 6/29/2007 (unaudited) | 12.03 | 0.03 | 1.35 | 1.38 | (0.06) | (1.32) | (1.38) | 12.03 | 11.37% | 105.9 | 0.84% | 0.56% | 1.05% | 0.36% | 63% | |
| Year Ended 12/31/2006 | 10.47 | 0.06 | 1.55 | 1.61 | (0.05) | — | (0.05) | 12.03 | 15.47% | 96.5 | 0.85% | 0.51% | 1.05% | 0.31% | 162% | |
| Year Ended 12/31/2005 | 8.89 | 0.05 | 1.58 | 1.63 | (0.05) | — | (0.05) | 10.47 | 18.33% | 82.2 | 0.95% | 0.62% | 1.08% | 0.49% | 150% | |
| Year Ended 12/31/2004 | 7.83 | 0.04 | 1.03 | 1.07 | (0.01) | — | (0.01) | 8.89 | 13.64% | 59.7 | 0.95% | 0.55% | 1.13% | 0.37% | 172% | |
| Year Ended 12/31/2003 | 6.35 | 0.02 | 1.47 | 1.49 | (0.01) | — | (0.01) | 7.83 | 23.52% | 48.6 | 0.95% | 0.26% | 1.12% | 0.09% | 163% | |
| Year Ended 12/31/2002 | 10.30 | (0.01) | (3.93) | (3.94) | — | (0.01) | (0.01) | 6.35 | (38.33)% | 35.5 | 0.95% | (0.18)% | 1.03% | (0.26)% | 192% | |
| LARGE CAP GROWTH PORTFOLIO | ||||||||||||||||
| Six Months Ended 6/29/2007 (unaudited) | 16.64 | 0.06 | 1.44 | 1.50 | (0.09) | — | (0.09) | 18.05 | 8.99% | 2,463.1 | 0.45% | 0.60% | 0.45% | 0.60% | 93% | |
| Year Ended 12/31/2006 | 15.67 | 0.09 | 0.96 | 1.05 | (0.08) | — | (0.08) | 16.64 | 6.72% | 2,331.7 | 0.45% | 0.54% | 0.45% | 0.53% | 141% | |
| Year Ended 12/31/2005 | 14.76 | 0.08 | 0.95 | 1.03 | (0.12) | — | (0.12) | 15.67 | 7.01% | 2,375.0 | 0.45% | 0.50% | 0.45% | 0.50% | 111% | |
| Year Ended 12/31/2004 | 13.78 | 0.11 | 0.94 | 1.05 | (0.07) | — | (0.07) | 14.76 | 7.68% | 2,448.2 | 0.45% | 0.79% | 0.45% | 0.79% | 104% | |
| Year Ended 12/31/2003 | 10.62 | 0.07 | 3.15 | 3.22 | (0.06) | — | (0.06) | 13.78 | 30.49% | 2,478.8 | 0.40% | 0.56% | 0.42% | 0.54% | 101% | |
| Year Ended 12/31/2002 | 15.25 | 0.07 | (4.63) | (4.56) | (0.07) | — | (0.07) | 10.62 | (29.99)% | 2,004.7 | 0.40% | 0.48% | 0.42% | 0.46% | 83% | |
| LARGE CAP GROWTH PORTFOLIO II | ||||||||||||||||
| Six Months Ended 6/29/2007 (unaudited) | 11.00 | 0.03 | 0.97 | 1.00 | (0.08) | (0.73) | (0.81) | 11.19 | 8.93% | 34.1 | 0.65% | 0.37% | 1.05% | (0.04)% | 88% | |
| Year Ended 12/31/2006 | 10.37 | 0.07 | 0.63 | 0.70 | (0.06) | (0.01) | (0.07) | 11.00 | 6.78% | 35.9 | 0.40% | 0.57% | 1.03% | (0.07)% | 132% | |
| Year Ended 12/31/2005 | 9.77 | 0.06 | 0.62 | 0.68 | (0.08) | — | (0.08) | 10.37 | 7.08% | 42.6 | 0.40% | 0.55% | 1.00% | (0.05)% | 113% | |
| Year Ended 12/31/2004 | 9.08 | 0.08 | 0.61 | 0.69 | — | — | — | 9.77 | 7.56% | 43.9 | 0.38% | 0.87% | 1.08% | 0.17% | 177% | |
| Year Ended 12/31/2003 | 7.40 | 0.01 | 1.68 | 1.69 | (0.01) | — | (0.01) | 9.08 | 22.75% | 39.1 | 0.80% | 0.10% | 1.26% | (0.36)% | 261% | |
| Year Ended 12/31/2002 | 10.08 | 0.01 | (2.68) | (2.67) | (0.01) | — | (0.01) | 7.40 | (26.53)% | 24.5 | 0.80% | 0.12% | 0.90% | 0.02% | 214% | |
| PARTNER GROWTH STOCK PORTFOLIO | ||||||||||||||||
| Six Months Ended 6/29/2007 (unaudited) | 13.08 | 0.05 | 1.07 | 1.12 | (0.07) | (0.68) | (0.75) | 13.45 | 8.49% | 122.5 | 0.79% | 0.68% | 0.89% | 0.57% | 21% | |
| Year Ended 12/31/2006 | 11.86 | 0.07 | 1.45 | 1.52 | (0.02) | (0.28) | (0.30) | 13.08 | 13.17% | 116.7 | 0.79% | 0.55% | 0.90% | 0.44% | 39% | |
| Year Ended 12/31/2005 | 11.21 | 0.02 | 0.68 | 0.70 | (0.05) | — | (0.05) | 11.86 | 6.32% | 120.4 | 0.90% | 0.23% | 0.90% | 0.22% | 42% | |
| Year Ended 12/31/2004 | 10.19 | 0.07 | 0.95 | 1.02 | — | — | — | 11.21 | 9.95% | 107.4 | 0.80% | 0.64% | 0.92% | 0.52% | 33% | |
| Year Ended 12/31/2003 | 7.79 | 0.02 | 2.40 | 2.42 | (0.02) | — | (0.02) | 10.19 | 31.05% | 69.7 | 0.80% | 0.26% | 0.96% | 0.10% | 41% | |
| Year Ended 12/31/2002 | 10.16 | 0.01 | (2.37) | (2.36) | (0.01) | — | (0.01) | 7.79 | (23.20)% | 36.8 | 0.80% | 0.26% | 0.89% | 0.17% | 37% | |
| (a) All per share amounts have been rounded to the nearest cent. | ||||||||||||||||
| (b)The amount shown may not correlate with the change in aggregate gains and losses of portfolio securities due to the timing of sales and redemptions of | (c)Total investment return assumes dividend reinvestment and does not reflect any deduction for sales charges. Not annualized for periods less than one year. | |||||||||||||||
| fund shares. | (d) Computed on an annualized basis for periods less than one year. | |||||||||||||||
| The accompanying Notes to Financial Statements are an integral part of this schedule. | The accompanying Notes to Financial Statements are an integral part of this schedule. | |||||||||||||||
| 268 | 269 | |||||||||||||||
| Thrivent Series Fund, Inc. | Thrivent Series Fund, Inc. | |||||||||||||||
| Financial Highlights — continued | Financial Highlights — continued | |||||||||||||||
| F O R A S H A R E O U T S T A N D I N G T H R O U G H O U T E A C H P E R I O D(a) | R A T I O S / S U P P L E M E N T A L D A T A | |||||||||||||||
| Ratios to Average | ||||||||||||||||
| Ratios to Average Net | Net Assets Before Expenses | |||||||||||||||
| Less Distributions | Assets(d) | Waived, Credited or Paid | ||||||||||||||
| Income from Investment Operations | from | Indirectly(d) | ||||||||||||||
| Net Asset | Net Realized | Net | Net Asset | |||||||||||||
| Value, | Net | and Unrealized | Total from | Net | Realized | Value, | Net Assets | Net | Net | Portfolio | ||||||
| Beginning | Investment | Gain (Loss) on | Investment | Investment | Gain on | Total | End of | Total | End of Period | Investment | Investment | Turnover | ||||
| of Period | Income (Loss) | Investments(b) | Operations | Income | Investments | Distributions | Period | Return(c) | (in millions) | Expenses | Income (Loss) | Expenses | Income (Loss) | Rate | ||
| LARGE CAP VALUE PORTFOLIO | ||||||||||||||||
| Six Months Ended 6/29/2007 (unaudited) | $13.50 | $0.08 | $0.95 | $1.03 | $(0.17) | $(0.59) | $(0.76) | $13.77 | 7.48% | $935.5 | 0.64% | 1.61% | 0.65% | 1.60% | 22% | |
| Year Ended 12/31/2006 | 11.78 | 0.18 | 1.97 | 2.15 | (0.14) | (0.29) | (0.43) | 13.50 | 18.72% | 771.7 | 0.64% | 1.65% | 0.65% | 1.64% | 43% | |
| Year Ended 12/31/2005 | 11.14 | 0.14 | 0.63 | 0.77 | (0.13) | — | (0.13) | 11.78 | 7.02% | 514.5 | 0.65% | 1.53% | 0.65% | 1.52% | 53% | |
| Year Ended 12/31/2004 | 9.76 | 0.13 | 1.25 | 1.38 | — | — | — | 11.14 | 14.13% | 351.2 | 0.66% | 1.52% | 0.66% | 1.52% | 51% | |
| Year Ended 12/31/2003 | 7.74 | 0.09 | 2.02 | 2.11 | (0.09) | — | (0.09) | 9.76 | 27.08% | 220.4 | 0.60% | 1.41% | 0.68% | 1.33% | 32% | |
| Year Ended 12/31/2002 | 10.14 | 0.07 | (2.39) | (2.32) | (0.08) | — | (0.08) | 7.74 | (22.85)% | 95.1 | 0.60% | 1.39% | 0.66% | 1.33% | 104% | |
| LARGE CAP STOCK PORTFOLIO | ||||||||||||||||
| Six Months Ended 6/29/2007 (unaudited) | 10.54 | 0.06 | 0.65 | 0.71 | (0.12) | (0.18) | (0.30) | 10.95 | 6.77% | 994.3 | 0.66% | 1.48% | 0.66% | 1.48% | 79% | |
| Year Ended 12/31/2006 | 9.62 | 0.13 | 0.99 | 1.12 | (0.07) | (0.13) | (0.20) | 10.54 | 11.95% | 829.3 | 0.67% | 1.45% | 0.68% | 1.44% | 77% | |
| Year Ended 12/31/2005 | 9.28 | 0.07 | 0.42 | 0.49 | (0.08) | (0.07) | (0.15) | 9.62 | 5.31% | 602.4 | 0.71% | 0.95% | 0.72% | 0.94% | 60% | |
| Year Ended 12/31/2004 | 8.56 | 0.10 | 0.62 | 0.72 | — | — | — | 9.28 | 8.49% | 442.9 | 0.72% | 1.16% | 0.73% | 1.15% | 68% | |
| Year Ended 12/31/2003 | 7.08 | 0.04 | 1.48 | 1.52 | (0.04) | — | (0.04) | 8.56 | 21.36% | 282.4 | 0.64% | 0.80% | 0.77% | 0.67% | 33% | |
| Year Ended 12/31/2002 | 9.19 | 0.04 | (2.11) | (2.07) | (0.04) | — | (0.04) | 7.08 | (22.50)% | 76.6 | 0.64% | 0.67% | 0.86% | 0.45% | 7% | |
| LARGE CAP INDEX PORTFOLIO | ||||||||||||||||
| Six Months Ended 6/29/2007 (unaudited) | 25.32 | 0.24 | 1.50 | 1.74 | (0.44) | (1.06) | (1.50) | 25.56 | 6.76% | 705.4 | 0.36% | 1.60% | 0.36% | 1.59% | 2% | |
| Year Ended 12/31/2006 | 22.31 | 0.43 | 2.94 | 3.37 | (0.36) | — | (0.36) | 25.32 | 15.36% | 727.3 | 0.36% | 1.59% | 0.36% | 1.59% | 7% | |
| Year Ended 12/31/2005 | 21.63 | 0.35 | 0.67 | 1.02 | (0.34) | — | (0.34) | 22.31 | 4.75% | 795.3 | 0.35% | 1.54% | 0.35% | 1.54% | 7% | |
| Year Ended 12/31/2004 | 19.79 | 0.34 | 1.73 | 2.07 | (0.23) | — | (0.23) | 21.63 | 10.56% | 831.9 | 0.32% | 1.70% | 0.37% | 1.65% | 6% | |
| Year Ended 12/31/2003 | 15.68 | 0.24 | 4.10 | 4.34 | (0.23) | — | (0.23) | 19.79 | 28.21% | 725.0 | 0.36% | 1.42% | 0.36% | 1.42% | 1% | |
| Year Ended 12/31/2002 | 20.26 | 0.23 | (4.73) | (4.50) | — | (0.08) | (0.08) | 15.68 | (22.21)% | 535.0 | 0.36% | 1.24% | 0.36% | 1.24% | 6% | |
| REAL ESTATE SECURITIES PORTFOLIO | ||||||||||||||||
| Six Months Ended 6/29/2007 (unaudited) | 22.93 | 0.22 | (1.47) | (1.25) | (0.30) | (1.37) | (1.67) | 20.01 | (6.14)% | 332.6 | 0.85% | 1.93% | 0.86% | 1.92% | 30% | |
| Year Ended 12/31/2006 | 18.16 | 0.29 | 5.65 | 5.94 | (0.29) | (0.88) | (1.17) | 22.93 | 34.18% | 367.9 | 0.84% | 1.41% | 0.86% | 1.40% | 69% | |
| Year Ended 12/31/2005 | 17.04 | 0.26 | 1.80 | 2.06 | (0.24) | (0.70) | (0.94) | 18.16 | 13.25% | 274.6 | 0.86% | 1.88% | 0.87% | 1.87% | 83% | |
| Year Ended 12/31/2004 | 12.66 | 0.37 | 4.07 | 4.44 | — | (0.06) | (0.06) | 17.04 | 35.19% | 175.0 | 0.79% | 2.60% | 0.90% | 2.49% | 119% | |
| Year Ended 12/31/2003 (e) | 10.00 | 0.20 | 2.80 | 3.00 | (0.20) | (0.14) | (0.34) | 12.66 | 30.02% | 51.8 | 0.80% | 4.87% | 1.11% | 4.56% | 45% | |
| BALANCED PORTFOLIO | ||||||||||||||||
| Six Months Ended 6/29/2007 (unaudited) | 16.77 | 0.29 | 0.52 | 0.81 | (0.53) | — | (0.53) | 17.05 | 4.78% | 528.2 | 0.38% | 2.76% | 0.39% | 2.75% | 62% | |
| Year Ended 12/31/2006 | 15.48 | 0.50 | 1.22 | 1.72 | (0.43) | — | (0.43) | 16.77 | 11.41% | 566.1 | 0.38% | 2.72% | 0.39% | 2.72% | 127% | |
| Year Ended 12/31/2005 | 15.28 | 0.42 | 0.16 | 0.58 | (0.38) | — | (0.38) | 15.48 | 3.92% | 663.5 | 0.37% | 2.52% | 0.38% | 2.52% | 130% | |
| Year Ended 12/31/2004 | 14.45 | 0.37 | 0.78 | 1.15 | (0.32) | — | (0.32) | 15.28 | 8.09% | 748.7 | 0.33% | 2.54% | 0.37% | 2.50% | 119% | |
| Year Ended 12/31/2003 | 12.75 | 0.33 | 1.78 | 2.11 | (0.41) | — | (0.41) | 14.45 | 17.17% | 721.1 | 0.36% | 2.49% | 0.36% | 2.49% | 69% | |
| Year Ended 12/31/2002 | 14.38 | 0.39 | (1.72) | (1.33) | — | (0.30) | (0.30) | 12.75 | (9.25)% | 620.7 | 0.36% | 2.81% | 0.36% | 2.81% | 25% | |
| HIGH YIELD PORTFOLIO | ||||||||||||||||
| Six Months Ended 6/29/2007 (unaudited) | 5.11 | 0.21 | (0.08) | 0.13 | (0.20) | — | (0.20) | 5.04 | 2.80% | 671.5 | 0.45% | 7.99% | 0.45% | 7.99% | 35% | |
| Year Ended 12/31/2006 | 5.01 | 0.40 | 0.10 | 0.50 | (0.40) | — | (0.40) | 5.11 | 10.31% | 847.0 | 0.45% | 8.00% | 0.45% | 7.99% | 66% | |
| Year Ended 12/31/2005 | 5.22 | 0.41 | (0.21) | 0.20 | (0.41) | — | (0.41) | 5.01 | 4.04% | 802.6 | 0.45% | 8.05% | 0.45% | 8.04% | 53% | |
| Year Ended 12/31/2004 | 5.14 | 0.42 | 0.08 | 0.50 | (0.42) | — | (0.42) | 5.22 | 10.14% | 884.5 | 0.45% | 8.21% | 0.45% | 8.21% | 71% | |
| Year Ended 12/31/2003 | 4.40 | 0.44 | 0.73 | 1.17 | (0.43) | — | (0.43) | 5.14 | 28.00% | 851.5 | 0.40% | 9.22% | 0.43% | 9.19% | 86% | |
| Year Ended 12/31/2002 | 5.41 | 0.56 | (1.01) | (0.45) | (0.56) | — | (0.56) | 4.40 | (8.65)% | 719.9 | 0.40% | 11.64% | 0.43% | 11.61% | 79% | |
| (a) All per share amounts have been rounded to the nearest cent. | (c) Total investment return assumes dividend reinvestment and does not reflect any deduction for sales charges. Not annualized for periods less than one year. | |||||||||||||||
| (b)The amount shown may not correlate with the change in aggregate gains and losses of portfolio securities due to the timing of sales and redemptions of | (d)Computed on an annualized basis for periods less than one year. | |||||||||||||||
| fund shares. | (e) Since inception, April 30, 2003. | |||||||||||||||
| The accompanying Notes to Financial Statements are an integral part of this schedule. | The accompanying Notes to Financial Statements are an integral part of this schedule. | |||||||||||||||
| 270 | 271 | |||||||||||||||
| Thrivent Series Fund, Inc. | Thrivent Series Fund, Inc. | |||||||||||||||
| Financial Highlights — continued | Financial Highlights — continued | |||||||||||||||
| F O R A S H A R E O U T S T A N D I N G T H R O U G H O U T E A C H P E R I O D(a) | R A T I O S / S U P P L E M E N T A L D A T A | |||||||||||||||
| Ratios to Average | ||||||||||||||||
| Ratios to Average Net | Net Assets Before Expenses | |||||||||||||||
| Less Distributions | Assets(d) | Waived, Credited or Paid | ||||||||||||||
| Income from Investment Operations | from | Indirectly (d) | ||||||||||||||
| Net Asset | Net Realized | Net | Net Asset | |||||||||||||
| Value, | Net | and Unrealized | Total from | Net | Realized | Value, | Net Assets | Net | Net | Portfolio | ||||||
| Beginning | Investment | Gain (Loss) on | Investment | Investment | Gain on | Total | End of | Total | End of Period | Investment | Investment | Turnover | ||||
| of Period | Income (Loss) | Investments(b) | Operations | Income | Investments | Distributions | Period | Return(c) | (in millions) | Expenses | Income (Loss) | Expenses | Income (Loss) | Rate | ||
| DIVERSIFIED INCOME PLUS PORTFOLIO | ||||||||||||||||
| Six Months Ended 6/29/2007 (unaudited) | $7.19 | $0.14 | $(0.07) | $0.07 | $(0.14) | $— | $(0.14) | $7.12 | 1.01% | $142.7 | 0.49% | 5.50% | 0.51% | 5.48% | 84% | |
| Year Ended 12/31/2006 | 6.54 | 0.42 | 0.48 | 0.90 | (0.25) | — | (0.25) | 7.19 | 14.19% | 108.1 | 0.51% | 6.62% | 0.52% | 6.60% | 170% | |
| Year Ended 12/31/2005 | 6.80 | 0.49 | (0.26) | 0.23 | (0.49) | — | (0.49) | 6.54 | 3.62% | 94.0 | 0.49% | 7.46% | 0.51% | 7.44% | 66% | |
| Year Ended 12/31/2004 | 6.74 | 0.46 | 0.06 | 0.52 | (0.46) | — | (0.46) | 6.80 | 8.02% | 105.1 | 0.49% | 6.89% | 0.51% | 6.87% | 91% | |
| Year Ended 12/31/2003 | 5.81 | 0.50 | 0.93 | 1.43 | (0.50) | — | (0.50) | 6.74 | 25.41% | 76.0 | 0.41% | 7.86% | 0.59% | 7.68% | 96% | |
| Year Ended 12/31/2002 | 6.33 | 0.52 | (0.52) | — | (0.52) | — | (0.52) | 5.81 | 0.40% | 41.1 | 0.40% | 8.89% | 0.64% | 8.65% | 100% | |
| INCOME PORTFOLIO | ||||||||||||||||
| Six Months Ended 6/29/2007 (unaudited) | 9.90 | 0.27 | (0.18) | 0.09 | (0.26) | — | (0.26) | 9.73 | 0.91% | 1,313.0 | 0.44% | 5.48% | 0.45% | 5.48% | 129% | |
| Year Ended 12/31/2006 | 9.95 | 0.51 | 0.01 | 0.52 | (0.51) | (0.06) | (0.57) | 9.90 | 5.42% | 1,081.8 | 0.45% | 5.22% | 0.45% | 5.22% | 303% | |
| Year Ended 12/31/2005 | 10.23 | 0.47 | (0.24) | 0.23 | (0.47) | (0.04) | (0.51) | 9.95 | 2.31% | 924.3 | 0.45% | 4.70% | 0.45% | 4.69% | 259% | |
| Year Ended 12/31/2004 | 10.20 | 0.44 | 0.03 | 0.47 | (0.44) | — | (0.44) | 10.23 | 4.74% | 985.1 | 0.45% | 4.36% | 0.45% | 4.36% | 207% | |
| Year Ended 12/31/2003 | 9.83 | 0.45 | 0.37 | 0.82 | (0.45) | — | (0.45) | 10.20 | 8.51% | 1,067.1 | 0.40% | 4.47% | 0.42% | 4.45% | 251% | |
| Year Ended 12/31/2002 | 9.80 | 0.51 | 0.03 | 0.54 | (0.51) | — | (0.51) | 9.83 | 5.75% | 1,146.3 | 0.40% | 5.29% | 0.43% | 5.26% | 151% | |
| BOND INDEX PORTFOLIO | ||||||||||||||||
| Six Months Ended 6/29/2007 (unaudited) | 10.22 | 0.24 | (0.16) | 0.08 | (0.24) | — | (0.24) | 10.06 | 0.78% | 221.7 | 0.41% | 4.83% | 0.43% | 4.82% | 171% | |
| Year Ended 12/31/2006 | 10.30 | 0.48 | (0.08) | 0.40 | (0.48) | — | (0.48) | 10.22 | 4.04% | 237.8 | 0.41% | 4.70% | 0.42% | 4.69% | 352% | |
| Year Ended 12/31/2005 | 10.52 | 0.44 | (0.22) | 0.22 | (0.44) | — | (0.44) | 10.30 | 2.18% | 272.4 | 0.40% | 4.19% | 0.41% | 4.18% | 360% | |
| Year Ended 12/31/2004 | 10.58 | 0.43 | (0.02) | 0.41 | (0.43) | (0.04) | (0.47) | 10.52 | 3.91% | 275.6 | 0.40% | 3.99% | 0.41% | 3.98% | 349% | |
| Year Ended 12/31/2003 | 10.66 | 0.42 | (0.05) | 0.37 | (0.45) | — | (0.45) | 10.58 | 3.59% | 244.7 | 0.34% | 3.90% | 0.41% | 3.83% | 213% | |
| Year Ended 12/31/2002 | 10.24 | 0.51 | 0.46 | 0.97 | (0.55) | — | (0.55) | 10.66 | 9.68% | 183.9 | 0.35% | 4.87% | 0.44% | 4.78% | 38% | |
| LIMITED MATURITY BOND PORTFOLIO | ||||||||||||||||
| Six Months Ended 6/29/2007 (unaudited) | 9.92 | 0.24 | (0.04) | 0.20 | (0.24) | — | (0.24) | 9.88 | 2.01% | 811.3 | 0.44% | 4.88% | 0.45% | 4.88% | 78% | |
| Year Ended 12/31/2006 | 9.92 | 0.44 | — | 0.44 | (0.44) | — | (0.44) | 9.92 | 4.57% | 665.6 | 0.44% | 4.49% | 0.45% | 4.48% | 137% | |
| Year Ended 12/31/2005 | 10.09 | 0.37 | (0.17) | 0.20 | (0.37) | — | (0.37) | 9.92 | 1.96% | 454.1 | 0.45% | 3.70% | 0.46% | 3.69% | 267% | |
| Year Ended 12/31/2004 | 10.21 | 0.29 | (0.10) | 0.19 | (0.29) | (0.02) | (0.31) | 10.09 | 1.89% | 316.2 | 0.46% | 2.84% | 0.46% | 2.84% | 219% | |
| Year Ended 12/31/2003 | 10.16 | 0.29 | 0.15 | 0.44 | (0.29) | (0.10) | (0.39) | 10.21 | 4.48% | 218.8 | 0.40% | 2.85% | 0.46% | 2.79% | 255% | |
| Year Ended 12/31/2002 | 9.91 | 0.32 | 0.25 | 0.57 | (0.32) | — | (0.32) | 10.16 | 5.78% | 159.3 | 0.40% | 3.11% | 0.46% | 3.05% | 236% | |
| MORTGAGE SECURITIES PORTFOLIO | ||||||||||||||||
| Six Months Ended 6/29/2007 (unaudited) | 9.71 | 0.24 | (0.18) | 0.06 | (0.24) | — | (0.24) | 9.53 | 0.56% | 53.4 | 0.64% | 5.11% | 0.64% | 5.11% | 390% | |
| Year Ended 12/31/2006 | 9.75 | 0.48 | (0.04) | 0.44 | (0.48) | — | (0.48) | 9.71 | 4.71% | 57.8 | 0.62% | 5.01% | 0.62% | 5.01% | 740% | |
| Year Ended 12/31/2005 | 9.99 | 0.43 | (0.24) | 0.19 | (0.43) | — | (0.43) | 9.75 | 2.00% | 66.9 | 0.61% | 4.40% | 0.62% | 4.39% | 703% | |
| Year Ended 12/31/2004 | 9.99 | 0.40 | — | 0.40 | (0.39) | (0.01) | (0.40) | 9.99 | 4.02% | 57.4 | 0.49% | 4.02% | 0.63% | 3.88% | 684% | |
| Year Ended 12/31/2003 (e) | 10.00 | 0.19 | (0.01) | 0.18 | (0.19) | — | (0.19) | 9.99 | 1.85% | 27.9 | 0.50% | 2.94% | 0.79% | 2.65% | 921% | |
| MONEY MARKET PORTFOLIO | ||||||||||||||||
| Six Months Ended 6/29/2007 (unaudited) | 1.00 | 0.03 | — | 0.03 | (0.03) | — | (0.03) | 1.00 | 2.53% | 696.8 | 0.35% | 5.03% | 0.45% | 4.93% | N/A | |
| Year Ended 12/31/2006 | 1.00 | 0.05 | — | 0.05 | (0.05) | — | (0.05) | 1.00 | 4.85% | 590.6 | 0.35% | 4.80% | 0.45% | 4.70% | N/A | |
| Year Ended 12/31/2005 | 1.00 | 0.03 | — | 0.03 | (0.03) | — | (0.03) | 1.00 | 2.86% | 373.7 | 0.46% | 2.85% | 0.46% | 2.85% | N/A | |
| Year Ended 12/31/2004 | 1.00 | 0.01 | — | 0.01 | (0.01) | — | (0.01) | 1.00 | 0.97% | 323.2 | 0.46% | 1.00% | 0.47% | 0.99% | N/A | |
| Year Ended 12/31/2003 | 1.00 | 0.01 | — | 0.01 | (0.01) | — | (0.01) | 1.00 | 0.84% | 289.3 | 0.40% | 0.84% | 0.45% | 0.79% | N/A | |
| Year Ended 12/31/2002 | 1.00 | 0.01 | — | 0.01 | (0.01) | — | (0.01) | 1.00 | 1.50% | 318.9 | 0.40% | 1.49% | 0.44% | 1.45% | N/A | |
| (a)All per share amounts have been rounded to the nearest cent. | (c)Total investment return assumes dividend reinvestment and does not reflect any deduction for sales charges. Not annualized for periods less than one year. | |||||||||||||||
| (b)The amount shown may not correlate with the change in aggregate gains and losses of portfolio securities due to the timing of sales and redemptions of | (d) Computed on an annualized basis for periods less than one year. | |||||||||||||||
| fund shares. | (e) Since inception, April 30, 2003. | |||||||||||||||
| The accompanying Notes to Financial Statements are an integral part of this schedule. | The accompanying Notes to Financial Statements are an integral part of this schedule. | |||||||||||||||
| 272 | 273 | |||||||||||||||
Additional Information
(unaudited)
Proxy Voting
The policies and procedures that the Fund uses to determine how to vote proxies relating to portfolio securities are attached to the Fund’s Statement of Additional Information. You may request a free copy of the Statement of Additional Information or the report of how the Fund voted proxies relating to portfolio securities during the most recent 12-month period ended June 30 by calling 1-800-847-4836. You also may review the Statement of Additional Information or the report of how the Fund voted proxies relating to portfolio securities during the most recent 12-month period ended June 30 at the Thrivent Financial web site (www.thrivent.com) or the SEC web site (www.sec.gov).
Quarterly Schedule of Portfolio Holdings
The Fund files its Schedule of Portfolio Holdings on Form N-Q with the SEC for the first and third quarters of each fiscal year. You may request a free copy of the Fund’s Forms N-Q by calling 1-800-847-4836. The Fund’s Forms N-Q also are available on the Thrivent Financial web site (www.thrivent.com) or the SEC web site (www.sec.gov). You also may review and copy the Forms N-Q for the Fund at the SEC’s Public Reference Room in Washington, DC. You may get information about the operation of the Public Reference Room by calling 1-800-SEC-0330.
Board Approval of New Subadvisory Agreement
At its meeting on February 13, 2007, the Board of Directors of the Fund, including the Independent Directors, voted unanimously to approve a new investment subadvisory agreement among the Fund, on behalf of the Thrivent Partner International Stock Portfolio, Thrivent Financial and Principal Global Investors, LLC (“Principal”). In connection with its approval of the sub-advisory agreement, the Board considered the following factors: The nature, extent and quality of the services provided by Thrivent Financial; the performance of the Portfolio; the cost of services provided and profits realized by Thrivent Financial; the extent to which economies of scale may be realized as the Portfolio grows; and whether the breakpoint levels reflect these economies of scale for the benefit of shareholders.
The Contracts Committee of the Board (consisting of each of the Independent Directors of the Fund) also reviewed information presented by Thrivent Financial addressing these factors. The Contracts Committee and the Independent Directors were represented by independent counsel throughout the meeting and during the executive session of the Independent Directors.
Management began by discussing its process for selecting a new subadviser to recommend to the Board, including the retention of an independent search firm. Representatives of Thrivent Financial stated that the scope and quality of services under the proposed agreement with Principal were expected to be at least equivalent to the scope and quality of services provided by T. Rowe Price International, Inc., the subadviser that Principal was proposed to replace. The Board also received information from Principal relating to its investment process and research capabilities.
In addition to receiving monthly performance reports, the Board, in connection with its regular quarterly meetings, received more extensive information on Portfolio performance, including absolute performance, relative performance rankings within the Portfolio’s Lipper peer group and performance as compared to benchmark index returns. Management also provided information on the performance of the portion of the Portfolio’s assets allocated to each of the Portfolio’s subadvisers. The Board observed that the performance of the international growth portion of the Portfolio’s assets had underperformed its peer group for an extended period of time. The Board also received information from Principal regarding the absolute and relative performance of its international growth portfolios, which are managed in a substantially identical manner to the manner in which Principal would manage the portion of the Portfolio allocated to it.
The Board also reviewed the amount of the fees to be paid to Principal under the subadvisory agreement and considered the fact that the contract had been negotiated at arm’s length between Thrivent Financial and Principal and that there were no separate arrangements for unrelated services between Principal and Thrivent Financial and its affiliates. Based on these factors, among others, the Contracts Committee recommended approval of the subadvisory agreement, and the Board approved the subadvisory agreement with Principal.
| 274 |
Thrivent Series Fund, Inc.
Supplement to Prospectus dated May 1, 2007
With respect to Thrivent Partner Small Cap Growth Portfolio
The “Portfolio Management” section of the prospectus is amended with respect to the following Portfolio:
The second paragraph under Thrivent Partner Small Cap Growth Portfolio is deleted and replaced with the following:
Turner has been in the investment advisory business since 1990 and, as of March 31, 2007, managed approximately $23.3 billion in equity investments for institutions and individuals. Turner uses an investment management team that has day-to-day responsibility for managing its portion of the Portfolio’s assets. William C. McVail, CFA serves as lead manager and has been with Turner since 1998. Jason D. Schrotberger, CFA serves as co-manager and has been with Turner since 2001. Rick Wetmore, CFA also s erves as co-manager and has been with Turner since 2001.
The date of this Supplement is July 31, 2007
Please include this Supplement with your Prospectus
| 275 |
Thrivent Series Fund, Inc.
Supplement to Prospectus dated May 1, 2007
With respect to Thrivent Small Cap Stock Portfolio
The “Portfolio Management” section of the prospectus is amended with respect to the following Portfolio:
The paragraph under Thrivent Small Cap Stock Portfolio is deleted and replaced with the following:
David A. Maule, CFA serves as portfolio manager of Thrivent Small Cap Stock Portfolio. He has been with Thrivent since 1998 and, since 2004, served as associate portfolio manager of the Portfolio. Prior to serving as associate portfolio manager, Mr. Maule served as a senior equity research analyst for Thrivent since 2002.
The date of this Supplement is June 8, 2007
Please include this Supplement with your Prospectus
| 276 |
Thrivent Variable Annuity Account I
Supplement to Prospectus dated May 1, 2007
Regarding
Guaranteed Lifetime Withdrawal Benefit known as the GLWB Rider
This supplement describes the Guaranteed Lifetime Withdrawal Benefit (“GLWB”) now available with the flexible premium deferred variable annuity contract (the “Contract”) (form # W-BC-FPVA) offered by Thrivent Financial for Lutherans. The GLWB is not available with the flexible premium variable annuity contract we began offering in 2002 (the “Prior Contract”) (form # W-BB-FPVA) that is also described in the prospectus. Please keep this supplement for future reference together with your prospectus. All capitalized terms have the same meaning as those included in the prospectus. The GLWB Rider may not be available in all states. The GLWB Rider is not available within certain employer-sponsored retirement plans. Please consult your financial representative for more details. Contract provisions may vary by state.
The following changes are made to your prospectus effective July 9, 2007:
1. Replace the last two lines of the Periodic Fees and Expenses other than Fund Expenses table on page 6 with the following:
| GLWB Risk Charge* | 1.25% | 1.25% | ||
| Maximum Total Separate Account Expenses6 | 2.50% | 2.40% | ||
2. Replace the Example 2 table on page 7 with the following:
Example 2: Contract with the GLWB Rider9
| Years | ||||
| 1 | 3 | 5 | 10 | |
| If you surrender or annuitize your Contract at | ||||
| the end of the applicable time period with | ||||
| Minimum Portfolio Expenses: | $913 | $1,303 | $1,700 | $2,859 |
| Maximum Portfolio Expenses: | $1,005 | $1,581 | $2,167 | $3,846 |
| If you do not surrender your Contract at end | ||||
| of the applicable time period with | ||||
| Minimum Portfolio Expenses: | $268 | $820 | $1,396 | $2,859 |
| Maximum Portfolio Expenses: | $366 | $1,113 | $1,878 | $3,846 |
3. Add footnote * and replace footnote numbers 6 and 9 in Notes to Fee and Expense Tables on page 8 with the following:
* The amount shown is based on the guaranteed maximum charge for the GLWB Rider. The current charge is as follows: 0.85%, 0.55%, and 0.35% for the Moderately Aggressive, Moderate and Moderately Conservative Allocations, respectively.
6 The maximum total separate account expenses occur when the GLWB Rider is selected as an optional benefit.
9 For this example, the annual Portfolio operating expenses range from a minimum of 0.75% and a maximum or 0.84% for a Contract with the GLWB Rider.
4. Add the following to CONTRACTS after Return Protection Allocation on page 23:
Guaranteed Lifetime Withdrawal Benefit (GLWB) Rider
The Guaranteed Lifetime Withdrawal Benefit (GLWB) Rider (the “Rider”) is an optional benefit that allows you to withdraw up to a guaranteed withdrawal amount (GWA) each Contract Year for as long as the Rider is in force. GWA payments are not subject to a surrender charge and may be withdrawn each Contract Year after the GLWB Calculation Date, described below. The GWA will vary based on the Age the Rider is added, the Age additional premium payments are ma de, and the length of time the Contract Owner waits to set guaranteed values. These factors determine the applicable Withdrawal Percentage and Benefit Base, described below, that are used to compute the GWA.
Generally, the longer the GLWB Rider is in place before you begin taking the GWA, the greater the GWA will be. The period of time before you begin taking the GWA is called the GLWB Waiting Period. See GLWB Waiting Period, below. The period of time after you begin taking the GWA is called the GLWB Withdrawal Period. See GLWB Withdrawal Period, below. The GWA will also be affected if you take Excess Partial Surrenders, which are surrender amounts in excess of the GWA in any Contract Year. See Effect of Excess Partial Surrenders, below.
| 277 |
The Rider also guarantees the return of the Accumulated Value on the Rider Date of Issue plus premiums added less adjustments for partial surrenders taken and charges deducted to the Contract Owner’s beneficiary if the Annuitant dies before the Annuity Date and before the foregoing guaranteed amount has been returned through guaranteed withdrawals. This guaranteed amount is called the GLWB Survivor Benefit and is subject to certain conditions. See GLWB Survivor Benefit, below.
We impose a GLWB Risk Charge for this benefit as a percentage of average daily Accumulated Value based on the Subaccount you choose. This charge will not exceed 1.25% and is in addition to the Contract’s Mortality and Expense Risk Charge. See GLWB Risk Charge, below. During the GLWB Withdrawal Period (described below), each Contract Year we will waive surrender charges provided your cumulative surrenders during a Contract Year do not exceed the GWA for that Contract Year or 10% of the Accumulated Value at the time the first partial surrender is made in that Contract Year.
You may purchase the GLWB Rider as a part of your Contract at the time the Contract is issued or after your Contract is issued. At the Date of Issue of the Rider the Annuitant must be at least 50 years of age, and no more than 85 years of age. When the GLWB Rider is issued, the premium or the Accumulated Value of the Contract should be at least $25,000. We must provide prior approval before issuing a GLWB Rider if the premium or Contract’s Accumulated Value is less than $25,000 or $1 million or more. We do not offer the GLWB Rider on Contracts with joint annuitants. The GLWB Rider is not available while any of the following optional benefits are in force:
• Maximum Anniversary Death Benefit;
• Premium Accumulation Death Benefit;
• Earnings Addition Death Benefit; or
• Return Protection Allocation.
If you do have any of the above benefits, they would have to be cancelled before we can issue the GLWB Rider. Neither Dollar Cost Averaging nor Asset Rebalancing is available if you have the GLWB Rider. You should carefully consider whether the absence or cancellation of these benefits is appropriate for you before electing the GLWB Rider.
GLWB Waiting Period. The GLWB Waiting Period begins when the Rider is issued and continues until you establish your GLWB Calculation Date. During both the GLWB Waiting and Withdrawal Periods, we will compute the Benefit Base, which we use to calculate the amount of GWA. On the GLWB Rider Date of Issue, the Benefit Base is equal to the Accumulated Value. If the GLWB Rider is issued on the Contract’s Date of Issue, the Benefit Base will equal the initial premium into the Contract. If the Rider is added after the Contract is issued, the Benefit Base will equal the Accumulated
Value that is transferred to the Subaccount you choose on the Date of Issue of the Rider. At the time the GLWB Rider is added, you must allocate all of your Accumulated Value to only one of the following investment options:
• Thrivent Moderately Aggressive Allocation Subaccount;
• Thrivent Moderate Allocation Subaccount; or
• Thrivent Moderately Conservative Allocation Subaccount.
If the Date of Issue of the GLWB Rider is after the Contract’s Date of Issue, the Accumulated Value will be transferred on the Date of Issue of the Rider to the Subaccount elected by you. A Market Value Adjustment will apply to Accumulated Value that is transferred from a Fixed Period Allocation more than 30 days before the end of its allocation period. The Market Value Adjustment may increase or decrease the amount transferred. See the section entitled “Market Value Adjustment” on page 17 of the prospectus for a description of the Market Value Adjustment.
While the GLWB Rider is in force, no transfers among Subaccounts are allowed except that all of the Accumulated Value may be transferred from one Subaccount to another Subaccount within 45 days after any Contract Anniversary on which the Benefit Base is increased to equal the Accumulated Value in accordance with the Rider.
Automatic transfers are not allowed while the GLWB Rider is in force.
Benefit Base during the GLWB Waiting Period. On each Contract Anniversary during the GLWB Waiting Period, the Benefit Base is ratcheted up to equal the Accumulated Value at the end of the prior day if such adjustment would increase the Benefit Base. If the Accumulated Value is less than the current Benefit Base, then the ratchet feature does not change the Benefit Base. The Benefit Base is increased by any premiums that we receive before the GLWB Calculation Date. However, no premiums can be paid within one year from any partial surrender.
During the GLWB Waiting Period, the Benefit Base is decreased in the event a partial surrender is taken or when the annual administrative charge is taken. The Benefit Base is decreased by the amount taken if the Benefit Base is less than or equal to the Accumulated Value. Otherwise, the Benefit Base is decreased by the same proportion that the Accumulated Value is decreased by the amount taken.
Example:
A $5,000 partial surrender is taken from a Contract in which the Accumulated Value is $90,000, but the Benefit Base is $100,000. The resulting Benefit Base would be calculated as follows:
[1- (5,000/90,000)] x 100,000 = $94,444.44
| 278 |
The Benefit Base on the Contract Anniversary that you elect to be the GLWB Calculation Date is adjusted as described above for any premiums allocated and partial surrenders made on or after that Contract Anniversary and before we receive notification of your election of the GLWB Calculation Date.
GLWB Withdrawal Period. The GLWB Waiting Period ends and the GLWB Withdrawal Period begins on the GLWB Calculation Date. To set your GLWB Calculation Date, you must notify us within 45 days after an eligible Contract Anniversary. An eligible Contract Anniversary is any Contract Anniversary on or after the Contract Anniversary the Annuitant reaches 62 years of age and on or before the Annuity Date. Once you provide the proper notification, the most recent Contract Anniversary date will become the GLWB Calculation Date. No further premiums will be accepted after you elect the GLWB Calculation Date. If you do not elect a GLWB Calculation Date before your Annuity Date, the GLWB Calculation Date will be the Annuity Date. Once the GLWB Calculation Date is set, the GWA is calculated. The calculation continues annually until the Rider terminates. No Annua l Administrative Charge is deducted during this period.
Benefit Base during the GLWB Withdrawal Period. On any Contract Anniversary after we receive notice of your election of the GLWB Calculation Date and on or before the date that the Annuitant reaches Age 90, the Benefit Base is adjusted to equal the Accumulated Value at the end of the prior day if the adjustment will increase the Benefit Base. After we receive notice of your election of the GLWB Calculation Date, the Benefit Base will be reduced for GLWB Excess Surrenders, defined below, but will not be reduced by the amount of the GWA. The amount of the reduction is described below under Effects of partial surrenders during the GLWB Withdrawal Period.
Withdrawal Percentage. The Withdrawal Percentage is the percentage that is applied to the Benefit Base to determine the GWA. The initial Withdrawal Percentage is determined on the GLWB Calculation Date. The Withdrawal Percentage is based on the Annuitant’s Age at which each premium payment is made and the waiting period from the premium payment date until the GLWB Calculation Date. The initial Withdrawal Percentage is equal to the weighted average of each adjusted premium multiplied by the applicable Percentage Applied from the table below, as follows:
1) the sum of adjusted premiums, each multiplied by its Percentage Applied shown in the table below; divided by
2) the sum of adjusted premiums.
| Annuitant’s | Percentage Applied | |||
| Age on | Full Contract Years from the Date of | |||
| Date of | Premium Allocation to the GLWB | |||
| Premium | Calculation Date | |||
| Allocation | 0-4 | 5-9 | 10-14 | 15+ |
| 50-56 | — | 4.5% | 5.0% | 6.0% |
| 57-61 | 4.0% | 4.5 | 5.5 | 6.5 |
| 62-66 | 4.0 | 5.0 | 6.0 | 7.0 |
| 67-71 | 4.5 | 5.5 | 6.5 | 7.5 |
| 72-76 | 5.0 | 6.0 | 7.0 | 7.0 |
| 77-81 | 5.5 | 6.5 | 6.5 | 6.5 |
| 82+ | 6.0 | 6.0 | 6.0 | 6.0 |
Each premium payment will be assigned a Percentage Applied. The Withdrawal Percentage used to determine the GWA is calculated as the weighted average of the Percentages Applied.
For example, assume the Accumulated Value at the time the Rider is added is $100,000 and the Annuitant is age 62. Two years later at the Annuitant’s age 64, the Annuitant makes an additional premium of $50,000. Then at age 68, the Annuitant adds another $50,000 premium payment. The Annuitant decides to begin taking the GWA at age 72. From the chart above, the weighted Withdrawal Percentage would be:
[(100,000 x 6%) + (50,000 x 5%) + (50,000 x 4.5%)] = 5.375%
200,000
For purposes of calculating the Withdrawal Percentage, adjusted premiums are determined by subtracting the amount of partial surrenders taken from premiums paid on a last-in, first-out basis at the time the partial surrender is taken. Generally, the Withdrawal Percentage will be higher if premiums are paid earlier and if partial surrenders are made later.
For example, if the Annuitant in the preceding example took a partial surrender of $10,000 at Age 63, and a partial surrender of $5,000 at age 69, the weighted Withdrawal Percentage would be:
[(90,000 x 6%) + (50,000 x 5%) + (45,000 x 4.5%)] = 5.365%
185,000
In addition, premiums paid within the first three months after a Contract Anniversary will be treated as if they were allocated on that Contract Anniversary and at the Age on that Anniversary. All other premiums allocated during the GLWB Waiting Period will be treated as if they were allocated on the next Contract Anniversary after the date of allocation and at the Age on that Anniversary. This treatment of premiums is only for purposes of assigning the Percentage Applied to the adjusted premium amount.
| 279 |
For example, assume an Annuitant’s Contract Anniversary falls on May 1 of each year. If the Annuitant pays a premium on August 1 of the current year (i.e., within 3 months of the May 1 Contract Anniversary), that premium will be treated as if it were allocated on May 1 of that year and at the Age on that Contract Anniversary. If the Annuitant pays a premium on September 1 of the current year (i.e., more than 3 months after the May 1 Contract Anniversary), that premium will be treated as if it were allocated on May 1 of the following year at the Age on May 1 of the following year.
Guaranteed Withdrawal Amount (GWA). You will need to notify us when you want to begin taking the GWA. The GWA is the amount that can be withdrawn each Contract Year without a surrender charge. The GWA is determined on the GLWB Calculation Date and each Contract Anniversary thereafter. The GWA is equal to the Benefit Base (not to exceed $5 million) multiplied by the Withdrawal Percentage. The GWA may change from year to year depending on whether the Benefit Base was increased, as described above, or decreased as a result of GLWB Excess Surrenders. On any day that the Benefit Base is decreased during the GLWB Withdrawal Period, the GWA will be adjusted, effective as of the next Contract Anniversary, to equal (a) the lesser of the Benefit Base on that date or $5,000,000, multiplied by (b) the Withdrawal Percentage, and the GWA will decrease proportio nately. On any Contract Anniversary that the Benefit Base has increased during the GLWB Withdrawal Period to equal the Accumulated Value in accordance with the Rider, the Withdrawal Percentage will be compared to the Withdrawal Percentages in the following table based on the current Age of the Annuitant. The larger of the two Withdrawal Percentages will become the new Withdrawal Percentage. The following table is based on your Age under your Contract.
| Annuitant | |
| Age on Contract | Attained Age |
| Anniversary | Percentage Applied |
| ———————————— | ———————————————— |
| 67-71 | 4.50% |
| 72-76 | 5.00% |
| 77-81 | 5.50% |
| 82-90 | 6.00% |
The lesser of the increased Benefit Base or $5 million will be multiplied by the new Withdrawal Percentage to determine your new GWA. If the Benefit Base increases, your GWA will increase. Your GWA will not decrease unless your Benefit Base decreases. Any decrease in your GWA is effective on the following Contract Anniversary. No surrender charges will apply when partial surrenders are made during the GLWB Withdrawal Period except to the extent that total surrenders in a Contract Year exceed the greater of (a) the GWA, or (b) 10% of the Accumulated Value at the time of the first partial surrender in that Contract Year. Withdrawals of the GWA are taxed in the same manner as partial surrenders
under the Contract. See Taxation of Partial and Full Surrenders on page 39 of the prospectus.
Withdrawals after your Annuity Date. While the GLWB Rider is in force, beginning on the Annuity Date, you will be required to withdraw a minimum amount from your Contract each year called a Required Withdrawal Amount. While the GLWB Rider is in force, instead of paying the Annuity Income beginning on the Annuity Date according to the Contract, we will pay you an amount equal to the excess, if any, of the Required Withdrawal Amount over the sum of any partial surrenders you have taken during that Contract Year. The Required Withdrawal Amount is the greater of (a) your GWA, and (b) the Accumulated Value at the end of the prior Contract Year multiplied by the Amortization Factor for the Age in the current Contract Year. Amortization Factors will not exceed the factors shown in the table below:
| Amortization Table Used after the Annuity Date | |||
| Age | Factor | Age | Factor |
| 90 | 6.04% | 101 | 10.40% |
| 91 | 6.24 | 102 | 11.28 |
| 92 | 6.47 | 103 | 12.36 |
| 93 | 6.71 | 104 | 13.70 |
| 94 | 7.00 | 105 | 15.43 |
| 95 | 7.31 | 106 | 17.72 |
| 96 | 7.66 | 107 | 20.93 |
| 97 | 8.06 | 108 | 22.63 |
| 98 | 8.52 | 109 | 33.30 |
| 99 | 9.05 | 110 | 47.14 |
| 100 | 9.67 | 111+ | 52.63 |
If a Required Minimum Distribution (RMD) is defined for the Contract by Section 401(a)(9) of the Internal Revenue Code, then at the end of each calendar year, we will pay you an amount equal to the excess, if any, of the Required Minimum Distribution determined by us for that calendar year over the sum of any partial surrenders you have taken during that calendar year.
Any amounts that we pay will be treated as partial surrenders under the Contract.
Effects of partial surrenders during the GLWB Withdrawal Period. If the sum of partial surrenders within a Contract Year exceeds the larger amount of:
• the GWA for that Contract Year,
• the Required Minimum Distribution (RMD) for that calendar year, if any, as we determine for the Contract, and
• if that day is in a Contract Year that began in the prior calendar year, the RMD, if any, for the prior calendar year that we determine for this Contract;
this excess amount is a GLWB Excess Surrender. Any subsequent partial surrender taken within the same
| 280 |
Contract Year in which a GLWB Excess Surrender is made will also be considered a GLWB Excess Surrender. A GLWB Excess Surrender affects the calculation of the Benefit Base. If the Benefit Base is less than or equal to the Accumulated Value, the Benefit Base is decreased by the amount of the GLWB Excess Surrender. Otherwise, the Benefit Base is decreased by the following ratio:
| a |
| b - (c-a) |
Where:
a = GLWB Excess Surrender amount
b = Accumulated Value prior to surrender
c = partial surrender amount
No surrender charges will apply to partial surrenders made during the GLWB Withdrawal Period to the extent partial surrenders in a Contract Year do not exceed the greater of the GWA for that Contract Year, or 10% of the Accumulated Value at the time of the first partial surrender in a Contract Year.
GLWB Survivor Benefit. If the Annuitant dies during the GLWB Withdrawal Period and before the Annuity Date, the beneficiary may elect to receive the GLWB Survivor Benefit, if any, in lieu of any death proceeds under the Contract. If the Annuitant dies after the Annuity Date, the beneficiary may elect to receive the GLWB Survivor Benefit, if any, in lieu of the Accumulated Value of the Contract. The beneficiary must notify us of their election to receive the GLWB Survivor Benefit within 60 days after we receive proof of death of the Annuitant. On the date the GLWB Rider is issued, the GLWB Survivor Benefit equals the Accumulated Value. Thereafter, the GLWB Survivor Benefit increases on a day we apply a premium by the amount of the premium, and decreases on a day in which a partial surrender or annual administrative charge is deducted by the amount of the partial surrender or administrative charge. However, if a GLWB Excess Surrender is taken, the GLWB Survivor Benefit is decreased as follows: if the GLWB Survivor Benefit is less than or equal to the Accumulated Value, the Benefit is decreased by the amount of the surrender; or, if the GLWB Survivor Benefit is greater than the Accumulated Value, the benefit is first decreased by the amount of the partial surrender that does not represent the GLWB Excess Surrender. The remaining amount is then decreased by the following ratio:
| a |
| b - (c-a) |
Where:
a = GLWB Excess Surrender amount
b = Accumulated Value prior to surrender
c = partial surrender amount
We will pay the GLWB Survivor Benefit in equal amounts under a settlement agreement. Payments will continue until the sum of payments equals the GLWB Survivor Benefit. The payment period will not exceed the life expectancy of the beneficiary. If the Annuitant dies before the Annuity Date and the spouse of the Annuitant is the sole primary benefi-ciary, the surviving spouse may elect to continue the Contract as Annuitant and owner. At the time this election becomes effective, the Accumulated Value of the Contract and any excess of Death Proceeds over the Accumulated Value on that date will remain in the Subaccount in which the Accumulated Value was allocated at that time, but will no longer be subject to the GLWB Risk Charge. We account for this by crediting the surviving spouse with Subaccount accumulation units that are not subject to the GLWB Risk Charge in lieu of units that are subject to the Charge. This election results in a termi nation of the GLWB Rider. If the election to continue the Contract is not made within 60 days from the date we receive proof of death, the surviving spouse will be deemed to have elected to continue the Contract effective on the Exchange Date. This also results in the termination of the GLWB Rider.
Termination of the GLWB Rider. You may terminate the GLWB Rider at any time provided it is at least two years after we issued the Rider. The termination will be effective on the date we receive Written Notice from you. The Rider also terminates at the earliest of any of the following events:
• the date of Contract termination;
• the date we receive satisfactory proof of the death of the Annuitant;
• the date you elect to receive annuity income under the Contract;
• the date during the GLWB Waiting Period that the sum of partial surrenders made and annual administrative charges deducted for this Contract exceeds the sum of premiums paid; or
• the date during the GLWB Withdrawal Period that the Benefit Base is reduced to zero.
If the Contract terminates because the GWA that is surrendered exceeds the Accumulated Value, we will continue to pay you the GWA each year for as long as the Annuitant is alive under a settlement agreement that we will issue. If the GLWB Rider terminates for reasons other than the termination of the entire Contract, the Accumulated Value will remain in the same Subaccount but will no longer be subject to the GLWB Risk Charge, unless you request a different allocation. We account for this by crediting you with Subaccount accumulation units that are not subject to the GLWB Risk Charge in lieu of units that are subject to the Charge. Once the GLWB Rider terminates, the GLWB Risk Charge will also
| 281 |
cease. If the Rider terminates after the Annuity Date and there is Accumulated Value remaining, we will begin paying Annuity Income according to the Contract.
If your Contract is used in a Qualified Plan or 403(b) Plan, you are subject to restrictions on withdrawals you may take prior to a triggering event and you should consult your tax or legal advisor prior to purchasing an optional guarantee, the primary benefit of which is guaranteeing withdrawals. For additional information regarding withdrawals and triggering events, see the Federal Tax Status section in the Prospectus. The GLWB Rider is not available within certain employer-sponsored retirement plans.
5. Replace the last sentence of the second paragraph of Risk Charge on page 32 under Charges and Deductions.
On or after the Annuity Date, the risk charge for Annuity Unit Values is 1.25% without the GLWB Rider in effect, or a maximum of 2.50% with the GLWB Rider in effect.
6. Add as last paragraph of Risk Charge on page 32 under Charges and Deductions.
GLWB Risk Charge. We impose a charge for the GLWB Rider equal to a percentage of the average daily Accumulated Value invested in the Subaccount you chose. This charge is in addition to the Mortality and Expense Risk charge for the Contract. The current effective annual charge for the Rider is as follows, and may not be increased beyond the maximum of 1.25% . This charge is deducted from the Subaccount and reflected in the daily Accumulation Unit Value.
| Guaranteed | ||
| Current | Maximum | |
| Annual | Annual | |
| GLWB Risk | GLWB Risk | |
| Chosen Subaccount | Charge | Charge |
| —————————————— | ||
| Thrivent Moderately | ||
| Aggressive Allocation | ||
| Subaccount | 0.85% | 1.25% |
| Thrivent Moderate | ||
| Allocation Subaccount | 0.55% | 1.25% |
| Thrivent Moderately | ||
| Conservative Allocation | ||
| Subaccount | 0.35% | 1.25% |
The following are the maximum charges for a Contract with the GLWB:
| Guaranteed | |||
| Maximum | Guaranteed | ||
| Mortality and | Maximum | ||
| Expense Risk | Annual GLWB | Total Risk | |
| Charge | Risk Charge | Charges | |
| Contract Years | |||
| 1-7 | 1.25% | 1.25% | 2.50% |
| Contract Years | |||
| 8+ | 1.15% | 1.25% | 2.40% |
In addition, charges may include the Annual Administrative Charge for Contracts with an Accumulated Value of $15,000 or less.
7. Add separate paragraph after 2nd paragraph in Allocation of Premiums on page 19.
If you add the GLWB Rider, you must allocate 100% of the Accumulated Value to one eligible Subaccount (see GLWB Rider). Premiums may only be paid during the GLWB Waiting period. We must approve any such allocation with less than $25,000 of Accumulated Value.
8. Add to Spouse Election to Continue the Contract on page 25 after #(2).
(3) the Accumulated Value of the Contract on the Exchange Date and any excess of Death Proceeds over the Accumulated Value on that date will be transferred from the GLWB subaccount to a Subaccount investing in the same underlying portfolio without the GLWB benefit.
Thrivent Financial for Lutherans
4321 North Ballard Road
Appleton, WI 54919-0001
800-847-4836
The date of this Supplement is July 9, 2007.
Please include this Supplement with your Prospectus.
| 282 |
This page intentionally left blank. |
| 283 |
.
| This page intentionally left blank. |
| 284 |

Item 2. Code of Ethics
Not applicable to semiannual report
Item 3. Audit Committee Financial Expert
Not applicable to semiannual report
Item 4. Principal Accountant Fees and Services
Not applicable to semiannual report
Item 5. Audit Committee of Listed Registrants
Not applicable.
Item 6. Schedule of Investments
Registrant's Schedule of Investments is included in the report to shareholders filed under Item 1.
Item 7. Disclosure of Proxy Voting Policies and Procedures for Closed-End Management Investment Companies
Not applicable.
Item 8. Portfolio Managers of Closed-End Management Investment Companies
Not applicable.
Item 9. Purchases of Equity Securities by Closed-End Management Investment Company and Affiliated Purchasers.
Not applicable.
Item 10. Submission of Matters to a Vote of Security Holders
There have been no material changes to the procedures by which shareholders may recommend nominees to registrant's board of directors.
Item 11. Controls and Procedures
(a)(i) Registrant's President and Treasurer have concluded that registrant's disclosure controls and procedures (as defined in Rule 30a-3(c) under the Investment Company Act) are effective, based on their evaluation of these controls and procedures as of a date within 90 days of the filing date of this report.
(a)(ii) Registrant's President and Treasurer are aware of no change in registrant's internal controls over financial reporting (as defined in Rule 30a-3(d) under the Investment Company Act) that occurred during registrant’s most recent fiscal quarter that has materially affected, or is reasonably likely to materially affect, registrant's internal control over financial reporting.
Item 12. Exhibits
(a) Certifications pursuant to Rules 30a-2(a) and 30a-2(b) under the Investment Company Act of 1940 are attached hereto.
SIGNATURES
Pursuant to the requirements of the Securities Exchange Act of 1934 and the Investment Company Act of 1940, the registrant has duly caused this report to be signed on its behalf by the undersigned, thereunto duly authorized.
| Date: August 24, 2007 | THRIVENT SERIES FUND, | ||
| INC. | |||
| By: /s/ Pamela J. Moret | |||
| Pamela J. Moret | |||
| President | |||
Pursuant to the requirements of the Securities Exchange Act of 1934 and the Investment Company Act of 1940, this report has been signed below by the following persons on behalf of the registrant and in the capacities and on the dates indicated.
| Date: August 24, 2007 | By: /s/ Pamela J. Moret | ||
| Pamela J. Moret | |||
| President | |||
| Date: August 24, 2007 | By: /s/ Gerard V. Vaillancourt | ||
| Gerard V. Vaillancourt | |||
| Treasurer | |||