Table of Contents
UNITED STATES
SECURITIES AND EXCHANGE COMMISSION
Washington, D.C. 20549
FORM N-CSR
CERTIFIED SHAREHOLDER REPORT OF REGISTERED MANAGEMENT INVESTMENT COMPANIES
Investment Company Act file number: 811-04603
Thrivent Series Fund, Inc.
| (Exact name of registrant as specified in charter) |
625 Fourth Avenue South Minneapolis, Minnesota | 55415 | |
| (Address of principal executive offices) | (Zip code) |
John L. Sullivan, Assistant Secretary
625 Fourth Avenue South
Minneapolis, Minnesota 55415
| (Name and address of agent for service) |
Registrant’s telephone number, including area code: (612) 844-5704
Date of fiscal year end: December 31
Date of reporting period: June 30, 2010
Table of Contents
| Item 1. | Report to Stockholders |
Table of Contents

Table of Contents
| 2 | ||
Portfolio Perspectives | ||
| 4 | ||
| 6 | ||
| 8 | ||
| 10 | ||
| 12 | ||
| 14 | ||
| 16 | ||
| 18 | ||
| 20 | ||
| 22 | ||
| 24 | ||
| 26 | ||
| 28 | ||
| 30 | ||
| 32 | ||
| 34 | ||
| 36 | ||
| 38 | ||
| 40 | ||
| 42 | ||
| 44 | ||
| 46 | ||
| 48 | ||
| 50 | ||
| 52 | ||
| 54 | ||
| 56 | ||
| 58 | ||
| 60 | ||
| 62 | ||
| 64 | ||
| 66 | ||
| 68 | ||
| 70 | ||
| 72 | ||
| 74 | ||
| 76 | ||
| 78 | ||
| 80 | ||
| 82 | ||
| 84 | ||
| 86 | ||
Schedules of Investments | ||
| 90 | ||
| 99 | ||
| 109 | ||
| 119 | ||
| 129 | ||
| 131 | ||
| 133 | ||
| 137 | ||
| 139 | ||
| 142 | ||
| 146 | ||
| 150 | ||
| 154 | ||
| 158 | ||
| 167 | ||
| 170 | ||
| 173 | ||
| 176 | ||
| 180 | ||
| 186 | ||
| 198 | ||
| 204 | ||
| 206 | ||
| 208 | ||
| 210 | ||
| 213 | ||
| 216 | ||
| 220 | ||
| 223 | ||
| 225 | ||
| 229 | ||
| 236 | ||
| 242 | ||
| 254 | ||
| 263 | ||
| 272 | ||
| 277 | ||
| 290 | ||
| 296 | ||
| 306 | ||
| 310 | ||
| 314 | ||
| 322 | ||
| 330 | ||
| 344 | ||
| 360 | ||
| 376 | ||
| 377 | ||
Table of Contents
 | Dear Member: |
The six-month period ended June 30, 2010, proved rewarding for investors as the U.S. economy and financial markets sprang back from early 2009 lows. In this letter, I will offer some comments in review of the period, as well as outline what we believe to be key topics in forming an outlook through the end of 2010.
A brief review on the economy
The U.S. economy expanded slowly during the reporting period with first quarter gross domestic product revised down to a 2.7% growth rate.1 Stronger economic conditions earlier in the period were spurred by improvement in consumer spending patterns and overall confidence, along with signs of modest stabilization in the nation’s housing markets. In May and June, concerns mounted in reaction to troubles in the European Union (EU), specifically with budget deficits and credit concerns in Greece, Portugal and Spain, among others. Here in the U.S., employment news and uncertainty with regard to financial reforms and budget deficits teamed to impede a stronger economic recovery.
The U.S. employment picture was a mixed bag, as month after month of net job losses finally turned positive (net job creation) in the early spring months, only to fall back in May and June as the pace and extent of job recovery remained in question. Initial claims for unemployment benefits, a leading indicator of the employment market, were (and continue to be) volatile with no clear trend emerging.
Inflation did not register to any significant degree, allowing the Federal Reserve Open Markets Committee (FOMC) to keep its target federal funds rate at a range of zero to 0.25% throughout the period. There are two sides of the coin with regard to today’s historically low interest rate environment. Low interest rates are supportive of economic growth, as companies and individuals can finance business plans or service debt at lower cost. But yields on conservative accounts and products (such as bank savings deposit, money market and fixed-account rates) are also extremely low and can prove discouraging for low-risk-taking savers and investors.
A brief review on the markets
Stock prices increased early in the six-month period ended June 30, 2010, before falling precipitously in May and June as debt- and credit-related problems in Europe roiled the world markets. This news largely overshadowed strong corporate profit reports and led to losses for equity-oriented asset classes across the board.
More aggressive investment categories fared better as their gains were stronger early in the period: Small-company U.S. stocks, as measured by the Russell 2000® Index, returned -1.95% versus large-company U.S. stocks, as measured by the S&P 500 Index, returned -5.12%. The value and growth styles of equities performed roughly in-line with one another: The Russell 1000® Growth Index had a -7.65% total return while the Russell 1000® Value Index had a -5.12% total return.
Overseas equity returns were impacted by the weak euro currency and deterioration in EU country balance sheets. The MSCI EAFE Index, a common benchmark for large, higher-quality international stocks, returned -12.93% over the period. Emerging markets, with fewer financial problems and account surpluses, outperformed developed markets as exhibited by the MSCI Emerging Markets Index’s -6.04% return.
With regard to the bond markets, benign inflation levels, a snap-back in corporate and mortgage-backed bond prices, and a flight to safer investments late in the period ushered in solidly positive returns for fixed-income investors. The broad proxy for the U.S. bond market, the Barclays Capital U.S. Aggregate Bond Index, produced a 5.33% total return for the six-month period ended June 30, 2010, while more aggressive indexes that typically accent more, and lower-quality, corporate bond holdings, performed well. The Barclays Capital U.S. Corporate High Yield Bond Index, buoyed by much improved business conditions and investor appetite for higher-yielding investments, added a 4.51% return over the same period.
Outlook
Some improvement in the economy is certainly visible. We have seen a general stabilization in the employment picture, with several months of net job gains having recently been recorded, the financial system emerging from a very troubling credit crisis (perhaps worse for wear, but intact) and the U.S. consumer appearing to have weathered the worst of the storm with spending patterns and overall confidence considerably better than a short time ago. Summed up, economic growth is positive and the market recovery over the six-month period reflects stronger fundamental underpinnings than we saw a year earlier. Why, then, are so many investors and citizens wary of the current economic picture and the potential of our nation’s financial markets?
2
Table of Contents
I would venture that a level of caution may be warranted and cite several thorny issues that may be important for future growth and confidence. Let us start with our current economic views and employment in particular.
Jobs: In 2008 and 2009, the U.S. economy shed more than 5 million jobs as the recession took root. That trend has begun to shift with a gain of 290,000 jobs created in April of 2010.2 But even on top of slighter employment gains in the late winter and early spring months, our economy will likely have to string together many months of strong job additions to continue the pace of economic growth and stock market returns we would like to see. Weaker jobs reports in May and June underscore the nation’s still unsettled employment picture.
I believe the best one can say for the current employment picture is that lay-off notices have slowed but new hiring has yet to take off. With a June unemployment rate of 9.5%, we expect new job creation to dominate political and economic debate into election season.3 The road to a robust recovery in employment will likely be long.
Debt: Global debt has also been in the news and will likely be a key consideration for international markets into the foreseeable future. The situation in Europe, and Greece in particular, holds potential lessons for many countries, including our own. With very high spending and tax rates, combined with economic growth rates that are roughly a third less than the U.S., some European countries have a significant challenge in reducing debt levels and spending. How and when they go about addressing this problem may have a meaningful impact on international and domestic markets.
Many investors question how a small country like Greece can have such a bearing on international markets. Greece, like any developed country, issues debt to fund its budget deficit and spending. Banks and other financial institutions buy this debt in exchange for a return or yield that compensates them for potential defaults. When the debt, or bonds, drop dramatically in price due to concerns over Greece’s finances, shares in companies that own the debt drop in turn. The value of the euro drops as confidence wavers in the EU’s ability to back Greece and the amount of money it will take to stabilize the Greek economy. Now other countries in the EU are forced to take on additional debt. And what if Greece is only one of several countries in the EU with emerging budget issues? It’s not a stretch to see how the cycle could repeat in other countries; my strategy team is following this topic closely.
Here in the United States, debt is also looming over the economy and markets. We too have to artfully balance our current deficit with spending, tax policy and spending reductions. How quickly and skillfully this is addressed will have a profound effect on future economic growth and market returns.
Trust: Some financial institutions and professionals have badly tarnished our industry’s reputation. For the first time in my career, I fight a wince when asked what I do for a living. This pains me because I take great pride in the work Thrivent Financial does in support of our investors and members, and I know how strongly my colleagues share this mission. I also greatly enjoy the investment management business and believe deeply in the power and long-term opportunity of the U.S. economy and financial markets.
Recent findings of the Chicago Booth/Kellogg School Financial Trust Index showed that only 23% of Americans trust the nation’s financial system.4 No surprise here as the nation just went through a devastating credit crisis, saw some major financial institutions implode and require government assistance and investment, and endured a severe pullback in the stock market from which we continue to recover.
When considering financial markets and trust in the financial system, what’s perhaps most relevant to you is a fear of a stock market decline. At Thrivent Financial for Lutherans, we generally believe strongly in including stocks as part of a long-term accumulation or retirement income plan. The allocation to stocks depends on several factors, including an individual’s risk tolerance, time horizon until the money is needed, the need for accessibility to the money at a given time, and the individual’s other investments or savings. Stocks, or equities, can provide long-term growth as well as serve as an effective hedge against inflation—two critical attributes for accumulating enough and not outliving your assets.
If fear of the stock market makes you sleepless at night, it’s time to sit down with a Thrivent Financial representative. He or she can help build a strategy that balances your personal appetite for risk with the goals you have for your investment. Thrivent Financial has many tools and product solutions that can help. Let us know if we can help in any way. Thank you for continuing to put your trust with us.
| Sincerely, |
 |
| Russell W. Swansen |
| President of Thrivent Series Fund, Inc. |
| 1 | Bureau of Economic Statistics |
| 2 | U.S. Department of Labor, Bureau of Labor Statistics |
| 3 | U.S. Department of Labor, Bureau of Labor Statistics |
| 4 | March 30, 2010, Chicago Booth/Kellogg School, Financial Trust Index, a quarterly look at Americans’ trust in the nation’s financial system. |
3
Table of Contents
The Portfolio’s performance depends upon how its assets are allocated across broad asset categories and applicable sub-classes within such categories. Some broad asset categories and sub-classes may perform below expectations or below the securities markets generally over short or extended periods. In particular, underperformance in the equity markets would have material adverse effect on the Portfolio’s total return, given its allocation to equity securities. Another risk of investing in the Portfolio is that its performance is dependent upon the performance of the underlying asset classes in which it invests. As a result, the Portfolio is subject to the same risks as those faced by the underlying asset classes. These and other risks are described in the Portfolio’s prospectus. Views expressed in this discussion of portfolio performance are the views of this particular portfolio’s management team.
How did the Portfolio perform during the six-month period ended June 30, 2010?
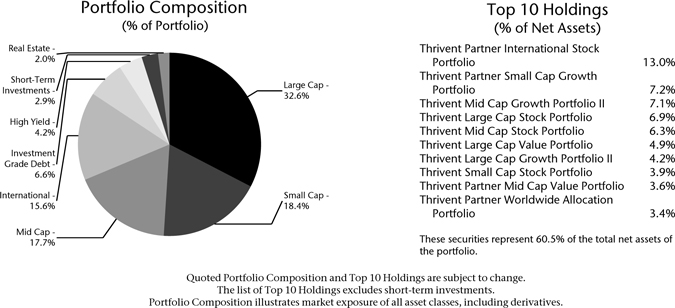
Thrivent Aggressive Allocation Portfolio earned a return of -5.72%, as compared to the S&P 500 Index, which earned -6.65%, while the Barclays Capital Aggregate Bond Index returned 5.33%. The median return in the Lipper Multi-Cap Core category was -6.43%.
What factors affected the Portfolio’s performance?
Equity markets advanced in the early part of the period, reflecting increased optimism about the vigor and sustainability of the unfolding economic recovery both in the U.S. and abroad. That optimism quickly turned to heightened uncertainty as sovereign debt default issues became apparent in the euro zone countries, specifically related to Greece but more broadly exposing a fundamental weakness in the construction of the euro bloc as a currency alternative to the dollar. Net growth and sustainability expectations were reduced globally, engendering a sell off in equity asset classes, a downward adjustment in interest rate levels and commensurate increase in bond prices.
The Portfolio allocation to equities was approximately 90%, reflecting a decision to modestly move below our strategic target about midway through the period. Additionally, we had upgraded our exposure to domestic and higher quality assets at the time of the Portfolio reallocation. Both of these actions proved to be timely and modestly aided Portfolio results versus the equity benchmarks.
In fixed income, we introduced exposure to U.S. government securities and balanced them with continued exposure to the high-yield sector, the former as a hedge to the increased riskiness of the environment, and the latter reflecting the continued attractive valuations in high-yield bonds versus their investment-grade alternatives.
What is your outlook?
We believe the economy is entering into a period of slower growth that heightens the risk that the economic recovery will not be sustained. While we do not believe that will be the case, we have taken steps in the Portfolio to recognize those risks. By the end of the period, equity markets had adjusted downward and bond prices have rallied, reflecting this revised outlook. The risk of disappointment, in our view, is priced into many asset classes.
4
Table of Contents
At this point, we believe the recovery will be sustained, inflation will be contained and the sovereign debt challenge in Europe will be mitigated. As such, we still maintain a healthy exposure to stocks and corporate bonds. At current levels of interest rates, if corporate earnings as currently forecast can be achieved, stocks are relatively cheap. It is key, in our view, that economic growth be sustained at reasonable levels to achieve those earnings targets. We continue to monitor the situation closely.
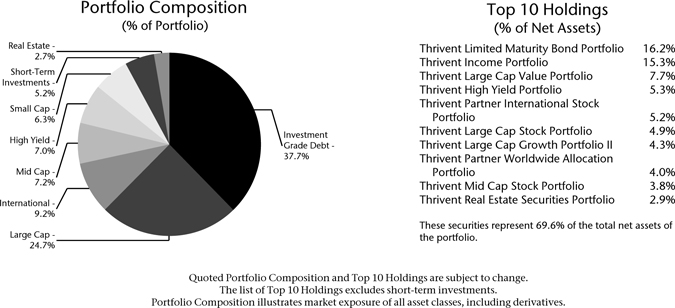
Portfolio Facts
As of June 30, 2010
Net Assets | $474,946,515 | |
NAV | $9.81 | |
NAV - High† | 4/23/2010 - $11.72 | |
NAV - Low† | 6/30/2010 - $9.81 | |
Number of Holdings: 314 |
| † | For the six months ended June 30, 2010 |
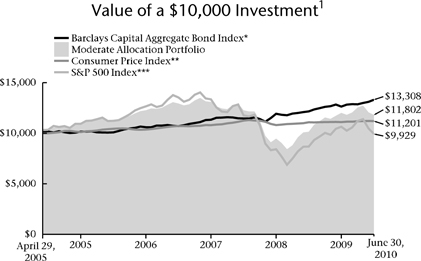
Average Annual Total Returns1
As of June 30, 2010
| 1-Year | 5-Year | From Inception 4/29/2005 | ||
| 15.57% | 1.02% | 1.86% |
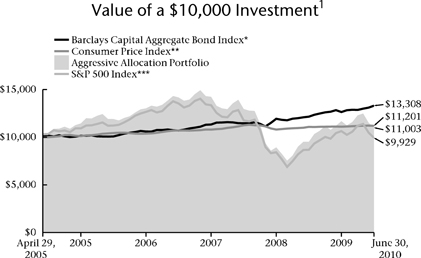
| * | The Barclays Capital Aggregate Bond Index is an index that measures the performance of U.S. investment grade bonds. It is not possible to invest directly in the Index. The performance of the Index does not reflect deductions for fees, expenses or taxes. |
| ** | The Consumer Price Index is an inflationary indicator that measures the change in the cost of a fixed basket of products and services, including housing, electricity, food and transportation. It is not possible to invest directly in the Index. |
| *** | The S&P 500 Index is an index that represents the average performance of a group of 500 widely held, publicly traded stocks. It is not possible to invest directly in the Index. The performance of the Index does not reflect deductions for fees, expenses or taxes. “S&P 500” is a trademark of The McGraw-Hill Companies, Inc. and has been licensed for use by Thrivent Financial for Lutherans. The product is not sponsored, endorsed or promoted by Standard & Poor’s, and Standard & Poor’s makes no representation regarding the advisability of investing in the product. |
Past performance is not an indication of future results. Total investment return and principal value of your investment will fluctuate and units, when redeemed, may be worth more or less than their original cost. Current performance may be higher or lower than the performance data quoted. Call 800-THRIVENT or visit www.thrivent.com for performance results current to the most recent month-end.
| 1 | Average annual total returns represent past performance and reflect changes in share prices, the reinvestment of all dividends and capital gains, and the effects of compounding. Periods of less than one year are not annualized. At various times, the Portfolio’s adviser may have waived its management fee and/or reimbursed Portfolio expenses. If this were the case, the Portfolio’s total returns would have been lower. The returns shown do not reflect charges and expenses imposed on contract holders by the variable accounts. Those charges and expenses reduce the returns received by contract holders as compared to the returns presented. |
The prospectus contains more complete information on the investment objectives, risks, charges and expenses of the investment company, which investors should read and consider carefully before investing. To obtain a prospectus, contact a registered representative or visit www.thrivent.com.
5
Table of Contents
| Thrivent Moderately Aggressive Allocation Portfolio
Russell W. Swansen (left), David C. Francis, CFA (right) and Mark L. Simenstad, CFA (far right), Portfolio Co-Managers |  |
The Portfolio seeks long-term capital growth.
The Portfolio’s performance depends upon how its assets are allocated across broad asset categories and applicable sub-classes within such categories. Some broad asset categories and sub-classes may perform below expectations or below the securities markets generally over short or extended periods. In particular, underperformance in the equity markets would have material adverse effect on the Portfolio’s total return, given its allocation to equity securities. Another risk of investing in the Portfolio is that its performance is dependent upon the performance of the underlying asset classes in which it invests. As a result, the Portfolio is subject to the same risks as those faced by the underlying asset classes. These and other risks are described in the Portfolio’s prospectus. Views expressed in this discussion of portfolio performance are the views of this particular portfolio’s management team.
How did the Portfolio perform during the six-month period ended June 30, 2010?
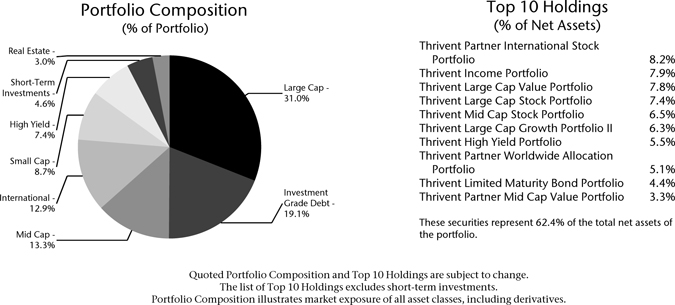
Thrivent Moderately Aggressive Allocation Portfolio earned a return of -3.93%, as compared to the S&P 500 Index, which returned - -6.65%, while the Barclays Capital Aggregate Bond Index returned 5.33%. The median return in the Lipper Mixed-Asset Target Allocation Growth category was -4.42%.
What factors affected the Portfolio’s performance?
Equity markets advanced in the early part of the period, reflecting increased optimism about the vigor and sustainability of the unfolding economic recovery both in the U.S. and abroad. That optimism quickly turned to heightened uncertainty as sovereign debt default issues became apparent in the euro zone countries, specifically related to Greece, but more broadly exposing a fundamental weakness in the construction of the euro bloc as a currency alternative to the dollar.
The Portfolio allocation to equities was reduced to approximately 75% from 79% and a commensurate increase in our bond holdings occurred, reflecting a decision to move modestly below our strategic targets in more risky categories about midway through the period. Additionally, we had upgraded our exposure to domestic and higher quality assets in both allocations at the time of the Portfolio reallocation. In fixed income, we introduced exposure to U.S. government securities and balanced them with continued exposure to the high-yield sector, the former as a hedge to the increased riskiness of the environment and the latter reflecting the continued attractive valuations in high-yield bonds versus their investment-grade alternatives.
What is your outlook?
We believe the economy is entering into a period of slower growth that heightens the risk that the economic recovery won’t be sustained. While we don’t believe that will be the case, we have taken steps in the Portfolio to recognize those risks. By the end of the period, equity markets had adjusted downward and bond prices have rallied, reflecting this revised outlook. The risk of disappointment, in our view, is priced into many asset classes.
At this point, we believe the recovery will be sustained, inflation will be contained and the sovereign debt
6
Table of Contents
challenge in Europe will be mitigated. As such, we still maintain a healthy exposure to stocks and corporate bonds. At current levels of interest rates, if corporate earnings as currently forecast can be achieved, stocks are relatively cheap. It is key, in our view, that economic growth be sustained at reasonable levels to achieve those earnings targets. We continue to monitor the situation closely.
Portfolio Facts
As of June 30, 2010
Net Assets | $2,029,330,612 | |
NAV | $9.90 | |
NAV - High† | 4/23/2010 - $11.66 | |
NAV - Low† | 6/30/2010 - $9.90 | |
Number of Holdings: 346 |
| † | For the six months ended June 30, 2010 |
Average Annual Total Returns1
As of June 30, 2010
| 1-Year | 5-Year | From Inception 4/29/2005 | ||
| 16.51% | 1.82% | 2.48% |
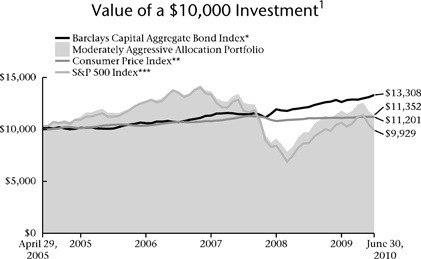
| * | The Barclays Capital Aggregate Bond Index is an index that measures the performance of U.S. investment grade bonds. It is not possible to invest directly in the Index. The performance of the Index does not reflect deductions for fees, expenses or taxes. |
| ** | The Consumer Price Index is an inflationary indicator that measures the change in the cost of a fixed basket of products and services, including housing, electricity, food and transportation. It is not possible to invest directly in the Index. |
| *** | The S&P 500 Index is an index that represents the average performance of a group of 500 widely held, publicly traded stocks. It is not possible to invest directly in the Index. The performance of the Index does not reflect deductions for fees, expenses or taxes. “S&P 500” is a trademark of The McGraw-Hill Companies, Inc. and has been licensed for use by Thrivent Financial for Lutherans. The product is not sponsored, endorsed or promoted by Standard & Poor’s, and Standard & Poor’s makes no representation regarding the advisability of investing in the product. |
Past performance is not an indication of future results. Total investment return and principal value of your investment will fluctuate and units, when redeemed, may be worth more or less than their original cost. Current performance may be higher or lower than the performance data quoted. Call 800-THRIVENT or visit www.thrivent.com for performance results current to the most recent month-end.
| 1 | Average annual total returns represent past performance and reflect changes in share prices, the reinvestment of all dividends and capital gains, and the effects of compounding. Periods of less than one year are not annualized. At various times, the Portfolio’s adviser may have waived its management fee and/or reimbursed Portfolio expenses. If this were the case, the Portfolio’s total returns would have been lower. The returns shown do not reflect charges and expenses imposed on contract holders by the variable accounts. Those charges and expenses reduce the returns received by contract holders as compared to the returns presented. |
The prospectus contains more complete information on the investment objectives, risks, charges and expenses of the investment company, which investors should read and consider carefully before investing. To obtain a prospectus, contact a registered representative or visit www.thrivent.com.
7
Table of Contents
The Portfolio’s performance depends upon how its assets are allocated across broad asset categories and applicable sub-classes within such categories. Some broad asset categories and sub-classes may perform below expectations or below the securities markets generally over short or extended periods. In particular, underperformance in the equity markets would have material adverse effect on the Portfolio’s total return, given its allocation to equity securities. Another risk of investing in the Portfolio is that its performance is dependent upon the performance of the underlying asset classes in which it invests. As a result, the Portfolio is subject to the same risks as those faced by the underlying asset classes. These and other risks are described in the Portfolio’s prospectus. Views expressed in this discussion of portfolio performance are the views of this particular portfolio’s management team.
How did the Portfolio perform during the six-month period ended June 30, 2010?
Thrivent Moderate Allocation Portfolio earned a return of -1.70%, as compared with the S&P 500 Index, which earned -6.65%, while the Barclays Capital Aggregate Bond Index returned 5.33%. The median return in the Lipper Mixed-Asset Target Allocation Moderate category was -2.36%.
What factors affected the Portfolio’s performance?
Equity markets advanced in the early part of the period, reflecting increased optimism about the vigor and sustainability of the unfolding economic recovery both in the U.S. and abroad. That optimism quickly turned to heightened uncertainty as sovereign debt default issues became apparent in the euro zone countries, specifically related to Greece but more broadly exposing a fundamental weakness in the construction of the euro bloc as a currency alternative to the dollar.
The Portfolio allocation to equities was reduced to approximately 55% from 58% and a commensurate increase in our bond holdings occurred, reflecting a decision to move modestly below our strategic targets in more risky categories about midway through the period.
Additionally, we had upgraded our exposure to domestic and higher-quality assets in both allocations at the time of the Portfolio reallocation. Taken together, these actions proved to be timely and modestly aided Portfolio results versus the equity benchmarks.
In fixed income, we introduced exposure to U.S. government securities and balanced them with continued exposure to the high-yield sector, the former as a hedge to the increased riskiness of the environment and the latter reflecting the continued attractive valuations in high-yield bonds versus their investment-grade alternatives.
What is your outlook?
We believe the economy is entering into a period of slower growth that heightens the risk the economic recovery will not be sustained. While we do not believe that will be the case, we have taken steps in the Portfolio to recognize those risks. By the end of the period, equity markets had adjusted downward and bond prices have rallied, reflecting this revised outlook. The risk of disappointment, in our view, is priced into many asset classes.
At this point, we believe the recovery will be sustained, inflation will be contained and the sovereign debt
8
Table of Contents
challenge in Europe will be mitigated. As such, we still maintain a healthy exposure to stocks and corporate bonds. At current levels of interest rates, if corporate earnings as currently forecast can be achieved, stocks are relatively cheap. It is key, in our view, that economic growth be sustained at reasonable levels to achieve those earnings targets. We continue to monitor the situation closely.
Portfolio Facts
As of June 30, 2010
Net Assets | $2,868,768,184 | |
NAV | $10.20 | |
NAV - High† | 4/23/2010 - $11.64 | |
NAV - Low† | 6/30/2010 - $10.20 | |
Number of Holdings: 347 |
| † | For the six months ended June 30, 2010 |
Average Annual Total Returns1
As of June 30, 2010
| 1-Year | 5-Year | From Inception 4/29/2005 | ||
| 16.39% | 2.74% | 3.25% |
| * | The Barclays Capital Aggregate Bond Index is an index that measures the performance of U.S. investment grade bonds. It is not possible to invest directly in the Index. The performance of the Index does not reflect deductions for fees, expenses or taxes. |
| ** | The Consumer Price Index is an inflationary indicator that measures the change in the cost of a fixed basket of products and services, including housing, electricity, food and transportation. It is not possible to invest directly in the Index. |
| *** | The S&P 500 Index is an index that represents the average performance of a group of 500 widely held, publicly traded stocks. It is not possible to invest directly in the Index. The performance of the Index does not reflect deductions for fees, expenses or taxes. “S&P 500” is a trademark of The McGraw-Hill Companies, Inc. and has been licensed for use by Thrivent Financial for Lutherans. The product is not sponsored, endorsed or promoted by Standard & Poor’s, and Standard & Poor’s makes no representation regarding the advisability of investing in the product. |
Past performance is not an indication of future results. Total investment return and principal value of your investment will fluctuate and units, when redeemed, may be worth more or less than their original cost. Current performance may be higher or lower than the performance data quoted. Call 800-THRIVENT or visit www.thrivent.com for performance results current to the most recent month-end.
| 1 | Average annual total returns represent past performance and reflect changes in share prices, the reinvestment of all dividends and capital gains, and the effects of compounding. Periods of less than one year are not annualized. At various times, the Portfolio’s adviser may have waived its management fee and/or reimbursed Portfolio expenses. If this were the case, the Portfolio’s total returns would have been lower. The returns shown do not reflect charges and expenses imposed on contract holders by the variable accounts. Those charges and expenses reduce the returns received by contract holders as compared to the returns presented. |
The prospectus contains more complete information on the investment objectives, risks, charges and expenses of the investment company, which investors should read and consider carefully before investing. To obtain a prospectus, contact a registered representative or visit www.thrivent.com.
9
Table of Contents
| Thrivent Moderately Conservative Allocation Portfolio
Russell W. Swansen (left), David C. Francis, CFA (right) and Mark L. Simenstad, CFA (far right), Portfolio Co-Managers | |
The Portfolio seeks long-term capital growth while providing reasonable stability of principal.
The Portfolio’s performance depends upon how its assets are allocated across broad asset categories and applicable sub-classes within such categories. Some broad asset categories and sub-classes may perform below expectations or below the securities markets generally over short or extended periods. In particular, underperformance in the equity markets would have material adverse effect on the Portfolio’s total return, given its allocation to equity securities. Another risk of investing in the Portfolio is that its performance is dependent upon the performance of the underlying asset classes in which it invests. As a result, the Portfolio is subject to the same risks as those faced by the underlying asset classes. These and other risks are described in the Portfolio’s prospectus. Views expressed in this discussion of portfolio performance are the views of this particular portfolio’s management team.
How did the Portfolio perform during the six-month period ended June 30, 2010?
Thrivent Moderately Conservative Allocation Portfolio earned a return of -0.01%, as compared to the S&P 500 Index, which returned -6.65%, while the Barclays Capital Aggregate Bond Index returned 5.33%. The median return in the Lipper Mixed-Asset Target Allocation Conservative category earned 0.39%.
What factors affected the Portfolio’s performance?
Equity markets advanced in the early part of the period, reflecting increased optimism about the vigor and sustainability of the unfolding economic recovery both in the U.S. and abroad. That optimism quickly turned to heightened uncertainty as sovereign debt default issues became apparent in the euro zone countries, specifically related to Greece, but more broadly exposing a fundamental weakness in the construction of the euro bloc as a currency alternative to the dollar.
The Portfolio allocation to equities was reduced to approximately 37% from 39% and a commensurate increase in our bond holdings occurred, reflecting a decision to move modestly below our strategic targets in more risky categories about midway through the period. Additionally, we had upgraded our exposure to domestic and higher-quality assets in both allocations at the time of the Portfolio reallocation. In fixed income, we introduced exposure to U.S. government securities and balanced them with continued exposure to the high-yield sector, the former as a hedge to the increased riskiness of the environment and the latter reflecting the continued attractive valuations in high-yield bonds versus their investment-grade alternatives.
What is your outlook?
We believe the economy is entering into a period of slower growth that heightens the risk the economic recovery will not be sustained. While we do not believe that will be the case, we have taken steps in the Portfolio to recognize those risks. By the end of the period, equity markets had adjusted downward and bond prices have rallied, reflecting this revised outlook.
At this point, we believe the recovery will be sustained, inflation will be contained and the sovereign debt challenge in Europe will be mitigated. As such, we still maintain a healthy exposure to stocks and corporate
10
Table of Contents
bonds. At current levels of interest rates, if corporate earnings as currently forecast can be achieved, stocks are relatively cheap. It is key, in our view, that economic growth be sustained at reasonable levels to achieve those earnings targets. We continue to monitor the situation closely.
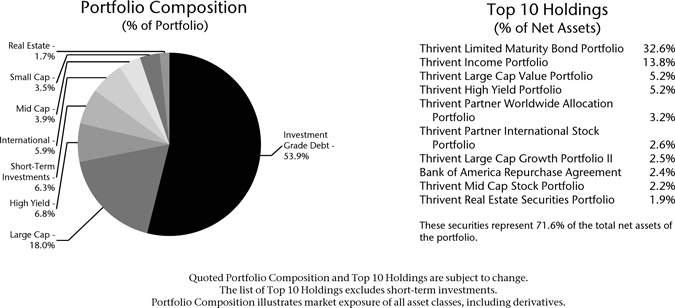
Portfolio Facts
As of June 30, 2010
Net Assets | $1,239,295,482 | |
NAV | $10.46 | |
NAV - High† | 4/23/2010 - $11.58 | |
NAV - Low† | 6/30/2010 - $10.46 | |
Number of Holdings: 343 |
| † | For the six months ended June 30, 2010 |
Average Annual Total Returns1
As of June 30, 2010
| 1-Year | 5-Year | From Inception 4/29/2005 | ||
| 14.54% | 3.35% | 3.72% |
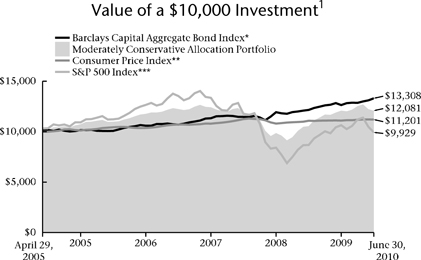
| * | The Barclays Capital Aggregate Bond Index is an index that measures the performance of U.S. investment grade bonds. It is not possible to invest directly in the Index. The performance of the Index does not reflect deductions for fees, expenses or taxes. |
| ** | The Consumer Price Index is an inflationary indicator that measures the change in the cost of a fixed basket of products and services, including housing, electricity, food and transportation. It is not possible to invest directly in the Index. |
| *** | The S&P 500 Index is an index that represents the average performance of a group of 500 widely held, publicly traded stocks. It is not possible to invest directly in the Index. The performance of the Index does not reflect deductions for fees, expenses or taxes. “S&P 500” is a trademark of The McGraw-Hill Companies, Inc. and has been licensed for use by Thrivent Financial for Lutherans. The product is not sponsored, endorsed or promoted by Standard & Poor’s, and Standard & Poor’s makes no representation regarding the advisability of investing in the product. |
Past performance is not an indication of future results. Total investment return and principal value of your investment will fluctuate and units, when redeemed, may be worth more or less than their original cost. Current performance may be higher or lower than the performance data quoted. Call 800-THRIVENT or visit www.thrivent.com for performance results current to the most recent month-end.
| 1 | Average annual total returns represent past performance and reflect changes in share prices, the reinvestment of all dividends and capital gains, and the effects of compounding. Periods of less than one year are not annualized. At various times, the Portfolio’s adviser may have waived its management fee and/or reimbursed Portfolio expenses. If this were the case, the Portfolio’s total returns would have been lower. The returns shown do not reflect charges and expenses imposed on contract holders by the variable accounts. Those charges and expenses reduce the returns received by contract holders as compared to the returns presented. |
The prospectus contains more complete information on the investment objectives, risks, charges and expenses of the investment company, which investors should read and consider carefully before investing. To obtain a prospectus, contact a registered representative or visit www.thrivent.com.
11
Table of Contents

How did the Portfolio perform during the six-month period ended June 30, 2010?
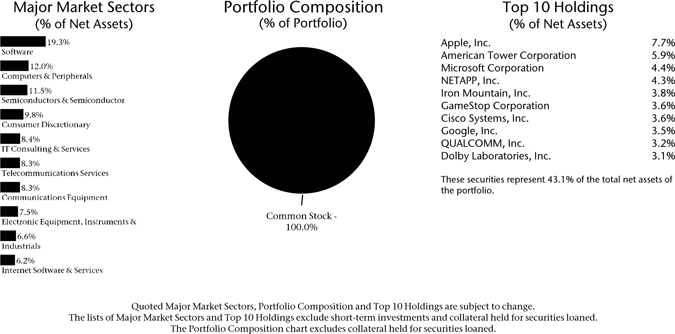
Thrivent Partner Technology Portfolio earned a return of -5.15% as compared with the median return of its peer group, the Lipper Science & Technology category, of -6.71%. The Portfolio’s market benchmarks, the S&P North American Technology Sector Index and the NASDAQ Composite Index earned a return of -10.40% and -6.62%, respectively.
What factors affected the Portfolio’s performance?
Netflix, Inc. was a top contributor to performance as the company reported earnings that exceeded expectations. The company announced that it added more than 1.5 million subscribers in the most recent fiscal quarter. Shares of Coinstar, Inc. were up after the company reported strong earnings growth for its most recent fiscal quarter. The results were primarily driven by recently acquired Redbox, a company that provides DVD rentals via self-service kiosks. NetApp, Inc., a company that develops data storage hardware and software for enterprise clients, contributed to performance. We believe NetApp has a strong competitive position in an industry that is benefiting from several growth trends, such as virtualization, which we believe will increase the demand for the company’s storage products.
FormFactor, Inc. was a top detractor from performance. The company designs and manufactures wafer probe cards that are used for testing semiconductor chips. While the company’s revenue generation has been consistent with market expectations, shares of the company traded down on concerns that higher-than-expected supply chain costs would push margins to fall below consensus expectations. Smartphone manufacturer Palm was a top detractor. Its shares fell as the company reported quarterly revenues that were lower than expected. We sold out of the company after it announced that it would be acquired by Hewlett-Packard at a premium to its trading price. Global Payments, Inc. also detracted from performance. Although the company reported earnings that were above expectations, revenues from Canada, an important market for Global Payments, were weak.
What is your outlook?
As we consider equity returns going forward, we believe stock prices will be driven by company-specific fundamentals, specifically, free cash flow and margin
12
Table of Contents
structure. In our view, the dramatic cost cutting that occurred in 2009 should provide certain companies with significant operating leverage. Our research efforts continue to be focused on companies that can grow revenue by gaining market share and determining whether the cost cutting was sustainable or transient. We believe that it will continue to be a stockpicker’s market and an investment manager’s ability to identity and purchase those companies best poised for earnings and free cash flow growth will be an important component of investor returns.
Portfolio Facts
As of June 30, 2010
Net Assets | $28,156,624 | |
NAV | $5.40 | |
NAV - High† | 4/26/2010 - $6.25 | |
NAV - Low† | 2/4/2010 - $5.18 | |
Number of Holdings: 38 |
| † | For the six months ended June 30, 2010 |
Average Annual Total Returns1
As of June 30, 2010
| 1-Year | 5-Year | From Inception 3/1/2001 | ||
| 18.43% | -0.50% | -4.28% |
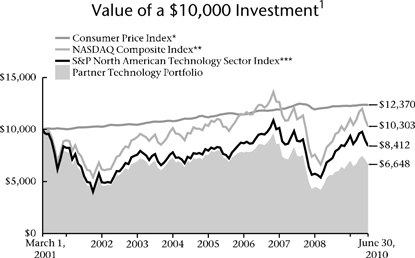
| * | The Consumer Price Index is an inflationary indicator that measures the change in the cost of a fixed basket of products and services, including housing, electricity, food and transportation. It is not possible to invest directly in the Index. |
| ** | The NASDAQ Composite Index is a market capitalization-weighted index of all domestic and foreign securities listed on the NASDAQ Stock Exchange. It is not possible to invest directly in the Index. The performance of the Index does not reflect deductions for fees, expenses or taxes. Effective July 1, 2009, the Adviser hired Goldman Sachs Asset Management, L.P. as subadviser to manage the Portfolio on a day-to-day basis. The Adviser believes that the NASDAQ Composite Index is a more appropriate benchmark for the Portfolio in light of the fact that the subadviser, in managing its own proprietary technology mutual fund, benchmarks against this Index. Thus, the S&P North American Technology Sector Index will not be shown in shareholder reports of the Portfolio for fiscal periods ended December 31, 2010 and beyond (unless the Adviser changes back to this benchmark index). |
| *** | The S&P North American Technology Sector Index is a modified capitalization-weighted index of selected technology stocks. The product is not sponsored, endorsed or promoted by Standard & Poor’s, and Standard & Poor’s makes no representation regarding the advisability of investing in the product. It is not possible to invest directly in the Index. The performance of the Index does not reflect deductions for fees, expenses or taxes. |
Past performance is not an indication of future results. Total investment return and principal value of your investment will fluctuate and units, when redeemed, may be worth more or less than their original cost. Current performance may be higher or lower than the performance data quoted. Call 800-THRIVENT or visit www.thrivent.com for performance results current to the most recent month-end.
| 1 | Average annual total returns represent past performance and reflect changes in share prices, the reinvestment of all dividends and capital gains, and the effects of compounding. Periods of less than one year are not annualized. At various times, the Portfolio’s adviser may have waived its management fee and/or reimbursed Portfolio expenses. If this were the case, the Portfolio’s total returns would have been lower. The returns shown do not reflect charges and expenses imposed on contract holders by the variable accounts. Those charges and expenses reduce the returns received by contract holders as compared to the returns presented. |
The prospectus contains more complete information on the investment objectives, risks, charges and expenses of the investment company, which investors should read and consider carefully before investing. To obtain a prospectus, contact a registered representative or visit www.thrivent.com.
13
Table of Contents
 | Thrivent Partner Healthcare Portfolio |
Subadvised by Sectoral Asset Management, Inc.
Thrivent Partner Healthcare Portfolio seeks long-term capital growth.
The Portfolio’s investments are concentrated in issuers in the health care industry; therefore, the Portfolio is more vulnerable to price changes in the securities of issuers in this industry and factors specific to this industry than a more broadly diversified fund. In addition, as a non-diversified fund, the Portfolio is susceptible to the risk that events affecting a particular issuer will significantly affect the Portfolio’s performance. These and other risks are described in the Portfolio’s prospectus. Views expressed in this discussion of portfolio performance are the views of this particular portfolio’s management team.
How did the Portfolio perform during the six-month period ended June 30, 2010?
Thrivent Partner Healthcare Portfolio earned a return of -2.35%, as compared to the median return of its peer group, the Lipper Health/Biotechnology category, of -6.21%. The Portfolio’s market benchmark, the MSCI World Healthcare Index, earned a return of -9.20%.
What factors affected the Portfolio’s performance?
The Portfolio outperformed its benchmark in the first six months of the year. The largest contributors to performance were medtech Thoratec, generics Hikma and Nichi-iko, and biotech Novo Nordisk. The largest performance detractors were pharmaceutical companies Pfizer, Roche and Abbott.
What is your outlook?
We believe that pharmaceuticals, as part of restructuring through mergers and acquisitions (Pfizer/Wyeth, Merck/Schering), spinouts (Bristol-Myers, Mead Johnson), and cost-cutting, are in the process of reinvigorating business models. Companies with manageable generic exposures, a significant presence in emerging markets, and developing pipelines offer, in our opinion, the most attractive investment opportunities.
In biotech, earnings are expected to grow while the industry pipeline should continue to advance. Recent approvals of several blockbusters and pipeline progress should position the industry for continued growth despite a deteriorating pricing and reimbursement environment. Biotech companies are trading near 10-year lows.
For generics, we expect companies based in emerging pharmaceutical markets to continue performing well, benefiting from strong domestic growth mainly driven by branded generics. Japan, a potentially huge market for generics that is currently not well penetrated, is showing some signs of progress, but more political support is still needed. We believe that the industry remains attractively valued, with projected sales and earnings growth over the next five years. Medtechs are expected to continue to grow, led by companies developing products offering significant innovations with marked improvements over current treatment practice.

14
Table of Contents
Portfolio Facts
As of June 30, 2010
Net Assets | $15,111,867 | |
NAV | $10.62 | |
NAV - High† | 4/15/2010 - $12.15 | |
NAV - Low† | 6/30/2010 - $10.62 | |
Number of Holdings: 34 |
| † | For the six months ended June 30, 2010 |
Average Annual Total Returns1
As of June 30, 2010
| 1-Year | From Inception 4/30/2008 | |
| 13.08% | 3.73% |
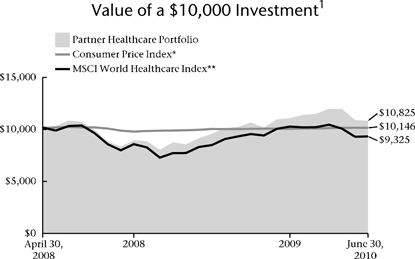
| * | The Consumer Price Index is an inflationary indicator that measures the change in the cost of a fixed basket of products and services, including housing, electricity, food and transportation. It is not possible to invest directly in the Index. |
| ** | The MSCI World Healthcare Index is a capitalization-weighted index of selected health care stocks from around the world. It is not possible to invest directly in the Index. The performance of the Index does not reflect deductions for fees, expenses or taxes. |
Past performance is not an indication of future results. Total investment return and principal value of your investment will fluctuate and units, when redeemed, may be worth more or less than their original cost. Current performance may be higher or lower than the performance data quoted. Call 800-THRIVENT or visit www.thrivent.com for performance results current to the most recent month-end.
| 1 | Average annual total returns represent past performance and reflect changes in share prices, the reinvestment of all dividends and capital gains, and the effects of compounding. Periods of less than one year are not annualized. At various times, the Portfolio’s adviser may have waived its management fee and/or reimbursed Portfolio expenses. If this were the case, the Portfolio’s total returns would have been lower. The returns shown do not reflect charges and expenses imposed on contract holders by the variable accounts. Those charges and expenses reduce the returns received by contract holders as compared to the returns presented. |
The prospectus contains more complete information on the investment objectives, risks, charges and expenses of the investment company, which investors should read and consider carefully before investing. To obtain a prospectus, contact a registered representative or visit www.thrivent.com.
15
Table of Contents
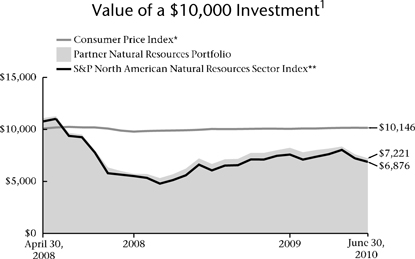
 | Thrivent Partner Natural Resources Portfolio |
Subadvised by BlackRock Investment Management, LLC
Thrivent Partner Natural Resources Portfolio seeks long-term capital growth.
The Portfolio’s investments are concentrated in issuers in the natural resources industry; therefore, the Portfolio is more vulnerable to price changes in the securities of issuers in this industry and factors specific to this industry than a more broadly diversified fund. In addition, as a non-diversified fund, the Portfolio is susceptible to the risk that events affecting a particular issuer will significantly affect the Portfolio’s performance. These and other risks are described in the Portfolio’s prospectus. Views expressed in this discussion of portfolio performance are the views of this particular portfolio’s management team.
How did the Portfolio perform during the six-month period ended June 30, 2010?
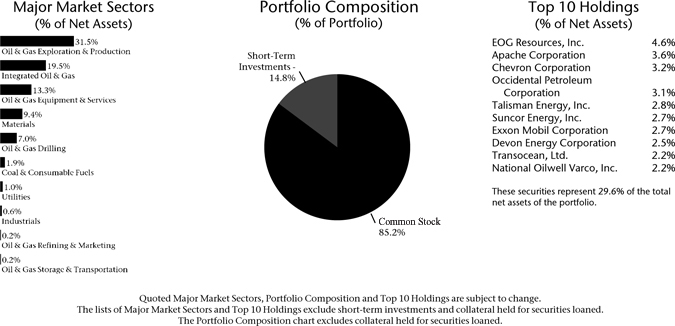
Thrivent Partner Natural Resources Portfolio earned a return of -12.33%, as compared to the median return of its peer group, the Lipper Natural Resources category, of -12.31%. The Portfolio’s market benchmark, the S&P North American Natural Resources Sector Index, earned a return of -9.32%.
What factors affected the Portfolio’s performance?
The BP oil spill in the Gulf of Mexico and the Massey, West Virginia mine explosion both served to weigh heavily on the sector during the second quarter. Our Portfolio’s relative underweighting to the troubled integrated sector and our overweighted position in the smaller cap exploration and production stocks has driven performance for the period.
What is your outlook?
Valuations in the sector are currently attractive, in our opinion. We continue to believe that as the economy recovers, we are supply constrained across a variety of commodities, notably oil and coal. Prices should remain elevated and the stocks are poised to perform well, assuming the global economy can expand at a conservative rate and some amount of risk appetite finds its way back into the marketplace.
16
Table of Contents
Portfolio Facts
As of June 30, 2010
Net Assets | $20,615,516 | |
NAV | $7.21 | |
NAV - High† | 4/23/2010 - $8.67 | |
NAV - Low† | 6/30/2010 - $7.21 | |
Number of Holdings: 95 |
| † | For the six months ended June 30, 2010 |
Average Annual Total Returns1
As of June 30, 2010
| 1-Year | From Inception 4/30/2008 | |
| 8.26% | -13.95% |
| * | The Consumer Price Index is an inflationary indicator that measures the change in the cost of a fixed basket of products and services, including housing, electricity, food and transportation. It is not possible to invest directly in the Index. |
| ** | The S&P North American Natural Resources Sector Index is an index of selected U.S. traded natural resource related stocks. The product is not sponsored, endorsed or promoted by Standard & Poor’s, and Standard & Poor’s makes no representation regarding the advisability of investing in the product. It is not possible to invest directly in the Index. The performance of the Index does not reflect deductions for fees, expenses or taxes. |
Past performance is not an indication of future results. Total investment return and principal value of your investment will fluctuate and units, when redeemed, may be worth more or less than their original cost. Current performance may be higher or lower than the performance data quoted. Call 800-THRIVENT or visit www.thrivent.com for performance results current to the most recent month-end.
| 1 | Average annual total returns represent past performance and reflect changes in share prices, the reinvestment of all dividends and capital gains, and the effects of compounding. Periods of less than one year are not annualized. At various times, the Portfolio’s adviser may have waived its management fee and/or reimbursed Portfolio expenses. If this were the case, the Portfolio’s total returns would have been lower. The returns shown do not reflect charges and expenses imposed on contract holders by the variable accounts. Those charges and expenses reduce the returns received by contract holders as compared to the returns presented. |
The prospectus contains more complete information on the investment objectives, risks, charges and expenses of the investment company, which investors should read and consider carefully before investing. To obtain a prospectus, contact a registered representative or visit www.thrivent.com.
17
Table of Contents
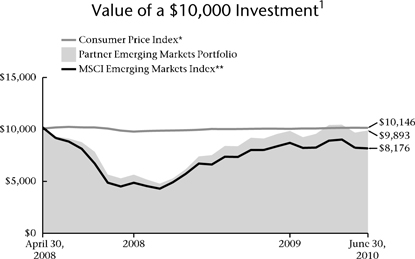
 | Thrivent Partner Emerging Markets Portfolio |
Subadvised by Aberdeen Asset Management Investment Services Limited
Thrivent Partner Emerging Markets Portfolio seeks long-term capital growth.
Foreign investments, as compared to domestic ones, involve additional risks, including currency fluctuations, different accounting standards, and greater political, economic and market instability. These risks are magnified when the Portfolio invests in emerging markets, which may be of relatively small size and less liquid than domestic markets. These and other risks are described in the Portfolio’s prospectus. Views expressed in this discussion of portfolio performance are the views of this particular portfolio’s management team.
How did the Portfolio perform during the six-month period ended June 30, 2010?
Thrivent Partner Emerging Markets Portfolio earned a return of 0.38%, compared with a decline of the market benchmark, the MSCI Emerging Markets Index, of - -6.04%. The median return in its peer group, the Lipper Emerging Markets category, was -6.49%.
What factors affected the Portfolio’s performance?
Emerging markets were volatile during the review period. Buoyant economic data and firmer crude oil prices lifted sentiment in the first three months, but confidence was later dented by growing concerns that policy tightening in China and Europe’s worsening debt problem might stifle the global recovery.
Against this backdrop, our focus on quality companies with strong balance sheets allowed the Portfolio to outperform the benchmark significantly. Our overweighting to domestically focused businesses and the underweighting to cyclical sectors added to performance given the concerns over global growth. Our non-benchmark exposure in Hong Kong also benefited the Portfolio, as did our overweighting to Thailand, which outpaced most of its peers, despite the recent domestic political unrest.
Stock selection was the main contributor to outperformance. Some of the laggards of 2009, such as our holdings in China Mobile and South African retailers Massmart and Truworths rebounded. Elsewhere, Indonesian conglomerate Astra International maintained its strong momentum from 2009 on the back of robust earnings. In Brazil, retailer Lojas Renner was buoyed by resilient retail sales and increased consumer confidence, while Souza Cruz’s defensive characteristics stood out. Meanwhile, GlaxoSmithKline India and Turkish food retailer BIM gained from solid quarterly results.
Conversely, our positions in drugmaker Gedeon Richter and seamless pipe maker Tenaris detracted from performance. Poor economic sentiment in Hungary weighed on Hungarian-based Richter, while fears over slowing global growth and the oil spill in the Gulf of Mexico hurt Tenaris.
What is your outlook?
In the West, deteriorating leading indicators have intensified fears of a double-dip recession, splitting opinions about whether the stimulus should be maintained. While some favor extending the stimulus, Europe’s debt problems have increased the call for fiscal discipline and austerity. However, this comes at a time
18
Table of Contents
when final private demand is still anemic and risks derailing the global recovery. Adding to these concerns is rising inflation and overheating worries in many developing economies.
Emerging markets will unlikely escape a renewed weakness in global trade, with volatility likely to remain high. However, we are focused on the long-term attributes of the asset class, namely, its robust finances, sound businesses and fast-growing middle class, and will look to buy when opportunities present themselves.
Portfolio Facts
As of June 30, 2010
Net Assets | $21,810,100 | |
NAV | $9.76 | |
NAV - High† | 4/6/2010 - $10.66 | |
NAV - Low† | 2/8/2010 - $8.91 | |
Number of Holdings: 54 |
| † | For the six months ended June 30, 2010 |
Average Annual Total Returns1
As of June 30, 2010
| 1-Year | From Inception 4/30/2008 | |
| 31.48% | -0.49% |
| * | The Consumer Price Index is an inflationary indicator that measures the change in the cost of a fixed basket of products and services, including housing, electricity, food and transportation. It is not possible to invest directly in the Index. |
| ** | The MSCI Emerging Markets Index is a modified capitalization-weighted index of selected emerging economies from around the world. It is not possible to invest directly in the Index. The performance of the Index does not reflect deductions for fees, expenses or taxes. |
Past performance is not an indication of future results. Total investment return and principal value of your investment will fluctuate and units, when redeemed, may be worth more or less than their original cost. Current performance may be higher or lower than the performance data quoted. Call 800-THRIVENT or visit www.thrivent.com for performance results current to the most recent month-end.
| 1 | Average annual total returns represent past performance and reflect changes in share prices, the reinvestment of all dividends and capital gains, and the effects of compounding. Periods of less than one year are not annualized. At various times, the Portfolio’s adviser may have waived its management fee and/or reimbursed Portfolio expenses. If this were the case, the Portfolio’s total returns would have been lower. The returns shown do not reflect charges and expenses imposed on contract holders by the variable accounts. Those charges and expenses reduce the returns received by contract holders as compared to the returns presented. |
The prospectus contains more complete information on the investment objectives, risks, charges and expenses of the investment company, which investors should read and consider carefully before investing. To obtain a prospectus, contact a registered representative or visit www.thrivent.com.
19
Table of Contents

How did the Portfolio perform during the six-month period ended June 30, 2010?
Thrivent Real Estate Securities Portfolio earned a return of 5.42%, compared with the median return of its peer group, the Lipper Real Estate category, of 4.30%. The Portfolio’s market benchmark, the FTSE NAREIT Equity REIT Index, earned a return of 5.56%.
What factors affected the Portfolio’s performance?
Real estate investment trust (REIT) stocks performed well during the first half of 2010, benefiting primarily from the early stages of an economic recovery in the United States. Job growth turned positive and expectations for improvement became more prevalent, as compared with 2009. A significant decline in commercial mortgage interest rates allowed many public REITs to issue debt at attractive rates, supporting acquisitions or to repay more expensive debt. Occupancy levels and rental rates began to stabilize for office and retail properties, and improved for apartments and hotel properties. Finally, competitive bidding emerged for General Growth Properties, which is preparing to emerge from bankruptcy, highlighting, in our view, the investment demand for high quality regional malls.
The best-performing sectors in the Portfolio were apartments, lodging, and self storage properties. The worst-performing sectors were industrial, office, and shopping center REITs. The Portfolio’s largest positive contributors to performance were: Equity Residential, which acquires, develops and manages apartment complexes; Digital Realty, which specializes in data centers and technology-related real estate; and Host Hotels & Resorts, which owns upscale and luxury full-service hotels in the U.S. and internationally.
What is your outlook?
The U.S. economy should continue to expand during the second half of 2010, though the pace of economic recovery is likely to be weaker than historical cyclical recoveries. Private sector job growth has not been strong enough to reduce the unemployment rate, and as a result, the commercial real estate market is likely to experience a more gradual recovery than typical after recession. Occupancy rates are substantially below historical levels, particularly for suburban office and industrial properties. The apartment sector is an exception, with a healthy occupancy rate, which has helped support modest rental rate increases in many markets throughout the country. Construction activity has been extremely low for all property types, and is expected to remain so, which is a necessary condition for improvement in occupancy and rental rates.
20
Table of Contents
The Portfolio has exposure to companies within each property sector, with the largest individual holdings being in large-capitalization REITs with experienced management teams and high-quality real estate portfolios. These companies have demonstrated their ability to access both debt and equity capital, which they are able to invest in attractive acquisitions or new development opportunities. In addition, the Portfolio also has exposure in mid- and small-capitalization REITs that, in our view, offer attractive relative value and long-term growth potential. We believe the second half of 2010 will be volatile due to the uncertain economic environment, and as a result, we expect to make adjustments that may be necessary to benefit the Portfolio and its future investment performance.
Portfolio Facts
As of June 30, 2010
Net Assets | $279,182,024 | |
NAV | $12.30 | |
NAV - High† | 5/3/2010 - $14.11 | |
NAV - Low† | 2/9/2010 - $10.73 | |
Number of Holdings: 114 | ||
† For the six months ended June 30, 2010 |
Average Annual Total Returns1
As of June 30, 2010
| 1-Year | 5-Year | From Inception 4/30/2003 | ||
| 52.69% | 0.37% | 9.35% |
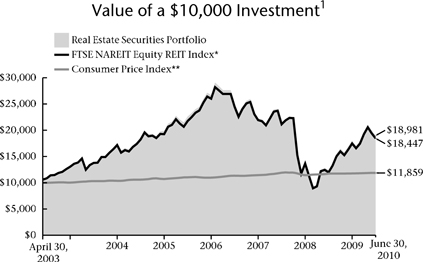
| * | The FTSE NAREIT Equity REIT Index is an unmanaged capitalization-weighted index of all equity real estate investment trusts. It is not possible to invest directly in this Index. The performance of this Index does not reflect deductions for fees, expenses or taxes. |
| ** | The Consumer Price Index is an inflationary indicator that measures the change in the cost of a fixed basket of products and services, including housing, electricity, food and transportation. It is not possible to invest directly in the Index. |
Past performance is not an indication of future results. Total investment return and principal value of your investment will fluctuate and units, when redeemed, may be worth more or less than their original cost. Current performance may be higher or lower than the performance data quoted. Call 800-THRIVENT or visit www.thrivent.com for performance results current to the most recent month-end.
| 1 | Average annual total returns represent past performance and reflect changes in share prices, the reinvestment of all dividends and capital gains, and the effects of compounding. Periods of less than one year are not annualized. At various times, the Portfolio’s adviser may have waived its management fee and/or reimbursed Portfolio expenses. If this were the case, the Portfolio’s total returns would have been lower. The returns shown do not reflect charges and expenses imposed on contract holders by the variable accounts. Those charges and expenses reduce the returns received by contract holders as compared to the returns presented. |
The prospectus contains more complete information on the investment objectives, risks, charges and expenses of the investment company, which investors should read and consider carefully before investing. To obtain a prospectus, contact a registered representative or visit www.thrivent.com.
21
Table of Contents
| Thrivent Partner Utilities Portfolio |
Subadvised by BlackRock Investment Management, LLC
Thrivent Partner Utilities Portfolio seeks capital appreciation and current income.
The Portfolio’s investments are concentrated in issuers in the utilities industry; therefore the Portfolio is more vulnerable to price changes in the securities of issuers in this industry and factors specific to this industry than a more broadly diversified fund. The Portfolio is also subject to the risks of investing in foreign (including emerging markets) stocks. These and other risks are described in the Portfolio’s prospectus. Views expressed in this discussion of portfolio performance are the views of this particular portfolio’s management team.
How did the Portfolio perform during the six-month period ended June 30, 2010?
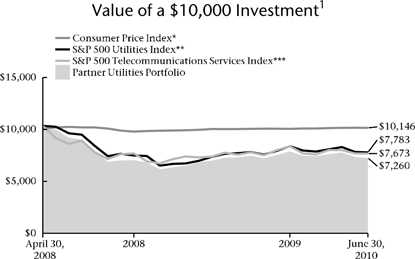
Thrivent Partner Utilities Portfolio earned a return of -7.96% for the period, as compared to the median return of its peer group, the Lipper Utility category, of -7.41%. The Portfolio’s benchmarks, the S&P 500 Utilities and the S&P 500 Telecommunications Services Indexes, earned returns of -7.14% and -8.37%, respectively.
What factors affected the Portfolio’s performance?
The Portfolio’s stock selection within the utilities industry, particularly with regard to independent power producers and integrated utilities, was very strong during the quarter and helped add to relative returns. Being strongly underweighted in the diversified telecommunications industry, as well as being less overweighted in the wireless telecommunications industry, also helped to boost portfolio performance. An average cash weighting of 5.7% during the quarter was beneficial as well, as shakier markets rewarded the team’s conservatism.
Owning higher-quality securities in the electric utilities and wireless telecommunications sub-industries worked against us during the quarter, detracting marginally from relative returns. Additionally, being overweighted in the energy and industrials sectors had a slightly negative effect on performance. Lastly, being overweighted an average of 4.4% in the independent power producers industry weighed on relative performance.
What is your outlook?
At the end of the quarter, the Portfolio was positioned to reflect conservatism in the current economic environment. The team has been placing more of an emphasis on domestic companies than foreign-domiciled names, especially with the challenges evident in many overseas markets. At the sector level, the team has been adding more to electric utilities holdings as opposed to telecommunications holdings, given signs of a stronger rebound in power demand, a better competitive landscape, and a higher degree of pricing stability.

22
Table of Contents
Portfolio Facts
As of June 30, 2010
Net Assets | $6,477,466 | |
NAV | $6.98 | |
NAV - High† | 1/4/2010 - $7.84 | |
NAV - Low† | 6/30/2010 - $6.98 | |
Number of Holdings: 89 | ||
† For the six months ended June 30, 2010 |
Average Annual Total Returns1
As of June 30, 2010
| 1-Year | From Inception 4/30/2008 | |
| 3.89% | -13.74% |
| * | The Consumer Price Index is an inflationary indicator that measures the change in the cost of a fixed basket of products and services, including housing, electricity, food and transportation. It is not possible to invest directly in the Index. |
| ** | The S&P 500 Utilities Index is a capitalization-weighted index of utilities sector securities. The product is not sponsored, endorsed or promoted by Standard & Poor’s, and Standard & Poor’s makes no representation regarding the advisability of investing in the product. It is not possible to invest directly in this Index. The performance of this Index does not reflect deductions for fees, expenses or taxes. |
| *** | The S&P 500 Telecommunications Services Index is a capitalization-weighted index of telecommunications sector securities. The product is not sponsored, endorsed or promoted by Standard & Poor’s, and Standard & Poor’s makes no representation regarding the advisability of investing in the product. It is not possible to invest directly in this Index. The performance of this Index does not reflect deductions for fees, expenses or taxes. |
Past performance is not an indication of future results. Total investment return and principal value of your investment will fluctuate and units, when redeemed, may be worth more or less than their original cost. Current performance may be higher or lower than the performance data quoted. Call 800-THRIVENT or visit www.thrivent.com for performance results current to the most recent month-end.
| 1 | Average annual total returns represent past performance and reflect changes in share prices, the reinvestment of all dividends and capital gains, and the effects of compounding. Periods of less than one year are not annualized. At various times, the Portfolio’s adviser may have waived its management fee and/or reimbursed Portfolio expenses. If this were the case, the Portfolio’s total returns would have been lower. The returns shown do not reflect charges and expenses imposed on contract holders by the variable accounts. Those charges and expenses reduce the returns received by contract holders as compared to the returns presented. |
The prospectus contains more complete information on the investment objectives, risks, charges and expenses of the investment company, which investors should read and consider carefully before investing. To obtain a prospectus, contact a registered representative or visit www.thrivent.com.
23
Table of Contents
 | Thrivent Partner Small Cap Growth Portfolio |
Subadvised by Turner Investment Partners, Inc.
Thrivent Partner Small Cap Growth Portfolio seeks long-term capital growth.
The Portfolio is exposed to the risks of investing in equity securities of smaller companies, which may include, but are not limited to, lower trading volume and less liquidity than larger, more established companies. Small company stock prices are generally more volatile than large company stock prices. These and other risks are described in the Portfolio’s prospectus. Views expressed in this discussion of portfolio performance are the views of this particular portfolio’s management team.
How did the Portfolio perform during the six-month period ended June 30, 2010?
Thrivent Partner Small Cap Growth Portfolio earned a return of - -2.61%, compared with the median return of its peer group, the Lipper Small-Cap Growth category, of -1.87%. The Portfolio’s market benchmark, the Russell 2000® Growth Index, returned -2.31%.
What factors affected the Portfolio’s performance?
The Portfolio, which focuses on investing in companies with above-average earnings growth, underperformed the Russell 2000® Growth Index. During the period, the U.S. equity markets witnessed a considerable sell off as risk aversion spread. This type of market correction usually presents a challenge for our strategy, which emphasizes higher-multiple stocks. With this backdrop, the small-cap space is typically the first place where assets are sold, placing further pressure on small-cap stocks. All but two sectors within the index posted a negative absolute return led by the energy and utilities sectors. On a relative basis, the producer durables and technology sectors were the worst performers. Conversely, health care and energy were two of the better-performing sectors versus the benchmark.
Although the health care reform bill has been passed by the Senate, the fallout and lack of clarity from the bill continues to linger over the industry. With that said, our health care sector team positioned the portfolio away from companies that could be damaged by the reform fallout. As a result, health care was our top contributor to relative results; most notable performers included ev3 Inc. and OSI Pharmaceuticals.
Despite the fact that the energy sector was the worst- performing sector in the Index (on an absolute basis), some of our stock selections within this sector provided the Portfolio with relative gains. Our cyclical team did a nice job of navigating through the period, which saw a decline in oil and gas prices, as well as ongoing headline news of BP’s oil spill in the Gulf of Mexico. A few stocks that held up relatively well included Swift Energy and Key Energy Services.
What is your outlook?
Although difficult to do in the midst of fear and uncertainty, we think investors should maintain some semblance of a balanced perspective. The recent signs of economic weakness are nothing out of the ordinary; indeed, they have been prevalent during the same phase
24
Table of Contents
of past economic recoveries. For instance, The Wall Street Journal noted that “after rebounding from a recession in late 2001 and early 2002, the economy had a 12-month stretch in which it grew at a paltry 1.5% annual rate, sparking fears of a double-dip recession. In late 1991, growth waned after a recovery had started.” In contrast, in the past 12 months, the economy has gotten off to a faster start than in 2002. The consensus among economists surveyed by the Journal forecasts that the economy will grow at a 3% rate in the second half of 2010—a rate that’s not exactly spectacular, but hardly catastrophic, either. Last but not least, we think stocks have attractive valuations going for them.
Portfolio Facts
As of June 30, 2010
Net Assets | $158,455,635 | |
NAV | $9.76 | |
NAV - High† | 4/23/2010 - $11.82 | |
NAV - Low† | 2/8/2010 - $9.33 | |
Number of Holdings: 206 | ||
† For the six months ended June 30, 2010 |
Average Annual Total Returns1
As of June 30, 2010
1-Year | 5-Year | From Inception 11/30/2001 | ||
| 18.16% | -0.27% | 1.81% |
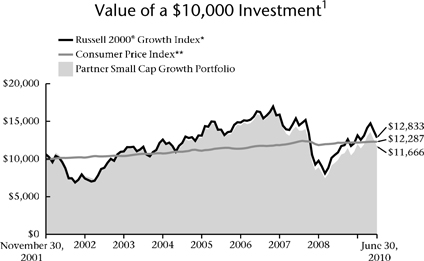
| * | The Russell 2000® Growth Index is an index comprised of small capitalization companies with a greater than average growth orientation. It is not possible to invest directly in the Index. The performance of the Index does not reflect deductions for fees, expenses or taxes. |
| ** | The Consumer Price Index is an inflationary indicator that measures the change in the cost of a fixed basket of products and services, including housing, electricity, food and transportation. It is not possible to invest directly in the Index. |
Past performance is not an indication of future results. Total investment return and principal value of your investment will fluctuate and units, when redeemed, may be worth more or less than their original cost. Current performance may be higher or lower than the performance data quoted. Call 800-THRIVENT or visit www.thrivent.com for performance results current to the most recent month-end.
| 1 | Average annual total returns represent past performance and reflect changes in share prices, the reinvestment of all dividends and capital gains, and the effects of compounding. Periods of less than one year are not annualized. At various times, the Portfolio’s adviser may have waived its management fee and/or reimbursed Portfolio expenses. If this were the case, the Portfolio’s total returns would have been lower. The returns shown do not reflect charges and expenses imposed on contract holders by the variable accounts. Those charges and expenses reduce the returns received by contract holders as compared to the returns presented. |
The prospectus contains more complete information on the investment objectives, risks, charges and expenses of the investment company, which investors should read and consider carefully before investing. To obtain a prospectus, contact a registered representative or visit www.thrivent.com.
25
Table of Contents
 | Thrivent Partner Small Cap Value Portfolio |
Subadvised by T. Rowe Price Advisors, Inc.
Thrivent Partner Small Cap Value Portfolio seeks long-term growth of capital.
The Portfolio is exposed to the risks of investing in equity securities of smaller companies, which may include, but are not limited to, lower trading volume and less liquidity than larger, more established companies. Small company stock prices are generally more volatile than large company stock prices. These and other risks are described in the Portfolio’s prospectus. Views expressed in this discussion of portfolio performance are the views of this particular portfolio’s management team.
How did the Portfolio perform during the six-month period ended June 30, 2010?
Thrivent Partner Small Cap Value Portfolio earned a return of - -2.25% for the period. The Lipper Small-Cap Value category’s median return was -2.48%, while the Russell 2000® Value Index returned -1.64%.
What factors affected the Portfolio’s performance?
The Portfolio slightly lagged the Russell 2000® Value Index for the period. The consumer discretionary and information technology sectors were responsible for the bulk of the underperformance. On the positive side, the materials and financials sectors outperformed.
U.S. stocks began the year with a steep sell off during January and February, but they battled back during March and ended first quarter positively. In the second quarter, the market turned downward and had heightened volatility, as investors became jittery about the pace of the economic recovery, the debt crisis in Greece and other global events. Small-cap value stocks led small-cap growth stocks and large-cap value stocks for the six-month period.
Our selection of consumer discretionary stocks constrained performance relative to the benchmark. Although we have found significant value in the specialty retail area, it was weak over the period. Sales trends were disappointing for discount fashion merchandiser Stein Mart, and the stalled economic recovery was a headwind. Hotel operator Orient-Express was negatively impacted by investors’ concerns regarding its European assets.
We like information technology companies with strong balance sheets and the ability to internally fund their growth; these holdings produced strong results in 2009. In the first half of 2010, weakness among our semiconductor holdings weighed on relative performance. A notable detractor was Formfactor, a manufacturer of wafer-probe cards for the semiconductor industry. Ongoing restructuring and increased spending have been impeding the company’s ability to capitalize on improving demand.
Our stock selections within materials and financials were favorable, and we outperformed the Index in these areas. Airgas, an online distributor of industrial, medical and specialty gases, welding supplies, and other products, was a top overall contributor. Within the Portfolio’s financials sector, performance was led by investments in commercial banks. Western Alliance Bancorp, an operator of community banks in Nevada, Arizona and California, did especially well.
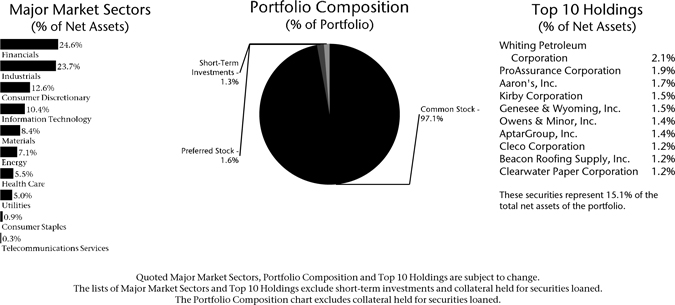
26
Table of Contents
What is your outlook?
Market corrections and periods of increased volatility, while discouraging, are cycles we have been through before, and we know enough not to panic. We think the market is set to move forward again when the fear subsides. We have been putting money to work in what we believe are good quality companies whose share prices have become more attractive as the stock market has headed lower. Our view of the global economy is generally favorable, and we think the U.S. is unlikely to experience a “double-dip” recession. Central banks around the world appear to be committed to low interest rates. Despite recent stresses in Europe, the global financial system seems in reasonable shape and is much improved from two years ago.
Portfolio Facts
As of June 30, 2010
Net Assets | $225,318,980 | |
NAV | $15.20 | |
NAV - High† | 4/29/2010 - $18.62 | |
NAV - Low† | 2/4/2010 - $14.77 | |
Number of Holdings: 170 |
| † | For the six months ended June 30, 2010 |
Average Annual Total Returns1
As of June 30, 2010
1-Year | 5-Year | From Inception 4/30/2003 | ||
| 23.76% | 3.39% | 10.35% |
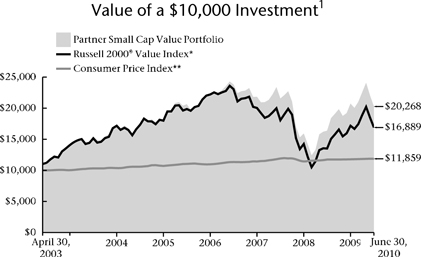
| * | The Russell 2000® Value Index measures the performance of small cap value stocks. It is not possible to invest directly in the Index. The performance of the Index does not reflect deductions for fees, expenses or taxes. |
| ** | The Consumer Price Index is an inflationary indicator that measures the change in the cost of a fixed basket of products and services, including housing, electricity, food and transportation. It is not possible to invest directly in the Index. |
Past performance is not an indication of future results. Total investment return and principal value of your investment will fluctuate and units, when redeemed, may be worth more or less than their original cost. Current performance may be higher or lower than the performance data quoted. Call 800-THRIVENT or visit www.thrivent.com for performance results current to the most recent month-end.
| 1 | Average annual total returns represent past performance and reflect changes in share prices, the reinvestment of all dividends and capital gains, and the effects of compounding. Periods of less than one year are not annualized. At various times, the Portfolio’s adviser may have waived its management fee and/or reimbursed Portfolio expenses. If this were the case, the Portfolio’s total returns would have been lower. The returns shown do not reflect charges and expenses imposed on contract holders by the variable accounts. Those charges and expenses reduce the returns received by contract holders as compared to the returns presented. |
The prospectus contains more complete information on the investment objectives, risks, charges and expenses of the investment company, which investors should read and consider carefully before investing. To obtain a prospectus, contact a registered representative or visit www.thrivent.com.
27
Table of Contents

How did the Portfolio perform during the six-month period ended June 30, 2010?
Thrivent Small Cap Stock Portfolio earned a return of -4.43%, compared with the return of its benchmark index, the Russell 2000® Index, -1.95%. The Lipper Small-Cap Core category median return was -2.06%.
What factors affected the Portfolio’s performance?
The Portfolio’s disappointing absolute and relative performance was attributable primarily to adverse stock selection in the materials and retail sectors. Significant exposure to coal stocks, such as Arch Coal, International Coal and James River, was predicated on declining domestic thermal coal inventories and strong export demand for metallurgical coal. Also, improved pricing was out of step with market concerns about slowing Asian economies (especially China) and the stronger dollar, which accompanied European sovereign debt concerns. We continue, however, to believe that demand fundamentals for coal remain meaningfully underappreciated and that our positioning will prove appropriate.
Within the retail sector, we proved to be overly cautious about the recovery in consumer spending in the first half, and were not positioned to benefit from the strong run by the higher-beta members, as same-store trends and profitability exceeded expectations. Private label women’s apparel retailer Chico’s and apparel manufacturer Warnaco were notable relative underperformers in a more growth-focused environment. Chico’s suffered from investor concerns about, among other things, its slower performance momentum versus its peers, while Warnaco was hurt by its above-average exposure to European markets. We believe both companies remain undervalued, and expect a more fundamentally focused market environment to recognize their attractiveness.
A secondary contributor to weaker performance was the Portfolio’s bias toward relatively larger, value-oriented companies within the small-cap universe. This profile was at odds with the pronounced outperformance of smaller, growth-oriented stocks of the first two quarters of 2010.
The aforementioned factors more than offset the benefits of solid stock selection within health care (medical device maker NuVasive and biotechnology company OSI Pharmaceuticals), communications (videoconferencing equipment manufacturer Polycom and transmission equipment producer Adtran), and business services (trucking company Old Dominion Freight).
What is your outlook?
We believe that the recession is over and that the economy has begun what will be a sub-par recovery in 2010, marked by stubborn unemployment, weak consumer spending and
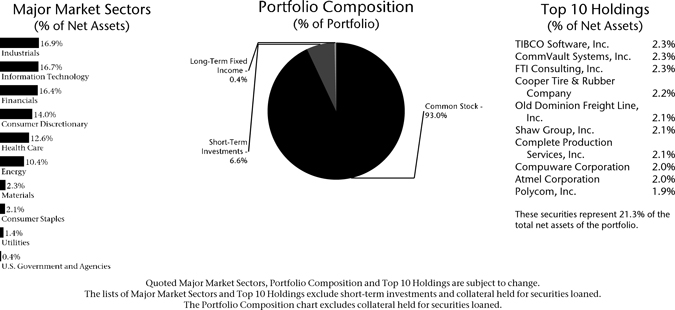
28
Table of Contents
a stagnant housing market. Offsets should include improved corporate profitability, strong export markets and the benefits of improved liquidity and credit availability. U.S. equity markets will likely remain volatile, but maintain an upward bias consistent with surprising earnings and a growing appetite for risk assets as confidence builds. We see particular opportunity in the tech, materials and industrial sectors because of their inordinate exposure to faster-growing emerging markets, while we suggest near-term caution toward financials and health care due to regulatory uncertainties. The biggest risks to our optimistic outlook are the potential impacts of financial, health care and tax legislation; possible policy misjudgments by central banks in the U.S., Europe and China; and adverse federal and state budget developments.
Portfolio Facts
As of June 30, 2010
Net Assets | $241,251,990 | |
NAV | $9.68 | |
NAV - High† | 4/23/2010 - $11.46 | |
NAV - Low† | 2/8/2010 - $9.53 | |
Number of Holdings: 86 | ||
† For the six months ended June 30, 2010 | ||
Average Annual Total Returns1
As of June 30, 2010
1-Year | 5-Year | From Inception 3/1/2001 | ||
| 18.32% | -1.60% | 3.70% |
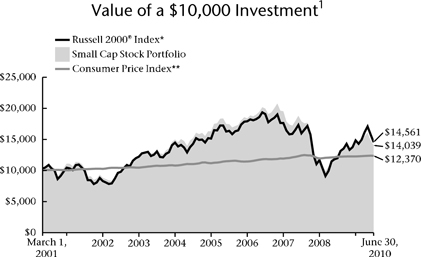
| * | The Russell 2000® Index measures the performance of small cap stocks. It is not possible to invest directly in the Index. The performance of the Index does not reflect deductions for fees, expenses or taxes. |
| ** | The Consumer Price Index is an inflationary indicator that measures the change in the cost of a fixed basket of products and services, including housing, electricity, food and transportation. It is not possible to invest directly in the Index. |
Past performance is not an indication of future results. Total investment return and principal value of your investment will fluctuate and units, when redeemed, may be worth more or less than their original cost. Current performance may be higher or lower than the performance data quoted. Call 800-THRIVENT or visit www.thrivent.com for performance results current to the most recent month-end.
| 1 | Average annual total returns represent past performance and reflect changes in share prices, the reinvestment of all dividends and capital gains, and the effects of compounding. Periods of less than one year are not annualized. At various times, the Portfolio’s adviser may have waived its management fee and/or reimbursed Portfolio expenses. If this were the case, the Portfolio’s total returns would have been lower. The returns shown do not reflect charges and expenses imposed on contract holders by the variable accounts. Those charges and expenses reduce the returns received by contract holders as compared to the returns presented. |
The prospectus contains more complete information on the investment objectives, risks, charges and expenses of the investment company, which investors should read and consider carefully before investing. To obtain a prospectus, contact a registered representative or visit www.thrivent.com.
29
Table of Contents
How did the Portfolio perform during the six-month period ended June 30, 2010?
Thrivent Small Cap Index Portfolio earned a return of -1.06%, compared with the median return of its peer group, the Lipper Small-Cap Core category, of - -2.06%. The Portfolio’s market benchmark, the S&P SmallCap 600 Index, returned -0.88%.
What factors affected the Portfolio’s performance?
The Portfolio seeks to replicate the performance of the S&P SmallCap 600 Index, a prime measure of small stock performance. We seek to maintain a fully invested position with limited transactions to minimize costs. As typically occurs with an index fund, the difference in performance between the benchmark index and the Portfolio itself can be largely attributed to expenses and minor differences in portfolio composition.
Small-cap stocks outperformed both mid-cap stocks and large-cap stocks for the last six months. Four sectors sported a positive return. Consumer discretionary and consumer staples had the most positive returns. The stocks of materials and telecommunication services were the weakest performers, posting the most negative returns. Market participants re-evaluated the economic stress in the global economic system, and growth expectations were diminished.
What is your outlook?
The Portfolio will remain fully invested in stocks designed to track the performance of the S&P SmallCap 600 Index. This strategy can offer individuals an attractive way to take advantage of the growth potential of the broad, diversified marketplace of small-cap stocks.
Small-cap stocks have resumed enjoying an advantage over larger-cap issues in the past year. Over the last six months, investors seemed to become less risk-averse, providing an environment that tends to favor mid- and small-capitalized companies. Small-
cap companies, particularly those exposed to the domestic markets and U.S. consumers, have had a less challenging operating environment relative to large-cap companies.
The financial markets appear to be resolving some of the uncertainty and ambiguity that has surrounded the fixed-income markets and led to the severe credit contraction that had increased the odds of a recession in the U.S. At a minimum, global growth is slowing and the prices of risk assets have adjusted significantly, reflecting the increased uncertainty. We are more than a year into the current
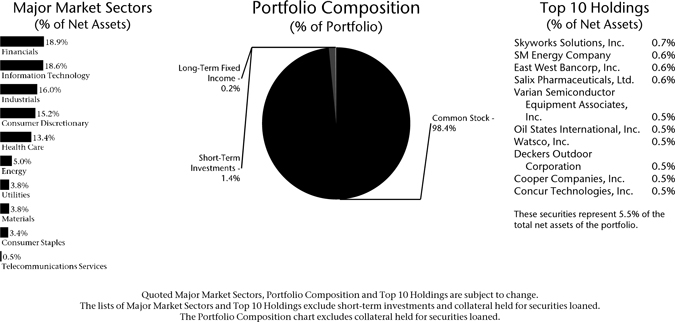
30
Table of Contents
cycle. Typically, as a new economic cycle matures, investors begin to favor larger cap issues over smaller-cap issues.
Whether this marks a period of rotation in the markets remains to be seen. We still believe there is solid opportunity in the small-cap arena, but the premium return for small stocks is likely to be limited in the future as the new cycle continues to mature.
Portfolio Facts
As of June 30, 2010
Net Assets | $186,377,730 | |
NAV | $10.36 | |
NAV - High† | 4/23/2010 - $12.56 | |
NAV - Low† | 2/8/2010 - $9.91 | |
Number of Holdings: 605 | ||
† For the six months ended June 30, 2010 |
Average Annual Total Returns1 As of June 30, 2010
| 1-Year | 5-Year | 10-Year | ||
| 23.10% | 0.61% | 5.26% |
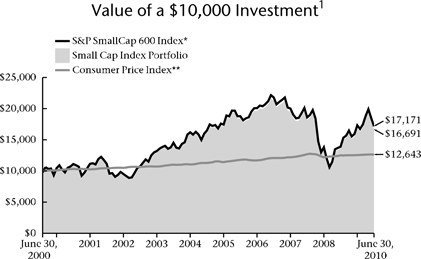
| * | The S&P SmallCap 600 Index is an index that represents the average performance of a group of 600 small capitalization stocks. The product is not sponsored, endorsed or promoted by Standard & Poor’s, and Standard & Poor’s makes no representation regarding the advisability of investing in the product. It is not possible to invest directly in the Index. The performance of the Index does not reflect deductions for fees, expenses and taxes. |
| ** | The Consumer Price Index is an inflationary indicator that measures the change in the cost of a fixed basket of products and services, including housing, electricity, food and transportation. It is not possible to invest directly in the Index. |
Past performance is not an indication of future results. Total investment return and principal value of your investment will fluctuate and units, when redeemed, may be worth more or less than their original cost. Current performance may be higher or lower than the performance data quoted. Call 800-THRIVENT or visit www.thrivent.com for performance results current to the most recent month-end.
| 1 | Average annual total returns represent past performance and reflect changes in share prices, the reinvestment of all dividends and capital gains, and the effects of compounding. Periods of less than one year are not annualized. At various times, the Portfolio’s adviser may have waived its management fee and/or reimbursed Portfolio expenses. If this were the case, the Portfolio’s total returns would have been lower. The returns shown do not reflect charges and expenses imposed on contract holders by the variable accounts. Those charges and expenses reduce the returns received by contract holders as compared to the returns presented. |
The prospectus contains more complete information on the investment objectives, risks, charges and expenses of the investment company, which investors should read and consider carefully before investing. To obtain a prospectus, contact a registered representative or visit www.thrivent.com.
31
Table of Contents

How did the Portfolio perform during the six-month period ended June 30, 2010?
Thrivent Mid Cap Growth Portfolio II earned a return of -2.56%, compared with the median return of its peer group, the Lipper Mid-Cap Growth category, of -3.11%. The Portfolio’s market benchmark, the Russell Midcap® Growth Index, returned - -3.31%.
What factors affected the Portfolio’s performance?
The market erased all of its year-to-date gains in the last two months of the period. A myriad of factors accounted for this, both internationally and domestically. European sovereign debt problems dominated the front pages of many newspapers in late April and May. Fears that Greece would default on its soverign debt sparked a crisis of confidence in the euro, as investors were concerned that Greece was just the tip of the iceberg, and other European Union countries were also troubled with budget deficits and anemic growth. Indications that China (considered by many as the engine of global growth) and the economic recovery may be slowing impacted the markets and hurt cyclical sectors, such as energy and materials. Finally, the belief that increased government spending from the stimulus package last spring—and the Federal Reserve’s unprecedented increase in its balance sheet—have had limited impact on job creation in the United States caused a rush out of riskier assets into the perceived “safe havens” of the U.S. dollar and U.S. Treasury bonds. Our individual stock selections in the materials, industrials and the consumer sectors helped performance, as we chose companies that had unique product cycles and those that would benefit from increased spending worldwide. Contrarily, our health care stock selections, especially in the higher beta biotech area, were especially weak and were a drag on performance.
What is your outlook?
Unemployment is still very high, which will likely limit further growth in demand. Our meetings with companies suggest many are reluctant to add staff until they see signs that end demand, beyond inventory restocking, is improving. Uncertainty about the impact of legislation in Washington is also a major concern for many corporations. The positive aspect of this is that corporations have been increasing cash balances. If some clarity on tax and regulatory policy returns to the market, we could see this cash deployed to purchase other companies or expand businesses.
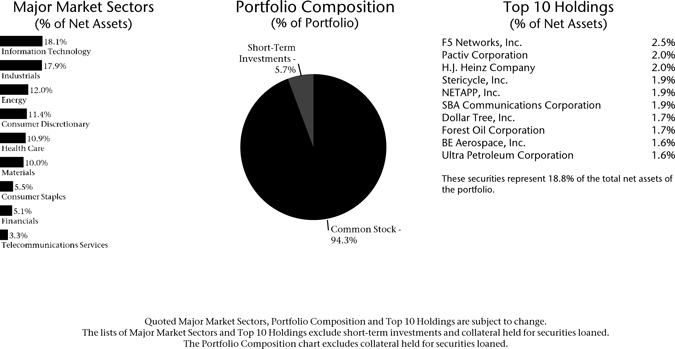
32
Table of Contents
We believe the currency markets will be a major story as we close the year, and this continues to have the potential to impede any forthcoming economic recovery. As we saw this quarter, the disruption in European demand from the weakening euro had a significant impact on U.S. and Chinese companies that sell into Europe.
We have upgraded the majority of the Portfolio into relatively more defensive names, and we anticipate increasing volatility in the market going forward.
Portfolio Facts
As of June 30, 2010
NAV | $8.13 | |
NAV - High† | 4/23/2010 - $9.53 | |
NAV - Low† | 2/8/2010 - $7.97 | |
Number of Holdings: 94 | ||
† For the six months ended June 30, 2010 |
Average Annual Total Returns1
As of June 30, 2010
| 1-Year | 5-Year | From Inception 11/30/2001 | ||
| 20.51% | 3.74% | 1.66% |
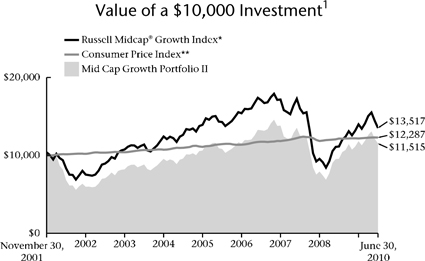
| * | The Russell Midcap® Growth Index measures the performance of mid cap growth stocks. It is not possible to invest directly in the Index. The performance of the Index does not reflect deductions for fees, expenses or taxes. |
| ** | The Consumer Price Index is an inflationary indicator that measures the change in the cost of a fixed basket of products and services, including housing, electricity, food and transportation. It is not possible to invest directly in the Index. |
Past performance is not an indication of future results. Total investment return and principal value of your investment will fluctuate and units, when redeemed, may be worth more or less than their original cost. Current performance may be higher or lower than the performance data quoted. Call 800-THRIVENT or visit www.thrivent.com for performance results current to the most recent month-end.
| 1 | Average annual total returns represent past performance and reflect changes in share prices, the reinvestment of all dividends and capital gains, and the effects of compounding. Periods of less than one year are not annualized. At various times, the Portfolio’s adviser may have waived its management fee and/or reimbursed Portfolio expenses. If this were the case, the Portfolio’s total returns would have been lower. The returns shown do not reflect charges and expenses imposed on contract holders by the variable accounts. Those charges and expenses reduce the returns received by contract holders as compared to the returns presented. |
The prospectus contains more complete information on the investment objectives, risks, charges and expenses of the investment company, which investors should read and consider carefully before investing. To obtain a prospectus, contact a registered representative or visit www.thrivent.com.
33
Table of Contents
How did the Portfolio perform during the six-month period ended June 30, 2010?
Thrivent Mid Cap Growth Portfolio earned a return of -2.70%, compared with the median return of its peer group, the Lipper Mid-Cap Growth category, of -3.11%. The Portfolio’s market benchmark, the Russell Midcap® Growth Index, returned - -3.31%.
What factors affected the Portfolio’s performance?
The market erased all of its year-to-date gains in the last two months of the period. A myriad of factors accounted for this, both internationally and domestically. European sovereign debt problems dominated the front pages of many newspapers in late April and May. Fears that Greece would default on its soverign debt sparked a crisis of confidence in the euro, as investors were concerned that Greece was just the tip of the iceberg and other European Union countries were also troubled with budget deficits and anemic growth. Indications that China (considered by many as the engine of global growth) and the economic recovery may be slowing impacted the markets and hurt cyclical sectors, such as energy and materials. Finally, the belief that increased government spending from the stimulus package last spring—and the Federal Reserve’s unprecedented increase in its balance sheet—have had limited impact on job creation in the United States caused a rush out of riskier assets into the perceived “safe havens” of the U.S. dollar and U.S. Treasury bonds. Our individual stock selections in the materials, industrials and the consumer sectors helped performance, as we chose companies that had unique product cycles and those that would benefit from increased spending worldwide. Contrarily, our health care stock selections, especially in the higher beta biotech area, were especially weak and were a drag on performance.
What is your outlook?
Unemployment is still very high, which will likely limit further growth in demand. Our meetings with companies suggest many are reluctant to add staff until they see signs that end demand, beyond inventory restocking, is improving. Uncertainty about the impact of legislation in Washington is also a major concern for many corporations. The positive aspect of this is that corporations have been increasing cash balances. If some clarity on tax and regulatory policy returns to the market, we could see this cash deployed to purchase other companies or expand businesses.
We believe the currency markets will be a major story as we close the year, and this continues to have the
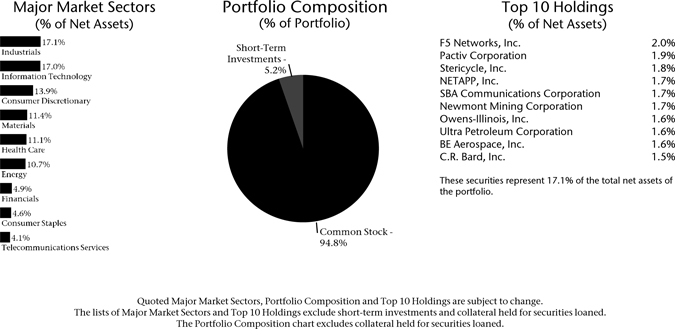
34
Table of Contents
potential to impede any forthcoming economic recovery. As we saw this quarter, the disruption in European demand from the weakening euro had a significant impact on U.S. and Chinese companies that sell into Europe.
We have upgraded the majority of the Portfolio into relatively more defensive names, and we anticipate increasing volatility in the market going forward.
Portfolio Facts
As of June 30, 2010
Net Assets | $338,409,062 | |
NAV | $13.99 | |
NAV - High† | 4/23/2010 - $16.37 | |
NAV - Low† | 2/8/2010 - $13.66 | |
Number of Holdings: 110 |
| † | For the six months ended June 30, 2010 |
Average Annual Total Returns1
As of June 30, 2010
| 1-Year | 5-Year | 10-Year | ||
| 21.76% | 4.53% | 1.15% |
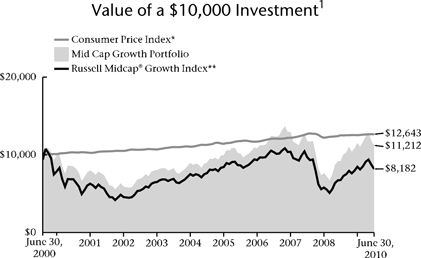
| * | The Consumer Price Index is an inflationary indicator that measures the change in the cost of a fixed basket of products and services, including housing, electricity, food and transportation. It is not possible to invest directly in the Index. |
| ** | The Russell Midcap® Growth Index measures the performance of mid cap growth stocks. It is not possible to invest directly in the Index. The performance of the Index does not reflect deductions for fees, expenses or taxes. |
Past performance is not an indication of future results. Total investment return and principal value of your investment will fluctuate and units, when redeemed, may be worth more or less than their original cost. Current performance may be higher or lower than the performance data quoted. Call 800-THRIVENT or visit www.thrivent.com for performance results current to the most recent month-end.
| 1 | Average annual total returns represent past performance and reflect changes in share prices, the reinvestment of all dividends and capital gains, and the effects of compounding. Periods of less than one year are not annualized. At various times, the Portfolio’s adviser may have waived its management fee and/or reimbursed Portfolio expenses. If this were the case, the Portfolio’s total returns would have been lower. The returns shown do not reflect charges and expenses imposed on contract holders by the variable accounts. Those charges and expenses reduce the returns received by contract holders as compared to the returns presented. |
The prospectus contains more complete information on the investment objectives, risks, charges and expenses of the investment company, which investors should read and consider carefully before investing. To obtain a prospectus, contact a registered representative or visit www.thrivent.com.
35
Table of Contents
How did the Portfolio perform during the six-month period ended June 30, 2010?
Thrivent Partner Mid Cap Value Portfolio earned a return of -3.28%, as compared with the median return of its peer group, the Lipper Mid-Cap Value category, of -3.20%. The Portfolio’s market benchmark, the Russell Midcap® Value Index, earned a return of -0.88%.
What factors affected the Portfolio’s performance?
During the period, our stock selection was challenged in the sectors that are most heavily impacted by regulatory uncertainty. In financials, we continue to favor a diversified mix of asset managers with strong capital positions, insurance companies with opportunity for pricing improvement, regional banks poised to benefit from better credit conditions, and select niche REITs.
As the equity market dropped in the double digits, shares of Janus Capital Group, Inc. declined as their equity-sensitive business mix experienced headwinds to their revenues. However, we continue to favor this global investment manager with an attractive risk-reward profile, which we believe will have strong earnings power in an improving equity market environment over the longer term.
In the consumer discretionary space, our holdings in global retailer Guess? Inc. was negatively impacted by European exposure concerns, as well as the departure of its COO and president. However, we believe that the stock already reflects the risks associated with these events and poses an attractive risk-reward tradeoff.
Our stock selection was strong in the telecommunication services sector, primarily driven by long-term holding Sprint Nextel Corp. After a positive earnings report in April, Sprint continued to gain momentum in May as investors grew more confident in the company’s turnaround, underscored by an analyst upgrade.
Stock selection was also strong in the materials sector, driven largely by our holding in Cliffs Natural Resources, Inc. The company is the only public iron ore firm in the U.S. and it benefited from improved volume, lower fixed costs and higher pricing, and also reported better-than-anticipated earnings and raised guidance.
What is your outlook?
We maintain a cautiously optimistic outlook, though we recognize that the path to a U.S. economic recovery may occur at an uneven pace. We believe that many of the headwinds have already been discounted in the U.S.
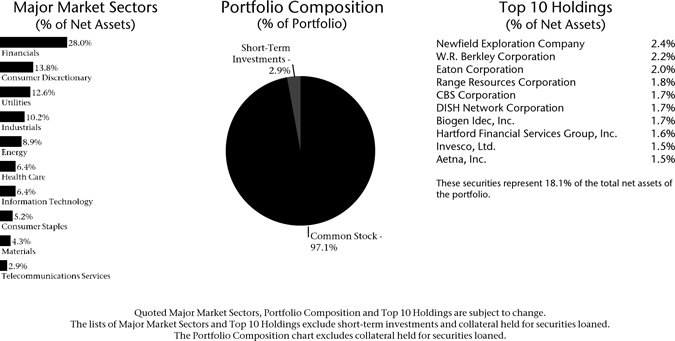
36
Table of Contents
equity market and that the risk-reward trade-off is an overall positive over the long term. Amidst a challenging macro backdrop, earnings volatility, regulatory uncertainty, and high unemployment, we are encouraged by data points at the company level. Whereas earnings improvements in the past quarter were primarily driven by cost-cutting, we believe revenue is beginning to stabilize. High cash levels and strong balance sheets bode well for capital expenditures—the fuel for long- term growth.
Portfolio Facts
As of June 30, 2010
Net Assets | $183,564,540 | |
NAV | $10.42 | |
NAV - High† | 4/23/2010 - $12.59 | |
NAV - Low† | 2/8/2010 - $10.24 | |
Number of Holdings: 111 |
| † | For the six months ended June 30, 2010 |
Average Annual Total Returns1
As of June 30, 2010
| 1-Year | 5-Year | From Inception 4/29/2005 | ||
| 21.97% | 1.04% | 2.66% |
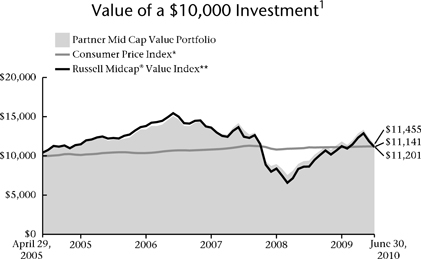
| * | The Consumer Price Index is an inflationary indicator that measures the change in the cost of a fixed basket of products and services, including housing, electricity, food and transportation. It is not possible to invest directly in the Index. |
| ** | The Russell Midcap® Value Index is an index comprised of mid-cap companies with lower than average price-to-book ratios and lower forecasted growth values. It is not possible to invest directly in the Index. The performance of the Index does not reflect deductions for fees, expenses or taxes. |
Past performance is not an indication of future results. Total investment return and principal value of your investment will fluctuate and units, when redeemed, may be worth more or less than their original cost. Current performance may be higher or lower than the performance data quoted. Call 800-THRIVENT or visit www.thrivent.com for performance results current to the most recent month-end.
| 1 | Average annual total returns represent past performance and reflect changes in share prices, the reinvestment of all dividends and capital gains, and the effects of compounding. Periods of less than one year are not annualized. At various times, the Portfolio’s adviser may have waived its management fee and/or reimbursed Portfolio expenses. If this were the case, the Portfolio’s total returns would have been lower. The returns shown do not reflect charges and expenses imposed on contract holders by the variable accounts. Those charges and expenses reduce the returns received by contract holders as compared to the returns presented. |
The prospectus contains more complete information on the investment objectives, risks, charges and expenses of the investment company, which investors should read and consider carefully before investing. To obtain a prospectus, contact a registered representative or visit www.thrivent.com.
37
Table of Contents

How did the Portfolio perform during the six-month period ended June 30, 2010?
Thrivent Mid Cap Stock Portfolio had a return of -3.75%, compared with the median return of its peer group, the Lipper Mid-Cap Core category, of -2.07%. The Portfolio’s market benchmark, the Russell Midcap® Index, earned a return of - -2.06%.
What factors affected the Portfolio’s performance?
The Portfolio’s underperformance was driven by security selection within the energy, consumer discretionary and financial sectors. A bias toward natural gas versus oil caused the Portfolio’s energy holdings to underperform. The rapid rebound in the rig count combined with increased production from unconventional shale acreage resulted in too much natural gas and falling prices. Resilient consumer spending hurt relative performance within the consumer discretionary sector as the Portfolio was positioned for a spending slowdown and rising savings rates.
Property and casualty insurance (P&C) investments weighed on the financial sector performance. While the industry offers attractive valuations, too much capacity and a lack of pricing power led P&C investments to trail the market. The performance within these sectors was somewhat offset by stock selection within the information technology (IT) and consumer staples sectors.
Within IT, the Portfolio’s software holdings significantly outperformed the market. The Portfolio’s communication equipment stocks also benefited from the continued build-out of broadband infrastructure. Within consumer staples, Tyson Foods, Inc. outperformed as low chicken, pork and beef inventories increased pricing.
What is your outlook?
Micro and macro factors diverged during the second quarter. Valuations remain attractive, corporate balance sheets are healthy, and many companies are positioned to generate positive operating leverage. Yet macro concerns—including Europe’s fiscal austerity plans, China’s slowing economy, and large fiscal and state deficits domestically—cloud the outlook. The Portfolio is tilted toward the micro view and has a pro-cyclical stance.
Opportunities now appear plentiful within the technology, materials, health care and energy sectors. Additionally, business spending should outpace consumer spending over the near term. For example, the
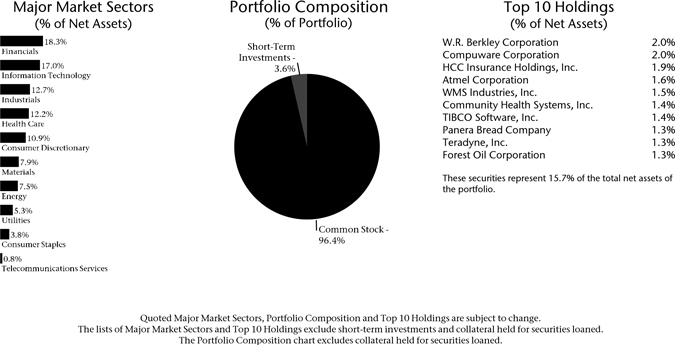
38
Table of Contents
IT sector should continue to benefit from business’ lack of investment over the past two years and minimal capacity additions.
Juxtapose these characteristics to those of the consumer discretionary sector. Consumers are over-leveraged, savings rates need to increase, unemployment is high, and income tax rates are rising—all substantial headwinds. Challenged fundamentals, relative valuation and lack of emerging market growth drivers keep consumer discretionary as the Portfolio’s largest underweighting.
Overall, the Portfolio is more aggressive today than it was three months ago.
Portfolio Facts
As of June 30, 2010
Net Assets | $404,962,485 | |
NAV | $9.42 | |
NAV - High† | 4/23/2010 - $11.19 | |
NAV - Low† | 2/8/2010 - $9.36 | |
Number of Holdings: 135 | ||
† For the six months ended June 30, 2010 | ||
| 1-Year | 5-Year | From Inception 3/1/2001 | ||
| 19.81% | 1.29% | 2.94% |
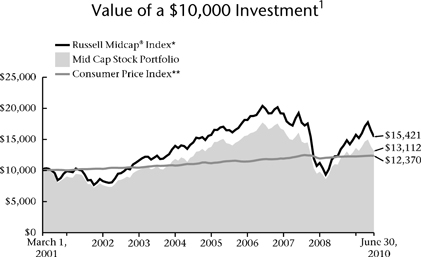
| * | The Russell Midcap® Index is an index that measures the performance of the smallest 800 securities in the Russell 1000® Index, as ranked by total market capitalization. It is not possible to invest directly in the Index. The performance of the Index does not reflect deductions for fees, expenses or taxes. |
| ** | The Consumer Price Index is an inflationary indicator that measures the change in the cost of a fixed basket of products and services, including housing, electricity, food and transportation. It is not possible to invest directly in the Index. |
Past performance is not an indication of future results. Total investment return and principal value of your investment will fluctuate and units, when redeemed, may be worth more or less than their original cost. Current performance may be higher or lower than the performance data quoted. Call 800-THRIVENT or visit www.thrivent.com for performance results current to the most recent month-end.
| 1 | Average annual total returns represent past performance and reflect changes in share prices, the reinvestment of all dividends and capital gains, and the effects of compounding. Periods of less than one year are not annualized. At various times, the Portfolio’s adviser may have waived its management fee and/or reimbursed Portfolio expenses. If this were the case, the Portfolio’s total returns would have been lower. The returns shown do not reflect charges and expenses imposed on contract holders by the variable accounts. Those charges and expenses reduce the returns received by contract holders as compared to the returns presented. |
The prospectus contains more complete information on the investment objectives, risks, charges and expenses of the investment company, which investors should read and consider carefully before investing. To obtain a prospectus, contact a registered representative or visit www.thrivent.com.
39
Table of Contents
How did the Portfolio perform during the six-month period ended June 30, 2010?
Thrivent Mid Cap Index Portfolio earned a return of -1.67%, as compared to the median return of its peer group, the Mid-Cap Core category, of -2.07%. The Portfolio’s market benchmark, the S&P MidCap 400 Index, earned a return of -1.36%.
What factors affected the Portfolio’s performance?
Because it is designed to invest in a way that reflects its benchmark index, the S&P MidCap 400, the only changes made to the Portfolio are done to reconcile it with any alterations in the composition of the index itself. As typically occurs with an index fund, the difference in performance between the benchmark index and the Portfolio itself can be largely attributed to expenses and minor differences in Portfolio composition.
Mid-cap stocks outperformed large-cap stocks, and slightly underperformed small-cap stocks. Three of the 10 sectors posted positive returns. Health care and materials posted the most positive returns. This was a continuation of a trend, as these sectors had performed well during the previous six-month period. Information technology and energy underperformed. Information technology companies with the most negative performance had more exposure to international operations. Energy under-performed due to a strengthening of the dollar and an abatement in demand for energy.
What is your outlook?
The Portfolio will remain fully invested in a way that tracks the performance of the S&P MidCap 400 Index. This is an attractive way for individuals to take advantage of the investment potential of the broad, diversified marketplace for mid-cap stocks.
Over the last six months, investors went from being extremely risk-averse to become less risk-averse, providing an environment that tends to favor smaller companies. Mid-cap companies, particularly those exposed to the domestic markets and U.S. consumers, outperformed their large-cap counterparts.
The financial markets appear to be resolving some of the uncertainty and ambiguity that has surrounded the fixed- income markets that led to the severe credit contraction that had increased the odds of a recession in the U.S. At a
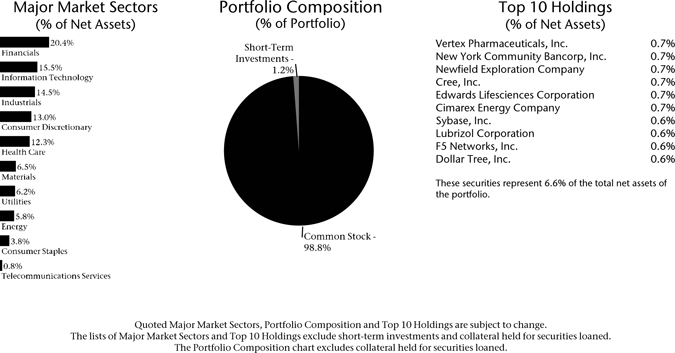
40
Table of Contents
minimum, global growth is slowing and the prices of risk assets have adjusted significantly, reflecting the increased uncertainty.
As mentioned a year ago, a transition in market leadership took place. Typically, as a new economic cycle matures, investors begin to favor large- and mid-cap issues over small-cap. We believe that attractive opportunities are available in the mid-cap marketplace in the months ahead. At the same time, we are realistic in our expectations that the premium return to the mid-cap sector is likely to be reduced in the future as the economic cycle continues.
Portfolio Facts
As of June 30, 2010
Net Assets | $79,329,021 | |
NAV | $10.08 | |
NAV - High† | 4/23/2010 - $12.15 | |
NAV - Low† | 2/8/2010 - $9.89 | |
Number of Holdings: 404 | ||
† For the six months ended June 30, 2010 |
Average Annual Total Returns1
As of June 30, 2010
| 1-Year | 5-Year | From Inception 3/1/2001 | ||
| 24.19% | 1.83% | 4.89% |

| * | The S&P MidCap 400 Index is an index that represents the average performance of a group of 400 medium capitalization stocks. The product is not sponsored, endorsed or promoted by Standard & Poor’s, and Standard & Poor’s makes no representation regarding the advisability of investing in the product. It is not possible to invest directly in the Index. The performance of the Index does not reflect deductions for fees, expenses or taxes. |
| ** | The Consumer Price Index is an inflationary indicator that measures the change in the cost of a fixed basket of products and services, including housing, electricity, food and transportation. It is not possible to invest directly in the Index. |
Past performance is not an indication of future results. Total investment return and principal value of your investment will fluctuate and units, when redeemed, may be worth more or less than their original cost. Current performance may be higher or lower than the performance data quoted. Call 800-THRIVENT or visit www.thrivent.com for performance results current to the most recent month-end.
| 1 | Average annual total returns represent past performance and reflect changes in share prices, the reinvestment of all dividends and capital gains, and the effects of compounding. Periods of less than one year are not annualized. At various times, the Portfolio’s adviser may have waived its management fee and/or reimbursed Portfolio expenses. If this were the case, the Portfolio’s total returns would have been lower. The returns shown do not reflect charges and expenses imposed on contract holders by the variable accounts. Those charges and expenses reduce the returns received by contract holders as compared to the returns presented. |
The prospectus contains more complete information on the investment objectives, risks, charges and expenses of the investment company, which investors should read and consider carefully before investing. To obtain a prospectus, contact a registered representative or visit www.thrivent.com.
41
Table of Contents

How did the Portfolio perform during the six-month period ended June 30, 2010?
Thrivent Partner Worldwide Allocation Portfolio earned a return of -8.38%, as compared to its market benchmark, the MSCI All Country World Index ex-USA, which earned a return of -10.80%. The median return for the Lipper International Core category was -13.01%.
What factors affected the Portfolio’s performance?
Asset allocation and manager performance were key contributors to results versus the Index in the period. Emerging market indexes outperformed the larger capitalization sectors of the markets in the period, and the Portfolio’s manager in that segment performed well versus the emerging market index. A focus on quality companies with strong balance sheets allowed the Portfolio to outperform the benchmark.
An overweighting to domestically focused businesses and an underweighting to cyclical sectors added to performance given the concerns over global growth. Non-benchmark exposure in Hong Kong also benefited the Portfolio, as did the overweighting to Thailand, which outpaced most of its peers, despite the recent domestic political unrest.
Positive selection in health technology, process industries and producer manufacturing offset adverse selection in finance, consumer services and industrial services. In the large-cap allocations, assets allocated to the growth segment outperformed the broad market index while those allocated to the value segment performed in-line. The Portfolio’s allocation to fixed income was particularly helpful as bonds handily outperformed stocks over the reporting period.
What is your outlook?
Market volatility is likely to remain elevated given the macroeconomic risks that abound. Most serious, in our view, is the growing mountain of debt that developed countries have taken on to pump prime economic activity. The negative impact on economic activity will likely become apparent in the coming quarters. The U.S.
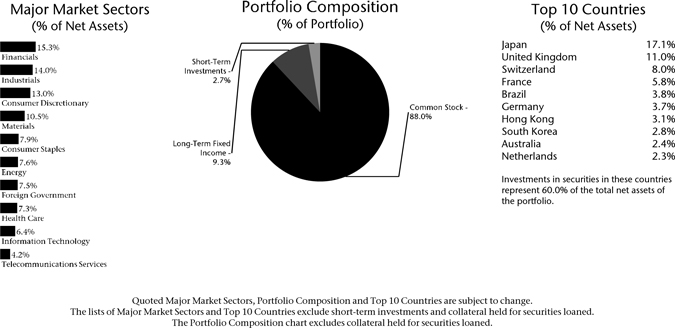
42
Table of Contents
and Japan are also facing unprecedented levels of indebtedness that are likely untenable over the long term.
Subdued economic growth, currency volatility and rising taxes are, in our view, a near certainty for much of the developed world. Alternatively, many emerging markets are relatively free of these problems and, in some cases, their economies are overheating due to rapid growth in recent years, which may also adversely impact these markets as governments implement austerity measures to mitigate inflationary pressures.
Portfolio Facts
As of June 30, 2010
Net Assets | $330,270,446 | |
NAV | $7.18 | |
NAV - High† | 4/14/2010 - $8.29 | |
NAV - Low† | 5/26/2010 - $6.96 | |
Number of Holdings: 450 |
| † | For the six months ended June 30, 2010 |
Average Annual Total Returns1
As of June 30, 2010
| 1-Year | From Inception 4/30/2008 | |
| 11.69% | -13.26% |
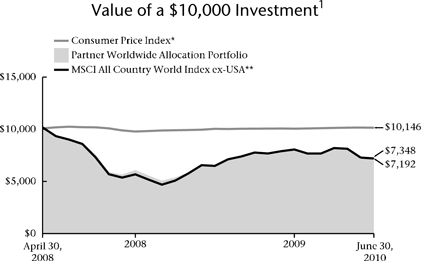
| * | The Consumer Price Index is an inflationary indicator that measures the change in the cost of a fixed basket of products and services, including housing, electricity, food and transportation. It is not possible to invest directly in the Index. |
| ** | The MSCI All Country World Index ex-USA is an unmanaged market capitalization-weighted index that is designed to represent the performance of developed and emerging stock markets throughout the world. It is not possible to invest directly in the Index. The performance of the Index does not reflect deductions for fees, expenses or taxes. |
Past performance is not an indication of future results. Total investment return and principal value of your investment will fluctuate and units, when redeemed, may be worth more or less than their original cost. Current performance may be higher or lower than the performance data quoted. Call 800-THRIVENT or visit www.thrivent.com for performance results current to the most recent month-end.
| 1 | Average annual total returns represent past performance and reflect changes in share prices, the reinvestment of all dividends and capital gains, and the effects of compounding. Periods of less than one year are not annualized. At various times, the Portfolio’s adviser may have waived its management fee and/or reimbursed Portfolio expenses. If this were the case, the Portfolio’s total returns would have been lower. The returns shown do not reflect charges and expenses imposed on contract holders by the variable accounts. Those charges and expenses reduce the returns received by contract holders as compared to the returns presented. |
The prospectus contains more complete information on the investment objectives, risks, charges and expenses of the investment company, which investors should read and consider carefully before investing. To obtain a prospectus, contact a registered representative or visit www.thrivent.com.
43
Table of Contents

How did the Portfolio perform during the six-month period ended June 30, 2010?
Thrivent Partner International Stock Portfolio earned a return of -12.73%, as compared to the median return of its peer group, the Lipper International Core category, of -13.01%. The Portfolio’s benchmark, the MSCI EAFE Index, earned a return of -12.93%.
What factors affected the Portfolio’s performance?
Riskier or more cyclically sensitive market sectors were particularly hard hit, with materials, energy and financials among the worst performers. On the other hand, consumer staples, industrials and information technology companies held up relatively well due to their defensive nature. Geographically, stocks within the euro zone, with the exception of Germany and Sweden, saw the greatest losses, while our Japanese and other Asian holdings were among the better performers.
The Portfolio’s holdings in the materials and industrials sectors underperformed versus their respective industry groups. Additionally, the account was overweighted in both sectors, and these factors combined to limit returns. Conversely, while the financial and energy sectors performed poorly, stock selection in the Portfolio was better than that of the groups. The Portfolio was also underweighted in the poorly performing financial sector. These actions offset much of the sub par returns in the aforementioned groups. Net, total Portfolio results were roughly in-line with the benchmark.
What is your outlook?
Market volatility is likely to remain at an elevated level given the macroeconomic risks that abound. Most serious, in our view, is the growing mountain of debt that developed countries have taken on to pump prime economic activity. Many governments in Europe have already slashed fiscal spending in an effort to bring debt to a more sustainable level. The negative impact on economic activity will likely become apparent in the coming quarters.
But Europe is not alone. The U.S. and Japan are also facing unprecedented levels of indebtedness, which are likely untenable over the long term. Subdued economic growth, currency volatility and rising taxes are, in our opinion, a
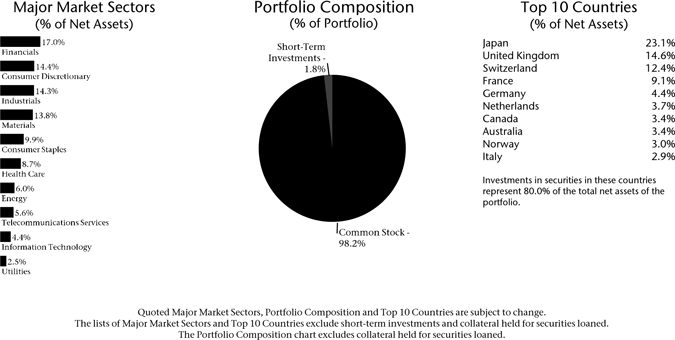
44
Table of Contents
near certainty for much of the developed world. Alternatively, many emerging markets are relatively free of these problems and, in some cases, their economies are overheating due to rapid growth in recent years, which may also adversely impact these markets as governments implement austerity measures to mitigate inflationary pressures.
Portfolio Facts
As of June 30, 2010
Net Assets | $740,402,867 | |
NAV | $8.72 | |
NAV - High† | 4/14/2010 - $10.38 | |
NAV - Low† | 6/7/2010 - $8.50 | |
Number of Holdings: 222 |
| † | For the six months ended June 30, 2010 |
Average Annual Total Returns1
As of June 30, 2010
| 1-Year | 5-Year | 10-Year | ||
| 6.49% | 0.12% | -1.59% |
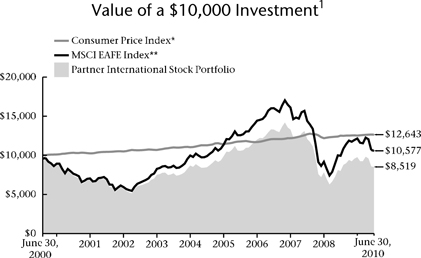
| * | The Consumer Price Index is an inflationary indicator that measures the change in the cost of a fixed basket of products and services, including housing, electricity, food and transportation. It is not possible to invest directly in the Index. |
| ** | The MSCI EAFE Index measures the performance of stocks in developed countries outside of North America. It is not possible to invest directly in the Index. The performance of the Index does not reflect deductions for fees, expenses or taxes. |
Past performance is not an indication of future results. Total investment return and principal value of your investment will fluctuate and units, when redeemed, may be worth more or less than their original cost. Current performance may be higher or lower than the performance data quoted. Call 800-THRIVENT or visit www.thrivent.com for performance results current to the most recent month-end.
| 1 | Average annual total returns represent past performance and reflect changes in share prices, the reinvestment of all dividends and capital gains, and the effects of compounding. Periods of less than one year are not annualized. At various times, the Portfolio’s adviser may have waived its management fee and/or reimbursed Portfolio expenses. If this were the case, the Portfolio’s total returns would have been lower. The returns shown do not reflect charges and expenses imposed on contract holders by the variable accounts. Those charges and expenses reduce the returns received by contract holders as compared to the returns presented. |
The prospectus contains more complete information on the investment objectives, risks, charges and expenses of the investment company, which investors should read and consider carefully before investing. To obtain a prospectus, contact a registered representative or visit www.thrivent.com.
45
Table of Contents
 | Thrivent Partner Socially Responsible Stock Portfolio |
Subadvised by Calvert Asset Management Company, Inc. and Atlanta Capital Management, L.L.C.
Thrivent Partner Socially Responsible Stock Portfolio seeks long-term capital growth.
Stocks are subject to the basic market risk that a particular security, or securities in general, may decrease in value over short or even extended time periods. In addition, the Portfolio is exposed to the risks of investing in mid-cap stocks, which generally are more volatile and less liquid than large-cap stocks. The Portfolio is also subject to the risks of investing in foreign stocks. These and other risks are described in the Portfolio’s prospectus. Views expressed in this discussion of portfolio performance are the views of this particular portfolio’s management team.
How did the Portfolio perform during the six-month period ended June 30, 2010?
Thrivent Partner Socially Responsible Stock Portfolio earned a return of -6.35%. The Portfolio’s market benchmark, the S&P 500 Index, earned a return of -6.65%, while the median return in the Lipper Large-Cap Growth Core category was -7.68%.
What factors affected the Portfolio’s performance?
Attribution analysis shows modest outperformance. Sector selection was negative with being underweighted in telecom and utilities detracting. Stock selection was positive with the largest contributions in consumer discretionary, industrials and materials, but with poor selection in financials. The top contributors to performance were Netflix and Apple. The leading detractors were CVS Caremark, QUALCOMM, Google, Hewlett-Packard and Gilead Sciences.
What is your outlook?
For the last 12 months, we have accepted the notion that this recovery was likely to be weak relative to historical standards. The headwinds of a de-leveraging consumer, banks that need to rebuild capital, high and sticky unemployment and a housing sector that will likely need years to get back to normal all conspired to make this the most likely outcome. For the last two months, the market has suffered from the fear that even this modest growth outlook was too optimistic.
The question that needs answering is: Where do we go from here? It’s tough to assign a zero probability to any outcome. While we believe that the odds of a “double-dip” recession have clearly risen, we still think those odds are quite low. It’s far more likely that the consensus modest recovery gets a bit more modest instead. Assuming that we don’t have a “double-dip,” the stock market is
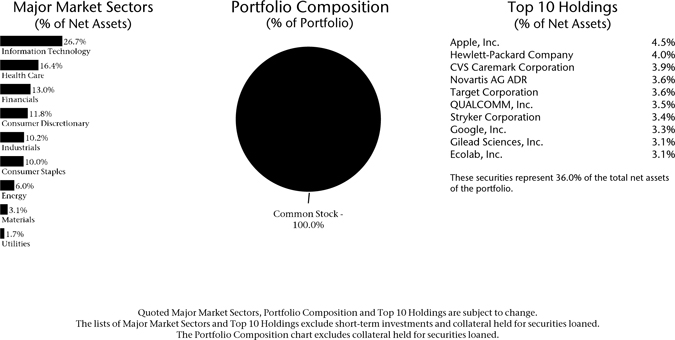
46
Table of Contents
quite cheap and the prospect for a solid full-year gain remains a possible outcome. The sell off is creating some significant individual stock bargains and scrambling previous sector or style level thoughts a bit. We’re evaluating opportunities one-by-one and look to second quarter earnings to hopefully clarify the outlook somewhat. As the markets stabilize, we continue to expect that higher-quality stocks with superior organic growth rates will be accorded a premium.
Portfolio Facts
As of June 30, 2010
Net Assets | $3,654,503 | |
NAV | $8.20 | |
NAV - High† | 4/23/2010 - $9.73 | |
NAV - Low† | 6/30/2010 - $8.20 | |
Number of Holdings: 50 |
| † | For the six months ended June 30, 2010 |
Average Annual Total Returns1
As of June 30, 2010
| 1-Year | From Inception 4/30/2008 | |
| 14.36% | -8.44% |
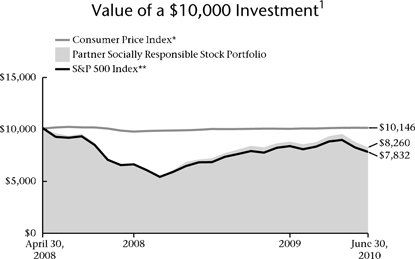
| * | The Consumer Price Index is an inflationary indicator that measures the change in the cost of a fixed basket of products and services, including housing, electricity, food and transportation. It is not possible to invest directly in the Index. |
| ** | The S&P 500 Index is an index that represents the average performance of a group of 500 widely held, publicly traded stocks. It is not possible to invest directly in the Index. The performance of the Index does not reflect deductions for fees, expenses or taxes. “S&P 500” is a trademark of The McGraw-Hill Companies, Inc. and has been licensed for use by Thrivent Financial for Lutherans. The product is not sponsored, endorsed or promoted by Standard & Poor’s, and Standard & Poor’s makes no representation regarding the advisability of investing in the product. |
Past performance is not an indication of future results. Total investment return and principal value of your investment will fluctuate and units, when redeemed, may be worth more or less than their original cost. Current performance may be higher or lower than the performance data quoted. Call 800-THRIVENT or visit www.thrivent.com for performance results current to the most recent month-end.
| 1 | Average annual total returns represent past performance and reflect changes in share prices, the reinvestment of all dividends and capital gains, and the effects of compounding. Periods of less than one year are not annualized. At various times, the Portfolio’s adviser may have waived its management fee and/or reimbursed Portfolio expenses. If this were the case, the Portfolio’s total returns would have been lower. The returns shown do not reflect charges and expenses imposed on contract holders by the variable accounts. Those charges and expenses reduce the returns received by contract holders as compared to the returns presented. |
The prospectus contains more complete information on the investment objectives, risks, charges and expenses of the investment company, which investors should read and consider carefully before investing. To obtain a prospectus, contact a registered representative or visit www.thrivent.com.
47
Table of Contents
 | Thrivent Partner All Cap Growth Portfolio |
Subadvised by Calamos Advisors LLC
Thrivent Partner All Cap Growth Portfolio seeks long-term capital growth.
Stocks are subject to the basic market risk that a particular security, or securities in general, may decrease in value over short or even extended time periods. In addition, the Portfolio is exposed to the risks of investing in mid-cap stocks, which generally are more volatile and less liquid than large-cap stocks. These and other risks are described in the Portfolio’s prospectus. Views expressed in this discussion of portfolio performance are the views of this particular portfolio’s management team.
How did the Portfolio perform during the six-month period ended June 30, 2010?
Thrivent Partner All Cap Growth Portfolio returned -8.23%, compared with the median -6.27% return of its peer group, the Lipper Multi-Cap Growth category. The Portfolio’s benchmark, the Russell 3000® Growth Index, returned -7.25%.
What factors affected the Portfolio’s performance?
The first half of 2010 has been difficult for equities. Renewed concern about the health of the economic recovery, heightened levels of government debt and increasing volatility has led to declines in all economic sectors within the Index.
The consumer discretionary sector detracted from performance the most, relative to the Index. As household de-leveraging continues, we have been slow and cautious in making new investments to the sector. An overweighted position and selection in the energy sector also detracted. We have reduced exposure to energy, given our concerns about regulatory risk and profitability.
The Portfolio achieved solid gains in the health care sector, enhancing relative performance. Investments in the health care equipment industry proved beneficial. We continue to assess opportunities to increase our exposure on a case-by-case basis, but remain cautious about the service providers.
Our selections within information technology (IT) also contributed to relative returns, with significant additions coming from investments in the IT services industry.
What is your outlook?
The Portfolio’s largest sector overweighting is to information technology. We believe technology has high long-term growth potential as companies seek to enhance productivity and as individuals demand devices that provide access to information anywhere and anytime. Our most significant underweighting is to consumer staples, where we continue to seek stocks with an attractive mix of growth potential and valuation.
A seemingly constant news cycle of economic hardship, both in the U.S. and abroad, has largely overshadowed positive developments. Market momentum from rising corporate profits, low interest rates and technological innovation quickly dissipates, as housing weakness, regulatory reform and surging sovereign debt levels remain at the forefront of investor attention.
Large government deficits, uncontrolled spending and the subsidizing of unproductive assets all factor into our
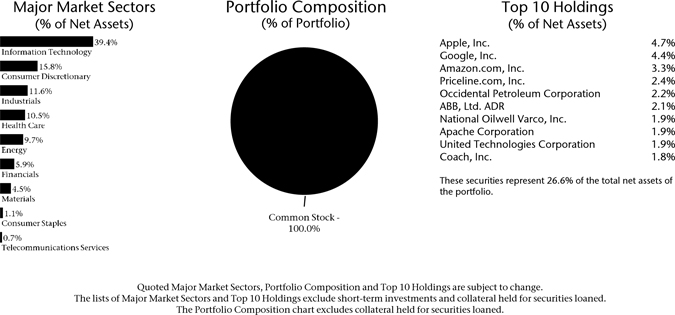
48
Table of Contents
cautious long-term view. We believe near-term corporate results should be reasonable, providing opportunities for prudent investors. Our higher-quality bias continues to lead us to solid multinational corporations with strong balance sheets and global brands, global revenues, higher internal-growth prospects and cash flows, and lower debt.
Portfolio Facts
As of June 30, 2010
Net Assets | $7,812,009 | |
NAV | $7.37 | |
NAV- High† | 4/23/2010 -$8.82 | |
NAV - Low† | 6/30/2010 -$7.37 | |
Number of Holdings: 88 |
| † | For the six months ended June 30, 2010 |
Average Annual Total Returns1
As of June 30, 2010
| 1-Year | From Inception 4/30/2008 | |
| 16.55% | -13.13% |
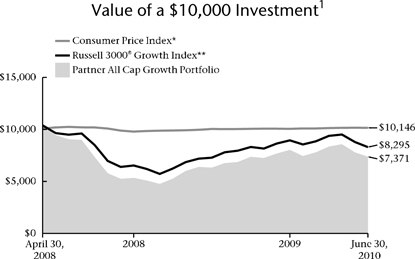
| * | The Consumer Price Index is an inflationary indicator that measures the change in the cost of a fixed basket of products and services, including housing, electricity, food and transportation. It is not possible to invest directly in the Index. |
| ** | The Russell 3000® Growth Index is an index that measures the performance of the broad growth segment of U.S. equities. It is not possible to invest directly in the Index. The performance of the Index does not reflect deductions for fees, expenses or taxes. |
Past performance is not an indication of future results. Total investment return and principal value of your investment will fluctuate and units, when redeemed, may be worth more or less than their original cost. Current performance may be higher or lower than the performance data quoted. Call 800-THRIVENT or visit www.thrivent.com for performance results current to the most recent month-end.
| 1 | Average annual total returns represent past performance and reflect changes in share prices, the reinvestment of all dividends and capital gains, and the effects of compounding. Periods of less than one year are not annualized. At various times, the Portfolio’s adviser may have waived its management fee and/or reimbursed Portfolio expenses. If this were the case, the Portfolio’s total returns would have been lower. The returns shown do not reflect charges and expenses imposed on contract holders by the variable accounts. Those charges and expenses reduce the returns received by contract holders as compared to the returns presented. |
The prospectus contains more complete information on the investment objectives, risks, charges and expenses of the investment company, which investors should read and consider carefully before investing. To obtain a prospectus, contact a registered representative or visit www.thrivent.com.
49
Table of Contents
 | Thrivent Partner All Cap Value Portfolio |
Subadvised by Oppenheimer Funds, Inc.
Thrivent Partner All Cap Value Portfolio seeks long-term capital growth.
Stocks are subject to the basic market risk that a particular security, or securities in general, may decrease in value over short or even extended time periods. In addition, the Portfolio is exposed to the risks of investing in small- and mid-cap stocks, which generally are more volatile and less liquid than large-cap stocks. The Portfolio is also subject to the risks of investing in foreign (including emerging market) stocks. These and other risks are described in the Portfolio’s prospectus. Views expressed in this discussion of portfolio performance are the views of this particular portfolio’s management team.
How did the Portfolio perform during the six-month period ended June 30, 2010?
Thrivent Partner All Cap Value Portfolio earned a return of -7.03%, compared with the median return of its peer group, the Lipper Multi-Cap Value category, of -6.25%. The Portfolio’s market benchmark, the Russell 3000® Value Index, earned a return of -4.83%.
What factors affected the Portfolio’s performance?
The greatest detractor to relative performance was the financials sector, followed by consumer staples and information technology. In financials, the Portfolio underperformed as it did not hold real estate investment trusts and was underweighted in commercial banks, which produced stronger results for the Index. The Portfolio was also overweighted in E*TRADE Financial Corp., which underperformed for the period.
Within consumer staples, overweighting Walgreen Co. and Chiquita Brands International, Inc., both of which experienced significant declines during the tumultuous reporting period, hurt relative results. Laggards in the information technology sector included overweighted positions to QUALCOMM, Inc., Motorola, Inc. and Dell, Inc. We exited our positions in QUALCOMM and Motorola by period end.
The Portfolio outperformed the Index in the industrials, health care and consumer discretionary sectors due to better relative stock selection. In industrials, Navistar International Corp. and Wabco Holdings, Inc. posted strong returns during the period, and so our overweighting to the stocks contributed to performance. In terms of health care, the Portfolio benefited from its pharmaceutical holdings, with contributions from an overweighting to Biovail Corp., which performed well during the period, and an underweighting to Pfizer, Inc., which underperformed. Within consumer discretionary, overweighting Brinker International, Inc. and stronger performing media companies such as Time Warner Cable, Inc. and Viacom, Inc., benefited Portfolio performance.
Positive contributors to performance in other sectors during the reporting period included an underweighted position to struggling energy stock Exxon Mobil Corp., and overweighting to financials stock MetLife, Inc., consumer staples holding Molson Coors Brewing Co. and industrials security AerCap Holdings NV.
What is your outlook?
Given the global equity and bond market pullbacks over the last two months of the reporting period, we continue
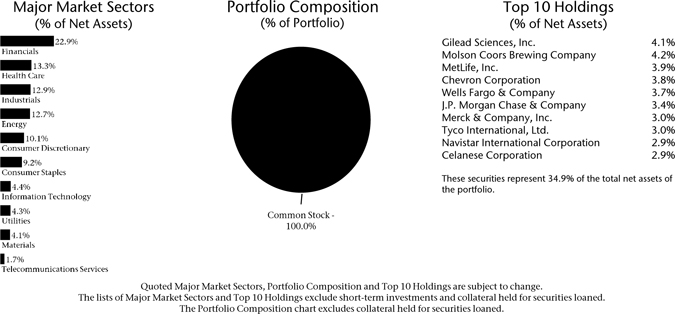
50
Table of Contents
to follow a long-term, bottom-up, fundamentals-based approach to investing. While we expect the volatility in the markets to continue based on the global uncertainty regarding debt levels of certain countries and other pressing issues, we also believe market corrections present investment opportunities. We will continue to monitor current events as they unfold, but we are optimistic regarding the Portfolio’s investment strategy over the long term.
Portfolio Facts
As of June 30, 2010
Net Assets | $5,673,411 | |
NAV | $7.11 | |
NAV - High† | 4/14/2010 - $8.53 | |
NAV - Low† | 6/30/2010 - $7.11 | |
Number of Holdings: 52 |
| † | For the six months ended June 30, 2010 |
Average Annual Total Returns1
As of June 30, 2010
| 1-Year | From Inception 4/30/2008 | |
| 13.25% | -13.39% |
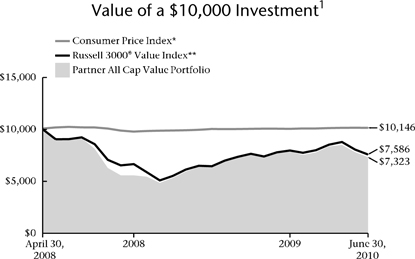
| * | The Consumer Price Index is an inflationary indicator that measures the change in the cost of a fixed basket of products and services, including housing, electricity, food and transportation. It is not possible to invest directly in the Index. |
| ** | The Russell 3000® Value Index is an index that measures the performance of the broad value segment of U.S. equities. It is not possible to invest directly in the Index. The performance of the Index does not reflect deductions for fees, expenses or taxes. |
Past performance is not an indication of future results. Total investment return and principal value of your investment will fluctuate and units, when redeemed, may be worth more or less than their original cost. Current performance may be higher or lower than the performance data quoted. Call 800-THRIVENT or visit www.thrivent.com for performance results current to the most recent month-end.
| 1 | Average annual total returns represent past performance and reflect changes in share prices, the reinvestment of all dividends and capital gains, and the effects of compounding. Periods of less than one year are not annualized. At various times, the Portfolio’s adviser may have waived its management fee and/or reimbursed Portfolio expenses. If this were the case, the Portfolio’s total returns would have been lower. The returns shown do not reflect charges and expenses imposed on contract holders by the variable accounts. Those charges and expenses reduce the returns received by contract holders as compared to the returns presented. |
The prospectus contains more complete information on the investment objectives, risks, charges and expenses of the investment company, which investors should read and consider carefully before investing. To obtain a prospectus, contact a registered representative or visit www.thrivent.com.
51
Table of Contents
 | Thrivent Partner All Cap Portfolio |
Subadvised by Pyramis Global Advisors, LLC, an affiliate of Fidelity Investments
Thrivent Partner All Cap Portfolio seeks long-term growth of capital.
Stocks are subject to the basic market risk that a particular security, or securities in general, may decrease in value over short or even extended time periods. These and other risks are described in the Portfolio’s prospectus. Views expressed in this discussion of portfolio performance are the views of this particular portfolio’s management team.
How did the Portfolio perform during the six-month period ended June 30, 2010?
Thrivent Partner All Cap Portfolio earned a return of -7.82% for the period. The median return in the Lipper Multi-Cap Core category was -6.43% and the Portfolio’s benchmark, the Russell 3000® Index earned -6.05%.
What factors affected the Portfolio’s performance?
The financials, information technology and health care sectors detracted from our relative performance. Within financials, our underweighting in insurance and Berkshire Hathaway, as well as our overweighting in Charles Schwab, both detracted from performance. In information technology, our investment in hard disk drive manufacturer Seagate Technology detracted from performance. Within health care, our overweighting in King Pharmaceuticals detracted from performance, as its shares declined after the Food and Drug Administration (FDA) advisory panel urged government regulators to reject its experimental painkiller. One of the largest individual detractors of performance was offshore oil driller Transocean—its shares declined after one of its oil rigs exploded and caused a catastrophic oil spill in the Gulf of Mexico.
The industrials and consumer discretionary sectors were the largest contributors to the Portfolio’s relative performance. Within the industrials sector, our overweighting in diesel engine manufacturer Cummins, and our underweighting in industrial conglomerate General Electric contributed to performance. Within consumer discretionary, our overweighting in Starbucks Corp. helped performance. Two of the largest individual contributors to performance were our overweightings in flash-memory card manufacturer SanDisk and soft drink maker Dr. Pepper Snapple Group. Shares of SanDisk rose thanks to favorable supply and demand characteristics from strong consumer demand for smartphones. Shares of Dr. Pepper Snapple Group rose in response to the company’s first-quarter profit announcement, which exceeded analysts’ estimates and was aided by volume gains in Latin America.
What is your outlook?
From a fundamental perspective, we continue to see incremental signs of improvement across sectors which should support equities, but the markets are indicating some clear apprehension at this possibility. Currently, it appears that two points of view prevail at the highest levels. Stock market declines suggest for many observers that equity prices may have started a longer-term journey down. On the other hand, corporate-bond yields have diverged from stock market valuations in recent weeks,
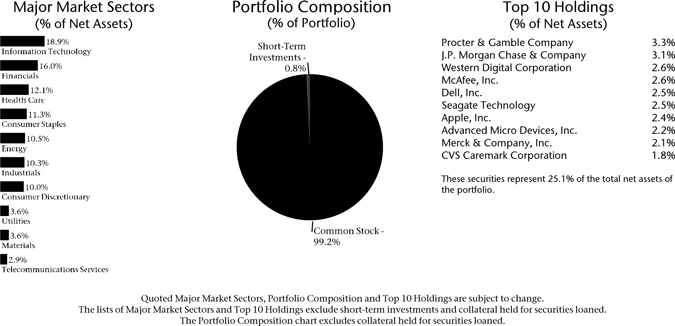
52
Table of Contents
suggesting that stocks are undervalued. At this time, our view is aligned more closely with the credit market view. We continue to believe that opportunities remain for continued positive equity performance, but understand that there is increased risk in this thesis—we believe there is an increasing influence of more macro and fewer company-specific factors. The Portfolio is positioned with a balance across companies we believe to have fundamental upside and balance sheet strength with those that offer the protection of attractive valuations relative to peers.
Portfolio Facts
As of June 30, 2010
Net Assets | $53,809,680 | |
NAV | $7.07 | |
NAV - High† | 4/23/2010 - $8.57 | |
NAV - Low† | 6/30/2010 - $7.07 | |
Number of Holdings: 119 |
| † | For the six months ended June 30, 2010 |
Average Annual Total Returns1
As of June 30, 2010
| 1-Year | 5-Year | From Inception 11/30/2001 | ||
| 12.30% | 1.17% | -0.09% |
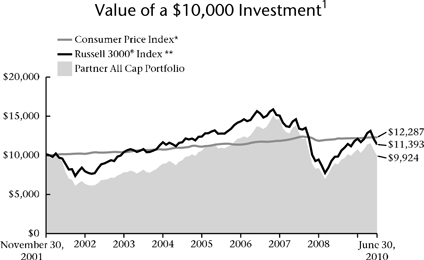
| * | The Consumer Price Index is an inflationary indicator that measures the change in the cost of a fixed basket of products and services, including housing, electricity, food and transportation. It is not possible to invest directly in the Index. |
| ** | The Russell 3000® Index is an index comprised of the 3,000 largest U.S. companies based on market capitalization. It is not possible to invest directly in the Index. The performance of the Index does not reflect deductions for fees, expenses or taxes. |
Past performance is not an indication of future results. Total investment return and principal value of your investment will fluctuate and units, when redeemed, may be worth more or less than their original cost. Current performance may be higher or lower than the performance data quoted. Call 800-THRIVENT or visit www.thrivent.com for performance results current to the most recent month-end.
| 1 | Average annual total returns represent past performance and reflect changes in share prices, the reinvestment of all dividends and capital gains, and the effects of compounding. Periods of less than one year are not annualized. At various times, the Portfolio’s adviser may have waived its management fee and/or reimbursed Portfolio expenses. If this were the case, the Portfolio’s total returns would have been lower. The returns shown do not reflect charges and expenses imposed on contract holders by the variable accounts. Those charges and expenses reduce the returns received by contract holders as compared to the returns presented. |
The prospectus contains more complete information on the investment objectives, risks, charges and expenses of the investment company, which investors should read and consider carefully before investing. To obtain a prospectus, contact a registered representative or visit www.thrivent.com.
53
Table of Contents

How did the Portfolio perform during the six-month period ended June 30, 2010?
Thrivent Large Cap Growth Portfolio II earned a return of -11.20%, compared with the median return of its peer group, the Lipper Large-Cap Growth category, of -8.58%. The Portfolio’s market benchmark, the Russell 1000® Growth Index, returned -7.65%.
What factors affected the Portfolio’s performance?
An aggressive market sell off for the first half of 2010 was fueled by concerns over the financial stability of several European countries, as well as concerns about the sustainability of the domestic economic recovery. The impact was most acutely felt in more cyclically sensitive sectors, such as materials, financials and technology. Consequently, our ownership of cyclically sensitive stocks in these sectors, coupled with our lack of exposure in more defensive sectors (e.g., consumer staples), led to underperformance during the six-month period.
Looking at sector-based analysis, the industrial and energy sectors were the largest positive contributors to Portfolio performance. Ownership in airlines and industrial machinery provided the greatest contribution. Within the energy sector, ownership of Occidental Petroleum and oil refiner Valero were performance drivers.
As stated earlier, our overweighted position in some of the more economically sensitive sectors hurt performance, including stock selections within technology and health care. Detracting from performance the most were Goldman Sachs, Pfizer, Google and Freeport Copper.
What is your outlook?
With the European financial crisis headed toward a path of possible improvement and domestic economic indicators suggesting a sustainable economic recovery, we believe the stock market is poised to rebound in the second half of 2010. Corporate earnings should continue to benefit from resurgence in economic demand, coupled with low interest rates and greater productivity. We are keeping a close eye on consumer-sensitive sectors, since employment is slow to recover and housing values are still depressed. In addition, a stronger U.S. dollar should have some impact on earnings for multinational companies and could become a bigger issue if the euro does not stabilize.
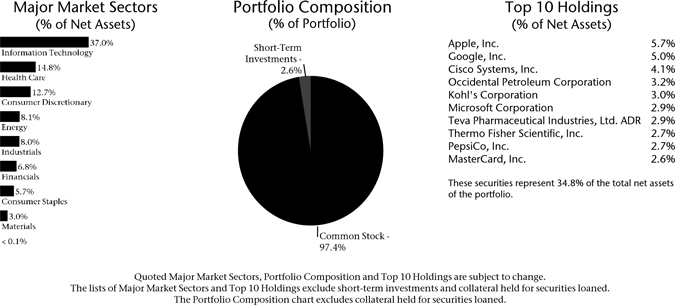
54
Table of Contents
Portfolio Facts
As of June 30, 2010
Net Assets | $316,164,261 | |
NAV | $6.28 | |
NAV - High† | 4/15/2010 - $7.84 | |
NAV - Low† | 6/30/2010 - $6.28 | |
Number of Holdings: 54 |
| † | For the six months ended June 30, 2010 |
Average Annual Total Returns1
As of June 30, 2010
| 1-Year | 5-Year | From Inception 11/30/2001 | ||
| 8.97% | -0.57% | -0.72% |
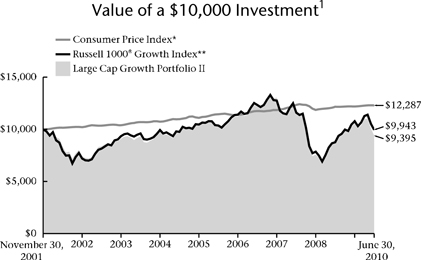
| * | The Consumer Price Index is an inflationary indicator that measures the change in the cost of a fixed basket of products and services, including housing, electricity, food and transportation. It is not possible to invest directly in the Index. |
| ** | The Russell 1000® Growth Index measures the performance of large cap growth stocks. It is not possible to invest directly in the Index. The performance of the Index does not reflect deductions for fees, expenses or taxes. |
Past performance is not an indication of future results. Total investment return and principal value of your investment will fluctuate and units, when redeemed, may be worth more or less than their original cost. Current performance may be higher or lower than the performance data quoted. Call 800-THRIVENT or visit www.thrivent.com for performance results current to the most recent month-end.
| 1 | Average annual total returns represent past performance and reflect changes in share prices, the reinvestment of all dividends and capital gains, and the effects of compounding. Periods of less than one year are not annualized. At various times, the Portfolio’s adviser may have waived its management fee and/or reimbursed Portfolio expenses. If this were the case, the Portfolio’s total returns would have been lower. The returns shown do not reflect charges and expenses imposed on contract holders by the variable accounts. Those charges and expenses reduce the returns received by contract holders as compared to the returns presented. |
The prospectus contains more complete information on the investment objectives, risks, charges and expenses of the investment company, which investors should read and consider carefully before investing. To obtain a prospectus, contact a registered representative or visit www.thrivent.com.
55
Table of Contents
How did the Portfolio perform during the six-month period ended June 30, 2010?
Thrivent Large Cap Growth Portfolio earned a return of -10.32%, compared with the median return of its peer group, the Lipper Large-Cap Growth category, of -8.58%. The Portfolio’s market benchmark, the Russell 1000® Growth Index, earned a return of
-7.65%.
What factors affected the Portfolio’s performance?
An aggressive market sell off for the first half of 2010 was fueled by concerns over the financial stability of several European countries, as well as concerns about the sustainability of the domestic economic recovery. The impact was most acutely felt in more cyclically sensitive sectors, such as materials, financials and technology. Consequently, our ownership of cyclically sensitive stocks in these sectors, coupled with our lack of exposure in more defensive sectors (e.g., consumer staples), led to underperformance during the six-month period.
Looking at sector-based analysis, the industrial and energy sectors were the largest positive contributors to Portfolio performance. Ownership in airlines and industrial machinery provided the greatest contribution. Within the energy sector, ownership of Occidental Petroleum and oil refiner Valero were performance drivers.
As stated earlier, our overweighted position in some of the more economically sensitive sectors hurt performance, including stock selections within technology and health care. Detracting from performance the most were Goldman Sachs, Pfizer, Google and Freeport Copper.
What is your outlook?
With the European financial crisis headed toward a path of possible improvement and domestic economic indicators suggesting a sustainable economic recovery, we believe the stock market is poised to rebound in the second half of 2010. Corporate earnings should continue to benefit from resurgence in economic demand, coupled with low interest rates and greater productivity. We are keeping a close eye on consumer-sensitive sectors, since employment is slow to recover and housing values are still depressed. In addition, a stronger U.S. dollar should have some impact on earnings for multinational companies and could become a bigger issue if the euro does not stabilize.
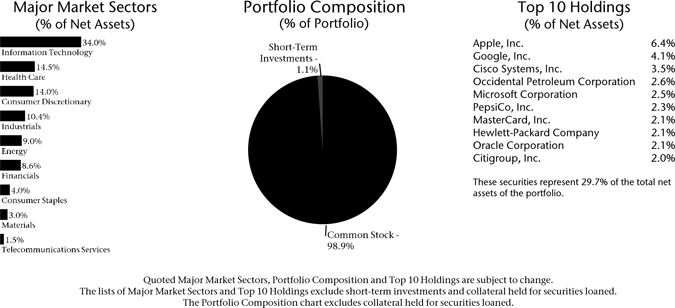
56
Table of Contents
Portfolio Facts
As of June 30, 2010
Net Assets | $858,818,040 | |
NAV | $13.80 | |
NAV - High† | 4/23/2010 - $16.60 | |
NAV - Low† | 6/30/2010 - $13.80 | |
Number of Holdings: 111 |
| † | For the six months ended June 30, 2010 |
Average Annual Total Returns1
As of June 30, 2010
| 1-Year | 5-Year | 10-Year | ||
| 10.93% | -0.14% | -3.50% |
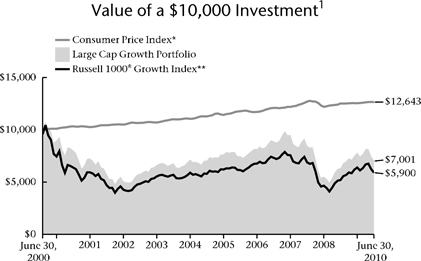
| * | The Consumer Price Index is an inflationary indicator that measures the change in the cost of a fixed basket of products and services, including housing, electricity, food and transportation. It is not possible to invest directly in the Index. |
| ** | The Russell 1000® Growth Index measures the performance of large cap growth stocks. It is not possible to invest directly in the Index. The performance of the Index does not reflect deductions for fees, expenses or taxes. |
Past performance is not an indication of future results. Total investment return and principal value of your investment will fluctuate and units, when redeemed, may be worth more or less than their original cost. Current performance may be higher or lower than the performance data quoted. Call 800-THRIVENT or visit www.thrivent.com for performance results current to the most recent month-end.
| 1 | Average annual total returns represent past performance and reflect changes in share prices, the reinvestment of all dividends and capital gains, and the effects of compounding. Periods of less than one year are not annualized. At various times, the Portfolio’s adviser may have waived its management fee and/or reimbursed Portfolio expenses. If this were the case, the Portfolio’s total returns would have been lower. The returns shown do not reflect charges and expenses imposed on contract holders by the variable accounts. Those charges and expenses reduce the returns received by contract holders as compared to the returns presented. |
The prospectus contains more complete information on the investment objectives, risks, charges and expenses of the investment company, which investors should read and consider carefully before investing. To obtain a prospectus, contact a registered representative or visit www.thrivent.com.
57
Table of Contents
How did the Portfolio perform during the six-month period ended June 30, 2010?
Thrivent Partner Growth Stock Portfolio earned a return of -8.08% for the period. The Lipper Large-Cap Growth category had a median return of -8.58%, and the S&P 500/Citigroup Growth Index earned -7.99%.
What factors affected the Portfolio’s performance?
Our sector allocations and stock selections both contributed to modest underperformance versus the index. The primary detractors of relative performance came from the financials, consumer discretionary and consumer staples sectors. Contrarily, health care, telecommunication services, and information technology contributed to performance.
The Portfolio’s stock selection within financials was a drag on performance. Specifically, our overweighting to the capital markets industry and stock selection therein were detrimental to results. Invesco, a mutual funds manager, was hit by a selloff due to investor uncertainty after it missed earnings estimates on unexpectedly higher expenses. And even though investment manager Franklin Resources, which operates the Templeton and Franklin mutual fund families, reported tripled earnings in the period, its stock price dropped as the market downturn reduced its assets under management and revenues. The Portfolio’s consumer discretionary sector (including an overweighting in Internet and catalog retail) underperfomed based on stock selection. Internet retailer Amazon.com declined on financial turmoil in Europe, and subsequent unfavorable foreign exchange earnings, as nearly half the company’s sales are international. Liberty Media was negatively affected by plans to split Liberty Media Interactive into an asset-based stock, in order for the parent company to more efficiently raise capital and pursue acquisitions. And the Portfolio’s underweighting within consumer staples also detracted from performance, missing out on the defensive sector’s outperformance of the overall Index.
Health care was a top performer, in terms of stock selection. Express Scripts, the pharmacy benefits manager, continues to benefit from increased use of its more-profitable generic drugs. Shares of McKesson, the large U.S. drug distributor, rose with the recent passage of health care reform legislation. The Portfolio trimmed its allocation to this sector in the period.
Other performance contributors among our stock selections came from the telecommunication services sector. Holdings in wireless telecommunication services performed relatively well. And information technology outperformed based on stock selection.
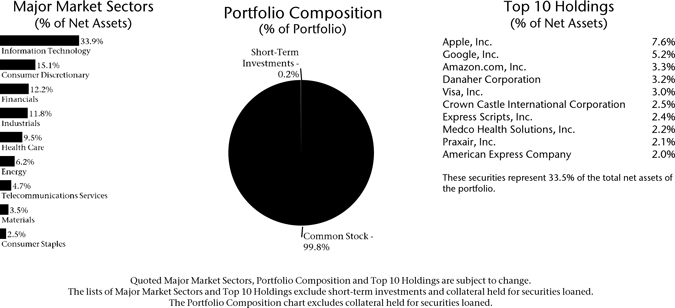
58
Table of Contents
What is your outlook?
While the financial turmoil in Europe and sluggish U.S. job growth are troubling, recent economic data has not been all negative. Corporate earnings have been strong, and the interest rate environment is favorable. Given the strong trend of investor pessimism, the risk/reward profile for stocks in general appears extremely attractive. We have taken advantage of the prevailing uncertainty, buying high-quality growth companies with solid fundamentals and believing that the Portfolio will perform well regardless of whether the economy enters a double-dip recession or a weaker-than-expected recovery.
Portfolio Facts
As of June 30, 2010
Net Assets | $51,809,021 | |
NAV | $9.13 | |
NAV - High† | 4/23/2010 - $10.85 | |
NAV - Low† | 6/30/2010 - $9.13 | |
Number of Holdings: 101 |
| † | For the six months ended June 30, 2010 |
Average Annual Total Returns1
As of June 30, 2010
| 1-Year | 5-Year | From Inception 11/30/2001 | |||
| 14.22 | % | 0.28% | 1.39% |
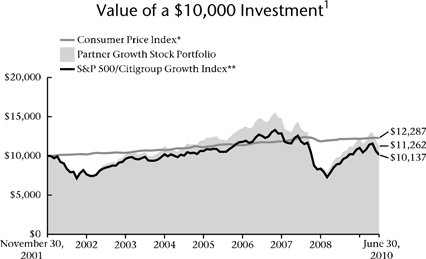
| * | The Consumer Price Index is an inflationary indicator that measures the change in the cost of a fixed basket of products and services, including housing, electricity, food and transportation. It is not possible to invest directly in the Index. |
| ** | The S&P 500/Citigroup Growth Index is a capitalization-weighted index comprised of the highest price-to-book ratio securities in the S&P 500 Index. The S&P 500/Citigroup Growth Index is designed so that approximately one-half of the S&P 500 Index market capitalization is characterized as “value” and the other half as “growth.” The product is not sponsored, endorsed or promoted by Standard & Poor’s, and Standard & Poor’s makes no representation regarding the advisability of investing in the product. It is not possible to invest directly in the Index. The performance of the Index does not reflect deductions for fees, expenses or taxes. |
Past performance is not an indication of future results. Total investment return and principal value of your investment will fluctuate and units, when redeemed, may be worth more or less than their original cost. Current performance may be higher or lower than the performance data quoted. Call 800-THRIVENT or visit www.thrivent.com for performance results current to the most recent month-end.
| 1 | Average annual total returns represent past performance and reflect changes in share prices, the reinvestment of all dividends and capital gains, and the effects of compounding. Periods of less than one year are not annualized. At various times, the Portfolio’s adviser may have waived its management fee and/or reimbursed Portfolio expenses. If this were the case, the Portfolio’s total returns would have been lower. The returns shown do not reflect charges and expenses imposed on contract holders by the variable accounts. Those charges and expenses reduce the returns received by contract holders as compared to the returns presented. |
The prospectus contains more complete information on the investment objectives, risks, charges and expenses of the investment company, which investors should read and consider carefully before investing. To obtain a prospectus, contact a registered representative or visit www.thrivent.com.
59
Table of Contents

How did the Portfolio perform during the six-month period ended June 30, 2010?
Thrivent Large Cap Value Portfolio earned a return of -9.09%, compared with the median return of its peer group, the Lipper Large-Cap Value category, of -7.18%. The Portfolio’s market benchmark, the Russell 1000® Value Index, returned - -5.12%.
What factors affected the Portfolio’s performance?
The primary reason for the Portfolio’s poor performance versus the benchmark index was stock selection. Specifically, stock selection in the financial, energy, technology, communications services and utilities sectors detracted the most from performance. Starting with the financial sector, not owning real estate investment trusts (REITs) detracted from our performance versus the index since REITs were up during the period and are well represented in the index. In energy, our position in Anadarko Petroleum (APC) hurt performance. It has an ownership interest in the BP well that ruptured in the Gulf of Mexico. We continue to hold this position because we believe that APC is well positioned for the long term.
Within technology, our position in Microsoft (MSFT) was the biggest negative performer, as its shares declined more than 23%. We maintain the position in MSFT because we believe there is considerable upside potential should the company achieve our expectations for operating performance. In communications services, our position in the European wireless communications provider Vodafone hurt performance and was sold since it did not meet our expectations for operating performance. Within the utilities sector, our position in Excelon accounted for the poor relative performance and was sold.
What is your outlook?
During the second quarter, investors became concerned about the strength and sustainability of the economic recovery. In the United States, employment has stabilized but has been slow to improve. Confidence was further shaken by disruptions to the sovereign debt markets in Europe as Greek debt solvency was questioned. While these and other variables are not to be neglected, our bottom-up analysis of companies and industries suggests that economic and market recovery will continue.
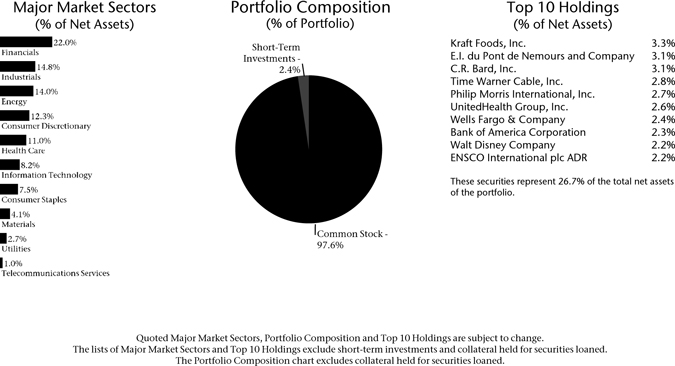
60
Table of Contents
Operating results are improving in many industries and valuations are reasonable given expected improvements in sales and earnings. We are mindful that risks to the economic recovery are still evident but at the same time are comfortable that the steps that have been and continue to be implemented will result in improving economic activity as the year progresses.
Portfolio Facts
As of June 30, 2010
Net Assets | $670,388,728 | |
NAV | $8.77 | |
NAV - High† | 4/23/2010 - $10.63 | |
NAV - Low† | 6/30/2010 - $8.77 | |
Number of Holdings: 76 |
| † | For the six months ended June 30, 2010 |
Average Annual Total Returns1
As of June 30, 2010
| 1-Year | 5-Year | From Inception 11/30/2001 | ||
| 11.34% | -0.92% | 1.03% |
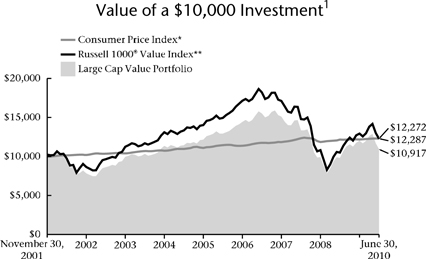
| * | The Consumer Price Index is an inflationary indicator that measures the change in the cost of a fixed basket of products and services, including housing, electricity, food and transportation. It is not possible to invest directly in the Index. |
| ** | The Russell 1000® Value Index measures the performance of large cap value stocks. It is not possible to invest directly in the Index. The performance of the Index does not reflect deductions for fees, expenses or taxes. |
Past performance is not an indication of future results. Total investment return and principal value of your investment will fluctuate and units, when redeemed, may be worth more or less than their original cost. Current performance may be higher or lower than the performance data quoted. Call 800-THRIVENT or visit www.thrivent.com for performance results current to the most recent month-end.
| 1 | Average annual total returns represent past performance and reflect changes in share prices, the reinvestment of all dividends and capital gains, and the effects of compounding. Periods of less than one year are not annualized. At various times, the Portfolio’s adviser may have waived its management fee and/or reimbursed Portfolio expenses. If this were the case, the Portfolio’s total returns would have been lower. The returns shown do not reflect charges and expenses imposed on contract holders by the variable accounts. Those charges and expenses reduce the returns received by contract holders as compared to the returns presented. |
The prospectus contains more complete information on the investment objectives, risks, charges and expenses of the investment company, which investors should read and consider carefully before investing. To obtain a prospectus, contact a registered representative or visit www.thrivent.com.
61
Table of Contents

How did the Portfolio perform during the six-month period ended June 30, 2010?
Thrivent Large Cap Stock Portfolio achieved a return of -9.46%. Over the same period, the median return in the Lipper Large-Cap Core category was -7.68%, while the Portfolio’s benchmark, the S&P 500 Index, returned -6.65%.
What factors affected the Portfolio’s performance?
Stocks rose early in the period but fell sharply from early May until the end of June, as investor confidence was shaken by debt issues in a number of European countries, lack of improvement in U.S. employment data, and concerns about slowing growth in China. Collectively, these issues resulted in a ratcheting down of growth expectations and increased investor uncertainty. In terms of the Portfolio’s underperformance, stock selection was the primary detractor. In particular, some of our holdings in finance, information technology and health care underperformed, and thus so did the overall sectors versus the Index. The Portfolio had exposure to companies that are related to the financial markets, and these holdings fell in the second half of the period along with the sharp decline in equity markets (in the U.S. and in many parts of the world). Insurance holdings in the Portfolio also did not keep pace with the industry or the market. Information technology was another group that did not perform well in the period. Concerns about the economic slowdown and the impact of a strengthening dollar were both factors in performance. The Portfolio’s holding in Google declined sharply, as did holdings in Qualcomm Inc. and Cisco Systems (within the communications industry). Health care stocks also were generally poor performers; for example, the Portfolio’s holding in Pfizer Corp. underperformed.
What is your outlook?
The market correction seen in the second quarter of this year appears to be in reaction to a loss of forward momentum in the economic recovery domestically and some signs that growth in other economies is moderating as well. In the U.S., fears appear to be rising that the economy has greater risk of relapsing back into a recession. While we acknowledge that could happen, we believe the likelihood of it is low. It is not unusual for economic growth to moderate in the second year of a
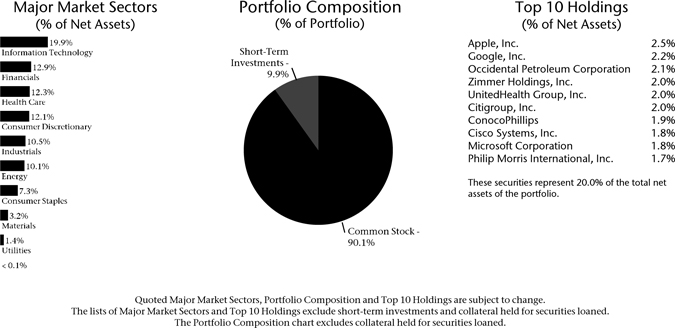
62
Table of Contents
recovery. Even so, we are aware of the disappointment about continued slow growth, especially within a period of unusually easy monetary policy, low interest rates and unprecedented levels of fiscal stimulus. Growth in the first year was subdued as housing is often an engine of growth early in a recovery. That has not been the case this time as there remains large amounts of real estate available from the excesses of the last cycle. We believe that this factor will make a recovery more moderate than would normally be the case. The adjustment in stock prices seen in the recent period has brought prices and expectations in closer alignment. Because operating results are improving in many industries and valuations are reasonable, we think that earnings will continue to recover and provide a basis for better equity market returns in the second half of 2010.
Portfolio Facts
As of June 30, 2010
Net Assets | $537,930,458 | |
NAV | $6.99 | |
NAV - High† | 4/23/2010 - $8.39 | |
NAV - Low† | 6/30/2010 - $6.99 | |
Number of Holdings: 113 |
| † | For the six months ended June 30, 2010 |
Average Annual Total Returns1
As of June 30, 2010
| 1-Year | 5-Year | From Inception 3/1/2001 | ||
| 10.91% | -1.67% | -1.61% |
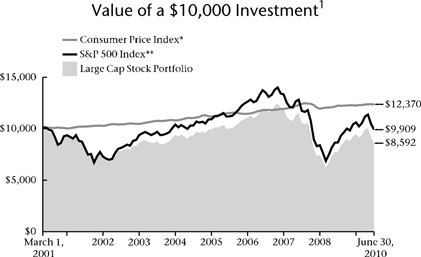
| * | The Consumer Price Index is an inflationary indicator that measures the change in the cost of a fixed basket of products and services, including housing, electricity, food and transportation. It is not possible to invest directly in the Index. |
| ** | The S&P 500 Index is an index that represents the average performance of a group of 500 widely held, publicly traded stocks. “S&P 500” is a trademark of The McGraw-Hill Companies, Inc. and has been licensed for use by Thrivent Financial for Lutherans. The product is not sponsored, endorsed or promoted by Standard & Poor’s and Standard & Poor’s makes no representation regarding the advisability of investing in the product. It is not possible to invest directly in the Index. The performance of the Index does not reflect deductions for fees, expenses or taxes. |
Past performance is not an indication of future results. Total investment return and principal value of your investment will fluctuate and units, when redeemed, may be worth more or less than their original cost. Current performance may be higher or lower than the performance data quoted. Call 800-THRIVENT or visit www.thrivent.com for performance results current to the most recent month-end.
| 1 | Average annual total returns represent past performance and reflect changes in share prices, the reinvestment of all dividends and capital gains, and the effects of compounding. Periods of less than one year are not annualized. At various times, the Portfolio’s adviser may have waived its management fee and/or reimbursed Portfolio expenses. If this were the case, the Portfolio’s total returns would have been lower. The returns shown do not reflect charges and expenses imposed on contract holders by the variable accounts. Those charges and expenses reduce the returns received by contract holders as compared to the returns presented. |
The prospectus contains more complete information on the investment objectives, risks, charges and expenses of the investment company, which investors should read and consider carefully before investing. To obtain a prospectus, contact a registered representative or visit www.thrivent.com.
63
Table of Contents
How did the Portfolio perform during the six-month period ended June 30, 2010?
Thrivent Large Cap Index Portfolio earned a return of -6.81%, compared with the median return of its peer group, the S&P 500 Index Objective category, of -6.80%. The Portfolio’s market benchmark, the S&P 500 Index, returned -6.65%.
What factors affected the Portfolio’s performance?
The Portfolio’s holdings are aligned with those of the S&P 500 Index. As typically occurs in an index portfolio, the difference in performance between the benchmark index and the portfolio itself can largely be attributed to expenses and minor differences in portfolio composition.
None of the sectors posted positive returns as of the six-month reporting end. Industrials and consumer discretionary were the best relative performing sectors in the market, posting the least negative returns. Large-cap stocks underperformed small- and mid-cap stocks over the reporting period, as large-cap stocks have more exposure to international markets. The materials and energy sectors delivered the most negative returns for the six-month period. Materials stocks were negatively impacted by a fear that a European meltdown would lower international demand. And energy stocks lagged as the euro devalued to the dollar, and a perception that a global slowdown was at hand.
What is your outlook?
Large-cap stocks underperformed both small- and mid cap stocks, not only for the last six months but over the past year. Over the last six months, markets experienced a steep increase through March, then a substantial drop from the highs through the end of June. If international concerns are proven to be overblown, that would tend to favor large caps over small- and mid-sized companies. We believe the dollar is as low as it should get. Risk levels will likely fluctuate in a range-bound manner. While opportunities for small and mid caps exist, our view is that as this cycle matures, large cap companies should outperform their small and mid cap counterparts.
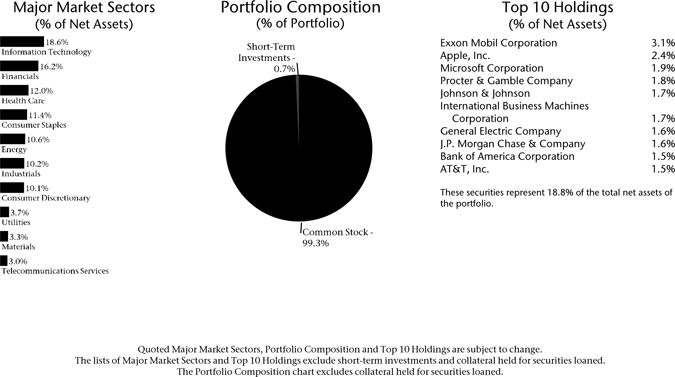
64
Table of Contents
The financial markets appear to be resolving some of the uncertainty and ambiguity that has surrounded the fixed- income markets that led to the severe credit contraction that had increased the odds of a recession in the U.S. At a minimum, global growth is slowing and the prices of risk assets have adjusted significantly, reflecting the increased uncertainty.
Portfolio Facts
As of June 30, 2010
Net Assets | $291,428,748 | |
NAV | $14.40 | |
NAV - High† | 4/23/2010 - $17.28 | |
NAV - Low† | 6/30/2010 - $14.40 | |
Number of Holdings: 503 |
| † | For the six months ended June 30, 2010 |
Average Annual Total Returns1
As of June 30, 2010
| 1-Year | 5-Year | 10-Year | ||
| 14.12% | -1.07% | -1.84% |
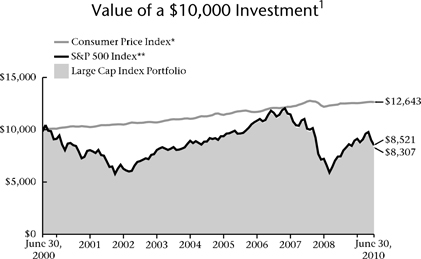
| * | The Consumer Price Index is an inflationary indicator that measures the change in the cost of a fixed basket of products and services, including housing, electricity, food and transportation. It is not possible to invest directly in the Index. |
| ** | The S&P 500 Index is an index that represents the average performance of a group of 500 widely held, publicly traded stocks. “S&P 500” is a trademark of The McGraw-Hill Companies, Inc. and has been licensed for use by Thrivent Financial for Lutherans. The product is not sponsored, endorsed or promoted by Standard & Poor’s and Standard & Poor’s makes no representation regarding the advisability of investing in the product. It is not possible to invest directly in the Index. The performance of the Index does not reflect deductions for fees, expenses or taxes. |
Past performance is not an indication of future results. Total investment return and principal value of your investment
will fluctuate and units, when redeemed, may be worth more or less than their original cost. Current performance may
be higher or lower than the performance data quoted. Call 800-THRIVENT or visit www.thrivent.com for performance
results current to the most recent month-end.
| 1 | Average annual total returns represent past performance and reflect changes in share prices, the reinvestment of all dividends and capital gains, and the effects of compounding. Periods of less than one year are not annualized. At various times, the Portfolio’s adviser may have waived its management fee and/or reimbursed Portfolio expenses. If this were the case, the Portfolio’s total returns would have been lower. The returns shown do not reflect charges and expenses imposed on contract holders by the variable accounts. Those charges and expenses reduce the returns received by contract holders as compared to the returns presented. |
The prospectus contains more complete information on the investment objectives, risks, charges and expenses of the
investment company, which investors should read and consider carefully before investing. To obtain a prospectus,
contact a registered representative or visit www.thrivent.com.
65
Table of Contents

How did the Portfolio perform during the six-month period ended June 30, 2010?
Thrivent Equity Income Plus Portfolio earned a return of -4.92%, as compared to the median return of its peer group, the Lipper Equity Income category, of - -6.01%. The Portfolio’s market benchmark, the S&P 500 Index, earned a return of -6.65%.
What factors affected the Portfolio’s performance?
The Portfolio maintains a diversified strategic allocation to complementary dividend-paying equities, including domestic and foreign common stock, domestic and foreign REITs, and preferred equity. Additionally, while not providing dividends, the Portfolio benefits from income generated by its covered call buy-write strategy. As a result of European debt contagion fears, the Portfolio’s foreign equity exposures underperformed for the year-to-date period; however, domestic equity exposures more than made up for that shortfall providing overall Portfolio outperformance to its benchmark and peer group.
No S&P 500 sector posted positive returns for the period year-to-date. However, several Portfolio sectors provided strong positive returns relative to the benchmark. Asset selection provided the majority of outperformance to the Portfolio’s benchmark and peer group with allocation effect contributing, but to a lesser degree. Asset selection outperformance came from the consumer staples, health care, financials, telecommunication, energy, consumer discretionary and industrials sectors. The only Portfolio sectors where asset selection was negative were utilities and information technology.
What is your outlook?
The Portfolio will maintain its strategic allocations to diversifying-dividend equity asset classes. At the sector and security level, the Portfolio has been positioned to cyclical sectors and securities, including consumer discretionary, technology, materials and financials, that have benefited from the broader market’s recovery. Going into the second half of the year, the Portfolio continues to be overweighted in cyclicals, but to a lesser degree. Portfolio exposure has been increased to more defensive counter-cyclical securities and sectors including utilities and consumer staples.
While there may be a midsummer rally off a very poor second quarter, the market may trade sideways to down as the economy struggles to gain greater traction in its recovery. These more defensive sectors may provide some
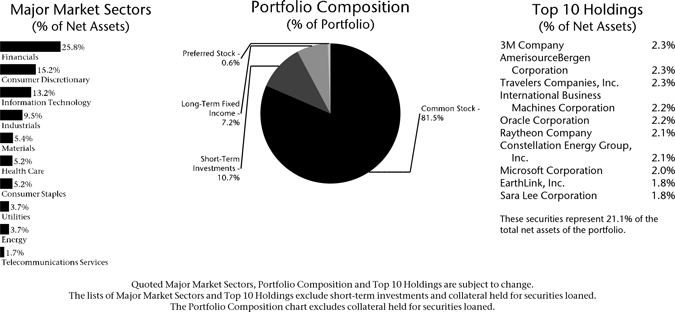
66
Table of Contents
relative protection. If the market’s recovery continues through the second half of the year, the Portfolio’s exposures to cyclical sectors and securities should participate with a positive move in the market.
Additionally, the Portfolio’s buy-write strategy may provide additional premiums that can enhance overall Portfolio income.
Portfolio Facts
As of June 30, 2010
Net Assets | $55,005,964 | |
NAV | $7.51 | |
NAV - High† | 4/23/2010 - $8.77 | |
NAV - Low† | 6/30/2010 - $7.51 | |
Number of Holdings: 305 |
| † | For the six months ended June 30, 2010 |
Average Annual Total Returns1
As of June 30, 2010
| 1-Year | From Inception 4/30/2008 | |
| 13.57% | -10.77% |
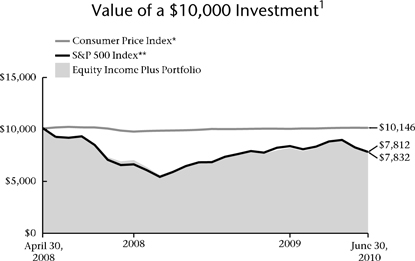
| * | The Consumer Price Index is an inflationary indicator that measures the change in the cost of a fixed basket of products and services, including housing, electricity, food and transportation. It is not possible to invest directly in the Index. |
| ** | The S&P 500 Index is an index that represents the average performance of a group of 500 widely held, publicly traded stocks. “S&P 500” is a trademark of The McGraw-Hill Companies, Inc. and has been licensed for use by Thrivent Financial for Lutherans. The product is not sponsored, endorsed or promoted by Standard & Poor’s and Standard & Poor’s makes no representation regarding the advisability of investing in the product. It is not possible to invest directly in the Index. The performance of the Index does not reflect deductions for fees, expenses or taxes. |
Past performance is not an indication of future results. Total investment return and principal value of your investment will fluctuate and units, when redeemed, may be worth more or less than their original cost. Current performance may be higher or lower than the performance data quoted. Call 800-THRIVENT or visit www.thrivent.com for performance results current to the most recent month-end.
| 1 | Average annual total returns represent past performance and reflect changes in share prices, the reinvestment of all dividends and capital gains, and the effects of compounding. Periods of less than one year are not annualized. At various times, the Portfolio’s adviser may have waived its management fee and/or reimbursed Portfolio expenses. If this were the case, the Portfolio’s total returns would have been lower. The returns shown do not reflect charges and expenses imposed on contract holders by the variable accounts. Those charges and expenses reduce the returns received by contract holders as compared to the returns presented. |
The prospectus contains more complete information on the investment objectives, risks, charges and expenses of the investment company, which investors should read and consider carefully before investing. To obtain a prospectus, contact a registered representative or visit www.thrivent.com.
67
Table of Contents
 |
Kevin R. Brimmer, FSA, and Michael G. Landreville, CFA, Portfolio Thrivent Balanced Portfolio seeks long-term total return through a balance
The Portfolio is subject to interest-rate risk, credit risk and volatility risk, |  |
How did the Portfolio perform during the six-month period ended June 30, 2010?
Thrivent Balanced Portfolio earned a total return for the period of -1.97%. The Portfolio’s market benchmarks, the S&P 500 Index and the Barclays Capital Aggregate Bond Index, returned -6.65% and 5.33%, respectively.
What factors affected the Portfolio’s performance?
We maintained an investment allocation of approximately two-thirds of assets in the equity segment and the remainder in fixed-income securities during the period.
Most sectors of the stock and bond markets posted strong gains over the first four months of the year. However, in May the debt crisis in Europe, concerns about a slowdown in China, and continued high unemployment in the United States renewed worries about the global economic recovery, spurring an investor flight to the safety of U.S. Treasury securities.
The equity component return was closely aligned with its benchmark, the S&P 500 Index. Within the Portfolio, industrials, consumer discretionary and consumer staples were the best-performing sectors, while materials, energy and information technology fared worst.
The fixed-income component of the Portfolio significantly outperformed the Barclays Capital Aggregate Bond Index. The main factor in the relative outperformance was the Portfolio’s floating-rate debt used to back its mortgage securities. Historically considered high quality and low risk, this floating-rate debt hurt performance in 2008. In 2009 and the first half of 2010, these securities rebounded as the credit markets recovered. They also continued paying down principal; once these securities are paid off, we do not plan to reinstitute this “dollar-roll” program.
What is your outlook?
We expect the economic recovery to continue, but at a slower pace than at the end of 2009 and first part of 2010. As is typical of economic recoveries, job growth could lag, causing the unemployment rate to stay high for the foreseeable future. We anticipate the Federal Reserve will keep short-term interest rates at current levels at least

68
Table of Contents
through the first quarter of 2011, and inflation should remain benign due to excess labor and manufacturing capacity. With continued slow growth, the stock market may be overdue for a pullback. Likewise, in our view, the bond market rally has gone too far, as we think the double-dip recession now priced in by investors is not likely to occur. Consequently, Treasury yields should move modestly higher over the medium term. The yield curve should remain steep as long as the Federal Reserve keeps short-term interest rates at current levels. However, once the Fed changes course, the next significant move will likely be to a flatter curve.
Going forward, we plan to keep the Portfolio at roughly two-thirds equities and one-third fixed-income securities.
Portfolio Facts
As of June 30, 2010
Net Assets | $255,625,257 | |
NAV | $12.73 | |
NAV - High† | 4/23/2010 - $14.48 | |
NAV - Low† | 6/30/2010 - $12.73 | |
Number of Holdings: 763 |
| † | For the six months ended June 30, 2010 |
Average Annual Total Returns1
As of June 30, 2010
| 1-Year | 5-Year | 10-Year | ||
| 15.15% | 1.44% | 1.58% |
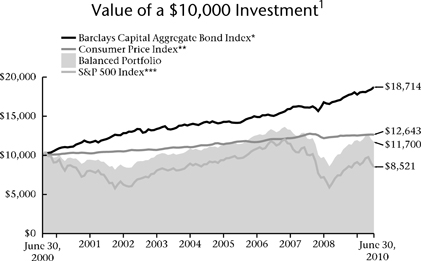
| * | The Barclays Capital Aggregate Bond Index is an index that measures the performance of U.S. investment grade bonds. It is not possible to invest directly in the Index. The performance of the Index does not reflect deductions for fees, expenses or taxes. |
| ** | The Consumer Price Index is an inflationary indicator that measures the change in the cost of a fixed basket of products and services, including housing, electricity, food and transportation. It is not possible to invest directly in the Index. |
| *** | The S&P 500 Index is an index that represents the average performance of a group of 500 widely held, publicly traded stocks. “S&P 500” is a trademark of The McGraw-Hill Companies, Inc. and has been licensed for use by Thrivent Financial for Lutherans. The product is not sponsored, endorsed or promoted by Standard & Poor’s and Standard & Poor’s makes no representation regarding the advisability of investing in the product. It is not possible to invest directly in the Index. The performance of the Index does not reflect deductions for fees, expenses or taxes. |
Past performance is not an indication of future results. Total investment return and principal value of your investment will fluctuate and units, when redeemed, may be worth more or less than their original cost. Current performance may be higher or lower than the performance data quoted. Call 800-THRIVENT or visit www.thrivent.com for performance results current to the most recent month-end.
| 1 | Average annual total returns represent past performance and reflect changes in share prices, the reinvestment of all dividends and capital gains, and the effects of compounding. Periods of less than one year are not annualized. At various times, the Portfolio’s adviser may have waived its management fee and/or reimbursed Portfolio expenses. If this were the case, the Portfolio’s total returns would have been lower. The returns shown do not reflect charges and expenses imposed on contract holders by the variable accounts. Those charges and expenses reduce the returns received by contract holders as compared to the returns presented. |
The prospectus contains more complete information on the investment objectives, risks, charges and expenses of the investment company, which investors should read and consider carefully before investing. To obtain a prospectus, contact a registered representative or visit www.thrivent.com.
69
Table of Contents
 |
Paul J. Ocenasek, CFA, Portfolio Manager Thrivent High Yield Portfolio seeks to achieve a higher level of income. The Portfolio will also consider
The Portfolio typically invests a majority of its assets in high-yield bonds (commonly referred to as junk |
How did the Portfolio perform during the six-month period ended June 30, 2010?
Thrivent High Yield Portfolio returned 3.51%, compared with a median return of 3.50% for its Lipper High Current Yield peer group. Our market benchmark, the Barclays Capital U.S. Corporate High Yield Bond Index, returned 4.51%.
What factors affected the Portfolio’s performance?
The high-yield bond market was choppy for much of the period as investor confidence in the recovery vacillated due to global economic developments. Because of this, the various high-yield rating categories differed little in return, a major reason the Portfolio nearly matched its Lipper peer group average return.
The Portfolio underperformed the Barclays Index mainly because 14% of the benchmark is composed of finance sector securities, whereas our allocation, along with most other high-yield mutual funds, holds 5% to 7% in the sector. Finance sector bonds outperformed the broader high-yield market during the period, driven in part by the recovery of large issuers that had fallen from the investment-grade sector during the credit crisis.
Contributing to the Portfolio’s performance were our overweighted position and securities selections in the lodging sector. Names performing well included Royal Caribbean and NCL, both cruise line companies, and Host Hotels. Our securities selections in the auto and health care sectors also benefited Portfolio performance.
Our strategy to remain nearly fully invested in high-yield securities, with only about 2% of Portfolio assets in cash, was a positive factor in our performance as well, especially considering the exceptionally low yields on cash investments.
Detracting from the Portfolio’s performance were our securities selections in the retail, electric utility and non-cable media sectors.
What is your outlook?
Potential threats to growth include high consumer debt, increasing taxes, soft consumer demand, and an unemployment rate that is high but at least has stabilized. We are also concerned that the debt problems in Europe could threaten global and U.S. growth and potentially cause a “double-dip” recession.
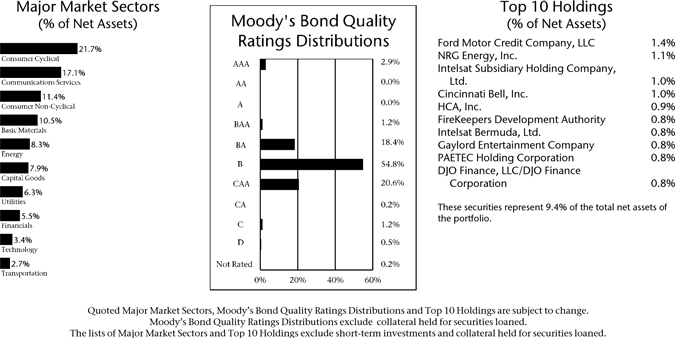
70
Table of Contents
With the return of economic growth, however, we expect default rates in high-yield bonds to fall further—from about 6% now to 2%–4% in one year. That would provide continued support for the high-yield market and room for further tightening of yield spreads, even with modest economic growth.
We have moved the Portfolio to a neutral position on credit risk, but we still have an underweighted position in the lowest quality issues as we feel that a number of these issuers will face inevitable problems.
We continue to see opportunities to add value to the Portfolio. Although the recent exceptional returns won’t likely be repeated anytime soon, we think the current economic recovery will provide a favorable environment for high-yield bond investors during the months ahead.
Portfolio Facts
As of June 30, 2010
Net Assets | $776,600,102 | |
NAV | $4.53 | |
NAV - High† | 4/26/2010 - $4.70 | |
NAV - Low† | 5/25/2010 - $4.46 | |
Number of Holdings: 270 |
| † | For the six months ended June 30, 2010 |
Average Annual Total Returns1
As of June 30, 2010
| 1-Year | 5-Year | 10-Year | ||
| 21.38% | 6.37% | 3.40% |
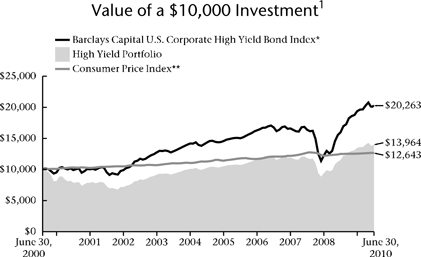
| * | The Barclays Capital U.S. Corporate High Yield Bond Index is an index which measures the performance of fixed-rate non-investment grade bonds. It is not possible to invest directly in the Index. The performance of the Index does not reflect deductions for fees, expenses or taxes. |
| ** | The Consumer Price Index is an inflationary indicator that measures the change in the cost of a fixed basket of products and services, including housing, electricity, food and transportation. It is not possible to invest directly in the Index. |
Past performance is not an indication of future results. Total investment return and principal value of your investment will fluctuate and units, when redeemed, may be worth more or less than their original cost. Current performance may be higher or lower than the performance data quoted. Call 800-THRIVENT or visit www.thrivent.com for performance results current to the most recent month-end.
| 1 | Average annual total returns represent past performance and reflect changes in share prices, the reinvestment of all dividends and capital gains, and the effects of compounding. Periods of less than one year are not annualized. At various times, the Portfolio’s adviser may have waived its management fee and/or reimbursed Portfolio expenses. If this were the case, the Portfolio’s total returns would have been lower. The returns shown do not reflect charges and expenses imposed on contract holders by the variable accounts. Those charges and expenses reduce the returns received by contract holders as compared to the returns presented. |
The prospectus contains more complete information on the investment objectives, risks, charges and expenses of the investment company, which investors should read and consider carefully before investing. To obtain a prospectus, contact a registered representative or visit www.thrivent.com.
71
Table of Contents
 | Thrivent Diversified Income Plus Portfolio
Mark L. Simenstad, CFA, Kevin R. Brimmer, FSA, David R. Spangler, CFA and Paul J. Ocenasek, CFA, Portfolio Co-Managers |  |
Thrivent Diversified Income Plus Portfolio seeks to maximize income while maintaining prospects for capital appreciation.
The Portfolio may invest in debt or equity securities. Debt securities include high-yield, high-risk securities commonly known as “junk bonds.” High- yield securities are subject to greater price fluctuations and increased risk of loss of principal than investment grade bonds. Equity securities include securities of REITs, which are subject to the risk that changes in real estate values or economic downturns can have a negative effect on issuers in the real estate industry. These and other risks are described in the Portfolio’s Prospectus. Views expressed in this discussion of portfolio performance are the views of this particular portfolio’s management team.
How did the Portfolio perform during the six-month period ended June 30, 2010?
Thrivent Diversified Income Plus Portfolio earned a total return of 2.14%. This compares with the Portfolio’s market benchmarks, the S&P 500 Dividend Aristocrats Index and the Barclays Capital Aggregate Bond Index, which returned -2.35% and 5.33%, respectively.
What factors affected the Portfolio’s performance?
Contributing most to performance was our modestly underweighted position in equity securities. We reduced our allocation to dividend-paying stocks during the period from roughly one-third of the Portfolio’s value to about one-quarter, with the remainder invested in fixed-income securities. Since stocks underperformed bonds significantly over the six months, the strategy paid off.
Other contributors to the Portfolio’s performance were our higher weightings of non-agency mortgage-backed, investment-grade corporate, and high-yield securities, hich provided average returns of 10%, 7% and 4%, respectively. The mortgage securities providing these impressive returns were holdings severely impacted by the liquidity crisis earlier, and they have recovered strongly. The increase in earnings to the Portfolio from these holdings enabled us to boost the Portfolio’s June 30 dividend payout from 2.1 cents to 2.6 cents per share.
Various hedging strategies we employed to manage risk also benefited the Portfolio’s performance and helped reduce volatility.
Detracting from performance was our allocation (about 7% of Portfolio assets) to convertible bonds, which underperformed the market during the period.
What is your outlook?
We expect the economic recovery to continue through the rest of 2010 but the pace of growth to be slower in the second half. We anticipate the Federal Reserve will keep short-term interest rates at current low levels through the rest of this year and possibly into early 2011.

72
Table of Contents
Going forward, we intend to keep the Portfolio at roughly three-quarters fixed-income securities and one-quarter dividend-paying stocks. Further, we plan to continue overweighting our positions in the types of securities that are adding income to the Portfolio. These include mortgage-backed, investment-grade corporate and high-yield bonds. While there’s plenty of uncertainty about the U.S. and global economic recovery, the fundamentals of bond and stock issuers are generally strong. So we think considering opportunities in lower-quality fixed-income securities is a reasonable approach. Within the high-yield category, however, we have shifted our focus to higher-quality securities.
As always, we will continue to monitor the economy and markets closely and watch for opportunities to add value to the Portfolio.
Portfolio Facts
As of June 30, 2010
Net Assets | $89,905,782 | |
NAV | $5.95 | |
NAV - High† | 4/26/2010 - $6.56 | |
NAV - Low† | 6/30/2010 - $5.95 | |
Number of Holdings: 230 |
| † | For the six months ended June 30, 2010 |
Average Annual Total Returns1 ,2
As of June 30, 2010
| 1-Year | 5-Year | 10-Year | ||
| 21.63% | 3.85% | 5.29% |
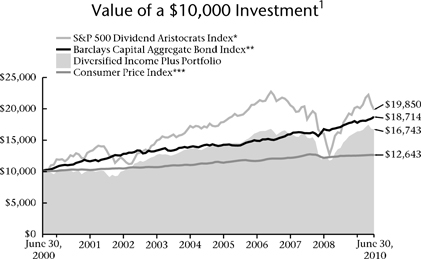
| * | The S&P 500 Dividend Aristocrats Index is an index which measures the performance of large-capitalization companies within the S&P 500 that have followed a managed dividends policy of consistently increasing dividends every year for at least 25 years. The index portfolio has both capital growth and dividend income characteristics, is equal-weighted and is broadly diversified across sectors. The product is not sponsored, endorsed or promoted by Standard & Poor’s, and Standard & Poor’s makes no representation regarding the advisability of investing in the product. It is not possible to invest directly in the Index. The performance of the Index does not reflect deductions for fees, expenses or taxes. |
| ** | The Barclays Capital Aggregate Bond Index is an index that measures the performance of U.S. investment grade bonds. It is not possible to invest directly in the Index. The performance of the Index does not reflect deductions for fees, expenses or taxes. |
| *** | The Consumer Price Index is an inflationary indicator that measures the change in the cost of a fixed basket of products and services, including housing, electricity, food and transportation. It is not possible to invest directly in the Index. |
Past performance is not an indication of future results. Total investment return and principal value of your investment will fluctuate and units, when redeemed, may be worth more or less than their original cost. Current performance may be higher or lower than the performance data quoted. Call 800-THRIVENT or visit www.thrivent.com for performance results current to the most recent month-end.
| 1 | Average annual total returns represent past performance and reflect changes in share prices, the reinvestment of all dividends and capital gains, and the effects of compounding. Periods of less than one year are not annualized. At various times, the Portfolio’s adviser may have waived its management fee and/or reimbursed Portfolio expenses. If this were the case, the Portfolio’s total returns would have been lower. The returns shown do not reflect charges and expenses imposed on contract holders by the variable accounts. Those charges and expenses reduce the returns received by contract holders as compared to the returns presented. |
| 2 | Prior to July 3, 2006, the Portfolio invested primarily in “junk bonds.” |
The prospectus contains more complete information on the investment objectives, risks, charges and expenses of the investment company, which investors should read and consider carefully before investing. To obtain a prospectus, contact a registered representative or visit www.thrivent.com.
73
Table of Contents
| Thrivent Partner Socially Responsible Bond Portfolio |
Subadvised by Calvert Asset Management Company, Inc.
Thrivent Partner Socially Responsible Bond Portfolio seeks to maximize income.
The Portfolio may invest a portion of its portfolio in high-yield, high-risk securities commonly known as “junk bonds.” High-yield securities are subject to greater price fluctuations and increased risk of loss of principal than investment grade bonds. In addition, as a non-diversified fund, the Portfolio is susceptible to the risk that events affecting a particular issuer will significantly affect the Portfolio’s performance. These and other risks are described in the Portfolio’s prospectus. Views expressed in this discussion of portfolio performance are the views of this particular portfolio’s management team.
How did the Portfolio perform during the six-month period ended June 30, 2010?
Thrivent Partner Socially Responsible Bond Portfolio earned a return of 6.93%, as compared to the median return of 5.33% for its Lipper Corporate Debt Funds BBB-Rated peer group. The Portfolio’s market benchmark, the Barclays Capital U.S. Credit Index, posted a return of 5.62%.
What factors affected the Portfolio’s performance?
The main reasons the Portfolio performed better than its Lipper peer group and benchmark index were our weightings in various bond sectors and, within those sectors, our selection of specific securities.
Our emphasis on floating-rate notes, mortgage-backed bonds and asset-backed securities, for example, contributed to the Portfolio’s relative performance as these types of securities outperformed the index. The prices of many of them were beaten down substantially during the liquidity crisis. During the reporting period, they recovered strongly as credit market troubles faded.
As with certain bond sectors, many fundamentally sound securities had plummeted in value during the credit crunch, and essentially were thrown out by other institutional investors. But with our analysis and “stress testing,” we were able to find opportunities—many below investment grade and not covered by the benchmark index—that performed significantly better than the index during 2010’s first six months.
Detracting from the Portfolio’s relative performance was our shorter portfolio duration in expectation of rising interest rates. Since interest rates did not rise during the period, the shorter duration hurt our performance somewhat.
What is your outlook?
We expect the economic recovery to continue through the remainder of 2010 but the pace of growth to be slower in the second half. We anticipate the Federal Reserve will keep short-term interest rates at current low levels for some time yet, but we expect higher rates eventually. As the probability of a rate hike rises, we intend to shorten the Portfolio’s duration accordingly.
We expect the yield curve to flatten during the remainder of the year, with credit-sector securities paying less of a yield premium or “spread” over that of Treasury securities.
As always, we will continue to watch economic and market developments closely and seek out opportunities to add value for investors.
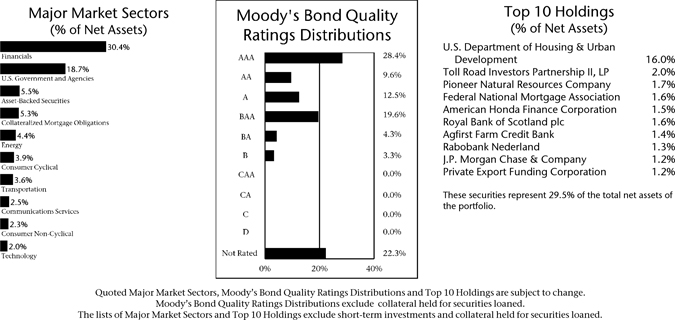
74
Table of Contents
Portfolio Facts
As of June 30, 2010
Net Assets | $6,425,449 | |
NAV | $10.71 | |
NAV - High† | 6/29/2010 - $10.72 | |
NAV - Low† | 1/4/2010 - $10.16 | |
Number of Holdings: 79 |
| † | For the six months ended June 30, 2010 |
Average Annual Total Returns1
As of June 30, 2010
| 1-Year | From Inception 4/30/2008 | |
| 13.50% | 9.56% |
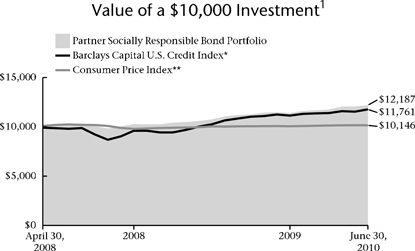
| * | The Barclays Capital U.S. Credit Index is an index comprised of both corporate and non-corporate sectors. The corporate sectors are Industrial, Utility and Finance, which include both U.S. and non-U.S. corporations. The non-corporate sectors are Sovereign, Supranational, Foreign Agency, and Foreign Local Government. It is not possible to invest directly in the Index. The performance of the Index does not reflect deductions for fees, expenses or taxes. |
| ** | The Consumer Price Index is an inflationary indicator that measures the change in the cost of a fixed basket of products and services, including housing, electricity, food and transportation. It is not possible to invest directly in the Index. |
Past performance is not an indication of future results. Total investment return and principal value of your investment will fluctuate and units, when redeemed, may be worth more or less than their original cost. Current performance may be higher or lower than the performance data quoted. Call 800-THRIVENT or visit www.thrivent.com for performance results current to the most recent month-end.
| 1 | Average annual total returns represent past performance and reflect changes in share prices, the reinvestment of all dividends and capital gains, and the effects of compounding. Periods of less than one year are not annualized. At various times, the Portfolio’s adviser may have waived its management fee and/or reimbursed Portfolio expenses. If this were the case, the Portfolio’s total returns would have been lower. The returns shown do not reflect charges and expenses imposed on contract holders by the variable accounts. Those charges and expenses reduce the returns received by contract holders as compared to the returns presented. |
The prospectus contains more complete information on the investment objectives, risks, charges and expenses of the investment company, which investors should read and consider carefully before investing. To obtain a prospectus, contact a registered representative or visit www.thrivent.com.
75
Table of Contents
 |
Stephen D. Lowe, CFA, Portfolio Manager Thrivent Income Portfolio seeks a high level of income over the longer term while providing reasonable
The Portfolio is subject to interest rate risk, credit risk related to a company’s underlying financial position |
How did the Portfolio perform during the six-month period ended June 30, 2010?
Thrivent Income Portfolio returned 5.97%, compared with a median return of 5.33% for its Lipper Corporate Debt BBB-Rated Funds peer group. The Portfolio’s market benchmark, the Barclays Capital Aggregate Bond Index, posted a return of 5.33%.
What factors affected the Portfolio’s performance?
Nongovernment spread-sector bonds rallied during the first four months of the period. But in May, the debt crisis in Europe, concerns about a slowdown in China, and continued high unemployment in the United States renewed worries about the global economic recovery, spurring an investor flight to the safety of U.S. Treasury securities.
Even with growing fears, securitized assets still provided strong returns during the period. The main reason the Portfolio outperformed both its Lipper peer group and benchmark index was its overweighted positions in nonagency mortgage and commercial mortgage-backed securities. Also contributing to our relative outperformance was a continued price recovery of the floating-rate debt securities that were used to support the forward purchase of mortgage securities. These assets were negatively affected by the liquidity crisis in 2008 but have rebounded strongly.
Detracting from the Portfolio’s relative performance was our underweighted positions in Treasury and agency securities. As noted, prices of government issues—especially in longer maturities—surged during the latter half of the period.
What is your outlook?
We expect the economic recovery to continue into 2011 but the pace of growth to be slow. We think the unemployment rate has peaked but will remain high for the foreseeable future. Job growth should continue to improve, however. We don’t expect the economy to dip back into recession, but many issues constraining growth won’t be going away anytime soon.
Inflation will likely remain under control over the near term due to high excess labor and manufacturing capacity. We anticipate the Federal Reserve will keep short-term interest rates at current low levels through the rest of this year and possibly into early 2011.
We think the major part of the rebound in spread-related investments is behind us but that the securities still offer value. Markets likely will remain volatile going forward.
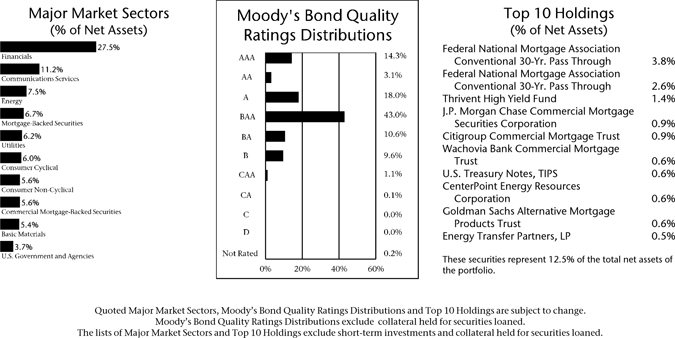
76
Table of Contents
Considering the recent exceptional performance of these assets, we are gradually reducing our overweighted position in them. At the same time we also are continuing to increase our holdings of government and other lower-risk securities—reducing our underweighting—to lower the Portfolio’s overall level of risk.
As always, we will continue to watch economic and market developments closely and seek out opportunities to add value for shareholders.
Portfolio Facts
As of June 30, 2010
Net Assets | $1,220,939,423 | |
NAV | $9.69 | |
NAV - High† | 4/30/2010 - $9.77 | |
NAV - Low† | 1/4/2010 - $9.40 | |
Number of Holdings: 447 |
| † | For the six months ended June 30, 2010 |
Average Annual Total Returns1
As of June 30, 2010
| 1-Year | 5-Year | 10-Year | ||
| 18.71% | 4.66% | 5.85% |
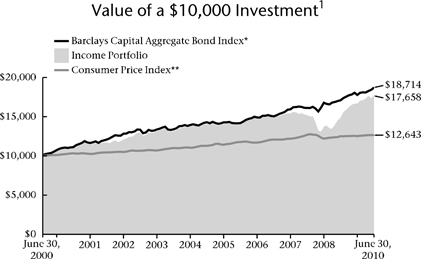
| * | The Barclays Capital Aggregate Bond Index is an index that measures the performance of U.S. investment grade bonds. It is not possible to invest directly in the Index. The performance of the Index does not reflect deductions for fees, expenses or taxes. |
| ** | The Consumer Price Index is an inflationary indicator that measures the change in the cost of a fixed basket of products and services, including housing, electricity, food and transportation. It is not possible to invest directly in the Index. |
Past performance is not an indication of future results. Total investment return and principal value of your investment will fluctuate and units, when redeemed, may be worth more or less than their original cost. Current performance may be higher or lower than the performance data quoted. Call 800-THRIVENT or visit www.thrivent.com for performance results current to the most recent month-end.
| 1 | Average annual total returns represent past performance and reflect changes in share prices, the reinvestment of all dividends and capital gains, and the effects of compounding. Periods of less than one year are not annualized. At various times, the Portfolio’s adviser may have waived its management fee and/or reimbursed Portfolio expenses. If this were the case, the Portfolio’s total returns would have been lower. The returns shown do not reflect charges and expenses imposed on contract holders by the variable accounts. Those charges and expenses reduce the returns received by contract holders as compared to the returns presented. |
The prospectus contains more complete information on the investment objectives, risks, charges and expenses of the investment company, which investors should read and consider carefully before investing. To obtain a prospectus, contact a registered representative or visit www.thrivent.com.
77
Table of Contents
|
Michael G. Landreville, CFA, Portfolio Manager Thrivent Bond Index Portfolio strives for investment results similar to the total return of the Barclays Capital
The Portfolio is subject to interest rate risk, credit risk related to a company’s underlying financial position, |
How did the Portfolio perform during the six-month period ended June 30, 2010?
Thrivent Bond Index Portfolio earned a total return of 7.12%, compared with a 5.33% return for the Portfolio’s market benchmark, the Barclays Capital Aggregate Bond Index.
What factors affected the Portfolio’s performance?
Most sectors of the bond market delivered strong gains over the first four months of the year. However, in May the debt crisis in Europe, concerns about a slowdown in China, and continued high unemployment in the U.S. renewed worries about the global economic recovery, spurring an investor flight to the safety of U.S. Treasuries.
The main reason for the Portfolio’s relative outperformance was a strong recovery in prices of the floating-rate debt we hold that backs our mortgage securities. These formerly high-quality, low-risk securities hurt performance in 2008, so their recovery in 2009 and the first half of 2010 was welcomed. The floating-rate debt securities also continued paying down principal through the period; once they are paid off, we do not plan to reinstitute this “dollar-roll” program.
Many non-Treasury fixed-income securities delivered exceptionally strong returns during the period with the ongoing rehabilitation of the credit markets. Liquidity and trading moved more toward normal. As this happened, yield spreads (the differences in yields between Treasury securities and other types of bonds of similar maturity lengths) tightened dramatically, especially during the first part of the period.
The Federal Reserve’s Federal Open Market Committee (FOMC) kept its target for the federal funds interest rate at a range of zero to 0.25% throughout the period. As investors fled for safety later in the period, the two-year Treasury yield fell from 1.14% to 0.61% (a record low), the 10-year yield plummeted from 3.85% to 2.97%, and the 30-year yield dropped from 4.63% to 3.91%.
What is your outlook?
We expect the economic recovery to continue, but it will be less robust than past economic cycles. As a result, job
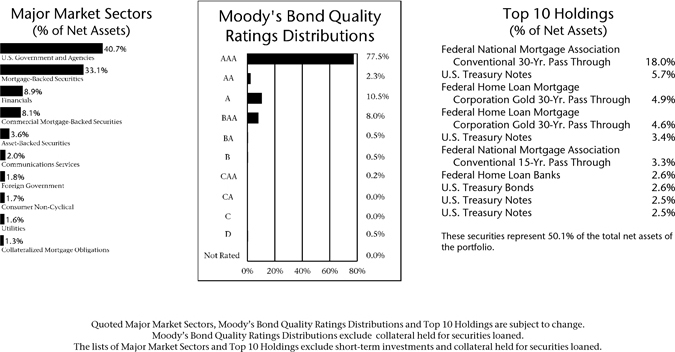
78
Table of Contents
growth could lag, causing the unemployment rate to stay high for the foreseeable future. We anticipate the Federal Reserve will keep short-term interest rates at current levels at least through the first quarter of 2011 as inflation will likely remain under control due to high excess labor and manufacturing capacity.
The bond market rally has gone too far, in our view, as we think the double-dip recession now priced in by investors is not likely to occur. Consequently, Treasury yields should move modestly higher over the short term. The yield curve should remain steep as long as the Federal Reserve keeps interest rates at current levels; however, the next significant move will likely be to a flatter curve.
As always, we intend to maintain a well-diversified mix of debt securities in our efforts to track the performance of the Index.
Portfolio Facts
As of June 30, 2010
Net Assets | $162,558,434 | |
NAV | $10.67 | |
NAV - High† | 6/29/2010 - $10.67 | |
NAV - Low† | 1/4/2010 - $10.15 | |
Number of Holdings: 258 |
| † | For the six months ended June 30, 2010 |
Average Annual Total Returns1
As of June 30, 2010
| 1-Year | 5-Year | 10-Year | ||
| 13.99% | 4.80% | 5.95% |
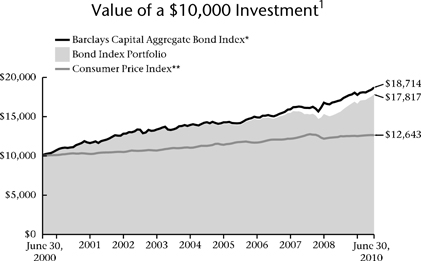
| * | The Barclays Capital Aggregate Bond Index is an index that measures the performance of U.S. investment grade bonds. It is not possible to invest directly in the Index. The performance of the Index does not reflect deductions for fees, expenses or taxes. |
| ** | The Consumer Price Index is an inflationary indicator that measures the change in the cost of a fixed basket of products and services, including housing, electricity, food and transportation. It is not possible to invest directly in the Index. |
Past performance is not an indication of future results. Total investment return and principal value of your investment will fluctuate and units, when redeemed, may be worth more or less than their original cost. Current performance may be higher or lower than the performance data quoted. Call 800-THRIVENT or visit www.thrivent.com for performance results current to the most recent month-end.
| 1 | Average annual total returns represent past performance and reflect changes in share prices, the reinvestment of all dividends and capital gains, and the effects of compounding. Periods of less than one year are not annualized. At various times, the Portfolio’s adviser may have waived its management fee and/or reimbursed Portfolio expenses. If this were the case, the Portfolio’s total returns would have been lower. The returns shown do not reflect charges and expenses imposed on contract holders by the variable accounts. Those charges and expenses reduce the returns received by contract holders as compared to the returns presented. |
The prospectus contains more complete information on the investment objectives, risks, charges and expenses of the investment company, which investors should read and consider carefully before investing. To obtain a prospectus, contact a registered representative or visit www.thrivent.com.
79
Table of Contents

How did the Portfolio perform during the six-month period ended June 30, 2010?
Thrivent Limited Maturity Bond Portfolio returned 2.86%, compared with a median return of 2.12% for its Lipper Short-Intermediate Investment Grade Debt peer group. The Portfolio’s market benchmark, the Barclays Capital Government/Credit 1-3 Year Bond Index, posted a return of 1.95%.
What factors affected the Portfolio’s performance?
Most sectors of the bond market delivered strong gains over the first four months of the year. However, in May the debt crisis in Europe, concerns about a slowdown in China, and continued high unemployment in the U.S. renewed worries about the global economic recovery, spurring an investor flight to the safety of U.S. Treasury securities.
The Portfolio outperformed its Lipper peer group and benchmark index mostly due to its heavier weighting in high-quality corporate bonds, mortgage-backed securities and asset-backed securities, many of which performed significantly better than Treasury and other government securities, especially during the first four months of the year. Investors were attracted to these securities due to their higher yields versus cash and Treasury alternatives.
Additionally, the Portfolio benefited by being nearly fully invested in bonds with a small amount of assets in cash, which offered little income, if any.
The Federal Reserve kept short-term rates at zero to 0.25% throughout the period. The yield on the two-year Treasury note plummeted from 1.14% to 0.61% during the period, a record low, due to exceptionally strong demand for the safety of Treasuries later in the period.
What is your outlook?
We expect the economic recovery to continue, but it could be less robust than past economic cycles. As a result, job growth could lag, causing the unemployment rate to stay high for the foreseeable future. We anticipate the Federal Reserve will keep short-term interest rates at current levels, at least through the first quarter of 2011, as inflation will likely remain under control due to high excess labor and manufacturing capacity.
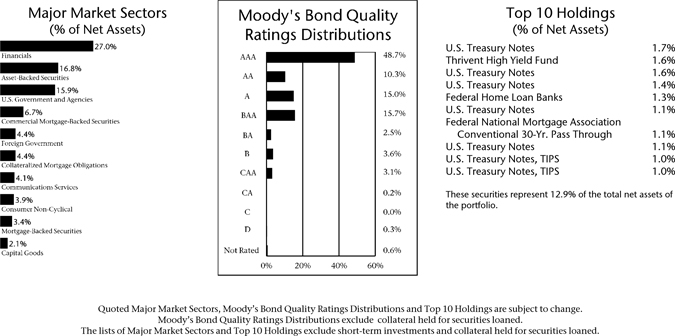
80
Table of Contents
The bond market rally has gone too far, in our view, as we think the double-dip recession now priced in by investors is not likely to occur. Consequently, Treasury yields should move modestly higher over the short term. The yield curve should remain steep as long as the Federal Reserve keeps interest rates at current levels. However, the next significant move will likely be to a flatter curve.
We think the major part of the rally in corporate bond and securitized asset bond investments is behind us, but they still offer reasonable value versus low-yielding Treasuries and cash alternatives. Considering the exceptional performance of these assets over the past year, we are gradually reducing our overweighted position in them. At the same time we also are continuing to increase our holdings of government securities—reducing our underweighted position—to lower the Portfolio’s overall level of risk.
Portfolio Facts
As of June 30, 2010
Net Assets | $1,193,541,384 | |
NAV | $9.73 | |
NAV - High† | 4/30/2010 - $9.79 | |
NAV - Low† | 1/4/2010 - $9.63 | |
Number of Holdings: 302 |
| † | For the six months ended June 30, 2010 |
Average Annual Total Returns1
As of June 30, 2010
| 1-Year | 5-Year | From Inception 11/30/2001 | ||
| 9.75% | 3.78% | 3.66% |
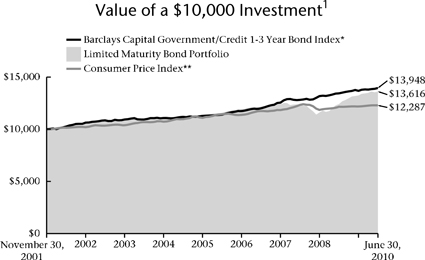
| * | The Barclays Capital Government/Credit 1-3 Year Bond Index is an index that measures the performance of government and corporate fixed-rate debt securities with maturities of 1-3 years. It is not possible to invest directly in the Index. The performance of the Index does not reflect deductions for fees, expenses or taxes. |
| ** | The Consumer Price Index is an inflationary indicator that measures the change in the cost of a fixed basket of products and services, including housing, electricity, food and transportation. It is not possible to invest directly in the Index. |
Past performance is not an indication of future results. Total investment return and principal value of your investment will fluctuate and units, when redeemed, may be worth more or less than their original cost. Current performance may be higher or lower than the performance data quoted. Call 800-THRIVENT or visit www.thrivent.com for performance results current to the most recent month-end.
| 1 | Average annual total returns represent past performance and reflect changes in share prices, the reinvestment of all dividends and capital gains, and the effects of compounding. Periods of less than one year are not annualized. At various times, the Portfolio’s adviser may have waived its management fee and/or reimbursed Portfolio expenses. If this were the case, the Portfolio’s total returns would have been lower. The returns shown do not reflect charges and expenses imposed on contract holders by the variable accounts. Those charges and expenses reduce the returns received by contract holders as compared to the returns presented. |
The prospectus contains more complete information on the investment objectives, risks, charges and expenses of the investment company, which investors should read and consider carefully before investing. To obtain a prospectus, contact a registered representative or visit www.thrivent.com.
81
Table of Contents

How did the Portfolio perform during the six-month period ended June 30, 2010?
Thrivent Mortgage Securities Portfolio earned a total return of 8.59%, compared with a median return of 5.28% for its Lipper U.S. Mortgage Funds peer group. The Portfolio’s market benchmark, the Barclays Capital Mortgage-Backed Securities Index, posted a return of 4.46%.
What factors affected the Portfolio’s performance?
Most sectors of the bond market delivered strong gains over the first four months of the year. However, in May the debt crisis in Europe, concerns about a slowdown in China, and continued high unemployment in the United States renewed worries about the global economic recovery, spurring an investor flight to the safety of U.S. Treasury securities. Agency-backed mortgage securities benefited from the flight to quality while non-agency mortgage securities prices were flat to slightly lower during the final two months of the period.
The main factor in the Portfolio’s outperformance of its Lipper peer group and benchmark index was its allocation to non-agency residential mortgage-backed securities (RMBS) and commercial mortgage-backed securities (CMBS). The prices of both types of securities continued to rebound, buoyed by strong demand from investors seeking higher yields and a shrinking supply of investable bonds. These securities generated high-single-digit to low-double-digit percentage returns that were significantly above agency mortgage-backed securities (MBS) returns for the period.
The Federal Reserve kept short-term rates at zero to 0.25% throughout the period. Yields on Treasury securities plummeted during the second half of the period, and for some maturities, to record lows.
What is your outlook?
We expect the economic recovery to continue, but it will be less robust than past economic cycles. As a result, job growth could lag, causing the unemployment rate to stay high for the foreseeable future. We anticipate the Federal Reserve will keep short-term interest rates at current levels, at least through the first quarter of 2011, as inflation will likely remain under control due to high excess labor and manufacturing capacity.
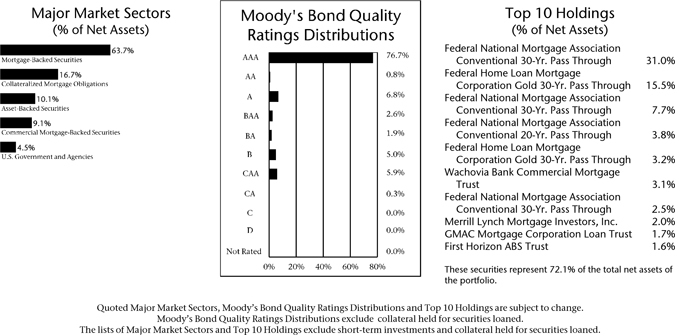
82
Table of Contents
The bond market rally has gone too far, in our view, as we think the double-dip recession now priced in by investors is not likely to occur. Consequently, we expect Treasury yields to move modestly higher over the short term. The yield curve should remain steep as long as the Federal Reserve keeps interest rates at current levels. However, the next significant move will likely be to a flatter curve.
We will continue to maintain an overweighted position in non-agency RMBS and CMBS versus agency MBS, as we believe these sectors still offer significant loss-adjusted yield advantages and the investable supply of these securities continues to decline as principal repayments exceed new issue supply.
Portfolio Facts
As of June 30, 2010
Net Assets | $32,828,141 | |
NAV | $10.20 | |
NAV - High† | 5/20/2010 - $10.28 | |
NAV - Low† | 1/4/2010 - $9.63 | |
Number of Holdings: 60 |
| † | For the six months ended June 30, 2010 |
Average Annual Total Returns1
As of June 30, 2010
| 1-Year | 5-Year | From Inception 4/30/2003 | ||
| 19.89% | 5.17% | 4.67% |
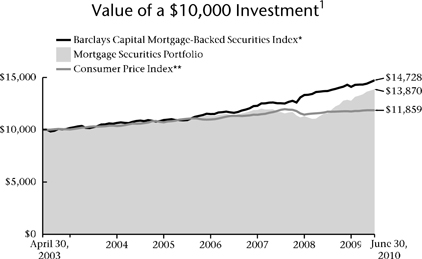
| * | The Barclays Capital Mortgage-Backed Securities Index (MBS) is formed by grouping the universe of over 600,000 individual fixed-rate U.S. government agency MBS pools into approximately 3,500 generic types of securities. It is not possible to invest directly in this Index. The performance of the Index does not reflect deductions for fees, expenses or taxes. |
| ** | The Consumer Price Index is an inflationary indicator that measures the change in the cost of a fixed basket of products and services, including housing, electricity, food and transportation. It is not possible to invest directly in the Index. |
Past performance is not an indication of future results. Total investment return and principal value of your investment will fluctuate and units, when redeemed, may be worth more or less than their original cost. Current performance may be higher or lower than the performance data quoted. Call 800-THRIVENT or visit www.thrivent.com for performance results current to the most recent month-end.
| 1 | Average annual total returns represent past performance and reflect changes in share prices, the reinvestment of all dividends and capital gains, and the effects of compounding. Periods of less than one year are not annualized. At various times, the Portfolio’s adviser may have waived its management fee and/or reimbursed Portfolio expenses. If this were the case, the Portfolio’s total returns would have been lower. The returns shown do not reflect charges and expenses imposed on contract holders by the variable accounts. Those charges and expenses reduce the returns received by contract holders as compared to the returns presented. |
The prospectus contains more complete information on the investment objectives, risks, charges and expenses of the investment company, which investors should read and consider carefully before investing. To obtain a prospectus, contact a registered representative or visit www.thrivent.com.
83
Table of Contents

How did the Portfolio perform during the six-month period ended June 30, 2010?
Thrivent Money Market Portfolio produced a 0.00% return during the period, and its Lipper Money Market Category reported a median net return of 0.00% over the same time frame.
What factors affected the Portfolio’s performance?
The Federal Reserve kept the federal funds target interest rate at a range of zero to 0.25% throughout the period. With the Fed funds rate remaining at historical lows, and continued meager supply in the short-term securities market, money market portfolios throughout the industry struggled to provide a positive yield during the period.
Adding to the challenges were declining balances in money funds throughout the industry as investors departed to seek higher yields elsewhere. To maintain a positive return for investors, the Portfolio’s adviser waived fees on the Portfolio throughout the period.
With credit markets still experiencing volatility, we structured the Portfolio conservatively to maintain credit quality and liquidity. By the end of June 2010, the Portfolio comprised almost 40% U.S. government-supported securities.
Also impacting performance was the implementation of the new Securities and Exchange Commission (SEC) regulatory requirements for money market funds during 2010. We believe the regulations may contribute to lower yields for money market funds. Regulators continue to work together to bring more meaningful reform to the industry. Under consideration is the potential to require money market portfolios to have a floating net asset value and to hold capital. The Portfolio’s adviser has had direct dialog with the Federal Reserve and the SEC, supporting both concepts. We intend to continue working with regulators to help shape positive reforms for the health of the money market fund industry.
The good news is that liquidity in the money market segment improved during the period to a point that all federal programs enacted to boost liquidity were phased out. In addition, the debt crisis in Europe seems to have subsided following the intervention and support from the European Central Bank.
What is your outlook?
Money market credit quality and liquidity should remain sound as the industry prepares for additional regulation and defends against market instability. Even though the U.S. economy appears to have stabilized, the Federal Reserve is unlikely to raise rates any time soon. The significant debt burdens of Europe and the United States, combined with low inflation expectations, are reasons the Fed is likely to be on hold into the foreseeable future.
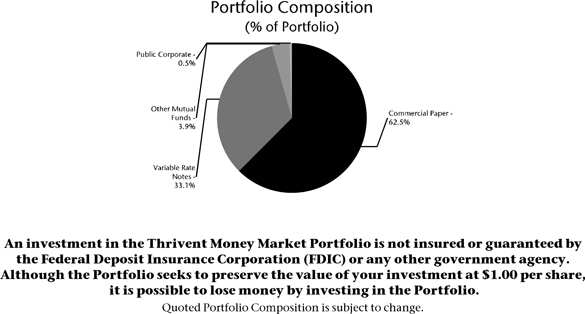
84
Table of Contents
As long as the Fed keeps the target benchmark rate between zero and 0.25%, yields for the Portfolio will likely remain close to zero in the months ahead.
As in any interest rate environment, we will continue to manage the Portfolio with safety and liquidity as our primary objectives.
Portfolio Facts
As of June 30, 2010
Net Assets | $207,918,096 | |
NAV | $1.00 | |
Number of Holdings: 83 |
| † | For the six months ended June 30, 2010 |
Average Annual Total Returns1
As of June 30, 2010
| 1-Year | 5-Year | 10-Year | ||
| 0.05% | 3.00% | 2.66% |
Money Market Portfolio Yields *
As of June 30, 2010
| Portfolio | ||
7-Day Yield | 0.00% | |
7-Day Yield Gross of Waivers | -0.06% | |
7-Day Effective Yield | 0.00% | |
7-Day Effective Yield Gross of Waivers | -0.06% | |
| * | Seven-day yields of Thrivent Money Market Portfolio refer to the income generated by an investment in the Portfolio over a specified seven-day period, though they are expressed as annual percentage rates. Effective yields reflect the reinvestment of income. A yield gross of waivers represents what the yield would have been if the Advisor were not reimbursing certain expenses associated with the Portfolio. Refer to the expense table in the Portfolio’s prospectus for details. Yields are subject to daily fluctuation and should not be considered an indication of future results. |
Past performance is not an indication of future results. Total investment return and principal value of your investment will fluctuate and units, when redeemed, may be worth more or less than their original cost. Current performance may be higher or lower than the performance data quoted. Call 800-THRIVENT or visit www.thrivent.com for performance results current to the most recent month-end.
| 1 | Average annual total returns represent past performance and reflect changes in share prices, the reinvestment of all dividends and capital gains, and the effects of compounding. Periods of less than one year are not annualized. At various times, the Portfolio’s adviser may have waived its management fee and/or reimbursed Portfolio expenses. If this were the case, the Portfolio’s total returns would have been lower. The returns shown do not reflect charges and expenses imposed on contract holders by the variable accounts. Those charges and expenses reduce the returns received by contract holders as compared to the returns presented. |
The prospectus contains more complete information on the investment objectives, risks, charges and expenses of the investment company, which investors should read and consider carefully before investing. To obtain a prospectus, contact a registered representative or visit www.thrivent.com.
85
Table of Contents
(Unaudited)
As a shareholder of the Thrivent Series Fund, Inc., you incur ongoing costs, including management fees and other Portfolio expenses. This Shareholder Expense Example is intended to help you understand your ongoing costs (in dollars) of investing in a Portfolio and to compare these costs with the ongoing costs of investing in other mutual funds. The Example is based on an investment of $1,000 invested at the beginning of the period and held for the entire period from January 1, 2010 through June 30, 2010. Shares in a Portfolio are currently sold, without sales charges, only to separate accounts of Thrivent Financial for Lutherans and Thrivent Life Insurance Company, which are used to fund benefits of variable life insurance and variable annuity contracts issued by Thrivent Financial for Lutherans and Thrivent Life Insurance Company, and retirement plans sponsored by Thrivent Financial for Lutherans. Expenses associated with these variable contracts and retirement plans are not included in these examples and had these costs been included, your costs would have been higher.
Actual Expenses
In the table below, the first section, labeled “Actual,” provides information about actual account values and actual expenses. You may use the information in this line, together with the amount you invested, to estimate the expenses that you paid over the period. Simply divide your account value by $1,000 (for example, an $8,600 account value divided by $1,000 = 8.6), then multiply the result by the number in the first line under the heading entitled “Expenses Paid During Period” to estimate the expenses you paid.
Hypothetical Example for Comparison Purposes
In the table below, the second section, labeled “Hypothetical,” provides information about hypothetical account values and hypothetical expenses based on the Portfolio’s actual expense ratio and an assumed rate of return of 5% per year before expenses, which is not the Portfolio’s actual return. The hypothetical account values and expenses may not be used to estimate the actual ending account balance or expenses you paid for the period. You may use this information to compare the ongoing costs of investing in the Portfolio and other funds. To do so, compare this 5% hypothetical example with the 5% hypothetical examples that appear in the shareholder reports of the other funds.
| Beginning Account Value 1/1/2010 | Ending Account Value 6/30/2010 | Expenses Paid During Period 1/1/2010- 6/30/2010* | Annualized Expense Ratio | |||||||||||
Thrivent Aggressive Allocation Portfolio | ||||||||||||||
Actual | $ | 1,000 | $ | 943 | $ | 1.61 | 0.33 | % | ||||||
Hypothetical** | $ | 1,000 | $ | 1,023 | $ | 1.68 | 0.33 | % | ||||||
Thrivent Moderately Aggressive Allocation Portfolio | ||||||||||||||
Actual | $ | 1,000 | $ | 961 | $ | 1.34 | 0.27 | % | ||||||
Hypothetical** | $ | 1,000 | $ | 1,023 | $ | 1.38 | 0.27 | % | ||||||
Thrivent Moderate Allocation Portfolio | ||||||||||||||
Actual | $ | 1,000 | $ | 983 | $ | 1.22 | 0.25 | % | ||||||
Hypothetical** | $ | 1,000 | $ | 1,024 | $ | 1.25 | 0.25 | % | ||||||
Thrivent Moderately Conservative Allocation Portfolio | ||||||||||||||
Actual | $ | 1,000 | $ | 1,000 | $ | 1.36 | 0.28 | % | ||||||
Hypothetical** | $ | 1,000 | $ | 1,023 | $ | 1.38 | 0.28 | % | ||||||
Thrivent Partner Technology Portfolio | ||||||||||||||
Actual | $ | 1,000 | $ | 949 | $ | 5.59 | 1.16 | % | ||||||
Hypothetical** | $ | 1,000 | $ | 1,019 | $ | 5.79 | 1.16 | % | ||||||
Thrivent Partner Healthcare Portfolio | ||||||||||||||
Actual | $ | 1,000 | $ | 977 | $ | 6.82 | 1.39 | % | ||||||
Hypothetical** | $ | 1,000 | $ | 1,018 | $ | 6.97 | 1.39 | % | ||||||
Thrivent Partner Natural Resources Portfolio | ||||||||||||||
Actual | $ | 1,000 | $ | 877 | $ | 5.55 | 1.19 | % | ||||||
Hypothetical** | $ | 1,000 | $ | 1,019 | $ | 5.97 | 1.19 | % | ||||||
86
Table of Contents
| Beginning Account Value 1/1/2010 | Ending Account Value 6/30/2010 | Expenses Paid During Period 1/1/2010- 6/30/2010* | Annualized Expense Ratio | |||||||||
Thrivent Partner Emerging Markets Portfolio | ||||||||||||
Actual | $ | 1,000 | $ | 1,004 | $ | 7.46 | 1.50 | % | ||||
Hypothetical** | $ | 1,000 | $ | 1,017 | $ | 7.51 | 1.50 | % | ||||
Thrivent Real Estate Securities Portfolio | ||||||||||||
Actual | $ | 1,000 | $ | 1,054 | $ | 4.44 | 0.87 | % | ||||
Hypothetical** | $ | 1,000 | $ | 1,020 | $ | 4.37 | 0.87 | % | ||||
Thrivent Partner Utilities Portfolio | ||||||||||||
Actual | $ | 1,000 | $ | 920 | $ | 4.31 | 0.90 | % | ||||
Hypothetical** | $ | 1,000 | $ | 1,020 | $ | 4.53 | 0.90 | % | ||||
Thrivent Partner Small Cap Growth Portfolio | ||||||||||||
Actual | $ | 1,000 | $ | 974 | $ | 4.98 | 1.02 | % | ||||
Hypothetical** | $ | 1,000 | $ | 1,020 | $ | 5.09 | 1.02 | % | ||||
Thrivent Partner Small Cap Value Portfolio | ||||||||||||
Actual | $ | 1,000 | $ | 977 | $ | 4.32 | 0.88 | % | ||||
Hypothetical** | $ | 1,000 | $ | 1,020 | $ | 4.41 | 0.88 | % | ||||
Thrivent Small Cap Stock Portfolio | ||||||||||||
Actual | $ | 1,000 | $ | 956 | $ | 3.78 | 0.78 | % | ||||
Hypothetical** | $ | 1,000 | $ | 1,021 | $ | 3.91 | 0.78 | % | ||||
Thrivent Small Cap Index Portfolio | ||||||||||||
Actual | $ | 1,000 | $ | 989 | $ | 2.27 | 0.46 | % | ||||
Hypothetical** | $ | 1,000 | $ | 1,023 | $ | 2.31 | 0.46 | % | ||||
Thrivent Mid Cap Growth Portfolio II | ||||||||||||
Actual | $ | 1,000 | $ | 974 | $ | 3.54 | 0.72 | % | ||||
Hypothetical** | $ | 1,000 | $ | 1,021 | $ | 3.62 | 0.72 | % | ||||
Thrivent Mid Cap Growth Portfolio | ||||||||||||
Actual | $ | 1,000 | $ | 973 | $ | 2.27 | 0.46 | % | ||||
Hypothetical** | $ | 1,000 | $ | 1,022 | $ | 2.33 | 0.46 | % | ||||
Thrivent Partner Mid Cap Value Portfolio | ||||||||||||
Actual | $ | 1,000 | $ | 967 | $ | 4.14 | 0.85 | % | ||||
Hypothetical** | $ | 1,000 | $ | 1,021 | $ | 4.25 | 0.85 | % | ||||
Thrivent Mid Cap Stock Portfolio | ||||||||||||
Actual | $ | 1,000 | $ | 962 | $ | 3.56 | 0.73 | % | ||||
Hypothetical** | $ | 1,000 | $ | 1,021 | $ | 3.67 | 0.73 | % | ||||
Thrivent Mid Cap Index Portfolio | ||||||||||||
Actual | $ | 1,000 | $ | 983 | $ | 2.63 | 0.53 | % | ||||
Hypothetical** | $ | 1,000 | $ | 1,022 | $ | 2.68 | 0.53 | % | ||||
Thrivent Partner Worldwide Allocation Portfolio | ||||||||||||
Actual | $ | 1,000 | $ | 916 | $ | 4.76 | 1.00 | % | ||||
Hypothetical** | $ | 1,000 | $ | 1,020 | $ | 5.01 | 1.00 | % | ||||
Thrivent Partner International Stock Portfolio | ||||||||||||
Actual | $ | 1,000 | $ | 873 | $ | 3.85 | 0.83 | % | ||||
Hypothetical** | $ | 1,000 | $ | 1,021 | $ | 4.15 | 0.83 | % | ||||
Thrivent Partner Socially Responsible Stock Portfolio | ||||||||||||
Actual | $ | 1,000 | $ | 936 | $ | 4.71 | 0.98 | % | ||||
Hypothetical** | $ | 1,000 | $ | 1,020 | $ | 4.91 | 0.98 | % | ||||
Thrivent Partner All Cap Growth Portfolio | ||||||||||||
Actual | $ | 1,000 | $ | 918 | $ | 4.76 | 1.00 | % | ||||
Hypothetical** | $ | 1,000 | $ | 1,020 | $ | 5.02 | 1.00 | % | ||||
87
Table of Contents
| Beginning Account Value 1/1/2010 | Ending Account Value 6/30/2010 | Expenses Paid During Period 1/1/2010- 6/30/2010* | Annualized Expense Ratio | |||||||||
Thrivent Partner All Cap Value Portfolio | ||||||||||||
Actual | $ | 1,000 | $ | 930 | $ | 4.71 | 0.98 | % | ||||
Hypothetical** | $ | 1,000 | $ | 1,020 | $ | 4.93 | 0.98 | % | ||||
Thrivent Partner All Cap Portfolio | ||||||||||||
Actual | $ | 1,000 | $ | 922 | $ | 4.87 | 1.02 | % | ||||
Hypothetical** | $ | 1,000 | $ | 1,020 | $ | 5.11 | 1.02 | % | ||||
Thrivent Large Cap Growth Portfolio II | ||||||||||||
Actual | $ | 1,000 | $ | 888 | $ | 2.89 | 0.62 | % | ||||
Hypothetical** | $ | 1,000 | $ | 1,022 | $ | 3.10 | 0.62 | % | ||||
Thrivent Large Cap Growth Portfolio | ||||||||||||
Actual | $ | 1,000 | $ | 897 | $ | 2.09 | 0.45 | % | ||||
Hypothetical** | $ | 1,000 | $ | 1,023 | $ | 2.23 | 0.45 | % | ||||
Thrivent Partner Growth Stock Portfolio | ||||||||||||
Actual | $ | 1,000 | $ | 919 | $ | 4.56 | 0.96 | % | ||||
Hypothetical** | $ | 1,000 | $ | 1,020 | $ | 4.80 | 0.96 | % | ||||
Thrivent Large Cap Value Portfolio | ||||||||||||
Actual | $ | 1,000 | $ | 909 | $ | 3.06 | 0.65 | % | ||||
Hypothetical** | $ | 1,000 | $ | 1,022 | $ | 3.24 | 0.65 | % | ||||
Thrivent Large Cap Stock Portfolio | ||||||||||||
Actual | $ | 1,000 | $ | 905 | $ | 3.27 | 0.69 | % | ||||
Hypothetical** | $ | 1,000 | $ | 1,021 | $ | 3.47 | 0.69 | % | ||||
Thrivent Large Cap Index Portfolio | ||||||||||||
Actual | $ | 1,000 | $ | 932 | $ | 1.99 | 0.42 | % | ||||
Hypothetical** | $ | 1,000 | $ | 1,023 | $ | 2.08 | 0.42 | % | ||||
Thrivent Equity Income Plus Portfolio | ||||||||||||
Actual | $ | 1,000 | $ | 951 | $ | 4.12 | 0.85 | % | ||||
Hypothetical** | $ | 1,000 | $ | 1,021 | $ | 4.27 | 0.85 | % | ||||
Thrivent Balanced Portfolio | ||||||||||||
Actual | $ | 1,000 | $ | 980 | $ | 2.14 | 0.44 | % | ||||
Hypothetical** | $ | 1,000 | $ | 1,023 | $ | 2.19 | 0.44 | % | ||||
Thrivent High Yield Portfolio | ||||||||||||
Actual | $ | 1,000 | $ | 1,035 | $ | 2.26 | 0.45 | % | ||||
Hypothetical** | $ | 1,000 | $ | 1,023 | $ | 2.25 | 0.45 | % | ||||
Thrivent Diversified Income Plus Portfolio | ||||||||||||
Actual | $ | 1,000 | $ | 1,021 | $ | 2.95 | 0.59 | % | ||||
Hypothetical** | $ | 1,000 | $ | 1,022 | $ | 2.95 | 0.59 | % | ||||
Thrivent Partner Socially Responsible Bond Portfolio | ||||||||||||
Actual | $ | 1,000 | $ | 1,069 | $ | 3.52 | 0.69 | % | ||||
Hypothetical** | $ | 1,000 | $ | 1,021 | $ | 3.44 | 0.69 | % | ||||
Thrivent Income Portfolio | ||||||||||||
Actual | $ | 1,000 | $ | 1,060 | $ | 2.23 | 0.44 | % | ||||
Hypothetical** | $ | 1,000 | $ | 1,023 | $ | 2.19 | 0.44 | % | ||||
Thrivent Bond Index Portfolio | ||||||||||||
Actual | $ | 1,000 | $ | 1,071 | $ | 2.39 | 0.46 | % | ||||
Hypothetical** | $ | 1,000 | $ | 1,022 | $ | 2.33 | 0.46 | % | ||||
Thrivent Limited Maturity Bond Portfolio | ||||||||||||
Actual | $ | 1,000 | $ | 1,029 | $ | 2.19 | 0.44 | % | ||||
Hypothetical** | $ | 1,000 | $ | 1,023 | $ | 2.19 | 0.44 | % | ||||
88
Table of Contents
| Beginning Account Value 1/1/2010 | Ending Account Value 6/30/2010 | Expenses Paid During Period 1/1/2010 - - 6/30/2010* | Annualized Expense Ratio | |||||||||
Thrivent Mortgage Securities Portfolio | ||||||||||||
Actual | $ | 1,000 | $ | 1,086 | $ | 4.65 | 0.90 | % | ||||
Hypothetical** | $ | 1,000 | $ | 1,020 | $ | 4.50 | 0.90 | % | ||||
Thrivent Money Market Portfolio | ||||||||||||
Actual | $ | 1,000 | $ | 1,000 | $ | 1.41 | 0.28 | % | ||||
Hypothetical** | $ | 1,000 | $ | 1,023 | $ | 1.43 | 0.28 | % | ||||
| * | Expenses are equal to the Portfolio’s annualized expense ratio, multiplied by the average account value over the period, multiplied by 181/365 to reflect the one-half year period. |
| ** | Assuming 5% annualized total return before expenses. |
89
Table of Contents
Aggressive Allocation Portfolio
Schedule of Investments as of June 30, 2010
(unaudited)
The accompanying Notes to Financial Statements are an integral part of this schedule.
90
Table of Contents
Aggressive Allocation Portfolio
Schedule of Investments as of June 30, 2010
(unaudited)
| Shares | Common Stock (21.1%) | Value | |||
| Financials (3.1%) - continued | |||||
| 3,735 | Hanover Insurance Group, Inc. | $ | 162,472 | ||
| 23,050 | Hartford Financial Services Group, Inc. | 510,096 | |||
| 17,127 | HCC Insurance Holdings, Inc. | 424,065 | |||
| 31,700 | Healthcare Realty Trust, Inc. | 696,449 | |||
| 15,148 | Host Hotels & Resorts, Inc. | 204,195 | |||
| 5,817 | IntercontinentalExchange, Inc.a | 657,496 | |||
| 11,253 | J.P. Morgan Chase & Company | 411,972 | |||
| 21,500 | KeyCorp | 165,335 | |||
| 4,031 | Lazard, Ltd. | 107,668 | |||
| 13,474 | Morgan Stanley | 312,732 | |||
| 11,401 | New York Community Bancorp, Inc. | 174,093 | |||
| 9,040 | Northern Trust Corporation | 422,168 | |||
| 70,227 | Ocwen Financial Corporationa | 715,613 | |||
| 20,500 | Potlatch Corporation | 732,465 | |||
| 7,890 | Principal Financial Group, Inc. | 184,942 | |||
| 8,330 | Prudential Financial, Inc. | 446,988 | |||
| 7,000 | SunTrust Banks, Inc. | 163,100 | |||
| 42,500 | Texas Capital Bancshares, Inc.a | 697,000 | |||
| 13,586 | W.R. Berkley Corporation | 359,486 | |||
| 42,494 | Washington Federal, Inc. | 687,553 | |||
| 19,340 | Wells Fargo & Company | 495,104 | |||
| 41,000 | Zions Bancorporation | 884,370 | |||
| Total Financials | 14,877,340 | ||||
| Health Care (2.8%) | |||||
| 48,300 | Align Technology, Inc.a | 718,221 | |||
| 1,679 | Beckman Coulter, Inc. | 101,227 | |||
| 10,138 | C.R. Bard, Inc. | 785,999 | |||
| 15,095 | Celgene Corporationa | 767,128 | |||
| 7,706 | Community Health Systems, Inc.a | 260,540 | |||
| 10,874 | Coventry Health Care, Inc.a | 192,252 | |||
| 5,060 | Covidien, Ltd. | 203,311 | |||
| 9,141 | Gilead Sciences, Inc.a | 313,353 | |||
| 7,954 | Hologic, Inc.a | 110,799 | |||
| 27,331 | ICON plc ADRa | 789,593 | |||
| 3,720 | Johnson & Johnson | 219,703 | |||
| 103,924 | King Pharmaceuticals, Inc.a | �� | 788,783 | ||
| 12,722 | Medco Health Solutions, Inc.a | 700,728 | |||
| 5,614 | Medtronic, Inc. | 203,620 | |||
| 20,250 | NuVasive, Inc.a | 718,065 | |||
| 24,900 | STERIS Corporation | 773,892 | |||
| 19,200 | Teva Pharmaceutical Industries, Ltd. ADR | 998,208 | |||
| 19,373 | Thermo Fisher Scientific, Inc.a | 950,246 | |||
| 17,213 | United Therapeutics Corporationa | 840,166 | |||
| 40,628 | UnitedHealth Group, Inc. | 1,153,835 | |||
| 2,533 | Varian Medical Systems, Inc.a | 132,425 | |||
| 5,574 | Vertex Pharmaceuticals, Inc.a | 183,385 | |||
| 22,960 | Zimmer Holdings, Inc.a | 1,240,988 | |||
| Total Health Care | 13,146,467 | ||||
| Industrials (2.8%) | |||||
| 3,240 | 3M Company | 255,928 | |||
| 1,760 | Avery Dennison Corporation | 56,549 | |||
| 3,270 | Boeing Company | 205,192 | |||
| 3,760 | Caterpillar, Inc. | 225,863 | |||
| 11,450 | Cooper Industries plc | 503,800 | |||
| 19,258 | CSX Corporation | 955,775 | |||
| 17,581 | Dover Corporation | 734,710 | |||
| 3,430 | Eaton Corporation | 224,459 | |||
| 7,140 | Emerson Electric Company | 311,947 | |||
| 3,300 | FedEx Corporation | 231,363 | |||
| 4,610 | Fluor Corporation | 195,925 | |||
| 22,500 | FTI Consulting, Inc.a | 980,775 | |||
| 18,670 | General Electric Company | 269,221 | |||
| 5,425 | Honeywell International, Inc. | 211,738 | |||
| 5,070 | Illinois Tool Works, Inc. | 209,290 | |||
| 10,032 | Ingersoll-Rand plc | 346,004 | |||
| 90,018 | Manitowoc Company, Inc. | 822,765 | |||
| 2,932 | Navistar International Corporationa | 144,254 | |||
| 25,700 | Old Dominion Freight Line, Inc.a | 903,098 | |||
| 35,925 | Oshkosh Corporationa | 1,119,423 | |||
| 2,728 | Parker Hannifin Corporation | 151,295 | |||
| 1,720 | Precision Castparts Corporation | 177,022 | |||
| 6,254 | Roper Industries, Inc. | 349,974 | |||
| 33,600 | Shaw Group, Inc.a | 1,149,792 | |||
| 7,550 | Siemens AG ADR | 675,951 | |||
| 6,420 | Spirit Aerosystems Holdings, Inc.a | 122,365 | |||
| 4,475 | SPX Corporation | 236,325 | |||
| 20,480 | Teledyne Technologies, Inc.a | 790,118 | |||
| 5,720 | Textron, Inc. | 97,068 | |||
| 3,498 | United Technologies Corporation | 227,055 | |||
| 11,747 | Werner Enterprises, Inc. | 257,142 | |||
| Total Industrials | 13,142,186 | ||||
| Information Technology (5.1%) | |||||
| 21,000 | Adobe Systems, Inc.a | 555,030 | |||
| 28,600 | ADTRAN, Inc. | 779,922 | |||
| 14,200 | Analog Devices, Inc. | 395,612 | |||
| 7,838 | Apple, Inc.a | 1,971,492 | |||
| 270,084 | Atmel Corporationa | 1,296,403 | |||
| 66,409 | Cisco Systems, Inc.a | 1,415,176 | |||
| 59,400 | Cogent, Inc.a | 535,194 | |||
| 44,300 | CommVault Systems, Inc.a | 996,750 | |||
| 150,150 | Compuware Corporationa | 1,198,197 | |||
| 17,050 | Corning, Inc. | 275,358 | |||
| 7,774 | eBay, Inc.a | 152,448 | |||
| 20,300 | EMC Corporationa | 371,490 | |||
| 2,479 | F5 Networks, Inc.a | 169,985 | |||
| 48,387 | FormFactor, Inc.a | 522,580 | |||
| 3,799 | Google, Inc.a | 1,690,365 | |||
| 23,770 | Hewlett-Packard Company | 1,028,766 | |||
| 37,841 | Intel Corporation | 736,007 | |||
| 3,263 | International Business Machines Corporation | 402,915 | |||
| 13,800 | JDS Uniphase Corporationa | 135,792 | |||
| 6,610 | Juniper Networks, Inc.a | 150,840 | |||
| 6,700 | KLA-Tencor Corporation | 186,796 | |||
| 10,000 | Lam Research Corporationa | 380,600 | |||
| 4,550 | MasterCard, Inc. | 907,861 | |||
| 8,804 | Maxim Integrated Products, Inc. | 147,291 | |||
| 6,850 | McAfee, Inc.a | 210,432 | |||
| 66,250 | Micron Technology, Inc.a | 562,462 | |||
| 53,620 | Microsoft Corporation | 1,233,796 | |||
| 1,300 | Netflix, Inc.a | 141,245 | |||
| 5,866 | Novellus Systems, Inc.a | 148,762 | |||
| 47,247 | Oracle Corporation | 1,013,921 | |||
| 5,900 | Paychex, Inc. | 153,223 | |||
| 33,976 | Polycom, Inc.a | 1,012,145 | |||
| 27,702 | Teradyne, Inc.a | 270,095 | |||
| 103,123 | TIBCO Software, Inc.a | 1,243,663 | |||
The accompanying Notes to Financial Statements are an integral part of this schedule.
91
Table of Contents
Aggressive Allocation Portfolio
Schedule of Investments as of June 30, 2010
(unaudited)
| Shares | Common Stock (21.1%) | Value | |||
| Information Technology (5.1%) - continued | |||||
| 10,496 | Tyco Electronics, Ltd. | $ | 266,388 | ||
| 21,300 | ValueClick, Inc.a | 227,697 | |||
| 9,700 | VeriFone Systems, Inc.a | 183,621 | |||
| 5,950 | Visa, Inc. | 420,963 | |||
| 15,990 | Vishay Intertechnology, Inc.a | 123,763 | |||
| 46,950 | Xerox Corporation | 377,478 | |||
| 6,566 | Xilinx, Inc. | 165,857 | |||
| Total Information Technology | 24,158,381 | ||||
| Materials (0.7%) | |||||
| 6,388 | Albemarle Corporation | 253,667 | |||
| 4,330 | Allegheny Technologies, Inc. | 191,343 | |||
| 2,950 | Ball Corporation | 155,849 | |||
| 7,600 | CF Industries Holdings, Inc. | 482,220 | |||
| 18,559 | E.I. du Pont de Nemours and Company | 641,956 | |||
| 11,612 | Freeport-McMoRan Copper & Gold, Inc. | 686,618 | |||
| 9,596 | Owens-Illinois, Inc.a | 253,814 | |||
| 4,266 | Silgan Holdings, Inc. | 121,069 | |||
| 10,370 | Steel Dynamics, Inc. | 136,780 | |||
| 12,100 | Temple-Inland, Inc. | 250,107 | |||
| Total Materials | 3,173,423 | ||||
| Telecommunications Services (<0.1%) | |||||
| 3,610 | Telephone and Data Systems, Inc. | 109,708 | |||
| Total Telecommunications Services | 109,708 | ||||
| Utilities (0.4%) | |||||
| 3,473 | Alliant Energy Corporation | 110,233 | |||
| 18,440 | American Electric Power Company, Inc. | 595,612 | |||
| 5,351 | DPL, Inc. | 127,889 | |||
| 876 | Entergy Corporation | 62,739 | |||
| 1,209 | FirstEnergy Corporation | 42,593 | |||
| 10,488 | NV Energy, Inc. | 123,863 | |||
| 7,077 | Portland General Electric Company | 129,721 | |||
| 20,379 | Southwest Gas Corporation | 601,181 | |||
| 3,975 | UGI Corporation | 101,124 | |||
| Total Utilities | 1,894,955 | ||||
Total Common Stock (cost $107,988,058) | 100,425,933 | ||||
| Principal Amount | Long-Term Fixed Income (9.2%) | ||||
| Asset-Backed Securities (0.2%) | |||||
| J.P. Morgan Mortgage Trust | |||||
| 1,000,000 | 5.461%, 10/25/2036 | 693,175 | |||
| Renaissance Home Equity Loan Trust | |||||
| 650,000 | 6.011%, 5/25/2036 | 374,747 | |||
| Total Asset-Backed Securities | 1,067,922 | ||||
| Basic Materials (0.4%) | |||||
| Arch Coal, Inc. | |||||
| 260,000 | 8.750%, 8/1/2016b | 271,050 | |||
| CF Industries, Inc. | |||||
| 260,000 | 7.125%, 5/1/2020 | 266,500 | |||
| CONSOL Energy, Inc. | |||||
| 260,000 | 8.000%, 4/1/2017b | 268,450 | |||
| Domtar Corporation | |||||
| 220,000 | 10.750%, 6/1/2017 | 264,000 | |||
| FMG Finance, Pty., Ltd. | |||||
| 230,000 | 10.625%, 9/1/2016b | 253,000 | |||
| Georgia-Pacific Corporation | |||||
| 250,000 | 8.000%, 1/15/2024 | 265,000 | |||
| Lyondell Chemical Company | |||||
| 250,000 | 11.000%, 5/1/2018 | 268,125 | |||
| Total Basic Materials | 1,856,125 | ||||
| Capital Goods (0.1%) | |||||
| Case New Holland, Inc. | |||||
| 260,000 | 7.875%, 12/1/2017b | 261,950 | |||
| Owens-Illinois, Inc. | |||||
| 260,000 | 7.800%, 5/15/2018 | 270,725 | |||
| Total Capital Goods | 532,675 | ||||
| Collateralized Mortgage Obligations (0.1%) | |||||
| Sequoia Mortgage Trust | |||||
| 192,918 | 5.713%, 9/20/2046 | 70,768 | |||
| WaMu Mortgage Pass Through Certificates | |||||
| 269,884 | 5.923%, 9/25/2036 | 236,046 | |||
| 367,663 | 6.020%, 10/25/2036 | 325,884 | |||
| Total Collateralized Mortgage Obligations | 632,698 | ||||
| Commercial Mortgage-Backed Securities (0.1%) | |||||
| Federal Home Loan Mortgage Corporation Multifamily Structured Pass Through Certificate | |||||
| 205,000 | 3.342%, 12/25/2019 | 209,561 | |||
| Government National Mortgage Association | |||||
| 203,946 | 3.214%, 1/16/2040 | 210,026 | |||
| Total Commercial Mortgage-Backed Securities | 419,587 | ||||
| Communications Services (0.4%) | |||||
| Clear Channel Worldwide Holdings, Inc. | |||||
| 200,000 | 9.250%, 12/15/2017b | 201,000 | |||
| Cricket Communications, Inc. | |||||
| 260,000 | 9.375%, 11/1/2014 | 263,900 | |||
| DISH DBS Corporation | |||||
| 270,000 | 7.125%, 2/1/2016 | 270,675 | |||
| Intelsat Jackson Holdings, Ltd. | |||||
| 200,000 | 8.500%, 11/1/2019b | 202,000 | |||
| New Communications Holdings, Inc. | |||||
| 210,000 | 8.250%, 4/15/2017b | 210,788 | |||
The accompanying Notes to Financial Statements are an integral part of this schedule.
92
Table of Contents
Aggressive Allocation Portfolio
Schedule of Investments as of June 30, 2010
(unaudited)
| Principal Amount | Long-Term Fixed Income (9.2%) | Value | |||
| Communications Services (0.4%) - continued | |||||
| Qwest Communications International, Inc. | |||||
| $280,000 | 7.500%, 2/15/2014 | $ | 280,700 | ||
| Virgin Media Finance plc | |||||
| 260,000 | 8.375%, 10/15/2019 | 263,250 | |||
| Wind Acquisition Holdings Finance SPA | |||||
| 260,000 | 12.250%, 7/15/2017b | 236,600 | |||
| Total Communications Services | 1,928,913 | ||||
| Consumer Cyclical (0.5%) | |||||
| Goodyear Tire & Rubber Company | |||||
| 190,000 | 10.500%, 5/15/2016 | 206,625 | |||
| KB Home | |||||
| 211,000 | 6.250%, 6/15/2015 | 187,790 | |||
| Macy’s Retail Holdings, Inc. | |||||
| 230,000 | 8.375%, 7/15/2015 | 253,575 | |||
| MGM Resorts International | |||||
| 230,000 | 11.125%, 11/15/2017 | 253,575 | |||
| Pinnacle Entertainment, Inc. | |||||
| 270,000 | 8.625%, 8/1/2017b | 278,100 | |||
| QVC, Inc. | |||||
| 210,000 | 7.125%, 4/15/2017b | 205,800 | |||
| Starwood Hotels & Resorts Worldwide, Inc. | |||||
| 270,000 | 6.750%, 5/15/2018 | 270,000 | |||
| Toys R Us Property Company I, LLC | |||||
| 240,000 | 10.750%, 7/15/2017b | 262,200 | |||
| WMG Acquisition Corporation | |||||
| 200,000 | 9.500%, 6/15/2016 | 213,000 | |||
| Total Consumer Cyclical | 2,130,665 | ||||
| Consumer Non-Cyclical (0.2%) | |||||
| Biomet, Inc. | |||||
| 200,000 | 10.375%, 10/15/2017 | 215,000 | |||
| Community Health Systems, Inc. | |||||
| 260,000 | 8.875%, 7/15/2015 | 268,125 | |||
| HCA, Inc. | |||||
| 250,000 | 9.625%, 11/15/2016 | 267,500 | |||
| JBS USA, LLC/JBS USA Finance, Inc. | |||||
| 240,000 | 11.625%, 5/1/2014 | 269,100 | |||
| Total Consumer Non-Cyclical | 1,019,725 | ||||
| Energy (0.2%) | |||||
| Forest Oil Corporation | |||||
| 270,000 | 7.250%, 6/15/2019 | 260,550 | |||
| Petrohawk Energy Corporation | |||||
| 260,000 | 7.875%, 6/1/2015 | 260,650 | |||
| Pioneer Natural Resources Company | |||||
| 200,000 | 7.500%, 1/15/2020 | 206,119 | |||
| Plains Exploration & Production Company | |||||
| 270,000 | 7.625%, 6/1/2018 | 263,925 | |||
| Total Energy | 991,244 | ||||
| Financials (0.3%) | |||||
| Achmea Hypotheekbank NV | |||||
| 205,000 | 3.200%, 11/3/2014b | 211,797 | |||
| Canadian Imperial Bank of Commerce | |||||
| 205,000 | 2.600%, 7/2/2015b,c | 206,117 | |||
| CIE Financement Foncier | |||||
| 225,000 | 2.125%, 4/22/2013b | 227,178 | |||
| CIT Group, Inc. | |||||
| 211,075 | 7.000%, 5/1/2017 | 189,968 | |||
| Dexia Credit Local SA | |||||
| 225,000 | 2.750%, 4/29/2014b | 226,719 | |||
| Icahn Enterprises, LP | |||||
| 210,000 | 8.000%, 1/15/2018b | 203,700 | |||
| International Bank for Reconstruction & Development | |||||
| 210,000 | 2.375%, 5/26/2015 | 213,514 | |||
| Royal Bank of Canada | |||||
| 160,000 | 3.125%, 4/14/2015b | 165,967 | |||
| Total Financials | 1,644,960 | ||||
| Foreign Government (0.2%) | |||||
| British Columbia Government Notes | |||||
| 225,000 | 2.850%, 6/15/2015 | 232,398 | |||
| Kommunalbanken AS | |||||
| 225,000 | 2.750%, 5/5/2015b | 229,032 | |||
| Kreditanstalt fuer Wiederaufbau | |||||
| 55,000 | 1.250%, 6/15/2012 | 55,083 | |||
| Manitoba Government Notes | |||||
| 210,000 | 2.625%, 7/15/2015 | 213,571 | |||
| Total Foreign Government | 730,084 | ||||
| Mortgage-Backed Securities (1.6%) | |||||
| Federal Home Loan Mortgage Corporation Gold 30-Yr. Pass Through | |||||
| 800,000 | 6.000%, 7/1/2040c | 868,249 | |||
| Federal National Mortgage Association Conventional 15-Yr. Pass Through | |||||
| 450,000 | 5.000%, 7/1/2025c | 480,094 | |||
| Federal National Mortgage Association Conventional 30-Yr. Pass Through | |||||
| 5,800,000 | 4.500%, 7/1/2040c,d | 6,011,155 | |||
| Total Mortgage-Backed Securities | 7,359,498 | ||||
| Technology (0.1%) | |||||
| Freescale Semiconductor, Inc. | |||||
| 260,000 | 9.250%, 4/15/2018b | 256,750 | |||
| Iron Mountain, Inc. | |||||
| 260,000 | 8.000%, 6/15/2020 | 263,900 | |||
| Total Technology | 520,650 | ||||
| U.S. Government and Agencies (4.7%) | |||||
| FDIC Structured Sale Guaranteed Notes | |||||
| 85,000 | Zero Coupon, 1/7/2012b | 83,748 | |||
The accompanying Notes to Financial Statements are an integral part of this schedule.
93
Table of Contents
Aggressive Allocation Portfolio
Schedule of Investments as of June 30, 2010
(unaudited)
| Principal Amount | Long-Term Fixed Income (9.2%) | Value | |||||
| U.S. Government and Agencies (4.7%) - continued | |||||||
| FDIC Structured Sale Guaranteed Notes | |||||||
| $ | 85,000 | Zero Coupon, 1/7/2014b | $ | 79,846 | |||
| Federal Home Loan Banks | |||||||
| 860,000 | 5.375%, 5/18/2016 | 1,003,302 | |||||
| 1,300,000 | 5.000%, 11/17/2017 | 1,483,479 | |||||
| Federal Home Loan Mortgage Corporation | |||||||
| 1,505,000 | 1.125%, 7/27/2012 | 1,515,639 | |||||
| 400,000 | 2.500%, 1/7/2014 | 414,749 | |||||
| 580,000 | 4.875%, 6/13/2018 | 656,475 | |||||
| 300,000 | 3.750%, 3/27/2019 | 312,997 | |||||
| Federal National Mortgage Association | |||||||
| 715,000 | 2.000%, 4/15/2013 | 722,189 | |||||
| 460,000 | 4.375%, 10/15/2015 | 508,758 | |||||
| 210,000 | 6.250%, 5/15/2029 | 259,833 | |||||
| Tennessee Valley Authority | |||||||
| 165,000 | 5.250%, 9/15/2039 | 182,406 | |||||
| U.S. Treasury Bonds | |||||||
| 300,000 | 4.625%, 2/15/2040 | 337,219 | |||||
| U.S. Treasury Bonds, TIPS | |||||||
| 55,472 | 2.125%, 2/15/2040 | 60,781 | |||||
| U.S. Treasury Notes | |||||||
| 1,500,000 | 0.875%, 12/31/2010e | 1,504,687 | |||||
| 550,000 | 1.125%, 6/15/2013 | 552,189 | |||||
| 1,425,000 | 1.750%, 1/31/2014 | 1,447,934 | |||||
| 830,000 | 2.500%, 3/31/2015 | 860,087 | |||||
| 2,150,000 | 2.500%, 4/30/2015 | 2,226,426 | |||||
| 625,000 | 2.625%, 2/29/2016 | 643,017 | |||||
| 1,500,000 | 3.250%, 3/31/2017 | 1,580,625 | |||||
| 1,300,000 | 3.625%, 2/15/2020 | 1,373,531 | |||||
| 1,050,000 | 3.500%, 5/15/2020 | 1,098,888 | |||||
| 420,000 | 7.625%, 2/15/2025 | 617,006 | |||||
| 550,000 | 4.375%, 5/15/2040 | 594,858 | |||||
| U.S. Treasury Notes, TIPS | |||||||
| 257,817 | 3.375%, 1/15/2012 | 271,796 | |||||
| 304,254 | 0.625%, 4/15/2013 | 310,506 | |||||
| 348,041 | 2.000%, 1/15/2014 | 370,772 | |||||
| 251,167 | 1.625%, 1/15/2015 | 265,139 | |||||
| 232,082 | 2.500%, 7/15/2016 | 258,263 | |||||
| 315,546 | 2.625%, 7/15/2017 | 355,951 | |||||
| 252,023 | 1.375%, 1/15/2020 | 258,067 | |||||
| 63,608 | 2.375%, 1/15/2025 | 70,560 | |||||
| Total U.S. Government and Agencies | 22,281,723 | ||||||
| Utilities (0.1%) | |||||||
| El Paso Corporation | |||||||
| 260,000 | 7.000%, 6/15/2017 | 258,536 | |||||
| NRG Energy, Inc. | |||||||
| 270,000 | 7.375%, 2/1/2016 | 268,650 | |||||
| Total Utilities | 527,186 | ||||||
Total Long-Term Fixed Income (cost $42,813,275) | 43,643,655 | ||||||
Short-Term Investments (2.7%)f | |||||||
| Enterprise Funding Company, LLC | |||||||
| 5,065,000 | 0.090%, 7/1/2010 | $ | 5,065,000 | ||||
| Federal Home Loan Bank Discount Notes | |||||||
| 2,395,000 | 0.010%, 7/2/2010 | 2,394,999 | |||||
| Federal National Mortgage Association Discount Notes | |||||||
| 2,300,000 | 0.176%, 7/7/2010e | 2,299,933 | |||||
| Thunder Bay Funding, Inc. | |||||||
| 2,915,000 | 0.060%, 7/1/2010 | 2,915,000 | |||||
| Total Short-Term Investments (at amortized cost) | 12,674,932 | ||||||
| Total Investments (cost $589,461,680) 101.4% | $ | 481,709,140 | |||||
| Other Assets and Liabilities, Net (1.4%) | (6,762,625 | ) | |||||
| Total Net Assets 100.0% | $ | 474,946,515 | |||||
| a | Non-income producing security. |
| b | Denotes securities sold under Rule 144A of the Securities Act of 1933, which exempts them from registration. These securities have been deemed liquid and may be resold to other dealers in the program or to other qualified institutional buyers. As of June 30, 2010, the value of these investments was $4,541,792 or 1.0% of total net assets. |
| c | Denotes investments purchased on a when-issued or delayed delivery basis. |
| d | All or a portion of the security was earmarked to cover written options. |
| e | At June 30, 2010, $3,454,630 of investments were held on deposit with the counterparty and pledged as the initial margin deposit for open futures contracts. |
| f | The interest rate shown reflects the yield, coupon rate or, for securities purchased at a discount, the discount rate at the date of purchase. |
Definitions:
| ADR | - | American Depositary Receipt, which are certificates for an underlying foreign security’s shares held by an issuing U.S. depository bank. | ||
| TIPS | - | Treasury Inflation Protected Security. |
Unrealized Appreciation (Depreciation)
Gross unrealized appreciation and depreciation of investments, based on cost for federal income tax purposes, were as follows:
Gross unrealized appreciation | $ | 8,996,956 | ||
Gross unrealized depreciation | (116,749,496 | ) | ||
Net unrealized appreciation (depreciation) | $ | (107,752,540 | ) | |
Cost for federal income tax purposes | $ | 589,461,680 | ||
The accompanying Notes to Financial Statements are an integral part of this schedule.
94
Table of Contents
Aggressive Allocation Portfolio
Schedule of Investments as of June 30, 2010
(unaudited)
Fair Valuation Measurements
The following table is a summary of the inputs used, as of June 30, 2010, in valuing Aggressive Allocation Portfolio’s assets carried at fair value as discussed in the Notes to Financial Statements.
Investments in Securities | Total | Level 1 | Level 2 | Level 3 | ||||||||
Mutual Funds | ||||||||||||
Equity Mutual Funds | 314,535,142 | 314,535,142 | — | — | ||||||||
Fixed Income Mutual Funds | 10,429,478 | 10,429,478 | — | — | ||||||||
Common Stock | ||||||||||||
Consumer Discretionary | 14,450,874 | 14,450,874 | — | — | ||||||||
Consumer Staples | 4,741,350 | 4,741,350 | — | — | ||||||||
Energy | 10,731,249 | 10,731,249 | — | — | ||||||||
Financials | 14,877,340 | 14,877,340 | — | — | ||||||||
Health Care | 13,146,467 | 13,146,467 | — | — | ||||||||
Industrials | 13,142,186 | 13,142,186 | — | — | ||||||||
Information Technology | 24,158,381 | 24,158,381 | — | — | ||||||||
Materials | 3,173,423 | 3,173,423 | — | — | ||||||||
Telecommunications Services | 109,708 | 109,708 | — | — | ||||||||
Utilities | 1,894,955 | 1,894,955 | — | — | ||||||||
Long-Term Fixed Income | ||||||||||||
Asset-Backed Securities | 1,067,922 | — | 1,067,922 | — | ||||||||
Basic Materials | 1,856,125 | — | 1,856,125 | — | ||||||||
Capital Goods | 532,675 | — | 532,675 | — | ||||||||
Collateralized Mortgage Obligations | 632,698 | — | 632,698 | — | ||||||||
Commercial Mortgage-Backed Securities | 419,587 | — | 419,587 | — | ||||||||
Communications Services | 1,928,913 | — | 1,928,913 | — | ||||||||
Consumer Cyclical | 2,130,665 | — | 2,130,665 | — | ||||||||
Consumer Non-Cyclical | 1,019,725 | — | 1,019,725 | — | ||||||||
Energy | 991,244 | — | 991,244 | — | ||||||||
Financials | 1,644,960 | — | 1,644,960 | — | ||||||||
Foreign Government | 730,084 | — | 730,084 | — | ||||||||
Mortgage-Backed Securities | 7,359,498 | — | 7,359,498 | — | ||||||||
Technology | 520,650 | — | 520,650 | — | ||||||||
U.S. Government and Agencies | 22,281,723 | — | 22,118,129 | 163,594 | ||||||||
Utilities | 527,186 | — | 527,186 | — | ||||||||
Short-Term Investments | 12,674,932 | — | 12,674,932 | — | ||||||||
Total | $ | 481,709,140 | $ | 425,390,553 | $ | 56,154,993 | $ | 163,594 | ||||
Other Financial Instruments | ||||||||||||
Asset Derivatives | ||||||||||||
Futures Contracts | 271,788 | 271,788 | — | — | ||||||||
Total Asset Derivatives | $ | 271,788 | $ | 271,788 | $ | — | $ | — | ||||
Liability Derivatives | ||||||||||||
Futures Contracts | 692,615 | 692,615 | — | — | ||||||||
Call Options Written | 41,344 | — | — | 41,344 | ||||||||
Total Liability Derivatives | $ | 733,959 | $ | 692,615 | $ | — | $ | 41,344 | ||||
The accompanying Notes to Financial Statements are an integral part of this schedule.
95
Table of Contents
Aggressive Allocation Portfolio
Schedule of Investments as of June 30, 2010
(unaudited)
The following table is a reconciliation of assets in which significant unobservable inputs (Level 3) were used in determining fair value for Aggressive Allocation Portfolio as discussed in item 2(A) of the Notes to Financial Statements.
Investments in Securities | Value December 31, 2009 | Accrued Discounts and/or Premiums | Realized Gain/(Loss) | Change in Unrealized Gain/(Loss) | Net Purchases/(Sales) | Transfers Into Level 3 | Transfers Out of Level 3 | Value June 30, 2010 | ||||||||||||||||
Long-Term Fixed Income | ||||||||||||||||||||||||
U.S. Government and Agencies | — | 363 | — | 1,300 | 161,931 | — | — | 163,594 | ||||||||||||||||
Total | $ | — | $ | 363 | $ | — | $ | 1,300 | $ | 161,931 | $ | — | $ | — | $ | 163,594 | ||||||||
Other Financial Instruments | ||||||||||||||||||||||||
Liability Derivatives | ||||||||||||||||||||||||
Call Options Written | — | — | — | 41,344 | — | — | — | 41,344 | ||||||||||||||||
Total | $ | — | $ | — | $ | — | $ | 41,344 | $ | — | $ | — | $ | — | $ | 41,344 | ||||||||
Futures Contracts | Number of Contracts Long/(Short) | Expiration Date | Notional Principal Amount | Value | Unrealized Gain/(Loss) | ||||||||||
E-Mini MSCI EAFE Index Futures | (23 | ) | September 2010 | ($1,623,047 | ) | ($1,512,480 | ) | $ 110,567 | |||||||
Russell 2000 Index Mini-Futures | (196 | ) | September 2010 | (12,001,521 | ) | (11,912,880 | ) | 88,641 | |||||||
S&P 400 Index Mini-Futures | (71 | ) | September 2010 | (5,113,580 | ) | (5,041,000 | ) | 72,580 | |||||||
S&P 500 Index Futures | 98 | September 2010 | 25,844,315 | 25,151,700 | (692,615 | ) | |||||||||
Total Futures Contracts | ($420,827 | ) | |||||||||||||
Call Options Written | Number of Contracts | Exercise Price | Expiration Date | Value | Unrealized Gain/(Loss) | ||||||||||
Federal National Mortgage | |||||||||||||||
Association Conventional 30- Yr. Pass Through | 5 | $ | 102.36 | July 2010 | ($ | 70,031 | ) | ($ | 41,344 | ) | |||||
Total Call Options Written | ($ | 70,031 | ) | ($ | 41,344 | ) | |||||||||
The following table summarizes the fair value and Statement of Assets and Liabilities location, as of June 30, 2010, for Aggressive Allocation Portfolio’s investments in financial derivative instruments by primary risk exposure as discussed under item (2) Significant Accounting Policies of the Notes to Financial Statements.
Derivatives by risk category | Statement of Assets and Liabilities Location | Fair Value | |||
Asset Derivatives | |||||
Equity Contracts | |||||
Futures* | Net Assets - Net unrealized appreciation/(depreciation) on Futures contracts | 271,788 | |||
Total Equity Contracts | 271,788 | ||||
Total Asset Derivatives | $ | 271,788 | |||
Liability Derivatives | |||||
Equity Contracts | |||||
Futures* | Net Assets - Net unrealized appreciation/(depreciation) on Futures contracts | 692,615 | |||
Total Equity Contracts | 692,615 | ||||
Interest Rate Contracts | |||||
Options Written | Net Assets - Net unrealized appreciation/(depreciation) on Written option contracts | 41,344 | |||
Total Interest Rate Contracts | 41,344 | ||||
Total Liability Derivatives | $ | 733,959 | |||
| * | Includes cumulative appreciation/depreciation of futures contracts as reported in the Schedule of Investments. Only current day’s variation margin is reported within the Statement of Assets and Liabilities. |
The accompanying Notes to Financial Statements are an integral part of this schedule.
96
Table of Contents
Aggressive Allocation Portfolio
Schedule of Investments as of June 30, 2010
(unaudited)
The following table summarizes the net realized gains/(losses) and Statement of Operations location, for the period ended June 30, 2010, for Aggressive Allocation Portfolio’s investments in financial derivative instruments by primary risk exposure.
Derivatives by risk category | Statement of Operations Location | Realized Gains/(Losses) recognized in Income | ||||
Equity Contracts | ||||||
Futures | Net realized gains/(losses) on Futures contracts | 2,208,566 | ||||
Total Equity Contracts | 2,208,566 | |||||
Credit Contracts | ||||||
Credit Default Swaps | Net realized gains/(losses) on Swap agreements | (110,967 | ) | |||
Total Credit Contracts | (110,967 | ) | ||||
Total | $ | 2,097,599 | ||||
The following table summarizes the change in net unrealized appreciation/(depreciation) and Statement of Operations location, for the period ended June 30, 2010, for Aggressive Allocation Portfolio’s investments in financial derivative instruments by primary risk exposure.
Derivatives by risk category | Statement of Operations Location | Change in unrealized appreciation/(depreciation) recognized in Income | |||
Equity Contracts | |||||
Futures | Change in net unrealized appreciation/(depreciation) on Futures contracts | (1,418,694 | ) | ||
Total Equity Contracts | (1,418,694 | ) | |||
Interest Rate Contracts | |||||
Options Written | Change in net unrealized appreciation/(depreciation) on Written option contracts | (41,344 | ) | ||
Total Interest Rate Contracts | (41,344 | ) | |||
Credit Contracts | |||||
Credit Default Swaps | Change in net unrealized appreciation/(depreciation) on Swap agreements | 128,858 | |||
Total Credit Contracts | 128,858 | ||||
Total | ($1,331,180 | ) | |||
The following table presents Aggressive Allocation Portfolio’s average volume of derivative activity during the period ended June 30, 2010.
Derivative Risk Category | Futures (Notional*) | Futures (Percentage of Average Net Assets) | Swaps (Notional*) | Swaps (Percentage of Average Net Assets) | Options (Contracts) | |||||||||
Equity Contracts | $ | 44,020,939 | 8.6 | % | N/A | N/A | 1 | |||||||
Credit Contracts | N/A | N/A | $ | 1,041,842 | 0.2 | % | N/A | |||||||
| * | Notional amount represents long or short, or both, derivative positions held by the portfolio. |
The accompanying Notes to Financial Statements are an integral part of this schedule.
97
Table of Contents
Aggressive Allocation Portfolio
Schedule of Investments as of June 30, 2010
(unaudited)
Investment in Affiliates
Affiliated issuers, as defined under the Investment Company Act of 1940, include those in which the Portfolio’s holdings of an issuer represent 5% or more of the outstanding voting securities of an issuer, or any affiliated mutual fund.
A summary of transactions for the fiscal year to date, in Aggressive Allocation Portfolio, is as follows:
Portfolio | Value December 31, 2009 | Gross Purchases | Gross Sales | Shares Held at June 30, 2010 | Value June 30, 2010 | Income Earned January 1, 2010- June 30, 2010 | |||||||||||
Real Estate Securities | $ | 9,257,711 | $ | 188,453 | $ | 259,387 | 788,886 | $ | 9,703,611 | $ | — | ||||||
Partner Small Cap Growth | 35,237,937 | 502,541 | 691,698 | 3,498,692 | 34,158,783 | — | |||||||||||
Partner Small Cap Value | 13,668,534 | 219,291 | 259,387 | 875,180 | 13,302,735 | 30,839 | |||||||||||
Small Cap Stock | 19,713,116 | 636,436 | 864,622 | 1,925,833 | 18,632,631 | 8,260 | |||||||||||
Mid Cap Growth II | 34,693,798 | 815,361 | 605,235 | 4,139,677 | 33,660,955 | — | |||||||||||
Partner Mid Cap Value | 17,809,343 | 318,378 | 345,849 | 1,645,039 | 17,145,250 | 67,107 | |||||||||||
Mid Cap Stock | 38,013,558 | 714,681 | 7,951,084 | 3,194,175 | 30,103,505 | 23,687 | |||||||||||
Partner Worldwide Allocation | 8,638,175 | 9,669,079 | 612,053 | 2,252,515 | 16,168,775 | 1,179 | |||||||||||
Partner International Stock | 71,544,054 | 30,391 | 857,805 | 7,071,114 | 61,631,830 | 30,391 | |||||||||||
Large Cap Growth II | 26,504,431 | 1,440,394 | 4,539,761 | 3,198,155 | 20,068,420 | 29,374 | |||||||||||
Large Cap Value | 25,779,138 | 634,656 | 864,622 | 2,648,795 | 23,228,873 | 6,479 | |||||||||||
Large Cap Stock | 36,416,956 | 508,895 | 691,698 | 4,691,192 | 32,805,977 | 6,354 | |||||||||||
Equity Income Plus | 4,126,856 | 4,932 | — | 522,428 | 3,923,797 | 4,932 | |||||||||||
High Yield | 10,041,199 | 686,715 | 217,884 | 2,304,806 | 10,429,478 | 432,850 | |||||||||||
Income | 15,431,962 | 409,210 | 16,285,338 | — | — | 220,757 | |||||||||||
Limited Maturity Bond | 8,002,838 | 265,909 | 8,375,116 | — | — | 77,456 | |||||||||||
Total Value and Income Earned | 374,879,606 | 324,964,620 | 939,668 | ||||||||||||||
The accompanying Notes to Financial Statements are an integral part of this schedule.
98
Table of Contents
Moderately Aggressive Allocation Portfolio
Schedule of Investments as of June 30, 2010
(unaudited)
The accompanying Notes to Financial Statements are an integral part of this schedule.
99
Table of Contents
Moderately Aggressive Allocation Portfolio
Schedule of Investments as of June 30, 2010
(unaudited)
| Shares | Common Stock (11.0%) | Value | |||
Financials (1.7%) - continued | |||||
| 5,858 | Goldman Sachs Group, Inc. | $ | 768,980 | ||
| 10,160 | Hanover Insurance Group, Inc. | 441,960 | |||
| 50,450 | Hartford Financial Services Group, Inc. | 1,116,458 | |||
| 45,272 | HCC Insurance Holdings, Inc. | 1,120,935 | |||
| 61,400 | Healthcare Realty Trust, Inc. | 1,348,958 | |||
| 39,695 | Host Hotels & Resorts, Inc. | 535,089 | |||
| 13,338 | IntercontinentalExchange, Inc.a | 1,507,594 | |||
| 28,039 | J.P. Morgan Chase & Company | 1,026,508 | |||
| 56,800 | KeyCorp | 436,792 | |||
| 11,150 | Lazard, Ltd. | 297,816 | |||
| 33,494 | Morgan Stanley | 777,396 | |||
| 30,304 | New York Community Bancorp, Inc. | 462,742 | |||
| 23,250 | Northern Trust Corporation | 1,085,775 | |||
| 135,991 | Ocwen Financial Corporationa | 1,385,748 | |||
| 39,578 | Potlatch Corporation | 1,414,122 | |||
| 19,752 | Principal Financial Group, Inc. | 462,987 | |||
| 20,770 | Prudential Financial, Inc. | 1,114,518 | |||
| 14,900 | SunTrust Banks, Inc. | 347,170 | |||
| 80,355 | Texas Capital Bancshares, Inc.a | 1,317,822 | |||
| 36,096 | W.R. Berkley Corporation | 955,100 | |||
| 82,192 | Washington Federal, Inc. | 1,329,866 | |||
| 48,200 | Wells Fargo & Company | 1,233,920 | |||
| 82,900 | Zions Bancorporation | 1,788,153 | |||
| Total Financials | 33,602,534 | ||||
Health Care (1.4%) | |||||
| 93,600 | Align Technology, Inc.a | 1,391,832 | |||
| 4,843 | Beckman Coulter, Inc. | 291,984 | |||
| 25,967 | C.R. Bard, Inc. | 2,013,222 | |||
| 32,324 | Celgene Corporationa | 1,642,706 | |||
| 20,315 | Community Health Systems, Inc.a | 686,850 | |||
| 28,732 | Coventry Health Care, Inc.a | 507,982 | |||
| 12,600 | Covidien, Ltd. | 506,268 | |||
| 19,569 | Gilead Sciences, Inc.a | 670,825 | |||
| 20,944 | Hologic, Inc.a | 291,750 | |||
| 52,496 | ICON plc ADRa | 1,516,609 | |||
| 9,270 | Johnson & Johnson | 547,486 | |||
| 212,039 | King Pharmaceuticals, Inc.a | 1,609,376 | |||
| 27,487 | Medco Health Solutions, Inc.a | 1,513,984 | |||
| 14,140 | Medtronic, Inc. | 512,858 | |||
| 39,160 | NuVasive, Inc.a | 1,388,614 | |||
| 48,400 | STERIS Corporation | 1,504,272 | |||
| 41,000 | Teva Pharmaceutical Industries, Ltd. ADR | 2,131,590 | |||
| 41,597 | Thermo Fisher Scientific, Inc.a | 2,040,333 | |||
| 35,535 | United Therapeutics Corporationa | 1,734,463 | |||
| 93,674 | UnitedHealth Group, Inc. | 2,660,342 | |||
| 7,154 | Varian Medical Systems, Inc.a | 374,011 | |||
| 14,730 | Vertex Pharmaceuticals, Inc.a | 484,617 | |||
| 51,840 | Zimmer Holdings, Inc.a | 2,801,952 | |||
| Total Health Care | 28,823,926 | ||||
Industrials (1.5%) | |||||
| 8,044 | 3M Company | 635,396 | |||
| 4,310 | Avery Dennison Corporation | 138,480 | |||
| 8,150 | Boeing Company | 511,412 | |||
| 9,360 | Caterpillar, Inc. | 562,255 | |||
| 24,550 | Cooper Industries plc | 1,080,200 | |||
| 43,746 | CSX Corporation | 2,171,114 | |||
| 37,707 | Dover Corporation | 1,575,776 | |||
| 8,515 | Eaton Corporation | 557,222 | |||
| 17,790 | Emerson Electric Company | 777,245 | |||
| 7,150 | FedEx Corporation | 501,287 | |||
| 11,470 | Fluor Corporation | 487,475 | |||
| 43,500 | FTI Consulting, Inc.a | 1,896,165 | |||
| 46,400 | General Electric Company | 669,088 | |||
| 13,482 | Honeywell International, Inc. | 526,202 | |||
| 12,630 | Illinois Tool Works, Inc. | 521,366 | |||
| 24,970 | Ingersoll-Rand plc | 861,215 | |||
| 189,488 | Manitowoc Company, Inc. | 1,731,920 | |||
| 8,052 | Navistar International Corporationa | 396,158 | |||
| 49,675 | Old Dominion Freight Line, Inc.a | 1,745,580 | |||
| 78,466 | Oshkosh Corporationa | 2,445,001 | |||
| 7,807 | Parker Hannifin Corporation | 432,976 | |||
| 4,988 | Precision Castparts Corporation | 513,365 | |||
| 16,511 | Roper Industries, Inc. | 923,956 | |||
| 70,200 | Shaw Group, Inc.a | 2,402,244 | |||
| 16,200 | Siemens AG ADR | 1,450,386 | |||
| 15,950 | Spirit Aerosystems Holdings, Inc.a | 304,007 | |||
| 12,267 | SPX Corporation | 647,820 | |||
| 40,070 | Teledyne Technologies, Inc.a | 1,545,901 | |||
| 14,220 | Textron, Inc. | 241,313 | |||
| 8,697 | United Technologies Corporation | 564,522 | |||
| 30,993 | Werner Enterprises, Inc. | 678,437 | |||
| Total Industrials | 29,495,484 | ||||
Information Technology (2.6%) | |||||
| 44,900 | Adobe Systems, Inc.a | 1,186,707 | |||
| 55,300 | ADTRAN, Inc. | 1,508,031 | |||
| 30,450 | Analog Devices, Inc. | 848,337 | |||
| 16,805 | Apple, Inc.a | 4,226,962 | |||
| 586,858 | Atmel Corporationa | 2,816,918 | |||
| 142,381 | Cisco Systems, Inc.a | 3,034,139 | |||
| 115,000 | Cogent, Inc.a | 1,036,150 | |||
| 85,800 | CommVault Systems, Inc.a | 1,930,500 | |||
| 320,088 | Compuware Corporationa | 2,554,302 | |||
| 37,250 | Corning, Inc. | 601,587 | |||
| 20,498 | eBay, Inc.a | 401,966 | |||
| 43,600 | EMC Corporationa | 797,880 | |||
| 7,043 | F5 Networks, Inc.a | 482,939 | |||
| 93,600 | FormFactor, Inc.a | 1,010,880 | |||
| 8,158 | Google, Inc.a | 3,629,902 | |||
| 52,440 | Hewlett-Packard Company | 2,269,603 | |||
| 80,989 | Intel Corporation | 1,575,236 | |||
| 8,141 | International Business Machines Corporation | 1,005,251 | |||
| 36,600 | JDS Uniphase Corporationa | 360,144 | |||
| 17,527 | Juniper Networks, Inc.a | 399,966 | |||
| 14,300 | KLA-Tencor Corporation | 398,684 | |||
| 21,300 | Lam Research Corporationa | 810,678 | |||
| 10,000 | MasterCard, Inc. | 1,995,300 | |||
| 23,078 | Maxim Integrated Products, Inc. | 386,095 | |||
| 14,791 | McAfee, Inc.a | 454,380 | |||
| 134,500 | Micron Technology, Inc.a | 1,141,905 | |||
| 120,010 | Microsoft Corporation | 2,761,430 | |||
| 3,500 | Netflix, Inc.a | 380,275 | |||
| 15,377 | Novellus Systems, Inc.a | 389,961 | |||
| 106,703 | Oracle Corporation | 2,289,846 | |||
The accompanying Notes to Financial Statements are an integral part of this schedule.
100
Table of Contents
Moderately Aggressive Allocation Portfolio
Schedule of Investments as of June 30, 2010
(unaudited)
| Shares | Common Stock (11.0%) | Value | |||
Information Technology (2.6%) - continued | |||||
| 15,600 | Paychex, Inc. | $ | 405,132 | ||
| 70,193 | Polycom, Inc.a | 2,091,049 | |||
| 73,305 | Teradyne, Inc.a | 714,724 | |||
| 213,043 | TIBCO Software, Inc.a | 2,569,299 | |||
| 26,151 | Tyco Electronics, Ltd. | 663,712 | |||
| 56,500 | ValueClick, Inc.a | 603,985 | |||
| 25,600 | VeriFone Systems, Inc.a | 484,608 | |||
| 13,050 | Visa, Inc. | 923,287 | |||
| 30,898 | Vishay Intertechnology, Inc.a | 239,151 | |||
| 116,970 | Xerox Corporation | 940,439 | |||
| 17,544 | Xilinx, Inc. | 443,161 | |||
| Total Information Technology | 52,764,501 | ||||
Materials (0.4%) | |||||
| 17,133 | Albemarle Corporation | 680,351 | |||
| 10,770 | Allegheny Technologies, Inc. | 475,926 | |||
| 8,001 | Ball Corporation | 422,693 | |||
| 13,700 | CF Industries Holdings, Inc. | 869,265 | |||
| 46,234 | E.I. du Pont de Nemours and Company | 1,599,234 | |||
| 24,924 | Freeport-McMoRan Copper & Gold, Inc. | 1,473,756 | |||
| 25,457 | Owens-Illinois, Inc.a | 673,338 | |||
| 11,410 | Silgan Holdings, Inc. | 323,816 | |||
| 27,320 | Steel Dynamics, Inc. | 360,351 | |||
| 31,800 | Temple-Inland, Inc. | 657,306 | |||
| Total Materials | 7,536,036 | ||||
Telecommunications Services (<0.1%) | |||||
| 9,960 | Telephone and Data Systems, Inc. | 302,684 | |||
| Total Telecommunications Services | 302,684 | ||||
Utilities (0.2%) | |||||
| 9,361 | Alliant Energy Corporation | 297,118 | |||
| 45,930 | American Electric Power Company, Inc. | 1,483,539 | |||
| 13,836 | DPL, Inc. | 330,681 | |||
| 2,336 | Entergy Corporation | 167,304 | |||
| 3,323 | FirstEnergy Corporation | 117,069 | |||
| 27,869 | NV Energy, Inc. | 329,133 | |||
| 18,906 | Portland General Electric Company | 346,547 | |||
| 39,478 | Southwest Gas Corporation | 1,164,601 | |||
| 11,034 | UGI Corporation | 280,705 | |||
| Total Utilities | 4,516,697 | ||||
Total Common Stock (cost $239,409,213) | 222,902,854 | ||||
| Principal Amount | Long-Term Fixed Income (9.8%) | ||||
Asset-Backed Securities (0.3%) | |||||
| GSAMP Trust | |||||
| 2,020,903 | 0.527%, 7/26/2010b | 1,598,323 | |||
| J.P. Morgan Mortgage Trust | |||||
| 3,800,000 | 5.461%, 10/25/2036 | 2,634,065 | |||
| Renaissance Home Equity Loan Trust | |||||
| 1,831,095 | 5.746%, 5/25/2036 | 999,177 | |||
| $1,600,000 | 6.011%, 5/25/2036 | 922,453 | |||
Total Asset-Backed Securities | 6,154,018 | ||||
Basic Materials (0.4%) | |||||
| Arch Coal, Inc. | |||||
| 1,020,000 | 8.750%, 8/1/2016c | 1,063,350 | |||
| CF Industries, Inc. | |||||
| 1,020,000 | 7.125%, 5/1/2020 | 1,045,500 | |||
| CONSOL Energy, Inc. | |||||
| 1,020,000 | 8.000%, 4/1/2017c | 1,053,150 | |||
| Domtar Corporation | |||||
| 860,000 | 10.750%, 6/1/2017 | 1,032,000 | |||
| FMG Finance, Pty., Ltd. | |||||
| 910,000 | 10.625%, 9/1/2016c | 1,001,000 | |||
| Georgia-Pacific Corporation | |||||
| 970,000 | 8.000%, 1/15/2024 | 1,028,200 | |||
| Lyondell Chemical Company | |||||
| 970,000 | 11.000%, 5/1/2018 | 1,040,325 | |||
| Total Basic Materials | 7,263,525 | ||||
Capital Goods (0.1%) | |||||
| Case New Holland, Inc. | |||||
| 1,090,000 | 7.875%, 12/1/2017c | 1,098,175 | |||
| Owens-Illinois, Inc. | |||||
| 1,020,000 | 7.800%, 5/15/2018 | 1,062,075 | |||
| Total Capital Goods | 2,160,250 | ||||
Collateralized Mortgage Obligations (1.0%) | |||||
| Citigroup Mortgage Loan Trust, Inc. | |||||
| 898,871 | 5.500%, 11/25/2035 | 687,866 | |||
| Citimortgage Alternative Loan Trust | |||||
| 2,851,699 | 5.750%, 4/25/2037 | 2,217,244 | |||
| Countrywide Alternative Loan Trust | |||||
| 589,046 | 6.000%, 1/25/2037 | 392,889 | |||
| Countrywide Home Loans | |||||
| 2,323,086 | 5.750%, 4/25/2037 | 1,853,695 | |||
| Deutsche Alt-A Securities, Inc. | |||||
| 701,464 | 5.500%, 10/25/2021 | 596,286 | |||
| 1,183,437 | 6.000%, 10/25/2021 | 938,255 | |||
| HomeBanc Mortgage Trust | |||||
| 2,003,732 | 5.958%, 4/25/2037 | 1,298,224 | |||
| J.P. Morgan Mortgage Trust | |||||
| 454,062 | 5.933%, 10/25/2036 | 398,139 | |||
| MASTR Alternative Loans Trust | |||||
| 638,580 | 6.500%, 7/25/2034 | 644,611 | |||
| Merrill Lynch Alternative Note Asset Trust | |||||
| 693,215 | 6.000%, 3/25/2037 | 523,027 | |||
| Sequoia Mortgage Trust | |||||
| 1,028,897 | 5.713%, 9/20/2046 | 377,427 | |||
| WaMu Mortgage Pass Through Certificates | |||||
| 981,395 | 5.923%, 9/25/2036 | 858,349 | |||
| 1,801,547 | 6.020%, 10/25/2036 | 1,596,834 | |||
The accompanying Notes to Financial Statements are an integral part of this schedule.
101
Table of Contents
Moderately Aggressive Allocation Portfolio
Schedule of Investments as of June 30, 2010
(unaudited)
| Principal Amount | Long-Term Fixed Income (9.8%) | Value | |||
Collateralized Mortgage Obligations (1.0%) - continued | |||||
| $6,583,029 | 5.570%, 11/25/2036 | $ | 5,752,560 | ||
| Total Collateralized Mortgage Obligations | 18,135,406 | ||||
Commercial Mortgage-Backed Securities (1.9%) | |||||
| Banc of America Commercial Mortgage, Inc. | |||||
| 3,800,000 | 5.356%, 10/10/2045 | 3,804,248 | |||
| 3,675,000 | 5.658%, 6/10/2049 | 3,551,226 | |||
| Bear Stearns Commercial Mortgage Securities, Inc. | |||||
| 1,710,000 | 5.331%, 2/11/2044 | 1,675,403 | |||
| 4,500,000 | 5.694%, 6/11/2050 | 4,555,206 | |||
| Citigroup/Deutsche Bank Commercial Mortgage | |||||
| 3,900,000 | 5.322%, 12/11/2049 | 3,787,891 | |||
| Citigroup/Deutsche Bank Commercial Mortgage Pass- Through Certificates | |||||
| 3,150,000 | 5.617%, 10/15/2048 | 3,226,236 | |||
| Credit Suisse Mortgage Capital Certificates | |||||
| 1,900,000 | 5.467%, 9/15/2039 | 1,867,271 | |||
| Federal Home Loan Mortgage Corporation Multifamily Structured Pass Through Certificate | |||||
| 465,000 | 3.342%, 12/25/2019 | 475,345 | |||
| Government National Mortgage Association | |||||
| 462,610 | 3.214%, 1/16/2040 | 476,401 | |||
| Greenwich Capital Commercial Funding Corporation | |||||
| 1,350,000 | 5.867%, 12/10/2049 | 1,071,872 | |||
| GS Mortgage Securities Corporation II | |||||
| 3,900,000 | 4.761%, 7/10/2039 | 3,961,179 | |||
| J.P. Morgan Chase Commercial Mortgage Securities Corporation | |||||
| 3,350,000 | 5.814%, 6/12/2043 | 3,476,158 | |||
| 3,625,000 | 5.336%, 5/15/2047 | 3,582,754 | |||
| LB-UBS Commercial Mortgage Trust | |||||
| 3,500,000 | 5.866%, 9/15/2045 | 3,526,117 | |||
Total Commercial Mortgage-Backed Securities | 39,037,307 | ||||
Communications Services (0.4%) | |||||
| Clear Channel Worldwide Holdings, Inc. | |||||
| 1,100,000 | 9.250%, 12/15/2017c | 1,105,500 | |||
| Cricket Communications, Inc. | |||||
| 1,020,000 | 9.375%, 11/1/2014 | 1,035,300 | |||
| DISH DBS Corporation | |||||
| 1,070,000 | 7.125%, 2/1/2016 | 1,072,675 | |||
| Intelsat Jackson Holdings, Ltd. | |||||
| 1,115,000 | 8.500%, 11/1/2019c | 1,126,150 | |||
| New Communications Holdings, Inc. | |||||
| 1,175,000 | 8.250%, 4/15/2017c | 1,179,406 | |||
| Qwest Communications International, Inc. | |||||
| 1,075,000 | 7.500%, 2/15/2014 | 1,077,688 | |||
| Virgin Media Finance plc | |||||
| 1,020,000 | 8.375%, 10/15/2019 | 1,032,750 | |||
| Wind Acquisition Holdings Finance SPA | |||||
| 1,020,000 | 12.250%, 7/15/2017c | 928,200 | |||
| Total Communications Services | 8,557,669 | ||||
Consumer Cyclical (0.5%) | |||||
| Goodyear Tire & Rubber Company | |||||
| 1,055,000 | 10.500%, 5/15/2016 | 1,147,312 | |||
| KB Home | |||||
| 1,172,000 | 6.250%, 6/15/2015 | 1,043,080 | |||
| Macy’s Retail Holdings, Inc. | |||||
| 910,000 | 8.375%, 7/15/2015 | 1,003,275 | |||
| MGM Resorts International | |||||
| 910,000 | 11.125%, 11/15/2017 | 1,003,275 | |||
| Pinnacle Entertainment, Inc. | |||||
| 1,080,000 | 8.625%, 8/1/2017c | 1,112,400 | |||
| QVC, Inc. | |||||
| 1,170,000 | 7.125%, 4/15/2017c | 1,146,600 | |||
| Starwood Hotels & Resorts Worldwide, Inc. | |||||
| 1,080,000 | 6.750%, 5/15/2018 | 1,080,000 | |||
| Toys R Us Property Company I, LLC | |||||
| 910,000 | 10.750%, 7/15/2017c | 994,175 | |||
| WMG Acquisition Corporation | |||||
| 1,050,000 | 9.500%, 6/15/2016 | 1,118,250 | |||
| Total Consumer Cyclical | 9,648,367 | ||||
Consumer Non-Cyclical (0.2%) | |||||
| Biomet, Inc. | |||||
| 1,050,000 | 10.375%, 10/15/2017 | 1,128,750 | |||
| Community Health Systems, Inc. | |||||
| 1,020,000 | 8.875%, 7/15/2015 | 1,051,875 | |||
| HCA, Inc. | |||||
| 970,000 | 9.625%, 11/15/2016 | 1,037,900 | |||
| JBS USA, LLC/JBS USA Finance, Inc. | |||||
| 910,000 | 11.625%, 5/1/2014 | 1,020,337 | |||
| Total Consumer Non-Cyclical | 4,238,862 | ||||
Energy (0.2%) | |||||
| Forest Oil Corporation | |||||
| 1,070,000 | 7.250%, 6/15/2019 | 1,032,550 | |||
| Petrohawk Energy Corporation | |||||
| 1,020,000 | 7.875%, 6/1/2015 | 1,022,550 | |||
| Pioneer Natural Resources Company | |||||
| 1,115,000 | 7.500%, 1/15/2020 | 1,149,116 | |||
The accompanying Notes to Financial Statements are an integral part of this schedule.
102
Table of Contents
Moderately Aggressive Allocation Portfolio
Schedule of Investments as of June 30, 2010
(unaudited)
| Principal Amount | Long-Term Fixed Income (9.8%) | Value | |||
| Energy (0.2%) - continued | |||||
Plains Exploration & Production Company | |||||
| $1,080,000 | 7.625%, 6/1/2018 | $ | 1,055,700 | ||
Total Energy | 4,259,916 | ||||
| Financials (0.2%) | |||||
Achmea Hypotheekbank NV | |||||
| 465,000 | 3.200%, 11/3/2014c | 480,418 | |||
Canadian Imperial Bank of Commerce | |||||
| 465,000 | 2.600%, 7/2/2015c,d | 467,534 | |||
CIE Financement Foncier | |||||
| 450,000 | 2.125%, 4/22/2013c | 454,357 | |||
CIT Group, Inc. | |||||
| 1,171,685 | 7.000%, 5/1/2017 | 1,054,517 | |||
Dexia Credit Local SA | |||||
| 450,000 | 2.750%, 4/29/2014c | 453,438 | |||
Icahn Enterprises, LP | |||||
| 1,170,000 | 8.000%, 1/15/2018c | 1,134,900 | |||
International Bank for Reconstruction & Development | |||||
| 465,000 | 2.375%, 5/26/2015 | 472,781 | |||
Royal Bank of Canada | |||||
| 400,000 | 3.125%, 4/14/2015c | 414,917 | |||
Total Financials | 4,932,862 | ||||
| Foreign Government (0.1%) | |||||
British Columbia Government Notes | |||||
| 450,000 | 2.850%, 6/15/2015 | 464,796 | |||
Kommunalbanken AS | |||||
| 450,000 | 2.750%, 5/5/2015c | 458,063 | |||
Kreditanstalt fuer Wiederaufbau | |||||
| 205,000 | 1.250%, 6/15/2012 | 205,310 | |||
Manitoba Government Notes | |||||
| 465,000 | 2.625%, 7/15/2015 | �� | 472,907 | ||
Total Foreign Government | 1,601,076 | ||||
Mortgage-Backed Securities (1.3%) | |||||
Federal Home Loan Mortgage Corporation Gold 30-Yr. Pass Through | |||||
| 1,800,000 | 6.000%, 7/1/2040d | 1,953,562 | |||
Federal National Mortgage Association Conventional 15- Yr. Pass Through | |||||
| 900,000 | 5.000%, 7/1/2025d | 960,187 | |||
Federal National Mortgage Association Conventional 30- Yr. Pass Through | |||||
| 22,800,000 | 4.500%, 7/1/2040d,e | 23,630,057 | |||
Total Mortgage-Backed Securities | 26,543,806 | ||||
Technology (0.1%) | |||||
Freescale Semiconductor, Inc. | |||||
| 1,020,000 | 9.250%, 4/15/2018c | 1,007,250 | |||
Iron Mountain, Inc. | |||||
| 1,020,000 | 8.000%, 6/15/2020 | 1,035,300 | |||
Total Technology | 2,042,550 | ||||
| U.S. Government and Agencies (3.0%) | |||||
FDIC Structured Sale Guaranteed Notes | |||||
| 185,000 | Zero Coupon, 1/7/2012c | 182,275 | |||
| 185,000 | Zero Coupon, 1/7/2014c | 173,782 | |||
Federal Home Loan Banks | |||||
| 1,870,000 | 5.375%, 5/18/2016 | 2,181,598 | |||
| 2,750,000 | 5.000%, 11/17/2017 | 3,138,130 | |||
Federal Home Loan Mortgage Corporation | |||||
| 3,295,000 | 1.125%, 7/27/2012 | 3,318,292 | |||
| 920,000 | 2.500%, 1/7/2014 | 953,922 | |||
| 1,400,000 | 4.875%, 6/13/2018 | 1,584,596 | |||
| 660,000 | 3.750%, 3/27/2019 | 688,593 | |||
Federal National Mortgage Association | |||||
| 1,725,000 | 2.000%, 4/15/2013 | 1,742,345 | |||
| 1,200,000 | 4.375%, 10/15/2015 | 1,327,195 | |||
| 505,000 | 6.250%, 5/15/2029 | 624,838 | |||
Tennessee Valley Authority | |||||
| 390,000 | 5.250%, 9/15/2039 | 431,141 | |||
U.S. Treasury Bonds | |||||
| 755,000 | 4.625%, 2/15/2040 | 848,667 | |||
U.S. Treasury Bonds, TIPS | |||||
| 131,117 | 2.125%, 2/15/2040 | 143,665 | |||
U.S. Treasury Notes | |||||
| 7,000,000 | 0.875%, 12/31/2010f | 7,021,875 | |||
| 800,000 | 1.125%, 6/15/2013 | 803,184 | |||
| 3,515,000 | 1.750%, 1/31/2014 | 3,571,570 | |||
| 1,845,000 | 2.500%, 3/31/2015 | 1,911,881 | |||
| 9,000,000 | 2.500%, 4/30/2015 | 9,319,923 | |||
| 1,390,000 | 2.625%, 2/29/2016 | 1,430,071 | |||
| 3,350,000 | 3.250%, 3/31/2017 | 3,530,062 | |||
| 2,900,000 | 3.625%, 2/15/2020 | 3,064,030 | |||
| 4,500,000 | 3.500%, 5/15/2020 | 4,709,520 | |||
| 950,000 | 7.625%, 2/15/2025 | 1,395,609 | |||
| 2,250,000 | 4.375%, 5/15/2040 | 2,433,510 | |||
U.S. Treasury Notes, TIPS | |||||
| 601,573 | 3.375%, 1/15/2012 | 634,190 | |||
| 680,704 | 0.625%, 4/15/2013 | 694,691 | |||
| 790,466 | 2.000%, 1/15/2014 | 842,093 | |||
| 593,668 | 1.625%, 1/15/2015 | 626,691 | |||
| 534,328 | 2.500%, 7/15/2016 | 594,606 | |||
| 704,719 | 2.625%, 7/15/2017 | 794,957 | |||
| 554,450 | 1.375%, 1/15/2020 | 567,747 | |||
| 156,128 | 2.375%, 1/15/2025 | 173,192 | |||
Total U.S. Government and Agencies | 61,458,441 | ||||
| Utilities (0.1%) | |||||
El Paso Corporation | |||||
| 1,020,000 | 7.000%, 6/15/2017 | 1,014,256 | |||
The accompanying Notes to Financial Statements are an integral part of this schedule.
103
Table of Contents
Moderately Aggressive Allocation Portfolio
Schedule of Investments as of June 30, 2010
(unaudited)
| Principal Amount | Long-Term Fixed Income (9.8%) | Value | ||||
Utilities (0.1%) - continued | ||||||
NRG Energy, Inc. | ||||||
| $1,070,000 | 7.375%, 2/1/2016 | $ | 1,064,650 | |||
Total Utilities | 2,078,906 | |||||
Total Long-Term Fixed Income (cost $192,057,915) | 198,112,961 | |||||
Short-Term Investments (4.4%)g | ||||||
Bank of America Repurchase Agreement |
| |||||
| 22,335,000 | 0.010%, 7/1/2010h | 22,335,000 | ||||
Enterprise Funding Company, LLC | ||||||
| 7,665,000 | 0.090%, 7/1/2010 | 7,665,000 | ||||
| Federal Home Loan Bank Discount Notes | ||||||
| 550,000 | 0.155%, 7/7/2010f | 549,986 | ||||
| 20,000,000 | 0.065%, 7/9/2010 | 19,999,711 | ||||
| 5,000,000 | 0.070%, 7/14/2010 | 4,999,874 | ||||
| Federal Home Loan Mortgage Corporation Discount Notes | ||||||
| 8,160,000 | 0.080%, 7/8/2010 | 8,159,873 | ||||
| 15,000,000 | 0.083%, 7/23/2010 | 14,999,236 | ||||
| Federal National Mortgage Association Discount Notes | ||||||
| 8,000,000 | 0.180%, 7/7/2010f | 7,999,763 | ||||
| 2,180,000 | 0.070%, 7/21/2010 | 2,179,915 | ||||
Total Short-Term Investments (at amortized cost) | 88,888,358 | |||||
Total Investments (cost $2,429,593,328) 101.2% | $ | 2,053,467,271 | ||||
Other Assets and Liabilities, Net (1.2%) | (24,136,659 | ) | ||||
Total Net Assets 100.0% | $ | 2,029,330,612 | ||||
| a | Non-income producing security. |
| b | Denotes variable rate obligations for which the current coupon rate and next scheduled reset date are shown. |
| c | Denotes securities sold under Rule 144A of the Securities Act of 1933, which exempts them from registration. These securities have been deemed liquid and may be resold to other dealers in the program or to other qualified institutional buyers. As of June 30, 2010, the value of these investments was $17,035,040 or 0.8% of total net assets. |
| d | Denotes investments purchased on a when-issued or delayed delivery basis. |
| e | All or a portion of the security was earmarked to cover written options. |
| f | At June 30, 2010, $15,571,624 of investments were held on deposit with the counterparty and pledged as the initial margin deposit for open futures contracts. |
| g | The interest rate shown reflects the yield, coupon rate or, for securities purchased at a discount, the discount rate at the date of purchase. |
| h | Repurchase agreement dated June 30, 2010, $22,335,006 maturing July 1, 2010, collateralized by $22,781,799 U.S. Treasury Notes, 3.125% due April 30, 2013. |
Definitions:
ADR | - | American Depositary Receipt, which are certificates for an underlying foreign security’s shares held by an issuing U.S. depository bank. | ||
TIPS | - | Treasury Inflation Protected Security. |
Unrealized Appreciation (Depreciation)
Gross unrealized appreciation and depreciation of investments, based on cost for federal income tax purposes, were as follows:
Gross unrealized appreciation | $ | 22,324,802 | ||
Gross unrealized depreciation | (398,450,859 | ) | ||
Net unrealized appreciation (depreciation) | $ | (376,126,057 | ) | |
Cost for federal income tax purposes | $ | 2,429,593,328 | ||
The accompanying Notes to Financial Statements are an integral part of this schedule.
104
Table of Contents
Moderately Aggressive Allocation Portfolio
Schedule of Investments as of June 30, 2010
(unaudited)
Fair Valuation Measurements
The following table is a summary of the inputs used, as of June 30, 2010, in valuing Moderately Aggressive Allocation Portfolio’s assets carried at fair value as discussed in the Notes to Financial Statements.
Investments in Securities | Total | Level 1 | Level 2 | Level 3 | ||||||||
Mutual Funds | ||||||||||||
Equity Mutual Funds | 1,181,949,808 | 1,181,949,808 | — | — | ||||||||
Fixed Income Mutual Funds | 361,613,290 | 361,613,290 | — | — | ||||||||
Common Stock | ||||||||||||
Consumer Discretionary | 31,287,729 | 31,287,729 | — | — | ||||||||
Consumer Staples | 10,844,171 | 10,844,171 | — | — | ||||||||
Energy | 23,729,092 | 23,729,092 | — | — | ||||||||
Financials | 33,602,534 | 33,602,534 | — | — | ||||||||
Health Care | 28,823,926 | 28,823,926 | — | — | ||||||||
Industrials | 29,495,484 | 29,495,484 | — | — | ||||||||
Information Technology | 52,764,501 | 52,764,501 | — | — | ||||||||
Materials | 7,536,036 | 7,536,036 | — | — | ||||||||
Telecommunications Services | 302,684 | 302,684 | — | — | ||||||||
Utilities | 4,516,697 | 4,516,697 | — | — | ||||||||
Long-Term Fixed Income | ||||||||||||
Asset-Backed Securities | 6,154,018 | — | 6,154,018 | — | ||||||||
Basic Materials | 7,263,525 | — | 7,263,525 | — | ||||||||
Capital Goods | 2,160,250 | — | 2,160,250 | — | ||||||||
Collateralized Mortgage Obligations | 18,135,406 | — | 18,135,406 | — | ||||||||
Commercial Mortgage-Backed Securities | 39,037,307 | — | 39,037,307 | — | ||||||||
Communications Services | 8,557,669 | — | 8,557,669 | — | ||||||||
Consumer Cyclical | 9,648,367 | — | 9,648,367 | — | ||||||||
Consumer Non-Cyclical | 4,238,862 | — | 4,238,862 | — | ||||||||
Energy | 4,259,916 | — | 4,259,916 | — | ||||||||
Financials | 4,932,862 | — | 4,932,862 | — | ||||||||
Foreign Government | 1,601,076 | — | 1,601,076 | — | ||||||||
Mortgage-Backed Securities | 26,543,806 | — | 26,543,806 | — | ||||||||
Technology | 2,042,550 | — | 2,042,550 | — | ||||||||
U.S. Government and Agencies | 61,458,441 | — | 61,102,384 | 356,057 | ||||||||
Utilities | 2,078,906 | — | 2,078,906 | — | ||||||||
Short-Term Investments | 88,888,358 | — | 88,888,358 | — | ||||||||
Total | $ | 2,053,467,271 | $ | 1,766,465,952 | $ | 286,645,262 | $ | 356,057 | ||||
Other Financial Instruments | ||||||||||||
Asset Derivatives | ||||||||||||
Futures Contracts | 278,586 | 278,586 | — | — | ||||||||
Total Asset Derivatives | $ | 278,586 | $ | 278,586 | $ | — | $ | — | ||||
Liability Derivatives | ||||||||||||
Futures Contracts | 1,971,832 | 1,971,832 | — | — | ||||||||
Call Options Written | 168,438 | — | — | 168,438 | ||||||||
Total Liability Derivatives | $ | 2,140,270 | $ | 1,971,832 | $ | — | $ | 168,438 | ||||
The accompanying Notes to Financial Statements are an integral part of this schedule.
105
Table of Contents
Moderately Aggressive Allocation Portfolio
Schedule of Investments as of June 30, 2010
(unaudited)
The following table is a reconciliation of assets in which significant unobservable inputs (Level 3) were used in determining fair value for Moderately Aggressive Allocation Portfolio as discussed in item 2(A) of the Notes to Financial Statements.
Investments in Securities | Value December 31, 2009 | Accrued Discounts and/or Premiums | Realized Gain/(Loss) | Change in Unrealized Gain/(Loss) | Net Purchases/(Sales) | Transfers Into Level 3 | Transfers Out of Level 3 | Value June 30, 2010 | ||||||||||||||||
Long-Term Fixed Income | ||||||||||||||||||||||||
U.S. Government and Agencies | — | 791 | — | 2,828 | 352,438 | — | — | 356,057 | ||||||||||||||||
Total | $ | — | $ | 791 | $ | — | $ | 2,828 | $ | 352,438 | $ | — | $ | — | $ | 356,057 | ||||||||
Other Financial Instruments | ||||||||||||||||||||||||
Liability Derivatives | ||||||||||||||||||||||||
Call Options Written | — | — | — | 168,438 | — | — | — | 168,438 | ||||||||||||||||
Total | $ | — | $ | — | $ | — | $ | 168,438 | $ | — | $ | — | $ | — | $ | 168,438 | ||||||||
Futures Contracts | Number of Contracts Long/(Short) | Expiration Date | Notional Principal Amount | Value | Unrealized Gain/(Loss) | |||||||||||||
Russell 2000 Index Mini-Futures | (616 | ) | September 2010 | ($ | 37,719,066 | ) | ($ | 37,440,480 | ) | $ | 278,586 | |||||||
S&P 500 Index Futures | 279 | September 2010 | 73,577,183 | 71,605,351 | (1,971,832 | ) | ||||||||||||
Total Futures Contracts | ($ | 1,693,246 | ) | |||||||||||||||
Call Options Written | Number of Contracts | Exercise Price | Expiration Date | Value | Unrealized Gain/(Loss) | |||||||||||||
Federal National Mortgage | ||||||||||||||||||
Association Conventional 30- Yr. Pass Through | 22 | $ | 102.36 | July 2010 | ($285,313 | ) | ($168,438 | ) | ||||||||||
Total Call Options Written | ($285,313 | ) | ($168,438 | ) | ||||||||||||||
The following table summarizes the fair value and Statement of Assets and Liabilities location, as of June 30, 2010, for Moderately Aggressive Allocation Portfolio’s investments in financial derivative instruments by primary risk exposure as discussed under item (2) Significant Accounting Policies of the Notes to Financial Statements.
Derivatives by risk category | Statement of Assets and Liabilities Location | Fair Value | |||
Asset Derivatives | |||||
Equity Contracts | |||||
Futures* | Net Assets - Net unrealized appreciation/(depreciation) on Futures contracts | 278,586 | |||
Total Equity Contracts | 278,586 | ||||
Total Asset Derivatives | $ | 278,586 | |||
Liability Derivatives | |||||
Equity Contracts | |||||
Futures* | Net Assets - Net unrealized appreciation/(depreciation) on Futures contracts | 1,971,832 | |||
Total Equity Contracts | 1,971,832 | ||||
Interest Rate Contracts | |||||
Options Written | Net Assets - Net unrealized appreciation/(depreciation) on Written option contracts | 168,438 | |||
Total Interest Rate Contracts | 168,438 | ||||
Total Liability Derivatives | $ | 2,140,270 | |||
| * | Includes cumulative appreciation/depreciation of futures contracts as reported in the Schedule of Investments. Only current day’s variation margin is reported within the Statement of Assets and Liabilities. |
The accompanying Notes to Financial Statements are an integral part of this schedule.
106
Table of Contents
Moderately Aggressive Allocation Portfolio
Schedule of Investments as of June 30, 2010
(unaudited)
The following table summarizes the net realized gains/(losses) and Statement of Operations location, for the period ended June 30, 2010, for Moderately Aggressive Allocation Portfolio’s investments in financial derivative instruments by primary risk exposure.
Derivatives by risk category | Statement of Operations Location | Realized Gains/(Losses) recognized in Income | ||||
Equity Contracts | ||||||
Futures | Net realized gains/(losses) on Futures contracts | 6,801,484 | ||||
Total Equity Contracts | 6,801,484 | |||||
Credit Contracts | ||||||
Credit Default Swaps | Net realized gains/(losses) on Swap agreements | (1,293,431 | ) | |||
Total Credit Contracts | (1,293,431 | ) | ||||
Total | $ | 5,508,053 | ||||
The following table summarizes the change in net unrealized appreciation/(depreciation) and Statement of Operations location, for the period ended June 30, 2010, for Moderately Aggressive Allocation Portfolio’s investments in financial derivative instruments by primary risk exposure.
Derivatives by risk category | Statement of Operations Location | Change in unrealized appreciation/(depreciation) recognized in Income | ||||
Equity Contracts | ||||||
Futures | Change in net unrealized appreciation/(depreciation) on Futures contracts | (5,117,197 | ) | |||
Total Equity Contracts | (5,117,197 | ) | ||||
Interest Rate Contracts | ||||||
Options Written | Change in net unrealized appreciation/(depreciation) on Written option contracts | (168,438 | ) | |||
Total Interest Rate Contracts | (168,438 | ) | ||||
Credit Contracts | ||||||
Credit Default Swaps | Change in net unrealized appreciation/(depreciation) on Swap agreements | 1,508,131 | ||||
Total Credit Contracts | 1,508,131 | |||||
Total | ($ | 3,777,504 | ) | |||
The following table presents Moderately Aggressive Allocation Portfolio’s average volume of derivative activity during the period ended June 30, 2010.
Derivative Risk Category | Futures (Notional*) | Futures (Percentage of Average Net Assets) | Swaps (Notional*) | Swaps (Percentage of Average Net Assets) | Options (Contracts) | |||||||||
Equity Contracts | $ | 139,235,555 | 6.7 | % | N/A | N/A | 6 | |||||||
Credit Contracts | N/A | N/A | $ | 12,502,108 | 0.6 | % | N/A | |||||||
| * | Notional amount represents long or short, or both, derivative positions held by the portfolio. |
The accompanying Notes to Financial Statements are an integral part of this schedule.
107
Table of Contents
Moderately Aggressive Allocation Portfolio
Schedule of Investments as of June 30, 2010
(unaudited)
Investment in Affiliates
Affiliated issuers, as defined under the Investment Company Act of 1940, include those in which the Portfolio’s holdings of an issuer represent 5% or more of the outstanding voting securities of an issuer, or any affiliated mutual fund.
A summary of transactions for the fiscal year to date, in Moderately Aggressive Allocation Portfolio, is as follows:
Portfolio | Value December 31, 2009 | Gross Purchases | Gross Sales | Shares Held at June 30, 2010 | Value June 30, 2010 | Income Earned January 1, 2010 - June 30, 2010 | |||||||||||
Real Estate Securities | $ | 57,409,186 | $ | 1,888,206 | $ | 261,417 | 5,066,126 | $ | 62,315,375 | $ | — | ||||||
Partner Small Cap Growth | 49,447,816 | 1,416,155 | 196,063 | 5,056,075 | 49,363,974 | — | |||||||||||
Partner Small Cap Value | 54,192,601 | 1,541,731 | 196,063 | 3,563,777 | 54,169,411 | 125,577 | |||||||||||
Small Cap Stock | 45,306,168 | 2,355,275 | 1,802,365 | 4,528,335 | 43,812,093 | 19,423 | |||||||||||
Mid Cap Growth II | 51,063,329 | 1,984,766 | 196,063 | 6,266,321 | 50,953,337 | — | |||||||||||
Partner Mid Cap Value | 66,785,383 | 2,147,214 | 261,417 | 6,349,210 | 66,174,006 | 259,008 | |||||||||||
Mid Cap Stock | 142,761,304 | 4,775,634 | 10,504,730 | 14,014,861 | 132,083,061 | 103,931 | |||||||||||
Partner Worldwide Allocation | 73,662,379 | 38,560,320 | 58,759 | 14,316,983 | 102,768,732 | 7,495 | |||||||||||
Partner International Stock | 192,151,514 | 82,207 | 986,908 | 19,126,961 | 166,710,596 | 82,207 | |||||||||||
Large Cap Growth II | 139,972,788 | 8,598,084 | 522,834 | 20,270,780 | 127,199,142 | 186,183 | |||||||||||
Large Cap Value | 170,664,869 | 5,709,128 | 784,250 | 18,195,481 | 159,567,094 | 44,509 | |||||||||||
Large Cap Stock | 168,883,667 | 3,766,494 | 6,483,784 | 21,506,659 | 150,398,219 | 29,131 | |||||||||||
Equity Income Plus | 16,875,813 | 492,711 | 65,354 | 2,188,181 | 16,434,768 | 20,659 | |||||||||||
High Yield | 109,725,904 | 9,376,693 | 7,212,291 | 24,572,836 | 111,194,539 | 4,703,511 | |||||||||||
Income | 229,716,268 | 13,979,874 | 90,974,963 | 16,520,609 | 160,155,744 | 5,179,676 | |||||||||||
Limited Maturity Bond | 81,682,750 | 14,262,130 | 6,575,001 | 9,277,250 | 90,263,007 | 1,437,270 | |||||||||||
Total Value and Income Earned | 1,650,301,739 | 1,543,563,098 | 12,198,581 | ||||||||||||||
The accompanying Notes to Financial Statements are an integral part of this schedule.
108
Table of Contents
Moderate Allocation Portfolio
Schedule of Investments as of June 30, 2010
(unaudited)
The accompanying Notes to Financial Statements are an integral part of this schedule.
109
Table of Contents
Moderate Allocation Portfolio
Schedule of Investments as of June 30, 2010
(unaudited)
| Principal Amount | Long-Term Fixed Income (10.3%) | Value | ||||
| Commercial Mortgage-Backed Securities (2.2%) - continued | ||||||
| $ | 6,300,000 | 5.694%, 6/11/2050 | $ | 6,377,288 | ||
Citigroup/Deutsche Bank Commercial Mortgage | ||||||
| 3,000,000 | 5.322%, 12/11/2049 | 2,913,762 | ||||
Citigroup/Deutsche Bank Commercial Mortgage Pass- Through Certificates | ||||||
| 8,600,000 | 5.617%, 10/15/2048 | 8,808,137 | ||||
Credit Suisse Mortgage Capital Certificates | ||||||
| 2,000,000 | 5.467%, 9/15/2039 | 1,965,548 | ||||
Federal Home Loan Mortgage Corporation Multifamily Structured Pass Through Certificate | ||||||
| 610,000 | 3.342%, 12/25/2019 | 623,571 | ||||
Government National Mortgage Association | ||||||
| 606,865 | 3.214%, 1/16/2040 | 624,956 | ||||
Greenwich Capital Commercial Funding Corporation | ||||||
| 3,150,000 | 5.867%, 12/10/2049 | 2,501,034 | ||||
GS Mortgage Securities Corporation II | ||||||
| 5,300,000 | 4.761%, 7/10/2039 | 5,383,141 | ||||
J.P. Morgan Chase Commercial Mortgage Securities Corporation | ||||||
| 3,700,000 | 5.814%, 6/12/2043 | 3,839,338 | ||||
| 6,125,000 | 5.336%, 5/15/2047 | 6,053,619 | ||||
LB-UBS Commercial Mortgage Trust | ||||||
| 7,300,000 | 5.866%, 9/15/2045 | 7,354,473 | ||||
Total Commercial Mortgage-Backed Securities | 63,206,017 | |||||
| Communications Services (0.4%) | ||||||
Clear Channel Worldwide Holdings, Inc. | ||||||
| 1,450,000 | 9.250%, 12/15/2017c | 1,457,250 | ||||
Cricket Communications, Inc. | ||||||
| 1,400,000 | 9.375%, 11/1/2014 | 1,421,000 | ||||
DISH DBS Corporation | ||||||
| 1,490,000 | 7.125%, 2/1/2016 | 1,493,725 | ||||
Intelsat Jackson Holdings, Ltd. | ||||||
| 1,430,000 | 8.500%, 11/1/2019c | 1,444,300 | ||||
New Communications Holdings, Inc. | ||||||
| 1,505,000 | 8.250%, 4/15/2017c | 1,510,644 | ||||
Qwest Communications International, Inc. | ||||||
| 1,480,000 | 7.500%, 2/15/2014 | 1,483,700 | ||||
Virgin Media Finance plc | ||||||
| 1,390,000 | 8.375%, 10/15/2019 | 1,407,375 | ||||
Wind Acquisition Holdings Finance SPA | ||||||
| 1,400,000 | 12.250%, 7/15/2017c | 1,274,000 | ||||
Total Communications Services | 11,491,994 | |||||
| Consumer Cyclical (0.5%) | ||||||
Goodyear Tire & Rubber Company | ||||||
| 1,355,000 | 10.500%, 5/15/2016 | 1,473,562 | ||||
KB Home | ||||||
| 1,506,000 | 6.250%, 6/15/2015 | 1,340,340 | ||||
Macy’s Retail Holdings, Inc. | ||||||
| 1,260,000 | 8.375%, 7/15/2015 | 1,389,150 | ||||
MGM Resorts International | ||||||
| 1,260,000 | 11.125%, 11/15/2017 | 1,389,150 | ||||
Pinnacle Entertainment, Inc. | ||||||
| 1,470,000 | 8.625%, 8/1/2017c | 1,514,100 | ||||
QVC, Inc. | ||||||
| 1,505,000 | 7.125%, 4/15/2017c | 1,474,900 | ||||
Starwood Hotels & Resorts Worldwide, Inc. | ||||||
| 1,480,000 | 6.750%, 5/15/2018 | 1,480,000 | ||||
Toys R Us Property Company I, LLC | ||||||
| 1,250,000 | 10.750%, 7/15/2017c | 1,365,625 | ||||
WMG Acquisition Corporation | ||||||
| 1,350,000 | 9.500%, 6/15/2016 | 1,437,750 | ||||
Total Consumer Cyclical | 12,864,577 | |||||
| Consumer Non-Cyclical (0.2%) | ||||||
Biomet, Inc. | ||||||
| 1,350,000 | 10.375%, 10/15/2017 | 1,451,250 | ||||
Community Health Systems, Inc. | ||||||
| 1,400,000 | 8.875%, 7/15/2015 | 1,443,750 | ||||
HCA, Inc. | ||||||
| 1,330,000 | 9.625%, 11/15/2016 | 1,423,100 | ||||
JBS USA, LLC/JBS USA Finance, Inc. | ||||||
| 1,250,000 | 11.625%, 5/1/2014 | 1,401,562 | ||||
Total Consumer Non-Cyclical | 5,719,662 | |||||
| Energy (0.2%) | ||||||
Forest Oil Corporation | ||||||
| 1,480,000 | 7.250%, 6/15/2019 | 1,428,200 | ||||
Petrohawk Energy Corporation | ||||||
| 1,400,000 | 7.875%, 6/1/2015 | 1,403,500 | ||||
Pioneer Natural Resources Company | ||||||
| 1,435,000 | 7.500%, 1/15/2020 | 1,478,907 | ||||
Plains Exploration & Production Company | ||||||
| 1,470,000 | 7.625%, 6/1/2018 | 1,436,925 | ||||
Total Energy | 5,747,532 | |||||
| Financials (0.2%) | ||||||
Achmea Hypotheekbank NV | ||||||
| 610,000 | 3.200%, 11/3/2014c | 630,226 | ||||
The accompanying Notes to Financial Statements are an integral part of this schedule.
110
Table of Contents
Moderate Allocation Portfolio
Schedule of Investments as of June 30, 2010
(unaudited)
| Principal Amount | Long-Term Fixed Income (10.3%) | Value | |||
| Financials (0.2%) - continued | |||||
Canadian Imperial Bank of Commerce | |||||
| $610,000 | 2.600%, 7/2/2015c,d | $ | 613,324 | ||
CIE Financement Foncier | |||||
| 600,000 | 2.125%, 4/22/2013c | 605,809 | |||
CIT Group, Inc. | |||||
| 1,506,555 | 7.000%, 5/1/2017 | 1,355,900 | |||
Dexia Credit Local SA | |||||
| 600,000 | 2.750%, 4/29/2014c | 604,584 | |||
Icahn Enterprises, LP | |||||
| 1,510,000 | 8.000%, 1/15/2018c | 1,464,700 | |||
International Bank for Reconstruction & Development | |||||
| 600,000 | 2.375%, 5/26/2015 | 610,040 | |||
Royal Bank of Canada | |||||
| 550,000 | 3.125%, 4/14/2015c | 570,511 | |||
Total Financials | 6,455,094 | ||||
| Foreign Government (0.1%) | |||||
British Columbia Government Notes | |||||
| 600,000 | 2.850%, 6/15/2015 | 619,729 | |||
Kommunalbanken AS | |||||
| 600,000 | 2.750%, 5/5/2015c | 610,751 | |||
Kreditanstalt fuer Wiederaufbau | |||||
| 295,000 | 1.250%, 6/15/2012 | 295,445 | |||
Manitoba Government Notes | |||||
| 600,000 | 2.625%, 7/15/2015 | 610,202 | |||
Total Foreign Government | 2,136,127 | ||||
| Mortgage-Backed Securities (1.3%) | |||||
Federal Home Loan Mortgage Corporation Gold 30-Yr. Pass Through | |||||
| 2,400,000 | 6.000%, 7/1/2040d | 2,604,749 | |||
Federal National Mortgage Association Conventional 15- Yr. Pass Through | |||||
| 1,200,000 | 5.000%, 7/1/2025d | 1,280,250 | |||
Federal National Mortgage Association Conventional 30- Yr. Pass Through | |||||
| 32,400,000 | 4.500%, 7/1/2040d,e | 33,579,554 | |||
Total Mortgage-Backed Securities | 37,464,553 | ||||
| Technology (0.1%) | |||||
Freescale Semiconductor, Inc. | |||||
| 1,400,000 | 9.250%, 4/15/2018c | 1,382,500 | |||
Iron Mountain, Inc. | |||||
| 1,400,000 | 8.000%, 6/15/2020 | 1,421,000 | |||
Total Technology | 2,803,500 | ||||
| U.S. Government and Agencies (2.8%) | |||||
FDIC Structured Sale Guaranteed Notes | |||||
| 240,000 | Zero Coupon, 1/7/2012c | 236,465 | |||
| 240,000 | Zero Coupon, 1/7/2014c | 225,446 | |||
| Federal Home Loan Banks | |||||
| 2,400,000 | 5.375%, 5/18/2016 | 2,799,912 | |||
| 3,500,000 | 5.000%, 11/17/2017 | 3,993,983 | |||
Federal Home Loan Mortgage Corporation | |||||
| 4,250,000 | 1.125%, 7/27/2012 | 4,280,043 | |||
| 1,200,000 | 2.500%, 1/7/2014 | 1,244,246 | |||
| 1,675,000 | 4.875%, 6/13/2018 | 1,895,855 | |||
| 850,000 | 3.750%, 3/27/2019 | 886,825 | |||
Federal National Mortgage Association | |||||
| 2,250,000 | 2.000%, 4/15/2013 | 2,272,624 | |||
| 1,520,000 | 4.375%, 10/15/2015 | 1,681,114 | |||
| 680,000 | 6.250%, 5/15/2029 | 841,365 | |||
Tennessee Valley Authority | |||||
| 520,000 | 5.250%, 9/15/2039 | 574,855 | |||
U.S. Treasury Bonds | |||||
| 1,020,000 | 4.625%, 2/15/2040 | 1,146,543 | |||
U.S. Treasury Bonds, TIPS | |||||
| 176,503 | 2.125%, 2/15/2040 | 193,395 | |||
U.S. Treasury Notes | |||||
| 9,000,000 | 0.875%, 12/31/2010f | 9,028,125 | |||
| 915,000 | 1.125%, 6/15/2013 | 918,642 | |||
| 4,665,000 | 1.750%, 1/31/2014 | 4,740,079 | |||
| 2,185,000 | 2.500%, 3/31/2015 | 2,264,206 | |||
| 12,950,000 | 2.500%, 4/30/2015 | 13,410,334 | |||
| 1,785,000 | 2.625%, 2/29/2016 | 1,836,458 | |||
| 4,350,000 | 3.250%, 3/31/2017 | 4,583,813 | |||
| 3,700,000 | 3.625%, 2/15/2020 | 3,909,279 | |||
| 6,575,000 | 3.500%, 5/15/2020 | 6,881,132 | |||
| 1,250,000 | 7.625%, 2/15/2025 | 1,836,328 | |||
| 2,975,000 | 4.375%, 5/15/2040 | 3,217,641 | |||
U.S. Treasury Notes, TIPS | |||||
| 761,174 | 3.375%, 1/15/2012 | 802,444 | |||
| 892,135 | 0.625%, 4/15/2013 | 910,466 | |||
| 985,133 | 2.000%, 1/15/2014 | 1,049,474 | |||
| 799,169 | 1.625%, 1/15/2015 | 843,623 | |||
| 701,643 | 2.500%, 7/15/2016 | 780,796 | |||
| 909,824 | 2.625%, 7/15/2017 | 1,026,325 | |||
| 730,865 | 1.375%, 1/15/2020 | 748,394 | |||
| 196,605 | 2.375%, 1/15/2025 | 218,093 | |||
Total U.S. Government and Agencies | 81,278,323 | ||||
| Utilities (0.1%) | |||||
| El Paso Corporation | |||||
| 1,400,000 | 7.000%, 6/15/2017 | 1,392,117 | |||
| NRG Energy, Inc. | |||||
| 1,480,000 | 7.375%, 2/1/2016 | 1,472,600 | |||
| Total Utilities | 2,864,717 | ||||
Total Long-Term Fixed Income (cost $285,004,043) | 296,692,555 | ||||
| Shares | Common Stock (7.4%) | ||||
| Consumer Discretionary (1.0%) | |||||
| 54,000 | Aeropostale, Inc.a | 1,546,560 | |||
| 9,821 | Amazon.com, Inc.a | 1,073,043 | |||
| 12,780 | Autoliv, Inc.a | 611,523 | |||
The accompanying Notes to Financial Statements are an integral part of this schedule.
111
Table of Contents
Moderate Allocation Portfolio
Schedule of Investments as of June 30, 2010
(unaudited)
| Shares | Common Stock (7.4%) | Value | |||
| Consumer Discretionary (1.0%) - continued | |||||
| 37,300 | Carnival Corporation | $ | 1,127,952 | ||
| 49,793 | Carter’s, Inc.a | 1,307,066 | |||
| 139,580 | Chico’s FAS, Inc. | 1,379,050 | |||
| 46,600 | Comcast Corporation | 809,442 | |||
| 90,399 | Cooper Tire & Rubber Company | 1,762,781 | |||
| 57,810 | Dana Holding Corporationa | 578,100 | |||
| 12,105 | Dollar Tree, Inc.a | 503,931 | |||
| 92,400 | Domino’s Pizza, Inc.a | 1,044,120 | |||
| 100,200 | Foot Locker, Inc. | 1,264,524 | |||
| 16,388 | Harman International Industries, Inc.a | 489,837 | |||
| 113,199 | International Game Technology | 1,777,224 | |||
| 64,070 | J.C. Penney Company, Inc. | 1,376,224 | |||
| 47,018 | Kohl’s Corporationa | 2,233,355 | |||
| 36,950 | Liberty Media Corporation - Interactivea | 387,975 | |||
| 52,300 | Lowe’s Companies, Inc. | 1,067,966 | |||
| 26,062 | Macy’s, Inc. | 466,510 | |||
| 6,940 | Omnicom Group, Inc. | 238,042 | |||
| 6,891 | Panera Bread Companya | 518,823 | |||
| 15,850 | Target Corporation | 779,345 | |||
| 25,400 | Time Warner Cable, Inc. | 1,322,832 | |||
| 73,635 | Walt Disney Company | 2,319,503 | |||
| 29,100 | Warnaco Group, Inc.a | 1,051,674 | |||
| 182,928 | Warner Music Group Corporationa | 889,030 | |||
| 50,977 | WMS Industries, Inc.a | 2,000,847 | |||
Total Consumer Discretionary | 29,927,279 | ||||
| Consumer Staples (0.4%) | |||||
| 17,770 | Avon Products, Inc. | 470,905 | |||
| 91,100 | Del Monte Foods Company | 1,310,929 | |||
| 16,316 | Flowers Foods, Inc. | 398,600 | |||
| 57,332 | Kraft Foods, Inc. | 1,605,296 | |||
| 16,485 | Kroger Company | 324,590 | |||
| 32,936 | PepsiCo, Inc. | 2,007,449 | |||
| 45,756 | Philip Morris International, Inc. | 2,097,455 | |||
| 15,461 | TreeHouse Foods, Inc.a | 705,949 | |||
| 29,400 | Wal-Mart Stores, Inc. | 1,413,258 | |||
Total Consumer Staples | 10,334,431 | ||||
| Energy (0.8%) | |||||
| 22,913 | Alpha Natural Resources, Inc.a | 776,063 | |||
| 11,730 | Anadarko Petroleum Corporation | 423,336 | |||
| 41,500 | Arch Coal, Inc. | 822,115 | |||
| 28,490 | Baker Hughes, Inc. | 1,184,329 | |||
| 115,900 | Complete Production Services, Inc.a | 1,657,370 | |||
| 37,318 | ConocoPhillips | 1,831,941 | |||
| 40,600 | Dresser-Rand Group, Inc.a | 1,280,930 | |||
| 52,980 | ENSCO International plc ADR | 2,081,054 | |||
| 8,349 | EOG Resources, Inc. | 821,291 | |||
| 68,729 | Forest Oil Corporationa | 1,880,425 | |||
| 254,500 | International Coal Group, Inc.a | 979,825 | |||
| 80,500 | James River Coal Companya | 1,281,560 | |||
| 12,683 | National Oilwell Varco, Inc. | 419,427 | |||
| 40,810 | Occidental Petroleum Corporation | 3,148,491 | |||
| 35,481 | Schlumberger, Ltd. | 1,963,519 | |||
| 24,200 | Ultra Petroleum Corporationa | 1,070,850 | |||
| 28,020 | Valero Energy Corporation | 503,800 | |||
| 36,100 | Weatherford International, Ltd.a | 474,354 | |||
Total Energy | 22,600,680 | ||||
| Financials (1.1%) | |||||
| 19,487 | Affiliated Managers Group, Inc.a | 1,184,225 | |||
| 20,168 | Ameriprise Financial, Inc. | 728,670 | |||
| 77,275 | Bank of America Corporation | 1,110,442 | |||
| 31,960 | Bank of New York Mellon Corporation | 789,092 | |||
| 23,370 | Capital One Financial Corporation | 941,811 | |||
| 730,160 | Citigroup, Inc.a | 2,745,402 | |||
| 10,300 | Comerica, Inc. | 379,349 | |||
| 123,689 | Duke Realty Corporation | 1,403,870 | |||
| 10,700 | Endurance Specialty Holdings, Ltd. | 401,571 | |||
| 24,043 | Equity One, Inc. | 375,071 | |||
| 48,247 | Fifth Third Bancorp | 592,956 | |||
| 5,858 | Goldman Sachs Group, Inc. | 768,980 | |||
| 8,815 | Hanover Insurance Group, Inc. | 383,452 | |||
| 50,750 | Hartford Financial Services Group, Inc. | 1,123,097 | |||
| 39,763 | HCC Insurance Holdings, Inc. | 984,532 | |||
| 58,900 | Healthcare Realty Trust, Inc. | 1,294,033 | |||
| 34,846 | Host Hotels & Resorts, Inc. | 469,724 | |||
| 12,766 | IntercontinentalExchange, Inc.a | 1,442,941 | |||
| 26,079 | J.P. Morgan Chase & Company | 954,752 | |||
| 49,700 | KeyCorp | 382,193 | |||
| 9,807 | Lazard, Ltd. | 261,945 | |||
| 31,134 | Morgan Stanley | 722,620 | |||
| 26,503 | New York Community Bancorp, Inc. | 404,701 | |||
| 21,190 | Northern Trust Corporation | 989,573 | |||
| 130,559 | Ocwen Financial Corporationa | 1,330,396 | |||
| 38,000 | Potlatch Corporation | 1,357,740 | |||
| 18,292 | Principal Financial Group, Inc. | 428,764 | |||
| 19,320 | Prudential Financial, Inc. | 1,036,711 | |||
| 15,000 | SunTrust Banks, Inc. | 349,500 | |||
| 76,300 | Texas Capital Bancshares, Inc.a | 1,251,320 | |||
| 31,534 | W.R. Berkley Corporation | 834,390 | |||
| 78,993 | Washington Federal, Inc. | 1,278,107 | |||
| 44,820 | Wells Fargo & Company | 1,147,392 | |||
| 78,600 | Zions Bancorporation | 1,695,402 | |||
Total Financials | 31,544,724 | ||||
| Health Care (1.0%) | |||||
| 89,800 | Align Technology, Inc.a | 1,335,326 | |||
| 4,251 | Beckman Coulter, Inc. | 256,293 | |||
| 23,861 | C.R. Bard, Inc. | 1,849,943 | |||
| 32,424 | Celgene Corporationa | 1,647,788 | |||
| 17,913 | Community Health Systems, Inc.a | 605,639 | |||
| 25,340 | Coventry Health Care, Inc.a | 448,011 | |||
| 11,710 | Covidien, Ltd. | 470,508 | |||
| 19,669 | Gilead Sciences, Inc.a | 674,253 | |||
| 18,426 | Hologic, Inc.a | 256,674 | |||
| 50,913 | ICON plc ADRa | 1,470,877 | |||
| 8,620 | Johnson & Johnson | 509,097 | |||
| 200,260 | King Pharmaceuticals, Inc.a | 1,519,973 | |||
| 27,287 | Medco Health Solutions, Inc.a | 1,502,968 | |||
The accompanying Notes to Financial Statements are an integral part of this schedule.
112
Table of Contents
Moderate Allocation Portfolio
Schedule of Investments as of June 30, 2010
(unaudited)
| Shares | Common Stock (7.4%) | Value | |||
| Health Care (1.0%) - continued | |||||
| 13,120 | Medtronic, Inc. | $ | 475,862 | ||
| 37,600 | NuVasive, Inc.a | 1,333,296 | |||
| 46,500 | STERIS Corporation | 1,445,220 | |||
| 41,100 | Teva Pharmaceutical Industries, Ltd. ADR | 2,136,789 | |||
| 41,697 | Thermo Fisher Scientific, Inc.a | 2,045,238 | |||
| 33,631 | United Therapeutics Corporationa | 1,641,529 | |||
| 90,554 | UnitedHealth Group, Inc. | 2,571,734 | |||
| 6,310 | Varian Medical Systems, Inc.a | 329,887 | |||
| 12,839 | Vertex Pharmaceuticals, Inc.a | 422,403 | |||
| 50,550 | Zimmer Holdings, Inc.a | 2,732,227 | |||
| Total Health Care | 27,681,535 | ||||
| Industrials (1.0%) | |||||
| 7,484 | 3M Company | 591,161 | |||
| 3,970 | Avery Dennison Corporation | 127,556 | |||
| 7,580 | Boeing Company | 475,645 | |||
| 8,710 | Caterpillar, Inc. | 523,210 | |||
| 24,700 | Cooper Industries plc | 1,086,800 | |||
| 42,277 | CSX Corporation | 2,098,208 | |||
| 37,857 | Dover Corporation | 1,582,044 | |||
| 7,915 | Eaton Corporation | 517,958 | |||
| 16,550 | Emerson Electric Company | 723,070 | |||
| 7,150 | FedEx Corporation | 501,286 | |||
| 10,660 | Fluor Corporation | 453,050 | |||
| 41,800 | FTI Consulting, Inc.a | 1,822,062 | |||
| 43,130 | General Electric Company | 621,935 | |||
| 12,522 | Honeywell International, Inc. | 488,734 | |||
| 11,740 | Illinois Tool Works, Inc. | 484,627 | |||
| 23,210 | Ingersoll-Rand plc | 800,513 | |||
| 176,971 | Manitowoc Company, Inc. | 1,617,515 | |||
| 7,008 | Navistar International Corporationa | 344,794 | |||
| 47,715 | Old Dominion Freight Line, Inc.a | 1,676,705 | |||
| 72,558 | Oshkosh Corporationa | 2,260,907 | |||
| 6,831 | Parker Hannifin Corporation | 378,847 | |||
| 4,314 | Precision Castparts Corporation | 443,997 | |||
| 14,459 | Roper Industries, Inc. | 809,126 | |||
| 65,800 | Shaw Group, Inc.a | 2,251,676 | |||
| 16,300 | Siemens AG ADR | 1,459,339 | |||
| 14,820 | Spirit Aerosystems Holdings, Inc.a | 282,469 | |||
| 10,709 | SPX Corporation | 565,542 | |||
| 38,675 | Teledyne Technologies, Inc.a | 1,492,081 | |||
| 13,220 | Textron, Inc. | 224,343 | |||
| 8,087 | United Technologies Corporation | 524,927 | |||
| 27,344 | Werner Enterprises, Inc. | 598,560 | |||
| Total Industrials | 27,828,687 | ||||
| Information Technology (1.8%) | |||||
| 45,000 | Adobe Systems, Inc.a | 1,189,350 | |||
| 53,100 | ADTRAN, Inc. | 1,448,037 | |||
| 30,600 | Analog Devices, Inc. | 852,516 | |||
| 16,805 | Apple, Inc.a | 4,226,962 | |||
| 543,363 | Atmel Corporationa | 2,608,142 | |||
| 142,781 | Cisco Systems, Inc.a | 3,042,663 | |||
| 110,500 | Cogent, Inc.a | 995,605 | |||
| 82,400 | CommVault Systems, Inc.a | 1,854,000 | |||
| 298,060 | Compuware Corporationa | 2,378,519 | |||
| 37,450 | Corning, Inc. | 604,817 | |||
| 17,974 | eBay, Inc.a | 352,470 | |||
| 43,700 | EMC Corporationa | 799,710 | |||
| 6,150 | F5 Networks, Inc.a | 421,706 | |||
| 89,823 | FormFactor, Inc.a | 970,088 | |||
| 8,208 | Google, Inc.a | 3,652,150 | |||
| 51,860 | Hewlett-Packard Company | 2,244,501 | |||
| 81,239 | Intel Corporation | 1,580,099 | |||
| 7,571 | International Business Machines Corporation | 934,867 | |||
| 31,900 | JDS Uniphase Corporationa | 313,896 | |||
| 15,424 | Juniper Networks, Inc.a | 351,976 | |||
| 14,400 | KLA-Tencor Corporation | 401,472 | |||
| 21,400 | Lam Research Corporationa | 814,484 | |||
| 10,000 | MasterCard, Inc. | 1,995,300 | |||
| 20,143 | Maxim Integrated Products, Inc. | 336,992 | |||
| 14,550 | McAfee, Inc.a | 446,976 | |||
| 134,900 | Micron Technology, Inc.a | 1,145,301 | |||
| 118,890 | Microsoft Corporation | 2,735,659 | |||
| 3,000 | Netflix, Inc.a | 325,950 | |||
| 13,555 | Novellus Systems, Inc.a | 343,755 | |||
| 105,003 | Oracle Corporation | 2,253,364 | |||
| 13,700 | Paychex, Inc. | 355,789 | |||
| 66,441 | Polycom, Inc.a | 1,979,277 | |||
| 64,305 | Teradyne, Inc.a | 626,974 | |||
| 200,300 | TIBCO Software, Inc.a | 2,415,618 | |||
| 24,321 | Tyco Electronics, Ltd. | 617,267 | |||
| 49,500 | ValueClick, Inc.a | 529,155 | |||
| 22,400 | VeriFone Systems, Inc.a | 424,032 | |||
| 12,900 | Visa, Inc. | 912,675 | |||
| 29,760 | Vishay Intertechnology, Inc.a | 230,342 | |||
| 108,790 | Xerox Corporation | 874,672 | |||
| 15,388 | Xilinx, Inc. | 388,701 | |||
| Total Information Technology | 50,975,829 | ||||
| Materials (0.2%) | |||||
| 15,004 | Albemarle Corporation | 595,809 | |||
| 10,020 | Allegheny Technologies, Inc. | 442,784 | |||
| 6,951 | Ball Corporation | 367,221 | |||
| 13,900 | CF Industries Holdings, Inc. | 881,955 | |||
| 43,004 | E.I. du Pont de Nemours and Company | 1,487,509 | |||
| 25,024 | Freeport-McMoRan Copper & Gold, Inc. | 1,479,669 | |||
| 22,325 | Owens-Illinois, Inc.a | 590,496 | |||
| 10,022 | Silgan Holdings, Inc. | 284,424 | |||
| 23,930 | Steel Dynamics, Inc. | 315,637 | |||
| 27,900 | Temple-Inland, Inc. | 576,693 | |||
| Total Materials | 7,022,197 | ||||
| Telecommunications Services (<0.1%) | |||||
| 8,590 | Telephone and Data Systems, Inc. | 261,050 | |||
| Total Telecommunications Services | 261,050 | ||||
| Utilities (0.1%) | |||||
| 8,304 | Alliant Energy Corporation | 263,569 | |||
| 42,720 | American Electric Power Company, Inc. | 1,379,856 | |||
| 12,119 | DPL, Inc. | 289,644 | |||
| 2,044 | Entergy Corporation | 146,391 | |||
| 2,820 | FirstEnergy Corporation | 99,349 | |||
| 24,373 | NV Energy, Inc. | 287,845 | |||
The accompanying Notes to Financial Statements are an integral part of this schedule.
113
Table of Contents
Moderate Allocation Portfolio
Schedule of Investments as of June 30, 2010
(unaudited)
| Shares | Common Stock (7.4%) | Value | ||||
| Utilities (0.1%) - continued | ||||||
| 16,480 | Portland General Electric Company | $ | 302,078 | |||
| 37,938 | Southwest Gas Corporation | 1,119,171 | ||||
| 9,742 | UGI Corporation | 247,837 | ||||
| Total Utilities | 4,135,740 | |||||
Total Common Stock (cost $229,327,807) | 212,312,152 | |||||
| Principal Amount | Short-Term Investments (5.1%)g | Value | ||||
| Bank of America Repurchase Agreement | ||||||
| 28,425,000 | 0.010%, 7/1/2010h | 28,425,000 | ||||
| Federal Home Loan Bank Discount Notes | ||||||
| 10,000,000 | 0.140%, 7/2/2010 | 9,999,961 | ||||
| 15,000,000 | 0.090%, 7/7/2010 | 14,999,775 | ||||
| 55,000,000 | 0.081%, 7/9/2010 | 54,999,011 | ||||
| 10,000,000 | 0.070%, 7/14/2010 | 9,999,747 | ||||
| Federal Home Loan Mortgage Corporation Discount Notes | ||||||
| 10,000,000 | 0.130%, 7/2/2010 | 9,999,964 | ||||
| 9,500,000 | 0.080%, 7/23/2010 | 9,499,536 | ||||
| Federal National Mortgage Association Discount Notes | ||||||
| 9,050,000 | 0.177%, 7/7/2010f | 9,049,735 | ||||
| Total Short-Term Investments (at amortized cost) | 146,972,729 | |||||
| Total Investments (cost $3,278,456,581) 101.2% | $ | 2,904,268,461 | ||||
| Other Assets and Liabilities, Net (1.2%) | (35,500,277 | ) | ||||
| Total Net Assets 100.0% | $ | 2,868,768,184 | ||||
| a | Non-income producing security. |
| b | Denotes variable rate obligations for which the current coupon rate and next scheduled reset date are shown. |
| c | Denotes securities sold under Rule 144A of the Securities Act of 1933, which exempts them from registration. These securities have been deemed liquid and may be resold to other dealers in the program or to other qualified institutional buyers. As of June 30, 2010, the value of these investments was $22,757,160 or 0.8% of total net assets. |
| d | Denotes investments purchased on a when-issued or delayed delivery basis. |
| e | All or a portion of the security was earmarked to cover written options. |
| f | At June 30, 2010, $16,227,914 of investments were held on deposit with the counterparty and pledged as the initial margin deposit for open futures contracts. |
| g | The interest rate shown reflects the yield, coupon rate or, for securities purchased at a discount, the discount rate at the date of purchase. |
| h | Repurchase agreement dated June 30, 2010, $28,425,008 maturing July 1, 2010, collateralized by $28,993,618 U.S. Treasury Notes, 3.125% due April 30, 2013. |
Definitions:
| ADR | - | American Depositary Receipt, which are certificates for an underlying foreign security’s shares held by an issuing U.S. depository bank. | ||
| TIPS | - | Treasury Inflation Protected Security. |
Unrealized Appreciation (Depreciation)
Gross unrealized appreciation and depreciation of investments, based on cost for federal income tax purposes, were as follows:
Gross unrealized appreciation | $ | 26,552,764 | ||
Gross unrealized depreciation | (400,740,884 | ) | ||
Net unrealized appreciation (depreciation) | $ | (374,188,120 | ) | |
Cost for federal income tax purposes | $ | 3,278,456,581 | ||
The accompanying Notes to Financial Statements are an integral part of this schedule.
114
Table of Contents
Moderate Allocation Portfolio
Schedule of Investments as of June 30, 2010
(unaudited)
Fair Valuation Measurements
The following table is a summary of the inputs used, as of June 30, 2010, in valuing Moderate Allocation Portfolio’s assets carried at fair value as discussed in the Notes to Financial Statements.
Investments in Securities | Total | Level 1 | Level 2 | Level 3 | ||||||||
Mutual Funds | ||||||||||||
Equity Mutual Funds | 1,192,572,232 | 1,192,572,232 | — | — | ||||||||
Fixed Income Mutual Funds | 1,055,718,793 | 1,055,718,793 | — | — | ||||||||
Long-Term Fixed Income | ||||||||||||
Asset-Backed Securities | 9,510,547 | — | 9,510,547 | — | ||||||||
Basic Materials | 9,978,225 | — | 9,978,225 | — | ||||||||
Capital Goods | 2,938,775 | — | 2,938,775 | — | ||||||||
Collateralized Mortgage Obligations | 42,232,912 | — | 42,232,912 | — | ||||||||
Commercial Mortgage-Backed Securities | 63,206,017 | — | 63,206,017 | — | ||||||||
Communications Services | 11,491,994 | — | 11,491,994 | — | ||||||||
Consumer Cyclical | 12,864,577 | — | 12,864,577 | — | ||||||||
Consumer Non-Cyclical | 5,719,662 | — | 5,719,662 | — | ||||||||
Energy | 5,747,532 | — | 5,747,532 | — | ||||||||
Financials | 6,455,094 | — | 6,455,094 | — | ||||||||
Foreign Government | 2,136,127 | — | 2,136,127 | — | ||||||||
Mortgage-Backed Securities | 37,464,553 | — | 37,464,553 | — | ||||||||
Technology | 2,803,500 | — | 2,803,500 | — | ||||||||
U.S. Government and Agencies | 81,278,323 | — | 80,816,412 | 461,911 | ||||||||
Utilities | 2,864,717 | — | 2,864,717 | — | ||||||||
Common Stock | ||||||||||||
Consumer Discretionary | 29,927,279 | 29,927,279 | — | — | ||||||||
Consumer Staples | 10,334,431 | 10,334,431 | — | — | ||||||||
Energy | 22,600,680 | 22,600,680 | — | — | ||||||||
Financials | 31,544,724 | 31,544,724 | — | — | ||||||||
Health Care | 27,681,535 | 27,681,535 | — | — | ||||||||
Industrials | 27,828,687 | 27,828,687 | — | — | ||||||||
Information Technology | 50,975,829 | 50,975,829 | — | — | ||||||||
Materials | 7,022,197 | 7,022,197 | — | — | ||||||||
Telecommunications Services | 261,050 | 261,050 | — | — | ||||||||
Utilities | 4,135,740 | 4,135,740 | — | — | ||||||||
Short-Term Investments | 146,972,729 | — | 146,972,729 | — | ||||||||
Total | $ | 2,904,268,461 | $ | 2,460,603,177 | $ | 443,203,373 | $ | 461,911 | ||||
Other Financial Instruments | Total | Level 1 | Level 2 | Level 3 | ||||||||
Asset Derivatives | ||||||||||||
Futures Contracts | 205,774 | 205,774 | — | — | ||||||||
Total Asset Derivatives | $ | 205,774 | $ | 205,774 | $ | — | $ | — | ||||
Liability Derivatives | ||||||||||||
Futures Contracts | 4,258,574 | 4,258,574 | — | — | ||||||||
Call Options Written | 238,875 | — | — | 238,875 | ||||||||
Total Rate of Return Swaps | 37,128 | — | 37,128 | — | ||||||||
Total Liability Derivatives | $ | 4,534,577 | $ | 4,258,574 | $ | 37,128 | $ | 238,875 | ||||
The accompanying Notes to Financial Statements are an integral part of this schedule.
115
Table of Contents
Moderate Allocation Portfolio
Schedule of Investments as of June 30, 2010
(unaudited)
The following table is a reconciliation of assets in which significant unobservable inputs (Level 3) were used in determining fair value for Moderate Allocation Portfolio as discussed in item 2(A) of the Notes to Financial Statements.
Investments in Securities | Value December 31, 2009 | Accrued Discounts and/or Premiums | Realized Gain/(Loss) | Change in Unrealized Gain/(Loss) | Net Purchases/(Sales) | Transfers Into Level 3 | Transfers Out of Level 3 | Value June 30, 2010 | ||||||||||||||||
Long-Term Fixed Income | ||||||||||||||||||||||||
U.S. Government and Agencies | — | 1,025 | — | 3,670 | 457,216 | — | — | 461,911 | ||||||||||||||||
Total | $ | — | $ | 1,025 | $ | — | $ | 3,670 | $ | 457,216 | $ | — | $ | — | $ | 461,911 | ||||||||
Other Financial Instruments | ||||||||||||||||||||||||
Liability Derivatives | ||||||||||||||||||||||||
Call Options Written | — | — | — | 238,875 | — | — | — | 238,875 | ||||||||||||||||
Total | $ | — | $ | — | $ | — | $ | 238,875 | $ | — | $ | — | $ | — | $ | 238,875 | ||||||||
Futures Contracts | Number of Contracts Long/(Short) | Expiration Date | Notional Principal Amount | Value | Unrealized Gain/(Loss) | ||||||||||||
E-Mini MSCI EAFE Index Futures | 215 | September 2010 | $ | 15,223,666 | $ | 14,138,400 | ($ | 1,085,266 | ) | ||||||||
Russell 2000 Index Mini-Futures | (455 | ) | September 2010 | (27,860,674 | ) | (27,654,900 | ) | 205,774 | |||||||||
S&P 500 Index Futures | 449 | September 2010 | 118,409,158 | 115,235,850 | (3,173,308 | ) | |||||||||||
Total Futures Contracts | ($ | 4,052,800 | ) | ||||||||||||||
Call Options Written | Number of Contracts | Exercise Price | Expiration Date | Value | Unrealized Gain/(Loss) | ||||||||||
Federal National Mortgage | |||||||||||||||
Association Conventional 30-Yr. Pass Through | 31 | $ | 102.36 | July 2010 | ($ | 404,625 | ) | ($ | 238,875 | ) | |||||
Total Call Options Written | ($ | 404,625 | ) | ($ | 238,875 | ) | |||||||||
Total Rate of Return Swaps and | Fund Receives | Fund Pays | Termination Date | Notional Principal Amount | Upfront Payments Received (Made) | Value | Unrealized Gain/(Loss) | |||||||||||
S&P 100 Total Return | Value of | 1 Month | 9/1/2010 | $ | 974,154 | N/A | $ | 937,026 | ($ | 37,128 | ) | |||||||
Equity Index Swap, | Index + gross | LIBOR + 10 | ||||||||||||||||
BNP Paribas | Dividends | bps | ||||||||||||||||
Total Rate of Return Swaps | $ | 974,154 | $ | 937,026 | ($ | 37,128 | ) | |||||||||||
The accompanying Notes to Financial Statements are an integral part of this schedule.
116
Table of Contents
Moderate Allocation Portfolio
Schedule of Investments as of June 30, 2010
(unaudited)
The following table summarizes the fair value and Statement of Assets and Liabilities location, as of June 30, 2010, for Moderate Allocation Portfolio’s investments in financial derivative instruments by primary risk exposure as discussed under item (2) Significant Accounting Policies of the Notes to Financial Statements.
Derivatives by risk category | Statement of Assets and Liabilities Location | Fair Value | |||
Asset Derivatives | |||||
Equity Contracts | |||||
Futures* | Net Assets - Net unrealized appreciation/(depreciation) on Futures contracts | 205,774 | |||
Total Equity Contracts | 205,774 | ||||
Total Asset Derivatives | $ | 205,774 | |||
Liability Derivatives | |||||
Equity Contracts | |||||
Futures* | Net Assets - Net unrealized appreciation/(depreciation) on Futures contracts | 4,258,574 | |||
Total Return Swaps | Receivable/Payable - Swap agreements, at value; Net Assets - Net unrealized appreciation/(depreciation) on Swap agreements | 37,128 | |||
Total Equity Contracts | 4,295,702 | ||||
Interest Rate Contracts | |||||
Options Written | Net Assets - Net unrealized appreciation/(depreciation) on Written option contracts | 238,875 | |||
Total Interest Rate Contracts | 238,875 | ||||
Total Liability Derivatives | $ | 4,534,577 | |||
| * | Includes cumulative appreciation/depreciation of futures contracts as reported in the Schedule of Investments. Only current day’s variation margin is reported within the Statement of Assets and Liabilities. |
The following table summarizes the net realized gains/(losses) and Statement of Operations location, for the period ended June 30, 2010, for Moderate Allocation Portfolio’s investments in financial derivative instruments by primary risk exposure.
Derivatives by risk category | Statement of Operations Location | Realized Gains/(Losses) recognized in Income | ||||
| Equity Contracts | ||||||
| Futures | Net realized gains/(losses) on Futures contracts | 9,944,997 | ||||
| Total Return Swaps | Net realized gains/(losses) on Swap agreements | (24,290 | ) | |||
Total Equity Contracts | 9,920,707 | |||||
| Credit Contracts | ||||||
| Credit Default Swaps | Net realized gains/(losses) on Swap agreements | (1,606,127 | ) | |||
| Total Credit Contracts | (1,606,127 | ) | ||||
| Total | $ | 8,314,580 | ||||
The accompanying Notes to Financial Statements are an integral part of this schedule.
117
Table of Contents
Moderate Allocation Portfolio
Schedule of Investments as of June 30, 2010
(unaudited)
The following table summarizes the change in net unrealized appreciation/(depreciation) and Statement of Operations location, for the period ended June 30, 2010, for Moderate Allocation Portfolio’s investments in financial derivative instruments by primary risk exposure.
Derivatives by risk category | Statement of Operations Location | Change in unrealized appreciation/(depreciation) recognized in Income | |||
| Equity Contracts | |||||
| Futures | Change in net unrealized appreciation/(depreciation) on Futures contracts | (8,735,647 | ) | ||
| Total Return Swaps | Change in net unrealized appreciation/(depreciation) on Swap agreements | (37,128 | ) | ||
| Total Equity Contracts | (8,772,775 | ) | |||
| Interest Rate Contracts | |||||
| Options Written | Change in net unrealized appreciation/(depreciation) on Written option Contracts | (238,875 | ) | ||
| Total Interest Rate Contracts | (238,875 | ) | |||
| Credit Contracts | |||||
| Credit Default Swaps | Change in net unrealized appreciation/(depreciation) on Swap agreements | 1,870,736 | |||
| Total Credit Contracts | 1,870,736 | ||||
| Total | ($7,140,914 | ) | |||
The following table presents Moderate Allocation Portfolio’s average volume of derivative activity during the period ended June 30, 2010.
Derivative Risk Category | Futures (Notional*) | Futures (Percentage of Average Net Assets) | Swaps (Notional*) | Swaps (Percentage of Average Net Assets) | Options (Contracts) | |||||||||
Equity Contracts | $ | 166,618,152 | 5.8 | % | $ | 184,812 | <0.1 | % | 8 | |||||
Credit Contracts | N/A | N/A | 15,419,266 | 0.5 | N/A | |||||||||
| * | Notional amount represents long or short, or both, derivative positions held by the portfolio. |
Investment in Affiliates
Affiliated issuers, as defined under the Investment Company Act of 1940, include those in which the Portfolio’s holdings of an issuer represent 5% or more of the outstanding voting securities of an issuer, or any affiliated mutual fund.
A summary of transactions for the fiscal year to date, in Moderate Allocation Portfolio, is as follows:
Portfolio | Value December 31, 2009 | Gross Purchases | Gross Sales | Shares Held at June 30, 2010 | Value June 30, 2010 | Income Earned January 1, 2010 - June 30, 2010 | |||||||||||
Real Estate Securities | $ | 74,232,873 | $ | 3,628,047 | $ | 30,521 | 6,680,212 | $ | 82,169,286 | $ | — | ||||||
Partner Small Cap Growth | 43,206,268 | 1,814,023 | 15,261 | 4,491,902 | 43,855,785 | — | |||||||||||
Partner Small Cap Value | 68,298,602 | 2,881,921 | 22,891 | 4,565,830 | 69,400,623 | 160,886 | |||||||||||
Small Cap Stock | 35,697,044 | 2,660,484 | 1,946,912 | 3,596,908 | 34,800,444 | 15,428 | |||||||||||
Mid Cap Growth II | 21,070,311 | 1,145,986 | 7,630 | 2,633,592 | 21,414,526 | — | |||||||||||
Partner Mid Cap Value | 59,064,656 | 3,865,318 | 30,521 | 5,816,354 | 60,620,366 | 237,271 | |||||||||||
Mid Cap Stock | 109,944,779 | 5,375,966 | 1,893,825 | 11,577,066 | 109,108,055 | 85,853 | |||||||||||
Partner Worldwide Allocation | 84,392,265 | 39,892,457 | 64,409 | 15,885,792 | 114,029,804 | 8,317 | |||||||||||
Partner International Stock | 172,123,931 | 74,060 | 27,155 | 17,231,420 | 150,189,060 | 74,060 | |||||||||||
Large Cap Growth II | 139,164,862 | 9,988,760 | 4,893,825 | 19,753,573 | 123,953,673 | 181,433 | |||||||||||
Large Cap Value | 234,271,133 | 10,039,055 | 83,933 | 25,315,666 | 222,008,266 | 61,927 | |||||||||||
Large Cap Stock | 154,405,740 | 4,435,421 | 4,911,521 | 19,928,807 | 139,364,139 | 26,994 | |||||||||||
Equity Income Plus | 21,869,980 | 934,237 | 7,630 | 2,883,647 | 21,658,205 | 27,225 | |||||||||||
High Yield | 132,591,457 | 21,097,720 | 126,849 | 33,641,660 | 152,231,874 | 5,980,361 | |||||||||||
Income | 445,825,251 | 40,778,792 | 63,641,526 | 45,187,757 | 438,063,670 | 11,606,936 | |||||||||||
Limited Maturity Bond | 423,125,775 | 40,341,156 | 2,912,753 | 47,836,297 | 465,423,249 | 7,559,841 | |||||||||||
Total Value and Income Earned | 2,219,284,927 | 2,248,291,025 | 26,026,530 | ||||||||||||||
The accompanying Notes to Financial Statements are an integral part of this schedule.
118
Table of Contents
Moderately Conservative Allocation Portfolio
Schedule of Investments as of June 30, 2010
(unaudited)
The accompanying Notes to Financial Statements are an integral part of this schedule.
119
Table of Contents
Moderately Conservative Allocation Portfolio
Schedule of Investments as of June 30, 2010
(unaudited)
| Principal Amount | Long-Term Fixed Income (11.4%) | Value | |||
Commercial Mortgage-Backed Securities (3.7%) - continued | |||||
Citigroup/Deutsche Bank Commercial Mortgage Pass- Through Certificates | |||||
| $5,300,000 | 5.617%, 10/15/2048 | $ | 5,428,271 | ||
Credit Suisse Mortgage Capital Certificates | |||||
| 2,900,000 | 5.467%, 9/15/2039 | 2,850,045 | |||
Federal Home Loan Mortgage Corporation Multifamily Structured Pass Through Certificate | |||||
| 220,000 | 3.342%, 12/25/2019 | 224,894 | |||
Government National Mortgage Association | |||||
| 218,869 | 3.214%, 1/16/2040 | 225,394 | |||
Greenwich Capital Commercial Funding Corporation | |||||
| 1,710,000 | 5.867%, 12/10/2049 | 1,357,704 | |||
GS Mortgage Securities Corporation II | |||||
| 6,549,700 | 4.761%, 7/10/2039 | 6,652,445 | |||
J.P. Morgan Chase Commercial | |||||
Mortgage Securities Corporation | |||||
| 5,100,000 | 5.814%, 6/12/2043 | 5,292,061 | |||
| 3,500,000 | 5.336%, 5/15/2047 | 3,459,211 | |||
LB-UBS Commercial Mortgage | |||||
Trust | |||||
| 2,750,000 | 5.866%, 9/15/2045 | 2,770,521 | |||
| Total Commercial Mortgage-Backed Securities | 46,163,703 | ||||
Communications Services (0.3%) | |||||
Clear Channel Worldwide Holdings, Inc. | |||||
| 500,000 | 9.250%, 12/15/2017b | 502,500 | |||
Cricket Communications, Inc. | |||||
| 570,000 | 9.375%, 11/1/2014 | 578,550 | |||
DISH DBS Corporation | |||||
| 600,000 | 7.125%, 2/1/2016 | 601,500 | |||
Intelsat Jackson Holdings, Ltd. | |||||
| 505,000 | 8.500%, 11/1/2019b | 510,050 | |||
New Communications Holdings, Inc. | |||||
| 535,000 | 8.250%, 4/15/2017b | 537,006 | |||
Qwest Communications International, Inc. | |||||
| 600,000 | 7.500%, 2/15/2014 | 601,500 | |||
Virgin Media Finance plc | |||||
| 570,000 | 8.375%, 10/15/2019 | 577,125 | |||
Wind Acquisition Holdings Finance SPA | |||||
| 570,000 | 12.250%, 7/15/2017b | 518,700 | |||
| Total Communications Services | 4,426,931 | ||||
Consumer Cyclical (0.4%) | |||||
Goodyear Tire & Rubber Company | |||||
| 480,000 | 10.500%, 5/15/2016 | 522,000 | |||
KB Home | |||||
| 533,000 | 6.250%, 6/15/2015 | 474,370 | |||
Macy’s Retail Holdings, Inc. | |||||
| 510,000 | 8.375%, 7/15/2015 | 562,275 | |||
MGM Resorts International | |||||
| 510,000 | 11.125%, 11/15/2017 | 562,275 | |||
Pinnacle Entertainment, Inc. | |||||
| 600,000 | 8.625%, 8/1/2017b | 618,000 | |||
QVC, Inc. | |||||
| 535,000 | 7.125%, 4/15/2017b | 524,300 | |||
Starwood Hotels & Resorts Worldwide, Inc. | |||||
| 600,000 | 6.750%, 5/15/2018 | 600,000 | |||
Toys R Us Property Company I, LLC | |||||
| 510,000 | 10.750%, 7/15/2017b | 557,175 | |||
WMG Acquisition Corporation | |||||
| 500,000 | 9.500%, 6/15/2016 | 532,500 | |||
| Total Consumer Cyclical | 4,952,895 | ||||
Consumer Non-Cyclical (0.2%) | |||||
Biomet, Inc. | |||||
| 500,000 | 10.375%, 10/15/2017 | 537,500 | |||
Community Health Systems, Inc. | |||||
| 570,000 | 8.875%, 7/15/2015 | 587,813 | |||
HCA, Inc. | |||||
| 540,000 | 9.625%, 11/15/2016 | 577,800 | |||
JBS USA, LLC/JBS USA Finance,Inc. | |||||
| 510,000 | 11.625%, 5/1/2014 | 571,837 | |||
| Total Consumer Non-Cyclical | 2,274,950 | ||||
Energy (0.2%) | |||||
Forest Oil Corporation | |||||
| 600,000 | 7.250%, 6/15/2019 | 579,000 | |||
Petrohawk Energy Corporation | |||||
| 570,000 | 7.875%, 6/1/2015 | 571,425 | |||
Pioneer Natural Resources Company | |||||
| 505,000 | 7.500%, 1/15/2020 | 520,451 | |||
Plains Exploration & Production Company | |||||
| 600,000 | 7.625%, 6/1/2018 | 586,500 | |||
| Total Energy | 2,257,376 | ||||
Financials (0.2%) | |||||
Achmea Hypotheekbank NV | |||||
| 220,000 | 3.200%, 11/3/2014b | 227,295 | |||
Canadian Imperial Bank of Commerce | |||||
| 220,000 | 2.600%, 7/2/2015b,c | 221,199 | |||
CIE Financement Foncier | |||||
| 225,000 | 2.125%, 4/22/2013b | 227,178 | |||
CIT Group, Inc. | |||||
| 532,740 | 7.000%, 5/1/2017 | 479,466 | |||
Dexia Credit Local SA | |||||
| 225,000 | 2.750%, 4/29/2014b | 226,719 | |||
Icahn Enterprises, LP | |||||
| 535,000 | 8.000%, 1/15/2018b | 518,950 | |||
The accompanying Notes to Financial Statements are an integral part of this schedule.
120
Table of Contents
Moderately Conservative Allocation Portfolio
Schedule of Investments as of June 30, 2010
(unaudited)
| Principal Amount | Long-Term Fixed Income (11.4%) | Value | ||||
| Financials (0.2%) - continued | ||||||
International Bank for Reconstruction & Development | ||||||
| $ | 225,000 | 2.375%, 5/26/2015 | $ | 228,765 | ||
Royal Bank of Canada | ||||||
| 215,000 | 3.125%, 4/14/2015b | 223,018 | ||||
Total Financials | 2,352,590 | |||||
| Foreign Government (0.1%) | ||||||
British Columbia Government Notes | ||||||
| 225,000 | 2.850%, 6/15/2015 | 232,398 | ||||
Kommunalbanken AS | ||||||
| 225,000 | 2.750%, 5/5/2015b | 229,032 | ||||
Kreditanstalt fuer Wiederaufbau | ||||||
| 120,000 | 1.250%, 6/15/2012 | 120,181 | ||||
Manitoba Government Notes | ||||||
| 225,000 | 2.625%, 7/15/2015 | 228,826 | ||||
Total Foreign Government | 810,437 | |||||
| Mortgage-Backed Securities (1.2%) | ||||||
Federal Home Loan Mortgage Corporation Gold 30-Yr. Pass Through | ||||||
| 875,000 | 6.000%, 7/1/2040c | 949,648 | ||||
Federal National Mortgage Association Conventional 15- Yr. Pass Through | ||||||
| 450,000 | 5.000%, 7/1/2025c | 480,094 | ||||
Federal National Mortgage Association Conventional 30- Yr. Pass Through | ||||||
| 12,875,000 | 4.500%, 7/1/2040c,d | 13,343,727 | ||||
| Total Mortgage-Backed Securities | 14,773,469 | |||||
| Technology (0.1%) | ||||||
Freescale Semiconductor, Inc. | ||||||
| 570,000 | 9.250%, 4/15/2018b | 562,875 | ||||
Iron Mountain, Inc. | ||||||
| 570,000 | 8.000%, 6/15/2020 | 578,550 | ||||
Total Technology | 1,141,425 | |||||
| U.S. Government and Agencies (2.5%) | ||||||
FDIC Structured Sale Guaranteed Notes | ||||||
| 90,000 | Zero Coupon, 1/7/2012b | 88,674 | ||||
| 90,000 | Zero Coupon, 1/7/2014b | 84,542 | ||||
Federal Home Loan Banks | ||||||
| 870,000 | 5.375%, 5/18/2016 | 1,014,968 | ||||
| 1,300,000 | 5.000%, 11/17/2017 | 1,483,479 | ||||
Federal Home Loan Mortgage Corporation | ||||||
| 1,575,000 | 1.125%, 7/27/2012 | 1,586,134 | ||||
| 430,000 | 2.500%, 1/7/2014 | 445,855 | ||||
| 595,000 | 4.875%, 6/13/2018 | 673,453 | ||||
| 315,000 | 3.750%, 3/27/2019 | 328,647 | ||||
Federal National Mortgage Association | ||||||
| 710,000 | 2.000%, 4/15/2013 | 717,139 | ||||
| 545,000 | 4.375%, 10/15/2015 | 602,768 | ||||
| 255,000 | 6.250%, 5/15/2029 | 315,512 | ||||
Tennessee Valley Authority | ||||||
| 200,000 | 5.250%, 9/15/2039 | 221,098 | ||||
U.S. Treasury Bonds | ||||||
| 375,000 | 4.625%, 2/15/2040 | 421,523 | ||||
U.S. Treasury Bonds, TIPS | ||||||
| 65,558 | 2.125%, 2/15/2040 | 71,832 | ||||
U.S. Treasury Notes | ||||||
| 4,000,000 | 0.875%, 12/31/2010e | 4,012,500 | ||||
| 260,000 | 1.125%, 6/15/2013 | 261,035 | ||||
| 1,745,000 | 1.750%, 1/31/2014 | 1,773,084 | ||||
| 840,000 | 2.500%, 3/31/2015 | 870,450 | ||||
| 5,150,000 | 2.500%, 4/30/2015 | 5,333,067 | ||||
| 650,000 | 2.625%, 2/29/2016 | 668,738 | ||||
| 1,550,000 | 3.250%, 3/31/2017 | 1,633,313 | ||||
| 1,350,000 | 3.625%, 2/15/2020 | 1,426,359 | ||||
| 2,575,000 | 3.500%, 5/15/2020 | 2,694,892 | ||||
| 455,000 | 7.625%, 2/15/2025 | 668,423 | ||||
| 1,275,000 | 4.375%, 5/15/2040 | 1,378,989 | ||||
U.S. Treasury Notes, TIPS | ||||||
| 282,371 | 3.375%, 1/15/2012 | 297,681 | ||||
| 314,568 | 0.625%, 4/15/2013 | 321,031 | ||||
| 353,940 | 2.000%, 1/15/2014 | 377,057 | ||||
| 296,834 | 1.625%, 1/15/2015 | 313,346 | ||||
| 259,068 | 2.500%, 7/15/2016 | 288,294 | ||||
| 331,323 | 2.625%, 7/15/2017 | 373,748 | ||||
| 277,225 | 1.375%, 1/15/2020 | 283,874 | ||||
| 75,173 | 2.375%, 1/15/2025 | 83,389 | ||||
| Total U.S. Government and Agencies | 31,114,894 | |||||
| Utilities (0.1%) | ||||||
El Paso Corporation | ||||||
| 570,000 | 7.000%, 6/15/2017 | 566,790 | ||||
NRG Energy, Inc. | ||||||
| 600,000 | 7.375%, 2/1/2016 | 597,000 | ||||
Total Utilities | 1,163,790 | |||||
Total Long-Term Fixed Income (cost $134,709,083) | 142,112,845 | |||||
| Shares | Common Stock (7.4%) | |||||
| Consumer Discretionary (1.0%) | ||||||
| 17,100 | Aeropostale, Inc.f | 489,744 | ||||
| 4,344 | Amazon.com, Inc.f | 474,625 | ||||
| 3,609 | Autoliv, Inc.f | 172,691 | ||||
| 16,600 | Carnival Corporation | 501,984 | ||||
| 15,796 | Carter’s, Inc.f | 414,645 | ||||
| 43,351 | Chico’s FAS, Inc. | 428,308 | ||||
| 20,750 | Comcast Corporation | 360,428 | ||||
| 28,580 | Cooper Tire & Rubber Company | 557,310 | ||||
| 39,760 | Dana Holding Corporationf | 397,600 | ||||
| 3,102 | Dollar Tree, Inc.f | 129,136 | ||||
| 29,200 | Domino’s Pizza, Inc.f | 329,960 | ||||
| 31,700 | Foot Locker, Inc. | 400,054 | ||||
The accompanying Notes to Financial Statements are an integral part of this schedule.
121
Table of Contents
Moderately Conservative Allocation Portfolio
Schedule of Investments as of June 30, 2010
(unaudited)
Shares | Common Stock (7.4%) | Value | |||
Consumer Discretionary (1.0%) - continued | |||||
4,797 | Harman International Industries, Inc.f | $ | 143,382 | ||
60,065 | International Game Technology | 943,021 | |||
33,530 | J.C. Penney Company, Inc. | 720,224 | |||
21,037 | Kohl’s Corporationf | 999,257 | |||
25,420 | Liberty Media Corporation - Interactivef | 266,910 | |||
22,950 | Lowe’s Companies, Inc. | 468,639 | |||
17,966 | Macy’s, Inc. | 321,591 | |||
4,780 | Omnicom Group, Inc. | 163,954 | |||
1,854 | Panera Bread Companyf | 139,588 | |||
10,930 | Target Corporation | 537,428 | |||
17,470 | Time Warner Cable, Inc. | 909,838 | |||
40,942 | Walt Disney Company | 1,289,673 | |||
9,200 | Warnaco Group, Inc.f | 332,488 | |||
59,978 | Warner Music Group Corporationf | 291,493 | |||
15,651 | WMS Industries, Inc.f | 614,302 | |||
Total Consumer Discretionary | 12,798,273 | ||||
Consumer Staples (0.4%) | |||||
12,240 | Avon Products, Inc. | 324,360 | |||
28,800 | Del Monte Foods Company | 414,432 | |||
4,776 | Flowers Foods, Inc. | 116,677 | |||
39,446 | Kraft Foods, Inc. | 1,104,488 | |||
4,896 | Kroger Company | 96,402 | |||
14,641 | PepsiCo, Inc. | 892,369 | |||
27,208 | Philip Morris International, Inc. | 1,247,215 | |||
4,289 | TreeHouse Foods, Inc.f | 195,836 | |||
13,100 | Wal-Mart Stores, Inc. | 629,717 | |||
| Total Consumer Staples | 5,021,496 | ||||
Energy (0.8%) | |||||
6,661 | Alpha Natural Resources, Inc.f | 225,608 | |||
8,070 | Anadarko Petroleum Corporation | 291,246 | |||
13,100 | Arch Coal, Inc. | 259,511 | |||
19,630 | Baker Hughes, Inc. | 816,019 | |||
36,600 | Complete Production Services, Inc.f | 523,380 | |||
25,734 | ConocoPhillips | 1,263,282 | |||
12,800 | Dresser-Rand Group, Inc.f | 403,840 | |||
28,840 | ENSCO International plc ADR | 1,132,835 | |||
5,765 | EOG Resources, Inc. | 567,103 | |||
21,394 | Forest Oil Corporationf | 585,340 | |||
80,400 | International Coal Group, Inc.f | 309,540 | |||
25,500 | James River Coal Companyf | 405,960 | |||
3,609 | National Oilwell Varco, Inc. | 119,350 | |||
20,390 | Occidental Petroleum Corporation | 1,573,089 | |||
15,750 | Schlumberger, Ltd. | 871,605 | |||
10,750 | Ultra Petroleum Corporationf | 475,688 | |||
19,330 | Valero Energy Corporation | 347,553 | |||
10,500 | Weatherford International, Ltd.f | 137,970 | |||
| Total Energy | 10,308,919 | ||||
Financials (1.1%) | |||||
6,215 | Affiliated Managers Group, Inc.f | 377,686 | |||
13,909 | Ameriprise Financial, Inc. | 502,532 | |||
53,153 | Bank of America Corporation | 763,809 | |||
21,990 | Bank of New York Mellon Corporation | 542,933 | |||
16,120 | Capital One Financial Corporation | 649,636 | |||
388,510 | Citigroup, Inc.f | 1,460,798 | |||
2,800 | Comerica, Inc. | 103,124 | |||
38,483 | Duke Realty Corporation | 436,782 | |||
2,800 | Endurance Specialty Holdings, Ltd. | 105,084 | |||
6,926 | Equity One, Inc. | 108,046 | |||
33,273 | Fifth Third Bancorp | 408,925 | |||
2,642 | Goldman Sachs Group, Inc. | 346,815 | |||
2,390 | Hanover Insurance Group, Inc. | 103,965 | |||
22,250 | Hartford Financial Services Group, Inc. | 492,393 | |||
11,618 | HCC Insurance Holdings, Inc. | 287,662 | |||
18,600 | Healthcare Realty Trust, Inc. | 408,642 | |||
10,098 | Host Hotels & Resorts, Inc. | 136,121 | |||
5,117 | IntercontinentalExchange, Inc.f | 578,375 | |||
17,935 | J.P. Morgan Chase & Company | 656,600 | |||
14,500 | KeyCorp | 111,505 | |||
2,588 | Lazard, Ltd. | 69,125 | |||
21,467 | Morgan Stanley | 498,249 | |||
7,701 | New York Community Bancorp, Inc. | 117,594 | |||
12,190 | Northern Trust Corporation | 569,273 | |||
41,264 | Ocwen Financial Corporationf | 420,480 | |||
12,000 | Potlatch Corporation | 428,760 | |||
12,586 | Principal Financial Group, Inc. | 295,016 | |||
13,290 | Prudential Financial, Inc. | 713,141 | |||
6,600 | SunTrust Banks, Inc. | 153,780 | |||
24,500 | Texas Capital Bancshares, Inc.f | 401,800 | |||
9,124 | W.R. Berkley Corporation | 241,421 | |||
24,997 | Washington Federal, Inc. | 404,451 | |||
30,840 | Wells Fargo & Company | 789,504 | |||
24,500 | Zions Bancorporation | 528,465 | |||
| Total Financials | 14,212,492 | ||||
Health Care (1.0%) | |||||
28,400 | Align Technology, Inc.f | 422,308 | |||
1,186 | Beckman Coulter, Inc. | 71,504 | |||
14,312 | C.R. Bard, Inc. | 1,109,609 | |||
14,392 | Celgene Corporationf | 731,401 | |||
5,204 | Community Health Systems, Inc.f | 175,947 | |||
7,283 | Coventry Health Care, Inc.f | 128,763 | |||
8,060 | Covidien, Ltd. | 323,851 | |||
8,746 | Gilead Sciences, Inc.f | 299,813 | |||
5,336 | Hologic, Inc.f | 74,331 | |||
16,165 | ICON plc ADRf | 467,007 | |||
5,930 | Johnson & Johnson | 350,226 | |||
62,256 | King Pharmaceuticals, Inc.f | 472,523 | |||
12,211 | Medco Health Solutions, Inc.f | 672,582 | |||
9,060 | Medtronic, Inc. | 328,606 | |||
11,900 | NuVasive, Inc.f | 421,974 | |||
14,700 | STERIS Corporation | 456,876 | |||
18,300 | Teva Pharmaceutical Industries, Ltd. ADR | 951,417 | |||
18,550 | Thermo Fisher Scientific, Inc.f | 909,878 | |||
10,309 | United Therapeutics Corporationf | 503,182 | |||
50,967 | UnitedHealth Group, Inc. | 1,447,463 | |||
1,689 | Varian Medical Systems, Inc.f | 88,301 | |||
3,582 | Vertex Pharmaceuticals, Inc.f | 117,848 | |||
The accompanying Notes to Financial Statements are an integral part of this schedule.
122
Table of Contents
Moderately Conservative Allocation Portfolio
Schedule of Investments as of June 30, 2010
(unaudited)
| Shares | Common Stock (7.4%) | Value | |||
| Health Care (1.0%) - continued | |||||
| 27,100 | Zimmer Holdings, Inc.f | $ | 1,464,755 | ||
| Total Health Care | 11,990,165 | ||||
| Industrials (1.0%) | |||||
| 5,167 | 3M Company | 408,141 | |||
| 2,770 | Avery Dennison Corporation | 89,000 | |||
| 5,220 | Boeing Company | 327,555 | |||
| 5,990 | Caterpillar, Inc. | 359,819 | |||
| 10,950 | Cooper Industries plc | 481,800 | |||
| 18,951 | CSX Corporation | 940,538 | |||
| 16,865 | Dover Corporation | 704,788 | |||
| 5,463 | Eaton Corporation | 357,499 | |||
| 11,390 | Emerson Electric Company | 497,629 | |||
| 3,150 | FedEx Corporation | 220,847 | |||
| 7,340 | Fluor Corporation | 311,950 | |||
| 13,200 | FTI Consulting, Inc.f | 575,388 | |||
| 29,740 | General Electric Company | 428,851 | |||
| 8,641 | Honeywell International, Inc. | 337,258 | |||
| 8,090 | Illinois Tool Works, Inc. | 333,955 | |||
| 15,990 | Ingersoll-Rand plc | 551,495 | |||
| 54,732 | Manitowoc Company, Inc. | 500,251 | |||
| 1,988 | Navistar International Corporationf | 97,810 | |||
| 15,100 | Old Dominion Freight Line, Inc.f | 530,614 | |||
| 22,217 | Oshkosh Corporationf | 692,282 | |||
| 1,752 | Parker Hannifin Corporation | 97,166 | |||
| 1,147 | Precision Castparts Corporation | 118,049 | |||
| 4,003 | Roper Industries, Inc. | 224,008 | |||
| 20,400 | Shaw Group, Inc.f | 698,088 | |||
| 7,250 | Siemens AG ADR | 649,093 | |||
| 10,210 | Spirit Aerosystems Holdings, Inc.f | 194,603 | |||
| 2,817 | SPX Corporation | 148,766 | |||
| 12,090 | Teledyne Technologies, Inc.f | 466,432 | |||
| 9,120 | Textron, Inc. | 154,766 | |||
| 5,574 | United Technologies Corporation | 361,808 | |||
| 8,098 | Werner Enterprises, Inc. | 177,265 | |||
Total Industrials | 12,037,514 | ||||
| Information Technology (1.7%) | |||||
| 20,000 | Adobe Systems, Inc.f | 528,600 | |||
| 16,800 | ADTRAN, Inc. | 458,136 | |||
| 13,600 | Analog Devices, Inc. | 378,896 | |||
| 7,486 | Apple, Inc.f | 1,882,954 | |||
| 166,789 | Atmel Corporationf | 800,587 | |||
| 63,433 | Cisco Systems, Inc.f | 1,351,757 | |||
| 34,997 | Cogent, Inc.f | 315,323 | |||
| 26,000 | CommVault Systems, Inc.f | 585,000 | |||
| 91,955 | Compuware Corporationf | 733,801 | |||
| 16,550 | Corning, Inc. | 267,282 | |||
| 5,150 | eBay, Inc.f | 100,991 | |||
| 19,400 | EMC Corporationf | 355,020 | |||
| 1,686 | F5 Networks, Inc.f | 115,609 | |||
| 28,400 | FormFactor, Inc.f | 306,720 | |||
| 3,632 | Google, Inc.f | 1,616,058 | |||
| 25,450 | Hewlett-Packard Company | 1,101,476 | |||
| 36,120 | Intel Corporation | 702,534 | |||
| 5,216 | International Business Machines Corporation | 644,072 | |||
| 9,300 | JDS Uniphase Corporationf | 91,512 | |||
| 4,407 | Juniper Networks, Inc.f | 100,568 | |||
| 6,400 | KLA-Tencor Corporation | 178,432 | |||
| 9,500 | Lam Research Corporationf | 361,570 | |||
| 4,400 | MasterCard, Inc. | 877,932 | |||
| 5,870 | Maxim Integrated Products, Inc. | 98,205 | |||
| 6,550 | McAfee, Inc.f | 201,216 | |||
| 60,000 | Micron Technology, Inc.f | 509,400 | |||
| 58,210 | Microsoft Corporation | 1,339,412 | |||
| 900 | Netflix, Inc.f | 97,785 | |||
| 3,744 | Novellus Systems, Inc.f | 94,948 | |||
| 53,175 | Oracle Corporation | 1,141,135 | |||
| 3,800 | Paychex, Inc. | 98,686 | |||
| 20,288 | Polycom, Inc.f | 604,380 | |||
| 18,701 | Teradyne, Inc.f | 182,335 | |||
| 62,284 | TIBCO Software, Inc.f | 751,145 | |||
| 16,731 | Tyco Electronics, Ltd. | 424,633 | |||
| 14,300 | ValueClick, Inc.f | 152,867 | |||
| 6,400 | VeriFone Systems, Inc.f | 121,152 | |||
| 5,750 | Visa, Inc. | 406,813 | |||
| 9,445 | Vishay Intertechnology, Inc.f | 73,104 | |||
| 74,840 | Xerox Corporation | 601,714 | |||
| 4,211 | Xilinx, Inc. | 106,370 | |||
| Total Information Technology | 20,860,130 | ||||
| Materials (0.3%) | |||||
| 4,158 | Albemarle Corporation | 165,114 | |||
| 6,900 | Allegheny Technologies, Inc. | 304,911 | |||
| 2,000 | Ball Corporation | 105,660 | |||
| 5,500 | CF Industries Holdings, Inc. | 348,975 | |||
| 29,582 | E.I. du Pont de Nemours and Company | 1,023,241 | |||
| 11,132 | Freeport-McMoRan Copper & Gold, Inc. | 658,235 | |||
| 6,364 | Owens-Illinois, Inc.f | 168,328 | |||
| 3,078 | Silgan Holdings, Inc. | 87,354 | |||
| 6,980 | Steel Dynamics, Inc. | 92,066 | |||
| 8,100 | Temple-Inland, Inc. | 167,427 | |||
Total Materials | 3,121,311 | ||||
| Telecommunications Services (<0.1%) | |||||
| 2,340 | Telephone and Data Systems, Inc. | 71,112 | |||
| Total Telecommunications Services | 71,112 | ||||
| Utilities (0.1%) | |||||
| 2,215 | Alliant Energy Corporation | 70,304 | |||
| 29,390 | American Electric Power Company, Inc. | 949,297 | |||
| 3,434 | DPL, Inc. | 82,073 | |||
| 584 | Entergy Corporation | 41,826 | |||
| 806 | FirstEnergy Corporation | 28,395 | |||
| 7,092 | NV Energy, Inc. | 83,757 | |||
| 4,852 | Portland General Electric Company | 88,937 | |||
| 11,959 | Southwest Gas Corporation | 352,790 | |||
| 2,583 | UGI Corporation | 65,712 | |||
Total Utilities | 1,763,091 | ||||
Total Common Stock (cost $100,040,982) | 92,184,503 | ||||
The accompanying Notes to Financial Statements are an integral part of this schedule.
123
Table of Contents
Moderately Conservative Allocation Portfolio
Schedule of Investments as of June 30, 2010
(unaudited)
| Principal Amount | Short-Term Investments (6.2%)g | Value | ||||
Bank of America Repurchase Agreement | ||||||
| 29,510,000 | 0.010%, 7/1/2010h | $ | 29,510,000 | |||
Enterprise Funding Company, LLC | ||||||
| 7,350,000 | 0.090%, 7/1/2010 | 7,350,000 | ||||
Federal Home Loan Bank Discount Notes | ||||||
| 5,000,000 | 0.140%, 7/2/2010 | 4,999,981 | ||||
| 5,000,000 | 0.090%, 7/7/2010 | 4,999,925 | ||||
| 10,000,000 | 0.070%, 7/9/2010 | 9,999,844 | ||||
| 10,000,000 | 0.070%, 7/14/2010 | 9,999,747 | ||||
Federal Home Loan Mortgage Corporation Discount Notes | ||||||
| 5,000,000 | 0.130%, 7/2/2010 | 4,999,982 | ||||
| 300,000 | 0.180%, 7/7/2010e | 299,991 | ||||
Federal National Mortgage Association Discount Notes | ||||||
| 4,100,000 | 0.169%, 7/7/2010e | 4,099,884 | ||||
| Total Short-Term Investments (at amortized cost) | 76,259,354 | |||||
| Total Investments (cost $1,343,984,927) 101.0% | $ | 1,252,202,352 | ||||
| Other Assets and Liabilities, Net (1.0%) | (12,906,870 | ) | ||||
| Total Net Assets 100.0% | $ | 1,239,295,482 | ||||
| a | Denotes variable rate obligations for which the current coupon rate and next scheduled reset date are shown. |
| b | Denotes securities sold under Rule 144A of the Securities Act of 1933, which exempts them from registration. These securities have been deemed liquid and may be resold to other dealers in the program or to other qualified institutional buyers. As of June 30, 2010, the value of these investments was $8,755,688 or 0.7% of total net assets. |
| c | Denotes investments purchased on a when-issued or delayed delivery basis. |
| d | All or a portion of the security was earmarked to cover written options. |
| e | At June 30, 2010, $5,062,470 of investments were held on deposit with the counterparty and pledged as the initial margin deposit for open futures contracts. |
| f | Non-income producing security. |
| g | The interest rate shown reflects the yield, coupon rate or, for securities purchased at a discount, the discount rate at the date of purchase. |
| h | Repurchase agreement dated June 30, 2010, $39,490,011 maturing July 1, 2010, collateralized by $40,280,052 U.S. Treasury Notes, 3.125% due April 30, 2013. |
Definitions:
ADR | - | American Depositary Receipt, which are certificates for an underlying foreign security’s shares held by an issuing U.S. depository bank. | ||
TIPS | - | Treasury Inflation Protected Security. |
Unrealized Appreciation (Depreciation)
Gross unrealized appreciation and depreciation of investments, based on cost for federal income tax purposes, were as follows:
Gross unrealized appreciation | $ | 10,935,325 | ||
Gross unrealized depreciation | (102,717,900 | ) | ||
Net unrealized appreciation (depreciation) | $ | (91,782,575 | ) | |
Cost for federal income tax purposes | $ | 1,343,984,927 | ||
The accompanying Notes to Financial Statements are an integral part of this schedule.
124
Table of Contents
Moderately Conservative Allocation Portfolio
Schedule of Investments as of June 30, 2010
(unaudited)
Fair Valuation Measurements
The following table is a summary of the inputs used, as of June 30, 2010, in valuing Moderately Conservative Allocation Portfolio’s assets carried at fair value as discussed in the Notes to Financial Statements.
Investments in Securities | Total | Level 1 | Level 2 | Level 3 | ||||||||
Mutual Funds | ||||||||||||
Equity Mutual Funds | 302,559,266 | 302,559,266 | — | — | ||||||||
Fixed Income Mutual Funds | 639,086,384 | 639,086,384 | — | — | ||||||||
Long-Term Fixed Income | ||||||||||||
Asset-Backed Securities | 9,334,455 | — | 9,334,455 | — | ||||||||
Basic Materials | 4,055,550 | — | 4,055,550 | — | ||||||||
Capital Goods | 1,228,238 | — | 1,228,238 | — | ||||||||
Collateralized Mortgage Obligations | 16,062,142 | — | 16,062,142 | — | ||||||||
Commercial Mortgage-Backed Securities | 46,163,703 | — | 46,163,703 | — | ||||||||
Communications Services | 4,426,931 | — | 4,426,931 | — | ||||||||
Consumer Cyclical | 4,952,895 | — | 4,952,895 | — | ||||||||
Consumer Non-Cyclical | 2,274,950 | — | 2,274,950 | — | ||||||||
Energy | 2,257,376 | — | 2,257,376 | — | ||||||||
Financials | 2,352,590 | — | 2,352,590 | — | ||||||||
Foreign Government | 810,437 | — | 810,437 | — | ||||||||
Mortgage-Backed Securities | 14,773,469 | — | 14,773,469 | — | ||||||||
Technology | 1,141,425 | — | 1,141,425 | — | ||||||||
U.S. Government and Agencies | 31,114,894 | — | 30,941,678 | 173,216 | ||||||||
Utilities | 1,163,790 | — | 1,163,790 | — | ||||||||
Common Stock | ||||||||||||
Consumer Discretionary | 12,798,273 | 12,798,273 | — | — | ||||||||
Consumer Staples | 5,021,496 | 5,021,496 | — | — | ||||||||
Energy | 10,308,919 | 10,308,919 | — | — | ||||||||
Financials | 14,212,492 | 14,212,492 | — | — | ||||||||
Health Care | 11,990,165 | 11,990,165 | — | — | ||||||||
Industrials | 12,037,514 | 12,037,514 | — | — | ||||||||
Information Technology | 20,860,130 | 20,860,130 | — | — | ||||||||
Materials | 3,121,311 | 3,121,311 | — | — | ||||||||
Telecommunications Services | 71,112 | 71,112 | — | — | ||||||||
Utilities | 1,763,091 | 1,763,091 | — | — | ||||||||
Short-Term Investments | 76,259,354 | — | 76,259,354 | — | ||||||||
Total | $ | 1,252,202,352 | $ | 1,033,830,153 | $ | 218,198,983 | $ | 173,216 | ||||
Other Financial Instruments | ||||||||||||
Asset Derivatives | ||||||||||||
Futures Contracts | 189,627 | 189,627 | — | — | ||||||||
Total Asset Derivatives | $ | 189,627 | $ | 189,627 | $ | — | $ | — | ||||
Liability Derivatives | ||||||||||||
Futures Contracts | 1,450,835 | 1,450,835 | — | — | ||||||||
Call Options Written | 94,938 | — | — | 94,938 | ||||||||
Total Liability Derivatives | $ | 1,545,773 | $ | 1,450,835 | $ | — | $ | 94,938 | ||||
The accompanying Notes to Financial Statements are an integral part of this schedule.
125
Table of Contents
Moderately Conservative Allocation Portfolio
Schedule of Investments as of June 30, 2010
(unaudited)
The following table is a reconciliation of assets in which significant unobservable inputs (Level 3) were used in determining fair value for Moderately Conservative Allocation Portfolio as discussed in item 2(A) of the Notes to Financial Statements.
Investments in Securities | Value December 31, 2009 | Accrued Discounts and/or Premiums | Realized Gain/(Loss) | Change in Unrealized Gain/ (Loss) | Net Purchases/(Sales) | Transfers Into Level 3 | Transfers Out of Level 3 | Value June 30, 2010 | ||||||||||||||||
Long-Term Fixed Income U.S. Government and Agencies | — | 384 | — | 1,376 | 171,456 | — | — | 173,216 | ||||||||||||||||
Total | $ | — | $ | 384 | $ | — | $ | 1,376 | $ | 171,456 | $ | — | $ | — | $ | 173,219 | ||||||||
Other Financial Instruments | ||||||||||||||||||||||||
Liability Derivatives Call Options Written | — | — | — | 94,938 | — | — | — | 94,938 | ||||||||||||||||
Total | $ | — | $ | — | $ | — | $ | 94,938 | $ | — | $ | — | $ | — | $ | 94,938 | ||||||||
Futures Contracts | Number of Contracts Long/(Short) | Expiration Date | Notional Principal Amount | Value | Unrealized Gain/(Loss) | ||||||||||||
E-Mini MSCI EAFE Index Futures | 48 | September 2010 | $ | 3,398,772 | $ | 3,156,480 | ($ | 242,292 | ) | ||||||||
Russell 2000 Index Mini-Futures | (191 | ) | September 2010 | (11,695,360 | ) | (11,608,980 | ) | 86,380 | |||||||||
S&P 400 Index Mini-Futures | (101 | ) | September 2010 | (7,274,247 | ) | (7,171,000 | ) | 103,247 | |||||||||
S&P 500 Index Futures | 171 | September 2010 | 45,095,693 | 43,887,150 | (1,208,543 | ) | |||||||||||
Total Futures Contracts | ($ | 1,261,208 | ) | ||||||||||||||
Call Options Written | Number of Contracts | Exercise Price | Expiration Date | Value | Unrealized Gain/(Loss) | ||||||||||
Federal National Mortgage Association Conventional 30- Yr. Pass Through | 12 | $ | 102.36 | July 2010 | ($ | 160,813 | ) | ($ | 94,938 | ) | |||||
Total Call Options Written | ($ | 160,813 | ) | ($ | 94,938 | ) | |||||||||
The accompanying Notes to Financial Statements are an integral part of this schedule.
126
Table of Contents
Moderately Conservative Allocation Portfolio
Schedule of Investments as of June 30, 2010
(unaudited)
The following table summarizes the fair value and Statement of Assets and Liabilities location, as of June 30, 2010, for Moderately Conservative Allocation Portfolio’s investments in financial derivative instruments by primary risk exposure as discussed under item (2) Significant Accounting Policies of the Notes to Financial Statements.
Derivatives by risk category | Statement of Assets and Liabilities Location | Fair Value | |||
Asset Derivatives | |||||
Equity Contracts | |||||
Futures* | Net Assets - Net unrealized appreciation/(depreciation) on Futures contracts | 189,627 | |||
Total Equity Contracts | 189,627 | ||||
Total Asset Derivatives | $ | 189,627 | |||
Liability Derivatives | |||||
Equity Contracts | |||||
Futures* | Net Assets - Net unrealized appreciation/(depreciation) on Futures contracts | 1,450,835 | |||
Total Equity Contracts | 1,450,835 | ||||
Interest Rate Contracts | |||||
Options Written | Net Assets - Net unrealized appreciation/(depreciation) on Written option contracts |
| 94,938 | ||
Total Interest Rate Contracts | 94,938 | ||||
Total Liability Derivatives | $ | 1,545,773 | |||
| * | Includes cumulative appreciation/depreciation of futures contracts as reported in the Schedule of Investments. Only current day’s variation margin is reported within the Statement of Assets and Liabilities. |
The following table summarizes the net realized gains/(losses) and Statement of Operations location, for the period ended June 30, 2010, for Moderately Conservative Allocation Portfolio’s investments in financial derivative instruments by primary risk exposure.
Derivatives by risk category | Statement of Operations Location | Realized Gains/(Losses) recognized in Income | ||||
Equity Contracts | ||||||
Futures | Net realized gains/(losses) on Futures contracts | 2,040,530 | ||||
Total Equity Contracts | 2,040,530 | |||||
Credit Contracts | ||||||
Credit Default Swaps | Net realized gains/(losses) on Swap agreements | (477,133 | ) | |||
Total Credit Contracts | (477,133 | ) | ||||
Total | $ | 1,563,397 | ||||
The following table summarizes the change in net unrealized appreciation/(depreciation) and Statement of Operations location, for the period ended June 30, 2010, for Moderately Conservative Allocation Portfolio’s investments in financial derivative instruments by primary risk exposure.
Derivatives by risk category | Statement of Operations Location | Change in unrealized appreciation/(depreciation) recognized in Income | |||
Equity Contracts | |||||
Futures | Change in net unrealized appreciation/(depreciation) on Futures contracts | (2,070,061 | ) | ||
Total Equity Contracts | (2,070,061 | ) | |||
Interest Rate Contracts | |||||
Options Written | Change in net unrealized appreciation/(depreciation) on Written option contracts | (94,938 | ) | ||
Total Interest Rate Contracts | (94,938 | ) | |||
Credit Contracts | |||||
Credit Default Swaps | Change in net unrealized appreciation/(depreciation) on Swap agreements | 555,798 | |||
Total Credit Contracts | 555,798 | ||||
Total | ($1,609,201 | ) | |||
The accompanying Notes to Financial Statements are an integral part of this schedule.
127
Table of Contents
Moderately Conservative Allocation Portfolio
Schedule of Investments as of June 30, 2010
(unaudited)
The following table presents Moderately Conservative Allocation Portfolio’s average volume of derivative activity during the period ended June 30, 2010.
Derivative Risk Category | Futures (Notional*) | Futures (Percentage of Average Net Assets) | Swaps (Notional*) | Swaps (Percentage of Average Net Assets) | Options (Contracts) | |||||||||
Equity Contracts | $ | 56,584,546 | 4.8 | % | N/A | N/A | 3 | |||||||
Credit Contracts | N/A | N/A | $ | 4,584,106 | 0.4 | % | N/A | |||||||
| * | Notional amount represents long or short, or both, derivative positions held by the portfolio. |
Investment in Affiliates
Affiliated issuers, as defined under the Investment Company Act of 1940, include those in which the Portfolio’s holdings of an issuer represent 5% or more of the outstanding voting securities of an issuer, or any affiliated mutual fund.
A summary of transactions for the fiscal year to date, in Moderately Conservative Allocation Portfolio, is as follows:
Portfolio | Value December 31, 2009 | Gross Purchases | Gross Sales | Shares Held at June 30, 2010 | Value June 30, 2010 | Income Earned January 1, 2010 - June 30, 2010 | |||||||||||
Real Estate Securities | $ | 20,581,955 | $ | 1,893,408 | $ | 28,896 | 1,928,042 | $ | 23,715,683 | $ | — | ||||||
Partner Small Cap Value | 18,563,033 | 990,874 | 14,448 | 1,253,516 | 19,053,449 | 44,170 | |||||||||||
Small Cap Stock | 14,943,231 | 1,426,982 | 21,672 | 1,614,844 | 15,623,777 | 6,926 | |||||||||||
Partner Mid Cap Value | 21,911,316 | 1,033,178 | 14,448 | 2,119,789 | 22,093,285 | 86,474 | |||||||||||
Mid Cap Stock | 33,656,035 | 1,915,029 | 7,528,896 | 2,915,499 | 27,477,120 | 21,621 | |||||||||||
Partner Worldwide Allocation | 32,456,561 | 10,789,705 | 57,793 | 5,518,412 | 39,611,715 | 2,889 | |||||||||||
Partner International Stock | 37,209,802 | 16,013 | — | 3,725,745 | 32,473,592 | 16,013 | |||||||||||
Large Cap Growth II | 33,851,497 | 2,999,672 | 1,483,294 | 4,842,556 | 30,387,039 | 44,478 | |||||||||||
Large Cap Value | 66,870,534 | 4,278,190 | 65,017 | 7,367,157 | 64,607,016 | 18,021 | |||||||||||
Large Cap Stock | 21,481,444 | 927,570 | 1,491,647 | 2,707,449 | 18,933,463 | 3,667 | |||||||||||
Equity Income Plus | 8,557,906 | 484,141 | 7,224 | 1,142,786 | 8,583,127 | 10,789 | |||||||||||
High Yield | 47,830,809 | 16,997,332 | 43,345 | 14,164,883 | 64,097,512 | 2,315,163 | |||||||||||
Income | 131,353,189 | 34,937,371 | 108,361 | 17,612,031 | 170,736,311 | 3,851,756 | |||||||||||
Limited Maturity Bond | 372,300,168 | 48,628,990 | 21,061,744 | 41,549,161 | 404,252,561 | 6,610,945 | |||||||||||
Total Value and Income Earned | 861,567,480 | 941,645,650 | 13,032,914 | ||||||||||||||
The accompanying Notes to Financial Statements are an integral part of this schedule.
128
Table of Contents
Partner Technology Portfolio
Schedule of Investments as of June 30, 2010
(unaudited)
| a | All or a portion of the security is on loan as discussed in item 2(M) of the Notes to Financial Statements. |
| b | Non-income producing security. |
Unrealized Appreciation (Depreciation)
Gross unrealized appreciation and depreciation of investments, based on cost for federal income tax purposes, were as follows:
Gross unrealized appreciation | $ | 5,611,262 | ||
Gross unrealized depreciation | (1,154,146 | ) | ||
Net unrealized appreciation (depreciation) | $ | 4,457,116 | ||
Cost for federal income tax purposes | $ | 28,379,399 | ||
The accompanying Notes to Financial Statements are an integral part of this schedule.
129
Table of Contents
Partner Technology Portfolio
Schedule of Investments as of June 30, 2010
(unaudited)
Fair Valuation Measurements
The following table is a summary of the inputs used, as of June 30, 2010, in valuing Partner Technology Portfolio’s assets carried at fair value as discussed in the Notes to Financial Statements.
Investments in Securities | Total | Level 1 | Level 2 | Level 3 | ||||||||
Common Stock | ||||||||||||
Communications Equipment | 2,336,152 | 2,336,152 | — | — | ||||||||
Computers & Peripherals | 3,370,417 | 3,370,417 | — | — | ||||||||
Consumer Discretionary | 2,754,568 | 2,754,568 | — | — | ||||||||
Electronic Equipment, Instruments & Components | 2,126,396 | 2,126,396 | — | — | ||||||||
Industrials | 1,851,256 | 1,851,256 | — | — | ||||||||
Internet Software & Services | 1,733,254 | 1,733,254 | — | — | ||||||||
IT Consulting & Services | 2,369,284 | 2,369,284 | — | — | ||||||||
Materials | 577,912 | 577,912 | — | — | ||||||||
Semiconductors & Semiconductor Equipment | 3,245,236 | 3,245,236 | — | — | ||||||||
Software | 5,438,639 | 5,438,639 | — | — | ||||||||
Telecommunications Services | 2,347,176 | 2,347,176 | — | — | ||||||||
Collateral Held for Securities Loaned | 4,686,225 | 4,686,225 | — | — | ||||||||
Total | $ | 32,836,515 | $ | 32,836,515 | $ | — | $ | — | ||||
Investment in Affiliates
Affiliated issuers, as defined under the Investment Company Act of 1940, include those in which the Portfolio’s holdings of an issuer represent 5% or more of the outstanding voting securities of an issuer, or any affiliated mutual fund.
A summary of transactions for the fiscal year to date, in Partner Technology Portfolio, is as follows:
Portfolio | Value December 31, 2009 | Gross Purchases | Gross Sales | Shares Held at June 30, 2010 | Value June 30, 2010 | Income Earned January 1, 2010 - June 30, 2010 | |||||||||||
Thrivent Financial Securities Lending Trust | $ | 3,353,411 | $ | 19,334,986 | $ | 18,002,172 | 4,686,225 | $ | 4,686,225 | $ | 6,646 | ||||||
Total Value and Income Earned | 3,353,411 | 4,686,225 | 6,646 | ||||||||||||||
The accompanying Notes to Financial Statements are an integral part of this schedule.
130
Table of Contents
Partner Healthcare Portfolio
Schedule of Investments as of June 30, 2010
(unaudited)
Definitions:
| ||
| ADR | - | American Depositary Receipt, which are certificates for an underlying foreign security’s shares held by an issuing U.S. depository bank. | ||
| GDR | - | Global Depository Receipts, which are certificates for shares of an underlying foreign security’s shares held by an issuing depository bank from more than one country. |
Unrealized Appreciation (Depreciation)
Gross unrealized appreciation and depreciation of investments, based on cost for federal income tax purposes, were as follows:
Gross unrealized appreciation | $ | 1,220,000 | ||
Gross unrealized depreciation | (425,363 | ) | ||
Net unrealized appreciation (depreciation) | $ | 794,637 | ||
Cost for federal income tax purposes | $ | 14,235,955 | ||
The accompanying Notes to Financial Statements are an integral part of this schedule.
131
Table of Contents
Partner Healthcare Portfolio
Schedule of Investments as of June 30, 2010
(unaudited)
Fair Valuation Measurements
The following table is a summary of the inputs used, as of June 30, 2010, in valuing Partner Healthcare Portfolio’s assets carried at fair value as discussed in the Notes to Financial Statements.
Investments in Securities | Total | Level 1 | Level 2 | Level 3 | ||||||||
Common Stock | ||||||||||||
Biotechnology | 4,459,944 | 4,459,944 | — | — | ||||||||
Health Care Equipment | 2,101,222 | 2,101,222 | — | — | ||||||||
Health Care Supplies | 319,512 | 319,512 | — | — | ||||||||
Life Sciences Tools & Services | 152,355 | 152,355 | — | — | ||||||||
Pharmaceuticals | 7,997,559 | 4,802,960 | 3,194,599 | — | ||||||||
Total | $ | 15,030,592 | $ | 11,835,993 | $ | 3,194,599 | $ | — | ||||
The following table summarizes the net realized gains/(losses) and Statement of Operations location, for the period ended June 30, 2010, for Partner Healthcare Portfolio’s investments in financial derivative instruments by primary risk exposure.
Derivatives by risk category | Statement of Operations Location | Realized Gains/(Losses) recognized in Income | |||
Foreign Exchange Contracts | |||||
Forward Contracts | Net realized gains/(losses) on Foreign currency transactions | (2,790 | ) | ||
Total Foreign Exchange Contracts | (2,790 | ) | |||
Total | ($2,790 | ) | |||
The following table presents Partner Healthcare Portfolio's average volume of derivative activity during the period ended June 30, 2010.
Derivative Risk Category | Forwards (Notional*) | Forwards (Percentage of Average Net Assets) | ||||
Foreign Exchange | ||||||
Contracts | $ | 15,685 | 0.1 | % | ||
| * | Notional amount represents long or short, or both, derivative positions held by the portfolio. |
The accompanying Notes to Financial Statements are an integral part of this schedule.
132
Table of Contents
Partner Natural Resources Portfolio
Schedule of Investments as of June 30, 2010
(unaudited)
The accompanying Notes to Financial Statements are an integral part of this schedule.
133
Table of Contents
Partner Natural Resources Portfolio
Schedule of Investments as of June 30, 2010
(unaudited)
| Shares | Common Stock (84.6%) | Value | |||
| Oil & Gas Refining & Marketing (0.2%) | |||||
| 1,900 | Valero Energy Corporation | $ | 34,162 | ||
Total Oil & Gas Refining & Marketing | 34,162 | ||||
| Oil & Gas Storage & Transportation (0.2%) | |||||
| 1,720 | Williams Companies, Inc. | 31,442 | |||
Total Oil & Gas Storage & Transportation | 31,442 | ||||
| Utilities (1.0%) | |||||
| 5,450 | EQT Corporation | 196,963 | |||
Total Utilities | 196,963 | ||||
Total Common Stock (cost $19,948,443) | 17,432,824 | ||||
| Principal Amount | Short-Term Investments (14.7%)b | ||||
Federal Home Loan Bank Discount Notes | |||||
| 100,000 | 0.045%, 7/9/2010 | 99,999 | |||
| 1,000,000 | 0.070%, 7/14/2010 | 999,975 | |||
Federal Home Loan Mortgage Corporation Discount Notes | |||||
| 1,000,000 | 0.060%, 7/19/2010 | 999,970 | |||
U.S. Treasury Bills | |||||
| 940,000 | 0.020%, 7/8/2010 | 939,996 | |||
Total Short-Term Investments (at amortized cost) | 3,039,940 | ||||
Total Investments (cost $22,988,383) 99.3% | $ | 20,472,764 | |||
Other Assets and Liabilities, Net 0.7% | 142,752 | ||||
Total Net Assets 100.0% | $ | 20,615,516 | |||
| a | Non-income producing security. |
| b | The interest rate shown reflects the yield, coupon rate or, for securities purchased at a discount, the discount rate at the date of purchase. |
Definitions:
| ADR | - | American Depositary Receipt, which are certificates for an underlying foreign security’s shares held by an issuing U.S. depository bank. |
Unrealized Appreciation (Depreciation)
Gross unrealized appreciation and depreciation of investments, based on cost for federal income tax purposes, were as follows:
Gross unrealized appreciation | $ | 750,625 | ||
Gross unrealized depreciation | (3,266,244 | ) | ||
Net unrealized appreciation (depreciation) | $ | (2,515,619 | ) | |
Cost for federal income tax purposes | $ | 22,988,383 | ||
Fair Valuation Measurements
The following table is a summary of the inputs used, as of June 30, 2010, in valuing Partner Natural Resources Portfolio’s assets carried at fair value as discussed in the Notes to Financial Statements.
Investments in Securities | Total | Level 1 | Level 2 | Level 3 | ||||||||
Common Stock | ||||||||||||
Coal & Consumable Fuels | 392,018 | 392,018 | — | — | ||||||||
Industrials | 120,341 | 28,971 | 91,370 | — | ||||||||
Integrated Oil & Gas | 4,030,129 | 3,416,295 | 613,834 | — | ||||||||
Materials | 1,935,139 | 537,506 | 1,397,633 | — | ||||||||
Oil & Gas Drilling | 1,441,448 | 1,441,448 | — | — | ||||||||
Oil & Gas Equipment & Services | 2,747,586 | 2,727,613 | 19,973 | — | ||||||||
Oil & Gas Exploration & Production | 6,503,596 | 4,633,202 | 1,870,394 | — | ||||||||
Oil & Gas Refining & Marketing | 34,162 | 34,162 | — | — | ||||||||
Oil & Gas Storage & Transportation | 31,442 | 31,442 | — | — | ||||||||
Utilities | 196,963 | 196,963 | — | — | ||||||||
Short-Term Investments | 3,039,940 | — | 3,039,940 | — | ||||||||
Total | $ | 20,472,764 | $ | 13,439,620 | $ | 7,033,144 | $ | — | ||||
The accompanying Notes to Financial Statements are an integral part of this schedule.
134
Table of Contents
Partner Natural Resources Portfolio
Schedule of Investments as of June 30, 2010
(unaudited)
The following table summarizes the net realized gains/(losses) and Statement of Operations location, for the period ended June 30, 2010, for Partner Natural Resources Portfolio’s investments in financial derivative instruments by primary risk exposure.
Derivatives by risk category | Statement of Operations Location | Realized Gains/(Losses) recognized in Income | |||
Foreign Exchange Contracts | |||||
Forward Contracts | Net realized gains/(losses) on Foreign currency transactions | 2,086 | |||
Total Foreign Exchange Contracts | 2,086 | ||||
Total | $ | 2,086 | |||
The following table presents Partner Natural Resources Portfolio’s average volume of derivative activity during the period ended June 30, 2010.
Derivative Risk Category | Forwards (Notional*) | Forwards (Percentage of Average Net Assets) | ||||
Foreign Exchange | ||||||
Contracts | $ | 4,875 | <0.1 | % | ||
| * | Notional amount represents long or short, or both, derivative positions held by the portfolio. |
The accompanying Notes to Financial Statements are an integral part of this schedule.
135
Table of Contents
Partner Natural Resources Portfolio
Schedule of Investments as of June 30, 2010
(unaudited)
The accompanying Notes to Financial Statements are an integral part of this schedule.
136
Table of Contents
Partner Emerging Markets Portfolio
Schedule of Investments as of June 30, 2010
(unaudited)
| Shares | Common Stock (97.6%) | Value | |||
United Kingdom (2.2%) | |||||
| 19,950 | Standard Chartered plc | $ | 485,790 | ||
Total United Kingdom | 485,790 | ||||
Total Common Stock (cost $20,598,431) | 21,274,963 | ||||
Principal | Short-Term Investments (1.2%)d | ||||
| U.S. Treasury Bills | |||||
| 270,000 | 0.020%, 7/8/2010 | 269,999 | |||
Total Short-Term Investments (at amortized cost) | 269,999 | ||||
Total Investments (cost $20,868,430) 98.8% | $ | 21,544,962 | |||
Other Assets and Liabilities, Net 1.2% | 265,138 | ||||
| Total Net Assets 100.0% | $ | 21,810,100 | |||
| a | Non-income producing security. |
| b | Security is fair valued as discussed in item 2(A) of the Notes to Financial Statements. |
| c | Denotes securities sold under Rule 144A of the Securities Act of 1933, which exempts them from registration. These securities have been deemed liquid and may be resold to other dealers in the program or to other qualified institutional buyers. As of June 30, 2010, the value of these investments was $333,753 or 1.5% of total net assets. |
| d | The interest rate shown reflects the yield, coupon rate or, for securities purchased at a discount, the discount rate at the date of purchase. |
Definitions:
ADR | - | American Depositary Receipt, which are certificates for an underlying foreign security’s shares held by an issuing U.S. depository bank. | ||
GDR | - | Global Depository Receipts, which are certificates for shares of an underlying foreign security’s shares held by an issuing depository bank from more than one country. |
Unrealized Appreciation (Depreciation)
Gross unrealized appreciation and depreciation of investments, based on cost for federal income tax purposes, were as follows:
Gross unrealized appreciation | $ | 2,209,976 | ||
Gross unrealized depreciation | (1,533,444 | ) | ||
Net unrealized appreciation (depreciation) | $ | 676,532 | ||
Cost for federal income tax purposes | $ | 20,868,430 |
Fair Valuation Measurements
The following table is a summary of the inputs used, as of June 30, 2010, in valuing Partner Emerging Markets Portfolio’s assets carried at fair value as discussed in the Notes to Financial Statements.
Investments in Securities | Total | Level 1 | Level 2 | Level 3 | ||||||||
Common Stock | ||||||||||||
Consumer Discretionary | 2,422,882 | — | 2,422,882 | — | ||||||||
Consumer Staples | 2,363,415 | 612,730 | 1,750,685 | — | ||||||||
Energy | 3,421,171 | 1,729,004 | 1,692,167 | — | ||||||||
Financials | 5,483,860 | 1,219,686 | 4,264,174 | — | ||||||||
Health Care | 1,001,668 | 231,356 | 770,312 | — | ||||||||
Industrials | 2,050,213 | 264,132 | 1,740,417 | 45,664 | ||||||||
Information Technology | 2,296,953 | 750,178 | 1,546,775 | — | ||||||||
Materials | 818,665 | 818,665 | — | — | ||||||||
Telecommunications Services | 1,416,136 | — | 1,416,136 | — | ||||||||
Short-Term Investments | 269,999 | — | 269,999 | — | ||||||||
Total | $ | 21,544,962 | $ | 5,625,751 | $ | 15,873,547 | $ | 45,664 | ||||
The accompanying Notes to Financial Statements are an integral part of this schedule.
137
Table of Contents
Partner Emerging Markets Portfolio
Schedule of Investments as of June 30, 2010
(unaudited)
The following table is a reconciliation of assets in which significant unobservable inputs (Level 3) were used in determining fair value for Partner Emerging Markets Portfolio as discussed in item 2(A) of the Notes to Financial Statements.
Investments in Securities | Value December 31, 2009 | Accrued Discounts and/or Premiums | Realized Gain/(Loss) | Change in Unrealized Gain/(Loss) | Net Purchases/(Sales) | Transfers Into Level 3 | Transfers Out of Level 3 | Value June 30, 2010 | |||||||||||||||||
Common Stock | |||||||||||||||||||||||||
Industrials | — | — | — | (102,899 | ) | 148,563 | — | — | 45,664 | ||||||||||||||||
Total | $ | — | $ | — | $ | — | ($ | 102,899 | ) | $ | 148,563 | $ | — | $ | — | $ | 45,664 | ||||||||
The following table summarizes the net realized gains/(losses) and Statement of Operations location, for the period ended June 30, 2010, for Partner Emerging Markets Portfolio’s investments in financial derivative instruments by primary risk exposure.
Derivatives by risk category | Statement of Operations Location | Realized Gains/(Losses) recognized in Income | |||
Foreign Exchange Contracts | |||||
Forward Contracts | Net realized gains/(losses) on Foreign currency transactions | (4,728 | ) | ||
Total Foreign Exchange Contracts | (4,728 | ) | |||
Total | ($4,728 | ) | |||
The following table summarizes the change in net unrealized appreciation/(depreciation) and Statement of Operations location, for the period ended June 30, 2010, for Partner Emerging Markets Portfolio’s investments in financial derivative instruments by primary risk exposure.
Derivatives by risk category | Statement of Operations Location | Change in unrealized appreciation/(depreciation) recognized in Income | |||
Foreign Exchange Contracts | |||||
Forward Contracts | Change in net unrealized appreciation/(depreciation) on Foreign currency | ||||
| forward contracts | (429 | ) | |||
Total Foreign Exchange Contracts | (429 | ) | |||
Total | ($429 | ) | |||
The following table presents Partner Emerging Markets Portfolio’s average volume of derivative activity during the period ended June 30, 2010.
Derivative Risk Category | Forwards (Notional*) | Forwards (Percentage of Average Net Assets) | ||||
Foreign Exchange | ||||||
Contracts | $ | 15,964 | 0.1 | % | ||
| * | Notional amount represents long or short, or both, derivative positions held by the portfolio. |
The accompanying Notes to Financial Statements are an integral part of this schedule.
138
Table of Contents
Real Estate Securities Portfolio
Schedule of Investments as of June 30, 2009
(unaudited)
Common Stock (98.0%) | Value | ||||
| Diversified REITS (7.0%) | |||||
39,352 | Colonial Properties Trust | $ | 571,784 | ||
7,200 | Excel Trust, Inc.a | 86,400 | |||
113,295 | Liberty Property Trustb | 3,268,561 | |||
16,500 | PS Business Parks, Inc. | 920,370 | |||
6,200 | Retail Opportunity Investments Corporation | 59,830 | |||
189,075 | Vornado Realty Trust | 13,793,021 | |||
32,920 | Washington Real Estate Investment Trust | 908,263 | |||
Total Diversified REITS | 19,608,229 | ||||
| Financials (4.1%) | |||||
128,600 | iShares Dow Jones U.S. Real Estate | ||||
Index Fundb | 6,071,206 | ||||
113,417 | Vanguard REIT ETFb | 5,272,756 | |||
Total Financials | 11,343,962 | ||||
| Hotels, Resorts & Cruise Lines (0.8%) | |||||
10,700 | Gaylord Entertainment | ||||
Companya,b | 236,363 | ||||
10,400 | Marriott International, Inc. | 311,376 | |||
43,721 | Starwood Hotels & Resorts | ||||
Worldwide, Inc. | 1,811,361 | ||||
Total Hotels, Resorts & Cruise Lines | 2,359,100 | ||||
| Industrial REITS (4.3%) | |||||
163,474 | AMB Property Corporation | 3,875,968 | |||
221,353 | DCT Industrial Trust, Inc. | 1,000,516 | |||
44,853 | DuPont Fabros Technology, Inc. | 1,101,590 | |||
27,000 | EastGroup Properties, Inc. | 960,660 | |||
23,950 | First Potomac Realty Trust | 344,161 | |||
461,285 | ProLogis | 4,672,817 | |||
Total Industrial REITS | 11,955,712 | ||||
| Mortgage REITS (0.5%) | |||||
25,213 | Annaly Capital Management, Inc. | 432,403 | |||
37,450 | Chimera Investment Corporation | 135,195 | |||
23,000 | Cypress Sharpridge Investments, Inc. | 291,180 | |||
13,350 | Invesco Mortgage Capital, Inc. | 267,133 | |||
25,000 | MFA Mortgage Investments, Inc. | 185,000 | |||
Total Mortgage REITS | 1,310,911 | ||||
| Office REITS (17.0%) | |||||
58,250 | Alexandria Real Estate Equities, Inc.b | 3,691,302 | |||
121,117 | BioMed Realty Trust, Inc. | 1,948,772 | |||
175,100 | Boston Properties, Inc. | 12,491,634 | |||
174,140 | Brandywine Realty Trust | 1,872,005 | |||
73,610 | CommonWealth REIT | 457,118 | |||
73,905 | Corporate Office Properties Trust | 2,790,653 | |||
131,575 | Digital Realty Trust, Inc.b | 7,589,246 | |||
132,000 | Douglas Emmett, Inc. | 1,877,040 | |||
199,500 | Duke Realty Corporation | 2,264,325 | |||
8,950 | Government Properties Income Trust | 228,404 | |||
68,300 | Highwoods Properties, Inc. | 1,896,008 | |||
67,061 | Kilroy Realty Corporation | 1,993,724 | |||
34,558 | Lexington Realty Trust | 207,694 | |||
84,475 | Mack-Cali Realty Corporation | 2,511,442 | |||
25,200 | Piedmont Office Realty Trust, Inc. | 471,996 | |||
92,099 | SL Green Realty Corporation | 5,069,129 | |||
Total Office REITS | 47,360,492 | ||||
| Real Estate Operating Companies (0.9%) | |||||
125,200 | Brookfield Properties Corporation | 1,757,808 | |||
63,940 | Forest City Enterprises, Inc.a,b | 723,801 | |||
Total Real Estate Operating Companies | 2,481,609 | ||||
| Residential REITS (16.6%) | |||||
84,300 | American Campus Communities, Inc. | 2,300,547 | |||
128,803 | Apartment Investment & Management Company | 2,494,914 | |||
28,400 | Associated Estates Realty Corporation | 367,780 | |||
98,840 | AvalonBay Communities, Inc. | 9,228,691 | |||
56,977 | BRE Properties, Inc. | 2,104,161 | |||
80,537 | Camden Property Trust | 3,289,936 | |||
36,000 | Education Realty Trust, Inc. | 217,080 | |||
49,015 | Equity Lifestyle Properties, Inc. | 2,363,993 | |||
303,850 | Equity Residential | 12,652,314 | |||
45,300 | Essex Property Trust, Inc. | 4,418,562 | |||
36,300 | Home Properties, Inc. | 1,636,041 | |||
31,412 | Mid-America Apartment Communities, Inc. | 1,616,776 | |||
47,076 | Post Properties, Inc. | 1,070,038 | |||
131,531 | UDR, Inc. | 2,516,188 | |||
Total Residential REITS | 46,277,021 | ||||
| Retail REITS (22.3%) | |||||
50,678 | Acadia Realty Trust | 852,404 | |||
6,350 | Agree Realty Corporation | 148,082 | |||
144,780 | CBL & Associates Properties, Inc. | 1,801,063 | |||
11,250 | Cedar Shopping Centers, Inc. | 67,725 | |||
120,460 | Developers Diversified Realty Corporation | 1,192,554 | |||
33,181 | Equity One, Inc. | 517,624 | |||
91,620 | Federal Realty Investment Trust | 6,438,137 | |||
20,300 | General Growth Properties, Inc. | 269,178 | |||
59,424 | Glimcher Realty Trust | 355,356 | |||
43,100 | Inland Real Estate Corporation | 341,352 | |||
336,200 | Kimco Realty Corporation | 4,518,528 | |||
60,100 | Kite Realty Group Trust | 251,218 | |||
145,742 | Macerich Company | 5,439,091 | |||
89,000 | National Retail Properties, Inc. | 1,908,160 | |||
10,800 | Pennsylvania Real Estate Investment Trustb | 131,976 | |||
39,486 | Ramco-Gershenson Properties Trust | 398,809 | |||
32,725 | Realty Income Corporationb | 992,549 | |||
120,100 | Regency Centers Corporation | 4,131,440 | |||
8,500 | Saul Centers, Inc. | 345,355 | |||
329,290 | Simon Property Group, Inc. | 26,590,168 | |||
48,851 | Tanger Factory Outlet Centers, | ||||
Inc. | 2,021,454 | ||||
63,000 | Taubman Centers, Inc. | 2,370,690 | |||
70,900 | Weingarten Realty Investorsb | 1,350,645 | |||
Total Retail REITS | 62,433,558 | ||||
| Specialized REITS (24.5%) | |||||
3,900 | Chatham Lodging Trusta | 69,693 | |||
The accompanying Notes to Financial Statements are an integral part of this schedule.
139
Table of Contents
Real Estate Securities Portfolio
Schedule of Investments as of June 30, 2009
(unaudited)
| Shares | Common Stock (98.0%) | Value | ||||
Specialized REITS (24.5%) - continued | ||||||
| 41,250 | Cogdell Spencer, Inc. | $ | 278,850 | |||
| 112,493 | DiamondRock Hospitality Companya | 924,692 | ||||
| 44,236 | Entertainment Properties Trust | 1,684,065 | ||||
| 103,100 | Extra Space Storage, Inc. | 1,433,090 | ||||
| 23,000 | FelCor Lodging Trust, Inc.a | 114,770 | ||||
| 283,579 | Health Care Property Investors, Inc. | 9,145,423 | ||||
| 113,124 | Health Care REIT, Inc. | 4,764,783 | ||||
| 48,875 | Healthcare Realty Trust, Inc. | 1,073,784 | ||||
| 99,700 | Hersha Hospitality Trust | 450,644 | ||||
| 75,355 | Hospitality Properties Trust | 1,589,990 | ||||
| 680,404 | Host Hotels & Resorts, Inc. | 9,171,846 | ||||
| 62,638 | LaSalle Hotel Properties | 1,288,464 | ||||
| 12,300 | LTC Properties, Inc. | 298,521 | ||||
| 60,778 | Medical Properties Trust, Inc. | 573,744 | ||||
| 130,525 | Nationwide Health Properties, Inc. | 4,668,879 | ||||
| 71,700 | Omega Healthcare Investors, Inc. | 1,428,981 | ||||
| 4,800 | Pebblebrook Hotel Trusta | 90,480 | ||||
| 45,609 | Plum Creek Timber Company, Inc.b | 1,574,879 | ||||
| 2,900 | Potlatch Corporation | 103,617 | ||||
| 153,532 | Public Storage, Inc. | 13,496,998 | ||||
| 20,500 | Rayonier, Inc. REIT | 902,410 | ||||
| 18,000 | Resource Capital Corporation | 102,240 | ||||
| 123,856 | Senior Housing Property Trust | 2,490,744 | ||||
| 9,700 | Sovran Self Storage, Inc. | 333,971 | ||||
| 45,000 | Strategic Hotel Capital, Inc.a | 197,550 | ||||
| 80,000 | Sunstone Hotel Investors, Inc.a | 794,400 | ||||
| 68,475 | U-Store-It Trust | 510,824 | ||||
| 191,359 | Ventas, Inc. | 8,984,305 | ||||
| Total Specialized REITS | 68,542,637 | |||||
| Total Common Stock | ||||||
| (cost $296,787,263) | 273,673,231 | |||||
| Principal Amount | Long-Term Fixed Income (0.2%) | |||||
Asset-Backed Securities (<0.1%) | ||||||
| Residential Funding Mortgage Securities | ||||||
| 91,205 | 4.470%, 7/25/2018c | 88,737 | ||||
| Total Asset-Backed Securities | 88,737 | |||||
| Collateralized Mortgage Obligations (0.2%) | ||||||
| Countrywide Home Loans, Inc. | ||||||
| 148,349 | 5.386%, 3/20/2036 | 144,045 | ||||
| Deutsche Alt-A Securities, Inc. | ||||||
| 164,038 | 5.888%, 6/25/2036 | 155,569 | ||||
| Impac Secured Assets Corporation | ||||||
| 168,899 | 0.457%, 7/26/2010d | 96,362 | ||||
| J.P. Morgan Alternative Loan Trust | ||||||
| 6,675 | 0.427%, 7/25/2010d | 6,624 | ||||
| Total Collateralized Mortgage Obligations | 402,600 | |||||
| Total Long-Term Fixed Income (cost $556,999) | 491,337 | |||||
| Shares | Collateral Held for Securities Loaned (11.3%) | |||||
| 31,495,608 | Thrivent Financial Securities Lending Trust | 31,495,608 | ||||
Total Collateral Held for Securities Loaned (cost $31,495,608) | 31,495,608 | |||||
| Principal Amount | Short-Term Investments (1.6%)e | |||||
| Jupiter Securitization Company, LLC | ||||||
| 4,570,000 | 0.090%, 7/1/2010 | 4,570,000 | ||||
| Total Short-Term Investments (at amortized cost) | 4,570,000 | |||||
| Total Investments (cost $333,409,870) 111.1% | $ | 310,230,176 | ||||
| Other Assets and Liabilities, Net (11.1%) | (31,048,152 | ) | ||||
| Total Net Assets 100.0% | $ | 279,182,024 | ||||
| a | Non-income producing security. |
| b | All or a portion of the security is on loan as discussed in item 2(M) of the Notes to Financial Statements. |
| c | All or a portion of the security is insured or guaranteed. |
| d | Denotes variable rate obligations for which the current coupon rate and next scheduled reset date are shown. |
| e | The interest rate shown reflects the yield, coupon rate or, for securities purchased at a discount, the discount rate at the date of purchase. |
Definitions:
REIT | - | Real Estate Investment Trust, is a company that buys, develops, manages and/or sells real estate assets. | ||
ETF | - | Exchange Traded Fund. |
Unrealized Appreciation (Depreciation)
Gross unrealized appreciation and depreciation of investments, based on cost for federal income tax purposes, were as follows:
Gross unrealized appreciation | $ | 25,382,217 | ||
Gross unrealized depreciation | (48,561,911 | ) | ||
Net unrealized appreciation (depreciation) | $ | (23,179,694 | ) | |
Cost for federal income tax purposes | $ | 333,409,870 |
The accompanying Notes to Financial Statements are an integral part of this schedule.
140
Table of Contents
Real Estate Securities Portfolio
Schedule of Investments as of June 30, 2010
(unaudited)
Fair Valuation Measurements
The following table is a summary of the inputs used, as of June 30, 2010, in valuing Real Estate Securities Portfolio’s assets carried at fair value as discussed in the Notes to Financial Statements.
Investments in Securities | Total | Level 1 | Level 2 | Level 3 | ||||||||
Common Stock | ||||||||||||
Diversified REITS | 19,608,229 | 19,608,229 | — | — | ||||||||
Financials | 11,343,962 | 11,343,962 | — | — | ||||||||
Hotels, Resorts & Cruise Lines | 2,359,100 | 2,359,100 | — | — | ||||||||
Industrial REITS | 11,955,712 | 11,955,712 | — | — | ||||||||
Mortgage REITS | 1,310,911 | 1,310,911 | — | — | ||||||||
Office REITS | 47,360,492 | 47,360,492 | — | — | ||||||||
Real Estate Operating Companies | 2,481,609 | 2,481,609 | — | — | ||||||||
Residential REITS | 46,277,021 | 46,277,021 | — | — | ||||||||
Retail REITS | 62,433,558 | 62,433,558 | — | — | ||||||||
Specialized REITS | 68,542,637 | 68,542,637 | — | — | ||||||||
Long-Term Fixed Income | ||||||||||||
Asset-Backed Securities | 88,737 | — | 88,737 | — | ||||||||
Collateralized Mortgage Obligations | 402,600 | — | 402,600 | — | ||||||||
Collateral Held for Securities Loaned | 31,495,608 | 31,495,608 | — | — | ||||||||
Short-Term Investments | 4,570,000 | — | 4,570,000 | — | ||||||||
Total | $ | 310,230,176 | $ | 305,168,839 | $ | 5,061,337 | $ | — | ||||
Investment in Affiliates
Affiliated issuers, as defined under the Investment Company Act of 1940, include those in which the Portfolio’s holdings of an issuer represent 5% or more of the outstanding voting securities of an issuer, or any affiliated mutual fund.
A summary of transactions for the fiscal year to date, in Real Estate Securities Portfolio, is as follows:
Portfolio | Value December 31, 2009 | Gross Purchases | Gross Sales | Shares Held at June 30, 2010 | Value June 30, 2010 | Income Earned January 1, 2010 - June 30, 2010 | |||||||||||
Thrivent Financial | |||||||||||||||||
Securities Lending | |||||||||||||||||
Trust | $ | 78,496,425 | $ | 118,517,861 | $ | 165,518,678 | 31,495,608 | $ | 31,495,608 | $ | 73,839 | ||||||
Total Value and | |||||||||||||||||
Income Earned | 78,496,425 | 31,495,608 | 73,839 | ||||||||||||||
The accompanying Notes to Financial Statements are an integral part of this schedule.
141
Table of Contents
Partner Utilities Portfolio
Schedule of Investments as of June 30, 2010
(unaudited)
Common Stock (93.9%) | Value | ||||||
| Alternative Carriers (0.4%) | |||||||
| 1,500 | TW Telecom, Inc.a | $ | 25,020 | ||||
Total Alternative Carriers | 25,020 | ||||||
| Consumer Discretionary (0.8%) | |||||||
| 3,000 | Comcast Corporation | 49,290 | |||||
Total Consumer Discretionary | 49,290 | ||||||
| Electric Utilities (33.6%) | |||||||
| 2,800 | AES Tiete SA | 32,018 | |||||
| 7,200 | American Electric Power | ||||||
Company, Inc. | 232,560 | ||||||
| 300 | CEZ | 12,211 | |||||
| 900 | Cleco Corporation | 23,769 | |||||
| 1,902 | Companhia Energetica de Minas | ||||||
Gerais ADR | 27,902 | ||||||
| 2,900 | Companhia Energetica de Sao | ||||||
Paulo | 39,540 | ||||||
| 400 | CPFL Energia SA ADR | 26,780 | |||||
| 4,000 | DPL, Inc. | 95,600 | |||||
| 9,100 | Duke Energy Corporation | 145,600 | |||||
| 4,100 | Edison International, Inc. | 130,052 | |||||
| 1,600 | EDP - Energias do Brasil SA | 31,424 | |||||
| 3,300 | Entergy Corporation | 236,346 | |||||
| 1,700 | Exelon Corporation | 64,549 | |||||
| 2,700 | FirstEnergy Corporation | 95,121 | |||||
| 3,100 | ITC Holdings Corporation | 164,021 | |||||
| 6,000 | NextEra Energy, Inc. | 292,560 | |||||
| 2,300 | Northeast Utilities | 58,604 | |||||
| 1,200 | NV Energy, Inc. | 14,172 | |||||
| 600 | Pinnacle West Capital | ||||||
Corporation | 21,816 | ||||||
| 2,600 | PPL Corporation | 64,870 | |||||
| 1,500 | Progress Energy, Inc. | 58,830 | |||||
| 7,970 | Southern Company | 265,241 | |||||
| 2,100 | Westar Energy, Inc. | 45,381 | |||||
Total Electric Utilities | 2,178,967 | ||||||
| Energy (3.8%) | |||||||
| 400 | Cabot Oil & Gas Corporation | 12,528 | |||||
| 400 | EOG Resources, Inc. | 39,348 | |||||
| 1,000 | Petrohawk Energy Corporationa | 16,970 | |||||
| 400 | Range Resources Corporation | 16,060 | |||||
| 900 | Southwestern Energy Companya | 34,776 | |||||
| 2,200 | Spectra Energy Corporation | 44,154 | |||||
| 1,900 | Talisman Energy, Inc. | 28,842 | |||||
| 3,100 | Williams Companies, Inc. | 56,668 | |||||
Total Energy | 249,346 | ||||||
| Gas Utilities (5.6%) | |||||||
| 8,100 | Centricia plc | 35,745 | |||||
| 1,600 | Energen Corporation | 70,928 | |||||
| 1,400 | EQT Corporation | 50,596 | |||||
| 1,200 | New Jersey Resources Corporation | 42,240 | |||||
| 3,100 | Questar Corporation | 141,019 | |||||
| 800 | UGI Corporation | 20,352 | |||||
Total Gas Utilities | 360,880 | ||||||
| Independent Power Producers & Energy | |||||||
| Traders (7.5%) | |||||||
| 6,800 | AES Corporationa | 62,832 | |||||
| 4,900 | Calpine Corporationa | 62,328 | |||||
| 4,600 | Constellation Energy Group, Inc. | 148,350 | |||||
| 7,400 | International Power plc | 33,055 | |||||
| 8,400 | NRG Energy, Inc.a | 178,164 | |||||
Total Independent Power Producers & Energy Traders | 484,729 | ||||||
| Industrials (1.0%) | |||||||
| 4,300 | Iberdrola SA | 24,167 | |||||
| 2,100 | Tetra Tech, Inc.a | 41,181 | |||||
Total Industrials | 65,348 | ||||||
| Information Technology (0.4%) | |||||||
| 300 | Equinix, Inc.a | 24,366 | |||||
Total Information Technology | 24,366 | ||||||
| Integrated Telecommunication Services (10.2%) | |||||||
| 9,500 | AT&T, Inc. | 229,805 | |||||
| 2,100 | BCE, Inc. | 61,467 | |||||
| 700 | CenturyLink, Inc. | 23,317 | |||||
| 22,300 | Qwest Communications International, Inc. | 117,075 | |||||
| 100 | Swisscom AG | 33,901 | |||||
| 1,700 | Telefonica SA | 31,490 | |||||
| 4,700 | Verizon Communications, Inc. | 131,694 | |||||
| 3,100 | Windstream Corporation | 32,736 | |||||
Total Integrated Telecommunication Services | 661,485 | ||||||
| Multi-Utilities (19.3%) | |||||||
| 3,700 | CenterPoint Energy, Inc. | 48,692 | |||||
| 8,000 | CMS Energy Corporation | 117,200 | |||||
| 2,300 | Consolidated Edison, Inc. | 99,130 | |||||
| 6,600 | Dominion Resources, Inc. | 255,684 | |||||
| 600 | DTE Energy Company | 27,366 | |||||
| 600 | Electricite de France | 22,827 | |||||
| 1,400 | NSTAR | 49,000 | |||||
| 1,000 | OGE Energy Corporation | 36,560 | |||||
| 3,800 | PG&E Corporation | 156,180 | |||||
| 6,200 | Public Service Enterprise Group, Inc. | 194,246 | |||||
| 1,800 | Sempra Energy | 84,222 | |||||
| 4,200 | United Utilities Group plc | 32,866 | |||||
| 1,600 | Wisconsin Energy Corporation | 81,184 | |||||
| 2,100 | Xcel Energy, Inc. | 43,281 | |||||
Total Multi-Utilities | 1,248,438 | ||||||
| Water Utilities (1.9%) | |||||||
| 100 | American States Water Company | 3,314 | |||||
| 2,800 | American Water Works | ||||||
Company, Inc. | 57,680 | ||||||
| 2,300 | Aqua America, Inc. | 40,664 | |||||
| 700 | California Water Service Group | 24,990 | |||||
Total Water Utilities | 126,648 | ||||||
| Wireless Telecommunication Services (9.4%) | |||||||
| 1,700 | America Movil SA de CV ADR | 80,750 | |||||
| 900 | American Tower Corporationa | 40,050 | |||||
The accompanying Notes to Financial Statements are an integral part of this schedule.
142
Table of Contents
Partner Utilities Portfolio
Schedule of Investments as of June 30, 2010
(unaudited)
Shares | Common Stock (93.9%) | Value | |||
| Wireless Telecommunication Services (9.4%) - - continued | |||||
| 6,600 | Cable & Wireless Communications plc | $ | 5,695 | ||
| 6,600 | Cable & Wireless Worldwidea | 8,540 | |||
| 1,200 | Cellcom Israel, Ltd. | 30,000 | |||
| 1,500 | Crown Castle International Corporationa | 55,890 | |||
| 400 | Millicom International Cellular SA | 32,428 | |||
| 1,800 | NII Holdings, Inc.a | 58,536 | |||
| 1,400 | NTELOS Holdings Corporation | 24,080 | |||
| 1,200 | Rogers Communications, Inc.a | 39,203 | |||
| 2,600 | SBA Communications Corporationa | 88,426 | |||
| 9,500 | Sprint Nextel Corporationa | 40,280 | |||
| 900 | Vivo Participacoes SA ADR | 23,328 | |||
| 4,000 | Vodafone Group plc ADR | 82,680 | |||
Total Wireless Telecommunication Services | 609,886 | ||||
Total Common Stock (cost $6,762,591) | 6,084,403 | ||||
Principal | Short-Term Investments (3.3%)b | ||||
Federal Home Loan Bank | |||||
Discount Notes | |||||
| 100,000 | 0.045%, 7/9/2010 | 99,999 | |||
U.S. Treasury Bills | |||||
| 110,000 | 0.020%, 7/8/2010 | 109,999 | |||
Total Short-Term Investments (at amortized cost) | 209,998 | ||||
Total Investments (cost $6,972,589) 97.2% | $ | 6,294,401 | |||
Other Assets and Liabilities, Net 2.8% | 183,065 | ||||
Total Net Assets 100.0% | $ | 6,477,466 | |||
| a | Non-income producing security. |
| b | The interest rate shown reflects the yield, coupon rate or, for securities purchased at a discount, the discount rate at the date of purchase. |
Definitions:
| ADR | - | American Depositary Receipt, which are certificates for an underlying foreign security’s shares held by an issuing U.S. depository bank. |
Unrealized Appreciation (Depreciation)
Gross unrealized appreciation and depreciation of investments, based on cost for federal income tax purposes, were as follows:
Gross unrealized appreciation | $ | 207,747 | ||
Gross unrealized depreciation | (885,935 | ) | ||
Net unrealized appreciation (depreciation) | $ | (678,188 | ) | |
Cost for federal income tax purposes | $ | 6,972,589 |
The accompanying Notes to Financial Statements are an integral part of this schedule.
143
Table of Contents
Partner Utilities Portfolio
Schedule of Investments as of June 30, 2010
(unaudited)
Fair Valuation Measurements
The following table is a summary of the inputs used, as of June 30, 2010, in valuing Partner Utilities Portfolio’s assets carried at fair value as discussed in the Notes to Financial Statements.
Investments in Securities | Total | Level 1 | Level 2 | Level 3 | ||||||||
Common Stock | ||||||||||||
Alternative Carriers | 25,020 | 25,020 | — | — | ||||||||
Consumer Discretionary | 49,290 | 49,290 | — | — | ||||||||
Electric Utilities | 2,178,967 | 2,063,774 | 115,193 | — | ||||||||
Energy | 249,346 | 249,346 | — | — | ||||||||
Gas Utilities | 360,880 | 325,135 | 35,745 | — | ||||||||
Independent Power Producers & Energy | ||||||||||||
Traders | 484,729 | 451,674 | 33,055 | — | ||||||||
Industrials | 65,348 | 41,181 | 24,167 | — | ||||||||
Information Technology | 24,366 | 24,366 | — | — | ||||||||
Integrated Telecommunication Services | 661,485 | 627,584 | 33,901 | — | ||||||||
Multi-Utilities | 1,248,438 | 1,192,745 | 55,693 | — | ||||||||
Water Utilities | 126,648 | 126,648 | — | — | ||||||||
Wireless Telecommunication Services | 609,886 | 556,448 | 53,438 | — | ||||||||
Short-Term Investments | 209,998 | — | 209,998 | — | ||||||||
Total | $ | 6,294,401 | $ | 5,733,211 | $ | 561,190 | $ | — | ||||
Other Financial Instruments | Total | Level 1 | Level 2 | Level 3 | ||||||||
Liability Derivatives | ||||||||||||
Foreign Currency Forward Contracts | 101 | — | 101 | — | ||||||||
Total Liability Derivatives | $ | 101 | $ | — | $ | 101 | $ | — | ||||
Foreign Currency Forward Contracts | Contracts to Deliver/Receive | Settlement Date | Value on Settlement Date | Value | Unrealized Gain/(Loss) | |||||||||
Sales | ||||||||||||||
Euro | 18,040 | 7/2/2010 | $ | 21,958 | $ | 22,059 | ($ | 101 | ) | |||||
Total Foreign Currency | ||||||||||||||
Forward Contracts Sales | $ | 21,958 | $ | 22,059 | ($ | 101 | ) | |||||||
Net Unrealized Gain/(Loss) on Foreign Currency Forward Contracts | ($ | 101 | ) | |||||||||||
The following table summarizes the fair value and Statement of Assets and Liabilities location, as of June 30, 2010, for Partner Utilities Portfolio’s investments in financial derivative instruments by primary risk exposure as discussed under item (2) Significant Accounting Policies of the Notes to Financial Statements.
Derivatives by risk category | Statement of Assets and Liabilities Location | Fair Value | |||
Liability Derivatives | |||||
Foreign Exchange Contracts | |||||
Forward Contracts | Receivable/Payable for forward contracts, Net Assets - Net unrealized | ||||
| appreciation/(depreciation) on Foreign currency forward contracts | 101 | ||||
Total Foreign Exchange Contracts | 101 | ||||
Total Liability Derivatives | $ | 101 | |||
The accompanying Notes to Financial Statements are an integral part of this schedule.
144
Table of Contents
Partner Utilities Portfolio
Schedule of Investments as of June 30, 2010
(unaudited)
The following table summarizes the net realized gains/(losses) and Statement of Operations location, for the period ended June 30, 2010, for Partner Utilities Portfolio’s investments in financial derivative instruments by primary risk exposure.
Derivatives by risk category | Statement of Operations Location | Realized Gains/(Losses) recognized in Income | |||
Foreign Exchange Contracts | |||||
Forward Contracts | Net realized gains/(losses) on Foreign currency transactions | 3,012 | |||
Total Foreign Exchange Contracts | 3,012 | ||||
Total | $ | 3,012 | |||
The following table summarizes the change in net unrealized appreciation/(depreciation) and Statement of Operations location, for the period ended June 30, 2010, for Partner Utilities Portfolio’s investments in financial derivative instruments by primary risk exposure.
Derivatives by risk category | Statement of Operations Location | Change in unrealized appreciation/(depreciation) recognized in Income | |||
Foreign Exchange Contracts | |||||
Forward Contracts | Change in net unrealized appreciation/(depreciation) on Foreign currency forward contracts | (101 | ) | ||
Total Foreign Exchange Contracts | (101 | ) | |||
Total | ($101 | ) | |||
The following table presents Partner Utilities Portfolio’s average volume of derivative activity during the period ended June 30, 2010.
Derivative Risk Category | Forwards (Notional*) | Forwards (Percentage of Average Net Assets) | ||||
Foreign Exchange | ||||||
Contracts | $ | 10,277 | 0.2 | % | ||
| * | Notional amount represents long or short, or both, derivative positions held by the portfolio. |
The accompanying Notes to Financial Statements are an integral part of this schedule.
145
Table of Contents
Partner Small Cap Growth Portfolio
Schedule of Investments as of June 30, 2010
(unaudited)
Common Stock (97.7%) | Value | ||||
| Consumer Discretionary (15.6%) | |||||
| 24,670 | 7 Days Group Holdings, Ltd. ADRa,b | $ | 269,150 | ||
| 14,460 | AnnTaylor Stores Corporationb | 235,264 | |||
| 16,940 | Asbury Automotive Group, Inc.b | 178,548 | |||
| 5,970 | Boyd Gaming Corporationa,b | 50,685 | |||
| 45,070 | Brunswick Corporation | 560,220 | |||
| 8,030 | Buffalo Wild Wings, Inc.a,b | 293,737 | |||
| 16,760 | California Pizza Kitchen, Inc.b | 253,914 | |||
| 16,440 | Capella Education Companyb | 1,337,394 | |||
| 14,200 | Chico’s FAS, Inc. | 140,296 | |||
| 5,500 | Children’s Place Retail Stores, Inc.b | 242,110 | |||
| 13,540 | Citi Trends, Inc.b | 446,008 | |||
| 18,220 | Cooper Tire & Rubber Company | 355,290 | |||
| 5,910 | Cracker Barrel Old Country Store, Inc. | 275,170 | |||
| 186,530 | Crocs, Inc.b | 1,973,487 | |||
| 3,570 | Deckers Outdoor Corporationb | 510,046 | |||
| 38,850 | DineEquity, Inc.a,b | 1,084,692 | |||
| 106,570 | Finish Line, Inc. | 1,484,520 | |||
| 51,882 | Gaylord Entertainment Companya,b | 1,146,073 | |||
| 8,570 | G-III Apparel Group, Ltd.b | 196,167 | |||
| 39,230 | hhgregg, Inc.b | 914,844 | |||
| 8,320 | Imax Corporationa,b | 121,472 | |||
| 4,170 | Jo-Ann Stores, Inc.b | 156,417 | |||
| 5,920 | Joseph A. Bank Clothiers, Inc.a,b | 319,621 | |||
| 35,420 | Lumber Liquidators Holdings, Inc.a,b | 826,349 | |||
| 74,910 | Orient-Express Hotels, Ltd.b | 554,334 | |||
| 10,110 | Pier 1 Imports, Inc.b | 64,805 | |||
| 7,600 | Ryland Group, Inc. | 120,232 | |||
| 185,200 | Saks, Inc.a,b | 1,405,668 | |||
| 10,950 | Select Comfort Corporationa,b | 95,813 | |||
| 6,410 | Skechers USA, Inc.b | 234,093 | |||
| 5,530 | Steven Madden, Ltd.b | 174,306 | |||
| 54,830 | Tempur-Pedic International, Inc.b | 1,686,022 | |||
| 116,570 | Texas Roadhouse, Inc.b | 1,471,113 | |||
| 67,700 | True Religion Apparel, Inc.a,b | 1,494,139 | |||
| 17,530 | Tupperware Brands Corporation | 698,570 | |||
| 37,130 | Ulta Salon Cosmetics & Fragrance, Inc.b | 878,496 | |||
| 36,700 | Warnaco Group, Inc.b | 1,326,338 | |||
| 27,540 | WMS Industries, Inc.b | 1,080,945 | |||
| Total Consumer Discretionary | 24,656,348 | ||||
| Consumer Staples (2.8%) | |||||
| 1,880 | Boston Beer Company, Inc.b | 126,806 | |||
| 24,080 | Central European Distribution Corporationb | 514,830 | |||
| 20,200 | Diamond Foods, Inc.a | 830,220 | |||
| 16,670 | Green Mountain Coffee Roasters, Inc.a,b | 428,419 | |||
| 10,620 | TreeHouse Foods, Inc.b | 484,909 | |||
| 67,410 | United Natural Foods, Inc.b | 2,014,211 | |||
| Total Consumer Staples | 4,399,395 | ||||
| Energy (4.1%) | |||||
| 19,280 | Brigham Exploration Companyb | 296,526 | |||
| 7,340 | Carrizo Oil & Gas, Inc.b | 113,990 | |||
| 77,450 | James River Coal Companya,b | 1,233,004 | |||
| 169,943 | Key Energy Services, Inc.b | 1,560,077 | |||
| 1,720 | Lufkin Industries, Inc. | 67,063 | |||
| 85,490 | Oasis Petroleum, Incb | 1,239,605 | |||
| 35,310 | Resolute Energy Corporationa,b | 432,195 | |||
| 44,670 | Rex Energy Corporationb | 451,167 | |||
| 42,090 | Swift Energy Companyb | 1,132,642 | |||
| Total Energy | 6,526,269 | ||||
| Financials (5.8%) | |||||
| 14,740 | American Physicians Capital, Inc. | 454,729 | |||
| 27,603 | Bank of the Ozarks, Inc. | 979,079 | |||
| 50,960 | Columbia Banking System, Inc. | 930,530 | |||
| 17,140 | DuPont Fabros Technology, Inc. | 420,958 | |||
| 6,170 | Harleysville Group, Inc. | 191,455 | |||
| 5,910 | IBERIABANK Corporation | 304,247 | |||
| 16,030 | iShares Russell 2000 Growth Index Funda | 1,067,277 | |||
| 30,140 | MGIC Investment Corporationa,b | 207,665 | |||
| 94,300 | National Financial Partnersa,b | 921,311 | |||
| 13,790 | Oriental Financial Group, Inc. | 174,581 | |||
| 31,850 | Radian Group, Inc. | 230,594 | |||
| 18,610 | Stifel Financial Corporationb | 807,488 | |||
| 91,910 | Sunstone Hotel Investors, Inc.b | 912,666 | |||
| 35,690 | Tanger Factory Outlet Centers, Inc. | 1,476,852 | |||
| 8,660 | Umpqua Holdings Corporation | 99,417 | |||
| 2,820 | Wilmington Trust Corporationa | 31,274 | |||
| Total Financials | 9,210,123 | ||||
| Health Care (21.8%) | |||||
| 36,400 | Acorda Therapeutics, Inc.b | 1,132,404 | |||
| 5,480 | AGA Medical Holdings, Inca,b | 69,541 | |||
| 9,780 | Alexion Pharmaceuticals, Inc.b | 500,638 | |||
| 27,800 | Align Technology, Inc.a,b | 413,386 | |||
| 25,900 | Alphatec Holdings, Inc.b | 120,176 | |||
| 61,290 | AMERIGROUP Corporationb | 1,990,699 | |||
| 5,010 | Ardea Biosciences, Inc.b | 103,006 | |||
| 9,060 | Bio-Reference Laboratories, Inc.b | 200,860 | |||
| 7,860 | Catalyst Health Solutions, Inc.b | 271,170 | |||
| 28,550 | Cooper Companies, Inc. | 1,136,004 | |||
| 8,140 | Dexcom, Inc.b | 94,098 | |||
| 31,840 | Emergency Medical Services Corporationb | 1,561,115 | |||
| 30,660 | ev3, Inc.b | 687,091 | |||
| 84,810 | Healthsouth Corporationb | 1,586,795 | |||
| 1,540 | HeartWare International, Inc.b | 107,908 | |||
| 32,060 | Hill-Rom Holdings, Inc. | 975,586 | |||
| 18,487 | HMS Holding Corporationb | 1,002,365 | |||
| 29,810 | Human Genome Sciences, Inc.a,b | 675,495 | |||
| 55,360 | ICON plc ADRb | 1,599,350 | |||
| 60,640 | Impax Laboratories, Inc.b | 1,155,798 | |||
| 35,250 | Incyte Corporationb | 390,218 | |||
| 5,800 | Integra LifeSciences Holdings Corporationb | 214,600 | |||
| 14,410 | Kendle International, Inc.b | 166,003 | |||
| 56,409 | MedAssets, Inc.b | 1,301,920 | |||
| 4,520 | Molina Healthcare, Inc.b | 130,176 | |||
| 7,600 | Momenta Pharmaceuticals, Inc.a,b | 93,176 | |||
| 25,430 | Onyx Pharmaceuticals, Inc.b | 549,034 | |||
| 15,220 | Orthofix International NVb | 487,801 | |||
| 7,020 | Par Pharmaceutical Companies, Inc.b | 182,239 | |||
The accompanying Notes to Financial Statements are an integral part of this schedule.
146
Table of Contents
Partner Small Cap Growth Portfolio
Schedule of Investments as of June 30, 2010
(unaudited)
Shares | Common Stock (97.7%) | Value | |||
| Health Care (21.8%) - continued | |||||
| 70,020 | PAREXEL International Corporationb | $ | 1,518,034 | ||
| 25,280 | Pharmasset, Inc.b | 691,155 | |||
| 51,250 | PSS World Medical, Inc.b | 1,083,938 | |||
| 58,580 | Psychiatric Solutions, Inc.b | 1,916,738 | |||
| 24,790 | Quality Systems, Inc.a | 1,437,572 | |||
| 18,980 | Regeneron Pharmaceuticals, Inc.b | 423,634 | |||
| 38,180 | Salix Pharmaceuticals, Ltd.b | 1,490,165 | |||
| 61,170 | Seattle Genetics, Inc.b | 733,428 | |||
| 24,050 | SXC Health Solutions Corporationb | 1,761,663 | |||
| 244,060 | Tenet Healthcare Corporationb | 1,059,220 | |||
| 23,330 | Thoratec Corporationa,b | 996,891 | |||
| 22,190 | United Therapeutics Corporationb | 1,083,094 | |||
| 1,690 | Vermillion, Inc.a,b | 20,601 | |||
| 32,990 | Volcano Corporationb | 719,842 | |||
| 17,350 | West Pharmaceutical Services, Inc. | 633,101 | |||
| Total Health Care | 34,467,728 | ||||
| Industrials (14.7%) | |||||
| 68,450 | Actuant Corporation | 1,288,913 | |||
| 18,530 | Alaska Air Group, Inc.b | 832,924 | |||
| 2,430 | Allegiant Travel Company | 103,737 | |||
| 1,850 | American Science & Engineering, Inc. | 140,988 | |||
| 126,980 | ArvinMeritor, Inc.b | 1,663,438 | |||
| 17,190 | Baldor Electric Company | 620,215 | |||
| 11,530 | Bucyrus International, Inc. | 547,099 | |||
| 15,690 | Clean Harbors, Inc.b | 1,041,973 | |||
| 4,260 | Consolidated Graphics, Inc.b | 184,202 | |||
| 29,850 | Copa Holdings SA | 1,319,967 | |||
| 20,310 | EnerNOC, Inc.a,b | 638,546 | |||
| 42,260 | EnPro Industries, Inc.b | 1,189,619 | |||
| 56,540 | Genesee & Wyoming, Inc.b | 2,109,507 | |||
| 87,730 | GrafTech International, Ltd.b | 1,282,613 | |||
| 76,880 | Hexcel Corporationb | 1,192,409 | |||
| 56,510 | Hub Group, Inc.b | 1,695,865 | |||
| 7,920 | Huron Consulting Group, Inc.b | 153,727 | |||
| 103,200 | Kforce, Inc.b | 1,315,800 | |||
| 40,740 | Knight Transportation, Inc. | 824,578 | |||
| 7,720 | Triumph Group, Inc. | 514,384 | |||
| 83,020 | TrueBlue, Inc.b | 928,994 | |||
| 4,500 | United Stationers, Inc.b | 245,115 | |||
| 21,120 | Watsco, Inc. | 1,223,270 | |||
| 37,520 | WESCO International, Inc.b | 1,263,299 | |||
| 35,266 | Woodward Governor Company | 900,341 | |||
| Total Industrials | 23,221,523 | ||||
| Information Technology (27.7%) | |||||
| 40,010 | Acme Packet, Inc.b | 1,075,469 | |||
| 47,490 | ADTRAN, Inc. | 1,295,052 | |||
| 11,870 | ANSYS, Inc.b | 481,566 | |||
| 43,480 | Applied Micro Circuits Corporationb | 455,670 | |||
| 4,109 | Archipelago Learning, Inc.b | 46,966 | |||
| 143,480 | Ariba, Inc.b | 2,285,636 | |||
| 135,520 | Aruba Networks, Inc.a,b | 1,929,805 | |||
| 11,750 | AsiaInfo Holdings, Inc.b | 256,855 | |||
| 57,200 | Atheros Communications, Inc.b | 1,575,288 | |||
| 7,170 | Blue Coat Systems, Inc.b | 146,483 | |||
| 8,270 | Bottomline Technologies, Inc.b | 107,758 | |||
| 53,910 | Broadsoft, Inc.b | 460,931 | |||
| 62,200 | Cavium Networks, Inc.a,b | 1,629,018 | |||
| 34,240 | Cirrus Logic, Inc.b | 541,334 | |||
| 13,200 | Cogo Group, Inc.b | 82,368 | |||
| 19,040 | CyberSource Corporationb | 486,091 | |||
| 8,380 | Diodes, Inc.b | 132,991 | |||
| 10,330 | Ebix, Inc.a,b | 161,974 | |||
| 131,480 | Entropic Communications, Inc.b | 833,583 | |||
| 10,450 | Fairchild Semiconductor International, Inc.b | 87,885 | |||
| 66,610 | Finisar Corporationa,b | 992,489 | |||
| 64,810 | GSI Commerce, Inc.b | 1,866,528 | |||
| 5,380 | Hittite Microwave Corporationb | 240,701 | |||
| 49,240 | Isilon Systems, Inc.b | 632,242 | |||
| 68,410 | Jack Henry & Associates, Inc. | 1,633,631 | |||
| 10,500 | Kenexa Corporationb | 126,000 | |||
| 9,590 | Manhattan Associates, Inc.b | 264,205 | |||
| 7,890 | MAXIMUS, Inc. | 456,594 | |||
| 33,310 | Mercadolibre, Inc.a,b | 1,750,441 | |||
| 24,730 | Netezza Corporationb | 338,306 | |||
| 86,220 | Netlogic Microsystems, Inc.a,b | 2,345,184 | |||
| 8,680 | NetScout Systems, Inc.b | 123,430 | |||
| 62,720 | Plexus Corporationb | 1,677,133 | |||
| 169,010 | PMC-Sierra, Inc.b | 1,270,955 | |||
| 5,550 | Power Integrations, Inc. | 178,682 | |||
| 47,390 | Rackspace Hosting, Inc.a,b | 869,133 | |||
| 56,570 | Riverbed Technology, Inc.b | 1,562,463 | |||
| 36,710 | Rubicon Technology, Inc.a,b | 1,093,591 | |||
| 15,330 | Sanmina-SCI Corporationb | 208,641 | |||
| 79,920 | Semtech Corporationb | 1,308,290 | |||
| 74,810 | SuccessFactors, Inc.a,b | 1,555,300 | |||
| 10,860 | Synchronoss Technologies, Inc.b | 206,014 | |||
| 59,520 | Taleo Corporationb | 1,445,741 | |||
| 185,540 | Teradyne, Inc.a,b | 1,809,015 | |||
| 5,360 | Tyler Technologies, Inc.b | 83,187 | |||
| 33,060 | Varian Semiconductor Equipment Associates, Inc.b | 947,500 | |||
| 35,850 | Veeco Instruments, Inc.a,b | 1,228,938 | |||
| 61,170 | VeriFone Systems, Inc.b | 1,157,948 | |||
| 24,940 | VistaPrint NVb | 1,184,401 | |||
| 47,170 | Volterra Semiconductor Corporationb | 1,087,740 | |||
| 10,640 | Xyratex, Ltd.b | 150,556 | |||
| Total Information Technology | 43,867,702 | ||||
| Materials (4.3%) | |||||
| 3,340 | A. Schulman, Inc. | 63,326 | |||
| 5,360 | Domtar Corporation | 263,444 | |||
| 53,030 | Georgia Gulf Corporationa,b | 707,420 | |||
| 32,730 | Huntsman Corporation | 283,769 | |||
| 8,709 | Rock-Tenn Company | 432,576 | |||
| 15,660 | Schweitzer-Mauduit International, Inc. | 790,047 | |||
| 127,200 | Solutia, Inc.b | 1,666,320 | |||
| 76,260 | Stillwater Mining Companya,b | 886,141 | |||
| 36,220 | Temple-Inland, Inc. | 748,668 | |||
| 85,070 | Thompson Creek Metals Company, Inc.a,b | 738,408 | |||
The accompanying Notes to Financial Statements are an integral part of this schedule.
147
Table of Contents
Partner Small Cap Growth Portfolio
Schedule of Investments as of June 30, 2010
(unaudited)
| Shares | Common Stock (97.7%) | Value | ||||
| Materials (4.3%) - continued | ||||||
| 5,160 | Walter Energy, Inc. | $ | 313,986 | |||
Total Materials | 6,894,105 | |||||
| Telecommunications Services (0.9%) | ||||||
| 44,120 | City Telecom HK, Ltd. ADR | 500,321 | ||||
| 59,970 | TW Telecom, Inc.b | 1,000,299 | ||||
Total Telecommunications Services | 1,500,620 | |||||
| Utilities (<0.1%) | ||||||
| 3,672 | Artesian Resources Corporation | 67,785 | ||||
Total Utilities | 67,785 | |||||
Total Common Stock (cost $133,873,776) | 154,811,598 | |||||
Collateral Held for Securities Loaned (18.9%) | ||||||
| 29,897,467 | Thrivent Financial Securities Lending Trust | 29,897,467 | ||||
Total Collateral Held for Securities Loaned (cost $29,897,467) | 29,897,467 | |||||
| Principal Amount | Short-Term Investments (2.0%)c | |||||
Federal Home Loan Bank | ||||||
Discount Notes | ||||||
| 700,000 | 0.045%, 7/9/2010 | 699,993 | ||||
U.S. Treasury Bills | ||||||
| 2,535,000 | 0.020%, 7/8/2010 | 2,534,990 | ||||
Total Short-Term Investments (at amortizedcost) | 3,234,983 | |||||
Total Investments (cost $167,006,226) 118.6% | $ | 187,944,048 | ||||
Other Assets and Liabilities, Net (18.6%) | (29,488,413 | ) | ||||
Total Net Assets 100.0% | $ | 158,455,635 | ||||
| a | All or a portion of the security is on loan as discussed in item 2(M) of the Notes to Financial Statements. |
| b | Non-income producing security. |
| c | The interest rate shown reflects the yield, coupon rate or, for securities purchased at a discount, the discount rate at the date of purchase. |
Definitions:
| ADR | - | American Depositary Receipt, which are certificates for an underlying foreign security's shares held by an issuing U.S. depository bank. |
Unrealized Appreciation (Depreciation)
Gross unrealized appreciation and depreciation of investments, based on cost for federal income tax purposes, were as follows:
Gross unrealized appreciation | $ | 26,206,124 | |||||
Gross unrealized depreciation | (5,268,302 | ) | |||||
Net unrealized appreciation (depreciation) | $ | 20,937,822 | |||||
Cost for federal income tax purposes | $ | 167,006,226 |
The accompanying Notes to Financial Statements are an integral part of this schedule.
148
Table of Contents
Partner Small Cap Growth Portfolio
Schedule of Investments as of June 30, 2010
(unaudited)
Fair Valuation Measurements
The following table is a summary of the inputs used, as of June 30, 2010, in valuing Partner Small Cap Growth Portfolio’s assets carried at fair value as discussed in the Notes to Financial Statements.
Investments in Securities | Total | Level 1 | Level 2 | Level 3 | ||||||||
Common Stock | ||||||||||||
Consumer Discretionary | 24,656,348 | 24,656,348 | — | — | ||||||||
Consumer Staples | 4,399,395 | 4,399,395 | — | — | ||||||||
Energy | 6,526,269 | 6,526,269 | — | — | ||||||||
Financials | 9,210,123 | 9,210,123 | — | — | ||||||||
Health Care | 34,467,728 | 34,467,728 | — | — | ||||||||
Industrials | 23,221,523 | 23,221,523 | — | — | ||||||||
Information Technology | 43,867,702 | 43,867,702 | — | — | ||||||||
Materials | 6,894,105 | 6,894,105 | — | — | ||||||||
Telecommunications Services | 1,500,620 | 1,500,620 | — | — | ||||||||
Utilities | 67,785 | 67,785 | — | — | ||||||||
Collateral Held for Securities Loaned | 29,897,467 | 29,897,467 | — | — | ||||||||
Short-Term Investments | 3,234,983 | — | 3,234,983 | — | ||||||||
Total | $ | 187,944,048 | $ | 184,709,065 | $ | 3,234,983 | $ | — | ||||
Investment in Affiliates
Affiliated issuers, as defined under the Investment Company Act of 1940, include those in which the Portfolio’s holdings of an issuer represent 5% or more of the outstanding voting securities of an issuer, or any affiliated mutual fund.
A summary of transactions for the fiscal year to date, in Partner Small Cap Growth Portfolio, is as follows:
Portfolio | Value December 31, 2009 | Gross Purchases | Gross Sales | Shares Held at June 30, 2010 | Value June 30, 2010 | Income Earned January 1, 2010 - June 30, 2010 | |||||||||||
Thrivent Financial | |||||||||||||||||
Securities Lending Trust | $ | 21,405,506 | $ | 79,235,900 | $ | 70,743,939 | 29,897,467 | $ | 29,897,467 | $ | 57,301 | ||||||
| Total Value and Income Earned | 21,405,506 | 29,897,467 | 57,301 | ||||||||||||||
The accompanying Notes to Financial Statements are an integral part of this schedule.
149
Table of Contents
Partner Small Cap Value Portfolio
Schedule of Investments as of June 30, 2010
(unaudited)
Common Stock (97.0%) | Value | |||||
| Consumer Discretionary (12.6%) | ||||||
| 223,500 | Aaron’s, Inc. | $3,815,145 | ||||
| 32,000 | Ascent Media Corporationa | 808,320 | ||||
| 64,800 | Brunswick Corporation | 805,464 | ||||
| 43,000 | Cavco Industries, Inc.a | 1,512,740 | ||||
| 39,000 | Corinthian Colleges, Inc.a,b | 384,150 | ||||
| 49,000 | CSS Industries, Inc. | 808,500 | ||||
| 79,000 | Dixie Group, Inc.a | 290,720 | ||||
| 61,000 | Dorman Products, Inc.a | 1,240,130 | ||||
| 103,200 | Drew Industries, Inc.a | 2,084,640 | ||||
| 89,000 | Fred’s, Inc. | 984,340 | ||||
| 99,000 | Haverty Furniture Companies, Inc. | 1,216,710 | ||||
| 42,000 | Hooker Furniture Corporation | 447,720 | ||||
| 68,300 | M/I Homes, Inc.a | 658,412 | ||||
| 87,000 | MarineMax, Inc.a | 603,780 | ||||
| 49,000 | Matthews International Corporation | 1,434,720 | ||||
| 78,500 | Men’s Wearhouse, Inc. | 1,441,260 | ||||
| 110,600 | Meritage Homes Corporationa | 1,800,568 | ||||
| 195,900 | Orient-Express Hotels, Ltd.a | 1,449,660 | ||||
| 585,000 | Sealy Corporationa,b | 1,561,950 | ||||
| 148,000 | Shiloh Industries, Inc.a | 1,252,080 | ||||
| 62,100 | Stanley Furniture Company, Inc.a,b | 252,126 | ||||
| 156,000 | Stein Mart, Inc.a | 971,880 | ||||
| 45,750 | Steven Madden, Ltd.a | 1,442,040 | ||||
| 117,000 | Winnebago Industries, Inc.a,b | 1,162,980 | ||||
Total Consumer Discretionary | 28,430,035 | |||||
| Consumer Staples (0.9%) | ||||||
| 255,000 | Alliance One International, Inc.a | 907,800 | ||||
| 33,000 | Nash Finch Company | 1,127,280 | ||||
Total Consumer Staples | 2,035,080 | |||||
| Energy (6.5%) | ||||||
| 18,900 | Carbo Ceramics, Inc. | 1,364,391 | ||||
| 75,000 | Cloud Peak Energy, Inc.a,b | 994,500 | ||||
| 63,600 | Forest Oil Corporationa | 1,740,096 | ||||
| 70,000 | Gulf Island Fabrication, Inc. | 1,086,400 | ||||
| 300,400 | Hercules Offshore, Inc.a | 729,972 | ||||
| 132,000 | Penn Virginia Corporation | 2,654,520 | ||||
| 156,700 | TETRA Technologies, Inc.a | 1,422,836 | ||||
| 59,900 | Whiting Petroleum Corporationa | 4,697,358 | ||||
Total Energy | 14,690,073 | |||||
| Financials (24.0%) | ||||||
| 91,000 | Alterra Capital Holdings, Ltd. | 1,708,980 | ||||
| 204,000 | Ares Capital Corporation | 2,556,120 | ||||
| 195,000 | CBL & Associates Properties, Inc. | 2,425,800 | ||||
| 131,500 | Cedar Shopping Centers, Inc. | 791,630 | ||||
| 51,700 | Central Fund of Canada, Ltd.b | 779,119 | ||||
| 101,700 | Columbia Banking System, Inc. | 1,857,042 | ||||
| 83,900 | East West Bancorp, Inc. | 1,279,475 | ||||
| 50,000 | Employers Holdings, Inc. | 736,500 | ||||
| 157,100 | First Opportunity Fund, Inc. | 937,887 | ||||
| 67,400 | First Potomac Realty Trust | 968,538 | ||||
| 100,000 | Glacier Bancorp, Inc. | 1,467,000 | ||||
| 71,000 | Gladstone Capital Corporation | 767,510 | ||||
| 85,000 | Hatteras Financial Corporationb | 2,364,700 | ||||
| 127,000 | Hercules Technology Growth Capital, Inc. | 1,169,670 | ||||
| 82,300 | Home Bancshares, Inc. | 1,877,263 | ||||
| 20,000 | iShares Russell 2000 Value Fundb | 1,140,800 | ||||
| 58,200 | JMP Group, Inc. | 360,258 | ||||
| 60,500 | Kilroy Realty Corporation | 1,798,665 | ||||
| 210,000 | Kite Realty Group Trust | 877,800 | ||||
| 81,000 | LaSalle Hotel Properties | 1,666,170 | ||||
| 4,000 | Markel Corporationa | 1,360,000 | ||||
| 100,000 | Meadowbrook Insurance Group, Inc. | 863,000 | ||||
| 71,200 | National Interstate Corporation | 1,411,184 | ||||
| 40,500 | Parkway Properties, Inc. | 590,085 | ||||
| 42,000 | Pebblebrook Hotel Trusta | 791,700 | ||||
| 182,500 | PennantPark Investment Corporation | 1,742,875 | ||||
| 33,000 | Piper Jaffray Companiesa | 1,063,260 | ||||
| 75,000 | Potlatch Corporation | 2,679,750 | ||||
| 74,000 | ProAssurance Corporationa | 4,200,240 | ||||
| 141,000 | Redwood Trust, Inc.b | 2,064,240 | ||||
| 127,000 | Safeguard Scientifics, Inc.a | 1,341,120 | ||||
| 150,000 | Sandy Spring Bancorp, Inc. | 2,101,500 | ||||
| 55,000 | SeaBright Holdings, Inc. | 521,400 | ||||
| 56,300 | SVB Financial Groupa | 2,321,249 | ||||
| 307,600 | Western Alliance Bancorpa,b | 2,205,492 | ||||
| 38,500 | Wintrust Financial Corporation | 1,283,590 | ||||
Total Financials | 54,071,612 | |||||
| Health Care (5.2%) | ||||||
| 39,000 | Angiodynamics, Inc.a | 575,250 | ||||
| 6,900 | Atrion Corporation | 931,845 | ||||
| 97,000 | Infinity Pharmaceuticals, Inc.a,b | 573,270 | ||||
| 868,800 | Lexicon Pharmaceuticals, Inc.a,b | 1,112,064 | ||||
| 33,500 | National Healthcare Corporationb | 1,154,410 | ||||
| 114,000 | Owens & Minor, Inc. | 3,235,320 | ||||
| 93,400 | Triple-S Management Corporationa | 1,732,570 | ||||
| 64,000 | West Pharmaceutical Services, Inc. | 2,335,360 | ||||
Total Health Care | 11,650,089 | |||||
| Industrials (23.7%) | ||||||
| 39,200 | A.O. Smith Corporation | 1,889,048 | ||||
| 50,300 | AirTran Holdings, Inc.a | 243,955 | ||||
| 37,200 | Alaska Air Group, Inc.a | 1,672,140 | ||||
| 28,900 | Ameron International Corporation | 1,743,537 | ||||
| 39,900 | Applied Industrial Technologies, Inc. | 1,010,268 | ||||
| 19,900 | Astec Industries, Inc.a | 551,827 | ||||
| 151,000 | Beacon Roofing Supply, Inc.a | 2,721,020 | ||||
| 49,000 | Belden, Inc. | 1,078,000 | ||||
| 39,900 | C&D Technologies, Inc.a,b | 35,156 | ||||
| 34,500 | Cascade Corporation | 1,228,545 | ||||
| 29,700 | Circor International, Inc. | 759,726 | ||||
| 66,600 | Colfax Corporationa | 693,306 | ||||
| 90,000 | Comfort Systems USA, Inc. | 869,400 | ||||
| 39,000 | Courier Corporation | 476,190 | ||||
| 50,800 | Dolan Companya | 564,896 | ||||
| 18,000 | Franklin Electric Company, Inc. | 518,760 | ||||
| 26,000 | FTI Consulting, Inc.a | 1,133,340 | ||||
| 59,000 | G & K Services, Inc. | 1,218,350 | ||||
| 88,500 | Genesee & Wyoming, Inc.a | 3,301,935 | ||||
| 98,300 | Gibraltar Industries, Inc.a | 992,830 | ||||
The accompanying Notes to Financial Statements are an integral part of this schedule.
150
Table of Contents
Partner Small Cap Value Portfolio
Schedule of Investments as of June 30, 2010
(unaudited)
Shares | Common Stock (97.0%) | Value | |||
| Industrials (23.7%) - continued | |||||
| 115,400 | Greenbrier Companies, Inc.a | $ | 1,292,480 | ||
| 67,500 | Hub Group, Inc.a | 2,025,675 | |||
| 56,000 | IDEX Corporation | 1,599,920 | |||
| 95,700 | Insituform Technologies, Inc.a | 1,959,936 | |||
| 50,000 | Kaman Corporation | 1,106,000 | |||
| 105,000 | Kforce, Inc.a | 1,338,750 | |||
| 87,500 | Kirby Corporationa | 3,346,875 | |||
| 44,500 | Kratos Defense & Security Solutions, Inc.a | 467,250 | |||
| 110,600 | McGrath Rentcorp | 2,519,468 | |||
| 42,900 | Mine Safety Appliances Company | 1,063,062 | |||
| 121,900 | Navigant Consulting, Inc.a | 1,265,322 | |||
| 30,700 | Nordson Corporation | 1,721,656 | |||
| 73,000 | Robbins & Myers, Inc. | 1,587,020 | |||
| 98,000 | SkyWest, Inc. | 1,197,560 | |||
| 55,400 | Sterling Construction Company, Inc.a | 716,876 | |||
| 29,600 | Sun Hydraulics Corporation | 694,416 | |||
| 48,500 | Universal Forest Products, Inc. | 1,470,035 | |||
| 149,000 | Vitran Corporation, Inc.a | 1,971,270 | |||
| 48,000 | Waste Connections, Inc.a | 1,674,720 | |||
| 68,000 | Woodward Governor Company | 1,736,040 | |||
| Total Industrials | 53,456,560 | ||||
| Information Technology (10.4%) | |||||
| 141,400 | Advanced Energy Industries, Inc.a | 1,737,806 | |||
| 37,700 | ATMI, Inc.a | 551,928 | |||
| 143,200 | Brooks Automation, Inc.a | 1,106,936 | |||
| 16,600 | Cabot Microelectronics Corporationa | 574,194 | |||
| 68,500 | Cognex Corporation | 1,204,230 | |||
| 61,000 | Cohu, Inc. | 739,930 | |||
| 119,900 | Electro Rent Corporation | 1,533,521 | |||
| 37,000 | Electro Scientific Industries, Inc.a | 494,320 | |||
| 74,000 | FormFactor, Inc.a | 799,200 | |||
| 150,000 | Ixiaa | 1,288,500 | |||
| 14,700 | Littelfuse, Inc.a | 464,667 | |||
| 50,400 | Mattson Technology, Inc.a | 191,016 | |||
| 88,000 | Methode Electronics, Inc. | 857,120 | |||
| 130,000 | Monotype Imaging Holdings, Inc.a | 1,171,300 | |||
| 89,200 | Progress Software Corporationa | 2,678,676 | |||
| 163,000 | ShoreTel, Inc.a | 756,320 | |||
| 328,200 | Sonus Networks, Inc.a | 889,422 | |||
| 42,000 | Standard Microsystems Corporationa | 977,760 | |||
| 85,000 | StarTek, Inc.a | 331,500 | |||
| 92,300 | Symyx Technologies, Inc.a | 462,423 | |||
| 69,300 | Synnex Corporationa | 1,775,466 | |||
| 78,000 | Teradyne, Inc.a | 760,500 | |||
| 68,300 | Xyratex, Ltd.a | 966,445 | |||
| 307,100 | Zarlink Semiconductor, Inc.a | 510,400 | |||
| 82,000 | Zygo Corporationa | 665,020 | |||
| Total Information Technology | 23,488,600 | ||||
| Materials (8.4%) | |||||
| 36,000 | AMCOL International Corporation | 846,000 | |||
| 97,000 | American Vanguard Corporationb | 769,210 | |||
| 82,500 | AptarGroup, Inc. | 3,120,150 | |||
| 77,700 | Arch Chemicals, Inc. | 2,388,498 | |||
| 59,000 | Carpenter Technology Corporation | 1,936,970 | |||
| 49,300 | Clearwater Paper Corporationa | 2,699,668 | |||
| 62,000 | Franco-Nevada Corporation | 1,886,906 | |||
| 49,700 | Innospec, Inc.a | 466,186 | |||
| 24,800 | Minerals Technologies, Inc. | 1,178,992 | |||
| 122,100 | Myers Industries, Inc. | 987,789 | |||
| 98,000 | Sims Metal Management, Ltd. ADR | 1,387,680 | |||
| 196,000 | Wausau Paper Corporationa | 1,326,920 | |||
| Total Materials | 18,994,969 | ||||
| Telecommunications Services (0.3%) | |||||
| 98,000 | Premiere Global Services, Inc.a | 621,320 | |||
| Total Telecommunications Services | 621,320 | ||||
| Utilities (5.0%) | |||||
| 49,000 | Black Hills Corporation | 1,395,030 | |||
| 104,500 | Cleco Corporation | 2,759,845 | |||
| 102,400 | El Paso Electric Companya | 1,981,440 | |||
| 24,500 | Empire District Electric Companyb | 459,865 | |||
| 54,900 | NorthWestern Corporation | 1,438,380 | |||
| 68,000 | Southwest Gas Corporation | 2,006,000 | |||
| 47,000 | Vectren Corporation | 1,112,020 | |||
| Total Utilities | 11,152,580 | ||||
Total Common Stock (cost $228,525,730) | 218,590,918 | ||||
Preferred Stock (1.5%) | |||||
| Energy (0.6%) | |||||
| 6,700 | Whiting Petroleum Corporation, Convertible | 1,297,723 | |||
| Total Energy | 1,297,723 | ||||
| Financials (0.6%) | |||||
| 8,400 | Assured Guaranty, Ltd., Convertible | 483,756 | |||
| 820 | East West Bancorp, Inc. | 987,075 | |||
| Total Financials | 1,470,831 | ||||
| Health Care (0.3%) | |||||
| 54,000 | National Healthcare Corporation, Convertible | 683,100 | |||
| Total Health Care | 683,100 | ||||
Total Preferred Stock (cost $2,631,996) | 3,451,654 | ||||
Collateral Held for Securities Loaned (6.3%) | |||||
| 14,206,950 | Thrivent Financial Securities Lending Trust | 14,206,950 | |||
Total Collateral Held for Securities Loaned (cost $14,206,950) | 14,206,950 | ||||
The accompanying Notes to Financial Statements are an integral part of this schedule.
151
Table of Contents
Partner Small Cap Value Portfolio
Schedule of Investments as of June 30, 2010
(unaudited)
Principal Amount | Short-Term Investments (1.3%)c | Value | ||||
| Federal Home Loan Bank Discount Notes | ||||||
| 100,000 | 0.045%, 7/9/2010 | $ | 99,999 | |||
| U.S. Treasury Bills | ||||||
| 2,785,000 | 0.020%, 7/8/2010 | 2,784,989 | ||||
| Total Short-Term Investments (at amortized cost) | 2,884,988 | |||||
| Total Investments (cost $248,249,664) 106.1% | $ | 239,134,510 | ||||
| Other Assets and Liabilities, Net (6.1%) | (13,815,530 | ) | ||||
| Total Net Assets 100.0% | $ | 225,318,980 | ||||
| a | Non-income producing security. |
| b | All or a portion of the security is on loan as discussed in item 2(M) of the Notes to Financial Statements. |
| c | The interest rate shown reflects the yield, coupon rate or, for securities purchased at a discount, the discount rate at the date of purchase. |
Unrealized Appreciation (Depreciation)
Gross unrealized appreciation and depreciation of investments, based on cost for federal income tax purposes, were as follows:
Gross unrealized appreciation | $ | 27,756,245 | ||
Gross unrealized depreciation | (36,871,399 | ) | ||
Net unrealized appreciation (depreciation) | $ | (9,115,154 | ) | |
Cost for federal income tax purposes | $ | 248,249,664 |
Fair Valuation Measurements
The following table is a summary of the inputs used, as of June 30, 2010, in valuing Partner Small Cap Value Portfolio’s assets carried at fair value as discussed in the Notes to Financial Statements.
Investments in Securities | Total | Level 1 | Level 2 | Level 3 | ||||||||
Common Stock | ||||||||||||
Consumer Discretionary | 28,430,035 | 28,430,035 | — | — | ||||||||
Consumer Staples | 2,035,080 | 2,035,080 | — | — | ||||||||
Energy | 14,690,073 | 14,690,073 | — | — | ||||||||
Financials | 54,071,612 | 54,071,612 | — | — | ||||||||
Health Care | 11,650,089 | 11,650,089 | — | — | ||||||||
Industrials | 53,456,560 | 53,456,560 | — | — | ||||||||
Information Technology | 23,488,600 | 23,488,600 | — | — | ||||||||
Materials | 18,994,969 | 17,108,063 | 1,886,906 | — | ||||||||
Telecommunications Services | 621,320 | 621,320 | — | — | ||||||||
Utilities | 11,152,580 | 11,152,580 | — | — | ||||||||
Preferred Stock | ||||||||||||
Energy | 1,297,723 | 1,297,723 | — | — | ||||||||
Financials | 1,470,831 | — | 1,470,831 | — | ||||||||
Health Care | 683,100 | 683,100 | — | — | ||||||||
Collateral Held for Securities Loaned | 14,206,950 | 14,206,950 | — | — | ||||||||
Short-Term Investments | 2,884,988 | — | 2,884,988 | — | ||||||||
Total | $ | 239,134,510 | $ | 232,891,785 | $ | 6,242,725 | $ | — | ||||
The following table is a reconciliation of assets in which significant unobservable inputs (Level 3) were used in determining fair value for Partner Small Cap Value Portfolio as discussed in item 2(A) of the Notes to Financial Statements.
Investments in Securities | Value December 31, 2009 | Accrued Discounts and/or Premiums | Realized Gain/(Loss) | Change in Unrealized Gain/(Loss) | Net Purchases/(Sales) | Transfers Into Level 3 | Transfers Out of Level 3 | Value June 30, 2010 | ||||||||||||||||||
Preferred Stock | ||||||||||||||||||||||||||
Financials | 760,032 | — | — | (276,276 | ) | — | — | (483,756 | ) | — | ||||||||||||||||
Total | $ | 760,032 | $ | — | $ | — | ($ | 276,276 | ) | $ | — | $ | — | ($ | 483,756 | ) | $ | — | ||||||||
The accompanying Notes to Financial Statements are an integral part of this schedule.
152
Table of Contents
Partner Small Cap Value Portfolio
Schedule of Investments as of June 30, 2010
(unaudited)
The following table summarizes the net realized gains/(losses) and Statement of Operations location, for the period ended June 30, 2010, for Partner Small Cap Value Portfolio’s investments in financial derivative instruments by primary risk exposure.
Derivatives by risk category | Statement of Operations Location | Realized Gains/(Losses) recognized in Income | |||
Foreign Exchange Contracts | |||||
Forward Contracts | Net realized gains/(losses) on Foreign currency transactions | 281 | |||
Total Foreign Exchange Contracts | 281 | ||||
Total | $ | 281 | |||
The following table presents Partner Small Cap Value Portfolio’s average volume of derivative activity during the period ended June 30, 2010.
Derivative Risk Category | Forwards (Notional*) | Forwards (Percentage of Average Net Assets) | ||||
Foreign Exchange | ||||||
Contracts | $ | 639 | <0.1 | % | ||
| * | Notional amount represents long or short, or both, derivative positions held by the portfolio. |
Investment in Affiliates
Affiliated issuers, as defined under the Investment Company Act of 1940, include those in which the Portfolio’s holdings of an issuer represent 5% or more of the outstanding voting securities of an issuer, or any affiliated mutual fund.
A summary of transactions for the fiscal year to date, in Partner Small Cap Value Portfolio, is as follows:
Portfolio | Value December 31, 2009 | Gross Purchases | Gross Sales | Shares Held at June 30, 2010 | Value June 30, 2010 | Income Earned January 1, 2010 - June 30, 2010 | |||||||||||
Thrivent Financial | |||||||||||||||||
Securities Lending Trust | $ | 30,107,005 | $ | 62,751,010 | $ | 78,651,065 | 14,206,950 | $ | 14,206,950 | $ | 16,310 | ||||||
Total Value and | |||||||||||||||||
Income Earned | 30,107,005 | 14,206,950 | 16,310 | ||||||||||||||
The accompanying Notes to Financial Statements are an integral part of this schedule.
153
Table of Contents
Small Cap Stock Portfolio
Schedule of Investments as of June 30, 2010
(unaudited)
Common Stock (92.8%) | Value | ||||
| Consumer Discretionary (14.0%) | |||||
| 155,500 | Aeropostale, Inc.a | $ | 4,453,520 | ||
| 148,700 | Carter’s, Inc.a | 3,903,375 | |||
| 331,000 | Chico’s FAS, Inc. | 3,270,280 | |||
| 269,800 | Cooper Tire & Rubber Company | 5,261,100 | |||
| 267,300 | Domino’s Pizza, Inc.a | 3,020,490 | |||
| 299,200 | Foot Locker, Inc. | 3,775,904 | |||
| 89,700 | Warnaco Group, Inc.a | 3,241,758 | |||
| 622,706 | Warner Music Group Corporationa | 3,026,351 | |||
| 97,100 | WMS Industries, Inc.a | 3,811,175 | |||
| Total Consumer Discretionary | 33,763,953 | ||||
| Consumer Staples (2.1%) | |||||
| 273,200 | Del Monte Foods Company | 3,931,348 | |||
| 26,200 | Herbalife, Ltd. | 1,206,510 | |||
| Total Consumer Staples | 5,137,858 | ||||
| Energy (10.4%) | |||||
| 126,200 | Arch Coal, Inc. | 2,500,022 | |||
| 70,300 | Brigham Exploration Companya | 1,081,214 | |||
| 345,800 | Complete Production Services, Inc.a | 4,944,940 | |||
| 122,100 | Dresser-Rand Group, Inc.a | 3,852,255 | |||
| 156,600 | Forest Oil Corporationa | 4,284,576 | |||
| 822,382 | International Coal Group, Inc.a,b | 3,166,171 | |||
| 240,300 | James River Coal Companya | 3,825,576 | |||
| 81,100 | Superior Well Services, Inc.a,b | 1,355,992 | |||
| Total Energy | 25,010,746 | ||||
| Financials (16.4%) | |||||
| 58,200 | Affiliated Managers Group, Inc.a | 3,536,814 | |||
| 321,400 | Duke Realty Corporation | 3,647,890 | |||
| 136,600 | First Niagara Financial Group, Inc. | 1,711,598 | |||
| 14,700 | Hancock Holding Company | 490,392 | |||
| 175,900 | Healthcare Realty Trust, Inc. | 3,864,523 | |||
| 61,050 | Home Bancshares, Inc. | 1,392,550 | |||
| 38,100 | IBERIABANK Corporation | 1,961,388 | |||
| 389,600 | Ocwen Financial Corporationa | 3,970,024 | |||
| 113,500 | Potlatch Corporation | 4,055,355 | |||
| 31,200 | SCBT Financial Corporation | 1,098,864 | |||
| 62,700 | Simmons First National Corporation | 1,646,502 | |||
| 246,600 | Texas Capital Bancshares, Inc.a | 4,044,240 | |||
| 235,600 | Washington Federal, Inc. | 3,812,008 | |||
| 200,800 | Zions Bancorporationb | 4,331,256 | |||
| Total Financials | 39,563,404 | ||||
| Health Care (12.6%) | |||||
| 274,500 | Align Technology, Inc.a,b | 4,081,815 | |||
| 234,304 | Endologix, Inc.a | 1,061,397 | |||
| 150,800 | ICON plc ADRa | 4,356,612 | |||
| 490,900 | King Pharmaceuticals, Inc.a | 3,725,931 | |||
| 41,550 | Lincare Holdings, Inc.a,b | 1,350,791 | |||
| 47,600 | Masimo Corporation | 1,133,356 | |||
| 112,300 | NuVasive, Inc.a,b | 3,982,158 | |||
| 61,400 | PSS World Medical, Inc.a | 1,298,610 | |||
| 30,000 | Salix Pharmaceuticals, Ltd.a | 1,170,900 | |||
| 138,900 | STERIS Corporation | 4,317,012 | |||
| 82,100 | United Therapeutics Corporationa | 4,007,301 | |||
| Total Health Care | 30,485,883 | ||||
| Industrials (16.9%) | |||||
| 223,700 | AirTran Holdings, Inc.a | 1,084,945 | |||
| 56,800 | Continental Airlines, Inc.a,b | 1,249,600 | |||
| 50,600 | Corrections Corporation of Americaa | 965,448 | |||
| 61,500 | Deluxe Corporation | 1,153,125 | |||
| 124,700 | FTI Consulting, Inc.a | 5,435,673 | |||
| 34,600 | Genesee & Wyoming, Inc.a | 1,290,926 | |||
| 56,600 | Herman Miller, Inc. | 1,068,042 | |||
| 48,300 | ICF International, Inc.a | 1,155,819 | |||
| 48,700 | Knight Transportation, Inc. | 985,688 | |||
| 377,400 | Manitowoc Company, Inc. | 3,449,436 | |||
| 99,800 | Navigant Consulting, Inc.a | 1,035,924 | |||
| 142,300 | Old Dominion Freight Line, Inc.a | 5,000,422 | |||
| 128,600 | Oshkosh Corporationa | 4,007,176 | |||
| 19,300 | Regal-Beloit Corporation | 1,076,554 | |||
| 146,000 | Shaw Group, Inc.a | 4,996,120 | |||
| 52,800 | Sykes Enterprises, Inc.a | 751,344 | |||
| 113,600 | Teledyne Technologies, Inc.a | 4,382,688 | |||
| 51,400 | Waste Connections, Inc.a | 1,793,346 | |||
| Total Industrials | 40,882,276 | ||||
| Information Technology (16.7%) | |||||
| 158,500 | ADTRAN, Inc. | 4,322,295 | |||
| 993,932 | Atmel Corporationa | 4,770,873 | |||
| 356,625 | Cogent, Inc.a | 3,213,191 | |||
| 142,374 | Cogo Group, Inc.a | 888,414 | |||
| 245,800 | CommVault Systems, Inc.a | 5,530,500 | |||
| 599,400 | Compuware Corporationa | 4,783,212 | |||
| 268,167 | FormFactor, Inc.a | 2,896,204 | |||
| 58,600 | Ingram Micro, Inc.a | 890,134 | |||
| 51,400 | J2 Global Communication, Inc.a | 1,122,576 | |||
| 73,200 | Monster Worldwide, Inc.a,b | 852,780 | |||
| 157,354 | Polycom, Inc.a | 4,687,576 | |||
| 465,900 | TIBCO Software, Inc.a | 5,618,754 | |||
| 88,600 | Vishay Intertechnology, Inc.a | 685,764 | |||
| Total Information Technology | 40,262,273 | ||||
| Materials (2.3%) | |||||
| 18,600 | CF Industries Holdings, Inc. | 1,180,170 | |||
| 67,000 | Pactiv Corporationa | 1,865,950 | |||
| 42,700 | Puda Coal, Inc.a,b | 312,991 | |||
| 13,300 | Reliance Steel & Aluminum Company | 480,795 | |||
| 74,000 | Rockwood Holdings, Inc.a | 1,679,060 | |||
| Total Materials | 5,518,966 | ||||
| Utilities (1.4%) | |||||
| 113,100 | Southwest Gas Corporation | 3,336,450 | |||
| Total Utilities | 3,336,450 | ||||
Total Common Stock (cost $229,238,165) | 223,961,809 | ||||
The accompanying Notes to Financial Statements are an integral part of this schedule.
154
Table of Contents
Small Cap Stock Portfolio
Schedule of Investments as of June 30, 2010
(unaudited)
| Principal Amount | Long-Term Fixed Income (0.4%) | Value | ||||
| U.S. Government and Agencies (0.4%) | ||||||
| U.S. Treasury Notes | ||||||
| $1,000,000 | 0.875%, 12/31/2010c | $ | 1,003,125 | |||
| Total U.S. Government and Agencies | 1,003,125 | |||||
Total Long-Term Fixed Income (cost $1,000,233) | 1,003,125 | |||||
Shares | Collateral Held for Securities Loaned (8.3%) | |||||
| 19,927,935 | Thrivent Financial Securities Lending Trust | 19,927,935 | ||||
Total Collateral Held for Securities Loaned (cost $19,927,935) | 19,927,935 | |||||
Principal Amount | Short-Term Investments (6.6%)d | |||||
| Federal Home Loan Bank Discount Notes | ||||||
| 2,655,000 | 0.050%, 7/9/2010 | 2,654,971 | ||||
| 10,000,000 | 0.070%, 7/14/2010 | 9,999,747 | ||||
| Jupiter Securitization Company, LLC | ||||||
| 3,195,000 | 0.090%, 7/1/2010 | 3,195,000 | ||||
| Total Short-Term Investments (at amortized cost) | 15,849,718 | |||||
| Total Investments (cost $266,016,051) 108.1% | $ | 260,742,587 | ||||
| Other Assets and Liabilities, Net (8.1%) | (19,490,597 | ) | ||||
| Total Net Assets 100.0% | $ | 241,251,990 | ||||
| a | Non-income producing security. |
| b | All or a portion of the security is on loan as discussed in item 2(M) of the Notes to Financial Statements. |
| c | At June 30, 2010, $1,003,125 of investments were held on deposit with the counterparty and pledged as the initial margin deposit for open futures contracts. |
| d | The interest rate shown reflects the yield, coupon rate or, for securities purchased at a discount, the discount rate at the date of purchase. |
Definitions:
ADR | - | American Depositary Receipt, which are certificates for an underlying foreign security’s shares held by an issuing U.S. depository bank. |
Unrealized Appreciation (Depreciation)
Gross unrealized appreciation and depreciation of investments, based on cost for federal income tax purposes, were as follows:
Gross unrealized appreciation | $ | 10,818,350 | ||
Gross unrealized depreciation | (16,091,814 | ) | ||
Net unrealized appreciation (depreciation) | ($5,273,464) | |||
Cost for federal income tax purposes | $ | 266,016,051 | ||
The accompanying Notes to Financial Statements are an integral part of this schedule.
155
Table of Contents
Small Cap Stock Portfolio
Schedule of Investments as of June 30, 2010
(unaudited)
Fair Valuation Measurements
The following table is a summary of the inputs used, as of June 30, 2010, in valuing Small Cap Stock Portfolio’s assets carried at fair value as discussed in the Notes to Financial Statements.
Investments in Securities | Total | Level 1 | Level 2 | Level 3 | ||||||||
Common Stock | ||||||||||||
Consumer Discretionary | 33,763,953 | 33,763,953 | — | — | ||||||||
Consumer Staples | 5,137,858 | 5,137,858 | — | — | ||||||||
Energy | 25,010,746 | 25,010,746 | — | — | ||||||||
Financials | 39,563,404 | 39,563,404 | — | — | ||||||||
Health Care | 30,485,883 | 30,485,883 | — | — | ||||||||
Industrials | 40,882,276 | 40,882,276 | — | — | ||||||||
Information Technology | 40,262,273 | 40,262,273 | — | — | ||||||||
Materials | 5,518,966 | 5,518,966 | — | — | ||||||||
Utilities | 3,336,450 | 3,336,450 | — | — | ||||||||
Long-Term Fixed Income | ||||||||||||
U.S. Government and Agencies | 1,003,125 | — | 1,003,125 | — | ||||||||
Collateral Held for Securities Loaned | 19,927,935 | 19,927,935 | — | — | ||||||||
Short-Term Investments | 15,849,718 | — | 15,849,718 | — | ||||||||
Total | $ | 260,742,587 | $ | 243,889,744 | $ | 16,852,843 | $ | — | ||||
Other Financial Instruments | Total | Level 1 | Level 2 | Level 3 | ||||||||
Liability Derivatives Futures Contracts | 121,998 | 121,998 | — | — | ||||||||
Total Liability Derivatives | $ | 121,998 | $ | 121,998 | $ | — | $ | — | ||||
Futures Contracts | Number of Contracts Long/(Short) | Expiration Date | Notional Principal Amount | Value | Unrealized Gain/(Loss) | |||||||||
Russell 2000 Index Mini-Futures | 66 | September 2010 | $ | 4,133,478 | $ | 4,011,480 | ($ | 121,998 | ) | |||||
Total Futures Contracts | ($ | 121,998 | ) | |||||||||||
The following table summarizes the fair value and Statement of Assets and Liabilities location, as of June 30, 2010, for Small Cap Stock Portfolio’s investments in financial derivative instruments by primary risk exposure as discussed under item (2) Significant Accounting Policies of the Notes to Financial Statements.
Derivatives by risk category | Statement of Assets and Liabilities Location | Fair Value | |||
Liability Derivatives | |||||
Equity Contracts | |||||
Futures* | Net Assets - Net unrealized appreciation/(depreciation) on Futures contracts | 121,998 | |||
Total Equity Contracts | 121,998 | ||||
Total Liability Derivatives | $ | 121,998 | |||
| * | Includes cumulative appreciation/depreciation of futures contracts as reported in the Schedule of Investments. Only current day’s variation margin is reported within the Statement of Assets and Liabilities. |
The accompanying Notes to Financial Statements are an integral part of this schedule.
156
Table of Contents
Small Cap Stock Portfolio
Schedule of Investments as of June 30, 2010
(unaudited)
The following table summarizes the net realized gains/(losses) and Statement of Operations location, for the period ended June 30, 2010, for Small Cap Stock Portfolio’s investments in financial derivative instruments by primary risk exposure.
Derivatives by risk category | Statement of Operations Location | Realized Gains/(Losses) recognized in Income | |||
Equity Contracts | |||||
Futures | Net realized gains/(losses) on Futures contracts | (976,629 | ) | ||
Total Equity Contracts | (976,629 | ) | |||
Foreign Exchange Contracts | |||||
Forward Contracts | Net realized gains/(losses) on Foreign currency transactions | (12,596 | ) | ||
Total Foreign Exchange Contracts | (12,596 | ) | |||
Total | ($989,225) | ||||
The following table summarizes the change in net unrealized appreciation/(depreciation) and Statement of Operations location, for the period ended June 30, 2010, for Small Cap Stock Portfolio’s investments in financial derivative instruments by primary risk exposure.
Derivatives by risk category | Statement of Operations Location | Change in unrealized appreciation/(depreciation) recognized in Income | |||
Equity Contracts | |||||
Futures | Change in net unrealized appreciation/(depreciation) on Futures contracts | (121,998 | ) | ||
Total Equity Contracts | (121,998 | ) | |||
Foreign Exchange Contracts | |||||
Forward Contracts | Change in net unrealized appreciation/(depreciation) on Foreign currency forward contracts | 5,249 | |||
Total Foreign Exchange Contracts | 5,249 | ||||
Total | ($116,749 | ) | |||
The following table presents Small Cap Stock Portfolio’s average volume of derivative activity during the period ended June 30, 2010.
Derivative Risk Category | Futures (Notional*) | Futures (Percentage of Average Net Assets) | Forwards (Notional*) | Forwards (Percentage of Average Net Assets) | ||||||||
Equity Contracts | $ | 6,512,852 | 2.5 | % | N/A | N/A | ||||||
Foreign Exchange Contracts | N/A | NA | $ | 17,168 | <0.1 | % | ||||||
| * | Notional amount represents long or short, or both, derivative positions held by the fund. |
Investment in Affiliates
Affiliated issuers, as defined under the Investment Company Act of 1940, include those in which the Portfolio’s holdings of an issuer represent 5% or more of the outstanding voting securities of an issuer, or any affiliated mutual fund.
A summary of transactions for the fiscal year to date, in Small Cap Stock Portfolio, is as follows:
Portfolio | Value December 31, 2009 | Gross Purchases | Gross Sales | Shares Held at June 30, 2010 | Value June 30, 2010 | Income Earned January 1, 2010 - June 30, 2010 | |||||||||||
Thrivent Financial Securities Lending Trust | $ | 14,969,779 | $ | 80,530,179 | $ | 75,572,023 | 19,927,935 | $ | 19,927,935 | $ | 132,344 | ||||||
Total Value and Income Earned | 14,969,779 | 19,927,935 | 132,344 | ||||||||||||||
The accompanying Notes to Financial Statements are an integral part of this schedule.
157
Table of Contents
Small Cap Index Portfolio
Schedule of Investments as of June 30, 2010
(unaudited)
The accompanying Notes to Financial Statements are an integral part of this schedule.
158
Table of Contents
Small Cap Index Portfolio
Schedule of Investments as of June 30, 2010
(unaudited)
| Shares | Common Stock (98.6%) | Value | |||
| Consumer Staples (3.4%) - continued | |||||
| 4,700 | Boston Beer Company, Inc.a | $ | 317,015 | ||
| 5,600 | Calavo Growers, Inc.b | 100,576 | |||
| 5,900 | Cal-Maine Foods, Inc.b | 188,387 | |||
| 23,900 | Casey’s General Stores, Inc. | 834,110 | |||
| 30,200 | Central Garden & Pet Companya | 270,894 | |||
| 38,700 | Darling International, Inc.a | 290,637 | |||
| 10,200 | Diamond Foods, Inc.b | 419,220 | |||
| 13,000 | Great Atlantic & Pacific Tea Company, Inc.a,b | 50,700 | |||
| 19,200 | Hain Celestial Group, Inc.a | 387,264 | |||
| 6,700 | J & J Snack Foods Corporation | 282,070 | |||
| 15,100 | Lance, Inc. | 248,999 | |||
| 7,300 | Mannatech, Inc.a | 14,527 | |||
| 6,100 | Medifast, Inc.a | 158,051 | |||
| 5,900 | Nash Finch Company | 201,544 | |||
| 9,200 | Sanderson Farms, Inc. | 466,808 | |||
| 10,600 | Spartan Stores, Inc. | 145,432 | |||
| 16,300 | TreeHouse Foods, Inc.a | 744,258 | |||
| 20,300 | United Natural Foods, Inc.a | 606,564 | |||
| 7,770 | WD-40 Company | 259,518 | |||
Total Consumer Staples | 6,415,656 | ||||
| Energy (5.0%) | |||||
| 10,900 | Basic Energy Services, Inc.a | 83,930 | |||
| 16,900 | Bristow Group, Inc.a | 496,860 | |||
| 9,000 | Carbo Ceramics, Inc. | 649,710 | |||
| 14,200 | Dril-Quip, Inc.a | 625,084 | |||
| 6,700 | Gulf Island Fabrication, Inc. | 103,984 | |||
| 20,500 | Holly Corporation | 544,890 | |||
| 10,900 | Hornbeck Offshore Services, Inc.a | 159,140 | |||
| 59,300 | ION Geophysical Corporationa | 206,364 | |||
| 14,000 | Lufkin Industries, Inc. | 545,860 | |||
| 12,400 | Matrix Service Companya | 115,444 | |||
| 23,500 | Oil States International, Inc.a | 930,130 | |||
| 21,300 | Penn Virginia Corporation | 428,343 | |||
| 9,000 | Petroleum Development Corporationa | 230,580 | |||
| 24,900 | PetroQuest Energy, Inc.a | 168,324 | |||
| 25,400 | Pioneer Drilling Companya | 144,018 | |||
| 10,550 | SEACOR Holdings, Inc.a | 745,463 | |||
| 5,520 | Seahawk Drilling, Inc.a | 53,654 | |||
| 29,500 | SM Energy Company | 1,184,720 | |||
| 19,800 | Stone Energy Corporationa | 220,968 | |||
| 8,700 | Superior Well Services, Inc.a,b | 145,464 | |||
| 17,800 | Swift Energy Companya | 478,998 | |||
| 35,550 | TETRA Technologies, Inc.a | 322,794 | |||
| 27,900 | World Fuel Services Corporation | 723,726 | |||
| Total Energy | 9,308,448 | ||||
| Financials (18.9%) | |||||
| 18,828 | Acadia Realty Trust | 316,687 | |||
| 3,833 | American Physicians Capital, Inc. | 118,248 | |||
| 8,800 | Amerisafe, Inc.a | 154,440 | |||
| 21,300 | Bank Mutual Corporation | 120,984 | |||
| 6,100 | Bank of the Ozarks, Inc. | 216,367 | |||
| 53,300 | BioMed Realty Trust, Inc. | 857,597 | |||
| 35,100 | Boston Private Financial Holdings, Inc. | 225,693 | |||
| 27,700 | Brookline Bancorp, Inc. | 245,976 | |||
| 13,900 | Cash America International, Inc. | 476,353 | |||
| 25,800 | Cedar Shopping Centers, Inc. | 155,316 | |||
| 7,400 | City Holding Company | 206,312 | |||
| 32,900 | Colonial Properties Trust | 478,037 | |||
| 18,400 | Columbia Banking System, Inc. | 335,984 | |||
| 15,500 | Community Bank System, Inc. | 341,465 | |||
| 22,365 | Delphi Financial Group, Inc. | 545,930 | |||
| 72,467 | DiamondRock Hospitality Companya | 595,679 | |||
| 11,975 | Dime Community Bancshares | 147,652 | |||
| 69,400 | East West Bancorp, Inc. | 1,058,350 | |||
| 12,600 | EastGroup Properties, Inc. | 448,308 | |||
| 11,000 | eHealth, Inc.a | 125,070 | |||
| 20,100 | Employers Holdings, Inc. | 296,073 | |||
| 21,800 | Entertainment Properties Trust | 829,926 | |||
| 40,900 | Extra Space Storage, Inc. | 568,510 | |||
| 23,100 | EZCORP, Inc.a | 428,505 | |||
| 35,600 | First BanCorpa,b | 18,868 | |||
| 12,600 | First Cash Financial Services, Inc.a | 274,680 | |||
| 36,000 | First Commonwealth Financial Corporation | 189,000 | |||
| 23,400 | First Financial Bancorp | 349,830 | |||
| 9,800 | First Financial Bankshares, Inc. | 471,282 | |||
| 34,712 | First Midwest Bancorp, Inc. | 422,098 | |||
| 17,100 | Forestar Real Estate Group, Inc.a | 307,116 | |||
| 31,800 | Franklin Street Properties Corporation | 375,558 | |||
| 33,800 | Glacier Bancorp, Inc.b | 495,846 | |||
| 13,300 | Hancock Holding Company | 443,688 | |||
| 24,000 | Hanmi Financial Corporationa,b | 30,240 | |||
| 24,100 | Hanmi Financial Corporation Rights, $1.20, expires 7/7/2010a,c | 1,446 | |||
| 29,200 | Healthcare Realty Trust, Inc. | 641,524 | |||
| 10,120 | Home Bancshares, Inc. | 230,837 | |||
| 17,100 | Home Properties, Inc. | 770,697 | |||
| 18,400 | Horace Mann Educators Corporation | 281,520 | |||
| 9,900 | Independent Bank Corporation (MA) | 244,332 | |||
| 6,200 | Infinity Property & Casualty Corporation | 286,316 | |||
| 33,700 | Inland Real Estate Corporation | 266,904 | |||
| 20,500 | Investment Technology Group, Inc.a | 329,230 | |||
| 24,500 | Kilroy Realty Corporation | 728,385 | |||
| 29,700 | Kite Realty Group Trust | 124,146 | |||
| 19,900 | LaBranche & Company, Inc.a | 85,172 | |||
| 32,800 | LaSalle Hotel Properties | 674,696 | |||
| 52,759 | Lexington Realty Trust | 317,081 | |||
| 11,200 | LTC Properties, Inc. | 271,824 | |||
| 52,200 | Medical Properties Trust, Inc. | 492,768 | |||
| 14,100 | Mid-America Apartment Communities, Inc. | 725,727 | |||
| 15,700 | Nara Bancorp, Inc.a | 132,351 | |||
| 20,000 | National Financial Partnersa,b | 195,400 | |||
| 59,200 | National Penn Bancshares, Inc. | 355,792 | |||
| 39,100 | National Retail Properties, Inc. | 838,304 | |||
| 6,100 | Navigators Group, Inc.a | 250,893 | |||
| 16,200 | NBT Bancorp, Inc. | 330,804 | |||
| 40,900 | Old National Bancorp | 423,724 | |||
| 19,900 | optionsXpress Holdings, Inc.a | 313,226 | |||
| 10,100 | Parkway Properties, Inc. | 147,157 | |||
| 23,100 | Pennsylvania Real Estate Investment Trustb | 282,282 | |||
The accompanying Notes to Financial Statements are an integral part of this schedule.
159
Table of Contents
Small Cap Index Portfolio
Schedule of Investments as of June 30, 2010
(unaudited)
| Shares | Common Stock (98.6%) | Value | |||
Financials (18.9%) - continued | |||||
| 15,700 | Pinnacle Financial Partners, Inc.a,b | $ | 201,745 | ||
| 8,100 | Piper Jaffray Companiesa | 260,982 | |||
| 8,000 | Portfolio Recovery Associates, Inc.a,b | 534,240 | |||
| 22,800 | Post Properties, Inc. | 518,244 | |||
| 9,700 | Presidential Life Corporation | 88,270 | |||
| 27,500 | PrivateBancorp, Inc. | 304,700 | |||
| 15,300 | ProAssurance Corporationa | 868,428 | |||
| 8,500 | PS Business Parks, Inc. | 474,130 | |||
| 4,133 | Rewards Network, Inc. | 56,498 | |||
| 8,100 | RLI Corporation | 425,331 | |||
| 11,300 | S&T Bancorp, Inc.b | 223,288 | |||
| 7,100 | Safety Insurance Group, Inc. | 262,842 | |||
| 25,000 | Selective Insurance Group, Inc. | 371,500 | |||
| 19,200 | Signature Banka | 729,792 | |||
| 7,300 | Simmons First National Corporation | 191,698 | |||
| 101,100 | South Financial Group, Inc. | 27,550 | |||
| 12,900 | Sovran Self Storage, Inc. | 444,147 | |||
| 12,600 | Sterling Bancorp | 113,400 | |||
| 47,800 | Sterling Bancshares, Inc. | 225,138 | |||
| 8,600 | Stewart Information Services Corporation | 77,572 | |||
| 17,900 | Stifel Financial Corporationa | 776,681 | |||
| 60,900 | Susquehanna Bancshares, Inc. | 507,297 | |||
| 13,326 | SWS Group, Inc. | 126,597 | |||
| 19,000 | Tanger Factory Outlet Centers, Inc. | 786,220 | |||
| 3,640 | Tompkins Financial Corporation | 137,410 | |||
| 21,100 | Tower Group, Inc. | 454,283 | |||
| 15,300 | Tradestation Group, Inc.a | 103,275 | |||
| 36,082 | TrustCo Bank Corporation NYb | 202,059 | |||
| 14,100 | UMB Financial Corporation | 501,396 | |||
| 53,700 | Umpqua Holdings Corporation | 616,476 | |||
| 18,000 | United Bankshares, Inc.b | 430,920 | |||
| 38,876 | United Community Banks, Inc.a | 153,560 | |||
| 10,400 | United Fire & Casualty Company | 206,128 | |||
| 10,200 | Urstadt Biddle Properties | 164,526 | |||
| 45,300 | Whitney Holding Corporation | 419,025 | |||
| 9,100 | Wilshire Bancorp, Inc.b | 79,625 | |||
| 14,600 | Wintrust Financial Corporation | 486,764 | |||
| 7,412 | World Acceptance Corporationa,b | 283,954 | |||
Total Financials | 35,249,897 | ||||
Health Care (13.4%) | |||||
| 10,400 | Abaxis, Inc.a | 222,872 | |||
| 5,100 | Air Methods Corporationa | 151,725 | |||
| 30,500 | Align Technology, Inc.a,b | 453,535 | |||
| 3,800 | Almost Family, Inc.a | 132,734 | |||
| 13,433 | Amedisys, Inc.a,b | 590,649 | |||
| 35,400 | American Medical Systems Holdings, Inc.a | 783,048 | |||
| 24,300 | AMERIGROUP Corporationa | 789,264 | |||
| 15,400 | AMN Healthcare Services, Inc.a | 115,192 | |||
| 14,550 | AmSurg Corporationa | 259,281 | |||
| 6,000 | Analogic Corporation | 273,060 | |||
| 13,200 | ArQule, Inc.a | 56,760 | |||
| 11,200 | Bio-Reference Laboratories, Inc.a | 248,304 | |||
| 13,800 | Cambrex Corporationa | 43,470 | |||
| 6,100 | Cantel Medical Corporation | 101,870 | |||
| 18,300 | Catalyst Health Solutions, Inc.a | 631,350 | |||
| 23,000 | Centene Corporationa | 494,500 | |||
| 10,700 | Chemed Corporation | 584,648 | |||
| 4,600 | Computer Programs and Systems, Inc. | 188,232 | |||
| 13,650 | CONMED Corporationa | 254,300 | |||
| 21,900 | Cooper Companies, Inc. | 871,401 | |||
| 3,300 | Corvel Corporationa | 111,507 | |||
| 14,600 | Cross Country Healthcare, Inc.a | 131,254 | |||
| 13,450 | CryoLife, Inc.a | 72,495 | |||
| 27,400 | Cubist Pharmaceuticals, Inc.a | 564,440 | |||
| 11,200 | Cyberonics, Inc.a | 265,216 | |||
| 8,300 | Dionex Corporationa | 618,018 | |||
| 27,000 | Eclipsys Corporationa | 481,680 | |||
| 7,900 | Emergent Biosolutions, Inc.a | 129,086 | |||
| 15,697 | Enzo Biochem, Inc.a | 63,887 | |||
| 19,900 | eResearch Technology, Inc.a | 156,812 | |||
| 8,200 | Genoptix, Inc.a | 141,040 | |||
| 14,000 | Gentiva Health Services, Inc.a | 378,140 | |||
| 10,900 | Greatbatch, Inc.a | 243,179 | |||
| 12,000 | Haemonetics Corporationa | 642,240 | |||
| 15,000 | Hanger Orthopedic Group, Inc.a | 269,400 | |||
| 23,100 | Healthspring, Inc.a | 358,281 | |||
| 16,000 | Healthways, Inc.a | 190,720 | |||
| 4,500 | Hi-Tech Pharmacal Companya | 103,095 | |||
| 12,700 | HMS Holding Corporationa | 688,594 | |||
| 5,400 | ICU Medical, Inc.a | 173,718 | |||
| 9,800 | Integra LifeSciences Holdings Corporationa | 362,600 | |||
| 15,200 | Invacare Corporation | 315,248 | |||
| 15,900 | inVentiv Health, Inc.a | 407,040 | |||
| 6,400 | IPC The Hospitalist Company, Inc.a | 160,640 | |||
| 7,000 | Kendle International, Inc.a | 80,640 | |||
| 4,600 | Kensey Nash Corporationa | 109,066 | |||
| 4,400 | Landauer, Inc. | 267,872 | |||
| 8,750 | LCA-Vision, Inc.a | 48,475 | |||
| 7,200 | LHC Group, Inc.a | 199,800 | |||
| 15,600 | Magellan Health Services, Inc.a | 566,592 | |||
| 15,600 | Martek Biosciences Corporationa,b | 369,876 | |||
| 8,700 | MedCath Corporationa | 68,382 | |||
| 19,100 | Meridian Bioscience, Inc. | 324,700 | |||
| 13,200 | Merit Medical Systems, Inc.a | 212,124 | |||
| 6,300 | Molina Healthcare, Inc.a | 181,440 | |||
| 5,800 | MWI Veterinary Supply, Inc.a | 291,508 | |||
| 13,400 | Natus Medical, Inc.a | 218,286 | |||
| 10,550 | Neogen Corporationa | 274,827 | |||
| 15,800 | Odyssey Healthcare, Inc.a | 422,176 | |||
| 15,300 | Omnicell, Inc.a | 178,857 | |||
| 8,500 | Osteotech, Inc.a | 26,945 | |||
| 8,700 | Palomar Medical Technologies, Inc.a | 97,353 | |||
| 16,500 | Par Pharmaceutical Companies, Inc.a | 428,340 | |||
| 27,400 | PAREXEL International Corporationa | 594,032 | |||
| 14,400 | PharMerica Corporationa | 211,104 | |||
| 20,500 | Phase Forward, Inc.a | 341,940 | |||
| 26,800 | PSS World Medical, Inc.a | 566,820 | |||
| 8,900 | Quality Systems, Inc.b | 516,111 | |||
| 30,400 | Regeneron Pharmaceuticals, Inc.a | 678,528 | |||
| 11,700 | RehabCare Group, Inc.a | 254,826 | |||
| 12,000 | Res-Care, Inc.a | 115,920 | |||
| 26,700 | Salix Pharmaceuticals, Ltd.a | 1,042,101 | |||
The accompanying Notes to Financial Statements are an integral part of this schedule.
160
Table of Contents
Small Cap Index Portfolio
Schedule of Investments as of June 30, 2010
(unaudited)
| Shares | Common Stock (98.6%) | Value | |||
| Health Care (13.4%) - continued | |||||
| 31,700 | Savient Pharmaceuticals, Inc.a,b | $ | 399,420 | ||
| 8,200 | SurModics, Inc.a,b | 134,562 | |||
| 16,900 | Symmetry Medical, Inc.a | 178,126 | |||
| 36,500 | ViroPharma, Inc.a | 409,165 | |||
| 15,600 | West Pharmaceutical Services, Inc. | 569,244 | |||
| 10,100 | Zoll Medical Corporationa | 273,710 | |||
Total Health Care | 24,927,393 | ||||
| Industrials (16.0%) | |||||
| 10,800 | A.O. Smith Corporation | 520,452 | |||
| 5,900 | AAON, Inc. | 137,529 | |||
| 18,300 | AAR Corporationa | 306,342 | |||
| 22,000 | ABM Industries, Inc. | 460,900 | |||
| 31,900 | Actuant Corporation | 600,677 | |||
| 10,700 | Administaff, Inc. | 258,512 | |||
| 7,000 | Aerovironment, Inc.a,b | 152,110 | |||
| 13,000 | Albany International Corporation | 210,470 | |||
| 7,100 | Allegiant Travel Companyb | 303,099 | |||
| 4,200 | American Science & Engineering, Inc. | 320,082 | |||
| 13,100 | Apogee Enterprises, Inc. | 141,873 | |||
| 17,450 | Applied Industrial Technologies, Inc.b | 441,834 | |||
| 6,300 | Applied Signal Technology, Inc. | 123,795 | |||
| 11,900 | Arkansas Best Corporation | 246,925 | |||
| 9,300 | Astec Industries, Inc.a | 257,889 | |||
| 9,400 | ATC Technology Corporationa | 151,528 | |||
| 5,800 | Azz, Inc. | 213,266 | |||
| 7,000 | Badger Meter, Inc. | 270,830 | |||
| 19,800 | Baldor Electric Company | 714,384 | |||
| 20,400 | Barnes Group, Inc. | 334,356 | |||
| 21,925 | Belden, Inc. | 482,350 | |||
| 18,858 | Bowne & Company, Inc. | 211,587 | |||
| 24,600 | Brady Corporation | 613,032 | |||
| 23,500 | Briggs & Stratton Corporation | 399,970 | |||
| 4,300 | Cascade Corporation | 153,123 | |||
| 6,000 | CDI Corporation | 93,180 | |||
| 11,950 | Ceradyne, Inc.a | 255,371 | |||
| 8,000 | Circor International, Inc. | 204,640 | |||
| 23,700 | CLARCOR, Inc. | 841,824 | |||
| 17,800 | Comfort Systems USA, Inc. | 171,948 | |||
| 5,300 | Consolidated Graphics, Inc.a | 229,172 | |||
| 7,300 | Cubic Corporation | 265,574 | |||
| 21,500 | Curtiss-Wright Corporation | 624,360 | |||
| 14,200 | Dolan Companya | 157,904 | |||
| 18,100 | Dycom Industries, Inc.a | 154,755 | |||
| 31,100 | EMCOR Group, Inc.a | 720,587 | |||
| 8,900 | Encore Wire Corporationb | 161,891 | |||
| 9,700 | EnPro Industries, Inc.a | 273,055 | |||
| 12,400 | ESCO Technologies, Inc. | 319,300 | |||
| 14,100 | Esterline Technologies Corporationa | 669,045 | |||
| 6,500 | Exponent, Inc.a | 212,680 | |||
| 31,500 | Federal Signal Corporation | 190,260 | |||
| 13,600 | Forward Air Corporation | 370,600 | |||
| 8,700 | G & K Services, Inc. | 179,655 | |||
| 23,900 | GenCorp, Inc.a,b | 104,682 | |||
| 23,100 | Geo Group, Inc.a | 479,325 | |||
| 14,200 | Gibraltar Industries, Inc.a | 143,420 | |||
| 20,730 | Griffon Corporationa | 229,274 | |||
| 20,525 | Healthcare Services Group, Inc. | 388,949 | |||
| 24,648 | Heartland Express, Inc. | 357,889 | |||
| 8,200 | Heidrick & Struggles International, Inc. | 187,124 | |||
| 17,800 | Hub Group, Inc.a | 534,178 | |||
| 12,100 | II-VI, Inc.a | 358,523 | |||
| 18,400 | Insituform Technologies, Inc.a | 376,832 | |||
| 26,500 | Interface, Inc. | 284,610 | |||
| 13,200 | John Bean Technologies Corporation | 201,300 | |||
| 12,200 | Kaman Corporation | 269,864 | |||
| 15,700 | Kaydon Corporation | 515,902 | |||
| 12,500 | Kelly Services, Inc.a | 185,875 | |||
| 27,450 | Knight Transportation, Inc. | 555,588 | |||
| 1,900 | Lawson Products, Inc. | 32,262 | |||
| 5,850 | Lindsay Manufacturing Company | 185,386 | |||
| 8,000 | Lydall, Inc.a | 61,120 | |||
| 17,100 | Mobile Mini, Inc.a | 278,388 | |||
| 21,250 | Moog, Inc.a | 684,887 | |||
| 17,700 | Mueller Industries, Inc. | 435,420 | |||
| 8,460 | NCI Building Systems, Inc.a | 70,810 | |||
| 13,150 | Old Dominion Freight Line, Inc.a | 462,091 | |||
| 17,100 | On Assignment, Inc.a | 86,013 | |||
| 27,000 | Orbital Sciences Corporationa | 425,790 | |||
| 4,100 | Powell Industries, Inc.a | 112,094 | |||
| 17,775 | Quanex Building Products Corporation | 307,330 | |||
| 15,500 | Robbins & Myers, Inc. | 336,970 | |||
| 7,500 | School Specialty, Inc.a | 135,525 | |||
| 24,400 | SFN Group, Inc.a | 133,224 | |||
| 18,100 | Simpson Manufacturing Company, Inc. | 444,355 | |||
| 26,300 | SkyWest, Inc. | 321,386 | |||
| 6,000 | Standard Register Company | 18,840 | |||
| 5,900 | Standex International Corporation | 149,565 | |||
| 7,700 | Stanley, Inc.a | 287,826 | |||
| 18,900 | Sykes Enterprises, Inc.a | 268,947 | |||
| 17,000 | Teledyne Technologies, Inc.a | 655,860 | |||
| 29,006 | Tetra Tech, Inc.a | 568,808 | |||
| 15,300 | Toro Company | 751,536 | |||
| 9,800 | Tredegar Corporation | 159,936 | |||
| 7,800 | Triumph Group, Inc. | 519,714 | |||
| 20,700 | TrueBlue, Inc.a | 231,633 | |||
| 11,400 | United Stationers, Inc.a | 620,958 | |||
| 9,100 | Universal Forest Products, Inc. | 275,821 | |||
| 9,600 | Viad Corporation | 169,440 | |||
| 9,200 | Vicor Corporationa | 114,908 | |||
| 5,700 | Volt Information Sciences, Inc.a | 47,880 | |||
| 15,250 | Watsco, Inc. | 883,280 | |||
| 13,800 | Watts Water Technologies, Inc. | 395,508 | |||
Total Industrials | 29,929,562 | ||||
| Information Technology (18.6%) | |||||
| 12,300 | Actel Corporationa | 157,686 | |||
| 56,500 | ADPT Corporationa | 163,285 | |||
| 15,600 | Advanced Energy Industries, Inc.a | 191,724 | |||
| 9,400 | Agilysys, Inc. | 62,886 | |||
| 13,300 | Anixter International, Inc.a | 566,580 | |||
| 59,523 | Arris Group, Inc.a | 606,539 | |||
| 14,800 | ATMI, Inc.a | 216,672 | |||
| 13,613 | Avid Technology, Inc.a | 173,293 | |||
| 5,500 | Bel Fuse, Inc. | 90,805 | |||
The accompanying Notes to Financial Statements are an integral part of this schedule.
161
Table of Contents
Small Cap Index Portfolio
Schedule of Investments as of June 30, 2010
(unaudited)
| Shares | Common Stock (98.6%) | Value | |||
| Information Technology (18.6%) - continued | |||||
| 29,550 | Benchmark Electronics, Inc.a | $ | 468,367 | ||
| 8,200 | Black Box Corporation | 228,698 | |||
| 21,000 | Blackbaud, Inc. | 457,170 | |||
| 20,000 | Blue Coat Systems, Inc.a | 408,600 | |||
| 33,100 | Brightpoint, Inc.a | 231,700 | |||
| 30,507 | Brooks Automation, Inc.a | 235,819 | |||
| 11,100 | Cabot Microelectronics Corporationa | 383,949 | |||
| 14,200 | CACI International, Inc.a | 603,216 | |||
| 18,500 | Checkpoint Systems, Inc.a | 321,160 | |||
| 32,500 | CIBER, Inc.a | 90,025 | |||
| 21,000 | Cogent, Inc.a | 189,210 | |||
| 18,600 | Cognex Corporation | 326,988 | |||
| 11,100 | Cohu, Inc. | 134,643 | |||
| 14,900 | Coinstar, Inc.a,b | 640,253 | |||
| 20,300 | CommVault Systems, Inc.a | 456,750 | |||
| 10,700 | Compellent Technologies, Inc.a | 129,684 | |||
| 11,600 | comScore, Inc.a | 191,052 | |||
| 13,300 | Comtech Telecommunications Corporationa | 398,069 | |||
| 20,400 | Concur Technologies, Inc.a | 870,672 | |||
| 16,000 | CSG Systems International, Inc.a | 293,280 | |||
| 15,900 | CTS Corporation | 146,916 | |||
| 33,125 | CyberSource Corporationa | 845,681 | |||
| 14,100 | Cymer, Inc.a | 423,564 | |||
| 77,000 | Cypress Semiconductor Corporationa | 773,080 | |||
| 16,200 | Daktronics, Inc.b | 121,500 | |||
| 18,900 | DealerTrack Holdings, Inc.a | 310,905 | |||
| 11,600 | DG FastChannel, Inc.a | 377,928 | |||
| 11,700 | Digi International, Inc.a | 96,759 | |||
| 16,450 | Diodes, Inc.a | 261,062 | |||
| 10,900 | DSP Group, Inc.a | 69,651 | |||
| 8,200 | DTS, Inc.a | 269,534 | |||
| 14,600 | Ebix, Inc.a,b | 228,928 | |||
| 12,900 | Electro Scientific Industries, Inc.a | 172,344 | |||
| 7,200 | EMS Technologies, Inc.a | 108,144 | |||
| 22,200 | Epicor Software Corporationa | 177,378 | |||
| 15,500 | EPIQ Systems, Inc.a | 200,415 | |||
| 20,600 | Exar Corporationa | 142,758 | |||
| 7,600 | FARO Technologies, Inc.a | 142,196 | |||
| 17,800 | FEI Companya | 350,838 | |||
| 7,000 | Forrester Research, Inc.a | 211,820 | |||
| 11,800 | Gerber Scientific, Inc.a | 63,130 | |||
| 45,500 | Harmonic, Inc.a | 247,520 | |||
| 17,800 | Heartland Payment Systems, Inc. | 264,152 | |||
| 10,200 | Hittite Microwave Corporationa | 456,348 | |||
| 11,000 | Hutchinson Technology, Inc.a | 47,630 | |||
| 16,800 | InfoSpace, Inc.a | 126,336 | |||
| 21,675 | Insight Enterprises, Inc.a | 285,243 | |||
| 8,200 | Integral Systems, Inc.a | 52,070 | |||
| 6,100 | Interactive Intelligence, Inc.a | 100,223 | |||
| 23,200 | Intermec, Inc.a | 237,800 | |||
| 10,500 | Intevac, Inc.a | 112,035 | |||
| 21,200 | J2 Global Communication, Inc.a | 463,008 | |||
| 17,200 | JDA Software Group, Inc.a | 378,056 | |||
| 6,400 | Keithley Instruments, Inc. | 56,512 | |||
| 14,100 | Knot, Inc.a | 109,698 | |||
| 31,300 | Kopin Corporationa | 106,107 | |||
| 32,900 | Kulicke and Soffa Industries, Inc.a | 230,958 | |||
| 10,300 | Littelfuse, Inc.a | 325,583 | |||
| 8,600 | LoJack Corporationa | 31,734 | |||
| 10,700 | Manhattan Associates, Inc.a | 294,785 | |||
| 8,200 | MAXIMUS, Inc. | 474,534 | |||
| 11,100 | Mercury Computer Systems, Inc.a | 130,203 | |||
| 17,500 | Methode Electronics, Inc. | 170,450 | |||
| 20,200 | Micrel, Inc. | 205,636 | |||
| 39,000 | Microsemi Corporationa | 570,570 | |||
| 4,300 | MicroStrategy, Inc.a | 322,887 | |||
| 23,500 | MKS Instruments, Inc.a | 439,920 | |||
| 7,700 | MTS Systems Corporation | 223,300 | |||
| 3,300 | NCI, Inc.a | 74,514 | |||
| 16,500 | NETGEAR, Inc.a | 294,360 | |||
| 16,500 | NetScout Systems, Inc.a | 234,630 | |||
| 14,100 | Network Equipment Technologies, Inc.a,b | 49,209 | |||
| 17,200 | Newport Corporationa | 155,832 | |||
| 14,700 | Novatel Wireless, Inc.a | 84,378 | |||
| 8,600 | OSI Systems, Inc.a | 238,822 | |||
| 9,650 | Park Electrochemical Corporation | 235,557 | |||
| 9,000 | PC-Tel, Inc.a | 45,360 | |||
| 14,400 | Perficient, Inc.a | 128,304 | |||
| 11,900 | Pericom Semiconductor Corporationa | 114,240 | |||
| 16,500 | Phoenix Technologies, Ltd.a | 47,685 | |||
| 18,900 | Plexus Corporationa | 505,386 | |||
| 19,800 | Progress Software Corporationa | 594,594 | |||
| 13,200 | Radiant Systems, Inc.a | 190,872 | |||
| 11,300 | RadiSys Corporationa | 107,576 | |||
| 7,400 | Rogers Corporationa | 205,498 | |||
| 14,600 | Rudolph Technologies, Inc.a | 110,230 | |||
| 12,600 | ScanSource, Inc.a | 314,118 | |||
| 12,700 | Sigma Designs, Inc.a,b | 127,127 | |||
| 83,000 | Skyworks Solutions, Inc.a | 1,393,570 | |||
| 14,300 | Smith Micro Software, Inc.a | 135,993 | |||
| 14,400 | Sonic Solutions, Inc.a,b | 120,240 | |||
| 10,500 | Standard Microsystems Corporationa | 244,440 | |||
| 5,600 | StarTek, Inc.a | 21,840 | |||
| 9,600 | Stratasys, Inc.a,b | 235,776 | |||
| 6,100 | Supertex, Inc.a | 150,426 | |||
| 20,550 | Symmetricom, Inc.a | 104,600 | |||
| 15,900 | Synaptics, Inc.a,b | 437,250 | |||
| 9,900 | Synnex Corporationa | 253,638 | |||
| 39,650 | Take-Two Interactive Software, Inc.a,b | 356,850 | |||
| 18,200 | Taleo Corporationa | 442,078 | |||
| 19,400 | Technitrol, Inc. | 61,304 | |||
| 32,100 | Tekelec, Inc.a | 425,004 | |||
| 15,000 | TeleTech Holdings, Inc.a | 193,350 | |||
| 23,600 | Tessera Technologies, Inc.a | 378,780 | |||
| 31,837 | THQ, Inc.a | 137,536 | |||
| 5,900 | Tollgrade Communications, Inc.a | 37,170 | |||
| 72,900 | TriQuint Semiconductor, Inc.a | 445,419 | |||
| 20,300 | TTM Technologies, Inc.a | 192,850 | |||
| 13,000 | Tyler Technologies, Inc.a | 201,760 | |||
| 11,200 | Ultratech, Inc.a | 182,224 | |||
| 40,900 | United Online, Inc. | 235,584 | |||
| 34,975 | Varian Semiconductor Equipment Associates, Inc.a | 1,002,384 | |||
| 19,000 | Veeco Instruments, Inc.a,b | 651,320 | |||
| 18,700 | ViaSat, Inc.a | 608,872 | |||
The accompanying Notes to Financial Statements are an integral part of this schedule.
162
Table of Contents
Small Cap Index Portfolio
Schedule of Investments as of June 30, 2010
(unaudited)
| Shares | Common Stock (98.6%) | Value | ||||
| Information Technology (18.6%) - continued | ||||||
| 20,300 | Websense, Inc.a | $ | 383,670 | |||
| 18,200 | Wright Express Corporationa | 540,540 | ||||
Total Information Technology | 34,679,364 | |||||
| Materials (3.8%) | ||||||
| 14,800 | A. Schulman, Inc. | 280,608 | ||||
| 7,900 | A.M. Castle & Companya | 109,731 | ||||
| 11,800 | AMCOL International Corporation | 277,300 | ||||
| 9,800 | American Vanguard Corporation | 77,714 | ||||
| 11,800 | Arch Chemicals, Inc. | 362,732 | ||||
| 13,200 | Balchem Corporation | 330,000 | ||||
| 9,500 | Brush Engineered Materials, Inc.a | 189,810 | ||||
| 18,400 | Buckeye Technologies, Inc.a | 183,080 | ||||
| 26,100 | Calgon Carbon Corporationa | 345,564 | ||||
| 27,000 | Century Aluminum Companya | 238,410 | ||||
| 5,400 | Clearwater Paper Corporationa | 295,704 | ||||
| 5,000 | Deltic Timber Corporation | 209,000 | ||||
| 20,600 | Eagle Materials, Inc. | 534,158 | ||||
| 23,000 | H.B. Fuller Company | 436,770 | ||||
| 28,400 | Headwaters, Inc.a | 80,656 | ||||
| 8,200 | LSB Industries, Inc.a | 109,142 | ||||
| 13,263 | Myers Industries, Inc. | 107,298 | ||||
| 6,900 | Neenah Paper, Inc. | 126,270 | ||||
| 4,200 | Olympic Steel, Inc. | 96,474 | ||||
| 14,500 | OM Group, Inc.a | 345,970 | ||||
| 5,300 | Penford Corporationa | 34,344 | ||||
| 43,500 | PolyOne Corporationa | 366,270 | ||||
| 5,200 | Quaker Chemical Corporation | 140,868 | ||||
| 14,100 | RTI International Metals, Inc.a | 339,951 | ||||
| 8,600 | Schweitzer-Mauduit International, Inc. | 433,870 | ||||
| 3,600 | Stepan Company | 246,348 | ||||
| 13,000 | Texas Industries, Inc.b | 384,020 | ||||
| 23,000 | Wausau Paper Corporationa | 155,710 | ||||
| 10,150 | Zep, Inc. | 177,016 | ||||
Total Materials | 7,014,788 | |||||
| Telecommunications Services (0.5%) | ||||||
| 12,800 | Cbeyond, Inc.a | 160,000 | ||||
| 20,900 | General Communication, Inc.a | 158,631 | ||||
| 15,500 | Neutral Tandem, Inc.a | 174,375 | ||||
| 14,100 | NTELOS Holdings Corporation | 242,520 | ||||
| 10,400 | USA Mobility, Inc. | 134,368 | ||||
Total Telecommunications Services | 869,894 | |||||
| Utilities (3.8%) | ||||||
| 14,133 | ALLETE, Inc. | 483,914 | ||||
| 8,750 | American States Water Company | 289,975 | ||||
| 25,800 | Avista Corporation | 503,874 | ||||
| 5,600 | Central Vermont Public Service Corporation | 110,544 | ||||
| 7,400 | CH Energy Group, Inc. | 290,376 | ||||
| 20,500 | El Paso Electric Companya | 396,675 | ||||
| 10,500 | Laclede Group, Inc. | 347,865 | ||||
| 19,350 | New Jersey Resources Corporation | 681,120 | ||||
| 12,500 | Northwest Natural Gas Company | 544,625 | ||||
| 17,000 | NorthWestern Corporation | 445,400 | ||||
| 33,700 | Piedmont Natural Gas Company, Inc. | $ | 852,610 | |||
| 14,000 | South Jersey Industries, Inc. | 601,440 | ||||
| 21,300 | Southwest Gas Corporation | 628,350 | ||||
| 14,066 | UIL Holdings Corporation | 352,072 | ||||
| 16,900 | UniSource Energy Corporation | 510,042 | ||||
Total Utilities | 7,038,882 | |||||
Total Common Stock (cost $181,500,757) | 183,852,356 | |||||
| Principal Amount | Long-Term Fixed Income (0.2%) | |||||
| U.S. Government and Agencies (0.2%) | ||||||
U.S. Treasury Notes | ||||||
| 400,000 | 0.875%, 12/31/2010d | 401,250 | ||||
Total U.S. Government and Agencies | 401,250 | |||||
Total Long-Term Fixed Income (cost $400,291) | 401,250 | |||||
| Shares | Collateral Held for Securities Loaned (8.4%) | |||||
| 15,610,052 | Thrivent Financial Securities Lending Trust | 15,610,052 | ||||
Total Collateral Held for Securities Loaned (cost $15,610,052) | 15,610,052 | |||||
| Principal Amount | Short-Term Investments (1.4%)e | |||||
Jupiter Securitization Company, LLC | ||||||
| 1,800,000 | 0.090%, 7/1/2010 | 1,800,000 | ||||
U.S. Treasury Bills | ||||||
| 810,000 | 0.020%, 7/8/2010 | 809,997 | ||||
Total Short-Term Investments (at amortized cost) | 2,609,997 | |||||
Total Investments (cost $200,121,097) 108.6% | $ | 202,473,655 | ||||
Other Assets and Liabilities, Net (8.6%) | (16,095,925 | ) | ||||
Total Net Assets 100.0% | $ | 186,377,730 | ||||
| a | Non-income producing security. |
| b | All or a portion of the security is on loan as discussed in item 2(M) of the Notes to Financial Statements. |
| c | Security is fair valued as discussed in item 2(A) of the Notes to Financial Statements. |
| d | At June 30, 2010, $401,250 of investments were held on deposit with the counterparty and pledged as the initial margin deposit for open futures contracts. |
| e | The interest rate shown reflects the yield, coupon rate or, for securities purchased at a discount, the discount rate at the date of purchase. |
The accompanying Notes to Financial Statements are an integral part of this schedule.
163
Table of Contents
Small Cap Index Portfolio
Schedule of Investments as of June 30, 2010
(unaudited)
Unrealized Appreciation (Depreciation)
Gross unrealized appreciation and depreciation of investments, based on cost for federal income tax purposes, were as follows:
Gross unrealized appreciation | $ | 40,486,742 | ||
Gross unrealized depreciation | (38,134,184 | ) | ||
Net unrealized appreciation (depreciation) | $ | 2,352,558 | ||
Cost for federal income tax purposes | $ | 200,121,097 | ||
Fair Valuation Measurements
The following table is a summary of the inputs used, as of June 30, 2010, in valuing Small Cap Index Portfolio’s assets carried at fair value as discussed in the Notes to Financial Statements.
Investments in Securities | Total | Level 1 | Level 2 | Level 3 | ||||||||
Common Stock | ||||||||||||
Consumer Discretionary | 28,418,472 | 28,418,472 | — | — | ||||||||
Consumer Staples | 6,415,656 | 6,415,656 | — | — | ||||||||
Energy | 9,308,448 | 9,308,448 | — | — | ||||||||
Financials | 35,249,897 | 35,248,451 | — | 1,446 | ||||||||
Health Care | 24,927,393 | 24,927,393 | — | — | ||||||||
Industrials | 29,929,562 | 29,929,562 | — | — | ||||||||
Information Technology | 34,679,364 | 34,679,364 | — | — | ||||||||
Materials | 7,014,788 | 7,014,788 | — | — | ||||||||
Telecommunications Services | 869,894 | 869,894 | — | — | ||||||||
Utilities | 7,038,882 | 7,038,882 | — | — | ||||||||
Long-Term Fixed Income | ||||||||||||
U.S. Government and Agencies | 401,250 | — | 401,250 | — | ||||||||
Collateral Held for Securities Loaned | 15,610,052 | 15,610,052 | — | — | ||||||||
Short-Term Investments | 2,609,997 | — | 2,609,997 | — | ||||||||
Total | $ | 202,473,655 | $ | 199,460,962 | $ | 3,011,247 | $ | 1,446 | ||||
Other Financial Instruments | Total | Level 1 | Level 2 | Level 3 | ||||||||
Liability Derivatives | ||||||||||||
Futures Contracts | 104,089 | 104,089 | — | — | ||||||||
Total Liability Derivatives | $ | 104,089 | $ | 104,089 | $ | — | $ | — | ||||
The following table is a reconciliation of assets in which significant unobservable inputs (Level 3) were used in determining fair value for Small Cap Index Portfolio as discussed in item 2(A) of the Notes to Financial Statements.
Investments in Securities | Value December 31, 2009 | Accrued Discounts and/or Premiums | Realized Gain/(Loss) | Change in Unrealized Gain/(Loss) | Net Purchases/(Sales) | Transfers Into Level 3 | Transfers Out of Level 3 | Value June 30, 2010 | ||||||||||||||||||
Common Stock Financials | — | — | — | — | 1,446 | — | — | 1,446 | ||||||||||||||||||
Total | $ | — | $ | — | $ | — | $ | — | $ | 1,446 | $ | — | — | $1,446 | ||||||||||||
Futures Contracts | Number of Contracts Long/(Short) | Expiration Date | Notional Principal Amount | Value | Unrealized Gain/(Loss) | |||||||||
Russell 2000 Index Mini-Futures | 47 | September 2010 | $ | 2,960,749 | $ | 2,856,660 | ($ | 104,089 | ) | |||||
Total Futures Contracts | ($ | 104,089 | ) | |||||||||||
The accompanying Notes to Financial Statements are an integral part of this schedule.
164
Table of Contents
Small Cap Index Portfolio
Schedule of Investments as of June 30, 2010
(unaudited)
The following table summarizes the fair value and Statement of Assets and Liabilities location, as of June 30, 2010, for Small Cap Index Portfolio’s investments in financial derivative instruments by primary risk exposure as discussed under item (2) Significant Accounting Policies of the Notes to Financial Statements.
Derivatives by risk category | Statement of Assets and Liabilities Location | Fair Value | |||
Liability Derivatives | |||||
Equity Contracts | |||||
Futures* | Net Assets - Net unrealized appreciation/(depreciation) on Futures contracts | 104,089 | |||
Total Equity Contracts | 104,089 | ||||
Total Liability Derivatives | $ | 104,089 | |||
| * | Includes cumulative appreciation/depreciation of futures contracts as reported in the Schedule of Investments. Only current day’s variation margin is reported within the Statement of Assets and Liabilities. |
The following table summarizes the net realized gains/(losses) and Statement of Operations location, for the period ended June 30, 2010, for Small Cap Index Portfolio’s investments in financial derivative instruments by primary risk exposure.
Derivatives by risk category | Statement of Operations Location | Realized Gains/(Losses) recognized in Income | |||
| Equity Contracts | |||||
Futures | Net realized gains/(losses) on Futures contracts | (267,994 | ) | ||
Total Equity Contracts | (267,994 | ) | |||
Total | ($267,994 | ) | |||
The following table summarizes the change in net unrealized appreciation/(depreciation) and Statement of Operations location, for the period ended June 30, 2010, for Small Cap Index Portfolio’s investments in financial derivative instruments by primary risk exposure.
Derivatives by risk category | Statement of Operations Location | Change in unrealized appreciation/(depreciation) recognized in Income | |||
| Equity Contracts | |||||
Futures | Change in net unrealized appreciation/(depreciation) on Futures contracts | (217,371 | ) | ||
Total Equity Contracts | (217,371 | ) | |||
Total | ($217,371 | ) | |||
The following table presents Small Cap Index Portfolio’s average volume of derivative activity during the period ended June 30, 2010.
Derivative Risk Category | Futures (Notional*) | Futures (Percentage of Average Net Assets) | ||||
Equity Contracts | $ | 2,674,117 | 1.3 | % | ||
| * | Notional amount represents long or short, or both, derivative positions held by the portfolio. |
The accompanying Notes to Financial Statements are an integral part of this schedule.
165
Table of Contents
Small Cap Index Portfolio
Schedule of Investments as of June 30, 2010
(unaudited)
Investment in Affiliates
Affiliated issuers, as defined under the Investment Company Act of 1940, include those in which the Portfolio’s holdings of an issuer represent 5% or more of the outstanding voting securities of an issuer, or any affiliated mutual fund.
A summary of transactions for the fiscal year to date, in Small Cap Index Portfolio, is as follows:
Portfolio | Value December 31, 2009 | Gross Purchases | Gross Sales | Shares Held at June 30, 2010 | Value June 30, 2010 | Income Earned January 1, 2010 - June 30, 2010 | |||||||||||
Thrivent Financial Securities Lending Trust | $ | 24,200,701 | $ | 44,913,331 | $ | 53,503,980 | 15,610,052 | $ | 15,610,052 | $ | 127,458 | ||||||
Total Value and Income Earned | 24,200,701 | 15,610,052 | 127,458 | ||||||||||||||
The accompanying Notes to Financial Statements are an integral part of this schedule.
166
Table of Contents
Mid Cap Growth Portfolio II
Schedule of Investments as of June 30, 2010
(unaudited)
The accompanying Notes to Financial Statements are an integral part of this schedule.
167
Table of Contents
Mid Cap Growth Portfolio II
Schedule of Investments as of June 30, 2010
(unaudited)
| Shares | Common Stock (94.2%) | Value | ||||
| Telecommunications Services (3.3%) - continued | ||||||
| 66,800 | SBA Communications Corporationa | $ | 2,271,868 | |||
Total Telecommunications Services | 4,001,932 | |||||
Total Common Stock (cost $104,893,464) | 116,151,810 | |||||
Collateral Held for Securities Loaned (4.9%) | ||||||
| 6,016,382 | Thrivent Financial Securities Lending Trust | 6,016,382 | ||||
Total Collateral Held for Securities Loaned (cost $6,016,382) | 6,016,382 | |||||
| Principal Amount | Short-Term Investments (5.7%)c | |||||
Federal Home Loan Bank Discount Notes | ||||||
| 2,300,000 | 0.050%, 7/7/2010 | 2,299,981 | ||||
| 3,000,000 | 0.070%, 7/14/2010 | 2,999,924 | ||||
U.S. Treasury Bills | ||||||
| 1,715,000 | 0.020%, 7/8/2010 | 1,714,993 | ||||
Total Short-Term Investments (at amortized cost) | 7,014,898 | |||||
Total Investments (cost $117,924,744) 104.8% | $ | 129,183,090 | ||||
Other Assets and Liabilities, Net (4.8%) | (5,859,694 | ) | ||||
Total Net Assets 100.0% | $ | 123,323,396 | ||||
| a | Non-income producing security. |
| b | All or a portion of the security is on loan as discussed in item 2(M) of the Notes to Financial Statements. |
| c | The interest rate shown reflects the yield, coupon rate or, for securities purchased at a discount, the discount rate at the date of purchase. |
Definitions:
| ADR | - | American Depositary Receipt, which are certificates for an underlying foreign security’s shares held by an issuing U.S. depository bank. |
Unrealized Appreciation (Depreciation)
Gross unrealized appreciation and depreciation of investments, based on cost for federal income tax purposes, were as follows:
Gross unrealized appreciation | $ | 17,324,405 | ||
Gross unrealized depreciation | (6,066,059 | ) | ||
Net unrealized appreciation (depreciation) | $ | 11,258,346 | ||
Cost for federal income tax purposes | $ | 117,924,744 | ||
Fair Valuation Measurements
The following table is a summary of the inputs used, as of June 30, 2010, in valuing Mid Cap Growth Portfolio II’s assets carried at fair value as discussed in the Notes to Financial Statements.
Investments in Securities | Total | Level 1 | Level 2 | Level 3 | ||||||||||
Common Stock | ||||||||||||||
Consumer Discretionary | 14,083,913 | 14,083,913 | — | — | ||||||||||
Consumer Staples | 6,723,122 | 6,723,122 | — | — | ||||||||||
Energy | 14,826,435 | 14,826,435 | — | — | ||||||||||
Financials | 6,303,637 | 6,303,637 | — | — | ||||||||||
Health Care | 13,455,377 | 13,455,377 | — | — | ||||||||||
Industrials | 22,105,928 | 22,105,928 | — | — | ||||||||||
Information Technology | 22,282,388 | 22,282,388 | — | — | ||||||||||
Materials | 12,369,078 | 12,369,078 | — | — | ||||||||||
Telecommunications Services | 4,001,932 | 4,001,932 | — | — | ||||||||||
Collateral Held for Securities Loaned | 6,016,382 | 6,016,382 | — | — | ||||||||||
Short-Term Investments | 7,014,898 | — | 7,014,898 | — | ||||||||||
Total | $ | 129,183,090 | $ | 122,168,192 | $ | 7,014,898 | $ | — | ||||||
The accompanying Notes to Financial Statements are an integral part of this schedule.
168
Table of Contents
Mid Cap Growth Portfolio II
Schedule of Investments as of June 30, 2010
(unaudited)
Investment in Affiliates
Affiliated issuers, as defined under the Investment Company Act of 1940, include those in which the Portfolio’s holdings of an issuer represent 5% or more of the outstanding voting securities of an issuer, or any affiliated mutual fund.
A summary of transactions for the fiscal year to date, in Mid Cap Growth Portfolio II, is as follows:
Portfolio | Value December 31, 2009 | Gross Purchases | Gross Sales | Shares Held at June 30, 2010 | Value June 30, 2010 | Income Earned January 1, 2010 - - June 30, 2010 | |||||||||||
Thrivent Financial Securities Lending Trust | $ | 2,701,775 | $ | 30,545,526 | $ | 27,230,919 | 6,016,382 | $ | 6,016,382 | $ | 19,270 | ||||||
Total Value and Income Earned | 2,701,775 | 6,016,382 | 19,270 | ||||||||||||||
The accompanying Notes to Financial Statements are an integral part of this schedule.
169
Table of Contents
Mid Cap Growth Portfolio
Schedule of Investments as of June 30, 2009
(unaudited)
Common Stock (94.8%) | Value | ||||
Consumer Discretionary (13.9%) | |||||
| 109,200 | American Eagle Outfitters, Inc. | $ | 1,283,100 | ||
| 54,400 | Autoliv, Inc.a | 2,603,040 | |||
| 39,725 | Bed Bath & Beyond, Inc.a | 1,473,003 | |||
| 69,250 | BorgWarner, Inc.a | 2,585,795 | |||
| 90,600 | Burger King Holdings, Inc. | 1,525,704 | |||
| 448,608 | Coldwater Creek, Inc.a,b | 1,507,323 | |||
| 94,100 | Darden Restaurants, Inc. | 3,655,785 | |||
| 92,350 | Discovery Communications, Inc.a | 3,297,819 | |||
| 107,400 | Dollar Tree, Inc.a | �� | 4,471,062 | ||
| 64,700 | DreamWorks Animation SKG, Inc.a | 1,847,185 | |||
| 90,050 | Hasbro, Inc. | 3,701,055 | |||
| 120,950 | International Game Technology | 1,898,915 | |||
| 72,850 | Jack in the Box, Inc.a | 1,416,932 | |||
| 99,800 | KB Home | 1,097,800 | |||
| 128,800 | Leapfrog Enterprises, Inc.a | 517,776 | |||
| 189,000 | MGM Resorts Internationala,b | 1,821,960 | |||
| 44,000 | O’Reilly Automotive, Inc.a | 2,092,640 | |||
| 125,725 | Toll Brothers, Inc.a | 2,056,861 | |||
| 36,700 | VF Corporation | 2,612,306 | |||
| 78,000 | WMS Industries, Inc.a | 3,061,500 | |||
| 152,825 | Zumiez, Inc.a,b | 2,462,011 | |||
| Total Consumer Discretionary | 46,989,572 | ||||
Consumer Staples (4.6%) | |||||
| 110,800 | Avon Products, Inc. | 2,936,200 | |||
| 110,600 | BJ’s Wholesale Club, Inc.a | 4,093,306 | |||
| 57,300 | Clorox Company | 3,561,768 | |||
| 116,000 | H.J. Heinz Company | 5,013,520 | |||
| Total Consumer Staples | 15,604,794 | ||||
Energy (10.7%) | |||||
| 92,600 | Alpha Natural Resources, Inc.a | 3,136,362 | |||
| 181,900 | Forest Oil Corporationa | 4,976,784 | |||
| 83,300 | Frontline, Ltd.b | 2,377,382 | |||
| 184,900 | Nabors Industries, Ltd.a | 3,257,938 | |||
| 236,625 | Petrohawk Energy Corporationa | 4,015,526 | |||
| 201,300 | Quicksilver Resources, Inc.a | 2,214,300 | |||
| 50,200 | Range Resources Corporation | 2,015,530 | |||
| 116,775 | Sunoco, Inc. | 4,060,267 | |||
| 124,200 | Ultra Petroleum Corporationa | 5,495,850 | |||
| 267,800 | Weatherford International, Ltd.a | 3,518,892 | |||
| 143,525 | Willbros Group, Inc.a | 1,062,085 | |||
| Total Energy | 36,130,916 | ||||
Financials (4.9%) | |||||
| 20,350 | IntercontinentalExchange, Inc.a | 2,300,160 | |||
| 129,250 | Lazard, Ltd. | 3,452,267 | |||
| 61,800 | MSCI, Inc.a | 1,693,320 | |||
| 57,600 | PartnerRe, Ltd. | 4,040,064 | |||
| 35,200 | T. Rowe Price Group, Inc. | 1,562,528 | |||
| 215,814 | TCF Financial Corporationb | 3,584,671 | |||
| Total Financials | 16,633,010 | ||||
Health Care (11.1%) | |||||
| 46,100 | Alexion Pharmaceuticals, Inc.a | 2,359,859 | |||
| 64,600 | Beckman Coulter, Inc. | 3,894,734 | |||
| 390,800 | Boston Scientific Corporationa | 2,266,640 | |||
| 67,575 | C.R. Bard, Inc. | 5,239,090 | |||
| 37,000 | Cephalon, Inc.a,b | 2,099,750 | |||
| 112,800 | CIGNA Corporation | 3,503,568 | |||
| 202,050 | Hologic, Inc.a | 2,814,557 | |||
| 34,800 | Illumina, Inc.a,b | 1,514,844 | |||
| 299,200 | King Pharmaceuticals, Inc.a | 2,270,928 | |||
| 38,700 | Life Technologies Corporationa | 1,828,575 | |||
| 151,850 | Myriad Genetics, Inc.a | 2,270,157 | |||
| 63,800 | Shire Pharmaceuticals Group plc ADR | 3,916,044 | |||
| 40,100 | Thermo Fisher Scientific, Inc.a | 1,966,905 | |||
| 51,300 | Vertex Pharmaceuticals, Inc.a | 1,687,770 | |||
| Total Health Care | 37,633,421 | ||||
Industrials (17.1%) | |||||
| 116,000 | Aecom Technology Corporationa | 2,674,960 | |||
| 209,500 | BE Aerospace, Inc.a | 5,327,585 | |||
| 37,800 | C.H. Robinson Worldwide, Inc. | 2,103,948 | |||
| 163,875 | Delta Air Lines, Inc.a | 1,925,531 | |||
| 139,295 | Expeditors International of Washington, Inc. | 4,807,070 | |||
| 45,300 | Flowserve Corporation | 3,841,440 | |||
| 58,647 | FTI Consulting, Inc.a | 2,556,423 | |||
| 145,600 | Knight Transportation, Inc.b | 2,946,944 | |||
| 104,675 | Pentair, Inc. | 3,370,535 | |||
| 48,450 | Precision Castparts Corporation | 4,986,474 | |||
| 175,200 | Quanta Services, Inc.a | 3,617,880 | |||
| 64,875 | Roper Industries, Inc. | 3,630,405 | |||
| 118,150 | Ryanair Holdings plc ADRa | 3,200,684 | |||
| 99,900 | Shaw Group, Inc.a | 3,418,578 | |||
| 62,500 | SPX Corporation | 3,300,625 | |||
| 92,800 | Stericycle, Inc.a | 6,085,824 | |||
| Total Industrials | 57,794,906 | ||||
Information Technology (17.0%) | |||||
| 75,514 | Akamai Technologies, Inc.a | 3,063,603 | |||
| 152,800 | Altera Corporation | 3,790,968 | |||
| 679,100 | Atmel Corporationa | 3,259,680 | |||
| 73,000 | Broadcom Corporation | 2,406,810 | |||
| 136,225 | Electronic Arts, Inc.a | 1,961,640 | |||
| 99,675 | F5 Networks, Inc.a | 6,834,715 | |||
| 71,450 | Hewitt Associates, Inc.a | 2,462,167 | |||
| 135,500 | Juniper Networks, Inc.a | 3,092,110 | |||
| 93,600 | Marvell Technology Group, Ltd.a | 1,475,136 | |||
| 46,200 | McAfee, Inc.a | 1,419,264 | |||
| 104,650 | Monster Worldwide, Inc.a,b | 1,219,173 | |||
| 157,375 | NETAPP, Inc.a | 5,871,661 | |||
| 104,302 | Netlogic Microsystems, Inc.a,b | 2,837,014 | |||
| 201,500 | Nuance Communications, Inc.a | 3,012,425 | |||
| 235,625 | NVIDIA Corporationa | 2,405,731 | |||
| 147,925 | Polycom, Inc.a | 4,406,686 | |||
| 69,600 | Riverbed Technology, Inc.a | 1,922,352 | |||
| 176,950 | Symantec Corporationa | 2,456,066 | |||
| 150,400 | Tyco Electronics, Ltd. | 3,817,152 | |||
| Total Information Technology | 57,714,353 | ||||
Materials (11.4%) | |||||
| 81,975 | Celanese Corporation | 2,041,997 | |||
| 79,300 | Ecolab, Inc. | 3,561,363 | |||
| 43,700 | FMC Corporation | 2,509,691 | |||
| 91,700 | Newmont Mining Corporation | 5,661,558 | |||
| 210,150 | Owens-Illinois, Inc.a | 5,558,467 | |||
| 227,500 | Pactiv Corporationa | 6,335,875 | |||
| 161,100 | Pan American Silver Corporation | 4,072,608 | |||
The accompanying Notes to Financial Statements are an integral part of this schedule.
170
Table of Contents
Mid Cap Growth Portfolio
Schedule of Investments as of June 30, 2010
(unaudited)
| Shares | Common Stock (94.8%) | Value | ||||
| Materials (11.4%) - continued | ||||||
| 25,900 | Randgold Resources, Ltd. ADRb | $ | 2,454,025 | |||
| 66,300 | Rock-Tenn Company | 3,293,121 | ||||
| 98,575 | Rockwood Holdings, Inc.a | 2,236,667 | ||||
| 12,100 | Walter Energy, Inc. | 736,285 | ||||
| Total Materials | 38,461,657 | |||||
| Telecommunications Services (4.1%) | ||||||
| 80,342 | American Tower Corporationa | 3,575,219 | ||||
| 138,450 | NII Holdings, Inc.a | 4,502,394 | ||||
| 168,600 | SBA Communications Corporationa,b | 5,734,086 | ||||
| Total Telecommunications Services | 13,811,699 | |||||
Total Common Stock (cost $320,254,412) | 320,774,328 | |||||
| Shares | Collateral Held for Securities Loaned (6.8%) | |||||
| 23,039,914 | Thrivent Financial Securities Lending Trust | 23,039,914 | ||||
Total Collateral Held for Securities Loaned (cost $23,039,914) | 23,039,914 | |||||
Principal | Short-Term Investments (5.2%)c | |||||
Federal Home Loan Bank Discount Notes | ||||||
| $ 5,000,000 | 0.140%, 7/2/2010 | 4,999,981 | ||||
| 5,000,000 | 0.090%, 7/7/2010 | 4,999,925 | ||||
| 5,100,000 | 0.050%, 7/9/2010 | 5,099,943 | ||||
U.S. Treasury Bills | ||||||
| 2,575,000 | 0.020%, 7/8/2010 | 2,574,990 | ||||
| Total Short-Term Investments (at amortized cost) | 17,674,839 | |||||
| Total Investments (cost $360,969,165) 106.8% | $ | 361,489,081 | ||||
| Other Assets and Liabilities, Net (6.8%) | (23,080,019 | ) | ||||
| Total Net Assets 100.0% | $ | 338,409,062 | ||||
| a | Non-income producing security. |
| b | All or a portion of the security is on loan as discussed in item 2(M) of the Notes to Financial Statements. |
| c | The interest rate shown reflects the yield, coupon rate or, for securities purchased at a discount, the discount rate at the date of purchase. |
Definitions:
ADR | - | American Depositary Receipt, which are certificates for an underlying foreign security’s shares held by an issuing U.S. depository bank. |
Unrealized Appreciation (Depreciation)
Gross unrealized appreciation and depreciation of investments, based on cost for federal income tax purposes, were as follows:
Gross unrealized appreciation | $ | 36,323,886 | ||
Gross unrealized depreciation | (35,803,970 | ) | ||
Net unrealized appreciation (depreciation) | $ | 519,916 | ||
Cost for federal income tax purposes | $ | 360,969,165 | ||
The accompanying Notes to Financial Statements are an integral part of this schedule.
171
Table of Contents
Mid Cap Growth Portfolio
Schedule of Investments as of June 30, 2009
(unaudited)
Fair Valuation Measurements
The following table is a summary of the inputs used, as of June 30, 2010, in valuing Mid Cap Growth Portfolio’s assets carried at fair value as discussed in the Notes to Financial Statements.
Investments in Securities | Total | Level 1 | Level 2 | Level 3 | ||||||||
Common Stock | ||||||||||||
Consumer Discretionary | 46,989,572 | 46,989,572 | — | — | ||||||||
Consumer Staples | 15,604,794 | 15,604,794 | — | — | ||||||||
Energy | 36,130,916 | 36,130,916 | — | — | ||||||||
Financials | 16,633,010 | 16,633,010 | — | — | ||||||||
Health Care | 37,633,421 | 37,633,421 | — | — | ||||||||
Industrials | 57,794,906 | 57,794,906 | — | — | ||||||||
Information Technology | 57,714,353 | 57,714,353 | — | — | ||||||||
Materials | 38,461,657 | 38,461,657 | — | — | ||||||||
Telecommunications Services | 13,811,699 | 13,811,699 | — | — | ||||||||
Collateral Held for Securities Loaned | 23,039,914 | 23,039,914 | — | — | ||||||||
Short-Term Investments | 17,674,839 | — | 17,674,839 | — | ||||||||
Total | $ | 361,489,081 | $ | 343,814,242 | $ | 17,674,839 | $ | – | ||||
Investment in Affiliates
Affiliated issuers, as defined under the Investment Company Act of 1940, include those in which the Portfolio’s holdings of an issuer represent 5% or more of the outstanding voting securities of an issuer, or any affiliated mutual fund.
A summary of transactions for the fiscal year to date, in Mid Cap Growth Portfolio, is as follows:
Portfolio | Value December 31, 2009 | Gross Purchases | Gross Sales | Shares Held at June 30, 2010 | Value June 30, 2010 | Income Earned January 1, 2010 - June 30, 2010 | |||||||||||
Thrivent Financial Securities Lending Trust | $ | 10,479,037 | $ | 84,268,916 | $ | 71,708,039 | 23,039,914 | $ | 23,039,914 | $ | 38,612 | ||||||
Total Value and Income Earned | 10,479,037 | 23,039,914 | 38,612 | ||||||||||||||
The accompanying Notes to Financial Statements are an integral part of this schedule.
172
Table of Contents
Partner Mid Cap Value Portfolio
Schedule of Investments as of June 30, 2009
(unaudited)
Common Stock (98.7%) | Value | ||||
Consumer Discretionary (13.8%) | |||||
| 244,040 | CBS Corporation | $ | 3,155,437 | ||
| 173,386 | DISH Network Corporation | 3,146,956 | |||
| 26,890 | Fossil, Inc.a | 933,083 | |||
| 66,530 | Guess ?, Inc. | 2,078,397 | |||
| 44,290 | Hanesbrands, Inc.a | 1,065,617 | |||
| 44,630 | Harley-Davidson, Inc. | 992,125 | |||
| 15,879 | J.C. Penney Company, Inc. | 341,081 | |||
| 218,000 | Liberty Media Corporation - Interactivea | 2,289,000 | |||
| 20,420 | Mohawk Industries, Inc.a | 934,419 | |||
| 167,894 | Newell Rubbermaid, Inc. | 2,457,968 | |||
| 2,518 | NVR, Inc.a | 1,649,366 | |||
| 37,330 | Penn National Gaming, Inc.a | 862,323 | |||
| 18,450 | Sherwin-Williams Company | 1,276,556 | |||
| 24,300 | Snap-On, Inc. | 994,113 | |||
| 66,600 | TRW Automotive Holdings Corporationa | 1,836,162 | |||
| 3,040 | Washington Post Company | 1,247,859 | |||
| Total Consumer Discretionary | 25,260,462 | ||||
Consumer Staples (5.2%) | |||||
| 8,410 | Alberto-Culver Company | 227,827 | |||
| 70,800 | ConAgra Foods, Inc. | 1,651,056 | |||
| 30,640 | Hansen Natural Corporationa | 1,198,331 | |||
| 35,390 | Hormel Foods Corporation | 1,432,587 | |||
| 23,428 | J.M. Smucker Company | 1,410,834 | |||
| 57,940 | NBTY, Inc.a | 1,970,539 | |||
| 82,870 | Safeway, Inc. | 1,629,224 | |||
| Total Consumer Staples | 9,520,398 | ||||
Energy (8.9%) | |||||
| 87,730 | Forest Oil Corporationa | 2,400,293 | |||
| 36,330 | Helmerich & Payne, Inc. | 1,326,772 | |||
| 147,120 | Key Energy Services, Inc.a | 1,350,562 | |||
| 90,019 | Newfield Exploration Companya | 4,398,328 | |||
| 83,249 | Range Resources Corporation | 3,342,447 | |||
| 168,010 | Weatherford International, Ltd.a | 2,207,651 | |||
| 17,361 | Whiting Petroleum Corporationa | 1,361,450 | |||
| Total Energy | 16,387,503 | ||||
Financials (28.0%) | |||||
| 27,649 | Alexandria Real Estate Equities, Inc.b | 1,752,117 | |||
| 36,252 | Boston Properties, Inc. | 2,586,218 | |||
| 44,560 | Comerica, Inc. | 1,641,145 | |||
| 31,970 | Digital Realty Trust, Inc.b | 1,844,030 | |||
| 127,978 | Douglas Emmett, Inc. | 1,819,847 | |||
| 36,333 | Everest Re Group, Ltd. | 2,569,470 | |||
| 153,070 | Fifth Third Bancorp | 1,881,230 | |||
| 123,111 | First Horizon National Corporationa | 1,409,621 | |||
| 142,130 | Genworth Financial, Inc.a | 1,857,639 | |||
| 130,575 | Hartford Financial Services Group, Inc. | 2,889,625 | |||
| 137,377 | Host Hotels & Resorts, Inc. | 1,851,842 | |||
| 162,568 | Invesco, Ltd. | 2,736,019 | |||
| 134,791 | Janus Capital Group, Inc. | 1,196,944 | |||
| 35,720 | Lazard, Ltd. | 954,081 | |||
| 55,073 | Lincoln National Corporation | 1,337,723 | |||
| 15,753 | M&T Bank Corporationb | 1,338,217 | |||
| 97,442 | Marsh & McLennan Companies, Inc. | $ | 2,197,317 | ||
| 97,990 | Marshall & Ilsley Corporation | 703,568 | |||
| 189,310 | MFA Mortgage Investments, Inc. | 1,400,894 | |||
| 113,989 | Principal Financial Group, Inc. | 2,671,902 | |||
| 60,730 | Progressive Corporation | 1,136,866 | |||
| 249,517 | SLM Corporationa | 2,592,482 | |||
| 111,852 | SunTrust Banks, Inc. | 2,606,152 | |||
| 17,120 | Tanger Factory Outlet Centers, Inc. | 708,425 | |||
| 29,000 | Ventas, Inc. | 1,361,550 | |||
| 155,853 | W.R. Berkley Corporation | 4,123,870 | |||
| 136,870 | XL Group plc | 2,191,289 | |||
| Total Financials | 51,360,083 | ||||
Health Care (6.4%) | |||||
| 103,639 | Aetna, Inc. | 2,733,997 | |||
| 7,280 | Amedisys, Inc.a | 320,102 | |||
| 65,519 | Biogen Idec, Inc.a | 3,108,876 | |||
| 27,389 | C.R. Bard, Inc. | 2,123,469 | |||
| 110,030 | Hologic, Inc.a | 1,532,718 | |||
| 53,786 | Kinetic Concepts, Inc.a | 1,963,727 | |||
| Total Health Care | 11,782,889 | ||||
Industrials (10.2%) | |||||
| 57,690 | BE Aerospace, Inc.a | 1,467,057 | |||
| 30,110 | Cooper Industries plc | 1,324,840 | |||
| 55,301 | Eaton Corporation | 3,618,897 | |||
| 60,630 | Equifax, Inc. | 1,701,278 | |||
| 221,920 | JetBlue Airways Corporationa,b | 1,218,341 | |||
| 40,620 | Kansas City Southern, Inc.a | 1,476,537 | |||
| 34,320 | Parker Hannifin Corporation | 1,903,387 | |||
| 59,970 | Pentair, Inc. | 1,931,034 | |||
| 60,977 | Republic Services, Inc. | 1,812,846 | |||
| 37,450 | Ryder System, Inc. | 1,506,613 | |||
| 47,780 | Textron, Inc.b | 810,827 | |||
| Total Industrials | 18,771,657 | ||||
Information Technology (6.4%) | |||||
| 46,784 | Amphenol Corporation | 1,837,676 | |||
| 54,900 | BMC Software, Inc.a | 1,901,187 | |||
| 46,231 | CommScope, Inc.a | 1,098,911 | |||
| 59,753 | IAC InterActiveCorpa | 1,312,773 | |||
| 39,770 | McAfee, Inc.a | 1,221,734 | |||
| 298,251 | ON Semiconductor Corporationa | 1,902,841 | |||
| 84,610 | Parametric Technology Corporationa | 1,325,839 | |||
| 119,884 | Teradyne, Inc.a | 1,168,869 | |||
| Total Information Technology | 11,769,830 | ||||
Materials (4.3%) | |||||
| 64,120 | Celanese Corporation | 1,597,229 | |||
| 24,070 | CF Industries Holdings, Inc. | 1,527,242 | |||
| 11,560 | Cliffs Natural Resources, Inc. | 545,170 | |||
| 40,200 | Commercial Metals Company | 531,444 | |||
| 20,370 | FMC Corporation | 1,169,849 | |||
| 45,640 | International Paper Company | 1,032,833 | |||
| 26,888 | Pactiv Corporationa | 748,831 | |||
| 58,280 | Steel Dynamics, Inc. | 768,713 | |||
| Total Materials | 7,921,311 | ||||
The accompanying Notes to Financial Statements are an integral part of this schedule.
173
Table of Contents
Partner Mid Cap Value Portfolio
Schedule of Investments as of June 30, 2009
(unaudited)
Shares | Common Stock (98.7%) | Value | ||||
Telecommunications Services (2.9%) | ||||||
| 37,879 | CenturyLink, Inc. | $ | 1,261,749 | |||
| 184,970 | Clearwire Corporationa,b | 1,346,582 | ||||
| 636,286 | Sprint Nextel Corporationa | 2,697,853 | ||||
| Total Telecommunications Services | 5,306,184 | |||||
Utilities (12.6%) | ||||||
| 33,220 | Alliant Energy Corporation | 1,054,403 | ||||
| 172,240 | CMS Energy Corporationb | 2,523,316 | ||||
| 47,172 | DPL, Inc. | 1,127,411 | ||||
| 73,039 | Edison International, Inc. | 2,316,797 | ||||
| 29,293 | FirstEnergy Corporation | 1,031,992 | ||||
| 23,440 | Great Plains Energy, Inc. | 398,949 | ||||
| 54,160 | Northeast Utilities | 1,379,997 | ||||
| 116,244 | NV Energy, Inc. | 1,372,842 | ||||
| 27,630 | Pinnacle West Capital Corporation | 1,004,627 | ||||
| 105,856 | PPL Corporation | 2,641,107 | ||||
| 34,990 | Progress Energy, Inc. | 1,372,308 | ||||
| 32,370 | Questar Corporation | 1,472,511 | ||||
| 72,530 | SCANA Corporation | 2,593,673 | ||||
| 25,850 | Sempra Energy | 1,209,521 | ||||
| 75,970 | Xcel Energy, Inc. | 1,565,742 | ||||
| Total Utilities | 23,065,196 | |||||
| Total Common Stock (cost $179,227,172) | 181,145,513 | |||||
Collateral Held for Securities Loaned (4.7%) | ||||||
| 8,654,545 | Thrivent Financial Securities Lending Trust | 8,654,545 | ||||
| Total Collateral Held for Securities Loaned (cost $8,654,545) | 8,654,545 | |||||
Principal | Short-Term Investments (2.9%)c | |||||
| Jupiter Securitization Company, LLC | ||||||
| 1,330,000 | 0.090%, 7/1/2010 | 1,330,000 | ||||
| U.S. Treasury Bills | ||||||
| 4,070,000 | 0.020%, 7/8/2010 | 4,069,984 | ||||
| Total Short-Term Investments (at amortized cost) | 5,399,984 | |||||
| Total Investments (cost $193,281,701) 106.3% | $ | 195,200,042 | ||||
| Other Assets and Liabilities, Net (6.3%) | (11,635,502 | ) | ||||
| Total Net Assets 100.0% | $ | 183,564,540 | ||||
| a | Non-income producing security. |
| b | All or a portion of the security is on loan as discussed in item 2(M) of the Notes to Financial Statements. |
| c | The interest rate shown reflects the yield, coupon rate or, for securities purchased at a discount, the discount rate at the date of purchase. |
Unrealized Appreciation (Depreciation)
Gross unrealized appreciation and depreciation of investments, based on cost for federal income tax purposes, were as follows:
Gross unrealized appreciation | $ | 13,401,821 | ||
Gross unrealized depreciation | (11,483,480 | ) | ||
Net unrealized appreciation (depreciation) | $ | 1,918,341 | ||
Cost for federal income tax purposes | $ | 193,281,701 | ||
The accompanying Notes to Financial Statements are an integral part of this schedule.
174
Table of Contents
Partner Mid Cap Value Portfolio
Schedule of Investments as of June 30, 2010
(unaudited)
Fair Valuation Measurements
The following table is a summary of the inputs used, as of June 30, 2010, in valuing Partner Mid Cap Value Portfolio’s assets carried at fair value as discussed in the Notes to Financial Statements.
Investments in Securities | Total | Level 1 | Level 2 | Level 3 | ||||||||
Common Stock | ||||||||||||
Consumer Discretionary | 25,260,462 | 25,260,462 | — | — | ||||||||
Consumer Staples | 9,520,398 | 9,520,398 | — | — | ||||||||
Energy | 16,387,503 | 16,387,503 | — | — | ||||||||
Financials | 51,360,083 | 51,360,083 | — | — | ||||||||
Health Care | 11,782,889 | 11,782,889 | — | — | ||||||||
Industrials | 18,771,657 | 18,771,657 | — | — | ||||||||
Information Technology | 11,769,830 | 11,769,830 | — | — | ||||||||
Materials | 7,921,311 | 7,921,311 | — | — | ||||||||
Telecommunications Services | 5,306,184 | 5,306,184 | — | — | ||||||||
Utilities | 23,065,196 | 23,065,196 | — | — | ||||||||
Collateral Held for Securities Loaned | 8,654,545 | 8,654,545 | — | — | ||||||||
Short-Term Investments | 5,399,984 | — | 5,399,984 | — | ||||||||
Total | $ | 195,200,042 | $ | 189,800,058 | $ | 5,399,984 | $ | — | ||||
Investment in Affiliates
Affiliated issuers, as defined under the Investment Company Act of 1940, include those in which the Portfolio’s holdings of an issuer represent 5% or more of the outstanding voting securities of an issuer, or any affiliated mutual fund.
A summary of transactions for the fiscal year to date, in Partner Mid Cap Value Portfolio, is as follows:
Portfolio | Value December 31, 2009 | Gross Purchases | Gross Sales | Shares Held at June 30, 2010 | Value June 30, 2010 | Income Earned January 1, 2010 - - June 30, 2010 | |||||||||||
Thrivent Financial Securities Lending Trust | $ | 9,806,665 | $ | 57,555,515 | $ | 58,707,635 | 8,654,545 | $ | 8,654,545 | $ | 27,996 | ||||||
Total Value and Income Earned | 9,806,665 | 8,654,545 | 27,996 | ||||||||||||||
The accompanying Notes to Financial Statements are an integral part of this schedule.
175
Table of Contents
Mid Cap Stock Portfolio
Schedule of Investments as of June 30, 2010
(unaudited)
The accompanying Notes to Financial Statements are an integral part of this schedule.
176
Table of Contents
Mid Cap Stock Portfolio
Schedule of Investments as of June 30, 2010
(unaudited)
| Shares | Common Stock (96.4%) | Value | ||||
Information Technology (17.0%) - continued |
| |||||
| 115,576 | Paychex, Inc. | $ | 3,001,509 | |||
| 140,632 | Polycom, Inc.a | 4,189,427 | ||||
| 543,087 | Teradyne, Inc.a,b | 5,295,098 | ||||
| 458,900 | TIBCO Software, Inc.a | 5,534,334 | ||||
| 280,800 | ValueClick, Inc.a | 3,001,752 | ||||
| 187,100 | VeriFone Systems, Inc.a | 3,541,803 | ||||
| 142,091 | Xilinx, Inc. | 3,589,219 | ||||
| 128,060 | Zebra Technologies Corporationa | 3,248,882 | ||||
Total Information Technology | 68,887,642 | |||||
| Materials (7.9%) | ||||||
| 109,717 | Albemarle Corporation | 4,356,862 | ||||
| 43,403 | Ball Corporation | 2,292,980 | ||||
| 31,500 | CF Industries Holdings, Inc. | 1,998,675 | ||||
| 37,300 | Cliffs Natural Resources, Inc. | 1,759,068 | ||||
| 179,832 | Commercial Metals Company | 2,377,379 | ||||
| 84,524 | Crown Holdings, Inc.a | 2,116,481 | ||||
| 110,058 | Owens-Illinois, Inc.a | 2,911,034 | ||||
| 134,580 | Packaging Corporation of America | 2,963,452 | ||||
| 129,429 | Sealed Air Corporation | 2,552,340 | ||||
| 80,324 | Silgan Holdings, Inc. | 2,279,595 | ||||
| 171,800 | Steel Dynamics, Inc. | 2,266,042 | ||||
| 205,400 | Temple-Inland, Inc. | 4,245,618 | ||||
Total Materials | 32,119,526 | |||||
| Telecommunications Services (0.8%) | ||||||
| 100,196 | Telephone and Data Systems, Inc. | 3,044,957 | ||||
Total Telecommunications Services | 3,044,957 | |||||
| Utilities (5.3%) | ||||||
| 82,247 | Alliant Energy Corporation | 2,610,520 | ||||
| 121,560 | DPL, Inc. | 2,905,284 | ||||
| 25,060 | Entergy Corporation | 1,794,797 | ||||
| 65,118 | EQT Corporation | 2,353,364 | ||||
| 34,642 | FirstEnergy Corporation | 1,220,438 | ||||
| 56,783 | National Fuel Gas Company | 2,605,204 | ||||
| 240,078 | NV Energy, Inc. | 2,835,321 | ||||
| 84,682 | Pepco Holdings, Inc. | 1,327,814 | ||||
| 88,085 | Portland General Electric Company | 1,614,598 | ||||
| 85,166 | UGI Corporation | 2,166,623 | ||||
Total Utilities | 21,433,963 | |||||
Total Common Stock (cost $380,944,389) | 390,511,767 | |||||
Collateral Held for Securities Loaned (5.1%) | ||||||
| 20,446,060 | Thrivent Financial Securities Lending Trust | 20,446,060 | ||||
Total Collateral Held for Securities Loaned (cost $20,446,060) | 20,446,060 | |||||
| Principal Amount | Short-Term Investments (3.6%)c | |||||
Federal Home Loan Bank Discount Notes | ||||||
| $5,500,000 | 0.050%, 7/7/2010 | 5,499,954 | ||||
| 5,000,000 | 0.070%, 7/14/2010 | 4,999,873 | ||||
Jupiter Securitization Company, LLC | ||||||
| 1,735,000 | 0.090%, 7/1/2010 | 1,735,000 | ||||
U.S. Treasury Bills | ||||||
| 2,385,000 | 0.020%, 7/8/2010 | 2,384,991 | ||||
Total Short-Term Investments (at amortized cost) | 14,619,818 | |||||
Total Investments (cost $416,010,267) 105.1% | $ | 425,577,645 | ||||
Other Assets and Liabilities, Net (5.1%) | (20,615,160 | ) | ||||
Total Net Assets 100.0% | $ | 404,962,485 | ||||
| a | Non-income producing security. |
| b | All or a portion of the security is on loan as discussed in item 2(M) of the Notes to Financial Statements. |
| c | The interest rate shown reflects the yield, coupon rate or, for securities purchased at a discount, the discount rate at the date of purchase. |
Definitions:
| ADR | - | American Depositary Receipt, which are certificates for an underlying foreign security’s shares held by an issuing U.S. depository bank. | ||
| REIT | - | Real Estate Investment Trust, is a company that buys, develops, manages and/or sells real estate assets. | ||
Unrealized Appreciation (Depreciation)
Gross unrealized appreciation and depreciation of investments, based on cost for federal income tax purposes, were as follows:
Gross unrealized appreciation | $ | 48,591,966 | ||
Gross unrealized depreciation | (39,024,588 | ) | ||
Net unrealized appreciation (depreciation) | $ | 9,567,378 | ||
Cost for federal income tax purposes | $ | 416,010,267 | ||
The accompanying Notes to Financial Statements are an integral part of this schedule.
177
Table of Contents
Mid Cap Stock Portfolio
Schedule of Investments as of June 30, 2010
(unaudited)
Fair Valuation Measurements
The following table is a summary of the inputs used, as of June 30, 2010, in valuing Mid Cap Stock Portfolio’s assets carried at fair value as discussed in the Notes to Financial Statements.
Investments in Securities | Total | Level 1 | Level 2 | Level 3 | ||||||||
Common Stock | ||||||||||||
Consumer Discretionary | 44,335,875 | 44,335,875 | — | — | ||||||||
Consumer Staples | 15,403,754 | 15,403,754 | — | — | ||||||||
Energy | 30,215,128 | 30,215,128 | — | — | ||||||||
Financials | 74,112,328 | 74,112,328 | — | — | ||||||||
Health Care | 49,450,013 | 49,450,013 | — | — | ||||||||
Industrials | 51,508,581 | 51,508,581 | — | — | ||||||||
Information Technology | 68,887,642 | 68,887,642 | — | — | ||||||||
Materials | 32,119,526 | 32,119,526 | — | — | ||||||||
Telecommunications Services | 3,044,957 | 3,044,957 | — | — | ||||||||
Utilities | 21,433,963 | 21,433,963 | — | — | ||||||||
Collateral Held for Securities Loaned | 20,446,060 | 20,446,060 | — | — | ||||||||
Short-Term Investments | 14,619,818 | — | 14,619,818 | — | ||||||||
Total | $ | 425,577,645 | $ | 410,957,827 | $ | 14,619,818 | $ | — | ||||
Investment in Affiliates
Affiliated issuers, as defined under the Investment Company Act of 1940, include those in which the Portfolio’s holdings of an issuer represent 5% or more of the outstanding voting securities of an issuer, or any affiliated mutual fund.
A summary of transactions for the fiscal year to date, in Mid Cap Stock Portfolio, is as follows:
Portfolio | Value December 31, 2009 | Gross Purchases | Gross Sales | Shares Held at June 30, 2010 | Value June 30, 2010 | Income Earned January 1, 2010 - June 30, 2010 | |||||||||||
Thrivent Financial Securities Lending Trust | $ | 18,736,612 | $ | 70,925,943 | $ | 69,216,495 | 20,446,060 | $ | 20,446,060 | $ | 10,303 | ||||||
Total Value and Income Earned | 18,736,612 | 20,446,060 | 10,303 | ||||||||||||||
The accompanying Notes to Financial Statements are an integral part of this schedule.
178
Table of Contents
Mid Cap Index Portfolio
Schedule of Investments as of June 30, 2010
(unaudited)
Common Stock (98.8%) | Value | ||||
Consumer Discretionary (13.0%) | |||||
3,833 | 99 Cents Only Storesa | $ | 56,728 | ||
7,200 | Aaron’s, Inc. | 122,904 | |||
7,800 | Advance Auto Parts, Inc. | 391,404 | |||
8,350 | Aeropostale, Inc.a | 239,144 | |||
18,280 | American Eagle Outfitters, Inc. | 214,790 | |||
3,500 | American Greetings Corporation | 65,660 | |||
5,250 | AnnTaylor Stores Corporationa | 85,418 | |||
5,000 | Bally Technologies, Inc.a | 161,950 | |||
3,470 | Barnes & Noble, Inc. | 44,763 | |||
2,710 | Bob Evans Farms, Inc. | 66,720 | |||
10,520 | BorgWarner, Inc.a | 392,817 | |||
4,800 | Boyd Gaming Corporationa,b | 40,752 | |||
9,055 | Brinker International, Inc. | 130,935 | |||
7,900 | Burger King Holdings, Inc. | 133,036 | |||
5,900 | Career Education Corporationa | 135,818 | |||
5,300 | Cheesecake Factory, Inc.a | 117,978 | |||
15,600 | Chico’s FAS, Inc. | 154,128 | |||
2,900 | Chipotle Mexican Grill, Inc.a | 396,749 | |||
4,500 | Coldwater Creek, Inc.a,b | 15,120 | |||
5,800 | Collective Brands, Inc.a | 91,640 | |||
7,600 | Corinthian Colleges, Inc.a,b | 74,860 | |||
8,100 | Dick’s Sporting Goods, Inc.a | 201,609 | |||
11,340 | Dollar Tree, Inc.a | 472,084 | |||
6,800 | DreamWorks Animation SKG, Inc.a | 194,140 | |||
5,400 | Dress Barn, Inc.a | 128,574 | |||
13,700 | Foot Locker, Inc. | 172,894 | |||
4,400 | Fossil, Inc.a | 152,680 | |||
12,320 | Gentex Corporation | 221,514 | |||
5,200 | Guess ?, Inc. | 162,448 | |||
8,500 | Hanesbrands, Inc.a | 204,510 | |||
3,000 | Harte-Hanks, Inc. | 31,350 | |||
2,670 | International Speedway Corporation | 68,779 | |||
2,600 | ITT Educational Services, Inc.a,b | 215,852 | |||
5,100 | J. Crew Group, Inc.a | 187,731 | |||
3,800 | John Wiley and Sons, Inc. | 146,946 | |||
6,300 | KB Home | 69,300 | |||
3,800 | Life Time Fitness, Inc.a,b | 120,802 | |||
12,600 | LKQ Corporationa | 242,928 | |||
3,400 | M.D.C. Holdings, Inc. | 91,630 | |||
2,600 | Matthews International Corporation | 76,128 | |||
5,070 | Mohawk Industries, Inc.a | 232,003 | |||
600 | NVR, Inc.a | 393,018 | |||
2,900 | Panera Bread Companya | 218,341 | |||
10,600 | PetSmart, Inc. | 319,802 | |||
5,100 | Phillips-Van Heusen Corporation | 235,977 | |||
5,000 | Regis Corporation | 77,850 | |||
5,800 | Rent-A-Center, Inc.a | 117,508 | |||
4,000 | Ryland Group, Inc. | 63,280 | |||
14,150 | Saks, Inc.a,b | 107,399 | |||
2,210 | Scholastic Corporation | 53,305 | |||
5,600 | Scientific Games Corporationa | 51,520 | |||
21,700 | Service Corporation International | 160,580 | |||
6,020 | Sotheby’s Holdings, Inc. | 137,677 | |||
1,300 | Strayer Education, Inc.b | 270,257 | |||
3,400 | Thor Industries, Inc. | 80,750 | |||
3,700 | Timberland Companya | 59,755 | |||
12,600 | Toll Brothers, Inc.a | 206,136 | |||
3,300 | Tractor Supply Company | 201,201 | |||
5,700 | Tupperware Brands Corporation | 227,145 | |||
3,400 | Under Armour, Inc.a,b | 112,642 | |||
4,000 | Warnaco Group, Inc.a | 144,560 | |||
28,214 | Wendy’s/Arby’s Group, Inc. | 112,856 | |||
9,580 | Williams-Sonoma, Inc. | 237,776 | |||
4,700 | WMS Industries, Inc.a | 184,475 | |||
| Total Consumer Discretionary | 10,301,026 | ||||
Consumer Staples (3.8%) | |||||
7,600 | Alberto-Culver Company | 205,884 | |||
4,840 | BJ’s Wholesale Club, Inc.a | 179,128 | |||
6,410 | Church & Dwight Company, Inc. | 401,971 | |||
6,700 | Corn Products International, Inc. | 203,010 | |||
6,250 | Energizer Holdings, Inc.a | 314,250 | |||
6,700 | Flowers Foods, Inc. | 163,681 | |||
9,400 | Green Mountain Coffee Roasters, Inc.a,b | 241,580 | |||
6,400 | Hansen Natural Corporationa | 250,304 | |||
1,740 | Lancaster Colony Corporation | 92,847 | |||
5,700 | NBTY, Inc.a | 193,857 | |||
4,900 | Ralcorp Holdings, Inc.a | 268,520 | |||
3,710 | Ruddick Corporation | 114,973 | |||
13,100 | Smithfield Foods, Inc.a | 195,190 | |||
2,298 | Tootsie Roll Industries, Inc.b | 54,348 | |||
2,240 | Universal Corporation | 88,883 | |||
| Total Consumer Staples | 2,968,426 | ||||
| Energy (5.8%) | |||||
14,400 | Arch Coal, Inc. | 285,264 | |||
5,000 | Atwood Oceanics, Inc.a | 127,600 | |||
3,500 | Bill Barrett Corporationa | 107,695 | |||
7,500 | Cimarex Energy Company | 536,850 | |||
4,300 | Comstock Resources, Inc.a | 119,196 | |||
5,678 | Exterran Holdings, Inc.a | 146,549 | |||
10,100 | Forest Oil Corporationa | 276,336 | |||
9,200 | Frontier Oil Corporation | 123,740 | |||
8,100 | Helix Energy Solutions Group, Inc.a | 87,237 | |||
9,200 | Mariner Energy, Inc.a,b | 197,616 | |||
11,900 | Newfield Exploration Companya | 581,434 | |||
4,900 | Oceaneering International, Inc.a | 220,010 | |||
2,300 | Overseas Shipholding Group, Inc.b | 85,192 | |||
6,700 | Patriot Coal Corporationa | 78,725 | |||
13,500 | Patterson-UTI Energy, Inc. | 173,745 | |||
12,539 | Plains Exploration & Production Companya | 258,429 | |||
15,520 | Pride International, Inc.a | 346,717 | |||
10,400 | Quicksilver Resources, Inc.a | 114,400 | |||
11,000 | Southern Union Company | 240,460 | |||
6,900 | Superior Energy Services, Inc.a | 128,823 | |||
4,600 | Tidewater, Inc. | 178,112 | |||
3,700 | Unit Corporationa | 150,183 | |||
| Total Energy | 4,564,313 | ||||
Financials (20.4%) | |||||
4,000 | Affiliated Managers Group, Inc.a | 243,080 | |||
4,000 | Alexandria Real Estate Equities, Inc.b | 253,480 | |||
15,000 | AMB Property Corporation | 355,650 | |||
6,635 | American Financial Group, Inc. | 181,268 | |||
The accompanying Notes to Financial Statements are an integral part of this schedule.
179
Table of Contents
Mid Cap Index Portfolio
Schedule of Investments as of June 30, 2010
(unaudited)
Shares | Common Stock (98.8%) | Value | |||
Financials (20.4%) - continued | |||||
8,590 | AmeriCredit Corporationa,b | $ | 156,510 | ||
16,900 | Apollo Investment Corporation | 157,677 | |||
9,100 | Arthur J. Gallagher & Company | 221,858 | |||
15,193 | Associated Banc-Corp | 186,266 | |||
7,070 | Astoria Financial Corporation | 97,283 | |||
6,400 | BancorpSouth, Inc.b | 114,432 | |||
4,300 | Bank of Hawaii Corporation | 207,905 | |||
5,600 | BRE Properties, Inc. | 206,808 | |||
10,600 | Brown & Brown, Inc. | 202,884 | |||
5,900 | Camden Property Trust | 241,015 | |||
6,800 | Cathay General Bancorpb | 70,244 | |||
3,920 | City National Corporation | 200,822 | |||
6,577 | Commerce Bancshares, Inc. | 236,706 | |||
5,300 | Corporate Office Properties Trust | 200,128 | |||
8,569 | Cousins Properties, Inc. | 57,755 | |||
5,400 | Cullen/Frost Bankers, Inc. | 277,560 | |||
23,100 | Duke Realty Corporation | 262,185 | |||
10,600 | Eaton Vance Corporation | 292,666 | |||
3,000 | Equity One, Inc.b | 46,800 | |||
2,700 | Essex Property Trust, Inc. | 263,358 | |||
5,310 | Everest Re Group, Ltd. | 375,523 | |||
5,500 | Federal Realty Investment Trust | 386,485 | |||
20,105 | Fidelity National Financial, Inc. | 261,164 | |||
9,000 | First American Financial Corporation | 114,120 | |||
17,900 | First Niagara Financial Group, Inc. | 224,287 | |||
9,298 | FirstMerit Corporation | 159,275 | |||
17,100 | Fulton Financial Corporation | 165,015 | |||
2,000 | Greenhill & Company, Inc. | 122,260 | |||
3,970 | Hanover Insurance Group, Inc. | 172,695 | |||
10,150 | HCC Insurance Holdings, Inc. | 251,314 | |||
6,300 | Highwoods Properties, Inc. | 174,888 | |||
10,900 | Hospitality Properties Trust | 229,990 | |||
4,500 | International Bancshares Corporation | 75,105 | |||
10,800 | Jefferies Group, Inc.b | 227,664 | |||
3,800 | Jones Lang LaSalle, Inc. | 249,432 | |||
10,100 | Liberty Property Trustb | 291,385 | |||
11,568 | Macerich Company | 431,718 | |||
7,100 | Mack-Cali Realty Corporation | 211,083 | |||
3,100 | Mercury General Corporation | 128,464 | |||
10,400 | MSCI, Inc.a | 284,960 | |||
10,700 | Nationwide Health Properties, Inc. | 382,739 | |||
38,311 | New York Community Bancorp, Inc.b | 585,009 | |||
8,600 | NewAlliance Bancshares, Inc. | 96,406 | |||
20,950 | Old Republic International Corporation | 254,124 | |||
8,100 | Omega Healthcare Investors, Inc. | 161,433 | |||
2,700 | PacWest Bancorp | 49,437 | |||
3,607 | Potlatch Corporation | 128,878 | |||
4,200 | Prosperity Bancshares, Inc. | 145,950 | |||
7,570 | Protective Life Corporation | 161,922 | |||
8,925 | Raymond James Financial, Inc. | 220,358 | |||
7,208 | Rayonier, Inc. REIT | 317,296 | |||
9,200 | Realty Income Corporationb | 279,036 | |||
7,300 | Regency Centers Corporation | 251,120 | |||
6,500 | Reinsurance Group of America, Inc. | 297,115 | |||
11,340 | SEI Investments Company | 230,883 | |||
11,200 | Senior Housing Property Trust | 225,232 | |||
7,000 | SL Green Realty Corporation | 385,280 | |||
4,200 | StanCorp Financial Group, Inc. | 170,268 | |||
3,730 | SVB Financial Groupa | 153,788 | |||
68,200 | Synovus Financial Corporation | 173,228 | |||
10,920 | TCF Financial Corporationb | 181,381 | |||
5,800 | Transatlantic Holdings, Inc. | 278,168 | |||
5,000 | Trustmark Corporation | 104,100 | |||
14,303 | UDR, Inc. | 273,616 | |||
4,400 | Unitrin, Inc. | 112,640 | |||
13,895 | Valley National Bancorpb | 189,250 | |||
11,475 | W.R. Berkley Corporation | 303,629 | |||
7,640 | Waddell & Reed Financial, Inc. | 167,163 | |||
9,827 | Washington Federal, Inc. | 159,001 | |||
5,930 | Webster Financial Corporation | 106,384 | |||
9,200 | Weingarten Realty Investors | 175,260 | |||
2,620 | Westamerica Bancorporationb | 137,602 | |||
7,880 | Wilmington Trust Corporationb | 87,389 | |||
| Total Financials | 16,216,252 | ||||
| Health Care (12.3%) | |||||
6,000 | Affymetrix, Inc.a | 35,400 | |||
6,230 | Beckman Coulter, Inc. | 375,607 | |||
1,800 | Bio-Rad Laboratories, Inc.a | 155,682 | |||
5,900 | Charles River Laboratories International, Inc.a,b | 201,839 | |||
8,500 | Community Health Systems, Inc.a | 287,385 | |||
5,810 | Covance, Inc.a | 298,169 | |||
10,140 | Edwards Lifesciences Corporationa | 568,043 | |||
10,200 | Endo Pharmaceutical Holdings, Inc.a | 222,564 | |||
4,500 | Gen-Probe, Inc.a | 204,390 | |||
21,900 | Health Management Associates, Inc.a | 170,163 | |||
8,880 | Health Net, Inc.a | 216,406 | |||
8,200 | Henry Schein, Inc.a | 450,180 | |||
5,550 | Hill-Rom Holdings, Inc. | 168,886 | |||
22,800 | Hologic, Inc.a | 317,604 | |||
5,200 | IDEXX Laboratories, Inc.a,b | 316,680 | |||
6,100 | Immucor, Inc.a | 116,205 | |||
3,400 | Kindred Healthcare, Inc.a | 43,656 | |||
5,600 | Kinetic Concepts, Inc.a | 204,456 | |||
5,000 | LifePoint Hospitals, Inc.a | 157,000 | |||
8,930 | Lincare Holdings, Inc.a,b | 290,314 | |||
4,800 | Masimo Corporation | 114,288 | |||
5,200 | Medicis Pharmaceutical Corporation | 113,776 | |||
4,200 | Mednax, Inc.a | 233,562 | |||
3,000 | Mettler-Toledo International, Inc.a | 334,890 | |||
10,620 | Omnicare, Inc. | 251,694 | |||
5,550 | Owens & Minor, Inc. | 157,509 | |||
7,250 | Perrigo Company | 428,258 | |||
10,600 | Pharmaceutical Product Development, Inc. | 269,346 | |||
5,100 | Psychiatric Solutions, Inc.a | 166,872 | |||
6,800 | ResMed, Inc.a | 413,508 | |||
5,300 | STERIS Corporation | 164,724 | |||
3,400 | Techne Corporation | 195,330 | |||
3,640 | Teleflex, Inc. | 197,579 | |||
5,200 | Thoratec Corporationa,b | 222,196 | |||
4,400 | United Therapeutics Corporationa | 214,764 | |||
The accompanying Notes to Financial Statements are an integral part of this schedule.
180
Table of Contents
Mid Cap Index Portfolio
Schedule of Investments as of June 30, 2010
(unaudited)
Shares | Common Stock (98.8%) | Value | |||
Health Care (12.3%) - continued | |||||
8,700 | Universal Health Services, Inc. | $ | 331,905 | ||
5,610 | Valeant Pharmaceuticals Internationala,b | 293,347 | |||
7,700 | VCA Antech, Inc.a | 190,652 | |||
18,020 | Vertex Pharmaceuticals, Inc.a | 592,858 | |||
3,800 | Wellcare Health Plans, Inc.a | 90,212 | |||
| Total Health Care | 9,777,899 | ||||
| Industrials (14.5%) | |||||
3,900 | Acuity Brands, Inc. | 141,882 | |||
10,100 | Aecom Technology Corporationa | 232,906 | |||
8,330 | AGCO Corporationa | 224,660 | |||
11,500 | AirTran Holdings, Inc.a | 55,775 | |||
3,140 | Alaska Air Group, Inc.a | 141,143 | |||
3,660 | Alexander & Baldwin, Inc. | 108,995 | |||
3,000 | Alliant Techsystems, Inc.a | 186,180 | |||
9,470 | AMETEK, Inc. | 380,220 | |||
9,100 | BE Aerospace, Inc.a | 231,413 | |||
4,160 | Brink’s Company | 79,165 | |||
7,300 | Bucyrus International, Inc. | 346,385 | |||
5,340 | Carlisle Companies, Inc. | 192,934 | |||
2,100 | Clean Harbors, Inc.a | 139,461 | |||
4,830 | Con-way, Inc. | 144,997 | |||
6,100 | Copart, Inc.a | 218,441 | |||
3,100 | Corporate Executive Board Company | 81,437 | |||
10,100 | Corrections Corporation of Americaa | 192,708 | |||
4,200 | Crane Company | 126,882 | |||
4,500 | Deluxe Corporation | 84,375 | |||
6,900 | Donaldson Company, Inc. | 294,285 | |||
4,200 | FTI Consulting, Inc.a | 183,078 | |||
4,600 | Gardner Denver, Inc. | 205,114 | |||
4,120 | GATX Corporation | 109,922 | |||
5,400 | Graco, Inc. | 152,226 | |||
3,060 | Granite Construction, Inc. | 72,155 | |||
7,100 | Harsco Corporation | 166,850 | |||
4,890 | Herman Miller, Inc. | 92,274 | |||
4,030 | HNI Corporation | 111,188 | |||
5,330 | Hubbell, Inc. | 211,548 | |||
7,200 | IDEX Corporation | 205,704 | |||
7,840 | JB Hunt Transport Services, Inc. | 256,133 | |||
17,975 | JetBlue Airways Corporationa,b | 98,683 | |||
9,250 | Joy Global, Inc. | 463,332 | |||
9,100 | Kansas City Southern, Inc.a | 330,785 | |||
14,300 | KBR, Inc. | 290,862 | |||
7,340 | Kennametal, Inc. | 186,656 | |||
4,800 | Kirby Corporationa | 183,600 | |||
3,940 | Korn/Ferry Internationala | 54,766 | |||
4,500 | Landstar System, Inc. | 175,455 | |||
4,400 | Lennox International, Inc. | 182,908 | |||
3,800 | Lincoln Electric Holdings, Inc. | 193,762 | |||
7,370 | Manpower, Inc. | 318,236 | |||
2,700 | Mine Safety Appliances Company | 66,906 | |||
4,000 | MSC Industrial Direct Company, Inc. | 202,640 | |||
4,100 | Navigant Consulting, Inc.a | 42,558 | |||
3,090 | Nordson Corporation | 173,287 | |||
8,000 | Oshkosh Corporationa | 249,280 | |||
8,760 | Pentair, Inc. | 282,072 | |||
3,500 | Regal-Beloit Corporation | 195,230 | |||
3,748 | Rollins, Inc. | 77,546 | |||
7,600 | Shaw Group, Inc.a | 260,072 | |||
4,460 | SPX Corporation | 235,533 | |||
9,700 | Terex Corporationa | 181,778 | |||
4,700 | Thomas & Betts Corporationa | 163,090 | |||
7,100 | Timken Company | 184,529 | |||
3,800 | Towers Watson & Company | 147,630 | |||
6,995 | Trinity Industries, Inc. | 123,951 | |||
5,298 | United Rentals, Inc.a | 49,377 | |||
7,300 | URS Corporationa | 287,255 | |||
1,800 | Valmont Industries, Inc. | 130,788 | |||
4,300 | Wabtec Corporation | 171,527 | |||
7,000 | Waste Connections, Inc.a | 244,230 | |||
3,900 | Werner Enterprises, Inc. | 85,371 | |||
5,100 | Woodward Governor Company | 130,203 | |||
| Total Industrials | 11,534,334 | ||||
| Information Technology (15.5%) | |||||
3,020 | ACI Worldwide, Inc.a | 58,799 | |||
6,890 | Acxiom Corporationa | 101,214 | |||
8,300 | ADC Telecommunications, Inc.a | 61,503 | |||
4,980 | ADTRAN, Inc. | 135,805 | |||
1,400 | Advent Software, Inc.a,b | 65,744 | |||
4,800 | Alliance Data Systems Corporationa | 285,696 | |||
8,100 | ANSYS, Inc.a | 328,617 | |||
9,400 | AOL, Inc.a | 195,426 | |||
10,770 | Arrow Electronics, Inc.a | 240,709 | |||
39,620 | Atmel Corporationa | 190,176 | |||
13,420 | Avnet, Inc.a | 323,556 | |||
11,900 | Broadridge Financial Solutions, Inc. | 226,695 | |||
23,180 | Cadence Design Systems, Inc.a | 134,212 | |||
8,300 | CIENA Corporationa,b | 105,244 | |||
8,474 | CommScope, Inc.a | 201,427 | |||
10,600 | Convergys Corporationa | 103,986 | |||
9,000 | CoreLogic, Inc. | 158,940 | |||
9,600 | Cree, Inc.a | 576,288 | |||
5,930 | Diebold, Inc. | 161,592 | |||
3,600 | Digital River, Inc.a | 86,076 | |||
3,210 | DST Systems, Inc. | 116,009 | |||
4,100 | Equinix, Inc.a,b | 333,002 | |||
7,200 | F5 Networks, Inc.a | 493,704 | |||
3,700 | FactSet Research Systems, Inc.b | 247,863 | |||
4,050 | Fair Isaac Corporation | 88,250 | |||
11,100 | Fairchild Semiconductor International, Inc.a | 93,351 | |||
5,400 | Gartner, Inc.a | 125,550 | |||
7,300 | Global Payments, Inc. | 266,742 | |||
7,300 | Hewitt Associates, Inc.a | 251,558 | |||
8,100 | Informatica Corporationa | 193,428 | |||
14,500 | Ingram Micro, Inc.a | 220,255 | |||
12,850 | Integrated Device Technology, Inc.a | 63,608 | |||
6,250 | International Rectifier Corporationa | 116,313 | |||
10,700 | Intersil Corporation | 129,577 | |||
3,600 | Itron, Inc.a | 222,552 | |||
7,560 | Jack Henry & Associates, Inc. | 180,533 | |||
11,300 | Lam Research Corporationa | 430,078 | |||
4,800 | Lamar Advertising Companya | 117,696 | |||
8,500 | Lender Processing Services, Inc. | 266,135 | |||
The accompanying Notes to Financial Statements are an integral part of this schedule.
181
Table of Contents
Mid Cap Index Portfolio
Schedule of Investments as of June 30, 2010
(unaudited)
Shares | Common Stock (98.8%) | Value | |||
Information Technology (15.5%) - continued | |||||
2,000 | ManTech International Corporationa | $ | 85,140 | ||
9,170 | Mentor Graphics Corporationa | 81,154 | |||
7,200 | MICROS Systems, Inc.a | 229,464 | |||
4,975 | National Instruments Corporation | 158,106 | |||
14,100 | NCR Corporationa | 170,892 | |||
3,700 | Netflix, Inc.a,b | 402,005 | |||
6,500 | NeuStar, Inc.a | 134,030 | |||
10,100 | Parametric Technology Corporationa | 158,267 | |||
4,440 | Plantronics, Inc. | 126,984 | |||
7,620 | Polycom, Inc.a | 227,000 | |||
5,400 | Quest Software, Inc.a | 97,416 | |||
23,140 | RF Micro Devices, Inc.a | 90,477 | |||
9,140 | Rovi Corporationa | 346,497 | |||
5,290 | Semtech Corporationa | 86,597 | |||
4,200 | Silicon Laboratories, Inc.a | 170,352 | |||
6,300 | Solera Holdings, Inc. | 228,060 | |||
3,800 | SRA International, Inc.a | 74,746 | |||
7,780 | Sybase, Inc.a | 503,055 | |||
12,880 | Synopsys, Inc.a | 268,806 | |||
4,580 | Tech Data Corporationa | 163,140 | |||
14,200 | TIBCO Software, Inc.a | 171,252 | |||
10,800 | Trimble Navigation, Ltd.a | 302,400 | |||
7,000 | ValueClick, Inc.a | 74,830 | |||
16,120 | Vishay Intertechnology, Inc.a | 124,769 | |||
5,200 | Zebra Technologies Corporationa | 131,924 | |||
| Total Information Technology | 12,305,272 | ||||
| Materials (6.5%) | |||||
8,120 | Albemarle Corporation | 322,445 | |||
6,100 | AptarGroup, Inc. | 230,702 | |||
7,000 | Ashland, Inc. | 324,940 | |||
5,890 | Cabot Corporation | 142,008 | |||
4,000 | Carpenter Technology Corporation | 131,320 | |||
10,000 | Commercial Metals Company | 132,200 | |||
4,360 | Cytec Industries, Inc. | 174,357 | |||
3,100 | Greif, Inc. | 172,174 | |||
3,700 | Intrepid Potash, Inc.a,b | 72,409 | |||
11,000 | Louisiana-Pacific Corporationa | 73,590 | |||
6,160 | Lubrizol Corporation | 494,710 | |||
4,120 | Martin Marietta Materials, Inc.b | 349,417 | |||
1,680 | Minerals Technologies, Inc. | 79,867 | |||
1,100 | NewMarket Corporation | 96,052 | |||
6,900 | Olin Corporation | 124,821 | |||
9,100 | Packaging Corporation of America | 200,382 | |||
5,800 | Reliance Steel & Aluminum Company | 209,670 | |||
3,500 | Rock-Tenn Company | 173,845 | |||
11,300 | RPM International, Inc. | 201,592 | |||
4,100 | Scotts Miracle-Gro Company | 182,081 | |||
4,330 | Sensient Technologies Corporation | 112,277 | |||
4,600 | Silgan Holdings, Inc. | 130,548 | |||
8,880 | Sonoco Products Company | 270,662 | |||
19,000 | Steel Dynamics, Inc. | 250,610 | |||
9,600 | Temple-Inland, Inc. | 198,432 | |||
8,760 | Valspar Corporation | 263,851 | |||
5,200 | Worthington Industries, Inc. | 66,872 | |||
| Total Materials | 5,181,834 | ||||
| Telecommunications Services (0.8%) | |||||
16,410 | Cincinnati Bell, Inc.a | 49,394 | |||
6,200 | Syniverse Holdings, Inc.a | 126,790 | |||
8,120 | Telephone and Data Systems, Inc. | 246,767 | |||
13,400 | TW Telecom, Inc.a | 223,512 | |||
| Total Telecommunications Services | 646,463 | ||||
| Utilities (6.2%) | |||||
6,880 | AGL Resources, Inc. | 246,442 | |||
9,900 | Alliant Energy Corporation | 314,226 | |||
11,866 | Aqua America, Inc.b | 209,791 | |||
8,200 | Atmos Energy Corporation | 221,728 | |||
3,400 | Black Hills Corporation | 96,798 | |||
5,100 | Cleco Corporation | 134,691 | |||
10,230 | DPL, Inc. | 244,497 | |||
8,500 | Dynegy, Inc.a | 32,725 | |||
6,400 | Energen Corporation | 283,712 | |||
11,763 | Great Plains Energy, Inc. | 200,206 | |||
8,180 | Hawaiian Electric Industries, Inc.b | 186,340 | |||
4,330 | IDACORP, Inc. | 144,059 | |||
16,525 | MDU Resources Group, Inc. | 297,946 | |||
7,300 | National Fuel Gas Company | 334,924 | |||
9,540 | NSTAR | 333,900 | |||
19,800 | NV Energy, Inc. | 233,838 | |||
8,590 | OGE Energy Corporation | 314,050 | |||
7,275 | PNM Resources, Inc. | 81,335 | |||
16,000 | Questar Corporationa | 258,400 | |||
9,500 | UGI Corporation | 241,680 | |||
6,990 | Vectren Corporation | 165,384 | |||
9,620 | Westar Energy, Inc. | 207,888 | |||
4,410 | WGL Holdings, Inc. | 150,072 | |||
| Total Utilities | 4,934,632 | ||||
| Total Common Stock (cost $76,320,973) | 78,430,451 | ||||
Collateral Held for Securities Loaned (8.7%) | |||||
6,899,558 | Thrivent Financial Securities Lending Trust | 6,899,558 | |||
| Total Collateral Held for Securities Loaned (cost $6,899,558) | 6,899,558 | ||||
Principal | Short-Term Investments (1.2%)c | ||||
| Federal Home Loan Bank Discount Notes | |||||
100,000 | 0.045%, 7/9/2010 | 99,999 | |||
| Federal National Mortgage Association Discount Notes | |||||
300,000 | 0.180%, 7/7/2010d | 299,991 | |||
The accompanying Notes to Financial Statements are an integral part of this schedule.
182
Table of Contents
Mid Cap Index Portfolio
Schedule of Investments as of June 30, 2010
(unaudited)
Principal | Short-Term Investments (1.2%)c | Value | ||||
| U.S. Treasury Bills | ||||||
| 540,000 | 0.020%, 7/8/2010 | $ | 539,998 | |||
| Total Short-Term Investments (at amortized cost) | 939,988 | |||||
| Total Investments (cost $84,160,519) 108.7% | $ | 86,269,997 | ||||
| Other Assets and Liabilities, Net (8.7%) | (6,940,976 | ) | ||||
| Total Net Assets 100.0% | $ | 79,329,021 | ||||
| a | Non-income producing security. |
| b | All or a portion of the security is on loan as discussed in item 2(M) of the Notes to Financial Statements. |
| c | The interest rate shown reflects the yield, coupon rate or, for securities purchased at a discount, the discount rate at the date of purchase. |
| d | At June 30, 2010, $299,991 of investments were held on deposit with the counterparty and pledged as the initial margin deposit for open futures contracts. |
Definitions: | ||
REIT - | Real Estate Investment Trust, is a company that buys, develops, manages and/or sells real estate assets. | |
Unrealized Appreciation (Depreciation) |
| |||
Gross unrealized appreciation and depreciation of investments, based on cost for federal income tax purposes, were as follows: |
| |||
Gross unrealized appreciation | $ | 13,886,519 | ||
Gross unrealized depreciation | (11,777,041 | ) | ||
Net unrealized appreciation (depreciation) | $ | 2,109,478 | ||
Cost for federal income tax purposes | $ | 84,160,519 | ||
Fair Valuation Measurements
The following table is a summary of the inputs used, as of June 30, 2010, in valuing Mid Cap Index Portfolio’s assets carried at fair value as discussed in the Notes to Financial Statements.
Investments in Securities | Total | Level 1 | Level 2 | Level 3 | ||||||||
Common Stock | ||||||||||||
Consumer Discretionary | 10,301,026 | 10,301,026 | — | — | ||||||||
Consumer Staples | 2,968,426 | 2,968,426 | — | — | ||||||||
Energy | 4,564,313 | 4,564,313 | — | — | ||||||||
Financials | 16,216,252 | 16,216,252 | — | — | ||||||||
Health Care | 9,777,899 | 9,777,899 | — | — | ||||||||
Industrials | 11,534,334 | 11,534,334 | — | — | ||||||||
Information Technology | 12,305,272 | 12,305,272 | — | — | ||||||||
Materials | 5,181,834 | 5,181,834 | — | — | ||||||||
Telecommunications Services | 646,463 | 646,463 | — | — | ||||||||
Utilities | 4,934,632 | 4,934,632 | — | — | ||||||||
Collateral Held for Securities Loaned | 6,899,558 | 6,899,558 | — | — | ||||||||
Short-Term Investments | 939,988 | — | 939,988 | — | ||||||||
Total | $ | 86,269,997 | $ | 85,330,009 | $ | 939,988 | $ | — | ||||
Other Financial Instruments | Total | Level 1 | Level 2 | Level 3 | ||||||||
Liability Derivatives | ||||||||||||
Futures Contracts | 22,021 | 22,021 | — | — | ||||||||
Total Liability Derivatives | $ | 22,021 | $ | 22,021 | $ | — | $ | — | ||||
Futures Contracts | Number of Contracts Long/(Short) | Expiration Date | Notional Principal Amount | Value | Unrealized Gain/(Loss) | |||||||||
S&P 400 Index Mini-Futures | 15 | September 2010 | $ | 1,087,021 | $ | 1,065,000 | ($ | 22,021 | ) | |||||
Total Futures Contracts | ($ | 22,021 | ) | |||||||||||
The accompanying Notes to Financial Statements are an integral part of this schedule.
183
Table of Contents
Mid Cap Index Portfolio
Schedule of Investments as of June 30, 2010
(unaudited)
The following table summarizes the fair value and Statement of Assets and Liabilities location, as of June 30, 2010, for Mid Cap Index Portfolio’s investments in financial derivative instruments by primary risk exposure as discussed under item (2) Significant Accounting Policies of the Notes to Financial Statements.
Derivatives by risk category | Statement of Assets and Liabilities Location | Fair Value | |||
Liability Derivatives | |||||
Equity Contracts Futures* | Net Assets - Net unrealized appreciation/(depreciation) on Futures contracts | 22,021 | |||
Total Equity Contracts | 22,021 | ||||
Total Liability Derivatives | $ | 22,021 | |||
| * | Includes cumulative appreciation/depreciation of futures contracts as reported in the Schedule of Investments. Only current day’s variation margin is reported within the Statement of Assets and Liabilities. |
The following table summarizes the net realized gains/(losses) and Statement of Operations location, for the period ended June 30, 2010, for Mid Cap Index Portfolio’s investments in financial derivative instruments by primary risk exposure.
Derivatives by risk category | Statement of Operations Location | Realized Gains/(Losses) recognized in Income | ||
Equity Contracts Futures | Net realized gains/(losses) on Futures contracts | 113,900 | ||
Total Equity Contracts | 113,900 | |||
Total | $113,900 | |||
The following table summarizes the change in net unrealized appreciation/(depreciation) and Statement of Operations location, for the period ended June 30, 2010, for Mid Cap Index Portfolio’s investments in financial derivative instruments by primary risk exposure.
Derivatives by risk category | Statement of Operations Location | Change in unrealized appreciation/(depreciation) recognized in Income | |||
Equity Contracts Futures | Change in net unrealized appreciation/(depreciation) on Futures contracts | (81,909 | ) | ||
Total Equity Contracts | (81,909 | ) | |||
Total | ($81,909) | ||||
The following table presents Mid Cap Index Portfolio’s average volume of derivative activity during the period ended June 30, 2010.
Derivative Risk Category | Futures (Notional*) | Futures (Percentage of Average Net Assets) | ||||
Equity Contracts | $ | 1,488,021 | 1.7 | % | ||
| * | Notional amount represents long or short, or both, derivative positions held by the portfolio. |
The accompanying Notes to Financial Statements are an integral part of this schedule.
184
Table of Contents
Mid Cap Index Portfolio
Schedule of Investments as of June 30, 2010
(unaudited)
Investment in Affiliates
Affiliated issuers, as defined under the Investment Company Act of 1940, include those in which the Portfolio’s holdings of an issuer represent 5% or more of the outstanding voting securities of an issuer, or any affiliated mutual fund.
A summary of transactions for the fiscal year to date, in Mid Cap Index Portfolio, is as follows:
Portfolio | Value December 31, 2009 | Gross Purchases | Gross Sales | Shares Held at June 30, 2010 | Value June 30, 2010 | Income Earned January 1, 2010 - June 30, 2010 | |||||||||||
Thrivent Financial Securities | $ | 6,345,282 | $ | 19,364,234 | $ | 18,809,958 | 6,899,558 | $ | 6,899,558 | $ | 16,402 | ||||||
Total Value and Income Earned | 6,345,282 | 6,899,558 | 16,402 | ||||||||||||||
The accompanying Notes to Financial Statements are an integral part of this schedule.
185
Table of Contents
Partner Worldwide Allocation Portfolio
Schedule of Investments as of June 30, 2010
(unaudited)
The accompanying Notes to Financial Statements are an integral part of this schedule.
186
Table of Contents
Partner Worldwide Allocation Portfolio
Schedule of Investments as of June 30, 2010
(unaudited)
| Shares | Common Stock (86.4%) | Value | |||
France (5.8%) - continued | |||||
| 73,850 | Vivendi | $ | 1,500,714 | ||
Total France | 19,148,678 | ||||
Germany (3.7%) | |||||
| 31,728 | Aixtron AG | 750,054 | |||
| 6,839 | Allianz AG | 676,847 | |||
| 11,234 | BASF SE | 613,800 | |||
| 4,058 | Continental AG | 210,393 | |||
| 45,169 | Daimler AGa | 2,284,785 | |||
| 22,044 | Demag Cranes AGa | 669,062 | |||
| 10,257 | Deutsche Bank AG | 576,100 | |||
| 21,793 | ElringKlinger AG | 464,102 | |||
| 7,045 | Hannover Rueckversicherung AG | 301,902 | |||
| 8,988 | Henkel AG & Company KGaA | 438,870 | |||
| 8,291 | Hochtief AG | 494,994 | |||
| 5,371 | K+S AG | 246,820 | |||
| 25,370 | ProSiebanSat.1 Media AG | 371,377 | |||
| 12,299 | Rheinmetall AG | 702,449 | |||
| 5,753 | SAP AG ADR | 255,808 | |||
| 19,860 | Siemens AG | 1,776,187 | |||
| 26,543 | Symrise AG | 548,023 | |||
| 37,634 | Tognum AG | 701,880 | |||
Total Germany | 12,083,453 | ||||
Hong Kong (3.1%) | |||||
| 210,000 | China Mobile, Ltd. | 2,086,947 | |||
| 290,000 | Hang Lung Group, Ltd. | 1,562,854 | |||
| 8,600 | Henderson Land Development Company, Ltd. Warrants, 58.00 HKD, expires 6/1/2011a | 1,458 | |||
| 42,000 | Hongkong Electric Holdings, Ltd. | 250,164 | |||
| 393,850 | Hutchison Whampoa, Ltd. | 2,423,780 | |||
| 1,146,450 | New World Development Company, Ltd. | 1,861,198 | |||
| 280,000 | PCCW, Ltd. | 81,682 | |||
| 2,755,455 | Shengli Oil & Gas Pipe Holdings, Ltd. | 610,192 | |||
| 85,500 | Swire Pacific, Ltd., Class A | 970,531 | |||
| 217,500 | Swire Pacific, Ltd., Class B | 461,946 | |||
Total Hong Kong | 10,310,752 | ||||
Hungary (0.4%) | |||||
| 7,200 | Richter Gedeon Nyrt | 1,272,959 | |||
Total Hungary | 1,272,959 | ||||
India (2.0%) | |||||
| 84,000 | Bharti Airtel, Ltd. | 472,922 | |||
| 13,100 | GlaxoSmithKline Pharmaceuticals, Ltd. | 613,538 | |||
| 7,344 | Grasim Industries, Ltd. | 288,993 | |||
| 8,000 | Grasim Industries, Ltd. GDR | 314,919 | |||
| 23,300 | Hero Honda Motors, Ltd. | 1,022,119 | |||
| 102,000 | Hindustan Unilever, Ltd. | 586,384 | |||
| 21,800 | Housing Development Finance Corporation | 1,373,832 | |||
| 5,500 | ICICI Bank, Ltd. | 100,591 | |||
| 10,400 | ICICI Bank, Ltd. ADR | 375,856 | |||
| 6,300 | Infosys Technologies, Ltd. | 375,878 | |||
| 16,504 | Infosys Technologies, Ltd. ADR | 988,754 | |||
| 7,344 | Samruddhi Cement, Ltd.a | 77,093 | |||
| 8,000 | Samruddhi Cement, Ltd. ADRa,b | 83,979 | |||
Total India | 6,674,858 | ||||
Indonesia (0.7%) | |||||
| 282,000 | PT Astra International Tbk | 1,489,944 | |||
| 840,200 | PT Telekomunikasi Indonesia | 712,165 | |||
| 7,300 | Telekomunik Indonesia SP ADR | 249,879 | |||
Total Indonesia | 2,451,988 | ||||
Ireland (0.2%) | |||||
| 143,399 | C&C Group plc | 566,372 | |||
Total Ireland | 566,372 | ||||
Israel (1.1%) | |||||
| 19,500 | Check Point Software Technologies, Ltd.a | 574,860 | |||
| 3,378 | Delek Group, Ltd. | 700,064 | |||
| 9,107 | Elbit Systems, Ltd. | 462,262 | |||
| 25,057 | Teva Pharmaceutical Industries, Ltd. | 1,309,160 | |||
| 14,000 | Teva Pharmaceutical Industries, Ltd. ADR | 727,860 | |||
Total Israel | 3,774,206 | ||||
Italy (2.1%) | |||||
| 38,432 | Astaldi SPA | 194,298 | |||
| 27,052 | Banca Generali SPA | 258,029 | |||
| 37,357 | Danieli & Company Officine Meccaniche SPA | 677,429 | |||
| 380,550 | Enel SPA | 1,611,218 | |||
| 68,200 | Eni SPA | 1,251,818 | |||
| 43,404 | Indesit Company SPA | 487,066 | |||
| 94,635 | Mediaset SPA | 538,128 | |||
| 278,011 | Parmalat SPA | 646,143 | |||
| 17,848 | Saipem SPA | 543,591 | |||
| 39,542 | Trevi Finanziaria SPA | 567,359 | |||
Total Italy | 6,775,079 | ||||
Japan (17.1%) | |||||
| 31,100 | Aeon Company, Ltd. | 329,079 | |||
| 14,500 | Aisin Seiki Company, Ltd. | 390,377 | |||
| 57,000 | Alps Electric Company, Ltd.a | 488,032 | |||
| 18,000 | Asahi Diamond Industrial Company, Ltd. | 277,199 | |||
| 38,000 | Asahi Glass Company, Ltd. | 356,814 | |||
| 65,000 | Asics Corporation | 595,133 | |||
| 156,950 | Bridgestone Corporation | 2,481,722 | |||
| 11,700 | Canon, Inc. | 436,053 | |||
| 36 | Central Japan Railway Company | 297,246 | |||
| 37,000 | Chiba Bank, Ltd. | 223,373 | |||
| 69,000 | Chiyoda Corporation | 501,080 | |||
| 22,000 | Dai Nippon Printing Company, Ltd. | 253,909 | |||
| 39,000 | Daicel Chemical Industries, Ltd. | 263,118 | |||
| 138,850 | Daiichi Sankyo Company, Ltd. | 2,480,678 | |||
| 29,777 | Daiseki Company, Ltd. | 619,486 | |||
| 62,550 | Daito Trust Construction Company, Ltd. | 3,542,123 | |||
| 449,300 | Daiwa Securities Group, Inc. | 1,896,923 | |||
| 148,000 | Denki Kagaku Kogyo KK | 688,876 | |||
| 14,900 | Disco Corporation | 942,634 | |||
| 32,200 | East Japan Railway Company | 2,144,055 | |||
The accompanying Notes to Financial Statements are an integral part of this schedule.
187
Table of Contents
Partner Worldwide Allocation Portfolio
Schedule of Investments as of June 30, 2010
(unaudited)
| Shares | Common Stock (86.4%) | Value | |||
| Japan (17.1%) - continued | |||||
| 26,900 | Elpida Memory, Inc.a | $ | 413,277 | ||
| 28,936 | Exedy Corporation | 741,832 | |||
| 20,700 | Fuji Oil Company, Ltd. | 304,333 | |||
| 76,000 | Fujitsu, Ltd. | 475,063 | |||
| 213,000 | Hitachi, Ltd.a | 773,681 | |||
| 50,100 | Honda Motor Company, Ltd. | 1,471,579 | |||
| 83,500 | ITOCHU Corporation | 652,758 | |||
| 12,900 | Japan Petroleum Exploration Company | 526,301 | |||
| 112,950 | Kao Corporation | 2,657,584 | |||
| 38,900 | Keihin Corporation | 671,732 | |||
| 10,849 | Kintetsu World Express, Inc. | 271,637 | |||
| 11,800 | K’s Holdings Corporation | 241,244 | |||
| 5,000 | Kyocera Corporation | 404,782 | |||
| 84,000 | Marubeni Corporation | 430,618 | |||
| 114,000 | Minebea Company, Ltd. | 631,519 | |||
| 20,200 | Mitsubishi Corporation | 417,907 | |||
| 47,000 | MS and AD Insurance Group Holdings, Inc. | 1,005,957 | |||
| 12,200 | Murata Manufacturing Company, Ltd. | 581,795 | |||
| 55,000 | Nabtesco Corporation | 847,807 | |||
| 20,608 | Nichi-iko Pharmaceutical Company, Ltd. | 767,296 | |||
| 32,740 | Nifco, Inc. | 675,101 | |||
| 16,004 | Nippon Suisan Kaisha, Ltd. | 51,950 | |||
| 355,100 | Nissan Motor Company, Ltd.a | 2,474,507 | |||
| 474 | NTT DoCoMo, Inc. | 717,773 | |||
| 16,900 | Pigeon Corporation | 623,482 | |||
| 86,500 | Pioneer Corporationa | 287,467 | |||
| 56,100 | Resona Holdings, Inc. | 684,644 | |||
| 41,500 | Secom Company, Ltd. | 1,842,852 | |||
| 28,100 | Shin-Etsu Chemical Company, Ltd. | 1,306,515 | |||
| 25,000 | Softbank Corporation | 663,082 | |||
| 217 | Sony Financial Holdings, Inc. | 723,860 | |||
| 227,950 | Sumitomo Corporation | 2,276,538 | |||
| 34,400 | Sumitomo Electric Industries, Ltd. | 400,895 | |||
| 468,500 | Sumitomo Trust and Banking Company, Ltd. | 2,385,210 | |||
| 62,000 | Suruga Bank, Ltd. | 562,704 | |||
| 12,400 | Sysmex Corporation | 704,245 | |||
| 42,000 | Taiyo Yuden Company, Ltd. | 564,025 | |||
| 16,100 | Takeda Pharmaceutical Company, Ltd. | 691,538 | |||
| 14,200 | TDK Corporation | 777,055 | |||
| 15,300 | Tokai Rika Company, Ltd. | 264,657 | |||
| 36,800 | Tokio Marine Holdings, Inc. | 967,466 | |||
| 13,300 | Tokyo Electron, Ltd. | 716,433 | |||
| 200,000 | Tokyo Gas Company, Ltd. | 913,029 | |||
| 68,000 | Toray Industries, Inc. | 325,929 | |||
| 11,310 | Toyo Tanso Company, Ltd. | 498,612 | |||
| 128,158 | Tsubakimoto Chain Company | 515,600 | |||
| 7,840 | Yamada Denki Company, Ltd. | 512,264 | |||
Total Japan | 56,624,045 | ||||
| Luxembourg (0.6%) | |||||
| 73,110 | Acergy SA | 1,082,461 | |||
| 27,000 | Tenaris SA ADR | 934,470 | |||
Total Luxembourg | 2,016,931 | ||||
| Malaysia (0.5%) | |||||
| 370,600 | CIMB Group Holdings Berhad | 797,920 | |||
| 199,400 | Public Bank Berhad | 734,408 | |||
Total Malaysia | 1,532,328 | ||||
| Mexico (1.2%) | |||||
| 172,000 | Consorcio ARA SAB de CV | 102,537 | |||
| 34,500 | Fomento Economico Mexicano SAB de CV ADR | 1,488,675 | |||
| 13,500 | Grupo Aeroportuario del Sureste SAB de CV ADR | 614,790 | |||
| 298,500 | Grupo Financiero Banorte SAB de CV ADR | 1,130,935 | |||
| 234,000 | Organizacion Soriana SAB de CVa | 599,425 | |||
Total Mexico | 3,936,362 | ||||
| Netherlands (2.3%) | |||||
| 34,050 | Arcelor Mittal | 913,238 | |||
| 11,531 | Heineken NV | 488,744 | |||
| 32,359 | Imtech NV | 832,831 | |||
| 63,855 | Koninklijke (Royal) Ahold NV | 789,841 | |||
| 70,042 | Koninklijke (Royal) KPN NV | 892,749 | |||
| 26,855 | Koninklijke (Royal) Philips Electronics NV | 801,906 | |||
| 50,258 | Koninklijke DSM NV | 1,997,758 | |||
| 36,015 | Unilever NV | 983,493 | |||
Total Netherlands | 7,700,560 | ||||
| Norway (2.3%) | |||||
| 28,737 | Aker Solutions ASA | 328,570 | |||
| 45,219 | DnB NOR ASA | 434,922 | |||
| 36,900 | Schibsted ASA | 707,619 | |||
| 136,204 | Statoil ASA | 2,623,925 | |||
| 107,400 | Storebrand ASAa | 552,181 | |||
| 60,083 | Telenor ASA | 756,878 | |||
| 38,230 | TGS Nopec Geophysical Company ASA | 440,917 | |||
| 61,850 | Yara International ASA | 1,738,560 | |||
Total Norway | 7,583,572 | ||||
| Philippines (0.4%) | |||||
| 2,321,000 | Ayala Land, Inc. | 654,406 | |||
| 595,000 | Bank of the Philippine Islands | 577,767 | |||
Total Philippines | 1,232,173 | ||||
| Poland (0.2%) | |||||
| 15,000 | Bank Pekao SA | 684,054 | |||
Total Poland | 684,054 | ||||
| Portugal (0.1%) | |||||
| 136,743 | Electricidade de Portugal SA | 406,918 | |||
Total Portugal | 406,918 | ||||
| Russia (0.4%) | |||||
| 25,500 | LUKOIL ADR | 1,306,980 | |||
Total Russia | 1,306,980 | ||||
| Singapore (2.2%) | |||||
| 1,047,000 | Biosenors International Group, Ltd.a | 572,172 | |||
| 905,725 | CSE Global, Ltd. | 563,319 | |||
The accompanying Notes to Financial Statements are an integral part of this schedule.
188
Table of Contents
Partner Worldwide Allocation Portfolio
Schedule of Investments as of June 30, 2010
(unaudited)
| Shares | Common Stock (86.4%) | Value | |||
| Singapore (2.2%) - continued | |||||
| 33,583 | Golden Agri-Resources, Ltd. Warrants, 0.54 SGD, expires 7/23/2012a | $ | 2,400 | ||
| 140,250 | Keppel Corporation, Ltd. | 846,762 | |||
| 28,050 | K-Green Trusta | 21,048 | |||
| 871,000 | Midas Holding, Ltd. | 563,508 | |||
| 908,591 | Osim International, Ltd. | 580,296 | |||
| 232,000 | Parkway Holdings, Ltd. | 587,138 | |||
| 202,750 | Singapore Airlines, Ltd. | 2,102,337 | |||
| 365,000 | Singapore Airport Terminal Services, Ltd. | 695,725 | |||
| 50,000 | United Overseas Bank, Ltd. | 701,065 | |||
Total Singapore | 7,235,770 | ||||
| South Africa (0.8%) | |||||
| 106,600 | Massmart Holdings, Ltd. | 1,633,808 | |||
| 154,000 | Truworths International, Ltd. | 1,071,892 | |||
Total South Africa | 2,705,700 | ||||
| South Korea (2.8%) | |||||
| 12,181 | Busan Bank | 109,752 | |||
| 38,572 | Eugene Technology Company, Ltd. | 462,063 | |||
| 16,266 | Hana Tour Service, Inc. | 721,153 | |||
| 66,540 | Iljin Display Company, Ltd.a | 644,488 | |||
| 4,763 | LG Innotek Company, Ltd. | 625,074 | |||
| 20,530 | Lock & Lock Company, Ltd. | 626,745 | |||
| 3,700 | POSCO | 1,401,970 | |||
| 4,700 | Samsung Electronics Company, Ltd. | 2,003,592 | |||
| 1,780 | Shinsegae Company, Ltd. | 769,092 | |||
| 3,521 | SK Telecom Company, Ltd. | 461,442 | |||
| 102,507 | SK Telecom Company, Ltd. ADR | 1,509,928 | |||
Total South Korea | 9,335,299 | ||||
| Spain (0.5%) | |||||
| 10,991 | Industria de Diseno Textil SA (Inditex) | 626,693 | |||
| 51,000 | Telefonica SA | 944,709 | |||
Total Spain | 1,571,402 | ||||
| Sweden (1.2%) | |||||
| 38,848 | Atlas Copco AB | 567,980 | |||
| 35,108 | Electrolux AB | 802,592 | |||
| 2,608 | Elekta AB | 66,359 | |||
| 64,757 | Hexagon AB | 841,574 | |||
| 23,782 | Hoganas AB | 616,317 | |||
| 252,812 | Niscayah Group AB | 346,533 | |||
| 23,378 | Svenska Cellulosa AB | 274,955 | |||
| 12,356 | Svenska Handelsbanken AB | 302,274 | |||
Total Sweden | 3,818,584 | ||||
| Switzerland (8.0%) | |||||
| 14,562 | ABB, Ltd.a | 253,521 | |||
| 37,450 | Adecco SA | 1,786,534 | |||
| 5,050 | Aryzta AG | 194,897 | |||
| 2,994 | Burckhardt Compression Holding AG | 527,320 | |||
| 28,769 | Compagnie Financiere Richemont SA | 1,004,346 | |||
| 57,463 | Credit Suisse Group | 2,160,345 | |||
| 2,622 | Givaudan SA | 2,226,847 | |||
| 1,285 | Helvetia Holding AG | 337,238 | |||
| 27,950 | Holcim, Ltd. | 1,870,937 | |||
| 26,086 | Meyer Burger Technology AGa | 642,499 | |||
| 96,751 | Nestle SA | 4,664,997 | |||
| 88,778 | Novartis AG | 4,302,253 | |||
| 4,662 | Pargesa Holding SA | 305,693 | |||
| 10,907 | Roche Holding AG | 1,501,188 | |||
| 3,204 | Schindler Holding AG | 270,041 | |||
| 395 | Sika AG | 700,165 | |||
| 2,031 | Swatch Group AG | 572,766 | |||
| 24,183 | UBS AGa | 320,356 | |||
| 12,088 | Zurich Financial Services AG | 2,664,236 | |||
Total Switzerland | 26,306,179 | ||||
| Taiwan (0.7%) | |||||
| 383,000 | Taiwan Mobile Company, Ltd. | 780,368 | |||
| 850,951 | Taiwan Semiconductor Manufacturing Company, Ltd. | 1,590,463 | |||
Total Taiwan | 2,370,831 | ||||
| Thailand (1.3%) | |||||
| 240,100 | PTT Exploration & Production pcl | 1,052,242 | |||
| 233,600 | PTT pcl | 1,756,254 | |||
| 170,900 | Siam Cement pcl | 1,466,170 | |||
Total Thailand | 4,274,666 | ||||
| Turkey (0.7%) | |||||
| 314,982 | Akbank TAS | 1,508,687 | |||
| 30,000 | BIM Birlesik Magazalar AS | 831,442 | |||
Total Turkey | 2,340,129 | ||||
| United Kingdom (11.0%) | |||||
| 391,010 | Aegis Group plc | 619,727 | |||
| 13,979 | Aggreko plc | 295,537 | |||
| 35,235 | Anglo American plca | 1,227,766 | |||
| 50,214 | ASOS plca | 642,128 | |||
| 17,221 | Associated British Foods plc | 249,387 | |||
| 15,515 | AstraZeneca plc | 731,465 | |||
| 31,560 | Babcock International Group plc | 280,376 | |||
| 63,989 | Barclays plc | 255,411 | |||
| 51,094 | BG Group plc | 759,906 | |||
| 44,458 | BHP Billiton plc | 1,152,726 | |||
| 17,832 | British American Tobacco plc | 565,911 | |||
| 323,787 | BT Group plc | 624,982 | |||
| 783,704 | Cable & Wireless Communications plc | 676,213 | |||
| 113,237 | Compass Group plc | 861,434 | |||
| 16,033 | Diageo plc | 251,842 | |||
| 135,187 | GlaxoSmithKline plc | 2,295,573 | |||
| 164,446 | Halma plc | 669,848 | |||
| 42,200 | HSBC Holdings plc ADR | 1,923,898 | |||
| 9,034 | Imperial Tobacco Group plc | 252,415 | |||
| 155,971 | Intermediate Capital Group plc | 578,489 | |||
| 75,754 | Invensys plc | 271,189 | |||
| 1,518,309 | Lloyds TSB Group plca | 1,198,450 | |||
| 83,885 | Marks and Spencer Group plc | 413,246 | |||
| 81,579 | Micro Focus International plc | 512,633 | |||
| 67,339 | National Grid plc | 491,636 | |||
| 6,307 | Next plc | 188,040 | |||
| 172,250 | Pearson plc | 2,265,372 | |||
The accompanying Notes to Financial Statements are an integral part of this schedule.
189
Table of Contents
Partner Worldwide Allocation Portfolio
Schedule of Investments as of June 30, 2010
(unaudited)
| Shares | Common Stock (86.4%) | Value | |||
United Kingdom (11.0%) - continued | |||||
| 18,674 | Pennon Group plc | $ | 154,291 | ||
| 91,541 | Persimmon plca | 475,130 | |||
| 29,120 | Rio Tinto plc | 1,278,783 | |||
| 64,604 | Rolls-Royce Group plca | 539,235 | |||
| 30,089 | Rotork plc | 574,964 | |||
| 13,856 | Shire, Ltd. | 284,244 | |||
| 360,163 | SIG plca | 542,854 | |||
| 299,954 | Spirent plc | 488,674 | |||
| 51,965 | SSL International plc | 625,793 | |||
| 74,888 | Standard Chartered plc | 1,823,550 | |||
| 105,797 | Telecity Group plca | 630,309 | |||
| 431,598 | Tesco plc | 2,434,760 | |||
| 25,698 | Ultra Electronics Holdings | 586,954 | |||
| 23,267 | Unilever plc | 621,972 | |||
| 1,062,800 | Vodafone Group plc | 2,189,752 | |||
| 14,713 | Whitbread plc | 307,250 | |||
| 279,750 | WPP plc | 2,635,367 | |||
Total United Kingdom | 36,449,482 | ||||
United States (0.2%) | |||||
| 16,920 | iShares MSCI EAFE Growth Index Fund | 813,344 | |||
Total United States | 813,344 | ||||
Total Common Stock (cost $290,320,908) | 285,391,795 | ||||
| Principal Amount | Long-Term Fixed Income (9.2%) | ||||
Argentina (0.3%) | |||||
Argentina Government International Bond | |||||
| $2,850,000 | 1.985%, 12/15/2010c | 254,402 | |||
| 2,920,000 | 3.169%, 12/15/2010c | 222,650 | |||
| 150,000 | 7.000%, 3/28/2011 | 150,563 | |||
| 10,000 | 7.000%, 9/12/2013 | 8,888 | |||
| 40,000 | 2.260%, 3/31/2019d | 14,429 | |||
| 230,000 | 2.500%, 3/31/2019d | 82,513 | |||
| 361,146 | 5.450%, 12/31/2033 | 256,132 | |||
Total Argentina | 989,577 | ||||
Brazil (0.6%) | |||||
Brazil Government International Bond | |||||
| 880,000 | 6.000%, 1/17/2017 | 968,000 | |||
| 1,030,000 | 4.875%, 1/22/2021 | 1,031,544 | |||
| 50,000 | 7.125%, 1/20/2037 | 59,000 | |||
Independencia International, Ltd. | |||||
| 88,740 | 12.000%, 12/30/2016e | 33,278 | |||
Total Brazil | 2,091,822 | ||||
Cayman Islands (0.1%) | |||||
MCE Finance, Ltd. | |||||
| 170,000 | 10.250%, 5/15/2018f | 176,588 | |||
TGI International, Ltd. | |||||
| 180,000 | 9.500%, 10/3/2017 | 199,800 | |||
Total Cayman Islands | 376,388 | ||||
Chile (0.1%) | |||||
Corporacion Nacional del Cobre de Chile - Codelco | |||||
| 200,000 | 6.150%, 10/24/2036 | 219,006 | |||
Total Chile | 219,006 | ||||
Colombia (0.2%) | |||||
Colombia Government International Bond | |||||
| 300,000 | 7.375%, 3/18/2019 | 351,000 | |||
| 210,000 | 7.375%, 9/18/2037 | 246,750 | |||
| 200,000 | 6.125%, 1/18/2041 | 202,500 | |||
Total Colombia | 800,250 | ||||
Costa Rica (0.1%) | |||||
Costa Rica Government International Bond | |||||
| 30,000 | 6.548%, 3/20/2014 | 33,150 | |||
| 323,000 | 9.995%, 8/1/2020 | 434,435 | |||
Total Costa Rica | 467,585 | ||||
Dominican Republic (0.2%) | |||||
Dominican Republic International Bond | |||||
| 560,000 | 7.500%, 5/6/2021 | 576,800 | |||
| 100,000 | 8.625%, 4/20/2027 | 108,750 | |||
Total Dominican Republic | 685,550 | ||||
Egypt (<0.1%) | |||||
Egypt Government International Bond | |||||
| 125,000 | 6.875%, 4/30/2040e | 121,875 | |||
Total Egypt | 121,875 | ||||
El Salvador (0.1%) | |||||
El Salvador Government International Bond | |||||
| 195,000 | 7.650%, 6/15/2035 | 206,700 | |||
Total El Salvador | 206,700 | ||||
Gabon (<0.1%) | |||||
Gabon Government International Bond | |||||
| 120,000 | 8.200%, 12/12/2017e | 127,200 | |||
Total Gabon | 127,200 | ||||
Germany (<0.1%) | |||||
Deutsche Bank AG | |||||
| 1,100,000,000 | 10.500%, 8/19/2030b,g | 129,683 | |||
Total Germany | 129,683 | ||||
Indonesia (0.9%) | |||||
Adaro Indonesia PT | |||||
| 120,000 | 7.625%, 10/22/2019 | 121,200 | |||
Indonesia Government International Bond | |||||
| 49,000 | 6.875%, 1/17/2018 | 55,248 | |||
| 790,000 | 11.625%, 3/4/2019 | 1,135,624 | |||
| 465,000 | 5.875%, 3/13/2020 | 492,319 | |||
| 755,000 | 8.500%, 10/12/2035 | 953,187 | |||
The accompanying Notes to Financial Statements are an integral part of this schedule.
190
Table of Contents
Partner Worldwide Allocation Portfolio
Schedule of Investments as of June 30, 2010
(unaudited)
Principal | Long-Term Fixed Income (9.2%) | Value | |||
| Indonesia (0.9%) - continued | |||||
| $190,000 | 7.750%, 1/17/2038 | $ | 224,200 | ||
Total Indonesia | 2,981,778 | ||||
| Iraq (0.1%) | |||||
Iraq Government International Bond | |||||
| 500,000 | 5.800%, 1/15/2028 | 402,500 | |||
Total Iraq | 402,500 | ||||
| Ireland (0.1%) | |||||
VIP Finance Ireland, Ltd. | |||||
| 230,000 | 9.125%, 4/30/2018 | 247,825 | |||
| 100,000 | 9.125%, 4/30/2018e | 107,625 | |||
Total Ireland | 355,450 | ||||
| Ivory Coast (0.1%) | |||||
Ivory Coast Government | |||||
International Bond | |||||
| 332,000 | 2.450%, 6/30/2010 | 182,600 | |||
Total Ivory Coast | 182,600 | ||||
| Kazakhstan (0.5%) | |||||
KazMunaiGaz Finance Sub BV | |||||
| 100,000 | 8.375%, 7/2/2013e | 107,250 | |||
| 600,000 | 11.750%, 1/23/2015 | 734,250 | |||
| 650,000 | 7.000%, 5/5/2020e | 652,470 | |||
| 130,000 | 7.000%, 5/5/2020 | 130,494 | |||
Total Kazakhstan | 1,624,464 | ||||
| Lebanon (0.2%) | |||||
Lebanon Government | |||||
International Bond | |||||
| 270,000 | 4.000%, 12/31/2017 | 258,525 | |||
| 300,000 | 6.375%, 3/9/2020 | 300,009 | |||
Total Lebanon | 558,534 | ||||
| Lithuania (<0.1%) | |||||
Lithuania Government | |||||
International Bond | |||||
| 110,000 | 7.375%, 2/11/2020 | 115,363 | |||
Total Lithuania | 115,363 | ||||
| Luxembourg (0.2%) | |||||
Gaz Capital SA | |||||
| 270,000 | 9.250%, 4/23/2019 | 310,500 | |||
Gazprom International | |||||
| 197,910 | 7.201%, 2/1/2020 | 205,351 | |||
Total Luxembourg | 515,851 | ||||
| Malaysia (0.1%) | |||||
Malaysia Government | |||||
International Bond | |||||
| 280,000 | 7.500%, 7/15/2011 | 296,812 | |||
Petronas Capital, Ltd. | |||||
| 170,000 | 5.250%, 8/12/2019 | 178,804 | |||
Total Malaysia | 475,616 | ||||
| Mexico (0.9%) | |||||
Cemex Finance, LLC | |||||
| 340,000 | 9.500%, 12/14/2016 | 331,330 | |||
Mexico Government | |||||
International Bond | |||||
| 506,000 | 5.950%, 3/19/2019 | 561,660 | |||
| 140,000 | 5.125%, 1/15/2020 | 145,600 | |||
| 8,680,000 | 10.000%, 12/5/2024h | 837,992 | |||
| 36,000 | 6.750%, 9/27/2034 | 41,490 | |||
| 260,000 | 6.050%, 1/11/2040 | 274,300 | |||
Pemex Project Funding Master Trust | |||||
| 415,000 | 5.750%, 3/1/2018 | 434,748 | |||
Petroleos Mexicanos | |||||
| 275,000 | 8.000%, 5/3/2019 | 327,250 | |||
Total Mexico | 2,954,370 | ||||
| Pakistan (0.1%) | |||||
Pakistan Government International Bond | |||||
| 200,000 | 6.875%, 6/1/2017 | 179,760 | |||
Total Pakistan | 179,760 | ||||
| Panama (0.2%) | |||||
Panama Government International Bond | |||||
| 581,000 | 7.250%, 3/15/2015 | 672,508 | |||
Total Panama | 672,508 | ||||
| Peru (0.3%) | |||||
Peru Government International Bond | |||||
| 41,000 | 7.125%, 3/30/2019 | 48,483 | |||
| 100,000 | 7.350%, 7/21/2025 | 119,750 | |||
| 417,000 | 8.750%, 11/21/2033 | 565,035 | |||
| 207,000 | 6.550%, 3/14/2037 | 228,735 | |||
Total Peru | 962,003 | ||||
| Philippines (0.8%) | |||||
Philippines Government International Bond | |||||
| 100,000 | 9.875%, 1/15/2019 | 132,880 | |||
| 100,000 | 6.500%, 1/20/2020 | 109,800 | |||
| 100,000 | 7.500%, 9/25/2024 | 117,120 | |||
| 40,000 | 9.500%, 10/21/2024 | 53,552 | |||
| 920,000 | 10.625%, 3/16/2025 | 1,327,100 | |||
| 217,000 | 9.500%, 2/2/2030 | 293,493 | |||
| 100,000 | 7.750%, 1/14/2031 | 115,880 | |||
Total Philippines | 2,149,825 | ||||
| Qatar (0.3%) | |||||
Qatar Government International Bond | |||||
| 100,000 | 6.550%, 4/9/2019 | 113,250 | |||
| 340,000 | 5.250%, 1/20/2020 | 355,300 | |||
Ras Laffan Liquefied Natural Gas Company, Ltd. II | |||||
| 500,000 | 5.298%, 9/30/2020 | 517,500 | |||
Total Qatar | 986,050 | ||||
The accompanying Notes to Financial Statements are an integral part of this schedule.
191
Table of Contents
Partner Worldwide Allocation Portfoilio
Schedule of Investments as of June 30, 2010
(unaudited)
| Principal Amount | Long-Term Fixed Income (9.2%) | Value | |||
Romania (<0.1%) | |||||
Romania Government International Bond | |||||
| $57,000 | 6.500%, 6/18/2018 | $ | 68,305 | ||
Total Romania | 68,305 | ||||
Russia (0.6%) | |||||
Russia Government | |||||
International Bond | |||||
| 200,000 | 5.000%, 4/29/2020 | 193,000 | |||
| 1,407,600 | 7.500%, 3/31/2030 | 1,586,787 | |||
Total Russia | 1,779,787 | ||||
Serbia (<0.1%) | |||||
Serbia Government International Bond | |||||
| 145,000 | 6.750%, 11/1/2024 | 141,375 | |||
Total Serbia | 141,375 | ||||
South Africa (0.3%) | |||||
Peermont Global Proprietary, Ltd. | |||||
| 290,000 | 7.750%, 4/30/2014 | 301,418 | |||
South Africa Government International Bond | |||||
| 60,000 | 6.500%, 6/2/2014 | 66,600 | |||
| 100,000 | 6.875%, 5/27/2019 | 114,375 | |||
| 530,000 | 5.500%, 3/9/2020 | 547,888 | |||
| 110,000 | 5.875%, 5/30/2022 | 116,336 | |||
Total South Africa | 1,146,617 | ||||
Sri Lanka (0.1%) | |||||
Sri Lanka Government International Bond | |||||
| 100,000 | 8.250%, 10/24/2012 | 106,558 | |||
| 290,000 | 7.400%, 1/22/2015 | 298,700 | |||
Total Sri Lanka | 405,258 | ||||
Turkey (0.6%) | |||||
Turkey Government International Bond | |||||
| 810,000 | 5.625%, 3/30/2021 | 801,899 | |||
| 700,000 | 7.250%, 3/5/2038 | 750,750 | |||
| 300,000 | 6.750%, 5/30/2040 | 300,750 | |||
Total Turkey | 1,853,399 | ||||
Ukraine (0.3%) | |||||
NAK Naftogaz Ukraine | |||||
| 110,000 | 9.500%, 9/30/2014 | 113,853 | |||
Ukraine Government | |||||
International Bond | |||||
| 615,000 | 4.950%, 10/13/2015 | 652,376 | |||
| 200,000 | 6.580%, 11/21/2016 | 185,260 | |||
Total Ukraine | 951,489 | ||||
United Arab Emirates (0.1%) | |||||
Dolphin Energy, Ltd. | |||||
| 249,418 | 5.888%, 6/15/2019 | 257,836 | |||
Total United Arab Emirates | 257,836 | ||||
United States (0.1%) | |||||
J.P. Morgan Chase Bank NA | |||||
| 1,801,000,000 | 10.500%, 8/19/2030b,g | 212,326 | |||
Total United States | 212,326 | ||||
Uruguay (0.2%) | |||||
Uruguay Government | |||||
International Bond | |||||
| 140,000 | 9.250%, 5/17/2017 | 176,750 | |||
| 754 | 8.000%, 11/18/2022 | 909 | |||
| 150,000 | 7.875%, 1/15/2033 | 177,750 | |||
| 328,000 | 7.625%, 3/21/2036 | 380,480 | |||
Total Uruguay | 735,889 | ||||
Venezuela (0.4%) | |||||
Petroleos de Venezuela SA | |||||
| 370,000 | 5.000%, 10/28/2015 | 196,100 | |||
| 660,600 | 5.250%, 4/12/2017 | 353,421 | |||
Venezuela Government | |||||
International Bond | |||||
| 90,000 | 5.750%, 2/26/2016 | 56,250 | |||
| 100,000 | 13.625%, 8/15/2018 | 87,000 | |||
| 90,000 | 7.000%, 12/1/2018 | 52,200 | |||
| 140,000 | 7.750%, 10/13/2019 | 83,650 | |||
| 316,500 | 6.000%, 12/9/2020 | 166,954 | |||
| 455,000 | 8.250%, 10/13/2024 | 262,762 | |||
| 390,000 | 7.650%, 4/21/2025 | 210,600 | |||
Total Venezuela | 1,468,937 | ||||
Total Long-Term Fixed Income (cost $29,396,532) | 30,353,526 | ||||
| Principal Amount | Short-Term Investments (2.6%)i | ||||
Federal Home Loan Bank | |||||
Discount Notes | |||||
| 3,650,000 | 0.010%, 7/2/2010 | 3,649,999 | |||
| 200,000 | 0.045%, 7/9/2010 | 199,998 | |||
Federal National Mortgage | |||||
Association Discount Notes | |||||
| 100,000 | 0.180%, 7/7/2010j | 99,996 | |||
U.S. Treasury Bills | |||||
| 4,785,000 | 0.020%, 7/8/2010 | 4,784,981 | |||
Total Short-Term Investments (at amortized cost) | 8,734,974 | ||||
Total Investments (cost $328,452,414) 98.2% | $ | 324,480,295 | |||
Other Assets and Liabilities, Net 1.8% | 5,790,151 | ||||
Total Net Assets 100.0% | $ | 330,270,446 | |||
| a | Non-income producing security. |
| b | Security is fair valued as discussed in item 2(A) of the Notes to Financial Statements. |
| c | Denotes variable rate obligations for which the current coupon rate and next scheduled reset date are shown. |
| d | Denotes step coupon bonds for which the current interest rate and next scheduled reset date are shown. |
The accompanying Notes to Financial Statements are an integral part of this schedule.
192
Table of Contents
Partner Worldwide Allocation Portfolio
Schedule of Investments as of June 30, 2010
(unaudited)
| e | Denotes restricted securities. Restricted securities are investment securities which have been deemed illiquid and cannot be offered for public sale without first being registered under the Securities Act of 1933. The following table indicates the acquisition date and cost of restricted securities Partner Worldwide Allocation Portfolio owned as of June 30, 2010. |
Security | Acquisition Date | Amortized Cost | |||
Egypt Government International Bond | 4/28/2010 | $ | 125,000 | ||
Gabon Government International Bond | 7/9/2009 | 108,944 | |||
Independencia International, Ltd. | 5/8/2008 | 98,243 | |||
KazMunaiGaz Finance Sub BV | 4/28/2010 | 643,136 | |||
KazMunaiGaz Finance Sub BV | 6/24/2008 | 99,499 | |||
VIP Finance Ireland, Ltd. | 5/2/2008 | 100,930 | |||
| f | Denotes securities sold under Rule 144A of the Securities Act of 1933, which exempts them from registration. These securities have been deemed liquid and may be resold to other dealers in the program or to other qualified institutional buyers. As of June 30, 2010, the value of these investments was $176,588 or 0.1% of total net assets. |
| g | Principal amount is displayed in Indonesian Rupiah. Security is linked to Indonesian Government Bonds due 8/2030. |
| h | Principal amount is displayed in Mexican Pesos. |
| i | The interest rate shown reflects the yield, coupon rate or, for securities purchased at a discount, the discount rate at the date of purchase. |
| j | At June 30, 2010, $99,996 of investments were held on deposit with the counterparty and pledged as the initial margin deposit for open futures contracts. |
Definitions:
ADR | - | American Depositary Receipt, which are certificates for an underlying foreign security’s shares held by an issuing U.S. depository bank. | ||
GDR | - | Global Depository Receipts, which are certificates for shares of an underlying foreign security’s shares held by an issuing depository bank from more than one country. |
Unrealized Appreciation (Depreciation)
Gross unrealized appreciation and depreciation of investments, based on cost for federal income tax purposes, were as follows:
Gross unrealized appreciation | $ | 18,812,851 | ||
Gross unrealized depreciation | (22,784,970 | ) | ||
Net unrealized appreciation (depreciation) | $ | (3,972,119 | ) | |
Cost for federal income tax purposes | $ | 328,452,414 | ||
The accompanying Notes to Financial Statements are an integral part of this schedule.
193
Table of Contents
Partner Worldwide Allocation Portfolio
Schedule of Investments as of June 30, 2010
(unaudited)
Fair Valuation Measurements
The following table is a summary of the inputs used, as of June 30, 2010, in valuing Partner Worldwide Allocation Portfolio’s assets carried at fair value as discussed in the Notes to Financial Statements.
Investments in Securities | Total | Level 1 | Level 2 | Level 3 | ||||||||
Common Stock | ||||||||||||
Communications Services | 712,165 | — | 712,165 | — | ||||||||
Consumer Cyclical | 325,929 | — | 325,929 | — | ||||||||
Consumer Discretionary | 42,650,711 | — | 42,650,711 | — | ||||||||
Consumer Staples | 25,570,779 | 1,488,675 | 24,082,104 | — | ||||||||
Energy | 21,977,992 | 6,172,015 | 15,805,977 | — | ||||||||
Financials | 49,875,471 | 5,670,808 | 44,204,663 | — | ||||||||
Health Care | 23,990,245 | 727,860 | 23,262,385 | — | ||||||||
Industrials | 46,042,726 | 614,790 | 45,343,957 | 83,979 | ||||||||
Information Technology | 20,739,638 | 1,563,614 | 19,176,024 | — | ||||||||
Materials | 34,400,807 | 2,636,015 | 31,764,792 | — | ||||||||
Technology | 81,682 | — | 81,682 | — | ||||||||
Telecommunications Services | 13,148,513 | 1,759,807 | 11,388,706 | — | ||||||||
Utilities | 5,875,137 | — | 5,875,137 | — | ||||||||
Long-Term Fixed Income | ||||||||||||
Basic Materials | 340,206 | — | 340,206 | — | ||||||||
Communications Services | 355,450 | — | 355,450 | — | ||||||||
Consumer Cyclical | 478,006 | — | 478,006 | — | ||||||||
Consumer Non-Cyclical | 33,278 | — | 33,278 | — | ||||||||
Energy | 2,921,125 | — | 2,921,125 | — | ||||||||
Financials | 673,339 | — | 331,330 | 342,009 | ||||||||
Foreign | 167,450 | — | 167,450 | — | ||||||||
Foreign Government | 24,865,668 | — | 24,865,668 | — | ||||||||
Transportation | 199,800 | — | 199,800 | — | ||||||||
Utilities | 319,204 | — | 319,204 | — | ||||||||
Short-Term Investments | 8,734,974 | — | 8,734,974 | — | ||||||||
Total | $ | 324,480,295 | $ | 20,633,584 | $ | 303,420,723 | $ | 425,988 | ||||
Other Financial Instruments | Total | Level 1 | Level 2 | Level 3 | ||||||||
Asset Derivatives | ||||||||||||
Foreign Currency Forward Contracts | 56,056 | — | 56,056 | — | ||||||||
Total Asset Derivatives | $ | 56,056 | $ | — | $ | 56,056 | $ | — | ||||
Liability Derivatives | ||||||||||||
Futures Contracts | 19,976 | 19,976 | — | — | ||||||||
Foreign Currency Forward Contracts | 118,320 | — | 118,320 | — | ||||||||
Total Liability Derivatives | $ | 138,296 | $ | 19,976 | $ | 118,320 | $ | — | ||||
The following table is a reconciliation of assets in which significant unobservable inputs (Level 3) were used in determining fair value for Partner Worldwide Allocation Portfolio as discussed in item 2(A) of the Notes to Financial Statements.
Investments in Securities | Value December 31, 2009 | Accrued Discounts and/or Premiums | Realized Gain/(Loss) | Change in Unrealized Gain/(Loss) | Net Purchases/(Sales) | Transfers Into Level 3 | Transfers Out of Level 3 | Value June 30, 2010 | ||||||||||||||||||
Common Stock Industrials | — | — | — | (33,819 | ) | 117,798 | — | — | 83,979 | |||||||||||||||||
Long-Term Fixed Income Financials | — | (86 | ) | — | (4,524 | ) | 346,619 | — | — | 342,009 | ||||||||||||||||
Total | $ | — | ($ | 86 | ) | $ | — | ($ | 38,343 | ) | $ | 464,417 | $ | — | $ | — | $ | 425,988 | ||||||||
The accompanying Notes to Financial Statements are an integral part of this schedule.
194
Table of Contents
Partner Worldwide Allocation Portfolio
Schedule of Investments as of June 30, 2010
(unaudited)
Futures Contracts | Number of Contracts Long/(Short) | Expiration Date | Notional Principal Amount | Value | Unrealized Gain/(Loss) | |||||||||
E-Mini MSCI EAFE Index Futures | 4 | September 2010 | $ | 283,016 | $ | 263,040 | ($19,976 | ) | ||||||
Total Futures Contracts | ($19,976 | ) | ||||||||||||
Foreign Currency Forward Contracts | Contracts to Deliver/Receive | Settlement Date | Value on Settlement Date | Value | Unrealized Gain/(Loss) | |||||||||
Purchases | ||||||||||||||
Australian Dollar | 632,059 | 7/2/2010 | $ | 537,504 | $ | 532,037 | ($5,467 | ) | ||||||
British Pound | 661,271 | 7/1/2010 - 7/2/2010 | 989,853 | 988,007 | (1,846 | ) | ||||||||
Canadian Dollar | 940,703 | 7/2/2010 - 7/6/2010 | 887,802 | 883,622 | (4,180 | ) | ||||||||
Chinese Renminbi Yua | 4,716,904 | 9/17/2010 | 691,000 | 696,513 | 5,513 | |||||||||
Danish Krone | 99,946 | 7/2/2010 | 16,496 | 16,407 | (89 | ) | ||||||||
EURO | 889,997 | 7/2/2010 | 1,090,198 | 1,088,285 | (1,913 | ) | ||||||||
Hong Kong Dollar | 37,480 | 7/2/2010 | 4,813 | 4,813 | — | |||||||||
Indian Rupee | 13,295,590 | 7/12/2010 | 284,000 | 285,841 | 1,841 | |||||||||
Indian Rupee | 11,187,800 | 7/12/2010 | 243,584 | 240,525 | (3,059 | ) | ||||||||
Indonesian Rupiah | 3,343,597,001 | 7/12/2010 | 361,080 | 368,213 | 7,133 | |||||||||
Israeli Shekel | 807,890 | 7/1/2010 - 7/2/2010 | 208,470 | 207,812 | (658 | ) | ||||||||
Japanese Yen | 105,076,073 | 7/1/2010 - 7/2/2010 | 1,184,826 | 1,188,441 | 3,615 | |||||||||
Malaysian Ringgit | 814,000 | 7/12/2010 | 244,489 | 251,376 | 6,887 | |||||||||
Mexican Peso | 8,524,987 | 9/15/2010 | 658,173 | 653,794 | (4,379 | ) | ||||||||
Norwegian Krone | 1,019,577 | 7/2/2010 | 157,003 | 156,670 | (333 | ) | ||||||||
Singapore Dollar | 971,256 | 7/2/2010 | 695,493 | 694,102 | (1,391 | ) | ||||||||
South Korea Won | 273,760,001 | 7/12/2010 | 240,393 | 224,118 | (16,275 | ) | ||||||||
Swedish Krona | 592,604 | 7/2/2010 | 76,150 | 75,999 | (151 | ) | ||||||||
Swiss Franc | 708,951 | 7/2/2010 | 657,837 | 657,715 | (122 | ) | ||||||||
Total Foreign Currency Forward Contracts Purchases | $ | 9,229,164 | $ | 9,214,290 | ($14,874 | ) | ||||||||
Sales | ||||||||||||||
Australian Dollar | 299,765 | 7/2/2010 - 7/6/2010 | $ | 253,503 | $ | 252,327 | $ | 1,176 | ||||||
British Pound | 366,651 | 7/6/2010 | 548,356 | 547,813 | 543 | |||||||||
Canadian Dollar | 879,515 | 7/6/2010 | 831,384 | 826,148 | 5,236 | |||||||||
EURO | 1,566,850 | 7/1/2010 - 7/6/2010 | 1,913,134 | 1,915,930 | (2,796 | ) | ||||||||
EURO | 1,878,465 | 7/15/2010 - 9/15/2010 | 2,248,065 | 2,296,972 | (48,907 | ) | ||||||||
Hong Kong Dollar | 5,440,793 | 7/6/2010 | 698,676 | 698,711 | (35 | ) | ||||||||
Indonesian Rupiah | 6,434,721,889 | 7/12/2010 | 696,345 | 708,623 | (12,278 | ) | ||||||||
Japanese Yen | 179,516,612 | 7/1/2010 - 7/6/2010 | 2,024,565 | 2,030,387 | (5,822 | ) | ||||||||
Malaysian Ringgit | 814,000 | 7/12/2010 | 248,398 | 251,376 | (2,978 | ) | ||||||||
Mexican Peso | 14,918,869 | 9/15/2010 | 1,163,563 | 1,144,148 | 19,415 | |||||||||
Singapore Dollar | 1,143,193 | 7/1/2010 - 7/6/2010 | 818,328 | 816,976 | 1,352 | |||||||||
South Korea Won | 273,759,999 | 7/12/2010 | 220,144 | 224,118 | (3,974 | ) | ||||||||
Swedish Krona | 6,555,308 | 7/1/2010 - 7/6/2010 | 842,276 | 840,705 | 1,571 | |||||||||
Swiss Franc | 621,781 | 7/6/2010 | 576,952 | 576,845 | 107 | |||||||||
Total Foreign Currency Forward Contracts Sales | $ | 13,083,689 | $ | 13,131,079 | ($ | 47,390 | ) | |||||||
Net Unrealized Gain/(Loss) on Foreign Currency Forward Contracts | ($62,264 | ) | ||||||||||||
The accompanying Notes to Financial Statements are an integral part of this schedule.
195
Table of Contents
Partner Worldwide Allocation Portfolio
Schedule of Investments as of June 30, 2010
(unaudited)
The following table summarizes the fair value and Statement of Assets and Liabilities location, as of June 30, 2010, for Partner Worldwide Allocation Portfolio’s investments in financial derivative instruments by primary risk exposure as discussed under item (2) Significant Accounting Policies of the Notes to Financial Statements.
Derivatives by risk category | Statement of Assets and Liabilities Location | Fair Value | |||
Asset Derivatives | |||||
Foreign Exchange Contracts | |||||
Forward Contracts | Receivable/Payable for forward contracts, Net Assets - Net unrealized appreciation/(depreciation) on Foreign currency forward contracts | 56,056 | |||
Total Foreign Exchange Contracts | 56,056 | ||||
Total Asset Derivatives | $ | 56,056 | |||
Liability Derivatives | |||||
Equity Contracts | |||||
Futures* | Net Assets - Net unrealized appreciation/(depreciation) on Futures contracts | 19,976 | |||
Total Equity Contracts | 19,976 | ||||
Foreign Exchange Contracts | |||||
Forward Contracts | Receivable/Payable for forward contracts, Net Assets - Net unrealized appreciation/(depreciation) on Foreign currency forward contracts | 118,320 | |||
Total Foreign Exchange Contracts | 118,320 | ||||
Total Liability Derivatives | $ | 138,296 | |||
| * | Includes cumulative appreciation/depreciation of futures contracts as reported in the Schedule of Investments. Only current day’s variation margin is reported within the Statement of Assets and Liabilities. |
The following table summarizes the net realized gains/(losses) and Statement of Operations location, for the period ended June 30, 2010, for Partner Worldwide Allocation Portfolio’s investments in financial derivative instruments by primary risk exposure.
Derivatives by risk category | Statement of Operations Location | Realized Gains/(Losses) recognized in Income | |||
Equity Contracts | |||||
Futures | Net realized gains/(losses) on Futures contracts | (1,019,466 | ) | ||
Total Equity Contracts | (1,019,466 | ) | |||
Foreign Exchange Contracts | |||||
Forward Contracts | Net realized gains/(losses) on Foreign currency transactions | 266,278 | |||
Total Foreign Exchange Contracts | 266,278 | ||||
Total | ($753,188 | ) | |||
The following table summarizes the change in net unrealized appreciation/(depreciation) and Statement of Operations location, for the period ended June 30, 2010, for Partner Worldwide Allocation Portfolio’s investments in financial derivative instruments by primary risk exposure.
Derivatives by risk category | Statement of Operations Location | Change in unrealized appreciation/(depreciation) recognized in Income | |||
Equity Contracts | |||||
Futures | Change in net unrealized appreciation/(depreciation) on Futures contracts | (29,147 | ) | ||
Total Equity Contracts | (29,147 | ) | |||
Foreign Exchange Contracts | |||||
Forward Contracts | Change in net unrealized appreciation/(depreciation) on Foreign currency forward contracts | (107,889 | ) | ||
Total Foreign Exchange Contracts | (107,889 | ) | |||
Total | ($137,036 | ) | |||
The accompanying Notes to Financial Statements are an integral part of this schedule.
196
Table of Contents
Partner Worldwide Allocation Portfolio
Schedule of Investments as of June 30, 2010
(unaudited)
The following table presents Partner Worldwide Allocation Portfolio’s average volume of derivative activity during the period ended June 30, 2010.
Derivative Risk Category | Futures (Notional*) | Futures (Percentage of Average Net Assets) | Forwards (Notional*) | Forwards (Percentage of Average Net Assets) | ||||||||
Equity Contracts | $ | 5,006,842 | 1.6 | % | N/A | N/A | ||||||
Foreign Exchange Contracts | N/A | N/A | $ | 14,582,315 | 4.7 | % | ||||||
| * | Notional amount represents long or short, or both, derivative positions held by the portfolio. |
The accompanying Notes to Financial Statements are an integral part of this schedule.
197
Table of Contents
Partner International Stock Portfolio
Schedule of Investments as of June 30, 2010
(unaudited)
The accompanying Notes to Financial Statements are an integral part of this schedule.
198
Table of Contents
Partner International Stock Portfolio
Schedule of Investments as of June 30, 2010
(unaudited)
| Shares | Common Stock (96.6%) | Value | |||
| Indonesia (0.5%) - continued | |||||
| 27,800 | Telekomunik Indonesia SP ADRa | $ | 951,594 | ||
Total Indonesia | 3,667,264 | ||||
| Israel (1.3%) | |||||
| 12,916 | Delek Group, Ltd. | 2,676,740 | |||
| 34,891 | Elbit Systems, Ltd. | 1,771,033 | |||
| 95,664 | Teva Pharmaceutical Industries, Ltd. | 4,998,183 | |||
Total Israel | 9,445,956 | ||||
| Italy (2.9%) | |||||
| 146,730 | Astaldi SPA | 741,814 | |||
| 103,434 | Banca Generali SPA | 986,582 | |||
| 29,256 | Danieli & Company Officine Meccaniche SPA | 530,525 | |||
| 1,460,100 | Enel SPAa | 6,181,947 | |||
| 255,600 | Eni SPA | 4,691,563 | |||
| 165,799 | Indesit Company SPA | 1,860,545 | |||
| 362,454 | Mediaset SPA | 2,061,042 | |||
| 1,057,424 | Parmalat SPA | 2,457,625 | |||
| 68,535 | Saipem SPA | 2,087,351 | |||
Total Italy | 21,598,994 | ||||
| Japan (23.1%) | |||||
| 119,800 | Aeon Company, Ltd. | 1,267,644 | |||
| 56,700 | Aisin Seiki Company, Ltd. | 1,526,509 | |||
| 225,400 | Alps Electric Company, Ltd.b | 1,929,866 | |||
| 151,000 | Asahi Glass Company, Ltd. | 1,417,864 | |||
| 585,700 | Bridgestone Corporation | 9,261,192 | |||
| 45,000 | Canon, Inc. | 1,677,125 | |||
| 134 | Central Japan Railway Company | 1,106,417 | |||
| 151,000 | Chiba Bank, Ltd. | 911,603 | |||
| 82,000 | Dai Nippon Printing Company, Ltd. | 946,388 | |||
| 159,000 | Daicel Chemical Industries, Ltd. | 1,072,710 | |||
| 520,400 | Daiichi Sankyo Company, Ltd. | 9,297,408 | |||
| 236,500 | Daito Trust Construction Company, Ltd. | 13,392,678 | |||
| 1,682,700 | Daiwa Securities Group, Inc. | 7,104,281 | |||
| 16,800 | Disco Corporation | 1,062,835 | |||
| 122,500 | East Japan Railway Company | 8,156,732 | |||
| 105,800 | Elpida Memory, Inc.b | 1,625,455 | |||
| 78,800 | Fuji Oil Company, Ltd. | 1,158,526 | |||
| 294,000 | Fujitsu, Ltd. | 1,837,742 | |||
| 814,000 | Hitachi, Ltd.b | 2,956,697 | |||
| 193,900 | Honda Motor Company, Ltd. | 5,695,394 | |||
| 319,300 | ITOCHU Corporation | 2,496,116 | |||
| 49,300 | Japan Petroleum Exploration Company | 2,011,369 | |||
| 419,400 | Kao Corporation | 9,868,000 | |||
| 47,000 | K’s Holdings Corporation | 960,887 | |||
| 19,700 | Kyocera Corporation | 1,594,840 | |||
| 329,000 | Marubeni Corporation | 1,686,586 | |||
| 80,400 | Mitsubishi Corporation | 1,663,351 | |||
| 171,445 | MS and AD Insurance Group Holdings, Inc. | 3,669,494 | |||
| 47,400 | Murata Manufacturing Company, Ltd. | 2,260,415 | |||
| 60,872 | Nippon Suisan Kaisha, Ltd. | 197,594 | |||
| 1,347,800 | Nissan Motor Company, Ltd.b | 9,392,115 | |||
| 1,854 | NTT DoCoMo, Inc. | 2,807,493 | |||
| 214,400 | Resona Holdings, Inc. | 2,616,536 | |||
| 157,700 | Secom Company, Ltd. | 7,002,837 | |||
| 104,000 | Shin-Etsu Chemical Company, Ltd. | 4,835,500 | |||
| 96,600 | Softbank Corporation | 2,562,147 | |||
| 826 | Sony Financial Holdings, Inc. | 2,755,336 | |||
| 867,200 | Sumitomo Corporation | 8,660,733 | |||
| 138,100 | Sumitomo Electric Industries, Ltd. | 1,609,408 | |||
| 1,734,100 | Sumitomo Trust and Banking Company, Ltd. | 8,828,588 | |||
| 61,800 | Takeda Pharmaceutical Company, Ltd. | 2,654,474 | |||
| 55,200 | TDK Corporation | 3,020,668 | |||
| 61,300 | Tokai Rika Company, Ltd. | 1,060,360 | |||
| 141,100 | Tokio Marine Holdings, Inc. | 3,709,498 | |||
| 51,100 | Tokyo Electron, Ltd. | 2,752,613 | |||
| 767,000 | Tokyo Gas Company, Ltd. | 3,501,463 | |||
| 193,000 | Toray Industries, Inc. | 925,064 | |||
| 30,010 | Yamada Denki Company, Ltd. | 1,960,847 | |||
Total Japan | 170,469,398 | ||||
| Luxembourg (0.1%) | |||||
| 70,622 | Acergy SAa | 1,045,624 | |||
Total Luxembourg | 1,045,624 | ||||
| Netherlands (3.7%) | |||||
| 129,200 | Arcelor Mittal | 3,465,208 | |||
| 44,287 | Heineken NV | 1,877,112 | |||
| 41,417 | Imtech NV | 1,065,959 | |||
| 250,088 | Koninklijke (Royal) Ahold NV | 3,093,409 | |||
| 267,704 | Koninklijke (Royal) KPN NV | 3,412,129 | |||
| 102,680 | Koninklijke (Royal) Philips Electronics NV | 3,066,087 | |||
| 189,128 | Koninklijke DSM NV | 7,517,849 | |||
| 138,085 | Unilever NV | 3,770,812 | |||
Total Netherlands | 27,268,565 | ||||
| Norway (3.0%) | |||||
| 109,873 | Aker Solutions ASA | 1,256,254 | |||
| 182,262 | DnB NOR ASA | 1,753,018 | |||
| 513,583 | Statoil ASA | 9,894,006 | |||
| 233,484 | Telenor ASA | 2,941,246 | |||
| 237,550 | Yara International ASA | 6,677,364 | |||
Total Norway | 22,521,888 | ||||
| Portugal (0.2%) | |||||
| 530,363 | Electricidade de Portugal SA | 1,578,248 | |||
Total Portugal | 1,578,248 | ||||
| Singapore (1.9%) | |||||
| 290,800 | Golden Agri-Resources, Ltd. Warrants, 0.54 SGD, expires 7/23/2012b | 20,782 | |||
| 544,350 | Keppel Corporation, Ltd. | 3,286,523 | |||
| 108,870 | K-Green Trustb | 81,693 | |||
| 755,900 | Singapore Airlines, Ltd. | 7,838,012 | |||
| 190,000 | United Overseas Bank, Ltd. | 2,664,047 | |||
Total Singapore | 13,891,057 | ||||
| South Korea (1.8%) | |||||
| 14,150 | POSCO | 5,361,589 | |||
| 25,110 | SK Telecom Company, Ltd. | 3,290,774 | |||
The accompanying Notes to Financial Statements are an integral part of this schedule.
199
Table of Contents
Partner International Stock Portfolio
Schedule of Investments as of June 30, 2010
(unaudited)
| Shares | Common Stock (96.6%) | Value | |||
| South Korea (1.8%) - continued | |||||
| 299,640 | SK Telecom Company, Ltd. ADRa | $ | 4,413,697 | ||
Total South Korea | 13,066,060 | ||||
| Spain (0.8%) | |||||
| 42,196 | Industria de Diseno Textil SA (Inditex) | 2,405,961 | |||
| 205,000 | Telefonica SA | 3,797,363 | |||
Total Spain | 6,203,324 | ||||
| Sweden (1.0%) | |||||
| 143,322 | Atlas Copco AB | 2,095,451 | |||
| 135,215 | Electrolux AB | 3,091,105 | |||
| 9,918 | Elekta AB | 252,357 | |||
| 88,050 | Svenska Cellulosa AB | 1,035,580 | |||
| 47,495 | Svenska Handelsbanken AB | 1,161,904 | |||
Total Sweden | 7,636,397 | ||||
Switzerland (12.4%) | |||||
| 55,697 | ABB, Ltd.b | 969,672 | |||
| 138,400 | Adecco SA | 6,602,305 | |||
| 19,207 | Aryzta AG | 741,267 | |||
| 110,709 | Compagnie Financiere Richemont SA | 3,864,924 | |||
| 216,520 | Credit Suisse Group | 8,140,160 | |||
| 9,727 | Givaudan SA | 8,261,076 | |||
| 4,910 | Helvetia Holding AG | 1,288,590 | |||
| 105,464 | Holcim, Ltd. | 7,059,621 | |||
| 361,739 | Nestle SA | 17,441,800 | |||
| 328,176 | Novartis AG | 15,903,673 | |||
| 17,840 | Pargesa Holding SA | 1,169,790 | |||
| 41,879 | Roche Holding AG | 5,764,029 | |||
| 12,194 | Schindler Holding AG | 1,027,740 | |||
| 7,804 | Swatch Group AG | 2,200,821 | |||
| 95,811 | UBS AGb | 1,269,222 | |||
| 45,576 | Zurich Financial Services AG | 10,045,104 | |||
Total Switzerland | 91,749,794 | ||||
Thailand (0.9%) | |||||
| 889,600 | PTT pcl | 6,688,199 | |||
Total Thailand | 6,688,199 | ||||
United Kingdom (14.6%) | |||||
| 53,161 | Aggreko plc | 1,123,903 | |||
| 135,475 | Anglo American plcb | 4,720,635 | |||
| 66,376 | Associated British Foods plc | 961,227 | |||
| 59,507 | AstraZeneca plc | 2,805,498 | |||
| 126,872 | Babcock International Group plc | 1,127,119 | |||
| 254,602 | Barclays plc | 1,016,240 | |||
| 202,083 | BG Group plc | 3,005,520 | |||
| 173,584 | BHP Billiton plc | 4,500,761 | |||
| 72,044 | British American Tobacco plc | 2,286,366 | |||
| 1,230,806 | BT Group plc | 2,375,733 | |||
| 2,992,051 | Cable & Wireless Communications plc | 2,581,667 | |||
| 431,306 | Compass Group plc | 3,281,096 | |||
| 60,991 | Diageo plc | 958,032 | |||
| 509,521 | GlaxoSmithKline plc | 8,652,036 | |||
| 158,100 | HSBC Holdings plc ADRa | 7,207,779 | |||
| 37,222 | Imperial Tobacco Group plc | 1,040,003 | |||
| 304,144 | Invensys plc | 1,088,793 | |||
| 5,820,114 | Lloyds TSB Group plcb | 4,594,003 | |||
| 319,706 | Marks and Spencer Group plc | 1,574,981 | |||
| 256,650 | National Grid plc | $ | 1,873,779 | ||
| 24,360 | Next plc | 726,280 | |||
| 638,300 | Pearson plc | 8,394,700 | |||
| 71,017 | Pennon Group plc | 586,768 | |||
| 113,744 | Rio Tinto plc | 4,994,981 | |||
| 245,424 | Rolls-Royce Group plcb | 2,048,500 | |||
| 52,640 | Shire, Ltd. | 1,079,863 | |||
| 104,029 | Standard Chartered plc | 2,533,144 | |||
| 1,653,899 | Tesco plc | 9,330,087 | |||
| 89,001 | Unilever plc | 2,379,171 | |||
| 3,986,987 | Vodafone Group plc | 8,214,635 | |||
| 56,461 | Whitbread plc | 1,179,067 | |||
| 1,037,000 | WPP plc | 9,768,995 | |||
Total United Kingdom | 108,011,362 | ||||
Total Common Stock (cost $771,955,740) | 715,190,448 | ||||
| Shares | Collateral Held for Securities Loaned (4.3%) | |||
| 31,575,411 | Thrivent Financial Securities Lending Trust | 31,575,411 | ||
| Total Collateral Held for Securities Loaned (cost $31,575,411) | 31,575,411 | |||
| Principal Amount | Short-Term Investments (1.7%)c | |||||
Federal Home Loan Bank Discount Notes | ||||||
| 5,000,000 | 0.050%, 7/9/2010 Jupiter Securitization Company, LLC | 4,999,944 | ||||
| 5,995,000 | 0.090%, 7/1/2010 U.S. Treasury Bills | 5,995,000 | ||||
| 1,555,000 | 0.020%, 7/8/2010 | 1,554,994 | ||||
Total Short-Term Investments (at amortized cost) | 12,549,938 | |||||
Total Investments (cost $816,081,089) 102.6% | $ | 759,315,797 | ||||
Other Assets and Liabilities, Net (2.6%) | (18,912,930 | ) | ||||
Total Net Assets 100.0% | $ | 740,402,867 | ||||
| a | All or a portion of the security is on loan as discussed in item 2(M) of the Notes to Financial Statements. |
| b | Non-income producing security. |
| c | The interest rate shown reflects the yield, coupon rate or, for securities purchased at a discount, the discount rate at the date of purchase. |
Definitions:
| ADR | - | American Depositary Receipt, which are certificates for an underlying foreign security’s shares held by an issuing U.S. depository bank. |
The accompanying Notes to Financial Statements are an integral part of this schedule.
200
Table of Contents
Partner International Stock Portfolio
Schedule of Investments as of June 30, 2010
(unaudited)
Unrealized Appreciation (Depreciation)
Gross unrealized appreciation and depreciation of investments, based on cost for federal income tax purposes, were as follows:
Gross unrealized appreciation | $ | 35,566,148 | ||
Gross unrealized depreciation | (92,331,440 | ) | ||
Net unrealized appreciation (depreciation) | $ | (56,765,292 | ) | |
Cost for federal income tax purposes | $ | 816,081,089 | ||
Fair Valuation Measurements
The following table is a summary of the inputs used, as of June 30, 2010, in valuing Partner International Stock Portfolio’s assets carried at fair value as discussed in the Notes to Financial Statements.
Investments in Securities | Total | Level 1 | Level 2 | Level 3 | ||||||||
Common Stock | ||||||||||||
Communications Services | 2,715,670 | — | 2,715,670 | — | ||||||||
Consumer Cyclical | 925,064 | — | 925,064 | — | ||||||||
Consumer Discretionary | 105,344,922 | — | 105,344,922 | — | ||||||||
Consumer Staples | 74,087,045 | — | 74,087,045 | — | ||||||||
Energy | 44,408,811 | 3,531,528 | 40,877,283 | — | ||||||||
Financials | 126,144,599 | 7,207,779 | 118,936,820 | — | ||||||||
Health Care | 64,206,419 | — | 64,206,419 | — | ||||||||
Industrials | 105,118,031 | — | 105,118,031 | — | ||||||||
Information Technology | 32,796,110 | — | 32,796,110 | — | ||||||||
Materials | 103,048,116 | 2,814,860 | 100,233,256 | — | ||||||||
Technology | 313,308 | — | 313,308 | — | ||||||||
Telecommunications Services | 37,776,411 | 5,365,291 | 32,411,120 | — | ||||||||
Utilities | 18,305,942 | — | 18,305,942 | — | ||||||||
Collateral Held for Securities Loaned | 31,575,411 | 31,575,411 | — | — | ||||||||
Short-Term Investments | 12,549,938 | — | 12,549,938 | — | ||||||||
Total | $ | 759,315,797 | $ | 50,494,869 | $ | 708,820,928 | $ | — | ||||
Other Financial Instruments | Total | Level 1 | Level 2 | Level 3 | ||||||||
Asset Derivatives | ||||||||||||
Foreign Currency Forward Contracts | 63,789 | — | 63,789 | — | ||||||||
Total Asset Derivatives | $ | 63,789 | $ | — | $ | 63,789 | $ | — | ||||
Liability Derivatives | ||||||||||||
Foreign Currency Forward Contracts | 97,596 | — | 97,596 | — | ||||||||
Total Liability Derivatives | $ | 97,596 | $ | — | $ | 97,596 | $ | — | ||||
The accompanying Notes to Financial Statements are an integral part of this schedule.
201
Table of Contents
Partner International Stock Portfolio
Schedule of Investments as of June 30, 2010
(unaudited)
Foreign Currency Forward Contracts | Contracts to Deliver/Receive | Settlement Date | Value on Settlement Date | Value | Unrealized Gain/(Loss) | |||||||||
Purchases | ||||||||||||||
Australian Dollar | 2,245,661 | 7/2/2010 | $ | 1,910,385 | $ | 1,890,287 | ($ | 20,098 | ) | |||||
British Pound | 1,673,024 | 7/2/2010 - 7/6/2010 | 2,502,176 | 2,499,663 | (2,513 | ) | ||||||||
Canadian Dollar | 3,504,748 | 7/2/2010 - 7/6/2010 | 3,307,627 | 3,292,080 | (15,547 | ) | ||||||||
EURO | 2,890,761 | 7/2/2010 | 3,541,181 | 3,534,801 | (6,380 | ) | ||||||||
Israeli Shekel | 2,907,648 | 7/1/2010 - 7/2/2010 | 750,415 | 747,928 | (2,487 | ) | ||||||||
Japanese Yen | 333,225,090 | 7/2/2010 | 3,758,506 | 3,768,875 | 10,369 | |||||||||
Norwegian Krone | 3,548,289 | 7/2/2010 | 546,395 | 545,236 | (1,159 | ) | ||||||||
Singapore Dollar | 3,690,698 | 7/2/2010 | 2,642,820 | 2,637,532 | (5,288 | ) | ||||||||
South Korean Won | 1,435,395,948 | 7/1/2010 | 1,160,450 | 1,174,662 | 14,212 | |||||||||
Swedish Krona | 1,949,714 | 7/2/2010 | 250,541 | 250,047 | (494 | ) | ||||||||
Swiss Franc | 2,484,935 | 7/2/2010 | 2,305,776 | 2,305,348 | (428 | ) | ||||||||
Total Foreign Currency Forward Contracts Purchases | $ | 22,676,272 | $ | 22,646,459 | ($29,813 | ) | ||||||||
Sales | ||||||||||||||
British Pound | 1,416,372 | 7/6/2010 | $ | 2,118,299 | $ | 2,116,200 | $ | 2,099 | ||||||
Canadian Dollar | 3,388,112 | 7/6/2010 | 3,202,664 | 3,182,521 | 20,143 | |||||||||
EURO | 4,637,275 | 7/1/2010 - 7/6/2010 | 5,665,993 | 5,670,427 | (4,434 | ) | ||||||||
Hong Kong Dollar | 20,757,029 | 7/2/2010 - 7/6/2010 | 2,665,497 | 2,665,635 | (138 | ) | ||||||||
Japanese Yen | 618,322,052 | 7/2/2010 - 7/6/2010 | 6,974,094 | 6,993,407 | (19,313 | ) | ||||||||
Singapore Dollar | 4,393,159 | 7/1/2010 - 7/6/2010 | 3,144,868 | 3,139,539 | 5,329 | |||||||||
South Korean Won | 1,435,395,948 | 7/1/2010 | 1,160,450 | 1,174,662 | (14,212 | ) | ||||||||
Swedish Krona | 24,109,765 | 7/6/2010 | 3,098,145 | 3,092,026 | 6,119 | |||||||||
Swiss Franc | 2,398,409 | 7/6/2010 | 2,225,489 | 2,225,076 | 413 | |||||||||
Total Foreign Currency Forward Contracts Sales | $ | 30,255,499 | $ | 30,259,493 | ($3,994 | ) | ||||||||
Net Unrealized Gain/(Loss) on Foreign Currency Forward Contracts | ($33,807 | ) | ||||||||||||
The following table summarizes the fair value and Statement of Assets and Liabilities location, as of June 30, 2010, for Partner International Stock Portfolio’s investments in financial derivative instruments by primary risk exposure as discussed under item (2) Significant Accounting Policies of the Notes to Financial Statements.
Derivatives by risk category | Statement of Assets and Liabilities Location | Fair Value | |||
Asset Derivatives | |||||
Foreign Exchange Contracts | |||||
Forward Contracts | Receivable/Payable for forward contracts, Net Assets - Net unrealized appreciation/(depreciation) on Foreign currency forward contracts | 63,789 | |||
Total Foreign Exchange Contracts | 63,789 | ||||
Total Asset Derivatives | $ | 63,789 | |||
Liability Derivatives | |||||
Foreign Exchange Contracts | |||||
Forward Contracts | Receivable/Payable for forward contracts, Net Assets - Net unrealized appreciation/(depreciation) on Foreign currency forward contracts | 97,596 | |||
Total Foreign Exchange Contracts | 97,596 | ||||
Total Liability Derivatives | $ | 97,596 | |||
The accompanying Notes to Financial Statements are an integral part of this schedule.
202
Table of Contents
Partner International Stock Portfolio
Schedule of Investments as of June 30, 2010
(unaudited)
The following table summarizes the net realized gains/(losses) and Statement of Operations location, for the period ended June 30, 2010, for Partner International Stock Portfolio’s investments in financial derivative instruments by primary risk exposure.
Derivatives by risk category | Statement of Operations Location | Realized Gains/(Losses) recognized in Income | |||
Foreign Exchange Contracts | |||||
Forward Contracts | Net realized gains/(losses) on Foreign currency transactions | (260,880 | ) | ||
Total Foreign Exchange Contracts | (260,880 | ) | |||
Total | ($260,880) | ||||
The following table summarizes the change in net unrealized appreciation/(depreciation) and Statement of Operations location, for the period ended June 30, 2010, for Partner International Stock Portfolio’s investments in financial derivative instruments by primary risk exposure.
Derivatives by risk category | Statement of Operations Location | Change in unrealized appreciation/(depreciation) recognized in Income | |||
Foreign Exchange Contracts | |||||
Forward Contracts | Change in net unrealized appreciation/(depreciation) on Foreign currency forward contracts | (34,361 | ) | ||
Total Foreign Exchange Contracts | (34,361 | ) | |||
Total | ($34,361) | ||||
The following table presents Partner International Stock Portfolio’s average volume of derivative activity during the period ended June 30, 2010.
Derivative Risk Category | Forwards (Notional*) | Forwards (Percentage of Average Net Assets) | ||||
Foreign Exchange Contracts | $ | 11,919,383 | 1.4 | % | ||
| * | Notional amount represents long or short, or both, derivative positions held by the portfolio. |
Investment in Affiliates
Affiliated issuers, as defined under the Investment Company Act of 1940, include those in which the Portfolio’s holdings of an issuer represent 5% or more of the outstanding voting securities of an issuer, or any affiliated mutual fund.
A summary of transactions for the fiscal year to date, in Partner International Stock Portfolio, is as follows:
Portfolio | Value December 31, 2009 | Gross Purchases | Gross Sales | Shares Held at June 30, 2010 | Value June 30, 2010 | Income Earned January 1, 2010 – June 30, 2010 | |||||||||||
Thrivent Financial Securities Lending Trust | $ | 13,880,242 | $ | 204,398,924 | $ | 186,703,755 | 31,575,411 | $ | 31,575,411 | $ | 466,282 | ||||||
Total Value and Income Earned | 13,880,242 | 31,575,411 | 466,282 | ||||||||||||||
The accompanying Notes to Financial Statements are an integral part of this schedule.
203
Table of Contents
Partner Socially Responsible Stock Portfolio
Schedule of Investments as of June 30, 2010
(unaudited)
| a | Non-income producing security. |
Definitions:
ADR- | American Depositary Receipt, which are certificates for an underlying foreign security’s shares held by an issuing U.S. depository bank. |
Unrealized Appreciation (Depreciation)
Gross unrealized appreciation and depreciation of investments, based on cost for federal income tax purposes, were as follows:
Gross unrealized appreciation | $ | 179,437 | ||
Gross unrealized depreciation | (456,237 | ) | ||
Net unrealized appreciation (depreciation) | $ | (276,800 | ) | |
Cost for federal income tax purposes | $ | 3,892,553 | ||
The accompanying Notes to Financial Statements are an integral part of this schedule.
204
Table of Contents
Partner Socially Responsible Stock Portfolio
Schedule of Investments as of June 30, 2010
(unaudited)
Fair Valuation Measurements
The following table is a summary of the inputs used, as of June 30, 2010, in valuing Partner Socially Responsible Stock Portfolio’s assets carried at fair value as discussed in the Notes to Financial Statements.
Investments in Securities | Total | Level 1 | Level 2 | Level 3 | ||||||||
Common Stock | ||||||||||||
Consumer Discretionary | 431,794 | 431,794 | — | — | ||||||||
Consumer Staples | 366,237 | 366,237 | — | — | ||||||||
Energy | 219,982 | 219,982 | — | — | ||||||||
Financials | 473,524 | 473,524 | — | — | ||||||||
Health Care | 598,863 | 598,863 | — | — | ||||||||
Industrials | 372,878 | 372,878 | — | — | ||||||||
Information Technology | 976,514 | 976,514 | — | — | ||||||||
Materials | 112,275 | 112,275 | — | — | ||||||||
Utilities | 63,686 | 63,686 | — | — | ||||||||
Total | $ | 3,615,753 | $ | 3,615,753 | $ | — | $ | — | ||||
The accompanying Notes to Financial Statements are an integral part of this schedule.
205
Table of Contents
Partner All Cap Growth Portfolio
Schedule of Investments as of June 30, 2010
(unaudited)
The accompanying Notes to Financial Statements are an integral part of this schedule.
206
Table of Contents
Partner All Cap Growth Portfolio
Schedule of Investments as of June 30, 2010
(unaudited)
| Shares | Common Stock (99.2%) | Value | |||
Telecommunications Services (0.7%) | |||||
| 1,775 | NII Holdings, Inc.a | $ | 57,723 | ||
Total Telecommunications Services | 57,723 | ||||
Total Common Stock (cost $7,805,863) | 7,750,837 | ||||
Total Investments (cost $7,805,863) 99.2% | $ | 7,750,837 | |||
Other Assets and Liabilities, Net 0.8% | 61,172 | ||||
Total Net Assets 100.0% | $ | 7,812,009 | |||
| a | Non-income producing security. |
Definitions:
ADR | - | American Depositary Receipt, which are certificates for an underlying foreign security’s shares held by an issuing U.S. depository bank. |
Unrealized Appreciation (Depreciation)
Gross unrealized appreciation and depreciation of investments, based on cost for federal income tax purposes, were as follows:
Gross unrealized appreciation | $ | 636,142 | ||
Gross unrealized depreciation | (691,168 | ) | ||
Net unrealized appreciation (depreciation) | $ | (55,026 | ) | |
Cost for federal income tax purposes | $ | 7,805,863 | ||
Fair Valuation Measurements
The following table is a summary of the inputs used, as of June 30, 2010, in valuing Partner All Cap Growth Portfolio’s assets carried at fair value as discussed in the Notes to Financial Statements.
Investments in Securities | Total | Level 1 | Level 2 | Level 3 | ||||||||
Common Stock | ||||||||||||
Consumer Discretionary | 1,231,864 | 1,231,864 | — | — | ||||||||
Consumer Staples | 86,788 | 86,788 | — | — | ||||||||
Energy | 759,434 | 759,434 | — | — | ||||||||
Financials | 457,220 | 457,220 | — | — | ||||||||
Health Care | 818,856 | 818,856 | — | — | ||||||||
Industrials | 906,734 | 906,734 | — | — | ||||||||
Information Technology | 3,080,177 | 3,080,177 | — | — | ||||||||
Materials | 352,041 | 352,041 | — | — | ||||||||
Telecommunications Services | 57,723 | 57,723 | — | — | ||||||||
Total | $ | 7,750,837 | $ | 7,750,837 | $ | — | $ | — | ||||
The accompanying Notes to Financial Statements are an integral part of this schedule.
207
Table of Contents
Partner All Cap Value Portfolio
Schedule of Investments as of June 30, 2010
(unaudited)
| a | Non-income producing security. |
Definitions:
| ADR | - | American Depositary Receipt, which are certificates for an underlying foreign security's shares held by an issuing U.S. depository bank. |
Unrealized Appreciation (Depreciation)
Gross unrealized appreciation and depreciation of investments, based on cost for federal income tax purposes, were as follows:
Gross unrealized appreciation | $ | 241,945 | ||
Gross unrealized depreciation | (643,989 | ) | ||
Net unrealized appreciation (depreciation) | $ | (402,044 | ) | |
Cost for federal income tax purposes | $ | 5,826,792 | ||
The accompanying Notes to Financial Statements are an integral part of this schedule.
208
Table of Contents
Partner All Cap Value Portfolio
Schedule of Investments as of June 30, 2010
(unaudited)
Fair Valuation Measurements
The following table is a summary of the inputs used, as of June 30, 2010, in valuing Partner All Cap Value Portfolio's assets carried at fair value as discussed in the Notes to Financial Statements.
Investments in Securities | Total | Level 1 | Level 2 | Level 3 | ||||||||
Common Stock | ||||||||||||
Consumer Discretionary | 572,856 | 572,856 | — | — | ||||||||
Consumer Staples | 523,559 | 523,559 | — | — | ||||||||
Energy | 718,473 | 718,473 | — | — | ||||||||
Financials | 1,299,628 | 1,299,628 | — | — | ||||||||
Health Care | 756,120 | 756,120 | — | — | ||||||||
Industrials | 729,637 | 729,637 | — | — | ||||||||
Information Technology | 250,969 | 250,969 | — | — | ||||||||
Materials | 231,296 | 231,296 | — | — | ||||||||
Telecommunications Services | 98,042 | 98,042 | — | — | ||||||||
Utilities | 244,168 | 244,168 | — | — | ||||||||
Total | $ | 5,424,748 | $ | 5,424,748 | $ | — | $ | — | ||||
The following table presents Partner All Cap Value Portfolio's average volume of derivative activity during the period ended June 30, 2010.
Derivative Risk Category | Options (Contracts) | |
Equity Contracts | 2 |
The accompanying Notes to Financial Statements are an integral part of this schedule.
209
Table of Contents
Partner All Cap Portfolio
Schedule of Investments as of June 30, 2010
(unaudited)
The accompanying Notes to Financial Statements are an integral part of this schedule.
210
Table of Contents
Partner All Cap Portfolio
Schedule of Investments as of June 30, 2010
(unaudited)
Shares | Common Stock (99.2%) | Value | ||||
| Information Technology (18.9%) - continued | ||||||
46,140 | Western Digital Corporationa | $ | 1,391,582 | |||
| Total Information Technology | 10,192,112 | |||||
| Materials (3.6%) | ||||||
3,490 | Albemarle Corporation | 138,588 | ||||
4,160 | Cliffs Natural Resources, Inc. | 196,186 | ||||
1,060 | Compass Minerals International, Inc. | 74,497 | ||||
9,160 | Dow Chemical Company | 217,275 | ||||
4,810 | Ecolab, Inc. | 216,017 | ||||
9,900 | Goldcorp, Inc. | 434,115 | ||||
5,760 | Monsanto Company | 266,227 | ||||
3,120 | Newmont Mining Corporation | 192,629 | ||||
2,650 | Praxair, Inc. | 201,373 | ||||
Total Materials | 1,936,907 | |||||
| Telecommunications Services (2.9%) | ||||||
| 6,220 | American Tower Corporationa | 276,790 | ||||
| 13,092 | AT&T, Inc. | 316,695 | ||||
| 16,180 | NII Holdings, Inc.a | 526,174 | ||||
| 84,050 | Qwest Communications International, Inc. | 441,262 | ||||
| Total Telecommunications Services | 1,560,921 | |||||
| Utilities (3.6%) | ||||||
| 24,780 | American Electric Power Company, Inc. | 800,394 | ||||
| 12,780 | American Water Works Company, Inc. | 263,268 | ||||
| 14,000 | CMS Energy Corporation | 205,100 | ||||
| 11,430 | PG&E Corporation | 469,773 | ||||
| 52,400 | RRI Energy, Inc.a | 198,596 | ||||
| Total Utilities | 1,937,131 | |||||
| Total Common Stock (cost $56,303,354) |
| 53,376,164 |
| |||
Shares | Collateral Held for Securities Loaned (5.2%) | |||||
| 2,793,525 | Thrivent Financial Securities Lending Trust | 2,793,525 | ||||
Total Collateral Held for Securities Loaned (cost $2,793,525) | 2,793,525 | |||||
Principal | Short-Term Investments (0.8%)c | |||||
Federal Home Loan Bank Discount Notes | ||||||
| $ 100,000 | 0.045%, 7/9/2010 | 99,999 | ||||
U.S. Treasury Bills | ||||||
| 320,000 | 0.020%, 7/8/2010 | $ | 319,999 | |||
Total Short-Term Investments (at amortized cost) | 419,998 | |||||
Total Investments (cost $59,516,877) 105.2% | $ | 56,589,687 | ||||
Other Assets and Liabilities, Net (5.2%) | (2,780,007 | ) | ||||
Total Net Assets 100.0% | $ | 53,809,680 | ||||
| a | Non-income producing security. |
| b | All or a portion of the security is on loan as discussed in item 2(M) of the Notes to Financial Statements. |
| c | The interest rate shown reflects the yield, coupon rate or, for securities purchased at a discount, the discount rate at the date of purchase. |
Definitions:
ADR | - | American Depositary Receipt, which are certificates for an underlying foreign security’s shares held by an issuing U.S. depository bank. |
Unrealized Appreciation (Depreciation)
Gross unrealized appreciation and depreciation of investments, based on cost for federal income tax purposes, were as follows:
Gross unrealized appreciation | $ | 3,400,766 | ||
Gross unrealized depreciation | $ | (6,327,956 | ) | |
Net unrealized appreciation (depreciation) | $ | (2,927,190 | ) | |
Cost for federal income tax purposes | $ | 59,516,877 | ||
The accompanying Notes to Financial Statements are an integral part of this schedule.
211
Table of Contents
Partner All Cap Portfolio
Schedule of Investments as of June 30, 2010
(unaudited)
Fair Valuation Measurements
The following table is a summary of the inputs used, as of June 30, 2010, in valuing Partner All Cap Portfolio’s assets carried at fair value as discussed in the Notes to Financial Statements.
Investments in Securities | Total | Level 1 | Level 2 | Level 3 | ||||||||
Common Stock | ||||||||||||
Consumer Discretionary | 5,370,539 | 5,370,539 | — | — | ||||||||
Consumer Staples | 6,077,411 | 6,077,411 | — | — | ||||||||
Energy | 5,648,818 | 5,648,818 | — | — | ||||||||
Financials | 8,604,768 | 8,604,768 | — | — | ||||||||
Health Care | 6,531,508 | 6,531,508 | — | — | ||||||||
Industrials | 5,516,049 | 5,516,049 | — | — | ||||||||
Information Technology | 10,192,112 | 10,192,112 | — | — | ||||||||
Materials | 1,936,907 | 1,936,907 | — | — | ||||||||
Telecommunications Services | 1,560,921 | 1,560,921 | — | — | ||||||||
Utilities | 1,937,131 | 1,937,131 | — | — | ||||||||
Collateral Held for Securities Loaned | 2,793,525 | 2,793,525 | — | — | ||||||||
Short-Term Investments | 419,998 | — | 419,998 | — | ||||||||
Total | $ | 56,589,687 | $ | 56,169,689 | $ | 419,998 | $ | — | ||||
Investment in Affiliates
Affiliated issuers, as defined under the Investment Company Act of 1940, include those in which the Portfolio’s holdings of an issuer represent 5% or more of the outstanding voting securities of an issuer, or any affiliated mutual fund.
A summary of transactions for the fiscal year to date, in Partner All Cap Portfolio, is as follows:
Portfolio | Value December 31, 2009 | Gross Purchases | Gross Sales | Shares Held at June 30, 2010 | Value June 30, 2010 | Income Earned January 1, 2010 - June 30, 2010 | |||||||||||
Thrivent Financial | $ | 1,275,375 | $ | 12,305,589 | $ | 10,787,439 | 2,793,525 | $ | 2,793,525 | $ | 1,642 | ||||||
Total Value and Income Earned | 1,275,375 | 2,793,525 | 1,642 | ||||||||||||||
The accompanying Notes to Financial Statements are an integral part of this schedule.
212
Table of Contents
Large Cap Growth Portfolio II
Schedule of Investments as of June 30, 2010
(unaudited)
Common Stock (96.1%) | Value | ||||
| Consumer Discretionary (12.7%) | |||||
| 40,430 | Amazon.com, Inc.a | $ | 4,417,382 | ||
| 153,750 | Carnival Corporation | 4,649,400 | |||
| 197,800 | Comcast Corporation | 3,435,786 | |||
| 308,555 | International Game Technology | 4,844,314 | |||
| 181,150 | J.C. Penney Company, Inc. | 3,891,102 | |||
| 198,245 | Kohl’s Corporationa | 9,416,637 | |||
| 216,650 | Lowe’s Companies, Inc. | 4,423,993 | |||
| 163,150 | Walt Disney Company | 5,139,225 | |||
| Total Consumer Discretionary | 40,217,839 | ||||
| Consumer Staples (5.7%) | |||||
| 140,632 | PepsiCo, Inc. | 8,571,520 | |||
| 75,500 | Philip Morris International, Inc. | 3,460,920 | |||
| 125,400 | Wal-Mart Stores, Inc. | 6,027,978 | |||
Total Consumer Staples | 18,060,418 | ||||
| Energy (8.1%) | |||||
| 80,550 | ENSCO International plc ADR | 3,164,004 | |||
| 128,950 | Occidental Petroleum Corporation | 9,948,492 | |||
| 145,337 | Schlumberger, Ltd. | 8,042,950 | |||
| 98,800 | Ultra Petroleum Corporationa | 4,371,900 | |||
Total Energy | 25,527,346 | ||||
| Financials (6.8%) | |||||
| 1,978,400 | Citigroup, Inc.a | 7,438,784 | |||
| 25,260 | Goldman Sachs Group, Inc. | 3,315,880 | |||
| 209,850 | Hartford Financial Services Group, Inc. | 4,643,980 | |||
| 40,863 | IntercontinentalExchange, Inc.a | 4,618,745 | |||
| 63,900 | SunTrust Banks, Inc. | 1,488,870 | |||
Total Financials | 21,506,259 | ||||
| Health Care (14.8%) | |||||
| 136,715 | Celgene Corporationa | 6,947,856 | |||
| 82,175 | Gilead Sciences, Inc.a | 2,816,959 | |||
| 116,017 | Medco Health Solutions, Inc.a | 6,390,217 | |||
| 174,500 | Teva Pharmaceutical Industries, Ltd. ADR | 9,072,255 | |||
| 177,883 | Thermo Fisher Scientific, Inc.a | 8,725,161 | |||
| 196,170 | UnitedHealth Group, Inc. | 5,571,228 | |||
| 135,900 | Zimmer Holdings, Inc.a | 7,345,395 | |||
Total Health Care | 46,869,071 | ||||
| Industrials (8.0%) | |||||
| 101,450 | Cooper Industries plc | 4,463,800 | |||
| 122,100 | CSX Corporation | 6,059,823 | |||
| 156,190 | Dover Corporation | 6,527,180 | |||
| 30,900 | FedEx Corporation | 2,166,399 | |||
| 70,000 | Siemens AG ADRb | 6,267,100 | |||
Total Industrials | 25,484,302 | ||||
| Information Technology (37.0%) | |||||
| 230,050 | Adobe Systems, Inc.a | 6,080,222 | |||
| 127,250 | Analog Devices, Inc. | 3,545,185 | |||
| 71,616 | Apple, Inc.a | 18,013,573 | |||
| 608,916 | Cisco Systems, Inc.a | 12,976,000 | |||
| 155,600 | Corning, Inc. | 2,512,940 | |||
| 186,200 | EMC Corporationa | 3,407,460 | |||
| 35,453 | Google, Inc.a | 15,774,812 | |||
| 179,900 | Hewlett-Packard Company | 7,786,072 | |||
| 345,461 | Intel Corporation | 6,719,216 | |||
| 61,400 | KLA-Tencor Corporation | 1,711,832 | |||
| 90,600 | Lam Research Corporationa | 3,448,236 | |||
| 41,800 | MasterCard, Inc. | 8,340,354 | |||
| 62,350 | McAfee, Inc.a | 1,915,392 | |||
| 572,450 | Micron Technology, Inc.a | 4,860,101 | |||
| 397,200 | Microsoft Corporation | 9,139,572 | |||
| 316,977 | Oracle Corporation | 6,802,326 | |||
| 54,900 | Visa, Inc. | 3,884,175 | |||
Total Information Technology | 116,917,468 | ||||
| Materials (3.0%) | |||||
| 49,600 | CF Industries Holdings, Inc. | 3,147,120 | |||
| 105,208 | Freeport-McMoRan Copper & Gold, Inc. | 6,220,949 | |||
Total Materials | 9,368,069 | ||||
Total Common Stock (cost $310,984,332) | 303,950,772 | ||||
Collateral Held for Securities Loaned (0.7%) | |||||
| 2,058,750 | Thrivent Financial Securities Lending Trust | 2,058,750 | |||
Total Collateral Held for Securities Loaned (cost $2,058,750) | 2,058,750 | ||||
Principal | Short-Term Investments (2.6%)c | ||||
Federal Home Loan Bank Discount Notes | |||||
| $7,000,000 | 0.140%, 7/2/2010 | 6,999,973 | |||
Jupiter Securitization Company, LLC | |||||
| 1,285,000 | 0.090%, 7/1/2010 | 1,285,000 | |||
Total Short-Term Investments (at amortized cost) | 8,284,973 | ||||
Total Investments (cost $321,328,055) 99.4% | $ | 314,294,495 | |||
Other Assets and Liabilities, Net 0.6% | 1,869,766 | ||||
Total Net Assets 100.0% | $ | 316,164,261 | |||
| a | Non-income producing security. |
| b | All or a portion of the security is on loan as discussed in item 2(M) of the Notes to Financial Statements. |
| c | The interest rate shown reflects the yield, coupon rate or, for securities purchased at a discount, the discount rate at the date of purchase. |
Definitions:
ADR | - | American Depositary Receipt, which are certificates for an underlying foreign security’s shares held by an issuing U.S. depository bank. |
The accompanying Notes to Financial Statements are an integral part of this schedule.
213
Table of Contents
Large Cap Growth Portfolio II
Schedule of Investments as of June 30, 2010
(unaudited)
Unrealized Appreciation (Depreciation)
Gross unrealized appreciation and depreciation of investments, based on cost for federal income tax purposes, were as follows:
Gross unrealized appreciation | $ | 19,427,105 | ||
Gross unrealized depreciation | (26,460,665 | ) | ||
Net unrealized appreciation (depreciation) | $ | (7,033,560 | ) | |
Cost for federal income tax purposes | $ | 321,328,055 | ||
Fair Valuation Measurements
The following table is a summary of the inputs used, as of June 30, 2010, in valuing Large Cap Growth Portfolio II’s assets carried at fair value as discussed in the Notes to Financial Statements.
Investments in Securities | Total | Level 1 | Level 2 | Level 3 | ||||||||
Common Stock | ||||||||||||
Consumer Discretionary | 40,217,839 | 40,217,839 | — | — | ||||||||
Consumer Staples | 18,060,418 | 18,060,418 | — | — | ||||||||
Energy | 25,527,346 | 25,527,346 | — | — | ||||||||
Financials | 21,506,259 | 21,506,259 | — | — | ||||||||
Health Care | 46,869,071 | 46,869,071 | — | — | ||||||||
Industrials | 25,484,302 | 25,484,302 | — | — | ||||||||
Information Technology | 116,917,468 | 116,917,468 | — | — | ||||||||
Materials | 9,368,069 | 9,368,069 | — | — | ||||||||
Collateral Held for Securities Loaned | 2,058,750 | 2,058,750 | — | — | ||||||||
Short-Term Investments | 8,284,973 | — | 8,284,973 | — | ||||||||
Total | $ | 314,294,495 | $ | 306,009,522 | $ | 8,284,973 | $ | — | ||||
The following table summarizes the net realized gains/(losses) and Statement of Operations location, for the period ended June 30, 2010, for Large Cap Growth Portfolio II’s investments in financial derivative instruments by primary risk exposure.
Derivatives by risk category | Statement of Operations Location | Realized Gains/(Losses) recognized in Income | |||
| Equity Contracts | |||||
Options Written | Net realized gains/(losses) on Written option contracts | 53,646 | |||
Total Equity Contracts | 53,646 | ||||
Total | $ | 53,646 | |||
The following table summarizes the change in net unrealized appreciation/(depreciation) and Statement of Operations location, for the period ended June 30, 2010, for Large Cap Growth Portfolio II’s investments in financial derivative instruments by primary risk exposure.
Derivatives by risk category | Statement of Operations Location | Change in unrealized appreciation/(depreciation) recognized in Income | |||
| Equity Contracts | |||||
Options Written | Change in net unrealized appreciation/(depreciation) on Written option contracts | 2,234 | |||
Total Equity Contracts | 2,234 | ||||
Total | $ | 2,234 | |||
The accompanying Notes to Financial Statements are an integral part of this schedule.
214
Table of Contents
Large Cap Growth Portfolio II
Schedule of Investments as of June 30, 2010
(unaudited)
The following table presents Large Cap Growth Portfolio II’s average volume of derivative activity during the period ended June 30, 2010.
Derivative Risk Category | Options (Contracts) | |
Equity Contracts | 72 |
Investment in Affiliates
Affiliated issuers, as defined under the Investment Company Act of 1940, include those in which the Portfolio’s holdings of an issuer represent 5% or more of the outstanding voting securities of an issuer, or any affiliated mutual fund.
A summary of transactions for the fiscal year to date, in Large Cap Growth Portfolio II, is as follows:
Portfolio | Value December 31, 2009 | Gross Purchases | Gross Sales | Shares Held at June 30, 2010 | Value June 30, 2010 | Income Earned January 1, 2010 - June 30, 2010 | |||||||||||
Thrivent Financial Securities Lending Trust | $ | 6,796,273 | $ | 16,447,975 | $ | 21,185,498 | 2,058,750 | $ | 2,058,750 | $ | 13,393 | ||||||
Total Value and Income Earned | 6,796,273 | 2,058,750 | 13,393 | ||||||||||||||
The accompanying Notes to Financial Statements are an integral part of this schedule.
215
Table of Contents
Large Cap Growth Portfolio
Schedule of Investments as of June 30, 2010
(unaudited)
The accompanying Notes to Financial Statements are an integral part of this schedule.
216
Table of Contents
Large Cap Growth Portfolio
Schedule of Investments as of June 30, 2010
(unaudited)
| Shares | Common Stock (99.0%) | Value | ||||
| Information Technology (34.0%) - continued | ||||||
| 249,900 | Yahoo!, Inc.a | $ | 3,456,117 | |||
Total Information Technology | 291,726,654 | |||||
| Materials (3.0%) | ||||||
| 83,300 | CF Industries Holdings, Inc. | 5,285,385 | ||||
| 16,700 | Cliffs Natural Resources, Inc. | 787,572 | ||||
| 93,500 | Crown Holdings, Inc.a | 2,341,240 | ||||
| 181,200 | Dow Chemical Company | 4,298,064 | ||||
| 200,900 | Freeport-McMoRan Copper & Gold, Inc. | 11,879,217 | ||||
| 14,500 | Potash Corporation of Saskatchewan, Inc. | 1,250,480 | ||||
Total Materials | 25,841,958 | |||||
| Telecommunications Services (1.5%) | ||||||
| 135,800 | America Movil SA de CV ADR | 6,450,500 | ||||
| 180,000 | SBA Communications Corporationa,b | 6,121,800 | ||||
Total Telecommunications Services | 12,572,300 | |||||
Total Common Stock (cost $870,668,008) | 850,153,287 | |||||
Collateral Held for Securities Loaned (1.9%) | ||||||
| 16,468,709 | Thrivent Financial Securities Lending Trust | 16,468,709 | ||||
Total Collateral Held for Securities Loaned (cost $16,468,709) | 16,468,709 | |||||
Principal | Short-Term Investments (1.1%)c | |||||
Federal Home Loan Bank Discount Notes | ||||||
| 100,000 | 0.045%, 7/9/2010 | 99,999 | ||||
Federal Home Loan Mortgage Corporation Discount Notes | ||||||
| 5,000,000 | 0.085%, 7/23/2010 | 4,999,740 | ||||
Federal National Mortgage Association Discount Notes | ||||||
| 2,000,000 | 0.080%, 7/14/2010 | 1,999,942 | ||||
U.S. Treasury Bills | ||||||
| 2,630,000 | 0.020%, 7/8/2010 | 2,629,990 | ||||
Total Short-Term Investments (at amortized cost) | 9,729,671 | |||||
Total Investments (cost $896,866,388) 102.0% | $ | 876,351,667 | ||||
Other Assets and Liabilities, Net (2.0%) | (17,533,627 | ) | ||||
Total Net Assets 100.0% | $ | 858,818,040 | ||||
| a | Non-income producing security. |
| b | All or a portion of the security is on loan as discussed in item 2(M) of the Notes to Financial Statements. |
| c | The interest rate shown reflects the yield, coupon rate or, for securities purchased at a discount, the discount rate at the date of purchase. |
Definitions:
ADR | - | American Depositary Receipt, which are certificates for an underlying foreign security’s shares held by an issuing U.S. depository bank. |
Unrealized Appreciation (Depreciation)
Gross unrealized appreciation and depreciation of investments, based on cost for federal income tax purposes, were as follows:
Gross unrealized appreciation | $ | 60,240,658 | ||
Gross unrealized depreciation | (80,755,379 | ) | ||
Net unrealized appreciation (depreciation) | $ | (20,514,721 | ) | |
Cost for federal income tax purposes | $ | 896,866,388 | ||
The accompanying Notes to Financial Statements are an integral part of this schedule.
217
Table of Contents
Large Cap Growth Portfolio
Schedule of Investments as of June 30, 2010
(unaudited)
Fair Valuation Measurements
The following table is a summary of the inputs used, as of June 30, 2010, in valuing Large Cap Growth Portfolio’s assets carried at fair value as discussed in the Notes to Financial Statements.
Investments in Securities | Total | Level 1 | Level 2 | Level 3 | ||||||||
Common Stock | ||||||||||||
Consumer Discretionary | 120,531,703 | 120,531,703 | — | — | ||||||||
Consumer Staples | 34,138,909 | 34,138,909 | — | — | ||||||||
Energy | 77,258,520 | 77,258,520 | — | — | ||||||||
Financials | 74,054,327 | 74,054,327 | — | — | ||||||||
Health Care | 124,796,094 | 124,796,094 | — | — | ||||||||
Industrials | 89,232,822 | 89,232,822 | — | — | ||||||||
Information Technology | 291,726,654 | 291,726,654 | — | — | ||||||||
Materials | 25,841,958 | 25,841,958 | — | — | ||||||||
Telecommunications Services | 12,572,300 | 12,572,300 | — | — | ||||||||
Collateral Held for Securities Loaned | 16,468,709 | 16,468,709 | — | — | ||||||||
Short-Term Investments | 9,729,671 | — | 9,729,671 | — | ||||||||
Total | $ | 876,351,667 | $ | 866,621,996 | $ | 9,729,671 | $ | — | ||||
The following table summarizes the net realized gains/(losses) and Statement of Operations location, for the period ended June 30, 2010, for Large Cap Growth Portfolio’s investments in financial derivative instruments by primary risk exposure.
Derivatives by risk category | Statement of Operations Location | Realized Gains/(Losses) recognized in Income | |||
Equity Contracts | |||||
Options Written | Net realized gains/(losses) on Written option contracts | 247,478 | |||
Total Equity Contracts | 247,478 | ||||
Total | $ | 247,478 | |||
The following table summarizes the change in net unrealized appreciation/(depreciation) and Statement of Operations location, for the period ended June 30, 2010, for Large Cap Growth Portfolio’s investments in financial derivative instruments by primary risk exposure.
Derivatives by risk category | Statement of Operations Location | Change in unrealized appreciation/(depreciation) recognized in Income | |||
| Equity Contracts | |||||
Options Written | Change in net unrealized appreciation/(depreciation) on Written option contracts | 5,235 | |||
Total Equity Contracts | 5,235 | ||||
Total | $ | 5,235 | |||
The following table presents Large Cap Growth Portfolio’s average volume of derivative activity during the period ended June 30, 2010.
Derivative Risk Category | Options (Contracts) | |
Equity Contracts | 232 |
The accompanying Notes to Financial Statements are an integral part of this schedule.
218
Table of Contents
Large Cap Growth Portfolio
Schedule of Investments as of June 30, 2010
(unaudited)
Investment in Affiliates
Affiliated issuers, as defined under the Investment Company Act of 1940, include those in which the Portfolio’s holdings of an issuer represent 5% or more of the outstanding voting securities of an issuer, or any affiliated mutual fund.
A summary of transactions for the fiscal year to date, in Large Cap Growth Portfolio, is as follows:
Portfolio | Value December 31, 2009 | Gross Purchases | Gross Sales | Shares Held at June 30, 2010 | Value June 30, 2010 | Income Earned January 1, 2010 - June 30, 2010 | |||||||||||
Thrivent Financial Securities | $ | 30,719,415 | $ | 107,944,692 | $ | 122,195,398 | 16,468,709 | $ | 16,468,709 | $ | 28,709 | ||||||
Total Value and Income Earned | 30,719,415 | 16,468,709 | 28,709 | ||||||||||||||
The accompanying Notes to Financial Statements are an integral part of this schedule.
219
Table of Contents
Partner Growth Stock Portfolio
Schedule of Investments as of June 30, 2010
(unaudited)
Common Stock (99.4%) | Value | ||||
| Consumer Discretionary (15.1%) | |||||
| 15,800 | Amazon.com, Inc.a | $ | 1,726,308 | ||
| 2,300 | AutoZone, Inc.a | 444,406 | |||
| 12,800 | CarMax, Inc.a | 254,720 | |||
| 8,400 | Carnival plc | 272,087 | |||
| 13,600 | Coach, Inc. | 497,080 | |||
| 6,100 | Kohl’s Corporationa | 289,750 | |||
| 32,100 | Liberty Media Corporation - Interactivea | 337,050 | |||
| 25,500 | Lowe’s Companies, Inc. | 520,710 | |||
| 19,433 | Marriott International, Inc. | 581,824 | |||
| 6,600 | McGraw-Hill Companies, Inc. | 185,724 | |||
| 18,300 | MGM Resorts Internationala,b | 176,412 | |||
| 6,900 | NIKE, Inc. | 466,095 | |||
| 5,400 | O’Reilly Automotive, Inc.a | 256,824 | |||
| 700 | Priceline.com, Inc.a | 123,578 | |||
| 30,500 | Starbucks Corporation | 741,150 | |||
| 8,100 | Starwood Hotels & Resorts Worldwide, Inc. | 335,583 | |||
| 19,000 | Walt Disney Company | 598,500 | |||
| Total Consumer Discretionary | 7,807,801 | ||||
| Consumer Staples (2.5%) | |||||
| 7,600 | Costco Wholesale Corporation | 416,708 | |||
| 6,900 | PepsiCo, Inc. | 420,555 | |||
| 7,737 | Procter & Gamble Company | 464,065 | |||
| Total Consumer Staples | 1,301,328 | ||||
| Energy (6.2%) | |||||
| 9,700 | Cameron International Corporationa | 315,444 | |||
| 6,300 | EOG Resources, Inc. | 619,731 | |||
| 5,400 | FMC Technologies, Inc.a | 284,364 | |||
| 3,400 | Murphy Oil Corporation | 168,470 | |||
| 16,500 | Petroleo Brasileiro SA ADR | 491,700 | |||
| 14,500 | Schlumberger, Ltd. | 802,430 | |||
| 18,400 | Suncor Energy, Inc. | 541,696 | |||
Total Energy | 3,223,835 | ||||
| Financials (12.2%) | |||||
| 26,400 | American Express Company | 1,048,080 | |||
| 23,000 | Charles Schwab Corporation | 326,140 | |||
| 6,600 | Franklin Resources, Inc. | 568,854 | |||
| 4,600 | IntercontinentalExchange, Inc.a | 519,938 | |||
| 26,200 | Invesco, Ltd. | 440,946 | |||
| 28,000 | J.P. Morgan Chase & Company | 1,025,080 | |||
| 8,400 | Morgan Stanley | 194,964 | |||
| 10,200 | Northern Trust Corporation | 476,340 | |||
| 9,200 | NYSE Euronext | 254,196 | |||
| 4,500 | PNC Financial Services Group, Inc. | 254,250 | |||
| 7,300 | Sun Life Financial, Inc. | 191,723 | |||
| 23,900 | U.S. Bancorp | 534,165 | |||
| 19,300 | Wells Fargo & Company | 494,080 | |||
Total Financials | 6,328,756 | ||||
| Health Care (9.5%) | |||||
| 9,300 | Allergan, Inc. | 541,818 | |||
| 4,700 | Celgene Corporationa | 238,854 | |||
| 26,000 | Express Scripts, Inc.a | 1,222,520 | |||
| 5,200 | Illumina, Inc.a | 226,356 | |||
| 1,000 | Intuitive Surgical, Inc.a | 315,620 | |||
| 9,200 | McKesson Corporation | 617,872 | |||
| 20,800 | Medco Health Solutions, Inc.a | 1,145,664 | |||
| 8,200 | Stryker Corporation | 410,492 | |||
| 3,900 | Zimmer Holdings, Inc.a | 210,795 | |||
Total Health Care | 4,929,991 | ||||
| Industrials (11.8%) | |||||
| 6,400 | 3M Company | 505,536 | |||
| 2,400 | Bucyrus International, Inc. | 113,880 | |||
| 43,900 | Danaher Corporation | 1,629,568 | |||
| 4,300 | Deere & Company | 239,424 | |||
| 3,600 | Emerson Electric Company | 157,284 | |||
| 11,000 | Expeditors International of Washington, Inc. | 379,610 | |||
| 9,300 | Fastenal Companyb | 466,767 | |||
| 6,000 | FedEx Corporation | 420,660 | |||
| 10,600 | McDermott International, Inc.a | 229,596 | |||
| 9,400 | PACCAR, Inc. | 374,778 | |||
| 5,800 | Precision Castparts Corporation | 596,936 | |||
| 9,100 | Republic Services, Inc. | 270,543 | |||
| 4,600 | Rockwell Automation, Inc. | 225,814 | |||
| 2,300 | Union Pacific Corporation | 159,873 | |||
| 5,700 | United Parcel Service, Inc. | 324,273 | |||
Total Industrials | 6,094,542 | ||||
| Information Technology (33.9%) | |||||
| 14,400 | Accenture plc | 556,560 | |||
| 10,100 | Akamai Technologies, Inc.a | 409,757 | |||
| 15,600 | Apple, Inc.a | 3,923,868 | |||
| 6,800 | ASML Holding NV | 186,796 | |||
| 3,900 | Autodesk, Inc.a | 95,004 | |||
| 6,800 | Automatic Data Processing, Inc. | 273,768 | |||
| 13,800 | Baidu.com, Inc. ADRa | 939,504 | |||
| 14,500 | Broadcom Corporation | 478,065 | |||
| 29,500 | Cisco Systems, Inc.a | 628,645 | |||
| 24,000 | Corning, Inc. | 387,600 | |||
| 9,300 | Dolby Laboratories, Inc.a | 583,017 | |||
| 18,200 | eBay, Inc.a | 356,902 | |||
| 6,000 | Google, Inc.a | 2,669,700 | |||
| 7,600 | Hewlett-Packard Company | 328,928 | |||
| 2,700 | International Business Machines Corporation | 333,396 | |||
| 19,600 | Juniper Networks, Inc.a | 447,272 | |||
| 15,100 | Marvell Technology Group, Ltd.a | 237,976 | |||
| 3,650 | MasterCard, Inc. | 728,285 | |||
| 7,100 | McAfee, Inc.a | 218,112 | |||
| 19,900 | NVIDIA Corporationa | 203,179 | |||
| 24,000 | QUALCOMM, Inc. | 788,160 | |||
| 1,800 | Salesforce.com, Inc.a | 154,476 | |||
| 263 | Samsung Electronics Company, Ltd. | 164,957 | |||
| 5,300 | SanDisk Corporationa | 222,971 | |||
| 31,500 | Tencent Holdings, Ltd. | 521,868 | |||
| 21,600 | Visa, Inc. | 1,528,200 | |||
| 15,200 | Western Union Company | 226,632 | |||
Total Information Technology | 17,593,598 | ||||
| Materials (3.5%) | |||||
| 2,800 | Agnico-Eagle Mines, Ltd. | 170,184 | |||
| 15,784 | BHP Billiton, Ltd. | 491,033 | |||
The accompanying Notes to Financial Statements are an integral part of this schedule.
220
Table of Contents
Partner Growth Stock Portfolio
Schedule of Investments as of June 30, 2010
(unaudited)
Shares | Common Stock (99.4%) | Value | ||||
| Materials (3.5%) - continued | ||||||
| 1,200 | Freeport-McMoRan Copper & Gold, Inc. | $ | 70,956 | |||
| 14,200 | Praxair, Inc. | 1,079,058 | ||||
Total Materials | 1,811,231 | |||||
| Telecommunications Services (4.7%) | ||||||
| 22,100 | American Tower Corporationa | 983,450 | ||||
| 34,400 | Crown Castle International Corporationa | 1,281,744 | ||||
| 4,800 | Leap Wireless International, Inc.a | 62,304 | ||||
| 13,600 | MetroPCS Communications, Inc.a | 111,384 | ||||
Total Telecommunications Services | 2,438,882 | |||||
Total Common Stock (cost $41,739,370) | 51,529,964 | |||||
Collateral Held for Securities Loaned (1.3%) | ||||||
| 669,349 | Thrivent Financial Securities Lending Trust | 669,349 | ||||
Total Collateral Held for Securities Loaned (cost $669,349) | 669,349 | |||||
Principal Amount | Short-Term Investments (0.2%)c | |||||
| 100,000 | U.S. Treasury Bills 0.020%, 7/8/2010 | 100,000 | ||||
Total Short-Term Investments (at amortized cost) | 100,000 | |||||
Total Investments (cost $42,508,719) 100.9% | $ | 52,299,313 | ||||
Other Assets and Liabilities, Net (0.9%) | (490,292 | ) | ||||
Total Net Assets 100.0% | $ | 51,809,021 | ||||
| a | Non-income producing security. |
| b | All or a portion of the security is on loan as discussed in item 2(M) of the Notes to Financial Statements. |
| c | The interest rate shown reflects the yield, coupon rate or, for securities purchased at a discount, the discount rate at the date of purchase. |
Definitions:
| ADR - | American Depositary Receipt, which are certificates for an underlying foreign security’s shares held by an issuing U.S. depository bank. |
Unrealized Appreciation (Depreciation)
Gross unrealized appreciation and depreciation of investments, based on cost for federal income tax purposes, were as follows:
Gross unrealized appreciation | $ | 12,093,195 | ||||
Gross unrealized depreciation | (2,302,601 | ) | ||||
Net unrealized appreciation (depreciation) | $ | 9,790,594 | ||||
Cost for federal income tax purposes | $ | 42,508,719 | ||||
The accompanying Notes to Financial Statements are an integral part of this schedule.
221
Table of Contents
Partner Growth Stock Portfolio
Schedule of Investments as of June 30, 2010
(unaudited)
Fair Valuation Measurements
The following table is a summary of the inputs used, as of June 30, 2010, in valuing Partner Growth Stock Portfolio’s assets carried at fair value as discussed in the Notes to Financial Statements.
Investments in Securities | Total | Level 1 | Level 2 | Level 3 | ||||||||
Common Stock | ||||||||||||
Consumer Discretionary | 7,807,801 | 7,535,714 | 272,087 | — | ||||||||
Consumer Staples | 1,301,328 | 1,301,328 | — | — | ||||||||
Energy | 3,223,835 | 3,223,835 | — | — | ||||||||
Financials | 6,328,756 | 6,137,033 | 191,723 | — | ||||||||
Health Care | 4,929,991 | 4,929,991 | — | — | ||||||||
Industrials | 6,094,542 | 6,094,542 | — | — | ||||||||
Information Technology | 17,593,598 | 16,906,773 | 686,825 | — | ||||||||
Materials | 1,811,231 | 1,320,198 | 491,033 | — | ||||||||
Telecommunications Services | 2,438,882 | 2,438,882 | — | — | ||||||||
Collateral Held for Securities Loaned | 669,349 | 669,349 | — | — | ||||||||
Short-Term Investments | 100,000 | — | 100,000 | — | ||||||||
Total | $ | 52,299,313 | $ | 50,557,645 | $ | 1,741,668 | $ | — | ||||
The following table summarizes the net realized gains/(losses) and Statement of Operations location, for the period ended June 30, 2010, for Partner Growth Stock Portfolio’s investments in financial derivative instruments by primary risk exposure.
Derivatives by risk category | Statement of Operations Location | Realized Gains/(Losses) recognized in Income | |||
Foreign Exchange Contracts | |||||
Forward Contracts | Net realized gains/(losses) on Foreign currency transactions | (843 | ) | ||
Total Foreign Exchange Contracts | (843 | ) | |||
Total | ($843 | ) | |||
The following table presents Partner Growth Stock Portfolio’s average volume of derivative activity during the period ended June 30, 2010.
Derivative Risk Category | Forwards (Notional*) | Forwards (Percentage of Average Net Assets) | ||||
Foreign Exchange Contracts | $ | 16,848 | <0.1 | % | ||
| * | Notional amount represents long or short, or both, derivative positions held by the portfolio. |
Investment in Affiliates
Affiliated issuers, as defined under the Investment Company Act of 1940, include those in which the Portfolio’s holdings of an issuer represent 5% or more of the outstanding voting securities of an issuer, or any affiliated mutual fund.
A summary of transactions for the fiscal year to date, in Partner Growth Stock Portfolio, is as follows:
Portfolio | Value December 31, 2009 | Gross Purchases | Gross Sales | Shares Held at June 30, 2010 | Value June 30, 2010 | Income Earned January 1, 2010 - June 30, 2010 | |||||||||||
Thrivent Financial Securities Lending Trust | $ | 196,140 | $ | 3,700,821 | $ | 3,227,612 | 669,349 | $ | 669,349 | $ | 349 | ||||||
Total Value and Income Earned | 196,140 | 669,349 | 349 | ||||||||||||||
The accompanying Notes to Financial Statements are an integral part of this schedule.
222
Table of Contents
Large Cap Value Portfolio
Schedule of Investments as of June 30, 2010
(unaudited)
Common Stock (97.6%) | Value | ||||
| Consumer Discretionary (12.3%) | |||||
| 107,987 | Carnival Corporation | $ | 3,265,527 | ||
| 808,530 | Dana Holding Corporationa | 8,085,300 | |||
| 559,428 | International Game Technology | 8,783,020 | |||
| 289,750 | J.C. Penney Company, Inc. | 6,223,830 | |||
| 207,410 | Liberty Media Corporation - Interactivea | 2,177,805 | |||
| 366,634 | Macy’s, Inc. | 6,562,749 | |||
| 95,490 | Omnicom Group, Inc. | 3,275,307 | |||
| 222,420 | Target Corporation | 10,936,391 | |||
| 355,320 | Time Warner Cable, Inc. | 18,505,066 | |||
| 469,125 | Walt Disney Company | 14,777,437 | |||
Total Consumer Discretionary | 82,592,432 | ||||
| Consumer Staples (7.5%) | |||||
| 255,380 | Avon Products, Inc. | 6,767,570 | |||
| 803,610 | Kraft Foods, Inc. | 22,501,080 | |||
| 393,369 | Philip Morris International, Inc. | 18,032,035 | |||
| 113,980 | Unilever NV ADR | 3,113,933 | |||
Total Consumer Staples | 50,414,618 | ||||
| Energy (14.0%) | |||||
| 164,090 | Anadarko Petroleum Corporation | 5,922,008 | |||
| 70,658 | Apache Corporation | 5,948,697 | |||
| 350,320 | Baker Hughes, Inc. | 14,562,802 | |||
| 182,055 | Chevron Corporation | 12,354,252 | |||
| 284,152 | ConocoPhillips | 13,949,022 | |||
| 370,960 | ENSCO International plc ADR | 14,571,309 | |||
| 89,222 | EOG Resources, Inc. | 8,776,768 | |||
| 135,710 | Occidental Petroleum Corporation | 10,470,027 | |||
| 391,580 | Valero Energy Corporation | 7,040,608 | |||
Total Energy | 93,595,493 | ||||
| Financials (22.0%) | |||||
| 112,142 | Allstate Corporation | 3,221,840 | |||
| 279,235 | Ameriprise Financial, Inc. | 10,088,761 | |||
| 1,083,727 | Bank of America Corporation | 15,573,157 | |||
| 449,030 | Bank of New York Mellon Corporation | 11,086,551 | |||
| 327,430 | Capital One Financial Corporation | 13,195,429 | |||
| 3,677,470 | Citigroup, Inc.a | 13,827,287 | |||
| 27,527 | Everest Re Group, Ltd. | 1,946,709 | |||
| 674,621 | Fifth Third Bancorp | 8,291,092 | |||
| 365,576 | J.P. Morgan Chase & Company | 13,383,737 | |||
| 435,051 | Morgan Stanley | 10,097,534 | |||
| 106,670 | Northern Trust Corporation | 4,981,489 | |||
| 256,630 | Principal Financial Group, Inc. | 6,015,407 | |||
| 209,170 | Prudential Financial, Inc. | 11,224,062 | |||
| 78,399 | SVB Financial Groupa | 3,232,391 | |||
| 108,313 | Travelers Companies, Inc. | 5,334,415 | |||
| 628,650 | Wells Fargo & Company | 16,093,440 | |||
Total Financials | 147,593,301 | ||||
| Health Care (11.0%) | |||||
| 264,880 | C.R. Bard, Inc. | 20,536,146 | |||
| 166,720 | Covidien, Ltd. | 6,698,810 | |||
| 123,845 | Johnson & Johnson | 7,314,286 | |||
| 188,436 | Medtronic, Inc. | 6,834,574 | |||
| 620,657 | UnitedHealth Group, Inc. | 17,626,659 | |||
| 269,010 | Zimmer Holdings, Inc.a | 14,539,990 | |||
Total Health Care | 73,550,465 | ||||
| Industrials (14.8%) | |||||
| 105,235 | 3M Company | 8,312,513 | |||
| 57,260 | Avery Dennison Corporation | 1,839,764 | |||
| 105,740 | Boeing Company | 6,635,185 | |||
| 121,750 | Caterpillar, Inc. | 7,313,523 | |||
| 83,457 | CSX Corporation | 4,141,971 | |||
| 108,657 | Eaton Corporation | 7,110,514 | |||
| 231,000 | Emerson Electric Company | 10,092,390 | |||
| 152,040 | Fluor Corporation | 6,461,700 | |||
| 102,860 | General Dynamics Corporation | 6,023,482 | |||
| 595,770 | General Electric Company | 8,591,003 | |||
| 175,510 | Honeywell International, Inc. | 6,850,155 | |||
| 164,090 | Illinois Tool Works, Inc. | 6,773,635 | |||
| 137,618 | Ingersoll-Rand plc | 4,746,445 | |||
| 205,070 | Spirit Aerosystems Holdings, Inc.a | 3,908,634 | |||
| 182,960 | Textron, Inc. | 3,104,831 | |||
| 112,784 | United Technologies Corporation | 7,320,809 | |||
Total Industrials | 99,226,554 | ||||
| Information Technology (8.2%) | |||||
| 150,417 | Avnet, Inc.a | 3,626,554 | |||
| 137,720 | Hewlett-Packard Company | 5,960,522 | |||
| 106,269 | International Business Machines Corporation | 13,122,096 | |||
| 328,240 | Microsoft Corporation | 7,552,802 | |||
| 386,265 | Oracle Corporation | 8,289,247 | |||
| 159,751 | Tyco Electronics, Ltd. | 4,054,480 | |||
| 1,520,840 | Xerox Corporation | 12,227,554 | |||
Total Information Technology | 54,833,255 | ||||
| Materials (4.1%) | |||||
| 142,700 | Allegheny Technologies, Inc. | 6,305,913 | |||
| 600,231 | E.I. du Pont de Nemours and Company | 20,761,990 | |||
Total Materials | 27,067,903 | ||||
| Telecommunications Services (1.0%) | |||||
| 285,941 | AT&T, Inc. | 6,916,913 | |||
Total Telecommunications Services | 6,916,913 | ||||
| Utilities (2.7%) | |||||
| 360,400 | American Electric Power Company, Inc. | 11,640,920 | |||
| 46,977 | Entergy Corporation | 3,364,493 | |||
| 156,174 | Xcel Energy, Inc. | 3,218,746 | |||
Total Utilities | 18,224,159 | ||||
Total Common Stock (cost $682,606,426) | 654,015,093 | ||||
Principal Amount | Short-Term Investments (2.3%)b | ||||
Falcon Asset Securitization Corporation, LLC | |||||
| 10,980,000 | 0.090%, 7/1/2010c | 10,980,000 | |||
The accompanying Notes to Financial Statements are an integral part of this schedule.
223
Table of Contents
Large Cap Value Portfolio
Schedule of Investments as of June 30, 2010
(unaudited)
| Principal Amount | Short-Term Investments (2.3%)b | Value | |||
Federal Home Loan Mortgage Corporation Discount Notes | |||||
| 5,000,000 | 0.085%, 7/23/2010 | $ | 4,999,741 | ||
Total Short-Term Investments (at amortized cost) | 15,979,741 | ||||
Total Investments (cost $698,586,167) 99.9% | $ | 669,994,834 | |||
Other Assets and Liabilities, Net 0.1% | 393,894 | ||||
Total Net Assets 100.0% | $ | 670,388,728 | |||
| a | Non-income producing security. |
| b | The interest rate shown reflects the yield, coupon rate or, for securities purchased at a discount, the discount rate at the date of purchase. |
| c | Denotes investments that benefit from credit enhancement or liquidity support provided by a third party bank or institution. |
Definitions:
| ADR | - | American Depositary Receipt, which are certificates for an underlying foreign security’s shares held by an issuing U.S. depository bank. |
Unrealized Appreciation (Depreciation)
Gross unrealized appreciation and depreciation of investments, based on cost for federal income tax purposes, were as follows:
Gross unrealized appreciation | $ | 35,633,402 | ||
Gross unrealized depreciation | (64,224,735 | ) | ||
Net unrealized appreciation (depreciation) | $ | (28,591,333 | ) | |
Cost for federal income tax purposes | $ | 698,586,167 | ||
Fair Valuation Measurements
The following table is a summary of the inputs used, as of June 30, 2010, in valuing Large Cap Value Portfolio’s assets carried at fair value as discussed in the Notes to Financial Statements.
Investments in Securities | Total | Level 1 | Level 2 | Level 3 | ||||||||
Common Stock | ||||||||||||
Consumer Discretionary | 82,592,432 | 82,592,432 | — | — | ||||||||
Consumer Staples | 50,414,618 | 50,414,618 | — | — | ||||||||
Energy | 93,595,493 | 93,595,493 | — | — | ||||||||
Financials | 147,593,301 | 147,593,301 | — | — | ||||||||
Health Care | 73,550,465 | 73,550,465 | — | — | ||||||||
Industrials | 99,226,554 | 99,226,554 | — | — | ||||||||
Information Technology | 54,833,255 | 54,833,255 | — | — | ||||||||
Materials | 27,067,903 | 27,067,903 | — | — | ||||||||
Telecommunications Services | 6,916,913 | 6,916,913 | — | — | ||||||||
Utilities | 18,224,159 | 18,224,159 | — | — | ||||||||
Short-Term Investments | 15,979,741 | — | 15,979,741 | — | ||||||||
Total | $ | 669,994,834 | $ | 654,015,093 | $ | 15,979,741 | $ | — | ||||
Investment in Affiliates
Affiliated issuers, as defined under the Investment Company Act of 1940, include those in which the Portfolio’s holdings of an issuer represent 5% or more of the outstanding voting securities of an issuer, or any affiliated mutual fund.
A summary of transactions for the fiscal year to date, in Large Cap Value Portfolio, is as follows:
Portfolio | Value December 31, 2009 | Gross Purchases | Gross Sales | Shares Held at June 30, 2010 | Value June 30, 2010 | Income Earned January 1, 2010 - June 30, 2010 | |||||||||||
Thrivent Financial Securities | $ | 2,450,287 | $ | 72,435,702 | $ | 74,885,989 | — | $ | — | $ | 2,583 | ||||||
Total Value and Income Earned | 2,450,287 | — | 2,583 | ||||||||||||||
The accompanying Notes to Financial Statements are an integral part of this schedule.
224
Table of Contents
Large Cap Stock Portfolio
Schedule of Investments as of June 30, 2010
(unaudited)
The accompanying Notes to Financial Statements are an integral part of this schedule.
225
Table of Contents
Large Cap Stock Portfolio
Schedule of Investments as of June 30, 2010
(unaudited)
| Shares | Common Stock (89.7%) | Value | |||||
| Information Technology (19.9%) -continued | ||||||
| 573,490 | Xerox Corporation | $ | 4,610,860 | ||||
| Total Information Technology | 107,255,342 | ||||||
| Materials (3.2%) | ||||||
| 52,760 | Allegheny Technologies, Inc. | 2,331,465 | |||||
| 36,500 | CF Industries Holdings, Inc. | 2,315,925 | |||||
| 226,707 | E.I. du Pont de Nemours and Company | 7,841,795 | |||||
| 77,800 | Freeport-McMoRan Copper & Gold, Inc. | 4,600,314 | |||||
| Total Materials | 17,089,499 | ||||||
| Utilities (1.4%) | |||||||
| 225,050 | American Electric Power Company, Inc. | 7,269,115 | |||||
Total Utilities | 7,269,115 | ||||||
Total Common Stock (cost $500,664,583) | 482,369,372 | ||||||
Collateral Held for Securities Loaned (0.8%) | |||||||
| 4,286,925 | Thrivent Financial Securities Lending Trust | 4,286,925 | |||||
| Total Collateral Held for Securities Loaned (cost $4,286,925) | 4,286,925 | ||||||
| Principal Amount | Short-Term Investments (9.8%)c | ||||||
Enterprise Funding Company, LLC | 6,145,000 | ||||||
| $ | 6,145,000 | 0.090%, 7/1/2010 | |||||
Federal Home Loan Bank Discount Notes | 4,999,922 | ||||||
| 5,000,000 | 0.070%, 7/9/2010 | ||||||
| 10,000,000 | 0.070%, 7/14/2010 | 9,999,747 | |||||
Federal Home Loan Mortgage Corporation Discount Notes | |||||||
| 5,000,000 | 0.130%, 7/2/2010 | 4,999,982 | |||||
| 10,000,000 | 0.120%, 7/13/2010 | 9,999,600 | |||||
Federal National Mortgage Association Discount Notes | |||||||
| 4,800,000 | 0.180%, 7/7/2010d | 4,799,858 | |||||
Jupiter Securitization Company, LLC | |||||||
| 6,410,000 | 0.090%, 7/1/2010 | 6,410,000 | |||||
Thunder Bay Funding, Inc. | |||||||
| 5,700,000 | 0.060%, 7/1/2010 | 5,700,000 | |||||
| Total Short-Term Investments (at amortized cost) | 53,054,109 | ||||||
| Total Investments (cost $558,005,617) 100.3% | $ | 539,710,406 | |||||
| Other Assets and Liabilities, Net (0.3%) | (1,779,948 | ) | |||||
| Total Net Assets 100.0% | $ | 537,930,458 | |||||
| a | Non-income producing security. |
| b | All or a portion of the security is on loan as discussed in item 2(M) of the Notes to Financial Statements. |
| c | The interest rate shown reflects the yield, coupon rate or, for securities purchased at a discount, the discount rate at the date of purchase. |
| d | At June 30, 2010, $4,799,858 of investments were held on deposit with the counterparty and pledged as the initial margin deposit for open futures contracts. |
Definitions:
ADR - | ||
American Depositary Receipt, which are certificates for an underlying foreign security’s shares held by an issuing U.S. depository bank. |
Unrealized Appreciation (Depreciation)
Gross unrealized appreciation and depreciation of investments, based on cost for federal income tax purposes, were as follows:
Gross unrealized appreciation | $ | 24,478,290 | ||
Gross unrealized depreciation | (42,773,501 | ) | ||
Net unrealized appreciation (depreciation) | $ | (18,295,211 | ) | |
Cost for federal income tax purposes | $ | 558,005,617 | ||
The accompanying Notes to Financial Statements are an integral part of this schedule.
226
Table of Contents
Large Cap Stock Portfolio
Schedule of Investments as of June 30, 2010
(unaudited)
Fair Valuation Measurements
The following table is a summary of the inputs used, as of June 30, 2010, in valuing Large Cap Stock Portfolio’s assets carried at fair value as discussed in the Notes to Financial Statements.
Investments in Securities | Total | Level 1 | Level 2 | Level 3 | |||||||
Common Stock | |||||||||||
Consumer Discretionary | 65,067,403 | 65,067,403 | — | — | |||||||
Consumer Staples | 39,112,082 | 39,112,082 | — | — | |||||||
Energy | 54,206,471 | 54,206,471 | — | — | |||||||
Financials | 69,320,919 | 69,320,919 | — | — | |||||||
Health Care | 66,407,686 | 66,407,686 | — | — | |||||||
Industrials | 56,640,855 | 56,640,855 | — | — | |||||||
Information Technology | 107,255,342 | 107,255,342 | — | — | |||||||
Materials | 17,089,499 | 17,089,499 | — | — | |||||||
Utilities | 7,269,115 | 7,269,115 | — | — | |||||||
Collateral Held for Securities Loaned | 4,286,925 | 4,286,925 | — | — | |||||||
Short-Term Investments | 53,054,109 | — | 53,054,109 | — | |||||||
Total | $ | 539,710,406 | $ | 486,656,297 | $ | 53,054,109 | $— | ||||
Other Financial Instruments | Total | Level 1 | Level 2 | Level 3 | |||||||
Liability Derivatives | |||||||||||
Futures Contracts | 1,190,315 | 1,190,315 | — | — | |||||||
Total Liability Derivatives | $1,190,315 | $1,190,315 | $— | $— | |||||||
Futures Contracts | Number of Contracts Long/(Short) | Expiration Date | Notional Principal Amount | Value | Unrealized Gain/(Loss) | |||||||
S&P 500 Index Futures | 153 | September 2010 | $ | 40,457,765 | $ | 39,267,450 | ($1,190,315) | |||||
Total Futures Contracts | ($1,190,315) | |||||||||||
The following table summarizes the fair value and Statement of Assets and Liabilities location, as of June 30, 2010, for Large Cap Stock Portfolio’s investments in financial derivative instruments by primary risk exposure as discussed under item (2) Significant Accounting Policies of the Notes to Financial Statements.
Derivatives by risk category | Statement of Assets and Liabilities Location | Fair Value | ||
Liability Derivatives | ||||
Equity Contracts | ||||
Futures* | Net Assets - Net unrealized appreciation/(depreciation) on Futures contracts | 1,190,315 | ||
Total Equity Contracts | 1,190,315 | |||
Total Liability Derivatives | $1,190,315 | |||
| * | Includes cumulative appreciation/depreciation of futures contracts as reported in the Schedule of Investments. Only current day’s variation margin is reported within the Statement of Assets and Liabilities. |
The following table summarizes the net realized gains/(losses) and Statement of Operations location, for the period ended June 30, 2010, for Large Cap Stock Portfolio’s investments in financial derivative instruments by primary risk exposure.
Derivatives by risk category | Statement of Operations Location | Realized Gains/(Losses) recognized in Income | ||
Equity Contracts | ||||
Options Written | Net realized gains/(losses) on Written option contracts | 66,601 | ||
Futures | Net realized gains/(losses) on Futures contracts | (910,642) | ||
Total Equity Contracts | (844,041) | |||
Total | ($844,041) | |||
The accompanying Notes to Financial Statements are an integral part of this schedule.
227
Table of Contents
Large Cap Stock Portfolio
Schedule of Investments as of June 30, 2010
(unaudited)
The following table summarizes the change in net unrealized appreciation/(depreciation) and Statement of Operations location, for the period ended June 30, 2010, for Large Cap Stock Portfolio’s investments in financial derivative instruments by primary risk exposure.
Derivatives by risk category | Statement of Operations Location | Change in unrealized appreciation/(depreciation) recognized in Income | |||
Equity Contracts | |||||
Options Written | Change in net unrealized appreciation/(depreciation) on Written option contracts | (76,331 | ) | ||
Futures | Change in net unrealized appreciation/(depreciation) on Futures contracts | (2,158,170 | ) | ||
Total Equity Contracts | (2,234,501 | ) | |||
Total | ($2,234,501 | ) | |||
The following table presents Large Cap Stock Portfolio’s average volume of derivative activity during the period ended June 30, 2010.
Derivative Risk Category | Futures (Notional*) | Futures (Percentage of Average Net Assets) | Options (Contracts) | |||||
Equity Contracts | $ | 60,616,006 | 9.9 | % | 484 | |||
| * | Notional amount represents long or short, or both, derivative positions held by the portfolio. |
Investment in Affiliates
Affiliated issuers, as defined under the Investment Company Act of 1940, include those in which the Portfolio’s holdings of an issuer represent 5% or more of the outstanding voting securities of an issuer, or any affiliated mutual fund.
A summary of transactions for the fiscal year to date, in Large Cap Stock Portfolio, is as follows:
Portfolio | Value December 31, 2009 | Gross Purchases | Gross Sales | Shares Held at June 30, 2010 | Value June 30, 2010 | Income Earned January 1, 2010 - June 30, 2010 | |||||||||||
Thrivent Financial Securities Lending Trust | $ | 5,875,573 | $ | 59,524,482 | $ | 61,113,130 | 4,286,925 | $ | 4,286,925 | $ | 11,120 | ||||||
Total Value and Income Earned | 5,875,573 | 4,286,925 | 11,120 | ||||||||||||||
The accompanying Notes to Financial Statements are an integral part of this schedule.
228
Table of Contents
Large Cap Index Portfolio
Schedule of Investments as of June 30, 2010
(unaudited)
The accompanying Notes to Financial Statements are an integral part of this schedule.
229
Table of Contents
Large Cap Index Portfolio
Schedule of Investments as of June 30, 2010
(unaudited)
| Shares | Common Stock (99.1%) | Value | |||
| Consumer Staples (11.4%) - continued | |||||
| 57,500 | Philip Morris International, Inc. | $ | 2,635,800 | ||
| 89,338 | Procter & Gamble Company | 5,358,493 | |||
| 5,300 | Reynolds American, Inc. | 276,236 | |||
| 11,800 | Safeway, Inc. | 231,988 | |||
| 19,800 | Sara Lee Corporation | 279,180 | |||
| 6,381 | SUPERVALU, Inc. | 69,170 | |||
| 18,300 | SYSCO Corporation | 522,831 | |||
| 9,200 | Tyson Foods, Inc. | 150,788 | |||
| 30,400 | Walgreen Company | 811,680 | |||
| 64,500 | Wal-Mart Stores, Inc. | 3,100,515 | |||
| 5,400 | Whole Foods Market, Inc.a,b | 194,508 | |||
Total Consumer Staples | 33,296,466 | ||||
| Energy (10.6%) | |||||
| 15,372 | Anadarko Petroleum Corporation | 554,776 | |||
| 10,520 | Apache Corporation | 885,679 | |||
| 13,383 | Baker Hughes, Inc. | 556,331 | |||
| 3,300 | Cabot Oil & Gas Corporation | 103,356 | |||
| 7,600 | Cameron International Corporationa | 247,152 | |||
| 20,100 | Chesapeake Energy Corporation | 421,095 | |||
| 62,296 | Chevron Corporation | 4,227,407 | |||
| 46,149 | ConocoPhillips | 2,265,454 | |||
| 7,100 | CONSOL Energy, Inc. | 239,696 | |||
| 12,200 | Denbury Resources, Inc.a | 178,608 | |||
| 13,900 | Devon Energy Corporation | 846,788 | |||
| 2,200 | Diamond Offshore Drilling, Inc.b | 136,818 | |||
| 21,218 | El Paso Corporation | 235,732 | |||
| 7,900 | EOG Resources, Inc. | 777,123 | |||
| 158,590 | Exxon Mobil Corporation | 9,050,731 | |||
| 3,800 | FMC Technologies, Inc.a | 200,108 | |||
| 28,000 | Halliburton Company | 687,400 | |||
| 3,300 | Helmerich & Payne, Inc. | 120,516 | |||
| 9,000 | Hess Corporation | 453,060 | |||
| 22,068 | Marathon Oil Corporation | 686,094 | |||
| 3,200 | Massey Energy Company | 87,520 | |||
| 6,000 | Murphy Oil Corporation | 297,300 | |||
| 8,800 | Nabors Industries, Ltd.a | 155,056 | |||
| 13,000 | National Oilwell Varco, Inc. | 429,910 | |||
| 5,500 | Noble Energy, Inc. | 331,815 | |||
| 25,200 | Occidental Petroleum Corporation | 1,944,180 | |||
| 8,400 | Peabody Energy Corporation | 328,692 | |||
| 3,600 | Pioneer Natural Resources Company | 214,020 | |||
| 5,000 | Range Resources Corporation | 200,750 | |||
| 3,500 | Rowan Companies, Inc.a | 76,790 | |||
| 37,000 | Schlumberger, Ltd. | 2,047,580 | |||
| 7,700 | Smith International, Inc. | 289,905 | |||
| 10,800 | Southwestern Energy Companya | 417,312 | |||
| 20,004 | Spectra Energy Corporation | 401,480 | |||
| 3,700 | Sunoco, Inc. | 128,649 | |||
| 4,200 | Tesoro Corporation | 49,014 | |||
| 17,300 | Valero Energy Corporation | 311,054 | |||
| 18,000 | Williams Companies, Inc. | 329,040 | |||
Total Energy | 30,913,991 | ||||
| Financials (16.2%) | |||||
| 14,600 | AFLAC, Inc. | 622,982 | |||
| 16,582 | Allstate Corporation | 476,401 | |||
| 37,300 | American Express Company | 1,480,810 | |||
| 4,267 | American International Group, Inc.a,b | 146,955 | |||
| 8,000 | Ameriprise Financial, Inc. | 289,040 | |||
| 8,325 | Aon Corporation | 309,024 | |||
| 3,536 | Apartment Investment & Management Company | 68,492 | |||
| 3,500 | Assurant, Inc. | 121,450 | |||
| 2,501 | AvalonBay Communities, Inc. | 233,518 | |||
| 310,910 | Bank of America Corporation | 4,467,777 | |||
| 37,452 | Bank of New York Mellon Corporation | 924,690 | |||
| 21,400 | BB&T Corporation | 563,034 | |||
| 51,369 | Berkshire Hathaway, Inc.a | 4,093,596 | |||
| 4,400 | Boston Properties, Inc. | 313,896 | |||
| 14,073 | Capital One Financial Corporation | 567,142 | |||
| 8,300 | CB Richard Ellis Group, Inc.a | 112,963 | |||
| 29,725 | Charles Schwab Corporation | 421,501 | |||
| 10,200 | Chubb Corporation | 510,102 | |||
| 5,038 | Cincinnati Financial Corporation | 130,333 | |||
| 699,739 | Citigroup, Inc.a | 2,631,019 | |||
| 2,100 | CME Group, Inc. | 591,255 | |||
| 5,550 | Comerica, Inc. | 204,407 | |||
| 16,625 | Discover Financial Services | 232,417 | |||
| 6,110 | E*TRADE Financial Corporationa | 72,220 | |||
| 8,700 | Equity Residential | 362,268 | |||
| 2,600 | Federated Investors, Inc. | 53,846 | |||
| 24,594 | Fifth Third Bancorp | 302,260 | |||
| 6,846 | First Horizon National Corporationa | 78,387 | |||
| 4,600 | Franklin Resources, Inc. | 396,474 | |||
| 15,100 | Genworth Financial, Inc.a | 197,357 | |||
| 15,900 | Goldman Sachs Group, Inc. | 2,087,193 | |||
| 13,800 | Hartford Financial Services Group, Inc. | 305,394 | |||
| 9,000 | Health Care Property Investors, Inc. | 290,250 | |||
| 3,900 | Health Care REIT, Inc. | 164,268 | |||
| 20,341 | Host Hotels & Resorts, Inc. | 274,197 | |||
| 13,900 | Hudson City Bancorp, Inc. | 170,136 | |||
| 21,971 | Huntington Bancshares, Inc. | 121,719 | |||
| 2,400 | IntercontinentalExchange, Inc.a | 271,272 | |||
| 14,300 | Invesco, Ltd. | 240,669 | |||
| 123,248 | J.P. Morgan Chase & Company | 4,512,109 | |||
| 5,300 | Janus Capital Group, Inc. | 47,064 | |||
| 26,900 | KeyCorp | 206,861 | |||
| 12,400 | Kimco Realty Corporation | 166,656 | |||
| 5,100 | Legg Mason, Inc. | 142,953 | |||
| 5,700 | Leucadia National Corporationa | 111,207 | |||
| 9,394 | Lincoln National Corporation | 228,180 | |||
| 10,800 | Loews Corporation | 359,748 | |||
| 2,500 | M&T Bank Corporationb | 212,375 | |||
| 16,600 | Marsh & McLennan Companies, Inc. | 374,330 | |||
| 16,100 | Marshall & Ilsley Corporation | 115,598 | |||
| 25,532 | MetLife, Inc. | 964,088 | |||
| 6,100 | Moody’s Corporationb | 121,512 | |||
| 43,350 | Morgan Stanley | 1,006,153 | |||
| 4,400 | Nasdaq OMX Group, Inc.a | 78,232 | |||
| 7,500 | Northern Trust Corporation | 350,250 | |||
| 8,000 | NYSE Euronext | 221,040 | |||
| 11,200 | People’s United Financial, Inc. | 151,200 | |||
The accompanying Notes to Financial Statements are an integral part of this schedule.
230
Table of Contents
Large Cap Index Portfolio
Schedule of Investments as of June 30, 2010
(unaudited)
| Shares | Common Stock (99.1%) | Value | |||
| Financials (16.2%) - continued | |||||
| 5,000 | Plum Creek Timber Company, Inc. | $ | 172,650 | ||
| 16,314 | PNC Financial Services Group, Inc. | 921,741 | |||
| 10,000 | Principal Financial Group, Inc. | 234,400 | |||
| 20,200 | Progressive Corporation | 378,144 | |||
| 14,700 | ProLogis | 148,911 | |||
| 14,500 | Prudential Financial, Inc. | 778,070 | |||
| 4,300 | Public Storage, Inc. | 378,013 | |||
| 36,677 | Regions Financial Corporation | 241,335 | |||
| 9,144 | Simon Property Group, Inc. | 738,378 | |||
| 14,800 | SLM Corporationa | 153,772 | |||
| 15,600 | State Street Corporation | 527,592 | |||
| 15,500 | SunTrust Banks, Inc. | 361,150 | |||
| 8,068 | T. Rowe Price Group, Inc. | 358,139 | |||
| 2,600 | Torchmark Corporation | 128,726 | |||
| 15,381 | Travelers Companies, Inc. | 757,514 | |||
| 59,385 | U.S. Bancorp | 1,327,255 | |||
| 10,224 | Unum Group | 221,861 | |||
| 4,900 | Ventas, Inc. | 230,055 | |||
| 4,997 | Vornado Realty Trust | 364,531 | |||
| 161,540 | Wells Fargo & Company | 4,135,424 | |||
| 10,600 | XL Group plc | 169,706 | |||
| 5,000 | Zions Bancorporationb | 107,850 | |||
Total Financials | 47,105,487 | ||||
| Health Care (12.0%) | |||||
| 47,900 | Abbott Laboratories | 2,240,762 | |||
| 13,096 | Aetna, Inc. | 345,472 | |||
| 9,600 | Allergan, Inc. | 559,296 | |||
| 8,600 | AmerisourceBergen Corporation | 273,050 | |||
| 29,740 | Amgen, Inc.a | 1,564,324 | |||
| 18,500 | Baxter International, Inc. | 751,840 | |||
| 7,300 | Becton, Dickinson and Company | 493,626 | |||
| 8,200 | Biogen Idec, Inc.a | 389,090 | |||
| 46,050 | Boston Scientific Corporationa | 267,090 | |||
| 53,098 | Bristol-Myers Squibb Company | 1,324,264 | |||
| 3,000 | C.R. Bard, Inc. | 232,590 | |||
| 11,275 | Cardinal Health, Inc. | 378,953 | |||
| 5,387 | CareFusion Corporationa | 122,285 | |||
| 14,300 | Celgene Corporationa | 726,726 | |||
| 2,400 | Cephalon, Inc.a,b | 136,200 | |||
| 2,200 | Cerner Corporationa | 166,958 | |||
| 8,600 | CIGNA Corporation | 267,116 | |||
| 4,600 | Coventry Health Care, Inc.a | 81,328 | |||
| 3,300 | DaVita, Inc.a | 206,052 | |||
| 4,600 | Dentsply International, Inc. | 137,586 | |||
| 31,400 | Eli Lilly and Company | 1,051,900 | |||
| 17,000 | Express Scripts, Inc.a | 799,340 | |||
| 9,300 | Forest Laboratories, Inc.a | 255,099 | |||
| 8,300 | Genzyme Corporationa | 421,391 | |||
| 27,600 | Gilead Sciences, Inc.a | 946,128 | |||
| 5,180 | Hospira, Inc.a | 297,591 | |||
| 5,200 | Humana, Inc.a | 237,484 | |||
| 1,300 | Intuitive Surgical, Inc.a | 410,306 | |||
| 85,540 | Johnson & Johnson | 5,051,992 | |||
| 6,900 | King Pharmaceuticals, Inc.a | 52,371 | |||
| 3,300 | Laboratory Corporation of America Holdingsa | 248,655 | |||
| 5,743 | Life Technologies Corporationa | 271,357 | |||
| 8,442 | McKesson Corporation | 566,965 | |||
| 14,186 | Medco Health Solutions, Inc.a | 781,365 | |||
| 34,200 | Medtronic, Inc. | 1,240,434 | |||
| 96,583 | Merck & Company, Inc. | 3,377,507 | |||
| 1,800 | Millipore Corporationa | 191,970 | |||
| 9,400 | Mylan, Inc.a,b | 160,176 | |||
| 2,900 | Patterson Companies, Inc. | 82,737 | |||
| 3,500 | PerkinElmer, Inc. | 72,345 | |||
| 249,260 | Pfizer, Inc. | 3,554,448 | |||
| 4,700 | Quest Diagnostics, Inc. | 233,919 | |||
| 10,084 | St. Jude Medical, Inc.a | 363,932 | |||
| 8,800 | Stryker Corporation | 440,528 | |||
| 12,800 | Tenet Healthcare Corporationa | 55,552 | |||
| 12,800 | Thermo Fisher Scientific, Inc.a | 627,840 | |||
| 35,200 | UnitedHealth Group, Inc. | 999,680 | |||
| 3,900 | Varian Medical Systems, Inc.a | 203,892 | |||
| 2,900 | Waters Corporationa | 187,630 | |||
| 3,400 | Watson Pharmaceuticals, Inc.a | 137,938 | |||
| 13,300 | WellPoint, Inc.a | 650,769 | |||
| 6,350 | Zimmer Holdings, Inc.a | 343,217 | |||
Total Health Care | 34,981,066 | ||||
| Industrials (10.2%) | |||||
| 22,200 | 3M Company | 1,753,578 | |||
| 3,500 | Avery Dennison Corporation | 112,455 | |||
| 23,560 | Boeing Company | 1,478,390 | |||
| 5,200 | C.H. Robinson Worldwide, Inc. | 289,432 | |||
| 19,500 | Caterpillar, Inc. | 1,171,365 | |||
| 4,000 | Cintas Corporation | 95,880 | |||
| 12,100 | CSX Corporation | 600,523 | |||
| 6,300 | Cummins, Inc. | 410,319 | |||
| 16,400 | Danaher Corporation | 608,768 | |||
| 13,200 | Deere & Company | 734,976 | |||
| 5,800 | Dover Corporation | 242,382 | |||
| 1,600 | Dun & Bradstreet Corporation | 107,392 | |||
| 5,200 | Eaton Corporation | 340,288 | |||
| 23,400 | Emerson Electric Company | 1,022,346 | |||
| 3,900 | Equifax, Inc. | 109,434 | |||
| 6,700 | Expeditors International of Washington, Inc. | 231,217 | |||
| 4,100 | Fastenal Companyb | 205,779 | |||
| 9,760 | FedEx Corporation | 684,274 | |||
| 1,600 | First Solar, Inc.a,b | 182,128 | |||
| 1,800 | Flowserve Corporation | 152,640 | |||
| 5,600 | Fluor Corporation | 238,000 | |||
| 12,000 | General Dynamics Corporation | 702,720 | |||
| 330,600 | General Electric Company | 4,767,252 | |||
| 3,800 | Goodrich Corporation | 251,750 | |||
| 23,675 | Honeywell International, Inc. | 924,035 | |||
| 12,100 | Illinois Tool Works, Inc. | 499,488 | |||
| 5,700 | ITT Corporation | 256,044 | |||
| 3,900 | Jacobs Engineering Group, Inc.a | 142,116 | |||
| 3,600 | L-3 Communications Holdings, Inc. | 255,024 | |||
| 9,700 | Lockheed Martin Corporation | 722,650 | |||
| 10,900 | Masco Corporation | 117,284 | |||
| 11,500 | Norfolk Southern Corporation | 610,075 | |||
| 9,398 | Northrop Grumman Corporation | 511,627 | |||
| 11,337 | PACCAR, Inc. | 452,006 | |||
| 3,700 | Pall Corporation | 127,169 | |||
| 5,075 | Parker Hannifin Corporation | 281,459 | |||
| 6,300 | Pitney Bowes, Inc. | 138,348 | |||
| 4,500 | Precision Castparts Corporation | 463,140 | |||
| 6,500 | Quanta Services, Inc.a | 134,225 | |||
The accompanying Notes to Financial Statements are an integral part of this schedule.
231
Table of Contents
Large Cap Index Portfolio
Schedule of Investments as of June 30, 2010
(unaudited)
| Shares | Common Stock (99.1%) | Value | |||
| Industrials (10.2%) - continued | |||||
| 6,200 | R.R. Donnelley & Sons Company | $ | 101,494 | ||
| 11,800 | Raytheon Company | 571,002 | |||
| 9,920 | Republic Services, Inc. | 294,922 | |||
| 4,600 | Robert Half International, Inc. | 108,330 | |||
| 4,500 | Rockwell Automation, Inc. | 220,905 | |||
| 4,800 | Rockwell Collins, Inc. | 255,024 | |||
| 3,000 | Roper Industries, Inc. | 167,880 | |||
| 1,700 | Ryder System, Inc. | 68,391 | |||
| 22,600 | Southwest Airlines Company | 251,086 | |||
| 2,700 | Stericycle, Inc.a | 177,066 | |||
| 8,500 | Textron, Inc.b | 144,245 | |||
| 15,700 | Union Pacific Corporation | 1,091,307 | |||
| 30,800 | United Parcel Service, Inc. | 1,752,212 | |||
| 29,000 | United Technologies Corporation | 1,882,390 | |||
| 2,000 | W.W. Grainger, Inc. | 198,900 | |||
| 14,799 | Waste Management, Inc. | 463,061 | |||
Total Industrials | 29,876,193 | ||||
| Information Technology (18.6%) | |||||
| 16,300 | Adobe Systems, Inc.a | 430,809 | |||
| 17,000 | Advanced Micro Devices, Inc.a,b | 124,440 | |||
| 10,815 | Agilent Technologies, Inc.a | 307,470 | |||
| 5,400 | Akamai Technologies, Inc.a | 219,078 | |||
| 9,200 | Altera Corporation | 228,252 | |||
| 5,400 | Amphenol Corporation | 212,112 | |||
| 9,300 | Analog Devices, Inc. | 259,098 | |||
| 28,300 | Apple, Inc.a | 7,118,299 | |||
| 40,900 | Applied Materials, Inc. | 491,618 | |||
| 7,200 | Autodesk, Inc.a | 175,392 | |||
| 15,500 | Automatic Data Processing, Inc. | 624,030 | |||
| 5,700 | BMC Software, Inc.a | 197,391 | |||
| 13,400 | Broadcom Corporation | 441,798 | |||
| 11,712 | CA, Inc. | 215,501 | |||
| 176,900 | Cisco Systems, Inc.a | 3,769,739 | |||
| 5,700 | Citrix Systems, Inc.a | 240,711 | |||
| 9,300 | Cognizant Technology Solutions Corporationa | 465,558 | |||
| 4,700 | Computer Sciences Corporation | 212,675 | |||
| 6,200 | Compuware Corporationa | 49,476 | |||
| 48,000 | Corning, Inc. | 775,200 | |||
| 53,000 | Dell, Inc.a | 639,180 | |||
| 35,100 | eBay, Inc.a | 688,311 | |||
| 10,000 | Electronic Arts, Inc.a | 144,000 | |||
| 63,486 | EMC Corporationa | 1,161,794 | |||
| 10,200 | Fidelity National Information Services, Inc. | 273,564 | |||
| 4,800 | Fiserv, Inc.a | 219,168 | |||
| 4,700 | FLIR Systems, Inc.a | 136,723 | |||
| 4,700 | GameStop Corporationa,b | 88,313 | |||
| 7,600 | Google, Inc.a | 3,381,620 | |||
| 4,100 | Harris Corporation | 170,765 | |||
| 72,386 | Hewlett-Packard Company | 3,132,866 | |||
| 172,200 | Intel Corporation | 3,349,290 | |||
| 39,800 | International Business Machines Corporation | 4,914,504 | |||
| 9,800 | Intuit, Inc.a | 340,746 | |||
| 5,400 | Iron Mountain, Inc. | 121,284 | |||
| 5,900 | Jabil Circuit, Inc. | 78,470 | |||
| 6,662 | JDS Uniphase Corporationa | 65,554 | |||
| 16,400 | Juniper Networks, Inc.a | 374,248 | |||
| 5,200 | KLA-Tencor Corporation | 144,976 | |||
| 2,400 | Lexmark International, Inc.a | 79,272 | |||
| 6,800 | Linear Technology Corporation | 189,108 | |||
| 18,600 | LSI Corporationa | 85,560 | |||
| 3,100 | MasterCard, Inc. | 618,543 | |||
| 4,800 | McAfee, Inc.a | 147,456 | |||
| 6,900 | MEMC Electronic Materials, Inc.a | 68,172 | |||
| 5,600 | Microchip Technology, Inc.b | 155,344 | |||
| 26,100 | Micron Technology, Inc.a | 221,589 | |||
| 236,200 | Microsoft Corporation | 5,434,962 | |||
| 4,000 | Molex, Inc.b | 72,960 | |||
| 3,700 | Monster Worldwide, Inc.a,b | 43,105 | |||
| 71,190 | Motorola, Inc.a | 464,159 | |||
| 7,000 | National Semiconductor Corporation | 94,220 | |||
| 10,700 | NETAPP, Inc.a | 399,217 | |||
| 10,000 | Novell, Inc.a | 56,800 | |||
| 3,000 | Novellus Systems, Inc.a | 76,080 | |||
| 17,350 | NVIDIA Corporationa | 177,144 | |||
| 120,837 | Oracle Corporation | 2,593,162 | |||
| 9,800 | Paychex, Inc. | 254,506 | |||
| 3,300 | QLogic Corporationa | 54,846 | |||
| 50,900 | QUALCOMM, Inc. | 1,671,556 | |||
| 5,900 | Red Hat, Inc.a | 170,746 | |||
| 8,600 | SAIC, Inc.a | 143,964 | |||
| 3,600 | Salesforce.com, Inc.a | 308,952 | |||
| 7,200 | SanDisk Corporationa | 302,904 | |||
| 24,524 | Symantec Corporationa | 340,393 | |||
| 10,700 | Tellabs, Inc. | 68,373 | |||
| 5,200 | Teradata Corporationa | 158,496 | |||
| 5,100 | Teradyne, Inc.a | 49,725 | |||
| 37,600 | Texas Instruments, Inc. | 875,328 | |||
| 5,800 | Total System Services, Inc. | 78,880 | |||
| 5,600 | VeriSign, Inc.a | 148,680 | |||
| 14,100 | Visa, Inc. | 997,575 | |||
| 7,100 | Western Digital Corporationa | 214,136 | |||
| 20,480 | Western Union Company | 305,357 | |||
| 42,685 | Xerox Corporation | 343,187 | |||
| 8,400 | Xilinx, Inc. | 212,184 | |||
| 36,200 | Yahoo!, Inc.a | 500,646 | |||
Total Information Technology | 54,161,310 | ||||
| Materials (3.3%) | |||||
| 6,600 | Air Products and Chemicals, Inc. | 427,746 | |||
| 2,500 | Airgas, Inc. | 155,500 | |||
| 3,300 | �� | AK Steel Holding Corporation | 39,336 | ||
| 31,264 | Alcoa, Inc. | 314,516 | |||
| 3,069 | Allegheny Technologies, Inc. | 135,619 | |||
| 2,800 | Ball Corporation | 147,924 | |||
| 3,300 | Bemis Company, Inc. | 89,100 | |||
| 2,300 | CF Industries Holdings, Inc. | 145,935 | |||
| 4,300 | Cliffs Natural Resources, Inc. | 202,788 | |||
| 35,793 | Dow Chemical Company | 849,010 | |||
| 28,011 | E.I. du Pont de Nemours and Company | 968,901 | |||
| 2,200 | Eastman Chemical Company | 117,392 | |||
| 7,300 | Ecolab, Inc. | 327,843 | |||
| 2,200 | FMC Corporation | 126,346 | |||
| 14,696 | Freeport-McMoRan Copper & Gold, Inc. | 868,974 | |||
| 2,400 | International Flavors & Fragrances, Inc. | 101,808 | |||
The accompanying Notes to Financial Statements are an integral part of this schedule.
232
Table of Contents
Large Cap Index Portfolio
Schedule of Investments as of June 30, 2010
(unaudited)
| Shares | Common Stock (99.1%) | Value | ||||
| Materials (3.3%) - continued | ||||||
| 13,471 | International Paper Company | $ | 304,849 | |||
| 5,181 | MeadWestvaco Corporation | 115,018 | ||||
| 16,978 | Monsanto Company | 784,723 | ||||
| 15,248 | Newmont Mining Corporation | 941,412 | ||||
| 9,800 | Nucor Corporation | 375,144 | ||||
| 5,200 | Owens-Illinois, Inc.a | 137,540 | ||||
| 4,100 | Pactiv Corporationa | 114,185 | ||||
| 5,100 | PPG Industries, Inc. | 308,091 | ||||
| 9,500 | Praxair, Inc. | 721,905 | ||||
| 4,752 | Sealed Air Corporation | 93,709 | ||||
| 3,800 | Sigma-Aldrich Corporation | 189,354 | ||||
| 2,600 | Titanium Metals Corporationa | 45,734 | ||||
| 4,500 | United States Steel Corporation | 173,475 | ||||
| 4,000 | Vulcan Materials Company | 175,320 | ||||
| 6,500 | Weyerhaeuser Company | 228,800 | ||||
Total Materials | 9,727,997 | |||||
| Telecommunications Services (3.0%) | ||||||
| 12,600 | American Tower Corporationa | 560,700 | ||||
| 182,939 | AT&T, Inc. | 4,425,294 | ||||
| 9,225 | CenturyLink, Inc. | 307,285 | ||||
| 9,600 | Frontier Communications Corporationb | 68,256 | ||||
| 7,800 | MetroPCS Communications, Inc.a | 63,882 | ||||
| 44,472 | Qwest Communications International, Inc. | 233,478 | ||||
| 91,420 | Sprint Nextel Corporationa | 387,621 | ||||
| 87,396 | Verizon Communications, Inc. | 2,448,836 | ||||
| 14,907 | Windstream Corporation | 157,418 | ||||
Total Telecommunications Services | 8,652,770 | |||||
| Utilities (3.7%) | ||||||
| 20,300 | AES Corporationa | 187,572 | ||||
| 5,200 | Allegheny Energy, Inc. | 107,536 | ||||
| 7,300 | Ameren Corporation | 173,521 | ||||
| 14,660 | American Electric Power Company, Inc. | 473,518 | ||||
| 12,273 | CenterPoint Energy, Inc. | 161,513 | ||||
| 6,500 | CMS Energy Corporation | 95,225 | ||||
| 8,800 | Consolidated Edison, Inc. | 379,280 | ||||
| 6,300 | Constellation Energy Group, Inc. | 203,175 | ||||
| 18,394 | Dominion Resources, Inc. | 712,584 | ||||
| 5,200 | DTE Energy Company | 237,172 | ||||
| 39,808 | Duke Energy Corporation | 636,928 | ||||
| 10,000 | Edison International, Inc. | 317,200 | ||||
| 5,900 | Entergy Corporation | 422,558 | ||||
| 4,500 | EQT Corporation | 162,630 | ||||
| 20,524 | Exelon Corporation | 779,296 | ||||
| 9,400 | FirstEnergy Corporation | 331,162 | ||||
| 2,315 | Integrys Energy Group, Inc. | �� | 101,258 | |||
| 12,900 | NextEra Energy, Inc. | 629,004 | ||||
| 1,400 | Nicor, Inc. | 56,700 | ||||
| 7,809 | NiSource, Inc. | 113,231 | ||||
| 5,400 | Northeast Utilities | 137,592 | ||||
| 7,900 | NRG Energy, Inc.a | 167,559 | ||||
| 3,300 | ONEOK, Inc. | 142,725 | ||||
| 6,600 | Pepco Holdings, Inc. | 103,488 | ||||
| 11,600 | PG&E Corporation | 476,760 | ||||
| 3,200 | Pinnacle West Capital Corporation | 116,352 | ||||
| 14,600 | PPL Corporation | 364,270 | ||||
| 8,820 | Progress Energy, Inc. | 345,920 | ||||
| 15,500 | Public Service Enterprise Group, Inc. | 485,615 | ||||
| 5,500 | Questar Corporation | 250,195 | ||||
| 3,500 | SCANA Corporation | 125,160 | ||||
| 7,675 | Sempra Energy | 359,113 | ||||
| 25,600 | Southern Company | 851,968 | ||||
| 6,200 | TECO Energy, Inc. | 93,434 | ||||
| 3,700 | Wisconsin Energy Corporation | 187,738 | ||||
| 14,005 | Xcel Energy, Inc. | 288,643 | ||||
Total Utilities | 10,777,595 | |||||
Total Common Stock (cost $310,489,909) | 288,974,130 | |||||
Collateral Held for Securities Loaned (1.2%) | ||||||
| 3,441,736 | Thrivent Financial Securities Lending Trust | 3,441,736 | ||||
Total Collateral Held for Securities Loaned (cost $3,441,736) | 3,441,736 | |||||
| Principal Amount | Short-Term Investments (0.8%)c | |||||
Federal National Mortgage Association Discount Notes | ||||||
| 700,000 | 0.180%, 7/7/2010d | 699,980 | ||||
U.S. Treasury Bills | ||||||
| 1,515,000 | 0.020%, 7/8/2010 | 1,514,994 | ||||
Total Short-Term Investments (at amortized cost) | 2,214,974 | |||||
Total Investments (cost $316,146,619) 101.1% | $ | 294,630,840 | ||||
Other Assets and Liabilities, Net (1.1%) | (3,202,092 | ) | ||||
Total Net Assets 100.0% | $ | 291,428,748 | ||||
| a | Non-income producing security. |
| b | All or a portion of the security is on loan as discussed in item 2(M) of the Notes to Financial Statements. |
| c | The interest rate shown reflects the yield, coupon rate or, for securities purchased at a discount, the discount rate at the date of purchase. |
| d | At June 30, 2010, $699,980 of investments were held on deposit with the counterparty and pledged as the initial margin deposit for open futures contracts. |
Definitions :
| REIT | - | Real Estate Investment Trust, is a company that buys, develops, manages and/or sells real estate assets. |
The accompanying Notes to Financial Statements are an integral part of this schedule.
233
Table of Contents
Large Cap Index Portfolio
Schedule of Investments as of June 30, 2010
(unaudited)
Unrealized Appreciation (Depreciation)
Gross unrealized appreciation and depreciation of investments, based on cost for federal income tax purposes, were as follows:
Gross unrealized appreciation | $ | 51,544,683 | ||
Gross unrealized depreciation | (73,060,462 | ) | ||
Net unrealized appreciation (depreciation) | $ | (21,515,779 | ) | |
Cost for federal income tax purposes | $ | 316,146,619 | ||
Fair Valuation Measurements
The following table is a summary of the inputs used, as of June 30, 2010, in valuing Large Cap Index Portfolio’s assets carried at fair value as discussed in the Notes to Financial Statements.
Investments in Securities | Total | Level 1 | Level 2 | Level 3 | ||||||||
Common Stock | ||||||||||||
Consumer Discretionary | 29,481,255 | 29,481,255 | — | — | ||||||||
Consumer Staples | 33,296,466 | 33,296,466 | — | — | ||||||||
Energy | 30,913,991 | 30,913,991 | — | — | ||||||||
Financials | 47,105,487 | 47,105,487 | — | — | ||||||||
Health Care | 34,981,066 | 34,981,066 | — | — | ||||||||
Industrials | 29,876,193 | 29,876,193 | — | — | ||||||||
Information Technology | 54,161,310 | 54,161,310 | — | — | ||||||||
Materials | 9,727,997 | 9,727,997 | — | — | ||||||||
Telecommunications Services | 8,652,770 | 8,652,770 | — | — | ||||||||
Utilities | 10,777,595 | 10,777,595 | — | — | ||||||||
Collateral Held for Securities Loaned | 3,441,736 | 3,441,736 | — | — | ||||||||
Short-Term Investments | 2,214,974 | — | 2,214,974 | — | ||||||||
Total | $ | 294,630,840 | $ | 292,415,866 | $ | 2,214,974 | $ | — | ||||
Other Financial Instruments | Total | Level 1 | Level 2 | Level 3 | ||||||||
Liability Derivatives | ||||||||||||
Futures Contracts | 56,540 | 56,540 | — | — | ||||||||
Total Liability Derivatives | $ | 56,540 | $ | 56,540 | $ | — | $ | — | ||||
Futures Contracts | Number of Contracts Long/(Short) | Expiration Date | Notional Principal Amount | Value | Unrealized Gain/(Loss) | ||||||||
S&P 500 Index Futures | 8 | September 2010 | $ | 2,109,740 | $ | 2,053,200 | ($56,540 | ) | |||||
Total Futures Contracts | ($56,540 | ) | |||||||||||
The following table summarizes the fair value and Statement of Assets and Liabilities location, as of June 30, 2010, for Large Cap Index Portfolio’s investments in financial derivative instruments by primary risk exposure as discussed under item (2) Significant Accounting Policies of the Notes to Financial Statements.
Derivatives by risk category | Statement of Assets and Liabilities Location | Fair Value | |||
Liability Derivatives | |||||
Equity Contracts | |||||
Futures* | Net Assets - Net unrealized appreciation/(depreciation) on Futures contracts | 56,540 | |||
Total Equity Contracts | 56,540 | ||||
Total Liability Derivatives | $ | 56,540 | |||
| * | Includes cumulative appreciation/depreciation of futures contracts as reported in the Schedule of Investments. Only current day’s variation margin is reported within the Statement of Assets and Liabilities. |
The accompanying Notes to Financial Statements are an integral part of this schedule.
234
Table of Contents
Large Cap Index Portfolio
Schedule of Investments as of June 30, 2010
(unaudited)
The following table summarizes the net realized gains/(losses) and Statement of Operations location, for the period ended June 30, 2010, for Large Cap Index Portfolio’s investments in financial derivative instruments by primary risk exposure.
Derivatives by risk category | Statement of Operations Location | Realized Gains/(Losses) recognized in Income | |||
Equity Contracts | |||||
Futures | Net realized gains/(losses) on Futures contracts | (119,651 | ) | ||
Total Equity Contracts | (119,651 | ) | |||
Total | ($119,651 | ) | |||
The following table summarizes the change in net unrealized appreciation/(depreciation) and Statement of Operations location, for the period ended June 30, 2010, for Large Cap Index Portfolio’s investments in financial derivative instruments by primary risk exposure.
Derivatives by risk category | Statement of Operations Location | Change in unrealized appreciation/(depreciation) recognized in Income | |||
Equity Contracts | |||||
Futures | Change in net unrealized appreciation/(depreciation) on Futures contracts | (96,695 | ) | ||
Total Equity Contracts | (96,695 | ) | |||
Total | ($96,695 | ) | |||
The following table presents Large Cap Index Portfolio’s average volume of derivative activity during the period ended June 30, 2010.
Derivative Risk Category | Futures (Notional*) | Futures (Percentage of Average Net Assets) | ||||
Equity Contracts | $ | 4,027,250 | 1.2 | % | ||
| * | Notional amount represents long or short, or both, derivative positions held by the portfolio. |
Investment in Affiliates
Affiliated issuers, as defined under the Investment Company Act of 1940, include those in which the Portfolio’s holdings of an issuer represent 5% or more of the outstanding voting securities of an issuer, or any affiliated mutual fund.
A summary of transactions for the fiscal year to date, in Large Cap Index Portfolio, is as follows:
Portfolio | Value December 31, 2009 | Gross Purchases | Gross Sales | Shares Held at June 30, 2010 | Value June 30, 2010 | Income Earned January 1, 2010 - June 30, 2010 | |||||||||||
Thrivent Financial Securities Lending Trust | $ | 2,928,421 | $ | 14,757,080 | $ | 14,243,765 | 3,441,736 | $ | 3,441,736 | $ | 10,979 | ||||||
Total Value and Income Earned | 2,928,421 | 3,441,736 | 10,979 | ||||||||||||||
The accompanying Notes to Financial Statements are an integral part of this schedule.
235
Table of Contents
Equity Income Plus Portfolio
Schedule of Investments as of June 30, 2010
(unaudited)
The accompanying Notes to Financial Statements are an integral part of this schedule.
236
Table of Contents
Equity Income Plus Portfolio
Schedule of Investments as of June 30, 2010
(unaudited)
| Shares | Common Stock (80.8%) | Value | |||
| Financials (20.7%) - continued | |||||
| 2,800 | Brookfield Asset Management, Inc. | $ | 63,336 | ||
| 1,500 | Brookfield Properties Corporation | 21,060 | |||
| 1,000 | Camden Property Trust | 40,850 | |||
| 26,200 | Cardinal Financial Corporation | 242,088 | |||
| 1,000 | CBL & Associates Properties, Inc. | 12,440 | |||
| 1,800 | China Life Insurance Company, Ltd. ADR | 117,360 | |||
| 300 | Corporate Office Properties Trust | 11,328 | |||
| 1,950 | Credit Suisse Group ADR | 72,989 | |||
| 2,200 | DCT Industrial Trust, Inc. | 9,944 | |||
| 1,050 | Deutsche Bank AG ADR | 58,968 | |||
| 800 | Developers Diversified Realty Corporation | 7,920 | |||
| 2,000 | DiamondRock Hospitality Companya | 16,440 | |||
| 1,200 | Digital Realty Trust, Inc. | 69,216 | |||
| 700 | Duke Realty Corporation | 7,945 | |||
| 700 | DuPont Fabros Technology, Inc. | 17,192 | |||
| 10,000 | East West Bancorp, Inc. | 152,500 | |||
| 100 | EastGroup Properties, Inc. | 3,558 | |||
| 1,400 | Education Realty Trust, Inc. | 8,442 | |||
| 200 | Entertainment Properties Trust | 7,614 | |||
| 1,500 | Equity One, Inc. | 23,400 | |||
| 3,200 | Equity Residential | 133,248 | |||
| 600 | Essex Property Trust, Inc. | 58,524 | |||
| 1,500 | Federal Realty Investment Trust | 105,405 | |||
| 12,900 | Fifth Third Bancorp | 158,541 | |||
| 700 | First Industrial Realty Trust, Inc.a | 3,374 | |||
| 700 | Forest City Enterprises, Inc.a | 7,924 | |||
| 2,700 | Franklin Street Properties Corporation | 31,887 | |||
| 16,600 | Fulton Financial Corporation | 160,190 | |||
| 1,000 | Getty Realty Corporation | 22,410 | |||
| 1,000 | Glimcher Realty Trust | 5,980 | |||
| 1,200 | Goldman Sachs Group, Inc. | 157,524 | |||
| 1,500 | Government Properties Income Trust | 38,280 | |||
| 2,900 | Health Care Property Investors, Inc. | 93,525 | |||
| 400 | Health Care REIT, Inc. | 16,848 | |||
| 1,100 | Highwoods Properties, Inc. | 30,536 | |||
| 11,100 | Horace Mann Educators Corporation | 169,830 | |||
| 400 | Hospitality Properties Trust | 8,440 | |||
| 7,800 | Host Hotels & Resorts, Inc. | 105,144 | |||
| 3,900 | HSBC Holdings plc ADR | 177,801 | |||
| 6,700 | ING Groep NV ADRa | 49,647 | |||
| 6,900 | Itau Unibanco Holding SA ADR | 124,269 | |||
| 4,300 | J.P. Morgan Chase & Company | 157,423 | |||
| 20,400 | KeyCorp | 156,876 | |||
| 600 | Kilroy Realty Corporation | 17,838 | |||
| 4,400 | Kimco Realty Corporation | 59,136 | |||
| 1,100 | Kite Realty Group Trust | 4,598 | |||
| 1,200 | LaSalle Hotel Properties | 24,684 | |||
| 800 | Lexington Realty Trust | 4,808 | |||
| 1,800 | Liberty Property Trust | 51,930 | |||
| 22,200 | Lloyds Banking Group plc ADRa | 70,152 | |||
| 500 | LTC Properties, Inc. | 12,135 | |||
| 1,100 | Macerich Company | 41,052 | |||
| 1,000 | Mack-Cali Realty Corporation | 29,730 | |||
| 3,600 | Manulife Financial Corporation | 52,488 | |||
| 700 | Medical Properties Trust, Inc. | 6,608 | |||
| 19,000 | Mitsubishi UFJ Financial Group, Inc. ADR | 86,640 | |||
| 1,100 | National Health Investors, Inc. | 42,416 | |||
| 1,700 | National Retail Properties, Inc. | 36,448 | |||
| 1,300 | Nationwide Health Properties, Inc. | 46,501 | |||
| 8,700 | Nelnet, Inc. | 167,736 | |||
| 700 | Omega Healthcare Investors, Inc. | 13,951 | |||
| 2,600 | PNC Financial Services Group, Inc. | 146,900 | |||
| 900 | Post Properties, Inc. | 20,457 | |||
| 400 | Potlatch Corporation | 14,292 | |||
| 6,100 | Principal Financial Group, Inc. | 142,984 | |||
| 8,600 | Progressive Corporation | 160,992 | |||
| 6,000 | ProLogis | 60,780 | |||
| 7,700 | Protective Life Corporation | 164,703 | |||
| 400 | PS Business Parks, Inc. | 22,312 | |||
| 1,900 | Public Storage, Inc. | 167,029 | |||
| 500 | Ramco-Gershenson Properties Trust | 5,050 | |||
| 600 | Rayonier, Inc. REIT | 26,412 | |||
| 700 | Realty Income Corporation | 21,231 | |||
| 1,500 | Regency Centers Corporation | 51,600 | |||
| 3,600 | Reinsurance Group of America, Inc. | 164,556 | |||
| 1,900 | Royal Bank of Canada ADR | 90,801 | |||
| 2,300 | Senior Housing Property Trust | 46,253 | |||
| 3,100 | Simon Property Group, Inc. | 250,325 | |||
| 1,100 | SL Green Realty Corporation | 60,544 | |||
| 100 | Sovran Self Storage, Inc. | 3,443 | |||
| 30,500 | SPDR DJ Wilshire International Real Estate ETF | 950,685 | |||
| 25,200 | Travelers Companies, Inc. | 1,241,100 | |||
| 7,000 | U.S. Bancorp | 156,450 | |||
| 5,700 | UBS AG ADRa | 75,354 | |||
| 700 | UDR, Inc. | 13,391 | |||
| 400 | Universal Health Realty Income Trust | 12,852 | |||
| 7,200 | Unum Group | 156,240 | |||
| 300 | Urstadt Biddle Properties | 4,839 | |||
| 100 | U-Store-It Trust | 746 | |||
| 1,900 | Ventas, Inc. | 89,205 | |||
| 1,800 | Vornado Realty Trust | 131,310 | |||
| 200 | Washington Real Estate Investment Trust | 5,518 | |||
| 5,800 | Wells Fargo & Company | 148,480 | |||
| 700 | Westpac Banking Corporation ADR | 62,006 | |||
| Total Financials | 11,393,807 | ||||
| Health Care (5.2%) | |||||
| 39,500 | AmerisourceBergen Corporation | 1,254,125 | |||
| 2,000 | AstraZeneca plc ADR | 94,260 | |||
| 3,200 | GlaxoSmithKline plc ADR | 108,832 | |||
| 11,400 | Medicis Pharmaceutical Corporation | 249,432 | |||
| 3,000 | Novartis AG ADR | 144,960 | |||
| 29,900 | Omnicare, Inc. | 708,630 | |||
| 3,200 | Sanofi-Aventis ADR | 96,192 | |||
| 1,100 | Shire Pharmaceuticals Group plc ADR | 67,518 | |||
The accompanying Notes to Financial Statements are an integral part of this schedule.
237
Table of Contents
Equity Income Plus Portfolio
Schedule of Investments as of June 30, 2010
(unaudited)
| Shares | Common Stock (80.8%) | Value | |||
| Health Care (5.2%) - continued | |||||
| 5,600 | UnitedHealth Group, Inc. | $ | 159,040 | ||
Total Health Care | 2,882,989 | ||||
| Industrials (9.5%) | |||||
| 15,900 | 3M Company | 1,255,941 | |||
| 3,700 | A.O. Smith Corporation | 178,303 | |||
| 4,950 | ABB, Ltd. ADRa | 85,536 | |||
| 7,300 | Alamo Group, Inc. | 158,410 | |||
| 8,100 | Briggs & Stratton Corporation | 137,862 | |||
| 3,100 | Bucyrus International, Inc. | 147,095 | |||
| 1,500 | Canadian National Railway Company | 86,070 | |||
| 4,200 | Carlisle Companies, Inc. | 151,746 | |||
| 5,700 | Circor International, Inc. | 145,806 | |||
| 2,400 | Cummins, Inc. | 156,312 | |||
| 4,400 | Ingersoll-Rand plc | 151,756 | |||
| 3,200 | Joy Global, Inc. | 160,288 | |||
| 2,500 | Nordson Corporation | 140,200 | |||
| 4,300 | Northrop Grumman Corporation | 234,092 | |||
| 8,300 | Quanex Building Products Corporation | 143,507 | |||
| 9,000 | R.R. Donnelley & Sons Company | 147,330 | |||
| 23,700 | Raytheon Company | 1,146,843 | |||
| 2,800 | Regal-Beloit Corporation | 156,184 | |||
| 1,200 | Siemens AG ADR | 107,436 | |||
| 13,300 | Southwest Airlines Company | 147,763 | |||
| 7,000 | TAL International Group, Inc. | 157,290 | |||
Total Industrials | 5,195,770 | ||||
| Information Technology (13.2%) | |||||
| 7,100 | Altera Corporation | 176,151 | |||
| 12,300 | AVX Corporation | 157,686 | |||
| 9,000 | Broadridge Financial Solutions, Inc. | 171,450 | |||
| 8,500 | CA, Inc. | 156,400 | |||
| 2,000 | Canon, Inc. ADR | 74,620 | |||
| 125,700 | EarthLink, Inc. | 1,000,572 | |||
| 3,500 | Harris Corporation | 145,775 | |||
| 4,500 | Hewlett-Packard Company | 194,760 | |||
| 2,000 | Hitachi, Ltd. ADRa | 72,600 | |||
| 7,700 | Intel Corporation | 149,765 | |||
| 9,800 | International Business Machines Corporation | 1,210,104 | |||
| 12,400 | Jabil Circuit, Inc. | 164,920 | |||
| 5,000 | Lender Processing Services, Inc. | 156,550 | |||
| 47,400 | Microsoft Corporation | 1,090,674 | |||
| 55,300 | Oracle Corporation | 1,186,738 | |||
| 5,700 | Plantronics, Inc. | 163,020 | |||
| 800 | Research in Motion, Ltd.a | 39,408 | |||
| 1,750 | SAP AG ADR | 77,525 | |||
| 7,000 | STMicroelectronics NV ADR | 55,370 | |||
| 8,000 | Taiwan Semiconductor Manufacturing Company, Ltd. ADR | 78,080 | |||
| 20,900 | Tellabs, Inc. | 133,551 | |||
| 6,800 | Texas Instruments, Inc. | 158,304 | |||
| 5,800 | Tyco Electronics, Ltd. | 147,204 | |||
| 18,300 | Xerox Corporation | 147,132 | |||
| 6,800 | Xilinx, Inc. | 171,768 | |||
Total Information Technology | 7,280,127 | ||||
| Materials (5.4%) | |||||
| 3,900 | Albemarle Corporation | 154,869 | |||
| 2,450 | ArcelorMittal | 65,562 | |||
| 3,200 | Ashland, Inc. | 148,544 | |||
| 1,700 | Barrick Gold Corporation | 77,197 | |||
| 3,400 | BHP Billiton plc ADR | 174,896 | |||
| 2,900 | BHP Billiton, Ltd. ADR | 179,771 | |||
| 3,900 | Cytec Industries, Inc. | 155,961 | |||
| 4,700 | E.I. du Pont de Nemours and Company | 162,573 | |||
| 2,400 | Freeport-McMoRan Copper & Gold, Inc. | 141,912 | |||
| 15,300 | Glatfelter Company | 166,005 | |||
| 1,500 | Goldcorp, Inc. | 65,775 | |||
| 7,300 | International Paper Company | 165,199 | |||
| 1,900 | Lubrizol Corporation | 152,589 | |||
| 1,600 | NewMarket Corporation | 139,712 | |||
| 800 | POSCO ADR | 75,456 | |||
| 500 | Potash Corporation of Saskatchewan, Inc. | 43,120 | |||
| 2,800 | Rio Tinto plc ADR | 122,080 | |||
| 8,800 | RPM International, Inc. | 156,992 | |||
| 2,100 | Southern Copper Corporation | 55,734 | |||
| 2,300 | Stepan Company | 157,389 | |||
| 1,200 | Syngenta AG ADR | 55,020 | |||
| 8,500 | Temple-Inland, Inc. | 175,695 | |||
| 7,000 | Vale SA SP ADR | 170,450 | |||
Total Materials | 2,962,501 | ||||
| Telecommunications Services (1.7%) | |||||
| 2,600 | America Movil SA de CV ADR | 123,500 | |||
| 5,100 | China Telecom Corporation, Ltd. ADR | 251,991 | |||
| 4,550 | France Telecom SA ADR | 78,760 | |||
| 5,000 | Nippon Telegraph & Telephone Corporation ADR | 101,700 | |||
| 8,000 | NTT DoCoMo, Inc. ADR | 120,640 | |||
| 2,200 | Telefonica SA ADR | 122,166 | |||
| 7,000 | Vodafone Group plc ADR | 144,690 | |||
Total Telecommunications Services | 943,447 | ||||
| Utilities (2.3%) | |||||
| 35,100 | Constellation Energy Group, Inc. | 1,131,975 | |||
| 1,500 | Empresa Nacional de Electricidad SA ADR | 69,270 | |||
| 1,900 | Veolia Environnement ADR | 44,403 | |||
Total Utilities | 1,245,648 | ||||
Total Common Stock (cost $48,683,593) | 44,441,532 | ||||
| Principal Amount | Long-Term Fixed Income (7.2%) | ||||
| Consumer Cyclical (0.7%) | |||||
| $400,000 | CVS Caremark Corporation 6.302%, 6/1/2037 | 358,000 | |||
Total Consumer Cyclical | 358,000 | ||||
The accompanying Notes to Financial Statements are an integral part of this schedule.
238
Table of Contents
Equity Income Plus Portfolio
Schedule of Investments as of June 30, 2010
(unaudited)
| Principal Amount | Long-Term Fixed Income (7.2%) | Value | |||
| Energy (0.6%) | |||||
Enbridge Energy Partners, LP | |||||
| $350,000 | 8.050%, 10/1/2037 | $ | 344,626 | ||
Total Energy | 344,626 | ||||
| Financials (4.6%) | |||||
American International Group, Inc. | |||||
| 150,000 | 8.175%, 5/15/2058 | 118,500 | |||
ING Capital Funding Trust III | |||||
| 350,000 | 8.439%, 12/31/2010 | 304,500 | |||
J.P. Morgan Chase & Company | |||||
| 175,000 | 7.900%, 4/30/2018 | 180,378 | |||
MetLife, Inc. | |||||
| 400,000 | 7.875%, 12/15/2037b | 384,000 | |||
Reinsurance Group of America, Inc. | |||||
| 425,000 | 6.750%, 12/15/2065 | 352,066 | |||
Wachovia Capital Trust III | |||||
| 250,000 | 5.800%, 3/15/2011 | 198,750 | |||
Wells Fargo Capital XIII | |||||
| 275,000 | 7.700%, 3/26/2013 | 277,750 | |||
XL Capital, Ltd. | |||||
| 475,000 | 6.500%, 4/15/2017 | 327,750 | |||
ZFS Finance USA Trust II | |||||
| 400,000 | 6.450%, 12/15/2065b | 358,000 | |||
Total Financials | 2,501,694 | ||||
| Utilities (1.3%) | |||||
Dominion Resources, Inc. | |||||
| 375,000 | 6.300%, 9/30/2066 | 345,000 | |||
Enterprise Products Operating, LLC | |||||
| 425,000 | 7.034%, 1/15/2068 | 391,000 | |||
Total Utilities | 736,000 | ||||
Total Long-Term Fixed Income (cost $4,133,672) | 3,940,320 | ||||
| Shares | Preferred Stock (0.6%) | ||||
| Financials (0.5%) | |||||
| 5,000 | Bank of America Corporation | 124,550 | |||
| 2,500 | J.P. Morgan Chase Capital XXIX | 59,275 | |||
| 3,000 | U.S. Bancorp | 82,830 | |||
Total Financials | 266,655 | ||||
| Utilities (0.1%) | |||||
| 2,870 | Xcel Energy, Inc. | 76,629 | |||
Total Utilities | 76,629 | ||||
Total Preferred Stock (cost $339,631) | 343,284 | ||||
| Principal Amount | Short-Term Investments (10.6%)c | ||||
Federal Home Loan Bank Discount Notes | |||||
| 3,000,000 | 0.140%, 7/2/2010 | 2,999,988 | |||
| 1,000,000 | 0.075%, 7/16/2010 | 999,969 | |||
Federal National Mortgage Association Discount Notes | |||||
| 600,000 | 0.180%, 7/7/2010d | 599,982 | |||
U.S. Treasury Bills | |||||
| 1,245,000 | 0.020%, 7/8/2010 | 1,244,995 | |||
Total Short-Term Investments (at amortized cost) | 5,844,934 | ||||
Total Investments (cost $59,001,830) 99.2% | $ | 54,570,070 | |||
Other Assets and Liabilities, Net 0.8% | 435,894 | ||||
Total Net Assets 100.0% | $ | 55,005,964 | |||
| a | Non-income producing security. |
| b | Denotes securities sold under Rule 144A of the Securities Act of 1933, which exempts them from registration. These securities have been deemed liquid and may be resold to other dealers in the program or to other qualified institutional buyers. As of June 30, 2010, the value of these investments was $742,000 or 1.3% of total net assets. |
| c | The interest rate shown reflects the yield, coupon rate or, for securities purchased at a discount, the discount rate at the date of purchase. |
| d | At June 30, 2010, $599,982 of investments were held on deposit with the counterparty and pledged as the initial margin deposit for open futures contracts. |
Definitions:
ADR | - | American Depositary Receipt, which are certificates for an underlying foreign security’s shares held by an issuing U.S. depository bank. | ||
REIT | - | Real Estate Investment Trust, is a company that buys, develops, manages and/or sells real estate assets. | ||
ETF | - | Exchange Traded Fund. |
Unrealized Appreciation (Depreciation)
Gross unrealized appreciation and depreciation of investments, based on cost for federal income tax purposes, were as follows:
Gross unrealized appreciation | $ | 620,900 | ||
Gross unrealized depreciation | (5,052,660 | ) | ||
Net unrealized appreciation (depreciation) | $ | (4,431,760 | ) | |
Cost for federal income tax purposes | $ | 59,001,830 | ||
The accompanying Notes to Financial Statements are an integral part of this schedule.
239
Table of Contents
Equity Income Plus Portfolio
Schedule of Investments as of June 30, 2010
(unaudited)
Fair Valuation Measurements
The following table is a summary of the inputs used, as of June 30, 2010, in valuing Equity Income Plus Portfolio’s assets carried at fair value as discussed in the Notes to Financial Statements.
Investments in Securities | Total | Level 1 | Level 2 | Level 3 | ||||||||
Common Stock | ||||||||||||
Consumer Discretionary | 7,971,048 | 7,971,048 | — | — | ||||||||
Consumer Staples | 2,859,674 | 2,859,674 | — | — | ||||||||
Energy | 1,706,521 | 1,706,521 | — | — | ||||||||
Financials | 11,393,807 | 11,393,807 | — | — | ||||||||
Health Care | 2,882,989 | 2,882,989 | — | — | ||||||||
Industrials | 5,195,770 | 5,195,770 | — | — | ||||||||
Information Technology | 7,280,127 | 7,280,127 | — | — | ||||||||
Materials | 2,962,501 | 2,962,501 | — | — | ||||||||
Telecommunications Services | 943,447 | 943,447 | — | — | ||||||||
Utilities | 1,245,648 | 1,245,648 | — | — | ||||||||
Long-Term Fixed Income | ||||||||||||
Consumer Cyclical | 358,000 | — | 358,000 | — | ||||||||
Energy | 344,626 | — | 344,626 | — | ||||||||
Financials | 2,501,694 | — | 2,501,694 | — | ||||||||
Utilities | 736,000 | — | 736,000 | — | ||||||||
Preferred Stock | ||||||||||||
Financials | 266,655 | 266,655 | — | — | ||||||||
Utilities | 76,629 | 76,629 | — | — | ||||||||
Short-Term Investments | 5,844,934 | — | 5,844,934 | — | ||||||||
Total | $ | 54,570,070 | $ | 44,784,816 | $ | 9,785,254 | $ | — | ||||
Other Financial Instruments | Total | Level 1 | Level 2 | Level 3 | ||||||||
Liability Derivatives | ||||||||||||
Futures Contracts | 124,454 | 124,454 | — | — | ||||||||
Total Liability Derivatives | $ | 124,454 | $ | 124,454 | $ | — | $ | — | ||||
Futures Contracts | Number of Contracts Long/(Short) | Expiration Date | Notional Principal Amount | Value | Unrealized Gain/(Loss) | |||||||||
S&P 500 Index Mini-Futures | 112 | September 2010 | $ | 5,873,414 | $ | 5,748,960 | ($ | 124,454 | ) | |||||
Total Futures Contracts | ($ | 124,454 | ) | |||||||||||
The following table summarizes the fair value and Statement of Assets and Liabilities location, as of June 30, 2010, for Equity Income Plus Portfolio’s investments in financial derivative instruments by primary risk exposure as discussed under item (2) Significant Accounting Policies of the Notes to Financial Statements.
Derivatives by risk category | Statement of Assets and Liabilities Location | Fair Value | |||
Liability Derivatives | |||||
Equity Contracts | |||||
Futures* | Net Assets - Net unrealized appreciation/(depreciation) on Futures contracts | 124,454 | |||
Total Equity Contracts | 124,454 | ||||
Total Liability Derivatives | $ | 124,454 | |||
| * | Includes cumulative appreciation/depreciation of futures contracts as reported in the Schedule of Investments. Only current day’s variation margin is reported within the Statement of Assets and Liabilities. |
The accompanying Notes to Financial Statements are an integral part of this schedule.
240
Table of Contents
Equity Income Plus Portfolio
Schedule of Investments as of June 30, 2010
(unaudited)
The following table summarizes the net realized gains/(losses) and Statement of Operations location, for the period ended June 30, 2010, for Equity Income Plus Portfolio’s investments in financial derivative instruments by primary risk exposure.
Derivatives by risk category | Statement of Operations Location | Realized Gains/(Losses) recognized in Income | |||
Equity Contracts | |||||
Options Written | Net realized gains/(losses) on Written option contracts | 2,863 | |||
Futures | Net realized gains/(losses) on Futures contracts | (196,694 | ) | ||
Total Equity Contracts | (193,831 | ) | |||
Total | ($193,831 | ) | |||
The following table summarizes the change in net unrealized appreciation/(depreciation) and Statement of Operations location, for the period ended June 30, 2010, for Equity Income Plus Portfolio’s investments in financial derivative instruments by primary risk exposure.
Derivatives by risk category | Statement of Operations Location | Change in unrealized appreciation/(depreciation) recognized in Income | |||
Equity Contracts | |||||
Options Written | Change in net unrealized appreciation/(depreciation) on Written option contracts | (9,172 | ) | ||
Futures | Change in net unrealized appreciation/(depreciation) on Futures contracts | (203,698 | ) | ||
Total Equity Contracts | (212,870 | ) | |||
Total | ($212,870 | ) | |||
The following table presents Equity Income Plus Portfolio’s average volume of derivative activity during the period ended June 30, 2010.
Derivative Risk Category | Futures (Notional*) | Futures (Percentage of Average Net Assets) | Options (Contracts) | |||||
Equity Contracts | $ | 6,078,014 | 10.4 | % | 44 | |||
| * | Notional amount represents long or short, or both, derivative positions held by the portfolio. |
The accompanying Notes to Financial Statements are an integral part of this schedule.
241
Table of Contents
Balanced Portfolio
Schedule of Investments as of June 30, 2010
(unaudited)
The accompanying Notes to Financial Statements are an integral part of this schedule.
242
Table of Contents
Balanced Portfolio
Schedule of Investments as of June 30, 2010
(unaudited)
| Shares | Common Stock (62.5%) | Value | |||
| Consumer Staples (7.2%) - continued | |||||
| 31,800 | Philip Morris International, Inc. | $ | 1,457,712 | ||
| 49,279 | Procter & Gamble Company | 2,955,754 | |||
| 2,900 | Reynolds American, Inc. | 151,148 | |||
| 6,800 | Safeway, Inc. | 133,688 | |||
| 11,800 | Sara Lee Corporation | 166,380 | |||
| 3,769 | SUPERVALU, Inc. | 40,856 | |||
| 10,200 | SYSCO Corporation | 291,414 | |||
| 5,300 | Tyson Foods, Inc. | 86,867 | |||
| 16,700 | Walgreen Company | 445,890 | |||
| 35,600 | Wal-Mart Stores, Inc. | 1,711,292 | |||
| 2,900 | Whole Foods Market, Inc.a | 104,458 | |||
Total Consumer Staples | 18,425,260 | ||||
| Energy (6.7%) | |||||
| 8,436 | Anadarko Petroleum Corporation | 304,455 | |||
| 5,768 | Apache Corporation | 485,608 | |||
| 7,361 | Baker Hughes, Inc. | 305,997 | |||
| 1,700 | Cabot Oil & Gas Corporation | 53,244 | |||
| 4,100 | Cameron International Corporationa | 133,332 | |||
| 11,100 | Chesapeake Energy Corporation | 232,545 | |||
| 34,374 | Chevron Corporation | 2,332,620 | |||
| 25,582 | ConocoPhillips | 1,255,820 | |||
| 3,800 | CONSOL Energy, Inc. | 128,288 | |||
| 6,900 | Denbury Resources, Inc.a | 101,016 | |||
| 7,600 | Devon Energy Corporation | 462,992 | |||
| 1,200 | Diamond Offshore Drilling, Inc.b | 74,628 | |||
| 12,186 | El Paso Corporation | 135,386 | |||
| 4,300 | EOG Resources, Inc. | 422,991 | |||
| 87,534 | Exxon Mobil Corporation | 4,995,565 | |||
| 2,000 | FMC Technologies, Inc.a | 105,320 | |||
| 15,600 | Halliburton Company | 382,980 | |||
| 1,800 | Helmerich & Payne, Inc. | 65,736 | |||
| 5,000 | Hess Corporation | 251,700 | |||
| 12,222 | Marathon Oil Corporation | 379,982 | |||
| 1,700 | Massey Energy Company | 46,495 | |||
| 3,200 | Murphy Oil Corporation | 158,560 | |||
| 4,900 | Nabors Industries, Ltd.a | 86,338 | |||
| 7,100 | National Oilwell Varco, Inc. | 234,797 | |||
| 3,000 | Noble Energy, Inc. | 180,990 | |||
| 14,000 | Occidental Petroleum Corporation | 1,080,100 | |||
| 4,600 | Peabody Energy Corporation | 179,998 | |||
| 2,000 | Pioneer Natural Resources Company | 118,900 | |||
| 2,700 | Range Resources Corporation | 108,405 | |||
| 1,900 | Rowan Companies, Inc.a | 41,686 | |||
| 20,400 | Schlumberger, Ltd. | 1,128,936 | |||
| 4,200 | Smith International, Inc. | 158,130 | |||
| 5,900 | Southwestern Energy Companya | 227,976 | |||
| 11,421 | Spectra Energy Corporation | 229,220 | |||
| 2,000 | Sunoco, Inc. | 69,540 | |||
| 2,600 | Tesoro Corporation | 30,342 | |||
| 9,800 | Valero Energy Corporation | 176,204 | |||
| 10,100 | Williams Companies, Inc. | 184,628 | |||
Total Energy | 17,051,450 | ||||
| Financials (10.2%) | |||||
| 8,000 | AFLAC, Inc. | 341,360 | |||
| 9,196 | Allstate Corporation | 264,201 | |||
| 20,600 | American Express Company | 817,820 | |||
| 2,420 | American International Group, Inc.a,b | 83,345 | |||
| 4,340 | Ameriprise Financial, Inc. | 156,804 | |||
| 4,550 | Aon Corporation | 168,896 | |||
| 2,054 | Apartment Investment & Management Company | 39,786 | |||
| 1,900 | Assurant, Inc. | 65,930 | |||
| 1,353 | AvalonBay Communities, Inc. | 126,330 | |||
| 171,954 | Bank of America Corporation | 2,470,979 | |||
| 20,801 | Bank of New York Mellon Corporation | 513,577 | |||
| 11,800 | BB&T Corporation | 310,458 | |||
| 28,350 | Berkshire Hathaway, Inc.a | 2,259,211 | |||
| 2,300 | Boston Properties, Inc. | 164,082 | |||
| 7,865 | Capital One Financial Corporation | 316,959 | |||
| 4,700 | CB Richard Ellis Group, Inc.a | 63,967 | |||
| 17,025 | Charles Schwab Corporation | 241,414 | |||
| 5,600 | Chubb Corporation | 280,056 | |||
| 2,951 | Cincinnati Financial Corporation | 76,342 | |||
| 388,089 | Citigroup, Inc.a | 1,459,215 | |||
| 1,100 | CME Group, Inc. | 309,705 | |||
| 3,100 | Comerica, Inc. | 114,173 | |||
| 9,495 | Discover Financial Services | 132,740 | |||
| 3,430 | E*TRADE Financial Corporationa | 40,543 | |||
| 4,900 | Equity Residential | 204,036 | |||
| 1,600 | Federated Investors, Inc. | 33,136 | |||
| 13,716 | Fifth Third Bancorp | 168,570 | |||
| 4,023 | First Horizon National Corporationa | 46,063 | |||
| 2,500 | Franklin Resources, Inc. | 215,475 | |||
| 8,400 | Genworth Financial, Inc.a | 109,788 | |||
| 8,900 | Goldman Sachs Group, Inc. | 1,168,303 | |||
| 7,600 | Hartford Financial Services Group, Inc. | 168,188 | |||
| 5,000 | Health Care Property Investors, Inc. | 161,250 | |||
| 2,100 | Health Care REIT, Inc. | 88,452 | |||
| 11,347 | Host Hotels & Resorts, Inc. | 152,958 | |||
| 8,500 | Hudson City Bancorp, Inc. | 104,040 | |||
| 12,516 | Huntington Bancshares, Inc. | 69,339 | |||
| 1,200 | IntercontinentalExchange, Inc.a | 135,636 | |||
| 8,100 | Invesco, Ltd. | 136,323 | |||
| 68,224 | J.P. Morgan Chase & Company | 2,497,681 | |||
| 3,400 | Janus Capital Group, Inc. | 30,192 | |||
| 15,300 | KeyCorp | 117,657 | |||
| 7,100 | Kimco Realty Corporation | 95,424 | |||
| 2,800 | Legg Mason, Inc. | 78,484 | |||
| 3,300 | Leucadia National Corporationa | 64,383 | |||
| 5,111 | Lincoln National Corporation | 124,146 | |||
| 6,000 | Loews Corporation | 199,860 | |||
| 1,400 | M&T Bank Corporationb | 118,930 | |||
| 9,200 | Marsh & McLennan Companies, Inc. | 207,460 | |||
| 9,200 | Marshall & Ilsley Corporation | 66,056 | |||
| 14,066 | MetLife, Inc. | 531,132 | |||
| 3,400 | Moody’s Corporationb | 67,728 | |||
| 23,990 | Morgan Stanley | 556,808 | |||
| 2,600 | Nasdaq OMX Group, Inc.a | 46,228 | |||
| 4,100 | Northern Trust Corporation | 191,470 | |||
| 4,400 | NYSE Euronext | 121,572 | |||
| 6,800 | People’s United Financial, Inc. | 91,800 | |||
The accompanying Notes to Financial Statements are an integral part of this schedule.
243
Table of Contents
Balanced Portfolio
Schedule of Investments as of June 30, 2010
(unaudited)
| Shares | Common Stock (62.5%) | Value | |||
| Financials (10.2%) - continued | |||||
| 2,800 | Plum Creek Timber Company, Inc. | $ | 96,684 | ||
| 9,120 | PNC Financial Services Group, Inc. | 515,280 | |||
| 5,400 | Principal Financial Group, Inc. | 126,576 | |||
| 11,700 | Progressive Corporation | 219,024 | |||
| 8,100 | ProLogis | 82,053 | |||
| 7,900 | Prudential Financial, Inc. | 423,914 | |||
| 2,300 | Public Storage, Inc. | 202,193 | |||
| 20,700 | Regions Financial Corporation | 136,206 | |||
| 5,053 | Simon Property Group, Inc. | 408,030 | |||
| 8,400 | SLM Corporationa | 87,276 | |||
| 8,600 | State Street Corporation | 290,852 | |||
| 8,500 | SunTrust Banks, Inc. | 198,050 | |||
| 4,400 | T. Rowe Price Group, Inc. | 195,316 | |||
| 1,400 | Torchmark Corporation | 69,314 | |||
| 8,425 | Travelers Companies, Inc. | 414,931 | |||
| 32,921 | U.S. Bancorp | 735,784 | |||
| 5,858 | Unum Group | 127,119 | |||
| 2,600 | Ventas, Inc. | 122,070 | |||
| 2,770 | Vornado Realty Trust | 202,071 | |||
| 89,382 | Wells Fargo & Company | 2,288,179 | |||
| 5,900 | XL Group plc | 94,459 | |||
| 2,700 | Zions Bancorporationb | 58,239 | |||
Total Financials | 26,080,081 | ||||
| Health Care (7.5%) | |||||
| 26,400 | Abbott Laboratories | 1,234,992 | |||
| 7,256 | Aetna, Inc. | 191,413 | |||
| 5,200 | Allergan, Inc. | 302,952 | |||
| 4,800 | AmerisourceBergen Corporation | 152,400 | |||
| 16,452 | Amgen, Inc.a | 865,375 | |||
| 10,200 | Baxter International, Inc. | 414,528 | |||
| 4,000 | Becton, Dickinson and Company | 270,480 | |||
| 4,530 | Biogen Idec, Inc.a | 214,949 | |||
| 26,650 | Boston Scientific Corporationa | 154,570 | |||
| 29,705 | Bristol-Myers Squibb Company | 740,843 | |||
| 1,600 | C.R. Bard, Inc. | 124,048 | |||
| 6,175 | Cardinal Health, Inc. | 207,542 | |||
| 3,187 | CareFusion Corporationa | 72,345 | |||
| 7,900 | Celgene Corporationa | 401,478 | |||
| 1,300 | Cephalon, Inc.a | 73,775 | |||
| 1,100 | Cerner Corporationa | 83,479 | |||
| 4,700 | CIGNA Corporation | 145,982 | |||
| 2,550 | Coventry Health Care, Inc.a | 45,084 | |||
| 1,700 | DaVita, Inc.a | 106,148 | |||
| 2,500 | Dentsply International, Inc. | 74,775 | |||
| 17,400 | Eli Lilly and Company | 582,900 | |||
| 9,400 | Express Scripts, Inc.a | 441,988 | |||
| 5,100 | Forest Laboratories, Inc.a | 139,893 | |||
| 4,500 | Genzyme Corporationa | 228,465 | |||
| 15,200 | Gilead Sciences, Inc.a | 521,056 | |||
| 2,830 | Hospira, Inc.a | 162,584 | |||
| 2,900 | Humana, Inc.a | 132,443 | |||
| 600 | Intuitive Surgical, Inc.a | 189,372 | |||
| 47,206 | Johnson & Johnson | 2,787,986 | |||
| 4,933 | King Pharmaceuticals, Inc.a | 37,441 | |||
| 1,700 | Laboratory Corporation of America Holdingsa | 128,095 | |||
| 3,137 | Life Technologies Corporationa | 148,223 | |||
| 4,580 | McKesson Corporation | 307,593 | |||
| 7,810 | Medco Health Solutions, Inc.a | 430,175 | |||
| 18,800 | Medtronic, Inc. | 681,876 | |||
| 53,427 | Merck & Company, Inc. | 1,868,342 | |||
| 900 | Millipore Corporationa | 95,985 | |||
| 5,400 | Mylan, Inc.a,b | 92,016 | |||
| 1,600 | Patterson Companies, Inc. | 45,648 | |||
| 2,100 | PerkinElmer, Inc. | 43,407 | |||
| 138,855 | Pfizer, Inc. | 1,980,072 | |||
| 2,600 | Quest Diagnostics, Inc. | 129,402 | |||
| 5,580 | St. Jude Medical, Inc.a | 201,382 | |||
| 4,800 | Stryker Corporation | 240,288 | |||
| 7,850 | Tenet Healthcare Corporationa | 34,069 | |||
| 7,000 | Thermo Fisher Scientific, Inc.a | 343,350 | |||
| 19,400 | UnitedHealth Group, Inc. | 550,960 | |||
| 2,100 | Varian Medical Systems, Inc.a | 109,788 | |||
| 1,600 | Waters Corporationa | 103,520 | |||
| 1,800 | Watson Pharmaceuticals, Inc.a | 73,026 | |||
| 7,400 | WellPoint, Inc.a | 362,082 | |||
| 3,490 | Zimmer Holdings, Inc.a | 188,635 | |||
Total Health Care | 19,259,220 | ||||
| Industrials (6.4%) | |||||
| 12,200 | 3M Company | 963,678 | |||
| 1,900 | Avery Dennison Corporation | 61,047 | |||
| 13,028 | Boeing Company | 817,507 | |||
| 2,800 | C.H. Robinson Worldwide, Inc. | 155,848 | |||
| 10,800 | Caterpillar, Inc. | 648,756 | |||
| 2,400 | Cintas Corporation | 57,528 | |||
| 6,600 | CSX Corporation | 327,558 | |||
| 3,400 | Cummins, Inc. | 221,442 | |||
| 9,000 | Danaher Corporation | 334,080 | |||
| 7,300 | Deere & Company | 406,464 | |||
| 3,200 | Dover Corporation | 133,728 | |||
| 800 | Dun & Bradstreet Corporation | 53,696 | |||
| 2,800 | Eaton Corporation | 183,232 | |||
| 12,900 | Emerson Electric Company | 563,601 | |||
| 2,100 | Equifax, Inc. | 58,926 | |||
| 3,600 | Expeditors International of Washington, Inc. | 124,236 | |||
| 2,200 | Fastenal Companyb | 110,418 | |||
| 5,340 | FedEx Corporation | 374,387 | |||
| 800 | First Solar, Inc.a,b | 91,064 | |||
| 900 | Flowserve Corporation | 76,320 | |||
| 3,000 | Fluor Corporation | 127,500 | |||
| 6,600 | General Dynamics Corporation | 386,496 | |||
| 183,000 | General Electric Company | 2,638,860 | |||
| 2,100 | Goodrich Corporation | 139,125 | |||
| 13,137 | Honeywell International, Inc. | 512,737 | |||
| 6,600 | Illinois Tool Works, Inc. | 272,448 | |||
| 3,100 | ITT Corporation | 139,252 | |||
| 2,100 | Jacobs Engineering Group, Inc.a | 76,524 | |||
| 2,000 | L-3 Communications Holdings, Inc. | 141,680 | |||
| 5,300 | Lockheed Martin Corporation | 394,850 | |||
| 6,300 | Masco Corporation | 67,788 | |||
| 6,300 | Norfolk Southern Corporation | 334,215 | |||
| 5,106 | Northrop Grumman Corporation | 277,971 | |||
| 6,250 | PACCAR, Inc. | 249,187 | |||
| 2,000 | Pall Corporation | 68,740 | |||
| 2,750 | Parker Hannifin Corporation | 152,515 | |||
| 3,700 | Pitney Bowes, Inc. | 81,252 | |||
| 2,400 | Precision Castparts Corporation | 247,008 | |||
| 3,600 | Quanta Services, Inc.a | 74,340 | |||
The accompanying Notes to Financial Statements are an integral part of this schedule.
244
Table of Contents
Balanced Portfolio
Schedule of Investments as of June 30, 2010
(unaudited)
| Shares | Common Stock (62.5%) | Value | |||
Industrials (6.4%) - continued | |||||
| 3,700 | R.R. Donnelley & Sons Company | $ | 60,569 | ||
| 6,500 | Raytheon Company | 314,535 | |||
| 5,505 | Republic Services, Inc. | 163,664 | |||
| 2,500 | Robert Half International, Inc. | 58,875 | |||
| 2,400 | Rockwell Automation, Inc. | 117,816 | |||
| 2,700 | Rockwell Collins, Inc. | 143,451 | |||
| 1,600 | Roper Industries, Inc. | 89,536 | |||
| 900 | Ryder System, Inc. | 36,207 | |||
| 13,180 | Southwest Airlines Company | 146,430 | |||
| 1,400 | Stericycle, Inc.a | 91,812 | |||
| 4,700 | Textron, Inc.b | 79,759 | |||
| 8,600 | Union Pacific Corporation | 597,786 | |||
| 16,900 | United Parcel Service, Inc. | 961,441 | |||
| 16,000 | United Technologies Corporation | 1,038,560 | |||
| 1,000 | W.W. Grainger, Inc. | 99,450 | |||
| 8,330 | Waste Management, Inc. | 260,646 | |||
| Total Industrials | 16,406,541 | ||||
| Information Technology (11.7%) | |||||
| 9,000 | Adobe Systems, Inc.a | 237,870 | |||
| 9,800 | Advanced Micro Devices, Inc.a | 71,736 | |||
| 6,063 | Agilent Technologies, Inc.a | 172,371 | |||
| 2,900 | Akamai Technologies, Inc.a | 117,653 | |||
| 5,100 | Altera Corporation | 126,531 | |||
| 2,900 | Amphenol Corporation | 113,912 | |||
| 5,100 | Analog Devices, Inc. | 142,086 | |||
| 15,600 | Apple, Inc.a | 3,923,868 | |||
| 23,500 | Applied Materials, Inc. | 282,470 | |||
| 3,900 | Autodesk, Inc.a | 95,004 | |||
| 8,600 | Automatic Data Processing, Inc. | 346,236 | |||
| 3,100 | BMC Software, Inc.a | 107,353 | |||
| 7,350 | Broadcom Corporation | 242,330 | |||
| 6,875 | CA, Inc. | 126,500 | |||
| 97,800 | Cisco Systems, Inc.a | 2,084,118 | |||
| 3,200 | Citrix Systems, Inc.a | 135,136 | |||
| 5,100 | Cognizant Technology Solutions Corporationa | 255,306 | |||
| 2,700 | Computer Sciences Corporation | 122,175 | |||
| 4,300 | Compuware Corporationa | 34,314 | |||
| 26,900 | Corning, Inc. | 434,435 | |||
| 29,700 | Dell, Inc.a | 358,182 | |||
| 19,600 | eBay, Inc.a | 384,356 | |||
| 5,700 | Electronic Arts, Inc.a | 82,080 | |||
| 35,424 | EMC Corporationa | 648,259 | |||
| 5,800 | Fidelity National Information Services, Inc. | 155,556 | |||
| 2,650 | Fiserv, Inc.a | 120,999 | |||
| 2,600 | FLIR Systems, Inc.a | 75,634 | |||
| 2,700 | GameStop Corporationa,b | 50,733 | |||
| 4,100 | Google, Inc.a | 1,824,295 | |||
| 2,200 | Harris Corporation | 91,630 | |||
| 39,961 | Hewlett-Packard Company | 1,729,512 | |||
| 95,700 | Intel Corporation | 1,861,365 | |||
| 22,000 | International Business Machines Corporation | 2,716,560 | |||
| 5,400 | Intuit, Inc.a | 187,758 | |||
| 3,100 | Iron Mountain, Inc. | 69,626 | |||
| 3,400 | Jabil Circuit, Inc. | 45,220 | |||
| 4,000 | JDS Uniphase Corporationa | 39,360 | |||
| 9,000 | Juniper Networks, Inc.a | 205,380 | |||
| 3,000 | KLA-Tencor Corporation | 83,640 | |||
| 1,400 | Lexmark International, Inc.a | 46,242 | |||
| 3,900 | Linear Technology Corporation | 108,459 | |||
| 12,200 | LSI Corporationa | 56,120 | |||
| 1,600 | MasterCard, Inc. | 319,248 | |||
| 2,600 | McAfee, Inc.a | 79,872 | |||
| 4,000 | MEMC Electronic Materials, Inc.a | 39,520 | |||
| 3,200 | Microchip Technology, Inc.b | 88,768 | |||
| 15,000 | Micron Technology, Inc.a | 127,350 | |||
| 130,700 | Microsoft Corporation | 3,007,407 | |||
| 2,450 | Molex, Inc. | 44,688 | |||
| 2,200 | Monster Worldwide, Inc.a,b | 25,630 | |||
| 40,421 | Motorola, Inc.a | 263,545 | |||
| 4,300 | National Semiconductor Corporation | 57,878 | |||
| 5,900 | NETAPP, Inc.a | 220,129 | |||
| 6,600 | Novell, Inc.a | 37,488 | |||
| 1,700 | Novellus Systems, Inc.a | 43,112 | |||
| 9,950 | NVIDIA Corporationa | 101,590 | |||
| 67,259 | Oracle Corporation | 1,443,378 | |||
| 5,450 | Paychex, Inc. | 141,537 | |||
| 2,000 | QLogic Corporationa | 33,240 | |||
| 28,100 | QUALCOMM, Inc. | 922,804 | |||
| 3,200 | Red Hat, Inc.a | 92,608 | |||
| 5,300 | SAIC, Inc.a | 88,722 | |||
| 1,900 | Salesforce.com, Inc.a | 163,058 | |||
| 3,900 | SanDisk Corporationa | 164,073 | |||
| 13,872 | Symantec Corporationa | 192,543 | |||
| 7,400 | Tellabs, Inc. | 47,286 | |||
| 2,800 | Teradata Corporationa | 85,344 | |||
| 3,300 | Teradyne, Inc.a | 32,175 | |||
| 21,000 | Texas Instruments, Inc. | 488,880 | |||
| 3,500 | Total System Services, Inc. | 47,600 | |||
| 3,200 | VeriSign, Inc.a | 84,960 | |||
| 7,700 | Visa, Inc. | 544,775 | |||
| 3,900 | Western Digital Corporationa | 117,624 | |||
| 11,762 | Western Union Company | 175,371 | |||
| 24,183 | Xerox Corporation | 194,431 | |||
| 4,800 | Xilinx, Inc. | 121,248 | |||
| 20,300 | Yahoo!, Inc.a | 280,749 | |||
| Total Information Technology | 30,031,001 | ||||
| Materials (2.1%) | |||||
| 3,600 | Air Products and Chemicals, Inc. | 233,316 | |||
| 1,400 | Airgas, Inc. | 87,080 | |||
| 1,900 | AK Steel Holding Corporation | 22,648 | |||
| 17,864 | Alcoa, Inc. | 179,712 | |||
| 1,681 | Allegheny Technologies, Inc. | 74,283 | |||
| 1,500 | Ball Corporation | 79,245 | |||
| 1,800 | Bemis Company, Inc. | 48,600 | |||
| 1,200 | CF Industries Holdings, Inc. | 76,140 | |||
| 2,300 | Cliffs Natural Resources, Inc. | 108,468 | |||
| 19,877 | Dow Chemical Company | 471,482 | |||
| 15,619 | E.I. du Pont de Nemours and Company | 540,261 | |||
| 1,300 | Eastman Chemical Company | 69,368 | |||
| 4,000 | Ecolab, Inc. | 179,640 | |||
| 1,200 | FMC Corporation | 68,916 | |||
| 8,144 | Freeport-McMoRan Copper & Gold, Inc. | 481,555 | |||
| 1,300 | International Flavors & Fragrances, Inc. | 55,146 | |||
The accompanying Notes to Financial Statements are an integral part of this schedule.
245
Table of Contents
Balanced Portfolio
Schedule of Investments as of June 30, 2010
(unaudited)
| Shares | Common Stock (62.5%) | Value | |||
| Materials (2.1%) - continued | |||||
| 7,521 | International Paper Company | $ | 170,200 | ||
| 2,980 | MeadWestvaco Corporation | 66,156 | |||
| 9,266 | Monsanto Company | 428,275 | |||
| 8,417 | Newmont Mining Corporation | 519,666 | |||
| 5,400 | Nucor Corporation | 206,712 | |||
| 2,800 | Owens-Illinois, Inc.a | 74,060 | |||
| 2,200 | Pactiv Corporationa | 61,270 | |||
| 2,900 | PPG Industries, Inc. | 175,189 | |||
| 5,200 | Praxair, Inc. | 395,148 | |||
| 2,828 | Sealed Air Corporation | 55,768 | |||
| 2,000 | Sigma-Aldrich Corporation | 99,660 | |||
| 1,500 | Titanium Metals Corporationa | 26,385 | |||
| 2,400 | United States Steel Corporation | 92,520 | |||
| 2,200 | Vulcan Materials Company | 96,426 | |||
| 3,700 | Weyerhaeuser Company | 130,240 | |||
| Total Materials | 5,373,535 | ||||
| Telecommunications Services (1.9%) | |||||
| 6,900 | American Tower Corporationa | 307,050 | |||
| 101,279 | AT&T, Inc. | 2,449,939 | |||
| 5,194 | CenturyLink, Inc. | 173,012 | |||
| 6,200 | Frontier Communications Corporationb | 44,082 | |||
| 4,700 | MetroPCS Communications, Inc.a | 38,493 | |||
| 26,918 | Qwest Communications International, Inc. | 141,319 | |||
| 51,569 | Sprint Nextel Corporationa | 218,653 | |||
| 48,370 | Verizon Communications, Inc. | 1,355,327 | |||
| 8,917 | Windstream Corporation | 94,164 | |||
| Total Telecommunications Services | 4,822,039 | ||||
| Utilities (2.4%) | |||||
| 11,800 | AES Corporationa | 109,032 | |||
| 3,000 | Allegheny Energy, Inc. | 62,040 | |||
| 4,200 | Ameren Corporation | 99,834 | |||
| 8,140 | American Electric Power Company, Inc. | 262,922 | |||
| 7,224 | CenterPoint Energy, Inc. | 95,068 | |||
| 4,400 | CMS Energy Corporation | 64,460 | |||
| 4,800 | Consolidated Edison, Inc. | 206,880 | |||
| 3,400 | Constellation Energy Group, Inc. | 109,650 | |||
| 10,230 | Dominion Resources, Inc. | 396,310 | |||
| 2,900 | DTE Energy Company | 132,269 | |||
| 23,042 | Duke Energy Corporation | 368,672 | |||
| 5,700 | Edison International, Inc. | 180,804 | |||
| 3,200 | Entergy Corporation | 229,184 | |||
| 2,400 | EQT Corporation | 86,736 | |||
| 11,374 | Exelon Corporation | 431,871 | |||
| 5,300 | FirstEnergy Corporation | 186,719 | |||
| 1,307 | Integrys Energy Group, Inc. | 57,168 | |||
| 7,100 | NextEra Energy, Inc. | 346,196 | |||
| 700 | Nicor, Inc. | 28,350 | |||
| 5,234 | NiSource, Inc. | 75,893 | |||
| 3,200 | Northeast Utilities | 81,536 | |||
| 4,400 | NRG Energy, Inc.a | 93,324 | |||
| 1,900 | ONEOK, Inc. | 82,175 | |||
| 4,100 | Pepco Holdings, Inc. | 64,288 | |||
| 6,400 | PG&E Corporation | 263,040 | |||
| 1,800 | Pinnacle West Capital Corporation | 65,448 | |||
| 8,200 | PPL Corporation | 204,590 | |||
| 4,991 | Progress Energy, Inc. | 195,747 | |||
| 8,600 | Public Service Enterprise Group, Inc. | 269,438 | |||
| 3,000 | Questar Corporation | 136,470 | |||
| 2,000 | SCANA Corporation | 71,520 | |||
| 4,187 | Sempra Energy | 195,910 | |||
| 14,200 | Southern Company | 472,576 | |||
| 4,100 | TECO Energy, Inc. | 61,787 | |||
| 2,000 | Wisconsin Energy Corporation | 101,480 | |||
| 8,210 | Xcel Energy, Inc. | 169,208 | |||
| Total Utilities | 6,058,595 | ||||
Total Common Stock (cost $163,975,533) | 159,761,541 | ||||
Principal | Long-Term Fixed Income (39.3%) | ||||
| Asset-Backed Securities (1.6%) | |||||
| Countrywide Asset-Backed Certificates | |||||
| 566,062 | 6.085%, 6/25/2021c | 197,609 | |||
| 634,867 | 5.549%, 8/25/2021c | 503,748 | |||
| Credit Based Asset Servicing and Securitization, LLC | |||||
| 376,032 | 5.501%, 12/25/2036 | 269,447 | |||
| First Horizon ABS Trust | |||||
| 623,301 | 0.477%, 7/26/2010c,d | 445,806 | |||
| 1,059,402 | 0.507%, 7/26/2010c,d | 538,048 | |||
| GMAC Mortgage Corporation Loan Trust | |||||
| 951,694 | 0.527%, 7/26/2010c,d | 510,788 | |||
| 1,584,951 | 0.527%, 7/26/2010c,d | 716,110 | |||
| IndyMac Seconds Asset-Backed Trust | |||||
| 443,232 | 0.517%, 7/26/2010c,d | 89,745 | |||
| Wachovia Asset Securitization, Inc. | |||||
| 1,211,484 | 0.487%, 7/26/2010c,d,e | 804,425 | |||
| Total Asset-Backed Securities | 4,075,726 | ||||
| Basic Materials (0.1%) | |||||
| Corporacion Nacional del Cobre de Chile | |||||
| 300,000 | 6.375%, 11/30/2012f | 329,924 | |||
| Total Basic Materials | 329,924 | ||||
| Capital Goods (0.2%) | |||||
| John Deere Capital Corporation | |||||
| 300,000 | 7.000%, 3/15/2012 | 329,427 | |||
| United Technologies Corporation | |||||
| 225,000 | 6.050%, 6/1/2036 | 256,616 | |||
| Total Capital Goods | 586,043 | ||||
| Collateralized Mortgage Obligations (0.5%) | |||||
| Bear Stearns Mortgage Funding Trust | |||||
| 345,993 | 0.487%, 7/26/2010d | 69,670 | |||
| Merrill Lynch Mortgage Investors, Inc. | |||||
| 955,744 | 3.256%, 6/25/2035 | 843,345 | |||
The accompanying Notes to Financial Statements are an integral part of this schedule.
246
Table of Contents
Balanced Portfolio
Schedule of Investments as of June 30, 2010
(unaudited)
| Principal Amount | Long-Term Fixed Income (39.3%) | Value | |||
| Collateralized Mortgage Obligations (0.5%) - continued | |||||
| Thornburg Mortgage Securities Trust | |||||
| $ 423,180 | 0.457%, 7/26/2010d | $ | 407,252 | ||
Total Collateralized Mortgage Obligations | 1,320,267 | ||||
| Commercial Mortgage-Backed Securities (3.7%) | |||||
| Banc of America Commercial Mortgage, Inc. | |||||
| 600,000 | 5.658%, 6/10/2049 | 579,792 | |||
| Bear Stearns Commercial Mortgage Securities, Inc. | |||||
| 2,500,000 | 0.500%, 7/15/2010d,e | 2,212,500 | |||
| Commercial Mortgage Pass- Through Certificates | |||||
| 26,220 | 0.450%, 7/15/2010d,f | 26,189 | |||
| 2,000,000 | 0.480%, 7/15/2010d,e | 1,722,976 | |||
| 750,000 | 5.306%, 12/10/2046 | 731,614 | |||
| Credit Suisse Mortgage Capital Certificates | |||||
| 2,000,000 | 0.520%, 7/15/2010d,f | 1,675,870 | |||
| 700,000 | 5.467%, 9/15/2039 | 687,942 | |||
| General Electric Commercial Mortgage Corporation | |||||
| 200,000 | 4.641%, 3/10/2040 | 205,985 | |||
| GS Mortgage Securities Corporation II | |||||
| 1,000,000 | 0.481%, 7/6/2010d,f | 958,468 | |||
| J.P. Morgan Chase Commercial Mortgage Securities Corporation | |||||
| 800,000 | 5.336%, 5/15/2047 | 790,677 | |||
Total Commercial Mortgage- Backed Securities | 9,592,013 | ||||
| Communications Services (0.8%) | |||||
| America Movil SA de CV | |||||
| 150,000 | 5.000%, 3/30/2020f | 154,976 | |||
| AT&T, Inc. | |||||
| 225,000 | 5.875%, 2/1/2012 | 240,679 | |||
| 200,000 | 6.400%, 5/15/2038 | 219,889 | |||
| CBS Corporation | |||||
| 200,000 | 7.875%, 9/1/2023 | 234,757 | |||
| Cox Communications, Inc. | |||||
| 115,000 | 6.450%, 12/1/2036f | 126,860 | |||
| NBC Universal, Inc. | |||||
| 125,000 | 5.150%, 4/30/2020f | 130,374 | |||
| News America, Inc. | |||||
| 225,000 | 6.400%, 12/15/2035 | 244,876 | |||
| Telecom Italia Capital SA | |||||
| 550,000 | 5.250%, 11/15/2013 | 568,093 | |||
| Time Warner Cable, Inc. | |||||
| 200,000 | 7.300%, 7/1/2038 | 232,200 | |||
| Total Communications Services | 2,152,704 | ||||
| Consumer Cyclical (0.5%) | |||||
| Toyota Motor Credit Corporation | |||||
| 175,000 | 4.500%, 6/17/2020 | 179,684 | |||
| Wal-Mart Stores, Inc. | |||||
| 450,000 | 7.550%, 2/15/2030 | 597,082 | |||
| Walt Disney Company | |||||
| 500,000 | 5.625%, 9/15/2016 | 582,431 | |||
| Total Consumer Cyclical | 1,359,197 | ||||
| Consumer Non-Cyclical (0.8%) | |||||
| AmerisourceBergen Corporation | |||||
| 300,000 | 4.875%, 11/15/2019 | 310,819 | |||
| Boston Scientific Corporation | |||||
| 225,000 | 7.000%, 11/15/2035 | 218,234 | |||
| GlaxoSmithKline Capital, Inc. | |||||
| 200,000 | 6.375%, 5/15/2038 | 238,027 | |||
| Kellogg Company | |||||
| 400,000 | 4.250%, 3/6/2013 | 428,705 | |||
| Philip Morris International, Inc. | |||||
| 200,000 | 6.375%, 5/16/2038 | 234,694 | |||
| Wyeth | |||||
| 450,000 | 6.000%, 2/15/2036 | 505,429 | |||
| Total Consumer Non-Cyclical | 1,935,908 | ||||
| Energy (0.2%) | |||||
| Energy Transfer Partners, LP | |||||
| 300,000 | 6.700%, 7/1/2018 | 322,611 | |||
| Petro-Canada | |||||
| 200,000 | 6.800%, 5/15/2038 | 229,465 | |||
| Total Energy | 552,076 | ||||
| Financials (3.0%) | |||||
| BAC Capital Trust XI | |||||
| 225,000 | 6.625%, 5/23/2036 | 205,726 | |||
| Bank of America Corporation | |||||
| 250,000 | 6.500%, 8/1/2016 | 270,556 | |||
| Bank One Corporation | |||||
| 750,000 | 5.900%, 11/15/2011 | 788,158 | |||
| Barclays Bank plc | |||||
| 200,000 | 5.000%, 9/22/2016 | 205,150 | |||
| BNP Paribas SA | |||||
| 900,000 | 5.186%, 6/29/2015f | 738,000 | |||
| Chubb Corporation | |||||
| 400,000 | 6.500%, 5/15/2038 | 455,399 | |||
| CIGNA Corporation | |||||
| 300,000 | 6.350%, 3/15/2018 | 335,223 | |||
| Citigroup, Inc. | |||||
| 250,000 | 6.000%, 12/13/2013 | 262,278 | |||
| General Electric Capital Corporation | |||||
| 225,000 | 5.875%, 1/14/2038 | 220,636 | |||
| Goldman Sachs Group, Inc. | |||||
| 675,000 | 6.600%, 1/15/2012 | 713,909 | |||
| Health Care REIT, Inc. | |||||
| 300,000 | 6.125%, 4/15/2020 | 310,333 | |||
| HSBC Finance Corporation | |||||
| 500,000 | 5.000%, 6/30/2015 | 521,699 | |||
| HSBC Holdings plc | |||||
| 200,000 | 6.800%, 6/1/2038 | 215,536 | |||
| Lloyds TSB Bank plc | |||||
| 150,000 | 5.800%, 1/13/2020f | 141,584 | |||
| Merrill Lynch & Company, Inc. | |||||
| 450,000 | 5.000%, 2/3/2014 | 465,671 | |||
The accompanying Notes to Financial Statements are an integral part of this schedule.
247
Table of Contents
Balanced Portfolio
Schedule of Investments as of June 30, 2010
(unaudited)
Principal | Long-Term Fixed Income (39.3%) | Value | ||||
| Financials (3.0%) - continued | ||||||
| MetLife, Inc. | ||||||
| $ | 150,000 | 5.000%, 6/15/2015 | $ | 160,331 | ||
| Preferred Term Securities XXIII, Ltd. | ||||||
| 1,182,909 | 0.737%, 9/22/2010d,e | 638,771 | ||||
| ProLogis | ||||||
| 100,000 | 6.875%, 3/15/2020 | 94,517 | ||||
| Prudential Financial, Inc. | ||||||
| 225,000 | 5.700%, 12/14/2036 | 209,080 | ||||
| Rabobank Nederland NV | ||||||
| 150,000 | 4.750%, 1/15/2020f | 154,012 | ||||
| Wachovia Bank NA | ||||||
| 425,000 | 4.875%, 2/1/2015 | 445,415 | ||||
| Washington Mutual Bank FA | ||||||
| 500,000 | 5.500%, 1/15/2013g | 2,500 | ||||
Total Financials | 7,554,484 | |||||
| Foreign Government (1.0%) | ||||||
| Italy Government International Bond | ||||||
| 750,000 | 4.375%, 6/15/2013 | 772,030 | ||||
| 300,000 | 5.375%, 6/12/2017 | 313,985 | ||||
| Newfoundland Government Notes | ||||||
| 500,000 | 8.650%, 10/22/2022 | 682,615 | ||||
| Quebec Government Notes | ||||||
| 600,000 | 4.875%, 5/5/2014 | 661,702 | ||||
Total Foreign Government | 2,430,332 | |||||
| Mortgage-Backed Securities (11.5%) | ||||||
| Federal Home Loan Mortgage Corporation Gold 15-Yr. Pass Through | ||||||
| 2,998 | 7.000%, 2/1/2011 | 3,039 | ||||
| 3,901 | 6.000%, 5/1/2012 | 4,210 | ||||
| 2,929 | 7.000%, 8/1/2012 | 3,088 | ||||
| 5,802 | 6.500%, 11/1/2012 | 6,304 | ||||
| 8,422 | 6.500%, 8/1/2013 | 9,151 | ||||
| 24,830 | 6.000%, 2/1/2014 | 26,955 | ||||
| 48,539 | 5.500%, 4/1/2014 | 52,479 | ||||
| 18,484 | 6.000%, 4/1/2014 | 20,066 | ||||
| 25,876 | 6.000%, 4/1/2014 | 28,091 | ||||
| 23,910 | 6.500%, 6/1/2014 | 25,978 | ||||
| 17,478 | 7.500%, 9/1/2014 | 18,824 | ||||
| 652,254 | 5.500%, 12/1/2017 | 708,052 | ||||
| Federal Home Loan Mortgage Corporation Gold 30-Yr. Pass Through | ||||||
| 17,652 | 6.500%, 4/1/2024 | 19,523 | ||||
| 29,704 | 9.000%, 11/1/2024 | 34,763 | ||||
| 1,785 | 9.000%, 4/1/2025 | 2,088 | ||||
| 2,655 | 7.000%, 9/1/2025 | 3,001 | ||||
| 2,888 | 8.500%, 9/1/2025 | 3,369 | ||||
| 2,883 | 8.000%, 1/1/2026 | 3,320 | ||||
| 1,389 | 6.500%, 5/1/2026 | 1,542 | ||||
| 1,244 | 7.000%, 5/1/2026 | 1,411 | ||||
| 13,138 | 6.000%, 7/1/2026 | 14,423 | ||||
| 1,262 | 7.500%, 7/1/2026 | 1,440 | ||||
| 470 | 7.500%, 8/1/2026 | 537 | ||||
| 3,089 | 8.000%, 11/1/2026 | 3,563 | ||||
| 2,665 | 7.500%, 1/1/2027 | 3,040 | ||||
| 5,199 | 6.500%, 2/1/2027 | 5,778 | ||||
| 7,906 | 7.000%, 2/1/2027 | 8,970 | ||||
| 18,520 | 8.000%, 3/1/2027 | 21,356 | ||||
| 5,281 | 7.500%, 4/1/2027 | 6,030 | ||||
| 1,991 | 7.000%, 5/1/2027 | 2,259 | ||||
| 13,489 | 8.000%, 6/1/2027 | 15,567 | ||||
| 5,085 | 8.500%, 7/1/2027 | 5,949 | ||||
| 5,648 | 7.000%, 9/1/2027 | 6,408 | ||||
| 8,597 | 8.000%, 10/1/2027 | 9,921 | ||||
| 7,648 | 7.500%, 11/1/2027 | 8,733 | ||||
| 3,303 | 7.500%, 12/1/2027 | 3,771 | ||||
| 27,710 | 6.500%, 6/1/2028 | 30,842 | ||||
| 11,002 | 7.000%, 10/1/2028 | 12,492 | ||||
| 60,959 | 6.500%, 11/1/2028 | 67,849 | ||||
| 50,411 | 6.000%, 3/1/2029 | 55,645 | ||||
| 23,183 | 6.500%, 4/1/2029 | 25,803 | ||||
| 47,198 | 6.000%, 5/1/2029 | 52,098 | ||||
| 48,291 | 7.000%, 5/1/2029 | 54,866 | ||||
| 17,803 | 6.500%, 7/1/2029 | 19,815 | ||||
| 19,025 | 6.500%, 8/1/2029 | 21,176 | ||||
| 8,426 | 7.000%, 9/1/2029 | 9,573 | ||||
| 10,808 | 7.000%, 10/1/2029 | 12,280 | ||||
| 7,888 | 7.500%, 11/1/2029 | 9,030 | ||||
| 8,919 | 7.000%, 1/1/2030 | 10,141 | ||||
| 15,272 | 7.500%, 1/1/2030 | 17,487 | ||||
| 7,033 | 8.000%, 8/1/2030 | 8,108 | ||||
| 36,422 | 6.000%, 3/1/2031 | 40,203 | ||||
| 121,105 | 6.000%, 6/1/2031 | 133,678 | ||||
| 104,028 | 6.000%, 1/1/2032 | 114,828 | ||||
| 6,500,000 | 5.000%, 7/1/2040h | 6,874,764 | ||||
| 3,050,000 | 6.000%, 7/1/2040h | 3,310,202 | ||||
| Federal National Mortgage Association Conventional 15-Yr. Pass Through | ||||||
| 337 | 6.000%, 2/1/2011 | 364 | ||||
| 1,661 | 7.000%, 6/1/2011 | 1,719 | ||||
| 477 | 6.500%, 7/1/2011 | 500 | ||||
| 313 | 7.500%, 7/1/2011 | 318 | ||||
| 7,163 | 6.500%, 5/1/2012 | 7,788 | ||||
| 2,235 | 6.500%, 7/1/2012 | 2,430 | ||||
| 10,517 | 7.000%, 10/1/2012 | 11,090 | ||||
| 4,546 | 6.500%, 6/1/2013 | 4,942 | ||||
| 23,034 | 6.000%, 11/1/2013 | 25,022 | ||||
| 52,344 | 5.500%, 12/1/2013 | 56,634 | ||||
| 24,785 | 6.000%, 12/1/2013 | 26,762 | ||||
| 7,089 | 7.500%, 4/1/2015 | 7,773 | ||||
| 4,000,000 | 5.000%, 7/1/2025h | 4,267,500 | ||||
| Federal National Mortgage Association Conventional 30-Yr. Pass Through | ||||||
| 5,117 | 10.500%, 8/1/2020 | 5,871 | ||||
| 5,584 | 9.500%, 4/1/2025 | 6,530 | ||||
| 1,035 | 7.500%, 9/1/2025 | 1,176 | ||||
| 2,362 | 8.500%, 11/1/2025 | 2,740 | ||||
| 6,799 | 6.500%, 2/1/2026 | 7,519 | ||||
| 3,457 | 7.000%, 3/1/2026 | 3,911 | ||||
| 5,422 | 6.500%, 4/1/2026 | 5,995 | ||||
| 1,530 | 8.500%, 5/1/2026 | 1,778 | ||||
| 2,201 | 7.500%, 7/1/2026 | 2,502 | ||||
| 14,022 | 7.500%, 8/1/2026 | 15,938 | ||||
The accompanying Notes to Financial Statements are an integral part of this schedule.
248
Table of Contents
Balanced Portfolio
Schedule of Investments as of June 30, 2010
(unaudited)
| Principal Amount | Long-Term Fixed Income (39.3%) | Value | ||||
| Mortgage-Backed Securities (11.5%) - continued | ||||||
| $ | 1,838 | 8.000%, 8/1/2026 | $ | 2,126 | ||
| 6,186 | 7.000%, 11/1/2026 | 6,998 | ||||
| 2,296 | 8.000%, 11/1/2026 | 2,656 | ||||
| 634 | 7.500%, 12/1/2026 | 720 | ||||
| 1,665 | 7.500%, 2/1/2027 | 1,892 | ||||
| 4,737 | 7.000%, 3/1/2027 | 5,358 | ||||
| 5,758 | 7.500%, 5/1/2027 | 6,550 | ||||
| 8,616 | 6.500%, 7/1/2027 | 9,528 | ||||
| 9,805 | 7.000%, 7/1/2027 | 11,101 | ||||
| 1,221 | 7.500%, 8/1/2027 | 1,388 | ||||
| 30,810 | 8.000%, 9/1/2027 | 35,679 | ||||
| 9,740 | 7.000%, 10/1/2027 | 11,027 | ||||
| 36,593 | 7.500%, 12/1/2027 | 41,626 | ||||
| 3,997 | 8.000%, 12/1/2027 | 4,628 | ||||
| 12,079 | 6.500%, 2/1/2028 | 13,357 | ||||
| 6,150 | 7.000%, 2/1/2028 | 6,962 | ||||
| 77,832 | 6.500%, 7/1/2028 | 86,897 | ||||
| 30,869 | 7.000%, 8/1/2028 | 34,974 | ||||
| 39,288 | 6.500%, 11/1/2028 | 43,864 | ||||
| 16,320 | 6.500%, 11/1/2028 | 18,221 | ||||
| 2,172 | 7.000%, 11/1/2028 | 2,461 | ||||
| 51,475 | 6.000%, 12/1/2028 | 57,019 | ||||
| 29,384 | 7.000%, 12/1/2028 | 33,291 | ||||
| 35,448 | 6.000%, 3/1/2029 | 39,267 | ||||
| 34,044 | 6.500%, 6/1/2029 | 38,010 | ||||
| 51,791 | 6.000%, 7/1/2029 | 57,369 | ||||
| 2,077 | 6.500%, 7/1/2029 | 2,319 | ||||
| 48,892 | 7.500%, 8/1/2029 | 55,693 | ||||
| 44,376 | 6.000%, 11/1/2029 | 49,156 | ||||
| 18,834 | 7.000%, 11/1/2029 | 21,352 | ||||
| 28,406 | 7.000%, 11/1/2029 | 32,203 | ||||
| 15,078 | 8.500%, 4/1/2030 | 17,558 | ||||
| 8,637 | 7.500%, 8/1/2030 | 9,845 | ||||
| 84,497 | 6.500%, 7/1/2031 | 94,338 | ||||
| 37,400 | 6.500%, 10/1/2031 | 41,756 | ||||
| 43,390 | 6.500%, 12/1/2031 | 48,443 | ||||
| 54,529 | 6.500%, 5/1/2032 | 60,881 | ||||
| 305,975 | 6.500%, 7/1/2032 | 341,611 | ||||
| 9,700,000 | 5.500%, 8/1/2040h | 10,379,000 | ||||
| Government National Mortgage Association 15-Yr. Pass Through | ||||||
| 1,605 | 6.000%, 4/15/2011 | 1,745 | ||||
| 645 | 6.500%, 6/15/2011 | 696 | ||||
| 3,077 | 7.000%, 4/15/2012 | 3,265 | ||||
| 37,337 | 6.000%, 7/15/2014 | 40,612 | ||||
| Government National Mortgage Association 30-Yr. Pass Through | ||||||
| 3,905 | 9.500%, 12/15/2024 | 4,581 | ||||
| 5,516 | 9.500%, 1/15/2025 | 6,485 | ||||
| 2,728 | 7.500%, 8/15/2025 | 3,099 | ||||
| 10,722 | 7.000%, 1/15/2026 | 12,160 | ||||
| 14,548 | 7.000%, 1/15/2026 | 16,499 | ||||
| 11,203 | 7.000%, 4/15/2026 | 12,705 | ||||
| 16,255 | 6.000%, 5/15/2026 | 17,891 | ||||
| 6,074 | 7.000%, 5/15/2026 | 6,889 | ||||
| 3,603 | 7.500%, 5/15/2026 | 4,091 | ||||
| 17,354 | 7.000%, 6/15/2026 | 19,681 | ||||
| 6,982 | 8.500%, 6/15/2026 | 8,128 | ||||
| 2,537 | 8.500%, 7/15/2026 | 2,953 | ||||
| 15,002 | 8.000%, 9/15/2026 | 17,350 | ||||
| 3,832 | 7.500%, 10/15/2026 | 4,352 | ||||
| 2,392 | 8.000%, 11/15/2026 | 2,767 | ||||
| 2,777 | 8.500%, 11/15/2026 | 3,233 | ||||
| 2,481 | 9.000%, 12/15/2026 | 2,900 | ||||
| 18,306 | 7.500%, 4/15/2027 | 20,811 | ||||
| 5,943 | 8.000%, 6/20/2027 | 6,858 | ||||
| 1,216 | 8.000%, 8/15/2027 | 1,408 | ||||
| 72,347 | 6.500%, 10/15/2027 | 80,827 | ||||
| 20,867 | 7.000%, 10/15/2027 | 23,686 | ||||
| 1,241 | 7.000%, 11/15/2027 | 1,409 | ||||
| 23,520 | 7.000%, 11/15/2027 | 26,696 | ||||
| 86,822 | 7.000%, 7/15/2028 | 98,621 | ||||
| 16,631 | 7.500%, 7/15/2028 | 18,925 | ||||
| 45,394 | 6.500%, 9/15/2028 | 51,013 | ||||
| 74,434 | 6.000%, 12/15/2028 | 82,372 | ||||
| 33,115 | 6.500%, 1/15/2029 | 37,132 | ||||
| 195,564 | 6.500%, 3/15/2029 | 219,281 | ||||
| 32,741 | 6.500%, 4/15/2029 | 36,711 | ||||
| 18,972 | 7.000%, 4/15/2029 | 21,563 | ||||
| 101,866 | 6.000%, 6/15/2029 | 112,730 | ||||
| 43,773 | 7.000%, 6/15/2029 | 49,752 | ||||
| 23,401 | 8.000%, 5/15/2030 | 27,169 | ||||
| 36,785 | 7.000%, 9/15/2031 | 41,789 | ||||
| 53,243 | 6.500%, 2/15/2032 | 59,335 | ||||
Total Mortgage-Backed Securities | 29,377,975 | |||||
| Technology (0.2%) | ||||||
| International Business Machines Corporation | ||||||
| 500,000 | 7.500%, 6/15/2013 | 583,779 | ||||
Total Technology | 583,779 | |||||
| Transportation (0.1%) | ||||||
| Union Pacific Corporation | ||||||
| 125,000 | 6.500%, 4/15/2012 | 135,870 | ||||
Total Transportation | 135,870 | |||||
| U.S. Government and Agencies (14.3%) | ||||||
| Federal Home Loan Banks | ||||||
| 500,000 | 0.875%, 8/22/2012 | 500,492 | ||||
| Federal Home Loan Mortgage Corporation | ||||||
| 500,000 | 1.125%, 7/27/2012 | 503,534 | ||||
| 2,800,000 | 5.125%, 11/17/2017 | 3,225,888 | ||||
| Federal National Mortgage Association | ||||||
| 500,000 | 2.875%, 12/11/2013 | 524,837 | ||||
| 1,500,000 | 5.625%, 4/17/2028 | 1,712,596 | ||||
| Resolution Funding Corporation | ||||||
| 1,000,000 | 8.625%, 1/15/2021 | 1,365,533 | ||||
| Tennessee Valley Authority | ||||||
| 150,000 | 5.250%, 9/15/2039 | 165,824 | ||||
| U.S. Treasury Bonds | ||||||
| 500,000 | 6.875%, 8/15/2025 | 693,750 | ||||
| 1,250,000 | 4.625%, 2/15/2040 | 1,405,078 | ||||
| U.S. Treasury Notes | ||||||
| 3,250,000 | 1.000%, 3/31/2012 | 3,274,635 | ||||
The accompanying Notes to Financial Statements are an integral part of this schedule.
249
Table of Contents
Balanced Portfolio
Schedule of Investments as of June 30, 2010
(unaudited)
| Principal Amount | Long-Term Fixed Income (39.3%) | Value | ||||
| U.S. Government and Agencies (14.3%) - continued | ||||||
| $6,500,000 | 1.125%, 6/15/2013 | $ | 6,525,870 | |||
| 1,750,000 | 2.000%, 11/30/2013 | 1,796,484 | ||||
| 3,000,000 | 2.250%, 5/31/2014 | 3,095,391 | ||||
| 1,000,000 | 4.250%, 8/15/2014 | 1,111,484 | ||||
| 1,250,000 | 2.500%, 3/31/2015 | 1,295,312 | ||||
| 1,000,000 | 2.625%, 2/29/2016 | 1,028,828 | ||||
| 1,750,000 | 3.250%, 5/31/2016 | 1,858,829 | ||||
| 1,500,000 | 3.250%, 3/31/2017 | 1,580,625 | ||||
| 450,000 | 3.125%, 5/15/2019 | 459,387 | ||||
| 4,250,000 | 3.625%, 8/15/2019 | 4,494,044 | ||||
Total U.S. Government and Agencies | 36,618,421 | |||||
| U.S. Municipals (0.1%) | ||||||
Chicago Metropolitan Water Reclamation District General Obligation Bonds (Build America Bonds) | ||||||
| 150,000 | 5.720%, 12/1/2038 | 162,757 | ||||
| Total U.S. Municipals | 162,757 | |||||
| Utilities (0.7%) | ||||||
Commonwealth Edison Company | ||||||
| 225,000 | 5.900%, 3/15/2036 | 245,010 | ||||
Oncor Electric Delivery Company | ||||||
| 425,000 | 6.375%, 1/15/2015 | 481,516 | ||||
ONEOK Partners, LP | ||||||
| 225,000 | 6.650%, 10/1/2036 | 230,801 | ||||
Progress Energy, Inc. | ||||||
| 300,000 | 7.000%, 10/30/2031 | 353,359 | ||||
Southern California Edison Company | ||||||
| 225,000 | 5.000%, 1/15/2014 | 246,295 | ||||
Xcel Energy, Inc. | ||||||
| 225,000 | 6.500%, 7/1/2036 | 259,561 | ||||
Total Utilities | 1,816,542 | |||||
Total Long-Term Fixed Income (cost $102,734,345) | 100,584,018 | |||||
| Shares | Collateral Held for Securities Loaned (0.6%) | |||||
| 1,585,283 | Thrivent Financial Securities Lending Trust | 1,585,283 | ||||
Total Collateral Held for Securities Loaned (cost $1,585,283) | 1,585,283 | |||||
| Principal Amount | Short-Term Investments (7.7%)i | |||||
Federal Home Loan Bank Discount Notes | ||||||
| 16,000,000 | 0.090%, 7/7/2010 | 15,999,760 | ||||
| 3,100,000 | 0.069%, 7/9/2010 | 3,099,952 | ||||
Federal National Mortgage Association Discount Notes | ||||||
| 500,000 | 0.180%, 7/7/2010j | 499,985 | ||||
| Total Short-Term Investments (at amortized cost) | 19,599,697 | |||||
| Total Investments (cost $287,894,858) 110.1% | $ | 281,530,539 | ||||
| Other Assets and Liabilities, Net (10.1%) | (25,905,282 | ) | ||||
| Total Net Assets 100.0% | $ | 255,625,257 | ||||
| a | Non-income producing security. |
| b | All or a portion of the security is on loan as discussed in item 2(M) of the Notes to Financial Statements. |
| c | All or a portion of the security is insured or guaranteed. |
| d | Denotes variable rate obligations for which the current coupon rate and next scheduled reset date are shown. |
| e | Denotes restricted securities. Restricted securities are investment securities which have been deemed illiquid and cannot be offered for public sale without first being registered under the Securities Act of 1933. The following table indicates the acquisition date and cost of restricted securities Balanced Portfolio owned as of June 30, 2010. |
Security | Acquisition Date | Amortized Cost | |||
Bear Stearns Commercial Mortgage Securities, Inc. | 3/30/2007 | $ | 2,500,000 | ||
Commercial Mortgage Pass-Through Certificates | 10/18/2006 | 2,000,000 | |||
Preferred Term Securities XXIII, Ltd. | 9/14/2006 | 1,182,909 | |||
Wachovia Asset Securitization, Inc. | 3/16/2007 | 1,211,484 | |||
| f | Denotes securities sold under Rule 144A of the Securities Act of 1933, which exempts them from registration. These securities have been deemed liquid and may be resold to other dealers in the program or to other qualified institutional buyers. As of June 30, 2010, the value of these investments was $4,436,257 or 1.7% of total net assets. |
| g | Defaulted security. Interest is not being accrued. |
| h | Denotes investments purchased on a when-issued or delayed delivery basis. |
| i | The interest rate shown reflects the yield, coupon rate or, for securities purchased at a discount, the discount rate at the date of purchase. |
| j | At June 30, 2010, $499,985 of investments were held on deposit with the counterparty and pledged as the initial margin deposit for open futures contracts. |
Definitions:
| REIT | - | Real Estate Investment Trust, is a company that buys, develops, manages and/or sells real estate assets. |
The accompanying Notes to Financial Statements are an integral part of this schedule.
250
Table of Contents
Balanced Portfolio
Schedule of Investments as of June 30, 2010
(unaudited)
Unrealized Appreciation (Depreciation)
Gross unrealized appreciation and depreciation of investments, based on cost for federal income tax purposes, were as follows:
Gross unrealized appreciation | $ | 49,323,108 | ||
Gross unrealized depreciation | (55,687,427 | ) | ||
Net unrealized appreciation (depreciation) | $ | (6,364,319 | ) | |
Cost for federal income tax purposes | $ | 287,894,858 | ||
Fair Valuation Measurements
The following table is a summary of the inputs used, as of June 30, 2010, in valuing Balanced Portfolio’s assets carried at fair value as discussed in the Notes to Financial Statements.
Investments in Securities | Total | Level 1 | Level 2 | Level 3 | ||||||||
Common Stock | ||||||||||||
Consumer Discretionary | 16,253,819 | 16,253,819 | — | — | ||||||||
Consumer Staples | 18,425,260 | 18,425,260 | — | — | ||||||||
Energy | 17,051,450 | 17,051,450 | — | — | ||||||||
Financials | 26,080,081 | 26,080,081 | — | — | ||||||||
Health Care | 19,259,220 | 19,259,220 | — | — | ||||||||
Industrials | 16,406,541 | 16,406,541 | — | — | ||||||||
Information Technology | 30,031,001 | 30,031,001 | — | — | ||||||||
Materials | 5,373,535 | 5,373,535 | — | — | ||||||||
Telecommunications Services | 4,822,039 | 4,822,039 | — | — | ||||||||
Utilities | 6,058,595 | 6,058,595 | — | — | ||||||||
Long-Term Fixed Income | ||||||||||||
Asset-Backed Securities | 4,075,726 | — | 3,271,301 | 804,425 | ||||||||
Basic Materials | 329,924 | — | 329,924 | — | ||||||||
Capital Goods | 586,043 | — | 586,043 | — | ||||||||
Collateralized Mortgage Obligations | 1,320,267 | — | 1,320,267 | — | ||||||||
Commercial Mortgage-Backed Securities | 9,592,013 | — | 9,592,013 | — | ||||||||
Communications Services | 2,152,704 | — | 2,152,704 | — | ||||||||
Consumer Cyclical | 1,359,197 | — | 1,359,197 | — | ||||||||
Consumer Non-Cyclical | 1,935,908 | — | 1,935,908 | — | ||||||||
Energy | 552,076 | — | 552,076 | — | ||||||||
Financials | 7,554,484 | — | 6,915,713 | 638,771 | ||||||||
Foreign Government | 2,430,332 | — | 2,430,332 | — | ||||||||
Mortgage-Backed Securities | 29,377,975 | — | 29,377,975 | — | ||||||||
Technology | 583,779 | — | 583,779 | — | ||||||||
Transportation | 135,870 | — | 135,870 | — | ||||||||
U.S. Government and Agencies | 36,618,421 | — | 36,618,421 | — | ||||||||
U.S. Municipals | 162,757 | — | 162,757 | — | ||||||||
Utilities | 1,816,542 | — | 1,816,542 | — | ||||||||
Collateral Held for Securities Loaned | 1,585,283 | 1,585,283 | — | — | ||||||||
Short-Term Investments | 19,599,697 | — | 19,599,697 | — | ||||||||
Total | $ | 281,530,539 | $ | 161,346,824 | $ | 118,740,519 | $ | 1,443,196 | ||||
Other Financial Instruments | Total | Level 1 | Level 2 | Level 3 | ||||||||
Liability Derivatives | ||||||||||||
Futures Contracts | 232,115 | 232,115 | — | — | ||||||||
Total Liability Derivatives | $ | 232,115 | $ | 232,115 | $ | — | $ | — | ||||
The accompanying Notes to Financial Statements are an integral part of this schedule.
251
Table of Contents
Balanced Portfolio
Schedule of Investments as of June 30, 2010
(unaudited)
The following table is a reconciliation of assets in which significant unobservable inputs (Level 3) were used in determining fair value for Balanced Portfolio as discussed in item 2(A) of the Notes to Financial Statements.
Investments in Securities | Value December 31, 2009 | Accrued Discounts and/or Premiums | Realized Gain/(Loss) | Change in Unrealized Gain/(Loss) | Net Purchases/(Sales) | Transfers Into Level 3 | Transfers Out of Level 3 | Value June 30, 2010 | |||||||||||||||||
Long-Term Fixed Income | |||||||||||||||||||||||||
Asset-Backed Securities | 628,952 | — | — | 243,024 | (67,551 | ) | — | — | 804,425 | ||||||||||||||||
Financials | 537,229 | — | — | 112,476 | (10,934 | ) | — | — | 638,771 | ||||||||||||||||
Total | $ | 1,166,181 | $ | — | $ | — | $ | 355,500 | ($ | 78,485 | ) | $ | — | $ | — | $ | 1,443,196 | ||||||||
Futures Contracts | Number of Contracts Long/(Short) | Expiration Date | Notional Principal Amount | Value | Unrealized Gain/(Loss) | ||||||||
S&P 500 Index Futures | 13 | September 2010 | $ | 3,568,565 | $ | 3,336,450 | ($232,115 | ) | |||||
Total Futures Contracts | ($232,115 | ) | |||||||||||
The following table summarizes the fair value and Statement of Assets and Liabilities location, as of June 30, 2010, for Balanced Portfolio’s investments in financial derivative instruments by primary risk exposure as discussed under item (2) Significant Accounting Policies of the Notes to Financial Statements.
Derivatives by risk category | Statement of Assets and Liabilities Location | Fair Value | |||
Liability Derivatives | |||||
Equity Contracts | |||||
Futures* | Net Assets - Net unrealized appreciation/(depreciation) on Futures contracts | 232,115 | |||
Total Equity Contracts | 232,115 | ||||
Total Liability Derivatives | $ | 232,115 | |||
| * | Includes cumulative appreciation/depreciation of futures contracts as reported in the Schedule of Investments. Only current day’s variation margin is reported within the Statement of Assets and Liabilities. |
The following table summarizes the net realized gains/(losses) and Statement of Operations location, for the period ended June 30, 2010, for Balanced Portfolio’s investments in financial derivative instruments by primary risk exposure.
Derivatives by risk category | Statement of Operations Location | Realized Gains/(Losses) recognized in Income | |||
| Equity Contracts | |||||
Futures | Net realized gains/(losses) on Futures contracts | (50,931 | ) | ||
Total Equity Contracts | (50,931 | ) | |||
Total | ($50,931 | ) | |||
The following table summarizes the change in net unrealized appreciation/(depreciation) and Statement of Operations location, for the period ended June 30, 2010, for Balanced Portfolio’s investments in financial derivative instruments by primary risk exposure.
Derivatives by risk category | Statement of Operations Location | Change in unrealized appreciation/(depreciation) recognized in Income | |||
| Equity Contracts | |||||
Futures | Change in net unrealized appreciation/(depreciation) on Futures contracts | (248,965 | ) | ||
Total Equity Contracts | (248,965 | ) | |||
Total | ($248,965 | ) | |||
The accompanying Notes to Financial Statements are an integral part of this schedule.
252
Table of Contents
Balanced Portfolio
Schedule of Investments as of June 30, 2010
(unaudited)
The following table presents Balanced Portfolio’s average volume of derivative activity during the period ended June 30, 2010.
Derivative Risk Category | Futures (Notional*) | Futures (Percentage of Average Net Assets) | ||||
Equity Contracts | $ | 2,766,707 | 1.0 | % | ||
| * | Notional amount represents long or short, or both, derivative positions held by the portfolio. |
Investment in Affiliates
Affiliated issuers, as defined under the Investment Company Act of 1940, include those in which the Portfolio’s holdings of an issuer represent 5% or more of the outstanding voting securities of an issuer, or any affiliated mutual fund.
A summary of transactions for the fiscal year to date, in Balanced Portfolio, is as follows:
Portfolio | Value December 31, 2009 | Gross Purchases | Gross Sales | Shares Held at June 30, 2010 | Value June 30, 2010 | Income Earned January 1, 2010 - June 30, 2010 | |||||||||||
Thrivent Financial | $ | 4,467,865 | $ | 33,708,599 | $ | 36,591,181 | 1,585,283 | $ | 1,585,283 | $ | 6,386 | ||||||
Total Value and Income Earned | 4,467,865 | 1,585,283 | 6,386 | ||||||||||||||
The accompanying Notes to Financial Statements are an integral part of this schedule.
253
Table of Contents
High Yield Portfolio
Schedule of Investments as of June 30, 2010
(unaudited)
The accompanying Notes to Financial Statements are an integral part of this schedule.
254
Table of Contents
High Yield Portfolio
Schedule of Investments as of June 30, 2010
(unaudited)
| Principal Amount | Long-Term Fixed Income (91.3%) | Value | |||
Capital Goods (7.9%) - continued | |||||
| General Cable Corporation, Convertible | |||||
| $2,257,000 | 4.500%, 11/15/2019g | $ | 2,115,937 | ||
| Goodman Global Group, Inc. | |||||
| 4,800,000 | Zero Coupon, 12/15/2014e | 2,928,000 | |||
| Graham Packaging Company, LP/GPC Capital Corporation I | |||||
| 3,515,000 | 9.875%, 10/15/2014d | 3,594,088 | |||
| 2,550,000 | 8.250%, 1/1/2017e | 2,511,750 | |||
| Leucadia National Corporation | |||||
| 6,100,000 | 7.125%, 3/15/2017 | 5,886,500 | |||
| Norcraft Companies, LP/Norcraft Finance Corporation | |||||
| 1,610,000 | 10.500%, 12/15/2015e | 1,658,300 | |||
| Owens-Illinois, Inc. | |||||
| 3,470,000 | 7.800%, 5/15/2018 | 3,613,137 | |||
| Plastipak Holdings, Inc. | |||||
| 2,995,000 | 8.500%, 12/15/2015e | 3,003,985 | |||
| 500,000 | 10.625%, 8/15/2019e | 555,000 | |||
| RBS Global, Inc./Rexnord Corporation | |||||
| 1,330,000 | 11.750%, 8/1/2016d | 1,386,525 | |||
| 4,520,000 | 8.500%, 5/1/2018e | 4,384,400 | |||
| Reynolds Group DL Escrow, Inc. | |||||
| 1,200,000 | 7.750%, 10/15/2016e | 1,173,000 | |||
| RSC Equipment Rental, Inc. | |||||
| 2,800,000 | 9.500%, 12/1/2014 | 2,782,500 | |||
| SPX Corporation | |||||
| 2,210,000 | 7.625%, 12/15/2014 | 2,270,775 | |||
| TransDigm, Inc. | |||||
| 4,645,000 | 7.750%, 7/15/2014 | 4,656,613 | |||
| United Rentals North America, Inc. | |||||
| 2,690,000 | 10.875%, 6/15/2016 | 2,885,025 | |||
| Total Capital Goods | 61,478,982 | ||||
Communications Services (17.1%) | |||||
| Cengage Learning Acquisitions, Inc. | |||||
| 5,340,000 | 10.500%, 1/15/2015e | 4,966,200 | |||
| Cincinnati Bell, Inc. | |||||
| 7,980,000 | 8.250%, 10/15/2017d | 7,461,300 | |||
| Clear Channel Worldwide Holdings, Inc. | |||||
| 5,170,000 | 9.250%, 12/15/2017e | 5,195,850 | |||
| Coleman Cable, Inc. | |||||
| 2,420,000 | 9.000%, 2/15/2018d,e | 2,311,100 | |||
| Cricket Communications, Inc. | |||||
| 5,330,000 | 9.375%, 11/1/2014d | 5,409,950 | |||
| CSC Holdings, Inc. | |||||
| 3,450,000 | 8.500%, 6/15/2015 | 3,562,125 | |||
| 1,150,000 | 8.625%, 2/15/2019 | 1,208,937 | |||
| DISH DBS Corporation | |||||
| 3,600,000 | 7.125%, 2/1/2016 | 3,609,000 | |||
| Equinix, Inc. | |||||
| 2,190,000 | 8.125%, 3/1/2018 | 2,239,275 | |||
| Frontier Communications Corporation | |||||
| 3,180,000 | 8.125%, 10/1/2018 | 3,160,125 | |||
| GCI, Inc. | |||||
| 4,800,000 | 8.625%, 11/15/2019e | 4,788,000 | |||
| Insight Communications Company, Inc. | |||||
| 2,660,000 | 9.375%, 7/15/2018e,h,i | 2,660,000 | |||
| Intelsat Bermuda, Ltd. | |||||
| 6,422,500 | 11.500%, 2/4/2017 | 6,406,444 | |||
| Intelsat Jackson Holdings, Ltd. | |||||
| 2,380,000 | 8.500%, 11/1/2019e | 2,403,800 | |||
| Intelsat Subsidiary Holding Company, Ltd. | |||||
| 7,740,000 | 8.875%, 1/15/2015 | 7,865,775 | |||
| 300,000 | 8.875%, 1/15/2015e | 303,375 | |||
| Level 3 Financing, Inc. | |||||
| 4,890,000 | 9.250%, 11/1/2014 | 4,437,675 | |||
| MetroPCS Wireless, Inc. | |||||
| 2,130,000 | 9.250%, 11/1/2014 | 2,193,900 | |||
| New Communications Holdings, Inc. | |||||
| 3,190,000 | 8.250%, 4/15/2017d,e | 3,201,963 | |||
| 5,000,000 | 8.500%, 4/15/2020e | 5,012,500 | |||
| Nextel Communications, Inc. | |||||
| 2,630,000 | 6.875%, 10/31/2013 | 2,547,812 | |||
| Nielsen Finance, LLC/Nielsen Finance Company | |||||
| 2,600,000 | 10.000%, 8/1/2014 | 2,658,500 | |||
| 1,500,000 | 11.500%, 5/1/2016 | 1,638,750 | |||
| NII Capital Corporation | |||||
| 5,330,000 | 8.875%, 12/15/2019 | 5,383,300 | |||
| PAETEC Holding Corporation | |||||
| 6,400,000 | 9.500%, 7/15/2015 | 6,224,000 | |||
| Quebecor Media, Inc. | |||||
| 3,790,000 | 7.750%, 3/15/2016 | 3,714,200 | |||
| Qwest Communications International, Inc. | |||||
| 4,760,000 | 7.500%, 2/15/2014 | 4,771,900 | |||
| 1,620,000 | 7.500%, 2/15/2014 | 1,624,050 | |||
| tw telecom holdings, inc. | |||||
| 2,400,000 | 8.000%, 3/1/2018e | 2,448,000 | |||
| Umbrella Acquisition | |||||
| 2,650,000 | 9.750%, 3/15/2015e | 2,206,125 | |||
| UPC Holding BV | |||||
| 4,500,000 | 9.875%, 4/15/2018e | 4,522,500 | |||
| Videotron Ltee | |||||
| 2,290,000 | 9.125%, 4/15/2018 | 2,484,650 | |||
| Virgin Media Finance plc | |||||
| 5,240,000 | 9.125%, 8/15/2016 | 5,423,400 | |||
| 1,790,000 | 8.375%, 10/15/2019 | 1,812,375 | |||
| Virgin Media Finance plc, Convertible | |||||
| 1,060,000 | 6.500%, 11/15/2016 | 1,241,525 | |||
| Wind Acquisition Holdings Finance SPA | |||||
| 5,900,000 | 12.250%, 7/15/2017e | 5,369,000 | |||
| Total Communications Services | 132,467,381 | ||||
Consumer Cyclical (20.8%) | |||||
| AMC Entertainment, Inc. | |||||
| 4,250,000 | 8.750%, 6/1/2019d | 4,271,250 | |||
The accompanying Notes to Financial Statements are an integral part of this schedule.
255
Table of Contents
High Yield Portfolio
Schedule of Investments as of June 30, 2010
(unaudited)
| Principal Amount | Long-Term Fixed Income (91.3%) | Value | ||||
| Consumer Cyclical (20.8%) - continued | |||||
| American Axle & Manufacturing Holdings, Inc. | ||||||
| $ | 690,000 | 9.250%, 1/15/2017e | $ | 710,700 | ||
| American Axle & Manufacturing, Inc. | ||||||
| 2,150,000 | 5.250%, 2/11/2014 | 1,806,000 | ||||
| Ameristar Casinos, Inc. | ||||||
| 3,190,000 | 9.250%, 6/1/2014 | 3,341,525 | ||||
| Beazer Homes USA, Inc. | ||||||
| 4,250,000 | 6.875%, 7/15/2015 | 3,729,375 | ||||
| 1,600,000 | 9.125%, 6/15/2018d | 1,480,000 | ||||
| Blockbuster, Inc. | ||||||
| 2,204,000 | 11.750%, 10/1/2014e | 1,432,600 | ||||
| Burlington Coat Factory | ||||||
| Warehouse Corporation | ||||||
| 4,150,000 | 11.125%, 4/15/2014 | 4,295,250 | ||||
| Circus & Eldorado Joint Venture/Silver Legacy Capital Corporation | ||||||
| 5,720,000 | 10.125%, 3/1/2012 | 5,291,000 | ||||
| Cooper-Standard Automotive, Inc. | ||||||
| 1,330,000 | 8.500%, 5/1/2018e | 1,339,975 | ||||
| FireKeepers Development Authority | ||||||
| 5,600,000 | 13.875%, 5/1/2015e | 6,468,000 | ||||
| Ford Motor Credit Company, LLC | ||||||
| 10,330,000 | 8.000%, 6/1/2014 | 10,661,169 | ||||
| 5,320,000 | 7.000%, 4/15/2015 | 5,262,384 | ||||
| Gaylord Entertainment Company | ||||||
| 6,650,000 | 6.750%, 11/15/2014d | 6,400,625 | ||||
| Goodyear Tire & Rubber Company | ||||||
| 3,200,000 | 10.500%, 5/15/2016 | 3,480,000 | ||||
| GWR Operating Partnership LLP | ||||||
| 2,130,000 | 10.875%, 4/1/2017e | 2,116,688 | ||||
| Hanesbrands, Inc. | ||||||
| 2,460,000 | 4.121%, 12/15/2010c | 2,327,775 | ||||
| KB Home | ||||||
| 3,460,000 | 6.250%, 6/15/2015 | 3,079,400 | ||||
| Lear Corporation | ||||||
| 2,200,000 | 7.875%, 3/15/2018 | 2,205,500 | ||||
| 2,200,000 | 8.125%, 3/15/2020 | 2,205,500 | ||||
| Levi Strauss & Company | ||||||
| 2,930,000 | 7.625%, 5/15/2020e | 2,871,400 | ||||
| Macy’s Retail Holdings, Inc. | ||||||
| 3,450,000 | 8.375%, 7/15/2015 | 3,803,625 | ||||
| MGM Resorts International | ||||||
| 2,140,000 | 6.750%, 9/1/2012 | 1,990,200 | ||||
| 2,700,000 | 7.500%, 6/1/2016 | 2,126,250 | ||||
| 2,000,000 | 11.125%, 11/15/2017 | 2,205,000 | ||||
| 1,580,000 | 11.375%, 3/1/2018e | 1,485,200 | ||||
| Mohegan Tribal Gaming Authority | ||||||
| 3,730,000 | 11.500%, 11/1/2017d,e | 3,692,700 | ||||
| NCL Corporation, Ltd. | ||||||
| 4,270,000 | 11.750%, 11/15/2016e | 4,462,150 | ||||
| Norcraft Holdings, LP/Norcraft Capital Corporation | ||||||
| 1,283,000 | 9.750%, 9/1/2012 | 1,214,039 | ||||
| Peninsula Gaming, LLC | ||||||
| 2,170,000 | 8.375%, 8/15/2015 | 2,161,863 | ||||
| 2,940,000 | 10.750%, 8/15/2017 | 2,925,300 | ||||
| Penn National Gaming, Inc. | ||||||
| 3,200,000 | 8.750%, 8/15/2019 | 3,288,000 | ||||
| Perry Ellis International, Inc. | ||||||
| 2,800,000 | 8.875%, 9/15/2013 | 2,835,000 | ||||
| Phillips-Van Heusen Corporation | ||||||
| 320,000 | 7.375%, 5/15/2020 | 322,800 | ||||
| Pinnacle Entertainment, Inc. | ||||||
| 4,000,000 | 7.500%, 6/15/2015 | 3,750,000 | ||||
| 1,580,000 | 8.750%, 5/15/2020e | 1,463,475 | ||||
| QVC, Inc. | ||||||
| 1,150,000 | 7.125%, 4/15/2017e | 1,127,000 | ||||
| 3,750,000 | 7.375%, 10/15/2020e | 3,646,875 | ||||
| Realogy Corporation | ||||||
| 2,120,000 | 10.500%, 4/15/2014d | 1,796,700 | ||||
| Rite Aid Corporation | ||||||
| 1,900,000 | 7.500%, 3/1/2017 | 1,681,500 | ||||
| 1,530,000 | 9.500%, 6/15/2017 | 1,212,525 | ||||
| Seminole Hard Rock Entertainment | ||||||
| 2,870,000 | 3.037%, 9/15/2010c,e | 2,446,675 | ||||
| Service Corporation International | ||||||
| 2,100,000 | 6.750%, 4/1/2015 | 2,084,250 | ||||
| Shingle Springs Tribal Gaming Authority | ||||||
| 5,950,000 | 9.375%, 6/15/2015e | 4,715,375 | ||||
| Speedway Motorsports, Inc. | ||||||
| 2,930,000 | 8.750%, 6/1/2016 | 3,076,500 | ||||
| Starwood Hotels & Resorts Worldwide, Inc. | ||||||
| 2,400,000 | 7.875%, 10/15/2014 | 2,580,000 | ||||
| Toys R Us Property Company I, LLC | ||||||
| 3,100,000 | 10.750%, 7/15/2017e | 3,386,750 | ||||
| Tunica-Biloxi Gaming Authority | ||||||
| 4,770,000 | 9.000%, 11/15/2015j | 4,269,150 | ||||
| Turning Stone Resort Casino Enterprise | ||||||
| 2,770,000 | 9.125%, 9/15/2014e | 2,763,075 | ||||
| Universal City Development Partners, Ltd. | ||||||
| 1,730,000 | 8.875%, 11/15/2015e | 1,738,650 | ||||
| 2,670,000 | 10.875%, 11/15/2016e | 2,723,400 | ||||
| West Corporation | ||||||
| 2,130,000 | 9.500%, 10/15/2014d | 2,140,650 | ||||
| WMG Acquisition Corporation | ||||||
| 2,600,000 | 9.500%, 6/15/2016d | 2,769,000 | ||||
| Wyndham Worldwide Corporation | ||||||
| 3,200,000 | 6.000%, 12/1/2016 | 3,104,544 | ||||
| 1,600,000 | 7.375%, 3/1/2020 | 1,641,360 | ||||
| Total Consumer Cyclical | 161,405,697 | |||||
| Consumer Discretionary (0.2%) | ||||||
| Libbey Glass, Inc. | ||||||
| 1,710,000 | 10.000%, 2/15/2015e | 1,769,850 | ||||
| Total Consumer Discretionary | 1,769,850 | |||||
The accompanying Notes to Financial Statements are an integral part of this schedule.
256
Table of Contents
High Yield Portfolio
Schedule of Investments as of June 30, 2010
(unaudited)
| Principal Amount | Long-Term Fixed Income (91.3%) | Value | |||
| Consumer Non-Cyclical (11.4%) | |||||
Apria Healthcare Group, Inc. | |||||
| $4,190,000 | 12.375%, 11/1/2014e | $ | 4,472,825 | ||
Biomet, Inc. | |||||
| 2,090,000 | 10.375%, 10/15/2017d | 2,246,750 | |||
| 1,810,000 | 11.625%, 10/15/2017 | 1,959,325 | |||
Capella Healthcare, Inc. | |||||
| 2,360,000 | 9.250%, 7/1/2017e | 2,383,600 | |||
Community Health Systems, Inc. | |||||
| 4,680,000 | 8.875%, 7/15/2015 | 4,826,250 | |||
Diversey Holdings, Inc. | |||||
| 2,761,171 | 10.500%, 5/15/2020e | 3,064,900 | |||
Diversey, Inc. | |||||
| 1,580,000 | 8.250%, 11/15/2019e | 1,627,400 | |||
DJO Finance, LLC/DJO Finance Corporation | |||||
| 5,675,000 | 10.875%, 11/15/2014 | 5,958,750 | |||
HCA, Inc. | |||||
| 6,854,000 | 9.625%, 11/15/2016 | 7,333,780 | |||
| 2,710,000 | 8.500%, 4/15/2019 | 2,872,600 | |||
| 4,270,000 | 7.250%, 9/15/2020 | 4,291,350 | |||
Ingles Markets, Inc. | |||||
| 1,600,000 | 8.875%, 5/15/2017 | 1,628,000 | |||
Jarden Corporation | |||||
| 3,730,000 | 7.500%, 5/1/2017 | 3,655,400 | |||
| 1,070,000 | 7.500%, 1/15/2020 | 1,045,925 | |||
JBS USA, LLC/JBS USA Finance, Inc. | |||||
| 3,150,000 | 11.625%, 5/1/2014 | 3,531,937 | |||
Michael Foods, Inc. | |||||
| 3,190,000 | 9.750%, 7/15/2018e | 3,277,725 | |||
Mylan Inc./PA | |||||
| 3,680,000 | 7.875%, 7/15/2020e | 3,753,600 | |||
Omnicare, Inc. | |||||
| 3,940,000 | 6.875%, 12/15/2015 | 3,940,000 | |||
| 900,000 | 7.750%, 6/1/2020d | 918,000 | |||
Pinnacle Foods Finance, LLC | |||||
| 3,720,000 | 9.250%, 4/1/2015d | 3,794,400 | |||
Pinnacle Foods Finance, | |||||
LLC/Pinnacle Foods Finance Corporation | |||||
| 1,070,000 | 9.250%, 4/1/2015e | 1,091,400 | |||
Revlon Consumer Products Corporation | |||||
| 3,200,000 | 9.750%, 11/15/2015e | 3,280,000 | |||
Select Medical Corporation | |||||
| 1,700,000 | 6.143%, 9/15/2010c,d | 1,470,500 | |||
| 3,445,000 | 7.625%, 2/1/2015 | 3,238,300 | |||
Spectrum Brands, Inc. | |||||
| 1,600,000 | 9.500%, 6/15/2018e | 1,650,000 | |||
U.S. Oncology, Inc. | |||||
| 2,090,000 | 10.750%, 8/15/2014 | 2,142,250 | |||
Valeant Pharmaceuticals International | |||||
| 3,200,000 | 8.375%, 6/15/2016 | 3,616,000 | |||
Visant Holding Corporation | |||||
| 4,185,000 | 10.250%, 12/1/2013 | 4,273,931 | |||
Viskase Companies, Inc. | |||||
| 1,340,000 | 9.875%, 1/15/2018e | 1,346,700 | |||
Total Consumer Non-Cyclical | 88,691,598 | ||||
| Energy (8.3%) | |||||
Chesapeake Energy Corporation | |||||
| 1,890,000 | 6.250%, 1/15/2018 | 1,908,900 | |||
Citgo Petroleum Corporation | |||||
| 5,050,000 | 11.500%, 7/1/2017e | 5,012,125 | |||
Coffeyville Resources, LLC | |||||
| 1,760,000 | 9.000%, 4/1/2015e | 1,742,400 | |||
| 3,600,000 | 10.875%, 4/1/2017e | 3,510,000 | |||
Compagnie Generale de Geophysique-Veritas | |||||
| 1,940,000 | 7.500%, 5/15/2015 | 1,847,850 | |||
| 1,280,000 | 9.500%, 5/15/2016 | 1,299,200 | |||
Connacher Oil and Gas, Ltd. | |||||
| 1,220,000 | 11.750%, 7/15/2014e | 1,305,400 | |||
| 3,440,000 | 10.250%, 12/15/2015e | 3,397,000 | |||
Denbury Resources, Inc. | |||||
| 3,235,000 | 7.500%, 12/15/2015 | 3,267,350 | |||
| 800,000 | 9.750%, 3/1/2016 | 864,000 | |||
| 428,000 | 8.250%, 2/15/2020 | 447,260 | |||
Ferrellgas Partners, LP | |||||
| 2,960,000 | 6.750%, 5/1/2014 | 2,900,800 | |||
Forest Oil Corporation | |||||
| 4,130,000 | 7.250%, 6/15/2019 | 3,985,450 | |||
Helix Energy Solutions Group, Inc. | |||||
| 2,680,000 | 9.500%, 1/15/2016e | 2,465,600 | |||
Linn Energy, LLC | |||||
| 2,250,000 | 8.625%, 4/15/2020e | 2,303,438 | |||
McJunkin Red Man Corporation | |||||
| 4,280,000 | 9.500%, 12/15/2016e | 4,151,600 | |||
Newfield Exploration Company | |||||
| 3,900,000 | 6.625%, 4/15/2016 | 3,919,500 | |||
PetroHawk Energy Corporation | |||||
| 3,440,000 | 9.125%, 7/15/2013 | 3,586,200 | |||
| 850,000 | 10.500%, 8/1/2014 | 913,750 | |||
Pioneer Natural Resources Company | |||||
| 3,200,000 | 7.500%, 1/15/2020 | 3,297,910 | |||
Plains Exploration & Production Company | |||||
| 1,670,000 | 7.750%, 6/15/2015 | 1,653,300 | |||
| 4,270,000 | 10.000%, 3/1/2016 | 4,568,900 | |||
SandRidge Energy, Inc. | |||||
| 3,010,000 | 9.875%, 5/15/2016e | 3,055,150 | |||
Southwestern Energy Company | |||||
| 2,950,000 | 7.500%, 2/1/2018 | 3,134,375 | |||
Total Energy | 64,537,458 | ||||
| Financials (3.5%) | |||||
Bank of America Corporation | |||||
| 3,660,000 | 8.125%, 5/15/2018d | 3,535,304 | |||
CIT Group, Inc. | |||||
| 5,300,000 | 7.000%, 5/1/2017d | 4,770,000 | |||
Deluxe Corporation | |||||
| 1,425,000 | 7.375%, 6/1/2015 | 1,414,312 | |||
General Motors Acceptance Corporation, LLC | |||||
| 3,862,000 | 6.875%, 9/15/2011 | 3,915,103 | |||
| 2,080,000 | 7.500%, 12/31/2013 | 2,074,800 | |||
GMAC, Inc. | |||||
| 2,650,000 | 8.000%, 3/15/2020d,e | 2,590,375 | |||
The accompanying Notes to Financial Statements are an integral part of this schedule.
257
Table of Contents
High Yield Portfolio
Schedule of Investments as of June 30, 2010
(unaudited)
Principal | Long-Term Fixed Income (91.3%) | Value | |||
Financials (3.5%) - continued | |||||
ING Capital Funding Trust III | |||||
| $1,600,000 | 8.439%, 12/31/2010 | $ | 1,392,000 | ||
International Lease Finance Corporation | |||||
| 2,250,000 | 8.625%, 9/15/2015e | 2,131,875 | |||
| 1,950,000 | 8.750%, 3/15/2017d,e | 1,847,625 | |||
SLM Corporation | |||||
| 4,250,000 | 8.000%, 3/25/2020 | 3,732,290 | |||
Total Financials | 27,403,684 | ||||
| Technology (3.4%) | |||||
Advanced Micro Devices, Inc. | |||||
| 3,200,000 | 8.125%, 12/15/2017e | 3,184,000 | |||
First Data Corporation | |||||
| 3,910,000 | 9.875%, 9/24/2015d | 2,971,600 | |||
Freescale Semiconductor, Inc. | |||||
| 4,530,000 | 8.875%, 12/15/2014d | 4,133,625 | |||
| 1,500,000 | 10.125%, 12/15/2016d | 1,200,000 | |||
NXP BV/NXP Funding, LLC | |||||
| 2,050,000 | 7.875%, 10/15/2014 | 1,880,875 | |||
| 2,130,000 | 9.500%, 10/15/2015 | 1,783,875 | |||
Seagate Technology HDD Holdings | |||||
| 4,995,000 | 6.800%, 10/1/2016 | 4,845,150 | |||
SunGard Data Systems, Inc. | |||||
| 1,730,000 | 9.125%, 8/15/2013 | 1,758,113 | |||
| 4,430,000 | 10.250%, 8/15/2015d | 4,573,975 | |||
Total Technology | 26,331,213 | ||||
| Transportation (2.5%) | |||||
American Petroleum Tankers LLC | |||||
| 1,330,000 | 10.250%, 5/1/2015e | 1,333,325 | |||
AMR Corporation, Convertible | |||||
| 1,870,000 | 6.250%, 10/15/2014 | 1,781,175 | |||
Delta Air Lines, Inc. | |||||
| 1,570,000 | 9.500%, 9/15/2014e | 1,648,500 | |||
Kansas City Southern de Mexico SA de CV | |||||
| 2,720,000 | 7.625%, 12/1/2013 | 2,774,400 | |||
| 1,130,000 | 7.375%, 6/1/2014 | 1,149,775 | |||
Navios Maritime Holdings, Inc. | |||||
| 3,300,000 | 9.500%, 12/15/2014 | 3,168,000 | |||
| 1,330,000 | 8.875%, 11/1/2017d,e | 1,339,975 | |||
UAL Pass Through Trust | |||||
| 200,283 | 7.730%, 7/1/2010 | 197,779 | |||
United Air Lines, Inc. | |||||
| 2,300,000 | 9.750%, 1/15/2017 | 2,455,250 | |||
United Maritime Group, LLC/United Maritime Group Finance Corporation | |||||
| 2,140,000 | 11.750%, 6/15/2015e | 2,022,300 | |||
Windsor Petroleum Transport Corporation | |||||
| 1,284,912 | 7.840%, 1/15/2021j | 1,066,477 | |||
Total Transportation | 18,936,956 | ||||
| Utilities (5.5%) | |||||
AES Corporation | |||||
| 680,000 | 8.750%, 5/15/2013d,e | 690,200 | |||
| 4,230,000 | 7.750%, 10/15/2015d | 4,282,875 | |||
Copano Energy, LLC | |||||
| 3,640,000 | 8.125%, 3/1/2016 | 3,585,400 | |||
Crosstex Energy/Crosstex Energy Finance Corporation | |||||
| 3,730,000 | 8.875%, 2/15/2018e | 3,725,338 | |||
Edison Mission Energy | |||||
| 2,960,000 | 7.000%, 5/15/2017 | 1,894,400 | |||
| 1,210,000 | 7.200%, 5/15/2019 | 744,150 | |||
El Paso Corporation | |||||
| 2,600,000 | 6.875%, 6/15/2014 | 2,647,255 | |||
| 1,530,000 | 7.000%, 6/15/2017 | 1,521,385 | |||
Energy Future Holdings Corporation | |||||
| 2,100,000 | 10.875%, 11/1/2017d | 1,554,000 | |||
Holly Energy Partners LP | |||||
| 2,130,000 | 8.250%, 3/15/2018e | 2,140,650 | |||
NRG Energy, Inc. | |||||
| 8,240,000 | 7.375%, 2/1/2016d | 8,198,800 | |||
Regency Energy Partners, LP | |||||
| 3,480,000 | 8.375%, 12/15/2013 | 3,584,400 | |||
| 1,690,000 | 9.375%, 6/1/2016e | 1,791,400 | |||
Southern Star Central Corporation | |||||
| 2,643,000 | 6.750%, 3/1/2016 | 2,557,102 | |||
Texas Competitive Electric Holdings Company, LLC | |||||
| 6,060,000 | 10.250%, 11/1/2015d | 3,999,600 | |||
Total Utilities | 42,916,955 | ||||
Total Long-Term Fixed Income (cost $701,125,006) | 709,390,838 | ||||
Shares | Preferred Stock (1.5%) | Value | |||
| Financials (1.5%) | |||||
| 3,400 | Bank of America Corporation, Convertible, 7.250% | 3,087,200 | |||
| 26,500 | Citigroup, Inc., Convertible, 7.500% | 2,994,500 | |||
| 3,381 | GMAC, Inc., 7.000%e | 2,627,988 | |||
| 3,000 | Wells Fargo & Company, Convertible, 7.500% | 2,793,000 | |||
Total Financials | 11,502,688 | ||||
Total Preferred Stock (cost $9,974,887) | 11,502,688 | ||||
Shares | Common Stock (0.6%) | Value | |||
| Consumer Discretionary (<0.1%) | |||||
| 121,520 | TVMAX Holdings, Inc.i,k | 0 | |||
Total Consumer Discretionary | 0 | ||||
| Materials (0.4%) | |||||
| 126,717 | Smurfit-Stone Container Enterprises, Inc.k | 3,136,246 | |||
| 80,000 | ZSC Specialty Chemical plc, Preferred Stock Warrants, £0.01, expires 7/1/2010i,j,k | 0 | |||
The accompanying Notes to Financial Statements are an integral part of this schedule.
258
Table of Contents
High Yield Portfolio
Schedule of Investments as of June 30, 2010
(unaudited)
| Shares | Common Stock (0.6%) | Value | ||||
| Materials (0.4%) - continued | ||||||
| 80,000 | ZSC Specialty Chemical plc, Stock Warrants, £0.01, expires 7/1/2010i,j,k | $ | 0 | |||
Total Materials | 3,136,246 | |||||
| Telecommunications Services (<0.1%) | ||||||
| 36 | USA Mobility, Inc. | 465 | ||||
Total Telecommunications Services | 465 | |||||
| Utilities (0.2%) | ||||||
| 51,692 | NRG Energy, Inc.k | 1,096,387 | ||||
| 12,652 | Semgroup Corporationk | 332,115 | ||||
| 13,318 | Semgroup Corporation Warrants, $25, expires 11/30/2014i,k | 79,039 | ||||
Total Utilities | 1,507,541 | |||||
Total Common Stock (cost $12,027,736) | 4,644,252 | |||||
| Shares | Collateral Held for Securities Loaned (8.5%) | Value | ||||
| 65,811,415 | Thrivent Financial Securities Lending Trust | 65,811,415 | ||||
Total Collateral Held for Securities Loaned (cost $65,811,415) | 65,811,415 | |||||
| Principal Amount | Short-Term Investments (3.2%)l | Value | ||||
| Enterprise Funding Company, LLC | ||||||
| 7,560,000 | 0.090%, 7/1/2010 | 7,560,000 | ||||
| Federal Home Loan Bank Discount Notes | ||||||
| 5,000,000 | 0.090%, 7/7/2010 | 4,999,925 | ||||
| 5,000,000 | 0.070%, 7/9/2010 | 4,999,922 | ||||
| 5,000,000 | 0.070%, 7/14/2010 | 4,999,874 | ||||
| Federal Home Loan Mortgage Corporation Discount Notes | ||||||
| 1,500,000 | 0.130%, 7/2/2010 | 1,499,994 | ||||
| Federal National Mortgage Association Discount Notes | ||||||
| 800,000 | 0.180%, 7/12/2010m | 799,956 | ||||
Total Short-Term Investments (at amortized cost) | 24,859,671 | |||||
Total Investments (cost $829,640,004) 107.1% | $ | 831,940,253 | ||||
Other Assets and Liabilities, Net (7.1%) | (55,340,151 | ) | ||||
Total Net Assets 100.0% | $ | 776,600,102 | ||||
| a | The stated interest rate represents the weighted average of all contracts within the bank loan facility. |
| b | All or a portion of the security is insured or guaranteed. |
| c | Denotes variable rate obligations for which the current coupon rate and next scheduled reset date are shown. |
| d | All or a portion of the security is on loan as discussed in item 2(M) of the Notes to Financial Statements. |
| e | Denotes securities sold under Rule 144A of the Securities Act of 1933, which exempts them from registration. These securities have been deemed liquid and may be resold to other dealers in the program or to other qualified institutional buyers. As of June 30, 2010, the value of these investments was $215,331,956 or 27.7% of total net assets. |
| f | In bankruptcy. Interest is not being accrued. |
| g | Denotes step coupon bonds for which the current interest rate and next scheduled reset date are shown. |
| h | Denotes investments purchased on a when-issued or delayed delivery basis. |
| i | Security is fair valued as discussed in item 2(A) of the Notes to Financial Statements. |
| j | Denotes restricted securities. Restricted securities are investment securities which have been deemed illiquid and cannot be offered for public sale without first being registered under the Securities Act of 1933. The following table indicates the acquisition date and cost of restricted securities High Yield Portfolio owned as of June 30, 2010. |
Security | Acquisition Date | Amortized Cost | |||
Tunica-Biloxi Gaming Authority | 11/8/2005 | $ | 4,745,569 | ||
Windsor Petroleum Transport Corporation | 4/15/1998 | 984,920 | |||
ZSC Specialty Chemical plc, Preferred Stock Warrants, £0.01, expires 7/1/2010 | 6/24/1999 | 47,568 | |||
ZSC Specialty Chemical plc, Stock Warrants, £0.01, expires 7/1/2010 | 6/24/1999 | 111,712 | |||
| k | Non-income producing security. |
| l | The interest rate shown reflects the yield, coupon rate or, for securities purchased at a discount, the discount rate at the date of purchase. |
| m | At June 30, 2010, $489,973 of investments were pledged as collateral with the custodian under the agreement between the counterparty, the custodian and the fund for open swap contracts. |
Unrealized Appreciation (Depreciation)
Gross unrealized appreciation and depreciation of investments, based on cost for federal income tax purposes, were as follows:
Gross unrealized appreciation | $ | 29,012,330 | ||
Gross unrealized depreciation | (26,712,081 | ) | ||
Net unrealized appreciation (depreciation) | $ | 2,300,249 | ||
Cost for federal income tax purposes | $ | 829,640,004 | ||
The accompanying Notes to Financial Statements are an integral part of this schedule.
259
Table of Contents
High Yield Portfolio
Schedule of Investments as of June 30, 2010
(unaudited)
Fair Valuation Measurements
The following table is a summary of the inputs used, as of June 30, 2010, in valuing High Yield Portfolio’s assets carried at fair value as discussed in the Notes to Financial Statements.
Investments in Securities | Total | Level 1 | Level 2 | Level 3 | ||||||||
Bank Loans | ||||||||||||
Consumer Cyclical | 5,669,680 | — | 5,669,680 | — | ||||||||
Consumer Non-Cyclical | 390,628 | — | 390,628 | — | ||||||||
Financials | 3,741,990 | — | 3,741,990 | — | ||||||||
Transportation | 1,590,985 | — | 1,590,985 | — | ||||||||
Utilities | 4,338,106 | — | 4,338,106 | — | ||||||||
Long-Term Fixed Income | ||||||||||||
Asset-Backed Securities | 5,013,306 | — | 5,013,306 | — | ||||||||
Basic Materials | 78,437,758 | — | 78,437,758 | — | ||||||||
Capital Goods | 61,478,982 | — | 61,478,982 | — | ||||||||
Communications Services | 132,467,381 | — | 129,807,381 | 2,660,000 | ||||||||
Consumer Cyclical | 161,405,697 | — | 161,405,697 | — | ||||||||
Consumer Discretionary | 1,769,850 | — | 1,769,850 | — | ||||||||
Consumer Non-Cyclical | 88,691,598 | — | 88,691,598 | — | ||||||||
Energy | 64,537,458 | — | 64,537,458 | — | ||||||||
Financials | 27,403,684 | — | 27,403,684 | — | ||||||||
Technology | 26,331,213 | — | 26,331,213 | — | ||||||||
Transportation | 18,936,956 | — | 15,415,229 | 3,521,727 | ||||||||
Utilities | 42,916,955 | — | 42,916,955 | — | ||||||||
Preferred Stock | ||||||||||||
Financials | 11,502,688 | 8,874,700 | 2,627,988 | — | ||||||||
Common Stock | ||||||||||||
Consumer Discretionary | — | — | — | — | ||||||||
Materials | 3,136,246 | 3,136,246 | — | — | ||||||||
Telecommunications Services | 465 | 465 | — | — | ||||||||
Utilities | 1,507,541 | 1,428,502 | — | 79,039 | ||||||||
Collateral Held for Securities Loaned | 65,811,415 | 65,811,415 | — | — | ||||||||
Short-Term Investments | 24,859,671 | — | 24,859,671 | — | ||||||||
Total | $ | 831,940,253 | $ | 79,251,328 | $ | 746,428,159 | $ | 6,260,766 | ||||
Other Financial Instruments | Total | Level 1 | Level 2 | Level 3 | ||||||||
Asset Derivatives | ||||||||||||
Credit Default Swaps | 52,014 | — | 52,014 | — | ||||||||
Total Asset Derivatives | $ | 52,014 | $ | — | $ | 52,014 | $ | — | ||||
The following table is a reconciliation of assets in which significant unobservable inputs (Level 3) were used in determining fair value for High Yield Portfolio as discussed in item 2(A) of the Notes to Financial Statements.
Investments in Securities | Value December 31, 2009 | Accrued Discounts and/or Premiums | Realized Gain/(Loss) | Change in Unrealized Gain/(Loss) | Net Purchases/(Sales) | Transfers Into Level 3 | Transfers Out of Level 3 | Value June 30, 2010 | ||||||||||||||||||||
Long-Term Fixed Income | ||||||||||||||||||||||||||||
Communications Services | — | — | — | — | 2,660,000 | — | — | 2,660,000 | ||||||||||||||||||||
Transportation | 6,239,212 | 13,962 | 41,261 | (68,016 | ) | (3,693,948 | ) | 1,187,035 | (197,779 | ) | 3,521,727 | |||||||||||||||||
Common Stock | ||||||||||||||||||||||||||||
Consumer Discretionary* | — | — | — | — | — | — | — | — | ||||||||||||||||||||
Materials* | — | — | (136,483 | ) | 136,483 | — | — | — | — | |||||||||||||||||||
Utilities | 329,285 | — | — | 81,869 | — | — | (332,115 | ) | 79,039 | |||||||||||||||||||
Total | $ | 6,568,497 | $ | 13,962 | ($ | 95,222 | ) | $ | 150,336 | ($ | 1,033,948 | ) | $ | 1,187,035 | ($ | 529,894 | ) | $ | 6,260,766 | |||||||||
| * | Securities in these sections are fair valued at $0. |
The accompanying Notes to Financial Statements are an integral part of this schedule.
260
Table of Contents
High Yield Portfolio
Schedule of Investments as of June 30, 2010
(unaudited)
Credit Default Swaps and Counterparty | Buy/Sell Protection1 | Termination Date | Notional Principal Amount2 | Upfront Payments Received (Made) | Value3 | Unrealized Gain/(Loss) | |||||||||||
CDX HY, Series 14, 5 Year, at 5.00%; J.P. Morgan Chaseand Co. | Sell | 6/20/2015 | $ | 8,000,000 | $ | 498,465 | ($ | 446,451 | ) | $ | 52,014 | ||||||
Total Credit Default Swaps | ($ | 446,451 | ) | $ | 52,014 | ||||||||||||
The following table summarizes the fair value and Statement of Assets and Liabilities location, as of June 30, 2010, for High Yield Portfolio’s investments in financial derivative instruments by primary risk exposure as discussed under item (2) Significant Accounting Policies of the Notes to Financial Statements.
Derivatives by risk category | Statement of Assets and Liabilities Location | Fair Value | |||
Asset Derivatives | |||||
Credit Contracts | |||||
Credit Default Swaps | Receivable/Payable - Swap agreements, at value; Net Assets - Net unrealized appreciation/(depreciation) on Swap agreements | 52,014 | |||
Total Credit Contracts | 52,014 | ||||
Total Asset Derivatives | $ | 52,014 | |||
The following table summarizes the net realized gains/(losses) and Statement of Operations location, for the period ended June 30, 2010, for High Yield Portfolio’s investments in financial derivative instruments by primary risk exposure.
Derivatives by risk category | Statement of Operations Location | Realized Gains/(Losses) recognized in Income | |||
Credit Contracts | |||||
Credit Default Swaps | Net realized gains/(losses) on Swap agreements | 600,424 | |||
Total Credit Contracts | 600,424 | ||||
Total | $ | 600,424 | |||
The following table summarizes the change in net unrealized appreciation/(depreciation) and Statement of Operations location, for the period ended June 30, 2010, for High Yield Portfolio’s investments in financial derivative instruments by primary risk exposure.
Derivatives by risk category | Statement of Operations Location | Change in unrealized appreciation/(depreciation) recognized in Income | |||
Credit Contracts | |||||
Credit Default Swaps | Change in net unrealized appreciation/(depreciation) on Swap agreements | 52,014 | |||
Total Credit Contracts | 52,014 | ||||
Total | $ | 52,014 | |||
The following table presents High Yield Portfolio’s average volume of derivative activity during the period ended June 30, 2010.
Derivative Risk Category | Swaps (Notional*) | Swaps (Percentage of Average Net Assets) | ||||
Credit Contracts | $ | 2,839,980 | 0.4 | % | ||
| * | Notional amount represents long or short, or both, derivative positions held by the portfolio. |
The accompanying Notes to Financial Statements are an integral part of this schedule.
261
Table of Contents
High Yield Portfolio
Schedule of Investments as of June 30, 2010
(unaudited)
Investment in Affiliates
Affiliated issuers, as defined under the Investment Company Act of 1940, include those in which the Portfolio’s holdings of an issuer represent 5% or more of the outstanding voting securities of an issuer, or any affiliated mutual fund.
A summary of transactions for the fiscal year to date, in High Yield Portfolio, is as follows:
Portfolio | Value December 31, 2009 | Gross Purchases | Gross Sales | Shares Held at June 30, 2010 | Value June 30, 2010 | Income Earned January 1, 2010 - June 30, 2010 | |||||||||||
Thrivent Financial Securities Lending Trust | $ | 36,175,205 | $ | 179,637,731 | $ | 150,001,521 | 65,811,415 | $ | 65,811,415 | $ | 86,301 | ||||||
Total Value and Income Earned | 36,175,205 | 65,811,415 | 86,301 | ||||||||||||||
The accompanying Notes to Financial Statements are an integral part of this schedule.
262
Table of Contents
Diversified Income Plus Portfolio
Schedule of Investments as of June 30, 2010
(unaudited)
The accompanying Notes to Financial Statements are an integral part of this schedule.
263
Table of Contents
Diversified Income Plus Portfolio
Schedule of Investments as of June 30, 2010
(unaudited)
| Principal Amount | Long-Term Fixed Income (69.4%) | Value | |||
Collateralized Mortgage Obligations (11.5%) - continued | |||||
| $ 697,268 | 6.000%, 7/25/2037 | $ | 605,424 | ||
Total Collateralized Mortgage Obligations | 10,362,240 | ||||
Commercial Mortgage-Backed Securities (4.3%) | |||||
Banc of America Commercial Mortgage, Inc. | |||||
| 750,000 | 5.356%, 10/10/2045 | 750,838 | |||
Commercial Mortgage Pass- Through Certificates | |||||
| 1,000,000 | 0.530%, 7/15/2010b,e | 845,574 | |||
Greenwich Capital Commercial Funding Corporation | |||||
| 250,000 | 5.867%, 12/10/2049 | 198,495 | |||
J.P. Morgan Chase Commercial Mortgage Securities Corporation | |||||
| 1,250,000 | 5.336%, 5/15/2047 | 1,235,433 | |||
Wachovia Bank Commercial Mortgage Trust | |||||
| 1,000,000 | 0.470%, 7/15/2010b,e | 819,669 | |||
Total Commercial Mortgage- Backed Securities | 3,850,009 | ||||
Communications Services (7.1%) | |||||
CBS Corporation | |||||
| 300,000 | 8.875%, 5/15/2019 | 377,435 | |||
Clear Channel Worldwide Holdings, Inc. | |||||
| 570,000 | 9.250%, 12/15/2017c | 572,850 | |||
Cricket Communications, Inc. | |||||
| 585,000 | 9.375%, 11/1/2014f | 593,775 | |||
DirecTV Holdings, LLC/DirecTV Financing Company, Inc. | |||||
| 400,000 | 7.625%, 5/15/2016 | 434,500 | |||
DISH DBS Corporation | |||||
| 570,000 | 7.125%, 2/1/2016 | 571,425 | |||
Intelsat Jackson Holdings, Ltd. | |||||
| 570,000 | 8.500%, 11/1/2019c | 575,700 | |||
New Communications Holdings, Inc. | |||||
| 570,000 | 8.250%, 4/15/2017c | 572,137 | |||
Qwest Communications International, Inc. | |||||
| 570,000 | 7.500%, 2/15/2014 | 571,425 | |||
Telecom Italia Capital SA | |||||
| 400,000 | 7.175%, 6/18/2019 | 430,645 | |||
Telefonica Emisiones SAU | |||||
| 200,000 | 5.134%, 4/27/2020 | 200,459 | |||
Time Warner Cable, Inc. | |||||
| 300,000 | 8.250%, 4/1/2019 | 368,941 | |||
Virgin Media Finance plc | |||||
| 570,000 | 8.375%, 10/15/2019 | 577,125 | |||
Wind Acquisition Holdings Finance SPA | |||||
| 620,000 | 12.250%, 7/15/2017c | 564,200 | |||
Total Communications Services | 6,410,617 | ||||
Consumer Cyclical (6.6%) | |||||
Blockbuster, Inc. | |||||
| 2,000 | 11.750%, 10/1/2014c | 1,300 | |||
CVS Caremark Corporation | |||||
| 500,000 | 6.302%, 6/1/2037 | 447,500 | |||
Goodyear Tire & Rubber Company | |||||
| 570,000 | 10.500%, 5/15/2016 | 619,875 | |||
KB Home | |||||
| 700,000 | 6.250%, 6/15/2015 | 623,000 | |||
Lennar Corporation, Convertible | |||||
| 300,000 | 2.000%, 12/1/2020c | 263,625 | |||
Macy’s Retail Holdings, Inc. | |||||
| 500,000 | 8.375%, 7/15/2015 | 551,250 | |||
MGM Resorts International | |||||
| 520,000 | 11.125%, 11/15/2017 | 573,300 | |||
Pinnacle Entertainment, Inc. | |||||
| 570,000 | 8.625%, 8/1/2017c | 587,100 | |||
QVC, Inc. | |||||
| 570,000 | 7.125%, 4/15/2017c | 558,600 | |||
Starwood Hotels & Resorts Worldwide, Inc. | |||||
| 570,000 | 6.750%, 5/15/2018 | 570,000 | |||
Toys R Us Property Company I, LLC | |||||
| 480,000 | 10.750%, 7/15/2017c | 524,400 | |||
WMG Acquisition Corporation | |||||
| 530,000 | 9.500%, 6/15/2016 | 564,450 | |||
Total Consumer Cyclical | 5,884,400 | ||||
Consumer Non-Cyclical (5.1%) | |||||
Archer-Daniels-Midland Company, Convertible | |||||
| 290,000 | 0.875%, 2/15/2014 | 273,325 | |||
Beckman Coulter, Inc., Convertible | |||||
| 261,000 | 2.500%, 12/15/2036 | 284,490 | |||
Biomet, Inc. | |||||
| 530,000 | 10.375%, 10/15/2017 | 569,750 | |||
Charles River Laboratories International, Inc., Convertible | |||||
| 290,000 | 2.250%, 6/15/2013 | 277,312 | |||
Community Health Systems, Inc. | |||||
| 550,000 | 8.875%, 7/15/2015 | 567,188 | |||
Fisher Scientific International, Inc. Convertible | |||||
| 232,000 | 3.250%, 3/1/2024 | 293,770 | |||
Gilead Sciences, Inc., Convertible | |||||
| 203,000 | 0.625%, 5/1/2013 | 225,330 | |||
HCA, Inc. | |||||
| 560,000 | 9.625%, 11/15/2016 | 599,200 | |||
JBS USA, LLC/JBS USA Finance, Inc. | |||||
| 570,000 | 11.625%, 5/1/2014 | 639,113 | |||
Life Technologies Corporation, Convertible | |||||
| 261,000 | 3.250%, 6/15/2025 | 293,625 | |||
Molson Coors Brewing Company Convertible | |||||
| 290,000 | 2.500%, 7/30/2013 | 311,025 | |||
The accompanying Notes to Financial Statements are an integral part of this schedule.
264
Table of Contents
Diversified Income Plus Portfolio
Schedule of Investments as of June 30, 2010
(unaudited)
Principal | Long-Term Fixed Income (69.4%) | Value | |||
| Consumer Non-Cyclical (5.1%) - continued | |||||
Teva Pharmaceutical Finance | |||||
Company, Convertible | |||||
| $232,000 | 1.750%, 2/1/2026 | $ | 265,640 | ||
Total Consumer Non-Cyclical | 4,599,768 | ||||
Energy (3.8%) | |||||
Enbridge Energy Partners, LP | |||||
| 400,000 | 8.050%, 10/1/2037 | 393,858 | |||
Exterran Holdings, Inc., | |||||
Convertible | |||||
| 261,000 | 4.250%, 6/15/2014 | 341,258 | |||
Forest Oil Corporation | |||||
| 590,000 | 7.250%, 6/15/2019 | 569,350 | |||
Marathon Oil Corporation | |||||
| 300,000 | 7.500%, 2/15/2019 | 359,734 | |||
Petrohawk Energy Corporation | |||||
| 570,000 | 7.875%, 6/1/2015 | 571,425 | |||
Pioneer Natural Resources Company | |||||
| 570,000 | 7.500%, 1/15/2020 | 587,440 | |||
Plains Exploration & Production Company | |||||
| 560,000 | 7.625%, 6/1/2018 | 547,400 | |||
Total Energy | 3,370,465 | ||||
| Financials (9.7%) | |||||
Aegon NV | |||||
| 400,000 | 3.891%, 7/15/2010b | 236,120 | |||
American Express Company | |||||
| 400,000 | 6.800%, 9/1/2066 | 381,000 | |||
American International Group, Inc. | |||||
| 400,000 | 8.250%, 8/15/2018 | 405,000 | |||
Bank of America Corporation | |||||
| 240,000 | 8.000%, 1/30/2018 | 231,823 | |||
CIT Group, Inc. | |||||
| 570,000 | 7.000%, 5/1/2017f | 513,000 | |||
CNA Financial Corporation | |||||
| 400,000 | 7.350%, 11/15/2019 | 425,058 | |||
Developers Diversified Realty Corporation | |||||
| 480,000 | 5.375%, 10/15/2012 | 474,066 | |||
Discover Bank | |||||
| 200,000 | 7.000%, 4/15/2020 | 201,946 | |||
ERP Operating, LP | |||||
| 300,000 | 5.750%, 6/15/2017 | 323,252 | |||
HCP, Inc. | |||||
| 300,000 | 6.700%, 1/30/2018 | 316,283 | |||
Icahn Enterprises, LP | |||||
| 570,000 | 8.000%, 1/15/2018c | 552,900 | |||
ING Capital Funding Trust III | |||||
| 200,000 | 8.439%, 12/31/2010 | 174,000 | |||
J.P. Morgan Chase Capital XX | |||||
| 440,000 | 6.550%, 9/29/2036 | 420,675 | |||
Lehman Brothers Holdings, Inc. | |||||
| 400,000 | 7.000%, 9/27/2027g | 79,000 | |||
Liberty Mutual Group, Inc. | |||||
| 200,000 | 10.750%, 6/15/2058c | 216,000 | |||
Lincoln National Corporation | |||||
| 630,000 | 6.050%, 4/20/2067 | 472,500 | |||
MetLife, Inc. | |||||
| 450,000 | 7.875%, 12/15/2037c | 432,000 | |||
ProLogis | |||||
| 400,000 | 5.625%, 11/15/2016 | 376,045 | |||
Reinsurance Group of America, Inc. | |||||
| 600,000 | 6.750%, 12/15/2065 | 497,035 | |||
SLM Corporation | |||||
| 300,000 | 5.125%, 8/27/2012 | 295,534 | |||
| 400,000 | 8.000%, 3/25/2020 | 351,274 | |||
Swiss RE Capital I, LP | |||||
| 420,000 | 6.854%, 5/25/2016c | 344,400 | |||
Wachovia Capital Trust III | |||||
| 320,000 | 5.800%, 3/15/2011 | 254,400 | |||
XL Capital, Ltd. | |||||
| 600,000 | 6.500%, 4/15/2017 | 414,000 | |||
ZFS Finance USA Trust II | |||||
| 350,000 | 6.450%, 12/15/2065c | 313,250 | |||
| Total Financials | 8,700,561 | ||||
Foreign Government (0.6%) | |||||
Russia Government International | |||||
Bond | |||||
| 600,000 | 5.000%, 4/29/2020c | 579,000 | |||
| Total Foreign Government | 579,000 | ||||
Technology (2.2%) | |||||
EMC Corporation, Convertible | |||||
| 232,000 | 1.750%, 12/1/2013 | 293,770 | |||
Freescale Semiconductor, Inc. | |||||
| 570,000 | 9.250%, 4/15/2018c | 562,875 | |||
Intel Corporation, Convertible | |||||
| 290,000 | 3.250%, 8/1/2039c | 326,613 | |||
International Game Technology, Convertible | |||||
| 232,000 | 3.250%, 5/1/2014 | 254,040 | |||
Iron Mountain, Inc. | |||||
| 570,000 | 8.000%, 6/15/2020 | 578,550 | |||
| Total Technology | 2,015,848 | ||||
Transportation (0.5%) | |||||
Delta Air Lines, Inc. | |||||
| 393,444 | 7.750%, 12/17/2019 | 424,919 | |||
| Total Transportation | 424,919 | ||||
Utilities (3.2%) | |||||
CMS Energy Corporation, | |||||
Convertible | |||||
| 232,000 | 5.500%, 6/15/2029 | 269,700 | |||
El Paso Corporation | |||||
| 570,000 | 7.000%, 6/15/2017 | 566,790 | |||
Energy Transfer Partners, LP | |||||
| 300,000 | 6.625%, 10/15/2036 | 287,911 | |||
Enterprise Products Operating, | |||||
LLC | |||||
| 700,000 | 7.034%, 1/15/2068 | 644,000 | |||
NRG Energy, Inc. | |||||
| 600,000 | 7.375%, 2/1/2016 | 597,000 | |||
Southern Union Company | |||||
| 200,000 | 7.200%, 11/1/2066 | 177,250 | |||
The accompanying Notes to Financial Statements are an integral part of this schedule.
265
Table of Contents
Diversified Income Plus Portfolio
Schedule of Investments as of June 30, 2010
(unaudited)
Principal Amount | Long-Term Fixed Income (69.4%) | Value | |||
| Utilities (3.2%) - continued | |||||
TransCanada PipeLines, Ltd. | |||||
| $400,000 | 6.350%, 5/15/2067 | $ | 356,500 | ||
Total Utilities | 2,899,151 | ||||
Total Long-Term Fixed Income (cost $63,376,030) | 62,413,128 | ||||
Shares | Common Stock (25.3%) | ||||
| Consumer Discretionary (2.3%) | |||||
| 13,700 | Comcast Corporation | 237,969 | |||
| 11,800 | Home Depot, Inc. | 331,226 | |||
| 11,400 | Mattel, Inc. | 241,224 | |||
| 2,900 | McDonald’s Corporation | 191,023 | |||
| 5,100 | McGraw-Hill Companies, Inc. | 143,514 | |||
| 7,600 | Omnicom Group, Inc. | 260,680 | |||
| 7,232 | Time Warner, Inc. | 209,077 | |||
| 2,300 | VF Corporation | 163,714 | |||
| 6,800 | Yum! Brands, Inc. | 265,472 | |||
Total Consumer Discretionary | 2,043,899 | ||||
| Consumer Staples (2.4%) | |||||
| 6,500 | Kimberly-Clark Corporation | 394,095 | |||
| 6,800 | Kraft Foods, Inc. | 190,400 | |||
| 7,700 | Nu Skin Enterprises, Inc. | 191,961 | |||
| 8,900 | Philip Morris International, Inc. | 407,976 | |||
| 3,537 | Procter & Gamble Company | 212,149 | |||
| 10,600 | Safeway, Inc. | 208,396 | |||
| 10,900 | SYSCO Corporation | 311,413 | |||
| 4,400 | Wal-Mart Stores, Inc. | 211,508 | |||
Total Consumer Staples | 2,127,898 | ||||
| Energy (2.4%) | |||||
| 6,900 | Chevron Corporation | 468,234 | |||
| 10,900 | ConocoPhillips | 535,081 | |||
| 6,000 | Exxon Mobil Corporation | 342,420 | |||
| 8,100 | Marathon Oil Corporation | 251,829 | |||
| 5,700 | National Oilwell Varco, Inc. | 188,499 | |||
| 6,000 | Noble Corporationh | 185,460 | |||
| 3,200 | Royal Dutch Shell plc ADR | 160,704 | |||
Total Energy | 2,132,227 | ||||
| Financials (8.4%) | |||||
| 4,400 | ACE, Ltd. | 226,512 | |||
| 3,900 | AFLAC, Inc. | 166,413 | |||
| 8,500 | Allstate Corporation | 244,205 | |||
| 4,500 | Ameriprise Financial, Inc. | 162,585 | |||
| 25,000 | Annaly Capital Management, Inc. | 428,750 | |||
| 63,000 | Anworth Mortgage Asset Corporation | 448,560 | |||
| 20,100 | Bank of America Corporation | 288,837 | |||
| 5,300 | Bank of Nova Scotia | 243,906 | |||
| 1,500 | Goldman Sachs Group, Inc. | 196,905 | |||
| 17,250 | Invesco Mortgage Capital, Inc. | 345,173 | |||
| 22,300 | iShares Dow Jones U.S. Real Estate Index Fundf | 1,052,783 | |||
| 12,000 | J.P. Morgan Chase & Company | 439,320 | |||
| 5,500 | MetLife, Inc. | 207,680 | |||
| 7,500 | Plum Creek Timber Company, Inc. | 258,975 | |||
| 3,500 | Royal Bank of Canada ADR | 167,265 | |||
| 12,400 | SEI Investments Company | 252,464 | |||
| 5,100 | SPDR S&P Dividend ETF | 230,234 | |||
| 4,400 | Travelers Companies, Inc. | 216,700 | |||
| 38,000 | Two Harbors Investment Corporationf | 313,500 | |||
| 7,600 | U.S. Bancorp | 169,860 | |||
| 10,000 | Unum Group | 217,000 | |||
| 22,300 | Vanguard REIT ETFf | 1,036,727 | |||
| 11,600 | Wells Fargo & Company | 296,960 | |||
Total Financials | 7,611,314 | ||||
| Health Care (2.1%) | |||||
| 4,100 | Abbott Laboratories | 191,798 | |||
| 8,800 | AmerisourceBergen Corporation | 279,400 | |||
| 6,500 | Cardinal Health, Inc. | 218,465 | |||
| 7,400 | Eli Lilly and Company | 247,900 | |||
| 4,900 | Johnson & Johnson | 289,394 | |||
| 8,844 | Merck & Company, Inc. | 309,275 | |||
| 24,653 | Pfizer, Inc. | 351,552 | |||
Total Health Care | 1,887,784 | ||||
| Industrials (2.5%) | |||||
| 2,700 | 3M Company | 213,273 | |||
| 4,600 | Caterpillar, Inc. | 276,322 | |||
| 5,300 | Cooper Industries plc | 233,200 | |||
| 9,300 | Equifax, Inc. | 260,958 | |||
| 8,500 | Honeywell International, Inc. | 331,755 | |||
| 4,500 | Illinois Tool Works, Inc. | 185,760 | |||
| 5,600 | ITT Corporation | 251,552 | |||
| 4,700 | Raytheon Company | 227,433 | |||
| 3,700 | United Technologies Corporation | 240,167 | |||
Total Industrials | 2,220,420 | ||||
| Information Technology (1.9%) | |||||
| 13,600 | Altera Corporation | 337,416 | |||
| 34,800 | EarthLink, Inc. | 277,008 | |||
| 12,000 | Intel Corporation | 233,400 | |||
| 3,700 | International Business Machines Corporation | 456,876 | |||
| 13,300 | Microsoft Corporation | 306,033 | |||
| 6,100 | Tyco Electronics, Ltd. | 154,818 | |||
Total Information Technology | 1,765,551 | ||||
| Materials (1.1%) | |||||
| 5,950 | ArcelorMittal | 159,222 | |||
| 6,400 | Bemis Company, Inc. | 172,800 | |||
| 3,400 | BHP Billiton, Ltd. ADR | 210,766 | |||
| 7,600 | E.I. du Pont de Nemours and Company | 262,884 | |||
| 2,100 | Lubrizol Corporation | 168,651 | |||
Total Materials | 974,323 | ||||
| Telecommunications Services (0.9%) | |||||
| 15,700 | AT&T, Inc. | 379,783 | |||
| 16,400 | Verizon Communications, Inc. | 459,528 | |||
Total Telecommunications Services | 839,311 | ||||
| Utilities (1.3%) | |||||
| 3,800 | Energen Corporation | 168,454 | |||
The accompanying Notes to Financial Statements are an integral part of this schedule.
266
Table of Contents
Diversified Income Plus Portfolio
Schedule of Investments as of June 30, 2010
(unaudited)
Shares | Common Stock (25.3%) | Value | ||||
| Utilities (1.3%) - continued | ||||||
| 6,400 | Nicor, Inc. | $ | 259,200 | |||
| 20,000 | NiSource, Inc. | 290,000 | ||||
| 5,800 | ONEOK, Inc. | 250,850 | ||||
| 388 | Semgroup Corporationh | 10,185 | ||||
| 408 | Semgroup Corporation Warrants, $25, expires 11/30/2014h,i | 2,421 | ||||
| 7,700 | UGI Corporation | 195,888 | ||||
Total Utilities | 1,176,998 | |||||
Total Common Stock (cost $24,239,538) | 22,779,725 | |||||
Preferred Stock (1.2%) | ||||||
| Financials (0.8%) | ||||||
| 6,960 | AMG Capital Trust I, Convertible, 5.100% | 274,485 | ||||
| 3,800 | Citigroup, Inc., Convertible, 7.500% | 429,400 | ||||
| 70 | GMAC, Inc., 7.000%c | 54,410 | ||||
Total Financials | 758,295 | |||||
| Utilities (0.4%) | ||||||
| 11,600 | CenterPoint Energy, Inc., Convertible, 2.000% | 339,880 | ||||
Total Utilities | 339,880 | |||||
Total Preferred Stock (cost $1,017,396) | 1,098,175 | |||||
Collateral Held for Securities Loaned (4.2%) | ||||||
| 3,749,300 | Thrivent Financial Securities Lending Trust | 3,749,300 | ||||
Total Collateral Held for Securities Loaned (cost $3,749,300) | 3,749,300 | |||||
Principal | Short-Term Investments (2.8%)j | |||||
Federal Home Loan Bank Discount Notes | ||||||
| 400,000 | 0.045%, 7/9/2010 | 399,996 | ||||
Federal National Mortgage Association Discount Notes | ||||||
| 300,000 | 0.180%, 7/7/2010k | 299,991 | ||||
Jupiter Securitization Company, LLC | ||||||
| 1,765,000 | 0.090%, 7/1/2010 | 1,765,000 | ||||
Total Short-Term Investments (at amortized cost) | 2,464,987 | |||||
Total Investments (cost $94,847,251) 102.9% | $ | 92,505,315 | ||||
Other Assets and Liabilities, Net (2.9%) | (2,599,533 | ) | ||||
Total Net Assets 100.0% | $ | 89,905,782 | ||||
| a | All or a portion of the security is insured or guaranteed. |
| b | Denotes variable rate obligations for which the current coupon rate and next scheduled reset date are shown. |
| c | Denotes securities sold under Rule 144A of the Securities Act of 1933, which exempts them from registration. These securities have been deemed liquid and may be resold to other dealers in the program or to other qualified institutional buyers. As of June 30, 2010, the value of these investments was $10,994,890 or 12.2% of total net assets. |
| d | Denotes step coupon bonds for which the current interest rate and next scheduled reset date are shown. |
| e | Denotes restricted securities. Restricted securities are investment securities which have been deemed illiquid and cannot be offered for public sale without first being registered under the Securities Act of 1933. The following table indicates the acquisition date and cost of restricted securities Diversified Income Plus Portfolio owned as of June 30, 2010. |
Security | Acquisition Date | Amortized Cost | |||
Commercial Mortgage Pass- Through Certificates | 5/2/2007 | $ | 1,000,000 | ||
Wachovia Bank Commercial Mortgage Trust | 4/25/2007 | 1,000,000 | |||
| f | All or a portion of the security is on loan as discussed in item 2(M) of the Notes to Financial Statements. |
| g | In bankruptcy. Interest is not being accrued. |
| h | Non-income producing security. |
| i | Security is fair valued as discussed in item 2(A) of the Notes to Financial Statements. |
| j | The interest rate shown reflects the yield, coupon rate or, for securities purchased at a discount, the discount rate at the date of purchase. |
| k | At June 30, 2010, $299,991 of investments were held on deposit with the counterparty and pledged as the initial margin deposit for open futures contracts. |
Definitions:
| ADR | - | American Depositary Receipt, which are certificates for an underlying foreign security’s shares held by an issuing U.S. depository bank. | ||
| REIT | - | Real Estate Investment Trust, is a company that buys, develops, manages and/or sells real estate assets. | ||
| ETF | - | Exchange Traded Fund. |
Unrealized Appreciation (Depreciation)
Gross unrealized appreciation and depreciation of investments, based on cost for federal income tax purposes, were as follows:
Gross unrealized appreciation | $ | 3,131,596 | ||
Gross unrealized depreciation | (5,473,532 | ) | ||
Net unrealized appreciation (depreciation) | $ | (2,341,936 | ) | |
Cost for federal income tax purposes | $ | 94,847,251 | ||
The accompanying Notes to Financial Statements are an integral part of this schedule.
267
Table of Contents
Diversified Income Plus Portfolio
Schedule of Investments as of June 30, 2010
(unaudited)
Fair Valuation Measurements
The following table is a summary of the inputs used, as of June 30, 2010, in valuing Diversified Income Plus Portfolio’s assets carried at fair value as discussed in the Notes to Financial Statements.
Investments in Securities | Total | Level 1 | Level 2 | Level 3 | ||||||||
Long-Term Fixed Income | ||||||||||||
Asset-Backed Securities | 5,241,392 | — | 4,441,512 | 799,880 | ||||||||
Basic Materials | 5,943,891 | — | 5,943,891 | — | ||||||||
Capital Goods | 2,130,867 | — | 2,130,867 | — | ||||||||
Collateralized Mortgage Obligations | 10,362,240 | — | 10,362,240 | — | ||||||||
Commercial Mortgage-Backed | ||||||||||||
Securities | 3,850,009 | — | 3,850,009 | — | ||||||||
Communications Services | 6,410,617 | — | 6,410,617 | — | ||||||||
Consumer Cyclical | 5,884,400 | — | 5,884,400 | — | ||||||||
Consumer Non-Cyclical | 4,599,768 | — | 4,599,768 | — | ||||||||
Energy | 3,370,465 | — | 3,370,465 | — | ||||||||
Financials | 8,700,561 | — | 8,700,561 | — | ||||||||
Foreign Government | 579,000 | — | 579,000 | — | ||||||||
Technology | 2,015,848 | — | 2,015,848 | — | ||||||||
Transportation | 424,919 | — | — | 424,919 | ||||||||
Utilities | 2,899,151 | — | 2,899,151 | — | ||||||||
Common Stock | ||||||||||||
Consumer Discretionary | 2,043,899 | 2,043,899 | — | — | ||||||||
Consumer Staples | 2,127,898 | 2,127,898 | — | — | ||||||||
Energy | 2,132,227 | 2,132,227 | — | — | ||||||||
Financials | 7,611,314 | 7,611,314 | — | — | ||||||||
Health Care | 1,887,784 | 1,887,784 | — | — | ||||||||
Industrials | 2,220,420 | 2,220,420 | — | — | ||||||||
Information Technology | 1,765,551 | 1,765,551 | — | — | ||||||||
Materials | 974,323 | 974,323 | — | — | ||||||||
Telecommunications Services | 839,311 | 839,311 | — | — | ||||||||
Utilities | 1,176,998 | 1,174,577 | — | 2,421 | ||||||||
Preferred Stock | ||||||||||||
Financials | 758,295 | 429,400 | 328,895 | — | ||||||||
Utilities | 339,880 | — | 339,880 | — | ||||||||
Collateral Held for Securities Loaned | 3,749,300 | 3,749,300 | — | — | ||||||||
Short-Term Investments | 2,464,987 | — | 2,464,987 | — | ||||||||
Total | $ | 92,505,315 | $ | 26,956,004 | $ | 64,322,091 | $ | 1,227,220 | ||||
Other Financial Instruments | Total | Level 1 | Level 2 | Level 3 | ||||||||
Asset Derivatives | ||||||||||||
Futures Contracts | 33,640 | 33,640 | — | — | ||||||||
Total Asset Derivatives | $ | 33,640 | $ | 33,640 | $ | — | $ | — | ||||
Liability Derivatives | ||||||||||||
Futures Contracts | 65,927 | 65,927 | — | — | ||||||||
Total Liability Derivatives | $ | 65,927 | $ | 65,927 | $ | — | $ | — | ||||
The accompanying Notes to Financial Statements are an integral part of this schedule.
268
Table of Contents
Diversified Income Plus Portfolio
Schedule of Investments as of June 30, 2010
(unaudited)
The following table is a reconciliation of assets in which significant unobservable inputs (Level 3) were used in determining fair value for Diversified Income Plus Portfolio as discussed in item 2(A) of the Notes to Financial Statements.
Investments in Securities | Value December 31, 2009 | Accrued Discounts and/or Premiums | Realized Gain/(Loss) | Change in Unrealized Gain/(Loss) | Net Purchases/(Sales) | Transfers Into Level 3 | Transfers Out of Level 3 | Value June 30, 2010 | |||||||||||||||||||
Long-Term Fixed Income | |||||||||||||||||||||||||||
Asset-Backed Securities | 1,631,215 | — | — | 68,665 | (900,000 | ) | — | — | 799,880 | ||||||||||||||||||
Transportation | 140,700 | (534 | ) | 697 | 8,962 | 275,094 | — | — | 424,919 | ||||||||||||||||||
Utilities | 10,098 | — | — | 2,508 | — | — | (10,185 | ) | 2,421 | ||||||||||||||||||
Total | $ | 1,782,013 | ($ | 534 | ) | $ | 697 | $ | 80,135 | ($ | 624,906 | ) | $ | — | ($ | 10,185 | ) | $ | 1,227,220 | ||||||||
Futures Contracts | Number of Contracts Long/(Short) | Expiration Date | Notional Principal Amount | Value | Unrealized Gain/(Loss) | ||||||||||||
5-Yr. U.S. Treasury Bond Futures | 26 | September 2010 | $ | 3,043,501 | $ | 3,077,141 | $ | 33,640 | |||||||||
10-Yr. U.S. Treasury Bond Futures | (15 | ) | September 2010 | (1,814,368 | ) | (1,838,203 | ) | (23,835 | ) | ||||||||
S&P 500 Index Mini-Futures | 37 | September 2010 | 1,941,302 | 1,899,210 | (42,092 | ) | |||||||||||
Total Futures Contracts | ($ | 32,287 | ) | ||||||||||||||
The following table summarizes the fair value and Statement of Assets and Liabilities location, as of June 30, 2010, for Diversified Income Plus Portfolio’s investments in financial derivative instruments by primary risk exposure as discussed under item (2) Significant Accounting Policies of the Notes to Financial Statements.
Derivatives by risk category | Statement of Assets and Liabilities Location | Fair Value | |||
Asset Derivatives | |||||
Interest Rate Contracts | |||||
Futures* | Net Assets - Net unrealized appreciation/(depreciation) on Futures contracts | 33,640 | |||
Total Interest Rate Contracts | 33,640 | ||||
Total Asset Derivatives | $ | 33,640 | |||
| Liability Derivatives | |||||
Equity Contracts | |||||
Futures* | Net Assets - Net unrealized appreciation/(depreciation) on Futures contracts | 42,092 | |||
Total Equity Contracts | 42,092 | ||||
Interest Rate Contracts | |||||
Futures* | Net Assets - Net unrealized appreciation/(depreciation) on Futures contracts | 23,835 | |||
Total Interest Rate Contracts | 23,835 | ||||
Total Liability Derivatives | $ | 65,927 | |||
| * | Includes cumulative appreciation/depreciation of futures contracts as reported in the Schedule of Investments. Only current day’s variation margin is reported within the Statement of Assets and Liabilities. |
The accompanying Notes to Financial Statements are an integral part of this schedule.
269
Table of Contents
Diversified Income Plus Portfolio
Schedule of Investments as of June 30, 2010
(unaudited)
The following table summarizes the net realized gains/(losses) and Statement of Operations location, for the period ended June 30, 2010, for Diversified Income Plus Portfolio’s investments in financial derivative instruments by primary risk exposure.
Derivatives by risk category | Statement of Operations Location | Realized Gains/(Losses) recognized in Income | |||
| Equity Contracts | |||||
Options Written | Net realized gains/(losses) on Written option contracts | 11,357 | |||
Futures | Net realized gains/(losses) on Futures contracts | (329,260 | ) | ||
Total Equity Contracts | (317,903 | ) | |||
| Interest Rate Contracts | |||||
Futures | Net realized gains/(losses) on Futures contracts | 1,942 | |||
Total Interest Rate Contracts | 1,942 | ||||
| Credit Contracts | |||||
Credit Default Swaps | Net realized gains/(losses) on Swap agreements | 11,237 | |||
Total Credit Contracts | 11,237 | ||||
Total | ($304,724 | ) | |||
The following table summarizes the change in net unrealized appreciation/(depreciation) and Statement of Operations location, for the period ended June 30, 2010, for Diversified Income Plus Portfolio’s investments in financial derivative instruments by primary risk exposure.
Derivatives by risk category | Statement of Operations Location | Change in unrealized appreciation/(depreciation) recognized in Income | ||||
| Interest Rate Contracts | ||||||
Futures | Change in net unrealized appreciation/(depreciation) on Futures contracts | 11,479 | ||||
Total Interest Rate Contracts | 11,479 | |||||
| Equity Contracts | ||||||
Options Written | Change in net unrealized appreciation/(depreciation) on Written option contracts | (4,680 | ) | |||
Futures | Change in net unrealized appreciation/(depreciation) on Futures contracts | (6,575 | ) | |||
Total Equity Contracts | (11,255 | ) | ||||
| Credit Contracts | ||||||
Credit Default Swaps | Change in net unrealized appreciation/(depreciation) on Swap agreements | 221,296 | ||||
Total Credit Contracts | 221,296 | |||||
Total | $ | 221,520 | ||||
The following table presents Diversified Income Plus Portfolio’s average volume of derivative activity during the period ended June 30, 2010.
Derivative Risk Category | Futures (Notional*) | Futures (Percentage of Average Net Assets) | Swaps (Notional*) | Swaps (Percentage of Average Net Assets) | Options (Contracts) | |||||||||
Equity Contracts | $ | 2,556,146 | 2.8 | % | N/A | N/A | 18 | |||||||
Interest Rate Contracts | 4,788,210 | 5.3 | N/A | N/A | N/A | |||||||||
Credit Contracts | N/A | N/A | $ | 1,453,813 | 1.6 | % | N/A | |||||||
| * | Notional amount represents long or short, or both, derivative positions held by the portfolio. |
The accompanying Notes to Financial Statements are an integral part of this schedule.
270
Table of Contents
Diversified Income Plus Portfolio
Schedule of Investments as of June 30, 2010
(unaudited)
Investment in Affiliates
Affiliated issuers, as defined under the Investment Company Act of 1940, include those in which the Portfolio’s holdings of an issuer represent 5% or more of the outstanding voting securities of an issuer, or any affiliated mutual fund.
A summary of transactions for the fiscal year to date, in Diversified Income Plus Portfolio, is as follows:
Portfolio | Value December 31, 2009 | Gross Purchases | Gross Sales | Shares Held at June 30, 2010 | Value June 30, 2010 | Income Earned January 1, 2010 - - June 30, 2010 | |||||||||||
Thrivent Financial Securities Lending Trust | $ | 1,336,140 | $ | 24,814,555 | $ | 22,401,395 | 3,749,300 | $ | 3,749,300 | $ | 4,243 | ||||||
Total Value and Income Earned | 1,336,140 | 3,749,300 | 4,243 | ||||||||||||||
The accompanying Notes to Financial Statements are an integral part of this schedule.
271
Table of Contents
Partner Socially Responsible Bond Portfolio
Schedule of Investments as of June 30, 2010
(unaudited)
The accompanying Notes to Financial Statements are an integral part of this schedule.
272
Table of Contents
Partner Socially Responsible Bond Portfolio
Schedule of Investments as of June 30, 2010
(unaudited)
| Principal Amount | Long-Term Fixed Income (82.8%) | Value | |||
| Financials (30.4%) - continued | |||||
BNP Paribas | |||||
| $50,000 | 0.695%, 7/8/2010c | $ | 48,738 | ||
Capital One Capital VI | |||||
| 50,000 | 8.875%, 5/15/2040 | 52,069 | |||
Credit Suisse USA, Inc. | |||||
| 50,000 | 0.636%, 8/16/2010c | 49,966 | |||
Glitnir Banki HF | |||||
| 50,000 | 3.226%, 1/21/2011d,e | 13,000 | |||
Goldman Sachs Group, Inc. | |||||
| 40,000 | 0.692%, 7/7/2010c | 39,647 | |||
| 50,000 | 0.707%, 7/22/2010c | 45,147 | |||
HCP, Inc. | |||||
| 60,000 | 5.950%, 9/15/2011 | 62,199 | |||
HRPT Properties Trust | |||||
| 50,000 | 1.137%, 9/16/2010c | 49,710 | |||
J.P. Morgan Chase & Company | |||||
| 70,000 | 0.421%, 7/1/2010c | 70,124 | |||
| 100,000 | 1.436%, 8/16/2010c | 73,161 | |||
| 80,000 | 0.787%, 9/27/2010c | 80,743 | |||
MBNA Capital | |||||
| 100,000 | 1.144%, 8/1/2010c | 67,574 | |||
Nationwide Health Properties, Inc. | |||||
| 60,000 | 6.900%, 10/1/2037 | 61,639 | |||
PACCAR Financial Corporation | |||||
| 70,000 | 0.801%, 7/6/2010c | 69,905 | |||
Private Export Funding Corporation | |||||
| 75,000 | 3.050%, 10/15/2014 | 78,416 | |||
Rabobank Nederland | |||||
| 70,000 | 11.000%, 6/30/2019b | 86,450 | |||
Royal Bank of Scotland plc | |||||
| 100,000 | 4.875%, 3/16/2015 | 99,496 | |||
State Street Bank and Trust Company | |||||
| 70,000 | 0.737%, 9/15/2010c | 70,278 | |||
Suncorp-Metway, Ltd. | |||||
| 70,000 | 0.914%, 9/17/2010b,c | 70,037 | |||
SunTrust Bank | |||||
| 70,000 | 0.588%, 8/23/2010c | 68,836 | |||
TD Ameritrade Holding Corporation | |||||
| 70,000 | 4.150%, 12/1/2014 | 72,644 | |||
US AgBank FCB | |||||
| 50,000 | 6.110%, 7/10/2012b | 36,228 | |||
| �� | Wachovia Corporation | ||||
| 70,000 | 0.688%, 9/1/2010c | 69,200 | |||
| 60,000 | 7.574%, 8/1/2026 | 68,154 | |||
Westfield Capital Corporation, Ltd./WT Finance Australia, Pty Ltd./WEA Finance, LLC | |||||
| 40,000 | 4.375%, 11/15/2010b | 40,434 | |||
Westpac Banking Corporation | |||||
| 70,000 | 0.605%, 7/21/2010b,c | 69,946 | |||
Total Financials | 1,955,369 | ||||
| Foreign Government (1.2%) | |||||
Ontario Government Notes | |||||
| 75,000 | 0.947%, 8/23/2010c | 75,224 | |||
Total Foreign Government | 75,224 | ||||
| Technology (2.0%) | |||||
Amphenol Corporation | |||||
| 50,000 | 4.750%, 11/15/2014 | 52,981 | |||
Arrow Electronics, Inc. | |||||
| 70,000 | 6.875%, 6/1/2018 | 77,311 | |||
Total Technology | 130,292 | ||||
| Transportation (3.6%) | |||||
APL, Ltd. | |||||
| 50,000 | 8.000%, 1/15/2024 | 32,500 | |||
Skyway Concession Company, LLC | |||||
| 50,000 | 0.813%, 9/30/2010b,c | 49,734 | |||
Toll Road Investors Partnership II, LP | |||||
| 800,000 | Zero Coupon, 2/15/2043b | 125,864 | |||
| 165,840 | Zero Coupon, 2/15/2045b | 22,271 | |||
Total Transportation | 230,369 | ||||
| U.S. Government and Agencies (18.7%) | |||||
Federal Home Loan Banks | |||||
| 60,000 | 5.000%, 11/17/2017 | 68,468 | |||
Federal National Mortgage Association | |||||
| 100,000 | 1.250%, 6/22/2012 | 100,953 | |||
U.S. Department of Housing & Urban Development | |||||
| 1,000,000 | 3.440%, 8/1/2011 | 1,031,894 | |||
Total U.S. Government and Agencies | 1,201,315 | ||||
| U.S. Municipals (0.8%) | |||||
Oakland, California Redevelopment Agency Tax Allocation Bonds (Central District Redevelopment) (NATL-RE Insured) | |||||
| 50,000 | 5.252%, 9/1/2016f | 49,288 | |||
Total U.S. Municipals | 49,288 | ||||
Total Long-Term Fixed Income (cost $5,056,709) | 5,323,047 | ||||
Short-Term Investments (12.6%)g | ||||
Federal Home Loan Bank Discount Notes | ||||
| 100,000 | 0.045%, 7/9/2010 | 99,999 | ||
Federal National Mortgage Association Discount Notes | ||||
| 100,000 | 0.180%, 7/7/2010h | 99,997 |
The accompanying Notes to Financial Statements are an integral part of this schedule.
273
Table of Contents
Partner Socially Responsible Bond Portfolio
Schedule of Investments as of June 30, 2010
(unaudited)
Principal Amount | Short-Term Investments (12.6%)g | Value | |||
U.S. Treasury Bills | |||||
$610,000 | 0.020%, 7/8/2010 | $ | 609,997 | ||
Total Short-Term Investments (at amortized cost) | 809,993 | ||||
Total Investments (cost $5,866,702) 95.4% | $ | 6,133,040 | |||
Other Assets and Liabilities, Net 4.6% | 292,409 | ||||
Total Net Assets 100.0% | $ | 6,425,449 | |||
| a | All or a portion of the security is insured or guaranteed. |
| b | Denotes securities sold under Rule 144A of the Securities Act of 1933, which exempts them from registration. These securities have been deemed liquid and may be resold to other dealers in the program or to other qualified institutional buyers. As of June 30, 2010, the value of these investments was $1,206,218 or 18.8% of total net assets. |
| c | Denotes variable rate obligations for which the current coupon rate and next scheduled reset date are shown. |
| d | Denotes restricted securities. Restricted securities are investment securities which have been deemed illiquid and cannot be offered for public sale without first being registered under the Securities Act of 1933. The following table indicates the acquisition date and cost of restricted securities Partner Socially Responsible Bond Portfolio owned as of June 30, 2010. |
Security | Acquisition Date | Amortized Cost | |||
Glitnir Banki HF | 5/1/2008 | $ | 48,097 | ||
| e | In bankruptcy. Interest is not being accrued. |
| f | To reduce certain risks associated with securities issued by municipalities, which may include but are not limited to economic development in a specific industry or municipality, the principal and/or interest payments are guaranteed by the bond insurance company or Government agency identified. |
| g | The interest rate shown reflects the yield, coupon rate or, for securities purchased at a discount, the discount rate at the date of purchase. |
| h | At June 30, 2010, $99,997 of investments were held on deposit with the counterparty and pledged as the initial margin deposit for open futures contracts. |
Unrealized Appreciation (Depreciation)
Gross unrealized appreciation and depreciation of investments, based on cost for federal income tax purposes, were as follows:
Gross unrealized appreciation | $ | 348,938 | ||
Gross unrealized depreciation | (82,600 | ) | ||
Net unrealized appreciation (depreciation) | $ | 266,338 | ||
Cost for federal income tax purposes | $ | 5,866,702 | ||
The accompanying Notes to Financial Statements are an integral part of this schedule.
274
Table of Contents
Partner Socially Responsible Bond Portfolio
Schedule of Investments as of June 30, 2010
(unaudited)
Fair Valuation Measurements
The following table is a summary of the inputs used, as of June 30, 2010, in valuing Partner Socially Responsible Bond Portfolio’s assets carried at fair value as discussed in the Notes to Financial Statements.
Investments in Securities | Total | Level 1 | Level 2 | Level 3 | ||||||||
Long-Term Fixed Income | ||||||||||||
Asset-Backed Securities | 359,533 | — | 359,533 | — | ||||||||
Basic Materials | 73,592 | — | 73,592 | — | ||||||||
Capital Goods | 64,291 | — | 64,291 | — | ||||||||
Collateralized Mortgage Obligations | 338,401 | — | 338,401 | — | ||||||||
Communications Services | 162,228 | — | 162,228 | — | ||||||||
Consumer Cyclical | 251,408 | — | 251,408 | — | ||||||||
Consumer Non-Cyclical | 145,503 | — | 145,503 | — | ||||||||
Energy | 286,234 | — | 286,234 | — | ||||||||
Financials | 1,955,369 | — | 1,955,369 | — | ||||||||
Foreign Government | 75,224 | — | 75,224 | — | ||||||||
Technology | 130,292 | — | 130,292 | — | ||||||||
Transportation | 230,369 | — | 230,369 | — | ||||||||
U.S. Government and Agencies | 1,201,315 | — | 1,201,315 | — | ||||||||
U.S. Municipals | 49,288 | — | 49,288 | — | ||||||||
Short-Term Investments | 809,993 | — | 809,993 | — | ||||||||
Total | $ | 6,133,040 | $ | — | $ | 6,133,040 | $ | — | ||||
Other Financial Instruments | Total | Level 1 | Level 2 | Level 3 | ||||||||
Asset Derivatives | ||||||||||||
Futures Contracts | 47,984 | 47,984 | — | — | ||||||||
Total Asset Derivatives | $ | 47,984 | $ | 47,984 | $ | — | $ | — | ||||
Liability Derivatives | ||||||||||||
Futures Contracts | 32,628 | 32,628 | — | — | ||||||||
Total Liability Derivatives | $ | 32,628 | $ | 32,628 | $ | — | $ | — | ||||
Futures Contracts | Number of Contracts Long/(Short) | Expiration Date | Notional Principal Amount | Value | Unrealized Gain/(Loss) | ||||||||||||
2-Yr. U.S. Treasury Bond Futures | (12 | ) | September 2010 | ($ | 2,615,174 | ) | ($ | 2,625,937 | ) | ($ | 10,763 | ) | |||||
5-Yr. U.S. Treasury Bond Futures | (12 | ) | September 2010 | (1,398,354 | ) | (1,420,219 | ) | (21,865 | ) | ||||||||
10-Yr. U.S. Treasury Bond Futures | 7 | September 2010 | 843,445 | 857,828 | 14,383 | ||||||||||||
20-Yr. U.S. Treasury Bond Futures | 9 | September 2010 | 1,113,899 | 1,147,500 | 33,601 | ||||||||||||
Total Futures Contracts | $ | 15,356 | |||||||||||||||
The following table summarizes the fair value and Statement of Assets and Liabilities location, as of June 30, 2010, for Partner Socially Responsible Bond Portfolio’s investments in financial derivative instruments by primary risk exposure as discussed under item (2) Significant Accounting Policies of the Notes to Financial Statements.
Derivatives by risk category | Statement of Assets and Liabilities Location | Fair Value | |||
Asset Derivatives | |||||
Interest Rate Contracts | |||||
Futures* | Net Assets - Net unrealized appreciation/(depreciation) on Futures contracts | 47,984 | |||
Total Interest Rate Contracts | 47,984 | ||||
Total Asset Derivatives | $ | 47,984 | |||
Liability Derivatives | |||||
Interest Rate Contracts | |||||
Futures* | Net Assets - Net unrealized appreciation/(depreciation) on Futures contracts | 32,628 | |||
Total Interest Rate Contracts | 32,628 | ||||
Total Liability Derivatives | $ | 32,628 | |||
| * | Includes cumulative appreciation/depreciation of futures contracts as reported in the Schedule of Investments. Only current day’s variation margin is reported within the Statement of Assets and Liabilities. |
The accompanying Notes to Financial Statements are an integral part of this schedule.
275
Table of Contents
Partner Socially Responsible Bond Portfolio
Schedule of Investments as of June 30, 2010
(unaudited)
The following table summarizes the net realized gains/(losses) and Statement of Operations location, for the period ended June 30, 2010, for Partner Socially Responsible Bond Portfolio’s investments in financial derivative instruments by primary risk exposure.
Derivatives by risk category | Statement of Operations Location | Realized Gains/(Losses) recognized in Income | |||
Interest Rate Contracts | |||||
Futures | Net realized gains/(losses) on Futures contracts | 36,874 | |||
Total Interest Rate Contracts | 36,874 | ||||
Total | $ | 36,874 | |||
The following table summarizes the change in net unrealized appreciation/(depreciation) and Statement of Operations location, for the period ended June 30, 2010, for Partner Socially Responsible Bond Portfolio’s investments in financial derivative instruments by primary risk exposure.
Derivatives by risk category | Statement of Operations Location | Change in unrealized appreciation/(depreciation) recognized in Income | |||
Interest Rate Contracts | |||||
Futures | Change in net unrealized appreciation/(depreciation) on Futures contracts | 51,563 | |||
Total Interest Rate Contracts | 51,563 | ||||
Total | $ | 51,563 | |||
The following table presents Partner Socially Responsible Bond Portfolio’s average volume of derivative activity during the period ended June 30, 2010.
Derivative Risk Category | Futures (Notional*) | Futures (Percentage of Average Net Assets) | ||||
Interest Rate Contracts (Long Position) | $ | 2,002,755 | 32.1 | % | ||
Interest Rate Contracts (Short Position) | 4,215,379 | 67.6 | ||||
| * | Notional amount represents long or short, or both, derivative positions held by the portfolio. |
The accompanying Notes to Financial Statements are an integral part of this schedule.
276
Table of Contents
Income Portfolio
Schedule of Investments as of June 30, 2010
(unaudited)
The accompanying Notes to Financial Statements are an integral part of this schedule.
277
Table of Contents
Income Portfolio
Schedule of Investments as of June 30, 2010
(unaudited)
| Principal Amount | Long-Term Fixed Income (95.7%) | Value | |||
| Basic Materials (5.1%) - continued | |||||
| Rio Tinto Finance plc | |||||
| $1,200,000 | 8.950%, 5/1/2014 | $ | 1,455,523 | ||
| Rio Tinto Finance USA, Ltd. | |||||
| 1,200,000 | 9.000%, 5/1/2019 | 1,574,723 | |||
| Rio Tinto Finance, Ltd. | |||||
| 3,285,000 | 6.500%, 7/15/2018 | 3,744,046 | |||
| Teck Resources, Ltd. | |||||
| 1,250,000 | 9.750%, 5/15/2014 | 1,477,270 | |||
| 2,560,000 | 10.250%, 5/15/2016 | 3,020,800 | |||
| Vale Overseas, Ltd. | |||||
| 3,125,000 | 6.875%, 11/10/2039 | 3,264,681 | |||
Total Basic Materials | 62,093,196 | ||||
| Capital Goods (2.2%) | |||||
| Bombardier, Inc. | |||||
| 950,000 | 7.750%, 3/15/2020h | 985,625 | |||
| Case New Holland, Inc. | |||||
| 1,550,000 | 7.875%, 12/1/2017h | 1,561,625 | |||
| CRH America, Inc. | |||||
| 1,900,000 | 8.125%, 7/15/2018 | 2,291,305 | |||
| Crown Americas, LLC | |||||
| 1,300,000 | 7.625%, 5/15/2017h | 1,345,500 | |||
| Hutchinson Whampoa Finance, Ltd. | |||||
| 2,250,000 | 4.625%, 9/11/2015h | 2,347,731 | |||
| John Deere Capital Corporation | |||||
| 3,300,000 | 5.350%, 4/3/2018 | 3,683,843 | |||
| L-3 Communications Corporation | |||||
| 1,250,000 | 5.875%, 1/15/2015 | 1,234,375 | |||
| Republic Services, Inc. | |||||
| 630,000 | 5.500%, 9/15/2019h | 681,737 | |||
| 1,600,000 | 5.000%, 3/1/2020h | 1,659,067 | |||
| 2,200,000 | 5.250%, 11/15/2021h | 2,314,730 | |||
| Textron, Inc. | |||||
| 2,500,000 | 6.200%, 3/15/2015 | 2,690,757 | |||
| Waste Management, Inc. | |||||
| 4,300,000 | 7.375%, 3/11/2019 | 5,210,908 | |||
| 1,050,000 | 4.750%, 6/30/2020 | 1,079,426 | |||
Total Capital Goods | 27,086,629 | ||||
| Collateralized Mortgage Obligations (2.0%) | |||||
| Banc of America Mortgage Securities, Inc. | |||||
| 6,398,149 | 4.787%, 9/25/2035 | 5,413,909 | |||
| Bear Stearns Mortgage Funding Trust | |||||
| 1,614,632 | 0.487%, 7/26/2010e | 325,127 | |||
| Countrywide Alternative Loan Trust | |||||
| 5,154,156 | 6.000%, 1/25/2037 | 3,437,781 | |||
| Deutsche Alt-A Securities, Inc. | |||||
| 3,528,129 | 1.191%, 7/1/2010e | 1,950,032 | |||
| HomeBanc Mortgage Trust | |||||
| 3,113,908 | 5.958%, 4/25/2037 | 2,017,510 | |||
| Merrill Lynch Mortgage Investors, Inc. | |||||
| 4,778,720 | 3.256%, 6/25/2035 | 4,216,724 | |||
| Wachovia Mortgage Loan Trust, LLC | |||||
| 4,095,722 | 5.531%, 5/20/2036 | 3,086,221 | |||
| Washington Mutual Mortgage Pass-Through Certificates | |||||
| 6,980,121 | 1.163%, 7/1/2010e | 2,874,309 | |||
| 1,013,824 | 0.637%, 7/25/2010e | 788,213 | |||
Total Collateralized Mortgage Obligations | 24,109,826 | ||||
| Commercial Mortgage-Backed Securities (5.6%) | |||||
| Bear Stearns Commercial Mortgage Securities, Inc. | |||||
| 3,000,000 | 0.500%, 7/15/2010d,e | 2,655,000 | |||
| 3,500,000 | 5.331%, 2/11/2044 | 3,429,188 | |||
| Citigroup Commercial Mortgage Trust | |||||
| 12,500,000 | 0.490%, 7/15/2010e,h | 10,888,200 | |||
| Citigroup/Deutsche Bank Commercial Mortgage | |||||
| 1,900,000 | 5.322%, 12/11/2049 | 1,845,383 | |||
| Commercial Mortgage Pass- Through Certificates | |||||
| 104,881 | 0.450%, 7/15/2010e,h | 104,755 | |||
| 2,000,000 | 0.480%, 7/15/2010d,e | 1,722,976 | |||
| 4,750,000 | 0.530%, 7/15/2010d,e | 4,016,477 | |||
| Credit Suisse Mortgage Capital Certificates | |||||
| 7,500,000 | 0.520%, 7/15/2010e,h | 6,284,512 | |||
| 3,250,000 | 5.467%, 9/15/2039 | 3,194,015 | |||
| Greenwich Capital Commercial Funding Corporation | |||||
| 4,750,000 | 5.867%, 12/10/2049 | 3,771,400 | |||
| J.P. Morgan Chase Commercial Mortgage Securities Corporation | |||||
| 11,285,000 | 5.336%, 5/15/2047 | 11,153,485 | |||
| Merrill Lynch Mortgage Trust | |||||
| 5,200,000 | 5.265%, 1/12/2044 | 4,956,401 | |||
| Wachovia Bank Commercial Mortgage Trust | |||||
| 7,500,000 | 0.470%, 7/15/2010d,e | 6,147,517 | |||
| 7,700,000 | 4.390%, 2/15/2041 | 7,783,052 | |||
| WaMu Commercial Mortgage Securities Trust | |||||
| 649,054 | 3.830%, 1/25/2035h | 655,393 | |||
Total Commercial Mortgage- Backed Securities | 68,607,754 | ||||
| Communications Services (11.0%) | |||||
| Alltel Corporation | |||||
| 3,875,000 | 7.000%, 3/15/2016 | 4,548,405 | |||
| America Movil SA de CV | |||||
| 3,800,000 | 5.000%, 3/30/2020h | 3,926,057 | |||
| American Tower Corporation | |||||
| 4,000,000 | 4.625%, 4/1/2015 | 4,160,948 | |||
| Cablevision Systems Corporation | |||||
| 1,250,000 | 8.000%, 4/15/2020g | 1,265,625 | |||
The accompanying Notes to Financial Statements are an integral part of this schedule.
278
Table of Contents
Income Portfolio
Schedule of Investments as of June 30, 2010
(unaudited)
| Principal Amount | Long-Term Fixed Income (95.7%) | Value | |||
| Communications Services (11.0%) - continued | |||||
| CBS Corporation | |||||
| $2,500,000 | 8.875%, 5/15/2019 | $ | 3,145,295 | ||
| 1,300,000 | 7.875%, 9/1/2023 | 1,525,919 | |||
| Charter Communications Operating, LLC | |||||
| 1,880,000 | 8.000%, 4/30/2012h | 1,955,200 | |||
| Cincinnati Bell, Inc. | |||||
| 1,870,000 | 8.250%, 10/15/2017 | 1,748,450 | |||
| Clear Channel Worldwide Holdings, Inc. | |||||
| 1,880,000 | 9.250%, 12/15/2017h | 1,889,400 | |||
| Comcast Corporation | |||||
| 1,900,000 | 6.300%, 11/15/2017 | 2,169,179 | |||
| 2,900,000 | 5.700%, 5/15/2018 | 3,187,819 | |||
| 3,200,000 | 5.150%, 3/1/2020 | 3,350,237 | |||
| 2,700,000 | 6.400%, 5/15/2038 | 2,908,915 | |||
| Cox Communications, Inc. | |||||
| 2,900,000 | 4.625%, 6/1/2013 | 3,092,116 | |||
| 1,230,000 | 5.450%, 12/15/2014 | 1,357,649 | |||
| 3,400,000 | 9.375%, 1/15/2019h | 4,505,867 | |||
| 2,500,000 | 8.375%, 3/1/2039h | 3,398,330 | |||
| Cricket Communications, Inc. | |||||
| 1,890,000 | 7.750%, 5/15/2016 | 1,927,800 | |||
| DIRECTV Holdings, LLC | |||||
| 2,600,000 | 6.375%, 6/15/2015 | 2,691,000 | |||
| DirecTV Holdings, LLC/DirecTV Financing Company, Inc. | |||||
| 4,390,000 | 7.625%, 5/15/2016 | 4,768,638 | |||
| Discovery Communications LLC | |||||
| 4,375,000 | 5.050%, 6/1/2020 | 4,547,673 | |||
| DISH DBS Corporation | |||||
| 1,875,000 | 7.125%, 2/1/2016 | 1,879,687 | |||
| Equinix, Inc. | |||||
| 750,000 | 8.125%, 3/1/2018 | 766,875 | |||
| Inmarsat Finance plc | |||||
| 1,070,000 | 7.375%, 12/1/2017h | 1,094,075 | |||
| Insight Communications Company, Inc. | |||||
| 630,000 | 9.375%, 7/15/2018c,h,i | 630,000 | |||
| Intelsat Jackson Holdings, Ltd. | |||||
| 310,000 | 8.500%, 11/1/2019h | 313,100 | |||
| Intelsat Subsidiary Holding Company, Ltd. | |||||
| 2,200,000 | 8.875%, 1/15/2015 | 2,235,750 | |||
| Lamar Media Corporation | |||||
| 160,000 | 7.875%, 4/15/2018h | 159,600 | |||
| MetroPCS Wireless, Inc. | |||||
| 1,890,000 | 9.250%, 11/1/2014g | 1,946,700 | |||
| NBC Universal, Inc. | |||||
| 5,000,000 | 5.150%, 4/30/2020h | 5,214,940 | |||
| New Cingular Wireless Services, Inc. | |||||
| 1,350,000 | 8.750%, 3/1/2031 | 1,853,283 | |||
| New Communications Holdings, Inc. | |||||
| 1,580,000 | 8.250%, 4/15/2017h | 1,585,925 | |||
| News America, Inc. | |||||
| 1,900,000 | 6.900%, 3/1/2019 | 2,250,622 | |||
| 1,900,000 | 5.650%, 8/15/2020 | 2,098,554 | |||
| 2,140,000 | 6.400%, 12/15/2035 | 2,329,043 | |||
| Nextel Communications, Inc. | |||||
| 1,270,000 | 7.375%, 8/1/2015 | 1,206,500 | |||
| NII Capital Corporation | |||||
| 1,900,000 | 8.875%, 12/15/2019 | 1,919,000 | |||
| Qwest Communications International, Inc. | |||||
| 1,900,000 | 7.125%, 4/1/2018h | 1,895,250 | |||
| Qwest Corporation | |||||
| 600,000 | 8.375%, 5/1/2016 | 655,500 | |||
| 3,200,000 | 6.500%, 6/1/2017 | 3,224,000 | |||
| Rogers Communications, Inc. | |||||
| 2,450,000 | 6.800%, 8/15/2018 | 2,896,160 | |||
| 2,410,000 | 8.750%, 5/1/2032 | 3,134,405 | |||
| SBA Tower Trust | |||||
| 3,500,000 | 5.101%, 4/15/2017h | 3,728,382 | |||
| Sprint Capital Corporation | |||||
| 1,250,000 | 8.375%, 3/15/2012 | 1,310,937 | |||
| Telecom Italia Capital SA | |||||
| 2,750,000 | 5.250%, 10/1/2015 | 2,775,435 | |||
| 2,500,000 | 7.175%, 6/18/2019 | 2,691,533 | |||
| Telefonica Emisiones SAU | |||||
| 3,850,000 | 5.134%, 4/27/2020 | 3,858,828 | |||
| Telefonica SA | |||||
| 2,500,000 | 4.949%, 1/15/2015 | 2,618,892 | |||
| Time Warner Cable, Inc. | |||||
| 2,500,000 | 8.250%, 4/1/2019 | 3,074,505 | |||
| 2,600,000 | 6.750%, 6/15/2039 | 2,872,280 | |||
| Time Warner Entertainment Company, LP | |||||
| 1,850,000 | 8.375%, 3/15/2023 | 2,371,904 | |||
| UPC Holding BV | |||||
| 1,070,000 | 9.875%, 4/15/2018h | 1,075,350 | |||
| Verizon Communications, Inc. | |||||
| 2,000,000 | 8.750%, 11/1/2018 | 2,599,946 | |||
| 1,650,000 | 8.950%, 3/1/2039g | 2,337,352 | |||
| Virgin Media Finance plc | |||||
| 1,270,000 | 9.500%, 8/15/2016 | 1,341,438 | |||
| 620,000 | 8.375%, 10/15/2019 | 627,750 | |||
Total Communications Services | 134,644,023 | ||||
| Consumer Cyclical (5.8%) | |||||
| Ameristar Casinos, Inc. | |||||
| 1,890,000 | 9.250%, 6/1/2014 | 1,979,775 | |||
| AOL Time Warner, Inc. | |||||
| 1,600,000 | 7.700%, 5/1/2032 | 1,929,655 | |||
| Cooper-Standard Automotive, Inc. | |||||
| 310,000 | 8.500%, 5/1/2018h | 312,325 | |||
| CVS Caremark Corporation | |||||
| 3,100,000 | 6.600%, 3/15/2019 | 3,607,408 | |||
| 2,500,000 | 6.302%, 6/1/2037 | 2,237,500 | |||
| FireKeepers Development Authority | |||||
| 1,240,000 | 13.875%, 5/1/2015h | 1,432,200 | |||
| Ford Motor Credit Company, LLC | |||||
| 1,480,000 | 8.000%, 6/1/2014 | 1,527,447 | |||
| 1,930,000 | 7.000%, 4/15/2015 | 1,909,098 | |||
| Home Depot, Inc. | |||||
| 3,900,000 | 5.875%, 12/16/2036 | 3,997,886 | |||
The accompanying Notes to Financial Statements are an integral part of this schedule.
279
Table of Contents
Income Portfolio
Schedule of Investments as of June 30, 2010
(unaudited)
| Principal Amount | Long-Term Fixed Income (95.7%) | Value | |||
| Consumer Cyclical (5.8%) - continued | |||||
Hyatt Hotels Corporation | |||||
| $3,100,000 | 5.750%, 8/15/2015h | $ | 3,234,326 | ||
Hyundai Motor Manufacturing Czech | |||||
| 2,525,000 | 4.500%, 4/15/2015h | 2,503,992 | |||
J.C. Penney Corporation, Inc. | |||||
| 1,200,000 | 7.950%, 4/1/2017 | 1,332,000 | |||
JC Penney Company, Inc. | |||||
| 3,250,000 | 5.650%, 6/1/2020 | 3,176,875 | |||
Macy’s Retail Holdings, Inc. | |||||
| 2,930,000 | 8.375%, 7/15/2015 | 3,230,325 | |||
MGM Resorts International | |||||
| 1,250,000 | 11.125%, 11/15/2017 | 1,378,125 | |||
| 1,300,000 | 9.000%, 3/15/2020h | 1,335,750 | |||
Nissan Motor Acceptance Corporation | |||||
| 4,100,000 | 5.625%, 3/14/2011h | 4,206,395 | |||
Pinnacle Entertainment, Inc. | |||||
| 1,260,000 | 8.750%, 5/15/2020h | 1,167,075 | |||
QVC, Inc. | |||||
| 1,270,000 | 7.125%, 4/15/2017h | 1,244,600 | |||
| 320,000 | 7.375%, 10/15/2020h | 311,200 | |||
Speedway Motorsports, Inc. | |||||
| 1,250,000 | 8.750%, 6/1/2016 | 1,312,500 | |||
Starwood Hotels & Resorts Worldwide, Inc. | |||||
| 1,850,000 | 6.750%, 5/15/2018 | 1,850,000 | |||
Time Warner, Inc. | |||||
| 3,200,000 | 4.875%, 3/15/2020 | 3,300,070 | |||
Toll Bros Finance Corporation | |||||
| 2,000,000 | 6.750%, 11/1/2019 | 1,960,578 | |||
Toyota Motor Credit Corporation | |||||
| 3,450,000 | 4.500%, 6/17/2020 | 3,542,336 | |||
Toys R Us Property Company I, LLC | |||||
| 1,250,000 | 10.750%, 7/15/2017h | 1,365,625 | |||
Universal City Development Partners, Ltd. | |||||
| 1,270,000 | 8.875%, 11/15/2015h | 1,276,350 | |||
Viacom, Inc. | |||||
| 4,300,000 | 6.250%, 4/30/2016 | 4,877,266 | |||
Volvo Treasury AB | |||||
| 3,100,000 | 5.950%, 4/1/2015h | 3,240,486 | |||
Wal-Mart Stores, Inc. | |||||
| 3,750,000 | 3.625%, 7/8/2020c,i | 3,746,550 | |||
WMG Acquisition Corporation | |||||
| 1,250,000 | 9.500%, 6/15/2016 | 1,331,250 | |||
Wyndham Worldwide Corporation | |||||
| 635,000 | 6.000%, 12/1/2016 | 616,058 | |||
| Total Consumer Cyclical | 70,473,026 | ||||
| Consumer Non-Cyclical (5.4%) | |||||
Abbott Laboratories | |||||
| 3,100,000 | 4.125%, 5/27/2020g | 3,247,501 | |||
Altria Group, Inc. | |||||
| 1,200,000 | 8.500%, 11/10/2013 | 1,400,816 | |||
| 3,000,000 | 9.700%, 11/10/2018 | 3,799,140 | |||
| 2,500,000 | 9.950%, 11/10/2038 | 3,284,410 | |||
Anheuser-Busch InBev Worldwide, Inc. | |||||
| 3,125,000 | 5.375%, 11/15/2014h | 3,416,622 | |||
| 1,900,000 | 6.875%, 11/15/2019h | 2,191,171 | |||
| 2,550,000 | 5.375%, 1/15/2020 | 2,747,862 | |||
| 2,525,000 | 5.000%, 4/15/2020h | 2,639,976 | |||
Biomet, Inc. | |||||
| 1,900,000 | 10.375%, 10/15/2017 | 2,042,500 | |||
Boston Scientific Corporation | |||||
| 1,875,000 | 6.000%, 1/15/2020 | 1,861,551 | |||
Campbell Soup Company | |||||
| 1,550,000 | 3.050%, 7/15/2017i | 1,545,521 | |||
Community Health Systems, Inc. | |||||
| 1,950,000 | 8.875%, 7/15/2015 | 2,010,938 | |||
Constellation Brands, Inc. | |||||
| 1,200,000 | 7.250%, 5/15/2017 | 1,216,500 | |||
DaVita, Inc. | |||||
| 1,250,000 | 7.250%, 3/15/2015 | 1,250,000 | |||
Del Monte Corporation | |||||
| 1,250,000 | 7.500%, 10/15/2019h | 1,278,125 | |||
Fortune Brands, Inc. | |||||
| 2,500,000 | 6.375%, 6/15/2014 | 2,782,722 | |||
| 1,300,000 | 5.375%, 1/15/2016 | 1,401,496 | |||
Genzyme Corporation | |||||
| 3,750,000 | 3.625%, 6/15/2015h | 3,793,148 | |||
Hasbro, Inc. | |||||
| 3,250,000 | 6.350%, 3/15/2040 | 3,310,947 | |||
HCA, Inc. | |||||
| 1,250,000 | 9.625%, 11/15/2016 | 1,337,500 | |||
| 2,490,000 | 8.500%, 4/15/2019 | 2,639,400 | |||
| 1,270,000 | 7.250%, 9/15/2020 | 1,276,350 | |||
Kraft Foods, Inc. | |||||
| 3,150,000 | 4.125%, 2/9/2016 | 3,324,746 | |||
| 3,100,000 | 5.375%, 2/10/2020 | 3,321,808 | |||
Kroger Company | |||||
| 2,500,000 | 6.400%, 8/15/2017 | 2,909,997 | |||
| 1,625,000 | 6.150%, 1/15/2020 | 1,877,158 | |||
Life Technologies Corporation | |||||
| 1,900,000 | 6.000%, 3/1/2020 | 2,057,529 | |||
TreeHouse Foods, Inc. | |||||
| 1,260,000 | 7.750%, 3/1/2018 | 1,307,250 | |||
Valeant Pharmaceuticals International | |||||
| 470,000 | 7.625%, 3/15/2020h | 554,600 | |||
| Total Consumer Non-Cyclical | 65,827,284 | ||||
| Energy (7.5%) | |||||
Anadarko Petroleum Corporation | |||||
| 1,900,000 | 5.950%, 9/15/2016 | 1,635,324 | |||
Cenovus Energy, Inc. | |||||
| 2,500,000 | 6.750%, 11/15/2039h | 2,870,268 | |||
CenterPoint Energy Resources Corporation | |||||
| 6,850,000 | 6.125%, 11/1/2017 | 7,580,744 | |||
Citgo Petroleum Corporation | |||||
| 940,000 | 11.500%, 7/1/2017h | 932,950 | |||
Denbury Resources, Inc. | |||||
| 219,000 | 8.250%, 2/15/2020 | 228,855 | |||
Enbridge Energy Partners, LP | |||||
| 950,000 | 5.200%, 3/15/2020 | 978,883 | |||
The accompanying Notes to Financial Statements are an integral part of this schedule.
280
Table of Contents
Income Portfolio
Schedule of Investments as of June 30, 2010
(unaudited)
| Principal Amount | Long-Term Fixed Income (95.7%) | Value | |||
| Energy (7.5%) - continued | |||||
| $3,800,000 | 8.050%, 10/1/2037 | $ | 3,741,651 | ||
Energy Transfer Partners, LP | |||||
| 5,900,000 | 6.700%, 7/1/2018 | 6,344,695 | |||
Enterprise Products Operating, LLC | |||||
| 4,000,000 | 6.300%, 9/15/2017 | 4,474,496 | |||
| 2,200,000 | 5.200%, 9/1/2020 | 2,259,424 | |||
EOG Resources, Inc. | |||||
| 1,875,000 | 4.400%, 6/1/2020 | 1,938,405 | |||
EQT Corporation | |||||
| 1,300,000 | 8.125%, 6/1/2019 | 1,529,258 | |||
Ferrellgas Partners, LP | |||||
| 1,870,000 | 6.750%, 5/1/2014 | 1,832,600 | |||
Forest Oil Corporation | |||||
| 1,200,000 | 7.250%, 6/15/2019 | 1,158,000 | |||
Kinder Morgan Energy Partners, LP | |||||
| 1,250,000 | 5.300%, 9/15/2020g | 1,292,794 | |||
| 3,100,000 | 5.800%, 3/1/2021 | 3,310,598 | |||
Magellan Midstream Partners, LP | |||||
| 2,700,000 | 6.450%, 6/1/2014 | 3,048,392 | |||
Marathon Oil Canada Corporation | |||||
| 3,100,000 | 8.375%, 5/1/2012 | 3,443,207 | |||
Marathon Oil Corporation | |||||
| 2,600,000 | 5.900%, 3/15/2018 | 2,869,485 | |||
Nexen, Inc. | |||||
| 1,300,000 | 6.200%, 7/30/2019 | 1,459,604 | |||
| 3,075,000 | 6.400%, 5/15/2037 | 3,206,656 | |||
Noble Energy, Inc. | |||||
| 3,100,000 | 8.250%, 3/1/2019 | 3,751,790 | |||
ONEOK Partners, LP | |||||
| 1,000,000 | 8.625%, 3/1/2019 | 1,231,947 | |||
| 3,250,000 | 6.850%, 10/15/2037 | 3,431,006 | |||
PetroHawk Energy Corporation | |||||
| 2,200,000 | 10.500%, 8/1/2014 | 2,365,000 | |||
Pioneer Natural Resources Company | |||||
| 2,500,000 | 6.875%, 5/1/2018 | 2,510,448 | |||
Plains All American Pipeline, LP | |||||
| 3,150,000 | 6.500%, 5/1/2018 | 3,466,811 | |||
Plains Exploration & Production Company | |||||
| 1,870,000 | 8.625%, 10/15/2019 | 1,893,375 | |||
Pride International, Inc. | |||||
| 1,880,000 | 7.375%, 7/15/2014 | 1,872,950 | |||
Valero Energy Corporation | |||||
| 3,125,000 | 6.125%, 2/1/2020 | 3,211,237 | |||
Weatherford International, Ltd. | |||||
| 3,100,000 | 6.000%, 3/15/2018 | 3,189,531 | |||
Williams Companies, Inc. | |||||
| 4,300,000 | 8.750%, 3/15/2032 | 5,017,949 | |||
Woodside Finance, Ltd. | |||||
| 3,125,000 | 4.500%, 11/10/2014h | 3,187,225 | |||
| Total Energy | 91,265,558 | ||||
| Financials (26.9%) | |||||
Abbey National Capital Trust I | |||||
| 3,090,000 | 8.963%, 6/30/2030 | 3,106,776 | |||
Aegon NV | |||||
| 2,600,000 | 3.891%, 7/15/2010e | 1,534,780 | |||
American Express Credit Corporation | |||||
| 1,650,000 | 7.300%, 8/20/2013 | 1,868,138 | |||
| 3,850,000 | 5.125%, 8/25/2014 | 4,142,103 | |||
American International Group, Inc. | |||||
| 2,450,000 | 8.250%, 8/15/2018 | 2,480,625 | |||
Associates Corporation of North America | |||||
| 3,800,000 | 6.950%, 11/1/2018 | 3,889,832 | |||
AXA SA | |||||
| 3,900,000 | 6.463%, 12/14/2018h | 3,037,125 | |||
Axis Specialty Finance, LLC | |||||
| 3,250,000 | 5.875%, 6/1/2020 | 3,114,228 | |||
BAC Capital Trust XI | |||||
| 1,300,000 | 6.625%, 5/23/2036 | 1,188,638 | |||
Bank of America Corporation | |||||
| 3,250,000 | 4.500%, 4/1/2015 | 3,284,843 | |||
| 1,900,000 | 8.000%, 1/30/2018 | 1,835,267 | |||
| 1,200,000 | 8.125%, 5/15/2018 | 1,159,116 | |||
| 2,500,000 | 5.625%, 7/1/2020 | 2,519,858 | |||
Barclays Bank plc | |||||
| 3,700,000 | 7.434%, 12/15/2017h | 3,293,000 | |||
Bear Stearns Companies, Inc. | |||||
| 1,900,000 | 6.400%, 10/2/2017 | 2,110,415 | |||
Boston Properties, Inc. | |||||
| 3,750,000 | 5.875%, 10/15/2019 | 4,011,994 | |||
Canadian Imperial Bank of Commerce | |||||
| 2,500,000 | 2.600%, 7/2/2015c,h | 2,513,625 | |||
Cantor Fitzgerald, LP | |||||
| 1,700,000 | 7.875%, 10/15/2019h | 1,758,998 | |||
Capital One Capital V | |||||
| 1,925,000 | 10.250%, 8/15/2039 | 2,030,875 | |||
Capital One Financial Corporation | |||||
| 1,500,000 | 6.150%, 9/1/2016 | 1,587,205 | |||
CIGNA Corporation | |||||
| 2,500,000 | 6.350%, 3/15/2018 | 2,793,527 | |||
CIT Group, Inc. | |||||
| 704,731 | 7.000%, 5/1/2017g | 634,258 | |||
Citigroup, Inc. | |||||
| 2,500,000 | 6.500%, 8/19/2013 | 2,662,943 | |||
| 3,125,000 | 6.000%, 12/13/2013 | 3,278,478 | |||
| 3,125,000 | 6.010%, 1/15/2015 | 3,277,759 | |||
| 2,700,000 | 6.125%, 5/15/2018 | 2,817,941 | |||
| 2,700,000 | 8.500%, 5/22/2019 | 3,218,735 | |||
CME Group Index Services, LLC | |||||
| 2,600,000 | 4.400%, 3/15/2018h | 2,649,444 | |||
CNA Financial Corporation | |||||
| 3,775,000 | 7.350%, 11/15/2019g | 4,011,481 | |||
Commonwealth Bank of Australia | |||||
| 3,250,000 | 5.000%, 3/19/2020h | 3,362,703 | |||
Corestates Capital Trust I | |||||
| 3,000,000 | 8.000%, 12/15/2026h | 3,115,935 | |||
Corporacion Andina de Fomento | |||||
| 2,000,000 | 8.125%, 6/4/2019 | 2,457,342 | |||
Developers Diversified Realty Corporation | |||||
| 1,250,000 | 5.375%, 10/15/2012 | 1,234,548 | |||
The accompanying Notes to Financial Statements are an integral part of this schedule.
281
Table of Contents
Income Portfolio
Schedule of Investments as of June 30, 2010
(unaudited)
| Principal Amount | Long-Term Fixed Income (95.7%) | Value | |||
| Financials (26.9%) - continued | |||||
Discover Bank | |||||
| $1,875,000 | 8.700%, 11/18/2019 | $ | 2,081,614 | ||
| 950,000 | 7.000%, 4/15/2020 | 959,244 | |||
Duke Realty, LP | |||||
| 3,100,000 | 5.950%, 2/15/2017 | 3,164,489 | |||
Endurance Specialty Holdings, Ltd. | |||||
| 4,200,000 | 6.150%, 10/15/2015 | 4,501,531 | |||
ERP Operating, LP | |||||
| 2,500,000 | 5.125%, 3/15/2016 | 2,631,618 | |||
| 1,900,000 | 5.750%, 6/15/2017 | 2,047,259 | |||
Fifth Third Bancorp | |||||
| 2,800,000 | 5.450%, 1/15/2017 | 2,866,170 | |||
GATX Corporation | |||||
| 1,875,000 | 4.750%, 10/1/2012 | 1,973,880 | |||
General Electric Capital Corporation | |||||
| 1,900,000 | 6.000%, 8/7/2019 | 2,056,885 | |||
| 1,900,000 | 5.500%, 1/8/2020g | 2,007,835 | |||
| 1,550,000 | 6.875%, 1/10/2039 | 1,711,405 | |||
| 4,500,000 | 6.375%, 11/15/2067 | 4,185,000 | |||
General Motors Acceptance Corporation, LLC | |||||
| 1,250,000 | 6.875%, 8/28/2012 | 1,253,125 | |||
Genworth Financial, Inc. | |||||
| 975,000 | 7.700%, 6/15/2020 | 973,944 | |||
GMAC, Inc. | |||||
| 2,100,000 | 8.300%, 2/12/2015h | 2,126,250 | |||
Goldman Sachs Group, Inc. | |||||
| 5,800,000 | 6.250%, 9/1/2017 | 6,138,877 | |||
| 600,000 | 5.950%, 1/18/2018 | 623,228 | |||
| 2,500,000 | 5.375%, 3/15/2020 | 2,470,290 | |||
| 3,125,000 | 6.000%, 6/15/2020 | 3,222,291 | |||
| 1,300,000 | 6.750%, 10/1/2037 | 1,274,445 | |||
Health Care REIT, Inc. | |||||
| 3,200,000 | 6.125%, 4/15/2020 | 3,310,224 | |||
Icahn Enterprises, LP | |||||
| 1,850,000 | 8.000%, 1/15/2018g,h | 1,794,500 | |||
ING Capital Funding Trust III | |||||
| 3,200,000 | 8.439%, 12/31/2010 | 2,784,000 | |||
International Lease Finance Corporation | |||||
| 1,900,000 | 5.300%, 5/1/2012 | 1,786,000 | |||
| 1,490,000 | 8.625%, 9/15/2015h | 1,411,775 | |||
J.P. Morgan Chase & Company | |||||
| 6,100,000 | 7.900%, 4/30/2018 | 6,287,453 | |||
| 3,100,000 | 6.300%, 4/23/2019 | 3,501,434 | |||
| 1,250,000 | 4.950%, 3/25/2020 | 1,299,062 | |||
J.P. Morgan Chase Capital XXV | |||||
| 3,100,000 | 6.800%, 10/1/2037 | 3,063,959 | |||
Keybank National Association | |||||
| 3,250,000 | 5.500%, 9/17/2012 | 3,460,971 | |||
LBG Capital No. 1 plc | |||||
| 3,100,000 | 7.875%, 11/1/2020 | 2,495,500 | |||
Liberty Property, LP | |||||
| 2,840,000 | 5.500%, 12/15/2016 | 2,946,761 | |||
Lincoln National Corporation | |||||
| 940,000 | 4.300%, 6/15/2015 | 956,086 | |||
| 1,250,000 | 6.250%, 2/15/2020 | 1,339,149 | |||
Lloyds TSB Bank plc | |||||
| 2,400,000 | 5.800%, 1/13/2020h | 2,265,348 | |||
Lukoil International Finance BV | |||||
| 3,100,000 | 6.375%, 11/5/2014h | 3,251,280 | |||
Merrill Lynch & Company, Inc. | |||||
| 3,250,000 | 5.450%, 2/5/2013 | 3,409,373 | |||
| 5,600,000 | 6.875%, 4/25/2018 | 5,973,974 | |||
| 3,000,000 | 7.750%, 5/14/2038 | 3,208,641 | |||
MetLife Capital Trust X | |||||
| 3,000,000 | 9.250%, 4/8/2038h | 3,240,000 | |||
Morgan Stanley | |||||
| 3,125,000 | 4.200%, 11/20/2014 | 3,085,744 | |||
| 1,900,000 | 5.450%, 1/9/2017 | 1,883,462 | |||
| 2,450,000 | 6.625%, 4/1/2018 | 2,567,928 | |||
| 1,900,000 | 5.625%, 9/23/2019 | 1,838,085 | |||
| 4,700,000 | 5.500%, 1/26/2020 | 4,546,780 | |||
MUFG Capital Finance 1, Ltd. | |||||
| 5,130,000 | 6.346%, 7/25/2016 | 4,963,224 | |||
National City Bank | |||||
| 3,100,000 | 5.800%, 6/7/2017 | 3,291,304 | |||
Nationwide Building Society | |||||
| 4,400,000 | 6.250%, 2/25/2020h | 4,642,915 | |||
New York Life Insurance Company | |||||
| 2,500,000 | 6.750%, 11/15/2039h | 2,920,242 | |||
Nomura Holdings, Inc. | |||||
| 950,000 | 5.000%, 3/4/2015 | 1,003,842 | |||
Nordea Bank AB | |||||
| 2,500,000 | 3.700%, 11/13/2014h | 2,546,770 | |||
PNC Funding Corporation | |||||
| 3,100,000 | 3.000%, 5/19/2014 | 3,129,714 | |||
Preferred Term Securities XXIII, Ltd. | |||||
| 5,520,241 | 0.737%, 9/22/2010d,e | 2,980,930 | |||
ProLogis | |||||
| 2,600,000 | 5.625%, 11/15/2015 | 2,493,403 | |||
| 1,875,000 | 7.375%, 10/30/2019 | 1,836,323 | |||
Prudential Financial, Inc. | |||||
| 1,250,000 | 6.200%, 1/15/2015 | 1,375,665 | |||
| 2,900,000 | 6.000%, 12/1/2017 | 3,099,984 | |||
| 3,125,000 | 5.375%, 6/21/2020 | 3,164,925 | |||
| 1,120,000 | 5.700%, 12/14/2036 | 1,040,753 | |||
QBE Insurance Group, Ltd. | |||||
| 1,680,000 | 9.750%, 3/14/2014h | 2,030,860 | |||
Regency Centers, LP | |||||
| 2,500,000 | 5.875%, 6/15/2017 | 2,635,415 | |||
Regions Financial Corporation | |||||
| 1,875,000 | 5.750%, 6/15/2015 | 1,863,139 | |||
Reinsurance Group of America, Inc. | |||||
| 4,785,000 | 5.625%, 3/15/2017 | 4,989,253 | |||
Resona Bank, Ltd. | |||||
| 4,400,000 | 5.850%, 4/15/2016h | 4,158,290 | |||
Royal Bank of Scotland plc | |||||
| 3,150,000 | 4.875%, 8/25/2014h | 3,159,173 | |||
| 4,000,000 | 4.875%, 3/16/2015 | 3,979,848 | |||
Simon Property Group, LP | |||||
| 2,280,000 | 5.750%, 12/1/2015 | 2,506,536 | |||
| 1,250,000 | 10.350%, 4/1/2019 | 1,663,819 | |||
| 3,000,000 | 5.650%, 2/1/2020 | 3,177,171 | |||
SLM Corporation | |||||
| 1,250,000 | 5.125%, 8/27/2012 | 1,231,392 | |||
| 3,200,000 | 5.000%, 10/1/2013 | 3,059,091 | |||
The accompanying Notes to Financial Statements are an integral part of this schedule.
282
Table of Contents
Income Portfolio
Schedule of Investments as of June 30, 2010
(unaudited)
Principal | Long-Term Fixed Income (95.7%) | Value | |||
| Financials (26.9%) - continued | |||||
Standard Chartered plc | |||||
| $ 3,775,000 | 3.850%, 4/27/2015h | $ | 3,808,696 | ||
Swiss RE Capital I, LP | |||||
| 4,200,000 | 6.854%, 5/25/2016h | 3,444,000 | |||
TD Ameritrade Holding Corporation | |||||
| 3,775,000 | 5.600%, 12/1/2019 | 3,976,902 | |||
TNK-BP Finance SA | |||||
| 3,100,000 | 7.500%, 7/18/2016h | 3,208,500 | |||
UnitedHealth Group, Inc. | |||||
| 2,500,000 | 6.500%, 6/15/2037 | 2,697,490 | |||
Unum Group | |||||
| 2,500,000 | 7.125%, 9/30/2016 | 2,746,875 | |||
USB Capital XIII Trust | |||||
| 3,150,000 | 6.625%, 12/15/2039 | 3,321,171 | |||
Wachovia Bank NA | |||||
| 2,025,000 | 4.875%, 2/1/2015 | 2,122,271 | |||
Wachovia Capital Trust III | |||||
| 3,585,000 | 5.800%, 3/15/2011 | 2,850,075 | |||
Wachovia Corporation | |||||
| 2,500,000 | 5.250%, 8/1/2014 | 2,647,465 | |||
WEA Finance, LLC | |||||
| 1,500,000 | 7.125%, 4/15/2018h | 1,692,494 | |||
WEA Finance, LLC/WT Finance Australia, Pty Ltd. | |||||
| 1,850,000 | 7.500%, 6/2/2014h | 2,096,538 | |||
Westpac Banking Corporation | |||||
| 3,100,000 | 4.200%, 2/27/2015 | 3,226,511 | |||
| 1,925,000 | 4.875%, 11/19/2019 | 1,988,071 | |||
Willis North America, Inc. | |||||
| 4,600,000 | 6.200%, 3/28/2017 | 4,788,264 | |||
| 1,900,000 | 7.000%, 9/29/2019 | 2,039,948 | |||
XL Capital, Ltd. | |||||
| 3,100,000 | 6.250%, 5/15/2027 | 2,939,067 | |||
| Total Financials | 328,497,723 | ||||
| Foreign Government (2.0%) | |||||
Brazil Government International Bond | |||||
| 3,150,000 | 5.625%, 1/7/2041 | 3,094,875 | |||
British Columbia Government Notes | |||||
| 4,350,000 | 2.850%, 6/15/2015 | 4,493,032 | |||
Export-Import Bank of Korea | |||||
| 1,575,000 | 5.875%, 1/14/2015 | 1,706,541 | |||
| 1,950,000 | 5.125%, 6/29/2020 | 1,957,841 | |||
Korea Development Bank/Republic of Korea | |||||
| 2,500,000 | 4.375%, 8/10/2015 | 2,549,100 | |||
Korea Expressway Corporation | |||||
| 1,250,000 | 4.500%, 3/23/2015h | 1,279,510 | |||
Manitoba Government Notes | |||||
| 4,375,000 | 2.625%, 7/15/2015 | 4,449,393 | |||
Russia Government International Bond | |||||
| 5,575,000 | 5.000%, 4/29/2020h | 5,379,875 | |||
| Total Foreign Government | 24,910,167 | ||||
| Mortgage-Backed Securities (6.7%) | |||||
Federal Home Loan Mortgage | |||||
Corporation 30-Yr. Gold | |||||
| 3,500,000 | 6.500%, 7/1/2040c | 3,836,329 | |||
Federal National Mortgage Association Conventional 30-Yr. Pass Through | |||||
| 29,000,000 | 6.000%, 7/1/2040c | 31,451,399 | |||
| 43,950,000 | 5.500%, 8/1/2040c | 47,026,500 | |||
| Total Mortgage-Backed Securities | 82,314,228 | ||||
| Technology (1.3%) | |||||
Affiliated Computer Services, Inc. | |||||
| 3,100,000 | 5.200%, 6/1/2015 | 3,243,635 | |||
CA, Inc. | |||||
| 3,075,000 | 5.375%, 12/1/2019 | 3,259,934 | |||
Flextronics International, Ltd. | |||||
| 1,890,000 | 6.250%, 11/15/2014 | 1,875,825 | |||
Iron Mountain, Inc. | |||||
| 1,200,000 | 8.000%, 6/15/2020g | 1,218,000 | |||
JDA Software Group, Inc. | |||||
| 310,000 | 8.000%, 12/15/2014h | 311,550 | |||
Oracle Corporation | |||||
| 1,900,000 | 6.125%, 7/8/2039 | 2,222,187 | |||
Seagate Technology HDD | |||||
Holdings | |||||
| 1,870,000 | 6.800%, 10/1/2016 | 1,813,900 | |||
Xerox Corporation | |||||
| 1,250,000 | 4.250%, 2/15/2015 | 1,294,120 | |||
| 950,000 | 5.625%, 12/15/2019 | 1,010,915 | |||
| Total Technology | 16,250,066 | ||||
| Transportation (2.3%) | |||||
American Airlines Pass Through Trust | |||||
| 1,886,914 | 10.375%, 7/2/2019 | 2,094,475 | |||
Continental Airlines, Inc. | |||||
| 1,125,000 | 7.250%, 11/10/2019 | 1,198,125 | |||
| 2,111,924 | 5.983%, 4/19/2022 | 2,071,798 | |||
CSX Corporation | |||||
| 1,293,000 | 7.900%, 5/1/2017 | 1,585,126 | |||
| 1,807,000 | 6.220%, 4/30/2040h | 1,993,426 | |||
Delta Air Lines, Inc. | |||||
| 1,250,000 | 9.500%, 9/15/2014h | 1,312,500 | |||
| 3,393,454 | 7.750%, 12/17/2019 | 3,664,930 | |||
ERAC USA Finance, LLC | |||||
| 3,450,000 | 5.250%, 10/1/2020h | 3,486,277 | |||
FedEx Corporation | |||||
| 3,176,963 | 6.845%, 1/15/2019 | 3,332,065 | |||
| 1,121,019 | 6.720%, 1/15/2022 | 1,231,404 | |||
Kansas City Southern de Mexico SA de CV | |||||
| 1,260,000 | 7.375%, 6/1/2014 | 1,282,050 | |||
Navios Maritime Holdings, Inc. | |||||
| 1,510,000 | 8.875%, 11/1/2017h | 1,521,325 | |||
United Air Lines, Inc. | |||||
| 2,728,667 | 10.400%, 11/1/2016g | 2,933,317 | |||
| Total Transportation | 27,706,818 | ||||
The accompanying Notes to Financial Statements are an integral part of this schedule.
283
Table of Contents
Income Portfolio
Schedule of Investments as of June 30, 2010
(unaudited)
| Principal Amount | Long-Term Fixed Income (95.7%) | Value | |||
| U.S. Government and Agencies (3.7%) | |||||
U.S. Treasury Notes | |||||
| $3,100,000 | 2.625%, 6/30/2014 | $ | 3,240,712 | ||
| 4,400,000 | 2.500%, 4/30/2015g | 4,556,407 | |||
| 3,300,000 | 3.250%, 5/31/2016 | 3,505,220 | |||
| 4,400,000 | 2.750%, 5/31/2017 | 4,492,814 | |||
| 4,500,000 | 3.125%, 5/15/2019 | 4,593,865 | |||
| 5,000,000 | 3.500%, 5/15/2020 | 5,232,800 | |||
U.S. Treasury Notes, TIPS | |||||
| 2,698,625 | 2.500%, 7/15/2016 | 3,003,062 | |||
| 3,225,767 | 1.625%, 1/15/2018 | 3,400,158 | |||
| 7,248,887 | 1.875%, 7/15/2019 | 7,771,032 | |||
| 5,846,922 | 1.375%, 1/15/2020 | 5,987,155 | |||
| Total U.S. Government and Agencies | 45,783,225 | ||||
| U.S. Municipals (0.6%) | |||||
California General Obligation Bonds (Build America Bonds) | |||||
| 3,250,000 | 7.950%, 3/1/2036 | 3,413,768 | |||
Illinois General Obligation Bonds (Build America Bonds) | |||||
| 3,765,000 | 6.630%, 2/1/2035 | 3,543,053 | |||
| Total U.S. Municipals | 6,956,821 | ||||
| Utilities (6.0%) | |||||
Abu Dhabi National Energy Company | |||||
| 1,600,000 | 6.250%, 9/16/2019h | 1,630,835 | |||
Cleveland Electric Illuminating Company | |||||
| 1,775,000 | 5.700%, 4/1/2017 | 1,923,938 | |||
Columbus Southern Power Company | |||||
| 2,400,000 | 6.050%, 5/1/2018 | 2,684,177 | |||
Commonwealth Edison Company | |||||
| 3,500,000 | 7.500%, 7/1/2013 | 3,969,371 | |||
| 1,500,000 | 6.150%, 9/15/2017 | 1,721,631 | |||
Consolidated Natural Gas Company | |||||
| 1,550,000 | 5.000%, 12/1/2014 | 1,677,255 | |||
DTE Energy Company | |||||
| 2,500,000 | 6.375%, 4/15/2033 | 2,626,813 | |||
El Paso Corporation | |||||
| 2,170,000 | 8.250%, 2/15/2016 | 2,273,075 | |||
Exelon Generation Company, LLC | |||||
| 1,050,000 | 5.200%, 10/1/2019 | 1,116,972 | |||
Florida Power Corporation | |||||
| 2,000,000 | 6.400%, 6/15/2038 | 2,390,314 | |||
Illinois Power Company | |||||
| 3,200,000 | 6.125%, 11/15/2017 | 3,596,384 | |||
ITC Holdings Corporation | |||||
| 3,000,000 | 5.875%, 9/30/2016h | 3,272,337 | |||
| 4,000,000 | 6.050%, 1/31/2018h | 4,419,920 | |||
MidAmerican Energy Holdings Company | |||||
| 3,350,000 | 6.500%, 9/15/2037 | 3,848,637 | |||
Nevada Power Company | |||||
| 2,800,000 | 6.750%, 7/1/2037 | 3,230,766 | |||
NiSource Finance Corporation | |||||
| 2,800,000 | 6.400%, 3/15/2018 | 3,080,941 | |||
NRG Energy, Inc. | |||||
| 2,250,000 | 7.375%, 2/1/2016 | 2,238,750 | |||
Ohio Edison Company | |||||
| 1,550,000 | 6.875%, 7/15/2036 | 1,735,427 | |||
Ohio Power Company | |||||
| 2,200,000 | 5.375%, 10/1/2021 | 2,347,536 | |||
Pennsylvania Electric Company | |||||
| 3,700,000 | 5.200%, 4/1/2020 | 3,856,743 | |||
Petrobras International Finance Company | |||||
| 2,050,000 | 5.750%, 1/20/2020 | 2,064,448 | |||
Power Receivables Finance, LLC | |||||
| 1,324,773 | 6.290%, 1/1/2012d | 1,350,924 | |||
Progress Energy, Inc. | |||||
| 1,075,000 | 7.000%, 10/30/2031 | 1,266,203 | |||
PSEG Power, LLC | |||||
| 4,800,000 | 5.000%, 4/1/2014 | 5,128,805 | |||
Southern Star Central Corporation | |||||
| 1,600,000 | 6.750%, 3/1/2016 | 1,548,000 | |||
Southwestern Public Service Company | |||||
| 2,770,000 | 6.000%, 10/1/2036 | 2,896,077 | |||
Union Electric Company | |||||
| 2,900,000 | 6.400%, 6/15/2017 | 3,289,400 | |||
Williams Partners, LP | |||||
| 2,500,000 | 5.250%, 3/15/2020h | 2,556,418 | |||
| Total Utilities | 73,742,097 | ||||
| Total Long-Term Fixed Income (cost $1,139,902,979) | 1,169,608,192 | ||||
| Shares | Mutual Funds (1.4%) | ||||
| Fixed Income Mutual Funds (1.4%) | |||||
| 3,779,609 | Thrivent High Yield Fund | 17,159,427 | |||
| Total Fixed Income Mutual Funds | 17,159,427 | ||||
| Total Mutual Funds (cost $13,300,000) | 17,159,427 | ||||
Preferred Stock (0.5%) | |||||
| Financials (0.5%) | |||||
| 52,000 | Citigroup Capital XII, 8.500% | 1,299,480 | |||
| 22,000 | Citigroup, Inc., Convertible, 7.500% | 2,486,000 | |||
| 359,990 | Federal National Mortgage Association, 8.250%j | 122,397 | |||
| 167 | GMAC, Inc., 7.000%h | 129,806 | |||
| 81,250 | HSBC Holdings plc, 8.000%j | 2,043,437 | |||
| Total Financials | 6,081,120 | ||||
| Total Preferred Stock (cost $12,551,986) | 6,081,120 | ||||
The accompanying Notes to Financial Statements are an integral part of this schedule.
284
Table of Contents
Income Portfolio
Schedule of Investments as of June 30, 2010
(unaudited)
| Shares | Common Stock (0.1%) | Value | ||||
| Financials (0.1%) | ||||||
| 17,331 | CIT Group, Inc.j | $ | 586,828 | |||
Total Financials | 586,828 | |||||
Total Common Stock (cost $554,987) | 586,828 | |||||
Collateral Held for Securities Loaned (1.7%) | ||||||
| 20,182,545 | Thrivent Financial Securities Lending Trust | 20,182,545 | ||||
Total Collateral Held for Securities Loaned (cost $20,182,545) | 20,182,545 | |||||
| Principal Amount | Short-Term Investments (7.7%)k | |||||
Barclays Bank plc Repurchase Agreement | ||||||
| 19,590,000 | 0.010%, 7/1/2010l | 19,590,000 | ||||
Federal Home Loan Bank Discount Notes | ||||||
| 14,000,000 | 0.070%, 7/9/2010 | 13,999,782 | ||||
| 36,000,000 | 0.080%, 7/14/2010 | 35,998,960 | ||||
Federal Home Loan Mortgage Corporation Discount Notes | ||||||
| 1,100,000 | 0.175%, 7/7/2010m | 1,099,968 | ||||
| 4,000,000 | 0.089%, 7/8/2010m | 3,999,928 | ||||
| 9,000,000 | 0.090%, 7/21/2010 | 8,999,550 | ||||
| 5,000,000 | 0.085%, 7/23/2010 | 4,999,740 | ||||
Federal National Mortgage Association Discount Notes | ||||||
| 1,090,000 | 0.180%, 7/7/2010m | 1,089,968 | ||||
| 3,460,000 | 0.080%, 7/15/2010 | 3,459,893 | ||||
| 1,385,000 | 0.070%, 7/21/2010 | 1,384,946 | ||||
Total Short-Term Investments (at amortized cost) | 94,622,735 | |||||
Total Investments (cost $1,295,814,067) 108.3% | $ | 1,322,793,215 | ||||
Other Assets and Liabilities, Net (8.3%) | (101,853,792 | ) | ||||
Total Net Assets 100.0% | $ | 1,220,939,423 | ||||
| a | The stated interest rate represents the weighted average of all contracts within the bank loan facility. |
| b | All or a portion of the loan is unfunded as discussed in item 2(T) of the Notes to Financial Statements. |
| c | Denotes investments purchased on a when-issued or delayed delivery basis. |
| d | Denotes restricted securities. Restricted securities are investment securities which have been deemed illiquid and cannot be offered for public sale without first being registered under the Securities Act of 1933. The following table indicates the acquisition date and cost of restricted securities Income Portfolio owned as of June 30, 2010. |
Security | Acquisition Date | Amortized Cost | |||
Bear Stearns Commercial Mortgage Securities, Inc. | 3/30/2007 | $ | 3,000,000 | ||
Capitalsource Commercial Loan Trust | 4/5/2007 | 1,844,782 | |||
Commercial Mortgage Pass- Through Certificates | 10/18/2006 | 2,000,000 | |||
Commercial Mortgage Pass- Through Certificates | 5/2/2007 | 4,750,000 | |||
Power Receivables Finance, LLC | 9/30/2003 | 1,324,384 | |||
Preferred Term Securities XXIII, Ltd. | 9/14/2006 | 5,520,240 | |||
Wachovia Bank Commercial Mortgage Trust | 4/25/2007 | 7,500,475 | |||
| e | Denotes variable rate obligations for which the current coupon rate and next scheduled reset date are shown. |
| f | All or a portion of the security is insured or guaranteed. |
| g | All or a portion of the security is on loan as discussed in item 2(M) of the Notes to Financial Statements. |
| h | Denotes securities sold under Rule 144A of the Securities Act of 1933, which exempts them from registration. These securities have been deemed liquid and may be resold to other dealers in the program or to other qualified institutional buyers. As of June 30, 2010, the value of these investments was $209,371,058 or 17.1% of total net assets. |
| i | Security is fair valued as discussed in item 2(A) of the Notes to Financial Statements. |
| j | Non-income producing security. |
| k | The interest rate shown reflects the yield, coupon rate or, for securities purchased at a discount, the discount rate at the date of purchase. |
| l | Repurchase agreement dated June 30, 2010, $19,590,005 maturing July 1, 2010, collateralized by $19,981,838 U.S. Treasury Notes, 6.000% due February 15, 2026. |
| m | At June 30, 2010, $1,899,947 of investments were held on deposit with the counterparty and pledged as the initial margin deposit for open futures contracts. |
Definitions:
REIT | - | Real Estate Investment Trust, is a company that buys, develops, manages and/or sells real estate assets. | ||
TIPS | - | Treasury Inflation Protected Security. | ||
€ | - | Euro. |
Unrealized Appreciation (Depreciation)
Gross unrealized appreciation and depreciation of investments, based on cost for federal income tax purposes, were as follows:
Gross unrealized appreciation | $ | 69,994,745 | ||
Gross unrealized depreciation | (43,015,597 | ) | ||
Net unrealized appreciation (depreciation) | $ | 26,979,148 | ||
Cost for federal income tax purposes | $ | 1,295,814,067 | ||
The accompanying Notes to Financial Statements are an integral part of this schedule.
285
Table of Contents
Income Portfolio
Schedule of Investments as of June 30, 2010
(unaudited)
Fair Valuation Measurements
The following table is a summary of the inputs used, as of June 30, 2010, in valuing Income Portfolio’s assets carried at fair value as discussed in the Notes to Financial Statements.
Investments in Securities | Total | Level 1 | Level 2 | Level 3 | ||||||||
Bank Loans | ||||||||||||
Basic Materials | 3,555,818 | — | 3,555,818 | — | ||||||||
Communications Services | 2,495,787 | — | 2,495,787 | — | ||||||||
Consumer Cyclical | 2,420,115 | — | 2,420,115 | — | ||||||||
Consumer Non-Cyclical | 2,875,336 | — | 2,875,336 | — | ||||||||
Financials | 340,113 | — | 340,113 | — | ||||||||
Technology | 1,097,812 | — | 1,097,812 | — | ||||||||
Utilities | 1,767,387 | — | 1,767,387 | — | ||||||||
Long-Term Fixed Income | ||||||||||||
Asset-Backed Securities | 19,339,751 | — | 19,339,751 | — | ||||||||
Basic Materials | 62,093,196 | — | 62,093,196 | — | ||||||||
Capital Goods | 27,086,629 | — | 27,086,629 | — | ||||||||
Collateralized Mortgage Obligations | 24,109,826 | — | 24,109,826 | — | ||||||||
Commercial Mortgage-Backed Securities | 68,607,754 | — | 68,607,754 | — | ||||||||
Communications Services | 134,644,023 | — | 134,014,023 | 630,000 | ||||||||
Consumer Cyclical | 70,473,026 | — | 66,726,476 | 3,746,550 | ||||||||
Consumer Non-Cyclical | 65,827,284 | — | 64,281,763 | 1,545,521 | ||||||||
Energy | 91,265,558 | — | 91,265,558 | — | ||||||||
Financials | 328,497,723 | — | 325,516,793 | 2,980,930 | ||||||||
Foreign Government | 24,910,167 | — | 24,910,167 | — | ||||||||
Mortgage-Backed Securities | 82,314,228 | — | 82,314,228 | — | ||||||||
Technology | 16,250,066 | — | 16,250,066 | — | ||||||||
Transportation | 27,706,818 | — | 15,744,173 | 11,962,645 | ||||||||
U.S. Government and Agencies | 45,783,225 | — | 45,783,225 | — | ||||||||
U.S. Municipals | 6,956,821 | — | 6,956,821 | — | ||||||||
Utilities | 73,742,097 | — | 73,742,097 | — | ||||||||
Mutual Funds | ||||||||||||
Fixed Income Mutual Funds | 17,159,427 | 17,159,427 | — | — | ||||||||
Preferred Stock | ||||||||||||
Financials | 6,081,120 | 5,951,314 | 129,806 | — | ||||||||
Common Stock | ||||||||||||
Financials | 586,828 | 586,828 | — | — | ||||||||
Collateral Held for Securities Loaned | 20,182,545 | 20,182,545 | — | — | ||||||||
Short-Term Investments | 94,622,735 | — | 94,622,735 | — | ||||||||
Total | $ | 1,322,793,215 | $ | 43,880,114 | $ | 1,258,047,455 | $ | 20,865,646 | ||||
Other Financial Instruments | Total | Level 1 | Level 2 | Level 3 | ||||||||
Asset Derivatives | ||||||||||||
Futures Contracts | 2,180,587 | 2,180,587 | — | — | ||||||||
Foreign Currency Forward Contracts | 550 | — | 550 | — | ||||||||
Credit Default Swaps | 55,999 | — | 55,999 | — | ||||||||
Total Asset Derivatives | $ | 2,237,136 | $ | 2,180,587 | $ | 56,549 | $ | — | ||||
Liability Derivatives | ||||||||||||
Futures Contracts | 2,881,799 | 2,881,799 | — | — | ||||||||
Credit Default Swaps | 86,911 | — | 86,911 | — | ||||||||
Total Liability Derivatives | $ | 2,968,710 | $ | 2,881,799 | $ | 86,911 | $ | — | ||||
The accompanying Notes to Financial Statements are an integral part of this schedule.
286
Table of Contents
Income Portfolio
Schedule of Investments as of June 30, 2010
(unaudited)
The following table is a reconciliation of assets in which significant unobservable inputs (Level 3) were used in determining fair value for Income Portfolio as discussed in item 2(A) of the Notes to Financial Statements.
Investments in Securities | Value December 31, 2009 | Accrued Discounts and/or Premiums | Realized Gain/(Loss) | Change in Unrealized Gain/(Loss) | Net Purchases/(Sales) | Transfers Into Level 3 | Transfers Out of Level 3 | Value June 30, 2010 | ||||||||||||||||||||
Long-Term Fixed Income | ||||||||||||||||||||||||||||
Asset-Backed Securities | 12,067,475 | — | (99,531 | ) | 182,525 | (12,150,469 | ) | — | — | — | ||||||||||||||||||
Commercial Mortgage- Backed Securities | 10,300,000 | — | 565,625 | (300,000 | ) | (10,565,625 | ) | — | — | — | ||||||||||||||||||
Communications Services | — | — | — | — | 630,000 | — | — | 630,000 | ||||||||||||||||||||
Consumer Cyclical | — | — | — | — | 3,746,550 | — | — | 3,746,550 | ||||||||||||||||||||
Consumer Non-Cyclical | — | — | — | — | 1,545,521 | — | — | 1,545,521 | ||||||||||||||||||||
Financials | 2,507,069 | — | — | 524,885 | (51,024 | ) | — | — | 2,980,930 | |||||||||||||||||||
Transportation | 14,309,188 | (8,759 | ) | 148,387 | 276,658 | (2,762,829 | ) | — | — | 11,962,645 | ||||||||||||||||||
Total | $ | 39,183,732 | ($ | 8,759 | ) | $ | 614,481 | $ | 684,068 | ($ | 19,607,876 | ) | $ | — | $ | — | $ | 20,865,646 | ||||||||||
Futures Contracts | Number of Contracts Long/(Short) | Expiration Date | Notional Principal Amount | Value | Unrealized Gain/(Loss) | ||||||||||||
2-Yr. U.S. Treasury Bond Futures | 315 | September 2010 | $ | 68,621,742 | $ | 68,930,861 | $ | 309,119 | |||||||||
5-Yr. U.S. Treasury Bond Futures | (595 | ) | September 2010 | (69,650,670 | ) | (70,419,178 | ) | (768,508 | ) | ||||||||
10-Yr. U.S. Treasury Bond Futures | (1,475 | ) | September 2010 | (178,643,357 | ) | (180,756,648 | ) | (2,113,291 | ) | ||||||||
20-Yr. U.S. Treasury Bond Futures | 695 | September 2010 | 86,741,032 | 88,612,500 | 1,871,468 | ||||||||||||
Total Futures Contracts | ($ | 701,212 | ) | ||||||||||||||
Foreign Currency Forward Contracts | Contracts to Deliver/Receive | Settlement Date | Value on Settlement Date | Value | Unrealized Gain/(Loss) | ||||||||
Purchases | |||||||||||||
EURO | 275,677 | 7/1/2010 | $ | 336,546 | $ | 337,096 | $ | 550 | |||||
Total Foreign Currency | |||||||||||||
Forward Contracts Purchases | $ | 336,546 | $ | 337,096 | $ | 550 | |||||||
Net Unrealized Gain/(Loss) on Foreign Currency Forward Contracts | $ | 550 | |||||||||||
Credit Default Swaps and Counterparty | Buy/Sell Protection1 | Termination Date | Notional Principal Amount2 | Upfront Payments Received (Made) | Value3 | Unrealized Gain/(Loss) | |||||||||||||
CDX IG, Series 14, 5 Year, at 1.00%; J.P. Morgan Chase and Co. | Sell | 6/20/2015 | $ | 31,300,000 | $ | 205,765 | ($ | 292,676 | ) | ($ | 86,911 | ) | |||||||
iTraxx, Series 13, 5 Year, at 1.00%; J.P. Morgan Chase and Co. | Buy | 6/20/2015 | € | 25,000,000 | (344,587 | ) | 400,586 | 55,999 | |||||||||||
Total Credit Default Swaps | $ | 107,910 | ($ | 30,912 | ) | ||||||||||||||
| 1 | As the buyer of protection, Income Portfolio pays periodic fees in return for payment by the seller which is contingent upon an adverse credit event occurring in the underlying issuer or reference entity. As the seller of protection, Income Portfolio collects periodic fees from the buyer and profits if the credit of the underlying issuer or reference entity remains stable or improves while the swap is outstanding, but the seller in a credit default swap contract would be required to pay the amount of credit loss, determined as specified in the agreement, to the buyer in the event of an adverse credit event in the reference entity. |
| 2 | The maximum potential amount of future payments Income Portfolio could be required to make as the seller or receive as the buyer of protection. |
| 3 | The market values for credit indexes (CDX or LCDX) serve as an indicator of the current status of the payment/performance risk and represent the liability or profit for the credit default swap contract had the contract been closed as of the reporting date. When protection has been sold, the market value of the swap will increase when the swap spread declines representing an improvement in the reference entity’s credit worthiness. The market value of the swap will decrease when the swap spread increases representing a deterioration in the reference entity’s credit worthiness. |
The accompanying Notes to Financial Statements are an integral part of this schedule.
287
Table of Contents
Income Portfolio
Schedule of Investments as of June 30, 2010
(unaudited)
The following table summarizes the fair value and Statement of Assets and Liabilities location, as of June 30, 2010, for Income Portfolio’s investments in financial derivative instruments by primary risk exposure as discussed under item (2) Significant Accounting Policies of the Notes to Financial Statements.
Derivatives by risk category | Statement of Assets and Liabilities Location | Fair Value | |||
Asset Derivatives | |||||
Interest Rate Contracts | |||||
Futures* | Net Assets - Net unrealized appreciation/(depreciation) on Futures contracts | $ | 2,180,587 | ||
Total Interest Rate Contracts | 2,180,587 | ||||
Foreign Exchange Contracts | |||||
Forward Contracts | Receivable/Payable for forward contracts, Net Assets - Net unrealized appreciation/(depreciation) on Foreign currency forward contracts | 550 | |||
Total Foreign Exchange Contracts | 550 | ||||
Credit Contracts | |||||
Credit Default Swaps | Receivable/Payable - Swap agreements, at value; Net Assets - Net unrealized appreciation/(depreciation) on Swap agreements | 55,999 | |||
Total Credit Contracts | 55,999 | ||||
Total Asset Derivatives | $ | 2,237,136 | |||
Liability Derivatives | |||||
Interest Rate Contracts | |||||
Futures* | Net Assets - Net unrealized appreciation/(depreciation) on Futures contracts | 2,881,799 | |||
Total Interest Rate Contracts | 2,881,799 | ||||
Credit Contracts | |||||
Credit Default Swaps | Receivable/Payable - Swap agreements, at value; Net Assets - Net unrealized appreciation/(depreciation) on Swap agreements | 86,911 | |||
Total Credit Contracts | 86,911 | ||||
Total Liability Derivatives | $ | 2,968,710 | |||
| * | Includes cumulative appreciation/depreciation of futures contracts as reported in the Schedule of Investments. Only current day’s variation margin is reported within the Statement of Assets and Liabilities. |
The following table summarizes the net realized gains/(losses) and Statement of Operations location, for the period ended June 30, 2010, for Income Portfolio’s investments in financial derivative instruments by primary risk exposure.
Derivatives by risk category | Statement of Operations Location | Realized Gains/(Losses) recognized in Income | |||
Equity Contracts | |||||
Futures | Net realized gains/(losses) on Futures contracts | 14,833 | |||
Total Equity Contracts | 14,833 | ||||
Interest Rate Contracts | |||||
Futures | Net realized gains/(losses) on Futures contracts | (3,599,656 | ) | ||
Total Interest Rate Contracts | (3,599,656 | ) | |||
Credit Contracts | |||||
Credit Default Swaps | Net realized gains/(losses) on Swap agreements | (136,036 | ) | ||
Total Credit Contracts | (136,036 | ) | |||
Total | ($3,720,859 | ) | |||
The accompanying Notes to Financial Statements are an integral part of this schedule.
288
Table of Contents
Income Portfolio
Schedule of Investments as of June 30, 2010
(unaudited)
The following table summarizes the change in net unrealized appreciation/(depreciation) and Statement of Operations location, for the period ended June 30, 2010, for Income Portfolio’s investments in financial derivative instruments by primary risk exposure.
Derivatives by risk category | Statement of Operations Location | Change in unrealized appreciation/(depreciation) recognized in Income | |||
Interest Rate Contracts | |||||
Futures | Change in net unrealized appreciation/(depreciation) on Futures contracts | (2,021,940 | ) | ||
Total Interest Rate Contracts | (2,021,940 | ) | |||
Foreign Exchange Contracts | |||||
Forward Contracts | Change in net unrealized appreciation/(depreciation) on Foreign currency forward contracts | 550 | |||
Total Foreign Exchange Contracts | 550 | ||||
Credit Contracts | |||||
Credit Default Swaps | Change in net unrealized appreciation/(depreciation) on Swap agreements | (361,251 | ) | ||
Total Credit Contracts | (361,251 | ) | |||
Total | ($2,382,641 | ) | |||
The following table presents Income Portfolio’s average volume of derivative activity during the period ended June 30, 2010.
Derivative Risk Category | Futures (Notional*) | Futures (Percentage of Average Net Assets) | Forwards (Notional*) | Forwards (Percentage of Average Net Assets) | Swaps (Notional*) | Swaps (Percentage of Average Net Assets) | ||||||||||||
Equity Contracts | $ | 768,195 | 0.1 | % | N/A | N/A | N/A | N/A | ||||||||||
Interest Rate Contracts | 378,797,109 | 29.9 | N/A | N/A | N/A | N/A | ||||||||||||
Foreign Exchange Contracts | N/A | N/A | $ | 1,862 | <0.1 | % | N/A | N/A | ||||||||||
Credit Contracts | N/A | N/A | N/A | N/A | $ | 16,931,643 | 1.3 | % | ||||||||||
| * | Notional amount represents long or short, or both, derivative positions held by the portfolio. |
Investment in Affiliates
Affiliated issuers, as defined under the Investment Company Act of 1940, include those in which the Portfolio’s holdings of an issuer represent 5% or more of the outstanding voting securities of an issuer, or any affiliated mutual fund.
A summary of transactions for the fiscal year to date, in Income Portfolio, is as follows:
Portfolio | Value December 31, 2009 | Gross Purchases | Gross Sales | Shares Held at June 30, 2010 | Value June 30, 2010 | Income Earned January 1, 2010 - June 30, 2010 | |||||||||||
High Yield Fund | $ | 17,310,611 | $ | — | $ | — | 3,779,609 | $ | 17,159,427 | $ | 725,305 | ||||||
Thrivent Financial | |||||||||||||||||
Securities Lending Trust | 7,956,950 | 134,327,092 | 122,101,497 | 20,182,545 | 20,182,545 | 10,474 | |||||||||||
Total Value and Income Earned | 25,267,561 | 37,341,972 | 735,779 | ||||||||||||||
The accompanying Notes to Financial Statements are an integral part of this schedule.
289
Table of Contents
Bond Index Portfolio
Schedule of Investments as of June 30, 2010
(unaudited)
The accompanying Notes to Financial Statements are an integral part of this schedule.
290
Table of Contents
Bond Index Portfolio
Schedule of Investments as of June 30, 2010
(unaudited)
| Principal Amount | Long-Term Fixed Income (107.5%) | Value | |||||
Communications Services (2.0%) - continued | |||||||
Telecom Italia Capital SA | |||||||
| $800,000 | 5.250%, 10/1/2015 | $ | 807,399 | ||||
Time Warner Cable, Inc. | |||||||
| 300,000 | 7.300%, 7/1/2038 | 348,301 | |||||
Verizon Global Funding Corporation | |||||||
| 27,000 | 7.750%, 12/1/2030 | 33,646 | |||||
Total Communications Services | 3,325,496 | ||||||
Consumer Cyclical (1.1%) | |||||||
AOL Time Warner, Inc. | |||||||
| 27,000 | 7.625%, 4/15/2031 | 32,480 | |||||
Daimler Finance NA, LLC | |||||||
| 27,000 | 8.500%, 1/18/2031 | 34,491 | |||||
Target Corporation | |||||||
| 27,000 | 7.000%, 7/15/2031 | 32,892 | |||||
Toyota Motor Credit Corporation | |||||||
| 325,000 | 4.500%, 6/17/2020 | 333,698 | |||||
Wal-Mart Stores, Inc. | |||||||
| 527,000 | 7.550%, 2/15/2030 | 699,250 | |||||
Walt Disney Company | |||||||
| 500,000 | 5.625%, 9/15/2016 | 582,431 | |||||
Total Consumer Cyclical | 1,715,242 | ||||||
Consumer Non-Cyclical (1.7%) | |||||||
AmerisourceBergen Corporation | |||||||
| 500,000 | 4.875%, 11/15/2019 | 518,032 | |||||
Boston Scientific Corporation | |||||||
| 275,000 | 7.000%, 11/15/2035 | 266,731 | |||||
GlaxoSmithKline Capital, Inc. | |||||||
| 300,000 | 6.375%, 5/15/2038 | 357,041 | |||||
Kellogg Company | |||||||
| 600,000 | 4.250%, 3/6/2013 | 643,057 | |||||
| 27,000 | 7.450%, 4/1/2031 | 35,644 | |||||
Kraft Foods, Inc. | |||||||
| 27,000 | 6.500%, 11/1/2031 | 29,643 | |||||
Philip Morris International, Inc. | |||||||
| 300,000 | 6.375%, 5/16/2038 | 352,040 | |||||
Wyeth | |||||||
| 550,000 | 6.000%, 2/15/2036 | 617,746 | |||||
Total Consumer Non-Cyclical | 2,819,934 | ||||||
Energy (1.1%) | |||||||
Anadarko Finance Company | |||||||
| 27,000 | 7.500%, 5/1/2031 | 22,707 | |||||
Conoco, Inc. | |||||||
| 27,000 | 6.950%, 4/15/2029 | 33,136 | |||||
Devon Financing Corporation, ULC | |||||||
| 27,000 | 7.875%, 9/30/2031 | 34,293 | |||||
Energy Transfer Partners, LP | |||||||
| 450,000 | 6.700%, 7/1/2018 | 483,918 | |||||
Petro-Canada | |||||||
| 300,000 | 6.800%, 5/15/2038 | 344,197 | |||||
Valero Energy Corporation | |||||||
| 500,000 | 4.750%, 6/15/2013 | 522,956 | |||||
XTO Energy, Inc. | |||||||
| 275,000 | 6.375%, 6/15/2038 | $340,263 | |||||
Total Energy | 1,781,470 | ||||||
Financials (8.9%) | |||||||
African Development Bank | |||||||
| 250,000 | 6.875%, 10/15/2015 | 297,797 | |||||
AIG SunAmerica Global Financing VI | |||||||
| 500,000 | 6.300%, 5/10/2011d | 505,000 | |||||
AXA SA | |||||||
| 27,000 | 8.600%, 12/15/2030 | 30,496 | |||||
BAC Capital Trust XI | |||||||
| 275,000 | 6.625%, 5/23/2036 | 251,443 | |||||
Bank of America Corporation | |||||||
| 500,000 | 6.500%, 8/1/2016 | 541,111 | |||||
Bank One Corporation | |||||||
| 900,000 | 5.900%, 11/15/2011 | 945,789 | |||||
Barclays Bank plc | |||||||
| 500,000 | 2.500%, 1/23/2013 | 497,976 | |||||
| 300,000 | 5.000%, 9/22/2016 | 307,724 | |||||
BNP Paribas SA | |||||||
| 1,100,000 | 5.186%, 6/29/2015d | 902,000 | |||||
Chubb Corporation | |||||||
| 600,000 | 6.500%, 5/15/2038 | 683,099 | |||||
CIGNA Corporation | |||||||
| 450,000 | 6.350%, 3/15/2018 | 502,835 | |||||
Citigroup, Inc. | |||||||
| 500,000 | 6.000%, 12/13/2013 | 524,557 | |||||
| 250,000 | 4.700%, 5/29/2015 | 247,964 | |||||
General Electric Capital Corporation | |||||||
| 475,000 | 5.875%, 1/14/2038 | 465,787 | |||||
Goldman Sachs Group, Inc. | |||||||
| 950,000 | 6.600%, 1/15/2012 | 1,004,761 | |||||
Health Care REIT, Inc. | |||||||
| 450,000 | 6.125%, 4/15/2020 | 465,500 | |||||
Household Finance Corporation | |||||||
| 650,000 | 6.375%, 11/27/2012 | 701,960 | |||||
HSBC Finance Corporation | |||||||
| 350,000 | 5.000%, 6/30/2015 | 365,189 | |||||
HSBC Holdings plc | |||||||
| 300,000 | 6.800%, 6/1/2038 | 323,304 | |||||
International Lease Finance Corporation | |||||||
| 850,000 | 5.875%, 5/1/2013 | 784,125 | |||||
Lloyds TSB Bank plc | |||||||
| 350,000 | 5.800%, 1/13/2020d | 330,363 | |||||
Marsh & McLennan Companies, Inc. | |||||||
| 185,000 | 5.750%, 9/15/2015 | 197,870 | |||||
Merrill Lynch & Company, Inc. | |||||||
| 475,000 | 5.000%, 2/3/2014 | 491,541 | |||||
MetLife, Inc. | |||||||
| 200,000 | 5.000%, 6/15/2015 | 213,775 | |||||
Morgan Stanley Dean Witter & Company | |||||||
| 850,000 | 6.750%, 4/15/2011 | 879,421 | |||||
Preferred Term Securities XXIII, Ltd. | |||||||
| 1,182,909 | 0.737%, 9/22/2010b,c | 638,771 | |||||
The accompanying Notes to Financial Statements are an integral part of this schedule.
291
Table of Contents
Bond Index Portfolio
Schedule of Investments as of June 30, 2010
(unaudited)
| Principal Amount | Long-Term Fixed Income (107.5%) | Value | |||
Financials (8.9%) - continued | |||||
ProLogis | |||||
| $ 200,000 | 6.875%, 3/15/2020 | $ | 189,034 | ||
Prudential Financial, Inc. | |||||
| 275,000 | 5.700%, 12/14/2036 | 255,542 | |||
Rabobank Nederland NV | |||||
| 350,000 | 4.750%, 1/15/2020d | 359,362 | |||
Wachovia Bank NA | |||||
| 500,000 | 4.875%, 2/1/2015 | 524,018 | |||
Washington Mutual Bank FA | |||||
| 500,000 | 5.500%, 1/15/2013e | 2,500 | |||
Total Financials | 14,430,614 | ||||
Foreign Government (1.8%) | |||||
Hydro-Quebec | |||||
| 27,000 | 8.400%, 1/15/2022 | 37,630 | |||
Italy Government International Bond | |||||
| 600,000 | 6.000%, 2/22/2011 | 615,673 | |||
| 200,000 | 4.375%, 6/15/2013 | 205,875 | |||
| 700,000 | 5.375%, 6/12/2017 | 732,631 | |||
Nova Scotia Government Notes | |||||
| 250,000 | 7.250%, 7/27/2013 | 285,241 | |||
Quebec Government Notes | |||||
| 400,000 | 4.875%, 5/5/2014 | 441,135 | |||
| 400,000 | 7.500%, 7/15/2023 | 540,900 | |||
Total Foreign Government | 2,859,085 | ||||
Mortgage-Backed Securities (33.1%) | |||||
Federal Home Loan Mortgage Corporation Gold 15-Yr. Pass Through | |||||
| 2,468 | 6.500%, 10/1/2012 | 2,682 | |||
| 2,445 | 6.500%, 1/1/2013 | 2,656 | |||
| 1,733 | 6.000%, 9/1/2013 | 1,882 | |||
| 5,960 | 5.500%, 3/1/2014 | 6,444 | |||
| 13,315 | 6.000%, 4/1/2014 | 14,455 | |||
| 5,249 | 7.000%, 10/1/2014 | 5,665 | |||
| 8,156 | 6.500%, 3/1/2016 | 8,862 | |||
| 17,993 | 6.000%, 6/1/2016 | 19,567 | |||
| 20,731 | 6.000%, 9/1/2016 | 22,544 | |||
| 209,799 | 7.000%, 6/1/2017 | 228,230 | |||
| 326,127 | 5.500%, 12/1/2017 | 354,026 | |||
Federal Home Loan Mortgage Corporation Gold 30-Yr. Pass Through | |||||
| 4,599 | 6.500%, 4/1/2024 | 5,090 | |||
| 5,711 | 7.000%, 5/1/2024 | 6,447 | |||
| 1,273 | 7.500%, 8/1/2025 | 1,451 | |||
| 14,860 | 8.500%, 11/1/2025 | 17,337 | |||
| 1,893 | 8.000%, 1/1/2026 | 2,180 | |||
| 2,436 | 7.000%, 4/1/2027 | 2,764 | |||
| 3,193 | 7.500%, 7/1/2027 | 3,643 | |||
| 4,682 | 7.000%, 8/1/2027 | 5,312 | |||
| 3,181 | 7.500%, 10/1/2027 | 3,632 | |||
| 3,835 | 7.000%, 5/1/2028 | 4,354 | |||
| 19,725 | 6.000%, 8/1/2028 | 21,773 | |||
| 7,936 | 6.500%, 2/1/2029 | 8,833 | |||
| 17,059 | 6.000%, 3/1/2029 | 18,830 | |||
| 10,398 | 7.000%, 7/1/2029 | 11,813 | |||
| 12,376 | 7.500%, 10/1/2029 | 14,167 | |||
| 5,199 | 7.500%, 11/1/2029 | 5,951 | |||
| 6,972 | 6.500%, 5/1/2031 | 7,760 | |||
| 41,176 | 6.000%, 6/1/2031 | 45,450 | |||
| 10,288 | 7.000%, 6/1/2031 | 11,702 | |||
| 9,418 | 7.000%, 6/1/2031 | 10,712 | |||
| 33,460 | 6.000%, 7/1/2031 | 36,934 | |||
| 10,516 | 7.000%, 9/1/2031 | 11,961 | |||
| 27,594 | 6.500%, 10/1/2031 | 30,713 | |||
| 178,442 | 6.000%, 1/1/2032 | 196,966 | |||
| 34,676 | 6.000%, 1/1/2032 | 38,276 | |||
| 18,180 | 7.000%, 5/1/2032 | 20,516 | |||
| 208,683 | 6.500%, 7/1/2032 | 232,141 | |||
| 159,318 | 6.500%, 10/1/2032 | 177,226 | |||
| 271,382 | 6.000%, 11/1/2032 | 298,791 | |||
| 7,000,000 | 5.000%, 7/1/2040f | 7,403,592 | |||
| 7,250,000 | 6.000%, 7/1/2040f | 7,868,512 | |||
Federal National Mortgage Association Conventional 15- Yr. Pass Through | |||||
| 505 | 6.000%, 4/1/2011 | 545 | |||
| 208 | 7.500%, 7/1/2011 | 216 | |||
| 1,087 | 8.000%, 7/1/2012 | 1,160 | |||
| 1,915 | 6.500%, 12/1/2012 | 2,082 | |||
| 4,535 | 6.500%, 6/1/2013 | 4,930 | |||
| 9,817 | 6.000%, 12/1/2013 | 10,664 | |||
| 5,000,000 | 5.000%, 7/1/2025f | 5,334,375 | |||
Federal National Mortgage Association Conventional 30- Yr. Pass Through | |||||
| 5,117 | 10.500%, 8/1/2020 | 5,871 | |||
| 4,450 | 8.000%, 12/1/2024 | 5,128 | |||
| 4,672 | 7.000%, 10/1/2025 | 5,280 | |||
| 20,358 | 6.500%, 11/1/2025 | 22,522 | |||
| 806 | 8.500%, 12/1/2025 | 935 | |||
| 4,026 | 7.500%, 1/1/2026 | 4,572 | |||
| 6,266 | 6.500%, 5/1/2026 | 6,930 | |||
| 3,120 | 8.000%, 9/1/2026 | 3,609 | |||
| 5,044 | 7.500%, 2/1/2027 | 5,733 | |||
| 3,623 | 7.000%, 3/1/2027 | 4,098 | |||
| 10,021 | 6.500%, 8/1/2027 | 11,081 | |||
| 1,241 | 7.500%, 11/1/2027 | 1,411 | |||
| 6,367 | 9.000%, 11/1/2027 | 7,427 | |||
| 4,095 | 7.000%, 1/1/2028 | 4,636 | |||
| 50,705 | 7.500%, 2/1/2028 | 57,679 | |||
| 6,200 | 6.000%, 5/1/2028 | 6,868 | |||
| 2,874 | 6.500%, 9/1/2028 | 3,209 | |||
| 11,045 | 7.000%, 10/1/2028 | 12,514 | |||
| 32,165 | 7.500%, 11/1/2028 | 36,558 | |||
| 9,317 | 6.500%, 2/1/2029 | 10,402 | |||
| 31,817 | 6.000%, 3/1/2029 | 35,244 | |||
| 14,963 | 7.000%, 3/1/2029 | 16,963 | |||
| 36,643 | 6.500%, 4/1/2029 | 40,911 | |||
| 4,137 | 6.500%, 8/1/2029 | 4,619 | |||
| 9,778 | 7.500%, 8/1/2029 | 11,139 | |||
| 14,886 | 7.000%, 10/1/2029 | 16,876 | |||
| 9,816 | 7.500%, 12/1/2029 | 11,181 | |||
| 5,561 | 8.000%, 4/1/2030 | 6,441 | |||
| 3,210 | 7.500%, 12/1/2030 | 3,660 | |||
| 69,664 | 6.000%, 5/1/2031 | 76,907 | |||
| 134,467 | 6.500%, 4/1/2032 | 150,128 | |||
| 109,059 | 6.500%, 5/1/2032 | 121,761 | |||
| 68,375 | 7.000%, 5/1/2032 | 77,314 | |||
The accompanying Notes to Financial Statements are an integral part of this schedule.
292
Table of Contents
Bond Index Portfolio
Schedule of Investments as of June 30, 2010
(unaudited)
| Principal Amount | Long-Term Fixed Income (107.5%) | Value | |||
Mortgage-Backed Securities (33.1%) - continued | |||||
| $ 456,907 | 6.500%, 7/1/2032 | $ | 510,123 | ||
| 206,359 | 6.500%, 8/1/2032 | 230,393 | |||
| 27,300,000 | 5.500%, 8/1/2040f | 29,211,000 | |||
Government National Mortgage Association 15-Yr. Pass Through | |||||
| 11,473 | 7.000%, 9/15/2013 | 12,247 | |||
Government National Mortgage Association 30-Yr. Pass Through | |||||
| 5,222 | 7.500%, 3/15/2023 | 5,929 | |||
| 2,114 | 7.000%, 1/15/2024 | 2,388 | |||
| 2,552 | 9.000%, 9/15/2024 | 2,968 | |||
| 6,248 | 8.000%, 6/15/2025 | 7,217 | |||
| 1,886 | 8.000%, 9/15/2026 | 2,181 | |||
| 8,064 | 7.500%, 10/15/2027 | 9,167 | |||
| 7,221 | 7.000%, 11/15/2027 | 8,196 | |||
| 3,691 | 7.000%, 1/15/2028 | 4,193 | |||
| 9,173 | 6.500%, 7/15/2028 | 10,309 | |||
| 6,801 | 7.000%, 8/15/2028 | 7,725 | |||
| 49,152 | 7.500%, 11/15/2028 | 55,930 | |||
| 9,375 | 6.500%, 12/15/2028 | 10,535 | |||
| 32,674 | 6.500%, 3/15/2029 | 36,637 | |||
| 3,100 | 6.500%, 4/15/2029 | 3,476 | |||
| 6,817 | 8.000%, 10/15/2030 | 7,915 | |||
| 12,772 | 7.500%, 1/15/2031 | 14,587 | |||
| 5,517 | 7.000%, 4/15/2031 | 6,268 | |||
| 21,174 | 6.500%, 6/15/2031 | 23,716 | |||
| 19,807 | 7.000%, 9/15/2031 | 22,502 | |||
| 212,864 | 6.500%, 1/15/2032 | 237,217 | |||
| 32,600 | 6.500%, 4/15/2032 | 36,330 | |||
Total Mortgage-Backed Securities | 53,814,570 | ||||
Transportation (0.4%) | |||||
Union Pacific Corporation | |||||
| 500,000 | 7.000%, 2/1/2016 | 592,047 | |||
Total Transportation | 592,047 | ||||
U.S. Government and Agencies (40.7%) | |||||
Federal Home Loan Banks | |||||
| 2,500,000 | 0.875%, 8/22/2012 | 2,502,463 | |||
| 1,000,000 | 3.625%, 5/29/2013 | 1,071,051 | |||
| 850,000 | 4.500%, 9/16/2013 | 934,663 | |||
| 1,000,000 | 3.625%, 10/18/2013 | 1,071,140 | |||
| 3,750,000 | 5.000%, 11/17/2017 | 4,279,267 | |||
Federal Home Loan Mortgage Corporation | |||||
| 1,000,000 | 5.125%, 7/15/2012 | 1,090,340 | |||
| 500,000 | 3.750%, 6/28/2013 | 539,227 | |||
| 1,700,000 | 5.125%, 11/17/2017 | 1,958,575 | |||
| 350,000 | 6.750%, 3/15/2031 | 463,280 | |||
Federal National Mortgage Association | |||||
| 1,000,000 | 5.000%, 4/15/2015 | 1,134,558 | |||
| 500,000 | 5.960%, 9/11/2028 | 592,747 | |||
| 100,000 | 6.250%, 5/15/2029 | 123,730 | |||
Resolution Funding Corporation | |||||
| 200,000 | 8.125%, 10/15/2019 | 276,086 | |||
Tennessee Valley Authority | |||||
| 250,000 | 6.000%, 3/15/2013 | 282,269 | |||
| 350,000 | 5.250%, 9/15/2039 | 386,922 | |||
U.S. Treasury Bonds | |||||
| 3,500,000 | 5.250%, 11/15/2028 | 4,212,579 | |||
| 325,000 | 4.250%, 5/15/2039 | 343,637 | |||
| 1,200,000 | 4.625%, 2/15/2040 | 1,348,874 | |||
U.S. Treasury Notes | |||||
| 2,500,000 | 4.500%, 11/30/2011 | 2,643,360 | |||
| 500,000 | 4.375%, 8/15/2012 | 540,039 | |||
| 4,000,000 | 1.125%, 6/15/2013 | 4,015,920 | |||
| 2,750,000 | 2.000%, 11/30/2013 | 2,823,046 | |||
| 1,500,000 | 1.875%, 4/30/2014 | 1,527,070 | |||
| 3,000,000 | 2.250%, 5/31/2014 | 3,095,391 | |||
| 2,500,000 | 4.250%, 8/15/2014 | 2,778,710 | |||
| 2,000,000 | 2.500%, 3/31/2015 | 2,072,500 | |||
| 4,000,000 | 2.625%, 2/29/2016 | 4,115,312 | |||
| 5,250,000 | 3.250%, 5/31/2016 | 5,576,487 | |||
| 1,500,000 | 2.750%, 11/30/2016 | 1,537,851 | |||
| 2,000,000 | 3.250%, 3/31/2017 | 2,107,500 | |||
| 8,750,000 | 3.625%, 8/15/2019 | 9,252,443 | |||
| 1,000,000 | 3.375%, 11/15/2019 | 1,035,703 | |||
| 500,000 | 3.500%, 2/15/2039 | 464,453 | |||
Total U.S. Government and Agencies | 66,197,193 | ||||
U.S. Municipals (0.2%) | |||||
Chicago Metropolitan Water Reclamation District General Obligation Bonds (Build America Bonds) | |||||
| 350,000 | 5.720%, 12/1/2038 | 379,768 | |||
Total U.S. Municipals | 379,768 | ||||
Utilities (1.6%) | |||||
CenterPoint Energy Houston Electric, LLC | |||||
| 400,000 | 5.600%, 7/1/2023 | 444,874 | |||
Commonwealth Edison Company | |||||
| 275,000 | 5.900%, 3/15/2036 | 299,456 | |||
FirstEnergy Corporation | |||||
| 27,000 | 7.375%, 11/15/2031 | 28,469 | |||
National Rural Utilities Cooperative Finance Corporation | |||||
| 27,000 | 8.000%, 3/1/2032 | 34,810 | |||
Oncor Electric Delivery Company | |||||
| 475,000 | 6.375%, 1/15/2015 | 538,165 | |||
ONEOK Partners, LP | |||||
| 275,000 | 6.650%, 10/1/2036 | 282,090 | |||
Progress Energy, Inc. | |||||
| 400,000 | 7.000%, 10/30/2031 | 471,145 | |||
Southern California Edison Company | |||||
| 225,000 | 5.000%, 1/15/2014 | 246,295 | |||
The accompanying Notes to Financial Statements are an integral part of this schedule.
293
Table of Contents
Bond Index Portfolio
Schedule of Investments as of June 30, 2010
(unaudited)
| Principal Amount | Long-Term Fixed Income (107.5%) | Value | ||||
Utilities (1.6%) - continued | ||||||
Xcel Energy, Inc. | ||||||
| $275,000 | 6.500%, 7/1/2036 | $ | 317,242 | |||
Total Utilities | 2,662,546 | |||||
Total Long-Term Fixed Income (cost $176,206,090) | 174,838,612 | |||||
Short-Term Investments (22.9%)g | ||||||
Federal Home Loan Bank Discount Notes | ||||||
| 13,000,000 | 0.090%, 7/7/2010 | 12,999,805 | ||||
Federal Home Loan Mortgage Corporation Discount Notes | ||||||
| 22,180,000 | 0.080%, 7/8/2010 | 22,179,655 | ||||
| 2,000,000 | 0.060%, 7/19/2010 | 1,999,940 | ||||
Total Short-Term Investments (at amortized cost) | 37,179,400 | |||||
Total Investments (cost $213,385,490) 130.4% | $ | 212,018,012 | ||||
Other Assets and Liabilities, Net (30.4%) | (49,459,578 | ) | ||||
Total Net Assets 100.0% | $ | 162,558,434 | ||||
| a | All or a portion of the security is insured or guaranteed. |
| b | Denotes variable rate obligations for which the current coupon rate and next scheduled reset date are shown. |
| c | Denotes restricted securities. Restricted securities are investment securities which have been deemed illiquid and cannot be offered for public sale without first being registered under the Securities Act of 1933. The following table indicates the acquisition date and cost of restricted securities Bond Index Portfolio owned as of June 30, 2010. |
Security | Acquisition Date | Amortized Cost | |||
Bear Stearns Commercial Mortgage Securities, Inc. | 3/30/2007 | $ | 2,500,000 | ||
Commercial Mortgage Pass- Through Certificates | 10/18/2006 | 2,500,000 | |||
Preferred Term Securities XXIII, Ltd. | 9/14/2006 | 1,182,909 | |||
Wachovia Asset Securitization, Inc. | 3/16/2007 | 1,615,312 | |||
| d | Denotes securities sold under Rule 144A of the Securities Act of 1933, which exempts them from registration. These securities have been deemed liquid and may be resold to other dealers in the program or to other qualified institutional buyers. As of June 30, 2010, the value of these investments was $7,761,968 or 4.8% of total net assets. |
| e | Defaulted security. Interest is not being accrued. |
| f | Denotes investments purchased on a when-issued or delayed delivery basis. |
| g | The interest rate shown reflects the yield, coupon rate or, for securities purchased at a discount, the discount rate at the date of purchase. |
Definitions:
REIT - Real Estate Investment Trust, is a company that buys, develops, manages and/or sells real estate assets.
| Unrealized Appreciation (Depreciation) | ||
| Gross unrealized appreciation and depreciation of investments, based on cost for federal income tax purposes, were as follows: | ||||
Gross unrealized appreciation | $ | 6,346,877 | ||
Gross unrealized depreciation | (7,714,355 | ) | ||
Net unrealized appreciation (depreciation) | $ | (1,367,478 | ) | |
Cost for federal income tax purposes | $ | 213,385,490 | ||
The accompanying Notes to Financial Statements are an integral part of this schedule.
294
Table of Contents
Bond Index Portfolio
Schedule of Investments as of June 30, 2010
(unaudited)
Fair Valuation Measurements
The following table is a summary of the inputs used, as of June 30, 2010, in valuing Bond Index Portfolio’s assets carried at fair value as discussed in the Notes to Financial Statements.
Investments in Securities | Total | Level 1 | Level 2 | Level 3 | ||||||||
Long-Term Fixed Income | ||||||||||||
Asset-Backed Securities | 5,909,025 | — | 4,836,458 | 1,072,567 | ||||||||
Basic Materials | 1,213,867 | — | 1,213,867 | — | ||||||||
Capital Goods | 1,867,461 | — | 1,867,461 | — | ||||||||
Collateralized Mortgage Obligations | 2,141,980 | — | 2,141,980 | — | ||||||||
Commercial Mortgage-Backed Securities | 13,128,314 | — | 13,128,314 | — | ||||||||
Communications Services | 3,325,496 | — | 3,325,496 | — | ||||||||
Consumer Cyclical | 1,715,242 | — | 1,715,242 | — | ||||||||
Consumer Non-Cyclical | 2,819,934 | — | 2,819,934 | — | ||||||||
Energy | 1,781,470 | — | 1,781,470 | — | ||||||||
Financials | 14,430,614 | — | 13,791,843 | 638,771 | ||||||||
Foreign Government | 2,859,085 | — | 2,859,085 | — | ||||||||
Mortgage-Backed Securities | 53,814,570 | — | 53,814,570 | — | ||||||||
Transportation | 592,047 | — | 592,047 | — | ||||||||
U.S. Government and Agencies | 66,197,193 | — | 66,197,193 | — | ||||||||
U.S. Municipals | 379,768 | — | 379,768 | — | ||||||||
Utilities | 2,662,546 | — | 2,662,546 | — | ||||||||
Short-Term Investments | 37,179,400 | — | 37,179,400 | — | ||||||||
Total | $ | 212,018,012 | $ | — | $ | 210,306,674 | $ | 1,711,338 | ||||
The following table is a reconciliation of assets in which significant unobservable inputs (Level 3) were used in determining fair value for Bond Index Portfolio as discussed in item 2(A) of the Notes to Financial Statements.
Investments in Securities | Value December 31, 2009 | Accrued Discounts and/or Premiums | Realized Gain/(Loss) | Change in Unrealized Gain/(Loss) | Net Purchases/(Sales) | Transfers Into Level 3 | Transfers Out of Level 3 | Value June 30, 2010 | |||||||||||||||||
Long-Term Fixed Income | |||||||||||||||||||||||||
Asset-Backed Securities | 838,603 | — | — | 324,031 | (90,067 | ) | — | — | 1,072,567 | ||||||||||||||||
Financials | 537,229 | — | — | 112,476 | (10,934 | ) | — | — | 638,771 | ||||||||||||||||
Total | $ | 1,375,832 | $ | — | $ | — | $ | 436,507 | ($ | 101,001 | ) | $ | — | $ | — | $ | 1,711,338 | ||||||||
Investment in Affiliates
Affiliated issuers, as defined under the Investment Company Act of 1940, include those in which the Portfolio’s holdings of an issuer represent 5% or more of the outstanding voting securities of an issuer, or any affiliated mutual fund.
A summary of transactions for the fiscal year to date, in Bond Index Portfolio, is as follows:
Portfolio | Value December 31, 2009 | Gross Purchases | Gross Sales | Shares Held at June 30, 2010 | Value June 30, 2010 | Income Earned January 1, 2010 - June 30, 2010 | |||||||||||
Thrivent Financial Securities Lending Trust | $ | 6,634,075 | $ | 4,578,275 | $ | 11,212,350 | — | $ | — | $ | 701 | ||||||
Total Value and Income Earned | 6,634,075 | — | 701 | ||||||||||||||
The accompanying Notes to Financial Statements are an integral part of this schedule.
295
Table of Contents
Limited Maturity Bond Portfolio
Schedule of Investments as of June 30, 2010
(unaudited)
The accompanying Notes to Financial Statements are an integral part of this schedule.
296
Table of Contents
Limited Maturity Bond Portfolio
Schedule of Investments as of June 30, 2010
(unaudited)
| Principal Amount | Long-Term Fixed Income (96.3%) | Value | |||
Capital Goods (2.1%) | |||||
Caterpillar Financial Services Corporation | |||||
| $ 4,500,000 | 2.000%, 4/5/2013 | $ | 4,552,164 | ||
Hutchinson Whampoa Finance, Ltd. | |||||
| 3,300,000 | 4.625%, 9/11/2015b | 3,443,339 | |||
John Deere Capital Corporation | |||||
| 2,500,000 | 1.875%, 6/17/2013 | 2,513,550 | |||
L-3 Communications Corporation | |||||
| 4,000,000 | 5.875%, 1/15/2015 | 3,950,000 | |||
Lockheed Martin Corporation | |||||
| 2,750,000 | 4.121%, 3/14/2013 | 2,944,637 | |||
Textron, Inc. | |||||
| 2,700,000 | 6.200%, 3/15/2015 | 2,906,018 | |||
Tyco International Finance SA | |||||
| 1,500,000 | 4.125%, 10/15/2014 | 1,592,250 | |||
Waste Management, Inc. | |||||
| 2,350,000 | 6.375%, 3/11/2015 | 2,694,921 | |||
Total Capital Goods | 24,596,879 | ||||
Collateralized Mortgage Obligations (4.4%) | |||||
American Home Mortgage Assets Trust | |||||
| 3,857,939 | 1.333%, 7/1/2010c | 1,769,857 | |||
Banc of America Mortgage Securities, Inc. | |||||
| 1,866,127 | 4.787%, 9/25/2035 | 1,579,057 | |||
Bear Stearns Adjustable Rate Mortgage Trust | |||||
| 2,269,258 | 4.625%, 8/25/2010c | 1,998,481 | |||
Chase Mortgage Finance Corporation | |||||
| 1,476,347 | 5.398%, 1/25/2036 | 388,084 | |||
Countrywide Alternative Loan Trust | |||||
| 2,259,118 | 5.500%, 2/25/2036 | 1,688,101 | |||
| 2,454,360 | 6.000%, 1/25/2037 | 1,637,038 | |||
Countrywide Home Loans, Inc. | |||||
| 3,057,214 | 5.243%, 3/20/2036 | 1,863,268 | |||
| 3,028,645 | 5.639%, 9/20/2036 | 1,801,150 | |||
Deutsche Alt-A Securities, Inc. | |||||
| 4,939,381 | 1.191%, 7/1/2010c | 2,730,045 | |||
GSR Mortgage Loan Trust | |||||
| 5,472,456 | 0.537%, 7/26/2010c | 4,413,684 | |||
HomeBanc Mortgage Trust | |||||
| 2,166,197 | 5.958%, 4/25/2037 | 1,403,485 | |||
Impac CMB Trust | |||||
| 1,238,286 | 0.607%, 7/26/2010c | 900,331 | |||
| 878,948 | 0.667%, 7/26/2010c | 615,443 | |||
J.P. Morgan Alternative Loan Trust | |||||
| 4,816,177 | 5.765%, 3/25/2036 | 3,103,082 | |||
J.P. Morgan Mortgage Trust | |||||
| 3,208,989 | 5.738%, 6/25/2036 | 3,067,765 | |||
| 1,259,266 | 5.933%, 10/25/2036 | 1,104,172 | |||
Merrill Lynch Mortgage Investors, Inc. | |||||
| 2,628,296 | 3.256%, 6/25/2035 | 2,319,198 | |||
Residential Accredit Loans, Inc. | |||||
| 2,027,372 | 5.576%, 9/25/2035 | 1,327,308 | |||
Thornburg Mortgage Securities Trust | |||||
| 1,481,132 | 0.457%, 7/26/2010c | 1,425,381 | |||
Wachovia Mortgage Loan Trust, LLC | |||||
| 2,482,256 | 5.531%, 5/20/2036 | 1,870,437 | |||
WaMu Mortgage Pass Through Certificates | |||||
| 4,409,952 | 1.153%, 7/1/2010c | 2,318,779 | |||
| 4,098,110 | 1.233%, 7/1/2010c | 2,416,500 | |||
| 4,287,684 | 1.293%, 7/1/2010c | 2,583,210 | |||
Washington Mutual Mortgage Pass-Through Certificates | |||||
| 5,971,881 | 1.163%, 7/1/2010c | 2,459,131 | |||
| 3,949,354 | 1.333%, 7/1/2010c | 1,610,697 | |||
| 1,448,319 | 0.637%, 7/25/2010c | 1,126,019 | |||
Wells Fargo Mortgage Backed Securities Trust | |||||
| 691,321 | 4.896%, 3/25/2036 | 612,660 | |||
| 1,913,833 | 5.051%, 3/25/2036 | 1,714,869 | |||
Total Collateralized Mortgage Obligations | 51,847,232 | ||||
Commercial Mortgage-Backed Securities (6.7%) | |||||
Banc of America Commercial Mortgage, Inc. | |||||
| 9,746 | 4.037%, 11/10/2039 | 9,743 | |||
Banc of America Large Loan Trust | |||||
| 3,171,296 | 0.460%, 7/15/2010b,c | 2,958,544 | |||
Bear Stearns Commercial Mortgage Securities, Inc. | |||||
| 4,000,000 | 0.500%, 7/15/2010c,d | 3,540,000 | |||
| 6,165,432 | 5.422%, 9/11/2042 | 6,376,845 | |||
| 2,000,000 | 5.331%, 2/11/2044 | 1,959,536 | |||
Chase Commercial Mortgage Securities Corporation | |||||
| 978,477 | 7.928%, 7/15/2032 | 977,027 | |||
Citigroup/Deutsche Bank Commercial Mortgage | |||||
| 3,000,000 | 5.322%, 12/11/2049 | 2,913,762 | |||
Commercial Mortgage Pass- Through Certificates | |||||
| 31,464 | 0.450%, 7/15/2010b,c | 31,426 | |||
| 4,000,000 | 0.530%, 7/15/2010c,d | 3,382,296 | |||
| 1,500,000 | 5.306%, 12/10/2046 | 1,463,229 | |||
Credit Suisse First Boston Mortgage Securities Corporation | |||||
| 262,037 | 3.382%, 5/15/2038 | 261,859 | |||
Credit Suisse Mortgage Capital Certificates | |||||
| 4,000,000 | 5.467%, 9/15/2039 | 3,931,096 | |||
Government National Mortgage Association | |||||
| 10,943,463 | 3.214%, 1/16/2040 | 11,269,699 | |||
| 6,483,152 | 2.870%, 3/16/2051 | 6,637,308 | |||
The accompanying Notes to Financial Statements are an integral part of this schedule.
297
Table of Contents
Limited Maturity Bond Portfolio
Schedule of Investments as of June 30, 2010
(unaudited)
| Principal Amount | Long-Term Fixed Income (96.3%) | Value | |||
Commercial Mortgage-Backed Securities (6.7%) - continued | |||||
GS Mortgage Securities Corporation II | |||||
| $5,500,000 | 5.396%, 8/10/2038 | $ | 5,801,526 | ||
J.P. Morgan Chase Commercial Mortgage Securities Corporation | |||||
| 3,000,000 | 5.336%, 5/15/2047 | 2,965,038 | |||
LB-UBS Commercial Mortgage Trust | |||||
| 431,777 | 4.207%, 11/15/2027 | 432,297 | |||
| 1,602,568 | 4.567%, 6/15/2029 | 1,618,797 | |||
| 337,165 | 4.187%, 8/15/2029 | 337,280 | |||
Morgan Stanley Capital I, Inc. | |||||
| 7,000,000 | 4.970%, 4/14/2040 | 7,135,702 | |||
TIAA Seasoned Commercial Mortgage Trust | |||||
| 4,750,000 | 5.790%, 8/15/2039 | 4,995,594 | |||
Wachovia Bank Commercial Mortgage Trust | |||||
| 4,203,283 | 3.894%, 11/15/2035 | 4,205,473 | |||
| 2,500,000 | 5.765%, 7/15/2045 | 2,621,242 | |||
| 2,800,000 | 5.308%, 11/15/2048 | 2,899,070 | |||
WaMu Commercial Mortgage Securities Trust | |||||
| 1,354,900 | 3.830%, 1/25/2035b | 1,368,132 | |||
Total Commercial Mortgage- Backed Securities | 80,092,521 | ||||
Communications Services (4.1%) | |||||
Alltel Corporation | |||||
| 2,675,000 | 7.000%, 7/1/2012 | 2,955,102 | |||
British Telecom plc | |||||
| 2,000,000 | 9.125%, 6/15/2010 | 2,068,448 | |||
CBS Corporation | |||||
| 2,500,000 | 8.875%, 5/15/2019 | 3,145,295 | |||
Crown Castle Towers, LLC | |||||
| 3,250,000 | 4.523%, 1/15/2015b | 3,391,030 | |||
DirecTV Holdings, LLC/DirecTV Financing Company, Inc. | |||||
| 4,000,000 | 7.625%, 5/15/2016 | 4,345,000 | |||
Discovery Communications, LLC | |||||
| 2,500,000 | 3.700%, 6/1/2015 | 2,563,110 | |||
NBC Universal, Inc. | |||||
| 3,500,000 | 3.650%, 4/30/2015b | 3,579,100 | |||
Qwest Corporation | |||||
| 5,000,000 | 8.875%, 3/15/2012 | 5,362,500 | |||
Rogers Communications, Inc. | |||||
| 2,620,000 | 7.875%, 5/1/2012 | 2,913,010 | |||
SBA Tower Trust | |||||
| 4,500,000 | 4.254%, 4/15/2015b | 4,718,619 | |||
Telecom Italia Capital SA | |||||
| 1,400,000 | 6.200%, 7/18/2011 | 1,450,736 | |||
Telefonica SA | |||||
| 4,000,000 | 4.949%, 1/15/2015 | 4,190,228 | |||
Time Warner Cable, Inc. | |||||
| 2,400,000 | 5.400%, 7/2/2012 | 2,563,620 | |||
| 3,350,000 | 7.500%, 4/1/2014 | 3,892,352 | |||
Verizon Communications, Inc. | |||||
| 1,350,000 | 4.350%, 2/15/2013 | 1,443,092 | |||
Total Communications Services | 48,581,242 | ||||
| Consumer Cyclical (1.6%) | |||||
American Honda Finance Corporation | |||||
| 4,500,000 | 2.375%, 3/18/2013b | 4,562,582 | |||
Ford Motor Credit Company, LLC | |||||
| 2,750,000 | 7.000%, 4/15/2015 | 2,720,217 | |||
Nissan Motor Acceptance Corporation | |||||
| 2,000,000 | 4.500%, 1/30/2015b | 2,063,644 | |||
Toyota Motor Credit Corporation | |||||
| 4,500,000 | 3.200%, 6/17/2015 | 4,592,979 | |||
Wal-Mart Stores, Inc. | |||||
| 4,000,000 | 2.250%, 7/8/2015f,g | 3,987,800 | |||
| 1,000,000 | 3.625%, 7/8/2020f,g | 999,080 | |||
Total Consumer Cyclical | 18,926,302 | ||||
Consumer Non-Cyclical (3.9%) | |||||
Altria Group, Inc. | |||||
| 6,000,000 | 8.500%, 11/10/2013 | 7,004,082 | |||
Amgen, Inc., Convertible | |||||
| 4,500,000 | 0.125%, 2/1/2011 | 4,449,375 | |||
Anheuser-Busch InBev Worldwide, Inc. | |||||
| 4,000,000 | 3.000%, 10/15/2012 | 4,106,192 | |||
| 3,500,000 | 5.375%, 11/15/2014b | 3,826,617 | |||
Cargill, Inc. | |||||
| 2,000,000 | 5.200%, 1/22/2013b | 2,153,842 | |||
Dr. Pepper Snapple Group, Inc. | |||||
| 2,000,000 | 2.350%, 12/21/2012 | 2,023,146 | |||
Genzyme Corporation | |||||
| 4,000,000 | 3.625%, 6/15/2015b | 4,046,024 | |||
Kraft Foods, Inc. | |||||
| 2,500,000 | 4.125%, 2/9/2016 | 2,638,688 | |||
Kroger Company | |||||
| 2,000,000 | 5.000%, 4/15/2013 | 2,140,692 | |||
Life Technologies Corporation | |||||
| 3,250,000 | 3.375%, 3/1/2013 | 3,322,059 | |||
| 1,250,000 | 4.400%, 3/1/2015 | 1,292,970 | |||
Teva Pharmaceutical Finance Company | |||||
| 4,500,000 | 3.000%, 6/15/2015 | 4,588,168 | |||
Wm. Wrigley, Jr. Company | |||||
| 4,500,000 | 1.912%, 9/28/2010b,c | 4,499,131 | |||
Total Consumer Non-Cyclical | 46,090,986 | ||||
Energy (1.8%) | |||||
Cenovus Energy, Inc. | |||||
| 2,000,000 | 4.500%, 9/15/2014b | 2,136,378 | |||
Energy Transfer Partners, LP | |||||
| 2,000,000 | 6.000%, 7/1/2013 | 2,170,658 | |||
Marathon Oil Canada Corporation | |||||
| 1,350,000 | 8.375%, 5/1/2012 | 1,499,461 | |||
The accompanying Notes to Financial Statements are an integral part of this schedule.
298
Table of Contents
Limited Maturity Bond Portfolio
Schedule of Investments as of June 30, 2010
(unaudited)
| Principal Amount | Long-Term Fixed Income (96.3%) | Value | |||
Energy (1.8%) - continued | |||||
Nabors Industries, Inc., Convertible | |||||
| $ 4,000,000 | 0.940%, 5/15/2011 | $ | 3,920,000 | ||
ONEOK Partners, LP | |||||
| 650,000 | 8.625%, 3/1/2019 | 800,766 | |||
Ras Laffan Liquefied Natural Gas Company, Ltd. III | |||||
| 3,300,000 | 4.500%, 9/30/2012b | 3,427,199 | |||
| 1,250,000 | 5.832%, 9/30/2016b | 1,344,375 | |||
Valero Energy Corporation | |||||
| 2,000,000 | 4.500%, 2/1/2015 | 2,055,104 | |||
| 650,000 | 6.125%, 2/1/2020 | 667,937 | |||
Williams Partners, LP | |||||
| 3,000,000 | 3.800%, 2/15/2015b | 3,019,476 | |||
Woodside Finance, Ltd. | |||||
| 1,000,000 | 8.125%, 3/1/2014b | 1,138,998 | |||
Total Energy | 22,180,352 | ||||
Financials (26.7%) | |||||
Abbey National Treasury Services plc | |||||
| 3,000,000 | 3.875%, 11/10/2014b | 2,962,110 | |||
Achmea Hypotheekbank NV | |||||
| 10,000,000 | 3.200%, 11/3/2014b | 10,331,570 | |||
Allstate Corporation | |||||
| 1,300,000 | 6.200%, 5/16/2014 | 1,474,656 | |||
AMB Property, LP | |||||
| 2,000,000 | 6.125%, 12/1/2016 | 2,138,158 | |||
ANZ National International, Ltd. | |||||
| 4,000,000 | 2.375%, 12/21/2012b | 4,051,576 | |||
Avalon Bay Communities, Inc. | |||||
| 2,000,000 | 5.700%, 3/15/2017 | 2,159,198 | |||
Banco Santander Chile | |||||
| 4,000,000 | 2.875%, 11/13/2012b | 3,968,784 | |||
Bank of America Corporation | |||||
| 3,250,000 | 4.500%, 4/1/2015 | 3,284,843 | |||
| 3,000,000 | 6.500%, 8/1/2016 | 3,246,666 | |||
Bank of Nova Scotia | |||||
| 4,500,000 | 2.375%, 12/17/2013 | 4,583,362 | |||
Bank of Tokyo - Mitsubishi UFJ, Ltd. | |||||
| 4,500,000 | 2.600%, 1/22/2013b | 4,573,589 | |||
Barclays Bank plc | |||||
| 1,800,000 | 2.500%, 1/23/2013 | 1,792,712 | |||
Barclays Bank plc, Convertible | |||||
| 4,500,000 | 1.000%, 6/25/2017h | 4,460,850 | |||
BB&T Corporation | |||||
| 3,350,000 | 5.700%, 4/30/2014 | 3,678,843 | |||
Bear Stearns Companies, Inc. | |||||
| 2,500,000 | 6.400%, 10/2/2017 | 2,776,862 | |||
Berkshire Hathaway Finance Corporation | |||||
| 3,250,000 | 0.423%, 7/13/2010c | 3,250,533 | |||
| 4,500,000 | 5.000%, 8/15/2013 | 4,941,473 | |||
BlackRock, Inc. | |||||
| 2,000,000 | 3.500%, 12/10/2014 | 2,074,208 | |||
Canadian Imperial Bank of Commerce | |||||
| 6,500,000 | 2.000%, 2/4/2013b | 6,572,287 | |||
Capital One Bank USA NA | |||||
| 1,000,000 | 8.800%, 7/15/2019 | 1,248,411 | |||
CDP Financial, Inc. | |||||
| 6,000,000 | 3.000%, 11/25/2014b | 6,055,284 | |||
CIE Financement Foncier | |||||
| 7,500,000 | 2.125%, 4/22/2013b | 7,572,607 | |||
Citigroup, Inc. | |||||
| 3,400,000 | 5.300%, 10/17/2012 | 3,523,461 | |||
| 2,000,000 | 5.500%, 4/11/2013 | 2,079,006 | |||
| 4,600,000 | 6.000%, 12/13/2013 | 4,825,920 | |||
CME Group Index Services, LLC | |||||
| 3,000,000 | 4.400%, 3/15/2018b | 3,057,051 | |||
CME Group, Inc. | |||||
| 2,700,000 | 5.400%, 8/1/2013 | 2,978,481 | |||
CNA Financial Corporation | |||||
| 3,000,000 | 6.500%, 8/15/2016 | 3,143,226 | |||
Commonwealth Bank of Australia | |||||
| 3,000,000 | 2.750%, 10/15/2012b | 3,058,419 | |||
| 6,700,000 | 2.500%, 12/10/2012b | 6,875,192 | |||
Corestates Capital Trust I | |||||
| 700,000 | 8.000%, 12/15/2026b | 727,052 | |||
Credit Suisse Securities USA, LLC, Convertible | |||||
| 5,500,000 | 1.000%, 4/28/2017h | 5,184,300 | |||
Dexia Credit Local SA | |||||
| 9,500,000 | 2.750%, 4/29/2014b | 9,572,580 | |||
Duke Realty, LP | |||||
| 2,000,000 | 7.375%, 2/15/2015 | 2,218,386 | |||
Fifth Third Bancorp | |||||
| 1,325,000 | 6.250%, 5/1/2013 | 1,441,560 | |||
Fifth Third Bank | |||||
| 4,165,000 | 0.546%, 8/17/2010c | 3,910,885 | |||
GATX Corporation | |||||
| 2,000,000 | 4.750%, 10/1/2012 | 2,105,472 | |||
| 2,000,000 | 4.750%, 5/15/2015 | 2,085,374 | |||
Goldman Sachs Group, Inc., Convertible | |||||
| 5,000,000 | 1.000%, 1/31/2015h | 4,363,388 | |||
Health Care REIT, Inc. | |||||
| 750,000 | 6.125%, 4/15/2020 | 775,834 | |||
International Lease Finance Corporation | |||||
| 1,100,000 | 8.625%, 9/15/2015b | 1,042,250 | |||
Irish Life & Permanent plc | |||||
| 9,500,000 | 3.600%, 1/14/2013b | 9,412,305 | |||
J.P. Morgan Chase & Company | |||||
| 5,000,000 | 3.400%, 6/24/2015 | 5,011,345 | |||
Lehman Brothers Holdings E- Capital Trust I | |||||
| 3,500,000 | 1.240%, 8/19/2065i,j | 350 | |||
Lincoln National Corporation | |||||
| 1,200,000 | 5.650%, 8/27/2012 | 1,269,239 | |||
| 1,350,000 | 4.750%, 2/15/2014 | 1,392,896 | |||
| 650,000 | 8.750%, 7/1/2019 | 796,632 | |||
Lloyds TSB Bank plc | |||||
| 5,500,000 | 4.375%, 1/12/2015b | 5,299,025 | |||
MassMutual Global Funding II | |||||
| 2,000,000 | 3.625%, 7/16/2012b | 2,088,120 | |||
Merrill Lynch & Company, Inc. | |||||
| 2,000,000 | 6.150%, 4/25/2013 | 2,138,280 | |||
Metropolitan Life Global Funding | |||||
| 2,680,000 | 5.125%, 4/10/2013b | 2,898,610 | |||
The accompanying Notes to Financial Statements are an integral part of this schedule.
299
Table of Contents
Limited Maturity Bond Portfolio
Schedule of Investments as of June 30, 2010
(unaudited)
| Principal Amount | Long-Term Fixed Income (96.3%) | Value | ||||
| Financials (26.7%) - continued | |||||
Morgan Stanley | ||||||
| $3,000,000 | 4.750%, 4/1/2014 | $ | 3,005,148 | |||
| 2,000,000 | 4.200%, 11/20/2014 | 1,974,876 | ||||
National Australia Bank, Ltd. | ||||||
| 5,500,000 | 2.500%, 1/8/2013b | 5,555,033 | ||||
Nationwide Building Society | ||||||
| 4,000,000 | 4.650%, 2/25/2015b | 4,084,220 | ||||
New York Life Global Funding | ||||||
| 3,000,000 | 2.250%, 12/14/2012b | 3,058,014 | ||||
| 3,000,000 | 3.000%, 5/4/2015b | 3,023,346 | ||||
Nordea Bank AB | ||||||
| 6,000,000 | 2.500%, 11/13/2012b | 6,065,634 | ||||
PNC Funding Corporation | ||||||
| 3,000,000 | 3.000%, 5/19/2014 | 3,028,755 | ||||
ProLogis | ||||||
| 2,700,000 | 7.625%, 8/15/2014 | 2,865,459 | ||||
| 2,000,000 | 6.250%, 3/15/2017 | 1,904,726 | ||||
Prudential Financial, Inc. | ||||||
| 1,675,000 | 3.625%, 9/17/2012 | 1,725,203 | ||||
| 2,000,000 | 4.750%, 9/17/2015 | 2,064,858 | ||||
Rabobank Nederland NV | ||||||
| 4,600,000 | 4.200%, 5/13/2014b | 4,884,018 | ||||
Regions Financial Corporation | ||||||
| 2,000,000 | 5.750%, 6/15/2015 | 1,987,348 | ||||
Reinsurance Group of America, Inc. | ||||||
| 2,500,000 | 6.450%, 11/15/2019 | 2,671,925 | ||||
Royal Bank of Canada | ||||||
| 6,500,000 | 3.125%, 4/14/2015b | 6,742,404 | ||||
Royal Bank of Scotland Group plc | �� | |||||
| 10,000,000 | 2.625%, 5/11/2012b | 10,227,870 | ||||
Royal Bank of Scotland plc | ||||||
| 4,000,000 | 4.875%, 8/25/2014b | 4,011,648 | ||||
Simon Property Group, LP | ||||||
| 3,700,000 | 6.750%, 5/15/2014 | 4,158,504 | ||||
SLM Corporation | ||||||
| 3,000,000 | 5.125%, 8/27/2012 | 2,955,342 | ||||
| 1,500,000 | 8.000%, 3/25/2020 | 1,317,279 | ||||
Standard Chartered plc | ||||||
| 2,000,000 | 3.850%, 4/27/2015b | 2,017,852 | ||||
State Street Capital Trust III | ||||||
| 2,000,000 | 8.250%, 3/15/2011 | 2,002,800 | ||||
Svenske Exportkredit AB | ||||||
| 5,000,000 | 3.250%, 9/16/2014 | 5,187,160 | ||||
Swedbank AB | ||||||
| 5,000,000 | 2.800%, 2/10/2012b | 5,128,260 | ||||
TD Ameritrade Holding Corporation | ||||||
| 4,000,000 | 2.950%, 12/1/2012 | 4,077,548 | ||||
U.S. Bank National Association | ||||||
| 4,000,000 | 3.778%, 4/29/2020 | 4,062,000 | ||||
U.S. Central Federal Credit Union | ||||||
| 6,500,000 | 1.900%, 10/19/2012 | 6,634,088 | ||||
UnitedHealth Group, Inc. | ||||||
| 2,000,000 | 5.500%, 11/15/2012 | 2,147,550 | ||||
Vestjysk Bank A/S | ||||||
| 9,500,000 | 1.089%, 9/17/2010b,c | 9,486,367 | ||||
Wachovia Capital Trust III | ||||||
| 700,000 | 5.800%, 3/15/2011 | 556,500 | ||||
WEA Finance, LLC/WT Finance Australia, Pty Ltd. | ||||||
| 3,350,000 | 5.750%, 9/2/2015b | 3,621,293 | ||||
Wells Fargo & Company | ||||||
| 4,000,000 | 4.950%, 10/16/2013 | 4,254,320 | ||||
| 2,500,000 | 3.625%, 4/15/2015i | 2,554,432 | ||||
Westpac Banking Corporation | ||||||
| 5,000,000 | 2.250%, 11/19/2012 | 5,042,510 | ||||
Westpac Securities New Zealand, Ltd. | ||||||
| 4,600,000 | 3.450%, 7/28/2014b | 4,804,847 | ||||
Total Financials | 319,362,358 | |||||
| Foreign Government (4.4%) | |||||
British Columbia Government Notes | ||||||
| 9,500,000 | 2.850%, 6/15/2015 | 9,812,369 | ||||
Corporacion Andina de Fomento | ||||||
| 5,000,000 | 5.750%, 1/12/2017 | 5,442,840 | ||||
Export-Import Bank of Korea | ||||||
| 1,650,000 | 5.875%, 1/14/2015 | 1,787,805 | ||||
Kommunalbanken AS | ||||||
| 7,500,000 | 2.750%, 5/5/2015b | 7,634,385 | ||||
Korea Development Bank/ Republic of Korea | ||||||
| 4,000,000 | 4.375%, 8/10/2015 | 4,078,560 | ||||
Korea Expressway Corporation | ||||||
| 3,000,000 | 4.500%, 3/23/2015b | 3,070,824 | ||||
Kreditanstalt fuer Wiederaufbau | ||||||
| 10,000,000 | 1.250%, 6/15/2012 | 10,015,100 | ||||
Qatar Government International Bond | ||||||
| 4,000,000 | 4.000%, 1/20/2015b | 4,110,000 | ||||
Russia Government International Bond | ||||||
| 6,500,000 | 3.625%, 4/29/2015b | 6,288,750 | ||||
Total Foreign Government | 52,240,633 | |||||
| Mortgage-Backed Securities (3.4%) | |||||
Federal Home Loan Mortgage Corporation 30-Yr. Gold | ||||||
| 4,000,000 | 6.500%, 7/1/2040f | 4,384,376 | ||||
Federal Home Loan Mortgage Corporation Gold 30-Yr. Pass Through | ||||||
| 5,718,838 | 6.500%, 9/1/2037 | 6,279,461 | ||||
Federal National Mortgage Association Conventional 15- Yr. Pass Through | ||||||
| 5,500,000 | 5.000%, 7/1/2025f | 5,867,812 | ||||
Federal National Mortgage Association Conventional 30- Yr. Pass Through | ||||||
| 5,974,364 | 5.970%, 9/1/2037 | 6,461,550 | ||||
| 4,597,433 | 5.806%, 10/1/2037 | 4,947,128 | ||||
| 12,000,000 | 6.000%, 7/1/2040f | 13,014,372 | ||||
Total Mortgage-Backed Securities | 40,954,699 | |||||
The accompanying Notes to Financial Statements are an integral part of this schedule.
300
Table of Contents
Limited Maturity Bond Portfolio
Schedule of Investments as of June 30, 2010
(unaudited)
| Principal Amount | Long-Term Fixed Income (96.3%) | Value | |||
Technology (0.4%) | |||||
Affiliated Computer Services, Inc. | |||||
| $2,000,000 | 5.200%, 6/1/2015 | $ | 2,092,668 | ||
Xerox Corporation | |||||
| 2,000,000 | 8.250%, 5/15/2014 | 2,344,292 | |||
Total Technology | 4,436,960 | ||||
Transportation (2.0%) | |||||
American Airlines Pass Through Trust | |||||
| 1,126,452 | 6.978%, 10/1/2012 | 1,134,901 | |||
Continental Airlines, Inc. | |||||
| 4,000,000 | 7.250%, 11/10/2019 | 4,260,000 | |||
CSX Corporation | |||||
| 2,500,000 | 6.250%, 4/1/2015 | 2,875,158 | |||
Delta Air Lines, Inc. | |||||
| 2,500,000 | 7.920%, 11/18/2010 | 2,525,000 | |||
| 1,967,220 | 7.750%, 12/17/2019 | 2,124,597 | |||
Erac USA Finance Company | |||||
| 4,500,000 | 2.750%, 7/1/2013b | 4,513,833 | |||
Northwest Airlines, Inc. | |||||
| 2,400,000 | 6.841%, 4/1/2011 | 2,436,000 | |||
United Air Lines, Inc. | |||||
| 1,949,048 | 10.400%, 11/1/2016 | 2,095,226 | |||
| 2,000,000 | 9.750%, 1/15/2017 | 2,135,000 | |||
Total Transportation | 24,099,715 | ||||
U.S. Government and Agencies (15.8%) | |||||
FDIC Structured Sale Guaranteed Notes | |||||
| 8,000,000 | Zero Coupon, 1/7/2013b | 7,758,160 | |||
Federal Farm Credit Bank | |||||
| 10,000,000 | 1.375%, 6/25/2013 | 10,056,040 | |||
Federal Home Loan Banks | |||||
| 9,700,000 | 1.000%, 3/15/2011k | 9,700,650 | |||
| 10,000,000 | 2.000%, 7/27/2012 | 10,010,240 | |||
| 15,500,000 | 0.875%, 8/22/2012 | 15,515,268 | |||
Federal National Mortgage Association | |||||
| 5,500,000 | 2.000%, 4/15/2013 | 5,555,302 | |||
U.S. Treasury Notes | |||||
| 13,000,000 | 1.125%, 6/15/2013 | 13,051,740 | |||
| 16,500,000 | 1.500%, 12/31/2013 | 16,639,227 | |||
| 9,000,000 | 1.750%, 1/31/2014 | 9,144,846 | |||
| 20,300,000 | 1.875%, 4/30/2014 | 20,666,354 | |||
| 18,000,000 | 2.375%, 9/30/2014 | 18,592,038 | |||
| 12,500,000 | 2.375%, 2/28/2015 | 12,882,875 | |||
| 4,000,000 | 2.500%, 3/31/2015 | 4,145,000 | |||
U.S. Treasury Notes, TIPS | |||||
| 10,956,417 | 2.500%, 7/15/2016 | 12,192,433 | |||
| 10,311,797 | 1.875%, 7/15/2019 | 11,054,566 | |||
| 11,088,990 | 1.375%, 1/15/2020 | 11,354,948 | |||
Total U.S. Government and Agencies | 188,319,687 | ||||
U.S. Municipals (0.1%) | |||||
Houston, Texas Combined Utility System Revenue Refunding Bonds | |||||
| 1,350,000 | 5.000%, 5/15/2011k | 1,397,439 | |||
Total U.S. Municipals | 1,397,439 | ||||
Utilities (1.3%) | |||||
Abu Dhabi National Energy Company | |||||
| $4,000,000 | 4.750%, 9/15/2014b | 4,035,284 | |||
Commonwealth Edison Company | |||||
| 3,300,000 | 6.150%, 3/15/2012 | 3,556,961 | |||
National Rural Utilities Cooperative Finance Corporation | |||||
| 2,650,000 | 5.500%, 7/1/2013 | 2,929,896 | |||
Oncor Electric Delivery Company | |||||
| 2,700,000 | 5.950%, 9/1/2013 | 2,973,024 | |||
Power Receivables Finance, LLC | |||||
| 209,175 | 6.290%, 1/1/2012d | 213,304 | |||
Virginia Electric & Power Company | |||||
| 1,360,000 | 5.100%, 11/30/2012 | 1,475,945 | |||
Total Utilities | 15,184,414 | ||||
Total Long-Term Fixed Income (cost $1,157,012,139) | 1,149,448,381 | ||||
| Shares | Mutual Funds (1.6%) | ||||
Fixed Income Mutual Funds (1.6%) | |||||
| 4,208,125 | Thrivent High Yield Fund | 19,104,889 | |||
Total Fixed Income Mutual Funds | 19,104,889 | ||||
Total Mutual Funds (cost $15,500,000) | 19,104,889 | ||||
Preferred Stock (0.3%) | |||||
Financials (0.3%) | |||||
| 18,750 | Citigroup, Inc., Convertible, | ||||
7.500% | 2,118,750 | ||||
| 148,505 | Federal National Mortgage | ||||
Association, 8.250%l | 50,492 | ||||
| 66,000 | HSBC Holdings plc, 8.000%l | 1,659,900 | |||
Total Financials | 3,829,142 | ||||
Total Preferred Stock (cost $6,754,280) | 3,829,142 | ||||
| Contracts | Options Purchased (0.1%) | ||||
Call on 10-Yr. U.S. Treasury Bond Futures | |||||
| 700 | $122.50, expires 8/27/2010 | $ | 973,441 | ||
Total Options Purchased (cost $964,600) | 973,441 | ||||
| Shares | Collateral Held for Securities Loaned (0.2%) | ||||
| 2,652,250 | Thrivent Financial Securities Lending Trust | 2,652,250 | |||
Total Collateral Held for Securities Loaned (cost $2,652,250) | 2,652,250 | ||||
The accompanying Notes to Financial Statements are an integral part of this schedule.
301
Table of Contents
Limited Maturity Bond Portfolio
Schedule of Investments as of June 30, 2010
(unaudited)
| Principal Amount | Short-Term Investments (3.4%)m | Value | ||||
Barclays Bank plc Repurchase Agreement | ||||||
| 15,260,000 | 0.010%, 7/1/2010n | $ | 15,260,000 | |||
Federal Home Loan Bank Discount Notes | ||||||
| 5,000,000 | 0.090%, 7/7/2010 | 4,999,925 | ||||
| 18,000,000 | 0.070%, 7/9/2010 | 17,999,720 | ||||
Federal National Mortgage Association Discount Notes | ||||||
| 2,260,000 | 0.180%, 7/7/2010o | 2,259,933 | ||||
Total Short-Term Investments (at amortized cost) | 40,519,578 | |||||
Total Investments (cost $1,223,402,847) 101.9% | $ | 1,216,527,681 | ||||
Other Assets and Liabilities, Net (1.9%) | (22,986,297 | ) | ||||
| �� | ||||||
Total Net Assets 100.0% | $ | 1,193,541,384 | ||||
| a | All or a portion of the security is insured or guaranteed. |
| b | Denotes securities sold under Rule 144A of the Securities Act of 1933, which exempts them from registration. These securities have been deemed liquid and may be resold to other dealers in the program or to other qualified institutional buyers. As of June 30, 2010, the value of these investments was $292,794,918 or 24.5% of total net assets. |
| c | Denotes variable rate obligations for which the current coupon rate and next scheduled reset date are shown. |
| d | Denotes restricted securities. Restricted securities are investment securities which have been deemed illiquid and cannot be offered for public sale without first being registered under the Securities Act of 1933. The following table indicates the acquisition date and cost of restricted securities Limited Maturity Bond Portfolio owned as of June 30, 2010. |
Security | Acquisition Date | Amortized Cost | |||
Bear Stearns Commercial Mortgage Securities, Inc. | 3/30/2007 | $ | 4,000,000 | ||
Commercial Mortgage Pass- Through Certificates | 5/2/2007 | 4,000,000 | |||
First Franklin Mortgage Loan Asset-Backed Certificates | 4/19/2006 | 214,738 | |||
Mortgage Equity Conversion Asset Trust | 2/14/2007 | 6,296,568 | |||
Mortgage Equity Conversion Asset Trust | 1/18/2007 | 6,404,414 | |||
Power Receivables Finance, LLC | 9/30/2003 | 209,113 | |||
Wachovia Asset Securitization, Inc. | 3/16/2007 | 2,019,140 | |||
| e | Defaulted security. Interest is not being accrued. |
| f | Denotes investments purchased on a when-issued or delayed delivery basis. |
| g | Security is fair valued as discussed in item 2(A) of the Notes to Financial Statements. |
| h | These securities are Equity-Linked Structured Securities as discussed in item 2(Q) of the Notes to Financial Statements. These securities are linked to the S&P 500 Index. |
| i | All or a portion of the security is on loan as discussed in item 2(M) of the Notes to Financial Statements. |
| j | In bankruptcy. Interest is not being accrued. |
| k | Denotes step coupon bonds for which the current interest rate and next scheduled reset date are shown. |
| l | Non-income producing security. |
| m | The interest rate shown reflects the yield, coupon rate or, for securities purchased at a discount, the discount rate at the date of purchase. |
| n | Repurchase agreement dated June 30, 2010, $15,260,004 maturing July 1, 2010, collateralized by $15,565,279 U.S. Treasury Notes, 6.000% due February 15, 2026. |
| o | At June 30, 2010, $1,799,947 of investments were held on deposit with the counterparty and pledged as the initial margin deposit for open futures contracts. |
Definitions:
| REIT | - | Real Estate Investment Trust, is a company that buys, develops, manages and/or sells real estate assets. | ||
| TIPS | - | Treasury Inflation Protected Security. |
Unrealized Appreciation (Depreciation)
Gross unrealized appreciation and depreciation of investments, based on cost for federal income tax purposes, were as follows:
Gross unrealized appreciation | $ | 37,324,982 | ||
Gross unrealized depreciation | (44,200,148 | ) | ||
Net unrealized appreciation (depreciation) | $ | (6,875,166 | ) | |
Cost for federal income tax purposes | $ | 1,223,402,847 | ||
The accompanying Notes to Financial Statements are an integral part of this schedule.
302
Table of Contents
Limited Maturity Bond Portfolio
Schedule of Investments as of June 30, 2010
(unaudited)
Fair Valuation Measurements
The following table is a summary of the inputs used, as of June 30, 2010, in valuing Limited Maturity Bond Portfolio’s assets carried at fair value as discussed in the Notes to Financial Statements.
Investments in Securities | Total | Level 1 | Level 2 | Level 3 | ||||||||
Long-Term Fixed Income | ||||||||||||
Asset-Backed Securities | 201,035,405 | — | 179,887,185 | 21,148,220 | ||||||||
Basic Materials | 10,101,557 | — | 10,101,557 | — | ||||||||
Capital Goods | 24,596,879 | — | 24,596,879 | — | ||||||||
Collateralized Mortgage Obligations | 51,847,232 | — | 51,847,232 | — | ||||||||
Commercial Mortgage-Backed Securities | 80,092,521 | — | 80,092,521 | — | ||||||||
Communications Services | 48,581,242 | — | 48,581,242 | — | ||||||||
Consumer Cyclical | 18,926,302 | — | 13,939,422 | 4,986,880 | ||||||||
Consumer Non-Cyclical | 46,090,986 | — | 46,090,986 | — | ||||||||
Energy | 22,180,352 | — | 22,180,352 | — | ||||||||
Financials | 319,362,358 | — | 309,717,208 | 9,645,150 | ||||||||
Foreign Government | 52,240,633 | — | 52,240,633 | — | ||||||||
Mortgage-Backed Securities | 40,954,699 | 11,408,678 | 29,546,021 | — | ||||||||
Technology | 4,436,960 | — | 4,436,960 | — | ||||||||
Transportation | 24,099,715 | — | 7,388,991 | 16,710,724 | ||||||||
U.S. Government and Agencies | 188,319,687 | — | 180,561,527 | 7,758,160 | ||||||||
U.S. Municipals | 1,397,439 | — | 1,397,439 | — | ||||||||
Utilities | 15,184,414 | — | 15,184,414 | — | ||||||||
Mutual Funds | ||||||||||||
Fixed Income Mutual Funds | 19,104,889 | 19,104,889 | — | — | ||||||||
Preferred Stock | ||||||||||||
Financials | 3,829,142 | 3,829,142 | — | — | ||||||||
Options Purchased | 973,441 | 973,441 | — | — | ||||||||
Collateral Held for Securities Loaned | 2,652,250 | 2,652,250 | — | — | ||||||||
Short-Term Investments | 40,519,578 | — | 40,519,578 | — | ||||||||
Total | $ | 1,216,527,681 | $ | 37,968,400 | $ | 1,118,310,147 | $ | 60,249,134 | ||||
Other Financial Instruments | Total | Level 1 | Level 2 | Level 3 | ||||||||
Asset Derivatives | ||||||||||||
Futures Contracts | 13,464 | 13,464 | — | — | ||||||||
Credit Default Swaps | 382,567 | — | 382,567 | — | ||||||||
Total Asset Derivatives | $ | 396,031 | $ | 13,464 | $ | 382,567 | $ | — | ||||
Liability Derivatives | ||||||||||||
Futures Contracts | 3,143,668 | 3,143,668 | — | — | ||||||||
Total Liability Derivatives | $ | 3,143,668 | $ | 3,143,668 | $ | — | $ | — | ||||
The following table is a reconciliation of assets in which significant unobservable inputs (Level 3) were used in determining fair value for Limited Maturity Bond Portfolio as discussed in item 2(A) of the Notes to Financial Statements.
Investments in Securities | Value December 31, 2009 | Accrued Discounts and/or Premiums | Realized Gain/(Loss) | Change in Unrealized Gain/(Loss) | Net Purchases/(Sales) | Transfers Into Level 3 | Transfers Out of Level 3 | Value June 30, 2010 | |||||||||||||||
Long-Term Fixed Income Asset-Backed Securities | 20,538,327 | — | — | 981,255 | (371,362 | ) | — | — | 21,148,220 | ||||||||||||||
Commercial Mortgage- Backed Securities | 6,695,000 | — | 367,656 | (195,000 | ) | (6,867,656 | ) | — | — | — | |||||||||||||
Consumer Cyclical | — | — | — | — | 4,986,880 | — | — | 4,986,880 | |||||||||||||||
Financials | — | — | — | (354,850 | ) | 10,000,000 | — | — | 9,645,150 | ||||||||||||||
Transportation | 14,177,257 | (28,203 | ) | 3,246 | 545,961 | 2,012,463 | — | — | 16,710,724 | ||||||||||||||
U.S. Government and Agencies | — | 17,314 | — | 82,190 | 7,658,656 | — | — | 7,758,160 | |||||||||||||||
Total | $ | 44,410,584 | ($10,889 | ) | $370,902 | $ | 1,059,556 | $17,418,981 | $— | $ | — | $ | 60,249,134 | ||||||||||
The accompanying Notes to Financial Statements are an integral part of this schedule.
303
Table of Contents
Limited Maturity Bond Portfolio
Schedule of Investments as of June 30, 2010
(unaudited)
Futures Contracts | Number of Contracts Long/(Short) | Expiration Date | Notional Principal Amount | Value | Unrealized Gain/(Loss) | |||||||||
2-Yr. U.S. Treasury Bond Futures | (55 | ) | September 2010 | ($11,991,551 | ) | ($12,035,547 | ) | ($43,996 | ) | |||||
5-Yr. U.S. Treasury Bond Futures | (1,865 | ) | September 2010 | (218,301,309 | ) | (220,725,660 | ) | (2,424,351 | ) | |||||
10-Yr. U.S. Treasury Bond Futures | (425 | ) | September 2010 | (51,407,103 | ) | (52,082,424 | ) | (675,321 | ) | |||||
20-Yr. U.S. Treasury Bond Futures | 5 | September 2010 | 624,036 | 637,500 | 13,464 | |||||||||
Total Futures Contracts | ($3,130,204 | ) |
Credit Default Swaps and Counterparty | Buy/Sell Protection1 | Termination Date | Notional Principal Amount2 | Upfront Payments Received (Made) | Value3 | Unrealized Gain/(Loss) | |||||||
CDX IG, Series 14, 5 Year, at 1.00%; Bank of America | Buy | 12/20/2015 | $23,500,000 | ($65,090 | ) | $219,740 | $154,650 | ||||||
CDX IG, Series 14, 5 Year, at 1.00%; J.P. Morgan Chase and Co. | Buy | 12/20/2015 | 35,250,000 | (101,694 | ) | 329,611 | 227,917 | ||||||
Total Credit Default Swaps | $549,351 | $382,567 |
| 1 | As the buyer of protection, Limited Maturity Bond Portfolio pays periodic fees in return for payment by the seller which is contingent upon an adverse credit event occurring in the underlying issuer or reference entity. As the seller of protection, Limited Maturity Bond Portfolio collects periodic fees from the buyer and profits if the credit of the underlying issuer or reference entity remains stable or improves while the swap is outstanding, but the seller in a credit default swap contract would be required to pay the amount of credit loss, determined as specified in the agreement, to the buyer in the event of an adverse credit event in the reference entity. |
| 2 | The maximum potential amount of future payments Limited Maturity Bond Portfolio could be required to make as the seller or receive as the buyer of protection. |
| 3 | The market values for credit indexes (CDX or LCDX) serve as an indicator of the current status of the payment/performance risk and represent the liability or profit for the credit default swap contract had the contract been closed as of the reporting date. When protection has been sold, the market value of the swap will increase when the swap spread declines representing an improvement in the reference entity’s credit worthiness. The market value of the swap will decrease when the swap spread increases representing a deterioration in the reference entity’s credit worthiness. |
The following table summarizes the fair value and Statement of Assets and Liabilities location, as of June 30, 2010, for Limited Maturity Bond Portfolio’s investments in financial derivative instruments by primary risk exposure as discussed under item (2) Significant Accounting Policies of the Notes to Financial Statements.
Derivatives by risk category | Statement of Assets and Liabilities Location | Fair Value | |||
Asset Derivatives | |||||
Interest Rate Contracts | |||||
Futures* | Net Assets - Net unrealized appreciation/(depreciation) on Futures contracts | 13,464 | |||
Options Purchased | Investments in securities at market value, Net Assets - Net unrealized appreciation/(depreciation) on Investments | 973,441 | |||
Total Interest Rate Contracts | 986,905 | ||||
Credit Contracts | |||||
Credit Default Swaps | Receivable/Payable - Swap agreements, at value; Net Assets - Net unrealized appreciation/(depreciation) on Swap agreements | 382,567 | |||
Total Credit Contracts | 382,567 | ||||
Total Asset Derivatives | $ | 1,369,472 | |||
Liability Derivatives | |||||
Interest Rate Contracts | |||||
Futures* | Net Assets - Net unrealized appreciation/(depreciation) on Futures contracts | 3,143,668 | |||
Total Interest Rate Contracts | 3,143,668 | ||||
Total Liability Derivatives | $ | 3,143,668 | |||
| * | Includes cumulative appreciation/depreciation of futures contracts as reported in the Schedule of Investments. Only current day's variation margin is reported within the Statement of Assets and Liabilities. |
The accompanying Notes to Financial Statements are an integral part of this schedule.
304
Table of Contents
Limited Maturity Bond Portfolio
Schedule of Investments as of June 30, 2010
(unaudited)
The following table summarizes the net realized gains/(losses) and Statement of Operations location, for the period ended June 30, 2010, for Limited Maturity Bond Portfolio’s investments in financial derivative instruments by primary risk exposure.
Derivatives by risk category | Statement of Operations Location | Realized Gains/(Losses) recognized in Income | |||
| Interest Rate Contracts | |||||
Options Purchased | Net realized gains/(losses) on Investments | 1,083,389 | |||
Futures | Net realized gains/(losses) on Futures contracts | (7,227,840 | ) | ||
Total Interest Rate Contracts | (6,144,451 | ) | |||
Credit Contracts | |||||
| Credit Default Swaps | Net realized gains/(losses) on Swap agreements | (88,482 | ) | ||
Total Credit Contracts | (88,482) | ||||
Total | ($6,232,933 | ) | |||
The following table summarizes the change in net unrealized appreciation/(depreciation) and Statement of Operations location, for the period ended June 30, 2010, for Limited Maturity Bond Portfolio’s investments in financial derivative instruments by primary risk exposure.
Derivatives by risk category | Statement of Operations Location | Change in unrealized appreciation/(depreciation) recognized in Income | ||||
| Interest Rate Contracts | ||||||
Futures | Change in net unrealized appreciation/(depreciation) on Futures contracts | (7,349,746 | ) | |||
Options Purchased | Change in net unrealized appreciation/(depreciation) on Investments | 123,864 | ||||
Total Interest Rate Contracts | (7,225,882) | |||||
Credit Contracts | ||||||
Credit Default Swaps | Change in net unrealized appreciation/(depreciation) on Swap agreements | 382,567 | ||||
Total Credit Contracts | 382,567 | |||||
Total | ($ | 6,843,315 | ) | |||
The following table presents Limited Maturity Bond Portfolio’s average volume of derivative activity during the period ended June 30, 2010.
Derivative Risk Category | Futures (Notional*) | Futures (Percentage of Average Net Assets) | Swaps (Notional*) | Swaps (Percentage of Average Net Assets) | Options (Contracts) | |||||||||
Interest Rate Contracts | $ | 258,808,436 | 22.4 | % | N/A | N/A | 716 | |||||||
Credit Contracts | N/A | N/A | $ | 49,756,939 | 4.3 | % | N/A | |||||||
| * | Notional amount represents long or short, or both, derivative positions held by the portfolio. |
Investment in Affiliates
Affiliated issuers, as defined under the Investment Company Act of 1940, include those in which the Portfolio’s holdings of an issuer represent 5% or more of the outstanding voting securities of an issuer, or any affiliated mutual fund.
A summary of transactions for the fiscal year to date, in Limited Maturity Bond Portfolio, is as follows:
Portfolio | Value December 31, 2009 | Gross Purchases | Gross Sales | Shares Held at June 30, 2010 | Value June 30, 2010 | Income Earned January 1, 2010 - June 30, 2010 | |||||||||||
High Yield Fund | $ | 19,273,214 | $ | — | $ | — | 4,208,125 | $ | 19,104,889 | $ | 807,537 | ||||||
Thrivent Financial Securities Lending Trust | 813,270 | 150,184,521 | 148,345,541 | 2,652,250 | 2,652,250 | 8,294 | |||||||||||
Total Value and Income Earned | 20,086,484 | 21,757,139 | 815,831 | ||||||||||||||
The accompanying Notes to Financial Statements are an integral part of this schedule.
305
Table of Contents
Mortgage Securities Portfolio
Schedule of Investments as of June 30, 2010
(unaudited)
The accompanying Notes to Financial Statements are an integral part of this schedule.
306
Table of Contents
Mortgage Securities Portfolio
Schedule of Investments as of June 30, 2010
(unaudited)
| Principal Amount | Long-Term Fixed Income (104.1%) | Value | ||||
| Mortgage-Backed Securities (63.7%) - continued | ||||||
Federal National Mortgage Association Conventional 20-Yr. Pass Through | ||||||
| $1,128,778 | 6.000%, 8/1/2024 | $ | 1,246,136 | |||
Federal National Mortgage Association Conventional 30-Yr. Pass Through | ||||||
| 800,000 | 4.500%, 7/1/2040e,f | 829,125 | ||||
| 2,300,000 | 6.500%, 7/1/2040e | 2,518,859 | ||||
| 9,500,000 | 5.500%, 8/1/2040e | 10,165,000 | ||||
Total Mortgage-Backed Securities | 20,917,742 | |||||
| U.S. Government and Agencies (4.5%) | ||||||
Federal Home Loan Banks | ||||||
| 300,000 | 1.000%, 3/15/2011g | 300,020 | ||||
U.S. Treasury Notes | ||||||
| 100,000 | 4.875%, 4/30/2011h | 103,750 | ||||
U.S. Treasury Notes, TIPS | ||||||
| 350,821 | 2.500%, 7/15/2016 | 390,398 | ||||
| 306,291 | 1.875%, 7/15/2019 | 328,354 | ||||
| 327,629 | 1.375%, 1/15/2020 | 335,487 | ||||
| Total U.S. Government and Agencies | 1,458,009 | |||||
Total Long-Term Fixed Income (cost $35,628,205) | 34,160,198 | |||||
Short-Term Investments (55.5%)i | ||||||
Federal Home Loan Bank Discount Notes | ||||||
| 10,985,000 | 0.090%, 7/7/2010 | 10,984,835 | ||||
| 6,100,000 | 0.070%, 7/9/2010 | 6,099,905 | ||||
U.S. Treasury Bills | ||||||
| 1,145,000 | 0.020%, 7/8/2010 | 1,144,996 | ||||
Total Short-Term Investments (at amortized cost) | 18,229,736 | |||||
Total Investments (cost $53,857,941) 159.6% | $ | 52,389,934 | ||||
Other Assets and Liabilities, Net (59.6%) | (19,561,793 | ) | ||||
Total Net Assets 100.0% | $ | 32,828,141 | ||||
| a | Denotes variable rate obligations for which the current coupon rate and next scheduled reset date are shown. |
| b | All or a portion of the security is insured or guaranteed. |
| c | Denotes restricted securities. Restricted securities are investment securities which have been deemed illiquid and cannot be offered for public sale without first being registered under the Securities Act of 1933. The following table indicates the acquisition date and cost of restricted securities Mortgage Securities Portfolio owned as of June 30, 2010. |
Security | Acquisition Date | Amortized Cost | |||
Wachovia Asset Securitization, Inc. | 3/16/2007 | $ | 807,656 | ||
Wachovia Bank Commercial Mortgage Trust | 2/28/2007 | 1,250,118 | |||
| d | Denotes securities sold under Rule 144A of the Securities Act of 1933, which exempts them from registration. These securities have been deemed liquid and may be resold to other dealers in the program or to other qualified institutional buyers. As of June 30, 2010, the value of these investments was $20,951 or 0.1% of total net assets. |
| e | Denotes investments purchased on a when-issued or delayed delivery basis. |
| f | All or a portion of the security was earmarked to cover written options. |
| g | Denotes step coupon bonds for which the current interest rate and next scheduled reset date are shown. |
| h | At June 30, 2010, $103,750 of investments were held on deposit with the counterparty and pledged as the initial margin deposit for open futures contracts. |
| i | The interest rate shown reflects the yield, coupon rate or, for securities purchased at a discount, the discount rate at the date of purchase. |
Definitions:
TIPS | - | Treasury Inflation Protected Security. |
Unrealized Appreciation (Depreciation)
Gross unrealized appreciation and depreciation of investments, based on cost for federal income tax purposes, were as follows:
Gross unrealized appreciation | $ | 878,205 | ||||
Gross unrealized depreciation | (2,346,212 | ) | ||||
Net unrealized appreciation (depreciation) | $ | (1,468,007 | ) | |||
Cost for federal income tax purposes | $ | 53,857,941 | ||||
The accompanying Notes to Financial Statements are an integral part of this schedule.
307
Table of Contents
Mortgage Securities Portfolio
Schedule of Investments as of June 30, 2010
(unaudited)
Fair Valuation Measurements
The following table is a summary of the inputs used, as of June 30, 2010, in valuing Mortgage Securities Portfolio’s assets carried at fair value as discussed in the Notes to Financial Statements.
Investments in Securities | Total | Level 1 | Level 2 | Level 3 | ||||||||
Long-Term Fixed Income | ||||||||||||
Asset-Backed Securities | 3,314,752 | — | 2,778,468 | 536,284 | ||||||||
Collateralized Mortgage Obligations | 5,496,662 | — | 5,496,662 | — | ||||||||
Commercial Mortgage-Backed Securities | 2,973,033 | — | 2,973,033 | — | ||||||||
Mortgage-Backed Securities | 20,917,742 | — | 20,917,742 | — | ||||||||
U.S. Government and Agencies | 1,458,009 | — | 1,458,009 | — | ||||||||
Short-Term Investments | 18,229,736 | — | 18,229,736 | — | ||||||||
Total | $ | 52,389,934 | $ | — | $ | 51,853,650 | $ | 536,284 | ||||
Other Financial Instruments | Total | Level 1 | Level 2 | Level 3 | ||||||||
Asset Derivatives | ||||||||||||
Futures Contracts | 8,501 | 8,501 | — | — | ||||||||
Total Asset Derivatives | $ | 8,501 | $ | 8,501 | $ | — | $ | — | ||||
Liability Derivatives | ||||||||||||
Call Options Written | 6,125 | — | — | 6,125 | ||||||||
Total Liability Derivatives | $ | 6,125 | $ | — | $ | — | $ | 6,125 | ||||
The following table is a reconciliation of assets in which significant unobservable inputs (Level 3) were used in determining fair value for Mortgage Securities Portfolio as discussed in item 2(A) of the Notes to Financial Statements.
Investments in Securities | Value December 31, 2009 | Accrued Discounts and/or Premiums | Realized Gain/(Loss) | Change in Unrealized Gain/(Loss) | Net Purchases/(Sales) | Transfers Into Level 3 | Transfers Out of Level 3 | Value June 30, 2010 | |||||||||||||||||
Long-Term Fixed Income | |||||||||||||||||||||||||
U.S. Government and Agencies | 419,301 | — | — | 162,017 | (45,034 | ) | — | — | 536,284 | ||||||||||||||||
Total | $ | 419,301 | $ | — | $ | — | $ | 162,017 | ($ | 45,034 | ) | $ | — | $ | — | $ | 536,284 | ||||||||
Other Financial Instruments | |||||||||||||||||||||||||
Liability Derivatives | |||||||||||||||||||||||||
Call Options Written | — | — | — | 6,125 | — | — | — | 6,125 | |||||||||||||||||
Total | $ | — | $ | — | $ | — | $ | 6,125 | $ | — | $ | — | $ | — | $ | 6,125 | |||||||||
Futures Contracts | Number of Contracts Long/(Short) | Expiration Date | Notional Principal Amount | Value | Unrealized Gain/(Loss) | ||||||||||
10-Yr. U.S. Treasury Bond Futures | 5 | September 2010 | $ | 604,234 | $ | 612,735 | $ | 8,501 | |||||||
Total Futures Contracts | $ | 8,501 | |||||||||||||
Call Options Written | Number of Contracts | Exercise Price | Expiration Date | Value | Unrealized Gain/(Loss) | ||||||||||
Federal National Mortgage | |||||||||||||||
Association Conventional 30- | |||||||||||||||
Yr. Pass Through | 1 | $ | 102.36 | July 2010 | ($10,375) | ($ | 6,125 | ) | |||||||
Total Call Options Written | ($10,375) | ($ | 6,125 | ) | |||||||||||
The accompanying Notes to Financial Statements are an integral part of this schedule.
308
Table of Contents
Mortgage Securities Portfolio
Schedule of Investments as of June 30, 2010
(unaudited)
The following table summarizes the fair value and Statement of Assets and Liabilities location, as of June 30, 2010, for Mortgage Securities Portfolio’s investments in financial derivative instruments by primary risk exposure as discussed under item (2) Significant Accounting Policies of the Notes to Financial Statements.
Derivatives by risk category | Statement of Assets and Liabilities Location | Fair Value | |||
Asset Derivatives | |||||
Interest Rate Contracts | |||||
Futures* | Net Assets - Net unrealized appreciation/(depreciation) on Futures contracts | $ | 8,501 | ||
Total Interest Rate Contracts | 8,501 | ||||
Total Asset Derivatives | $ | 8,501 | |||
Liability Derivatives | |||||
Interest Rate Contracts | |||||
Options Written | Net Assets - Net unrealized appreciation/(depreciation) on Written option contracts | 6,125 | |||
Total Interest Rate Contracts | 6,125 | ||||
Total Liability Derivatives | $ | 6,125 | |||
| * | Includes cumulative appreciation/depreciation of futures contracts as reported in the Schedule of Investments. Only current day’s variation margin is reported within the Statement of Assets and Liabilities. |
The following table summarizes the net realized gains/(losses) and Statement of Operations location, for the period ended June 30, 2010, for Mortgage Securities Portfolio’s investments in financial derivative instruments by primary risk exposure.
Derivatives by risk category | Statement of Operations Location | Realized Gains/(Losses) recognized in Income | ||||
Interest Rate Contracts | ||||||
Options Purchased | Net realized gains/(losses) on Investments | (9,435 | ) | |||
Futures | Net realized gains/(losses) on Futures contracts | 23,848 | ||||
Total Interest Rate Contracts | 14,413 | |||||
Total | $ | 14,413 | ||||
The following table summarizes the change in net unrealized appreciation/(depreciation) and Statement of Operations location, for the
period ended June 30, 2010, for Mortgage Securities Portfolio’s investments in financial derivative instruments by primary risk exposure.
Derivatives by risk category | Statement of Operations Location | Change in unrealized appreciation/(depreciation) recognized in Income | ||||
Interest Rate Contracts | ||||||
Futures | Change in net unrealized appreciation/(depreciation) on Futures contracts | 22,654 | ||||
Options Written | Change in net unrealized appreciation/(depreciation) on Written option contracts | (6,125 | ) | |||
Total Interest Rate Contracts | 16,529 | |||||
Total | $ | 16,529 | ||||
The following table presents Mortgage Securities Portfolio’s average volume of derivative activity during the period ended June 30, 2010.
Derivative Risk Category | Futures (Notional*) | Futures (Percentage of Average Net Assets) | Options (Contracts) | |||||
Equity Contracts | N/A | N/A | <1 | |||||
Interest Rate Contracts | $ | 590,411 | 1.8 | % | 6 | |||
| * | Notional amount represents long or short, or both, derivative positions held by the portfolio. |
The accompanying Notes to Financial Statements are an integral part of this schedule.
309
Table of Contents
Money Market Portfolio
Schedule of Investments as of June 30, 2010
(unaudited)
The accompanying Notes to Financial Statements are an integral part of this schedule.
310
Table of Contents
Money Market Portfolio
Schedule of Investments as of June 30, 2010
(unaudited)
| Shares | Other Mutual Funds (3.9%) | Value | |||
| 15,000 | AIM Investments Institutional Government and Agency Portfolio | $ | 15,000 | ||
| 8,053,000 | Barclays Prime Money Market Fund | 8,053,000 | |||
| 150,000 | DWS Money Market Series | 150,000 | |||
Total Other Mutual Funds | 8,218,000 | ||||
Public Corporate (0.5%) | |||||
| Finance (0.5%) | |||||
General Electric Capital Corporation | |||||
| 1,000,000 | 4.875%, 10/21/2010 | 1,013,226 | |||
Total Finance | 1,013,226 | ||||
Total Public Corporate | 1,013,226 | ||||
| Principal Amount | Variable Rate Notes (33.1%)a | ||||
| Banking-Domestic (9.3%) | |||||
Bank of America NA | |||||
| 1,800,000 | 0.566%, 9/13/2010b,c | 1,800,407 | |||
| 6,360,000 | 0.718%, 9/23/2010b,c | 6,367,977 | |||
J.P. Morgan Chase & Company | |||||
| 6,380,000 | 0.421%, 7/1/2010b,c | 6,380,000 | |||
U.S. Central Federal Credit Union | |||||
| 4,750,000 | 0.304%, 7/19/2010b,c | 4,750,000 | |||
Total Banking-Domestic | 19,298,384 | ||||
| Banking-Foreign (1.9%) | |||||
Royal Bank of Canada | |||||
| 1,900,000 | 0.390%, 7/1/2010c | 1,900,000 | |||
| 2,000,000 | 0.938%, 9/23/2010c | 2,007,930 | |||
Total Banking-Foreign | 3,907,930 | ||||
| Finance (3.8%) | |||||
General Electric Capital Corporation | |||||
| 2,000,000 | 0.645%, 8/20/2010c | 2,000,541 | |||
| 5,850,000 | 0.617%, 9/13/2010b,c | 5,855,992 | |||
Total Finance | 7,856,533 | ||||
| U.S. Government and Agencies (15.2%) | |||||
Federal Home Loan Banks | |||||
| 2,000,000 | 0.261%, 7/27/2010c | 2,000,000 | |||
| 1,000,000 | 0.268%, 7/29/2010c | 999,966 | |||
Federal Home Loan Mortgage Corporation | |||||
| 2,000,000 | 0.150%, 7/1/2010c | 1,992,711 | |||
| 6,994,000 | 0.284%, 7/16/2010c | 6,995,721 | |||
| 3,840,000 | 0.308%, 7/19/2010c | 3,837,606 | |||
| 2,100,000 | 0.298%, 7/21/2010c | 2,098,437 | |||
| 4,800,000 | 0.607%, 9/9/2010c | 4,803,897 | |||
| 4,395,000 | 0.508%, 9/24/2010c | 4,395,000 | |||
Federal National Mortgage Association | |||||
| 2,200,000 | 0.308%, 7/19/2010c | 2,198,912 | |||
Overseas Private Investment Corporation | |||||
| 2,413,793 | 0.250%, 7/7/2010b,c | 2,413,793 | |||
Total U.S. Government and Agencies | 31,736,043 | ||||
| U.S. Municipals (2.9%) | |||||
Denver, Colorado City and County Airport Revenue Bonds | |||||
| 2,000,000 | 0.220%, 7/7/2010b,c | 2,000,000 | |||
Louisiana Housing Finance Agency Variable Rate Demand Qualified Gulf Opportunity Zone Bonds (Canterbury House Apartments - Sherwood) | |||||
| 2,000,000 | 0.300%, 7/1/2010b,c | 2,000,000 | |||
Oregon Health and Science University Variable Rate Demand Revenue Bonds | |||||
| 2,055,000 | 0.250%, 7/1/2010b,c | 2,055,000 | |||
Total U.S. Municipals | 6,055,000 | ||||
Total Variable Rate Notes | 68,853,890 | ||||
Total Investments (at amortized cost) 99.9% | $ | 207,805,647 | |||
Other Assets and Liabilities, Net 0.1% | 112,449 | ||||
Total Net Assets 100.0% | $ | 207,918,096 | |||
| a | The interest rate shown reflects the yield, coupon rate or, for securities purchased at a discount, the discount rate at the date of purchase. |
| b | Denotes investments that benefit from credit enhancement or liquidity support provided by a third party bank or institution. |
| c | Denotes variable rate obligations for which the current coupon rate and next scheduled reset date are shown. |
Cost for federal income tax purposes | $ | 207,805,647 |
The accompanying Notes to Financial Statements are an integral part of this schedule.
311
Table of Contents
Money Market Portfolio
Schedule of Investments as of June 30, 2010
(unaudited)
Fair Valuation Measurements
The following table is a summary of the inputs used, as of June 30, 2010, in valuing Money Market Portfolio’s assets carried at fair value or amortized cost, which approximates fair value, as discussed in the Notes to Financial Statements.
Investments in Securities | Total | Level 1 | Level 2 | Level 3 | ||||||||
Commercial Paper | ||||||||||||
Banking-Domestic | 30,878,761 | — | 30,878,761 | — | ||||||||
Banking-Foreign | 999,264 | — | 999,264 | — | ||||||||
Consumer Cyclical | 5,398,532 | — | 5,398,532 | — | ||||||||
Consumer Non-Cyclical | 1,998,475 | — | 1,998,475 | — | ||||||||
Energy | 999,883 | — | 999,883 | — | ||||||||
Finance | 82,446,545 | — | 82,446,545 | — | ||||||||
U.S. Government and Agencies | 6,999,071 | — | 6,999,071 | — | ||||||||
Other Mutual Funds | 8,218,000 | 8,218,000 | — | — | ||||||||
Public Corporate | ||||||||||||
Finance | 1,013,226 | — | 1,013,226 | — | ||||||||
Variable Rate Notes | ||||||||||||
Banking-Domestic | 19,298,384 | — | 19,298,384 | — | ||||||||
Banking-Foreign | 3,907,930 | — | 3,907,930 | — | ||||||||
Finance | 7,856,533 | — | 7,856,533 | — | ||||||||
U.S. Government and Agencies | 31,736,043 | — | 31,736,043 | — | ||||||||
U.S. Municipals | 6,055,000 | — | 6,055,000 | — | ||||||||
Total | $ | 207,805,647 | $ | 8,218,000 | $ | 199,587,647 | $ | — | ||||
The accompanying Notes to Financial Statements are an integral part of this schedule.
312
Table of Contents
[THIS PAGE INTENTIONALLY LEFT BLANK]
313
Table of Contents
Thrivent Series Fund, Inc.
Statement of Assets and Liabilities
| Aggressive Allocation Portfolio | Moderately Aggressive Allocation Portfolio | Moderate Allocation Portfolio | Moderately Conservative Allocation Portfolio | |||||||||||||
Assets | ||||||||||||||||
Investments at cost | $ | 589,461,680 | $ | 2,429,593,328 | $ | 3,278,456,581 | $ | 1,343,984,927 | ||||||||
Investments in securities at market value | 156,744,520 | 509,904,173 | 655,977,436 | 310,556,702 | ||||||||||||
Investments in affiliates at market value | 324,964,620 | 1,543,563,098 | 2,248,291,025 | 941,645,650 | ||||||||||||
Investments at Market Value | 481,709,140 | 2,053,467,271 | 2,904,268,461 | 1,252,202,352 | ||||||||||||
Cash | 6,440 | 209,770 | 947 | 151,311 | ||||||||||||
Dividends and interest receivable | 421,104 | 1,680,395 | 2,326,267 | 1,066,261 | ||||||||||||
Prepaid expenses | 5,402 | 14,184 | 18,307 | 9,006 | ||||||||||||
Receivable for investments sold | 923,172 | 2,070,921 | 2,973,285 | 783,996 | ||||||||||||
Receivable for fund shares sold | 220,812 | 1,373,121 | 2,371,598 | 2,005,827 | ||||||||||||
Receivable for variation margin | 142,095 | 332,640 | 245,700 | 139,500 | ||||||||||||
Total Assets | 483,428,165 | 2,059,148,302 | 2,912,204,565 | 1,256,358,253 | ||||||||||||
Liabilities | ||||||||||||||||
Accrued expenses | 35,250 | 53,519 | 65,646 | 42,751 | ||||||||||||
Other liabilities | — | — | — | — | ||||||||||||
Payable for investments purchased | 7,917,982 | 27,839,480 | 40,023,305 | 16,120,151 | ||||||||||||
Payable upon return of collateral for securities loaned | — | — | — | — | ||||||||||||
Payable for fund shares redeemed | 97,642 | 482,156 | 1,148,141 | 37,999 | ||||||||||||
Unrealized loss on forward contracts | — | — | — | — | ||||||||||||
Open options written, at value | 70,031 | 285,313 | 404,625 | 160,813 | ||||||||||||
Swap agreements, at value | — | — | 37,128 | — | ||||||||||||
Payable for variation margin | 213,150 | 606,825 | 1,076,550 | �� | 394,245 | |||||||||||
Payable to affiliate | 145,492 | 545,952 | 674,865 | 304,510 | ||||||||||||
Mortgage dollar roll deferred revenue | 2,103 | 4,445 | 6,121 | 2,302 | ||||||||||||
Total Liabilities | 8,481,650 | 29,817,690 | 43,436,381 | 17,062,771 | ||||||||||||
Net Assets | ||||||||||||||||
Capital stock (beneficial interest) | 563,499,159 | 2,353,290,863 | 3,166,219,391 | 1,303,194,394 | ||||||||||||
Accumulated undistributed net investment income/(loss) | 1,201,713 | 14,264,787 | 30,610,878 | 15,418,340 | ||||||||||||
Accumulated undistributed net realized gain/(loss) | 18,460,354 | 39,762,703 | 50,454,838 | 13,821,469 | ||||||||||||
Net unrealized appreciation/(depreciation) on: | ||||||||||||||||
Investments | (6,731,745 | ) | (10,451,313 | ) | (5,327,143 | ) | (452,717 | ) | ||||||||
Affiliated investments | (101,020,795 | ) | (365,674,744 | ) | (368,860,977 | ) | (91,329,858 | ) | ||||||||
Written option contracts | (41,344 | ) | (168,438 | ) | (238,875 | ) | (94,938 | ) | ||||||||
Futures contracts | (420,827 | ) | (1,693,246 | ) | (4,052,800 | ) | (1,261,208 | ) | ||||||||
Swap agreements | — | — | (37,128 | ) | — | |||||||||||
Foreign currency forward contracts | — | — | — | — | ||||||||||||
Foreign currency transactions | — | — | — | — | ||||||||||||
Total Net Assets | $ | 474,946,515 | $ | 2,029,330,612 | $ | 2,868,768,184 | $ | 1,239,295,482 | ||||||||
Shares of beneficial interest outstanding | 48,433,608 | 205,061,402 | 281,375,394 | 118,444,935 | ||||||||||||
Net asset value per share | $ | 9.81 | $ | 9.90 | $ | 10.20 | $ | 10.46 | ||||||||
The accompanying Notes to Financial Statements are an integral part of this schedule.
314
Table of Contents
Thrivent Series Fund, Inc.
Statement of Assets and Liabilities – continued
| Partner Technology Portfolio | Partner Healthcare Portfolio | Partner Natural Resources Portfolio | Partner Emerging Markets Portfolio | Real Estate Securities Portfolio | Partner Utilities Portfolio | Partner Small Cap Growth Portfolio | ||||||||||||||||||||
| $ | 28,379,399 | $ | 14,235,955 | $ | 22,988,383 | $ | 20,868,430 | $ | 333,409,870 | $ | 6,972,589 | $ | 167,006,226 | |||||||||||||
| 28,150,290 | 15,030,592 | 20,472,764 | 21,544,962 | 278,734,568 | 6,294,401 | 158,046,581 | ||||||||||||||||||||
| 4,686,225 | — | — | — | 31,495,608 | — | 29,897,467 | ||||||||||||||||||||
| 32,836,515 | 15,030,592 | 20,472,764 | 21,544,962 | 310,230,176 | 6,294,401 | 187,944,048 | ||||||||||||||||||||
| — | 161,940 | (a) | 151,780 | 252,650 | (b) | 1,429 | 151,335 | (c) | 399,130 | |||||||||||||||||
| 8,911 | 38,489 | 13,387 | 54,426 | 844,207 | 18,445 | 29,495 | ||||||||||||||||||||
| 2,732 | 2,645 | 2,684 | 2,676 | 4,146 | 2,597 | 3,520 | ||||||||||||||||||||
| 94,541 | 63,310 | 53 | — | 84,590 | 23,477 | 1,830,356 | ||||||||||||||||||||
| 2,630 | 2,688 | 10,315 | 30,936 | 3,917 | 2,554 | 319 | ||||||||||||||||||||
| — | — | — | — | — | — | — | ||||||||||||||||||||
| 32,945,329 | 15,299,664 | 20,650,983 | 21,885,650 | 311,168,465 | 6,492,809 | 190,206,868 | ||||||||||||||||||||
| 16,982 | 12,122 | 11,876 | 25,738 | 40,770 | 12,547 | 29,985 | ||||||||||||||||||||
| 25,610 | — | — | — | — | — | — | ||||||||||||||||||||
| — | 159,252 | — | 163 | 169,939 | — | 1,666,693 | ||||||||||||||||||||
| 4,686,225 | — | — | — | 31,495,608 | — | 29,897,467 | ||||||||||||||||||||
| 32,356 | 295 | 2,630 | 26,494 | 55,326 | 149 | 9,943 | ||||||||||||||||||||
| — | — | — | — | — | 101 | — | ||||||||||||||||||||
| — | — | — | — | — | — | — | ||||||||||||||||||||
| — | — | — | — | — | — | — | ||||||||||||||||||||
| — | — | — | — | — | — | — | ||||||||||||||||||||
| 27,532 | 16,128 | 20,961 | 23,155 | 224,798 | 2,546 | 147,145 | ||||||||||||||||||||
| — | — | — | — | — | — | — | ||||||||||||||||||||
| 4,788,705 | 187,797 | 35,467 | 75,550 | 31,986,441 | 15,343 | 31,751,233 | ||||||||||||||||||||
| 36,991,176 | 14,093,082 | 23,394,556 | 21,890,839 | 323,789,912 | 8,009,253 | 195,614,957 | ||||||||||||||||||||
| (104,880 | ) | 29,320 | (11,856 | ) | 115,799 | 3,604,222 | 96,332 | (558,667 | ) | |||||||||||||||||
| (13,186,788 | ) | 194,213 | (251,439 | ) | (872,698 | ) | (25,031,384 | ) | (949,824 | ) | (57,538,477 | ) | ||||||||||||||
| 4,457,116 | 794,637 | (2,515,619 | ) | 676,532 | (23,179,694 | ) | (678,188 | ) | 20,937,822 | |||||||||||||||||
| — | — | — | — | — | — | — | ||||||||||||||||||||
| — | — | — | — | — | — | — | ||||||||||||||||||||
| — | — | — | — | — | — | — | ||||||||||||||||||||
| — | — | — | — | — | — | — | ||||||||||||||||||||
| — | — | — | — | — | (101 | ) | — | |||||||||||||||||||
| — | 615 | (126 | ) | (372 | ) | (1,032 | ) | (6 | ) | — | ||||||||||||||||
| $ | 28,156,624 | $ | 15,111,867 | $ | 20,615,516 | $ | 21,810,100 | $ | 279,182,024 | $ | 6,477,466 | $ | 158,455,635 | |||||||||||||
| 5,216,489 | 1,423,265 | 2,860,868 | 2,235,057 | 22,697,008 | 927,486 | 16,229,669 | ||||||||||||||||||||
| $ | 5.40 | $ | 10.62 | $ | 7.21 | $ | 9.76 | $ | 12.30 | $ | 6.98 | $ | 9.76 | |||||||||||||
| (a) | Includes foreign currency holdings of $1,060 (cost $1,048). |
| (b) | Includes foreign currency holdings of $35,301 (cost $35,730). |
| (c) | Includes foreign currency holdings of $4 (cost $4). |
The accompanying Notes to Financial Statements are an integral part of this schedule.
315
Table of Contents
Thrivent Series Fund, Inc.
Statement of Assets and Liabilities – continued
As of June 30, 2010 (unaudited) | Partner Small Cap Value Portfolio | Small Cap Stock Portfolio | Small Cap Index Portfolio | Mid Cap Growth Portfolio II | ||||||||||||
Assets | ||||||||||||||||
Investments at cost | $ | 248,249,664 | $ | 266,016,051 | $ | 200,121,097 | $ | 117,924,744 | ||||||||
Investments in securities at market value | 224,927,560 | 240,814,652 | 186,863,603 | 123,166,708 | ||||||||||||
Investments in affiliates at market value | 14,206,950 | 19,927,935 | 15,610,052 | 6,016,382 | ||||||||||||
Investments at Market Value | 239,134,510 | 260,742,587 | 202,473,655 | 129,183,090 | ||||||||||||
Cash | 207,324 | 2,588 | 744 | 239,610 | ||||||||||||
Dividends and interest receivable | 326,380 | 36,245 | 193,391 | 48,874 | ||||||||||||
Prepaid expenses | 3,912 | 4,028 | 3,706 | 3,294 | ||||||||||||
Receivable for investments sold | 39,540 | 707,419 | 13,432 | 354,573 | ||||||||||||
Receivable for fund shares sold | 57,001 | 3,075 | 949 | 238 | ||||||||||||
Unrealized gain on forward contracts | — | — | — | — | ||||||||||||
Total Assets | 239,768,667 | 261,495,942 | 202,685,877 | 129,829,679 | ||||||||||||
Liabilities | ||||||||||||||||
Accrued expenses | 33,770 | 54,310 | 58,019 | 21,047 | ||||||||||||
Payable for investments purchased | — | — | 333,182 | 384,525 | ||||||||||||
Payable upon return of collateral for securities loaned | 14,206,950 | 19,927,935 | 15,610,052 | 6,016,382 | ||||||||||||
Payable for fund shares redeemed | 24,639 | 56,750 | 208,370 | 4,663 | ||||||||||||
Unrealized loss on forward contracts | — | — | — | — | ||||||||||||
Payable for variation margin | — | 35,640 | 25,598 | — | ||||||||||||
Payable to affiliate | 184,328 | 169,317 | 72,926 | 79,666 | ||||||||||||
Total Liabilities | 14,449,687 | 20,243,952 | 16,308,147 | 6,506,283 | ||||||||||||
Net Assets | ||||||||||||||||
Capital stock (beneficial interest) | 241,917,661 | 335,216,334 | 189,278,827 | 106,858,481 | ||||||||||||
Accumulated undistributed net investment income/(loss) | 681,390 | (45,542 | ) | 680,089 | (68,551 | ) | ||||||||||
Accumulated undistributed net realized gain/(loss) | (8,164,696 | ) | (88,523,340 | ) | (5,829,655 | ) | 5,275,120 | |||||||||
Net unrealized appreciation/(depreciation) on: | ||||||||||||||||
Investments | (9,115,154 | ) | (5,273,464 | ) | 2,352,558 | 11,258,346 | ||||||||||
Futures contracts | — | (121,998 | ) | (104,089 | ) | — | ||||||||||
Foreign currency forward contracts | — | — | — | — | ||||||||||||
Foreign currency transactions | (221 | ) | — | — | — | |||||||||||
Total Net Assets | $ | 225,318,980 | $ | 241,251,990 | $ | 186,377,730 | $ | 123,323,396 | ||||||||
Shares of beneficial interest outstanding | 14,823,620 | 24,935,381 | 17,983,205 | 15,166,513 | ||||||||||||
Net asset value per share | $ | 15.20 | $ | 9.68 | $ | 10.36 | $ | 8.13 | ||||||||
The accompanying Notes to Financial Statements are an integral part of this schedule.
316
Table of Contents
Thrivent Series Fund, Inc.
Statement of Assets and Liabilities – continued
| Mid Cap Growth Portfolio | Partner Mid Cap Value Portfolio | Mid Cap Stock Portfolio | Mid Cap Index Portfolio | Partner Worldwide Allocation Portfolio | Partner International Stock Portfolio | Partner Socially Responsible Stock Portfolio | ||||||||||||||||||||
| $ | 360,969,165 | $ | 193,281,701 | $ | 416,010,267 | $ | 84,160,519 | $ | 328,452,414 | $ | 816,081,089 | $ | 3,892,553 | |||||||||||||
| 338,449,167 | 186,545,497 | 405,131,585 | 79,370,439 | 324,480,295 | 727,740,386 | 3,615,753 | ||||||||||||||||||||
| 23,039,914 | 8,654,545 | 20,446,060 | 6,899,558 | — | 31,575,411 | — | ||||||||||||||||||||
| 361,489,081 | 195,200,042 | 425,577,645 | 86,269,997 | 324,480,295 | 759,315,797 | 3,615,753 | ||||||||||||||||||||
| 226,983 | 4,651 | 708 | 198,821 | 1,502,045 | (a) | 887,423 | (b) | 44,450 | ||||||||||||||||||
| 123,888 | 222,667 | 306,977 | 77,997 | 1,510,594 | 3,083,265 | 4,599 | ||||||||||||||||||||
| 4,625 | 3,675 | 5,035 | 3,053 | 4,318 | 7,259 | 2,583 | ||||||||||||||||||||
| 1,040,844 | 2,387,984 | 1,190,202 | 30,200 | 9,671,931 | 31,126,082 | — | ||||||||||||||||||||
| 15,534 | 19 | 10,848 | 552 | 53,284 | 4,332 | 900 | ||||||||||||||||||||
| — | — | — | — | 52,551 | 44,471 | — | ||||||||||||||||||||
| 362,900,955 | 197,819,038 | 427,091,415 | 86,580,620 | 337,275,018 | 794,468,629 | 3,668,285 | ||||||||||||||||||||
| 62,921 | 27,025 | 53,398 | 24,286 | 88,540 | 143,541 | 12,205 | ||||||||||||||||||||
| 1,059,020 | 5,405,619 | 1,297,091 | 258,240 | 6,527,533 | 21,562,788 | — | ||||||||||||||||||||
| 23,039,914 | 8,654,545 | 20,446,060 | 6,899,558 | — | 31,575,411 | — | ||||||||||||||||||||
| 187,089 | 24,044 | 57,401 | 29,158 | 9,053 | 160,490 | 1,031 | ||||||||||||||||||||
| — | — | — | — | 114,815 | 78,278 | — | ||||||||||||||||||||
| — | — | — | 5,443 | 1,860 | — | — | ||||||||||||||||||||
| 142,949 | 143,265 | 274,980 | 34,914 | 262,771 | 545,254 | 546 | ||||||||||||||||||||
| 24,491,893 | 14,254,498 | 22,128,930 | 7,251,599 | 7,004,572 | 54,065,762 | 13,782 | ||||||||||||||||||||
| 407,916,351 | 212,080,703 | 502,563,195 | 77,975,836 | 350,993,961 | 1,103,560,963 | 4,573,492 | ||||||||||||||||||||
| 196,757 | 459,687 | 937,886 | 391,259 | 3,891,362 | 12,114,001 | 374 | ||||||||||||||||||||
| (70,223,962 | ) | (30,894,191 | ) | (108,105,974 | ) | (1,125,531 | ) | (20,565,154 | ) | (318,546,383 | ) | (642,563 | ) | |||||||||||||
| 519,916 | 1,918,341 | 9,567,378 | 2,109,478 | (3,972,119 | ) | (56,765,292 | ) | (276,800 | ) | |||||||||||||||||
| — | — | — | (22,021 | ) | (19,976 | ) | — | — | ||||||||||||||||||
| — | — | — | — | (62,264 | ) | (33,807 | ) | — | ||||||||||||||||||
| — | — | — | — | 4,636 | 73,385 | — | ||||||||||||||||||||
| $ | 338,409,062 | $ | 183,564,540 | $ | 404,962,485 | $ | 79,329,021 | $ | 330,270,446 | $ | 740,402,867 | $ | 3,654,503 | |||||||||||||
| 24,189,580 | 17,612,583 | 42,969,084 | 7,866,579 | 46,014,698 | 84,956,244 | 445,530 | ||||||||||||||||||||
| $ | 13.99 | $ | 10.42 | $ | 9.42 | $ | 10.08 | $ | 7.18 | $ | 8.72 | $ | 8.20 | |||||||||||||
| (a) | Includes foreign currency holdings of $241,361 (cost $240,619). |
| (b) | Includes foreign currency holdings of $676,538 (cost $646,545). |
The accompanying Notes to Financial Statements are an integral part of this schedule.
317
Table of Contents
Thrivent Series Fund, Inc.
Statement of Assets and Liabilities – continued
As of June 30, 2010 (unaudited) | Partner All Cap Growth Portfolio | Partner All Cap Value Portfolio | Partner All Cap Portfolio | Large Cap Growth Portfolio II | ||||||||||||
Assets | ||||||||||||||||
Investments at cost | $ | 7,805,863 | $ | 5,826,792 | $ | 59,516,877 | $ | 321,328,055 | ||||||||
Investments in securities at market value | 7,750,837 | 5,424,748 | 53,796,162 | 312,235,745 | ||||||||||||
Investments in affiliates at market value | — | — | 2,793,525 | 2,058,750 | ||||||||||||
Investments at Market Value | 7,750,837 | 5,424,748 | 56,589,687 | 314,294,495 | ||||||||||||
Cash | 73,873 | 239,658 | 163,072 | 3,708 | ||||||||||||
Dividends and interest receivable | 2,516 | 5,373 | 44,674 | 188,239 | ||||||||||||
Prepaid expenses | 2,611 | 2,595 | 2,908 | 4,566 | ||||||||||||
Receivable for investments sold | 110,344 | 160,220 | 925,172 | 5,705,430 | ||||||||||||
Receivable for fund shares sold | 445 | 1,049 | — | — | ||||||||||||
Total Assets | 7,940,626 | 5,833,643 | 57,725,513 | 320,196,438 | ||||||||||||
Liabilities | ||||||||||||||||
Accrued expenses | 12,048 | 13,759 | 23,032 | 34,287 | ||||||||||||
Payable for investments purchased | 110,837 | 144,898 | 1,028,174 | 1,753,051 | ||||||||||||
Payable upon return of collateral for securities loaned | — | — | 2,793,525 | 2,058,750 | ||||||||||||
Payable for fund shares redeemed | 220 | 134 | 24,078 | 5,590 | ||||||||||||
Payable for variation margin | — | — | — | — | ||||||||||||
Payable to affiliate | 5,512 | 1,441 | 47,024 | 180,499 | ||||||||||||
Mortgage dollar roll deferred revenue | — | — | — | — | ||||||||||||
Total Liabilities | 128,617 | 160,232 | 3,915,833 | 4,032,177 | ||||||||||||
Net Assets | ||||||||||||||||
Capital stock (beneficial interest) | 9,054,441 | 7,281,628 | 77,229,296 | 295,777,419 | ||||||||||||
Accumulated undistributed net investment income/(loss) | (20,718 | ) | (2,658 | ) | 89,251 | 507,847 | ||||||||||
Accumulated undistributed net realized gain/(loss) | (1,166,688 | ) | (1,203,515 | ) | (20,581,677 | ) | 26,912,555 | |||||||||
Net unrealized appreciation/(depreciation) on: | ||||||||||||||||
Investments | (55,026 | ) | (402,044 | ) | (2,927,190 | ) | (7,033,560 | ) | ||||||||
Futures contracts | — | — | — | — | ||||||||||||
Foreign currency transactions | — | — | — | — | ||||||||||||
Total Net Assets | $ | 7,812,009 | $ | 5,673,411 | $ | 53,809,680 | $ | 316,164,261 | ||||||||
Shares of beneficial interest outstanding | 1,059,882 | 797,663 | 7,609,056 | 50,384,369 | ||||||||||||
Net asset value per share | $ | 7.37 | $ | 7.11 | $ | 7.07 | $ | 6.28 | ||||||||
The accompanying Notes to Financial Statements are an integral part of this schedule.
318
Table of Contents
Thrivent Series Fund, Inc.
Statement of Assets and Liabilities – continued
| Large Cap Growth Portfolio | Partner Growth Stock Portfolio | Large Cap Value Portfolio | Large Cap Stock Portfolio | Large Cap Index Portfolio | Equity Income Plus Portfolio | Balanced Portfolio | ||||||||||||||||||||
| $ | 896,866,388 | $ | 42,508,719 | $ | 698,586,167 | $ | 558,005,617 | $ | 316,146,619 | $ | 59,001,830 | $ | 287,894,858 | |||||||||||||
| 859,882,958 | 51,629,964 | 669,994,834 | 535,423,481 | 291,189,104 | 54,570,070 | 279,945,256 | ||||||||||||||||||||
| 16,468,709 | 669,349 | — | 4,286,925 | 3,441,736 | �� | — | 1,585,283 | |||||||||||||||||||
| 876,351,667 | 52,299,313 | 669,994,834 | 539,710,406 | 294,630,840 | 54,570,070 | 281,530,539 | ||||||||||||||||||||
| 338,766 | 195,841 | 780 | 3,218 | 153,341 | 394,847 | 199,816 | ||||||||||||||||||||
| 468,362 | 37,030 | 934,676 | 534,381 | 397,892 | 140,941 | 771,506 | ||||||||||||||||||||
| 8,147 | 2,893 | 6,785 | 5,970 | 4,402 | 2,887 | 4,091 | ||||||||||||||||||||
| 35,286,975 | 28,051 | — | 4,197,016 | 50 | — | 13,630,279 | ||||||||||||||||||||
| 41,482 | 21 | 40,975 | 137 | 300 | 1,516 | 36,323 | ||||||||||||||||||||
| 912,495,399 | 52,563,149 | 670,978,050 | 544,451,128 | 295,186,825 | 55,110,261 | 296,172,554 | ||||||||||||||||||||
| 190,771 | 21,018 | 84,639 | 85,157 | 81,191 | 17,643 | 75,506 | ||||||||||||||||||||
| 36,244,756 | — | — | 1,310,164 | — | — | 38,477,523 | ||||||||||||||||||||
| 16,468,709 | 669,349 | — | 4,286,925 | 3,441,736 | — | 1,585,283 | ||||||||||||||||||||
| 416,429 | 20,905 | 99,479 | 155,078 | 110,070 | 182 | 221,536 | ||||||||||||||||||||
| — | — | — | 334,755 | 17,730 | 48,991 | 28,275 | ||||||||||||||||||||
| 356,694 | 42,856 | 405,204 | 348,591 | 107,350 | 37,481 | 94,729 | ||||||||||||||||||||
| — | — | — | — | — | — | 64,445 | ||||||||||||||||||||
| 53,677,359 | 754,128 | 589,322 | 6,520,670 | 3,758,077 | 104,297 | 40,547,297 | ||||||||||||||||||||
| 2,091,878,199 | 53,094,015 | 869,855,760 | 722,062,933 | 341,624,953 | 69,527,304 | 261,887,577 | ||||||||||||||||||||
| 2,572,763 | (76,918 | ) | 4,989,723 | 1,971,319 | 2,519,959 | 599,564 | 2,693,119 | |||||||||||||||||||
| (1,215,118,201 | ) | (10,998,290 | ) | (175,865,422 | ) | (166,618,268 | ) | (31,143,845 | ) | (10,564,690 | ) | (2,359,005 | ) | |||||||||||||
| (20,514,721 | ) | 9,790,594 | (28,591,333 | ) | (18,295,211 | ) | (21,515,779 | ) | (4,431,760 | ) | (6,364,319 | ) | ||||||||||||||
| — | — | — | (1,190,315 | ) | (56,540 | ) | (124,454 | ) | (232,115 | ) | ||||||||||||||||
| — | (380 | ) | — | — | — | — | — | |||||||||||||||||||
| $ | 858,818,040 | $ | 51,809,021 | $ | 670,388,728 | $ | 537,930,458 | $ | 291,428,748 | $ | 55,005,964 | $ | 255,625,257 | |||||||||||||
| 62,213,950 | 5,675,980 | 76,444,255 | 76,923,464 | 20,242,187 | 7,323,706 | 20,074,968 | ||||||||||||||||||||
| $ | 13.80 | $ | 9.13 | $ | 8.77 | $ | 6.99 | $ | 14.40 | $ | 7.51 | $ | 12.73 | |||||||||||||
The accompanying Notes to Financial Statements are an integral part of this schedule.
319
Table of Contents
Thrivent Series Fund, Inc.
Statement of Assets and Liabilities – continued
As of June 30, 2010 (unaudited) | High Yield Portfolio | Diversified Income Plus Portfolio | Partner Socially Responsible Bond Portfolio | Income Portfolio | |||||||||||
Assets | |||||||||||||||
Investments at cost | $ | 829,640,004 | $ | 94,847,251 | $ | 5,866,702 | $ | 1,295,814,067 | |||||||
Investments in securities at market value | 766,128,838 | 88,756,015 | 6,133,040 | 1,285,451,243 | |||||||||||
Investments in affiliates at market value | 65,811,415 | 3,749,300 | — | 37,341,972 | |||||||||||
Investments at Market Value | 831,940,253 | 92,505,315 | 6,133,040 | 1,322,793,215 | |||||||||||
Cash | 1,111 | 225,218 | 194,889 | 748 | |||||||||||
Dividends and interest receivable | 13,938,288 | 862,022 | 43,339 | 14,200,049 | |||||||||||
Prepaid expenses | 6,745 | 3,053 | 2,594 | 9,656 | |||||||||||
Receivable for investments sold | — | 152,929 | 203,050 | 54,058,073 | |||||||||||
Receivable for fund shares sold | 242,625 | 32,673 | — | 521,835 | |||||||||||
Swap agreements, at value | — | — | — | 400,586 | |||||||||||
Unrealized gain on forward contracts | — | — | — | 550 | |||||||||||
Receivable for variation margin | — | — | 4,921 | 307,112 | |||||||||||
Total Assets | 846,129,022 | 93,781,210 | 6,581,833 | 1,392,291,824 | |||||||||||
Liabilities | |||||||||||||||
Distributions payable | — | — | 22 | — | |||||||||||
Accrued expenses | 90,666 | 23,969 | 12,622 | 131,891 | |||||||||||
Payable for investments purchased | 2,660,000 | — | 142,879 | 149,794,836 | |||||||||||
Payable upon return of collateral for securities loaned | 65,811,415 | 3,749,300 | — | 20,182,545 | |||||||||||
Payable for fund shares redeemed | 220,900 | 42,622 | 179 | 244,086 | |||||||||||
Open options written, at value | — | — | — | — | |||||||||||
Swap agreements, at value | 446,451 | — | — | 292,676 | |||||||||||
Payable for variation margin | — | 18,496 | — | 37,818 | |||||||||||
Payable to affiliate | 299,488 | 41,041 | 682 | 457,413 | |||||||||||
Mortgage dollar roll deferred revenue | — | — | — | 211,136 | |||||||||||
Total Liabilities | 69,528,920 | 3,875,428 | 156,384 | 171,352,401 | |||||||||||
Net Assets | |||||||||||||||
Capital stock (beneficial interest) | 1,453,245,697 | 111,347,138 | 5,977,232 | 1,264,079,198 | |||||||||||
Accumulated undistributed net investment income/(loss) | 485,027 | 2,828,522 | 17,811 | 548,664 | |||||||||||
Accumulated undistributed net realized gain/(loss) | (679,482,885 | ) | (21,895,655 | ) | 148,712 | (69,937,280 | ) | ||||||||
Net unrealized appreciation/(depreciation) on: | |||||||||||||||
Investments | 2,300,249 | (2,341,936 | ) | 266,338 | 23,119,721 | ||||||||||
Affiliated investments | — | — | — | 3,859,427 | |||||||||||
Written option contracts | — | — | — | — | |||||||||||
Futures contracts | — | (32,287 | ) | 15,356 | (701,212 | ) | |||||||||
Swap agreements | 52,014 | — | — | (30,912 | ) | ||||||||||
Foreign currency forward contracts | — | — | — | 550 | |||||||||||
Foreign currency transactions | — | — | — | 1,267 | |||||||||||
Total Net Assets | $ | 776,600,102 | $ | 89,905,782 | $ | 6,425,449 | $ | 1,220,939,423 | |||||||
Shares of beneficial interest outstanding | 171,619,590 | 15,115,657 | 599,691 | 125,943,849 | |||||||||||
Net asset value per share | $ | 4.53 | $ | 5.95 | $ | 10.71 | $ | 9.69 | |||||||
The accompanying Notes to Financial Statements are an integral part of this schedule.
320
Table of Contents
Thrivent Series Fund, Inc.
Statement of Assets and Liabilities – continued
| Bond Index Portfolio | Limited Maturity Bond Portfolio | Mortgage Securities Portfolio | Money Market Portfolio | |||||||||||
| $213,385,490 | $ | 1,223,402,847 | $ | 53,857,941 | $ | 207,805,647 | ||||||||
| 212,018,012 | 1,194,770,542 | 52,389,934 | 207,805,647 | |||||||||||
| — | 21,757,139 | — | — | |||||||||||
| 212,018,012 | 1,216,527,681 | 52,389,934 | 207,805,647 | a | ||||||||||
| 220,757 | 8,497 | 154,841 | 3,911 | |||||||||||
| 1,038,925 | 7,610,616 | 78,208 | 36,441 | |||||||||||
| 3,418 | 8,796 | 2,734 | 3,749 | |||||||||||
| 33,613,344 | 3,899,642 | 10,281,094 | — | |||||||||||
| 53,870 | 889,200 | 28,298 | 271,697 | |||||||||||
| — | 549,351 | — | — | |||||||||||
| — | — | — | — | |||||||||||
| — | 150,165 | 78 | — | |||||||||||
| 246,948,326 | 1,229,643,948 | 62,935,187 | 208,121,445 | |||||||||||
| — | — | — | — | |||||||||||
| 40,215 | 102,276 | 16,790 | 62,031 | |||||||||||
| 84,006,380 | 32,672,997 | 30,008,344 | — | |||||||||||
| — | 2,652,250 | — | — | |||||||||||
| 119,888 | 207,091 | 275 | 69,027 | |||||||||||
| — | — | 10,375 | — | |||||||||||
| — | — | — | — | |||||||||||
| — | 6,643 | — | — | |||||||||||
| 60,771 | 447,765 | 22,085 | 72,291 | |||||||||||
| 162,638 | 13,542 | 49,177 | — | |||||||||||
| 84,389,892 | 36,102,564 | 30,107,046 | 203,349 | |||||||||||
| 163,995,123 | 1,217,655,676 | 34,137,543 | 207,950,482 | |||||||||||
| (240,624 | ) | 196,264 | 112,828 | (46,760 | ) | |||||||||
| 171,413 | (14,687,753 | ) | 43,401 | 14,374 | ||||||||||
| (1,367,478 | ) | (10,480,055 | ) | (1,468,007 | ) | — | ||||||||
| — | 3,604,889 | — | — | |||||||||||
| — | — | (6,125 | ) | — | ||||||||||
| — | (3,130,204 | ) | 8,501 | — | ||||||||||
| — | 382,567 | — | — | |||||||||||
| — | — | — | — | |||||||||||
| — | — | — | — | |||||||||||
| $ | 162,558,434 | $ | 1,193,541,384 | $ | 32,828,141 | $ | 207,918,096 | |||||||
| 15,237,329 | 122,671,907 | 3,218,739 | 207,918,096 | |||||||||||
| $ | 10.67 | $ | 9.73 | $ | 10.20 | $ | 1.00 | |||||||
| a | Securities held by this fund are valued on the basis of amortized cost, which approximates market value. |
The accompanying Notes to Financial Statements are an integral part of this schedule.
321
Table of Contents
Statement of Operations
For the six months ended June 30, 2010 (unaudited) | Aggressive Allocation Portfolio | Moderately Aggressive Allocation Portfolio | Moderate Allocation Portfolio | Moderately Conservative Allocation Portfolio | ||||||||||||
Investment Income | ||||||||||||||||
Dividends | $ | 503,160 | $ | 1,121,661 | $ | 1,069,046 | $ | 511,899 | ||||||||
Interest | 512,916 | 3,235,414 | 6,298,093 | 3,276,685 | ||||||||||||
Income from mortgage dollar rolls | 9,813 | 21,402 | 28,848 | 10,654 | ||||||||||||
Income from securities loaned | — | — | — | — | ||||||||||||
Income from affiliated investments | 939,668 | 12,198,581 | 26,026,530 | 13,032,914 | ||||||||||||
Foreign dividend tax withholding | (210 | ) | (449 | ) | (434 | ) | (234 | ) | ||||||||
Total Investment Income | 1,965,347 | 16,576,609 | 33,422,083 | 16,831,918 | ||||||||||||
Expenses | ||||||||||||||||
Adviser fees | 809,709 | 2,505,723 | 3,065,631 | 1,365,478 | ||||||||||||
Sub-Adviser fees | — | — | — | — | ||||||||||||
Administrative service fees | 90,606 | 247,405 | 322,653 | 156,475 | ||||||||||||
Audit and legal fees | 13,875 | 30,010 | 37,335 | 20,091 | ||||||||||||
Custody fees | 38,900 | 43,716 | 54,243 | 40,715 | ||||||||||||
Insurance expenses | 3,515 | 8,756 | 11,241 | 5,682 | ||||||||||||
Directors’ fees | 4,730 | 8,134 | 10,113 | 6,062 | ||||||||||||
Other expenses | 6,363 | 8,052 | 8,628 | 7,314 | ||||||||||||
Total Expenses Before Reimbursement | 967,698 | 2,851,796 | 3,509,844 | 1,601,817 | ||||||||||||
Less: | ||||||||||||||||
Reimbursement from adviser | (121,621 | ) | — | — | — | |||||||||||
Custody earnings credit | (185 | ) | (212 | ) | (171 | ) | (293 | ) | ||||||||
Total Net Expenses | 845,892 | 2,851,584 | 3,509,673 | 1,601,524 | ||||||||||||
Net Investment Income/(Loss) | 1,119,455 | 13,725,025 | 29,912,410 | 15,230,394 | ||||||||||||
Realized and Unrealized Gains/(Losses) | ||||||||||||||||
Net realized gains/(losses) on: | ||||||||||||||||
Investments | 2,995,335 | 3,595,083 | 3,165,496 | 1,698,999 | ||||||||||||
Affiliated investments | (836,003 | ) | 955,066 | 226,541 | 510,003 | |||||||||||
Distributions of realized capital gains from affiliated investments | 1,106,986 | 5,204,099 | 4,756,189 | 1,107,388 | ||||||||||||
Futures contracts | 2,208,566 | 6,801,484 | 9,944,997 | 2,040,530 | ||||||||||||
Foreign currency transactions | — | — | — | — | ||||||||||||
Swap agreements | (110,967 | ) | (1,293,431 | ) | (1,630,417 | ) | (477,133 | ) | ||||||||
Change in net unrealized appreciation/(depreciation) on: | ||||||||||||||||
Investments | (11,690,714 | ) | (19,892,193 | ) | (15,317,796 | ) | (6,373,822 | ) | ||||||||
Affiliated investments | (22,702,766 | ) | (91,548,066 | ) | (79,556,684 | ) | (15,823,502 | ) | ||||||||
Written option contracts | (41,344 | ) | (168,438 | ) | (238,875 | ) | (94,938 | ) | ||||||||
Futures contracts | (1,418,694 | ) | (5,117,197 | ) | (8,735,647 | ) | (2,070,061 | ) | ||||||||
Foreign currency forward contracts | — | — | — | — | ||||||||||||
Foreign currency transactions | — | — | — | — | ||||||||||||
Swap agreements | 128,858 | 1,508,131 | 1,833,608 | 555,798 | ||||||||||||
Net Realized and Unrealized Gains/(Losses) | (30,360,743 | ) | (99,955,462 | ) | (85,552,588 | ) | (18,926,738 | ) | ||||||||
Net Increase/(Decrease) in Net Assets Resulting From Operations | $ | (29,241,288 | ) | $ | (86,230,437 | ) | $ | (55,640,178 | ) | $ | (3,696,344 | ) | ||||
The accompanying Notes to Financial Statements are an integral part of this schedule.
322
Table of Contents
Thrivent Series Fund, Inc.
Statement of Operations – continued
Partner Technology Portfolio | Partner Healthcare Portfolio | Partner Natural Resources Portfolio | Partner Emerging Markets Portfolio | Real Estate Securities Portfolio | Partner Utilities Portfolio | Partner Small Cap Growth Portfolio | |||||||||||||||||||
| $ | 72,901 | $ | 149,544 | $ | 128,118 | $ | 302,401 | $ | 4,727,795 | $ | 131,100 | $ | 254,137 | ||||||||||||
| — | 4 | 1,160 | 30 | 63,289 | 2 | 3,534 | |||||||||||||||||||
| — | — | — | — | — | — | — | |||||||||||||||||||
| 6,646 | — | — | — | 73,839 | — | 57,301 | |||||||||||||||||||
| — | — | — | — | — | — | — | |||||||||||||||||||
| — | (11,358 | ) | (6,051 | ) | (21,742 | ) | (5,254 | ) | (2,269 | ) | (56 | ) | |||||||||||||
| 79,547 | 138,190 | 123,227 | 280,689 | 4,859,669 | 128,833 | 314,916 | |||||||||||||||||||
| 45,845 | 22,493 | 33,306 | 41,770 | 1,130,226 | 9,772 | 305,846 | |||||||||||||||||||
| 68,768 | 48,736 | 49,958 | 79,554 | — | 14,657 | 541,509 | |||||||||||||||||||
| 43,056 | 41,499 | 42,220 | 42,022 | 68,255 | 40,651 | 56,947 | |||||||||||||||||||
| 8,781 | 8,582 | 8,653 | 10,475 | 11,432 | 8,515 | 10,187 | |||||||||||||||||||
| 2,492 | 2,638 | 2,690 | 16,874 | 7,500 | 3,737 | 19,921 | |||||||||||||||||||
| 1,879 | 1,812 | 1,821 | 1,812 | 2,613 | 1,783 | 2,329 | |||||||||||||||||||
| 2,256 | 2,095 | 2,096 | 2,095 | 7,380 | 2,095 | 5,196 | |||||||||||||||||||
| 3,622 | 4,133 | 4,962 | 6,727 | 4,517 | 5,155 | 4,620 | |||||||||||||||||||
| 176,699 | 131,988 | 145,706 | 201,329 | 1,231,923 | 86,365 | 946,555 | |||||||||||||||||||
| — | (27,581 | ) | (13,206 | ) | (49,469 | ) | — | (56,915 | ) | (84,735 | ) | ||||||||||||||
| (168) | (188 | ) | (388 | ) | (205 | ) | (262 | ) | (135 | ) | (462 | ) | |||||||||||||
| 176,531 | 104,219 | 132,112 | 151,655 | 1,231,661 | 29,315 | 861,358 | |||||||||||||||||||
| (96,984) | 33,971 | (8,885 | ) | 129,034 | 3,628,008 | 99,518 | (546,442 | ) | |||||||||||||||||
| 878,114 | 198,049 | (7,780 | ) | (3,599 | ) | 2,048,873 | (278,498 | ) | 6,063,132 | ||||||||||||||||
| — | — | — | — | — | — | — | |||||||||||||||||||
| — | — | — | — | — | — | — | |||||||||||||||||||
| — | — | — | — | — | — | — | |||||||||||||||||||
| — | (3,232 | ) | (2,423 | ) | (10,714 | ) | — | (1,803 | ) | — | |||||||||||||||
| — | — | — | — | — | — | — | |||||||||||||||||||
| (2,315,515) | (708,038 | ) | (2,940,676 | ) | (124,816 | ) | 9,280,065 | (358,894 | ) | (9,696,964 | ) | ||||||||||||||
| — | — | — | — | — | — | — | |||||||||||||||||||
| — | — | — | — | — | — | — | |||||||||||||||||||
| — | — | — | — | — | — | — | |||||||||||||||||||
| — | — | — | (429 | ) | — | (101 | ) | �� | — | ||||||||||||||||
| — | (290 | ) | (177 | ) | (637 | ) | (552 | ) | 3 | — | |||||||||||||||
| — | — | — | — | — | — | — | |||||||||||||||||||
| (1,437,401) | (513,511 | ) | (2,951,056 | ) | (140,195 | ) | 11,328,386 | (639,293 | ) | (3,633,832 | ) | ||||||||||||||
| $ | (1,534,385) | $ | (479,540 | ) | $ | (2,959,941 | ) | $ | (11,161 | ) | $ | 14,956,394 | $ | (539,775 | ) | $ | (4,180,274 | ) | |||||||
The accompanying Notes to Financial Statements are an integral part of this schedule.
323
Table of Contents
Thrivent Series Fund, Inc.
Statement of Operations – continued
For the six months ended June 30, 2010 (unaudited) | Partner Small Cap Value Portfolio | Small Cap Stock Portfolio | Small Cap Index Portfolio | Mid Cap Growth Portfolio II | ||||||||||||
Investment Income | ||||||||||||||||
Dividends | $ | 1,946,727 | $ | 851,432 | $ | 1,035,859 | $ | 387,989 | ||||||||
Interest | 3,165 | 16,003 | 2,603 | 3,863 | ||||||||||||
Income from securities loaned | 16,310 | 132,344 | 127,458 | 19,270 | ||||||||||||
Foreign dividend tax withholding | (1,349 | ) | (1,060 | ) | — | (241 | ) | |||||||||
Total Investment Income | 1,964,853 | 998,719 | 1,165,920 | 410,881 | ||||||||||||
Expenses | ||||||||||||||||
Adviser fees | 241,616 | 902,904 | 359,304 | 587,744 | ||||||||||||
Sub-Adviser fees | 724,848 | — | — | — | ||||||||||||
Administrative service fees | 64,161 | 66,255 | 60,531 | 53,061 | ||||||||||||
Audit and legal fees | 10,929 | 11,477 | 10,766 | 9,796 | ||||||||||||
Custody fees | 8,950 | 28,586 | 24,959 | 5,890 | ||||||||||||
Insurance expenses | 2,546 | 2,855 | 2,519 | 2,196 | ||||||||||||
Directors’ fees | 6,613 | 7,573 | 6,783 | 4,834 | ||||||||||||
Other expenses | 4,648 | 5,009 | 7,079 | 4,111 | ||||||||||||
Total Expenses Before Reimbursement | 1,064,311 | 1,024,659 | 471,941 | 667,632 | ||||||||||||
Less: | ||||||||||||||||
Reimbursement from adviser | — | — | — | (195,915 | ) | |||||||||||
Custody earnings credit | (161 | ) | (60 | ) | (198 | ) | (145 | ) | ||||||||
Total Net Expenses | 1,064,150 | 1,024,599 | 471,743 | 471,572 | ||||||||||||
Net Investment Income/(Loss) | 900,703 | (25,880 | ) | 694,177 | (60,691 | ) | ||||||||||
Realized and Unrealized Gains/(Losses) | ||||||||||||||||
Net realized gains/(losses) on: | ||||||||||||||||
Investments | 4,620,326 | 43,790,243 | 6,630,437 | 5,942,886 | ||||||||||||
Futures contracts | — | (976,629 | ) | (267,994 | ) | — | ||||||||||
Foreign currency transactions | 206 | (596 | ) | — | — | |||||||||||
Change in net unrealized appreciation/(depreciation) on: | ||||||||||||||||
Investments | (10,813,394 | ) | (53,585,163 | ) | (8,044,947 | ) | (9,052,000 | ) | ||||||||
Futures contracts | — | (121,998 | ) | (217,371 | ) | — | ||||||||||
Foreign currency forward contracts | — | 5,249 | — | — | ||||||||||||
Foreign currency transactions | (221 | ) | (4,653 | ) | — | — | ||||||||||
Net Realized and Unrealized Gains/(Losses) | (6,193,083 | ) | (10,893,547 | ) | (1,899,875 | ) | (3,109,114 | ) | ||||||||
Net Increase/(Decrease) in Net Assets Resulting | ||||||||||||||||
From Operations | $ | (5,292,380 | ) | $ | (10,919,427 | ) | $ | (1,205,698 | ) | $ | (3,169,805 | ) | ||||
The accompanying Notes to Financial Statements are an integral part of this schedule.
324
Table of Contents
Thrivent Series Fund, Inc.
Statement of Operations – continued
Mid Cap Growth Portfolio | Partner Mid Cap Value Portfolio | Mid Cap Stock Portfolio | Mid Cap Index Portfolio | Partner Worldwide Allocation Portfolio | Partner International Stock Portfolio | Partner Socially Responsible Stock Portfolio | |||||||||||||||||||
| $ | 1,105,341 | $ | 1,274,268 | $ | 2,612,413 | $ | 619,790 | $ | 5,247,619 | $ | 17,063,785 | $ | 23,985 | ||||||||||||
| 9,975 | 3,318 | 12,089 | 477 | 952,436 | 8,736 | — | |||||||||||||||||||
| 38,612 | 27,996 | 10,303 | 16,402 | — | 466,282 | — | |||||||||||||||||||
| (541) | — | — | — | (540,639 | ) | (1,848,788 | ) | (768 | ) | ||||||||||||||||
| 1,153,387 | 1,305,582 | 2,634,805 | 636,669 | 5,659,416 | 15,690,015 | 23,217 | |||||||||||||||||||
| 735,590 | 263,015 | 1,500,402 | 153,399 | 583,555 | 1,957,111 | 6,084 | |||||||||||||||||||
| — | 473,967 | — | — | 790,430 | 1,468,767 | 10,139 | |||||||||||||||||||
| 76,779 | 59,652 | 84,640 | 48,765 | 70,870 | 122,547 | 40,405 | |||||||||||||||||||
| 12,462 | 10,427 | 13,448 | 9,415 | 19,982 | 18,451 | 9,138 | |||||||||||||||||||
| 10,087 | 14,728 | 14,156 | 12,060 | 165,757 | 109,821 | 1,234 | |||||||||||||||||||
| 3,087 | 2,405 | 3,464 | 2,087 | 2,586 | 4,912 | 1,776 | |||||||||||||||||||
| 10,510 | 5,608 | 10,957 | 2,533 | 6,744 | 20,127 | 2,096 | |||||||||||||||||||
| 4,912 | 4,191 | 5,322 | 5,758 | 31,036 | 22,446 | 3,635 | |||||||||||||||||||
| 853,427 | 833,993 | 1,632,389 | 234,017 | 1,670,960 | 3,724,182 | 74,507 | |||||||||||||||||||
| — | — | — | — | (126,098 | ) | (306,162 | ) | (54,626 | ) | ||||||||||||||||
| (42) | (149 | ) | (69 | ) | (224 | ) | (1,333 | ) | (334 | ) | (8 | ) | |||||||||||||
| 853,385 | 833,844 | 1,632,320 | 233,793 | 1,543,529 | 3,417,686 | 19,873 | |||||||||||||||||||
| 300,002 | 471,738 | 1,002,485 | 402,876 | 4,115,887 | 12,272,329 | 3,344 | |||||||||||||||||||
| 10,529,808 | 12,348,452 | 18,349,839 | 2,306,401 | (2,299,321 | ) | (20,574,429 | ) | (40,943 | ) | ||||||||||||||||
| — | — | — | 113,900 | (1,019,466 | ) | — | — | ||||||||||||||||||
| — | — | — | — | 84,132 | (880,485 | ) | — | ||||||||||||||||||
| (19,705,030) | (19,051,793 | ) | (33,443,893 | ) | (3,776,570 | ) | (30,747,823 | ) | (100,572,014 | ) | (205,542 | ) | |||||||||||||
| — | — | — | (81,909 | ) | (29,147 | ) | — | — | |||||||||||||||||
| — | — | — | — | (107,889 | ) | (34,361 | ) | — | |||||||||||||||||
| — | — | — | — | 4,987 | 56,274 | — | |||||||||||||||||||
| (9,175,222) | (6,703,341 | ) | (15,094,054 | ) | (1,438,178 | ) | (34,114,527 | ) | (122,005,015 | ) | (246,485 | ) | |||||||||||||
| $ | (8,875,220) | $ | (6,231,603 | ) | $ | (14,091,569 | ) | $ | (1,035,302 | ) | $ | (29,998,640 | ) | $ | (109,732,686 | ) | $ | (243,141 | ) | ||||||
The accompanying Notes to Financial Statements are an integral part of this schedule.
325
Table of Contents
Thrivent Series Fund, Inc.
Statement of Operations – continued
For the six months ended June 30, 2010 (unaudited) | Partner All Cap Growth Portfolio | Partner All Cap Value Portfolio | Partner All Cap Portfolio | Large Cap Growth Portfolio II | ||||||||||||
Investment Income | ||||||||||||||||
Dividends | $ | 25,931 | $ | 39,042 | $ | 408,059 | $ | 1,604,035 | ||||||||
Interest | — | — | 41 | 8,996 | ||||||||||||
Income from mortgage dollar rolls | — | — | — | — | ||||||||||||
Income from securities loaned | — | — | 1,642 | 13,393 | ||||||||||||
Foreign dividend tax withholding | (243 | ) | (372 | ) | (22 | ) | (1,161 | ) | ||||||||
Total Investment Income | 25,688 | 38,670 | 409,720 | 1,625,263 | ||||||||||||
Expenses | ||||||||||||||||
Adviser fees | 13,031 | 9,000 | 107,634 | 1,417,653 | ||||||||||||
Sub-Adviser fees | 28,233 | 13,500 | 184,515 | — | ||||||||||||
Administrative service fees | 40,868 | 40,599 | 46,150 | 75,441 | ||||||||||||
Audit and legal fees | 8,524 | 8,499 | 9,157 | 12,457 | ||||||||||||
Custody fees | 2,890 | 7,757 | 19,789 | 15,485 | ||||||||||||
Insurance expenses | 1,783 | 1,777 | 1,997 | 3,164 | ||||||||||||
Directors’ fees | 2,095 | 2,095 | 2,227 | 9,444 | ||||||||||||
Other expenses | 3,850 | 3,682 | 4,098 | 4,841 | ||||||||||||
Total Expenses Before Reimbursement | 101,274 | 86,909 | 375,567 | 1,538,485 | ||||||||||||
Less: | ||||||||||||||||
Reimbursement from adviser | (57,750 | ) | (57,404 | ) | (61,505 | ) | (443,017 | ) | ||||||||
Custody earnings credit | (88 | ) | (105 | ) | (156 | ) | (109 | ) | ||||||||
Total Net Expenses | 43,436 | 29,400 | 313,906 | 1,095,359 | ||||||||||||
Net Investment Income/(Loss) | (17,748 | ) | 9,270 | 95,814 | 529,904 | |||||||||||
Realized and Unrealized Gains/(Losses) | ||||||||||||||||
Net realized gains/(losses) on: | ||||||||||||||||
Investments | 83,103 | 234,865 | 4,510,024 | 27,482,413 | ||||||||||||
Written option contracts | — | — | — | 53,646 | ||||||||||||
Futures contracts | — | — | — | — | ||||||||||||
Foreign currency transactions | — | — | — | — | ||||||||||||
Change in net unrealized appreciation/(depreciation) on: | ||||||||||||||||
Investments | (778,279 | ) | (709,929 | ) | (9,105,480 | ) | (67,943,556 | ) | ||||||||
Written option contracts | — | — | — | 2,234 | ||||||||||||
Futures contracts | — | — | — | — | ||||||||||||
Foreign currency transactions | — | — | — | — | ||||||||||||
Net Realized and Unrealized Gains/(Losses) | (695,176 | ) | (475,064 | ) | (4,595,456 | ) | (40,405,263 | ) | ||||||||
Net Increase/(Decrease) in Net Assets Resulting From Operations | $ | (712,924 | ) | $ | (465,794 | ) | $ | (4,499,642 | ) | $ | (39,875,359 | ) | ||||
The accompanying Notes to Financial Statements are an integral part of this schedule.
326
Table of Contents
Thrivent Series Fund, Inc.
Statement of Operations – continued
Large Cap Growth Portfolio | Partner Growth Stock Portfolio | Large Cap Value Portfolio | Large Cap Stock Portfolio | Large Cap Index Portfolio | Equity Income Plus Portfolio | Balanced Portfolio | |||||||||||||||||||
| $ | 4,919,840 | $ | 215,444 | $ | 7,452,129 | $ | 4,066,972 | $ | 3,196,048 | $ | 734,894 | $ | 1,761,587 | ||||||||||||
| 12,625 | — | 9,742 | 49,310 | 2,566 | 122,952 | 1,109,537 | |||||||||||||||||||
| — | — | — | — | — | — | 448,629 | |||||||||||||||||||
| 28,709 | 349 | 2,583 | 11,120 | 10,979 | — | 6,386 | |||||||||||||||||||
| (9,940) | (3,105 | ) | (9,385 | ) | (2,896 | ) | — | (11,201 | ) | — | |||||||||||||||
| 4,951,234 | 212,688 | 7,455,069 | 4,124,506 | 3,209,593 | 846,645 | 3,326,139 | |||||||||||||||||||
| 1,974,608 | 117,451 | 2,238,514 | 1,928,216 | 553,097 | 187,673 | 474,824 | |||||||||||||||||||
| — | 117,451 | — | — | — | — | — | |||||||||||||||||||
| 138,730 | 45,872 | 114,617 | 100,600 | 72,741 | 45,774 | 67,522 | |||||||||||||||||||
| 21,055 | 9,126 | 16,712 | 15,287 | 12,306 | 9,048 | 11,680 | |||||||||||||||||||
| 25,763 | 12,096 | 14,542 | 26,447 | 21,431 | 15,273 | 21,671 | |||||||||||||||||||
| 5,566 | 1,991 | 4,532 | 3,973 | 3,041 | 1,957 | 2,870 | |||||||||||||||||||
| 26,407 | 2,270 | 18,243 | 15,839 | 10,570 | 2,257 | 9,447 | |||||||||||||||||||
| 6,594 | 4,438 | 5,953 | 5,640 | 7,045 | 4,975 | 11,687 | |||||||||||||||||||
| 2,198,723 | 310,695 | 2,413,113 | 2,096,002 | 680,231 | 266,957 | 599,701 | |||||||||||||||||||
| — | (29,363 | ) | — | — | — | (21,122 | ) | — | |||||||||||||||||
| (71) | (45 | ) | (51 | ) | (178 | ) | (125 | ) | (416 | ) | (92 | ) | |||||||||||||
| 2,198,652 | 281,287 | 2,413,062 | 2,095,824 | 680,106 | 245,419 | 599,609 | |||||||||||||||||||
| 2,752,582 | (68,599 | ) | 5,042,007 | 2,028,682 | 2,529,487 | 601,226 | 2,726,530 | ||||||||||||||||||
| 60,639,509 | 2,411,740 | 43,531,209 | 38,380,480 | 97,474 | 1,513,111 | 5,062,359 | |||||||||||||||||||
| 247,478 | — | — | 66,601 | — | 2,863 | — | |||||||||||||||||||
| — | — | — | (910,642 | ) | (119,651 | ) | (196,694 | ) | (50,931 | ) | |||||||||||||||
| — | (265 | ) | — | — | — | — | — | ||||||||||||||||||
| (162,263,853) | (6,865,685 | ) | (115,488,847 | ) | (93,461,894 | ) | (23,345,480 | ) | (4,583,571 | ) | (12,117,681 | ) | |||||||||||||
| 5,235 | — | — | (76,331 | ) | — | (9,172 | ) | — | |||||||||||||||||
| — | — | — | (2,158,170 | ) | (96,695 | ) | (203,698 | ) | (248,965 | ) | |||||||||||||||
| — | (536 | ) | — | — | — | — | — | ||||||||||||||||||
| (101,371,631) | (4,454,746 | ) | (71,957,638 | ) | (58,159,956 | ) | (23,464,352 | ) | (3,477,161 | ) | (7,355,218 | ) | |||||||||||||
| $ | (98,619,049) | $ | (4,523,345 | ) | $ | (66,915,631 | ) | $ | (56,131,274 | ) | $ | (20,934,865 | ) | $ | (2,875,935 | ) | $ | (4,628,688 | ) | ||||||
The accompanying Notes to Financial Statements are an integral part of this schedule.
327
Table of Contents
Thrivent Series Fund, Inc.
Statement of Operations – continued
For the six months ended June 30, 2010 (unaudited) | High Yield Portfolio | Diversified Income Plus Portfolio | Partner Socially Responsible Bond Portfolio | Income Portfolio | ||||||||||||
Investment Income | ||||||||||||||||
Dividends | $ | 455,538 | $ | 474,629 | $ | — | $ | 116,781 | ||||||||
Interest | 33,553,374 | 2,655,550 | 129,994 | 33,681,896 | ||||||||||||
Income from mortgage dollar rolls | — | — | — | 711,921 | ||||||||||||
Income from securities loaned | 86,301 | 4,243 | — | 10,474 | ||||||||||||
Income from affiliated investments | — | — | — | 725,305 | ||||||||||||
Foreign dividend tax withholding | — | (3,256 | ) | — | — | |||||||||||
Total Investment Income | 34,095,213 | 3,131,166 | 129,994 | 35,246,377 | ||||||||||||
Expenses | ||||||||||||||||
Adviser fees | 1,530,319 | 179,177 | 9,272 | 2,513,037 | ||||||||||||
Sub-Adviser fees | — | — | 12,362 | — | ||||||||||||
Administrative service fees | 116,515 | 48,958 | 40,618 | 165,651 | ||||||||||||
Audit and legal fees | 16,860 | 9,417 | 9,163 | 22,802 | ||||||||||||
Custody fees | 13,315 | 10,643 | 1,818 | 23,290 | ||||||||||||
Insurance expenses | 4,674 | 2,094 | 1,789 | 6,709 | ||||||||||||
Directors’ fees | 19,338 | 3,875 | 2,096 | 30,825 | ||||||||||||
Other expenses | 11,843 | 9,163 | 4,844 | 17,317 | ||||||||||||
Total Expenses Before Reimbursement | 1,712,864 | 263,327 | 81,962 | 2,779,631 | ||||||||||||
Less: | ||||||||||||||||
Reimbursement from adviser | — | — | (60,779 | ) | (33,343 | ) | ||||||||||
Custody earnings credit | (150 | ) | (491 | ) | (168 | ) | (48 | ) | ||||||||
Total Net Expenses | 1,712,714 | 262,836 | 21,015 | 2,746,240 | ||||||||||||
Net Investment Income/(Loss) | 32,382,499 | 2,868,330 | 108,979 | 32,500,137 | ||||||||||||
Realized and Unrealized Gains/(Losses) | ||||||||||||||||
Net realized gains/(losses) on: | ||||||||||||||||
Investments | 2,576,752 | 1,357,341 | 89,956 | 27,322,020 | ||||||||||||
Written option contracts | — | 11,357 | — | — | ||||||||||||
Futures contracts | — | (327,318 | ) | 36,874 | (3,584,823 | ) | ||||||||||
Swap agreements | 600,424 | 11,237 | — | (136,036 | ) | |||||||||||
Change in net unrealized appreciation/(depreciation) on: | ||||||||||||||||
Investments | (9,328,857 | ) | (2,279,014 | ) | 132,907 | 21,337,382 | ||||||||||
Affiliated investments | — | — | — | (151,184 | ) | |||||||||||
Written option contracts | — | (4,680 | ) | — | — | |||||||||||
Futures contracts | — | 4,904 | 51,563 | (2,021,940 | ) | |||||||||||
Foreign currency forward contracts | — | — | — | 550 | ||||||||||||
Foreign currency transactions | — | — | — | 1,267 | ||||||||||||
Swap agreements | 52,014 | 221,296 | — | (361,251 | ) | |||||||||||
Net Realized and Unrealized Gains/(Losses) | (6,099,667 | ) | (1,004,877 | ) | 311,300 | 42,405,985 | ||||||||||
Net Increase/(Decrease) in Net Assets Resulting From Operations | $ | 26,282,832 | $ | 1,863,453 | $ | 420,279 | $ | 74,906,122 | ||||||||
The accompanying Notes to Financial Statements are an integral part of this schedule.
328
Table of Contents
Thrivent Series Fund, Inc.
Statement of Operations – continued
| Bond Index Portfolio | Limited Maturity Bond Portfolio | Mortgage Securities Portfolio | Money Market Portfolio | ||||||||||
| $ | — | $ | 67,575 | $ | — | $ | 2,034 | ||||||
| 2,041,931 | 20,982,326 | 463,350 | 297,123 | ||||||||||
| 821,634 | 290,196 | 271,062 | — | ||||||||||
| 701 | 8,294 | — | — | ||||||||||
| — | 807,537 | — | — | ||||||||||
| — | — | — | — | ||||||||||
| 2,864,266 | 22,155,928 | 734,412 | 299,157 | ||||||||||
| 277,626 | 2,287,398 | 80,547 | 440,129 | ||||||||||
| — | — | — | — | ||||||||||
| 55,864 | 154,370 | 43,221 | 62,006 | ||||||||||
| 10,284 | 20,814 | 8,814 | 12,743 | ||||||||||
| 7,444 | 22,286 | 3,501 | 6,015 | ||||||||||
| 2,445 | 6,119 | 1,896 | 3,880 | ||||||||||
| 6,197 | 26,303 | 2,233 | 9,386 | ||||||||||
| 8,800 | 12,775 | 4,514 | 7,929 | ||||||||||
| 368,660 | 2,530,065 | 144,726 | 542,088 | ||||||||||
| — | (37,122 | ) | — | (228,549 | ) | ||||||||
| (193) | (124 | ) | (217 | ) | (8 | ) | |||||||
| 368,467 | 2,492,819 | 144,509 | 313,531 | ||||||||||
| 2,495,799 | 19,663,109 | 589,903 | (14,374 | ) | |||||||||
| 1,512,393 | 15,979,380 | 99,766 | 14,374 | ||||||||||
| — | — | — | — | ||||||||||
| — | (7,227,840 | ) | 23,848 | — | |||||||||
| — | (88,482 | ) | — | — | |||||||||
| 6,988,065 | 11,107,759 | 1,940,985 | — | ||||||||||
| — | (168,325 | ) | — | — | |||||||||
| — | — | (6,125 | ) | — | |||||||||
| — | (7,349,746 | ) | 22,654 | — | |||||||||
| — | — | — | — | ||||||||||
| — | — | — | — | ||||||||||
| — | 382,567 | — | — | ||||||||||
| 8,500,458 | 12,635,313 | 2,081,128 | 14,374 | ||||||||||
| $ | 10,996,257 | $ | 32,298,422 | $ | 2,671,031 | $ | — | ||||||
The accompanying Notes to Financial Statements are an integral part of this schedule.
329
Table of Contents
Statement of Changes in Net Assets
| Aggressive Allocation Portfolio | Moderately Aggressive Allocation Portfolio | |||||||||||||||
For the periods ended | 6/30/2010 (unaudited) | 12/31/2009 | 6/30/2010 (unaudited) | 12/31/2009 | ||||||||||||
Operations | ||||||||||||||||
Net investment income/(loss) | $ | 1,119,455 | $ | 5,236,625 | $ | 13,725,025 | $ | 37,888,690 | ||||||||
Net realized gains/(losses) | 5,363,917 | 6,749,517 | 15,262,301 | 50,431,279 | ||||||||||||
Change in net unrealized appreciation/(depreciation) | (35,724,660 | ) | 102,808,518 | (115,217,763 | ) | 343,326,328 | ||||||||||
Net Change in Net Assets Resulting From Operations | (29,241,288 | ) | 114,794,660 | (86,230,437 | ) | 431,646,297 | ||||||||||
Distributions to Shareholders | ||||||||||||||||
From net investment income | (7,662,901 | ) | (18,135,548 | ) | (49,859,905 | ) | (77,679,068 | ) | ||||||||
From net realized gains | (4,658,714 | ) | (160,158 | ) | (32,185,155 | ) | — | |||||||||
Total Distributions to Shareholders | (12,321,615 | ) | (18,295,706 | ) | (82,045,060 | ) | (77,679,068 | ) | ||||||||
Capital Stock Transactions | ||||||||||||||||
Sold | 29,933,770 | 62,333,686 | 174,726,509 | 262,244,472 | ||||||||||||
Distributions reinvested | 12,321,615 | 18,295,706 | 82,045,060 | 77,679,068 | ||||||||||||
Redeemed | (23,322,566 | ) | (33,861,667 | ) | (42,133,221 | ) | (65,488,124 | ) | ||||||||
Capital Stock Transactions | 18,932,819 | 46,767,725 | 214,638,348 | 274,435,416 | ||||||||||||
Net Increase/(Decrease) in Net Assets | (22,630,084 | ) | 143,266,679 | 46,362,851 | 628,402,645 | |||||||||||
Net Assets, Beginning of Period | 497,576,599 | 354,309,920 | 1,982,967,761 | 1,354,565,116 | ||||||||||||
Net Assets, End of Period | $ | 474,946,515 | $ | 497,576,599 | $ | 2,029,330,612 | $ | 1,982,967,761 | ||||||||
Accumulated undistributed net investment income/(loss) | $ | 1,201,713 | $ | 7,745,159 | $ | 14,264,787 | $ | 50,399,667 | ||||||||
Capital Stock Share Transactions | ||||||||||||||||
Sold | 2,748,382 | 6,919,123 | 15,971,047 | 27,844,433 | ||||||||||||
Distributions reinvested | 1,191,980 | 1,859,131 | 7,946,176 | 7,812,123 | ||||||||||||
Redeemed | (2,167,453 | ) | (3,766,744 | ) | (3,893,531 | ) | (7,416,567 | ) | ||||||||
Total Capital Stock Share Transactions | 1,772,909 | 5,011,510 | 20,023,692 | 28,239,989 | ||||||||||||
The accompanying Notes to Financial Statements are an integral part of this schedule.
330
Table of Contents
Thrivent Series Fund, Inc.
Statement of Changes in Net Assets – continued
| Moderate Allocation Portfolio | Moderately Conservative Allocation Portfolio | Partner Technology Portfolio | Partner Healthcare Portfolio | |||||||||||||||||||||||||||
| 6/30/2010 (unaudited) | 12/31/2009 | 6/30/2010 (unaudited) | 12/31/2009 | 6/30/2010 (unaudited) | 12/31/2009 | 6/30/2010 (unaudited) | 12/31/2009 | |||||||||||||||||||||||
| $ | 29,912,410 | $ | 66,584,261 | $ | 15,230,394 | $ | 29,172,718 | $ | (96,984 | ) | $ | (174,850 | ) | $ | 33,971 | $ | 19,365 | |||||||||||||
| 16,462,806 | 80,031,567 | 4,879,787 | 29,530,413 | 878,114 | 1,367,865 | 194,817 | 392,382 | |||||||||||||||||||||||
| (102,015,394 | ) | 375,952,232 | (23,806,525 | ) | 122,345,818 | (2,315,515 | ) | 10,534,837 | (708,328 | ) | 2,043,886 | |||||||||||||||||||
| (55,640,178 | ) | 522,568,060 | (3,696,344 | ) | 181,048,949 | (1,534,385 | ) | 11,727,852 | (479,540 | ) | 2,455,633 | |||||||||||||||||||
| (76,890,889 | ) | (103,104,758 | ) | (31,302,287 | ) | (36,683,505 | ) | — | — | (23,542 | ) | (1,353 | ) | |||||||||||||||||
| (45,561,952 | ) | — | (19,836,135 | ) | — | — | — | (262,307 | ) | — | ||||||||||||||||||||
| (122,452,841 | ) | (103,104,758 | ) | (51,138,422 | ) | (36,683,505 | ) | — | — | (285,849 | ) | (1,353 | ) | |||||||||||||||||
| 317,654,616 | 420,024,727 | 196,722,157 | 229,376,369 | 2,200,924 | 4,164,161 | 3,445,435 | 5,875,845 | |||||||||||||||||||||||
| 122,452,841 | 103,104,758 | 51,138,422 | 36,683,505 | — | — | 285,849 | 1,353 | |||||||||||||||||||||||
| (51,771,887 | ) | (95,625,567 | ) | (29,110,082 | ) | (49,801,447 | ) | (3,458,545 | ) | (9,260,649 | ) | (1,152,987 | ) | (2,167,917 | ) | |||||||||||||||
| 388,335,570 | 427,503,918 | 218,750,497 | 216,258,427 | (1,257,621 | ) | (5,096,488 | ) | 2,578,297 | 3,709,281 | |||||||||||||||||||||
| 210,242,551 | 846,967,220 | 163,915,731 | 360,623,871 | (2,792,006 | ) | 6,631,364 | 1,812,908 | 6,163,561 | ||||||||||||||||||||||
| 2,658,525,633 | 1,811,558,413 | 1,075,379,751 | 714,755,880 | 30,948,630 | 24,317,266 | 13,298,959 | 7,135,398 | |||||||||||||||||||||||
| $ | 2,868,768,184 | $ | 2,658,525,633 | $ | 1,239,295,482 | $ | 1,075,379,751 | $ | 28,156,624 | $ | 30,948,630 | $ | 15,111,867 | $ | 13,298,959 | |||||||||||||||
| $ | 30,610,878 | $ | 77,589,357 | $ | 15,418,340 | $ | 31,490,233 | $ | (104,880 | ) | $ | (7,896 | ) | $ | 29,320 | $ | 18,891 | |||||||||||||
| 28,750,947 | 43,010,345 | 17,687,807 | 22,979,021 | 384,364 | 906,480 | 297,591 | 631,405 | |||||||||||||||||||||||
| 11,646,203 | 10,186,103 | 4,793,583 | 3,557,016 | — | — | 26,099 | 142 | |||||||||||||||||||||||
| (4,702,211 | ) | (10,558,694 | ) | (2,610,083 | ) | (5,101,337 | ) | (606,565 | ) | (2,159,106 | ) | (101,230 | ) | (228,457 | ) | |||||||||||||||
| 35,694,939 | 42,637,754 | 19,871,307 | 21,434,700 | (222,201 | ) | (1,252,626 | ) | 222,460 | 403,090 | |||||||||||||||||||||
The accompanying Notes to Financial Statements are an integral part of this schedule.
331
Table of Contents
Thrivent Series Fund, Inc.
Statement of Changes in Net Assets – continued
| Partner Natural Resources Portfolio | Partner Emerging Markets Portfolio | |||||||||||||||
For the periods ended | 6/30/2010 (unaudited) | 12/31/2009 | 6/30/2010 (unaudited) | 12/31/2009 | ||||||||||||
Operations | ||||||||||||||||
Net investment income/(loss) | $ | (8,885 | ) | $ | 19,733 | $ | 129,034 | $ | 66,563 | |||||||
Net realized gains/(losses) | (10,203 | ) | (167,407 | ) | (14,313 | ) | (528,539 | ) | ||||||||
Change in net unrealized appreciation/(depreciation) | (2,940,853 | ) | 4,710,942 | (125,882 | ) | 4,794,107 | ||||||||||
Net Change in Net Assets Resulting From Operations | (2,959,941 | ) | 4,563,268 | (11,161 | ) | 4,332,131 | ||||||||||
Distributions to Shareholders | ||||||||||||||||
From net investment income | (19,477 | ) | — | — | (76,466 | ) | ||||||||||
From net realized gains | — | — | — | — | ||||||||||||
From return of capital | — | — | — | — | ||||||||||||
Total Distributions to Shareholders | (19,477 | ) | — | — | (76,466 | ) | ||||||||||
Capital Stock Transactions | ||||||||||||||||
Sold | 4,479,228 | 12,737,918 | 7,110,936 | 12,684,986 | ||||||||||||
Distributions reinvested | 19,477 | — | — | 76,466 | ||||||||||||
Redeemed | (2,035,613 | ) | (2,763,376 | ) | (2,716,560 | ) | (4,919,497 | ) | ||||||||
Capital Stock Transactions | 2,463,092 | 9,974,542 | 4,394,376 | 7,841,955 | ||||||||||||
Net Increase/(Decrease) in Net Assets | (516,326 | ) | 14,537,810 | 4,383,215 | 12,097,620 | |||||||||||
Net Assets, Beginning of Period | 21,131,842 | 6,594,032 | 17,426,885 | 5,329,265 | ||||||||||||
Net Assets, End of Period | $ | 20,615,516 | $ | 21,131,842 | $ | 21,810,100 | $ | 17,426,885 | ||||||||
Accumulated undistributed net investment income/(loss) | $ | (11,856 | ) | $ | 16,506 | $ | 115,799 | $ | (13,235 | ) | ||||||
Capital Stock Share Transactions | ||||||||||||||||
Sold | 547,966 | 1,837,899 | 718,094 | 1,543,971 | ||||||||||||
Distributions reinvested | 2,527 | — | — | 7,887 | ||||||||||||
Redeemed | (258,158 | ) | (421,288 | ) | (275,751 | ) | (712,596 | ) | ||||||||
Total Capital Stock Share Transactions | 292,335 | 1,416,611 | 442,343 | 839,262 | ||||||||||||
The accompanying Notes to Financial Statements are an integral part of this schedule.
332
Table of Contents
Thrivent Series Fund, Inc.
Statement of Changes in Net Assets – continued
| Real Estate Securities Portfolio | Partner Utilities Portfolio | Partner Small Cap Growth Portfolio | Partner Small Cap Value Portfolio | |||||||||||||||||||||||||||
| 6/30/2010 (unaudited) | 12/31/2009 | 6/30/2010 (unaudited) | 12/31/2009 | 6/30/2010 (unaudited) | 12/31/2009 | 6/30/2010 (unaudited) | 12/31/2009 | |||||||||||||||||||||||
| $ | 3,628,008 | $ | 6,401,449 | $ | 99,518 | $ | 148,844 | $ | (546,442 | ) | $ | (491,521 | ) | $ | 900,703 | $ | 1,522,980 | |||||||||||||
| 2,048,873 | (18,106,885 | ) | (280,301 | ) | (242,067 | ) | 6,063,132 | (11,073,509 | ) | 4,620,532 | (11,704,586 | ) | ||||||||||||||||||
| 9,279,513 | 67,919,294 | (358,992 | ) | 805,011 | (9,696,964 | ) | 50,769,096 | (10,813,615 | ) | 59,656,759 | ||||||||||||||||||||
| 14,956,394 | 56,213,858 | (539,775 | ) | 711,788 | (4,180,274 | ) | 39,204,066 | (5,292,380 | ) | 49,475,153 | ||||||||||||||||||||
| — | (6,291,795 | ) | (150,229 | ) | — | — | (111,079 | ) | (522,557 | ) | (1,581,418 | ) | ||||||||||||||||||
| — | — | — | — | — | — | — | (159,744 | ) | ||||||||||||||||||||||
| — | (2,508,205 | ) | — | — | — | — | — | — | ||||||||||||||||||||||
| — | (8,800,000 | ) | (150,229 | ) | — | — | (111,079 | ) | (522,557 | ) | (1,741,162 | ) | ||||||||||||||||||
| 14,488,725 | 37,489,864 | 1,299,262 | 2,724,661 | 6,337,591 | 16,165,667 | 9,652,362 | 23,552,161 | |||||||||||||||||||||||
| — | 8,800,000 | 150,229 | — | — | 111,079 | 522,557 | 1,741,162 | |||||||||||||||||||||||
| (15,665,800 | ) | (25,720,724 | ) | (658,307 | ) | (1,412,214 | ) | (4,188,261 | ) | (7,344,076 | ) | (5,387,375 | ) | (14,611,741 | ) | |||||||||||||||
| (1,177,075 | ) | 20,569,140 | 791,184 | 1,312,447 | 2,149,330 | 8,932,670 | 4,787,544 | 10,681,582 | ||||||||||||||||||||||
| 13,779,319 | 67,982,998 | 101,180 | 2,024,235 | (2,030,944 | ) | 48,025,657 | (1,027,393 | ) | 58,415,573 | |||||||||||||||||||||
| 265,402,705 | 197,419,707 | 6,376,286 | 4,352,051 | 160,486,579 | 112,460,922 | 226,346,373 | 167,930,800 | |||||||||||||||||||||||
| $ | 279,182,024 | $ | 265,402,705 | $ | 6,477,466 | $ | 6,376,286 | $ | 158,455,635 | $ | 160,486,579 | $ | 225,318,980 | $ | 226,346,373 | |||||||||||||||
| $ | 3,604,222 | $ | (23,786 | ) | $ | 96,332 | $ | 147,043 | $ | (558,667 | ) | $ | (12,225 | ) | $ | 681,390 | $ | 303,244 | ||||||||||||
| 1,214,470 | 3,975,463 | 173,285 | 398,132 | 621,664 | 1,848,403 | 596,577 | 1,738,781 | |||||||||||||||||||||||
| — | 741,059 | 20,755 | — | — | 13,562 | 32,441 | 120,126 | |||||||||||||||||||||||
| (1,264,241 | ) | (3,096,946 | ) | (88,070 | ) | (204,597 | ) | (400,599 | ) | (956,588 | ) | (329,637 | ) | (1,250,415 | ) | |||||||||||||||
| (49,771 | ) | 1,619,576 | 105,970 | 193,535 | 221,065 | 905,377 | 299,381 | 608,492 | ||||||||||||||||||||||
The accompanying Notes to Financial Statements are an integral part of this schedule.
333
Table of Contents
Thrivent Series Fund, Inc.
Statement of Changes in Net Assets – continued
| Small Cap Stock Portfolio | Small Cap Index Portfolio | |||||||||||||||
For the periods ended | 6/30/2010 (unaudited) | 12/31/2009 | 6/30/2010 (unaudited) | 12/31/2009 | ||||||||||||
Operations | ||||||||||||||||
Net investment income/(loss) | $ | (25,880 | ) | $ | 1,788,616 | $ | 694,177 | $ | 1,699,363 | |||||||
Net realized gains/(losses) | 42,813,018 | (6,916,337 | ) | 6,362,443 | (4,729,130 | ) | ||||||||||
Change in net unrealized appreciation/(depreciation) | (53,706,565 | ) | 53,295,962 | (8,262,318 | ) | 43,883,619 | ||||||||||
Net Change in Net Assets Resulting From Operations | (10,919,427 | ) | 48,168,241 | (1,205,698 | ) | 40,853,852 | ||||||||||
Distributions to Shareholders | ||||||||||||||||
From net investment income | (107,303 | ) | (2,254,275 | ) | (1,688,689 | ) | (3,597,439 | ) | ||||||||
From net realized gains | — | — | — | (31,411,591 | ) | |||||||||||
Total Distributions to Shareholders | (107,303 | ) | (2,254,275 | ) | (1,688,689 | ) | (35,009,030 | ) | ||||||||
Capital Stock Transactions | ||||||||||||||||
Sold | 10,800,868 | 31,855,260 | 1,850,390 | 3,874,146 | ||||||||||||
Distributions reinvested | 107,303 | 2,254,275 | 1,688,689 | 35,009,030 | ||||||||||||
Redeemed | (17,122,189 | ) | (28,326,953 | ) | (18,186,454 | ) | (33,002,127 | ) | ||||||||
In-kind redemptions | — | (81,263,535 | ) | — | — | |||||||||||
Capital Stock Transactions | (6,214,018 | ) | (75,480,953 | ) | (14,647,375 | ) | 5,881,049 | |||||||||
Net Increase/(Decrease) in Net Assets | (17,240,748 | ) | (29,566,987 | ) | (17,541,762 | ) | 11,725,871 | |||||||||
Net Assets, Beginning of Period | 258,492,738 | 288,059,725 | 203,919,492 | 192,193,621 | ||||||||||||
Net Assets, End of Period | $ | 241,251,990 | �� | $ | 258,492,738 | $ | 186,377,730 | $ | 203,919,492 | |||||||
Accumulated undistributed net investment income/(loss) | $ | (45,542 | ) | $ | 87,641 | $ | 680,089 | $ | 1,674,601 | |||||||
Capital Stock Share Transactions | ||||||||||||||||
Sold | 1,060,421 | 3,553,935 | 163,360 | 402,579 | ||||||||||||
Distributions reinvested | 10,599 | 233,373 | 155,052 | 4,157,496 | ||||||||||||
Redeemed | (1,658,819 | ) | (3,399,243 | ) | (1,634,591 | ) | (3,496,648 | ) | ||||||||
In-kind redemptions | — | (8,813,833 | ) | — | — | |||||||||||
Total Capital Stock Share Transactions | (587,799 | ) | (8,425,768 | ) | (1,316,179 | ) | 1,063,427 | |||||||||
The accompanying Notes to Financial Statements are an integral part of this schedule.
334
Table of Contents
Thrivent Series Fund, Inc.
Statement of Changes in Net Assets – continued
| Mid Cap Growth Portfolio II | Mid Cap Growth Portfolio | Partner Mid Cap Value Portfolio | Mid Cap Stock Portfolio | |||||||||||||||||||||||||||
| 6/30/2010 (unaudited) | 12/31/2009 | 6/30/2010 (unaudited) | 12/31/2009 | 6/30/2010 (unaudited) | 12/31/2009 | 6/30/2010 (unaudited) | 12/31/2009 | |||||||||||||||||||||||
| $ | (60,691 | ) | $ | (48,427 | ) | $ | 300,002 | $ | 922,344 | $ | 471,738 | $ | 1,980,078 | $ | 1,002,485 | $ | 2,300,832 | |||||||||||||
| 5,942,886 | 3,074,088 | 10,529,808 | (32,463,158 | ) | 12,348,452 | (15,137,528 | ) | 18,349,839 | (9,046,940 | ) | ||||||||||||||||||||
| (9,052,000 | ) | 36,378,132 | (19,705,030 | ) | 159,600,719 | (19,051,793 | ) | 54,456,720 | (33,443,893 | ) | 149,325,178 | |||||||||||||||||||
| (3,169,805 | ) | 39,403,793 | (8,875,220 | ) | 128,059,905 | (6,231,603 | ) | 41,299,270 | (14,091,569 | ) | 142,579,070 | |||||||||||||||||||
| — | (1,858 | ) | (947,099 | ) | (53,590 | ) | (718,800 | ) | (1,544,209 | ) | (319,045 | ) | (2,265,664 | ) | ||||||||||||||||
| (1,376,838 | ) | — | — | — | — | — | — | — | ||||||||||||||||||||||
| (1,376,838 | ) | (1,858 | ) | (947,099 | ) | (53,590 | ) | (718,800 | ) | (1,544,209 | ) | (319,045 | ) | (2,265,664 | ) | |||||||||||||||
| 3,529,211 | 11,002,912 | 6,701,441 | 9,597,955 | 8,545,350 | 24,284,192 | 14,885,393 | 44,812,008 | |||||||||||||||||||||||
| 1,376,838 | 1,858 | 947,099 | 53,590 | 718,800 | 1,544,209 | 319,045 | 2,265,664 | |||||||||||||||||||||||
| (2,878,501 | ) | (5,335,093 | ) | (24,632,658 | ) | (47,544,157 | ) | (2,453,244 | ) | (5,216,249 | ) | (39,353,823 | ) | (28,894,369 | ) | |||||||||||||||
| — | — | — | — | — | — | — | (94,857,255 | ) | ||||||||||||||||||||||
| 2,027,548 | 5,669,677 | (16,984,118 | ) | (37,892,612 | ) | 6,810,906 | 20,612,152 | (24,149,385 | ) | (76,673,952 | ) | |||||||||||||||||||
| (2,519,095 | ) | 45,071,612 | (26,806,437 | ) | 90,113,703 | (139,497 | ) | 60,367,213 | (38,559,999 | ) | 63,639,454 | |||||||||||||||||||
| 125,842,491 | 80,770,879 | 365,215,499 | 275,101,796 | 183,704,037 | 123,336,824 | 443,522,484 | 379,883,030 | |||||||||||||||||||||||
| $ | 123,323,396 | $ | 125,842,491 | $ | 338,409,062 | $ | 365,215,499 | $ | 183,564,540 | $ | 183,704,037 | $ | 404,962,485 | $ | 443,522,484 | |||||||||||||||
| $ | (68,551 | ) | $ | (7,860 | ) | $ | 196,757 | $ | 843,854 | $ | 459,687 | $ | 706,749 | $ | 937,886 | $ | 254,446 | |||||||||||||
| 415,585 | 1,475,899 | 443,494 | 818,856 | 781,047 | 2,536,751 | 1,507,421 | 5,114,930 | |||||||||||||||||||||||
| 159,598 | 273 | 63,855 | 4,650 | 64,388 | 147,914 | 31,941 | 235,365 | |||||||||||||||||||||||
| (330,789 | ) | (853,810 | ) | (1,650,679 | ) | (4,288,947 | ) | (217,986 | ) | (655,612 | ) | (3,831,551 | ) | (3,635,718 | ) | |||||||||||||||
| — | — | — | — | — | — | — | (10,101,945 | ) | ||||||||||||||||||||||
| 244,394 | 622,362 | (1,143,330 | ) | (3,465,441 | ) | 627,449 | 2,029,053 | (2,292,189 | ) | (8,387,368 | ) | |||||||||||||||||||
The accompanying Notes to Financial Statements are an integral part of this schedule.
335
Table of Contents
Thrivent Series Fund, Inc.
Statement of Changes in Net Assets – continued
| Mid Cap Index Portfolio | Partner Worldwide Allocation Portfolio | |||||||||||||||
For the periods ended | 6/30/2010 (unaudited) | 12/31/2009 | 6/30/2010 (unaudited) | 12/31/2009 | ||||||||||||
Operations | ||||||||||||||||
Net investment income/(loss) | $ | 402,876 | $ | 912,375 | $ | 4,115,887 | $ | 3,223,252 | ||||||||
Net realized gains/(losses) | 2,420,301 | (1,605,754 | ) | (3,234,655 | ) | (3,510,140 | ) | |||||||||
Change in net unrealized appreciation/(depreciation) | (3,858,479 | ) | 24,798,146 | (30,879,872 | ) | 49,581,521 | ||||||||||
Net Change in Net Assets Resulting From Operations | (1,035,302 | ) | 24,104,767 | (29,998,640 | ) | 49,294,633 | ||||||||||
Distributions to Shareholders | ||||||||||||||||
From net investment income | (915,779 | ) | (1,478,447 | ) | (24,083 | ) | (3,279,164 | ) | ||||||||
From net realized gains | — | (4,989,989 | ) | — | — | |||||||||||
Total Distributions to Shareholders | (915,779 | ) | (6,468,436 | ) | (24,083 | ) | (3,279,164 | ) | ||||||||
Capital Stock Transactions | ||||||||||||||||
Sold | 2,143,297 | 3,308,320 | 108,314,686 | 104,369,167 | ||||||||||||
Distributions reinvested | 915,779 | 6,468,436 | 24,083 | 3,279,164 | ||||||||||||
Redeemed | (8,711,302 | ) | (15,621,055 | ) | (2,917,445 | ) | (4,693,486 | ) | ||||||||
Capital Stock Transactions | (5,652,226 | ) | (5,844,299 | ) | 105,421,324 | 102,954,845 | ||||||||||
Net Increase/(Decrease) in Net Assets | (7,603,307 | ) | 11,792,032 | 75,398,601 | 148,970,314 | |||||||||||
Net Assets, Beginning of Period | 86,932,328 | 75,140,296 | 254,871,845 | 105,901,531 | ||||||||||||
Net Assets, End of Period | $ | 79,329,021 | $ | 86,932,328 | $ | 330,270,446 | $ | 254,871,845 | ||||||||
Accumulated undistributed net investment income/(loss) | $ | 391,259 | $ | 904,162 | $ | 3,891,362 | $ | (200,442 | ) | |||||||
Capital Stock Share Transactions | ||||||||||||||||
Sold | 194,784 | 382,861 | 13,870,512 | 15,224,114 | ||||||||||||
Distributions reinvested | 86,004 | 791,604 | 3,209 | 420,103 | ||||||||||||
Redeemed | (798,333 | ) | (1,829,731 | ) | (388,502 | ) | (679,559 | ) | ||||||||
Total Capital Stock Share Transactions | (517,545 | ) | (655,266 | ) | 13,485,219 | 14,964,658 | ||||||||||
The accompanying Notes to Financial Statements are an integral part of this schedule.
336
Table of Contents
Thrivent Series Fund, Inc.
Statement of Changes in Net Assets – continued
| Partner International Stock Portfolio | Partner Socially Responsible Stock Portfolio | Partner All Cap Growth Portfolio | Partner All Cap Value Portfolio | |||||||||||||||||||||||||||
| 6/30/2010 (unaudited) | 12/31/2009 | 6/30/2010 (unaudited) | 12/31/2009 | 6/30/2010 (unaudited) | 12/31/2009 | 6/30/2010 (unaudited) | 12/31/2009 | |||||||||||||||||||||||
| $ | 12,272,329 | $ | 17,683,619 | $ | 3,344 | $ | 14,493 | $ | (17,748 | ) | $ | (6,294 | ) | $ | 9,270 | $ | 42,158 | |||||||||||||
| (21,454,914 | ) | (121,748,365 | ) | (40,943 | ) | (321,107 | ) | 83,103 | (435,801 | ) | 234,865 | (268,937 | ) | |||||||||||||||||
| (100,550,101) | 278,620,507 | (205,542 | ) | 1,399,369 | (778,279 | ) | 2,145,133 | (709,929 | ) | 1,305,621 | ||||||||||||||||||||
| (109,732,686) | 174,555,761 | (243,141 | ) | 1,092,755 | (712,924 | ) | 1,703,038 | (465,794 | ) | 1,078,842 | ||||||||||||||||||||
| (365,985) | (18,300,363 | ) | — | (16,869 | ) | — | — | — | (56,625 | ) | ||||||||||||||||||||
| — | — | — | — | — | — | — | — | |||||||||||||||||||||||
| (365,985) | (18,300,363 | ) | — | (16,869 | ) | — | — | — | (56,625 | ) | ||||||||||||||||||||
| 3,078,371 | 7,808,530 | 904,434 | 1,124,562 | 2,067,150 | 6,018,255 | 1,416,723 | 3,449,075 | |||||||||||||||||||||||
| 365,985 | 18,300,363 | — | 16,869 | — | — | — | 56,625 | |||||||||||||||||||||||
| (35,885,900) | (77,546,663 | ) | (1,136,805 | ) | (1,288,022 | ) | (1,638,657 | ) | (2,034,630 | ) | (800,978 | ) | (1,465,765 | ) | ||||||||||||||||
| (32,441,544) | (51,437,770 | ) | (232,371 | ) | (146,591 | ) | 428,493 | 3,983,625 | 615,745 | 2,039,935 | ||||||||||||||||||||
| (142,540,215) | 104,817,628 | (475,512 | ) | 929,295 | (284,431 | ) | 5,686,663 | 149,951 | 3,062,152 | |||||||||||||||||||||
| 882,943,082 | 778,125,454 | 4,130,015 | 3,200,720 | 8,096,440 | 2,409,777 | 5,523,460 | 2,461,308 | |||||||||||||||||||||||
| $ | 740,402,867 | $ | 882,943,082 | $ | 3,654,503 | $ | 4,130,015 | $ | 7,812,009 | $ | 8,096,440 | $ | 5,673,411 | $ | 5,523,460 | |||||||||||||||
| $ | 12,114,001 | $ | 207,657 | $ | 374 | $ | (2,970 | ) | $ | (20,718 | ) | $ | (2,970 | ) | $ | (2,658 | ) | $ | (11,928 | ) | ||||||||||
| 321,258 | 950,413 | 101,504 | 151,940 | 254,845 | 906,141 | 179,027 | 514,033 | |||||||||||||||||||||||
| 39,955 | 1,849,007 | — | 1,928 | — | — | — | 7,401 | |||||||||||||||||||||||
| (3,771,994) | (9,592,809 | ) | (127,502 | ) | (176,017 | ) | (203,030 | ) | (349,083 | ) | (103,338 | ) | (249,068 | ) | ||||||||||||||||
| (3,410,781) | (6,793,389 | ) | (25,998 | ) | (22,149 | ) | 51,815 | 557,058 | 75,689 | 272,366 | ||||||||||||||||||||
The accompanying Notes to Financial Statements are an integral part of this schedule.
337
Table of Contents
Thrivent Series Fund, Inc.
Statement of Changes in Net Assets – continued
| Partner All Cap Portfolio | Large Cap Growth Portfolio II | |||||||||||||||
For the periods ended | 6/30/2010 (unaudited) | 12/31/2009 | 6/30/2010 (unaudited) | 12/31/2009 | ||||||||||||
Operations | ||||||||||||||||
Net investment income/(loss) | $ | 95,814 | $ | 422,911 | $ | 529,904 | $ | 2,244,993 | ||||||||
Net realized gains/(losses) | 4,510,024 | (2,362,387 | ) | 27,536,059 | 48,044,595 | |||||||||||
Change in net unrealized appreciation/(depreciation) | (9,105,480 | ) | 15,986,057 | (67,941,322 | ) | 65,858,838 | ||||||||||
Net Change in Net Assets Resulting From Operations | (4,499,642 | ) | 14,046,581 | (39,875,359 | ) | 116,148,426 | ||||||||||
Distributions to Shareholders | ||||||||||||||||
From net investment income | (425,206 | ) | (744,537 | ) | (462,853 | ) | (1,800,000 | ) | ||||||||
From net realized gains | — | — | (11,523,852 | ) | (34,604,586 | ) | ||||||||||
Total Distributions to Shareholders | (425,206 | ) | (744,537 | ) | (11,986,705 | ) | (36,404,586 | ) | ||||||||
Capital Stock Transactions | ||||||||||||||||
Sold | 2,091,771 | 3,017,479 | 11,796,207 | 37,627,887 | ||||||||||||
Distributions reinvested | 425,206 | 744,537 | 11,986,705 | 36,404,586 | ||||||||||||
Redeemed | (6,397,264 | ) | (10,602,481 | ) | (13,142,418 | ) | (12,742,230 | ) | ||||||||
In-kind redemptions | — | — | — | (92,633,477 | ) | |||||||||||
Capital Stock Transactions | (3,880,287 | ) | (6,840,465 | ) | 10,640,494 | (31,343,234 | ) | |||||||||
Net Increase/(Decrease) in Net Assets | (8,805,135 | ) | 6,461,579 | (41,221,570 | ) | 48,400,606 | ||||||||||
Net Assets, Beginning of Period | 62,614,815 | 56,153,236 | 357,385,831 | 308,985,225 | ||||||||||||
Net Assets, End of Period | $ | 53,809,680 | $ | 62,614,815 | $ | 316,164,261 | $ | 357,385,831 | ||||||||
Accumulated undistributed net investment income/(loss) | $ | 89,251 | $ | 418,643 | $ | 507,847 | $ | 440,796 | ||||||||
Capital Stock Share Transactions | ||||||||||||||||
Sold | 263,952 | 462,092 | 1,633,463 | 5,172,919 | ||||||||||||
Distributions reinvested | 56,045 | 117,219 | 1,776,703 | 5,075,903 | ||||||||||||
Redeemed | (812,544 | ) | (1,685,580 | ) | (1,816,216 | ) | (2,095,667 | ) | ||||||||
In-kind redemptions | — | — | — | (12,151,976 | ) | |||||||||||
Total Capital Stock Share Transactions | (492,547 | ) | (1,106,269 | ) | 1,593,950 | (3,998,821 | ) | |||||||||
The accompanying Notes to Financial Statements are an integral part of this schedule.
338
Table of Contents
Thrivent Series Fund, Inc.
Statement of Changes in Net Assets – continued
| Large Cap Growth Portfolio | Partner Growth Stock Portfolio | Large Cap Value Portfolio | Large Cap Stock Portfolio | |||||||||||||||||||||||||||
| 6/30/2010 (unaudited) | 12/31/2009 | 6/30/2010 (unaudited) | 12/31/2009 | 6/30/2010 (unaudited) | 12/31/2009 | 6/30/2010 (unaudited) | 12/31/2009 | |||||||||||||||||||||||
| $ | 2,752,582 | $ | 7,117,900 | $ | (68,599 | ) | $ | 8,053 | $ | 5,042,007 | $ | 11,851,639 | $ | 2,028,682 | $ | 5,355,536 | ||||||||||||||
| 60,886,987 | (43,627,231 | ) | 2,411,475 | (6,420,038 | ) | 43,531,209 | (130,856,830 | ) | 37,536,439 | (61,424,828 | ) | |||||||||||||||||||
| (162,258,618 | ) | 350,249,363 | (6,866,221 | ) | 25,925,820 | (115,488,847 | ) | 260,863,957 | (95,696,395 | ) | 186,052,726 | |||||||||||||||||||
| (98,619,049 | ) | 313,740,032 | (4,523,345 | ) | 19,513,835 | (66,915,631 | ) | 141,858,766 | (56,131,274 | ) | 129,983,434 | |||||||||||||||||||
| (377,772 | ) | (6,800,000 | ) | (10,928 | ) | (168,813 | ) | (187,197 | ) | (12,050,128 | ) | (104,436 | ) | (5,328,987 | ) | |||||||||||||||
| — | — | — | — | — | — | — | — | |||||||||||||||||||||||
| (377,772 | ) | (6,800,000 | ) | (10,928 | ) | (168,813 | ) | (187,197 | ) | (12,050,128 | ) | (104,436 | ) | (5,328,987 | ) | |||||||||||||||
| 8,105,319 | 15,247,288 | 1,224,808 | 2,008,107 | 24,280,455 | 115,078,386 | 11,712,024 | 36,368,850 | |||||||||||||||||||||||
| 377,772 | 6,800,000 | 10,928 | 168,813 | 187,197 | 12,050,128 | 104,436 | 5,328,987 | |||||||||||||||||||||||
| (75,981,191 | ) | (148,213,234 | ) | (6,230,467 | ) | (12,277,879 | ) | (19,995,952 | ) | (51,951,746 | ) | (34,922,834 | ) | (46,479,433 | ) | |||||||||||||||
| — | — | — | — | — | (136,060,265 | ) | — | — | ||||||||||||||||||||||
| (67,498,100 | ) | (126,165,946 | ) | (4,994,731 | ) | (10,100,959 | ) | 4,471,700 | (60,883,497 | ) | (23,106,374 | ) | (4,781,596 | ) | ||||||||||||||||
| (166,494,921 | ) | 180,774,086 | (9,529,004 | ) | 9,244,063 | (62,631,128 | ) | 68,925,141 | (79,342,084 | ) | 119,872,851 | |||||||||||||||||||
| 1,025,312,961 | 844,538,875 | 61,338,025 | 52,093,962 | 733,019,856 | 664,094,715 | 617,272,542 | 497,399,691 | |||||||||||||||||||||||
| $ | 858,818,040 | $ | 1,025,312,961 | $ | 51,809,021 | $ | 61,338,025 | $ | 670,388,728 | $ | 733,019,856 | $ | 537,930,458 | $ | 617,272,542 | |||||||||||||||
| $ | 2,572,763 | $ | 197,953 | $ | (76,918 | ) | $ | 2,609 | $ | 4,989,723 | $ | 134,913 | $ | 1,971,319 | $ | 47,073 | ||||||||||||||
| 526,902 | 1,221,624 | 121,655 | 250,857 | 2,512,565 | 13,763,893 | 1,522,840 | 5,248,402 | |||||||||||||||||||||||
| 25,428 | 437,921 | 1,117 | 21,147 | 20,014 | 1,245,398 | 13,970 | 685,503 | |||||||||||||||||||||||
| (4,922,840 | ) | (12,116,518 | ) | (622,667 | ) | (1,581,892 | ) | (2,054,856 | ) | (6,675,323 | ) | (4,519,483 | ) | (7,473,745 | ) | |||||||||||||||
| — | — | — | — | — | (14,352,349 | ) | — | — | ||||||||||||||||||||||
| (4,370,510 | ) | (10,456,973 | ) | (499,895 | ) | (1,309,888 | ) | 477,723 | (6,018,381 | ) | (2,982,673 | ) | (1,539,840 | ) | ||||||||||||||||
The accompanying Notes to Financial Statements are an integral part of this schedule.
339
Table of Contents
Thrivent Series Fund, Inc.
Statement of Changes in Net Assets – continued
| Large Cap Index Portfolio | Equity Income Plus Portfolio | |||||||||||||||
For the periods ended | 6/30/2010 (unaudited) | 12/31/2009 | 6/30/2010 (unaudited) | 12/31/2009 | ||||||||||||
Operations | ||||||||||||||||
Net investment income/(loss) | $ | 2,529,487 | $ | 6,110,966 | $ | 601,226 | $ | 975,504 | ||||||||
Net realized gains/(losses) | (22,177 | ) | (12,662,349 | ) | 1,319,280 | (2,085,233 | ) | |||||||||
Change in net unrealized appreciation/(depreciation) | (23,442,175 | ) | 77,470,581 | (4,796,441 | ) | 8,440,660 | ||||||||||
Net Change in Net Assets Resulting From Operations | (20,934,865 | ) | 70,919,198 | (2,875,935 | ) | 7,330,931 | ||||||||||
Distributions to Shareholders | ||||||||||||||||
From net investment income | (6,071,009 | ) | (9,467,689 | ) | (69,095 | ) | (906,000 | ) | ||||||||
From net realized gains | — | (17,308,240 | ) | — | — | |||||||||||
Total Distributions to Shareholders | (6,071,009 | ) | (26,775,929 | ) | (69,095 | ) | (906,000 | ) | ||||||||
Capital Stock Transactions | ||||||||||||||||
Sold | 2,173,905 | 5,924,668 | 3,547,063 | 7,722,033 | ||||||||||||
Distributions reinvested | 6,071,009 | 26,775,929 | 69,095 | 906,000 | ||||||||||||
Redeemed | (27,980,767 | ) | (58,384,704 | ) | (644,256 | ) | (1,425,336 | ) | ||||||||
Capital Stock Transactions | (19,735,853 | ) | (25,684,107 | ) | 2,971,902 | 7,202,697 | ||||||||||
Net Increase/(Decrease) in Net Assets | (46,741,727 | ) | 18,459,162 | 26,872 | 13,627,628 | |||||||||||
Net Assets, Beginning of Period | 338,170,475 | 319,711,313 | 54,979,092 | 41,351,464 | ||||||||||||
Net Assets, End of Period | $ | 291,428,748 | $ | 338,170,475 | $ | 55,005,964 | $ | 54,979,092 | ||||||||
Accumulated undistributed net investment income/(loss) | $ | 2,519,959 | $ | 6,061,481 | $ | 599,564 | $ | 67,433 | ||||||||
Capital Stock Share Transactions | ||||||||||||||||
Sold | 135,661 | 435,006 | 444,993 | 1,060,712 | ||||||||||||
Distributions reinvested | 396,951 | 2,079,361 | 8,713 | 113,302 | ||||||||||||
Redeemed | (1,752,444 | ) | (4,351,097 | ) | (81,667 | ) | (223,105 | ) | ||||||||
Total Capital Stock Share Transactions | (1,219,832 | ) | (1,836,730 | ) | 372,039 | 950,909 | ||||||||||
The accompanying Notes to Financial Statements are an integral part of this schedule.
340
Table of Contents
Thrivent Series Fund, Inc.
Statement of Changes in Net Assets – continued
| Balanced Portfolio | High Yield Portfolio | Diversified Income Plus Portfolio | Partner Socially Responsible Bond Portfolio | |||||||||||||||||||||||||||
| 6/30/2010 (unaudited) | 12/31/2009 | 6/30/2010 (unaudited) | 12/31/2009 | 6/30/2010 (unaudited) | 12/31/2009 | 6/30/2010 (unaudited) | 12/31/2009 | |||||||||||||||||||||||
| $ | 2,726,530 | $ | 6,741,178 | $ | 32,382,499 | $ | 63,190,081 | $ | 2,868,330 | $ | 5,464,674 | $ | 108,979 | $ | 275,353 | |||||||||||||||
| 5,011,428 | 3,502,410 | 3,177,176 | (39,327,941 | ) | 1,052,617 | (4,915,023 | ) | 126,830 | 84,431 | |||||||||||||||||||||
| (12,366,646 | ) | 40,989,265 | (9,276,843 | ) | 221,535,617 | (2,057,494 | ) | 21,423,316 | 184,470 | 332,393 | ||||||||||||||||||||
| (4,628,688 | ) | 51,232,853 | 26,282,832 | 245,397,757 | 1,863,453 | 21,972,967 | 420,279 | 692,177 | ||||||||||||||||||||||
| (7,030,465 | ) | (11,644,909 | ) | (32,363,200 | ) | (62,236,431 | ) | (4,650,351 | ) | (5,981,706 | ) | (90,088 | ) | (234,799 | ) | |||||||||||||||
| (1,826,310 | ) | (4,181,300 | ) | — | — | — | — | — | (346,960 | ) | ||||||||||||||||||||
| (8,856,775 | ) | (15,826,209 | ) | (32,363,200 | ) | (62,236,431 | ) | (4,650,351 | ) | (5,981,706 | ) | (90,088 | ) | (581,759 | ) | |||||||||||||||
| 3,359,234 | 4,403,989 | 42,923,812 | 52,076,075 | 8,061,485 | 7,684,739 | 2,476,760 | 2,952,032 | |||||||||||||||||||||||
| 8,856,775 | 15,826,209 | 32,363,200 | 62,236,431 | 4,650,351 | 5,981,706 | 90,046 | 582,116 | |||||||||||||||||||||||
| (24,263,486 | ) | (54,499,515 | ) | (48,575,088 | ) | (138,725,078 | ) | (7,170,808 | ) | (17,511,175 | ) | (2,655,486 | ) | (4,276,959 | ) | |||||||||||||||
| (12,047,477 | ) | (34,269,317 | ) | 26,711,924 | (24,412,572 | ) | 5,541,028 | (3,844,730 | ) | (88,680 | ) | (742,811 | ) | |||||||||||||||||
| (25,532,940 | ) | 1,137,327 | 20,631,556 | 158,748,754 | 2,754,130 | 12,146,531 | 241,511 | (632,393 | ) | |||||||||||||||||||||
| 281,158,197 | 280,020,870 | 755,968,546 | 597,219,792 | 87,151,652 | 75,005,121 | 6,183,938 | 6,816,331 | |||||||||||||||||||||||
| $ | 255,625,257 | $ | 281,158,197 | $ | 776,600,102 | $ | 755,968,546 | $ | 89,905,782 | $ | 87,151,652 | $ | 6,425,449 | $ | 6,183,938 | |||||||||||||||
| $ | 2,693,119 | $ | 6,997,054 | $ | 485,027 | $ | 465,728 | $ | 2,828,522 | $ | 4,610,543 | $ | 17,811 | $ | (1,080 | ) | ||||||||||||||
| 246,015 | 363,420 | 9,318,133 | 12,542,548 | 1,282,818 | 1,373,725 | 235,274 | 290,876 | |||||||||||||||||||||||
| 670,374 | 1,383,688 | 7,076,810 | 15,502,844 | 770,104 | 1,166,457 | 8,625 | 57,700 | |||||||||||||||||||||||
| (1,766,810 | ) | (4,643,812 | ) | (10,592,928 | ) | (33,976,502 | ) | (1,140,050 | ) | (3,307,219 | ) | (252,594 | ) | (420,767 | ) | |||||||||||||||
| (850,421 | ) | (2,896,704 | ) | 5,802,015 | (5,931,110 | ) | 912,872 | (767,037 | ) | (8,695 | ) | (72,191 | ) | |||||||||||||||||
The accompanying Notes to Financial Statements are an integral part of this schedule.
341
Table of Contents
Thrivent Series Fund, Inc.
Statement of Changes in Net Assets – continued
| Income Portfolio | Bond Index Portfolio | |||||||||||||||
For the periods ended | 6/30/2010 (unaudited) | 12/31/2009 | 6/30/2010 (unaudited) | 12/31/2009 | ||||||||||||
Operations | ||||||||||||||||
Net investment income/(loss) | $ | 32,500,137 | $ | 65,695,155 | $ | 2,495,799 | $ | 6,005,484 | ||||||||
Net realized gains/(losses) | 23,601,161 | (41,235,693 | ) | 1,512,393 | 3,014,854 | |||||||||||
Change in net unrealized appreciation/(depreciation) | 18,804,824 | 198,015,845 | 6,988,065 | 3,482,736 | ||||||||||||
Net Change in Net Assets Resulting From Operations | 74,906,122 | 222,475,307 | 10,996,257 | 12,503,074 | ||||||||||||
Distributions to Shareholders | ||||||||||||||||
From net investment income | (32,611,378 | ) | (66,102,037 | ) | (2,735,787 | ) | (6,320,731 | ) | ||||||||
From net realized gains | — | — | — | — | ||||||||||||
Total Distributions to Shareholders | (32,611,378 | ) | (66,102,037 | ) | (2,735,787 | ) | (6,320,731 | ) | ||||||||
Capital Stock Transactions | ||||||||||||||||
Sold | 76,919,075 | 101,063,089 | 9,850,199 | 13,056,172 | ||||||||||||
Distributions reinvested | 32,611,378 | 66,102,037 | 2,735,787 | 6,320,731 | ||||||||||||
Redeemed | (209,041,489 | ) | (142,485,709 | ) | (14,816,171 | ) | (43,680,117 | ) | ||||||||
Capital Stock Transactions | (99,511,036 | ) | 24,679,417 | (2,230,185 | ) | (24,303,214 | ) | |||||||||
Net Increase/(Decrease) in Net Assets | (57,216,292 | ) | 181,052,687 | 6,030,285 | (18,120,871 | ) | ||||||||||
Net Assets, Beginning of Period | 1,278,155,715 | 1,097,103,028 | 156,528,149 | 174,649,020 | ||||||||||||
Net Assets, End of Period | $ | 1,220,939,423 | $ | 1,278,155,715 | $ | 162,558,434 | $ | 156,528,149 | ||||||||
Accumulated undistributed net investment income/(loss) | $ | 548,664 | $ | 659,905 | $ | (240,624 | ) | $ | (636 | ) | ||||||
Capital Stock Share Transactions | ||||||||||||||||
Sold | 8,012,921 | 11,238,206 | 946,971 | 1,322,464 | ||||||||||||
Distributions reinvested | 3,401,568 | 7,637,385 | 263,217 | 644,945 | ||||||||||||
Redeemed | (21,638,130 | ) | (16,534,979 | ) | (1,423,553 | ) | (4,488,055 | ) | ||||||||
Total Capital Stock Share Transactions | (10,223,641 | ) | 2,340,612 | (213,365 | ) | (2,520,646 | ) | |||||||||
The accompanying Notes to Financial Statements are an integral part of this schedule.
342
Table of Contents
Thrivent Series Fund, Inc.
Statement of Changes in Net Assets – continued
| Limited Maturity Bond Portfolio | Mortgage Securities Portfolio | Money Market Portfolio | ||||||||||||||||||||
| 6/30/2010 (unaudited) | 12/31/2009 | 6/30/2010 (unaudited) | 12/31/2009 | 6/30/2010 (unaudited) | 12/31/2009 | |||||||||||||||||
| $ | 19,663,109 | $ | 41,538,278 | $ | 589,903 | $ | 1,462,372 | $ | (14,374 | ) | $ | 2,773,294 | ||||||||||
| 8,663,058 | (3,921,593 | ) | 123,614 | 808,926 | 14,374 | 92,385 | ||||||||||||||||
| 3,972,255 | 90,309,241 | 1,957,514 | 1,415,938 | — | — | |||||||||||||||||
| 32,298,422 | 127,925,926 | 2,671,031 | 3,687,236 | — | 2,865,679 | |||||||||||||||||
| (19,524,360 | ) | (40,607,051 | ) | (477,075 | ) | (1,111,908 | ) | — | (2,865,679 | ) | ||||||||||||
| — | — | (314,976 | ) | — | — | — | ||||||||||||||||
| (19,524,360 | ) | (40,607,051 | ) | (792,051 | ) | (1,111,908 | ) | — | (2,865,679 | ) | ||||||||||||
| 115,785,041 | 153,358,304 | 1,920,252 | 1,508,556 | 35,381,429 | 2,263,584,061 | |||||||||||||||||
| 19,524,360 | 40,611,936 | 792,051 | 1,111,908 | — | 2,865,687 | |||||||||||||||||
| (60,182,691 | ) | (101,588,023 | ) | (3,316,204 | ) | (8,809,487 | ) | (73,471,407 | ) | (2,703,888,201 | ) | |||||||||||
| 75,126,710 | 92,382,217 | (603,901 | ) | (6,189,023 | ) | (38,089,978 | ) | (437,438,453 | ) | |||||||||||||
| 87,900,772 | 179,701,092 | 1,275,079 | (3,613,695 | ) | (38,089,978 | ) | (437,438,453 | ) | ||||||||||||||
| 1,105,640,612 | 925,939,520 | 31,553,062 | 35,166,757 | 246,008,074 | 683,446,527 | |||||||||||||||||
| $ | 1,193,541,384 | $ | 1,105,640,612 | $ | 32,828,141 | $ | 31,553,062 | $ | 207,918,096 | $ | 246,008,074 | |||||||||||
| $ | 196,264 | $ | 57,515 | $ | 112,828 | $ | — | $ | (46,760 | ) | $ | (32,386 | ) | |||||||||
| 11,913,825 | 16,309,348 | 191,179 | 163,053 | 35,381,429 | 2,263,584,061 | |||||||||||||||||
| 2,010,078 | 4,409,004 | 78,520 | 123,075 | — | 2,865,687 | |||||||||||||||||
| (6,182,592 | ) | (11,098,117 | ) | (329,706 | ) | (992,951 | ) | (73,471,407 | ) | (2,703,888,201 | ) | |||||||||||
| 7,741,311 | 9,620,235 | (60,007 | ) | (706,823 | ) | (38,089,978 | ) | (437,438,453 | ) | |||||||||||||
The accompanying Notes to Financial Statements are an integral part of this schedule.
343
Table of Contents
Thrivent Series Fund, Inc.
Notes to Financial Statements
As of June 30, 2010
(unaudited)
Thrivent Series Fund, Inc. (the “Fund”), a company organized under the laws of Minnesota, is registered under the Investment Company Act of 1940 (the “1940 Act”). The Fund is divided into forty-one separate series (each, a “Portfolio”), each with its own investment objective and policies. The Fund consists of four asset allocation portfolios, twenty-eight equity portfolios, two hybrid portfolios, six fixed-income portfolios, and one money market portfolio. The assets of each Portfolio are segregated, and each has a separate class of capital stock.
Shares in the Fund are currently sold, without sales charges, only to retirement plans sponsored by Thrivent Financial for Lutherans (“Thrivent Financial” or the “Adviser”) or separate accounts of Thrivent Financial or Thrivent Life Insurance Company (“Thrivent Life”), which are used to fund benefits of variable life insurance and variable annuity contracts issued by Thrivent Financial and Thrivent Life.
Under the Fund’s organizational documents, its officers and directors are indemnified against certain liabilities arising out of the performance of their duties to the Fund. In addition, in the normal course of business, the Fund enters into contracts with service providers and others that provide general damage clauses. The Fund’s maximum exposure under these contracts is unknown, as this would involve future claims that may be made against the Fund. However, based on experience, the Fund expects the risk of loss to be remote.
(2) SIGNIFICANT ACCOUNTING POLICIES
(A) Valuation of Investments – Securities traded on U.S. or foreign securities exchanges or included in a national market system are valued at the official closing price at the close of each business day unless otherwise stated below. Over-the-counter securities and listed securities for which no price is readily available are valued at the current bid price considered best to represent the value at that time. Swap agreements are valued at the fair value of the contract as furnished by an independent pricing service. Security prices are based on quotes that are obtained from an independent pricing service approved by the Board of Directors. The pricing service, in determining values of fixed-income securities, takes into consideration such factors as current quotations by broker/dealers, coupon, maturity, quality, type of issue, trading characteristics, and other yield and risk factors it deems relevant in determining valuations. Securities which cannot be valued by the approved pricing service are valued using valuations obtained from dealers that make markets in the securities. Exchange-listed options and futures contracts are valued at the last quoted sales price. Investments in open-ended mutual funds are valued at their net asset value at the close of each business day. Short-term securities are valued at amortized cost to the extent it is not materially different than market value.
Securities held by Money Market Portfolio are valued on the basis of amortized cost (which approximates market value), whereby a portfolio security is valued at its cost initially and thereafter valued to reflect a constant amortization to maturity of any discount or premium. Money Market Portfolio and the Adviser follow procedures necessary to maintain a constant net asset value of $1.00 per share.
The various inputs used to determine the fair value of the Portfolios’ investments are summarized in three broad levels: Level 1 includes quoted prices in active markets for identical securities; Level 2 includes other significant observable inputs such as quoted prices for similar securities, interest rates, prepayment speeds and credit risk; and Level 3 includes significant unobservable inputs such as the Portfolio’s own assumptions and broker evaluations in determining the fair value of investments. Of the Level 3 securities, those for which market values were not readily available or were deemed unreliable were valued as determined in good faith under the direction of the Board of Directors. As of June 30, 2010, the following Portfolios held these types of securities:
Portfolio | Number of Securities | Percent of Portfolio’s Net Assets | |||
Partner Emerging Markets | 1 | 0.21 | % | ||
Small Cap Index | 1 | <0.01 | % | ||
Partner Worldwide Allocation | 3 | 0.13 | % | ||
High Yield | 5 | 0.35 | % | ||
Diversified Income Plus | 1 | 0.00 | % | ||
Income | 3 | 0.49 | % | ||
Limited Maturity Bond | 2 | 0.42 | % |
The valuation levels are not necessarily an indication of the risk associated with investing in these securities or other investments.
Valuation of International Securities – Because many foreign markets close before the U.S. markets, events may occur between the close of the foreign market and the close of the U.S. markets that could have a material impact on the valuation of foreign securities. The Portfolios, under the supervision of the Board of Directors, evaluate the impacts of these events and may adjust the valuation of foreign securities to reflect the fair value as of the close of the U.S. markets. The Board of Directors has authorized the Adviser to make fair valuation determinations pursuant to policies approved by the Board of Directors.
(B) Foreign Currency Translation – The accounting records of each Portfolio are maintained in U.S. dollars. Securities and other assets and liabilities that are denominated in foreign currencies are translated into U.S.
344
Table of Contents
Thrivent Series Fund, Inc.
Notes to Financial Statements
As of June 30, 2010
(unaudited)
2) SIGNIFICANT ACCOUNTING POLICIES – CONTINUED
dollars at the daily closing rates of exchange.
Foreign currency amounts related to the purchase or sale of securities and income and expenses are translated at the exchange rate on the transaction date. Net realized and unrealized currency gains and losses are recorded from sales of foreign currency, exchange gains or losses between the trade date and settlement dates on securities transactions, and other translation gains or losses on dividends, interest income and foreign withholding taxes. The Portfolios do not separately report the effect of changes in foreign exchange rates from changes in market prices on securities held. Such changes are included in net realized and unrealized gain or loss from investments in the Statement of Operations.
For federal income tax purposes, the Portfolios treat the effect of changes in foreign exchange rates arising from actual foreign currency transactions and the changes in foreign exchange rates between the trade date and settlement date as ordinary income.
(C) Foreign Currency Forward Contracts – In connection with purchases and sales of securities denominated in foreign currencies all Portfolios, except Money Market Portfolio, may enter into foreign currency forward contracts. Additionally, the Portfolios may enter into such contracts to hedge certain other foreign-currency-denominated investments. These contracts are recorded at market value and the related realized and unrealized foreign exchange gains and losses are included in the Statement of Operations. In the event that counterparties fail to settle these forward contracts, the Portfolios could be exposed to foreign currency fluctuations. Foreign currency contracts are valued daily and unrealized appreciation or depreciation is recorded daily as the difference between the contract exchange rate and the closing forward rate applied to the face amount of the contract. A realized gain or loss is recorded at the time a forward contract is closed. These contracts are over-the-counter and the Portfolio is exposed to counterparty risk equal to the discounted net amount of payments to the Fund. During the six months ended June 30, 2010, Partner Emerging Markets Portfolio, Partner Utilities Portfolio, Small Cap Stock Portfolio, Partner Worldwide Allocation Portfolio, Partner International Stock Portfolio and Income Portfolio engaged in this type of investment.
(D) Foreign Denominated Investments – Foreign denominated assets and currency contracts may involve more risks than domestic transactions including currency risk, political and economic risk, regulatory risk, and market risk. Certain Portfolios may also invest in securities of companies located in emerging markets. Future economic or political developments could adversely affect the liquidity or value, or both, of such securities.
(E) Federal Income Taxes – No provision has been made for income taxes because each Portfolio’s policy is to qualify as a regulated investment company under the Internal Revenue Code and distribute substantially all investment company taxable income and net capital gain on a timely basis. It is also the intention of each Portfolio to distribute an amount sufficient to avoid imposition of any federal excise tax. The Portfolios, accordingly, anticipate paying no federal taxes and no federal tax provision was recorded. Each Portfolio is treated as a separate taxable entity for federal income tax purposes. Certain Portfolios may utilize earnings and profits distributed to shareholders on the redemption of shares as part of the dividends paid deduction.
Certain Portfolios are subject to foreign income taxes imposed by certain countries in which they invest. Withholding taxes on foreign dividends and gains, if applicable, have been provided for in accordance with the applicable country’s tax rules and rates. These amounts are shown as foreign dividend tax withholding on the Statement of Operations.
U.S. Generally Accepted Accounting Principles (“GAAP”) require management of the Portfolios to make additional tax disclosures with respect to the tax effects of any uncertain income tax positions, whether those positions were taken on previously filed tax returns or are expected to be taken on future returns. In order to be recognized in the financial statements, the benefits of a tax position must meet a “more likely than not” standard, based on the technical merits of the position. In evaluating whether a tax position has met the more-likely-than-not recognition threshold, management of the Portfolio must presume that the position will be examined by the appropriate taxing authority that has full knowledge of all relevant information.
Management of the Portfolios analyzed all open tax years, as defined by the statute of limitations, for all major jurisdictions. Open tax years are those that are open for examination by taxing authorities. Major jurisdictions for the Portfolios include U.S. Federal, Minnesota, and Wisconsin, as well as certain foreign countries. As of June 30, 2010, open U.S. Federal, Minnesota, and Wisconsin tax years include the tax years ended December 31, 2006, through 2009. Additionally, as of June 30, 2010, the tax year ended December 31, 2005, is open for Wisconsin. The Portfolios have no examinations in progress and none are expected at this time.
As of June 30, 2010, management of the Portfolios has reviewed all open tax years and major jurisdictions and concluded that there is no effect to the Portfolios’ tax liability, financial position or results of operations. There is no tax liability resulting from unrecognized tax benefits related to uncertain income tax positions taken or expected
345
Table of Contents
Thrivent Series Fund, Inc.
Notes to Financial Statements
As of June 30, 2010
(unaudited)
(2) SIGNIFICANT ACCOUNTING POLICIES – CONTINUED
to be taken in future tax returns. The Portfolios are also not aware of any tax positions for which it is reasonably possible that the total amounts of unrecognized tax benefits will significantly change in the next 12 months.
(F) Expenses and Income – Estimated expenses are accrued daily. The Portfolios are charged for those expenses that are directly attributable to them. Expenses that are not directly attributable to a Portfolio are allocated among all appropriate Portfolios in proportion to their respective net assets, number of shareholder accounts or other reasonable basis.
Interest income is accrued daily and is determined on the basis of interest or discount earned on all debt securities, including accretion of market discount and original issue discount and amortization of premium. Paydown gains and losses on mortgage- and asset-backed securities are recorded as components of interest income. Dividend income is recorded on the ex-dividend date.
(G) Custody Earnings Credit – The Portfolios have a deposit arrangement with the custodian whereby interest earned on uninvested cash balances is used to pay a portion of custodian fees. This deposit arrangement is an alternative to overnight investments. Earnings credits are shown as a reduction of total expenses on the Statement of Operations.
(H) Distributions to Shareholders – Dividends and capital gain distributions are recorded on the ex-dividend date. With the exception of Money Market Portfolio, net realized gains from securities transactions, if any, are paid at least annually after the close of the fiscal year. Any Portfolio subject to excise taxes would require an additional distribution prior to the close of the fiscal year.
Dividends are declared and reinvested daily for High Yield Portfolio, Partner Socially Responsible Bond Portfolio, Income Portfolio, Bond Index Portfolio, Limited Maturity Bond Portfolio and Mortgage Securities Portfolio; declared daily and reinvested monthly for Money Market Portfolio; and declared and reinvested at least annually for all other Portfolios.
(I) Options – All Portfolios, with the exception of Money Market Portfolio, may buy put and call options and write put and covered call options. The Portfolios intend to use such derivative instruments as hedges to facilitate buying or selling securities or to provide protection against adverse movements in security prices or interest rates. The Portfolios may also enter into options contracts to protect against adverse foreign exchange rate fluctuations. Option contracts are valued daily and unrealized appreciation or depreciation is recorded. A Portfolio will realize a gain or loss upon expiration or closing of the option transaction. When an option is exercised, the proceeds upon sale for a written call option or the cost of a security for purchased put and call options is adjusted by the amount of premium received or paid.
Buying put options tends to decrease a Portfolio’s exposure to the underlying security while buying call options tends to increase a Portfolio’s exposure to the underlying security. The risk associated with purchasing put and call options is limited to the premium paid. There is no significant counterparty risk on exchange-traded options as the exchange guarantees the contract against default. Writing put options tends to increase a Portfolio’s exposure to the underlying security while writing call options tends to decrease a Portfolio’s exposure to the underlying security. The writer of an option has no control over whether the underlying security may be bought or sold, and therefore bears the market risk of an unfavorable change in the price of the underlying security. The counterparty risk for written options arises when the Portfolio has purchased an option, exercised that option, and the counterparty doesn’t buy from the Portfolio or sell to the Portfolio the underlying asset as required. In the case where the Portfolio has written an option, the Portfolio doesn’t have counterparty risk. Counterparty risk on purchased over-the-counter options is partially mitigated by the Portfolio’s collateral posting requirements. As the option increases in value to the Portfolio, the Portfolio receives collateral from the counterparty. Risks of loss may exceed amounts recognized on the Statement of Assets and Liabilities. During the six months ended June 30, 2010, Aggressive Allocation Portfolio, Moderately Aggressive Allocation Portfolio, Moderate Allocation Portfolio, Moderately Conservative Allocation Portfolio, Partner All Cap Value Portfolio, Large Cap Growth Portfolio II, Large Cap Growth Portfolio, Large Cap Stock Portfolio, Equity Income Plus Portfolio, Diversified Income Plus Portfolio, Limited Maturity Bond Portfolio and Mortgage Securities Portfolio engaged in these types of investments.
(J) Futures Contracts – Certain Portfolios may use futures contracts to manage the exposure to interest rate and market or currency fluctuations. Gains or losses on futures contracts can offset changes in the yield of securities. When a futures contract is opened, cash or other investments equal to the required “initial margin deposit” are held on deposit with and pledged to the broker. Additional securities held by the Portfolios may be earmarked to cover open futures contracts. The futures contract’s daily change in value (“variation margin”) is either paid to or received from the broker, and is recorded as an unrealized gain or loss. When the contract is closed, realized gain or loss is recorded equal to the difference between the value of the contract when opened and the value of the contract when closed. Futures contracts involve, to varying degrees, risk of loss in excess of the variation margin disclosed in the Statement of Assets and Liabilities. Exchange-traded futures have no significant counterparty
346
Table of Contents
Thrivent Series Fund, Inc.
Notes to Financial Statements
As of June 30, 2010
(unaudited)
2) SIGNIFICANT ACCOUNTING POLICIES – CONTINUED
risk as the exchange guarantees the contracts against default. During the six months ended June 30, 2010, Aggressive Allocation Portfolio, Moderately Aggressive Allocation Portfolio, Moderate Allocation Portfolio, Moderately Conservative Allocation Portfolio, Small Cap Stock Portfolio, Small Cap Index Portfolio, Mid Cap Index Portfolio, Partner Worldwide Allocation Portfolio, Large Cap Stock Portfolio, Large Cap Index Portfolio, Equity Income Plus Portfolio, Balanced Portfolio, Diversified Income Plus Portfolio, Partner Socially Responsible Bond Portfolio, Income Portfolio, Limited Maturity Bond Portfolio and Mortgage Securities Portfolio engaged in this type of investment.
(K) Swap Agreements – Certain Portfolios enter into swap transactions, which involve swapping one or more investment characteristics of a security or a basket of securities with another party. Such transactions include market risk, risk of default by the other party to the transaction, risk of imperfect correlation and manager risk and may involve commissions or other costs. Swap transactions generally do not involve delivery of securities, other underlying assets or principal. Accordingly, the risk of loss with respect to swap transactions is generally limited to the net amount of payments that the Portfolio is contractually obligated to make, or in the case of the counterparty defaulting, the net amount of payments that the Portfolio is contractually entitled to receive. Risks of loss may exceed amounts recognized on the Statement of Assets and Liabilities. If there is a default by the counterparty, the Portfolio may have contractual remedies pursuant to the agreements related to the transaction. The contracts are valued daily and unrealized appreciation or depreciation is recorded. Swap agreements are valued at fair value of the contract as provided by an independent pricing service. The pricing service takes into account such factors as swap curves, default probabilities, recent trades, recovery rates and other factors it deems relevant in determining valuations. Periodic payments and receipts and payments received or made as a result of a credit event or termination of the contract are recognized as realized gains or losses on the Statement of Operations. Collateral, in the form of cash or securities, may be required to be held with the Portfolio’s custodian, or third party, in connection with these agreements. These swap agreements are over-the-counter and the Portfolio is exposed to counterparty risk, which is the discounted net amount of payments owed to the Portfolio. This risk is partially mitigated by the Portfolio’s collateral posting requirements. As the swap increases in value to the Portfolio, the Portfolio receives collateral from the counterparty.
Credit Default Swaps – A credit default swap is a swap agreement between two parties to exchange the credit risk of a particular issuer, basket of securities or reference entity. In a credit default swap transaction, a buyer pays periodic fees in return for payment by the seller which is contingent upon an adverse credit event occurring in the underlying issuer or reference entity. The seller collects periodic fees from the buyer and profits if the credit of the underlying issuer or reference entity remains stable or improves while the swap is outstanding, but the seller in a credit default swap contract would be required to pay the amount of credit loss, determined as specified in the agreement, to the buyer in the event of an adverse credit event in the reference entity. A buyer of a credit default swap is said to buy protection whereas a seller of a credit default swap is said to sell protection. The Portfolios may be either the protection seller or the protection buyer.
Certain Portfolios enter into credit default derivative contracts directly through credit default swaps (CDS) or through credit default swap indices (CDX Indices). CDX Indices are static pools of equally weighted credit default swaps referencing corporate bonds and/or loans designed to provide diversified credit exposure to these asset classes. Portfolios sell default protection and assume long-risk positions in individual credits or indices. Index positions are entered into to gain exposure to the corporate bond and/or loan markets in a cost-efficient and diversified structure. In the event that a position defaults, by going into bankruptcy and failing to pay interest or principal on borrowed money, within any given CDX Index held, the maximum potential amount of future payments required would be equal to the pro-rata share of that position within the index based on the notional amount of the index. In the event of a default under a CDS contract, the maximum potential amount of future payments would be the notional amount. For CDS, the default events could be bankruptcy and failing to pay interest or principal on borrowed money or a restructuring. A restructuring is a change in the underlying obligations which would include reduction in interest or principal, maturity extension and subordination to other obligations. During the six months ended June 30, 2010, Aggressive Allocation Portfolio, Moderately Aggressive Allocation Portfolio, Moderate Allocation Portfolio, Moderately Conservative Allocation Portfolio, High Yield Portfolio, Diversified Income Plus Portfolio, Income Portfolio and Limited Maturity Bond Portfolio engaged in these types of investments. Refer to the credit default swap tables located within the Portfolios’ Schedules of Investments for additional information as of June 30, 2010.
Total Rate of Return Swaps – A total rate of return swap is an agreement in which one party makes payments based on a set rate, either fixed or variable, while the other party makes payments based on the return of an underlying asset plus any capital gains and losses over the payment period. The underlying asset is typically an index, loan or a basket of assets. Total rate of return swaps provide the Portfolios with the additional flexibility of gaining exposure to a market or securities index by using the most cost-
347
Table of Contents
Thrivent Series Fund, Inc.
Notes to Financial Statements
As of June 30, 2010
(unaudited)
(2) SIGNIFICANT ACCOUNTING POLICIES – CONTINUED
effective vehicle available. During the six months ended June 30, 2010, Moderate Allocation Portfolio engaged in these types of investments. Refer to the credit default swap tables located within the Portfolios’ Schedules of Investments for additional information as of June 30, 2010.
(L) Mortgage Dollar Roll Transactions – Certain Portfolios enter into mortgage dollar roll transactions on securities to be issued by the Government National Mortgage Association, Federal National Mortgage Association and Federal Home Loan Mortgage Corporation, in which the Portfolios sell mortgage securities and simultaneously agree to repurchase similar (same type and coupon) securities at a later date at an agreed upon price. The Portfolios maintain liquid securities having a value not less than the repurchase price (including accrued interest) for such dollar rolls. The market value of the securities that the Portfolios are required to purchase may decline below the agreed upon repurchase price of those securities.
The Portfolios are compensated from negotiated fees paid by brokers offered as an inducement to the Portfolios to “roll over” their purchase commitments, thus enhancing the yield. Mortgage dollar rolls may be renewed with a new purchase and repurchase price and a cash settlement made on settlement date without physical delivery of the securities subject to the contract. The fees received are recognized over the roll period and are included in Income from mortgage dollar rolls in the Statement of Operations. During the six months ended June 30, 2010, Aggressive Allocation Portfolio, Moderately Aggressive Allocation Portfolio, Moderate Allocation Portfolio, Moderately Conservative Allocation Portfolio, Balanced Portfolio, Income Portfolio, Bond Index Portfolio, Limited Maturity Bond Portfolio and Mortgage Securities Portfolio engaged in this type of transaction.
(M) Securities Lending – The Fund has entered into a Securities Lending Agreement (the “Agreement”) with Deutsche Bank AG (“Deutsche”). The Agreement authorizes Deutsche to lend securities to authorized borrowers on behalf of the Portfolios. Pursuant to the Agreement, all loaned securities are initially collateralized by cash equal to at least 102% of the value of the loaned securities. All cash collateral received is invested in Thrivent Financial Securities Lending Trust. The Portfolios receive payments equivalent to the dividends and interest that would have been earned on the securities loaned while simultaneously seeking to earn income on the investment of cash collateral. Amounts earned on investments in Thrivent Financial Securities Lending Trust, net of rebates, fees paid to Deutsche for services provided and any other securities lending expenses, are included in Income from securities loaned on the Statement of Operations. By investing any cash collateral it receives in these transactions, a Portfolio could realize additional gains or losses. If the borrower fails to return the securities or the invested collateral has declined in value, the Portfolio could lose money.
During the six months ended June 30, 2010, all Portfolios except Aggressive Allocation Portfolio, Moderately Aggressive Allocation Portfolio, Moderate Allocation Portfolio, Moderately Conservative Allocation Portfolio, Partner Healthcare Portfolio, Partner Natural Resources Portfolio, Partner Emerging Markets Portfolio, Partner Utilities Portfolio, Partner Worldwide Allocation Portfolio, Partner Socially Responsible Stock Portfolio, Partner All Cap Growth Portfolio, Partner All Cap Value Portfolio, Equity Income Plus Portfolio, Partner Socially Responsible Bond Portfolio, Mortgage Securities Portfolio and Money Market Portfolio had securities on loan. As of June 30, 2010, the value of securities on loan is as follows:
Fund | Securities on Loan | ||
Partner Technology | $ | 4,587,151 | |
Real Estate Securities | 30,631,689 | ||
Partner Small Cap Growth | 28,798,737 | ||
Partner Small Cap Value | 13,379,223 | ||
Small Cap Stock | 19,141,086 | ||
Small Cap Index | 15,024,490 | ||
Mid Cap Growth II | 5,687,629 | ||
Mid Cap Growth | 22,075,890 | ||
Partner Mid Cap Value | 8,398,735 | ||
Mid Cap Stock | 19,701,592 | ||
Mid Cap Index | 6,677,928 | ||
Partner International Stock | 26,731,356 | ||
Partner All Cap | 2,665,242 | ||
Large Cap Growth II | 2,014,425 | ||
Large Cap Growth | 16,069,019 | ||
Partner Growth Stock | 641,473 | ||
Large Cap Stock | 4,200,906 | ||
Large Cap Index | 3,347,832 | ||
Balanced | 1,545,656 | ||
High Yield | 60,099,861 | ||
Diversified Income Plus | 3,509,785 | ||
Income | 19,522,394 | ||
Limited Maturity Bond | 2,554,455 | ||
(N) When Issued and Delayed Delivery Transactions – Certain Portfolios may purchase or sell securities on a when-issued or delayed delivery basis. These transactions involve a commitment by a Portfolio to purchase or sell securities for a predetermined price or yield, with payment and delivery taking place beyond the customary settlement period. When delayed delivery purchases are outstanding, a Portfolio will designate liquid assets in an amount sufficient to meet the purchase price. When purchasing a security on a delayed delivery basis, a Portfolio assumes the rights and risks of ownership of the security, including the risk of price and yield fluctuations, and takes such fluctuations into account when determining its net asset value. A Portfolio may dispose of a delayed delivery transaction after it is entered into, and may sell when-issued securities before they are delivered, which may result in a capital gain or loss. When a Portfolio
348
Table of Contents
Thrivent Series Fund, Inc.
Notes to Financial Statements
As of June 30, 2010
(unaudited)
(2) SIGNIFICANT ACCOUNTING POLICIES – CONTINUED
has sold a security on a delayed delivery basis, a Portfolio does not participate in future gains and losses with respect to the security.
(O) Treasury Inflation Protected Securities – Certain Portfolios may invest in treasury inflation protected securities (TIPS). These securities are fixed income securities whose principal value is periodically adjusted to the rate of inflation. The interest rate is generally fixed at issuance. Interest is paid based on the principal value, which is adjusted for inflation. Any increase in the principal amount will be included as taxable interest in the Statement of Operations and received upon maturity or sale of the security. During the six months ended June 30, 2010, Aggressive Allocation Portfolio, Moderately Aggressive Allocation Portfolio, Moderate Allocation Portfolio, Moderately Conservative Allocation Portfolio, Income Portfolio, Limited Maturity Bond Portfolio and Mortgage Securities Portfolio engaged in this type of investment.
(P) Repurchase Agreements – Each Portfolio may engage in repurchase agreement transactions in pursuit of its investment objective. A repurchase agreement consists of a purchase and a simultaneous agreement to resell an investment for later delivery at an agreed upon price and rate of interest. The Portfolio must take possession of collateral either directly or through a third-party custodian. If the original seller of a security subject to a repurchase agreement fails to repurchase the security at the agreed upon time, the Portfolio could incur a loss due to a drop in the market value of the security during the time it takes the Portfolio to either sell the security or take action to enforce the original seller’s agreement to repurchase the security. Also, if a defaulting original seller filed for bankruptcy or became insolvent, disposition of such security might be delayed by pending legal action. The Portfolio may only enter into repurchase agreements with banks and other recognized financial institutions such as broker/dealers that are found by the Adviser or subadviser to be creditworthy. During the six months ended June 30, 2010, Moderately Aggressive Allocation Portfolio, Moderate Allocation Portfolio, Moderately Conservative Allocation Portfolio, Technology Portfolio, Partner International Stock Portfolio, Large Cap Growth Portfolio, Large Cap Value Portfolio, Large Cap Stock Portfolio, High Yield Portfolio, Income Portfolio and Limited Maturity Bond Portfolio engaged in this type of investment.
(Q) Equity-Linked Structured Securities – Certain Portfolios may invest in equity-linked structured notes. Equity-linked structured notes are debt securities which combine the characteristics of common stock and the sale of an option. The return component is based upon the performance of a single equity security, a basket of equity securities, or an equity index and the sale of an option. There is no guaranteed return of principal with these securities. The appreciation potential of these securities may be limited by a maximum payment or call right and can be influenced by many unpredictable factors. In addition to the performance of the equity, the nature and credit of the issuer may also impact return. During the six months ended June 30, 2010, Limited Maturity Bond Portfolio engaged in this type of investment.
(R) Credit Risk – The Portfolios may be susceptible to credit risk to the extent the issuer or counterparty defaults on its payment obligation. The Portfolios’ policy is to monitor the creditworthiness of the issuers. Interest receivables on defaulted securities are monitored for the ability to collect payments in default and adjusted accordingly.
(S) Accounting Estimates – The preparation of financial statements in conformity with GAAP require management to make estimates and assumptions that affect the reported amounts of assets and liabilities and disclosure of contingent assets and liabilities at the date of the financial statements and the reported amounts of income and expenses during the reporting period. Actual results could differ from those estimates.
(T) Loan Commitments – Certain Portfolios may enter into loan commitments, which generally have interest rates which are reset daily, monthly, quarterly or semi-annually by reference to a base lending rate, plus a premium. These base rates are primarily the London-Interbank Offered Rate (“LIBOR”), and secondarily the prime rate offered by one or more major United States banks (the “Prime Rate”) and the certificate of deposit (“CD”) rate or other base lending rates used by commercial lenders. Loan commitments often require prepayments from excess cash flows or allow the borrower to repay at its election. The rate at which the borrower repays cannot be predicted with accuracy. Therefore, the remaining maturity may be considerably less than the stated maturity shown in the Schedule of Investments.
All or a portion of these loan commitments may be unfunded. The Portfolio is obligated to fund these commitments at the borrower’s discretion. Therefore, the Portfolio must have funds sufficient to cover its contractual obligation. These unfunded loan commitments, which are marked to market daily, are presented in the Schedule of Investments and may represent all or a portion of the loan’s market value.
(U) Loss Contingencies – Thrivent High Yield Portfolio and Thrivent Income Portfolio are defendants in an adversary action filed on July 31, 2009 by the Official Committee of Unsecured Creditors of Motors Liquidation Company, formerly known as General Motors Corporation (GM), against prior and current holders of term loan debt of GM. The suit seeks to determine whether GM’s term loan
349
Table of Contents
Thrivent Series Fund, Inc.
Notes to Financial Statements
As of June 30, 2010
(unaudited)
2) SIGNIFICANT ACCOUNTING POLICIES – CONTINUED
facility was secured at the time it entered bankruptcy. High Yield Portfolio at one time held term loans in an amount of at least $4,627,531 and, if the plaintiffs are successful, it is reasonably possible that the Portfolio will be required to make payments in some amount. This loss contingency has not been accrued as a liability because the amount of potential damages and the likelihood of loss cannot be reasonably estimated. Although Thrivent Income Portfolio is named as a defendant in this action, we do not expect that the Portfolio’s assets will be subject to a loss contingency.
(V) In-Kind Redemptions – During the year ended December 31, 2009, the Thrivent Asset Allocation Portfolios, as the shareholders of Portfolios of the Fund (the “underlying portfolios”), redeemed their shares in-kind (“in-kind redemption”). The underlying portfolios distributed portfolio securities rather than cash as payment for the redemption of these portfolio shares. For financial reporting purposes, the underlying portfolios recognize gain on these transactions to the extent the value of the distributed securities on the date of redemption exceeds the cost of those securities; they recognize a loss if the cost exceeds the value. The net realized gains below are included in the Statement of Operations of the underlying portfolios as net realized gains/losses on in-kind redemptions. The in-kind amounts and shares redeemed are included in the Capital Stock Transactions of the Statement of Changes in Net Assets of the underlying portfolios. These in-kind transactions were conducted at market value. The transactions were as follows:
Underlying Portfolio | Underlying Shares Redeemed | Date | In-kind Amount | Net Realized Gain | ||||||||
Aggressive Allocation Portfolio | ||||||||||||
Large Cap Growth II | 3,195,439 | 9/29/ 2009 | $ | 24,477,060 | $ | 3,035,443 | ||||||
Large Cap Value | 1,537,741 | 10/ 7/ 2009 | 14,577,788 | 1,381,084 | ||||||||
Mid Cap Stock | 1,515,286 | 10/ 26/ 2009 | 14,228,534 | 2,387,605 | ||||||||
Small Cap Stock | 2,073,841 | 10/ 28/ 2009 | 19,120,811 | 2,410,449 | ||||||||
Moderately Aggressive Allocation Portfolio | ||||||||||||
Large Cap Growth II | 3,834,479 | 9/29/ 2009 | $ | 29,372,109 | $ | 3,572,459 | ||||||
Large Cap Value | 5,125,837 | 10/ 7/ 2009 | 48,592,931 | 5,123,681 | ||||||||
Mid Cap Stock | 4,040,753 | 10/ 26/ 2009 | 37,942,669 | 6,650,830 | ||||||||
Small Cap Stock | 3,110,760 | 10/ 28/ 2009 | 28,681,210 | 3,469,982 | ||||||||
Moderate Allocation Portfolio | ||||||||||||
Large Cap Growth II | 3,834,479 | 9/29/ 2009 | $ | 29,372,109 | $ | 3,901,784 | ||||||
Large Cap Value | 5,125,837 | 10/ 7/ 2009 | 48,592,931 | 5,302,997 | ||||||||
Mid Cap Stock | 3,535,679 | 10/ 26/ 2009 | 33,200,023 | 5,271,453 | ||||||||
Small Cap Stock | 2,592,308 | 10/ 28/ 2009 | 23,901,077 | 2,522,694 | ||||||||
Moderately Conservative Allocation Portfolio | ||||||||||||
Large Cap Growth II | 1,287,579 | 8/ 3/ 2009 | $ | 9,412,199 | $ | 693,692 | ||||||
Large Cap Value | 2,562,934 | 10/ 7/ 2009 | 24,296,615 | 2,382,088 | ||||||||
Mid Cap Stock | 1,010,227 | 10/ 26/ 2009 | 9,486,029 | 894,881 | ||||||||
Small Cap Stock | 1,036,924 | 10/ 28/ 2009 | 9,560,437 | 882,070 | ||||||||
(W) Recent Accounting Pronouncements
FASB ASC 815-10-50: Derivatives and Hedging
This pronouncement was announced in March 2008 and is intended to improve financial reporting for derivative instruments by requiring enhanced disclosure that enables investors to understand how and why an entity uses derivatives, how derivatives are accounted for and how derivative instruments affect an entity’s results of operations and financial position. The Portfolios implemented this provision for the December 31, 2009 shareholder report.
FASB ASC 850-10-50: Related Party Transactions
This pronouncement was announced in May 2009 and is intended to establish general standards of accounting for and disclosure of events or transactions that occur after the balance sheet date but before financial statements are issued or available to be issued. It requires the disclosure of the date through which an entity has evaluated subsequent events and the basis for that date. The Portfolios implemented this provision for the December 31, 2009 shareholder report.
350
Table of Contents
Thrivent Series Fund, Inc.
Notes to Financial Statements
As of June 30, 2010
(unaudited)
2) SIGNIFICANT ACCOUNTING POLICIES – CONTINUED
FASB ASC 820-10-65: Fair Value Measurements and Disclosures
This pronouncement was announced in April 2009 and provides additional guidance for estimating fair value. The pronouncement focuses on markets that experience significant decline in volume and level of activity for assets or liabilities as compared to markets that have a history of being inactive. When this exposure to pricing conditions is present further evaluation and disclosure is provided. The Portfolios implemented this provision for the December 31, 2009 shareholder report.
(X) Other – For financial statement purposes, investment security transactions are accounted for on the trade date. Realized gains and losses from investment transactions are determined on a specific cost identification basis, which is the same basis used for federal income tax purposes.
(3) FEES AND COMPENSATION PAID TO AFFILIATES
(A) Investment Advisory Fees – The Fund has entered into an Investment Advisory Agreement with Thrivent Financial, the Adviser. Under the Investment Advisory Agreement, each of the Portfolios pays a fee for investment advisory services. The fees are accrued daily and paid monthly.
The four Asset Allocation Portfolios – Aggressive Allocation Portfolio, Moderately Aggressive Allocation Portfolio, Moderate Allocation Portfolio and Moderately Conservative Allocation Portfolio – pay investment advisory fees for its asset allocation services. In addition, for investments (other then underlying Thrivent Portfolios) held directly by the Asset Allocation Portfolios, each Asset Allocation Portfolio will pay an additional advisory fee. The annual rates of fees as a percentage of average daily net assets under the Investment Advisory Agreement are as follows:
Portfolio (M – Millions) | $0 to $500M | $500 to $2,000M | Over $2,000M | ||||||
Aggressive Allocation | 0.150 | % | 0.125 | % | 0.100 | % | |||
Aggressive Allocation – Direct Holdings | 0.600 | % | 0.600 | % | 0.600 | % | |||
Moderately Aggressive Allocation | 0.150 | % | 0.125 | % | 0.100 | % | |||
Moderately Aggressive Allocation – Direct Holdings | 0.550 | % | 0.550 | % | 0.550 | % | |||
Moderate Allocation | 0.150 | % | 0.125 | % | 0.100 | % | |||
Moderate Allocation – Direct Holdings | 0.500 | % | 0.500 | % | 0.500 | % | |||
Moderately Conservative Allocation | 0.150 | % | 0.125 | % | 0.100 | % | |||
Moderately Conservative Allocation – Direct Holdings | 0.450 | % | 0.450 | % | 0.450 | % |
For all other Portfolios, the annual rates of fees as a percent of average daily net assets under the Investment Advisory Agreement are as follows:
Portfolio (M - Millions) | $0 to $50M | $50 to $200M | $200 to $250M | $250 to $500M | $500 to$750M | $750 to $1,000M | $1,000 to $1,500M | $1,500 to $2,000M | $2,000 to $2,500M | $2,500 to $5,000M | Over $5,000M | ||||||||||||||||||||||
Partner Technology | 0.750 | % | 0.750 | % | 0.750 | % | 0.750 | % | 0.750 | % | 0.750 | % | 0.750 | % | 0.750 | % | 0.750 | % | 0.750 | % | 0.750 | % | |||||||||||
Partner Healthcare | 0.950 | % | 0.900 | % | 0.900 | % | 0.900 | % | 0.900 | % | 0.900 | % | 0.900 | % | 0.900 | % | 0.900 | % | 0.900 | % | 0.900 | % | |||||||||||
Partner Natural Resources | 0.750 | % | 0.725 | % | 0.725 | % | 0.725 | % | 0.725 | % | 0.725 | % | 0.725 | % | 0.725 | % | 0.725 | % | 0.725 | % | 0.725 | % | |||||||||||
Partner Emerging Markets | 1.200 | % | 1.070 | % | 1.070 | % | 1.070 | % | 1.070 | % | 1.070 | % | 1.070 | % | 1.070 | % | 1.070 | % | 1.070 | % | 1.070 | % | |||||||||||
Real Estate Securities | 0.800 | % | 0.800 | % | 0.800 | % | 0.800 | % | 0.750 | % | 0.750 | % | 0.750 | % | 0.750 | % | 0.750 | % | 0.750 | % | 0.750 | % | |||||||||||
Partner Utilities | 0.750 | % | 0.725 | % | 0.725 | % | 0.725 | % | 0.725 | % | 0.725 | % | 0.725 | % | 0.725 | % | 0.725 | % | 0.725 | % | 0.725 | % | |||||||||||
Partner Small Cap Growth | 1.000 | % | 1.000 | % | 1.000 | % | 1.000 | % | 0.900 | % | 0.900 | % | 0.900 | % | 0.900 | % | 0.900 | % | 0.900 | % | 0.900 | % | |||||||||||
Partner Small Cap Value | 0.800 | % | 0.800 | % | 0.800 | % | 0.800 | % | 0.800 | % | 0.800 | % | 0.800 | % | 0.800 | % | 0.800 | % | 0.800 | % | 0.800 | % | |||||||||||
Small Cap Stock | 0.700 | % | 0.700 | % | 0.650 | % | 0.650 | % | 0.650 | % | 0.650 | % | 0.600 | % | 0.600 | % | 0.600 | % | 0.550 | % | 0.525 | % | |||||||||||
Small Cap Index | 0.350 | % | 0.350 | % | 0.350 | % | 0.300 | % | 0.250 | % | 0.250 | % | 0.200 | % | 0.150 | % | 0.100 | % | 0.100 | % | 0.100 | % | |||||||||||
Mid Cap Growth II | 0.900 | % | 0.900 | % | 0.900 | % | 0.900 | % | 0.800 | % | 0.800 | % | 0.800 | % | 0.800 | % | 0.800 | % | 0.800 | % | 0.800 | % | |||||||||||
Mid Cap Growth | 0.400 | % | 0.400 | % | 0.400 | % | 0.400 | % | 0.400 | % | 0.400 | % | 0.400 | % | 0.400 | % | 0.400 | % | 0.400 | % | 0.400 | % | |||||||||||
Partner Mid Cap Value | 0.750 | % | 0.750 | % | 0.700 | % | 0.700 | % | 0.700 | % | 0.700 | % | 0.700 | % | 0.700 | % | 0.700 | % | 0.700 | % | 0.700 | % | |||||||||||
Mid Cap Stock | 0.700 | % | 0.700 | % | 0.650 | % | 0.650 | % | 0.650 | % | 0.650 | % | 0.600 | % | 0.600 | % | 0.600 | % | 0.550 | % | 0.525 | % | |||||||||||
Mid Cap Index | 0.350 | % | 0.350 | % | 0.350 | % | 0.300 | % | 0.250 | % | 0.250 | % | 0.200 | % | 0.150 | % | 0.100 | % | 0.100 | % | 0.100 | % |
351
Table of Contents
Thrivent Series Fund, Inc.
Notes to Financial Statements
As of June 30, 2010
(unaudited)
(3) FEES AND COMPENSATION PAID TO AFFILIATES – CONTINUED
Portfolio (M - Millions) | $0 to $50M | $50 to $200M | $200 to $250M | $250 to $500M | $500 to $750M | $750 to $1,000M | $1,000 to $1,500M | $1,500 to $2,000M | $2,000 to $2,500M | $2,500 to $5,000M | Over $5,000M | ||||||||||||||||||||||
Partner Worldwide | |||||||||||||||||||||||||||||||||
Allocation | 0.900 | % | 0.900 | % | 0.900 | % | 0.850 | % | 0.850 | % | 0.850 | % | 0.850 | % | 0.850 | % | 0.850 | % | 0.850 | % | 0.850 | % | |||||||||||
Partner International Stock | 0.850 | % | 0.850 | % | 0.850 | % | 0.850 | % | 0.800 | % | 0.800 | % | 0.750 | % | 0.700 | % | 0.700 | % | 0.700 | % | 0.700 | % | |||||||||||
Partner Socially Responsible Stock | 0.800 | % | 0.775 | % | 0.775 | % | 0.775 | % | 0.775 | % | 0.775 | % | 0.775 | % | 0.775 | % | 0.775 | % | 0.775 | % | 0.775 | % | |||||||||||
Partner All Cap Growth | 0.950 | % | 0.950 | % | 0.950 | % | 0.900 | % | 0.900 | % | 0.900 | % | 0.900 | % | 0.900 | % | 0.900 | % | 0.900 | % | 0.900 | % | |||||||||||
Partner All Cap Value | 0.750 | % | 0.700 | % | 0.700 | % | 0.700 | % | 0.700 | % | 0.700 | % | 0.700 | % | 0.700 | % | 0.700 | % | 0.700 | % | 0.700 | % | |||||||||||
Partner All Cap | 0.950 | % | 0.950 | % | 0.950 | % | 0.950 | % | 0.900 | % | 0.900 | % | 0.900 | % | 0.900 | % | 0.900 | % | 0.900 | % | 0.900 | % | |||||||||||
Large Cap Growth II | 0.800 | % | 0.800 | % | 0.800 | % | 0.800 | % | 0.700 | % | 0.700 | % | 0.700 | % | 0.700 | % | 0.700 | % | 0.700 | % | 0.700 | % | |||||||||||
Large Cap Growth | 0.400 | % | 0.400 | % | 0.400 | % | 0.400 | % | 0.400 | % | 0.400 | % | 0.400 | % | 0.400 | % | 0.400 | % | 0.400 | % | 0.400 | % | |||||||||||
Partner Growth Stock | 0.800 | % | 0.800 | % | 0.800 | % | 0.800 | % | 0.700 | % | 0.700 | % | 0.700 | % | 0.700 | % | 0.700 | % | 0.700 | % | 0.700 | % | |||||||||||
Large Cap Value | 0.600 | % | 0.600 | % | 0.600 | % | 0.600 | % | 0.600 | % | 0.600 | % | 0.600 | % | 0.600 | % | 0.600 | % | 0.600 | % | 0.600 | % | |||||||||||
Large Cap Stock | 0.650 | % | 0.650 | % | 0.650 | % | 0.650 | % | 0.575 | % | 0.550 | % | 0.475 | % | 0.475 | % | 0.475 | % | 0.450 | % | 0.425 | % | |||||||||||
Large Cap Index | 0.350 | % | 0.350 | % | 0.350 | % | 0.300 | % | 0.250 | % | 0.250 | % | 0.200 | % | 0.150 | % | 0.100 | % | 0.100 | % | 0.100 | % | |||||||||||
Equity Income Plus | 0.650 | % | 0.650 | % | 0.650 | % | 0.600 | % | 0.600 | % | 0.600 | % | 0.600 | % | 0.600 | % | 0.600 | % | 0.600 | % | 0.600 | % | |||||||||||
Balanced | 0.350 | % | 0.350 | % | 0.350 | % | 0.300 | % | 0.300 | % | 0.300 | % | 0.300 | % | 0.300 | % | 0.300 | % | 0.300 | % | 0.300 | % | |||||||||||
High Yield | 0.400 | % | 0.400 | % | 0.400 | % | 0.400 | % | 0.400 | % | 0.400 | % | 0.400 | % | 0.400 | % | 0.400 | % | 0.400 | % | 0.400 | % | |||||||||||
Diversified Income Plus | 0.400 | % | 0.400 | % | 0.400 | % | 0.400 | % | 0.400 | % | 0.400 | % | 0.400 | % | 0.400 | % | 0.400 | % | 0.400 | % | 0.400 | % | |||||||||||
Partner Socially Responsible Bond | 0.700 | % | 0.675 | % | 0.675 | % | 0.675 | % | 0.675 | % | 0.675 | % | 0.675 | % | 0.675 | % | 0.675 | % | 0.675 | % | 0.675 | % | |||||||||||
Income | 0.400 | % | 0.400 | % | 0.400 | % | 0.400 | % | 0.400 | % | 0.400 | % | 0.400 | % | 0.400 | % | 0.400 | % | 0.400 | % | 0.400 | % | |||||||||||
Bond Index | 0.350 | % | 0.350 | % | 0.350 | % | 0.300 | % | 0.250 | % | 0.250 | % | 0.200 | % | 0.150 | % | 0.100 | % | 0.100 | % | 0.100 | % | |||||||||||
Limited Maturity Bond | 0.400 | % | 0.400 | % | 0.400 | % | 0.400 | % | 0.400 | % | 0.400 | % | 0.400 | % | 0.400 | % | 0.400 | % | 0.400 | % | 0.400 | % | |||||||||||
Mortgage Securities | 0.500 | % | 0.500 | % | 0.500 | % | 0.500 | % | 0.500 | % | 0.500 | % | 0.500 | % | 0.500 | % | 0.500 | % | 0.500 | % | 0.500 | % | |||||||||||
Money Market | 0.400 | % | 0.400 | % | 0.400 | % | 0.400 | % | 0.400 | % | 0.400 | % | 0.400 | % | 0.400 | % | 0.400 | % | 0.400 | % | 0.400 | % |
(B) Sub-Adviser Fees – The following subadvisory fees are charged as part of the total investment advisory fees stated in the table above. The subadvisory fees are borne directly by the Adviser and do not increase the overall fees paid by the Portfolio.
Partner Technology Portfolio
Effective July 1, 2009, the Adviser has entered into a subadvisory agreement with GSAM for the performance of subadvisory services. The fee payable is equal to 0.45% of average daily net assets.
Partner Healthcare Portfolio
The Adviser has entered into a subadvisory agreement with Sectoral Asset Management, Inc. for the performance of subadvisory services. The fee payable is equal to 0.65% of the first $50 million of average daily net assets, 0.60% of the next $50 million, 0.40% of the next $150 million and 0.35% of average daily net assets over $250 million.
Partner Natural Resources Portfolio
The Adviser has entered into a subadvisory agreement with BlackRock Investment Management, LLC (“BlackRock”) for the performance of subadvisory services. The fee payable is equal to 0.45% of the first $50 million of average daily net assets, 0.425% of the next $50 million, 0.40% of the next $150 million and 0.375% of average daily net assets over $250 million. Thrivent Partner Utilities Portfolio is included in determining breakpoints for the assets managed by BlackRock.
Partner Emerging Markets Portfolio
The Adviser has entered into a subadvisory agreement with Aberdeen Asset Management Investment Services Limited (“Aberdeen”) for the performance of subadvisory services. The fee payable is equal to 0.85% of the first $50 million of average daily net assets, 0.72% of the next $50 million and 0.68% of average daily net assets over $100 million. Thrivent Partner Worldwide Allocation Portfolio and Thrivent Partner Worldwide Allocation Fund are included in determining breakpoints for the assets managed by Aberdeen.
Partner Utilities Portfolio
The Adviser has entered into a subadvisory agreement with BlackRock for the performance of subadvisory services. The fee payable is equal to 0.45% of the first $50 million of average daily net assets, 0.425% of the next $50 million, 0.40% of the next $150 million and 0.375% of average daily net assets over $250 million. Thrivent Partner Natural Resources Portfolio is included in determining breakpoints for the assets managed by BlackRock.
Partner Small Cap Growth Portfolio
The Adviser has entered into a subadvisory agreement with Turner Investment Partners, Inc. (“Turner”) for the performance of subadvisory services. The fee payable is equal to 0.65% of the first $100 million of average daily net assets and 0.60% of average daily net assets over $100 million. Thrivent Partner Small Cap Growth Fund is included in determining breakpoints for the assets managed by Turner.
352
Table of Contents
Thrivent Series Fund, Inc.
Notes to Financial Statements
As of June 30, 2010
(unaudited)
3) FEES AND COMPENSATION PAID TO AFFILIATES – CONTINUED
Effective December 1, 2009, the Adviser has entered into a new subadvisory agreement with Turner for performance of subadvisory services. For assets that are defined as microcap assets, the fee payable is equal to 0.80% of the average daily net assets in that microcap portion. For all other assets, the fee payable is equal to 0.65% of the average daily net assets when the entire portfolio assets (including the microcap portion) are no greater than $100 million, 0.60% of the average daily net assets when the entire portfolio assets are greater than $100 million but no greater than $350 million, and 0.575% of the average daily net assets when the entire portfolio assets are greater than $350 million. Thrivent Partner Small Cap Growth Fund (including the microcap portion of that Fund) is included in determining breakpoints for the assets managed by Turner.
Partner Small Cap Value Portfolio
The Adviser has entered into a subadvisory agreement with T. Rowe Price Associates, Inc. for the performance of subadvisory services. The fee payable is equal to 0.60% of average daily net assets.
Partner Mid Cap Value Portfolio
The Adviser has entered into a subadvisory agreement with Goldman Sachs Asset Management, LP (“GSAM”) for the performance of subadvisory services. The fee payable is equal to 0.50% of average daily net assets for the first $200 million and 0.45% for assets over $200 million. Thrivent Partner Mid Cap Value Fund is included in determining breakpoints for the assets managed by GSAM.
Partner Worldwide Allocation Portfolio
The Adviser has entered into subadvisory agreements with Mercator Asset Management, LP (“Mercator”), Principal Global Investors, LLC (“Principal”), Aberdeen, Victory Capital Management, Inc. (“Victory”) and GSAM for the performance of subadvisory services.
The fee payable for Mercator is equal to 0.75% of the first $25 million of average daily net assets managed by Mercator, 0.60% of the next $25 million, 0.55% of the next $25 million, 0.50% of the next $225 million, 0.40% of the next $200 million and 0.20% of average daily net assets over $500 million. Thrivent Partner Worldwide Allocation Fund, Thrivent Partner International Stock Portfolio and Thrivent Partner International Stock Fund are included in determining breakpoints for the assets managed by Mercator.
The fee payable for Principal is equal to 0.35% of the first $500 million of average daily net assets managed by Principal, 0.30% of the next $500 million and 0.25% of average daily net assets over $1 billion. Thrivent Partner Worldwide Allocation Fund, Thrivent Partner International Stock Portfolio and Thrivent Partner International Stock Fund are included in determining breakpoints for the assets managed by Principal.
The fee payable for Aberdeen is equal to 0.85% of the first $50 million of average daily net assets managed by Aberdeen, 0.72% of the next $50 million and 0.68% of average daily net assets over $100 million. Thrivent Partner Emerging Markets Portfolio and Partner Worldwide Allocation Fund are included in determining breakpoints for the assets managed by Aberdeen.
The fee payable for Victory is equal to 0.95% of the first $25 million of average daily net assets managed by Victory, 0.85% of the next $75 million and 0.80% of average daily net assets over $100 million. Thrivent Partner Worldwide Allocation Fund is included in determining breakpoints for the assets managed by Victory.
The fee payable for GSAM is equal to 0.55% of the first $50 million of average daily net assets managed by GSAM, 0.50% of the next $200 million and 0.45% of average daily net assets over $250 million. Thrivent Partner Worldwide Allocation Fund is included in determining breakpoints for the assets managed by GSAM.
Partner International Stock Portfolio
The Adviser has entered into subadvisory agreements with Principal and Mercator for the performance of subadvisory services.
The fee payable for Mercator is equal to 0.75% of the first $25 million of average daily net assets managed by Mercator, 0.60% of the next $25 million, 0.55% of the next $25 million, 0.50% of the next $225 million, 0.40% of the next $200 million and 0.20% of average daily net assets over $500 million. Thrivent Partner International Stock Fund, Thrivent Partner Worldwide Allocation Portfolio and Thrivent Partner Worldwide Allocation Fund are included in determining breakpoints for the assets managed by Mercator.
The fee payable for Principal is equal to 0.35% of the first $500 million of average daily net assets managed by Principal, 0.30% of the next $500 million and 0.25% of average daily net assets over $1 billion. Thrivent Partner International Stock Fund, Thrivent Partner Worldwide Allocation Portfolio and Thrivent Partner Worldwide Allocation Fund are included in determining breakpoints for the assets managed by Principal.
Partner Socially Responsible Stock Portfolio
The Adviser has entered into a subadvisory agreement with Calvert Asset Management Company, Inc. (“Calvert”) for the performance of subadvisory services. The fee payable is equal to 0.50% of average daily net assets for the first $50 million, 0.475% for the next $50 million, 0.45% for the next $50 million, 0.425% of the next $100 million and 0.40% for assets over $250 million.
353
Table of Contents
Thrivent Series Fund, Inc.
Notes to Financial Statements
As of June 30, 2010
(unaudited)
3) FEES AND COMPENSATION PAID TO AFFILIATES – CONTINUED
Partner All Cap Growth Portfolio
The Adviser has entered into a subadvisory agreement with Calamos Advisors LLC for the performance of subadvisory services. The fee payable is equal to 0.65% of average daily net assets.
Partner All Cap Value Portfolio
The Adviser has entered into a subadvisory agreement with OppenheimerFunds, Inc. for the performance of subadvisory services. The fee payable is equal to 0.45% of the first $50 million of average daily net assets, 0.40% of the next $200 million and 0.35% of average daily net assets over $250 million.
Partner All Cap Portfolio
The Adviser has entered into a subadvisory agreement with Pyramis Global Advisors, LLC (“Pyramis Advisors”) for the performance of subadvisory services. Pyramis Advisors is a wholly owned subsidiary of Fidelity Management & Research Corporation. The fee payable is equal to 0.60% of average daily net assets for the first $100 million, 0.55% for the next $400 million, 0.50% for the next $250 million and 0.45% for assets over $750 million.
Partner Growth Stock Portfolio
The Adviser has entered into a subadvisory agreement with T. Rowe Price Associates, Inc. for the performance of subadvisory services. The fee payable is equal to 0.40% of average daily net assets for the first $500 million and 0.35% for assets over $500 million.
Partner Socially Responsible Bond Portfolio
The Adviser has entered into a subadvisory agreement with Calvert for the performance of subadvisory services. The fee payable is equal to 0.40% of average daily net assets for the first $50 million, 0.375% for the next $50 million, 0.35% for the next $50 million, 0.325% of the next $100 million and 0.30% for assets over $250 million.
(C) Expense Reimbursements – As of June 30, 2010, the following voluntary expense reimbursements, as a percentage of net assets, were in effect:
Portfolio | Expense Reimbursement | Expiration Date | |||
Partner Small Cap Growth | 0.10 | % | N/A | ||
Mid Cap Growth II | 0.30 | % | N/A | ||
Partner International Stock | 0.07 | % | N/A | ||
Partner All Cap | 0.20 | % | N/A | ||
Large Cap Growth II | 0.25 | % | N/A | ||
Partner Growth Stock | 0.10 | % | N/A | ||
Money Market | 0.10 | % | N/A |
As of June 30, 2010, contractual expense reimbursements to limit expenses to the following percentages were in effect:
Portfolio | Expense Limit | Expiration Date | |||
Aggressive Allocation | 0.89 | % | 5/15/2011 | ||
Moderately Aggressive Allocation | 0.83 | % | 5/15/2011 | ||
Moderate Allocation | 0.77 | % | 5/15/2011 | ||
Moderately Conservative Allocation | 0.73 | % | 5/15/2011 | ||
Partner Healthcare | 1.39 | % | 4/30/2011 | ||
Partner Natural Resources | 1.19 | % | 4/30/2011 | ||
Partner Emerging Markets | 1.50 | % | 4/30/2011 | ||
Partner Utilities | 0.90 | % | 4/30/2011 | ||
Partner Worldwide Allocation | 1.00 | % | 4/30/2011 | ||
Partner Socially Responsible Stock | 0.98 | % | 4/30/2011 | ||
Partner All Cap Growth | 1.00 | % | 4/30/2011 | ||
Partner All Cap Value | 0.98 | % | 4/30/2011 | ||
Equity Income Plus | 0.85 | % | 4/30/2011 | ||
Partner Socially Responsible Bond | 0.68 | % | 4/30/2011 |
Each equity, hybrid and fixed income Portfolio may invest in High Yield Fund and Money Market Portfolio, subject to certain limitations. During the six months ended June 30, 2010, Income Portfolio and Limited Maturity Bond Portfolio invested in High Yield Fund. During the six months ended June 30, 2010, no Portfolios invested in Money Market Portfolio. These related-party transactions are subject to the same terms as non-related party transactions except that, to avoid duplicate investment advisory fees, Thrivent Financial reimburses an amount equal to the advisory fee which is charged to the Portfolio for its investment in High Yield Fund and Money Market Portfolio.
(D) Other Expenses – The Fund has entered into an accounting and administrative services agreement with the Adviser to provide certain accounting and administrative personnel and services to the Portfolios. For the six months ended June 30, 2010, the Adviser received aggregate fees for accounting and administrative personnel and services of $3,375,094 from the Fund.
Each Director is eligible to participate in a deferred compensation plan with respect to fees received from the Fund. Participants in the plan may designate their deferred Director’s fees as if invested in any one of the portfolios of Thrivent Mutual Funds. The value of each Director’s deferred compensation account will increase or decrease as if it were invested in shares of the selected portfolios of Thrivent Mutual Funds. The deferred fees remain in the appropriate fund until distribution in accordance with the plan. The deferred fee liability is an unsecured liability.
Those Directors not participating in the above plan received $125,796 in fees from the Fund for the six months ended June 30, 2010. No remuneration has been paid by the Fund to any of the officers or non-independent Directors of the Fund. In addition, the Fund reimbursed independent Directors for reasonable expenses incurred in relation to attendance at the meetings and industry conferences.
354
Table of Contents
Thrivent Series Fund, Inc.
Notes to Financial Statements
As of June 30, 2010
(unaudited)
3) FEES AND COMPENSATION PAID TO AFFILIATES – CONTINUED
Certain officers and non-independent directors of the Fund are officers and directors of Thrivent Financial and Thrivent Life; however, they receive no compensation from the Fund.
(E) Indirect Expenses – Some Portfolios invest in other mutual funds. Fees and expenses of those underlying funds are not included in the Portfolios’ expense ratios. The Portfolios indirectly bear their proportionate share of the annualized weighted average expense ratio of the underlying funds in which they invest.
(4) TAX INFORMATION
Distributions are based on amounts calculated in accordance with applicable federal income tax regulations, which may differ from GAAP. To the extent that these differences are permanent in nature, such amounts are reclassified within the capital accounts based on their federal tax-basis treatment; temporary differences do not require reclassifications. At fiscal year-end, the character and amount of distributions, on a tax-basis, and components of distributable earnings, are finalized. Therefore, as of June 30, 2010, tax-basis balances have not yet been determined.
At December 31, 2009, the following Portfolios had accumulated net realized capital loss carryovers expiring as follows:
Portfolio | Capital Loss Carryover | Expiration Year | |||
Partner Technology | $ | 11,378,393 | 2016 | ||
| 2,198,564 | 2017 | ||||
| $ | 13,576,957 | ||||
Partner Natural Resources | 19,375 | 2016 | |||
| 220,112 | 2017 | ||||
| $ | 239,487 | ||||
Partner Emerging Markets | 63,274 | 2016 | |||
| 783,676 | 2017 | ||||
| $ | 846,950 | ||||
Real Estate Securities | 8,066,759 | 2016 | |||
| 18,439,010 | 2017 | ||||
| $ | 26,505,769 | ||||
Partner Utilities | 375,164 | 2016 | |||
| 285,260 | 2017 | ||||
| $ | 660,424 | ||||
Partner Small Cap Growth | 34,011,452 | 2016 | |||
| 28,535,801 | 2017 | ||||
| $ | 62,547,253 | ||||
Partner Small Cap Value | 11,480,883 | 2017 | |||
| $ | 11,480,883 | ||||
Small Cap Stock | 60,076,135 | 2016 | |||
| 69,139,593 | 2017 | ||||
| $ | 129,215,728 | ||||
Small Cap Index | 6,962,218 | 2017 | |||
| $ | 6,962,218 | ||||
Mid Cap Growth | 10,809,135 | 2010 | |||
| 252,495 | 2016 | ||||
| 60,666,902 | 2017 | ||||
| $ | 71,728,532 | ||||
Partner Mid Cap Value | 16,998,457 | 2016 | |||
| 23,650,190 | 2017 | ||||
| $ | 40,648,647 | ||||
Mid Cap Stock | 90,742,741 | 2016 | |||
| 27,996,719 | 2017 | ||||
| $ | 118,739,460 | ||||
Mid Cap Index | 888,376 | 2017 | |||
| $ | 888,376 | ||||
Partner Worldwide Allocation | 8,058,363 | 2016 | |||
| 8,548,351 | 2017 | ||||
| $ | 16,606,714 | ||||
Partner International Stock | 2,858,197 | 2010 | |||
| 103,512,513 | 2016 | ||||
| 186,079,623 | 2017 | ||||
| $ | 292,450,333 | ||||
Partner Socially Responsible Stock | 99,213 | 2016 | |||
| 493,087 | 2017 | ||||
| $ | 592,300 | ||||
Partner All Cap Growth | 536,343 | 2016 | |||
| 586,578 | 2017 | ||||
| $ | 1,122,921 | ||||
Partner All Cap Value | 499,329 | 2016 | |||
| 885,072 | 2017 | ||||
| $ | 1,384,401 | ||||
Partner All Cap | 12,922,307 | 2016 | |||
| 11,312,120 | 2017 | ||||
| $ | 24,234,427 | ||||
Large Cap Growth | 724,404,403 | 2010 | |||
| 198,356,425 | 2011 | ||||
| 163,432,783 | 2016 | ||||
| 185,646,034 | 2017 | ||||
| $ | 1,271,839,645 | ||||
Partner Growth Stock | 1,995,784 | 2016 | |||
| 11,047,477 | 2017 | ||||
| $ | 13,043,261 | ||||
Large Cap Value | 71,155,534 | 2016 | |||
| 139,308,484 | 2017 | ||||
| $ | 210,464,018 | ||||
Large Cap Stock | 94,107,202 | 2016 | |||
| 98,352,276 | 2017 | ||||
| $ | 192,459,478 | ||||
Large Cap Index | 9,154,087 | 2017 | |||
| $ | 9,154,087 | ||||
Equity Income Plus | 5,806,765 | 2016 | |||
| 5,497,079 | 2017 | ||||
| $ | 11,303,844 | ||||
355
Table of Contents
Thrivent Series Fund, Inc.
Notes to Financial Statements
As of June 30, 2010
(unaudited)
(4) TAX INFORMATION – CONTINUED
Portfolio | Capital Loss Carryover | Expiration Year | |||
High Yield | 184,350,285 | 2010 | |||
| 364,926,135 | 2011 | ||||
| 30,516,064 | 2012 | ||||
| 10,993,224 | 2013 | ||||
| 560,014 | 2014 | ||||
| 42,742,264 | 2016 | ||||
| 46,838,004 | 2017 | ||||
| $ | 680,925,990 | ||||
Diversified Income Plus | 2,850,377 | 2010 | |||
| 9,888,303 | 2016 | ||||
| 9,354,607 | 2017 | ||||
| $ | 22,093,287 | ||||
Income | 2,082,528 | 2014 | |||
| 39,514,415 | 2016 | ||||
| 51,183,448 | 2017 | ||||
| $ | 92,780,391 | ||||
Bond Index | 1,161,958 | 2014 | |||
| 103,719 | 2015 | ||||
| $ | 1,265,677 | ||||
Limited Maturity Bond | 2,108,299 | 2013 | |||
| 1,181,750 | 2014 | ||||
| 1,010,934 | 2015 | ||||
| 10,441,148 | 2016 | ||||
| 6,959,975 | 2017 | ||||
| $ | 21,702,106 | ||||
To the extent that these Portfolios realize future net capital gains, taxable distributions will be reduced by any unused capital loss carryovers as permitted by the Internal Revenue Code.
The following Portfolios deferred, on a tax basis, the following post-October 2009 losses:
Portfolio | Post-October Loss | ||
Partner Healthcare | $ | 1,681 | |
Partner Emerging Markets | 2,964 | ||
Partner Utilities | 216 | ||
Partner Small Cap Value | 414,892 | ||
Small Cap Index | 537,807 | ||
Mid Cap Growth | 2,738,883 | ||
Partner Mid Cap Value | 69,456 | ||
Partner Worldwide Allocation | 1,632 | ||
Partner International Stock | 940,958 | ||
Partner All Cap Growth | 119,009 | ||
Partner All Cap Value | 21,588 | ||
Partner All Cap | 261,708 | ||
Partner Growth Stock | 56,085 | ||
Large Cap Value | 4,405,919 | ||
Large Cap Index | 891,250 | ||
Equity Income Plus | 269,813 | ||
High Yield | 1,317,551 | ||
Diversified Income Plus | 276,002 | ||
Partner Socially Responsible Bond | 14,325 | ||
Income | 1,558,121 | ||
Mortgage Securities | 94,366 | ||
These amounts are deferred for tax purposes and deemed to occur in the fiscal year ended December 31, 2010.
(5) SECURITY TRANSACTIONS
(A) Purchases and Sales of Investment Securities – For the six months ended June 30, 2010, the cost of purchases and the proceeds from sales of investment securities, other than U.S. Government and short-term securities, were as follows:
| In thousands | ||||||
Portfolio | Purchases | Sales | ||||
Aggressive Allocation | $ | 159,375 | $ | 148,108 | ||
Moderately Aggressive Allocation | 441,495 | 307,907 | ||||
Moderate Allocation | 526,352 | 257,744 | ||||
Moderately Conservative Allocation | 285,548 | 118,330 | ||||
Partner Technology | 6,666 | 7,637 | ||||
Partner Healthcare | 5,265 | 2,770 | ||||
Partner Natural Resources | 3,885 | 392 | ||||
Partner Emerging Markets | 5,389 | 650 | ||||
Real Estate Securities | 20,591 | 14,393 | ||||
Partner Utilities | 1,606 | 936 | ||||
Partner Small Cap Growth | 88,230 | 86,779 | ||||
Partner Small Cap Value | 41,318 | 32,332 | ||||
Small Cap Stock | 355,960 | 370,158 | ||||
Small Cap Index | 8,851 | 23,422 | ||||
Mid Cap Growth II | 32,205 | 28,920 | ||||
Mid Cap Growth | 87,760 | 106,332 | ||||
Partner Mid Cap Value | 104,438 | 93,152 | ||||
Mid Cap Stock | 108,258 | 127,823 | ||||
Mid Cap Index | 5,788 | 10,617 | ||||
Partner Worldwide Allocation | 249,453 | 133,895 | ||||
Partner International Stock | 414,010 | 453,210 | ||||
Partner Socially Responsible Stock | 942 | 1,162 | ||||
Partner All Cap Growth | 3,914 | 3,347 | ||||
Partner All Cap Value | 4,775 | 4,214 | ||||
Partner All Cap | 65,652 | 69,787 | ||||
Large Cap Growth II | 389,116 | 392,340 | ||||
Large Cap Growth | 1,068,431 | 1,126,699 | ||||
Partner Growth Stock | 11,004 | 16,121 | ||||
Large Cap Value | 535,255 | 527,194 | ||||
Large Cap Stock | 538,524 | 527,210 | ||||
Large Cap Index | 12,361 | 34,081 | ||||
Equity Income Plus | 148,280 | 142,004 | ||||
Balanced | 10,479 | 29,066 | ||||
High Yield | 290,699 | 274,830 | ||||
Diversified Income Plus | 56,836 | 49,934 | ||||
Partner Socially Responsible Bond | 2,011 | 2,389 | ||||
Income | 523,964 | 631,592 | ||||
Bond Index | 4,680 | 8,780 | ||||
Limited Maturity Bond | 416,825 | 389,588 | ||||
Mortgage Securities | 1,162 | 3,616 | ||||
Purchases and Sales of U.S. Government Securities were:
| In thousands | ||||||
Portfolio | Purchases | Sales | ||||
Aggressive Allocation | $ | 40,410 | $ | 13,178 | ||
Moderately Aggressive Allocation | 117,324 | 38,826 | ||||
Moderate Allocation | 159,846 | 53,451 | ||||
Moderately Conservative Allocation | 61,193 | 20,591 | ||||
Balanced | 194,120 | 192,690 | ||||
Diversified Income Plus | 1,495 | 1,490 | ||||
Partner Socially Responsible Bond | 143 | 43 | ||||
Income | 453,976 | 435,360 | ||||
356
Table of Contents
Thrivent Series Fund, Inc.
Notes to Financial Statements
As of June 30, 2010
(unaudited)
(5) SECURITY TRANSACTIONS – CONTINUED
| In thousands | ||||
Portfolio | Purchases | Sales | ||
Bond Index | 350,865 | 349,064 | ||
Limited Maturity Bond | 334,294 | 274,879 | ||
Mortgage Securities | 111,597 | 109,726 | ||
(B) Investments in Restricted Securities – Certain Portfolios may own restricted securities that have been deemed illiquid and were purchased in private placement transactions without registration under the Securities Act of 1933. Unless such securities subsequently become registered, they generally may be resold only in privately negotiated transactions with a limited number of purchasers. As of June 30, 2010, the following Portfolios held restricted securities:
Portfolio | Number of Securities | Percent of Portfolio’s Net Assets | |||
Partner Worldwide Allocation | 6 | 0.35 | % | ||
Balanced | 4 | 2.10 | % | ||
High Yield | 4 | 0.69 | % | ||
Diversified Income Plus | 2 | 1.85 | % | ||
Partner Socially Responsible Bond | 1 | 0.20 | % | ||
Income | 7 | 1.69 | % | ||
Bond Index | 4 | 3.74 | % | ||
Limited Maturity Bond | 7 | 1.74 | % | ||
Mortgage Securities | 2 | 4.75 | % |
The Portfolios have no right to require registration of unregistered securities.
(C) Investments in High-Yielding Securities – High Yield Portfolio invests primarily in high-yielding fixed income securities. Each of the other Portfolios, except Money Market Portfolio, may also invest in high-yielding securities. These securities will typically be in the lower rating categories or will be non-rated and generally will involve more risk than securities in the higher rating categories. Lower rated or unrated securities are more likely to react to developments affecting market risk and credit risk than are more highly rated securities, which react primarily to movements in the general level of interest rates.
(D) Investments in Options and Futures Contracts – The movement in the price of the security underlying an option or futures contract may not correlate perfectly with the movement in the prices of the portfolio securities being hedged. A lack of correlation could render the Portfolio’s hedging strategy unsuccessful and could result in a loss to the Portfolio. In the event that a liquid secondary market would not exist, the Portfolio could be prevented from entering into a closing transaction which could result in additional losses to the Portfolio.
(E) Written Option Contracts – The number of contracts and premium amounts associated with covered call option contracts written during the six months ended June 30, 2010, were as follows:
| Number of Contracts | Premium Amount | ||||||
Aggressive Allocation | |||||||
Balance at December 31, 2009 | — | $ | — | ||||
Opened | 11 | 58,469 | |||||
Closed | — | — | |||||
Expired | — | — | |||||
Exercised | (6 | ) | (29,781 | ) | |||
Balance at June 30, 2010 | 5 | $ | 28,688 | ||||
Moderately Aggressive Allocation | |||||||
Balance at December 31, 2009 | — | $ | — | ||||
Opened | 44 | 237,813 | |||||
Closed | — | — | |||||
Expired | — | — | |||||
Exercised | (22 | ) | (120,938 | ) | |||
Balance at June 30, 2010 | 22 | $ | 116,875 | ||||
Moderate Allocation | |||||||
Balance at December 31, 2009 | — | $ | — | ||||
Opened | 62 | 337,125 | |||||
Closed | — | — | |||||
Expired | — | — | |||||
Exercised | (31 | ) | (171,375 | ) | |||
Balance at June 30, 2010 | 31 | $ | 165,750 | ||||
Moderately Conservative Allocation | |||||||
Balance at December 31, 2009 | — | $ | — | ||||
Opened | 25 | 133,938 | |||||
Closed | — | — | |||||
Expired | — | — | |||||
Exercised | (13 | ) | (68,063 | ) | |||
Balance at June 30, 2010 | 12 | $ | 65,875 | ||||
Large Cap Growth II | |||||||
Balance at December 31, 2009 | 195 | $ | 11,416 | ||||
Opened | 761 | 56,800 | |||||
Closed | (112 | ) | (6,837 | ) | |||
Expired | (649 | ) | (49,963 | ) | |||
Exercised | (195 | ) | (11,416 | ) | |||
Balance at June 30, 2010 | — | $ | — | ||||
Large Cap Growth | |||||||
Balance at December 31, 2009 | 457 | $ | 26,754 | ||||
Opened | 3,858 | 313,574 | |||||
Closed | (1,922 | ) | (172,667 | ) | |||
Expired | (1,936 | ) | (140,908 | ) | |||
Exercised | (457 | ) | (26,755 | ) | |||
Balance at June 30, 2010 | — | $ | — | ||||
357
Table of Contents
Thrivent Series Fund, Inc.
Notes to Financial Statements
As of June 30, 2010
(unaudited)
(5) SECURITY TRANSACTIONS – CONTINUED
| Number of Contracts | Premium Amount | ||||||
Large Cap Stock | |||||||
Balance at December 31, 2009 | 1,145 | $ | 415,231 | ||||
Opened | 9,086 | 3,643,437 | |||||
Closed | (9,113 | ) | (3,930,464 | ) | |||
Expired | (973 | ) | (119,715 | ) | |||
Exercised | (145 | ) | (8,489 | ) | |||
Balance at June 30, 2010 | — | $ | — | ||||
Equity Income Plus | |||||||
Balance at December 31, 2009 | 110 | $ | 44,897 | ||||
Opened | 870 | 369,305 | |||||
Closed | (930 | ) | (405,871 | ) | |||
Expired | (50 | ) | (8,331 | ) | |||
Exercised | — | — | |||||
Balance at June 30, 2010 | — | $ | — | ||||
Diversified Income Plus | |||||||
Balance at December 31, 2009 | 60 | $ | 24,405 | ||||
Opened | 350 | 147,888 | |||||
Closed | (390 | ) | (168,960 | ) | |||
Expired | (20 | ) | (3,333 | ) | |||
Exercised | — | — | |||||
Balance at June 30, 2010 | — | $ | — | ||||
Mortgage Securities | |||||||
Balance at December 31, 2009 | — | $ | — | ||||
Opened | 2 | 9,125 | |||||
Closed | — | — | |||||
Expired | — | — | |||||
Exercised | (1 | ) | (4,875 | ) | |||
Balance at June 30, 2010 | 1 | $ | 4,250 | ||||
(6) SECURITY TRANSACTIONS WITH AFFILIATED FUNDS
The Portfolios are permitted to purchase or sell securities from or to certain other Portfolios under specified conditions outlined in procedures adopted by the Board of Directors. The procedures have been designed to ensure that any purchase or sale of securities by the Portfolio from or to another portfolio or fund that is or could be considered an affiliate by virtue of having a common investment adviser (or affiliated investment advisers), common Directors and/ or common officers complies with Rule 17a-7 of the 1940 Act. Further, as defined under the procedures, each transaction is effected at the current market price. Pursuant to these procedures, during the six months ended June 30, 2010, the Portfolios engaged in purchases and sales of securities of $22,932,586 and $21,483,582, respectively.
(7) SHARES OF BENEFICIAL INTEREST
The shares of each Portfolio have equal rights and privileges with all shares of that Portfolio. Shares in the Portfolio are currently sold only to separate accounts of Thrivent Financial, Thrivent Life and retirement plans sponsored by Thrivent Financial.
Authorized capital stock consists of ten billion shares as follows:
Portfolio | Shares Authorized | Par Value | |||
Aggressive Allocation | 300,000,000 | $ | 0.01 | ||
Moderately Aggressive Allocation | 350,000,000 | 0.01 | |||
Moderate Allocation | 350,000,000 | 0.01 | |||
Moderately Conservative Allocation | 300,000,000 | 0.01 | |||
Partner Technology | 100,000,000 | 0.01 | |||
Partner Healthcare | 200,000,000 | 0.01 | |||
Partner Natural Resources | 200,000,000 | 0.01 | |||
Partner Emerging Markets | 200,000,000 | 0.01 | |||
Real Estate Securities | 200,000,000 | 0.01 | |||
Partner Utilities | 200,000,000 | 0.01 | |||
Partner Small Cap Growth | 200,000,000 | 0.01 | |||
Partner Small Cap Value | 200,000,000 | 0.01 | |||
Small Cap Stock | 200,000,000 | 0.01 | |||
Small Cap Index | 200,000,000 | 0.01 | |||
Mid Cap Growth II | 200,000,000 | 0.01 | |||
Mid Cap Growth | 200,000,000 | 0.01 | |||
Partner Mid Cap Value | 200,000,000 | 0.01 | |||
Mid Cap Stock | 200,000,000 | 0.01 | |||
Mid Cap Index | 200,000,000 | 0.01 | |||
Partner Worldwide Allocation | 200,000,000 | 0.01 | |||
Partner International Stock | 250,000,000 | 0.01 | |||
Partner Socially Responsible Stock | 200,000,000 | 0.01 | |||
Partner All Cap Growth | 200,000,000 | 0.01 | |||
Partner All Cap Value | 200,000,000 | 0.01 | |||
Partner All Cap | 200,000,000 | 0.01 | |||
Large Cap Growth II | 200,000,000 | 0.01 | |||
Large Cap Growth | 300,000,000 | 0.01 | |||
Partner Growth Stock | 200,000,000 | 0.01 | |||
Large Cap Value | 200,000,000 | 0.01 | |||
Large Cap Stock | 250,000,000 | 0.01 | |||
Large Cap Index | 200,000,000 | 0.01 | |||
Equity Income Plus | 200,000,000 | 0.01 | |||
Balanced | 200,000,000 | 0.01 | |||
High Yield | 300,000,000 | 0.01 | |||
Diversified Income Plus | 200,000,000 | 0.01 | |||
Partner Socially Responsible Bond | 200,000,000 | 0.01 | |||
Income | 300,000,000 | 0.01 | |||
Bond Index | 200,000,000 | 0.01 | |||
Limited Maturity Bond | 200,000,000 | 0.01 | |||
Mortgage Securities | 200,000,000 | 0.01 | |||
Money Market | 1,200,000,000 | 0.01 | |||
(8) SUBSEQUENT EVENTS
Management of the Portfolios has evaluated the impact of subsequent events through August 19, 2010, the date the financial statements were issued, and, except as already included in the Notes to Financial Statements, has determined that no additional items require disclosure.
358
Table of Contents
[THIS PAGE INTENTIONALLY LEFT BLANK]
359
Table of Contents
Thrivent Series Fund, Inc.
Financial Highlights
| (a) | The amount shown may not correlate with the change in aggregate gains and losses of portfolio securities due to the timing of sales and redemptions of fund shares. |
| (c) | Since inception, April 29, 2005. |
| * | All per share amounts have been rounded to the nearest cent. |
The accompanying Notes to Financial Statements are an integral part of this schedule.
360
Table of Contents
Thrivent Series Fund, Inc.
Financial Highlights – continued
| RATIOS / SUPPLEMENTAL DATA | |||||||||||||||||||||||||
| Ratio to Average Net Assets** | Ratios to Average Net Assets Before Expenses Waived, Credited or Paid indirectly** | ||||||||||||||||||||||||
Total Distributions | Net Asset Value, End of Period | Total Return(b) | Net Assets, End of Period (in millions) | Expenses | Net Investment Income/(Loss) | Expenses | Net Investment Income/(Loss) | Portfolio Turnover Rate | |||||||||||||||||
| $ | (0.26) | $ | 9.81 | (5.72 | )% | $ | 474.9 | 0.33 | % | 0.44 | % | 0.38 | % | 0.39 | % | 34 | % | ||||||||
| (0.41) | 10.66 | 30.62 | % | 497.6 | 0.23 | % | 1.29 | % | 0.26 | % | 1.27 | % | 22 | % | |||||||||||
| (0.49) | 8.51 | (37.23 | )% | 354.3 | 0.20 | % | 2.45 | % | 0.20 | % | 2.45 | % | 30 | % | |||||||||||
| (0.14) | 14.09 | 9.33 | % | 496.4 | 0.15 | % | 1.17 | % | 0.20 | % | 1.12 | % | 16 | % | |||||||||||
| — | 13.01 | 13.77 | % | 333.6 | 0.04 | % | 0.88 | % | 0.20 | % | 0.72 | % | 8 | % | |||||||||||
| — | 11.44 | 14.45 | % | 71.8 | 0.10 | % | 0.11 | % | 0.37 | % | (0.16 | )% | 7 | % | |||||||||||
| (0.41) | 9.90 | (3.93 | )% | 2,029.3 | 0.27 | % | 1.32 | % | 0.27 | % | 1.32 | % | 18 | % | |||||||||||
| (0.46) | 10.72 | 29.80 | % | 1,983.0 | 0.20 | % | 2.41 | % | 0.20 | % | 2.41 | % | 17 | % | |||||||||||
| (0.46) | 8.64 | (33.40 | )% | 1,354.6 | 0.17 | % | 3.36 | % | 0.17 | % | 3.36 | % | 27 | % | |||||||||||
| (0.16) | 13.48 | 7.74 | % | 1,780.8 | 0.13 | % | 1.86 | % | 0.17 | % | 1.82 | % | 18 | % | |||||||||||
| — | 12.66 | 13.15 | % | 1,063.8 | 0.05 | % | 1.58 | % | 0.18 | % | 1.44 | % | 14 | % | |||||||||||
| (0.02) | 11.19 | 12.12 | % | 238.1 | 0.10 | % | 0.69 | % | 0.24 | % | 0.55 | % | 4 | % | |||||||||||
| (0.46) | 10.20 | (1.70 | )% | 2,868.8 | 0.25 | % | 2.12 | % | 0.25 | % | 2.12 | % | 12 | % | |||||||||||
| (0.47) | 10.82 | 26.89 | % | 2,658.5 | 0.19 | % | 3.16 | % | 0.19 | % | 3.16 | % | 16 | % | |||||||||||
| (0.44) | 8.92 | (27.74 | )% | 1,811.6 | 0.17 | % | 3.91 | % | 0.17 | % | 3.91 | % | 22 | % | |||||||||||
| (0.22) | 12.82 | 6.75 | % | 2,168.9 | 0.14 | % | 2.68 | % | 0.17 | % | 2.65 | % | 18 | % | |||||||||||
| — | 12.22 | 11.52 | % | 1,274.0 | 0.08 | % | 2.29 | % | 0.18 | % | 2.19 | % | 19 | % | |||||||||||
| (0.04) | 10.96 | 9.98 | % | 331.2 | 0.12 | % | 1.29 | % | 0.22 | % | 1.19 | % | 4 | % | |||||||||||
| (0.46) | 10.46 | (0.01 | )% | 1,239.3 | 0.28 | % | 2.62 | % | 0.28 | % | 2.62 | % | 13 | % | |||||||||||
| (0.42) | 10.91 | 22.53 | % | 1,075.4 | 0.22 | % | 3.41 | % | 0.22 | % | 3.41 | % | 16 | % | |||||||||||
| (0.38) | 9.27 | (20.61 | )% | 714.8 | 0.18 | % | 4.09 | % | 0.18 | % | 4.09 | % | 21 | % | |||||||||||
| (0.27) | 12.08 | 5.59 | % | 756.9 | 0.17 | % | 3.36 | % | 0.19 | % | 3.34 | % | 13 | % | |||||||||||
| — | 11.69 | 9.53 | % | 434.9 | 0.15 | % | 2.94 | % | 0.20 | % | 2.89 | % | 19 | % | |||||||||||
| (0.06) | 10.68 | 7.40 | % | 146.7 | 0.17 | % | 2.12 | % | 0.27 | % | 2.02 | % | 5 | % | |||||||||||
| — | 5.40 | (5.15 | )% | 28.2 | 1.16 | % | (0.64 | )% | 1.16 | % | (0.64 | )% | 22 | % | |||||||||||
| — | 5.69 | 56.58 | % | 30.9 | 1.22 | % | (0.67 | )% | 1.23 | % | (0.68 | )% | 181 | % | |||||||||||
| (1.02) | 3.63 | (48.32 | )% | 24.3 | 0.89 | % | (0.01 | )% | 0.91 | % | (0.03 | )% | 269 | % | |||||||||||
| (0.27) | 8.24 | 11.08 | % | 56.6 | 0.86 | % | (0.14 | )% | 0.87 | % | (0.15 | )% | 147 | % | |||||||||||
| (0.10) | 7.67 | 3.26 | % | 53.4 | 0.88 | % | (0.23 | )% | 0.89 | % | (0.24 | )% | 133 | % | |||||||||||
| (0.02) | 7.53 | 3.72 | % | 59.8 | 0.86 | % | (0.33 | )% | 0.88 | % | (0.34 | )% | 47 | % | |||||||||||
| ( b) | Total investment return assumes dividend reinvestment and does not reflect any deduction for sales charges. Not annualized for periods less than one year. Total return shown does not reflect charges and expenses imposed on contract holders by the variable accounts. Those charges and expenses reduce the return received by contract holders as compared to the return presented. |
361
Table of Contents
Thrivent Series Fund, Inc.
Financial Highlights – continued
| FOR A SHARE OUTSTANDING THROUGHOUT EACH PERIOD* | |||||||||||||||||||||||||||
| Income from Investment Operations | Less Distributions from | ||||||||||||||||||||||||||
| Net Asset Value, Beginning of Period | Net Investment Income/(Loss) | Net Realized and Unrealized Gain/(Loss) on Investments(a) | Total from Investment Operations | Net Investment Income | Net Realized Gain on Investments | Return of Capital | |||||||||||||||||||||
PARTNER HEALTHCARE PORTFOLIO | |||||||||||||||||||||||||||
Period Ended 6/30/2010 (unaudited) | $ | 11.08 | $ | 0.02 | $ | (0.27 | ) | $ | (0.25 | ) | $ | (0.02 | ) | $ | (0.19 | ) | $ | — | |||||||||
Year Ended 12/31/2009 | 8.94 | 0.02 | 2.12 | 2.14 | — | — | — | ||||||||||||||||||||
Year Ended 12/31/2008 (c) | 10.00 | — | (1.05 | ) | (1.05 | ) | (0.01 | ) | — | — | |||||||||||||||||
PARTNER NATURAL RESOURCES PORTFOLIO | |||||||||||||||||||||||||||
Period Ended 6/30/2010 (unaudited) | 8.23 | — | (1.01 | ) | (1.01 | ) | (0.01 | ) | — | — | |||||||||||||||||
Year Ended 12/31/2009 | 5.72 | 0.01 | 2.50 | 2.51 | — | — | — | ||||||||||||||||||||
Year Ended 12/31/2008 (c) | 10.00 | 0.01 | (4.28 | ) | (4.27 | ) | (0.01 | ) | — | — | |||||||||||||||||
PARTNER EMERGING MARKETS PORTFOLIO | |||||||||||||||||||||||||||
Period Ended 6/30/2010 (unaudited) | 9.72 | 0.06 | (0.02 | ) | 0.04 | — | — | — | |||||||||||||||||||
Year Ended 12/31/2009 | 5.59 | 0.04 | 4.13 | 4.17 | (0.04 | ) | — | — | |||||||||||||||||||
Year Ended 12/31/2008 (c) | 10.00 | 0.06 | (4.42 | ) | (4.36 | ) | (0.05 | ) | — | — | |||||||||||||||||
REAL ESTATE SECURITIES PORTFOLIO | |||||||||||||||||||||||||||
Period Ended 6/30/2010 (unaudited) | 11.67 | 0.16 | 0.47 | 0.63 | — | — | — | ||||||||||||||||||||
Year Ended 12/31/2009 | 9.34 | 0.29 | 2.44 | 2.73 | (0.29 | ) | — | (0.11 | ) | ||||||||||||||||||
Year Ended 12/31/2008 | 17.74 | 0.41 | (6.35 | ) | (5.94 | ) | (0.74 | ) | (1.46 | ) | (0.26 | ) | |||||||||||||||
Year Ended 12/31/2007 | 22.93 | 0.32 | (3.84 | ) | (3.52 | ) | (0.30 | ) | (1.37 | ) | — | ||||||||||||||||
Year Ended 12/31/2006 | 18.16 | 0.29 | 5.65 | 5.94 | (0.29 | ) | (0.88 | ) | — | ||||||||||||||||||
Year Ended 12/31/2005 | 17.04 | 0.26 | 1.80 | 2.06 | (0.24 | ) | (0.70 | ) | — | ||||||||||||||||||
PARTNER UTILITIES PORTFOLIO | |||||||||||||||||||||||||||
Period Ended 6/30/2010 (unaudited) | 7.76 | 0.09 | (0.70 | ) | (0.61 | ) | (0.17 | ) | — | — | |||||||||||||||||
Year Ended 12/31/2009 | 6.93 | 0.18 | 0.65 | 0.83 | — | — | — | ||||||||||||||||||||
Year Ended 12/31/2008 (c) | 10.00 | 0.12 | (3.08 | ) | (2.96 | ) | (0.11 | ) | — | — | |||||||||||||||||
PARTNER SMALL CAP GROWTH PORTFOLIO | |||||||||||||||||||||||||||
Period Ended 6/30/2010 (unaudited) | 10.03 | (0.03 | ) | (0.24 | ) | (0.27 | ) | — | — | — | |||||||||||||||||
Year Ended 12/31/2009 | 7.45 | (0.03 | ) | 2.62 | 2.59 | (0.01 | ) | — | — | ||||||||||||||||||
Year Ended 12/31/2008 | 13.94 | 0.01 | (5.77 | ) | (5.76 | ) | — | (0.73 | ) | — | |||||||||||||||||
Year Ended 12/31/2007 | 13.58 | (0.04 | ) | 1.21 | 1.17 | — | (0.81 | ) | — | ||||||||||||||||||
Year Ended 12/31/2006 | 12.11 | (0.05 | ) | 1.57 | 1.52 | — | (0.05 | ) | — | ||||||||||||||||||
Year Ended 12/31/2005 | 12.33 | (0.06 | ) | 0.50 | 0.44 | — | (0.66 | ) | — | ||||||||||||||||||
| (a) | The amount shown may not correlate with the change in aggregate gains and losses of portfolio securities due to the timing of sales and redemptions of fund shares. |
| (c) | Since inception, April 30, 2008. |
362
Table of Contents
Thrivent Series Fund, Inc.
Financial Highlights - continued
| RATIOS / SUPPLEMENTAL DATA | ||||||||||||||||||||||||||
| Ratio to Average Net Assets** | Ratios to Average Net Assets Before Expenses Waived, Credited or Paid Indirectly** | |||||||||||||||||||||||||
Total Distributions | Net Asset Value, End of Period | Total Return(b) | Net Assets, End of Period (in millions) | Expenses | Net Investment Income/(Loss) | Expenses | Net Investment Income/(Loss) | Portfolio Turnover Rate | ||||||||||||||||||
| $ | (0.21 | ) | $ | 10.62 | (2.35 | )% | $ | 15.1 | 1.39 | % | 0.45 | % | 1.76 | % | 0.08 | % | 19 | % | ||||||||
| — | 11.08 | 23.83 | % | 13.3 | 1.39 | % | 0.19 | % | 2.10 | % | (0.52 | )% | 80 | % | ||||||||||||
| (0.01) | 8.94 | (10.48 | )% | 7.1 | 1.39 | % | (0.09 | )% | 2.12 | % | (0.83 | )% | 40 | % | ||||||||||||
| (0.01) | 7.21 | (12.33 | )% | 20.6 | 1.19 | % | (0.08 | )% | 1.31 | % | (0.20 | )% | 2 | % | ||||||||||||
| — | 8.23 | 43.72 | % | 21.1 | 1.19 | % | 0.15 | % | 1.70 | % | (0.36 | )% | 2 | % | ||||||||||||
| (0.01) | 5.72 | (42.68 | )% | 6.6 | 1.19 | % | 0.23 | % | 1.87 | % | (0.45 | )% | 1 | % | ||||||||||||
| — | 9.76 | 0.38 | % | 21.8 | 1.50 | % | 1.27 | % | 1.99 | % | 0.78 | % | 3 | % | ||||||||||||
| (0.04) | 9.72 | 74.70 | % | 17.4 | 1.50 | % | 0.78 | % | 2.91 | % | (0.63 | )% | 13 | % | ||||||||||||
| (0.05) | 5.59 | (43.58 | )% | 5.3 | 1.50 | % | 1.18 | % | 2.68 | % | 0.00 | % | 25 | % | ||||||||||||
| — | 12.30 | 5.42 | % | 279.2 | 0.87 | % | 2.57 | % | 0.87 | % | 2.57 | % | 5 | % | ||||||||||||
| (0.40) | 11.67 | 29.08 | % | 265.4 | 0.89 | % | 3.34 | % | 0.90 | % | 3.33 | % | 18 | % | ||||||||||||
| (2.46) | 9.34 | (37.24 | )% | 197.4 | 0.85 | % | 2.74 | % | 0.86 | % | 2.73 | % | 45 | % | ||||||||||||
| (1.67) | 17.74 | (16.80 | )% | 326.4 | 0.86 | % | 1.60 | % | 0.86 | % | 1.60 | % | 71 | % | ||||||||||||
| (1.17) | 22.93 | 34.18 | % | 367.9 | 0.84 | % | 1.41 | % | 0.86 | % | 1.40 | % | 69 | % | ||||||||||||
| (0.94) | 18.16 | 13.25 | % | 274.6 | 0.86 | % | 1.88 | % | 0.87 | % | 1.87 | % | 83 | % | ||||||||||||
| (0.17) | 6.98 | (7.96 | )% | 6.5 | 0.90 | % | 3.05 | % | 2.65 | % | 1.30 | % | 15 | % | ||||||||||||
| — | 7.76 | 12.00 | % | 6.4 | 0.90 | % | 2.93 | % | 3.10 | % | 0.73 | % | 22 | % | ||||||||||||
| (0.11) | 6.93 | (29.57 | )% | 4.4 | 0.90 | % | 2.55 | % | 2.31 | % | 1.14 | % | 22 | % | ||||||||||||
| — | 9.76 | (2.61 | )% | 158.5 | 1.02 | % | (0.65 | )% | 1.12 | % | (0.75 | )% | 54 | % | ||||||||||||
| (0.01) | 10.03 | 34.75 | % | 160.5 | 1.02 | % | (0.39 | )% | 1.14 | % | (0.51 | )% | 118 | % | ||||||||||||
| (0.73) | 7.45 | (43.23 | )% | 112.5 | 0.98 | % | 0.08 | % | 1.09 | % | (0.04 | )% | 199 | % | ||||||||||||
| (0.81) | 13.94 | 8.52 | % | 167.6 | 0.99 | % | (0.32 | )% | 1.10 | % | (0.42 | )% | 98 | % | ||||||||||||
| (0.05) | 13.58 | 12.59 | % | 107.4 | 0.99 | % | (0.42 | )% | 1.12 | % | (0.55 | )% | 113 | % | ||||||||||||
| (0.66) | 12.11 | 3.96 | % | 64.7 | 0.99 | % | (0.60 | )% | 1.17 | % | (0.78 | )% | 104 | % | ||||||||||||
| (b) | Total investment return assumes dividend reinvestment and does not reflect any deduction for sales charges. Not annualized for periods less than one year. Total return shown does not reflect charges and expenses imposed on contract holders by the variable accounts. Those charges and expenses reduce the return received by contract holders as compared to the return presented. |
363
Table of Contents
Thrivent Series Fund, Inc.
Financial Highlights – continued
| FOR A SHARE OUTSTANDING THROUGHOUT EACH PERIOD* | ||||||||||||||||||||||
| Income from Investment Operations | Less Distributions from | |||||||||||||||||||||
| Net Asset Value, Beginning of Period | Net Investment Income/(Loss) | Net Realized and Unrealized Gain/(Loss) on Investments(a) | Total from Investment Operations | Net Investment Income | Net Realized Gain on Investments | |||||||||||||||||
PARTNER SMALL CAP VALUE PORTFOLIO | ||||||||||||||||||||||
Period Ended 6/30/2010 (unaudited) | $ | 15.58 | $ | 0.06 | $ | (0.40 | ) | $ | (0.34 | ) | $ | (0.04 | ) | $ | — | |||||||
Year Ended 12/31/2009 | 12.07 | 0.11 | 3.52 | 3.63 | (0.11 | ) | (0.01 | ) | ||||||||||||||
Year Ended 12/31/2008 | 18.44 | 0.13 | (4.85 | ) | (4.72 | ) | (0.20 | ) | (1.45 | ) | ||||||||||||
Year Ended 12/31/2007 | 19.57 | 0.11 | (0.21 | ) | (0.10 | ) | (0.07 | ) | (0.96 | ) | ||||||||||||
Year Ended 12/31/2006 | 16.82 | 0.08 | 3.45 | 3.53 | (0.04 | ) | (0.74 | ) | ||||||||||||||
Year Ended 12/31/2005 | 16.56 | 0.07 | 0.71 | 0.78 | (0.04 | ) | (0.48 | ) | ||||||||||||||
SMALL CAP STOCK PORTFOLIO | ||||||||||||||||||||||
Period Ended 6/30/2010 (unaudited) | 10.13 | — | (0.45 | ) | (0.45 | ) | — | — | ||||||||||||||
Year Ended 12/31/2009 | 8.49 | 0.07 | 1.65 | 1.72 | (0.08 | ) | — | |||||||||||||||
Year Ended 12/31/2008 | 15.48 | 0.06 | (5.34 | ) | (5.28 | ) | (0.13 | ) | (1.58 | ) | ||||||||||||
Year Ended 12/31/2007 | 15.43 | 0.10 | 0.88 | 0.98 | (0.05 | ) | (0.88 | ) | ||||||||||||||
Year Ended 12/31/2006 | 14.62 | 0.05 | 1.78 | 1.83 | (0.02 | ) | (1.00 | ) | ||||||||||||||
Year Ended 12/31/2005 | 14.74 | 0.02 | 1.16 | 1.18 | (0.01 | ) | (1.29 | ) | ||||||||||||||
SMALL CAP INDEX PORTFOLIO | ||||||||||||||||||||||
Period Ended 6/30/2010 (unaudited) | 10.57 | 0.05 | (0.17 | ) | (0.12 | ) | (0.09 | ) | — | |||||||||||||
Year Ended 12/31/2009 | 10.54 | 0.11 | 2.03 | 2.14 | (0.22 | ) | (1.89 | ) | ||||||||||||||
Year Ended 12/31/2008 | 19.21 | 0.22 | (5.15 | ) | (4.93 | ) | (0.20 | ) | (3.54 | ) | ||||||||||||
Year Ended 12/31/2007 | 21.55 | 0.24 | (0.11 | ) | 0.13 | (0.14 | ) | (2.33 | ) | |||||||||||||
Year Ended 12/31/2006 | 19.41 | 0.17 | 2.64 | 2.81 | (0.14 | ) | (0.53 | ) | ||||||||||||||
Year Ended 12/31/2005 | 19.26 | 0.15 | 1.18 | 1.33 | (0.13 | ) | (1.05 | ) | ||||||||||||||
MID CAP GROWTH PORTFOLIO II | ||||||||||||||||||||||
Period Ended 6/30/2010 (unaudited) | 8.43 | — | (0.21 | ) | (0.21 | ) | — | (0.09 | ) | |||||||||||||
Year Ended 12/31/2009 | 5.65 | — | 2.78 | 2.78 | — | — | ||||||||||||||||
Year Ended 12/31/2008 | 11.42 | 0.01 | (4.37 | ) | (4.36 | ) | (0.03 | ) | (1.38 | ) | ||||||||||||
Year Ended 12/31/2007 | 11.37 | 0.03 | 2.13 | 2.16 | (0.06 | ) | (2.05 | ) | ||||||||||||||
Year Ended 12/31/2006 | 10.60 | 0.06 | 0.85 | 0.91 | (0.02 | ) | (0.12 | ) | ||||||||||||||
Year Ended 12/31/2005 | 9.53 | 0.02 | 1.05 | 1.07 | — | — | ||||||||||||||||
MID CAP GROWTH PORTFOLIO | ||||||||||||||||||||||
Period Ended 6/30/2010 (unaudited) | 14.42 | 0.01 | (0.40 | ) | (0.39 | ) | (0.04 | ) | — | |||||||||||||
Year Ended 12/31/2009 | 9.55 | 0.04 | 4.83 | 4.87 | — | — | ||||||||||||||||
Year Ended 12/31/2008 | 20.18 | 0.10 | (7.19 | ) | (7.09 | ) | (0.18 | ) | (3.36 | ) | ||||||||||||
Year Ended 12/31/2007 | 17.59 | 0.08 | 3.38 | 3.46 | (0.08 | ) | (0.79 | ) | ||||||||||||||
Year Ended 12/31/2006 | 16.21 | 0.08 | 1.32 | 1.40 | (0.02 | ) | — | |||||||||||||||
Year Ended 12/31/2005 | 14.57 | 0.02 | 1.62 | 1.64 | — | — | ||||||||||||||||
| (a) | The amount shown may not correlate with the change in aggregate gains and losses of portfolio securities due to the timing of sales and redemptions of fund shares. |
364
Table of Contents
Thrivent Series Fund, Inc.
Financial Highlights – continued
| RATIOS / SUPPLEMENTAL DATA | ||||||||||||||||||||||||||
| Ratio to Average Net Assets** | Ratios to Average Net Assets Before Expenses Waived, Credited or Paid Indirectly** | |||||||||||||||||||||||||
Total Distributions | Net Asset Value, End of Period | Total Return(b) | Net Assets, End of Period (in millions) | Expenses | Net Investment Income/(Loss) | Expenses | Net Investment Income/(Loss) | Portfolio Turnover Rate | ||||||||||||||||||
| $ | (0.04 | ) | $ | 15.20 | (2.25 | )% | $ | 225.3 | 0.88 | % | 0.75 | % | 0.88 | % | 0.75 | % | 14 | % | ||||||||
| (0.12 | ) | 15.58 | 30.24 | % | 226.3 | 0.89 | % | 0.86 | % | 0.90 | % | 0.85 | % | 19 | % | |||||||||||
| (1.65 | ) | 12.07 | (27.05 | )% | 167.9 | 0.86 | % | 1.08 | % | 0.87 | % | 1.07 | % | 31 | % | |||||||||||
| (1.03 | ) | 18.44 | (1.03 | )% | 185.6 | 0.86 | % | 0.68 | % | 0.87 | % | 0.66 | % | 29 | % | |||||||||||
| (0.78 | ) | 19.57 | 21.50 | % | 163.6 | 0.86 | % | 0.52 | % | 0.88 | % | 0.51 | % | 25 | % | |||||||||||
| (0.52 | ) | 16.82 | 4.89 | % | 106.2 | 0.88 | % | 0.51 | % | 0.89 | % | 0.49 | % | 37 | % | |||||||||||
| — | 9.68 | (4.43 | )% | 241.3 | 0.78 | % | (0.02 | )% | 0.78 | % | (0.02 | )% | 145 | % | ||||||||||||
| (0.08 | ) | 10.13 | 20.38 | % | 258.5 | 0.78 | % | 0.65 | % | 0.78 | % | 0.65 | % | 254 | % | |||||||||||
| (1.71 | ) | 8.49 | (37.52 | )% | 288.1 | 0.73 | % | 0.66 | % | 0.75 | % | 0.64 | % | 286 | % | |||||||||||
| (0.93 | ) | 15.48 | 6.14 | % | 399.9 | 0.72 | % | 0.66 | % | 0.74 | % | 0.65 | % | 126 | % | |||||||||||
| (1.02 | ) | 15.43 | 12.79 | % | 406.7 | 0.73 | % | 0.33 | % | 0.74 | % | 0.32 | % | 94 | % | |||||||||||
| (1.30 | ) | 14.62 | 8.81 | % | 290.2 | 0.74 | % | 0.20 | % | 0.76 | % | 0.19 | % | 113 | % | |||||||||||
| (0.09 | ) | 10.36 | (1.06 | )% | 186.4 | 0.46 | % | 0.68 | % | 0.46 | % | 0.68 | % | 4 | % | |||||||||||
| (2.11 | ) | 10.57 | 25.29 | % | 203.9 | 0.47 | % | 0.94 | % | 0.48 | % | 0.94 | % | 13 | % | |||||||||||
| (3.74 | ) | 10.54 | (31.07 | )% | 192.2 | 0.42 | % | 1.28 | % | 0.42 | % | 1.28 | % | 31 | % | |||||||||||
| (2.47 | ) | 19.21 | (0.50 | )% | 357.9 | 0.39 | % | 1.00 | % | 0.39 | % | 0.99 | % | 16 | % | |||||||||||
| (0.67 | ) | 21.55 | 14.72 | % | 439.8 | 0.39 | % | 0.71 | % | 0.39 | % | 0.71 | % | 14 | % | |||||||||||
| (1.18 | ) | 19.41 | 7.32 | % | 473.7 | 0.39 | % | 0.75 | % | 0.39 | % | 0.75 | % | 14 | % | |||||||||||
| (0.09 | ) | 8.13 | (2.56 | )% | 123.3 | 0.72 | % | (0.09 | )% | 1.02 | % | (0.39 | )% | 24 | % | |||||||||||
| — | 8.43 | 49.31 | % | 125.8 | 0.68 | % | (0.05 | )% | 1.05 | % | (0.42 | )% | 73 | % | ||||||||||||
| (1.41 | ) | 5.65 | (42.71 | )% | 80.8 | 0.56 | % | 0.30 | % | 1.07 | % | (0.22 | )% | 104 | % | |||||||||||
| (2.11 | ) | 11.42 | 19.80 | % | 32.4 | 0.59 | % | 0.18 | % | 1.11 | % | (0.33 | )% | 81 | % | |||||||||||
| (0.14 | ) | 11.37 | 8.60 | % | 31.7 | 0.39 | % | 0.44 | % | 1.11 | % | (0.28 | )% | 147 | % | |||||||||||
| — | 10.60 | 11.22 | % | 38.2 | 0.39 | % | 0.17 | % | 1.10 | % | (0.54 | )% | 136 | % | ||||||||||||
| (0.04 | ) | 13.99 | (2.70 | )% | 338.4 | 0.46 | % | 0.16 | % | 0.46 | % | 0.16 | % | 25 | % | |||||||||||
| — | 14.42 | 50.94 | % | 365.2 | 0.48 | % | 0.30 | % | 0.48 | % | 0.29 | % | 61 | % | ||||||||||||
| (3.54 | ) | 9.55 | (41.13 | )% | 275.1 | 0.44 | % | 0.54 | % | 0.45 | % | 0.52 | % | 82 | % | |||||||||||
| (0.87 | ) | 20.18 | 19.92 | % | 669.8 | 0.44 | % | 0.35 | % | 0.45 | % | 0.34 | % | 80 | % | |||||||||||
| (0.02 | ) | 17.59 | 8.63 | % | 654.9 | 0.45 | % | 0.40 | % | 0.45 | % | 0.40 | % | 149 | % | |||||||||||
| — | 16.21 | 11.27 | % | 747.5 | 0.45 | % | 0.11 | % | 0.45 | % | 0.11 | % | 135 | % | ||||||||||||
| (b) | Total investment return assumes dividend reinvestment and does not reflect any deduction for sales charges. Not annualized for periods less than one year. Total return shown does not reflect charges and expenses imposed on contract holders by the variable accounts. Those charges and expenses reduce the return received by contract holders as compared to the return presented. |
365
Table of Contents
Thrivent Series Fund, Inc.
Financial Highlights – continued
| FOR A SHARE OUSTANDING THROUGHOUT EACH PERIOD* | ||||||||||||||||||||||
| Income from Investment Operations | Less Distributions from | |||||||||||||||||||||
| Net Asset Value, Beginning of Period | Net Investment Income/(Loss) | Net Realized and Unrealized Gain/(Loss) on Investments(a) | Total from Investment Operations | Net Investment Income | Net Realized Gain on Investments | |||||||||||||||||
PARTNER MID CAP VALUE PORTFOLIO | ||||||||||||||||||||||
Period Ended 6/30/2010 (unaudited) | $ | 10.82 | $ | 0.03 | $ | (0.39 | ) | $ | (0.36 | ) | $ | (0.04 | ) | $ | — | |||||||
Year Ended 12/31/2009 | 8.25 | 0.12 | 2.54 | 2.66 | (0.09 | ) | — | |||||||||||||||
Year Ended 12/31/2008 | 13.41 | 0.08 | (4.61 | ) | (4.53 | ) | (0.18 | ) | (0.45 | ) | ||||||||||||
Year Ended 12/31/2007 | 13.06 | 0.14 | 0.28 | 0.42 | — | (0.07 | ) | |||||||||||||||
Year Ended 12/31/2006 | 11.48 | 0.10 | 1.70 | 1.80 | (0.10 | ) | (0.12 | ) | ||||||||||||||
Year Ended 12/31/2005 (c) | 10.00 | 0.04 | 1.51 | 1.55 | (0.04 | ) | (0.03 | ) | ||||||||||||||
MID CAP STOCK PORTFOLIO | ||||||||||||||||||||||
Period Ended 6/30/2010 (unaudited) | 9.80 | 0.02 | (0.39 | ) | (0.37 | ) | (0.01 | ) | — | |||||||||||||
Year Ended 12/31/2009 | 7.08 | 0.05 | 2.72 | 2.77 | (0.05 | ) | — | |||||||||||||||
Year Ended 12/31/2008 | 13.15 | 0.04 | (5.08 | ) | (5.04 | ) | (0.12 | ) | (0.91 | ) | ||||||||||||
Year Ended 12/31/2007 | 13.41 | 0.08 | 0.76 | 0.84 | (0.12 | ) | (0.98 | ) | ||||||||||||||
Year Ended 12/31/2006 | 12.82 | 0.13 | 1.51 | 1.64 | (0.05 | ) | (1.00 | ) | ||||||||||||||
Year Ended 12/31/2005 | 11.66 | 0.05 | 1.76 | 1.81 | (0.02 | ) | (0.63 | ) | ||||||||||||||
MID CAP INDEX PORTFOLIO | ||||||||||||||||||||||
Period Ended 6/30/2010 (unaudited) | 10.37 | 0.06 | (0.23 | ) | (0.17 | ) | (0.12 | ) | — | |||||||||||||
Year Ended 12/31/2009 | 8.31 | 0.12 | 2.72 | 2.84 | (0.18 | ) | (0.60 | ) | ||||||||||||||
Year Ended 12/31/2008 | 15.20 | 0.19 | (5.02 | ) | (4.83 | ) | (0.19 | ) | (1.87 | ) | ||||||||||||
Year Ended 12/31/2007 | 15.05 | 0.20 | 1.00 | 1.20 | (0.15 | ) | (0.90 | ) | ||||||||||||||
Year Ended 12/31/2006 | 14.43 | 0.18 | 1.20 | 1.38 | (0.14 | ) | (0.62 | ) | ||||||||||||||
Year Ended 12/31/2005 | 13.34 | 0.14 | 1.44 | 1.58 | (0.07 | ) | (0.42 | ) | ||||||||||||||
PARTNER WORLDWIDE ALLOCATION PORTFOLIO | ||||||||||||||||||||||
Period Ended 6/30/2010 (unaudited) | 7.84 | 0.09 | (0.75 | ) | (0.66 | ) | — | — | ||||||||||||||
Year Ended 12/31/2009 | 6.03 | 0.10 | 1.81 | 1.91 | (0.10 | ) | — | |||||||||||||||
Year Ended 12/31/2008(d) | 10.00 | 0.07 | (3.98 | ) | (3.91 | ) | (0.06 | ) | — | |||||||||||||
PARTNER INTERNATIONAL STOCK PORTFOLIO | ||||||||||||||||||||||
Period Ended 6/30/2010 (unaudited) | 9.99 | 0.14 | (1.41 | ) | (1.27 | ) | — | — | ||||||||||||||
Year Ended 12/31/2009 | 8.18 | 0.20 | 1.82 | 2.02 | (0.21 | ) | — | |||||||||||||||
Year Ended 12/31/2008 | 17.26 | 0.33 | (6.56 | ) | (6.23 | ) | (0.68 | ) | (2.17 | ) | ||||||||||||
Year Ended 12/31/2007 | 16.32 | 0.36 | 1.37 | 1.73 | (0.24 | ) | (0.55 | ) | ||||||||||||||
Year Ended 12/31/2006 | 13.63 | 0.23 | 2.67 | 2.90 | (0.21 | ) | — | |||||||||||||||
Year Ended 12/31/2005 | 12.12 | 0.17 | 1.48 | 1.65 | (0.14 | ) | — | |||||||||||||||
PARTNER SOCIALLY RESPONSIBLE STOCK PORTFOLIO | ||||||||||||||||||||||
Period Ended 6/30/2010 (unaudited) | 8.76 | 0.01 | (0.57 | ) | (0.56 | ) | — | — | ||||||||||||||
Year Ended 12/31/2009 | 6.48 | 0.03 | 2.29 | 2.32 | (0.04 | ) | — | |||||||||||||||
Year Ended 12/31/2008(d) | 10.00 | 0.02 | (3.52 | ) | (3.50 | ) | (0.02 | ) | — | |||||||||||||
| (a) | The amount shown may not correlate with the change in aggregate gains and losses of portfolio securities due to the timing of sales and redemptions of fund shares. |
| (c) | Since inception, April 29, 2005. |
| (d) | Since inception, April 30, 2008. |
366
Table of Contents
Thrivent Series Fund, Inc.
Financial Highlights - continued
| RATIOS / SUPPLEMENTAL DATA | ||||||||||||||||||||||||||
| Ratio to Average Net Assets** | Ratios to Average Net Assets Before Expenses Waived, Credited or Paid Indirectly** | |||||||||||||||||||||||||
Total Distributions | Net Asset Value, End of Period | Total Return(b) | Net Assets, End of Period (in millions) | Expenses | Net Investment Income/(Loss) | Expenses | Net Investment Income/(Loss) | Portfolio Turnover Rate | ||||||||||||||||||
| $ | (0.04 | ) | $ | 10.42 | (3.28 | )% | $ | 183.6 | 0.85 | % | 0.48 | % | 0.85 | % | 0.48 | % | 49 | % | ||||||||
| (0.09 | ) | 10.82 | 32.33 | % | 183.7 | 0.87 | % | 1.42 | % | 0.88 | % | 1.41 | % | 114 | % | |||||||||||
| (0.63 | ) | 8.25 | (35.05 | )% | 123.3 | 0.83 | % | 1.41 | % | 0.85 | % | 1.39 | % | 97 | % | |||||||||||
| (0.07 | ) | 13.41 | 3.16 | % | 95.0 | 0.89 | % | 1.24 | % | 0.90 | % | 1.23 | % | 85 | % | |||||||||||
| (0.22 | ) | 13.06 | 15.72 | % | 54.9 | 0.96 | % | 1.07 | % | 0.98 | % | 1.05 | % | 57 | % | |||||||||||
| (0.07 | ) | 11.48 | 15.44 | % | 21.2 | 1.25 | % | 0.88 | % | 1.49 | % | 0.63 | % | 30 | % | |||||||||||
| (0.01 | ) | 9.42 | (3.75 | )% | 405.0 | 0.73 | % | 0.45 | % | 0.73 | % | 0.45 | % | 26 | % | |||||||||||
| (0.05 | ) | 9.80 | 39.10 | % | 443.5 | 0.73 | % | 0.55 | % | 0.74 | % | 0.54 | % | 53 | % | |||||||||||
| (1.03 | ) | 7.08 | (40.75 | )% | 379.9 | 0.72 | % | 0.81 | % | 0.73 | % | 0.80 | % | 234 | % | |||||||||||
| (1.10 | ) | 13.15 | 5.70 | % | 387.9 | 0.72 | % | 0.70 | % | 0.74 | % | 0.69 | % | 215 | % | |||||||||||
| (1.05 | ) | 13.41 | 13.41 | % | 363.8 | 0.73 | % | 1.26 | % | 0.75 | % | 1.24 | % | 184 | % | |||||||||||
| (0.65 | ) | 12.82 | 16.37 | % | 224.2 | 0.76 | % | 0.62 | % | 0.78 | % | 0.60 | % | 124 | % | |||||||||||
| (0.12 | ) | 10.08 | (1.67 | )% | 79.3 | 0.53 | % | 0.92 | % | 0.53 | % | 0.92 | % | 7 | % | |||||||||||
| (0.78 | ) | 10.37 | 36.69 | % | 86.9 | 0.56 | % | 1.19 | % | 0.57 | % | 1.19 | % | 18 | % | |||||||||||
| (2.06 | ) | 8.31 | (36.29 | )% | 75.1 | 0.46 | % | 1.33 | % | 0.46 | % | 1.32 | % | 24 | % | |||||||||||
| (1.05 | ) | 15.20 | 7.63 | % | 146.2 | 0.43 | % | 1.16 | % | 0.43 | % | 1.15 | % | 20 | % | |||||||||||
| (0.76 | ) | 15.05 | 9.81 | % | 159.8 | 0.43 | % | 1.10 | % | 0.43 | % | 1.10 | % | 11 | % | |||||||||||
| (0.49 | ) | 14.43 | 12.34 | % | 171.5 | 0.43 | % | 1.08 | % | 0.44 | % | 1.07 | % | 19 | % | |||||||||||
| — | 7.18 | (8.39 | )% | 330.3 | 1.00 | % | 2.67 | % | 1.08 | % | 2.58 | % | 46 | % | ||||||||||||
| (0.10 | ) | 7.84 | 31.67 | % | 254.9 | 1.00 | % | 2.01 | % | 1.20 | % | 1.81 | % | 80 | % | |||||||||||
| (0.06 | ) | 6.03 | (39.09 | )% | 105.9 | 1.00 | % | 2.17 | % | 1.25 | % | 1.92 | % | 49 | % | |||||||||||
| — | 8.72 | (12.74 | )% | 740.4 | 0.83 | % | 2.97 | % | 0.90 | % | 2.90 | % | 51 | % | ||||||||||||
| (0.21 | ) | 9.99 | 24.79 | % | 882.9 | 0.85 | % | 2.29 | % | 0.91 | % | 2.23 | % | 76 | % | |||||||||||
| (2.85 | ) | 8.18 | (41.10 | )% | 778.1 | 0.81 | % | 2.54 | % | 0.89 | % | 2.46 | % | 70 | % | |||||||||||
| (0.79 | ) | 17.26 | 10.57 | % | 1,443.8 | 0.81 | % | 2.11 | % | 0.88 | % | 2.04 | % | 113 | % | |||||||||||
| (0.21 | ) | 16.32 | 21.50 | % | 1,341.8 | 0.89 | % | 1.51 | % | 0.89 | % | 1.51 | % | 50 | % | |||||||||||
| (0.14 | ) | 13.63 | 13.71 | % | 1,055.9 | 0.94 | % | 1.58 | % | 0.94 | % | 1.58 | % | 46 | % | |||||||||||
| — | 8.20 | (6.35 | )% | 3.7 | 0.98 | % | 0.16 | % | 3.67 | % | (2.53 | )% | 24 | % | ||||||||||||
| (0.04 | ) | 8.76 | 35.65 | % | 4.1 | 0.98 | % | 0.41 | % | 4.06 | % | (2.67 | )% | 41 | % | |||||||||||
| (0.02 | ) | 6.48 | (34.98 | )% | 3.2 | 0.98 | % | 0.30 | % | 2.19 | % | (0.92 | )% | 32 | % | |||||||||||
| (b) | Total investment return assumes dividend reinvestment and does not reflect any deduction for sales charges. Not annualized for periods less than one year. Total return shown does not reflect charges and expenses imposed on contract holders by the variable accounts. Those charges and expenses reduce the return received by contract holders as compared to the return presented. |
367
Table of Contents
Thrivent Series Fund, Inc.
Financial Highlights – continued
| FOR A SHARE OUSTANDING THROUGHOUT EACH PERIOD* | |||||||||||||||||||||||
| Income from Investment Operations | Less Distributions from | ||||||||||||||||||||||
| Net Asset Value, Beginning of Period | Net Investment Income/(Loss) | Net Realized and Unrealized Gain/(Loss) on Investments(a) | Total from Investment Operations | Net Investment Income | Net Realized Gain on Investments | ||||||||||||||||||
PARTNER ALL CAP GROWTH PORTFOLIO | |||||||||||||||||||||||
Period Ended 6/30/2010 (unaudited) | $ | 8.03 | $ | (0.02 | ) | $ | (0.64 | ) | $ | (0.66 | ) | $ | — | $ | — | ||||||||
Year Ended 12/31/2009 | 5.34 | (0.01 | ) | 2.70 | 2.69 | — | — | ||||||||||||||||
Year Ended 12/31/2008 (c) | 10.00 | (0.01 | ) | (4.65 | ) | (4.66 | ) | — | — | ||||||||||||||
PARTNER ALL CAP VALUE PORTFOLIO | |||||||||||||||||||||||
Period Ended 6/30/2010 (unaudited) | 7.65 | 0.01 | (0.55 | ) | (0.54 | ) | — | — | |||||||||||||||
Year Ended 12/31/2009 | 5.47 | 0.06 | 2.20 | 2.26 | (0.08 | ) | — | ||||||||||||||||
Year Ended 12/31/2008 (c) | 10.00 | 0.08 | (4.51 | ) | (4.43 | ) | (0.10 | ) | — | ||||||||||||||
PARTNER ALL CAP PORTFOLIO | |||||||||||||||||||||||
Period Ended 6/30/2010 (unaudited) | 7.73 | 0.02 | (0.62 | ) | (0.60 | ) | (0.06 | ) | — | ||||||||||||||
Year Ended 12/31/2009 | 6.10 | 0.06 | 1.66 | 1.72 | (0.09 | ) | — | ||||||||||||||||
Year Ended 12/31/2008 | 13.00 | 0.09 | (5.05 | ) | (4.96 | ) | (0.08 | ) | (1.86 | ) | |||||||||||||
Year Ended 12/31/2007 | 12.03 | 0.07 | 2.28 | 2.35 | (0.06 | ) | (1.32 | ) | |||||||||||||||
Year Ended 12/31/2006 | 10.47 | 0.06 | 1.55 | 1.61 | (0.05 | ) | — | ||||||||||||||||
Year Ended 12/31/2005 | 8.89 | 0.05 | 1.58 | 1.63 | (0.05 | ) | — | ||||||||||||||||
LARGE CAP GROWTH PORTFOLIO II | |||||||||||||||||||||||
Period Ended 6/30/2010 (unaudited) | 7.32 | 0.01 | (0.80 | ) | (0.79 | ) | (0.01 | ) | (0.24 | ) | |||||||||||||
Year Ended 12/31/2009 | 5.85 | 0.05 | 2.26 | 2.31 | (0.04 | ) | (0.80 | ) | |||||||||||||||
Year Ended 12/31/2008 | 11.96 | 0.02 | (4.49 | ) | (4.47 | ) | (0.06 | ) | (1.58 | ) | |||||||||||||
Year Ended 12/31/2007 | 11.00 | 0.06 | 1.71 | 1.77 | (0.08 | ) | (0.73 | ) | |||||||||||||||
Year Ended 12/31/2006 | 10.37 | 0.07 | 0.63 | 0.70 | (0.06 | ) | (0.01 | ) | |||||||||||||||
Year Ended 12/31/2005 | 9.77 | 0.06 | 0.62 | 0.68 | (0.08 | ) | — | ||||||||||||||||
LARGE CAP GROWTH PORTFOLIO | |||||||||||||||||||||||
Period Ended 6/30/2010 (unaudited) | 15.40 | 0.04 | (1.63 | ) | (1.59 | ) | (0.01 | ) | — | ||||||||||||||
Year Ended 12/31/2009 | 10.96 | 0.11 | 4.43 | 4.54 | (0.10 | ) | — | ||||||||||||||||
Year Ended 12/31/2008 | 19.23 | 0.18 | (8.26 | ) | (8.08 | ) | (0.19 | ) | — | ||||||||||||||
Year Ended 12/31/2007 | 16.64 | 0.12 | 2.67 | 2.79 | (0.20 | ) | — | ||||||||||||||||
Year Ended 12/31/2006 | 15.67 | 0.09 | 0.96 | 1.05 | (0.08 | ) | — | ||||||||||||||||
Year Ended 12/31/2005 | 14.76 | 0.08 | 0.95 | 1.03 | (0.12 | ) | — | ||||||||||||||||
| (a) | The amount shown may not correlate with the change in aggregate gains and losses of portfolio securities due to the timing of sales and redemptions of fund shares. |
| (c) | Since inception, April 30, 2008. |
368
Table of Contents
Thrivent Series Fund, Inc.
Financial Highlights – continued
| RATIOS / SUPPLEMENTAL DATA | ||||||||||||||||||||||||||
| Ratio to Average Net Assets** | Ratios to Average Net Assets Before Expenses Waived, Credited or Paid Indirectly** | |||||||||||||||||||||||||
Total | Net Asset Value, End of Period | Total Return(b) | Net Assets, End of Period (in millions) | Expenses | Net Investment Income/(Loss) | Expenses | Net Investment Income/(Loss) | Portfolio Turnover Rate | ||||||||||||||||||
| $ | — | $ | 7.37 | (8.23 | )% | $ | 7.8 | 1.00 | % | (0.41 | )% | 2.33 | % | (1.74 | )% | 40 | % | |||||||||
| — | 8.03 | 50.32 | % | 8.1 | 1.00 | % | (0.15 | )% | 3.79 | % | (2.94 | )% | 46 | % | ||||||||||||
| — | 5.34 | (46.57 | )% | 2.4 | 1.00 | % | (0.14 | )% | 2.64 | % | (1.79 | )% | 62 | % | ||||||||||||
| — | 7.11 | (7.03 | )% | 5.7 | 0.98 | % | 0.31 | % | 2.90 | % | (1.61 | )% | 74 | % | ||||||||||||
| (0.08 | ) | 7.65 | 41.20 | % | 5.5 | 0.98 | % | 1.26 | % | 4.67 | % | (2.43 | )% | 143 | % | |||||||||||
| (0.10 | ) | 5.47 | (44.21 | )% | 2.5 | 0.98 | % | 1.43 | % | 2.80 | % | (0.40 | )% | 168 | % | |||||||||||
| (0.06 | ) | 7.07 | (7.82 | )% | 53.8 | 1.02 | % | 0.31 | % | 1.22 | % | 0.11 | % | 109 | % | |||||||||||
| (0.09 | ) | 7.73 | 28.48 | % | 62.6 | 1.04 | % | 0.76 | % | 1.24 | % | 0.56 | % | 231 | % | |||||||||||
| (1.94 | ) | 6.10 | (42.91 | )% | 56.2 | 0.86 | % | 0.84 | % | 1.07 | % | 0.64 | % | 260 | % | |||||||||||
| (1.38 | ) | 13.00 | 20.37 | % | 117.6 | 0.84 | % | 0.61 | % | 1.05 | % | 0.41 | % | 169 | % | |||||||||||
| (0.05 | ) | 12.03 | 15.47 | % | 96.5 | 0.85 | % | 0.51 | % | 1.05 | % | 0.31 | % | 162 | % | |||||||||||
| (0.05 | ) | 10.47 | 18.33 | % | 82.2 | 0.95 | % | 0.62 | % | 1.08 | % | 0.49 | % | 150 | % | |||||||||||
| (0.25 | ) | 6.28 | (11.20 | )% | 316.2 | 0.62 | % | 0.30 | % | 0.87 | % | 0.05 | % | 115 | % | |||||||||||
| (0.84 | ) | 7.32 | 39.78 | % | 357.4 | 0.57 | % | 0.67 | % | 0.87 | % | 0.37 | % | 235 | % | |||||||||||
| (1.64 | ) | 5.85 | (41.92 | )% | 309.0 | 0.62 | % | 0.90 | % | 1.03 | % | 0.49 | % | 149 | % | |||||||||||
| (0.81 | ) | 11.96 | 16.47 | % | 34.0 | 0.65 | % | 0.39 | % | 1.06 | % | (0.01 | )% | 156 | % | |||||||||||
| (0.07 | ) | 11.00 | 6.78 | % | 35.9 | 0.40 | % | 0.57 | % | 1.03 | % | (0.07 | )% | 132 | % | |||||||||||
| (0.08 | ) | 10.37 | 7.08 | % | 42.6 | 0.40 | % | 0.55 | % | 1.00 | % | (0.05 | )% | 113 | % | |||||||||||
| (0.01 | ) | 13.80 | (10.32 | )% | 858.8 | 0.45 | % | 0.56 | % | 0.45 | % | 0.56 | % | 112 | % | |||||||||||
| (0.10 | ) | 15.40 | 41.40 | % | 1,025.3 | 0.45 | % | 0.79 | % | 0.45 | % | 0.79 | % | 216 | % | |||||||||||
| (0.19 | ) | 10.96 | (42.00 | )% | 844.5 | 0.44 | % | 0.74 | % | 0.45 | % | 0.73 | % | 177 | % | |||||||||||
| (0.20 | ) | 19.23 | 16.75 | % | 2,553.5 | 0.44 | % | 0.63 | % | 0.45 | % | 0.63 | % | 163 | % | |||||||||||
| (0.08 | ) | 16.64 | 6.72 | % | 2,331.7 | 0.45 | % | 0.54 | % | 0.45 | % | 0.53 | % | 141 | % | |||||||||||
| (0.12 | ) | 15.67 | 7.01 | % | 2,375.0 | 0.45 | % | 0.50 | % | 0.45 | % | 0.50 | % | 111 | % | |||||||||||
| (b) | Total investment return assumes dividend reinvestment and does not reflect any deduction for sales charges. Not annualized for periods less than one year. Total return shown does not reflect charges and expenses imposed on contract holders by the variable accounts. Those charges and expenses reduce the return received by contract holders as compared to the return presented. |
369
Table of Contents
Thrivent Series Fund, Inc.
Financial Highlights – continued
| FOR A SHARE OUSTANDING THROUGHOUT EACH PERIOD* | |||||||||||||||||||||||
| Income from Investment Operations | Less Distributions from | ||||||||||||||||||||||
| Net Asset Value, Beginning of Period | Net Investment Income/(Loss) | Net Realized and Unrealized Gain/(Loss) on Investments(a) | Total from Investment Operations | Net Investment Income | Net Realized Gain on Investments | ||||||||||||||||||
PARTNER GROWTH STOCK PORTFOLIO | |||||||||||||||||||||||
Period Ended 6/30/2010 (unaudited) | $ | 9.93 | $ | (0.01 | ) | $ | (0.79 | ) | $ | (0.80 | ) | $ | — | $ | — | ||||||||
Year Ended 12/31/2009 | 6.96 | — | 3.00 | 3.00 | (0.03 | ) | — | ||||||||||||||||
Year Ended 12/31/2008 | 13.55 | 0.05 | (5.29 | ) | (5.24 | ) | (0.09 | ) | (1.26 | ) | |||||||||||||
Year Ended 12/31/2007 | 13.08 | 0.08 | 1.14 | 1.22 | (0.07 | ) | (0.68 | ) | |||||||||||||||
Year Ended 12/31/2006 | 11.86 | 0.07 | 1.45 | 1.52 | (0.02 | ) | (0.28 | ) | |||||||||||||||
Year Ended 12/31/2005 | 11.21 | 0.02 | 0.68 | 0.70 | (0.05 | ) | — | ||||||||||||||||
LARGE CAP VALUE PORTFOLIO | |||||||||||||||||||||||
Period Ended 6/30/2010 (unaudited) | 9.65 | 0.07 | (0.95 | ) | (0.88 | ) | — | — | |||||||||||||||
Year Ended 12/31/2009 | 8.10 | 0.16 | 1.55 | 1.71 | (0.16 | ) | — | ||||||||||||||||
Year Ended 12/31/2008 | 13.41 | 0.23 | (4.66 | ) | (4.43 | ) | (0.43 | ) | (0.45 | ) | |||||||||||||
Year Ended 12/31/2007 | 13.50 | 0.19 | 0.48 | 0.67 | (0.17 | ) | (0.59 | ) | |||||||||||||||
Year Ended 12/31/2006 | 11.78 | 0.18 | 1.97 | 2.15 | (0.14 | ) | (0.29 | ) | |||||||||||||||
Year Ended 12/31/2005 | 11.14 | 0.14 | 0.63 | 0.77 | (0.13 | ) | — | ||||||||||||||||
LARGE CAP STOCK PORTFOLIO | |||||||||||||||||||||||
Period Ended 6/30/2010 (unaudited) | 7.72 | 0.03 | (0.76 | ) | (0.73 | ) | — | — | |||||||||||||||
Year Ended 12/31/2009 | 6.11 | 0.07 | 1.61 | 1.68 | (0.07 | ) | — | ||||||||||||||||
Year Ended 12/31/2008 | 11.04 | 0.15 | (4.05 | ) | (3.90 | ) | (0.28 | ) | (0.75 | ) | |||||||||||||
Year Ended 12/31/2007 | 10.54 | 0.12 | 0.68 | 0.80 | (0.12 | ) | (0.18 | ) | |||||||||||||||
Year Ended 12/31/2006 | 9.62 | 0.13 | 0.99 | 1.12 | (0.07 | ) | (0.13 | ) | |||||||||||||||
Year Ended 12/31/2005 | 9.28 | 0.07 | 0.42 | 0.49 | (0.08 | ) | (0.07 | ) | |||||||||||||||
LARGE CAP INDEX PORTFOLIO | |||||||||||||||||||||||
Period Ended 6/30/2010 (unaudited) | 15.76 | 0.15 | (1.21 | ) | (1.06 | ) | (0.30 | ) | — | ||||||||||||||
Year Ended 12/31/2009 | 13.72 | 0.33 | 2.98 | 3.31 | (0.45 | ) | (0.82 | ) | |||||||||||||||
Year Ended 12/31/2008 | 25.18 | 0.47 | (8.99 | ) | (8.52 | ) | (0.50 | ) | (2.44 | ) | |||||||||||||
Year Ended 12/31/2007 | 25.32 | 0.49 | 0.87 | 1.36 | (0.44 | ) | (1.06 | ) | |||||||||||||||
Year Ended 12/31/2006 | 22.31 | 0.43 | 2.94 | 3.37 | (0.36 | ) | — | ||||||||||||||||
Year Ended 12/31/2005 | 21.63 | 0.35 | 0.67 | 1.02 | (0.34 | ) | — | ||||||||||||||||
EQUITY INCOME PLUS PORTFOLIO | |||||||||||||||||||||||
Period Ended 6/30/2010 (unaudited) | 7.91 | 0.08 | (0.47 | ) | (0.39 | ) | (0.01 | ) | — | ||||||||||||||
Year Ended 12/31/2009 | 6.89 | 0.14 | 1.01 | 1.15 | (0.13 | ) | — | ||||||||||||||||
Year Ended 12/31/2008 (c) | 10.00 | 0.15 | (3.11 | ) | (2.96 | ) | (0.15 | ) | — | ||||||||||||||
| (a) | The amount shown may not correlate with the change in aggregate gains and losses of portfolio securities due to the timing of sales and redemptions of fund shares. |
| (c) | Since inception, April 30, 2008. |
370
Table of Contents
Thrivent Series Fund, Inc.
Financial Highlights – continued
| RATIOS / SUPPLEMENTAL DATA | ||||||||||||||||||||||||||
| Ratio to Average Net Assets** | Ratios to Average Net Assets Before Expenses Waived, Credited or Paid Indirectly** | |||||||||||||||||||||||||
Total | Net Asset Value, End of Period | Total Return(b) | Net Assets, End of Period (in millions) | Expenses | Net Investment Income/(Loss) | Expenses | Net Investment Income/(Loss) | Portfolio Turnover Rate | ||||||||||||||||||
| $ | — | $ | 9.13 | (8.08 | )% | $ | 51.8 | 0.96 | % | (0.23 | )% | 1.06 | % | (0.33 | )% | 19 | % | |||||||||
| (0.03 | ) | 9.93 | 43.17 | % | 61.3 | 0.98 | % | 0.01 | % | 1.08 | % | (0.09 | )% | 53 | % | |||||||||||
| (1.35 | ) | 6.96 | (42.13 | )% | 52.1 | 0.82 | % | 0.34 | % | 0.92 | % | 0.23 | % | 44 | % | |||||||||||
| (0.75 | ) | 13.55 | 9.28 | % | 118.1 | 0.80 | % | 0.59 | % | 0.91 | % | 0.48 | % | 55 | % | |||||||||||
| (0.30 | ) | 13.08 | 13.17 | % | 116.7 | 0.79 | % | 0.55 | % | 0.90 | % | 0.44 | % | 39 | % | |||||||||||
| (0.05 | ) | 11.86 | 6.32 | % | 120.4 | 0.90 | % | 0.23 | % | 0.90 | % | 0.22 | % | 42 | % | |||||||||||
| — | 8.77 | (9.09 | )% | 670.4 | 0.65 | % | 1.35 | % | 0.65 | % | 1.35 | % | 73 | % | ||||||||||||
| (0.16 | ) | 9.65 | 21.11 | % | 733.0 | 0.65 | % | 1.77 | % | 0.65 | % | 1.77 | % | 110 | % | |||||||||||
| (0.88 | ) | 8.10 | (34.33 | )% | 664.1 | 0.64 | % | 2.16 | % | 0.65 | % | 2.16 | % | 53 | % | |||||||||||
| (0.76 | ) | 13.41 | 4.70 | % | 1,004.9 | 0.64 | % | 1.68 | % | 0.65 | % | 1.67 | % | 37 | % | |||||||||||
| (0.43 | ) | 13.50 | 18.72 | % | 771.7 | 0.64 | % | 1.65 | % | 0.65 | % | 1.64 | % | 43 | % | |||||||||||
| (0.13 | ) | 11.78 | 7.02 | % | 514.5 | 0.65 | % | 1.53 | % | 0.65 | % | 1.52 | % | 53 | % | |||||||||||
| — | 6.99 | (9.46 | )% | 537.9 | 0.69 | % | 0.67 | % | 0.69 | % | 0.67 | % | 100 | % | ||||||||||||
| (0.07 | ) | 7.72 | 27.59 | % | 617.3 | 0.70 | % | 1.03 | % | 0.71 | % | 1.03 | % | 169 | % | |||||||||||
| (1.03 | ) | 6.11 | (37.68 | )% | 497.4 | 0.66 | % | 1.42 | % | 0.67 | % | 1.41 | % | 100 | % | |||||||||||
| (0.30 | ) | 11.04 | 7.57 | % | 1,060.1 | 0.65 | % | 1.31 | % | 0.66 | % | 1.30 | % | 114 | % | |||||||||||
| (0.20 | ) | 10.54 | 11.95 | % | 829.3 | 0.67 | % | 1.45 | % | 0.68 | % | 1.44 | % | 77 | % | |||||||||||
| (0.15 | ) | 9.62 | 5.31 | % | 602.4 | 0.71 | % | 0.95 | % | 0.72 | % | 0.94 | % | 60 | % | |||||||||||
| (0.30 | ) | 14.40 | (6.81 | )% | 291.4 | 0.42 | % | 1.55 | % | 0.42 | % | 1.55 | % | 4 | % | |||||||||||
| (1.27 | ) | 15.76 | 26.20 | % | 338.2 | 0.43 | % | 2.00 | % | 0.43 | % | 2.00 | % | 7 | % | |||||||||||
| (2.94 | ) | 13.72 | (37.12 | )% | 319.7 | 0.38 | % | 2.01 | % | 0.39 | % | 2.00 | % | 8 | % | |||||||||||
| (1.50 | ) | 25.18 | 5.17 | % | 633.5 | 0.36 | % | 1.64 | % | 0.36 | % | 1.64 | % | 5 | % | |||||||||||
| (0.36 | ) | 25.32 | 15.36 | % | 727.3 | 0.36 | % | 1.59 | % | 0.36 | % | 1.59 | % | 7 | % | |||||||||||
| (0.34 | ) | 22.31 | 4.75 | % | 795.3 | 0.35 | % | 1.54 | % | 0.35 | % | 1.54 | % | 7 | % | |||||||||||
| (0.01 | ) | 7.51 | (4.92 | )% | 55.0 | 0.85 | % | 2.08 | % | 0.92 | % | 2.01 | % | 282 | % | |||||||||||
| (0.13 | ) | 7.91 | 16.68 | % | 55.0 | 0.85 | % | 2.24 | % | 0.99 | % | 2.10 | % | 416 | % | |||||||||||
| (0.15 | ) | 6.89 | (29.58 | )% | 41.4 | 0.80 | % | 2.74 | % | 0.84 | % | 2.71 | % | 74 | % | |||||||||||
| (b) | Total investment return assumes dividend reinvestment and does not reflect any deduction for sales charges. Not annualized for periods less than one year. Total return shown does not reflect charges and expenses imposed on contract holders by the variable accounts. Those charges and expenses reduce the return received by contract holders as compared to the return presented. |
371
Table of Contents
Thrivent Series Fund, Inc.
Financial Highlights – continued
| FOR A SHARE OUSTANDING THROUGHOUT EACH PERIOD* | ||||||||||||||||||||||
| Income from Investment Operations | Less Distributions from | |||||||||||||||||||||
| Net Asset Value, Beginning of Period | Net Investment Income/(Loss) | Net Realized and Unrealized Gain/(Loss) on Investments(a) | Total from Investment Operations | Net Investment Income | Net Realized Gain on Investments | |||||||||||||||||
BALANCED PORTFOLIO | ||||||||||||||||||||||
Period Ended 6/30/2010 (unaudited) | $ | 13.44 | $ | 0.16 | $ | (0.42 | ) | $ | (0.26 | ) | $ | (0.36 | ) | $ | (0.09 | ) | ||||||
Year Ended 12/31/2009 | 11.75 | 0.38 | 2.06 | 2.44 | (0.55 | ) | (0.20 | ) | ||||||||||||||
Year Ended 12/31/2008 | 17.16 | 0.56 | (4.82 | ) | (4.26 | ) | (0.58 | ) | (0.57 | ) | ||||||||||||
Year Ended 12/31/2007 | 16.77 | 0.57 | 0.35 | 0.92 | (0.53 | ) | — | |||||||||||||||
Year Ended 12/31/2006 | 15.48 | 0.50 | 1.22 | 1.72 | (0.43 | ) | — | |||||||||||||||
Year Ended 12/31/2005 | 15.28 | 0.42 | 0.16 | 0.58 | (0.38 | ) | — | |||||||||||||||
HIGH YIELD PORTFOLIO | ||||||||||||||||||||||
Period Ended 6/30/2010 (unaudited) | 4.56 | 0.19 | (0.03 | ) | 0.16 | (0.19 | ) | — | ||||||||||||||
Year Ended 12/31/2009 | 3.48 | 0.38 | 1.07 | 1.45 | (0.37 | ) | — | |||||||||||||||
Year Ended 12/31/2008 | 4.84 | 0.37 | (1.34 | ) | (0.97 | ) | (0.39 | ) | — | |||||||||||||
Year Ended 12/31/2007 | 5.11 | 0.40 | (0.26 | ) | 0.14 | (0.41 | ) | — | ||||||||||||||
Year Ended 12/31/2006 | 5.01 | 0.40 | 0.10 | 0.50 | (0.40 | ) | — | |||||||||||||||
Year Ended 12/31/2005 | 5.22 | 0.41 | (0.21 | ) | 0.20 | (0.41 | ) | — | ||||||||||||||
DIVERSIFIED INCOME PLUS PORTFOLIO | ||||||||||||||||||||||
Period Ended 6/30/2010 (unaudited) | 6.14 | 0.19 | (0.06 | ) | 0.13 | (0.32 | ) | — | ||||||||||||||
Year Ended 12/31/2009 | 5.01 | 0.43 | 1.15 | 1.58 | (0.45 | ) | — | |||||||||||||||
Year Ended 12/31/2008 | 6.98 | 0.46 | (2.00 | ) | (1.54 | ) | (0.43 | ) | — | |||||||||||||
Year Ended 12/31/2007 | 7.19 | 0.34 | (0.41 | ) | (0.07 | ) | (0.14 | ) | — | |||||||||||||
Year Ended 12/31/2006 | 6.54 | 0.42 | 0.48 | 0.90 | (0.25 | ) | — | |||||||||||||||
Year Ended 12/31/2005 | 6.80 | 0.49 | (0.26 | ) | 0.23 | (0.49 | ) | — | ||||||||||||||
PARTNER SOCIALLY RESPONSIBLE BOND PORTFOLIO | ||||||||||||||||||||||
Period Ended 6/30/2010 (unaudited) | 10.16 | 0.18 | 0.52 | 0.70 | (0.15 | ) | — | |||||||||||||||
Year Ended 12/31/2009 | 10.02 | 0.43 | 0.62 | 1.05 | (0.36 | ) | (0.55 | ) | ||||||||||||||
Year Ended 12/31/2008 (c) | 10.00 | 0.26 | 0.01 | 0.27 | (0.25 | ) | — | |||||||||||||||
INCOME PORTFOLIO | ||||||||||||||||||||||
Period Ended 6/30/2010 (unaudited) | 9.39 | 0.25 | 0.30 | 0.55 | (0.25 | ) | — | |||||||||||||||
Year Ended 12/31/2009 | 8.20 | 0.50 | 1.19 | 1.69 | (0.50 | ) | — | |||||||||||||||
Year Ended 12/31/2008 | 9.74 | 0.51 | (1.53 | ) | (1.02 | ) | (0.52 | ) | — | |||||||||||||
Year Ended 12/31/2007 | 9.90 | 0.53 | (0.17 | ) | 0.36 | (0.52 | ) | — | ||||||||||||||
Year Ended 12/31/2006 | 9.95 | 0.51 | 0.01 | 0.52 | (0.51 | ) | (0.06 | ) | ||||||||||||||
Year Ended 12/31/2005 | 10.23 | 0.47 | (0.24 | ) | 0.23 | (0.47 | ) | (0.04 | ) | |||||||||||||
| (a) | The amount shown may not correlate with the change in aggregate gains and losses of portfolio securities due to the timing of sales and redemptions of fund shares. |
| (c) | Since inception, April 30, 2008. |
372
Table of Contents
Thrivent Series Fund, Inc.
Financial Highlights – continued
| RATIOS / SUPPLEMENTAL DATA | ||||||||||||||||||||||||||
| Ratio to Average Net Assets** | Ratios to Average Net Assets Before Expenses Waived, Credited or Paid Indirectly** | |||||||||||||||||||||||||
Total Distributions | Net Asset Value, End of Period | Total Return(b) | Net Assets, End of Period (in millions) | Expenses | Net Investment Income/(Loss) | Expenses | Net Investment Income/(Loss) | Portfolio Turnover Rate | ||||||||||||||||||
| $ | (0.45 | ) | $ | 12.73 | (1.97 | )% | $ | 255.6 | 0.44 | % | 1.98 | % | 0.44 | % | 1.98 | % | 73 | % | ||||||||
| (0.75 | ) | 13.44 | 21.76 | % | 281.2 | 0.44 | % | 2.55 | % | 0.44 | % | 2.54 | % | 115 | % | |||||||||||
| (1.15 | ) | 11.75 | (26.06 | )% | 280.0 | 0.39 | % | 3.00 | % | 0.41 | % | 2.98 | % | 133 | % | |||||||||||
| (0.53 | ) | 17.16 | 5.46 | % | 488.4 | 0.38 | % | 2.78 | % | 0.39 | % | 2.77 | % | 121 | % | |||||||||||
| (0.43 | ) | 16.77 | 11.41 | % | 566.1 | 0.38 | % | 2.72 | % | 0.39 | % | 2.72 | % | 127 | % | |||||||||||
| (0.38 | ) | 15.48 | 3.92 | % | 663.5 | 0.37 | % | 2.52 | % | 0.38 | % | 2.52 | % | 130 | % | |||||||||||
| (0.19 | ) | 4.53 | 3.51 | % | 776.6 | 0.45 | % | 8.46 | % | 0.45 | % | 8.46 | % | 37 | % | |||||||||||
| (0.37 | ) | 4.56 | 43.49 | % | 756.0 | 0.45 | % | 9.28 | % | 0.46 | % | 9.28 | % | 61 | % | |||||||||||
| (0.39 | ) | 3.48 | (21.19 | )% | 597.2 | 0.43 | % | 8.63 | % | 0.45 | % | 8.61 | % | 50 | % | |||||||||||
| (0.41 | ) | 4.84 | 2.71 | % | 774.6 | 0.45 | % | 8.00 | % | 0.45 | % | 8.00 | % | 69 | % | |||||||||||
| (0.40 | ) | 5.11 | 10.31 | % | 847.0 | 0.45 | % | 8.00 | % | 0.45 | % | 7.99 | % | 66 | % | |||||||||||
| (0.41 | ) | 5.01 | 4.04 | % | 802.6 | 0.45 | % | 8.05 | % | 0.45 | % | 8.04 | % | 53 | % | |||||||||||
| (0.32 | ) | 5.95 | 2.14 | % | 89.9 | 0.59 | % | 6.40 | % | 0.59 | % | 6.40 | % | 62 | % | |||||||||||
| (0.45 | ) | 6.14 | 33.06 | % | 87.2 | 0.61 | % | 7.08 | % | 0.63 | % | 7.07 | % | 88 | % | |||||||||||
| (0.43 | ) | 5.01 | (23.30 | )% | 75.0 | 0.51 | % | 5.61 | % | 0.52 | % | 5.59 | % | 115 | % | |||||||||||
| (0.14 | ) | 6.98 | (0.99 | )% | 131.3 | 0.48 | % | 5.30 | % | 0.50 | % | 5.28 | % | 168 | % | |||||||||||
| (0.25 | ) | 7.19 | 14.19 | % | 108.1 | 0.51 | % | 6.62 | % | 0.52 | % | 6.60 | % | 170 | % | |||||||||||
| (0.49 | ) | 6.54 | 3.62 | % | 94.0 | 0.49 | % | 7.46 | % | 0.51 | % | 7.44 | % | 66 | % | |||||||||||
| (0.15 | ) | 10.71 | 6.93 | % | 6.4 | 0.69 | % | 3.52 | % | 2.65 | % | 1.55 | % | 40 | % | |||||||||||
| (0.91 | ) | 10.16 | 10.98 | % | 6.2 | 0.68 | % | 4.17 | % | 2.51 | % | 2.33 | % | 148 | % | |||||||||||
| (0.25 | ) | 10.02 | 2.68 | % | 6.8 | 0.68 | % | 3.89 | % | 1.66 | % | 2.91 | % | 60 | % | |||||||||||
| (0.25 | ) | 9.69 | 5.97 | % | 1,220.9 | 0.44 | % | 5.17 | % | 0.44 | % | 5.17 | % | 79 | % | |||||||||||
| (0.50 | ) | 9.39 | 21.29 | % | 1,278.2 | 0.44 | % | 5.72 | % | 0.45 | % | 5.71 | % | 160 | % | |||||||||||
| (0.52 | ) | 8.20 | (10.85 | )% | 1,097.1 | 0.44 | % | 5.61 | % | 0.45 | % | 5.60 | % | 160 | % | |||||||||||
| (0.52 | ) | 9.74 | 3.77 | % | 1,418.3 | 0.44 | % | 5.43 | % | 0.45 | % | 5.43 | % | 228 | % | |||||||||||
| (0.57 | ) | 9.90 | 5.42 | % | 1,081.8 | 0.45 | % | 5.22 | % | 0.45 | % | 5.22 | % | 303 | % | |||||||||||
| (0.51 | ) | 9.95 | 2.31 | % | 924.3 | 0.45 | % | 4.70 | % | 0.45 | % | 4.69 | % | 259 | % | |||||||||||
| (b) | Total investment return assumes dividend reinvestment and does not reflect any deduction for sales charges. Not annualized for periods less than one year. Total return shown does not reflect charges and expenses imposed on contract holders by the variable accounts. Those charges and expenses reduce the return received by contract holders as compared to the return presented. |
373
Table of Contents
Thrivent Series Fund, Inc.
Financial Highlights – continued
| FOR A SHARE OUSTANDING THROUGHOUT EACH PERIOD* | ||||||||||||||||||||||
| Income from Investment Operations | Less Distributions from | |||||||||||||||||||||
| Net Asset Value, Beginning of Period | Net Investment Income/(Loss) | Net Realized and Unrealized Gain/(Loss) on Investments(a) | Total from Investment Operations | Net Investment Income | Net Realized Gain on Investments | |||||||||||||||||
BOND INDEX PORTFOLIO | ||||||||||||||||||||||
Period Ended 6/30/2010 (unaudited) | $ | 10.13 | $ | 0.16 | $ | 0.56 | $ | 0.72 | $ | (0.18 | ) | $ | — | |||||||||
Year Ended 12/31/2009 | 9.72 | 0.37 | 0.43 | 0.80 | (0.39 | ) | — | |||||||||||||||
Year Ended 12/31/2008 | 10.29 | 0.48 | (0.56 | ) | (0.08 | ) | (0.49 | ) | — | |||||||||||||
Year Ended 12/31/2007 | 10.22 | 0.50 | 0.07 | 0.57 | (0.50 | ) | — | |||||||||||||||
Year Ended 12/31/2006 | 10.30 | 0.48 | (0.08 | ) | 0.40 | (0.48 | ) | — | ||||||||||||||
Year Ended 12/31/2005 | 10.52 | 0.44 | (0.22 | ) | 0.22 | (0.44 | ) | — | ||||||||||||||
LIMITED MATURITY BOND | ||||||||||||||||||||||
Period Ended 6/30/2010 (unaudited) | 9.62 | 0.17 | 0.10 | 0.27 | (0.16 | ) | — | |||||||||||||||
Year Ended 12/31/2009 | 8.79 | 0.39 | 0.82 | 1.21 | (0.38 | ) | — | |||||||||||||||
Year Ended 12/31/2008 | 9.84 | 0.42 | (1.04 | ) | (0.62 | ) | (0.43 | ) | — | |||||||||||||
Year Ended 12/31/2007 | 9.92 | 0.47 | (0.08 | ) | 0.39 | (0.47 | ) | — | ||||||||||||||
Year Ended 12/31/2006 | 9.92 | 0.44 | — | 0.44 | (0.44 | ) | — | |||||||||||||||
Year Ended 12/31/2005 | 10.09 | 0.37 | (0.17 | ) | 0.20 | (0.37 | ) | — | ||||||||||||||
MORTGAGE SECURITIES | ||||||||||||||||||||||
Period Ended 6/30/2010 (unaudited) | 9.62 | 0.18 | 0.65 | 0.83 | (0.15 | ) | (0.10 | ) | ||||||||||||||
Year Ended 12/31/2009 | 8.82 | 0.43 | 0.69 | 1.12 | (0.32 | ) | — | |||||||||||||||
Year Ended 12/31/2008 | 9.71 | 0.44 | (0.91 | ) | (0.47 | ) | (0.42 | ) | — | |||||||||||||
Year Ended 12/31/2007 | 9.71 | 0.49 | (0.01 | ) | 0.48 | (0.48 | ) | — | ||||||||||||||
Year Ended 12/31/2006 | 9.75 | 0.48 | (0.04 | ) | 0.44 | (0.48 | ) | — | ||||||||||||||
Year Ended 12/31/2005 | 9.99 | 0.43 | (0.24 | ) | 0.19 | (0.43 | ) | — | ||||||||||||||
MONEY MARKET PORTFOLIO | ||||||||||||||||||||||
Period Ended 6/30/2010 (unaudited) | 1.00 | — | — | — | — | — | ||||||||||||||||
Year Ended 12/31/2009 | 1.00 | — | — | — | — | — | ||||||||||||||||
Year Ended 12/31/2008 | 1.00 | 0.03 | — | 0.03 | (0.03 | ) | — | |||||||||||||||
Year Ended 12/31/2007 | 1.00 | 0.05 | — | 0.05 | (0.05 | ) | — | |||||||||||||||
Year Ended 12/31/2006 | 1.00 | 0.05 | — | 0.05 | (0.05 | ) | — | |||||||||||||||
Year Ended 12/31/2005 | 1.00 | 0.03 | — | 0.03 | (0.03 | ) | — | |||||||||||||||
| (a) | The amount shown may not correlate with the change in aggregate gains and losses of portfolio securities due to the timing of sales and redemptions of fund shares. |
| * | All per share amounts have been rounded to the nearest cent. |
The accompanying Notes to Financial Statements are an integral part of this schedule.
374
Table of Contents
Thrivent Series Fund, Inc.
Financial Highlights – continued
| RATIOS / SUPPLEMENTAL DATA | ||||||||||||||||||||||||||
| Ratio to Average Net Assets** | Ratios to Average Net Assets Before Expenses Waived, Credited or Paid Indirectly** | |||||||||||||||||||||||||
Total | Net Asset Value, End of Period | Total Return(b) | Net Assets, End of Period (in millions) | Expenses | Net Investment Income/(Loss) | Expenses | Net Investment Income/(Loss) | Portfolio Turnover Rate | ||||||||||||||||||
| $ | (0.18 | ) | $ | 10.67 | 7.12 | % | $ | 162.6 | 0.46 | % | 3.15 | % | 0.46 | % | 3.15 | % | 206 | % | ||||||||
| (0.39 | ) | 10.13 | 8.47 | % | 156.5 | 0.46 | % | 3.78 | % | 0.47 | % | 3.77 | % | 388 | % | |||||||||||
| (0.49 | ) | 9.72 | (0.82 | )% | 174.6 | 0.39 | % | 4.83 | % | 0.43 | % | 4.79 | % | 346 | % | |||||||||||
| (0.50 | ) | 10.29 | 5.66 | % | 215.2 | 0.40 | % | 4.86 | % | 0.43 | % | 4.84 | % | 331 | % | |||||||||||
| (0.48 | ) | 10.22 | 4.04 | % | 237.8 | 0.41 | % | 4.70 | % | 0.42 | % | 4.69 | % | 352 | % | |||||||||||
| (0.44 | ) | 10.30 | 2.18 | % | 272.4 | 0.40 | % | 4.19 | % | 0.41 | % | 4.18 | % | 360 | % | |||||||||||
| (0.16 | ) | 9.73 | 2.86 | % | 1,193.5 | 0.44 | % | 3.44 | % | 0.44 | % | 3.43 | % | 59 | % | |||||||||||
| (0.38 | ) | 9.62 | 14.04 | % | 1,105.6 | 0.44 | % | 4.23 | % | 0.45 | % | 4.23 | % | 145 | % | |||||||||||
| (0.43 | ) | 8.79 | (6.46 | )% | 925.9 | 0.44 | % | 4.44 | % | 0.45 | % | 4.43 | % | 121 | % | |||||||||||
| (0.47 | ) | 9.84 | 3.98 | % | 973.8 | 0.44 | % | 4.82 | % | 0.45 | % | 4.81 | % | 128 | % | |||||||||||
| (0.44 | ) | 9.92 | 4.57 | % | 665.6 | 0.44 | % | 4.49 | % | 0.45 | % | 4.48 | % | 137 | % | |||||||||||
| (0.37 | ) | 9.92 | 1.96 | % | 454.1 | 0.45 | % | 3.70 | % | 0.46 | % | 3.69 | % | 267 | % | |||||||||||
| (0.25 | ) | 10.20 | 8.59 | % | 32.8 | 0.90 | % | 3.66 | % | 0.90 | % | 3.66 | % | 332 | % | |||||||||||
| (0.32 | ) | 9.62 | 13.02 | % | 31.6 | 0.92 | % | 4.67 | % | 0.92 | % | 4.67 | % | 643 | % | |||||||||||
| (0.42 | ) | 8.82 | (4.96 | )% | 35.2 | 0.67 | % | 4.67 | % | 0.67 | % | 4.67 | % | 721 | % | |||||||||||
| (0.48 | ) | 9.71 | 5.09 | % | 49.8 | 0.65 | % | 5.05 | % | 0.65 | % | 5.05 | % | 731 | % | |||||||||||
| (0.48 | ) | 9.71 | 4.71 | % | 57.8 | 0.62 | % | 5.01 | % | 0.62 | % | 5.01 | % | 740 | % | |||||||||||
| (0.43 | ) | 9.75 | 2.00 | % | 66.9 | 0.61 | % | 4.40 | % | 0.62 | % | 4.39 | % | 703 | % | |||||||||||
| — | 1.00 | — | 207.9 | 0.28 | % | (0.01 | )% | 0.49 | % | (0.22 | )% | N/A | ||||||||||||||
| — | 1.00 | 0.43 | % | 246.0 | 0.39 | % | 0.47 | % | 0.49 | % | 0.37 | % | N/A | |||||||||||||
| (0.03 | ) | 1.00 | 2.95 | % | 683.4 | 0.36 | % | 2.93 | % | 0.46 | % | 2.83 | % | N/A | ||||||||||||
| (0.05 | ) | 1.00 | 5.14 | % | 741.6 | 0.35 | % | 5.03 | % | 0.45 | % | 4.93 | % | N/A | ||||||||||||
| (0.05 | ) | 1.00 | 4.85 | % | 590.6 | 0.35 | % | 4.80 | % | 0.45 | % | 4.70 | % | N/A | ||||||||||||
| (0.03 | ) | 1.00 | 2.86 | % | 373.7 | 0.46 | % | 2.85 | % | 0.46 | % | 2.85 | % | N/A | ||||||||||||
| (b ) | Total investment return assumes dividend reinvestment and does not reflect any deduction for sales charges. Not annualized for periods less than one year. Total return shown does not reflect charges and expenses imposed on contract holders by the variable accounts. Those charges and expenses reduce the return received by contract holders as compared to the return presented. |
375
Table of Contents
Additional Information
(unaudited)
The policies and procedures that the Fund uses to determine how to vote proxies relating to portfolio securities are attached to the Fund’s Statement of Additional Information. You may request a free copy of the Statement of Additional Information or the report of how the Fund voted proxies relating to portfolio securities during the most recent 12-month period ended June 30 by calling 1-800-847-4836. You also may review the Statement of Additional Information or the report of how the Fund voted proxies relating to portfolio securities during the most recent 12-month period ended June 30 at www.thrivent.com or www.sec.gov.
Quarterly Schedule of Portfolio Holdings
The Fund files its Schedule of Portfolio Holdings on Form N-Q with the SEC for the first and third quarters of each fiscal year. You may request a free copy of the Fund’s Forms N-Q by calling 1-800-847-4836. The Fund’s most recent Form N-Q Schedule of Investments also is available at www.thrivent.com or www.sec.gov. You also may review and copy the Forms N-Q for the Fund at the SEC’s Public Reference Room in Washington, DC. You may get information about the operation of the Public Reference Room by calling 1-800-SEC-0330.
376
Table of Contents
Thrivent Series Fund, Inc.
Supplement to Prospectus dated April 30, 2010
With respect to Thrivent Money Market Portfolio
The Principal Strategies sections for the Thrivent Money Market Portfolio in the summary and non-summary sections of the prospectus are replaced with the following:
The Portfolio tries to produce current income while maintaining liquidity by investing in high quality, short-term money market instruments, including U.S. dollar-denominated commercial paper, bank instruments such as certificates of deposit, U.S. government discount notes and U.S. Treasury Bills. The Portfolio’s Adviser looks for prime commercial paper issued by corporations that it believes are financially sound, have strong cash flows and solid capital levels, are leaders in their industry and have experienced management.
The Adviser uses fundamental, quantitative and technical investment research techniques to determine which money market instruments to buy and sell.
The Adviser manages the Portfolio subject to strict rules established by the Securities and Exchange Commission that are designed so that the Portfolio may maintain a stable $1.00 share price. Those rules generally require the Portfolio, among other things, to invest only in high quality securities that generally are diversified with respect to issuers, are denominated in U.S. dollars and have short remaining maturities. In addition, the rules require the Portfolio to maintain a weighted average maturity of not more than 60 days and a weighted average life of not more than 120 days.
Under these rules, at least 97% of the Portfolio’s total assets must be invested in “first tier” securities. First-tier securities generally must be rated by at least two rating agencies in their highest short-term major rating categories (or one, if only one agency has rated the security or, if the securities are unrated, determined to be of comparable quality). First-tier securities include U.S. Government securities, such as U.S. Treasury bills and securities issued or sponsored by U.S. government agencies. They also may include corporate debt securities, finance company commercial paper and certain obligations of U.S. and foreign banks.
The remainder of the Portfolio’s assets will be invested in securities rated within the two highest rating categories by at least two rating agencies (or one, if only one agency has rated the security or, if the securities are unrated, determined to be of comparable quality) or kept in cash.
The date of this Supplement is June 30, 2010
Please include this Supplement with your Prospectus
377
Table of Contents
Thrivent Series Fund, Inc.
Supplement to Prospectus dated April 30, 2010
With respect to Thrivent Partner Socially Responsible Bond Portfolio
The last paragraph on page 126 of the prospectus in the “Sustainable and Socially Responsible Investment Criteria” section and the next-to-last full paragraph on page 170 of the prospectus in the “Sustainable and Socially Responsible Investment Criteria” section are deleted and replaced with the following:
With respect to U.S. government securities, the Portfolio invests in debt obligations issued by the U.S. Government (i.e., Treasury securities) or guaranteed by agencies or instrumentalities of the U.S. Government whose purposes further, or are compatible with, the Portfolio’s sustainable and socially responsible investment criteria.
The date of this Supplement is July 6, 2010
Please include this Supplement with your Prospectus
378
Table of Contents
[THIS PAGE INTENTIONALLY LEFT BLANK]
379
Table of Contents
[THIS PAGE INTENTIONALLY LEFT BLANK]
380
Table of Contents
[THIS PAGE INTENTIONALLY LEFT BLANK]
381
Table of Contents
[THIS PAGE INTENTIONALLY LEFT BLANK]
382
Table of Contents
[THIS PAGE INTENTIONALLY LEFT BLANK]
383
Table of Contents
[THIS PAGE INTENTIONALLY LEFT BLANK]
384
Table of Contents

We’re Listening to You!
In response to concerns regarding multiple mailings, we send one copy of an annual and semiannual report and one copy of a prospectus for Thrivent Series Fund, Inc., to each household. This consolidation helps reduce printing and postage costs, thereby saving money and reducing waste. If you wish to receive an additional copy of this report, call us toll-free at 800-847-4836. Or you can enroll in eDelivery today at Thrivent.com and receive your annual and semiannual reports and prospectus electronically.
625 Fourth Ave. S., Minneapolis, MN 55415-1665 Thrivent.com • email: mail@thrivent.com 800-THRIVENT (800-847-4836)
23572SAR R8-10
Table of Contents
| Item 2. | Code of Ethics |
Not applicable to semiannual report
| Item 3. | Audit Committee Financial Expert |
Not applicable to semiannual report
| Item 4. | Principal Accountant Fees and Services |
Not applicable to semiannual report
| Item 5. | Audit Committee of Listed Registrants |
Not applicable.
| Item 6. | Schedule of Investments |
| (1) | Registrant’s Schedule of Investments is included in the report to shareholders filed under Item 1. |
| (2) | Not applicable to this filing. |
| Item 7. | Disclosure of Proxy Voting Policies and Procedures for Closed-End Management Investment Companies |
Not applicable.
| Item 8. | Portfolio Managers of Closed-End Management Investment Companies |
Not applicable.
| Item 9. | Purchases of Equity Securities by Closed-End Management Investment Company and Affiliated Purchasers. |
Not applicable.
| Item 10. | Submission of Matters to a Vote of Security Holders |
There have been no material changes to the procedures by which shareholders may recommend nominees to registrant’s board of directors.
| Item 11. | Controls and Procedures |
(a)(i) Registrant’s President and Treasurer have concluded that registrant’s disclosure controls and procedures (as defined in Rule 30a-3(c) under the Investment Company Act) are effective, based on their evaluation of these controls and procedures as of a date within 90 days of the filing date of this report.
(a)(ii) Registrant’s President and Treasurer are aware of no change in registrant’s internal control over financial reporting (as defined in Rule 30a-3(d) under the Investment Company Act) that occurred during registrant’s most recent fiscal quarter that has materially affected, or is reasonably likely to materially affect, registrant’s internal control over financial reporting.
| Item 12. | Exhibits |
| (a) | Certifications pursuant to Rules 30a-2(a) and 30a-2(b) under the Investment Company Act of 1940 are attached hereto. |
Table of Contents
SIGNATURES
Pursuant to the requirements of the Securities Exchange Act of 1934 and the Investment Company Act of 1940, the registrant has duly caused this report to be signed on its behalf by the undersigned, thereunto duly authorized.
| Date: August 27, 2010 | THRIVENT SERIES FUND, INC. | |||||
| By: | /s/ Russell W. Swansen | |||||
| Russell W. Swansen | ||||||
| President | ||||||
Pursuant to the requirements of the Securities Exchange Act of 1934 and the Investment Company Act of 1940, this report has been signed below by the following persons on behalf of the registrant and in the capacities and on the dates indicated.
| Date: August 27, 2010 | By: | /s/ Russell W. Swansen | ||||
| Russell W. Swansen | ||||||
| President | ||||||
| Date: August 27, 2010 | By: | /s/ Gerard V. Vaillancourt | ||||
| Gerard V. Vaillancourt | ||||||
| Treasurer | ||||||