Table of Contents
UNITED STATES
SECURITIES AND EXCHANGE COMMISSION
Washington, D.C. 20549
FORM N-CSR
CERTIFIED SHAREHOLDER REPORT OF REGISTERED MANAGEMENT INVESTMENT COMPANIES
Investment Company Act file number: 811-04603
Thrivent Series Fund, Inc.
| (Exact name of registrant as specified in charter) |
625 Fourth Avenue South Minneapolis, Minnesota | 55415 | |
| (Address of principal executive offices) | (Zip code) |
John L. Sullivan, Assistant Secretary
625 Fourth Avenue South
Minneapolis, Minnesota 55415
| (Name and address of agent for service) |
Registrant’s telephone number, including area code: (612) 844-5704
Date of fiscal year end: December 31
Date of reporting period: June 30, 2009
Table of Contents
| Item 1. | Report to Stockholders |
Table of Contents

Thrivent Series Fund, Inc.
Semiannual Report June 30, 2009
Go Paperless.
Log in to MyThrivent at Thrivent.com. Enroll in eDelivery and you can receive this document electronically.
23572SAR R8-09 Thrivent.com
Table of Contents
| 2 | ||
Portfolio Perspectives | ||
| 4 | ||
| 6 | ||
| 8 | ||
| 10 | ||
| 12 | ||
| 14 | ||
| 16 | ||
| 18 | ||
| 20 | ||
| 22 | ||
| 24 | ||
| 26 | ||
| 28 | ||
| 30 | ||
| 32 | ||
| 34 | ||
| 36 | ||
| 38 | ||
| 40 | ||
| 42 | ||
| 44 | ||
| 46 | ||
| 48 | ||
| 50 | ||
| 52 | ||
| 54 | ||
| 56 | ||
| 58 | ||
| 60 | ||
| 62 | ||
| 64 | ||
| 66 | ||
| 68 | ||
| 70 | ||
| 72 | ||
| 74 | ||
| 76 | ||
| 78 | ||
| 80 | ||
| 82 | ||
| 84 | ||
| 86 | ||
Schedules of Investments | ||
| 90 | ||
| 93 | ||
| 96 | ||
| 99 | ||
| 102 | ||
| 104 | ||
| 106 | ||
| 109 | ||
| 112 | ||
| 115 | ||
| 118 | ||
| 122 | ||
| 126 | ||
| 131 | ||
| 139 | ||
| 142 | ||
| 145 | ||
| 148 | ||
| 151 | ||
| 157 | ||
| 167 | ||
| 172 | ||
| 174 | ||
| 176 | ||
| 178 | ||
| 181 | ||
| 185 | ||
| 189 | ||
| 193 | ||
| 196 | ||
| 201 | ||
| 208 | ||
| 213 | ||
| 224 | ||
| 232 | ||
| 243 | ||
| 248 | ||
| 259 | ||
| 265 | ||
| 276 | ||
| 280 | ||
| 284 | ||
| 292 | ||
| 300 | ||
| 314 | ||
| 330 | ||
| 346 | ||
| 348 | ||
Table of Contents
 | Dear Member: |
Economic and Market Review
Stocks and bonds generally posted positive returns during the six-month period ended June 30, 2009, as economic weakness slowed and market currents began to reverse. Investors continued to seek safety from the global economic downturn during the first part of the reporting period, favoring Treasury securities over riskier investments. The situation began to reverse in March, however, as massive government liquidity programs and hints of a potential economic recovery began to draw investors back to stocks and more aggressive bonds.
U.S. Economy
The economy continued to shrink during the reporting period as tight lending standards, declining housing and investment values and rising unemployment curbed consumer and business spending. The nation’s gross domestic product decreased 5.5% in the first quarter of 2009 and appeared to contract again during the second quarter, although less sharply.1
The housing market showed some signs of improvement, though sales and prices of existing homes remained well below their year-earlier levels. Lower mortgage rates and cheaper home prices attracted increasing numbers of first-time home buyers in lower-priced listings, but sales of higher-priced homes remained sluggish. Existing home sales rose in both April and May, the first back-to-back monthly gain since September 2005.2
A growing drag on consumer confidence and spending was, in part, the sharp increase in job losses throughout the six-month reporting period. The national unemployment rate jumped from 7.2% in December 2008 to 9.5% in June, a 26-year high. During the period, the number of unemployed persons increased from 11.1 million to 14.7 million.3
Inflation & Monetary Policy
Inflation grew during the period, though few market watchers believed inflation would become a problem in the near future since the recession continued to curb wages and spending. The Consumer Price Index (CPI) rose at a 2.7% annual rate during the first six months of 2009, compared with a 0.1% rate for all of 2008.
The Federal Reserve’s Federal Open Market Committee (FOMC) kept the federal funds target interest rate at a range of zero to 0.25% throughout the period. Members noted in June that economic conditions were likely to warrant exceptionally low interest rate levels for an extended period. More important to the investment markets were the Fed’s extraordinary measures to expand its balance sheet and inject massive liquidity into the financial system, including buying large amounts of agency mortgage-backed and Treasury securities.
Equity Performance
Stock prices generally declined early in the period—with some indexes falling in March to lows not seen in over a decade—as investors worried about the troubled credit, housing, job and consumer markets and about how long the recession would last. Stocks reversed course in March, however, and rebounded into June, indicating that investors possibly began to see signs that the nation’s economy might start growing again.
Large-company and small-company stocks performed similarly over the period. The S&P 500 Index of large-company stocks posted a 3.19% total return, while the Russell 2000® Index of small-company stocks recorded a 2.64% return. Growth-oriented stocks outperformed value stocks by a wide margin, with the Russell 1000® Growth Index returning 11.53% and the Russell 1000® Value Index posting a return of -2.87%. Information technology, materials and consumer discretionary were the best-performing market sectors, while the industrials, telecommunications services and financials sectors fared worst.
Major market foreign stocks outperformed most domestic markets. The Morgan Stanley Capital International Europe, Australasia, Far East (MSCI EAFE) Index posted a 8.42% total return in dollar terms during the period, and the MSCI Emerging Markets Index returned an extraordinary 36.22%.
Fixed-Income Performance
Fixed-income investors continued to seek safety from the global liquidity crisis during the first part of the period, shunning most types of risk assets such as corporate bonds and mortgage-backed securities. In March, however, large-scale government liquidity programs and signs of a potential economic recovery appeared to attract investors back to riskier bond types.
The yield curve steepened during the period as Treasury yields rose sharply in longer-maturity lengths. The six-month Treasury yield increased from 0.27% to 0.35%, the five-year yield rose from 1.55% to 2.54%, the 10-year yield increased from 2.25% to 3.53%, and the 30-year Treasury yield rose from 2.69% to 4.32%. One-month Treasury yields hovered near zero on several occasions during the period.
2
Table of Contents
The Barclays Capital Aggregate Bond Index of the broad U.S. bond market posted a 1.90% total return for the six-month period, while the Barclays Capital Government/Corporate 1-3 Year Bond Index registered a 2.00% total return. The Barclays Capital Municipal Bond Index posted a 6.35% total return. Below-investment-grade corporate bonds were among the strongest performers, with the Barclays Capital U.S. Corporate High Yield Bond Index registering a robust 30.43% total return.
Outlook
We expect an economic recovery to begin sometime in the second half of 2009. The unprecedented amount of government stimulus in the system should begin to spur growth in the second half, but we believe growth will likely remain below trend and unemployment could stay stubbornly high for the foreseeable future. Under such a scenario, the Federal Reserve will likely keep short-term interest rates at current record-low levels for the foreseeable future.
We remain concerned about the threats to growth posed by continued problems in the housing and credit markets, rising unemployment and weak consumer and business spending, but the worst appears to be behind us. As always, we will monitor the economy and markets closely and work hard to provide ongoing value to you.
What do I do now?
That is the question I am often asked when discussing today’s challenging markets with members and colleagues. Given the turbulence the markets have exhibited over the course of the past year, investors have every right to ask the question. Let me offer some thoughts.
What is your view on cash positions?
With money market and savings account yields at historic lows and no indication of a rise in short-term interest rates on the horizon, consider looking for more potential return in other financial vehicles. Depending on your liquidity needs, your risk tolerance and your overall goals for your current money market or bank account assets, Thrivent Financial and your Thrivent Financial representative stand at the ready with products and guidance, depending on your own specific situation, that could offer more potential return with moderate market risk.
When and how does one get back into the market?
Many investors grew alarmed last fall and this past winter when the market endured a particularly painful sell-off and pulled money from the market because they were scared of losing even more. Now you may wonder if it’s “safe” to get back in. Unfortunately, no one can predict whether or not the stock market will continue its recent recovery—there are simply too many unknowns.
What I can tell you, however, is that the stock market appears to us to be attractively valued right now and that an allocation to stocks, and their historic long-term growth potential, is often a component of a successful retirement strategy.
How is Thrivent Financial weathering the economic and market storms of the past year?
I’m gratified to say that Thrivent Financial remains solid and that its capital position is among the strongest in the industry. Certainly, we have experienced some financial impact as a result of market declines, but our general avoidance of lower-quality mortgage-backed securities and our attention to risk control processes helped us avoid major exposure to troubled financial companies. Please note, however, that our current and future investment holdings are always subject to market risk, among other risks.
Our strength lies in our difference from other companies. Rather than focusing on short-term earnings to please Wall Street, we focus on you, our members. While we, and our products tied to the financial markets, are not immune to volatility, we are committed to helping you with your financial security and goals. Our financial representatives have a wealth of tools and materials to assist with today’s volatile markets. I recommend that you consult with your Thrivent Financial representative if you would like to talk about your particular situation. If you would like to find a Thrivent Financial representative, go to Thrivent.com or call 800-THRIVENT (800-847-4836).
In the meantime, thank you for continuing to turn to us for your financial needs and goals.
Sincerely,
 |
| Russell W. Swansen |
| President, Director and Chief Investment Officer Thrivent Series Fund, Inc. |
| 1 | U.S. Department of Commerce, Bureau of Economic Analysis |
| 2 | National Association of Realtors |
| 3 | U.S. Department of Labor, Bureau of Labor Statistics |
3
Table of Contents
The Portfolio’s performance depends upon how its assets are allocated across broad asset categories and applicable sub-classes within such categories. Some broad asset categories and sub-classes may perform below expectations or below the securities markets generally over short or extended periods. In particular, underperformance in the equity markets would have material adverse effect on the Portfolio’s total return given its significant allocation to equity securities. Therefore, a principal risk of investing in the Portfolio is that the allocation strategies used, and the allocation decisions made will not produce the desired results. In addition, the performance of the Portfolio is heavily dependent upon the performance of the underlying asset classes in which the Portfolio invests. As a result, the Portfolio is subject to the same risks as those faced by the underlying asset classes. These and other risks are described in the Portfolio’s prospectus.
How did the Portfolio perform during the six-month period ended June 30, 2009?
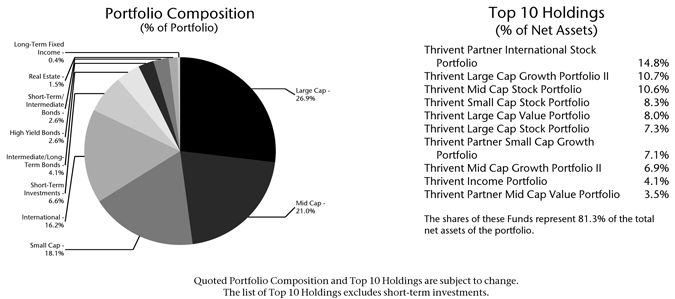
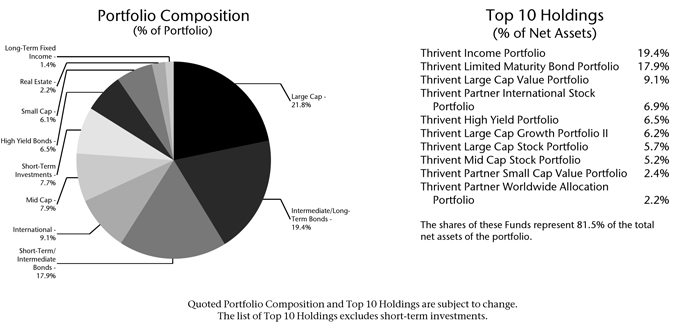
Thrivent Aggressive Allocation Portfolio earned a total return of 6.56% as compared to the median return of its peer group, the Lipper Multi-Cap Core category, of 6.67%. The Portfolio’s market benchmarks, the S&P 500 Index and the Barclays Capital Aggregate Bond Index, achieved a return of 3.19% and 1.90%, respectively.
What factors affected the Portfolio’s performance?
Underweighting the most conservative fixed-income categories and Treasury bonds, an overweighted allocation to credit in fixed-income segments and broad diversification in the equity component of the Portfolio were the primary factors leading to better-than-benchmark results in the reporting period.
Investors’ appetite for risky asset segments returned in the first half of 2009, following the extraordinary decline in risk assets in the second half of 2008. In the fixed-income segment of the account, we remained underweighted in U.S. Treasury securities and overweighted in credit-exposed components of the fixed-income markets. The high-yield component of the account achieved handsome returns, far ahead of many equity segments of the markets.
In the equity components of the Portfolio, many of the subsectors also outperformed their respective benchmarks, with particularly good results achieved in the mid-cap accounts. The Portfolio was broadly diversified across most of the major equity market segments and that diversification provided exposure to many markets that outperformed the S&P 500 Index.
What is your outlook?
Evidence suggests the economy is recovering from the extreme weakness seen late in 2008 and early this year. While the economic recovery remains fragile due to the continued challenges in the financial sector, it appears policy actions have been sufficient to forestall an ongoing credit contraction.
We believe that the economic recovery will likely be muted versus past experience. That does not negate the
4
Table of Contents
probability of a cyclical rally in the financial markets, but suggests more limited opportunities as the markets advance. It is our belief that earnings will be the key driver this cycle, much as it was in the advance in equities in the prior cycle, as price/earnings ratios are unlikely to expand given the expectations for high levels of debt issuance in the coming years. Corporate earnings, excluding the financial sector, have held up relatively well due to aggressive cost cutting and inventory management. That said, corporations cannot cut costs indefinitely and at some point sales growth will be necessary to drive earnings higher. We believe global growth will be sufficient to allow revenue expansion, as the economic recovery should take hold in the second half of this year.
Portfolio Facts
As of June 30, 2009
Net Assets | $397,484,583 | |
NAV | $9.06 | |
NAV - High† | 6/2/2009 - $9.34 | |
NAV - Low† | 3/9/2009 - $6.61 | |
Number of Holdings: 21 |
| † | For the six months ended June 30, 2009 |
Average Annual Total Returns1
As of June 30, 2009
| 1-Year | From Inception 4/29/2005 | |
| (26.55%) | (1.17%) |
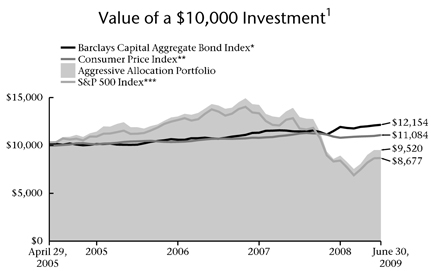
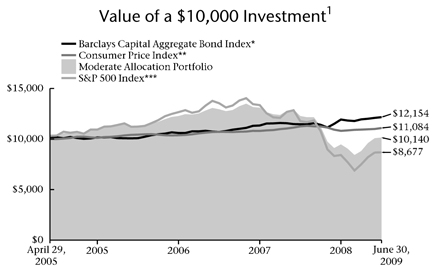
| * | The Barclays Capital Aggregate Bond Index is an index that measures the performance of U.S. investment grade bonds. It is not possible to invest directly in the Index. The performance of the Index does not reflect deductions for fees, expenses or taxes. |
| ** | The Consumer Price Index is an inflationary indicator that measures the change in the cost of a fixed basket of products and services, including housing, electricity, food and transportation. It is not possible to invest directly in the Index. |
| *** | The S&P 500 Index is an index that represents the average performance of a group of 500 widely held, publicly traded stocks. It is not possible to invest directly in the Index. The performance of the Index does not reflect deductions for fees, expenses or taxes. “S&P 500” is a trademark of The McGraw-Hill Companies, Inc. and has been licensed for use by Thrivent Financial for Lutherans. The product is not sponsored, endorsed or promoted by Standard & Poor’s, and Standard & Poor’s makes no representation regarding the advisability of investing in the product. |
| 1 | Past performance is not an indication of future results. Total investment return and principal value of your investment will fluctuate and units, when redeemed, may be worth more or less than their original cost. Current performance may be higher or lower than the performance data quoted. Call 800-THRIVENT or visit www.thrivent.com for performance results current to the most recent month-end. |
Annualized total returns represent past performance and reflect changes in share prices, the reinvestment of all dividends and capital gains, and the effects of compounding. Periods of less than one year are not annualized. At various times, the Portfolio’s adviser waived its management fee and/or reimbursed Portfolio expenses. Had the adviser not done so, the Portfolio’s total returns would have been lower. The returns shown do not reflect charges and expenses imposed on contract holders by the variable accounts. Those charges and expenses reduce the returns received by contract holders as compared to the returns presented.
The prospectus contains more complete information on the investment objectives, risks, charges and expenses of the investment company, which investors should read and consider carefully before investing. To obtain a prospectus, contact a registered representative or visit Thrivent.com.
5
Table of Contents
| Thrivent Moderately Aggressive Allocation Portfolio
Russell W. Swansen, David C. Francis, CFA, and Mark L. Simenstad, CFA, Portfolio Co-Managers |  |
Thrivent Moderately Aggressive Allocation Portfolio seeks long-term capital growth by implementing an asset allocation strategy. The Portfolio’s performance depends upon how its assets are allocated across broad asset categories and applicable sub-classes within such categories. Some broad asset categories and sub-classes may perform below expectations or below the securities markets generally over short or extended periods. In particular, underperformance in the equity markets would have material adverse effect on the Portfolio’s total return given its significant allocation to equity securities. Therefore, a principal risk of investing in the Portfolio is that the allocation strategies used, and the allocation decisions made will not produce the desired results. In addition, the performance of the Portfolio is heavily dependent upon the performance of the underlying asset classes in which the Portfolio invests. As a result, the Portfolio is subject to the same risks as those faced by the underlying asset classes. These and other risks are described in the Portfolio’s prospectus.
How did the Portfolio perform during the six-month period ended June 30, 2009?
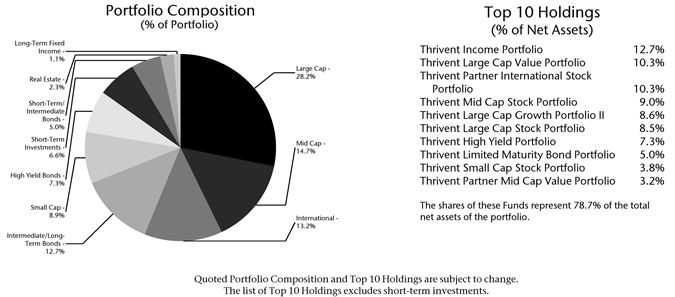
Thrivent Moderately Aggressive Allocation Portfolio earned a total return of 7.03% as compared to the median return of its peer group, the Lipper Mixed-Asset Target Allocation Growth category, of 6.00%. The Portfolio’s market benchmarks, the S&P 500 Index and the Barclays Capital Aggregate Bond Index, achieved a return of 3.19% and 1.90%, respectively.
What factors affected the Portfolio’s performance?
Underweighting the most conservative fixed-income categories and Treasury bonds, an overweighted allocation to credit in fixed-income segments and broad diversification in the equity component of the Portfolio were the primary factors leading to better-than-benchmark results in the reporting period.
Investors’ appetite for risky asset segments returned in the first half of 2009, following the extraordinary decline in risk assets in the second half of 2008. In the fixed-income segment of the account, we remained underweighted in U.S. Treasury securities and overweighted in credit-exposed components of the fixed-income markets. The high-yield component of the account achieved handsome returns, far ahead of many equity segments of the markets.
In the equity components of the Portfolio, many of the subsectors also outperformed their respective benchmarks, with particularly good results achieved in the mid-cap accounts. The Portfolio was broadly diversified across most of the major equity market segments and that diversification provided exposure to many markets that outperformed the S&P 500 Index.
What is your outlook?
Evidence suggests the economy is recovering from the extreme weakness seen late in 2008 and early this year. While the economic recovery remains fragile due to the continued challenges in the financial sector, it appears policy actions have been sufficient to forestall an ongoing credit contraction.
We believe that the economic recovery will likely be muted versus past experience. That does not negate the probability of a cyclical rally in the financial markets,
6
Table of Contents
but suggests more limited opportunities as the markets advance. It is our belief that earnings will be the key driver this cycle, much as it was in the advance in equities in the prior cycle, as price/earnings ratios are unlikely to expand given the expectations for high levels of debt issuance in the coming years. Corporate earnings, excluding the financial sector, have held up relatively well due to aggressive cost cutting and inventory management. That said, corporations cannot cut costs indefinitely and at some point sales growth will be necessary to drive earnings higher. We believe global growth will be sufficient to allow revenue expansion as the economic recovery should take hold in the second half of this year.
Portfolio Facts
As of June 30, 2009
Net Assets | $1,529,495,643 | |
NAV | $9.25 | |
NAV - High† | 6/2/2009 - $9.46 | |
NAV - Low† | 3/9/2009 - $6.92 | |
Number of Holdings: 36 |
| † | For the six months ended June 30, 2009 |
Average Annual Total Returns1
As of June 30, 2009
| 1-Year | From Inception 4/29/2005 | |
| (22.44%) | (0.62%) |
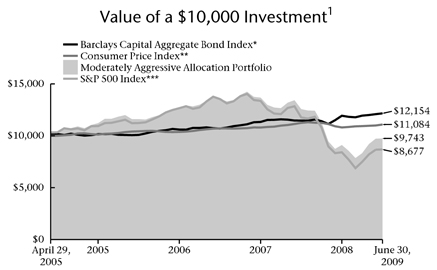
| * | The Barclays Capital Aggregate Bond Index is an index that measures the performance of U.S. investment grade bonds. It is not possible to invest directly in the Index. The performance of the Index does not reflect deductions for fees, expenses or taxes. |
| ** | The Consumer Price Index is an inflationary indicator that measures the change in the cost of a fixed basket of products and services, including housing, electricity, food and transportation. It is not possible to invest directly in the Index. |
| *** | The S&P 500 Index is an index that represents the average performance of a group of 500 widely held, publicly traded stocks. It is not possible to invest directly in the Index. The performance of the Index does not reflect deductions for fees, expenses or taxes. “S&P 500” is a trademark of The McGraw-Hill Companies, Inc. and has been licensed for use by Thrivent Financial for Lutherans. The product is not sponsored, endorsed or promoted by Standard & Poor’s, and Standard & Poor’s makes no representation regarding the advisability of investing in the product. |
| 1 | Past performance is not an indication of future results. Total investment return and principal value of your investment will fluctuate and units, when redeemed, may be worth more or less than their original cost. Current performance may be higher or lower than the performance data quoted. Call 800-THRIVENT or visit www.thrivent.com for performance results current to the most recent month-end. |
Annualized total returns represent past performance and reflect changes in share prices, the reinvestment of all dividends and capital gains, and the effects of compounding. Periods of less than one year are not annualized. At various times, the Portfolio’s adviser waived its management fee and/or reimbursed Portfolio expenses. Had the adviser not done so, the Portfolio’s total returns would have been lower. The returns shown do not reflect charges and expenses imposed on contract holders by the variable accounts. Those charges and expenses reduce the returns received by contract holders as compared to the returns presented.
The prospectus contains more complete information on the investment objectives, risks, charges and expenses of the investment company, which investors should read and consider carefully before investing. To obtain a prospectus, contact a registered representative or visit Thrivent.com.
7
Table of Contents
The Portfolio’s performance depends upon how its assets are allocated across broad asset categories and applicable sub-classes within such categories. Some broad asset categories and sub-classes may perform below expectations or below the securities markets generally over short or extended periods. In particular, underperformance in the equity markets would have material adverse effect on the Portfolio’s total return given its significant allocation to equity securities. Therefore, a principal risk of investing in the Portfolio is that the allocation strategies used, and the allocation decisions made will not produce the desired results. In addition, the performance of the Portfolio is heavily dependent upon the performance of the underlying asset classes in which the Portfolio invests. As a result, the Portfolio is subject to the same risks as those faced by the underlying asset classes. These and other risks are described in the Portfolio’s prospectus.
How did the Portfolio perform during the six-month period ended June 30, 2009?
Thrivent Moderate Allocation Portfolio earned a total return of 7.17% as compared to the median return of its peer group, the Lipper Mixed-Asset Target Allocation Moderate category, of 6.04%. The Portfolio’s market benchmarks, the S&P 500 Index and the Barclays Capital Aggregate Bond Index, achieved a return of 3.19% and 1.90%, respectively.
What factors affected the Portfolio’s performance?
Underweighting the most conservative fixed-income categories and Treasury bonds, an overweighted allocation to credit in fixed-income segments and broad diversification in the equity component of the Portfolio were the primary factors leading to better-than-benchmark results in the reporting period.
Investors’ appetite for risky asset segments returned in the first half of 2009, following the extraordinary decline in risk assets in the second half of 2008. In the fixed-income segment of the account, we remained underweighted in U.S. Treasury securities and overweighted in credit-exposed components of the fixed-income markets. The high-yield component of the account achieved handsome returns, far ahead of many equity segments of the markets.
In the equity components of the Portfolio, many of the subsectors also outperformed their respective benchmarks, with particularly good results achieved in the mid-cap accounts. The Portfolio was broadly diversified across most of the major equity market segments and that diversification provided exposure to many markets that outperformed the S&P 500 Index.
What is your outlook?
Evidence suggests the economy is recovering from the extreme weakness seen late in 2008 and early this year. While the economic recovery remains fragile due to the continued challenges in the financial sector, it appears policy actions have been sufficient to forestall an ongoing credit contraction.
8
Table of Contents
We believe that the economic recovery will likely be muted versus past experience. That does not negate the probability of a cyclical rally in the financial markets, but suggests more limited opportunities as the markets advance. It is our belief that earnings will be the key driver this cycle, much as it was in the advance in equities in the prior cycle, as price/earnings ratios are unlikely to expand given the expectations for high levels of debt issuance in the coming years. Corporate earnings, excluding the financial sector, have held up relatively well due to aggressive cost cutting and inventory management. That said, corporations cannot cut costs indefinitely and at some point sales growth will be necessary to drive earnings higher. We believe global growth will be sufficient to allow revenue expansion as the economic recovery should take hold in the second half of this year.
Portfolio Facts
As of June 30, 2009
Net Assets | $2,050,439,073 | |
NAV | $9.56 | |
NAV - High† | 6/12/2009 - $9.69 | |
NAV - Low† | 3/9/2009 - $7.48 | |
Number of Holdings: 39 |
| † | For the six months ended June 30, 2009 |
Average Annual Total Returns1
As of June 30, 2009
| 1-Year | From Inception 4/29/2005 | |
| (17.36%) | 0.33% |
| * | The Barclays Capital Aggregate Bond Index is an index that measures the performance of U.S. investment grade bonds. It is not possible to invest directly in the Index. The performance of the Index does not reflect deductions for fees, expenses or taxes. |
| ** | The Consumer Price Index is an inflationary indicator that measures the change in the cost of a fixed basket of products and services, including housing, electricity, food and transportation. It is not possible to invest directly in the Index. |
| *** | The S&P 500 Index is an index that represents the average performance of a group of 500 widely held, publicly traded stocks. It is not possible to invest directly in the Index. The performance of the Index does not reflect deductions for fees, expenses or taxes. “S&P 500” is a trademark of The McGraw-Hill Companies, Inc. and has been licensed for use by Thrivent Financial for Lutherans. The product is not sponsored, endorsed or promoted by Standard & Poor’s, and Standard & Poor’s makes no representation regarding the advisability of investing in the product. |
| 1 | Past performance is not an indication of future results. Total investment return and principal value of your investment will fluctuate and units, when redeemed, may be worth more or less than their original cost. Current performance may be higher or lower than the performance data quoted. Call 800-THRIVENT or visit www.thrivent.com for performance results current to the most recent month-end. |
Annualized total returns represent past performance and reflect changes in share prices, the reinvestment of all dividends and capital gains, and the effects of compounding. Periods of less than one year are not annualized. At various times, the Portfolio’s adviser waived its management fee and/or reimbursed Portfolio expenses. Had the adviser not done so, the Portfolio’s total returns would have been lower. The returns shown do not reflect charges and expenses imposed on contract holders by the variable accounts. Those charges and expenses reduce the returns received by contract holders as compared to the returns presented.
The prospectus contains more complete information on the investment objectives, risks, charges and expenses of the investment company, which investors should read and consider carefully before investing. To obtain a prospectus, contact a registered representative or visit Thrivent.com.
9
Table of Contents
| Thrivent Moderately Conservative Allocation Portfolio
Russell W. Swansen, David C. Francis, CFA, and Mark L. Simenstad, CFA, Portfolio Co-Managers | |
Thrivent Moderately Conservative Allocation Portfolio seeks long-term capital growth while providing reasonable stability of principal by implementing an asset allocation strategy. The Portfolio’s performance depends upon how its assets are allocated across broad asset categories and applicable sub-classes within such categories. Some broad asset categories and sub-classes may perform below expectations or below the securities markets generally over short or extended periods. In particular, underperformance in the equity markets would have material adverse effect on the Portfolio’s total return given its significant allocation to equity securities. Therefore, a principal risk of investing in the Portfolio is that the allocation strategies used, and the allocation decisions made will not produce the desired results. In addition, the performance of the Portfolio is heavily dependent upon the performance of the underlying asset classes in which the Portfolio invests. As a result, the Portfolio is subject to the same risks as those faced by the underlying asset classes. These and other risks are described in the Portfolio’s prospectus.
How did the Portfolio perform during the six-month period ended June 30, 2009?
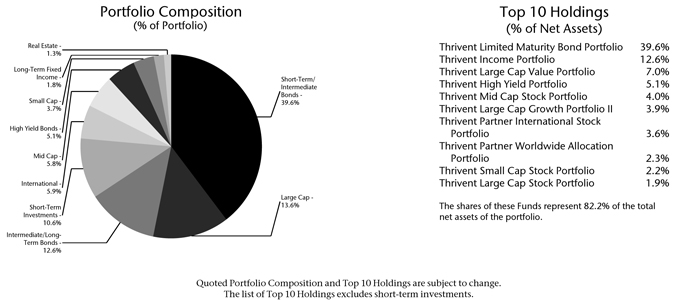
Thrivent Moderately Conservative Allocation Portfolio earned a total return of 6.96% as compared to the median return of its peer group, the Lipper Mixed-Asset Target Allocation Conservative category, of 6.08%. The Portfolio’s market benchmarks, the S&P 500 Index and the Barclays Capital Aggregate Bond Index, achieved a return of 3.19% and 1.90%, respectively.
What factors affected the Portfolio’s performance?
Underweighting the most conservative fixed-income categories and Treasury bonds, an overweighted allocation to credit in fixed-income segments and broad diversification in the equity component of the Portfolio were the primary factors leading to better-than-benchmark results in the reporting period.
Investors’ appetite for risky asset segments returned in the first half of 2009, following the extraordinary decline in risk assets in the second half of 2008. In the fixed-income segment of the account, we remained underweighted in U.S. Treasury securities and overweighted in credit-exposed components of the fixed-income markets. The high-yield component of the account achieved handsome returns, far ahead of many equity segments of the markets.
In the equity components of the Portfolio, many of the subsectors also outperformed their respective benchmarks, with particularly good results achieved in the mid-cap accounts. The Portfolio was broadly diversified across most of the major equity market segments and that diversification provided exposure to many markets that outperformed the S&P 500 Index.
What is your outlook?
Evidence suggests the economy is recovering from the extreme weakness seen late in 2008 and early this year. While the economic recovery remains fragile due to the continued challenges in the financial sector, it appears policy actions have been sufficient to forestall an ongoing credit contraction.
10
Table of Contents
We believe that the economic recovery will likely be muted versus past experience. That does not negate the probability of a cyclical rally in the financial markets, but suggests more limited opportunities as the markets advance. It is our belief that earnings will be the key driver this cycle, much as it was in the advance in equities in the prior cycle, as price/earnings ratios are unlikely to expand given the expectations for high levels of debt issuance in the coming years. Corporate earnings, excluding the financial sector, have held up relatively well due to aggressive cost cutting and inventory management. That said, corporations cannot cut costs indefinitely and at some point sales growth will be necessary to drive earnings higher. We believe global growth will be sufficient to allow revenue expansion as the economic recovery should take hold in the second half of this year.
Portfolio Facts
As of June 30, 2009
Net Assets | $839,977,834 | |
NAV | $9.91 | |
NAV - High† | 6/12/2009 - $9.98 | |
NAV - Low† | 3/9/2009 - $8.24 | |
Number of Holdings: 32 |
| † | For the six months ended June 30, 2009 |
Average Annual Total Returns1
As of June 30, 2009
| 1-Year | From Inception 4/29/2005 | |
| (11.31%) | 1.28% |
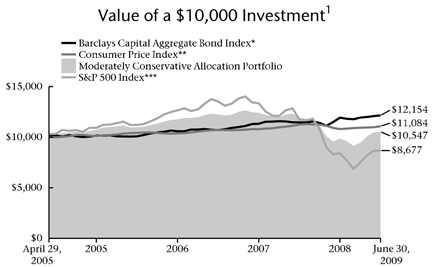
| * | The Barclays Capital Aggregate Bond Index is an index that measures the performance of U.S. investment grade bonds. It is not possible to invest directly in the Index. The performance of the Index does not reflect deductions for fees, expenses or taxes. |
| ** | The Consumer Price Index is an inflationary indicator that measures the change in the cost of a fixed basket of products and services, including housing, electricity, food and transportation. It is not possible to invest directly in the Index. |
| *** | The S&P 500 Index is an index that represents the average performance of a group of 500 widely held, publicly traded stocks. It is not possible to invest directly in the Index. The performance of the Index does not reflect deductions for fees, expenses or taxes. “S&P 500” is a trademark of The McGraw-Hill Companies, Inc. and has been licensed for use by Thrivent Financial for Lutherans. The product is not sponsored, endorsed or promoted by Standard & Poor’s, and Standard & Poor’s makes no representation regarding the advisability of investing in the product. |
| 1 | Past performance is not an indication of future results. Total investment return and principal value of your investment will fluctuate and units, when redeemed, may be worth more or less than their original cost. Current performance may be higher or lower than the performance data quoted. Call 800-THRIVENT or visit www.thrivent.com for performance results current to the most recent month-end. |
Annualized total returns represent past performance and reflect changes in share prices, the reinvestment of all dividends and capital gains, and the effects of compounding. Periods of less than one year are not annualized. At various times, the Portfolio’s adviser waived its management fee and/or reimbursed Portfolio expenses. Had the adviser not done so, the Portfolio’s total returns would have been lower. The returns shown do not reflect charges and expenses imposed on contract holders by the variable accounts. Those charges and expenses reduce the returns received by contract holders as compared to the returns presented.
The prospectus contains more complete information on the investment objectives, risks, charges and expenses of the investment company, which investors should read and consider carefully before investing. To obtain a prospectus, contact a registered representative or visit Thrivent.com.
11
Table of Contents
 |
Darren M. Bagwell, CFA, Portfolio Manager* Thrivent Technology Portfolio seeks long-term growth of capital.
The Portfolio primarily invests in securities of technology-related companies. As a consequence, the Portfolio may be subject to greater price volatility than a portfolio investing in a broad range of industries. These and other risks are described in the Portfolio’s prospectus.
* Effective July 1, 2009, the Portfolio, which has been renamed Thrivent Partner Technology Portfolio, is managed by subadviser Goldman Sachs Asset Management, L.P. |
How did the Portfolio perform during the six-month period ended June 30, 2009?
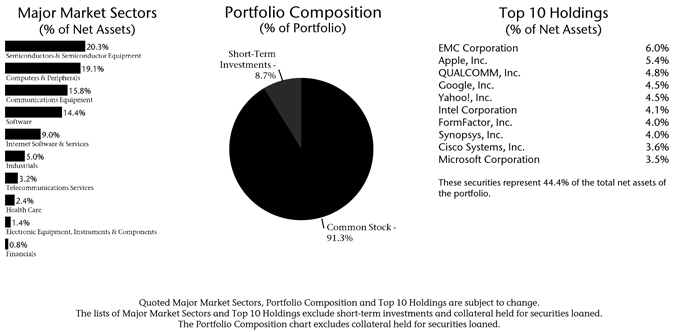
Thrivent Technology Portfolio earned a total return of 25.41% as compared to the median return of its peer group, the Lipper Science & Technology category, of 25.23%. The Portfolio’s market benchmark, the S&P North American Technology Sector Index, earned a total return of 26.23%.
What factors affected the Portfolio’s performance?
The Portfolio achieved healthy relative outperformance in the “traditional” areas of technology (computer hardware, semiconductors and software and services), which was offset to a disappointing degree by the collective performance of its smaller, diversifying holdings in alternative energy, health care and finance.
On its own, alternative energy was a positive influence on relative returns in the first half of 2009, as confidence in the stimulus-related commitments of China and the U.S. improved sentiment. Technology hardware-related positions were the biggest source of relative outperformance for the period. Positions in value-oriented communication equipment producers ADC Telecommunications, Motorola and Brocade Communications Systems were especially notable. The semiconductor sector was a meaningful contributor to relative performance as well, even though the Portfolio was underexposed to the better-performing chip producers relative to the equipment makers.
Finally, software and services was a neutral influence on Portfolio relative performance, with underperformance in application software and Internet-related holdings offsetting outperformance in IT services and systems-focused holdings.
What is your outlook?
We believe that the second half of 2009 will be characterized by improving (but still anemic) domestic economic growth, depressed interest rates, a stable dollar and technology spending in excess of overall economic growth—but below 2008 and below trend.
These conditions, combined with technology’s growing share of overall capital expenditures (increasingly at the Federal level), generally lean inventories and disciplined spending patterns over the previous cycle, should still allow for relative market leadership by the sector in 2009.
12
Table of Contents
We expect storage, virtualization, mobile Internet and alternative energy to be areas of notable investment opportunities in the year ahead, and believe the semiconductor sector still harbors significant revaluation opportunities despite a difficult demand environment.
We remain steadfast in the Portfolio’s positioning to benefit over the medium- and longer-terms from six key secular trends: “Green” IT Datacenters; Storage Growth; Network/IP Infrastructure Requirements; Alternative Energy Development; Mobile Internet/Smartphone Penetration; and Cloud Computing/Software as a Service. The majority of the Portfolio holdings remain leveraged to these emerging themes, and we are confident that the strategic focus of the Portfolio positions it well for longer-term outperformance.
Portfolio Facts
As of June 30, 2009
Net Assets | $24,491,330 | |
NAV | $4.56 | |
NAV - High† | 6/11/2009 - $4.79 | |
NAV - Low† | 3/9/2009 - $3.17 | |
Number of Holdings: 39 |
| † | For the six months ended June 30, 2009 |
Average Annual Total Returns1
As of June 30, 2009
| 1-Year | 5-Year | From Inception 3/1/2001 | ||
| (25.04%) | (4.31%) | (6.69%) |
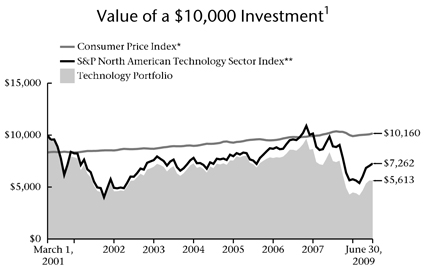
| * | The Consumer Price Index is an inflationary indicator that measures the change in the cost of a fixed basket of products and services, including housing, electricity, food and transportation. It is not possible to invest directly in the Index. |
| ** | The S&P North American Technology Sector Index is a modified capitalization-weighted index of selected technology stocks. It is not possible to invest directly in the Index. The performance of the Index does not reflect deductions for fees, expenses or taxes. The S&P North American Technology Sector Index is the new name for the index formerly known as the CBOE GSTI Composite Index. The S&P North American Technology Sector Index assumes the prior history and is compiled going forward using the same methodology of the CBOE GSTI Composite Index. |
| 1 | Past performance is not an indication of future results. Total investment return and principal value of your investment will fluctuate and units, when redeemed, may be worth more or less than their original cost. Current performance may be higher or lower than the performance data quoted. Call 800-THRIVENT or visit www.thrivent.com for performance results current to the most recent month-end. |
Annualized total returns represent past performance and reflect changes in share prices, the reinvestment of all dividends and capital gains, and the effects of compounding. Periods of less than one year are not annualized. At various times, the Portfolio’s adviser waived its management fee and/or reimbursed Portfolio expenses. Had the adviser not done so, the Portfolio’s total returns would have been lower. The returns shown do not reflect charges and expenses imposed on contract holders by the variable accounts. Those charges and expenses reduce the returns received by contract holders as compared to the returns presented.
The prospectus contains more complete information on the investment objectives, risks, charges and expenses of the investment company, which investors should read and consider carefully before investing. To obtain a prospectus, contact a registered representative or visit Thrivent.com.
13
Table of Contents
 |
Subadvised by Sectoral Asset Management, Inc.
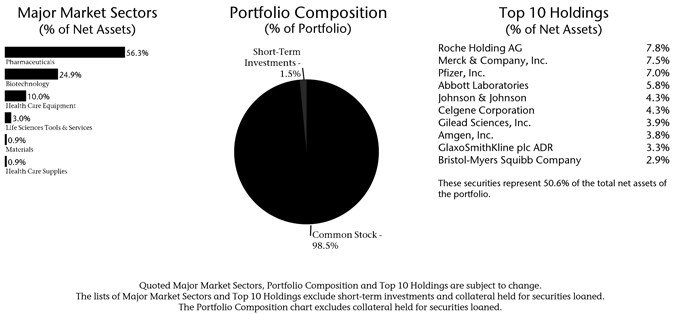
Thrivent Partner Healthcare Portfolio seeks long-term capital growth.
The Portfolio’s investments are concentrated in issuers in the health care industry; therefore, the Portfolio is more vulnerable to price changes in the securities of issuers in this industry and factors specific to this industry than a more broadly diversified fund. In addition, as a non-diversified fund, the portfolio is susceptible to the risk that events affecting a particular issuer will significantly affect the portfolio’s performance. These and other risks are described in the Portfolio’s prospectus.
How did the Portfolio perform during the six-month period ended June 30, 2009?
Thrivent Partner Healthcare Portfolio earned a total return of 6.94% as compared to the median return of its peer group, the Lipper Health/Biotechnology category, of 3.51%. The Portfolio’s market benchmark, the MSCI World Healthcare Index, earned a total return of -1.04%.
What factors affected the Portfolio’s performance?
So far this year, accumulating signs of financial and economic stabilization have led to a recovery in the stock markets in general and commodity, technology and emerging markets in particular. Although health care outperformed during the prior periods of market turmoil, it has underperformed in the most recent six months.
During the first half of 2009, stock selection aided outperformance while industry selection detracted. Both large pharmaceutical takeover targets (Wyeth by Pfizer and Schering-Plough by Merck) were significant positions before their respective acquisition announcements. Other positions that benefitted the Portfolio include medical device company Intuitive Surgical and generics companies Mylan and Teva Pharmaceutical Industries. Undoubtedly, the greatest disappointment was the announcement by the biotechnology company Sequenom of “mishandling of R&D test data and results” on the part of the team behind the development of the (heretofore) promising non-invasive Down’s syndrome test.
What is your outlook?
In times of economic uncertainty, we believe that health care is one of the few sectors that offers investors earnings visibility and growth. With regards to pharmaceuticals, we forecast that worldwide sales growth should be about 3-6% for the next five years with the “pharmerging” markets delivering the bulk of the growth, the U.S. contracting slightly and Europe and Japan growing within the global range. Within the pharmaceutical industry, our preference goes to global players with solid emerging markets exposures, strong R&D capabilities and biologic drugs sales. The last six months of earnings have indicated that demand for
14
Table of Contents
biotech products–setting aside inventory and other temporary effects–continues to be strong. We believe that the second half of the year promises numerous significant clinical and regulatory developments and thus should have plentiful news flow. The focus in the specialty pharmacy and generics industry goes to global players and companies with exposures to countries with low generic and pharmaceutical exposures. Med tech is expected to continue recovering, led by manufacturers with reimbursed devices.
Portfolio Facts
As of June 30, 2009
Net Assets | $10,536,578 | |
NAV | $9.56 | |
NAV - High† | 6/29/2009 - $9.63 | |
NAV - Low† | 3/5/2009 - $7.64 | |
Number of Holdings: 41 |
| † | For the six months ended June 30, 2009 |
Average Annual Total Returns1
As of June 30, 2009
| 1-Year | From Inception 4/30/2008 | |
| (7.14%) | (3.67%) |
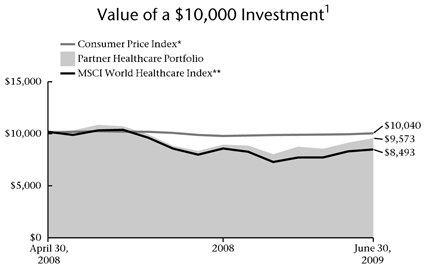
| * | The Consumer Price Index is an inflationary indicator that measures the change in the cost of a fixed basket of products and services, including housing, electricity, food and transportation. It is not possible to invest directly in the Index. |
| ** | The MSCI World Healthcare Index is a capitalization-weighted index of selected health care stocks from around the world. It is not possible to invest directly in the Index. The performance of the Index does not reflect deductions for fees, expenses or taxes. |
| 1 | Past performance is not an indication of future results. Total investment return and principal value of your investment will fluctuate and units, when redeemed, may be worth more or less than their original cost. Current performance may be higher or lower than the performance data quoted. Call 800-THRIVENT or visit www.thrivent.com for performance results current to the most recent month-end. |
Annualized total returns represent past performance and reflect changes in share prices, the reinvestment of all dividends and capital gains, and the effects of compounding. Periods of less than one year are not annualized. At various times, the Portfolio’s adviser waived its management fee and/or reimbursed Portfolio expenses. Had the adviser not done so, the Portfolio’s total returns would have been lower. The returns shown do not reflect charges and expenses imposed on contract holders by the variable accounts. Those charges and expenses reduce the returns received by contract holders as compared to the returns presented.
The prospectus contains more complete information on the investment objectives, risks, charges and expenses of the investment company, which investors should read and consider carefully before investing. To obtain a prospectus, contact a registered representative or visit Thrivent.com.
15
Table of Contents
 |
Subadvised by BlackRock Investment Management, LLC
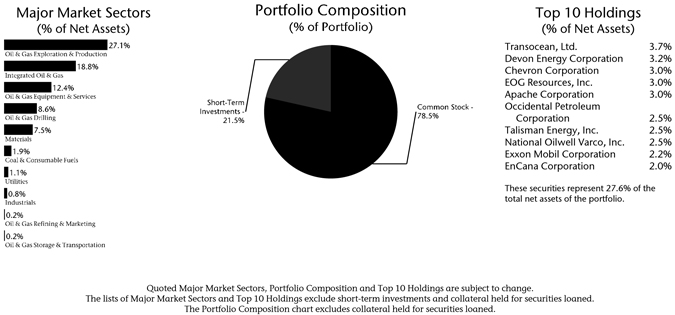
Thrivent Partner Natural Resources Portfolio seeks long-term capital growth. The Portfolio’s investments are concentrated in issuers in the natural resources industry; therefore, the Portfolio is more vulnerable to price changes in the securities of issuers in this industry and factors specific to this industry than a more broadly diversified fund. In addition, as a non-diversified fund, the Portfolio is susceptible to the risk that events affecting a particular issuer will significantly affect the Portfolio’s performance. These and other risks are described in the Portfolio’s prospectus.
How did the Portfolio perform during the six-month period ended June 30, 2009?
Thrivent Partner Natural Resources Portfolio earned a total return of 16.38% as compared to the median return of its peer group, the Lipper Natural Resources category, of 18.59%. The Portfolio’s market benchmark, the S&P North American Natural Resources Sector Index, earned a total return of 9.96%.
What factors affected the Portfolio’s performance?
Several key areas of commodities markets posted substantial gains as investor sentiment notably improved throughout the semiannual period. Improved growth prospects, coupled with supply cuts resulting from the precipitous price declines in the second half of 2008 and the first few months of 2009, gave investors increased confidence that supply overhangs would be short-lived across a variety of supply-constrained commodities. Oil prices, which had fallen below $35/barrel (bbl) in February, rallied to over $70/bbl before finishing the period at $69/bbl. Economically sensitive commodities such as nickel, lead, copper and zinc also gained.
The Portfolio performed strongly, fueled by gains in March and April across the commodity spectrum. Specifically, the Portfolio benefitted from positioning within the oil and gas equipment and services and oil and gas exploration and production segments. As oil prices rose off the lows set earlier in the year, service companies and producers rallied sharply before pulling back in June. The correction toward the end of the period can be attributed to these expectations perhaps turning out to be a bit too optimistic.
What is your outlook?
While commodity-related stocks outperformed, generating healthy returns during the quarter, they rallied off extremely low levels and remain substantially below where they were in the first half of 2008. We continue to believe that energy stocks offer compelling value at current levels. As market conditions have “normalized,” commodity prices have rebounded, despite continued weakness in demand. Both equity and commodity markets tend to be forward-discounting mechanisms.
Despite remaining constructive on a mid- to long-term basis, given the speed at which the stocks rallied in the March to early June time period, we believe the correction/consolidation period that began in late June is somewhat expected and should be followed by another upturn in stock prices. While macro concerns
16
Table of Contents
appear to be weighing on the sector, underlying supply-demand data remains constructive. In the last month, we have allowed cash to accumulate, but remain otherwise aggressively positioned, favoring exploration and production, service/drilling, coal producers and diversified miners. We will look to deploy cash balances on further weakness.
Portfolio Facts
As of June 30, 2009
Net Assets | $12,210,101 | |
NAV | $6.66 | |
NAV - High† | 6/1/2009 - $7.44 | |
NAV - Low† | 3/2/2009 - $4.97 | |
Number of Holdings: 95 |
| † | For the six months ended June 30, 2009 |
Average Annual Total Returns1
As of June 30, 2009
| 1-Year | From Inception 4/30/2008 | |
| (40.76%) | (29.32%) |
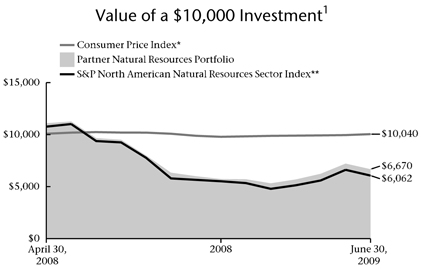
| * | The Consumer Price Index is an inflationary indicator that measures the change in the cost of a fixed basket of products and services, including housing, electricity, food and transportation. It is not possible to invest directly in the Index. |
| ** | The S&P North American Natural Resources Sector Index is an index of selected U.S. traded natural resource related stocks. The product is not sponsored, endorsed or promoted by Standard & Poor’s, and Standard & Poor’s makes no representation regarding the advisability of investing in the product. It is not possible to invest directly in the Index. The performance of the Index does not reflect deductions for fees, expenses or taxes. |
| 1 | Past performance is not an indication of future results. Total investment return and principal value of your investment will fluctuate and units, when redeemed, may be worth more or less than their original cost. Current performance may be higher or lower than the performance data quoted. Call 800-THRIVENT or visit www.thrivent.com for performance results current to the most recent month-end. |
Annualized total returns represent past performance and reflect changes in share prices, the reinvestment of all dividends and capital gains, and the effects of compounding. Periods of less than one year are not annualized. At various times, the Portfolio’s adviser waived its management fee and/or reimbursed Portfolio expenses. Had the adviser not done so, the Portfolio’s total returns would have been lower. The returns shown do not reflect charges and expenses imposed on contract holders by the variable accounts. Those charges and expenses reduce the returns received by contract holders as compared to the returns presented.
The prospectus contains more complete information on the investment objectives, risks, charges and expenses of the investment company, which investors should read and consider carefully before investing. To obtain a prospectus, contact a registered representative or visit Thrivent.com.
17
Table of Contents
 |
Subadvised by Aberdeen Asset Management Investment Services Limited
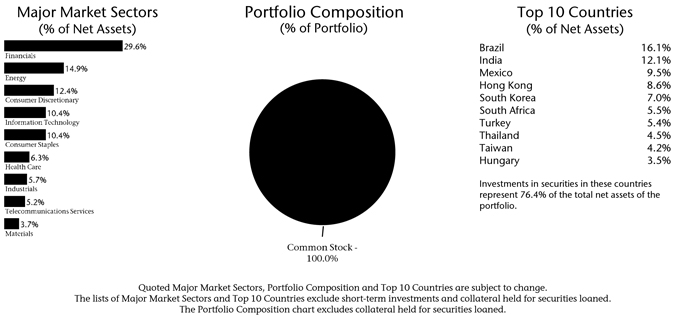
Thrivent Partner Emerging Markets Portfolio seeks long-term capital growth.
Foreign investments, as compared to domestic ones, involve additional risks, including currency fluctuations, different accounting standards, and greater political, economic and market instability. These risks are magnified when the portfolio invests in emerging markets, which may be of relatively small size and less liquid than domestic markets. These and other risks are described in the Portfolio’s prospectus.
How did the Portfolio perform during the six-month period ended June 30, 2009?
Thrivent Partner Emerging Markets Portfolio earned a total return of 33.38% (in U.S dollar terms) as compared to the median return of its peer group, the Lipper Emerging Markets category, of 31.53%. The Portfolio’s market benchmark, the MSCI Emerging Markets Index, earned a total return of 36.22%.
What factors affected the Portfolio’s performance?
Negative stock selection outweighed positive asset allocation, resulting in the Portfolio’s modest underperformance versus the benchmark. Hopes that the worst of the global financial crisis may soon be over fuelled a rally in emerging markets. Against such a backdrop, our defensive holdings lagged behind the high-beta stocks that led the rally. In stock selection, our holdings in India, China and Taiwan hurt performance the most. India’s Satyam Computer Services, for example, was the biggest detractor to relative return; the share price of the company fell sharply after its chairman’s stunning admission of fraud. We have since sold our holding in the company. Meanwhile, China Mobile underperformed amid concerns of rising competition. Mitigating the losses were the positive contributions from our holdings in Indonesia and Turkey.
At the country level, our exposure in (non-benchmark) Hong Kong and overweighted position to India were among the top contributors to relative return. However, the gains were pared by our overweighted stance to Mexico, which lagged behind its peers on concerns over the ongoing drug war and the swine flu outbreak.
What is your outlook?
Emerging markets have risen sharply from their March lows. The rally so far has been driven by strong liquidity flows, loose monetary policy, better-than-expected first-quarter results and optimism that a global economic recovery is just around the corner, which emboldened investors to increase risk appetite and funnel excess cash into financial assets. However, it looks increasingly like markets have run ahead of both economic fundamentals and earnings. Economic conditions remain weak and there has yet to be a pickup in consumer demand. A pullback or period of consolidation would be considered healthy and overdue for markets. Nevertheless, we
18
Table of Contents
remain upbeat over the long-term prospects for emerging markets, underpinned by solid fundamentals.
As bottom-up stock pickers, our global allocation strategy depends upon where we can find good quality companies with attractive valuations. To this end, we will maintain our overweighted stance to India and Mexico, as well as our exposure in (non-benchmark) Hong Kong, while remaining underweighted in holdings to China, Korea, Taiwan and Russia.
Portfolio Facts
As of June 30, 2009
Net Assets | $6,630,164 | |
NAV | $7.46 | |
NAV - High† | 6/11/2009 - $7.69 | |
NAV - Low† | 3/2/2009 - $4.46 | |
Number of Holdings: 48 |
| † | For the six months ended June 30, 2009 |
Average Annual Total Returns1
As of June 30, 2009
| 1-Year | From Inception 4/30/2008 | |
| (19.24%) | (21.61%) |
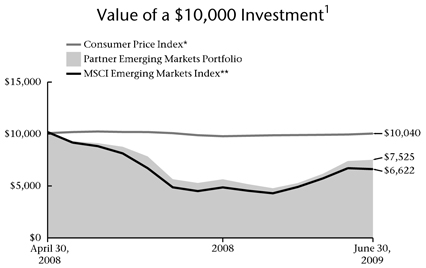
| * | The Consumer Price Index is an inflationary indicator that measures the change in the cost of a fixed basket of products and services, including housing, electricity, food and transportation. It is not possible to invest directly in the Index. |
| ** | The MSCI Emerging Markets Index is a modified capitalization-weighted index of selected emerging economies from around the world. It is not possible to invest directly in the Index. The performance of the Index does not reflect deductions for fees, expenses or taxes. |
| 1 | Past performance is not an indication of future results. Total investment return and principal value of your investment will fluctuate and units, when redeemed, may be worth more or less than their original cost. Current performance may be higher or lower than the performance data quoted. Call 800-THRIVENT or visit www.thrivent.com for performance results current to the most recent month-end. |
Annualized total returns represent past performance and reflect changes in share prices, the reinvestment of all dividends and capital gains, and the effects of compounding. Periods of less than one year are not annualized. At various times, the Portfolio’s adviser waived its management fee and/or reimbursed Portfolio expenses. Had the adviser not done so, the Portfolio’s total returns would have been lower. The returns shown do not reflect charges and expenses imposed on contract holders by the variable accounts. Those charges and expenses reduce the returns received by contract holders as compared to the returns presented.
The prospectus contains more complete information on the investment objectives, risks, charges and expenses of the investment company, which investors should read and consider carefully before investing. To obtain a prospectus, contact a registered representative or visit Thrivent.com.
19
Table of Contents

How did the Portfolio perform during the six-month period ended June 30, 2009?
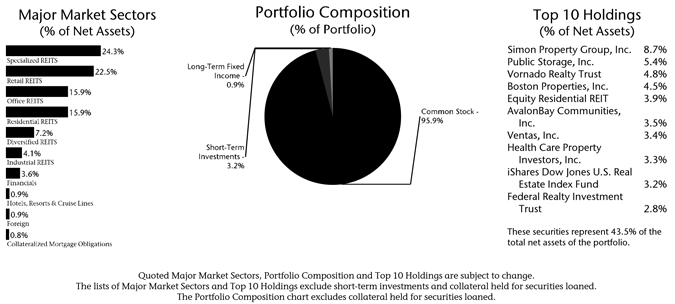
Thrivent Real Estate Securities Portfolio earned a total return of -10.87%, net of expenses, as compared to the median return for its peer group, the Lipper Real Estate Variable Account category, of -8.66%. The Portfolio’s market benchmark, the FTSE NAREIT Equity REIT Index, earned a total return of -12.21%.
What factors affected the Portfolio’s performance?
Equity real estate investment trusts (REITs) were under pressure during the first half of 2009, as a result of the faltering U.S. economy, which has caused rising vacancy rates and declining rental rates for all types of real estate. REIT stocks were impacted most significantly by job losses across all industries and reduced demand for real estate space, which led to rising vacancy rates and downward pressure on rental rates for all property types. However, more than 40 REITs were successful in issuing over $13 billion of equity during the first half of 2009, which helped REIT stock prices rebound from their lows in early March. This issuance of new equity has reduced the risk of insolvency within the REIT sector, and started the process of deleveraging.
The best-performing sectors in the Portfolio were regional malls, lodging, specialty, and mortgage REITs. All of these sectors generated positive returns during the first half of 2009. The Portfolio’s underweighted allocation to diversified and self-storage REITs, which underperformed other property sectors during the period, also contributed positively to results.
What is your outlook?
We believe that the U.S. economy will remain weak for the near future, and as a result we expect real estate vacancy rates to continue to rise. Housing price declines and job losses are likely to negatively impact consumer spending until housing prices stabilize and job growth resumes.
Based on our outlook, we plan to concentrate the Portfolio’s exposure in well-capitalized U.S. REITs with high-quality real estate and best-in-class management teams. We also believe that property sectors with long-term leases and stable cash flows will perform well in this environment. As a result, we intend to maintain meaningful exposure in the health care REIT and net lease sectors. We believe that economic weakness will
20
Table of Contents
continue to pressure the travel industry and consumer spending, and therefore we intend to maintain less exposure in the lodging and shopping center sectors than we would in an expanding economy. In the event U.S. economic conditions improve during the second half of 2009, we will make adjustments in property sectors and individual securities that we believe would benefit performance.
Portfolio Facts
As of June 30, 2009
Net Assets | $172,941,244 | |
NAV | $8.33 | |
NAV - High† | 1/6/2009 - $9.37 | |
NAV - Low† | 3/6/2009 - $5.52 | |
Number of Holdings: 94 |
| † | For the six months ended June 30, 2009 |
Average Annual Total Returns1
As of June 30, 2009
| 1-Year | 5-Year | From Inception 4/30/2003 | ||
| (42.12%) | (2.19%) | 3.59% |
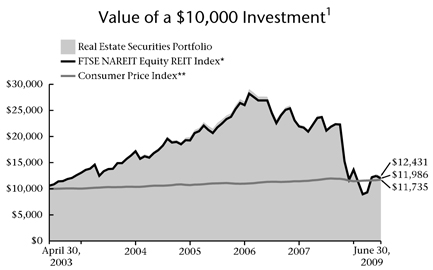
| * | The FTSE NAREIT Equity REIT Index is an unmanaged capitalization-weighted index of all equity real estate investment trusts. It is not possible to invest directly in this Index. The performance of this Index does not reflect deductions for fees, expenses or taxes. |
| ** | The Consumer Price Index is an inflationary indicator that measures the change in the cost of a fixed basket of products and services, including housing, electricity, food and transportation. It is not possible to invest directly in the Index. |
| 1 | Past performance is not an indication of future results. Total investment return and principal value of your investment will fluctuate and units, when redeemed, may be worth more or less than their original cost. Current performance may be higher or lower than the performance data quoted. Call 800-THRIVENT or visit www.thrivent.com for performance results current to the most recent month-end. |
Annualized total returns represent past performance and reflect changes in share prices, the reinvestment of all dividends and capital gains, and the effects of compounding. Periods of less than one year are not annualized. At various times, the Portfolio’s adviser waived its management fee and/or reimbursed Portfolio expenses. Had the adviser not done so, the Portfolio’s total returns would have been lower. The returns shown do not reflect charges and expenses imposed on contract holders by the variable accounts. Those charges and expenses reduce the returns received by contract holders as compared to the returns presented.
The prospectus contains more complete information on the investment objectives, risks, charges and expenses of the investment company, which investors should read and consider carefully before investing. To obtain a prospectus, contact a registered representative or visit Thrivent.com.
21
Table of Contents
|
Subadvised by BlackRock Investment Management, LLC
Thrivent Partner Utilities Portfolioseeks capital appreciation and current income.
The Portfolio’s investments are concentrated in issuers in the utilities industry; therefore the Portfolio is more vulnerable to price changes in the securities of issuers in this industry and factors specific to this industry than a more broadly diversified fund. The Portfolio is also subject to the risks of investing in foreign (including emerging markets) stocks. These and other risks are described in the Portfolio’s prospectus.
How did the Portfolio perform during the six-month period ended June 30, 2009?
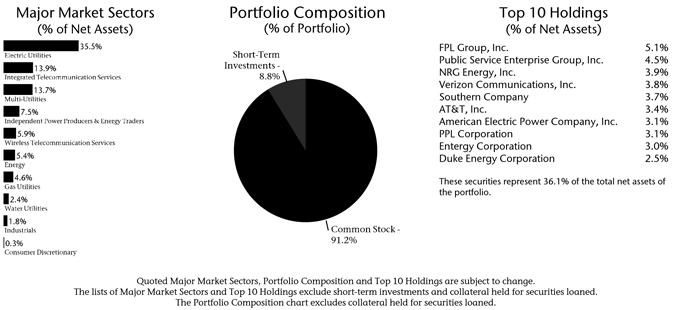
Thrivent Partner Utilities Portfolio earned a total return of -0.78% as compared to the median return of its peer group, the Lipper Utility category, of 1.54%. The Portfolio’s market benchmarks, the S&P 500 Utilities Index and S&P 500 Telecommunications Services Index, earned total returns of -1.71% and -3.96%, respectively.
What factors affected the Portfolio’s performance?
On the whole, our bias towards utilities, as opposed to telecom, generated positive return comparisons for the reporting period. Most notably, an underweighted stance in large, diversified players such as AT&T contributed strongly to relative returns. Security selection within the electric utilities segment also benefitted performance, as our underweighted holding in Southern Co. in favor of some of the Brazilian companies within the group generated strong returns. Meanwhile, the positive results generated from maintaining an overweighted position in wireless telecommunications services were more than offset by poor security selection within the segment. With this exception, no other industry detracted significantly from performance during the six months.
There was little significant change in the composition of the Portfolio during the period, although we did eliminate some smaller telecom positions.
What is your outlook?
Overall, the U.S. electric utility sector looks attractively valued relative to historical price/earnings and price/book ratios, and relative to corporate bonds and Treasuries. Though normally viewed as a recession-proof industry, what we have actually seen this time is pressure on sales, particularly on the industrial side. While clearly disappointing, it is important to note that industrial sales tend to have lower margins than residential and commercial. On the positive side, we are hearing from companies that the worst is probably behind us in terms of industrial sales, but that they still are not seeing any signs of a pick-up. In this environment, stock selection remains key. We continue to shy away from companies that need large rate increases, given the current economic situation and potential for political backlash. We have found a number of companies in our universe
22
Table of Contents
selling at less than ten times earnings and with dividend yields of at least 5%. As a result, we are bullish on the sector, particularly at these levels in this environment.
At period-end, we continue to emphasize the electric utility segment and, given the year-to-date weakness in the sector, the more regulated utilities stocks have become much more attractively valued. We also continue to emphasize U.S. companies, as we believe the worst effects of the weak economy are behind them and valuations look attractive given this backdrop.
Portfolio Facts
As of June 30, 2009
Net Assets | $5,229,624 | |
NAV | $6.88 | |
NAV - High† | 1/5/2009 - $7.11 | |
NAV - Low† | 3/9/2009 - $5.55 | |
Number of Holdings: 85 |
| † | For the six months ended June 30, 2009 |
Average Annual Total Returns1
As of June 30, 2009
| 1-Year | From Inception 4/30/2008 | |
| (29.92%) | (26.44%) |
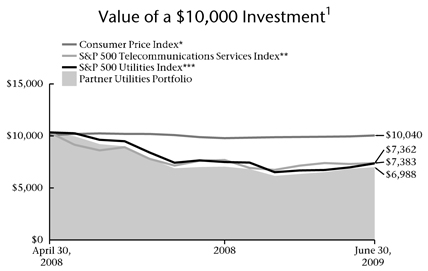
| * | The Consumer Price Index is an inflationary indicator that measures the change in the cost of a fixed basket of products and services, including housing, electricity, food and transportation. It is not possible to invest directly in the Index. |
| ** | The S&P 500 Telecommunications Services Index is a capitalization-weighted index of telecommunications sector securities. The product is not sponsored, endorsed or promoted by Standard & Poor’s, and Standard & Poor’s makes no representation regarding the advisability of investing in the product. It is not possible to invest directly in this Index. The performance of this Index does not reflect deductions for fees, expenses or taxes. |
| *** | The S&P 500 Utilities Index is a capitalization-weighted index of utilities sector securities. The product is not sponsored, endorsed or promoted by Standard & Poor’s, and Standard & Poor’s makes no representation regarding the advisability of investing in the product. It is not possible to invest directly in this Index. The performance of this Index does not reflect deductions for fees, expenses or taxes. |
| 1 | Past performance is not an indication of future results. Total investment return and principal value of your investment will fluctuate and units, when redeemed, may be worth more or less than their original cost. Current performance may be higher or lower than the performance data quoted. Call 800-THRIVENT or visit www.thrivent.com for performance results current to the most recent month-end. |
Annualized total returns represent past performance and reflect changes in share prices, the reinvestment of all dividends and capital gains, and the effects of compounding. Periods of less than one year are not annualized. At various times, the Portfolio’s adviser waived its management fee and/or reimbursed Portfolio expenses. Had the adviser not done so, the Portfolio’s total returns would have been lower. The returns shown do not reflect charges and expenses imposed on contract holders by the variable accounts. Those charges and expenses reduce the returns received by contract holders as compared to the returns presented.
The prospectus contains more complete information on the investment objectives, risks, charges and expenses of the investment company, which investors should read and consider carefully before investing. To obtain a prospectus, contact a registered representative or visit Thrivent.com.
23
Table of Contents
 |
Subadvised by Turner Investment Partners, Inc.
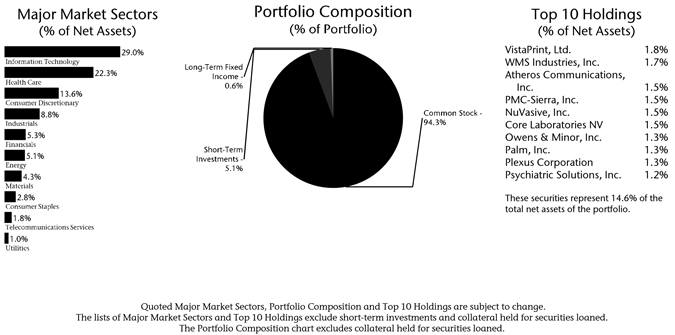
Thrivent Partner Small Cap Growth Portfolio seeks long-term capital growth by investing primarily in a diversified portfolio of common stocks of U.S. small capitalization companies. The Portfolio is exposed to the risks of investing in equity securities of smaller companies, which may include, but are not limited to, lower trading volume and less liquidity than larger, more established companies. Small company stock prices are generally more volatile than large company stock prices. These and other risks are described in the Portfolio’s prospectus.
How did the Portfolio perform during the six-month period ended June 30, 2009?
Thrivent Partner Small Cap Growth Portfolio earned a total return of 11.07% as compared to the median return of its peer group, the Lipper Small Cap Growth category, of 10.44%. The Portfolio’s market benchmark, the Russell 2000® Growth Index, earned a total return of 11.36%.
What factors affected the Portfolio’s performance?
Despite a period where very small and micro-market capitalization stocks outperformed significantly as a part of a low-quality market rally, the Portfolio, which focuses on investing in companies with above-average earnings growth, performed in line with its benchmark Index.
Many have dubbed the rally that started on March 6 as a “low quality” rally. Beginning with the market bottom and continuing through the end of the quarter, small-cap growth stocks priced below $5 a share returned an astounding 88%, compared to a return of 34% for stocks priced above $10 a share.
A breakdown of the Portfolio’s performance by sector indicates that the recent rally was broad-based. On a relative basis, the Portfolio generated positive results in five of the nine market sectors.
What is your outlook?
Aside from being diversified by sector, we continue to classify companies in the Portfolio into three broad categories: traditional growth, early cycle, or market share gainer. Pure growth companies are a staple of the Portfolio. We look, in part, to companies in this category that are seeking to grow their earnings through new products and services and that are run by dynamic management teams. In addition, the Portfolio consists of particular early cycle holdings within the durables sector because we believe that these securities are likely to be the first to rebound from an improving economy. Finally, we like certain companies looking to expand their market share and to take advantage of weakened companies within their respective industries.
As we see it, the government’s stimulus is working and should lead to economic growth without any significant acceleration in inflation next year. And we think the
24
Table of Contents
stock market should retain an upward bias into 2010 and beyond, although it may be vulnerable to a correction in the near-term after the strong run-up. In our estimation, growth stocks continue to offer attractive valuations by historical standards and in relative terms to value stocks. In addition, we believe they offer attractive return potential at a time when earnings growth is increasingly hard to come by.
Portfolio Facts
As of June 30, 2009
Net Assets | $125,065,141 | |
NAV | $8.26 | |
NAV - High† | 6/11/2009 - $8.37 | |
NAV - Low† | 3/9/2009 - $5.68 | |
Number of Holdings: 127 |
| † | For the six months ended June 30, 2009 |
Average Annual Total Returns1
As of June 30, 2009
| 1-Year | 5-Year | From Inception 11/30/2001 | ||
| (28.26%) | (3.04%) | (0.17%) |
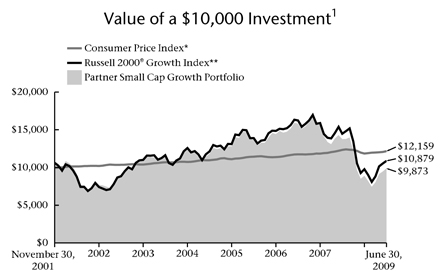
| * | The Consumer Price Index is an inflationary indicator that measures the change in the cost of a fixed basket of products and services, including housing, electricity, food and transportation. It is not possible to invest directly in the Index. |
| ** | The Russell 2000® Growth Index is an index comprised of small capitalization companies with a greater than average growth orientation. It is not possible to invest directly in the Index. The performance of the Index does not reflect deductions for fees, expenses or taxes. |
| 1 | Past performance is not an indication of future results. Total investment return and principal value of your investment will fluctuate and units, when redeemed, may be worth more or less than their original cost. Current performance may be higher or lower than the performance data quoted. Call 800-THRIVENT or visit www.thrivent.com for performance results current to the most recent month-end. |
Annualized total returns represent past performance and reflect changes in share prices, the reinvestment of all dividends and capital gains, and the effects of compounding. Periods of less than one year are not annualized. At various times, the Portfolio’s adviser waived its management fee and/or reimbursed Portfolio expenses. Had the adviser not done so, the Portfolio’s total returns would have been lower. The returns shown do not reflect charges and expenses imposed on contract holders by the variable accounts. Those charges and expenses reduce the returns received by contract holders as compared to the returns presented.
The prospectus contains more complete information on the investment objectives, risks, charges and expenses of the investment company, which investors should read and consider carefully before investing. To obtain a prospectus, contact a registered representative or visit Thrivent.com.
25
Table of Contents
 |
Subadvised by T. Rowe Price Associates, Inc.
Thrivent Partner Small Cap Value Portfolio seeks long-term growth of capital by investing primarily in a diversified portfolio of small capitalization common stocks and securities convertible into small company stocks.
The Portfolio is exposed to the risks of investing in equity securities of smaller companies, which may include, but are not limited to, lower trading volume and less liquidity than larger, more established companies. Small company stock prices are generally more volatile than large company stock prices. These and other risks are described in the Portfolio’s prospectus.
How did the Portfolio perform during the six-month period ended June 30, 2009?
Thrivent Partner Small Cap Value Portfolio earned a total return of 2.68% as compared to the median return of its peer group, the Lipper Small Cap Value category, of 2.90%. The Portfolio’s market benchmark, the Russell 2000® Value Index, earned a total return of 5.17%.
What factors affected the Portfolio’s performance?
After a dismal year in 2008, the stock market began a rebound in early March that continued well into June before losing steam. Investor sentiment improved, responding to economic news that was “less bad” than expected. Within the universe of small company stocks, value stocks vastly underperformed growth stocks for the period. Small-cap value stocks trailed large-cap value stocks.
Food and staples retailers dragged on the Portfolio’s results relative to the index in the consumer staples sector. Although their stock prices held up well during the brunt of the economic downturn, they did not keep pace in the market rally of the past three months.
Although financial stocks have rallied since bottoming out in March, they were unable to erase earlier losses, and the financials sector ended the six-month period as the index’s weakest performer. With a single-digit loss, the Portfolio substantially outperformed the index in the sector, due to an underweighted position and stock selection.
Holdings in the industrials and business services sector outpaced those in the index, but an overweighted position subtracted a little from relative performance. Vitran, a Canadian less-than-truckload carrier that is rapidly expanding in the U.S., was a notable contributor.
The Portfolio also benefitted from an overweighted position in the consumer discretionary sector and the performance of our health care holdings versus the index.
What is your outlook?
While the economy remains challenging, encouraging signs of stabilization have surfaced in some areas. Only time will tell whether we have seen the bottom of this economic downturn, but the efforts of global
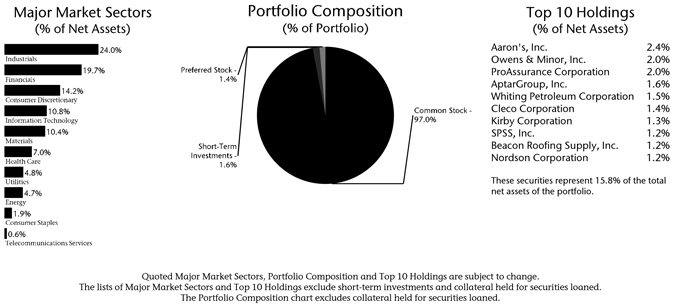
26
Table of Contents
policymakers, combined with lower commodity costs and interest rates, have at the very least had a positive effect on investor confidence. Solid evidence of a business rebound will be needed to sustain the stock market rally we have seen over the past few months. We remain cautiously optimistic that the equity markets will finish the year in positive territory. Despite the uncertain environment, we feel confident that we can continue to find opportunities to buy good businesses at attractive prices.
Portfolio Facts
As of June 30, 2009
Net Assets | $169,699,130 | |
NAV | $12.37 | |
NAV - High† | 6/4/2009 - $12.95 | |
NAV - Low† | 3/9/2009 - $8.08 | |
Number of Holdings: 163 |
| † | For the six months ended June 30, 2009 |
Average Annual Total Returns1
As of June 30, 2009
| 1-Year | 5-Year | From Inception 4/30/2003 | ||
| (24.02%) | 1.16% | 8.32% |
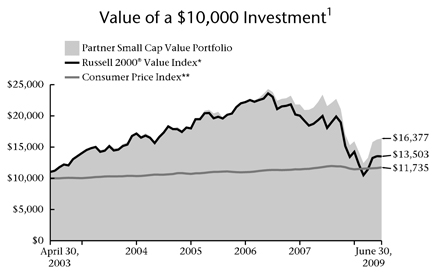
| * | The Russell 2000® Value Index measures the performance of small cap value stocks. It is not possible to invest directly in the Index. The performance of the Index does not reflect deductions for fees, expenses or taxes. |
| ** | The Consumer Price Index is an inflationary indicator that measures the change in the cost of a fixed basket of products and services, including housing, electricity, food and transportation. It is not possible to invest directly in the Index. |
| 1 | Past performance is not an indication of future results. Total investment return and principal value of your investment will fluctuate and units, when redeemed, may be worth more or less than their original cost. Current performance may be higher or lower than the performance data quoted. Call 800-THRIVENT or visit www.thrivent.com for performance results current to the most recent month-end. |
Annualized total returns represent past performance and reflect changes in share prices, the reinvestment of all dividends and capital gains, and the effects of compounding. Periods of less than one year are not annualized. At various times, the Portfolio’s adviser waived its management fee and/or reimbursed Portfolio expenses. Had the adviser not done so, the Portfolio’s total returns would have been lower. The returns shown do not reflect charges and expenses imposed on contract holders by the variable accounts. Those charges and expenses reduce the returns received by contract holders as compared to the returns presented.
The prospectus contains more complete information on the investment objectives, risks, charges and expenses of the investment company, which investors should read and consider carefully before investing. To obtain a prospectus, contact a registered representative or visit Thrivent.com.
27
Table of Contents

How did the Portfolio perform during the six-month period ending June 30, 2009?
Thrivent Small Cap Stock Portfolio earned a total return of -2.76% as compared to the median return of its peer group, the Lipper Small Cap Core category, of 2.95%. The Portfolio’s market benchmark, the Russell 2000® Index, earned a total return of 2.64%.
What factors affected the Portfolio’s performance?
During the period, the financial markets were extremely volatile as investors struggled to comprehend the severity of the financial crisis while interpreting the ramifications of federal government intervention in the marketplace. During the first two months of 2009, the equity markets declined severely, while the latter half of the period saw a powerful market rally. Initially, the Portfolio was positioned defensively, focusing on high-quality companies situated in noncyclical sectors of the market. While the market was in decline, the Portfolio performed very well primarily due to appropriate sector allocation.
However, the Portfolio’s focus on high-quality stocks, along with the speculative nature of the market rally, resulted in below-market returns for the period. The best-performing stocks during this period were low-quality stocks (as measured by economic returns), as well as stocks with a low market cap, low dollar price, little-to-no earnings, and high debt levels. While many of these stocks may have been oversold due to the severity of the economic crisis, they were difficult for any prudent long-term investor to own.
Security selection also detracted from performance for the period, particularly in the information technology, health care and financials sectors, while security selection within the industrials and consumer staples sectors improved performance.
What is your outlook?
Given the strength of the recent market rally, in the near term we expect the market to, at a minimum, consolidate its recent gains while possibly testing its prior March lows. Longer term, our outlook for equity returns is more favorable, as valuations remain attractive while economic indicators may be showing signs of stabilization.
While we are still in the midst of a debt deflation cycle, the massive government stimulus programs should at least stimulate economic growth in the short term. From

28
Table of Contents
a sector allocation basis, the Portfolio will be looking to capitalize on stimulus-related opportunities within the basic materials, energy, information technology and consumer discretionary sectors. Overall, the Portfolio will continue to focus on its core investment philosophy of owning high-quality stocks with improving fundamentals, solid valuation support and positive economic returns. While optimistic that we have seen the worst of this economic crisis, we remain diligent in analyzing new data as it becomes available.
Portfolio Facts
As of June 30, 2009
Net Assets | $276,130,070 | |
NAV | $8.23 | |
NAV - High† | 6/2/2009 - $8.75 | |
NAV - Low† | 3/9/2009 - $6.28 | |
Number of Holdings: 302 |
| † | For the six months ended June 30, 2009 |
Average Annual Total Returns1
As of June 30, 2009
| 1-Year | 5-Year | From Inception 3/1/2001 | ||
| (33.68%) | (2.42%) | 2.07% |
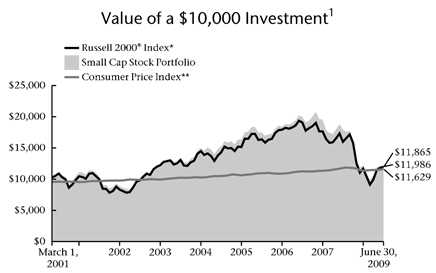
| * | The Russell 2000® Index measures the performance of small cap stocks. It is not possible to invest directly in the Index. The performance of the Index does not reflect deductions for fees, expenses or taxes. |
| ** | The Consumer Price Index is an inflationary indicator that measures the change in the cost of a fixed basket of products and services, including housing, electricity, food and transportation. It is not possible to invest directly in the Index. |
| 1 | Past performance is not an indication of future results. Total investment return and principal value of your investment will fluctuate and units, when redeemed, may be worth more or less than their original cost. Current performance may be higher or lower than the performance data quoted. Call 800-THRIVENT or visit www.thrivent.com for performance results current to the most recent month-end. |
Annualized total returns represent past performance and reflect changes in share prices, the reinvestment of all dividends and capital gains, and the effects of compounding. Periods of less than one year are not annualized. At various times, the Portfolio’s adviser waived its management fee and/or reimbursed Portfolio expenses. Had the adviser not done so, the Portfolio’s total returns would have been lower. The returns shown do not reflect charges and expenses imposed on contract holders by the variable accounts. Those charges and expenses reduce the returns received by contract holders as compared to the returns presented.
The prospectus contains more complete information on the investment objectives, risks, charges and expenses of the investment company, which investors should read and consider carefully before investing. To obtain a prospectus, contact a registered representative or visit Thrivent.com.
29
Table of Contents
How did the Portfolio perform during the six-month period ended June 30, 2009?
Thrivent Small Cap Index Portfolio earned a total return of 0.70% as compared to the median return of its peer group, the Lipper Small Cap Core category, of 2.95%. The Portfolio’s market benchmark, the S&P SmallCap 600 Index, earned a total return of 0.67%.
What factors affected the Portfolio’s performance?
The Portfolio is managed to virtually replicate the performance of the S&P SmallCap 600 Index, a prime measure of small stock performance. We seek to maintain a fully invested position with limited transactions to minimize costs. As typically occurs with an index portfolio, the difference in performance between the benchmark index and the portfolio itself can be largely attributed to expenses and minor differences in portfolio composition.
Small-cap stocks underperformed both mid-cap stocks and large-cap stocks for the last six months. Six sectors sported a positive return, with consumer discretionary and information technology posting the most positive returns. The stocks of financial firms and telecommunication services were the weakest performers, posting the most negative returns. Market participants re-evaluated the economic stress in the global economic system and growth expectations were diminished.
What is your outlook?
The Portfolio will remain fully invested in stocks designed to track the performance of the S&P SmallCap 600 Index. This can offer individuals an attractive way to take advantage of the growth potential of the broad, diversified marketplace of small-cap stocks.
Policy actions have been undertaken to forestall any lasting impact from the ongoing unwinding of the excesses in housing that occurred last cycle. The financial markets appear to be resolving some of the uncertainty and ambiguity that has surrounded the fixed-income markets and led to the severe credit contraction. It is possible that a new cycle may be starting. Typically, as a new economic cycle starts, investors begin to favor smaller-cap issues.
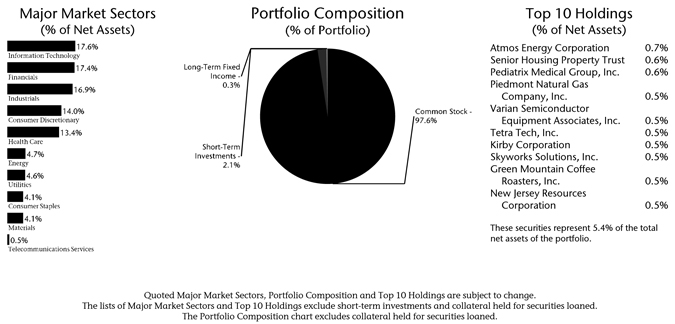
30
Table of Contents
While there appears to be gathering evidence that the worst of the economic decline is behind us, the data does not appear to be sufficiently conclusive to indicate that we are on the road to recovery. Our position is that a tepid but sustained recovery will unfold over the next few years. We still believe there is solid opportunity in the small-cap arena, but the premium return for small stocks is likely to be limited in the future as the new cycle continues to unfold.
Portfolio Facts
As of June 30, 2009
Net Assets | $176,278,869 | |
NAV | $8.49 | |
NAV - High† | 6/4/2009 - $11.09 | |
NAV - Low† | 3/9/2009 - $7.16 | |
Number of Holdings: 604 |
| † | For the six months ended June 30, 2009 |
Average Annual Total Returns1
As of June 30, 2009
| 1-Year | 5-Year | 10-Year | ||
| (25.23%) | (1.11%) | 4.44% |
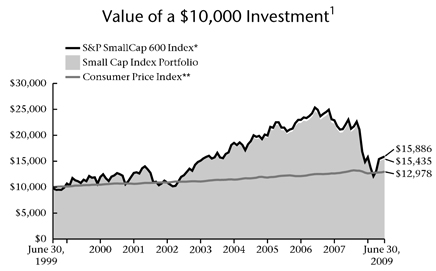
| * | The S&P SmallCap 600 Index is an index that represents the average performance of a group of 600 small capitalization stocks. The product is not sponsored, endorsed or promoted by Standard & Poor’s, and Standard & Poor’s makes no representation regarding the advisability of investing in the product. It is not possible to invest directly in the Index. The performance of the Index does not reflect deductions for fees, expenses and taxes. |
| ** | The Consumer Price Index is an inflationary indicator that measures the change in the cost of a fixed basket of products and services, including housing, electricity, food and transportation. It is not possible to invest directly in the Index. |
| 1 | Past performance is not an indication of future results. Total investment return and principal value of your investment will fluctuate and units, when redeemed, may be worth more or less than their original cost. Current performance may be higher or lower than the performance data quoted. Call 800-THRIVENT or visit www.thrivent.com for performance results current to the most recent month-end. |
Annualized total returns represent past performance and reflect changes in share prices, the reinvestment of all dividends and capital gains, and the effects of compounding. Periods of less than one year are not annualized. At various times, the Portfolio’s adviser waived its management fee and/or reimbursed Portfolio expenses. Had the adviser not done so, the Portfolio’s total returns would have been lower. The returns shown do not reflect charges and expenses imposed on contract holders by the variable accounts. Those charges and expenses reduce the returns received by contract holders as compared to the returns presented.
The prospectus contains more complete information on the investment objectives, risks, charges and expenses of the investment company, which investors should read and consider carefully before investing. To obtain a prospectus, contact a registered representative or visit Thrivent.com.
31
Table of Contents

How did the Portfolio perform during the six-month period ended June 30, 2009?
Thrivent Mid Cap Growth Portfolio II earned a total return of 20.73% as compared to the median return of its peer group, the Lipper Mid Cap Growth category, of 13.59%. The Portfolio’s market benchmark, the Russell Midcap® Growth Index, earned a total return of 16.61%.
What factors affected the Portfolio’s performance?
In the early months of 2009, we increased our positions in companies that we believed would benefit from stabilization in the economy, as many investors were literally betting that the U.S. economy would never recover. We overweighted more aggressive sectors, such as consumer discretionary and technology, that typically benefit from economic stabilization. The positioning of the Portfolio toward early cycle stocks was critical to outperformance.
The technology sector added to performance, both from a sector allocation and a security selection standpoint, as many of these companies had strong balance sheets and benefitted from inventory replenishment and improving product cycles. Our stock picks in the materials and energy sector hurt performance, as we bought these names too early, but we believe worldwide demand will return and these sectors should benefit.
What is your outlook?
The market has had a significant move off the lows of early March, as investors are beginning to see signs that the economy is stabilizing. The housing market appears to be stabilizing, retail sales are starting to improve and credit spreads are narrowing, which are all positive developments.
We believe the U.S. unemployment rate will remain stubbornly high for some time to come as excess manufacturing capacity still remains in the global system. Consumers may be forced to continue to de-leverage their balance sheets by spending less and saving more as it is unlikely they will be able to use the equity in their homes as a personal “ATM” going forward. In addition, banks will likely be imposing significantly tighter lending standards on individual and corporate borrowers, which should dampen growth. All of these factors ultimately affect consumer spending, which is still a main driver to the U.S. economy.
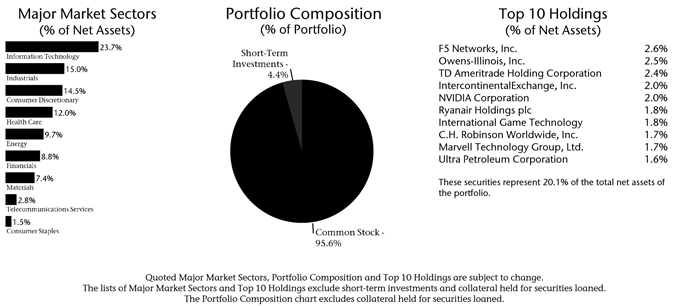
32
Table of Contents
We continue to believe the emerging markets will, over the course of time, be an ever-bigger factor in global supply and demand equations, especially in the commodities market. We look for investments in these emerging areas and look toward U.S. sectors (such as energy and materials) that should benefit from a resurgence of growth in these economies.
Portfolio Facts
As of June 30, 2009
Net Assets | $97,050,424 | |
NAV | $6.82 | |
NAV - High† | 6/11/2009 - $7.16 | |
NAV - Low† | 3/9/2009 - $4.51 | |
Number of Holdings: 94 |
| † | For the six months ended June 30, 2009 |
Average Annual Total Returns1
As of June 30, 2009
1-Year | 5-Year | From Inception 11/30/2001 | ||
| (23.63%) | 1.59% | (0.60%) |
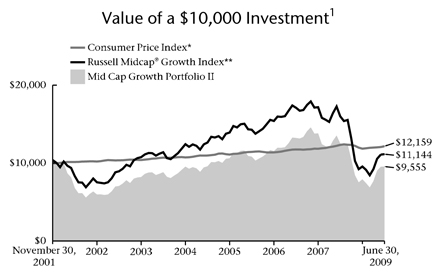
| * | The Consumer Price Index is an inflationary indicator that measures the change in the cost of a fixed basket of products and services, including housing, electricity, food and transportation. It is not possible to invest directly in the Index. |
| ** | The Russell Midcap® Growth Index measures the performance of mid cap growth stocks. It is not possible to invest directly in the Index. The performance of the Index does not reflect deductions for fees, expenses or taxes. |
| 1 | Past performance is not an indication of future results. Total investment return and principal value of your investment will fluctuate and units, when redeemed, may be worth more or less than their original cost. Current performance may be higher or lower than the performance data quoted. Call 800-THRIVENT or visit www.thrivent.com for performance results current to the most recent month-end. |
Annualized total returns represent past performance and reflect changes in share prices, the reinvestment of all dividends and capital gains, and the effects of compounding. Periods of less than one year are not annualized. At various times, the Portfolio’s adviser waived its management fee and/or reimbursed Portfolio expenses. Had the adviser not done so, the Portfolio’s total returns would have been lower. The returns shown do not reflect charges and expenses imposed on contract holders by the variable accounts. Those charges and expenses reduce the returns received by contract holders as compared to the returns presented.
The prospectus contains more complete information on the investment objectives, risks, charges and expenses of the investment company, which investors should read and consider carefully before investing. To obtain a prospectus, contact a registered representative or visit Thrivent.com.
33
Table of Contents
How did the Portfolio perform during the six-month period ended June 30, 2009?
Thrivent Mid Cap Growth Portfolio earned a total return of 20.61% as compared to the median return of its peer group, the Lipper Mid Cap Growth category, of 13.59%. The Portfolio’s market benchmark, the Russell Midcap® Growth Index, earned a total return of 16.61%.
What factors affected the Portfolio’s performance?
In the early months of 2009, we increased our positions in companies that we believed would benefit from stabilization in the economy, as many investors were literally betting that the U.S. economy would never recover. We overweighted more aggressive sectors, such as consumer discretionary and technology, that typically benefit from economic stabilization. The positioning of the Portfolio toward early cycle stocks was critical to outperformance.
The technology sector added to performance, both from a sector allocation and a security selection standpoint, as many of these companies had strong balance sheets and benefitted from inventory replenishment and improving product cycles. Our stock picks in the materials and energy sector hurt performance, as we bought these names too early, but we believe worldwide demand will return and these sectors should benefit.
What is your outlook?
The market has had a significant move off the lows of early March, as investors are beginning to see signs that the economy is stabilizing. The housing market appears to be stabilizing, retail sales are starting to improve and credit spreads are narrowing, which are all positive developments.
We believe the U.S. unemployment rate will remain stubbornly high for some time to come as excess manufacturing capacity still remains in the global system. Consumers may be forced to continue to de-leverage their balance sheets by spending less and saving more as it is unlikely they will be able to use the equity in their homes as a personal “ATM” going forward. In addition, banks will likely be imposing significantly tighter lending standards on individual and corporate borrowers, which should dampen growth. All of these factors ultimately affect consumer spending, which is still a main driver to the U.S. economy.

34
Table of Contents
We continue to believe the emerging markets will, over the course of time, be an ever-bigger factor in global supply and demand equations, especially in the commodities market. We look for investments in these emerging areas and look toward U.S. sectors (such as energy and materials) that should benefit from a resurgence of growth in these economies.
Portfolio Facts
As of June 30, 2009
Net Assets | $306,745,726 | |
NAV | $11.52 | |
NAV - High† | 6/11/2009 - $12.06 | |
NAV - Low† | 3/9/2009 - $7.72 | |
Number of Holdings: 126 |
| † | For the six months ended June 30, 2009 |
Average Annual Total Returns1
As of June 30, 2009
| 1-Year | 5-Year | 10-Year | ||
| (21.73%) | 2.13% | 3.14% |
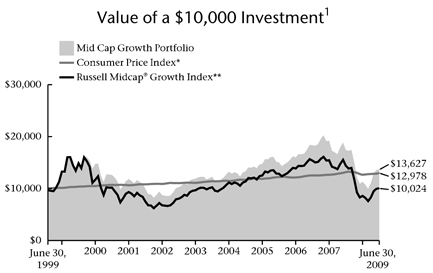
| * | The Consumer Price Index is an inflationary indicator that measures the change in the cost of a fixed basket of products and services, including housing, electricity, food and transportation. It is not possible to invest directly in the Index. |
| ** | The Russell Midcap® Growth Index measures the performance of mid cap growth stocks. It is not possible to invest directly in the Index. The performance of the Index does not reflect deductions for fees, expenses or taxes. |
| 1 | Past performance is not an indication of future results. Total investment return and principal value of your investment will fluctuate and units, when redeemed, may be worth more or less than their original cost. Current performance may be higher or lower than the performance data quoted. Call 800-THRIVENT or visit www.thrivent.com for performance results current to the most recent month-end. |
Annualized total returns represent past performance and reflect changes in share prices, the reinvestment of all dividends and capital gains, and the effects of compounding. Periods of less than one year are not annualized. At various times, the Portfolio’s adviser waived its management fee and/or reimbursed Portfolio expenses. Had the adviser not done so, the Portfolio’s total returns would have been lower. The returns shown do not reflect charges and expenses imposed on contract holders by the variable accounts. Those charges and expenses reduce the returns received by contract holders as compared to the returns presented.
The prospectus contains more complete information on the investment objectives, risks, charges and expenses of the investment company, which investors should read and consider carefully before investing. To obtain a prospectus, contact a registered representative or visit Thrivent.com.
35
Table of Contents

How did the Portfolio perform during the six-month period ended June 30, 2009?
Thrivent Partner Mid Cap Value Portfolio earned a total return of 4.94% as compared to the median return of its peer group, the Lipper Mid Cap Value Category, of 5.79%. The Portfolio’s market benchmark, the Russell Midcap® Value Index, earned a total return of 3.19%.
What factors affected the Portfolio’s performance?
The Portfolio’s defensive positioning in the weakest market segments helped us weather stock-specific volatility and contributed to the Portfolio’s outperformance relative to its benchmark. Stock selection in the financials, basic materials and utilities sectors contributed to performance, while holdings in consumer staples, technology and insurance detracted. Air Products & Chemicals, Inc., which comprised 1% of the Portfolio, ranked among top performers, as the company benefitted from a combination of long-term contracts, stable pricing and high barriers to entry.
Several of our consumer staples holdings experienced weakness as economic trends intensified. These concerns impacted Newell Rubbermaid, Inc., which we reduced in response to a weaker near-term outlook. Our holding in H&R Block, Inc. was challenged during the reporting period as consumer volume was lighter than expected.
What is your outlook?
As value investors, we constantly strive to balance the price and prospects of each security. With many companies qualifying on the price side, our steady focus on quality has played a major role in the investment process. We continue to seek companies that demonstrate strong leadership with a proven track record. We also favor companies with recurring free cash flows backed by healthy balance sheets. In light of the environment of low expectations, we think the current market offers a compelling opportunity to fundamental stock pickers.
When volatility is not at extreme levels, there is less correlation among stock returns and thus higher differentiation, providing an attractive environment for active management. In our view, this environment should allow businesses with competitive advantages to take market share from weaker competitors and benefit from improved pricing power. While we cannot predict the expiration date of the ongoing financial crisis, we are
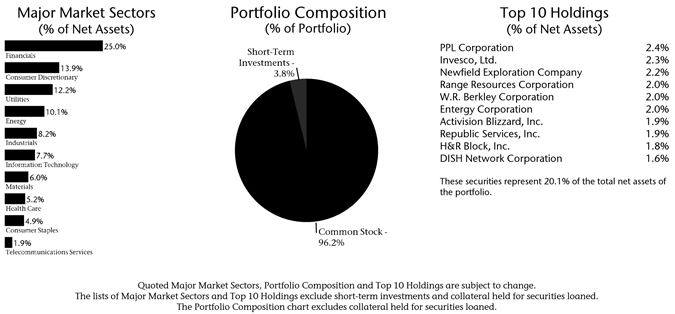
36
Table of Contents
optimistic that equity markets remain cyclical in nature and we subsequently view the current environment as temporary. For any investment manager in this uncertain environment, deep research resources, a forward-looking investment process and truly actively managed portfolios are (we believe) keys to both preserving capital and outperforming the market over time.
Portfolio Facts
As of June 30, 2009
Net Assets | $131,698,378 | |
NAV | $8.64 | |
NAV - High† | 6/12/2009 - $8.95 | |
NAV - Low† | 3/9/2009 - $6.41 | |
Number of Holdings: 122 |
| † | For the six months ended June 30, 2009 |
Average Annual Total Returns1
As of June 30, 2009
1-Year | From Inception 4/29/2005 | |
| (29.41%) | (1.49%) |
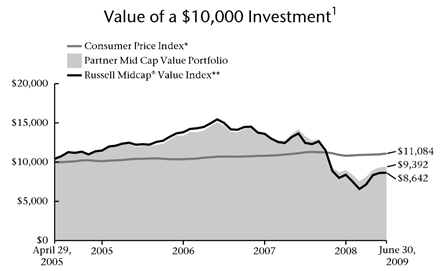
| * | The Consumer Price Index is an inflationary indicator that measures the change in the cost of a fixed basket of products and services, including housing, electricity, food and transportation. It is not possible to invest directly in the Index. |
| ** | The Russell Midcap® Value Index is an index comprised of mid-cap companies with lower than average price-to-book ratios and lower forecasted growth values. It is not possible to invest directly in the Index. The performance of the Index does not reflect deductions for fees, expenses or taxes. |
| 1 | Past performance is not an indication of future results. Total investment return and principal value of your investment will fluctuate and units, when redeemed, may be worth more or less than their original cost. Current performance may be higher or lower than the performance data quoted. Call 800-THRIVENT or visit www.thrivent.com for performance results current to the most recent month-end. |
Annualized total returns represent past performance and reflect changes in share prices, the reinvestment of all dividends and capital gains, and the effects of compounding. Periods of less than one year are not annualized. At various times, the Portfolio’s adviser waived its management fee and/or reimbursed Portfolio expenses. Had the adviser not done so, the Portfolio’s total returns would have been lower. The returns shown do not reflect charges and expenses imposed on contract holders by the variable accounts. Those charges and expenses reduce the returns received by contract holders as compared to the returns presented.
The prospectus contains more complete information on the investment objectives, risks, charges and expenses of the investment company, which investors should read and consider carefully before investing. To obtain a prospectus, contact a registered representative or visit Thrivent.com.
37
Table of Contents

How did the Portfolio perform during the six-month period ended June 30, 2009?
Thrivent Mid Cap Stock Portfolio earned a total return of 11.75% as compared to the median return of its peer group, the Lipper Mid Cap Core Category, of 8.15%. The Portfolio’s market benchmark, the Russell Midcap® Index, earned a total return of 9.96%.
What factors affected the Portfolio’s performance?
The Portfolio’s outperformance was broad-based with the information technology, industrial, energy and utility sectors all contributing. An overweighted position in information technology—the highest returning sector—and outperformance within the sector proved most beneficial during the period. Performance within the sector was led by the communication equipment and semiconductor industries. Exceptional stock selection within the industrial space drove that sector’s outperformance versus the benchmark. The Portfolio’s energy holdings appreciated dramatically during the quarter, as optimism on economic recovery and rising oil prices outweighed high inventory levels and falling rig counts. While both the energy service and exploration and production (E&P) companies provided excellent absolute returns, the service companies’ performance outpaced their E&P brethren. Since the Portfolio was weighted toward energy services versus E&P companies, this return differential aided overall performance. Finally, significantly underweighting the underperforming utility sector proved wise.
The financial sector was the only sector that was negative on an absolute basis during the period. While the Portfolio was underweighted in this sector, security selection was detrimental to performance.
What is your outlook?
Cyclical exposure continues to gain prominence within the Portfolio. While the economy remains weak, and will probably continue to exhibit weakness throughout the year, monetary easing, fiscal stimulus, and low interest rates should prove catalysts for economic growth in 2010. However, given economic uncertainty, the Portfolio’s focus remains on attractive valuations, solid balance sheets and strong free-cash flow. Cyclical names exhibiting these characteristics should provide downside support and simultaneous upside leverage when economic recovery takes hold. Information technology and materials remain overweighted. The

38
Table of Contents
Portfolio has maintained its overweighted position in container and packaging companies within the materials sector. Exposure to this less-cyclical subsector has been reduced, yet some leverage has been maintained as fundamentals and valuations remain attractive. The Portfolio is currently underweighted in consumer discretionary stocks, since consumers continue to increase their savings and no longer have access to the “home ATM.” Combine these factors with less-attractive valuations, and other sectors offer better opportunities. In summary, the Portfolio continues to position for an economic upturn with a disciplined focus on valuation, solid balance sheets and financial flexibility.
Portfolio Facts
As of June 30, 2009
Net Assets | $421,756,237 | |
NAV | $7.91 | |
NAV - High† | 6/2/2009 - $8.26 | |
NAV - Low† | 3/9/2009 - $5.65 | |
Number of Holdings: 132 |
| † | For the six months ended June 30, 2009 |
Average Annual Total Returns1
As of June 30, 2009
| 1-Year | 5-Year | From Inception 3/1/2001 | ||
| (25.26%) | 0.38% | 1.09% |
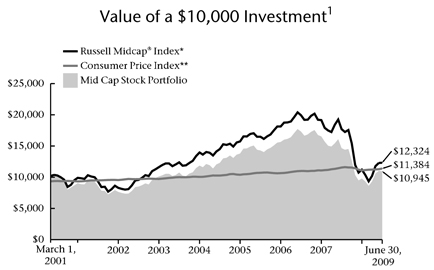
| * | The Russell Midcap® Index is an index that measures the performance of the smallest 800 securities in the Russell 1000® Index, as ranked by total market capitalization. It is not possible to invest directly in the index. The performance of the Index does not reflect deductions for fees, expenses or taxes. |
| ** | The Consumer Price Index is an inflationary indicator that measures the change in the cost of a fixed basket of products and services, including housing, electricity, food and transportation. It is not possible to invest directly in the Index. |
| 1 | Past performance is not an indication of future results. Total investment return and principal value of your investment will fluctuate and units, when redeemed, may be worth more or less than their original cost. Current performance may be higher or lower than the performance data quoted. Call 800-THRIVENT or visit www.thrivent.com for performance results current to the most recent month-end. |
Annualized total returns represent past performance and reflect changes in share prices, the reinvestment of all dividends and capital gains, and the effects of compounding. Periods of less than one year are not annualized. At various times, the Portfolio’s adviser waived its management fee and/or reimbursed Portfolio expenses. Had the adviser not done so, the Portfolio’s total returns would have been lower. The returns shown do not reflect charges and expenses imposed on contract holders by the variable accounts. Those charges and expenses reduce the returns received by contract holders as compared to the returns presented.
The prospectus contains more complete information on the investment objectives, risks, charges and expenses of the investment company, which investors should read and consider carefully before investing. To obtain a prospectus, contact a registered representative or visit Thrivent.com.
39
Table of Contents
How did the Portfolio perform during the six-month period ended June 30, 2009?
Thrivent Mid Cap Index Portfolio earned a total return of 8.32% as compared to the median return of its peer group, the Lipper Mid Cap Core category, of 8.15%. The Portfolio’s market benchmark, the S&P MidCap 400 Index, earned a total return of 9.47%.
What factors affected the Portfolio’s performance?
Because it is designed to invest in a way that reflects its benchmark index, the only changes made to the Portfolio are done so as to reconcile it with any alterations in the composition of the index itself. As typically occurs with an index portfolio, the difference in performance between the benchmark index and the Portfolio itself can be largely attributed to expenses and minor differences in portfolio composition.
Mid-cap stocks outperformed both large-cap and small-cap stocks, with eight of the 10 sectors posting positive returns. Energy and information technology posted the most positive returns. This was a bit of a reverse, since these sectors had underperformed the most in the previous six-month period. The financials and telecommunication services underperformed the most, due to a handful of names with exposure to higher-than-average debt levels.
What is your outlook?
The Portfolio will remain fully invested in a way that tracks the performance of the S&P MidCap 400 Index. This can be an attractive way for individuals to take advantage of the investment potential of the broad, diversified marketplace for mid-cap stocks.
Over the last six months, investors went from being extremely risk-averse to becoming less risk-averse, providing an environment that tends to favor smaller companies. Mid-cap companies, particularly those exposed to the domestic markets and U.S. consumers, outperformed their large-cap counterparts.
Policy actions have been undertaken to forestall any lasting impact from the ongoing unwinding of the excesses in housing that occurred last cycle. Additionally, the financial markets appear to be resolving some of the uncertainty and ambiguity that
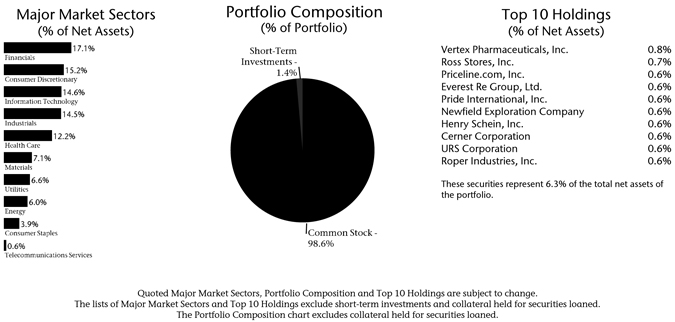
40
Table of Contents
has surrounded the fixed-income markets and led to the severe credit contraction. As mentioned six months ago, it is possible that a transition may be taking place. Typically, as a new economic cycle starts, investors begin to favor mid- and small-cap issues. We believe that attractive opportunities are available in the mid-cap marketplace in the months ahead. At the same time, we are realistic in our expectations that the premium return to the mid-cap sector is likely to be reduced in the future as the economic cycle continues.
Portfolio Facts
As of June 30, 2009
Net Assets | $74,145,229 | |
NAV | $8.21 | |
NAV - High† | 6/11/2009 - $9.31 | |
NAV - Low† | 3/9/2009 - $6.27 | |
Number of Holdings: 403 |
| † | For the six months ended June 30, 2009 |
Average Annual Total Returns1
As of June 30, 2009
| 1-Year | 5-Year | From Inception 3/1/2001 | ||
| (28.20%) | 0.04% | 2.78% |
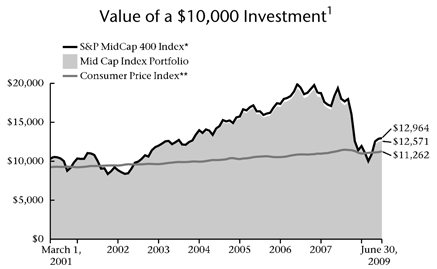
| * | The S&P MidCap 400 Index is an index that represents the average performance of a group of 400 medium capitalization stocks. The product is not sponsored, endorsed or promoted by Standard & Poor’s, and Standard & Poor’s makes no representation regarding the advisability of investing in the product. It is not possible to invest directly in the Index. The performance of the Index does not reflect deductions for fees, expenses or taxes. |
| ** | The Consumer Price Index is an inflationary indicator that measures the change in the cost of a fixed basket of products and services, including housing, electricity, food and transportation. It is not possible to invest directly in the Index. |
| 1 | Past performance is not an indication of future results. Total investment return and principal value of your investment will fluctuate and units, when redeemed, may be worth more or less than their original cost. Current performance may be higher or lower than the performance data quoted. Call 800-THRIVENT or visit www.thrivent.com for performance results current to the most recent month-end. |
Annualized total returns represent past performance and reflect changes in share prices, the reinvestment of all dividends and capital gains, and the effects of compounding. Periods of less than one year are not annualized. At various times, the Portfolio’s adviser waived its management fee and/or reimbursed Portfolio expenses. Had the adviser not done so, the Portfolio’s total returns would have been lower. The returns shown do not reflect charges and expenses imposed on contract holders by the variable accounts. Those charges and expenses reduce the returns received by contract holders as compared to the returns presented.
The prospectus contains more complete information on the investment objectives, risks, charges and expenses of the investment company, which investors should read and consider carefully before investing. To obtain a prospectus, contact a registered representative or visit Thrivent.com.
41
Table of Contents

How did the Portfolio perform during the six-month period ended June 30, 2009?
Thrivent Partner Worldwide Allocation Portfolio earned a total return of 8.00% as compared to the median return of its peer group, the Lipper International Core category, of 6.64%. The Portfolio’s market benchmark, the MSCI All Country World Index ex-USA, earned a total return of 14.35%.
What factors affected the Portfolio’s performance?
The primary factor leading to the subpar performance versus the benchmark was the two large-cap managers and the small-cap manager lagging behind the sharp advance that began in March. The value-managed and small-cap segments of the account had been defensively positioned and did not fully participate in the sharp advance.
The same variables came into play in the growth section of the Portfolio, as many of the companies favored by the management team did not keep up with the broader averages during the second half advance. Prior to the equity market lows of early March, performance leadership had been strongly biased toward defensive stocks with the most visible and stable earnings power.
A mitigating factor to the results described above were strong results in the emerging markets and emerging market debt segments, which advanced considerably in the period. Commodities and energy staged a strong rally in anticipation of renewed growth in developing economies like China.
What is your outlook?
From a broad perspective, the prospects for the global economy certainly seem brighter than they did at the start of the year. Confidence is improving, the housing market is showing some signs of life and corporate profit warnings appear to have peaked. But major headwinds persist. Unemployment is high and rising, banks have yet to fully address their balance sheet issues, capacity utilization remains depressed, and many governments are focusing on greater protectionism and regulation. In addition, the increasing amount of debt issued by governments worldwide is of concern. The long-term
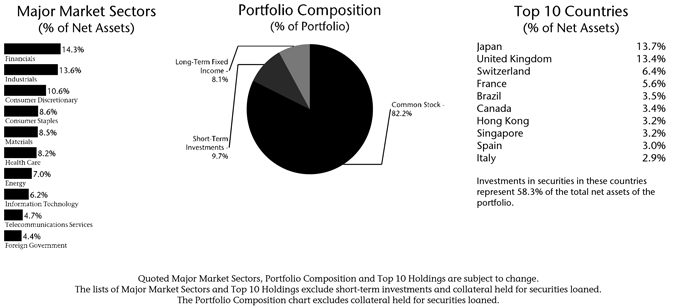
42
Table of Contents
impact may be heightened inflation, greater currency instability and higher taxes, all contributing to a possibly more muted-than-typical recovery.
Unlike the developed economies, many of the developing economies avoided the financial pitfalls that are now limiting the recovery. While exports are a significant factor for the emerging world, domestic demand can also be a source of organic growth. Recent events and performance demonstrate the advantage of a more broadly-diversified portfolio.
Portfolio Facts
As of June 30, 2009
Net Assets | $153,913,638 | |
NAV | $6.51 | |
NAV - High† | 6/11/2009 - $6.70 | |
NAV - Low† | 3/9/2009 - $4.73 | |
Number of Holdings: 407 |
| † | For the six months ended June 30, 2009 |
Average Annual Total Returns1
As of June 30, 2009
| 1-Year | From Inception 4/30/2008 | |
| (29.83%) | (30.15%) |
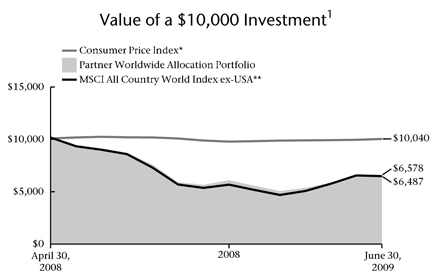
| * | The Consumer Price Index is an inflationary indicator that measures the change in the cost of a fixed basket of products and services, including housing, electricity, food and transportation. It is not possible to invest directly in the Index. |
| ** | The MSCI All Country World Index ex-USA is an unmanaged market capitalization-weighted index that is designed to represent the performance of developed and emerging stock markets throughout the world. It is not possible to invest directly in the Index. The performance of the Index does not reflect deductions for fees, expenses or taxes. |
| 1 | Past performance is not an indication of future results. Total investment return and principal value of your investment will fluctuate and units, when redeemed, may be worth more or less than their original cost. Current performance may be higher or lower than the performance data quoted. Call 800-THRIVENT or visit www.thrivent.com for performance results current to the most recent month-end. |
Annualized total returns represent past performance and reflect changes in share prices, the reinvestment of all dividends and capital gains, and the effects of compounding. Periods of less than one year are not annualized. At various times, the Portfolio’s adviser waived its management fee and/or reimbursed Portfolio expenses. Had the adviser not done so, the Portfolio’s total returns would have been lower. The returns shown do not reflect charges and expenses imposed on contract holders by the variable accounts. Those charges and expenses reduce the returns received by contract holders as compared to the returns presented.
The prospectus contains more complete information on the investment objectives, risks, charges and expenses of the investment company, which investors should read and consider carefully before investing. To obtain a prospectus, contact a registered representative or visit Thrivent.com.
43
Table of Contents

How did the Portfolio perform during the six-month period ended June 30, 2009?
Thrivent Partner International Stock Portfolio earned a total return of 2.26% as compared to the median return of its peer group, the Lipper International Core Category, of 6.64%. The Portfolio’s market benchmark, the MSCI Europe Australasia and Far East Index, earned a total return of 8.42%.
What factors affected the Portfolio’s performance?
The primary factor leading to the subpar performance versus the benchmark was not fully participating in the sharp advance that began in March and continued until the end of the quarter. The value-managed segment of the account had been defensively positioned, and missed out on some of this sharp rally. The value segment performed better in the first part of the period, when markets were under pressure, but the advance was of sufficient magnitude that the advantage gained in the early part of the year was not enough to offset the lagging results in the rally.
The same variables came into play in the growth section of the account, as the sharp rotation in the market that accompanied the advance in the second half of the period caused many of the companies in the Portfolio to lag behind the broader averages. Prior to the equity market lows of early March, performance leadership had been strongly biased toward defensive stocks with the most visible and stable earnings power. Later in March and continuing into April and May, the market experienced an abrupt and substantial rebound, as many of the previously underperforming stocks experienced a relief rally.
What is your outlook?
From a broad perspective, the prospects for the global economy certainly seem brighter than they did at the start of the year. Confidence is improving, the housing market is showing some signs of life and corporate profit warnings appear to have peaked. But major headwinds persist. Unemployment is high and rising, banks have yet to fully address their balance sheet issues, capacity utilization remains depressed, and many governments
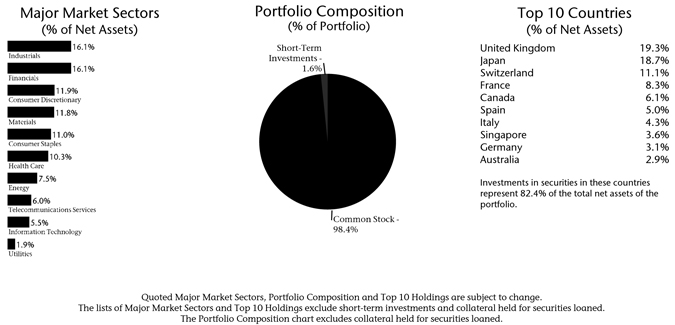
44
Table of Contents
are focusing on greater protectionism and regulation. In addition, the increasing amount of debt issued by governments worldwide is of concern. The long-term impact may be rising inflation, greater currency instability and higher taxes, all contributing to a possibly more muted-than-typical recovery. While this possibility is not insignificant, it is unlikely to prevent a recovery but rather alter the course of it.
Portfolio Facts
As of June 30, 2009
Net Assets | $750,695,734 | |
NAV | $8.35 | |
NAV - High† | 6/2/2009 - $8.70 | |
NAV - Low† | 3/9/2009 - $6.12 | |
Number of Holdings: 234 |
| † | For the six months ended June 30, 2009 |
Average Annual Total Returns1
As of June 30, 2009
| 1-Year | 5-Year | 10-Year | ||
| (33.78%) | 0.77% | (0.15%) |
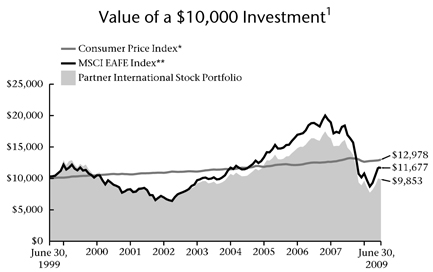
| * | The Consumer Price Index is an inflationary indicator that measures the change in the cost of a fixed basket of products and services, including housing, electricity, food and transportation. It is not possible to invest directly in the Index. |
| ** | The MSCI EAFE Index measures the performance of stocks in developed countries outside of North America. It is not possible to invest directly in the Index. The performance of the Index does not reflect deductions for fees, expenses or taxes. |
| 1 | Past performance is not an indication of future results. Total investment return and principal value of your investment will fluctuate and units, when redeemed, may be worth more or less than their original cost. Current performance may be higher or lower than the performance data quoted. Call 800-THRIVENT or visit www.thrivent.com for performance results current to the most recent month-end. |
Annualized total returns represent past performance and reflect changes in share prices, the reinvestment of all dividends and capital gains, and the effects of compounding. Periods of less than one year are not annualized. At various times, the Portfolio’s adviser waived its management fee and/or reimbursed Portfolio expenses. Had the adviser not done so, the Portfolio’s total returns would have been lower. The returns shown do not reflect charges and expenses imposed on contract holders by the variable accounts. Those charges and expenses reduce the returns received by contract holders as compared to the returns presented.
The prospectus contains more complete information on the investment objectives, risks, charges and expenses of the investment company, which investors should read and consider carefully before investing. To obtain a prospectus, contact a registered representative or visit Thrivent.com.
45
Table of Contents
 |
Subadvised by Calvert Asset Management Company, Inc. and Atlanta Capital Management, L.L.C.
Thrivent Partner Socially Responsible Stock Portfolio seeks long-term capital growth.
Stocks are subject to the basic market risk that a particular secutity, or securities in general, may decrease in value over short or even extended time periods. In addition, the Portfolio is exposed to the risks of investing in small-cap and mid-cap stocks, which generally are more volatile and less liquid than large-cap stocks. The Portfolio is also subject to the risks of investing in foreign stocks. These and other risks are described in the Portfolio’s prospectus.
How did the Portfolio perform during the six-month period ended June 30, 2009?
Thrivent Partner Socially Responsible Stock Portfolio earned a total return of 11.08% as compared to the median return of its peer group, the Lipper Large Cap Growth category, of 12.11%. The Portfolio’s market benchmark, the S&P 500 Index, earned a total return of 3.19%.
What factors affected the Portfolio’s performance?
The Portfolio’s outperformance versus the benchmark was roughly evenly split between stock selection and our weighting decisions. Many areas of the Portfolio contributed, with our decisions to overweight and underweight various sectors proving fortuitous. Our overweighted stance in technology contributed the most, but being underweighted in the lagging industrials and energy sectors also contributed. Our stock picks outpaced their respective sector averages in every sector other than utilities. Individual top contributors included Kohl’s, Goldman Sachs, Intuitive Surgical, Apple, Google and QUALCOMM. Each of these companies are leaders in their respective industries, have, in our opinion, outsized growth opportunities and have also weathered the recession far better than their peers.
What is your outlook?
While the global economy remains weak, debate rages as to where we go from here. We believe that we have stepped back from the precipice, propelled by massive global fiscal and monetary stimulus. Economic variables appear to have turned from all negative to equivocal. Therein lies the debate. Have we generated enough momentum for the recovery to be self-sustaining or do we limp along at a depressed level? We believe the worst has passed, both for the economy and the market. Consequently, we are positioned, in most respects, for somewhat better times ahead. That includes overweighted holdings in consumer discretionary and technology. We are underweighted in consumer staples, energy and industrials. The consumer remains challenged and credit issues abound, but valuation (and our judgment) favors the discretionary stocks over the staples.
While we expect outperformance for the energy sector in the intermediate term, we believe for now that the stocks have run too far ahead of a turn in demand to justify an overweighted position. Lastly, even though health care is generally considered defensive, we are overweighted in the sector as the fear of health care reform has pushed prices lower. It is our judgment that the market is too
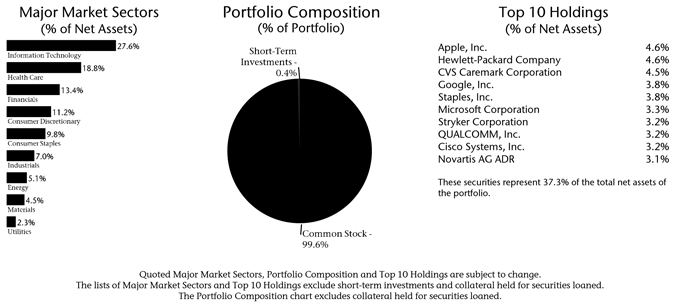
46
Table of Contents
pessimistic on this impact. In conclusion, we expect the recovery in the market and economy to continue, but the economy’s growth may be modest for some time. In that environment, we would expect that the type of high-quality growth stocks that dominate this Portfolio to be relative outperformers.
Portfolio Facts
As of June 30, 2009
Net Assets | $3,419,816 | |
NAV | $7.20 | |
NAV - High† | 6/2/2009 -$7.36 | |
NAV - Low† | 3/9/2009 -$5.00 | |
Number of Holdings: 49 |
| † | For the six months ended June 30, 2009 |
Average Annual Total Returns1
As of June 30, 2009
| 1-Year | From Inception 4/30/2008 | |
| (24.98%) | (24.33%) |
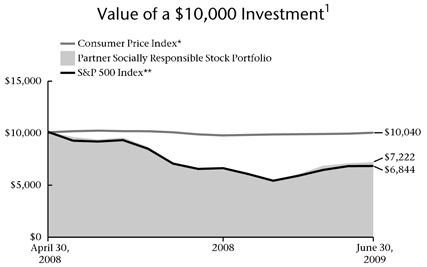
| * | The Consumer Price Index is an inflationary indicator that measures the change in the cost of a fixed basket of products and services, including housing, electricity, food and transportation. It is not possible to invest directly in the Index. |
| ** | The S&P 500 Index is an index that represents the average performance of a group of 500 widely held, publicly traded stocks. It is not possible to invest directly in the Index. The performance of the Index does not reflect deductions for fees, expenses or taxes. “S&P 500” is a trademark of The McGraw-Hill Companies, Inc. and has been licensed for use by Thrivent Financial for Lutherans. The product is not sponsored, endorsed or promoted by Standard & Poor’s, and Standard & Poor’s makes no representation regarding the advisability of investing in the product. |
| 1 | Past performance is not an indication of future results. Total investment return and principal value of your investment will fluctuate and units, when redeemed, may be worth more or less than their original cost. Current performance may be higher or lower than the performance data quoted. Call 800-THRIVENT or visit www.thrivent.com for performance results current to the most recent month-end. |
Annualized total returns represent past performance and reflect changes in share prices, the reinvestment of all dividends and capital gains, and the effects of compounding. Periods of less than one year are not annualized. At various times, the Portfolio’s adviser waived its management fee and/or reimbursed Portfolio expenses. Had the adviser not done so, the Portfolio’s total returns would have been lower. The returns shown do not reflect charges and expenses imposed on contract holders by the variable accounts. Those charges and expenses reduce the returns received by contract holders as compared to the returns presented.
The prospectus contains more complete information on the investment objectives, risks, charges and expenses of the investment company, which investors should read and consider carefully before investing. To obtain a prospectus, contact a registered representative or visit Thrivent.com.
47
Table of Contents
 |
Subadvised by Calamos Advisors LLC
Thrivent Partner All Cap Growth Portfolio seeks long-term capital growth.
Stocks are subject to the basic market risk that a particular security, or securities in general, may decrease in value over short or even extended time periods. In addition, the Portfolio is exposed to the risks of investing in small-cap and mid-cap stocks, which generally are more volatile and less liquid than large-cap stocks. These and other risks are described in the Portfolio’s prospectus.
How did the Portfolio perform during the six-month period ended June 30, 2009?
Thrivent Partner All Cap Growth Portfolio earned a total return of 18.36% as compared to the median return of its peer group, the Lipper Multi-Cap Growth category, of 11.46%. The Portfolio’s market benchmark, the Russell 3000® Growth Index, earned a total return of 11.52%.
What factors affected the Portfolio’s performance?
Security selection within information technology added the most value during the quarter. An overweighted position in financials also added value. While we remain cautious and selective within this sector, we have found attractive investments within asset managers and global derivative exchanges. An underweighted stance to consumer staples added to relative performance. While valuations are reasonable, we feel that a number of firms in this sector are expensive on a relative basis.
Security selection within financials was the most significant detractor, most notably in what the Portfolio did not own. During the second quarter, many of the previously beaten-down and lower-quality financials rebounded strongly and experienced what we believe is a “dead cat bounce” as investors determined the threat of bankruptcy and ultimate failure had been taken off the table. Security selection within materials detracted from relative returns, as names within the metals and mining industry underperformed the Index. We remain positive regarding this sector, since we believe valuations are attractive and any further U.S. dollar devaluation and global stimulus spending should lead to an increase in commodity prices.
What is your outlook?
We continue to find opportunities in the technology sector and in the energy, materials and industrials sectors. As in the past, we will focus on investments where the fundamentals suggest a compelling opportunity, where your investment is compensated for the risk taken, and where government action is predictable, or preferably absent, from our company analysis.
Our research seeks out higher-quality growth businesses with diversified global revenue bases, sustainable brands and market leadership. We favor the technology sector, as well as early cyclical growth within energy, industrials and materials. In technology, consumers remain willing to purchase the latest gadgets, and software companies are offering solutions for cost reduction and productivity
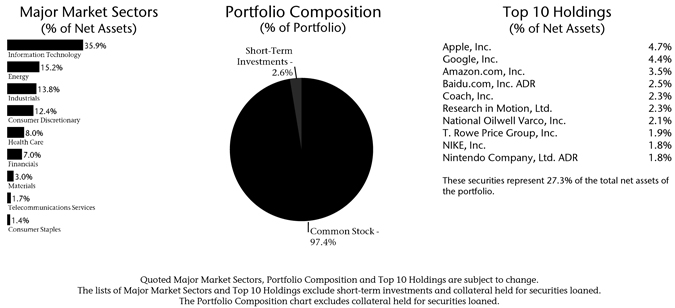
48
Table of Contents
enhancement. The recent addition of exposure to the energy sector is based on our view that valuations are attractive and the potential for U.S. dollar devaluation.
Areas where we remain broadly cautious and selective include financials and the consumer. Even in an environment of uncertainty, we believe that our portfolios are advantageously positioned to seize upon the most compelling investment prospects.
Portfolio Facts
As of June 30, 2009
Net Assets | $3,875,132 | |
NAV | $6.32 | |
NAV - High† | 6/9/2009 - $6.70 | |
NAV - Low† | 3/9/2009 - $4.42 | |
Number of Holdings: 85 |
| † | For the six months ended June 30, 2009 |
Average Annual Total Returns1
As of June 30, 2009
| 1-Year | From Inception 4/30/2008 | |
| (33.16%) | (32.47%) |
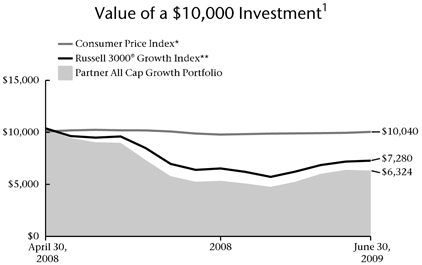
| * | The Consumer Price Index is an inflationary indicator that measures the change in the cost of a fixed basket of products and services, including housing, electricity, food and transportation. It is not possible to invest directly in the Index. |
| ** | The Russell 3000® Growth Index is an index that measures the performance of the broad growth segment of U.S. equities. It is not possible to invest directly in the Index. The performance of the Index does not reflect deductions for fees, expenses or taxes. |
| 1 | Past performance is not an indication of future results. Total investment return and principal value of your investment will fluctuate and units, when redeemed, may be worth more or less than their original cost. Current performance may be higher or lower than the performance data quoted. Call 800-THRIVENT or visit www.thrivent.com for performance results current to the most recent month-end. |
Annualized total returns represent past performance and reflect changes in share prices, the reinvestment of all dividends and capital gains, and the effects of compounding. Periods of less than one year are not annualized. At various times, the Portfolio’s adviser waived its management fee and/or reimbursed Portfolio expenses. Had the adviser not done so, the Portfolio’s total returns would have been lower. The returns shown do not reflect charges and expenses imposed on contract holders by the variable accounts. Those charges and expenses reduce the returns received by contract holders as compared to the returns presented.
The prospectus contains more complete information on the investment objectives, risks, charges and expenses of the investment company, which investors should read and consider carefully before investing. To obtain a prospectus, contact a registered representative or visit Thrivent.com.
49
Table of Contents
 |
Subadvised by OppenheimerFunds, Inc.
Thrivent Partner All Cap Value Portfolio seeks long-term capital growth.
Stocks are subject to the basic market risk that a particular security, or securities in general, may decrease in value over short or even extended time periods. In addition, the Portfolio is exposed to the risks of investing in small- and mid-cap stocks, which generally are more volatile and less liquid than large-cap stocks. The Portfolio is also subject to the risks of investing in foreign (including emerging market) stocks. These and other risks are described in the Portfolio’s prospectus.
How did the Portfolio perform during the six-month period ended June 30, 2009?
Thrivent Partner All Cap Value Portfolio earned a total return of 15.91% as compared to the median return of its peer group, the Lipper Multi-Cap Value category, of 3.16%. The Portfolio’s market benchmark, the Russell 3000® Value Index, earned a total return of - -3.05%.
What factors affected the Portfolio’s performance?
The Portfolio outperformed the Index in all sectors other than consumer staples and telecommunications services. Outperformance was highest versus the Index in the industrials, financials, health care, information technology, materials and energy sectors.
Stock selection drove outperformance in the industrials sector, with commercial trucking manufacturer Navistar International Corp. leading the sector. The stock appreciated significantly for the period, signaling some market optimism that there is renewed demand for Navistar’s products and services. Stock selection also drove outperformance within the financials sector, where top contributors included Morgan Stanley, student loan provider SLM Corp., and MetLife, Inc.
The Portfolio outperformed the Index in the health care sector, where it had better relative stock selection. The two top contributors to performance were Schering-Plough Corp. and Wyeth. Last year was a historically volatile year for pharmaceutical stocks; as market volatility lessened over the first half of 2009, renewed market optimism about the intrinsic value of pharmaceutical companies was reflected in their higher stock price.
Within consumer staples, the Portfolio was overweighted versus the Index, which hurt relative performance as stock selection in this sector was weakest. Performance detractors included Kroger Co. and Molson Coors Brewing Co. Within the utilities sector, performance was roughly even with that of the Index. On a total return basis, the utilities sector was one of the weaker performing sectors for the period.
What is your outlook?
At the end of the reporting period, the Portfolio was overweighted versus the index in the health care, materials and consumer staples sectors and underweighted versus the index primarily in the energy, telecommunication services, utilities, financials and information technology sectors.
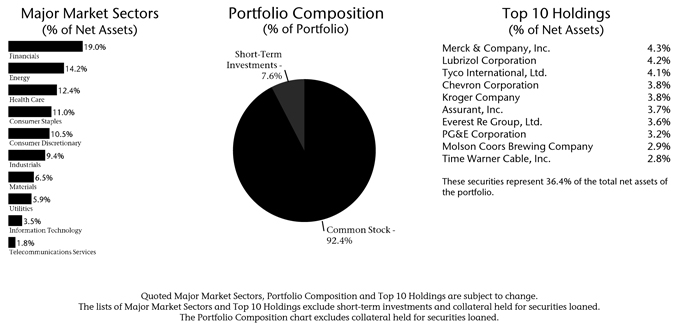
50
Table of Contents
We build portfolios using a disciplined, bottom-up stock selection process rooted in analysis of a company’s long-term earnings power, which our analysis has shown is the primary driver of a company’s performance prospects. We believe that focusing on valuations relative to long-term earnings power, rather than large sector or macroeconomic bets, is a more sustainable strategy than attempting to predict which sectors are most likely to outperform.
Portfolio Facts
As of June 30, 2009
Net Assets | $3,050,631 | |
NAV | $6.35 | |
NAV - High† | 6/11/2009 - $6.51 | |
NAV - Low† | 3/9/2009 - $4.37 | |
Number of Holdings: 55 |
| † | For the six months ended June 30, 2009 |
Average Annual Total Returns1
As of June 30, 2009
| 1-Year | From Inception 4/30/2008 | |
| (29.55%) | (31.17%) |

| * | The Consumer Price Index is an inflationary indicator that measures the change in the cost of a fixed basket of products and services, including housing, electricity, food and transportation. It is not possible to invest directly in the Index. |
| ** | The Russell 3000® Value Index is an index that measures the performance of the broad value segment of U.S. equities. It is not possible to invest directly in the Index. The performance of the Index does not reflect deductions for fees, expenses or taxes. |
| 1 | Past performance is not an indication of future results. Total investment return and principal value of your investment will fluctuate and units, when redeemed, may be worth more or less than their original cost. Current performance may be higher or lower than the performance data quoted. Call 800-THRIVENT or visit www.thrivent.com for performance results current to the most recent month-end. |
Annualized total returns represent past performance and reflect changes in share prices, the reinvestment of all dividends and capital gains, and the effects of compounding. Periods of less than one year are not annualized. At various times, the Portfolio’s adviser waived its management fee and/or reimbursed Portfolio expenses. Had the adviser not done so, the Portfolio’s total returns would have been lower. The returns shown do not reflect charges and expenses imposed on contract holders by the variable accounts. Those charges and expenses reduce the returns received by contract holders as compared to the returns presented.
The prospectus contains more complete information on the investment objectives, risks, charges and expenses of the investment company, which investors should read and consider carefully before investing. To obtain a prospectus, contact a registered representative or visit Thrivent.com.
51
Table of Contents
 |
Subadvised by Pyramis Global Advisors, LLC, an affiliate of Fidelity Investments
Thrivent Partner All Cap Portfolio seeks long-term growth of capital.
Stocks are subject to the basic market risk that a particular security, or securities in general, may decrease in value over short or even extended time periods. These and other risks are described in the Portfolio’s prospectus.
How did the Portfolio perform during the six-month period ended June 30, 2009?
Thrivent Partner All Cap Portfolio earned a total return of 5.46% as compared to the median return of its peer group, the Lipper Multi-Cap Core category, of 6.67%. The Portfolio’s market benchmark, the Russell 3000® Index, earned a total return of 4.20%.
What factors affected the Portfolio’s performance?
The information technology and telecommunications services sectors were the largest contributors to relative performance. Within information technology, our overweighted position in network equipment and services provider Brocade Communications Systems contributed to performance when its share price rose substantially after IBM indicated that it would begin selling Ethernet switching and routing products from Brocade, in addition to the company’s report of better-than-expected second quarter earnings. In the telecommunications services sector, our underweighted position in communications company AT&T contributed to performance. One of the largest individual contributors to performance came from the leather handbags retailer Coach Inc., the share price of which rose significantly after the company reported third quarter revenue that beat analysts’ estimates.
The financials and materials sectors detracted from relative performance. In the financials sector, our underweighted position to Bank of America weighed on performance, as did our underweighted stance to miner Freeport-McMoRan Copper & Gold in materials. Two of the largest individual detractors from performance came from our overweighted positions in shipping firm DryShips Inc. and in retailer Wal-Mart Stores.
What is your outlook?
The macro environment has continued to deteriorate and corporate earnings growth remains at risk; however, we are seeing some, albeit small, signs of improvement in some areas of the economy. At the margin, the deterioration in the credit markets appears to have slowed, and market volatility has fallen from historic levels. Additionally, we have observed a slowdown in the deterioration, and by some measure even an improvement, in the manufacturing side of the economy. Given this macro backdrop, we have generally continued to maintain the Portfolio’s defensive posture with higher levels of diversification.
Within financials, we are slightly more optimistic than three months ago, but remain cautious. As such, we have slowly begun to cover our underweighted position in banks with incremental exposure to both the larger
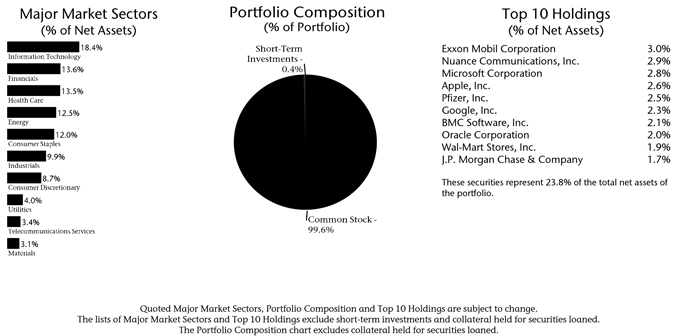
52
Table of Contents
commercial banks as well as selected strong regional players, especially those with strong core deposits and capital positions. Within energy, we have moved to a more defensive stance as global demand continues to remain weak.
Not all areas of the Portfolio are positioned defensively. We have found several strong product stories with the software and storage areas of technology and have meaningful active positions in these.
Portfolio Facts
As of June 30, 2009
Net Assets | $54,462,266 | |
NAV | $6.34 | |
NAV - High† | 6/2/2009 - $6.73 | |
NAV - Low† | 3/9/2009 - $4.69 | |
Number of Holdings: 119 |
| † | For the six months ended June 30, 2009 |
Average Annual Total Returns1
As of June 30, 2009
| 1-Year | 5-Year | From Inception 11/30/2001 | ||
| (31.09%) | 1.58% | (1.62%) |
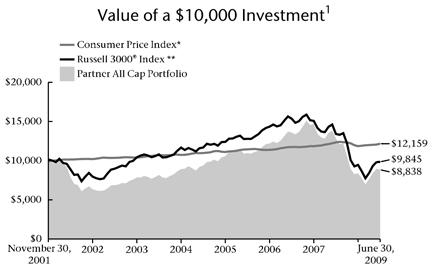
| * | The Consumer Price Index is an inflationary indicator that measures the change in the cost of a fixed basket of products and services, including housing, electricity, food and transportation. It is not possible to invest directly in the Index. |
| ** | The Russell 3000® Index is an index comprised of the 3,000 largest U.S. companies based on market capitalization. It is not possible to invest directly in the Index. The performance of the Index does not reflect deductions for fees, expenses or taxes. |
| 1 | Past performance is not an indication of future results. Total investment return and principal value of your investment will fluctuate and units, when redeemed, may be worth more or less than their original cost. Current performance may be higher or lower than the performance data quoted. Call 800-THRIVENT or visit www.thrivent.com for performance results current to the most recent month-end. |
Annualized total returns represent past performance and reflect changes in share prices, the reinvestment of all dividends and capital gains, and the effects of compounding. Periods of less than one year are not annualized. At various times, the Portfolio’s adviser waived its management fee and/or reimbursed Portfolio expenses. Had the adviser not done so, the Portfolio’s total returns would have been lower. The returns shown do not reflect charges and expenses imposed on contract holders by the variable accounts. Those charges and expenses reduce the returns received by contract holders as compared to the returns presented.
The prospectus contains more complete information on the investment objectives, risks, charges and expenses of the investment company, which investors should read and consider carefully before investing. To obtain a prospectus, contact a registered representative or visit Thrivent.com.
53
Table of Contents

How did the Portfolio perform during the six-month period ended June 30, 2009?
Thrivent Large Cap Growth Portfolio II earned a total return of 13.91% as compared to the median return of its peer group, the Lipper Large Cap Growth category, of 12.11%. The Portfolio’s market benchmark, the Russell 1000® Growth Index, earned a total return of 11.53%.
What factors affected the Portfolio’s performance?
Fueled by a possible return in confidence in our financial institutions and early signals that the worst economic declines may be behind us, the equity markets staged an impressive rally in the first half of 2009. Our performance in comparison to both our benchmark and peer group was strong on both a stock selection and sector allocation basis.
Looking at sector-based analysis, the technology and energy sectors were the biggest contributors, as energy prices rebounded and demand for technology-related companies showed signs of recovery. Strong performance in overweighted technology positions Marvell Technology, Micron Technology and Ciena, coupled with energy positions Petrobras and Transocean, were the largest contributors to our outperformance.
The two most negative contributors to performance were in the industrial and consumer discretionary sectors. Our overweighted position in the airline sector was the greatest performance detractor in the Portfolio. Poor performance of gaming-related companies such as Wynn Resorts and WMS Industries, along with untimely trades in shares of Target Corp., was the primary issue in the consumer discretionary sector.
What is your outlook?
Our outlook for the equity markets is positive, and we have positioned the Portfolio to take advantage of an improvement in our economic condition. We are overweighted in the financial sector; we find companies in this sector with strong balance sheets and competitive positions to be attractive. We believe that technology will benefit from an uptick in the economy, especially in
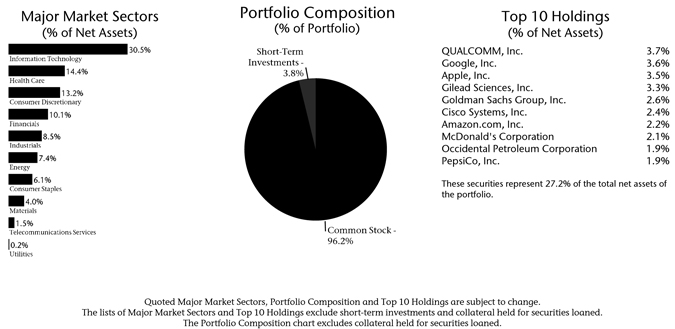
54
Table of Contents
semiconductors. We also believe that the materials and energy sectors are leveraged to an improving worldwide economic activity; thus, this area is overweighted within the Portfolio. Within these sectors, we like companies with good production profiles. We are also de-emphasizing defensive sectors, such as consumer staples, within the Portfolio.
Portfolio Facts
As of June 30, 2009
Net Assets | $350,926,957 | |
NAV | $6.67 | |
NAV - High† | 6/9/2009 - $6.86 | |
NAV - Low† | 3/9/2009 - $4.91 | |
Number of Holdings: 93 |
| † | For the six months ended June 30, 2009 |
Average Annual Total Returns1
As of June 30, 2009
| 1-Year | 5-Year | From Inception 11/30/2001 | ||
| (25.67%) | (1.53%) | (1.94%) |
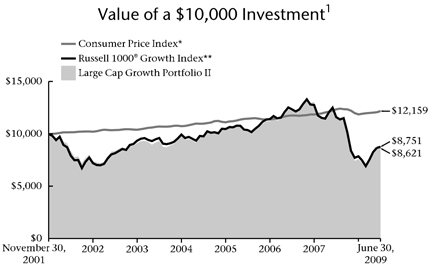
| * | The Consumer Price Index is an inflationary indicator that measures the change in the cost of a fixed basket of products and services, including housing, electricity, food and transportation. It is not possible to invest directly in the Index. |
| ** | The Russell 1000® Growth Index measures the performance of large cap growth stocks. It is not possible to invest directly in the Index. The performance of the Index does not reflect deductions for fees, expenses or taxes. |
| 1 | Past performance is not an indication of future results. Total investment return and principal value of your investment will fluctuate and units, when redeemed, may be worth more or less than their original cost. Current performance may be higher or lower than the performance data quoted. Call 800-THRIVENT or visit www.thrivent.com for performance results current to the most recent month-end. |
Annualized total returns represent past performance and reflect changes in share prices, the reinvestment of all dividends and capital gains, and the effects of compounding. Periods of less than one year are not annualized. At various times, the Portfolio’s adviser waived its management fee and/or reimbursed Portfolio expenses. Had the adviser not done so, the Portfolio’s total returns would have been lower. The returns shown do not reflect charges and expenses imposed on contract holders by the variable accounts. Those charges and expenses reduce the returns received by contract holders as compared to the returns presented.
The prospectus contains more complete information on the investment objectives, risks, charges and expenses of the investment company, which investors should read and consider carefully before investing. To obtain a prospectus, contact a registered representative or visit Thrivent.com.
55
Table of Contents
How did the Portfolio perform during the six-month period ended June 30, 2009?
Thrivent Large Cap Growth Portfolio earned a total return of 14.32% as compared to the median return of its peer group, the Lipper Large Cap Growth category, of 12.11%. The Portfolio’s market benchmark, the Russell 1000® Growth Index, earned a total return of 11.53%.
What factors affected the Portfolio’s performance?
Fueled by a possible return in confidence in our financial institutions and early signals that the worst economic declines may be behind us, the equity markets staged an impressive rally in the first half of 2009. Our performance in comparison to both our benchmark and peer group was strong on both a stock selection and sector allocation basis.
Looking at sector-based analysis, the technology and energy sectors were the biggest contributors, as energy prices rebounded and demand for technology-related companies showed signs of recovery. Strong performance in overweighted technology positions Marvell Technology, Micron Technology and Ciena, coupled with energy positions Petrobras and Transocean, were the largest contributors to our outperformance.
The two most negative contributors to performance were in the industrial and consumer discretionary sectors. Our overweighted position in the airline sector was the greatest performance detractor in the Portfolio. Poor performance of gaming-related companies such as Wynn Resorts and WMS Industries, along with untimely trades in shares of Target Corp., was the primary issue in the consumer discretionary sector.
What is your outlook?
Our outlook for the equity markets is positive, and we have positioned the Portfolio to take advantage of an improvement in our economic condition. We are overweighted in the financial sector; we find companies in this sector with strong balance sheets and competitive positions to be attractive. We believe that technology will benefit from an uptick in the economy, especially in
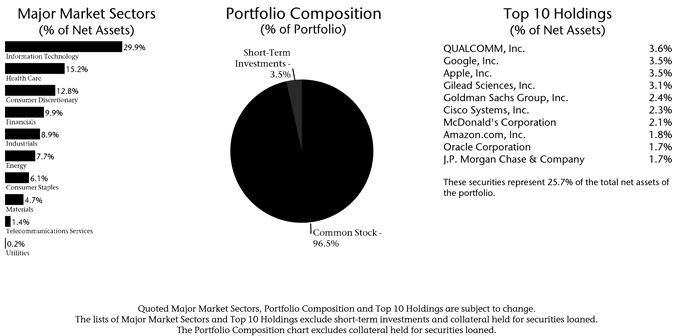
56
Table of Contents
semiconductors. We also believe that the materials and energy sectors are leveraged to an improving worldwide economic activity; thus, this area is overweighted within the Portfolio. Within these sectors, we like companies with good production profiles. We are also de-emphasizing defensive sectors, such as consumer staples, within the Portfolio.
Portfolio Facts
As of June 30, 2009
Net Assets | $883,038,968 | |
NAV | $12.53 | |
NAV - High† | 6/9/2009 - $12.91 | |
NAV - Low† | 3/9/2009 - $9.21 | |
Number of Holdings: 116 |
| † | For the six months ended June 30, 2009 |
Average Annual Total Returns1
As of June 30, 2009
| 1-Year | 5-Year | 10-Year | ||
| (25.46%) | (1.47%) | (2.01%) |
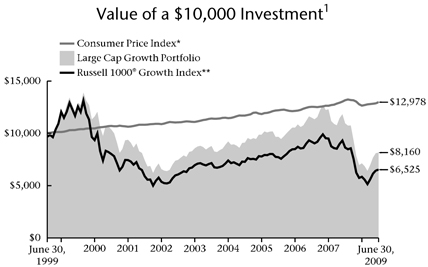
| * | The Consumer Price Index is an inflationary indicator that measures the change in the cost of a fixed basket of products and services, including housing, electricity, food and transportation. It is not possible to invest directly in the Index. |
| ** | The Russell 1000® Growth Index measures the performance of large cap growth stocks. It is not possible to invest directly in the Index. The performance of the Index does not reflect deductions for fees, expenses or taxes. |
| 1 | Past performance is not an indication of future results. Total investment return and principal value of your investment will fluctuate and units, when redeemed, may be worth more or less than their original cost. Current performance may be higher or lower than the performance data quoted. Call 800-THRIVENT or visit www.thrivent.com for performance results current to the most recent month-end. |
Annualized total returns represent past performance and reflect changes in share prices, the reinvestment of all dividends and capital gains, and the effects of compounding. Periods of less than one year are not annualized. At various times, the Portfolio’s adviser waived its management fee and/or reimbursed Portfolio expenses. Had the adviser not done so, the Portfolio’s total returns would have been lower. The returns shown do not reflect charges and expenses imposed on contract holders by the variable accounts. Those charges and expenses reduce the returns received by contract holders as compared to the returns presented.
The prospectus contains more complete information on the investment objectives, risks, charges and expenses of the investment company, which investors should read and consider carefully before investing. To obtain a prospectus, contact a registered representative or visit Thrivent.com.
57
Table of Contents

How did the Portfolio perform during the six-month period ended June 30, 2009?
Thrivent Partner Growth Stock Portfolio earned a total return of 15.22% as compared to the median return of its peer group, the Lipper Large Cap Growth category, of 12.11%. The Portfolio’s market benchmark, the S&P 500/Citigroup Growth Index, earned a total return of 7.53%.
What factors influenced the Portfolio’s performance?
After a steep decline earlier this year, the S&P 500 Index finished in positive territory for the six-month period, but most of the component sectors were unable to rebound into positive positions. Information technology far outpaced other sectors, as many companies reported surprisingly positive earnings. Materials posted strong results as global demand returned, especially from China. Industrials and business services was the worst performer, followed by telecommunication services and financials. Mid-cap stocks outperformed large- and small-caps in the period. In the large-cap stock universe, growth outpaced value.
Information technology outperformed on stock selection, and significant overweighting also benefitted the Portfolio. Computers and peripherals led the way, as top overall Portfolio contributor Apple beat quarterly estimates on strong iPod and iPhone sales in the face of a tough consumer economy.
Stock selection within health care also contributed to outperformance. Biotech firm Genentech merged with Roche Holdings in March, after accepting an increased bid for the minority share that Roche did not already own. Express Scripts, the pharmacy benefits manager, posted impressive results driven by greater use of generic drugs, which is more profitable for the firm.
Energy benefitted from stock selection as energy prices rebounded sharply after a dramatic fall in the second half of 2008. With rising energy prices, major oil companies underperformed the overall sector, as they are less leveraged to the price of oil.
Stock selection drove outperformance in the consumer discretionary sector. Most of the benefit came from Amazon.com, which reported surprisingly strong holiday shopping sales results in a sluggish economy and showed indications of gaining market share from e-commerce rivals.
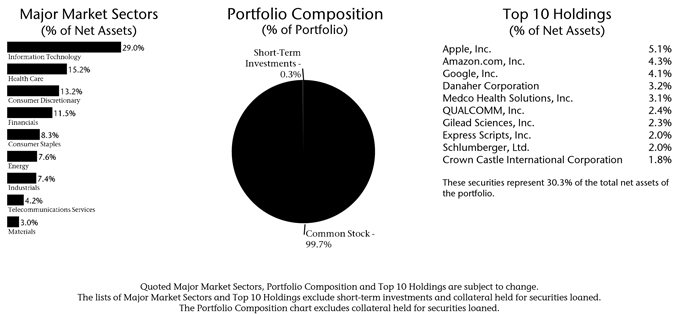
58
Table of Contents
What is your outlook?
We are optimistic that the worst of the global economic and market downturn is behind us, as economic data suggest the U.S. economy is stabilizing and the world economy is poised to recover from the first global recession since World War II. But the strength of the rebound leaves us cautious, as markets may have gotten ahead of the recovery. Investors should not be surprised at a pullback, and we anticipate sluggish growth for the second half of 2009. The Portfolio is positioned to benefit from a rebound.
Portfolio Facts
As of June 30, 2009
Net Assets | $53,385,384 | |
NAV | $7.99 | |
NAV - High† | 6/9/2009 - $8.20 | |
NAV - Low† | 3/9/2009 - $6.06 | |
Number of Holdings: 109 |
| † | For the six months ended June 30, 2009 |
Average Annual Total Returns1
As of June 30, 2009
| 1-Year | 5-Year | From Inception 11/30/2001 | ||
| (26.61%) | (1.22%) | (0.19%) |
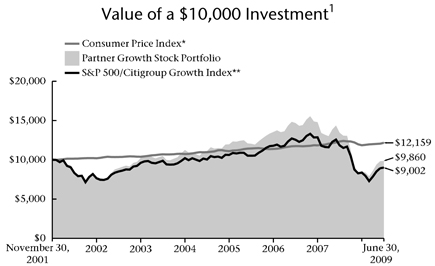
| * | The Consumer Price Index is an inflationary indicator that measures the change in the cost of a fixed basket of products and services, including housing, electricity, food and transportation. It is not possible to invest directly in the Index. |
| ** | The S&P 500/Citigroup Growth Index is a capitalization-weighted index comprised of highest price-to-book ratio securities in the S&P 500 Index. The S&P 500/Citigroup Growth Index is designed so that approximately one-half of the S&P 500 Index market capitalization is characterized as “value” and the other half as “growth.” The product is not sponsored, endorsed or promoted by Standard & Poor’s, and Standard & Poor’s makes no representation regarding the advisability of investing in the product. It is not possible to invest directly in the Index. The performance of the Index does not reflect deductions for fees, expenses or taxes. |
| 1 | Past performance is not an indication of future results. Total investment return and principal value of your investment will fluctuate and units, when redeemed, may be worth more or less than their original cost. Current performance may be higher or lower than the performance data quoted. Call 800-THRIVENT or visit www.thrivent.com for performance results current to the most recent month-end. |
Annualized total returns represent past performance and reflect changes in share prices, the reinvestment of all dividends and capital gains, and the effects of compounding. Periods of less than one year are not annualized. At various times, the Portfolio’s adviser waived its management fee and/or reimbursed Portfolio expenses. Had the adviser not done so, the Portfolio’s total returns would have been lower. The returns shown do not reflect charges and expenses imposed on contract holders by the variable accounts. Those charges and expenses reduce the returns received by contract holders as compared to the returns presented.
The prospectus contains more complete information on the investment objectives, risks, charges and expenses of the investment company, which investors should read and consider carefully before investing. To obtain a prospectus, contact a registered representative or visit Thrivent.com.
59
Table of Contents

How did the Portfolio perform during the six-month period ended June 30, 2009?
Thrivent Large Cap Value Portfolio earned a total return of -1.12% as compared to the median return of its peer group, the Lipper Large Cap Value category, of 1.23%. The Portfolio’s market benchmark, the Russell 1000® Value Index, earned a total return of -2.87%.
What factors affected the Portfolio’s performance?
Sector allocation decisions hurt performance versus the peer group. An overweighted stance in financials negatively affected performance, as this was the worst-performing area of the market during the period. In addition, the Portfolio retained less cash than its peers.
Stock selection overall detracted from performance, primarily due to Portfolio positioning in the consumer cyclical sector. Specifically, owning shares of home builder Pulte Homes hurt performance. This position has been sold as we had been too optimistic about a recovery in housing. Stock selection in the energy sector also hurt performance, with an overweighted position in ConocoPhillips (integrated oil), which did not keep pace with the energy sector. Not owning shares of pharmaceutical manufacturer Schering-Plough hurt relative performance as Merck offered to buy this company at a substantial premium during the period.
On the positive side, an overweighted holding in technology stocks and strong stock selection helped performance. Shares of semiconductor equipment manufacturer Teradyne appreciated considerably during the period.
What is your outlook?
Economic forecasting is not an area where we have consistently added value. Therefore, our focus is on stock selection, which is guided by valuation. Currently we continue to find the most attractive valuations in the financial services and consumer cyclical areas of the market. We would add selected industrial and technology companies to this list as well. The Portfolio continues to be overweighted in the financial services and consumer cyclical sectors. While valuations are attractive, a major risk to these areas of the market is that any recession is long and these companies suffer accordingly.
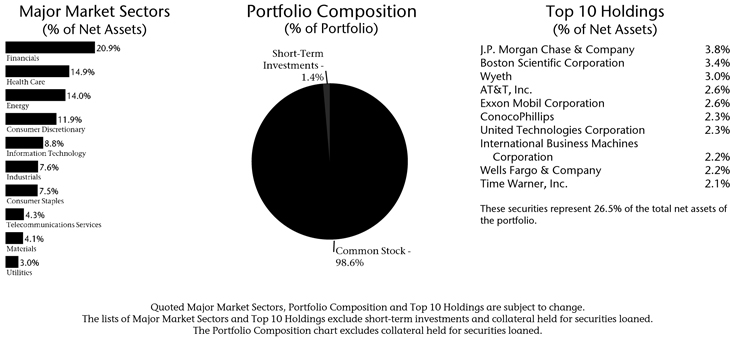
60
Table of Contents
The biggest change in sector weightings during the period was a decline in consumer staples positions and an increase in health care. Concern about federal government involvement in the health care industry has pushed the valuations of selected companies to attractive levels.
Portfolio Facts
As of June 30, 2009
Net Assets | $639,899,072 | |
NAV | $8.00 | |
NAV - High† | 1/6/2009 - $8.34 | |
NAV - Low† | 3/9/2009 - $5.84 | |
Number of Holdings: 97 |
| † | For the six months ended June 30, 2009 |
Average Annual Total Returns1
As of June 30, 2009
| 1-Year | 5-Year | From Inception 11/30/2001 | ||
| (26.50%) | (1.03%) | (0.26%) |
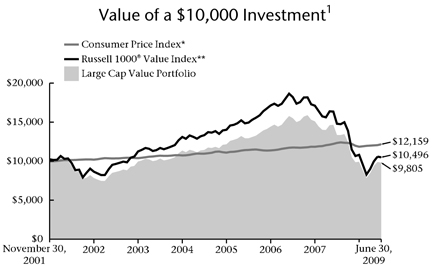
| * | The Consumer Price Index is an inflationary indicator that measures the change in the cost of a fixed basket of products and services, including housing, electricity, food and transportation. It is not possible to invest directly in the Index. |
| ** | The Russell 1000® Value Index measures the performance of large cap value stocks. It is not possible to invest directly in the Index. The performance of the Index does not reflect deductions for fees, expenses or taxes. |
| 1 | Past performance is not an indication of future results. Total investment return and principal value of your investment will fluctuate and units, when redeemed, may be worth more or less than their original cost. Current performance may be higher or lower than the performance data quoted. Call 800-THRIVENT or visit www.thrivent.com for performance results current to the most recent month-end. |
Annualized total returns represent past performance and reflect changes in share prices, the reinvestment of all dividends and capital gains, and the effects of compounding. Periods of less than one year are not annualized. At various times, the Portfolio’s adviser waived its management fee and/or reimbursed Portfolio expenses. Had the adviser not done so, the Portfolio’s total returns would have been lower. The returns shown do not reflect charges and expenses imposed on contract holders by the variable accounts. Those charges and expenses reduce the returns received by contract holders as compared to the returns presented.
The prospectus contains more complete information on the investment objectives, risks, charges and expenses of the investment company, which investors should read and consider carefully before investing. To obtain a prospectus, contact a registered representative or visit Thrivent.com.
61
Table of Contents
How did the Portfolio perform during the six-month period ended June 30, 2009?
Thrivent Large Cap Stock Portfolio earned a total return of 4.16% as compared to the median return of its peer group, the Lipper Large Cap Core category, of 5.38%. The Portfolio’s market benchmark, the S&P 500 Index, earned a total return of 3.19%.
What factors affected the Portfolio’s performance?
Stock selection was the most significant contributor to performance versus the Index. Information technology stocks had the most significant positive impact on results, while both the energy and materials groups also had good returns in the companies held. A modestly overweighted stance in the financial sector mitigated some of those gains as the group did not perform as well over the full six-month period. As a group, financial stocks exhibited extraordinary volatility over the period, falling sharply in the first two months of the first quarter and staging an explosive rally in the second quarter. The Portfolio’s bias toward higher-quality holdings in this group limited the impact of this poorly-performing sector as our holdings modestly outperformed the group. Our holdings in the industrial group did not keep pace with those in the Index, but a moderately underweighted stance to this poorly-performing sector offset some of the weakness from stock selection.
Holdings in the semiconductor, communications equipment and the computer hardware and peripherals industries were the factors leading to above-benchmark results in the information technology sector. Generally, the account was underweighted in the extremely large companies in the groups, which did not perform as well as more specialized industry participants. In the energy sector, the Portfolio was biased to companies that provide goods and services to the major producers of energy products, rather than directly to the commodity companies, and the former group performed well versus the latter. In the materials group, Freeport-McMoRan Copper & Gold performed particularly well and the stock was overweighted in the account.
What is your outlook?
It is likely the cyclical decline in the major indexes came to an end in March 2009. While economic and financial risks remain high, it appears the myriad of policy steps taken by both the Treasury and Federal Reserve banks are having the desired effect of moderating the economic decline and setting the stage for an improvement in the economy beginning in the second half of the year.
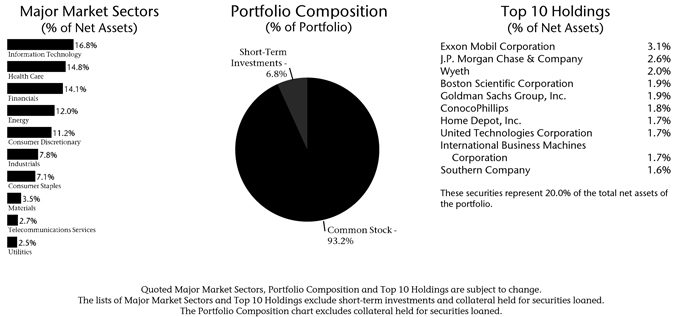
62
Table of Contents
While the advance off the bottom could be called a new bull market, this rally, in fact, has only taken the major indexes back to levels that existed around the beginning of 2009. Further advances will require a higher level of conviction the economy is on a path of sustained recovery. Quarter to quarter, the recovery is likely to be fragile, but we believe the trend rate of growth will improve, albeit modestly versus prior periods of economic growth. The Portfolio is positioned to be positively impacted by stronger growth; however, selectivity is important as we believe the contour of the recovery will be uneven.
Portfolio Facts
As of June 30, 2009
Net Assets | $499,781,206 | |
NAV | $6.36 | |
NAV - High† | 6/2/2009 - $6.54 | |
NAV - Low† | 3/9/2009 - $4.71 | |
Number of Holdings: 170 |
| † | For the six months ended June 30, 2009 |
Average Annual Total Returns1
As June 30, 2009
| 1-Year | 5-Year | From Inception 3/1/2001 | ||
| (26.29%) | (2.49%) | (3.02%) |
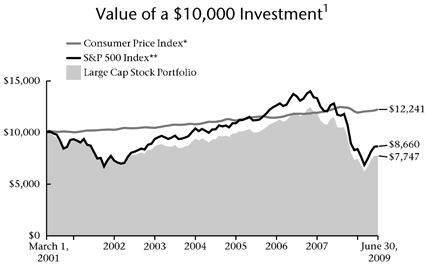
| * | The Consumer Price Index is an inflationary indicator that measures the change in the cost of a fixed basket of products and services, including housing, electricity, food and transportation. It is not possible to invest directly in the Index. |
| ** | The S&P 500 Index is an index that represents the average performance of a group of 500 widely held, publicly traded stocks. “S&P 500” is a trademark of The McGraw-Hill Companies, Inc. and has been licensed for use by Thrivent Financial for Lutherans. The product is not sponsored, endorsed or promoted by Standard & Poor’s and Standard & Poor’s makes no representation regarding the advisability of investing in the product. It is not possible to invest directly in the Index. The performance of the Index does not reflect deductions for fees, expenses or taxes. |
| 1 | Past performance is not an indication of future results. Total investment return and principal value of your investment will fluctuate and units, when redeemed, may be worth more or less than their original cost. Current performance may be higher or lower than the performance data quoted. Call 800-THRIVENT or visit www.thrivent.com for performance results current to the most recent month-end. |
Annualized total returns represent past performance and reflect changes in share prices, the reinvestment of all dividends and capital gains, and the effects of compounding. Periods of less than one year are not annualized. At various times, the Portfolio’s adviser waived its management fee and/or reimbursed Portfolio expenses. Had the adviser not done so, the Portfolio’s total returns would have been lower. The returns shown do not reflect charges and expenses imposed on contract holders by the variable accounts. Those charges and expenses reduce the returns received by contract holders as compared to the returns presented.
The prospectus contains more complete information on the investment objectives, risks, charges and expenses of the investment company, which investors should read and consider carefully before investing. To obtain a prospectus, contact a registered representative or visit Thrivent.com.
63
Table of Contents
How did the Portfolio perform during the six-month period ended June 30, 2009?
Thrivent Large Cap Index Portfolio earned a total return of 3.06% as compared to the median return of its peer group, the Lipper S&P 500 Index Objective category, of 3.05%. The Portfolio’s market benchmark, the S&P 500 Index, earned a total return of 3.19%.
What factors affected the Portfolio’s performance?
The Portfolio’s holdings are aligned with those of the S&P 500 Index. As typically occurs in an index fund, the difference in performance between the benchmark index and the Portfolio itself can largely be attributed to expenses and minor differences in portfolio composition.
Four sectors posted positive returns for the year to date, led by information technology and materials. Because these two sectors were oversold (in our view) in the previous six months, the return could be characterized as a reversion. Large-cap stocks outperformed small-cap stocks, but underperformed mid-cap stocks over the reporting period.
Industrials and telecommunication services delivered the most negative returns for the six-month period. Industrial stocks were negatively impacted by continued deterioration in a handful of companies that have a high market cap and a large exposure to international sales. Telecommunication services results were driven by underperformance from the two largest names in the sector.
What is your outlook?
These last six months showed a steep decline through mid-March, then a huge recovery from the lows through the end of June. There are signs that a rotation in market leadership could be underway. As a generalization, this type of environment tends to favor mid- and small-cap companies. Additionally, investors seem to be coming more risk-tolerant, also an environment that tends to favor mid- and small-capitalized companies. We believe that the dollar is as low as it should get and that risk levels are coming down. While opportunities for large cap exist, our view is that as we enter a new cycle, mid-and small-cap companies should outperform their large-cap counterparts.
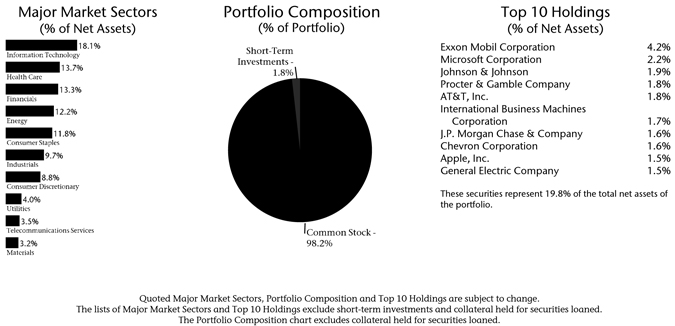
64
Table of Contents
Policy actions have been undertaken to forestall any lasting impact from the ongoing unwinding of the excesses in housing that occurred last cycle. Additionally, the financial markets appear to be resolving some of the uncertainty and ambiguity that has surrounded the fixed-income markets and led to the severe credit contraction.
Portfolio Facts
As of June 30, 2009
Net Assets | $296,133,484 | |
NAV | $12.87 | |
NAV - High† | 6/12/2009 - $14.55 | |
NAV - Low† | 3/9/2009 - $10.35 | |
Number of Holdings: 504 |
| † | For the six months ended June 30, 2009 |
Average Annual Total Returns1
As of June 30, 2009
| 1-Year | 5-Year | 10-Year | ||
| (26.33%) | (2.48%) | (2.46%) |
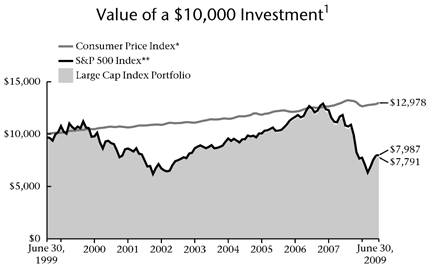
| * | The Consumer Price Index is an inflationary indicator that measures the change in the cost of a fixed basket of products and services, including housing, electricity, food and transportation. It is not possible to invest directly in the Index. |
| ** | The S&P 500 Index is an index that represents the average performance of a group of 500 widely held, publicly traded stocks. “S&P 500” is a trademark of The McGraw-Hill Companies, Inc. and has been licensed for use by Thrivent Financial for Lutherans. The product is not sponsored, endorsed or promoted by Standard & Poor’s and Standard & Poor’s makes no representation regarding the advisability of investing in the product. It is not possible to invest directly in the Index. The performance of the Index does not reflect deductions for fees, expenses or taxes. |
| 1 | Past performance is not an indication of future results. Total investment return and principal value of your investment will fluctuate and units, when redeemed, may be worth more or less than their original cost. Current performance may be higher or lower than the performance data quoted. Call 800-THRIVENT or visit www.thrivent.com for performance results current to the most recent month-end. |
Annualized total returns represent past performance and reflect changes in share prices, the reinvestment of all dividends and capital gains, and the effects of compounding. Periods of less than one year are not annualized. At various times, the Portfolio’s adviser waived its management fee and/or reimbursed Portfolio expenses. Had the adviser not done so, the Portfolio’s total returns would have been lower. The returns shown do not reflect charges and expenses imposed on contract holders by the variable accounts. Those charges and expenses reduce the returns received by contract holders as compared to the returns presented.
The prospectus contains more complete information on the investment objectives, risks, charges and expenses of the investment company, which investors should read and consider carefully before investing. To obtain a prospectus, contact a registered representative or visit Thrivent.com.
65
Table of Contents

How did the Portfolio perform during the six-month period ended June 30, 2009?
Thrivent Equity Income Plus Portfolio earned a total return of -2.32% as compared to the median return of its peer group, the Lipper Equity Income Funds category, of 1.01%. The Portfolio’s market benchmark, the S&P 500 Index, earned a total return of 3.19%.
What factors affected the Portfolio’s performance?
The Portfolio has maintained a position of investing in high-quality firms exhibiting strong operating performance and an ability to pay and grow dividends. For the first six months of 2009, the market rewarded stocks of lower quality, low or no dividend and higher risk. Additionally, growth investing significantly outperformed value investing during the period; however, the Portfolio’s style is value-oriented.
At the sector and security level, sector allocations provided a positive impact to performance, while security selection was the major contributor to underperformance. Stock selection was strongest in health care and industrials, and weakest in energy, consumer discretionary, financials and materials.
The Portfolio’s options buy-write strategy added value by generating premiums and moderating volatility. However, the Portfolio’s exposure to real estate investment trusts (REITs) and preferred equity detracted from performance, as both asset classes significantly underperformed the overall market for the period. REITs continued their underperformance from 2008 due, in part, to historic tightening of credit and the acceleration of the domestic and global recessions. Within the preferred market, financials constitute the majority of preferred securities and were one the market’s worst-performing sectors for the period.
What is your outlook?
The market had a terrible first quarter followed by an April and May rally that was one of the strongest quarterly stock gains in more than a decade. In June the market began to wane as investors, in our opinion, looked beyond “less-worse” economic news and instead looked for actual signs of recovery, only to find rising unemployment and reduced consumer spending. With this backdrop, the Portfolio maintains its more conservative approach, which emphasizes dividend coverage, improving operating performance, quality
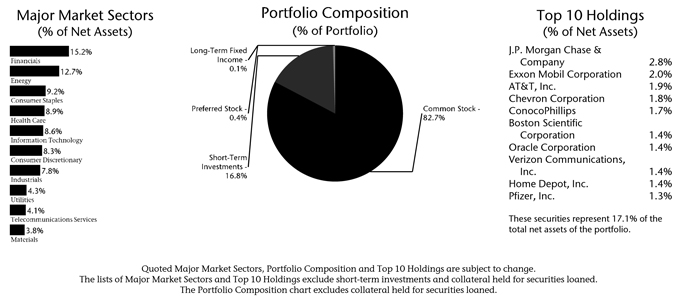
66
Table of Contents
balance sheets, and attractive valuations. With the expectation of a slow recovery, we have modestly rotated to consumer discretionary and technology sectors and underweighted consumer staples and utilities. The Portfolio continues to use a call-writing strategy to generate premium income; however, if volatility continues to fall to below average levels the Portfolio may suspend this strategy or initiate a put-writing strategy to enhance Portfolio income.
Portfolio Facts
As of June 30, 2009
Net Assets | $41,639,552 | |
NAV | $6.73 | |
NAV - High† | 1/2/2009 - $7.05 | |
NAV - Low† | 3/9/2009 - $5.05 | |
Number of Holdings: 199 |
| † | For the six months ended June 30, 2009 |
Average Annual Total Returns1
As of June 30, 2009
| 1-Year | From Inception 4/30/2008 | |
| (25.28%) | (27.43%) |
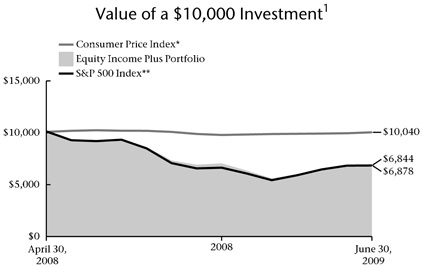
| * | The Consumer Price Index is an inflationary indicator that measures the change in the cost of a fixed basket of products and services, including housing, electricity, food and transportation. It is not possible to invest directly in the Index. |
| ** | The S&P 500 Index is an index that represents the average performance of a group of 500 widely held, publicly traded stocks. “S&P 500” is a trademark of The McGraw-Hill Companies, Inc. and has been licensed for use by Thrivent Financial for Lutherans. The product is not sponsored, endorsed or promoted by Standard & Poor’s and Standard & Poor’s makes no representation regarding the advisability of investing in the product. It is not possible to invest directly in the Index. The performance of the Index does not reflect deductions for fees, expenses or taxes. |
| 1 | Past performance is not an indication of future results. Total investment return and principal value of your investment will fluctuate and units, when redeemed, may be worth more or less than their original cost. Current performance may be higher or lower than the performance data quoted. Call 800-THRIVENT or visit www.thrivent.com for performance results current to the most recent month-end. |
Annualized total returns represent past performance and reflect changes in share prices, the reinvestment of all dividends and capital gains, and the effects of compounding. Periods of less than one year are not annualized. At various times, the Portfolio’s adviser waived its management fee and/or reimbursed Portfolio expenses. Had the adviser not done so, the Portfolio’s total returns would have been lower. The returns shown do not reflect charges and expenses imposed on contract holders by the variable accounts. Those charges and expenses reduce the returns received by contract holders as compared to the returns presented.
The prospectus contains more complete information on the investment objectives, risks, charges and expenses of the investment company, which investors should read and consider carefully before investing. To obtain a prospectus, contact a registered representative or visit Thrivent.com.
67
Table of Contents
 |
Kevin R. Brimmer, FSA, and Michael G. Landreville, CFA, Portfolio Co-Managers Thrivent Balanced Portfolio seeks long-term total return through a balance between income and the potential for long-term capital growth by investing primarily in a diversified portfolio of common stocks, bonds and money market instruments.
The Portfolio is subject to interest-rate risk, credit risk and volatility risk, which may result in overall price fluctuations over short or even extended time periods. Stocks are subject to the basic market risk that a particular security, or securities in general, may decrease in value over short or even extended time periods. These and other risks are described in the Portfolio’s prospectus. |  |
How did the Portfolio perform during the six-month period ended June 30, 2009?
Thrivent Balanced Portfolio earned a total return of 3.65%. The Portfolio’s market benchmarks, the S&P 500 Index and the Barclays Capital Aggregate Bond Index, returned 3.19% and 1.90%, respectively.
What factors affected the Portfolio’s performance?
We maintained an investment allocation of approximately two-thirds of assets in the equity segment and the remainder in fixed-income securities during the period.
The equity component return was closely aligned with its benchmark, the S&P 500 Index. Within the Portfolio, information technology, materials and consumer discretionary were the best-performing industry sectors. Health care was the only other sector providing a positive return during the period. Faring worst were the telecommunications and industrials sectors (industrials being hindered, in part, by the slide in demand and prices of commodities).
The fixed-income component of the Portfolio modestly outperformed the Barclays Capital Aggregate Bond Index. The main factor in the relative outperformance was the Portfolio’s overweighted position in corporate and mortgage-backed bonds, whose prices rose sharply during most of the period as investors’ appetite for risk increased. Conversely, the Portfolio’s underweighted position in Treasury securities, which underperformed as their yields increased, also benefitted relative performance.
What is your outlook?
We expect the recession to end in the second half of 2009. The unprecedented amount of government stimulus in the system should begin to spur growth during the rest of the year, but we anticipate that growth will remain below trend and that unemployment will stay high for the foreseeable future. Under such a scenario, the Federal Reserve will likely keep short-term interest rates at current record low levels at least through the year.
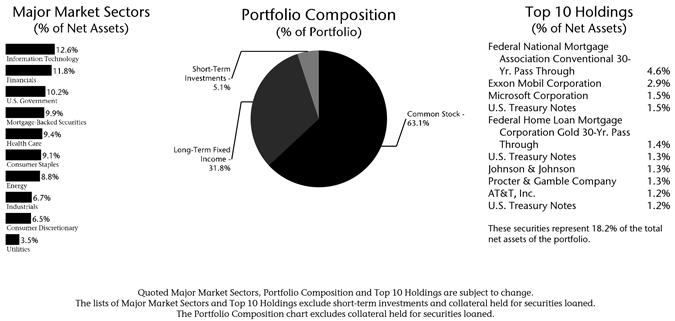
68
Table of Contents
The stock market will need to see validation of its recent advance in the form of improved earnings reports and revenue expectations. The equity segment of the account is invested in line with the S&P 500 Index which suggests a bias towards larger-capitalization equities.
We expect the yield curve to remain steep and credit spreads to continue narrowing closer to their long-term averages. Much of this will likely be due to strong demand for spread-related fixed-income investments as investors are crowded out of low-yielding government securities and money market investments. In addition, we expect investors will migrate into higher-risk bonds as the outlook for the economy should improve during the year.
As always, we intend to maintain a well-diversified mix of securities in our efforts to track the performance of the benchmark indexes.
Portfolio Facts
As of June 30, 2009
Net Assets | $258,063,518 | |
NAV | $11.44 | |
NAV - High† | 6/12/2009 - $12.36 | |
NAV - Low† | 3/9/2009 - $9.75 | |
Number of Holdings: 771 |
| † | For the six months ended June 30, 2009 |
Average Annual Total Returns1
As of June 30, 2009
| 1-Year | 5-Year | 10-Year | ||
| (16.36%) | (0.16%) | 0.77% |
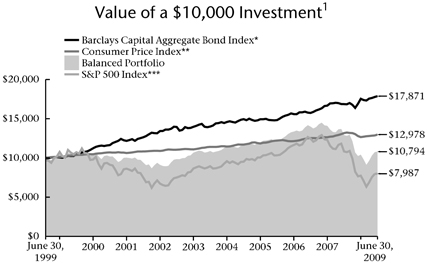
| * | The Barclays Capital Aggregate Bond Index is an index that measures the performance of U.S. investment grade bonds. It is not possible to invest directly in the Index. The performance of the Index does not reflect deductions for fees, expenses or taxes. |
| ** | The Consumer Price Index is an inflationary indicator that measures the change in the cost of a fixed basket of products and services, including housing, electricity, food and transportation. It is not possible to invest directly in the Index. |
| *** | The S&P 500 Index is an index that represents the average performance of a group of 500 widely held, publicly traded stocks. “S&P 500” is a trademark of The McGraw-Hill Companies, Inc. and has been licensed for use by Thrivent Financial for Lutherans. The product is not sponsored, endorsed or promoted by Standard & Poor’s and Standard & Poor’s makes no representation regarding the advisability of investing in the product. It is not possible to invest directly in the Index. The performance of the Index does not reflect deductions for fees, expenses or taxes. |
| 1 | Past performance is not an indication of future results. Total investment return and principal value of your investment will fluctuate and units, when redeemed, may be worth more or less than their original cost. Current performance may be higher or lower than the performance data quoted. Call 800-THRIVENT or visit www.thrivent.com for performance results current to the most recent month-end. |
Annualized total returns represent past performance and reflect changes in share prices, the reinvestment of all dividends and capital gains, and the effects of compounding. Periods of less than one year are not annualized. At various times, the Portfolio’s adviser waived its management fee and/or reimbursed Portfolio expenses. Had the adviser not done so, the Portfolio’s total returns would have been lower. The returns shown do not reflect charges and expenses imposed on contract holders by the variable accounts. Those charges and expenses reduce the returns received by contract holders as compared to the returns presented.
The prospectus contains more complete information on the investment objectives, risks, charges and expenses of the investment company, which investors should read and consider carefully before investing. To obtain a prospectus, contact a registered representative or visit Thrivent.com.
69
Table of Contents
 |
Paul J. Ocenasek, CFA, Portfolio Manager Thrivent High Yield Portfolio seeks a higher level of income through investment in a diversified portfolio of high-yield, high-risk securities, commonly referred to as “junk bonds,” which involve greater risks than higher quality investments. The Portfolio will also consider growth of capital as a secondary objective.
Although high-yield bonds typically have a higher current yield than investment-grade bonds, high-yield bonds are also subject to greater price fluctuations and increased risk of loss of principal than investment-grade bonds. These and other risks are described in the Portfolio’s prospectus. |
How did the Portfolio perform during the six-month period ended June 30, 2009?
Thrivent High Yield Portfolio earned a total return of 22.36% as compared to the median return of its peer group, the Lipper U.S. High Current Yield category, of 22.02%. The Portfolio’s market benchmark, the Barclays Capital U.S. Corporate High Yield Bond Index, earned a total return of 30.43%.
What factors affected the Portfolio’s performance?
The high-yield bond market rallied for much of the six-month period, as investors increasingly believed that government bailouts and liquidity programs would help revive the U.S. economy and markets. The yield premium or “spread” high-yield bonds offered over that of Treasury securities fell from 16.54% at the end of 2008 to 9.45% on June 30.
The Portfolio outperformed its peer group mainly because it remained nearly fully invested in high-yield securities, unlike many of our peers, with only about 1% of Portfolio assets in cash. With exceptionally strong performance in the high-yield sector during the period, and meager yields on cash, remaining invested in this sector was rewarded. Our securities selection in the auto industry also benefitted our performance relative to our peer group.
The main reason the Portfolio (and the high-yield peer group) underperformed the index was that we owned few junk-rated preferred securities issued by major banks. These subordinated securities surged during the first half as investors’ risk appetite appeared to have increased.
What is your outlook?
We expect the U.S. economy to stabilize in the second half of the year. By then the unprecedented amount of government stimulus in the system should begin to spur growth.
We remain concerned, however, about the threats to growth posed by continued problems in the housing and
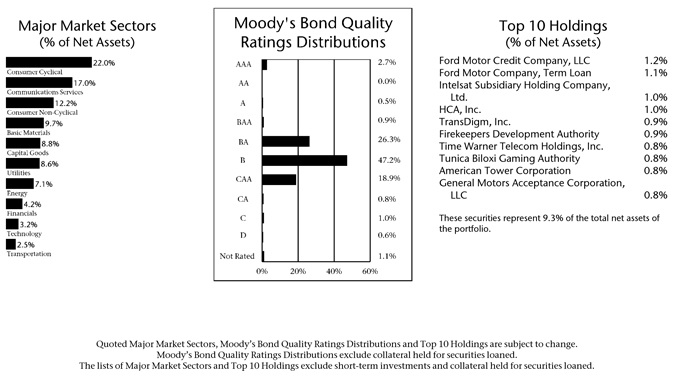
70
Table of Contents
credit markets, softening consumer demand and rising unemployment. With slow or no economic growth, we expect default rates in high-yield bonds to peak toward the end of the year and then start to decline significantly in 2010.
At current price levels, the high-yield market appears fairly valued given the prevailing economic and default rate environment. For suitable investors, we believe that now is a good time to add some exposure to high-yield bonds.
Portfolio Facts
As of June 30, 2009
Net Assets | $709,084,252 | |
NAV | $4.06 | |
NAV - High† | 6/12/2009 - $4.10 | |
NAV - Low† | 3/9/2009 - $3.38 | |
Number of Holdings: 273 |
| † | For the six months ended June 30, 2009 |
Average Annual Total Returns1
As of June 30, 2009
| 1-Year | 5-Year | 10-Year | ||
| (2.69%) | 4.33% | 1.51% |
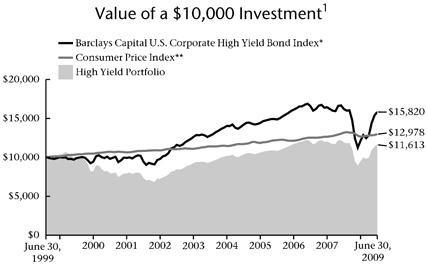
| * | The Barclays Capital U.S. Corporate High Yield Bond Index is an index which measures the performance of fixed-rate non-investment grade bonds. It is not possible to invest directly in the Index. The performance of the Index does not reflect deductions for fees, expenses or taxes. |
| ** | The Consumer Price Index is an inflationary indicator that measures the change in the cost of a fixed basket of products and services, including housing, electricity, food and transportation. It is not possible to invest directly in the Index. |
| 1 | Past performance is not an indication of future results. Total investment return and principal value of your investment will fluctuate and units, when redeemed, may be worth more or less than their original cost. Current performance may be higher or lower than the performance data quoted. Call 800-THRIVENT or visit www.thrivent.com for performance results current to the most recent month-end. |
Annualized total returns represent past performance and reflect changes in share prices, the reinvestment of all dividends and capital gains, and the effects of compounding. Periods of less than one year are not annualized. At various times, the Portfolio’s adviser waived its management fee and/or reimbursed Portfolio expenses. Had the adviser not done so, the Portfolio’s total returns would have been lower. The returns shown do not reflect charges and expenses imposed on contract holders by the variable accounts. Those charges and expenses reduce the returns received by contract holders as compared to the returns presented.
The prospectus contains more complete information on the investment objectives, risks, charges and expenses of the investment company, which investors should read and consider carefully before investing. To obtain a prospectus, contact a registered representative or visit Thrivent.com.
71
Table of Contents
 | Thrivent Diversified Income Plus Portfolio
Mark L. Simenstad, CFA, Kevin R. Brimmer, FSA, David R. Spangler, CFA and Paul J. Ocenasek, CFA, Portfolio Co-Managers |  |
Thrivent Diversified Income Plus Portfolio seeks to maximize income while maintaining prospects for capital appreciation by investing primarily in a diversified portfolio of income-producing securities.
The Portfolio may invest in debt or equity securities. Debt securities include high-yield, high-risk securities commonly known as “junk bonds.” High-yield securities are subject to greater price fluctuations and increased risk of loss of principal than investment grade bonds. Equity securities include securities of REITs, which are subject to the risk that changes in real estate values or economic downturns can have a negative effect on issuers in the real estate industry. These and other risks are described in the Portfolio’s Prospectus.
How did the Portfolio perform during the six-month period ended June 30, 2009?
Thrivent Diversified Income Plus Portfolio earned a total return of 11.74%. This compares with the Portfolio’s market benchmarks, the S&P 500 Dividend Aristocrats Index and the Barclays Capital Aggregate Bond Index, returned 0.46% and 1.90%, respectively.
What factors affected the Portfolio’s performance?
Non-Treasury sectors of the credit market reversed course and rallied for much of the period, as investors increasingly appeared to believe that government bailouts and liquidity programs would help revive the U.S. economy and markets. The extra yield premium, or “spread,” riskier bonds offered over that of Treasury securities narrowed considerably.
High-yield, investment-grade corporate and mortgage-related bonds were among the best-performing sectors during the period, while the prices of U.S. government securities sagged. Despite a strong rally in the stock market during the period, equity real estate investment trust (REIT) shares generally posted negative returns.
The Portfolio’s favorable performance relative to its benchmark indexes were due to several factors, including: an overweighted position in high-yield bonds; an underweighted position in REITs; a large position in mortgage-related bonds; and a meaningful allocation to preferred stocks.
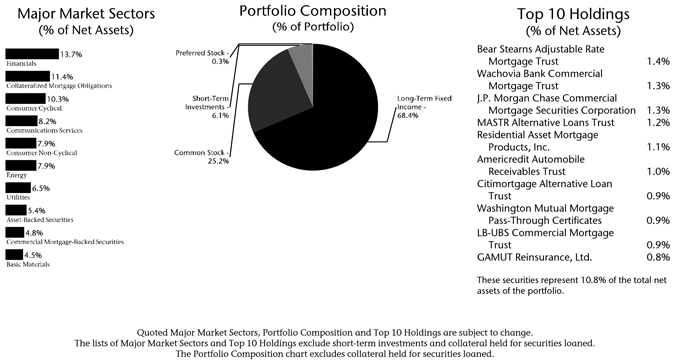
72
Table of Contents
What is your outlook?
The unprecedented amount of government stimulus in the system should begin to spur economic growth in the second half of 2009, but growth will remain below trend and unemployment will stay high for the foreseeable future. We continue to see opportunities in several investment areas going forward, including mortgage-backed, investment-grade corporate and high-yield bonds. We will remain cautious on REITs and intend to stay at the low end of our overall allocation to equities. As always we will continue to monitor the economy and markets carefully, adding value to the Portfolio whenever possible.
Portfolio Facts
As of June 30, 2009
Net Assets | $74,643,233 | |
NAV | $5.15 | |
NAV - High† | 6/12/2009 - $5.64 | |
NAV - Low† | 3/9/2009 - $4.55 | |
Number of Holdings: 449 |
| † | For the six months ended June 30, 2009 |
Average Annual Total Returns1,2
As of June 30, 2009
| 1-Year | 5-Year | 10-Year | ||
| (10.67%) | 1.72% | 2.75% |
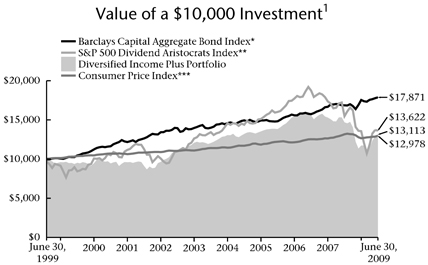
| * | The Barclays Capital Aggregate Bond Index is an index that measures the performance of U.S. investment grade bonds. It is not possible to invest directly in the Index. The performance of the Index does not reflect deductions for fees, expenses or taxes. |
| ** | The S&P 500 Dividend Aristocrats Index is an index which measures the performance of large-capitalization companies within the S&P 500 that have followed a managed dividends policy of consistently increasing dividends every year for at least 25 years. The index portfolio has both capital growth and dividend income characteristics, is equal-weighted and is broadly diversified across sectors. The product is not sponsored, endorsed or promoted by Standard & Poor’s, and Standard & Poor’s makes no representation regarding the advisability of investing in the product. It is not possible to invest directly in the Index. The performance of the Index does not reflect deductions for fees, expenses or taxes. |
| *** | The Consumer Price Index is an inflationary indicator that measures the change in the cost of a fixed basket of products and services, including housing, electricity, food and transportation. It is not possible to invest directly in the Index. |
| 1 | Past performance is not an indication of future results. Total investment return and principal value of your investment will fluctuate and units, when redeemed, may be worth more or less than their original cost. Current performance may be higher or lower than the performance data quoted. Call 800-THRIVENT or visit www.thrivent.com for performance results current to the most recent month-end. |
| 2 | Prior to July 3, 2006, the Portfolio invested primarily in “junk bonds”. |
Annualized total returns represent past performance and reflect changes in share prices, the reinvestment of all dividends and capital gains, and the effects of compounding. Periods of less than one year are not annualized. At various times, the Portfolio’s adviser waived its management fee and/or reimbursed Portfolio expenses. Had the adviser not done so, the Portfolio’s total returns would have been lower. The returns shown do not reflect charges and expenses imposed on contract holders by the variable accounts. Those charges and expenses reduce the returns received by contract holders as compared to the returns presented.
The prospectus contains more complete information on the investment objectives, risks, charges and expenses of the investment company, which investors should read and consider carefully before investing. To obtain a prospectus, contact a registered representative or visit Thrivent.com.
73
Table of Contents
|
Subadvised by Calvert Asset Management Company, Inc.
Thrivent Partner Socially Responsible Bond Portfolio seeks to maximize income.
The Portfolio may invest a portion of its portfolio in high-yield, high-risk securities commonly known as “junk bonds.” High-yield securities are subject to greater price fluctuations and increased risk of loss of principal than investment grade bonds. In addition, as a non-diversified fund, the Portfolio is susceptible to the risk that events affecting a particular issuer will significantly affect the Portfolio’s performance. These and other risks are described in the Portfolio’s prospectus.
How did the Portfolio perform during the six-month period ended June 30, 2009?
Thrivent Partner Socially Responsible Bond Portfolio earned a total return of 4.57% as compared to the median return of its peer group, the Lipper Corporate Debt Funds BBB-Rated category, of 5.80%. The Portfolio’s market benchmark, the Barclays Capital U.S. Credit Index, earned a total return of 6.88%.
What factors affected the Portfolio’s performance?
The first half of 2009 saw Treasury yields trend higher on concerns about the heavy supply of new U.S. debt coming to market to fund the various rescue and economic stimulus packages, along with inflationary risks as a result of the Federal Reserve’s Treasury purchase program. The yield curve also steepened to historic levels in May.
In the second quarter, investors began to add yield to portfolios, and corporate yields, which narrowed in the first quarter, staged a strong rally, with the Barclays Capital benchmark spread narrowing 200 bps. Lower-quality and longer-duration issues outpaced shorter and higher-quality securities. For example, high yield, as measured by the Barclays Capital High Yield Index, returned 23.1% in the quarter, as compared to the higher-quality AA component of the Barclays Capital U.S. Credit benchmark, which posted a quarterly return of 5.3%.
The Portfolio’s short relative duration was a key driver of outperformance in the first quarter but detracted from second quarter performance. Performance was helped by our active yield anticipation trades, which benefit from movements in the spread differential between various dated Treasuries. Performance was hindered by the Portfolio’s higher-quality bias and by some specific holdings that did not participate in the strong long-end credit rally (e.g., long-dated military housing bonds and taxable municipal securities [toll roads]).
What is your outlook?
Looking ahead, we continue to maintain a short relative duration in anticipation of higher yields resulting from continued large new issuance of U.S. debt. We believe
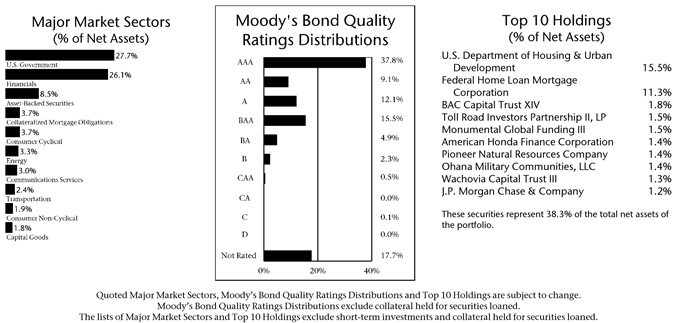
74
Table of Contents
the credit markets may pause from their strong second quarter performance and investors will look to rotate out of out-performers into those securities that are still cheap given their reasonable fundamentals. The Portfolio is positioned to take advantage of a flattening yield curve from the very steep levels witnessed in May. We will also continue to anticipate volatile Treasury moves and will look for opportunities to take advantage of such moves.
Portfolio Facts
As of June 30, 2009
Net Assets | $6,744,323 | |
NAV | $9.95 | |
NAV - High† | 6/23/2009 - $10.24 | |
NAV - Low† | 2/19/2009 - $9.80 | |
Number of Holdings: 80 |
| † | For the six months ended June 30, 2009 |
Average Annual Total Returns1
As of June 30, 2009
| 1-Year | From Inception 4/30/2008 | |
| 6.65% | 6.29% |
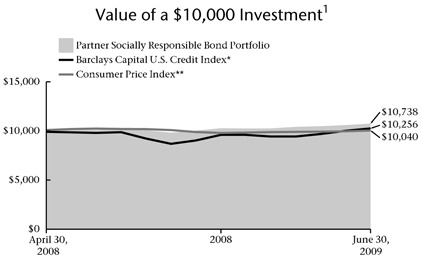
| * | The Barclays Capital U.S. Credit Index is an index comprised of both corporate and non-corporate sectors. The corporate sectors are Industrial, Utility and Finance, which include both U.S. and non-U.S. corporations. The non-corporate sectors are Sovereign, Supranational, Foreign Agency, and Foreign Local Government. It is not possible to invest directly in the Index. The performance of the Index does not reflect deductions for fees, expenses or taxes. |
| ** | The Consumer Price Index is an inflationary indicator that measures the change in the cost of a fixed basket of products and services, including housing, electricity, food and transportation. It is not possible to invest directly in the Index. |
| 1 | Past performance is not an indication of future results. Total investment return and principal value of your investment will fluctuate and units, when redeemed, may be worth more or less than their original cost. Current performance may be higher or lower than the performance data quoted. Call 800-THRIVENT or visit www.thrivent.com for performance results current to the most recent month-end. |
Annualized total returns represent past performance and reflect changes in share prices, the reinvestment of all dividends and capital gains, and the effects of compounding. Periods of less than one year are not annualized. At various times, the Portfolio’s adviser waived its management fee and/or reimbursed Portfolio expenses. Had the adviser not done so, the Portfolio’s total returns would have been lower. The returns shown do not reflect charges and expenses imposed on contract holders by the variable accounts. Those charges and expenses reduce the returns received by contract holders as compared to the returns presented.
The prospectus contains more complete information on the investment objectives, risks, charges and expenses of the investment company, which investors should read and consider carefully before investing. To obtain a prospectus, contact a registered representative or visit Thrivent.com.
75
Table of Contents
 |
Stephen D. Lowe, CFA, Portfolio Manager Thrivent Income Portfolio seeks a high level of income over the longer term while providing reasonable safety of capital through investment primarily in readily marketable intermediate and long-term fixed-income securities.
The Portfolio is subject to interest rate risk, credit risk related to a company’s underlying financial position and volatility risk, which may result in overall price fluctuations over short or even extended time periods. These and other risks are described in the Portfolio’s prospectus. |
How did the Portfolio perform during the six-month period ended June 30, 2009?
Thrivent Income Portfolio earned a total return of 8.27% as compared to the median return of its peer group, the Lipper Corporate Debt Funds BBB-Rated category, of 5.80%. The Portfolio’s market benchmark, the Barclays Capital Aggregate Bond Index, earned a total return of 1.90%.
What factors affected the Portfolio’s Performance?
The most significant reason the Portfolio outperformed its Lipper peer group was our overweighted position in investment-grade corporate securities. The prices of these securities rose sharply during the period as investors’ appetite for risk increased. Within the corporate bond area, our overweighted position in the financial sector also benefitted our relative performance, as the previously most beat-up sectors tended to do best.
Conversely, the Portfolio’s underweighted position in less risky segments such as Treasury and agency mortgage-backed securities, which underperformed, also benefitted relative performance.
While government liquidity programs helped revive prices of our securitized assets, the Portfolio continued to be negatively impacted by illiquid floating-rate securities that were used to support the forward purchase of mortgage securities. However, these securities did quite well and boosted our performance during the last three months of the period.
What is your outlook?
We expect an economic recovery to begin in the second half of 2009. The unprecedented amount of government stimulus in the system should begin to spur growth in the second half, but we anticipate that growth will remain below trend and that unemployment will stay high for the foreseeable future. Under such a scenario, the Federal Reserve will likely keep short-term interest rates at current record-low levels at least through the year.
The yield premium or “spreads” offered by credit-related bonds over that of Treasury securities has narrowed considerably, and we expect further tightening during the remainder of 2009 but at a slower rate. The large amount of government market support will continue to crowd investors into non-Treasury bonds.
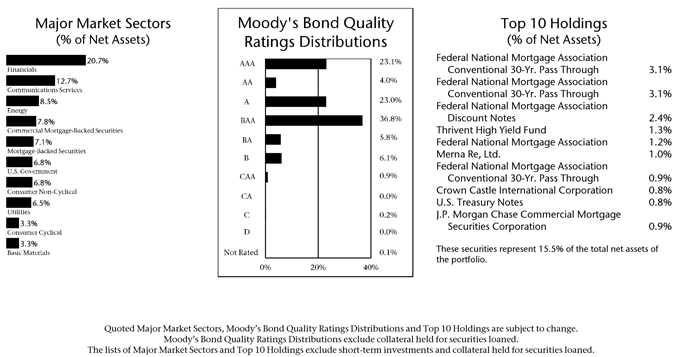
76
Table of Contents
We continue to hold an overweighted position in corporate bonds and other spread products, as we believe that current valuations are attractive, particularly those of investment-grade corporate bonds.
We are also maintaining our modestly overweighted position in securitized products and believe that various government programs will continue to improve liquidity and valuations. Additionally, our strategy is to reduce our more illiquid holdings over time. We believe that current valuations still do not reflect the underlying value in many of these securities.
Portfolio Facts
As of June 30, 2009
Net Assets | $1,144,767,636 | |
NAV | $8.61 | |
NAV - High† | 6/26/2009 - $8.62 | |
NAV - Low† | 3/10/2009 - $7.77 | |
Number of Holdings: 375 |
| † | For the six months ended June 30, 2009 |
Average Annual Returns1
As of June 30, 2009
| 1-Year | 5-Year | 10-Year | ||
| (2.07%) | 2.51% | 4.45% |
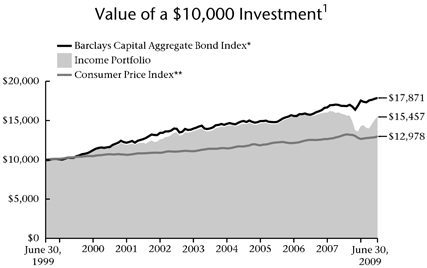
| * | The Barclays Capital Aggregate Bond Index is an index that measures the performance of U.S. investment grade bonds. It is not possible to invest directly in the Index. The performance of the Index does not reflect deductions for fees, expenses or taxes. |
| ** | The Consumer Price Index is an inflationary indicator that measures the change in the cost of a fixed basket of products and services, including housing, electricity, food and transportation. It is not possible to invest directly in the Index. |
| 1 | Past performance is not an indication of future results. Total investment return and principal value of your investment will fluctuate and units, when redeemed, may be worth more or less than their original cost. Current performance may be higher or lower than the performance data quoted. Call 800-THRIVENT or visit www.thrivent.com for performance results current to the most recent month-end. |
Annualized total returns represent past performance and reflect changes in share prices, the reinvestment of all dividends and capital gains, and the effects of compounding. Periods of less than one year are not annualized. At various times, the Portfolio’s adviser waived its management fee and/or reimbursed Portfolio expenses. Had the adviser not done so, the Portfolio’s total returns would have been lower. The returns shown do not reflect charges and expenses imposed on contract holders by the variable accounts. Those charges and expenses reduce the returns received by contract holders as compared to the returns presented.
The prospectus contains more complete information on the investment objectives, risks, charges and expenses of the investment company, which investors should read and consider carefully before investing. To obtain a prospectus, contact a registered representative or visit Thrivent.com.
77
Table of Contents
|
Michael G. Landreville, CFA, Portfolio Manager Thrivent Bond Index Portfolio strives for investment results similar to the total return of the Barclays Capital Aggregate Bond Index by investing primarily in bonds and other debt securities included in the Index.
The Portfolio is subject to interest rate risk, credit risk related to a company’s underlying financial position, and prepayment and extension risk, which may result in overall price fluctuations over short or even extended time periods. While the Portfolio attempts to closely track the Barclays Capital Aggregate Bond Index, it does not duplicate the composition of the Index. Individuals may not invest directly in any index. Index portfolios are subject to the same market risks associated with the securities in their respective indexes. These and other risks are described in the Portfolio’s prospectus. |
How did the Portfolio perform during the six-month period ended June 30?
Thrivent Bond Index Portfolio earned a total return of 1.94% as compared to a 1.90% total return for the Portfolio’s market benchmark, the Barclays Capital Aggregate Bond Index.
What factors affected the Portfolio’s performance?
Since the Portfolio’s objective is to track the performance of the aggregate bond index, its allocations to various sectors of the broad U.S. fixed-income markets generally mirror those of the index. However, the Portfolio’s return reflects operating expenses incurred, whereas no expenses were incurred by the index.
The main reason the Portfolio outperformed its benchmark index was a recovery in the floating-rate debt we hold that backs our mortgage securities. The prices of these securities declined during the first quarter, but they more than made up the lost ground over the second quarter.
Investors continued to seek safety from the global liquidity crisis during the first part of the period, discounting the prices of most types of risk assets such as corporate bonds and mortgage-backed securities. The situation reversed in March, however, as government liquidity programs and signs of a potential economic recovery drew investors back to risk assets.
The Federal Reserve kept the federal funds target interest rate at a range of zero to 0.25% throughout the period. As noted above, more important were the Fed’s extraordinary measures to expand its balance sheet and inject massive liquidity into the financial system, including buying large amounts of agency mortgage-backed and Treasury securities. As investors sought out riskier assets during the period, the two-year Treasury yield rose from 0.76% to 1.11%, the 10-year yield increased from 2.25% to 3.53%, and the 30-year yield rose from 2.69% to 4.32%.
What is your outlook?
We expect the recession that started in December 2007 to end in late 2009. The unprecedented amount of government stimulus in the system should begin to spur growth in the second half, but we anticipate that growth will remain below trend and that unemployment will stay high for the foreseeable future. Under such a scenario, the Federal Reserve will likely keep short-term interest rates at current record low levels at least through the year.
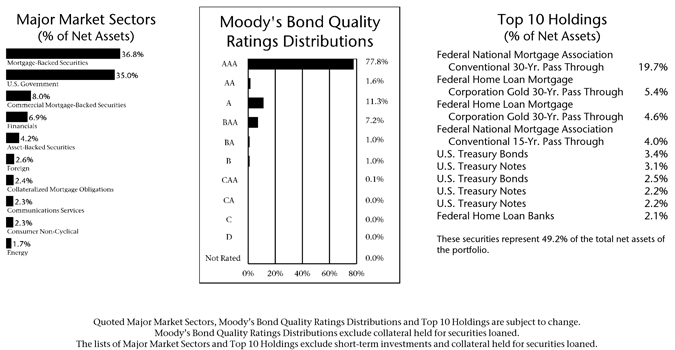
78
Table of Contents
We expect the yield curve to remain steep and credit spreads to continue narrowing closer to their long-term averages. In addition, we expect investors will migrate into higher-risk investments as the outlook for the economy improves during the year.
As always, we intend to maintain a well-diversified mix of debt securities in our efforts to track the performance of the index.
Portfolio Facts
As of June 30, 2009
Net Assets | $155,611,003 | |
NAV | $9.71 | |
NAV - High† | 1/12/2009 - $9.75 | |
NAV - Low† | 3/17/2009 - $9.37 | |
Number of Holdings: 274 |
| † | For the six months ended June 30, 2009 |
Average Annual Total Returns1
As of June 30, 2009
| 1-Year | 5-Year | 10-Year | ||
| 1.90% | 3.38% | 5.00% |
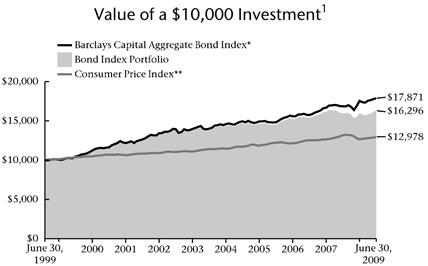
| * | The Barclays Capital Aggregate Bond Index is an index that measures the performance of U.S. investment grade bonds. It is not possible to invest directly in the Index. The performance of the Index does not reflect deductions for fees, expenses or taxes. |
| ** | The Consumer Price Index is an inflationary indicator that measures the change in the cost of a fixed basket of products and services, including housing, electricity, food and transportation. It is not possible to invest directly in the Index. |
| 1 | Past performance is not an indication of future results. Total investment return and principal value of your investment will fluctuate and units, when redeemed, may be worth more or less than their original cost. Current performance may be higher or lower than the performance data quoted. Call 800-THRIVENT or visit www.thrivent.com for performance results current to the most recent month-end. |
Annualized total returns represent past performance and reflect changes in share prices, the reinvestment of all dividends and capital gains, and the effects of compounding. Periods of less than one year are not annualized. At various times, the Portfolio’s adviser waived its management fee and/or reimbursed Portfolio expenses. Had the adviser not done so, the Portfolio’s total returns would have been lower. The returns shown do not reflect charges and expenses imposed on contract holders by the variable accounts. Those charges and expenses reduce the returns received by contract holders as compared to the returns presented.
The prospectus contains more complete information on the investment objectives, risks, charges and expenses of the investment company, which investors should read and consider carefully before investing. To obtain a prospectus, contact a registered representative or visit Thrivent.com.
79
Table of Contents

How did the Portfolio perform during the six-month period ended June 30, 2009?
Thrivent Limited Maturity Bond Portfolio earned a total return of 6.89% compared to a median return of its peer group, the Lipper Short Investment Grade Debt Funds category, of 4.79%. The Portfolio’s market benchmark, the Barclays Capital Government/Credit 1-3 Year Bond Index, earned a total return of 2.00%.
What factors affected the Portfolio’s performance?
The largest factor in the Portfolio’s outperformance of its Lipper peer group was our underweighted position in Treasury securities and overweighted position in Treasury inflation-protected securities (TIPS), which significantly outperformed nominal U.S. Treasury securities during the period. Also benefitting the Portfolio’s relative performance was our positioning in investment-grade corporate bonds, which experienced rising prices during the period, as investors were attracted to the historically wide valuations in the sector.
Investors continued to seek safety from the global liquidity crisis during the first part of the reporting period, keeping Treasury yields low in the face of growing supply and discounting the prices of most other types of bonds. The situation reversed in mid-March, however, as the Federal Reserve announced major plans to further ease credit markets and the Treasury provided details on its plan to take troubled securities off of bank balance sheets.
The Federal Reserve’s Federal Open Market Committee (FOMC) kept the federal funds target interest rate at a range of zero to 0.25% throughout the period. As noted above, more important was the government’s continued extraordinary measures to expand its balance sheet and inject liquidity into the financial system, resulting in a significant easing of credit. The yield on the two-year Treasury note rose from 0.76% to 1.11% during the period.
What is your outlook?
We expect the recession that started in December 2007 to end in late 2009. The unprecedented amount of government stimulus in the system should begin to spur growth in the second half, but growth will remain below trend and unemployment will stay high for the foreseeable future.
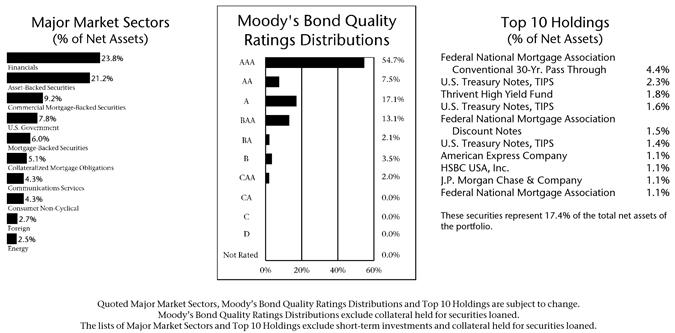
80
Table of Contents
We expect the yield curve to remain steep and credit spreads to continue narrowing closer to their long-term averages. In addition, we expect investors will migrate into higher-risk investments as the outlook for the economy improves during the year.
We will maintain our overweighted position in spread-sector investments, which remain at historically attractive levels, and continue adding to these holdings as opportunities arise.
Portfolio Facts
As of June 30, 2009
Net Assets | $983,946,264 | |
NAV | $9.20 | |
NAV - High† | 6/30/2009 - $9.20 | |
NAV - Low† | 3/10/2009 - $8.70 | |
Number of Holdings: 283 |
| † | For the six months ended June 30, 2009 |
Average Annual Total Returns1
As of June 30, 2009
| 1-Year | 5-Year | From Inception 11/30/2001 | ||
| 0.44% | 2.49% | 2.88% |
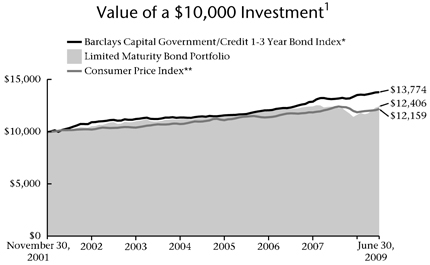
| * | The Barclays Capital Government/Credit 1-3 Year Bond Index is an index that measures the performance of government and corporate fixed-rate debt securities with maturities of 1-3 years. It is not possible to invest directly in the Index. The performance of the Index does not reflect deductions for fees, expenses or taxes. |
| ** | The Consumer Price Index is an inflationary indicator that measures the change in the cost of a fixed basket of products and services, including housing, electricity, food and transportation. It is not possible to invest directly in the Index. |
| 1 | Past performance is not an indication of future results. Total investment return and principal value of your investment will fluctuate and units, when redeemed, may be worth more or less than their original cost. Current performance may be higher or lower than the performance data quoted. Call 800-THRIVENT or visit www.thrivent.com for performance results current to the most recent month-end. |
Annualized total returns represent past performance and reflect changes in share prices, the reinvestment of all dividends and capital gains, and the effects of compounding. Periods of less than one year are not annualized. At various times, the Portfolio’s adviser waived its management fee and/or reimbursed Portfolio expenses. Had the adviser not done so, the Portfolio’s total returns would have been lower. The returns shown do not reflect charges and expenses imposed on contract holders by the variable accounts. Those charges and expenses reduce the returns received by contract holders as compared to the returns presented.
The prospectus contains more complete information on the investment objectives, risks, charges and expenses of the investment company, which investors should read and consider carefully before investing. To obtain a prospectus, contact a registered representative or visit Thrivent.com.
81
Table of Contents


How did the Portfolio perform during the six-month period ended June 30, 2009?
Thrivent Mortgage Securities Portfolio earned a total return of 2.37% as compared to the median return of its peer group, the Lipper U.S. Mortgage Funds category, of 2.37%. The Portfolio’s market benchmark, the Barclays Capital Mortgage-Backed Securities Index, earned a total return of 2.91%.
What factors affected the Portfolio’s performance?
The Portfolio’s return was in line with its Lipper peer group, while it modestly underperformed the index—mainly because the Portfolio incurs operating expenses whereas the index has none.
A major factor that helped the Portfolio’s performance was our allocation to AAA-rated non-agency residential mortgage-backed securities and AAA-rated commercial mortgage-backed securities. Both types of securities rebounded in the second quarter.
Investors continued to seek safety from the global financial crisis during the first part of the reporting period, keeping Treasury yields low in the face of growing supply and discounting the prices of most other types of bonds. The situation reversed in mid-March, however, as the Federal Reserve announced major plans to further ease credit markets and the Treasury provided details on its plan to take troubled securities off of bank balance sheets.
The Federal Reserve’s Federal Open Market Committee (FOMC) kept the federal funds target interest rate at a range of zero to 0.25% throughout the period.
What is your outlook?
We expect the recession that started in December 2007 to end in late 2009. We expect economic growth will remain below trend and unemployment will stay high for the foreseeable future. Under such a scenario, the Federal Reserve will likely keep short-term interest rates at current record low levels at least through the year.
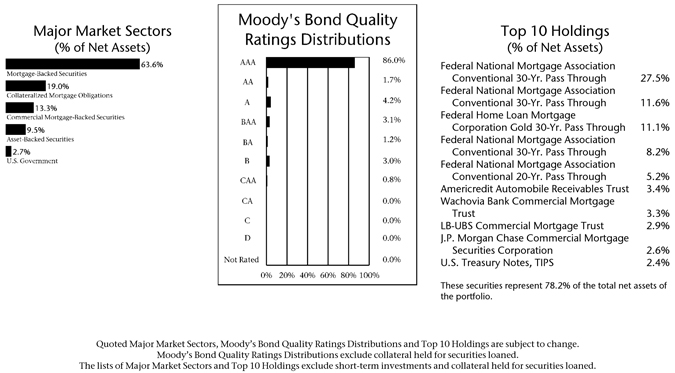
82
Table of Contents
We expect that agency-backed mortgage securities will be a safe haven and benefit as the Federal Reserve continues to buy them, although spreads on these securities have tightened to long-term averages. While the fundamentals for non-agency sector and commercial mortgage-backed securities remain poor and continue to worsen, prices of these securities offer 10-15% loss-adjusted yields at very extreme scenarios for the housing market and economy—and they remain attractive versus agency mortgage-backed securities.
We will maintain our overweighted position in non-agency securities relative to agency issues, which have benefitted from large Federal Reserve and Treasury purchases.
Portfolio Facts
As of June 30, 2009
Net Assets | $30,037,293 | |
NAV | $8.88 | |
NAV - High† | 6/29/2009 - $8.88 | |
NAV - Low† | 3/20/2009 - $8.44 | |
Number of Holdings: 54 |
| † | For the six months ended June 30, 2009 |
Average Annual Total Returns1
As of June 30, 2009
| 1-Year | 5-Year | From Inception 4/30/2003 | ||
| (0.99%) | 2.49% | 2.39% |
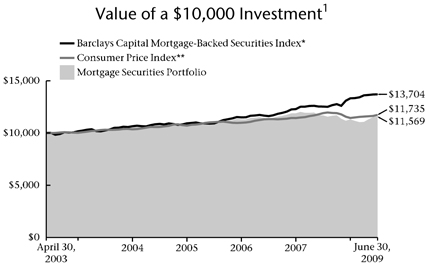
| * | The Barclays Capital Mortgage-Backed Securities Index (MBS) is formed by grouping the universe of over 600,000 individual fixed-rate U.S. government agency MBS pools into approximately 3,500 generic types of securities. It is not possible to invest directly in this Index. The performance of the Index does not reflect deductions for fees, expenses or taxes. |
| ** | The Consumer Price Index is an inflationary indicator that measures the change in the cost of a fixed basket of products and services, including housing, electricity, food and transportation. It is not possible to invest directly in the Index. |
| 1 | Past performance is not an indication of future results. Total investment return and principal value of your investment will fluctuate and units, when redeemed, may be worth more or less than their original cost. Current performance may be higher or lower than the performance data quoted. Call 800-THRIVENT or visit www.thrivent.com for performance results current to the most recent month-end. |
Annualized total returns represent past performance and reflect changes in share prices, the reinvestment of all dividends and capital gains, and the effects of compounding. Periods of less than one year are not annualized. At various times, the Portfolio’s adviser waived its management fee and/or reimbursed Portfolio expenses. Had the adviser not done so, the Portfolio’s total returns would have been lower. The returns shown do not reflect charges and expenses imposed on contract holders by the variable accounts. Those charges and expenses reduce the returns received by contract holders as compared to the returns presented.
The prospectus contains more complete information on the investment objectives, risks, charges and expenses of the investment company, which investors should read and consider carefully before investing. To obtain a prospectus, contact a registered representative or visit Thrivent.com.
83
Table of Contents

How did the Portfolio perform during the six-month period ended June 30, 2009?
Thrivent Money Market Portfolio produced a 0.38% return during the period, while its Lipper Money Market Portfolios category reported a median net return of 0.12% over the same time frame.
What factors affected the Portfolio’s performance?
The Federal Reserve’s Federal Open Market Committee (FOMC) kept the federal funds target interest rate at a range of zero to 0.25% throughout the period. Members noted in June that economic conditions were likely to warrant exceptionally low interest rate levels for an extended period.
The government also undertook extraordinary measures to support liquidity across other sectors of the market, including money market securities. With the government buying massive amounts of short-term securities, available supply plummeted. As supply dropped, prices jumped and yields fell. The yield on the 30-day Treasury bill stayed low during the period, moving from 0.11% to 0.17%, and actually approached zero on several days. With yields so low, many money market funds began to have difficulty maintaining a positive yield to shareholders.
One factor benefitting our relative performance was that we purchased some longer-dated (three to six months) securities at attractive prices early in and just prior to the period, enabling us to extend the Portfolio’s weighted average maturity in high-quality investments. When government intervention boosted credit quality and liquidity, we took advantage of the pricing discrepancies that remained in the market. Money market securities in general continued to benefit during the period from federal programs designed to boost market liquidity and investor confidence.
What is your outlook?
The Federal Reserve will likely keep short-term interest rates at current record-low levels at least through third quarter 2009 in an attempt to improve prospects for economic growth. The low-yield environment is an indication that credit quality and liquidity in money market securities has improved, and we expect money market credit quality and liquidity to remain sound. As a
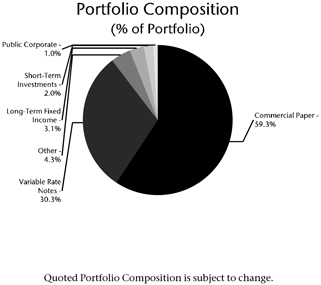
84
Table of Contents
result of the low interest rate environment—and the fact that most of our higher-yielding agency and floating-rate securities will mature in the third quarter—yields for shareholders of the Portfolio will likely hover around zero in the months ahead. We remain optimistic, however, that the low-yield environment will turn around.
As in any interest rate environment, we continue to manage the Portfolio conservatively, focusing our primary concerns on safety and liquidity while pursuing the optimum risk-adjusted yield.
Portfolio Facts
As of June 30, 2009
Net Assets | $610,086,348 | |
NAV | $1.00 | |
Number of Holdings: 83 |
| † | For the six months ended June 30, 2009 |
Average Annual Total Returns1
As of June 30, 2009
| 1-Year | 5-Year | 10-Year | ||
| 1.62% | 3.36% | 3.21% |
Money Market Portfolio Yields *
As of June 30, 2009
| Portfolio | ||
7-Day Yield | 0.30% | |
7-Day Effective Yield | 0.30% |
| * | Seven-day yields of Thrivent Money Market Portfolio refer to the income generated by an investment in the Portfolio over a specified seven-day period, though they are expressed as annual percentage rates. Effective yields reflect the reinvestment of income. Yields are subject to daily fluctuation and should not be considered an indication of future results. |
| 1 | Past performance is not an indication of future results. Total investment return and principal value of your investment will fluctuate and units, when redeemed, may be worth more or less than their original cost. Current performance may be higher or lower than the performance data quoted. Call 800-THRIVENT or visit www.thrivent.com for performance results current to the most recent month-end. |
Annualized total returns represent past performance and reflect changes in share prices, the reinvestment of all dividends and capital gains, and the effects of compounding. Periods of less than one year are not annualized. At various times, the Portfolio’s adviser waived its management fee and/or reimbursed Portfolio expenses. Had the adviser not done so, the Portfolio’s total returns would have been lower. The returns shown do not reflect charges and expenses imposed on contract holders by the variable accounts. Those charges and expenses reduce the returns received by contract holders as compared to the returns presented.
The prospectus contains more complete information on the investment objectives, risks, charges and expenses of the investment company, which investors should read and consider carefully before investing. To obtain a prospectus, contact a registered representative or visit Thrivent.com.
85
Table of Contents
(Unaudited)
As a shareholder of the Thrivent Series Fund, Inc., you incur ongoing costs, including management fees and other Portfolio expenses. This Shareholder Expense Example is intended to help you understand your ongoing costs (in dollars) of investing in a Portfolio and to compare these costs with the ongoing costs of investing in other mutual funds. The Example is based on an investment of $1,000 invested at the beginning of the period and held for the entire period from January 1, 2009 through June 30, 2009. Shares in a Portfolio are currently sold, without sales charges, only to separate accounts of Thrivent Financial for Lutherans and Thrivent Life Insurance Company, which are used to fund benefits of variable life insurance and variable annuity contracts issued by Thrivent Financial for Lutherans and Thrivent Life Insurance Company, and retirement plans sponsored by Thrivent Financial for Lutherans. Expenses associated with these variable contracts and retirement plans are not included in these examples and had these costs been included, your costs would have been higher.
Actual Expenses
In the table below, the first section, labeled “Actual,” provides information about actual account values and actual expenses. You may use the information in this line, together with the amount you invested, to estimate the expenses that you paid over the period. Simply divide your account value by $1,000 (for example, an $8,600 account value divided by $1,000 = 8.6), then multiply the result by the number in the first line under the heading entitled “Expenses Paid During Period” to estimate the expenses you paid.
Hypothetical Example for Comparison Purposes
In the table below, the second section, labeled “Hypothetical,” provides information about hypothetical account values and hypothetical expenses based on the Portfolio’s actual expense ratio and an assumed rate of return of 5% per year before expenses, which is not the Portfolio’s actual return. The hypothetical account values and expenses may not be used to estimate the actual ending account balance or expenses you paid for the period. You may use this information to compare the ongoing costs of investing in the Portfolio and other funds. To do so, compare this 5% hypothetical example with the 5% hypothetical examples that appear in the shareholder reports of the other funds.
| Beginning Account Value 01/01/09 | Ending Account Value 06/30/09 | Expenses Paid During Period 01/01/09- 06/30/09* | Annualized Expense Ratio | |||||||||
Thrivent Aggressive Allocation Portfolio | ||||||||||||
Actual | $ | 1,000 | $ | 1,066 | $ | 1.10 | 0.21 | % | ||||
Hypothetical** | $ | 1,000 | $ | 1,024 | $ | 1.08 | 0.21 | % | ||||
Thrivent Moderately Aggressive Allocation Portfolio | ||||||||||||
Actual | $ | 1,000 | $ | 1,070 | $ | 0.91 | 0.18 | % | ||||
Hypothetical** | $ | 1,000 | $ | 1,024 | $ | 0.89 | 0.18 | % | ||||
Thrivent Moderate Allocation Portfolio | ||||||||||||
Actual | $ | 1,000 | $ | 1,072 | $ | 0.88 | 0.17 | % | ||||
Hypothetical** | $ | 1,000 | $ | 1,024 | $ | 0.86 | 0.17 | % | ||||
Thrivent Moderately Conservative Allocation Portfolio | ||||||||||||
Actual | $ | 1,000 | $ | 1,070 | $ | 0.97 | 0.19 | % | ||||
Hypothetical** | $ | 1,000 | $ | 1,024 | $ | 0.95 | 0.19 | % | ||||
Thrivent Technology Portfolio | ||||||||||||
Actual | $ | 1,000 | $ | 1,254 | $ | 6.99 | 1.25 | % | ||||
Hypothetical** | $ | 1,000 | $ | 1,019 | $ | 6.26 | 1.25 | % | ||||
Thrivent Partner Healthcare Portfolio | ||||||||||||
Actual | $ | 1,000 | $ | 1,069 | $ | 7.13 | 1.39 | % | ||||
Hypothetical** | $ | 1,000 | $ | 1,018 | $ | 6.95 | 1.39 | % | ||||
Thrivent Partner Natural Resources Portfolio | ||||||||||||
Actual | $ | 1,000 | $ | 1,164 | $ | 6.40 | 1.19 | % | ||||
Hypothetical** | $ | 1,000 | $ | 1,019 | $ | 5.97 | 1.19 | % | ||||
86
Table of Contents
| Beginning Account Value 01/01/09 | Ending Account Value 06/30/09 | Expenses Paid During Period 01/01/09- 06/30/09* | Annualized Expense Ratio | |||||||||
Thrivent Partner Emerging Markets Portfolio | ||||||||||||
Actual | $ | 1,000 | $ | 1,334 | $ | 8.68 | 1.50 | % | ||||
Hypothetical** | $ | 1,000 | $ | 1,017 | $ | 7.50 | 1.50 | % | ||||
Thrivent Real Estate Securities Portfolio | ||||||||||||
Actual | $ | 1,000 | $ | 891 | $ | 4.31 | 0.92 | % | ||||
Hypothetical** | $ | 1,000 | $ | 1,020 | $ | 4.61 | 0.92 | % | ||||
Thrivent Partner Utilities Portfolio | ||||||||||||
Actual | $ | 1,000 | $ | 992 | $ | 4.47 | 0.90 | % | ||||
Hypothetical** | $ | 1,000 | $ | 1,020 | $ | 4.53 | 0.90 | % | ||||
Thrivent Partner Small Cap Growth Portfolio | ||||||||||||
Actual | $ | 1,000 | $ | 1,111 | $ | 5.43 | 1.04 | % | ||||
Hypothetical** | $ | 1,000 | $ | 1,020 | $ | 5.19 | 1.04 | % | ||||
Thrivent Partner Small Cap Value Portfolio | ||||||||||||
Actual | $ | 1,000 | $ | 1,029 | $ | 4.60 | 0.91 | % | ||||
Hypothetical** | $ | 1,000 | $ | 1,020 | $ | 4.58 | 0.91 | % | ||||
Thrivent Small Cap Stock Portfolio | ||||||||||||
Actual | $ | 1,000 | $ | 972 | $ | 3.88 | 0.79 | % | ||||
Hypothetical** | $ | 1,000 | $ | 1,021 | $ | 3.97 | 0.79 | % | ||||
Thrivent Small Cap Index Portfolio | ||||||||||||
Actual | $ | 1,000 | $ | 1,007 | $ | 2.49 | 0.50 | % | ||||
Hypothetical** | $ | 1,000 | $ | 1,022 | $ | 2.51 | 0.50 | % | ||||
Thrivent Mid Cap Growth Portfolio II | ||||||||||||
Actual | $ | 1,000 | $ | 1,207 | $ | 3.48 | 0.64 | % | ||||
Hypothetical** | $ | 1,000 | $ | 1,022 | $ | 3.18 | 0.64 | % | ||||
Thrivent Mid Cap Growth Portfolio | ||||||||||||
Actual | $ | 1,000 | $ | 1,206 | $ | 2.73 | 0.50 | % | ||||
Hypothetical** | $ | 1,000 | $ | 1,022 | $ | 2.50 | 0.50 | % | ||||
Thrivent Partner Mid Cap Value Portfolio | ||||||||||||
Actual | $ | 1,000 | $ | 1,049 | $ | 4.45 | 0.88 | % | ||||
Hypothetical** | $ | 1,000 | $ | 1,020 | $ | 4.39 | 0.88 | % | ||||
Thrivent Mid Cap Stock Portfolio | ||||||||||||
Actual | $ | 1,000 | $ | 1,117 | $ | 3.89 | 0.74 | % | ||||
Hypothetical** | $ | 1,000 | $ | 1,021 | $ | 3.72 | 0.74 | % | ||||
Thrivent Mid Cap Index Portfolio | ||||||||||||
Actual | $ | 1,000 | $ | 1,082 | $ | 3.16 | 0.61 | % | ||||
Hypothetical** | $ | 1,000 | $ | 1,022 | $ | 3.07 | 0.61 | % | ||||
Thrivent Partner Worldwide Allocation Portfolio | ||||||||||||
Actual | $ | 1,000 | $ | 1,080 | $ | 5.16 | 1.00 | % | ||||
Hypothetical** | $ | 1,000 | $ | 1,020 | $ | 5.01 | 1.00 | % | ||||
Thrivent Partner International Stock Portfolio | ||||||||||||
Actual | $ | 1,000 | $ | 1,023 | $ | 4.35 | 0.87 | % | ||||
Hypothetical** | $ | 1,000 | $ | 1,020 | $ | 4.34 | 0.87 | % | ||||
Thrivent Partner Socially Responsible Stock Portfolio | ||||||||||||
Actual | $ | 1,000 | $ | 1,111 | $ | 5.13 | 0.98 | % | ||||
Hypothetical** | $ | 1,000 | $ | 1,020 | $ | 4.91 | 0.98 | % | ||||
Thrivent Partner All Cap Growth Portfolio | ||||||||||||
Actual | $ | 1,000 | $ | 1,184 | $ | 5.41 | 1.00 | % | ||||
Hypothetical** | $ | 1,000 | $ | 1,020 | $ | 5.01 | 1.00 | % | ||||
87
Table of Contents
| Beginning Account Value 01/01/09 | Ending Account Value 06/30/09 | Expenses Paid During Period 01/01/09- 06/30/09* | �� | Annualized Expense Ratio | ||||||||
Thrivent Partner All Cap Value Portfolio | ||||||||||||
Actual | $ | 1,000 | $ | 1,159 | $ | 5.25 | 0.98 | % | ||||
Hypothetical** | $ | 1,000 | $ | 1,020 | $ | 4.91 | 0.98 | % | ||||
Thrivent Partner All Cap Portfolio | ||||||||||||
Actual | $ | 1,000 | $ | 1,055 | $ | 5.47 | 1.07 | % | ||||
Hypothetical** | $ | 1,000 | $ | 1,019 | $ | 5.38 | 1.07 | % | ||||
Thrivent Large Cap Growth Portfolio II | ||||||||||||
Actual | $ | 1,000 | $ | 1,139 | $ | 2.77 | 0.52 | % | ||||
Hypothetical** | $ | 1,000 | $ | 1,022 | $ | 2.62 | 0.52 | % | ||||
Thrivent Large Cap Growth Portfolio | ||||||||||||
Actual | $ | 1,000 | $ | 1,143 | $ | 2.46 | 0.46 | % | ||||
Hypothetical** | $ | 1,000 | $ | 1,022 | $ | 2.32 | 0.46 | % | ||||
Thrivent Partner Growth Stock Portfolio | ||||||||||||
Actual | $ | 1,000 | $ | 1,152 | $ | 5.41 | 1.01 | % | ||||
Hypothetical** | $ | 1,000 | $ | 1,020 | $ | 5.08 | 1.01 | % | ||||
Thrivent Large Cap Value Portfolio | ||||||||||||
Actual | $ | 1,000 | $ | 989 | $ | 3.25 | 0.66 | % | ||||
Hypothetical** | $ | 1,000 | $ | 1,022 | $ | 3.30 | 0.66 | % | ||||
Thrivent Large Cap Stock Portfolio | ||||||||||||
Actual | $ | 1,000 | $ | 1,042 | $ | 3.62 | 0.72 | % | ||||
Hypothetical** | $ | 1,000 | $ | 1,021 | $ | 3.58 | 0.72 | % | ||||
Thrivent Large Cap Index Portfolio | ||||||||||||
Actual | $ | 1,000 | $ | 1,031 | $ | 2.25 | 0.45 | % | ||||
Hypothetical** | $ | 1,000 | $ | 1,023 | $ | 2.24 | 0.45 | % | ||||
Thrivent Equity Income Plus Portfolio | ||||||||||||
Actual | $ | 1,000 | $ | 977 | $ | 4.17 | 0.85 | % | ||||
Hypothetical** | $ | 1,000 | $ | 1,021 | $ | 4.26 | 0.85 | % | ||||
Thrivent Balanced Portfolio | ||||||||||||
Actual | $ | 1,000 | $ | 1,036 | $ | 2.23 | 0.44 | % | ||||
Hypothetical** | $ | 1,000 | $ | 1,023 | $ | 2.21 | 0.44 | % | ||||
Thrivent High Yield Portfolio | ||||||||||||
Actual | $ | 1,000 | $ | 1,224 | $ | 2.55 | 0.46 | % | ||||
Hypothetical** | $ | 1,000 | $ | 1,022 | $ | 2.32 | 0.46 | % | ||||
Thrivent Diversified Income Plus Portfolio | ||||||||||||
Actual | $ | 1,000 | $ | 1,117 | $ | 3.46 | 0.66 | % | ||||
Hypothetical** | $ | 1,000 | $ | 1,022 | $ | 3.30 | 0.66 | % | ||||
Thrivent Partner Socially Responsible Bond Portfolio | ||||||||||||
Actual | $ | 1,000 | $ | 1,046 | $ | 3.45 | 0.68 | % | ||||
Hypothetical** | $ | 1,000 | $ | 1,021 | $ | 3.41 | 0.68 | % | ||||
Thrivent Income Portfolio | ||||||||||||
Actual | $ | 1,000 | $ | 1,083 | $ | 2.30 | 0.45 | % | ||||
Hypothetical** | $ | 1,000 | $ | 1,023 | $ | 2.23 | 0.45 | % | ||||
Thrivent Bond Index Portfolio | ||||||||||||
Actual | $ | 1,000 | $ | 1,019 | $ | 2.34 | 0.47 | % | ||||
Hypothetical** | $ | 1,000 | $ | 1,022 | $ | 2.34 | 0.47 | % | ||||
Thrivent Limited Maturity Bond Portfolio | ||||||||||||
Actual | $ | 1,000 | $ | 1,069 | $ | 2.28 | 0.45 | % | ||||
Hypothetical** | $ | 1,000 | $ | 1,023 | $ | 2.23 | 0.45 | % | ||||
88
Table of Contents
| Beginning Account Value 01/01/09 | Ending Account Value 06/30/09 | Expenses Paid During Period 01/01/09- 06/30/09* | Annualized Expense Ratio | |||||||||
Thrivent Mortgage Securities Portfolio | ||||||||||||
Actual | $ | 1,000 | $ | 1,024 | $ | 4.72 | 0.94 | % | ||||
Hypothetical** | $ | 1,000 | $ | 1,020 | $ | 4.71 | 0.94 | % | ||||
Thrivent Money Market Portfolio | ||||||||||||
Actual | $ | 1,000 | $ | 1,004 | $ | 1.99 | 0.40 | % | ||||
Hypothetical** | $ | 1,000 | $ | 1,023 | $ | 2.01 | 0.40 | % | ||||
| * | Expenses are equal to the Portfolio’s annualized expense ratio, multiplied by the average account value over the period, multiplied by 181/365 to reflect the one-half year period. |
| ** | Assuming 5% total return before expenses. |
89
Table of Contents
Aggressive Allocation Portfolio
Schedule of Investments as of June 30, 2009
(unaudited)
| Shares | Mutual Funds (93.0%) | Value | ||||
| Equity Mutual Funds (83.7%) | ||||||
| 741,225 | Thrivent Real Estate Securities Portfolio | $ | 6,173,147 | |||
| 3,436,127 | Thrivent Partner Small Cap Growth Portfolio | 28,393,058 | ||||
| 853,596 | Thrivent Partner Small Cap Value Portfolio | 10,562,220 | ||||
| 4,007,411 | Thrivent Small Cap Stock Portfolio | 32,997,822 | ||||
| 4,032,445 | Thrivent Mid Cap Growth Portfolio II | 27,498,048 | ||||
| 1,598,958 | Thrivent Partner Mid Cap Value Portfolio | 13,807,475 | ||||
| 5,349,414 | Thrivent Mid Cap Stock Portfolio | 42,300,489 | ||||
| 879,970 | Thrivent Partner Worldwide Allocation Portfolio | 5,727,813 | ||||
| 7,023,139 | Thrivent Partner International Stock Portfolio | 58,626,357 | ||||
| 6,368,822 | Thrivent Large Cap Growth Portfolio II | 42,462,211 | ||||
| 3,982,773 | Thrivent Large Cap Value Portfolio | 31,881,697 | ||||
| 4,573,660 | Thrivent Large Cap Stock Portfolio | 29,088,932 | ||||
| 513,284 | Thrivent Equity Income Plus Portfolio | 3,454,964 | ||||
Total Equity Mutual Funds | 332,974,233 | |||||
| Fixed Income Mutual Funds (9.3%) | ||||||
| 2,545,059 | Thrivent High Yield Portfolio | 10,328,611 | ||||
| 1,903,571 | Thrivent Income Portfolio | 16,393,936 | ||||
| 1,108,244 | Thrivent Limited Maturity Bond Portfolio | 10,198,062 | ||||
Total Fixed Income Mutual Funds | 36,920,609 | |||||
Total Mutual Funds (cost $524,293,523) | 369,894,842 | |||||
| Principal Amount | Long-Term Fixed Income (0.4%) | |||||
| U.S. Government (0.4%) | ||||||
U.S. Treasury Notes | ||||||
| 1,500,000 | 0.875%, 12/31/2010a | 1,502,050 | ||||
Total U.S. Government | 1,502,050 | |||||
Total Long-Term Fixed Income (cost $1,501,048) | 1,502,050 | |||||
| Shares or Principal Amount | Short-Term Investments (6.6%)b | |||||
Federal Home Loan Bank Discount Notes | ||||||
| 5,000,000 | Zero Coupon, 8/5/2009 | 4,998,979 | ||||
Federal Home Loan Mortgage Corporation Discount Notes | ||||||
| 1,900,000 | Zero Coupon, 9/21/2009a | 1,899,150 | ||||
| 5,000,000 | Zero Coupon, 9/23/2009 | 4,997,083 | ||||
| 14,346,551 | Thrivent Money Market Portfolio | 14,346,551 | ||||
| Total Short-Term Investments (at amortized cost) | 26,241,763 | |||||
| Total Investments (cost $552,036,334) 100.0% | $ | 397,638,655 | ||||
| Other Assets and Liabilities, Net (<0.1%) | (154,072 | ) | ||||
| Total Net Assets 100.0% | $ | 397,484,583 | ||||
| a | At June 30, 2009, $3,401,200 of investments were held on deposit with the counterparty and pledged as the initial margin deposit for open futures contracts. |
| b | The interest rate shown reflects the yield, coupon rate or, for securities purchased at a discount, the discount rate at the date of purchase. |
Unrealized Appreciation (Depreciation)
Gross unrealized appreciation and depreciation of investments, based on cost for federal income tax purposes, were as follows:
Gross unrealized appreciation | $ | 5,604,572 | ||
Gross unrealized depreciation | (160,002,251 | ) | ||
Net unrealized appreciation (depreciation) | $ | (154,397,679 | ) | |
Cost for federal income tax purposes | $ | 552,036,334 | ||
90
Table of Contents
Aggressive Allocation Portfolio
Schedule of Investments as of June 30, 2009
(unaudited)
Fair Valuation Measurements
The following table is a summary of the inputs used, as of June 30, 2009, in valuing Aggressive Allocation Portfolio’s assets carried at fair value as discussed in the Notes to Financial Statements.
Investments in Securities | Total | Level 1 | Level 2 | Level 3 | ||||||||||
Mutual Funds | ||||||||||||||
Equity Mutual Funds | 332,974,233 | 332,974,233 | — | — | ||||||||||
Fixed Income Mutual Funds | 36,920,609 | 36,920,609 | — | — | ||||||||||
Long-Term Fixed Income | ||||||||||||||
U.S. Government | 1,502,050 | — | 1,502,050 | — | ||||||||||
Short-Term Investments | 26,241,763 | 14,346,551 | 11,895,212 | — | ||||||||||
Total | $ | 397,638,655 | $ | 384,241,393 | $ | 13,397,262 | $ | — | ||||||
Other Financial Instruments* | ($1,001,527 | ) | ($1,001,527 | ) | $ | — | $ | — | ||||||
| * | Other Financial Instruments include Futures, Forwards, Written Options and Swap agreements. |
Futures Contracts | Number of | Expiration | Notional Principal Amount | Value | Unrealized Gain/(Loss) | ||||||||
E-Mini MSCI Eafe Index Futures | 100 | September 2009 | $ | 6,764,651 | $ | 6,514,500 | ($250,151 | ) | |||||
Russell 2000 Index Mini-Futures | 198 | September 2009 | 10,350,995 | 10,042,561 | (308,434 | ) | |||||||
S&P 400 Index Mini-Futures | 131 | September 2009 | 7,802,352 | 7,554,770 | (247,582 | ) | |||||||
S&P 500 Index Futures | 37 | September 2009 | 8,663,735 | 8,468,375 | (195,360 | ) | |||||||
Total Futures Contracts | ($1,001,527 | ) | |||||||||||
The following table summarizes the fair value and Statement of Assets and Liabilities location, as of June 30, 2009, for the Aggressive Allocation Portfolio’s investments in financial derivative instruments by primary risk exposure as discussed under item (2) Significant Accounting Policies of the Notes to Financial Statements.
Derivatives by Risk Category | Statement of Assets and Liabilities Location | Fair Value | |||
Liability Derivatives | |||||
Equity Contracts | |||||
Future* | Net Assets - Net unrealized appreciation/(depreciation) on Futures contracts | 1,001,527 | |||
Total Equity Contracts | 1,001,527 | ||||
Total Liability Derivatives | $ | 1,001,527 | |||
| * | Includes cumulative appreciation/depreciation of futures contracts as reported in the Schedule of Investments. Only current day’s variation margin is reported within the Statement of Assets and Liabilities. |
The following table summarizes the net realized gains/(losses) and Statement of Operations location, for the period ended June 30, 2009, for Aggressive Allocation Portfolio’s investments in financial derivative instruments by primary risk exposure.
Derivatives by Risk | Statement of Operations Location | Realized Gains/(Losses) recognized in Income | |||
Equity Contracts | |||||
Future | Net realized gains/(losses) on Futures contracts | 4,810,197 | |||
Total Equity Contracts | 4,810,197 | ||||
Total | $ | 4,810,197 | |||
The accompanying Notes to Financial Statements are an integral part of this schedule.
91
Table of Contents
Aggressive Allocation Portfolio
Schedule of Investments as of June 30, 2009
(unaudited)
The following table summarizes the change in net unrealized appreciation/(depreciation) and Statement of Operations location, for the period ended June 30, 2009, for the Aggressive Allocation Portfolio’s investments in financial derivative instruments by primary risk exposure.
Derivatives by Risk Category | Statement of Operations Location | Change in Unrealized Appreciation/(Depreciation) recognized in Income | |||
Equity Contracts | |||||
Future | Change in net unrealized appreciation/(depreciation) on Futures contracts | (1,670,502 | ) | ||
Total Equity Contracts | (1,670,502 | ) | |||
Total | ($1,670,502 | ) | |||
Investment in Affiliates
Affiliated issuers, as defined under the Investment Company Act of 1940, include those in which the Portfolio’s holdings of an issuer represent 5% or more of the outstanding voting securities of an issuer, or any affiliated mutual fund.
A summary of transactions for the fiscal year to date, in Aggressive Allocation Portfolio, is as follows:
Portfolio | Value December 31, 2008 | Gross Purchases | Gross Sales | Shares Held at June 30, 2009 | Value June 30, 2009 | Income Earned January 1, 2009 - June 30, 2009 | |||||||||||
Real Estate Securities | $ | 6,831,279 | $ | 323,346 | $ | 192,218 | 741,225 | $ | 6,173,147 | $ | — | ||||||
Partner Small Cap Growth | 25,422,654 | 787,459 | 512,580 | 3,436,127 | 28,393,058 | 25,263 | |||||||||||
Partner Small Cap Value | 10,222,302 | 319,192 | 192,218 | 853,596 | 10,562,220 | 23,408 | |||||||||||
Small Cap Stock | 33,717,707 | 1,019,069 | 640,725 | 4,007,411 | 32,997,822 | 66,324 | |||||||||||
Mid Cap Growth II | 22,699,981 | 667,449 | 448,508 | 4,032,445 | 27,498,048 | 527 | |||||||||||
Partner Mid Cap Value | 13,078,930 | 410,475 | 256,290 | 1,598,959 | 13,807,475 | 29,377 | |||||||||||
Mid Cap Stock | 37,675,608 | 1,075,209 | 704,798 | 5,349,414 | 42,300,489 | 27,189 | |||||||||||
Partner Worldwide Allocation | 2,219,334 | 3,221,884 | 206,449 | 879,970 | 5,727,813 | 2,218 | |||||||||||
Partner International Stock | 57,328,763 | 101,453 | — | 7,023,139 | 58,626,357 | 101,453 | |||||||||||
Large Cap Growth II | 37,423,862 | 1,048,020 | 1,016,369 | 6,368,822 | 42,462,211 | — | |||||||||||
Large Cap Value | 32,366,920 | 971,714 | 900,368 | 3,982,773 | 31,881,697 | 18,969 | |||||||||||
Large Cap Stock | 28,077,766 | 765,629 | 772,223 | 4,573,660 | 29,088,932 | 3,433 | |||||||||||
Equity Income Plus | 3,601,214 | — | 51,928 | 513,284 | 3,454,964 | — | |||||||||||
High Yield | 8,443,730 | 592,798 | 128,145 | 2,545,059 | 10,328,611 | 450,553 | |||||||||||
Income | 15,131,694 | 675,774 | 192,218 | 1,903,571 | 16,393,936 | 462,336 | |||||||||||
Limited Maturity Bond | 9,528,194 | 418,094 | 192,218 | 1,108,244 | 10,198,062 | 204,656 | |||||||||||
Money Market | 7,615,610 | 55,438,031 | 48,707,090 | 14,346,551 | 14,346,551 | 41,068 | |||||||||||
Total Value and Income Earned | 351,385,548 | 384,241,393 | 1,456,774 | ||||||||||||||
The accompanying Notes to Financial Statements are an integral part of this schedule.
92
Table of Contents
Moderately Aggressive Allocation Portfolio
Schedule of Investments as of June 30, 2009
(unaudited)
| Shares | Mutual Funds (92.3%) | Value | ||||
| Equity Mutual Funds (67.3%) | ||||||
| 4,308,723 | Thrivent Real Estate Securities Portfolio | $ | 35,884,336 | |||
| 4,546,224 | Thrivent Partner Small Cap Growth Portfolio | 37,565,907 | ||||
| 3,213,805 | Thrivent Partner Small Cap Value Portfolio | 39,766,979 | ||||
| 7,071,371 | Thrivent Small Cap Stock Portfolio | 58,227,086 | ||||
| 5,601,119 | Thrivent Mid Cap Growth Portfolio II | 38,195,152 | ||||
| 5,659,937 | Thrivent Partner Mid Cap Value Portfolio | 48,875,254 | ||||
| 17,467,112 | Thrivent Mid Cap Stock Portfolio | 138,121,185 | ||||
| 6,744,884 | Thrivent Partner Worldwide Allocation Portfolio | 43,903,124 | ||||
| 18,862,599 | Thrivent Partner International Stock Portfolio | 157,457,435 | ||||
| 19,768,583 | Thrivent Large Cap Growth Portfolio II | 131,801,095 | ||||
| 19,709,057 | Thrivent Large Cap Value Portfolio | 157,769,030 | ||||
| 20,372,690 | Thrivent Large Cap Stock Portfolio | 129,572,346 | ||||
| 1,942,584 | Thrivent Equity Income Plus Portfolio | 13,075,725 | ||||
Total Equity Mutual Funds | 1,030,214,654 | |||||
| Fixed Income Mutual Funds (25.0%) | ||||||
| 27,497,320 | Thrivent High Yield Portfolio | 111,592,375 | ||||
| 22,613,964 | Thrivent Income Portfolio | 194,755,982 | ||||
| 8,326,890 | Thrivent Limited Maturity Bond Portfolio | 76,624,044 | ||||
Total Fixed Income Mutual Funds | 382,972,401 | |||||
Total Mutual Funds (cost $1,946,083,606) | 1,413,187,055 | |||||
| Principal Amount | Long-Term Fixed Income (1.1%) | |||||
| Collateralized Mortgage Obligations (0.5%) | ||||||
Citigroup Mortgage Loan Trust, Inc. | ||||||
| $1,006,167 | 5.500%, 11/25/2035 | 710,632 | ||||
Citimortgage Alternative Loan Trust | ||||||
| 3,070,567 | 5.750%, 4/25/2037 | 1,961,454 | ||||
Countrywide Alternative Loan Trust | ||||||
| 761,847 | 6.000%, 1/25/2037 | 558,440 | ||||
Countrywide Home Loans | ||||||
| 3,030,783 | 5.750%, 4/25/2037 | 2,219,003 | ||||
Deutsche Alt-A Securities, Inc. | ||||||
| 777,322 | 5.500%, 10/25/2021 | 580,319 | ||||
| 1,307,311 | 6.000%, 10/25/2021 | 768,764 | ||||
J.P. Morgan Mortgage Trust | ||||||
| 689,615 | 6.048%, 10/25/2036 | 541,572 | ||||
Master Alternative Loans Trust | ||||||
| 706,554 | 6.500%, 7/25/2034 | 554,535 | ||||
Merrill Lynch Alternative Note Asset Trust | ||||||
| 792,530 | 6.000%, 3/25/2037 | 408,559 | �� | |||
Total Collateralized Mortgage Obligations | 8,303,278 | |||||
| Commercial Mortgage-Backed Securities (0.1%) | ||||||
Greenwich Capital Commercial Funding Corporation | ||||||
| 1,350,000 | 5.867%, 8/10/2017 | 707,232 | ||||
| Total Commercial Mortgage- Backed Securities | 707,232 | |||||
| U.S. Government (0.5%) | ||||||
U.S. Treasury Notes | ||||||
| 7,000,000 | 0.875%, 12/31/2010a | 7,009,569 | ||||
| Total U.S. Government | 7,009,569 | |||||
Total Long-Term Fixed Income (cost $17,675,965) | 16,020,079 | |||||
| Shares or Principal Amount | Short-Term Investments (6.6%)b | |||||
Federal Home Loan Bank Discount Notes | ||||||
| 5,000,000 | Zero Coupon, 8/5/2009 | 4,998,980 | ||||
Federal Home Loan Mortgage Corporation Discount Notes | ||||||
| 5,000,000 | Zero Coupon, 7/7/2009 | 4,999,892 | ||||
| 10,000,000 | Zero Coupon, 7/7/2009 | 9,999,783 | ||||
| 9,000,000 | Zero Coupon, 9/21/2009a | 8,995,962 | ||||
| 5,000,000 | Zero Coupon, 9/23/2009 | 4,997,084 | ||||
Federal National Mortgage Association Discount Notes | ||||||
| 10,000,000 | Zero Coupon, 7/14/2009 | 9,999,422 | ||||
| 5,000,000 | 0.120%, 7/20/2009 | 4,999,683 | ||||
Ranger Funding Company, LLC | ||||||
| 7,370,000 | 0.100%, 7/1/2009 | 7,370,000 | ||||
| 44,444,991 | Thrivent Money Market Portfolio | 44,444,991 | ||||
| Total Short-Term Investments (at amortized cost) | 100,805,797 | |||||
| Total Investments (cost $2,064,565,368) 100.0% | $ | 1,530,012,931 | ||||
| Other Assets and Liabilities, Net (<0.1%) | (517,288 | ) | ||||
| Total Net Assets 100.0% | $ | 1,529,495,643 | ||||
| a | At June 30, 2009, $16,005,531 of investments were held on deposit with the counterparty and pledged as the initial margin deposit for open futures contracts. |
93
Table of Contents
Moderately Aggressive Allocation Portfolio
Schedule of Investments as of June 30, 2009
(unaudited)
| b | The interest rate shown reflects the yield, coupon rate or, for securities purchased at a discount, the discount rate at the date of purchase. |
Unrealized Appreciation (Depreciation)
Gross unrealized appreciation and depreciation of investments, based on cost for federal income tax purposes, were as follows:
Gross unrealized appreciation | $ | 15,192,200 | ||
Gross unrealized depreciation | (549,744,637 | ) | ||
Net unrealized appreciation (depreciation) | $ | (534,552,437 | ) | |
Cost for federal income tax purposes | $ | 2,064,565,368 | ||
Fair Valuation Measurements
The following table is a summary of the inputs used, as of June 30, 2009, in valuing Moderately Aggressive Allocation Portfolio’s assets carried at fair value as discussed in the Notes to Financial Statements.
Investments in Securities | Total | Level 1 | Level 2 | Level 3 | ||||||||||
Mutual Funds | ||||||||||||||
Equity Mutual Funds | 1,030,214,654 | 1,030,214,654 | — | — | ||||||||||
Fixed Income Mutual Funds | 382,972,401 | 382,972,401 | — | — | ||||||||||
Long-Term Fixed Income | ||||||||||||||
Collateralized Mortgage Obligations | 8,303,278 | — | 8,303,278 | — | ||||||||||
Commercial Mortgage-Backed Securities | 707,232 | — | 707,232 | — | ||||||||||
U.S. Government | 7,009,569 | — | 7,009,569 | — | ||||||||||
Short-Term Investments | 100,805,797 | 44,444,991 | 56,360,806 | — | ||||||||||
Total | $ | 1,530,012,931 | $ | 1,457,632,046 | $ | 72,380,885 | $ | — | ||||||
Other Financial Instruments* | ($4,910,391 | ) | ($4,910,391 | ) | $ | — | $ | — | ||||||
| * | Other Financial Instruments include Futures, Forwards, Written Options and Swap agreements. |
Futures Contracts | Number of Contracts Long/(Short) | Expiration Date | Notional Principal Amount | Value | Unrealized Gain/(Loss) | ||||||||
E-Mini MSCI Eafe Index Futures | 860 | September 2009 | $ | 58,175,994 | $ | 56,024,700 | ($2,151,294 | ) | |||||
Russell 2000 Index Mini-Futures | 686 | September 2009 | 35,862,537 | 34,793,920 | (1,068,617 | ) | |||||||
S&P 400 Index Mini-Futures | 833 | September 2009 | 49,613,430 | 48,039,110 | (1,574,320 | ) | |||||||
S&P 500 Index Futures | 22 | September 2009 | 5,151,410 | 5,035,250 | (116,160 | ) | |||||||
Total Futures Contracts | ($4,910,391 | ) | |||||||||||
The following table summarizes the fair value and Statement of Assets and Liabilities location, as of June 30, 2009, for the Moderately Aggressive Allocation Portfolio’s investments in financial derivative instruments by primary risk exposure as discussed under item (2) Significant Accounting Policies of the Notes to Financial Statements.
Derivatives by Risk Category | Statement of Assets and Liabilities Location | Fair Value | |||
Liability Derivatives | |||||
Equity Contracts | |||||
Future* | Net Assets - Net unrealized appreciation/(depreciation) on Futures contracts | 4,910,391 | |||
Total Equity Contracts | 4,910,391 | ||||
Total LiabilityDerivatives | $ | 4,910,391 | |||
| * | Includes cumulative appreciation/depreciation of futures contracts as reported in the Schedule of Investments. Only current day’s variation margin is reported within the Statement of Assets and Liabilities. |
The accompanying Notes to Financial Statements are an integral part of this schedule.
94
Table of Contents
Moderately Aggressive Allocation Portfolio
Schedule of Investments as of June 30, 2009
(unaudited)
The following table summarizes the net realized gains/(losses) and Statement of Operations location, for the period ended June 30, 2009, for Moderately Aggressive Allocation Portfolio’s investments in financial derivative instruments by primary risk exposure.
Derivatives by Risk Category | Statement of Operations Location | Realized Gains/(Losses) recognized in Income | |||
Equity Contracts | |||||
Future | Net realized gains/(losses) on Futures contracts | 22,918,696 | |||
Total Equity Contracts | 22,918,696 | ||||
Total | $ | 22,918,696 | |||
The following table summarizes the change in net unrealized appreciation/(depreciation) and Statement of Operations location, for the period ended June 30, 2009, for the Moderately Aggressive Allocation Portfolio’s investments in financial derivative instruments by primary risk exposure.
Derivatives by Risk Category | Statement of Operations Location | Change in Unrealized Appreciation/(Depreciation) recognized in Income | |||
Equity Contracts | |||||
Future | Change in net unrealized appreciation/(depreciation) on Futures contracts | (8,695,447 | ) | ||
Total Equity Contracts | (8,695,447 | ) | |||
Total | ($8,695,447 | ) | |||
Investment in Affiliates
Affiliated issuers, as defined under the Investment Company Act of 1940, include those in which the Portfolio’s holdings of an issuer represent 5% or more of the outstanding voting securities of an issuer, or any affiliated mutual fund.
A summary of transactions for the fiscal year to date, in Moderately Aggressive Allocation Portfolio, is as follows:
Portfolio | Value December 31, 2008 | Gross Purchases | Gross Sales | Shares Held at June 30, 2009 | Value June 30, 2009 | Income Earned January 1, 2009 - June 30, 2009 | |||||||||||
Real Estate Securities | $ | 39,120,717 | $ | 1,800,234 | $ | 596,535 | 4,308,723 | $ | 35,884,336 | $ | — | ||||||
Partner Small Cap Growth | 33,422,897 | 1,038,634 | 452,791 | 4,546,224 | 37,565,907 | 33,346 | |||||||||||
Partner Small Cap Value | 38,261,829 | 1,130,649 | 452,791 | 3,213,805 | 39,766,979 | 87,942 | |||||||||||
Small Cap Stock | 59,095,132 | 1,792,220 | 754,651 | 7,071,371 | 58,227,086 | 116,741 | |||||||||||
Mid Cap Growth II | 31,319,073 | 1,006,018 | 452,790 | 5,601,119 | 38,195,152 | 731 | |||||||||||
Partner Mid Cap Value | 46,000,879 | 1,444,123 | 603,721 | 5,659,938 | 48,875,254 | 103,740 | |||||||||||
Mid Cap Stock | 122,321,299 | 3,439,550 | 1,509,302 | 17,467,112 | 138,121,185 | 88,592 | |||||||||||
Partner Worldwide Allocation | 27,036,551 | 13,378,413 | 39,322 | 6,744,884 | 43,903,124 | 16,880 | |||||||||||
Partner International Stock | 153,972,385 | 272,480 | — | 18,862,599 | 157,457,435 | 272,480 | |||||||||||
Large Cap Growth II | 115,320,245 | 2,680,767 | 1,801,332 | 19,768,583 | 131,801,095 | — | |||||||||||
Large Cap Value | 159,244,087 | 4,114,819 | 2,998,942 | 19,709,057 | 157,769,030 | 93,669 | |||||||||||
Large Cap Stock | 123,957,202 | 2,696,033 | 1,801,332 | 20,372,690 | 129,572,346 | 15,267 | |||||||||||
Equity Income Plus | 13,230,889 | 335,096 | 150,930 | 1,942,584 | 13,075,725 | — | |||||||||||
High Yield | 90,546,222 | 6,519,556 | 754,651 | 27,497,320 | 111,592,375 | 4,844,578 | |||||||||||
Income | 177,917,275 | 9,463,082 | 1,811,162 | 22,613,964 | 194,755,982 | 5,441,932 | |||||||||||
Limited Maturity Bond | 70,686,329 | 3,533,552 | 905,581 | 8,326,890 | 76,624,044 | 1,522,978 | |||||||||||
Money Market | 28,319,832 | 176,212,084 | 160,086,925 | 44,444,991 | 44,444,991 | 125,872 | |||||||||||
Total Value and Income Earned | 1,329,772,843 | 1,457,632,046 | 12,764,748 | ||||||||||||||
The accompanying Notes to Financial Statements are an integral part of this schedule.
95
Table of Contents
Schedule of Investments as of June 30, 2009
(unaudited)
| Shares | Mutual Funds (90.9%) | Value | ||||
| Equity Mutual Funds (47.1%) | ||||||
| 5,327,454 | Thrivent Real Estate Securities Portfolio | $ | 44,368,639 | |||
| 3,839,930 | Thrivent Partner Small Cap Growth Portfolio | 31,729,729 | ||||
| 3,911,796 | Thrivent Partner Small Cap Value Portfolio | 48,403,776 | ||||
| 5,526,491 | Thrivent Small Cap Stock Portfolio | 45,506,232 | ||||
| 2,222,376 | Thrivent Mid Cap Growth Portfolio II | 15,154,829 | ||||
| 4,560,455 | Thrivent Partner Mid Cap Value Portfolio | 39,380,899 | ||||
| 13,478,287 | Thrivent Mid Cap Stock Portfolio | 106,579,557 | ||||
| 7,167,042 | Thrivent Partner Worldwide Allocation Portfolio | 46,650,994 | ||||
| 16,896,587 | Thrivent Partner International Stock Portfolio | 141,045,948 | ||||
| 19,208,712 | Thrivent Large Cap Growth Portfolio II | 128,068,322 | ||||
| 23,336,914 | Thrivent Large Cap Value Portfolio | 186,809,662 | ||||
| 18,332,262 | Thrivent Large Cap Stock Portfolio | 116,595,022 | ||||
| 2,435,130 | Thrivent Equity Income Plus Portfolio | 16,391,102 | ||||
Total Equity Mutual Funds | 966,684,711 | |||||
| Fixed Income Mutual Funds (43.8%) | ||||||
| 32,982,496 | Thrivent High Yield Portfolio | 133,852,865 | ||||
| 46,039,277 | Thrivent Income Portfolio | 396,499,458 | ||||
| 39,884,943 | Thrivent Limited Maturity Bond Portfolio | 367,021,250 | ||||
Total Fixed Income Mutual Funds | 897,373,573 | |||||
Total Mutual Funds (cost $2,424,957,046) | 1,864,058,284 | |||||
| Principal Amount | Long-Term Fixed Income (1.4%) | |||||
| Collateralized Mortgage Obligations (0.9%) | ||||||
Citigroup Mortgage Loan Trust, Inc. | ||||||
| $2,347,723 | 5.500%, 11/25/2035 | 1,658,140 | ||||
Citimortgage Alternative Loan Trust | ||||||
| 7,018,440 | 5.750%, 4/25/2037 | 4,483,323 | ||||
Countrywide Alternative Loan Trust | ||||||
| 1,777,643 | 6.000%, 1/25/2037 | 1,303,027 | ||||
Countrywide Home Loans | ||||||
| 6,819,262 | 5.750%, 4/25/2037 | 4,992,756 | ||||
Deutsche Alt-A Securities, Inc. | ||||||
| 1,813,750 | 5.500%, 10/25/2021 | 1,354,079 | ||||
| 3,005,991 | 6.000%, 10/25/2021 | 1,767,673 | ||||
J.P. Morgan Mortgage Trust | ||||||
| 1,609,101 | 6.048%, 10/25/2036 | 1,263,668 | ||||
Master Alternative Loans Trust | ||||||
| 1,641,029 | 6.500%, 7/25/2034 | 1,287,952 | ||||
Merrill Lynch Alternative Note Asset Trust | ||||||
| 1,849,237 | 6.000%, 3/25/2037 | 953,304 | ||||
Total Collateralized Mortgage Obligations | 19,063,922 | |||||
| Commercial Mortgage-Backed Securities (0.1%) | ||||||
Greenwich Capital Commercial Funding Corporation | ||||||
| 3,150,000 | 5.867%, 8/10/2017 | 1,650,209 | ||||
Total Commercial Mortgage-Backed Securities | 1,650,209 | |||||
| U.S. Government (0.4%) | ||||||
U.S. Treasury Notes | ||||||
| 9,000,000 | 0.875%, 12/31/2010a | 9,012,303 | ||||
Total U.S. Government | 9,012,303 | |||||
Total Long-Term Fixed Income (cost $33,546,065) | 29,726,434 | |||||
| Shares or Principal Amount | Short-Term Investments (7.7%)b | |||||
Federal Home Loan Bank Discount Notes | ||||||
| 5,000,000 | Zero Coupon, 8/5/2009 | 4,998,979 | ||||
| 4,095,000 | Zero Coupon, 9/11/2009 | 4,093,116 | ||||
Federal Home Loan Mortgage Corporation Discount Notes | ||||||
| 9,000,000 | Zero Coupon, 7/7/2009 | 8,999,775 | ||||
| 5,000,000 | Zero Coupon, 7/14/2009 | 4,999,801 | ||||
| 15,000,000 | Zero Coupon, 7/21/2009 | 14,998,917 | ||||
| 5,000,000 | 0.120%, 8/3/2009 | 4,999,450 | ||||
| 5,000,000 | Zero Coupon, 9/14/2009 | 4,997,604 | ||||
| 16,000,000 | Zero Coupon, 9/21/2009a | 15,992,822 | ||||
| 5,000,000 | Zero Coupon, 9/23/2009 | 4,997,083 | ||||
Federal National Mortgage Association Discount Notes | ||||||
| 15,000,000 | 0.120%, 7/20/2009 | 14,999,050 | ||||
Ranger Funding Company, LLC | ||||||
| 6,360,000 | 0.100%, 7/1/2009 | 6,360,000 | ||||
| 66,934,825 | Thrivent Money Market Portfolio | 66,934,825 | ||||
Total Short-Term Investments (at amortized cost) | 157,371,422 | |||||
Total Investments (cost $2,615,874,533) 100.0% | $ | 2,051,156,140 | ||||
Other Assets and Liabilities, Net (<0.1%) | (717,067 | ) | ||||
Total Net Assets 100.0% | $ | 2,050,439,073 | ||||
| a | At June 30, 2009, $25,005,125 of investments were held on deposit with the counterparty and pledged as the initial margin deposit for open futures contracts. |
96
Table of Contents
Moderate Allocation Portfolio
Schedule of Investments as of June 30, 2009
(unaudited)
| b | The interest rate shown reflects the yield, coupon rate or, for securities purchased at a discount, the discount rate at the date of purchase. |
Unrealized Appreciation (Depreciation)
Gross unrealized appreciation and depreciation of investments, based on cost for federal income tax purposes, were as follows:
Gross unrealized appreciation | $ | 17,029,967 | ||
Gross unrealized depreciation | (581,748,360 | ) | ||
Net unrealized appreciation (depreciation) | $ | (564,718,393 | ) | |
Cost for federal income tax purposes | $ | 2,615,874,533 | ||
Fair Valuation Measurements
The following table is a summary of the inputs used, as of June 30, 2009, in valuing Moderate Allocation Portfolio’s assets carried at fair value as discussed in the Notes to Financial Statements.
Investments in Securities | Total | Level 1 | Level 2 | Level 3 | ||||||||||
Mutual Funds | ||||||||||||||
Equity Mutual Funds | 966,684,711 | 966,684,711 | — | — | ||||||||||
Fixed Income Mutual Funds | 897,373,573 | 897,373,573 | — | — | ||||||||||
Long-Term Fixed Income | ||||||||||||||
Collateralized Mortgage Obligations | 19,063,922 | — | 19,063,922 | — | ||||||||||
Commercial Mortgage-Backed Securities | 1,650,209 | — | 1,650,209 | — | ||||||||||
U.S. Government | 9,012,303 | — | 9,012,303 | — | ||||||||||
Short-Term Investments | 157,371,422 | 66,934,825 | 90,436,597 | — | ||||||||||
Total | $ | 2,051,156,140 | $ | 1,930,993,109 | $ | 120,163,031 | $ | — | ||||||
Other Financial Instruments* | ($6,914,439 | ) | ($6,914,439 | ) | $ | — | $ | — | ||||||
| * | Other Financial Instruments include Futures, Forwards, Written Options and Swap agreements. |
Futures Contracts | Number of Contracts Long/(Short) | Expiration | Notional Principal Amount | Value | Unrealized Gain/(Loss) | ||||||||
E-Mini MSCI Eafe Index Futures | 1,090 | September 2009 | $ | 73,734,690 | $ | 71,008,049 | ($2,726,641 | ) | |||||
Russell 2000 Index Mini-Futures | 871 | September 2009 | 45,533,920 | 44,177,120 | (1,356,800 | ) | |||||||
S&P 400 Index Mini-Futures | 1,199 | September 2009 | 71,412,368 | 69,146,330 | (2,266,038 | ) | |||||||
S&P 500 Index Futures | 107 | September 2009 | 25,054,585 | 24,489,625 | (564,960 | ) | |||||||
Total Futures Contracts | ($6,914,439 | ) | |||||||||||
The following table summarizes the fair value and Statement of Assets and Liabilities location, as of June 30, 2009, for the Moderate Allocation Portfolio’s investments in financial derivative instruments by primary risk exposure as discussed under item (2) Significant Accounting Policies of the Notes to Financial Statements.
Derivatives by Risk Category | Statement of Assets and Liabilities Location | Fair Value | |||
Liability Derivatives | |||||
Equity Contracts | |||||
Future* | Net Assets - Net unrealized appreciation/(depreciation) on Futures contracts | 6,914,439 | |||
Total Equity Contracts | 6,914,439 | ||||
Total Liability Derivatives | $ | 6,914,439 | |||
| * | Includes cumulative appreciation/depreciation of futures contracts as reported in the Schedule of Investments. Only current day’s variation margin is reported within the Statement of Assets and Liabilities. |
The accompanying Notes to Financial Statements are an integral part of this schedule.
97
Table of Contents
Moderate Allocation Portfolio
Schedule of Investments as of June 30, 2009
(unaudited)
The following table summarizes the net realized gains/(losses) and Statement of Operations location, for the period ended June 30, 2009, for Moderate Allocation Portfolio’s investments in financial derivative instruments by primary risk exposure.
Derivatives by Risk Category | Statement of Operations Location | Realized Gains/(Losses) recognized in Income | |||
Equity Contracts | |||||
Future | Net realized gains/(losses) on Futures contracts | 35,748,283 | |||
Total Equity Contracts | 35,748,283 | ||||
Total | $ | 35,748,283 | |||
The following table summarizes the change in net unrealized appreciation/(depreciation) and Statement of Operations location, for the period ended June 30, 2009, for the Moderate Allocation Portfolio’s investments in financial derivative instruments by primary risk exposure.
Derivatives by Risk Category | Statement of Operations Location | Change in Unrealized Appreciation/(Depreciation) recognized in Income | |||
Equity Contracts | |||||
Future | Change in net unrealized appreciation/(depreciation) on Futures contracts | (13,164,314 | ) | ||
Total Equity Contracts | (13,164,314 | ) | |||
Total | ($13,164,314 | ) | |||
Investment in Affiliates
Affiliated issuers, as defined under the Investment Company Act of 1940, include those in which the Portfolio’s holdings of an issuer represent 5% or more of the outstanding voting securities of an issuer, or any affiliated mutual fund.
A summary of transactions for the fiscal year to date, in Moderate Allocation Portfolio, is as follows:
Portfolio | Value December 31, 2008 | Gross Purchases | Gross Sales | Shares Held at June 30, 2009 | Value June 30, 2009 | Income Earned January 1, 2009 - June 30, 2009 | |||||||||||
Technology | $ | 4,269,555 | $ | — | $ | 4,955,150 | — | $ | — | $ | — | ||||||
Real Estate Securities | 49,393,237 | 2,985,123 | 1,886,862 | 5,327,454 | 44,368,639 | — | |||||||||||
Partner Small Cap Growth | 28,096,145 | 1,118,732 | 448,136 | 3,839,930 | 31,729,729 | 28,112 | |||||||||||
Partner Small Cap Value | 46,353,405 | 1,788,216 | 672,204 | 3,911,796 | 48,403,776 | 106,829 | |||||||||||
Small Cap Stock | 47,277,589 | 1,726,993 | 1,672,204 | 5,526,491 | 45,506,232 | 91,063 | |||||||||||
Mid Cap Growth II | 12,361,202 | 545,599 | 224,068 | 2,222,376 | 15,154,829 | 289 | |||||||||||
Partner Mid Cap Value | 36,513,686 | 2,264,425 | 896,272 | 4,560,456 | 39,380,899 | 83,186 | |||||||||||
Mid Cap Stock | 94,011,700 | 3,340,107 | 1,344,409 | 13,478,287 | 106,579,557 | 68,247 | |||||||||||
Partner Worldwide Allocation | 30,587,271 | 12,561,541 | — | 7,167,042 | 46,650,994 | 17,822 | |||||||||||
Partner International Stock | 143,177,677 | 244,080 | 4,000,000 | 16,896,587 | 141,045,948 | 244,080 | |||||||||||
Large Cap Growth II | 112,299,552 | 3,271,860 | 2,464,749 | 19,208,712 | 128,068,322 | — | |||||||||||
Large Cap Value | 187,460,023 | 6,109,129 | 3,585,090 | 23,336,914 | 186,809,662 | 110,720 | |||||||||||
Large Cap Stock | 111,217,996 | 2,740,273 | 1,568,477 | 18,332,262 | 116,595,022 | 13,724 | |||||||||||
Equity Income Plus | 16,507,327 | 545,310 | 224,068 | 2,435,130 | 16,391,102 | — | |||||||||||
High Yield | 108,347,447 | 8,249,501 | 1,008,306 | 32,982,496 | 133,852,865 | 5,796,206 | |||||||||||
Income | 362,069,509 | 20,868,869 | 5,033,226 | 46,039,277 | 396,499,458 | 11,053,291 | |||||||||||
Limited Maturity Bond | 337,673,887 | 17,911,793 | 4,369,328 | 39,884,943 | 367,021,250 | 7,278,249 | |||||||||||
Money Market | 28,065,946 | 256,676,211 | 217,807,332 | 66,934,825 | 66,934,825 | 159,532 | |||||||||||
Total Value and Income Earned | 1,755,683,154 | 1,930,993,109 | 25,051,350 | ||||||||||||||
The accompanying Notes to Financial Statements are an integral part of this schedule.
98
Table of Contents
Moderately Conservative Allocation Portfolio
Schedule of Investments as of June 30, 2009
(unaudited)
| Shares | Mutual Funds (87.6%) | Value | ||||
| Equity Mutual Funds (30.3%) | ||||||
| 1,298,364 | Thrivent Real Estate Securities Portfolio | $ | 10,813,165 | |||
| 1,036,882 | Thrivent Partner Small Cap Value Portfolio | 12,830,172 | ||||
| 2,209,883 | Thrivent Small Cap Stock Portfolio | 18,196,617 | ||||
| 1,798,363 | Thrivent Partner Mid Cap Value Portfolio | 15,529,401 | ||||
| 4,226,953 | Thrivent Mid Cap Stock Portfolio | 33,424,634 | ||||
| 2,944,299 | Thrivent Partner Worldwide Allocation Portfolio | 19,164,736 | ||||
| 3,652,709 | Thrivent Partner International Stock Portfolio | 30,491,354 | ||||
| 4,939,675 | Thrivent Large Cap Growth Portfolio II | 32,933,802 | ||||
| 7,372,262 | Thrivent Large Cap Value Portfolio | 59,014,218 | ||||
| 2,462,761 | Thrivent Large Cap Stock Portfolio | 15,663,409 | ||||
| 923,184 | Thrivent Equity Income Plus Portfolio | 6,214,045 | ||||
Total Equity Mutual Funds | 254,275,553 | |||||
| Fixed Income Mutual Funds (57.3%) | ||||||
| 10,516,705 | Thrivent High Yield Portfolio | 42,679,942 | ||||
| 12,334,914 | Thrivent Income Portfolio | 106,230,745 | ||||
| 36,128,601 | Thrivent Limited Maturity Bond Portfolio | 332,455,387 | ||||
Total Fixed Income Mutual Funds | 481,366,074 | |||||
Total Mutual Funds (cost $893,187,797) | 735,641,627 | |||||
| Principal Amount | Long-Term Fixed Income (1.8%) | |||||
| Collateralized Mortgage Obligations (1.2%) | ||||||
Citigroup Mortgage Loan Trust, Inc. | ||||||
| $1,274,478 | 5.500%, 11/25/2035 | 900,133 | ||||
Citimortgage Alternative Loan Trust | ||||||
| 3,860,142 | 5.750%, 4/25/2037 | 2,465,827 | ||||
Countrywide Alternative Loan Trust | ||||||
| 965,006 | 6.000%, 1/25/2037 | 707,358 | ||||
Countrywide Home Loans | ||||||
| 3,788,479 | 5.750%, 4/25/2037 | 2,773,754 | ||||
Deutsche Alt-A Securities, Inc. | ||||||
| 984,607 | 5.500%, 10/25/2021 | 735,071 | ||||
| 1,650,348 | 6.000%, 10/25/2021 | 970,486 | ||||
J.P. Morgan Mortgage Trust | ||||||
| 873,512 | 6.048%, 10/25/2036 | 685,991 | ||||
Master Alternative Loans Trust | ||||||
| 934,475 | 6.500%, 7/25/2034 | 733,417 | ||||
Merrill Lynch Alternative Note Asset Trust | ||||||
| 1,003,871 | 6.000%, 3/25/2037 | 517,508 | ||||
Total Collateralized Mortgage Obligations | 10,489,545 | |||||
| Commercial Mortgage-Backed Securities (0.1%) | ||||||
Greenwich Capital Commercial Funding Corporation | ||||||
| 1,710,000 | 5.867%, 8/10/2017 | 895,828 | ||||
Total Commercial Mortgage-Backed Securities | 895,828 | |||||
| U.S. Government (0.5%) | ||||||
U.S. Treasury Notes | ||||||
| 4,000,000 | 0.875%, 12/31/2010a | 4,005,468 | ||||
Total U.S. Government | 4,005,468 | |||||
Total Long-Term Fixed Income (cost $17,483,450) | 15,390,841 | |||||
| Shares or Principal Amount | Short-Term Investments (10.6%)b | |||||
Federal Home Loan Bank Discount Notes | ||||||
| 4,000,000 | Zero Coupon, 9/11/2009 | 3,998,160 | ||||
Federal Home Loan Mortgage Corporation Discount Notes | ||||||
| 5,000,000 | 0.120%, 8/3/2009 | 4,999,450 | ||||
| 5,000,000 | 0.140%, 8/25/2009 | 4,998,931 | ||||
| 4,000,000 | Zero Coupon, 9/21/2009a | 3,997,936 | ||||
Federal National Mortgage Association Discount Notes | ||||||
| 5,000,000 | Zero Coupon, 7/14/2009 | 4,999,711 | ||||
Ranger Funding Company, LLC | ||||||
| 6,015,000 | 0.100%, 7/1/2009 | 6,015,000 | ||||
| 60,201,944 | Thrivent Money Market Portfolio | 60,201,944 | ||||
Total Short-Term Investments (at amortized cost) | 89,211,132 | |||||
Total Investments (cost $999,882,379) 100.0% | $ | 840,243,600 | ||||
Other Assets and Liabilities, Net (<0.1%) | (265,766 | ) | ||||
Total Net Assets 100.0% | $ | 839,977,834 | ||||
| a | At June 30, 2009, $8,003,404 of investments were held on deposit with the counterparty and pledged as the initial margin deposit for open futures contracts. |
| b | The interest rate shown reflects the yield, coupon rate or, for securities purchased at a discount, the discount rate at the date of purchase. |
The accompanying Notes to Financial Statements are an integral part of this schedule.
99
Table of Contents
Moderately Conservative Allocation Portfolio
Schedule of Investments as of June 30, 2009
(unaudited)
Unrealized Appreciation (Depreciation)
Gross unrealized appreciation and depreciation of investments, based on cost for federal income tax purposes, were as follows:
Gross unrealized appreciation | $ | 3,840,567 | ||
Gross unrealized depreciation | (163,479,346 | ) | ||
Net unrealized appreciation (depreciation) | $ | (159,638,779 | ) | |
Cost for federal income tax purposes | $ | 999,882,379 | ||
Fair Valuation Measurements
The following table is a summary of the inputs used, as of June 30, 2009, in valuing Moderately Conservative Allocation Portfolio’s assets carried at fair value as discussed in the Notes to Financial Statements.
Investments in Securities | Total | Level 1 | Level 2 | Level 3 | ||||||||||
Mutual Funds | ||||||||||||||
Equity Mutual Funds | 254,275,553 | 254,275,553 | — | — | ||||||||||
Fixed Income Mutual Funds | 481,366,074 | 481,366,074 | — | — | ||||||||||
Long-Term Fixed Income | ||||||||||||||
Collateralized Mortgage Obligations | 10,489,545 | — | 10,489,545 | — | ||||||||||
Commercial Mortgage-Backed Securities | 895,828 | — | 895,828 | — | ||||||||||
U.S. Government | 4,005,468 | — | 4,005,468 | — | ||||||||||
Short-Term Investments | 89,211,132 | 60,201,944 | 29,009,188 | — | ||||||||||
Total | $ | 840,243,600 | $ | 795,843,571 | $ | 44,400,029 | $ | — | ||||||
Other Financial Instruments* | ($2,119,101 | ) | ($2,119,101 | ) | $ | — | $ | — | ||||||
| * | Other Financial Instruments include Futures, Forwards, Written Options and Swap agreements. |
Futures Contracts | Number of Contracts Long/(Short) | Expiration Date | Notional Principal Amount | Value | Unrealized Gain/(Loss) | ||||||||
E-Mini MSCI Eafe Index Futures | 340 | September 2009 | $ | 22,999,812 | $ | 22,149,300 | ($850,512 | ) | |||||
Russell 2000 Index Mini-Futures | 273 | September 2009 | 14,271,826 | 13,846,561 | (425,265 | ) | |||||||
S&P 400 Index Mini-Futures | 97 | September 2009 | 5,777,314 | 5,593,990 | (183,324 | ) | |||||||
S&P 500 Index Futures | 125 | September 2009 | 29,269,375 | 28,609,375 | (660,000 | ) | |||||||
Total Futures Contracts | ($2,119,101 | ) | |||||||||||
The following table summarizes the fair value and Statement of Assets and Liabilities location, as of June 30, 2009, for the Moderately Conservative Allocation Portfolio’s investments in financial derivative instruments by primary risk exposure as discussed under item (2) Significant Accounting Policies of the Notes to Financial Statements.
Derivatives by Risk Category | Statement of Assets and Liabilities Location | Fair Value | |||
| Liability Derivatives | |||||
Equity Contracts | |||||
Future* | Net Assets - Net unrealized appreciation/(depreciation) on Futures contracts | 2,119,101 | |||
Total Equity Contracts | 2,119,101 | ||||
Total Liability Derivatives | $ | 2,119,101 | |||
| * | Includes cumulative appreciation/depreciation of futures contracts as reported in the Schedule of Investments. Only current day’s variation margin is reported within the Statement of Assets and Liabilities. |
The accompanying Notes to Financial Statements are an integral part of this schedule.
100
Table of Contents
Moderately Conservative Allocation Portfolio
Schedule of Investments as of June 30, 2009
(unaudited)
The following table summarizes the net realized gains/(losses) and Statement of Operations location, for the period ended June 30, 2009, for Moderately Conservative Allocation Portfolio’s investments in financial derivative instruments by primary risk exposure.
Derivatives by Risk Category | Statement of Operations Location | Realized Gains/(Losses) recognized in Income | |||
Equity Contracts | |||||
| Future | Net realized gains/(losses) on Futures contracts | 12,769,992 | |||
Total Equity Contracts | 12,769,992 | ||||
Total | $ | 12,769,992 | |||
The following table summarizes the change in net unrealized appreciation/(depreciation) and Statement of Operations location, for the period ended June 30, 2009, for the Moderately Conservative Allocation Portfolio’s investments in financial derivative instruments by primary risk exposure.
Derivatives by Risk Category | Statement of Operations Location | Change in Unrealized Appreciation/(Depreciation) recognized in Income | |||
Equity Contracts | |||||
| Future | Change in net unrealized appreciation/(depreciation) on Futures contracts | (3,650,583 | ) | ||
Total Equity Contracts | (3,650,583 | ) | |||
Total | ($3,650,583 | ) | |||
Investment in Affiliates
Affiliated issuers, as defined under the Investment Company Act of 1940, include those in which the Portfolio’s holdings of an issuer represent 5% or more of the outstanding voting securities of an issuer, or any affiliated mutual fund.
A summary of transactions for the fiscal year to date, in Moderately Conservative Allocation Portfolio, is as follows:
Portfolio | Value December 31, 2008 | Gross Purchases | Gross Sales | Shares Held at June 30, 2009 | Value June 30, 2009 | Income Earned January 1, 2009 - June 30, 2009 | |||||||||||
Real Estate Securities | $ | 10,895,334 | $ | 1,336,673 | $ | 195,820 | 1,298,364 | $ | 10,813,165 | $ | — | ||||||
Partner Small Cap Value | 12,043,151 | 600,853 | 100,065 | 1,036,882 | 12,830,172 | 28,296 | |||||||||||
Small Cap Stock | 18,025,517 | 877,161 | 150,098 | 2,209,883 | 18,196,617 | 36,386 | |||||||||||
Partner Mid Cap Value | 14,371,785 | 593,428 | 100,065 | 1,798,364 | 15,529,401 | 32,912 | |||||||||||
Mid Cap Stock | 29,122,644 | 1,142,439 | 200,130 | 4,226,953 | 33,424,634 | 21,406 | |||||||||||
Partner Worldwide Allocation | 15,645,703 | 2,249,426 | — | 2,944,299 | 19,164,736 | 7,359 | |||||||||||
Partner International Stock | 29,816,480 | 52,765 | — | 3,652,709 | 30,491,354 | 52,765 | |||||||||||
Large Cap Growth II | 28,289,254 | 1,121,034 | 350,228 | 4,939,675 | 32,933,802 | — | |||||||||||
Large Cap Value | 57,828,193 | 2,557,273 | 600,390 | 7,372,262 | 59,014,218 | 34,947 | |||||||||||
Large Cap Stock | 14,721,702 | 562,358 | 200,130 | 2,462,761 | 15,663,409 | 1,841 | |||||||||||
Equity Income Plus | 6,132,818 | 280,258 | 50,032 | 923,184 | 6,214,045 | — | |||||||||||
High Yield | 33,776,091 | 3,492,388 | 300,195 | 10,516,705 | 42,679,942 | 1,811,024 | |||||||||||
Income | 94,900,381 | 7,116,307 | 750,488 | 12,334,914 | 106,230,745 | 2,912,431 | |||||||||||
Limited Maturity Bond | 302,430,975 | 17,755,967 | 2,001,300 | 36,128,601 | 332,455,387 | 6,545,631 | |||||||||||
Money Market | 23,837,188 | 113,090,864 | 76,726,108 | 60,201,944 | 60,201,944 | 148,600 | |||||||||||
Total Value and Income Earned | 691,837,216 | 795,843,571 | 11,633,598 | ||||||||||||||
The accompanying Notes to Financial Statements are an integral part of this schedule.
101
Table of Contents
Schedule of Investments as of June 30, 2009
(unaudited)
| Shares | Common Stock (91.4%) | Value | ||||
| Communications Equipment (15.8%) | ||||||
| 43,000 | ADC Telecommunications, Inc.a | $ | 342,280 | |||
| 35,800 | CIENA Corporationa,b | 370,530 | ||||
| 47,600 | Cisco Systems, Inc.a | 887,264 | ||||
| 69,500 | Motorola, Inc. | 460,785 | ||||
| 25,793 | QUALCOMM, Inc. | 1,165,843 | ||||
| 9,100 | Research in Motion, Ltd.a | 646,555 | ||||
Total Communications Equipment | 3,873,257 | |||||
| Computers & Peripherals (19.1%) | ||||||
| 9,256 | Apple, Inc.a | 1,318,332 | ||||
| 111,929 | EMC Corporationa | 1,466,270 | ||||
| 17,900 | Hewlett-Packard Company | 691,835 | ||||
| 7,057 | International Business Machines Corporation | 736,892 | ||||
| 17,500 | Western Digital Corporationa | 463,750 | ||||
Total Computers & Peripherals | 4,677,079 | |||||
| Electronic Equipment, Instruments & Components (1.4%) | ||||||
| 27,339 | Comverge, Inc.a,b | 330,802 | ||||
Total Electronic Equipment, Instruments & Components | 330,802 | |||||
| Financials (0.8%) | ||||||
| 13,700 | First Trust Global Wind Energy ETF | 205,089 | ||||
Total Financials | 205,089 | |||||
| Health Care (2.4%) | ||||||
| 1,900 | Alcon, Inc. | 220,628 | ||||
| 23,489 | BioMarin Pharmaceutical, Inc.a,b | 366,663 | ||||
Total Health Care | 587,291 | |||||
| Industrials (5.0%) | ||||||
| 14,962 | American Superconductor Corporationa,b | 392,753 | ||||
| 22,700 | A-Power Energy Generation Systems, Ltd.a,b | 181,146 | ||||
| 2,135 | First Solar, Inc.a,b | 346,126 | ||||
| 28,129 | Polypore International, Inc.a | 312,794 | ||||
Total Industrials | 1,232,819 | |||||
| Internet Software & Services (9.0%) | ||||||
| 2,625 | Google, Inc.a | 1,106,674 | ||||
| 69,900 | Yahoo!, Inc.a | 1,094,634 | ||||
Total Internet Software & Services | 2,201,308 | |||||
| Semiconductors & Semiconductor Equipment (20.3%) | ||||||
| 38,600 | Applied Materials, Inc. | 423,442 | ||||
| 56,885 | FormFactor, Inc.a | 980,697 | ||||
| 61,200 | Intel Corporation | 1,012,860 | ||||
| 19,300 | MEMC Electronic Materials, Inc.a | 343,733 | ||||
| 17,300 | Microchip Technology, Inc.b | 390,115 | ||||
| 60,200 | Micron Technology, Inc.a | 304,612 | ||||
| 47,100 | ON Semiconductor Corporationa | 323,106 | ||||
| 58,200 | Taiwan Semiconductor Manufacturing Company, Ltd. ADR | 547,662 | ||||
| 92,039 | Teradyne, Inc.a | 631,388 | ||||
Total Semiconductors & Semiconductor Equipment | 4,957,615 | |||||
| Software (14.4%) | ||||||
| 87,400 | Compuware Corporationa | 599,564 | ||||
| 36,000 | Microsoft Corporation | 855,720 | ||||
| 35,500 | Nuance Communications, Inc.a | 429,195 | ||||
| 50,000 | Synopsys, Inc.a | 975,500 | ||||
| 24,515 | VMware, Inc.a,b | 668,524 | ||||
Total Software | 3,528,503 | |||||
| Telecommunications Services (3.2%) | ||||||
| 145,200 | Alcatel-Lucent ADRa | 360,096 | ||||
| 88,500 | Sprint Nextel Corporationa | 425,685 | ||||
Total Telecommunications Services | 785,781 | |||||
Total Common Stock (cost $18,355,444) | 22,379,544 | |||||
Collateral Held for Securities Loaned (10.3%) | ||||||
| 2,510,954 | Thrivent Financial Securities Lending Trust | 2,510,954 | ||||
Total Collateral Held for Securities Loaned (cost $2,510,954) | 2,510,954 | |||||
Short-Term Investments (8.7%) | ||||||
| 2,141,032 | Thrivent Money Market Portfolio | 2,141,032 | ||||
Total Short-Term Investments (at amortized cost) | 2,141,032 | |||||
Total Investments (cost $23,007,430) 110.4% | $ | 27,031,530 | ||||
Other Assets and Liabilities, Net (10.4%) | (2,540,200 | ) | ||||
Total Net Assets 100.0% | $ | 24,491,330 | ||||
| a | Non-income producing security. |
| b | All or a portion of the security is on loan as discussed in item 2(M) of the Notes to Financial Statements. |
Definitions:
| ADR | - | American Depositary Receipt, which are certificates for an underlying foreign security’s shares held by an issuing U.S. depository bank. | ||
| ETF | - | Exchange Traded Fund. |
The accompanying Notes to Financial Statements are an integral part of this schedule.
102
Table of Contents
Technology Portfolio
Schedule of Investments as of June 30, 2009
(unaudited)
Unrealized Appreciation (Depreciation)
Gross unrealized appreciation and depreciation of investments, based on cost for federal income tax purposes, were as follows:
Gross unrealized appreciation | $ | 4,251,211 | ||
Gross unrealized depreciation | (227,111 | ) | ||
Net unrealized appreciation (depreciation) | $ | 4,024,100 | ||
Cost for federal income tax purposes | $ | 23,007,430 | ||
Fair Valuation Measurements
The following table is a summary of the inputs used, as of June 30, 2009, in valuing Technology Portfolio’s assets carried at fair value as discussed in the Notes to Financial Statements.
Investments in Securities | Total | Level 1 | Level 2 | Level 3 | ||||||||
Common Stock | ||||||||||||
Communications Equipment | 3,873,257 | 3,873,257 | — | — | ||||||||
Computers & Peripherals | 4,677,079 | 4,677,079 | — | — | ||||||||
Electronic Equipment, Instruments & Components | 330,802 | 330,802 | — | — | ||||||||
Financials | 205,089 | 205,089 | — | — | ||||||||
Health Care | 587,291 | 587,291 | — | — | ||||||||
Industrials | 1,232,819 | 1,232,819 | — | — | ||||||||
Internet Software & Services | 2,201,308 | 2,201,308 | — | — | ||||||||
Semiconductors & Semiconductor Equipment | 4,957,615 | 4,957,615 | — | — | ||||||||
Software | 3,528,503 | 3,528,503 | — | — | ||||||||
Telecommunications Services | 785,781 | 785,781 | — | — | ||||||||
Collateral Held for Securities Loaned | 2,510,954 | 2,510,954 | — | — | ||||||||
Short-Term Investments | 2,141,032 | 2,141,032 | — | — | ||||||||
Total | $ | 27,031,530 | $ | 27,031,530 | $ | — | $ | — | ||||
The following table summarizes the net realized gains/(losses) and Statement of Operations location, for the period ended June 30, 2009, for Technology Portfolio’s investments in financial derivative instruments by primary risk exposure.
Derivatives by Risk Category | Statement of Operations Location | Realized Gains/(Losses) recognized in Income | |||
Equity Contracts | |||||
| Future | Net realized gains/(losses) on Futures contracts | (157,196 | ) | ||
Total Equity Contracts | (157,196 | ) | |||
Total | ($157,196 | ) | |||
Investment in Affiliates
Affiliated issuers, as defined under the Investment Company Act of 1940, include those in which the Portfolio’s holdings of an issuer represent 5% or more of the outstanding voting securities of an issuer, or any affiliated mutual fund.
A summary of transactions for the fiscal year to date, in Technology Portfolio, is as follows:
Portfolio | Value December 31, 2008 | Gross Purchases | Gross Sales | Shares Held at June 30, 2009 | Value June 30, 2009 | Income Earned January 1, 2009 - June 30, 2009 | |||||||||||
Money Market | $ | 1,319,500 | $ | 10,401,153 | $ | 9,579,621 | 2,141,032 | $ | 2,141,032 | $ | 5,463 | ||||||
Thrivent Financial Securities Lending Trust | 2,295,165 | 12,091,598 | 11,875,809 | 2,510,954 | 2,510,954 | 12,157 | |||||||||||
Total Value and Income Earned | 3,614,665 | 4,651,986 | 17,620 | ||||||||||||||
The accompanying Notes to Financial Statements are an integral part of this schedule.
103
Table of Contents
Schedule of Investments as of June 30, 2009
(unaudited)
| Shares | Common Stock (96.0%) | Value | |||
| Biotechnology (24.9%) | |||||
| 5,200 | Alexion Pharmaceuticals, Inc.a | $ | 213,824 | ||
| 7,500 | Amgen, Inc.a | 397,050 | |||
| 1,290 | Basilea Pharmaceuticaa | 110,621 | |||
| 14,067 | BioMarin Pharmaceutical, Inc.a | 219,586 | |||
| 9,400 | Celgene Corporationa | 449,696 | |||
| 8,900 | Gilead Sciences, Inc.a | 416,876 | |||
| 4,700 | InterMune, Inc.a | 71,440 | |||
| 5,091 | Momenta Pharmaceuticals, Inc.a | 61,245 | |||
| 7,074 | Myriad Genetics, Inc.a | 252,188 | |||
| 1,943 | Myriad Pharmaceuticals, Inc.a | 9,035 | |||
| 7,900 | Onyx Pharmaceuticals, Inc.a | 223,254 | |||
| 2,417 | United Therapeutics Corporationa | 201,408 | |||
Total Biotechnology | 2,626,223 | ||||
| Health Care Equipment (10.0%) | |||||
| 10,200 | Given Imaging, Ltd. | 100,470 | |||
| 900 | Intuitive Surgical, Inc.a | 147,294 | |||
| 6,800 | St. Jude Medical, Inc.a | 279,480 | |||
| 4,900 | Stryker Corporation | 194,726 | |||
| 8,357 | Thoratec Corporationa | 223,801 | |||
| 3,167 | Varian Medical Systems, Inc.a | 111,289 | |||
Total Health Care Equipment | 1,057,060 | ||||
| Health Care Supplies (0.9%) | |||||
| 8,700 | Align Technology, Inc.a | 92,220 | |||
Total Health Care Supplies | 92,220 | ||||
| Life Sciences Tools & Services (3.0%) | |||||
| 5,000 | Life Technologies Corporationa | 208,600 | |||
| 5,800 | Luminex Corporationa | 107,532 | |||
Total Life Sciences Tools & Services | 316,132 | ||||
| Materials (0.9%) | |||||
| 1,000 | Lonza Group AG | 99,473 | |||
Total Materials | 99,473 | ||||
| Pharmaceuticals (56.3%) | |||||
| 13,100 | Abbott Laboratories | 616,224 | |||
| 3,400 | Allergan, Inc. | 161,772 | |||
| 14,900 | Bristol-Myers Squibb Company | 302,619 | |||
| 11,492 | Dr. Reddy’s Laboratories, Ltd. ADR | 194,789 | |||
| 9,700 | GlaxoSmithKline plc ADR | 342,798 | |||
| 28,100 | Hikma Pharmaceuticals plc | 217,736 | |||
| 8,000 | Johnson & Johnson | 454,400 | |||
| 28,300 | Merck & Company, Inc. | 791,268 | |||
| 13,400 | Mylan Laboratories, Inc.a | 174,870 | |||
| 3,700 | Nichi-iko Pharmaceutical Company, Ltd. | 115,542 | |||
| 6,500 | Novartis AG | 264,585 | |||
| 3,740 | Novo Nordisk A/S ADR | 203,680 | |||
| 49,100 | Pfizer, Inc. | 736,500 | |||
| 6,220 | Pharmstandard GDRa | 94,200 | |||
| 800 | Richter Gedeon Nyrt | 143,887 | |||
| 6,010 | Roche Holding AG | 818,838 | |||
| 3,700 | Stada Arzneimittel AG | 92,496 | |||
| 4,100 | Teva Pharmaceutical Industries, Ltd. ADR | 202,294 | |||
Total Pharmaceuticals | 5,928,498 | ||||
Total Common Stock (cost $9,913,843) | 10,119,606 | ||||
Short-Term Investments (1.5%) | |||||
| 155,373 | Thrivent Money Market Portfolio | 155,373 | |||
Total Short-Term Investments (at amortized cost) | 155,373 | ||||
Total Investments (cost $10,069,216) 97.5% | $ | 10,274,979 | |||
Other Assets and Liabilities, Net 2.5% | 261,599 | ||||
Total Net Assets 100.0% | $ | 10,536,578 | |||
| a | Non-income producing security. |
Definitions:
| ADR | - | American Depositary Receipt, which are certificates for an underlying foreign security’s shares held by an issuing U.S. depository bank. | ||
| GDR | - | Global Depository Receipts, which are certificates for shares of an underlying foreign security’s shares held by an issuing depository bank from more than one country. |
Unrealized Appreciation (Depreciation)
Gross unrealized appreciation and depreciation of investments, based on cost for federal income tax purposes, were as follows:
Gross unrealized appreciation | $ | 793,188 | ||
Gross unrealized depreciation | (587,425 | ) | ||
Net unrealized appreciation (depreciation) | $ | 205,763 | ||
Cost for federal income tax purposes | $ | 10,069,216 | ||
The accompanying Notes to Financial Statements are an integral part of this schedule.
104
Table of Contents
Partner Healthcare Portfolio
Schedule of Investments as of June 30, 2009
(unaudited)
Fair Valuation Measurements
The following table is a summary of the inputs used, as of June 30, 2009, in valuing Partner Healthcare Portfolio’s assets carried at fair value as discussed in the Notes to Financial Statements.
Investments in Securities | Total | Level 1 | Level 2 | Level 3 | ||||||||
Common Stock | ||||||||||||
Biotechnology | 2,626,223 | 2,515,602 | 110,621 | — | ||||||||
Health Care Equipment | 1,057,060 | 1,057,060 | — | — | ||||||||
Health Care Supplies | 92,220 | 92,220 | — | — | ||||||||
Life Sciences Tools & Services | 316,132 | 316,132 | — | — | ||||||||
Materials | 99,473 | — | 99,473 | — | ||||||||
Pharmaceuticals | 5,928,498 | 4,181,214 | 1,747,284 | — | ||||||||
Short-Term Investments | 155,373 | 155,373 | — | — | ||||||||
Total | $ | 10,274,979 | $ | 8,317,601 | $ | 1,957,378 | $ | — | ||||
Investment in Affiliates
Affiliated issuers, as defined under the Investment Company Act of 1940, include those in which the Portfolio’s holdings of an issuer represent 5% or more of the outstanding voting securities of an issuer, or any affiliated mutual fund.
A summary of transactions for the fiscal year to date, in Partner Healthcare Portfolio, is as follows:
Portfolio | Value December 31, 2008 | Gross Purchases | Gross Sales | Shares Held at June 30, 2009 | Value June 30, 2009 | Income Earned January 1, 2009 - June 30, 2009 | |||||||||||
Money Market | $ | 348,090 | $ | 3,449,238 | $ | 3,641,955 | 155,373 | $ | 155,373 | $ | 2,051 | ||||||
Total Value and Income Earned | 348,090 | 155,373 | 2,051 | ||||||||||||||
The accompanying Notes to Financial Statements are an integral part of this schedule.
105
Table of Contents
Partner Natural Resources Portfolio
Schedule of Investments as of June 30, 2009
(unaudited)
| Shares | Common Stock (78.6%) | Value | |||
| Coal & Consumable Fuels (1.9%) | |||||
| 790 | Arch Coal, Inc. | $ | 12,142 | ||
| 2,040 | CONSOL Energy, Inc. | 69,279 | |||
| 210 | Patriot Coal Corporationa | 1,340 | |||
| 5,040 | Peabody Energy Corporation | 152,006 | |||
Total Coal & Consumable Fuels | 234,767 | ||||
| Industrials (0.8%) | |||||
| 1,450 | Aegean Marine Petroleum Network, Inc. | 21,895 | |||
| 3,000 | Saipem SPA | 73,298 | |||
Total Industrials | 95,193 | ||||
| Integrated Oil & Gas (18.8%) | |||||
| 1,320 | BP plc ADR | 62,938 | |||
| 5,530 | Chevron Corporation | 366,362 | |||
| 4,300 | Coastal Energy Companya | 10,499 | |||
| 2,680 | ConocoPhillips | 112,721 | |||
| 450 | Eni SPA | 21,334 | |||
| 3,810 | Exxon Mobil Corporation | 266,357 | |||
| 2,650 | Hess Corporation | 142,437 | |||
| 1,230 | Husky Energy, Inc. | 34,398 | |||
| 5,530 | Marathon Oil Corporation | 166,619 | |||
| 4,390 | Murphy Oil Corporation | 238,465 | |||
| 4,690 | Occidental Petroleum Corporation | 308,649 | |||
| 3,720 | Petroleo Brasileiro SA ADR | 152,446 | |||
| 7,290 | Suncor Energy, Inc. | 221,671 | |||
| 3,610 | Total SA ADR | 195,770 | |||
Total Integrated Oil & Gas | 2,300,666 | ||||
| Materials (7.5%) | |||||
| 200 | Alcoa, Inc. | 2,066 | |||
| 2,040 | Aluminum Corporation of China, Ltd. | 47,614 | |||
| 1,920 | Barrick Gold Corporation | 64,622 | |||
| 3,140 | BHP Billiton, Ltd. | 86,023 | |||
| 900 | E.I. du Pont de Nemours and Company | 23,058 | |||
| 12,610 | Eldorado Gold Corporationa | 113,611 | |||
| 2,160 | First Quantum Minerals, Ltd. | 104,453 | |||
| 5,040 | Goldcorp, Inc. | 175,178 | |||
| 2,880 | HudBay Minerals, Inc.a | 19,015 | |||
| 200 | Intrepid Potash, Inc.a | 5,616 | |||
| 2,350 | Newcrest Mining, Ltd. | 57,437 | |||
| 120 | Newmont Mining Corporation | 4,904 | |||
| 480 | Praxair, Inc. | 34,114 | |||
| 3,240 | Southern Copper Corporation | 66,226 | |||
| 4,920 | Vale SA SP ADR | 86,740 | |||
| 1,910 | Votorantim Celulose e Papel SA ADRa | 20,456 | |||
Total Materials | 911,133 | ||||
| Oil & Gas Drilling (8.6%) | |||||
| 2,160 | Diamond Offshore Drilling, Inc. | 179,388 | |||
| 3,610 | Helmerich & Payne, Inc. | 111,441 | |||
| 4,330 | Nabors Industries, Ltd.a | 67,461 | |||
| 6,010 | Noble Corporation | 181,802 | |||
| 2,040 | Pride International, Inc.a | 51,122 | |||
| 430 | Rowan Companies, Inc. | 8,308 | |||
| 6,010 | Transocean, Ltd.a | 446,483 | |||
Total Oil & Gas Drilling | 1,046,005 | ||||
| Oil & Gas Equipment & Services (12.4%) | |||||
| 1,560 | Acergy SA | 15,350 | |||
| 3,610 | Baker Hughes, Inc. | 131,548 | |||
| 430 | BJ Services Company | 5,861 | |||
| 7,570 | Cameron International Corporationa | 214,231 | |||
| 4,080 | Dresser-Rand Group, Inc.a | 106,488 | |||
| 790 | Dril-Quip, Inc.a | 30,099 | |||
| 2,880 | FMC Technologies, Inc.a | 108,230 | |||
| 7,080 | Halliburton Company | 146,556 | |||
| 9,250 | National Oilwell Varco, Inc.a | 302,105 | |||
| 2,100 | Schlumberger, Ltd. | 113,631 | |||
| 2,580 | Smith International, Inc. | 66,435 | |||
| 790 | Technip SA | 38,821 | |||
| 1,390 | Tesco Corporationa | 11,037 | |||
| 960 | Trican Well Service, Ltd.a | 8,270 | |||
| 11,050 | Weatherford International, Ltd.a | 216,138 | |||
Total Oil & Gas Equipment & Services | 1,514,800 | ||||
| Oil & Gas Exploration & Production (27.1%) | |||||
| 750 | Addax Petroleum Corporation | 31,807 | |||
| 2,160 | Anadarko Petroleum Corporation | 98,042 | |||
| 5,040 | Apache Corporation | 363,636 | |||
| 3,610 | Cabot Oil & Gas Corporation | 110,610 | |||
| 3,130 | Canadian Natural Resources, Ltd. | 164,653 | |||
| 960 | Carrizo Oil & Gas, Inc.a | 16,464 | |||
| 200 | Cimarex Energy Company | 5,668 | |||
| 900 | CNOOC, Ltd. | 110,727 | |||
| 6,800 | Connacher Oil & Gas, Ltd.a | 5,378 | |||
| 7,570 | Crew Energy, Inc.a | 33,841 | |||
| 1,230 | Denbury Resources, Inc.a | 18,118 | |||
| 7,210 | Devon Energy Corporation | 392,945 | |||
| 5,040 | EnCana Corporation | 249,877 | |||
| 5,360 | EOG Resources, Inc. | 364,051 | |||
| 1,450 | Forest Oil Corporationa | 21,634 | |||
| 1,200 | Iteration Energy, Ltd.a | 1,207 | |||
| 450 | Mariner Energy, Inc.a | 5,288 | |||
| 2,650 | Newfield Exploration Companya | 86,576 | |||
| 4,080 | Nexen, Inc. | 88,636 | |||
| 240 | Niko Resources, Ltd. | 16,506 | |||
| 2,770 | Noble Energy, Inc. | 163,347 | |||
| 2,130 | Pan Orient Energy Corporationa | 10,255 | |||
| 600 | Paramount Resources, Ltd.a | 3,095 | |||
| 2,690 | Petro-Canada | 103,881 | |||
| 800 | Pioneer Natural Resources Company | 20,400 | |||
| 5,040 | Progress Energy Resources Corporation | 44,022 | |||
| 5,400 | Range Resources Corporation | 223,614 | |||
| 2,520 | Southwestern Energy Companya | 97,902 | |||
| 21,370 | Talisman Energy, Inc. | 306,992 | |||
| 6,370 | TriStar Oil & Gas, Ltd.a | 60,184 | |||
| 1,920 | Whiting Petroleum Corporationa | 67,507 | |||
| 480 | XTO Energy, Inc. | 18,307 | |||
Total Oil & Gas Exploration & Production | 3,305,170 | ||||
The accompanying Notes to Financial Statements are an integral part of this schedule.
106
Table of Contents
Partner Natural Resources Portfolio
Schedule of Investments as of June 30, 2009
(unaudited)
| Shares | Common Stock (78.6%) | Value | ||||
| Oil & Gas Refining & Marketing (0.2%) | ||||||
| 1,800 | Valero Energy Corporation | $ | 30,402 | |||
Total Oil & Gas Refining & Marketing | 30,402 | |||||
| Oil & Gas Storage & Transportation (0.2%) | ||||||
| 1,500 | Williams Companies, Inc. | 23,415 | ||||
Total Oil & Gas Storage & Transportation | 23,415 | |||||
| Utilities (1.1%) | ||||||
| 3,970 | EQT Corporation | 138,593 | ||||
Total Utilities | 138,593 | |||||
Total Common Stock (cost $12,400,323) | 9,600,144 | |||||
| Shares or Principal Amount | Short-Term Investments (21.5%)b | |||||
Federal National Mortgage Association Discount Notes | ||||||
| 1,000,000 | 0.160%, 7/14/2009 | 999,942 | ||||
| 1,625,164 | Thrivent Money Market Portfolio | 1,625,164 | ||||
Total Short-Term Investments (at amortized cost) | 2,625,106 | |||||
Total Investments (cost $15,025,429) 100.1% | $ | 12,225,250 | ||||
Other Assets and Liabilities, Net (0.1%) | (15,149 | ) | ||||
Total Net Assets 100.0% | $ | 12,210,101 | ||||
| a | Non-income producing security. |
| b | The interest rate shown reflects the yield, coupon rate or, for securities purchased at a discount, the discount rate at the date of purchase. |
Definitions:
| ADR | - | American Depositary Receipt, which are certificates for an underlying foreign security’s shares held by an issuing U.S. depository bank. |
Unrealized Appreciation (Depreciation)
Gross unrealized appreciation and depreciation of investments, based on cost for federal income tax purposes, were as follows:
Gross unrealized appreciation | $ | 68,638 | ||
Gross unrealized depreciation | (2,868,817 | ) | ||
Net unrealized appreciation (depreciation) | $ | (2,800,179 | ) | |
Cost for federal income tax purposes | $ | 15,025,429 | ||
Fair Valuation Measurements
The following table is a summary of the inputs used, as of June 30, 2009, in valuing Partner Natural Resources Portfolio’s assets carried at fair value as discussed in the Notes to Financial Statements.
Investments in Securities | Total | Level 1 | Level 2 | Level 3 | ||||||||
Common Stock | ||||||||||||
Coal & Consumable Fuels | 234,767 | 234,767 | — | — | ||||||||
Industrials | 95,193 | 21,895 | 73,298 | — | ||||||||
Integrated Oil & Gas | 2,300,666 | 2,300,666 | — | — | ||||||||
Materials | 911,133 | 767,673 | 143,460 | — | ||||||||
Oil & Gas Drilling | 1,046,005 | 1,046,005 | — | — | ||||||||
Oil & Gas Equipment & Services | 1,514,800 | 1,514,800 | — | — | ||||||||
Oil & Gas Exploration & Production | 3,305,170 | 3,305,170 | — | — | ||||||||
Oil & Gas Refining & Marketing | 30,402 | 30,402 | — | — | ||||||||
Oil & Gas Storage & Transportation | 23,415 | 23,415 | — | — | ||||||||
Utilities | 138,593 | 138,593 | — | — | ||||||||
Short-Term Investments | 2,625,106 | 1,625,164 | 999,942 | — | ||||||||
Total | $ | 12,225,250 | $ | 11,008,550 | $ | 1,216,700 | $ | — | ||||
The accompanying Notes to Financial Statements are an integral part of this schedule.
107
Table of Contents
Partner Natural Resources Portfolio
Schedule of Investments as of June 30, 2009
(unaudited)
The following table summarizes the change in net unrealized appreciation/(depreciation) and Statement of Operations location, for the period ended June 30, 2009, for the Partner Natural Resources Portfolio’s investments in financial derivative instruments by primary risk exposure.
Derivatives by Risk Category | Statement of Operations Location | Change in Unrealized Appreciation/(Depreciation) recognized in Income | |||
Foreign Exchange Contracts | |||||
Forward Contract | Change in net unrealized appreciation/(depreciation) on Foreign currency forward contracts | 2,272 | |||
Total Foreign Exchange Contracts | 2,272 | ||||
Total | $ | 2,272 | |||
Investment in Affiliates
Affiliated issuers, as defined under the Investment Company Act of 1940, include those in which the Portfolio’s holdings of an issuer represent 5% or more of the outstanding voting securities of an issuer, or any affiliated mutual fund.
A summary of transactions for the fiscal year to date, in Partner Natural Resources Portfolio, is as follows:
Portfolio | Value December 31, 2008 | Gross Purchases | Gross Sales | Shares Held at June 30, 2009 | Value June 30, 2009 | Income Earned January 1, 2009 - June 30, 2009 | |||||||||||
Money Market | $ | 680,495 | $ | 5,509,154 | $ | 4,564,485 | 1,625,164 | $ | 1,625,164 | $ | 4,208 | ||||||
Total Value and Income Earned | 680,495 | 1,625,164 | 4,208 | ||||||||||||||
The accompanying Notes to Financial Statements are an integral part of this schedule.
108
Table of Contents
Partner Emerging Markets Portfolio
Schedule of Investments as of June 30, 2009
(unaudited)
| Shares | Common Stock (98.6%) | Valuea | |||
| Brazil (16.1%) | |||||
| 13,300 | Banco Bradesco SA ADR | $ | 196,441 | ||
| 11,300 | Lojas Renner SA | 125,139 | |||
| 6,700 | Petroleo Brasileiro SA ADR | 223,512 | |||
| 4,000 | Souza Cruz SA | 114,580 | |||
| 5,000 | Ultrapar Participacoes SA | 157,566 | |||
| 15,700 | Vale SA SP PREF ADR | 240,995 | |||
Total Brazil | 1,058,233 | ||||
| Chile (2.0%) | |||||
| 2,900 | Banco Santander Chile SA ADR | 135,401 | |||
Total Chile | 135,401 | ||||
| China (2.9%) | |||||
| 175,000 | PetroChina Company, Ltd. | 193,382 | |||
Total China | 193,382 | ||||
| Hong Kong (8.6%) | |||||
| 20,000 | China Mobile, Ltd. | 200,247 | |||
| 38,000 | Hang Lung Group, Ltd. | 177,815 | |||
| 19,000 | Swire Pacific, Ltd. | 190,719 | |||
Total Hong Kong | 568,781 | ||||
| Hungary (3.5%) | |||||
| 1,300 | Richter Gedeon Nyrt | 233,816 | |||
Total Hungary | 233,816 | ||||
| India (12.1%) | |||||
| 2,000 | Bharti Airtel, Ltd.b | 33,433 | |||
| 2,600 | GlaxoSmithKline Pharmaceuticals, Ltd. | 64,973 | |||
| 2,500 | Grasim Industries, Ltd. | 120,650 | |||
| 3,000 | Hero Honda Motors, Ltd. | 87,475 | |||
| 3,058 | Hindustan Unilever, Ltd. | 17,020 | |||
| 4,100 | Housing Development Finance Corporationb | 200,136 | |||
| 3,700 | ICICI Bank, Ltd. ADR | 109,150 | |||
| 1,100 | Infosys Technologies, Ltd. | 40,678 | |||
| 3,500 | Infosys Technologies, Ltd. ADR | 128,730 | |||
Total India | 802,245 | ||||
| Indonesia (2.4%) | |||||
| 70,000 | PT Astra International Tbk | 162,527 | |||
Total Indonesia | 162,527 | ||||
| Israel (3.2%) | |||||
| 4,000 | Check Point Software Technologies, Ltd.b | 93,880 | |||
| 2,350 | Teva Pharmaceutical Industries, Ltd. ADR | 115,949 | |||
Total Israel | 209,829 | ||||
| Luxembourg (2.2%) | |||||
| 5,500 | Tenaris SA ADR | 148,720 | |||
Total Luxembourg | 148,720 | ||||
| Malaysia (2.7%) | |||||
| 37,000 | Bumiputra-Commerce Holdings Berhad | 94,994 | |||
| 34,000 | Public Bank Berhad | 86,937 | |||
Total Malaysia | 181,931 | ||||
| Mexico (9.5%) | |||||
| 115,000 | Consorcio ARA SAB de CVb | 50,041 | |||
| 6,100 | Fomento Economico Mexicano SAB de CV ADR | 196,664 | |||
| 2,400 | Grupo Aeroportuario del Sureste SAB de CV ADR | 93,600 | |||
| 70,000 | Grupo Financiero Banorte SA de CV ADR | 169,574 | |||
| 50,500 | Organizacion Soriana SAB de CVb | 113,132 | |||
Total Mexico | 623,011 | ||||
| Philippines (2.4%) | |||||
| 515,000 | Ayala Land, Inc. | 86,454 | |||
| 87,000 | Bank of the Philippine Islands | 75,576 | |||
Total Philippines | 162,030 | ||||
| Russia (2.0%) | |||||
| 2,937 | LUKOIL ADR | 130,655 | |||
Total Russia | 130,655 | ||||
| South Africa (5.5%) | |||||
| 20,700 | Massmart Holdings, Ltd. | 214,813 | |||
| 32,000 | Truworths International, Ltd. | 153,579 | |||
Total South Africa | 368,392 | ||||
| South Korea (7.0%) | |||||
| 9,501 | Busan Bank | 64,817 | |||
| 1,773 | Samsung Electronics Company, Ltd. GDR | 264,409 | |||
| 330 | Shinsegae Company, Ltd. | 130,408 | |||
Total South Korea | 459,634 | ||||
| Taiwan (4.2%) | |||||
| 66,000 | Taiwan Mobile Company, Ltd. | 112,490 | |||
| 100,000 | Taiwan Semiconductor | ||||
Manufacturing Company, Ltd. | 164,120 | ||||
Total Taiwan | 276,610 | ||||
| Thailand (4.5%) | |||||
| 34,000 | PTT Exploration & Production pcl | 134,740 | |||
| 35,000 | Siam Cement Public Company, Ltd. | 164,982 | |||
Total Thailand | 299,722 | ||||
| Turkey (5.4%) | |||||
| 48,000 | Akbank TAS | 212,710 | |||
| 4,200 | BIM Birlesik Magazalar AS | 146,535 | |||
Total Turkey | 359,245 | ||||
| United Kingdom (2.4%) | |||||
| 8,607 | Standard Chartered plc | 161,845 | |||
Total United Kingdom | 161,845 | ||||
Total Common Stock (cost $8,429,719) | 6,536,009 | ||||
The accompanying Notes to Financial Statements are an integral part of this schedule.
109
Table of Contents
Partner Emerging Markets Portfolio
Schedule of Investments as of June 30, 2009
(unaudited)
| Shares | Short-Term Investments (<0.1%) | Value | |||
| 13 | Thrivent Money Market Portfolio | $ | 13 | ||
Total Short-Term Investments (at amortized cost) | 13 | ||||
Total Investments (cost $8,429,732) 98.6% | $ | 6,536,022 | |||
Other Assets and Liabilities, Net 1.4% | 94,142 | ||||
Total Net Assets 100.0% | $ | 6,630,164 | |||
| a | Security is fair valued as discussed in item 2(A) of the Notes to Financial Statements. |
| b | Non-income producing security. |
Definitions:
| ADR | - | American Depositary Receipt, which are certificates for an underlying foreign security’s shares held by an issuing U.S. depository bank. | ||
| GDR | - | Global Depository Receipts, which are certificates for shares of an underlying foreign security’s shares held by an issuing depository bank from more than one country. |
Unrealized Appreciation (Depreciation)
Gross unrealized appreciation and depreciation of investments, based on cost for federal income tax purposes, were as follows:
Gross unrealized appreciation | $ | 174,293 | ||
Gross unrealized depreciation | (2,068,003 | ) | ||
Net unrealized appreciation (depreciation) | $ | (1,893,710 | ) | |
Cost for federal income tax purposes | $ | 8,429,732 | ||
Fair Valuation Measurements
The following table is a summary of the inputs used, as of June 30, 2009, in valuing Partner Emerging Markets Portfolio’s assets carried at fair value as discussed in the Notes to Financial Statements.
Investments in Securities | Total | Level 1 | Level 2 | Level 3 | ||||||||||
Common Stock | ||||||||||||||
Communications Services | 33,433 | — | 33,433 | — | ||||||||||
Consumer Discretionary | 822,301 | — | 822,301 | — | ||||||||||
Consumer Staples | 689,612 | 196,664 | 492,948 | — | ||||||||||
Energy | 988,575 | 372,232 | 616,343 | — | ||||||||||
Financials | 1,962,569 | 440,992 | 1,521,577 | — | ||||||||||
Health Care | 414,738 | 115,949 | 298,789 | — | ||||||||||
Industrials | 379,232 | 93,600 | 285,632 | — | ||||||||||
Information Technology | 691,817 | 222,610 | 469,207 | — | ||||||||||
Materials | 240,995 | 240,995 | — | — | ||||||||||
Telecommunications Services | 312,737 | — | 312,737 | — | ||||||||||
Short-Term Investments | 13 | 13 | — | — | ||||||||||
Total | $ | 6,536,022 | $ | 1,683,055 | $ | 4,852,967 | $ | — | ||||||
Other Financial Instruments* | ($159 | ) | ($159 | ) | $ | — | $ | — | ||||||
| * | Other Financial Instruments include Futures, Forwards, Written Options and Swap agreements. |
Foreign Currency Forward Contracts | Contracts to Deliver/Receive | Settlement Date | Value on Settlement Date | Value | Unrealized Gain/(Loss) | |||||||||
Sales | ||||||||||||||
British Pound | 8,233 | 7/1/2009 - 7/6/2009 | $ | 13,577 | $ | 13,546 | $ | 31 | ||||||
Malaysian Ringgit | 72,094 | 7/1/2009 - 7/6/2009 | 20,371 | 20,510 | (139 | ) | ||||||||
Philippine Peso | 638,937 | 7/1/2009 - 7/6/2009 | 13,226 | 13,277 | (51 | ) | ||||||||
Total Foreign Currency | ||||||||||||||
Forward Contracts Sales | $ | 47,174 | $ | 47,333 | ($159 | ) | ||||||||
Net Unrealized Gain/(Loss) on Foreign Currency Forward Contracts | ($159 | ) | ||||||||||||
The accompanying Notes to Financial Statements are an integral part of this schedule.
110
Table of Contents
Partner Emerging Markets Portfolio
Schedule of Investments as of June 30, 2009
(unaudited)
The following table summarizes the fair value and Statement of Assets and Liabilities location, as of June 30, 2009, for the Partner Emerging Markets Portfolio’s investments in financial derivative instruments by primary risk exposure as discussed under item (2) Significant Accounting Policies of the Notes to Financial Statements.
Derivatives by Risk Category | Statement of Assets and Liabilities Location | Fair Value | |||
Asset Derivatives | |||||
Foreign Exchange Contracts | |||||
Forward Contract | Receivable for forward contracts, Net Assets - Net unrealized appreciation/(depreciation) on Foreign currency forward contracts | 31 | |||
Total Foreign Exchange Contracts | 31 | ||||
Total Asset Derivatives | $ | 31 | |||
| Liability Derivatives | |||||
Foreign Exchange Contracts | |||||
Forward Contract | Payable for forward contracts, Net Assets - Net unrealized appreciation/(depreciation) on Foreign currency forward contracts | 190 | |||
Total Foreign Exchange Contracts | 190 | ||||
Total Liability Derivatives | $ | 190 | |||
The following table summarizes the change in net unrealized appreciation/(depreciation) and Statement of Operations location, for the period ended June 30, 2009, for the Partner Emerging Markets Portfolio’s investments in financial derivative instruments by primary risk exposure.
Derivatives by Risk Category | Statement of Operations Location | Change in Unrealized Appreciation/(Depreciation) recognized in Income | |||
| Foreign Exchange Contracts | |||||
Forward Contract | Change in net unrealized appreciation/(depreciation) on Foreign currency forward contracts | (159 | ) | ||
Total Foreign Exchange Contracts | (159 | ) | |||
Total | ($159 | ) | |||
Investment in Affiliates
Affiliated issuers, as defined under the Investment Company Act of 1940, include those in which the Portfolio’s holdings of an issuer represent 5% or more of the outstanding voting securities of an issuer, or any affiliated mutual fund.
A summary of transactions for the fiscal year to date, in Partner Emerging Markets Portfolio, is as follows:
Portfolio | Value December 31, 2008 | Gross Purchases | Gross Sales | Shares Held at June 30, 2009 | Value June 30, 2009 | Income Earned January 1, 2009 - June 30, 2009 | |||||||||||
Money Market | $ | 71,414 | $ | 393,686 | $ | 465,087 | 13 | $ | 13 | $ | 164 | ||||||
Total Value and Income Earned | 71,414 | 13 | 164 | ||||||||||||||
The accompanying Notes to Financial Statements are an integral part of this schedule.
111
Table of Contents
Real Estate Securities Portfolio
Schedule of Investments as of June 30, 2009
(unaudited)
| Shares | Common Stock (96.1%) | Value | |||
| Diversified REITS (7.2%) | |||||
| 31,565 | Colonial Properties Trusta | $ | 233,581 | ||
| 110,595 | Liberty Property Trust | 2,548,109 | |||
| 14,800 | PS Business Parks, Inc. | 716,912 | |||
| 186,181 | Vornado Realty Trust | 8,383,730 | |||
| 28,400 | Washington Real Estate Investment Trust | 635,308 | |||
Total Diversified REITS | 12,517,640 | ||||
| Financials (3.6%) | |||||
| 168,452 | iShares Dow Jones U.S. Real Estate Index Funda | 5,447,738 | |||
| 6,497 | SPDR DJ Wilshire International Real Estate ETF | 186,659 | |||
| 18,649 | Vanguard REIT ETFa | 578,305 | |||
Total Financials | 6,212,702 | ||||
| Foreign (0.9%) | |||||
| 187,700 | Brookfield Properties Corporationa | 1,495,969 | |||
Total Foreign | 1,495,969 | ||||
| Hotels, Resorts & Cruise Lines (0.9%) | |||||
| 70,421 | Starwood Hotels & Resorts Worldwide, Inc. | 1,563,346 | |||
Total Hotels, Resorts & Cruise Lines | 1,563,346 | ||||
| Industrial REITS (4.1%) | |||||
| 113,413 | AMB Property Corporation | 2,133,299 | |||
| 227,853 | DCT Industrial Trust, Inc. | 929,640 | |||
| 25,475 | DuPont Fabros Technology, Inc. | 239,974 | |||
| 28,700 | EastGroup Properties, Inc. | 947,674 | |||
| 25,100 | First Potomac Realty Trust | 244,725 | |||
| 326,365 | ProLogis Trust | 2,630,502 | |||
Total Industrial REITS | 7,125,814 | ||||
| Mortgage REITS (0.6%) | |||||
| 26,680 | Annaly Capital Management, Inc. | 403,935 | |||
| 16,300 | Anworth Mortgage Asset Corporation | 117,523 | |||
| 98,600 | Chimera Investment Corporation | 344,114 | |||
| 21,907 | MFA Mortgage Investments, Inc. | 151,597 | |||
Total Mortgage REITS | 1,017,169 | ||||
| Office REITS (15.9%) | |||||
| 52,000 | Alexandria Real Estate Equities, Inc.a | 1,861,080 | |||
| 93,307 | BioMed Realty Trust, Inc. | 954,531 | |||
| 162,500 | Boston Properties, Inc. | 7,751,250 | |||
| 133,585 | Brandywine Realty Trust | 995,208 | |||
| 76,830 | Corporate Office Properties Trust | 2,253,424 | |||
| 124,375 | Digital Realty Trust, Inc.a | 4,458,844 | |||
| 123,100 | Douglas Emmett, Inc. | 1,106,669 | |||
| 158,100 | Duke Realty Corporation | 1,386,537 | |||
| 66,600 | Highwoods Properties, Inc. | 1,489,842 | |||
| 41,960 | HRPT Properties Trust | 170,357 | |||
| 52,965 | Kilroy Realty Corporationa | 1,087,901 | |||
| 80,075 | Mack-Cali Realty Corporation | 1,825,710 | |||
| 5,100 | Parkway Properties, Inc. | 66,300 | |||
| 89,199 | SL Green Realty Corporationa | 2,046,225 | |||
Total Office REITS | 27,453,878 | ||||
| Real Estate Operating Companies (0.2%) | |||||
| 50,000 | Forest City Enterprises | 330,000 | |||
Total Real Estate Operating Companies | 330,000 | ||||
| Residential REITS (15.9%) | |||||
| 71,450 | American Campus Communities, Inc. | 1,584,761 | |||
| 97,736 | Apartment Investment & Management Company | 864,964 | |||
| 109,540 | AvalonBay Communities, Inc. | 6,127,668 | |||
| 56,577 | BRE Properties, Inc. | 1,344,270 | |||
| 84,400 | Camden Property Trust | 2,329,440 | |||
| 38,571 | Equity Lifestyle Properties, Inc. | 1,434,070 | |||
| 301,966 | Equity Residential REIT | 6,712,704 | |||
| 43,500 | Essex Property Trust, Inc. | 2,707,005 | |||
| 37,000 | Home Properties, Inc. | 1,261,700 | |||
| 33,012 | Mid-America Apartment Communities, Inc. | 1,211,870 | |||
| 44,575 | Post Properties, Inc. | 599,088 | |||
| 124,831 | UDR, Inc. | 1,289,504 | |||
Total Residential REITS | 27,467,044 | ||||
| Retail REITS (22.5%) | |||||
| 50,678 | Acadia Realty Trust | 661,348 | |||
| 53,847 | CBL & Associates Properties, Inc.a | 290,235 | |||
| 77,807 | Developers Diversified Realty Corporationa | 379,698 | |||
| 23,797 | Equity One, Inc.a | 315,548 | |||
| 93,500 | Federal Realty Investment Trust | 4,817,120 | |||
| 57,000 | Inland Real Estate Corporation | 399,000 | |||
| 281,750 | Kimco Realty Corporation | 2,831,588 | |||
| 34,700 | Kite Realty Group Trust | 101,324 | |||
| 131,511 | Macerich Companya | 2,315,909 | |||
| 89,000 | National Retail Properties, Inc.a | 1,544,150 | |||
| 10,963 | Ramco-Gershenson Properties Trust | 109,740 | |||
| 38,125 | Realty Income Corporationa | 835,700 | |||
| 116,600 | Regency Centers Corporationa | 4,070,506 | |||
| 8,500 | Saul Centers, Inc. | 251,345 | |||
| 292,938 | Simon Property Group, Inc. | 15,065,801 | |||
| 47,201 | Tanger Factory Outlet Centers, Inc.a | 1,530,728 | |||
| 91,000 | Taubman Centers, Inc. | 2,444,260 | |||
| 70,200 | Weingarten Realty Investorsa | 1,018,602 | |||
Total Retail REITS | 38,982,602 | ||||
| Specialized REITS (24.3%) | |||||
| 56,550 | DiamondRock Hospitality Company | 354,003 | |||
| 33,945 | Entertainment Properties Trust | 699,267 | |||
| 103,500 | Extra Space Storage, Inc. | 864,225 | |||
| 266,129 | Health Care Property Investors, Inc. | 5,639,274 | |||
| 98,124 | Health Care REIT, Inc. | 3,346,028 | |||
| 51,875 | Healthcare Realty Trust, Inc. | 873,056 | |||
| 54,137 | Hospitality Properties Trust | 643,689 | |||
| 557,056 | Host Marriott Corporation | 4,673,700 | |||
| 54,438 | LaSalle Hotel Properties | 671,765 | |||
The accompanying Notes to Financial Statements are an integral part of this schedule.
112
Table of Contents
Real Estate Securities Portfolio
Schedule of Investments as of June 30, 2009
(unaudited)
| Shares | Common Stock (96.1%) | Value | ||||
Specialized REITS (24.3%) - continued | ||||||
| 16,300 | LTC Properties, Inc. | $ | 333,335 | |||
| 22,813 | Medical Properties Trust, Inc. | 138,475 | ||||
| 124,425 | Nationwide Health Properties, Inc. | 3,202,699 | ||||
| 64,900 | Omega Healthcare Investors, Inc. | 1,007,248 | ||||
| 45,609 | Plum Creek Timber Company, Inc.a | 1,358,236 | ||||
| 141,948 | Public Storage, Inc. | 9,294,755 | ||||
| 15,000 | Rayonier, Inc. REIT | 545,250 | ||||
| 122,556 | Senior Housing Property Trust | 2,000,114 | ||||
| 7,500 | Sovran Self Storage, Inc. | 184,500 | ||||
| 46,736 | Sunstone Hotel Investors, Inc.a | 250,038 | ||||
| 198,159 | Ventas, Inc. | 5,917,028 | ||||
Total Specialized REITS | 41,996,685 | |||||
Total Common Stock (cost $274,578,616) | 166,162,849 | |||||
| Principal Amount | Long-Term Fixed Income (0.9%) | |||||
| Asset-Backed Securities (0.1%) | ||||||
Residential Funding Mortgage Securities | ||||||
| 300,255 | 4.470%, 7/25/2018b | 268,394 | ||||
Total Asset-Backed Securities | 268,394 | |||||
| Collateralized Mortgage Obligations (0.8%) | ||||||
Countrywide Home Loans, Inc. | ||||||
| 328,686 | 5.526%, 3/20/2036 | 304,561 | ||||
Deutsche Alt-A Securities Mortgage Loan Trust | ||||||
| 153,108 | 0.394%, 7/27/2009c | 150,107 | ||||
Deutsche Alt-A Securities, Inc. | ||||||
| 310,104 | 5.888%, 6/25/2036 | 284,508 | ||||
Impac Secured Assets Corporation | ||||||
| 284,759 | 0.424%, 7/27/2009c | 251,134 | ||||
J.P. Morgan Alternative Loan Trust | ||||||
| 400,540 | 0.394%, 7/25/2009c | 373,531 | ||||
Total Collateralized Mortgage Obligations | 1,363,841 | |||||
| Commercial Mortgage-Backed Securities (<0.1%) | ||||||
Banc of America Commercial Mortgage, Inc. | ||||||
| 13,873 | 4.875%, 6/10/2039 | 13,856 | ||||
Total Commercial Mortgage-Backed Securities | 13,856 | |||||
Total Long-Term Fixed Income (cost $1,667,082) | 1,646,091 | |||||
| Shares | Collateral Held for Securities Loaned (14.7%) | |||||
| 25,490,440 | Thrivent Financial Securities Lending Trust | 25,490,440 | ||||
Total Collateral Held for Securities Loaned (cost $25,490,440) | 25,490,440 | |||||
Short-Term Investments (3.2%) | ||||||
| 5,466,058 | Thrivent Money Market Portfolio | 5,466,058 | ||||
Total Short-Term Investments (at amortized cost) | 5,466,058 | |||||
Total Investments (cost $307,202,196) 114.9% | $ | 198,765,438 | ||||
Other Assets and Liabilities, Net (14.9%) | (25,824,194 | ) | ||||
Total Net Assets 100.0% | $ | 172,941,244 | ||||
| a | All or a portion of the security is on loan as discussed in item 2(M) of the Notes to Financial Statements. |
| b | All or a portion of the security is insured or guaranteed. |
| c | Denotes variable rate obligations for which the current yield and next scheduled reset date are shown. |
Definitions:
| REIT | - | Real Estate Investment Trust, is a company that buys, develops, manages and/or sells real estate assets. | ||
| ETF | - | Exchange Traded Fund. |
Unrealized Appreciation (Depreciation)
Gross unrealized appreciation and depreciation of investments, based on cost for federal income tax purposes, were as follows:
Gross unrealized appreciation | $ | 678,707 | ||
Gross unrealized depreciation | (109,115,465 | ) | ||
Net unrealized appreciation (depreciation) | $ | (108,436,758 | ) | |
Cost for federal income tax purposes | $ | 307,202,196 | ||
The accompanying Notes to Financial Statements are an integral part of this schedule.
113
Table of Contents
Real Estate Securities Portfolio
Schedule of Investments as of June 30, 2009
(unaudited)
Fair Valuation Measurements
The following table is a summary of the inputs used, as of June 30, 2009, in valuing Real Estate Securities Portfolio’s assets carried at fair value as discussed in the Notes to Financial Statements.
Investments in Securities | Total | Level 1 | Level 2 | Level 3 | ||||||||
Common Stock | ||||||||||||
Diversified REITS | 12,517,640 | 12,517,640 | — | — | ||||||||
Financials | 6,212,702 | 6,212,702 | — | — | ||||||||
Foreign | 1,495,969 | 1,495,969 | — | — | ||||||||
Hotels, Resorts & Cruise Lines | 1,563,346 | 1,563,346 | — | — | ||||||||
Industrial REITS | 7,125,814 | 7,125,814 | — | — | ||||||||
Mortgage REITS | 1,017,169 | 1,017,169 | — | — | ||||||||
Office REITS | 27,453,878 | 27,453,878 | — | — | ||||||||
Real Estate Operating Companies | 330,000 | 330,000 | — | — | ||||||||
Residential REITS | 27,467,044 | 27,467,044 | — | — | ||||||||
Retail REITS | 38,982,602 | 38,982,602 | — | — | ||||||||
Specialized REITS | 41,996,685 | 41,996,685 | — | — | ||||||||
Long-Term Fixed Income | ||||||||||||
Asset-Backed Securities | 268,394 | — | 268,394 | — | ||||||||
Collateralized Mortgage Obligations | 1,363,841 | — | 1,363,841 | — | ||||||||
Commercial Mortgage-Backed Securities | 13,856 | — | 13,856 | — | ||||||||
Collateral Held for Securities Loaned | 25,490,440 | 25,490,440 | — | — | ||||||||
Short-Term Investments | 5,466,058 | 5,466,058 | — | — | ||||||||
Total | $ | 198,765,438 | $ | 197,119,347 | $ | 1,646,091 | $ | — | ||||
Investment in Affiliates
Affiliated issuers, as defined under the Investment Company Act of 1940, include those in which the Portfolio’s holdings of an issuer represent 5% or more of the outstanding voting securities of an issuer, or any affiliated mutual fund.
A summary of transactions for the fiscal year to date, in Real Estate Securities Portfolio, is as follows:
Portfolio | Value December 31, 2008 | Gross Purchases | Gross Sales | Shares Held at June 30, 2009 | Value June 30, 2009 | Income Earned January 1, 2009 - June 30, 2009 | |||||||||||
Money Market | $ | 6,360,905 | $ | 13,862,579 | $ | 14,757,426 | 5,466,058 | $ | 5,466,058 | $ | 18,298 | ||||||
Thrivent Financial Securities Lending Trust | 28,447,323 | 184,705,840 | 187,662,723 | 25,490,440 | 25,490,440 | 108,122 | |||||||||||
Total Value and Income Earned | 34,808,228 | 30,956,498 | 126,420 | ||||||||||||||
The accompanying Notes to Financial Statements are an integral part of this schedule.
114
Table of Contents
Schedule of Investments as of June 30, 2009
(unaudited)
Shares | Common Stock (91.0%) | Value | |||
| Consumer Discretionary (0.3%) | |||||
| 700 | Vivendi Universal SA | $ | 16,803 | ||
Total Consumer Discretionary | 16,803 | ||||
| Electric Utilities (35.5%) | |||||
| 3,100 | AES Tiete SA | 32,400 | |||
| 2,700 | Allegheny Energy, Inc. | 69,255 | |||
| 5,600 | American Electric Power Company, Inc. | 161,784 | |||
| 300 | CEZ | 13,409 | |||
| 2,675 | Companhia Energetica de Minas Gerais ADR | 35,952 | |||
| 700 | CPFL Energia SA | 33,908 | |||
| 3,100 | DPL, Inc. | 71,827 | |||
| 9,000 | Duke Energy Corporation | 131,310 | |||
| 400 | E.ON AG | 14,200 | |||
| 1,600 | Edison International, Inc. | 50,336 | |||
| 1,200 | Energias do Brasil SA | 16,271 | |||
| 2,000 | Entergy Corporation | 155,040 | |||
| 2,100 | Exelon Corporation | 107,541 | |||
| 2,800 | FirstEnergy Corporation | 108,500 | |||
| 800 | Fortum Oyj | 18,236 | |||
| 4,700 | FPL Group, Inc. | 267,242 | |||
| 2,400 | ITC Holdings Corporation | 108,864 | |||
| 1,800 | Northeast Utilities | 40,158 | |||
| 2,000 | NV Energy, Inc. | 21,580 | |||
| 4,900 | PPL Corporation | 161,504 | |||
| 1,100 | Progress Energy, Inc. | 41,613 | |||
| 6,270 | Southern Company | 195,373 | |||
Total Electric Utilities | 1,856,303 | ||||
| Energy (5.4%) | |||||
| 700 | Cabot Oil & Gas Corporation | 21,448 | |||
| 200 | CONSOL Energy, Inc. | 6,792 | |||
| 700 | Devon Energy Corporation | 38,150 | |||
| 400 | EOG Resources, Inc. | 27,168 | |||
| 1,045 | GDF Suez | 39,118 | |||
| 900 | Petrohawk Energy Corporationa | 20,070 | |||
| 400 | Range Resources Corporation | 16,564 | |||
| 200 | RWE AG | 15,773 | |||
| 800 | Southwestern Energy Companya | 31,080 | |||
| 1,700 | Spectra Energy Corporation | 28,764 | |||
| 2,400 | Williams Companies, Inc. | 37,464 | |||
Total Energy | 282,391 | ||||
| Gas Utilities (4.6%) | |||||
| 6,200 | Centricia plc | 22,799 | |||
| 600 | Energen Corporation | 23,940 | |||
| 1,800 | EQT Corporation | 62,838 | |||
| 900 | New Jersey Resources Corporation | 33,336 | |||
| 2,400 | Questar Corporation | 74,664 | |||
| 800 | UGI Corporation | 20,392 | |||
Total Gas Utilities | 237,969 | ||||
| Independent Power Producers & Energy Traders (7.5%) | |||||
| 3,600 | AES Corporationa | 41,796 | |||
| 3,600 | Constellation Energy Group, Inc. | 95,688 | |||
| 5,800 | International Power plc | 22,782 | |||
| 7,800 | NRG Energy, Inc.a | 202,488 | |||
| 700 | Ormat Technologies, Inc. | 28,217 | |||
Total Independent Power Producers & Energy Traders | 390,971 | ||||
| Industrials (1.8%) | |||||
| 4,900 | Iberdrola SA | 39,958 | |||
| 1,200 | Quanta Services, Inc.a | 27,756 | |||
| 900 | Tetra Tech, Inc.a | 25,785 | |||
Total Industrials | 93,499 | ||||
| Integrated Telecommunication Services (13.9%) | |||||
| 7,100 | AT&T, Inc. | 176,364 | |||
| 1,700 | BCE, Inc. | 35,122 | |||
| 5,600 | Cable & Wireless plc | 12,292 | |||
| 1,500 | Deutsche Telekom AG | 17,735 | |||
| 1,300 | France Telecom SA | 29,581 | |||
| 4,300 | Frontier Communications Corporation | 30,702 | |||
| 1,000 | Global Village Telecom Holding SAa | 16,601 | |||
| 1,200 | Koninklijke (Royal) KPN NV | 16,558 | |||
| 19,200 | Qwest Communications International, Inc. | 79,680 | |||
| 4,000 | Telefonica SA | 90,842 | |||
| 6,500 | Verizon Communications, Inc. | 199,745 | |||
| 2,400 | Windstream Corporation | 20,064 | |||
Total Integrated Telecommunication Services | 725,286 | ||||
| Multi-Utilities (13.7%) | |||||
| 6,800 | CMS Energy Corporation | 82,144 | |||
| 2,100 | Consolidated Edison, Inc. | 78,582 | |||
| 2,200 | Dominion Resources, Inc. | 73,524 | |||
| 400 | Electricite de France | 19,532 | |||
| 2,000 | National Grid plc | 18,048 | |||
| 1,000 | NSTAR | 32,110 | |||
| 2,900 | PG&E Corporation | 111,476 | |||
| 7,200 | Public Service Enterprise Group, Inc. | 234,936 | |||
| 400 | Sempra Energy | 19,852 | |||
| 1,200 | Wisconsin Energy Corporation | 48,852 | |||
Total Multi-Utilities | 719,056 | ||||
| Water Utilities (2.4%) | |||||
| 100 | American States Water Company | 3,464 | |||
| 1,200 | American Water Works Company, Inc. | 22,932 | |||
| 1,800 | Aqua America, Inc. | 32,220 | |||
| 700 | California Water Service Group | 25,788 | |||
| 2,100 | Cia de Saneamento de Minas Gerais | 27,211 | |||
| 3,800 | Northumbrian Water Group plc | 15,504 | |||
Total Water Utilities | 127,119 | ||||
| Wireless Telecommunication Services (5.9%) | |||||
| 1,700 | America Movil SA de CV ADR | 65,824 | |||
| 800 | American Tower Corporationa | 25,224 | |||
| 600 | Crown Castle International Corporationa | 14,412 | |||
The accompanying Notes to Financial Statements are an integral part of this schedule.
115
Table of Contents
Partner Utilities Portfolio
Schedule of Investments as of June 30, 2009
(unaudited)
| Shares | Common Stock (91.0%) | Value | |||
Wireless Telecommunication Services (5.9%) - continued | |||||
| 600 | Leap Wireless International, Inc.a | $ | 19,758 | ||
| 400 | Millicom International Cellular SAa | 22,504 | |||
| 1,000 | Rogers Communications, Inc. | 25,750 | |||
| 2,100 | SBA Communications Corporationa | 51,534 | |||
| 4,300 | Vodafone Group plc ADR | 83,807 | |||
Total Wireless Telecommunication Services | 308,813 | ||||
Total Common Stock (cost $5,775,977) | 4,758,210 | ||||
Short-Term Investments (8.8%) | |||||
| 459,341 | Thrivent Money Market Portfolio | 459,341 | |||
Total Short-Term Investments (at amortized cost) | 459,341 | ||||
Total Investments (cost $6,235,318) 99.8% | $ | 5,217,551 | |||
Other Assets and Liabilities, Net 0.2% | 12,073 | ||||
Total Net Assets 100.0% | $ | 5,229,624 | |||
| a | Non-income producing security. |
Definitions:
| ADR | - | American Depositary Receipt, which are certificates for an underlying foreign security’s shares held by an issuing U.S. depository bank. |
Unrealized Appreciation (Depreciation)
Gross unrealized appreciation and depreciation of investments, based on cost for federal income tax purposes, were as follows:
Gross unrealized appreciation | $ | 65,691 | ||
Gross unrealized depreciation | (1,083,458 | ) | ||
Net unrealized appreciation (depreciation) | $ | (1,017,767 | ) | |
Cost for federal income tax purposes | $ | 6,235,318 | ||
Fair Valuation Measurements
The following table is a summary of the inputs used, as of June 30, 2009, in valuing Partner Utilities Portfolio’s assets carried at fair value as discussed in the Notes to Financial Statements.
Investments in Securities | Total | Level 1 | Level 2 | Level 3 | ||||||||
Common Stock | ||||||||||||
Consumer Discretionary | 16,803 | — | 16,803 | — | ||||||||
Electric Utilities | 1,856,303 | 1,761,787 | 94,516 | — | ||||||||
Energy | 282,391 | 227,500 | 54,891 | — | ||||||||
Gas Utilities | 237,969 | 215,170 | 22,799 | — | ||||||||
Independent Power Producers & Energy Traders | 390,971 | 368,189 | 22,782 | — | ||||||||
Industrials | 93,499 | 53,541 | 39,958 | — | ||||||||
Integrated Telecommunication Services | 725,286 | 541,677 | 183,609 | — | ||||||||
Multi-Utilities | 719,056 | 681,476 | 37,580 | — | ||||||||
Water Utilities | 127,119 | 84,404 | 42,715 | — | ||||||||
Wireless Telecommunication Services | 308,813 | 308,813 | — | — | ||||||||
Short-Term Investments | 459,341 | 459,341 | — | — | ||||||||
Total | $ | 5,217,551 | $ | 4,701,898 | $ | 515,653 | $ | — | ||||
The accompanying Notes to Financial Statements are an integral part of this schedule.
116
Table of Contents
Partner Utilities Portfolio
Schedule of Investments as of June 30, 2009
(unaudited)
The following table summarizes the change in net unrealized appreciation/(depreciation) and Statement of Operations location, for the period ended June 30, 2009, for the Partner Utilities Portfolio’s investments in financial derivative instruments by primary risk exposure.
Derivatives by Risk Category | Statement of Operations Location | Change in Unrealized Appreciation/(Depreciation) recognized in Income | |||
Foreign Exchange Contracts Forward Contract | Change in net unrealized appreciation/(depreciation) on Foreign currency forward contracts | 55 | |||
Total Foreign Exchange Contracts | 55 | ||||
Total | $ | 55 | |||
Investment in Affiliates
Affiliated issuers, as defined under the Investment Company Act of 1940, include those in which the Portfolio’s holdings of an issuer represent 5% or more of the outstanding voting securities of an issuer, or any affiliated mutual fund.
A summary of transactions for the fiscal year to date, in Partner Utilities Portfolio, is as follows:
Portfolio | Value December 31, 2008 | Gross Purchases | Gross Sales | Shares Held at June 30, 2009 | Value June 30, 2009 | Income Earned January 1, 2009 - June 30, 2009 | |||||||||||
Money Market | $ | 562,032 | $ | 1,354,330 | $ | 1,457,021 | 459,341 | $ | 459,341 | $ | 1,228 | ||||||
Total Value and Income Earned | 562,032 | 459,341 | 1,228 | ||||||||||||||
The accompanying Notes to Financial Statements are an integral part of this schedule.
117
Table of Contents
Partner Small Cap Growth Portfolio
Schedule of Investments as of June 30, 2009
(unaudited)
| Shares | Common Stock (94.0%) | Value | |||
| Consumer Discretionary (13.6%) | |||||
| 27,940 | Aeropostale, Inc.a | $ | 957,504 | ||
| 165,310 | ArvinMeritor, Inc. | 725,711 | |||
| 26,080 | Buckle, Inc.b | 828,562 | |||
| 20,820 | Capella Education Companya | 1,248,159 | |||
| 73,250 | Coldwater Creek, Inc.a | 443,895 | |||
| 50,120 | Collective Brands, Inc.a | 730,248 | |||
| 18,570 | Deckers Outdoor Corporationa | 1,304,914 | |||
| 3,900 | Interactive Data Corporation | 90,246 | |||
| 31,210 | J. Crew Group, Inc.a,b | 843,294 | |||
| 45,460 | Life Time Fitness, Inc.a | 909,655 | |||
| 149,360 | Orient Express Hotels, Ltd.b | 1,268,066 | |||
| 40,240 | Ryland Group, Inc. | 676,032 | |||
| 179,430 | Saks, Inc.a,b | 794,875 | |||
| 63,950 | Scientific Games Corporationa | 1,008,492 | |||
| 98,410 | Texas Roadhouse, Inc.a | 1,073,653 | |||
| 46,440 | True Religion Apparel, Inc.a,b | 1,035,612 | |||
| 31,510 | Warnaco Group, Inc.a | 1,020,924 | |||
| 66,020 | WMS Industries, Inc.a | 2,080,290 | |||
Total Consumer Discretionary | 17,040,132 | ||||
| Consumer Staples (2.8%) | |||||
| 18,090 | Chattem, Inc.a,b | 1,231,929 | |||
| 9,370 | Green Mountain Coffee Roasters, Inc.a,b | 553,954 | |||
| 19,220 | Lance, Inc. | 444,559 | |||
| 46,610 | United Natural Foods, Inc.a | 1,223,512 | |||
Total Consumer Staples | 3,453,954 | ||||
| Energy (5.1%) | |||||
| 45,360 | Arena Resources, Inc.a | 1,444,716 | |||
| 31,540 | Bill Barrett Corporationa | 866,088 | |||
| 3,770 | Concho Resources, Inc.a | 108,161 | |||
| 21,040 | Core Laboratories NVb | 1,833,636 | |||
| 22,450 | Goodrich Petroleum Corporationa,b | 552,046 | |||
| 145,293 | Key Energy Services, Inc.a | 836,888 | |||
| 37,370 | Massey Energy Company | 730,210 | |||
Total Energy | 6,371,745 | ||||
| Financials (5.3%) | |||||
| 41,010 | Bank of the Ozarks, Inc.b | 887,046 | |||
| 37,950 | E-House China Holdings, Ltd. ADRa | 585,948 | |||
| 116,210 | GLG Partners, Inc.b | 475,299 | |||
| 45,170 | MSCI, Inc.a | 1,103,955 | |||
| 27,300 | ProAssurance Corporationa | 1,261,533 | |||
| 19,430 | Stifel Financial Corporationa | 934,389 | |||
| 19,690 | Tanger Factory Outlet Centers, Inc. | 638,547 | |||
| 113,321 | Western Alliance Bancorpa,b | 775,115 | |||
Total Financials | 6,661,832 | ||||
| Health Care (22.3%) | |||||
| 51,000 | Acorda Therapeutics, Inc.a | 1,437,690 | |||
| 34,810 | Alexion Pharmaceuticals, Inc.a | �� | 1,431,387 | ||
| 42,440 | Align Technology, Inc.a,b | 449,864 | |||
| 62,490 | Alkermes, Inc.a | 676,142 | |||
| 44,560 | AMERIGROUP Corporationa | 1,196,436 | |||
| 43,440 | Auxilium Pharmaceuticals, Inc.a,b | 1,363,147 | |||
| 23,540 | CardioNet, Inc.a,b | 384,173 | |||
| 20,520 | Cooper Companies, Inc. | 507,460 | |||
| 19,510 | Cougar Biotechnology, Inc.a | 838,149 | |||
| 23,200 | Haemonetics Corporationa | 1,322,400 | |||
| 91,200 | Healthsouth Corporationa,b | 1,316,928 | |||
| 55,230 | Immucor, Inc.a | 759,965 | |||
| 42,589 | MedAssets, Inc.a | 828,356 | |||
| 2,490 | Myriad Pharmaceuticals, Inc.a | 11,578 | |||
| 41,400 | NuVasive, Inc.a,b | 1,846,440 | |||
| 13,730 | OSI Pharmaceuticals, Inc.a | 387,598 | |||
| 37,100 | Owens & Minor, Inc. | 1,625,722 | |||
| 64,950 | PAREXEL International Corporationa | 933,981 | |||
| 28,900 | Perrigo Company | 802,842 | |||
| 67,090 | Psychiatric Solutions, Inc.a | 1,525,626 | |||
| 15,030 | Quality Systems, Inc.b | 856,109 | |||
| 28,450 | Savient Pharmaceuticals, Inc.a | 394,317 | |||
| 34,250 | STERIS Corporation | 893,240 | |||
| 311,640 | Tenet Healthcare Corporationa | 878,825 | |||
| 29,150 | Thoratec Corporationa | 780,637 | |||
| 18,200 | United Therapeutics Corporationa | 1,516,606 | |||
| 38,560 | West Pharmaceutical Services, Inc.b | 1,343,816 | |||
| 55,120 | Wright Medical Group, Inc.a | 896,251 | |||
| 28,780 | Xenoport, Inc.a | 666,833 | |||
Total Health Care | 27,872,518 | ||||
| Industrials (8.8%) | |||||
| 23,720 | American Superconductor Corporationa,b | 622,650 | |||
| 23,690 | Copa Holdings SA | 967,026 | |||
| 55,410 | Duff & Phelps Corporation | 985,190 | |||
| 28,930 | ESCO Technologies, Inc.a | 1,296,064 | |||
| 38,730 | Genesee & Wyoming, Inc.a | 1,026,732 | |||
| 22,480 | Hub Group, Inc.a | 463,987 | |||
| 113,360 | Kforce, Inc.a | 937,487 | |||
| 83,450 | Mobile Mini, Inc.a,b | 1,224,212 | |||
| 11,110 | Nordson Corporation | 429,513 | |||
| 41,490 | Tetra Tech, Inc.a | 1,188,688 | |||
| 26,890 | Watsco, Inc.b | 1,315,728 | |||
| 38,510 | Yingli Green Energy Holding Company, Ltd. ADRa,b | 521,810 | |||
Total Industrials | 10,979,087 | ||||
| Information Technology (29.0%) | |||||
| 53,730 | 3PAR, Inc.a | 666,252 | |||
| 30,190 | ADTRAN, Inc. | 648,179 | |||
| 82,680 | Ariba, Inc.a,b | 813,571 | |||
| 32,780 | AsiaInfo Holdings, Inc.a | 564,144 | |||
| 97,880 | Atheros Communications, Inc.a,b | 1,883,211 | |||
| 35,270 | Comscore, Inc.a | 469,796 | |||
| 58,770 | CyberSource Corporationa | 899,181 | |||
| 23,140 | Cymer, Inc.a | 687,952 | |||
| 19,650 | Digital River, Inc.a | 713,688 | |||
| 54,790 | Diodes, Inc.a | 856,916 | |||
| 28,760 | F5 Networks, Inc.a | 994,808 | |||
| 214,340 | Fairchild Semiconductor International, Inc.a | 1,498,237 | |||
| 56,900 | GSI Commerce, Inc.a,b | 810,825 | |||
| 33,680 | Mercadolibre, Inc.a,b | 905,318 | |||
| 59,090 | Net 1 UEPS Technology, Inc.a | 803,033 | |||
| 36,880 | Netlogic Microsystems, Inc.a,b | 1,344,645 | |||
| 64,610 | Novellus Systems, Inc.a | 1,078,987 | |||
| 100,650 | Omniture, Inc.a,b | 1,264,164 | |||
The accompanying Notes to Financial Statements are an integral part of this schedule.
118
Table of Contents
Partner Small Cap Growth Portfolio
Schedule of Investments as of June 30, 2009
(unaudited)
| Shares | Common Stock (94.0%) | Value | ||||
| Information Technology (29.0%) - continued | ||||||
| 94,620 | Palm, Inc.a,b | $ | 1,567,853 | |||
| 76,610 | Plexus Corporationa | 1,567,441 | ||||
| 235,290 | PMC-Sierra, Inc.a | 1,872,908 | ||||
| 28,630 | Riverbed Technology, Inc.a,b | 663,930 | ||||
| 31,600 | Rosetta Stone, Inc.a,b | 867,104 | ||||
| 65,470 | Semtech Corporationa | 1,041,628 | ||||
| 16,350 | Solarwinds, Inc.a | 269,612 | ||||
| 46,734 | Sybase, Inc.a | 1,464,644 | ||||
| 39,450 | Synaptics, Inc.a,b | 1,524,743 | ||||
| 212,910 | Teradyne, Inc.a | 1,460,563 | ||||
| 65,150 | TiVo, Inc.a | 682,772 | ||||
| 62,710 | Ultratech, Inc.a | 771,960 | ||||
| 50,090 | Varian Semiconductor Equipment Associates, Inc.a | 1,201,659 | ||||
| 94,520 | Verigy, Ltd.a | 1,150,308 | ||||
| 53,050 | VistaPrint, Ltd.a,b | 2,262,582 | ||||
| 50,060 | Vocus, Inc.a,b | 989,186 | ||||
Total Information Technology | 36,261,800 | |||||
| Materials (4.3%) | ||||||
| 27,660 | Ashland, Inc. | 775,863 | ||||
| 66,800 | Century Aluminum Companya | 416,164 | ||||
| 18,700 | Compass Minerals International, Inc. | 1,026,817 | ||||
| 24,450 | Greif, Inc. | 1,081,179 | ||||
| 14,490 | Schnitzer Steel Industries, Inc. | 765,941 | ||||
| 31,970 | Temple-Inland, Inc. | 419,447 | ||||
| 89,740 | Thompson Creek Metals Company, Inc.a,b | 917,143 | ||||
Total Materials | 5,402,554 | |||||
| Telecommunications Services (1.8%) | ||||||
| 18,980 | Leap Wireless International, Inc.a,b | 625,011 | ||||
| 8,990 | Neutral Tandem, Inc.a | 265,385 | ||||
| 79,200 | Premiere Global Services, Inc.a | 858,528 | ||||
| 47,590 | TW Telecom, Inc.a | 488,749 | ||||
Total Telecommunications Services | 2,237,673 | |||||
| Utilities (1.0%) | ||||||
| 26,730 | ITC Holdings Corporation | 1,212,473 | ||||
Total Utilities | 1,212,473 | |||||
Total Common Stock (cost $108,445,082) | 117,493,768 | |||||
| Principal Amount | Long-Term Fixed Income (0.6%) | |||||
| U.S. Government (0.6%) | ||||||
U.S. Treasury Notes | ||||||
| 800,000 | 0.875%, 12/31/2010c | 801,093 | ||||
Total U.S. Government | 801,093 | |||||
Total Long-Term Fixed Income (cost $800,559) | 801,093 | |||||
| Shares | Collateral Held for Securities Loaned (23.3%) | |||||
| 29,191,894 | Thrivent Financial Securities Lending Trust | 29,191,894 | ||||
Total Collateral Held for Securities Loaned (cost $29,191,894) | 29,191,894 | |||||
Short-Term Investments (5.0%) | ||||||
| 6,235,811 | Thrivent Money Market Portfolio | 6,235,811 | ||||
Total Short-Term Investments (at amortized cost) | 6,235,811 | |||||
Total Investments (cost $144,673,346) 122.9% | $ | 153,722,566 | ||||
Other Assets and Liabilities, Net (22.9%) | (28,657,425 | ) | ||||
Total Net Assets 100.0% | $ | 125,065,141 | ||||
| a | Non-income producing security. |
| b | All or a portion of the security is on loan as discussed in item 2(M) of the Notes to Financial Statements. |
| c | At June 30, 2009, $801,093 of investments were held on deposit with the counterparty and pledged as the initial margin deposit for open futures contracts. |
Definitions:
| ADR | - | American Depositary Receipt, which are certificates for an underlying foreign security’s shares held by an issuing U.S. depository bank. |
Unrealized Appreciation (Depreciation)
Gross unrealized appreciation and depreciation of investments, based on cost for federal income tax purposes, were as follows:
Gross unrealized appreciation | $ | 17,243,332 | ||
Gross unrealized depreciation | (8,194,112 | ) | ||
Net unrealized appreciation (depreciation) | $ | 9,049,220 | ||
Cost for federal income tax purposes | $ | 144,673,346 | ||
The accompanying Notes to Financial Statements are an integral part of this schedule.
119
Table of Contents
Partner Small Cap Growth Portfolio
Schedule of Investments as of June 30, 2009
(unaudited)
Fair Valuation Measurements
The following table is a summary of the inputs used, as of June 30, 2009, in valuing Partner Small Cap Growth Portfolio’s assets carried at fair value as discussed in the Notes to Financial Statements.
Investments in Securities | Total | Level 1 | Level 2 | Level 3 | ||||||||||
Common Stock | ||||||||||||||
Consumer Discretionary | 17,040,132 | 17,040,132 | — | — | ||||||||||
Consumer Staples | 3,453,954 | 3,453,954 | — | — | ||||||||||
Energy | 6,371,745 | 6,371,745 | — | — | ||||||||||
Financials | 6,661,832 | 6,661,832 | — | — | ||||||||||
Health Care | 27,872,518 | 27,872,518 | — | — | ||||||||||
Industrials | 10,979,087 | 10,979,087 | — | — | ||||||||||
Information Technology | 36,261,800 | 36,261,800 | — | — | ||||||||||
Materials | 5,402,554 | 5,402,554 | — | — | ||||||||||
Telecommunications Services | 2,237,673 | 2,237,673 | — | — | ||||||||||
Utilities | 1,212,473 | 1,212,473 | — | — | ||||||||||
Long-Term Fixed Income | ||||||||||||||
U.S. Government | 801,093 | — | 801,093 | — | ||||||||||
Collateral Held for Securities Loaned | 29,191,894 | 29,191,894 | — | — | ||||||||||
Short-Term Investments | 6,235,811 | 6,235,811 | — | — | ||||||||||
Total | $ | 153,722,566 | $ | 152,921,473 | $ | 801,093 | $ | — | ||||||
Other Financial Instruments* | ($100,309 | ) | ($100,309 | ) | $ | — | $ | — | ||||||
| * | Other Financial Instruments include Futures, Forwards, Written Options and Swap agreements. |
Futures Contracts | Number of Contracts Long/(Short) | Expiration Date | Notional Principal Amount | Value | Unrealized Gain/(Loss) | |||||||||
Russell 2000 Index Mini-Futures | 65 | September 2009 | $ | 3,397,109 | $ | 3,296,800 | ($ | 100,309 | ) | |||||
Total Futures Contracts | ($ | 100,309 | ) | |||||||||||
The following table summarizes the fair value and Statement of Assets and Liabilities location, as of June 30, 2009, for the Partner Small Cap Growth Portfolio’s investments in financial derivative instruments by primary risk exposure as discussed under item (2) Significant Accounting Policies of the Notes to Financial Statements.
Derivatives by Risk Category | Statement of Assets and Liabilities Location | Fair Value | |||
Liability Derivatives | |||||
Equity Contracts | |||||
Future* | Net Assets - Net unrealized appreciation/(depreciation) on Futures contracts | 100,309 | |||
Total Equity Contracts | 100,309 | ||||
Total Liability Derivatives | $ | 100,309 | |||
| * | Includes cumulative appreciation/depreciation of futures contracts as reported in the Schedule of Investments. Only current day’s variation margin is reported within the Statement of Assets and Liabilities. |
The following table summarizes the net realized gains/(losses) and Statement of Operations location, for the period ended June 30, 2009, for Partner Small Cap Growth Portfolio’s investments in financial derivative instruments by primary risk exposure.
Derivatives by Risk Category | Statement of Operations Location | Realized Gains/(Losses) recognized in Income | |||
Equity Contracts | |||||
Future | Net realized gains/(losses) on Futures contracts | 830,380 | |||
Total Equity Contracts | 830,380 | ||||
Total | $ | 830,380 | |||
The accompanying Notes to Financial Statements are an integral part of this schedule.
120
Table of Contents
Partner Small Cap Growth Portfolio
Schedule of Investments as of June 30, 2009
(unaudited)
The following table summarizes the change in net unrealized appreciation/(depreciation) and Statement of Operations location, for the period ended June 30, 2009, for the Partner Small Cap Growth Portfolio’s investments in financial derivative instruments by primary risk exposure.
Derivatives by Risk Category | Statement of Operations Location | Change in Unrealized Appreciation/(Depreciation) recognized in Income | |||
Equity Contracts | |||||
Future | Change in net unrealized appreciation/(depreciation) on Futures contracts | (641,877 | ) | ||
Total Equity Contracts | (641,877 | ) | |||
Total | ($641,877 | ) | |||
Investment in Affiliates
Affiliated issuers, as defined under the Investment Company Act of 1940, include those in which the Portfolio’s holdings of an issuer represent 5% or more of the outstanding voting securities of an issuer, or any affiliated mutual fund.
A summary of transactions for the fiscal year to date, in Partner Small Cap Growth Portfolio, is as follows:
Portfolio | Value December 31, 2008 | Gross Purchases | Gross Sales | Shares Held at June 30, 2009 | Value June 30, 2009 | Income Earned January 1, 2009 - June 30, 2009 | |||||||||||
Money Market | $ | 6,507,240 | $ | 34,556,008 | $ | 34,827,437 | 6,235,811 | $ | 6,235,811 | $ | 25,315 | ||||||
Thrivent Financial Securities Lending Trust | 19,195,880 | 66,365,213 | 56,369,199 | 29,191,894 | 29,191,894 | 118,629 | |||||||||||
Total Value and Income Earned | 25,703,120 | 35,427,705 | 143,944 | ||||||||||||||
The accompanying Notes to Financial Statements are an integral part of this schedule.
121
Table of Contents
Partner Small Cap Value Portfolio
Schedule of Investments as of June 30, 2009
(unaudited)
| Shares | Common Stock (96.8%) | Value | |||
| Consumer Discretionary (14.2%) | |||||
| 137,000 | Aaron’s, Inc. | $ | 4,085,340 | ||
| 43,000 | Cavco Industries, Inc.a | 1,089,190 | |||
| 48,000 | Corinthian Colleges, Inc.a,b | 812,640 | |||
| 44,500 | CSS Industries, Inc. | 906,910 | |||
| 76,500 | Dixie Group, Inc.a | 222,615 | |||
| 60,400 | Dorman Products, Inc.a | 835,332 | |||
| 92,000 | Drew Industries, Inc.a,b | 1,119,640 | |||
| 68,000 | Fred’s, Inc. | 856,800 | |||
| 68,000 | Haverty Furniture Companies, Inc.b | 622,200 | |||
| 36,000 | Hooker Furniture Corporation | 413,280 | |||
| 60,100 | Knology, Inc.a | 518,663 | |||
| 49,600 | M/I Homes, Inc.b | 485,584 | |||
| 65,000 | MarineMax, Inc.a,b | 223,600 | |||
| 43,000 | Matthews International Corporation | 1,338,160 | |||
| 78,000 | Men’s Wearhouse, Inc. | 1,496,040 | |||
| 80,000 | Meritage Homes Corporationa,b | 1,508,800 | |||
| 153,000 | Orient Express Hotels, Ltd.b | 1,298,970 | |||
| 68,200 | Pool Corporationb | 1,129,392 | |||
| 19,900 | Saga Communications, Inc.a | 102,485 | |||
| 141,000 | Shiloh Industries, Inc.a | 520,290 | |||
| 57,100 | Stanley Furniture Company, Inc.b | 616,109 | |||
| 75,000 | Steak n Shake Companya,b | 655,500 | |||
| 145,000 | Stein Mart, Inc.a | 1,284,700 | |||
| 46,900 | Steven Madden, Ltd.a | 1,193,605 | |||
| 104,000 | Winnebago Industries, Inc.b | 772,720 | |||
Total Consumer Discretionary | 24,108,565 | ||||
| Consumer Staples (1.9%) | |||||
| 255,000 | Alliance One International, Inc.a | 969,000 | |||
| 44,000 | Casey’s General Stores, Inc. | 1,130,360 | |||
| 40,000 | Nash Finch Company | 1,082,400 | |||
Total Consumer Staples | 3,181,760 | ||||
| Energy (4.3%) | |||||
| 43,700 | Carbo Ceramics, Inc.b | 1,494,540 | |||
| 145,000 | Hercules Offshore, Inc.a,b | 575,650 | |||
| 48,100 | Mariner Energy, Inc.a | 565,175 | |||
| 175,000 | NGAS Resources, Inc.a,b | 365,750 | |||
| 8,800 | Overseas Shipholding Group, Inc.b | 299,552 | |||
| 95,000 | Penn Virginia Corporation | 1,555,150 | |||
| 71,000 | Whiting Petroleum Corporationa | 2,496,360 | |||
Total Energy | 7,352,177 | ||||
| Financials (19.2%) | |||||
| 190,000 | Ares Capital Corporation | 1,531,400 | |||
| 218,000 | CBL & Associates Properties, Inc.b | 1,175,020 | |||
| 131,500 | Cedar Shopping Centers, Inc. | 594,380 | |||
| 122,000 | East West Bancorp, Inc.b | 791,780 | |||
| 43,500 | Employers Holdings, Inc. | 589,425 | |||
| 118,000 | First Opportunity Fund, Inc. | 587,640 | |||
| 86,000 | Glacier Bancorp, Inc.b | 1,270,220 | |||
| 71,000 | Gladstone Capital Corporationb | 534,630 | |||
| 64,500 | Hatteras Financial Corporation | 1,844,055 | |||
| 124,000 | Hercules Technology Growth Capital, Inc.b | 1,036,640 | |||
| 37,300 | Home Bancshares, Inc.b | 710,192 | |||
| 16,000 | iShares Russell 2000 Value Fund | 744,480 | |||
| 58,200 | JMP Group, Inc. | 447,558 | |||
| 41,700 | Kilroy Realty Corporation | 856,518 | |||
| 143,000 | Kite Realty Group Trust | 417,560 | |||
| 60,000 | LaSalle Hotel Properties | 740,400 | |||
| 3,600 | Markel Corporationa | 1,014,120 | |||
| 92,000 | Max Re Capital, Ltd.b | 1,698,320 | |||
| 91,000 | Meadowbrook Insurance Group, Inc. | 594,230 | |||
| 56,000 | National Interstate Corporationb | 850,080 | |||
| 36,000 | Parkway Properties, Inc. | 468,000 | |||
| 158,800 | PennantPark Investment Corporation | 1,127,480 | |||
| 33,500 | Piper Jaffray Companiesa | 1,462,945 | |||
| 63,000 | Potlatch Corporation | 1,530,270 | |||
| 72,000 | ProAssurance Corporationa | 3,327,120 | |||
| 81,000 | Redwood Trust, Inc.b | 1,195,560 | |||
| 760,000 | Safeguard Scientifics, Inc.a | 1,003,200 | |||
| 56,000 | Sandy Spring Bancorp, Inc.b | 823,200 | |||
| 53,000 | Seabright Insurance Holdingsa | 536,890 | |||
| 64,900 | SVB Financial Groupa,b | 1,766,578 | |||
| 64,300 | Western Alliance Bancorpa,b | 439,812 | |||
| 48,000 | Wintrust Financial Corporation | 771,840 | |||
Total Financials | 32,481,543 | ||||
| Health Care (6.6%) | |||||
| 24,800 | Analogic Corporation | 916,360 | |||
| 39,000 | Angiodynamics, Inc.a | 517,530 | |||
| 7,000 | Atrion Corporation | 938,630 | |||
| 410,000 | Lexicon Pharmaceuticals, Inc.a | 508,400 | |||
| 81,000 | Momenta Pharmaceuticals, Inc.a,b | 974,430 | |||
| 32,000 | National Healthcare Corporationb | 1,214,080 | |||
| 76,200 | Owens & Minor, Inc. | 3,339,084 | |||
| 66,500 | Triple-S Management Corporationa | 1,036,735 | |||
| 51,000 | West Pharmaceutical Services, Inc.b | 1,777,350 | |||
Total Health Care | 11,222,599 | ||||
| Industrials (24.0%) | |||||
| 27,000 | A.O. Smith Corporation | 879,390 | |||
| 129,700 | Accuride Corporationa,b | 42,672 | |||
| 79,500 | Alaska Air Group, Inc.a | 1,451,670 | |||
| 28,000 | Ameron International Corporation | 1,877,120 | |||
| 51,900 | Applied Industrial Technologies, Inc. | 1,022,430 | |||
| 33,000 | Astec Industries, Inc.a,b | 979,770 | |||
| 140,000 | Beacon Roofing Supply, Inc.a | 2,024,400 | |||
| 54,000 | Belden, Inc. | 901,800 | |||
| 79,200 | C&D Technologies, Inc.a,b | 158,400 | |||
| 30,000 | Cascade Corporation | 471,900 | |||
| 46,000 | Circor International, Inc. | 1,086,060 | |||
| 91,000 | Comfort Systems USA, Inc. | 932,750 | |||
| 39,000 | Courier Corporation | 595,140 | |||
| 42,000 | Dollar Thrifty Automotive Group, Inc.a,b | 585,900 | |||
| 16,200 | Franklin Electric Company, Inc. | 419,904 | |||
| 18,000 | FTI Consulting, Inc.a | 912,960 | |||
| 59,000 | G & K Services, Inc. | 1,247,850 | |||
| 58,000 | Genesee & Wyoming, Inc.a | 1,537,580 | |||
| 82,200 | Gibraltar Industries, Inc. | 564,714 | |||
| 48,500 | Greenbrier Companies, Inc. | 348,715 | |||
| 62,000 | Hub Group, Inc.a | 1,279,680 | |||
The accompanying Notes to Financial Statements are an integral part of this schedule.
122
Table of Contents
Partner Small Cap Value Portfolio
Schedule of Investments as of June 30, 2009
(unaudited)
| Shares | Common Stock (96.8%) | Value | |||
| Industrials (24.0%) - continued | |||||
| 57,500 | IDEX Corporation | $ | 1,412,775 | ||
| 80,000 | Insituform Technologies, Inc.a | 1,357,600 | |||
| 49,000 | Kaman Corporation | 818,300 | |||
| 188,000 | Kforce, Inc.a | 1,554,760 | |||
| 71,000 | Kirby Corporationa | 2,257,090 | |||
| 432,400 | Kratos Defense & Security Solutions, Inc.a | 384,836 | |||
| 96,500 | McGrath Rentcorp | 1,839,290 | |||
| 201,000 | MPS Group, Inc.a | 1,535,640 | |||
| 58,900 | Navigant Consulting, Inc.a | 760,988 | |||
| 51,000 | Nordson Corporation | 1,971,660 | |||
| 22,400 | School Specialty, Inc.a,b | 452,704 | |||
| 76,300 | Sterling Construction Company, Inc.a | 1,164,338 | |||
| 48,500 | Universal Forest Products, Inc. | 1,604,865 | |||
| 147,500 | Vitran Corporation, Inc.a | 1,460,250 | |||
| 50,000 | Waste Connections, Inc.a | 1,295,500 | |||
| 78,500 | Woodward Governor Company | 1,554,300 | |||
Total Industrials | 40,745,701 | ||||
| Information Technology (10.8%) | |||||
| 126,000 | Advanced Energy Industries, Inc.a | 1,132,740 | |||
| 119,000 | Ariba, Inc.a,b | 1,170,960 | |||
| 110,000 | Brooks Automation, Inc.a | 492,800 | |||
| 19,500 | Cabot Microelectronics Corporationa | 551,655 | |||
| 107,000 | Electro Rent Corporation | 1,015,430 | |||
| 60,000 | FormFactor, Inc.a | 1,034,400 | |||
| 150,000 | GSI Group, Inc.a | 147,000 | |||
| 137,900 | Ixiaa | 929,446 | |||
| 38,000 | Littelfuse, Inc.a | 758,480 | |||
| 80,000 | Methode Electronics, Inc. | 561,600 | |||
| 53,400 | Palm, Inc.a,b | 884,838 | |||
| 85,000 | Progress Software Corporationa | 1,799,450 | |||
| 311,100 | Sonus Networks, Inc.a | 500,871 | |||
| 62,500 | SPSS, Inc.a | 2,085,625 | |||
| 30,500 | Standard Microsystems Corporationa | 623,725 | |||
| 82,400 | StarTek, Inc.a | 660,848 | |||
| 92,300 | Symyx Technologies, Inc.a | 539,955 | |||
| 66,500 | Synnex Corporationa | 1,661,835 | |||
| 125,700 | Teradyne, Inc.a | 862,302 | |||
| 23,000 | Vignette Corporationa | 302,450 | |||
| 53,300 | Xyratex, Ltd.a | 265,967 | |||
| 444,000 | Zarlink Semiconductor, Inc.a | 249,972 | |||
Total Information Technology | 18,232,349 | ||||
| Materials (10.4%) | |||||
| 42,500 | Airgas, Inc. | 1,722,525 | |||
| 62,200 | AMCOL International Corporationb | 1,342,276 | |||
| 96,000 | American Vanguard Corporationb | 1,084,800 | |||
| 78,500 | AptarGroup, Inc. | 2,650,945 | |||
| 60,000 | Arch Chemicals, Inc. | 1,475,400 | |||
| 59,000 | Carpenter Technology Corporation | 1,227,790 | |||
| 31,000 | Clearwater Paper Corporationa | 783,990 | |||
| 13,500 | Deltic Timber Corporation | 478,845 | |||
| 47,100 | Franco-Nevada Corporation | 1,132,149 | |||
| 76,500 | Innospec, Inc. | 822,375 | |||
| 200,000 | International Royalty Corporationb | 652,000 | |||
| 24,800 | Minerals Technologies, Inc. | 893,296 | |||
| 142,000 | Myers Industries, Inc. | 1,181,440 | |||
| 53,500 | Sims Metal Management, Ltd. ADR | 1,103,170 | |||
| 165,000 | Wausau Paper Corporation | 1,108,800 | |||
Total Materials | 17,659,801 | ||||
| Telecommunications Services (0.6%) | |||||
| 98,000 | Premiere Global Services, Inc.a | 1,062,320 | |||
Total Telecommunications Services | 1,062,320 | ||||
| Utilities (4.8%) | |||||
| 73,500 | Black Hills Corporation | 1,689,765 | |||
| 104,500 | Cleco Corporation | 2,342,890 | |||
| 65,000 | El Paso Electric Companya | 907,400 | |||
| 41,500 | Empire District Electric Companyb | 685,580 | |||
| 64,700 | Southwest Gas Corporation | 1,436,987 | |||
| 47,000 | Vectren Corporation | 1,101,210 | |||
Total Utilities | 8,163,832 | ||||
Total Common Stock (cost $211,254,295) | 164,210,647 | ||||
Preferred Stock (1.3%) | |||||
| Energy (0.4%) | |||||
| 6,700 | Whiting Petroleum Corporation, Convertiblea | 660,888 | |||
Total Energy | 660,888 | ||||
| Financials (0.5%) | |||||
| 8,400 | Assured Guaranty, Ltd., Convertiblea | 457,800 | |||
| 820 | East West Bancorp, Inc. | 476,625 | |||
Total Financials | 934,425 | ||||
| Health Care (0.4%) | |||||
| 55,300 | National Healthcare Corporation, Convertible | 649,222 | |||
Total Health Care | 649,222 | ||||
Total Preferred Stock (cost $2,650,261) | 2,244,535 | ||||
Collateral Held for Securities Loaned (16.1%) | |||||
| 27,419,237 | Thrivent Financial Securities Lending Trust | 27,419,237 | |||
Total Collateral Held for Securities Loaned (cost $27,419,237) | 27,419,237 | ||||
The accompanying Notes to Financial Statements are an integral part of this schedule.
123
Table of Contents
Partner Small Cap Value Portfolio
Schedule of Investments as of June 30, 2009
(unaudited)
| Shares | Short-Term Investments (1.7%) | Value | ||||
| 2,821,081 | Thrivent Money Market Portfolio | $ | 2,821,081 | |||
Total Short-Term Investments (at amortized cost) | 2,821,081 | |||||
Total Investments (cost $244,144,874) 115.9% | $ | 196,695,500 | ||||
Other Assets and Liabilities, Net (15.9%) | (26,996,370 | ) | ||||
Total Net Assets 100.0% | $ | 169,699,130 | ||||
| a | Non-income producing security. |
| b | All or a portion of the security is on loan as discussed in item 2(M) of the Notes to Financial Statements. |
Unrealized Appreciation (Depreciation)
Gross unrealized appreciation and depreciation of investments, based on cost for federal income tax purposes, were as follows:
Gross unrealized appreciation | $ | 11,674,061 | ||
Gross unrealized depreciation | (59,123,435 | ) | ||
Net unrealized appreciation (depreciation) | $ | (47,449,374 | ) | |
Cost for federal income tax purposes | $ | 244,144,874 | ||
Fair Valuation Measurements
The following table is a summary of the inputs used, as of June 30, 2009, in valuing Partner Small Cap Value Portfolio’s assets carried at fair value as discussed in the Notes to Financial Statements.
Investments in Securities | Total | Level 1 | Level 2 | Level 3 | ||||||||
Common Stock | ||||||||||||
Consumer Discretionary | 24,108,565 | 24,108,565 | — | — | ||||||||
Consumer Staples | 3,181,760 | 3,181,760 | — | — | ||||||||
Energy | 7,352,177 | 7,352,177 | — | — | ||||||||
Financials | 32,481,543 | 32,481,543 | — | — | ||||||||
Health Care | 11,222,599 | 11,222,599 | — | — | ||||||||
Industrials | 40,745,701 | 40,745,701 | — | — | ||||||||
Information Technology | 18,232,349 | 18,232,349 | — | — | ||||||||
Materials | 17,659,801 | 17,659,801 | — | — | ||||||||
Telecommunications Services | 1,062,320 | 1,062,320 | — | — | ||||||||
Utilities | 8,163,832 | 8,163,832 | — | — | ||||||||
Preferred Stock | ||||||||||||
Energy | 660,888 | 660,888 | — | — | ||||||||
Financials | 934,425 | — | 476,625 | 457,800 | ||||||||
Health Care | 649,222 | 649,222 | — | — | ||||||||
Collateral Held for Securities Loaned | 27,419,237 | 27,419,237 | — | — | ||||||||
Short-Term Investments | 2,821,081 | 2,821,081 | — | — | ||||||||
Total | $ | 196,695,500 | $ | 195,761,075 | $ | 476,625 | $ | 457,800 | ||||
The following table is a reconciliation of assets in which significant unobservable inputs (Level 3) were used in determining fair value for the Partner Small Cap Value Portfolio as discussed in item 2(A) of the Notes to Financial Statements.
Investments in Securities | Value December 31, 2008 | Accrued Discounts and/or Premiums | Realized Gain/(Loss) | Change in Unrealized Gain/(Loss) | Net Purchases/(Sales) | Transfers in and/or (Out of) Level 3 | Value June 30, 2009 | ||||||||||||||
Preferred Stock | |||||||||||||||||||||
Financials | — | — | — | 37,800 | 420,000 | — | 457,800 | ||||||||||||||
Total | $ | — | $ | — | $ | — | $ | 37,800 | $ | 420,000 | $ | — | $ | 457,800 | |||||||
The accompanying Notes to Financial Statements are an integral part of this schedule.
124
Table of Contents
Partner Small Cap Value Portfolio
Schedule of Investments as of June 30, 2009
(unaudited)
Investment in Affiliates
Affiliated issuers, as defined under the Investment Company Act of 1940, include those in which the Portfolio’s holdings of an issuer represent 5% or more of the outstanding voting securities of an issuer, or any affiliated mutual fund.
A summary of transactions for the fiscal year to date, in Partner Small Cap Value Portfolio, is as follows:
Portfolio | Value December 31, 2008 | Gross Purchases | Gross Sales | Shares Held at June 30, 2009 | Value June 30, 2009 | Income Earned January 1, 2009 - June 30, 2009 | |||||||||||
Money Market | $ | 2,927,734 | $ | 10,857,108 | $ | 10,963,761 | 2,821,081 | $ | 2,821,081 | $ | 7,800 | ||||||
Thrivent Financial Securities Lending Trust | 26,942,036 | 70,140,615 | 69,663,414 | 27,419,237 | 27,419,237 | 62,108 | |||||||||||
Total Value and Income Earned | 29,869,770 | 30,240,318 | 69,908 | ||||||||||||||
The accompanying Notes to Financial Statements are an integral part of this schedule.
125
Table of Contents
Schedule of Investments as of June 30, 2009
(unaudited)
| Shares | Common Stock (94.6%) | Value | |||
| Consumer Discretionary (13.9%) | |||||
| 35,000 | Aaron’s, Inc.a | $ | 1,043,700 | ||
| 16,500 | Aeropostale, Inc.b | 565,455 | |||
| 32,600 | American Casinos, Inc. | 620,378 | |||
| 48,600 | Autoliv, Inc. | 1,398,222 | |||
| 6,600 | BorgWarner, Inc. | 225,258 | |||
| 60,000 | Bridgepoint Education, Inc.b | 1,020,000 | |||
| 41,500 | Brinker International, Inc. | 706,745 | |||
| 5,200 | Buckle, Inc. | 165,204 | |||
| 14,700 | Buffalo Wild Wings, Inc.a,b | 478,044 | |||
| 70,300 | Career Education Corporationb | 1,749,767 | |||
| 24,400 | Carter’s, Inc.b | 600,484 | |||
| 53,000 | CEC Entertainment, Inc.b | 1,562,440 | |||
| 83,600 | Chico’s FAS, Inc.b | 813,428 | |||
| 21,900 | Children’s Place Retail Stores, Inc.b | 578,817 | |||
| 88,400 | Cooper Tire & Rubber Company | 876,928 | |||
| 44,400 | Discovery Communications, Inc., Class Ab | 1,001,220 | |||
| 60,900 | Dolan Media Companyb | 778,911 | |||
| 168,000 | Domino’s Pizza, Inc.b | 1,258,320 | |||
| 73,700 | Fossil, Inc.b | 1,774,696 | |||
| 81,500 | Fred’s, Inc. | 1,026,900 | |||
| 101,500 | Gentex Corporation | 1,177,400 | |||
| 35,900 | Goodyear Tire & Rubber Companyb | 404,234 | |||
| 34,700 | Guess ?, Inc. | 894,566 | |||
| 40,200 | Jack in the Box, Inc.b | 902,490 | |||
| 63,600 | Jones Apparel Group, Inc. | 682,428 | |||
| 12,100 | Joseph A. Bank Clothiers, Inc.b | 416,966 | |||
| 74,300 | KB Homea | 1,016,424 | |||
| 70,300 | Leggett & Platt, Inc. | 1,070,669 | |||
| 31,100 | LKQ Corporationb | 511,595 | |||
| 67,800 | M/I Homes, Inc. | 663,762 | |||
| 44,900 | Men’s Wearhouse, Inc. | 861,182 | |||
| 42,400 | Penn National Gaming, Inc.b | 1,234,264 | |||
| 5,600 | Priceline.com, Inc.a,b | 624,680 | |||
| 81,600 | Regal Entertainment Groupa | 1,084,464 | |||
| 51,400 | Shuffle Master, Inc.b | 339,754 | |||
| 43,300 | Shutterfly, Inc.b | 604,035 | |||
| 76,900 | Texas Roadhouse, Inc.b | 838,979 | |||
| 52,500 | Thor Industries, Inc. | 964,425 | |||
| 48,700 | Tupperware Corporation | 1,267,174 | |||
| 112,200 | Valassis Communications, Inc.b | 685,542 | |||
| 36,600 | Warnaco Group, Inc.b | 1,185,840 | |||
| 42,300 | WMS Industries, Inc.b | 1,332,873 | |||
| 61,800 | Wolverine World Wide, Inc. | 1,363,308 | |||
Total Consumer Discretionary | 38,371,971 | ||||
| Consumer Staples (3.2%) | |||||
| 19,600 | American Italian Pasta Companyb | 571,144 | |||
| 81,200 | Bare Escentuals, Inc.b | 720,244 | |||
| 35,542 | Calavo Growers, Inc. | 704,798 | |||
| 30,900 | Casey’s General Stores, Inc. | 793,821 | |||
| 16,500 | Chattem, Inc.a,b | 1,123,650 | |||
| 156,500 | Del Monte Foods Company | 1,467,970 | |||
| 37,800 | Herbalife, Ltd. | 1,192,212 | |||
| 18,800 | Sanderson Farms, Inc. | 846,000 | |||
| 26,800 | TreeHouse Foods, Inc.b | 771,036 | |||
| 39,100 | Vector Group, Ltd.a | 558,739 | |||
Total Consumer Staples | 8,749,614 | ||||
| Energy (4.7%) | |||||
| 60,600 | Arch Coal, Inc. | 931,422 | |||
| 37,700 | Cabot Oil & Gas Corporation | 1,155,128 | |||
| 54,600 | Carrizo Oil & Gas, Inc.a,b | 936,390 | |||
| 7,400 | Core Laboratories NVa | 644,910 | |||
| 19,800 | Dresser-Rand Group, Inc.b | 516,780 | |||
| 12,900 | Forest Oil Corporationb | 192,468 | |||
| 216,500 | Global Industries, Ltd.a,b | 1,225,390 | |||
| 41,600 | Key Energy Services, Inc.b | 239,616 | |||
| 34,200 | Oil States International, Inc.b | 827,982 | |||
| 95,100 | Patterson-UTI Energy, Inc. | 1,222,986 | |||
| 89,800 | SandRidge Energy, Inc.a,b | 765,096 | |||
| 24,200 | Superior Energy Services, Inc.b | 417,934 | |||
| 44,000 | T-3 Energy Services, Inc.b | 524,040 | |||
| 97,400 | Tesco Corporationb | 773,356 | |||
| 29,600 | TETRA Technologies, Inc.b | 235,616 | |||
| 113,500 | Union Drilling, Inc.b | 751,370 | |||
| 66,800 | Willbros Group, Inc.b | 835,668 | |||
| 22,000 | World Fuel Services Corporation | 907,060 | |||
Total Energy | 13,103,212 | ||||
| Financials (17.2%) | |||||
| 28,100 | Affiliated Managers Group, Inc.b | 1,635,139 | |||
| 48,500 | American Campus Communities, Inc. | 1,075,730 | |||
| 25,500 | Aspen Insurance Holdings, Ltd. | 569,670 | |||
| 27,300 | BancorpSouth, Inc. | 560,469 | |||
| 5,200 | Bank of the Ozarks, Inc.a | 112,476 | |||
| 95,100 | Cardinal Financial Corporation | 744,633 | |||
| 43,200 | Cohen & Steers, Inc.a | 645,840 | |||
| 39,500 | Delphi Financial Group, Inc. | 767,485 | |||
| 84,700 | Duke Realty Corporation | 742,819 | |||
| 115,500 | DuPont Fabros Technology, Inc. | 1,088,010 | |||
| 51,100 | East West Bancorp, Inc.a | 331,639 | |||
| 61,800 | eHealth, Inc.b | 1,091,388 | |||
| 29,600 | Endurance Specialty Holdings, Ltd. | 867,280 | |||
| 46,600 | Evercore Partners, Inc. | 915,224 | |||
| 44,200 | FBR Capital Markets Corporationb | 207,740 | |||
| 80,500 | Fifth Third Bancorp | 571,550 | |||
| 76,300 | First Mercury Financial Corporation | 1,050,651 | |||
| 47,800 | Glacier Bancorp, Inc.a | 706,006 | |||
| 57,500 | HCC Insurance Holdings, Inc. | 1,380,575 | |||
| 70,200 | Hilltop Holdings, Inc.b | 833,274 | |||
| 29,600 | Home Bancshares, Inc.a | 563,584 | |||
| 40,200 | IPC Holdings, Ltd. | 1,099,068 | |||
| 24,200 | iShares Russell 2000 Index Fund | 1,233,232 | |||
| 36,700 | iShares Russell Microcap Index Funda | 1,207,430 | |||
| 115,600 | Kite Realty Group Trust | 337,552 | |||
| 59,200 | Knight Capital Group, Inc.b | 1,009,360 | |||
| 67,700 | LaSalle Hotel Properties | 835,418 | |||
| 128,100 | Meadowbrook Insurance Group, Inc. | 836,493 | |||
| 164,900 | MFA Mortgage Investments, Inc. | 1,141,108 | |||
| 247,700 | MGIC Investment Corporationa | 1,089,880 | |||
| 28,800 | Mid-America Apartment Communities, Inc. | 1,057,248 | |||
| 67,800 | National Retail Properties, Inc. | 1,176,330 | |||
| 66,100 | NewAlliance Bancshares, Inc. | 760,150 | |||
| 85,400 | Ocwen Financial Corporationb | 1,107,638 | |||
| 73,000 | optionsXpress Holdings, Inc. | 1,133,690 | |||
The accompanying Notes to Financial Statements are an integral part of this schedule.
126
Table of Contents
Small Cap Stock Portfolio
Schedule of Investments as of June 30, 2009
(unaudited)
| Shares | Common Stock (94.6%) | Value | |||
| Financials (17.2%) - continued | |||||
| 38,500 | Pinnacle Financial Partners, Inc.b | $ | 512,820 | ||
| 16,400 | Platinum Underwriters Holdings, Ltd. | 468,876 | |||
| 22,700 | Potlatch Corporation | 551,383 | |||
| 62,800 | ProLogis Trust | 506,168 | |||
| 41,700 | Prosperity Bancshares, Inc.a | 1,243,911 | |||
| 86,600 | Protective Life Corporation | 990,704 | |||
| 9,700 | Regency Centers Corporation | 338,627 | |||
| 19,000 | Renasant Corporation | 285,380 | |||
| 14,600 | Senior Housing Property Trust | 238,272 | |||
| 39,100 | Signature Bankb | 1,060,392 | |||
| 165,150 | Sterling Bancshares, Inc. | 1,045,399 | |||
| 35,550 | Stifel Financial Corporationb | 1,709,600 | |||
| 114,100 | Sunstone Hotel Investors, Inc.a | 610,435 | |||
| 26,400 | SVB Financial Groupa,b | 718,608 | |||
| 67,600 | Texas Capital Bancshares, Inc.b | 1,045,772 | |||
| 45,400 | Tower Group, Inc. | 1,125,012 | |||
| 60,200 | Waddell & Reed Financial, Inc. | 1,587,474 | |||
| 92,700 | Western Alliance Bancorpa,b | 634,068 | |||
| 64,400 | Westfield Financial, Inc. | 583,464 | |||
| 101,700 | XL Capital, Ltd. | 1,165,482 | |||
| 49,600 | Zions Bancorporationa | 573,376 | |||
Total Financials | 47,481,002 | ||||
| Health Care (11.6%) | |||||
| 94,800 | American Medical Systems Holdings, Inc.b | 1,497,840 | |||
| 26,600 | AMERIGROUP Corporationb | 714,210 | |||
| 17,000 | Beckman Coulter, Inc. | 971,380 | |||
| 76,676 | BioMarin Pharmaceutical, Inc.a,b | 1,196,913 | |||
| 12,300 | Bio-Rad Laboratories, Inc.b | 928,404 | |||
| 11,900 | Cerner Corporationa,b | 741,251 | |||
| 21,900 | Chemed Corporation | 864,612 | |||
| 27,400 | Cooper Companies, Inc. | 677,602 | |||
| 17,800 | Dionex Corporationb | 1,086,334 | |||
| 119,900 | ev3, Inc.b | 1,285,328 | |||
| 92,600 | Healthsouth Corporationb | 1,337,144 | |||
| 74,100 | Hologic, Inc.b | 1,054,443 | |||
| 24,900 | ICON plc ADRb | 537,342 | |||
| 12,500 | Invacare Corporation | 220,625 | |||
| 11,300 | Kinetic Concepts, Inc.b | 307,925 | |||
| 127,600 | King Pharmaceuticals, Inc.b | 1,228,788 | |||
| 14,400 | Life Technologies Corporationb | 600,768 | |||
| 75,800 | MedAssets, Inc.b | 1,474,310 | |||
| 42,200 | Medicis Pharmaceutical Corporation | 688,704 | |||
| 10,500 | Medidata Solutions, Inc.b | 171,990 | |||
| 18,100 | Myriad Genetics, Inc.b | 645,265 | |||
| 7,225 | Myriad Pharmaceuticals, Inc.b | 33,596 | |||
| 25,700 | NuVasive, Inc.a,b | 1,146,220 | |||
| 35,100 | Owens & Minor, Inc. | 1,538,082 | |||
| 79,100 | PAREXEL International Corporationb | 1,137,458 | |||
| 25,300 | Pediatrix Medical Group, Inc.b | 1,065,889 | |||
| 40,600 | Perrigo Company | 1,127,868 | |||
| 60,400 | Phase Forward, Inc.b | 912,644 | |||
| 29,500 | RehabCare Group, Inc.b | 705,935 | |||
| 43,100 | STERIS Corporation | 1,124,048 | |||
| 14,100 | United Therapeutics Corporationb | 1,174,953 | |||
| 26,500 | Universal Health Services, Inc. | 1,294,525 | |||
| 35,600 | Varian, Inc.b | 1,403,708 | |||
| 37,300 | Watson Pharmaceuticals, Inc.b | 1,255,518 | |||
Total Health Care | 32,151,622 | ||||
| Industrials (13.2%) | |||||
| 54,500 | AAON, Inc. | 1,085,640 | |||
| 22,500 | Aecom Technology Corporationb | 720,000 | |||
| 109,300 | AirTran Holdings, Inc.a,b | 676,567 | |||
| 39,600 | Baldor Electric Company | 942,084 | |||
| 96,400 | BE Aerospace, Inc.b | 1,384,304 | |||
| 71,700 | Beacon Roofing Supply, Inc.b | 1,036,782 | |||
| 120,600 | Chicago Bridge and Iron Company | 1,495,440 | |||
| 29,100 | Copa Holdings SA | 1,187,862 | |||
| 26,500 | Cubic Corporation | 948,435 | |||
| 52,600 | Duff & Phelps Corporation | 935,228 | |||
| 21,100 | EMCOR Group, Inc.b | 424,532 | |||
| 62,800 | EnerSysb | 1,142,332 | |||
| 10,400 | Flowserve Corporation | 726,024 | |||
| 21,400 | FTI Consulting, Inc.b | 1,085,408 | |||
| 50,000 | Gardner Denver, Inc.b | 1,258,500 | |||
| 39,500 | Genco Shipping & Trading, Ltd.a | 857,940 | |||
| 15,400 | General Cable Corporationa,b | 578,732 | |||
| 51,900 | Griffon Corporationb | 431,808 | |||
| 31,600 | IDEX Corporation | 776,412 | |||
| 197,400 | JA Solar Holdings Company, Ltd. ADRa,b | 927,780 | |||
| 23,600 | Kaydon Corporation | 768,416 | |||
| 34,200 | Kirby Corporationb | 1,087,218 | |||
| 63,800 | Knight Transportation, Inc. | 1,055,890 | |||
| 27,200 | Landstar System, Inc. | 976,752 | |||
| 21,200 | Lennox International, Inc. | 681,368 | |||
| 180,200 | Manitowoc Company, Inc. | 947,852 | |||
| 60,200 | MasTec, Inc.b | 705,544 | |||
| 29,000 | Middleby Corporationa,b | 1,273,680 | |||
| 97,600 | Monster Worldwide, Inc.b | 1,152,656 | |||
| 29,500 | Navistar International Corporationb | 1,286,200 | |||
| 106,300 | Oshkosh Corporation | 1,545,602 | |||
| 84,200 | Polypore International, Inc.b | 936,304 | |||
| 23,700 | Regal-Beloit Corporationa | 941,364 | |||
| 53,000 | Resources Global Professionalsb | 910,010 | |||
| 30,800 | Robert Half International, Inc. | 727,496 | |||
| 7,200 | Roper Industries, Inc. | 326,232 | |||
| 34,700 | SunPower Corporationa,b | 924,408 | |||
| 19,000 | Triumph Group, Inc. | 760,000 | |||
| 2,200 | URS Corporationb | 108,944 | |||
| 32,400 | Werner Enterprises, Inc. | 587,088 | |||
Total Industrials | 36,324,834 | ||||
| Information Technology (18.5%) | |||||
| 71,500 | 3PAR, Inc.b | 886,600 | |||
| 137,900 | ADC Telecommunications, Inc.b | 1,097,684 | |||
| 53,100 | ADTRAN, Inc. | 1,140,057 | |||
| 164,600 | Advanced Micro Devices, Inc.a,b | 637,002 | |||
| 43,300 | Akamai Technologies, Inc.b | 830,494 | |||
| 56,549 | Anaren Microware, Inc.b | 999,786 | |||
| 105,000 | Arris Group, Inc.b | 1,276,800 | |||
| 34,500 | AsiaInfo Holdings, Inc.b | 593,745 | |||
| 283,000 | Atmel Corporationb | 1,055,590 | |||
| 132,116 | BigBand Networks, Inc.b | 683,040 | |||
| 90,200 | CIENA Corporationa,b | 933,570 | |||
| 70,500 | Commvault Systems, Inc.b | 1,168,890 | |||
The accompanying Notes to Financial Statements are an integral part of this schedule.
127
Table of Contents
Small Cap Stock Portfolio
Schedule of Investments as of June 30, 2009
(unaudited)
| Shares | Common Stock (94.6%) | Value | |||
| Information Technology (18.5%) - continued | |||||
| 99,942 | Compuware Corporationb | $ | 685,602 | ||
| 127,800 | Comtech Group, Inc.b | 762,966 | |||
| 36,300 | DTS, Inc.a,b | 982,641 | |||
| 127,900 | EarthLink, Inc.b | 947,739 | |||
| 131,200 | Emulex Corporationb | 1,283,136 | |||
| 42,500 | EPIQ Systems, Inc.b | 652,375 | |||
| 36,500 | F5 Networks, Inc.b | 1,262,535 | |||
| 208,800 | FalconStor Software, Inc.b | 991,800 | |||
| 21,500 | Fidelity National Information Services, Inc. | 429,140 | |||
| 25,805 | FormFactor, Inc.b | 444,878 | |||
| 79,800 | Heartland Payment Systems, Inc. | 763,686 | |||
| 21,000 | Hittite Microwave Corporationb | 729,750 | |||
| 66,700 | Ixiab | 449,558 | |||
| 132,600 | Jabil Circuit, Inc. | 983,892 | |||
| 471,400 | Lattice Semiconductor Corporationb | 886,232 | |||
| 197,800 | Limelight Networks, Inc.b | 870,320 | |||
| 10,500 | LogMeIn, Inc. | 168,000 | |||
| 14,600 | Loral Space & Communications, Inc.b | 375,950 | |||
| 22,800 | Macrovision Solutions Corporationb | 497,268 | |||
| 103,700 | Mellanox Technologies, Ltd.b | 1,247,511 | |||
| 51,500 | MICROS Systems, Inc.b | 1,303,980 | |||
| 280,900 | MIPS Technologies, Inc.b | 842,700 | |||
| 52,400 | Monolithic Power Systems, Inc.b | 1,174,284 | |||
| 34,400 | Multi-Fineline Electronix, Inc.b | 736,160 | |||
| 87,000 | Netezza Corporationb | 723,840 | |||
| 24,500 | Netlogic Microsystems, Inc.a,b | 893,270 | |||
| 39,800 | Nuance Communications, Inc.b | 481,182 | |||
| 87,300 | Perot Systems Corporationb | 1,251,009 | |||
| 146,869 | PMC-Sierra, Inc.b | 1,169,077 | |||
| 53,300 | Polycom, Inc.b | 1,080,391 | |||
| 85,500 | QLogic Corporationb | 1,084,140 | |||
| 130,600 | Skyworks Solutions, Inc.b | 1,277,268 | |||
| 210,100 | Smart Modular Technologies (WWH), Inc.b | 476,927 | |||
| 51,100 | Solera Holdings, Inc.b | 1,297,940 | |||
| 3,400 | Sybase, Inc.b | 106,556 | |||
| 59,200 | Synnex Corporationb | 1,479,408 | |||
| 214,300 | Tellabs, Inc.b | 1,227,939 | |||
| 132,000 | Teradyne, Inc.b | 905,520 | |||
| 185,300 | TIBCO Software, Inc.b | 1,328,601 | |||
| 215,700 | TriQuint Semiconductor, Inc.b | 1,145,367 | |||
| 135,900 | TTM Technologies, Inc.b | 1,081,764 | |||
| 41,500 | Varian Semiconductor Equipment Associates, Inc.b | 995,585 | |||
| 166,300 | Vishay Intertechnology, Inc.b | 1,129,177 | |||
| 107,800 | Zoran Corporationb | 1,175,020 | |||
Total Information Technology | 51,085,342 | ||||
| Materials (7.0%) | |||||
| 21,600 | Airgas, Inc. | 875,448 | |||
| 40,400 | Albemarle Corporation | 1,033,028 | |||
| 114,000 | Allied Nevada Gold Corporationa,b | 918,840 | |||
| 10,000 | CF Industries Holdings, Inc. | 741,400 | |||
| 55,800 | Commercial Metals Company | 894,474 | |||
| 24,500 | FMC Corporation | 1,158,850 | |||
| 25,700 | Greif, Inc. | 1,136,454 | |||
| 102,800 | Horsehead Holding Corporationb | 765,860 | |||
| 50,000 | Innophos Holdings, Inc. | 844,500 | |||
| 142,700 | Kingsgate Consolidated, Ltd.b | 765,222 | |||
| 55,900 | Myers Industries, Inc. | 465,088 | |||
| 52,400 | Packaging Corporation of America | 848,880 | |||
| 48,925 | Pan American Silver Corporationa,b | 896,795 | |||
| 15,900 | Reliance Steel & Aluminum Company | 610,401 | |||
| 95,800 | Rockwood Holdings, Inc.b | 1,402,512 | |||
| 52,000 | RTI International Metals, Inc.b | 918,840 | |||
| 18,400 | Schnitzer Steel Industries, Inc. | 972,624 | |||
| 12,600 | Scotts Miracle-Gro Company | 441,630 | |||
| 12,500 | SPDR Gold Trustb | 1,139,750 | |||
| 34,700 | Steel Dynamics, Inc. | 511,131 | |||
| 30,900 | Terra Industries, Inc. | 748,398 | |||
| 12,200 | Walter Energy, Inc. | 442,128 | |||
| 57,900 | Worthington Industries, Inc. | 740,541 | |||
Total Materials | 19,272,794 | ||||
| Telecommunications Services (1.7%) | |||||
| 119,900 | Alaska Communication Systems Group, Inc. | 877,668 | |||
| 31,800 | Cellcom Israel, Ltd. | 844,926 | |||
| 20,800 | CenturyTel, Inc. | 638,560 | |||
| 3,700 | Embarq Corporation | 155,622 | |||
| 72,000 | Iowa Telecommunications Services, Inc. | 900,720 | |||
| 19,300 | NTELOS Holdings Corporation | 355,506 | |||
| 96,800 | Premiere Global Services, Inc.b | 1,049,312 | |||
Total Telecommunications Services | 4,822,314 | ||||
| Utilities (3.6%) | |||||
| 80,100 | CMS Energy Corporation | 967,608 | |||
| 25,200 | Energen Corporation | 1,005,480 | |||
| 33,800 | National Fuel Gas Company | 1,219,504 | |||
| 26,600 | New Jersey Resources Corporation | 985,264 | |||
| 31,300 | Nicor, Inc. | 1,083,606 | |||
| 52,400 | NorthWestern Corporation | 1,192,624 | |||
| 27,000 | Piedmont Natural Gas Company, Inc. | 650,970 | |||
| 49,000 | Portland General Electric Company | 954,520 | |||
| 57,500 | UGI Corporation | 1,465,675 | |||
| 18,700 | UIL Holdings Corporation | 419,815 | |||
Total Utilities | 9,945,066 | ||||
Total Common Stock (cost $236,760,203) | 261,307,771 | ||||
The accompanying Notes to Financial Statements are an integral part of this schedule.
128
Table of Contents
Small Cap Stock Portfolio
Schedule of Investments as of June 30, 2009
(unaudited)
| Principal Amount | Long-Term Fixed Income (0.4%) | Value | ||||
| U.S. Government (0.4%) | ||||||
U.S. Treasury Notes | ||||||
| $1,000,000 | 0.875%, 12/31/2010 | $ | 1,001,367 | |||
Total U.S. Government | 1,001,367 | |||||
Total Long-Term Fixed Income (cost $1,000,699) | 1,001,367 | |||||
| Shares | Collateral Held for Securities Loaned (10.3%) | |||||
| 28,385,989 | Thrivent Financial Securities Lending Trust | 28,385,989 | ||||
Total Collateral Held for Securities Loaned (cost $28,385,989) | 28,385,989 | |||||
| Shares or Principal Amount | Short-Term Investments (5.0%)c | |||||
Federal Home Loan Bank Discount Notes | ||||||
| 6,000,000 | 0.120%, 7/2/2009 | 5,999,980 | ||||
Novartis Finance Corporation | ||||||
| 7,150,000 | 0.100%, 7/1/2009 | 7,150,000 | ||||
| 596,766 | Thrivent Money Market Portfolio | 596,766 | ||||
Total Short-Term Investments (at amortized cost) | 13,746,746 | |||||
Total Investments (cost $279,893,637) 110.3% | $ | 304,441,873 | ||||
Other Assets and Liabilities, Net (10.3%) | (28,311,803 | ) | ||||
Total Net Assets 100.0% | $ | 276,130,070 | ||||
| a | All or a portion of the security is on loan as discussed in item 2(M) of the Notes to Financial Statements. |
| b | Non-income producing security. |
| c | The interest rate shown reflects the yield, coupon rate or, for securities purchased at a discount, the discount rate at the date of purchase. |
Definitions:
| ADR | - | American Depositary Receipt, which are certificates for an underlying foreign security’s shares held by an issuing U.S. depository bank. |
Unrealized Appreciation (Depreciation)
Gross unrealized appreciation and depreciation of investments, based on cost for federal income tax purposes, were as follows:
Gross unrealized appreciation | $ | 30,562,886 | ||
Gross unrealized depreciation | (6,014,650 | ) | ||
Net unrealized appreciation (depreciation) | $ | 24,548,236 | ||
Cost for federal income tax purposes | $ | 279,893,637 | ||
Fair Valuation Measurements
The following table is a summary of the inputs used, as of June 30, 2009, in valuing Small Cap Stock Portfolio’s assets carried at fair value as discussed in the Notes to Financial Statements.
Investments in Securities | Total | Level 1 | Level 2 | Level 3 | ||||||||
Common Stock | ||||||||||||
Consumer Discretionary | 38,371,971 | 38,371,971 | — | — | ||||||||
Consumer Staples | 8,749,614 | 8,749,614 | — | — | ||||||||
Energy | 13,103,212 | 13,103,212 | — | — | ||||||||
Financials | 47,481,002 | 47,481,002 | — | — | ||||||||
Health Care | 32,151,622 | 32,151,622 | — | — | ||||||||
Industrials | 36,324,834 | 36,324,834 | — | — | ||||||||
Information Technology | 51,085,342 | 51,085,342 | — | — | ||||||||
Materials | 19,272,794 | 18,507,572 | 765,222 | — | ||||||||
Telecommunications Services | 4,822,314 | 4,822,314 | — | — | ||||||||
Utilities | 9,945,066 | 9,945,066 | — | — | ||||||||
Long-Term Fixed Income | ||||||||||||
U.S. Government | 1,001,367 | — | 1,001,367 | — | ||||||||
Collateral Held for Securities Loaned | 28,385,989 | 28,385,989 | — | — | ||||||||
Short-Term Investments | 13,746,746 | 596,766 | 13,149,980 | — | ||||||||
Total | $ | 304,441,873 | $ | 289,525,304 | $ | 14,916,569 | $ | — | ||||
The accompanying Notes to Financial Statements are an integral part of this schedule.
129
Table of Contents
Small Cap Stock Portfolio
Schedule of Investments as of June 30, 2009
(unaudited)
The following table summarizes the net realized gains/(losses) and Statement of Operations location, for the period ended June 30, 2009, for Small Cap Stock Portfolio’s investments in financial derivative instruments by primary risk exposure.
Derivatives by Risk Category | Statement of Operations Location | Realized Gains/(Losses) recognized in Income | |||
Equity Contracts | |||||
Future | Net realized gains/(losses) on Futures contracts | 760,128 | |||
Total Equity Contracts | 760,128 | ||||
Total | $ | 760,128 | |||
Investment in Affiliates
Affiliated issuers, as defined under the Investment Company Act of 1940, include those in which the Portfolio’s holdings of an issuer represent 5% or more of the outstanding voting securities of an issuer, or any affiliated mutual fund.
A summary of transactions for the fiscal year to date, in Small Cap Stock Portfolio, is as follows:
Portfolio | Value December 31, 2008 | Gross Purchases | Gross Sales | Shares Held at June 30, 2009 | Value June 30, 2009 | Income Earned January 1, 2009 - June 30, 2009 | |||||||||||
Money Market | $ | 5,893,633 | $ | 54,076,194 | $ | 59,373,061 | 596,766 | $ | 596,766 | $ | 19,099 | ||||||
Thrivent Financial Securities Lending Trust | 28,172,401 | 115,261,291 | 115,047,703 | 28,385,989 | 28,385,989 | 186,729 | |||||||||||
Total Value and Income Earned | 34,066,034 | 28,982,755 | 205,828 | ||||||||||||||
The accompanying Notes to Financial Statements are an integral part of this schedule.
130
Table of Contents
Schedule of Investments as of June 30, 2009
(unaudited)
| Shares | Common Stock (97.3%) | Value | |||
| Consumer Discretionary (14.0%) | |||||
| 8,500 | American Public Education, Inc.a | $ | 336,685 | ||
| 14,100 | Arbitron, Inc. | 224,049 | |||
| 6,400 | Arctic Cat, Inc. | 25,856 | |||
| 9,900 | Audiovox Corporationa | 58,014 | |||
| 11,500 | Big 5 Sporting Goods Corporation | 127,190 | |||
| 7,700 | Blue Nile, Inc.a,b | 331,023 | |||
| 22,625 | Brown Shoe Company, Inc. | 163,805 | |||
| 47,100 | Brunswick Corporation | 203,472 | |||
| 12,550 | Buckle, Inc.b | 398,713 | |||
| 9,600 | Buffalo Wild Wings, Inc.a,b | 312,192 | |||
| 21,100 | Cabela’s, Inc.a,b | 259,530 | |||
| 12,900 | California Pizza Kitchen, Inc.a | 171,441 | |||
| 7,600 | Capella Education Companya | 455,620 | |||
| 30,100 | Carter’s, Inc.a | 740,761 | |||
| 15,700 | Cato Corporation | 273,808 | |||
| 12,125 | CEC Entertainment, Inc.a | 357,445 | |||
| 11,200 | Charlotte Russe Holding, Inc.a | 144,256 | |||
| 12,900 | Children’s Place Retail Stores, Inc.a | 340,947 | |||
| 18,925 | Christopher & Banks Corporation | 126,987 | |||
| 29,200 | CKE Restaurants, Inc. | 247,616 | |||
| 15,900 | Coinstar, Inc.a | 424,530 | |||
| 12,000 | Cracker Barrel Old Country Store, Inc. | 334,800 | |||
| 44,200 | Crocs, Inc.a,b | 150,280 | |||
| 7,000 | Deckers Outdoor Corporationa | 491,890 | |||
| 8,200 | DineEquity, Inc.b | 255,758 | |||
| 24,100 | Dress Barn, Inc.a,b | 344,630 | |||
| 10,300 | Drew Industries, Inc.a,b | 125,351 | |||
| 15,533 | E.W. Scripps Company | 32,464 | |||
| 15,350 | Ethan Allen Interiors, Inc.b | 159,026 | |||
| 29,293 | Finish Line, Inc. | 217,354 | |||
| 21,350 | Fred’s, Inc. | 269,010 | |||
| 10,300 | Genesco, Inc.a | 193,743 | |||
| 12,800 | Group 1 Automotive, Inc.b | 333,056 | |||
| 15,500 | Gymboree Corporationa | 549,940 | |||
| 9,900 | Haverty Furniture Companies, Inc. | 90,585 | |||
| 16,100 | Helen of Troy, Ltd.a | 270,319 | |||
| 15,250 | Hibbett Sports, Inc.a | 274,500 | |||
| 33,000 | Hillenbrand, Inc. | 549,120 | |||
| 23,375 | Hot Topic, Inc.a | 170,871 | |||
| 21,000 | HSN, Inc.a | 221,970 | |||
| 35,900 | Iconix Brand Group, Inc.a | 552,142 | |||
| 21,000 | Interval Leisure Group, Inc.a | 195,720 | |||
| 30,400 | Jack in the Box, Inc.a | 682,480 | |||
| 14,900 | JAKKS Pacific, Inc.a | 191,167 | |||
| 13,830 | Jo-Ann Stores, Inc.a | 285,866 | |||
| 9,775 | Joseph A. Bank Clothiers, Inc.a,b | 336,846 | |||
| 14,300 | K-Swiss, Inc. | 121,550 | |||
| 6,600 | Landry’s Restaurants, Inc.a,b | 56,760 | |||
| 27,500 | La-Z-Boy, Inc. | 129,800 | |||
| 8,900 | Lithia Motors, Inc.b | 82,236 | |||
| 44,700 | Live Nation, Inc.a | 217,242 | |||
| 50,800 | Liz Claiborne, Inc.b | 146,304 | |||
| 9,800 | M/I Homes, Inc. | 95,942 | |||
| 10,000 | Maidenform Brands, Inc.a | 114,700 | |||
| 11,300 | Marcus Corporation | 118,876 | |||
| 9,900 | MarineMax, Inc.a | 34,056 | |||
| 27,700 | Men’s Wearhouse, Inc. | 531,286 | |||
| 16,500 | Meritage Homes Corporationa | 311,190 | |||
| 7,500 | Midas, Inc.a | 78,600 | |||
| 6,100 | Monarch Casino & Resort, Inc.a | 44,530 | |||
| 9,600 | Movado Group, Inc. | 101,184 | |||
| 12,400 | Multimedia Games, Inc.a | 61,504 | |||
| 2,600 | National Presto Industries, Inc. | 197,860 | |||
| 11,900 | Nautilus Group, Inc.a,b | 13,447 | |||
| 16,400 | NutriSystem, Inc.b | 237,800 | |||
| 11,400 | O’Charley’s, Inc. | 105,450 | |||
| 40,800 | OfficeMax, Inc. | 256,224 | |||
| 7,300 | Oxford Industries, Inc. | 85,045 | |||
| 12,900 | P.F. Chang’s China Bistro, Inc.a,b | 413,574 | |||
| 11,500 | Papa John’s International, Inc.a | 285,085 | |||
| 6,600 | Peet’s Coffee & Tea, Inc.a | 166,320 | |||
| 22,800 | Pep Boys - Manny, Moe & Jack | 231,192 | |||
| 5,600 | Perry Ellis International, Inc.a | 40,768 | |||
| 12,500 | PetMed Express, Inc.a | 187,875 | |||
| 32,100 | Pinnacle Entertainment, Inc.a | 298,209 | |||
| 17,400 | Polaris Industries, Inc.b | 558,888 | |||
| 25,812 | Pool Corporationb | 427,447 | |||
| 3,900 | Pre-Paid Legal Services, Inc.a | 170,001 | |||
| 67,800 | Quiksilver, Inc.a | 125,430 | |||
| 9,200 | RC2 Corporationa | 121,716 | |||
| 8,300 | Red Robin Gourmet Burgers, Inc.a | 155,625 | |||
| 28,200 | Ruby Tuesday, Inc.a | 187,812 | |||
| 9,000 | Russ Berrie and Company, Inc.a | 35,190 | |||
| 10,300 | Ruth’s Hospitality Group, Inc.a | 37,801 | |||
| 28,625 | Shuffle Master, Inc.a | 189,211 | |||
| 17,700 | Skechers USA, Inc.a | 172,929 | |||
| 3,600 | Skyline Corporation | 78,300 | |||
| 15,000 | Sonic Automotive, Inc.b | 152,400 | |||
| 32,352 | Sonic Corporationa | 324,491 | |||
| 17,500 | Spartan Motors, Inc. | 198,275 | |||
| 20,300 | Stage Stores, Inc. | 225,330 | |||
| 7,000 | Stamps.com, Inc.a | 59,360 | |||
| 6,400 | Standard Motor Products, Inc. | 52,928 | |||
| 49,500 | Standard Pacific Corporationa | 100,485 | |||
| 15,317 | Steak n Shake Companya | 133,871 | |||
| 13,600 | Stein Mart, Inc.a | 120,496 | |||
| 10,200 | Sturm, Ruger & Company, Inc. | 126,888 | |||
| 12,400 | Superior Industries International, Inc.b | 174,840 | |||
| 27,100 | Texas Roadhouse, Inc.a | 295,661 | |||
| 21,400 | Ticketmaster Entertainment, Inc.a | 137,388 | |||
| 16,900 | Tractor Supply Companya | 698,308 | |||
| 9,800 | True Religion Apparel, Inc.a | 218,540 | |||
| 16,600 | Tuesday Morning Corporationa | 55,942 | |||
| 13,200 | Tween Brands, Inc.a | 88,176 | |||
| 7,600 | UniFirst Corporation | 282,492 | |||
| 7,500 | Universal Electronic, Inc.a | 151,275 | |||
| 10,800 | Universal Technical Institute, Inc.a | 161,244 | |||
| 8,500 | Volcom, Inc.a,b | 106,250 | |||
| 15,500 | Winnebago Industries, Inc.b | 115,165 | |||
| 26,500 | Wolverine World Wide, Inc. | 584,590 | |||
| 17,000 | Zale Corporationa,b | 58,480 | |||
| 10,700 | Zumiez, Inc.a,b | 85,707 | |||
Total Consumer Discretionary | 24,736,369 | ||||
| Consumer Staples (4.1%) | |||||
| 47,500 | Alliance One International, Inc.a | 180,500 | |||
| 9,700 | Andersons, Inc.b | 290,418 | |||
The accompanying Notes to Financial Statements are an integral part of this schedule.
131
Table of Contents
Small Cap Index Portfolio
Schedule of Investments as of June 30, 2009
(unaudited)
| Shares | Common Stock (97.3%) | Value | |||
| Consumer Staples (4.1%) - continued | |||||
| 5,400 | Boston Beer Company, Inc.a,b | $ | 159,786 | ||
| 6,700 | Cal-Maine Foods, Inc.b | 167,232 | |||
| 27,200 | Casey’s General Stores, Inc. | 698,768 | |||
| 37,800 | Central Garden & Pet Companya | 372,330 | |||
| 10,400 | Chattem, Inc.a,b | 708,240 | |||
| 43,700 | Darling International, Inc.a | 288,420 | |||
| 8,700 | Diamond Foods, Inc. | 242,730 | |||
| 16,100 | Great Atlantic & Pacific Tea Company, Inc.a,b | 68,425 | |||
| 14,250 | Green Mountain Coffee Roasters, Inc.a,b | 842,460 | |||
| 21,600 | Hain Celestial Group, Inc.a | 337,176 | |||
| 7,400 | J & J Snack Foods Corporation | 265,660 | |||
| 16,900 | Lance, Inc. | 390,897 | |||
| 8,300 | Mannatech, Inc.b | 27,390 | |||
| 6,800 | Nash Finch Companyb | 184,008 | |||
| 9,300 | Sanderson Farms, Inc. | 418,500 | |||
| 11,900 | Spartan Stores, Inc. | 147,679 | |||
| 16,900 | TreeHouse Foods, Inc.a | 486,213 | |||
| 22,900 | United Natural Foods, Inc.a | 601,125 | |||
| 8,770 | WD-40 Company | 254,330 | |||
Total Consumer Staples | 7,132,287 | ||||
| Energy (4.7%) | |||||
| 29,800 | Atwood Oceanics, Inc.a | 742,318 | |||
| 12,000 | Basic Energy Services, Inc.a | 81,960 | |||
| 15,600 | Bristow Group, Inc.a,b | 462,228 | |||
| 10,500 | Carbo Ceramics, Inc.b | 359,100 | |||
| 16,100 | Dril-Quip, Inc.a | 613,410 | |||
| 7,600 | Gulf Island Fabrication, Inc. | 120,308 | |||
| 21,900 | Holly Corporation | 393,762 | |||
| 12,400 | Hornbeck Offshore Services, Inc.a | 265,236 | |||
| 48,000 | Input/Output, Inc.a | 123,360 | |||
| 7,900 | Lufkin Industries, Inc. | 332,195 | |||
| 13,300 | Matrix Service Companya | 152,684 | |||
| 10,600 | NATCO Group, Inc.a | 348,952 | |||
| 26,500 | Oil States International, Inc.a | 641,565 | |||
| 24,200 | Penn Virginia Corporation | 396,154 | |||
| 7,900 | Petroleum Development Corporationa | 123,951 | |||
| 28,400 | PetroQuest Energy, Inc.a,b | 104,796 | |||
| 26,700 | Pioneer Drilling Companya | 127,893 | |||
| 10,650 | SEACOR Holdings, Inc.a | 801,306 | |||
| 33,300 | St. Mary Land & Exploration Company | 694,971 | |||
| 21,900 | Stone Energy Corporationa | 162,498 | |||
| 8,800 | Superior Well Services, Inc.a | 52,360 | |||
| 16,500 | Swift Energy Companya | 274,725 | |||
| 40,250 | TETRA Technologies, Inc.a | 320,390 | |||
| 15,700 | World Fuel Services Corporation | 647,311 | |||
Total Energy | 8,343,433 | ||||
| Financials (17.4%) | |||||
| 20,828 | Acadia Realty Trust | 271,805 | |||
| 4,000 | American Physicians Capital, Inc. | 156,640 | |||
| 10,100 | Amerisafe, Inc.a | 157,156 | |||
| 25,500 | Bank Mutual Corporation | 222,360 | |||
| 6,700 | Bank of the Ozarks, Inc.b | 144,921 | |||
| 51,900 | BioMed Realty Trust, Inc. | 530,937 | |||
| 34,100 | Boston Private Financial Holdings, Inc. | 152,768 | |||
| 31,200 | Brookline Bancorp, Inc. | 290,784 | |||
| 15,000 | Cascade Bancorpb | 21,150 | |||
| 15,800 | Cash America International, Inc. | 369,562 | |||
| 23,800 | Cedar Shopping Centers, Inc. | 107,576 | |||
| 15,400 | Central Pacific Financial Corporation | 57,750 | |||
| 26,000 | Colonial Properties Trustb | 192,400 | |||
| 9,700 | Columbia Banking System, Inc. | 99,231 | |||
| 17,400 | Community Bank System, Inc. | 253,344 | |||
| 23,465 | Delphi Financial Group, Inc. | 455,925 | |||
| 56,400 | DiamondRock Hospitality Company | 353,064 | |||
| 14,075 | Dime Community Bancshares | 128,223 | |||
| 34,100 | East West Bancorp, Inc.b | 221,309 | |||
| 13,400 | EastGroup Properties, Inc. | 442,468 | |||
| 13,400 | eHealth, Inc.a | 236,644 | |||
| 23,600 | Employers Holdings, Inc. | 319,780 | |||
| 18,600 | Entertainment Properties Trust | 383,160 | |||
| 45,800 | Extra Space Storage, Inc. | 382,430 | |||
| 13,850 | Financial Federal Corporation | 284,617 | |||
| 40,600 | First BanCorpb | 160,370 | |||
| 13,800 | First Cash Financial Services, Inc.a | 241,776 | |||
| 40,000 | First Commonwealth Financial Corporation | 253,600 | |||
| 22,500 | First Financial Bancorp | 169,200 | |||
| 11,100 | First Financial Bankshares, Inc.b | 558,996 | |||
| 26,012 | First Midwest Bancorp, Inc. | 190,148 | |||
| 19,200 | Forestar Real Estate Group, Inc.a | 228,096 | |||
| 31,600 | Franklin Street Properties Corporation | 418,700 | |||
| 25,200 | Frontier Financial Corporationb | 30,492 | |||
| 32,900 | Glacier Bancorp, Inc.b | 485,933 | |||
| 9,800 | Greenhill & Company, Inc.b | 707,658 | |||
| 12,700 | Hancock Holding Companyb | 412,623 | |||
| 19,900 | Hanmi Financial Corporation | 34,825 | |||
| 7,100 | Home Bancshares, Inc.b | 135,184 | |||
| 17,600 | Home Properties, Inc. | 600,160 | |||
| 11,100 | Independent Bank Corporation (MA)b | 218,670 | |||
| 10,665 | Independent Bank Corporation (MI)b | 14,078 | |||
| 7,500 | Infinity Property & Casualty Corporation | 273,450 | |||
| 38,400 | Inland Real Estate Corporation | 268,800 | |||
| 23,200 | Investment Technology Group, Inc.a | 473,048 | |||
| 22,300 | Kilroy Realty Corporation | 458,042 | |||
| 31,500 | Kite Realty Group Trust | 91,980 | |||
| 25,800 | LaBranche & Company, Inc.a | 110,940 | |||
| 33,000 | LaSalle Hotel Properties | 407,220 | |||
| 44,105 | Lexington Corporate Properties Trust | 149,957 | |||
| 12,400 | LTC Properties, Inc. | 253,580 | |||
| 40,600 | Medical Properties Trust, Inc. | 246,442 | |||
| 15,100 | Mid-America Apartment Communities, Inc. | 554,321 | |||
| 11,900 | Nara Bancorp, Inc. | 61,642 | |||
| 21,300 | National Financial Partnersb | 155,916 | |||
| 43,900 | National Penn Bancshares, Inc. | 202,379 | |||
| 42,200 | National Retail Properties, Inc. | 732,170 | |||
| 7,100 | Navigators Group, Inc.a | 315,453 | |||
| 17,400 | NBT Bancorp, Inc. | 377,754 | |||
| 35,400 | Old National Bancorpb | 347,628 | |||
The accompanying Notes to Financial Statements are an integral part of this schedule.
132
Table of Contents
Small Cap Index Portfolio
Schedule of Investments as of June 30, 2009
(unaudited)
| Shares | Common Stock (97.3%) | Value | |||
| Financials (17.4%) - continued | |||||
| 22,200 | optionsXpress Holdings, Inc. | $ | 344,766 | ||
| 11,600 | Parkway Properties, Inc. | 150,800 | |||
| 21,100 | Pennsylvania Real Estate Investment Trustb | 105,500 | |||
| 16,900 | Pinnacle Financial Partners, Inc.a,b | 225,108 | |||
| 8,400 | Piper Jaffray Companiesa | 366,828 | |||
| 8,200 | Portfolio Recovery Associates, Inc.a,b | 317,586 | |||
| 23,600 | Post Properties, Inc. | 317,184 | |||
| 11,500 | Presidential Life Corporation | 87,055 | |||
| 19,800 | PrivateBancorp, Inc.b | 440,352 | |||
| 17,800 | ProAssurance Corporationa | 822,538 | |||
| 21,900 | Prosperity Bancshares, Inc.b | 653,277 | |||
| 8,000 | PS Business Parks, Inc. | 387,520 | |||
| 14,500 | Rewards Network, Inc.a | 54,810 | |||
| 9,500 | RLI Corporation | 425,600 | |||
| 12,600 | S&T Bancorp, Inc.b | 153,216 | |||
| 8,700 | Safety Insurance Group, Inc. | 265,872 | |||
| 28,200 | Selective Insurance Group, Inc. | 360,114 | |||
| 64,300 | Senior Housing Property Trust | 1,049,376 | |||
| 21,200 | Signature Banka | 574,944 | |||
| 6,600 | Simmons First National Corporation | 176,352 | |||
| 45,300 | South Financial Group, Inc.b | 53,907 | |||
| 11,800 | Sovran Self Storage, Inc. | 290,280 | |||
| 9,600 | Sterling Bancorp | 80,160 | |||
| 43,000 | Sterling Bancshares, Inc. | 272,190 | |||
| 28,015 | Sterling Financial Corporationb | 81,524 | |||
| 9,700 | Stewart Information Services Corporation | 138,225 | |||
| 14,400 | Stifel Financial Corporationa | 692,496 | |||
| 46,000 | Susquehanna Bancshares, Inc. | 224,940 | |||
| 14,626 | SWS Group, Inc. | 204,325 | |||
| 19,700 | Tanger Factory Outlet Centers, Inc. | 638,871 | |||
| 3,600 | Tompkins Financial Corporationb | 172,620 | |||
| 18,700 | Tower Group, Inc. | 463,386 | |||
| 17,100 | Tradestation Group, Inc.a | 144,666 | |||
| 40,482 | TrustCo Bank Corporation NYb | 239,249 | |||
| 62,700 | UCBH Holdings, Inc.b | 79,002 | |||
| 15,800 | UMB Financial Corporation | 600,558 | |||
| 32,100 | Umpqua Holdings Corporationb | 249,096 | |||
| 20,200 | United Bankshares, Inc.b | 394,708 | |||
| 22,111 | United Community Banks, Inc.a,b | 132,445 | |||
| 12,000 | United Fire & Casualty Company | 205,800 | |||
| 11,400 | Urstadt Biddle Properties | 160,512 | |||
| 34,200 | Whitney Holding Corporation | 313,272 | |||
| 10,300 | Wilshire Bancorp, Inc. | 59,225 | |||
| 12,800 | Wintrust Financial Corporation | 205,824 | |||
| 8,612 | World Acceptance Corporationa,b | 171,465 | |||
| 19,900 | Zenith National Insurance Corporation | 432,626 | |||
Total Financials | 30,557,405 | ||||
| Health Care (13.4%) | |||||
| 11,700 | Abaxis, Inc.a | 240,318 | |||
| 5,700 | Air Methods Corporationa | 155,952 | |||
| 32,100 | Align Technology, Inc.a | 340,260 | |||
| 3,400 | Almost Family, Inc.a,b | 88,774 | |||
| 14,533 | Amedisys, Inc.a,b | 479,879 | |||
| 39,400 | American Medical Systems Holdings, Inc.a | 622,520 | |||
| 28,400 | AMERIGROUP Corporationa | 762,540 | |||
| 17,400 | AMN Healthcare Services, Inc.a | 111,012 | |||
| 16,850 | AmSurg Corporationa | 361,264 | |||
| 6,800 | Analogic Corporation | 251,260 | |||
| 15,200 | ArQule, Inc.a | 93,328 | |||
| 6,200 | Bio-Reference Laboratories, Inc.a | 195,982 | |||
| 15,600 | Cambrex Corporationa | 64,272 | |||
| 20,600 | Catalyst Health Solutions, Inc.a | 513,764 | |||
| 23,000 | Centene Corporationa | 459,540 | |||
| 12,000 | Chemed Corporation | 473,760 | |||
| 5,000 | Computer Programs and Systems, Inc. | 191,550 | |||
| 15,550 | CONMED Corporationa | 241,336 | |||
| 24,100 | Cooper Companies, Inc. | 595,993 | |||
| 4,100 | Corvel Corporationa | 93,357 | |||
| 16,400 | Cross Country Healthcare, Inc.a | 112,668 | |||
| 15,050 | CryoLife, Inc.a | 83,377 | |||
| 30,800 | Cubist Pharmaceuticals, Inc.a | 564,564 | |||
| 12,400 | Cyberonics, Inc.a | 206,212 | |||
| 9,500 | Dionex Corporationa | 579,785 | |||
| 30,000 | Eclipsys Corporationa | 533,400 | |||
| 17,397 | Enzo Biochem, Inc.a | 77,069 | |||
| 23,300 | EResearch Technology, Inc.a | 144,693 | |||
| 5,100 | Genoptix, Inca | 163,149 | |||
| 15,400 | Gentiva Health Services, Inc.a | 253,484 | |||
| 12,300 | Greatbatch, Inc.a | 278,103 | |||
| 13,600 | Haemonetics Corporationa | 775,200 | |||
| 16,600 | Hanger Orthopedic Group, Inc.a | 225,594 | |||
| 26,100 | Healthspring, Inc.a | 283,446 | |||
| 18,000 | Healthways, Inc.a | 242,100 | |||
| 13,600 | HMS Holding Corporationa | 553,792 | |||
| 6,900 | ICU Medical, Inc.a | 283,935 | |||
| 10,700 | Integra LifeSciences Holdings Corporationa | 283,657 | |||
| 17,200 | Invacare Corporation | 303,580 | |||
| 17,800 | inVentiv Health, Inc.a | 240,834 | |||
| 4,600 | IPC The Hospitalist Company, Inc.a | 122,774 | |||
| 7,100 | Kendle International, Inc.a | 86,904 | |||
| 6,200 | Kensey Nash Corporationa | 162,502 | |||
| 5,000 | Landauer, Inc. | 306,700 | |||
| 9,950 | LCA-Vision, Inc.a | 41,989 | |||
| 7,900 | LHC Group, Inc.a | 175,459 | |||
| 19,600 | Magellan Health Services, Inc.a | 643,272 | |||
| 17,700 | Martek Biosciences Corporationa,b | 374,355 | |||
| 10,500 | MedCath Corporationa | 123,480 | |||
| 21,600 | Meridian Bioscience, Inc. | 487,728 | |||
| 15,000 | Merit Medical Systems, Inc.a | 244,500 | |||
| 7,500 | Molina Healthcare, Inc.a | 179,400 | |||
| 6,500 | MWI Veterinary Supply, Inc.a | 226,590 | |||
| 15,000 | Natus Medical, Inc.a | 173,100 | |||
| 7,900 | Neogen Corporationa | 228,942 | |||
| 13,300 | Noven Pharmaceuticals, Inc.a | 190,190 | |||
| 17,500 | Odyssey Healthcare, Inc.a | 179,900 | |||
| 16,700 | Omnicell, Inc.a | 179,525 | |||
| 9,600 | Osteotech, Inc.a | 42,240 | |||
| 9,900 | Palomar Medical Technologies, Inc.a | 145,134 | |||
| 18,600 | Par Pharmaceutical Companies, Inc.a,b | 281,790 | |||
| 30,800 | PAREXEL International Corporationa | 442,904 | |||
The accompanying Notes to Financial Statements are an integral part of this schedule.
133
Table of Contents
Small Cap Index Portfolio
Schedule of Investments as of June 30, 2009
(unaudited)
| Shares | Common Stock (97.3%) | Value | |||
| Health Care (13.4%) - continued | |||||
| 24,400 | Pediatrix Medical Group, Inc.a | $ | 1,027,972 | ||
| 16,300 | PharMerica Corporationa,b | 319,969 | |||
| 22,900 | Phase Forward, Inc.a | 346,019 | |||
| 32,300 | PSS World Medical, Inc.a | 597,873 | |||
| 9,700 | Quality Systems, Inc.b | 552,512 | |||
| 33,800 | Regeneron Pharmaceuticals, Inc.a | 605,696 | |||
| 9,800 | RehabCare Group, Inc.a | 234,514 | |||
| 13,700 | Res-Care, Inc.a | 195,910 | |||
| 25,700 | Salix Pharmaceuticals, Ltd.a | 253,659 | |||
| 28,200 | Savient Pharmaceuticals, Inc.a,b | 390,852 | |||
| 7,800 | SurModics, Inc.a | 176,514 | |||
| 19,100 | Symmetry Medical, Inc.a | 178,012 | |||
| 17,800 | Theragenics Corporationa | 22,428 | |||
| 41,400 | ViroPharma, Inc.a | 245,502 | |||
| 17,500 | West Pharmaceutical Services, Inc.b | 609,875 | |||
| 11,300 | Zoll Medical Corporationa | 218,542 | |||
Total Health Care | 23,540,530 | ||||
| Industrials (16.9%) | |||||
| 12,100 | A.O. Smith Corporation | 394,097 | |||
| 20,700 | AAR Corporationa,b | 332,235 | |||
| 23,800 | ABM Industries, Inc. | 430,066 | |||
| 35,600 | Actuant Corporation | 434,320 | |||
| 21,600 | Acuity Brands, Inc.b | 605,880 | |||
| 11,700 | Administaff, Inc. | 272,259 | |||
| 8,300 | Aerovironment, Inc.a | 256,138 | |||
| 14,300 | Albany International Corporation | 162,734 | |||
| 4,900 | American Science & Engineering, Inc. | 338,688 | |||
| 14,900 | Apogee Enterprises, Inc. | 183,270 | |||
| 19,350 | Applied Industrial Technologies, Inc. | 381,195 | |||
| 6,900 | Applied Signal Technology, Inc. | 176,019 | |||
| 13,500 | Arkansas Best Corporation | 355,725 | |||
| 10,600 | Astec Industries, Inc.a | 314,714 | |||
| 10,600 | ATC Technology Corporationa | 153,700 | |||
| 4,900 | Axsys Technologies, Inc.a | 262,836 | |||
| 6,700 | Azz, Inc.a | 230,547 | |||
| 7,300 | Badger Meter, Inc. | 299,300 | |||
| 24,700 | Baldor Electric Company | 587,613 | |||
| 22,400 | Barnes Group, Inc. | 266,336 | |||
| 24,925 | Belden, Inc. | 416,247 | |||
| 14,840 | Bowne & Company, Inc. | 96,608 | |||
| 27,400 | Brady Corporation | 688,288 | |||
| 26,600 | Briggs & Stratton Corporationb | 354,844 | |||
| 14,000 | C&D Technologies, Inc.a,b | 28,000 | |||
| 4,500 | Cascade Corporation | 70,785 | |||
| 6,900 | CDI Corporation | 76,935 | |||
| 13,850 | Ceradyne, Inc.a | 244,591 | |||
| 9,000 | Circor International, Inc. | 212,490 | |||
| 27,200 | CLARCOR, Inc. | 793,968 | |||
| 6,000 | Consolidated Graphics, Inc.a | 104,520 | |||
| 8,300 | Cubic Corporation | 297,057 | |||
| 24,200 | Curtiss-Wright Corporation | 719,466 | |||
| 35,100 | EMCOR Group, Inc.a | 706,212 | |||
| 10,800 | EnPro Industries, Inc.a | 194,508 | |||
| 14,000 | ESCO Technologies, Inc.a | 627,200 | |||
| 15,900 | Esterline Technologies Corporationa | 430,413 | |||
| 15,500 | Forward Air Corporation | 330,460 | |||
| 9,900 | G & K Services, Inc. | 209,385 | |||
| 27,700 | Gardner Denver, Inc.a | 697,209 | |||
| 26,500 | GenCorp, Inc.a | 50,615 | |||
| 27,300 | Geo Group, Inc.a | 507,234 | |||
| 14,400 | Gibraltar Industries, Inc. | 98,928 | |||
| 25,930 | Griffon Corporationa | 215,738 | |||
| 23,025 | Healthcare Services Group, Inc. | 411,687 | |||
| 28,648 | Heartland Express, Inc. | 421,699 | |||
| 8,700 | Heidrick & Struggles International, Inc. | 158,775 | |||
| 20,200 | Hub Group, Inc.a | 416,928 | |||
| 12,900 | II-VI, Inc.a | 285,993 | |||
| 20,600 | Insituform Technologies, Inc.a | 349,582 | |||
| 30,000 | Interface, Inc. | 186,000 | |||
| 14,700 | John Bean Technologies Corporation | 184,044 | |||
| 13,600 | Kaman Corporation | 227,120 | |||
| 18,000 | Kaydon Corporation | 586,080 | |||
| 28,700 | Kirby Corporationa | 912,373 | |||
| 30,350 | Knight Transportation, Inc. | 502,293 | |||
| 2,200 | Lawson Products, Inc. | 31,262 | |||
| 6,550 | Lindsay Manufacturing Companyb | 216,805 | |||
| 8,900 | Lydall, Inc.a | 30,260 | |||
| 16,600 | MagneTek, Inc.a | 23,074 | |||
| 18,900 | Mobile Mini, Inc.a,b | 277,263 | |||
| 22,750 | Moog, Inc.a | 587,178 | |||
| 19,800 | Mueller Industries, Inc. | 411,840 | |||
| 10,500 | NCI Building Systems, Inc.a,b | 27,720 | |||
| 14,750 | Old Dominion Freight Line, Inc.a | 495,157 | |||
| 19,100 | On Assignment, Inc.a | 74,681 | |||
| 30,500 | Orbital Sciences Corporationa | 462,685 | |||
| 20,175 | Quanex Building Products Corporation | 226,364 | |||
| 18,800 | Regal-Beloit Corporation | 746,736 | |||
| 17,500 | Robbins & Myers, Inc. | 336,875 | |||
| 8,500 | School Specialty, Inc.a | 171,785 | |||
| 20,000 | Simpson Manufacturing Company, Inc.b | 432,400 | |||
| 30,400 | SkyWest, Inc. | 310,080 | |||
| 28,000 | Spherion Corporationa | 115,360 | |||
| 6,800 | Standard Register Company | 22,168 | |||
| 6,600 | Standex International Corporation | 76,560 | |||
| 7,200 | Stanley, Inc.a | 236,736 | |||
| 17,900 | Sykes Enterprises, Inc.a | 323,811 | |||
| 19,200 | Teledyne Technologies, Inc.a | 628,800 | |||
| 32,206 | Tetra Tech, Inc.a | 922,702 | |||
| 19,100 | Toro Companyb | 571,090 | |||
| 10,300 | Tredegar Corporation | 137,196 | |||
| 8,900 | Triumph Group, Inc. | 356,000 | |||
| 23,100 | TrueBlue, Inc.a | 194,040 | |||
| 12,700 | United Stationers, Inc.a | 442,976 | |||
| 9,000 | Universal Forest Products, Inc. | 297,810 | |||
| 10,800 | Viad Corporation | 185,976 | |||
| 10,500 | Vicor Corporation | 75,810 | |||
| 6,500 | Volt Information Sciences, Inc.a | 40,755 | |||
| 16,400 | Wabash National Corporation | 11,480 | |||
| 15,150 | Watsco, Inc.b | 741,289 | |||
| 15,700 | Watts Water Technologies, Inc. | 338,178 | |||
Total Industrials | 29,832,849 | ||||
The accompanying Notes to Financial Statements are an integral part of this schedule.
134
Table of Contents
Small Cap Index Portfolio
Schedule of Investments as of June 30, 2009
(unaudited)
| Shares | Common Stock (97.3%) | Value | |||
| Information Technology (17.6%) | |||||
| 13,800 | Actel Corporationa | $ | 148,074 | ||
| 65,100 | Adaptec, Inc.a | 172,515 | |||
| 17,500 | Advanced Energy Industries, Inc.a | 157,325 | |||
| 12,100 | Agilysys, Inc. | 56,628 | |||
| 16,000 | Anixter International, Inc.a | 601,440 | |||
| 65,723 | Arris Group, Inc.a | 799,192 | |||
| 16,800 | ATMI, Inc.a | 260,904 | |||
| 16,213 | Avid Technology, Inc.a,b | 217,416 | |||
| 7,400 | Bankrate, Inc.a,b | 186,776 | |||
| 6,100 | Bel Fuse, Inc. | 97,844 | |||
| 34,850 | Benchmark Electronics, Inc.a | 501,840 | |||
| 9,400 | Black Box Corporation | 314,618 | |||
| 23,400 | Blackbaud, Inc. | 363,870 | |||
| 20,900 | Blue Coat Systems, Inc.a | 345,686 | |||
| 27,500 | Brightpoint, Inc.a | 172,425 | |||
| 34,007 | Brooks Automation, Inc.a | 152,351 | |||
| 12,500 | Cabot Microelectronics Corporationa | 353,625 | |||
| 16,000 | CACI International, Inc.a | 683,360 | |||
| 20,700 | Checkpoint Systems, Inc.a | 324,783 | |||
| 32,300 | CIBER, Inc.a | 100,130 | |||
| 21,200 | Cognex Corporation | 299,556 | |||
| 12,500 | Cohu, Inc. | 112,250 | |||
| 22,200 | Commvault Systems, Inc.a | 368,076 | |||
| 9,800 | Comscore, Inc.a | 130,536 | |||
| 15,000 | Comtech Telecommunications Corporationa | 478,200 | |||
| 22,500 | Concur Technologies, Inc.a,b | 699,300 | |||
| 18,800 | CSG Systems International, Inc.a | 248,912 | |||
| 18,000 | CTS Corporation | 117,900 | |||
| 36,825 | CyberSource Corporationa | 563,423 | |||
| 15,800 | Cymer, Inc.a | 469,734 | |||
| 73,700 | Cypress Semiconductor Corporationa | 678,040 | |||
| 18,200 | Daktronics, Inc.b | 140,140 | |||
| 21,300 | DealerTrack Holdings, Inc.a | 362,100 | |||
| 13,400 | Digi International, Inc.a | 130,650 | |||
| 17,450 | Diodes, Inc.a | 272,918 | |||
| 12,100 | DSP Group, Inc.a | 81,796 | |||
| 9,300 | DTS, Inc.a | 251,751 | |||
| 4,700 | Ebix, Inc.a | 147,204 | |||
| 14,500 | Electro Scientific Industries, Inc.a | 162,110 | |||
| 8,100 | EMS Technologies, Inc.a | 169,290 | |||
| 32,000 | Epicor Software Corporationa,b | 169,600 | |||
| 19,100 | EPIQ Systems, Inc.a | 293,185 | |||
| 22,900 | Exar Corporationa | 164,651 | |||
| 8,900 | Faro Technologies, Inc.a | 138,217 | |||
| 19,900 | FEI Companya | 455,710 | |||
| 8,200 | Forrester Research, Inc.a | 201,310 | |||
| 12,900 | Gerber Scientific, Inc.a | 32,250 | |||
| 51,000 | Harmonic, Inc.a | 300,390 | |||
| 13,100 | Heartland Payment Systems, Inc. | 125,367 | |||
| 10,100 | Hittite Microwave Corporationa | 350,975 | |||
| 12,400 | Hutchinson Technology, Inc.a | 24,180 | |||
| 46,600 | Informatica Corporationa | 801,054 | |||
| 18,700 | InfoSpace, Inc.a | 123,981 | |||
| 24,275 | Insight Enterprises, Inc.a | 234,497 | |||
| 9,200 | Integral Systems, Inc.a | 76,544 | |||
| 25,900 | Intermec, Inc.a | 334,110 | |||
| 11,700 | Intevac, Inc.a | 101,907 | |||
| 23,500 | J2 Global Communication, Inc.a | 530,160 | |||
| 14,600 | JDA Software Group, Inc.a | 218,416 | |||
| 7,300 | Keithley Instruments, Inc. | 29,200 | |||
| 15,400 | Knot, Inc.a | 121,352 | |||
| 36,500 | Kopin Corporationa | 133,955 | |||
| 32,600 | Kulicke and Soffa Industries, Inc.a | 111,818 | |||
| 11,600 | Littelfuse, Inc.a | 231,536 | |||
| 9,300 | LoJack Corporationa | 38,967 | |||
| 12,600 | Manhattan Associates, Inc.a | 229,572 | |||
| 9,300 | MAXIMUS, Inc. | 383,625 | |||
| 12,100 | Mercury Computer Systems, Inc.a | 111,925 | |||
| 20,200 | Methode Electronics, Inc. | 141,804 | |||
| 24,500 | Micrel, Inc. | 179,340 | |||
| 43,300 | Microsemi Corporationa | 597,540 | |||
| 26,500 | MKS Instruments, Inc.a | 349,535 | |||
| 9,000 | MTS Systems Corporation | 185,850 | |||
| 18,400 | NETGEAR, Inc.a | 265,144 | |||
| 15,600 | Network Equipment Technologies, Inc.a | 66,456 | |||
| 19,200 | Newport Corporationa | 111,168 | |||
| 16,200 | Novatel Wireless, Inc.a | 146,124 | |||
| 10,950 | Park Electrochemical Corporation | 235,753 | |||
| 9,700 | PC TEL, Inc.a | 51,895 | |||
| 17,100 | Perficient, Inc.a | 119,529 | |||
| 13,500 | Pericom Semiconductor Corporationa | 113,670 | |||
| 15,500 | Phoenix Technologies, Ltd.a | 42,005 | |||
| 21,000 | Plexus Corporationa | 429,660 | |||
| 21,300 | Progress Software Corporationa | 450,921 | |||
| 14,700 | Radiant Systems, Inc.a | 122,010 | |||
| 12,400 | RadiSys Corporationa | 111,724 | |||
| 8,400 | Rogers Corporationa | 169,932 | |||
| 16,400 | Rudolph Technologies, Inc.a | 90,528 | |||
| 14,100 | ScanSource, Inc.a,b | 345,732 | |||
| 88,400 | Skyworks Solutions, Inc.a | 864,552 | |||
| 14,900 | Smith Micro Software, Inc.a | 146,318 | |||
| 14,200 | Sonic Solutions, Inc.a | 41,890 | |||
| 9,700 | SPSS, Inc.a | 323,689 | |||
| 11,700 | Standard Microsystems Corporationa | 239,265 | |||
| 6,200 | StarTek, Inc.a | 49,724 | |||
| 10,800 | Stratasys, Inc.a,b | 118,692 | |||
| 6,900 | Supertex, Inc.a | 173,259 | |||
| 23,550 | Symmetricom, Inc.a | 135,884 | |||
| 18,200 | Synaptics, Inc.a,b | 703,430 | |||
| 10,100 | Synnex Corporationa | 252,399 | |||
| 41,550 | Take-Two Interactive Software, Inc.a,b | 393,478 | |||
| 16,400 | Taleo Corporationa | 299,628 | |||
| 21,900 | Technitrol, Inc. | 141,693 | |||
| 35,400 | Tekelec, Inc.a | 595,782 | |||
| 17,200 | TeleTech Holdings, Inc.a | 260,580 | |||
| 35,837 | THQ, Inc.a | 256,593 | |||
| 7,100 | Tollgrade Communications, Inc.a | 37,204 | |||
| 78,700 | TriQuint Semiconductor, Inc.a | 417,897 | |||
| 22,900 | TTM Technologies, Inc.a | 182,284 | |||
| 15,300 | Tyler Technologies, Inc.a | 238,986 | |||
| 12,500 | Ultratech, Inc.a | 153,875 | |||
| 43,900 | United Online, Inc. | 285,789 | |||
| 39,075 | Varian Semiconductor Equipment Associates, Inc.a,b | 937,409 | |||
| 17,200 | Veeco Instruments, Inc.a | 199,348 | |||
| 14,600 | ViaSat, Inc.a | 374,344 | |||
The accompanying Notes to Financial Statements are an integral part of this schedule.
135
Table of Contents
Small Cap Index Portfolio
Schedule of Investments as of June 30, 2009
(unaudited)
| Shares | Common Stock (97.3%) | Value | ||||
| Information Technology (17.6%) - continued | ||||||
| 24,000 | Websense, Inc.a | $ | 428,160 | |||
| 20,400 | Wright Express Corporationa | 519,588 | ||||
Total Information Technology | 31,061,202 | |||||
| Materials (4.1%) | ||||||
| 13,900 | A. Schulman, Inc. | 210,029 | ||||
| 8,800 | A.M. Castle & Company | 106,304 | ||||
| 12,000 | AMCOL International Corporationb | 258,960 | ||||
| 10,800 | American Vanguard Corporation | 122,040 | ||||
| 13,300 | Arch Chemicals, Inc. | 327,047 | ||||
| 9,700 | Balchem Corporation | 237,844 | ||||
| 10,700 | Brush Engineered Materials, Inc.a | 179,225 | ||||
| 20,700 | Buckeye Technologies, Inc.a | 92,943 | ||||
| 28,900 | Calgon Carbon Corporationa | 401,421 | ||||
| 29,500 | Century Aluminum Companya,b | 183,785 | ||||
| 6,000 | Clearwater Paper Corporationa | 151,740 | ||||
| 5,600 | Deltic Timber Corporation | 198,632 | ||||
| 23,300 | Eagle Materials, Inc.b | 588,092 | ||||
| 26,000 | H.B. Fuller Company | 488,280 | ||||
| 22,600 | Headwaters, Inc.a,b | 75,936 | ||||
| 15,063 | Myers Industries, Inc. | 125,324 | ||||
| 7,800 | Neenah Paper, Inc. | 68,718 | ||||
| 6,600 | NewMarket Corporation | 444,378 | ||||
| 4,800 | Olympic Steel, Inc. | 117,456 | ||||
| 16,300 | OM Group, Inc.a | 473,026 | ||||
| 6,000 | Penford Corporation | 34,740 | ||||
| 49,400 | PolyOne Corporationa | 133,874 | ||||
| 5,800 | Quaker Chemical Corporation | 77,082 | ||||
| 20,400 | Rock-Tenn Company | 778,464 | ||||
| 12,300 | RTI International Metals, Inc.a | 217,341 | ||||
| 8,200 | Schweitzer-Mauduit International, Inc. | 223,122 | ||||
| 3,900 | Stepan Company | 172,224 | ||||
| 14,800 | Texas Industries, Inc.b | 464,128 | ||||
| 26,100 | Wausau Paper Corporation | 175,392 | ||||
| 11,250 | Zep, Inc. | 135,563 | ||||
Total Materials | 7,263,110 | |||||
| Telecommunications Services (0.5%) | ||||||
| 13,700 | Cbeyond, Inc.a | 196,595 | ||||
| 47,600 | FairPoint Communications, Inc. | 28,560 | ||||
| 23,600 | General Communication, Inc.a | 163,548 | ||||
| 17,100 | Iowa Telecommunications Services, Inc. | 213,921 | ||||
| 9,500 | Neutral Tandem, Inc.a | 280,440 | ||||
Total Telecommunications Services | 883,064 | |||||
| Utilities (4.6%) | ||||||
| 14,633 | ALLETE, Inc. | 420,699 | ||||
| 9,750 | American States Water Company | 337,740 | ||||
| 49,000 | Atmos Energy Corporation | 1,226,960 | ||||
| 29,200 | Avista Corporation | 520,052 | ||||
| 6,100 | Central Vermont Public Service Corporation | 110,410 | ||||
| 8,400 | CH Energy Group, Inc. | 392,280 | ||||
| 24,000 | El Paso Electric Companya | 335,040 | ||||
| 11,800 | Laclede Group, Inc. | 390,934 | ||||
| 22,650 | New Jersey Resources Corporation | 838,956 | ||||
| 14,200 | Northwest Natural Gas Company | 629,344 | ||||
| 39,300 | Piedmont Natural Gas Company, Inc.b | 947,523 | ||||
| 15,900 | South Jersey Industries, Inc. | 554,751 | ||||
| 23,700 | Southwest Gas Corporation | 526,377 | ||||
| 15,666 | UIL Holdings Corporation | 351,701 | ||||
| 19,000 | UniSource Energy Corporation | 504,260 | ||||
Total Utilities | 8,087,027 | |||||
Total Common Stock (cost $204,423,236) | 171,437,276 | |||||
| Principal Amount | Long-Term Fixed Income (0.3%) | |||||
| U.S. Government (0.3%) | ||||||
U.S. Treasury Notes | ||||||
| 500,000 | 0.875%, 12/31/2010c | 500,684 | ||||
Total U.S. Government | 500,684 | |||||
Total Long-Term Fixed Income (cost $500,350) | 500,684 | |||||
| Shares | Collateral Held for Securities Loaned (14.7%) | |||||
| 25,999,591 | Thrivent Financial Securities Lending Trust | 25,999,591 | ||||
Total Collateral Held for Securities Loaned (cost $25,999,591) | 25,999,591 | |||||
| Shares or Principal Amount | Short-Term Investments (2.1%)d | |||||
Novartis Finance Corporation | ||||||
| 3,660,000 | 0.100%, 7/1/2009 | 3,660,000 | ||||
| 1 | Thrivent Money Market Portfolio | 1 | ||||
Total Short-Term Investments (at amortized cost) | 3,660,001 | |||||
Total Investments (cost $234,583,178) 114.4% | $ | 201,597,552 | ||||
Other Assets and Liabilities, Net (14.4%) | (25,318,683 | ) | ||||
Total Net Assets 100.0% | $ | 176,278,869 | ||||
| a | Non-income producing security. |
| b | All or a portion of the security is on loan as discussed in item 2(M) of the Notes to Financial Statements. |
| c | At June 30, 2009, $500,684 of investments were held on deposit with the counterparty and pledged as the initial margin deposit for open futures contracts. |
| d | The interest rate shown reflects the yield, coupon rate or, for securities purchased at a discount, the discount rate at the date of purchase. |
The accompanying Notes to Financial Statements are an integral part of this schedule.
136
Table of Contents
Small Cap Index Portfolio
Schedule of Investments as of June 30, 2009
(unaudited)
Unrealized Appreciation (Depreciation)
Gross unrealized appreciation and depreciation of investments, based on cost for federal income tax purposes, were as follows:
Gross unrealized appreciation | $ | 31,040,687 | ||
Gross unrealized depreciation | (64,026,313 | ) | ||
Net unrealized appreciation (depreciation) | $ | (32,985,626 | ) | |
Cost for federal income tax purposes | $ | 234,583,178 | ||
Fair Valuation Measurements
The following table is a summary of the inputs used, as of June 30, 2009, in valuing Small Cap Index Portfolio’s assets carried at fair value as discussed in the Notes to Financial Statements.
Investments in Securities | Total | Level 1 | Level 2 | Level 3 | ||||||||||
Common Stock | ||||||||||||||
Consumer Discretionary | 24,736,369 | 24,736,369 | — | — | ||||||||||
Consumer Staples | 7,132,287 | 7,132,287 | — | — | ||||||||||
Energy | 8,343,433 | 8,343,433 | — | — | ||||||||||
Financials | 30,557,405 | 30,557,405 | — | — | ||||||||||
Health Care | 23,540,530 | 23,540,530 | — | — | ||||||||||
Industrials | 29,832,849 | 29,832,849 | — | — | ||||||||||
Information Technology | 31,061,202 | 31,061,202 | — | — | ||||||||||
Materials | 7,263,110 | 7,263,110 | — | — | ||||||||||
Telecommunications Services | 883,064 | 883,064 | — | — | ||||||||||
Utilities | 8,087,027 | 8,087,027 | — | — | ||||||||||
Long-Term Fixed Income | ||||||||||||||
U.S. Government | 500,684 | — | 500,684 | — | ||||||||||
Collateral Held for Securities Loaned | 25,999,591 | 25,999,591 | — | — | ||||||||||
Short-Term Investments | 3,660,001 | 1 | 3,660,000 | — | ||||||||||
Total | $ | 201,597,552 | $ | 197,436,868 | $ | 4,160,684 | $ | — | ||||||
Other Financial Instruments* | ($124,916 | ) | ($124,916 | ) | $ | — | $ | — | ||||||
| * | Other Financial Instruments include Futures, Forwards, Written Options and Swap agreements. |
Futures Contracts | Number of Contracts Long/(Short) | Expiration Date | Notional Principal Amount | Value | Unrealized Gain/(Loss) | |||||||||
Russell 2000 Index Mini-Futures | 84 | September 2009 | $ | 4,385,396 | $ | 4,260,480 | ($ | 124,916 | ) | |||||
Total Futures Contracts | ($ | 124,916 | ) | |||||||||||
The following table summarizes the fair value and Statement of Assets and Liabilities location, as of June 30, 2009, for the Small Cap Index Portfolio’s investments in financial derivative instruments by primary risk exposure as discussed under item (2) Significant Accounting Policies of the Notes to Financial Statements.
Derivatives by Risk Category | Statement of Assets and Liabilities Location | Fair Value | |||
Liability Derivatives | |||||
Equity Contracts | |||||
Future* | Net Assets - Net unrealized appreciation/(depreciation) on Futures contracts | 124,916 | |||
Total Equity Contracts | 124,916 | ||||
Total Liability Derivatives | $ | 124,916 | |||
| * | Includes cumulative appreciation/depreciation of futures contracts as reported in the Schedule of Investments. Only current day’s variation margin is reported within the Statement of Assets and Liabilities. |
The accompanying Notes to Financial Statements are an integral part of this schedule.
137
Table of Contents
Small Cap Index Portfolio
Schedule of Investments as of June 30, 2009
(unaudited)
The following table summarizes the net realized gains/(losses) and Statement of Operations location, for the period ended June 30, 2009, for Small Cap Index Portfolio’s investments in financial derivative instruments by primary risk exposure.
Derivatives by Risk Category | Statement of Operations Location | Realized Gains/(Losses) recognized in Income | |||
| Equity Contracts | |||||
Future | Net realized gains/(losses) on Futures contracts | 753,824 | |||
Total Equity Contracts | 753,824 | ||||
Total | $ | 753,824 | |||
The following table summarizes the change in net unrealized appreciation/(depreciation) and Statement of Operations location, for the period ended June 30, 2009, for the Small Cap Index Portfolio’s investments in financial derivative instruments by primary risk exposure.
Derivatives by Risk Category | Statement of Operations Location | Change in Unrealized Appreciation/(Depreciation) recognized in Income | |||
| Equity Contracts | |||||
Future | Change in net unrealized appreciation/(depreciation) on Futures contracts | (228,152 | ) | ||
Total Equity Contracts | (228,152 | ) | |||
Total | ($228,152 | ) | |||
Investment in Affiliates
Affiliated issuers, as defined under the Investment Company Act of 1940, include those in which the Portfolio’s holdings of an issuer represent 5% or more of the outstanding voting securities of an issuer, or any affiliated mutual fund.
A summary of transactions for the fiscal year to date, in Small Cap Index Portfolio, is as follows:
Portfolio | Value December 31, 2008 | Gross Purchases | Gross Sales | Shares Held at June 30, 2009 | Value June 30, 2009 | Income Earned January 1, 2009 - June 30, 2009 | |||||||||||
Money Market | $ | 968,867 | $ | 11,872,014 | $ | 12,840,880 | 1 | $ | 1 | $ | 4,378 | ||||||
Thrivent Financial Securities Lending Trust | 44,468,815 | 54,882,884 | 73,352,108 | 25,999,591 | 25,999,591 | 160,234 | |||||||||||
Total Value and Income Earned | 45,437,682 | 25,999,592 | 164,612 | ||||||||||||||
The accompanying Notes to Financial Statements are an integral part of this schedule.
138
Table of Contents
Schedule of Investments as of June 30, 2009
(unaudited)
| Shares | Common Stock (95.4%) | Value | |||
| Consumer Discretionary (14.5%) | |||||
| 41,700 | Bed Bath & Beyond, Inc.a | $ | 1,282,275 | ||
| 33,500 | Burger King Holdings, Inc. | 578,545 | |||
| 14,500 | Central European Media Enterprises, Ltd.a,b | 285,505 | |||
| 207,300 | Coldwater Creek, Inc.a | 1,256,238 | |||
| 19,400 | DeVry, Inc. | 970,776 | |||
| 36,200 | Discovery Communications, Inc., Class Aa | 816,310 | |||
| 93,900 | Gentex Corporation | 1,089,240 | |||
| 129,100 | Goodyear Tire & Rubber Companya | 1,453,666 | |||
| 107,500 | International Game Technology | 1,709,250 | |||
| 25,600 | Jack in the Box, Inc.a | 574,720 | |||
| 25,900 | Kohl’s Corporationa | 1,107,225 | |||
| 118,300 | Leapfrog Enterprises, Inc.a | 270,907 | |||
| 35,900 | Toll Brothers, Inc.a | 609,223 | |||
| 9,600 | VF Corporation | 531,360 | |||
| 30,000 | WMS Industries, Inc.a | 945,300 | |||
| 70,900 | Zumiez, Inc.a,b | 567,909 | |||
Total Consumer Discretionary | 14,048,449 | ||||
| Consumer Staples (1.5%) | |||||
| 41,800 | H.J. Heinz Company | 1,492,260 | |||
Total Consumer Staples | 1,492,260 | ||||
| Energy (9.7%) | |||||
| 29,500 | Forest Oil Corporationa | 440,140 | |||
| 54,400 | Nabors Industries, Ltd.a | 847,552 | |||
| 27,600 | Oil States International, Inc.a | 668,196 | |||
| 29,000 | Peabody Energy Corporation | 874,640 | |||
| 51,400 | Petrohawk Energy Corporationa | 1,146,220 | |||
| 11,500 | Southwestern Energy Companya | 446,775 | |||
| 43,000 | Sunoco, Inc. | 997,600 | |||
| 40,400 | Ultra Petroleum Corporationa | 1,575,600 | |||
| 60,900 | Weatherford International, Ltd.a | 1,191,204 | |||
| 48,300 | Willbros Group, Inc.a | 604,233 | |||
| 15,400 | XTO Energy, Inc. | 587,356 | |||
Total Energy | 9,379,516 | ||||
| Financials (8.8%) | |||||
| 1,800 | CME Group, Inc. | 559,998 | |||
| 72,100 | Hudson City Bancorp, Inc. | 958,209 | |||
| 17,000 | IntercontinentalExchange, Inc.a | 1,942,080 | |||
| 46,800 | Lazard, Ltd. | 1,259,856 | |||
| 18,800 | T. Rowe Price Group, Inc. | 783,396 | |||
| 53,600 | TCF Financial Corporationb | 716,632 | |||
| 130,500 | TD Ameritrade Holding Corporationa | 2,288,970 | |||
Total Financials | 8,509,141 | ||||
| Health Care (12.0%) | |||||
| 20,300 | Alexion Pharmaceuticals, Inc.a | 834,736 | |||
| 81,200 | Amylin Pharmaceuticals, Inc.a | 1,096,200 | |||
| 26,100 | Beckman Coulter, Inc. | 1,491,354 | |||
| 131,100 | Boston Scientific Corporationa | 1,329,354 | |||
| 19,000 | C.R. Bard, Inc. | 1,414,550 | |||
| 13,100 | CardioNet, Inc.a | 213,792 | |||
| 22,400 | CIGNA Corporation | 539,616 | |||
| 89,100 | Hologic, Inc.a | 1,267,893 | |||
| 28,600 | Myriad Genetics, Inc.a | 1,019,590 | |||
| 5,750 | Myriad Pharmaceuticals, Inc.a | 26,737 | |||
| 20,900 | Shire Pharmaceuticals Group plc ADR | 866,932 | |||
| 15,700 | Thermo Fisher Scientific, Inc.a | 640,089 | |||
| 25,500 | Vertex Pharmaceuticals, Inc.a | 908,820 | |||
Total Health Care | 11,649,663 | ||||
| Industrials (15.0%) | |||||
| 23,600 | Aecom Technology Corporationa | 755,200 | |||
| 72,900 | BE Aerospace, Inc.a | 1,046,844 | |||
| 31,900 | C.H. Robinson Worldwide, Inc. | 1,663,585 | |||
| 31,300 | Con-way, Inc. | 1,105,203 | |||
| 242,300 | Delta Air Lines, Inc.a | 1,402,917 | |||
| 16,000 | Flowserve Corporation | 1,116,960 | |||
| 20,299 | FTI Consulting, Inc.a | 1,029,565 | |||
| 52,260 | Monster Worldwide, Inc.a,b | 617,191 | |||
| 15,600 | Precision Castparts Corporation | 1,139,268 | |||
| 54,900 | Quanta Services, Inc.a | 1,269,837 | |||
| 62,900 | Ryanair Holdings plca | 1,785,731 | |||
| 10,000 | SPX Corporation | 489,700 | |||
| 15,900 | Stericycle, Inc.a | 819,327 | |||
| 13,900 | SunPower Corporationa,b | 370,296 | |||
Total Industrials | 14,611,624 | ||||
| Information Technology (23.7%) | |||||
| 49,187 | Akamai Technologies, Inc.a | 943,407 | |||
| 63,800 | ASML Holding NVb | 1,381,270 | |||
| 26,500 | Broadcom Corporationa | 656,935 | |||
| 25,400 | Electronic Arts, Inc.a | 551,688 | |||
| 71,800 | F5 Networks, Inc.a | 2,483,562 | |||
| 57,900 | FormFactor, Inc.a | 998,196 | |||
| 30,400 | Juniper Networks, Inc.a | 717,440 | |||
| 142,700 | Marvell Technology Group, Ltd.a | 1,661,028 | |||
| 43,300 | Mercadolibre, Inc.a,b | 1,163,904 | |||
| 58,500 | Molex, Inc. | 909,675 | |||
| 61,000 | NETAPP, Inc.a | 1,202,920 | |||
| 70,400 | Nuance Communications, Inc.a | 851,136 | |||
| 170,000 | NVIDIA Corporationa | 1,919,300 | |||
| 59,600 | Omniture, Inc.a | 748,576 | |||
| 153,400 | PMC-Sierra, Inc.a | 1,221,064 | |||
| 47,300 | Polycom, Inc.a | 958,771 | |||
| 96,200 | Seagate Technology | 1,006,252 | |||
| 56,500 | Symantec Corporationa | 879,140 | |||
| 32,000 | Synaptics, Inc.a,b | 1,236,800 | |||
| 33,100 | Synopsys, Inc.a | 645,781 | |||
| 33,000 | VMware, Inc.a,b | 899,910 | |||
Total Information Technology | 23,036,755 | ||||
| Materials (7.4%) | |||||
| 56,800 | Celanese Corporation | 1,349,000 | |||
| 18,700 | FMC Corporation | 884,510 | |||
| 86,300 | Owens-Illinois, Inc.a | 2,417,263 | |||
| 56,600 | Pactiv Corporationa | 1,229,918 | |||
| 7,900 | SPDR Gold Trusta | 720,322 | |||
| 15,100 | Walter Energy, Inc. | 547,224 | |||
Total Materials | 7,148,237 | ||||
| Telecommunications Services (2.8%) | |||||
| 39,300 | NII Holdings, Inc.a | 749,451 | |||
| 44,100 | SBA Communications | ||||
Corporationa | 1,082,214 | ||||
The accompanying Notes to Financial Statements are an integral part of this schedule.
139
Table of Contents
Mid Cap Growth Portfolio II
Schedule of Investments as of June 30, 2009
(unaudited)
| Shares | Common Stock (95.4%) | Value | ||||
| Telecommunications Services (2.8%) - continued | ||||||
| 89,800 | TW Telecom, Inc.a | $ | 922,246 | |||
Total Telecommunications Services | 2,753,911 | |||||
Total Common Stock (cost $88,540,094) | 92,629,556 | |||||
Collateral Held for Securities Loaned (6.8%) | ||||||
| 6,588,180 | Thrivent Financial Securities Lending Trust | 6,588,180 | ||||
Total Collateral Held for Securities Loaned (cost $6,588,180) | 6,588,180 | |||||
Short-Term Investments (4.4%) | ||||||
| 4,275,659 | Thrivent Money Market Portfolio | 4,275,659 | ||||
Total Short-Term Investments (at amortized cost) | 4,275,659 | |||||
Total Investments (cost $99,403,933) 106.6% | $ | 103,493,395 | ||||
Other Assets and Liabilities, Net (6.6%) | (6,442,971 | ) | ||||
Total Net Assets 100.0% | $ | 97,050,424 | ||||
| a | Non-income producing security. |
| b | All or a portion of the security is on loan as discussed in item 2(M) of the Notes to Financial Statements. |
Definitions:
| ADR | - | American Depositary Receipt, which are certificates for an underlying foreign security’s shares held by an issuing U.S. depository bank. |
Unrealized Appreciation (Depreciation)
Gross unrealized appreciation and depreciation of investments, based on cost for federal income tax purposes, were as follows:
Gross unrealized appreciation | $ | 11,366,447 | ||
Gross unrealized depreciation | (7,276,985 | ) | ||
Net unrealized appreciation (depreciation) | $ | 4,089,462 | ||
Cost for federal income tax purposes | $ | 99,403,933 | ||
Fair Valuation Measurements
The following table is a summary of the inputs used, as of June 30, 2009, in valuing Mid Cap Growth Portfolio II’s assets carried at fair value as discussed in the Notes to Financial Statements.
Investments in Securities | Total | Level 1 | Level 2 | Level 3 | ||||||||
Common Stock | ||||||||||||
Consumer Discretionary | 14,048,449 | 14,048,449 | — | — | ||||||||
Consumer Staples | 1,492,260 | 1,492,260 | — | — | ||||||||
Energy | 9,379,516 | 9,379,516 | — | — | ||||||||
Financials | 8,509,141 | 8,509,141 | — | — | ||||||||
Health Care | 11,649,663 | 11,649,663 | — | — | ||||||||
Industrials | 14,611,624 | 14,611,624 | — | — | ||||||||
Information Technology | 23,036,755 | 23,036,755 | — | — | ||||||||
Materials | 7,148,237 | 7,148,237 | — | — | ||||||||
Telecommunications Services | 2,753,911 | 2,753,911 | — | — | ||||||||
Collateral Held for Securities Loaned | 6,588,180 | 6,588,180 | — | — | ||||||||
Short-Term Investments | 4,275,659 | 4,275,659 | — | — | ||||||||
Total | $ | 103,493,395 | $ | 103,493,395 | $ | — | $ | — | ||||
The accompanying Notes to Financial Statements are an integral part of this schedule.
140
Table of Contents
Mid Cap Growth Portfolio II
Schedule of Investments as of June 30, 2009
(unaudited)
Investment in Affiliates
Affiliated issuers, as defined under the Investment Company Act of 1940, include those in which the Portfolio’s holdings of an issuer represent 5% or more of the outstanding voting securities of an issuer, or any affiliated mutual fund.
A summary of transactions for the fiscal year to date, in Mid Cap Growth Portfolio II, is as follows:
Portfolio | Value December 31, 2008 | Gross Purchases | Gross Sales | Shares Held at June 30, 2009 | Value June 30, 2009 | Income Earned January 1, 2009 - June 30, 2009 | |||||||||||
Money Market | $ | 3,679,661 | $ | 20,851,170 | $ | 20,255,172 | 4,275,659 | $ | 4,275,659 | $ | 11,239 | ||||||
Thrivent Financial Securities Lending Trust | 5,387,577 | 33,571,952 | 32,371,349 | 6,588,180 | 6,588,180 | 40,978 | |||||||||||
Total Value and Income Earned | 9,067,238 | 10,863,839 | 52,217 | ||||||||||||||
The accompanying Notes to Financial Statements are an integral part of this schedule.
141
Table of Contents
Schedule of Investments as of June 30, 2009
(unaudited)
| Shares | Common Stock (97.6%) | Value | |||
| Consumer Discretionary (15.9%) | |||||
| 114,825 | Bed Bath & Beyond, Inc.a | $ | 3,530,869 | ||
| 71,950 | BorgWarner, Inc. | 2,455,654 | |||
| 119,000 | Burger King Holdings, Inc. | 2,055,130 | |||
| 27,925 | Central European Media Enterprises, Ltd.a,b | 549,843 | |||
| 601,600 | Coldwater Creek, Inc.a,b | 3,645,696 | |||
| 56,700 | DeVry, Inc. | 2,837,268 | |||
| 104,050 | Discovery Communications, Inc., Class Aa | 2,346,328 | |||
| 206,750 | Gap, Inc. | 3,390,700 | |||
| 254,600 | Gentex Corporation | 2,953,360 | |||
| 280,875 | Goodyear Tire & Rubber Companya | 3,162,652 | |||
| 74,950 | Hasbro, Inc. | 1,816,788 | |||
| 225,150 | International Game Technology | 3,579,885 | |||
| 72,850 | Jack in the Box, Inc.a | 1,635,483 | |||
| 123,900 | KB Homeb | 1,694,952 | |||
| 62,800 | Kohl’s Corporationa | 2,684,700 | |||
| 292,700 | Leapfrog Enterprises, Inc.a | 670,283 | |||
| 45,875 | Marvel Entertainment, Inc.a | 1,632,691 | |||
| 117,225 | Toll Brothers, Inc.a | 1,989,308 | |||
| 31,700 | VF Corporation | 1,754,595 | |||
| 95,900 | WMS Industries, Inc.a | 3,021,809 | |||
| 175,725 | Zumiez, Inc.a,b | 1,407,557 | |||
Total Consumer Discretionary | 48,815,551 | ||||
| Consumer Staples (2.2%) | |||||
| 70,700 | Avon Products, Inc. | 1,822,646 | |||
| 29,100 | General Mills, Inc. | 1,630,182 | |||
| 93,300 | H.J. Heinz Company | 3,330,810 | |||
Total Consumer Staples | 6,783,638 | ||||
| Energy (9.6%) | |||||
| 51,475 | Cameron International Corporationa | 1,456,743 | |||
| 28,725 | Diamond Offshore Drilling, Inc. | 2,385,611 | |||
| 96,000 | Forest Oil Corporationa | 1,432,320 | |||
| 103,600 | Nabors Industries, Ltd.a | 1,614,088 | |||
| 70,900 | Oil States International, Inc.a | 1,716,489 | |||
| 79,200 | Patterson-UTI Energy, Inc. | 1,018,512 | |||
| 91,525 | Peabody Energy Corporation | 2,760,394 | |||
| 112,925 | Petrohawk Energy Corporationa | 2,518,227 | |||
| 38,150 | Southwestern Energy Companya | 1,482,127 | |||
| 89,175 | Sunoco, Inc. | 2,068,860 | |||
| 114,900 | Ultra Petroleum Corporationa | 4,481,100 | |||
| 180,400 | Weatherford International, Ltd.a | 3,528,624 | |||
| 143,525 | Willbros Group, Inc.a | 1,795,498 | |||
| 29,200 | XTO Energy, Inc. | 1,113,688 | |||
Total Energy | 29,372,281 | ||||
| Financials (7.9%) | |||||
| 5,900 | CME Group, Inc. | 1,835,549 | |||
| 183,500 | Hudson City Bancorp, Inc. | 2,438,715 | |||
| 39,350 | IntercontinentalExchange, Inc.a | 4,495,344 | |||
| 119,950 | Lazard, Ltd. | 3,229,054 | |||
| 46,100 | Northern Trust Corporation | 2,474,648 | |||
| 52,600 | T. Rowe Price Group, Inc. | 2,191,842 | |||
| 135,300 | TCF Financial Corporationb | 1,808,961 | |||
| 318,600 | TD Ameritrade Holding Corporationa | 5,588,244 | |||
Total Financials | 24,062,357 | ||||
| Health Care (13.2%) | |||||
| 54,800 | Alexion Pharmaceuticals, Inc.a | 2,253,376 | |||
| 132,325 | Amylin Pharmaceuticals, Inc.a,b | 1,786,387 | |||
| 53,600 | Beckman Coulter, Inc. | 3,062,704 | |||
| 136,100 | BioMarin Pharmaceutical, Inc.a,b | 2,124,521 | |||
| 271,900 | Boston Scientific Corporationa | 2,757,066 | |||
| 57,775 | C.R. Bard, Inc. | 4,301,349 | |||
| 42,900 | CardioNet, Inc.a,b | 700,128 | |||
| 18,500 | Cephalon, Inc.a,b | 1,048,025 | |||
| 71,100 | CIGNA Corporation | 1,712,799 | |||
| 46,700 | Express Scripts, Inc.a | 3,210,625 | |||
| 223,150 | Hologic, Inc.a | 3,175,424 | |||
| 27,700 | Life Technologies Corporationa | 1,155,644 | |||
| 52,500 | Millipore Corporationa | 3,686,025 | |||
| 92,050 | Myriad Genetics, Inc.a | 3,281,583 | |||
| 20,812 | Myriad Pharmaceuticals, Inc.a | 96,776 | |||
| 72,300 | Shire Pharmaceuticals Group plc ADR | 2,999,004 | |||
| 31,800 | Thermo Fisher Scientific, Inc.a | 1,296,486 | |||
| 51,300 | Vertex Pharmaceuticals, Inc.a | 1,828,332 | |||
Total Health Care | 40,476,254 | ||||
| Industrials (14.3%) | |||||
| 51,200 | Aecom Technology Corporationa | 1,638,400 | |||
| 188,000 | BE Aerospace, Inc.a,b | 2,699,680 | |||
| 72,400 | C.H. Robinson Worldwide, Inc. | 3,775,660 | |||
| 76,600 | Con-way, Inc. | 2,704,746 | |||
| 558,575 | Delta Air Lines, Inc.a | 3,234,149 | |||
| 60,695 | Expeditors International of | ||||
Washington, Inc. | 2,023,571 | ||||
| 5,350 | First Solar, Inc.a,b | 867,342 | |||
| 46,200 | Flowserve Corporation | 3,225,222 | |||
| 46,647 | FTI Consulting, Inc.a | 2,365,936 | |||
| 67,800 | Knight Transportation, Inc. | 1,122,090 | |||
| 129,050 | Monster Worldwide, Inc.a | 1,524,081 | |||
| 75,575 | Pentair, Inc. | 1,936,232 | |||
| 44,450 | Precision Castparts Corporation | 3,246,184 | |||
| 172,700 | Quanta Services, Inc.a | 3,994,551 | |||
| 23,675 | Roper Industries, Inc. | 1,072,714 | |||
| 136,450 | Ryanair Holdings plca | 3,873,815 | |||
| 33,000 | SPX Corporation | 1,616,010 | |||
| 49,200 | Stericycle, Inc.a | 2,535,276 | |||
| 18,075 | SunPower Corporationa,b | 481,518 | |||
Total Industrials | 43,937,177 | ||||
| Information Technology (22.4%) | |||||
| 106,814 | Akamai Technologies, Inc.a | 2,048,693 | |||
| 141,300 | ASML Holding NV | 3,059,145 | |||
| 76,100 | Broadcom Corporationa | 1,886,519 | |||
| 95,025 | Electronic Arts, Inc.a | 2,063,943 | |||
| 176,375 | F5 Networks, Inc.a | 6,100,811 | |||
| 142,100 | FormFactor, Inc.a | 2,449,804 | |||
| 51,850 | Hewitt Associates, Inc.a | 1,544,093 | |||
| 160,875 | Intersil Corporation | 2,022,199 | |||
| 71,800 | Juniper Networks, Inc.a | 1,694,480 | |||
| 394,200 | Marvell Technology Group, Ltd.a | 4,588,488 | |||
| 7,850 | MasterCard, Inc. | 1,313,384 | |||
| 135,749 | Mercadolibre, Inc.a,b | 3,648,933 | |||
The accompanying Notes to Financial Statements are an integral part of this schedule.
142
Table of Contents
Mid Cap Growth Portfolio
Schedule of Investments as of June 30, 2009
(unaudited)
| Shares | Common Stock (97.6%) | Value | ||||
| Information Technology (22.4%) - continued | ||||||
| 162,625 | Molex, Inc. | $ | 2,528,819 | |||
| 182,675 | NETAPP, Inc.a | 3,602,351 | ||||
| 131,000 | Nuance Communications, Inc.a | 1,583,790 | ||||
| 418,025 | NVIDIA Corporationa | 4,719,502 | ||||
| 191,025 | Omniture, Inc.a | 2,399,274 | ||||
| 401,550 | PMC-Sierra, Inc.a | 3,196,338 | ||||
| 102,825 | Polycom, Inc.a | 2,084,263 | ||||
| 296,475 | Seagate Technology | 3,101,128 | ||||
| 119,650 | Symantec Corporationa | 1,861,754 | ||||
| 69,825 | Synaptics, Inc.a,b | 2,698,736 | ||||
| 113,375 | Synopsys, Inc.a | 2,211,946 | ||||
| 340,575 | Tellabs, Inc.a | 1,951,495 | ||||
| 103,000 | Tyco Electronics, Ltd. | 1,914,770 | ||||
| 88,750 | VMware, Inc.a,b | 2,420,212 | ||||
Total Information Technology | 68,694,870 | |||||
| Materials (8.3%) | ||||||
| 42,525 | Albemarle Corporation | 1,087,364 | ||||
| 137,875 | Celanese Corporation | 3,274,531 | ||||
| 55,400 | FMC Corporation | 2,620,420 | ||||
| 231,850 | Owens-Illinois, Inc.a | 6,494,119 | ||||
| 147,300 | Pactiv Corporationa | 3,200,829 | ||||
| 21,400 | Praxair, Inc. | 1,520,898 | ||||
| 99,075 | Rockwood Holdings, Inc.a | 1,450,458 | ||||
| 26,100 | SPDR Gold Trusta | 2,379,798 | ||||
| 66,250 | Terra Industries, Inc. | 1,604,575 | ||||
| 47,900 | Walter Energy, Inc. | 1,735,896 | ||||
Total Materials | 25,368,888 | |||||
| Telecommunications Services (3.8%) | ||||||
| 93,542 | American Tower Corporationa | 2,949,379 | ||||
| 124,650 | NII Holdings, Inc.a | 2,377,076 | ||||
| 157,000 | SBA Communications Corporationa | 3,852,780 | ||||
| 252,250 | TW Telecom, Inc.a | 2,590,607 | ||||
Total Telecommunications Services | 11,769,842 | |||||
Total Common Stock (cost $347,271,138) | 299,280,858 | |||||
Collateral Held for Securities Loaned (5.4%) | ||||||
| 16,539,541 | Thrivent Financial Securities Lending Trust | 16,539,541 | ||||
Total Collateral Held for Securities Loaned (cost $16,539,541) | 16,539,541 | |||||
| Shares or Principal Amount | Short-Term Investments (2.4%)c | |||||
Federal Home Loan Bank Discount Notes | ||||||
| 5,000,000 | 0.120%, 7/2/2009 | 4,999,983 | ||||
| 2,369,396 | Thrivent Money Market Portfolio | 2,369,396 | ||||
Total Short-Term Investments (at amortized cost) | 7,369,379 | |||||
Total Investments (cost $371,180,058) 105.4% | $ | 323,189,778 | ||||
Other Assets and Liabilities, Net (5.4%) | (16,444,052 | ) | ||||
Total Net Assets 100.0% | $ | 306,745,726 | ||||
| a | Non-income producing security. |
| b | All or a portion of the security is on loan as discussed in item 2(M) of the Notes to Financial Statements. |
| c | The interest rate shown reflects the yield, coupon rate or, for securities purchased at a discount, the discount rate at the date of purchase. |
Definitions:
| ADR | - | American Depositary Receipt, which are certificates for an underlying foreign security’s shares held by an issuing U.S. depository bank. |
Unrealized Appreciation (Depreciation)
Gross unrealized appreciation and depreciation of investments, based on cost for federal income tax purposes, were as follows:
Gross unrealized appreciation | $ | 22,907,936 | ||
Gross unrealized depreciation | (70,898,216 | ) | ||
Net unrealized appreciation (depreciation) | $ | (47,990,280 | ) | |
Cost for federal income tax purposes | $ | 371,180,058 | ||
The accompanying Notes to Financial Statements are an integral part of this schedule.
143
Table of Contents
Mid Cap Growth Portfolio
Schedule of Investments as of June 30, 2009
(unaudited)
Fair Valuation Measurements
The following table is a summary of the inputs used, as of June 30, 2009, in valuing Mid Cap Growth Portfolio’s assets carried at fair value as discussed in the Notes to Financial Statements.
Investments in Securities | Total | Level 1 | Level 2 | Level 3 | ||||||||
Common Stock | ||||||||||||
Consumer Discretionary | 48,815,551 | 48,815,551 | — | — | ||||||||
Consumer Staples | 6,783,638 | 6,783,638 | — | — | ||||||||
Energy | 29,372,281 | 29,372,281 | — | — | ||||||||
Financials | 24,062,357 | 24,062,357 | — | — | ||||||||
Health Care | 40,476,254 | 40,476,254 | — | — | ||||||||
Industrials | 43,937,177 | 43,937,177 | — | — | ||||||||
Information Technology | 68,694,870 | 68,694,870 | — | — | ||||||||
Materials | 25,368,888 | 25,368,888 | — | — | ||||||||
Telecommunications Services | 11,769,842 | 11,769,842 | — | — | ||||||||
Collateral Held for Securities Loaned | 16,539,541 | 16,539,541 | — | — | ||||||||
Short-Term Investments | 7,369,379 | 2,369,396 | 4,999,983 | — | ||||||||
Total | $ | 323,189,778 | $ | 318,189,795 | $ | 4,999,983 | $ | — | ||||
Investment in Affiliates
Affiliated issuers, as defined under the Investment Company Act of 1940, include those in which the Portfolio’s holdings of an issuer represent 5% or more of the outstanding voting securities of an issuer, or any affiliated mutual fund.
A summary of transactions for the fiscal year to date, in Mid Cap Growth Portfolio, is as follows:
Portfolio | Value December 31, 2008 | Gross Purchases | Gross Sales | Shares Held at June 30, 2009 | Value June 30, 2009 | Income Earned January 1, 2009 - June 30, 2009 | |||||||||||
Money Market | $ | 11,178,760 | $ | 33,339,076 | $ | 42,148,440 | 2,369,396 | $ | 2,369,396 | $ | 23,464 | ||||||
Thrivent Financial Securities Lending Trust | 34,543,185 | 101,590,320 | 119,593,964 | 16,539,541 | 16,539,541 | 99,696 | |||||||||||
Total Value and Income Earned | 45,721,945 | 18,908,937 | 123,160 | ||||||||||||||
The accompanying Notes to Financial Statements are an integral part of this schedule.
144
Table of Contents
Partner Mid Cap Value Portfolio
Schedule of Investments as of June 30, 2009
(unaudited)
| Shares | Common Stock (95.1%) | Value | |||
| Consumer Discretionary (13.9%) | |||||
| 3,003 | AutoZone, Inc.a | $ | 453,783 | ||
| 132,432 | DISH Network Corporationa | 2,146,723 | |||
| 25,670 | Fortune Brands, Inc. | 891,776 | |||
| 135,784 | H&R Block, Inc. | 2,339,558 | |||
| 45,168 | J.C. Penney Company, Inc. | 1,296,773 | |||
| 48,011 | Johnson Controls, Inc. | 1,042,799 | |||
| 21,810 | Kohl’s Corporationa | 932,377 | |||
| 10,078 | M.D.C. Holdings, Inc. | 303,449 | |||
| 9,490 | Mohawk Industries, Inc.a,b | 338,603 | |||
| 64,204 | Newell Rubbermaid, Inc. | 668,364 | |||
| 2,856 | NVR, Inc.a | 1,434,826 | |||
| 26,763 | Ross Stores, Inc. | 1,033,052 | |||
| 20,680 | Snap-On, Inc. | 594,343 | |||
| 45,270 | Starwood Hotels & Resorts Worldwide, Inc. | 1,004,994 | |||
| 54,932 | TJX Companies, Inc. | 1,728,161 | |||
| 25,570 | Urban Outfitters, Inc.a | 533,646 | |||
| 66,050 | Viacom, Inc.a | 1,499,335 | |||
Total Consumer Discretionary | 18,242,562 | ||||
| Consumer Staples (4.9%) | |||||
| 4,940 | Alberto-Culver Company | 125,624 | |||
| 11,838 | Campbell Soup Company | 348,274 | |||
| 28,235 | Clorox Company | 1,576,360 | |||
| 31,767 | Coca-Cola Enterprises, Inc. | 528,920 | |||
| 51,132 | ConAgra Foods, Inc. | 974,576 | |||
| 6,050 | Energizer Holdings, Inc.a | 316,052 | |||
| 16,880 | H.J. Heinz Company | 602,616 | |||
| 15,230 | J.M. Smucker Company | 741,092 | |||
| 12,600 | Molson Coors Brewing Company | 533,358 | |||
| 31,440 | Safeway, Inc. | 640,433 | |||
Total Consumer Staples | 6,387,305 | ||||
| Energy (10.1%) | |||||
| 32,457 | Dril-Quip, Inc.a | 1,236,612 | |||
| 87,981 | Newfield Exploration Companya | 2,874,339 | |||
| 32,900 | Noble Energy, Inc. | 1,940,113 | |||
| 31,750 | Pride International, Inc.a | 795,655 | |||
| 64,538 | Range Resources Corporation | 2,672,518 | |||
| 52,048 | Smith International, Inc. | 1,340,236 | |||
| 59,530 | Weatherford International, Ltd.a | 1,164,407 | |||
| 37,460 | Whiting Petroleum Corporationa | 1,317,094 | |||
Total Energy | 13,340,974 | ||||
| Financials (25.0%) | |||||
| 26,610 | Alexandria Real Estate Equities, Inc.b | 952,372 | |||
| 24,160 | Arch Capital Group, Ltd.a | 1,415,293 | |||
| 27,020 | Boston Properties, Inc. | 1,288,854 | |||
| 62,240 | Discover Financial Services | 639,205 | |||
| 83,310 | Douglas Emmett, Inc. | 748,957 | |||
| 9,520 | Essex Property Trust, Inc. | 592,430 | |||
| 26,767 | Everest Re Group, Ltd. | 1,915,714 | |||
| 12,320 | Federal Realty Investment Trust | 634,727 | |||
| 38,020 | Fifth Third Bancorp | 269,942 | |||
| 38,220 | Hartford Financial Services Group, Inc. | 453,671 | |||
| 18,510 | Health Care REIT, Inc. | 631,191 | |||
| 84,880 | Host Marriott Corporation | 712,143 | |||
| 171,588 | Invesco, Ltd. | 3,057,698 | |||
| 99,710 | Janus Capital Group, Inc. | 1,136,694 | |||
| 89,480 | KeyCorp | 468,875 | |||
| 13,713 | Lazard, Ltd. | 369,154 | |||
| 57,368 | Lincoln National Corporation | 987,303 | |||
| 7,053 | M&T Bank Corporationb | 359,209 | |||
| 86,102 | Marsh & McLennan Companies, Inc. | 1,733,233 | |||
| 30,010 | Nasdaq OMX Group, Inc.a | 639,513 | |||
| 84,200 | New York Community Bancorp, Inc.b | 900,098 | |||
| 9,427 | Northern Trust Corporation | 506,041 | |||
| 11,778 | PartnerRe, Ltd. | 764,981 | |||
| 48,760 | Principal Financial Group, Inc. | 918,638 | |||
| 116,936 | Progressive Corporationa | 1,766,903 | |||
| 10,170 | Raymond James Financial, Inc. | 175,026 | |||
| 229,600 | Regions Financial Corporationb | 927,584 | |||
| 93,102 | SLM Corporationa | 956,158 | |||
| 37,910 | SunTrust Banks, Inc. | 623,620 | |||
| 101,569 | Synovus Financial Corporation | 303,691 | |||
| 15,261 | Torchmark Corporationb | 565,268 | |||
| 57,243 | UnumProvident Corporation | 907,874 | |||
| 124,130 | W.R. Berkley Corporation | 2,665,071 | |||
| 52,740 | Willis Group Holdings, Ltd. | 1,357,000 | |||
| 49,450 | XL Capital, Ltd. | 566,697 | |||
Total Financials | 32,910,828 | ||||
| Health Care (5.2%) | |||||
| 9,760 | Becton, Dickinson and Company | 695,986 | |||
| 12,720 | Biogen Idec, Inc.a | 574,308 | |||
| 8,380 | C.R. Bard, Inc. | 623,891 | |||
| 21,340 | Edwards Lifesciences Corporationa | 1,451,760 | |||
| 41,688 | Kinetic Concepts, Inc.a | 1,135,998 | |||
| 7,339 | Laboratory Corporation of America Holdingsa | 497,511 | |||
| 36,590 | WellPoint, Inc.a | 1,862,065 | |||
Total Health Care | 6,841,519 | ||||
| Industrials (8.2%) | |||||
| 9,194 | Alliant Techsystems, Inc.a | 757,218 | |||
| 25,643 | Cooper Industries, Ltd. | 796,215 | |||
| 22,500 | Cummins, Inc. | 792,225 | |||
| 28,961 | Eaton Corporation | 1,291,950 | |||
| 57,445 | Iron Mountain, Inc.a | 1,651,544 | |||
| 16,406 | Landstar System, Inc. | 589,139 | |||
| 15,234 | Lennox International, Inc. | 489,621 | |||
| 15,400 | Norfolk Southern Corporation | 580,118 | |||
| 20,827 | Parker-Hannifin Corporation | 894,728 | |||
| 101,498 | Republic Services, Inc. | 2,477,566 | |||
| 14,740 | Rockwell Automation, Inc. | 473,449 | |||
Total Industrials | 10,793,773 | ||||
| Information Technology (7.7%) | |||||
| 197,647 | Activision Blizzard, Inc.a | 2,496,282 | |||
| 13,480 | Affiliated Computer Services, Inc.a | 598,782 | |||
| 54,124 | Amphenol Corporation | 1,712,483 | |||
| 30,350 | CA, Inc. | 529,000 | |||
| 50,918 | CommScope, Inc.a | 1,337,107 | |||
| 18,360 | Hewitt Associates, Inc.a | 546,761 | |||
| 48,460 | IAC InterActiveCorpa | 777,783 | |||
| 19,890 | KLA-Tencor Corporation | 502,222 | |||
| 20,780 | Linear Technology Corporation | 485,213 | |||
The accompanying Notes to Financial Statements are an integral part of this schedule.
145
Table of Contents
Partner Mid Cap Value Portfolio
Schedule of Investments as of June 30, 2009
(unaudited)
| Shares | Common Stock (95.1%) | Value | ||||
| Information Technology (7.7%) - continued | ||||||
| 63,800 | Parametric Technology Corporationa | $ | 745,822 | |||
| 68,420 | Teradyne, Inc.a | 469,361 | ||||
Total Information Technology | 10,200,816 | |||||
| Materials (6.0%) | ||||||
| 31,810 | Airgas, Inc. | 1,289,259 | ||||
| 43,000 | Celanese Corporation | 1,021,250 | ||||
| 50,670 | Intrepid Potash, Inc.a | 1,422,814 | ||||
| 90,210 | Steel Dynamics, Inc. | 1,328,793 | ||||
| 27,770 | Terra Industries, Inc. | 672,589 | ||||
| 28,860 | Vulcan Materials Companyb | 1,243,866 | ||||
| 26,490 | Walter Energy, Inc. | 959,998 | ||||
Total Materials | 7,938,569 | |||||
| Telecommunications Services (1.9%) | ||||||
| 23,900 | Embarq Corporation | 1,005,234 | ||||
| 313,470 | Sprint Nextel Corporationa | 1,507,791 | ||||
Total Telecommunications Services | 2,513,025 | |||||
| Utilities (12.2%) | ||||||
| 68,573 | American Electric Power Company, Inc. | 1,981,074 | ||||
| 66,673 | CMS Energy Corporation | 805,410 | ||||
| 67,103 | DPL, Inc. | 1,554,777 | ||||
| 63,488 | Edison International, Inc. | 1,997,332 | ||||
| 33,733 | Entergy Corporation | 2,614,982 | ||||
| 35,441 | EQT Corporation | 1,237,245 | ||||
| 29,812 | FirstEnergy Corporation | 1,155,215 | ||||
| 34,070 | NV Energy, Inc. | 367,615 | ||||
| 11,566 | PG&E Corporation | 444,597 | ||||
| 95,648 | PPL Corporation | 3,152,558 | ||||
| 8,423 | Sempra Energy | 418,034 | ||||
| 20,830 | Xcel Energy, Inc. | 383,480 | ||||
Total Utilities | 16,112,319 | |||||
Total Common Stock (cost $133,332,503) | 125,281,690 | |||||
Collateral Held for Securities Loaned (3.8%) | ||||||
| 4,982,498 | Thrivent Financial Securities Lending Trust | 4,982,498 | ||||
Total Collateral Held for Securities Loaned (cost $4,982,498) | 4,982,498 | |||||
Short-Term Investments (3.8%) | ||||||
| 4,949,434 | Thrivent Money Market Portfolio | 4,949,434 | ||||
Total Short-Term Investments (at amortized cost) | 4,949,434 | |||||
Total Investments (cost $143,264,435) 102.7% | $ | 135,213,622 | ||||
Other Assets and Liabilities, Net (2.7%) | (3,515,244 | ) | ||||
Total Net Assets 100.0% | $ | 131,698,378 | ||||
| a | Non-income producing security. |
| b | All or a portion of the security is on loan as discussed in item 2(M) of the Notes to Financial Statements. |
Definitions:
| REIT | - | Real Estate Investment Trust, is a company that buys, develops, manages and/or sells real estate assets. |
Unrealized Appreciation (Depreciation)
Gross unrealized appreciation and depreciation of investments, based on cost for federal income tax purposes, were as follows:
Gross unrealized appreciation | $ | 7,481,889 | ||
Gross unrealized depreciation | (15,532,702 | ) | ||
Net unrealized appreciation (depreciation) | $ | (8,050,813 | ) | |
Cost for federal income tax purposes | $ | 143,264,435 | ||
The accompanying Notes to Financial Statements are an integral part of this schedule.
146
Table of Contents
Partner Mid Cap Value Portfolio
Schedule of Investments as of June 30, 2009
(unaudited)
Fair Valuation Measurements
The following table is a summary of the inputs used, as of June 30, 2009, in valuing Partner Mid Cap Value Portfolio’s assets carried at fair value as discussed in the Notes to Financial Statements.
Investments in Securities | Total | Level 1 | Level 2 | Level 3 | ||||||||
Common Stock | ||||||||||||
Consumer Discretionary | 18,242,562 | 18,242,562 | — | — | ||||||||
Consumer Staples | 6,387,305 | 6,387,305 | — | — | ||||||||
Energy | 13,340,974 | 13,340,974 | — | — | ||||||||
Financials | 32,910,828 | 32,910,828 | — | — | ||||||||
Health Care | 6,841,519 | 6,841,519 | — | — | ||||||||
Industrials | 10,793,773 | 10,793,773 | — | — | ||||||||
Information Technology | 10,200,816 | 10,200,816 | — | — | ||||||||
Materials | 7,938,569 | 7,938,569 | — | — | ||||||||
Telecommunications Services | 2,513,025 | 2,513,025 | — | — | ||||||||
Utilities | 16,112,319 | 16,112,319 | — | — | ||||||||
Collateral Held for Securities Loaned | 4,982,498 | 4,982,498 | — | — | ||||||||
Short-Term Investments | 4,949,434 | 4,949,434 | — | — | ||||||||
Total | $ | 135,213,622 | $ | 135,213,622 | $ | — | $ | — | ||||
Investment in Affiliates
Affiliated issuers, as defined under the Investment Company Act of 1940, include those in which the Portfolio’s holdings of an issuer represent 5% or more of the outstanding voting securities of an issuer, or any affiliated mutual fund.
A summary of transactions for the fiscal year to date, in Partner Mid Cap Value Portfolio, is as follows:
Portfolio | Value December 31, 2008 | Gross Purchases | Gross Sales | Shares Held at June 30, 2009 | Value June 30, 2009 | Income Earned January 1, 2009 - June 30, 2009 | |||||||||||
Money Market | $ | 1,933,759 | $ | 20,878,641 | $ | 17,862,966 | 4,949,434 | $ | 4,949,434 | $ | 9,926 | ||||||
Thrivent Financial Securities Lending Trust | 4,605,487 | 38,783,851 | 38,406,840 | 4,982,498 | 4,982,498 | 21,447 | |||||||||||
Total Value and Income Earned | 6,539,246 | 9,931,932 | 31,373 | ||||||||||||||
The accompanying Notes to Financial Statements are an integral part of this schedule.
147
Table of Contents
Schedule of Investments as of June 30, 2009
(unaudited)
| Shares | Common Stock (95.1%) | Value | |||
| Consumer Discretionary (12.1%) | |||||
| 113,000 | Advance Auto Parts, Inc. | $ | 4,688,370 | ||
| 124,100 | Autoliv, Inc. | 3,570,357 | |||
| 111,000 | Career Education Corporationa | 2,762,790 | |||
| 86,800 | CEC Entertainment, Inc.a | 2,558,864 | |||
| 129,200 | Discovery Communications, Inc.a | 2,913,460 | |||
| 72,000 | Dollar Tree, Inc.a | 3,031,200 | |||
| 231,100 | Gap, Inc. | 3,790,040 | |||
| 82,300 | Guess ?, Inc. | 2,121,694 | |||
| 259,800 | KB Homeb | 3,554,064 | |||
| 89,400 | Kohl’s Corporationa | 3,821,850 | |||
| 88,300 | McGraw-Hill Companies, Inc. | 2,658,713 | |||
| 81,100 | Panera Bread Companya,b | 4,043,646 | |||
| 106,700 | Penn National Gaming, Inc.a | 3,106,037 | |||
| 193,400 | Toll Brothers, Inc.a,b | 3,281,998 | |||
| 171,100 | WMS Industries, Inc.a | 5,391,361 | |||
Total Consumer Discretionary | 51,294,444 | ||||
| Consumer Staples (3.5%) | |||||
| 146,000 | Flowers Foods, Inc. | 3,188,640 | |||
| 60,500 | J.M. Smucker Company | 2,943,930 | |||
| 107,700 | Kroger Company | 2,374,785 | |||
| 213,300 | TreeHouse Foods, Inc.a,b | 6,136,641 | |||
Total Consumer Staples | 14,643,996 | ||||
| Energy (7.3%) | |||||
| 258,200 | BJ Services Company | 3,519,266 | |||
| 57,900 | Comstock Resources, Inc.a | 1,913,595 | |||
| 171,400 | Forest Oil Corporationa | 2,557,288 | |||
| 122,600 | Helmerich & Payne, Inc.b | 3,784,662 | |||
| 132,800 | National Oilwell Varco, Inc.a | 4,337,248 | |||
| 385,300 | Patterson-UTI Energy, Inc. | 4,954,958 | |||
| 45,200 | Range Resources Corporation | 1,871,732 | |||
| 65,900 | Southwestern Energy Companya | 2,560,215 | |||
| 159,400 | Weatherford International, Ltd.a | 3,117,864 | |||
| 182,300 | Willbros Group, Inc.a | 2,280,573 | |||
Total Energy | 30,897,401 | ||||
| Financials (13.6%) | |||||
| 86,771 | Commerce Bancshares, Inc. | 2,761,921 | |||
| 92,182 | Cousins Properties, Inc.b | 783,547 | |||
| 160,100 | Duke Realty Corporation | 1,404,077 | |||
| 78,300 | Eaton Vance Corporation | 2,094,525 | |||
| 98,200 | Endurance Specialty Holdings, Ltd. | 2,877,260 | |||
| 166,500 | Equity One, Inc.b | 2,207,790 | |||
| 92,700 | Hanover Insurance Group, Inc. | 3,532,797 | |||
| 360,600 | HCC Insurance Holdings, Inc. | 8,658,006 | |||
| 408,300 | Host Marriott Corporation | 3,425,637 | |||
| 136,500 | Invesco, Ltd. | 2,432,430 | |||
| 82,800 | Lazard, Ltd. | 2,228,976 | |||
| 239,600 | Marshall & Ilsley Corporation | 1,150,080 | |||
| 372,800 | New York Community Bancorp, Inc.b | 3,985,232 | |||
| 38,200 | Northern Trust Corporation | 2,050,576 | |||
| 43,400 | PartnerRe, Ltd. | 2,818,830 | |||
| 52,500 | Rayonier, Inc. REIT | 1,908,375 | |||
| 349,500 | W.R. Berkley Corporation | 7,503,765 | |||
| 81,000 | Westamerica Bancorporationb | 4,018,410 | |||
| 134,000 | Zions Bancorporationb | 1,549,040 | |||
Total Financials | 57,391,274 | ||||
| Health Care (12.3%) | |||||
| 68,000 | Beckman Coulter, Inc. | 3,885,520 | |||
| 150,400 | BioMarin Pharmaceutical, Inc.a,b | 2,347,744 | |||
| 57,500 | C.R. Bard, Inc. | 4,280,875 | |||
| 67,300 | Charles River Laboratories International, Inc.a | 2,271,375 | |||
| 219,400 | Community Health Systems, Inc.a | 5,539,850 | |||
| 205,300 | Coventry Health Care, Inc.a | 3,841,163 | |||
| 50,500 | Gen-Probe, Inc.a | 2,170,490 | |||
| 37,800 | Henry Schein, Inc.a | 1,812,510 | |||
| 217,600 | Hologic, Inc.a | 3,096,448 | |||
| 124,200 | Kinetic Concepts, Inc.a | 3,384,450 | |||
| 95,500 | Lincare Holdings, Inc.a | 2,246,160 | |||
| 86,900 | Masimo Corporationa | 2,095,159 | |||
| 29,300 | NuVasive, Inc.a,b | 1,306,780 | |||
| 58,600 | Shire Pharmaceuticals Group plc ADR | 2,430,728 | |||
| 29,700 | United Therapeutics Corporationa | 2,474,901 | |||
| 63,200 | Varian Medical Systems, Inc.a | 2,220,848 | |||
| 58,900 | Varian, Inc.a | 2,322,427 | |||
| 116,800 | Vertex Pharmaceuticals, Inc.a | 4,162,752 | |||
Total Health Care | 51,890,180 | ||||
| Industrials (13.0%) | |||||
| 31,100 | Alliant Techsystems, Inc.a | 2,561,396 | |||
| 289,600 | BE Aerospace, Inc.a,b | 4,158,656 | |||
| 68,900 | CSX Corporation | 2,386,007 | |||
| 82,600 | IDEX Corporation | 2,029,482 | |||
| 253,800 | Monster Worldwide, Inc.a | 2,997,378 | |||
| 92,600 | Navistar International Corporationa | 4,037,360 | |||
| 149,600 | Oshkosh Corporation | 2,175,184 | |||
| 84,900 | Pall Corporation | 2,254,944 | |||
| 95,800 | Parker-Hannifin Corporation | 4,115,568 | |||
| 153,200 | Polypore International, Inc.a | 1,703,584 | |||
| 26,800 | Precision Castparts Corporation | 1,957,204 | |||
| 141,100 | Robert Half International, Inc. | 3,332,782 | |||
| 76,600 | Rockwell Automation, Inc. | 2,460,392 | |||
| 94,500 | Rockwell Collins, Inc. | 3,943,485 | |||
| 73,700 | Roper Industries, Inc. | 3,339,347 | |||
| 84,200 | SPX Corporation | 4,123,274 | |||
| 82,700 | Tyco International, Ltd. | 2,148,546 | |||
| 181,400 | Werner Enterprises, Inc. | 3,286,968 | |||
| 70,900 | WESCO International, Inc.a | 1,775,336 | |||
Total Industrials | 54,786,893 | ||||
| Information Technology (16.8%) | |||||
| 139,600 | Akamai Technologies, Inc.a | 2,677,528 | |||
| 1,834,100 | Atmel Corporationa | 6,841,193 | |||
| 289,900 | CIENA Corporationa,b | 3,000,465 | |||
| 1,124,500 | Compuware Corporationa | 7,714,070 | |||
| 321,200 | eBay, Inc.a | 5,502,156 | |||
| 167,800 | F5 Networks, Inc.a | 5,804,202 | |||
| 297,300 | FormFactor, Inc.a | 5,125,452 | |||
| 180,300 | Juniper Networks, Inc.a | 4,255,080 | |||
| 93,300 | Lam Research Corporationa | 2,425,800 | |||
| 110,100 | Novellus Systems, Inc.a | 1,838,670 | |||
| 113,500 | Paychex, Inc. | 2,860,200 | |||
| 239,800 | PMC-Sierra, Inc.a | 1,908,808 | |||
| 180,400 | Polycom, Inc.a | 3,656,708 | |||
| 60,800 | Sybase, Inc.a | 1,905,472 | |||
| 579,000 | Teradyne, Inc.a | 3,971,940 | |||
| 524,400 | TIBCO Software, Inc.a | 3,759,948 | |||
The accompanying Notes to Financial Statements are an integral part of this schedule.
148
Table of Contents
Mid Cap Stock Portfolio
Schedule of Investments as of June 30, 2009
(unaudited)
| Shares | Common Stock (95.1%) | Value | ||||
| Information Technology (16.8%) - continued | ||||||
| 83,500 | Western Digital Corporationa | $ | 2,212,750 | |||
| 92,700 | Xilinx, Inc. | 1,896,642 | ||||
| 146,400 | Zebra Technologies Corporationa | 3,463,824 | ||||
Total Information Technology | 70,820,908 | |||||
| Materials (10.2%) | ||||||
| 238,300 | Albemarle Corporation | 6,093,331 | ||||
| 139,605 | Ball Corporation | 6,304,562 | ||||
| 19,700 | CF Industries Holdings, Inc. | 1,460,558 | ||||
| 205,400 | Commercial Metals Company | 3,292,562 | ||||
| 229,000 | Crown Holdings, Inc.a | 5,528,060 | ||||
| 160,100 | Owens-Illinois, Inc.a | 4,484,401 | ||||
| 242,300 | Packaging Corporation of America | 3,925,260 | ||||
| 148,100 | Sealed Air Corporation | 2,732,445 | ||||
| 134,400 | Silgan Holdings, Inc. | 6,589,632 | ||||
| 146,200 | Steel Dynamics, Inc. | 2,153,526 | ||||
| 8,900 | Walter Energy, Inc. | 322,536 | ||||
Total Materials | 42,886,873 | |||||
| Telecommunications Services (0.8%) | ||||||
| 124,500 | Telephone and Data Systems, Inc. | 3,523,350 | ||||
Total Telecommunications Services | 3,523,350 | |||||
| Utilities (5.5%) | ||||||
| 94,000 | Alliant Energy Corporation | 2,456,220 | ||||
| 139,100 | DPL, Inc. | 3,222,947 | ||||
| 28,700 | Entergy Corporation | 2,224,824 | ||||
| 74,500 | EQT Corporation | 2,600,795 | ||||
| 39,500 | FirstEnergy Corporation | 1,530,625 | ||||
| 64,800 | National Fuel Gas Company | 2,337,984 | ||||
| 274,400 | NV Energy, Inc. | 2,960,776 | ||||
| 96,700 | Pepco Holdings, Inc. | 1,299,648 | ||||
| 100,600 | Portland General Electric Company | 1,959,688 | ||||
| 97,300 | UGI Corporation | 2,480,177 | ||||
Total Utilities | 23,073,684 | |||||
Total Common Stock (cost $428,788,284) | 401,209,003 | |||||
Collateral Held for Securities Loaned (7.7%) | ||||||
| 32,397,507 | Thrivent Financial Securities Lending Trust | 32,397,507 | ||||
Total Collateral Held for Securities Loaned (cost $32,397,507) | 32,397,507 | |||||
| Shares or Principal Amount | Short-Term Investments (4.9%)c | |||||
Federal Home Loan Bank Discount Notes | ||||||
| 5,000,000 | 0.120%, 7/2/2009 | 4,999,983 | ||||
| 5,000,000 | 0.155%, 7/10/2009 | 4,999,806 | ||||
Federal National Mortgage Association Discount Notes | ||||||
| 4,000,000 | 0.160%, 7/14/2009 | 3,999,769 | ||||
Novartis Finance Corporation | ||||||
| 4,870,000 | 0.100%, 7/1/2009 | 4,870,000 | ||||
| 1,567,244 | Thrivent Money Market Portfolio | 1,567,244 | ||||
Total Short-Term Investments (at amortized cost) | 20,436,802 | |||||
Total Investments (cost $481,622,593) 107.7% | $ | 454,043,312 | ||||
Other Assets and Liabilities, Net (7.7%) | (32,287,075 | ) | ||||
Total Net Assets 100.0% | $ | 421,756,237 | ||||
| a | Non-income producing security. |
| b | All or a portion of the security is on loan as discussed in item 2(M) of the Notes to Financial Statements. |
| c | The interest rate shown reflects the yield, coupon rate or, for securities purchased at a discount, the discount rate at the date of purchase. |
Definitions:
| ADR | - | American Depositary Receipt, which are certificates for an underlying foreign security's shares held by an issuing U.S. depository bank. | ||
| REIT | - | Real Estate Investment Trust, is a company that buys, develops, manages and/or sells real estate assets. |
Unrealized Appreciation (Depreciation)
Gross unrealized appreciation and depreciation of investments, based on cost for federal income tax purposes, were as follows:
Gross unrealized appreciation | $ | 33,802,842 | ||
Gross unrealized depreciation | (61,382,123 | ) | ||
Net unrealized appreciation (depreciation) | $ | (27,579,281 | ) | |
Cost for federal income tax purposes | $ | 481,622,593 | ||
The accompanying Notes to Financial Statements are an integral part of this schedule.
149
Table of Contents
Mid Cap Stock Portfolio
Schedule of Investments as of June 30, 2009
(unaudited)
Fair Valuation Measurements
The following table is a summary of the inputs used, as of June 30, 2009, in valuing Mid Cap Stock Portfolio's assets carried at fair value as discussed in the Notes to Financial Statements.
Investments in Securities | Total | Level 1 | Level 2 | Level 3 | ||||||||
Common Stock | ||||||||||||
Consumer Discretionary | 51,294,444 | 51,294,444 | — | — | ||||||||
Consumer Staples | 14,643,996 | 14,643,996 | — | — | ||||||||
Energy | 30,897,401 | 30,897,401 | — | — | ||||||||
Financials | 57,391,274 | 57,391,274 | — | — | ||||||||
Health Care | 51,890,180 | 51,890,180 | — | — | ||||||||
Industrials | 54,786,893 | 54,786,893 | — | — | ||||||||
Information Technology | 70,820,908 | 70,820,908 | — | — | ||||||||
Materials | 42,886,873 | 42,886,873 | — | — | ||||||||
Telecommunications Services | 3,523,350 | 3,523,350 | — | — | ||||||||
Utilities | 23,073,684 | 23,073,684 | — | — | ||||||||
Collateral Held for Securities Loaned | 32,397,507 | 32,397,507 | — | — | ||||||||
Short-Term Investments | 20,436,802 | 1,567,244 | 18,869,558 | — | ||||||||
Total | $ | 454,043,312 | $ | 435,173,754 | $ | 18,869,558 | $ | — | ||||
Investment in Affiliates
Affiliated issuers, as defined under the Investment Company Act of 1940, include those in which the Portfolio's holdings of an issuer represent 5% or more of the outstanding voting securities of an issuer, or any affiliated mutual fund.
A summary of transactions for the fiscal year to date, in Mid Cap Stock Portfolio, is as follows:
Portfolio | Value December 31, 2008 | Gross Purchases | Gross Sales | Shares Held at June 30, 2009 | Value June 30, 2009 | Income Earned January 1, 2009 - June 30, 2009 | |||||||||||
Money Market | $ | 13,558 | $ | 40,253,507 | $ | 38,699,821 | 1,567,244 | $ | 1,567,244 | $ | 16,751 | ||||||
Thrivent Financial Securities Lending Trust | 26,343,474 | 109,929,280 | 103,875,247 | 32,397,507 | 32,397,507 | 131,651 | |||||||||||
Total Value and Income Earned | 26,357,032 | 33,964,751 | 148,402 | ||||||||||||||
The accompanying Notes to Financial Statements are an integral part of this schedule.
150
Table of Contents
Schedule of Investments as of June 30, 2009
(unaudited)
| Shares | Common Stock (97.8%) | Value | |||
| Consumer Discretionary (15.2%) | |||||
| 4,733 | 99 Cents Only Storesa | $ | 64,274 | ||
| 5,500 | Aaron’s, Inc. | 164,010 | |||
| 9,700 | Advance Auto Parts, Inc. | 402,453 | |||
| 6,800 | Aeropostale, Inc.a | 233,036 | |||
| 20,980 | American Eagle Outfitters, Inc. | 297,286 | |||
| 4,000 | American Greetings Corporation | 46,720 | |||
| 5,850 | AnnTaylor Stores Corporationa | 46,683 | |||
| 3,770 | Barnes & Noble, Inc.b | 77,775 | |||
| 582 | Blyth, Inc. | 19,084 | |||
| 3,110 | Bob Evans Farms, Inc. | 89,381 | |||
| 11,720 | BorgWarner, Inc.b | 400,004 | |||
| 5,700 | Boyd Gaming Corporationa | 48,450 | |||
| 10,355 | Brinker International, Inc. | 176,346 | |||
| 4,160 | Brink’s Home Security Holdings, Inc.a | 117,770 | |||
| 6,560 | Callaway Golf Company | 33,259 | |||
| 7,500 | Career Education Corporationa | 186,675 | |||
| 22,400 | CarMax, Inc.a,b | 329,280 | |||
| 6,100 | Cheesecake Factory, Inc.a | 105,530 | |||
| 18,000 | Chico’s FAS, Inc.a | 175,140 | |||
| 3,300 | Chipotle Mexican Grill, Inc.a,b | 264,000 | |||
| 4,800 | Coldwater Creek, Inc.a | 29,088 | |||
| 6,500 | Collective Brands, Inc.a | 94,705 | |||
| 8,800 | Corinthian Colleges, Inc.a | 148,984 | |||
| 8,700 | Dick’s Sporting Goods, Inc.a,b | 149,640 | |||
| 9,260 | Dollar Tree, Inc.a | 389,846 | |||
| 7,800 | DreamWorks Animation SKG, Inc.a | 215,202 | |||
| 15,800 | Foot Locker, Inc. | 165,426 | |||
| 4,400 | Fossil, Inc.a | 105,952 | |||
| 14,020 | Gentex Corporation | 162,632 | |||
| 6,100 | Guess ?, Inc. | 157,258 | |||
| 9,500 | Hanesbrands, Inc.a | 142,595 | |||
| 3,900 | Harte-Hanks, Inc. | 36,075 | |||
| 2,870 | International Speedway Corporation | 73,501 | |||
| 3,200 | ITT Educational Services, Inc.a | 322,112 | |||
| 5,300 | J. Crew Group, Inc.a | 143,206 | |||
| 4,300 | John Wiley and Sons, Inc. | 142,975 | |||
| 7,700 | Lamar Advertising Companya,b | 117,579 | |||
| 3,500 | Life Time Fitness, Inc.a | 70,035 | |||
| 14,200 | LKQ Corporationa | 233,590 | |||
| 3,700 | M.D.C. Holdings, Inc. | 111,407 | |||
| 5,000 | Marvel Entertainment, Inc.a | 177,950 | |||
| 3,100 | Matthews International Corporation | 96,472 | |||
| 5,670 | Mohawk Industries, Inc.a,b | 202,306 | |||
| 4,200 | Netflix, Inc.a,b | 173,628 | |||
| 600 | NVR, Inc.a | 301,434 | |||
| 3,100 | Panera Bread Companya,b | 154,566 | |||
| 12,900 | PetSmart, Inc. | 276,834 | |||
| 5,200 | Phillips-Van Heusen Corporation | 149,188 | |||
| 4,200 | Priceline.com, Inc.a,b | 468,510 | |||
| 4,400 | Regis Corporation | 76,604 | |||
| 6,700 | Rent-A-Center, Inc.a | 119,461 | |||
| 13,160 | Ross Stores, Inc. | 507,976 | |||
| 4,400 | Ryland Group, Inc. | 73,920 | |||
| 14,450 | Saks, Inc.a,b | 64,013 | |||
| 2,610 | Scholastic Corporation | 51,652 | |||
| 6,600 | Scientific Games Corporationa | 104,082 | |||
| 26,000 | Service Corporation International | 142,480 | |||
| 6,820 | Sotheby’s Holdings, Inc. | 96,230 | |||
| 1,400 | Strayer Education, Inc. | 305,354 | |||
| 3,600 | Thor Industries, Inc. | 66,132 | |||
| 4,700 | Timberland Companya | 62,369 | |||
| 13,200 | Toll Brothers, Inc.a | 224,004 | |||
| 6,400 | Tupperware Corporation | 166,528 | |||
| 3,700 | Under Armour, Inc.a,b | 82,806 | |||
| 11,600 | Urban Outfitters, Inc.a | 242,092 | |||
| 4,700 | Warnaco Group, Inc.a | 152,280 | |||
| 42,514 | Wendy’s/Arby’s Group, Inc. | 170,056 | |||
| 8,780 | Williams-Sonoma, Inc.b | 104,219 | |||
| 4,800 | WMS Industries, Inc.a | 151,248 | |||
Total Consumer Discretionary | 11,253,358 | ||||
| Consumer Staples (3.9%) | |||||
| 8,700 | Alberto-Culver Company | 221,241 | |||
| 5,540 | BJ’s Wholesale Club, Inc.a | 178,554 | |||
| 7,110 | Church & Dwight Company, Inc. | 386,144 | |||
| 7,600 | Corn Products International, Inc. | 203,604 | |||
| 6,850 | Energizer Holdings, Inc.a | 357,844 | |||
| 8,000 | Flowers Foods, Inc. | 174,720 | |||
| 7,400 | Hansen Natural Corporationa | 228,068 | |||
| 2,040 | Lancaster Colony Corporation | 89,903 | |||
| 5,600 | NBTY, Inc.a | 157,472 | |||
| 5,810 | PepsiAmericas, Inc. | 155,766 | |||
| 5,800 | Ralcorp Holdings, Inc.a | 353,336 | |||
| 4,010 | Ruddick Corporation | 93,954 | |||
| 12,100 | Smithfield Foods, Inc.a | 169,037 | |||
| 2,726 | Tootsie Roll Industries, Inc.b | 61,853 | |||
| 2,540 | Universal Corporation | 84,100 | |||
Total Consumer Staples | 2,915,596 | ||||
| Energy (6.0%) | |||||
| 14,500 | Arch Coal, Inc. | 222,865 | |||
| 3,800 | Bill Barrett Corporationa | 104,348 | |||
| 8,500 | Cimarex Energy Company | 240,890 | |||
| 4,700 | Comstock Resources, Inc.a | 155,335 | |||
| 5,300 | Encore Acquisition Companya | 163,505 | |||
| 6,278 | Exterran Holdings, Inc.a | 100,699 | |||
| 11,200 | Forest Oil Corporationa | 167,104 | |||
| 10,600 | Frontier Oil Corporation | 138,966 | |||
| 10,000 | Helix Energy Solutions Group, Inc.a | 108,700 | |||
| 10,680 | Helmerich & Payne, Inc.b | 329,692 | |||
| 10,200 | Mariner Energy, Inc.a | 119,850 | |||
| 13,500 | Newfield Exploration Companya | 441,045 | |||
| 5,600 | Oceaneering International, Inc.a | 253,120 | |||
| 2,400 | Overseas Shipholding Group, Inc.b | 81,696 | |||
| 6,500 | Patriot Coal Corporationa,b | 41,470 | |||
| 15,600 | Patterson-UTI Energy, Inc. | 200,616 | |||
| 12,139 | Plains Exploration & Production Companya | 332,123 | |||
| 17,620 | Pride International, Inc.a | 441,557 | |||
| 11,500 | Quicksilver Resources, Inc.a | 106,835 | |||
| 12,600 | Southern Union Company | 231,714 | |||
| 7,900 | Superior Energy Services, Inc.a | 136,433 | |||
| 5,200 | Tidewater, Inc. | 222,924 | |||
| 4,800 | Unit Corporationa | 132,336 | |||
Total Energy | 4,473,823 | ||||
The accompanying Notes to Financial Statements are an integral part of this schedule.
151
Table of Contents
Mid Cap Index Portfolio
Schedule of Investments as of June 30, 2009
(unaudited)
| Shares | Common Stock (97.8%) | Value | |||
| Financials (17.1%) | |||||
| 4,200 | Affiliated Managers Group, Inc.a | $ | 244,398 | ||
| 4,000 | Alexandria Real Estate Equities, Inc.b | 143,160 | |||
| 14,200 | AMB Property Corporation | 267,102 | |||
| 7,635 | American Financial Group, Inc. | 164,763 | |||
| 13,390 | AmeriCredit Corporationa,b | 181,434 | |||
| 14,500 | Apollo Investment Corporation | 87,000 | |||
| 9,800 | Arthur J. Gallagher & Company | 209,132 | |||
| 12,993 | Associated Banc-Corp | 162,412 | |||
| 8,270 | Astoria Financial Corporation | 70,957 | |||
| 7,400 | BancorpSouth, Inc. | 151,922 | |||
| 4,900 | Bank of Hawaii Corporation | 175,567 | |||
| 5,200 | BRE Properties, Inc. | 123,552 | |||
| 11,800 | Brown & Brown, Inc. | 235,174 | |||
| 6,300 | Camden Property Trust | 173,880 | |||
| 5,000 | Cathay General Bancorpb | 47,550 | |||
| 4,320 | City National Corporationb | 159,106 | |||
| 6,745 | Commerce Bancshares, Inc. | 214,693 | |||
| 5,800 | Corporate Office Properties Trust | 170,114 | |||
| 4,477 | Cousins Properties, Inc.b | 38,054 | |||
| 6,000 | Cullen/Frost Bankers, Inc. | 276,720 | |||
| 21,800 | Duke Realty Corporation | 191,186 | |||
| 11,900 | Eaton Vance Corporation | 318,325 | |||
| 3,700 | Equity One, Inc.b | 49,062 | |||
| 2,700 | Essex Property Trust, Inc. | 168,021 | |||
| 6,210 | Everest Re Group, Ltd. | 444,450 | |||
| 6,000 | Federal Realty Investment Trust | 309,120 | |||
| 23,505 | Fidelity National Financial, Inc. | 318,023 | |||
| 9,500 | First American Corporation | 246,145 | |||
| 14,800 | First Niagara Financial Group, Inc. | 169,016 | |||
| 8,341 | FirstMerit Corporation | 141,630 | |||
| 17,800 | Fulton Financial Corporation | 92,738 | |||
| 5,170 | Hanover Insurance Group, Inc. | 197,029 | |||
| 11,550 | HCC Insurance Holdings, Inc. | 277,315 | |||
| 7,100 | Highwoods Properties, Inc. | 158,827 | |||
| 3,960 | Horace Mann Educators Corporation | 39,481 | |||
| 9,600 | Hospitality Properties Trust | 114,144 | |||
| 5,200 | International Bancshares Corporationb | 53,612 | |||
| 12,500 | Jefferies Group, Inc.a | 266,625 | |||
| 4,200 | Jones Lang LaSalle, Inc. | 137,466 | |||
| 10,300 | Liberty Property Trust | 237,312 | |||
| 8,016 | Macerich Companyb | 141,162 | |||
| 7,800 | Mack-Cali Realty Corporation | 177,840 | |||
| 3,600 | Mercury General Corporation | 120,348 | |||
| 10,400 | Nationwide Health Properties, Inc. | 267,696 | |||
| 35,111 | New York Community Bancorp, Inc.b | 375,336 | |||
| 10,900 | NewAlliance Bancshares, Inc. | 125,350 | |||
| 23,950 | Old Republic International Corporation | 235,908 | |||
| 8,400 | Omega Healthcare Investors, Inc. | 130,368 | |||
| 2,500 | PacWest Bancorp | 32,900 | |||
| 4,007 | Potlatch Corporation | 97,330 | |||
| 8,470 | Protective Life Corporation | 96,897 | |||
| 10,025 | Raymond James Financial, Inc.b | 172,530 | |||
| 8,008 | Rayonier, Inc. REIT | 291,091 | |||
| 10,600 | Realty Income Corporationb | 232,352 | |||
| 8,000 | Regency Centers Corporationb | 279,280 | |||
| 7,400 | Reinsurance Group of America, Inc. | 258,334 | |||
| 13,640 | SEI Investments Company | 246,066 | |||
| 7,600 | SL Green Realty Corporationb | 174,344 | |||
| 5,000 | StanCorp Financial Group, Inc. | 143,400 | |||
| 3,330 | SVB Financial Groupa | 90,643 | |||
| 28,600 | Synovus Financial Corporation | 85,514 | |||
| 11,420 | TCF Financial Corporationb | 152,685 | |||
| 5,000 | Trustmark Corporation | 96,600 | |||
| 15,103 | UDR, Inc. | 156,014 | |||
| 5,000 | Unitrin, Inc. | 60,100 | |||
| 14,405 | Valley National Bancorpb | 168,538 | |||
| 14,175 | W.R. Berkley Corporation | 304,337 | |||
| 8,640 | Waddell & Reed Financial, Inc. | 227,837 | |||
| 8,927 | Washington Federal, Inc. | 116,051 | |||
| 5,330 | Webster Financial Corporation | 42,907 | |||
| 10,400 | Weingarten Realty Investorsb | 150,904 | |||
| 2,920 | Westamerica Bancorporationb | 144,861 | |||
| 6,980 | Wilmington Trust Corporation | 95,347 | |||
Total Financials | 12,717,087 | ||||
| Health Care (12.2%) | |||||
| 7,200 | Affymetrix, Inc.a | 42,696 | |||
| 6,430 | Beckman Coulter, Inc. | 367,410 | |||
| 1,900 | Bio-Rad Laboratories, Inc.a | 143,412 | |||
| 6,900 | Cerner Corporationa,b | 429,801 | |||
| 6,800 | Charles River Laboratories International, Inc.a | 229,500 | |||
| 9,300 | Community Health Systems, Inc.a | 234,825 | |||
| 6,410 | Covance, Inc.a | 315,372 | |||
| 5,720 | Edwards Lifesciences Corporationa | 389,132 | |||
| 11,900 | Endo Pharmaceutical Holdings, Inc.a | 213,248 | |||
| 5,300 | Gen-Probe, Inc.a | 227,794 | |||
| 25,100 | Health Management Associates, Inc.a | 123,994 | |||
| 10,580 | Health Net, Inc.a | 164,519 | |||
| 9,100 | Henry Schein, Inc.a | 436,345 | |||
| 6,350 | Hill-Rom Holdings, Inc. | 102,997 | |||
| 26,100 | Hologic, Inc.a | 371,403 | |||
| 6,000 | IDEXX Laboratories, Inc.a,b | 277,200 | |||
| 7,200 | Immucor, Inc.a | 99,072 | |||
| 3,000 | Kindred Healthcare, Inc.a | 37,110 | |||
| 5,600 | Kinetic Concepts, Inc.a | 152,600 | |||
| 5,300 | LifePoint Hospitals, Inc.a | 139,125 | |||
| 6,920 | Lincare Holdings, Inc.a | 162,759 | |||
| 4,900 | Masimo Corporationa | 118,139 | |||
| 5,800 | Medicis Pharmaceutical Corporation | 94,656 | |||
| 10,620 | Omnicare, Inc. | 273,571 | |||
| 5,900 | OSI Pharmaceuticals, Inc.a | 166,557 | |||
| 4,200 | Owens & Minor, Inc. | 184,044 | |||
| 7,850 | Perrigo Company | 218,073 | |||
| 12,000 | Pharmaceutical Product Development, Inc. | 278,640 | |||
| 5,700 | Psychiatric Solutions, Inc.a | 129,618 | |||
| 7,700 | ResMed, Inc.a | 313,621 | |||
| 11,150 | Sepracor, Inc.a | 193,118 | |||
| 5,900 | STERIS Corporation | 153,872 | |||
| 3,800 | Techne Corporation | 242,478 | |||
| 4,040 | Teleflex, Inc. | 181,113 | |||
The accompanying Notes to Financial Statements are an integral part of this schedule.
152
Table of Contents
Mid Cap Index Portfolio
Schedule of Investments as of June 30, 2009
(unaudited)
| Shares | Common Stock (97.8%) | Value | |||
| Health Care (12.2%) - continued | |||||
| 5,700 | Thoratec Corporationa | $ | 152,646 | ||
| 2,400 | United Therapeutics Corporationa | 199,992 | |||
| 5,000 | Universal Health Services, Inc. | 244,250 | |||
| 8,310 | Valeant Pharmaceuticals Internationala,b | 213,733 | |||
| 2,900 | Varian, Inc.a | 114,347 | |||
| 8,600 | VCA Antech, Inc.a | 229,620 | |||
| 17,620 | Vertex Pharmaceuticals, Inc.a | 627,977 | |||
| 4,300 | Wellcare Health Plans, Inc.a | 79,507 | |||
Total Health Care | 9,069,886 | ||||
| Industrials (14.5%) | |||||
| 9,300 | Aecom Technology Corporationa | 297,600 | |||
| 9,330 | AGCO Corporationa | 271,223 | |||
| 12,200 | AirTran Holdings, Inc.a,b | 75,518 | |||
| 3,740 | Alaska Air Group, Inc.a | 68,292 | |||
| 4,160 | Alexander & Baldwin, Inc. | 97,510 | |||
| 3,300 | Alliant Techsystems, Inc.a | 271,788 | |||
| 10,870 | AMETEK, Inc. | 375,885 | |||
| 10,300 | BE Aerospace, Inc.a | 147,908 | |||
| 4,160 | Brink’s Company | 120,765 | |||
| 7,600 | Bucyrus International, Inc. | 217,056 | |||
| 6,240 | Carlisle Companies, Inc. | 150,010 | |||
| 2,100 | Clean Harbors, Inc.a | 113,379 | |||
| 4,730 | Con-way, Inc. | 167,016 | |||
| 6,400 | Copart, Inc.a | 221,888 | |||
| 3,500 | Corporate Executive Board Company | 72,660 | |||
| 12,200 | Corrections Corporation of Americaa | 207,278 | |||
| 4,800 | Crane Company | 107,088 | |||
| 5,200 | Deluxe Corporation | 66,612 | |||
| 7,800 | Donaldson Company, Inc. | 270,192 | |||
| 3,970 | Dycom Industries, Inc.a | 43,948 | |||
| 4,800 | Federal Signal Corporation | 36,720 | |||
| 5,200 | FTI Consulting, Inc.a | 263,744 | |||
| 4,920 | GATX Corporation | 126,542 | |||
| 6,100 | Graco, Inc. | 134,322 | |||
| 3,360 | Granite Construction, Inc. | 111,821 | |||
| 8,200 | Harsco Corporation | 232,060 | |||
| 5,490 | Herman Miller, Inc. | 84,217 | |||
| 4,530 | HNI Corporation | 81,812 | |||
| 5,730 | Hubbell, Inc. | 183,704 | |||
| 8,200 | IDEX Corporation | 201,474 | |||
| 8,340 | JB Hunt Transport Services, Inc. | 254,620 | |||
| 20,575 | JetBlue Airways Corporationa | 87,855 | |||
| 10,350 | Joy Global, Inc. | 369,702 | |||
| 9,300 | Kansas City Southern, Inc.a | 149,823 | |||
| 16,500 | KBR, Inc. | 304,260 | |||
| 2,820 | Kelly Services, Inc. | 30,879 | |||
| 7,440 | Kennametal, Inc. | 142,699 | |||
| 4,540 | Korn/Ferry Internationala | 48,306 | |||
| 5,300 | Landstar System, Inc. | 190,323 | |||
| 4,800 | Lennox International, Inc. | 154,272 | |||
| 4,300 | Lincoln Electric Holdings, Inc. | 154,972 | |||
| 7,970 | Manpower, Inc. | 337,450 | |||
| 3,000 | Mine Safety Appliances Company | 72,300 | |||
| 9,260 | MPS Group, Inc.a | 70,747 | |||
| 4,600 | MSC Industrial Direct Company, Inc. | 163,208 | |||
| 4,800 | Navigant Consulting, Inc.a | 62,016 | |||
| 3,390 | Nordson Corporation | 131,057 | |||
| 7,600 | Oshkosh Corporation | 110,504 | |||
| 9,960 | Pentair, Inc. | 255,175 | |||
| 4,148 | Rollins, Inc. | 71,802 | |||
| 9,100 | Roper Industries, Inc. | 412,321 | |||
| 8,500 | Shaw Group, Inc.a | 232,985 | |||
| 5,060 | SPX Corporation | 247,788 | |||
| 10,800 | Terex Corporationa,b | 130,356 | |||
| 5,400 | Thomas & Betts Corporationa | 155,682 | |||
| 8,600 | Timken Company | 146,888 | |||
| 8,095 | Trinity Industries, Inc. | 110,254 | |||
| 6,098 | United Rentals, Inc.a | 39,576 | |||
| 8,600 | URS Corporationa | 425,872 | |||
| 1,800 | Valmont Industries, Inc. | 129,744 | |||
| 4,900 | Wabtec Corporation | 157,633 | |||
| 8,100 | Waste Connections, Inc.a | 209,871 | |||
| 4,300 | Watson Wyatt Worldwide, Inc. | 161,379 | |||
| 4,400 | Werner Enterprises, Inc. | 79,728 | |||
| 5,600 | Woodward Governor Company | 110,880 | |||
Total Industrials | 10,732,959 | ||||
| Information Technology (14.6%) | |||||
| 39,300 | 3Com Corporationa | 185,103 | |||
| 3,520 | ACI Worldwide, Inc.a | 49,139 | |||
| 6,890 | Acxiom Corporation | 60,839 | |||
| 9,800 | ADC Telecommunications, Inc.a | 78,008 | |||
| 5,580 | ADTRAN, Inc. | 119,803 | |||
| 1,600 | Advent Software, Inc.a,b | 52,464 | |||
| 6,100 | Alliance Data Systems Corporationa | 251,259 | |||
| 9,100 | ANSYS, Inc.a | 283,556 | |||
| 12,170 | Arrow Electronics, Inc.a | 258,491 | |||
| 45,620 | Atmel Corporationa | 170,163 | |||
| 15,220 | Avnet, Inc.a | 320,077 | |||
| 4,680 | Avocent Corporationa | 65,333 | |||
| 14,300 | Broadridge Financial Solutions, Inc. | 237,094 | |||
| 26,880 | Cadence Design Systems, Inc.a | 158,592 | |||
| 8,274 | CommScope, Inc.a | 217,275 | |||
| 9,000 | Cree, Inc.a,b | 264,510 | |||
| 6,730 | Diebold, Inc. | 177,403 | |||
| 3,800 | Digital River, Inc.a | 138,016 | |||
| 4,110 | DST Systems, Inc.a | 151,864 | |||
| 3,700 | Equinix, Inc.a | 269,138 | |||
| 8,100 | F5 Networks, Inc.a | 280,179 | |||
| 4,300 | FactSet Research Systems, Inc.b | 214,441 | |||
| 4,950 | Fair Isaac Corporation | 76,527 | |||
| 12,600 | Fairchild Semiconductor International, Inc.a | 88,074 | |||
| 6,000 | Gartner, Inc.a | 91,560 | |||
| 8,200 | Global Payments, Inc. | 307,172 | |||
| 8,500 | Hewitt Associates, Inc.a | 253,130 | |||
| 3,110 | Imation Corporation | 23,667 | |||
| 16,400 | Ingram Micro, Inc.a | 287,000 | |||
| 16,750 | Integrated Device Technology, Inc.a | 101,170 | |||
| 7,350 | International Rectifier Corporationa | 108,853 | |||
| 12,400 | Intersil Corporation | 155,868 | |||
| 4,100 | Itron, Inc.a | 225,787 | |||
| 8,560 | Jack Henry & Associates, Inc. | 177,620 | |||
| 12,800 | Lam Research Corporationa | 332,800 | |||
| 8,500 | Lender Processing Services, Inc. | 236,045 | |||
The accompanying Notes to Financial Statements are an integral part of this schedule.
153
Table of Contents
Mid Cap Index Portfolio
Schedule of Investments as of June 30, 2009
(unaudited)
| Shares | Common Stock (97.8%) | Value | |||
| Information Technology (14.6%) - continued | |||||
| 8,340 | Macrovision Solutions Corporationa | $ | 181,895 | ||
| 2,100 | ManTech International Corporationa | 90,384 | |||
| 9,370 | Mentor Graphics Corporationa | 51,254 | |||
| 9,100 | Metavante Technologies, Inc.a | 235,326 | |||
| 3,400 | Mettler-Toledo International, Inc.a | 262,310 | |||
| 8,200 | MICROS Systems, Inc.a | 207,624 | |||
| 5,675 | National Instruments Corporation | 128,028 | |||
| 16,100 | NCR Corporationa | 190,463 | |||
| 7,500 | NeuStar, Inc.a | 166,200 | |||
| 13,600 | Palm, Inc.a,b | 225,352 | |||
| 11,800 | Parametric Technology Corporationa | 137,942 | |||
| 4,940 | Plantronics, Inc. | 93,415 | |||
| 8,520 | Polycom, Inc.a | 172,700 | |||
| 26,740 | RF Micro Devices, Inc.a | 100,542 | |||
| 20,600 | SAIC, Inc.a | 382,130 | |||
| 6,190 | Semtech Corporationa | 98,483 | |||
| 4,600 | Silicon Laboratories, Inc.a | 174,524 | |||
| 4,300 | SRA International, Inc.a | 75,508 | |||
| 8,380 | Sybase, Inc.a | 262,629 | |||
| 14,580 | Synopsys, Inc.a | 284,456 | |||
| 5,080 | Tech Data Corporationa | 166,167 | |||
| 12,100 | Trimble Navigation, Ltd.a | 237,523 | |||
| 8,800 | ValueClick, Inc.a | 92,576 | |||
| 19,020 | Vishay Intertechnology, Inc.a | 129,146 | |||
| 6,950 | Wind River Systems, Inc.a | 79,647 | |||
| 6,200 | Zebra Technologies Corporationa | 146,692 | |||
Total Information Technology | 10,840,936 | ||||
| Materials (7.1%) | |||||
| 8,290 | Airgas, Inc. | 335,994 | |||
| 9,320 | Albemarle Corporation | 238,312 | |||
| 6,900 | AptarGroup, Inc. | 233,013 | |||
| 6,700 | Ashland, Inc. | 187,935 | |||
| 6,690 | Cabot Corporation | 84,160 | |||
| 4,500 | Carpenter Technology Corporation | 93,645 | |||
| 13,100 | Cliffs Natural Resources, Inc. | 320,557 | |||
| 11,400 | Commercial Metals Company | 182,742 | |||
| 4,760 | Cytec Industries, Inc. | 88,631 | |||
| 7,400 | FMC Corporation | 350,020 | |||
| 3,500 | Greif, Inc. | 154,770 | |||
| 9,300 | Louisiana-Pacific Corporationa | 31,806 | |||
| 6,860 | Lubrizol Corporation | 324,547 | |||
| 4,520 | Martin Marietta Materials, Inc.b | 356,538 | |||
| 1,880 | Minerals Technologies, Inc. | 67,717 | |||
| 7,900 | Olin Corporation | 93,931 | |||
| 10,400 | Packaging Corporation of America | 168,480 | |||
| 6,500 | Reliance Steel & Aluminum Company | 249,535 | |||
| 13,100 | RPM International, Inc. | 183,924 | |||
| 4,500 | Scotts Miracle-Gro Company | 157,725 | |||
| 4,930 | Sensient Technologies Corporation | 111,270 | |||
| 10,180 | Sonoco Products Company | 243,811 | |||
| 18,900 | Steel Dynamics, Inc. | 278,397 | |||
| 10,800 | Temple-Inland, Inc. | 141,696 | |||
| 10,100 | Terra Industries, Inc. | 244,622 | |||
| 10,160 | Valspar Corporation | 228,905 | |||
| 6,100 | Worthington Industries, Inc. | 78,019 | |||
Total Materials | 5,230,702 | ||||
| Telecommunications Services (0.6%) | |||||
| 21,810 | Cincinnati Bell, Inc.a | 61,940 | |||
| 5,300 | Syniverse Holdings, Inc.a | 84,959 | |||
| 10,220 | Telephone and Data Systems, Inc. | 289,226 | |||
Total Telecommunications Services | 436,125 | ||||
| Utilities (6.6%) | |||||
| 7,780 | AGL Resources, Inc. | 247,404 | |||
| 11,200 | Alliant Energy Corporation | 292,656 | |||
| 13,766 | Aqua America, Inc.b | 246,411 | |||
| 3,900 | Black Hills Corporation | 89,661 | |||
| 6,100 | Cleco Corporation | 136,762 | |||
| 11,830 | DPL, Inc. | 274,101 | |||
| 7,300 | Energen Corporation | 291,270 | |||
| 13,163 | Great Plains Energy, Inc. | 204,685 | |||
| 9,180 | Hawaiian Electric Industries, Inc. | 174,971 | |||
| 4,730 | IDACORP, Inc. | 123,642 | |||
| 18,725 | MDU Resources Group, Inc. | 355,213 | |||
| 8,100 | National Fuel Gas Company | 292,248 | |||
| 10,840 | NSTAR | 348,073 | |||
| 23,800 | NV Energy, Inc. | 256,802 | |||
| 9,590 | OGE Energy Corporation | 271,589 | |||
| 10,700 | ONEOK, Inc. | 315,543 | |||
| 8,775 | PNM Resources, Inc. | 93,980 | |||
| 11,000 | UGI Corporation | 280,390 | |||
| 8,190 | Vectren Corporation | 191,892 | |||
| 11,020 | Westar Energy, Inc. | 206,845 | |||
| 5,110 | WGL Holdings, Inc. | 163,622 | |||
Total Utilities | 4,857,760 | ||||
Total Common Stock (cost $83,544,138) | 72,528,232 | ||||
Collateral Held for Securities Loaned (10.4%) | |||||
| 7,690,716 | Thrivent Financial Securities Lending Trust | 7,690,716 | |||
Total Collateral Held for Securities Loaned (cost $7,690,716) | 7,690,716 | ||||
| Shares or Principal Amount | Short-Term Investments (1.4%)c | ||||
Federal Home Loan Mortgage Corporation Discount Notes | |||||
| 300,000 | 0.200%, 9/21/2009d | 299,865 | |||
The accompanying Notes to Financial Statements are an integral part of this schedule.
154
Table of Contents
Mid Cap Index Portfolio
Schedule of Investments as of June 30, 2009
(unaudited)
| Shares or Principal Amount | Short-Term Investments (1.4%)c | Value | ||||
| 769,853 | Thrivent Money Market Portfolio | 769,853 | ||||
Total Short-Term Investments (at amortized cost) | 1,069,718 | |||||
Total Investments (cost $92,304,572) 109.6% | $ | 81,288,666 | ||||
Other Assets and Liabilities, Net (9.6%) | (7,143,437 | ) | ||||
Total Net Assets 100.0% | $ | 74,145,229 | ||||
| a | Non-income producing security. |
| b | All or a portion of the security is on loan as discussed in item 2(M) of the Notes to Financial Statements. |
| c | The interest rate shown reflects the yield, coupon rate or, for securities purchased at a discount, the discount rate at the date of purchase. |
| d | At June 30, 2009, $299,865 of investments were held on deposit with the counterparty and pledged as the initial margin deposit for open futures contracts. |
Definitions:
| REIT | - | Real Estate Investment Trust, is a company that buys, develops, manages and/or sells real estate assets. |
Unrealized Appreciation (Depreciation)
Gross unrealized appreciation and depreciation of investments, based on cost for federal income tax purposes, were as follows:
Gross unrealized appreciation | $ | 9,724,777 | ||
Gross unrealized depreciation | (20,740,683 | ) | ||
Net unrealized appreciation (depreciation) | $ | (11,015,906 | ) | |
Cost for federal income tax purposes | $ | 92,304,572 | ||
Fair Valuation Measurements
The following table is a summary of the inputs used, as of June 30, 2009, in valuing Mid Cap Index Portfolio's assets carried at fair value as discussed in the Notes to Financial Statements.
Investments in Securities | Total | Level 1 | Level 2 | Level 3 | ||||||||||
Common Stock | ||||||||||||||
Consumer Discretionary | 11,253,358 | 11,253,358 | — | — | ||||||||||
Consumer Staples | 2,915,596 | 2,915,596 | — | — | ||||||||||
Energy | 4,473,823 | 4,473,823 | — | — | ||||||||||
Financials | 12,717,087 | 12,717,087 | — | — | ||||||||||
Health Care | 9,069,886 | 9,069,886 | — | — | ||||||||||
Industrials | 10,732,959 | 10,732,959 | — | — | ||||||||||
Information Technology | 10,840,936 | 10,840,936 | — | — | ||||||||||
Materials | 5,230,702 | 5,230,702 | — | — | ||||||||||
Telecommunications Services | 436,125 | 436,125 | — | — | ||||||||||
Utilities | 4,857,760 | 4,857,760 | — | — | ||||||||||
Collateral Held for Securities Loaned | 7,690,716 | 7,690,716 | — | — | ||||||||||
Short-Term Investments | 1,069,718 | 769,853 | 299,865 | — | ||||||||||
Total | $ | 81,288,666 | $ | 80,988,801 | $ | 299,865 | $ | — | ||||||
Other Financial Instruments* | ($26,934 | ) | ($26,934 | ) | $ | — | $ | — | ||||||
| * | Other Financial Instruments include Futures, Forwards, Written Options and Swap agreements. |
Futures Contracts | Number of Contracts Long/(Short) | Expiration Date | Notional Principal Amount | Value | Unrealized Gain/(Loss) | ||||||||
S&P 400 Index Mini-Futures | 16 | September 2009 | $ | 949,654 | $ | 922,720 | ($26,934 | ) | |||||
Total Futures Contracts | ($26,934 | ) | |||||||||||
The accompanying Notes to Financial Statements are an integral part of this schedule.
155
Table of Contents
Mid Cap Index Portfolio
Schedule of Investments as of June 30, 2009
(unaudited)
The following table summarizes the fair value and Statement of Assets and Liabilities location, as of June 30, 2009, for the Mid Cap Index Portfolio’s investments in financial derivative instruments by primary risk exposure as discussed under item (2) Significant Accounting Policies of the Notes to Financial Statements.
Derivatives by Risk Category | Statement of Assets and Liabilities Location | Fair Value | |||
Liability Derivatives | |||||
Equity Contracts | |||||
Future* | Net Assets - Net unrealized appreciation/(depreciation) on Futures contracts | $ | 26,934 | ||
Total Equity Contracts | 26,934 | ||||
Total Liability Derivatives | $ | 26,934 | |||
| * | Includes cumulative appreciation/depreciation of futures contracts as reported in the Schedule of Investments. Only current day’s variation margin is reported within the Statement of Assets and Liabilities. |
The following table summarizes the net realized gains/(losses) and Statement of Operations location, for the period ended June 30, 2009, for Mid Cap Index Portfolio’s investments in financial derivative instruments by primary risk exposure.
Derivatives by Risk Category | Statement of Operations Location | Realized Gains/(Losses) recognized in Income | |||
| Equity Contracts | |||||
Future | Net realized gains/(losses) on Futures contracts | 180,921 | |||
Total Equity Contracts | 180,921 | ||||
Total | $ | 180,921 | |||
The following table summarizes the change in net unrealized appreciation/(depreciation) and Statement of Operations location, for the period ended June 30, 2009, for the Mid Cap Index Portfolio’s investments in financial derivative instruments by primary risk exposure.
Derivatives by Risk Category | Statement of Operations Location | Change in Unrealized Appreciation/(Depreciation) recognized in Income | |||
| Equity Contracts | |||||
Future | Change in net unrealized appreciation/(depreciation) on Futures contracts | (79,513 | ) | ||
Total Equity Contracts | (79,513 | ) | |||
Total | ($79,513 | ) | |||
Investment in Affiliates
Affiliated issuers, as defined under the Investment Company Act of 1940, include those in which the Portfolio’s holdings of an issuer represent 5% or more of the outstanding voting securities of an issuer, or any affiliated mutual fund.
A summary of transactions for the fiscal year to date, in Mid Cap Index Portfolio, is as follows:
Portfolio | Value December 31, 2008 | Gross Purchases | Gross Sales | Shares Held at June 30, 2009 | Value June 30, 2009 | Income Earned January 1, 2009 - June 30, 2009 | |||||||||||
Money Market | $ | 1,291,295 | $ | 7,655,276 | $ | 8,176,718 | 769,853 | $ | 769,853 | $ | 3,436 | ||||||
Thrivent Financial Securities Lending Trust | 9,562,918 | 20,932,859 | 22,805,061 | 7,690,716 | 7,690,716 | 50,255 | |||||||||||
Total Value and Income Earned | 10,854,213 | 8,460,569 | 53,691 | ||||||||||||||
The accompanying Notes to Financial Statements are an integral part of this schedule.
156
Table of Contents
Partner Worldwide Allocation Portfolio
Schedule of Investments as of June 30, 2009
(unaudited)
| Shares | Common Stock (82.3%) | Valuea | |||
| Australia (2.4%) | |||||
| 78,484 | Ausenco Limited | $ | 255,038 | ||
| 29,555 | BHP Billiton, Ltd. | 809,687 | |||
| 13,910 | CSL, Ltd. | 359,659 | |||
| 30,705 | Foster’s Group, Ltd. | 127,222 | |||
| 21,701 | JB Hi-Fi, Ltd. | 268,080 | |||
| 38,939 | Monadelphous Group, Ltd. | 372,675 | |||
| 12,592 | Newcrest Mining, Ltd. | 307,765 | |||
| 6,951 | Rio Tinto, Ltd. | 290,352 | |||
| 33,196 | United Group, Ltd. | 276,024 | |||
| 12,010 | Westpac Banking Corporation | 195,398 | |||
| 17,827 | Woolworths, Ltd. | 378,216 | |||
Total Australia | 3,640,116 | ||||
| Austria (0.3%) | |||||
| 5,774 | Andritz AG | 243,492 | |||
| 7,207 | Intercell AGb | 247,721 | |||
Total Austria | 491,213 | ||||
| Belgium (0.8%) | |||||
| 11,069 | Anheuser-Busch InBev NV | 401,375 | |||
| 771 | Colruyt SA | 176,144 | |||
| 6,133 | EVS Broadcast Equipment SA | 310,577 | |||
| 1,874 | Group Bruxelles Lambert SA | 137,380 | |||
| 1,538 | Solvay SA | 130,115 | |||
Total Belgium | 1,155,591 | ||||
| Bermuda (0.2%) | |||||
| 3,183 | ACE, Ltd. | 140,784 | |||
| 144,000 | Noble Group, Ltd. | 179,473 | |||
Total Bermuda | 320,257 | ||||
| Brazil (2.6%) | |||||
| 49,000 | Banco Bradesco SA ADR | 723,730 | |||
| 42,100 | Lojas Renner SA | 466,226 | |||
| 21,000 | Petroleo Brasileiro SA ADR | 700,560 | |||
| 12,500 | Souza Cruz SA | 358,063 | |||
| 15,000 | Ultrapar Participacoes SA | 474,450 | |||
| 25,700 | Vale SA SP ADR | 453,091 | |||
| 51,000 | Vale SA SP PREF ADR | 782,850 | |||
Total Brazil | 3,958,970 | ||||
| Canada (3.4%) | |||||
| 20,700 | Bank of Montreal | 872,347 | |||
| 11,100 | Barrick Gold Corporation | 373,595 | |||
| 7,600 | Canadian National Railway Company | 326,489 | |||
| 8,100 | Canadian Natural Resources, Ltd. | 426,100 | |||
| 2,800 | Canadian Utilities, Ltd. | 91,351 | |||
| 8,524 | Enbridge, Inc. | 295,761 | |||
| 10,500 | EnCana Corporation | 520,576 | |||
| 3,300 | First Quantum Minerals, Ltd. | 159,581 | |||
| 17,797 | Groupe Aeroplan, Inc. | 126,225 | |||
| 4,900 | Husky Energy, Inc. | 137,033 | |||
| 14,200 | IAMGOLD Corporation | 143,807 | |||
| 2,800 | Inmet Mining Corporation | 102,713 | |||
| 3,400 | Metro, Inc. | 111,132 | |||
| 3,200 | National Bank of Canada | 147,868 | |||
| 1,300 | Potash Corporation of Saskatchewan, Inc. | 121,249 | |||
| 6,100 | Research In Motion, Ltd.b | 433,587 | |||
| 6,100 | Royal Bank of Canada | 249,464 | |||
| 15,800 | Sino-Forest Corporationb | 168,432 | |||
| 6,300 | Suncor Energy, Inc. | 191,567 | |||
| 10,400 | Talisman Energy, Inc. | 149,402 | |||
| 10,000 | Viterra, Inc.b | 86,829 | |||
Total Canada | 5,235,108 | ||||
| Cayman Islands (0.5%) | |||||
| 349,000 | Asia Cement China Holdings Corporation | 253,776 | |||
| 336,000 | Xinyi Glass Holdings Company, Ltd. | 288,163 | |||
| 513,575 | Xtep International Holdings, Ltd. | 255,419 | |||
Total Cayman Islands | 797,358 | ||||
| Chile (0.3%) | |||||
| 9,700 | Banco Santander Chile SA ADR | 452,893 | |||
Total Chile | 452,893 | ||||
| China (1.1%) | |||||
| 2,177,700 | Bank of China, Ltd. | 1,031,205 | |||
| 610,000 | PetroChina Company, Ltd. | 674,077 | |||
Total China | 1,705,282 | ||||
| Denmark (0.5%) | |||||
| 26,988 | DSV A/Sb | 334,740 | |||
| 8,322 | Novo Nordisk AS | 453,255 | |||
Total Denmark | 787,995 | ||||
| Finland (0.2%) | |||||
| 5,134 | Kone Oyj | 157,660 | |||
| 10,125 | Nokia Oyj | 148,308 | |||
Total Finland | 305,968 | ||||
| France (5.6%) | |||||
| 4,478 | Alstom | 265,900 | |||
| 43,600 | Axa SA | 825,250 | |||
| 3,286 | BNP Paribas SA | 214,298 | |||
| 8,252 | Bourbon SA | 325,086 | |||
| 2,185 | Bureau Veritas SA | 107,627 | |||
| 21,800 | Cap Gemini SA | 806,841 | |||
| 1,225 | CNP Assurances | 117,213 | |||
| 22,642 | Compagnie de Saint-Gobain | 761,884 | |||
| 6,405 | Euler Hermes SA | 392,166 | |||
| 5,440 | Eutelsat Communicationsb | 140,810 | |||
| 1,383 | Hermes International | 192,562 | |||
| 1,348 | Neopost SA | 121,388 | |||
| 8,009 | Orpeab | 354,105 | |||
| 2,397 | Sanofi-Aventis | 141,644 | |||
| 11,200 | Schneider Electric SA | 857,264 | |||
| 3,162 | Sodexo | 162,812 | |||
| 5,117 | Teleperformance | 156,196 | |||
| 11,236 | Total SA | 609,025 | |||
| 16,370 | UBISOFT Entertainment SAb | 400,388 | |||
| 994 | Unibail-Rodamco | 148,623 | |||
| 5,546 | Vinci SA | 250,269 | |||
| 50,367 | Vivendi Universal SA | 1,209,055 | |||
Total France | 8,560,406 | ||||
| Germany (2.4%) | |||||
| 9,100 | Adidas AG | 346,792 | |||
| 21,529 | Aixtron AG | 265,542 | |||
| 5,137 | BASF SE | 204,676 | |||
The accompanying Notes to Financial Statements are an integral part of this schedule.
157
Table of Contents
Partner Worldwide Allocation Portfolio
Schedule of Investments as of June 30, 2009
(unaudited)
| Shares | Common Stock (82.3%) | Valuea | |||
| Germany (2.4%) - continued | |||||
| 2,776 | Bayer AG | $ | 149,189 | ||
| 2,261 | Bilfinger Berger AG | 105,254 | |||
| 4,981 | Centrotherm Photovoltaics AGb | 216,152 | |||
| 3,480 | E.ON AG | 123,538 | |||
| 3,305 | Hannover Rueckversicherung AGb | 122,183 | |||
| 2,158 | Hochtief AG | 108,979 | |||
| 3,392 | MTU Aero Engines Holding AG | 123,949 | |||
| 7,804 | Rheinmetall AG | 339,073 | |||
| 12,003 | Rhoen-Klinikum AG | 265,354 | |||
| 2,073 | RWE AG | 163,483 | |||
| 5,093 | SAP AG | 205,350 | |||
| 12,300 | Siemens AG | 850,613 | |||
| 928 | Vossloh AG | 111,621 | |||
Total Germany | 3,701,748 | ||||
| Greece (0.4%) | |||||
| 4,038 | Greek Organization of Football Prognostics SA | 107,678 | |||
| 32,474 | Jumbo SA | 318,007 | |||
| 6,291 | Public Power Corporation SAb | 129,813 | |||
Total Greece | 555,498 | ||||
| Hong Kong (3.2%) | |||||
| 76,000 | China Mobile, Ltd. | 760,937 | |||
| 227,000 | Golden Eagle Retail Group, Ltd. | 263,035 | |||
| 125,000 | Hang Lung Group, Ltd. | 584,918 | |||
| 11,300 | Hang Seng Bank, Ltd. | 158,156 | |||
| 15,800 | Hong Kong Exchanges and Clearing, Ltd. | 244,211 | |||
| 18,500 | HongKong Electric Holdings | 102,769 | |||
| 103,900 | Hutchison Whampoa, Ltd. | 675,879 | |||
| 650,800 | New World Development Company, Ltd. | 1,171,451 | |||
| 33,000 | Swire Pacific, Ltd., Class A | 331,249 | |||
| 145,000 | Swire Pacific, Ltd., Class B | 276,600 | |||
| 476,000 | Techtronic Industries Company | 327,920 | |||
Total Hong Kong | 4,897,125 | ||||
| Hungary (0.5%) | |||||
| 4,200 | Richter Gedeon Nyrt | 755,407 | |||
Total Hungary | 755,407 | ||||
| India (1.8%) | |||||
| 6,000 | Bharti Airtel, Ltd.b | 100,298 | |||
| 8,600 | GlaxoSmithKline Pharmaceuticals, Ltd. | 214,909 | |||
| 8,000 | Grasim Industries, Ltd. | 386,080 | |||
| 12,000 | Hero Honda Motors, Ltd. | 349,900 | |||
| 15,826 | Hindustan Unilever, Ltd. | 88,083 | |||
| 13,500 | Housing Development Finance Corporationb | 658,987 | |||
| 10,400 | ICICI Bank, Ltd. ADR | 306,800 | |||
| 16,504 | Infosys Technologies, Ltd. ADR | 607,018 | |||
Total India | 2,712,075 | ||||
| Indonesia (0.4%) | |||||
| 250,000 | PT Astra International Tbk | 580,455 | |||
Total Indonesia | 580,455 | ||||
| Ireland (0.4%) | |||||
| 10,170 | CRH plc | 233,759 | |||
| 14,689 | Paddy Power plc | 342,193 | |||
Total Ireland | 575,952 | ||||
| Israel (0.5%) | |||||
| 13,000 | Check Point Software Technologies, Ltd.b | 305,110 | |||
| 9,500 | Teva Pharmaceutical Industries, Ltd. ADR | 468,730 | |||
Total Israel | 773,840 | ||||
| Italy (2.9%) | |||||
| 10,553 | Atlantia SPA | 213,756 | |||
| 25,064 | Autogrill SPA | 211,803 | |||
| 34,504 | Azimut Holding SPA | 327,865 | |||
| 43,681 | Davide Campari - Milano SPA | 350,361 | |||
| 98,498 | Enel SPA | 480,869 | |||
| 53,950 | Eni SPA | 1,279,587 | |||
| 73,082 | Finmeccanica SPA | 1,030,643 | |||
| 17,707 | Italcementi SPA | 104,280 | |||
| 6,036 | Lottomatica SPA | 116,555 | |||
| 11,700 | Saipem SPA | 285,862 | |||
Total Italy | 4,401,581 | ||||
| Japan (13.7%) | |||||
| 5,400 | Aisin Seiki Company, Ltd. | 116,658 | |||
| 18,000 | Asahi Glass Company, Ltd. | 144,180 | |||
| 4,200 | Astellas Pharmaceutical, Inc. | 148,311 | |||
| 34,300 | Bridgestone Corporation | 537,291 | |||
| 7,300 | Canon, Inc. | 238,447 | |||
| 7,100 | Chugai Pharmaceutical Company, Ltd. | 135,105 | |||
| 11,000 | COMSYS Holdings Corporation | 121,363 | |||
| 23,600 | Credit Saison Company, Ltd. | 299,359 | |||
| 31,500 | Daifuku Company, Ltd. | 224,336 | |||
| 28,500 | Daiichi Sankyo Company, Ltd. | 508,709 | |||
| 13,077 | Daiseki Company, Ltd. | 287,534 | |||
| 22,300 | Daito Trust Construction Company, Ltd. | 1,051,498 | |||
| 32,000 | Daiwa Securities Group, Inc. | 190,150 | |||
| 5,100 | Denso Corporation | 130,727 | |||
| 5,500 | East Japan Railway Company | 331,132 | |||
| 18,300 | Exedy Corporation | 360,387 | |||
| 1,994 | Fast Retailing Company, Ltd. | 259,867 | |||
| 34,000 | Fujitsu, Ltd. | 184,696 | |||
| 36,000 | Furukawa Electric Company, Ltd. | 161,952 | |||
| 3,800 | Hisamitsu Pharmaceutical Company, Inc. | 118,060 | |||
| 25,711 | Hitachi Transport System, Ltd. | 298,566 | |||
| 12,800 | Honda Motor Company, Ltd. | 352,139 | |||
| 13,000 | Horiba, Ltd. | 312,428 | |||
| 5,300 | IBIDEN Company, Ltd. | 148,611 | |||
| 1,400 | Idemitsu Kosan Company, Ltd. | 119,942 | |||
| 23,000 | ITOCHU Corporation | 159,602 | |||
| 184 | Jupiter Telecommunications Company, Ltd. | 139,569 | |||
| 95 | Kakaku.com, Inc. | 360,080 | |||
| 13,000 | Kirin Holdings Company, Ltd. | 181,370 | |||
| 81,000 | Kobe Steel, Ltd. | 150,855 | |||
| 1,500 | Kyocera Corporation | 112,611 | |||
| 3,800 | Lawson, Inc. | 167,261 | |||
| 28,128 | Megane TOP Company, Ltd. | 430,144 | |||
| 19,000 | Mitsubishi Estate Company, Ltd. | 315,432 | |||
The accompanying Notes to Financial Statements are an integral part of this schedule.
158
Table of Contents
Partner Worldwide Allocation Portfolio
Schedule of Investments as of June 30, 2009
(unaudited)
| Shares | Common Stock (82.3%) | Valuea | |||
| Japan (13.7%) - continued | |||||
| 42,000 | Mitsubishi Materials Corporation | $ | 130,762 | ||
| 104,700 | Mitsubishi UFJ Financial Group, Inc. | 646,501 | |||
| 17,000 | Mitsui O.S.K. Lines, Ltd. | 109,860 | |||
| 36,700 | Mitsui Sumitomo Insurance Group Holdings, Inc. | 960,100 | |||
| 32,000 | Nabtesco Corporation | 315,601 | |||
| 52,000 | NEC Corporationb | 203,402 | |||
| 8,300 | Nichi-iko Pharmaceutical Company, Ltd. | 259,190 | |||
| 19,040 | Nifco, Inc. | 294,948 | |||
| 1,200 | Nintendo Company, Ltd. | 332,106 | |||
| 13 | Nippon Building Fund, Inc. | 111,124 | |||
| 14,000 | Nippon Electric Glass Company, Ltd. | 156,513 | |||
| 29,000 | Nissan Motor Company, Ltd. | 175,998 | |||
| 1,800 | Nitori Company, Ltd. | 127,468 | |||
| 8,400 | Pigeon Corporation | 267,712 | |||
| 223 | Rakuten, Inc. | 134,375 | |||
| 4,400 | Santen Pharmaceutical Comany, Ltd. | 134,042 | |||
| 35 | Seven Bank, Ltd. | 91,783 | |||
| 34,000 | Shimadzu Corporation | 271,672 | |||
| 15,100 | Shin-Etsu Chemical Company, Ltd. | 700,322 | |||
| 18,300 | Softbank Corporation | 356,501 | |||
| 16,100 | Sony Corporation | 420,033 | |||
| 52 | Sony Financial Holdings, Inc. | 143,373 | |||
| 99,400 | Sumitomo Corporation | 1,010,371 | |||
| 12,300 | Sumitomo Electric Industries, Ltd. | 137,905 | |||
| 4,400 | Sumitomo Mitsui Financial Group, Inc. | 178,047 | |||
| 183,200 | Sumitomo Trust and Banking Company, Ltd. | 983,029 | |||
| 36,000 | Suruga Bank, Ltd. | 344,429 | |||
| 7,800 | Suzuki Motor Corporation | 174,898 | |||
| 63,000 | Taiheiyo Cement Corporation | 107,961 | |||
| 16,200 | Takeda Pharmaceutical Company, Ltd. | 629,855 | |||
| 7,300 | Tokai Rika Company, Ltd. | 116,130 | |||
| 12,300 | Tokio Marine Holdings, Inc. | 337,716 | |||
| 5,100 | Tokyo Electric Power Company, Inc. | 131,128 | |||
| 28,000 | Toshiba Plant Systems & Services Corporation | 317,459 | |||
| 6,000 | Toyo Suisan Kaisha, Ltd. | 123,620 | |||
| 16,600 | Toyota Motor Corporation | 627,768 | |||
| 8,700 | Tsumura & Company | 271,488 | |||
| 58,000 | Ube Industries, Ltd. | 161,857 | |||
| 10,466 | Unicharm Petcare Corporation | 312,370 | |||
| 23,000 | Yokohama Rubber Company, Ltd. | 113,791 | |||
Total Japan | 21,221,580 | ||||
| Luxembourg (0.4%) | |||||
| 8,853 | SES Global SA | 169,294 | |||
| 16,000 | Tenaris SA ADR | 432,640 | |||
Total Luxembourg | 601,934 | ||||
| Malaysia (0.4%) | |||||
| 120,000 | Bumiputra-Commerce Holdings Berhad | 308,088 | |||
| 135,000 | Public Bank Berhad | 345,193 | |||
Total Malaysia | 653,281 | ||||
| Mexico (1.2%) | |||||
| 172,000 | Consorcio ARA SAB de CVb | 74,843 | |||
| 19,500 | Fomento Economico Mexicano SAB de CV ADR | 628,679 | |||
| 7,500 | Grupo Aeroportuario del Sureste SAB de CV ADR | 292,500 | |||
| 228,500 | Grupo Financiero Banorte SA de CV ADR | 553,538 | |||
| 163,000 | Organizacion Soriana SAB de CVb | 365,158 | |||
Total Mexico | 1,914,718 | ||||
| Netherlands (1.6%) | |||||
| 4,200 | Akzo Nobel NV | 185,660 | |||
| 3,982 | Arcelor Mittal | 131,783 | |||
| 17,487 | Imtech NV | 340,965 | |||
| 42,800 | ING Groep NV | 433,626 | |||
| 29,199 | Koninklijke (Royal) Ahold NV | 336,632 | |||
| 2,551 | Koninklijke Vopak NVb | 127,799 | |||
| 14,412 | Qiagen NVb | 267,653 | |||
| 15,445 | Ten Cate NV | 374,540 | |||
| 11,259 | Unilever NV | 272,323 | |||
Total Netherlands | 2,470,981 | ||||
| Norway (1.3%) | |||||
| 17,400 | DnB NOR ASAb | 132,952 | |||
| 130,300 | Norsk Hydro ASAb | 671,377 | |||
| 51,600 | StatoilHydro ASA | 1,019,255 | |||
| 9,000 | Tandberg ASA | 151,863 | |||
Total Norway | 1,975,447 | ||||
| Papua New Guinea (0.1%) | |||||
| 47,368 | Lihir Gold, Ltd.b | 110,893 | |||
Total Papua New Guinea | 110,893 | ||||
| Philippines (0.3%) | |||||
| 1,800,000 | Ayala Land, Inc. | 302,168 | |||
| 210,000 | Bank of the Philippine Islands | 182,424 | |||
Total Philippines | 484,592 | ||||
| Russia (0.3%) | |||||
| 11,226 | LUKOIL ADR | 499,399 | |||
Total Russia | 499,399 | ||||
| Singapore (3.2%) | |||||
| 493,880 | Golden Agri-Resources, Ltd. | 128,721 | |||
| 83,959 | Golden Agri-Resources, Ltd. Rightsa,b | 11,449 | |||
| 119,900 | Keppel Corporation, Ltd. | 568,333 | |||
| 526,000 | Midas Holding, Ltd. | 283,228 | |||
| 260,000 | Olam International, Ltd. | 433,567 | |||
| 70,000 | Oversea-Chinese Banking Corporation | 321,380 | |||
| 308,000 | Parkway Holdings, Ltd. | 353,230 | |||
| 841,992 | Raffles Education Corporation, Ltd. | 318,334 | |||
| 190,000 | SembCorp Marine, Ltd. | 350,196 | |||
| 75,900 | Singapore Airlines, Ltd. | 694,875 | |||
The accompanying Notes to Financial Statements are an integral part of this schedule.
159
Table of Contents
Partner Worldwide Allocation Portfolio
Schedule of Investments as of June 30, 2009
(unaudited)
| Shares | Common Stock (82.3%) | Valuea | |||
| Singapore (3.2%) - continued | |||||
| 563,800 | Singapore Telecommunications, Ltd. | $ | 1,163,178 | ||
| 13,000 | United Overseas Bank, Ltd. | 131,179 | |||
| 33,000 | Wilmar International, Ltd. | 113,821 | |||
Total Singapore | 4,871,491 | ||||
| South Africa (0.7%) | |||||
| 68,000 | Massmart Holdings, Ltd. | 705,665 | |||
| 86,000 | Truworths International, Ltd. | 412,744 | |||
Total South Africa | 1,118,409 | ||||
| South Korea (1.8%) | |||||
| 12,181 | Busan Bank | 83,100 | |||
| 12,500 | KB Financial Group, Inc.b | 416,735 | |||
| 1,734 | MegaStudy Company, Ltd. | 311,571 | |||
| 3,200 | Samsung Electronics Company, Ltd. | 975,722 | |||
| 1,100 | Shinsegae Company, Ltd. | 434,692 | |||
| 4,323 | SODIFF Advanced Materials Company, Ltd. | 285,080 | |||
| 3,885 | Taewoong Company, Ltd. | 272,586 | |||
Total South Korea | 2,779,486 | ||||
| Spain (3.0%) | |||||
| 53,732 | Banco Bilbao Vizcaya Argentaria SA | 676,595 | |||
| 9,224 | Banco Santander Central Hispano SA | 111,506 | |||
| 6,164 | Grifols SA | 109,347 | |||
| 116,095 | Iberdrola SA | 946,741 | |||
| 4,597 | Indra Sistemas SA | 99,776 | |||
| 30,291 | Laboratorios Almirall SA | 337,191 | |||
| 103,606 | Telefonica SA | 2,352,953 | |||
Total Spain | 4,634,109 | ||||
| Sweden (1.3%) | |||||
| 10,952 | Elekta AB | 160,908 | |||
| 3,018 | Hennes & Mauritz AB | 150,701 | |||
| 36,564 | Hexagon AB | 330,377 | |||
| 34,542 | Loomis AB | 343,807 | |||
| 14,891 | SSAB Svenskt Stal AB | 160,778 | |||
| 86,422 | Telefonaktiebolaget LM Ericsson | 851,374 | |||
Total Sweden | 1,997,945 | ||||
| Switzerland (6.4%) | |||||
| 7,117 | ABB, Ltd.b | 112,377 | |||
| 3,432 | Actelion, Ltd.b | 179,877 | |||
| 22,300 | Adecco SA | 932,034 | |||
| 1,321 | Baloise Holding AG | 98,229 | |||
| 13,000 | Credit Suisse Group | 595,580 | |||
| 287 | Galenica AG | 84,728 | |||
| 1,787 | Geberit AG | 220,165 | |||
| 1,472 | Givaudan SA | 903,543 | |||
| 7,590 | Holcim, Ltd.b | 432,110 | |||
| 64,415 | Nestle SA | 2,432,096 | |||
| 54,366 | Novartis AG | 2,212,986 | |||
| 7,312 | Roche Holding AG | 996,230 | |||
| 304 | Sika Finanz AG Bearer | 338,493 | |||
| 1,624 | Transocean, Ltd.b | 120,647 | |||
| 1,031 | Zurich Financial Services AG | 182,224 | |||
Total Switzerland | 9,841,319 | ||||
| Taiwan (0.9%) | |||||
| 158,000 | Taiwan Mobile Company, Ltd. | 269,296 | |||
| 382,962 | Taiwan Semiconductor Manufacturing Company, Ltd. | 628,517 | |||
| 53,431 | Taiwan Semiconductor Manufacturing Company, Ltd. ADR | 502,786 | |||
Total Taiwan | 1,400,599 | ||||
| Thailand (1.1%) | |||||
| 110,000 | PTT Exploration & Production pcl | 435,923 | |||
| 48,300 | PTT pcl | 330,371 | |||
| 62,600 | PTT pclc | 429,950 | |||
| 115,000 | Siam Cement Public Company, Ltd. | 542,084 | |||
Total Thailand | 1,738,328 | ||||
| Turkey (0.7%) | |||||
| 154,000 | Akbank TAS | 682,445 | |||
| 11,000 | BIM Birlesik Magazalar AS | 383,781 | |||
Total Turkey | 1,066,226 | ||||
| United Kingdom (13.4%) | |||||
| 238,433 | Aegis Group plc | 362,632 | |||
| 14,884 | Aggreko plc | 127,214 | |||
| 6,153 | Anglo American plc | 179,916 | |||
| 15,500 | AstraZeneca plc | 683,466 | |||
| 6,374 | Autonomy Corporation plcb | 151,037 | |||
| 55,715 | Babcock International Group plc | 442,027 | |||
| 57,662 | BAE Systems plc | 322,226 | |||
| 30,175 | Barclays plc | 140,231 | |||
| 40,451 | BG Group plc | 681,211 | |||
| 15,557 | BHP Billiton plc | 350,649 | |||
| 107,100 | BP Amoco plc | 846,316 | |||
| 22,561 | British American Tobacco plc | 622,807 | |||
| 97,000 | British Sky Broadcasting Group plc | 728,186 | |||
| 13,630 | Capita Group plc | 160,714 | |||
| 3,159 | Chemring Group plc | 112,955 | |||
| 55,145 | Cobham plc | 157,070 | |||
| 33,025 | Compass Group plc | 186,424 | |||
| 46,798 | Connaught plc | 289,481 | |||
| 33,551 | Croda International plc | 295,219 | |||
| 30,463 | Dignity plc | 301,984 | |||
| 26,150 | Experian plc | 196,112 | |||
| 43,372 | GAME GROUP plc | 117,685 | |||
| 93,137 | GlaxoSmithKline plc | 1,645,176 | |||
| 54,063 | Group 4 Securicor plc | 186,214 | |||
| 36,746 | Halma plc | 120,600 | |||
| 56,603 | IG Group Holdings plc | 261,260 | |||
| 16,170 | Imperial Tobacco Group plc | 420,886 | |||
| 6,936 | Intertek Group plc | 119,307 | |||
| 336,713 | Kingfisher plc | 987,868 | |||
| 32,441 | Marks and Spencer Group plc | 163,593 | |||
| 58,148 | Micro Focus International plc | 359,096 | |||
| 39,181 | National Grid plc | 353,570 | |||
| 94,200 | Pearson plc | 948,664 | |||
| 57,797 | Persimmon plc | 333,574 | |||
| 42,955 | Qinetiq Group plc | 101,614 | |||
| 9,239 | Reckitt Benckiser Group plc | 421,946 | |||
| 5,877 | Rio Tinto plc | 203,539 | |||
| 28,995 | Rotork plc | 395,549 | |||
| 5,989 | Royal Dutch Shell plc | 150,782 | |||
The accompanying Notes to Financial Statements are an integral part of this schedule.
160
Table of Contents
Partner Worldwide Allocation Portfolio
Schedule of Investments as of June 30, 2009
(unaudited)
| Shares | Common Stock (82.3%) | Valuea | |||
| United Kingdom (13.4%) - continued | |||||
| 58,551 | RSA Insurance Group plc | $ | 116,264 | ||
| 4,439 | SABMiller plc | 90,639 | |||
| 40,051 | Sage Group plc | 117,682 | |||
| 187,332 | SIG plc | 303,867 | |||
| 51,456 | Standard Chartered plc | 967,573 | |||
| 89,332 | Tesco plc | 521,706 | |||
| 12,737 | Ultra Electronics Holdings | 228,866 | |||
| 48,845 | Unilever plc | 1,148,011 | |||
| 15,161 | United Utilities Group plc | 124,326 | |||
| 597,300 | Vodafone Group plc | 1,161,679 | |||
| 50,734 | William Morrison Supermarkets plc | 198,161 | |||
| 113,300 | WPP plc | 753,469 | |||
| 29,878 | Xstrata plc | 324,735 | |||
Total United Kingdom | 20,685,778 | ||||
| United States (0.1%) | |||||
| 4,179 | iShares MSCI EAFE Index Fund | 191,440 | |||
Total United States | 191,440 | ||||
Total Common Stock (cost $129,929,510) | 126,622,793 | ||||
| Principal Amount | Long-Term Fixed Income (8.0%) | ||||
| Argentina (0.5%) | |||||
Argentina Bonos | |||||
| $120,000 | 1.683%, 08/03/09d | 15,132 | |||
| 780,000 | 1.683%, 08/03/09d | 189,150 | |||
| 910,000 | 7.000%, 10/03/15 | 453,635 | |||
Republic of Argentina International Bond | |||||
| 660,000 | 2.500%, 03/31/19e | 177,210 | |||
Total Argentina | 835,127 | ||||
| Bermuda (0.2%) | |||||
Digicel Group, Ltd. | |||||
| 100,000 | 8.875%, 01/15/15 | 83,000 | |||
Qtel International Finance, Ltd. | |||||
| 180,000 | 7.875%, 06/10/19f | 183,128 | |||
Total Bermuda | 266,128 | ||||
| Brazil (0.9%) | |||||
Brazilian Government International Bond | |||||
| 100,000 | 5.875%, 01/15/19 | 100,900 | |||
Federative Republic of Brazil International Bond | |||||
| 880,000 | 6.000%, 01/17/17 | 903,320 | |||
| 150,000 | 8.250%, 01/20/34 . | 178,125 | |||
Independencia International, Ltd | |||||
| 170,000 | 9.875%, 05/15/15g,h | 20,400 | |||
Telemar Norte Leste SA | |||||
| 100,000 | 9.500%, 04/23/19f | 108,875 | |||
Total Brazil | 1,311,620 | ||||
| Chile (0.1%) | |||||
Empresa Nacional del Petroleo | |||||
| 100,000 | 6.250%, 07/08/19 | 99,144 | |||
Total Chile | 99,144 | ||||
| Colombia (0.2%) | |||||
Colombia Government International Bond | |||||
| 100,000 | 7.375%, 03/18/19 | 106,750 | |||
| 210,000 | 7.375%, 09/18/37 | 214,200 | |||
Total Colombia | 320,950 | ||||
| Dominican Republic (<0.1%) | |||||
Dominican Republic International Bond | |||||
| 65,579 | 9.040%, 01/23/18 | 57,053 | |||
Total Dominican Republic | 57,053 | ||||
| Indonesia (0.9%) | |||||
Republic of Indonesia Government International Bond | |||||
| 1,060,000 | 11.625%, 03/04/19 | 1,341,930 | |||
| 100,000 | 6.625%, 02/17/37 | 80,936 | |||
Total Indonesia | 1,422,866 | ||||
| Ireland (0.1%) | |||||
VIP Finance Ireland, Ltd. | |||||
| 100,000 | 9.125%, 04/30/18f | 84,750 | |||
| 130,000 | 9.125%, 04/30/18 | 111,963 | |||
Total Ireland | 196,713 | ||||
| Kazakhstan (0.1%) | |||||
KazMunaiGaz Finance Sub BV | |||||
| 100,000 | 8.375%, 07/02/13f | 92,250 | |||
Total Kazakhstan | 92,250 | ||||
| Lebanon (0.1%) | |||||
Lebanon Government International Bond | |||||
| 195,500 | 4.000%, 12/31/17 | 166,908 | |||
Total Lebanon | 166,908 | ||||
| Malaysia (0.2%) | |||||
Malaysia Government International Bond | |||||
| 330,000 | 7.500%, 07/15/11 | 360,864 | |||
Total Malaysia | 360,864 | ||||
| Mexico (0.6%) | |||||
Mexico Government International Bond | |||||
| 170,000 | 5.950%, 03/19/19 | 171,700 | |||
| 180,000 | 7.500%, 04/08/33 | 197,550 | |||
| 80,000 | 6.750%, 09/27/34 | 80,680 | |||
Pemex Project Funding Master Trust | |||||
| 130,000 | 5.750%, 03/01/18 | 119,600 | |||
Petroleos Mexicanos | |||||
| 240,000 | 8.000%, 05/03/19 | 259,956 | |||
United Mexican States | |||||
| 110,000 | 6.050%, 01/11/40 | 99,935 | |||
Total Mexico | 929,421 | ||||
The accompanying Notes to Financial Statements are an integral part of this schedule.
161
Table of Contents
Partner Worldwide Allocation Portfolio
Schedule of Investments as of June 30, 2009
(unaudited)
| Principal Amount | Long-Term Fixed Income (8.0%) | Valuea | ||||
| Netherlands (<0.1%) | ||||||
TuranAlem Finance BV | ||||||
| $ 140,000 | 8.000%, 03/24/14 | $ | 30,800 | |||
Total Netherlands | 30,800 | |||||
| Panama (0.1%) | ||||||
Panama Government International Bond | ||||||
| 20,000 | 9.375%, 04/01/29 | 25,100 | ||||
| 150,000 | 6.700%, 01/26/36 | 145,500 | ||||
Total Panama | 170,600 | |||||
| Peru (0.4%) | ||||||
Peruvian Government International Bond | ||||||
| 150,000 | 6.550%, 03/14/37 | 145,500 | ||||
Republic of Peru International Bond | ||||||
| 370,000 | 7.125%, 03/30/19 | 394,975 | ||||
Total Peru | 540,475 | |||||
| Philippines (0.5%) | ||||||
Republic of the Philippines Government International Bond | ||||||
| 100,000 | 8.375%, 06/17/19 | 115,000 | ||||
| 530,000 | 10.625%, 03/16/25 | 691,650 | ||||
| 60,000 | 9.500%, 02/02/30 | 73,200 | ||||
Total Philippines | 879,850 | |||||
| Qatar (0.1%) | ||||||
Qatar Government International Bond | ||||||
| 100,000 | 6.550%, 04/09/19 | 102,375 | ||||
Total Qatar | 102,375 | |||||
| Russia (0.8%) | ||||||
Russian Federation International Bond | ||||||
| 1,209,600 | 7.500%, 03/31/30 | 1,190,851 | ||||
Total Russia | 1,190,851 | |||||
| Serbia And Montenegro (<0.1%) | ||||||
Republic of Serbia International Bond | ||||||
| 50,000 | 3.750%, 11/01/09e | 43,625 | ||||
Total Serbia And Montenegro | 43,625 | |||||
| South Africa (0.1%) | ||||||
Republic of South Africa International Bond | ||||||
| 120,000 | 6.875%, 05/27/19 | 123,300 | ||||
| 110,000 | 5.875%, 05/30/22 | 101,750 | ||||
Total South Africa | 225,050 | |||||
| Turkey (1.0%) | ||||||
Republic of Turkey International Bond | ||||||
| 700,000 | 16.000%, 03/07/12 | 489,064 | ||||
| 420,000 | 6.750%, 04/03/18 | 416,065 | ||||
| 70,000 | 7.000%, 03/11/19 | 70,623 | ||||
| 310,000 | 7.500%, 11/07/19 | 320,850 | ||||
| 190,000 | 7.250%, 03/05/38 | 181,925 | ||||
Total Turkey | 1,478,527 | |||||
| Ukraine (0.3%) | ||||||
Ukraine Government International Bond | ||||||
| 100,000 | 6.875%, 03/04/11 | 85,000 | ||||
| 100,000 | 7.650%, 06/11/13 | 76,500 | ||||
| 250,000 | 6.750%, 11/14/17 | 171,250 | ||||
| 100,000 | 6.750%, 11/14/17f | 68,500 | ||||
Total Ukraine | 401,250 | |||||
| Uruguay (0.3%) | ||||||
Uruguay Government International Bond | ||||||
| 20,000 | 8.000%, 11/18/22 | 20,900 | ||||
| 428,000 | 7.625%, 03/21/36 | 411,950 | ||||
Total Uruguay | 432,850 | |||||
| Venezuela (0.5%) | ||||||
Petroleos de Venezuela SA | ||||||
| 460,000 | 5.375%, 04/12/27 | 181,700 | ||||
Venezuela Government International Bond | ||||||
| 360,000 | 6.000%, 12/09/20 | 180,900 | ||||
| 130,000 | 9.000%, 05/07/23 | 79,560 | ||||
| 290,000 | 7.650%, 04/21/25 | 155,150 | ||||
| 120,000 | 9.250%, 09/15/27 | 81,600 | ||||
| 70,000 | 7.000%, 03/31/38 | 34,125 | ||||
Total Venezuela | 713,035 | |||||
Total Long-Term Fixed Income (cost $11,969,263) | 12,268,332 | |||||
| Shares or Principal Amount | Short-Term Investments (9.7%)i | |||||
Federal Home Loan Mortgage Corporation Discount Notes | ||||||
| 1,050,000 | 0.212%, 09/21/09j | 1,049,498 | ||||
| 13,918,598 | Thrivent Money Market Portfolio | 13,918,598 | ||||
Total Short-Term Investments (at amortized cost) | 14,968,096 | |||||
Total Investments (cost $156,986,896) 100.1% | $ | 153,995,237 | ||||
Other Assets and Liabilities, Net (0.1%) | (81,599 | ) | ||||
Total Net Assets 100.0% | $ | 153,913,638 | ||||
| a | Security is fair valued as discussed in item 2(A) of the Notes to Financial Statements. |
| b | Non-income producing security. |
| c | Denotes investments purchased on a when-issued or delayed delivery basis. |
| d | Denotes variable rate obligations for which the current yield and next scheduled reset date are shown. |
The accompanying Notes to Financial Statements are an integral part of this schedule.
162
Table of Contents
Partner Worldwide Allocation Portfolio
Schedule of Investments as of June 30, 2009
(unaudited)
| e | Denotes step coupon bonds for which the current interest rate and next scheduled reset date are shown. |
| f | Denotes securities sold under Rule 144A of the Securities Act of 1933, which exempts them from registration. These securities have been deemed liquid and may be resold to other dealers in the program or to other qualified institutional buyers. As of June 30, 2009, the value of these investments was $537,503 or 0.3% of total net assets. |
| g | Denotes restricted securities. Restricted securities are investment securities which have been deemed illiquid and cannot be offered for public sale without first being registered under the Securities Act of 1933. The following table indicates the acquisition date and cost of restricted securities Partner Worldwide Allocation Portfolio owned as of June 30, 2009. |
Security | Acquisition Date | Cost | |||
Independencia International, Ltd. | 5/8/2008 | $ | 93,983 | ||
| h | In bankruptcy. |
| i | The interest rate shown reflects the yield, coupon rate or, for securities purchased at a discount, the discount rate at the date of purchase. |
| j | At June 30, 2009, $1,049,498 of investments were held on deposit with the counterparty and pledged as the initial margin deposit for open futures contracts. |
Definitions:
| ADR | - | American Depositary Receipt, which are certificates for an underlying foreign security’s shares held by an issuing U.S. depository bank. |
Unrealized Appreciation (Depreciation)
Gross unrealized appreciation and depreciation of investments, based on cost for federal income tax purposes, were as follows:
Gross unrealized appreciation | $ | 8,830,372 | ||
Gross unrealized depreciation | (11,822,031 | ) | ||
Net unrealized appreciation (depreciation) | $ | (2,991,659 | ) | |
Cost for federal income tax purposes | $ | 156,986,896 | ||
The accompanying Notes to Financial Statements are an integral part of this schedule.
163
Table of Contents
Partner Worldwide Allocation Portfolio
Schedule of Investments as of June 30, 2009
(unaudited)
Fair Valuation Measurements
The following table is a summary of the inputs used, as of June 30, 2009, in valuing Partner Worldwide Allocation Portfolio’s assets carried at fair value as discussed in the Notes to Financial Statements.
Investments in Securities | Total | Level 1 | Level 2 | Level 3 | ||||||||||
Common Stock | ||||||||||||||
Communications Services | 100,298 | — | 100,298 | — | ||||||||||
Consumer Discretionary | 16,515,257 | 126,225 | 16,389,032 | — | ||||||||||
Consumer Staples | 13,347,361 | 826,640 | 12,509,272 | 11,449 | ||||||||||
Energy | 10,158,970 | 3,878,686 | 6,280,284 | — | ||||||||||
Financials | 21,728,394 | 3,085,326 | 18,643,068 | — | ||||||||||
Health Care | 12,875,635 | 468,730 | 12,406,905 | — | ||||||||||
Industrials | 21,157,206 | 618,989 | 20,538,217 | — | ||||||||||
Information Technology | 9,588,586 | 1,414,914 | 8,173,672 | — | ||||||||||
Materials | 12,677,190 | 2,508,857 | 10,168,333 | — | ||||||||||
Telecommunications Services | 6,262,993 | 433,587 | 5,829,406 | — | ||||||||||
Utilities | 2,210,903 | 91,351 | 2,119,552 | — | ||||||||||
Long-Term Fixed Income | ||||||||||||||
Asset-Backed Securities | 20,900 | — | 20,900 | — | ||||||||||
Communications Services | 571,716 | — | 571,716 | — | ||||||||||
Consumer Non-Cyclical | 20,400 | — | 20,400 | — | ||||||||||
Energy | 633,050 | — | 633,050 | — | ||||||||||
Financials | 30,800 | — | 30,800 | — | ||||||||||
Foreign | 4,073,876 | — | 4,073,876 | — | ||||||||||
Foreign Government | 6,917,590 | — | 6,917,590 | — | ||||||||||
Short-Term Investments | 14,968,096 | 13,918,598 | 1,049,498 | — | ||||||||||
Total | $ | 153,995,237 | $ | 27,371,903 | $ | 126,611,885 | $ | 11,449 | ||||||
Other Financial Instruments* | ($41,080 | ) | ($41,080 | ) | $ | — | $ | — | ||||||
| * | Other Financial Instruments include Futures, Forwards, Written Options and Swap agreements. |
The following table is a reconciliation of assets in which significant unobservable inputs (Level 3) were used in determining fair value for the Partner Worldwide Allocation Portfolio as discussed in item 2(A) of the Notes to Financial Statements.
Investments in Securities | Value December 31, 2008 | Accrued Discounts and/or Premiums | Realized Gain/(Loss) | Change in Unrealized Gain/(Loss) | Net Purchases/(Sales) | Transfers in and/or (Out of) Level 3 | Value June 30, 2009 | ||||||||||||||
Common Stock | |||||||||||||||||||||
Consumer Staples | — | — | — | — | 11,449 | — | 11,449 | ||||||||||||||
Transportation | 304,477 | — | — | (57,392 | ) | 84,047 | (331,132 | ) | — | ||||||||||||
Total | $ | 304,477 | $ | — | $ | — | ($57,392 | ) | $ | 95,496 | ($331,132 | ) | $ | 11,449 | |||||||
The accompanying Notes to Financial Statements are an integral part of this schedule.
164
Table of Contents
Partner Worldwide Allocation Portfolio
Schedule of Investments as of June 30, 2009
(unaudited)
Futures Contracts | Number of Contracts Long/(Short) | Expiration Date | Notional Principal Amount | Value | Unrealized Gain/(Loss) | |||||||||
E-Mini MSCI Eafe Index Futures | 136 | September 2009 | $ | 8,922,906 | $ | 8,859,720 | ($63,186 | ) | ||||||
Total Futures Contracts | ($63,186 | ) | ||||||||||||
Foreign Currency Forward Contracts | Contracts to Deliver/Receive | Settlement Date | Value on Settlement Date | Value | Unrealized Gain/(Loss) | |||||||||
Purchases | ||||||||||||||
Australian Dollar | 183,960 | 7/1/2009 - 7/6/2009 | $ | 148,823 | $ | 148,236 | ($587 | ) | ||||||
Brazilian Real | 815,021 | 8/3/2009 | 389,882 | 413,184 | 23,302 | |||||||||
British Pound | 151,658 | 7/1/2009 - 7/6/2009 | 250,808 | 249,517 | (1,291 | ) | ||||||||
Hong Kong Dollar | 20,649 | 7/1/2009 - 7/6/2009 | 2,664 | 2,664 | — | |||||||||
Mexican Peso | 2,922,594 | 7/29/2009 | 218,931 | 220,997 | 2,066 | |||||||||
Swedish Krona | 538,359 | 7/1/2009 - 7/6/2009 | 69,682 | 69,784 | 102 | |||||||||
Total Foreign Currency Forward Contracts Purchases | $ | 1,080,790 | $ | 1,104,382 | $ | 23,592 | ||||||||
Sales | ||||||||||||||
Brazilian Real | 235,020 | 8/3/2009 | $ | 120,000 | $ | 119,146 | $ | 854 | ||||||
Japanese Yen | 1,825,915 | 7/1/2009 - 7/6/2009 | 18,922 | 18,954 | (32 | ) | ||||||||
Mexican Peso | 2,922,595 | 7/29/2009 | 218,781 | 220,997 | (2,216 | ) | ||||||||
Turkish Lira | 213,000 | 9/16/2009 | 135,764 | 135,856 | (92 | ) | ||||||||
Total Foreign Currency Forward Contracts Sales | $ | 493,467 | $ | 494,953 | ($1,486 | ) | ||||||||
Net Unrealized Gain/(Loss) on Foreign Currency Forward Contracts | $ | 22,106 | ||||||||||||
The following table summarizes the fair value and Statement of Assets and Liabilities location, as of June 30, 2009, for the Partner Worldwide Allocation Portfolio’s investments in financial derivative instruments by primary risk exposure as discussed under item (2) Significant Accounting Policies of the Notes to Financial Statements.
Derivatives by Risk Category | Statement of Assets and Liabilities Location | Fair Value | |||
Asset Derivatives | |||||
Foreign Exchange Contracts | |||||
Forward Contract | Receivable for forward contracts, Net Assets - Net unrealized appreciation/(depreciation) on Foreign currency forward contracts | 26,324 | |||
Total Foreign Exchange Contracts | 26,324 | ||||
Total Asset Derivatives | $ | 26,324 | |||
Liability Derivatives | |||||
Equity Contracts | |||||
Future* | Net Assets - Net unrealized appreciation/(depreciation) on Futures contracts | 63,186 | |||
Total Equity Contracts | 63,186 | ||||
Foreign Exchange Contracts | |||||
Forward Contract | Payable for forward contracts, Net Assets - Net unrealized appreciation/(depreciation) on Foreign currency forward contracts | 4,218 | |||
Total Foreign Exchange Contracts | 4,218 | ||||
Total Liability Derivatives | $ | 67,404 | |||
| * | Includes cumulative appreciation/depreciation of futures contracts as reported in the Schedule of Investments. Only current day’s variation margin is reported within the Statement of Assets and Liabilities. |
The accompanying Notes to Financial Statements are an integral part of this schedule.
165
Table of Contents
Partner Worldwide Allocation Portfolio
Schedule of Investments as of June 30, 2009
(unaudited)
The following table summarizes the net realized gains/(losses) and Statement of Operations location, for the period ended June 30, 2009, for Partner Worldwide Allocation Portfolio’s investments in financial derivative instruments by primary risk exposure.
Derivatives by Risk Category | Statement of Operations Location | Realized Gains/(Losses) recognized in Income | ||||
Equity Contracts | ||||||
Future | Net realized gains/(losses) on Futures contracts | 407,942 | ||||
Total Equity Contracts | 407,942 | |||||
Total | $ | 407,942 | ||||
| The following table summarizes the change in net unrealized appreciation/(depreciation) and Statement of Operations location, for the period ended June 30, 2009, for the Partner Worldwide Allocation Portfolio’s investments in financial derivative instruments by primary risk exposure. | ||||||
Derivatives by Risk Category | Statement of Operations Location | Change in Unrealized Appreciation/(Depreciation) recognized in Income | ||||
Equity Contracts | ||||||
Future | Change in net unrealized appreciation/(depreciation) on Futures contracts | (210,819 | ) | |||
Total Equity Contracts | (210,819 | ) | ||||
Foreign Exchange Contracts | ||||||
Forward Contract | Change in net unrealized appreciation/(depreciation) on Foreign currency forward contracts | 12,893 | ||||
Total Foreign Exchange Contracts | 12,893 | |||||
Total | ($197,926 | ) | ||||
Investment in Affiliates
Affiliated issuers, as defined under the Investment Company Act of 1940, include those in which the Portfolio’s holdings of an issuer represent 5% or more of the outstanding voting securities of an issuer, or any affiliated mutual fund.
A summary of transactions for the fiscal year to date, in Partner Worldwide Allocation Portfolio, is as follows:
Portfolio | Value December 31, 2008 | Gross Purchases | Gross Sales | Shares Held at June 30, 2009 | Value June 30, 2009 | Income Earned January 1, 2009 - June 30, 2009 | |||||||||||
Money Market | $ | 8,811,716 | $ | 65,588,522 | $ | 60,481,640 | 13,918,598 | $ | 13,918,598 | $ | 33,741 | ||||||
Total Value and Income Earned | 8,811,716 | 13,918,598 | 33,741 | ||||||||||||||
The accompanying Notes to Financial Statements are an integral part of this schedule.
166
Table of Contents
Partner International Stock Portfolio
Schedule of Investments as of June 30, 2009
(unaudited)
| Shares | Common Stock (98.1%) | Valuea | |||
| Australia (2.9%) | |||||
| 255,327 | BHP Billiton, Ltd. | $ | 6,994,910 | ||
| 122,475 | CSL, Ltd. | 3,166,734 | |||
| 264,825 | Foster’s Group, Ltd. | 1,097,263 | |||
| 110,878 | Newcrest Mining, Ltd. | 2,709,998 | |||
| 60,973 | Rio Tinto, Ltd. | 2,546,922 | |||
| 105,751 | Westpac Banking Corporation | 1,720,529 | |||
| 156,960 | Woolworths, Ltd. | 3,330,056 | |||
Total Australia | 21,566,412 | ||||
| Belgium (1.0%) | |||||
| 97,463 | Anheuser-Busch InBev NVb | 3,534,114 | |||
| 6,650 | Colruyt SA | 1,519,274 | |||
| 16,504 | Group Bruxelles Lambert SA | 1,209,886 | |||
| 13,538 | Solvay SA | 1,145,319 | |||
Total Belgium | 7,408,593 | ||||
| Bermuda (0.4%) | |||||
| 28,021 | ACE, Ltd. | 1,239,369 | |||
| 1,263,000 | Noble Group, Ltd. | 1,574,128 | |||
Total Bermuda | 2,813,497 | ||||
| Brazil (0.6%) | |||||
| 244,000 | Vale SA SP ADR | 4,301,720 | |||
Total Brazil | 4,301,720 | ||||
| Canada (6.1%) | |||||
| 184,600 | Bank of Montreal | 7,779,480 | |||
| 97,700 | Barrick Gold Corporation | 3,288,304 | |||
| 66,500 | Canadian National Railway Company | 2,856,779 | |||
| 71,300 | Canadian Natural Resources, Ltd. | 3,750,728 | |||
| 24,400 | Canadian Utilities, Ltd. | 796,063 | |||
| 74,913 | Enbridge, Inc.b | 2,599,285 | |||
| 91,400 | EnCana Corporation | 4,531,499 | |||
| 29,300 | First Quantum Minerals, Ltd. | 1,416,889 | |||
| 154,194 | Groupe Aeroplan, Inc. | 1,093,621 | |||
| 42,600 | Husky Energy, Inc.b | 1,191,350 | |||
| 125,100 | IAMGOLD Corporation | 1,266,917 | |||
| 24,600 | Inmet Mining Corporation | 902,409 | |||
| 29,600 | Metro, Inc. | 967,496 | |||
| 28,800 | National Bank of Canada | 1,330,812 | |||
| 11,300 | Potash Corporation of Saskatchewan, Inc. | 1,053,935 | |||
| 53,500 | Research In Motion, Ltd.c | 3,802,768 | |||
| 52,400 | Royal Bank of Canada | 2,142,940 | |||
| 139,000 | Sino-Forest Corporationc | 1,481,774 | |||
| 55,400 | Suncor Energy, Inc. | 1,684,575 | |||
| 89,600 | Talisman Energy, Inc. | 1,287,153 | |||
| 92,700 | Viterra, Inc.c | 804,909 | |||
Total Canada | 46,029,686 | ||||
| China (1.2%) | |||||
| 19,396,600 | Bank of China, Ltd. | 9,184,860 | |||
Total China | 9,184,860 | ||||
| Denmark (0.5%) | |||||
| 73,279 | Novo Nordisk AS | 3,991,121 | |||
Total Denmark | 3,991,121 | ||||
| Finland (0.4%) | |||||
| 45,018 | Kone Oyj | 1,382,453 | |||
| 88,820 | Nokia Oyj | 1,301,011 | |||
Total Finland | 2,683,464 | ||||
| France (8.3%) | |||||
| 39,428 | Alstomb | 2,341,203 | |||
| 387,300 | Axa SA | 7,330,718 | |||
| 28,779 | BNP Paribas SA | 1,876,832 | |||
| 19,144 | Bureau Veritas SA | 942,984 | |||
| 189,100 | Cap Gemini SA | 6,998,796 | |||
| 10,722 | CNP Assurances | 1,025,926 | |||
| 201,400 | Compagnie de Saint-Gobainb | 6,776,935 | |||
| 47,861 | Eutelsat Communicationsc | 1,238,847 | |||
| 12,128 | Hermes Internationalb | 1,688,640 | |||
| 11,654 | Neopost SA | 1,049,450 | |||
| 21,106 | Sanofi-Aventis | 1,247,203 | |||
| 99,900 | Schneider Electric SA | 7,646,485 | |||
| 27,844 | Sodexo | 1,433,693 | |||
| 45,056 | Teleperformance | 1,375,333 | |||
| 97,068 | Total SA | 5,261,377 | |||
| 8,575 | Unibail-Rodamco | 1,282,138 | |||
| 48,834 | Vinci SA | 2,203,689 | |||
| 444,005 | Vivendi Universal SA | 10,658,299 | |||
Total France | 62,378,548 | ||||
| Germany (3.1%) | |||||
| 80,100 | Adidas AG | 3,052,531 | |||
| 45,046 | BASF SE | 1,794,787 | |||
| 24,444 | Bayer AG | 1,313,680 | |||
| 20,049 | Bilfinger Berger AG | 933,319 | |||
| 30,460 | E.ON AG | 1,081,313 | |||
| 28,989 | Hannover Rueckversicherung AGc | 1,071,698 | |||
| 18,679 | Hochtief AG | 943,292 | |||
| 29,311 | MTU Aero Engines Holding AG | 1,071,073 | |||
| 18,181 | RWE AG | 1,433,807 | |||
| 44,557 | SAP AG | 1,796,538 | |||
| 109,800 | Siemens AG | 7,593,269 | |||
| 8,230 | Vossloh AG | 989,917 | |||
Total Germany | 23,075,224 | ||||
| Greece (0.3%) | |||||
| 34,839 | Greek Organization of Football Prognostics SA | 929,025 | |||
| 55,027 | Public Power Corporation SAc | 1,135,465 | |||
Total Greece | 2,064,490 | ||||
| Hong Kong (2.7%) | |||||
| 100,000 | Hang Seng Bank, Ltd. | 1,399,606 | |||
| 139,100 | Hong Kong Exchanges and Clearing, Ltd. | 2,149,985 | |||
| 161,500 | Hong Kong Electric Holdings | 897,147 | |||
| 927,700 | Hutchison Whampoa, Ltd. | 6,034,772 | |||
| 5,616,200 | New World Development Company, Ltd. | 10,109,247 | |||
Total Hong Kong | 20,590,757 | ||||
| Ireland (0.3%) | |||||
| 89,540 | CRH plc | 2,058,088 | |||
Total Ireland | 2,058,088 | ||||
| Italy (4.3%) | |||||
| 92,577 | Atlantia SPA | 1,875,191 | |||
| 865,906 | Enel SPAb | 4,227,366 | |||
The accompanying Notes to Financial Statements are an integral part of this schedule.
167
Table of Contents
Partner International Stock Portfolio
Schedule of Investments as of June 30, 2009
(unaudited)
| Shares | Common Stock (98.1%) | Valuea | |||
| Italy (4.3%) - continued | |||||
| 496,574 | Eni SPA | $ | 11,777,749 | ||
| 668,389 | Finmeccanica SPA | 9,425,991 | |||
| 155,328 | Italcementi SPA | 914,753 | |||
| 53,100 | Lottomatica SPAb | 1,025,363 | |||
| 110,500 | Saipem SPA | 2,699,809 | |||
Total Italy | 31,946,222 | ||||
| Japan (18.7%) | |||||
| 47,300 | Aisin Seiki Company, Ltd. | 1,021,840 | |||
| 158,000 | Asahi Glass Company, Ltd. | 1,265,579 | |||
| 36,400 | Astellas Pharmaceutical, Inc. | 1,285,363 | |||
| 304,700 | Bridgestone Corporation | 4,772,960 | |||
| 64,400 | Canon, Inc. | 2,103,562 | |||
| 61,700 | Chugai Pharmaceutical Company, Ltd. | 1,174,079 | |||
| 97,000 | COMSYS Holdings Corporation | 1,070,199 | |||
| 252,800 | Daiichi Sankyo Company, Ltd. | 4,512,342 | |||
| 194,400 | Daito Trust Construction Company, Ltd. | 9,166,430 | |||
| 274,000 | Daiwa Securities Group, Inc. | 1,628,162 | |||
| 44,500 | Denso Corporation | 1,140,653 | |||
| 48,800 | East Japan Railway Company | 2,938,047 | |||
| 17,230 | Fast Retailing Company, Ltd. | 2,245,491 | |||
| 299,000 | Fujitsu, Ltd. | 1,624,237 | |||
| 314,000 | Furukawa Electric Company, Ltd. | 1,412,580 | |||
| 33,500 | Hisamitsu Pharmaceutical Company, Inc. | 1,040,795 | |||
| 112,400 | Honda Motor Company, Ltd. | 3,092,219 | |||
| 46,300 | IBIDEN Company, Ltd. | 1,298,245 | |||
| 11,900 | Idemitsu Kosan Company, Ltd. | 1,019,508 | |||
| 199,000 | ITOCHU Corporation | 1,380,904 | |||
| 1,608 | Jupiter Telecommunications Company, Ltd. | 1,219,715 | |||
| 113,000 | Kirin Holdings Company, Ltd. | 1,576,527 | |||
| 707,000 | Kobe Steel, Ltd. | 1,316,726 | |||
| 13,100 | Kyocera Corporation | 983,471 | |||
| 32,900 | Lawson, Inc. | 1,448,126 | |||
| 168,000 | Mitsubishi Estate Company, Ltd. | 2,789,081 | |||
| 367,000 | Mitsubishi Materials Corporation | 1,142,609 | |||
| 932,500 | Mitsubishi UFJ Financial Group, Inc. | 5,757,998 | |||
| 142,000 | Mitsui O.S.K. Lines, Ltd. | 917,653 | |||
| 323,445 | Mitsui Sumitomo Insurance Group Holdings, Inc. | 8,461,572 | |||
| 455,000 | NEC Corporationc | 1,779,769 | |||
| 10,700 | Nintendo Company, Ltd. | 2,961,278 | |||
| 119 | Nippon Building Fund, Inc. | 1,017,208 | |||
| 122,000 | Nippon Electric Glass Company, Ltd. | 1,363,896 | |||
| 255,100 | Nissan Motor Company, Ltd. | 1,548,174 | |||
| 15,250 | Nitori Company, Ltd. | 1,079,935 | |||
| 1,920 | Rakuten, Inc. | 1,156,951 | |||
| 38,400 | Santen Pharmaceutical Comany, Ltd. | 1,169,820 | |||
| 332 | Seven Bank, Ltd. | 870,624 | |||
| 132,800 | Shin-Etsu Chemical Company, Ltd. | 6,159,119 | |||
| 160,500 | Softbank Corporation | 3,126,690 | |||
| 139,200 | Sony Corporation | 3,631,591 | |||
| 488 | Sony Financial Holdings, Inc. | 1,345,496 | |||
| 879,000 | Sumitomo Corporation | 8,934,765 | |||
| 107,400 | Sumitomo Electric Industries, Ltd. | 1,204,149 | |||
| 38,600 | Sumitomo Mitsui Financial Group, Inc. | 1,561,961 | |||
| 1,588,000 | Sumitomo Trust and Banking Company, Ltd. | 8,521,024 | |||
| 69,000 | Suzuki Motor Corporation | 1,547,175 | |||
| 556,000 | Taiheiyo Cement Corporation | 952,801 | |||
| 149,800 | Takeda Pharmaceutical Company, Ltd. | 5,824,214 | |||
| 63,700 | Tokai Rika Company, Ltd. | 1,013,357 | |||
| 108,600 | Tokio Marine Holdings, Inc. | 2,981,786 | |||
| 43,500 | Tokyo Electric Power Company, Inc. | 1,118,442 | |||
| 48,000 | Toyo Suisan Kaisha, Ltd. | 988,957 | |||
| 147,900 | Toyota Motor Corporation | 5,593,189 | |||
| 502,000 | Ube Industries, Ltd. | 1,400,901 | |||
| 200,000 | Yokohama Rubber Company, Ltd. | 989,486 | |||
Total Japan | 140,649,431 | ||||
| Luxembourg (0.2%) | |||||
| 77,664 | SES Global SA | 1,485,150 | |||
Total Luxembourg | 1,485,150 | ||||
| Netherlands (1.8%) | |||||
| 41,600 | Akzo Nobel NVb | 1,838,927 | |||
| 34,848 | Arcelor Mittal | 1,153,279 | |||
| 377,700 | ING Groep NV | 3,826,650 | |||
| 257,090 | Koninklijke (Royal) Ahold NV | 2,963,965 | |||
| 22,092 | Koninklijke Vopak NVc | 1,106,757 | |||
| 99,089 | Unilever NV | 2,396,680 | |||
Total Netherlands | 13,286,258 | ||||
| Norway (2.4%) | |||||
| 151,400 | DnB NOR ASAc | 1,156,834 | |||
| 1,153,100 | Norsk Hydro ASAc | 5,941,401 | |||
| 476,175 | StatoilHydro ASA | 9,405,889 | |||
| 78,600 | Tandberg ASA | 1,326,270 | |||
Total Norway | 17,830,394 | ||||
| Papua New Guinea (0.1%) | |||||
| 408,541 | Lihir Gold, Ltd.c | 956,434 | |||
Total Papua New Guinea | 956,434 | ||||
| Singapore (3.6%) | |||||
| 4,276,480 | Golden Agri-Resources, Ltd. | 1,114,590 | |||
| 727,001 | Golden Agri-Resources, Ltd. Rightsa,c | 99,139 | |||
| 1,037,900 | Keppel Corporation, Ltd. | 4,919,706 | |||
| 616,000 | Oversea-Chinese Banking Corporation | 2,828,139 | |||
| 681,400 | Singapore Airlines, Ltd. | 6,238,310 | |||
| 4,867,350 | Singapore Telecommunications, Ltd. | 10,041,850 | |||
| 107,000 | United Overseas Bank, Ltd. | 1,079,707 | |||
| 292,000 | Wilmar International, Ltd. | 1,007,142 | |||
Total Singapore | 27,328,583 | ||||
| South Korea (0.5%) | |||||
| 110,800 | KB Financial Group, Inc.c | 3,693,945 | |||
Total South Korea | 3,693,945 | ||||
The accompanying Notes to Financial Statements are an integral part of this schedule.
168
Table of Contents
Partner International Stock Portfolio
Schedule of Investments as of June 30, 2009
(unaudited)
| Shares | Common Stock (98.1%) | Valuea | ||||
| Spain (5.0%) | ||||||
| 478,327 | Banco Bilbao Vizcaya Argentaria SA | $ | 6,023,109 | |||
| 79,998 | Banco Santander Central Hispano SA | 967,069 | ||||
| 54,234 | Grifols SA | 962,090 | ||||
| 1,000,876 | Iberdrola SAb | 8,162,026 | ||||
| 40,017 | Indra Sistemas SA | 868,556 | ||||
| 900,648 | Telefonica SA | 20,454,237 | ||||
Total Spain | 37,437,087 | |||||
| Sweden (1.6%) | ||||||
| 95,592 | Elekta ABb | 1,404,448 | ||||
| 26,569 | Hennes & Mauritz ABb | 1,326,696 | ||||
| 131,112 | SSAB Svenskt Stal AB | 1,415,619 | ||||
| 774,296 | Telefonaktiebolaget LM Ericsson | 7,627,870 | ||||
Total Sweden | 11,774,633 | |||||
| Switzerland (11.1%) | ||||||
| 62,660 | ABB, Ltd.c | 989,395 | ||||
| 30,021 | Actelion, Ltd.c | 1,573,453 | ||||
| 193,200 | Adecco SA | 8,074,839 | ||||
| 11,588 | Baloise Holding AG | 861,683 | ||||
| 113,098 | Credit Suisse Group | 5,181,452 | ||||
| 2,541 | Galenica AG | 750,153 | ||||
| 15,676 | Geberit AG | 1,931,342 | ||||
| 13,179 | Givaudan SAb | 8,089,531 | ||||
| 67,300 | Holcim, Ltd.c | 3,831,492 | ||||
| 565,116 | Nestle SA | 21,336,900 | ||||
| 475,012 | Novartis AG | 19,335,514 | ||||
| 63,168 | Roche Holding AG | 8,606,381 | ||||
| 14,314 | Transocean, Ltd.c | 1,063,387 | ||||
| 8,892 | Zurich Financial Services AG | 1,571,618 | ||||
Total Switzerland | 83,197,140 | |||||
| Taiwan (0.6%) | ||||||
| 473,537 | Taiwan Semiconductor Manufacturing Company, Ltd. ADR | 4,455,983 | ||||
Total Taiwan | 4,455,983 | |||||
| Thailand (0.9%) | ||||||
| 550,400 | PTT pcld | 3,780,264 | ||||
| 429,800 | PTT pcl | 2,939,823 | ||||
Total Thailand | 6,720,087 | |||||
| United Kingdom (19.3%) | ||||||
| 128,817 | Aggreko plc | 1,101,006 | ||||
| 54,175 | Anglo American plc | 1,584,097 | ||||
| 138,200 | AstraZeneca plc | 6,093,874 | ||||
| 55,716 | Autonomy Corporation plcc | 1,320,234 | ||||
| 128,809 | Babcock International Group plc | 1,021,931 | ||||
| 507,682 | BAE Systems plc | 2,837,022 | ||||
| 264,552 | Barclays plc | 1,229,440 | ||||
| 350,711 | BG Group plc | 5,906,116 | ||||
| 136,470 | BHP Billiton plc | 3,075,986 | ||||
| 925,500 | BP Amoco plc | 7,313,399 | ||||
| 197,556 | British American Tobacco plc | 5,453,625 | ||||
| 855,900 | British Sky Broadcasting Group plc | 6,425,305 | ||||
| 120,009 | Capita Group plc | 1,415,052 | ||||
| 27,348 | Chemring Group plc | 977,873 | ||||
| 485,531 | Cobham plc | 1,382,941 | ||||
| 290,770 | Compass Group plc | 1,641,382 | ||||
| 230,240 | Experian plc | 1,726,686 | ||||
| 381,873 | GAME GROUP plc | 1,036,171 | ||||
| 809,041 | GlaxoSmithKline plc | 14,290,928 | ||||
| 476,003 | Group 4 Securicor plc | 1,639,540 | ||||
| 142,373 | Imperial Tobacco Group plc | 3,705,797 | ||||
| 60,026 | Intertek Group plc | 1,032,510 | ||||
| 2,966,729 | Kingfisher plc | 8,703,968 | ||||
| 279,658 | Marks and Spencer Group plc | 1,410,253 | ||||
| 343,709 | National Grid plc | 3,101,637 | ||||
| 841,500 | Pearson plc | 8,474,534 | ||||
| 81,342 | Reckitt Benckiser Group plc | 3,714,899 | ||||
| 51,746 | Rio Tinto plc | 1,792,125 | ||||
| 61,462 | Rotork plc | 838,464 | ||||
| 52,707 | Royal Dutch Shell plc | 1,326,980 | ||||
| 515,512 | RSA Insurance Group plc | 1,023,645 | ||||
| 38,787 | SABMiller plc | 791,987 | ||||
| 345,316 | Sage Group plc | 1,014,643 | ||||
| 218,160 | Standard Chartered plc | 4,102,255 | ||||
| 774,604 | Tesco plc | 4,523,749 | ||||
| 434,436 | Unilever plc | 10,210,605 | ||||
| 133,492 | United Utilities Group plc | 1,094,687 | ||||
| 5,092,787 | Vodafone Group plc | 9,904,876 | ||||
| 446,681 | William Morrison Supermarkets plc | 1,744,687 | ||||
| 1,038,700 | WPP plc | 6,907,577 | ||||
| 262,100 | Xstrata plc | 2,848,688 | ||||
Total United Kingdom | 145,741,174 | |||||
| United States (0.2%) | ||||||
| 36,927 | iShares MSCI EAFE Index Fund | 1,691,626 | ||||
Total United States | 1,691,626 | |||||
Total Common Stock (cost $835,095,383) | 736,340,607 | |||||
Collateral Held for Securities Loaned (4.6%) | ||||||
| 34,613,876 | Thrivent Financial Securities Lending Trust | 34,613,876 | ||||
Total Collateral Held for Securities Loaned (cost $34,613,876) | 34,613,876 | |||||
| Shares or Principal Amount | Short-Term Investments (1.5%)e | |||||
Enterprise Funding Corporation | ||||||
| 8,305,000 | 0.100%, 07/01/09 | 8,305,000 | ||||
| 3,286,125 | Thrivent Money Market Portfolio | 3,286,125 | ||||
Total Short-Term Investments (at amortized cost) | 11,591,125 | |||||
Total Investments (cost $881,300,384) 104.2% | $ | 782,545,608 | ||||
Other Assets and Liabilities, Net (4.2%) | (31,849,874 | ) | ||||
Total Net Assets 100.0% | $ | 750,695,734 | ||||
| a | Security is fair valued as discussed in item 2(A) of the Notes to Financial Statements. |
The accompanying Notes to Financial Statements are an integral part of this schedule.
169
Table of Contents
Partner International Stock Portfolio
Schedule of Investments as of June 30, 2009
(unaudited)
| b | All or a portion of the security is on loan as discussed in item 2(M) of the Notes to Financial Statements. |
| c | Non-income producing security. |
| d | Denotes investments purchased on a when-issued or delayed delivery basis. |
| e | The interest rate shown reflects the yield, coupon rate or, for securities purchased at a discount, the discount rate at the date of purchase. |
Definitions:
| ADR | - | American Depositary Receipt, which are certificates for an underlying foreign security's shares held by an issuing U.S. depository bank. |
Unrealized Appreciation (Depreciation)
Gross unrealized appreciation and depreciation of investments, based on cost for federal income tax purposes, were as follows:
Gross unrealized appreciation | $ | 49,469,007 | ||
Gross unrealized depreciation | (148,223,783 | ) | ||
Net unrealized appreciation (depreciation) | $ | (98,754,776 | ) | |
Cost for federal income tax purposes | $ | 881,300,384 | ||
Fair Valuation Measurements
The following table is a summary of the inputs used, as of June 30, 2009, in valuing Partner International Stock Portfolio's assets carried at fair value as discussed in the Notes to Financial Statements.
Investments in Securities | Total | Level 1 | Level 2 | Level 3 | ||||||||
Common Stock | ||||||||||||
Consumer Discretionary | 88,962,789 | 1,093,621 | 87,869,168 | — | ||||||||
Consumer Staples | 83,016,385 | 1,772,405 | 81,144,841 | 99,139 | ||||||||
Energy | 56,711,191 | 19,888,241 | 36,822,950 | — | ||||||||
Financials | 121,783,388 | 14,184,227 | 107,599,161 | — | ||||||||
Health Care | 77,371,496 | — | 77,371,496 | — | ||||||||
Industrials | 118,734,567 | 2,856,779 | 115,877,788 | — | ||||||||
Information Technology | 41,809,755 | 4,455,983 | 37,353,772 | — | ||||||||
Materials | 88,123,980 | 15,504,073 | 72,619,907 | — | ||||||||
Telecommunications Services | 45,273,930 | 24,257,005 | 21,016,925 | — | ||||||||
Utilities | 14,553,126 | 796,063 | 13,757,063 | — | ||||||||
Collateral Held for Securities Loaned | 34,613,876 | 34,613,876 | — | — | ||||||||
Short-Term Investments | 11,591,125 | 3,286,125 | 8,305,000 | — | ||||||||
Total | $ | 782,545,608 | $ | 122,708,398 | $ | 659,738,071 | $ | 99,139 | ||||
Other Financial Instruments* | $ | 9 | $ | 9 | $ | — | $ | — | ||||
| * | Other Financial Instruments include Futures, Forwards, Written Options and Swap agreements. |
The following table is a reconciliation of assets in which significant unobservable inputs (Level 3) were used in determining fair value for the Partner International Stock Portfolio as discussed in item 2(A) of the Notes to Financial Statements.
Investments in Securities | Value December 31, 2008 | Accrued Discounts and/or Premiums | Realized Gain/(Loss) | Change in Unrealized Gain/(Loss) | Net Purchases/(Sales) | Transfers in and/or (Out of) Level 3 | Value June 30, 2009 | |||||||||||||||
Common Stock | ||||||||||||||||||||||
Consumer Staples | — | — | — | — | 99,139 | — | 99,139 | |||||||||||||||
Transportation | 3,722,232 | — | (15,033 | ) | (762,334 | ) | (6,818 | ) | (2,938,047 | ) | — | |||||||||||
Total | $ | 3,722,232 | $ | — | ($15,033 | ) | ($762,334 | ) | $ | 92,321 | ($2,938,047 | ) | $ | 99,139 | ||||||||
The accompanying Notes to Financial Statements are an integral part of this schedule.
170
Table of Contents
Partner International Stock Portfolio
Schedule of Investments as of June 30, 2009
(unaudited)
Foreign Currency | Contracts to Deliver/Receive | Settlement Date | Value on Settlement Date | Value | Unrealized Gain/(Loss) | ||||||||
Sales | |||||||||||||
Canadian Dollar | 17,739 | 7/2/2009 - 7/6/2009 | $ | 15,260 | $ | 15,251 | $ | 9 | |||||
Total Foreign Currency | |||||||||||||
Forward Contracts Sales | $ | 15,260 | $ | 15,251 | $ | 9 | |||||||
Net Unrealized Gain/(Loss) on Foreign | $ | 9 | |||||||||||
The following table summarizes the fair value and Statement of Assets and Liabilities location, as of June 30, 2009, for the Partner International Stock Portfolio’s investments in financial derivative instruments by primary risk exposure as discussed under item (2) Significant Accounting Policies of the Notes to Financial Statements.
Derivatives by Risk Category | Statement of Assets and Liabilities Location | Fair Value | |||
Asset Derivatives | |||||
Foreign Exchange Contracts | |||||
Forward Contract | Receivable for forward contracts, Net Assets - Net unrealized appreciation/(depreciation) on Foreign currency forward contracts | 9 | |||
Total Foreign Exchange Contracts | 9 | ||||
Total Asset Derivatives | $ | 9 | |||
The following table summarizes the change in net unrealized appreciation/(depreciation) and Statement of Operations location, for the period ended June 30, 2009, for the Partner International Stock Portfolio’s investments in financial derivative instruments by primary risk exposure.
Derivatives by Risk Category | Statement of Operations Location | Change in Unrealized Appreciation/(Depreciation) recognized in Income | |||
| Foreign Exchange Contracts | |||||
Forward Contract | Change in net unrealized appreciation/(depreciation) on Foreign currency forward contracts | 9 | |||
Total Foreign Exchange Contracts | 9 | ||||
Total | $ | 9 | |||
Investment in Affiliates
Affiliated issuers, as defined under the Investment Company Act of 1940, include those in which the Portfolio’s holdings of an issuer represent 5% or more of the outstanding voting securities of an issuer, or any affiliated mutual fund.
A summary of transactions for the fiscal year to date, in Partner International Stock Portfolio , is as follows:
Portfolio | Value December 31, 2008 | Gross Purchases | Gross Sales | Shares Held at June 30, 2009 | Value June 30, 2009 | Income Earned January 1, 2009 - June 30, 2009 | |||||||||||
Money Market | $ | 21,861,973 | $ | 74,413,154 | $ | 92,989,002 | 3,286,125 | $ | 3,286,125 | $ | 77,614 | ||||||
Thrivent Financial Securities Lending Trust | 13,420,165 | 213,915,115 | 192,721,404 | 34,613,876 | 34,613,876 | 404,210 | |||||||||||
Total Value and Income Earned | 35,282,138 | 37,900,001 | 481,824 | ||||||||||||||
The accompanying Notes to Financial Statements are an integral part of this schedule.
171
Table of Contents
Partner Socially Responsible Stock Portfolio
Schedule of Investments as of June 30, 2009
(unaudited)
| Shares | Common Stock (99.7%) | Value | ||||
| Consumer Discretionary (11.2%) | ||||||
| 1,700 | Kohl’s Corporationa | $ | 72,675 | |||
| 1,700 | Lowe’s Companies, Inc. | 32,997 | ||||
| 2,300 | Omnicom Group, Inc. | 72,634 | ||||
| 6,400 | Staples, Inc. | 129,088 | ||||
| 1,900 | Target Corporation | 74,993 | ||||
Total Consumer Discretionary | 382,387 | |||||
| Consumer Staples (9.8%) | ||||||
| 700 | Costco Wholesale Corporation | 31,990 | ||||
| 4,850 | CVS Caremark Corporation | 154,570 | ||||
| 1,580 | Procter & Gamble Company | 80,738 | ||||
| 3,100 | SYSCO Corporation | 69,688 | ||||
Total Consumer Staples | 336,986 | |||||
| Energy (5.1%) | ||||||
| 1,150 | EOG Resources, Inc. | 78,108 | ||||
| 1,450 | FMC Technologies, Inc.a | 54,491 | ||||
| 1,600 | Smith International, Inc. | 41,200 | ||||
Total Energy | 173,799 | |||||
| Financials (13.4%) | ||||||
| 2,800 | AFLAC, Inc. | 87,052 | ||||
| 2,600 | Bank of New York Mellon Corporation | 76,206 | ||||
| 2,900 | Charles Schwab Corporation | 50,866 | ||||
| 450 | Goldman Sachs Group, Inc. | 66,348 | ||||
| 3,900 | SEI Investments Company | 70,356 | ||||
| 2,000 | SunTrust Banks, Inc. | 32,900 | ||||
| 700 | T. Rowe Price Group, Inc. | 29,169 | ||||
| 1,300 | Wells Fargo & Company | 31,538 | ||||
| 1,300 | Zions Bancorporation | 15,028 | ||||
Total Financials | 459,463 | |||||
| Health Care (18.8%) | ||||||
| 2,100 | Dentsply International, Inc. | 64,092 | ||||
| 1,100 | Genzyme Corporationa | 61,237 | ||||
| 200 | Intuitive Surgical, Inc.a | 32,732 | ||||
| 1,150 | Laboratory Corporation of America Holdingsa | 77,958 | ||||
| 2,000 | Medtronic, Inc. | 69,780 | ||||
| 2,600 | Novartis AG ADR | 106,054 | ||||
| 1,800 | St. Jude Medical, Inc.a | 73,980 | ||||
| 2,800 | Stryker Corporation | 111,272 | ||||
| 1,300 | Varian Medical Systems, Inc.a | 45,682 | ||||
Total Health Care | 642,787 | |||||
| Industrials (7.0%) | ||||||
| 950 | C.H. Robinson Worldwide, Inc. | 49,543 | ||||
| 1,100 | Danaher Corporation | 67,914 | ||||
| 600 | Deere & Company | 23,970 | ||||
| 900 | Emerson Electric Company | 29,160 | ||||
| 550 | Fastenal Company | 18,243 | ||||
| 1,000 | United Parcel Service, Inc. | 49,990 | ||||
Total Industrials | 238,820 | |||||
| Information Technology (27.6%) | ||||||
| 1,100 | Apple, Inc.a | 156,673 | ||||
| 5,900 | Cisco Systems, Inc.a | 109,976 | ||||
| 310 | Google, Inc.a | 130,693 | ||||
| 4,050 | Hewlett-Packard Company | 156,532 | ||||
| 5,550 | Intel Corporation | 91,853 | ||||
| 1,000 | Linear Technology Corporation | 23,350 | ||||
| 4,700 | Microsoft Corporation | 111,719 | ||||
| 3,500 | Nokia Oyj ADR | 51,030 | ||||
| 2,450 | QUALCOMM, Inc. | 110,740 | ||||
Total Information Technology | 942,566 | |||||
| Materials (4.5%) | ||||||
| 1,200 | Air Products and Chemicals, Inc. | 77,508 | ||||
| 2,000 | Ecolab, Inc. | 77,980 | ||||
Total Materials | 155,488 | |||||
| Utilities (2.3%) | ||||||
| 2,500 | Questar Corporation | 77,775 | ||||
Total Utilities | 77,775 | |||||
Total Common Stock (cost $4,397,764) | 3,410,071 | |||||
Short-Term Investments (0.4%) | ||||||
| 12,501 | Thrivent Money Market Portfolio | 12,501 | ||||
Total Short-Term Investments (at amortized cost) | 12,501 | |||||
Total Investments (cost $4,410,265) 100.1% | $ | 3,422,572 | ||||
Other Assets and Liabilities, Net (0.1%) | (2,756 | ) | ||||
Total Net Assets 100.0% | $ | 3,419,816 | ||||
| a | Non-income producing security. |
Definitions:
| ADR | - | American Depositary Receipt, which are certificates for an underlying foreign security's shares held by an issuing U.S. depository bank. |
Unrealized Appreciation (Depreciation)
Gross unrealized appreciation and depreciation of investments, based on cost for federal income tax purposes, were as follows:
Gross unrealized appreciation | $ | 45,332 | ||
Gross unrealized depreciation | (1,033,025 | ) | ||
Net unrealized appreciation (depreciation) | $ | (987,693 | ) | |
Cost for federal income tax purposes | $ | 4,410,265 | ||
The accompanying Notes to Financial Statements are an integral part of this schedule.
172
Table of Contents
Partner Socially Responsible Stock Portfolio
Schedule of Investments as of June 30, 2009
(unaudited)
Fair Valuation Measurements
The following table is a summary of the inputs used, as of June 30, 2009, in valuing Partner Socially Responsible Stock Portfolio's assets carried at fair value as discussed in the Notes to Financial Statements.
Investments in Securities | Total | Level 1 | Level 2 | Level 3 | ||||||||
Common Stock | ||||||||||||
Consumer Discretionary | 382,387 | 382,387 | — | — | ||||||||
Consumer Staples | 336,986 | 336,986 | — | — | ||||||||
Energy | 173,799 | 173,799 | — | — | ||||||||
Financials | 459,463 | 459,463 | — | — | ||||||||
Health Care | 642,787 | 642,787 | — | — | ||||||||
Industrials | 238,820 | 238,820 | — | — | ||||||||
Information Technology | 942,566 | 942,566 | — | — | ||||||||
Materials | 155,488 | 155,488 | — | — | ||||||||
Utilities | 77,775 | 77,775 | — | — | ||||||||
Short-Term Investments | 12,501 | 12,501 | — | — | ||||||||
Total | $ | 3,422,572 | $ | 3,422,572 | $ | — | $ | — | ||||
Investment in Affiliates
Affiliated issuers, as defined under the Investment Company Act of 1940, include those in which the Portfolio's holdings of an issuer represent 5% or more of the outstanding voting securities of an issuer, or any affiliated mutual fund.
A summary of transactions for the fiscal year to date, in Partner Socially Responsible Stock Portfolio , is as follows:
Portfolio | Value December 31, 2008 | Gross Purchases | Gross Sales | Shares Held at June 30, 2009 | Value June 30, 2009 | Income Earned January 1, 2009 - June 30, 2009 | |||||||||||
Money Market | $ | 69,852 | $ | 347,293 | $ | 404,644 | 12,501 | $ | 12,501 | $ | 233 | ||||||
Total Value and Income Earned | 69,852 | 12,501 | 233 | ||||||||||||||
The accompanying Notes to Financial Statements are an integral part of this schedule.
173
Table of Contents
Partner All Cap Growth Portfolio
Schedule of Investments as of June 30, 2009
(unaudited)
| Shares | Common Stock (98.4%) | Value | |||
| Consumer Discretionary (12.4%) | |||||
| 1,630 | Amazon.com, Inc.a | $ | 136,366 | ||
| 3,300 | Coach, Inc. | 88,704 | |||
| 2,225 | GameStop Corporationa | 48,972 | |||
| 550 | Guess ?, Inc. | 14,179 | |||
| 1,975 | LKQ Corporationa | 32,489 | |||
| 1,345 | NIKE, Inc. | 69,644 | |||
| 400 | Priceline.com, Inc.a | 44,620 | |||
| 2,055 | Starbucks Corporationa | 28,544 | |||
| 600 | WMS Industries, Inc.a | 18,906 | |||
Total Consumer Discretionary | 482,424 | ||||
| Consumer Staples (1.4%) | |||||
| 950 | Avon Products, Inc. | 24,491 | |||
| 650 | Coca-Cola Company | 31,193 | |||
Total Consumer Staples | 55,684 | ||||
| Energy (15.2%) | |||||
| 450 | Apache Corporation | 32,468 | |||
| 1,575 | Cameron International Corporationa | 44,572 | |||
| 675 | Devon Energy Corporation | 36,788 | |||
| 1,900 | ENSCO International, Inc. | 66,253 | |||
| 2,150 | Halliburton Company | 44,505 | |||
| 2,475 | National Oilwell Varco, Inc.a | 80,834 | |||
| 1,500 | Noble Corporation | 45,375 | |||
| 825 | Noble Energy, Inc. | 48,650 | |||
| 1,450 | Pride International, Inc.a | 36,337 | |||
| 850 | Schlumberger, Ltd. | 45,993 | |||
| 1,300 | Suncor Energy, Inc. | 39,442 | |||
| 900 | Transocean, Ltd.a | 66,861 | |||
Total Energy | 588,078 | ||||
| Financials (7.0%) | |||||
| 365 | BlackRock, Inc. | 64,028 | |||
| 200 | CME Group, Inc. | 62,222 | |||
| 190 | Goldman Sachs Group, Inc. | 28,014 | |||
| 385 | IntercontinentalExchange, Inc.a | 43,982 | |||
| 1,725 | T. Rowe Price Group, Inc. | 71,881 | |||
Total Financials | 270,127 | ||||
| Health Care (8.0%) | |||||
| 550 | Allergan, Inc. | 26,169 | |||
| 395 | C.R. Bard, Inc. | 29,408 | |||
| 660 | Celgene Corporationa | 31,574 | |||
| 955 | Dentsply International, Inc. | 29,147 | |||
| 625 | Gen-Probe, Inc.a | 26,862 | |||
| 145 | Intuitive Surgical, Inc.a | 23,731 | |||
| 1,800 | PerkinElmer, Inc. | 31,320 | |||
| 1,400 | Stryker Corporation | 55,636 | |||
| 750 | Varian Medical Systems, Inc.a | 26,355 | |||
| 575 | Waters Corporationa | 29,595 | |||
Total Health Care | 309,797 | ||||
| Industrials (13.8%) | |||||
| 525 | AGCO Corporationa | 15,262 | |||
| 600 | AMETEK, Inc. | 20,748 | |||
| 1,700 | Bucyrus International, Inc. | 48,552 | |||
| 1,150 | Emerson Electric Company | 37,260 | |||
| 830 | Expeditors International of Washington, Inc. | 27,672 | |||
| 265 | First Solar, Inc.a | 42,962 | |||
| 885 | Fluor Corporation | 45,391 | |||
| 525 | FTI Consulting, Inc.a | 26,628 | |||
| 700 | General Dynamics Corporation | 38,773 | |||
| 1,450 | Honeywell International, Inc. | 45,530 | |||
| 1,525 | Jacobs Engineering Group, Inc.a | 64,187 | |||
| 575 | Parker-Hannifin Corporation | 24,702 | |||
| 325 | SunPower Corporationa | 8,658 | |||
| 1,250 | United Technologies Corporation | 64,950 | |||
| 775 | Wabtec Corporation | 24,932 | |||
Total Industrials | 536,207 | ||||
| Information Technology (35.9%) | |||||
| 2,675 | Altera Corporation | 43,549 | |||
| 675 | Amphenol Corporation | 21,357 | |||
| 1,000 | ANSYS, Inc.a | 31,160 | |||
| 1,275 | Apple, Inc.a | 181,598 | |||
| 327 | Baidu.com, Inc. ADRa | 98,456 | |||
| 1,800 | Broadcom Corporationa | 44,622 | |||
| 1,125 | Check Point Software Technologies, Ltd.a | 26,404 | |||
| 3,025 | Cisco Systems, Inc.a | 56,386 | |||
| 2,250 | Dell, Inc.a | 30,893 | |||
| 750 | Dolby Laboratories, Inc.a | 27,960 | |||
| 3,260 | eBay, Inc.a | 55,844 | |||
| 400 | FactSet Research Systems, Inc. | 19,948 | |||
| 1,300 | FLIR Systems, Inc.a | 29,328 | |||
| 407 | Google, Inc.a | 171,587 | |||
| 1,625 | Juniper Networks, Inc.a | 38,350 | |||
| 1,150 | Linear Technology Corporation | 26,852 | |||
| 3,575 | Marvell Technology Group, Ltd.a | 41,613 | |||
| 1,275 | MEMC Electronic Materials, Inc.a | 22,708 | |||
| 1,725 | NETAPP, Inc.a | 34,017 | |||
| 2,000 | Nintendo Company, Ltd. ADR | 68,940 | |||
| 2,650 | Nokia Oyj ADR | 38,637 | |||
| 3,900 | Nuance Communications, Inc.a | 47,151 | |||
| 2,250 | Oracle Corporation | 48,195 | |||
| 2,450 | Parametric Technology Corporationa | 28,641 | |||
| 875 | QUALCOMM, Inc. | 39,550 | |||
| 1,240 | Research in Motion, Ltd.a | 88,102 | |||
| 1,475 | Trimble Navigation, Ltd.a | 28,954 | |||
Total Information Technology | 1,390,802 | ||||
| Materials (3.0%) | |||||
| 1,025 | Agrium, Inc. | 40,887 | |||
| 1,025 | Barrick Gold Corporation | 34,389 | |||
| 925 | Nucor Corporation | 41,098 | |||
Total Materials | 116,374 | ||||
| Telecommunications Services (1.7%) | |||||
| 1,675 | America Movil SA de CV ADR | 64,856 | |||
Total Telecommunications Services | 64,856 | ||||
Total Common Stock (cost $4,594,608) | 3,814,349 | ||||
The accompanying Notes to Financial Statements are an integral part of this schedule.
174
Table of Contents
Partner All Cap Growth Portfolio
Schedule of Investments as of June 30, 2009
(unaudited)
| Shares | Short-Term Investments (2.6%) | Value | ||||
| 100,136 | Thrivent Money Market Portfolio | $ | 100,136 | |||
Total Short-Term Investments (at amortized cost) | 100,136 | |||||
Total Investments (cost $4,694,744) 101.0% | $ | 3,914,485 | ||||
Other Assets and Liabilities, Net (1.0%) | (39,353 | ) | ||||
Total Net Assets 100.0% | $ | 3,875,132 | ||||
| a | Non-income producing security. |
Definitions:
| ADR | - | American Depositary Receipt, which are certificates for an underlying foreign security's shares held by an issuing U.S. depository bank. |
Unrealized Appreciation (Depreciation)
Gross unrealized appreciation and depreciation of investments, based on cost for federal income tax purposes, were as follows:
Gross unrealized appreciation | $ | 133,060 | ||
Gross unrealized depreciation | (913,319 | ) | ||
Net unrealized appreciation (depreciation) | $ | (780,259 | ) | |
Cost for federal income tax purposes | $ | 4,694,744 | ||
Fair Valuation Measurements
The following table is a summary of the inputs used, as of June 30, 2009, in valuing Partner All Cap Growth Portfolio's assets carried at fair value as discussed in the Notes to Financial Statements.
Investments in Securities | Total | Level 1 | Level 2 | Level 3 | ||||||||
Common Stock | ||||||||||||
Consumer Discretionary | 482,424 | 482,424 | — | — | ||||||||
Consumer Staples | 55,684 | 55,684 | — | — | ||||||||
Energy | 588,078 | 588,078 | — | — | ||||||||
Financials | 270,127 | 270,127 | — | — | ||||||||
Health Care | 309,797 | 309,797 | — | — | ||||||||
Industrials | 536,207 | 536,207 | — | — | ||||||||
Information Technology | 1,390,802 | 1,390,802 | — | — | ||||||||
Materials | 116,374 | 116,374 | — | — | ||||||||
Telecommunications Services | 64,856 | 64,856 | — | — | ||||||||
Short-Term Investments | 100,136 | 100,136 | — | — | ||||||||
Total | $ | 3,914,485 | $ | 3,914,485 | $ | — | $ | — | ||||
Investment in Affiliates
Affiliated issuers, as defined under the Investment Company Act of 1940, include those in which the Portfolio's holdings of an issuer represent 5% or more of the outstanding voting securities of an issuer, or any affiliated mutual fund.
A summary of transactions for the fiscal year to date, in Partner All Cap Growth Portfolio, is as follows:
Portfolio | Value December 31, 2008 | Gross Purchases | Gross Sales | Shares Held at June 30, 2009 | Value June 30, 2009 | Income Earned January 1, 2009 - June 30, 2009 | |||||||||||
Money Market | $ | 77,149 | $ | 1,270,002 | $ | 1,247,015 | 100,136 | $ | 100,136 | $ | 276 | ||||||
Total Value and Income Earned | 77,149 | 100,136 | 276 | ||||||||||||||
The accompanying Notes to Financial Statements are an integral part of this schedule.
175
Table of Contents
Partner All Cap Value Portfolio
Schedule of Investments as of June 30, 2009
(unaudited)
| Shares | Common Stock (94.2%) | Value | ||||
| Consumer Discretionary (10.5%) | ||||||
| 940 | Bed Bath & Beyond, Inc.a | $ | 28,905 | |||
| 2,810 | Cablevision Systems New York Group | 54,542 | ||||
| 3,870 | Cinemark Holdings, Inc. | 43,808 | ||||
| 3,371 | Goodyear Tire & Rubber Companya | 37,957 | ||||
| 4,760 | News Corporation | 43,364 | ||||
| 1,710 | Scientific Games Corporationa | 26,967 | ||||
| 2,676 | Time Warner Cable, Inc. | 84,749 | ||||
Total Consumer Discretionary | 320,292 | |||||
| Consumer Staples (11.0%) | ||||||
| 1,130 | Campbell Soup Company | 33,245 | ||||
| 3,030 | Chiquita Brands International, Inc.a | 31,088 | ||||
| 5,310 | Kroger Company | 117,085 | ||||
| 2,050 | Molson Coors Brewing Company | 86,776 | ||||
| 2,280 | Walgreen Company | 67,032 | ||||
Total Consumer Staples | 335,226 | |||||
| Energy (14.2%) | ||||||
| 780 | Apache Corporation | 56,277 | ||||
| 3,269 | Capital Product Partners, LP | 29,486 | ||||
| 1,770 | Chevron Corporation | 117,263 | ||||
| 1,070 | Devon Energy Corporation | 58,315 | ||||
| 1,090 | Exxon Mobil Corporation | 76,202 | ||||
| 970 | Marathon Oil Corporation | 29,226 | ||||
| 1,510 | Petroleo Brasileiro SA ADR | 50,374 | ||||
| 880 | Valero Energy Corporation | 14,863 | ||||
Total Energy | 432,006 | |||||
| Financials (19.0%) | ||||||
| 4,730 | Assurant, Inc. | 113,946 | ||||
| 2,550 | Bank of America Corporation | 33,660 | ||||
| 1,560 | Everest Re Group, Ltd. | 111,649 | ||||
| 240 | Goldman Sachs Group, Inc. | 35,386 | ||||
| 1,040 | J.P. Morgan Chase & Company | 35,474 | ||||
| 2,010 | MetLife, Inc. | 60,320 | ||||
| 980 | Morgan Stanley | 27,940 | ||||
| 4,040 | National Financial Partners | 29,573 | ||||
| 350 | Prudential Financial, Inc. | 13,027 | ||||
| 3,270 | SLM Corporationa | 33,583 | ||||
| 597 | Transatlantic Holdings, Inc. | 25,868 | ||||
| 2,500 | Wells Fargo & Company | 60,650 | ||||
Total Financials | 581,076 | |||||
| Health Care (12.4%) | ||||||
| 1,600 | Aetna, Inc. | 40,080 | ||||
| 2,230 | Covidien, Ltd. | 83,491 | ||||
| 4,725 | Merck & Company, Inc. | 132,111 | ||||
| 2,950 | Pfizer, Inc. | 44,250 | ||||
| 1,750 | Wyeth | 79,433 | ||||
Total Health Care | 379,365 | |||||
| Industrials (9.4%) | ||||||
| 3,410 | Aircastle, Ltd. | 25,063 | ||||
| 10,035 | Genesis Lease, Ltd. | 43,251 | ||||
| 1,830 | Navistar International Corporationa | 79,788 | ||||
| 1,050 | Owens Corning, Inc.a | 13,419 | ||||
| 4,770 | Tyco International, Ltd. | 123,925 | ||||
Total Industrials | 285,446 | |||||
| Information Technology (3.5%) | ||||||
| 230 | Apple, Inc.a | 32,759 | ||||
| 70 | Google, Inc.a | 29,511 | ||||
| 4,460 | Motorola, Inc. | 29,570 | ||||
| 330 | QUALCOMM, Inc. | 14,916 | ||||
Total Information Technology | 106,756 | |||||
| Materials (6.5%) | ||||||
| 797 | AK Steel Holding Corporation | 15,294 | ||||
| 1,330 | Celanese Corporation | 31,588 | ||||
| 2,710 | Lubrizol Corporation | 128,210 | ||||
| 240 | Potash Corporation of Saskatchewan, Inc. | 22,332 | ||||
Total Materials | 197,424 | |||||
| Telecommunications Services (1.8%) | ||||||
| 2,250 | AT&T, Inc. | 55,890 | ||||
Total Telecommunications Services | 55,890 | |||||
| Utilities (5.9%) | ||||||
| 590 | CMS Energy Corporation | 7,127 | ||||
| 1,470 | Exelon Corporation | 75,279 | ||||
| 2,530 | PG&E Corporation | 97,253 | ||||
Total Utilities | 179,659 | |||||
Total Common Stock (cost $3,142,256) | 2,873,140 | |||||
Short-Term Investments (7.7%) | ||||||
| 236,251 | Thrivent Money Market Portfolio | 236,251 | ||||
Total Short-Term Investments (at amortized cost) | 236,251 | |||||
Total Investments (cost $3,378,507) 101.9% | $ | 3,109,391 | ||||
Other Assets and Liabilities, Net (1.9%) | (58,760 | ) | ||||
Total Net Assets 100.0% | $ | 3,050,631 | ||||
| a | Non-income producing security. |
Definitions:
| ADR | - | American Depositary Receipt, which are certificates for an underlying foreign security's shares held by an issuing U.S. depository bank. |
The accompanying Notes to Financial Statements are an integral part of this schedule.
176
Table of Contents
Partner All Cap Value Portfolio
Schedule of Investments as of June 30, 2009
(unaudited)
Unrealized Appreciation (Depreciation)
Gross unrealized appreciation and depreciation of investments, based on cost for federal income tax purposes, were as follows:
Gross unrealized appreciation | $ | 157,043 | ||
Gross unrealized depreciation | (426,159 | ) | ||
Net unrealized appreciation (depreciation) | $ | (269,116 | ) | |
Cost for federal income tax purposes | $ | 3,378,507 | ||
Fair Valuation Measurements
The following table is a summary of the inputs used, as of June 30, 2009, in valuing Partner All Cap Value Portfolio's assets carried at fair value as discussed in the Notes to Financial Statements.
Investments in Securities | Total | Level 1 | Level 2 | Level 3 | ||||||||
Common Stock | ||||||||||||
Consumer Discretionary | 320,292 | 320,292 | — | — | ||||||||
Consumer Staples | 335,226 | 335,226 | — | — | ||||||||
Energy | 432,006 | 432,006 | — | — | ||||||||
Financials | 581,076 | 581,076 | — | — | ||||||||
Health Care | 379,365 | 379,365 | — | — | ||||||||
Industrials | 285,446 | 285,446 | — | — | ||||||||
Information Technology | 106,756 | 106,756 | — | — | ||||||||
Materials | 197,424 | 197,424 | — | — | ||||||||
Telecommunications Services | 55,890 | 55,890 | — | — | ||||||||
Utilities | 179,659 | 179,659 | — | — | ||||||||
Short-Term Investments | 236,251 | 236,251 | — | — | ||||||||
Total | $ | 3,109,391 | $ | 3,109,391 | $ | — | $ | — | ||||
The following table summarizes the net realized gains/(losses) and Statement of Operations location, for the period ended June 30, 2009, for Partner All Cap Value Portfolio's investments in financial derivative instruments by primary risk exposure.
Derivatives by Risk Category | Statement of Operations Location | Realized Gains/(Losses) recognized in Income | |||
Equity Contracts | |||||
Option Written | Net realized gains/(losses) on Written option contracts | 577 | |||
Total Equity Contracts | 577 | ||||
Total | $ | 577 | |||
Investment in Affiliates
Affiliated issuers, as defined under the Investment Company Act of 1940, include those in which the Portfolio's holdings of an issuer represent 5% or more of the outstanding voting securities of an issuer, or any affiliated mutual fund.
A summary of transactions for the fiscal year to date, in Partner All Cap Value Portfolio, is as follows:
Portfolio | Value December 31, 2008 | Gross Purchases | Gross Sales | Shares Held at June 30, 2009 | Value June 30, 2009 | Income Earned January 1, 2009 - June 30, 2009 | |||||||||||
Money Market | $ | 201,541 | $ | 1,454,271 | $ | 1,419,561 | 236,251 | $ | 236,251 | $ | 471 | ||||||
Total Value and Income Earned | 201,541 | 236,251 | 471 | ||||||||||||||
The accompanying Notes to Financial Statements are an integral part of this schedule.
177
Table of Contents
Schedule of Investments as of June 30, 2009
(unaudited)
| Shares | Common Stock (99.1%) | Value | |||
| Consumer Discretionary (8.7%) | |||||
| 28,840 | Coach, Inc. | $ | 775,219 | ||
| 39,920 | Comcast Corporation | 578,441 | |||
| 17,040 | Hasbro, Inc. | 413,049 | |||
| 17,770 | International Game Technology | 282,543 | |||
| 35,760 | Lowe’s Companies, Inc. | 694,102 | |||
| 9,700 | Polo Ralph Lauren Corporation | 519,338 | |||
| 20,810 | Staples, Inc. | 419,738 | |||
| 9,390 | Target Corporation | 370,623 | |||
| 27,900 | Tiffany & Company | 707,544 | |||
Total Consumer Discretionary | 4,760,597 | ||||
| Consumer Staples (12.0%) | |||||
| 12,700 | Alberto-Culver Company | 322,961 | |||
| 16,210 | Archer-Daniels-Midland Company | 433,942 | |||
| 17,410 | Avon Products, Inc. | 448,830 | |||
| 7,300 | Bunge, Ltd.a | 439,825 | |||
| 5,860 | Clorox Company | 327,164 | |||
| 13,460 | Coca-Cola Enterprises, Inc. | 224,109 | |||
| 22,210 | ConAgra Foods, Inc. | 423,322 | |||
| 11,870 | CVS Caremark Corporation | 378,297 | |||
| 15,230 | Dr. Pepper Snapple Group, Inc.b | 322,724 | |||
| 28,080 | Kraft Foods, Inc. | 711,547 | |||
| 13,690 | Molson Coors Brewing Company | 579,498 | |||
| 52,310 | Sara Lee Corporation | 510,545 | |||
| 15,280 | Tyson Foods, Inc. | 192,681 | |||
| 6,640 | Walgreen Company | 195,216 | |||
| 21,050 | Wal-Mart Stores, Inc. | 1,019,662 | |||
Total Consumer Staples | 6,530,323 | ||||
| Energy (12.5%) | |||||
| 6,350 | Anadarko Petroleum Corporation | 288,227 | |||
| 5,470 | Chevron Corporation | 362,387 | |||
| 19,310 | EXCO Resources, Inc.b | 249,485 | |||
| 23,700 | Exxon Mobil Corporation | 1,656,867 | |||
| 7,350 | Goodrich Petroleum Corporationa,b | 180,737 | |||
| 13,290 | Halliburton Company | 275,103 | |||
| 24,570 | Nabors Industries, Ltd.b | 382,801 | |||
| 15,000 | Nexen, Inc. | 324,750 | |||
| 16,300 | Schlumberger, Ltd. | 881,993 | |||
| 19,930 | Southwestern Energy Companyb | 774,280 | |||
| 8,810 | Transocean, Ltd.b | 654,495 | |||
| 19,240 | Weatherford International, Ltd.b | 376,334 | |||
| 10,960 | XTO Energy, Inc. | 418,014 | |||
Total Energy | 6,825,473 | ||||
| Financials (13.6%) | |||||
| 12,680 | ACE, Ltd. | 560,836 | |||
| 12,780 | Annaly Capital Management, Inc. | 193,489 | |||
| 7,150 | Bank of America Corporation | 94,380 | |||
| 11,626 | Bank of New York Mellon Corporation | 340,758 | |||
| 200 | Berkshire Hathaway, Inc.b | 579,146 | |||
| 5,580 | Chubb Corporation | 222,530 | |||
| 2,850 | CME Group, Inc. | 886,664 | |||
| 2,950 | Goldman Sachs Group, Inc. | 434,948 | |||
| 16,420 | Interactive Brokers Group, Inc.b | 255,003 | |||
| 2,210 | IntercontinentalExchange, Inc.b | 252,470 | |||
| 26,570 | J.P. Morgan Chase & Company | 906,303 | |||
| 8,250 | Lincoln National Corporation | 141,983 | |||
| 12,640 | MetLife, Inc. | 379,326 | |||
| 4,300 | PartnerRe, Ltd. | 279,285 | |||
| 11,080 | People’s United Financial, Inc. | 166,643 | |||
| 12,980 | PNC Financial Services Group, Inc. | 503,754 | |||
| 19,550 | SunTrust Banks, Inc. | 321,598 | |||
| 36,320 | Wells Fargo & Company | 881,123 | |||
Total Financials | 7,400,239 | ||||
| Health Care (13.5%) | |||||
| 14,180 | Aetna, Inc. | 355,209 | |||
| 10,490 | Allergan, Inc. | 499,114 | |||
| 8,410 | Baxter International, Inc. | 445,394 | |||
| 8,060 | Biogen Idec, Inc.b | 363,909 | |||
| 7,790 | CIGNA Corporation | 187,661 | |||
| 16,400 | Covidien, Ltd. | 614,016 | |||
| 4,960 | Genzyme Corporationb | 276,123 | |||
| 6,200 | Humana, Inc.b | 200,012 | |||
| 7,030 | Johnson & Johnson | 399,304 | |||
| 37,870 | King Pharmaceuticals, Inc.b | 364,688 | |||
| 3,320 | Laboratory Corporation of America Holdingsb | 225,063 | |||
| 7,750 | Medco Health Solutions, Inc.b | 353,478 | |||
| 92,100 | Pfizer, Inc. | 1,381,500 | |||
| 30,720 | Schering-Plough Corporation | 771,686 | |||
| 9,230 | Thermo Fisher Scientific, Inc.b | 376,307 | |||
| 11,920 | Wyeth | 541,049 | |||
Total Health Care | 7,354,513 | ||||
| Industrials (9.9%) | |||||
| 17,730 | Bucyrus International, Inc. | 506,369 | |||
| 10,650 | Caterpillar, Inc. | 351,876 | |||
| 18,600 | CNH Global NVa,b | 261,144 | |||
| 5,170 | CSX Corporation | 179,037 | |||
| 9,260 | Cummins, Inc. | 326,045 | |||
| 6,850 | Deere & Company | 273,657 | |||
| 8,800 | Diana Shipping, Inc. | 117,216 | |||
| 58,400 | Dryships, Inc.a | 337,552 | |||
| 68,860 | General Electric Company | 807,039 | |||
| 16,340 | Joy Global, Inc. | 583,665 | |||
| 2,740 | KBR, Inc. | 50,526 | |||
| 2,890 | Lockheed Martin Corporation | 233,079 | |||
| 3,310 | Precision Castparts Corporation | 241,729 | |||
| 12,190 | Rockwell Automation, Inc. | 391,543 | |||
| 23,490 | Terex Corporationa,b | 283,524 | |||
| 20,390 | Textron, Inc.a | 196,967 | |||
| 3,060 | Union Pacific Corporation | 159,304 | |||
| 2,270 | United Parcel Service, Inc. | 113,477 | |||
Total Industrials | 5,413,749 | ||||
| Information Technology (18.4%) | |||||
| 9,930 | Apple, Inc.b | 1,414,330 | |||
| 33,370 | BMC Software, Inc.b | 1,127,572 | |||
| 25,160 | Electronic Arts, Inc.b | 546,475 | |||
| 2,910 | Google, Inc.b | 1,226,827 | |||
| 64,220 | Microsoft Corporation | 1,526,509 | |||
| 31,190 | NETAPP, Inc.b | 615,067 | |||
| 132,390 | Nuance Communications, Inc.b | 1,600,595 | |||
| 51,850 | Oracle Corporation | 1,110,627 | |||
| 17,570 | SAIC, Inc.b | 325,924 | |||
The accompanying Notes to Financial Statements are an integral part of this schedule.
178
Table of Contents
Partner All Cap Portfolio
Schedule of Investments as of June 30, 2009
(unaudited)
| Shares | Common Stock (99.1%) | Value | ||||
| Information Technology (18.4%) - continued | ||||||
| 35,290 | SanDisk Corporationb | $ | 518,410 | |||
Total Information Technology | 10,012,336 | |||||
| Materials (3.1%) | ||||||
| 7,530 | Albemarle Corporation | 192,542 | ||||
| 5,700 | FMC Corporation | 269,610 | ||||
| 3,030 | Freeport-McMoRan Copper & Gold, Inc. | 151,833 | ||||
| 9,030 | Mosaic Company | 400,029 | ||||
| 4,510 | Newmont Mining Corporation | 184,324 | ||||
| 3,880 | Nucor Corporation | 172,389 | ||||
| 4,360 | Praxair, Inc. | 309,865 | ||||
Total Materials | 1,680,592 | |||||
| Telecommunications Services (3.4%) | ||||||
| 15,460 | American Tower Corporationb | 487,454 | ||||
| 12,632 | AT&T, Inc. | 313,779 | ||||
| 13,990 | NII Holdings, Inc.b | 266,789 | ||||
| 142,950 | Qwest Communications International, Inc.a | 593,242 | ||||
| 7,100 | SBA Communications Corporationb | 174,234 | ||||
Total Telecommunications Services | 1,835,498 | |||||
| Utilities (4.0%) | ||||||
| 15,230 | American Electric Power Company, Inc. | 439,995 | ||||
| 24,920 | CMS Energy Corporation | 301,034 | ||||
| 4,370 | FirstEnergy Corporation | 169,337 | ||||
| 15,260 | NRG Energy, Inc.a,b | 396,150 | ||||
| 15,590 | PPL Corporation | 513,846 | ||||
| 70,780 | RRI Energy, Inc.b | 354,608 | ||||
Total Utilities | 2,174,970 | |||||
Total Common Stock (cost $56,763,920) | 53,988,290 | |||||
Collateral Held for Securities Loaned (4.7%) | ||||||
| 2,577,600 | Thrivent Financial Securities Lending Trust | 2,577,600 | ||||
Total Collateral Held for Securities Loaned (cost $2,577,600) | 2,577,600 | |||||
Short-Term Investments (0.5%) | ||||||
| 239,687 | Thrivent Money Market Portfolio | 239,687 | ||||
Total Short-Term Investments (at amortized cost) | 239,687 | |||||
Total Investments (cost $59,581,207) 104.3% | $ | 56,805,577 | ||||
Other Assets and Liabilities, Net (4.3%) | (2,343,311 | ) | ||||
Total Net Assets 100.0% | $ | 54,462,266 | ||||
| a | All or a portion of the security is on loan as discussed in item 2(M) of the Notes to Financial Statements. |
| b | Non-income producing security. |
Unrealized Appreciation (Depreciation)
Gross unrealized appreciation and depreciation of investments, based on cost for federal income tax purposes, were as follows:
Gross unrealized appreciation | $ | 3,319,983 | ||
Gross unrealized depreciation | (6,095,613 | ) | ||
Net unrealized appreciation (depreciation) | $ | (2,775,630 | ) | |
Cost for federal income tax purposes | $ | 59,581,207 | ||
The accompanying Notes to Financial Statements are an integral part of this schedule.
179
Table of Contents
Partner All Cap Portfolio
Schedule of Investments as of June 30, 2009
(unaudited)
Fair Valuation Measurements
The following table is a summary of the inputs used, as of June 30, 2009, in valuing Partner All Cap Portfolio's assets carried at fair value as discussed in the Notes to Financial Statements.
Investments in Securities | Total | Level 1 | Level 2 | Level 3 | ||||||||
Common Stock | ||||||||||||
Consumer Discretionary | 4,760,597 | 4,760,597 | — | — | ||||||||
Consumer Staples | 6,530,323 | 6,530,323 | — | — | ||||||||
Energy | 6,825,473 | 6,825,473 | — | — | ||||||||
Financials | 7,400,239 | 7,400,239 | — | — | ||||||||
Health Care | 7,354,513 | 7,354,513 | — | — | ||||||||
Industrials | 5,413,749 | 5,413,749 | — | — | ||||||||
Information Technology | 10,012,336 | 10,012,336 | — | — | ||||||||
Materials | 1,680,592 | 1,680,592 | — | — | ||||||||
Telecommunications Services | 1,835,498 | 1,835,498 | — | — | ||||||||
Utilities | 2,174,970 | 2,174,970 | — | — | ||||||||
Collateral Held for Securities Loaned | 2,577,600 | 2,577,600 | — | — | ||||||||
Short-Term Investments | 239,687 | 239,687 | — | — | ||||||||
Total | $ | 56,805,577 | $ | 56,805,577 | $ | — | $ | — | ||||
Investment in Affiliates
Affiliated issuers, as defined under the Investment Company Act of 1940, include those in which the Portfolio's holdings of an issuer represent 5% or more of the outstanding voting securities of an issuer, or any affiliated mutual fund.
A summary of transactions for the fiscal year to date, in Partner All Cap Portfolio, is as follows:
Portfolio | Value December 31, 2008 | Gross Purchases | Gross Sales | Shares Held at June 30, 2009 | Value June 30, 2009 | Income Earned January 1, 2009 - June 30, 2009 | |||||||||||
Money Market | $ | 71,709 | $ | 10,294,771 | $ | 10,126,793 | 239,687 | $ | 239,687 | $ | 1,630 | ||||||
Thrivent Financial Securities Lending Trust | 2,623,789 | 13,763,264 | 13,809,453 | 2,577,600 | 2,577,600 | 5,256 | |||||||||||
Total Value and Income Earned | 2,695,498 | 2,817,287 | 6,886 | ||||||||||||||
The accompanying Notes to Financial Statements are an integral part of this schedule.
180
Table of Contents
Schedule of Investments as of June 30, 2009
(unaudited)
| Shares | Common Stock (95.9%) | Value | |||
| Consumer Discretionary (13.2%) | |||||
| 92,050 | Amazon.com, Inc.a | $ | 7,700,903 | ||
| 73,700 | Bed Bath & Beyond, Inc.a | 2,266,275 | |||
| 74,750 | Best Buy Company, Inc. | 2,503,378 | |||
| 302,750 | D.R. Horton, Inc. | 2,833,740 | |||
| 117,700 | Home Depot, Inc. | 2,781,251 | |||
| 113,100 | Kohl’s Corporationa | 4,835,025 | |||
| 129,400 | McDonald’s Corporation | 7,439,206 | |||
| 106,900 | McGraw-Hill Companies, Inc. | 3,218,759 | |||
| 274,790 | Melco PBL Entertainment Macau, Ltd. ADRa,b | 1,236,555 | |||
| 365,000 | MGM MIRAGEa,b,c | 2,332,350 | |||
| 153,200 | Starwood Hotels & Resorts Worldwide, Inc. | 3,401,040 | |||
| 115,850 | Time Warner, Inc. | 2,918,261 | |||
| 89,600 | Yum! Brands, Inc. | 2,987,264 | |||
Total Consumer Discretionary | 46,454,007 | ||||
| Consumer Staples (6.1%) | |||||
| 65,950 | Avon Products, Inc. | 1,700,191 | |||
| 33,100 | Clorox Company | 1,847,973 | |||
| 163,900 | CVS Caremark Corporation | 5,223,493 | |||
| 121,800 | PepsiCo, Inc. | 6,694,128 | |||
| 119,500 | Wal-Mart Stores, Inc. | 5,788,580 | |||
Total Consumer Staples | 21,254,365 | ||||
| Energy (7.4%) | |||||
| 57,100 | Devon Energy Corporation | 3,111,950 | |||
| 109,900 | Halliburton Company | 2,274,930 | |||
| 46,750 | Hess Corporation | 2,512,812 | |||
| 86,600 | Nabors Industries, Ltd.a | 1,349,228 | |||
| 103,600 | Occidental Petroleum Corporation | 6,817,916 | |||
| 71,750 | Petroleo Brasileiro SA ADR | 2,940,315 | |||
| 145,250 | Weatherford International, Ltd.a | 2,841,090 | |||
| 107,450 | XTO Energy, Inc. | 4,098,143 | |||
Total Energy | 25,946,384 | ||||
| Financials (10.1%) | |||||
| 239,300 | Bank of America Corporation | 3,158,760 | |||
| 50,700 | Fidelity National Financial, Inc. | 685,971 | |||
| 61,850 | Goldman Sachs Group, Inc. | 9,119,164 | |||
| 22,150 | IntercontinentalExchange, Inc.a | 2,530,416 | |||
| 190,500 | J.P. Morgan Chase & Company | 6,497,955 | |||
| 112,400 | Lincoln National Corporation | 1,934,404 | |||
| 108,450 | Morgan Stanley | 3,091,910 | |||
| 45,650 | Prudential Financial, Inc. | 1,699,093 | |||
| 57,300 | State Street Corporation | 2,704,560 | |||
| 235,500 | TD Ameritrade Holding Corporationa | 4,130,670 | |||
Total Financials | 35,552,903 | ||||
| Health Care (14.4%) | |||||
| 78,300 | Abbott Laboratories | 3,683,232 | |||
| 35,000 | Alcon, Inc. | 4,064,200 | |||
| 69,600 | Allergan, Inc. | 3,311,568 | |||
| 43,200 | Amgen, Inc.a | 2,287,008 | |||
| 406,201 | Boston Scientific Corporationa | 4,118,878 | |||
| 111,650 | Covidien, Ltd. | 4,180,176 | |||
| 55,600 | Express Scripts, Inc.a | 3,822,500 | |||
| 245,950 | Gilead Sciences, Inc.a | 11,520,298 | |||
| 69,200 | Hospira, Inc.a | 2,665,584 | |||
| 83,100 | UnitedHealth Group, Inc. | 2,075,838 | |||
| 110,100 | Vertex Pharmaceuticals, Inc.a | 3,923,964 | |||
| 103,400 | Wyeth | 4,693,326 | |||
Total Health Care | 50,346,572 | ||||
| Industrials (8.5%) | |||||
| 65,700 | Danaher Corporation | 4,056,318 | |||
| 662,261 | Delta Air Lines, Inc.a | 3,834,491 | |||
| 106,500 | Diana Shipping, Inc.b | 1,418,580 | |||
| 62,450 | Dover Corporation | 2,066,470 | |||
| 114,450 | Honeywell International, Inc. | 3,593,730 | |||
| 21,097 | Navistar International Corporationa | 919,829 | |||
| 68,650 | Raytheon Company | 3,050,120 | |||
| 107,650 | Union Pacific Corporation | 5,604,259 | |||
| 66,300 | United Technologies Corporation | 3,444,948 | |||
| 107,700 | Werner Enterprises, Inc. | 1,951,524 | |||
Total Industrials | 29,940,269 | ||||
| Information Technology (30.5%) | |||||
| 86,700 | Apple, Inc.a | 12,348,681 | |||
| 84,100 | Broadcom Corporationa | 2,084,839 | |||
| 245,750 | Brocade Communicationsa | 1,921,765 | |||
| 442,570 | Cisco Systems, Inc.a | 8,249,505 | |||
| 265,400 | Corning, Inc. | 4,262,324 | |||
| 236,600 | Dell, Inc.a | 3,248,518 | |||
| 157,700 | EMC Corporationa | 2,065,870 | |||
| 30,150 | Google, Inc.a | 12,710,938 | |||
| 319,600 | Intel Corporation | 5,289,380 | |||
| 54,350 | International Business Machines Corporation | 5,675,227 | |||
| 40,000 | Linear Technology Corporation | 934,000 | |||
| 147,250 | Marvell Technology Group, Ltd.a | 1,713,990 | |||
| 12,200 | MasterCard, Inc. | 2,041,182 | |||
| 178,900 | Maxim Integrated Products, Inc. | 2,806,941 | |||
| 370,231 | Micron Technology, Inc.a | 1,873,369 | |||
| 285,240 | Oracle Corporation | 6,109,841 | |||
| 288,293 | QUALCOMM, Inc. | 13,030,844 | |||
| 51,900 | Research in Motion, Ltd.a | 3,687,495 | |||
| 208,700 | Symantec Corporationa | 3,247,372 | |||
| 207,600 | Taiwan Semiconductor Manufacturing Company, Ltd. ADR | 1,953,516 | |||
| 113,650 | VeriSign, Inc.a | 2,100,252 | |||
| 83,800 | Visa, Inc. | 5,217,388 | |||
| 121,550 | Western Union Company | 1,993,420 | |||
| 150,000 | Yahoo!, Inc.a | 2,349,000 | |||
Total Information Technology | 106,915,657 | ||||
| Materials (4.0%) | |||||
| 61,450 | ArcelorMittalb | 2,032,766 | |||
| 46,200 | Freeport-McMoRan Copper & Gold, Inc. | 2,315,082 | |||
| 127,200 | Mosaic Company | 5,634,960 | |||
| 58,250 | Praxair, Inc. | 4,139,827 | |||
Total Materials | 14,122,635 | ||||
| Telecommunications Services (1.5%) | |||||
| 132,648 | Crown Castle International Corporationa | 3,186,205 | |||
The accompanying Notes to Financial Statements are an integral part of this schedule.
181
Table of Contents
Large Cap Growth Portfolio II
Schedule of Investments as of June 30, 2009
(unaudited)
| Shares | Common Stock (95.9%) | Value | ||||
| Telecommunications Services (1.5%) - continued | ||||||
| 505,597 | Qwest Communications International, Inc.b | $ | 2,098,228 | |||
Total Telecommunications Services | 5,284,433 | |||||
| Utilities (0.2%) | ||||||
| 37,000 | American Water Works Company, Inc. | 707,070 | ||||
Total Utilities | 707,070 | |||||
Total Common Stock (cost $300,645,398) | 336,524,295 | |||||
Collateral Held for Securities Loaned (2.5%) | ||||||
| 8,856,958 | Thrivent Financial Securities Lending Trust | 8,856,958 | ||||
Total Collateral Held for Securities Loaned (cost $8,856,958) | 8,856,958 | |||||
| Shares or Principal Amount | Short-Term Investments (3.8%)d | |||||
Enterprise Funding Corporation | ||||||
| 4,890,000 | 0.100%, 7/1/2009 | 4,890,000 | ||||
Federal Home Loan Mortgage Corporation Discount Notes | ||||||
| 6,000,000 | 0.130%, 7/7/2009 | 5,999,870 | ||||
| 2,338,058 | Thrivent Money Market Portfolio | 2,338,058 | ||||
Total Short-Term Investments (at amortized cost) | 13,227,928 | |||||
Total Investments (cost $322,730,284) 102.2% | $ | 358,609,181 | ||||
Other Assets and Liabilities, Net (2.2%) | (7,682,224 | ) | ||||
Total Net Assets 100.0% | $ | 350,926,957 | ||||
| a | Non-income producing security. |
| b | All or a portion of the security is on loan as discussed in item 2(M) of the Notes to Financial Statements. |
| c | All or a portion of the security was earmarked to cover options. |
| d | The interest rate shown reflects the yield, coupon rate or, for securities purchased at a discount, the discount rate at the date of purchase. |
Definitions:
| ADR | - | American Depositary Receipt, which are certificates for an underlying foreign security’s shares held by an issuing U.S. depository bank. |
Unrealized Appreciation (Depreciation)
Gross unrealized appreciation and depreciation of investments, based on cost for federal income tax purposes, were as follows:
Gross unrealized appreciation | $ | 41,544,624 | ||
Gross unrealized depreciation | (5,665,727 | ) | ||
Net unrealized appreciation (depreciation) | $ | 35,878,897 | ||
Cost for federal income tax purposes | $ | 322,730,284 | ||
The accompanying Notes to Financial Statements are an integral part of this schedule.
182
Table of Contents
Large Cap Growth Portfolio II
Schedule of Investments as of June 30, 2009
(unaudited)
Fair Valuation Measurements
The following table is a summary of the inputs used, as of June 30, 2009, in valuing Large Cap Growth Portfolio II’s assets carried at fair value as discussed in the Notes to Financial Statements.
Investments in Securities | Total | Level 1 | Level 2 | Level 3 | ||||||||
Common Stock | ||||||||||||
Consumer Discretionary | 46,454,007 | 46,454,007 | — | — | ||||||||
Consumer Staples | 21,254,365 | 21,254,365 | — | — | ||||||||
Energy | 25,946,384 | 25,946,384 | — | — | ||||||||
Financials | 35,552,903 | 35,552,903 | — | — | ||||||||
Health Care | 50,346,572 | 50,346,572 | — | — | ||||||||
Industrials | 29,940,269 | 29,940,269 | — | — | ||||||||
Information Technology | 106,915,657 | 106,915,657 | — | — | ||||||||
Materials | 14,122,635 | 14,122,635 | — | — | ||||||||
Telecommunications Services | 5,284,433 | 5,284,433 | — | — | ||||||||
Utilities | 707,070 | 707,070 | — | — | ||||||||
Collateral Held for Securities Loaned | 8,856,958 | 8,856,958 | — | — | ||||||||
Short-Term Investments | 13,227,928 | 2,338,058 | 10,889,870 | — | ||||||||
Total | $ | 358,609,181 | $ | 347,719,311 | $ | 10,889,870 | $ | — | ||||
Other Financial Instruments* | $ | 27,069 | $ | 27,069 | $ | — | $ | — | ||||
| * | Other Financial Instruments include Futures, Forwards, Written Options and Swap agreements. |
Call Options Written | Number of Contracts | Exercise Price | Expiration Date | Value | Unrealized Gain/(Loss) | |||||||||
MGM MIRAGE | 967 | $ | 7.00 | July 2009 | ($ | 19,340 | ) | $ | 27,069 | |||||
Total Call Options Written | ($ | 19,340 | ) | $ | 27,069 | |||||||||
The following table summarizes the fair value and Statement of Assets and Liabilities location, as of June 30, 2009, for the Large Cap Growth Portfolio II’s investments in financial derivative instruments by primary risk exposure as discussed under item (2) Significant Accounting Policies of the Notes to Financial Statements.
Derivatives by Risk Category | Statement of Assets and Liabilities Location | Fair Value | |||
Asset Derivatives | |||||
Equity Contracts | |||||
Option Written | Net Assets - Net unrealized appreciation/(depreciation) on Written option contracts | 27,069 | |||
Total Equity Contracts | 27,069 | ||||
Total Asset Derivatives | $ | 27,069 | |||
The following table summarizes the net realized gains/(losses) and Statement of Operations location, for the period ended June 30, 2009, for Large Cap Growth Portfolio II’s investments in financial derivative instruments by primary risk exposure.
Derivatives by Risk Category | Statement of Operations Location | Realized Gains/(Losses) recognized in Income | |||
| Equity Contracts | |||||
Option Written | Net realized gains/(losses) on Written option contracts | (173,249 | ) | ||
Total Equity Contracts | (173,249 | ) | |||
Total | ($173,249 | ) | |||
The accompanying Notes to Financial Statements are an integral part of this schedule.
183
Table of Contents
Large Cap Growth Portfolio II
Schedule of Investments as of June 30, 2009
(unaudited)
The following table summarizes the change in net unrealized appreciation/(depreciation) and Statement of Operations location, for the period ended June 30, 2009, for the Large Cap Growth Portfolio II’s investments in financial derivative instruments by primary risk exposure.
Derivatives by Risk Category | Statement of Operations Location | Change in Unrealized Appreciation/(Depreciation) recognized in Income | |||
| Equity Contracts | |||||
Option Written | Change in net unrealized appreciation/(depreciation) on Written option contracts | 27,069 | |||
Total Equity Contracts | 27,069 | ||||
Total | $ | 27,069 | |||
Investment in Affiliates
Affiliated issuers, as defined under the Investment Company Act of 1940, include those in which the Portfolio’s holdings of an issuer represent 5% or more of the outstanding voting securities of an issuer, or any affiliated mutual fund.
A summary of transactions for the fiscal year to date, in Large Cap Growth Portfolio II, is as follows:
Portfolio | Value December 31, 2008 | Gross Purchases | Gross Sales | Shares Held at June 30, 2009 | Value June 30, 2009 | Income Earned January 1, 2009 - June 30, 2009 | |||||||||||
Money Market | $ | 9,917,185 | $ | 55,108,753 | $ | 62,687,880 | 2,338,058 | $ | 2,338,058 | $ | 30,627 | ||||||
Thrivent Financial Securities Lending Trust | 211,680 | 87,787,777 | 79,142,499 | 8,856,958 | 8,856,958 | 29,254 | |||||||||||
Total Value and Income Earned | 10,128,865 | 11,195,016 | 59,881 | ||||||||||||||
The accompanying Notes to Financial Statements are an integral part of this schedule.
184
Table of Contents
Schedule of Investments as of June 30, 2009
(unaudited)
| Shares | Common Stock (96.8%) | Value | |||
| Consumer Discretionary (12.8%) | |||||
| 191,350 | Amazon.com, Inc.a | $ | 16,008,341 | ||
| 17,800 | AutoZone, Inc.a | 2,689,758 | |||
| 139,900 | Bed Bath & Beyond, Inc.a | 4,301,925 | |||
| 162,700 | Best Buy Company, Inc. | 5,448,823 | |||
| 96,600 | Coach, Inc. | 2,596,608 | |||
| 454,900 | D.R. Horton, Inc. | 4,257,864 | |||
| 62,600 | Fortune Brands, Inc. | 2,174,724 | |||
| 105,100 | Harley-Davidson, Inc.b | 1,703,671 | |||
| 276,500 | Home Depot, Inc. | 6,533,695 | |||
| 253,300 | Kohl’s Corporationa | 10,828,575 | |||
| 319,800 | McDonald’s Corporation | 18,385,302 | |||
| 239,200 | McGraw-Hill Companies, Inc. | 7,202,312 | |||
| 685,500 | Melco PBL Entertainment Macau, Ltd. ADRa,b | 3,084,750 | |||
| 707,600 | MGM MIRAGEa,b,c | 4,521,564 | |||
| 364,000 | Starwood Hotels & Resorts Worldwide, Inc. | 8,080,800 | |||
| 196,300 | Time Warner, Inc. | 4,944,797 | |||
| 151,900 | Viacom, Inc.a | 3,448,130 | |||
| 209,800 | Yum! Brands, Inc. | 6,994,732 | |||
Total Consumer Discretionary | 113,206,371 | ||||
| Consumer Staples (6.1%) | |||||
| 167,400 | Avon Products, Inc. | 4,315,572 | |||
| 83,500 | Clorox Company | 4,661,805 | |||
| 391,600 | CVS Caremark Corporation | 12,480,292 | |||
| 71,700 | Kellogg Company | 3,339,069 | |||
| 266,500 | PepsiCo, Inc. | 14,646,840 | |||
| 297,300 | Wal-Mart Stores, Inc. | 14,401,212 | |||
Total Consumer Staples | 53,844,790 | ||||
| Energy (7.7%) | |||||
| 139,400 | Devon Energy Corporation | 7,597,300 | |||
| 81,300 | EOG Resources, Inc. | 5,521,896 | |||
| 301,200 | Halliburton Company | 6,234,840 | |||
| 116,400 | Hess Corporation | 6,256,500 | |||
| 202,100 | Nabors Industries, Ltd.a | 3,148,718 | |||
| 212,900 | Noble Corporation | 6,440,225 | |||
| 192,400 | Occidental Petroleum Corporation | 12,661,844 | |||
| 150,350 | Petroleo Brasileiro SA ADR | 6,161,343 | |||
| 331,500 | Weatherford International, Ltd.a | 6,484,140 | |||
| 194,450 | XTO Energy, Inc. | 7,416,323 | |||
Total Energy | 67,923,129 | ||||
| Financials (9.9%) | |||||
| 581,550 | Bank of America Corporation | 7,676,460 | |||
| 137,300 | Bank of New York Mellon Corporation | 4,024,263 | |||
| 377,800 | Chimera Investment Corporation | 1,318,522 | |||
| 165,200 | Fidelity National Financial, Inc. | 2,235,156 | |||
| 142,400 | Goldman Sachs Group, Inc. | 20,995,456 | |||
| 54,800 | IntercontinentalExchange, Inc.a | 6,260,352 | |||
| 438,850 | J.P. Morgan Chase & Company | 14,969,174 | |||
| 277,450 | Lincoln National Corporation | 4,774,914 | |||
| 241,800 | Morgan Stanley | 6,893,718 | |||
| 112,500 | Prudential Financial, Inc. | 4,187,250 | |||
| 123,400 | State Street Corporation | 5,824,480 | |||
| 446,700 | TD Ameritrade Holding Corporationa | 7,835,118 | |||
Total Financials | 86,994,863 | ||||
| Health Care (15.2%) | |||||
| 185,700 | Abbott Laboratories | 8,735,328 | |||
| 64,400 | Alcon, Inc. | 7,478,128 | |||
| 140,500 | Allergan, Inc. | 6,684,990 | |||
| 77,100 | Amgen, Inc.a | 4,081,674 | |||
| 135,796 | Baxter International, Inc. | 7,191,756 | |||
| 637,400 | Boston Scientific Corporationa | 6,463,236 | |||
| 218,400 | Bristol-Myers Squibb Company | 4,435,704 | |||
| 97,750 | Celgene Corporationa | 4,676,360 | |||
| 208,900 | Covidien, Ltd. | 7,821,216 | |||
| 136,700 | Express Scripts, Inc.a | 9,398,125 | |||
| 593,000 | Gilead Sciences, Inc.a | 27,776,120 | |||
| 115,400 | Hospira, Inc.a | 4,445,208 | |||
| 99,835 | St. Jude Medical, Inc.a | 4,103,218 | |||
| 126,550 | Teva Pharmaceutical Industries, Ltd. ADR | 6,243,977 | |||
| 60,958 | Thermo Fisher Scientific, Inc.a | 2,485,258 | |||
| 206,900 | UnitedHealth Group, Inc. | 5,168,362 | |||
| 214,500 | Vertex Pharmaceuticals, Inc.a | 7,644,780 | |||
| 205,400 | Wyeth | 9,323,106 | |||
Total Health Care | 134,156,546 | ||||
| Industrials (8.9%) | |||||
| 76,800 | C.H. Robinson Worldwide, Inc. | 4,005,120 | |||
| 109,600 | CSX Corporation | 3,795,448 | |||
| 162,750 | Danaher Corporation | 10,048,185 | |||
| 1,517,915 | Delta Air Lines, Inc.a | 8,788,728 | |||
| 232,100 | Diana Shipping, Inc.b | 3,091,572 | |||
| 114,300 | Dover Corporation | 3,782,187 | |||
| 267,200 | Honeywell International, Inc. | 8,390,080 | |||
| 20,102 | Navistar International Corporationa | 876,447 | |||
| 79,900 | PACCAR, Inc. | 2,597,549 | |||
| 58,900 | Parker-Hannifin Corporation | 2,530,344 | |||
| 149,800 | Raytheon Company | 6,655,614 | |||
| 88,100 | Shaw Group, Inc.a | 2,414,821 | |||
| 195,400 | Union Pacific Corporation | 10,172,524 | |||
| 137,600 | United Technologies Corporation | 7,149,696 | |||
| 213,800 | Werner Enterprises, Inc. | 3,874,056 | |||
Total Industrials | 78,172,371 | ||||
| Information Technology (29.9%) | |||||
| 215,700 | Apple, Inc.a | 30,722,151 | |||
| 209,800 | Broadcom Corporationa | 5,200,942 | |||
| 612,900 | Brocade Communicationsa | 4,792,878 | |||
| 1,093,950 | Cisco Systems, Inc.a | 20,391,228 | |||
| 658,400 | Corning, Inc. | 10,573,904 | |||
| 584,900 | Dell, Inc.a | 8,030,677 | |||
| 403,800 | EMC Corporationa | 5,289,780 | |||
| 74,452 | Google, Inc.a | 31,388,219 | |||
| 893,300 | Intel Corporation | 14,784,115 | |||
| 133,750 | International Business Machines Corporation | 13,966,175 | |||
| 101,200 | Linear Technology Corporation | 2,363,020 | |||
| 374,550 | Marvell Technology Group, Ltd.a | 4,359,762 | |||
| 30,500 | MasterCard, Inc. | 5,102,955 | |||
| 440,100 | Maxim Integrated Products, Inc. | 6,905,169 | |||
| 1,002,856 | Micron Technology, Inc.a | 5,074,451 | |||
The accompanying Notes to Financial Statements are an integral part of this schedule.
185
Table of Contents
Large Cap Growth Portfolio
Schedule of Investments as of June 30, 2009
(unaudited)
| Shares | Common Stock (96.8%) | Value | ||||
| Information Technology (29.9%) - continued | ||||||
| 710,200 | Oracle Corporation | $ | 15,212,484 | |||
| 712,044 | QUALCOMM, Inc. | 32,184,389 | ||||
| 128,361 | Research in Motion, Ltd.a | 9,120,049 | ||||
| 371,850 | Symantec Corporationa | 5,785,986 | ||||
| 513,800 | Taiwan Semiconductor Manufacturing Company, Ltd. ADR | 4,834,858 | ||||
| 292,500 | VeriSign, Inc.a | 5,405,400 | ||||
| 193,800 | Visa, Inc. | 12,065,988 | ||||
| 302,000 | Western Union Company | 4,952,800 | ||||
| 374,500 | Yahoo!, Inc.a | 5,864,670 | ||||
Total Information Technology | 264,372,050 | |||||
| Materials (4.7%) | ||||||
| 147,600 | ArcelorMittalb | 4,882,608 | ||||
| 72,800 | Ball Corporation | 3,287,648 | ||||
| 97,100 | Freeport-McMoRan Copper & Gold, Inc. | 4,865,681 | ||||
| 124,350 | Monsanto Company | 9,244,179 | ||||
| 235,200 | Mosaic Company | 10,419,360 | ||||
| 127,200 | Praxair, Inc. | 9,040,104 | ||||
Total Materials | 41,739,580 | |||||
| Telecommunications Services (1.4%) | ||||||
| 323,500 | Crown Castle International Corporationa | 7,770,470 | ||||
| 1,144,500 | Qwest Communications International, Inc.b | 4,749,675 | ||||
Total Telecommunications Services | 12,520,145 | |||||
| Utilities (0.2%) | ||||||
| 92,500 | American Water Works Company, Inc. | 1,767,675 | ||||
Total Utilities | 1,767,675 | |||||
Total Common Stock (cost $810,783,520) | 854,697,520 | |||||
Collateral Held for Securities Loaned (2.3%) | ||||||
| 20,712,287 | Thrivent Financial Securities Lending Trust | 20,712,287 | ||||
Total Collateral Held for Securities Loaned (cost $20,712,287) | 20,712,287 | |||||
| Shares or Principal Amount | Short-Term Investments (3.5%)d | |||||
Barclays Bank plc Repurchase Agreement | ||||||
| 20,870,000 | 0.080%, 7/1/2009e | 20,870,000 | ||||
Federal Home Loan Mortgage Corporation Discount Notes | ||||||
| 10,000,000 | 0.130%, 7/7/2009 | 9,999,783 | ||||
| 123,337 | Thrivent Money Market Portfolio | 123,337 | ||||
Total Short-Term Investments (at amortized cost) | 30,993,120 | |||||
Total Investments (cost $862,488,927) 102.6% | $ | 906,402,927 | ||||
Other Assets and Liabilities, Net (2.6%) | (23,363,959 | ) | ||||
Total Net Assets 100.0% | $ | 883,038,968 | ||||
| a | Non-income producing security. |
| b | All or a portion of the security is on loan as discussed in item 2(M) of the Notes to Financial Statements. |
| c | All or a portion of the security was earmarked to cover options. |
| d | The interest rate shown reflects the yield, coupon rate or, for securities purchased at a discount, the discount rate at the date of purchase. |
| e | Repurchase agreement dated June 30, 2009, $20,870,046 maturing July 1, 2009, collateralized by Federal Farm Credit Banks ($1,103,087 at 5.250% due 8/3/2009, $1,497,525 at Zero Coupon due 10/12/2010, $1,209,840 at 2.625% due 4/17/2014, $1,067,216 at 4.875% due 1/17/2017), Federal Home Loan Banks ($835,408 at 4.400% due 6/15/2010), Federal Home Loan Mortgage Corporation ($236,523 at 7.000% due 3/15/2010, $1,521,273 at 5.000% due 10/18/2010), Federal National Mortgage Association ($1,521,306 at 2.500% due 3/19/2012, $1,517,893 at 3.250% due 2/11/2014, $1,537,708 at 5.000% due 4/26/2017), Resolution Funding Corporation Interest Strip ($1,277,450 at Zero Coupon due 1/15/2017, $1,460,428 at Zero Coupon due 10/15/2017, $1,279,686 at Zero Coupon due 7/15/2021, $1,450,650 at Zero Coupon due 7/15/2023, $1,527,125 at Zero Coupon due 10/15/2025, $1,172,995 at Zero Coupon due 7/15/2028, $1,075,768 at Zero Coupon due 1/15/2030). |
Definitions:
| ADR | - | American Depositary Receipt, which are certificates for an underlying foreign security’s shares held by an issuing U.S. depository bank. |
Unrealized Appreciation (Depreciation)
Gross unrealized appreciation and depreciation of investments, based on cost for federal income tax purposes, were as follows:
Gross unrealized appreciation | $ | 101,868,803 | ||
Gross unrealized depreciation | (57,954,803 | ) | ||
Net unrealized appreciation (depreciation) | $ | 43,914,000 | ||
Cost for federal income tax purposes | $ | 862,488,927 | ||
The accompanying Notes to Financial Statements are an integral part of this schedule.
186
Table of Contents
Large Cap Growth Portfolio
Schedule of Investments as of June 30, 2009
(unaudited)
Fair Valuation Measurements
The following table is a summary of the inputs used, as of June 30, 2009, in valuing Large Cap Growth Portfolio’s assets carried at fair value as discussed in the Notes to Financial Statements.
Investments in Securities | Total | Level 1 | Level 2 | Level 3 | ||||||||
Common Stock | ||||||||||||
Consumer Discretionary | 113,206,371 | 113,206,371 | — | — | ||||||||
Consumer Staples | 53,844,790 | 53,844,790 | — | — | ||||||||
Energy | 67,923,129 | 67,923,129 | — | — | ||||||||
Financials | 86,994,863 | 86,994,863 | — | — | ||||||||
Health Care | 134,156,546 | 134,156,546 | — | — | ||||||||
Industrials | 78,172,371 | 78,172,371 | — | — | ||||||||
Information Technology | 264,372,050 | 264,372,050 | — | — | ||||||||
Materials | 41,739,580 | 41,739,580 | — | — | ||||||||
Telecommunications Services | 12,520,145 | 12,520,145 | — | — | ||||||||
Utilities | 1,767,675 | 1,767,675 | — | — | ||||||||
Collateral Held for Securities Loaned | 20,712,287 | 20,712,287 | — | — | ||||||||
Short-Term Investments | 30,993,120 | 123,337 | 30,869,783 | — | ||||||||
Total | $ | 906,402,927 | $ | 875,533,144 | $ | 30,869,783 | $ | — | ||||
Other Financial Instruments* | $ | 68,442 | $ | 68,442 | $ | — | $ | — | ||||
| * | Other Financial Instruments include Futures, Forwards, Written Options and Swap agreements. |
Call Options Written | Number of Contracts | Exercise Price | Expiration Date | Value | Unrealized Gain/(Loss) | |||||||||
MGM MIRAGE | 2,445 | $ | 7.00 | July 2009 | ($ | 48,900 | ) | $ | 68,442 | |||||
Total Call Options Written | ($ | 48,900 | ) | $ | 68,442 | |||||||||
The following table summarizes the fair value and Statement of Assets and Liabilities location, as of June 30, 2009, for the Large Cap Growth Portfolio’s investments in financial derivative instruments by primary risk exposure as discussed under item (2) Significant Accounting Policies of the Notes to Financial Statements.
Derivatives by Risk Category | Statement of Assets and Liabilities Location | Fair Value | |||
Asset Derivatives | |||||
Equity Contracts | |||||
Option Written | Net Assets - Net unrealized appreciation/(depreciation) on Written option contracts | 68,442 | |||
Total Equity Contracts | 68,442 | ||||
Total Asset Derivatives | $ | 68,442 | |||
The following table summarizes the net realized gains/(losses) and Statement of Operations location, for the period ended June 30, 2009, for Large Cap Growth Portfolio’s investments in financial derivative instruments by primary risk exposure.
Derivatives by Risk Category | Statement of Operations Location | Realized Gains/(Losses) recognized in Income | |||
| Equity Contracts | |||||
Option Written | Net realized gains/(losses) on Written option contracts | (185,222 | ) | ||
Total Equity Contracts | (185,222 | ) | |||
Total | ($185,222 | ) | |||
The accompanying Notes to Financial Statements are an integral part of this schedule.
187
Table of Contents
Large Cap Growth Portfolio
Schedule of Investments as of June 30, 2009
(unaudited)
The following table summarizes the change in net unrealized appreciation/(depreciation) and Statement of Operations location, for the period ended June 30, 2009, for the Large Cap Growth Portfolio’s investments in financial derivative instruments by primary risk exposure.
Derivatives by Risk Category | Statement of Operations Location | Change in Unrealized Appreciation/(Depreciation) recognized in Income | |||
| Equity Contracts | |||||
Option Written | Change in net unrealized appreciation/(depreciation) on Written option contracts | 68,442 | |||
Total Equity Contracts | 68,442 | ||||
Total | $ | 68,442 | |||
Investment in Affiliates
Affiliated issuers, as defined under the Investment Company Act of 1940, include those in which the Portfolio’s holdings of an issuer represent 5% or more of the outstanding voting securities of an issuer, or any affiliated mutual fund.
A summary of transactions for the fiscal year to date, in Large Cap Growth Portfolio, is as follows:
Portfolio | Value December 31, 2008 | Gross Purchases | Gross Sales | Shares Held at June 30, 2009 | Value June 30, 2009 | Income Earned January 1, 2009 - June 30, 2009 | |||||||||||
Money Market | $ | 9,280,189 | $ | 35,792,005 | $ | 44,948,857 | 123,337 | $ | 123,337 | $ | 27,545 | ||||||
Thrivent Financial Securities Lending Trust | 23,002,052 | 283,312,676 | 285,602,441 | 20,712,287 | 20,712,287 | 121,030 | |||||||||||
Total Value and Income Earned | 32,282,241 | 20,835,624 | 148,575 | ||||||||||||||
The accompanying Notes to Financial Statements are an integral part of this schedule.
188
Table of Contents
Partner Growth Stock Portfolio
Schedule of Investments as of June 30, 2009
(unaudited)
| Shares | Common Stock (99.4%) | Value | |||
| Consumer Discretionary (13.2%) | |||||
| 27,600 | Amazon.com, Inc.a | $ | 2,309,016 | ||
| 4,400 | Apollo Group, Inc.a | 312,928 | |||
| 4,400 | AutoZone, Inc.a | 664,884 | |||
| 7,200 | Dollar Tree, Inc.a | 303,120 | |||
| 17,809 | Expedia, Inc.a | 269,094 | |||
| 14,900 | Lowe’s Companies, Inc. | 289,209 | |||
| 12,044 | Marriott International, Inc. | 265,811 | |||
| 7,100 | McDonald’s Corporation | 408,179 | |||
| 28,200 | McGraw-Hill Companies, Inc. | 849,102 | |||
| 8,600 | MGM MIRAGEa | 54,954 | |||
| 8,700 | NIKE, Inc. | 450,486 | |||
| 6,200 | O’Reilly Automotive, Inc.a | 236,096 | |||
| 1,700 | Priceline.com, Inc.a | 189,635 | |||
| 13,100 | Yum! Brands, Inc. | 436,752 | |||
Total Consumer Discretionary | 7,039,266 | ||||
| Consumer Staples (8.3%) | |||||
| 10,000 | Coca-Cola Company | 479,900 | |||
| 8,900 | Costco Wholesale Corporation | 406,730 | |||
| 15,837 | CVS Caremark Corporation | 504,725 | |||
| 7,024 | Groupe Danone | 348,299 | |||
| 10,263 | Nestle SA | 387,497 | |||
| 16,900 | PepsiCo, Inc. | 928,824 | |||
| 14,037 | Procter & Gamble Company | 717,291 | |||
| 13,600 | Wal-Mart Stores, Inc. | 658,784 | |||
Total Consumer Staples | 4,432,050 | ||||
| Energy (7.6%) | |||||
| 10,500 | Cameron International Corporationa | 297,150 | |||
| 2,900 | Chevron Corporation | 192,125 | |||
| 5,100 | EOG Resources, Inc. | 346,392 | |||
| 8,200 | Exxon Mobil Corporation | 573,262 | |||
| 4,400 | Murphy Oil Corporation | 239,008 | |||
| 3,500 | Occidental Petroleum Corporation | 230,335 | |||
| 21,300 | Petroleo Brasileiro SA ADR | 710,568 | |||
| 19,300 | Schlumberger, Ltd. | 1,044,323 | |||
| 10,800 | Smith International, Inc. | 278,100 | |||
| 5,100 | Suncor Energy, Inc. | 154,734 | |||
Total Energy | 4,065,997 | ||||
| Financials (11.5%) | |||||
| 16,000 | American Express Company | 371,840 | |||
| 53,200 | Bank of America Corporation | 702,240 | |||
| 11,100 | Bank of New York Mellon Corporation | 325,341 | |||
| 1,000 | BlackRock, Inc. | 175,420 | |||
| 13,100 | Charles Schwab Corporation | 229,774 | |||
| 25,600 | Companhia Brasileira de Meios de Pagamentoa | 220,138 | |||
| 2,800 | Franklin Resources, Inc. | 201,628 | |||
| 3,500 | Goldman Sachs Group, Inc. | 516,040 | |||
| 3,000 | IntercontinentalExchange, Inc.a | 342,720 | |||
| 20,900 | J.P. Morgan Chase & Company | 712,899 | |||
| 7,700 | Moody’s Corporation | 202,895 | |||
| 12,800 | Morgan Stanley | 364,928 | |||
| 5,300 | Northern Trust Corporation | 284,504 | |||
| 3,500 | PNC Financial Services Group, Inc. | 135,835 | |||
| 3,600 | Redecard SA | 55,116 | |||
| 14,700 | State Street Corporation | 693,840 | |||
| 12,400 | U.S. Bancorp | 222,208 | |||
| 16,500 | Wells Fargo & Company | 400,290 | |||
Total Financials | 6,157,656 | ||||
| Health Care (15.2%) | |||||
| 13,500 | Allergan, Inc. | 642,330 | |||
| 900 | Becton, Dickinson and Company | 64,179 | |||
| 6,700 | Celgene Corporationa | 320,528 | |||
| 4,700 | Covidien, Ltd. | 175,968 | |||
| 4,300 | Dentsply International, Inc. | 131,236 | |||
| 24,200 | Elan Corporation plc ADRa | 154,154 | |||
| 15,200 | Express Scripts, Inc.a | 1,045,000 | |||
| 26,300 | Gilead Sciences, Inc.a | 1,231,892 | |||
| 2,900 | Illumina, Inc.a | 112,926 | |||
| 2,300 | Intuitive Surgical, Inc.a,b | 376,418 | |||
| 10,200 | McKesson Corporation | 448,800 | |||
| 36,600 | Medco Health Solutions, Inc.a | 1,669,326 | |||
| 4,330 | Novo Nordisk AS | 235,832 | |||
| 9,600 | St. Jude Medical, Inc.a | 394,560 | |||
| 6,700 | Stryker Corporation | 266,258 | |||
| 6,600 | Teva Pharmaceutical Industries, Ltd. ADR | 325,644 | |||
| 10,500 | WellPoint, Inc.a | 534,345 | |||
Total Health Care | 8,129,396 | ||||
| Industrials (7.4%) | |||||
| 3,600 | 3M Company | 216,360 | |||
| 27,800 | Danaher Corporation | 1,716,372 | |||
| 5,600 | Deere & Company | 223,720 | |||
| 11,800 | Expeditors International of Washington, Inc. | 393,412 | |||
| 5,100 | Lockheed Martin Corporation | 411,315 | |||
| 8,100 | Quanta Services, Inc.a | 187,353 | |||
| 13,400 | Republic Services, Inc. | 327,094 | |||
| 1,900 | Union Pacific Corporation | 98,914 | |||
| 7,200 | United Parcel Service, Inc. | 359,928 | |||
Total Industrials | 3,934,468 | ||||
| Information Technology (29.0%) | |||||
| 14,800 | Accenture, Ltd. | 495,208 | |||
| 19,000 | Apple, Inc.a | 2,706,170 | |||
| 18,200 | Autodesk, Inc.a | 345,436 | |||
| 11,500 | Automatic Data Processing, Inc. | 407,560 | |||
| 12,200 | Broadcom Corporationa | 302,438 | |||
| 33,000 | Cisco Systems, Inc.a | 615,120 | |||
| 11,300 | Dolby Laboratories, Inc.a | 421,264 | |||
| 7,600 | Fiserv, Inc.a | 347,320 | |||
| 5,150 | Google, Inc.a | 2,171,188 | |||
| 19,300 | Intel Corporation | 319,415 | |||
| 18,400 | Juniper Networks, Inc.a | 434,240 | |||
| 35,600 | Marvell Technology Group, Ltd.a | 414,384 | |||
| 3,250 | MasterCard, Inc. | 543,758 | |||
| 14,200 | McAfee, Inc.a | 599,098 | |||
| 35,875 | Microsoft Corporation | 852,749 | |||
| 28,600 | QUALCOMM, Inc. | 1,292,720 | |||
| 6,900 | Research in Motion, Ltd.a | 490,245 | |||
| 4,600 | Salesforce.com, Inc.a,b | 175,582 | |||
| 41,200 | Tencent Holdings, Ltd. | 478,024 | |||
| 23,500 | VeriSign, Inc.a | 434,280 | |||
| 14,600 | Visa, Inc. | 908,996 | |||
The accompanying Notes to Financial Statements are an integral part of this schedule.
189
Table of Contents
Partner Growth Stock Portfolio
Schedule of Investments as of June 30, 2009
(unaudited)
| Shares | Common Stock (99.4%) | Value | ||||
| Information Technology (29.0%) - continued | ||||||
| 43,300 | Western Union Company | $ | 710,120 | |||
Total Information Technology | 15,465,315 | |||||
| Materials (3.0%) | ||||||
| 800 | Agnico-Eagle Mines, Ltd. | 41,984 | ||||
| 14,284 | BHP Billiton, Ltd. | 391,323 | ||||
| 4,300 | Monsanto Company | 319,662 | ||||
| 1,000 | Potash Corporation of Saskatchewan, Inc. | 93,050 | ||||
| 10,500 | Praxair, Inc. | 746,235 | ||||
Total Materials | 1,592,254 | |||||
| Telecommunications Services (4.2%) | ||||||
| 27,700 | American Tower Corporationa | 873,381 | ||||
| 40,800 | Crown Castle International Corporationa | 980,016 | ||||
| 6,200 | Leap Wireless International, Inc.a,b | 204,166 | ||||
| 14,500 | MetroPCS Communications, Inc.a | 192,995 | ||||
Total Telecommunications Services | 2,250,558 | |||||
Total Common Stock (cost $49,150,679) | 53,066,960 | |||||
Collateral Held for Securities Loaned (1.1%) | ||||||
| 570,550 | Thrivent Financial Securities Lending Trust | 570,550 | ||||
Total Collateral Held for Securities Loaned (cost $570,550) | 570,550 | |||||
Short-Term Investments (0.3%) | ||||||
| 183,697 | Thrivent Money Market Portfolio | 183,697 | ||||
Total Short-Term Investments (at amortized cost) | 183,697 | |||||
Total Investments (cost $49,904,926) 100.8% | $ | 53,821,207 | ||||
Other Assets and Liabilities, Net (0.8%) | (435,823 | ) | ||||
Total Net Assets 100.0% | $ | 53,385,384 | ||||
| a | Non-income producing security. |
| b | All or a portion of the security is on loan as discussed in item 2(M) of the Notes to Financial Statements. |
Definitions:
| ADR | - | American Depositary Receipt, which are certificates for an underlying foreign security’s shares held by an issuing U.S. depository bank. |
Unrealized Appreciation (Depreciation)
Gross unrealized appreciation and depreciation of investments, based on cost for federal income tax purposes, were as follows:
Gross unrealized appreciation | $ | 8,671,499 | ||
Gross unrealized depreciation | (4,755,218 | ) | ||
Net unrealized appreciation (depreciation) | $ | 3,916,281 | ||
Cost for federal income tax purposes | $ | 49,904,926 | ||
The accompanying Notes to Financial Statements are an integral part of this schedule.
190
Table of Contents
Partner Growth Stock Portfolio
Schedule of Investments as of June 30, 2009
(unaudited)
Fair Valuation Measurements
The following table is a summary of the inputs used, as of June 30, 2009, in valuing Partner Growth Stock Portfolio’s assets carried at fair value as discussed in the Notes to Financial Statements.
Investments in Securities | Total | Level 1 | Level 2 | Level 3 | ||||||
Common Stock | ||||||||||
Consumer Discretionary | 7,039,266 | 7,039,266 | — | — | ||||||
Consumer Staples | 4,432,050 | 3,696,254 | 735,796 | — | ||||||
Energy | 4,065,997 | 4,065,997 | — | — | ||||||
Financials | 6,157,656 | 6,102,540 | 55,116 | — | ||||||
Health Care | 8,129,396 | 7,893,564 | 235,832 | — | ||||||
Industrials | 3,934,468 | 3,934,468 | — | — | ||||||
Information Technology | 15,465,315 | 14,987,291 | 478,024 | — | ||||||
Materials | 1,592,254 | 1,200,931 | 391,323 | — | ||||||
Telecommunications Services | 2,250,558 | 2,250,558 | — | — | ||||||
Collateral Held for Securities Loaned | 570,550 | 570,550 | — | — | ||||||
Short-Term Investments | 183,697 | 183,697 | — | — | ||||||
Total | $53,821,207 | $51,925,116 | $1,896,091 | $— | ||||||
Other Financial Instruments* | ($966 | ) | ($966 | ) | $— | $— | ||||
| * | Other Financial Instruments include Futures, Forwards, Written Options and Swap agreements. |
Foreign Currency | Contracts to Deliver/Receive | Settlement Date | Value on Settlement Date | Value | Unrealized Gain/(Loss) | ||||||||
Purchases | |||||||||||||
Brazilian Real | 400,747 | 7/1/2009 - 7/2/2009 | $ | 205,481 | $ | 204,515 | ($966 | ) | |||||
Total Foreign Currency Forward Contracts Purchases | $ | 205,481 | $ | 204,515 | ($966 | ) | |||||||
Net Unrealized Gain/(Loss) on Foreign Currency Forward Contracts | ($966 | ) | |||||||||||
The following table summarizes the fair value and Statement of Assets and Liabilities location, as of June 30, 2009, for the Partner Growth Stock Portfolio’s investments in financial derivative instruments by primary risk exposure as discussed under item (2) Significant Accounting Policies of the Notes to Financial Statements.
Derivatives by Risk Category | Statement of Assets and Liabilities Location | Fair Value | ||||
Liability Derivatives | ||||||
Foreign Exchange Contracts | ||||||
Forward Contract | Payable for forward contracts, Net Assets - Net unrealized appreciation/(depreciation) on Foreign currency forward contracts | 966 | ||||
Total Foreign Exchange Contracts | 966 | |||||
Total Liability Derivatives | $ | 966 | ||||
| The following table summarizes the change in net unrealized appreciation/(depreciation) and Statement of Operations location, for the period ended June 30, 2009, for the Partner Growth Stock Portfolio’s investments in financial derivative instruments by primary risk exposure. | ||||||
Derivatives by Risk Category | Statement of Operations Location | Change in Unrealized Appreciation/(Depreciation) recognized in Income | ||||
Foreign Exchange Contracts | ||||||
Forward Contract | Change in net unrealized appreciation/(depreciation) on Foreign currency forward contracts | (966 | ) | |||
Total Foreign Exchange Contracts | (966 | ) | ||||
Total | ($966 | ) | ||||
The accompanying Notes to Financial Statements are an integral part of this schedule.
191
Table of Contents
Partner Growth Stock Portfolio
Schedule of Investments as of June 30, 2009
(unaudited)
Investment in Affiliates
Affiliated issuers, as defined under the Investment Company Act of 1940, include those in which the Portfolio’s holdings of an issuer represent 5% or more of the outstanding voting securities of an issuer, or any affiliated mutual fund.
A summary of transactions for the fiscal year to date, in Partner Growth Stock Portfolio, is as follows:
Portfolio | Value December 31, 2008 | Gross Purchases | Gross Sales | Shares Held at June 30, 2009 | Value June 30, 2009 | Income Earned January 1, 2009 - June 30, 2009 | |||||||||||
Money Market | $ | 1,223,771 | $ | 7,167,887 | $ | 8,207,961 | 183,697 | $ | 183,697 | $ | 3,873 | ||||||
Thrivent Financial Securities Lending Trust | 779,005 | 8,732,183 | 8,940,638 | 570,550 | 570,550 | 3,128 | |||||||||||
Total Value and Income Earned | 2,002,776 | 754,247 | 7,001 | ||||||||||||||
The accompanying Notes to Financial Statements are an integral part of this schedule.
192
Table of Contents
Schedule of Investments as of June 30, 2009
(unaudited)
| Shares | Common Stock (97.0%) | Value | |||
| Consumer Discretionary (11.9%) | |||||
| 182,800 | Brinker International, Inc. | $ | 3,113,084 | ||
| 179,100 | Fortune Brands, Inc. | 6,221,934 | |||
| 355,200 | Harman International Industries, Inc. | 6,677,760 | |||
| 545,950 | Home Depot, Inc. | 12,900,798 | |||
| 372,800 | Macy’s, Inc | 4,384,128 | |||
| 51,100 | McDonald’s Corporation | 2,937,739 | |||
| 208,400 | McGraw-Hill Companies, Inc. | 6,274,924 | |||
| 59,050 | Sherwin-Williams Company | 3,173,937 | |||
| 122,220 | Tiffany & Company | 3,099,499 | |||
| 547,450 | Time Warner, Inc. | 13,790,266 | |||
| 197,950 | Toll Brothers, Inc.a,b | 3,359,211 | |||
| 210,750 | Walt Disney Company | 4,916,798 | |||
| 88,500 | Whirlpool Corporationa | 3,766,560 | |||
| 208,206 | Winnebago Industries, Inc.a | 1,546,971 | |||
Total Consumer Discretionary | 76,163,609 | ||||
| Consumer Staples (7.5%) | |||||
| 292,200 | Altria Group, Inc. | 4,789,158 | |||
| 162,380 | CVS Caremark Corporation | 5,175,051 | |||
| 93,500 | General Mills, Inc. | 5,237,870 | |||
| 123,700 | Kimberly-Clark Corporation | 6,485,591 | |||
| 346,250 | Kraft Foods, Inc. | 8,773,975 | |||
| 150,800 | Philip Morris International, Inc. | 6,577,896 | |||
| 621,750 | Tyson Foods, Inc. | 7,840,267 | |||
| 105,470 | Walgreen Company | 3,100,818 | |||
Total Consumer Staples | 47,980,626 | ||||
| Energy (14.0%) | |||||
| 395,200 | BJ Services Company | 5,386,576 | |||
| 185,366 | Chevron Corporation | 12,280,498 | |||
| 352,058 | ConocoPhillips | 14,807,559 | |||
| 52,200 | Devon Energy Corporation | 2,844,900 | |||
| 70,750 | EOG Resources, Inc. | 4,805,340 | |||
| 233,499 | Exxon Mobil Corporation | 16,323,915 | |||
| 201,000 | Halliburton Company | 4,160,700 | |||
| 785,700 | Nabors Industries, Ltd.b | 12,241,206 | |||
| 121,250 | Occidental Petroleum Corporation | 7,979,462 | |||
| 67,250 | Total SA ADR | 3,646,968 | |||
| 128,300 | XTO Energy, Inc. | 4,893,362 | |||
Total Energy | 89,370,486 | ||||
| Financials (20.9%) | |||||
| 87,050 | ACE, Ltd. | 3,850,221 | |||
| 117,750 | Allstate Corporation | 2,873,100 | |||
| 401,200 | Ameriprise Financial, Inc. | 9,737,124 | |||
| 640,950 | Bank of America Corporation | 8,460,540 | |||
| 127,200 | Capital One Financial Corporation | 2,783,136 | |||
| 28,100 | Everest Re Group, Ltd. | 2,011,117 | |||
| 208,550 | Fidelity National Financial, Inc. | 2,821,681 | |||
| 76,000 | Goldman Sachs Group, Inc. | 11,205,440 | |||
| 35,265 | Hartford Financial Services Group, Inc. | 418,596 | |||
| 715,052 | J.P. Morgan Chase & Company | 24,390,424 | |||
| 120,960 | Lazard, Ltd. | 3,256,243 | |||
| 113,500 | MetLife, Inc. | 3,406,135 | |||
| 160,700 | Morgan Stanley | 4,581,557 | |||
| 74,750 | PNC Financial Services Group, Inc. | 2,901,048 | |||
| 102,600 | Principal Financial Group, Inc. | 1,932,984 | |||
| 68,550 | S&P 500 Large Index Depository Receipts | 6,301,116 | |||
| 180,450 | State Street Corporation | 8,517,240 | |||
| 248,100 | SVB Financial Groupa,b | 6,753,282 | |||
| 104,600 | T. Rowe Price Group, Inc. | 4,358,682 | |||
| 230,450 | Travelers Companies, Inc. | 9,457,668 | |||
| 570,227 | Wells Fargo & Company | 13,833,707 | |||
Total Financials | 133,851,041 | ||||
| Health Care (14.9%) | |||||
| 65,170 | Alcon, Inc. | 7,567,540 | |||
| 2,120,350 | Boston Scientific Corporationb | 21,500,349 | |||
| 275,650 | Covidien, Ltd. | 10,320,336 | |||
| 64,950 | iShares Nasdaq Biotechnology Index Funda,b | 4,725,762 | |||
| 186,100 | Medtronic, Inc. | 6,493,029 | |||
| 704,900 | Pfizer, Inc. | 10,573,500 | |||
| 209,650 | Schering-Plough Corporation | 5,266,408 | |||
| 188,250 | WellPoint, Inc.b | 9,580,043 | |||
| 422,700 | Wyeth | 19,186,353 | |||
Total Health Care | 95,213,320 | ||||
| Industrials (7.6%) | |||||
| 107,000 | 3M Company | 6,430,700 | |||
| 97,500 | Canadian Pacific Railway, Ltd. | 3,880,500 | |||
| 65,050 | Caterpillar, Inc. | 2,149,252 | |||
| 99,450 | Cummins, Inc. | 3,501,635 | |||
| 113,300 | Eaton Corporation | 5,054,313 | |||
| 112,150 | FedEx Corporation | 6,237,783 | |||
| 140,650 | Ingersoll-Rand Companyb | 2,939,585 | |||
| 91,950 | Navistar International Corporationb | 4,009,020 | |||
| 277,850 | United Technologies Corporation | 14,437,086 | |||
Total Industrials | 48,639,874 | ||||
| Information Technology (8.8%) | |||||
| 173,400 | Agilent Technologies, Inc.b | 3,521,754 | |||
| 152,850 | Avnet, Inc.b | 3,214,436 | |||
| 59,000 | F5 Networks, Inc.b | 2,040,810 | |||
| 137,300 | International Business Machines Corporation | 14,336,866 | |||
| 152,250 | Lam Research Corporationb | 3,958,500 | |||
| 141,640 | Nokia Oyj ADR | 2,065,111 | |||
| 466,750 | Oracle Corporation | 9,997,785 | |||
| 1,257,000 | Teradyne, Inc.a,b | 8,623,020 | |||
| 272,300 | Texas Instruments, Inc. | 5,799,990 | |||
| 162,260 | Tyco Electronics, Ltd. | 3,016,413 | |||
Total Information Technology | 56,574,685 | ||||
| Materials (4.1%) | |||||
| 119,110 | E.I. du Pont de Nemours and Company | 3,051,598 | |||
| 227,700 | International Paper Company | 3,445,101 | |||
| 138,800 | PPG Industries, Inc. | 6,093,320 | |||
| 91,950 | Praxair, Inc. | 6,534,887 | |||
| 230,450 | Sealed Air Corporation | 4,251,802 | |||
| 92,600 | Weyerhaeuser Company | 2,817,818 | |||
Total Materials | 26,194,526 | ||||
The accompanying Notes to Financial Statements are an integral part of this schedule.
193
Table of Contents
Large Cap Value Portfolio
Schedule of Investments as of June 30, 2009
(unaudited)
| Shares | Common Stock (97.0%) | Value | ||||
| Telecommunications Services (4.3%) | ||||||
| 665,623 | AT&T, Inc. | $ | 16,534,075 | |||
| 352,955 | Verizon Communications, Inc. | 10,846,307 | ||||
Total Telecommunications Services | 27,380,382 | |||||
| Utilities (3.0%) | ||||||
| 78,850 | Entergy Corporation | 6,112,452 | ||||
| 139,350 | FirstEnergy Corporation | 5,399,813 | ||||
| 86,950 | FPL Group, Inc. | 4,943,977 | ||||
| 159,900 | Xcel Energy, Inc. | 2,943,759 | ||||
Total Utilities | 19,400,001 | |||||
Total Common Stock (cost $657,746,311) | 620,768,550 | |||||
Collateral Held for Securities Loaned (3.1%) | ||||||
| 19,683,341 | Thrivent Financial Securities Lending Trust | 19,683,341 | ||||
Total Collateral Held for Securities Loaned (cost $19,683,341) | 19,683,341 | |||||
| Shares or Principal Amount | Short-Term Investments (1.4%)c | |||||
Societe Generale North American | ||||||
| 7,300,000 | 0.130%, 7/1/2009 | 7,300,000 | ||||
| 1,890,317 | Thrivent Money Market Portfolio | 1,890,317 | ||||
Total Short-Term Investments (at amortized cost) | 9,190,317 | |||||
Total Investments (cost $686,619,969) 101.5% | $ | 649,642,208 | ||||
Other Assets and Liabilities, Net (1.5%) | (9,743,136 | ) | ||||
Total Net Assets 100.0% | $ | 639,899,072 | ||||
| a | All or a portion of the security is on loan as discussed in item 2(M) of the Notes to Financial Statements. |
| b | Non-income producing security. |
| c | The interest rate shown reflects the yield, coupon rate or, for securities purchased at a discount, the discount rate at the date of purchase. |
Definitions:
| ADR | - | American Depositary Receipt, which are certificates for an underlying foreign security’s shares held by an issuing U.S. depository bank. |
Unrealized Appreciation (Depreciation)
Gross unrealized appreciation and depreciation of investments, based on cost for federal income tax purposes, were as follows:
Gross unrealized appreciation | $ | 43,520,997 | ||
Gross unrealized depreciation | (80,498,758 | ) | ||
Net unrealized appreciation (depreciation) | $ | (36,977,761 | ) | |
Cost for federal income tax purposes | $ | 686,619,969 | ||
The accompanying Notes to Financial Statements are an integral part of this schedule.
194
Table of Contents
Large Cap Value Portfolio
Schedule of Investments as of June 30, 2009
(unaudited)
Fair Valuation Measurements
The following table is a summary of the inputs used, as of June 30, 2009, in valuing Large Cap Value Portfolio’s assets carried at fair value as discussed in the Notes to Financial Statements.
Investments in Securities | Total | Level 1 | Level 2 | Level 3 | ||||||||
Common Stock | ||||||||||||
Consumer Discretionary | 76,163,609 | 76,163,609 | — | — | ||||||||
Consumer Staples | 47,980,626 | 47,980,626 | — | — | ||||||||
Energy | 89,370,486 | 89,370,486 | — | — | ||||||||
Financials | 133,851,041 | 133,851,041 | — | — | ||||||||
Health Care | 95,213,320 | 95,213,320 | — | — | ||||||||
Industrials | 48,639,874 | 48,639,874 | — | — | ||||||||
Information Technology | 56,574,685 | 56,574,685 | — | — | ||||||||
Materials | 26,194,526 | 26,194,526 | — | — | ||||||||
Telecommunications Services | 27,380,382 | 27,380,382 | — | — | ||||||||
Utilities | 19,400,001 | 19,400,001 | — | — | ||||||||
Collateral Held for Securities Loaned | 19,683,341 | 19,683,341 | — | — | ||||||||
Short-Term Investments | 9,190,317 | 1,890,317 | 7,300,000 | — | ||||||||
Total | $ | 649,642,208 | $ | 642,342,208 | $ | 7,300,000 | $ | — | ||||
Investment in Affiliates
Affiliated issuers, as defined under the Investment Company Act of 1940, include those in which the Portfolio’s holdings of an issuer represent 5% or more of the outstanding voting securities of an issuer, or any affiliated mutual fund.
A summary of transactions for the fiscal year to date, in Large Cap Value Portfolio, is as follows:
Portfolio | Value December 31, 2008 | Gross Purchases | Gross Sales | Shares Held at June 30, 2009 | Value June 30, 2009 | Income Earned January 1, 2009 - June 30, 2009 | |||||||||||
Money Market | $ | 16,598,217 | $ | 32,920,134 | $ | 47,628,034 | 1,890,317 | $ | 1,890,317 | $ | 24,109 | ||||||
Thrivent Financial Securities Lending Trust | 11,994,350 | 200,280,555 | 192,591,564 | 19,683,341 | 19,683,341 | 100,343 | |||||||||||
Total Value and Income Earned | 28,592,567 | 21,573,658 | 124,452 | ||||||||||||||
The accompanying Notes to Financial Statements are an integral part of this schedule.
195
Table of Contents
Schedule of Investments as of June 30, 2009
(unaudited)
| Shares | Common Stock (92.5%) | Value | |||
| Consumer Discretionary (11.2%) | |||||
| 56,600 | Amazon.com, Inc.a | $ | 4,735,156 | ||
| 45,450 | Bed Bath & Beyond, Inc.a | 1,397,588 | |||
| 45,800 | Best Buy Company, Inc. | 1,533,842 | |||
| 61,000 | Brinker International, Inc. | 1,038,830 | |||
| 186,450 | D.R. Horton, Inc. | 1,745,172 | |||
| 59,950 | Fortune Brands, Inc. | 2,082,663 | |||
| 50,000 | Goodyear Tire & Rubber Companya | 563,000 | |||
| 119,900 | Harman International Industries, Inc. | 2,254,120 | |||
| 369,500 | Home Depot, Inc. | 8,731,285 | |||
| 69,350 | Kohl’s Corporationa | 2,964,713 | |||
| 124,500 | Macy’s, Inc | 1,464,120 | |||
| 96,750 | McDonald’s Corporation | 5,562,157 | |||
| 135,200 | McGraw-Hill Companies, Inc. | 4,070,872 | |||
| 168,450 | Melco PBL Entertainment Macau, Ltd. ADRa,b | 758,025 | |||
| 224,000 | MGM MIRAGEa,b,c | 1,431,360 | |||
| 19,650 | Sherwin-Williams Company | 1,056,187 | |||
| 94,400 | Starwood Hotels & Resorts Worldwide, Inc. | 2,095,680 | |||
| 40,550 | Tiffany & Company | 1,028,348 | |||
| 254,716 | Time Warner, Inc. | 6,416,296 | |||
| 68,450 | Toll Brothers, Inc.a | 1,161,596 | |||
| 29,800 | Whirlpool Corporationb | 1,268,288 | |||
| 69,904 | Winnebago Industries, Inc.b | 519,387 | |||
| 54,300 | Yum! Brands, Inc. | 1,810,362 | |||
Total Consumer Discretionary | 55,689,047 | ||||
| Consumer Staples (7.1%) | |||||
| 149,731 | Altria Group, Inc. | 2,454,091 | |||
| 40,800 | Avon Products, Inc. | 1,051,824 | |||
| 20,300 | Clorox Company | 1,133,349 | |||
| 155,740 | CVS Caremark Corporation | 4,963,434 | |||
| 31,277 | General Mills, Inc. | 1,752,138 | |||
| 8,125 | J.M. Smucker Company | 395,363 | |||
| 42,750 | Kimberly-Clark Corporation | 2,241,382 | |||
| 145,446 | Kraft Foods, Inc. | 3,685,602 | |||
| 81,050 | PepsiCo, Inc. | 4,454,508 | |||
| 50,331 | Philip Morris International, Inc. | 2,195,438 | |||
| 58,028 | Procter & Gamble Company | 2,965,231 | |||
| 208,150 | Tyson Foods, Inc. | 2,624,771 | |||
| 35,100 | Walgreen Company | 1,031,940 | |||
| 97,450 | Wal-Mart Stores, Inc. | 4,720,478 | |||
Total Consumer Staples | 35,669,549 | ||||
| Energy (12.0%) | |||||
| 132,400 | BJ Services Company | 1,804,612 | |||
| 62,000 | Chevron Corporation | 4,107,500 | |||
| 213,880 | ConocoPhillips | 8,995,793 | |||
| 52,800 | Devon Energy Corporation | 2,877,600 | |||
| 24,050 | EOG Resources, Inc. | 1,633,476 | |||
| 219,115 | Exxon Mobil Corporation | 15,318,330 | |||
| 136,900 | Halliburton Company | 2,833,830 | |||
| 28,700 | Hess Corporation | 1,542,625 | |||
| 324,000 | Nabors Industries, Ltd.a | 5,047,920 | |||
| 105,950 | Occidental Petroleum Corporation | 6,972,569 | |||
| 43,950 | Petroleo Brasileiro SA ADR | 1,801,071 | |||
| 22,329 | Total SA ADR | 1,210,902 | |||
| 89,000 | Weatherford International, Ltd.a | 1,740,840 | |||
| 110,450 | XTO Energy, Inc. | 4,212,563 | |||
Total Energy | 60,099,631 | ||||
| Financials (14.1%) | |||||
| 29,150 | ACE, Ltd. | 1,289,304 | |||
| 46,350 | Allstate Corporation | 1,130,940 | |||
| 20,000 | American Express Company | 464,800 | |||
| 174,270 | Ameriprise Financial, Inc. | 4,229,533 | |||
| 473,653 | Bank of America Corporation | 6,252,220 | |||
| 42,550 | Capital One Financial Corporation | 930,994 | |||
| 31,800 | Citigroup, Inc.b | 94,446 | |||
| 100,900 | Fidelity National Financial, Inc. | 1,365,177 | |||
| 63,450 | Goldman Sachs Group, Inc. | 9,355,068 | |||
| 13,700 | IntercontinentalExchange, Inc.a | 1,565,088 | |||
| 378,058 | J.P. Morgan Chase & Company | 12,895,558 | |||
| 39,240 | Lazard, Ltd. | 1,056,341 | |||
| 68,650 | Lincoln National Corporation | 1,181,467 | |||
| 41,400 | Loews Corporation | 1,134,360 | |||
| 37,850 | MetLife, Inc. | 1,135,878 | |||
| 135,550 | Morgan Stanley | 3,864,531 | |||
| 24,900 | PNC Financial Services Group, Inc. | 966,369 | |||
| 35,494 | Principal Financial Group, Inc. | 668,707 | |||
| 61,958 | Prudential Financial, Inc. | 2,306,077 | |||
| 8,987 | Reinsurance Group of America, Inc. | 313,736 | |||
| 95,950 | State Street Corporation | 4,528,840 | |||
| 82,900 | SVB Financial Groupa,b | 2,256,538 | |||
| 35,200 | T. Rowe Price Group, Inc. | 1,466,784 | |||
| 134,400 | TD Ameritrade Holding Corporationa | 2,357,376 | |||
| 77,056 | Travelers Companies, Inc. | 3,162,378 | |||
| 191,454 | Wells Fargo & Company | 4,644,674 | |||
Total Financials | 70,617,184 | ||||
| Health Care (14.8%) | |||||
| 47,976 | Abbott Laboratories | 2,256,791 | |||
| 42,510 | Alcon, Inc. | 4,936,261 | |||
| 42,450 | Allergan, Inc. | 2,019,771 | |||
| 26,350 | Amgen, Inc.a | 1,394,969 | |||
| 957,850 | Boston Scientific Corporationa | 9,712,599 | |||
| 160,200 | Covidien, Ltd. | 5,997,888 | |||
| 34,100 | Express Scripts, Inc.a | 2,344,375 | |||
| 150,290 | Gilead Sciences, Inc.a | 7,039,584 | |||
| 42,100 | Hospira, Inc.a | 1,621,692 | |||
| 22,200 | iShares Nasdaq Biotechnology Index Funda,b | 1,615,272 | |||
| 130,086 | Johnson & Johnson | 7,388,885 | |||
| 60,420 | Medtronic, Inc. | 2,108,054 | |||
| 274,965 | Pfizer, Inc. | 4,124,475 | |||
| 70,100 | Schering-Plough Corporation | 1,760,912 | |||
| 51,000 | UnitedHealth Group, Inc. | 1,273,980 | |||
| 67,350 | Vertex Pharmaceuticals, Inc.a | 2,400,354 | |||
| 112,014 | WellPoint, Inc.a | 5,700,392 | |||
| 220,000 | Wyeth | 9,985,800 | |||
Total Health Care | 73,682,054 | ||||
| Industrials (7.8%) | |||||
| 35,700 | 3M Company | 2,145,570 | |||
| 35,100 | Canadian Pacific Railway, Ltd. | 1,396,980 | |||
| 34,541 | Caterpillar, Inc. | 1,141,235 | |||
The accompanying Notes to Financial Statements are an integral part of this schedule.
196
Table of Contents
Large Cap Stock Portfolio
Schedule of Investments as of June 30, 2009
(unaudited)
| Shares | Common Stock (92.5%) | Value | |||
| Industrials (7.8%) - continued | |||||
| 33,300 | Cummins, Inc. | $ | 1,172,493 | ||
| 39,382 | Danaher Corporation | 2,431,445 | |||
| 403,449 | Delta Air Lines, Inc.a | 2,335,970 | |||
| 65,850 | Diana Shipping, Inc.b | 877,122 | |||
| 38,400 | Dover Corporation | 1,270,656 | |||
| 39,350 | Eaton Corporation | 1,755,403 | |||
| 37,850 | FedEx Corporation | 2,105,217 | |||
| 223,239 | General Electric Company | 2,616,361 | |||
| 70,450 | Honeywell International, Inc. | 2,212,130 | |||
| 47,050 | Ingersoll-Rand Companya | 983,345 | |||
| 38,547 | Navistar International Corporationa | 1,680,649 | |||
| 41,300 | Raytheon Company | 1,834,959 | |||
| 66,492 | Union Pacific Corporation | 3,461,574 | |||
| 161,568 | United Technologies Corporation | 8,395,073 | |||
| 66,350 | Werner Enterprises, Inc. | 1,202,262 | |||
Total Industrials | 39,018,444 | ||||
| Information Technology (16.8%) | |||||
| 58,050 | Agilent Technologies, Inc.a | 1,178,996 | |||
| 53,274 | Apple, Inc.a | 7,587,816 | |||
| 49,700 | Avnet, Inc.a | 1,045,191 | |||
| 51,800 | Broadcom Corporationa | 1,284,122 | |||
| 150,050 | Brocade Communicationsa | 1,173,391 | |||
| 270,080 | Cisco Systems, Inc.a | 5,034,291 | |||
| 163,250 | Corning, Inc. | 2,621,795 | |||
| 144,500 | Dell, Inc.a | 1,983,985 | |||
| 97,900 | EMC Corporationa | 1,282,490 | |||
| 20,350 | F5 Networks, Inc.a | 703,907 | |||
| 18,421 | Google, Inc.a | 7,766,109 | |||
| 196,800 | Intel Corporation | 3,257,040 | |||
| 79,108 | International Business Machines Corporation | 8,260,457 | |||
| 53,150 | Lam Research Corporationa | 1,381,900 | |||
| 24,850 | Linear Technology Corporation | 580,247 | |||
| 91,350 | Marvell Technology Group, Ltd.a | 1,063,314 | |||
| 7,450 | MasterCard, Inc. | 1,246,459 | |||
| 109,150 | Maxim Integrated Products, Inc. | 1,712,564 | |||
| 227,720 | Micron Technology, Inc.a,b | 1,152,263 | |||
| 14,000 | Microsoft Corporation | 332,780 | |||
| 329,388 | Oracle Corporation | 7,055,491 | |||
| 176,214 | QUALCOMM, Inc. | 7,964,873 | |||
| 31,650 | Research in Motion, Ltd.a | 2,248,732 | |||
| 129,000 | Symantec Corporationa | 2,007,240 | |||
| 126,900 | Taiwan Semiconductor Manufacturing Company, Ltd. ADR | 1,194,129 | |||
| 420,850 | Teradyne, Inc.a | 2,887,031 | |||
| 94,100 | Texas Instruments, Inc. | 2,004,330 | |||
| 54,000 | Tyco Electronics, Ltd. | 1,003,860 | |||
| 69,350 | VeriSign, Inc.a | 1,281,588 | |||
| 50,800 | Visa, Inc. | 3,162,808 | |||
| 74,557 | Western Union Company | 1,222,735 | |||
| 91,550 | Yahoo!, Inc.a | 1,433,673 | |||
Total Information Technology | 84,115,607 | ||||
| Materials (3.5%) | |||||
| 37,700 | ArcelorMittalb | 1,247,116 | |||
| 39,637 | E.I. du Pont de Nemours and Company | 1,015,500 | |||
| 28,550 | Freeport-McMoRan Copper & Gold, Inc. | 1,430,640 | |||
| 76,000 | International Paper Company | 1,149,880 | |||
| 77,650 | Mosaic Company | 3,439,895 | |||
| 46,350 | PPG Industries, Inc. | 2,034,765 | |||
| 68,509 | Praxair, Inc. | 4,868,935 | |||
| 77,550 | Sealed Air Corporation | 1,430,797 | |||
| 30,900 | Weyerhaeuser Company | 940,287 | |||
Total Materials | 17,557,815 | ||||
| Telecommunications Services (2.7%) | |||||
| 239,900 | AT&T, Inc. | 5,959,116 | |||
| 81,791 | Crown Castle International Corporationa | 1,964,620 | |||
| 310,900 | Qwest Communications International, Inc.b | 1,290,235 | |||
| 131,200 | Verizon Communications, Inc. | 4,031,776 | |||
Total Telecommunications Services | 13,245,747 | ||||
| Utilities (2.5%) | |||||
| 22,750 | American Water Works Company, Inc. | 434,753 | |||
| 39,500 | DTE Energy Company | 1,264,000 | |||
| 29,300 | FPL Group, Inc. | 1,665,998 | |||
| 257,782 | Southern Company | 8,032,487 | |||
| 53,850 | Xcel Energy, Inc. | 991,378 | |||
Total Utilities | 12,388,616 | ||||
Total Common Stock (cost $461,163,267) | 462,083,694 | ||||
Collateral Held for Securities Loaned (2.1%) | |||||
| 10,379,018 | Thrivent Financial Securities Lending Trust | 10,379,018 | |||
Total Collateral Held for Securities Loaned (cost $10,379,018) | 10,379,018 | ||||
Shares or | Short-Term Investments (6.7%)d | ||||
Barclays Bank plc Repurchase Agreement | |||||
| 11,740,000 | 0.080%, 7/1/2009e | 11,740,000 | |||
Federal Home Loan Bank Discount Notes | |||||
| 4,995,000 | 0.150%, 7/8/2009 | 4,994,854 | |||
Federal Home Loan Mortgage Corporation Discount Notes | |||||
| 5,000,000 | 0.120%, 8/3/2009 | 4,999,450 | |||
| 2,500,000 | 0.200%, 9/21/2009f | 2,498,879 | |||
Ranger Funding Company, LLC | |||||
| 7,375,000 | 0.100%, 7/1/2009 | 7,375,000 | |||
The accompanying Notes to Financial Statements are an integral part of this schedule.
197
Table of Contents
Large Cap Stock Portfolio
Schedule of Investments as of June 30, 2009
(unaudited)
| Shares or Principal Amount | Short-Term Investments (6.7%)d | Value | ||||
| 2,112,706 | Thrivent Money Market Portfolio | 2,112,706 | ||||
Total Short-Term Investments (at amortized cost) | 33,720,889 | |||||
Total Investments (cost $505,263,174) 101.3% | $ | 506,183,601 | ||||
Other Assets and Liabilities, Net (1.3%) | (6,402,395 | ) | ||||
Total Net Assets 100.0% | $ | 499,781,206 | ||||
| a | Non-income producing security. |
| b | All or a portion of the security is on loan as discussed in item 2(M) of the Notes to Financial Statements. |
| c | All or a portion of the security was earmarked to cover options. |
| d | The interest rate shown reflects the yield, coupon rate or, for securities purchased at a discount, the discount rate at the date of purchase. |
| e | Repurchase agreement dated June 30, 2009, $11,740,026 maturing July 1, 2009, collateralized by Federal Farm Credit Banks ($589,074 at 5.000% due 9/18/2009, $506,824 at 2.900% due 10/2/2009, $506,260 at 3.500% due 10/3/2011, $513,421 at 5.050% due 2/1/2023), Federal Farm Credit Discount Notes ($499,950 at Zero Coupon due 7/29/2009), Federal Home Loan Bank Discount Notes ($500,000 at Zero Coupon due 7/6/2009), Federal Home Loan Banks ($515,960 at 6.500% due 8/14/2009, $501,521 at Zero Coupon due 10/13/2009, $510,128 at 2.375% due 3/12/2010, $206,666 at 3.750% due 4/1/2010, $520,891 at 4.500% due 9/16/2013, $511,952 at 5.050% due 10/2/2013), Federal Home Loan Mortgage Corporation ($562,557 at 4.750% due 11/3/2009, $543,382 at 1.500% due 1/7/2011, $521,628 at Zero Coupon due 1/28/2011, $588,477 at 4.125% due 9/27/2013, $556,791 at 3.750% due 3/27/2019, $510,303 at 5.100% due 9/20/2020, $542,160 at 5.750% due 2/7/2022, $502,938 at 5.010% due 1/30/2023, $510,642 at 5.600% due 2/27/2023, $517,248 at 5.550% due 1/13/2025), Federal Home Loan Mortgage Corporation Discount Notes ($500,000 at Zero Coupon due 7/7/2009, $240,807 at Zero Coupon due 11/9/2009). |
| f | At June 30, 2009, $2,498,879 of investments were held on deposit with the counterparty and pledged as the initial margin deposit for open futures contracts. |
Definitions:
| ADR | - | American Depositary Receipt, which are certificates for an underlying foreign security’s shares held by an issuing U.S. depository bank. |
Unrealized Appreciation (Depreciation)
Gross unrealized appreciation and depreciation of investments, based on cost for federal income tax purposes, were as follows:
Gross unrealized appreciation | $ | 43,247,694 | ||
Gross unrealized depreciation | (42,327,267 | ) | ||
Net unrealized appreciation (depreciation) | $ | 920,427 | ||
Cost for federal income tax purposes | $ | 505,263,174 | ||
The accompanying Notes to Financial Statements are an integral part of this schedule.
198
Table of Contents
Large Cap Stock Portfolio
Schedule of Investments as of June 30, 2009
(unaudited)
Fair Valuation Measurements
The following table is a summary of the inputs used, as of June 30, 2009, in valuing Large Cap Stock Portfolio’s assets carried at fair value as discussed in the Notes to Financial Statements.
Investments in Securities | Total | Level 1 | Level 2 | Level 3 | ||||||||||
Common Stock | ||||||||||||||
Consumer Discretionary | 55,689,047 | 55,689,047 | — | — | ||||||||||
Consumer Staples | 35,669,549 | 35,669,549 | — | — | ||||||||||
Energy | 60,099,631 | 60,099,631 | — | — | ||||||||||
Financials | 70,617,184 | 70,617,184 | — | — | ||||||||||
Health Care | 73,682,054 | 73,682,054 | — | — | ||||||||||
Industrials | 39,018,444 | 39,018,444 | — | — | ||||||||||
Information Technology | 84,115,607 | 84,115,607 | — | — | ||||||||||
Materials | 17,557,815 | 17,557,815 | — | — | ||||||||||
Telecommunications Services | 13,245,747 | 13,245,747 | — | — | ||||||||||
Utilities | 12,388,616 | 12,388,616 | — | — | ||||||||||
Collateral Held for Securities Loaned | 10,379,018 | 10,379,018 | — | — | ||||||||||
Short-Term Investments | 33,720,889 | 2,112,706 | 31,608,183 | — | ||||||||||
Total | $ | 506,183,601 | $ | 474,575,418 | $ | 31,608,183 | $ | — | ||||||
Other Financial Instruments* | ($209,123 | ) | ($209,123 | ) | $ | — | $ | — | ||||||
| * | Other Financial Instruments include Futures, Forwards, Written Options and Swap agreements. |
Futures Contracts | Number of Contracts Long/(Short) | Expiration Date | Notional Principal Amount | Value | Unrealized Gain/(Loss) | |||||||||||
S&P 500 Index Futures | 107 | September 2009 | $ | 24,716,132 | $ | 24,489,626 | ($ | 226,506 | ) | |||||||
Total Futures Contracts | ($ | 226,506 | ) | |||||||||||||
Call Options Written | Number of Contracts | Exercise Price | Expiration Date | Value | Unrealized Gain/(Loss) | |||||||||||
MGM MIRAGE | 621 | $ | 7.00 | July 2009 | ($12,420 | ) | $ | 17,383 | ||||||||
Total Call Options Written | ($12,420 | ) | $ | 17,383 | ||||||||||||
The following table summarizes the fair value and Statement of Assets and Liabilities location, as of June 30, 2009, for the Large Cap Stock Portfolio’s investments in financial derivative instruments by primary risk exposure as discussed under item (2) Significant Accounting Policies of the Notes to Financial Statements.
Derivatives by Risk Category | Statement of Assets and Liabilities Location | Fair Value | |||
Asset Derivatives | |||||
Equity Contracts | |||||
Option Written | Net Assets - Net unrealized appreciation/(depreciation) on Written option contracts | 17,383 | |||
Total Equity Contracts | 17,383 | ||||
Total Asset Derivatives | $ | 17,383 | |||
Liability Derivatives | |||||
Equity Contracts | |||||
Future* | Net Assets - Net unrealized appreciation/(depreciation) on Futures contracts | 226,506 | |||
Total Equity Contracts | 226,506 | ||||
Total Liability Derivatives | $ | 226,506 | |||
| * | Includes cumulative appreciation/depreciation of futures contracts as reported in the Schedule of Investments. Only current day’s variation margin is reported within the Statement of Assets and Liabilities. |
The accompanying Notes to Financial Statements are an integral part of this schedule.
199
Table of Contents
Large Cap Stock Portfolio
Schedule of Investments as of June 30, 2009
(unaudited)
The following table summarizes the net realized gains/(losses) and Statement of Operations location, for the period ended June 30, 2009, for Large Cap Stock Portfolio’s investments in financial derivative instruments by primary risk exposure.
Derivatives by Risk Category | Statement of Operations Location | Realized Gains/(Losses) recognized in Income | ||||
Equity Contracts | ||||||
Option Written | Net realized gains/(losses) on Written option contracts | (115,908 | ) | |||
Future | Net realized gains/(losses) on Futures contracts | 3,835,491 | ||||
Total Equity Contracts | 3,719,583 | |||||
Total | $ | 3,719,583 | ||||
The following table summarizes the change in net unrealized appreciation/(depreciation) and Statement of Operations location, for the period ended June 30, 2009, for the Large Cap Stock Portfolio’s investments in financial derivative instruments by primary risk exposure.
Derivatives by Risk Category | Statement of Operations Location | Change in Unrealized Appreciation/(Depreciation) recognized in Income | |||
Equity Contracts | |||||
Option Written | Change in net unrealized appreciation/(depreciation) on Written option contracts | 17,383 | |||
Future | Change in net unrealized appreciation/(depreciation) on Futures contracts | (294,821 | ) | ||
Total Equity Contracts | (277,438 | ) | |||
Total | ($277,438 | ) | |||
Investment in Affiliates
Affiliated issuers, as defined under the Investment Company Act of 1940, include those in which the Portfolio’s holdings of an issuer represent 5% or more of the outstanding voting securities of an issuer, or any affiliated mutual fund.
A summary of transactions for the fiscal year to date, in Large Cap Stock Portfolio, is as follows:
Portfolio | Value December 31, 2008 | Gross Purchases | Gross Sales | Shares Held at June 30, 2009 | Value June 30, 2009 | Income Earned January 1, 2009 - June 30, 2009 | |||||||||||
Money Market | $ | 23,020,086 | $ | 120,430,198 | $ | 141,337,578 | 2,112,706 | $ | 2,112,706 | $ | 57,317 | ||||||
Thrivent Financial Securities Lending Trust | 9,071,777 | 66,807,192 | 65,499,951 | 10,379,018 | 10,379,018 | 51,539 | |||||||||||
Total Value and Income Earned | 32,091,863 | 12,491,724 | 108,856 | ||||||||||||||
The accompanying Notes to Financial Statements are an integral part of this schedule.
200
Table of Contents
Schedule of Investments as of June 30, 2009
(unaudited)
| Shares | Common Stock (98.3%) | Value | |||
| Consumer Discretionary (8.8%) | |||||
| 3,100 | Abercrombie & Fitch Companya | $ | 78,709 | ||
| 11,600 | Amazon.com, Inc.b | 970,456 | |||
| 3,900 | Apollo Group, Inc.b | 277,368 | |||
| 3,900 | AutoNation, Inc.b | 67,665 | |||
| 1,400 | AutoZone, Inc.b | 211,554 | |||
| 9,400 | Bed Bath & Beyond, Inc.b | 289,050 | |||
| 12,325 | Best Buy Company, Inc. | 412,764 | |||
| 3,000 | Big Lots, Inc.b | 63,090 | |||
| 2,200 | Black & Decker Corporation | 63,052 | |||
| 15,800 | Carnival Corporation | 407,166 | |||
| 24,572 | CBS Corporation | 170,038 | |||
| 4,500 | Centex Corporation | 38,070 | |||
| 11,500 | Coach, Inc. | 309,120 | |||
| 104,315 | Comcast Corporation | 1,511,524 | |||
| 10,000 | D.R. Horton, Inc. | 93,600 | |||
| 4,950 | Darden Restaurants, Inc. | 163,251 | |||
| 2,200 | DeVry, Inc. | 110,088 | |||
| 19,000 | DIRECTV Group, Inc.a,b | 469,490 | |||
| 9,700 | Eastman Kodak Company | 28,712 | |||
| 7,600 | Expedia, Inc.b | 114,836 | |||
| 5,100 | Family Dollar Stores, Inc. | 144,330 | |||
| 116,911 | Ford Motor Companyb | 709,650 | |||
| 5,400 | Fortune Brands, Inc. | 187,596 | |||
| 5,900 | GameStop Corporationb | 129,859 | |||
| 8,400 | Gannett Company, Inc. | 29,988 | |||
| 16,662 | Gap, Inc. | 273,257 | |||
| 5,800 | Genuine Parts Company | 194,648 | |||
| 8,700 | Goodyear Tire & Rubber Companyb | 97,962 | |||
| 12,300 | H&R Block, Inc. | 211,929 | |||
| 8,400 | Harley-Davidson, Inc.a | 136,164 | |||
| 2,500 | Harman International Industries, Inc. | 47,000 | |||
| 4,450 | Hasbro, Inc. | 107,868 | |||
| 61,300 | Home Depot, Inc. | 1,448,519 | |||
| 10,700 | International Game Technology | 170,130 | |||
| 17,267 | Interpublic Group of Companies, Inc.b | 87,198 | |||
| 8,000 | J.C. Penney Company, Inc. | 229,680 | |||
| 21,500 | Johnson Controls, Inc. | 466,980 | |||
| 2,700 | KB Home | 36,936 | |||
| 11,000 | Kohl’s Corporationb | 470,250 | |||
| 5,700 | Leggett & Platt, Inc. | 86,811 | |||
| 5,100 | Lennar Corporation | 49,419 | |||
| 9,804 | Limited Brands, Inc. | 117,354 | |||
| 53,400 | Lowe’s Companies, Inc. | 1,036,494 | |||
| 15,168 | Macy’s, Inc | 178,376 | |||
| 10,739 | Marriott International, Inc. | 237,010 | |||
| 12,950 | Mattel, Inc. | 207,847 | |||
| 39,900 | McDonald’s Corporation | 2,293,851 | |||
| 11,400 | McGraw-Hill Companies, Inc. | 343,254 | |||
| 1,300 | Meredith Corporation | 33,215 | |||
| 4,200 | New York Times Companya | 23,142 | |||
| 10,073 | Newell Rubbermaid, Inc. | 104,860 | |||
| 83,300 | News Corporation | 758,863 | |||
| 14,000 | NIKE, Inc. | 724,920 | |||
| 5,800 | Nordstrom, Inc.a | 115,362 | |||
| 9,900 | Office Depot, Inc.b | 45,144 | |||
| 11,200 | Omnicom Group, Inc. | 353,696 | |||
| 4,900 | O’Reilly Automotive, Inc.b | 186,592 | |||
| 2,000 | Polo Ralph Lauren Corporation | 107,080 | |||
| 7,800 | Pulte Homes, Inc.a | 68,874 | |||
| 4,500 | RadioShack Corporation | 62,820 | |||
| 3,300 | Scripps Networks Interactive | 91,839 | |||
| 2,032 | Sears Holdings Corporationa,b | 135,169 | |||
| 3,600 | Sherwin-Williams Company | 193,500 | |||
| 2,100 | Snap-On, Inc. | 60,354 | |||
| 2,900 | Stanley Works | 98,136 | |||
| 25,875 | Staples, Inc. | 521,899 | |||
| 26,600 | Starbucks Corporationb | 369,474 | |||
| 6,800 | Starwood Hotels & Resorts Worldwide, Inc. | 150,960 | |||
| 27,200 | Target Corporation | 1,073,584 | |||
| 4,500 | Tiffany & Company | 114,120 | |||
| 12,758 | Time Warner Cable, Inc.a | 404,046 | |||
| 43,250 | Time Warner, Inc. | 1,089,467 | |||
| 15,000 | TJX Companies, Inc. | 471,900 | |||
| 3,200 | VF Corporation | 177,120 | |||
| 21,972 | Viacom, Inc.b | 498,764 | |||
| 67,147 | Walt Disney Company | 1,566,540 | |||
| 170 | Washington Post Companya | 59,871 | |||
| 2,657 | Whirlpool Corporationa | 113,082 | |||
| 6,372 | Wyndham Worldwide Corporation | 77,229 | |||
| 2,400 | Wynn Resorts, Ltd.a,b | 84,720 | |||
| 16,680 | Yum! Brands, Inc. | 556,111 | |||
Total Consumer Discretionary | 26,072,416 | ||||
| Consumer Staples (11.8%) | |||||
| 74,800 | Altria Group, Inc. | 1,225,972 | |||
| 23,168 | Archer-Daniels-Midland Company | 620,207 | |||
| 15,400 | Avon Products, Inc. | 397,012 | |||
| 3,525 | Brown-Forman Corporation | 151,504 | |||
| 7,200 | Campbell Soup Company | 211,824 | |||
| 5,000 | Clorox Company | 279,150 | |||
| 72,000 | Coca-Cola Company | 3,455,280 | |||
| 11,500 | Coca-Cola Enterprises, Inc. | 191,475 | |||
| 18,100 | Colgate-Palmolive Company | 1,280,394 | |||
| 16,200 | ConAgra Foods, Inc. | 308,772 | |||
| 7,100 | Constellation Brands, Inc.b | 90,028 | |||
| 15,700 | Costco Wholesale Corporation | 717,490 | |||
| 52,644 | CVS Caremark Corporation | 1,677,764 | |||
| 6,400 | Dean Foods Companyb | 122,816 | |||
| 9,200 | Dr. Pepper Snapple Group, Inc.b | 194,948 | |||
| 4,200 | Estee Lauder Companies, Inc. | 137,214 | |||
| 11,900 | General Mills, Inc. | 666,638 | |||
| 11,400 | H.J. Heinz Company | 406,980 | |||
| 6,000 | Hershey Company | 216,000 | |||
| 2,500 | Hormel Foods Corporation | 86,350 | |||
| 4,251 | J.M. Smucker Company | 206,854 | |||
| 9,100 | Kellogg Company | 423,787 | |||
| 14,992 | Kimberly-Clark Corporation | 786,031 | |||
| 53,352 | Kraft Foods, Inc. | 1,351,940 | |||
| 23,600 | Kroger Company | 520,380 | |||
| 6,100 | Lorillard, Inc. | 413,397 | |||
| 4,700 | McCormick & Company, Inc. | 152,891 | |||
| 5,400 | Molson Coors Brewing Company | 228,582 | |||
| 4,900 | Pepsi Bottling Group, Inc. | 165,816 | |||
| 56,270 | PepsiCo, Inc. | 3,092,599 | |||
| 71,000 | Philip Morris International, Inc. | 3,097,020 | |||
| 105,538 | Procter & Gamble Company | 5,392,992 | |||
The accompanying Notes to Financial Statements are an integral part of this schedule.
201
Table of Contents
Large Cap Index Portfolio
Schedule of Investments as of June 30, 2009
(unaudited)
| Shares | Common Stock (98.3%) | Value | |||
| Consumer Staples (11.8%) - continued | |||||
| 6,100 | Reynolds American, Inc. | $ | 235,582 | ||
| 15,500 | Safeway, Inc. | 315,735 | |||
| 25,200 | Sara Lee Corporation | 245,952 | |||
| 7,681 | SUPERVALU, Inc. | 99,469 | |||
| 21,300 | SYSCO Corporation | 478,824 | |||
| 10,900 | Tyson Foods, Inc. | 137,449 | |||
| 35,900 | Walgreen Company | 1,055,460 | |||
| 80,800 | Wal-Mart Stores, Inc. | 3,913,952 | |||
| 5,100 | Whole Foods Market, Inc.a | 96,798 | |||
Total Consumer Staples | 34,849,328 | ||||
| Energy (12.2%) | |||||
| 18,072 | Anadarko Petroleum Corporation | 820,288 | |||
| 12,120 | Apache Corporation | 874,458 | |||
| 11,200 | Baker Hughes, Inc. | 408,128 | |||
| 10,600 | BJ Services Company | 144,478 | |||
| 3,700 | Cabot Oil & Gas Corporation | 113,368 | |||
| 7,800 | Cameron International Corporationb | 220,740 | |||
| 20,300 | Chesapeake Energy Corporation | 402,549 | |||
| 72,496 | Chevron Corporation | 4,802,860 | |||
| 53,549 | ConocoPhillips | 2,252,271 | |||
| 6,500 | CONSOL Energy, Inc. | 220,740 | |||
| 9,000 | Denbury Resources, Inc.b | 132,570 | |||
| 16,000 | Devon Energy Corporation | 872,000 | |||
| 2,500 | Diamond Offshore Drilling, Inc. | 207,625 | |||
| 25,318 | El Paso Corporation | 233,685 | |||
| 5,100 | ENSCO International, Inc. | 177,837 | |||
| 9,000 | EOG Resources, Inc. | 611,280 | |||
| 176,608 | Exxon Mobil Corporation | 12,346,665 | |||
| 4,500 | FMC Technologies, Inc.b | 169,110 | |||
| 32,400 | Halliburton Company | 670,680 | |||
| 10,300 | Hess Corporation | 553,625 | |||
| 25,568 | Marathon Oil Corporation | 770,364 | |||
| 3,100 | Massey Energy Company | 60,574 | |||
| 6,900 | Murphy Oil Corporation | 374,808 | |||
| 10,200 | Nabors Industries, Ltd.b | 158,916 | |||
| 15,100 | National Oilwell Varco, Inc.b | 493,166 | |||
| 6,300 | Noble Energy, Inc. | 371,511 | |||
| 29,300 | Occidental Petroleum Corporation | 1,928,233 | |||
| 9,700 | Peabody Energy Corporation | 292,552 | |||
| 4,200 | Pioneer Natural Resources Company | 107,100 | |||
| 5,600 | Range Resources Corporation | 231,896 | |||
| 4,100 | Rowan Companies, Inc. | 79,212 | |||
| 43,300 | Schlumberger, Ltd. | 2,342,963 | |||
| 7,900 | Smith International, Inc. | 203,425 | |||
| 12,400 | Southwestern Energy Companyb | 481,740 | |||
| 23,304 | Spectra Energy Corporation | 394,304 | |||
| 4,200 | Sunoco, Inc. | 97,440 | |||
| 5,000 | Tesoro Petroleum Corporation | 63,650 | |||
| 20,100 | Valero Energy Corporation | 339,489 | |||
| 20,900 | Williams Companies, Inc. | 326,249 | |||
| 20,950 | XTO Energy, Inc. | 799,033 | |||
Total Energy | 36,151,582 | ||||
| Financials (13.3%) | |||||
| 16,900 | AFLAC, Inc. | 525,421 | |||
| 19,382 | Allstate Corporation | 472,921 | |||
| 43,000 | American Express Company | 999,320 | |||
| 97,340 | American International Group, Inc.a | 112,914 | |||
| 9,200 | Ameriprise Financial, Inc. | 223,284 | |||
| 9,925 | Aon Corporation | 375,860 | |||
| 4,236 | Apartment Investment & Management Companya | 37,489 | |||
| 4,300 | Assurant, Inc. | 103,587 | |||
| 2,901 | AvalonBay Communities, Inc. | 162,282 | |||
| 292,610 | Bank of America Corporation | 3,862,452 | |||
| 43,252 | Bank of New York Mellon Corporation | 1,267,716 | |||
| 23,400 | BB&T Corporationa | 514,332 | |||
| 5,000 | Boston Properties, Inc. | 238,500 | |||
| 16,373 | Capital One Financial Corporation | 358,241 | |||
| 8,600 | CB Richard Ellis Group, Inc.b | 80,496 | |||
| 33,925 | Charles Schwab Corporation | 595,045 | |||
| 12,700 | Chubb Corporation | 506,476 | |||
| 5,838 | Cincinnati Financial Corporation | 130,479 | |||
| 14,100 | CIT Group, Inc.a | 30,315 | |||
| 200,139 | Citigroup, Inc.a | 594,413 | |||
| 2,400 | CME Group, Inc. | 746,664 | |||
| 5,450 | Comerica, Inc. | 115,268 | |||
| 17,425 | Discover Financial Services | 178,955 | |||
| 36,400 | E*TRADE Financial Corporationb | 46,592 | |||
| 9,900 | Equity Residential REIT | 220,077 | |||
| 3,200 | Federated Investors, Inc. | 77,088 | |||
| 26,594 | Fifth Third Bancorp | 188,817 | |||
| 7,720 | First Horizon National Corporationb | 92,640 | |||
| 5,500 | Franklin Resources, Inc. | 396,055 | |||
| 15,700 | Genworth Financial, Inc. | 109,743 | |||
| 18,200 | Goldman Sachs Group, Inc. | 2,683,408 | |||
| 11,800 | Hartford Financial Services Group, Inc. | 140,066 | |||
| 9,800 | Health Care Property Investors, Inc. | 207,662 | |||
| 4,000 | Health Care REIT, Inc. | 136,400 | |||
| 21,800 | Host Marriott Corporation | 182,902 | |||
| 18,900 | Hudson City Bancorp, Inc. | 251,181 | |||
| 19,671 | Huntington Bancshares, Inc.a | 82,225 | |||
| 2,600 | IntercontinentalExchange, Inc.b | 297,024 | |||
| 14,900 | Invesco, Ltd. | 265,518 | |||
| 141,148 | J.P. Morgan Chase & Company | 4,814,558 | |||
| 5,800 | Janus Capital Group, Inc. | 66,120 | |||
| 25,600 | KeyCorp | 134,144 | |||
| 11,700 | Kimco Realty Corporation | 117,585 | |||
| 5,200 | Legg Mason, Inc. | 126,776 | |||
| 6,600 | Leucadia National Corporationb | 139,194 | |||
| 10,694 | Lincoln National Corporation | 184,044 | |||
| 13,100 | Loews Corporation | 358,940 | |||
| 3,000 | M&T Bank Corporationa | 152,790 | |||
| 18,900 | Marsh & McLennan Companies, Inc. | 380,457 | |||
| 12,700 | Marshall & Ilsley Corporation | 60,960 | |||
| 6,150 | MBIA, Inc.a,b | 26,630 | |||
| 29,632 | MetLife, Inc. | 889,256 | |||
| 6,900 | Moody’s Corporation | 181,815 | |||
| 48,950 | Morgan Stanley | 1,395,564 | |||
| 5,000 | Nasdaq OMX Group, Inc.b | 106,550 | |||
| 8,700 | Northern Trust Corporation | 467,016 | |||
| 9,400 | NYSE Euronext | 256,150 | |||
The accompanying Notes to Financial Statements are an integral part of this schedule.
202
Table of Contents
Large Cap Index Portfolio
Schedule of Investments as of June 30, 2009
(unaudited)
| Shares | Common Stock (98.3%) | Value | |||
| Financials (13.3%) - continued | |||||
| 12,600 | People’s United Financial, Inc. | $ | 189,504 | ||
| 5,900 | Plum Creek Timber Company, Inc.a | 175,702 | |||
| 16,614 | PNC Financial Services Group, Inc. | 644,789 | |||
| 11,200 | Principal Financial Group, Inc. | 211,008 | |||
| 24,600 | Progressive Corporationb | 371,706 | |||
| 16,000 | ProLogis Trust | 128,960 | |||
| 16,700 | Prudential Financial, Inc. | 621,574 | |||
| 4,500 | Public Storage, Inc. | 294,660 | |||
| 41,777 | Regions Financial Corporation | 168,779 | |||
| 10,096 | Simon Property Group, Inc. | 519,237 | |||
| 16,900 | SLM Corporationb | 173,563 | |||
| 17,900 | State Street Corporation | 844,880 | |||
| 16,900 | SunTrust Banks, Inc. | 278,005 | |||
| 9,268 | T. Rowe Price Group, Inc. | 386,198 | |||
| 3,000 | Torchmark Corporation | 111,120 | |||
| 21,181 | Travelers Companies, Inc. | 869,268 | |||
| 68,685 | U.S. Bancorp | 1,230,835 | |||
| 12,024 | UnumProvident Corporation | 190,701 | |||
| 5,600 | Ventas, Inc. | 167,216 | |||
| 5,722 | Vornado Realty Trust | 257,662 | |||
| 168,440 | Wells Fargo & Company | 4,086,354 | |||
| 12,400 | XL Capital, Ltd. | 142,104 | |||
| 4,200 | Zions Bancorporationa | 48,552 | |||
Total Financials | 39,580,754 | ||||
| Health Care (13.7%) | |||||
| 55,900 | Abbott Laboratories | 2,629,536 | |||
| 16,196 | Aetna, Inc. | 405,710 | |||
| 11,100 | Allergan, Inc. | 528,138 | |||
| 11,000 | AmerisourceBergen Corporation | 195,140 | |||
| 36,640 | Amgen, Inc.b | 1,939,722 | |||
| 21,900 | Baxter International, Inc. | 1,159,824 | |||
| 8,700 | Becton, Dickinson and Company | 620,397 | |||
| 10,400 | Biogen Idec, Inc.b | 469,560 | |||
| 54,550 | Boston Scientific Corporationb | 553,137 | |||
| 71,600 | Bristol-Myers Squibb Company | 1,454,196 | |||
| 3,600 | C.R. Bard, Inc. | 268,020 | |||
| 13,075 | Cardinal Health, Inc. | 399,441 | |||
| 16,600 | Celgene Corporationb | 794,144 | |||
| 2,700 | Cephalon, Inc.a,b | 152,955 | |||
| 9,800 | CIGNA Corporation | 236,082 | |||
| 5,400 | Coventry Health Care, Inc.b | 101,034 | |||
| 3,800 | DaVita, Inc.b | 187,948 | |||
| 5,400 | Dentsply International, Inc. | 164,808 | |||
| 36,600 | Eli Lilly and Company | 1,267,824 | |||
| 9,800 | Express Scripts, Inc.b | 673,750 | |||
| 10,900 | Forest Laboratories, Inc.b | 273,699 | |||
| 9,800 | Genzyme Corporationb | 545,566 | |||
| 32,800 | Gilead Sciences, Inc.b | 1,536,352 | |||
| 5,780 | Hospira, Inc.b | 222,646 | |||
| 6,100 | Humana, Inc.b | 196,786 | |||
| 6,600 | IMS Health, Inc. | 83,820 | |||
| 1,400 | Intuitive Surgical, Inc.a,b | 229,124 | |||
| 99,740 | Johnson & Johnson | 5,665,232 | |||
| 8,900 | King Pharmaceuticals, Inc.b | 85,707 | |||
| 3,900 | Laboratory Corporation of America Holdingsb | 264,381 | |||
| 6,243 | Life Technologies Corporationb | 260,458 | |||
| 9,842 | McKesson Corporation | 433,048 | |||
| 17,486 | Medco Health Solutions, Inc.b | 797,536 | |||
| 40,400 | Medtronic, Inc. | 1,409,556 | |||
| 76,300 | Merck & Company, Inc. | 2,133,348 | |||
| 2,000 | Millipore Corporationb | 140,420 | |||
| 11,000 | Mylan Laboratories, Inc.a,b | 143,550 | |||
| 3,300 | Patterson Companies, Inc.b | 71,610 | |||
| 4,200 | PerkinElmer, Inc. | 73,080 | |||
| 244,153 | Pfizer, Inc. | 3,662,295 | |||
| 5,400 | Quest Diagnostics, Inc. | 304,722 | |||
| 58,900 | Schering-Plough Corporation | 1,479,568 | |||
| 12,484 | St. Jude Medical, Inc.b | 513,092 | |||
| 8,600 | Stryker Corporation | 341,764 | |||
| 15,100 | Tenet Healthcare Corporationb | 42,582 | |||
| 15,100 | Thermo Fisher Scientific, Inc.b | 615,627 | |||
| 43,000 | UnitedHealth Group, Inc. | 1,074,140 | |||
| 4,500 | Varian Medical Systems, Inc.b | 158,130 | |||
| 3,500 | Waters Corporationb | 180,145 | |||
| 3,800 | Watson Pharmaceuticals, Inc.b | 127,908 | |||
| 17,500 | WellPoint, Inc.b | 890,575 | |||
| 48,300 | Wyeth | 2,192,337 | |||
| 7,750 | Zimmer Holdings, Inc.b | 330,150 | |||
Total Health Care | 40,680,320 | ||||
| Industrials (9.7%) | |||||
| 25,100 | 3M Company | 1,508,510 | |||
| 4,100 | Avery Dennison Corporation | 105,288 | |||
| 26,260 | Boeing Company | 1,116,050 | |||
| 10,092 | Burlington Northern Santa Fe Corporation | 742,166 | |||
| 6,200 | C.H. Robinson Worldwide, Inc. | 323,330 | |||
| 21,800 | Caterpillar, Inc. | 720,272 | |||
| 4,800 | Cintas Corporation | 109,632 | |||
| 6,000 | Cooper Industries, Ltd. | 186,300 | |||
| 14,200 | CSX Corporation | 491,746 | |||
| 7,300 | Cummins, Inc. | 257,033 | |||
| 9,200 | Danaher Corporation | 568,008 | |||
| 15,300 | Deere & Company | 611,235 | |||
| 6,700 | Dover Corporation | 221,703 | |||
| 1,900 | Dun & Bradstreet Corporation | 154,299 | |||
| 6,000 | Eaton Corporation | 267,660 | |||
| 27,200 | Emerson Electric Company | 881,280 | |||
| 4,600 | Equifax, Inc. | 120,060 | |||
| 7,700 | Expeditors International of Washington, Inc. | 256,718 | |||
| 4,700 | Fastenal Companya | 155,899 | |||
| 11,260 | FedEx Corporation | 626,281 | |||
| 2,000 | Flowserve Corporation | 139,620 | |||
| 6,600 | Fluor Corporation | 338,514 | |||
| 14,000 | General Dynamics Corporation | 775,460 | |||
| 383,200 | General Electric Company | 4,491,104 | |||
| 4,500 | Goodrich Corporation | 224,865 | |||
| 26,875 | Honeywell International, Inc. | 843,875 | |||
| 13,900 | Illinois Tool Works, Inc. | 519,026 | |||
| 6,500 | Iron Mountain, Inc.b | 186,875 | |||
| 6,600 | ITT Corporation | 293,700 | |||
| 4,500 | Jacobs Engineering Group, Inc.b | 189,405 | |||
| 4,300 | L-3 Communications Holdings, Inc. | 298,334 | |||
| 11,800 | Lockheed Martin Corporation | 951,670 | |||
| 4,700 | Manitowoc Company, Inc. | 24,722 | |||
| 13,000 | Masco Corporation | 124,540 | |||
| 4,600 | Monster Worldwide, Inc.b | 54,326 | |||
| 13,300 | Norfolk Southern Corporation | 501,011 | |||
The accompanying Notes to Financial Statements are an integral part of this schedule.
203
Table of Contents
Large Cap Index Portfolio
Schedule of Investments as of June 30, 2009
(unaudited)
| Shares | Common Stock (98.3%) | Value | |||
| Industrials (9.7%) - continued | |||||
| 11,798 | Northrop Grumman Corporation | $ | 538,932 | ||
| 13,137 | PACCAR, Inc. | 427,084 | |||
| 4,300 | Pall Corporation | 114,208 | |||
| 5,775 | Parker-Hannifin Corporation | 248,094 | |||
| 7,500 | Pitney Bowes, Inc. | 164,475 | |||
| 5,100 | Precision Castparts Corporation | 372,453 | |||
| 7,400 | Quanta Services, Inc.b | 171,162 | |||
| 7,400 | R.R. Donnelley & Sons Company | 85,988 | |||
| 14,300 | Raytheon Company | 635,349 | |||
| 11,620 | Republic Services, Inc. | 283,644 | |||
| 5,500 | Robert Half International, Inc. | 129,910 | |||
| 5,100 | Rockwell Automation, Inc. | 163,812 | |||
| 5,700 | Rockwell Collins, Inc. | 237,861 | |||
| 2,000 | Ryder System, Inc. | 55,840 | |||
| 26,800 | Southwest Airlines Company | 180,364 | |||
| 3,100 | Stericycle, Inc.b | 159,743 | |||
| 9,700 | Textron, Inc. | 93,702 | |||
| 18,200 | Union Pacific Corporation | 947,492 | |||
| 36,000 | United Parcel Service, Inc. | 1,799,640 | |||
| 34,100 | United Technologies Corporation | 1,771,836 | |||
| 2,300 | W.W. Grainger, Inc. | 188,324 | |||
| 17,799 | Waste Management, Inc. | 501,220 | |||
Total Industrials | 28,651,650 | ||||
| Information Technology (18.1%) | |||||
| 18,900 | Adobe Systems, Inc.b | 534,870 | |||
| 20,200 | Advanced Micro Devices, Inc.a,b | 78,174 | |||
| 3,500 | Affiliated Computer Services, Inc.b | 155,470 | |||
| 12,415 | Agilent Technologies, Inc.b | 252,149 | |||
| 6,200 | Akamai Technologies, Inc.b | 118,916 | |||
| 10,600 | Altera Corporation | 172,568 | |||
| 6,200 | Amphenol Corporation | 196,168 | |||
| 10,500 | Analog Devices, Inc. | 260,190 | |||
| 32,200 | Apple, Inc.b | 4,586,246 | |||
| 48,200 | Applied Materials, Inc. | 528,754 | |||
| 8,200 | Autodesk, Inc.b | 155,636 | |||
| 18,200 | Automatic Data Processing, Inc. | 645,008 | |||
| 6,700 | BMC Software, Inc.b | 226,393 | |||
| 15,400 | Broadcom Corporationb | 381,766 | |||
| 14,212 | CA, Inc. | 247,715 | |||
| 3,257 | CIENA Corporationb | 33,710 | |||
| 208,700 | Cisco Systems, Inc.b | 3,890,168 | |||
| 6,500 | Citrix Systems, Inc.b | 207,285 | |||
| 10,500 | Cognizant Technology Solutions Corporationb | 280,350 | |||
| 5,500 | Computer Sciences Corporationb | 243,650 | |||
| 8,800 | Compuware Corporationb | 60,368 | |||
| 4,400 | Convergys Corporationb | 40,832 | |||
| 56,200 | Corning, Inc. | 902,572 | |||
| 62,900 | Dell, Inc.b | 863,617 | |||
| 39,100 | eBay, Inc.b | 669,783 | |||
| 11,600 | Electronic Arts, Inc.b | 251,952 | |||
| 72,786 | EMC Corporationb | 953,497 | |||
| 6,900 | Fidelity National Information Services, Inc. | 137,724 | |||
| 5,600 | Fiserv, Inc.b | 255,920 | |||
| 5,500 | FLIR Systems, Inc.b | 124,080 | |||
| 8,700 | Google, Inc.b | 3,667,833 | |||
| 4,800 | Harris Corporation | 136,128 | |||
| 86,386 | Hewlett-Packard Company | 3,338,819 | |||
| 202,100 | Intel Corporation | 3,344,755 | |||
| 47,800 | International Business Machines Corporation | 4,991,276 | |||
| 11,600 | Intuit, Inc.b | 326,656 | |||
| 7,700 | Jabil Circuit, Inc. | 57,134 | |||
| 7,962 | JDS Uniphase Corporationb | 45,543 | |||
| 18,900 | Juniper Networks, Inc.b | 446,040 | |||
| 6,100 | KLA-Tencor Corporation | 154,025 | |||
| 2,800 | Lexmark International, Inc.b | 44,380 | |||
| 8,000 | Linear Technology Corporation | 186,800 | |||
| 23,500 | LSI Corporationb | 107,160 | |||
| 2,600 | MasterCard, Inc. | 435,006 | |||
| 5,600 | McAfee, Inc.b | 236,264 | |||
| 8,100 | MEMC Electronic Materials, Inc.b | 144,261 | |||
| 6,600 | Microchip Technology, Inc.a | 148,830 | |||
| 30,600 | Micron Technology, Inc.a,b | 154,836 | |||
| 277,000 | Microsoft Corporation | 6,584,291 | |||
| 5,000 | Molex, Inc. | 77,750 | |||
| 83,090 | Motorola, Inc. | 550,887 | |||
| 7,100 | National Semiconductor Corporation | 89,105 | |||
| 12,000 | NETAPP, Inc.b | 236,640 | |||
| 12,500 | Novell, Inc.b | 56,625 | |||
| 3,500 | Novellus Systems, Inc.b | 58,450 | |||
| 19,750 | NVIDIA Corporationb | 222,977 | |||
| 137,037 | Oracle Corporation | 2,935,332 | |||
| 11,600 | Paychex, Inc. | 292,320 | |||
| 4,300 | QLogic Corporationb | 54,524 | |||
| 59,900 | QUALCOMM, Inc. | 2,707,480 | |||
| 3,800 | Salesforce.com, Inc.a,b | 145,046 | |||
| 8,200 | SanDisk Corporationb | 120,458 | |||
| 26,950 | Sun Microsystems, Inc.b | 248,479 | |||
| 29,624 | Symantec Corporationb | 460,949 | |||
| 14,300 | Tellabs, Inc.b | 81,939 | |||
| 6,300 | Teradata Corporationb | 147,609 | |||
| 6,200 | Teradyne, Inc.b | 42,532 | |||
| 46,200 | Texas Instruments, Inc. | 984,060 | |||
| 7,100 | Total System Services, Inc. | 95,069 | |||
| 7,000 | VeriSign, Inc.b | 129,360 | |||
| 7,600 | Western Digital Corporationb | 201,400 | |||
| 25,380 | Western Union Company | 416,232 | |||
| 31,300 | Xerox Corporation | 202,824 | |||
| 9,900 | Xilinx, Inc. | 202,554 | |||
| 50,400 | Yahoo!, Inc.b | 789,264 | |||
Total Information Technology | 53,555,433 | ||||
| Materials (3.2%) | |||||
| 7,600 | Air Products and Chemicals, Inc. | 490,884 | |||
| 4,000 | AK Steel Holding Corporation | 76,760 | |||
| 35,264 | Alcoa, Inc. | 364,277 | |||
| 3,569 | Allegheny Technologies, Inc. | 124,665 | |||
| 3,400 | Ball Corporation | 153,544 | |||
| 3,600 | Bemis Company, Inc. | 90,720 | |||
| 1,700 | CF Industries Holdings, Inc. | 126,038 | |||
| 38,893 | Dow Chemical Company | 627,733 | |||
| 32,611 | E.I. du Pont de Nemours and Company | 835,494 | |||
| 2,600 | Eastman Chemical Company | 98,540 | |||
| 6,100 | Ecolab, Inc. | 237,839 | |||
| 14,896 | Freeport-McMoRan Copper & Gold, Inc. | 746,439 | |||
The accompanying Notes to Financial Statements are an integral part of this schedule.
204
Table of Contents
Large Cap Index Portfolio
Schedule of Investments as of June 30, 2009
(unaudited)
| Shares | Common Stock (98.3%) | Value | ||||
| Materials (3.2%) - continued | ||||||
| 2,800 | International Flavors & Fragrances, Inc. | $ | 91,616 | |||
| 15,671 | International Paper Company | 237,102 | ||||
| 6,181 | MeadWestvaco Corporation | 101,430 | ||||
| 19,778 | Monsanto Company | 1,470,297 | ||||
| 17,648 | Newmont Mining Corporation | 721,274 | ||||
| 11,400 | Nucor Corporation | 506,502 | ||||
| 6,000 | Owens-Illinois, Inc.b | 168,060 | ||||
| 4,800 | Pactiv Corporationb | 104,304 | ||||
| 5,900 | PPG Industries, Inc. | 259,010 | ||||
| 11,100 | Praxair, Inc. | 788,877 | ||||
| 5,752 | Sealed Air Corporation | 106,124 | ||||
| 4,400 | Sigma-Aldrich Corporation | 218,064 | ||||
| 3,100 | Titanium Metals Corporation | 28,489 | ||||
| 5,100 | United States Steel Corporationa | 182,274 | ||||
| 4,500 | Vulcan Materials Companya | 193,950 | ||||
| 7,600 | Weyerhaeuser Company | 231,268 | ||||
Total Materials | 9,381,574 | |||||
| Telecommunications Services (3.5%) | ||||||
| 14,400 | American Tower Corporationb | 454,032 | ||||
| 213,539 | AT&T, Inc. | 5,304,309 | ||||
| 3,600 | CenturyTel, Inc.a | 110,520 | ||||
| 5,201 | Embarq Corporation | 218,754 | ||||
| 11,300 | Frontier Communications Corporation | 80,682 | ||||
| 8,500 | MetroPCS Communications, Inc.b | 113,135 | ||||
| 53,572 | Qwest Communications International, Inc.a | 222,324 | ||||
| 103,920 | Sprint Nextel Corporationb | 499,855 | ||||
| 102,696 | Verizon Communications, Inc. | 3,155,848 | ||||
| 15,807 | Windstream Corporation | 132,146 | ||||
Total Telecommunications Services | 10,291,605 | |||||
| Utilities (4.0%) | ||||||
| 24,100 | AES Corporationb | 279,801 | ||||
| 6,100 | Allegheny Energy, Inc. | 156,465 | ||||
| 7,700 | Ameren Corporation | 191,653 | ||||
| 17,260 | American Electric Power Company, Inc. | 498,641 | ||||
| 12,573 | CenterPoint Energy, Inc. | 139,309 | ||||
| 8,200 | CMS Energy Corporation | 99,056 | ||||
| 9,900 | Consolidated Edison, Inc.a | 370,458 | ||||
| 7,200 | Constellation Energy Group, Inc. | 191,376 | ||||
| 21,394 | Dominion Resources, Inc. | 714,987 | ||||
| 5,900 | DTE Energy Company | 188,800 | ||||
| 46,608 | Duke Energy Corporation | 680,011 | ||||
| 18,304 | Dynegy, Inc.b | 41,550 | ||||
| 11,800 | Edison International, Inc. | 371,228 | ||||
| 7,100 | Entergy Corporation | 550,392 | ||||
| 4,700 | EQT Corporation | 164,077 | ||||
| 23,824 | Exelon Corporation | 1,220,027 | ||||
| 11,000 | FirstEnergy Corporation | 426,250 | ||||
| 14,800 | FPL Group, Inc. | 841,528 | ||||
| 2,715 | Integrys Energy Group, Inc. | 81,423 | ||||
| 1,600 | Nicor, Inc. | 55,392 | ||||
| 9,909 | NiSource, Inc. | 115,539 | ||||
| 6,300 | Northeast Utilities | 140,553 | ||||
| 7,900 | Pepco Holdings, Inc. | 106,176 | ||||
| 13,300 | PG&E Corporation | 511,252 | ||||
| 3,700 | Pinnacle West Capital Corporation | 111,555 | ||||
| 13,600 | PPL Corporation | 448,256 | ||||
| 10,120 | Progress Energy, Inc. | 382,840 | ||||
| 18,300 | Public Service Enterprise Group, Inc. | 597,129 | ||||
| 6,300 | Questar Corporation | 195,993 | ||||
| 4,400 | SCANA Corporation | 142,868 | ||||
| 8,775 | Sempra Energy | 435,503 | ||||
| 28,300 | Southern Company | 881,828 | ||||
| 7,700 | TECO Energy, Inc. | 91,861 | ||||
| 4,200 | Wisconsin Energy Corporation | 170,982 | ||||
| 16,405 | Xcel Energy, Inc. | 302,016 | ||||
Total Utilities | 11,896,775 | |||||
Total Common Stock (cost $353,263,885) | 291,111,437 | |||||
Collateral Held for Securities Loaned (2.0%) | ||||||
| 5,861,549 | Thrivent Financial Securities Lending Trust | 5,861,549 | ||||
Total Collateral Held for Securities Loaned (cost $5,861,549) | 5,861,549 | |||||
| Shares or Principal Amount | Short-Term Investments (1.8%)c | |||||
Federal Home Loan Mortgage Corporation Discount Notes | ||||||
| 1,150,000 | 0.209%, 9/21/2009d | 1,149,455 | ||||
| 4,082,419 | Thrivent Money Market Portfolio | 4,082,419 | ||||
Total Short-Term Investments (at amortized cost) | 5,231,874 | |||||
Total Investments (cost $364,357,308) 102.1% | $ | 302,204,860 | ||||
Other Assets and Liabilities, Net (2.1%) | (6,071,376 | ) | ||||
Total Net Assets 100.0% | $ | 296,133,484 | ||||
| a | All or a portion of the security is on loan as discussed in item 2(M) of the Notes to Financial Statements. |
| b | Non-income producing security. |
| c | The interest rate shown reflects the yield, coupon rate or, for securities purchased at a discount, the discount rate at the date of purchase. |
| d | At June 30, 2009, $1,149,455 of investments were held on deposit with the counterparty and pledged as the initial margin deposit for open futures contracts. |
Definitions:
| REIT | - | Real Estate Investment Trust, is a company that buys, develops, manages and/or sells real estate assets. |
The accompanying Notes to Financial Statements are an integral part of this schedule.
205
Table of Contents
Large Cap Index Portfolio
Schedule of Investments as of June 30, 2009
(unaudited)
Unrealized Appreciation (Depreciation)
Gross unrealized appreciation and depreciation of investments, based on cost for federal income tax purposes, were as follows:
Gross unrealized appreciation | $ | 47,946,517 | ||
Gross unrealized depreciation | (110,098,965 | ) | ||
Net unrealized appreciation (depreciation) | $ | (62,152,448 | ) | |
Cost for federal income tax purposes | $ | 364,357,308 | ||
Fair Valuation Measurements
The following table is a summary of the inputs used, as of June 30, 2009, in valuing Large Cap Index Portfolio’s assets carried at fair value as discussed in the Notes to Financial Statements.
Investments in Securities | Total | Level 1 | Level 2 | Level 3 | ||||||||||
Common Stock | ||||||||||||||
Consumer Discretionary | 26,072,416 | 26,072,416 | — | — | ||||||||||
Consumer Staples | 34,849,328 | 34,849,328 | — | — | ||||||||||
Energy | 36,151,582 | 36,151,582 | — | — | ||||||||||
Financials | 39,580,754 | 39,580,754 | — | — | ||||||||||
Health Care | 40,680,320 | 40,680,320 | — | — | ||||||||||
Industrials | 28,651,650 | 28,651,650 | — | — | ||||||||||
Information Technology | 53,555,433 | 53,555,433 | — | — | ||||||||||
Materials | 9,381,574 | 9,381,574 | — | — | ||||||||||
Telecommunications Services | 10,291,605 | 10,291,605 | — | — | ||||||||||
Utilities | 11,896,775 | 11,896,775 | — | — | ||||||||||
Collateral Held for Securities Loaned | 5,861,549 | 5,861,549 | — | — | ||||||||||
Short-Term Investments | 5,231,874 | — | 5,231,874 | — | ||||||||||
Total | $ | 302,204,860 | $ | 296,972,986 | $ | 5,231,874 | $ | — | ||||||
Other Financial Instruments* | ($104,980 | ) | ($104,980 | ) | $ | — | $ | — | ||||||
| * | Other Financial Instruments include Futures, Forwards, Written Options and Swap agreements. |
Futures Contracts | Number of Contracts Long/(Short) | Expiration Date | Notional Principal Amount | Value | Unrealized Gain/(Loss) | ||||||
S&P 500 Index Futures | 21 | September 2009 | $4,911,355 | $4,806,375 | ($104,980 | ) | |||||
Total Futures Contracts | ($104,980 | ) |
The following table summarizes the fair value and Statement of Assets and Liabilities location, as of June 30, 2009, for the Large Cap Index Portfolio’s investments in financial derivative instruments by primary risk exposure as discussed under item (2) Significant Accounting Policies of the Notes to Financial Statements.
Derivatives by Risk Category | Statement of Assets and Liabilities Location | Fair Value | |||
Liability Derivatives | |||||
Equity Contracts | |||||
Future* | Net Assets - Net unrealized appreciation/(depreciation) on Futures contracts | 104,980 | |||
Total Equity Contracts | 104,980 | ||||
Total Liability Derivatives | $ | 104,980 | |||
| * | Includes cumulative appreciation/depreciation of futures contracts as reported in the Schedule of Investments. Only current day’s variation margin is reported within the Statement of Assets and Liabilities. |
The accompanying Notes to Financial Statements are an integral part of this schedule.
206
Table of Contents
Large Cap Index Portfolio
Schedule of Investments as of June 30, 2009
(unaudited)
The following table summarizes the net realized gains/(losses) and Statement of Operations location, for the period ended June 30, 2009, for Large Cap Index Portfolio’s investments in financial derivative instruments by primary risk exposure.
Derivatives by Risk Category | Statement of Operations Location | Realized Gains/(Losses) recognized in Income | |||
Equity Contracts | |||||
Future | Net realized gains/(losses) on Futures contracts | 376,388 | |||
Total Equity Contracts | 376,388 | ||||
Total | $ | 376,388 | |||
The following table summarizes the change in net unrealized appreciation/(depreciation) and Statement of Operations location, for the period ended June 30, 2009, for the Large Cap Index Portfolio’s investments in financial derivative instruments by primary risk exposure.
Derivatives by Risk Category | Statement of Operations Location | Change in Unrealized Appreciation/(Depreciation) recognized in Income | |||
Equity Contracts | |||||
Future | Change in net unrealized appreciation/(depreciation) on Futures contracts | (122,295 | ) | ||
Total Equity Contracts | (122,295 | ) | |||
Total | ($122,295 | ) | |||
Investment in Affiliates
Affiliated issuers, as defined under the Investment Company Act of 1940, include those in which the Portfolio’s holdings of an issuer represent 5% or more of the outstanding voting securities of an issuer, or any affiliated mutual fund.
A summary of transactions for the fiscal year to date, in Large Cap Index Portfolio, is as follows:
Portfolio | Value December 31, 2008 | Gross Purchases | Gross Sales | Shares Held at June 30, 2009 | Value June 30, 2009 | Income Earned January 1, 2009 - June 30, 2009 | |||||||||||
Money Market | $ | 1,750,233 | $ | 27,615,472 | $ | 25,283,286 | 4,082,419 | $ | 4,082,419 | $ | 7,279 | ||||||
Thrivent Financial Securities Lending Trust | 7,915,380 | 41,103,271 | 43,157,102 | 5,861,549 | 5,861,549 | 140,712 | |||||||||||
Total Value and Income Earned | 9,665,613 | 9,943,968 | 147,991 | ||||||||||||||
The accompanying Notes to Financial Statements are an integral part of this schedule.
207
Table of Contents
Schedule of Investments as of June 30, 2009
(unaudited)
| Shares | Common Stock (82.4%) | Value | |||
| Consumer Discretionary (8.3%) | |||||
| 4,300 | Best Buy Company, Inc. | $ | 144,007 | ||
| 11,200 | CBS Corporation | 77,504 | |||
| 5,700 | Comcast Corporation | 82,593 | |||
| 3,600 | Family Dollar Stores, Inc. | 101,880 | |||
| 6,300 | Genuine Parts Company | 211,428 | |||
| 23,800 | Home Depot, Inc. | 562,394 | |||
| 16,300 | KB Home | 222,984 | |||
| 5,800 | McDonald’s Corporationa | 333,442 | |||
| 11,100 | McGraw-Hill Companies, Inc.a | 334,221 | |||
| 1,500 | National Presto Industries, Inc. | 114,150 | |||
| 5,900 | Snap-On, Inc. | 169,566 | |||
| 4,400 | Stanley Works | 148,896 | |||
| 8,600 | Staples, Inc. | 173,462 | |||
| 300 | Starwood Hotels & Resorts Worldwide, Inc. | 6,660 | |||
| 14,333 | Time Warner, Inc. | 361,048 | |||
| 3,200 | VF Corporation | 177,120 | |||
| 5,100 | Whirlpool Corporation | 217,056 | |||
Total Consumer Discretionary | 3,438,411 | ||||
| Consumer Staples (9.2%) | |||||
| 15,900 | Altria Group, Inc. | 260,601 | |||
| 3,200 | Coca-Cola Company | 153,568 | |||
| 3,200 | ConAgra Foods, Inc. | 60,992 | |||
| 2,700 | CVS Caremark Corporation | 86,049 | |||
| 2,700 | Diageo plc ADR | 154,575 | |||
| 4,200 | General Mills, Inc. | 235,284 | |||
| 5,200 | Kimberly-Clark Corporation | 272,636 | |||
| 13,500 | Kraft Foods, Inc.a | 342,090 | |||
| 4,400 | Lorillard, Inc.a | 298,188 | |||
| 2,000 | McCormick & Company, Inc. | 65,060 | |||
| 12,400 | Nu Skin Enterprises, Inc. | 189,720 | |||
| 3,200 | PepsiCo, Inc. | 175,872 | |||
| 11,200 | Philip Morris International, Inc. | 488,544 | |||
| 6,608 | Procter & Gamble Company | 337,669 | |||
| 10,300 | SUPERVALU, Inc. | 133,385 | |||
| 4,000 | SYSCO Corporation | 89,920 | |||
| 13,200 | Tyson Foods, Inc. | 166,452 | |||
| 3,700 | Unilever plc ADR | 86,950 | |||
| 1,100 | Village Super Market, Inc. | 32,725 | |||
| 4,500 | Wal-Mart Stores, Inc. | 217,980 | |||
Total Consumer Staples | 3,848,260 | ||||
| Energy (12.7%) | |||||
| 1,700 | Apache Corporation | 122,655 | |||
| 11,300 | BJ Services Company | 154,019 | |||
| 5,600 | BP plc ADR | 267,008 | |||
| 11,100 | Chevron Corporation | 735,375 | |||
| 16,500 | ConocoPhillips | 693,990 | |||
| 2,000 | Devon Energy Corporation | 109,000 | |||
| 1,600 | Diamond Offshore Drilling, Inc. | 132,880 | |||
| 1,600 | Encana Corporation | 79,152 | |||
| 4,300 | ENSCO International, Inc. | 149,941 | |||
| 12,100 | Exxon Mobil Corporation | 845,911 | |||
| 6,300 | Halliburton Company | 130,410 | |||
| 9,800 | Marathon Oil Corporation | 295,274 | |||
| 3,900 | National Oilwell Varco, Inc.b | 127,374 | |||
| 5,500 | Noble Corporation | 166,375 | |||
| 4,000 | Occidental Petroleum Corporation | 263,240 | |||
| 700 | PetroChina Company, Ltd. | 77,336 | |||
| 2,600 | Petroleo Brasileiro SA ADR | 86,736 | |||
| 3,300 | Royal Dutch Shell plc ADR | 165,627 | |||
| 9,200 | Teekay Shipping Corporation | 193,476 | |||
| 3,700 | Tidewater, Inc. | 158,619 | |||
| 3,050 | Total SA ADR | 165,402 | |||
| 6,300 | Valero Energy Corporation | 106,407 | |||
| 2,000 | XTO Energy, Inc. | 76,280 | |||
Total Energy | 5,302,487 | ||||
| Financials (14.9%) | |||||
| 5,800 | ACE, Ltd. | 256,534 | |||
| 4,600 | AFLAC, Inc. | 143,014 | |||
| 7,500 | Allstate Corporation | 183,000 | |||
| 400 | AMB Property Corporation | 7,524 | |||
| 300 | American Campus Communities, Inc. | 6,654 | |||
| 5,300 | American Express Company | 123,172 | |||
| 6,600 | Ameriprise Financial, Inc. | 160,182 | |||
| 6,500 | Annaly Capital Management, Inc. | 98,410 | |||
| 312 | AvalonBay Communities, Inc. | 17,453 | |||
| 18,700 | Bank of America Corporation | 246,840 | |||
| 7,400 | Bank of New York Mellon Corporation | 216,894 | |||
| 7,400 | BB&T Corporation | 162,652 | |||
| 600 | BlackRock, Inc. | 105,252 | |||
| 1,250 | Boston Properties, Inc. | 59,625 | |||
| 200 | BRE Properties, Inc. | 4,752 | |||
| 650 | Brookfield Properties Corporation | 5,180 | |||
| 300 | Camden Property Trust | 8,280 | |||
| 3,100 | Chubb Corporation | 123,628 | |||
| 2,100 | City Holding Company | 63,756 | |||
| 300 | Corporate Office Properties Trust | 8,799 | |||
| 2,200 | Cullen/Frost Bankers, Inc. | 101,464 | |||
| 900 | DCT Industrial Trust, Inc. | 3,672 | |||
| 400 | Digital Realty Trust, Inc. | 14,340 | |||
| 500 | Douglas Emmett, Inc. | 4,495 | |||
| 200 | Equity Lifestyle Properties, Inc. | 7,436 | |||
| 950 | Equity Residential REIT | 21,118 | |||
| 150 | Essex Property Trust, Inc. | 9,335 | |||
| 100 | Federal Realty Investment Trust | 5,152 | |||
| 1,700 | Goldman Sachs Group, Inc. | 250,648 | |||
| 800 | Health Care Property Investors, Inc. | 16,952 | |||
| 300 | Health Care REIT, Inc. | 10,230 | |||
| 1,400 | Highwoods Properties, Inc. | 31,318 | |||
| 100 | Home Properties, Inc. | 3,410 | |||
| 1,900 | Hospitality Properties Trust | 22,591 | |||
| 1,800 | Host Marriott Corporation | 15,102 | |||
| 10,600 | Hudson City Bancorp, Inc. | 140,874 | |||
| 34,500 | J.P. Morgan Chase & Company | 1,176,795 | |||
| 850 | Kimco Realty Corporation | 8,543 | |||
| 400 | Liberty Property Trust | 9,216 | |||
| 513 | Macerich Company | 9,034 | |||
| 300 | Mack-Cali Realty Corporation | 6,840 | |||
| 3,100 | Morgan Stanley | 88,381 | |||
| 500 | Nationwide Health Properties, Inc. | 12,870 | |||
| 5,900 | New York Community Bancorp, Inc. | 63,071 | |||
| 7,630 | People’s United Financial, Inc. | 114,755 | |||
| 250 | Plum Creek Timber Company, Inc. | 7,445 | |||
The accompanying Notes to Financial Statements are an integral part of this schedule.
208
Table of Contents
Equity Income Plus Portfolio
Schedule of Investments as of June 30, 2009
(unaudited)
| Shares | Common Stock (82.4%) | Value | |||
| Financials (14.9%) - continued | |||||
| 4,900 | PNC Financial Services Group, Inc. | $ | 190,169 | ||
| 900 | ProLogis Trust | 7,254 | |||
| 400 | Public Storage, Inc. | 26,192 | |||
| 400 | Regency Centers Corporation | 13,964 | |||
| 500 | Senior Housing Property Trust | 8,160 | |||
| 835 | Simon Property Group, Inc. | 42,944 | |||
| 9,000 | State Street Corporation | 424,800 | |||
| 8,400 | Sunstone Hotel Investors, Inc. | 44,940 | |||
| 4,500 | T. Rowe Price Group, Inc. | 187,515 | |||
| 200 | Tanger Factory Outlet Centers, Inc. | 6,486 | |||
| 300 | Taubman Centers, Inc. | 8,058 | |||
| 10,400 | Travelers Companies, Inc. | 426,816 | |||
| 13,600 | U.S. Bancorp | 243,712 | |||
| 600 | Ventas, Inc. | 17,916 | |||
| 566 | Vornado Realty Trust | 25,487 | |||
| 15,400 | Wells Fargo & Company | 373,604 | |||
Total Financials | 6,204,705 | ||||
| Health Care (8.9%) | |||||
| 7,200 | Abbott Laboratories | 338,688 | |||
| 1,100 | Amgen, Inc.b | 58,234 | |||
| 2,300 | Baxter International, Inc. | 121,808 | |||
| 1,200 | Becton, Dickinson and Company | 85,572 | |||
| 58,300 | Boston Scientific Corporationb | 591,162 | |||
| 10,900 | Bristol-Myers Squibb Company | 221,379 | |||
| 5,200 | Eli Lilly and Company | 180,128 | |||
| 9,500 | Johnson & Johnson | 539,600 | |||
| 4,400 | Medtronic, Inc. | 153,516 | |||
| 8,500 | Merck & Company, Inc. | 237,660 | |||
| 3,450 | Novartis AG ADR | 140,726 | |||
| 36,600 | Pfizer, Inc. | 549,000 | |||
| 600 | Teva Pharmaceutical Industries, Ltd. ADR | 29,604 | |||
| 4,300 | UnitedHealth Group, Inc. | 107,414 | |||
| 7,600 | Wyeth | 344,964 | |||
Total Health Care | 3,699,455 | ||||
| Industrials (7.8%) | |||||
| 3,100 | 3M Company | 186,310 | |||
| 3,100 | Caterpillar, Inc. | 102,424 | |||
| 4,200 | Dover Corporation | 138,978 | |||
| 2,700 | Eaton Corporation | 120,447 | |||
| 4,000 | Emerson Electric Company | 129,600 | |||
| 3,100 | FedEx Corporation | 172,422 | |||
| 3,600 | Fluor Corporation | 184,644 | |||
| 2,500 | General Dynamics Corporation | 138,475 | |||
| 33,100 | General Electric Company | 387,932 | |||
| 3,700 | Honeywell International, Inc. | 116,180 | |||
| 9,100 | Illinois Tool Works, Inc. | 339,794 | |||
| 3,800 | Parker-Hannifin Corporation | 163,248 | |||
| 10,800 | R.R. Donnelley & Sons Company | 125,496 | |||
| 3,400 | Republic Services, Inc. | 82,994 | |||
| 5,400 | Timken Company | 92,232 | |||
| 11,100 | Tyco International, Ltd. | 288,378 | |||
| 2,900 | United Parcel Service, Inc. | 144,971 | |||
| 6,500 | United Technologies Corporation | 337,740 | |||
Total Industrials | 3,252,265 | ||||
| Information Technology (8.6%) | |||||
| 3,600 | Accenture, Ltd. | 120,456 | |||
| 9,100 | Cisco Systems, Inc.b | 169,624 | |||
| 400 | Google, Inc.b | 168,636 | |||
| 4,200 | Harris Corporation | 119,112 | |||
| 4,200 | Hewlett-Packard Company | 162,330 | |||
| 18,400 | Intel Corporation | 304,520 | |||
| 5,000 | International Business Machines Corporation | 522,100 | |||
| 20,700 | Microsoft Corporation | 492,039 | |||
| 8,000 | Nokia Oyj ADR | 116,640 | |||
| 27,200 | Oracle Corporation | 582,624 | |||
| 6,500 | Paychex, Inc. | 163,800 | |||
| 6,800 | QUALCOMM, Inc. | 307,360 | |||
| 10,300 | Tyco Electronics, Ltd. | 191,477 | |||
| 25,700 | United Online, Inc. | 167,307 | |||
Total Information Technology | 3,588,025 | ||||
| Materials (3.8%) | |||||
| 2,200 | Air Products and Chemicals, Inc. | 142,098 | |||
| 3,300 | BHP Billiton, Ltd. | 180,609 | |||
| 9,200 | E.I. du Pont de Nemours and Company | 235,704 | |||
| 3,800 | Lubrizol Corporation | 179,778 | |||
| 4,800 | Nucor Corporation | 213,264 | |||
| 9,500 | Olin Corporation | 112,955 | |||
| 9,900 | Packaging Corporation of America | 160,380 | |||
| 3,400 | PPG Industries, Inc. | 149,260 | |||
| 1,100 | Praxair, Inc. | 78,177 | |||
| 7,000 | Southern Copper Corporation | 143,080 | |||
Total Materials | 1,595,305 | ||||
| Telecommunications Services (4.1%) | |||||
| 31,700 | AT&T, Inc. | 787,428 | |||
| 18,400 | Verizon Communications, Inc. | 565,432 | |||
| 8,800 | Vodafone Group plc ADR | 171,512 | |||
| 19,800 | Windstream Corporation | 165,528 | |||
Total Telecommunications Services | 1,689,900 | ||||
| Utilities (4.1%) | |||||
| 4,800 | AGL Resources, Inc. | 152,640 | |||
| 11,300 | Duke Energy Corporation | 164,867 | |||
| 5,500 | Energen Corporation | 219,450 | |||
| 1,100 | Entergy Corporation | 85,272 | |||
| 2,600 | Exelon Corporation | 133,146 | |||
| 4,500 | FPL Group, Inc. | 255,870 | |||
| 7,400 | Integrys Energy Group, Inc. | 221,926 | |||
| 4,500 | Mirant Corporationb | 70,830 | |||
| 13,300 | NiSource, Inc. | 155,078 | |||
| 3,800 | PG&E Corporation | 146,072 | |||
| 2,700 | Questar Corporation | 83,997 | |||
Total Utilities | 1,689,148 | ||||
Total Common Stock (cost $37,933,825) | 34,307,961 | ||||
The accompanying Notes to Financial Statements are an integral part of this schedule.
209
Table of Contents
Equity Income Plus Portfolio
Schedule of Investments as of June 30, 2009
(unaudited)
| Shares | Preferred Stock (0.4%) | Value | |||
| Financials (0.2%) | |||||
| 3,000 | U.S. Bancorp, 7.875% | $ | 74,550 | ||
Total Financials | 74,550 | ||||
| Utilities (0.2%) | |||||
| 2,870 | Xcel Energy, Inc., 7.600% | 72,697 | |||
Total Utilities | 72,697 | ||||
Total Preferred Stock (cost $150,381) | 147,247 | ||||
| Principal Amount | Long-Term Fixed Income (0.1%) | ||||
| Financials (0.1%) | |||||
American International Group, Inc. | |||||
| 150,000 | 8.175%, 5/15/2058c | 42,794 | |||
Total Financials | 42,794 | ||||
Total Long-Term Fixed Income (cost $150,000) | 42,794 | ||||
| Shares or Principal Amount | Short-Term Investments (16.7%)d | ||||
Federal Home Loan Mortgage Corporation Discount Notes | |||||
| 600,000 | 0.190%, 9/21/2009e | 599,744 | |||
| 6,390,430 | Thrivent Money Market Portfolio | 6,390,430 | |||
Total Short-Term Investments (at amortized cost) | 6,990,174 | ||||
Total Investments (cost $45,224,380) 99.6% | $ | 41,488,176 | |||
Other Assets and Liabilities, Net 0.4% | 151,376 | ||||
Total Net Assets 100.0% | $ | 41,639,552 | |||
| a | All or a portion of the security was earmarked to cover options. |
| b | Non-income producing security. |
| c | Denotes securities sold under Rule 144A of the Securities Act of 1933, which exempts them from registration. These securities have been deemed liquid and may be resold to other dealers in the program or to other qualified institutional buyers. As of June 30, 2009, the value of these investments was $42,794 or 0.1% of total net assets. |
| d | The interest rate shown reflects the yield, coupon rate or, for securities purchased at a discount, the discount rate at the date of purchase. |
| e | At June 30, 2009, $599,744 of investments were held on deposit with the counterparty and pledged as the initial margin deposit for open futures contracts. |
Definitions:
| ADR | - | American Depositary Receipt, which are certificates for an underlying foreign security’s shares held by an issuing U.S. depository bank. | ||
| REIT | - | Real Estate Investment Trust, is a company that buys, develops, manages and/or sells real estate assets. |
Unrealized Appreciation (Depreciation)
Gross unrealized appreciation and depreciation of investments, based on cost for federal income tax purposes, were as follows:
Gross unrealized appreciation | $ | 1,820,672 | ||
Gross unrealized depreciation | (5,556,876 | ) | ||
Net unrealized appreciation (depreciation) | $ | (3,736,204 | ) | |
Cost for federal income tax purposes | $ | 45,224,380 | ||
The accompanying Notes to Financial Statements are an integral part of this schedule.
210
Table of Contents
Equity Income Plus Portfolio
Schedule of Investments as of June 30, 2009
(unaudited)
Fair Valuation Measurements
The following table is a summary of the inputs used, as of June 30, 2009, in valuing Equity Income Plus Portfolio’s assets carried at fair value as discussed in the Notes to Financial Statements.
Investments in Securities | Total | Level 1 | Level 2 | Level 3 | ||||||||||
Common Stock | ||||||||||||||
Consumer Discretionary | 3,438,411 | 3,438,411 | — | — | ||||||||||
Consumer Staples | 3,848,260 | 3,848,260 | — | — | ||||||||||
Energy | 5,302,487 | 5,302,487 | — | — | ||||||||||
Financials | 6,204,705 | 6,204,705 | — | — | ||||||||||
Health Care | 3,699,455 | 3,699,455 | — | — | ||||||||||
Industrials | 3,252,265 | 3,252,265 | — | — | ||||||||||
Information Technology | 3,588,025 | 3,588,025 | — | — | ||||||||||
Materials | 1,595,305 | 1,595,305 | — | — | ||||||||||
Telecommunications Services | 1,689,900 | 1,689,900 | — | — | ||||||||||
Utilities | 1,689,148 | 1,689,148 | — | — | ||||||||||
Preferred Stock | ||||||||||||||
Financials | 74,550 | 74,550 | — | — | ||||||||||
Utilities | 72,697 | 72,697 | — | — | ||||||||||
Long-Term Fixed Income | ||||||||||||||
Financials | 42,794 | — | 42,794 | — | ||||||||||
Short-Term Investments | 6,990,174 | 6,390,430 | 599,744 | — | ||||||||||
Total | $ | 41,488,176 | $ | 40,845,638 | $ | 642,538 | $ | — | ||||||
Other Financial Instruments* | ($94,827 | ) | ($94,827 | ) | $ | — | $ | — | ||||||
| * | Other Financial Instruments include Futures, Forwards, Written Options and Swap agreements. |
Futures Contracts | Number of Contracts Long/(Short) | Expiration Date | Notional Principal Amount | Value | Unrealized Gain/(Loss) | |||||||||||
S&P 500 Index Mini-Futures | 105 | September 2009 | $ | 4,904,446 | $ | 4,806,375 | ($ | 98,071 | ) | |||||||
Total Futures Contracts | ($ | 98,071 | ) | |||||||||||||
Call Options Written | Number of Contracts | Exercise Price | Expiration Date | Value | Unrealized Gain/(Loss) | |||||||||||
S&P 500 Index Mini-Futures | 25 | $ | 945.00 | July 2009 | ($7,625 | ) | $ | 3,244 | ||||||||
Total Call Options Written | ($7,625 | ) | $ | 3,244 | ||||||||||||
The accompanying Notes to Financial Statements are an integral part of this schedule.
211
Table of Contents
Equity Income Plus Portfolio
Schedule of Investments as of June 30, 2009
(unaudited)
The following table summarizes the fair value and Statement of Assets and Liabilities location, as of June 30, 2009, for the Equity Income Plus Portfolio’s investments in financial derivative instruments by primary risk exposure as discussed under item (2) Significant Accounting Policies of the Notes to Financial Statements.
Derivatives by Risk Category | Statement of Assets and Liabilities Location | Fair Value | |||
Asset Derivatives | |||||
Equity Contracts | |||||
Option Written | Net Assets - Net unrealized appreciation/(depreciation) on Written option contracts | $ | 3,244 | ||
Total Equity Contracts | 3,244 | ||||
Total Asset Derivatives | $ | 3,244 | |||
Liability Derivatives | |||||
Equity Contracts | |||||
Future* | Net Assets - Net unrealized appreciation/(depreciation) on Futures contracts | 98,071 | |||
Total Equity Contracts | 98,071 | ||||
Total Liability Derivatives | $ | 98,071 | |||
| * | Includes cumulative appreciation/depreciation of futures contracts as reported in the Schedule of Investments. Only current day’s variation margin is reported within the Statement of Assets and Liabilities. |
The following table summarizes the net realized gains/(losses) and Statement of Operations location, for the period ended June 30, 2009, for Equity Income Plus Portfolio’s investments in financial derivative instruments by primary risk exposure.
Derivatives by Risk Category | Statement of Operations Location | Realized Gains/(Losses) recognized in Income | |||
Equity Contracts | |||||
Option Written | Net realized gains/(losses) on Written option contracts | 51,480 | |||
Future | Net realized gains/(losses) on Futures contracts | 305,038 | |||
Total Equity Contracts | 356,518 | ||||
Total | $ | 356,518 | |||
The following table summarizes the change in net unrealized appreciation/(depreciation) and Statement of Operations location, for the period ended June 30, 2009, for the Equity Income Plus Portfolio’s investments in financial derivative instruments by primary risk exposure.
Derivatives by Risk Category | Statement of Operations Location | Change in Unrealized Appreciation/(Depreciation) recognized in Income | |||
| Equity Contracts | |||||
Option Written | Change in net unrealized appreciation/(depreciation) on Written option contracts | 1,756 | |||
Future | Change in net unrealized appreciation/(depreciation) on Futures contracts | (232,490 | ) | ||
Total Equity Contracts | (230,734 | ) | |||
Total | ($230,734 | ) | |||
Investment in Affiliates
Affiliated issuers, as defined under the Investment Company Act of 1940, include those in which the Portfolio’s holdings of an issuer represent 5% or more of the outstanding voting securities of an issuer, or any affiliated mutual fund.
A summary of transactions for the fiscal year to date, in Equity Income Plus Portfolio, is as follows:
Portfolio | Value December 31, 2008 | Gross Purchases | Gross Sales | Shares Held at June 30, 2009 | Value June 30, 2009 | Income Earned January 1, 2009 - June 30, 2009 | |||||||||||
Money Market | $ | 6,999,027 | $ | 13,225,157 | $ | 13,833,754 | 6,390,430 | $ | 6,390,430 | $ | 20,677 | ||||||
Total Value and Income Earned | 6,999,027 | 6,390,430 | 20,677 | ||||||||||||||
The accompanying Notes to Financial Statements are an integral part of this schedule.
212
Table of Contents
Schedule of Investments as of June 30, 2009
(unaudited)
| Shares | Common Stock (67.7%) | Value | |||
| Consumer Discretionary (6.1%) | |||||
| 1,900 | Abercrombie & Fitch Company | $ | 48,241 | ||
| 6,900 | Amazon.com, Inc.a | 577,254 | |||
| 2,300 | Apollo Group, Inc.a | 163,576 | |||
| 2,400 | AutoNation, Inc.a | 41,640 | |||
| 800 | AutoZone, Inc.a | 120,888 | |||
| 5,600 | Bed Bath & Beyond, Inc.a | 172,200 | |||
| 7,375 | Best Buy Company, Inc. | 246,989 | |||
| 1,800 | Big Lots, Inc.a | 37,854 | |||
| 1,300 | Black & Decker Corporation | 37,258 | |||
| 9,500 | Carnival Corporation | 244,815 | |||
| 14,762 | CBS Corporation | 102,153 | |||
| 2,700 | Centex Corporation | 22,842 | |||
| 6,900 | Coach, Inc. | 185,472 | |||
| 62,665 | Comcast Corporation | 908,016 | |||
| 6,000 | D.R. Horton, Inc. | 56,160 | |||
| 3,000 | Darden Restaurants, Inc. | 98,940 | |||
| 1,300 | DeVry, Inc. | 65,052 | |||
| 11,400 | DIRECTV Group, Inc.a,b | 281,694 | |||
| 5,800 | Eastman Kodak Company | 17,168 | |||
| 4,600 | Expedia, Inc.a | 69,506 | |||
| 3,100 | Family Dollar Stores, Inc. | 87,730 | |||
| 69,988 | Ford Motor Companya | 424,827 | |||
| 3,300 | Fortune Brands, Inc. | 114,642 | |||
| 3,500 | GameStop Corporationa | 77,035 | |||
| 5,000 | Gannett Company, Inc. | 17,850 | |||
| 10,000 | Gap, Inc. | 164,000 | |||
| 3,500 | Genuine Parts Company | 117,460 | |||
| 5,300 | Goodyear Tire & Rubber Companya | 59,678 | |||
| 7,400 | H&R Block, Inc. | 127,502 | |||
| 5,100 | Harley-Davidson, Inc.b | 82,671 | |||
| 1,500 | Harman International Industries, Inc. | 28,200 | |||
| 2,700 | Hasbro, Inc. | 65,448 | |||
| 36,800 | Home Depot, Inc. | 869,584 | |||
| 6,400 | International Game Technology | 101,760 | |||
| 10,389 | Interpublic Group of Companies, Inc.a | 52,464 | |||
| 4,800 | J.C. Penney Company, Inc. | 137,808 | |||
| 12,900 | Johnson Controls, Inc. | 280,188 | |||
| 1,700 | KB Home | 23,256 | |||
| 6,600 | Kohl’s Corporationa | 282,150 | |||
| 3,400 | Leggett & Platt, Inc. | 51,782 | |||
| 3,100 | Lennar Corporation | 30,039 | |||
| 5,862 | Limited Brands, Inc. | 70,168 | |||
| 32,000 | Lowe’s Companies, Inc. | 621,120 | |||
| 9,100 | Macy’s, Inc | 107,016 | |||
| 6,423 | Marriott International, Inc. | 141,756 | |||
| 7,825 | Mattel, Inc. | 125,591 | |||
| 24,000 | McDonald’s Corporation | 1,379,760 | |||
| 6,800 | McGraw-Hill Companies, Inc. | 204,748 | |||
| 800 | Meredith Corporation | 20,440 | |||
| 2,600 | New York Times Company | 14,326 | |||
| 6,026 | Newell Rubbermaid, Inc. | 62,731 | |||
| 49,900 | News Corporation | 454,589 | |||
| 8,400 | NIKE, Inc. | 434,952 | |||
| 3,500 | Nordstrom, Inc. | 69,615 | |||
| 6,000 | Office Depot, Inc.a | 27,360 | |||
| 6,800 | Omnicom Group, Inc. | 214,744 | |||
| 3,000 | O’Reilly Automotive, Inc.a | 114,240 | |||
| 1,300 | Polo Ralph Lauren Corporation | 69,602 | |||
| 4,700 | Pulte Homes, Inc. | 41,501 | |||
| 2,700 | RadioShack Corporation | 37,692 | |||
| 2,000 | Scripps Networks Interactive | 55,660 | |||
| 1,180 | Sears Holdings Corporationa,b | 78,494 | |||
| 2,200 | Sherwin-Williams Company | 118,250 | |||
| 1,300 | Snap-On, Inc. | 37,362 | |||
| 1,800 | Stanley Works | 60,912 | |||
| 15,500 | Staples, Inc. | 312,635 | |||
| 16,000 | Starbucks Corporationa | 222,240 | |||
| 4,000 | Starwood Hotels & Resorts Worldwide, Inc. | 88,800 | |||
| 16,300 | Target Corporation | 643,361 | |||
| 2,700 | Tiffany & Company | 68,472 | |||
| 7,580 | Time Warner Cable, Inc.b | 240,059 | |||
| 26,016 | Time Warner, Inc. | 655,343 | |||
| 9,000 | TJX Companies, Inc. | 283,140 | |||
| 1,900 | VF Corporation | 105,165 | |||
| 13,162 | Viacom, Inc.a | 298,777 | |||
| 40,287 | Walt Disney Company | 939,896 | |||
| 130 | Washington Post Company | 45,783 | |||
| 1,658 | Whirlpool Corporationb | 70,564 | |||
| 3,832 | Wyndham Worldwide Corporation | 46,444 | |||
| 1,400 | Wynn Resorts, Ltd.a | 49,420 | |||
| 9,920 | Yum! Brands, Inc. | 330,733 | |||
Total Consumer Discretionary | 15,657,253 | ||||
| Consumer Staples (8.1%) | |||||
| 44,900 | Altria Group, Inc. | 735,911 | |||
| 13,841 | Archer-Daniels-Midland Company | 370,524 | |||
| 9,200 | Avon Products, Inc. | 237,176 | |||
| 2,125 | Brown-Forman Corporation | 91,333 | |||
| 4,300 | Campbell Soup Company | 126,506 | |||
| 3,000 | Clorox Company | 167,490 | |||
| 43,200 | Coca-Cola Company | 2,073,168 | |||
| 6,900 | Coca-Cola Enterprises, Inc. | 114,885 | |||
| 10,800 | Colgate-Palmolive Company | 763,992 | |||
| 9,700 | ConAgra Foods, Inc. | 184,882 | |||
| 4,200 | Constellation Brands, Inc.a | 53,256 | |||
| 9,400 | Costco Wholesale Corporation | 429,580 | |||
| 31,605 | CVS Caremark Corporation | 1,007,251 | |||
| 3,800 | Dean Foods Companya | 72,922 | |||
| 5,500 | Dr. Pepper Snapple Group, Inc.a | 116,545 | |||
| 2,500 | Estee Lauder Companies, Inc. | 81,675 | |||
| 7,200 | General Mills, Inc. | 403,344 | |||
| 6,850 | H.J. Heinz Company | 244,545 | |||
| 3,600 | Hershey Company | 129,600 | |||
| 1,600 | Hormel Foods Corporation | 55,264 | |||
| 2,555 | J.M. Smucker Company | 124,326 | |||
| 5,500 | Kellogg Company | 256,135 | |||
| 8,980 | Kimberly-Clark Corporation | 470,821 | |||
| 31,960 | Kraft Foods, Inc. | 809,866 | |||
| 14,100 | Kroger Company | 310,905 | |||
| 3,700 | Lorillard, Inc. | 250,749 | |||
| 2,900 | McCormick & Company, Inc. | 94,337 | |||
| 3,300 | Molson Coors Brewing Company | 139,689 | |||
| 3,000 | Pepsi Bottling Group, Inc. | 101,520 | |||
| 33,820 | PepsiCo, Inc. | 1,858,747 | |||
| 42,600 | Philip Morris International, Inc. | 1,858,212 | |||
| 63,279 | Procter & Gamble Company | 3,233,557 | |||
The accompanying Notes to Financial Statements are an integral part of this schedule.
213
Table of Contents
Balanced Portfolio
Schedule of Investments as of June 30, 2009
(unaudited)
| Shares | Common Stock (67.7%) | Value | |||
| Consumer Staples (8.1%) - continued | |||||
| 3,700 | Reynolds American, Inc. | $ | 142,894 | ||
| 9,200 | Safeway, Inc. | 187,404 | |||
| 15,100 | Sara Lee Corporation | 147,376 | |||
| 4,569 | SUPERVALU, Inc. | 59,169 | |||
| 12,900 | SYSCO Corporation | 289,992 | |||
| 6,600 | Tyson Foods, Inc. | 83,226 | |||
| 21,500 | Walgreen Company | 632,100 | |||
| 48,400 | Wal-Mart Stores, Inc. | 2,344,496 | |||
| 3,100 | Whole Foods Market, Inc.b | 58,838 | |||
Total Consumer Staples | 20,914,208 | ||||
| Energy (8.4%) | |||||
| 10,836 | Anadarko Petroleum Corporation | 491,846 | |||
| 7,268 | Apache Corporation | 524,386 | |||
| 6,720 | Baker Hughes, Inc. | 244,877 | |||
| 6,300 | BJ Services Company | 85,869 | |||
| 2,300 | Cabot Oil & Gas Corporation | 70,472 | |||
| 4,800 | Cameron International Corporationa | 135,840 | |||
| 12,200 | Chesapeake Energy Corporation | 241,926 | |||
| 43,474 | Chevron Corporation | 2,880,152 | |||
| 32,082 | ConocoPhillips | 1,349,369 | |||
| 3,900 | CONSOL Energy, Inc. | 132,444 | |||
| 5,400 | Denbury Resources, Inc.a | 79,542 | |||
| 9,600 | Devon Energy Corporation | 523,200 | |||
| 1,600 | Diamond Offshore Drilling, Inc. | 132,880 | |||
| 15,186 | El Paso Corporation | 140,167 | |||
| 3,100 | ENSCO International, Inc. | 108,097 | |||
| 5,400 | EOG Resources, Inc. | 366,768 | |||
| 105,872 | Exxon Mobil Corporation | 7,401,512 | |||
| 2,700 | FMC Technologies, Inc.a | 101,466 | |||
| 19,500 | Halliburton Company | 403,650 | |||
| 6,100 | Hess Corporation | 327,875 | |||
| 15,322 | Marathon Oil Corporation | 461,652 | |||
| 1,900 | Massey Energy Company | 37,126 | |||
| 4,200 | Murphy Oil Corporation | 228,144 | |||
| 6,200 | Nabors Industries, Ltd.a | 96,596 | |||
| 9,000 | National Oilwell Varco, Inc.a | 293,940 | |||
| 3,800 | Noble Energy, Inc. | 224,086 | |||
| 17,600 | Occidental Petroleum Corporation | 1,158,256 | |||
| 5,800 | Peabody Energy Corporation | 174,928 | |||
| 2,500 | Pioneer Natural Resources Company | 63,750 | |||
| 3,400 | Range Resources Corporation | 140,794 | |||
| 2,500 | Rowan Companies, Inc. | 48,300 | |||
| 26,000 | Schlumberger, Ltd. | 1,406,860 | |||
| 4,800 | Smith International, Inc. | 123,600 | |||
| 7,400 | Southwestern Energy Companya | 287,490 | |||
| 13,921 | Spectra Energy Corporation | 235,543 | |||
| 2,600 | Sunoco, Inc. | 60,320 | |||
| 3,000 | Tesoro Petroleum Corporation | 38,190 | |||
| 12,100 | Valero Energy Corporation | 204,369 | |||
| 12,500 | Williams Companies, Inc. | 195,125 | |||
| 12,550 | XTO Energy, Inc. | 478,657 | |||
Total Energy | 21,700,064 | ||||
| Financials (9.2%) | |||||
| 10,100 | AFLAC, Inc. | 314,009 | |||
| 11,596 | Allstate Corporation | 282,942 | |||
| 25,800 | American Express Company | 599,592 | |||
| 58,402 | American International Group, Inc.b | 67,746 | |||
| 5,540 | Ameriprise Financial, Inc. | 134,456 | |||
| 6,050 | Aon Corporation | 229,114 | |||
| 2,554 | Apartment Investment & Management Company | 22,603 | |||
| 2,600 | Assurant, Inc. | 62,634 | |||
| 1,753 | AvalonBay Communities, Inc. | 98,063 | |||
| 175,654 | Bank of America Corporation | 2,318,633 | |||
| 26,001 | Bank of New York Mellon Corporation | 762,089 | |||
| 14,000 | BB&T Corporation | 307,720 | |||
| 3,000 | Boston Properties, Inc. | 143,100 | |||
| 9,765 | Capital One Financial Corporation | 213,658 | |||
| 5,100 | CB Richard Ellis Group, Inc.a | 47,736 | |||
| 20,425 | Charles Schwab Corporation | 358,254 | |||
| 7,700 | Chubb Corporation | 307,076 | |||
| 3,551 | Cincinnati Financial Corporation | 79,365 | |||
| 8,500 | CIT Group, Inc.b | 18,275 | |||
| 119,989 | Citigroup, Inc.b | 356,367 | |||
| 1,400 | CME Group, Inc. | 435,554 | |||
| 3,300 | Comerica, Inc. | 69,795 | |||
| 10,395 | Discover Financial Services | 106,757 | |||
| 22,000 | E*TRADE Financial Corporationa | 28,160 | |||
| 5,900 | Equity Residential REIT | 131,157 | |||
| 2,000 | Federated Investors, Inc. | 48,180 | |||
| 16,016 | Fifth Third Bancorp | 113,714 | |||
| 4,693 | First Horizon National Corporationa | 56,316 | |||
| 3,300 | Franklin Resources, Inc. | 237,633 | |||
| 9,400 | Genworth Financial, Inc. | 65,706 | |||
| 10,900 | Goldman Sachs Group, Inc. | 1,607,096 | |||
| 7,100 | Hartford Financial Services Group, Inc. | 84,277 | |||
| 5,900 | Health Care Property Investors, Inc. | 125,021 | |||
| 2,400 | Health Care REIT, Inc. | 81,840 | |||
| 13,000 | Host Marriott Corporation | 109,070 | |||
| 11,300 | Hudson City Bancorp, Inc. | 150,177 | |||
| 11,816 | Huntington Bancshares, Inc.b | 49,391 | |||
| 1,500 | IntercontinentalExchange, Inc.a | 171,360 | |||
| 8,900 | Invesco, Ltd. | 158,598 | |||
| 84,724 | J.P. Morgan Chase & Company | 2,889,936 | |||
| 3,500 | Janus Capital Group, Inc. | 39,900 | |||
| 15,400 | KeyCorp | 80,696 | |||
| 7,100 | Kimco Realty Corporation | 71,355 | |||
| 3,100 | Legg Mason, Inc. | 75,578 | |||
| 3,900 | Leucadia National Corporationa | 82,251 | |||
| 6,411 | Lincoln National Corporation | 110,333 | |||
| 7,900 | Loews Corporation | 216,460 | |||
| 1,800 | M&T Bank Corporationb | 91,674 | |||
| 11,300 | Marsh & McLennan Companies, Inc. | 227,469 | |||
| 7,700 | Marshall & Ilsley Corporation | 36,960 | |||
| 3,700 | MBIA, Inc.a | 16,021 | |||
| 17,766 | MetLife, Inc. | 533,158 | |||
| 4,200 | Moody’s Corporation | 110,670 | |||
| 29,390 | Morgan Stanley | 837,909 | |||
| 3,000 | Nasdaq OMX Group, Inc.a | 63,930 | |||
| 5,200 | Northern Trust Corporation | 279,136 | |||
| 5,700 | NYSE Euronext | 155,325 | |||
The accompanying Notes to Financial Statements are an integral part of this schedule.
214
Table of Contents
Balanced Portfolio
Schedule of Investments as of June 30, 2009
(unaudited)
| Shares | Common Stock (67.7%) | Value | |||
| Financials (9.2%) - continued | |||||
| 7,600 | People’s United Financial, Inc. | $ | 114,304 | ||
| 3,600 | Plum Creek Timber Company, Inc.b | 107,208 | |||
| 10,020 | PNC Financial Services Group, Inc. | 388,876 | |||
| 6,800 | Principal Financial Group, Inc. | 128,112 | |||
| 14,800 | Progressive Corporationa | 223,628 | |||
| 9,600 | ProLogis Trust | 77,376 | |||
| 10,000 | Prudential Financial, Inc. | 372,200 | |||
| 2,800 | Public Storage, Inc. | 183,344 | |||
| 25,100 | Regions Financial Corporation | 101,404 | |||
| 6,066 | Simon Property Group, Inc. | 311,974 | |||
| 10,100 | SLM Corporationa | 103,727 | |||
| 10,800 | State Street Corporation | 509,760 | |||
| 10,100 | SunTrust Banks, Inc. | 166,145 | |||
| 5,600 | T. Rowe Price Group, Inc. | 233,352 | |||
| 1,800 | Torchmark Corporation | 66,672 | |||
| 12,625 | Travelers Companies, Inc. | 518,130 | |||
| 41,221 | U.S. Bancorp | 738,680 | |||
| 7,158 | UnumProvident Corporation | 113,526 | |||
| 3,400 | Ventas, Inc. | 101,524 | |||
| 3,526 | Vornado Realty Trust | 158,776 | |||
| 101,082 | Wells Fargo & Company | 2,452,249 | |||
| 7,400 | XL Capital, Ltd. | 84,804 | |||
| 2,500 | Zions Bancorporationb | 28,900 | |||
Total Financials | 23,756,666 | ||||
| Health Care (9.4%) | |||||
| 33,500 | Abbott Laboratories | 1,575,840 | |||
| 9,656 | Aetna, Inc. | 241,883 | |||
| 6,600 | Allergan, Inc. | 314,028 | |||
| 6,600 | AmerisourceBergen Corporation | 117,084 | |||
| 21,952 | Amgen, Inc.a | 1,162,139 | |||
| 13,100 | Baxter International, Inc. | 693,776 | |||
| 5,200 | Becton, Dickinson and Company | 370,812 | |||
| 6,230 | Biogen Idec, Inc.a | 281,284 | |||
| 32,750 | Boston Scientific Corporationa | 332,085 | |||
| 43,000 | Bristol-Myers Squibb Company | 873,330 | |||
| 2,200 | C.R. Bard, Inc. | 163,790 | |||
| 7,775 | Cardinal Health, Inc. | 237,526 | |||
| 9,900 | Celgene Corporationa | 473,616 | |||
| 1,700 | Cephalon, Inc.a,b | 96,305 | |||
| 5,900 | CIGNA Corporation | 142,131 | |||
| 3,150 | Coventry Health Care, Inc.a | 58,936 | |||
| 2,300 | DaVita, Inc.a | 113,758 | |||
| 3,300 | Dentsply International, Inc. | 100,716 | |||
| 21,900 | Eli Lilly and Company | 758,616 | |||
| 5,900 | Express Scripts, Inc.a | 405,625 | |||
| 6,500 | Forest Laboratories, Inc.a | 163,215 | |||
| 5,800 | Genzyme Corporationa | 322,886 | |||
| 19,700 | Gilead Sciences, Inc.a | 922,748 | |||
| 3,530 | Hospira, Inc.a | 135,976 | |||
| 3,600 | Humana, Inc.a | 116,136 | |||
| 4,000 | IMS Health, Inc. | 50,800 | |||
| 800 | Intuitive Surgical, Inc.a,b | 130,928 | |||
| 59,806 | Johnson & Johnson | 3,396,981 | |||
| 5,333 | King Pharmaceuticals, Inc.a | 51,357 | |||
| 2,400 | Laboratory Corporation of America Holdingsa | 162,696 | |||
| 3,737 | Life Technologies Corporationa | 155,908 | |||
| 5,880 | McKesson Corporation | 258,720 | |||
| 10,510 | Medco Health Solutions, Inc.a | 479,361 | |||
| 24,300 | Medtronic, Inc. | 847,827 | |||
| 45,800 | Merck & Company, Inc. | 1,280,568 | |||
| 1,200 | Millipore Corporationa | 84,252 | |||
| 6,600 | Mylan Laboratories, Inc.a,b | 86,130 | |||
| 2,000 | Patterson Companies, Inc.a | 43,400 | |||
| 2,600 | PerkinElmer, Inc. | 45,240 | |||
| 146,451 | Pfizer, Inc. | 2,196,765 | |||
| 3,300 | Quest Diagnostics, Inc. | 186,219 | |||
| 35,400 | Schering-Plough Corporation | 889,248 | |||
| 7,480 | St. Jude Medical, Inc.a | 307,428 | |||
| 5,200 | Stryker Corporation | 206,648 | |||
| 9,050 | Tenet Healthcare Corporationa | 25,521 | |||
| 9,000 | Thermo Fisher Scientific, Inc.a | 366,930 | |||
| 25,800 | UnitedHealth Group, Inc. | 644,484 | |||
| 2,700 | Varian Medical Systems, Inc.a | 94,878 | |||
| 2,100 | Waters Corporationa | 108,087 | |||
| 2,300 | Watson Pharmaceuticals, Inc.a | 77,418 | |||
| 10,500 | WellPoint, Inc.a | 534,345 | |||
| 28,900 | Wyeth | 1,311,771 | |||
| 4,690 | Zimmer Holdings, Inc.a | 199,794 | |||
Total Health Care | 24,397,945 | ||||
| Industrials (6.7%) | |||||
| 15,000 | 3M Company | 901,500 | |||
| 2,400 | Avery Dennison Corporation | 61,632 | |||
| 15,728 | Boeing Company | 668,440 | |||
| 5,992 | Burlington Northern Santa Fe Corporation | 440,652 | |||
| 3,700 | C.H. Robinson Worldwide, Inc. | 192,955 | |||
| 13,000 | Caterpillar, Inc. | 429,520 | |||
| 2,900 | Cintas Corporation | 66,236 | |||
| 3,600 | Cooper Industries, Ltd. | 111,780 | |||
| 8,600 | CSX Corporation | 297,818 | |||
| 4,300 | Cummins, Inc. | 151,403 | |||
| 5,600 | Danaher Corporation | 345,744 | |||
| 9,200 | Deere & Company | 367,540 | |||
| 4,100 | Dover Corporation | 135,669 | |||
| 1,200 | Dun & Bradstreet Corporation | 97,452 | |||
| 3,600 | Eaton Corporation | 160,596 | |||
| 16,400 | Emerson Electric Company | 531,360 | |||
| 2,800 | Equifax, Inc. | 73,080 | |||
| 4,600 | Expeditors International of Washington, Inc. | 153,364 | |||
| 2,800 | Fastenal Companyb | 92,876 | |||
| 6,740 | FedEx Corporation | 374,879 | |||
| 1,300 | Flowserve Corporation | 90,753 | |||
| 3,900 | Fluor Corporation | 200,031 | |||
| 8,400 | General Dynamics Corporation | 465,276 | |||
| 230,000 | General Electric Company | 2,695,600 | |||
| 2,700 | Goodrich Corporation | 134,919 | |||
| 16,137 | Honeywell International, Inc. | 506,702 | |||
| 8,300 | Illinois Tool Works, Inc. | 309,922 | |||
| 4,000 | Iron Mountain, Inc.a | 115,000 | |||
| 4,000 | ITT Corporation | 178,000 | |||
| 2,600 | Jacobs Engineering Group, Inc.a | 109,434 | |||
| 2,600 | L-3 Communications Holdings, Inc. | 180,388 | |||
| 7,100 | Lockheed Martin Corporation | 572,615 | |||
| 2,900 | Manitowoc Company, Inc. | 15,254 | |||
| 7,800 | Masco Corporation | 74,724 | |||
| 2,700 | Monster Worldwide, Inc.a | 31,887 | |||
| 7,900 | Norfolk Southern Corporation | 297,593 | |||
The accompanying Notes to Financial Statements are an integral part of this schedule.
215
Table of Contents
Balanced Portfolio
Schedule of Investments as of June 30, 2009
(unaudited)
| Shares | Common Stock (67.7%) | Value | |||
| Industrials (6.7%) - continued | |||||
| 7,106 | Northrop Grumman Corporation | $ | 324,602 | ||
| 7,850 | PACCAR, Inc. | 255,203 | |||
| 2,600 | Pall Corporation | 69,056 | |||
| 3,550 | Parker-Hannifin Corporation | 152,508 | |||
| 4,500 | Pitney Bowes, Inc. | 98,685 | |||
| 3,000 | Precision Castparts Corporation | 219,090 | |||
| 4,400 | Quanta Services, Inc.a | 101,772 | |||
| 4,500 | R.R. Donnelley & Sons Company | 52,290 | |||
| 8,600 | Raytheon Company | 382,098 | |||
| 7,005 | Republic Services, Inc. | 170,992 | |||
| 3,400 | Robert Half International, Inc. | 80,308 | |||
| 3,100 | Rockwell Automation, Inc. | 99,572 | |||
| 3,500 | Rockwell Collins, Inc. | 146,055 | |||
| 1,200 | Ryder System, Inc. | 33,504 | |||
| 16,080 | Southwest Airlines Company | 108,218 | |||
| 1,900 | Stericycle, Inc.a | 97,907 | |||
| 5,800 | Textron, Inc. | 56,028 | |||
| 10,900 | Union Pacific Corporation | 567,454 | |||
| 21,600 | United Parcel Service, Inc. | 1,079,784 | |||
| 20,500 | United Technologies Corporation | 1,065,180 | |||
| 1,400 | W.W. Grainger, Inc. | 114,632 | |||
| 10,630 | Waste Management, Inc. | 299,341 | |||
Total Industrials | 17,206,873 | ||||
| Information Technology (12.4%) | |||||
| 11,400 | Adobe Systems, Inc.a | 322,620 | |||
| 12,100 | Advanced Micro Devices, Inc.a,b | 46,827 | |||
| 2,200 | Affiliated Computer Services, Inc.a | 97,724 | |||
| 7,463 | Agilent Technologies, Inc.a | 151,574 | |||
| 3,700 | Akamai Technologies, Inc.a | 70,966 | |||
| 6,400 | Altera Corporation | 104,192 | |||
| 3,800 | Amphenol Corporation | 120,232 | |||
| 6,300 | Analog Devices, Inc. | 156,114 | |||
| 19,400 | Apple, Inc.a | 2,763,142 | |||
| 28,900 | Applied Materials, Inc. | 317,033 | |||
| 4,900 | Autodesk, Inc.a | 93,002 | |||
| 10,900 | Automatic Data Processing, Inc. | 386,296 | |||
| 4,100 | BMC Software, Inc.a | 138,539 | |||
| 9,350 | Broadcom Corporationa | 231,786 | |||
| 8,575 | CA, Inc. | 149,462 | |||
| 2,014 | CIENA Corporationa | 20,845 | |||
| 125,200 | Cisco Systems, Inc.a | 2,333,728 | |||
| 4,000 | Citrix Systems, Inc.a | 127,560 | |||
| 6,300 | Cognizant Technology Solutions Corporationa | 168,210 | |||
| 3,300 | Computer Sciences Corporationa | 146,190 | |||
| 5,300 | Compuware Corporationa | 36,358 | |||
| 2,700 | Convergys Corporationa | 25,056 | |||
| 33,700 | Corning, Inc. | 541,222 | |||
| 37,800 | Dell, Inc.a | 518,994 | |||
| 23,500 | eBay, Inc.a | 402,555 | |||
| 7,000 | Electronic Arts, Inc.a | 152,040 | |||
| 43,624 | EMC Corporationa | 571,474 | |||
| 4,100 | Fidelity National Information Services, Inc. | 81,836 | |||
| 3,350 | Fiserv, Inc.a | 153,095 | |||
| 3,200 | FLIR Systems, Inc.a | 72,192 | |||
| 5,200 | Google, Inc.a | 2,192,268 | |||
| 2,900 | Harris Corporation | 82,244 | |||
| 51,761 | Hewlett-Packard Company | 2,000,563 | |||
| 121,200 | Intel Corporation | 2,005,860 | |||
| 28,700 | International Business Machines Corporation | 2,996,854 | |||
| 7,000 | Intuit, Inc.a | 197,120 | |||
| 4,600 | Jabil Circuit, Inc. | 34,132 | |||
| 4,800 | JDS Uniphase Corporationa | 27,456 | |||
| 11,300 | Juniper Networks, Inc.a | 266,680 | |||
| 3,700 | KLA-Tencor Corporation | 93,425 | |||
| 1,700 | Lexmark International, Inc.a | 26,945 | |||
| 4,800 | Linear Technology Corporation | 112,080 | |||
| 14,100 | LSI Corporationa | 64,296 | |||
| 1,500 | MasterCard, Inc. | 250,965 | |||
| 3,400 | McAfee, Inc.a | 143,446 | |||
| 4,800 | MEMC Electronic Materials, Inc.a | 85,488 | |||
| 4,000 | Microchip Technology, Inc.b | 90,200 | |||
| 18,400 | Micron Technology, Inc.a | 93,104 | |||
| 166,200 | Microsoft Corporation | 3,950,574 | |||
| 3,050 | Molex, Inc. | 47,428 | |||
| 49,721 | Motorola, Inc. | 329,650 | |||
| 4,300 | National Semiconductor Corporation | 53,965 | |||
| 7,200 | NETAPP, Inc.a | 141,984 | |||
| 7,500 | Novell, Inc.a | 33,975 | |||
| 2,200 | Novellus Systems, Inc.a | 36,740 | |||
| 11,850 | NVIDIA Corporationa | 133,786 | |||
| 82,159 | Oracle Corporation | 1,759,846 | |||
| 6,950 | Paychex, Inc. | 175,140 | |||
| 2,600 | QLogic Corporationa | 32,968 | |||
| 35,900 | QUALCOMM, Inc. | 1,622,680 | |||
| 2,300 | Salesforce.com, Inc.a,b | 87,791 | |||
| 4,900 | SanDisk Corporationa | 71,981 | |||
| 16,175 | Sun Microsystems, Inc.a | 149,134 | |||
| 17,772 | Symantec Corporationa | 276,532 | |||
| 8,600 | Tellabs, Inc.a | 49,278 | |||
| 3,800 | Teradata Corporationa | 89,034 | |||
| 3,700 | Teradyne, Inc.a | 25,382 | |||
| 27,700 | Texas Instruments, Inc. | 590,010 | |||
| 4,300 | Total System Services, Inc. | 57,577 | |||
| 4,200 | VeriSign, Inc.a | 77,616 | |||
| 4,500 | Western Digital Corporationa | 119,250 | |||
| 15,262 | Western Union Company | 250,297 | |||
| 18,800 | Xerox Corporation | 121,824 | |||
| 6,000 | Xilinx, Inc. | 122,760 | |||
| 30,300 | Yahoo!, Inc.a | 474,498 | |||
Total Information Technology | 32,145,690 | ||||
| Materials (2.2%) | |||||
| 4,500 | Air Products and Chemicals, Inc. | 290,655 | |||
| 2,400 | AK Steel Holding Corporation | 46,056 | |||
| 21,164 | Alcoa, Inc. | 218,624 | |||
| 2,081 | Allegheny Technologies, Inc. | 72,689 | |||
| 2,100 | Ball Corporation | 94,836 | |||
| 2,200 | Bemis Company, Inc. | 55,440 | |||
| 1,000 | CF Industries Holdings, Inc. | 74,140 | |||
| 23,377 | Dow Chemical Company | 377,305 | |||
| 19,619 | E.I. du Pont de Nemours and Company | 502,639 | |||
| 1,600 | Eastman Chemical Company | 60,640 | |||
| 3,700 | Ecolab, Inc. | 144,263 | |||
| 8,844 | Freeport-McMoRan Copper & Gold, Inc. | 443,173 | |||
The accompanying Notes to Financial Statements are an integral part of this schedule.
216
Table of Contents
Balanced Portfolio
Schedule of Investments as of June 30, 2009
(unaudited)
| Shares | Common Stock (67.7%) | Value | |||
| Materials (2.2%) - continued | |||||
| 1,700 | International Flavors & Fragrances, Inc. | $ | 55,624 | ||
| 9,421 | International Paper Company | 142,540 | |||
| 3,780 | MeadWestvaco Corporation | 62,030 | |||
| 11,866 | Monsanto Company | 882,118 | |||
| 10,717 | Newmont Mining Corporation | 438,004 | |||
| 6,800 | Nucor Corporation | 302,124 | |||
| 3,600 | Owens-Illinois, Inc.a | 100,836 | |||
| 2,900 | Pactiv Corporationa | 63,017 | |||
| 3,600 | PPG Industries, Inc. | 158,040 | |||
| 6,600 | Praxair, Inc. | 469,062 | |||
| 3,428 | Sealed Air Corporation | 63,246 | |||
| 2,600 | Sigma-Aldrich Corporation | 128,856 | |||
| 1,900 | Titanium Metals Corporation | 17,461 | |||
| 3,100 | United States Steel Corporation | 110,794 | |||
| 2,700 | Vulcan Materials Companyb | 116,370 | |||
| 4,600 | Weyerhaeuser Company | 139,978 | |||
Total Materials | 5,630,560 | ||||
| Telecommunications Services (2.4%) | |||||
| 8,600 | American Tower Corporationa | 271,158 | |||
| 128,079 | AT&T, Inc. | 3,181,482 | |||
| 2,250 | CenturyTel, Inc.b | 69,075 | |||
| 3,098 | Embarq Corporation | 130,302 | |||
| 6,800 | Frontier Communications Corporation | 48,552 | |||
| 5,100 | MetroPCS Communications, Inc.a | 67,881 | |||
| 32,218 | Qwest Communications International, Inc.b | 133,705 | |||
| 62,469 | Sprint Nextel Corporationa | 300,476 | |||
| 61,670 | Verizon Communications, Inc. | 1,895,119 | |||
| 9,517 | Windstream Corporation | 79,562 | |||
Total Telecommunications Services | 6,177,312 | ||||
| Utilities (2.8%) | |||||
| 14,500 | AES Corporationa | 168,345 | |||
| 3,700 | Allegheny Energy, Inc. | 94,905 | |||
| 4,600 | Ameren Corporation | 114,494 | |||
| 10,340 | American Electric Power Company, Inc. | 298,723 | |||
| 7,524 | CenterPoint Energy, Inc. | 83,366 | |||
| 4,900 | CMS Energy Corporation | 59,192 | |||
| 6,000 | Consolidated Edison, Inc. | 224,520 | |||
| 4,300 | Constellation Energy Group, Inc. | 114,294 | |||
| 12,830 | Dominion Resources, Inc. | 428,779 | |||
| 3,600 | DTE Energy Company | 115,200 | |||
| 27,942 | Duke Energy Corporation | 407,674 | |||
| 11,009 | Dynegy, Inc.a | 24,990 | |||
| 7,100 | Edison International, Inc. | 223,366 | |||
| 4,300 | Entergy Corporation | 333,336 | |||
| 2,900 | EQT Corporation | 101,239 | |||
| 14,274 | Exelon Corporation | 730,972 | |||
| 6,600 | FirstEnergy Corporation | 255,750 | |||
| 8,900 | FPL Group, Inc. | 506,054 | |||
| 1,707 | Integrys Energy Group, Inc. | 51,193 | |||
| 1,000 | Nicor, Inc. | 34,620 | |||
| 5,934 | NiSource, Inc. | 69,190 | |||
| 3,800 | Northeast Utilities | 84,778 | |||
| 4,700 | Pepco Holdings, Inc. | 63,168 | |||
| 7,900 | PG&E Corporation | 303,676 | |||
| 2,200 | Pinnacle West Capital Corporation | 66,330 | |||
| 8,100 | PPL Corporation | 266,976 | |||
| 6,091 | Progress Energy, Inc. | 230,422 | |||
| 11,000 | Public Service Enterprise Group, Inc. | 358,930 | |||
| 3,800 | Questar Corporation | 118,218 | |||
| 2,600 | SCANA Corporation | 84,422 | |||
| 5,287 | Sempra Energy | 262,394 | |||
| 17,000 | Southern Company | 529,720 | |||
| 4,600 | TECO Energy, Inc. | 54,878 | |||
| 2,600 | Wisconsin Energy Corporation | 105,846 | |||
| 9,810 | Xcel Energy, Inc. | 180,602 | |||
Total Utilities | 7,150,562 | ||||
Total Common Stock (cost $195,647,252) | 174,737,133 | ||||
| Principal Amount | Long-Term Fixed Income (34.1%) | ||||
| Asset-Backed Securities (1.9%) | |||||
Americredit Automobile Receivables Trust | |||||
| 1,042,020 | 0.398%, 7/6/2009c,d | 1,002,434 | |||
Bear Stearns Mortgage Funding Trust | |||||
| 529,195 | 0.454%, 7/27/2009d | 95,265 | |||
Countrywide Asset-Backed Certificates | |||||
| 961,533 | 5.549%, 4/25/2036c | 691,705 | |||
Countrywide Home Loans Asset-Backed Securities | |||||
| 722,820 | 6.085%, 6/25/2021c | 208,736 | |||
Credit Based Asset Servicing and Securitization, LLC | |||||
| 120,823 | 0.424%, 7/27/2009d | 119,689 | |||
| 538,093 | 5.501%, 12/25/2036 | 367,968 | |||
First Franklin Mortgage Loan Asset-Backed Certificates | |||||
| 310,346 | 0.424%, 7/27/2009d | 303,599 | |||
First Horizon ABS Trust | |||||
| 689,603 | 0.444%, 7/27/2009c,d | 293,294 | |||
| 1,151,386 | 0.474%, 7/27/2009c,d | 280,220 | |||
GMAC Mortgage Corporation Loan Trust | |||||
| 1,164,125 | 0.494%, 7/27/2009c,d | 349,993 | |||
| 1,926,301 | 0.494%, 7/27/2009c,d | 528,517 | |||
IndyMac Seconds Asset-Backed Trust | |||||
| 588,010 | 0.484%, 7/27/2009c,d | 158,042 | |||
SLM Student Loan Trust | |||||
| 123,998 | 1.102%, 7/27/2009d | 123,983 | |||
Wachovia Asset Securitization, Inc. | |||||
| 1,279,034 | 0.454%, 7/27/2009c,d,e | 406,848 | |||
Total Asset-Backed Securities | 4,930,293 | ||||
| Capital Goods (0.2%) | |||||
John Deere Capital Corporation | |||||
| 300,000 | 7.000%, 3/15/2012 | 329,447 | |||
The accompanying Notes to Financial Statements are an integral part of this schedule.
217
Table of Contents
Balanced Portfolio
Schedule of Investments as of June 30, 2009
(unaudited)
| Principal Amount | Long-Term Fixed Income (34.1%) | Value | |||
| Capital Goods (0.2%) - continued | |||||
United Technologies Corporation | |||||
| $ 225,000 | 6.050%, 6/1/2036 | $ | 238,649 | ||
Total Capital Goods | 568,096 | ||||
| Collateralized Mortgage Obligations(1.0%) | |||||
J.P. Morgan Mortgage Trust | |||||
| 1,431,169 | 5.008%, 7/25/2035 | 1,107,111 | |||
Merrill Lynch Mortgage Investors, Inc. | |||||
| 1,172,431 | 4.866%, 6/25/2035 | 883,581 | |||
Thornburg Mortgage Securities Trust | |||||
| 539,668 | 0.424%, 7/27/2009d | 484,704 | |||
Total Collateralized Mortgage Obligations | 2,475,396 | ||||
| Commercial Mortgage-Backed Securities (3.3%) | |||||
Bear Stearns Commercial Mortgage Securities, Inc. | |||||
| 2,500,000 | 0.469%, 7/15/2009d,e | 1,875,127 | |||
| 700,000 | 5.835%, 9/11/2042 | 363,739 | |||
Citigroup Commercial Mortgage Trust | |||||
| 6,202 | 0.389%, 7/15/2009d,f | 5,243 | |||
Commercial Mortgage Pass-Through Certificates | |||||
| 75,055 | 0.419%, 7/15/2009d,f | 72,966 | |||
| 2,000,000 | 0.449%, 7/15/2009d,e | 1,246,532 | |||
Credit Suisse Mortgage Capital Certificates | |||||
| 2,000,000 | 0.489%, 7/15/2009d,f | 984,294 | |||
General Electric Commercial Mortgage Corporation | |||||
| 200,000 | 4.641%, 9/10/2013 | 188,237 | |||
GMAC Commercial Mortgage Securities, Inc. | |||||
| 1,500,000 | 4.547%, 12/10/2041 | 1,417,129 | |||
GS Mortgage Securities Corporation II | |||||
| 1,000,000 | 0.448%, 7/6/2009d,f | 792,985 | |||
J.P. Morgan Chase Commercial Mortgage Securities Corporation | |||||
| 400,000 | 4.654%, 1/12/2037 | 345,800 | |||
| 1,500,000 | 5.336%, 5/15/2047 | 1,149,892 | |||
Total Commercial Mortgage-Backed Securities | 8,441,944 | ||||
| Communications Services (1.0%) | |||||
AT&T, Inc. | |||||
| 200,000 | 6.400%, 5/15/2038 | 195,782 | |||
British Telecom plc | |||||
| 225,000 | 9.125%, 12/15/2030 | 249,448 | |||
Cingular Wireless, Inc. | |||||
| 450,000 | 6.500%, 12/15/2011 | 485,470 | |||
Cox Communications, Inc. | |||||
| 115,000 | 6.450%, 12/1/2036f | 103,977 | |||
France Telecom SA | |||||
| 225,000 | 7.750%, 3/1/2011 | 243,345 | |||
News America, Inc. | |||||
| 225,000 | 6.400%, 12/15/2035 | 196,928 | |||
SBC Communications, Inc. | |||||
| 225,000 | 5.875%, 2/1/2012 | 240,175 | |||
Telecom Italia Capital SA | |||||
| 550,000 | 5.250%, 11/15/2013 | 539,323 | |||
Time Warner Cable, Inc. | |||||
| 200,000 | 7.300%, 7/1/2038 | 208,345 | |||
Total Communications Services | 2,462,793 | ||||
| Consumer Cyclical (0.4%) | |||||
Wal-Mart Stores, Inc. | |||||
| 450,000 | 7.550%, 2/15/2030 | 571,449 | |||
Walt Disney Company | |||||
| 500,000 | 5.625%, 9/15/2016 | 537,179 | |||
Total Consumer Cyclical | 1,108,628 | ||||
| Consumer Non-Cyclical (1.0%) | |||||
Boston Scientific Corporation | |||||
| 225,000 | 7.000%, 11/15/2035 | 182,250 | |||
Bunge Limited Finance Corporation | |||||
| 700,000 | 5.350%, 4/15/2014 | 681,094 | |||
Coca-Cola HBC Finance BV | |||||
| 425,000 | 5.125%, 9/17/2013 | 430,809 | |||
GlaxoSmithKline Capital, Inc. | |||||
| 200,000 | 6.375%, 5/15/2038 | 217,487 | |||
Kellogg Company | |||||
| 400,000 | 4.250%, 3/6/2013 | 411,776 | |||
Philip Morris International, Inc. | |||||
| 200,000 | 6.375%, 5/16/2038 | 212,788 | |||
Wyeth | |||||
| 450,000 | 6.000%, 2/15/2036 | 477,303 | |||
Total Consumer Non-Cyclical | 2,613,507 | ||||
| Energy (0.4%) | |||||
Burlington Resources, Inc. | |||||
| 500,000 | 6.500%, 12/1/2011 | 547,006 | |||
Energy Transfer Partners, LP | |||||
| 300,000 | 6.700%, 7/1/2018 | 306,691 | |||
Petro-Canada | |||||
| 200,000 | 6.800%, 5/15/2038 | 197,167 | |||
Total Energy | 1,050,864 | ||||
| Financials (2.6%) | |||||
BAC Capital Trust XI | |||||
| 225,000 | 6.625%, 5/23/2036 | 169,673 | |||
Bank One Corporation | |||||
| 750,000 | 5.900%, 11/15/2011 | 785,464 | |||
BNP Paribas SA | |||||
| 900,000 | 5.186%, 6/29/2015f | 585,849 | |||
Chubb Corporation | |||||
| 400,000 | 6.500%, 5/15/2038 | 433,630 | |||
CIGNA Corporation | |||||
| 300,000 | 6.350%, 3/15/2018 | 265,551 | |||
General Electric Capital Corporation | |||||
| 500,000 | 2.200%, 6/8/2012 | 502,562 | |||
| 225,000 | 5.875%, 1/14/2038 | 178,062 | |||
The accompanying Notes to Financial Statements are an integral part of this schedule.
218
Table of Contents
Balanced Portfolio
Schedule of Investments as of June 30, 2009
(unaudited)
| Principal Amount | Long-Term Fixed Income (34.1%) | Value | |||
| Financials (2.6%) - continued | |||||
Goldman Sachs Group, Inc. | |||||
| $ 675,000 | 6.600%, 1/15/2012 | $ | 718,689 | ||
| HSBC Finance Corporation | |||||
| 500,000 | 5.000%, 6/30/2015 | 465,897 | |||
| HSBC Holdings plc | |||||
| 200,000 | 6.800%, 6/1/2038 | 200,993 | |||
| J.P. Morgan Chase & Company | |||||
| 500,000 | 3.125%, 12/1/2011 | 517,226 | |||
| Merrill Lynch & Company, Inc. | |||||
| 450,000 | 5.000%, 2/3/2014 | 431,693 | |||
| MetLife, Inc. | |||||
| 150,000 | 5.000%, 6/15/2015 | 142,914 | |||
| Preferred Term Securities XXIII, Ltd. | |||||
| 1,207,758 | 0.829%, 9/22/2009d,e | 422,715 | |||
| ProLogis Trust | |||||
| 425,000 | 5.500%, 3/1/2013 | 372,530 | |||
| Prudential Financial, Inc. | |||||
| 225,000 | 5.700%, 12/14/2036 | 168,806 | |||
| Wachovia Bank NA | |||||
| 425,000 | 4.875%, 2/1/2015 | 405,828 | |||
| Washington Mutual Bank FA | |||||
| 500,000 | 5.500%, 1/15/2013g | 250 | |||
Total Financials | 6,768,332 | ||||
| Foreign (1.2%) | |||||
| Codelco, Inc. | |||||
| 300,000 | 6.375%, 11/30/2012f | 323,832 | |||
| Kreditanstalt fuer Wiederaufbau | |||||
| 400,000 | 3.750%, 6/27/2011 | 418,079 | |||
| Province of Newfoundland | |||||
| 500,000 | 8.650%, 10/22/2022 | 710,797 | |||
| Province of Quebec | |||||
| 600,000 | 4.875%, 5/5/2014 | 630,407 | |||
| Republic of Italy | |||||
| 750,000 | 4.375%, 6/15/2013 | 784,985 | |||
| 300,000 | 5.375%, 6/12/2017 | 304,905 | |||
Total Foreign | 3,173,005 | ||||
| Mortgage-Backed Securities (9.9%) | |||||
| Federal Home Loan Mortgage Corporation Gold 15-Yr. Pass Through | |||||
| 3,065 | 7.500%, 8/1/2010 | 3,180 | |||
| 13,198 | 7.000%, 2/1/2011 | 13,616 | |||
| 12,691 | 6.000%, 5/1/2012 | 13,447 | |||
| 2,737 | 8.000%, 6/1/2012 | 2,914 | |||
| 5,165 | 7.000%, 8/1/2012 | 5,452 | |||
| 10,676 | 6.500%, 11/1/2012 | 11,317 | |||
| 10,853 | 6.500%, 8/1/2013 | 11,522 | |||
| 37,685 | 6.000%, 2/1/2014 | 40,003 | |||
| 76,101 | 5.500%, 4/1/2014 | 80,139 | |||
| 39,341 | 6.000%, 4/1/2014 | 41,723 | |||
| 27,486 | 6.000%, 4/1/2014 | 29,177 | |||
| 33,631 | 6.500%, 6/1/2014 | 35,682 | |||
| 24,516 | 7.500%, 9/1/2014 | 26,109 | |||
| 849,233 | 5.500%, 12/1/2017 | 897,215 | |||
| Federal Home Loan Mortgage Corporation Gold 30-Yr. Pass Through | |||||
| 19,342 | 6.500%, 4/1/2024 | 20,790 | |||
| 37,389 | 9.000%, 11/1/2024 | 41,565 | |||
| 2,011 | 9.000%, 4/1/2025 | 2,232 | |||
| 3,267 | 7.000%, 9/1/2025 | 3,599 | |||
| 5,051 | 8.500%, 9/1/2025 | 5,604 | |||
| 3,706 | 8.000%, 1/1/2026 | 4,104 | |||
| 2,716 | 6.500%, 5/1/2026 | 2,919 | |||
| 1,734 | 7.000%, 5/1/2026 | 1,897 | |||
| 15,399 | 6.000%, 7/1/2026 | 16,229 | |||
| 1,299 | 7.500%, 7/1/2026 | 1,417 | |||
| 791 | 7.500%, 8/1/2026 | 863 | |||
| 3,173 | 8.000%, 11/1/2026 | 3,514 | |||
| 3,238 | 7.500%, 1/1/2027 | 3,532 | |||
| 7,750 | 6.500%, 2/1/2027 | 8,331 | |||
| 9,182 | 7.000%, 2/1/2027 | 10,020 | |||
| 18,992 | 8.000%, 3/1/2027 | 21,033 | |||
| 6,505 | 7.500%, 4/1/2027 | 7,099 | |||
| 2,046 | 7.000%, 5/1/2027 | 2,232 | |||
| 16,386 | 8.000%, 6/1/2027 | 18,157 | |||
| 6,538 | 8.500%, 7/1/2027 | 7,259 | |||
| 6,930 | 7.000%, 9/1/2027 | 7,563 | |||
| 11,292 | 8.000%, 10/1/2027 | 12,512 | |||
| 9,564 | 7.500%, 11/1/2027 | 10,437 | |||
| 3,387 | 7.500%, 12/1/2027 | 3,696 | |||
| 43,459 | 6.500%, 6/1/2028 | 46,719 | |||
| 20,811 | 7.000%, 10/1/2028 | 22,627 | |||
| 62,572 | 6.500%, 11/1/2028 | 67,266 | |||
| 552 | 6.500%, 1/1/2029 | 593 | |||
| 64,050 | 6.000%, 3/1/2029 | 67,494 | |||
| 31,565 | 6.500%, 4/1/2029 | 33,913 | |||
| 60,540 | 6.000%, 5/1/2029 | 63,795 | |||
| 71,999 | 7.000%, 5/1/2029 | 78,212 | |||
| 25,251 | 6.500%, 7/1/2029 | 27,129 | |||
| 19,477 | 6.500%, 8/1/2029 | 20,926 | |||
| 11,366 | 7.000%, 9/1/2029 | 12,346 | |||
| 13,344 | 7.000%, 10/1/2029 | 14,495 | |||
| 9,372 | 7.500%, 11/1/2029 | 10,154 | |||
| 9,115 | 7.000%, 1/1/2030 | 9,895 | |||
| 23,564 | 7.500%, 1/1/2030 | 25,526 | |||
| 8,565 | 8.000%, 8/1/2030 | 9,421 | |||
| 44,029 | 6.000%, 3/1/2031 | 46,355 | |||
| 160,448 | 6.000%, 6/1/2031 | 168,925 | |||
| 134,579 | 6.000%, 1/1/2032 | 141,689 | |||
| 499,221 | 6.000%, 10/1/2032 | 525,283 | |||
| 3,500,000 | 5.000%, 7/1/2039h | 3,559,063 | |||
| 2,050,000 | 6.000%, 7/1/2039h | 2,139,048 | |||
| Federal National Mortgage Association Conventional 15-Yr. Pass Through | |||||
| 334 | 9.000%, 4/1/2010 | 350 | |||
| 824 | 9.000%, 4/1/2010 | 863 | |||
| 861 | 6.000%, 2/1/2011 | 912 | |||
| 3,172 | 8.000%, 5/1/2011 | 3,348 | |||
| 4,429 | 7.000%, 6/1/2011 | 4,636 | |||
| 1,350 | 6.500%, 7/1/2011 | 1,430 | |||
| 1,204 | 7.500%, 7/1/2011 | 1,249 | |||
| 16,604 | 6.500%, 5/1/2012 | 17,619 | |||
| 3,236 | 6.500%, 7/1/2012 | 3,434 | |||
| 19,278 | 7.000%, 10/1/2012 | 20,268 | |||
| 4,099 | 7.000%, 12/1/2012 | 4,310 | |||
| 10,333 | 6.500%, 6/1/2013 | 10,980 | |||
The accompanying Notes to Financial Statements are an integral part of this schedule.
219
Table of Contents
Balanced Portfolio
Schedule of Investments as of June 30, 2009
(unaudited)
| Principal Amount | Long-Term Fixed Income (34.1%) | Value | |||
| Mortgage-Backed Securities (9.9%) - continued | |||||
| $ 34,808 | 6.000%, 11/1/2013 | $ | 37,025 | ||
| 71,154 | 5.500%, 12/1/2013 | 75,085 | |||
| 30,925 | 6.000%, 12/1/2013 | 32,836 | |||
| 13,911 | 7.500%, 4/1/2015 | 14,782 | |||
| 2,000,000 | 5.000%, 7/1/2024h | 2,069,376 | |||
| Federal National Mortgage Association Conventional 30-Yr. Pass Through | |||||
| 5,899 | 10.500%, 8/1/2020 | 6,658 | |||
| 5,833 | 9.500%, 4/1/2025 | 6,391 | |||
| 1,069 | 7.500%, 9/1/2025 | 1,166 | |||
| 3,516 | 8.500%, 11/1/2025 | 3,845 | |||
| 2,483 | 7.000%, 1/1/2026 | 2,732 | |||
| 8,437 | 6.500%, 2/1/2026 | 9,102 | |||
| 3,860 | 7.000%, 3/1/2026 | 4,239 | |||
| 6,440 | 6.500%, 4/1/2026 | 6,948 | |||
| 1,574 | 8.500%, 5/1/2026 | 1,719 | |||
| 2,396 | 7.500%, 7/1/2026 | 2,614 | |||
| 15,907 | 7.500%, 8/1/2026 | 17,348 | |||
| 1,906 | 8.000%, 8/1/2026 | 2,089 | |||
| 6,471 | 7.000%, 11/1/2026 | 7,106 | |||
| 2,774 | 8.000%, 11/1/2026 | 3,040 | |||
| 652 | 7.500%, 12/1/2026 | 712 | |||
| 1,851 | 7.500%, 2/1/2027 | 2,018 | |||
| 6,070 | 7.000%, 3/1/2027 | 6,665 | |||
| 5,990 | 7.500%, 5/1/2027 | 6,535 | |||
| 9,181 | 6.500%, 7/1/2027 | 9,904 | |||
| 10,106 | 7.000%, 7/1/2027 | 11,091 | |||
| 3,678 | 7.500%, 8/1/2027 | 4,012 | |||
| 37,317 | 8.000%, 9/1/2027 | 40,841 | |||
| 11,866 | 7.000%, 10/1/2027 | 13,023 | |||
| 37,598 | 7.500%, 12/1/2027 | 41,016 | |||
| 6,771 | 8.000%, 12/1/2027 | 7,411 | |||
| 17,133 | 6.500%, 2/1/2028 | 18,483 | |||
| 6,377 | 7.000%, 2/1/2028 | 6,999 | |||
| 100,380 | 6.500%, 7/1/2028 | 108,224 | |||
| 32,029 | 7.000%, 8/1/2028 | 35,167 | |||
| 16,755 | 6.500%, 11/1/2028 | 18,064 | |||
| 43,631 | 6.500%, 11/1/2028 | 47,040 | |||
| 2,240 | 7.000%, 11/1/2028 | 2,459 | |||
| 98,271 | 6.000%, 12/1/2028 | 103,924 | |||
| 32,931 | 7.000%, 12/1/2028 | 36,157 | |||
| 41,218 | 6.000%, 3/1/2029 | 43,563 | |||
| 48,731 | 6.500%, 6/1/2029 | 52,479 | |||
| 67,151 | 6.000%, 7/1/2029 | 70,972 | |||
| 5,829 | 6.500%, 7/1/2029 | 6,277 | |||
| 61,653 | 7.500%, 8/1/2029 | 67,166 | |||
| 47,710 | 6.000%, 11/1/2029 | 50,425 | |||
| 21,244 | 7.000%, 11/1/2029 | 23,325 | |||
| 29,138 | 7.000%, 11/1/2029 | 31,993 | |||
| 19,285 | 8.500%, 4/1/2030 | 21,037 | |||
| 8,809 | 7.500%, 8/1/2030 | 9,617 | |||
| 118,744 | 6.500%, 7/1/2031 | 127,615 | |||
| 47,393 | 6.500%, 10/1/2031 | 50,934 | |||
| 56,668 | 6.500%, 12/1/2031 | 60,901 | |||
| 71,861 | 6.500%, 5/1/2032 | 77,207 | |||
| 395,965 | 6.500%, 7/1/2032 | 425,422 | |||
| 11,400,000 | 5.500%, 7/1/2039h | 11,766,943 | |||
| Government National Mortgage Association 15-Yr. Pass Through | |||||
| 7,201 | 6.000%, 4/15/2011 | 7,689 | |||
| 1,307 | 6.500%, 6/15/2011 | 1,395 | |||
| 541 | 7.500%, 7/15/2011 | 573 | |||
| 5,773 | 7.000%, 4/15/2012 | 6,154 | |||
| 59,358 | 6.000%, 7/15/2014 | 63,490 | |||
| Government National Mortgage Association 30-Yr. Pass Through | |||||
| 4,030 | 9.500%, 12/15/2024 | 4,472 | |||
| 6,693 | 9.500%, 1/15/2025 | 7,550 | |||
| 2,819 | 7.500%, 8/15/2025 | 3,089 | |||
| 17,760 | 7.000%, 1/15/2026 | 19,355 | |||
| 11,126 | 7.000%, 1/15/2026 | 12,125 | |||
| 11,583 | 7.000%, 4/15/2026 | 12,623 | |||
| 6,345 | 8.000%, 4/15/2026 | 6,999 | |||
| 17,840 | 6.000%, 5/15/2026 | 18,732 | |||
| 6,283 | 7.000%, 5/15/2026 | 6,847 | |||
| 5,799 | 7.500%, 5/15/2026 | 6,356 | |||
| 23,564 | 7.000%, 6/15/2026 | 25,681 | |||
| 7,190 | 8.500%, 6/15/2026 | 7,859 | |||
| 2,626 | 8.500%, 7/15/2026 | 2,870 | |||
| 16,356 | 8.000%, 9/15/2026 | 18,042 | |||
| 4,965 | 7.500%, 10/15/2026 | 5,442 | |||
| 2,701 | 8.000%, 11/15/2026 | 2,980 | |||
| 2,907 | 8.500%, 11/15/2026 | 3,178 | |||
| 3,401 | 9.000%, 12/15/2026 | 3,752 | |||
| 26,907 | 7.500%, 4/15/2027 | 29,506 | |||
| 6,502 | 8.000%, 6/20/2027 | 7,309 | |||
| 1,271 | 8.000%, 8/15/2027 | 1,434 | |||
| 74,929 | 6.500%, 10/15/2027 | 80,686 | |||
| 25,845 | 7.000%, 10/15/2027 | 28,177 | |||
| 37,774 | 7.000%, 11/15/2027 | 41,182 | |||
| 1,290 | 7.000%, 11/15/2027 | 1,406 | |||
| 90,077 | 7.000%, 7/15/2028 | 98,236 | |||
| 17,036 | 7.500%, 7/15/2028 | 18,697 | |||
| 47,690 | 6.500%, 9/15/2028 | 51,507 | |||
| 81,641 | 6.000%, 12/15/2028 | 85,809 | |||
| 47,729 | 6.500%, 1/15/2029 | 51,520 | |||
| 202,793 | 6.500%, 3/15/2029 | 218,898 | |||
| 33,571 | 6.500%, 4/15/2029 | 36,237 | |||
| 19,622 | 7.000%, 4/15/2029 | 21,434 | |||
| 126,897 | 6.000%, 6/15/2029 | 133,495 | |||
| 51,082 | 7.000%, 6/15/2029 | 55,798 | |||
| 23,854 | 8.000%, 5/15/2030 | 26,991 | |||
| 42,656 | 7.000%, 9/15/2031 | 46,616 | |||
| 67,018 | 6.500%, 2/15/2032 | 72,047 | |||
Total Mortgage-Backed Securities | 25,652,333 | ||||
| Technology (0.2%) | |||||
| International Business Machines Corporation | |||||
| 500,000 | 7.500%, 6/15/2013 | 569,173 | |||
Total Technology | 569,173 | ||||
The accompanying Notes to Financial Statements are an integral part of this schedule.
220
Table of Contents
Balanced Portfolio
Schedule of Investments as of June 30, 2009
(unaudited)
| Principal Amount | Long-Term Fixed Income (34.1%) | Value | ||||
| Transportation (0.1%) | ||||||
Union Pacific Corporation | ||||||
| $ 250,000 | 6.500%, 4/15/2012 | $ | 263,431 | |||
Total Transportation | 263,431 | |||||
| U.S. Government (10.2%) | ||||||
Federal Farm Credit Bank | ||||||
| 1,000,000 | 5.375%, 7/18/2011b | 1,079,291 | ||||
Federal Home Loan Mortgage Corporation | ||||||
| 2,800,000 | 5.125%, 11/17/2017b | 3,073,078 | ||||
Federal National Mortgage Association | ||||||
| 1,500,000 | 5.625%, 4/17/2028 | 1,622,474 | ||||
Resolution Funding Corporation | ||||||
| 1,000,000 | 8.625%, 1/15/2021 | 1,335,272 | ||||
U.S. Treasury Bonds | ||||||
| 1,400,000 | 7.250%, 5/15/2016 | 1,754,703 | ||||
| 500,000 | 6.875%, 8/15/2025 | 655,078 | ||||
U.S. Treasury Notes | ||||||
| 3,250,000 | 4.375%, 12/15/2010 | 3,419,991 | ||||
| 3,500,000 | 4.500%, 11/30/2011 | 3,768,243 | ||||
| 3,000,000 | 2.875%, 1/31/2013 | 3,101,484 | ||||
| 1,750,000 | 2.000%, 11/30/2013 | 1,724,296 | ||||
| 2,000,000 | 4.250%, 8/15/2014 | 2,156,876 | ||||
| 700,000 | 4.500%, 2/15/2016 | 759,117 | ||||
| 2,000,000 | 2.750%, 2/15/2019 | 1,873,120 | ||||
Total U.S. Government | 26,323,023 | |||||
| Utilities (0.7%) | ||||||
Commonwealth Edison Company | ||||||
| 225,000 | 5.900%, 3/15/2036 | 215,855 | ||||
Oncor Electric Delivery Company | ||||||
| 425,000 | 6.375%, 1/15/2015 | 444,395 | ||||
Oneok Partners, LP | ||||||
| 225,000 | 6.650%, 10/1/2036 | 207,452 | ||||
Progress Energy, Inc. | ||||||
| 300,000 | 7.000%, 10/30/2031 | 326,350 | ||||
Southern California Edison Company | ||||||
| 225,000 | 5.000%, 1/15/2014 | 236,527 | ||||
Xcel Energy, Inc. | ||||||
| 225,000 | 6.500%, 7/1/2036 | 224,628 | ||||
Total Utilities | 1,655,207 | |||||
Total Long-Term Fixed Income (cost $97,824,433) | 88,056,025 | |||||
| Shares | Collateral Held for Securities Loaned (2.5%) | |||||
| 6,481,223 | Thrivent Financial Securities Lending Trust | 6,481,223 | ||||
Total Collateral Held for Securities Loaned (cost $6,481,223) | 6,481,223 | |||||
| Shares or Principal Amount | Short-Term Investments (5.6%)i | |||||
Federal Home Loan Mortgage Corporation Discount Notes | ||||||
| 9,780,000 | 0.155%, 7/13/2009 | $ | 9,779,495 | |||
| 800,000 | 0.200%, 9/21/2009j | 799,641 | ||||
| 3,772,307 | Thrivent Money Market Portfolio | 3,772,307 | ||||
Total Short-Term Investments (at amortized cost) | 14,351,443 | |||||
Total Investments (cost $314,304,351) 109.9% | $ | 283,625,824 | ||||
Other Assets and Liabilities, Net (9.9%) | (25,562,306 | ) | ||||
Total Net Assets 100.0% | $ | 258,063,518 | ||||
| a | Non-income producing security. |
| b | All or a portion of the security is on loan as discussed in item 2(M) of the Notes to Financial Statements. |
| c | All or a portion of the security is insured or guaranteed. |
| d | Denotes variable rate obligations for which the current yield and next scheduled reset date are shown. |
| e | Denotes restricted securities. Restricted securities are investment securities which have been deemed illiquid and cannot be offered for public sale without first being registered under the Securities Act of 1933. The following table indicates the acquisition date and cost of restricted securities Balanced Portfolio owned as of June 30, 2009. |
Security | Acquisition Date | Cost | |||
Bear Stearns Commercial Mortgage Securities, Inc. | 3/30/2007 | $ | 2,500,000 | ||
Commercial Mortgage Pass-Through Certificates | 10/18/2006 | 2,000,000 | |||
Preferred Term Securities XXIII, Ltd. | 9/14/2006 | 1,207,758 | |||
Wachovia Asset Securitization, Inc. | 3/16/2007 | 1,279,034 | |||
| f | Denotes securities sold under Rule 144A of the Securities Act of 1933, which exempts them from registration. These securities have been deemed liquid and may be resold to other dealers in the program or to other qualified institutional buyers. As of June 30, 2009, the value of these investments was $2,869,146 or 1.1% of total net assets. |
| g | Defaulted security. |
| h | Denotes investments purchased on a when-issued or delayed delivery basis. |
| i | The interest rate shown reflects the yield, coupon rate or, for securities purchased at a discount, the discount rate at the date of purchase. |
| j | At June 30, 2009, $799,641 of investments were held on deposit with the counterparty and pledged as the initial margin deposit for open futures contracts. |
Definitions:
| REIT | - | Real Estate Investment Trust, is a company that buys, develops, manages and/or sells real estate assets. |
The accompanying Notes to Financial Statements are an integral part of this schedule.
221
Table of Contents
Balanced Portfolio
Schedule of Investments as of June 30, 2009
(unaudited)
Unrealized Appreciation (Depreciation)
Gross unrealized appreciation and depreciation of investments, based on cost for federal income tax purposes, were as follows:
Gross unrealized appreciation | $ | 46,733,307 | ||
Gross unrealized depreciation | (77,411,834 | ) | ||
Net unrealized appreciation (depreciation) | $ | (30,678,527 | ) | |
Cost for federal income tax purposes | $ | 314,304,351 | ||
Fair Valuation Measurements
The following table is a summary of the inputs used, as of June 30, 2009, in valuing Balanced Portfolio’s assets carried at fair value as discussed in the Notes to Financial Statements.
Investments in Securities | Total | Level 1 | Level 2 | Level 3 | ||||||||||
Common Stock | ||||||||||||||
Consumer Discretionary | 15,657,253 | 15,657,253 | — | — | ||||||||||
Consumer Staples | 20,914,208 | 20,914,208 | — | — | ||||||||||
Energy | 21,700,064 | 21,700,064 | — | — | ||||||||||
Financials | 23,756,666 | 23,756,666 | — | — | ||||||||||
Health Care | 24,397,945 | 24,397,945 | — | — | ||||||||||
Industrials | 17,206,873 | 17,206,873 | — | — | ||||||||||
Information Technology | 32,145,690 | 32,145,690 | — | — | ||||||||||
Materials | 5,630,560 | 5,630,560 | — | — | ||||||||||
Telecommunications Services | 6,177,312 | 6,177,312 | �� | — | — | |||||||||
Utilities | 7,150,562 | 7,150,562 | — | — | ||||||||||
Long-Term Fixed Income | ||||||||||||||
Asset-Backed Securities | 4,930,293 | — | 4,523,445 | 406,848 | ||||||||||
Capital Goods | 568,096 | — | 568,096 | — | ||||||||||
Collateralized Mortgage Obligations | 2,475,396 | — | 2,475,396 | — | ||||||||||
Commercial Mortgage-Backed Securities | 8,441,944 | — | 8,441,944 | — | ||||||||||
Communications Services | 2,462,793 | — | 2,462,793 | — | ||||||||||
Consumer Cyclical | 1,108,628 | — | 1,108,628 | — | ||||||||||
Consumer Non-Cyclical | 2,613,507 | — | 2,613,507 | — | ||||||||||
Energy | 1,050,864 | — | 1,050,864 | — | ||||||||||
Financials | 6,768,332 | — | 6,768,332 | — | ||||||||||
Foreign | 3,173,005 | — | 3,173,005 | — | ||||||||||
Mortgage-Backed Securities | 25,652,333 | — | 25,652,333 | — | ||||||||||
Technology | 569,173 | — | 569,173 | — | ||||||||||
Transportation | 263,431 | — | 263,431 | — | ||||||||||
U.S. Government | 26,323,023 | — | 26,323,023 | — | ||||||||||
Utilities | 1,655,207 | — | 1,655,207 | — | ||||||||||
Collateral Held for Securities Loaned | 6,481,223 | 6,481,223 | — | — | ||||||||||
Short-Term Investments | 14,351,443 | 3,772,307 | 10,579,136 | — | ||||||||||
Total | $ | 283,625,824 | $ | 184,990,663 | $ | 98,228,313 | $ | 406,848 | ||||||
Other Financial Instruments* | ($63,360 | ) | ($63,360 | ) | $ | — | $ | — | ||||||
| * | Other Financial Instruments include Futures, Forwards, Written Options and Swap agreements. |
The following table is a reconciliation of assets in which significant unobservable inputs (Level 3) were used in determining fair value for the Balanced Portfolio as discussed in item 2(A) of the Notes to Financial Statements.
Investments in Securities | Value December 31, 2008 | Accrued Discounts and/or Premiums | Realized Gain/(Loss) | Change in Unrealized Gain/(Loss) | Net Purchases/(Sales) | Transfers in and/or (Out of) Level 3 | Value June 30, 2009 | ||||||||||||||||
Long-Term Fixed Income | |||||||||||||||||||||||
Asset-Backed Securities | — | — | — | (78,768 | ) | 1,769 | 483,847 | 406,848 | |||||||||||||||
Financials | 510,175 | — | — | (76,161 | ) | (11,299 | ) | (422,715 | ) | — | |||||||||||||
Total | $ | 510,175 | $ | — | $ | — | ($ | 154,929 | ) | ($9,530 | ) | $ | 61,132 | $ | 406,848 | ||||||||
The accompanying Notes to Financial Statements are an integral part of this schedule.
222
Table of Contents
Balanced Portfolio
Schedule of Investments as of June 30, 2009
(unaudited)
Futures Contracts | Number of Contracts Long/(Short) | Expiration Date | Notional Principal Amount | Value | Unrealized Gain/(Loss) | |||||||||
S&P 500 Index Futures | 12 | September 2009 | $ | 2,809,860 | $ | 2,746,500 | ($ | 63,360 | ) | |||||
Total Futures Contracts | ($ | 63,360 | ) | |||||||||||
The following table summarizes the fair value and Statement of Assets and Liabilities location, as of June 30, 2009, for the Balanced Portfolio’s investments in financial derivative instruments by primary risk exposure as discussed under item (2) Significant Accounting Policies of the Notes to Financial Statements.
Derivatives by Risk Category | Statement of Assets and Liabilities Location | Fair Value | |||
Liability Derivatives | |||||
Equity Contracts | |||||
Future* | Net Assets - Net unrealized appreciation/(depreciation) on Futures contracts | 63,360 | |||
Total Equity Contracts | 63,360 | ||||
Total LiabilityDerivatives | $ | 63,360 | |||
| * | Includes cumulative appreciation/depreciation of futures contracts as reported in the Schedule of Investments. Only current day’s variation margin is reported within the Statement of Assets and Liabilities. |
The following table summarizes the net realized gains/(losses) and Statement of Operations location, for the period ended June 30, 2009, for Balanced Portfolio’s investments in financial derivative instruments by primary risk exposure.
Derivatives by Risk Category | Statement of Operations Location | Realized Gains/(Losses) recognized in Income | |||
Equity Contracts | |||||
Future | Net realized gains/(losses) on Futures contracts | 462,028 | |||
Total Equity Contracts | 462,028 | ||||
Total | $ | 462,028 | |||
The following table summarizes the change in net unrealized appreciation/(depreciation) and Statement of Operations location, for the period ended June 30, 2009, for the Balanced Portfolio’s investments in financial derivative instruments by primary risk exposure.
Derivatives by Risk Category | Statement of Operations Location | Change in Unrealized Appreciation/(Depreciation) recognized in Income | |||
Equity Contracts | |||||
Future | Change in net unrealized appreciation/(depreciation) on Futures contracts | (107,280 | ) | ||
Total Equity Contracts | (107,280 | ) | |||
Total | ($107,280 | ) | |||
Investment in Affiliates
Affiliated issuers, as defined under the Investment Company Act of 1940, include those in which the Portfolio’s holdings of an issuer represent 5% or more of the outstanding voting securities of an issuer, or any affiliated mutual fund.
A summary of transactions for the fiscal year to date, in Balanced Portfolio, is as follows:
Portfolio | Value December 31, 2008 | Gross Purchases | Gross Sales | Shares Held at June 30, 2009 | Value June 30, 2009 | Income Earned January 1, 2009 - June 30, 2009 | |||||||||||
Money Market | $ | 12,047,152 | $ | 28,233,231 | $ | 36,508,076 | 3,772,307 | $ | 3,772,307 | $ | 18,081 | ||||||
Thrivent Financial Securities Lending Trust | 16,513,429 | 32,889,969 | 42,922,175 | 6,481,223 | 6,481,223 | 105,040 | |||||||||||
Total Value and Income Earned | 28,560,581 | 10,253,530 | 123,121 | ||||||||||||||
The accompanying Notes to Financial Statements are an integral part of this schedule.
223
Table of Contents
Schedule of Investments as of June 30, 2009
(unaudited)
| Principal Amount | Bank Loans (3.6%)a | Value | |||
| Basic Materials (0.5%) | |||||
Lyondell Chemical Company, Debtor in Possession Facility Term Loan | |||||
| $ 1,200,401 | 13.000%, 12/15/2009b,c | $ | 1,233,868 | ||
Lyondell Chemical Company, Dutch Revolving Credit Loan | |||||
| 53,993 | 3.815%, 12/20/2012 | 23,371 | |||
Lyondell Chemical Company, Dutch Tranche A Term Loan | |||||
| 125,422 | 3.815%, 12/20/2013 | 54,290 | |||
Lyondell Chemical Company, German Tranche B-1 Euro Term Loan | |||||
| 155,009 | 4.065%, 12/20/2014 | 67,097 | |||
Lyondell Chemical Company, German Tranche B-2 Euro Term Loan | |||||
| 155,009 | 4.065%, 12/20/2014 | 67,097 | |||
Lyondell Chemical Company, German Tranche B-3 Euro Term Loan | |||||
| 155,009 | 4.065%, 12/20/2014 | 67,097 | |||
Lyondell Chemical Company, Primary U.S. Revolving Credit Loan | |||||
| 202,474 | 3.815%, 12/20/2014 | 87,643 | |||
Lyondell Chemical Company, Roll-Up Term Loan Facility | |||||
| 1,199,218 | 5.825%, 12/15/2009 | 994,703 | |||
Lyondell Chemical Company, U.S. Tranche A Term Loan | |||||
| 385,770 | 3.815%, 12/20/2013 | 166,985 | |||
Lyondell Chemical Company, U.S. Tranche B-1 Term Loan | |||||
| 672,628 | 7.000%, 12/20/2014 | 291,154 | |||
Lyondell Chemical Company, U.S. Tranche B-2 Term Loan | |||||
| 672,628 | 7.000%, 12/20/2014 | 291,154 | |||
Lyondell Chemical Company, U.S. Tranche B-3 Term Loan | |||||
| 672,628 | 7.000%, 12/20/2014 | 291,154 | |||
Total Basic Materials | 3,635,613 | ||||
| Communications Services (0.4%) | |||||
Charter Communications Operating, LLC, Term Loan | |||||
| 2,885,353 | 6.250%, 3/6/2014 | 2,588,393 | |||
Total Communications Services | 2,588,393 | ||||
| Consumer Cyclical (1.5%) | |||||
Blockbuster, Inc., Term Loan | |||||
| 2,017,099 | 5.102%, 8/20/2011 | 1,548,749 | |||
Ford Motor Company, Term Loan | |||||
| 10,935,875 | 3.594%, 12/15/2013 | 7,925,119 | |||
Rite Aid Corporation | |||||
| 1,360,000 | 9.500%, 6/5/2015 | 1,352,071 | |||
Total Consumer Cyclical | 10,825,939 | ||||
| Technology (0.3%) | |||||
Flextronics Semiconductor, Ltd., Term Loan | |||||
| 2,383,301 | 3.037%, 10/1/2014 | 1,978,140 | |||
| 684,857 | 3.381%, 10/1/2014 | 568,431 | |||
Total Technology | 2,546,571 | ||||
| Utilities (0.9%) | |||||
Energy Future Holdings, Term Loan | |||||
| 5,936,625 | 3.821%, 10/10/2014 | 4,237,266 | |||
NRG Energy, Inc., Term Loan | |||||
| 1,379,999 | 2.016%, 2/1/2013 | 1,296,454 | |||
| 738,799 | 2.970%, 2/1/2013 | 694,072 | |||
Total Utilities | 6,227,792 | ||||
Total Bank Loans (cost $29,842,689) | 25,824,308 | ||||
Long-Term Fixed Income (90.8%) | |||||
| Asset-Backed Securities (0.2%) | |||||
Countrywide Home Loans Asset-Backed Securities | |||||
| 1,862,030 | 0.424%, 7/27/2009d,e | 1,161,657 | |||
Total Asset-Backed Securities | 1,161,657 | ||||
| Basic Materials (9.2%) | |||||
Arch Western Finance, LLC | |||||
| 3,535,000 | 6.750%, 7/1/2013 | 3,225,687 | |||
Cellu Tissue Holdings, Inc. | |||||
| 1,550,000 | 11.500%, 6/1/2014f | 1,522,875 | |||
Domtar Corporation | |||||
| 1,630,000 | 10.750%, 6/1/2017 | 1,564,800 | |||
Domtar, Inc. | |||||
| 4,440,000 | 7.125%, 8/15/2015 | 3,707,400 | |||
Drummond Company, Inc. | |||||
| 3,475,000 | 7.375%, 2/15/2016f | 2,536,750 | |||
FMG Finance, Pty., Ltd. | |||||
| 5,735,000 | 10.625%, 9/1/2016f | 5,505,600 | |||
Freeport-McMoRan Copper & Gold, Inc. | |||||
| 2,880,000 | 8.250%, 4/1/2015 | 2,908,800 | |||
| 4,295,000 | 8.375%, 4/1/2017 | 4,327,212 | |||
General Cable Corporation, Convertible | |||||
| 2,440,000 | 1.000%, 10/15/2012 | 1,915,400 | |||
Georgia-Pacific, LLC | |||||
| 1,640,000 | 8.125%, 5/15/2011 | 1,640,000 | |||
| 950,000 | 8.250%, 5/1/2016f | 921,500 | |||
| 2,115,000 | 7.125%, 1/15/2017f | 1,966,950 | |||
Graphic Packaging International Corporation | |||||
| 5,160,000 | 9.500%, 8/15/2013g | 4,927,800 | |||
Griffin Coal Mining Company, Pty., Ltd. | |||||
| 3,475,000 | 9.500%, 12/1/2016f | 1,789,625 | |||
Jefferson Smurfit Corporation | |||||
| 1,520,000 | 8.250%, 10/1/2012g,h | 570,000 | |||
NewPage Corporation | |||||
| 2,430,000 | 10.000%, 5/1/2012 | 1,166,400 | |||
The accompanying Notes to Financial Statements are an integral part of this schedule.
224
Table of Contents
High Yield Portfolio
Schedule of Investments as of June 30, 2009
(unaudited)
| Principal Amount | Long-Term Fixed Income (90.8%) | Value | |||
| Basic Materials (9.2%) - continued | |||||
Peabody Energy Corporation | |||||
| $4,710,000 | 6.875%, 3/15/2013 | $ | 4,662,900 | ||
Rock-Tenn Company | |||||
| 850,000 | 9.250%, 3/15/2016 | 864,875 | |||
| 1,600,000 | 9.250%, 3/15/2016f | 1,628,000 | |||
Ryerson, Inc. | |||||
| 2,300,000 | 12.000%, 11/1/2015 | 1,874,500 | |||
Smurfit-Stone Container Enterprises, Inc. | |||||
| 2,160,000 | 8.000%, 3/15/2017g,h | 799,200 | |||
Southern Copper Corporation | |||||
| 1,970,000 | 7.500%, 7/27/2035 | 1,781,020 | |||
Steel Dynamics, Inc. | |||||
| 4,920,000 | 8.250%, 4/15/2016f | 4,637,100 | |||
Teck Resources, Ltd. | |||||
| 2,560,000 | 10.250%, 5/15/2016f | 2,681,600 | |||
| 2,440,000 | 10.750%, 5/15/2019f | 2,623,000 | |||
Terra Capital, Inc. | |||||
| 3,710,000 | 7.000%, 2/1/2017 | 3,390,013 | |||
Total Basic Materials | 65,139,007 | ||||
| Capital Goods (8.8%) | |||||
Ball Corporation | |||||
| 2,525,000 | 6.625%, 3/15/2018 | 2,310,375 | |||
Berry Plastics Holding Corporation | |||||
| 1,800,000 | 8.875%, 9/15/2014 | 1,516,500 | |||
Case New Holland, Inc. | |||||
| 2,900,000 | 7.125%, 3/1/2014 | 2,646,250 | |||
Crown Americas, Inc. | |||||
| 2,150,000 | 7.625%, 11/15/2013 | 2,096,250 | |||
| 2,150,000 | 7.750%, 11/15/2015 | 2,101,625 | |||
DRS Technologies, Inc. | |||||
| 3,400,000 | 6.625%, 2/1/2016 | 3,303,844 | |||
Graham Packaging Company, Inc. | |||||
| 3,515,000 | 9.875%, 10/15/2014 | 3,268,950 | |||
L-3 Communications Corporation | |||||
| 5,000,000 | 6.125%, 1/15/2014g | 4,650,000 | |||
| 3,470,000 | 6.375%, 10/15/2015 | 3,149,025 | |||
Legrand SA | |||||
| 1,150,000 | 8.500%, 2/15/2025 | 990,493 | |||
Leucadia National Corporation | |||||
| 6,100,000 | 7.125%, 3/15/2017 | 4,956,250 | |||
Mueller Water Products, Inc. | |||||
| 1,780,000 | 7.375%, 6/1/2017 | 1,312,750 | |||
Norcraft Companies, LP/Norcraft Finance Corporation | |||||
| 2,340,000 | 9.000%, 11/1/2011 | 2,316,600 | |||
Owens-Brockway Glass Container, Inc. | |||||
| 1,630,000 | 8.250%, 5/15/2013 | 1,638,150 | |||
Owens-Illinois, Inc. | |||||
| 5,750,000 | 7.800%, 5/15/2018g | 5,426,563 | |||
Plastipak Holdings, Inc. | |||||
| 3,495,000 | 8.500%, 12/15/2015f | 3,132,394 | |||
RBS Global, Inc./Rexnord Corporation | |||||
| 3,125,000 | 9.500%, 8/1/2014g | 2,671,875 | |||
Rental Services Corporation | |||||
| 2,400,000 | 9.500%, 12/1/2014g | 1,926,000 | |||
RSC Equipment Rental, Inc. | |||||
| 540,000 | 10.000%, 7/15/2017f | 525,825 | |||
SPX Corporation | |||||
| 4,020,000 | 7.625%, 12/15/2014 | 3,879,300 | |||
TransDigm, Inc. | |||||
| 6,585,000 | 7.750%, 7/15/2014 | 6,255,750 | |||
United Rentals North America, Inc. | |||||
| 2,260,000 | 6.500%, 2/15/2012g | 2,192,200 | |||
Total Capital Goods | 62,266,969 | ||||
| Commercial Mortgage-Backed Securities (0.3%) | |||||
Greenwich Capital Commercial Funding Corporation | |||||
| 4,000,000 | 5.867%, 8/10/2017 | 2,095,504 | |||
Total Commercial Mortgage-Backed Securities | 2,095,504 | ||||
| Communications Services (16.6%) | |||||
American Tower Corporation | |||||
| 5,900,000 | 7.000%, 10/15/2017 | 5,708,250 | |||
CC Holdings GS V, LLC | |||||
| 900,000 | 7.750%, 5/1/2017f | 877,500 | |||
Centennial Communications Corporation | |||||
| 3,940,000 | 8.125%, 2/1/2014 | 4,028,650 | |||
Charter Communications Operating, LLC | |||||
| 2,880,000 | 10.375%, 4/30/2014f,h | 2,757,600 | |||
Cricket Communications, Inc. | |||||
| 3,870,000 | 9.375%, 11/1/2014 | 3,811,950 | |||
Crown Castle International Corporation | |||||
| 5,160,000 | 9.000%, 1/15/2015g | 5,250,300 | |||
CSC Holdings, Inc. | |||||
| 2,870,000 | 8.500%, 4/15/2014f | 2,844,887 | |||
| 3,450,000 | 8.500%, 6/15/2015f | 3,389,625 | |||
| 1,150,000 | 8.625%, 2/15/2019f | 1,118,375 | |||
Dex Media West, LLC/Dex Media West Finance Company | |||||
| 1,310,000 | 9.875%, 8/15/2013h | 199,775 | |||
DIRECTV Holdings, LLC | |||||
| 5,780,000 | 7.625%, 5/15/2016 | 5,621,050 | |||
EchoStar DBS Corporation | |||||
| 4,220,000 | 7.125%, 2/1/2016 | 3,935,150 | |||
Intelsat Subsidiary Holding Company, Ltd. | |||||
| 7,740,000 | 8.875%, 1/15/2015f | 7,469,100 | |||
| 300,000 | 8.875%, 1/15/2015 | 288,000 | |||
Intelsat, Ltd. | |||||
| 6,170,000 | Zero Coupon, 2/1/2010i | 5,522,150 | |||
Level 3 Financing, Inc. | |||||
| 2,340,000 | 9.250%, 11/1/2014 | 1,918,800 | |||
Mediacom, LLC/Mediacom Capital Corporation | |||||
| 5,020,000 | 9.500%, 1/15/2013g | 4,781,550 | |||
MetroPCS Wireless, Inc. | |||||
| 4,550,000 | 9.250%, 11/1/2014g | 4,521,563 | |||
The accompanying Notes to Financial Statements are an integral part of this schedule.
225
Table of Contents
High Yield Portfolio
Schedule of Investments as of June 30, 2009
(unaudited)
| Principal Amount | Long-Term Fixed Income (90.8%) | Value | |||
Communications Services (16.6%) - continued | |||||
| $1,150,000 | 9.250%, 11/1/2014f | $ | 1,138,500 | ||
Nextel Communications, Inc. | |||||
| 4,230,000 | 6.875%, 10/31/2013 | 3,500,325 | |||
Nielsen Finance, LLC/Nielsen Finance Company | |||||
| 2,450,000 | 10.000%, 8/1/2014 | 2,318,312 | |||
| 1,500,000 | 11.500%, 5/1/2016f,g | 1,458,750 | |||
NTL Cable plc | |||||
| 5,330,000 | 9.125%, 8/15/2016 | 5,130,125 | |||
Paetec Holding Corporation | |||||
| 3,090,000 | 8.875%, 6/30/2017f | 2,904,600 | |||
Quebecor Media, Inc. | |||||
| 3,430,000 | 7.750%, 3/15/2016 | 3,108,438 | |||
Qwest Communications International, Inc. | |||||
| 1,270,000 | 7.500%, 2/15/2014 | 1,158,875 | |||
Qwest Corporation | |||||
| 3,580,000 | 7.875%, 9/1/2011 | 3,580,000 | |||
| 1,950,000 | 7.625%, 6/15/2015 | 1,833,000 | |||
| 600,000 | 8.375%, 5/1/2016f | 579,000 | |||
R.H. Donnelley Corporation | |||||
| 4,605,000 | 6.875%, 1/15/2013h | 236,006 | |||
Sprint Capital Corporation | |||||
| 4,180,000 | 8.375%, 3/15/2012 | 4,117,300 | |||
Time Warner Telecom Holdings, Inc. | |||||
| 5,890,000 | 9.250%, 2/15/2014g | 5,845,825 | |||
UPC Holding BV | |||||
| 3,700,000 | 9.875%, 4/15/2018f | 3,519,625 | |||
Videotron Ltee | |||||
| 5,560,000 | 6.875%, 1/15/2014 | 5,143,000 | |||
| 1,430,000 | 9.125%, 4/15/2018f | 1,453,238 | |||
| 860,000 | 9.125%, 4/15/2018 | 873,975 | |||
Virgin Media Finance plc | |||||
| 2,840,000 | 8.750%, 4/15/2014 | 2,769,000 | |||
Windstream Corporation | |||||
| 1,270,000 | 8.625%, 8/1/2016 | 1,216,025 | |||
| 2,100,000 | 7.000%, 3/15/2019 | 1,827,000 | |||
Total Communications Services | 117,755,194 | ||||
| Consumer Cyclical (20.5%) | |||||
AMC Entertainment, Inc. | |||||
| 5,060,000 | 8.750%, 6/1/2019f | 4,756,400 | |||
Ameristar Casinos, Inc. | |||||
| 3,780,000 | 9.250%, 6/1/2014f | 3,855,600 | |||
Beazer Homes USA, Inc. | |||||
| 1,205,000 | 8.625%, 5/15/2011 | 819,400 | |||
Blockbuster, Inc. | |||||
| 3,450,000 | 9.000%, 9/1/2012g | 1,656,000 | |||
Boyd Gaming Corporation | |||||
| 4,430,000 | 6.750%, 4/15/2014g | 3,588,300 | |||
Burlington Coat Factory Warehouse Corporation | |||||
| 4,150,000 | 11.125%, 4/15/2014 | 3,299,250 | |||
Circus & Eldorado Joint Venture/Silver Legacy Capital Corporation | |||||
| 5,410,000 | 10.125%, 3/1/2012 | 4,307,712 | |||
Dollarama Group, LP | |||||
| 1,970,000 | 7.468%, 12/15/2009e | 1,822,250 | |||
| 5,260,000 | 8.875%, 8/15/2012 | 5,089,050 | |||
Firekeepers Development Authority | |||||
| 6,600,000 | 13.875%, 5/1/2015f | 6,088,500 | |||
Ford Motor Credit Company, LLC | |||||
| 3,830,000 | 7.375%, 2/1/2011 | 3,467,203 | |||
| 10,830,000 | 8.000%, 6/1/2014g | 8,762,748 | |||
Gaylord Entertainment Company | |||||
| 4,890,000 | 6.750%, 11/15/2014 | 3,655,275 | |||
Goodyear Tire & Rubber Company | |||||
| 1,020,000 | 10.500%, 5/15/2016 | 1,030,200 | |||
Group 1 Automotive, Inc. | |||||
| 4,660,000 | 8.250%, 8/15/2013 | 3,937,700 | |||
Hanesbrands, Inc. | |||||
| 2,460,000 | 4.593%, 12/15/2009e | 1,980,300 | |||
Harrah’s Operating Company, Inc. | |||||
| 5,160,000 | 11.250%, 6/1/2017f | 4,876,200 | |||
Host Hotels & Resorts, LP | |||||
| 1,960,000 | 6.875%, 11/1/2014 | 1,764,000 | |||
KB Home | |||||
| 3,960,000 | 6.250%, 6/15/2015 | 3,385,800 | |||
Lear Corporation | |||||
| 5,180,000 | 8.500%, 12/1/2013 | 1,346,800 | |||
Limited Brands, Inc. | |||||
| 2,700,000 | 6.900%, 7/15/2017 | 2,336,332 | |||
Macy’s Retail Holdings, Inc. | |||||
| 3,450,000 | 8.875%, 7/15/2015 | 3,338,603 | |||
MGM MIRAGE | |||||
| 4,550,000 | 11.125%, 11/15/2017f,g | 4,823,000 | |||
Norcraft Holdings, LP/Norcraft Capital Corporation | |||||
| 1,655,000 | 9.750%, 9/1/2012 | 1,547,425 | |||
Perry Ellis International, Inc. | |||||
| 2,800,000 | 8.875%, 9/15/2013 | 2,282,000 | |||
Pinnacle Entertainment, Inc. | |||||
| 3,620,000 | 7.500%, 6/15/2015 | 3,095,100 | |||
Pokagon Gaming Authority | |||||
| 4,193,000 | 10.375%, 6/15/2014f | 4,109,140 | |||
Pulte Homes, Inc. | |||||
| 4,020,000 | 5.200%, 2/15/2015 | 3,356,700 | |||
Rite Aid Corporation | |||||
| 2,295,000 | 8.625%, 3/1/2015g | 1,526,175 | |||
| 1,630,000 | 9.750%, 6/12/2016f | 1,630,000 | |||
| 1,900,000 | 7.500%, 3/1/2017 | 1,486,750 | |||
Royal Caribbean Cruises, Ltd. | |||||
| 3,020,000 | 7.000%, 6/15/2013 | 2,638,725 | |||
Seminole Hard Rock Entertainment | |||||
| 3,370,000 | 3.129%, 9/15/2009e,f | 2,325,300 | |||
Service Corporation International | |||||
| 2,100,000 | 6.750%, 4/1/2015 | 1,900,500 | |||
Shingle Springs Tribal Gaming Authority | |||||
| 6,730,000 | 9.375%, 6/15/2015f | 4,038,000 | |||
Speedway Motorsports, Inc. | |||||
| 3,965,000 | 6.750%, 6/1/2013 | 3,806,400 | |||
| 1,090,000 | 8.750%, 6/1/2016f | 1,103,625 | |||
The accompanying Notes to Financial Statements are an integral part of this schedule.
226
Table of Contents
High Yield Portfolio
Schedule of Investments as of June 30, 2009
(unaudited)
| Principal Amount | Long-Term Fixed Income (90.8%) | Value | |||
| Consumer Cyclical (20.5%) - continued | |||||
Starwood Hotels & Resorts Worldwide, Inc. | |||||
| $2,400,000 | 7.875%, 10/15/2014 | $ | 2,256,000 | ||
Stewart Enterprises, Inc., Convertible | |||||
| 2,710,000 | 3.125%, 7/15/2014 | 2,147,675 | |||
| 1,030,000 | 3.375%, 7/15/2016g | 778,938 | |||
TRW Automotive, Inc. | |||||
| 1,870,000 | 7.000%, 3/15/2014f,g | 1,346,400 | |||
Tunica Biloxi Gaming Authority | |||||
| 6,510,000 | 9.000%, 11/15/2015j | 5,728,800 | |||
Turning Stone Resort Casino Enterprise | |||||
| 2,000,000 | 9.125%, 12/15/2010j | 1,865,000 | |||
| 4,940,000 | 9.125%, 9/15/2014j | 4,211,350 | |||
Universal City Development Services | |||||
| 1,730,000 | 11.750%, 4/1/2010 | 1,647,825 | |||
Universal City Florida Holding Company I/II | |||||
| 4,855,000 | 5.778%, 8/1/2009e | 3,968,962 | |||
Warnaco, Inc. | |||||
| 4,145,000 | 8.875%, 6/15/2013 | 4,186,450 | |||
WMG Acquisition Corporation | |||||
| 2,600,000 | 9.500%, 6/15/2016f | 2,587,000 | |||
Total Consumer Cyclical | 145,556,863 | ||||
| Consumer Non-Cyclical (12.2%) | |||||
Biomet, Inc. | |||||
| 3,810,000 | 10.000%, 10/15/2017f | 3,876,675 | |||
| 2,090,000 | 10.375%, 10/15/2017 | 2,022,075 | |||
| 2,310,000 | 11.625%, 10/15/2017 | 2,263,800 | |||
Community Health Systems, Inc. | |||||
| 4,680,000 | 8.875%, 7/15/2015g | 4,586,400 | |||
Constellation Brands, Inc. | |||||
| 2,470,000 | 7.250%, 9/1/2016g | 2,284,750 | |||
HCA, Inc. | |||||
| 8,350,000 | 6.750%, 7/15/2013g | 7,348,000 | |||
| 3,124,000 | 9.625%, 11/15/2016g | 3,092,760 | |||
| 3,710,000 | 8.500%, 4/15/2019f | 3,635,800 | |||
Ingles Markets, Inc. | |||||
| 1,600,000 | 8.875%, 5/15/2017f | 1,576,000 | |||
Jarden Corporation | |||||
| 3,730,000 | 7.500%, 5/1/2017g | 3,263,750 | |||
JBS USA, LLC/JBS USA Finance, Inc. | |||||
| 3,150,000 | 11.625%, 5/1/2014f | 2,976,750 | |||
M-Foods Holdings, Inc. | |||||
| 3,600,000 | 9.750%, 10/1/2013f | 3,465,000 | |||
Michael Foods, Inc. | |||||
| 3,240,000 | 8.000%, 11/15/2013 | 3,159,000 | |||
Omnicare, Inc. | |||||
| 5,390,000 | 6.875%, 12/15/2015 | 4,864,475 | |||
Pinnacle Foods Finance, LLC | |||||
| 3,720,000 | 9.250%, 4/1/2015g | 3,366,600 | |||
Sealy Corporation | |||||
| 540,000 | 10.875%, 4/15/2016f | 565,650 | |||
Select Medical Corporation | |||||
| 1,700,000 | 7.654%, 9/15/2009e,g | 1,207,000 | |||
| 3,945,000 | 7.625%, 2/1/2015 | 3,205,313 | |||
Smithfield Foods, Inc. | |||||
| 950,000 | 10.000%, 7/15/2014c,f | 938,125 | |||
Stater Brothers Holdings, Inc. | |||||
| 2,150,000 | 8.125%, 6/15/2012 | 2,117,750 | |||
Sun Healthcare Group, Inc. | |||||
| 3,410,000 | 9.125%, 4/15/2015 | 3,375,900 | |||
SUPERVALU, Inc. | |||||
| 2,680,000 | 7.500%, 11/15/2014 | 2,572,800 | |||
Surgical Care Affiliates, Inc. | |||||
| 3,780,000 | 8.875%, 7/15/2015j | 2,910,600 | |||
Tenet Healthcare Corporation | |||||
| 1,700,000 | 7.375%, 2/1/2013 | 1,530,000 | |||
| 1,530,000 | 9.000%, 5/1/2015f,g | 1,541,475 | |||
| 1,530,000 | 10.000%, 5/1/2018f,g | 1,606,500 | |||
US Oncology, Inc. | |||||
| 2,090,000 | 10.750%, 8/15/2014 | 2,069,100 | |||
| 3,910,000 | 9.125%, 8/15/2017f | 3,880,675 | |||
Valeant Pharmaceuticals International | |||||
| 1,630,000 | 8.375%, 6/15/2016f | 1,617,775 | |||
Ventas Realty, LP/Ventas Capital Corporation | |||||
| 1,770,000 | 6.500%, 6/1/2016 | 1,584,150 | |||
Visant Holding Corporation | |||||
| 4,185,000 | 10.250%, 12/1/2013 | 4,153,612 | |||
Total Consumer Non-Cyclical | 86,658,260 | ||||
| Energy (7.1%) | |||||
Chesapeake Energy Corporation | |||||
| 2,290,000 | 7.500%, 9/15/2013 | 2,192,675 | |||
| 4,150,000 | 6.250%, 1/15/2018 | 3,444,500 | |||
Cie Generale de Geophysique- Veritas | |||||
| 1,280,000 | 9.500%, 5/15/2016f | 1,276,800 | |||
Connacher Oil and Gas, Ltd. | |||||
| 1,220,000 | 11.750%, 7/15/2014f | 1,177,300 | |||
| 3,440,000 | 10.250%, 12/15/2015f | 2,081,200 | |||
Denbury Resources, Inc. | |||||
| 3,035,000 | 7.500%, 12/15/2015 | 2,883,250 | |||
| 1,720,000 | 9.750%, 3/1/2016g | 1,767,300 | |||
Forest Oil Corporation | |||||
| 4,130,000 | 7.250%, 6/15/2019 | 3,696,350 | |||
Helix Energy Solutions Group, Inc. | |||||
| 2,170,000 | 9.500%, 1/15/2016f | 1,980,125 | |||
Hornbeck Offshore Services, Inc. | |||||
| 2,135,000 | 6.125%, 12/1/2014 | 1,934,844 | |||
Key Energy Services, Inc. | |||||
| 3,900,000 | 8.375%, 12/1/2014 | 3,441,750 | |||
Mariner Energy, Inc. | |||||
| 2,580,000 | 11.750%, 6/30/2016g | 2,567,100 | |||
Newfield Exploration Company | |||||
| 3,900,000 | 6.625%, 4/15/2016 | 3,519,750 | |||
Penn Virginia Corporation | |||||
| 1,090,000 | 10.375%, 6/15/2016 | 1,109,075 | |||
PetroHawk Energy Corporation | |||||
| 3,190,000 | 9.125%, 7/15/2013 | 3,174,050 | |||
| 850,000 | 10.500%, 8/1/2014f | 869,125 | |||
The accompanying Notes to Financial Statements are an integral part of this schedule.
227
Table of Contents
High Yield Portfolio
Schedule of Investments as of June 30, 2009
(unaudited)
| Principal Amount | Long-Term Fixed Income (90.8%) | Value | |||
| Energy (7.1%) - continued | |||||
Plains Exploration & Production Company | |||||
| $3,220,000 | 7.750%, 6/15/2015g | $ | 3,010,700 | ||
| 4,025,000 | 10.000%, 3/1/2016 | 4,135,687 | |||
Quicksilver Resources, Inc. | |||||
| 1,080,000 | 11.750%, 1/1/2016g | 1,117,800 | |||
Sandridge Energy, Inc. | |||||
| 2,150,000 | 9.875%, 5/15/2016f | 2,074,750 | |||
Southwestern Energy Company | |||||
| 2,950,000 | 7.500%, 2/1/2018f | 2,832,000 | |||
Total Energy | 50,286,131 | ||||
| Financials (3.0%) | |||||
Bank of America Corporation | |||||
| 3,660,000 | 8.125%, 5/15/2018 | 3,056,796 | |||
Countrywide Financial Corporation | |||||
| 2,880,000 | 6.250%, 5/15/2016 | 2,555,064 | |||
Deluxe Corporation | |||||
| 1,425,000 | 7.375%, 6/1/2015 | 1,140,000 | |||
FTI Consulting, Inc. | |||||
| 2,050,000 | 7.625%, 6/15/2013 | 1,993,625 | |||
General Motors Acceptance Corporation, LLC | |||||
| 2,820,000 | 5.375%, 6/6/2011f,g | 2,397,000 | |||
| 6,512,000 | 6.875%, 9/15/2011f | 5,698,000 | |||
| 1,960,000 | 7.500%, 12/31/2013f | 1,519,000 | |||
Lender Processing Services, Inc. | |||||
| 720,000 | 8.125%, 7/1/2016 | 705,600 | |||
Nuveen Investments, Inc. | |||||
| 2,870,000 | 10.500%, 11/15/2015f | 1,980,300 | |||
Total Financials | 21,045,385 | ||||
| Technology (2.9%) | |||||
Amkor Technology, Inc. | |||||
| 2,880,000 | 7.750%, 5/15/2013 | 2,642,400 | |||
Avago Technologies Finance Pte | |||||
| 650,000 | 6.168%, 9/1/2009e | 560,625 | |||
| 4,440,000 | 10.125%, 12/1/2013 | 4,528,800 | |||
First Data Corporation | |||||
| 2,870,000 | 9.875%, 9/24/2015g | 2,037,700 | |||
NXP BV/NXP Funding, LLC | |||||
| 1,280,000 | 10.000%, 7/15/2013f | 931,200 | |||
Seagate Technology HDD Holdings | |||||
| 4,805,000 | 6.800%, 10/1/2016 | 4,120,288 | |||
SunGard Data Systems, Inc. | |||||
| 1,730,000 | 9.125%, 8/15/2013 | 1,634,850 | |||
| 4,430,000 | 10.250%, 8/15/2015 | 4,092,212 | |||
Total Technology | 20,548,075 | ||||
| Transportation (2.5%) | |||||
Continental Airlines, Inc. | |||||
| 2,928,370 | 7.875%, 7/2/2018 | 1,713,097 | |||
Delta Air Lines, Inc. | |||||
| 2,670,000 | 7.920%, 11/18/2010 | 2,456,400 | |||
Hertz Corporation | |||||
| 1,825,000 | 8.875%, 1/1/2014 | 1,679,000 | |||
Kansas City Southern de Mexico SA de CV | |||||
| 2,720,000 | 7.625%, 12/1/2013 | 2,339,200 | |||
| 1,130,000 | 7.375%, 6/1/2014 | 949,200 | |||
Kansas City Southern Railway Company | |||||
| 580,000 | 13.000%, 12/15/2013 | 638,000 | |||
Navios Maritime Holdings, Inc. | |||||
| 3,300,000 | 9.500%, 12/15/2014 | 2,706,000 | |||
United Air Lines, Inc. | |||||
| 2,084,216 | 7.730%, 7/1/2010 | 2,042,532 | |||
Windsor Petroleum Transport Corporation | |||||
| 3,500,000 | 7.840%, 1/15/2021j | 3,177,821 | |||
Total Transportation | 17,701,250 | ||||
| Utilities (7.5%) | |||||
AES Corporation | |||||
| 1,616,000 | 8.750%, 5/15/2013f | 1,640,240 | |||
| 3,800,000 | 7.750%, 10/15/2015 | 3,534,000 | |||
| 3,800,000 | 8.000%, 10/15/2017 | 3,534,000 | |||
Copano Energy, LLC | |||||
| 3,490,000 | 8.125%, 3/1/2016 | 3,280,600 | |||
Dynegy Holdings, Inc. | |||||
| 2,020,000 | 6.875%, 4/1/2011g | 1,944,250 | |||
| 2,125,000 | 8.375%, 5/1/2016g | 1,800,937 | |||
Edison Mission Energy | |||||
| 2,230,000 | 7.500%, 6/15/2013 | 1,995,850 | |||
| 2,960,000 | 7.000%, 5/15/2017g | 2,271,800 | |||
| 3,560,000 | 7.200%, 5/15/2019 | 2,652,200 | |||
El Paso Corporation | |||||
| 860,000 | 12.000%, 12/12/2013 | 946,000 | |||
| 2,280,000 | 6.875%, 6/15/2014 | 2,127,799 | |||
| 860,000 | 8.250%, 2/15/2016 | 836,350 | |||
| 2,280,000 | 7.000%, 6/15/2017 | 2,076,519 | |||
Ferrellgas Partners, LP | |||||
| 2,960,000 | 6.750%, 5/1/2014f | 2,560,400 | |||
NRG Energy, Inc. | |||||
| 5,580,000 | 7.375%, 2/1/2016 | 5,280,075 | |||
Regency Energy Partners, LP | |||||
| 3,350,000 | 8.375%, 12/15/2013 | 3,232,750 | |||
| 1,510,000 | 9.375%, 6/1/2016f | 1,460,925 | |||
SemGroup, LP | |||||
| 4,890,000 | 8.750%, 11/15/2015f,h | 195,600 | |||
Southern Star Central Corporation | |||||
| 2,503,000 | 6.750%, 3/1/2016 | 2,230,799 | |||
Texas Competitive Electric Holdings Company, LLC | |||||
| 7,620,000 | 10.250%, 11/1/2015g | 4,743,450 | |||
Williams Companies, Inc. | |||||
| 2,940,000 | 7.625%, 7/15/2019 | 2,903,250 | |||
Williams Partners, LP | |||||
| 2,400,000 | 7.250%, 2/1/2017 | 2,190,000 | |||
Total Utilities | 53,437,794 | ||||
Total Long-Term Fixed Income (cost $706,834,767) | 643,652,089 | ||||
| Shares | Preferred Stock (1.2%) | ||||
Financials (1.2%) | |||||
| 91,000 | Bank of America Corporation, 8.625% | 1,845,480 | |||
The accompanying Notes to Financial Statements are an integral part of this schedule.
228
Table of Contents
High Yield Portfolio
Schedule of Investments as of June 30, 2009
(unaudited)
| Shares | Preferred Stock (1.2%) | Value | ||||
| Financials (1.2%) - continued | ||||||
| 3,400 | Bank of America Corporation, Convertible, 7.250% | $ | 2,842,502 | |||
| 86,177 | Credit Suisse XLF Equity-Linked Note, Convertible, 11.100%k,l | 980,694 | ||||
| 1,381 | Preferred Blocker, Inc., 7.000%f | 593,917 | ||||
| 3,000 | Wells Fargo & Company, Convertible, 7.500% | 2,354,910 | ||||
Total Financials | 8,617,503 | |||||
Total Preferred Stock (cost $8,754,613) | 8,617,503 | |||||
Common Stock (0.2%) | ||||||
| Consumer Discretionary (<0.1%) | ||||||
| 121,520 | TVMAX Holdings, Inc.k,m | 0 | ||||
Total Consumer Discretionary | 0 | |||||
| Materials (<0.1%) | ||||||
| 30 | Pliant Corporationh,k,m | 0 | ||||
| 80,000 | ZSC Specialty Chemical plc, Preferred Stock Warrantsj,k,m | 0 | ||||
| 80,000 | ZSC Specialty Chemical plc, Stock Warrantsj,k,m | 0 | ||||
Total Materials | 0 | |||||
| Telecommunications Services (<0.1%) | ||||||
| 4,621 | XO Holdings, Inc.k | 1,412 | ||||
| 9,243 | XO Holdings, Inc., Class A Stock Warrantsk | 55 | ||||
| 6,932 | XO Holdings, Inc., Class B Stock Warrantsk | 8 | ||||
| 6,932 | XO Holdings, Inc., Class C Stock Warrantsk | 7 | ||||
Total Telecommunications Services | 1,482 | |||||
| Utilities (0.2%) | ||||||
| 51,692 | NRG Energy, Inc.g,k | 1,341,924 | ||||
Total Utilities | 1,341,924 | |||||
Total Common Stock (cost $7,826,202) | 1,343,406 | |||||
Collateral Held for Securities Loaned (8.3%) | ||||||
| 58,870,977 | Thrivent Financial Securities Lending Trust | 58,870,977 | ||||
Total Collateral Held for Securities Loaned (cost $58,870,977) | 58,870,977 | |||||
| Shares or Principal Amount | Short-Term Investments (1.9%)n | |||||
Federal Home Loan Mortgage Corporation Discount Notes | ||||||
| 2,400,000 | 0.200%, 9/21/2009 | 2,398,923 | ||||
Novartis Finance Corporation | ||||||
| 4,550,000 | 0.100%, 7/1/2009 | 4,550,000 | ||||
Societe Generale North American | ||||||
| 6,400,000 | 0.130%, 7/1/2009 | 6,400,000 | ||||
| 275,651 | Thrivent Money Market Portfolio | 275,651 | ||||
Total Short-Term Investments (at amortized cost) | 13,624,574 | |||||
Total Investments (cost $825,753,822) 106.0% | $ | 751,932,857 | ||||
Other Assets and Liabilities, Net (6.0%) | (42,848,605 | ) | ||||
Total Net Assets 100.0% | $ | 709,084,252 | ||||
| a | The stated interest rate represents the weighted average of all contracts within the bank loan facility as discussed in item 2(U) in the Notes to Financial Statements. |
| b | All or a portion of the loan is unfunded as discussed in item 2(U) of the Notes to Financial Statements. |
| c | Denotes investments purchased on a when-issued or delayed delivery basis. |
| d | All or a portion of the security is insured or guaranteed. |
| e | Denotes variable rate obligations for which the current yield and next scheduled reset date are shown. |
| f | Denotes securities sold under Rule 144A of the Securities Act of 1933, which exempts them from registration. These securities have been deemed liquid and may be resold to other dealers in the program or to other qualified institutional buyers. As of June 30, 2009, the value of these investments was $157,469,491 or 22.2% of total net assets. |
| g | All or a portion of the security is on loan as discussed in item 2(M) of the Notes to Financial Statements. |
| h | In bankruptcy. |
| i | Denotes step coupon bonds for which the current interest rate and next scheduled reset date are shown. |
| j | Denotes restricted securities. Restricted securities are investment securities which have been deemed illiquid and cannot be offered for public sale without first being registered under the Securities Act of 1933. The following table indicates the acquisition date and cost of restricted securities High Yield Portfolio owned as of June 30, 2009. |
Security | Acquisition Date | Cost | |||
Surgical Care Affiliates, Inc. | 6/21/2007 | $ | 3,780,000 | ||
Tunica Biloxi Gaming Authority | 11/8/2005 | 6,522,475 | |||
Turning Stone Resort Casino Enterprise | 9/8/2006 | 4,884,608 | |||
Turning Stone Resort Casino Enterprise | 5/1/2007 | 2,015,046 | |||
Windsor Petroleum Transport Corporation | 4/15/1998 | 2,891,750 | |||
ZSC Specialty Chemical plc, Preferred Stock Warrants | 6/24/1999 | 47,567 | |||
ZSC Specialty Chemical plc, Stock Warrants | 6/24/1999 | 111,712 | |||
| k | Non-income producing security. |
| l | These securities are Equity-Linked Structured Securities as discussed in item 2(Q) of the Notes to Financial Statements. |
The accompanying Notes to Financial Statements are an integral part of this schedule.
229
Table of Contents
High Yield Portfolio
Schedule of Investments as of June 30, 2009
(unaudited)
| m | Security is fair valued as discussed in item 2(A) of the Notes to Financial Statements. |
| n | The interest rate shown reflects the yield, coupon rate or, for securities purchased at a discount, the discount rate at the date of purchase. |
Unrealized Appreciation (Depreciation)
Gross unrealized appreciation and depreciation of investments, based on cost for federal income tax purposes, were as follows:
Gross unrealized appreciation | $ | 11,886,680 | ||
Gross unrealized depreciation | (85,707,645 | ) | ||
Net unrealized appreciation (depreciation) | $ | (73,820,965 | ) | |
Cost for federal income tax purposes | $ | 825,753,822 | ||
Fair Valuation Measurements
The following table is a summary of the inputs used, as of June 30, 2009, in valuing High Yield Portfolio’s assets carried at fair value as discussed in the Notes to Financial Statements.
Investments in Securities | Total | Level 1 | Level 2 | Level 3 | ||||||||
Bank Loans | ||||||||||||
Basic Materials | 3,635,613 | — | 3,635,613 | — | ||||||||
Communications Services | 2,588,393 | — | 2,588,393 | — | ||||||||
Consumer Cyclical | 10,825,939 | — | 10,825,939 | — | ||||||||
Technology | 2,546,571 | — | 2,546,571 | — | ||||||||
Utilities | 6,227,792 | — | 6,227,792 | — | ||||||||
Long-Term Fixed Income | ||||||||||||
Asset-Backed Securities | 1,161,657 | — | 1,161,657 | — | ||||||||
Basic Materials | 65,139,007 | — | 65,139,007 | — | ||||||||
Capital Goods | 62,266,969 | — | 62,266,969 | — | ||||||||
Commercial Mortgage-Backed Securities | 2,095,504 | — | 2,095,504 | — | ||||||||
Communications Services | 117,755,194 | — | 117,755,194 | — | ||||||||
Consumer Cyclical | 145,556,863 | — | 145,556,863 | — | ||||||||
Consumer Non-Cyclical | 86,658,260 | — | 86,658,260 | — | ||||||||
Energy | 50,286,131 | — | 50,286,131 | — | ||||||||
Financials | 21,045,385 | — | 21,045,385 | — | ||||||||
Technology | 20,548,075 | — | 20,548,075 | — | ||||||||
Transportation | 17,701,250 | — | 11,489,221 | 6,212,029 | ||||||||
Utilities | 53,437,794 | — | 53,437,794 | — | ||||||||
Preferred Stock | ||||||||||||
Financials | 8,617,503 | 7,042,892 | 593,917 | 980,694 | ||||||||
Common Stock | ||||||||||||
Consumer Discretionary | — | — | — | — | ||||||||
Materials | — | — | — | — | ||||||||
Telecommunications Services | 1,482 | 1,482 | — | — | ||||||||
Utilities | 1,341,924 | 1,341,924 | — | — | ||||||||
Collateral Held for Securities Loaned | 58,870,977 | 58,870,977 | — | — | ||||||||
Short-Term Investments | 13,624,574 | 275,651 | 13,348,923 | — | ||||||||
Total | $ | 751,932,857 | $ | 67,532,926 | $ | 677,207,208 | $ | 7,192,723 | ||||
The accompanying Notes to Financial Statements are an integral part of this schedule.
230
Table of Contents
High Yield Portfolio
Schedule of Investments as of June 30, 2009
(unaudited)
The following table is a reconciliation of assets in which significant unobservable inputs (Level 3) were used in determining fair value for the High Yield Portfolio as discussed in item 2(A) of the Notes to Financial Statements.
Investments in Securities | Value December 31, 2008 | Accrued Discounts and/or Premiums | Realized Gain/(Loss) | Change in Unrealized Gain/(Loss) | Net Purchases/(Sales) | Transfers in and/or (Out of) Level 3 | Value June 30, 2009 | ||||||||||||||||
Common Stock | |||||||||||||||||||||||
Materials* | — | — | — | — | — | — | — | ||||||||||||||||
Consumer Discretionary* | — | — | — | — | — | — | — | ||||||||||||||||
Preferred Stock | |||||||||||||||||||||||
Financials | 1,445,526 | — | (1,332,383 | ) | 1,442,508 | 18,959 | (593,916 | ) | 980,694 | ||||||||||||||
Long-Term Fixed Income | |||||||||||||||||||||||
Transportation | 3,438,128 | 32,432 | 48,525 | 843,583 | (946,096 | ) | 2,795,457 | 6,212,029 | |||||||||||||||
Total | $ | 4,883,654 | $ | 32,432 | ($1,283,858 | ) | $ | 2,286,091 | ($ | 927,137 | ) | $ | 2,201,541 | $ | 7,192,723 | ||||||||
| * | Securities in these sections are fair valued at $0. |
The following table summarizes the net realized gains/(losses) and Statement of Operations location, for the period ended June 30, 2009, for High Yield Portfolio’s investments in financial derivative instruments by primary risk exposure.
Derivatives by Risk Category | Statement of Operations Location | Realized Gains/(Losses) recognized in Income | |||
| Credit Contracts | |||||
Credit Default Swap | Net realized gains/(losses) on Swap agreements | (1,788,912 | ) | ||
Total Credit Contracts | (1,788,912 | ) | |||
Total | ($1,788,912 | ) | |||
The following table summarizes the change in net unrealized appreciation/(depreciation) and Statement of Operations location, for the period ended June 30, 2009, for the High Yield Portfolio’s investments in financial derivative instruments by primary risk exposure.
Derivatives by Risk Category | Statement of Operations Location | Change in Unrealized Appreciation/(Depreciation) recognized in Income | ||
| Credit Contracts | ||||
Credit Default Swap | Change in net unrealized appreciation/(depreciation) on Swap agreements | 1,181,418 | ||
Total Credit Contracts | 1,181,418 | |||
Total | $1,181,418 | |||
Investment in Affiliates
Affiliated issuers, as defined under the Investment Company Act of 1940, include those in which the Portfolio’s holdings of an issuer represent 5% or more of the outstanding voting securities of an issuer, or any affiliated mutual fund.
A summary of transactions for the fiscal year to date, in High Yield Portfolio, is as follows:
Portfolio | Value December 31, 2008 | Gross Purchases | Gross Sales | Shares Held at June 30, 2009 | Value June 30, 2009 | Income Earned January 1, 2009 - June 30, 2009 | |||||||||||
Money Market | $ | 6,177,798 | $ | 18,765,599 | $ | 24,667,746 | 275,651 | $ | 275,651 | $ | 22,262 | ||||||
Thrivent Financial Securities Lending Trust | 49,481,715 | 157,778,210 | 148,388,948 | 58,870,977 | 58,870,977 | 133,768 | |||||||||||
Total Value and Income Earned | 55,659,513 | 59,146,628 | 156,030 | ||||||||||||||
The accompanying Notes to Financial Statements are an integral part of this schedule.
231
Table of Contents
Diversified Income Plus Portfolio
Schedule of Investments as of June 30, 2009
(unaudited)
| Principal Amount | Long-Term Fixed Income (67.5%) | Value | |||
| Asset-Backed Securities (5.4%) | |||||
Americredit Automobile Receivables Trust | |||||
| $ 768,493 | 5.490%, 7/6/2012a | $ | 773,368 | ||
GAMUT Reinsurance, Ltd. | |||||
| 650,000 | 8.039%, 8/3/2009b,c | 591,500 | |||
| 250,000 | 16.039%, 8/3/2009b,c | 190,000 | |||
GMAC Mortgage Corporation Loan Trust | |||||
| 675,000 | 6.180%, 5/25/2036a | 494,545 | |||
Merna Re, Ltd. | |||||
| 400,000 | 2.348%, 9/30/2009b,c | 372,560 | |||
| 400,000 | 3.348%, 9/30/2009b,c | 371,560 | |||
Residential Asset Mortgage Products, Inc. | |||||
| 1,092,618 | 4.547%, 12/25/2034 | 837,493 | |||
Residential Funding Mortgage Securities | |||||
| 400,339 | 4.470%, 7/25/2018a | 357,859 | |||
Total Asset-Backed Securities | 3,988,885 | ||||
| Basic Materials (3.5%) | |||||
Airgas, Inc. | |||||
| 100,000 | 7.125%, 10/1/2018b | 93,750 | |||
Arch Western Finance, LLC | |||||
| 160,000 | 6.750%, 7/1/2013 | 146,000 | |||
Cascades, Inc. | |||||
| 100,000 | 7.250%, 2/15/2013 | 87,250 | |||
Domtar, Inc. | |||||
| 185,000 | 7.125%, 8/15/2015 | 154,475 | |||
Drummond Company, Inc. | |||||
| 160,000 | 7.375%, 2/15/2016b | 116,800 | |||
FMG Finance, Pty., Ltd. | |||||
| 230,000 | 10.625%, 9/1/2016b | 220,800 | |||
General Cable Corporation, Convertible | |||||
| 100,000 | 1.000%, 10/15/2012 | 78,500 | |||
Georgia-Pacific, LLC | |||||
| 90,000 | 8.125%, 5/15/2011 | 90,000 | |||
| 340,000 | 7.125%, 1/15/2017b | 316,200 | |||
Graphic Packaging International Corporation | |||||
| 110,000 | 9.500%, 8/15/2013 | 105,050 | |||
Griffin Coal Mining Company, Pty., Ltd. | |||||
| 240,000 | 9.500%, 12/1/2016b | 123,600 | |||
Invista | |||||
| 110,000 | 9.250%, 5/1/2012b | 103,675 | |||
Jefferson Smurfit Corporation | |||||
| 80,000 | 8.250%, 10/1/2012d | 30,000 | |||
Nalco Company | |||||
| 205,000 | 8.875%, 11/15/2013 | 209,100 | |||
NewPage Corporation | |||||
| 100,000 | 12.000%, 5/1/2013 | 28,000 | |||
Peabody Energy Corporation | |||||
| 200,000 | 5.875%, 4/15/2016 | 176,000 | |||
Smurfit-Stone Container Enterprises, Inc. | |||||
| 160,000 | 8.000%, 3/15/2017d,e | 59,200 | |||
Stora Enso Oyj | |||||
| 200,000 | 6.404%, 4/15/2016b | 148,000 | |||
Teck Resources, Ltd. | |||||
| 100,000 | 10.250%, 5/15/2016b | 104,750 | |||
| 100,000 | 10.750%, 5/15/2019b | 107,500 | |||
Terra Capital, Inc. | |||||
| 120,000 | 7.000%, 2/1/2017 | 109,650 | |||
Total Basic Materials | 2,608,300 | ||||
| Capital Goods (2.6%) | |||||
Case New Holland, Inc. | |||||
| 210,000 | 7.125%, 3/1/2014 | 191,625 | |||
Crown Americas, Inc. | |||||
| 100,000 | 7.625%, 11/15/2013 | 97,500 | |||
| 100,000 | 7.750%, 11/15/2015 | 97,750 | |||
L-3 Communications Corporation | |||||
| 260,000 | 5.875%, 1/15/2015 | 230,750 | |||
Legrand SA | |||||
| 100,000 | 8.500%, 2/15/2025 | 86,130 | |||
Leucadia National Corporation | |||||
| 210,000 | 7.125%, 3/15/2017 | 170,625 | |||
Mueller Water Products, Inc. | |||||
| 140,000 | 7.375%, 6/1/2017 | 103,250 | |||
Owens Corning, Inc. | |||||
| 185,000 | 6.500%, 12/1/2016 | 162,164 | |||
Owens-Brockway Glass Container, Inc. | |||||
| 70,000 | 8.250%, 5/15/2013 | 70,350 | |||
RBS Global, Inc./Rexnord Corporation | |||||
| 210,000 | 9.500%, 8/1/2014 | 179,550 | |||
SPX Corporation | |||||
| 205,000 | 7.625%, 12/15/2014 | 197,825 | |||
TransDigm, Inc. | |||||
| 110,000 | 7.750%, 7/15/2014 | 104,500 | |||
United Rentals North America, Inc. | |||||
| 270,000 | 7.000%, 2/15/2014 | 220,725 | |||
Total Capital Goods | 1,912,744 | ||||
| Collateralized Mortgage Obligations (11.4%) | |||||
Bear Stearns Adjustable Rate Mortgage Trust | |||||
| 1,307,771 | 4.625%, 8/25/2010c | 1,034,716 | |||
Citigroup Mortgage Loan Trust, Inc. | |||||
| 824,183 | 5.500%, 11/25/2035 | 582,101 | |||
Citimortgage Alternative Loan Trust | |||||
| 1,052,766 | 5.750%, 4/25/2037 | 672,499 | |||
Countrywide Alternative Loan Trust | |||||
| 507,898 | 6.000%, 1/25/2037 | 372,293 | |||
Deutsche Alt-A Securities, Inc. | |||||
| 1,608,538 | 2.209%, 7/1/2009c | 587,779 | |||
| 485,826 | 5.500%, 10/25/2021 | 362,700 | |||
First Horizon ABS Trust | |||||
| 771,015 | 5.845%, 8/25/2037 | 463,033 | |||
J.P. Morgan Alternative Loan Trust | |||||
| 300,684 | 0.384%, 7/25/2009c | 248,414 | |||
The accompanying Notes to Financial Statements are an integral part of this schedule.
232
Table of Contents
Diversified Income Plus Portfolio
Schedule of Investments as of June 30, 2009
(unaudited)
| Principal Amount | Long-Term Fixed Income (67.5%) | Value | |||
| Collateralized Mortgage Obligations (11.4%) - continued | |||||
J.P. Morgan Mortgage Trust | |||||
| $ 406,178 | 6.500%, 1/25/2035 | $ | 290,354 | ||
| 735,589 | 6.048%, 10/25/2036 | 577,676 | |||
| Master Alternative Loans Trust | |||||
| 440,061 | 6.500%, 7/25/2034 | 345,379 | |||
| MASTR Alternative Loans Trust | |||||
| 1,020,746 | 6.500%, 5/25/2034 | 882,786 | |||
| Washington Mutual Mortgage Pass-Through Certificates | |||||
| 1,280,056 | 2.090%, 7/1/2009c | 413,668 | |||
| 855,167 | 5.841%, 8/25/2046 | 662,354 | |||
| Wells Fargo Mortgage Backed Securities Trust | |||||
| 1,656,933 | 6.031%, 9/25/2036 | 481,553 | |||
| 827,194 | 6.000%, 7/25/2037 | 574,771 | |||
Total Collateralized Mortgage Obligations | 8,552,076 | ||||
| Commercial Mortgage-Backed Securities (4.8%) | |||||
| Commercial Mortgage Pass-Through Certificates | |||||
| 1,000,000 | 0.499%, 7/15/2009c,f | 556,142 | |||
| Greenwich Capital Commercial Funding Corporation | |||||
| 750,000 | 5.867%, 8/10/2017 | 392,907 | |||
| J.P. Morgan Chase Commercial Mortgage Securities Corporation | |||||
| 1,250,000 | 5.336%, 5/15/2047 | 958,243 | |||
| LB-UBS Commercial Mortgage Trust | |||||
| 750,000 | 4.568%, 1/15/2031 | 643,887 | |||
| Wachovia Bank Commercial Mortgage Trust | |||||
| 2,000,000 | 0.439%, 7/15/2009c,f | 1,000,000 | |||
Total Commercial Mortgage-Backed Securities | 3,551,179 | ||||
| Communications Services (7.1%) | |||||
| American Tower Corporation | |||||
| 70,000 | 7.000%, 10/15/2017 | 67,725 | |||
| Charter Communications Operating, LLC | |||||
| 100,000 | 10.000%, 4/30/2012b,d | 96,250 | |||
| 200,000 | 10.375%, 4/30/2014b,d | 191,500 | |||
| Cincinnati Bell, Inc. | |||||
| 205,000 | 7.250%, 7/15/2013 | 187,575 | |||
| Cricket Communications, Inc. | |||||
| 205,000 | 9.375%, 11/1/2014 | 201,925 | |||
| CSC Holdings, Inc. | |||||
| 100,000 | 8.500%, 4/15/2014b | 99,125 | |||
| Dex Media West, LLC/Dex Media West Finance Company | |||||
| 100,000 | 8.500%, 8/15/2010d | 72,000 | |||
| 70,000 | 9.875%, 8/15/2013d | 10,675 | |||
| DIRECTV Holdings, LLC | |||||
| 165,000 | 6.375%, 6/15/2015 | 152,625 | |||
| 190,000 | 7.625%, 5/15/2016 | 184,775 | |||
| EchoStar DBS Corporation | |||||
| 215,000 | 6.625%, 10/1/2014 | 198,338 | |||
| Intelsat Subsidiary Holding Company, Ltd. | |||||
| 160,000 | 8.500%, 1/15/2013 | 153,600 | |||
| 205,000 | 8.875%, 1/15/2015b | 197,825 | |||
| Level 3 Financing, Inc. | |||||
| 100,000 | 9.250%, 11/1/2014 | 82,000 | |||
| Liberty Media Corporation | |||||
| 220,000 | 5.700%, 5/15/2013g | 190,300 | |||
| Mediacom Broadband, LLC | |||||
| 210,000 | 8.500%, 10/15/2015 | 189,000 | |||
| Nextel Communications, Inc. | |||||
| 100,000 | 7.375%, 8/1/2015 | 79,750 | |||
| Nielsen Finance, LLC/Nielsen Finance Company | |||||
| 100,000 | 10.000%, 8/1/2014 | 94,625 | |||
| NTL Cable plc | |||||
| 170,000 | 9.125%, 8/15/2016 | 163,625 | |||
| Paetec Holding Corporation | |||||
| 120,000 | 8.875%, 6/30/2017b | 112,800 | |||
| Quebecor Media, Inc. | |||||
| 250,000 | 7.750%, 3/15/2016 | 226,563 | |||
| Qwest Communications International, Inc. | |||||
| 200,000 | 7.250%, 2/15/2011 | 194,000 | |||
| Qwest Corporation | |||||
| 150,000 | 7.875%, 9/1/2011 | 150,000 | |||
| R.H. Donnelley Corporation | |||||
| 200,000 | 6.875%, 1/15/2013d | 10,250 | |||
| R.H. Donnelley, Inc. | |||||
| 4,000 | 11.750%, 5/15/2015b,d | 1,840 | |||
| Sprint Capital Corporation | |||||
| 210,000 | 8.375%, 3/15/2012 | 206,850 | |||
| Sprint Nextel Corporation | |||||
| 145,000 | 6.000%, 12/1/2016 | 118,537 | |||
| Time Warner Cable, Inc. | |||||
| 200,000 | 5.850%, 5/1/2017 | 199,720 | |||
| 300,000 | 8.250%, 4/1/2019 | 340,385 | |||
| Verizon Communications, Inc. | |||||
| 300,000 | 6.350%, 4/1/2019 | 312,087 | |||
| Verizon Wireless Capital, LLC | |||||
| 300,000 | 8.500%, 11/15/2018b | 358,528 | |||
| Videotron Ltee | |||||
| 260,000 | 6.875%, 1/15/2014 | 240,500 | |||
| Windstream Corporation | |||||
| 200,000 | 8.625%, 8/1/2016 | 191,500 | |||
Total Communications Services | 5,276,798 | ||||
| Consumer Cyclical (8.0%) | |||||
| AMC Entertainment, Inc. | |||||
| 190,000 | 8.750%, 6/1/2019b | 178,600 | |||
| Ameristar Casinos, Inc. | |||||
| 140,000 | 9.250%, 6/1/2014b | 142,800 | |||
| Boyd Gaming Corporation | |||||
| 100,000 | 6.750%, 4/15/2014 | 81,000 | |||
| Burlington Coat Factory Warehouse Corporation | |||||
| 130,000 | 11.125%, 4/15/2014 | 103,350 | |||
The accompanying Notes to Financial Statements are an integral part of this schedule.
233
Table of Contents
Diversified Income Plus Portfolio
Schedule of Investments as of June 30, 2009
(unaudited)
| Principal Amount | Long-Term Fixed Income (67.5%) | Value | |||
| Consumer Cyclical (8.0%) - continued | |||||
Centex Corporation | |||||
| $300,000 | 7.500%, 1/15/2012 | $ | 302,250 | ||
| Circus & Eldorado Joint Venture/Silver Legacy Capital Corporation | |||||
| 230,000 | 10.125%, 3/1/2012 | 183,137 | |||
| Corrections Corporation of America | |||||
| 130,000 | 6.250%, 3/15/2013 | 123,175 | |||
| CVS Caremark Corporation | |||||
| 200,000 | 6.600%, 3/15/2019 | 213,701 | |||
| D.R. Horton, Inc. | |||||
| 200,000 | 6.500%, 4/15/2016 | 171,000 | |||
| Dollarama Group, LP | |||||
| 102,000 | 7.468%, 12/15/2009c | 94,350 | |||
| 180,000 | 8.875%, 8/15/2012 | 174,150 | |||
| Ford Motor Credit Company, LLC | |||||
| 410,000 | 8.000%, 6/1/2014 | 331,738 | |||
| Gaylord Entertainment Company | |||||
| 130,000 | 6.750%, 11/15/2014 | 97,175 | |||
| Goodyear Tire & Rubber Company | |||||
| 100,000 | 8.625%, 12/1/2011 | 98,500 | |||
| Harrah’s Operating Company, Inc. | |||||
| 190,000 | 11.250%, 6/1/2017b | 179,550 | |||
| Host Marriott, LP | |||||
| 330,000 | 6.375%, 3/15/2015 | 285,450 | |||
| KB Home | |||||
| 220,000 | 6.250%, 6/15/2015 | 188,100 | |||
| Lear Corporation | |||||
| 205,000 | 8.500%, 12/1/2013 | 53,300 | |||
| Levi Strauss & Company | |||||
| 100,000 | 9.750%, 1/15/2015 | 98,250 | |||
| Limited Brands, Inc. | |||||
| 200,000 | 6.900%, 7/15/2017 | 173,062 | |||
| MGM MIRAGE | |||||
| 205,000 | 6.625%, 7/15/2015e | 133,763 | |||
| 160,000 | 11.125%, 11/15/2017b,g | 169,600 | |||
| Neiman Marcus Group, Inc. | |||||
| 100,000 | 10.375%, 10/15/2015 | 58,500 | |||
| Pinnacle Entertainment, Inc. | |||||
| 100,000 | 7.500%, 6/15/2015 | 85,500 | |||
| Pokagon Gaming Authority | |||||
| 196,000 | 10.375%, 6/15/2014b | 192,080 | |||
| Pulte Homes, Inc. | |||||
| 180,000 | 5.200%, 2/15/2015 | 150,300 | |||
| Rite Aid Corporation | |||||
| 100,000 | 10.375%, 7/15/2016e | 90,000 | |||
| 160,000 | 7.500%, 3/1/2017 | 125,200 | |||
| Royal Caribbean Cruises, Ltd. | |||||
| 250,000 | 7.250%, 6/15/2016 | 197,500 | |||
| Service Corporation International | |||||
| 130,000 | 6.750%, 4/1/2015 | 117,650 | |||
| Shingle Springs Tribal Gaming Authority | |||||
| 180,000 | 9.375%, 6/15/2015b | 108,000 | |||
| Stewart Enterprises, Inc., Convertible | |||||
| 120,000 | 3.125%, 7/15/2014 | 95,100 | |||
| 40,000 | 3.375%, 7/15/2016 | 30,250 | |||
| TRW Automotive, Inc. | |||||
| 180,000 | 7.000%, 3/15/2014b | 129,600 | |||
| Tunica Biloxi Gaming Authority | |||||
| 260,000 | 9.000%, 11/15/2015f | 228,800 | |||
| Turning Stone Resort Casino Enterprise | |||||
| 230,000 | 9.125%, 9/15/2014f | 196,075 | |||
| Universal City Florida Holding Company I/II | |||||
| 180,000 | 5.778%, 8/1/2009c | 147,150 | |||
| Viacom, Inc. | |||||
| 300,000 | 6.250%, 4/30/2016 | 295,548 | |||
| Warnaco, Inc. | |||||
| 150,000 | 8.875%, 6/15/2013 | 151,500 | |||
Total Consumer Cyclical | 5,974,754 | ||||
| Consumer Non-Cyclical (5.4%) | |||||
| Altria Group, Inc. | |||||
| 300,000 | 9.950%, 11/10/2038 | 346,297 | |||
| Biomet, Inc. | |||||
| 170,000 | 10.000%, 10/15/2017b | 172,975 | |||
| 80,000 | 10.375%, 10/15/2017 | 77,400 | |||
| Community Health Systems, Inc. | |||||
| 280,000 | 8.875%, 7/15/2015 | 274,400 | |||
| Constellation Brands, Inc. | |||||
| 75,000 | 7.250%, 9/1/2016 | 69,375 | |||
| DaVita, Inc. | |||||
| 210,000 | 6.625%, 3/15/2013 | 197,925 | |||
| Del Monte Corporation | |||||
| 100,000 | 8.625%, 12/15/2012 | 101,250 | |||
| General Mills, Inc. | |||||
| 200,000 | 5.650%, 2/15/2019 | 209,033 | |||
| HCA, Inc. | |||||
| 340,000 | 9.250%, 11/15/2016 | 334,900 | |||
| Jarden Corporation | |||||
| 190,000 | 7.500%, 5/1/2017e | 166,250 | |||
| Kroger Company | |||||
| 300,000 | 6.400%, 8/15/2017 | 318,054 | |||
| M-Foods Holdings, Inc. | |||||
| 150,000 | 9.750%, 10/1/2013b | 144,375 | |||
| Michael Foods, Inc. | |||||
| 160,000 | 8.000%, 11/15/2013 | 156,000 | |||
| Omega Healthcare Investors, Inc. | |||||
| 100,000 | 7.000%, 4/1/2014 | 91,250 | |||
| Omnicare, Inc. | |||||
| 110,000 | 6.875%, 12/15/2015 | 99,275 | |||
| Stater Brothers Holdings, Inc. | |||||
| 210,000 | 8.125%, 6/15/2012 | 206,850 | |||
| SUPERVALU, Inc. | |||||
| 240,000 | 7.500%, 11/15/2014 | 230,400 | |||
| Tenet Healthcare Corporation | |||||
| 200,000 | 7.375%, 2/1/2013 | 180,000 | |||
| 100,000 | 9.000%, 5/1/2015b | 100,750 | |||
| 100,000 | 10.000%, 5/1/2018b | 105,000 | |||
| Tyson Foods, Inc. | |||||
| 200,000 | 7.850%, 4/1/2016 | 192,852 | |||
| US Oncology, Inc. | |||||
| 80,000 | 10.750%, 8/15/2014 | 79,200 | |||
| 100,000 | 9.125%, 8/15/2017b | 99,250 | |||
The accompanying Notes to Financial Statements are an integral part of this schedule.
234
Table of Contents
Diversified Income Plus Portfolio
Schedule of Investments as of June 30, 2009
(unaudited)
| Principal Amount | Long-Term Fixed Income (67.5%) | Value | |||
| Consumer Non-Cyclical (5.4%) - continued | |||||
Visant Corporation | |||||
| $100,000 | 7.625%, 10/1/2012 | $ | 99,750 | ||
Total Consumer Non-Cyclical | 4,052,811 | ||||
| Energy (4.5%) | |||||
| Chesapeake Energy Corporation | |||||
| 140,000 | 9.500%, 2/15/2015 | 141,050 | |||
| 320,000 | 6.375%, 6/15/2015 | 284,800 | |||
| 140,000 | 6.250%, 1/15/2018 | 116,200 | |||
| Cie Generale de Geophysique Veritas | |||||
| 200,000 | 7.500%, 5/15/2015 | 183,500 | |||
| Connacher Oil and Gas, Ltd. | |||||
| 220,000 | 10.250%, 12/15/2015b | 133,100 | |||
| ConocoPhillips | |||||
| 200,000 | 6.500%, 2/1/2039 | 212,887 | |||
| Denbury Resources, Inc. | |||||
| 155,000 | 7.500%, 12/15/2015 | 147,250 | |||
| Forest Oil Corporation | |||||
| 200,000 | 8.500%, 2/15/2014b | 196,500 | |||
| 210,000 | 7.250%, 6/15/2019 | 187,950 | |||
| Hornbeck Offshore Services, Inc. | |||||
| 130,000 | 6.125%, 12/1/2014 | 117,813 | |||
| Marathon Oil Corporation | |||||
| 300,000 | 7.500%, 2/15/2019 | 327,436 | |||
| Mariner Energy, Inc. | |||||
| 90,000 | 11.750%, 6/30/2016 | 89,550 | |||
| Newfield Exploration Company | |||||
| 135,000 | 6.625%, 4/15/2016 | 121,837 | |||
| 100,000 | 7.125%, 5/15/2018 | 90,875 | |||
| PetroHawk Energy Corporation | |||||
| 200,000 | 9.125%, 7/15/2013 | 199,000 | |||
| Petroplus Finance, Ltd. | |||||
| 140,000 | 7.000%, 5/1/2017b | 116,200 | |||
| Plains Exploration & Production Company | |||||
| 150,000 | 7.750%, 6/15/2015 | 140,250 | |||
| 185,000 | 10.000%, 3/1/2016 | 190,087 | |||
| Pride International, Inc. | |||||
| 95,000 | 7.375%, 7/15/2014 | 94,287 | |||
| Sandridge Energy, Inc. | |||||
| 70,000 | 9.875%, 5/15/2016b | 67,550 | |||
| Tesoro Corporation | |||||
| 200,000 | 6.625%, 11/1/2015 | 179,500 | |||
Total Energy | 3,337,622 | ||||
| Financials (6.7%) | |||||
| AvalonBay Communities, Inc. | |||||
| 300,000 | 5.750%, 9/15/2016 | 279,290 | |||
| AXA SA | |||||
| 200,000 | 6.463%, 12/14/2018b | 126,000 | |||
| BBVA Bancomer SA | |||||
| 200,000 | 6.008%, 5/17/2022b | 158,856 | |||
| Boston Properties, LP | |||||
| 300,000 | 5.000%, 6/1/2015 | 269,891 | |||
| Deluxe Corporation | |||||
| 100,000 | 5.125%, 10/1/2014 | 76,500 | |||
| ERP Operating, LP | |||||
| 300,000 | 5.750%, 6/15/2017 | 279,864 | |||
| Fairfax Financial Holdings, Ltd. | |||||
| 100,000 | 7.750%, 6/15/2017 | 89,500 | |||
| General Motors Acceptance Corporation, LLC | |||||
| 110,000 | 5.375%, 6/6/2011b,e | 93,500 | |||
| 105,000 | 6.875%, 9/15/2011b | 91,875 | |||
| 80,000 | 7.500%, 12/31/2013b | 62,000 | |||
| HCP, Inc. | |||||
| 300,000 | 6.700%, 1/30/2018 | 260,609 | |||
| J.P. Morgan Chase Capital XX | |||||
| 440,000 | 6.550%, 9/29/2036 | 349,722 | |||
| Lehman Brothers Holdings, Inc. | |||||
| 400,000 | 7.000%, 9/27/2027d | 59,000 | |||
| Liberty Mutual Group, Inc. | |||||
| 200,000 | 10.750%, 6/15/2038b | 144,000 | |||
| Lincoln National Corporation | |||||
| 630,000 | 7.000%, 5/17/2016g | 396,900 | |||
| MetLife, Inc. | |||||
| 50,000 | 7.875%, 12/15/2037b | 40,500 | |||
| Mitsubishi UFG Capital Finance, Ltd. | |||||
| 200,000 | 6.346%, 7/25/2016 | 175,082 | |||
| Nuveen Investments, Inc. | |||||
| 100,000 | 10.500%, 11/15/2015b | 69,000 | |||
| ProLogis Trust | |||||
| 210,000 | 5.625%, 11/15/2016 | 161,426 | |||
| Prudential Financial, Inc. | |||||
| 85,000 | 8.875%, 6/15/2038 | 70,550 | |||
| Rabobank Nederland | |||||
| 315,000 | 11.000%, 6/30/2019b | 350,438 | |||
| Regency Centers, LP | |||||
| 300,000 | 5.875%, 6/15/2017 | 243,039 | |||
| Simon Property Group, LP | |||||
| 300,000 | 6.125%, 5/30/2018 | 279,049 | |||
| Swiss RE Capital I, LP | |||||
| 420,000 | 6.854%, 5/25/2016b | 231,168 | |||
| Wachovia Capital Trust III | |||||
| 420,000 | 5.800%, 3/15/2011 | 252,000 | |||
| Wells Fargo Capital XIII | |||||
| 440,000 | 7.700%, 3/26/2013 | 365,200 | |||
Total Financials | 4,974,959 | ||||
| Technology (1.6%) | |||||
| Amkor Technology, Inc. | |||||
| 100,000 | 7.750%, 5/15/2013 | 91,750 | |||
| Avago Technologies Finance Pte | |||||
| 26,000 | 6.168%, 9/1/2009c | 22,425 | |||
| 130,000 | 10.125%, 12/1/2013 | 132,600 | |||
| First Data Corporation | |||||
| 300,000 | 9.875%, 9/24/2015 | 213,000 | |||
| Flextronics International, Ltd. | |||||
| 170,000 | 6.250%, 11/15/2014 | 158,950 | |||
| Iron Mountain, Inc. | |||||
| 205,000 | 7.750%, 1/15/2015 | 196,800 | |||
| NXP BV/NXP Funding, LLC | |||||
| 21,000 | 10.000%, 7/15/2013b | 15,277 | |||
| Seagate Technology HDD Holdings | |||||
| 130,000 | 6.800%, 10/1/2016 | 111,475 | |||
| Sungard Data Systems, Inc. | |||||
| 330,000 | 4.875%, 1/15/2014 | 292,050 | |||
Total Technology | 1,234,327 | ||||
The accompanying Notes to Financial Statements are an integral part of this schedule.
235
Table of Contents
Diversified Income Plus Portfolio
Schedule of Investments as of June 30, 2009
(unaudited)
| Principal Amount | Long-Term Fixed Income (67.5%) | Value | |||
| Transportation (1.2%) | |||||
American Airlines Pass Through Trust | |||||
| $100,000 | 7.858%, 10/1/2011 | $ | 93,750 | ||
| Continental Airlines, Inc. | |||||
| 189,153 | 7.875%, 7/2/2018 | 110,655 | |||
| Delta Air Lines, Inc. | |||||
| 140,000 | 7.920%, 11/18/2010 | 128,800 | |||
| Hertz Corporation | |||||
| 270,000 | 8.875%, 1/1/2014 | 248,400 | |||
| Kansas City Southern de Mexico SA de CV | |||||
| 150,000 | 7.625%, 12/1/2013 | 129,000 | |||
| 200,000 | 12.500%, 4/1/2016b | 203,000 | |||
Total Transportation | 913,605 | ||||
| Utilities (5.3%) | |||||
| AES Corporation | |||||
| 330,000 | 7.750%, 10/15/2015 | 306,900 | |||
| AmeriGas Partners, LP | |||||
| 100,000 | 7.250%, 5/20/2015 | 93,750 | |||
| Dynegy Holdings, Inc. | |||||
| 110,000 | 6.875%, 4/1/2011e | 105,875 | |||
| 120,000 | 8.375%, 5/1/2016 | 101,700 | |||
| 100,000 | 7.750%, 6/1/2019 | 77,875 | |||
| Edison Mission Energy | |||||
| 130,000 | 7.750%, 6/15/2016 | 105,950 | |||
| 200,000 | 7.000%, 5/15/2017 | 153,500 | |||
| El Paso Corporation | |||||
| 100,000 | 12.000%, 12/12/2013 | 110,000 | |||
| 250,000 | 6.875%, 6/15/2014 | 233,311 | |||
| Energy Future Holdings Corporation | |||||
| 210,000 | 10.875%, 11/1/2017e | 153,300 | |||
| Enterprise Products Operating, LP | |||||
| 700,000 | 7.034%, 1/15/2018 | 516,250 | |||
| Illinois Power Company | |||||
| 160,000 | 6.125%, 11/15/2017 | 155,450 | |||
| Kinder Morgan Energy Partners, LP | |||||
| 100,000 | 6.500%, 9/1/2012 | 97,750 | |||
| Kinder Morgan Finance Company ulc | |||||
| 120,000 | 5.700%, 1/5/2016 | 102,900 | |||
| Mirant North America, LLC | |||||
| 170,000 | 7.375%, 12/31/2013 | 163,200 | |||
| NRG Energy, Inc. | |||||
| 320,000 | 7.375%, 2/1/2016 | 302,800 | |||
| Pacific Energy Partners, LP/Pacific Energy Finance Corporation | |||||
| 110,000 | 7.125%, 6/15/2014 | 112,633 | |||
| PNM Resources, Inc. | |||||
| 100,000 | 9.250%, 5/15/2015 | 92,625 | |||
| Regency Energy Partners, LP | |||||
| 100,000 | 8.375%, 12/15/2013 | 96,500 | |||
| 130,000 | 9.375%, 6/1/2016b | 125,775 | |||
| Sabine Pass LNG, LP | |||||
| 205,000 | 7.500%, 11/30/2016 | 165,538 | |||
| SemGroup, LP | |||||
| 150,000 | 8.750%, 11/15/2015b,d | 6,000 | |||
| Southern Star Central Corporation | |||||
| 110,000 | 6.750%, 3/1/2016 | 98,037 | |||
| Southern Union Company | |||||
| 200,000 | 7.200%, 11/1/2011 | 136,000 | |||
| Trans-Canada Pipelines | |||||
| 400,000 | 6.350%, 5/15/2017 | 278,000 | |||
| Williams Partners, LP | |||||
| 120,000 | 7.250%, 2/1/2017 | 109,500 | |||
Total Utilities | 4,001,119 | ||||
Total Long-Term Fixed Income (cost $57,923,622) | 50,379,179 | ||||
| Shares | Common Stock (25.0%) | ||||
| Consumer Discretionary (2.3%) | |||||
| 2,100 | Best Buy Company, Inc. | 70,329 | |||
| 5,600 | CBS Corporation | 38,752 | |||
| 2,700 | Comcast Corporation | 39,123 | |||
| 1,700 | Family Dollar Stores, Inc. | 48,110 | |||
| 3,000 | Genuine Parts Company | 100,680 | |||
| 11,400 | Home Depot, Inc. | 269,382 | |||
| 7,600 | KB Homee | 103,968 | |||
| 2,900 | McDonald’s Corporation | 166,721 | |||
| 5,300 | McGraw-Hill Companies, Inc. | 159,583 | |||
| 700 | National Presto Industries, Inc. | 53,270 | |||
| 2,800 | Snap-On, Inc. | 80,472 | |||
| 2,100 | Stanley Works | 71,064 | |||
| 4,100 | Staples, Inc. | 82,697 | |||
| 1,700 | Starwood Hotels & Resorts Worldwide, Inc. | 37,740 | |||
| 6,732 | Time Warner, Inc. | 169,579 | |||
| 1,500 | VF Corporation | 83,025 | |||
| 2,600 | Whirlpool Corporatione | 110,656 | |||
Total Consumer Discretionary | 1,685,151 | ||||
| Consumer Staples (2.5%) | |||||
| 7,600 | Altria Group, Inc. | 124,564 | |||
| 1,600 | Coca-Cola Company | 76,784 | |||
| 1,600 | ConAgra Foods, Inc. | 30,496 | |||
| 1,300 | CVS Caremark Corporation | 41,431 | |||
| 1,300 | Diageo plc ADR | 74,425 | |||
| 2,000 | General Mills, Inc. | 112,040 | |||
| 2,500 | Kimberly-Clark Corporation | 131,075 | |||
| 6,600 | Kraft Foods, Inc. | 167,244 | |||
| 2,100 | Lorillard, Inc. | 142,317 | |||
| 1,000 | McCormick & Company, Inc. | 32,530 | |||
| 5,900 | Nu Skin Enterprises, Inc. | 90,270 | |||
| 1,600 | PepsiCo, Inc. | 87,936 | |||
| 5,400 | Philip Morris International, Inc. | 235,548 | |||
| 3,237 | Procter & Gamble Company | 165,411 | |||
| 4,900 | SUPERVALU, Inc. | 63,455 | |||
| 2,000 | SYSCO Corporation | 44,960 | |||
| 6,100 | Tyson Foods, Inc. | 76,921 | |||
| 1,700 | Unilever plc ADR | 39,950 | |||
| 500 | Village Super Market, Inc. | 14,875 | |||
| 2,200 | Wal-Mart Stores, Inc. | 106,568 | |||
Total Consumer Staples | 1,858,800 | ||||
The accompanying Notes to Financial Statements are an integral part of this schedule.
236
Table of Contents
Diversified Income Plus Portfolio
Schedule of Investments as of June 30, 2009
(unaudited)
| Shares | Common Stock (25.0%) | Value | |||
| Energy (3.4%) | |||||
| 800 | Apache Corporation | $ | 57,720 | ||
| 5,200 | BJ Services Company | 70,876 | |||
| 2,700 | BP plc ADR | 128,736 | |||
| 5,400 | Chevron Corporation | 357,750 | |||
| 7,800 | ConocoPhillips | 328,068 | |||
| 1,000 | Devon Energy Corporation | 54,500 | |||
| 700 | Diamond Offshore Drilling, Inc. | 58,135 | |||
| 700 | Encana Corporation | 34,629 | |||
| 2,100 | ENSCO International, Inc. | 73,227 | |||
| 5,800 | Exxon Mobil Corporation | 405,478 | |||
| 3,300 | Halliburton Company | 68,310 | |||
| 4,700 | Marathon Oil Corporation | 141,611 | |||
| 1,900 | National Oilwell Varco, Inc.h | 62,054 | |||
| 2,700 | Noble Corporation | 81,675 | |||
| 1,900 | Occidental Petroleum Corporation | 125,039 | |||
| 300 | PetroChina Company, Ltd. | 33,144 | |||
| 1,200 | Petroleo Brasileiro SA ADR | 40,032 | |||
| 1,600 | Royal Dutch Shell plc ADR | 80,304 | |||
| 4,400 | Teekay Shipping Corporation | 92,532 | |||
| 1,800 | Tidewater, Inc. | 77,166 | |||
| 1,450 | Total SA ADR | 78,634 | |||
| 3,000 | Valero Energy Corporation | 50,670 | |||
| 900 | XTO Energy, Inc. | 34,326 | |||
Total Energy | 2,534,616 | ||||
| Financials (6.8%) | |||||
| 2,800 | ACE, Ltd. | 123,844 | |||
| 2,200 | AFLAC, Inc. | 68,398 | |||
| 3,600 | Allstate Corporation | 87,840 | |||
| 2,000 | AMB Property Corporation | 37,620 | |||
| 1,700 | American Campus Communities, Inc. | �� | 37,706 | ||
| 1,000 | American Express Company | 23,240 | |||
| 3,100 | Ameriprise Financial, Inc. | 75,237 | |||
| 2,500 | Annaly Capital Management, Inc. | 37,850 | |||
| 1,937 | AvalonBay Communities, Inc. | 108,356 | |||
| 9,000 | Bank of America Corporation | 118,800 | |||
| 3,500 | Bank of New York Mellon Corporation | 102,585 | |||
| 3,600 | BB&T Corporation | 79,128 | |||
| 300 | BlackRock, Inc. | 52,626 | |||
| 3,200 | Boston Properties, Inc. | 152,640 | |||
| 1,300 | BRE Properties, Inc. | 30,888 | |||
| 3,700 | Brookfield Properties Corporatione | 29,489 | |||
| 1,600 | Camden Property Trust | 44,160 | |||
| 1,600 | Chubb Corporation | 63,808 | |||
| 1,200 | City Holding Company | 36,432 | |||
| 1,600 | Corporate Office Properties Trust | 46,928 | |||
| 1,000 | Cullen/Frost Bankers, Inc. | 46,120 | |||
| 5,000 | DCT Industrial Trust, Inc. | 20,400 | |||
| 2,300 | Digital Realty Trust, Inc. | 82,455 | |||
| 2,900 | Douglas Emmett, Inc. | 26,071 | |||
| 1,000 | Equity Lifestyle Properties, Inc. | 37,180 | |||
| 5,200 | Equity Residential REIT | 115,596 | |||
| 900 | Essex Property Trust, Inc. | 56,007 | |||
| 1,700 | Federal Realty Investment Trust | 87,584 | |||
| 1,000 | Goldman Sachs Group, Inc. | 147,440 | |||
| 4,400 | Health Care Property Investors, Inc. | 93,236 | |||
| 1,900 | Health Care REIT, Inc. | 64,790 | |||
| 2,100 | Highwoods Properties, Inc. | 46,977 | |||
| 800 | Home Properties, Inc. | 27,280 | |||
| 1,100 | Hospitality Properties Trust | 13,079 | |||
| 10,100 | Host Marriott Corporation | 84,739 | |||
| 5,200 | Hudson City Bancorp, Inc. | 69,108 | |||
| 14,300 | J.P. Morgan Chase & Company | 487,773 | |||
| 4,422 | Kimco Realty Corporation | 44,441 | |||
| 2,500 | Liberty Property Trust | 57,600 | |||
| 2,566 | Macerich Companye | 45,187 | |||
| 1,800 | Mack-Cali Realty Corporation | 41,040 | |||
| 1,700 | Morgan Stanley | 48,467 | |||
| 2,600 | Nationwide Health Properties, Inc. | 66,924 | |||
| 2,900 | New York Community Bancorp, Inc. | 31,001 | |||
| 3,700 | People’s United Financial, Inc. | 55,648 | |||
| 1,200 | Plum Creek Timber Company, Inc.e | 35,736 | |||
| 2,300 | PNC Financial Services Group, Inc. | 89,263 | |||
| 5,000 | ProLogis Trust | 40,300 | |||
| 2,456 | Public Storage, Inc. | 160,819 | |||
| 2,000 | Regency Centers Corporation | 69,820 | |||
| 2,700 | Senior Housing Property Trust | 44,064 | |||
| 4,817 | Simon Property Group, Inc. | 247,738 | |||
| 4,200 | State Street Corporation | 198,240 | |||
| 8,600 | Sunstone Hotel Investors, Inc. | 46,010 | |||
| 2,100 | T. Rowe Price Group, Inc. | 87,507 | |||
| 1,100 | Tanger Factory Outlet Centers, Inc. | 35,673 | |||
| 1,700 | Taubman Centers, Inc. | 45,662 | |||
| 4,900 | Travelers Companies, Inc. | 201,096 | |||
| 6,500 | U.S. Bancorp | 116,480 | |||
| 3,500 | Ventas, Inc. | 104,510 | |||
| 3,063 | Vornado Realty Trust | 137,927 | |||
| 7,400 | Wells Fargo & Company | 179,524 | |||
Total Financials | 5,094,087 | ||||
| Health Care (2.4%) | |||||
| 3,500 | Abbott Laboratories | 164,640 | |||
| 600 | Amgen, Inc.h | 31,764 | |||
| 1,100 | Baxter International, Inc. | 58,256 | |||
| 600 | Becton, Dickinson and Company | 42,786 | |||
| 27,200 | Boston Scientific Corporationh | 275,808 | |||
| 5,300 | Bristol-Myers Squibb Company | 107,643 | |||
| 2,500 | Eli Lilly and Company | 86,600 | |||
| 4,600 | Johnson & Johnson | 261,280 | |||
| 2,100 | Medtronic, Inc. | 73,269 | |||
| 4,100 | Merck & Company, Inc. | 114,636 | |||
| 1,650 | Novartis AG ADR | 67,303 | |||
| 17,700 | Pfizer, Inc. | 265,500 | |||
| 300 | Teva Pharmaceutical Industries, Ltd. ADR | 14,802 | |||
| 2,100 | UnitedHealth Group, Inc. | 52,458 | |||
| 3,600 | Wyeth | 163,404 | |||
Total Health Care | 1,780,149 | ||||
| Industrials (2.1%) | |||||
| 1,500 | 3M Company | 90,150 | |||
| 1,500 | Caterpillar, Inc. | 49,560 | |||
| 2,000 | Dover Corporation | 66,180 | |||
| 1,300 | Eaton Corporation | 57,993 | |||
The accompanying Notes to Financial Statements are an integral part of this schedule.
237
Table of Contents
Diversified Income Plus Portfolio
Schedule of Investments as of June 30, 2009
(unaudited)
| Shares | Common Stock (25.0%) | Value | ||||
| Industrials (2.1%) - continued | ||||||
| 1,900 | Emerson Electric Company | $ | 61,560 | |||
| 1,500 | FedEx Corporation | 83,430 | ||||
| 1,700 | Fluor Corporation | 87,193 | ||||
| 1,200 | General Dynamics Corporation | 66,468 | ||||
| 15,900 | General Electric Company | 186,348 | ||||
| 1,800 | Honeywell International, Inc. | 56,520 | ||||
| 4,600 | Illinois Tool Works, Inc. | 171,764 | ||||
| 1,800 | Parker-Hannifin Corporation | 77,328 | ||||
| 5,400 | R.R. Donnelley & Sons Company | 62,748 | ||||
| 1,800 | Republic Services, Inc. | 43,938 | ||||
| 2,400 | Timken Company | 40,992 | ||||
| 5,200 | Tyco International, Ltd. | 135,096 | ||||
| 1,500 | United Parcel Service, Inc. | 74,985 | ||||
| 3,300 | United Technologies Corporation | 171,468 | ||||
Total Industrials | 1,583,721 | |||||
| Information Technology (2.3%) | ||||||
| 1,700 | Accenture, Ltd. | 56,882 | ||||
| 4,300 | Cisco Systems, Inc.h | 80,152 | ||||
| 200 | Google, Inc.h | 84,318 | ||||
| 2,100 | Harris Corporation | 59,556 | ||||
| 2,100 | Hewlett-Packard Company | 81,165 | ||||
| 8,900 | Intel Corporation | 147,295 | ||||
| 2,400 | International Business Machines Corporation | 250,608 | ||||
| 9,900 | Microsoft Corporation | 235,323 | ||||
| 3,950 | Nokia Oyj ADR | 57,591 | ||||
| 12,700 | Oracle Corporation | 272,034 | ||||
| 3,100 | Paychex, Inc. | 78,120 | ||||
| 3,300 | QUALCOMM, Inc. | 149,160 | ||||
| 4,900 | Tyco Electronics, Ltd. | 91,091 | ||||
| 12,300 | United Online, Inc. | 80,073 | ||||
Total Information Technology | 1,723,368 | |||||
| Materials (1.0%) | ||||||
| 1,100 | Air Products and Chemicals, Inc. | 71,049 | ||||
| 1,600 | BHP Billiton, Ltd.e | 87,568 | ||||
| 4,400 | E.I. du Pont de Nemours and Company | 112,728 | ||||
| 1,800 | Lubrizol Corporation | 85,158 | ||||
| 2,300 | Nucor Corporation | 102,189 | ||||
| 4,600 | Olin Corporation | 54,694 | ||||
| 4,800 | Packaging Corporation of America | 77,760 | ||||
| 1,600 | PPG Industries, Inc. | 70,240 | ||||
| 600 | Praxair, Inc. | 42,642 | ||||
| 3,400 | Southern Copper Corporatione | 69,496 | ||||
Total Materials | 773,524 | |||||
| Telecommunications Services (1.1%) | ||||||
| 15,200 | AT&T, Inc. | 377,568 | ||||
| 8,800 | Verizon Communications, Inc. | 270,424 | ||||
| 4,200 | Vodafone Group plc ADR | 81,858 | ||||
| 9,500 | Windstream Corporation | 79,420 | ||||
Total Telecommunications Services | 809,270 | |||||
| Utilities (1.1%) | ||||||
| 2,400 | AGL Resources, Inc. | 76,320 | ||||
| 5,400 | Duke Energy Corporation | 78,786 | ||||
| 2,600 | Energen Corporation | 103,740 | ||||
| 500 | Entergy Corporation | 38,760 | ||||
| 1,200 | Exelon Corporation | 61,452 | ||||
| 2,200 | FPL Group, Inc. | 125,092 | ||||
| 3,500 | Integrys Energy Group, Inc. | 104,965 | ||||
| 2,200 | Mirant Corporationh | 34,628 | ||||
| 6,400 | NiSource, Inc. | 74,624 | ||||
| 1,800 | PG&E Corporation | 69,192 | ||||
| 1,400 | Questar Corporation | 43,554 | ||||
Total Utilities | 811,113 | |||||
Total Common Stock (cost $21,027,723) | 18,653,799 | |||||
Preferred Stock (0.3%) | ||||||
| Financials (0.2%) | ||||||
| 2,600 | Bank of America Corporation, | |||||
8.625% | 52,728 | |||||
| 2,600 | Federal National Mortgage | |||||
Association, 8.250% | 3,484 | |||||
| 70 | Preferred Blocker, Inc., 7.000%b | 30,104 | ||||
| 2,600 | U.S. Bancorp, 7.875% | 64,610 | ||||
Total Financials | 150,926 | |||||
| Utilities (0.1%) | ||||||
| 2,600 | Xcel Energy, Inc., 7.600% | 65,858 | ||||
Total Utilities | 65,858 | |||||
Total Preferred Stock (cost $278,782) | 216,784 | |||||
Collateral Held for Securities Loaned (1.7%) | ||||||
| 1,292,240 | Thrivent Financial Securities Lending Trust | 1,292,240 | ||||
Total Collateral Held for Securities Loaned (cost $1,292,240) | 1,292,240 | |||||
| Shares or Principal Amount | Short-Term Investments (6.1%)i | |||||
Federal Home Loan Mortgage Corporation Discount Notes | ||||||
| 700,000 | 0.217%, 9/21/2009j | 699,658 | ||||
| 3,826,892 | Thrivent Money Market Portfolio | 3,826,892 | ||||
Total Short-Term Investments (at amortized cost) | 4,526,550 | |||||
Total Investments (cost $85,048,917) 100.6% | $ | 75,068,552 | ||||
Other Assets and Liabilities, Net (0.6%) | (425,319 | ) | ||||
Total Net Assets 100.0% | $ | 74,643,233 | ||||
| a | All or a portion of the security is insured or guaranteed. |
The accompanying Notes to Financial Statements are an integral part of this schedule.
238
Table of Contents
Diversified Income Plus Portfolio
Schedule of Investments as of June 30, 2009
(unaudited)
| b | Denotes securities sold under Rule 144A of the Securities Act of 1933, which exempts them from registration. These securities have been deemed liquid and may be resold to other dealers in the program or to other qualified institutional buyers. As of June 30, 2009, the value of these investments was $7,901,986 or 10.6% of total net assets. |
| c | Denotes variable rate obligations for which the current yield and next scheduled reset date are shown. |
| d | In bankruptcy. |
| e | All or a portion of the security is on loan as discussed in item 2(M) of the Notes to Financial Statements. |
| f | Denotes restricted securities. Restricted securities are investment securities which have been deemed illiquid and cannot be offered for public sale without first being registered under the Securities Act of 1933. The following table indicates the acquisition date and cost of restricted securities Diversified Income Plus Portfolio owned as of June 30, 2009. |
Security | Acquisition Date | Cost | |||
Commercial Mortgage Pass-Through Certificates | 5/2/2007 | $ | 1,000,000 | ||
Tunica Biloxi Gaming Authority | 11/8/2005 | 260,000 | |||
Turning Stone Resort Casino Enterprise | 9/8/2006 | 199,659 | |||
Wachovia Bank Commercial Mortgage Trust | 4/25/2007 | 2,000,000 | |||
| g | All or a portion of the security was earmarked to cover options. |
| h | Non-income producing security. |
| i | The interest rate shown reflects the yield, coupon rate or, for securities purchased at a discount, the discount rate at the date of purchase. |
| j | At June 30, 2009, $699,658 of investments were held on deposit with the counterparty and pledged as the initial margin deposit for open futures contracts. |
Definitions:
| ADR | - | American Depositary Receipt, which are certificates for an underlying foreign security’s shares held by an issuing U.S. depository bank. | ||
| REIT | - | Real Estate Investment Trust, is a company that buys, develops, manages and/or sells real estate assets. |
Unrealized Appreciation (Depreciation)
Gross unrealized appreciation and depreciation of investments, based on cost for federal income tax purposes, were as follows:
Gross unrealized appreciation | $ | 2,219,271 | ||
Gross unrealized depreciation | (12,199,636 | ) | ||
Net unrealized appreciation (depreciation) | $(9,980,365) | |||
Cost for federal income tax purposes | $ | 85,048,917 | ||
The accompanying Notes to Financial Statements are an integral part of this schedule.
239
Table of Contents
Diversified Income Plus Portfolio
Schedule of Investments as of June 30, 2009
(unaudited)
Fair Valuation Measurements
The following table is a summary of the inputs used, as of June 30, 2009, in valuing Diversified Income Plus Portfolio’s assets carried at fair value as discussed in the Notes to Financial Statements.
Investments in Securities | Total | Level 1 | Level 2 | Level 3 | ||||||||||
Long-Term Fixed Income | ||||||||||||||
Asset-Backed Securities | 3,988,885 | — | 3,988,885 | — | ||||||||||
Basic Materials | 2,608,300 | — | 2,608,300 | — | ||||||||||
Capital Goods | 1,912,744 | — | 1,912,744 | — | ||||||||||
Collateralized Mortgage Obligations | 8,552,076 | — | 8,552,076 | — | ||||||||||
Commercial Mortgage-Backed Securities | 3,551,179 | — | 3,551,179 | — | ||||||||||
Communications Services | 5,276,798 | — | 5,276,798 | — | ||||||||||
Consumer Cyclical | 5,974,754 | — | 5,974,754 | — | ||||||||||
Consumer Non-Cyclical | 4,052,811 | — | 4,052,811 | — | ||||||||||
Energy | 3,337,622 | — | 3,337,622 | — | ||||||||||
Financials | 4,974,959 | — | 4,974,959 | — | ||||||||||
Technology | 1,234,327 | — | 1,234,327 | — | ||||||||||
Transportation | 913,605 | — | 580,400 | 333,205 | ||||||||||
Utilities | 4,001,119 | — | 4,001,119 | — | ||||||||||
Common Stock | ||||||||||||||
Consumer Discretionary | 1,685,151 | 1,685,151 | — | — | ||||||||||
Consumer Staples | 1,858,800 | 1,858,800 | — | — | ||||||||||
Energy | 2,534,616 | 2,534,616 | — | — | ||||||||||
Financials | 5,094,087 | 5,094,087 | — | — | ||||||||||
Health Care | 1,780,149 | 1,780,149 | — | — | ||||||||||
Industrials | 1,583,721 | 1,583,721 | — | — | ||||||||||
Information Technology | 1,723,368 | 1,723,368 | — | — | ||||||||||
Materials | 773,524 | 773,524 | — | — | ||||||||||
Telecommunications Services | 809,270 | 809,270 | — | — | ||||||||||
Utilities | 811,113 | 811,113 | — | — | ||||||||||
Preferred Stock | ||||||||||||||
Financials | 150,926 | 120,822 | 30,104 | — | ||||||||||
Utilities | 65,858 | 65,858 | — | — | ||||||||||
Collateral Held for Securities Loaned | 1,292,240 | 1,292,240 | — | — | ||||||||||
Short-Term Investments | 4,526,550 | 3,826,892 | 699,658 | — | ||||||||||
Total | $ | 75,068,552 | $ | 23,959,611 | $ | 50,775,736 | $ | 333,205 | ||||||
Other Financial Instruments* | ($36,576 | ) | ($36,576 | ) | $ | — | $ | — | ||||||
| * | Other Financial Instruments include Futures, Forwards, Written Options and Swap agreements. |
The following table is a reconciliation of assets in which significant unobservable inputs (Level 3) were used in determining fair value for the Diversified Income Plus Portfolio as discussed in item 2(A) of the Notes to Financial Statements.
Investments in Securities | Value December 31, 2008 | Accrued Discounts and/or Premiums | Realized Gain/(Loss) | Change in Unrealized Gain/(Loss) | Net Purchases/(Sales) | Transfers in and/or (Out of) Level 3 | Value June 30, 2009 | ||||||||||||||
Preferred Stock | |||||||||||||||||||||
Financials | 305,589 | — | (87,446 | ) | 96,456 | (284,495 | ) | (30,104 | ) | — | |||||||||||
Long-Term Fixed Income | |||||||||||||||||||||
Asset-Backed Securities | 1,312,255 | — | — | 23,365 | — | (1,335,620 | ) | — | |||||||||||||
Transportation | 424,051 | 1,208 | (38,995 | ) | 134,778 | (187,837 | ) | — | 333,205 | ||||||||||||
Total | $ | 2,041,895 | $ | 1,208 | ($126,441 | ) | $ | 254,599 | ($472,332 | ) | ($1,365,724 | ) | $ | 333,205 | |||||||
The accompanying Notes to Financial Statements are an integral part of this schedule.
240
Table of Contents
Diversified Income Plus Portfolio
Schedule of Investments as of June 30, 2009
(unaudited)
Futures Contracts | Number of Contracts Long/(Short) | Expiration Date | Notional Principal Amount | Value | Unrealized Gain/(Loss) | |||||||||||||
5-Yr. U.S. Treasury Bond Futures | 26 | September 2009 | $ | 2,988,048 | $ | 2,982,688 | ($5,360 | ) | ||||||||||
10-Yr. U.S. Treasury Bond Futures | (15 | ) | September 2009 | (1,733,275 | ) | (1,743,985 | ) | (10,710 | ) | |||||||||
S&P 500 Index Futures | (12 | ) | September 2009 | (2,778,551 | ) | (2,746,500 | ) | 32,051 | ||||||||||
S&P 500 Index Mini-Futures | 62 | September 2009 | 2,892,553 | 2,838,050 | (54,503 | ) | ||||||||||||
Total Futures Contracts | ($38,522 | ) | ||||||||||||||||
Call Options Written | Number of Contracts | Exercise Price | Expiration Date | Value | Unrealized Gain/(Loss) | |||||||||||||
S&P 500 Index Mini-Futures | 15 | $ | 945.00 | July 2009 | ($4,575 | ) | $ | 1,946 | ||||||||||
Total Call Options Written | ($4,575 | ) | $ | 1,946 | ||||||||||||||
The following table summarizes the fair value and Statement of Assets and Liabilities location, as of June 30, 2009, for the Diversified Income Plus Portfolio’s investments in financial derivative instruments by primary risk exposure as discussed under item (2) Significant Accounting Policies of the Notes to Financial Statements.
Derivatives by Risk Category | Statement of Assets and Liabilities Location | Fair Value | |||
Asset Derivatives | |||||
Equity Contracts | |||||
Option Written | Net Assets - Net unrealized appreciation/(depreciation) on Written option contracts | 1,946 | |||
Future* | Net Assets - Net unrealized appreciation/(depreciation) on Futures contracts | 32,051 | |||
Total Equity Contracts | 33,997 | ||||
Total Asset Derivatives | $ | 33,997 | |||
Liability Derivatives | |||||
Interest Rate Contracts | |||||
Future* | Net Assets - Net unrealized appreciation/(depreciation) on Futures contracts | 16,070 | |||
Total Interest Rate Contracts | 16,070 | ||||
Equity Contracts | |||||
Future* | Net Assets - Net unrealized appreciation/(depreciation) on Futures contracts | 54,503 | |||
Total Equity Contracts | 54,503 | ||||
Total LiabilityDerivatives | $ | 70,573 | |||
| * | Includes cumulative appreciation/depreciation of futures contracts as reported in the Schedule of Investments. Only current day’s variation margin is reported within the Statement of Assets and Liabilities. |
The following table summarizes the net realized gains/(losses) and Statement of Operations location, for the period ended June 30, 2009, for Diversified Income Plus Portfolio’s investments in financial derivative instruments by primary risk exposure.
Derivatives by Risk Category | Statement of Operations Location | Realized Gains/(Losses) recognized in Income | |||
Equity Contracts | |||||
Option Written | Net realized gains/(losses) on Written option contracts | 11,492 | |||
Future | Net realized gains/(losses) on Futures contracts | 297,025 | |||
Total Equity Contracts | 308,517 | ||||
Interest Rate Contracts | |||||
Future | Net realized gains/(losses) on Futures contracts | 106,055 | |||
Total Interest Rate Contracts | 106,055 | ||||
Total | $ | 414,572 | |||
The accompanying Notes to Financial Statements are an integral part of this schedule.
241
Table of Contents
Diversified Income Plus Portfolio
Schedule of Investments as of June 30, 2009
(unaudited)
The following table summarizes the change in net unrealized appreciation/(depreciation) and Statement of Operations location, for the period ended June 30, 2009, for the Diversified Income Plus Portfolio’s investments in financial derivative instruments by primary risk exposure.
Derivatives by Risk Category | Statement of Operations Location | Change in Unrealized Appreciation/(Depreciation) recognized in Income | |||
Equity Contracts | |||||
Option Written | Change in net unrealized appreciation/(depreciation) on Written option contracts | 1,946 | |||
Future | Change in net unrealized appreciation/(depreciation) on Futures contracts | (104,939 | ) | ||
Total Equity Contracts | (102,993 | ) | |||
Interest Rate Contracts | |||||
Future | Change in net unrealized appreciation/(depreciation) on Futures contracts | (16,070 | ) | ||
Total Interest Rate Contracts | (16,070 | ) | |||
Total | ($119,063 | ) | |||
Investment in Affiliates
Affiliated issuers, as defined under the Investment Company Act of 1940, include those in which the Portfolio’s holdings of an issuer represent 5% or more of the outstanding voting securities of an issuer, or any affiliated mutual fund.
A summary of transactions for the fiscal year to date, in Diversified Income Plus Portfolio, is as follows:
Portfolio | Value December 31, 2008 | Gross Purchases | Gross Sales | Shares Held at June 30, 2009 | Value June 30, 2009 | Income Earned January 1, 2009 - June 30, 2009 | |||||||||||
Money Market | $ | 1,906,331 | $ | 21,922,368 | $ | 20,001,807 | 3,826,892 | $ | 3,826,892 | $ | 8,049 | ||||||
Thrivent Financial Securities Lending Trust | 1,642,478 | 6,196,882 | 6,547,120 | 1,292,240 | 1,292,240 | 6,540 | |||||||||||
Total Value and Income Earned | 3,548,809 | 5,119,132 | 14,589 | ||||||||||||||
The accompanying Notes to Financial Statements are an integral part of this schedule.
242
Table of Contents
Partner Socially Responsible Bond Portfolio
Schedule of Investments as of June 30, 2009
(unaudited)
| Principal Amount | Long-Term Fixed Income (86.8%) | Value | |||
| Asset-Backed Securities (8.5%) | |||||
Americredit Automobile Receivables Trust | |||||
| $26,051 | 0.398%, 7/6/2009a,b | $ | 25,061 | ||
| 2,140 | 4.870%, 12/6/2010a | 2,141 | |||
| 30,593 | 5.200%, 3/6/2011 | 30,634 | |||
| 36,506 | 3.430%, 7/6/2011a | 36,791 | |||
| 8,586 | 5.210%, 10/6/2011a | 8,572 | |||
Bear Stearns Asset-Backed Securities, Inc. | |||||
| 69,803 | 5.000%, 1/25/2034 | 61,741 | |||
Capital Auto Receivables Asset Trust | |||||
| 17,968 | 0.379%, 7/15/2009b | 17,681 | |||
| 30,000 | 0.419%, 7/15/2009b | 28,041 | |||
| 80,000 | 4.730%, 9/15/2010 | 80,254 | |||
Capital One Auto Finance Trust | |||||
| 51,737 | 0.359%, 7/15/2009a,b | 50,149 | |||
Carmax Auto Owner Trust | |||||
| 59,393 | 1.019%, 7/15/2009b | 59,420 | |||
DaimlerChrysler Auto Trust | |||||
| 15,188 | 4.200%, 7/8/2010 | 15,199 | |||
Ford Credit Auto Owner Trust | |||||
| 32,008 | 5.160%, 11/15/2010 | 32,248 | |||
Harley Davidson Motorcycle Trust | |||||
| 20,230 | 1.219%, 7/15/2009b | 20,238 | |||
Household Automotive Trust | |||||
| 26,721 | 5.610%, 8/17/2011 | 27,224 | |||
| 7,327 | 5.280%, 9/17/2011 | 7,433 | |||
| 73,283 | 4.550%, 7/17/2012 | 73,610 | |||
Total Asset-Backed Securities | 576,437 | ||||
| Basic Materials (1.1%) | |||||
Yara International ASA | |||||
| 70,000 | 7.875%, 6/11/2019c | 72,946 | |||
Total Basic Materials | 72,946 | ||||
| Capital Goods (1.8%) | |||||
Roper Industries, Inc. | |||||
| 70,000 | 6.625%, 8/15/2013 | 69,907 | |||
Weyerhaeuser Company | |||||
| 50,000 | 1.610%, 9/24/2009b | 49,364 | |||
Total Capital Goods | 119,271 | ||||
| Collateralized Mortgage Obligations (3.7%) | |||||
American Home Mortgage Assets Trust | |||||
| 134,117 | 2.300%, 7/1/2009b | 56,770 | |||
| 126,598 | 0.439%, 7/27/2009b | 49,552 | |||
| 82,452 | 0.504%, 7/27/2009b | 33,371 | |||
Chase Funding Trust | |||||
| 39,655 | 4.045%, 11/25/2029 | 37,101 | |||
Impac CMB Trust | |||||
| 25,554 | 0.584%, 7/27/2009b | 11,388 | |||
Master Alternative Loans Trust | |||||
| 30,139 | 6.250%, 7/25/2036 | 15,004 | |||
Residential Asset Securitization Trust | |||||
| 41,136 | 6.250%, 11/25/2036 | 23,576 | |||
Structured Asset Securities Corporation | |||||
| 27,675 | 5.000%, 6/25/2035 | 20,548 | |||
Total Collateralized Mortgage Obligations | 247,310 | ||||
| Commercial Mortgage-Backed Securities (0.7%) | |||||
Citigroup/Deutsche Bank Commercial Mortgage Securities, Inc. | |||||
| 40,000 | 5.205%, 12/11/2049 | 36,587 | |||
Credit Suisse First Boston Mortgage Securities Corporation | |||||
| 53,814 | 4.665%, 12/25/2033 | 13,593 | |||
Total Commercial Mortgage-Backed Securities | 50,180 | ||||
| Communications Services (3.0%) | |||||
CC Holdings GS V, LLC | |||||
| 50,000 | 7.750%, 5/1/2017c | 48,750 | |||
Thomson Reuters Corporation | |||||
| 70,000 | 5.950%, 7/15/2013 | 71,608 | |||
Time Warner Cable, Inc. | |||||
| 70,000 | 8.250%, 4/1/2019 | 79,423 | |||
Total Communications Services | 199,781 | ||||
| Consumer Cyclical (3.7%) | |||||
American Honda Finance Corporation | |||||
| 100,000 | 1.359%, 9/20/2009b,c | 96,495 | |||
Home Depot, Inc. | |||||
| 60,000 | 0.749%, 9/16/2009b | 59,817 | |||
Ohana Military Communities, LLC | |||||
| 120,000 | 6.000%, 10/1/2051c | 91,396 | |||
Total Consumer Cyclical | 247,708 | ||||
| Consumer Non-Cyclical (1.9%) | |||||
Hospira, Inc. | |||||
| 60,000 | 1.078%, 9/30/2009b | 59,463 | |||
Koninklijke (Royal) Philips Electronics NV | |||||
| 70,000 | 1.798%, 3/11/2011b | 70,134 | |||
Total Consumer Non-Cyclical | 129,597 | ||||
| Energy (3.3%) | |||||
Great River Energy | |||||
| 65,480 | 5.829%, 7/1/2017c | 63,004 | |||
Pioneer Natural Resources Company | |||||
| 110,000 | 5.875%, 7/15/2016 | 94,846 | |||
Rockies Express Pipeline, LLC | |||||
| 70,000 | 4.500%, 8/20/2009b,c | 69,913 | |||
Total Energy | 227,763 | ||||
The accompanying Notes to Financial Statements are an integral part of this schedule.
243
Table of Contents
Partner Socially Responsible Bond Portfolio
Schedule of Investments as of June 30, 2009
(unaudited)
| Principal Amount | Long-Term Fixed Income (86.8%) | Value | ||||
| Financials (26.1%) | ||||||
BAC Capital Trust XIV | ||||||
| $ 250,000 | 1.468%, 9/1/2009b | $ | 123,324 | |||
Bear Stearns Companies, LLC | ||||||
| 70,000 | 0.903%, 9/9/2009b | 69,969 | ||||
| 70,000 | 7.250%, 2/1/2018 | 73,779 | ||||
Capital One Bank USA NA | ||||||
| 70,000 | 8.800%, 7/15/2019 | 71,514 | ||||
Chase Manhattan Corporation | ||||||
| 70,000 | 7.000%, 11/15/2009 | 71,096 | ||||
Credit Agricole SA | ||||||
| 100,000 | 6.637%, 5/31/2017c | 58,750 | ||||
Deutsche Bank NY | ||||||
| 70,000 | 1.213%, 9/18/2009b | 69,077 | ||||
First Union Corporation | ||||||
| 60,000 | 7.574%, 8/1/2026 | 60,493 | ||||
Glitnir Banki HF | ||||||
| 50,000 | 3.226%, 1/21/2011d,e | 8,125 | ||||
Goldman Sachs Group, Inc. | ||||||
| 80,000 | 1.430%, 7/23/2009b | 79,962 | ||||
HRPT Properties Trust | ||||||
| 50,000 | 1.224%, 9/16/2009b | 43,547 | ||||
Independence Community Bank Corporation | ||||||
| 70,000 | 3.028%, 7/1/2009b | 49,783 | ||||
J.P. Morgan Chase & Company | ||||||
| 70,000 | 1.362%, 7/1/2009a,b | 70,402 | ||||
| 100,000 | 1.883%, 8/17/2009b | 50,989 | ||||
| 80,000 | 0.854%, 9/28/2009b | 80,800 | ||||
MBNA Capital | ||||||
| 100,000 | 1.828%, 8/1/2009b | 52,550 | ||||
MetLife, Inc. | ||||||
| 70,000 | 0.921%, 9/29/2009b | 70,872 | ||||
Monumental Global Funding III | ||||||
| 100,000 | 1.283%, 8/17/2009b,c | 99,536 | ||||
ProLogis | ||||||
| 50,000 | 6.625%, 5/15/2018 | 39,370 | ||||
Rabobank Nederland | ||||||
| 70,000 | 11.000%, 6/30/2019c | 77,875 | ||||
Royal Bank of Scotland Group plc | ||||||
| 140,000 | 7.640%, 9/29/2017 | 56,700 | ||||
SLM Corporation | ||||||
| 25,000 | 1.232%, 7/27/2009b | 24,907 | ||||
Sovereign Bank | ||||||
| 15,000 | 2.738%, 8/3/2009b | 11,316 | ||||
State Street Bank and Trust Company | ||||||
| 70,000 | 0.829%, 9/15/2009b | 70,539 | ||||
Suncorp-Metway, Ltd. | ||||||
| 70,000 | 0.989%, 9/17/2009b,c | 69,856 | ||||
SunTrust Bank | ||||||
| 70,000 | 0.863%, 8/21/2009b | 62,162 | ||||
Svenska Handelsbanken AB | ||||||
| 50,000 | 4.875%, 6/10/2014c | 49,496 | ||||
Wachovia Capital Trust III | ||||||
| 150,000 | 5.800%, 3/15/2011 | 90,000 | ||||
Total Financials | 1,756,789 | |||||
| Foreign (1.1%) | ||||||
Province of Ontario | ||||||
| 75,000 | 1.166%, 8/22/2009b | 74,723 | ||||
Total Foreign | 74,723 | |||||
| Transportation (2.4%) | ||||||
Skyway Concession Company, LLC | ||||||
| 50,000 | 0.878%, 9/30/2009b,c | 44,590 | ||||
Toll Road Investors Partnership II, LP | ||||||
| 500,000 | Zero Coupon, 2/15/2043c | 99,915 | ||||
| 173,660 | Zero Coupon, 2/15/2045c | 15,714 | ||||
Total Transportation | 160,219 | |||||
| U.S. Government (27.7%) | ||||||
Federal Home Loan Banks | ||||||
| 60,000 | 5.000%, 11/17/2017 | 63,847 | ||||
Federal Home Loan Mortgage Corporation | ||||||
| 750,000 | 6.625%, 9/15/2009 | 759,832 | ||||
U.S. Department of Housing & Urban Development | ||||||
| 1,000,000 | 3.440%, 8/1/2011 | 1,042,502 | ||||
Total U.S. Government | 1,866,181 | |||||
| U.S. Municipals (0.8%) | ||||||
Oakland, California Redevelopment Agency Taxable Bonds (Series T) | ||||||
| 60,000 | 5.252%, 9/1/2016 | 57,986 | ||||
Total U.S. Municipals | 57,986 | |||||
| Utilities (1.0%) | ||||||
Enterprise Products Operating, LP | ||||||
| 70,000 | 4.600%, 8/1/2012 | 70,479 | ||||
Total Utilities | 70,479 | |||||
Total Long-Term Fixed Income (cost $5,878,437) | 5,857,370 | |||||
| Shares or Principal Amount | Short-Term Investments (13.7%)f | |||||
Federal Home Loan Mortgage Corporation Discount Notes | ||||||
| 100,000 | 0.200%, 9/21/2009g | 99,955 | ||||
| 819,283 | Thrivent Money Market Portfolio | 819,283 | ||||
Total Short-Term Investments (at amortized cost) | 919,238 | |||||
Total Investments (cost $6,797,675) 100.5% | $ | 6,776,608 | ||||
Other Assets and Liabilities, Net (0.5%) | (32,285 | ) | ||||
Total Net Assets 100.0% | $ | 6,744,323 | ||||
| a | All or a portion of the security is insured or guaranteed. |
The accompanying Notes to Financial Statements are an integral part of this schedule.
244
Table of Contents
Partner Socially Responsible Bond Portfolio
Schedule of Investments as of June 30, 2009
(unaudited)
| b | Denotes variable rate obligations for which the current yield and next scheduled reset date are shown. |
| c | Denotes securities sold under Rule 144A of the Securities Act of 1933, which exempts them from registration. These securities have been deemed liquid and may be resold to other dealers in the program or to other qualified institutional buyers. As of June 30, 2009, the value of these investments was $958,236 or 14.2% of total net assets. |
| d | Denotes restricted securities. Restricted securities are investment securities which have been deemed illiquid and cannot be offered for public sale without first being registered under the Securities Act of 1933. The following table indicates the acquisition date and cost of restricted securities Partner Socially Responsible Bond Portfolio owned as of June 30, 2009. |
Security | Acquisition Date | Cost | |||
Glitnir Banki HF | 5/1/2008 | $ | 45,116 | ||
| e | In bankruptcy. |
| f | The interest rate shown reflects the yield, coupon rate or, for securities purchased at a discount, the discount rate at the date of purchase. |
| g | At June 30, 2009, $99,955 of investments were held on deposit with the counterparty and pledged as the initial margin deposit for open futures contracts. |
Unrealized Appreciation (Depreciation)
Gross unrealized appreciation and depreciation of investments, based on cost for federal income tax purposes, were as follows:
Gross unrealized appreciation | $ | 185,755 | ||
Gross unrealized depreciation | (206,822 | ) | ||
Net unrealized appreciation (depreciation) | $ | (21,067 | ) | |
Cost for federal income tax purposes | $ | 6,797,675 | ||
Fair Valuation Measurements
The following table is a summary of the inputs used, as of June 30, 2009, in valuing Partner Socially Responsible Bond Portfolio’s assets carried at fair value as discussed in the Notes to Financial Statements.
Investments in Securities | Total | Level 1 | Level 2 | Level 3 | ||||||||
Long-Term Fixed Income | ||||||||||||
Asset-Backed Securities | 576,437 | — | 576,437 | — | ||||||||
Basic Materials | 72,946 | — | 72,946 | — | ||||||||
Capital Goods | 119,271 | — | 119,271 | — | ||||||||
Collateralized Mortgage Obligations | 247,310 | — | 247,310 | — | ||||||||
Commercial Mortgage-Backed Securities | 50,180 | — | 50,180 | — | ||||||||
Communications Services | 199,781 | — | 199,781 | — | ||||||||
Consumer Cyclical | 247,708 | — | 247,708 | — | ||||||||
Consumer Non-Cyclical | 129,597 | — | 129,597 | — | ||||||||
Energy | 227,763 | — | 227,763 | — | ||||||||
Financials | 1,756,789 | — | 1,756,789 | — | ||||||||
Foreign | 74,723 | — | 74,723 | — | ||||||||
Transportation | 160,219 | — | 160,219 | — | ||||||||
U.S. Government | 1,866,181 | — | 1,866,181 | — | ||||||||
U.S. Municipals | 57,986 | — | 57,986 | — | ||||||||
Utilities | 70,479 | — | 70,479 | — | ||||||||
Short-Term Investments | 919,238 | 819,283 | 99,955 | — | ||||||||
Total | $ | 6,776,608 | $ | 819,283 | $ | 5,957,325 | $ | — | ||||
Other Financial Instruments* | $ | 39,392 | $ | 39,392 | $ | — | $ | — | ||||
| * | Other Financial Instruments include Futures, Forwards, Written Options and Swap agreements. |
The accompanying Notes to Financial Statements are an integral part of this schedule.
245
Table of Contents
Partner Socially Responsible Bond Portfolio
Schedule of Investments as of June 30, 2009
(unaudited)
Futures Contracts | Number of Contracts Long/(Short) | Expiration Date | Notional Principal Amount | Value | Unrealized Gain/(Loss) | |||||||||||
2-Yr. U.S. Treasury Bond Futures | (25) | September 2009 | ($ | 5,422,773 | ) | ($ | 5,405,468 | ) | $ | 17,305 | ||||||
5-Yr. U.S. Treasury Bond Futures | (3) | September 2009 | (349,384 | ) | (344,156 | ) | 5,228 | |||||||||
10-Yr. U.S. Treasury Bond Futures | 21 | September 2009 | 2,443,222 | 2,441,578 | (1,644 | ) | ||||||||||
20-Yr. U.S. Treasury Bond Futures | 6 | September 2009 | 691,653 | 710,156 | 18,503 | |||||||||||
Total Futures Contracts | $ | 39,392 | ||||||||||||||
The following table summarizes the fair value and Statement of Assets and Liabilities location, as of June 30, 2009, for the Partner Socially Responsible Bond Portfolio’s investments in financial derivative instruments by primary risk exposure as discussed under item (2) Significant Accounting Policies of the Notes to Financial Statements.
Derivatives by Risk Category | Statement of Assets and Liabilities Location | Fair Value | |||
Asset Derivatives | |||||
Interest Rate Contracts | |||||
Future* | Net Assets - Net unrealized appreciation/(depreciation) on Futures contracts | 41,036 | |||
Total Interest Rate Contracts | 41,036 | ||||
Total Asset Derivatives | $ | 41,036 | |||
Liability Derivatives | |||||
Interest Rate Contracts | |||||
Future* | Net Assets - Net unrealized appreciation/(depreciation) on Futures contracts | 1,644 | |||
Total Interest Rate Contracts | 1,644 | ||||
Total Liability Derivatives | $ | 1,644 | |||
| * | Includes cumulative appreciation/depreciation of futures contracts as reported in the Schedule of Investments. Only current day’s variation margin is reported within the Statement of Assets and Liabilities. |
The following table summarizes the net realized gains/(losses) and Statement of Operations location, for the period ended June 30, 2009, for Partner Socially Responsible Bond Portfolio’s investments in financial derivative instruments by primary risk exposure.
Derivatives by Risk Category | Statement of Operations Location | Realized Gains/(Losses) recognized in Income | |||
Interest Rate Contracts | |||||
Future | Net realized gains/(losses) on Futures contracts | (114,543 | ) | ||
Total Interest Rate Contracts | (114,543 | ) | |||
Total | ($114,543 | ) | |||
The following table summarizes the change in net unrealized appreciation/(depreciation) and Statement of Operations location, for the period ended June 30, 2009, for the Partner Socially Responsible Bond Portfolio’s investments in financial derivative instruments by primary risk exposure.
Derivatives by Risk Category | Statement of Operations Location | Change in Unrealized Appreciation/(Depreciation) recognized in Income | |||
Interest Rate Contracts | |||||
Future | Change in net unrealized appreciation/(depreciation) on Futures contracts | 71,147 | |||
Total Interest Rate Contracts | 71,147 | ||||
Total | $ | 71,147 | |||
The accompanying Notes to Financial Statements are an integral part of this schedule.
246
Table of Contents
Partner Socially Responsible Bond Portfolio
Schedule of Investments as of June 30, 2009
(unaudited)
Investment in Affiliates
Affiliated issuers, as defined under the Investment Company Act of 1940, include those in which the Portfolio’s holdings of an issuer represent 5% or more of the outstanding voting securities of an issuer, or any affiliated mutual fund.
A summary of transactions for the fiscal year to date, in Partner Socially Responsible Bond Portfolio, is as follows:
Portfolio | Value December 31, 2008 | Gross Purchases | Gross Sales | Shares Held at June 30, 2009 | Value June 30, 2009 | Income Earned January 1, 2009 - June 30, 2009 | |||||||||||
Money Market | $ | 605,703 | $ | 5,047,231 | $ | 4,833,651 | 819,283 | $ | 819,283 | $ | 2,891 | ||||||
Total Value and Income Earned | 605,703 | 819,283 | 2,891 | ||||||||||||||
The accompanying Notes to Financial Statements are an integral part of this schedule.
247
Table of Contents
Schedule of Investments as of June 30, 2009
(unaudited)
| Principal Amount | Bank Loans (0.3%)a | Value | |||
| Utilities (0.3%) | |||||
NRG Energy, Inc., Term Loan | |||||
| $2,649,104 | 2.016%, 2/1/2013 | $ | 2,488,728 | ||
| 1,418,230 | 2.970%, 2/1/2013 | 1,332,370 | |||
Total Utilities | 3,821,098 | ||||
Total Bank Loans (cost $3,706,613) | 3,821,098 | ||||
Long-Term Fixed Income (95.6%) | |||||
| Asset-Backed Securities (2.1%) | |||||
Bear Stearns Mortgage Funding Trust | |||||
| 2,469,578 | 0.454%, 7/27/2009b | 444,568 | |||
Capitalsource Commercial Loan Trust | |||||
| 4,018,348 | 0.445%, 7/20/2009b,c | 3,353,082 | |||
Countrywide Asset-Backed Certificates | |||||
| 1,505,490 | 4.778%, 2/25/2036 | 875,986 | |||
Credit Based Asset Servicing and Securitization, LLC | |||||
| 302,056 | 0.424%, 7/27/2009b | 299,223 | |||
First Franklin Mortgage Loan Asset-Backed Certificates | |||||
| 2,035,551 | 0.404%, 7/27/2009b | 1,903,187 | |||
GMAC Mortgage Corporation Loan Trust | |||||
| 8,924,959 | 0.494%, 7/27/2009b,d | 2,683,280 | |||
| 7,705,204 | 0.494%, 7/27/2009b,d | 2,114,069 | |||
IndyMac Seconds Asset-Backed Trust | |||||
| 1,176,020 | 0.484%, 7/27/2009b,d | 316,084 | |||
Merna Re, Ltd. | |||||
| 12,250,000 | 2.348%, 9/30/2009b,e | 11,409,650 | |||
Total Asset-Backed Securities | 23,399,129 | ||||
| Basic Materials (3.3%) | |||||
ArcelorMittal | |||||
| 2,500,000 | 9.000%, 2/15/2015 | 2,636,033 | |||
| 6,050,000 | 6.125%, 6/1/2018 | 5,293,749 | |||
Arch Western Finance, LLC | |||||
| 1,900,000 | 6.750%, 7/1/2013 | 1,733,750 | |||
Barrick Gold Corporation | |||||
| 2,585,000 | 6.950%, 4/1/2019 | 2,895,216 | |||
Dow Chemical Company | |||||
| 2,550,000 | 8.550%, 5/15/2019 | 2,554,539 | |||
E.I. Du Pont de Nemours & Company | |||||
| 2,600,000 | 6.000%, 7/15/2018 | 2,802,621 | |||
FMG Finance, Pty., Ltd. | |||||
| 1,870,000 | 10.625%, 9/1/2016e | 1,795,200 | |||
Freeport-McMoRan Copper & Gold, Inc. | |||||
| 1,860,000 | 8.375%, 4/1/2017 | 1,873,950 | |||
Georgia-Pacific Corporation | |||||
| 2,310,000 | 9.500%, 12/1/2011f | 2,379,300 | |||
International Paper Company | |||||
| 2,500,000 | 9.375%, 5/15/2019 | 2,548,398 | |||
Mosaic Global Holdings, Inc., Convertible | |||||
| 2,500,000 | 7.375%, 12/1/2014e | 2,575,000 | |||
Nalco Company | |||||
| 1,870,000 | 8.875%, 11/15/2013 | 1,907,400 | |||
Rio Tinto Finance, Ltd. | |||||
| 1,200,000 | 5.875%, 7/15/2013 | 1,207,520 | |||
| 3,285,000 | 6.500%, 7/15/2018 | 3,286,915 | |||
Teck Resources, Ltd. | |||||
| 1,870,000 | 9.750%, 5/15/2014e | 1,935,450 | |||
Total Basic Materials | 37,425,041 | ||||
| Capital Goods (3.1%) | |||||
BAE Systems Holdings, Inc. | |||||
| 3,100,000 | 4.950%, 6/1/2014e | 3,115,950 | |||
Case New Holland, Inc. | |||||
| 1,200,000 | 7.125%, 3/1/2014 | 1,095,000 | |||
Caterpillar, Inc. | |||||
| 3,400,000 | 7.900%, 12/15/2018 | 3,921,359 | |||
CRH America, Inc. | |||||
| 2,400,000 | 6.000%, 9/30/2016 | 2,135,827 | |||
| 1,900,000 | 8.125%, 7/15/2018 | 1,829,143 | |||
Honeywell International, Inc. | |||||
| 3,400,000 | 5.300%, 3/1/2018 | 3,550,821 | |||
John Deere Capital Corporation | |||||
| 5,200,000 | 5.350%, 4/3/2018 | 5,168,919 | |||
Lockheed Martin Corporation | |||||
| 1,805,000 | 6.150%, 9/1/2036 | 1,926,767 | |||
Owens-Brockway Glass Container, Inc. | |||||
| 1,870,000 | 8.250%, 5/15/2013 | 1,879,350 | |||
Systems 2001 Asset Trust, LLC | |||||
| 2,943,331 | 6.664%, 9/15/2013c | 2,949,825 | |||
United Technologies Corporation | |||||
| 3,500,000 | 4.875%, 5/1/2015 | 3,721,795 | |||
Waste Management, Inc. | |||||
| 4,300,000 | 7.375%, 3/11/2019 | 4,607,979 | |||
Total Capital Goods | 35,902,735 | ||||
| Collateralized Mortgage Obligations (2.8%) | |||||
Banc of America Mortgage Securities, Inc. | |||||
| 7,999,843 | 4.802%, 9/25/2035 | 5,543,163 | |||
Countrywide Alternative Loan Trust | |||||
| 6,666,163 | 6.000%, 1/25/2037 | 4,886,351 | |||
Deutsche Alt-A Securities, Inc. | |||||
| 4,021,345 | 2.209%, 7/1/2009b | 1,469,447 | |||
HomeBanc Mortgage Trust | |||||
| 3,510,759 | 5.939%, 4/25/2037 | 2,156,982 | |||
J.P. Morgan Mortgage Trust | |||||
| 7,155,847 | 5.008%, 7/25/2035 | 5,535,556 | |||
Merrill Lynch Mortgage Investors, Inc. | |||||
| 5,862,153 | 4.866%, 6/25/2035 | 4,417,906 | |||
Wachovia Mortgage Loan Trust, LLC | |||||
| 4,719,355 | 5.557%, 5/20/2036 | 3,234,118 | |||
The accompanying Notes to Financial Statements are an integral part of this schedule.
248
Table of Contents
Income Portfolio
Schedule of Investments as of June 30, 2009
(unaudited)
| Principal Amount | Long-Term Fixed Income (95.6%) | Value | |||
| Collateralized Mortgage Obligations (2.8%) - continued | |||||
Washington Mutual Mortgage | |||||
Pass-Through Certificates | |||||
| $7,680,337 | 2.090%, 7/1/2009b | $ | 2,482,007 | ||
| 1,139,388 | 0.604%, 7/25/2009b | 596,083 | |||
| 2,169,754 | 4.829%, 9/25/2035 | 1,765,640 | |||
Total Collateralized Mortgage Obligations | 32,087,253 | ||||
| Commercial Mortgage-Backed Securities (7.8%) | |||||
Banc of America Large Loan Trust | |||||
| 3,593,062 | 0.429%, 7/15/2009b,e | 2,915,648 | |||
| 3,250,000 | 0.529%, 7/15/2009b,e | 2,423,093 | |||
Bear Stearns Commercial Mortgage Securities | |||||
| 3,500,000 | 5.331%, 2/11/2044 | 2,832,564 | |||
Bear Stearns Commercial Mortgage Securities, Inc. | |||||
| 3,000,000 | 0.469%, 7/15/2009b,c | 2,250,153 | |||
Citigroup Commercial Mortgage Trust | |||||
| 15,506 | 0.389%, 7/15/2009b,e | 13,106 | |||
| 12,500,000 | 0.459%, 7/15/2009b,e | 5,161,163 | |||
Commercial Mortgage Pass-Through Certificates | |||||
| 300,218 | 0.419%, 7/15/2009b,e | 291,862 | |||
| 2,000,000 | 0.449%, 7/15/2009b,c | 1,246,532 | |||
| 4,750,000 | 0.499%, 7/15/2009b,c | 2,641,675 | |||
Credit Suisse Mortgage Capital Certificates | |||||
| 7,500,000 | 0.489%, 7/15/2009b,e | 3,691,103 | |||
Crown Castle International Corporation | |||||
| 10,000,000 | 5.245%, 11/15/2036e | 9,600,000 | |||
Greenwich Capital Commercial Funding Corporation | |||||
| 10,750,000 | 5.867%, 8/10/2017 | 5,631,667 | |||
J.P. Morgan Chase Commercial Mortgage Securities Corporation | |||||
| 5,500,000 | 4.302%, 1/15/2038 | 4,994,897 | |||
| 11,285,000 | 5.336%, 5/15/2047 | 8,651,024 | |||
| 11,500,000 | 5.819%, 6/15/2049 | 8,781,802 | |||
Merrill Lynch Mortgage Trust | |||||
| 6,000,000 | 4.747%, 5/12/2043 | 5,149,878 | |||
| 8,625,000 | 5.265%, 1/12/2044 | 5,608,682 | |||
Wachovia Bank Commercial Mortgage Trust | |||||
| 15,000,001 | 0.439%, 7/15/2009b,c | 7,499,999 | |||
| 7,700,000 | 4.390%, 2/15/2036 | 7,305,845 | |||
| 2,000,000 | 5.765%, 7/15/2045 | 1,598,792 | |||
Washington Mutual Asset Securities Corporation | |||||
| 1,048,114 | 3.830%, 1/25/2035e | 1,018,717 | |||
Total Commercial Mortgage-Backed Securities | 89,308,202 | ||||
| Communications Services (12.7%) | |||||
Alltel Corporation | |||||
| 1,250,000 | 7.000%, 3/15/2016 | 1,348,508 | |||
AT&T, Inc. | |||||
| 3,100,000 | 6.700%, 11/15/2013 | 3,404,491 | |||
| 4,275,000 | 5.500%, 2/1/2018 | 4,268,745 | |||
| 2,000,000 | 6.400%, 5/15/2038 | 1,957,824 | |||
| 3,000,000 | 6.550%, 2/15/2039 | 2,994,666 | |||
British Telecom plc | |||||
| 3,075,000 | 9.125%, 12/15/2030 | 3,409,123 | |||
CC Holdings GS V, LLC | |||||
| 1,550,000 | 7.750%, 5/1/2017e | 1,511,250 | |||
Citizens Communications Company | |||||
| 2,490,000 | 6.250%, 1/15/2013 | 2,290,800 | |||
Comcast Corporation | |||||
| 4,300,000 | 5.900%, 3/15/2016 | 4,448,022 | |||
| 1,900,000 | 6.300%, 11/15/2017 | 2,010,901 | |||
| 6,000,000 | 5.700%, 5/15/2018 | 6,032,237 | |||
| 2,700,000 | 6.400%, 5/15/2038 | 2,643,062 | |||
Cox Communications, Inc. | |||||
| 2,900,000 | 4.625%, 6/1/2013 | 2,853,226 | |||
| 1,230,000 | 5.450%, 12/15/2014 | 1,221,005 | |||
| 3,400,000 | 9.375%, 1/15/2019e | 4,094,049 | |||
| 2,500,000 | 8.375%, 3/1/2039e | 2,787,458 | |||
Cricket Communications, Inc. | |||||
| 1,240,000 | 7.750%, 5/15/2016e | 1,193,500 | |||
CSC Holdings, Inc. | |||||
| 1,860,000 | 7.625%, 7/15/2018 | 1,722,825 | |||
Deutsche Telekom International Finance BV | |||||
| 5,500,000 | 6.750%, 8/20/2018 | 5,837,226 | |||
DIRECTV Holdings, LLC | |||||
| 1,290,000 | 7.625%, 5/15/2016 | 1,254,525 | |||
EchoStar DBS Corporation | |||||
| 1,250,000 | 7.125%, 2/1/2016 | 1,165,625 | |||
France Telecom SA | |||||
| 3,200,000 | 5.375%, 7/8/2019g | 3,223,136 | |||
Intelsat Subsidiary Holding Company, Ltd. | |||||
| 2,800,000 | 8.875%, 1/15/2015e | 2,702,000 | |||
Level 3 Financing, Inc. | |||||
| 1,540,000 | 9.250%, 11/1/2014f | 1,262,800 | |||
New Cingular Wireless Services, Inc. | |||||
| 1,350,000 | 8.750%, 3/1/2031 | 1,645,394 | |||
News America, Inc. | |||||
| 1,900,000 | 6.900%, 3/1/2019e | 1,979,838 | |||
| 2,140,000 | 6.400%, 12/15/2035 | 1,873,003 | |||
Nextel Communications, Inc. | |||||
| 2,490,000 | 7.375%, 8/1/2015 | 1,985,775 | |||
Qtel International Finance, Ltd. | |||||
| 3,750,000 | 6.500%, 6/10/2014e | 3,811,523 | |||
Qwest Communications International, Inc. | |||||
| 2,500,000 | 7.500%, 2/15/2014 | 2,281,250 | |||
| 600,000 | 7.500%, 2/15/2014 | 547,500 | |||
Qwest Corporation | |||||
| 600,000 | 8.375%, 5/1/2016e | 579,000 | |||
Rogers Cable, Inc. | |||||
| 2,410,000 | 8.750%, 5/1/2032 | 2,911,015 | |||
Rogers Communications, Inc. | |||||
| 3,750,000 | 6.800%, 8/15/2018 | 4,020,098 | |||
The accompanying Notes to Financial Statements are an integral part of this schedule.
249
Table of Contents
Income Portfolio
Schedule of Investments as of June 30, 2009
(unaudited)
| Principal Amount | Long-Term Fixed Income (95.6%) | Value | |||
| Communications Services (12.7%) - continued | |||||
Rogers Wireless Communications, Inc. | |||||
| $ 3,000,000 | 6.375%, 3/1/2014 | $ | 3,215,613 | ||
| 3,200,000 | 7.500%, 3/15/2015 | 3,480,944 | |||
Sprint Capital Corporation | |||||
| 620,000 | 8.375%, 3/15/2012 | 610,700 | |||
Telecom Italia Capital SA | |||||
| 2,950,000 | 5.250%, 11/15/2013 | 2,892,735 | |||
| 2,750,000 | 5.250%, 10/1/2015 | 2,654,677 | |||
| 2,500,000 | 7.175%, 6/18/2019 | 2,534,238 | |||
Telefonica SA | |||||
| 2,500,000 | 4.949%, 1/15/2015g | 2,541,135 | |||
| 2,500,000 | 5.877%, 7/15/2019g | 2,577,483 | |||
Thomson Reuters Corporation | |||||
| 4,500,000 | 6.500%, 7/15/2018 | 4,683,239 | |||
Time Warner Cable, Inc. | |||||
| 3,500,000 | 5.850%, 5/1/2017 | 3,495,104 | |||
| 2,800,000 | 8.750%, 2/14/2019 | 3,261,838 | |||
| 2,500,000 | 8.250%, 4/1/2019 | 2,836,543 | |||
| 2,600,000 | 6.750%, 6/15/2039 | 2,530,557 | |||
Time Warner Entertainment Company, LP | |||||
| 1,850,000 | 8.375%, 3/15/2023 | 2,039,860 | |||
UPC Holding BV | |||||
| 1,070,000 | 9.875%, 4/15/2018e | 1,017,838 | |||
Verizon Communications, Inc. | |||||
| 2,750,000 | 5.500%, 2/15/2018 | 2,731,055 | |||
| 2,000,000 | 8.750%, 11/1/2018 | 2,368,958 | |||
| 5,150,000 | 8.950%, 3/1/2039 | 6,503,512 | |||
Verizon Wireless Capital, LLC | |||||
| 3,100,000 | 5.550%, 2/1/2014e | 3,291,047 | |||
Vodafone Group plc | |||||
| 3,100,000 | 5.450%, 6/10/2019 | 3,048,388 | |||
Total Communications Services | 145,586,864 | ||||
| Consumer Cyclical (3.3%) | |||||
AOL Time Warner, Inc. | |||||
| 3,100,000 | 7.700%, 5/1/2032 | 3,046,265 | |||
Corrections Corporation of America | |||||
| 1,870,000 | 6.250%, 3/15/2013 | 1,771,825 | |||
D.R. Horton, Inc. | |||||
| 2,900,000 | 5.375%, 6/15/2012 | 2,697,000 | |||
Firekeepers Development Authority | |||||
| 1,240,000 | 13.875%, 5/1/2015e | 1,143,900 | |||
Ford Motor Credit Company, LLC | |||||
| 2,490,000 | 7.375%, 10/28/2009 | 2,468,656 | |||
| 1,480,000 | 8.000%, 6/1/2014 | 1,197,495 | |||
Harrah’s Operating Company, Inc. | |||||
| 1,240,000 | 11.250%, 6/1/2017e | 1,171,800 | |||
Home Depot, Inc. | |||||
| 3,100,000 | 5.400%, 3/1/2016 | 3,094,485 | |||
JC Penney & Company, Inc. | |||||
| 1,200,000 | 7.950%, 4/1/2017 | 1,176,227 | |||
Macy’s Retail Holdings, Inc. | |||||
| 1,250,000 | 8.875%, 7/15/2015 | 1,209,639 | |||
MGM MIRAGE | |||||
| 1,550,000 | 10.375%, 5/15/2014e | 1,608,125 | |||
Nissan Motor Acceptance Corporation | |||||
| 4,100,000 | 5.625%, 3/14/2011e | 3,990,677 | |||
Rite Aid Corporation | |||||
| 1,250,000 | 9.750%, 6/12/2016e | 1,250,000 | |||
Starwood Hotels & Resorts Worldwide, Inc. | |||||
| 1,240,000 | 7.875%, 10/15/2014 | 1,165,600 | |||
Time Warner, Inc. | |||||
| 3,100,000 | 5.875%, 11/15/2016 | 3,055,081 | |||
Viacom, Inc. | |||||
| 4,300,000 | 6.250%, 4/30/2016 | 4,236,187 | |||
Wal-Mart Stores, Inc. | |||||
| 3,025,000 | 5.875%, 4/5/2027 | 3,131,320 | |||
Total Consumer Cyclical | 37,414,282 | ||||
| Consumer Non-Cyclical (6.8%) | |||||
Abbott Laboratories | |||||
| 3,200,000 | 5.125%, 4/1/2019 | 3,294,816 | |||
Altria Group, Inc. | |||||
| 3,000,000 | 9.700%, 11/10/2018 | 3,439,338 | |||
| 2,500,000 | 9.950%, 11/10/2038 | 2,885,810 | |||
AmerisourceBergen Corporation | |||||
| 3,000,000 | 5.875%, 9/15/2015 | 2,859,435 | |||
Anheuser-Busch InBev Worldwide, Inc. | |||||
| 3,125,000 | 5.375%, 11/15/2014e | 3,152,872 | |||
| 1,900,000 | 6.875%, 11/15/2019e | 1,970,283 | |||
Bottling Group, LLC | |||||
| 3,750,000 | 6.950%, 3/15/2014 | 4,277,175 | |||
Bunge Limited Finance Corporation | |||||
| 2,530,000 | 5.350%, 4/15/2014 | 2,461,670 | |||
Cargill, Inc. | |||||
| 4,600,000 | 5.600%, 9/15/2012e | 4,786,751 | |||
Constellation Brands, Inc. | |||||
| 2,500,000 | 7.250%, 5/15/2017 | 2,312,500 | |||
General Mills, Inc. | |||||
| 3,500,000 | 5.650%, 9/10/2012 | 3,735,221 | |||
| 4,600,000 | 5.200%, 3/17/2015 | 4,850,286 | |||
HCA, Inc. | |||||
| 1,240,000 | 6.750%, 7/15/2013 | 1,091,200 | |||
| 1,250,000 | 9.625%, 11/15/2016 | 1,237,500 | |||
| 2,490,000 | 8.500%, 4/15/2019e | 2,440,200 | |||
Kellogg Company | |||||
| 5,600,000 | 4.250%, 3/6/2013 | 5,764,869 | |||
Kroger Company | |||||
| 2,500,000 | 6.400%, 8/15/2017 | 2,650,450 | |||
| 1,625,000 | 6.150%, 1/15/2020 | 1,660,316 | |||
McKesson Corporation | |||||
| 1,600,000 | 7.500%, 2/15/2019 | 1,801,840 | |||
Merck & Company, Inc. | |||||
| 3,100,000 | 5.000%, 6/30/2019 | 3,138,843 | |||
Novartis Securities Investment, Ltd. | |||||
| 2,850,000 | 5.125%, 2/10/2019 | 2,915,795 | |||
Pfizer, Inc | |||||
| 1,500,000 | 5.350%, 3/15/2015 | 1,611,900 | |||
The accompanying Notes to Financial Statements are an integral part of this schedule.
250
Table of Contents
Income Portfolio
Schedule of Investments as of June 30, 2009
(unaudited)
| Principal Amount | Long-Term Fixed Income (95.6%) | Value | |||
| Consumer Non-Cyclical (6.8%) - continued | |||||
Roche Holdings, Inc. | |||||
| $1,900,000 | 5.000%, 3/1/2014e | $ | 1,987,220 | ||
| 3,100,000 | 6.000%, 3/1/2019e | 3,305,471 | |||
Safeway, Inc. | |||||
| 1,600,000 | 6.350%, 8/15/2017 | 1,690,837 | |||
Smithfield Foods, Inc. | |||||
| 1,250,000 | 10.000%, 7/15/2014e,g | 1,234,375 | |||
SUPERVALU, Inc. | |||||
| 1,870,000 | 7.500%, 11/15/2014 | 1,795,200 | |||
Tenet Healthcare Corporation | |||||
| 1,870,000 | 10.000%, 5/1/2018e,f | 1,963,500 | |||
US Oncology, Inc. | |||||
| 1,230,000 | 9.125%, 8/15/2017e | 1,220,775 | |||
Total Consumer Non-Cyclical | 77,536,448 | ||||
| Energy (8.5%) | |||||
Anadarko Petroleum Corporation | |||||
| 1,100,000 | 5.750%, 6/15/2014 | 1,118,355 | |||
| 1,900,000 | 5.950%, 9/15/2016 | 1,874,586 | |||
Apache Corporation | |||||
| 4,145,000 | 5.250%, 4/15/2013 | 4,354,081 | |||
CenterPoint Energy Resources Corporation | |||||
| 6,850,000 | 6.125%, 11/1/2017 | 6,345,346 | |||
Chesapeake Energy Corporation | |||||
| 4,370,000 | 6.500%, 8/15/2017 | 3,670,800 | |||
ConocoPhillips | |||||
| 3,100,000 | 4.600%, 1/15/2015 | 3,185,700 | |||
Energy Transfer Partners, LP | |||||
| 5,900,000 | 6.700%, 7/1/2018 | 6,031,587 | |||
Enterprise Products Operating, LP | |||||
| 3,725,000 | 5.600%, 10/15/2014 | 3,828,320 | |||
| 4,000,000 | 6.300%, 9/15/2017 | 4,019,840 | |||
EOG Resources, Inc. | |||||
| 3,500,000 | 5.875%, 9/15/2017 | 3,722,593 | |||
EQT Corporation | |||||
| 1,300,000 | 8.125%, 6/1/2019 | 1,391,478 | |||
Halliburton Company | |||||
| 2,500,000 | 7.450%, 9/15/2039 | 2,916,235 | |||
Magellan Midstream Partners, LP | |||||
| 2,700,000 | 6.450%, 6/1/2014 | 2,726,825 | |||
Nexen, Inc. | |||||
| 3,075,000 | 6.400%, 5/15/2037 | 2,824,265 | |||
Noble Energy, Inc. | |||||
| 3,100,000 | 8.250%, 3/1/2019 | 3,527,000 | |||
Oneok Partners, LP | |||||
| 3,250,000 | 6.850%, 10/15/2037 | 3,089,288 | |||
ONEOK Partners, LP | |||||
| 1,500,000 | 8.625%, 3/1/2019 | 1,677,581 | |||
PetroHawk Energy Corporation | |||||
| 2,200,000 | 10.500%, 8/1/2014e | 2,249,500 | |||
Pioneer Natural Resources Company | |||||
| 2,500,000 | 6.875%, 5/1/2018 | 2,177,960 | |||
Plains All American Pipeline, LP | |||||
| 3,150,000 | 6.500%, 5/1/2018 | 3,187,523 | |||
Premcor Refining Group, Inc. | |||||
| 2,500,000 | 6.125%, 5/1/2011 | 2,564,403 | |||
| 2,800,000 | 6.750%, 5/1/2014 | 2,772,689 | |||
Ras Laffan Liquefied Natural Gas Company, Ltd. II | |||||
| 1,750,000 | 5.298%, 9/30/2020e | 1,600,393 | |||
Ras Laffan Liquefied Natural Gas Company, Ltd. III | |||||
| 1,600,000 | 5.832%, 9/30/2016e | 1,568,944 | |||
Tesoro Corporation | |||||
| 1,250,000 | 9.750%, 6/1/2019 | 1,234,375 | |||
Transcontinental Gas Pipe Corporation | |||||
| 3,000,000 | 8.875%, 7/15/2012 | 3,298,536 | |||
| 900,000 | 6.400%, 4/15/2016 | 923,671 | |||
Transocean, Inc. | |||||
| 4,200,000 | 6.000%, 3/15/2018 | 4,366,386 | |||
Weatherford International, Ltd. | |||||
| 3,100,000 | 6.000%, 3/15/2018 | 3,044,225 | |||
Western Oil Sands, Inc. | |||||
| 3,100,000 | 8.375%, 5/1/2012 | 3,414,185 | |||
Williams Companies, Inc. | |||||
| 3,100,000 | 8.750%, 1/15/2020e | 3,231,750 | |||
XTO Energy, Inc. | |||||
| 3,100,000 | 5.300%, 6/30/2015 | 3,186,316 | |||
| 2,500,000 | 6.750%, 8/1/2037 | 2,609,883 | |||
Total Energy | 97,734,619 | ||||
| Financials (20.7%) | |||||
Ace INA Holdings, Inc. | |||||
| 1,425,000 | 5.800%, 3/15/2018 | 1,419,830 | |||
| 1,250,000 | 5.900%, 6/15/2019f | 1,252,941 | |||
Allstate Corporation | |||||
| 3,100,000 | 7.450%, 5/16/2019 | 3,353,766 | |||
American Express Centurion Bank | |||||
| 2,800,000 | 5.550%, 10/17/2012 | 2,797,435 | |||
American Express Credit Corporation | |||||
| 1,650,000 | 7.300%, 8/20/2013 | 1,715,520 | |||
American International Group, Inc. | |||||
| 4,050,000 | 8.250%, 8/15/2018e | 2,383,453 | |||
Associates Corporation of North America | |||||
| 3,800,000 | 6.950%, 11/1/2018 | 3,399,818 | |||
Australia & New Zealand Banking Group, Ltd. | |||||
| 2,600,000 | 6.200%, 7/19/2013e | 2,678,447 | |||
AXA SA | |||||
| 3,900,000 | 6.463%, 12/14/2018e | 2,457,000 | |||
Bank of America Corporation | |||||
| 3,000,000 | 6.000%, 9/1/2017 | 2,727,612 | |||
| 3,100,000 | 5.650%, 5/1/2018 | 2,739,256 | |||
Barclays Bank plc | |||||
| 3,100,000 | 6.750%, 5/22/2019 | 3,074,493 | |||
Bear Stearns Companies, Inc. | |||||
| 3,800,000 | 6.400%, 10/2/2017 | 3,806,745 | |||
BNP Paribas SA | |||||
| 3,350,000 | 5.186%, 6/29/2015e | 2,180,659 | |||
Capital One Bank USA NA | |||||
| 1,900,000 | 8.800%, 7/15/2019 | 1,941,086 | |||
The accompanying Notes to Financial Statements are an integral part of this schedule.
251
Table of Contents
Income Portfolio
Schedule of Investments as of June 30, 2009
(unaudited)
| Principal Amount | Long-Term Fixed Income (95.6%) | Value | |||
| Financials (20.7%) - continued | |||||
Capital One Financial Corporation | |||||
| $1,250,000 | 7.375%, 5/23/2014 | $ | 1,288,975 | ||
| 1,500,000 | 6.150%, 9/1/2016 | 1,327,545 | |||
| 1,200,000 | 6.750%, 9/15/2017 | 1,148,143 | |||
Capmark Financial Group, Inc. | |||||
| 3,200,000 | 8.300%, 5/10/2017 | 754,608 | |||
Charles Schwab Corporation | |||||
| 1,250,000 | 4.950%, 6/1/2014f | 1,271,469 | |||
Chubb Corporation | |||||
| 3,250,000 | 5.750%, 5/15/2018 | 3,371,014 | |||
CIGNA Corporation | |||||
| 4,000,000 | 6.350%, 3/15/2018 | 3,540,684 | |||
CIT Group, Inc. | |||||
| 900,000 | 5.400%, 2/13/2012 | 612,094 | |||
| 3,805,000 | 7.625%, 11/30/2012 | 2,605,459 | |||
Citigroup, Inc. | |||||
| 2,500,000 | 6.500%, 8/19/2013 | 2,428,445 | |||
| 2,700,000 | 8.500%, 5/22/2019 | 2,746,545 | |||
CME Group, Inc. | |||||
| 6,299,999 | 5.400%, 8/1/2013 | 6,619,081 | |||
Corestates Capital Trust I | |||||
| 3,000,000 | 8.000%, 12/15/2026e | 1,964,790 | |||
Coventry Health Care, Inc. | |||||
| 1,800,000 | 5.875%, 1/15/2012 | 1,721,889 | |||
Credit Agricole SA | |||||
| 3,600,000 | 6.637%, 5/31/2017e | 2,115,000 | |||
Credit Suisse/New York, NY | |||||
| 4,500,000 | 6.000%, 2/15/2018 | 4,492,463 | |||
Endurance Specialty Holdings, Ltd. | |||||
| 4,200,000 | 6.150%, 10/15/2015 | 3,502,666 | |||
ERP Operating, LP | |||||
| 2,500,000 | 5.125%, 3/15/2016 | 2,292,743 | |||
| 1,900,000 | 5.750%, 6/15/2017 | 1,772,472 | |||
Fifth Third Bancorp | |||||
| 2,800,000 | 5.450%, 1/15/2017 | 2,196,457 | |||
General Electric Capital Corporation | |||||
| 1,300,000 | 5.900%, 5/13/2014 | 1,326,859 | |||
| 2,800,000 | 5.625%, 9/15/2017f | 2,679,734 | |||
| 1,550,000 | 6.875%, 1/10/2039 | 1,395,175 | |||
| 4,500,000 | 6.375%, 11/15/2067 | 3,002,495 | |||
General Motors Acceptance Corporation, LLC | |||||
| 2,500,000 | 6.875%, 9/15/2011e | 2,187,500 | |||
Goldman Sachs Group, Inc. | |||||
| 1,550,000 | 6.000%, 5/1/2014 | 1,617,673 | |||
| 5,500,000 | 5.125%, 1/15/2015 | 5,409,942 | |||
| 1,600,000 | 5.950%, 1/18/2018 | 1,551,934 | |||
| 1,300,000 | 6.750%, 10/1/2037 | 1,155,692 | |||
HSBC Capital Funding, LP/Jersey Channel Islands | |||||
| 4,000,000 | 9.547%, 6/30/2010e | 3,730,184 | |||
HSBC Holdings plc | |||||
| 2,200,000 | 6.800%, 6/1/2038 | 2,210,919 | |||
International Lease Finance Corporation | |||||
| 3,250,000 | 5.750%, 6/15/2011 | 2,695,102 | |||
| 3,100,000 | 5.300%, 5/1/2012 | 2,403,018 | |||
J.P. Morgan Chase & Company | |||||
| 2,800,000 | 5.750%, 1/2/2013 | 2,887,576 | |||
| 6,100,000 | 7.900%, 4/30/2018 | 5,338,109 | |||
| 3,100,000 | 6.300%, 4/23/2019 | 3,118,054 | |||
Keybank National Association | |||||
| 3,250,000 | 5.500%, 9/17/2012 | 3,214,816 | |||
Lehman Brothers Holdings, Inc. | |||||
| 5,500,000 | 5.625%, 1/24/2013h | 831,875 | |||
Liberty Property, LP | |||||
| 2,840,000 | 5.500%, 12/15/2016 | 2,308,349 | |||
Lincoln National Corporation | |||||
| 1,250,000 | 8.750%, 7/1/2019 | 1,260,591 | |||
Merrill Lynch & Company, Inc. | |||||
| 5,000,000 | 5.450%, 2/5/2013 | 4,866,485 | |||
| 3,000,000 | 7.750%, 5/14/2038 | 2,786,715 | |||
MetLife Capital Trust X | |||||
| 3,800,000 | 9.250%, 4/8/2038e | 3,382,000 | |||
MetLife, Inc. | |||||
| 3,200,000 | 6.817%, 8/15/2018 | 3,222,749 | |||
Mitsubishi UFG Capital Finance, Ltd. | |||||
| 5,130,000 | 6.346%, 7/25/2016 | 4,490,853 | |||
Morgan Stanley | |||||
| 4,325,000 | 6.000%, 5/13/2014 | 4,378,924 | |||
| 4,950,000 | 6.625%, 4/1/2018 | 4,934,684 | |||
| 1,850,000 | 7.300%, 5/13/2019 | 1,918,358 | |||
National City Bank | |||||
| 3,100,000 | 5.800%, 6/7/2017 | 2,951,169 | |||
Nationwide Health Properties, Inc. | |||||
| 5,150,000 | 6.250%, 2/1/2013 | 4,878,919 | |||
Preferred Term Securities XXIII, Ltd. | |||||
| 5,636,205 | 0.829%, 9/22/2009b,c | 1,972,672 | |||
ProLogis | |||||
| 2,670,000 | 5.500%, 4/1/2012 | 2,457,997 | |||
| 2,600,000 | 5.625%, 11/15/2015 | 2,061,556 | |||
Prudential Financial, Inc. | |||||
| 1,250,000 | 6.200%, 1/15/2015 | 1,221,988 | |||
| 2,900,000 | 6.000%, 12/1/2017 | 2,728,195 | |||
| 1,095,000 | 5.900%, 3/17/2036 | 875,006 | |||
| 1,120,000 | 5.700%, 12/14/2036 | 840,279 | |||
QBE Insurance Group, Ltd. | |||||
| 1,680,000 | 9.750%, 3/14/2014e | 1,822,793 | |||
Rabobank Nederland | |||||
| 1,250,000 | 11.000%, 6/30/2019e | 1,390,625 | |||
Regency Centers, LP | |||||
| 2,500,000 | 5.875%, 6/15/2017 | 2,025,325 | |||
Reinsurance Group of America, Inc. | |||||
| 4,785,000 | 5.625%, 3/15/2017 | 3,607,062 | |||
Resona Bank, Ltd. | |||||
| 6,000,000 | 5.850%, 4/15/2016e | 4,530,000 | |||
Simon Property Group, LP | |||||
| 2,280,000 | 5.750%, 12/1/2015 | 2,099,841 | |||
| 1,250,000 | 10.350%, 4/1/2019 | 1,420,293 | |||
SLM Corporation | |||||
| 3,500,000 | 5.400%, 10/25/2011f | 3,147,865 | |||
Student Loan Marketing Corporation | |||||
| 1,800,000 | 4.500%, 7/26/2010f | 1,701,000 | |||
The accompanying Notes to Financial Statements are an integral part of this schedule.
252
Table of Contents
Income Portfolio
Schedule of Investments as of June 30, 2009
(unaudited)
| Principal Amount | Long-Term Fixed Income (95.6%) | Value | |||
| Financials (20.7%) - continued | |||||
Svenska Handelsbanken AB | |||||
| $3,750,000 | 4.875%, 6/10/2014e | $ | 3,712,215 | ||
Swiss RE Capital I, LP | |||||
| 4,200,000 | 6.854%, 5/25/2016e | 2,311,680 | |||
Travelers Companies, Inc. | |||||
| 995,000 | 6.250%, 6/15/2037 | 1,030,463 | |||
Travelers Property Casualty Corporation | |||||
| 3,000,000 | 5.000%, 3/15/2013 | 3,021,615 | |||
United Health Group | |||||
| 2,500,000 | 6.500%, 6/15/2037 | 2,167,598 | |||
Wachovia Bank NA | |||||
| 3,825,000 | 4.875%, 2/1/2015 | 3,652,454 | |||
Wachovia Capital Trust III | |||||
| 3,585,000 | 5.800%, 3/15/2011 | 2,151,000 | |||
Wachovia Corporation | |||||
| 2,500,000 | 5.250%, 8/1/2014 | 2,446,430 | |||
WEA Finance, LLC | |||||
| 1,850,000 | 7.500%, 6/2/2014e | 1,834,325 | |||
| 1,500,000 | 7.125%, 4/15/2018e | 1,392,195 | |||
Wells Fargo & Company | |||||
| 1,900,000 | 7.980%, 3/15/2018 | 1,577,000 | |||
Willis North America, Inc. | |||||
| 4,600,000 | 6.200%, 3/28/2017 | 4,073,677 | |||
Total Financials | 237,110,205 | ||||
| Foreign (0.2%) | |||||
Corporacion Andina de Fomento | |||||
| 2,000,000 | 8.125%, 6/4/2019 | 2,118,956 | |||
Total Foreign | 2,118,956 | ||||
| Mortgage-Backed Securities (7.1%) | |||||
Federal National Mortgage Association Conventional 30-Yr. Pass Through | |||||
| 35,000,000 | 4.500%, 7/1/2039g | 34,923,420 | |||
| 34,750,000 | 5.500%, 7/1/2039g | 35,868,533 | |||
| 10,000,000 | 6.500%, 7/1/2039g | 10,650,000 | |||
Total Mortgage-Backed Securities | 81,441,953 | ||||
| Technology (2.0%) | |||||
Cisco Systems, Inc. | |||||
| 1,900,000 | 5.900%, 2/15/2039 | 1,871,111 | |||
Dell, Inc. | |||||
| 3,100,000 | 5.875%, 6/15/2019 | 3,164,192 | |||
Hewlett-Packard Company | |||||
| 3,900,000 | 4.500%, 3/1/2013 | 4,054,673 | |||
International Game Technology | |||||
| 2,850,000 | 7.500%, 6/15/2019f | 2,875,593 | |||
Oracle Corporation | |||||
| 2,500,000 | 3.750%, 7/8/2014g,i | 2,500,000 | |||
| 3,100,000 | 6.125%, 7/8/2039g,i | 3,079,354 | |||
Seagate Technology HDD Holdings | |||||
| 1,870,000 | 6.800%, 10/1/2016 | 1,603,525 | |||
TDIC Finance, Ltd. | |||||
| 1,900,000 | 6.500%, 7/2/2014e,g | 1,904,750 | |||
Xerox Corporation | |||||
| 1,550,000 | 8.250%, 5/15/2014 | 1,611,788 | |||
Total Technology | 22,664,986 | ||||
| Transportation (2.2%) | |||||
American Airlines, Inc. | |||||
| 1,900,000 | 10.375%, 7/2/2019g | 1,919,000 | |||
Burlington Northern Santa Fe Corporation | |||||
| 2,800,000 | 7.000%, 12/15/2025 | 2,868,723 | |||
Continental Airlines, Inc. | |||||
| 567,459 | 7.875%, 7/2/2018 | 331,964 | |||
| 2,150,000 | 5.983%, 4/19/2022 | 1,773,750 | |||
Delta Air Lines, Inc. | |||||
| 2,600,000 | 7.111%, 9/18/2011 | 2,418,000 | |||
FedEx Corporation | |||||
| 3,354,040 | 6.845%, 1/15/2019 | 3,486,456 | |||
| 3,141,341 | 6.720%, 1/15/2022 | 3,127,607 | |||
Kansas City Southern de Mexico SA de CV | |||||
| 2,180,000 | 7.375%, 6/1/2014 | 1,831,200 | |||
Union Pacific Corporation | |||||
| 4,700,001 | 5.450%, 1/31/2013f | 4,872,476 | |||
| 2,600,000 | 5.700%, 8/15/2018 | 2,605,314 | |||
Total Transportation | 25,234,490 | ||||
| U.S. Government (6.8%) | |||||
Federal Home Loan Banks | |||||
| 7,800,000 | 3.625%, 10/18/2013 | 8,064,849 | |||
Federal Home Loan Mortgage Corporation | |||||
| 7,400,000 | 4.125%, 9/27/2013 | 7,840,130 | |||
| 5,000,000 | 5.000%, 12/14/2018 | 4,747,005 | |||
Federal National Mortgage Association | |||||
| 13,000,000 | 5.250%, 8/1/2012j | 13,508,300 | |||
U.S. Treasury Bonds | |||||
| 2,000,000 | 6.250%, 8/15/2023f | 2,436,250 | |||
U.S. Treasury Notes | |||||
| 7,200,000 | 2.750%, 2/28/2013 | 7,405,315 | |||
| 3,300,000 | 3.250%, 5/31/2016 | 3,314,438 | |||
| 8,665,000 | 4.000%, 8/15/2018f | 8,987,910 | |||
| 6,200,000 | 2.750%, 2/15/2019 | 5,806,672 | |||
| 3,100,000 | 3.125%, 5/15/2019f | 2,998,289 | |||
U.S. Treasury Notes, TIPS | |||||
| 3,506,627 | 2.000%, 7/15/2014 | 3,588,815 | |||
| 5,279,050 | 2.500%, 7/15/2016f | 5,541,355 | |||
| 3,155,118 | 1.625%, 1/15/2018 | 3,124,551 | |||
Total U.S. Government | 77,363,879 | ||||
| Utilities (6.2%) | |||||
AES Corporation | |||||
| 1,850,000 | 8.000%, 6/1/2020 | 1,660,375 | |||
Cleveland Electric Illuminating Company | |||||
| 1,775,000 | 5.700%, 4/1/2017 | 1,729,303 | |||
Columbus Southern Power Company | |||||
| 2,400,000 | 6.050%, 5/1/2018 | 2,445,540 | |||
The accompanying Notes to Financial Statements are an integral part of this schedule.
253
Table of Contents
Income Portfolio
Schedule of Investments as of June 30, 2009
(unaudited)
| Principal Amount | Long-Term Fixed Income (95.6%) | Value | |||
| Utilities (6.2%) - continued | |||||
Commonwealth Edison Company | |||||
| $2,930,000 | 5.400%, 12/15/2011 | $ | 3,064,657 | ||
| 3,500,000 | 7.500%, 7/1/2013 | 3,772,349 | |||
| 1,500,000 | 6.150%, 9/15/2017 | 1,558,353 | |||
Consolidated Natural Gas Company | |||||
| 1,550,000 | 5.000%, 12/1/2014 | 1,586,141 | |||
DTE Energy Company | |||||
| 2,500,000 | 6.375%, 4/15/2033 | 1,877,230 | |||
El Paso Corporation | |||||
| 2,170,000 | 8.250%, 2/15/2016 | 2,110,325 | |||
Ferrellgas Partners, LP | |||||
| 1,870,000 | 6.750%, 5/1/2014e | 1,617,550 | |||
Florida Power Corporation | |||||
| 2,000,000 | 6.400%, 6/15/2038 | 2,223,834 | |||
Illinois Power Company | |||||
| 3,600,000 | 6.125%, 11/15/2017 | 3,497,627 | |||
ITC Holdings Corporation | |||||
| 3,000,000 | 5.875%, 9/30/2016e | 2,839,695 | |||
| 4,000,000 | 6.050%, 1/31/2018e | 3,752,860 | |||
MidAmerican Energy Holdings Company | |||||
| 2,400,000 | 6.125%, 4/1/2036 | 2,372,347 | |||
| 3,350,000 | 6.500%, 9/15/2037 | 3,476,777 | |||
Mirant Americas Generation, LLC | |||||
| 1,250,000 | 8.300%, 5/1/2011 | 1,246,875 | |||
Nevada Power Company | |||||
| 2,800,000 | 6.750%, 7/1/2037 | 2,884,899 | |||
Nisource Finance Corporation | |||||
| 2,800,000 | 6.400%, 3/15/2018 | 2,568,980 | |||
NRG Energy, Inc. | |||||
| 1,500,000 | 7.375%, 2/1/2016 | 1,419,375 | |||
Ohio Edison Company | |||||
| 1,550,000 | 6.875%, 7/15/2036 | 1,561,755 | |||
Power Contract Financing, LLC | |||||
| 693,752 | 6.256%, 2/1/2010c | 682,777 | |||
Power Receivables Finance, LLC | |||||
| 2,017,308 | 6.290%, 1/1/2012c | 1,988,702 | |||
Progress Energy, Inc. | |||||
| 1,075,000 | 7.000%, 10/30/2031 | 1,169,422 | |||
PSEG Power, LLC | |||||
| 4,800,000 | 5.000%, 4/1/2014 | 4,838,265 | |||
RRI Energy, Inc. | |||||
| 948,000 | 6.750%, 12/15/2014f | 913,635 | |||
Southern Star Central Corporation | |||||
| 3,600,000 | 6.750%, 3/1/2016f | 3,208,500 | |||
Southwestern Public Service Company | |||||
| 2,770,000 | 6.000%, 10/1/2036 | 2,589,568 | |||
Union Electric Company | |||||
| 2,900,000 | 6.400%, 6/15/2017 | 2,977,636 | |||
Virginia Electric and Power Company | |||||
| 1,300,000 | 5.950%, 9/15/2017 | 1,395,527 | |||
| 1,300,000 | 6.350%, 11/30/2037 | 1,396,407 | |||
Total Utilities | 70,427,286 | ||||
Total Long-Term Fixed Income (cost $1,178,829,132) | 1,092,756,328 | ||||
| Shares | Mutual Funds (1.3%) | ||||
| Fixed Income Mutual Funds (1.3%) | |||||
| 3,779,609 | Thrivent High Yield Fund | 15,420,806 | |||
Total Fixed Income Mutual Funds | 15,420,806 | ||||
Total Mutual Funds (cost $13,300,000) | 15,420,806 | ||||
Preferred Stock (<0.1%) | |||||
| Financials (<0.1%) | |||||
| 359,990 | Federal National Mortgage Association, 8.250% | 482,387 | |||
| 167 | Preferred Blocker, Inc., 7.000%e | 71,820 | |||
Total Financials | 554,207 | ||||
Total Preferred Stock (cost $7,020,736) | 554,207 | ||||
Collateral Held for Securities Loaned (3.2%) | |||||
| 36,248,935 | Thrivent Financial Securities Lending Trust | 36,248,935 | |||
Total Collateral Held for Securities Loaned (cost $36,248,935) | 36,248,935 | ||||
| Shares or Principal Amount | Short-Term Investments (9.9%)k | ||||
Barclays Bank plc Repurchase Agreement | |||||
| 31,390,000 | 0.080%, 7/1/2009l | 31,390,000 | |||
Federal Home Loan Bank Discount Notes | |||||
| 12,480,000 | 0.150%, 7/8/2009 | 12,479,636 | |||
| 1,980,000 | 0.120%, 7/10/2009 | 1,979,941 | |||
| 15,985,000 | 0.109%, 7/15/2009 | 15,984,321 | |||
Federal Home Loan Mortgage Corporation Discount Notes | |||||
| 8,590,000 | 0.150%, 7/13/2009 | 8,589,570 | |||
| 15,000,000 | 0.110%, 7/14/2009 | 14,999,404 | |||
| 400,000 | 0.230%, 9/21/2009m | 399,794 | |||
Federal National Mortgage Association Discount Notes | |||||
| 28,330,000 | 0.150%, 7/13/2009 | 28,328,584 | |||
The accompanying Notes to Financial Statements are an integral part of this schedule.
254
Table of Contents
Income Portfolio
Schedule of Investments as of June 30, 2009
(unaudited)
Shares or | Short-Term Investments (9.9%)k | Value | ||||
| 157,434 | Thrivent Money Market Portfolio | 157,434 | ||||
Total Short-Term Investments (at amortized cost) | 114,308,684 | |||||
Total Investments (cost $1,353,414,100) 110.3% | $ | 1,263,110,058 | ||||
Other Assets and Liabilities, Net (10.3%) | (118,342,422 | ) | ||||
Total Net Assets 100.0% | $ | 1,144,767,636 | ||||
| a | The stated interest rate represents the weighted average of all contracts within the bank loan facility as discussed in item 2(U) in the Notes to Financial Statements. |
| b | Denotes variable rate obligations for which the current yield and next scheduled reset date are shown. |
| c | Denotes restricted securities. Restricted securities are investment securities which have been deemed illiquid and cannot be offered for public sale without first being registered under the Securities Act of 1933. The following table indicates the acquisition date and cost of restricted securities Income Portfolio owned as of June 30, 2009. |
Security | Acquisition Date | Cost | |||
Bear Stearns Commercial Mortgage Securities, Inc. | 3/30/2007 | $ | 3,000,000 | ||
Capitalsource Commercial Loan Trust | 4/5/2007 | 4,018,348 | |||
Commercial Mortgage Pass-Through Certificates | 10/18/2006 | 2,000,000 | |||
Commercial Mortgage Pass-Through Certificates | 5/2/2007 | 4,750,000 | |||
Power Contract Financing, LLC | 6/11/2003 | 693,642 | |||
Power Receivables Finance, LLC | 9/30/2003 | 2,016,715 | |||
Preferred Term Securities XXIII, Ltd. | 9/14/2006 | 5,636,204 | |||
Systems 2001 Asset Trust, LLC | 6/4/2001 | 2,943,331 | |||
Wachovia Bank Commercial Mortgage Trust | 4/25/2007 | 15,000,690 | |||
| d | All or a portion of the security is insured or guaranteed. |
| e | Denotes securities sold under Rule 144A of the Securities Act of 1933, which exempts them from registration. These securities have been deemed liquid and may be resold to other dealers in the program or to other qualified institutional buyers. As of June 30, 2009, the value of these investments was $159,049,522 or 13.9% of total net assets. |
| f | All or a portion of the security is on loan as discussed in item 2(M) of the Notes to Financial Statements. |
| g | Denotes investments purchased on a when-issued or delayed delivery basis. |
| h | In bankruptcy. |
| i | Security is fair valued as discussed in item 2(A) of the Notes to Financial Statements. |
| j | At June 30, 2009, $3,636,850 of investments were held on deposit with the counterparty and pledged as the initial margin deposit for open futures contracts. |
| k | The interest rate shown reflects the yield, coupon rate or, for securities purchased at a discount, the discount rate at the date of purchase. |
| l | Repurchase agreement dated June 30, 2009, $31,390,070 maturing July 1, 2009, collateralized by Federal Home Loan Banks ($2,500,297 at Zero Coupon due 9/4/2009, $2,448,873 at 4.125% due 8/13/2010, $2,492,934 at 5.150% due 1/25/2023), Federal Home Loan Mortgage Corporation ($2,455,963 at 4.000% due 12/15/2009, $2,189,239 at Zero Coupon due 1/14/2011, $688,383 at 1.625% due 4/26/2011, $2,393,869 at 4.875% due 11/15/2013), Federal National Mortgage Association ($2,529,688 at 1.750% due 3/30/2011, $2,508,661 at 6.125% due 3/15/2012), Federal National Mortgage Association Discount Notes ($2,411,070 at Zero Coupon due 11/3/2009), Resolution Funding Corporation Interest Strip ($2,528,699 at Zero Coupon due 4/15/2018, $2,446,716 at Zero Coupon due 4/15/2019, $2,384,803 at Zero Coupon due 1/15/2028, $2,038,766 at Zero Coupon due 7/15/2029). |
| m | At June 30, 2009, $139,928 of investments were pledged as collateral with the custodian under the agreement between the counterparty, the custodian and the fund for open swap contracts. |
Definitions:
| TIPS | - | Treasury Inflation Protected Security. |
Unrealized Appreciation (Depreciation)
Gross unrealized appreciation and depreciation of investments, based on cost for federal income tax purposes, were as follows:
Gross unrealized appreciation | $ | 31,613,556 | ||
Gross unrealized depreciation | (121,917,598 | ) | ||
Net unrealized appreciation (depreciation) | $ | (90,304,042 | ) | |
Cost for federal income tax purposes | $ | 1,353,414,100 | ||
The accompanying Notes to Financial Statements are an integral part of this schedule.
255
Table of Contents
Income Portfolio
Schedule of Investments as of June 30, 2009
(unaudited)
Fair Valuation Measurements
The following table is a summary of the inputs used, as of June 30, 2009, in valuing Income Portfolio’s assets carried at fair value as discussed in the Notes to Financial Statements.
Investments in Securities | Total | Level 1 | Level 2 | Level 3 | ||||||||
Bank Loans | ||||||||||||
Utilities | 3,821,098 | — | 3,821,098 | — | ||||||||
Long-Term Fixed Income | ||||||||||||
Asset-Backed Securities | 23,399,129 | — | 23,399,129 | — | ||||||||
Basic Materials | 37,425,041 | — | 37,425,041 | — | ||||||||
Capital Goods | 35,902,735 | — | 35,902,735 | — | ||||||||
Collateralized Mortgage Obligations | 32,087,253 | — | 32,087,253 | — | ||||||||
Commercial Mortgage-Backed Securities | 89,308,202 | — | 79,708,202 | 9,600,000 | ||||||||
Communications Services | 145,586,864 | — | 145,586,864 | — | ||||||||
Consumer Cyclical | 37,414,282 | — | 37,414,282 | — | ||||||||
Consumer Non-Cyclical | 77,536,448 | — | 77,536,448 | — | ||||||||
Energy | 97,734,619 | — | 97,734,619 | — | ||||||||
Financials | 237,110,205 | — | 237,110,205 | — | ||||||||
Foreign | 2,118,956 | — | 2,118,956 | — | ||||||||
Mortgage-Backed Securities | 81,441,953 | — | 81,441,953 | — | ||||||||
Technology | 22,664,986 | — | 17,085,632 | 5,579,354 | ||||||||
Transportation | 25,234,490 | — | 20,710,776 | 4,523,714 | ||||||||
U.S. Government | 77,363,879 | — | 77,363,879 | — | ||||||||
Utilities | 70,427,286 | — | 70,427,286 | — | ||||||||
Mutual Funds | ||||||||||||
Fixed Income Mutual Funds | 15,420,806 | 15,420,806 | — | — | ||||||||
Preferred Stock | ||||||||||||
Financials | 554,207 | 482,387 | 71,820 | — | ||||||||
Collateral Held for Securities Loaned | 36,248,935 | 36,248,935 | — | — | ||||||||
Short-Term Investments | 114,308,684 | 157,434 | 114,151,250 | — | ||||||||
Total | $ | 1,263,110,058 | $ | 52,309,562 | $ | 1,191,097,428 | $ | 19,703,068 | ||||
Other Financial Instruments* | $ | 2,000,366 | $ | 1,850,484 | $ | 149,882 | $ | — | ||||
| * | Other Financial Instruments include Futures, Forwards, Written Options and Swap agreements. |
The following table is a reconciliation of assets in which significant unobservable inputs (Level 3) were used in determining fair value for the Income Portfolio as discussed in item 2(A) of the Notes to Financial Statements.
Investments in Securities | Value December 31, 2008 | Accrued Discounts and/or Premiums | Realized Gain/(Loss) | Change in Unrealized Gain/(Loss) | Net Purchases/(Sales) | Transfers in and/or (Out of) Level 3 | Value June 30, 2009 | ||||||||||||||
Preferred Stock | |||||||||||||||||||||
Financials | 52,563 | — | — | 19,257 | — | (71,820 | ) | — | |||||||||||||
Long-Term Fixed Income | |||||||||||||||||||||
Asset-Backed Securities | 11,076,438 | — | — | 349,286 | (16,074 | ) | (11,409,650 | ) | — | ||||||||||||
Commercial Mortgage-Backed Securities | 8,315,400 | — | — | 1,284,600 | — | — | 9,600,000 | ||||||||||||||
Financials | 4,464,909 | 21,712 | 12,992 | 43,755 | (747,903 | ) | (3,795,465 | ) | — | ||||||||||||
Technology | — | — | — | — | 5,579,354 | — | 5,579,354 | ||||||||||||||
Transportation | 16,416,728 | (22,764 | ) | (2,307,709 | ) | 4,485,209 | (14,047,750 | ) | — | 4,523,714 | |||||||||||
U.S. Government | 6,794,998 | — | (393,718 | ) | 363,518 | (6,764,798 | ) | — | — | ||||||||||||
Total | $ | 47,121,036 | ($1,052 | ) | ($2,688,435 | ) | $ | 6,545,625 | ($15,997,171 | ) | ($15,276,935 | ) | $ | 19,703,068 | |||||||
The accompanying Notes to Financial Statements are an integral part of this schedule.
256
Table of Contents
Income Portfolio
Schedule of Investments as of June 30, 2009
(unaudited)
Futures Contracts | Number of Contracts Long/(Short) | Expiration Date | Notional Principal Amount | Value | Unrealized Gain/(Loss) | ||||||||||||
2-Yr. U.S. Treasury Bond Futures | 315 | September 2009 | $ | 68,252,601 | $ | 68,108,909 | ($143,692 | ) | |||||||||
5-Yr. U.S. Treasury Bond Futures | (295 | ) | September 2009 | (33,838,974 | ) | (33,842,031 | ) | (3,057 | ) | ||||||||
10-Yr. U.S. Treasury Bond Futures | (975 | ) | September 2009 | (113,203,666 | ) | (113,358,989 | ) | (155,323 | ) | ||||||||
20-Yr. U.S. Treasury Bond Futures | 700 | September 2009 | 80,699,010 | 82,851,566 | 2,152,556 | ||||||||||||
Total Futures Contracts | $ | 1,850,484 | |||||||||||||||
Credit Default Swaps and Counterparty | Buy/Sell Protection1 | Termination Date | Notional Principal Amount2 | Upfront Payments Received (Made) | Value3 | Unrealized Gain/(Loss) | |||||||||||
CDX IG, Series 12, 5 Year, at 1.00%; Bank of America | Sell | 6/20/2014 | $ | 9,700,000 | $ | 289,791 | ($ | 139,909 | ) | $ | 149,882 | ||||||
Total Credit Default Swaps | ($ | 139,909 | ) | $ | 149,882 | ||||||||||||
| 1 | As the buyer of protection, Income Portfolio pays periodic fees in return for payment by the seller which is contingent upon an adverse credit event occurring in the underlying issuer or reference entity. As the seller of protection, Income Portfolio collects periodic fees from the buyer and profits if the credit of the underlying issuer or reference entity remains stable or improves while the swap is outstanding, but the seller in a credit default swap contract would be required to pay the amount of credit loss, determined as specified in the agreement, to the buyer in the event of an adverse credit event in the reference entity. |
| 2 | The maximum potential amount of future payments Income Portfolio could be required to make as the seller or receive as the buyer of protection. |
| 3 | The market value for credit indexes (CDX or LCDX) serve as an indicator of the current status of the payment/performance risk and represent the liability or profit for the credit default swap contract had the contract been closed as of the reporting date. In the case when protection has been sold, the market value of the swap will increase when the swap spread declines representing an improvement in the reference entity’s credit worthiness. The market value of the swap will decrease when the swap spread increases representing a deterioration in the reference entity’s credit worthiness. |
The following table summarizes the fair value and Statement of Assets and Liabilities location, as of June 30, 2009, for the Income Portfolio’s investments in financial derivative instruments by primary risk exposure as discussed under item (2) Significant Accounting Policies of the Notes to Financial Statements.
Derivatives by Risk Category | Statement of Assets and Liabilities Location | Fair Value | |||
Asset Derivatives | |||||
Interest Rate Contracts | |||||
Future* | Net Assets - Net unrealized appreciation/(depreciation) on Futures contracts | 2,152,556 | |||
Total Interest Rate Contracts | 2,152,556 | ||||
Credit Contracts | |||||
Credit Default Swap | Receivable/Payable - Swap agreements, at value; Net Assets - Net unrealized appreciation/(depreciation) on Swap agreements | 149,882 | |||
Total Credit Contracts | 149,882 | ||||
Total Asset Derivatives | $ | 2,302,438 | |||
Liability Derivatives | |||||
Interest Rate Contracts | |||||
Future* | Net Assets - Net unrealized appreciation/(depreciation) on Futures contracts | 302,072 | |||
Total Interest Rate Contracts | 302,072 | ||||
Total Liability Derivatives | $ | 302,072 | |||
| * | Includes cumulative appreciation/depreciation of futures contracts as reported in the Schedule of Investments. Only current day’s variation margin is reported within the Statement of Assets and Liabilities. |
The accompanying Notes to Financial Statements are an integral part of this schedule.
257
Table of Contents
Income Portfolio
Schedule of Investments as of June 30, 2009
(unaudited)
The following table summarizes the net realized gains/(losses) and Statement of Operations location, for the period ended June 30, 2009, for Income Portfolio’s investments in financial derivative instruments by primary risk exposure.
Derivatives by Risk Category | Statement of Operations Location | Realized Gains/(Losses) recognized in Income | |||
| Interest Rate Contracts | |||||
Future | Net realized gains/(losses) on Futures contracts | (7,581,844 | ) | ||
Total Interest Rate Contracts | (7,581,844 | ) | |||
| Credit Contracts | |||||
Credit Default Swap | Net realized gains/(losses) on Swap agreements | (10,320,805 | ) | ||
Total Credit Contracts | (10,320,805 | ) | |||
Total | ($17,902,649 | ) | |||
The following table summarizes the change in net unrealized appreciation/(depreciation) and Statement of Operations location, for the period ended June 30, 2009, for the Income Portfolio’s investments in financial derivative instruments by primary risk exposure.
Derivatives by Risk Category | Statement of Operations Location | Change in Unrealized Appreciation/(Depreciation) recognized in Income | |||
| Interest Rate Contracts | |||||
Future | Change in net unrealized appreciation/(depreciation) on Futures contracts | 6,999,587 | |||
Total Interest Rate Contracts | 6,999,587 | ||||
| Credit Contracts | |||||
Credit Default Swap | Change in net unrealized appreciation/(depreciation) on Swap agreements | 5,415,435 | |||
Total Credit Contracts | 5,415,435 | ||||
Total | $ | 12,415,022 | |||
Investment in Affiliates
Affiliated issuers, as defined under the Investment Company Act of 1940, include those in which the Portfolio’s holdings of an issuer represent 5% or more of the outstanding voting securities of an issuer, or any affiliated mutual fund.
A summary of transactions for the fiscal year to date, in Income Portfolio, is as follows:
Portfolio | Value December 31, 2008 | Gross Purchases | Gross Sales | Shares Held at June 30, 2009 | Value June 30, 2009 | Income Earned January 1, 2009 - June 30, 2009 | |||||||||||
High Yield Fund | $ | — | $ | 13,300,000 | $ | — | 3,779,609 | $ | 15,420,806 | $ | 394,992 | ||||||
Money Market | 15,221,153 | 20,029,886 | 35,093,605 | 157,434 | 157,434 | 39,803 | |||||||||||
Thrivent Financial | |||||||||||||||||
Securities Lending Trust | 37,623,842 | 184,074,564 | 185,449,471 | 36,248,935 | 36,248,935 | 81,808 | |||||||||||
Total Value and Income Earned | 52,844,995 | 51,827,175 | 516,603 | ||||||||||||||
The accompanying Notes to Financial Statements are an integral part of this schedule.
258
Table of Contents
Schedule of Investments as of June 30, 2009
(unaudited)
| Principal Amount | Long-Term Fixed Income (106.8%) | Value | |||
| Asset-Backed Securities (4.2%) | |||||
Americredit Automobile Receivables Trust | |||||
| $1,042,020 | 0.398%, 7/6/2009a,b | $ | 1,002,434 | ||
Bear Stearns Mortgage Funding Trust | |||||
| 529,195 | 0.454%, 7/27/2009b | 95,265 | |||
Countrywide Asset-Backed Certificates | |||||
| 1,201,917 | 5.549%, 4/25/2036a | 864,631 | |||
Countrywide Home Loans Asset-Backed Securities | |||||
| 722,820 | 6.085%, 6/25/2021a | 208,736 | |||
Credit Based Asset Servicing and Securitization, LLC | |||||
| 151,028 | 0.424%, 7/27/2009b | 149,611 | |||
| 672,616 | 5.501%, 12/25/2036 | 459,960 | |||
First Franklin Mortgage Loan Asset-Backed Certificates | |||||
| 465,519 | 0.424%, 7/27/2009b | 455,398 | |||
First Horizon ABS Trust | |||||
| 1,724,007 | 0.444%, 7/27/2009a,b | 733,234 | |||
| 1,439,233 | 0.474%, 7/27/2009a,b | 350,275 | |||
GMAC Mortgage Corporation Loan Trust | |||||
| 2,328,250 | 0.494%, 7/27/2009a,b | 699,986 | |||
| 1,926,301 | 0.494%, 7/27/2009a,b | 528,517 | |||
Green Tree Financial Corporation | |||||
| 32,824 | 6.330%, 11/1/2029 | 29,091 | |||
IndyMac Seconds Asset-Backed Trust | |||||
| 784,014 | 0.484%, 7/27/2009a,b | 210,723 | |||
SLM Student Loan Trust | |||||
| 123,998 | 1.102%, 7/27/2009b | 123,983 | |||
Wachovia Asset Securitization, Inc. | |||||
| 1,705,379 | 0.454%, 7/27/2009a,b,c | 542,464 | |||
Total Asset-Backed Securities | 6,454,308 | ||||
| Basic Materials (0.5%) | |||||
Alcan, Inc. | |||||
| 500,000 | 5.200%, 1/15/2014 | 471,870 | |||
Dow Chemical Company | |||||
| 27,000 | 7.375%, 11/1/2029 | 24,538 | |||
Potash Corporation of Saskatchewan, Inc. | |||||
| 300,000 | 7.750%, 5/31/2011 | 328,913 | |||
Total Basic Materials | 825,321 | ||||
| Capital Goods (1.2%) | |||||
General Electric Company | |||||
| 600,000 | 5.000%, 2/1/2013 | 624,310 | |||
Honeywell International, Inc. | |||||
| 500,000 | 5.300%, 3/1/2018 | 522,180 | |||
John Deere Capital Corporation | |||||
| 350,000 | 7.000%, 3/15/2012 | 384,355 | |||
Lockheed Martin Corporation | |||||
| 27,000 | 6.150%, 9/1/2036 | 28,821 | |||
United Technologies Corporation | |||||
| 275,000 | 6.050%, 6/1/2036 | 291,682 | |||
Total Capital Goods | 1,851,348 | ||||
| Collateralized Mortgage Obligations (2.4%) | |||||
J.P. Morgan Mortgage Trust | |||||
| 1,788,962 | 5.008%, 7/25/2035 | 1,383,889 | |||
Merrill Lynch Mortgage Investors, Inc. | |||||
| 1,465,538 | 4.866%, 6/25/2035 | 1,104,476 | |||
Thornburg Mortgage Securities Trust | |||||
| 1,349,169 | 0.424%, 7/27/2009b | 1,211,760 | |||
Total Collateralized Mortgage Obligations | 3,700,125 | ||||
| Commercial Mortgage-Backed Securities (8.0%) | |||||
Bear Stearns Commercial Mortgage Securities, Inc. | |||||
| 2,500,000 | 0.469%, 7/15/2009b,c | 1,875,128 | |||
| 1,000,000 | 5.835%, 9/11/2042 | 519,627 | |||
Citigroup Commercial Mortgage Trust | |||||
| 7,753 | 0.389%, 7/15/2009b,d | 6,553 | |||
Commercial Mortgage Pass-Through Certificates | |||||
| 75,055 | 0.419%, 7/15/2009b,d | 72,966 | |||
| 2,500,000 | 0.449%, 7/15/2009b,c | 1,558,165 | |||
Credit Suisse First Boston Mortgage Securities Corporation | |||||
| 75,600 | 3.861%, 3/15/2036 | 75,283 | |||
Credit Suisse Mortgage Capital Certificates | |||||
| 2,500,000 | 0.489%, 7/15/2009b,d | 1,230,368 | |||
Crown Castle International Corporation | |||||
| 1,000,000 | 5.245%, 11/15/2036d | 960,000 | |||
General Electric Commercial Mortgage Corporation | |||||
| 800,000 | 4.641%, 9/10/2013 | 752,946 | |||
GMAC Commercial Mortgage Securities, Inc. | |||||
| 500,000 | 4.547%, 12/10/2041 | 472,376 | |||
Greenwich Capital Commercial Funding Corporation | |||||
| 1,000,000 | 5.867%, 8/10/2017 | 523,876 | |||
GS Mortgage Securities Corporation II | |||||
| 2,000,000 | 0.448%, 7/6/2009b,d | 1,585,970 | |||
J.P. Morgan Chase Commercial Mortgage Securities Corporation | |||||
| 500,000 | 4.654%, 1/12/2037 | 432,251 | |||
| 1,500,000 | 5.336%, 5/15/2047 | 1,149,892 | |||
LB-UBS Commercial Mortgage Trust | |||||
| 700,000 | 4.786%, 10/15/2029 | 590,248 | |||
| 666,793 | 4.553%, 7/15/2030 | 660,617 | |||
Total Commercial Mortgage-Backed Securities | 12,466,266 | ||||
The accompanying Notes to Financial Statements are an integral part of this schedule.
259
Table of Contents
Bond Index Portfolio
Schedule of Investments as of June 30, 2009
(unaudited)
| Principal Amount | Long-Term Fixed Income (106.8%) | Value | |||
| Communications Services (2.3%) | |||||
AT&T, Inc. | |||||
| $ 300,000 | 6.400%, 5/15/2038 | $ | 293,674 | ||
BellSouth Corporation | |||||
| 27,000 | 6.875%, 10/15/2031 | 27,815 | |||
British Telecom plc | |||||
| 302,000 | 9.125%, 12/15/2030 | 334,815 | |||
Cingular Wireless, Inc. | |||||
| 400,000 | 6.500%, 12/15/2011 | 431,529 | |||
Cox Communications, Inc. | |||||
| 500,000 | 7.750%, 11/1/2010 | 520,498 | |||
| 135,000 | 6.450%, 12/1/2036d | 122,060 | |||
France Telecom SA | |||||
| 200,000 | 7.750%, 3/1/2011 | 216,306 | |||
News America, Inc. | |||||
| 275,000 | 6.400%, 12/15/2035 | 240,690 | |||
SBC Communications, Inc. | |||||
| 275,000 | 5.875%, 2/1/2012 | 293,546 | |||
Telecom Italia Capital SA | |||||
| 800,000 | 5.250%, 10/1/2015 | 772,269 | |||
Time Warner Cable, Inc. | |||||
| 300,000 | 7.300%, 7/1/2038 | 312,518 | |||
Verizon Global Funding Corporation | |||||
| 27,000 | 7.750%, 12/1/2030 | 30,153 | |||
Total Communications Services | 3,595,873 | ||||
| Consumer Cyclical (0.8%) | |||||
AOL Time Warner, Inc. | |||||
| 27,000 | 7.625%, 4/15/2031 | 26,248 | |||
DaimlerChrysler North American Holdings Corporation | |||||
| 27,000 | 8.500%, 1/18/2031 | 28,403 | |||
Target Corporation | |||||
| 27,000 | 7.000%, 7/15/2031 | 28,863 | |||
Wal-Mart Stores, Inc. | |||||
| 527,000 | 7.550%, 2/15/2030 | 669,230 | |||
Walt Disney Company | |||||
| 500,000 | 5.625%, 9/15/2016 | 537,179 | |||
Total Consumer Cyclical | 1,289,923 | ||||
| Consumer Non-Cyclical (2.3%) | |||||
Boston Scientific Corporation | |||||
| 275,000 | 7.000%, 11/15/2035 | 222,750 | |||
Bunge Limited Finance Corporation | |||||
| 500,000 | 5.350%, 4/15/2014 | 486,496 | |||
Coca-Cola HBC Finance BV | |||||
| 475,000 | 5.125%, 9/17/2013 | 481,492 | |||
Genentech, Inc. | |||||
| 400,000 | 4.400%, 7/15/2010 | 411,513 | |||
GlaxoSmithKline Capital, Inc. | |||||
| 300,000 | 6.375%, 5/15/2038 | 326,230 | |||
Kellogg Company | |||||
| 600,000 | 4.250%, 3/6/2013 | 617,665 | |||
| 27,000 | 7.450%, 4/1/2031 | 32,423 | |||
Kraft Foods, Inc. | |||||
| 27,000 | 6.500%, 11/1/2031 | 26,808 | |||
Philip Morris International, Inc. | |||||
| 300,000 | 6.375%, 5/16/2038 | 319,181 | |||
Wyeth | |||||
| 550,000 | 6.000%, 2/15/2036 | 583,371 | |||
Total Consumer Non-Cyclical | 3,507,929 | ||||
| Energy (1.7%) | |||||
Anadarko Finance Company | |||||
| 500,000 | 6.750%, 5/1/2011 | 520,400 | |||
| 27,000 | 7.500%, 5/1/2031 | 26,346 | |||
Burlington Resources, Inc. | |||||
| 500,000 | 6.500%, 12/1/2011 | 547,006 | |||
Conoco, Inc. | |||||
| 27,000 | 6.950%, 4/15/2029 | 29,093 | |||
Devon Financing Corporation, ULC | |||||
| 27,000 | 7.875%, 9/30/2031 | 31,793 | |||
Energy Transfer Partners, LP | |||||
| 450,000 | 6.700%, 7/1/2018 | 460,036 | |||
Petro-Canada | |||||
| 300,000 | 6.800%, 5/15/2038 | 295,751 | |||
Valero Energy Corporation | |||||
| 500,000 | 4.750%, 6/15/2013 | 478,495 | |||
XTO Energy, Inc. | |||||
| 275,000 | 6.375%, 6/15/2038 | 281,048 | |||
Total Energy | 2,669,968 | ||||
| Financials (6.9%) | |||||
Abbey National plc | |||||
| 27,000 | 7.950%, 10/26/2029 | 24,000 | |||
AIG SunAmerica Global Financing VI | |||||
| 500,000 | 6.300%, 5/10/2011d | 469,728 | |||
AXA SA | |||||
| 27,000 | 8.600%, 12/15/2030 | 25,295 | |||
BAC Capital Trust XI | |||||
| 275,000 | 6.625%, 5/23/2036 | 207,379 | |||
Bank One Corporation | |||||
| 900,000 | 5.900%, 11/15/2011 | 942,556 | |||
BNP Paribas SA | |||||
| 1,100,000 | 5.186%, 6/29/2015d | 716,037 | |||
Chubb Corporation | |||||
| 600,000 | 6.500%, 5/15/2038 | 650,445 | |||
CIGNA Corporation | |||||
| 450,000 | 6.350%, 3/15/2018 | 398,327 | |||
Citigroup, Inc. | |||||
| 250,000 | 4.700%, 5/29/2015 | 204,895 | |||
General Electric Capital Corporation | |||||
| 500,000 | 2.200%, 6/8/2012 | 502,561 | |||
| 475,000 | 5.875%, 1/14/2038 | 375,909 | |||
Goldman Sachs Group, Inc. | |||||
| 950,000 | 6.600%, 1/15/2012 | 1,011,489 | |||
Household Finance Corporation | |||||
| 650,000 | 6.375%, 11/27/2012 | 661,145 | |||
HSBC Finance Corporation | |||||
| 350,000 | 5.000%, 6/30/2015 | 326,128 | |||
HSBC Holdings plc | |||||
| 300,000 | 6.800%, 6/1/2038 | 301,489 | |||
International Lease Finance Corporation | |||||
| 850,000 | 5.875%, 5/1/2013 | 643,829 | |||
The accompanying Notes to Financial Statements are an integral part of this schedule.
260
Table of Contents
Bond Index Portfolio
Schedule of Investments as of June 30, 2009
(unaudited)
| Principal Amount | Long-Term Fixed Income (106.8%) | Value | |||
| Financials (6.9%) - continued | |||||
Marsh & McLennan Companies, Inc. | |||||
| $ 185,000 | 5.750%, 9/15/2015 | $ | 176,255 | ||
Merrill Lynch & Company, Inc. | |||||
| 475,000 | 5.000%, 2/3/2014 | 455,676 | |||
MetLife, Inc. | |||||
| 200,000 | 5.000%, 6/15/2015 | 190,551 | |||
Morgan Stanley Dean Witter & Company | |||||
| 850,000 | 6.750%, 4/15/2011 | 890,433 | |||
Preferred Term Securities XXIII, Ltd. | |||||
| 1,207,758 | 0.829%, 9/22/2009b,c | 422,715 | |||
ProLogis Trust | |||||
| 500,000 | 5.500%, 3/1/2013 | 438,270 | |||
Prudential Financial, Inc. | |||||
| 275,000 | 5.700%, 12/14/2036 | 206,318 | |||
Wachovia Bank NA | |||||
| 500,000 | 4.875%, 2/1/2015 | 477,445 | |||
Washington Mutual Bank FA | |||||
| 500,000 | 5.500%, 1/15/2013e | 250 | |||
Total Financials | 10,719,125 | ||||
| Foreign (2.6%) | |||||
African Development Bank | |||||
| 250,000 | 6.875%, 10/15/2015 | 280,369 | |||
Codelco, Inc. | |||||
| 300,000 | 6.375%, 11/30/2012d | 323,832 | |||
Hydro-Quebec | |||||
| 27,000 | 8.400%, 1/15/2022 | 32,995 | |||
Kreditanstalt fuer Wiederaufbau | |||||
| 600,000 | 3.750%, 6/27/2011 | 627,118 | |||
Province of Nova Scotia | |||||
| 250,000 | 7.250%, 7/27/2013 | 282,569 | |||
Province of Quebec | |||||
| 400,000 | 4.875%, 5/5/2014 | 420,271 | |||
| 400,000 | 7.500%, 7/15/2023 | 468,325 | |||
Republic of Italy | |||||
| 600,000 | 6.000%, 2/22/2011 | 644,850 | |||
| 200,000 | 4.375%, 6/15/2013 | 209,329 | |||
| 700,000 | 5.375%, 6/12/2017 | 711,446 | |||
Total Foreign | 4,001,104 | ||||
| Mortgage-Backed Securities (36.8%) | |||||
Federal Home Loan Mortgage Corporation Gold 15-Yr. Pass Through | |||||
| 803 | 7.500%, 12/1/2009 | 814 | |||
| 4,113 | 6.500%, 10/1/2012 | 4,360 | |||
| 3,443 | 6.500%, 1/1/2013 | 3,655 | |||
| 2,332 | 6.000%, 9/1/2013 | 2,473 | |||
| 7,760 | 5.500%, 3/1/2014 | 8,172 | |||
| 20,244 | 6.000%, 4/1/2014 | 21,470 | |||
| 7,919 | 7.000%, 10/1/2014 | 8,428 | |||
| 12,442 | 6.500%, 3/1/2016 | 13,192 | |||
| 22,018 | 6.000%, 6/1/2016 | 23,448 | |||
| 27,692 | 6.000%, 9/1/2016 | 29,490 | |||
| 255,706 | 7.000%, 6/1/2017 | 272,300 | |||
| 424,617 | 5.500%, 12/1/2017 | 448,607 | |||
Federal Home Loan Mortgage Corporation Gold 30-Yr. Pass Through | |||||
| 4,817 | 6.500%, 4/1/2024 | 5,176 | |||
| 6,829 | 7.000%, 5/1/2024 | 7,481 | |||
| 1,320 | 7.500%, 8/1/2025 | 1,441 | |||
| 15,419 | 8.500%, 11/1/2025 | 17,107 | |||
| 2,434 | 8.000%, 1/1/2026 | 2,696 | |||
| 3,119 | 7.000%, 4/1/2027 | 3,404 | |||
| 3,956 | 7.500%, 7/1/2027 | 4,315 | |||
| 6,813 | 7.000%, 8/1/2027 | 7,434 | |||
| 4,108 | 7.500%, 10/1/2027 | 4,483 | |||
| 4,930 | 7.000%, 5/1/2028 | 5,360 | |||
| 23,354 | 6.000%, 8/1/2028 | 24,639 | |||
| 10,088 | 6.500%, 2/1/2029 | 10,844 | |||
| 25,963 | 6.000%, 3/1/2029 | 27,359 | |||
| 10,667 | 7.000%, 7/1/2029 | 11,588 | |||
| 15,094 | 7.500%, 10/1/2029 | 16,353 | |||
| 8,412 | 7.500%, 11/1/2029 | 9,114 | |||
| 12,766 | 6.500%, 5/1/2031 | 13,700 | |||
| 54,552 | 6.000%, 6/1/2031 | 57,435 | |||
| 12,375 | 7.000%, 6/1/2031 | 13,410 | |||
| 12,361 | 7.000%, 6/1/2031 | 13,395 | |||
| 58,594 | 6.000%, 7/1/2031 | 61,689 | |||
| 13,561 | 7.000%, 9/1/2031 | 14,696 | |||
| 39,879 | 6.500%, 10/1/2031 | 42,796 | |||
| 44,860 | 6.000%, 1/1/2032 | 47,229 | |||
| 234,413 | 6.000%, 1/1/2032 | 246,798 | |||
| 21,092 | 7.000%, 5/1/2032 | 22,838 | |||
| 294,312 | 6.500%, 7/1/2032 | 315,472 | |||
| 208,490 | 6.500%, 10/1/2032 | 223,479 | |||
| 371,296 | 6.000%, 11/1/2032 | 390,680 | |||
| 7,000,000 | 5.000%, 7/1/2039f | 7,118,125 | |||
| 8,000,000 | 6.000%, 7/1/2039f | 8,347,504 | |||
Federal National Mortgage Association Conventional 15-Yr. Pass Through | |||||
| 1,282 | 6.000%, 4/1/2011 | 1,359 | |||
| 445 | 7.500%, 7/1/2011 | 468 | |||
| 2,021 | 8.000%, 7/1/2012 | 2,148 | |||
| 3,490 | 6.500%, 12/1/2012 | 3,704 | |||
| 7,381 | 6.500%, 6/1/2013 | 7,843 | |||
| 15,626 | 6.000%, 12/1/2013 | 16,621 | |||
| 6,000,000 | 5.000%, 7/1/2024f | 6,208,128 | |||
Federal National Mortgage Association Conventional 30-Yr. Pass Through | |||||
| 5,899 | 10.500%, 8/1/2020 | 6,658 | |||
| 5,244 | 8.000%, 12/1/2024 | 5,725 | |||
| 6,193 | 7.000%, 10/1/2025 | 6,815 | |||
| 25,729 | 6.500%, 11/1/2025 | 27,756 | |||
| 1,097 | 8.500%, 12/1/2025 | 1,200 | |||
| 5,963 | 7.500%, 1/1/2026 | 6,503 | |||
| 7,288 | 6.500%, 5/1/2026 | 7,862 | |||
| 4,525 | 8.000%, 9/1/2026 | 4,959 | |||
| 5,188 | 7.500%, 2/1/2027 | 5,658 | |||
| 3,727 | 7.000%, 3/1/2027 | 4,092 | |||
| 10,301 | 6.500%, 8/1/2027 | 11,112 | |||
| 1,303 | 7.500%, 11/1/2027 | 1,421 | |||
| 6,936 | 9.000%, 11/1/2027 | 7,589 | |||
The accompanying Notes to Financial Statements are an integral part of this schedule.
261
Table of Contents
Bond Index Portfolio
Schedule of Investments as of June 30, 2009
(unaudited)
| Principal Amount | Long-Term Fixed Income (106.8%) | Value | |||
| Mortgage-Backed Securities (36.8%) - continued | |||||
| $ 4,214 | 7.000%, 1/1/2028 | $ | 4,625 | ||
| 60,510 | 7.500%, 2/1/2028 | 66,009 | |||
| 9,013 | 6.000%, 5/1/2028 | 9,532 | |||
| 2,984 | 6.500%, 9/1/2028 | 3,217 | |||
| 11,692 | 7.000%, 10/1/2028 | 12,837 | |||
| 38,510 | 7.500%, 11/1/2028 | 41,999 | |||
| 68,406 | 6.000%, 12/1/2028 | 72,341 | |||
| 4,920 | 7.000%, 12/1/2028 | 5,401 | |||
| 11,223 | 6.500%, 2/1/2029 | 12,100 | |||
| 38,989 | 6.000%, 3/1/2029 | 41,232 | |||
| 20,993 | 7.000%, 3/1/2029 | 23,049 | |||
| 46,977 | 6.500%, 4/1/2029 | 50,589 | |||
| 4,260 | 6.500%, 8/1/2029 | 4,587 | |||
| 12,331 | 7.500%, 8/1/2029 | 13,433 | |||
| 15,479 | 7.000%, 10/1/2029 | 16,996 | |||
| 11,291 | 7.500%, 12/1/2029 | 12,301 | |||
| 7,274 | 8.000%, 4/1/2030 | 7,936 | |||
| 4,460 | 7.500%, 12/1/2030 | 4,869 | |||
| 71,250 | 6.000%, 5/1/2031 | 75,171 | |||
| 164,314 | 6.500%, 4/1/2032 | 176,539 | |||
| 143,721 | 6.500%, 5/1/2032 | 154,414 | |||
| 84,602 | 7.000%, 5/1/2032 | 92,605 | |||
| 546,658 | 6.500%, 7/1/2032 | 587,327 | |||
| 243,879 | 6.500%, 8/1/2032 | 262,022 | |||
| 29,600,000 | 5.500%, 7/1/2039f | 30,552,765 | |||
Government National Mortgage Association 15-Yr. Pass Through | |||||
| 15,651 | 7.000%, 9/15/2013 | 16,720 | |||
Government National Mortgage Association 30-Yr. Pass Through | |||||
| 5,502 | 7.500%, 3/15/2023 | 6,040 | |||
| 4,208 | 7.000%, 1/15/2024 | 4,576 | |||
| 2,750 | 9.000%, 9/15/2024 | 2,977 | |||
| 6,450 | 8.000%, 6/15/2025 | 7,128 | |||
| 1,938 | 8.000%, 9/15/2026 | 2,138 | |||
| 9,067 | 7.500%, 3/15/2027 | 9,943 | |||
| 8,271 | 7.500%, 10/15/2027 | 9,070 | |||
| 7,730 | 7.000%, 11/15/2027 | 8,428 | |||
| 7,396 | 7.000%, 1/15/2028 | 8,066 | |||
| 11,533 | 6.500%, 7/15/2028 | 12,456 | |||
| 10,091 | 7.000%, 8/15/2028 | 11,005 | |||
| 50,289 | 7.500%, 11/15/2028 | 55,192 | |||
| 9,635 | 6.500%, 12/15/2028 | 10,406 | |||
| 34,792 | 6.500%, 3/15/2029 | 37,555 | |||
| 8,450 | 6.500%, 4/15/2029 | 9,121 | |||
| 8,081 | 8.000%, 10/15/2030 | 9,144 | |||
| 14,077 | 7.500%, 1/15/2031 | 15,412 | |||
| 5,652 | 7.000%, 4/15/2031 | 6,177 | |||
| 25,565 | 6.500%, 6/15/2031 | 27,539 | |||
| 22,968 | 7.000%, 9/15/2031 | 25,101 | |||
| 264,342 | 6.500%, 1/15/2032 | 284,177 | |||
| 39,206 | 6.500%, 4/15/2032 | 42,148 | |||
Total Mortgage-Backed Securities | 57,186,485 | ||||
| Technology (0.3%) | |||||
International Business Machines Corporation | |||||
| 500,000 | 4.250%, 9/15/2009 | 503,530 | |||
Total Technology | 503,530 | ||||
| Transportation (0.3%) | |||||
Union Pacific Corporation | |||||
| 500,000 | 7.000%, 2/1/2016 | 515,567 | |||
Total Transportation | 515,567 | ||||
| U.S. Government (35.0%) | |||||
Federal Farm Credit Bank | |||||
| 1,000,000 | 5.375%, 7/18/2011 | 1,079,291 | |||
Federal Home Loan Banks | |||||
| 1,000,000 | 3.625%, 5/29/2013 | 1,040,128 | |||
| 850,000 | 4.500%, 9/16/2013 | 910,959 | |||
| 1,000,000 | 3.625%, 10/18/2013 | 1,033,955 | |||
| 3,000,000 | 5.000%, 11/17/2017 | 3,192,342 | |||
Federal Home Loan Mortgage Corporation | |||||
| 1,000,000 | 5.125%, 7/15/2012 | 1,095,610 | |||
| 500,000 | 3.750%, 6/28/2013 | 525,026 | |||
| 1,700,000 | 5.125%, 11/17/2017g | 1,865,798 | |||
| 1,000,000 | 5.000%, 12/14/2018 | 949,401 | |||
| 350,000 | 6.750%, 3/15/2031 | 433,899 | |||
Federal National Mortgage Association | |||||
| 2,000,000 | 6.125%, 3/15/2012 | 2,234,558 | |||
| 1,000,000 | 5.000%, 4/15/2015 | 1,094,978 | |||
| 500,000 | 5.960%, 9/11/2028 | 566,351 | |||
| 100,000 | 6.250%, 5/15/2029 | 117,403 | |||
Resolution Funding Corporation | |||||
| 200,000 | 8.125%, 10/15/2019 | 256,641 | |||
Tennessee Valley Authority | |||||
| 250,000 | 6.000%, 3/15/2013 | 279,239 | |||
U.S. Treasury Bonds | |||||
| 4,200,000 | 7.250%, 5/15/2016 | 5,264,108 | |||
| 3,500,000 | 5.250%, 11/15/2028 | 3,935,312 | |||
U.S. Treasury Notes | |||||
| 3,000,000 | 6.000%, 8/15/2009 | 3,005,887 | |||
| 3,250,000 | 4.375%, 12/15/2010 | 3,419,991 | |||
| 2,945,000 | 5.000%, 2/15/2011 | 3,140,566 | |||
| 4,500,000 | 4.500%, 11/30/2011 | 4,844,884 | |||
| 500,000 | 4.375%, 8/15/2012 | 541,094 | |||
| 1,000,000 | 2.875%, 1/31/2013 | 1,033,828 | |||
| 2,250,000 | 2.000%, 11/30/2013 | 2,216,952 | |||
| 2,500,000 | 4.250%, 8/15/2014 | 2,696,095 | |||
| 3,175,000 | 4.500%, 2/15/2016 | 3,443,138 | |||
| 400,000 | 4.625%, 2/15/2017 | 435,219 | |||
| 600,000 | 4.500%, 5/15/2017 | 647,485 | |||
| 450,000 | 3.750%, 11/15/2018 | 457,771 | |||
| 2,000,000 | 2.750%, 2/15/2019 | 1,873,120 | |||
| 500,000 | 3.500%, 2/15/2039 | 432,345 | |||
| 325,000 | 4.250%, 5/15/2039 | 321,698 | |||
Total U.S. Government | 54,385,072 | ||||
| Utilities (1.5%) | |||||
CenterPoint Energy Houston Electric, LLC | |||||
| 400,000 | 5.600%, 7/1/2023 | 356,681 | |||
The accompanying Notes to Financial Statements are an integral part of this schedule.
262
Table of Contents
Bond Index Portfolio
Schedule of Investments as of June 30, 2009
(unaudited)
| Principal Amount | Long-Term Fixed Income (106.8%) | Value | ||||
| Utilities (1.5%) - continued | ||||||
Commonwealth Edison Company | ||||||
| $ 275,000 | 5.900%, 3/15/2036 | $ | 263,823 | |||
FirstEnergy Corporation | ||||||
| 27,000 | 7.375%, 11/15/2031 | 25,484 | ||||
National Rural Utilities Cooperative Finance | ||||||
| 27,000 | 8.000%, 3/1/2032 | 30,331 | ||||
Oncor Electric Delivery Company | ||||||
| 475,000 | 6.375%, 1/15/2015 | 496,677 | ||||
Oneok Partners, LP | ||||||
| 275,000 | 6.650%, 10/1/2036 | 253,552 | ||||
Progress Energy, Inc. | ||||||
| 400,000 | 7.000%, 10/30/2031 | 435,133 | ||||
Southern California Edison Company | ||||||
| 225,000 | 5.000%, 1/15/2014 | 236,527 | ||||
Xcel Energy, Inc. | ||||||
| 275,000 | 6.500%, 7/1/2036 | 274,545 | ||||
Total Utilities | 2,372,753 | |||||
Total Long-Term Fixed Income (cost $179,380,641) | 166,044,697 | |||||
| Shares | Collateral Held for Securities Loaned (0.9%) | |||||
| 1,457,625 | Thrivent Financial Securities Lending Trust | 1,457,625 | ||||
Total Collateral Held for Securities Loaned (cost $1,457,625) | 1,457,625 | |||||
| Shares or Principal Amount | Short-Term Investments (26.1%)h | |||||
Enterprise Funding Corporation | ||||||
| 4,240,000 | 0.100%, 7/1/2009 | 4,240,000 | ||||
Federal Home Loan Bank Discount Notes | ||||||
| 10,125,000 | 0.150%, 7/8/2009 | 10,124,705 | ||||
| 5,435,000 | 0.155%, 7/10/2009 | 5,434,790 | ||||
Federal Home Loan Mortgage Corporation Discount Notes | ||||||
| 17,310,000 | 0.153%, 7/13/2009 | 17,309,117 | ||||
| 3,609,299 | Thrivent Money Market Portfolio | 3,609,299 | ||||
Total Short-Term Investments (at amortized cost) | 40,717,911 | |||||
Total Investments (cost $221,556,177) 133.8% | $ | 208,220,233 | ||||
Other Assets and Liabilities, Net (33.8%) | (52,609,230 | ) | ||||
Total Net Assets 100.0% | $ | 155,611,003 | ||||
| a | All or a portion of the security is insured or guaranteed. |
| b | Denotes variable rate obligations for which the current yield and next scheduled reset date are shown. |
| c | Denotes restricted securities. Restricted securities are investment securities which have been deemed illiquid and cannot be offered for public sale without first being registered under the Securities Act of 1933. The following table indicates the acquisition date and cost of restricted securities Bond Index Portfolio owned as of June 30, 2009. |
Security | Acquisition Date | Cost | |||
Bear Stearns Commercial Mortgage Securities, Inc. | 3/30/2007 | $ | 2,500,000 | ||
Commercial Mortgage Pass-Through Certificates | 10/18/2006 | 2,500,000 | |||
Preferred Term Securities XXIII, Ltd. | 9/14/2006 | 1,207,758 | |||
Wachovia Asset Securitization, Inc. | 3/16/2007 | 1,705,379 | |||
| d | Denotes securities sold under Rule 144A of the Securities Act of 1933, which exempts them from registration. These securities have been deemed liquid and may be resold to other dealers in the program or to other qualified institutional buyers. As of June 30, 2009, the value of these investments was $5,487,514 or 3.5% of total net assets. |
| e | Defaulted security. |
| f | Denotes investments purchased on a when-issued or delayed delivery basis. |
| g | All or a portion of the security is on loan as discussed in item 2(M) of the Notes to Financial Statements. |
| h | The interest rate shown reflects the yield, coupon rate or, for securities purchased at a discount, the discount rate at the date of purchase. |
Unrealized Appreciation (Depreciation)
Gross unrealized appreciation and depreciation of investments, based on cost for federal income tax purposes, were as follows:
Gross unrealized appreciation | $ | 4,024,750 | ||
Gross unrealized depreciation | (17,360,694 | ) | ||
Net unrealized appreciation (depreciation) | $ | (13,335,944 | ) | |
Cost for federal income tax purposes | $ | 221,556,177 | ||
The accompanying Notes to Financial Statements are an integral part of this schedule.
263
Table of Contents
Bond Index Portfolio
Schedule of Investments as of June 30, 2009
(unaudited)
Fair Valuation Measurements
The following table is a summary of the inputs used, as of June 30, 2009, in valuing Bond Index Portfolio’s assets carried at fair value as discussed in the Notes to Financial Statements.
Investments in Securities | Total | Level 1 | Level 2 | Level 3 | ||||||||
Long-Term Fixed Income | ||||||||||||
Asset-Backed Securities | 6,454,308 | — | 5,911,844 | 542,464 | ||||||||
Basic Materials | 825,321 | — | 825,321 | — | ||||||||
Capital Goods | 1,851,348 | — | 1,851,348 | — | ||||||||
Collateralized Mortgage Obligations | 3,700,125 | — | 3,700,125 | — | ||||||||
Commercial Mortgage-Backed Securities | 12,466,266 | — | 11,506,266 | 960,000 | ||||||||
Communications Services | 3,595,873 | — | 3,595,873 | — | ||||||||
Consumer Cyclical | 1,289,923 | — | 1,289,923 | — | ||||||||
Consumer Non-Cyclical | 3,507,929 | — | 3,507,929 | — | ||||||||
Energy | 2,669,968 | — | 2,669,968 | — | ||||||||
Financials | 10,719,125 | — | 10,719,125 | — | ||||||||
Foreign | 4,001,104 | — | 4,001,104 | — | ||||||||
Mortgage-Backed Securities | 57,186,485 | — | 57,186,485 | — | ||||||||
Technology | 503,530 | — | 503,530 | — | ||||||||
Transportation | 515,567 | — | 515,567 | — | ||||||||
U.S. Government | 54,385,072 | — | 54,385,072 | — | ||||||||
Utilities | 2,372,753 | — | 2,372,753 | — | ||||||||
Collateral Held for Securities Loaned | 1,457,625 | 1,457,625 | — | — | ||||||||
Short-Term Investments | 40,717,911 | 3,609,299 | 37,108,612 | — | ||||||||
Total | $ | 208,220,233 | $ | 5,066,924 | $ | 201,650,845 | $ | 1,502,464 | ||||
The following table is a reconciliation of assets in which significant unobservable inputs (Level 3) were used in determining fair value for the Bond Index Portfolio as discussed in item 2(A) of the Notes to Financial Statements.
Investments in Securities | Value December 31, 2008 | Accrued Discounts and/or Premiums | Realized Gain/(Loss) | Change in Unrealized Gain/(Loss) | Net Purchases/(Sales) | Transfers in and/or (Out of) Level 3 | Value June 30, 2009 | |||||||||||||||
Long-Term Fixed Income | ||||||||||||||||||||||
Asset-Backed Securities | — | — | — | (105,024 | ) | 2,359 | 645,129 | 542,464 | ||||||||||||||
Commercial Mortgage-Backed Securities | 831,540 | — | — | 128,460 | — | — | 960,000 | |||||||||||||||
Financials | 510,175 | — | — | (76,161 | ) | (11,299 | ) | (422,715 | ) | — | ||||||||||||
Total | $ | 1,341,715 | $ | — | $ | — | ($52,725 | ) | ($8,940 | ) | $ | 222,414 | $ | 1,502,464 | ||||||||
Investment in Affiliates
Affiliated issuers, as defined under the Investment Company Act of 1940, include those in which the Portfolio’s holdings of an issuer represent 5% or more of the outstanding voting securities of an issuer, or any affiliated mutual fund.
A summary of transactions for the fiscal year to date, in Bond Index Portfolio, is as follows:
Portfolio | Value December 31, 2008 | Gross Purchases | Gross Sales | Shares Held at June 30, 2009 | Value June 30, 2009 | Income Earned January 1, 2009 - June 30, 2009 | |||||||||||
Money Market | $ | 12,754,279 | $ | 39,455,512 | $ | 48,600,492 | 3,609,299 | $ | 3,609,299 | $ | 25,174 | ||||||
Thrivent Financial Securities Lending Trust | 17,005,159 | 47,440,054 | 62,987,588 | 1,457,625 | 1,457,625 | 21,654 | |||||||||||
Total Value and Income Earned | 29,759,438 | 5,066,924 | 46,828 | ||||||||||||||
The accompanying Notes to Financial Statements are an integral part of this schedule.
264
Table of Contents
Limited Maturity Bond Portfolio
Schedule of Investments as of June 30, 2009
(unaudited)
| Principal Amount | Bank Loans (0.3%)a | Value | |||
| Utilities (0.3%) | |||||
NRG Energy, Inc., Term Loan | |||||
| $2,156,248 | 2.016%, 2/1/2013 | $ | 2,025,708 | ||
| 1,154,373 | 2.970%, 2/1/2013 | 1,084,488 | |||
Total Utilities | 3,110,196 | ||||
Total Bank Loans (cost $3,017,066) | 3,110,196 | ||||
Long-Term Fixed Income (96.4%) | |||||
| Asset-Backed Securities (21.2%) | |||||
Americredit Automobile Receivables Trust | |||||
| 1,563,029 | 0.398%, 7/6/2009b,c | 1,503,652 | |||
| 2,246,542 | 3.430%, 7/6/2011b | 2,264,063 | |||
| 3,842,465 | 5.490%, 7/6/2012b | 3,866,838 | |||
BMW Vehicle Lease Trust | |||||
| 4,000,000 | 2.910%, 3/15/2012 | 4,022,884 | |||
Cabela’s Master Credit Card Trust | |||||
| 7,500,000 | 4.310%, 12/16/2013d | 7,592,347 | |||
Capital Auto Receivables Asset Trust | |||||
| 2,515,499 | 5.380%, 7/15/2010 | 2,491,327 | |||
| 3,920,886 | 4.980%, 5/15/2011 | 3,983,209 | |||
Carmax Auto Owner Trust | |||||
| 4,500,000 | 4.120%, 3/15/2013 | 4,630,055 | |||
Chase Funding Issuance Trust | |||||
| 7,000,000 | 2.400%, 6/17/2013 | 6,949,936 | |||
CIT Equipment | |||||
| 4,500,000 | 3.070%, 8/15/2016d | 4,492,265 | |||
CNH Equipment Trust | |||||
| 3,762,458 | 4.400%, 5/16/2011 | 3,805,549 | |||
| 3,350,000 | 7.210%, 12/16/2013 | 3,500,626 | |||
Countrywide Asset-Backed Certificates | |||||
| 2,403,833 | 5.549%, 4/25/2036b | 1,729,262 | |||
| 5,000,000 | 5.683%, 10/25/2046 | 4,175,885 | |||
Countrywide Home Loans Asset-Backed Securities | |||||
| 4,336,922 | 6.085%, 6/25/2021b | 1,252,416 | |||
CPL Transition Funding, LLC | |||||
| 1,798,019 | 5.560%, 1/15/2012 | 1,825,457 | |||
Credit Based Asset Servicing and Securitization, LLC | |||||
| 3,228,556 | 5.501%, 12/25/2036 | 2,207,806 | |||
DaimlerChrysler Auto Trust | |||||
| 294,336 | 5.330%, 8/8/2010 | 294,959 | |||
Discover Card Master Trust | |||||
| 9,500,000 | 5.100%, 10/15/2013 | 9,856,430 | |||
First Franklin Mortgage Loan Asset-Backed Certificates | |||||
| 215,069 | 5.500%, 3/25/2036e,f | 22 | |||
First Horizon ABS Trust | |||||
| 1,045,998 | 0.444%, 7/27/2009b,c | 522,232 | |||
Ford Credit Auto Owner Trust | |||||
| 6,500,000 | 3.960%, 5/15/2013 | 6,647,322 | |||
GMAC Mortgage Corporation Loan Trust | |||||
| 5,432,584 | 0.494%, 7/27/2009b,c | 1,633,301 | |||
| 2,311,561 | 0.494%, 7/27/2009b,c | 634,221 | |||
| 4,976,012 | 5.750%, 10/25/2036b | 3,083,565 | |||
Harley Davidson Motorcycle Trust | |||||
| 5,923,490 | 0.669%, 7/15/2009c | 5,903,966 | |||
| 3,500,000 | 3.190%, 11/15/2013 | 3,519,191 | |||
Honda Auto Receivables Owner Trust | |||||
| 4,000,000 | 4.470%, 1/18/2012 | 4,117,268 | |||
| 5,500,000 | 4.430%, 8/15/2012 | 5,596,822 | |||
Household Credit Card Master Note Trust | |||||
| 4,065,000 | 5.100%, 6/15/2012 | 4,073,902 | |||
Household Home Equity Loan Trust | |||||
| 6,500,000 | 5.320%, 3/20/2036 | 6,017,707 | |||
| 3,500,000 | 5.660%, 3/20/2036 | 3,260,838 | |||
Merna Re, Ltd. | |||||
| 7,500,000 | 2.348%, 9/30/2009c,d | 6,985,500 | |||
Merrill Auto Trust Securitization | |||||
| 9,000,000 | 5.500%, 3/15/2012 | 9,289,584 | |||
Mortgage Equity Conversion Asset Trust | |||||
| 6,613,524 | 1.060%, 7/25/2009c,e | 6,222,665 | |||
| 6,654,654 | 1.080%, 7/25/2009c,e | 6,262,029 | |||
Nissan Auto Receivables Owner Trust | |||||
| 6,500,000 | 4.280%, 7/15/2013 | 6,637,904 | |||
| 6,000,000 | 4.740%, 8/17/2015 | 6,162,270 | |||
Nomura Asset Acceptance Corporation | |||||
| 124,069 | 0.454%, 7/27/2009c,d | 108,837 | |||
Popular ABS Mortgage Pass-Through Trust | |||||
| 286,555 | 4.000%, 12/25/2034 | 277,734 | |||
Renaissance Home Equity Loan Trust | |||||
| 4,620,871 | 5.608%, 5/25/2036 | 3,837,777 | |||
Residential Asset Mortgage Products, Inc. | |||||
| 1,529,665 | 4.547%, 12/25/2034 | 1,172,490 | |||
Residential Asset Securities Corporation | |||||
| 1,284,780 | 3.990%, 4/25/2033 | 941,826 | |||
| 1,618,391 | 5.010%, 4/25/2033 | 910,771 | |||
| 1,704,876 | 3.870%, 5/25/2033 | 1,365,012 | |||
Residential Funding Mortgage Securities | |||||
| 800,679 | 4.470%, 7/25/2018b | 715,717 | |||
SLM Student Loan Trust | |||||
| 185,997 | 1.102%, 7/27/2009c | 185,974 | |||
USAA Auto Owner Trust | |||||
| 7,000,000 | 4.500%, 10/15/2013 | 7,255,108 | |||
| 5,500,000 | 4.770%, 9/15/2014 | 5,633,738 | |||
Volkswagen Auto Lease Trust | |||||
| 6,500,000 | 3.410%, 4/16/2012 | 6,568,868 | |||
Wachovia Asset Securitization, Inc. | |||||
| 2,131,724 | 0.454%, 7/27/2009b,c,e | 678,080 | |||
Wachovia Auto Loan Owner Trust | |||||
| 1,026,431 | 5.230%, 8/22/2011d | 1,032,810 | |||
The accompanying Notes to Financial Statements are an integral part of this schedule.
265
Table of Contents
Limited Maturity Bond Portfolio
Schedule of Investments as of June 30, 2009
(unaudited)
| Principal Amount | Long-Term Fixed Income (96.4%) | Value | |||
| Asset-Backed Securities (21.2%) - continued | |||||
Wachovia Auto Owner Trust | |||||
| $9,500,000 | 4.810%, 9/20/2012 | $ | 9,894,041 | ||
Washington Mutual Master Note Trust | |||||
| 9,000,000 | 0.349%, 7/15/2009c,d | 8,941,536 | |||
World Omni Auto Receivables Trust | |||||
| 2,000,000 | 5.120%, 5/15/2014 | 2,068,850 | |||
Total Asset-Backed Securities | 208,604,444 | ||||
| Basic Materials (1.3%) | |||||
ArcelorMittal | |||||
| 2,500,000 | 9.000%, 2/15/2015g | 2,636,033 | |||
Dow Chemical Company | |||||
| 3,200,000 | 7.600%, 5/15/2014 | 3,296,003 | |||
E.I. Du Pont de Nemours & Company | |||||
| 3,350,000 | 5.875%, 1/15/2014 | 3,627,752 | |||
Nucor Corporation | |||||
| 2,700,000 | 5.000%, 6/1/2013 | 2,817,936 | |||
Total Basic Materials | 12,377,724 | ||||
| Capital Goods (2.3%) | |||||
General Dynamics Corporation | |||||
| 2,350,000 | 5.250%, 2/1/2014 | 2,510,909 | |||
Honeywell International, Inc. | |||||
| 3,350,000 | 3.875%, 2/15/2014 | 3,423,003 | |||
John Deere Capital Corporation | |||||
| 2,500,000 | 4.400%, 7/15/2009 | 2,497,543 | |||
John Deere Owner Trust | |||||
| 3,500,000 | 3.960%, 5/16/2016 | 3,456,250 | |||
Litton Industries, Inc. | |||||
| 3,350,000 | 8.000%, 10/15/2009 | 3,412,544 | |||
Lockheed Martin Corporation | |||||
| 2,750,000 | 4.121%, 3/14/2013 | 2,804,940 | |||
Textron Financial Corporation | |||||
| 2,100,000 | 5.125%, 2/3/2011 | 1,927,317 | |||
Waste Management, Inc. | |||||
| 2,350,000 | 6.375%, 3/11/2015 | 2,434,701 | |||
Total Capital Goods | 22,467,207 | ||||
| Collateralized Mortgage Obligations (5.1%) | |||||
American Home Mortgage Assets Trust | |||||
| 4,419,804 | 2.260%, 7/1/2009c | 1,477,265 | |||
Banc of America Mortgage Securities, Inc. | |||||
| 2,333,288 | 4.802%, 9/25/2035 | 1,616,756 | |||
Bear Stearns Adjustable Rate Mortgage Trust | |||||
| 2,743,703 | 4.625%, 8/25/2010c | 2,170,834 | |||
Chase Mortgage Finance Corporation | |||||
| 1,809,853 | 5.398%, 1/25/2036 | 497,134 | |||
Countrywide Alternative Loan Trust | |||||
| 3,100,436 | 5.500%, 2/25/2036 | 2,468,635 | |||
| 3,174,363 | 6.000%, 1/25/2037 | 2,326,834 | |||
Countrywide Home Loans, Inc. | |||||
| 3,387,319 | 5.315%, 3/20/2036 | 1,578,020 | |||
| 3,325,380 | 5.779%, 9/20/2036 | 1,523,114 | |||
Deutsche Alt-A Securities, Inc. | |||||
| 5,629,883 | 2.209%, 7/1/2009c | 2,057,226 | |||
HomeBanc Mortgage Trust | |||||
| 2,442,267 | 5.939%, 4/25/2037 | 1,500,509 | |||
Impac CMB Trust | |||||
| 1,449,774 | 0.574%, 7/27/2009c | 627,921 | |||
| 1,020,091 | 0.634%, 7/27/2009c | 405,170 | |||
J.P. Morgan Alternative Loan Trust | |||||
| 5,390,710 | 5.802%, 3/25/2036 | 3,044,986 | |||
J.P. Morgan Mortgage Trust | |||||
| 4,293,508 | 5.008%, 7/25/2035 | 3,321,334 | |||
| 5,719,058 | 5.780%, 6/25/2036 | 4,538,771 | |||
Merrill Lynch Mortgage Investors, Inc. | |||||
| 3,224,184 | 4.866%, 6/25/2035 | 2,429,848 | |||
Residential Accredit Loans, Inc. | |||||
| 2,305,838 | 5.590%, 9/25/2035 | 1,396,913 | |||
Thornburg Mortgage Securities Trust | |||||
| 1,888,837 | 0.424%, 7/27/2009c | 1,696,464 | |||
Wachovia Mortgage Loan Trust, LLC | |||||
| 2,860,215 | 5.557%, 5/20/2036 | 1,960,071 | |||
Washington Mutual Alternative Loan Trust | |||||
| 4,385,029 | 2.260%, 7/1/2009c | 1,575,447 | |||
Washington Mutual Mortgage Pass-Through Certificates | |||||
| 4,705,891 | 2.080%, 7/1/2009c | 1,622,525 | |||
| 6,570,955 | 2.090%, 7/1/2009c | 2,123,495 | |||
| 1,627,697 | 0.604%, 7/25/2009c | 851,548 | |||
| 2,234,846 | 4.829%, 9/25/2035 | 1,818,608 | |||
Washington Mutual, Inc. | |||||
| 4,856,296 | 2.080%, 7/1/2009c | 1,711,029 | |||
| 4,456,031 | 2.160%, 7/1/2009c | 1,506,942 | |||
Wells Fargo Mortgage Backed Securities Trust | |||||
| 832,002 | 4.950%, 3/25/2036 | 587,429 | |||
| 2,305,735 | 5.092%, 3/25/2036 | 1,564,623 | |||
Total Collateralized Mortgage Obligations | 49,999,451 | ||||
| Commercial Mortgage-Backed Securities (9.2%) | |||||
Banc of America Commercial Mortgage, Inc. | |||||
| 4,440,518 | 5.001%, 9/10/2010 | 4,416,379 | |||
| 155,711 | 4.037%, 11/10/2039 | 155,508 | |||
Banc of America Large Loan Trust | |||||
| 5,748,899 | 0.429%, 7/15/2009c,d | 4,665,036 | |||
| 4,200,000 | 0.529%, 7/15/2009c,d | 3,131,381 | |||
Bear Stearns Commercial Mortgage Securities | |||||
| 2,000,000 | 5.331%, 2/11/2044 | 1,618,608 | |||
The accompanying Notes to Financial Statements are an integral part of this schedule.
266
Table of Contents
Limited Maturity Bond Portfolio
Schedule of Investments as of June 30, 2009
(unaudited)
| Principal Amount | Long-Term Fixed Income (96.4%) | Value | |||
| Commercial Mortgage-Backed Securities (9.2%) - continued | |||||
Bear Stearns Commercial Mortgage Securities, Inc. | |||||
| $4,000,000 | 0.469%, 7/15/2009c,e | $ | 3,000,204 | ||
| 151,552 | 3.869%, 2/11/2041 | 151,344 | |||
| 7,112,809 | 5.422%, 9/11/2042 | 7,201,790 | |||
Chase Commercial Mortgage Securities Corporation | |||||
| 3,500,000 | 7.928%, 7/15/2032 | 3,475,811 | |||
Citigroup Commercial Mortgage Trust | |||||
| 6,203 | 0.389%, 7/15/2009c,d | 5,243 | |||
Commercial Mortgage Pass-Through Certificates | |||||
| 90,066 | 0.419%, 7/15/2009c,d | 87,559 | |||
| 4,000,000 | 0.499%, 7/15/2009c,e | 2,224,568 | |||
Credit Suisse First Boston Mortgage Securities Corporation | |||||
| 4,382,836 | 4.609%, 2/15/2038 | 4,356,162 | |||
| 7,256,933 | 3.382%, 5/15/2038 | 7,313,842 | |||
Crown Castle International Corporation | |||||
| 6,500,000 | 5.245%, 11/15/2036d | 6,240,000 | |||
General Electric Commercial Mortgage Corporation | |||||
| 1,762,058 | 4.591%, 7/10/2045 | 1,768,468 | |||
GS Mortgage Securities Corporation II | |||||
| 5,500,000 | 5.396%, 8/10/2038 | 4,903,410 | |||
J.P. Morgan Chase Commercial Mortgage Securities Corporation | |||||
| 251,921 | 2.790%, 1/12/2039 | 250,857 | |||
| 9,100,000 | 5.198%, 12/15/2044 | 8,807,153 | |||
LB-UBS Commercial Mortgage Trust | |||||
| 808,696 | 4.207%, 11/15/2027 | 802,935 | |||
| 3,465,271 | 4.567%, 6/15/2029 | 3,459,453 | |||
| 4,287,098 | 4.187%, 8/15/2029 | 4,281,688 | |||
| 4,084,000 | 4.568%, 1/15/2031 | 3,506,179 | |||
| 872,863 | 4.741%, 9/15/2040 | 875,753 | |||
TIAA Real Estate CDO, Ltd. | |||||
| 8,000,000 | 5.814%, 8/15/2039 | 7,281,488 | |||
Wachovia Bank Commercial Mortgage Trust | |||||
| 5,015,248 | 3.894%, 11/15/2035 | 5,004,606 | |||
Washington Mutual Asset Securities Corporation | |||||
| 2,187,938 | 3.830%, 1/25/2035d | 2,126,573 | |||
Total Commercial Mortgage-Backed Securities | 91,111,998 | ||||
| Communications Services (4.3%) | |||||
Alltel Corporation | |||||
| 2,675,000 | 7.000%, 7/1/2012 | 2,889,211 | |||
AT&T, Inc. | |||||
| 1,250,000 | 4.950%, 1/15/2013 | 1,300,008 | |||
| 2,700,000 | 6.700%, 11/15/2013g | 2,965,202 | |||
British Telecom plc | |||||
| 2,000,000 | 9.125%, 12/15/2010 | 2,124,144 | |||
Cox Communications, Inc. | |||||
| 1,760,000 | 7.875%, 8/15/2009 | 1,765,134 | |||
| 1,400,000 | 4.625%, 1/15/2010 | 1,406,636 | |||
France Telecom SA | |||||
| 4,000,000 | 4.375%, 7/8/2014h | 4,031,116 | |||
Qtel International Finance, Ltd. | |||||
| 4,000,000 | 6.500%, 6/10/2014d | 4,065,624 | |||
Rogers Cable, Inc. | |||||
| 2,620,000 | 7.875%, 5/1/2012 | 2,823,949 | |||
Telecom Italia Capital SA | |||||
| 1,400,000 | 6.200%, 7/18/2011 | 1,449,276 | |||
Telefonica SA | |||||
| 4,000,000 | 4.949%, 1/15/2015h | 4,065,816 | |||
Thomson Reuters Corporation | |||||
| 2,000,000 | 5.950%, 7/15/2013 | 2,045,952 | |||
Time Warner Cable, Inc. | |||||
| 2,400,000 | 5.400%, 7/2/2012 | 2,480,640 | |||
| 3,350,000 | 7.500%, 4/1/2014i | 3,690,347 | |||
Verizon Communications, Inc. | |||||
| 1,350,000 | 4.350%, 2/15/2013g | 1,378,975 | |||
Verizon Wireless Capital, LLC | |||||
| 2,000,000 | 5.550%, 2/1/2014d | 2,123,256 | |||
Vodafone Group plc | |||||
| 1,300,000 | 5.450%, 6/10/2019 | 1,278,356 | |||
Total Communications Services | 41,883,642 | ||||
| Consumer Cyclical (1.3%) | |||||
CVS Caremark Corporation | |||||
| 2,700,000 | 0.968%, 9/1/2009c | 2,680,854 | |||
CVS Corporation | |||||
| 2,800,000 | 4.000%, 9/15/2009 | 2,816,302 | |||
Ford Motor Credit Company, LLC | |||||
| 4,000,000 | 7.375%, 10/28/2009 | 3,965,712 | |||
Nissan Motor Acceptance Corporation | |||||
| 2,800,000 | 4.625%, 3/8/2010d | 2,759,501 | |||
SLM Private Credit Student Loan Trust | |||||
| 1,180,720 | 0.639%, 9/15/2009c | 1,152,407 | |||
Total Consumer Cyclical | 13,374,776 | ||||
| Consumer Non-Cyclical (4.3%) | |||||
Altria Group, Inc. | |||||
| 2,700,000 | 8.500%, 11/10/2013 | 3,069,160 | |||
Anheuser-Busch InBev Worldwide, Inc. | |||||
| 3,500,000 | 5.375%, 11/15/2014d | 3,531,216 | |||
Board of Trustees of Stanford University | |||||
| 2,650,000 | 3.625%, 5/1/2014 | 2,671,518 | |||
Cargill, Inc. | |||||
| 2,000,000 | 5.200%, 1/22/2013d | 2,023,650 | |||
ConAgra Foods, Inc. | |||||
| 2,000,000 | 5.875%, 4/15/2014 | 2,120,348 | |||
Diageo Capital plc | |||||
| 3,000,000 | 5.200%, 1/30/2013 | 3,120,063 | |||
Express Scripts, Inc. | |||||
| 2,000,000 | 5.250%, 6/15/2012 | 2,066,308 | |||
The accompanying Notes to Financial Statements are an integral part of this schedule.
267
Table of Contents
Limited Maturity Bond Portfolio
Schedule of Investments as of June 30, 2009
(unaudited)
| Principal Amount | Long-Term Fixed Income (96.4%) | Value | |||
| Consumer Non-Cyclical (4.3%) - continued | |||||
H. J. Heinz Company | |||||
| $ 3,300,000 | 15.590%, 12/1/2011d | $ | 4,109,688 | ||
Kellogg Company | |||||
| 2,750,000 | 5.125%, 12/3/2012 | 2,939,654 | |||
McKesson Corporation | |||||
| 2,000,000 | 6.500%, 2/15/2014 | 2,133,838 | |||
Merck & Company, Inc. | |||||
| 3,300,000 | 4.000%, 6/30/2015g | 3,358,063 | |||
Novartis Capital Corporation | |||||
| 3,350,000 | 4.125%, 2/10/2014 | 3,448,390 | |||
Philip Morris International, Inc. | |||||
| 3,700,000 | 6.875%, 3/17/2014 | 4,174,780 | |||
Roche Holdings, Inc. | |||||
| 3,500,000 | 5.000%, 3/1/2014d | 3,660,668 | |||
Total Consumer Non-Cyclical | 42,427,344 | ||||
| Energy (2.5%) | |||||
ConocoPhillips | |||||
| 4,000,000 | 4.600%, 1/15/2015 | 4,110,580 | |||
Energy Transfer Partners, LP | |||||
| 2,000,000 | 6.000%, 7/1/2013 | 2,034,624 | |||
Enterprise Products Operating, LP | |||||
| 1,000,000 | 4.625%, 10/15/2009 | 1,002,943 | |||
| 2,700,000 | 9.750%, 1/31/2014 | 3,103,674 | |||
Husky Energy, Inc. | |||||
| 2,000,000 | 5.900%, 6/15/2014 | 2,092,300 | |||
Marathon Oil Corporation | |||||
| 2,000,000 | 6.500%, 2/15/2014 | 2,138,100 | |||
ONEOK Partners, LP | |||||
| 650,000 | 8.625%, 3/1/2019 | 726,952 | |||
Premcor Refining Group, Inc. | |||||
| 2,100,000 | 6.125%, 5/1/2011 | 2,154,098 | |||
Ras Laffan Liquefied Natural Gas Company, Ltd. III | |||||
| 1,250,000 | 5.832%, 9/30/2016d | 1,225,737 | |||
Sempra Energy | |||||
| 3,400,000 | 7.950%, 3/1/2010 | 3,521,982 | |||
Transocean, Inc. | |||||
| 1,350,000 | 5.250%, 3/15/2013 | 1,399,887 | |||
Western Oil Sands, Inc. | |||||
| 1,350,000 | 8.375%, 5/1/2012 | 1,486,822 | |||
Total Energy | 24,997,699 | ||||
| Financials (23.7%) | |||||
Allstate Corporation | |||||
| 1,300,000 | 6.200%, 5/16/2014 | 1,363,530 | |||
Allstate Life Global Funding Trust | |||||
| 2,000,000 | 5.375%, 4/30/2013 | 2,067,972 | |||
American Express Centurion Bank | |||||
| 2,000,000 | 5.200%, 11/26/2010 | 2,010,010 | |||
American Express Company | |||||
| 10,000,000 | 3.150%, 12/9/2011 | 10,354,410 | |||
| 3,350,000 | 5.875%, 5/2/2013 | 3,326,446 | |||
Australia & New Zealand Banking Group, Ltd. | |||||
| 3,350,000 | 6.200%, 7/19/2013d | 3,451,076 | |||
Bank of America Corporation | |||||
| 10,000,000 | 2.100%, 4/30/2012 | 10,015,240 | |||
Bank of New York Mellon Corporation | |||||
| 3,400,000 | 4.950%, 11/1/2012 | 3,595,136 | |||
Barclays Bank plc | |||||
| 2,500,000 | 6.750%, 5/22/2019 | 2,479,430 | |||
BB&T Corporation | |||||
| 870,000 | 6.500%, 8/1/2011 | 898,894 | |||
| 3,350,000 | 5.700%, 4/30/2014 | 3,421,797 | |||
Bear Stearns Companies, Inc. | |||||
| 2,000,000 | 4.550%, 6/23/2010 | 2,041,124 | |||
Berkshire Hathaway Finance Corporation | |||||
| 4,500,000 | 4.000%, 4/15/2012d | 4,650,714 | |||
Capital One Bank USA NA | |||||
| 1,000,000 | 8.800%, 7/15/2019 | 1,021,624 | |||
CIT Group, Inc. | |||||
| 2,400,000 | 5.200%, 11/3/2010 | 1,895,890 | |||
| 1,000,000 | 7.625%, 11/30/2012 | 684,746 | |||
Citigroup, Inc. | |||||
| 10,000,000 | 2.125%, 4/30/2012 | 10,043,900 | |||
| 3,400,000 | 5.300%, 10/17/2012 | 3,279,497 | |||
| 2,000,000 | 5.500%, 4/11/2013 | 1,874,490 | |||
CME Group, Inc. | |||||
| 2,700,000 | 5.400%, 8/1/2013 | 2,836,750 | |||
Commonwealth Bank of Australia | |||||
| 6,700,000 | 2.500%, 12/10/2012d | 6,725,353 | |||
Corestates Capital Trust I | |||||
| 700,000 | 8.000%, 12/15/2026d | 458,451 | |||
Credit Suisse New York, NY | |||||
| 3,300,000 | 3.450%, 7/2/2012 | 3,301,630 | |||
| 2,000,000 | 5.000%, 5/15/2013 | 2,044,646 | |||
Danske Bank A/S | |||||
| 10,000,000 | 2.500%, 5/10/2012d | 10,025,200 | |||
Dexia Credit Local | |||||
| 6,700,000 | 2.375%, 9/23/2011d | 6,745,607 | |||
Fifth Third Bancorp | |||||
| 1,325,000 | 6.250%, 5/1/2013 | 1,302,125 | |||
General Electric Capital Corporation | |||||
| 2,000,000 | 5.875%, 2/15/2012 | 2,088,986 | |||
| 10,000,000 | 2.200%, 6/8/2012 | 10,051,230 | |||
| 5,600,000 | 5.900%, 5/13/2014 | 5,715,702 | |||
Goldman Sachs Group, Inc. | |||||
| 3,000,000 | 6.000%, 5/1/2014 | 3,130,980 | |||
Goldman Sachs Group, Inc., Convertible | |||||
| 5,000,000 | 1.000%, 1/31/2015j | 3,864,650 | |||
| 2,500,000 | 1.000%, 5/7/2015j | 1,880,875 | |||
HSBC USA, Inc. | |||||
| 10,000,000 | 3.125%, 12/16/2011 | 10,352,290 | |||
International Lease Finance Corporation | |||||
| 2,050,000 | 5.750%, 6/15/2011 | 1,699,987 | |||
| 3,350,000 | 5.000%, 9/15/2012 | 2,590,920 | |||
J.P. Morgan Chase & Company | |||||
| 10,000,000 | 3.125%, 12/1/2011 | 10,344,520 | |||
| 4,500,000 | 4.650%, 6/1/2014 | 4,488,129 | |||
Lehman Brothers Holdings E-Capital Trust I | |||||
| 3,500,000 | Zero Coupon, 8/19/2010i,k | 350 | |||
The accompanying Notes to Financial Statements are an integral part of this schedule.
268
Table of Contents
Limited Maturity Bond Portfolio
Schedule of Investments as of June 30, 2009
(unaudited)
| Principal Amount | Long-Term Fixed Income (96.4%) | Value | |||
| Financials (23.7%) - continued | |||||
Lehman Brothers Holdings, Inc. | |||||
| $ 1,700,000 | 5.250%, 2/6/2012k | $ | 250,750 | ||
Lincoln National Corporation | |||||
| 1,200,000 | 5.650%, 8/27/2012 | 1,164,762 | |||
| 650,000 | 8.750%, 7/1/2019 | 655,507 | |||
MassMutual Global Funding II | |||||
| 2,000,000 | 3.625%, 7/16/2012d,h | 2,000,440 | |||
Merrill Lynch & Company, Inc. | |||||
| 2,000,000 | 6.150%, 4/25/2013 | 2,002,826 | |||
MetLife, Inc. | |||||
| 2,000,000 | 6.750%, 6/1/2016 | 2,036,110 | |||
Metropolitan Life Global Funding | |||||
| 2,680,000 | 5.125%, 4/10/2013d | 2,725,766 | |||
Monumental Global Funding, Ltd. | |||||
| 1,330,000 | 5.500%, 4/22/2013d | 1,283,259 | |||
Morgan Stanley | |||||
| 1,350,000 | 5.050%, 1/21/2011 | 1,376,619 | |||
| 1,350,000 | 5.250%, 11/2/2012i | 1,369,726 | |||
| 4,000,000 | 6.000%, 5/13/2014 | 4,049,872 | |||
Northern Trust Company | |||||
| 2,000,000 | 5.500%, 8/15/2013 | 2,120,398 | |||
Protective Life Secured Trust | |||||
| 2,000,000 | 4.000%, 10/7/2009 | 2,008,822 | |||
Rabobank Nederland NV | |||||
| 4,600,000 | 4.200%, 5/13/2014d | 4,588,201 | |||
Royal Bank of Scotland Group plc | |||||
| 10,000,000 | 2.625%, 5/11/2012d | 10,071,850 | |||
Simon Property Group, LP | |||||
| 2,000,000 | 6.750%, 5/15/2014i | 2,009,608 | |||
State Street Capital Trust II | |||||
| 2,000,000 | 8.250%, 3/15/2011 | 1,689,480 | |||
Svenska Handelsbanken AB | |||||
| 4,000,000 | 4.875%, 6/10/2014d | 3,959,696 | |||
Swedbank AB | |||||
| 10,000,000 | 2.800%, 2/10/2012d | 10,119,560 | |||
UnitedHealth Group, Inc. | |||||
| 2,000,000 | 5.500%, 11/15/2012 | 2,069,676 | |||
Wachovia Capital Trust III | |||||
| 700,000 | 5.800%, 3/15/2011 | 420,000 | |||
Wachovia Corporation | |||||
| 2,000,000 | 5.500%, 5/1/2013 | 2,066,008 | |||
WEA Finance, LLC | |||||
| 4,000,000 | 7.500%, 6/2/2014d | 3,966,108 | |||
Wells Fargo & Company | |||||
| 10,000,000 | 2.125%, 6/15/2012i | 10,029,290 | |||
| 675,000 | 4.375%, 1/31/2013 | 680,812 | |||
Total Financials | 232,839,453 | ||||
| Foreign (2.7%) | |||||
Corporacion Andina de Fomento | |||||
| 5,000,000 | 5.750%, 1/12/2017 | 4,816,735 | |||
Kreditanstalt fuer Wiederaufbau | |||||
| 10,000,000 | 2.250%, 4/16/2012 | 10,093,590 | |||
Province of Ontario | |||||
| 5,300,000 | 4.100%, 6/16/2014 | 5,404,987 | |||
Societe Financement de l’Economie Francaise | |||||
| 6,700,000 | 3.375%, 5/5/2014d | 6,716,710 | |||
Total Foreign | 27,032,022 | ||||
| Mortgage-Backed Securities (6.0%) | |||||
Federal Home Loan Mortgage Corporation 30-Yr. | |||||
| 9,452,032 | 6.500%, 9/1/2037 | 10,055,733 | |||
Federal National Mortgage Association Conventional 15-Yr. Pass Through | |||||
| 5,500,000 | 5.000%, 7/1/2024h | 5,690,784 | |||
Federal National Mortgage Association Conventional 30-Yr. Pass Through | |||||
| 41,000,000 | 6.500%, 7/1/2039h | 43,665,000 | |||
Total Mortgage-Backed Securities | 59,411,517 | ||||
| Technology (1.0%) | |||||
Dell, Inc. | |||||
| 3,300,000 | 3.375%, 6/15/2012 | 3,359,196 | |||
Oracle Corporation | |||||
| 4,300,000 | 3.750%, 7/8/2014h,l | 4,300,000 | |||
Xerox Corporation | |||||
| 2,100,000 | 5.500%, 5/15/2012 | 2,094,252 | |||
Total Technology | 9,753,448 | ||||
| Transportation (1.0%) | |||||
American Airlines, Inc. | |||||
| 3,410,000 | 7.024%, 10/15/2009 | 3,367,375 | |||
Northwest Airlines, Inc. | |||||
| 2,400,000 | 6.841%, 4/1/2011 | 2,208,000 | |||
Union Pacific Corporation | |||||
| 1,150,000 | 6.125%, 1/15/2012 | 1,201,949 | |||
| 800,000 | 5.450%, 1/31/2013 | 829,358 | |||
| 2,000,000 | 5.125%, 2/15/2014 | 2,067,292 | |||
Total Transportation | 9,673,974 | ||||
| U.S. Government (7.8%) | |||||
Federal Farm Credit Bank | |||||
| 10,000,000 | 2.125%, 6/18/2012 | 10,032,880 | |||
Federal Home Loan Banks | |||||
| 4,000,000 | 3.625%, 10/18/2013 | 4,135,820 | |||
Federal National Mortgage Association | |||||
| 10,000,000 | 4.625%, 5/1/2013 | 10,151,900 | |||
U.S. Treasury Notes, TIPS | |||||
| 14,300,000 | 1.875%, 4/30/2014i | 13,876,577 | |||
| 15,214,237 | 2.000%, 7/15/2014 | 15,570,828 | |||
| 21,432,943 | 2.500%, 7/15/2016i | 22,497,903 | |||
Total U.S. Government | 76,265,908 | ||||
| U.S. Municipals (1.4%) | |||||
California State Revenue General Obligation Bonds (Build America Bonds) | |||||
| 3,350,000 | 5.650%, 4/1/2013c | 3,297,773 | |||
| 3,350,000 | 5.250%, 4/1/2014 | 3,291,643 | |||
Denver, Colorado City & County Airport Revenue Bonds | |||||
| 5,500,000 | 5.250%, 11/15/2032 | 5,573,425 | |||
The accompanying Notes to Financial Statements are an integral part of this schedule.
269
Table of Contents
Limited Maturity Bond Portfolio
Schedule of Investments as of June 30, 2009
(unaudited)
| Principal Amount | Long-Term Fixed Income (96.4%) | Value | ||||
| U.S. Municipals (1.4%) - continued | ||||||
Houston, Texas Utility System Revenue Bonds | ||||||
| $1,350,000 | 5.000%, 5/15/2011c | $ | 1,399,640 | |||
Total U.S. Municipals | 13,562,481 | |||||
| Utilities (1.3%) | ||||||
Cleveland Electric Illuminating Company | ||||||
| 625,000 | 7.430%, 11/1/2009 | 632,624 | ||||
Duke Energy Carolinas, LLC | ||||||
| 2,700,000 | 5.750%, 11/15/2013g | 2,902,986 | ||||
National Rural Utilities Cooperative Finance Corporation | ||||||
| 2,650,000 | 5.500%, 7/1/2013g | 2,799,306 | ||||
Oncor Electric Delivery Company | ||||||
| 2,700,000 | 5.950%, 9/1/2013 | 2,809,477 | ||||
Power Receivables Finance, LLC | ||||||
| 318,522 | 6.290%, 1/1/2012e | 314,006 | ||||
Virginia Electric & Power Company | ||||||
| 2,000,000 | 4.500%, 12/15/2010 | 2,048,510 | ||||
| 1,360,000 | 5.100%, 11/30/2012 | 1,437,093 | ||||
Total Utilities | 12,944,002 | |||||
Total Long-Term Fixed Income (cost $1,004,021,344) | 948,727,090 | |||||
| Shares | Mutual Funds (1.8%) | |||||
| Fixed Income Mutual Funds (1.8%) | ||||||
| 4,208,125 | Thrivent High Yield Fund | 17,169,151 | ||||
Total Fixed Income Mutual Funds | 17,169,151 | |||||
Total Mutual Funds (cost $15,500,000) | 17,169,151 | |||||
Preferred Stock (0.1%) | ||||||
| Financials (0.1%) | ||||||
| 94,063 | Credit Suisse XLF Equity-Linked Note, Convertible, 11.100%j,m | 1,070,437 | ||||
| 148,505 | Federal National Mortgage Association, 8.250% | 198,997 | ||||
Total Financials | 1,269,434 | |||||
Total Preferred Stock (cost $4,300,658) | 1,269,434 | |||||
| Contracts | Options Purchased (<0.1%) | |||||
Call on 10-Yr. U.S. Treasury Bond Futures | ||||||
| 110 | $119.00, expires 8/25/2009 | 30,937 | ||||
Total Options Purchased (cost $79,392) | 30,937 | |||||
| Shares | Collateral Held for Securities Loaned (4.7%) | |||||
| 46,444,495 | Thrivent Financial Securities Lending Trust | 46,444,495 | ||||
Total Collateral Held for Securities Loaned (cost $46,444,495) | 46,444,495 | |||||
| Shares or Principal Amount | Short-Term Investments (7.0%)n | |||||
Barton Capital Corporation | ||||||
| 2,014,000 | 0.200%, 7/1/2009 | 2,014,000 | ||||
Federal Home Loan Bank Discount Notes | ||||||
| 2,000,000 | 0.010%, 7/2/2009 | 1,999,999 | ||||
| 4,520,000 | 0.150%, 7/8/2009 | 4,519,868 | ||||
| 23,680,000 | 0.155%, 7/10/2009 | 23,679,082 | ||||
Federal Home Loan Mortgage Corporation Discount Notes | ||||||
| 10,640,000 | 0.150%, 7/13/2009 | 10,639,468 | ||||
| 2,600,000 | 0.200%, 9/21/2009o,p | 2,598,834 | ||||
Federal National Mortgage Association Discount Notes | ||||||
| 15,270,000 | 0.150%, 7/13/2009 | 15,269,237 | ||||
| 5,000,000 | 0.160%, 7/14/2009 | 4,999,711 | ||||
Societe Generale North American | ||||||
| 2,485,000 | 0.130%, 7/1/2009 | 2,485,000 | ||||
| 228,347 | Thrivent Money Market Portfolio | 228,347 | ||||
Total Short-Term Investments (at amortized cost) | 68,433,546 | |||||
Total Investments (cost $1,141,796,501) 110.3% | $ | 1,085,184,849 | ||||
Other Assets and Liabilities, Net (10.3%) | (101,238,585 | ) | ||||
Total Net Assets 100.0% | $ | 983,946,264 | ||||
| a | The stated interest rate represents the weighted average of all contracts within the bank loan facility as discussed in item 2(U) in the Notes to Financial Statements. |
| b | All or a portion of the security is insured or guaranteed. |
| c | Denotes variable rate obligations for which the current yield and next scheduled reset date are shown. |
| d | Denotes securities sold under Rule 144A of the Securities Act of 1933, which exempts them from registration. These securities have been deemed liquid and may be resold to other dealers in the program or to other qualified institutional buyers. As of June 30, 2009, the value of these investments was $146,396,418 or 14.9% of total net assets. |
The accompanying Notes to Financial Statements are an integral part of this schedule.
270
Table of Contents
Limited Maturity Bond Portfolio
Schedule of Investments as of June 30, 2009
(unaudited)
| e | Denotes restricted securities. Restricted securities are investment securities which have been deemed illiquid and cannot be offered for public sale without first being registered under the Securities Act of 1933. The following table indicates the acquisition date and cost of restricted securities Limited Maturity Bond Portfolio owned as of June 30, 2009. |
Security | Acquisition Date | Cost | |||
Bear Stearns Commercial Mortgage Securities, Inc. | 3/30/2007 | $ | 4,000,000 | ||
Commercial Mortgage Pass-Through Certificates | 5/2/2007 | 4,000,000 | |||
First Franklin Mortgage Loan Asset-Backed Certificates | 4/19/2006 | 214,738 | |||
Mortgage Equity Conversion Asset Trust | 1/18/2007 | 6,654,654 | |||
Mortgage Equity Conversion Asset Trust | 2/14/2007 | 6,613,524 | |||
Power Receivables Finance, LLC | 9/30/2003 | 318,429 | |||
Wachovia Asset Securitization, Inc. | 3/16/2007 | 2,131,724 | |||
| f | Defaulted security. |
| g | All or a portion of the security was earmarked to cover options. |
| h | Denotes investments purchased on a when-issued or delayed delivery basis. |
| i | All or a portion of the security is on loan as discussed in item 2(M) of the Notes to Financial Statements. |
| j | These securities are Equity-Linked Structured Securities as discussed in item 2(Q) of the Notes to Financial Statements. |
| k | In bankruptcy. |
| l | Security is fair valued as discussed in item 2(A) of the Notes to Financial Statements. |
| m | Non-income producing security. |
| n | The interest rate shown reflects the yield, coupon rate or, for securities purchased at a discount, the discount rate at the date of purchase. |
| o | At June 30, 2009, $2,298,968 of investments were held on deposit with the counterparty and pledged as the initial margin deposit for open futures contracts. |
| p | At June 30, 2009, $299,865 of investments were pledged as collateral with the custodian under the agreement between the counterparty, the custodian and the fund for open swap contracts. |
Definitions:
| TIPS | - | Treasury Inflation Protected Security. |
Unrealized Appreciation (Depreciation)
Gross unrealized appreciation and depreciation of investments, based on cost for federal income tax purposes, were as follows:
Gross unrealized appreciation | $ | 19,673,817 | ||
Gross unrealized depreciation | (76,285,469 | ) | ||
Net unrealized appreciation (depreciation) | $ | (56,611,652 | ) | |
Cost for federal income tax purposes | $ | 1,141,796,501 | ||
The accompanying Notes to Financial Statements are an integral part of this schedule.
271
Table of Contents
Limited Maturity Bond Portfolio
Schedule of Investments as of June 30, 2009
(unaudited)
Fair Valuation Measurements
The following table is a summary of the inputs used, as of June 30, 2009, in valuing Limited Maturity Bond Portfolio’s assets carried at fair value as discussed in the Notes to Financial Statements.
Investments in Securities | Total | Level 1 | Level 2 | Level 3 | |||||||||
Bank Loans | |||||||||||||
Utilities | 3,110,196 | — | 3,110,196 | — | |||||||||
Long-Term Fixed Income | |||||||||||||
Asset-Backed Securities | 208,604,444 | — | 195,441,670 | 13,162,774 | |||||||||
Basic Materials | 12,377,724 | — | 12,377,724 | — | |||||||||
Capital Goods | 22,467,207 | — | 19,010,957 | 3,456,250 | |||||||||
Collateralized Mortgage Obligations | 49,999,451 | — | 49,999,451 | — | |||||||||
Commercial Mortgage-Backed Securities | 91,111,998 | — | 84,871,998 | 6,240,000 | |||||||||
Communications Services | 41,883,642 | — | 41,883,642 | — | |||||||||
Consumer Cyclical | 13,374,776 | — | 13,374,776 | — | |||||||||
Consumer Non-Cyclical | 42,427,344 | — | 42,427,344 | — | |||||||||
Energy | 24,997,699 | — | 24,997,699 | — | |||||||||
Financials | 232,839,453 | — | 227,093,928 | 5,745,525 | |||||||||
Foreign | 27,032,022 | — | 27,032,022 | — | |||||||||
Mortgage-Backed Securities | 59,411,517 | — | 59,411,517 | — | |||||||||
Technology | 9,753,448 | — | 5,453,448 | 4,300,000 | |||||||||
Transportation | 9,673,974 | — | 4,098,599 | 5,575,375 | |||||||||
U.S. Government | 76,265,908 | — | 76,265,908 | — | |||||||||
U.S. Municipals | 13,562,481 | — | 13,562,481 | — | |||||||||
Utilities | 12,944,002 | — | 12,944,002 | — | |||||||||
Mutual Funds | |||||||||||||
Fixed Income Mutual Funds | 17,169,151 | 17,169,151 | — | — | |||||||||
Preferred Stock | |||||||||||||
Financials | 1,269,434 | 198,997 | — | 1,070,437 | |||||||||
Options Purchased | 30,937 | 30,937 | — | — | |||||||||
Collateral Held for Securities Loaned | 46,444,495 | 46,444,495 | — | — | |||||||||
Short-Term Investments | 68,433,546 | 228,347 | 68,205,199 | — | |||||||||
Total | $ | 1,085,184,849 | $ | 64,071,927 | $ | 981,562,561 | $ | 39,550,361 | |||||
Other Financial Instruments* | $ | 76,263 | ($143,642 | ) | $ | 219,905 | $ | — | |||||
| * | Other Financial Instruments include Futures, Forwards, Written Options and Swap agreements. |
The following table is a reconciliation of assets in which significant unobservable inputs (Level 3) were used in determining fair value for the Limited Maturity Bond Portfolio as discussed in item 2(A) of the Notes to Financial Statements.
Investments in Securities | Value December 31, 2008 | Accrued Discounts and/or Premiums | Realized Gain/(Loss) | Change in Unrealized Gain/(Loss) | Net Purchases/(Sales) | Transfers in and/or (Out of) Level 3 | Value June 30, 2009 | ||||||||||||||||
Preferred Stock | |||||||||||||||||||||||
Financials | 2,791,196 | — | (1,974,818 | ) | 1,926,790 | (1,672,731 | ) | — | 1,070,437 | ||||||||||||||
Long-Term Fixed Income | |||||||||||||||||||||||
Asset-Backed Securities | 19,844,472 | — | — | 28,693 | (531,303 | ) | (6,179,088 | ) | 13,162,774 | ||||||||||||||
Capital Goods | — | — | — | (43,008 | ) | 3,499,258 | — | 3,456,250 | |||||||||||||||
Commercial Mortgage- Backed Securities | 5,405,010 | — | — | 834,990 | — | — | 6,240,000 | ||||||||||||||||
Financials | 6,166,250 | — | — | (420,725 | ) | — | — | 5,745,525 | |||||||||||||||
Technology | — | — | — | — | 4,300,000 | — | 4,300,000 | ||||||||||||||||
Transportation | 3,068,000 | 2,412 | (196,881 | ) | 535,944 | 2,165,900 | — | 5,575,375 | |||||||||||||||
U.S. Government | 4,026,666 | — | (233,315 | ) | 215,418 | (4,008,769 | ) | — | — | ||||||||||||||
Total | $ | 41,301,594 | $ | 2,412 | ($2,405,014 | ) | $ | 3,078,102 | $ | 3,752,355 | ($6,179,088 | ) | $ | 39,550,361 | |||||||||
The accompanying Notes to Financial Statements are an integral part of this schedule.
272
Table of Contents
Limited Maturity Bond Portfolio
Schedule of Investments as of June 30, 2009
(unaudited)
Futures Contracts | Number of Contracts Long/(Short) | Expiration Date | Notional Principal Amount | Value | Unrealized Gain/(Loss) | ||||||||||
2-Yr. U.S. Treasury Bond Futures | (55 | ) | September 2009 | ($11,917,645 | ) | ($11,892,033 | ) | $ | 25,612 | ||||||
5-Yr. U.S. Treasury Bond Futures | (1,375 | ) | September 2009 | (157,768,376 | ) | (157,738,282 | ) | 30,094 | |||||||
10-Yr. U.S. Treasury Bond Futures | (325 | ) | September 2009 | (37,554,282 | ) | (37,786,331 | ) | (232,049 | ) | ||||||
20-Yr. U.S. Treasury Bond Futures | 5 | September 2009 | 586,265 | 591,796 | 5,531 | ||||||||||
Total Futures Contracts | ($170,812 | ) | |||||||||||||
Call Options Written | Number of Contracts | Exercise Price | Expiration Date | Value | Unrealized Gain/(Loss) | |||||||||
10-Yr. U.S. Treasury Bond Futures | 110 | $ | 121.00 | July 2009 | ($ | 6,875 | ) | $ | 27,170 | |||||
Total Call Options Written | ($ | 6,875 | ) | $ | 27,170 | |||||||||
Credit Default Swaps and | Buy/Sell Protection1 | Termination Date | Notional Principal Amount2 | Upfront Payments Received (Made) | Value3 | Unrealized Gain/(Loss) | ||||||||||
CDX HY, Series 11, 5 Year, at 5.00%; Bank of America | Sell | 12/20/2013 | $ | 1,068,000 | $ | 166,466 | ($156,892 | ) | $ | 9,574 | ||||||
CDX HY, Series 11, 5 Year, at 5.00%; Bank of America | Sell | 12/20/2013 | 845,500 | 257,280 | (124,207 | ) | 133,073 | |||||||||
CDX IG, Series 12, 5 Year, at 1.00%; Bank of America | Sell | 6/20/2014 | 5,000,000 | 149,377 | (72,119 | ) | 77,258 | |||||||||
Total Credit Default Swaps | ($353,218 | ) | $ | 219,905 | ||||||||||||
| 1 | As the buyer of protection, Limited Maturity Bond Portfolio pays periodic fees in return for payment by the seller which is contingent upon an adverse credit event occurring in the underlying issuer or reference entity. As the seller of protection, Limited Maturity Bond Portfolio collects periodic fees from the buyer and profits if the credit of the underlying issuer or reference entity remains stable or improves while the swap is outstanding, but the seller in a credit default swap contract would be required to pay the amount of credit loss, determined as specified in the agreement, to the buyer in the event of an adverse credit event in the reference entity. |
| 2 | The maximum potential amount of future payments Limited Maturity Bond Portfolio could be required to make as the seller or receive as the buyer of protection. |
| 3 | The market value for credit indexes (CDX or LCDX) serve as an indicator of the current status of the payment/performance risk and represent the liability or profit for the credit default swap contract had the contract been closed as of the reporting date. In the case when protection has been sold, the market value of the swap will increase when the swap spread declines representing an improvement in the reference entity’s credit worthiness. The market value of the swap will decrease when the swap spread increases representing a deterioration in the reference entity’s credit worthiness. |
The accompanying Notes to Financial Statements are an integral part of this schedule.
273
Table of Contents
Limited Maturity Bond Portfolio
Schedule of Investments as of June 30, 2009
(unaudited)
The following table summarizes the fair value and Statement of Assets and Liabilities location, as of June 30, 2009, for the Limited Maturity Bond Portfolio’s investments in financial derivative instruments by primary risk exposure as discussed under item (2) Significant Accounting Policies of the Notes to Financial Statements.
Derivatives by Risk Category | Statement of Assets and Liabilities Location | Fair Value | |||
Asset Derivatives | |||||
Interest Rate Contracts | |||||
Future* | Net Assets - Net unrealized appreciation/(depreciation) on Futures contracts | $ | 61,237 | ||
Option Written | Net Assets - Net unrealized appreciation/(depreciation) on Written option contracts | 27,170 | |||
Option Purchased | Investments in securities at market value, Net Assets - Net unrealized appreciation/(depreciation) on Investments | 30,937 | |||
Total Interest Rate Contracts | 119,344 | ||||
Credit Contracts | |||||
Credit Default Swap | Receivable/Payable - Swap agreements, at value; Net Assets - Net unrealized appreciation/(depreciation) on Swap agreements | 219,905 | |||
Total Credit Contracts | 219,905 | ||||
Total Asset Derivatives | $ | 339,249 | |||
| Liability Derivatives | |||||
Interest Rate Contracts | |||||
Future* | Net Assets - Net unrealized appreciation/(depreciation) on Futures contracts | 232,049 | |||
Total Interest Rate Contracts | 232,049 | ||||
Total Liability Derivatives | $ | 232,049 | |||
| * | Includes cumulative appreciation/depreciation of futures contracts as reported in the Schedule of Investments. Only current day’s variation margin is reported within the Statement of Assets and Liabilities. |
The following table summarizes the net realized gains/(losses) and Statement of Operations location, for the period ended June 30, 2009, for Limited Maturity Bond Portfolio’s investments in financial derivative instruments by primary risk exposure.
Derivatives by Risk Category | Statement of Operations Location | Realized Gains/(Losses) recognized in Income | |||
| Interest Rate Contracts | |||||
Option Written | Net realized gains/(losses) on Written option contracts | 271,982 | |||
Option Purchased | Net realized gains/(losses) on Investments | (197,449 | ) | ||
Future | Net realized gains/(losses) on Futures contracts | (529,613 | ) | ||
Total Interest Rate Contracts | (455,080 | ) | |||
| Credit Contracts | |||||
Credit Default Swap | Net realized gains/(losses) on Swap agreements | (3,935,472 | ) | ||
Total Credit Contracts | (3,935,472 | ) | |||
Total | ($4,390,552 | ) | |||
The accompanying Notes to Financial Statements are an integral part of this schedule.
274
Table of Contents
Limited Maturity Bond Portfolio
Schedule of Investments as of June 30, 2009
(unaudited)
The following table summarizes the change in net unrealized appreciation/(depreciation) and Statement of Operations location, for the period ended June 30, 2009, for the Limited Maturity Bond Portfolio’s investments in financial derivative instruments by primary risk exposure.
Derivatives by Risk Category | Statement of Operations Location | Change in Unrealized Appreciation/(Depreciation) recognized in Income | ||||
| Interest Rate Contracts | ||||||
Future | Change in net unrealized appreciation/(depreciation) on Futures contracts | 6,492,536 | ||||
Option Written | Change in net unrealized appreciation/(depreciation) on Written option contracts | 27,170 | ||||
Option Purchased | Change in net unrealized appreciation/(depreciation) on Investments | (177,760 | ) | |||
Interest Rate Swap | Change in net unrealized appreciation/(depreciation) on Swap agreements | (956,416 | ) | |||
Total Interest Rate Contracts | 5,385,530 | |||||
| Credit Contracts | ||||||
Credit Default Swap | Change in net unrealized appreciation/(depreciation) on Swap agreements | 3,234,159 | ||||
Total Credit Contracts | 3,234,159 | |||||
Total | $ | 8,619,689 | ||||
Investment in Affiliates
Affiliated issuers, as defined under the Investment Company Act of 1940, include those in which the Portfolio’s holdings of an issuer represent 5% or more of the outstanding voting securities of an issuer, or any affiliated mutual fund.
A summary of transactions for the fiscal year to date, in Limited Maturity Bond Portfolio, is as follows:
Portfolio | Value December 31, 2008 | Gross Purchases | Gross Sales | Shares Held at June 30, 2009 | Value June 30, 2009 | Income Earned January 1, 2009 - June 30, 2009 | |||||||||||
High Yield Fund | $ | — | $ | 15,500,000 | $ | — | 4,208,125 | $ | 17,169,151 | $ | 348,654 | ||||||
Money Market | 1,334,891 | 43,926,933 | 45,033,477 | 228,347 | 228,347 | 19,481 | |||||||||||
Thrivent Financial Securities Lending Trust | 105,038,013 | 213,314,641 | 271,908,159 | 46,444,495 | 46,444,495 | 128,140 | |||||||||||
Total Value and Income Earned | 106,372,904 | 63,841,993 | 496,275 | ||||||||||||||
The accompanying Notes to Financial Statements are an integral part of this schedule.
275
Table of Contents
Schedule of Investments as of June 30, 2009
(unaudited)
| Principal Amount | Long-Term Fixed Income (108.1%) | Value | |||
| Asset-Backed Securities (9.5%) | |||||
Americredit Automobile Receivables Trust | |||||
| $1,042,020 | 0.398%, 7/6/2009a,b | $ | 1,002,434 | ||
Credit Based Asset Servicing and Securitization, LLC | |||||
| 120,822 | 0.424%, 7/27/2009b | 119,689 | |||
| 215,237 | 5.501%, 12/25/2036 | 147,187 | |||
First Horizon ABS Trust | |||||
| 689,603 | 0.444%, 7/27/2009a,b | 293,294 | |||
| 1,151,386 | 0.474%, 7/27/2009a,b | 280,220 | |||
GMAC Mortgage Corporation Loan Trust | |||||
| 1,541,041 | 0.494%, 7/27/2009a,b | 422,814 | |||
Residential Funding Mortgage Securities | |||||
| 200,170 | 4.470%, 7/25/2018a | 178,929 | |||
SLM Student Loan Trust | |||||
| 123,998 | 1.102%, 7/27/2009b | 123,983 | |||
Wachovia Asset Securitization, Inc. | |||||
| 852,689 | 0.454%, 7/27/2009a,b,c | 271,232 | |||
Total Asset-Backed Securities | 2,839,782 | ||||
| Collateralized Mortgage Obligations (19.0%) | |||||
Banc of America Mortgage Securities, Inc. | |||||
| 666,654 | 4.802%, 9/25/2035 | 461,930 | |||
Chaseflex Trust | |||||
| 95,855 | 5.590%, 9/25/2036 | 92,425 | |||
Countrywide Alternative Loan Trust | |||||
| 310,044 | 5.500%, 2/25/2036 | 246,863 | |||
| 253,949 | 6.000%, 1/25/2037 | 186,147 | |||
Countrywide Home Loans | |||||
| 271,998 | 0.404%, 7/27/2009b | 261,235 | |||
Credit Suisse First Boston Mortgage Securities Corporation | |||||
| 42,082 | 1.054%, 7/27/2009b | 21,672 | |||
GSAA Home Equity Trust | |||||
| 239,082 | 4.316%, 11/25/2034d | 219,984 | |||
Impac CMB Trust | |||||
| 483,258 | 0.574%, 7/27/2009b | 209,307 | |||
| 85,105 | 0.634%, 7/27/2009b | 33,803 | |||
J.P. Morgan Alternative Loan Trust | |||||
| 213,185 | 0.384%, 7/25/2009b,d | 176,126 | |||
| 344,798 | 5.810%, 5/25/2036 | 296,411 | |||
J.P. Morgan Mortgage Trust | |||||
| 230,167 | 6.500%, 1/25/2035 | 164,534 | |||
MASTR Alternative Loans Trust | |||||
| 291,642 | 6.500%, 5/25/2034 | 252,225 | |||
Merrill Lynch Mortgage Investors, Inc. | |||||
| 923,289 | 4.866%, 6/25/2035 | 695,820 | |||
MLCC Mortgage Investors, Inc. | |||||
| 236,223 | 0.644%, 7/25/2009b | 172,447 | |||
Residential Accredit Loans, Inc. | |||||
| 263,737 | 5.500%, 12/25/2034 | 190,286 | |||
| 259,407 | 5.590%, 9/25/2035 | 157,153 | |||
Washington Mutual Mortgage Pass-Through Certificates | |||||
| 285,056 | 5.841%, 8/25/2046 | 220,785 | |||
Washington Mutual, Inc. | |||||
| 383,001 | 6.051%, 10/25/2036 | 266,101 | |||
Wells Fargo Mortgage Backed Securities Trust | |||||
| 599,041 | 4.950%, 3/25/2036 | 422,949 | |||
| 389,816 | 5.240%, 4/25/2036 | 306,795 | |||
| 371,266 | 5.500%, 4/25/2036 | 282,975 | |||
| 533,540 | 6.000%, 7/25/2037 | 370,727 | |||
Total Collateralized Mortgage Obligations | 5,708,700 | ||||
| Commercial Mortgage-Backed Securities (13.3%) | |||||
Commercial Mortgage Pass-Through Certificates | |||||
| 60,044 | 0.419%, 7/15/2009b,e | 58,373 | |||
GMAC Commercial Mortgage Securities, Inc. | |||||
| 230,000 | 4.547%, 12/10/2041 | 217,293 | |||
Greenwich Capital Commercial Funding Corporation | |||||
| 500,000 | 5.867%, 8/10/2017 | 261,938 | |||
J.P. Morgan Chase Commercial Mortgage Securities Corporation | |||||
| 400,000 | 4.302%, 1/15/2038 | 363,265 | |||
| 1,000,000 | 5.819%, 6/15/2049 | 763,635 | |||
LB-UBS Commercial Mortgage Trust | |||||
| 889,057 | 4.553%, 7/15/2030 | 880,823 | |||
TIAA Real Estate CDO, Ltd. | |||||
| 500,000 | 5.814%, 8/15/2039 | 455,093 | |||
Wachovia Bank Commercial Mortgage Trust | |||||
| 2,000,000 | 0.439%, 7/15/2009b,c | 1,000,000 | |||
Total Commercial Mortgage-Backed Securities | 4,000,420 | ||||
| Mortgage-Backed Securities (63.6%) | |||||
Federal Home Loan Mortgage Corporation Gold 30-Yr. Pass Through | |||||
| 3,200,000 | 6.000%, 7/1/2039f | 3,339,001 | |||
Federal National Mortgage Association Conventional 20-Yr. Pass Through | |||||
| 1,469,559 | 6.000%, 8/1/2024 | 1,550,455 | |||
Federal National Mortgage Association Conventional 30-Yr. Pass Through | |||||
| 3,500,000 | 4.500%, 7/1/2039f | 3,492,342 | |||
| 8,000,000 | 5.500%, 7/1/2039f | 8,257,504 | |||
| 2,300,000 | 6.500%, 7/1/2039f | 2,449,500 | |||
Total Mortgage-Backed Securities | 19,088,802 | ||||
The accompanying Notes to Financial Statements are an integral part of this schedule.
276
Table of Contents
Mortgage Securities Portfolio
Schedule of Investments as of June 30, 2009
(unaudited)
| Principal Amount | Long-Term Fixed Income (108.1%) | Value | ||||
| U.S. Government (2.7%) | ||||||
U.S. Treasury Notes | ||||||
| $ 100,000 | 4.875%, 4/30/2011g | $ | 106,906 | |||
U.S. Treasury Notes, TIPS | ||||||
| 686,277 | 2.500%, 7/15/2016 | 720,376 | ||||
Total U.S. Government | 827,282 | |||||
Total Long-Term Fixed Income (cost $37,802,539) | 32,464,986 | |||||
| Contracts | Options Purchased (<0.1%) | |||||
Call on 10-Yr. U.S. Treasury Bond Futures | ||||||
| 3 | $119.00, expires 8/25/2009 | $ | 844 | |||
Total Options Purchased (cost $2,165) | 844 | |||||
| Shares or Principal Amount | Short-Term Investments (50.4%)h | |||||
Federal Home Loan Bank Discount Notes | ||||||
| 310,000 | 0.010%, 7/1/2009 | 310,000 | ||||
| 965,000 | 0.010%, 7/2/2009 | 965,000 | ||||
| 7,000,000 | 0.150%, 7/8/2009 | 6,999,796 | ||||
| 5,000,000 | 0.155%, 7/10/2009 | 4,999,806 | ||||
| 1,855,000 | 0.070%, 7/15/2009 | 1,854,949 | ||||
| 899 | Thrivent Money Market Portfolio | 899 | ||||
Total Short-Term Investments (at amortized cost) | 15,130,450 | |||||
Total Investments (cost $52,935,154) 158.5% | $ | 47,596,280 | ||||
Other Assets and Liabilities, Net (58.5%) | (17,558,987 | ) | ||||
Total Net Assets 100.0% | $ | 30,037,293 | ||||
| a | All or a portion of the security is insured or guaranteed. |
| b | Denotes variable rate obligations for which the current yield and next scheduled reset date are shown. |
| c | Denotes restricted securities. Restricted securities are investment securities which have been deemed illiquid and cannot be offered for public sale without first being registered under the Securities Act of 1933. The following table indicates the acquisition date and cost of restricted securities Mortgage Securities Portfolio owned as of June 30, 2009. |
Security | Acquisition Date | Cost | |||
Wachovia Asset Securitization, Inc. | 3/16/2007 | $ | 852,689 | ||
Wachovia Bank Commercial Mortgage Trust | 2/28/2007 | 2,000,205 | |||
| d | All or a portion of the security was earmarked to cover options. |
| e | Denotes securities sold under Rule 144A of the Securities Act of 1933, which exempts them from registration. These securities have been deemed liquid and may be resold to other dealers in the program or to other qualified institutional buyers. As of June 30, 2009, the value of these investments was $58,373 or 0.2% of total net assets. |
| f | Denotes investments purchased on a when-issued or delayed delivery basis. |
| g | At June 30, 2009, $106,906 of investments were held on deposit with the counterparty and pledged as the initial margin deposit for open futures contracts. |
| h | The interest rate shown reflects the yield, coupon rate or, for securities purchased at a discount, the discount rate at the date of purchase. |
Definitions:
TIPS | - | Treasury Inflation Protected Security. |
Unrealized Appreciation (Depreciation)
Gross unrealized appreciation and depreciation of investments, based on cost for federal income tax purposes, were as follows:
Gross unrealized appreciation | $ | 250,076 | ||
Gross unrealized depreciation | (5,588,950 | ) | ||
Net unrealized appreciation (depreciation) | $ | (5,338,874 | ) | |
Cost for federal income tax purposes | $ | 52,935,154 | ||
The accompanying Notes to Financial Statements are an integral part of this schedule.
277
Table of Contents
Mortgage Securities Portfolio
Schedule of Investments as of June 30, 2009
(unaudited)
Fair Valuation Measurements
The following table is a summary of the inputs used, as of June 30, 2009, in valuing Mortgage Securities Portfolio’s assets carried at fair value as discussed in the Notes to Financial Statements.
Investments in Securities | Total | Level 1 | Level 2 | Level 3 | ||||||||
Long-Term Fixed Income | ||||||||||||
Asset-Backed Securities | 2,839,782 | — | 2,568,550 | 271,232 | ||||||||
Collateralized Mortgage Obligations | 5,708,700 | — | 5,708,700 | — | ||||||||
Commercial Mortgage-Backed Securities | 4,000,420 | — | 4,000,420 | — | ||||||||
Mortgage-Backed Securities | 19,088,802 | — | 19,088,802 | — | ||||||||
U.S. Government | 827,282 | — | 827,282 | — | ||||||||
Options Purchased | 844 | 844 | — | — | ||||||||
Short-Term Investments | 15,130,450 | 899 | 15,129,551 | — | ||||||||
Total | $ | 47,596,280 | $ | 1,743 | $ | 47,323,305 | $ | 271,232 | ||||
Other Financial Instruments* | $ | 2,757 | $ | 2,757 | $ | — | $ | — | ||||
| * | Other Financial Instruments include Futures, Forwards, Written Options and Swap agreements. |
The following table is a reconciliation of assets in which significant unobservable inputs (Level 3) were used in determining fair value for the Mortgage Securities Portfolio as discussed in item 2(A) of the Notes to Financial Statements.
Investments in Securities | Value December 31, 2008 | Accrued Discounts and/or Premiums | Realized Gain/(Loss) | Change in Unrealized Gain/(Loss) | Net Purchases/(Sales) | Transfers in and/or (Out of) Level 3 | Value June 30, 2009 | ||||||||||||||
Long-Term Fixed Income | |||||||||||||||||||||
Asset-Backed Securities | — | — | — | (52,512 | ) | 1,179 | 322,565 | 271,232 | |||||||||||||
Total | $ | — | $ | — | $ | — | ($52,512 | ) | $ | 1,179 | $ | 322,565 | $ | 271,232 | |||||||
Futures Contracts | Number of Contracts Long/(Short) | Expiration Date | Notional Principal Amount | Value | Unrealized Gain/(Loss) | ||||||||||
10-Yr. U.S. Treasury Bond Futures | 5 | September 2009 | $ | 579,312 | $ | 581,328 | $ | 2,016 | |||||||
Total Futures Contracts | $ | 2,016 | |||||||||||||
Call Options Written | Number of Contracts | Exercise Price | Expiration Date | Value | Unrealized Gain/(Loss) | ||||||||||
10-Yr. U.S. Treasury Bond Futures | 3 | $ | 121.00 | August 2009 | ($187 | ) | $ | 741 | |||||||
Total Call Options Written | ($187 | ) | $ | 741 | |||||||||||
The following table summarizes the fair value and Statement of Assets and Liabilities location, as of June 30, 2009, for the Mortgage Securities Portfolio’s investments in financial derivative instruments by primary risk exposure as discussed under item (2) Significant Accounting Policies of the Notes to Financial Statements.
Derivatives by Risk Category | Statement of Assets and Liabilities Location | Fair Value | |||
Asset Derivatives | |||||
Interest Rate Contracts | |||||
Future* | Net Assets - Net unrealized appreciation/(depreciation) on Futures contracts | 2,016 | |||
Option Written | Net Assets - Net unrealized appreciation/(depreciation) on Written option contracts | 741 | |||
Option Purchased | Investments in securities at market value, Net Assets - Net unrealized appreciation/(depreciation) on Investments | 844 | |||
Total Interest Rate Contracts | 3,601 | ||||
Total Asset Derivatives | $ | 3,601 | |||
| * | Includes cumulative appreciation/depreciation of futures contracts as reported in the Schedule of Investments. Only current day’s variation margin is reported within the Statement of Assets and Liabilities. |
The accompanying Notes to Financial Statements are an integral part of this schedule.
278
Table of Contents
Mortgage Securities Portfolio
Schedule of Investments as of June 30, 2009
(unaudited)
The following table summarizes the net realized gains/(losses) and Statement of Operations location, for the period ended June 30, 2009, for Mortgage Securities Portfolio’s investments in financial derivative instruments by primary risk exposure.
Derivatives by Risk Category | Statement of Operations Location | Realized Gains/(Losses) recognized in Income | |||
Interest Rate Contracts | |||||
Option Written | Net realized gains/(losses) on Written option contracts | 2,769 | |||
Option Purchased | Net realized gains/(losses) on Investments | 1,554 | |||
Future | Net realized gains/(losses) on Futures contracts | 1,658 | |||
Total Interest Rate Contracts | 5,981 | ||||
Total | $ | 5,981 | |||
The following table summarizes the change in net unrealized appreciation/(depreciation) and Statement of Operations location, for the period ended June 30, 2009, for the Mortgage Securities Portfolio’s investments in financial derivative instruments by primary risk exposure.
Derivatives by Risk Category | Statement of Operations Location | Change in Unrealized Appreciation/(Depreciation) recognized in Income | |||
Interest Rate Contracts | |||||
Future | Change in net unrealized appreciation/(depreciation) on Futures contracts | (32,500 | ) | ||
Option Written | Change in net unrealized appreciation/(depreciation) on Written option contracts | 741 | |||
Option Purchased | Change in net unrealized appreciation/(depreciation) on Investments | (4,259 | ) | ||
Total Interest Rate Contracts | (36,018 | ) | |||
Total | ($36,018 | ) | |||
Investment in Affiliates
Affiliated issuers, as defined under the Investment Company Act of 1940, include those in which the Portfolio’s holdings of an issuer represent 5% or more of the outstanding voting securities of an issuer, or any affiliated mutual fund.
A summary of transactions for the fiscal year to date, in Mortgage Securities Portfolio , is as follows:
Portfolio | Value December 31, 2008 | Gross Purchases | Gross Sales | Shares Held at June 30, 2009 | Value June 30, 2009 | Income Earned January 1, 2009 - June 30, 2009 | |||||||||||
Money Market | $ | 896 | $ | 3 | $ | — | 899 | $ | 899 | $ | 4 | ||||||
Total Value and Income Earned | 896 | 899 | 4 | ||||||||||||||
The accompanying Notes to Financial Statements are an integral part of this schedule.
279
Table of Contents
Schedule of Investments as of June 30, 2009
(unaudited)
| Principal Amount | Commercial Paper (60.6%)a | Value | |||
| Banking-Domestic (4.3%) | |||||
Rabobank USA Financial Corporation | |||||
| $ 8,000,000 | 0.640%, 7/14/2009b | $ | 7,998,151 | ||
| 8,000,000 | 0.740%, 7/23/2009b | 7,996,382 | |||
River Fuel Company No. 3, Inc. | |||||
| 7,484,000 | 0.550%, 7/31/2009b | 7,480,570 | |||
River Fuel Trust No. 1 | |||||
| 2,829,000 | 0.550%, 7/31/2009b | 2,827,703 | |||
Total Banking-Domestic | 26,302,806 | ||||
| Consumer Cyclical (1.3%) | |||||
Toyota Motor Credit Corporation | |||||
| 8,000,000 | 0.220%, 7/8/2009 | 7,999,658 | |||
Total Consumer Cyclical | 7,999,658 | ||||
| Finance (23.3%) | |||||
Bryant Park Funding, LLC | |||||
| 9,600,000 | 0.430%, 7/27/2009b | 9,597,019 | |||
| 6,360,000 | 0.320%, 8/21/2009b | 6,357,117 | |||
| 7,860,000 | 0.380%, 9/10/2009b | 7,854,109 | |||
| 5,260,000 | 0.370%, 9/28/2009b | 5,255,189 | |||
Cofco Capital Corporation | |||||
| 8,360,000 | 1.250%, 7/22/2009b | 8,353,904 | |||
Falcon Asset Securitization Company, LLC | |||||
| 8,033,000 | 0.400%, 7/23/2009b | 8,031,037 | |||
| 4,480,000 | 0.400%, 7/27/2009b | 4,478,706 | |||
Falcon Asset Securitization Corporation, LLC | |||||
| 5,760,000 | 0.300%, 8/25/2009b | 5,757,360 | |||
General Electric Capital Corporation | |||||
| 9,600,000 | 0.620%, 7/20/2009b | 9,596,858 | |||
Old Line Funding, LLC | |||||
| 8,000,000 | 0.600%, 7/15/2009b | 7,998,133 | |||
| 6,400,000 | 0.650%, 9/17/2009b | 6,390,987 | |||
| 9,600,000 | 0.650%, 9/21/2009b | 9,585,786 | |||
| 7,975,000 | 0.650%, 10/14/2009b | 7,959,881 | |||
Reckitt Benckiser Treasury Services plc | |||||
| 9,560,000 | 0.770%, 8/13/2009b | 9,551,207 | |||
| 9,560,000 | 0.750%, 8/18/2009b | 9,550,440 | |||
| 9,600,000 | 0.550%, 9/9/2009b | 9,589,733 | |||
Straight-A Funding, LLC | |||||
| 7,965,000 | 0.360%, 8/26/2009b | 7,960,540 | |||
Thunder Bay Funding, LLC | |||||
| 7,975,000 | 0.700%, 9/10/2009b | 7,963,990 | |||
Total Finance | 141,831,996 | ||||
| Foreign (5.3%) | |||||
Caisse D’Amortissement de la Dette Sociale | |||||
| 6,950,000 | 0.520%, 7/1/2009 | 6,950,000 | |||
| 8,000,000 | 0.660%, 8/11/2009 | 7,993,987 | |||
| 17,670,000 | 0.585%, 10/13/2009 | 17,640,161 | |||
Total Foreign | 32,584,148 | ||||
| Insurance (2.2%) | |||||
ING America Insurance Holdings | |||||
| 2,000,000 | 0.600%, 7/7/2009b | 1,999,800 | |||
| 4,790,000 | 0.600%, 7/8/2009b | 4,789,441 | |||
| 6,290,000 | 0.600%, 7/9/2009b | 6,289,161 | |||
Total Insurance | 13,078,402 | ||||
| U.S. Government (21.3%) | |||||
Federal Home Loan Bank Discount Notes | |||||
| 9,600,000 | 0.540%, 7/29/2009 | 9,595,968 | |||
| 9,550,000 | 0.205%, 8/11/2009 | 9,547,770 | |||
| 4,110,000 | 1.150%, 12/4/2009 | 4,089,518 | |||
Federal Home Loan Mortgage Corporation Discount Notes | |||||
| 4,800,000 | 0.560%, 9/1/2009 | 4,795,371 | |||
| 1,280,000 | 0.640%, 9/14/2009 | 1,278,294 | |||
| 4,840,000 | 0.700%, 9/21/2009 | 4,832,283 | |||
| 6,400,000 | 0.630%, 9/23/2009 | 6,390,592 | |||
| 15,400,000 | 0.593%, 9/30/2009 | 15,376,901 | |||
| 5,270,000 | 0.700%, 10/23/2009 | 5,258,318 | |||
| 4,955,000 | 0.680%, 11/9/2009 | 4,942,739 | |||
Federal National Mortgage Association Discount Notes | |||||
| 1,920,000 | 0.530%, 8/5/2009 | 1,919,011 | |||
| 4,600,000 | 0.540%, 9/8/2009 | 4,595,239 | |||
| 9,600,000 | 0.560%, 9/9/2009 | 9,589,547 | |||
| 16,050,000 | 0.610%, 9/14/2009 | 16,029,594 | |||
| 6,450,000 | 0.680%, 9/15/2009 | 6,440,740 | |||
| 9,650,000 | 0.660%, 9/21/2009 | 9,635,487 | |||
| 15,400,000 | 0.602%, 9/25/2009 | 15,377,836 | |||
Total U.S. Government | 129,695,208 | ||||
| U.S. Municipal (4.8%) | |||||
Alaska Housing Financing Corporation | |||||
| 9,600,000 | 1.150%, 8/26/2009 | 9,582,827 | |||
| 6,380,000 | 1.100%, 9/4/2009 | 6,367,329 | |||
| 8,215,000 | 0.900%, 9/10/2009 | 8,200,418 | |||
| 5,111,000 | 0.850%, 10/5/2009 | 5,099,415 | |||
Total U.S. Municipal | 29,249,989 | ||||
Total Commercial Paper | 380,742,207 | ||||
U.S. Government (3.1%)a | |||||
Federal Home Loan Banks | |||||
| 19,020,000 | 3.750%, 8/18/2009 | 19,094,877 | |||
Total U.S. Government | 19,094,877 | ||||
Other Mutual Funds (4.4%) | |||||
| 10,350,000 | Barclays Prime Money Market Fund | 10,350,000 | |||
| 16,505,000 | DWS Money Market Series | 16,505,000 | |||
Total Other Mutual Funds | 26,855,000 | ||||
Variable Rate Notes (31.9%)a | |||||
| Banking-Domestic (9.9%) | |||||
Bank of America NA | |||||
| 4,860,000 | 1.397%, 7/3/2009c,d | 4,860,000 | |||
| 5,000,000 | 1.207%, 8/6/2009d | 5,000,000 | |||
Barclays Bank plc NY | |||||
| 4,880,000 | 1.406%, 8/11/2009d | 4,880,000 | |||
The accompanying Notes to Financial Statements are an integral part of this schedule.
280
Table of Contents
Money Market Portfolio
Schedule of Investments as of June 30, 2009
(unaudited)
| Principal Amount | Variable Rate Notes (31.9%)a | Value | ||||
| Banking-Domestic (9.9%) - continued | ||||||
Branch Banking and Trust Company | ||||||
| $6,485,000 | 1.046%, 9/4/2009d | $ | 6,485,000 | |||
Deutsche Bank AG/NY | ||||||
| 6,470,000 | 0.839%, 7/21/2009d | 6,470,000 | ||||
J.P. Morgan Chase & Company | ||||||
| 6,380,000 | 1.362%, 7/1/2009b | 6,380,000 | ||||
Royal Bank of Canada NY | ||||||
| 6,490,000 | 1.508%, 7/1/2009d | 6,490,000 | ||||
Svenska Handelsbanken NY | ||||||
| 9,770,000 | 1.011%, 8/26/2009d | 9,770,000 | ||||
Wells Fargo & Company | ||||||
| 4,136,000 | 0.380%, 7/6/2009d | 4,140,991 | ||||
| 5,775,000 | 0.469%, 7/15/2009c,d | 5,775,000 | ||||
Total Banking-Domestic | 60,250,991 | |||||
| Banking-Foreign (4.0%) | ||||||
ING Bank NV | ||||||
| 6,480,000 | 0.874%, 7/24/2009c,d | 6,480,000 | ||||
Royal Bank of Canada | ||||||
| 4,850,000 | 1.183%, 8/17/2009c,d | 4,850,000 | ||||
Societe Generale | ||||||
| 4,880,000 | 1.056%, 9/4/2009c,d | 4,880,000 | ||||
Svenska Handelsbanken AB | ||||||
| 8,100,000 | 1.462%, 7/27/2009c,d | 8,100,000 | ||||
Total Banking-Foreign | 24,310,000 | |||||
| Brokerage (1.6%) | ||||||
Citigroup Funding, Inc. | ||||||
| 9,610,000 | 1.139%, 7/30/2009b,d | 9,614,767 | ||||
Total Brokerage | 9,614,767 | |||||
| Consumer Cyclical (2.0%) | ||||||
American Honda Finance Corporation | ||||||
| 8,770,000 | 1.287%, 7/8/2009c,d | 8,770,000 | ||||
| 3,240,000 | 1.269%, 7/14/2009c,d | 3,240,000 | ||||
Total Consumer Cyclical | 12,010,000 | |||||
| U.S. Government (14.4%) | ||||||
Federal Home Loan Banks | ||||||
| 4,800,000 | 0.690%, 7/1/2009d | 4,800,000 | ||||
| 4,800,000 | 0.810%, 7/1/2009d | 4,800,000 | ||||
| 4,800,000 | 0.321%, 7/9/2009d | 4,800,000 | ||||
| 6,400,000 | 0.445%, 7/21/2009d | 6,400,000 | ||||
| 8,030,000 | 0.979%, 8/18/2009d | 8,030,000 | ||||
| 4,330,000 | 0.605%, 8/20/2009d | 4,323,673 | ||||
Federal Home Loan Mortgage Corporation | ||||||
| 4,800,000 | 0.630%, 7/1/2009d | 4,800,000 | ||||
| 6,400,000 | 0.770%, 7/1/2009d | 6,400,000 | ||||
| 9,050,000 | 0.246%, 7/20/2009d | 9,044,581 | ||||
| 12,480,000 | 0.288%, 7/20/2009d | 12,476,634 | ||||
| 8,000,000 | 0.630%, 9/3/2009d | 7,997,852 | ||||
| 6,395,000 | 0.580%, 9/24/2009d | 6,395,000 | ||||
Federal National Mortgage Association | ||||||
| 8,000,000 | 1.029%, 7/13/2009d | 7,995,704 | ||||
Total U.S. Government | 88,263,444 | |||||
Total Variable Rate Notes | 194,449,202 | |||||
Total Investments (at amortized cost) 101.8% | $ | 621,141,286 | ||||
Other Assets and Liabilities, Net (1.8)% | (11,054,938 | ) | ||||
Total Net Assets 100.0% | $ | 610,086,348 | ||||
| a | The interest rate shown reflects the yield, coupon rate or, for securities purchased at a discount, the discount rate at the date of purchase. |
| b | Denotes investments that benefit from credit enhancement or liquidity support provided by a third party bank or institution. |
| c | Denotes securities sold under Rule 144A of the Securities Act of 1933, which exempts them from registration. These securities have been deemed liquid and may be resold to other dealers in the program or to other qualified institutional buyers. As of June 30, 2009, the value of these investments was $46,955,000 or 7.7% of total net assets. |
| d | Denotes variable rate obligations for which the current yield and next scheduled reset date are shown. |
Cost for federal income tax purposes | $ | 621,141,286 |
The accompanying Notes to Financial Statements are an integral part of this schedule.
281
Table of Contents
Money Market Portfolio
Schedule of Investments as of June 30, 2009
(unaudited)
Fair Valuation Measurements
The following table is a summary of the inputs used, as of June 30, 2009, in valuing Money Market Portfolio’s assets carried at fair value as discussed in the Notes to Financial Statements.
Security Type and Industry | Total | Level 1 | Level 2 | Level 3 | ||||||||
Commercial Paper | ||||||||||||
Banking-Domestic | 26,302,806 | — | 26,302,806 | — | ||||||||
Consumer Cyclical | 7,999,658 | — | 7,999,658 | — | ||||||||
Finance | 141,831,996 | — | 141,831,996 | — | ||||||||
Foreign | 32,584,148 | — | 32,584,148 | — | ||||||||
Insurance | 13,078,402 | — | 13,078,402 | — | ||||||||
U.S. Government | 129,695,208 | — | 129,695,208 | — | ||||||||
U.S. Municipal | 29,249,989 | — | 29,249,989 | — | ||||||||
U.S. Government | 19,094,877 | — | 19,094,877 | — | ||||||||
Other Mutual Funds | 26,855,000 | — | 26,855,000 | — | ||||||||
Variable Rate Notes | ||||||||||||
Banking-Domestic | 60,250,991 | — | 60,250,991 | — | ||||||||
Banking-Foreign | 24,310,000 | — | 24,310,000 | — | ||||||||
Brokerage | 9,614,767 | — | 9,614,767 | — | ||||||||
Consumer Cyclical | 12,010,000 | — | 12,010,000 | — | ||||||||
U.S. Government | 88,263,444 | — | 88,263,444 | — | ||||||||
Total | $ | 621,141,286 | $ | — | $ | 621,141,286 | $ | — | ||||
The accompanying Notes to Financial Statements are an integral part of this schedule.
282
Table of Contents
[THIS PAGE INTENTIONALLY LEFT BLANK]
283
Table of Contents
Statement of Assets and Liabilities
As of June 30, 2009 (unaudited) | Aggressive Allocation Portfolio | Moderately Aggressive Allocation Portfolio | Moderate Allocation Portfolio | Moderately Conservative Allocation Portfolio | ||||||||||||
Assets | ||||||||||||||||
Investments at cost | $ | 552,036,334 | $ | 2,064,565,368 | $ | 2,615,874,533 | $ | 999,882,379 | ||||||||
Investments in securities at market value | 13,397,262 | 72,380,885 | 120,163,031 | 44,400,029 | ||||||||||||
Investments in affiliates at market value | 384,241,393 | 1,457,632,046 | 1,930,993,109 | 795,843,571 | ||||||||||||
Investments at Market Value | 397,638,655 | 1,530,012,931 | 2,051,156,140 | 840,243,600 | ||||||||||||
Cash | — | 4,246 | 916 | 1,591 | ||||||||||||
Dividends and interest receivable | 6,656 | 96,593 | 190,805 | 100,762 | ||||||||||||
Prepaid expenses | 5,143 | 12,082 | 15,413 | 8,043 | ||||||||||||
Receivable for investments sold | 66,175 | — | — | — | ||||||||||||
Receivable for fund shares sold | 96,917 | 1,386,868 | 3,353,715 | 665,232 | ||||||||||||
Unrealized gain on forward contracts | — | — | — | — | ||||||||||||
Total Assets | 397,813,546 | 1,531,512,720 | 2,054,716,989 | 841,019,228 | ||||||||||||
Liabilities | ||||||||||||||||
Accrued expenses | 35,107 | 67,779 | 69,847 | 34,398 | ||||||||||||
Payable for investments purchased | — | 1,033,933 | 2,918,761 | 485,794 | ||||||||||||
Payable upon return of collateral for securities loaned | — | — | — | — | ||||||||||||
Payable for fund shares redeemed | 99,944 | 103,269 | 103,942 | 38,079 | ||||||||||||
Unrealized loss on forward contracts | — | — | — | — | ||||||||||||
Payable for variation margin | 130,765 | 562,430 | 854,355 | 341,765 | ||||||||||||
Payable to affiliate | 63,147 | 249,666 | 331,011 | 141,358 | ||||||||||||
Total Liabilities | 328,963 | 2,017,077 | 4,277,916 | 1,041,394 | ||||||||||||
Net Assets | ||||||||||||||||
Capital stock (beneficial interest) | 502,720,596 | 1,887,216,484 | 2,409,347,369 | 928,641,891 | ||||||||||||
Accumulated undistributed net investment income/(loss) | 19,290,077 | 90,355,307 | 128,684,757 | 48,598,192 | ||||||||||||
Accumulated undistributed net realized gain/(loss) | 30,873,116 | 91,386,680 | 84,039,779 | 24,495,631 | ||||||||||||
Net unrealized appreciation/(depreciation) on: | ||||||||||||||||
Investments | 1,002 | (1,655,886 | ) | (3,819,632 | ) | (2,092,609 | ) | |||||||||
Affiliated investments | (154,398,681 | ) | (532,896,551 | ) | (560,898,761 | ) | (157,546,170 | ) | ||||||||
Futures contracts | (1,001,527 | ) | (4,910,391 | ) | (6,914,439 | ) | (2,119,101 | ) | ||||||||
Foreign currency forward contracts | — | — | — | — | ||||||||||||
Foreign currency transactions | — | — | — | — | ||||||||||||
Total Net Assets | $ | 397,484,583 | $ | 1,529,495,643 | $ | 2,050,439,073 | $ | 839,977,834 | ||||||||
Shares of beneficial interest outstanding | 43,849,785 | 165,414,951 | 214,447,908 | 84,755,791 | ||||||||||||
Net asset value per share | $ | 9.06 | $ | 9.25 | $ | 9.56 | $ | 9.91 | ||||||||
The accompanying Notes to Financial Statements are an integral part of this schedule.
284
Table of Contents
Thrivent Series Fund, Inc.
Statement of Assets and Liabilities – continued
| Technology Portfolio | Partner Healthcare Portfolio | Partner Natural Resources Portfolio | Partner Emerging Markets Portfolio | Real Estate Securities Portfolio | Partner Utilities Portfolio | Partner Small Cap Growth Portfolio | ||||||||||||||||||||
| $ | 23,007,430 | $ | 10,069,216 | $ | 15,025,429 | $ | 8,429,732 | $ | 307,202,196 | $ | 6,235,318 | $ | 144,673,346 | |||||||||||||
| 22,379,544 | 10,119,606 | 10,600,086 | 6,536,009 | 167,808,940 | 4,758,210 | 118,294,861 | ||||||||||||||||||||
| 4,651,986 | 155,373 | 1,625,164 | 13 | 30,956,498 | 459,341 | 35,427,705 | ||||||||||||||||||||
| 27,031,530 | 10,274,979 | 12,225,250 | 6,536,022 | 198,765,438 | 5,217,551 | 153,722,566 | ||||||||||||||||||||
| — | — | — | 29,450 | (a) | — | 357 | (b) | — | ||||||||||||||||||
| 16,793 | 23,314 | 8,382 | 18,175 | 782,294 | 14,339 | 41,800 | ||||||||||||||||||||
| 2,908 | 2,787 | 2,782 | 2,758 | 3,695 | 2,755 | 3,462 | ||||||||||||||||||||
| — | 257,098 | — | 68,945 | 150,121 | — | 1,900,585 | ||||||||||||||||||||
| 1,853 | 860 | 16,661 | 18,791 | 182,620 | 5,356 | 108,703 | ||||||||||||||||||||
| — | — | — | 31 | — | — | — | ||||||||||||||||||||
| 27,053,084 | 10,559,038 | 12,253,075 | 6,674,172 | 199,884,168 | 5,240,358 | 155,777,116 | ||||||||||||||||||||
| 21,178 | 10,279 | 10,938 | 14,324 | 51,018 | 10,137 | 28,596 | ||||||||||||||||||||
| — | — | 23,393 | 4,909 | 919,543 | — | 1,375,590 | ||||||||||||||||||||
| 2,510,954 | — | — | — | 25,490,440 | — | 29,191,894 | ||||||||||||||||||||
| 6,568 | 3,231 | 244 | 21,029 | 351,171 | 53 | 6,992 | ||||||||||||||||||||
| — | — | — | 190 | — | — | — | ||||||||||||||||||||
| — | — | — | — | — | — | 5,200 | ||||||||||||||||||||
| 23,054 | 8,950 | 8,399 | 3,556 | 130,752 | 544 | 103,703 | ||||||||||||||||||||
| 2,561,754 | 22,460 | 42,974 | 44,008 | 26,942,924 | 10,734 | 30,711,975 | ||||||||||||||||||||
| 38,095,034 | 10,452,591 | 15,243,680 | 9,300,634 | 305,588,679 | 6,765,076 | 185,887,252 | ||||||||||||||||||||
| (77,672 | ) | 36,562 | 11,861 | 51,810 | 4,175,846 | 71,851 | (140,026 | ) | ||||||||||||||||||
| (17,550,134 | ) | (158,904 | ) | (245,098 | ) | (829,624 | ) | (28,386,026 | ) | (589,471 | ) | (69,630,996 | ) | |||||||||||||
| 4,024,100 | 205,763 | (2,800,179 | ) | (1,893,710 | ) | (108,436,758 | ) | (1,017,767 | ) | 9,049,220 | ||||||||||||||||
| — | — | — | — | — | — | — | ||||||||||||||||||||
| — | — | — | — | — | — | (100,309 | ) | |||||||||||||||||||
| — | — | — | (159 | ) | — | — | — | |||||||||||||||||||
| 2 | 566 | (163 | ) | 1,213 | (497 | ) | (65 | ) | — | |||||||||||||||||
| $ | 24,491,330 | $ | 10,536,578 | $ | 12,210,101 | $ | 6,630,164 | $ | 172,941,244 | $ | 5,229,624 | $ | 125,065,141 | |||||||||||||
| 5,373,774 | 1,101,661 | 1,832,838 | 889,285 | 20,765,418 | 760,459 | 15,135,317 | ||||||||||||||||||||
| $ | 4.56 | $ | 9.56 | $ | 6.66 | $ | 7.46 | $ | 8.33 | $ | 6.88 | $ | 8.26 | |||||||||||||
| (a) | Includes foreign currency holdings of $29,820 (cost $28,656). |
| (b) | Includes foreign currency holdings of $357 (cost $359). |
The accompanying Notes to Financial Statements are an integral part of this schedule.
285
Table of Contents
Thrivent Series Fund, Inc.
Statement of Assets and Liabilities – continued
As of June 30, 2009 (unaudited) | Partner Small Cap Value Portfolio | Small Cap Stock Portfolio | Small Cap Index Portfolio | Mid Cap Growth Portfolio II | ||||||||||||
Assets | ||||||||||||||||
Investments at cost | $ | 244,144,874 | $ | 279,893,637 | $ | 234,583,178 | $ | 99,403,933 | ||||||||
Investments in securities at market value | 166,455,182 | 275,459,118 | 175,597,960 | 92,629,556 | ||||||||||||
Investments in affiliates at market value | 30,240,318 | 28,982,755 | 25,999,592 | 10,863,839 | ||||||||||||
Investments at Market Value | 196,695,500 | 304,441,873 | 201,597,552 | 103,493,395 | ||||||||||||
Cash | — | 100 | 197 | — | ||||||||||||
Dividends and interest receivable | 189,578 | 406,265 | 221,183 | 61,074 | ||||||||||||
Prepaid expenses | 3,729 | 4,537 | 3,851 | 3,294 | ||||||||||||
Receivable for investments sold | 329,729 | 4,894,109 | 1,285,556 | 100,121 | ||||||||||||
Receivable for fund shares sold | 136,705 | 157,156 | 320 | 62,268 | ||||||||||||
Unrealized gain on forward contracts | — | — | — | — | ||||||||||||
Receivable from affiliate | — | — | — | — | ||||||||||||
Total Assets | 197,355,241 | 309,904,040 | 203,108,659 | 103,720,152 | ||||||||||||
Liabilities | ||||||||||||||||
Accrued expenses | 36,569 | 63,428 | 69,830 | 18,781 | ||||||||||||
Other liabilities | — | — | — | — | ||||||||||||
Payable for investments purchased | 33,718 | 5,108,006 | 612,396 | — | ||||||||||||
Payable upon return of collateral for securities loaned | 27,419,237 | 28,385,989 | 25,999,591 | 6,588,180 | ||||||||||||
Payable for fund shares redeemed | 39,058 | 37,110 | 76,628 | 4,811 | ||||||||||||
Unrealized loss on forward contracts | — | — | — | — | ||||||||||||
Payable for variation margin | — | — | 6,866 | — | ||||||||||||
Payable to affiliate | 127,529 | 179,437 | 64,479 | 57,956 | ||||||||||||
Total Liabilities | 27,656,111 | 33,773,970 | 26,829,790 | 6,669,728 | ||||||||||||
Net Assets | ||||||||||||||||
Capital stock (beneficial interest) | 225,239,714 | 416,253,048 | 218,073,116 | 99,371,907 | ||||||||||||
Accumulated undistributed net investment income/(loss) | 960,467 | 898,766 | 1,025,014 | 12,376 | ||||||||||||
Accumulated undistributed net realized gain/(loss) | (9,051,477 | ) | (165,569,980 | ) | (9,708,719 | ) | (6,423,321 | ) | ||||||||
Net unrealized appreciation/(depreciation) on: | ||||||||||||||||
Investments | (47,449,374 | ) | 24,548,236 | (32,985,626 | ) | 4,089,462 | ||||||||||
Futures contracts | — | — | (124,916 | ) | — | |||||||||||
Foreign currency forward contracts | — | — | — | — | ||||||||||||
Foreign currency transactions | (200 | ) | — | — | — | |||||||||||
Total Net Assets | $ | 169,699,130 | $ | 276,130,070 | $ | 176,278,869 | $ | 97,050,424 | ||||||||
Shares of beneficial interest outstanding | 13,714,415 | 33,534,585 | 20,758,764 | 14,231,845 | ||||||||||||
Net asset value per share | $ | 12.37 | $ | 8.23 | $ | 8.49 | $ | 6.82 | ||||||||
The accompanying Notes to Financial Statements are an integral part of this schedule.
286
Table of Contents
Thrivent Series Fund, Inc.
Statement of Assets and Liabilities – continued
| Mid Cap Growth Portfolio | Partner Mid Cap Value Portfolio | Mid Cap Stock Portfolio | Mid Cap Index Portfolio | Partner Worldwide Allocation Portfolio | Partner International Stock Portfolio | Partner Socially Responsible Stock Portfolio | ||||||||||||||||||||
| $ | 371,180,058 | $ | 143,264,435 | $ | 481,622,593 | $ | 92,304,572 | $ | 156,986,896 | $ | 881,300,384 | $ | 4,410,265 | |||||||||||||
| 304,280,841 | 125,281,690 | 420,078,561 | 72,828,097 | 140,076,639 | 744,645,607 | 3,410,071 | ||||||||||||||||||||
| 18,908,937 | 9,931,932 | 33,964,751 | 8,460,569 | 13,918,598 | 37,900,001 | 12,501 | ||||||||||||||||||||
| 323,189,778 | 135,213,622 | 454,043,312 | 81,288,666 | 153,995,237 | 782,545,608 | 3,422,572 | ||||||||||||||||||||
| — | — | 4,517 | — | 109,056 | (a) | 579,729 | (b) | — | ||||||||||||||||||
| 371,931 | 233,098 | 312,402 | 81,367 | 646,561 | 2,652,652 | 4,421 | ||||||||||||||||||||
| 4,633 | 3,542 | 5,358 | 3,208 | 3,438 | 7,476 | 2,745 | ||||||||||||||||||||
| 160,194 | 4,949,727 | 210,284 | 1,066,988 | 176,046 | 546,611 | — | ||||||||||||||||||||
| 1,631 | 171,235 | 302,646 | 113 | 567,845 | 30 | 1,627 | ||||||||||||||||||||
| — | — | — | — | 26,324 | 9 | — | ||||||||||||||||||||
| — | — | — | — | — | — | 432 | ||||||||||||||||||||
| 323,728,167 | 140,571,224 | 454,878,519 | 82,440,342 | 155,524,507 | 786,332,115 | 3,431,797 | ||||||||||||||||||||
| 89,304 | 22,503 | 55,207 | 36,547 | 57,929 | 169,807 | 10,332 | ||||||||||||||||||||
| — | 35,509 | — | — | — | — | — | ||||||||||||||||||||
| — | 3,730,426 | 373,361 | 504,075 | 1,407,221 | 174,394 | — | ||||||||||||||||||||
| 16,539,541 | 4,982,498 | 32,397,507 | 7,690,716 | — | 34,613,876 | — | ||||||||||||||||||||
| 232,250 | 8,248 | 32,677 | 30,080 | 11,312 | 141,819 | 1,649 | ||||||||||||||||||||
| — | — | — | — | 4,218 | — | — | ||||||||||||||||||||
| — | — | — | 3,088 | 48,988 | — | — | ||||||||||||||||||||
| 121,346 | 93,662 | 263,530 | 30,607 | 81,201 | 536,485 | — | ||||||||||||||||||||
| 16,982,441 | 8,872,846 | 33,122,282 | 8,295,113 | 1,610,869 | 35,636,381 | 11,981 | ||||||||||||||||||||
| 464,956,405 | 187,707,682 | 605,377,060 | 89,767,396 | 178,773,144 | 1,159,803,396 | 4,832,603 | ||||||||||||||||||||
| 396,441 | 852,072 | 1,291,621 | 542,705 | 1,790,086 | 12,235,679 | 11,323 | ||||||||||||||||||||
| (110,616,840 | ) | (48,810,563 | ) | (157,333,163 | ) | (5,122,032 | ) | (23,623,905 | ) | (322,645,176 | ) | (436,417 | ) | |||||||||||||
| (47,990,280 | ) | (8,050,813 | ) | (27,579,281 | ) | (11,015,906 | ) | (2,991,659 | ) | (98,754,776 | ) | (987,693 | ) | |||||||||||||
| — | — | — | (26,934 | ) | (63,186 | ) | — | — | ||||||||||||||||||
| — | — | — | — | 22,106 | 9 | — | ||||||||||||||||||||
| — | — | — | — | 7,052 | 56,602 | — | ||||||||||||||||||||
| $ | 306,745,726 | $ | 131,698,378 | $ | 421,756,237 | $ | 74,145,229 | $ | 153,913,638 | $ | 750,695,734 | $ | 3,419,816 | |||||||||||||
| 26,627,507 | 15,251,151 | 53,335,975 | 9,031,756 | 23,645,716 | 89,929,726 | 474,861 | ||||||||||||||||||||
| $ | 11.52 | $ | 8.64 | $ | 7.91 | $ | 8.21 | $ | 6.51 | $ | 8.35 | $ | 7.20 | |||||||||||||
| (a) | Includes foreign currency holdings of $110,925 (cost $109,921). |
| (b) | Includes foreign currency holdings of $578,175 (cost $575,202). |
The accompanying Notes to Financial Statements are an integral part of this schedule.
287
Table of Contents
Thrivent Series Fund, Inc.
Statement of Assets and Liabilities – continued
As of June 30, 2009 (unaudited) | Partner All Cap Growth Portfolio | Partner All Cap Value Portfolio | Partner All Cap Portfolio | Large Cap Growth Portfolio II | ||||||||||||
Assets | ||||||||||||||||
Investments at cost | $ | 4,694,744 | $ | 3,378,507 | $ | 59,581,207 | $ | 322,730,284 | ||||||||
Investments in securities at market value | 3,814,349 | 2,873,140 | 53,988,290 | 347,414,165 | ||||||||||||
Investments in affiliates at market value | 100,136 | 236,251 | 2,817,287 | 11,195,016 | ||||||||||||
Investments at Market Value | 3,914,485 | 3,109,391 | 56,805,577 | 358,609,181 | ||||||||||||
Cash | — | — | — | 2,760 | ||||||||||||
Dividends and interest receivable | 1,683 | 4,841 | 58,648 | 205,790 | ||||||||||||
Prepaid expenses | 2,740 | 2,738 | 3,084 | 4,926 | ||||||||||||
Receivable for investments sold | — | 32,707 | 754,998 | 3,365,636 | ||||||||||||
Receivable for fund shares sold | 8,077 | 1,658 | 785 | 283,279 | ||||||||||||
Receivable from affiliate | 110 | 1,969 | — | — | ||||||||||||
Total Assets | 3,927,095 | 3,153,304 | 57,623,092 | 362,471,572 | ||||||||||||
Liabilities | ||||||||||||||||
Accrued expenses | 10,587 | 12,378 | 26,799 | 29,292 | ||||||||||||
Payable for investments purchased | 38,122 | 90,257 | 476,721 | 2,451,030 | ||||||||||||
Payable upon return of collateral for securities loaned | — | — | 2,577,600 | 8,856,958 | ||||||||||||
Payable for fund shares redeemed | 3,254 | 38 | 35,625 | 8,463 | ||||||||||||
Unrealized loss on forward contracts | — | — | — | — | ||||||||||||
Open options written, at value | — | — | — | 19,340 | ||||||||||||
Payable for variation margin | — | — | — | — | ||||||||||||
Payable to affiliate | — | — | 44,081 | 179,532 | ||||||||||||
Mortgage dollar roll deferred revenue | — | — | — | — | ||||||||||||
Total Liabilities | 51,963 | 102,673 | 3,160,826 | 11,544,615 | ||||||||||||
Net Assets | ||||||||||||||||
Capital stock (beneficial interest) | 5,697,019 | 4,877,009 | 84,534,661 | 317,404,764 | ||||||||||||
Accumulated undistributed net investment income/(loss) | (2,115 | ) | 35,704 | 227,276 | 1,462,310 | |||||||||||
Accumulated undistributed net realized gain/(loss) | (1,039,513 | ) | (1,592,966 | ) | (27,524,041 | ) | (3,846,083 | ) | ||||||||
Net unrealized appreciation/(depreciation) on: | ||||||||||||||||
Investments | (780,259 | ) | (269,116 | ) | (2,775,630 | ) | 35,878,897 | |||||||||
Written option contracts | — | — | — | 27,069 | ||||||||||||
Futures contracts | — | — | — | — | ||||||||||||
Foreign currency forward contracts | — | — | — | — | ||||||||||||
Foreign currency transactions | — | — | — | — | ||||||||||||
Total Net Assets | $ | 3,875,132 | $ | 3,050,631 | $ | 54,462,266 | $ | 350,926,957 | ||||||||
Shares of beneficial interest outstanding | 612,775 | 480,732 | 8,584,902 | 52,632,126 | ||||||||||||
Net asset value per share | $ | 6.32 | $ | 6.35 | $ | 6.34 | $ | 6.67 | ||||||||
The accompanying Notes to Financial Statements are an integral part of this schedule.
288
Table of Contents
Thrivent Series Fund, Inc.
Statement of Assets and Liabilities – continued
| Large Cap Growth Portfolio | Partner Growth Stock Portfolio | Large Cap Value Portfolio | Large Cap Stock Portfolio | Large Cap Index Portfolio | Equity Income Plus Portfolio | Balanced Portfolio | ||||||||||||||||||||
| $ | 862,488,927 | $ | 49,904,926 | $ | 686,619,969 | $ | 505,263,174 | $ | 364,357,308 | $ | 45,224,380 | $ | 314,304,351 | |||||||||||||
| 885,567,303 | 53,066,960 | 628,068,550 | 493,691,877 | 292,260,892 | 35,097,746 | 273,372,294 | ||||||||||||||||||||
| 20,835,624 | 754,247 | 21,573,658 | 12,491,724 | 9,943,968 | 6,390,430 | 10,253,530 | ||||||||||||||||||||
| 906,402,927 | 53,821,207 | 649,642,208 | 506,183,601 | 302,204,860 | 41,488,176 | 283,625,824 | ||||||||||||||||||||
| 2,096 | — | 3,734 | 8,753 | 1,820 | — | 1,190 | ||||||||||||||||||||
| 490,164 | 54,553 | 605,380 | 438,502 | 444,416 | 79,006 | 827,641 | ||||||||||||||||||||
| 8,555 | 3,082 | 6,810 | 5,948 | 4,717 | 2,986 | 4,517 | ||||||||||||||||||||
| 2,193,028 | 378,795 | 17,143,414 | 7,882,234 | 241,828 | 102,220 | 145,105 | ||||||||||||||||||||
| 464 | 11,044 | 491,145 | 245,345 | 29 | 45,312 | 4,433 | ||||||||||||||||||||
| — | — | — | — | — | — | — | ||||||||||||||||||||
| 909,097,234 | 54,268,681 | 667,892,691 | 514,764,383 | 302,897,670 | 41,717,700 | 284,608,710 | ||||||||||||||||||||
| 219,018 | 26,168 | 91,230 | 90,565 | 97,112 | 15,427 | 75,345 | ||||||||||||||||||||
| 4,297,485 | 229,593 | 7,816,413 | 3,954,348 | 493,687 | — | 19,776,713 | ||||||||||||||||||||
| 20,712,287 | 570,550 | 19,683,341 | 10,379,018 | 5,861,549 | — | 6,481,223 | ||||||||||||||||||||
| 444,533 | 15,386 | 48,036 | 93,064 | 181,084 | 37 | 85,636 | ||||||||||||||||||||
| — | 966 | — | — | — | — | — | ||||||||||||||||||||
| 48,900 | — | — | 12,420 | — | 7,625 | — | ||||||||||||||||||||
| — | — | — | 152,730 | 29,680 | 30,085 | 17,100 | ||||||||||||||||||||
| 336,043 | 40,634 | 354,599 | 301,032 | 101,074 | 24,974 | 89,744 | ||||||||||||||||||||
| — | — | — | — | — | — | 19,431 | ||||||||||||||||||||
| 26,058,266 | 883,297 | 27,993,619 | 14,983,177 | 6,764,186 | 78,148 | 26,545,192 | ||||||||||||||||||||
| 2,215,074,889 | 62,636,477 | 915,698,985 | 735,060,869 | 384,081,336 | 60,678,175 | 294,680,575 | ||||||||||||||||||||
| 4,088,211 | 28,886 | 6,423,107 | 3,582,441 | 3,397,339 | 498,294 | 3,630,547 | ||||||||||||||||||||
| (1,380,106,574 | ) | (13,196,295 | ) | (245,245,259 | ) | (239,573,408 | ) | (29,087,763 | ) | (15,705,886 | ) | (9,505,717 | ) | |||||||||||||
| 43,914,000 | 3,916,281 | (36,977,761 | ) | 920,427 | (62,152,448 | ) | (3,736,204 | ) | (30,678,527 | ) | ||||||||||||||||
| 68,442 | — | — | 17,383 | — | 3,244 | — | ||||||||||||||||||||
| — | — | — | (226,506 | ) | (104,980 | ) | (98,071 | ) | (63,360 | ) | ||||||||||||||||
| — | (966 | ) | — | — | — | — | — | |||||||||||||||||||
| — | 1,001 | — | — | — | — | — | ||||||||||||||||||||
| $ | 883,038,968 | $ | 53,385,384 | $ | 639,899,072 | $ | 499,781,206 | $ | 296,133,484 | $ | 41,639,552 | $ | 258,063,518 | |||||||||||||
| 70,461,273 | 6,678,592 | 79,938,671 | 78,578,507 | 23,014,222 | 6,186,123 | 22,562,291 | ||||||||||||||||||||
| $ | 12.53 | $ | 7.99 | $ | 8.00 | $ | 6.36 | $ | 12.87 | $ | 6.73 | $ | 11.44 | |||||||||||||
The accompanying Notes to Financial Statements are an integral part of this schedule.
289
Table of Contents
Thrivent Series Fund, Inc.
Statement of Assets and Liabilities – continued
As of June 30, 2009 (unaudited) | High Yield Portfolio | Diversified Income Plus Portfolio | Partner Socially Responsible Bond Portfolio | Income Portfolio | ||||||||||||
Assets | ||||||||||||||||
Investments at cost | $ | 825,753,822 | $ | 85,048,917 | $ | 6,797,675 | $ | 1,353,414,100 | ||||||||
Investments in securities at market value | 692,786,229 | 69,949,420 | 5,957,325 | 1,211,282,883 | ||||||||||||
Investments in affiliates at market value | 59,146,628 | 5,119,132 | 819,283 | 51,827,175 | ||||||||||||
Investments at Market Value | 751,932,857 | 75,068,552 | 6,776,608 | 1,263,110,058 | ||||||||||||
Cash | 3,452 | — | — | 33,268 | ||||||||||||
Dividends and interest receivable | 14,119,388 | 847,089 | 60,931 | 14,124,389 | ||||||||||||
Prepaid expenses | 7,277 | 3,227 | 2,773 | 10,468 | ||||||||||||
Receivable for investments sold | 4,507,013 | 117,535 | — | 16,068,673 | ||||||||||||
Receivable for fund shares sold | 233,784 | 142 | 6,032 | 745,137 | ||||||||||||
Receivable for variation margin | — | 19,913 | 1,250 | 228,906 | ||||||||||||
Total Assets | 770,803,771 | 76,056,458 | 6,847,594 | 1,294,320,899 | ||||||||||||
Liabilities | ||||||||||||||||
Accrued expenses | 110,434 | 31,559 | 11,057 | 134,380 | ||||||||||||
Payable for investments purchased | 2,283,448 | — | 80,629 | 112,177,364 | ||||||||||||
Payable upon return of collateral for securities loaned | 58,870,977 | 1,292,240 | — | 36,248,935 | ||||||||||||
Payable for fund shares redeemed | 188,938 | 30,224 | 6,145 | 230,385 | ||||||||||||
Open options written, at value | — | 4,575 | — | — | ||||||||||||
Swap agreements, at value | — | — | — | 139,909 | ||||||||||||
Payable for variation margin | — | 21,893 | 5,156 | 152,037 | ||||||||||||
Payable to affiliate | 265,722 | 32,734 | 284 | 414,975 | ||||||||||||
Mortgage dollar roll deferred revenue | — | — | — | 55,278 | ||||||||||||
Total Liabilities | 61,719,519 | 1,413,225 | 103,271 | 149,553,263 | ||||||||||||
Net Assets | ||||||||||||||||
Capital stock (beneficial interest) | 1,752,094,625 | 110,868,905 | 6,779,424 | 1,332,531,791 | ||||||||||||
Accumulated undistributed net investment income/(loss) | 1,134,794 | 2,738,817 | 16,084 | 653,991 | ||||||||||||
Accumulated undistributed net realized gain/(loss) | (970,324,202 | ) | (28,947,548 | ) | (69,510 | ) | (100,114,470 | ) | ||||||||
Net unrealized appreciation/(depreciation) on: | ||||||||||||||||
Investments | (73,820,965 | ) | (9,980,365 | ) | (21,067 | ) | (92,424,849 | ) | ||||||||
Affiliated investments | — | — | — | 2,120,807 | ||||||||||||
Written option contracts | — | 1,946 | — | — | ||||||||||||
Futures contracts | — | (38,522 | ) | 39,392 | 1,850,484 | |||||||||||
Swap agreements | — | — | — | 149,882 | ||||||||||||
Total Net Assets | $ | 709,084,252 | $ | 74,643,233 | $ | 6,744,323 | $ | 1,144,767,636 | ||||||||
Shares of beneficial interest outstanding | 174,723,609 | 14,485,320 | 677,773 | 132,924,927 | ||||||||||||
Net asset value per share | $ | 4.06 | $ | 5.15 | $ | 9.95 | $ | 8.61 | ||||||||
The accompanying Notes to Financial Statements are an integral part of this schedule.
290
Table of Contents
Thrivent Series Fund, Inc.
Statement of Assets and Liabilities – continued
| Bond Index Portfolio | Limited Maturity Bond Portfolio | Mortgage Securities Portfolio | Money Market Portfolio | |||||||||||
| $ | 221,556,177 | $ | 1,141,796,501 | $ | 52,935,154 | $ | 621,141,286 | |||||||
| 203,153,309 | 1,021,342,856 | 47,595,381 | 621,141,286 | |||||||||||
| 5,066,924 | 63,841,993 | 899 | — | |||||||||||
| 208,220,233 | 1,085,184,849 | 47,596,280 | 621,141,286 | a | ||||||||||
| 2,955 | 1,021 | 1,790 | 1,162 | |||||||||||
| 1,072,862 | 6,229,372 | 61,564 | 522,882 | |||||||||||
| 3,918 | 9,562 | 2,952 | 70,432 | |||||||||||
| — | 8,028,342 | 986,406 | — | |||||||||||
| 85,491 | 903,185 | 62 | 3,007,832 | |||||||||||
| — | 258,530 | — | — | |||||||||||
| 209,385,459 | 1,100,614,861 | 48,649,054 | 624,743,594 | |||||||||||
| 46,426 | 92,611 | 20,204 | 75,060 | |||||||||||
| 52,094,313 | 69,300,444 | 18,551,078 | 11,078,602 | |||||||||||
| 1,457,625 | 46,444,495 | — | — | |||||||||||
| 52,745 | 59,627 | 3,279 | 3,324,336 | |||||||||||
| — | 6,875 | 187 | — | |||||||||||
| — | 353,218 | — | — | |||||||||||
| — | 1,016 | 938 | — | |||||||||||
| 55,314 | 356,132 | 20,352 | 179,248 | |||||||||||
| 68,033 | 54,179 | 15,723 | — | |||||||||||
| 53,774,456 | 116,668,597 | 18,611,761 | 14,657,246 | |||||||||||
| 171,926,181 | 1,065,450,383 | 35,711,967 | 610,086,348 | |||||||||||
| (159,917 | ) | 322,690 | 178,166 | (55,337 | ) | |||||||||
| (2,819,317 | ) | (25,291,420 | ) | (516,723 | ) | 55,337 | ||||||||
| (13,335,944 | ) | (58,280,803 | ) | (5,338,874 | ) | — | ||||||||
| — | 1,669,151 | — | — | |||||||||||
| — | 27,170 | 741 | — | |||||||||||
| — | (170,812 | ) | 2,016 | — | ||||||||||
| — | 219,905 | — | — | |||||||||||
| $ | 155,611,003 | $ | 983,946,264 | $ | 30,037,293 | $ | 610,086,348 | |||||||
| 16,028,385 | 106,927,711 | 3,383,697 | 610,086,348 | |||||||||||
| $ | 9.71 | $ | 9.20 | $ | 8.88 | $ | 1.00 | |||||||
| a | Securities held by this fund are valued on the basis of amortized cost, which approximates market value. |
The accompanying Notes to Financial Statements are an integral part of this schedule.
291
Table of Contents
Statement of Operations
For the six months ended June 30, 2009 (unaudited) | Aggressive Allocation Portfolio | Moderately Aggressive Allocation Portfolio | Moderate Allocation Portfolio | Moderately Conservative Allocation Portfolio | ||||||||||||
Investment Income | ||||||||||||||||
Dividends | $ | — | $ | — | $ | — | $ | — | ||||||||
Interest | 11,918 | 694,208 | 1,554,275 | 839,988 | ||||||||||||
Income from securities loaned | — | — | — | — | ||||||||||||
Income from affiliated investments | 1,456,774 | 12,764,748 | 25,051,350 | 11,633,598 | ||||||||||||
Foreign dividend tax withholding | — | — | — | — | ||||||||||||
Total Investment Income | 1,468,692 | 13,458,956 | 26,605,625 | 12,473,586 | ||||||||||||
Expenses | ||||||||||||||||
Adviser fees | 268,939 | 936,421 | 1,243,746 | 541,923 | ||||||||||||
Sub-Adviser fees | — | — | — | — | ||||||||||||
Administrative service fees | 74,810 | 173,741 | 220,212 | 113,803 | ||||||||||||
Audit and legal fees | 11,473 | 23,013 | 28,278 | 15,623 | ||||||||||||
Custody fees | 3,345 | 4,146 | 7,291 | 3,711 | ||||||||||||
Insurance expenses | 3,211 | 7,397 | 9,210 | 4,685 | ||||||||||||
Printing and postage expenses | 17,850 | 39,315 | 35,925 | 12,963 | ||||||||||||
Directors’ fees | 2,088 | 2,088 | 2,089 | 2,089 | ||||||||||||
Other expenses | 2,858 | 3,679 | 3,928 | 3,178 | ||||||||||||
Total Expenses Before Reimbursement | 384,574 | 1,189,800 | 1,550,679 | 697,975 | ||||||||||||
Less: | ||||||||||||||||
Reimbursement from adviser | (10,807 | ) | — | — | — | |||||||||||
Custody earnings credit | — | (6 | ) | (17 | ) | — | ||||||||||
Total Net Expenses | 373,767 | 1,189,794 | 1,550,662 | 697,975 | ||||||||||||
Net Investment Income/(Loss) | 1,094,925 | 12,269,162 | 25,054,963 | 11,775,611 | ||||||||||||
Realized and Unrealized Gains/(Losses) | ||||||||||||||||
Net realized gains/(losses) on: | ||||||||||||||||
Investments | 107 | 1,325 | 421 | 402 | ||||||||||||
Affiliated investments | (1,434,272 | ) | (2,852,805 | ) | (8,777,227 | ) | (295,588 | ) | ||||||||
Distributions of realized capital gains from affiliated investments | 9,960 | 37,420 | 45,457 | 12,040 | ||||||||||||
Futures contracts | 4,810,197 | 22,918,696 | 35,748,283 | 12,769,992 | ||||||||||||
Foreign currency transactions | — | — | — | — | ||||||||||||
Change in net unrealized appreciation/(depreciation) on: | ||||||||||||||||
Investments | 1,002 | 302,370 | 685,941 | 372,922 | ||||||||||||
Affiliated investments | 21,568,863 | 75,026,555 | 93,299,302 | 33,197,795 | ||||||||||||
Futures contracts | (1,670,502 | ) | (8,695,447 | ) | (13,164,314 | ) | (3,650,583 | ) | ||||||||
Foreign currency forward contracts | — | — | — | — | ||||||||||||
Foreign currency transactions | — | — | — | — | ||||||||||||
Net Realized and Unrealized Gains/(Losses) | 23,285,355 | 86,738,114 | 107,837,863 | 42,406,980 | ||||||||||||
Net Increase/(Decrease) in Net Assets Resulting From Operations | $ | 24,380,280 | $ | 99,007,276 | $ | 132,892,826 | $ | 54,182,591 | ||||||||
The accompanying Notes to Financial Statements are an integral part of this schedule.
292
Table of Contents
Thrivent Series Fund, Inc.
Statement of Operations – continued
| Technology Portfolio | Partner Healthcare Portfolio | Partner Natural Resources Portfolio | Partner Emerging Markets Portfolio | Real Estate Securities Portfolio | Partner Utilities Portfolio | Partner Small Cap Growth Portfolio | ||||||||||||||||||||
| $ | 67,540 | $ | 101,469 | $ | 62,890 | $ | 99,605 | $ | 4,693,110 | $ | 93,681 | $ | 275,659 | |||||||||||||
| 16 | — | 251 | 22 | 102,212 | — | 3,473 | ||||||||||||||||||||
| 12,157 | — | — | — | 108,122 | — | 118,629 | ||||||||||||||||||||
| 5,463 | 2,051 | 4,208 | 164 | 18,298 | 1,228 | 25,315 | ||||||||||||||||||||
| (3,340 | ) | (7,902 | ) | (2,883 | ) | (6,725 | ) | (7,883 | ) | (2,177 | ) | (676 | ) | |||||||||||||
| 81,836 | 95,618 | 64,466 | 93,066 | 4,913,859 | 92,732 | 422,400 | ||||||||||||||||||||
| 92,468 | 12,599 | 13,041 | 9,205 | 629,049 | 6,579 | 262,759 | ||||||||||||||||||||
| — | 27,297 | 19,562 | 22,879 | — | 9,869 | 273,438 | ||||||||||||||||||||
| 42,466 | 40,840 | 40,869 | 40,535 | 55,726 | 40,438 | 50,723 | ||||||||||||||||||||
| 7,665 | 7,464 | 7,459 | 4,931 | 9,611 | 7,430 | 8,682 | ||||||||||||||||||||
| 677 | 1,110 | 1,262 | 3,258 | 5,200 | 2,149 | 9,430 | ||||||||||||||||||||
| 1,831 | 1,725 | 1,724 | 1,723 | 2,551 | 1,714 | 2,190 | ||||||||||||||||||||
| 6,630 | 228 | 261 | 120 | 19,950 | 84 | 6,492 | ||||||||||||||||||||
| 2,123 | 1,920 | 1,921 | 1,920 | 6,560 | 1,919 | 4,683 | ||||||||||||||||||||
| 3,125 | 3,250 | 4,829 | 4,469 | 4,227 | 4,348 | 3,726 | ||||||||||||||||||||
| 156,985 | 96,433 | 90,928 | 89,040 | 732,874 | 74,530 | 622,123 | ||||||||||||||||||||
| (2,775 | ) | (38,059 | ) | (39,049 | ) | (48,935 | ) | (9,564 | ) | (54,686 | ) | (66,016 | ) | |||||||||||||
| — | — | (148 | ) | — | (1 | ) | (106 | ) | — | |||||||||||||||||
| 154,210 | 58,374 | 51,731 | 40,105 | 723,309 | 19,738 | 556,107 | ||||||||||||||||||||
| (72,374 | ) | 37,244 | 12,735 | 52,961 | 4,190,550 | 72,994 | (133,707 | ) | ||||||||||||||||||
| (1,957,025 | ) | (28,052 | ) | (167,338 | ) | (497,866 | ) | (19,312,497 | ) | (161,174 | ) | (17,933,276 | ) | |||||||||||||
| — | — | — | — | — | — | — | ||||||||||||||||||||
| — | — | — | — | — | — | — | ||||||||||||||||||||
| (157,196 | ) | — | — | — | — | — | 830,380 | |||||||||||||||||||
| (1,574 | ) | (381 | ) | (1,578 | ) | 935 | — | (183 | ) | — | ||||||||||||||||
| 7,786,306 | 746,091 | 1,485,376 | 2,098,212 | (8,058,023 | ) | 106,253 | 29,725,098 | |||||||||||||||||||
| — | — | — | — | — | — | — | ||||||||||||||||||||
| — | — | — | — | — | — | (641,877 | ) | |||||||||||||||||||
| — | — | 2,272 | (159 | ) | — | 55 | — | |||||||||||||||||||
| 2 | 544 | (2,156 | ) | 1,356 | 301 | 174 | — | |||||||||||||||||||
| 5,670,513 | 718,202 | 1,316,576 | 1,602,478 | (27,370,219 | ) | (54,875 | ) | 11,980,325 | ||||||||||||||||||
| $ | 5,598,139 | $ | 755,446 | $ | 1,329,311 | $ | 1,655,439 | $ | (23,179,669 | ) | $ | 18,119 | $ | 11,846,618 | ||||||||||||
The accompanying Notes to Financial Statements are an integral part of this schedule.
293
Table of Contents
Thrivent Series Fund, Inc.
Statement of Operations – continued
For the six months ended June 30, 2009 (unaudited) | Partner Small Cap Value Portfolio | Small Cap Stock Portfolio | Small Cap Index Portfolio | Mid Cap Growth Portfolio II | ||||||||||||
Investment Income | ||||||||||||||||
Dividends | $ | 1,560,428 | $ | 1,699,523 | $ | 1,249,831 | $ | 231,094 | ||||||||
Interest | — | 9,519 | 2,611 | 200 | ||||||||||||
Income from securities loaned | 62,108 | 186,729 | 160,234 | 40,978 | ||||||||||||
Income from affiliated investments | 7,800 | 19,099 | 4,378 | 11,239 | ||||||||||||
Foreign dividend tax withholding | (685 | ) | (5,826 | ) | (574 | ) | (2,518 | ) | ||||||||
Total Investment Income | 1,629,651 | 1,909,044 | 1,416,480 | 280,993 | ||||||||||||
Expenses | ||||||||||||||||
Adviser fees | 150,315 | 891,418 | 289,041 | 372,398 | ||||||||||||
Sub-Adviser fees | 450,945 | — | — | — | ||||||||||||
Administrative service fees | 55,031 | 65,903 | 56,517 | 48,275 | ||||||||||||
Audit and legal fees | 9,299 | 10,686 | 9,606 | 8,311 | ||||||||||||
Custody fees | 1,874 | 32,468 | 21,580 | 4,487 | ||||||||||||
Insurance expenses | 2,304 | 2,880 | 2,547 | 1,930 | ||||||||||||
Printing and postage expenses | 11,697 | 17,937 | 22,143 | 3,240 | ||||||||||||
Directors’ fees | 5,903 | 8,868 | 6,957 | 2,734 | ||||||||||||
Other expenses | 3,988 | 5,540 | 7,342 | 3,158 | ||||||||||||
Total Expenses Before Reimbursement | 691,356 | 1,035,700 | 415,733 | 444,533 | ||||||||||||
Less: | ||||||||||||||||
Reimbursement from adviser | (4,596 | ) | (8,481 | ) | (2,431 | ) | (181,699 | ) | ||||||||
Custody earnings credit | — | (5 | ) | — | (14 | ) | ||||||||||
Total Net Expenses | 686,760 | 1,027,214 | 413,302 | 262,820 | ||||||||||||
Net Investment Income/(Loss) | 942,891 | 881,830 | 1,003,178 | 18,173 | ||||||||||||
Realized and Unrealized Gains/(Losses) | ||||||||||||||||
Net realized gains/(losses) on: | ||||||||||||||||
Investments | (7,937,116 | ) | (40,459,190 | ) | (2,952,977 | ) | (4,104,669 | ) | ||||||||
Futures contracts | — | 760,128 | 753,824 | — | ||||||||||||
Foreign currency transactions | (2,407 | ) | (206 | ) | — | — | ||||||||||
Change in net unrealized appreciation/(depreciation) on: | ||||||||||||||||
Investments | 10,509,145 | 29,533,095 | 490,442 | 20,157,248 | ||||||||||||
Futures contracts | — | — | (228,152 | )�� | — | |||||||||||
Foreign currency forward contracts | — | — | — | — | ||||||||||||
Foreign currency transactions | (200 | ) | — | — | — | |||||||||||
Net Realized and Unrealized Gains/(Losses) | 2,569,422 | (10,166,173 | ) | (1,936,863 | ) | 16,052,579 | ||||||||||
Net Increase/(Decrease) in Net Assets Resulting From Operations | $ | 3,512,313 | $ | (9,284,343 | ) | $ | (933,685 | ) | $ | 16,070,752 | ||||||
The accompanying Notes to Financial Statements are an integral part of this schedule.
294
Table of Contents
Thrivent Series Fund, Inc.
Statement of Operations – continued
| Mid Cap Growth Portfolio | Partner Mid Cap Value Portfolio | Mid Cap Stock Portfolio | Mid Cap Index Portfolio | Partner Worldwide Allocation Portfolio | Partner International Stock Portfolio | Partner Socially Responsible Stock Portfolio | ||||||||||||||||||||
| $ | 1,018,736 | $ | 1,342,496 | $ | 2,554,663 | $ | 667,880 | $ | 2,181,216 | $ | 17,180,789 | $ | 27,790 | |||||||||||||
| 5,025 | — | 8,383 | 539 | 438,342 | (1,370 | ) | — | |||||||||||||||||||
| 99,696 | 21,447 | 131,651 | 50,255 | — | 404,210 | — | ||||||||||||||||||||
| 23,464 | 9,926 | 16,751 | 3,436 | 33,741 | 77,614 | 233 | ||||||||||||||||||||
| (5,708 | ) | — | — | — | (211,775 | ) | (1,724,372 | ) | (801 | ) | ||||||||||||||||
| 1,141,213 | 1,373,869 | 2,711,448 | 722,110 | 2,441,524 | 15,936,871 | 27,222 | ||||||||||||||||||||
| 548,757 | 146,786 | 1,273,381 | 121,507 | 202,682 | 1,538,723 | 4,658 | ||||||||||||||||||||
| — | 293,572 | — | — | 300,261 | 1,346,031 | 7,763 | ||||||||||||||||||||
| 67,438 | 51,743 | 77,655 | 46,944 | 51,176 | 109,020 | 40,310 | ||||||||||||||||||||
| 10,538 | 8,789 | 11,725 | 8,254 | 6,023 | 16,147 | 8,068 | ||||||||||||||||||||
| 8,443 | 5,888 | 6,802 | 14,435 | 123,709 | 84,033 | 908 | ||||||||||||||||||||
| 3,184 | 2,110 | 3,125 | 2,051 | 2,087 | 5,276 | 1,711 | ||||||||||||||||||||
| 40,941 | 2,283 | 16,308 | 12,834 | 246 | 53,655 | 12 | ||||||||||||||||||||
| 9,598 | 4,767 | 11,182 | 2,785 | 3,917 | 20,065 | 1,919 | ||||||||||||||||||||
| 5,072 | 3,485 | 4,670 | 5,341 | 24,218 | 20,455 | 2,892 | ||||||||||||||||||||
| 693,971 | 519,423 | 1,404,848 | 214,151 | 714,319 | 3,193,405 | 68,241 | ||||||||||||||||||||
| (9,526 | ) | (4,869 | ) | (8,113 | ) | (1,632 | ) | (155,447 | ) | (201,534 | ) | (53,025 | ) | |||||||||||||
| (11 | ) | — | (21 | ) | — | (46 | ) | (3 | ) | — | ||||||||||||||||
| 684,434 | 514,554 | 1,396,714 | 212,519 | 558,826 | 2,991,868 | 15,216 | ||||||||||||||||||||
| 456,779 | 859,315 | 1,314,734 | 509,591 | 1,882,698 | 12,945,003 | 12,006 | ||||||||||||||||||||
| (39,483,282 | ) | (20,704,362 | ) | (37,523,313 | ) | (3,321,548 | ) | (10,020,526 | ) | (138,000,992 | ) | (155,904 | ) | |||||||||||||
| — | — | — | 180,921 | 407,942 | — | — | ||||||||||||||||||||
| — | — | — | — | (79,880 | ) | (27,608 | ) | — | ||||||||||||||||||
| 91,385,493 | 25,435,773 | 78,734,626 | 7,888,883 | 19,913,775 | 136,034,013 | 482,934 | ||||||||||||||||||||
| — | — | — | (79,513 | ) | (210,819 | ) | — | — | ||||||||||||||||||
| — | — | — | — | 12,893 | 9 | — | ||||||||||||||||||||
| — | — | — | — | 9,836 | 63,933 | — | ||||||||||||||||||||
| 51,902,211 | 4,731,411 | 41,211,313 | 4,668,743 | 10,033,221 | (1,930,645 | ) | 327,030 | |||||||||||||||||||
| $ | 52,358,990 | $ | 5,590,726 | $ | 42,526,047 | $ | 5,178,334 | $ | 11,915,919 | $ | 11,014,358 | $ | 339,036 | |||||||||||||
The accompanying Notes to Financial Statements are an integral part of this schedule.
295
Table of Contents
Thrivent Series Fund, Inc.
Statement of Operations – continued
For the six months ended June 30, 2009 (unaudited) | Partner All Cap Growth Portfolio | Partner All Cap Value Portfolio | Partner All Cap Portfolio | Large Cap Growth Portfolio II | ||||||||||||
Investment Income | ||||||||||||||||
Dividends | $ | 11,614 | $ | 46,851 | $ | 501,092 | $ | 2,234,399 | ||||||||
Interest | — | — | — | 3,313 | ||||||||||||
Income from mortgage dollar rolls | — | — | — | — | ||||||||||||
Income from securities loaned | — | — | 5,256 | 29,254 | ||||||||||||
Income from affiliated investments | 276 | 471 | 1,630 | 30,627 | ||||||||||||
Foreign dividend tax withholding | (195 | ) | (74 | ) | (187 | ) | (24,825 | ) | ||||||||
Total Investment Income | 11,695 | 47,248 | 507,791 | 2,272,768 | ||||||||||||
Expenses | ||||||||||||||||
Adviser fees | 3,939 | 3,576 | 90,070 | 1,242,187 | ||||||||||||
Sub-Adviser fees | 8,533 | 5,364 | 154,405 | — | ||||||||||||
Administrative service fees | 40,262 | 40,238 | 45,147 | 71,055 | ||||||||||||
Audit and legal fees | 8,060 | 7,598 | 8,028 | 10,933 | ||||||||||||
Custody fees | 1,316 | 7,330 | 16,383 | 18,319 | ||||||||||||
Insurance expenses | 1,710 | 1,710 | 1,972 | 2,477 | ||||||||||||
Printing and postage expenses | 30 | 24 | 7,314 | 2,985 | ||||||||||||
Directors’ fees | 1,920 | 1,920 | 2,093 | 7,847 | ||||||||||||
Other expenses | 3,141 | 2,930 | 3,367 | 3,169 | ||||||||||||
Total Expenses Before Reimbursement | 68,911 | 70,690 | 328,779 | 1,358,972 | ||||||||||||
Less: | ||||||||||||||||
Reimbursement from adviser | (55,783 | ) | (59,009 | ) | (52,532 | ) | (548,493 | ) | ||||||||
Custody earnings credit | — | — | — | (77 | ) | |||||||||||
Total Net Expenses | 13,128 | 11,681 | 276,247 | 810,402 | ||||||||||||
Net Investment Income/(Loss) | (1,433 | ) | 35,567 | 231,544 | 1,462,366 | |||||||||||
Realized and Unrealized Gains/(Losses) | ||||||||||||||||
Net realized gains/(losses) on: | ||||||||||||||||
Investments | (225,523 | ) | (425,958 | ) | (4,794,727 | ) | (831,892 | ) | ||||||||
Written option contracts | — | 577 | — | (173,249 | ) | |||||||||||
Futures contracts | — | — | — | — | ||||||||||||
Foreign currency transactions | — | (73 | ) | — | — | |||||||||||
Change in net unrealized appreciation/(depreciation) on: | ||||||||||||||||
Investments | 641,621 | 728,620 | 7,032,137 | 40,829,973 | ||||||||||||
Written option contracts | — | — | — | 27,069 | ||||||||||||
Futures contracts | — | — | — | — | ||||||||||||
Foreign currency forward contracts | — | — | — | — | ||||||||||||
Foreign currency transactions | — | — | — | — | ||||||||||||
Net Realized and Unrealized Gains/(Losses) | 416,098 | 303,166 | 2,237,410 | 39,851,901 | ||||||||||||
Net Increase/(Decrease) in Net Assets Resulting From Operations | $ | 414,665 | $ | 338,733 | $ | 2,468,954 | $ | 41,314,267 | ||||||||
The accompanying Notes to Financial Statements are an integral part of this schedule.
296
Table of Contents
Thrivent Series Fund, Inc.
Statement of Operations – continued
| Large Cap Growth Portfolio | Partner Growth Stock Portfolio | Large Cap Value Portfolio | Large Cap Stock Portfolio | Large Cap Index Portfolio | Equity Income Plus Portfolio | Balanced Portfolio | ||||||||||||||||||||
| $ | 5,734,870 | $ | 289,564 | $ | 8,315,948 | $ | 4,995,724 | $ | 3,789,054 | $ | 620,425 | $ | 2,158,575 | |||||||||||||
| 16,166 | — | 7,544 | 14,333 | 2,935 | 22,412 | 1,519,573 | ||||||||||||||||||||
| — | — | — | — | — | — | 350,499 | ||||||||||||||||||||
| 121,030 | 3,128 | 100,343 | 51,539 | 140,712 | — | 105,040 | ||||||||||||||||||||
| 27,545 | 3,873 | 24,109 | 57,317 | 7,279 | 20,677 | 18,081 | ||||||||||||||||||||
| (61,583 | ) | (7,277 | ) | (50,009 | ) | (28,676 | ) | — | (4,215 | ) | — | |||||||||||||||
| 5,838,028 | 289,288 | 8,397,935 | 5,090,237 | 3,939,980 | 659,299 | 4,151,768 | ||||||||||||||||||||
| 1,637,572 | 100,655 | 1,771,108 | 1,495,369 | 488,187 | 122,600 | 438,293 | ||||||||||||||||||||
| — | 100,654 | — | — | — | — | — | ||||||||||||||||||||
| 121,878 | 45,033 | 99,037 | 86,024 | 68,426 | 43,773 | 65,150 | ||||||||||||||||||||
| 17,027 | 7,987 | 14,837 | 13,007 | 11,081 | 7,847 | 10,622 | ||||||||||||||||||||
| 22,513 | 12,141 | 10,986 | 25,016 | 21,674 | 14,368 | 6,565 | ||||||||||||||||||||
| 6,963 | 1,967 | 4,482 | 4,215 | 3,178 | 1,791 | 2,951 | ||||||||||||||||||||
| 63,744 | 7,482 | 29,379 | 24,690 | 28,731 | 42 | 15,693 | ||||||||||||||||||||
| 27,843 | 2,123 | 17,222 | 14,284 | 10,451 | 1,920 | 9,558 | ||||||||||||||||||||
| 9,485 | 3,669 | 6,028 | 6,271 | 7,346 | 4,213 | 12,565 | ||||||||||||||||||||
| 1,907,025 | 281,711 | 1,953,079 | 1,668,876 | 639,074 | 196,554 | 561,397 | ||||||||||||||||||||
| (9,893 | ) | (26,670 | ) | (8,145 | ) | (22,720 | ) | (3,240 | ) | (36,123 | ) | (7,103 | ) | |||||||||||||
| (19 | ) | — | (12 | ) | (8 | ) | (12 | ) | (108 | ) | (7 | ) | ||||||||||||||
| 1,897,113 | 255,041 | 1,944,922 | 1,646,148 | 635,822 | 160,323 | 554,287 | ||||||||||||||||||||
| 3,940,915 | 34,247 | 6,453,013 | 3,444,089 | 3,304,158 | 498,976 | 3,597,481 | ||||||||||||||||||||
| (146,219,777 | ) | (6,208,128 | ) | (155,165,019 | ) | (100,386,297 | ) | (10,862,166 | ) | (6,254,081 | ) | (1,144,022 | ) | |||||||||||||
| (185,222 | ) | — | — | (115,908 | ) | — | 51,480 | — | ||||||||||||||||||
| — | — | — | 3,835,491 | 376,388 | 305,038 | 462,028 | ||||||||||||||||||||
| — | 1,643 | — | — | — | — | — | ||||||||||||||||||||
| 252,419,466 | 13,185,087 | 136,988,682 | 110,830,599 | 13,465,592 | 4,600,136 | 4,584,446 | ||||||||||||||||||||
| 68,442 | — | — | 17,383 | — | 1,756 | — | ||||||||||||||||||||
| — | — | — | (294,821 | ) | (122,295 | ) | (232,490 | ) | (107,280 | ) | ||||||||||||||||
| — | (966 | ) | — | — | — | — | — | |||||||||||||||||||
| — | 1,580 | — | — | — | — | — | ||||||||||||||||||||
| 106,082,909 | 6,979,216 | (18,176,337 | ) | 13,886,447 | 2,857,519 | (1,528,161 | ) | 3,795,172 | ||||||||||||||||||
| $ | 110,023,824 | $ | 7,013,463 | $ | (11,723,324 | ) | $ | 17,330,536 | $ | 6,161,677 | $ | (1,029,185 | ) | $ | 7,392,653 | |||||||||||
The accompanying Notes to Financial Statements are an integral part of this schedule.
297
Table of Contents
Thrivent Series Fund, Inc.
Statement of Operations – continued
For the six months ended June 30, 2009 (unaudited) | High Yield Portfolio | Diversified Income Plus Portfolio | Partner Socially Responsible Bond Portfolio | Income Portfolio | ||||||||||||
Investment Income | ||||||||||||||||
Dividends | $ | 386,829 | $ | 419,294 | $ | — | $ | 4,532 | ||||||||
Interest | 32,700,479 | 2,582,411 | 165,216 | 33,191,921 | ||||||||||||
Income from mortgage dollar rolls | — | — | — | 1,370,403 | ||||||||||||
Income from securities loaned | 133,768 | 6,540 | — | 81,808 | ||||||||||||
Income from affiliated investments | 22,262 | 8,049 | 2,891 | 434,795 | ||||||||||||
Foreign dividend tax withholding | — | (2,109 | ) | — | — | |||||||||||
Total Investment Income | 33,243,338 | 3,014,185 | 168,107 | 35,083,459 | ||||||||||||
Expenses | ||||||||||||||||
Adviser fees | 1,273,304 | 142,511 | 9,958 | 2,142,118 | ||||||||||||
Sub-Adviser fees | — | — | 13,277 | — | ||||||||||||
Administrative service fees | 103,666 | 47,126 | 40,663 | 147,106 | ||||||||||||
Audit and legal fees | 14,286 | 8,253 | 8,112 | 21,745 | ||||||||||||
Custody fees | 11,803 | 17,843 | 1,293 | 15,181 | ||||||||||||
Insurance expenses | 4,357 | 2,047 | 1,723 | 6,376 | ||||||||||||
Printing and postage expenses | 45,183 | 8,754 | 12 | 38,304 | ||||||||||||
Directors’ fees | 17,646 | 2,160 | 1,919 | 28,448 | ||||||||||||
Other expenses | 12,781 | 11,159 | 4,344 | 16,170 | ||||||||||||
Total Expenses Before Reimbursement | 1,483,026 | 239,853 | 81,301 | 2,415,448 | ||||||||||||
Less: | ||||||||||||||||
Reimbursement from adviser | (8,242 | ) | (4,936 | ) | (58,726 | ) | (31,898 | ) | ||||||||
Custody earnings credit | (45 | ) | (3 | ) | (4 | ) | (4 | ) | ||||||||
Total Net Expenses | 1,474,739 | 234,914 | 22,571 | 2,383,546 | ||||||||||||
Net Investment Income/(Loss) | 31,768,599 | 2,779,271 | 145,536 | 32,699,913 | ||||||||||||
Realized and Unrealized Gains/(Losses) | ||||||||||||||||
Net realized gains/(losses) on: | ||||||||||||||||
Investments | (35,071,633 | ) | (7,044,311 | ) | 13,278 | (30,318,559 | ) | |||||||||
Written option contracts | — | 11,492 | — | — | ||||||||||||
Futures contracts | — | 403,080 | (114,543 | ) | (7,581,844 | ) | ||||||||||
Swap agreements | (1,788,912 | ) | — | — | (10,320,805 | ) | ||||||||||
Change in net unrealized appreciation/(depreciation) on: | ||||||||||||||||
Investments | 134,904,128 | 11,842,167 | 182,347 | 87,732,323 | ||||||||||||
Affiliated investments | — | — | — | 2,120,807 | ||||||||||||
Written option contracts | — | 1,946 | — | — | ||||||||||||
Futures contracts | — | (121,009 | ) | 71,147 | 6,999,587 | |||||||||||
Swap agreements | 1,181,418 | — | — | 5,415,435 | ||||||||||||
Net Realized and Unrealized Gains/(Losses) | 99,225,001 | 5,093,365 | 152,229 | 54,046,944 | ||||||||||||
Net Increase/(Decrease) in Net Assets Resulting From Operations | $ | 130,993,600 | $ | 7,872,636 | $ | 297,765 | $ | 86,746,857 | ||||||||
The accompanying Notes to Financial Statements are an integral part of this schedule.
298
Table of Contents
Thrivent Series Fund, Inc.
Statement of Operations – continued
| Bond Index Portfolio | Limited Maturity Bond Portfolio | Mortgage Securities Portfolio | Money Market Portfolio | |||||||||||
| $ | — | $ | 138,775 | $ | — | $ | 13,721 | |||||||
| 2,559,893 | 20,785,794 | 557,084 | 3,772,932 | |||||||||||
| 846,890 | 423,600 | 313,398 | — | |||||||||||
| 21,654 | 128,140 | — | — | |||||||||||
| 25,174 | 368,135 | 4 | — | |||||||||||
| — | — | — | — | |||||||||||
| 3,453,611 | 21,844,444 | 870,486 | 3,786,653 | |||||||||||
| 279,344 | 1,850,674 | 78,026 | 1,325,075 | |||||||||||
| — | — | — | — | |||||||||||
| 55,963 | 132,533 | 43,121 | 106,254 | |||||||||||
| 9,399 | 19,758 | 7,788 | 15,353 | |||||||||||
| 7,810 | 18,060 | 5,200 | 13,288 | |||||||||||
| 2,424 | 5,480 | 1,848 | 156,508 | |||||||||||
| 13,374 | 19,068 | 5,079 | 16,515 | |||||||||||
| 6,319 | 24,340 | 2,098 | 18,771 | |||||||||||
| 9,213 | 13,742 | 3,554 | 5,889 | |||||||||||
| 383,846 | 2,083,655 | 146,714 | 1,657,653 | |||||||||||
| (10,726 | ) | (23,580 | ) | (2 | ) | (331,269 | ) | |||||||
| (205 | ) | (5 | ) | (80 | ) | (3 | ) | |||||||
| 372,915 | 2,060,070 | 146,632 | 1,326,381 | |||||||||||
| 3,080,696 | 19,784,374 | 723,854 | 2,460,272 | |||||||||||
| 1,229,463 | (576,847 | ) | 403,476 | 89,681 | ||||||||||
| — | 271,982 | 2,769 | — | |||||||||||
| — | (529,613 | ) | 1,658 | — | ||||||||||
| — | (3,935,472 | ) | — | — | ||||||||||
| (1,497,665 | ) | 36,902,310 | (465,275 | ) | — | |||||||||
| — | 1,669,151 | — | — | |||||||||||
| — | 27,170 | 741 | — | |||||||||||
| — | 6,492,536 | (32,500 | ) | — | ||||||||||
| — | 2,277,743 | — | — | |||||||||||
| (268,202 | ) | 42,598,960 | (89,131 | ) | 89,681 | |||||||||
| $ | 2,812,494 | $ | 62,383,334 | $ | 634,723 | $ | 2,549,953 | |||||||
The accompanying Notes to Financial Statements are an integral part of this schedule.
299
Table of Contents
Statement of Changes in Net Assets
| Aggressive Allocation Portfolio | Moderately Aggressive Allocation Portfolio | |||||||||||||||
For the periods ended | 06/30/09 (unaudited) | 12/31/08 | 06/30/09 (unaudited) | 12/31/08 | ||||||||||||
Operations | ||||||||||||||||
Net investment income/(loss) | $ | 1,094,925 | $ | 10,946,873 | $ | 12,269,162 | $ | 55,524,816 | ||||||||
Net realized gains/(losses) | 3,385,992 | 6,743,183 | 20,104,636 | 3,500,384 | ||||||||||||
Change in net unrealized appreciation/(depreciation) | 19,899,363 | (217,861,605 | ) | 66,633,478 | (710,280,244 | ) | ||||||||||
Net Change in Net Assets Resulting From Operations | 24,380,280 | (200,171,549 | ) | 99,007,276 | (651,255,044 | ) | ||||||||||
Distributions to Shareholders | ||||||||||||||||
From net investment income | — | (6,895,956 | ) | — | (33,855,722 | ) | ||||||||||
From net realized gains | — | (11,712,072 | ) | — | (33,582,044 | ) | ||||||||||
Total Distributions to Shareholders | — | (18,608,028 | ) | — | (67,437,766 | ) | ||||||||||
Capital Stock Transactions | ||||||||||||||||
Sold | 33,221,287 | 96,905,699 | 113,010,270 | 305,758,512 | ||||||||||||
Distributions reinvested | — | 18,608,028 | — | 67,437,766 | ||||||||||||
Redeemed | (14,426,904 | ) | (38,848,508 | ) | (37,087,019 | ) | (80,759,724 | ) | ||||||||
Capital Stock Transactions | 18,794,383 | 76,665,219 | 75,923,251 | 292,436,554 | ||||||||||||
Net Increase/(Decrease) in Net Assets | 43,174,663 | (142,114,358 | ) | 174,930,527 | (426,256,256 | ) | ||||||||||
Net Assets, Beginning of Period | 354,309,920 | 496,424,278 | 1,354,565,116 | 1,780,821,372 | ||||||||||||
Net Assets, End of Period | $ | 397,484,583 | $ | 354,309,920 | $ | 1,529,495,643 | $ | 1,354,565,116 | ||||||||
Accumulated undistributed net investment income/(loss) | $ | 19,290,077 | $ | 18,195,152 | $ | 90,355,307 | $ | 78,086,145 | ||||||||
Capital Stock Share Transactions | ||||||||||||||||
Sold | 4,035,691 | 8,287,460 | 13,266,143 | 26,380,154 | ||||||||||||
Distributions reinvested | — | 1,517,412 | — | 5,684,906 | ||||||||||||
Redeemed | (1,835,095 | ) | (3,386,481 | ) | (4,648,913 | ) | (7,372,833 | ) | ||||||||
Total Capital Stock Share Transactions | 2,200,596 | 6,418,391 | 8,617,230 | 24,692,227 | ||||||||||||
The accompanying Notes to Financial Statements are an integral part of this schedule.
300
Table of Contents
Thrivent Series Fund, Inc.
Statement of Changes in Net Assets – continued
| Moderate Allocation Portfolio | Moderately Conservative Allocation Portfolio | Technology Portfolio | Partner Healthcare Portfolio | |||||||||||||||||||||||||||
| 06/30/09 (unaudited) | 12/31/08 | 06/30/09 (unaudited) | 12/31/08 | 06/30/09 (unaudited) | 12/31/08 | 06/30/09 (unaudited) | 12/31/08(a) | |||||||||||||||||||||||
| $ | 25,054,963 | $ | 82,995,454 | $ | 11,775,611 | $ | 32,491,728 | $ | (72,374 | ) | $ | (4,856 | ) | $ | 37,244 | $ | (3,260 | ) | ||||||||||||
| 27,016,934 | (14,343,786 | ) | 12,486,846 | (3,929,188 | ) | (2,115,795 | ) | (15,125,436 | ) | (28,433 | ) | (120,790 | ) | |||||||||||||||||
| 80,820,929 | (744,254,686 | ) | 29,920,134 | (211,313,361 | ) | 7,786,308 | (10,146,791 | ) | 746,635 | (540,306 | ) | |||||||||||||||||||
| 132,892,826 | (675,603,018 | ) | 54,182,591 | (182,750,821 | ) | 5,598,139 | (25,277,083 | ) | 755,446 | (664,356 | ) | |||||||||||||||||||
| — | (52,371,012 | ) | — | (21,495,292 | ) | — | — | (1,353 | ) | (5,750 | ) | |||||||||||||||||||
| — | (32,531,242 | ) | — | (6,930,728 | ) | — | (6,532,649 | ) | — | — | ||||||||||||||||||||
| — | (84,902,254 | ) | — | (28,426,020 | ) | — | (6,532,649 | ) | (1,353 | ) | (5,750 | ) | ||||||||||||||||||
| 161,199,525 | 441,267,971 | 95,255,772 | 217,799,157 | 1,689,773 | 14,361,328 | 3,556,342 | 13,723,313 | |||||||||||||||||||||||
| — | 84,902,254 | — | 28,426,020 | — | 6,532,649 | 1,353 | 5,750 | |||||||||||||||||||||||
| (55,211,691 | ) | (122,966,627 | ) | (24,216,409 | ) | (77,240,026 | ) | (7,113,848 | ) | (21,405,970 | ) | (910,608 | ) | (5,923,559 | ) | |||||||||||||||
| 105,987,834 | 403,203,598 | 71,039,363 | 168,985,151 | (5,424,075 | ) | (511,993 | ) | 2,647,087 | 7,805,504 | |||||||||||||||||||||
| 238,880,660 | (357,301,674 | ) | 125,221,954 | (42,191,690 | ) | 174,064 | (32,321,725 | ) | 3,401,180 | 7,135,398 | ||||||||||||||||||||
| 1,811,558,413 | 2,168,860,087 | 714,755,880 | 756,947,570 | 24,317,266 | 56,638,991 | 7,135,398 | – | |||||||||||||||||||||||
| $ | 2,050,439,073 | $ | 1,811,558,413 | $ | 839,977,834 | $ | 714,755,880 | $ | 24,491,330 | $ | 24,317,266 | $ | 10,536,578 | $ | 7,135,398 | |||||||||||||||
| $ | 128,684,757 | $ | 103,629,794 | $ | 48,598,192 | $ | 36,822,581 | $ | (77,672 | ) | $ | (5,298 | ) | $ | 36,562 | $ | 671 | |||||||||||||
| 18,074,795 | 38,318,715 | 10,294,515 | 19,393,557 | 417,102 | 2,324,976 | 409,474 | 1,368,023 | |||||||||||||||||||||||
| — | 7,376,967 | — | 2,556,274 | — | 1,107,867 | 142 | 643 | |||||||||||||||||||||||
| (6,669,588 | ) | (11,781,195 | ) | (2,677,652 | ) | (7,494,597 | ) | (1,734,644 | ) | (3,612,354 | ) | (105,670 | ) | (570,951 | ) | |||||||||||||||
| 11,405,207 | 33,914,487 | 7,616,863 | 14,455,234 | (1,317,542 | ) | (179,511 | ) | 303,946 | 797,715 | |||||||||||||||||||||
| (a) | For the period from April 30, 2008 (inception) through December 31, 2008. |
The accompanying Notes to Financial Statements are an integral part of this schedule.
301
Table of Contents
Thrivent Series Fund, Inc.
Statement of Changes in Net Assets – continued
| Partner Natural Resources Portfolio | Partner Emerging Markets Portfolio | |||||||||||||||
For the periods ended | 06/30/09 (unaudited) | 12/31/08(a) | 06/30/09 (unaudited) | 12/31/08(a) | ||||||||||||
Operations | ||||||||||||||||
Net investment income/(loss) | $ | 12,735 | $ | 10,699 | $ | 52,961 | $ | 60,471 | ||||||||
Net realized gains/(losses) | (168,916 | ) | (79,605 | ) | (496,931 | ) | (344,349 | ) | ||||||||
Change in net unrealized appreciation/(depreciation) | 1,485,492 | (4,285,834 | ) | 2,099,409 | (3,992,065 | ) | ||||||||||
Net Change in Net Assets Resulting From Operations | 1,329,311 | (4,354,740 | ) | 1,655,439 | (4,275,943 | ) | ||||||||||
Distributions to Shareholders | ||||||||||||||||
From net investment income | — | (8,150 | ) | (666 | ) | (49,300 | ) | |||||||||
From net realized gains | — | — | — | — | ||||||||||||
From return of capital | — | — | — | — | ||||||||||||
Total Distributions to Shareholders | — | (8,150 | ) | (666 | ) | (49,300 | ) | |||||||||
Capital Stock Transactions | ||||||||||||||||
Sold | 5,666,712 | 18,271,675 | 2,982,587 | 14,221,039 | ||||||||||||
Distributions reinvested | — | 8,150 | 666 | 49,300 | ||||||||||||
Redeemed | (1,379,954 | ) | (7,322,903 | ) | (3,337,127 | ) | (4,615,831 | ) | ||||||||
Capital Stock Transactions | 4,286,758 | 10,956,922 | (353,874 | ) | 9,654,508 | |||||||||||
Net Increase/(Decrease) in Net Assets | 5,616,069 | 6,594,032 | 1,300,899 | 5,329,265 | ||||||||||||
Net Assets, Beginning of Period | 6,594,032 | — | 5,329,265 | — | ||||||||||||
Net Assets, End of Period | $ | 12,210,101 | $ | 6,594,032 | $ | 6,630,164 | $ | 5,329,265 | ||||||||
Accumulated undistributed net investment income/(loss) | $ | 11,861 | $ | (874 | ) | $ | 51,810 | $ | (485 | ) | ||||||
Capital Stock Share Transactions | ||||||||||||||||
Sold | 918,998 | 1,877,037 | 454,462 | 1,492,935 | ||||||||||||
Distributions reinvested | — | 1,424 | 90 | 8,820 | ||||||||||||
Redeemed | (238,082 | ) | (726,539 | ) | (518,719 | ) | (548,303 | ) | ||||||||
Total Capital Stock Share Transactions | 680,916 | 1,151,922 | (64,167 | ) | 953,452 | |||||||||||
| (a) | For the period from April 30, 2008 (inception) through December 31, 2008. |
The accompanying Notes to Financial Statements are an integral part of this schedule.
302
Table of Contents
Thrivent Series Fund, Inc.
Statement of Changes in Net Assets – continued
| Real Estate Securities Portfolio | Partner Utilities Portfolio | Partner Small Cap Growth Portfolio | Partner Small Cap Value Portfolio | |||||||||||||||||||||||||||
| 06/30/09 (unaudited) | 12/31/08 | 06/30/09 (unaudited) | 12/31/08(a) | 06/30/09 (unaudited) | 12/31/08 | 06/30/09 (unaudited) | 12/31/08 | |||||||||||||||||||||||
| $ | 4,190,550 | $ | 8,442,766 | $ | 72,994 | $ | 74,681 | $ | (133,707 | ) | $ | 123,135 | $ | 942,891 | $ | 2,047,203 | ||||||||||||||
| (19,312,497 | ) | (7,116,231 | ) | (161,357 | ) | (435,251 | ) | (17,102,896 | ) | (51,544,571 | ) | (7,939,523 | ) | 6,100,805 | ||||||||||||||||
| (8,057,722 | ) | (121,962,655 | ) | 106,482 | (1,124,314 | ) | 29,083,221 | (31,775,286 | ) | 10,508,945 | (72,429,819 | ) | ||||||||||||||||||
| (23,179,669 | ) | (120,636,120 | ) | 18,119 | (1,484,884 | ) | 11,846,618 | (83,196,722 | ) | 3,512,313 | (64,281,811 | ) | ||||||||||||||||||
| — | (14,566,225 | ) | — | (70,001 | ) | (111,079 | ) | (14,000 | ) | (375,418 | ) | (2,545,338 | ) | |||||||||||||||||
| — | (28,080,349 | ) | — | — | — | (10,509,420 | ) | (159,744 | ) | (16,838,215 | ) | |||||||||||||||||||
| — | (5,059,614 | ) | — | — | — | — | — | — | ||||||||||||||||||||||
| — | (47,706,188 | ) | — | (70,001 | ) | (111,079 | ) | (10,523,420 | ) | (535,162 | ) | (19,383,553 | ) | |||||||||||||||||
| 12,906,783 | 69,004,871 | 1,503,503 | 11,290,054 | 4,582,969 | 45,652,970 | 7,046,901 | 84,134,259 | |||||||||||||||||||||||
| — | 47,706,188 | — | 70,001 | 111,079 | 10,523,420 | 535,162 | 19,383,553 | |||||||||||||||||||||||
| (14,205,577 | ) | (77,375,670 | ) | (644,049 | ) | (5,453,119 | ) | (3,825,368 | ) | (17,565,263 | ) | (8,790,884 | ) | (37,539,486 | ) | |||||||||||||||
| (1,298,794 | ) | 39,335,389 | 859,454 | 5,906,936 | 868,680 | 38,611,127 | (1,208,821 | ) | 65,978,326 | |||||||||||||||||||||
| (24,478,463 | ) | (129,006,919 | ) | 877,573 | 4,352,051 | 12,604,219 | (55,109,015 | ) | 1,768,330 | (17,687,038 | ) | |||||||||||||||||||
| 197,419,707 | 326,426,626 | 4,352,051 | — | 112,460,922 | 167,569,937 | 167,930,800 | 185,617,838 | |||||||||||||||||||||||
| $ | 172,941,244 | $ | 197,419,707 | $ | 5,229,624 | $ | 4,352,051 | $ | 125,065,141 | $ | 112,460,922 | $ | 169,699,130 | $ | 167,930,800 | |||||||||||||||
| $ | 4,175,846 | $ | (14,704 | ) | $ | 71,851 | $ | (1,143 | ) | $ | (140,026 | ) | $ | 104,760 | $ | 960,467 | $ | 392,994 | ||||||||||||
| 1,633,297 | 4,166,491 | 230,649 | �� | 1,202,982 | 592,371 | 3,890,323 | 602,351 | 4,761,828 | ||||||||||||||||||||||
| — | 3,559,449 | — | 10,101 | 13,562 | 910,882 | 43,659 | 1,332,053 | |||||||||||||||||||||||
| (1,995,082 | ) | (4,997,767 | ) | (98,171 | ) | (585,102 | ) | (573,843 | ) | (1,717,371 | ) | (847,342 | ) | (2,242,123 | ) | |||||||||||||||
| (361,785 | ) | 2,728,173 | 132,478 | 627,981 | 32,090 | 3,083,834 | (201,332 | ) | 3,851,758 | |||||||||||||||||||||
The accompanying Notes to Financial Statements are an integral part of this schedule.
303
Table of Contents
Thrivent Series Fund, Inc.
Statement of Changes in Net Assets – continued
| Small Cap Stock Portfolio | Small Cap Index Portfolio | |||||||||||||||
For the periods ended | 06/30/09 (unaudited) | 12/31/08 | 06/30/09 (unaudited) | 12/31/08 | ||||||||||||
Operations | ||||||||||||||||
Net investment income/(loss) | $ | 881,830 | $ | 2,456,589 | $ | 1,003,178 | $ | 3,650,741 | ||||||||
Net realized gains/(losses) | (39,699,268 | ) | (124,347,195 | ) | (2,199,153 | ) | 26,275,366 | |||||||||
Change in net unrealized appreciation/(depreciation) | 29,533,095 | (47,846,509 | ) | 262,290 | (125,267,802 | ) | ||||||||||
Net Change in Net Assets Resulting From Operations | (9,284,343 | ) | (169,737,115 | ) | (933,685 | ) | (95,341,695 | ) | ||||||||
Distributions to Shareholders | ||||||||||||||||
From net investment income | (554,275 | ) | (4,048,322 | ) | (3,597,439 | ) | (3,385,779 | ) | ||||||||
From net realized gains | — | (46,096,464 | ) | (31,411,591 | ) | (58,824,685 | ) | |||||||||
Total Distributions to Shareholders | (554,275 | ) | (50,144,786 | ) | (35,009,030 | ) | (62,210,464 | ) | ||||||||
Capital Stock Transactions | ||||||||||||||||
Sold | 9,892,495 | 103,667,043 | 1,999,195 | 6,966,769 | ||||||||||||
Distributions reinvested | 554,275 | 50,144,786 | 35,009,030 | 62,210,464 | ||||||||||||
Redeemed | (12,537,807 | ) | (45,725,077 | ) | (16,980,262 | ) | (77,326,919 | ) | ||||||||
Capital Stock Transactions | (2,091,037 | ) | 108,086,752 | 20,027,963 | (8,149,686 | ) | ||||||||||
Net Increase/(Decrease) in Net Assets | (11,929,655 | ) | (111,795,149 | ) | (15,914,752 | ) | (165,701,845 | ) | ||||||||
Net Assets, Beginning of Period | 288,059,725 | 399,854,874 | 192,193,621 | 357,895,466 | ||||||||||||
Net Assets, End of Period | $ | 276,130,070 | $ | 288,059,725 | $ | 176,278,869 | $ | 192,193,621 | ||||||||
Accumulated undistributed net investment income/(loss) | $ | 898,766 | $ | 571,211 | $ | 1,025,014 | $ | 3,619,275 | ||||||||
Capital Stock Share Transactions | ||||||||||||||||
Sold | 1,221,894 | 7,926,538 | 207,912 | 436,587 | ||||||||||||
Distributions reinvested | 67,566 | 4,096,169 | 4,157,496 | 4,267,480 | ||||||||||||
Redeemed | (1,703,823 | ) | (3,899,039 | ) | (1,842,601 | ) | (5,095,584 | ) | ||||||||
Total Capital Stock Share Transactions | (414,363 | ) | 8,123,668 | 2,522,807 | (391,517 | ) | ||||||||||
The accompanying Notes to Financial Statements are an integral part of this schedule.
304
Table of Contents
Thrivent Series Fund, Inc.
Statement of Changes in Net Assets – continued
| Mid Cap Growth Portfolio II | Mid Cap Growth Portfolio | Partner Mid Cap Value Portfolio | Mid Cap Stock Portfolio | |||||||||||||||||||||||||||
| 06/30/09 (unaudited) | 12/31/08 | 06/30/09 (unaudited) | 12/31/08 | 06/30/09 (unaudited) | 12/31/08 | 06/30/09 (unaudited) | 12/31/08 | |||||||||||||||||||||||
| $ | 18,173 | $ | 109,517 | $ | 456,779 | $ | 2,770,776 | $ | 859,315 | $ | 1,644,483 | $ | 1,314,734 | $ | 3,331,992 | |||||||||||||||
| (4,104,669 | ) | (2,275,305 | ) | (39,483,282 | ) | (36,950,006 | ) | (20,704,362 | ) | (26,491,608 | ) | (37,523,313 | ) | (110,131,447 | ) | |||||||||||||||
| 20,157,248 | (21,214,625 | ) | 91,385,493 | (216,054,842 | ) | 25,435,773 | (37,787,729 | ) | 78,734,626 | (127,005,637 | ) | |||||||||||||||||||
| 16,070,752 | (23,380,413 | ) | 52,358,990 | (250,234,072 | ) | 5,590,726 | (62,634,854 | ) | 42,526,047 | (233,805,092 | ) | |||||||||||||||||||
| (1,858 | ) | (179,857 | ) | (53,590 | ) | (5,290,257 | ) | (279,209 | ) | (2,140,821 | ) | (270,664 | ) | (5,709,119 | ) | |||||||||||||||
| — | (5,096,454 | ) | — | (105,080,869 | ) | — | (3,977,150 | ) | — | (35,581,789 | ) | |||||||||||||||||||
| (1,858 | ) | (5,276,311 | ) | (53,590 | ) | (110,371,126 | ) | (279,209 | ) | (6,117,971 | ) | (270,664 | ) | (41,290,908 | ) | |||||||||||||||
| 3,177,248 | 79,643,955 | 4,253,096 | 33,072,691 | 6,246,542 | 105,815,967 | 11,322,087 | 271,252,543 | |||||||||||||||||||||||
| 1,858 | 5,276,311 | 53,590 | 110,371,126 | 279,209 | 6,117,971 | 270,664 | 41,290,908 | |||||||||||||||||||||||
| (2,968,455 | ) | (7,938,547 | ) | (24,968,156 | ) | (177,573,481 | ) | (3,475,714 | ) | (14,864,298 | ) | (11,974,927 | ) | (45,510,935 | ) | |||||||||||||||
| 210,651 | 76,981,719 | (20,661,470 | ) | (34,129,664 | ) | 3,050,037 | 97,069,640 | (382,176 | ) | 267,032,516 | ||||||||||||||||||||
| 16,279,545 | 48,324,995 | 31,643,930 | (394,734,862 | ) | 8,361,554 | 28,316,815 | 41,873,207 | (8,063,484 | ) | |||||||||||||||||||||
| 80,770,879 | 32,445,884 | 275,101,796 | 669,836,658 | 123,336,824 | 95,020,009 | 379,883,030 | 387,946,514 | |||||||||||||||||||||||
| $ | 97,050,424 | $ | 80,770,879 | $ | 306,745,726 | $ | 275,101,796 | $ | 131,698,378 | $ | 123,336,824 | $ | 421,756,237 | $ | 379,883,030 | |||||||||||||||
| $ | 12,376 | $ | (3,939 | ) | $ | 396,441 | $ | (6,748 | ) | $ | 852,072 | $ | 271,966 | $ | 1,291,621 | $ | 247,551 | |||||||||||||
| 480,602 | 11,784,491 | 411,991 | 1,930,847 | 741,717 | 8,857,013 | 1,458,525 | 24,745,093 | |||||||||||||||||||||||
| 273 | 600,104 | 4,650 | 7,534,490 | 32,463 | 558,889 | 34,327 | 4,028,721 | |||||||||||||||||||||||
| (548,787 | ) | (925,192 | ) | (2,587,485 | ) | (13,854,985 | ) | (479,110 | ) | (1,545,235 | ) | (1,805,518 | ) | (4,616,668 | ) | |||||||||||||||
| (67,912 | ) | 11,459,403 | (2,170,844 | ) | (4,389,648 | ) | 295,070 | 7,870,667 | (312,666 | ) | 24,157,146 | |||||||||||||||||||
The accompanying Notes to Financial Statements are an integral part of this schedule.
305
Table of Contents
Thrivent Series Fund, Inc.
Statement of Changes in Net Assets – continued
| Mid Cap Index Portfolio | Partner Worldwide Allocation Portfolio | |||||||||||||||
For the periods ended | 06/30/09 (unaudited) | 12/31/08 | 06/30/09 (unaudited) | 12/31/08(a) | ||||||||||||
Operations | ||||||||||||||||
Net investment income/(loss) | $ | 509,591 | $ | 1,522,425 | $ | 1,882,698 | $ | 1,247,035 | ||||||||
Net realized gains/(losses) | (3,140,627 | ) | 4,434,504 | (9,692,464 | ) | (14,141,924 | ) | |||||||||
Change in net unrealized appreciation/(depreciation) | 7,809,370 | (52,876,255 | ) | 19,725,685 | (22,751,372 | ) | ||||||||||
Net Change in Net Assets Resulting From Operations | 5,178,334 | (46,919,326 | ) | 11,915,919 | (35,646,261 | ) | ||||||||||
Distributions to Shareholders | ||||||||||||||||
From net investment income | (1,478,447 | ) | (1,606,594 | ) | (59,164 | ) | (1,070,000 | ) | ||||||||
From net realized gains | (4,989,989 | ) | (15,982,601 | ) | — | — | ||||||||||
Total Distributions to Shareholders | (6,468,436 | ) | (17,589,195 | ) | (59,164 | ) | (1,070,000 | ) | ||||||||
Capital Stock Transactions | ||||||||||||||||
Sold | 1,917,619 | 4,158,752 | 37,330,556 | 213,602,323 | ||||||||||||
Distributions reinvested | 6,468,436 | 17,589,195 | 59,164 | 1,070,000 | ||||||||||||
Redeemed | (8,091,020 | ) | (28,281,629 | ) | (1,234,368 | ) | (72,054,531 | ) | ||||||||
Capital Stock Transactions | 295,035 | (6,533,682 | ) | 36,155,352 | 142,617,792 | |||||||||||
Net Increase/(Decrease) in Net Assets | (995,067 | ) | (71,042,203 | ) | 48,012,107 | 105,901,531 | ||||||||||
Net Assets, Beginning of Period | 75,140,296 | 146,182,499 | 105,901,531 | — | ||||||||||||
Net Assets, End of Period | $ | 74,145,229 | $ | 75,140,296 | $ | 153,913,638 | $ | 105,901,531 | ||||||||
Accumulated undistributed net investment income/(loss) | $ | 542,705 | $ | 1,511,561 | $ | 1,790,086 | $ | (33,448 | ) | |||||||
Capital Stock Share Transactions | ||||||||||||||||
Sold | 237,515 | 350,475 | 6,290,582 | 25,128,268 | ||||||||||||
Distributions reinvested | 791,604 | 1,408,522 | 9,132 | 177,470 | ||||||||||||
Redeemed | (1,036,753 | ) | (2,336,499 | ) | (218,819 | ) | (7,740,917 | ) | ||||||||
Total Capital Stock Share Transactions | (7,634 | ) | (577,502 | ) | 6,080,895 | 17,564,821 | ||||||||||
| (a) | For the period from April 30, 2008 (inception) through December 31, 2008. |
The accompanying Notes to Financial Statements are an integral part of this schedule.
306
Table of Contents
Thrivent Series Fund, Inc.
Statement of Changes in Net Assets – continued
| Partner International Stock Portfolio | Partner Socially Responsible Stock Portfolio | Partner All Cap Growth Portfolio | Partner All Cap Value Portfolio | |||||||||||||||||||||||||||
| 06/30/09 (unaudited) | 12/31/08 | 06/30/09 (unaudited) | 12/31/08(a) | 06/30/09 (unaudited) | 12/31/08(a) | 06/30/09 (unaudited) | 12/31/08(a) | |||||||||||||||||||||||
| $ | 12,945,003 | $ | 29,670,893 | $ | 12,006 | $ | 8,481 | $ | (1,433 | ) | $ | (3,685 | ) | $ | 35,567 | $ | 37,077 | |||||||||||||
| (138,028,600 | ) | (166,010,131 | ) | (155,904 | ) | (280,513 | ) | (225,523 | ) | (813,990 | ) | (425,454 | ) | (1,158,452 | ) | |||||||||||||||
| 136,097,955 | (442,860,262 | ) | 482,934 | (1,470,627 | ) | 641,621 | (1,421,880 | ) | 728,620 | (997,736 | ) | |||||||||||||||||||
| 11,014,358 | (579,199,500 | ) | 339,036 | (1,742,659 | ) | 414,665 | (2,239,555 | ) | 338,733 | (2,119,111 | ) | |||||||||||||||||||
| (1,300,363 | ) | (58,984,879 | ) | (89 | ) | (9,075 | ) | — | — | — | (46,000 | ) | ||||||||||||||||||
| — | (180,439,928 | ) | — | — | — | — | — | — | ||||||||||||||||||||||
| (1,300,363 | ) | (239,424,807 | ) | (89 | ) | (9,075 | ) | — | — | — | (46,000 | ) | ||||||||||||||||||
| 4,986,432 | 118,759,221 | 477,990 | 6,091,780 | 2,431,497 | 7,332,525 | 1,212,689 | 8,189,090 | |||||||||||||||||||||||
| 1,300,363 | 239,424,807 | 89 | 9,075 | — | — | — | 46,000 | |||||||||||||||||||||||
| (43,430,510 | ) | (205,204,537 | ) | (597,930 | ) | (1,148,401 | ) | (1,380,807 | ) | (2,683,193 | ) | (962,099 | ) | (3,608,671 | ) | |||||||||||||||
| (37,143,715 | ) | 152,979,491 | (119,851 | ) | 4,952,454 | 1,050,690 | 4,649,332 | 250,590 | 4,626,419 | |||||||||||||||||||||
| (27,429,720 | ) | (665,644,816 | ) | 219,096 | 3,200,720 | 1,465,355 | 2,409,777 | 589,323 | 2,461,308 | |||||||||||||||||||||
| 778,125,454 | 1,443,770,270 | 3,200,720 | — | 2,409,777 | — | 2,461,308 | — | |||||||||||||||||||||||
| $ | 750,695,734 | $ | 778,125,454 | $ | 3,419,816 | $ | 3,200,720 | $ | 3,875,132 | $ | 2,409,777 | $ | 3,050,631 | $ | 2,461,308 | |||||||||||||||
| $ | 12,235,679 | $ | 591,039 | $ | 11,323 | $ | (594 | ) | $ | (2,115 | ) | $ | (682 | ) | $ | 35,704 | $ | 137 | ||||||||||||
| 653,609 | 7,911,742 | 75,318 | 628,024 | 417,714 | 782,391 | 212,692 | 887,796 | |||||||||||||||||||||||
| 155,881 | 19,901,572 | 12 | 1,400 | — | — | — | 8,403 | |||||||||||||||||||||||
| (6,040,178 | ) | (16,309,607 | ) | (94,146 | ) | (135,747 | ) | (255,948 | ) | (331,382 | ) | (181,568 | ) | (446,591 | ) | |||||||||||||||
| (5,230,688 | ) | 11,503,707 | (18,816 | ) | 493,677 | 161,766 | 451,009 | 31,124 | 449,608 | |||||||||||||||||||||
The accompanying Notes to Financial Statements are an integral part of this schedule.
307
Table of Contents
Thrivent Series Fund, Inc.
Statement of Changes in Net Assets – continued
| Partner All Cap Portfolio | Large Cap Growth Portfolio II | |||||||||||||||
For the periods ended | 06/30/09 (unaudited) | 12/31/08 | 06/30/09 (unaudited) | 12/31/08 | ||||||||||||
Operations | ||||||||||||||||
Net investment income/(loss) | $ | 231,544 | $ | 744,699 | $ | 1,462,366 | $ | 319,255 | ||||||||
Net realized gains/(losses) | (4,794,727 | ) | (22,629,783 | ) | (1,005,141 | ) | (2,757,765 | ) | ||||||||
Change in net unrealized appreciation/(depreciation) | 7,032,137 | (25,229,107 | ) | 40,857,042 | (11,416,914 | ) | ||||||||||
Net Change in Net Assets Resulting From Operations | 2,468,954 | (47,114,191 | ) | 41,314,267 | (13,855,424 | ) | ||||||||||
Distributions to Shareholders | ||||||||||||||||
From net investment income | (744,537 | ) | (654,002 | ) | — | (458,318 | ) | |||||||||
From net realized gains | — | (15,641,826 | ) | — | (3,907,923 | ) | ||||||||||
Total Distributions to Shareholders | (744,537 | ) | (16,295,828 | ) | — | (4,366,241 | ) | |||||||||
Capital Stock Transactions | ||||||||||||||||
Sold | 1,374,800 | 11,206,437 | 8,509,393 | 296,963,301 | ||||||||||||
Distributions reinvested | 744,537 | 16,295,828 | — | 4,366,241 | ||||||||||||
Redeemed | (5,534,724 | ) | (25,510,363 | ) | (7,881,928 | ) | (8,106,552 | ) | ||||||||
Capital Stock Transactions | (3,415,387 | ) | 1,991,902 | 627,465 | 293,222,990 | |||||||||||
Net Increase/(Decrease) in Net Assets | (1,690,970 | ) | (61,418,117 | ) | 41,941,732 | 275,001,325 | ||||||||||
Net Assets, Beginning of Period | 56,153,236 | 117,571,353 | 308,985,225 | 33,983,900 | ||||||||||||
Net Assets, End of Period | $ | 54,462,266 | $ | 56,153,236 | $ | 350,926,957 | $ | 308,985,225 | ||||||||
Accumulated undistributed net investment income/(loss) | $ | 227,276 | $ | 740,269 | $ | 1,462,310 | $ | (56 | ) | |||||||
Capital Stock Share Transactions | ||||||||||||||||
Sold | 232,823 | 1,175,844 | 1,294,942 | 50,351,554 | ||||||||||||
Distributions reinvested | 117,219 | 1,829,882 | — | 514,033 | ||||||||||||
Redeemed | (973,012 | ) | (2,839,612 | ) | (1,452,056 | ) | (917,601 | ) | ||||||||
Total Capital Stock Share Transactions | (622,970 | ) | 166,114 | (157,114 | ) | 49,947,986 | ||||||||||
The accompanying Notes to Financial Statements are an integral part of this schedule.
308
Table of Contents
Thrivent Series Fund, Inc.
Statement of Changes in Net Assets – continued
| Large Cap Growth Portfolio | Partner Growth Stock Portfolio | Large Cap Value Portfolio | Large Cap Stock Portfolio | |||||||||||||||||||||||||||
| 06/30/09 (unaudited) | 12/31/08 | 06/30/09 (unaudited) | 12/31/08 | 06/30/09 (unaudited) | 12/31/08 | 06/30/09 (unaudited) | 12/31/08 | |||||||||||||||||||||||
| $ | 3,940,915 | $ | 13,831,496 | $ | 34,247 | $ | 292,873 | $ | 6,453,013 | $ | 19,012,085 | $ | 3,444,089 | $ | 11,554,735 | |||||||||||||||
| (146,404,999 | ) | (298,149,885 | ) | (6,206,485 | ) | (6,644,074 | ) | (155,165,019 | ) | (79,374,035 | ) | (96,666,714 | ) | (129,336,858 | ) | |||||||||||||||
| 252,487,908 | (635,129,474 | ) | 13,185,701 | (36,888,660 | ) | 136,988,682 | (293,816,484 | ) | 110,553,161 | (226,078,475 | ) | |||||||||||||||||||
| 110,023,824 | (919,447,863 | ) | 7,013,463 | (43,239,861 | ) | (11,723,324 | ) | (354,178,434 | ) | 17,330,536 | (343,860,598 | ) | ||||||||||||||||||
| — | (15,449,558 | ) | (168,813 | ) | (684,434 | ) | (380,128 | ) | (33,783,735 | ) | (58,987 | ) | (23,831,561 | ) | ||||||||||||||||
| — | — | — | (9,541,540 | ) | — | (34,992,145 | ) | — | (67,919,651 | ) | ||||||||||||||||||||
| — | (15,449,558 | ) | (168,813 | ) | (10,225,974 | ) | (380,128 | ) | (68,775,880 | ) | (58,987 | ) | (91,751,212 | ) | ||||||||||||||||
| 8,434,278 | 82,982,927 | 1,101,928 | 3,498,176 | 17,101,597 | 125,697,204 | 10,348,894 | 52,961,051 | |||||||||||||||||||||||
| — | 15,449,558 | 168,813 | 10,225,974 | 380,128 | 68,775,880 | 58,987 | 91,751,212 | |||||||||||||||||||||||
| (79,958,009 | ) | (872,447,212 | ) | (6,823,969 | ) | (26,218,829 | ) | (29,573,916 | ) | (112,324,933 | ) | (25,297,915 | ) | (271,830,135 | ) | |||||||||||||||
| (71,523,731 | ) | (774,014,727 | ) | (5,553,228 | ) | (12,494,679 | ) | (12,092,191 | ) | 82,148,151 | (14,890,034 | ) | (127,117,872 | ) | ||||||||||||||||
| 38,500,093 | (1,708,912,148 | ) | 1,291,422 | (65,960,514 | ) | (24,195,643 | ) | (340,806,163 | ) | 2,381,515 | (562,729,682 | ) | ||||||||||||||||||
| 844,538,875 | 2,553,451,023 | 52,093,962 | 118,054,476 | 664,094,715 | 1,004,900,878 | 497,399,691 | 1,060,129,373 | |||||||||||||||||||||||
| $ | 883,038,968 | $ | 844,538,875 | $ | 53,385,384 | $ | 52,093,962 | $ | 639,899,072 | $ | 664,094,715 | $ | 499,781,206 | $ | 497,399,691 | |||||||||||||||
| $ | 4,088,211 | $ | 147,296 | $ | 28,886 | $ | 163,452 | $ | 6,423,107 | $ | 350,222 | $ | 3,582,441 | $ | 197,339 | |||||||||||||||
| 744,800 | 4,950,812 | 150,527 | 314,980 | 2,166,633 | 10,311,148 | 1,677,697 | 5,383,871 | |||||||||||||||||||||||
| — | 1,348,205 | 21,147 | 958,565 | 47,578 | 6,720,986 | 9,272 | 10,941,285 | |||||||||||||||||||||||
| (7,324,960 | ) | (62,070,891 | ) | (978,845 | ) | (2,499,468 | ) | (4,260,453 | ) | (9,997,370 | ) | (4,554,439 | ) | (30,939,551 | ) | |||||||||||||||
| (6,580,160 | ) | (55,771,874 | ) | (807,171 | ) | (1,225,923 | ) | (2,046,242 | ) | 7,034,764 | (2,867,470 | ) | (14,614,395 | ) | ||||||||||||||||
The accompanying Notes to Financial Statements are an integral part of this schedule.
309
Table of Contents
Thrivent Series Fund, Inc.
Statement of Changes in Net Assets – continued
| Large Cap Index Portfolio | Equity Income Plus Portfolio | |||||||||||||||
For the periods ended | 06/30/09 (unaudited) | 12/31/08 | 06/30/09 (unaudited) | 12/31/08(a) | ||||||||||||
Operations | ||||||||||||||||
Net investment income/(loss) | $ | 3,304,158 | $ | 9,646,518 | $ | 498,976 | $ | 861,950 | ||||||||
Net realized gains/(losses) | (10,485,778 | ) | 5,547,235 | (5,897,563 | ) | (9,808,402 | ) | |||||||||
Change in net unrealized appreciation/(depreciation) | 13,343,297 | (223,961,063 | ) | 4,369,402 | (8,200,433 | ) | ||||||||||
Net Change in Net Assets Resulting From Operations | 6,161,677 | (208,767,310 | ) | (1,029,185 | ) | (17,146,885 | ) | |||||||||
Distributions to Shareholders | ||||||||||||||||
From net investment income | (9,467,689 | ) | (11,179,657 | ) | — | (862,553 | ) | |||||||||
From net realized gains | (17,308,240 | ) | (54,442,738 | ) | — | — | ||||||||||
From return of capital | — | — | — | (22,448 | ) | |||||||||||
Total Distributions to Shareholders | (26,775,929 | ) | (65,622,395 | ) | — | (885,001 | ) | |||||||||
Capital Stock Transactions | ||||||||||||||||
Sold | 3,418,725 | 8,728,957 | 2,144,631 | 63,762,264 | ||||||||||||
Distributions reinvested | 26,775,929 | 65,622,395 | — | 885,001 | ||||||||||||
Redeemed | (33,158,231 | ) | (113,707,492 | ) | (827,358 | ) | (5,263,915 | ) | ||||||||
Capital Stock Transactions | (2,963,577 | ) | (39,356,140 | ) | 1,317,273 | 59,383,350 | ||||||||||
Net Increase/(Decrease) in Net Assets | (23,577,829 | ) | (313,745,845 | ) | 288,088 | 41,351,464 | ||||||||||
Net Assets, Beginning of Period | 319,711,313 | 633,457,158 | 41,351,464 | — | ||||||||||||
Net Assets, End of Period | $ | 296,133,484 | $ | 319,711,313 | $ | 41,639,552 | $ | 41,351,464 | ||||||||
Accumulated undistributed net investment income/(loss) | $ | 3,397,339 | $ | 9,560,870 | $ | 498,294 | $ | (682 | ) | |||||||
Capital Stock Share Transactions | ||||||||||||||||
Sold | 261,222 | 467,473 | 329,082 | 6,404,407 | ||||||||||||
Distributions reinvested | 2,079,361 | 3,423,235 | — | 128,430 | ||||||||||||
Redeemed | (2,625,110 | ) | (5,753,579 | ) | (143,717 | ) | (532,079 | ) | ||||||||
Total Capital Stock Share Transactions | (284,527 | ) | (1,862,871 | ) | 185,365 | 6,000,758 | ||||||||||
| (a) | For the period from April 30, 2008 (inception) through December 31, 2008. |
The accompanying Notes to Financial Statements are an integral part of this schedule.
310
Table of Contents
Thrivent Series Fund, Inc.
Statement of Changes in Net Assets – continued
| Balanced Portfolio | High Yield Portfolio | Diversified Income Plus Portfolio | Partner Socially Responsible Bond Portfolio | |||||||||||||||||||||||||||
| 06/30/09 (unaudited) | 12/31/08 | 06/30/09 (unaudited) | 12/31/08 | 06/30/09 (unaudited) | 12/31/08 | 06/30/09 (unaudited) | 12/31/08(a) | |||||||||||||||||||||||
| $ | 3,597,481 | $ | 11,660,944 | $ | 31,768,599 | $ | 63,907,368 | $ | 2,779,271 | $ | 5,963,663 | $ | 145,536 | $ | 179,846 | |||||||||||||||
| (681,994 | ) | 5,991,728 | (36,860,545 | ) | (50,266,914 | ) | (6,629,739 | ) | (14,541,514 | ) | (101,265 | ) | 234,261 | |||||||||||||||||
| 4,477,166 | (129,660,743 | ) | 136,085,546 | (181,141,932 | ) | 11,723,104 | (16,884,578 | ) | 253,494 | (235,169 | ) | |||||||||||||||||||
| 7,392,653 | (112,008,071 | ) | 130,993,600 | (167,501,478 | ) | 7,872,636 | (25,462,429 | ) | 297,765 | 178,938 | ||||||||||||||||||||
| (11,644,909 | ) | (14,582,912 | ) | (31,350,287 | ) | (66,652,176 | ) | (5,981,706 | ) | (6,984,985 | ) | (129,093 | ) | (171,330 | ) | |||||||||||||||
| (4,181,300 | ) | (14,276,173 | ) | — | — | — | — | (211,381 | ) | — | ||||||||||||||||||||
| — | — | — | — | — | — | — | — | |||||||||||||||||||||||
| (15,826,209 | ) | (28,859,085 | ) | (31,350,287 | ) | (66,652,176 | ) | (5,981,706 | ) | (6,984,985 | ) | (340,474 | ) | (171,330 | ) | |||||||||||||||
| 1,868,804 | 6,880,428 | 18,865,714 | 109,379,698 | 2,272,907 | 3,367,953 | 1,642,995 | 9,301,898 | |||||||||||||||||||||||
| 15,826,209 | 28,859,085 | 31,350,287 | 66,652,176 | 5,981,706 | 6,984,985 | 340,832 | 170,972 | |||||||||||||||||||||||
| (31,218,809 | ) | (103,300,713 | ) | (37,994,854 | ) | (119,240,873 | ) | (10,507,431 | ) | (34,178,684 | ) | (2,013,126 | ) | (2,664,147 | ) | |||||||||||||||
| (13,523,796 | ) | (67,561,200 | ) | 12,221,147 | 56,791,001 | (2,252,818 | ) | (23,825,746 | ) | (29,299 | ) | 6,808,723 | ||||||||||||||||||
| (21,957,352 | ) | (208,428,356 | ) | 111,864,460 | (177,362,653 | ) | (361,888 | ) | (56,273,160 | ) | (72,008 | ) | 6,816,331 | |||||||||||||||||
| 280,020,870 | 488,449,226 | 597,219,792 | 774,582,445 | 75,005,121 | 131,278,281 | 6,816,331 | — | |||||||||||||||||||||||
| $ | 258,063,518 | $ | 280,020,870 | $ | 709,084,252 | $ | 597,219,792 | $ | 74,643,233 | $ | 75,005,121 | $ | 6,744,323 | $ | 6,816,331 | |||||||||||||||
| $ | 3,630,547 | $ | 11,677,975 | $ | 1,134,794 | $ | 716,482 | $ | 2,738,817 | $ | 5,941,252 | $ | 16,084 | $ | (359 | ) | ||||||||||||||
| 164,361 | 457,968 | 4,924,836 | 23,707,042 | 445,372 | 535,255 | 164,026 | 930,798 | |||||||||||||||||||||||
| 1,383,688 | 1,992,233 | 8,415,083 | 15,699,435 | 1,166,457 | 1,120,322 | 34,194 | 17,193 | |||||||||||||||||||||||
| (2,807,851 | ) | (7,093,103 | ) | (10,364,995 | ) | (27,769,002 | ) | (2,096,331 | ) | (5,483,298 | ) | (201,024 | ) | (267,414 | ) | |||||||||||||||
| (1,259,802 | ) | (4,642,902 | ) | 2,974,924 | 11,637,475 | (484,502 | ) | (3,827,721 | ) | (2,804 | ) | 680,577 | ||||||||||||||||||
The accompanying Notes to Financial Statements are an integral part of this schedule.
311
Table of Contents
Thrivent Series Fund, Inc.
Statement of Changes in Net Assets – continued
| Income Portfolio | Bond Index Portfolio | |||||||||||||||
For the periods ended | 06/30/09 (unaudited) | 12/31/08 | 06/30/09 (unaudited) | 12/31/08 | ||||||||||||
Operations | ||||||||||||||||
Net investment income/(loss) | $ | 32,699,913 | $ | 72,678,081 | $ | 3,080,696 | $ | 9,666,370 | ||||||||
Net realized gains/(losses) | (48,221,208 | ) | (41,957,306 | ) | 1,229,463 | 1,649,536 | ||||||||||
Change in net unrealized appreciation/(depreciation) | 102,268,152 | (175,029,046 | ) | (1,497,665 | ) | (13,481,529 | ) | |||||||||
Net Change in Net Assets Resulting From Operations | 86,746,857 | (144,308,271 | ) | 2,812,494 | (2,165,623 | ) | ||||||||||
Distributions to Shareholders | ||||||||||||||||
From net investment income | (32,703,223 | ) | (73,945,918 | ) | (3,248,170 | ) | (9,755,017 | ) | ||||||||
Total Distributions to Shareholders | (32,703,223 | ) | (73,945,918 | ) | (3,248,170 | ) | (9,755,017 | ) | ||||||||
Capital Stock Transactions | ||||||||||||||||
Sold | 23,114,486 | 118,286,630 | 5,751,559 | 16,193,275 | ||||||||||||
Distributions reinvested | 32,703,221 | 73,945,918 | 3,248,170 | 9,755,017 | ||||||||||||
Redeemed | (62,196,733 | ) | (295,159,930 | ) | (27,602,070 | ) | (54,595,260 | ) | ||||||||
Capital Stock Transactions | (6,379,026 | ) | (102,927,382 | ) | (18,602,341 | ) | (28,646,968 | ) | ||||||||
Net Increase/(Decrease) in Net Assets | 47,664,608 | (321,181,571 | ) | (19,038,017 | ) | (40,567,608 | ) | |||||||||
Net Assets, Beginning of Period | 1,097,103,028 | 1,418,284,599 | 174,649,020 | 215,216,628 | ||||||||||||
Net Assets, End of Period | $ | 1,144,767,636 | $ | 1,097,103,028 | $ | 155,611,003 | $ | 174,649,020 | ||||||||
Accumulated undistributed net investment income/(loss) | $ | 653,991 | $ | 657,301 | $ | (159,917 | ) | $ | 7,557 | |||||||
Capital Stock Share Transactions | ||||||||||||||||
Sold | 2,751,476 | 12,419,141 | 602,030 | 1,598,241 | ||||||||||||
Distributions reinvested | 3,993,959 | 8,157,489 | 339,245 | 978,080 | ||||||||||||
Redeemed | (7,647,386 | ) | (32,348,747 | ) | (2,884,230 | ) | (5,524,475 | ) | ||||||||
Total Capital Stock Share Transactions | (901,951 | ) | (11,772,117 | ) | (1,942,955 | ) | (2,948,154 | ) | ||||||||
The accompanying Notes to Financial Statements are an integral part of this schedule.
312
Table of Contents
Thrivent Series Fund, Inc.
Statement of Changes in Net Assets – continued
| Limited Maturity Bond Portfolio | Mortgage Securities Portfolio | Money Market Portfolio | ||||||||||||||||||||
| 06/30/09 (unaudited) | 12/31/08 | 06/30/09 (unaudited) | 12/31/08 | 06/30/09 (unaudited) | 12/31/08 | |||||||||||||||||
| $ | 19,784,374 | $ | 44,099,773 | $ | 723,854 | $ | 1,994,014 | $ | 2,460,272 | $ | 22,193,984 | |||||||||||
| (4,769,950 | ) | (11,933,103 | ) | 407,903 | 919,157 | 89,681 | (30,902 | ) | ||||||||||||||
| 47,368,910 | (98,663,346 | ) | (497,034 | ) | (4,975,162 | ) | — | — | ||||||||||||||
| 62,383,334 | (66,496,676 | ) | 634,723 | (2,061,991 | ) | 2,549,953 | 22,163,082 | |||||||||||||||
| (19,680,224 | ) | (45,270,503 | ) | (545,687 | ) | (1,935,505 | ) | (2,549,953 | ) | (22,163,082 | ) | |||||||||||
| (19,680,224 | ) | (45,270,503 | ) | (545,687 | ) | (1,935,505 | ) | (2,549,953 | ) | (22,163,082 | ) | |||||||||||
| 34,575,514 | 121,741,322 | 403,219 | 1,597,422 | 1,545,877,407 | 3,604,017,558 | |||||||||||||||||
| 19,685,109 | 45,265,617 | 545,687 | 1,935,505 | 2,549,960 | 22,163,082 | |||||||||||||||||
| (38,956,989 | ) | (103,109,449 | ) | (6,167,406 | ) | (14,157,852 | ) | (1,621,787,546 | ) | (3,684,287,640 | ) | |||||||||||
| 15,303,634 | 63,897,490 | (5,218,500 | ) | (10,624,925 | ) | (73,360,179 | ) | (58,107,000 | ) | |||||||||||||
| 58,006,744 | (47,869,689 | ) | (5,129,464 | ) | (14,622,421 | ) | (73,360,179 | ) | (58,107,000 | ) | ||||||||||||
| 925,939,520 | 973,809,209 | 35,166,757 | 49,789,178 | 683,446,527 | 741,553,527 | |||||||||||||||||
| $ | 983,946,264 | $ | 925,939,520 | $ | 30,037,293 | $ | 35,166,757 | $ | 610,086,348 | $ | 683,446,527 | |||||||||||
| $ | 322,690 | $ | 218,540 | $ | 178,166 | $ | (1 | ) | $ | (55,337 | ) | $ | 34,344 | |||||||||
| 3,807,321 | 12,556,040 | 46,377 | 170,644 | 1,545,877,407 | 3,604,017,559 | |||||||||||||||||
| 2,203,343 | 4,806,381 | 62,763 | 206,750 | 2,549,960 | 22,163,081 | |||||||||||||||||
| (4,393,314 | ) | (11,037,603 | ) | (711,012 | ) | (1,517,992 | ) | (1,621,787,546 | ) | (3,684,287,640 | ) | |||||||||||
| 1,617,350 | 6,324,818 | (601,872 | ) | (1,140,598 | ) | (73,360,179 | ) | (58,107,000 | ) | |||||||||||||
The accompanying Notes to Financial Statements are an integral part of this schedule.
313
Table of Contents
Notes to Financial Statements
As of June 30, 2009
(unaudited)
(1) ORGANIZATION
Thrivent Series Fund, Inc. (the “Fund”), a company organized under the laws of Minnesota, is registered under the Investment Company Act of 1940. The Fund is divided into forty-one separate series (each, a “Portfolio”), each with its own investment objective and policies. The Fund consists of four asset allocation portfolios, twenty-eight equity portfolios, two hybrid portfolios, six fixed-income portfolios, and one money market portfolio. The assets of each Portfolio are segregated, and each has a separate class of capital stock.
Shares in the Fund are currently sold, without sales charges, only to retirement plans sponsored by Thrivent Financial for Lutherans (“Thrivent Financial” or the “Adviser”) or separate accounts of Thrivent Financial or Thrivent Life Insurance Company (“Thrivent Life”), which are used to fund benefits of variable life insurance and variable annuity contracts issued by Thrivent Financial and Thrivent Life.
Under the Fund’s organizational documents, its officers and directors are indemnified against certain liabilities arising out of the performance of their duties to the Fund. In addition, in the normal course of business, the Fund enters into contracts with service providers and others that provide general damage clauses. The Fund’s maximum exposure under these contracts is unknown, as this would involve future claims that may be made against the Fund. However, based on experience, the Fund expects the risk of loss to be remote.
(2) SIGNIFICANT ACCOUNTING POLICIES
(A) Valuation of Investments – Securities traded on U.S. or foreign securities exchanges or included in a national market system are valued at the official closing price at the close of each business day unless otherwise stated below. Over-the-counter securities and listed securities for which no price is readily available are valued at the current bid price considered best to represent the value at that time. Swap agreements are valued at the fair value of the contract as furnished by an independent pricing service. Security prices are based on quotes that are obtained from an independent pricing service approved by the Board of Directors. The pricing service, in determining values of fixed-income securities, takes into consideration such factors as current quotations by broker/dealers, coupon, maturity, quality, type of issue, trading characteristics, and other yield and risk factors it deems relevant in determining valuations. Securities which cannot be valued by the approved pricing service are valued using valuations obtained from dealers that make markets in the securities. Exchange listed options and futures contracts are valued at the last quoted sales price. Investments in open-ended mutual funds are valued at their net asset value at the close of each business day.
For all Portfolios, other than Money Market Portfolio, short-term securities with maturities of 60 days or less are valued at amortized cost. Securities held by Money Market Portfolio are valued on the basis of amortized cost (which approximates market value), whereby a portfolio security is valued at its cost initially and thereafter valued to reflect a constant amortization to maturity of any discount or premium. The market values of the securities held in Money Market Portfolio are determined once per week using prices supplied by the Fund’s independent pricing service. Money Market Portfolio and the Fund’s investment adviser follow procedures necessary to maintain a constant net asset value of $1.00 per share.
All securities for which market values are not readily available or deemed unreliable are appraised at fair value as determined in good faith under the direction of the Board of Directors. As of June 30, 2009, the following Portfolios held fair valued securities:
Portfolio | Number of Securities | Percent of Fund’s Net Assets | |||
Partner Worldwide Allocation | 1 | 0.01 | % | ||
Partner International Stock | 1 | 0.01 | % | ||
High Yield | 4 | <0.01 | % | ||
Income | 2 | 0.49 | % | ||
Limited Maturity Bond | 1 | 0.44 | % |
In September 2006, the FASB issued FASB Statement No. 157 – Fair Value Measurements (FAS 157). The objective of the statement is to improve the consistency and comparability of fair value measurements used in financial reporting. FAS 157 defines fair value, establishes a framework for measuring fair value in generally accepted accounting principles, and expands disclosures about fair value requirements. Various inputs are summarized in the three broad levels: Level 1 includes quoted prices in active markets for identical securities; Level 2 includes other significant observable inputs such as quoted prices for similar securities, interest rates, prepayment speeds and credit risk; and Level 3 includes significant unobservable inputs such as the Portfolio’s own assumptions and broker evaluations in determining the fair value of investments.
Fair Valuation of International Securities – Because many foreign markets close before the U.S. markets, events may occur between the close of the foreign market and the close of the U.S. markets that could have a material impact on the valuation of foreign securities. The Portfolios, under the supervision of the Board of Directors, evaluate the impacts of these events and may adjust the valuation of foreign securities to reflect the fair value as of the close of the U.S. markets. The Board of Directors has authorized the Fund’s investment adviser to make fair valuation determinations pursuant to policies approved by the Board of Directors.
314
Table of Contents
THRIVENT SERIES FUND, INC.
Notes to Financial Statements
As of June 30, 2009
(unaudited)
(2) SIGNIFICANT ACCOUNTING POLICIES – CONTINUED
(B) Foreign Currency Translation – The accounting records of each Portfolio are maintained in U.S. dollars. Securities and other assets and liabilities that are denominated in foreign currencies are translated into U.S. dollars at the daily closing rates of exchange.
Foreign currency amounts related to the purchase or sale of securities and income and expenses are translated at the exchange rate on the transaction date. Net realized and unrealized currency gains and losses are recorded from sales of foreign currency, exchange gains or losses between the trade date and settlement dates on securities transactions, and other translation gains or losses on dividends, interest income and foreign withholding taxes. The Portfolios do not separately report the effect of changes in foreign exchange rates from changes in market prices on securities held. Such changes are included in net realized and unrealized gain or loss from investments in the Statement of Operations.
For federal income tax purposes, the portfolios treat the effect of changes in foreign exchange rates arising from actual foreign currency transactions and the changes in foreign exchange rates between the trade date and settlement date as ordinary income.
(C) Foreign Currency Forward Contracts – In connection with purchases and sales of securities denominated in foreign currencies all Portfolios, except Money Market Portfolio, may enter into foreign currency forward contracts. Additionally, the Portfolios may enter into such contracts to hedge certain other foreign currency denominated investments. These contracts are recorded at market value and the related realized and unrealized foreign exchange gains and losses are included in the Statement of Operations. In the event that counterparties fail to settle these forward contracts, the Portfolios could be exposed to foreign currency fluctuations. Foreign currency contracts are valued daily and unrealized appreciation or depreciation is recorded daily as the difference between the contract exchange rate and the closing forward rate applied to the face amount of the contract. A realized gain or loss is recorded at the time a forward contract is closed. These contracts are over-the-counter and the Portfolio is exposed to counterparty risk equal to the discounted net amount of payments to the Portfolio. This risk is partially mitigated by the Portfolio’s collateral posting requirements. During the six months ended June 30, 2009, Technology Portfolio, Partner Healthcare Portfolio, Partner Natural Resources Portfolio, Partner Emerging Markets Portfolio, Real Estate Securities Portfolio, Partner Utilities Portfolio, Partner Small Cap Value Portfolio, Small Cap Stock Portfolio, Partner Worldwide Allocation Portfolio, Partner International Stock Portfolio, Partner All Cap Value Portfolio and Partner Growth Stock Portfolio engaged in this type of investment.
(D) Foreign Denominated Investments – Foreign denominated assets and currency contracts may involve more risks than domestic transactions including currency risk, political and economic risk, regulatory risk, and market risk. Certain Portfolios may also invest in securities of companies located in emerging markets. Future economic or political developments could adversely affect the liquidity or value, or both, of such securities.
(E) Income Taxes – No provision has been made for income taxes because each Portfolio’s policy is to qualify as a regulated investment company under the Internal Revenue Code and distribute substantially all taxable income on a timely basis. It is also the intention of the Portfolios to distribute an amount sufficient to avoid imposition of any federal excise tax. The Portfolios, accordingly, anticipate paying no federal taxes and no federal tax provision was recorded. Each Portfolio is treated as a separate taxable entity for federal income tax purposes.
Certain Portfolios are subject to foreign income taxes imposed by certain countries in which they invest. Withholding taxes have been provided for in accordance with the applicable country’s tax rules and rates. These amounts are shown as foreign dividend tax withholding on the Statement of Operations.
In June 2006, the Financial Accounting Standards Board (FASB) issued FASB Interpretation No. 48 – Accounting for Uncertainty in Income Taxes (FIN 48), an interpretation of FASB Statement 109 that requires additional disclosures with respect to the tax effects of certain income tax positions, whether those positions were taken on previously filed tax returns or are expected to be taken on future returns. These positions must meet a “more likely than not” standard that, based on the technical merits of the position, would have a greater than 50 percent likelihood of being sustained upon examination. In evaluating whether a tax position has met the more-likely-than-not recognition threshold, management of the Fund must presume that the position will be examined by the appropriate taxing authority that has full knowledge of all relevant information. The Portfolios adopted the provisions of FIN 48 on June 29, 2007, the extended required implementation date set by the U.S. Securities and Exchange Commission for mutual funds.
FIN 48 requires management of the Fund to analyze all open tax years, as defined by the statute of limitations, for all major jurisdictions. Open tax years are those that are open for examination by taxing authorities. Major jurisdictions for the Portfolios include Federal, Minnesota and Wisconsin, as well as certain foreign countries. As of June 30, 2009, open Federal, Minnesota and Wisconsin tax years include the tax years ended December 31, 2005, through 2008. Additionally, as of June 30, 2009, the December 31, 2004, tax year is open for Minnesota and Wisconsin. The
315
Table of Contents
THRIVENT SERIES FUND, INC.
Notes to Financial Statements
As of June 30, 2009
(unaudited)
(2) SIGNIFICANT ACCOUNTING POLICIES – CONTINUED
Portfolios have no examinations in progress and none are expected at this time.
As of June 30, 2009, management of the Fund has reviewed all open tax years and major jurisdictions and concluded that the adoption of FIN 48 resulted in no effect to the Portfolio’s tax liability, financial position or results of operations. There is no tax liability resulting from unrecognized tax benefits related to uncertain income tax positions taken or expected to be taken in future tax returns. The Portfolios are also not aware of any tax positions for which it is reasonably possible that the total amounts of unrecognized tax benefits will significantly change in the next 12 months.
(F) Expenses and Income – Estimated expenses are accrued daily. The Portfolios are charged for those expenses that are directly attributable to them. Expenses that are not directly attributable to a Portfolio are allocated among all appropriate Portfolios in proportion to their respective net assets, number of shareholder accounts or other reasonable basis.
Interest income is accrued daily and is determined on the basis of interest or discount earned on all debt securities, including accretion of market discount and original issue discount and amortization of premium. Paydown gains and losses on mortgage- and asset-backed securities are recorded as components of interest income. Dividend income is recorded on the ex-dividend date.
(G) Custody Earnings Credit – The Portfolios have a deposit arrangement with the custodian whereby interest earned on uninvested cash balances is used to pay a portion of custodian fees. This deposit arrangement is an alternative to overnight investments. Earnings credits are shown as a reduction of total expenses on the Statement of Operations.
(H) Distributions to Shareholders – Dividends from net investment income and distributions from realized capital gains, if available, are declared and paid to each shareholder. Dividends and capital gain distributions are recorded on the ex-dividend date. With the exception of Money Market Portfolio, net realized gains from securities transactions, if any, are paid at least annually for all Portfolios after the close of the Portfolios’ fiscal year. Any Portfolio subject to excise taxes would require an additional distribution prior to the close of the fiscal year.
Dividends are declared and reinvested daily for High Yield Portfolio, Partner Socially Responsible Bond Portfolio, Income Portfolio, Bond Index Portfolio, Limited Maturity Bond Portfolio and Mortgage Securities Portfolio; declared daily and reinvested monthly for Money Market Portfolio; and declared and reinvested at least annually for all other Portfolios.
(I) Options – All Portfolios, with the exception of Money Market Portfolio, may buy put and call options and write put and covered call options. The Portfolios intend to use such derivative instruments as hedges to facilitate buying or selling securities or to provide protection against adverse movements in security prices or interest rates. The Portfolios may also enter into options contracts to protect against adverse foreign exchange rate fluctuations. Option contracts are valued daily and unrealized appreciation or depreciation is recorded. A Portfolio will realize a gain or loss upon expiration or closing of the option transaction. When an option is exercised, the proceeds upon sale for a written call option or the cost of a security for purchased put and call options is adjusted by the amount of premium received or paid.
Buying put options tends to decrease a Portfolio’s exposure to the underlying security while buying call options tends to increase a Portfolio’s exposure to the underlying security. The risk associated with purchasing put and call options is limited to the premium paid and has no significant counterparty risk as the exchange guarantees the contract against default. Writing put options tends to increase a Portfolio’s exposure to the underlying security while writing call options tends to decrease a Portfolio’s exposure to the underlying security. The writer of an option has no control over whether the underlying security may be bought or sold, and therefore bears the market risk of an unfavorable change in the price of the underlying security. The counterparty risk for written options arises when the Portfolio has purchased an option, exercised that option, and the counterparty doesn’t buy or sell the Portfolio’s underlying asset as required. In the case where a Portfolio has sold an option, the Portfolio doesn’t have counterparty risk. Counterparty risk on written options is partially mitigated by the Portfolio’s collateral posting requirements. As the written option increases in value to the Portfolio, the Portfolio receives collateral from the counterparty. Risks of loss may exceed amounts recognized on the Statement of Assets and Liabilities. During the six months ended June 30, 2009, Partner All Cap Value Portfolio, Large Cap Growth Portfolio II, Large Cap Growth Portfolio, Large Cap Stock Portfolio, Equity Income Plus Portfolio, Diversified Income Plus Portfolio, Limited Maturity Bond Portfolio and Mortgage Securities Portfolio engaged in these types of investments.
(J) Futures Contracts – Certain Portfolios may use futures contracts to manage the exposure to interest rate, market and currency fluctuations. Gains or losses on futures contracts can offset changes in the yield of securities. When a futures contract is opened, cash or other investments equal to the required “initial margin deposit” are held on deposit with and pledged to the broker. Additional securities held by the Portfolios may be earmarked to cover open futures contracts. The futures contract’s daily change in value (“variation margin”) is either paid to or received from the broker, and is recorded as an unrealized gain or loss. When
316
Table of Contents
THRIVENT SERIES FUND, INC.
Notes to Financial Statements
As of June 30, 2009
(unaudited)
(2) SIGNIFICANT ACCOUNTING POLICIES – CONTINUED
the contract is closed, the realized gain or loss is recorded equal to the difference between the value of the contract when opened and the value of the contract when closed. Futures contracts involve, to varying degrees, risks of loss in excess of the variation margin disclosed in the Statement of Assets and Liabilities. Exchange-traded futures have no significant counterparty risk as the exchange guarantees the contracts against default. During the six months ended June 30, 2009, Aggressive Allocation Portfolio, Moderately Aggressive Allocation Portfolio, Moderate Allocation Portfolio, Moderately Conservative Allocation Portfolio, Technology Portfolio, Partner Small Cap Growth Portfolio, Small Cap Stock Portfolio, Small Cap Index Portfolio, Mid Cap Index Portfolio, Partner Worldwide Allocation Portfolio, Large Cap Stock Portfolio, Large Cap Index Portfolio, Equity Income Plus Portfolio, Balanced Portfolio, Diversified Income Plus Portfolio, Partner Socially Responsible Bond Portfolio, Income Portfolio, Limited Maturity Bond Portfolio and Mortgage Securities Portfolio engaged in this type of investment.
(K) Swap Agreements – Certain Portfolios enter into swap transactions, which involve swapping one or more investment characteristics of a security, or a basket of securities, with another party. Such transactions include market risk, risk of default by the other party to the transaction, risk of imperfect correlation and manager risk and may involve commissions or other costs. Swap transactions generally do not involve delivery of securities, other underlying assets or principal. Accordingly, the risk of loss with respect to swap transactions is generally limited to the net amount of payments that the Portfolio is contractually obligated to make, or in the case of the counterparty defaulting, the net amount of payments that the Portfolio is contractually entitled to receive. Risks of loss may exceed amounts recognized on the Statement of Assets and Liabilities. If there is a default by the counterparty, the Portfolio may have contractual remedies pursuant to the agreements related to the transaction. The contracts are valued daily and unrealized appreciation or depreciation is recorded. Swap agreements are valued at fair value of the contract as provided by an independent pricing service. The pricing service takes into account such factors as swap curves, default probabilities, recent trades, recovery rates and other factors it deems relevant in determining valuations. Periodic payments and receipts and payments received or made as a result of a credit event or termination of the contract are recognized as realized gains or losses on the Statement of Operations. Collateral, in the form of cash or securities, may be required to be held with the Fund’s custodian, or third party, in connection with these agreements. These swap agreements are over-the-counter and the Portfolio is exposed to counterparty risk, which is the discounted net amount of payments owed to the Portfolio. This risk is partially mitigated by the Portfolio’s collateral posting requirements. As the swap increases in value to the Portfolio, the Portfolio receives collateral from the counterparty.
Credit Default Swaps – A credit default swap is a swap agreement between two parties to exchange the credit risk of a particular issuer, basket of securities or reference entity. In a credit default swap transaction, a buyer pays periodic fees in return for payment by the seller which is contingent upon an adverse credit event occurring in the underlying issuer or reference entity. The seller collects periodic fees from the buyer and profits if the credit of the underlying issuer or reference entity remains stable or improves while the swap is outstanding, but the seller in a credit default swap contract would be required to pay the amount of credit loss, determined as specified in the agreement, to the buyer in the event of an adverse credit event in the reference entity. A buyer of a credit default swap is said to buy protection whereas a seller of a credit default swap is said to sell protection. The Portfolios may be either the protection seller or the protection buyer.
Certain Portfolios enter into credit default derivative contracts directly through credit default swaps (CDS) or through credit default swap indices (CDX Indices). CDX indices are static portfolios of equally weighted credit default swaps referencing corporate bonds and/or loans designed to provide diversified credit exposure to these asset classes. Portfolios sell default protection and assume long-risk positions in individual credits or the indices. Index positions are entered into to gain exposure to the corporate bond and/or loan markets in a cost efficient and diversified structure. In the event that a position would default, by going into bankruptcy and failing to pay interest or principal on borrowed money, within any given CDX index held, the maximum potential amount of future payments required would be equal to the pro-rata share of that position within the index based on the notional amount of the index. In the event of a default under a CDS contract the maximum potential amount of future payments would be the notional amount. For CDS contracts, the default events could be bankruptcy and failing to pay interest or principal on borrowed money or a restructuring. A restructuring is a change in the underlying obligations which would include reduction in interest or principal, maturity extension and subordination to other obligations. Refer to the credit default swap tables located within the Portfolio’s Schedule of Investments for additional information as of June 30, 2009. During the six months ended June 30, 2009, High Yield Portfolio, Income Portfolio and Limited Maturity Bond Portfolio engaged in these types of investments.
Total Rate of Return Swaps – A total rate of return swap is a swap agreement in which one party makes payments based on a set rate, either fixed or variable, while the other party makes payments based on the return of an underlying asset plus any capital gains and losses over the payment
317
Table of Contents
THRIVENT SERIES FUND, INC.
Notes to Financial Statements
As of June 30, 2009
(unaudited)
(2) SIGNIFICANT ACCOUNTING POLICIES – CONTINUED
period. The underlying asset is typically an index, loan or a basket of assets. Total rate of return swaps provide the Portfolios with the additional flexibility of gaining exposure to a market or securities index by using the most cost-effective vehicle available. During the six months ended June 30, 2009, none of the Portfolios engaged in this type of investment.
Interest Rate Swaps – An interest rate swap is a swap agreement between two parties to exchange cash flows based on the difference between two interest rates. Typically, one party pays a fixed-rate for a specific period while the other pays a variable-rate based on an underlying index for the same period. Interest rate swaps allow the Portfolios to manage exposure to interest rate fluctuations. During the six months ended June 30, 2009, Limited Maturity Bond Portfolio engaged in this type of investment.
(L) Mortgage Dollar Roll Transactions – Certain Portfolios enter into dollar roll transactions on securities issued or to be issued by the Government National Mortgage Association, Federal National Mortgage Association and Federal Home Loan Mortgage Corporation, in which the Portfolios sell mortgage securities and simultaneously agree to repurchase similar (same type and coupon) securities at a later date at an agreed upon price. During the period between the sale and repurchase, the Portfolios forgo principal and interest paid on the mortgage securities sold. The Portfolios are compensated from negotiated fees paid by brokers offered as an inducement to the Portfolios to roll over their purchase commitments. These fees are recognized over the roll period and are included in Income from mortgage dollar rolls in the Statement of Operations. During the six months ended June 30, 2009, Balanced Portfolio, Income Portfolio, Bond Index Portfolio, Limited Maturity Bond Portfolio and Mortgage Securities Portfolio engaged in this type of transaction.
(M) Securities Lending – The Fund has entered into a Securities Lending Agreement (the “Agreement”) with Dresdner Bank AG (“Dresdner”). The Agreement authorizes Dresdner to lend securities to authorized borrowers on behalf of the Portfolios. Pursuant to the Agreement, all loaned securities are initially collateralized by cash equal to at least 102% of the value of the loaned securities. All cash collateral received is invested in Thrivent Financial Securities Lending Trust. The Portfolios receive dividends and interest that would have been earned on the securities loaned while simultaneously seeking to earn income on the investment of cash collateral. Amounts earned on investments in Thrivent Financial Securities Lending Trust, net of rebates, fees paid to Dresdner for services provided and any other securities lending expenses, are included in Income from securities loaned on the Statement of Operations. By investing any cash collateral it receives in these transactions, a Portfolio could realize additional gains or losses. If the borrower fails to return the securities or the invested collateral has declined in value, the Portfolio could lose money. During the six months ended June 30, 2009, all Portfolios except Aggressive Allocation Portfolio, Moderately Aggressive Allocation Portfolio, Moderate Allocation Portfolio, Moderately Conservative Allocation Portfolio, Partner Healthcare Portfolio, Partner Natural Resources Portfolio, Partner Emerging Markets Portfolio, Partner Utilities Portfolio, Partner Worldwide Allocation Portfolio, Partner Socially Responsible Stock Portfolio, Partner All Cap Growth Portfolio, Partner All Cap Value Portfolio, Equity Income Plus Portfolio, Partner Socially Responsible Bond Portfolio, Mortgage Securities Portfolio and Money Market Portfolio had securities on loan. As of June 30, 2009, the value of securities on loan is as follows:
Portfolio | Securities on Loan | ||
Technology | $ | 2,382,941 | |
Real Estate Securities | 25,006,823 | ||
Partner Small Cap Growth | 28,207,549 | ||
Partner Small Cap Value | 26,052,471 | ||
Small Cap Stock | 27,072,581 | ||
Small Cap Index | 24,762,992 | ||
Mid Cap Growth II | 6,376,168 | ||
Mid Cap Growth | 15,973,749 | ||
Partner Mid Cap Value | 4,744,111 | ||
Mid Cap Stock | 31,052,070 | ||
Mid Cap Index | 7,436,774 | ||
Partner International Stock | 39,467,217 | ||
Partner All Cap | 2,441,372 | ||
Large Cap Growth II | 8,336,026 | ||
Large Cap Growth | 19,595,056 | ||
Partner Growth Stock | 547,376 | ||
Large Cap Value | 18,560,661 | ||
Large Cap Stock | 9,844,831 | ||
Large Cap Index | 5,398,045 | ||
Balanced | 6,239,525 | ||
High Yield | 52,350,754 | ||
Diversified Income Plus | 1,235,278 | ||
Income | 33,601,128 | ||
Bond Index | 1,426,786 | ||
Limited Maturity Bond | 45,428,487 | ||
(N) When Issued and Delayed Delivery Transactions – Certain Portfolios may purchase or sell securities on a when-issued or delayed delivery basis. These transactions involve a commitment by a Portfolio to purchase or sell securities for a predetermined price or yield, with payment and delivery taking place beyond the customary settlement period. When delayed delivery purchases are outstanding, a Portfolio will designate liquid assets in an amount sufficient to meet the purchase price. When purchasing a security on a delayed delivery basis, a Portfolio assumes the rights and risks of ownership of the security, including the risk of price and yield fluctuations, and takes such fluctuations into account when determining its net asset value. A Portfolio may dispose of a delayed delivery transaction after it is entered into, and may sell when-issued securities before they are delivered, which may result in a capital gain or loss.
318
Table of Contents
THRIVENT SERIES FUND, INC.
Notes to Financial Statements
As of June 30, 2009
(unaudited)
(2) SIGNIFICANT ACCOUNTING POLICIES – CONTINUED
When a Portfolio has sold a security on a delayed delivery basis, a Portfolio does not participate in future gains and losses with respect to the security.
(O) Treasury Inflation Protected Securities – Certain Portfolios may invest in treasury inflation protected securities (TIPS). These securities are fixed-income securities whose principal value is periodically adjusted to the rate of inflation. The interest rate is generally fixed at issuance. Interest is paid based on the principal value, which is adjusted for inflation. Generally, any increase or decrease in the principal amount will be included as taxable interest in the Statement of Operations and received upon maturity or sale of the security. During the six months ended June 30, 2009, Income Portfolio, Limited Maturity Bond Portfolio and Mortgage Securities Portfolio engaged in this type of investment.
(P) Repurchase Agreements – Each Portfolio may engage in repurchase agreement transactions in pursuit of its investment objective. A repurchase agreement consists of a purchase and a simultaneous agreement to resell an investment for later delivery at an agreed upon price and rate of interest. The Portfolio must take possession of collateral either directly or through a third-party custodian. If the original seller of a security subject to a repurchase agreement fails to repurchase the security at the agreed upon time, the Portfolio could incur a loss due to a drop in the market value of the security during the time it takes the Portfolio to either sell the security or take action to enforce the original seller’s agreement to repurchase the security. Also, if a defaulting original seller filed for bankruptcy or became insolvent, disposition of such security might be delayed by pending court action. The Portfolio may only enter into repurchase agreements with banks and other recognized financial institutions such as broker/dealers that are found by the Portfolios’ investment adviser (or a subadviser) to be creditworthy. During the six months ended June 30, 2009, Partner International Stock Portfolio, Large Cap Growth Portfolio, Large Cap Value Portfolio, Large Cap Stock Portfolio, High Yield Portfolio, Income Portfolio and Limited Maturity Bond Portfolio engaged in this type of investment.
(Q) Equity-Linked Structured Securities – Certain Portfolios may invest in equity-linked structured notes, which are debt securities that combine the characteristics of common stock and the sale of an option. The return component is based upon the performance of a single equity security, a basket of equity securities, or an equity index and the sale of an option which is recognized as income. There is no guaranteed return of principal with these securities. The appreciation potential of these securities may be limited by a maximum payment or call right and can be influenced by many unpredictable factors. During the six months ended June 30, 2009, High Yield Portfolio, Diversified Income Plus Portfolio and Limited Maturity Bond Portfolio engaged in this type of investment.
(R) Credit Risk – The Portfolios may be susceptible to credit risk to the extent the issuer or counterparty defaults on its payment obligation. The Portfolios’ policy is to monitor the creditworthiness of the issuers. Interest receivables on defaulted securities are monitored for the ability to collect payments in default and adjusted accordingly.
(S) Accounting Estimates – The preparation of financial statements in conformity with accounting principles generally accepted in the United States of America require management to make estimates and assumptions that affect the reported amounts of assets and liabilities and disclosure of contingent assets and liabilities at the date of the financial statements and the reported amounts of income and expenses during the reporting period. Actual results could differ from those estimates.
(T) Temporary Guarantee Program – The Fund, on behalf of Thrivent Money Market Portfolio, was a participant in the U.S. Department of the Treasury’s Temporary Guarantee Program for Money Market Funds (the “Program”) during the Program’s initial phase from September 19, 2008 through December 18, 2008 and the first extension of the Program from December 19, 2008 through April 30, 2009. The U.S. Treasury has extended the Program for a second time through September 18, 2009, and the Fund, on behalf of the Portfolio, is a participant in this second extension of the Program.
The Program continues to guarantee the share price of a fund held by shareholders as of September 19, 2008, at $1.00 per share. Persons who were not shareholders as of September 19, 2008, are not covered by the Program.
The guarantee under the Program would be triggered if a fund’s per share net asset value falls below $0.995 (a “Guarantee Event”) and the fund commences the process of liquidation. Under the terms of the Program, the U.S. Treasury guarantees payment to each eligible shareholder the difference between the amount received in liquidation and the amount that eligible shareholder would have received had the net asset value of the fund been $1.00 per share. If the number of shares held by the eligible shareholder in a participating fund fluctuates over the duration of the Program, the Program would cover the lesser of (i) the number of shares held by the eligible shareholder in the fund as of September 19, 2008, or (ii) the number of shares held by the eligible shareholder as of the date of the Guarantee Event.
319
Table of Contents
THRIVENT SERIES FUND, INC.
Notes to Financial Statements
As of June 30, 2009
(unaudited)
(2) SIGNIFICANT ACCOUNTING POLICIES – CONTINUED
To participate in the initial phase of the Program, Thrivent Money Market Portfolio was required to pay an initial participation fee in the amount of 0.01% of the total net assets of the Portfolio as of September 19, 2008. To participate in the first extension of the Program, the Portfolio was required to pay a participation fee of 0.015% of the total net assets of the Portfolio as of September 19, 2008. To participate in the second extension of the Program, the Portfolio was required to pay a participation fee of 0.015% of the total net assets of the Portfolio as of September 19, 2008.
(U) Loan Commitments – Certain Portfolios may enter into loan commitments, which generally have interest rates which are reset daily, monthly, quarterly or semi-annually by reference to a base lending rate, plus a premium. These base rates are primarily the London-Interbank Offered Rate (“LIBOR”), and secondarily the prime rate offered by one or more major United States banks (the “Prime Rate”) and the certificate of deposit (“CD”) rate or other base lending rates used by commercial lenders. Loan commitments often require prepayments from excess cash flows or allow the borrower to repay at its election. The rate at which the borrower repays cannot be predicted with accuracy. Therefore, the remaining maturity may be considerably less than the stated maturity shown in the Schedule of Investments.
All or a portion of these loan commitments may be unfunded. The Portfolio is obligated to fund these commitments at the borrower’s discretion. Therefore, the Portfolio must have funds sufficient to cover its contractual obligation. These unfunded loan commitments, which are marked to market daily, are presented in the Schedule of Investments.
(V) Recent Accounting Pronouncements – In March 2008, the FASB issued Statement of Financial Accounting Standards No. 161 – Disclosures about Derivative Instruments and Hedging Activities: An Amendment of FASB Statement No. 133 (“FAS 161”). FAS 161 is intended to improve financial reporting for derivative instruments by requiring enhanced disclosure that enables investors to understand how and why an entity uses derivatives, how derivatives are accounted for and how derivative instruments affect an entity’s results of operations and financial position. The Portfolios have implemented this provision for the June 30, 2009, shareholder report.
In May 2009, the FASB issued Statement of Financial Accounting Standards No. 165 – Subsequent Events. The statement is intended to establish general standards of accounting for and disclosure of events or transactions that occur after the balance sheet date but before financial statements are issued or available to be issued. It requires the disclosure of the date through which an entity has evaluated subsequent events and the basis for that date. The Portfolios have implemented this provision for the June 30, 2009, shareholder report. Management of the Funds have evaluated the impact of subsequent events through August 19, 2009, the date the financial statements were available to be issued.
In April 2009, the FASB issued Staff Position (FSP) FAS 157-4 – Determining Fair Value When the Volume and Level of Activity for the Asset or Liability Have Significantly Decreased and Identifying Transactions That Are Not Orderly. This FSP provides additional guidance for estimating fair value in accordance with FASB Statement No. 157, Fair Value Measurements. FAS 157-4 focuses on markets that experience significant decline in volume and level of activity for assets or liabilities as compared to markets that have a history of being inactive. When this exposure to pricing conditions is present further evaluation and disclosure is provided. The Portfolios have implemented this provision for the June 30, 2009, shareholder report.
(W) Loss Contingencies – Thrivent High Yield Portfolio and Thrivent Income Portfolio are defendants in an adversary action filed on July 31, 2009 by the Official Committee of Unsecured Creditors of Motors Liquidation Company formerly known as General Motors Corporation (GM) against prior and current holders of term loan debt of GM. The suit seeks to determine whether GM’s term loan facility was secured at the time it entered bankruptcy. Thrivent High Yield Portfolio at one time held term loans in an amount of at least $4,627,531 and, if the plaintiffs are successful, it is reasonably possible that the Portfolio will be required to make payments in some amount. This loss contingency has not been accrued as a liability because the amount of potential damages and the likelihood of loss cannot be reasonably estimated. Although Thrivent Income Portfolio is named as a defendant in this action, we do not expect that the Portfolio’s assets will be subject to a loss contingency.
(X) Other – For financial statement purposes, investment security transactions are accounted for on the trade date. Realized gains and losses from investment transactions are determined on a specific cost identification basis, which is the same basis used for federal income tax purposes.
320
Table of Contents
THRIVENT SERIES FUND, INC.
Notes to Financial Statements
As of June 30, 2009
(unaudited)
(3) FEES AND COMPENSATION PAID TO AFFILIATES
(A) Investment Advisory Fees – Each Portfolio pays Thrivent Financial, the Fund’s investment adviser, a fee for its advisory services. The fees are accrued daily and paid monthly. The annual rates of fees as a percent of average daily net assets were as follows:
Portfolio (M - Millions) | $0 to $50M | $50 to $200M | $200 to $250M | $250 to $500M | $500 to $750M | $750 to $1,000M | $1,000 to $1,500M | $1,500 to $2,000M | $2,000 to $2,500M | $2,500 to $5,000M | Over $5,000M | ||||||||||||||||||||||
Aggressive Allocation | 0.150 | % | 0.150 | % | 0.150 | % | 0.150 | % | 0.125 | % | 0.125 | % | 0.125 | % | 0.125 | % | 0.100 | % | 0.100 | % | 0.100 | % | |||||||||||
Moderately Aggressive Allocation | 0.150 | % | 0.150 | % | 0.150 | % | 0.150 | % | 0.125 | % | 0.125 | % | 0.125 | % | 0.125 | % | 0.100 | % | 0.100 | % | 0.100 | % | |||||||||||
Moderate Allocation | 0.150 | % | 0.150 | % | 0.150 | % | 0.150 | % | 0.125 | % | 0.125 | % | 0.125 | % | 0.125 | % | 0.100 | % | 0.100 | % | 0.100 | % | |||||||||||
Moderately Conservative Allocation | 0.150 | % | 0.150 | % | 0.150 | % | 0.150 | % | 0.125 | % | 0.125 | % | 0.125 | % | 0.125 | % | 0.100 | % | 0.100 | % | 0.100 | % | |||||||||||
Technology | 0.750 | % | 0.750 | % | 0.750 | % | 0.750 | % | 0.750 | % | 0.750 | % | 0.750 | % | 0.750 | % | 0.750 | % | 0.750 | % | 0.750 | % | |||||||||||
Partner Healthcare | 0.950 | % | 0.900 | % | 0.900 | % | 0.900 | % | 0.900 | % | 0.900 | % | 0.900 | % | 0.900 | % | 0.900 | % | 0.900 | % | 0.900 | % | |||||||||||
Partner Natural Resources | 0.750 | % | 0.725 | % | 0.725 | % | 0.725 | % | 0.725 | % | 0.725 | % | 0.725 | % | 0.725 | % | 0.725 | % | 0.725 | % | 0.725 | % | |||||||||||
Partner Emerging Markets | 1.200 | % | 1.070 | % | 1.070 | % | 1.070 | % | 1.070 | % | 1.070 | % | 1.070 | % | 1.070 | % | 1.070 | % | 1.070 | % | 1.070 | % | |||||||||||
Real Estate Securities | 0.800 | % | 0.800 | % | 0.800 | % | 0.800 | % | 0.750 | % | 0.750 | % | 0.750 | % | 0.750 | % | 0.750 | % | 0.750 | % | 0.750 | % | |||||||||||
Partner Utilities | 0.750 | % | 0.725 | % | 0.725 | % | 0.725 | % | 0.725 | % | 0.725 | % | 0.725 | % | 0.725 | % | 0.725 | % | 0.725 | % | 0.725 | % | |||||||||||
Partner Small Cap Growth | 1.000 | % | 1.000 | % | 1.000 | % | 1.000 | % | 0.900 | % | 0.900 | % | 0.900 | % | 0.900 | % | 0.900 | % | 0.900 | % | 0.900 | % | |||||||||||
Partner Small Cap Value | 0.800 | % | 0.800 | % | 0.800 | % | 0.800 | % | 0.800 | % | 0.800 | % | 0.800 | % | 0.800 | % | 0.800 | % | 0.800 | % | 0.800 | % | |||||||||||
Small Cap Stock | 0.700 | % | 0.700 | % | 0.650 | % | 0.650 | % | 0.650 | % | 0.650 | % | 0.600 | % | 0.600 | % | 0.600 | % | 0.550 | % | 0.525 | % | |||||||||||
Small Cap Index | 0.350 | % | 0.350 | % | 0.350 | % | 0.300 | % | 0.250 | % | 0.250 | % | 0.200 | % | 0.150 | % | 0.100 | % | 0.100 | % | 0.100 | % | |||||||||||
Mid Cap Growth II | 0.900 | % | 0.900 | % | 0.900 | % | 0.900 | % | 0.800 | % | 0.800 | % | 0.800 | % | 0.800 | % | 0.800 | % | 0.800 | % | 0.800 | % | |||||||||||
Mid Cap Growth | 0.400 | % | 0.400 | % | 0.400 | % | 0.400 | % | 0.400 | % | 0.400 | % | 0.400 | % | 0.400 | % | 0.400 | % | 0.400 | % | 0.400 | % | |||||||||||
Partner Mid Cap Value | 0.750 | % | 0.750 | % | 0.700 | % | 0.700 | % | 0.700 | % | 0.700 | % | 0.700 | % | 0.700 | % | 0.700 | % | 0.700 | % | 0.700 | % | |||||||||||
Mid Cap Stock | 0.700 | % | 0.700 | % | 0.650 | % | 0.650 | % | 0.650 | % | 0.650 | % | 0.600 | % | 0.600 | % | 0.600 | % | 0.550 | % | 0.525 | % | |||||||||||
Mid Cap Index | 0.350 | % | 0.350 | % | 0.350 | % | 0.300 | % | 0.250 | % | 0.250 | % | 0.200 | % | 0.150 | % | 0.100 | % | 0.100 | % | 0.100 | % | |||||||||||
Partner Worldwide Allocation | 0.900 | % | 0.900 | % | 0.900 | % | 0.850 | % | 0.850 | % | 0.850 | % | 0.850 | % | 0.850 | % | 0.850 | % | 0.850 | % | 0.850 | % | |||||||||||
Partner International Stock | 0.850 | % | 0.850 | % | 0.850 | % | 0.850 | % | 0.800 | % | 0.800 | % | 0.750 | % | 0.700 | % | 0.700 | % | 0.700 | % | 0.700 | % | |||||||||||
Partner Socially Responsible Stock | 0.800 | % | 0.775 | % | 0.775 | % | 0.775 | % | 0.775 | % | 0.775 | % | 0.775 | % | 0.775 | % | 0.775 | % | 0.775 | % | 0.775 | % | |||||||||||
Partner All Cap Growth | 0.950 | % | 0.950 | % | 0.950 | % | 0.900 | % | 0.900 | % | 0.900 | % | 0.900 | % | 0.900 | % | 0.900 | % | 0.900 | % | 0.900 | % | |||||||||||
Partner All Cap Value | 0.750 | % | 0.700 | % | 0.700 | % | 0.700 | % | 0.700 | % | 0.700 | % | 0.700 | % | 0.700 | % | 0.700 | % | 0.700 | % | 0.700 | % | |||||||||||
Partner All Cap | 0.950 | % | 0.950 | % | 0.950 | % | 0.950 | % | 0.900 | % | 0.900 | % | 0.900 | % | 0.900 | % | 0.900 | % | 0.900 | % | 0.900 | % | |||||||||||
Large Cap Growth II | 0.800 | % | 0.800 | % | 0.800 | % | 0.800 | % | 0.700 | % | 0.700 | % | 0.700 | % | 0.700 | % | 0.700 | % | 0.700 | % | 0.700 | % | |||||||||||
Large Cap Growth | 0.400 | % | 0.400 | % | 0.400 | % | 0.400 | % | 0.400 | % | 0.400 | % | 0.400 | % | 0.400 | % | 0.400 | % | 0.400 | % | 0.400 | % | |||||||||||
Partner Growth Stock | 0.800 | % | 0.800 | % | 0.800 | % | 0.800 | % | 0.700 | % | 0.700 | % | 0.700 | % | 0.700 | % | 0.700 | % | 0.700 | % | 0.700 | % | |||||||||||
Large Cap Value | 0.600 | % | 0.600 | % | 0.600 | % | 0.600 | % | 0.600 | % | 0.600 | % | 0.600 | % | 0.600 | % | 0.600 | % | 0.600 | % | 0.600 | % | |||||||||||
Large Cap Stock | 0.650 | % | 0.650 | % | 0.650 | % | 0.650 | % | 0.575 | % | 0.550 | % | 0.475 | % | 0.475 | % | 0.475 | % | 0.450 | % | 0.425 | % | |||||||||||
Large Cap Index | 0.350 | % | 0.350 | % | 0.350 | % | 0.300 | % | 0.250 | % | 0.250 | % | 0.200 | % | 0.150 | % | 0.100 | % | 0.100 | % | 0.100 | % | |||||||||||
Equity Income Plus | 0.650 | % | 0.650 | % | 0.650 | % | 0.600 | % | 0.600 | % | 0.600 | % | 0.600 | % | 0.600 | % | 0.600 | % | 0.600 | % | 0.600 | % | |||||||||||
Balanced | 0.350 | % | 0.350 | % | 0.350 | % | 0.300 | % | 0.300 | % | 0.300 | % | 0.300 | % | 0.300 | % | 0.300 | % | 0.300 | % | 0.300 | % | |||||||||||
High Yield | 0.400 | % | 0.400 | % | 0.400 | % | 0.400 | % | 0.400 | % | 0.400 | % | 0.400 | % | 0.400 | % | 0.400 | % | 0.400 | % | 0.400 | % | |||||||||||
Diversified Income Plus | 0.400 | % | 0.400 | % | 0.400 | % | 0.400 | % | 0.400 | % | 0.400 | % | 0.400 | % | 0.400 | % | 0.400 | % | 0.400 | % | 0.400 | % | |||||||||||
Partner Socially Responsible Bond | 0.700 | % | 0.675 | % | 0.675 | % | 0.675 | % | 0.675 | % | 0.675 | % | 0.675 | % | 0.675 | % | 0.675 | % | 0.675 | % | 0.675 | % | |||||||||||
Income | 0.400 | % | 0.400 | % | 0.400 | % | 0.400 | % | 0.400 | % | 0.400 | % | 0.400 | % | 0.400 | % | 0.400 | % | 0.400 | % | 0.400 | % | |||||||||||
Bond Index | 0.350 | % | 0.350 | % | 0.350 | % | 0.300 | % | 0.250 | % | 0.250 | % | 0.200 | % | 0.150 | % | 0.100 | % | 0.100 | % | 0.100 | % | |||||||||||
Limited Maturity Bond | 0.400 | % | 0.400 | % | 0.400 | % | 0.400 | % | 0.400 | % | 0.400 | % | 0.400 | % | 0.400 | % | 0.400 | % | 0.400 | % | 0.400 | % | |||||||||||
Mortgage Securities | 0.500 | % | 0.500 | % | 0.500 | % | 0.500 | % | 0.500 | % | 0.500 | % | 0.500 | % | 0.500 | % | 0.500 | % | 0.500 | % | 0.500 | % | |||||||||||
Money Market | 0.400 | % | 0.400 | % | 0.400 | % | 0.400 | % | 0.400 | % | 0.400 | % | 0.400 | % | 0.400 | % | 0.400 | % | 0.400 | % | 0.400 | % |
At a special shareholder meeting on May 15, 2009, the applicable shareholders voted to approve a new advisory fee structure for the four Asset Allocation Portfolios: Thrivent Aggressive Allocation Portfolio, Thrivent Moderately Aggressive Allocation Portfolio, Thrivent Moderate Allocation Portfolio and Thrivent Moderately Conservative Allocation Portfolio. Under the new fee structure, which went into effect on June 1, 2009, each Asset Allocation Portfolio would continue to pay the investment advisory fees displayed above for its asset allocation work. In addition, for investments (other than underlying Thrivent Portfolios) held directly by the Asset Allocation Portfolios, each Asset Allocation Portfolio will pay an additional advisory fee. The fee payable on such investments for Thrivent Aggressive
321
Table of Contents
THRIVENT SERIES FUND, INC.
Notes to Financial Statements
As of June 30, 2009
(unaudited)
(3) FEES AND COMPENSATION PAID TO AFFILIATES – CONTINUED
Allocation Portfolio, Thrivent Moderately Aggressive Allocation Portfolio, Thrivent Moderate Allocation Portfolio and Thrivent Moderately Conservative Allocation Portfolio will be 0.60%, 0.55%, 0.50% and 0.45% of average daily net assets, respectively.
In addition, at a Board of Directors meeting held on May 28, 2009, the Board, including the independent Directors, approved, with respect to Partner Mid Cap Value Portfolio, a change in the breakpoint level from $250 million to $200 million; therefore, for assets over $200 million, the advisory fee would be 0.700% as opposed to 0.750% . This breakpoint change went into effect on July 1, 2009.
(B) Sub-Adviser Fees – The following subadvisory fees are charged as part of the total investment advisory fees stated in the table above. The subadvisory fees are borne directly by the Adviser and do not increase the overall fees paid by the Portfolio.
Partner Healthcare Portfolio
The Adviser has entered into a subadvisory agreement with Sectoral Asset Management, Inc. for the performance of subadvisory services. The fee payable is equal to 0.65% of the first $50 million of average daily net assets, 0.60% of the next $50 million, 0.40% of the next $150 million and 0.35% of average daily net assets over $250 million.
Partner Natural Resources Portfolio
The Adviser has entered into a subadvisory agreement with BlackRock Investment Management, LLC (“BlackRock”) for the performance of subadvisory services. The fee payable is equal to 0.45% of the first $50 million of average daily net assets, 0.425% of the next $50 million, 0.40% of the next $150 million and 0.375% of average daily net assets over $250 million. Thrivent Partner Utilities Portfolio is included in determining breakpoints for the assets managed by BlackRock.
Partner Emerging Markets Portfolio
The Adviser has entered into a subadvisory agreement with Aberdeen Asset Management Investment Services Limited (“Aberdeen”) for the performance of subadvisory services. The fee payable is equal to 0.85% of the first $50 million of average daily net assets, 0.72% of the next $50 million and 0.68% of average daily net assets over $100 million. Thrivent Partner Worldwide Allocation Portfolio and Thrivent Partner Worldwide Allocation Fund are included in determining breakpoints for the assets managed by Aberdeen.
Partner Utilities Portfolio
The Adviser has entered into a subadvisory agreement with BlackRock for the performance of subadvisory services. The fee payable is equal to 0.45% of the first $50 million of average daily net assets, 0.425% of the next $50 million, 0.40% of the next $150 million and 0.375% of average daily net assets over $250 million. Thrivent Partner Natural Resources Portfolio is included in determining breakpoints for the assets managed by BlackRock.
Partner Small Cap Growth Portfolio
The Adviser has entered into a subadvisory agreement with Turner Investment Partners, Inc. (“Turner”) for the performance of subadvisory services. The fee payable is equal to 0.65% of the first $100 million of average daily net assets and 0.60% of average daily net assets over $100 million. Thrivent Partner Small Cap Growth Fund is included in determining breakpoints for the assets managed by Turner.
Partner Small Cap Value Portfolio
The Adviser has entered into a subadvisory agreement with T. Rowe Price Associates, Inc. for the performance of subadvisory services. The fee payable is equal to 0.60% of average daily net assets.
Partner Mid Cap Value Portfolio
The Adviser has entered into a subadvisory agreement with Goldman Sachs Asset Management, LP (“GSAM”) for the performance of subadvisory services. The fee payable is equal to 0.50% of average daily net assets for the first $200 million and 0.45% for assets over $200 million. Thrivent Partner Mid Cap Value Fund is included in determining breakpoints for the assets managed by GSAM.
Partner Worldwide Allocation Portfolio
The Adviser has entered into subadvisory agreements with Mercator Asset Management, LP (“Mercator”), Principal Global Investors, LLC (“Principal”), Aberdeen, Victory Capital Management, Inc. (“Victory”) and GSAM for the performance of subadvisory services.
The fee payable for Mercator is equal to 0.75% of the first $25 million of average daily net assets managed by Mercator, 0.60% of the next $25 million, 0.55% of the next $25 million, 0.50% of the next $225 million, 0.40% of the next $200 million and 0.20% of average daily net assets over $500 million. Thrivent Partner Worldwide Allocation Fund, Thrivent Partner International Stock Portfolio and Thrivent Partner International Stock Fund are included in determining breakpoints for the assets managed by Mercator.
The fee payable for Principal is equal to 0.35% of the first $500 million of average daily net assets managed by Principal, 0.30% of the next $500 million and 0.25% of average daily net assets over $1 billion. Thrivent Partner Worldwide Allocation Fund, Thrivent Partner International Stock Portfolio and Thrivent Partner International Stock Fund are included in determining breakpoints for the assets managed by Principal.
The fee payable for Aberdeen is equal to 0.85% of the first $50 million of average daily net assets managed by Aberdeen, 0.72% of the next $50 million and 0.68% of average daily net assets over $100 million. Thrivent Partner Emerging Markets Portfolio and Partner Worldwide Allocation Fund are included in determining breakpoints for the assets managed by Aberdeen.
322
Table of Contents
THRIVENT SERIES FUND, INC.
Notes to Financial Statements
As of June 30, 2009
(unaudited)
(3) FEES AND COMPENSATION PAID TO AFFILIATES – CONTINUED
The fee payable for Victory is equal to 0.95% of the first $25 million of average daily net assets managed by Victory, 0.85% of the next $75 million and 0.80% of average daily net assets over $100 million. Thrivent Partner Worldwide Allocation Fund is included in determining breakpoints for the assets managed by Victory.
The fee payable for GSAM is equal to 0.55% of the first $50 million of average daily net assets managed by GSAM, 0.50% of the next $200 million and 0.45% of average daily net assets over $250 million. Thrivent Partner Worldwide Allocation Fund is included in determining breakpoints for the assets managed by GSAM.
Partner International Stock Portfolio
The Adviser has entered into subadvisory agreements with Principal and Mercator for the performance of subadvisory services.
The fee payable for Mercator is equal to 0.75% of the first $25 million of average daily net assets managed by Mercator, 0.60% of the next $25 million, 0.55% of the next $25 million, 0.50% of the next $225 million, 0.40% of the next $200 million and 0.20% of average daily net assets over $500 million. Thrivent Partner International Stock Fund, Thrivent Partner Worldwide Allocation Portfolio and Thrivent Partner Worldwide Allocation Fund are included in determining breakpoints for the assets managed by Mercator.
The fee payable for Principal is equal to 0.35% of the first $500 million of average daily net assets managed by Principal, 0.30% of the next $500 million and 0.25% of average daily net assets over $1 billion. Thrivent Partner International Stock Fund, Thrivent Partner Worldwide Allocation Portfolio and Thrivent Partner Worldwide Allocation Fund are included in determining breakpoints for the assets managed by Principal.
Partner Socially Responsible Stock Portfolio
The Adviser has entered into a subadvisory agreement with Calvert Asset Management Company, Inc. (“Calvert”) for the performance of subadvisory services. The fee payable is equal to 0.50% of average daily net assets for the first $50 million, 0.475% for the next $50 million, 0.45% for the next $50 million, 0.425% of the next $100 million and 0.40% for assets over $250 million.
Partner All Cap Growth Portfolio
The Adviser has entered into a subadvisory agreement with Calamos Advisors LLC for the performance of subadvisory services. The fee payable is equal to 0.65% of average daily net assets.
Partner All Cap Value Portfolio
The Adviser has entered into a subadvisory agreement with OppenheimerFunds, Inc. for the performance of subadvisory services. The fee payable is equal to 0.45% of the first $50 million of average daily net assets, 0.40% of the next $200 million and 0.35% of average daily net assets over $250 million.
Partner All Cap Portfolio
The Adviser has entered into a subadvisory agreement with Pyramis Global Advisors, LLC (“Pyramis Advisors”) for the performance of subadvisory services. Pyramis Advisors is a wholly owned subsidiary of Fidelity Management & Research Corporation. The fee payable is equal to 0.60% of average daily net assets for the first $100 million, 0.55% for the next 400 million, 0.50% for the next $250 million and 0.45% for assets over $750 million.
Partner Growth Stock Portfolio
The Adviser has entered into a subadvisory agreement with T. Rowe Price Associates, Inc. for the performance of subadvisory services. The fee payable is equal to 0.40% of average daily net assets for the first $500 million and 0.35% for assets over $500 million.
Partner Socially Responsible Bond Portfolio
The Adviser has entered into a subadvisory agreement with Calvert for the performance of subadvisory services. The fee payable is equal to 0.40% of average daily net assets for the first $50 million, 0.375% for the next $50 million, 0.35% for the next $50 million, 0.325% of the next $100 million and 0.30% for assets over $250 million.
Technology Portfolio
Effective July 1, 2009, the Adviser has entered into a subadvisory agreement with GSAM for the performance of subadvisory services. The fee payable is equal to 0.45% of average daily net assets.
(C) Expense Reimbursements – As of June 30, 2009, the following voluntary expense reimbursements, as a percentage of net assets, were in effect:
Portfolio | Expense Reimbursement | Expiration Date | |||
Partner Small Cap Growth | 0.10 | % | N/A | ||
Mid Cap Growth II | 0.30 | % | N/A | ||
Partner International Stock | 0.07 | % | N/A | ||
Partner All Cap | 0.20 | % | N/A | ||
Large Cap Growth II | 0.25 | % | N/A | ||
Partner Growth Stock | 0.10 | % | N/A | ||
Money Market | 0.10 | % | N/A |
323
Table of Contents
THRIVENT SERIES FUND, INC.
Notes to Financial Statements
As of June 30, 2009
(unaudited)
(3) FEES AND COMPENSATION PAID TO AFFILIATES – CONTINUED
As of June 30, 2009, contractual expense reimbursements to limit expenses to the following percentages were in effect:
Portfolio | Expense Limit | Expiration Date | |||
Partner Healthcare | 1.39 | % | 04/30/10 | ||
Partner Natural Resources | 1.19 | % | 04/30/10 | ||
Partner Emerging Markets | 1.50 | % | 04/30/10 | ||
Partner Utilities | 0.90 | % | 04/30/10 | ||
Partner Worldwide Allocation | 1.00 | % | 04/30/10 | ||
Partner Socially Responsible Stock | 0.98 | % | 04/30/10 | ||
Partner All Cap Growth | 1.00 | % | 04/30/10 | ||
Partner All Cap Value | 0.98 | % | 04/30/10 | ||
Equity Income Plus | 0.85 | % | 04/30/10 | ||
Partner Socially Responsible Bond | 0.68 | % | 04/30/10 |
Each equity, hybrid and fixed income Portfolio may invest in High Yield Fund and Money Market Portfolio, subject to certain limitations. During the six months ended June 30, 2009, Income Portfolio and Limited Maturity Bond Portfolio invested in High Yield Fund. During the six months ended June 30, 2009, all Portfolios invested in Money Market Portfolio. These related-party transactions are subject to the same terms as non-related party transactions except that, to avoid duplicate investment advisory fees, Thrivent Financial reimburses an amount equal to the advisory fee which is charged to the Portfolio for its investment in High Yield Fund and Money Market Portfolio.
(D) Other Expenses – The Fund has entered into an accounting and administrative services agreement with the Adviser to provide certain accounting and administrative personnel and services to the Portfolios. For the six months ended June 30, 2009, the Adviser received aggregate fees for accounting and administrative personnel and services of $2,966,630 from the Fund.
Each Director is eligible to participate in a deferred compensation plan with respect to fees received from the Fund. Participants in the plan may designate their deferred Director’s fees as if invested in any one of the portfolios of Thrivent Mutual Funds. The value of each Director’s deferred compensation account will increase or decrease as if it were invested in shares of the selected portfolios of Thrivent Mutual Funds. The deferred fees remain in the appropriate fund until distribution in accordance with the plan. The deferred fee liability is an unsecured liability.
Those Directors not participating in the above plan received $122,102 in fees from the Fund for the six months ended June 30, 2009. No remuneration has been paid by the Fund to any of the officers or affiliated Directors of the Fund. In addition, the Fund reimbursed unaffiliated Directors for reasonable expenses incurred in relation to attendance at the meetings and industry conferences.
Certain officers and non-independent directors of the Fund are officers and directors of Thrivent Financial and Thrivent Life; however, they receive no compensation from the Fund.
(E) Indirect Expenses – Some Portfolios invest in other mutual funds. Fees and expenses of those underlying funds are not included in the Portfolio’s expense ratio. The Portfolio indirectly bears its proportionate share of the annualized weighted average expense ratio for the underlying funds in which it invests.
(4) TAX INFORMATION
Distributions are based on amounts calculated in accordance with the applicable federal income tax regulations, which may differ from accounting principles generally accepted in the United States of America. To the extent that these differences are permanent in nature, such amounts are reclassified within the capital accounts based on their federal tax-basis treatment; temporary differences do not require reclassifications. At fiscal year-end, the character and amount of distributions, on a tax-basis, and components of distributable earnings, are finalized. Therefore, as of June 30, 2009, tax-basis balances have not been determined.
At December 31, 2008, the following Porfolios had accumulated net realized capital loss carryovers expiring as follows:
Portfolio | Capital Loss Carryover | Expiration Year | |||
Technology | 11,378,393 | 2016 | |||
| $ | 11,378,393 | ||||
Partner Healthcare | 63,868 | 2016 | |||
| $ | 63,868 | ||||
Partner Natural Resources | 19,375 | 2016 | |||
| $ | 19,375 | ||||
Partner Emerging Markets | 63,274 | 2016 | |||
| $ | 63,274 | ||||
Real Estate Securities | 8,066,759 | 2016 | |||
| $ | 8,066,759 | ||||
Partner Utilities | 375,164 | 2016 | |||
| $ | 375,164 | ||||
Partner Small Cap Growth | 34,011,452 | 2016 | |||
| $ | 34,011,452 | ||||
Small Cap Stock | 60,076,135 | 2016 | |||
| $ | 60,076,135 | ||||
Mid Cap Growth II | 967,037 | 2016 | |||
| $ | 967,037 | ||||
324
Table of Contents
THRIVENT SERIES FUND, INC.
Notes to Financial Statements
As of June 30, 2009
(unaudited)
(4) TAX INFORMATION – CONTINUED
Portfolio | Capital Loss Carryover | Expiration Year | |||
Mid Cap Growth | 22,824,794 | 2009 | |||
| 10,809,135 | 2010 | ||||
| 252,495 | 2016 | ||||
| $ | 33,886,424 | ||||
Partner Mid Cap Value | 16,998,457 | 2016 | |||
| $ | 16,998,457 | ||||
Mid Cap Stock | 90,742,741 | 2016 | |||
| $ | 90,742,741 | ||||
Partner Worldwide Allocation | 8,058,363 | 2016 | |||
| $ | 8,058,363 | ||||
Partner International Stock | 9,506,834 | 2009 | |||
| 2,858,197 | 2010 | ||||
| 103,512,513 | 2016 | ||||
| $ | 115,877,544 | ||||
Partner Socially Responsible Stock | 99,213 | 2016 | |||
| $ | 99,213 | ||||
Partner All Cap Growth | 536,343 | 2016 | |||
| $ | 536,343 | ||||
Partner All Cap Value | 499,329 | 2016 | |||
| $ | 499,329 | ||||
Partner All Cap | 12,922,307 | 2016 | |||
| $ | 12,922,307 | ||||
Large Cap Growth II | 1,615,414 | 2016 | |||
| $ | 1,615,414 | ||||
Large Cap Growth | 790,945 | 2009 | |||
| 724,404,403 | 2010 | ||||
| 198,356,425 | 2011 | ||||
| 163,432,783 | 2016 | ||||
| $ | 1,086,984,556 | ||||
Partner Growth Stock | 1,995,784 | 2016 | |||
| $ | 1,995,784 | ||||
Large Cap Value | 71,155,534 | 2016 | |||
| $ | 71,155,534 | ||||
Large Cap Stock | 94,107,202 | 2016 | |||
| $ | 94,107,202 | ||||
Equity Income Plus | 5,806,765 | 2016 | |||
| $ | 5,806,765 | ||||
High Yield | 288,927,133 | 2009 | |||
| 184,350,285 | 2010 | ||||
| 364,926,135 | 2011 | ||||
| 30,516,064 | 2012 | ||||
| 10,993,224 | 2013 | ||||
| 560,014 | 2014 | ||||
| 42,742,264 | 2016 | ||||
| $ | 923,015,119 | ||||
Diversified Income Plus | 3,470,883 | 2009 | |||
| 2,850,377 | 2010 | ||||
| 9,888,303 | 2016 | ||||
| $ | 16,209,563 | ||||
Income | 2,082,528 | 2014 | |||
| 39,514,415 | 2016 | ||||
| $ | 41,596,943 | ||||
Bond Index | 3,724,141 | 2014 | |||
| 103,719 | 2015 | ||||
| $ | 3,827,860 | ||||
Limited Maturity Bond | 2,108,299 | 2013 | |||
| 1,181,750 | 2014 | ||||
| 1,010,934 | 2015 | ||||
| 10,441,148 | 2016 | ||||
| $ | 14,742,131 | ||||
Mortgage Securities | 890,110 | 2014 | |||
| $ | 890,110 | ||||
Money Market | 3,442 | 2015 | |||
| 30,902 | 2016 | ||||
| $ | 34,344 | ||||
To the extent that these Portfolios realize future net capital gains, taxable distributions will be reduced by any unused capital loss carryovers as permitted by the Internal Revenue Code.
The following Portfolios deferred, on a tax basis, the following post-October 2008 losses:
Portfolio | Post-October Loss | ||
Moderately Aggressive Allocation | $ | 388,794 | |
Moderate Allocation | 3,715,725 | ||
Moderately Conservative Allocation | 2,207,080 | ||
Technology | 835,927 | ||
Partner Healthcare | 64,815 | ||
Partner Natural Resources | 55,071 | ||
Partner Emerging Markets | 268,709 | ||
Real Estate Securities | 542,139 | ||
Partner Utilities | 22,868 | ||
Partner Small Cap Growth | 15,922,461 | ||
Partner Small Cap Value | 243,032 | ||
Small Cap Stock | 49,854,209 | ||
Small Cap Index | 4,359,823 | ||
Mid Cap Growth II | 802,728 | ||
Mid Cap Growth | 27,204,445 | ||
Partner Mid Cap Value | 7,923,634 | ||
Mid Cap Stock | 16,784,992 | ||
Partner Worldwide Allocation | 4,844,901 | ||
Partner International Stock | 62,964,622 | ||
Partner Socially Responsible Stock | 181,300 | ||
Partner All Cap Growth | 277,647 | ||
Partner All Cap Value | 626,266 | ||
Partner All Cap | 8,383,199 | ||
Large Cap Growth II | 496,162 | ||
Large Cap Growth | 129,778,694 | ||
325
Table of Contents
THRIVENT SERIES FUND, INC.
Notes to Financial Statements
As of June 30, 2009
(unaudited)
(4) TAX INFORMATION – CONTINUED
Portfolio | Post-October Loss | |
Partner Growth Stock | 4,750,102 | |
Large Cap Value | 17,805,726 | |
Large Cap Stock | 32,529,335 | |
Large Cap Index | 965,084 | |
Equity Income Plus | 3,360,800 | |
Balanced | 377,351 | |
High Yield | 10,092,262 | |
Diversified Income Plus | 5,208,131 | |
Income | 1,938,672 | |
Bond Index | 143,510 | |
Limited Maturity Bond | 4,143,639 |
These amounts are deferred for tax purposes and deemed to occur in the fiscal year ended December 31, 2009.
(5) SECURITY TRANSACTIONS
(A) Purchases and Sales of Investment Securities – For the six months ended June 30, 2009, the cost of purchases and the proceeds from sales of investment securities other than U.S. Government and short-term securities were as follows:
| In thousands | ||||||
Portfolio | Purchases | Sales | ||||
Aggressive Allocation | $ | 12,398 | $ | 6,407 | ||
Moderately Aggressive Allocation | 54,645 | 16,167 | ||||
Moderate Allocation | 86,272 | 36,834 | ||||
Moderately Conservative Allocation | 39,738 | 6,363 | ||||
Technology | 18,847 | 25,249 | ||||
Partner Healthcare | 5,491 | 2,873 | ||||
Partner Natural Resources | 2,685 | 70 | ||||
Partner Emerging Markets | 502 | 820 | ||||
Real Estate Securities | 27,443 | 21,634 | ||||
Partner Utilities | 1,146 | 525 | ||||
Partner Small Cap Growth | 65,116 | 64,416 | ||||
Partner Small Cap Value | 16,350 | 17,118 | ||||
Small Cap Stock | 383,826 | 391,372 | ||||
Small Cap Index | 10,644 | 27,811 | ||||
Mid Cap Growth II | 31,631 | 32,326 | ||||
Mid Cap Growth | 93,643 | 110,392 | ||||
Partner Mid Cap Value | 67,143 | 67,948 | ||||
Mid Cap Stock | 120,171 | 130,950 | ||||
Mid Cap Index | 7,258 | 12,216 | ||||
Partner Worldwide Allocation | 83,113 | 50,535 | ||||
Partner International Stock | 310,778 | 328,204 | ||||
Partner Socially Responsible Stock | 518 | 564 | ||||
Partner All Cap Growth | 1,713 | 678 | ||||
Partner All Cap Value | 2,414 | 2,118 | ||||
Partner All Cap | 63,745 | 67,904 | ||||
Large Cap Growth II | 396,589 | 397,522 | ||||
Large Cap Growth | 944,139 | 1,005,285 | ||||
Partner Growth Stock | 14,813 | 19,492 | ||||
Large Cap Value | 365,574 | 374,148 | ||||
Large Cap Stock | 393,410 | 414,088 | ||||
Large Cap Index | 7,212 | 35,704 | ||||
Equity Income Plus | 34,610 | 32,092 | ||||
Balanced | 5,787 | 19,152 | ||||
High Yield | 183,399 | 162,465 | ||||
Diversified Income Plus | 29,110 | 36,983 | ||||
Partner Socially Responsible Bond | 4,430 | 4,618 | ||||
Income | 416,952 | 475,630 | ||||
Bond Index | 1,497 | 18,840 | ||||
Limited Maturity Bond | 445,009 | 479,625 | ||||
Mortgage Securities | — | 6,178 | ||||
Purchases and Sales of U.S. Government Securities were:
| In thousands | ||||||
Portfolio | Purchases | Sales | ||||
Aggressive Allocation | $ | 1,501 | $ | — | ||
Moderately Aggressive Allocation | 7,006 | — | ||||
Moderate Allocation | 9,008 | — | ||||
Moderately Conservative Allocation | 4,004 | — | ||||
Partner Small Cap Growth | 801 | — | ||||
Small Cap Stock | 1,001 | — | ||||
Small Cap Index | 500 | — | ||||
Balanced | 133,262 | 145,396 | ||||
Partner Socially Responsible Bond | 63 | — | ||||
Income | 559,650 | 562,583 | ||||
Bond Index | 324,548 | 332,815 | ||||
Limited Maturity Bond | 298,762 | 256,420 | ||||
Mortgage Securities | 114,536 | 118,311 | ||||
(B) Investments in Restricted Securities – Certain Portfolios may own restricted securities that have been deemed illiquid and were purchased in private placement transactions without registration under the Securities Act of 1933. Unless such securities subsequently become registered, they generally may be resold only in privately negotiated transactions with a limited number of purchasers. As of June 30, 2009, the following Portfolios held restricted securities:
Portfolio | Number of Securities | Percent of Fund’s Net Assets | |||
Partner Worldwide Allocation | 1 | 0.01 | % | ||
Balanced | 4 | 1.53 | % | ||
High Yield | 7 | 2.52 | % | ||
Diversified Income Plus | 4 | 2.65 | % | ||
Partner Socially Responsible Bond | 1 | 0.12 | % | ||
Income | 9 | 2.15 | % | ||
Bond Index | 4 | 2.83 | % | ||
Limited Maturity Bond | 7 | 1.90 | % | ||
Mortgage Securities | 2 | 4.23 | % |
The Portfolios have no right to require registration of unregistered securities.
(C) Investments in High-Yielding Securities – High Yield Portfolio invests primarily in high-yielding fixed income securities. Each of the other Portfolios, except Money Market Portfolio, may also invest in high-yielding securities. These securities will typically be in the lower rating categories or will be non-rated and generally will involve more risk than securities in the higher rating categories. Lower rated or unrated securities are more likely to react to developments affecting market risk and credit risk than are more highly rated securities, which react primarily to movements in the general level of interest rates.
326
Table of Contents
THRIVENT SERIES FUND, INC.
Notes to Financial Statements
As of June 30, 2009
(unaudited)
(5) SECURITY TRANSACTIONS – CONTINUED
(D) Investments in Options and Futures Contracts – The movement in the price of the security underlying an option or futures contract may not correlate perfectly with the movement in the prices of the portfolio securities being hedged. A lack of correlation could render the Portfolio’s hedging strategy unsuccessful and could result in a loss to the Portfolio. In the event that a liquid secondary market would not exist, the Portfolio could be prevented from entering into a closing transaction which could result in additional losses to the Portfolio.
(E) Written Option Contracts – The number of contracts and premium amounts associated with covered call option contracts written during the six months ended June 30, 2009, were as follows:
| Number of Contracts | Premium Amount | ||||||
Partner All Cap Value | |||||||
Balance at December 31, 2008 | — | $ | — | ||||
Opened | 63 | 5,505 | |||||
Closed | (57 | ) | (4,899 | ) | |||
Expired | (2 | ) | (72 | ) | |||
Exercised | (4 | ) | (533 | ) | |||
Balance at June 30, 2009 | — | $ | — | ||||
Large Cap Growth II | |||||||
Balance at December 31, 2008 | — | $ | — | ||||
Opened | 7,835 | 1,159,121 | |||||
Closed | (3,538 | ) | (717,699 | ) | |||
Expired | (2,601 | ) | (166,226 | ) | |||
Exercised | (729 | ) | (228,786 | ) | |||
Balance at June 30, 2009 | 967 | $ | 46,409 | ||||
Large Cap Growth | |||||||
Balance at December 31, 2008 | — | $ | — | ||||
Opened | 16,495 | 2,112,839 | |||||
Closed | (6,869 | ) | (1,223,618 | ) | |||
Expired | (5,571 | ) | (341,141 | ) | |||
Exercised | (1,610 | ) | (430,737 | ) | |||
Balance at June 30, 2009 | 2,445 | $ | 117,342 | ||||
Large Cap Stock | |||||||
Balance at December 31, 2008 | — | $ | — | ||||
Opened | 4,977 | 737,773 | |||||
Closed | (2,181 | ) | (451,050 | ) | |||
Expired | (1,599 | ) | (98,752 | ) | |||
Exercised | (576 | ) | (158,168 | ) | |||
Balance at June 30, 2009 | 621 | $ | 29,803 | ||||
Equity Income Plus | |||||||
Balance at December 31, 2008 | 50 | $ | 26,738 | ||||
Opened | 905 | 581,386 | |||||
Closed | (920 | ) | (590,783 | ) | |||
Expired | (10 | ) | (6,473 | ) | |||
Exercised | — | — | |||||
Balance at June 30, 2009 | 25 | $ | 10,869 | ||||
Diversified Income Plus | |||||||
Balance at December 31, 2008 | — | $ | — | ||||
Opened | 256 | 135,376 | |||||
Closed | (241 | ) | (128,855 | ) | |||
Expired | — | — | |||||
Exercised | — | — | |||||
Balance at June 30, 2009 | 15 | $ | 6,521 | ||||
Limited Maturity Bond | |||||||
Balance at December 31, 2008 | — | $ | — | ||||
Opened | 2,870 | 1,959,515 | |||||
Closed | (2,540 | ) | (1,895,193 | ) | |||
Expired | (220 | ) | (30,278 | ) | |||
Exercised | — | — | |||||
Balance at June 30, 2009 | 110 | $ | 34,045 | ||||
Mortgage Securities | |||||||
Balance at December 31, 2008 | — | $ | — | ||||
Opened | 75 | 47,853 | |||||
Closed | (67 | ) | (46,237 | ) | |||
Expired | (5 | ) | (688 | ) | |||
Exercised | — | — | |||||
Balance at June 30, 2009 | 3 | $ | 928 | ||||
(6) SECURITY TRANSACTIONS WITH AFFILIATED FUNDS
The Portfolios are permitted to purchase or sell securities from or to certain other Portfolios under specified conditions outlined in procedures adopted by the Board of Directors. The procedures have been designed to ensure that any purchase or sale of securities by the Portfolio from or to another portfolio or fund that is or could be considered an affiliate by virtue of having a common investment adviser (or affiliated investment advisers), common Directors and/ or common officers complies with Rule 17a-7 of the Investment Company Act of 1940. Further, as defined under the procedures, each transaction is effected at the current market price. Pursuant to these procedures, during the six months ended June 30, 2009, the Portfolios engaged in purchases and sales of securities of $6,554,247 and $251,569,133, respectively.
327
Table of Contents
THRIVENT SERIES FUND, INC.
Notes to Financial Statements
As of June 30, 2009
(unaudited)
(7) SHARES OF BENEFICIAL INTEREST
The shares of each Portfolio have equal rights and privileges with all shares of that Portfolio. Shares in the Portfolio are currently sold only to separate accounts of Thrivent Financial, Thrivent Life and retirement plans sponsored by Thrivent Financial.
Authorized capital stock consists of ten billion shares as follows:
Portfolio | Shares Authorized | Par Value | |||
Aggressive Allocation | 300,000,000 | $ | 0.01 | ||
Moderately Aggressive Allocation | 350,000,000 | 0.01 | |||
Moderate Allocation | 350,000,000 | 0.01 | |||
Moderately Conservative Allocation | 300,000,000 | 0.01 | |||
Technology | 100,000,000 | 0.01 | |||
Partner Healthcare | 200,000,000 | 0.01 | |||
Partner Natural Resources | 200,000,000 | 0.01 | |||
Partner Emerging Markets | 200,000,000 | 0.01 | |||
Real Estate Securities | 200,000,000 | 0.01 | |||
Partner Utilities | 200,000,000 | 0.01 | |||
Partner Small Cap Growth | 200,000,000 | 0.01 | |||
Partner Small Cap Value | 200,000,000 | 0.01 | |||
Small Cap Stock | 200,000,000 | 0.01 | |||
Small Cap Index | 200,000,000 | 0.01 | |||
Mid Cap Growth II | 200,000,000 | 0.01 | |||
Mid Cap Growth | 200,000,000 | 0.01 | |||
Partner Mid Cap Value | 200,000,000 | 0.01 | |||
Mid Cap Stock | 200,000,000 | 0.01 | |||
Mid Cap Index | 200,000,000 | 0.01 | |||
Partner Worldwide Allocation | 200,000,000 | 0.01 | |||
Partner International Stock | 250,000,000 | 0.01 | |||
Partner Socially Responsible Stock | 200,000,000 | 0.01 | |||
Partner All Cap Growth | 200,000,000 | 0.01 | |||
Partner All Cap Value | 200,000,000 | 0.01 | |||
Partner All Cap | 200,000,000 | 0.01 | |||
Large Cap Growth II | 200,000,000 | 0.01 | |||
Large Cap Growth | 300,000,000 | 0.01 | |||
Partner Growth Stock | 200,000,000 | 0.01 | |||
Large Cap Value | 200,000,000 | 0.01 | |||
Large Cap Stock | 250,000,000 | 0.01 | |||
Large Cap Index | 200,000,000 | 0.01 | |||
Equity Income Plus | 200,000,000 | 0.01 | |||
Balanced | 200,000,000 | 0.01 | |||
High Yield | 300,000,000 | 0.01 | |||
Diversified Income Plus | 200,000,000 | 0.01 | |||
Partner Socially Responsible Bond | 200,000,000 | 0.01 | |||
Income | 300,000,000 | 0.01 | |||
Bond Index | 200,000,000 | 0.01 | |||
Limited Maturity Bond | 200,000,000 | 0.01 | |||
Mortgage Securities | 200,000,000 | 0.01 | |||
Money Market | 1,200,000,000 | 0.01 | |||
328
Table of Contents
[THIS PAGE INTENTIONALLY LEFT BLANK]
329
Table of Contents
Financial Highlights
| FOR A SHARE OUSTANDING THROUGHOUT EACH PERIOD* | |||||||||||||||||||||||
| Income from Investment Operations | Less Distributions from | ||||||||||||||||||||||
| Net Asset Value, Beginning of Period | Net Investment Income/(Loss) | Net Realized and Unrealized Gain/(Loss) on Investments(a) | Total from Investment Operations | Net Investment Income | Net Realized Gain on Investments | ||||||||||||||||||
AGGRESSIVE ALLOCATION PORTFOLIO | |||||||||||||||||||||||
Period Ended 06/30/09 (unaudited) | $ | 8.51 | $ | — | $ | 0.55 | $ | 0.55 | $ | — | $ | — | |||||||||||
Year Ended 12/31/08 | 14.09 | 0.25 | (5.34 | ) | (5.09 | ) | (0.18 | ) | (0.31 | ) | |||||||||||||
Year Ended 12/31/07 | 13.01 | 0.13 | 1.09 | 1.22 | (0.08 | ) | (0.06 | ) | |||||||||||||||
Year Ended 12/31/06 | 11.44 | 0.07 | 1.50 | 1.57 | — | — | |||||||||||||||||
Year Ended 12/31/05 (c) | 10.00 | — | 1.44 | 1.44 | — | — | |||||||||||||||||
MODERATELY AGGRESSIVE ALLOCATION PORTFOLIO | |||||||||||||||||||||||
Period Ended 06/30/09 (unaudited) | 8.64 | 0.05 | 0.56 | 0.61 | — | — | |||||||||||||||||
Year Ended 12/31/08 | 13.48 | 0.33 | (4.71 | ) | (4.38 | ) | (0.23 | ) | (0.23 | ) | |||||||||||||
Year Ended 12/31/07 | 12.66 | 0.18 | 0.80 | 0.98 | (0.11 | ) | (0.05 | ) | |||||||||||||||
Year Ended 12/31/06 | 11.19 | 0.12 | 1.35 | 1.47 | — | — | |||||||||||||||||
Year Ended 12/31/05 (c) | 10.00 | 0.02 | 1.19 | 1.21 | (0.02 | ) | — | ||||||||||||||||
MODERATE ALLOCATION PORTFOLIO | |||||||||||||||||||||||
Period Ended 06/30/09 (unaudited) | 8.92 | 0.09 | 0.55 | 0.64 | — | — | |||||||||||||||||
Year Ended 12/31/08 | 12.82 | 0.37 | (3.83 | ) | (3.46 | ) | (0.27 | ) | (0.17 | ) | |||||||||||||
Year Ended 12/31/07 | 12.22 | 0.24 | 0.58 | 0.82 | (0.15 | ) | (0.07 | ) | |||||||||||||||
Year Ended 12/31/06 | 10.96 | 0.18 | 1.08 | 1.26 | — | — | |||||||||||||||||
Year Ended 12/31/05 (c) | 10.00 | 0.04 | 0.96 | 1.00 | (0.04 | ) | — | ||||||||||||||||
MODERATELY CONSERVATIVE ALLOCATION PORTFOLIO | |||||||||||||||||||||||
Period Ended 06/30/09 (unaudited) | 9.27 | 0.10 | 0.54 | 0.64 | — | — | |||||||||||||||||
Year Ended 12/31/08 | 12.08 | 0.37 | (2.80 | ) | (2.43 | ) | (0.29 | ) | (0.09 | ) | |||||||||||||
Year Ended 12/31/07 | 11.69 | 0.27 | 0.39 | 0.66 | (0.20 | ) | (0.07 | ) | |||||||||||||||
Year Ended 12/31/06 | 10.68 | 0.23 | 0.78 | 1.01 | — | — | |||||||||||||||||
Year Ended 12/31/05 (c) | 10.00 | 0.06 | 0.68 | 0.74 | (0.06 | ) | — | ||||||||||||||||
TECHNOLOGY PORTFOLIO | |||||||||||||||||||||||
Period Ended 06/30/09 (unaudited) | 3.63 | (0.01 | ) | 0.94 | 0.93 | — | — | ||||||||||||||||
Year Ended 12/31/08 | 8.24 | — | (3.59 | ) | (3.59 | ) | — | (1.02 | ) | ||||||||||||||
Year Ended 12/31/07 | 7.67 | (0.01 | ) | 0.85 | 0.84 | — | (0.27 | ) | |||||||||||||||
Year Ended 12/31/06 | 7.53 | (0.02 | ) | 0.26 | 0.24 | — | (0.10 | ) | |||||||||||||||
Year Ended 12/31/05 | 7.28 | (0.02 | ) | 0.29 | 0.27 | (0.02 | ) | — | |||||||||||||||
Year Ended 12/31/04 | 6.94 | 0.02 | 0.32 | 0.34 | — | — | |||||||||||||||||
| (a) | The amount shown may not correlate with the change in aggregate gains and losses of portfolio securities due to the timing of sales and redemptions of fund shares. |
| (c) | Since inception, April 29, 2005. |
| * | All per share amounts have been rounded to the nearest cent. |
The accompanying Notes to Financial Statements are an integral part of this schedule.
330
Table of Contents
Thrivent Series Fund, Inc.
Financial Highlights – continued
| RATIOS / SUPPLEMENTAL DATA | ||||||||||||||||||||||||||
| Ratio to Average Net Assets** | Ratios to Average Net Assets Before Expenses Waived, Credited or Paid Indirectly** | |||||||||||||||||||||||||
Total | Net Asset Value, End of Period | Total Return(b) | Net Assets, End of Period (in millions) | Expenses | Net Investment Income/(Loss) | Expenses | Net Investment Income/(Loss) | Portfolio Turnover Rate | ||||||||||||||||||
| $ | — | $ | 9.06 | 6.56 | % | $ | 397.5 | 0.21 | % | 0.63 | % | 0.22 | % | 0.62 | % | 2 | % | |||||||||
| (0.49 | ) | 8.51 | (37.23 | )% | 354.3 | 0.20 | % | 2.45 | % | 0.20 | % | 2.45 | % | 30 | % | |||||||||||
| (0.14 | ) | 14.09 | 9.33 | % | 496.4 | 0.15 | % | 1.17 | % | 0.20 | % | 1.12 | % | 16 | % | |||||||||||
| — | 13.01 | 13.77 | % | 333.6 | 0.04 | % | 0.88 | % | 0.20 | % | 0.72 | % | 8 | % | ||||||||||||
| — | 11.44 | 14.45 | % | 71.8 | 0.10 | % | 0.11 | % | 0.37 | % | (0.16 | )% | 7 | % | ||||||||||||
| — | 9.25 | 7.03 | % | 1,529.5 | 0.18 | % | 1.83 | % | 0.18 | % | 1.83 | % | 1 | % | ||||||||||||
| (0.46 | ) | 8.64 | (33.40 | )% | 1,354.6 | 0.17 | % | 3.36 | % | 0.17 | % | 3.36 | % | 27 | % | |||||||||||
| (0.16 | ) | 13.48 | 7.74 | % | 1,780.8 | 0.13 | % | 1.86 | % | 0.17 | % | 1.82 | % | 18 | % | |||||||||||
| — | 12.66 | 13.15 | % | 1,063.8 | 0.05 | % | 1.58 | % | 0.18 | % | 1.44 | % | 14 | % | ||||||||||||
| (0.02 | ) | 11.19 | 12.12 | % | 238.1 | 0.10 | % | 0.69 | % | 0.24 | % | 0.55 | % | 4 | % | |||||||||||
| — | 9.56 | 7.17 | % | 2,050.4 | 0.17 | % | 2.78 | % | 0.17 | % | 2.78 | % | 2 | % | ||||||||||||
| (0.44 | ) | 8.92 | (27.74 | )% | 1,811.6 | 0.17 | % | 3.91 | % | 0.17 | % | 3.91 | % | 22 | % | |||||||||||
| (0.22 | ) | 12.82 | 6.75 | % | 2,168.9 | 0.14 | % | 2.68 | % | 0.17 | % | 2.65 | % | 18 | % | |||||||||||
| — | 12.22 | 11.52 | % | 1,274.0 | 0.08 | % | 2.29 | % | 0.18 | % | 2.19 | % | 19 | % | ||||||||||||
| (0.04 | ) | 10.96 | 9.98 | % | 331.2 | 0.12 | % | 1.29 | % | 0.22 | % | 1.19 | % | 4 | % | |||||||||||
| — | 9.91 | 6.96 | % | 840.0 | 0.19 | % | 3.19 | % | 0.19 | % | 3.19 | % | 1 | % | ||||||||||||
| (0.38 | ) | 9.27 | (20.61 | )% | 714.8 | 0.18 | % | 4.09 | % | 0.18 | % | 4.09 | % | 21 | % | |||||||||||
| (0.27 | ) | 12.08 | 5.59 | % | 756.9 | 0.17 | % | 3.36 | % | 0.19 | % | 3.34 | % | 13 | % | |||||||||||
| — | 11.69 | 9.53 | % | 434.9 | 0.15 | % | 2.94 | % | 0.20 | % | 2.89 | % | 19 | % | ||||||||||||
| (0.06 | ) | 10.68 | 7.40 | % | 146.7 | 0.17 | % | 2.12 | % | 0.27 | % | 2.02 | % | 5 | % | |||||||||||
| — | 4.56 | 25.41 | % | 24.5 | 1.25 | % | (0.59 | )% | 1.27 | % | (0.61 | )% | 82 | % | ||||||||||||
| (1.02 | ) | 3.63 | (48.32 | )% | 24.3 | 0.89 | % | (0.01 | )% | 0.91 | % | (0.03 | )% | 269 | % | |||||||||||
| (0.27 | ) | 8.24 | 11.08 | % | 56.6 | 0.86 | % | (0.14 | )% | 0.87 | % | (0.15 | )% | 147 | % | |||||||||||
| (0.10 | ) | 7.67 | 3.26 | % | 53.4 | 0.88 | % | (0.23 | )% | 0.89 | % | (0.24 | )% | 133 | % | |||||||||||
| (0.02 | ) | 7.53 | 3.72 | % | 59.8 | 0.86 | % | (0.33 | )% | 0.88 | % | (0.34 | )% | 47 | % | |||||||||||
| — | 7.28 | 4.85 | % | 56.6 | 0.73 | % | 0.35 | % | 0.90 | % | 0.18 | % | 59 | % | ||||||||||||
| (b) | Total investment return assumes dividend reinvestment and does not reflect any deduction for sales charges. Not annualized for periods less than one year. Total return shown does not reflect charges and expenses imposed on contract holders by the variable accounts. Those charges and expenses reduce the return received by contract holders as compared to the return presented. |
| ** | Computed on an annualized basis for periods less than one year. |
The accompanying Notes to Financial Statements are an integral part of this schedule.
331
Table of Contents
Thrivent Series Fund, Inc.
Financial Highlights – continued
| FOR A SHARE OUSTANDING THROUGHOUT EACH PERIOD* | |||||||||||||||||||||||||||
| Income from Investment Operations | Less Distributions from | ||||||||||||||||||||||||||
| Net Asset Value, Beginning of Period | Net Investment Income/(Loss) | Net Realized and Unrealized Gain/(Loss) on Investments(a) | Total from Investment Operations | Net Investment Income | Net Realized Gain on Investments | Return of Capital | |||||||||||||||||||||
PARTNER HEALTHCARE PORTFOLIO | |||||||||||||||||||||||||||
Period Ended 06/30/09 (unaudited) | $ | 8.94 | $ | 0.03 | $ | 0.59 | $ | 0.62 | $ | — | $ | — | $ | — | |||||||||||||
Year Ended 12/31/08 (c) | 10.00 | — | (1.05 | ) | (1.05 | ) | (0.01 | ) | — | — | |||||||||||||||||
PARTNER NATURAL RESOURCES PORTFOLIO | |||||||||||||||||||||||||||
Period Ended 06/30/09 (unaudited) | 5.72 | 0.01 | 0.93 | 0.94 | — | — | — | ||||||||||||||||||||
Year Ended 12/31/08 (c) | 10.00 | 0.01 | (4.28 | ) | (4.27 | ) | (0.01 | ) | — | — | |||||||||||||||||
PARTNER EMERGING MARKETS PORTFOLIO | |||||||||||||||||||||||||||
Period Ended 06/30/09 (unaudited) | 5.59 | 0.06 | 1.81 | 1.87 | — | — | — | ||||||||||||||||||||
Year Ended 12/31/08 (c) | 10.00 | 0.06 | (4.42 | ) | (4.36 | ) | (0.05 | ) | — | — | |||||||||||||||||
REAL ESTATE SECURITIES PORTFOLIO | |||||||||||||||||||||||||||
Period Ended 06/30/09 (unaudited) | 9.34 | 0.20 | (1.21 | ) | (1.01 | ) | — | — | — | ||||||||||||||||||
Year Ended 12/31/08 | 17.74 | 0.41 | (6.35 | ) | (5.94 | ) | (0.74 | ) | (1.46 | ) | (0.26 | ) | |||||||||||||||
Year Ended 12/31/07 | 22.93 | 0.32 | (3.84 | ) | (3.52 | ) | (0.30 | ) | (1.37 | ) | — | ||||||||||||||||
Year Ended 12/31/06 | 18.16 | 0.29 | 5.65 | 5.94 | (0.29 | ) | (0.88 | ) | — | ||||||||||||||||||
Year Ended 12/31/05 | 17.04 | 0.26 | 1.80 | 2.06 | (0.24 | ) | (0.70 | ) | — | ||||||||||||||||||
Year Ended 12/31/04 | 12.66 | 0.37 | 4.07 | 4.44 | — | (0.06 | ) | — | |||||||||||||||||||
PARTNER UTILITIES PORTFOLIO | |||||||||||||||||||||||||||
Period Ended 06/30/09 (unaudited) | 6.93 | 0.10 | (0.15 | ) | (0.05 | ) | — | — | — | ||||||||||||||||||
Year Ended 12/31/08 (c) | 10.00 | 0.12 | (3.08 | ) | (2.96 | ) | (0.11 | ) | — | — | |||||||||||||||||
PARTNER SMALL CAP GROWTH PORTFOLIO | |||||||||||||||||||||||||||
Period Ended 06/30/09 (unaudited) | 7.45 | (0.01 | ) | 0.83 | 0.82 | (0.01 | ) | — | — | ||||||||||||||||||
Year Ended 12/31/08 | 13.94 | 0.01 | (5.77 | ) | (5.76 | ) | — | (0.73 | ) | — | |||||||||||||||||
Year Ended 12/31/07 | 13.58 | (0.04 | ) | 1.21 | 1.17 | — | (0.81 | ) | — | ||||||||||||||||||
Year Ended 12/31/06 | 12.11 | (0.05 | ) | 1.57 | 1.52 | — | (0.05 | ) | — | ||||||||||||||||||
Year Ended 12/31/05 | 12.33 | (0.06 | ) | 0.50 | 0.44 | — | (0.66 | ) | — | ||||||||||||||||||
Year Ended 12/31/04 | 11.07 | (0.07 | ) | 1.33 | 1.26 | — | — | — | |||||||||||||||||||
| (a) | The amount shown may not correlate with the change in aggregate gains and losses of portfolio securities due to the timing of sales and redemptions of fund shares. |
| (c) | Since inception, April 30, 2008. |
| * | All per share amounts have been rounded to the nearest cent. |
The accompanying Notes to Financial Statements are an integral part of this schedule.
332
Table of Contents
Thrivent Series Fund, Inc.
Financial Highlights - continued
| RATIOS / SUPPLEMENTAL DATA | ||||||||||||||||||||||||||
| Ratio to Average Net Assets** | Ratios to Average Net Assets Before Expenses Waived, Credited or Paid Indirectly** | |||||||||||||||||||||||||
Total | Net Asset Value, End of Period | Total Return(b) | Net Assets, End of Period (in millions) | Expenses | Net Investment Income/(Loss) | Expenses | Net Investment Income/(Loss) | Portfolio Turnover Rate | ||||||||||||||||||
| $ | — | $ | 9.56 | 6.94 | % | $ | 10.5 | 1.39 | % | 0.89 | % | 2.30 | % | (0.02 | )% | 36 | % | |||||||||
| (0.01 | ) | 8.94 | (10.48 | )% | 7.1 | 1.39 | % | (0.09 | )% | 2.12 | % | (0.83 | )% | 40 | % | |||||||||||
| — | 6.66 | 16.38 | % | 12.2 | 1.19 | % | 0.29 | % | 2.09 | % | (0.61 | )% | 1 | % | ||||||||||||
| (0.01 | ) | 5.72 | (42.68 | )% | 6.6 | 1.19 | % | 0.23 | % | 1.87 | % | (0.45 | )% | 1 | % | |||||||||||
| — | 7.46 | 33.40 | % | 6.6 | 1.50 | % | 1.98 | % | 3.33 | % | 0.15 | % | 9 | % | ||||||||||||
| (0.05 | ) | 5.59 | (43.58 | )% | 5.3 | 1.50 | % | 1.18 | % | 2.68 | % | 0.00 | % | 25 | % | |||||||||||
| — | 8.33 | (10.87 | )% | 172.9 | 0.92 | % | 5.33 | % | 0.93 | % | 5.32 | % | 14 | % | ||||||||||||
| (2.46 | ) | 9.34 | (37.24 | )% | 197.4 | 0.85 | % | 2.74 | % | 0.86 | % | 2.73 | % | 45 | % | |||||||||||
| (1.67 | ) | 17.74 | (16.80 | )% | 326.4 | 0.86 | % | 1.60 | % | 0.86 | % | 1.60 | % | 71 | % | |||||||||||
| (1.17 | ) | 22.93 | 34.18 | % | 367.9 | 0.84 | % | 1.41 | % | 0.86 | % | 1.40 | % | 69 | % | |||||||||||
| (0.94 | ) | 18.16 | 13.25 | % | 274.6 | 0.86 | % | 1.88 | % | 0.87 | % | 1.87 | % | 83 | % | |||||||||||
| (0.06 | ) | 17.04 | 35.19 | % | 175.0 | 0.79 | % | 2.60 | % | 0.90 | % | 2.49 | % | 119 | % | |||||||||||
| — | 6.88 | (0.78 | )% | 5.2 | 0.90 | % | 3.32 | % | 3.40 | % | 0.83 | % | 13 | % | ||||||||||||
| (0.11 | ) | 6.93 | (29.57 | )% | 4.4 | 0.90 | % | 2.55 | % | 2.31 | % | 1.14 | % | 22 | % | |||||||||||
| (0.01 | ) | 8.26 | 11.07 | % | 125.1 | 1.04 | % | (0.25 | )% | 1.16 | % | (0.37 | )% | 63 | % | |||||||||||
| (0.73 | ) | 7.45 | (43.23 | )% | 112.5 | 0.98 | % | 0.08 | % | 1.09 | % | (0.04 | )% | 199 | % | |||||||||||
| (0.81 | ) | 13.94 | 8.52 | % | 167.6 | 0.99 | % | (0.32 | )% | 1.10 | % | (0.42 | )% | 98 | % | |||||||||||
| (0.05 | ) | 13.58 | 12.59 | % | 107.4 | 0.99 | % | (0.42 | )% | 1.12 | % | (0.55 | )% | 113 | % | |||||||||||
| (0.66 | ) | 12.11 | 3.96 | % | 64.7 | 0.99 | % | (0.60 | )% | 1.17 | % | (0.78 | )% | 104 | % | |||||||||||
| — | 12.33 | 11.32 | % | 53.9 | 1.00 | % | (0.69 | )% | 1.19 | % | (0.88 | )% | 255 | % | ||||||||||||
| (b) | Total investment return assumes dividend reinvestment and does not reflect any deduction for sales charges. Not annualized for periods less than one year. Total return shown does not reflect charges and expenses imposed on contract holders by the variable accounts. Those charges and expenses reduce the return received by contract holders as compared to the return presented. |
| ** | Computed on an annualized basis for periods less than one year. |
The accompanying Notes to Financial Statements are an integral part of this schedule.
333
Table of Contents
Thrivent Series Fund, Inc.
Financial Highlights – continued
| FOR A SHARE OUSTANDING THROUGHOUT EACH PERIOD* | ||||||||||||||||||||||
| Income from Investment Operations | Less Distributions from | |||||||||||||||||||||
| Net Asset Value, Beginning of Period | Net Investment Income/(Loss) | Net Realized and Unrealized Gain/(Loss) on Investments(a) | Total from Investment Operations | Net Investment Income | Net Realized Gain on Investments | |||||||||||||||||
PARTNER SMALL CAP VALUE PORTFOLIO | ||||||||||||||||||||||
Period Ended 06/30/09 (unaudited) | $ | 12.07 | $ | 0.07 | $ | 0.27 | $ | 0.34 | $ | (0.03 | ) | $ | (0.01 | ) | ||||||||
Year Ended 12/31/08 | 18.44 | 0.13 | (4.85 | ) | (4.72 | ) | (0.20 | ) | (1.45 | ) | ||||||||||||
Year Ended 12/31/07 | 19.57 | 0.11 | (0.21 | ) | (0.10 | ) | (0.07 | ) | (0.96 | ) | ||||||||||||
Year Ended 12/31/06 | 16.82 | 0.08 | 3.45 | 3.53 | (0.04 | ) | (0.74 | ) | ||||||||||||||
Year Ended 12/31/05 | 16.56 | 0.07 | 0.71 | 0.78 | (0.04 | ) | (0.48 | ) | ||||||||||||||
Year Ended 12/31/04 | 13.73 | 0.07 | 2.95 | 3.02 | — | (0.19 | ) | |||||||||||||||
SMALL CAP STOCK PORTFOLIO | ||||||||||||||||||||||
Period Ended 06/30/09 (unaudited) | 8.49 | 0.03 | (0.27 | ) | (0.24 | ) | (0.02 | ) | — | |||||||||||||
Year Ended 12/31/08 | 15.48 | 0.06 | (5.34 | ) | (5.28 | ) | (0.13 | ) | (1.58 | ) | ||||||||||||
Year Ended 12/31/07 | 15.43 | 0.10 | 0.88 | 0.98 | (0.05 | ) | (0.88 | ) | ||||||||||||||
Year Ended 12/31/06 | 14.62 | 0.05 | 1.78 | 1.83 | (0.02 | ) | (1.00 | ) | ||||||||||||||
Year Ended 12/31/05 | 14.74 | 0.02 | 1.16 | 1.18 | (0.01 | ) | (1.29 | ) | ||||||||||||||
Year Ended 12/31/04 | 12.34 | 0.01 | 2.56 | 2.57 | — | (0.17 | ) | |||||||||||||||
SMALL CAP INDEX PORTFOLIO | ||||||||||||||||||||||
Period Ended 06/30/09 (unaudited) | 10.54 | 0.07 | (0.01 | ) | 0.06 | (0.22 | ) | (1.89 | ) | |||||||||||||
Year Ended 12/31/08 | 19.21 | 0.22 | (5.15 | ) | (4.93 | ) | (0.20 | ) | (3.54 | ) | ||||||||||||
Year Ended 12/31/07 | 21.55 | 0.24 | (0.11 | ) | 0.13 | (0.14 | ) | (2.33 | ) | |||||||||||||
Year Ended 12/31/06 | 19.41 | 0.17 | 2.64 | 2.81 | (0.14 | ) | (0.53 | ) | ||||||||||||||
Year Ended 12/31/05 | 19.26 | 0.15 | 1.18 | 1.33 | (0.13 | ) | (1.05 | ) | ||||||||||||||
Year Ended 12/31/04 | 15.83 | 0.13 | 3.36 | 3.49 | (0.06 | ) | — | |||||||||||||||
MID CAP GROWTH PORTFOLIO II | ||||||||||||||||||||||
Period Ended 06/30/09 (unaudited) | 5.65 | — | 1.17 | 1.17 | — | — | ||||||||||||||||
Year Ended 12/31/08 | 11.42 | 0.01 | (4.37 | ) | (4.36 | ) | (0.03 | ) | (1.38 | ) | ||||||||||||
Year Ended 12/31/07 | 11.37 | 0.03 | 2.13 | 2.16 | (0.06 | ) | (2.05 | ) | ||||||||||||||
Year Ended 12/31/06 | 10.60 | 0.06 | 0.85 | 0.91 | (0.02 | ) | (0.12 | ) | ||||||||||||||
Year Ended 12/31/05 | 9.53 | 0.02 | 1.05 | 1.07 | — | — | ||||||||||||||||
Year Ended 12/31/04 | 8.19 | — | 1.34 | 1.34 | — | — | ||||||||||||||||
MID CAP GROWTH PORTFOLIO | ||||||||||||||||||||||
Period Ended 06/30/09 (unaudited) | 9.55 | 0.02 | 1.95 | 1.97 | — | — | ||||||||||||||||
Year Ended 12/31/08 | 20.18 | 0.10 | (7.19 | ) | (7.09 | ) | (0.18 | ) | (3.36 | ) | ||||||||||||
Year Ended 12/31/07 | 17.59 | 0.08 | 3.38 | 3.46 | (0.08 | ) | (0.79 | ) | ||||||||||||||
Year Ended 12/31/06 | 16.21 | 0.08 | 1.32 | 1.40 | (0.02 | ) | — | |||||||||||||||
Year Ended 12/31/05 | 14.57 | 0.02 | 1.62 | 1.64 | — | — | ||||||||||||||||
Year Ended 12/31/04 | 13.08 | — | 1.49 | 1.49 | — | — | ||||||||||||||||
| (a) | The amount shown may not correlate with the change in aggregate gains and losses of portfolio securities due to the timing of sales and redemptions of fund shares. |
| * | All per share amounts have been rounded to the nearest cent. |
The accompanying Notes to Financial Statements are an integral part of this schedule.
334
Table of Contents
Thrivent Series Fund, Inc.
Financial Highlights – continued
| RATIOS / SUPPLEMENTAL DATA | ||||||||||||||||||||||||||
| Ratio to Average Net Assets** | Ratios to Average Net Assets Before Expenses Waived, Credited or Paid Indirectly** | |||||||||||||||||||||||||
Total | Net Asset Value, End of Period | Total Return(b) | Net Assets, End of Period (in millions) | Expenses | Net Investment Income/(Loss) | Expenses | Net Investment Income/(Loss) | Portfolio Turnover Rate | ||||||||||||||||||
| $ | (0.04 | ) | $ | 12.37 | 2.86 | % | $ | 169.7 | 0.91 | % | 1.25 | % | 0.92 | % | 1.25 | % | 11 | % | ||||||||
| (1.65 | ) | 12.07 | (27.05 | )% | 167.9 | 0.86 | % | 1.08 | % | 0.87 | % | 1.07 | % | 31 | % | |||||||||||
| (1.03 | ) | 18.44 | (1.03 | )% | 185.6 | 0.86 | % | 0.68 | % | 0.87 | % | 0.66 | % | 29 | % | |||||||||||
| (0.78 | ) | 19.57 | 21.50 | % | 163.6 | 0.86 | % | 0.52 | % | 0.88 | % | 0.51 | % | 25 | % | |||||||||||
| (0.52 | ) | 16.82 | 4.89 | % | 106.2 | 0.88 | % | 0.51 | % | 0.89 | % | 0.49 | % | 37 | % | |||||||||||
| (0.19 | ) | 16.56 | 22.26 | % | 77.5 | 0.80 | % | 0.51 | % | 0.99 | % | 0.32 | % | 106 | % | |||||||||||
| (0.02 | ) | 8.23 | (2.76 | )% | 276.1 | 0.79 | % | 0.68 | % | 0.80 | % | 0.67 | % | 153 | % | |||||||||||
| (1.71 | ) | 8.49 | (37.52 | )% | 288.1 | 0.73 | % | 0.66 | % | 0.75 | % | 0.64 | % | 286 | % | |||||||||||
| (0.93 | ) | 15.48 | 6.14 | % | 399.9 | 0.72 | % | 0.66 | % | 0.74 | % | 0.65 | % | 126 | % | |||||||||||
| (1.02 | ) | 15.43 | 12.79 | % | 406.7 | 0.73 | % | 0.33 | % | 0.74 | % | 0.32 | % | 94 | % | |||||||||||
| (1.30 | ) | 14.62 | 8.81 | % | 290.2 | 0.74 | % | 0.20 | % | 0.76 | % | 0.19 | % | 113 | % | |||||||||||
| (0.17 | ) | 14.74 | 20.94 | % | 216.8 | 0.76 | % | 0.06 | % | 0.78 | % | 0.04 | % | 93 | % | |||||||||||
| (2.11 | ) | 8.49 | 0.70 | % | 176.3 | 0.50 | % | 1.21 | % | 0.50 | % | 1.21 | % | 7 | % | |||||||||||
| (3.74 | ) | 10.54 | (31.07 | )% | 192.2 | 0.42 | % | 1.28 | % | 0.42 | % | 1.28 | % | 31 | % | |||||||||||
| (2.47 | ) | 19.21 | (0.50 | )% | 357.9 | 0.39 | % | 1.00 | % | 0.39 | % | 0.99 | % | 16 | % | |||||||||||
| (0.67 | ) | 21.55 | 14.72 | % | 439.8 | 0.39 | % | 0.71 | % | 0.39 | % | 0.71 | % | 14 | % | |||||||||||
| (1.18 | ) | 19.41 | 7.32 | % | 473.7 | 0.39 | % | 0.75 | % | 0.39 | % | 0.75 | % | 14 | % | |||||||||||
| (0.06 | ) | 19.26 | 22.10 | % | 485.9 | 0.34 | % | 0.80 | % | 0.39 | % | 0.75 | % | 21 | % | |||||||||||
| — | 6.82 | 20.73 | % | 97.1 | 0.64 | % | 0.04 | % | 1.07 | % | (0.40 | )% | 40 | % | ||||||||||||
| (1.41 | ) | 5.65 | (42.71 | )% | 80.8 | 0.56 | % | 0.30 | % | 1.07 | % | (0.22 | )% | 104 | % | |||||||||||
| (2.11 | ) | 11.42 | 19.80 | % | 32.4 | 0.59 | % | 0.18 | % | 1.11 | % | (0.33 | )% | 81 | % | |||||||||||
| (0.14 | ) | 11.37 | 8.60 | % | 31.7 | 0.39 | % | 0.44 | % | 1.11 | % | (0.28 | )% | 147 | % | |||||||||||
| — | 10.60 | 11.22 | % | 38.2 | 0.39 | % | 0.17 | % | 1.10 | % | (0.54 | )% | 136 | % | ||||||||||||
| — | 9.53 | 16.41 | % | 38.4 | 0.47 | % | (0.04 | )% | 1.16 | % | (0.73 | )% | 227 | % | ||||||||||||
| — | 11.52 | 20.61 | % | 306.7 | 0.50 | % | 0.33 | % | 0.51 | % | 0.33 | % | 35 | % | ||||||||||||
| (3.54 | ) | 9.55 | (41.13 | )% | 275.1 | 0.44 | % | 0.54 | % | 0.45 | % | 0.52 | % | 82 | % | |||||||||||
| (0.87 | ) | 20.18 | 19.92 | % | 669.8 | 0.44 | % | 0.35 | % | 0.45 | % | 0.34 | % | 80 | % | |||||||||||
| (0.02 | ) | 17.59 | 8.63 | % | 654.9 | 0.45 | % | 0.40 | % | 0.45 | % | 0.40 | % | 149 | % | |||||||||||
| — | 16.21 | 11.27 | % | 747.5 | 0.45 | % | 0.11 | % | 0.45 | % | 0.11 | % | 135 | % | ||||||||||||
| — | 14.57 | 11.36 | % | 784.9 | 0.45 | % | 0.00 | % | 0.46 | % | (0.01 | )% | 150 | % | ||||||||||||
| (b) | Total investment return assumes dividend reinvestment and does not reflect any deduction for sales charges. Not annualized for periods less than one year. Total return shown does not reflect charges and expenses imposed on contract holders by the variable accounts. Those charges and expenses reduce the return received by contract holders as compared to the return presented. |
| ** | Computed on an annualized basis for periods less than one year. |
The accompanying Notes to Financial Statements are an integral part of this schedule.
335
Table of Contents
Thrivent Series Fund, Inc.
Financial Highlights – continued
| FOR A SHARE OUSTANDING THROUGHOUT EACH PERIOD* | ||||||||||||||||||||||
| Income from Investment Operations | Less Distributions from | |||||||||||||||||||||
| Net Asset Value, Beginning of Period | Net Investment Income/(Loss) | Net Realized and Unrealized Gain/(Loss) on Investments(a) | Total from Investment Operations | Net Investment Income | Net Realized Gain on Investments | |||||||||||||||||
PARTNER MID CAP VALUE PORTFOLIO | ||||||||||||||||||||||
Period Ended 06/30/09 (unaudited) | $ | 8.25 | $ | 0.06 | $ | 0.35 | $ | 0.41 | $ | (0.02 | ) | $ | — | |||||||||
Year Ended 12/31/08 | 13.41 | 0.08 | (4.61 | ) | (4.53 | ) | (0.18 | ) | (0.45 | ) | ||||||||||||
Year Ended 12/31/07 | 13.06 | 0.14 | 0.28 | 0.42 | — | (0.07 | ) | |||||||||||||||
Year Ended 12/31/06 | 11.48 | 0.10 | 1.70 | 1.80 | (0.10 | ) | (0.12 | ) | ||||||||||||||
Year Ended 12/31/05 (c) | 10.00 | 0.04 | 1.51 | 1.55 | (0.04 | ) | (0.03 | ) | ||||||||||||||
MID CAP STOCK PORTFOLIO | ||||||||||||||||||||||
Period Ended 06/30/09 (unaudited) | 7.08 | 0.02 | 0.82 | 0.84 | (0.01 | ) | — | |||||||||||||||
Year Ended 12/31/08 | 13.15 | 0.04 | (5.08 | ) | (5.04 | ) | (0.12 | ) | (0.91 | ) | ||||||||||||
Year Ended 12/31/07 | 13.41 | 0.08 | 0.76 | 0.84 | (0.12 | ) | (0.98 | ) | ||||||||||||||
Year Ended 12/31/06 | 12.82 | 0.13 | 1.51 | 1.64 | (0.05 | ) | (1.00 | ) | ||||||||||||||
Year Ended 12/31/05 | 11.66 | 0.05 | 1.76 | 1.81 | (0.02 | ) | (0.63 | ) | ||||||||||||||
Year Ended 12/31/04 | 10.04 | 0.02 | 1.70 | 1.72 | — | (0.10 | ) | |||||||||||||||
MID CAP INDEX PORTFOLIO | ||||||||||||||||||||||
Period Ended 06/30/09 (unaudited) | 8.31 | 0.07 | 0.61 | 0.68 | (0.18 | ) | (0.60 | ) | ||||||||||||||
Year Ended 12/31/08 | 15.20 | 0.19 | (5.02 | ) | (4.83 | ) | (0.19 | ) | (1.87 | ) | ||||||||||||
Year Ended 12/31/07 | 15.05 | 0.20 | 1.00 | 1.20 | (0.15 | ) | (0.90 | ) | ||||||||||||||
Year Ended 12/31/06 | 14.43 | 0.18 | 1.20 | 1.38 | (0.14 | ) | (0.62 | ) | ||||||||||||||
Year Ended 12/31/05 | 13.34 | 0.14 | 1.44 | 1.58 | (0.07 | ) | (0.42 | ) | ||||||||||||||
Year Ended 12/31/04 | 11.53 | 0.08 | 1.74 | 1.82 | — | (0.01 | ) | |||||||||||||||
PARTNER WORLDWIDE ALLOCATION PORTFOLIO | ||||||||||||||||||||||
Period Ended 06/30/09 (unaudited) | 6.03 | 0.08 | 0.40 | 0.48 | — | — | ||||||||||||||||
Year Ended 12/31/08 (d) | 10.00 | 0.07 | (3.98 | ) | (3.91 | ) | (0.06 | ) | — | |||||||||||||
PARTNER INTERNATIONAL STOCK PORTFOLIO | ||||||||||||||||||||||
Period Ended 06/30/09 (unaudited) | 8.18 | 0.14 | 0.04 | 0.18 | (0.01 | ) | — | |||||||||||||||
Year Ended 12/31/08 | 17.26 | 0.33 | (6.56 | ) | (6.23 | ) | (0.68 | ) | (2.17 | ) | ||||||||||||
Year Ended 12/31/07 | 16.32 | 0.36 | 1.37 | 1.73 | (0.24 | ) | (0.55 | ) | ||||||||||||||
Year Ended 12/31/06 | 13.63 | 0.23 | 2.67 | 2.90 | (0.21 | ) | — | |||||||||||||||
Year Ended 12/31/05 | 12.12 | 0.17 | 1.48 | 1.65 | (0.14 | ) | — | |||||||||||||||
Year Ended 12/31/04 | 10.62 | 0.13 | 1.52 | 1.65 | (0.15 | ) | — | |||||||||||||||
PARTNER SOCIALLY RESPONSIBLE STOCK PORTFOLIO | ||||||||||||||||||||||
Period Ended 06/30/09 (unaudited) | 6.48 | 0.03 | 0.69 | 0.72 | — | — | ||||||||||||||||
Year Ended 12/31/08 (d) | 10.00 | 0.02 | (3.52 | ) | (3.50 | ) | (0.02 | ) | — | |||||||||||||
| (a) | The amount shown may not correlate with the change in aggregate gains and losses of portfolio securities due to the timing of sales and redemptions of fund shares. |
| (c) | Since inception, April 29, 2005. |
| (d) | Since inception, April 30, 2008. |
| * | All per share amounts have been rounded to the nearest cent. |
The accompanying Notes to Financial Statements are an integral part of this schedule.
336
Table of Contents
Thrivent Series Fund, Inc.
Financial Highlights – continued
| RATIOS / SUPPLEMENTAL DATA | ||||||||||||||||||||||||
| Ratio to Average Net Assets** | Ratios to Average Net Assets Before Expenses Waived, Credited or Paid Indirectly** | |||||||||||||||||||||||
Total | Net Asset Value, End of Period | Total Return(b) | Net Assets, End of Period (in millions) | Expenses | Net Investment Income/(Loss) | Expenses | Net Investment Income/(Loss) | Portfolio Turnover Rate | ||||||||||||||||
| $(0.02) | $ | 8.64 | 4.94 | % | $ | 131.7 | 0.88 | % | 1.46 | % | 0.88 | % | 1.46 | % | 58 | % | ||||||||
| (0.63) | 8.25 | (35.05 | )% | 123.3 | 0.83 | % | 1.41 | % | 0.85 | % | 1.39 | % | 97 | % | ||||||||||
| (0.07) | 13.41 | 3.16 | % | 95.0 | 0.89 | % | 1.24 | % | 0.90 | % | 1.23 | % | 85 | % | ||||||||||
| (0.22) | 13.06 | 15.72 | % | 54.9 | 0.96 | % | 1.07 | % | 0.98 | % | 1.05 | % | 57 | % | ||||||||||
| (0.07) | 11.48 | 15.44 | % | 21.2 | 1.25 | % | 0.88 | % | 1.49 | % | 0.63 | % | 30 | % | ||||||||||
| (0.01) | 7.91 | 11.75 | % | 421.8 | 0.74 | % | 0.70 | % | 0.75 | % | 0.69 | % | 33 | % | ||||||||||
| (1.03) | 7.08 | (40.75 | )% | 379.9 | 0.72 | % | 0.81 | % | 0.73 | % | 0.80 | % | 234 | % | ||||||||||
| (1.10) | 13.15 | 5.70 | % | 387.9 | 0.72 | % | 0.70 | % | 0.74 | % | 0.69 | % | 215 | % | ||||||||||
| (1.05) | 13.41 | 13.41 | % | 363.8 | 0.73 | % | 1.26 | % | 0.75 | % | 1.24 | % | 184 | % | ||||||||||
| (0.65) | 12.82 | 16.37 | % | 224.2 | 0.76 | % | 0.62 | % | 0.78 | % | 0.60 | % | 124 | % | ||||||||||
| (0.10) | 11.66 | 17.24 | % | 111.7 | 0.68 | % | 0.26 | % | 0.82 | % | 0.12 | % | 126 | % | ||||||||||
| (0.78) | 8.21 | 8.23 | % | 74.1 | 0.61 | % | 1.47 | % | 0.62 | % | 1.46 | % | 11 | % | ||||||||||
| (2.06) | 8.31 | (36.29 | )% | 75.1 | 0.46 | % | 1.33 | % | 0.46 | % | 1.32 | % | 24 | % | ||||||||||
| (1.05) | 15.20 | 7.63 | % | 146.2 | 0.43 | % | 1.16 | % | 0.43 | % | 1.15 | % | 20 | % | ||||||||||
| (0.76) | 15.05 | 9.81 | % | 159.8 | 0.43 | % | 1.10 | % | 0.43 | % | 1.10 | % | 11 | % | ||||||||||
| (0.49) | 14.43 | 12.34 | % | 171.5 | 0.43 | % | 1.08 | % | 0.44 | % | 1.07 | % | 19 | % | ||||||||||
| (0.01) | 13.34 | 15.75 | % | 135.4 | 0.45 | % | 0.77 | % | 0.46 | % | 0.76 | % | 23 | % | ||||||||||
| — | 6.51 | 8.00 | % | 153.9 | 1.00 | % | 3.37 | % | 1.28 | % | 3.09 | % | 48 | % | ||||||||||
| (0.06) | 6.03 | (39.09 | )% | 105.9 | 1.00 | % | 2.17 | % | 1.25 | % | 1.92 | % | 49 | % | ||||||||||
| (0.01) | 8.35 | 2.26 | % | 750.7 | 0.87 | % | 3.75 | % | 0.93 | % | 3.69 | % | 46 | % | ||||||||||
| (2.85) | 8.18 | (41.10 | )% | 778.1 | 0.81 | % | 2.54 | % | 0.89 | % | 2.46 | % | 70 | % | ||||||||||
| (0.79) | 17.26 | 10.57 | % | 1,443.8 | 0.81 | % | 2.11 | % | 0.88 | % | 2.04 | % | 113 | % | ||||||||||
| (0.21) | 16.32 | 21.50 | % | 1,341.8 | 0.89 | % | 1.51 | % | 0.89 | % | 1.51 | % | 50 | % | ||||||||||
| (0.14) | 13.63 | 13.71 | % | 1,055.9 | 0.94 | % | 1.58 | % | 0.94 | % | 1.58 | % | 46 | % | ||||||||||
| (0.15) | 12.12 | 15.65 | % | 721.0 | 0.94 | % | 1.18 | % | 0.94 | % | 1.18 | % | 63 | % | ||||||||||
| — | 7.20 | 11.08 | % | 3.4 | 0.98 | % | 0.77 | % | 4.40 | % | (2.64 | )% | 17 | % | ||||||||||
| (0.02) | 6.48 | (34.98 | )% | 3.2 | 0.98 | % | 0.30 | % | 2.19 | % | (0.92 | )% | 32 | % | ||||||||||
| (b) | Total investment return assumes dividend reinvestment and does not reflect any deduction for sales charges. Not annualized for periods less than one year. Total return shown does not reflect charges and expenses imposed on contract holders by the variable accounts. Those charges and expenses reduce the return received by contract holders as compared to the return presented. |
| ** | Computed on an annualized basis for periods less than one year. |
The accompanying Notes to Financial Statements are an integral part of this schedule.
337
Table of Contents
Thrivent Series Fund, Inc.
Financial Highlights – continued
| FOR A SHARE OUTSTANDING THROUGHOUT EACH PERIOD* | |||||||||||||||||||||||
| Income from Investment Operations | Less Distributions from | ||||||||||||||||||||||
| Net Asset Value, Beginning of Period | Net Investment Income/(Loss) | Net Realized and Unrealized Gain/(Loss) on Investments(a) | Total from Investment Operations | Net Investment Income | Net Realized Gain on Investments | ||||||||||||||||||
PARTNER ALL CAP GROWTH PORTFOLIO | |||||||||||||||||||||||
Period Ended 06/30/09 (unaudited) | $ | 5.34 | $ | — | $ | 0.98 | $ | 0.98 | $ | — | $ | — | |||||||||||
Year Ended 12/31/08 (c) | 10.00 | (0.01 | ) | (4.65 | ) | (4.66 | ) | — | — | ||||||||||||||
PARTNER ALL CAP VALUE PORTFOLIO | |||||||||||||||||||||||
Period Ended 06/30/09 (unaudited) | 5.47 | 0.07 | 0.81 | 0.88 | — | — | |||||||||||||||||
Year Ended 12/31/08 (c) | 10.00 | 0.08 | (4.51 | ) | (4.43 | ) | (0.10 | ) | — | ||||||||||||||
PARTNER ALL CAP PORTFOLIO | |||||||||||||||||||||||
Period Ended 06/30/09 (unaudited) | 6.10 | 0.03 | 0.30 | 0.33 | (0.09 | ) | — | ||||||||||||||||
Year Ended 12/31/08 | 13.00 | 0.09 | (5.05 | ) | (4.96 | ) | (0.08 | ) | (1.86 | ) | |||||||||||||
Year Ended 12/31/07 | 12.03 | 0.07 | 2.28 | 2.35 | (0.06 | ) | (1.32 | ) | |||||||||||||||
Year Ended 12/31/06 | 10.47 | 0.06 | 1.55 | 1.61 | (0.05 | ) | — | ||||||||||||||||
Year Ended 12/31/05 | 8.89 | 0.05 | 1.58 | 1.63 | (0.05 | ) | — | ||||||||||||||||
Year Ended 12/31/04 | 7.83 | 0.04 | 1.03 | 1.07 | (0.01 | ) | — | ||||||||||||||||
LARGE CAP GROWTH PORTFOLIO II | |||||||||||||||||||||||
Period Ended 06/30/09 (unaudited) | 5.85 | 0.03 | 0.79 | 0.82 | — | — | |||||||||||||||||
Year Ended 12/31/08 | 11.96 | 0.02 | (4.49 | ) | (4.47 | ) | (0.06 | ) | (1.58 | ) | |||||||||||||
Year Ended 12/31/07 | 11.00 | 0.06 | 1.71 | 1.77 | (0.08 | ) | (0.73 | ) | |||||||||||||||
Year Ended 12/31/06 | 10.37 | 0.07 | 0.63 | 0.70 | (0.06 | ) | (0.01 | ) | |||||||||||||||
Year Ended 12/31/05 | 9.77 | 0.06 | 0.62 | 0.68 | (0.08 | ) | — | ||||||||||||||||
Year Ended 12/31/04 | 9.08 | 0.08 | 0.61 | 0.69 | — | — | |||||||||||||||||
LARGE CAP GROWTH PORTFOLIO | |||||||||||||||||||||||
Period Ended 06/30/09 (unaudited) | 10.96 | 0.06 | 1.51 | 1.57 | — | — | |||||||||||||||||
Year Ended 12/31/08 | 19.23 | 0.18 | (8.26 | ) | (8.08 | ) | (0.19 | ) | — | ||||||||||||||
Year Ended 12/31/07 | 16.64 | 0.12 | 2.67 | 2.79 | (0.20 | ) | — | ||||||||||||||||
Year Ended 12/31/06 | 15.67 | 0.09 | 0.96 | 1.05 | (0.08 | ) | — | ||||||||||||||||
Year Ended 12/31/05 | 14.76 | 0.08 | 0.95 | 1.03 | (0.12 | ) | — | ||||||||||||||||
Year Ended 12/31/04 | 13.78 | 0.11 | 0.94 | 1.05 | (0.07 | ) | — | ||||||||||||||||
| (a) | The amount shown may not correlate with the change in aggregate gains and losses of portfolio securities due to the timing of sales and redemptions of fund shares. |
| (c) | Since inception, April 30, 2008. |
| * | All per share amounts have been rounded to the nearest cent. |
The accompanying Notes to Financial Statements are an integral part of this schedule.
338
Table of Contents
Thrivent Series Fund, Inc.
Financial Highlights – continued
| RATIOS / SUPPLEMENTAL DATA | ||||||||||||||||||||||||
| Ratio to Average Net Assets** | Ratios to Average Net Assets Before Expenses Waived, Credited or Paid Indirectly** | |||||||||||||||||||||||
Total | Net Asset Value, End of Period | Total Return(b) | Net Assets, End of Period (in millions) | Expenses | Net Investment Income/(Loss) | Expenses | Net Investment Income/(Loss) | Portfolio Turnover Rate | ||||||||||||||||
| $— | $ | 6.32 | 18.36 | % | $ | 3.9 | 1.00 | % | (0.11 | )% | 5.25 | % | (4.36 | )% | 26 | % | ||||||||
| — | 5.34 | (46.57 | )% | 2.4 | 1.00 | % | (0.14 | )% | 2.64 | % | (1.79 | )% | 62 | % | ||||||||||
| — | 6.35 | 15.92 | % | 3.1 | 0.98 | % | 2.98 | % | 5.93 | % | (1.97 | )% | 93 | % | ||||||||||
| (0.10) | 5.47 | (44.21 | )% | 2.5 | 0.98 | % | 1.43 | % | 2.80 | % | (0.40 | )% | 168 | % | ||||||||||
| (0.09) | 6.34 | 5.46 | % | 54.5 | 1.07 | % | 0.90 | % | 1.28 | % | 0.70 | % | 124 | % | ||||||||||
| (1.94) | 6.10 | (42.91 | )% | 56.2 | 0.86 | % | 0.84 | % | 1.07 | % | 0.64 | % | 260 | % | ||||||||||
| (1.38) | 13.00 | 20.37 | % | 117.6 | 0.84 | % | 0.61 | % | 1.05 | % | 0.41 | % | 169 | % | ||||||||||
| (0.05) | 12.03 | 15.47 | % | 96.5 | 0.85 | % | 0.51 | % | 1.05 | % | 0.31 | % | 162 | % | ||||||||||
| (0.05) | 10.47 | 18.33 | % | 82.2 | 0.95 | % | 0.62 | % | 1.08 | % | 0.49 | % | 150 | % | ||||||||||
| (0.01) | 8.89 | 13.64 | % | 59.7 | 0.95 | % | 0.55 | % | 1.13 | % | 0.37 | % | 172 | % | ||||||||||
| — | 6.67 | 13.91 | % | 350.9 | 0.52 | % | 0.94 | % | 0.88 | % | 0.59 | % | 131 | % | ||||||||||
| (1.64) | 5.85 | (41.92 | )% | 309.0 | 0.62 | % | 0.90 | % | 1.03 | % | 0.49 | % | 149 | % | ||||||||||
| (0.81) | 11.96 | 16.47 | % | 34.0 | 0.65 | % | 0.39 | % | 1.06 | % | (0.01 | )% | 156 | % | ||||||||||
| (0.07) | 11.00 | 6.78 | % | 35.9 | 0.40 | % | 0.57 | % | 1.03 | % | (0.07 | )% | 132 | % | ||||||||||
| (0.08) | 10.37 | 7.08 | % | 42.6 | 0.40 | % | 0.55 | % | 1.00 | % | (0.05 | )% | 113 | % | ||||||||||
| — | 9.77 | 7.56 | % | 43.9 | 0.38 | % | 0.87 | % | 1.08 | % | 0.17 | % | 177 | % | ||||||||||
| — | 12.53 | 14.32 | % | 883.0 | 0.46 | % | 0.96 | % | 0.47 | % | 0.96 | % | 118 | % | ||||||||||
| (0.19) | 10.96 | (42.00 | )% | 844.5 | 0.44 | % | 0.74 | % | 0.45 | % | 0.73 | % | 177 | % | ||||||||||
| (0.20) | 19.23 | 16.75 | % | 2,553.5 | 0.44 | % | 0.63 | % | 0.45 | % | 0.63 | % | 163 | % | ||||||||||
| (0.08) | 16.64 | 6.72 | % | 2,331.7 | 0.45 | % | 0.54 | % | 0.45 | % | 0.53 | % | 141 | % | ||||||||||
| (0.12) | 15.67 | 7.01 | % | 2,375.0 | 0.45 | % | 0.50 | % | 0.45 | % | 0.50 | % | 111 | % | ||||||||||
| (0.07) | 14.76 | 7.68 | % | 2,448.2 | 0.45 | % | 0.79 | % | 0.45 | % | 0.79 | % | 104 | % | ||||||||||
| (b) | Total investment return assumes dividend reinvestment and does not reflect any deduction for sales charges. Not annualized for periods less than one year. Total return shown does not reflect charges and expenses imposed on contract holders by the variable accounts. Those charges and expenses reduce the return received by contract holders as compared to the return presented. |
| ** | Computed on an annualized basis for periods less than one year. |
The accompanying Notes to Financial Statements are an integral part of this schedule.
339
Table of Contents
Thrivent Series Fund, Inc.
Financial Highlights – continued
| FOR A SHARE OUSTANDING THROUGHOUT EACH PERIOD* | ||||||||||||||||||||||
| Income from Investment Operations | Less Distributions from | |||||||||||||||||||||
| Net Asset Value, Beginning of Period | Net Investment Income/(Loss) | Net Realized and Unrealized Gain/(Loss) on Investments(a) | Total from Investment Operations | Net Investment Income | Net Realized Gain on Investments | |||||||||||||||||
PARTNER GROWTH STOCK PORTFOLIO | ||||||||||||||||||||||
Period Ended 06/30/09 (unaudited) | $ | 6.96 | $ | 0.01 | $ | 1.05 | $ | 1.06 | $ | (0.03 | ) | $ | — | |||||||||
Year Ended 12/31/08 | 13.55 | 0.05 | (5.29 | ) | (5.24 | ) | (0.09 | ) | (1.26 | ) | ||||||||||||
Year Ended 12/31/07 | 13.08 | 0.08 | 1.14 | 1.22 | (0.07 | ) | (0.68 | ) | ||||||||||||||
Year Ended 12/31/06 | 11.86 | 0.07 | 1.45 | 1.52 | (0.02 | ) | (0.28 | ) | ||||||||||||||
Year Ended 12/31/05 | 11.21 | 0.02 | 0.68 | 0.70 | (0.05 | ) | — | |||||||||||||||
Year Ended 12/31/04 | 10.19 | 0.07 | 0.95 | 1.02 | — | — | ||||||||||||||||
LARGE CAP VALUE PORTFOLIO | ||||||||||||||||||||||
Period Ended 06/30/09 (unaudited) | 8.10 | 0.08 | (0.18 | ) | (0.10 | ) | — | — | ||||||||||||||
Year Ended 12/31/08 | 13.41 | 0.23 | (4.66 | ) | (4.43 | ) | (0.43 | ) | (0.45 | ) | ||||||||||||
Year Ended 12/31/07 | 13.50 | 0.19 | 0.48 | 0.67 | (0.17 | ) | (0.59 | ) | ||||||||||||||
Year Ended 12/31/06 | 11.78 | 0.18 | 1.97 | 2.15 | (0.14 | ) | (0.29 | ) | ||||||||||||||
Year Ended 12/31/05 | 11.14 | 0.14 | 0.63 | 0.77 | (0.13 | ) | — | |||||||||||||||
Year Ended 12/31/04 |
| 9.76 | 0.13 | 1.25 | 1.38 | — | — | |||||||||||||||
LARGE CAP STOCK PORTFOLIO | ||||||||||||||||||||||
Period Ended 06/30/09 (unaudited) | 6.11 | 0.04 | 0.21 | 0.25 | — | — | ||||||||||||||||
Year Ended 12/31/08 | 11.04 | 0.15 | (4.05 | ) | (3.90 | ) | (0.28 | ) | (0.75 | ) | ||||||||||||
Year Ended 12/31/07 | 10.54 | 0.12 | 0.68 | 0.80 | (0.12 | ) | (0.18 | ) | ||||||||||||||
Year Ended 12/31/06 | 9.62 | 0.13 | 0.99 | 1.12 | (0.07 | ) | (0.13 | ) | ||||||||||||||
Year Ended 12/31/05 | 9.28 | 0.07 | 0.42 | 0.49 | (0.08 | ) | (0.07 | ) | ||||||||||||||
Year Ended 12/31/04 | 8.56 | 0.10 | 0.62 | 0.72 | — | — | ||||||||||||||||
LARGE CAP INDEX PORTFOLIO | ||||||||||||||||||||||
Period Ended 06/30/09 (unaudited) | 13.72 | 0.19 | 0.23 | 0.42 | (0.45 | ) | (0.82 | ) | ||||||||||||||
Year Ended 12/31/08 | 25.18 | 0.47 | (8.99 | ) | (8.52 | ) | (0.50 | ) | (2.44 | ) | ||||||||||||
Year Ended 12/31/07 | 25.32 | 0.49 | 0.87 | 1.36 | (0.44 | ) | (1.06 | ) | ||||||||||||||
Year Ended 12/31/06 | 22.31 | 0.43 | 2.94 | 3.37 | (0.36 | ) | — | |||||||||||||||
Year Ended 12/31/05 | 21.63 | 0.35 | 0.67 | 1.02 | (0.34 | ) | — | |||||||||||||||
Year Ended 12/31/04 | 19.79 | 0.34 | 1.73 | 2.07 | (0.23 | ) | — | |||||||||||||||
EQUITY INCOME PLUS PORTFOLIO | ||||||||||||||||||||||
Period Ended 06/30/09 (unaudited) | 6.89 | 0.08 | (0.24 | ) | (0.16 | ) | — | — | ||||||||||||||
Year Ended 12/31/08 (c) | 10.00 | 0.15 | (3.11 | ) | (2.96 | ) | (0.15 | ) | — | |||||||||||||
| (a) | The amount shown may not correlate with the change in aggregate gains and losses of portfolio securities due to the timing of sales and redemptions of fund shares. |
| (c) | Since inception, April 30, 2008. |
| * | All per share amounts have been rounded to the nearest cent. |
The accompanying Notes to Financial Statements are an integral part of this schedule.
340
Table of Contents
Thrivent Series Fund, Inc.
Financial Highlights – continued
| RATIOS / SUPPLEMENTAL DATA | ||||||||||||||||||||||||||
| Ratio to Average Net Assets** | Ratios to Average Net Assets Before Expenses Waived, Credited or Paid Indirectly** | |||||||||||||||||||||||||
Total | Net Asset Value, End of Period | Total Return(b) | Net Assets, End of Period (in millions) | Expenses | Net Investment Income/(Loss) | Expenses | Net Investment Income/(Loss) | Portfolio Turnover Rate | ||||||||||||||||||
| $ | (0.03 | ) | $ | 7.99 | 15.22 | % | $ | 53.4 | 1.01 | % | 0.14 | % | 1.12 | % | 0.03 | % | 30 | % | ||||||||
| (1.35 | ) | 6.96 | (42.13 | )% | 52.1 | 0.82 | % | 0.34 | % | 0.92 | % | 0.23 | % | 44 | % | |||||||||||
| (0.75 | ) | 13.55 | 9.28 | % | 118.1 | 0.80 | % | 0.59 | % | 0.91 | % | 0.48 | % | 55 | % | |||||||||||
| (0.30 | ) | 13.08 | 13.17 | % | 116.7 | 0.79 | % | 0.55 | % | 0.90 | % | 0.44 | % | 39 | % | |||||||||||
| (0.05 | ) | 11.86 | 6.32 | % | 120.4 | 0.90 | % | 0.23 | % | 0.90 | % | 0.22 | % | 42 | % | |||||||||||
| — | 11.21 | 9.95 | % | 107.4 | 0.80 | % | 0.64 | % | 0.92 | % | 0.52 | % | 33 | % | ||||||||||||
| — | 8.00 | (1.12 | )% | 639.9 | 0.66 | % | 2.19 | % | 0.66 | % | 2.18 | % | 63 | % | ||||||||||||
| (0.88 | ) | 8.10 | (34.33 | )% | 664.1 | 0.64 | % | 2.16 | % | 0.65 | % | 2.16 | % | 53 | % | |||||||||||
| (0.76 | ) | 13.41 | 4.70 | % | 1,004.9 | 0.64 | % | 1.68 | % | 0.65 | % | 1.67 | % | 37 | % | |||||||||||
| (0.43 | ) | 13.50 | 18.72 | % | 771.7 | 0.64 | % | 1.65 | % | 0.65 | % | 1.64 | % | 43 | % | |||||||||||
| (0.13 | ) | 11.78 | 7.02 | % | 514.5 | 0.65 | % | 1.53 | % | 0.65 | % | 1.52 | % | 53 | % | |||||||||||
| — | 11.14 | 14.13 | % | 351.2 | 0.66 | % | 1.52 | % | 0.66 | % | 1.52 | % | 51 | % | ||||||||||||
| — | 6.36 | 4.16 | % | 499.8 | 0.72 | % | 1.50 | % | 0.73 | % | 1.49 | % | 90 | % | ||||||||||||
| (1.03 | ) | 6.11 | (37.68 | )% | 497.4 | 0.66 | % | 1.42 | % | 0.67 | % | 1.41 | % | 100 | % | |||||||||||
| (0.30 | ) | 11.04 | 7.57 | % | 1,060.1 | 0.65 | % | 1.31 | % | 0.66 | % | 1.30 | % | 114 | % | |||||||||||
| (0.20 | ) | 10.54 | 11.95 | % | 829.3 | 0.67 | % | 1.45 | % | 0.68 | % | 1.44 | % | 77 | % | |||||||||||
| (0.15 | ) | 9.62 | 5.31 | % | 602.4 | 0.71 | % | 0.95 | % | 0.72 | % | 0.94 | % | 60 | % | |||||||||||
| — | 9.28 | 8.49 | % | 442.9 | 0.72 | % | 1.16 | % | 0.73 | % | 1.15 | % | 68 | % | ||||||||||||
| (1.27 | ) | 12.87 | 3.06 | % | 296.1 | 0.45 | % | 2.32 | % | 0.45 | % | 2.32 | % | 3 | % | |||||||||||
| (2.94 | ) | 13.72 | (37.12 | )% | 319.7 | 0.38 | % | 2.01 | % | 0.39 | % | 2.00 | % | 8 | % | |||||||||||
| (1.50 | ) | 25.18 | 5.17 | % | 633.5 | 0.36 | % | 1.64 | % | 0.36 | % | 1.64 | % | 5 | % | |||||||||||
| (0.36 | ) | 25.32 | 15.36 | % | 727.3 | 0.36 | % | 1.59 | % | 0.36 | % | 1.59 | % | 7 | % | |||||||||||
| (0.34 | ) | 22.31 | 4.75 | % | 795.3 | 0.35 | % | 1.54 | % | 0.35 | % | 1.54 | % | 7 | % | |||||||||||
| (0.23 | ) | 21.63 | 10.56 | % | 831.9 | 0.32 | % | 1.70 | % | 0.37 | % | 1.65 | % | 6 | % | |||||||||||
| — | 6.73 | (2.32 | )% | 41.6 | 0.85 | % | 2.64 | % | 1.04 | % | 2.45 | % | 100 | % | ||||||||||||
| (0.15 | ) | 6.89 | (29.58 | )% | 41.4 | 0.80 | % | 2.74 | % | 0.84 | % | 2.71 | % | 74 | % | |||||||||||
| (b) | Total investment return assumes dividend reinvestment and does not reflect any deduction for sales charges. Not annualized for periods less than one year. Total return shown does not reflect charges and expenses imposed on contract holders by the variable accounts. Those charges and expenses reduce the return received by contract holders as compared to the return presented. |
| ** | Computed on an annualized basis for periods less than one year. |
The accompanying Notes to Financial Statements are an integral part of this schedule.
341
Table of Contents
Thrivent Series Fund, Inc.
Financial Highlights – continued
| FOR A SHARE OUSTANDING THROUGHOUT EACH PERIOD* | ||||||||||||||||||||||
| Income from Investment Operations | Less Distributions from | |||||||||||||||||||||
| Net Asset Value, Beginning of Period | Net Investment Income/(Loss) | Net Realized and Unrealized Gain/(Loss) on Investments(a) | Total from Investment Operations | Net Investment Income | Net Realized Gain on Investments | |||||||||||||||||
BALANCED PORTFOLIO | ||||||||||||||||||||||
Period Ended 06/30/09 (unaudited) | $ | 11.75 | $ | 0.22 | $ | 0.22 | $ | 0.44 | $ | (0.55 | ) | $ | (0.20 | ) | ||||||||
Year Ended 12/31/08 | 17.16 | 0.56 | (4.82 | ) | (4.26 | ) | (0.58 | ) | (0.57 | ) | ||||||||||||
Year Ended 12/31/07 | 16.77 | 0.57 | 0.35 | 0.92 | (0.53 | ) | — | |||||||||||||||
Year Ended 12/31/06 | 15.48 | 0.50 | 1.22 | 1.72 | (0.43 | ) | — | |||||||||||||||
Year Ended 12/31/05 | 15.28 | 0.42 | 0.16 | 0.58 | (0.38 | ) | — | |||||||||||||||
Year Ended 12/31/04 | 14.45 | 0.37 | 0.78 | 1.15 | (0.32 | ) | — | |||||||||||||||
HIGH YIELD PORTFOLIO | ||||||||||||||||||||||
Period Ended 06/30/09 (unaudited) | 3.48 | 0.18 | 0.58 | 0.76 | (0.18 | ) | — | |||||||||||||||
Year Ended 12/31/08 | 4.84 | 0.37 | (1.34 | ) | (0.97 | ) | (0.39 | ) | — | |||||||||||||
Year Ended 12/31/07 | 5.11 | 0.40 | (0.26 | ) | 0.14 | (0.41 | ) | — | ||||||||||||||
Year Ended 12/31/06 | 5.01 | 0.40 | 0.10 | 0.50 | (0.40 | ) | — | |||||||||||||||
Year Ended 12/31/05 | 5.22 | 0.41 | (0.21 | ) | 0.20 | (0.41 | ) | — | ||||||||||||||
Year Ended 12/31/04 | 5.14 | 0.42 | 0.08 | 0.50 | (0.42 | ) | — | |||||||||||||||
DIVERSIFIED INCOME PLUS PORTFOLIO | ||||||||||||||||||||||
Period Ended 06/30/09 (unaudited) | 5.01 | 0.24 | 0.35 | 0.59 | (0.45 | ) | — | |||||||||||||||
Year Ended 12/31/08 | 6.98 | 0.46 | (2.00 | ) | (1.54 | ) | (0.43 | ) | — | |||||||||||||
Year Ended 12/31/07 | 7.19 | 0.34 | (0.41 | ) | (0.07 | ) | (0.14 | ) | — | |||||||||||||
Year Ended 12/31/06 | 6.54 | 0.42 | 0.48 | 0.90 | (0.25 | ) | — | |||||||||||||||
Year Ended 12/31/05 | 6.80 | 0.49 | (0.26 | ) | 0.23 | (0.49 | ) | — | ||||||||||||||
Year Ended 12/31/04 | 6.74 | 0.46 | 0.06 | 0.52 | (0.46 | ) | — | |||||||||||||||
PARTNER SOCIALLY RESPONSIBLE BOND PORTFOLIO | ||||||||||||||||||||||
Period Ended 06/30/09 (unaudited) | 10.02 | 0.22 | 0.22 | 0.44 | (0.19 | ) | (0.32 | ) | ||||||||||||||
Year Ended 12/31/08 (c) | 10.00 | 0.26 | 0.01 | 0.27 | (0.25 | ) | — | |||||||||||||||
INCOME PORTFOLIO | ||||||||||||||||||||||
Period Ended 06/30/09 (unaudited) | 8.20 | 0.25 | 0.41 | 0.66 | (0.25 | ) | — | |||||||||||||||
Year Ended 12/31/08 | 9.74 | 0.51 | (1.53 | ) | (1.02 | ) | (0.52 | ) | — | |||||||||||||
Year Ended 12/31/07 | 9.90 | 0.53 | (0.17 | ) | 0.36 | (0.52 | ) | — | ||||||||||||||
Year Ended 12/31/06 | 9.95 | 0.51 | 0.01 | 0.52 | (0.51 | ) | (0.06 | ) | ||||||||||||||
Year Ended 12/31/05 | 10.23 | 0.47 | (0.24 | ) | 0.23 | (0.47 | ) | (0.04 | ) | |||||||||||||
Year Ended 12/31/04 | 10.20 | 0.44 | 0.03 | 0.47 | (0.44 | ) | — | |||||||||||||||
| (a) | The amount shown may not correlate with the change in aggregate gains and losses of portfolio securities due to the timing of sales and redemptions of fund shares. |
| (C) | Since inception, April 30, 2008. |
| * | All per share amounts have been rounded to the nearest cent. |
The accompanying Notes to Financial Statements are an integral part of this schedule.
342
Table of Contents
Thrivent Series Fund, Inc.
Financial Highlights – continued
| RATIOS / SUPPLEMENTAL DATA | ||||||||||||||||||||||||||
| Ratio to Average Net Assets** | Ratios to Average Net Assets Before Expenses Waived, Credited or Paid Indirectly** | |||||||||||||||||||||||||
Total | Net Asset Value, End of Period | Total Return(b) | Net Assets, End of Period (in millions) | Expenses | Net Investment Income/(Loss) | Expenses | Net Investment Income/(Loss) | Portfolio Turnover Rate | ||||||||||||||||||
| $ | (0.75 | ) | $ | 11.44 | 3.65 | % | $ | 258.1 | 0.44 | % | 2.86 | % | 0.45 | % | 2.86 | % | 54 | % | ||||||||
| (1.15 | ) | 11.75 | (26.06 | )% | 280.0 | 0.39 | % | 3.00 | % | 0.41 | % | 2.98 | % | 133 | % | |||||||||||
| (0.53 | ) | 17.16 | 5.46 | % | 488.4 | 0.38 | % | 2.78 | % | 0.39 | % | 2.77 | % | 121 | % | |||||||||||
| (0.43 | ) | 16.77 | 11.41 | % | 566.1 | 0.38 | % | 2.72 | % | 0.39 | % | 2.72 | % | 127 | % | |||||||||||
| (0.38 | ) | 15.48 | 3.92 | % | 663.5 | 0.37 | % | 2.52 | % | 0.38 | % | 2.52 | % | 130 | % | |||||||||||
| (0.32 | ) | 15.28 | 8.09 | % | 748.7 | 0.33 | % | 2.54 | % | 0.37 | % | 2.50 | % | 119 | % | |||||||||||
| (0.18 | ) | 4.06 | 22.36 | % | 709.1 | 0.46 | % | 9.98 | % | 0.47 | % | 9.98 | % | 27 | % | |||||||||||
| (0.39 | ) | 3.48 | (21.19 | )% | 597.2 | 0.43 | % | 8.63 | % | 0.45 | % | 8.61 | % | 50 | % | |||||||||||
| (0.41 | ) | 4.84 | 2.71 | % | 774.6 | 0.45 | % | 8.00 | % | 0.45 | % | 8.00 | % | 69 | % | |||||||||||
| (0.40 | ) | 5.11 | 10.31 | % | 847.0 | 0.45 | % | 8.00 | % | 0.45 | % | 7.99 | % | 66 | % | |||||||||||
| (0.41 | ) | 5.01 | 4.04 | % | 802.6 | 0.45 | % | 8.05 | % | 0.45 | % | 8.04 | % | 53 | % | |||||||||||
| (0.42 | ) | 5.22 | 10.14 | % | 884.5 | 0.45 | % | 8.21 | % | 0.45 | % | 8.21 | % | 71 | % | |||||||||||
| (0.45 | ) | 5.15 | 11.74 | % | 74.6 | 0.66 | % | 7.80 | % | 0.67 | % | 7.79 | % | 43 | % | |||||||||||
| (0.43 | ) | 5.01 | (23.30 | )% | 75.0 | 0.51 | % | 5.61 | % | 0.52 | % | 5.59 | % | 115 | % | |||||||||||
| (0.14 | ) | 6.98 | (0.99 | )% | 131.3 | 0.48 | % | 5.30 | % | 0.50 | % | 5.28 | % | 168 | % | |||||||||||
| (0.25 | ) | 7.19 | 14.19 | % | 108.1 | 0.51 | % | 6.62 | % | 0.52 | % | 6.60 | % | 170 | % | |||||||||||
| (0.49 | ) | 6.54 | 3.62 | % | 94.0 | 0.49 | % | 7.46 | % | 0.51 | % | 7.44 | % | 66 | % | |||||||||||
| (0.46 | ) | 6.80 | 8.02 | % | 105.1 | 0.49 | % | 6.89 | % | 0.51 | % | 6.87 | % | 91 | % | |||||||||||
| (0.51 | ) | 9.95 | 4.57 | % | 6.7 | 0.68 | % | 4.38 | % | 2.45 | % | 2.62 | % | 86 | % | |||||||||||
| (0.25 | ) | 10.02 | 2.68 | % | 6.8 | 0.68 | % | 3.89 | % | 1.66 | % | 2.91 | % | 60 | % | |||||||||||
| (0.25 | ) | 8.61 | 8.27 | % | 1,144.8 | 0.45 | % | 6.11 | % | 0.45 | % | 6.10 | % | 90 | % | |||||||||||
| (0.52 | ) | 8.20 | (10.85 | )% | 1,097.1 | 0.44 | % | 5.61 | % | 0.45 | % | 5.60 | % | 160 | % | |||||||||||
| (0.52 | ) | 9.74 | 3.77 | % | 1,418.3 | 0.44 | % | 5.43 | % | 0.45 | % | 5.43 | % | 228 | % | |||||||||||
| (0.57 | ) | 9.90 | 5.42 | % | 1,081.8 | 0.45 | % | 5.22 | % | 0.45 | % | 5.22 | % | 303 | % | |||||||||||
| (0.51 | ) | 9.95 | 2.31 | % | 924.3 | 0.45 | % | 4.70 | % | 0.45 | % | 4.69 | % | 259 | % | |||||||||||
| (0.44 | ) | 10.23 | 4.74 | % | 985.1 | 0.45 | % | 4.36 | % | 0.45 | % | 4.36 | % | 207 | % | |||||||||||
| (b) | Total investment return assumes dividend reinvestment and does not reflect any deduction for sales charges. Not annualized for periods less than one year. Total return shown does not reflect charges and expenses imposed on contract holders by the variable accounts. Those charges and expenses reduce the return received by contract holders as compared to the return presented. |
| ** | Computed on an annualized basis for periods less than one year. |
The accompanying Notes to Financial Statements are an integral part of this schedule.
343
Table of Contents
Thrivent Series Fund, Inc.
Financial Highlights – continued
| FOR A SHARE OUSTANDING THROUGHOUT EACH PERIOD* | ||||||||||||||||||||||
| Income from Investment Operations | Less Distributions from | |||||||||||||||||||||
| Net Asset Value, Beginning of Period | Net Investment Income/(Loss) | Net Realized and Unrealized Gain/(Loss) on Investments(a) | Total from Investment Operations | Net Investment Income | Net Realized Gain on Investments | |||||||||||||||||
BOND INDEX PORTFOLIO | ||||||||||||||||||||||
Period Ended 06/30/09 (unaudited) | $ | 9.72 | $ | 0.18 | $ | — | $ | 0.18 | $ | (0.19 | ) | $ | — | |||||||||
Year Ended 12/31/08 | 10.29 | 0.48 | (0.56 | ) | (0.08 | ) | (0.49 | ) | — | |||||||||||||
Year Ended 12/31/07 | 10.22 | 0.50 | 0.07 | 0.57 | (0.50 | ) | — | |||||||||||||||
Year Ended 12/31/06 | 10.30 | 0.48 | (0.08 | ) | 0.40 | (0.48 | ) | — | ||||||||||||||
Year Ended 12/31/05 | 10.52 | 0.44 | (0.22 | ) | 0.22 | (0.44 | ) | — | ||||||||||||||
Year Ended 12/31/04 | 10.58 | 0.43 | (0.02 | ) | 0.41 | (0.43 | ) | (0.04 | ) | |||||||||||||
LIMITED MATURITY BOND PORTFOLIO | ||||||||||||||||||||||
Period Ended 06/30/09 (unaudited) | 8.79 | 0.19 | 0.41 | 0.60 | (0.19 | ) | — | |||||||||||||||
Year Ended 12/31/08 | 9.84 | 0.42 | (1.04 | ) | (0.62 | ) | (0.43 | ) | — | |||||||||||||
Year Ended 12/31/07 | 9.92 | 0.47 | (0.08 | ) | 0.39 | (0.47 | ) | — | ||||||||||||||
Year Ended 12/31/06 | 9.92 | 0.44 | — | 0.44 | (0.44 | ) | — | |||||||||||||||
Year Ended 12/31/05 | 10.09 | 0.37 | (0.17 | ) | 0.20 | (0.37 | ) | — | ||||||||||||||
Year Ended 12/31/04 | 10.21 | 0.29 | (0.10 | ) | 0.19 | (0.29 | ) | (0.02 | ) | |||||||||||||
MORTGAGE SECURITIES PORTFOLIO | ||||||||||||||||||||||
Period Ended 06/30/09 (unaudited) | 8.82 | 0.20 | 0.01 | 0.21 | (0.15 | ) | — | |||||||||||||||
Year Ended 12/31/08 | 9.71 | 0.44 | (0.91 | ) | (0.47 | ) | (0.42 | ) | — | |||||||||||||
Year Ended 12/31/07 | 9.71 | 0.49 | (0.01 | ) | 0.48 | (0.48 | ) | — | ||||||||||||||
Year Ended 12/31/06 | 9.75 | 0.48 | (0.04 | ) | 0.44 | (0.48 | ) | — | ||||||||||||||
Year Ended 12/31/05 | 9.99 | 0.43 | (0.24 | ) | 0.19 | (0.43 | ) | — | ||||||||||||||
Year Ended 12/31/04 | 9.99 | 0.40 | — | 0.40 | (0.39 | ) | (0.01 | ) | ||||||||||||||
MONEY MARKET PORTFOLIO | ||||||||||||||||||||||
Period Ended 06/30/09 (unaudited) | 1.00 | — | — | — | — | — | ||||||||||||||||
Year Ended 12/31/08 | 1.00 | 0.03 | — | 0.03 | (0.03 | ) | — | |||||||||||||||
Year Ended 12/31/07 | 1.00 | 0.05 | — | 0.05 | (0.05 | ) | — | |||||||||||||||
Year Ended 12/31/06 | 1.00 | 0.05 | — | 0.05 | (0.05 | ) | — | |||||||||||||||
Year Ended 12/31/05 | 1.00 | 0.03 | — | 0.03 | (0.03 | ) | — | |||||||||||||||
Year Ended 12/31/04 | 1.00 | 0.01 | — | 0.01 | (0.01 | ) | — | |||||||||||||||
| (a) | The amount shown may not correlate with the change in aggregate gains and losses of portfolio securities due to the timing of sales and redemptions of fund shares. |
| * | All per share amounts have been rounded to the nearest cent. |
The accompanying Notes to Financial Statements are an integral part of this schedule.
344
Table of Contents
Thrivent Series Fund, Inc.
Financial Highlights – continued
| RATIOS / SUPPLEMENTAL DATA | ||||||||||||||||||||||||||
| Ratio to Average Net Assets** | Ratios to Average Net Assets Before Expenses Waived, Credited or Paid Indirectly** | |||||||||||||||||||||||||
Total | Net Asset Value, End of Period | Total Return(b) | Net Assets, End of Period (in millions) | Expenses | Net Investment Income/(Loss) | Expenses | Net Investment Income/(Loss) | Portfolio Turnover Rate | ||||||||||||||||||
| $ | (0.19 | ) | $ | 9.71 | 1.94 | % | $ | 155.6 | 0.47 | % | 3.86 | % | 0.48 | % | 3.85 | % | 185 | % | ||||||||
| (0.49 | ) | 9.72 | (0.82 | )% | 174.6 | 0.39 | % | 4.83 | % | 0.43 | % | 4.79 | % | 346 | % | |||||||||||
| (0.50 | ) | 10.29 | 5.66 | % | 215.2 | 0.40 | % | 4.86 | % | 0.43 | % | 4.84 | % | 331 | % | |||||||||||
| (0.48 | ) | 10.22 | 4.04 | % | 237.8 | 0.41 | % | 4.70 | % | 0.42 | % | 4.69 | % | 352 | % | |||||||||||
| (0.44 | ) | 10.30 | 2.18 | % | 272.4 | 0.40 | % | 4.19 | % | 0.41 | % | 4.18 | % | 360 | % | |||||||||||
| (0.47 | ) | 10.52 | 3.91 | % | 275.6 | 0.40 | % | 3.99 | % | 0.41 | % | 3.98 | % | 349 | % | |||||||||||
| (0.19 | ) | 9.20 | 6.89 | % | 983.9 | 0.45 | % | 4.28 | % | 0.45 | % | 4.27 | % | 79 | % | |||||||||||
| (0.43 | ) | 8.79 | (6.46 | )% | 925.9 | 0.44 | % | 4.44 | % | 0.45 | % | 4.43 | % | 121 | % | |||||||||||
| (0.47 | ) | 9.84 | 3.98 | % | 973.8 | 0.44 | % | 4.82 | % | 0.45 | % | 4.81 | % | 128 | % | |||||||||||
| (0.44 | ) | 9.92 | 4.57 | % | 665.6 | 0.44 | % | 4.49 | % | 0.45 | % | 4.48 | % | 137 | % | |||||||||||
| (0.37 | ) | 9.92 | 1.96 | % | 454.1 | 0.45 | % | 3.70 | % | 0.46 | % | 3.69 | % | 267 | % | |||||||||||
| (0.31 | ) | 10.09 | 1.89 | % | 316.2 | 0.46 | % | 2.84 | % | 0.46 | % | 2.84 | % | 219 | % | |||||||||||
| (0.15 | ) | 8.88 | 2.37 | % | 30.0 | 0.94 | % | 4.64 | % | 0.94 | % | 4.64 | % | 308 | % | |||||||||||
| (0.42 | ) | 8.82 | (4.96 | )% | 35.2 | 0.67 | % | 4.67 | % | 0.67 | % | 4.67 | % | 721 | % | |||||||||||
| (0.48 | ) | 9.71 | 5.09 | % | 49.8 | 0.65 | % | 5.05 | % | 0.65 | % | 5.05 | % | 731 | % | |||||||||||
| (0.48 | ) | 9.71 | 4.71 | % | 57.8 | 0.62 | % | 5.01 | % | 0.62 | % | 5.01 | % | 740 | % | |||||||||||
| (0.43 | ) | 9.75 | 2.00 | % | 66.9 | 0.61 | % | 4.40 | % | 0.62 | % | 4.39 | % | 703 | % | |||||||||||
| (0.40 | ) | 9.99 | 4.02 | % | 57.4 | 0.49 | % | 4.02 | % | 0.63 | % | 3.88 | % | 684 | % | |||||||||||
| — | 1.00 | 0.38 | % | 610.1 | 0.40 | % | 0.74 | % | 0.50 | % | 0.64 | % | N/A | |||||||||||||
| (0.03 | ) | 1.00 | 2.95 | % | 683.4 | 0.36 | % | 2.93 | % | 0.46 | % | 2.83 | % | N/A | ||||||||||||
| (0.05 | ) | 1.00 | 5.14 | % | 741.6 | 0.35 | % | 5.03 | % | 0.45 | % | 4.93 | % | N/A | ||||||||||||
| (0.05 | ) | 1.00 | 4.85 | % | 590.6 | 0.35 | % | 4.80 | % | 0.45 | % | 4.70 | % | N/A | ||||||||||||
| (0.03 | ) | 1.00 | 2.86 | % | 373.7 | 0.46 | % | 2.85 | % | 0.46 | % | 2.85 | % | N/A | ||||||||||||
| (0.01 | ) | 1.00 | 0.97 | % | 323.2 | 0.46 | % | 1.00 | % | 0.47 | % | 0.99 | % | N/A | ||||||||||||
| (b) | Total investment return assumes dividend reinvestment and does not reflect any deduction for sales charges. Not annualized for periods less than one year. Total return shown does not reflect charges and expenses imposed on contract holders by the variable accounts. Those charges and expenses reduce the return received by contract holders as compared to the return presented. |
| ** | Computed on an annualized basis for periods less than one year. |
The accompanying Notes to Financial Statements are an integral part of this schedule.
345
Table of Contents
(unaudited)
Proxy Voting
The policies and procedures that the Fund uses to determine how to vote proxies relating to portfolio securities are attached to the Fund’s Statement of Additional Information. You may request a free copy of the Statement of Additional Information or the report of how the Fund voted proxies relating to portfolio securities during the most recent 12-month period ended June 30 by calling 1-800-847-4836. You also may review the Statement of Additional Information or the report of how the Fund voted proxies relating to portfolio securities during the most recent 12-month period ended June 30 at the Thrivent Financial web site (Thrivent.com) or the SEC web site (www.sec.gov).
Quarterly Schedule of Portfolio Holdings
The Fund files its Schedule of Portfolio Holdings on Form N-Q with the SEC for the first and third quarters of each fiscal year. You may request a free copy of the Fund’s Forms N-Q by calling 1-800-847-4836. The Fund’s most recent Form N-Q Schedule of Investments also is available on the Thrivent Financial web site (Thrivent.com) or the SEC web site (www.sec.gov). You also may review and copy the Forms N-Q for the Fund at the SEC’s Public Reference Room in Washington, DC. You may get information about the operation of the Public Reference Room by calling 1-800-SEC-0330.
Results of Special Shareholder Meetings
A special meeting of shareholders of the Fund convened on May 15, 2009 to elect a Board of Directors for the Fund, which was proposed to consist of the following individuals: F. Gregory Campbell, Herbert F. Eggerding, Jr., Noel K. Estenson, Richard L. Gady, Richard A. Hauser, Paul R. Laubscher, Connie M. Levi, Douglas D. Sims, Constance L. Souders and Russell W. Swansen.
Shareholder votes rendered the following results:
Name | For | Against | Abstain | |||
F. Gregory Campbell | 2,230,060,599.297 | 63,668,730.158 | 0 | |||
Herbert F. Eggerding, Jr. | 2,229,626,109.015 | 64,103,220.440 | 0 | |||
Noel K. Estenson | 2,231,231,249.319 | 62,498,080.136 | 0 | |||
Richard L. Gady | 2,235,029,533.871 | 58,699,795,584 | 0 | |||
Richard A. Hauser | 2,234,611,711.552 | 59,117,617.903 | 0 | |||
Paul R. Laubscher | 2,233,475,854.996 | 60,253,474.459 | 0 | |||
Connie M. Levi | 2,233,417,037.974 | 60,312,291.481 | 0 | |||
Douglas D. Sims | 2,236,577,110.600 | 57,152,218.855 | 0 | |||
Constance L. Souders | 2,236,506,034.706 | 57,223,294.749 | 0 | |||
Russell W. Swansen | 2,233,631,600.817 | 60,097,728.638 | 0 |
In addition, a special meeting of shareholders of the Aggressive Allocation Portfolio, the Moderately Aggressive Allocation Portfolio, the Moderate Allocation Portfolio and the Moderately Conservative Allocation Portfolio convened on May 15, 2009 to approve a new investment advisory fee structure for each of these Portfolios.
Shareholder votes rendered the following results:
Name | For | Against | Abstain | Broker Non-Votes | ||||
Aggressive Allocation Portfolio | 34,962,189.804 | 4,273,250.953 | 2,716,606.243 | 0 | ||||
Moderately Aggressive Allocation Portfolio | 133,332,930.478 | 12,121,426.891 | 11,347,691.632 | 0 | ||||
Moderate Allocation Portfolio | 170,235,996.230 | 15,171,690.144 | 17,263,857.253 | 0 | ||||
Moderately Conservative Allocation Portfolio | 68,205,211.963 | 5,689,351.130 | 5,722,625.907 | 0 |
Board Approval of Investment Subadvisory Agreement
At their meeting on May 28, 2009, the members of the Board of Directors (the “Board”), including the Independent Directors, unanimously voted to approve a new investment subadvisory agreement (the “Subadvisory Agreement”) among the Fund (on behalf of Thrivent Partner Technology Portfolio (the “Portfolio”)), Thrivent Financial and Goldman Sachs Asset Management, L.P. (“GSAM”). In connection with its approval of the Subadvisory Agreement, the Board considered the following factors: The nature, extent, and quality of the services provided by the Subadviser; the investment performance of the Portfolio; the costs of the services to be provided and profits anticipated to be realized; the extent to which economies of scale may be realized as the Portfolio grows; and whether fee breakpoint levels reflect these economies of scale for the benefit of the Portfolio’s shareholders.
346
Table of Contents
Additional Information
(unaudited)
The Board, including the Independent Directors, reviewed information presented by Thrivent Financial addressing the factors listed above. The Independent Directors were represented by independent counsel throughout the meeting.
Management began by discussing its process for selecting a new subadviser to recommend to the Board, which included identifying appropriate candidates and convening representatives from cross-functional areas within Thrivent (i.e., Investments, Product Management, Marketing, Accounting, Legal, Compliance and Investment Operations) to interview the candidates. Management then reviewed with the Board the proposed Subadvisory Agreement and reported that Thrivent Financial’s subadvisory due diligence committee had met with representatives of GSAM to learn more about how GSAM would manage a technology portfolio. Management stated that the scope and quality of services under the new investment subadvisory agreement with GSAM was expected to be at least equivalent to the scope and quality of services provided by Thrivent Financial, which, prior to the appointment of GSAM, was the exclusive investment adviser to the Portfolio. The Board also received information relating to GSAM’s investment process and research capabilities. In addition, the Board took into consideration that GSAM acts as a subadviser to four other Thrivent mutual funds (i.e., Thrivent Partner Mid Cap Value Portfolio and Fund, and Thrivent Partner Worldwide Allocation Portfolio and Fund) and the information made in presentations to the Board in the recent past concerning its investment process and research capabilities, among other things.
The Board received regular monthly performance reports, which included both the absolute and relative investment performance of the Portfolio. In addition, in connection with each of its regular quarterly meetings, the Board received more extensive information on the performance of the Portfolio, including absolute performance, relative performance rankings within the Portfolio’s Lipper peer group and performance as compared to benchmark index returns. The Board observed that the Portfolio’s relative performance versus its peer group had been inconsistent. The Board also received information regarding GSAM’s absolute and relative performance of its technology portfolio, which is managed in a substantially identical manner to the manner in which GSAM would manage the Portfolio. The Board observed that for the one-, three- and five-year periods ended March 31, 2009, the technology portfolio managed by GSAM had outperformed the median return of its peer group.
With respect to fees to be paid to GSAM under the Subadvisory Agreement, the Board reviewed the amount of the fees and considered that the contract had been negotiated at arm’s length between Thrivent Financial and GSAM and that the markup for additional services to be provided by Thrivent Financial was reasonable. The Board was also informed of all material separate arrangements for unrelated services between GSAM and Thrivent Financial or its affiliates.
The Directors noted that fees under the Subadvisory Agreement are paid by Thrivent Financial out of its investment advisory fees. At its previous meeting on November 11, 2008, the Board considered whether economies of scale might be realized as the Portfolio’s assets increase. Because of differences between funds as to management style and cost, it is difficult to generalize as to whether or to what extent economies in the advisory function may be realized as a fund’s assets increase. Typically, expected economies of scale, where they exist, are shared through the use of fee breakpoints and/or fee waivers by Thrivent Financial. At the November meeting, the Directors considered information provided by Thrivent Financial related to breakpoints and fee waivers provided by Thrivent Financial. Thrivent Financial explained that its general goal with respect to fee waivers, expense reimbursements and breakpoints was that the overall expense ratio for the Portfolio should be at or below the median expense ratio of its peer group. Thrivent Financial noted that the Portfolio had net operating expenses of 0.87%, below the median net operating expense ratio of 1.10% for its peer group, placing the Portfolio in the 15th percentile for net operating expenses. The Board also noted that while some portfolios of the Fund were increasing in assets and others were decreasing in assets, the portfolios overall were not experiencing significant asset growth. Based on the factors discussed above, the Board, including all of the Independent Directors, approved the Subadvisory Agreement with GSAM.
347
Table of Contents
Supplement to Prospectus dated April 30, 2009
With respect to Thrivent Aggressive Allocation Portfolio
The second paragraph of the “Principal Strategies” section on page 4 of the prospectus is deleted in its entirety and replaced with the following:
The Portfolio will pursue its asset allocation strategy by investing in a combination of Thrivent mutual funds (the “Underlying Portfolios”) and other financial instruments (the “direct investments”).
The “Principal Risks” section on pages 5 through 6 of the prospectus is revised to reflect the fact that the Portfolio not only invests in Underlying Portfolios but also direct investments. In addition, the second paragraph of the “Underlying Portfolio Risk” factor is deleted in its entirety and replaced with the following:
As a shareholder of the Portfolio, you will bear your share of the Portfolio’s operating expenses as well as the Portfolio’s share of the Underlying Portfolios’ operating expenses. Consequently, an investment in the Portfolio would result in higher aggregate operating costs than investing directly in the Underlying Portfolios.
Effective June 1, 2009, the “Fees and Expenses” table and its introductory paragraph on page 7 of the prospectus are deleted in their entirety and replaced with the following:
This table describes the fees and expenses that you may pay if you buy and hold shares of the Portfolio. Because the Portfolio invests, in part, in Underlying Portfolios, there are two layers of fees and expenses associated with an investment in the Portfolio that you will bear: (1) the fees and expenses directly incurred by the Portfolio itself, and (2) the fees and expenses associated with the Portfolio’s investments in the Underlying Portfolios. The table also reflects a 20% allocation to direct investments, although the actual allocation may vary over time. If you own a variable annuity contract or variable life insurance contract, you will have additional expenses including mortality and expense risk charges. Please refer to the prospectus for your variable contract for additional information about charges for those contracts.
SHAREHOLDER FEES (fees paid directly from your investment) | |||
Maximum Sales Charge (Load) | N/A | ||
Maximum Deferred Sales Charge (Load) | N/A | ||
ANNUAL PORTFOLIO OPERATING EXPENSES AS A PERCENTAGE OF AVERAGE NET ASSETS (expenses that are deducted from Portfolio assets) | |||
Management Fees1 | 0.27 | % | |
Other Expenses | 0.05 | % | |
Acquired Portfolio (Underlying Portfolio) Fees and Expenses | 0.55 | % | |
Total Annual Portfolio Operating Expenses | 0.87 | % |
| 1 | Management Fees are calculated by multiplying the applicable advisory fee on direct investments (0.60%) by the percentage of assets allocated to direct investments (20%) and adding such amount to the applicable advisory fee on all assets (0.15%), which includes both direct investments and Underlying Portfolios. |
In addition, the expense “Example” table on page 7 of the prospectus is deleted in its entirety and replaced with the following:
| 1 Year | 3 Years | 5 Years | 10 Years | |||||||||
Thrivent Aggressive Allocation Portfolio | $ | 89 | $ | 278 | $ | 482 | $ | 1,073 | ||||
The date of this Supplement is May 29, 2009
Please include this Supplement with your Prospectus
348
Table of Contents
Thrivent Series Fund, Inc.
Supplement to Prospectus dated April 30, 2009
With respect to Thrivent Moderately Aggressive Allocation Portfolio
The second paragraph of the “Principal Strategies” section on page 8 of the prospectus is deleted in its entirety and replaced with the following:
The Portfolio will pursue its asset allocation strategy by investing in a combination of Thrivent mutual funds (the “Underlying Portfolios”) and other financial instruments (the “direct investments”).
The “Principal Risks” section on pages 8 through 10 of the prospectus is revised to reflect the fact that the Portfolio not only invests in Underlying Portfolios but also direct investments. In addition, the second paragraph of the “Underlying Portfolio Risk” factor is deleted in its entirety and replaced with the following:
As a shareholder of the Portfolio, you will bear your share of the Portfolio’s operating expenses as well as the Portfolio’s share of the Underlying Portfolios’ operating expenses. Consequently, an investment in the Portfolio would result in higher aggregate operating costs than investing directly in the Underlying Portfolios.
Effective June 1, 2009, the “Fees and Expenses” table and its introductory paragraph on page 10 of the prospectus are deleted in their entirety and replaced with the following:
This table describes the fees and expenses that you may pay if you buy and hold shares of the Portfolio. Because the Portfolio invests, in part, in Underlying Portfolios, there are two layers of fees and expenses associated with an investment in the Portfolio that you will bear: (1) the fees and expenses directly incurred by the Portfolio itself, and (2) the fees and expenses associated with the Portfolio’s investments in the Underlying Portfolios. The table also reflects a 20% allocation to direct investments, although the actual allocation may vary over time. If you own a variable annuity contract or variable life insurance contract, you will have additional expenses including mortality and expense risk charges. Please refer to the prospectus for your variable contract for additional information about charges for those contracts.
SHAREHOLDER FEES (fees paid directly from your investment) | |||
Maximum Sales Charge (Load) | N/A | ||
Maximum Deferred Sales Charge (Load) | N/A | ||
ANNUAL PORTFOLIO OPERATING EXPENSES AS A PERCENTAGE OF AVERAGE NET ASSETS (expenses that are deducted from Portfolio assets) | |||
Management Fees1 | 0.24 | % | |
Other Expenses | 0.04 | % | |
Acquired Portfolio (Underlying Portfolio) Fees and Expenses | 0.53 | % | |
Total Annual Portfolio Operating Expenses | 0.81 | % |
| 1 | Management Fees are calculated by multiplying the applicable advisory fee on direct investments (0.55%) by the percentage of assets allocated to direct investments (20%) and adding such amount to the applicable advisory fee on all assets (0.13%), which includes both direct investments and Underlying Portfolios. |
In addition, the expense “Example” table on page 11 of the prospectus is deleted in its entirety and replaced with the following:
| 1 Year | 3 Years | 5 Years | 10 Years | |||||||||
Thrivent Moderately Aggressive Allocation Portfolio | $ | 83 | $ | 259 | $ | 450 | $ | 1,002 | ||||
The date of this Supplement is May 29, 2009
Please include this Supplement with your Prospectus
349
Table of Contents
Thrivent Series Fund, Inc.
Supplement to Prospectus dated April 30, 2009
With respect to Thrivent Moderate Allocation Portfolio
The second paragraph of the “Principal Strategies” section on page 12 of the prospectus is deleted in its entirety and replaced with the following:
The Portfolio will pursue its asset allocation strategy by investing in a combination of Thrivent mutual funds (the “Underlying Portfolios”) and other financial instruments (the “direct investments”).
The “Principal Risks” section on pages 12 through 14 of the prospectus is revised to reflect the fact that the Portfolio not only invests in Underlying Portfolios but also direct investments. In addition, the second paragraph of the “Underlying Portfolio Risk” factor is deleted in its entirety and replaced with the following:
As a shareholder of the Portfolio, you will bear your share of the Portfolio’s operating expenses as well as the Portfolio’s share of the Underlying Portfolios’ operating expenses. Consequently, an investment in the Portfolio would result in higher aggregate operating costs than investing directly in the Underlying Portfolios.
Effective June 1, 2009, the “Fees and Expenses” table and its introductory paragraph on page 14 of the prospectus are deleted in their entirety and replaced with the following:
This table describes the fees and expenses that you may pay if you buy and hold shares of the Portfolio. Because the Portfolio invests, in part, in Underlying Portfolios, there are two layers of fees and expenses associated with an investment in the Portfolio that you will bear: (1) the fees and expenses directly incurred by the Portfolio itself, and (2) the fees and expenses associated with the Portfolio’s investments in the Underlying Portfolios. The table also reflects a 20% allocation to direct investments, although the actual allocation may vary over time. If you own a variable annuity contract or variable life insurance contract, you will have additional expenses including mortality and expense risk charges. Please refer to the prospectus for your variable contract for additional information about charges for those contracts.
SHAREHOLDER FEES (fees paid directly from your investment) | |||
Maximum Sales Charge (Load) | N/A | ||
Maximum Deferred Sales Charge (Load) | N/A | ||
ANNUAL PORTFOLIO OPERATING EXPENSES AS A PERCENTAGE OF AVERAGE NET ASSETS (expenses that are deducted from Portfolio assets) | |||
Management Fees1 | 0.23 | % | |
Other Expenses | 0.04 | % | |
Acquired Portfolio (Underlying Portfolio) Fees and Expenses | 0.48 | % | |
Total Annual Portfolio Operating Expenses | 0.75 | % |
| 1 | Management Fees are calculated by multiplying the applicable advisory fee on direct investments (0.50%) by the percentage of assets allocated to direct investments (20%) and adding such amount to the applicable advisory fee on all assets (0.13%), which includes both direct investments and Underlying Portfolios. |
In addition, the expense “Example” table on page 15 of the prospectus is deleted in its entirety and replaced with the following:
| 1 Year | 3 Years | 5 Years | 10 Years | |||||||||
Thrivent Moderate Allocation Portfolio | $ | 77 | $ | 240 | $ | 417 | $ | 930 | ||||
The date of this Supplement is May 29, 2009
Please include this Supplement with your Prospectus
350
Table of Contents
Thrivent Series Fund, Inc.
Supplement to Prospectus dated April 30, 2009
With respect to Thrivent Moderately Conservative Allocation Portfolio
The second paragraph of the “Principal Strategies” section on page 16 of the prospectus is deleted in its entirety and replaced with the following:
The Portfolio will pursue its asset allocation strategy by investing in a combination of Thrivent mutual funds (the “Underlying Portfolios”) and other financial instruments (the “direct investments”).
The “Principal Risks” section on pages 16 through 18 of the prospectus is revised to reflect the fact that the Portfolio not only invests in Underlying Portfolios but also direct investments. In addition, the second paragraph of the “Underlying Portfolio Risk” factor is deleted in its entirety and replaced with the following:
As a shareholder of the Portfolio, you will bear your share of the Portfolio’s operating expenses as well as the Portfolio’s share of the Underlying Portfolios’ operating expenses. Consequently, an investment in the Portfolio would result in higher aggregate operating costs than investing directly in the Underlying Portfolios.
Effective June 1, 2009, the “Fees and Expenses” table and its introductory paragraph on pages 18 through 19 of the prospectus are deleted in their entirety and replaced with the following:
This table describes the fees and expenses that you may pay if you buy and hold shares of the Portfolio. Because the Portfolio invests, in part, in Underlying Portfolios, there are two layers of fees and expenses associated with an investment in the Portfolio that you will bear: (1) the fees and expenses directly incurred by the Portfolio itself, and (2) the fees and expenses associated with the Portfolio’s investments in the Underlying Portfolios. The table also reflects a 20% allocation to direct investments, although the actual allocation may vary over time. If you own a variable annuity contract or variable life insurance contract, you will have additional expenses including mortality and expense risk charges. Please refer to the prospectus for your variable contract for additional information about charges for those contracts.
SHAREHOLDER FEES (fees paid directly from your investment) | |||
Maximum Sales Charge (Load) | N/A | ||
Maximum Deferred Sales Charge (Load) | N/A | ||
ANNUAL PORTFOLIO OPERATING EXPENSES AS A PERCENTAGE OF AVERAGE NET ASSETS (expenses that are deducted from Portfolio assets) | |||
Management Fees1 | 0.23 | % | |
Other Expenses | 0.04 | % | |
Acquired Portfolio (Underlying Portfolio) Fees and Expenses | 0.44 | % | |
Total Annual Portfolio Operating Expenses | 0.71 | % |
| 1 | Management Fees are calculated by multiplying the applicable advisory fee on direct investments (0.45%) by the percentage of assets allocated to direct investments (20%) and adding such amount to the applicable advisory fee on all assets (0.14%), which includes both direct investments and Underlying Portfolios. |
In addition, the expense “Example” table on page 19 of the prospectus is deleted in its entirety and replaced with the following:
| 1 Year | 3 Years | 5 Years | 10 Years | |||||||||
Thrivent Moderately Conservative Allocation Portfolio | $ | 73 | $ | 227 | $ | 395 | $ | 883 | ||||
The date of this Supplement is May 29, 2009
Please include this Supplement with your Prospectus
351
Table of Contents
THRIVENT VARIABLE LIFE ACCOUNT I
THRIVENT VARIABLE INSURANCE ACCOUNT A
TLIC VARIABLE INSURANCE ACCOUNT A
THRIVENT VARIABLE ANNUITY ACCOUNT I
THRIVENT VARIABLE ANNUITY ACCOUNT II
THRIVENT VARIABLE ANNUITY ACCOUNT A
THRIVENT VARIABLE ANNUITY ACCOUNT B
TLIC VARIABLE ANNUITY ACCOUNT A
Supplement to Prospectuses dated April 30, 2009
With respect to Thrivent Technology Subaccount
As described in the prospectuses for Contracts offered by the Variable Accounts listed above, we allocate premiums based on your designation to one or more Subaccounts of the Variable Account associated with your Contract. The assets of each Subaccount are invested in a corresponding Portfolio of Thrivent Series Fund, Inc. (“the Fund”).
Effective July 1, 2009, the name of Thrivent Technology Portfolio of the Fund, has changed to become “Thrivent Partner Technology Portfolio” (the “Portfolio”). Correspondingly, the Subaccount that invests in the Portfolio has changed its name to “Thrivent Partner Technology Subaccount.” All references to Thrivent Technology Portfolio or Thrivent Technology Subaccount are replaced by the new names.
In addition, the language of the investment objective for the Portfolio has been amended to read as follows, although the objective remains the same:
The Portfolio seeks long-term growth of capital.
Also effective July 1, 2009, the prospectuses for Contracts offered by the Variable Accounts listed above are amended to reflect the hiring of Goldman Sachs Asset Management, L.P. as subadviser to the Portfolio.
The supplement to the prospectus for the Fund dated June 25, 2009 describes further information about the investment objectives and attendant risks of Thrivent Partner Technology Portfolio.
The date of this Supplement is June 25, 2009
Please include this Supplement with your Prospectus
Thrivent Financial for Lutherans
Service Center
4321 North Ballard Road
Appleton, WI 54919-0001
Toll-Free Telephone Number
800-847-4836
352
Table of Contents
Thrivent Series Fund, Inc.
Supplement to Prospectus dated April 30, 2009
With respect to Thrivent Technology Portfolio
Effective July 1, 2009, pages 20 through 21 and pages 110-111 of the prospectus are amended to reflect the hiring of Goldman Sachs Asset Management, L.P. as subadviser to this portfolio and the ensuing changes in the investment strategies and risks.
The name of the portfolio has changed to “Thrivent Partner Technology Portfolio.”
The language of the “Investment Objective” on page 20 has changed to the following, although the objective remains the same:
The Portfolio seeks long-term growth of capital.
The “Principal Strategies” section on page 20 is deleted in its entirety and replaced with the following:
Under normal circumstances, the Portfolio, through its subadviser Goldman Sachs Asset Management, L.P., invests at least 80% of its net assets (plus the amount of any borrowing for investment purposes) in securities of technology companies. Technology companies may include companies engaged in technology-oriented businesses in the following industries: information technology, telecommunications services, computer and electronics retail, internet retail, aerospace and defense, data processing services, electrical components and equipment, and media.
The subadviser invests primarily in common stocks and may invest in foreign securities, including those in emerging markets. Securities may be purchased without regard to market capitalization, and the Portfolio will likely have exposure to the securities of small and medium sized companies. In addition, the subadviser may invest in a relatively few number of issuers; therefore, the Portfolio may be more susceptible to adverse developments affecting any single issuer held in its portfolio and may be more susceptible to greater losses because of these developments. Should the Adviser determine that the Portfolio would benefit from reducing the percentage of its assets invested in securities of technology companies from 80% to a lesser amount, we will notify you at least 60 days prior to such a change.
Goldman Sachs Asset Management, L.P. (“GSAM”)
When selecting potential investments, GSAM employs fundamental investment research techniques to identify issuers that meet particular investment criteria, which include the following: strong brand name, dominant market share, recurring revenue streams, free cash flow generation, long product life cycles, enduring competitive advantages and excellent management. GSAM will typically sell a position if an issuer’s long-term fundamentals deteriorate, if the security reaches full valuation, if the issuer pursues a strategy that, in GSAM’s view, does not maximize shareholder value, or if the position grows beyond a weight with which GSAM is comfortable from a risk management standpoint.
The “Principal Risks” section is amended. The “Investment Adviser Risk” factor on page 21 of the prospectus is deleted in its entirety and replaced with the following risk factors:
Internet Risk. Stock prices of Internet and Internet-related companies and therefore the value of the Portfolio will experience significant price movements as a result of intense market volatility, worldwide competition, consumer preferences, product compatibility, product obsolescence, government regulation, excessive investor optimism or pessimism, or other factors.
Small and Mid Cap Risk. Small- and medium-sized companies often have greater price volatility, lower trading volumes, and less liquidity than larger, more established companies. These companies tend to have smaller revenues, narrower product lines, less management depth and experience, smaller shares of their product or service markets, fewer financial resources, and less competitive strength than larger companies. In addition, small cap companies seldom pay significant dividends that could cushion returns in a falling market.
Emerging Markets Risk. The economic and political structures of developing nations, in most cases, do not compare favorably with the U.S. or other developed countries in terms of wealth and stability, and their financial markets often lack liquidity. Portfolio performance will likely be negatively affected by portfolio exposure to nations in the midst of, among other things, hyperinflation, currency devaluation, trade disagreements, sudden political upheaval or interventionist government policies. Significant buying or selling actions by a few major investors may also heighten the volatility of emerging markets. These factors make investing in emerging market countries significantly riskier than in other countries and events in any one country could cause the Portfolio’s share price to decline.
353
Table of Contents
Liquidity Risk. Liquidity is the ability to sell a security relatively quickly for a price that most closely reflects the actual value of the security. Certain securities (e.g., small-cap stocks and foreign securities) often have a less liquid resale market. As a result, the Portfolio may have difficulty selling or disposing of securities quickly in certain markets or may only be able to sell the holdings at prices substantially less than what the Portfolio believes they are worth.
Investment Adviser Risk. The Portfolio is actively managed and the success of the Portfolio’s investment strategy depends significantly on the skills of the Adviser and/or subadviser(s) in assessing the potential of the securities in which the Portfolio invests. This assessment of companies held in the Portfolio may prove incorrect, resulting in losses or poor performance even in rising markets.
The listing of the Subadvised Portfolios on page 110, as that term is defined on that page, is amended to include the Thrivent Partner Technology Portfolio.
The description for Thrivent Technology Portfolio in the “Portfolio Management” section on page 111 is deleted in its entirety and replaced with the following:
Thrivent Partner Technology Portfolio
Thrivent Financial has engaged Goldman Sachs Asset Management, L.P. (“GSAM”), 32 Old Slip, New York, New York 10005, as investment subadviser for Thrivent Partner Technology Portfolio. GSAM has been registered as an investment adviser since 1990 and is an affiliate of Goldman, Sachs & Co. As of December 31, 2008, GSAM, including its investment advisory affiliates, had assets under management of approximately $739.4 billion. GSAM uses its Growth Investment Team to manage the Portfolio. Steven M. Barry and David G. Shell, CFA are co-portfolio managers to the Portfolio, and each is a Managing Director, Chief Investment Officer and Senior Portfolio Manager at GSAM. Mr. Barry and Mr. Shell have been with GSAM since the respective years of 1999 and 1997.
The date of this Supplement is June 25, 2009
Please include this Supplement with your Prospectus
354
Table of Contents
[THIS PAGE INTENTIONALLY LEFT BLANK]
355
Table of Contents
[THIS PAGE INTENTIONALLY LEFT BLANK]
356
Table of Contents
[THIS PAGE INTENTIONALLY LEFT BLANK]
357
Table of Contents
[THIS PAGE INTENTIONALLY LEFT BLANK]
358
Table of Contents
[THIS PAGE INTENTIONALLY LEFT BLANK]
359
Table of Contents
[THIS PAGE INTENTIONALLY LEFT BLANK]
360
Table of Contents

We’re Listening to You!
In response to concerns regarding multiple mailings, we send one copy of an annual and semiannual report and one copy of a prospectus for Thrivent Series Fund, Inc., to each household. This consolidation helps reduce printing and postage costs, thereby saving money and reducing waste. If you wish to receive an additional copy of this report, call us toll-free at 800-847-4836. Or you can enroll in eDelivery today at Thrivent.com and receive your annual and semiannual reports and prospectus electronically.
625 Fourth Ave. S., Minneapolis, MN 55415-1665 Thrivent.com • email: mail@thrivent.com 800-THRIVENT (800-847-4836)
23572SAR R8-09
Table of Contents
| Item 2. | Code of Ethics |
Not applicable to semiannual report
| Item 3. | Audit Committee Financial Expert |
Not applicable to semiannual report
| Item 4. | Principal Accountant Fees and Services |
Not applicable to semiannual report
| Item 5. | Audit Committee of Listed Registrants |
Not applicable.
| Item 6. | Schedule of Investments |
| (1) | Registrant’s Schedule of Investments is included in the report to shareholders filed under Item 1. |
| (2) | Not applicable to this filing. |
| Item 7. | Disclosure of Proxy Voting Policies and Procedures for Closed-End Management Investment Companies |
Not applicable.
| Item 8. | Portfolio Managers of Closed-End Management Investment Companies |
Not applicable.
| Item 9. | Purchases of Equity Securities by Closed-End Management Investment Company and Affiliated Purchasers. |
Not applicable.
| Item 10. | Submission of Matters to a Vote of Security Holders |
There have been no material changes to the procedures by which shareholders may recommend nominees to registrant’s board of directors.
| Item 11. | Controls and Procedures |
(a)(i) Registrant’s President and Treasurer have concluded that registrant’s disclosure controls and procedures (as defined in Rule 30a-3(c) under the Investment Company Act) are effective, based on their evaluation of these controls and procedures as of a date within 90 days of the filing date of this report.
(a)(ii) Registrant’s President and Treasurer are aware of no change in registrant’s internal control over financial reporting (as defined in Rule 30a-3(d) under the Investment Company Act) that occurred during registrant’s most recent fiscal quarter that has materially affected, or is reasonably likely to materially affect, registrant’s internal control over financial reporting.
| Item 12. | Exhibits |
| (a) | Certifications pursuant to Rules 30a-2(a) and 30a-2(b) under the Investment Company Act of 1940 are attached hereto. |
Table of Contents
SIGNATURES
Pursuant to the requirements of the Securities Exchange Act of 1934 and the Investment Company Act of 1940, the registrant has duly caused this report to be signed on its behalf by the undersigned, thereunto duly authorized.
| Date: August 27, 2009 | THRIVENT SERIES FUND, INC. | |||||
| By: | /s/ Russell W. Swansen | |||||
| Russell W. Swansen | ||||||
| President | ||||||
Pursuant to the requirements of the Securities Exchange Act of 1934 and the Investment Company Act of 1940, this report has been signed below by the following persons on behalf of the registrant and in the capacities and on the dates indicated.
| Date: August 27, 2009 | By: | /s/ Russell W. Swansen | ||||
| Russell W. Swansen | ||||||
| President | ||||||
| Date: August 27, 2009 | By: | /s/ Gerard V. Vaillancourt | ||||
| Gerard V. Vaillancourt | ||||||
| Treasurer | ||||||