Table of Contents
UNITED STATES
SECURITIES AND EXCHANGE COMMISSION
Washington, D.C. 20549
FORM N-CSR
CERTIFIED SHAREHOLDER REPORT OF REGISTERED MANAGEMENT INVESTMENT COMPANIES
Investment Company Act file number: 811-04603
Thrivent Series Fund, Inc.
(Exact name of registrant as specified in charter)
625 Fourth Avenue South
Minneapolis, Minnesota 55415
(Address of principal executive offices) (Zip code)
Rebecca A. Paulzine, Assistant Secretary
625 Fourth Avenue South
Minneapolis, Minnesota 55415
(Name and address of agent for service)
Registrant’s telephone number, including area code: (612) 844-5168
Date of fiscal year end: December 31
Date of reporting period: June 30, 2012
Table of Contents
| Item 1. | Report to Stockholders |
Table of Contents

Table of Contents
| 2 | ||||
Portfolio Summaries | ||||
| 4 | ||||
| 4 | ||||
| 5 | ||||
| 5 | ||||
| 6 | ||||
| 6 | ||||
| 7 | ||||
| 7 | ||||
| 8 | ||||
| 8 | ||||
| 9 | ||||
| 9 | ||||
| 10 | ||||
| 10 | ||||
| 11 | ||||
| 11 | ||||
| 12 | ||||
| 12 | ||||
| 13 | ||||
| 13 | ||||
| 14 | ||||
| 14 | ||||
| 15 | ||||
| 15 | ||||
| 16 | ||||
| 16 | ||||
| 17 | ||||
| 17 | ||||
| 18 | ||||
| 18 | ||||
| 19 | ||||
| 19 | ||||
| 20 | ||||
| 20 | ||||
| 21 | ||||
| 21 | ||||
| 22 | ||||
| 22 | ||||
| 23 | ||||
| 23 | ||||
| 24 | ||||
| 25 | ||||
| 29 | ||||
| 37 | ||||
| 52 | ||||
| 67 | ||||
| 81 | ||||
| 83 | ||||
| 85 | ||||
| 87 | ||||
| 90 | ||||
| 93 | ||||
| 95 | ||||
| 98 | ||||
| 101 | ||||
| 105 | ||||
| 113 | ||||
| 115 | ||||
| 117 | ||||
| 120 | ||||
| 122 | ||||
| 128 | ||||
| 143 | ||||
| 149 | ||||
| 151 | ||||
| 153 | ||||
| 155 | ||||
| 158 | ||||
| 160 | ||||
| 162 | ||||
| 166 | ||||
| 168 | ||||
| 172 | ||||
| 179 | ||||
| 184 | ||||
| 196 | ||||
| 204 | ||||
| 214 | ||||
| 219 | ||||
| 232 | ||||
| 238 | ||||
| 248 | ||||
| 252 | ||||
| 256 | ||||
| 264 | ||||
| 272 | ||||
| 286 | ||||
| 302 | ||||
| 316 | ||||
| 318 | ||||
Table of Contents
 Dear Member: Dear Member: | ||
The six-month period ended June 30, 2012 was rewarding for investors despite growing evidence of a global economic slowdown. Domestic stock and bond markets ended the period with strong gains, and overseas stock markets also finished modestly higher.
A brief review of the economy
The U.S. economy grew at a moderate 1.9% annual rate during the first quarter of 2012, down from a 3.0% rate in the fourth quarter of 2011. Reduced government spending, accompanied by a deceleration in business investment, contributed to the slower pace. The long-running debt crisis in southern Europe and slower economic growth in China, an important global export market, also weighed on the U.S. economy, damping expectations for an acceleration in the second quarter.
With the economy growing slowly, the job market also shifted into low gear. After adding an average of 226,000 new jobs per month in the first quarter of 2012, the U.S. added an average of just 76,000 per month in the second quarter. That pace barely made a dent in the unemployment rate, which stood at 8.3% in January, then dipped as low as 8.1% by April, before climbing back to 8.2% in May and June. While the unemployment rate has been moving in the right direction since peaking at 10.2% in October 2009, it is still extraordinarily high three years into a recovery.
As might have been expected in a slowing economic environment, inflation moderated over the first half of the year. After averaging 3.2% last year, it fell to 1.7% for the 12-month period ended in May.
A brief review of the markets
The U.S. stock market rose strongly for the first three months of the year, and then gave up almost all of those gains over the next two amid concerns about the European debt crisis and slowing economic growth in Europe, China and the U.S. The market rebounded in June as energy prices moderated and policymakers announced some progress in addressing Europe’s debt woes.
For the six-month period, the Standard & Poor’s 500 Index of large-company stocks posted a total return—price gains plus reinvested dividends—of 9.49%, while the Russell 2000® Index of small-company stocks earned 8.53%. Growth stocks modestly outperformed their value counterparts. The Russell 2000® Growth Index earned 8.81%, for example, while the Russell 2000® Value Index earned 8.23%.
International stocks also turned in positive results, with the MSCI EAFE Index—a widely followed benchmark for large, higher-quality international shares—posting a total return of 3.38%. Stocks in emerging markets did slightly better, with the MSCI Emerging Markets Index generating a total return of 4.12%. Despite the slowdown in China, many emerging-market countries continue to grow faster than the United States, western Europe and Japan, and they shoulder less onerous debt burdens.
U.S. bond markets were mostly higher in the first half of 2012, although sentiment shifted dramatically over the course of the period. In the first quarter, investors flocked to corporate bonds amid signs that the U.S. economy was growing fairly strongly. That trend weakened demand for U.S. Treasury bonds, allowing the yield on the benchmark 10-year Treasury note to rise to 2.22% from 1.87%.
In the second quarter, news that the U.S. economy was growing more slowly than expected, compounded by renewed fears over the European debt crisis, sent investors back to the perceived safety of Treasury bonds. Nonetheless, most bond-market sectors finished the first half with solid gains, allowing the Barclays U.S. Aggregate Bond Index to post a total return of 2.37%. Among key sectors, the Barclays U.S. Government Bond Index earned 1.48%, the Barclays U.S. Corporate Investment Grade Bond Index earned 4.55% and the Barclays U.S. Corporate High Yield Bond Index earned 7.27%.
Outlook
Stringing together 11 consecutive quarters of economic growth, as the U.S. has now done, is an accomplishment not to be discounted. It will be 12 if the streak continues, as expected, in this year’s second quarter. Still, the U.S. economy—and U.S. investors—face many of the same uncertainties and challenges that were weighing on them a year ago.
The federal debt. With Congress having failed to reach bipartisan agreement on a way to reduce the burgeoning federal debt, the country was left veering toward what pundits have dubbed a fiscal cliff: a combination of tax increases and automatic government spending cuts scheduled to phase in beginning in January 2013. Economists have warned that edging over the cliff could push the economy into
2
Table of Contents
a recession. We anticipate that Congress will take action to prevent that, probably in the form of a temporary stay of at least some of the scheduled tax increases and spending cuts. It likely will not act until after this year’s elections, however, when the need to once again raise the federal debt ceiling forces its hand. In the meantime, investors should be prepared for alarming headlines and heated campaign rhetoric as the second half of the year unfolds.
European fiscal challenges. For the past few years, Europe has flitted from one flare-up in its debt crisis to another. Each time, policymakers have come up with a solution, if only a temporary one. We anticipate that European leaders will continue to do so in the months ahead, and are particularly encouraged by the recent decision to create a centralized banking authority for the entire euro-zone. That said, Europe still faces significant long-term challenges to a fundamental resolution of its debt problems, which will likely take years.
The housing market. New home sales rose 7.6% in May to a seasonally adjusted annual rate of 369,000 units, the fastest pace in two years. The housing market may be bottoming at last, which would be a positive for the economy. Still, housing starts, sales and prices remain far below their levels during the boom years of the mid-2000s, and the industry cannot be expected to boost the economy as much in the years ahead as it did then. During the boom, rapidly inflating housing values made it easy for people to borrow against their homes and use the proceeds to buy cars, big-screen TVs and other goods. At the same time, overheated demand for new houses created a bumper crop of jobs in construction and related industries. Neither situation exists today.
Monetary policy. The Federal Reserve has pledged to keep short-term interest rates at historically low levels through 2014 as it tries to stimulate the economy and drive down unemployment without igniting inflation. That balancing act became a little easier in the first half of this year as inflation moderated. However, the current low interest-rate environment continues to hurt individuals who depend on income from bank savings deposits, money market funds and other conservative, short-term investment products. In many cases, those assets are yielding less than the rate of inflation, which means investors are losing purchasing power. By the end of the second quarter, the Fed had not announced plans for any other types of economic stimulus, although Fed Chairman Ben Bernanke would soon reiterate that the Fed was looking for ways to address weakness in the economy should more help be needed.
China. Not only is China still the world’s second-largest economy after the U.S., it is also a critical export market for the U.S. For most of the past two decades, China’s economy has grown at a double-digit pace. In the first quarter of this year, it grew just 8.1% year-over-year, worrying investors. Chinese policymakers are taking steps to spur additional growth by loosening lending standards and spending on new infrastructure. Backed by years of accumulated trade surpluses, they have ample money to finance their growth agenda. Still, financial markets are likely to remain unnerved until they see evidence that these latest measures are bearing fruit.
In conclusion
We expect the U.S. economy to grow about 2% for the full year, driven largely by consumer spending, offset in part by reduced government spending. Modest though that forecast may be, the economic outlook may actually appear worse in the months ahead as politicians and pundits fret about the fiscal cliff and slower economic growth in China and debt-strapped Europe.
We anticipate that policymakers at home and abroad will take measures to prevent the global economy from spinning into a free fall, even if they postpone doing so until the last minute. With corporate balance sheets still healthy and corporate profits still growing—albeit slower than what we saw over the past three years—stock and bond markets should add modestly to the gains registered in the first half of the year.
If you are uncertain about how this economic outlook might impact your financial strategy, meet soon with your Thrivent Financial representative. He or she can help make sure your investment portfolio is on track to meet your goals while remaining in-line with your tolerance for risk. Let us know if we can be of any further assistance, and as always, thank you for continuing to put your trust with us.
Sincerely,

Russell W. Swansen
President
Thrivent Series Fund, Inc.
3
Table of Contents
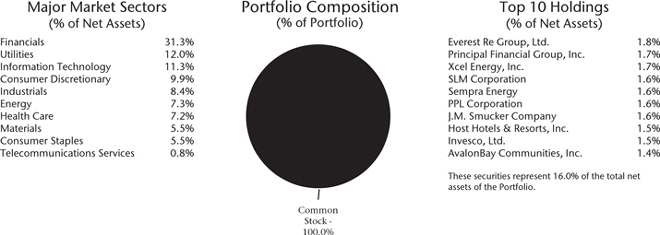
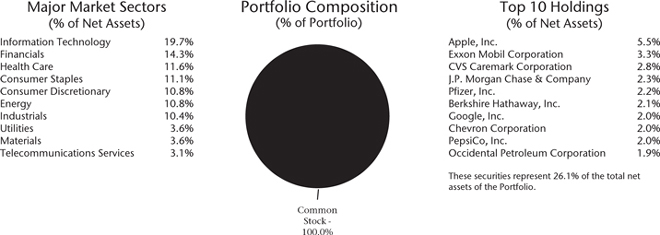
Thrivent Aggressive Allocation Portfolio
Russell W. Swansen, David C. Francis, CFA and Mark L. Simenstad, CFA Portfolio Co-Managers
The Portfolio seeks long-term capital growth.
The Portfolio’s performance depends upon how its assets are allocated across broad asset categories and applicable sub-classes within such categories. Some broad asset categories and sub-classes may perform below expectations or below the securities markets generally over short or extended periods. In particular, underperformance in the equity markets would have material adverse effect on the Portfolio’s total return, given its allocation to equity securities. Another risk of investing in the Portfolio is that its performance is dependent upon the performance of the underlying asset classes in which it invests. As a result, the Portfolio is subject to the same risks as those faced by the underlying asset classes. These and other risks are described in the Portfolio’s prospectus.
Thrivent Moderately Aggressive Allocation Portfolio
Russell W. Swansen, David C. Francis, CFA and Mark L. Simenstad, CFA Portfolio Co-Managers
The Portfolio seeks long-term capital growth.
The Portfolio’s performance depends upon how its assets are allocated across broad asset categories and applicable sub-classes within such categories. Some broad asset categories and sub-classes may perform below expectations or below the securities markets generally over short or extended periods. In particular, underperformance in the equity markets would have material adverse effect on the Portfolio’s total return, given its allocation to equity securities. Another risk of investing in the Portfolio is that its performance is dependent upon the performance of the underlying asset classes in which it invests. As a result, the Portfolio is subject to the same risks as those faced by the underlying asset classes. These and other risks are described in the Portfolio’s prospectus.
4
Table of Contents
Thrivent Moderate Allocation Portfolio
Russell W. Swansen, David C. Francis, CFA and Mark L. Simenstad, CFA Portfolio Co-Managers
The Portfolio seeks long-term capital growth while providing reasonable stability of principal.
The Portfolio’s performance depends upon how its assets are allocated across broad asset categories and applicable sub-classes within such categories. Some broad asset categories and sub-classes may perform below expectations or below the securities markets generally over short or extended periods. In particular, underperformance in the equity markets would have material adverse effect on the Portfolio’s total return, given its allocation to equity securities. Another risk of investing in the Portfolio is that its performance is dependent upon the performance of the underlying asset classes in which it invests. As a result, the Portfolio is subject to the same risks as those faced by the underlying asset classes. These and other risks are described in the Portfolio’s prospectus.
Thrivent Moderately Conservative Allocation Portfolio
Russell W. Swansen, David C. Francis, CFA and Mark L. Simenstad, CFA Portfolio Co-Managers
The Portfolio seeks long-term capital growth while providing reasonable stability of principal.
The Portfolio’s performance depends upon how its assets are allocated across broad asset categories and applicable sub-classes within such categories. Some broad asset categories and sub-classes may perform below expectations or below the securities markets generally over short or extended periods. In particular, underperformance in the equity markets would have material adverse effect on the Portfolio’s total return, given its allocation to equity securities. Another risk of investing in the Portfolio is that its performance is dependent upon the performance of the underlying asset classes in which it invests. As a result, the Portfolio is subject to the same risks as those faced by the underlying asset classes. These and other risks are described in the Portfolio’s prospectus.
5
Table of Contents
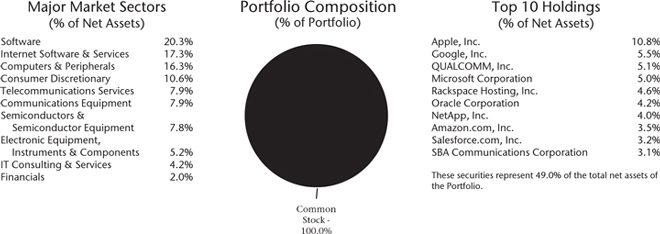
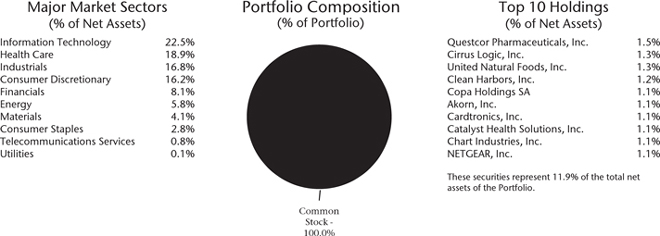
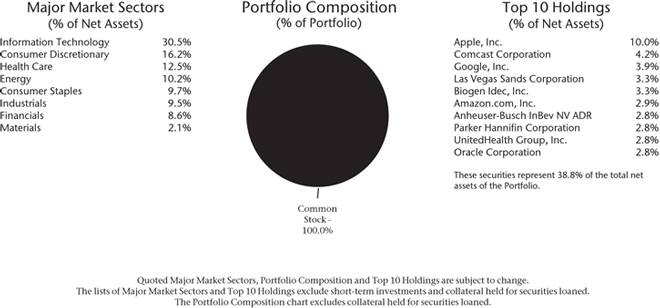
Thrivent Partner Technology Portfolio
Subadvised by Goldman Sachs Asset Management, L.P.
Thrivent Partner Technology Portfolio seeks long-term growth of capital.
The Portfolio primarily invests in securities of technology-related companies. As a consequence, the Portfolio may be subject to greater price volatility than a portfolio investing in a broad range of industries. These and other risks are described in the Portfolio’s prospectus.
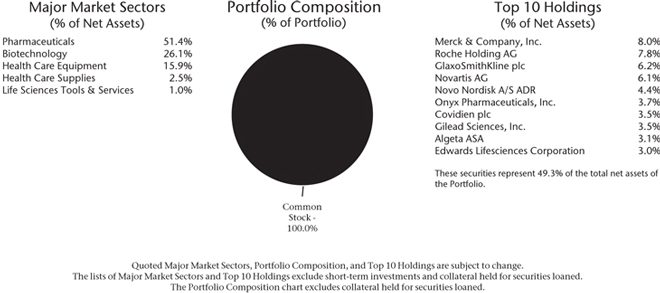
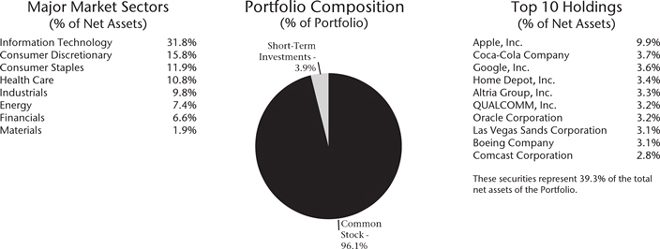
Thrivent Partner Healthcare Portfolio
Subadvised by Sectoral Asset Management, Inc.
Thrivent Partner Healthcare Portfolio seeks long-term capital growth.
The Portfolio’s investments are concentrated in issuers in the health care industry; therefore, the Portfolio is more vulnerable to price changes in the securities of issuers in this industry and factors specific to this industry than a more broadly diversified portfolio. In addition, as a non-diversified portfolio, the Portfolio is susceptible to the risk that events affecting a particular issuer will significantly affect the Portfolio’s performance. These and other risks are described in the Portfolio’s prospectus.
6
Table of Contents
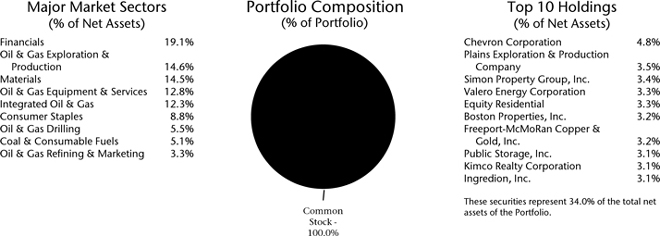
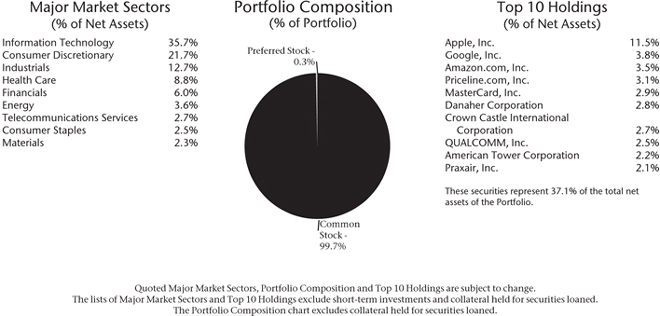
Thrivent Partner Natural Resources Portfolio
David C. Francis, CFA and Darren M. Bagwell, CFA, Portfolio Co-Managers
Thrivent Partner Natural Resources Portfolio seeks long-term capital growth.
The Portfolio’s investments are concentrated in issuers in the natural resources industry; therefore, the Portfolio is more vulnerable to price changes in the securities of issuers in this industry and factors specific to this industry than a more broadly diversified portfolio. In addition, as a non-diversified portfolio, the Portfolio is susceptible to the risk that events affecting a particular issuer will significantly affect the Portfolio’s performance. These and other risks are described in the Portfolio’s prospectus.
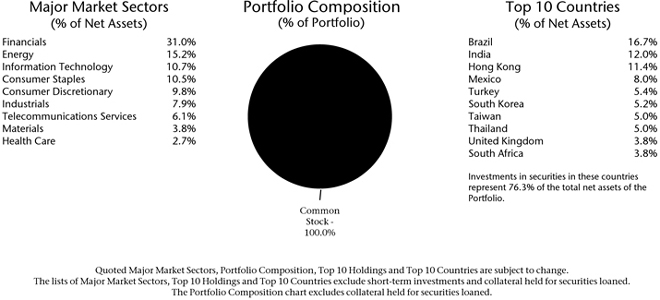
Thrivent Partner Emerging Markets Portfolio
Subadvised by Aberdeen Asset Managers Limited
Thrivent Partner Emerging Markets Portfolio seeks long-term capital growth.
Foreign investments, as compared to domestic ones, involve additional risks, including currency fluctuations, different accounting standards, and greater political, economic and market instability. These risks are magnified when the Portfolio invests in emerging markets, which may be of relatively small size and less liquid than domestic markets. These and other risks are described in the Portfolio’s prospectus.
7
Table of Contents
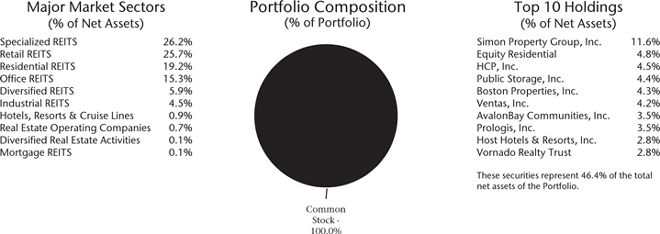
Thrivent Real Estate Securities Portfolio
Reginald L. Pfeifer, CFA, Portfolio Manager
Thrivent Real Estate Securities Portfolio seeks to provide long-term capital appreciation and high current income.
The Portfolio is subject to risks arising from the fact that it invests, under normal circumstances, at least 80% of its total assets in securities of companies that are primarily engaged in the real estate industry. Portfolio security prices are influenced by the underlying value of properties owned by the issuer, which may be influenced by the supply and demand for space and other factors. The real estate industry is cyclical, and securities issued by companies doing business in the real estate industry may fluctuate in value. These and other risks are described in the Portfolio’s prospectus.
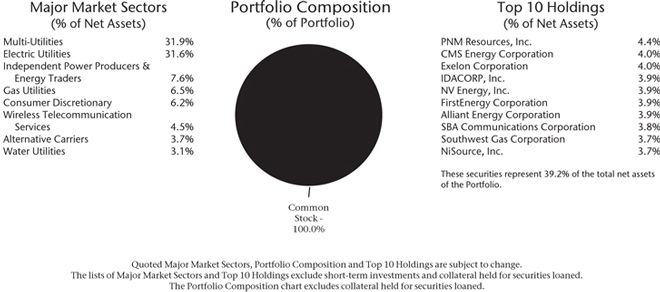
Thrivent Partner Utilities Portfolio*
Darren M. Bagwell, CFA, Portfolio Manager
Thrivent Partner Utilities Portfolio seeks capital appreciation and current income.
The Portfolio’s investments are concentrated in issuers in the utilities industry; therefore the Portfolio is more vulnerable to price changes in the securities of issuers in this industry and factors specific to this industry than a more broadly diversified portfolio. The Portfolio is also subject to the risks of investing in foreign (including emerging markets) stocks. These and other risks are described in the Portfolio’s prospectus.
* Thrivent Partner Utilities Portfolio merged into Thrivent Diversified Income Plus Portfolio on July 27, 2012.
8
Table of Contents
Thrivent Partner Small Cap Growth Portfolio
Subadvised by Turner Investments, L.P.
Thrivent Partner Small Cap Growth Portfolio seeks long-term capital growth.
The Portfolio is exposed to the risks of investing in equity securities of smaller companies, which may include, but are not limited to, lower trading volume and less liquidity than larger, more established companies. Small company stock prices are generally more volatile than large company stock prices. These and other risks are described in the Portfolio’s prospectus.
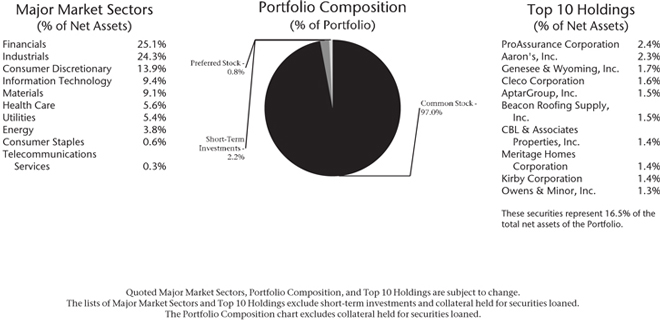
Thrivent Partner Small Cap Value Portfolio
Subadvised by T. Rowe Price Associates, Inc.
Thrivent Partner Small Cap Value Portfolio seeks long-term capital appreciation.
The Portfolio is exposed to the risks of investing in equity securities of smaller companies, which may include, but are not limited to, lower trading volume and less liquidity than larger, more established companies. Small company stock prices are generally more volatile than large company stock prices. These and other risks are described in the Portfolio’s prospectus.
9
Table of Contents
Thrivent Small Cap Stock Portfolio
Darren M. Bagwell, CFA, Portfolio Manager
Thrivent Small Cap Stock Portfolio seeks long-term capital growth.
The Portfolio is exposed to the risks of investing in equity securities of smaller companies, which may include, but are not limited to, lower trading volume and less liquidity than larger, more established companies. Small company stock prices are generally more volatile than large company stock prices. These and other risks are described in the Portfolio’s prospectus.
Thrivent Small Cap Index Portfolio
Kevin R. Brimmer, FSA, Portfolio Manager
Thrivent Small Cap Index Portfolio strives for capital growth that tracks the performance of the S&P SmallCap 600 Index.
The Portfolio is exposed to the risks of investing in equity securities of smaller companies, which may include, but are not limited to, lower trading volume and less liquidity than larger, more established companies. Small company stock prices are generally more volatile than large company stock prices. While the Portfolio attempts to closely track the S&P SmallCap 600 Index, it does not duplicate the composition of the Index. Individuals may not invest directly in any index. Index portfolios are subject to the same market risks associated with the stocks in their respective indexes. These and other risks are described in the Portfolio’s prospectus.
10
Table of Contents
Thrivent Mid Cap Growth Portfolio II*
Andrea J. Thomas, CFA, Portfolio Manager
Thrivent Mid Cap Growth Portfolio II seeks long-term growth of capital.
Mid-cap stocks offer the potential for long-term gains but can be subject to short-term price movements. Mid-sized company stock prices are generally more volatile than large company stock prices. These and other risks are described in the Portfolio’s prospectus.
* Thrivent Mid Cap Growth Portfolio II merged into Thrivent Mid Cap Growth Portfolio on July 27, 2012.
Thrivent Mid Cap Growth Portfolio
Andrea J. Thomas, CFA, Portfolio Manager
Thrivent Mid Cap Growth Portfolio seeks long-term growth of capital.
Mid-cap stocks offer the potential for long-term gains but can be subject to short-term price movements. Mid-sized company stock prices are generally more volatile than large company stock prices. These and other risks are described in the Portfolio’s prospectus.
11
Table of Contents
Thrivent Partner Mid Cap Value Portfolio
Subadvised by Goldman Sachs Asset Management, L.P.
Thrivent Partner Mid Cap Value Portfolio seeks to achieve long-term capital appreciation.
Mid-cap stocks offer the potential for long-term gains but can be subject to short-term price movements. Mid-sized company stock prices are generally more volatile than large company stock prices. These and other risks are described in the Portfolio’s prospectus.
Thrivent Mid Cap Stock Portfolio
Brian J. Flanagan, CFA, Portfolio Manager
Thrivent Mid Cap Stock Portfolio seeks long-term capital growth.
Mid-cap stocks offer the potential for long-term gains but can be subject to short-term price movements. Mid-sized company stock prices are generally more volatile than large company stock prices. These and other risks are described in the Portfolio’s prospectus.
12
Table of Contents
Thrivent Mid Cap Index Portfolio
Kevin R. Brimmer, FSA, Portfolio Manager
Thrivent Mid Cap Index Portfolio seeks total returns that track the performance of the S&P MidCap 400 Index.
Mid-cap stocks offer the potential for long term gains but can be subject to short term price movements. Mid-sized company stock prices are generally more volatile than large company stock prices. While the Portfolio attempts to closely track the S&P MidCap 400 Index, it does not duplicate the composition of the index. Individuals may not invest directly in any index. Index portfolios are subject to the same market risks associated with the stocks in their respective indexes. These and other risks are described in the Portfolio’s prospectus.
Thrivent Partner Worldwide Allocation Portfolio
Subadvised by Principal Global Investors, LLC, Mercator Asset Management, LP, Victory Capital Management Inc., Aberdeen Asset Managers Limited and Goldman Sachs Asset Management, L.P.
Thrivent Partner Worldwide Allocation Portfolio seeks long-term capital growth.
Foreign investments, as compared to domestic ones, involve additional risks, including currency fluctuations, different accounting standards, and greater political, economic and market instability. These risks are magnified when the Portfolio invests in emerging markets, which may be of relatively small size and less liquid than domestic markets. These and other risks are described in the Portfolio’s prospectus.
13
Table of Contents
Thrivent Partner International Stock Portfolio*
Subadvised by Mercator Asset Management, LP and Principal Global Investors, LLC
Thrivent Partner International Stock Portfolio seeks long-term growth of capital.
Foreign investments involve additional risks including currency fluctuations and greater political, economic and market instability and different accounting standards, as compared with domestic investments. These risks are magnified when the Portfolio invests in emerging markets, which may be of relatively small size and less liquid than domestic markets. These and other risks are described in the Portfolio’s prospectus.
* Thrivent Partner International Stock Portfolio merged into Thrivent Partner Worldwide Allocation Portfolio on July 27, 2012.
Thrivent Partner Socially Responsible Stock Portfolio
Subadvised by Calvert Investment Management, Inc. and Atlanta Capital Management, L.L.C.
Thrivent Partner Socially Responsible Stock Portfolio seeks long-term capital growth.
Stocks are subject to the basic market risk that a particular security, or securities in general, may decrease in value over short or even extended time periods. In addition, the Portfolio is exposed to the risks of investing in mid-cap stocks, which generally are more volatile and less liquid than large-cap stocks. The Portfolio is also subject to the risks of investing in foreign stocks. These and other risks are described in the Portfolio’s prospectus.
14
Table of Contents
Thrivent Partner All Cap Growth Portfolio
Subadvised by Calamos Advisors LLC
Thrivent Partner All Cap Growth Portfolio seeks long-term capital growth.
Stocks are subject to the basic market risk that a particular security, or securities in general, may decrease in value over short or even extended time periods. In addition, the Portfolio is exposed to the risks of investing in mid-cap stocks, which generally are more volatile and less liquid than large-cap stocks. These and other risks are described in the Portfolio’s prospectus.
Thrivent Partner All Cap Value Portfolio
Subadvised by OppenheimerFunds, Inc.
Thrivent Partner All Cap Value Portfolio seeks long-term capital growth.
Stocks are subject to the basic market risk that a particular security, or securities in general, may decrease in value over short or even extended time periods. In addition, the Portfolio is exposed to the risks of investing in small- and mid-cap stocks, which generally are more volatile and less liquid than large-cap stocks. The Portfolio is also subject to the risks of investing in foreign (including emerging market) stocks. These and other risks are described in the Portfolio’s prospectus.
15
Table of Contents
Thrivent Partner All Cap Portfolio
Subadvised by Pyramis Global Advisors, LLC, an affiliate of Fidelity Investments
Thrivent Partner All Cap Portfolio seeks long-term growth of capital.
Stocks are subject to the basic market risk that a particular security, or securities in general, may decrease in value over short or even extended time periods. These and other risks are described in the Portfolio’s prospectus.
Thrivent Large Cap Growth Portfolio II*
David C. Francis, CFA, Portfolio Manager
Thrivent Large Cap Growth Portfolio II seeks long-term growth of capital and future income.
Large-cap stocks are subject to the basic market risk that a particular security, or securities in general, may decrease in value over short or even extended time periods. These and other risks are described in the Portfolio’s prospectus.
* Thrivent Large Cap Growth Portfolio II merged into Thrivent Large Cap Growth Portfolio on July 27, 2012.
16
Table of Contents
Thrivent Large Cap Growth Portfolio
David C. Francis, CFA, Portfolio Manager
Thrivent Large Cap Growth Portfolio seeks long-term growth of capital.
Large-cap stocks are subject to the basic market risk that a particular security, or securities in general, may decrease in value over short or even extended time periods. These and other risks are described in the Portfolio’s prospectus.
Thrivent Partner Growth Stock Portfolio
Subadvised by T. Rowe Price Associates, Inc.
Thrivent Partner Growth Stock Portfolio seeks long-term growth of capital and, secondarily, to increase dividend income.
Stocks, in general, are subject to the basic market risk that a particular security, or securities in general, may decrease in value over short or even extended time periods. These and other risks are described in the Portfolio’s prospectus.
17
Table of Contents
Thrivent Large Cap Value Portfolio
Matthew D. Finn, CFA, Portfolio Manager
Thrivent Large Cap Value Portfolio seeks long-term growth of capital.
Large-cap stocks are subject to the basic market risk that a particular security, or securities in general, may decrease in value over short or even extended time periods. These and other risks are described in the Portfolio’s prospectus.
Thrivent Large Cap Stock Portfolio
David C. Francis, CFA and Matthew D. Finn, CFA Portfolio Co-Managers
Thrivent Large Cap Stock Portfolio seeks long-term capital growth.
Large-cap stocks are subject to the basic market risk that a particular security, or securities in general, may decrease in value over short or even extended time periods. These and other risks are described in the Portfolio’s prospectus.
18
Table of Contents
Thrivent Large Cap Index Portfolio
Kevin R. Brimmer, FSA, Portfolio Manager
Thrivent Large Cap Index Portfolio seeks total returns that track the performance of the S&P 500 Index.
Large-cap stocks are subject to the basic market risk that a particular security, or securities in general, may decrease in value over short or even extended time periods. While the Portfolio attempts to closely track the S&P 500 Index, it does not exactly duplicate the composition of the index. Individuals may not invest directly in any index. Index portfolios are subject to the same market risks associated with the stocks in their respective indexes. These and other risks are described in the Portfolio’s prospectus.
Thrivent Equity Income Plus Portfolio
David R. Spangler, CFA and Kevin R. Brimmer, FSA, Portfolio Co-Managers
Thrivent Equity Income Plus Portfolio seeks income plus long-term capital growth.
The Portfolio may invest in, among others, preferred stocks and foreign (including emerging market) stocks. These investments are subject to unique risks. The Portfolio may also sell covered options on any securities in which the Portfolio invests. Successful use of this strategy can augment portfolio return but can also magnify losses if executed incorrectly. These and other risks are described in the Portfolio’s prospectus.
19
Table of Contents
Kevin R. Brimmer, FSA and Michael G. Landreville, CFA, Portfolio Co-Managers
Thrivent Balanced Portfolio seeks long-term total return through a balance between income and the potential for long-term capital growth.
The Portfolio is subject to interest-rate risk, credit risk and volatility risk, which may result in overall price fluctuations over short or even extended time periods. Stocks are subject to the basic market risk that a particular security, or securities in general, may decrease in value over short or even extended time periods. These and other risks are described in the Portfolio’s prospectus.
Paul J. Ocenasek, CFA, Portfolio Manager
Thrivent High Yield Portfolio seeks to achieve a higher level of income. The Portfolio will also consider growth of capital as a secondary objective.
The Portfolio typically invests a majority of its assets in high-yield bonds (commonly referred to as junk bonds). Although high-yield bonds typically have a higher current yield than investment-grade bonds, high-yield bonds are also subject to greater price fluctuations and increased risk of loss of principal than investment-grade bonds. The Portfolio is subject to interest-rate risk, credit risk and volatility risk, which may result in overall price fluctuations over short or even extended time periods. These and other risks are described in the Portfolio’s prospectus.
20
Table of Contents
Thrivent Diversified Income Plus Portfolio
Mark L. Simenstad, CFA, David R. Spangler, CFA and Paul J. Ocenasek, CFA, Portfolio Co-Managers
Thrivent Diversified Income Plus Portfolio seeks to maximize income while maintaining prospects for capital appreciation.
The Portfolio may invest in debt or equity securities. Debt securities include high-yield, high-risk securities commonly known as “junk bonds.” High-yield securities are subject to greater price fluctuations and increased risk of loss of principal than investment grade bonds. Debt securities also include mortgage-related and other asset-backed securities, the value of which will be influenced by factors affecting the housing market and the assets underlying such securities. The Portfolio is subject to interest-rate risk, credit risk and volatility risk, which may result in overall price fluctuations over short or even extended time periods. These and other risks are described in the Portfolio’s prospectus.
Thrivent Partner Socially Responsible Bond Portfolio*
Subadvised by Calvert Investment Management, Inc.
Thrivent Partner Socially Responsible Bond Portfolio seeks to maximize income.
The Portfolio may invest a portion of its portfolio in high-yield, high-risk securities commonly known as “junk bonds.” High-yield securities are subject to greater price fluctuations and increased risk of loss of principal than investment grade bonds. In addition, as a non-diversified portfolio, the Portfolio is susceptible to the risk that events affecting a particular issuer will significantly affect the Portfolio’s performance. The Portfolio is subject to interest-rate risk, credit risk and volatility risk, which may result in overall price fluctuations over short or even extended time periods. These and other risks are described in the Portfolio’s prospectus.
* Thrivent Partner Socially Responsible Bond Portfolio merged into Thrivent Income Portfolio on July 27, 2012.
21
Table of Contents
Stephen D. Lowe, CFA, Portfolio Manager
Thrivent Income Portfolio seeks a high level of income over the longer term while providing reasonable safety of capital.
The Portfolio is subject to interest rate risk, credit risk related to a company’s underlying financial position and volatility risk, which may result in overall price fluctuations over short or even extended time periods. These and other risks are described in the Portfolio’s prospectus.
Michael G. Landreville, CFA, Portfolio Manager
Thrivent Bond Index Portfolio strives for investment results similar to the total return of the Barclays Capital U.S. Aggregate Bond Index.
The Portfolio is subject to interest rate risk, credit risk related to a company’s underlying financial position, and prepayment and extension risk. While the Portfolio attempts to closely track the Barclays Capital U.S. Aggregate Bond Index, it does not duplicate the composition of the Index. Individuals may not invest directly in any index. Index portfolios are subject to the same market risks associated with the securities in their respective indexes. These and other risks are described in the Portfolio’s prospectus.
22
Table of Contents
Thrivent Limited Maturity Bond Portfolio
Michael G. Landreville, CFA and Gregory R. Anderson, CFA, Portfolio Co-Managers
Thrivent Limited Maturity Bond Portfolio seeks a high level of current income with stability of principal.
The Portfolio is subject to interest rate risk, credit risk related to a company’s underlying financial position and volatility risk, which may result in overall price fluctuations over short or even extended time periods. These and other risks are described in the Portfolio’s prospectus.
Thrivent Mortgage Securities Portfolio
Gregory R. Anderson, CFA and Scott A. Lalim, Portfolio Co-Managers
Thrivent Mortgage Securities Portfolio seeks a combination of current income and long-term capital appreciation.
The risks presented by mortgage securities include, but are not limited to, reinvestment of prepaid principal at lower rates of return. The real estate industry—and therefore, the performance of the Portfolio—is highly sensitive to economic conditions. In addition, the value of mortgage securities may fluctuate in response to changes in interest rates. The Portfolio is subject to interest-rate risk, credit risk and volatility risk, which may result in overall price fluctuations over short or even extended time periods. These and other risks are described in the Portfolio’s prospectus.
23
Table of Contents
Thrivent Money Market Portfolio
William D. Stouten, Portfolio Manager
Thrivent Money Market Portfolio seeks to achieve the maximum current income that is consistent with stability of capital and maintenance of liquidity.
The principal risk of investing in the Portfolio is current income risk—that is, the income the Portfolio receives may fall as a result of a decline in interest rates. The Portfolio is subject to interest-rate risk and credit risk, which may result in overall price fluctuations over short or even extended time periods. These and other risks are described in the Portfolio’s prospectus.
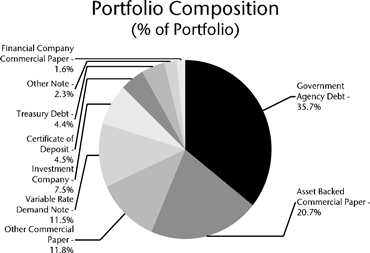
An investment in the Thrivent Money Market Portfolio is not insured or guaranteed by the FDIC or any other government agency. Although the Portfolio seeks to preserve the value of your investment at $1.00 per share, it is possible to lose money by investing in the Portfolio.
Quoted Portfolio Composition is subject to change.
24
Table of Contents
(unaudited)
As a shareholder of the Thrivent Series Fund, Inc., you incur ongoing costs, including management fees and other Portfolio expenses. This Shareholder Expense Example is intended to help you understand your ongoing costs (in dollars) of investing in a Portfolio and to compare these costs with the ongoing costs of investing in other mutual funds. The Example is based on an investment of $1,000 invested at the beginning of the period and held for the entire period from January 1, 2012 through June 29, 2012. Shares in a Portfolio are currently sold, without sales charges, only to separate accounts of Thrivent Financial for Lutherans and Thrivent Life Insurance Company, which are used to fund benefits of variable life insurance and variable annuity contracts issued by Thrivent Financial for Lutherans and Thrivent Life Insurance Company, and retirement plans sponsored by Thrivent Financial for Lutherans. Expenses associated with these variable contracts and retirement plans are not included in these examples and had these costs been included, your costs would have been higher.
Actual Expenses
In the table below, the first section, labeled “Actual,” provides information about actual account values and actual expenses. You may use the information in this line, together with the amount you invested, to estimate the expenses that you paid over the period. Simply divide your account value by $1,000 (for example, an $8,600 account value divided by $1,000 = 8.6), then multiply the result by the number in the first line under the heading entitled “Expenses Paid During Period” to estimate the expenses you paid.
Hypothetical Example for Comparison Purposes
In the table below, the second section, labeled “Hypothetical,” provides information about hypothetical account values and hypothetical expenses based on the Portfolio’s actual expense ratio and an assumed rate of return of 5% per year before expenses, which is not the Portfolio’s actual return. The hypothetical account values and expenses may not be used to estimate the actual ending account balance or expenses you paid for the period. You may use this information to compare the ongoing costs of investing in the Portfolio and other funds. To do so, compare this 5% hypothetical example with the 5% hypothetical examples that appear in the shareholder reports of the other funds.
| Beginning Account Value 1/1/2012 | Ending Account Value 6/29/2012 | Expenses Paid During Period 1/1/2012 - 6/29/2012* | Annualized Expense Ratio | |||||||||||||
Thrivent Aggressive Allocation Portfolio |
| |||||||||||||||
Actual | $ | 1,000 | $ | 1,053 | $ | 2.58 | 0.51 | % | ||||||||
Hypothetical** | $ | 1,000 | $ | 1,022 | $ | 2.54 | 0.51 | % | ||||||||
Thrivent Moderately Aggressive Allocation Portfolio |
| |||||||||||||||
Actual | $ | 1,000 | $ | 1,056 | $ | 2.10 | 0.41 | % | ||||||||
Hypothetical** | $ | 1,000 | $ | 1,023 | $ | 2.07 | 0.41 | % | ||||||||
Thrivent Moderate Allocation Portfolio |
| |||||||||||||||
Actual | $ | 1,000 | $ | 1,055 | $ | 1.91 | 0.38 | % | ||||||||
Hypothetical** | $ | 1,000 | $ | 1,023 | $ | 1.88 | 0.38 | % | ||||||||
Thrivent Moderately Conservative Allocation Portfolio |
| |||||||||||||||
Actual | $ | 1,000 | $ | 1,046 | $ | 2.07 | 0.41 | % | ||||||||
Hypothetical** | $ | 1,000 | $ | 1,023 | $ | 2.04 | 0.41 | % | ||||||||
Thrivent Partner Technology Portfolio |
| |||||||||||||||
Actual | $ | 1,000 | $ | 1,150 | $ | 6.05 | 1.14 | % | ||||||||
Hypothetical** | $ | 1,000 | $ | 1,019 | $ | 5.68 | 1.14 | % | ||||||||
Thrivent Partner Healthcare Portfolio |
| |||||||||||||||
Actual | $ | 1,000 | $ | 1,144 | $ | 6.63 | 1.25 | % | ||||||||
Hypothetical** | $ | 1,000 | $ | 1,019 | $ | 6.24 | 1.25 | % | ||||||||
Thrivent Partner Natural Resources Portfolio |
| |||||||||||||||
Actual | $ | 1,000 | $ | 917 | $ | 5.18 | 1.09 | % | ||||||||
Hypothetical** | $ | 1,000 | $ | 1,019 | $ | 5.46 | 1.09 | % | ||||||||
25
Table of Contents
| Beginning Account Value 1/1/2012 | Ending Account Value 6/29/2012 | Expenses Paid During Period 1/1/2012 - 6/29/2012* | Annualized Expense Ratio | |||||||||||||
Thrivent Partner Emerging Markets Portfolio |
| |||||||||||||||
Actual | $ | 1,000 | $ | 1,099 | $ | 7.27 | 1.40 | % | ||||||||
Hypothetical** | $ | 1,000 | $ | 1,018 | $ | 6.99 | 1.40 | % | ||||||||
Thrivent Real Estate Securities Portfolio |
| |||||||||||||||
Actual | $ | 1,000 | $ | 1,146 | $ | 4.95 | 0.93 | % | ||||||||
Hypothetical** | $ | 1,000 | $ | 1,020 | $ | 4.66 | 0.93 | % | ||||||||
Thrivent Partner Utilities Portfolio |
| |||||||||||||||
Actual | $ | 1,000 | $ | 1,052 | $ | 4.61 | 0.91 | % | ||||||||
Hypothetical** | $ | 1,000 | $ | 1,020 | $ | 4.54 | 0.91 | % | ||||||||
Thrivent Partner Small Cap Growth Portfolio |
| |||||||||||||||
Actual | $ | 1,000 | $ | 1,061 | $ | 5.06 | 0.99 | % | ||||||||
Hypothetical** | $ | 1,000 | $ | 1,020 | $ | 4.96 | 0.99 | % | ||||||||
Thrivent Partner Small Cap Value Portfolio |
| |||||||||||||||
Actual | $ | 1,000 | $ | 1,048 | $ | 4.44 | 0.88 | % | ||||||||
Hypothetical** | $ | 1,000 | $ | 1,020 | $ | 4.38 | 0.88 | % | ||||||||
Thrivent Small Cap Stock Portfolio |
| |||||||||||||||
Actual | $ | 1,000 | $ | 1,021 | $ | 3.82 | 0.76 | % | ||||||||
Hypothetical** | $ | 1,000 | $ | 1,021 | $ | 3.82 | 0.76 | % | ||||||||
Thrivent Small Cap Index Portfolio |
| |||||||||||||||
Actual | $ | 1,000 | $ | 1,078 | $ | 2.35 | 0.46 | % | ||||||||
Hypothetical** | $ | 1,000 | $ | 1,022 | $ | 2.29 | 0.46 | % | ||||||||
Thrivent Mid Cap Growth Portfolio II |
| |||||||||||||||
Actual | $ | 1,000 | $ | 1,061 | $ | 9.97 | 1.96 | % | ||||||||
Hypothetical** | $ | 1,000 | $ | 1,015 | $ | 9.74 | 1.96 | % | ||||||||
Thrivent Mid Cap Growth Portfolio |
| |||||||||||||||
Actual | $ | 1,000 | $ | 1,064 | $ | 2.37 | 0.46 | % | ||||||||
Hypothetical** | $ | 1,000 | $ | 1,022 | $ | 2.32 | 0.46 | % | ||||||||
Thrivent Partner Mid Cap Value Portfolio |
| |||||||||||||||
Actual | $ | 1,000 | $ | 1,076 | $ | 4.31 | 0.84 | % | ||||||||
Hypothetical** | $ | 1,000 | $ | 1,021 | $ | 4.19 | 0.84 | % | ||||||||
Thrivent Mid Cap Stock Portfolio |
| |||||||||||||||
Actual | $ | 1,000 | $ | 1,056 | $ | 3.68 | 0.72 | % | ||||||||
Hypothetical** | $ | 1,000 | $ | 1,021 | $ | 3.62 | 0.72 | % | ||||||||
Thrivent Mid Cap Index Portfolio |
| |||||||||||||||
Actual | $ | 1,000 | $ | 1,077 | $ | 2.74 | 0.53 | % | ||||||||
Hypothetical** | $ | 1,000 | $ | 1,022 | $ | 2.67 | 0.53 | % | ||||||||
Thrivent Partner Worldwide Allocation Portfolio |
| |||||||||||||||
Actual | $ | 1,000 | $ | 1,051 | $ | 4.98 | 0.98 | % | ||||||||
Hypothetical** | $ | 1,000 | $ | 1,020 | $ | 4.90 | 0.98 | % | ||||||||
Thrivent Partner International Stock Portfolio |
| |||||||||||||||
Actual | $ | 1,000 | $ | 1,035 | $ | 4.53 | 0.90 | % | ||||||||
Hypothetical** | $ | 1,000 | $ | 1,020 | $ | 4.50 | 0.90 | % | ||||||||
Thrivent Partner Socially Responsible Stock Portfolio |
| |||||||||||||||
Actual | $ | 1,000 | $ | 1,095 | $ | 5.09 | 0.98 | % | ||||||||
Hypothetical** | $ | 1,000 | $ | 1,020 | $ | 4.91 | 0.98 | % | ||||||||
Thrivent Partner All Cap Growth Portfolio |
| |||||||||||||||
Actual | $ | 1,000 | $ | 1,076 | $ | 5.15 | 1.00 | % | ||||||||
Hypothetical** | $ | 1,000 | $ | 1,020 | $ | 5.01 | 1.00 | % | ||||||||
26
Table of Contents
| Beginning Account Value 1/1/2012 | Ending Account Value 6/29/2012 | Expenses Paid During Period 1/1/2012 - 6/29/2012* | Annualized Expense Ratio | |||||||||||||
Thrivent Partner All Cap Value Portfolio |
| |||||||||||||||
Actual | $ | 1,000 | $ | 1,030 | $ | 4.93 | 0.98 | % | ||||||||
Hypothetical** | $ | 1,000 | $ | 1,020 | $ | 4.91 | 0.98 | % | ||||||||
Thrivent Partner All Cap Portfolio |
| |||||||||||||||
Actual | $ | 1,000 | $ | 1,082 | $ | 5.40 | 1.05 | % | ||||||||
Hypothetical** | $ | 1,000 | $ | 1,020 | $ | 5.24 | 1.05 | % | ||||||||
Thrivent Large Cap Growth Portfolio II |
| |||||||||||||||
Actual | $ | 1,000 | $ | 1,088 | $ | 12.77 | 2.47 | % | ||||||||
Hypothetical** | $ | 1,000 | $ | 1,012 | $ | 12.31 | 2.47 | % | ||||||||
Thrivent Large Cap Growth Portfolio |
| |||||||||||||||
Actual | $ | 1,000 | $ | 1,110 | $ | 2.33 | 0.45 | % | ||||||||
Hypothetical** | $ | 1,000 | $ | 1,023 | $ | 2.23 | 0.45 | % | ||||||||
Thrivent Partner Growth Stock Portfolio |
| |||||||||||||||
Actual | $ | 1,000 | $ | 1,132 | $ | 5.13 | 0.97 | % | ||||||||
Hypothetical** | $ | 1,000 | $ | 1,020 | $ | 4.86 | 0.97 | % | ||||||||
Thrivent Large Cap Value Portfolio |
| |||||||||||||||
Actual | $ | 1,000 | $ | 1,066 | $ | 3.29 | 0.64 | % | ||||||||
Hypothetical** | $ | 1,000 | $ | 1,022 | $ | 3.22 | 0.64 | % | ||||||||
Thrivent Large Cap Stock Portfolio |
| |||||||||||||||
Actual | $ | 1,000 | $ | 1,078 | $ | 3.54 | 0.69 | % | ||||||||
Hypothetical** | $ | 1,000 | $ | 1,021 | $ | 3.44 | 0.69 | % | ||||||||
Thrivent Large Cap Index Portfolio |
| |||||||||||||||
Actual | $ | 1,000 | $ | 1,092 | $ | 2.18 | 0.42 | % | ||||||||
Hypothetical** | $ | 1,000 | $ | 1,023 | $ | 2.11 | 0.42 | % | ||||||||
Thrivent Equity Income Plus Portfolio |
| |||||||||||||||
Actual | $ | 1,000 | $ | 1,078 | $ | 4.16 | 0.81 | % | ||||||||
Hypothetical** | $ | 1,000 | $ | 1,021 | $ | 4.05 | 0.81 | % | ||||||||
Thrivent Balanced Portfolio |
| |||||||||||||||
Actual | $ | 1,000 | $ | 1,073 | $ | 2.30 | 0.45 | % | ||||||||
Hypothetical** | $ | 1,000 | $ | 1,023 | $ | 2.25 | 0.45 | % | ||||||||
Thrivent High Yield Portfolio |
| |||||||||||||||
Actual | $ | 1,000 | $ | 1,079 | $ | 2.29 | 0.45 | % | ||||||||
Hypothetical** | $ | 1,000 | $ | 1,023 | $ | 2.23 | 0.45 | % | ||||||||
Thrivent Diversified Income Plus Portfolio |
| |||||||||||||||
Actual | $ | 1,000 | $ | 1,079 | $ | 2.74 | 0.53 | % | ||||||||
Hypothetical** | $ | 1,000 | $ | 1,022 | $ | 2.66 | 0.53 | % | ||||||||
Thrivent Partner Socially Responsible Bond Portfolio |
| |||||||||||||||
Actual | $ | 1,000 | $ | 1,037 | $ | 3.46 | 0.69 | % | ||||||||
Hypothetical** | $ | 1,000 | $ | 1,021 | $ | 3.43 | 0.69 | % | ||||||||
Thrivent Income Portfolio |
| |||||||||||||||
Actual | $ | 1,000 | $ | 1,055 | $ | 2.23 | 0.44 | % | ||||||||
Hypothetical** | $ | 1,000 | $ | 1,023 | $ | 2.19 | 0.44 | % | ||||||||
Thrivent Bond Index Portfolio |
| |||||||||||||||
Actual | $ | 1,000 | $ | 1,028 | $ | 2.32 | 0.46 | % | ||||||||
Hypothetical** | $ | 1,000 | $ | 1,022 | $ | 2.31 | 0.46 | % | ||||||||
Thrivent Limited Maturity Bond Portfolio |
| |||||||||||||||
Actual | $ | 1,000 | $ | 1,022 | $ | 2.16 | 0.43 | % | ||||||||
Hypothetical** | $ | 1,000 | $ | 1,023 | $ | 2.16 | 0.43 | % | ||||||||
27
Table of Contents
| Beginning Account Value 1/1/2012 | Ending Account Value 6/29/2012 | Expenses Paid During Period 1/1/2012 - 6/29/2012* | Annualized Expense Ratio | |||||||||||||
Thrivent Mortgage Securities Portfolio |
| |||||||||||||||
Actual | $ | 1,000 | $ | 1,027 | $ | 4.33 | 0.86 | % | ||||||||
Hypothetical** | $ | 1,000 | $ | 1,020 | $ | 4.32 | 0.86 | % | ||||||||
Thrivent Money Market Portfolio |
| |||||||||||||||
Actual | $ | 1,000 | $ | 1,000 | $ | 1.54 | 0.31 | % | ||||||||
Hypothetical** | $ | 1,000 | $ | 1,023 | $ | 1.56 | 0.31 | % | ||||||||
| * | Expenses are equal to the Portfolio’s annualized expense ratio, multiplied by the average account value over the period, multiplied by 181/366 to reflect the one-half year period. |
| ** | Assuming 5% annualized total return before expenses. |
28
Table of Contents
Aggressive Allocation Portfolio
Schedule of Investments as of June 29, 2012
(unaudited)
| Shares | Mutual Funds (51.6%) | Value | ||||||
| Equity Mutual Funds (47.2%) | |||||||
| 3,498,692 | Thrivent Partner Small Cap Growth Portfolioa | $ | 46,129,209 | |||||
| 672,963 | Thrivent Partner Small Cap Value Portfolio | 13,058,377 | ||||||
| 1,708,411 | Thrivent Small Cap Stock Portfolioa | 20,913,338 | ||||||
| 1,575,131 | Thrivent Partner Mid Cap Value Portfolio | 21,014,446 | ||||||
| 2,502,383 | Thrivent Mid Cap Stock Portfolio | 30,245,051 | ||||||
| 3,092,021 | Thrivent Partner Worldwide Allocation Portfolio | 24,022,532 | ||||||
| 6,673,062 | Thrivent Partner International Stock Portfolio | 61,617,721 | ||||||
| 2,732,516 | Thrivent Large Cap Value Portfolio | 29,720,207 | ||||||
| 3,091,854 | Thrivent Large Cap Stock Portfolio | 26,733,101 | ||||||
| 539,342 | Thrivent Equity Income Plus Portfolio | 5,044,359 | ||||||
|
| |||||||
| Total | 278,498,341 | |||||||
|
| |||||||
| Fixed Income Mutual Funds (4.4%) | |||||||
| 2,746,736 | Thrivent High Yield Portfolio | 13,323,042 | ||||||
| 807,942 | Thrivent Income Portfolio | 8,424,972 | ||||||
| 430,619 | Thrivent Limited Maturity Bond Portfolio | 4,218,951 | ||||||
|
| |||||||
| Total | 25,966,965 | |||||||
|
| |||||||
| Total Mutual Funds (cost $352,308,897) | 304,465,306 | |||||||
|
| |||||||
Common Stock (39.6%) | ||||||||
| Consumer Discretionary (5.2%) | |||||||
| 9,742 | Abercrombie & Fitch Company | 332,592 | ||||||
| 7,956 | Amazon.com, Inc.a | 1,816,753 | ||||||
| 1,950 | AutoZone, Inc.a | 715,981 | ||||||
| 26,500 | Big Lots, Inc.a | 1,080,935 | ||||||
| 17,700 | BJ’s Restaurants, Inc.a | 672,600 | ||||||
| 5,630 | CBS Corporation | 184,551 | ||||||
| 5,200 | Charter Communications, Inc.a | 368,524 | ||||||
| 18,500 | Children’s Place Retail Stores, Inc.a | 921,855 | ||||||
| 6,800 | Coach, Inc. | 397,664 | ||||||
| 84,898 | Comcast Corporation | 2,714,189 | ||||||
| 7,050 | Darden Restaurants, Inc. | 356,942 | ||||||
| 14,359 | Delphi Automotive plca | 366,155 | ||||||
| 17,949 | Discovery Communications, Inc.a | 969,246 | ||||||
| 7,300 | DISH Network Corporation | 208,415 | ||||||
| 26,420 | Dollar Tree, Inc.a | 1,421,396 | ||||||
| 39,065 | Foot Locker, Inc. | 1,194,608 | ||||||
| 8,708 | Gentex Corporation | 181,736 | ||||||
| 15,640 | GNC Holdings, Inc. | 613,088 | ||||||
| 2,730 | Harley-Davidson, Inc. | 124,843 | ||||||
| 26,300 | Home Depot, Inc. | 1,393,637 | ||||||
| 49,260 | Las Vegas Sands Corporation | 2,142,317 | ||||||
| 19,388 | Life Time Fitness, Inc.a | 901,736 | ||||||
| 14,919 | Limited Brands, Inc. | 634,505 | ||||||
| 18,440 | Lowe’s Companies, Inc. | 524,434 | ||||||
| 24,500 | Meredith Corporation | 782,530 | ||||||
| 29,070 | News Corporation | 654,656 | ||||||
| 11,700 | NIKE, Inc. | 1,027,026 | ||||||
| 10,260 | Omnicom Group, Inc. | 498,636 | ||||||
| 4,568 | O’Reilly Automotive, Inc.a | 382,661 | ||||||
| 1,782 | Panera Bread Companya | 248,482 | ||||||
| 23,600 | Penn National Gaming, Inc.a | 1,052,324 | ||||||
| 13,192 | PetSmart, Inc. | 899,431 | ||||||
| 68,568 | Pier 1 Imports, Inc. | 1,126,572 | ||||||
| 1,000 | Priceline.com, Inc.a | 664,520 | ||||||
| 24,100 | Sally Beauty Holdings, Inc.a | 620,334 | ||||||
| 4,530 | Time Warner Cable, Inc. | 371,913 | ||||||
| 21,400 | Toll Brothers, Inc.a | 636,222 | ||||||
| 9,073 | Tractor Supply Company | 753,603 | ||||||
| 2,526 | VF Corporation | 337,095 | ||||||
| 13,036 | WMS Industries, Inc.a | 260,068 | ||||||
|
| |||||||
| Total | 30,554,775 | |||||||
|
| |||||||
| Consumer Staples (2.9%) | |||||||
| 29,753 | Altria Group, Inc. | 1,027,966 | ||||||
| 22,830 | Anheuser-Busch InBev NV ADR | 1,818,410 | ||||||
| 29,370 | Archer-Daniels-Midland Company | 867,002 | ||||||
| 9,817 | British American Tobacco plc ADR | 1,002,512 | ||||||
| 6,900 | Bunge, Ltd. | 432,906 | ||||||
| 6,439 | Clorox Company | 466,570 | ||||||
| 16,846 | Coca-Cola Company | 1,317,189 | ||||||
| 10,400 | Colgate-Palmolive Company | 1,082,640 | ||||||
| 7,300 | CVS Caremark Corporation | 341,129 | ||||||
| 5,000 | Diageo plc ADR | 515,350 | ||||||
| 34,672 | Ingredion, Inc. | 1,716,957 | ||||||
| 3,590 | Kimberly-Clark Corporation | 300,734 | ||||||
| 20,580 | Kraft Foods, Inc. | 794,800 | ||||||
| 21,586 | Philip Morris International, Inc. | 1,883,594 | ||||||
| 5,126 | TreeHouse Foods, Inc.a | 319,299 | ||||||
| 35,600 | Walgreen Company | 1,053,048 | ||||||
| 14,954 | Wal-Mart Stores, Inc. | 1,042,593 | ||||||
| 12,057 | Whole Foods Market, Inc. | 1,149,273 | ||||||
|
| |||||||
| Total | 17,131,972 | |||||||
|
| |||||||
| Energy (5.3%) | |||||||
| 59,391 | Alpha Natural Resources, Inc.a | 517,296 | ||||||
| 37,171 | Apache Corporation | 3,266,959 | ||||||
| 25,300 | Arch Coal, Inc. | 174,317 | ||||||
| 7,600 | Baker Hughes, Inc. | 312,360 | ||||||
| 20,846 | BP plc ADR | 845,097 | ||||||
| 14,600 | Cameron International Corporationa | 623,566 | ||||||
| 11,500 | Chevron Corporation | 1,213,250 | ||||||
| 7,398 | Concho Resources, Inc.a | 629,718 | ||||||
| 47,330 | ConocoPhillips | 2,644,800 | ||||||
| 41,400 | Consol Energy, Inc. | 1,251,936 | ||||||
| 6,900 | Dril-Quip, Inc.a | 452,571 | ||||||
| 41,929 | Ensco plc | 1,969,405 | ||||||
| 19,103 | EOG Resources, Inc. | 1,721,371 | ||||||
| 8,350 | EQT Corporation | 447,810 | ||||||
| 12,000 | Exxon Mobil Corporation | 1,026,840 | ||||||
| 44,133 | Helix Energy Solutions Group, Inc.a | 724,223 | ||||||
| 28,000 | Nabors Industries, Ltd.a | 403,200 | ||||||
| 10,364 | National Oilwell Varco, Inc. | 667,856 | ||||||
| 14,900 | Newfield Exploration Companya | 436,719 | ||||||
| 22,470 | Occidental Petroleum Corporation | 1,927,252 | ||||||
The accompanying Notes to Financial Statements are an integral part of this schedule.
29
Table of Contents
Aggressive Allocation Portfolio
Schedule of Investments as of June 29, 2012
(unaudited)
| Shares | Common Stock (39.6%) | Value | ||||||
| Energy (5.3%) - continued | |||||||
| 16,568 | Oil States International, Inc.a | $ | 1,096,802 | |||||
| 30,879 | Peabody Energy Corporation | 757,153 | ||||||
| 16,800 | Petroleo Brasileiro SA ADR | 315,336 | ||||||
| 69,075 | Petroleum Geo-Services ASA | 844,232 | ||||||
| 15,500 | Plains Exploration & Production Companya | 545,290 | ||||||
| 5,300 | Range Resources Corporation | 327,911 | ||||||
| 3,100 | Schlumberger, Ltd. | 201,221 | ||||||
| 5,600 | SM Energy Company | 275,016 | ||||||
| 7,300 | Southwestern Energy Companya | 233,089 | ||||||
| 40,262 | Swift Energy Companya | 749,276 | ||||||
| 13,800 | Ultra Petroleum Corporationa | 318,366 | ||||||
| 66,090 | Valero Energy Corporation | 1,596,073 | ||||||
| 202,418 | Weatherford International, Ltd.a | 2,556,539 | ||||||
| 3,322 | Whiting Petroleum Corporationa | 136,601 | ||||||
|
| |||||||
| Total | 31,209,451 | |||||||
|
| |||||||
| Financials (5.8%) | |||||||
| 5,900 | ACE, Ltd. | 437,367 | ||||||
| 16,041 | Affiliated Managers Group, Inc.a | 1,755,687 | ||||||
| 3,100 | Allied World Assurance Company Holdings AG | 246,357 | ||||||
| 9,400 | American Campus Communities, Inc. | 422,812 | ||||||
| 24,600 | Ameriprise Financial, Inc. | 1,285,596 | ||||||
| 17,100 | Apartment Investment & Management Company | 462,213 | ||||||
| 7,200 | Aspen Insurance Holdings, Ltd. | 208,080 | ||||||
| 22,590 | Bank of America Corporation | 184,786 | ||||||
| 4,405 | Boston Properties, Inc. | 477,370 | ||||||
| 4,010 | Capital One Financial Corporation | 219,187 | ||||||
| 14,300 | CBL & Associates Properties, Inc. | 279,422 | ||||||
| 22,120 | Charles Schwab Corporation | 286,012 | ||||||
| 85,801 | Citigroup, Inc. | 2,351,805 | ||||||
| 4,825 | CME Group, Inc. | 1,293,631 | ||||||
| 30,282 | Discover Financial Services | 1,047,152 | ||||||
| 20,300 | Douglas Emmett, Inc. | 468,930 | ||||||
| 16,724 | Duke Realty Corporation | 244,839 | ||||||
| 5,700 | Endurance Specialty Holdings, Ltd. | 218,424 | ||||||
| 5,800 | Equity Lifestyle Properties, Inc. | 400,026 | ||||||
| 7,689 | Equity Residential | 479,486 | ||||||
| 21,827 | HCC Insurance Holdings, Inc. | 685,368 | ||||||
| 7,000 | Home Properties, Inc. | 429,520 | ||||||
| 20,648 | Host Hotels & Resorts, Inc. | 326,651 | ||||||
| 134,400 | Huntington Bancshares, Inc. | 860,160 | ||||||
| 15,500 | iShares Russell 2000 Index Fund | 1,234,575 | ||||||
| 73,476 | J.P. Morgan Chase & Company | 2,625,297 | ||||||
| 23,929 | Kimco Realty Corporation | 455,369 | ||||||
| 26,650 | KKR & Company, LP | 343,519 | ||||||
| 7,531 | Lazard, Ltd. | 195,731 | ||||||
| 3,200 | M&T Bank Corporation | 264,224 | ||||||
| 33,753 | Marsh & McLennan Companies, Inc. | 1,087,859 | ||||||
| 19,730 | MetLife, Inc. | 608,670 | ||||||
| 10,900 | NASDAQ OMX Group, Inc. | 247,103 | ||||||
| 5,900 | Northern Trust Corporation | 271,518 | ||||||
| 19,200 | Och-Ziff Capital Management Group, LLC | 145,536 | ||||||
| 59,086 | Ocwen Financial Corporationa | 1,109,635 | ||||||
| 59,951 | Popular, Inc.a | 995,786 | ||||||
| 2,500 | ProAssurance Corporation | 222,725 | ||||||
| 37,600 | Progressive Corporation | 783,208 | ||||||
| 6,700 | Protective Life Corporation | 197,047 | ||||||
| 3,253 | Public Storage, Inc. | 469,766 | ||||||
| 2,762 | S&P 500 Large Index Depository Receipts | 376,378 | ||||||
| 3,310 | Simon Property Group, Inc. | 515,235 | ||||||
| 14,370 | State Street Corporation | 641,477 | ||||||
| 23,080 | SunTrust Banks, Inc. | 559,228 | ||||||
| 4,780 | SVB Financial Groupa | 280,682 | ||||||
| 13,300 | Tanger Factory Outlet Centers, Inc. | 426,265 | ||||||
| 3,125 | Taubman Centers, Inc. | 241,125 | ||||||
| 24,265 | TD Ameritrade Holding Corporation | 412,505 | ||||||
| 9,400 | Tower Group, Inc. | 196,178 | ||||||
| 5,347 | Vornado Realty Trust | 449,041 | ||||||
| 14,086 | W.R. Berkley Corporation | 548,227 | ||||||
| 56,812 | Wells Fargo & Company | 1,899,793 | ||||||
| 64,015 | Zions Bancorporation | 1,243,171 | ||||||
|
| |||||||
| Total | 34,117,754 | |||||||
|
| |||||||
| Health Care (4.9%) | |||||||
| 10,700 | Abbott Laboratories | 689,829 | ||||||
| 9,507 | Alexion Pharmaceuticals, Inc.a | 944,045 | ||||||
| 38,000 | Align Technology, Inc.a | 1,271,480 | ||||||
| 14,580 | AmerisourceBergen Corporation | 573,723 | ||||||
| 15,573 | Amgen, Inc. | 1,137,452 | ||||||
| 33,718 | Baxter International, Inc. | 1,792,112 | ||||||
| 14,500 | Biogen Idec, Inc.a | 2,093,510 | ||||||
| 8,600 | BioMarin Pharmaceutical, Inc.a | 340,388 | ||||||
| 55,700 | Bristol-Myers Squibb Company | 2,002,415 | ||||||
| 2,358 | C.R. Bard, Inc. | 253,344 | ||||||
| 7,130 | CIGNA Corporation | 313,720 | ||||||
| 17,917 | Covance, Inc.a | 857,328 | ||||||
| 10,560 | Covidien plc | 564,960 | ||||||
| 28,500 | Eli Lilly and Company | 1,222,935 | ||||||
| 33,094 | Health Net, Inc.a | 803,191 | ||||||
| 13,980 | Johnson & Johnson | 944,489 | ||||||
| 7,400 | Medicines Companya | 169,756 | ||||||
| 19,420 | Merck & Company, Inc. | 810,785 | ||||||
| 2,554 | Mettler-Toledo International, Inc.a | 398,041 | ||||||
| 4,983 | Onyx Pharmaceuticals, Inc.a | 331,120 | ||||||
| 4,600 | Perrigo Company | 542,478 | ||||||
| 67,564 | Pfizer, Inc. | 1,553,972 | ||||||
| 36,462 | PSS World Medical, Inc.a | 765,337 | ||||||
| 13,970 | Sanofi ADR | 527,787 | ||||||
| 17,100 | Shire Pharmaceuticals Group plc ADR | 1,477,269 | ||||||
| 7,818 | SXC Health Solutions Corporationa | 775,624 | ||||||
| 9,100 | Thoratec Corporationa | 305,578 | ||||||
| 19,440 | United Therapeutics Corporationa | 959,947 | ||||||
| 56,235 | UnitedHealth Group, Inc. | 3,289,748 | ||||||
| 2,200 | Waters Corporationa | 174,834 | ||||||
| 13,479 | Watson Pharmaceuticals, Inc.a | 997,311 | ||||||
| 4,520 | Zimmer Holdings, Inc. | 290,907 | ||||||
|
| |||||||
| Total | 29,175,415 | |||||||
|
| |||||||
The accompanying Notes to Financial Statements are an integral part of this schedule.
30
Table of Contents
Aggressive Allocation Portfolio
Schedule of Investments as of June 29, 2012
(unaudited)
| Shares | Common Stock (39.6%) | Value | ||||||
| Industrials (5.0%) | |||||||
| 8,900 | 3M Company | $ | 797,440 | |||||
| 34,300 | Actuant Corporation | 931,588 | ||||||
| 13,960 | AMETEK, Inc. | 696,744 | ||||||
| 17,296 | BE Aerospace, Inc.a | 755,143 | ||||||
| 18,255 | Boeing Company | 1,356,346 | ||||||
| 15,656 | Chicago Bridge and Iron Company | 594,302 | ||||||
| 8,855 | CSX Corporation | 197,998 | ||||||
| 6,200 | Cummins, Inc. | 600,842 | ||||||
| 36,644 | Deluxe Corporation | 913,901 | ||||||
| 30,300 | Dover Corporation | 1,624,383 | ||||||
| 32,224 | EMCOR Group, Inc. | 896,472 | ||||||
| 16,662 | Expeditors International of Washington, Inc. | 645,652 | ||||||
| 2,980 | FedEx Corporation | 272,998 | ||||||
| 5,327 | Flowserve Corporation | 611,273 | ||||||
| 25,100 | GATX Corporation | 966,350 | ||||||
| 14,270 | General Electric Company | 297,387 | ||||||
| 6,945 | Honeywell International, Inc. | 387,809 | ||||||
| 22,140 | Jacobs Engineering Group, Inc.a | 838,220 | ||||||
| 17,980 | JB Hunt Transport Services, Inc. | 1,071,608 | ||||||
| 13,918 | Kansas City Southern | 968,136 | ||||||
| 8,700 | L-3 Communications Holdings, Inc. | 643,887 | ||||||
| 14,200 | Landstar System, Inc. | 734,424 | ||||||
| 19,600 | Lockheed Martin Corporation | 1,706,768 | ||||||
| 84,620 | Manitowoc Company, Inc. | 990,054 | ||||||
| 3,800 | Manpower, Inc. | 139,270 | ||||||
| 3,890 | Norfolk Southern Corporation | 279,185 | ||||||
| 11,725 | Oshkosh Corporationa | 245,639 | ||||||
| 30,742 | Parker Hannifin Corporation | 2,363,445 | ||||||
| 12,692 | Pentair, Inc. | 485,850 | ||||||
| 10,232 | Roper Industries, Inc. | 1,008,671 | ||||||
| 28,573 | Shaw Group, Inc.a | 780,329 | ||||||
| 13,904 | SPX Corporation | 908,209 | ||||||
| 7,181 | Stericycle, Inc.a | 658,282 | ||||||
| 30,100 | Tyco International, Ltd. | 1,590,785 | ||||||
| 19,518 | United Technologies Corporation | 1,474,195 | ||||||
|
| |||||||
| Total | 29,433,585 | |||||||
|
| |||||||
| Information Technology (8.1%) | |||||||
| 11,500 | Accenture plc | 691,035 | ||||||
| 27,600 | ADTRAN, Inc. | 833,244 | ||||||
| 26,958 | Akamai Technologies, Inc.a | 855,916 | ||||||
| 4,500 | Alliance Data Systems Corporationa | 607,500 | ||||||
| 13,435 | ANSYS, Inc.a | 847,883 | ||||||
| 11,802 | Apple, Inc.a | 6,892,368 | ||||||
| 131,773 | Atmel Corporationa | 882,879 | ||||||
| 11,357 | Autodesk, Inc.a | 397,381 | ||||||
| 23,701 | Broadcom Corporationa | 801,094 | ||||||
| 33,700 | Cavium, Inc.a | 943,600 | ||||||
| 29,200 | Ciena Corporationa | 478,004 | ||||||
| 21,935 | Cognizant Technology Solutions Corporationa | 1,316,100 | ||||||
| 17,300 | CoreLogic, Inc.a | 316,763 | ||||||
| 32,316 | eBay, Inc.a | 1,357,595 | ||||||
| 33,208 | Electronic Arts, Inc.a | 410,119 | ||||||
| 8,692 | F5 Networks, Inc.a | 865,376 | ||||||
| 13,451 | Fortinet, Inc.a | 312,332 | ||||||
| 4,323 | Google, Inc.a | 2,507,643 | ||||||
| 3,700 | International Business Machines Corporation | 723,646 | ||||||
| 6,398 | Itron, Inc.a | 263,854 | ||||||
| 12,010 | Juniper Networks, Inc.a | 195,883 | ||||||
| 3,741 | Lam Research Corporationa | 141,185 | ||||||
| 54,938 | Marvell Technology Group, Ltd. | 619,701 | ||||||
| 1,600 | MasterCard, Inc. | 688,176 | ||||||
| 4,453 | Mercadolibre, Inc. | 337,537 | ||||||
| 108,234 | Microsoft Corporation | 3,310,878 | ||||||
| 51,212 | NetApp, Inc.a | 1,629,566 | ||||||
| 4,775 | Nice Systems, Ltd. ADRa | 174,765 | ||||||
| 34,193 | Nuance Communications, Inc.a | 814,477 | ||||||
| 81,368 | NVIDIA Corporationa | 1,124,506 | ||||||
| 44,400 | ON Semiconductor Corporationa | 315,240 | ||||||
| 29,400 | OpenTable, Inc.a | 1,323,294 | ||||||
| 115,023 | Oracle Corporation | 3,416,183 | ||||||
| 23,066 | Plantronics, Inc. | 770,404 | ||||||
| 66,000 | Polycom, Inc.a | 694,320 | ||||||
| 27,420 | QUALCOMM, Inc. | 1,526,746 | ||||||
| 9,130 | Red Hat, Inc.a | 515,662 | ||||||
| 16,300 | Riverbed Technology, Inc.a | 263,245 | ||||||
| 1,600 | ServiceNow, Inc.a,b | 39,360 | ||||||
| 23,596 | Teradata Corporationa | 1,699,148 | ||||||
| 77,238 | Teradyne, Inc.a | 1,085,966 | ||||||
| 72,820 | Texas Instruments, Inc. | 2,089,206 | ||||||
| 25,653 | TIBCO Software, Inc.a | 767,538 | ||||||
| 31,373 | VeriFone Systems, Inc.a | 1,038,133 | ||||||
| 25,644 | Xilinx, Inc. | 860,869 | ||||||
|
| |||||||
| Total | 47,746,320 | |||||||
|
| |||||||
| Materials (1.4%) | |||||||
| 2,700 | Agrium, Inc. | 238,869 | ||||||
| 35,400 | AK Steel Holding Corporation | 207,798 | ||||||
| 4,488 | Albemarle Corporation | 267,664 | ||||||
| 5,500 | BHP Billiton, Ltd. ADR | 359,150 | ||||||
| 7,900 | Buckeye Technologies, Inc. | 225,071 | ||||||
| 6,418 | Celanese Corporation | 222,191 | ||||||
| 7,000 | Cliffs Natural Resources, Inc. | 345,030 | ||||||
| 7,200 | Eagle Materials, Inc. | 268,848 | ||||||
| 10,632 | FMC Corporation | 568,599 | ||||||
| 51,621 | Freeport-McMoRan Copper & Gold, Inc. | 1,758,727 | ||||||
| 7,700 | H.B. Fuller Company | 236,390 | ||||||
| 3,730 | LyondellBasell Industries NV | 150,207 | ||||||
| 11,400 | Materials Select Sector SPDR Fund | 402,306 | ||||||
| 6,300 | Mosaic Company | 344,988 | ||||||
| 7,624 | Newmont Mining Corporation | 369,840 | ||||||
| 7,500 | Rio Tinto plc ADR | 358,575 | ||||||
| 4,104 | Sigma-Aldrich Corporation | 303,409 | ||||||
| 6,966 | Silgan Holdings, Inc. | 297,379 | ||||||
| 13,453 | Silver Wheaton Corporation | 361,079 | ||||||
| 19,970 | Steel Dynamics, Inc. | 234,648 | ||||||
| 17,200 | SunCoke Energy, Inc.a | 251,980 | ||||||
| 14,586 | Walter Energy, Inc. | 644,118 | ||||||
|
| |||||||
| Total | 8,416,866 | |||||||
|
| |||||||
| Telecommunications Services (0.3%) | |||||||
| 8,176 | SBA Communications Corporationa | 466,441 | ||||||
| 28,375 | TW Telecom, Inc.a | 728,102 | ||||||
The accompanying Notes to Financial Statements are an integral part of this schedule.
31
Table of Contents
Aggressive Allocation Portfolio
Schedule of Investments as of June 29, 2012
(unaudited)
| Shares | Common Stock (39.6%) | Value | ||||||
| Telecommunications Services (0.3%) - continued | |||||||
| 14,648 | Verizon Communications, Inc. | $ | 650,957 | |||||
|
| |||||||
| Total | 1,845,500 | |||||||
|
| |||||||
| Utilities (0.7%) | |||||||
| 13,600 | CMS Energy Corporation | 319,600 | ||||||
| 23,930 | NiSource, Inc. | 592,268 | ||||||
| 18,188 | NV Energy, Inc. | 319,745 | ||||||
| 48,300 | PNM Resources, Inc. | 943,782 | ||||||
| 7,500 | Public Service Enterprise Group, Inc. | 243,750 | ||||||
| 20,878 | Southwest Gas Corporation | 911,325 | ||||||
| 13,050 | Utilities Select Sector SPDR Fund | 482,719 | ||||||
|
| |||||||
| Total | 3,813,189 | |||||||
|
| |||||||
Total Common Stock (cost $224,550,894) | 233,444,827 | |||||||
|
| |||||||
| Principal Amount | Long-Term Fixed Income (4.9%) | |||||||
| Asset-Backed Securities (0.2%) | |||||||
| J.P. Morgan Mortgage Acquisition Corporation | ||||||||
| $945,608 | 5.461%, 10/25/2036 | 737,936 | ||||||
| Renaissance Home Equity Loan Trust | ||||||||
| 650,000 | 6.011%, 5/25/2036 | 366,567 | ||||||
|
| |||||||
| Total | 1,104,503 | |||||||
|
| |||||||
| Collateralized Mortgage Obligations (<0.1%) | |||||||
| Sequoia Mortgage Trust | ||||||||
| 131,128 | 5.371%, 9/20/2046 | 44,557 | ||||||
| WaMu Mortgage Pass Through Certificates | ||||||||
| 90,135 | 2.506%, 9/25/2036 | 64,455 | ||||||
| 139,566 | 2.561%, 10/25/2036 | 98,450 | ||||||
|
| |||||||
| Total | 207,462 | |||||||
|
| |||||||
| Commercial Mortgage-Backed Securities (0.1%) | |||||||
| Credit Suisse Mortgage Capital Certificates | ||||||||
| 250,000 | 5.509%, 9/15/2039 | 244,889 | ||||||
| Government National Mortgage Association | ||||||||
| 177,372 | 2.164%, 3/16/2033 | 180,112 | ||||||
| 157,361 | 3.214%, 1/16/2040 | 165,113 | ||||||
|
| |||||||
| Total | 590,114 | |||||||
|
| |||||||
| Financials (0.3%) | |||||||
| Achmea Hypotheekbank NV | ||||||||
| 205,000 | 3.200%, 11/3/2014c | 213,842 | ||||||
| Bank of Nova Scotia | ||||||||
| 225,000 | 1.450%, 7/26/2013c | 227,281 | ||||||
| Canadian Imperial Bank of Commerce | ||||||||
| 205,000 | 2.600%, 7/2/2015c | 215,606 | ||||||
| Dexia Credit Local SA | ||||||||
| 225,000 | 2.750%, 4/29/2014c | 219,564 | ||||||
| International Bank for Reconstruction & Development | ||||||||
| 210,000 | 2.375%, 5/26/2015 | 221,779 | ||||||
| Royal Bank of Canada | ||||||||
| 160,000 | 3.125%, 4/14/2015c | 169,447 | ||||||
| Toronto-Dominion Bank | ||||||||
| 205,000 | 2.200%, 7/29/2015c | 213,331 | ||||||
|
| |||||||
| Total | 1,480,850 | |||||||
|
| |||||||
| Foreign Government (<0.1%) | |||||||
| Kommunalbanken AS | ||||||||
| 225,000 | 2.750%, 5/5/2015c | 236,260 | ||||||
| Kreditanstalt fuer Wiederaufbau | ||||||||
| 55,000 | 0.253%, 6/17/2013d | 55,004 | ||||||
|
| |||||||
| Total | 291,264 | |||||||
|
| |||||||
| Mortgage-Backed Securities (0.7%) | |||||||
| Federal Home Loan Mortgage Corporation Gold 15-Yr. Pass Through | ||||||||
| 400,000 | 3.000%, 7/1/2027b | 418,188 | ||||||
| Federal National Mortgage Association Conventional 15- Yr. Pass Through | ||||||||
| 1,205,000 | 3.000%, 7/1/2027b | 1,262,425 | ||||||
| Federal National Mortgage Association Conventional 30- Yr. Pass Through | ||||||||
| 250,000 | 3.500%, 7/1/2042b | 262,773 | ||||||
| 1,405,000 | 4.000%, 7/1/2042b | 1,495,228 | ||||||
| 700,000 | 5.500%, 7/1/2042b | 763,547 | ||||||
|
| |||||||
| Total | 4,202,161 | |||||||
|
| |||||||
| U.S. Government and Agencies (3.6%) | |||||||
| FDIC Structured Sale Guaranteed Notes | ||||||||
| 85,000 | Zero Coupon, 1/7/2014c | 83,894 | ||||||
| Federal Agricultural Mortgage Corporation | ||||||||
| 210,000 | 2.125%, 9/15/2015 | 218,155 | ||||||
| Federal Home Loan Banks | ||||||||
| 1,300,000 | 0.375%, 1/29/2014 | 1,300,506 | ||||||
| 1,015,000 | 1.000%, 6/21/2017 | 1,015,745 | ||||||
| 1,010,000 | 5.000%, 11/17/2017 | 1,219,570 | ||||||
| Federal National Mortgage Association | ||||||||
| 715,000 | 1.250%, 2/27/2014 | 726,946 | ||||||
| 400,000 | 0.500%, 5/27/2015 | 399,710 | ||||||
| 255,000 | 4.375%, 10/15/2015 | 286,218 | ||||||
| 860,000 | 1.375%, 11/15/2016 | 880,214 | ||||||
| 210,000 | 6.250%, 5/15/2029 | 302,408 | ||||||
| Tennessee Valley Authority | ||||||||
| 165,000 | 5.250%, 9/15/2039 | 215,137 | ||||||
| U.S. Treasury Bonds | ||||||||
| 420,000 | 7.625%, 2/15/2025 | 687,488 | ||||||
| 550,000 | 4.375%, 5/15/2040 | 732,961 | ||||||
| 350,000 | 3.125%, 11/15/2041 | 376,250 | ||||||
| U.S. Treasury Bonds, TIPS | ||||||||
| 67,121 | 2.375%, 1/15/2025 | 88,396 | ||||||
| 58,537 | 2.125%, 2/15/2040 | 83,086 | ||||||
The accompanying Notes to Financial Statements are an integral part of this schedule.
32
Table of Contents
Aggressive Allocation Portfolio
Schedule of Investments as of June 29, 2012
(unaudited)
| Principal Amount | Long-Term Fixed Income (4.9%) | Value | ||||||
| U.S. Government and Agencies (3.6%) - continued | ||||||||
U.S. Treasury Notes | ||||||||
| $ 150,000 | 0.250%, 4/30/2014 | $ | 149,818 | |||||
| 75,000 | 2.250%, 5/31/2014 | 77,730 | ||||||
| 1,975,000 | 0.750%, 6/15/2014 | 1,991,355 | ||||||
| 2,150,000 | 2.500%, 4/30/2015 | 2,275,809 | ||||||
| 465,000 | 2.000%, 1/31/2016 | 489,267 | ||||||
| 625,000 | 2.625%, 2/29/2016 | 672,608 | ||||||
| 1,500,000 | 3.250%, 3/31/2017 | 1,676,601 | ||||||
| 3,340,000 | 2.000%, 2/15/2022 | 3,452,465 | ||||||
U.S. Treasury Notes, TIPS | ||||||||
| 367,266 | 2.000%, 1/15/2014 | 381,326 | ||||||
| 265,043 | 1.625%, 1/15/2015 | 281,649 | ||||||
| 313,140 | 0.500%, 4/15/2015 | 325,127 | ||||||
| 238,008 | 0.125%, 4/15/2017 | 251,247 | ||||||
| 332,976 | 2.625%, 7/15/2017 | 395,513 | ||||||
| 262,897 | 1.125%, 1/15/2021 | 302,537 | ||||||
|
| |||||||
| Total | 21,339,736 | |||||||
|
| |||||||
Total Long-Term Fixed Income (cost $27,753,538) | 29,216,090 | |||||||
|
| |||||||
Short-Term Investments (4.4%)e | ||||||||
Federal Home Loan Bank Discount Notes | ||||||||
| 3,000,000 | 0.065%, 7/25/2012f | 2,999,865 | ||||||
| 15,000,000 | 0.105%, 8/22/2012f | 14,997,681 | ||||||
Federal Home Loan Mortgage Corporation Discount Notes | ||||||||
| 8,000,000 | 0.070%, 7/11/2012f | 7,999,829 | ||||||
Federal National Mortgage Association Discount Notes | ||||||||
| 100,000 | 0.120%, 7/18/2012f,g | 99,994 | ||||||
|
| |||||||
Total Short-Term Investments (cost $26,097,368) | 26,097,369 | |||||||
|
| |||||||
Total Investments (cost $630,710,697) 100.5% | $ | 593,223,592 | ||||||
|
| |||||||
Other Assets and Liabilities, Net (0.5%) | (3,123,789 | ) | ||||||
|
| |||||||
Total Net Assets 100.0% | $ | 590,099,803 | ||||||
|
| |||||||
| a | Non-income producing security. |
| b | Denotes investments purchased on a when-issued or delayed delivery basis. |
| c | Denotes securities sold under Rule 144A of the Securities Act of 1933, which exempts them from registration. These securities have been deemed liquid and may be resold to other dealers in the program or to other qualified institutional buyers. As of June 29, 2012, the value of these investments was $1,579,225 or 0.3% of total net assets. |
| d | Denotes variable rate securities. Variable rate securities are securities whose yields vary with a designated market index or market rate. The rate shown is as of June 29, 2012. |
| e | The interest rate shown reflects the yield, coupon rate or the discount rate at the date of purchase. |
| f | Denotes investments that benefit from credit enhancement or liquidity support provided by a third party bank, institution or government. |
| g | At June 29, 2012, $99,994 of investments were held on deposit with the counterparty and pledged as the initial margin deposit for open futures contracts. |
Definitions:
ADR | - | American Depositary Receipt, which are certificates for an underlying foreign security’s shares held by an issuing U.S. depository bank. | ||
TIPS | - | Treasury Inflation Protected Security. |
Unrealized Appreciation (Depreciation)
Gross unrealized appreciation and depreciation of investments, based on cost for federal income tax purposes, were as follows:
Gross unrealized appreciation | $ | 32,166,425 | ||
Gross unrealized depreciation | (70,716,612 | ) | ||
|
| |||
Net unrealized appreciation (depreciation) | $ | (38,550,187 | ) | |
Cost for federal income tax purposes | $ | 631,773,779 |
The accompanying Notes to Financial Statements are an integral part of this schedule.
33
Table of Contents
Aggressive Allocation Portfolio
Schedule of Investments as of June 29, 2012
(unaudited)
Fair Valuation Measurements
The following table is a summary of the inputs used, as of June 29, 2012, in valuing Aggressive Allocation Portfolio’s assets carried at fair value.
Investments in Securities | Total | Level 1 | Level 2 | Level 3 | ||||||||||||
Mutual Funds | ||||||||||||||||
Equity Mutual Funds | 278,498,341 | 278,498,341 | — | — | ||||||||||||
Fixed Income Mutual Funds | 25,966,965 | 25,966,965 | — | — | ||||||||||||
Common Stock | ||||||||||||||||
Consumer Discretionary | 30,554,775 | 30,554,775 | — | — | ||||||||||||
Consumer Staples | 17,131,972 | 17,131,972 | — | — | ||||||||||||
Energy | 31,209,451 | 30,365,219 | 844,232 | — | ||||||||||||
Financials | 34,117,754 | 34,117,754 | — | — | ||||||||||||
Health Care | 29,175,415 | 29,175,415 | — | — | ||||||||||||
Industrials | 29,433,585 | 29,433,585 | — | — | ||||||||||||
Information Technology | 47,746,320 | 47,746,320 | — | — | ||||||||||||
Materials | 8,416,866 | 8,416,866 | — | — | ||||||||||||
Telecommunications Services | 1,845,500 | 1,845,500 | — | — | ||||||||||||
Utilities | 3,813,189 | 3,813,189 | — | — | ||||||||||||
Long-Term Fixed Income | ||||||||||||||||
Asset-Backed Securities | 1,104,503 | — | 1,104,503 | — | ||||||||||||
Collateralized Mortgage Obligations | 207,462 | — | 207,462 | — | ||||||||||||
Commercial Mortgage-Backed Securities | 590,114 | — | 590,114 | — | ||||||||||||
Financials | 1,480,850 | — | 1,480,850 | — | ||||||||||||
Foreign Government | 291,264 | — | 291,264 | — | ||||||||||||
Mortgage-Backed Securities | 4,202,161 | — | 4,202,161 | — | ||||||||||||
U.S. Government and Agencies | 21,339,736 | — | 21,339,736 | — | ||||||||||||
Short-Term Investments | 26,097,369 | — | 26,097,369 | — | ||||||||||||
|
|
|
|
|
|
|
| |||||||||
Total | $ | 593,223,592 | $ | 537,065,901 | $ | 56,157,691 | $ | — | ||||||||
|
|
|
|
|
|
|
| |||||||||
Other Financial Instruments | Total | Level 1 | Level 2 | Level 3 | ||||||||||||
Asset Derivatives | ||||||||||||||||
Futures Contracts | 4,788,005 | 4,788,005 | — | — | ||||||||||||
|
|
|
|
|
|
|
| |||||||||
Total Asset Derivatives | $ | 4,788,005 | $ | 4,788,005 | $ | — | $ | — | ||||||||
|
|
|
|
|
|
|
| |||||||||
Liability Derivatives | ||||||||||||||||
Futures Contracts | 4,617,805 | 4,617,805 | — | — | ||||||||||||
|
|
|
|
|
|
|
| |||||||||
Total Liability Derivatives | $ | 4,617,805 | $ | 4,617,805 | $ | — | $ | — | ||||||||
|
|
|
|
|
|
|
| |||||||||
There were no significant transfers between the Levels during the period ended June 29, 2012. Transfers between the levels are identified as of the end of the period.
Futures Contracts | Number of Contracts Long/(Short) | Expiration Date | Notional Principal Amount | Value | Unrealized Gain/(Loss) | |||||||||||||||
2-Yr. U.S. Treasury Bond Futures | (15 | ) | September 2012 | ($3,303,236 | ) | ($3,302,813 | ) | $ | 423 | |||||||||||
10-Yr. U.S. Treasury Bond Futures | (20 | ) | September 2012 | (2,654,002 | ) | (2,667,500 | ) | (13,498 | ) | |||||||||||
Mini MSCI EAFE Index Futures | 90 | September 2012 | 6,049,171 | 6,407,100 | 357,929 | |||||||||||||||
Russell 2000 Index Mini-Futures | (783 | ) | September 2012 | (59,255,639 | ) | (62,279,820 | ) | (3,024,181 | ) | |||||||||||
S&P 400 Index Mini-Futures | (698 | ) | September 2012 | (63,996,975 | ) | (65,577,101 | ) | (1,580,126 | ) | |||||||||||
S&P 500 Index Futures | 382 | September 2012 | 125,106,547 | 129,536,200 | 4,429,653 | |||||||||||||||
Total Futures Contracts | $ | 170,200 | ||||||||||||||||||
The accompanying Notes to Financial Statements are an integral part of this schedule.
34
Table of Contents
Aggressive Allocation Portfolio
Schedule of Investments as of June 29, 2012
(unaudited)
The following table summarizes the fair value and Statement of Assets and Liabilities location, as of June 29, 2012, for Aggressive Allocation Portfolio’s investments in financial derivative instruments by primary risk exposure as discussed under item (2) Significant Accounting Policies of the Notes to Financial Statements.
Derivatives by risk category | Statement of Assets and Liabilities Location | Fair Value | ||||
| Asset Derivatives | ||||||
Interest Rate Contracts | ||||||
Futures* | Net Assets - Net unrealized appreciation/(depreciation) on Futures contracts | $ | 423 | |||
Total Interest Rate Contracts | 423 | |||||
Equity Contracts | ||||||
Futures* | Net Assets - Net unrealized appreciation/(depreciation) on Futures contracts | 4,787,582 | ||||
Total Equity Contracts | 4,787,582 | |||||
|
| |||||
Total Asset Derivatives | $ | 4,788,005 | ||||
|
| |||||
Liability Derivatives | ||||||
Equity Contracts | ||||||
Futures* | Net Assets - Net unrealized appreciation/(depreciation) on Futures contracts | 4,604,307 | ||||
Total Equity Contracts | 4,604,307 | |||||
Interest Rate Contracts | ||||||
Futures* | Net Assets - Net unrealized appreciation/(depreciation) on Futures contracts | 13,498 | ||||
Total Interest Rate Contracts | 13,498 | |||||
|
| |||||
Total Liability Derivatives | $ | 4,617,805 | ||||
|
| |||||
| * | Includes cumulative appreciation/depreciation of futures contracts as reported in the Schedule of Investments. Only current day’s variation margin is reported within the Statement of Assets and Liabilities. |
The following table summarizes the net realized gains/(losses) and Statement of Operations location, for the period ended June 29, 2012, for Aggressive Allocation Portfolio’s investments in financial derivative instruments by primary risk exposure.
Derivatives by risk category | Statement of Operations Location | Realized Gains/(Losses) recognized in Income | ||||
Equity Contracts | ||||||
Futures | Net realized gains/(losses) on Futures contracts | 2,047,122 | ||||
Total Equity Contracts | 2,047,122 | |||||
Foreign Exchange Contracts | ||||||
Forward Contracts | Net realized gains/(losses) on Foreign currency transactions | (11,303 | ) | |||
Total Foreign Exchange Contracts | (11,303 | ) | ||||
Interest Rate Contracts | ||||||
Futures | Net realized gains/(losses) on Futures contracts | (100,817 | ) | |||
Total Interest Rate Contracts | (100,817 | ) | ||||
Credit Contracts | ||||||
Credit Default Swaps | Net realized gains/(losses) on Swap agreements | 28,857 | ||||
Total Credit Contracts | 28,857 | |||||
|
| |||||
Total | $ | 1,963,859 | ||||
|
| |||||
The accompanying Notes to Financial Statements are an integral part of this schedule.
35
Table of Contents
Aggressive Allocation Portfolio
Schedule of Investments as of June 29, 2012
(unaudited)
The following table summarizes the change in net unrealized appreciation/(depreciation) and Statement of Operations location, for the period ended June 29, 2012, for Aggressive Allocation Portfolio’s investments in financial derivative instruments by primary risk exposure.
Derivatives by risk category | Statement of Operations Location | Change in unrealized appreciation/(depreciation) recognized in Income | ||||
Equity Contracts | ||||||
Futures | Change in net unrealized appreciation/(depreciation) on Futures contracts | (683,529 | ) | |||
Total Equity Contracts | (683,529 | ) | ||||
Interest Rate Contracts | ||||||
Futures | Change in net unrealized appreciation/(depreciation) on Futures contracts | 29,610 | ||||
Total Interest Rate Contracts | 29,610 | |||||
Credit Contracts | ||||||
Credit Default Swaps | Change in net unrealized appreciation/(depreciation) on Swap agreements | (3,247 | ) | |||
Total Credit Contracts | (3,247 | ) | ||||
|
| |||||
Total | ($ | 657,166 | ) | |||
|
| |||||
The following table presents Aggressive Allocation Portfolio’s average volume of derivative activity during the period ended June 29, 2012.
Derivative Risk Category | Futures (Notional*) | Futures (Percentage of Average Net Assets) | Forwards (Notional*) | Forwards (Percentage of Average Net Assets) | Swaps (Notional*) | |||||||||||||||
Equity Contracts | $ | 266,031,058 | 44.8 | % | N/A | N/A | N/A | |||||||||||||
Interest Rate Contracts | 6,005,138 | 1.0 | N/A | N/A | N/A | |||||||||||||||
Foreign Exchange Contracts | N/A | N/A | $ | 163,866 | <0.1 | % | N/A | |||||||||||||
Credit Contracts | N/A | N/A | N/A | N/A | $ | 93,040 | ||||||||||||||
| * | Notional amount represents long or short, or both, derivative positions held by the Portfolio. |
Investment in Affiliates
Affiliated issuers, as defined under the Investment Company Act of 1940, include those in which the Portfolio’s holdings of an issuer represent 5% or more of the outstanding voting securities of an issuer, or any affiliated mutual fund.
A summary of transactions for the fiscal year to date, in Aggressive Allocation Portfolio, is as follows:
Portfolio | Value December 31, 2011 | Gross Purchases | Gross Sales | Shares Held at June 29, 2012 | Value June 29, 2012 | Income Earned January 1, 2012 - June 29, 2012 | ||||||||||||||||||
Partner Small Cap Growth | $ | 43,458,307 | $ | — | $ | — | 3,498,692 | $ | 46,129,209 | $ | — | |||||||||||||
Partner Small Cap Value | 14,393,204 | 87,027 | 2,000,000 | 672,963 | 13,058,377 | 87,027 | ||||||||||||||||||
Small Cap Stock | 20,485,040 | — | — | 1,708,411 | 20,913,338 | — | ||||||||||||||||||
Partner Mid Cap Value | 19,535,065 | 176,063 | — | 1,575,131 | 21,014,446 | 176,063 | ||||||||||||||||||
Mid Cap Stock | 28,649,596 | 76,744 | — | 2,502,383 | 30,245,051 | 76,744 | ||||||||||||||||||
Partner Worldwide Allocation | 22,849,130 | 7,554 | — | 3,092,021 | 24,022,532 | 7,554 | ||||||||||||||||||
Partner International Stock | 59,536,061 | 1,711,274 | — | 6,673,062 | 61,617,721 | 1,711,274 | ||||||||||||||||||
Large Cap Value | 27,887,419 | 521,401 | — | 2,732,516 | 29,720,207 | 521,401 | ||||||||||||||||||
Large Cap Stock | 24,807,764 | 279,164 | — | 3,091,854 | 26,733,101 | 279,164 | ||||||||||||||||||
Equity Income Plus | 4,678,836 | 76,166 | — | 539,342 | 5,044,359 | 76,166 | ||||||||||||||||||
High Yield | 5,669,944 | 7,653,606 | 310,502 | 2,746,736 | 13,323,042 | 279,873 | ||||||||||||||||||
Income | 6,032,325 | 2,156,646 | — | 807,942 | 8,424,972 | 156,664 | ||||||||||||||||||
Limited Maturity Bond | — | 4,219,419 | — | 430,619 | 4,218,951 | 19,419 | ||||||||||||||||||
Thrivent Financial Securities Lending Trust | — | 940,873 | 940,873 | — | — | 60 | ||||||||||||||||||
Total Value and Income Earned | 277,982,691 | 304,465,306 | 3,391,409 | |||||||||||||||||||||
The accompanying Notes to Financial Statements are an integral part of this schedule.
36
Table of Contents
Moderately Aggressive Allocation Portfolio
Schedule of Investments as of June 29, 2012
(unaudited)
| Principal Amount | Bank Loans (0.8%)a | Value | ||||||
| Basic Materials (0.1%) | |||||||
| Arch Coal, Inc., Term Loan | ||||||||
| $ 800,000 | 5.750%, 5/1/2018 | $ | 784,664 | |||||
| Ineos Group Holdings, Term Loan | ||||||||
| 1,038,782 | 6.391%, 5/4/2018b,c | 1,015,700 | ||||||
|
| |||||||
| Total | 1,800,364 | |||||||
|
| |||||||
| Capital Goods (<0.1%) | |||||||
| Reynolds Group, Term Loan | ||||||||
| 798,400 | 5.250%, 8/9/2018b,c | 804,013 | ||||||
|
| |||||||
| Total | 804,013 | |||||||
|
| |||||||
| Communications Services (0.2%) | |||||||
| Atlantic Broadband Finance, LLC, Term Loan | ||||||||
| 925,000 | 5.250%, 3/20/2019 | 925,388 | ||||||
| Charter Communications Operation, Term Loan | ||||||||
| 738,150 | 4.000%, 3/28/2019 | 732,481 | ||||||
| Clear Channel Communications, Term Loan | ||||||||
| 925,000 | 3.895%, 1/29/2016 | 736,920 | ||||||
| Cumulus Media Holdings, Inc., Term Loan | ||||||||
| 1,122,445 | 4.900%, 9/16/2018b,c | 1,116,631 | ||||||
| Lawson Software, Inc., Term Loan | ||||||||
| 924,538 | 7.520%, 3/16/2018b,c | 927,857 | ||||||
| Toys R Us, Inc., Term Loan | ||||||||
| 740,000 | 5.250%, 5/25/2018 | 672,475 | ||||||
| Univision Communications, Inc., Term Loan | ||||||||
| 640,000 | 2.245%, 9/29/2014 | 626,669 | ||||||
| Zayo Group, LLC, Term Loan | ||||||||
| 1,200,000 | 0.000%, 6/14/2019b,c | 1,202,784 | ||||||
|
| |||||||
| Total | 6,941,205 | |||||||
|
| |||||||
| Consumer Cyclical (0.1%) | |||||||
| Burlington Coat Factory Warehouse Corporation, Term Loan | ||||||||
| 1,020,659 | 5.500%, 2/28/2017 | 1,014,137 | ||||||
| Chrysler Group, LLC, Term Loan | ||||||||
| 922,670 | 6.000%, 5/24/2017 | 928,437 | ||||||
|
| |||||||
| Total | 1,942,574 | |||||||
|
| |||||||
| Consumer Non-Cyclical (0.2%) | |||||||
| Bausch & Lomb, Inc., Term Loan | ||||||||
| 800,000 | 5.250%, 4/17/2019 | 794,800 | ||||||
| CHS/Community Health Systems, Inc., Term Loan | ||||||||
| 800,000 | 3.967%, 1/25/2017 | 787,288 | ||||||
| DJO Finance, LLC, Term Loan | ||||||||
| 800,000 | 5.000%, 9/15/2017b,c | 792,664 | ||||||
| Roundy’s Supermarkets, Inc., Term Loan | ||||||||
| 1,002,487 | 5.730%, 2/13/2019b,c | 1,003,380 | ||||||
| Visant Corporation, Term Loan | ||||||||
| 1,075,000 | 4.645%, 12/22/2016b,c | 1,040,062 | ||||||
|
| |||||||
| Total | 4,418,194 | |||||||
|
| |||||||
| Energy (0.1%) | |||||||
| Chesapeake Energy Corporation, Term Loan | ||||||||
| 1,080,000 | 8.111%, 12/2/2017b,c | 1,070,431 | ||||||
| GenOn Energy, Inc., Term Loan | ||||||||
| 640,000 | 4.250%, 9/20/2017b,c | 632,800 | ||||||
|
| |||||||
| Total | 1,703,231 | |||||||
|
| |||||||
| Financials (<0.1%) | |||||||
| Nuveen Investments, Inc., Term Loan | ||||||||
| 800,000 | 5.685%, 5/13/2017b,c | 786,400 | ||||||
|
| |||||||
| Total | 786,400 | |||||||
|
| |||||||
| Technology (0.1%) | |||||||
| First Data Corporation Extended, Term Loan | ||||||||
| 925,000 | 4.245%, 3/26/2018 | 847,189 | ||||||
| Freescale Semiconductor, Inc., Term Loan | ||||||||
| 1,127,175 | 5.646%, 2/28/2019b,c | 1,107,855 | ||||||
| Intelsat Jackson Holdings SA, Term Loan | ||||||||
| 925,000 | 5.250%, 4/2/2018 | 922,882 | ||||||
|
| |||||||
| Total | 2,877,926 | |||||||
|
| |||||||
| Transportation (<0.1%) | |||||||
| Delta Air Lines, Inc., Term Loan | ||||||||
| 922,670 | 5.500%, 4/20/2017 | 919,791 | ||||||
|
| |||||||
| Total | 919,791 | |||||||
|
| |||||||
| Utilities (<0.1%) | |||||||
| NGPL PipeCo, LLC, Term Loan | ||||||||
| 1,195,000 | 6.750%, 5/15/2017 | 1,170,108 | ||||||
|
| |||||||
| Total | 1,170,108 | |||||||
|
| |||||||
Total Bank Loans (cost $23,545,155) | 23,363,806 | |||||||
|
| |||||||
The accompanying Notes to Financial Statements are an integral part of this schedule.
37
Table of Contents
Moderately Aggressive Allocation Portfolio
Schedule of Investments as of June 29, 2012
(unaudited)
| Shares | Mutual Funds (56.0%) | Value | ||||||
| Equity Mutual Funds (42.1%) | |||||||
| 5,056,075 | Thrivent Partner Small Cap Growth Portfoliod | $ | 66,662,828 | |||||
| 3,460,967 | Thrivent Partner Small Cap Value Portfolio | 67,157,638 | ||||||
| 4,528,335 | Thrivent Small Cap Stock Portfoliod | 55,433,159 | ||||||
| 6,211,851 | Thrivent Partner Mid Cap Value Portfolio | 82,874,786 | ||||||
| 14,108,172 | Thrivent Mid Cap Stock Portfolio | 170,518,417 | ||||||
| 21,862,556 | Thrivent Partner Worldwide Allocation Portfolio | 169,854,574 | ||||||
| 20,052,862 | Thrivent Partner International Stock Portfolio | 185,164,114 | ||||||
| 18,770,587 | Thrivent Large Cap Value Portfolio | 204,158,288 | ||||||
| 21,892,974 | Thrivent Large Cap Stock Portfolio | 189,293,218 | ||||||
| 2,259,027 | Thrivent Equity Income Plus Portfolio | 21,128,228 | ||||||
|
| |||||||
| Total | 1,212,245,250 | |||||||
|
| |||||||
| Fixed Income Mutual Funds (13.9%) | |||||||
| 23,202,043 | Thrivent High Yield Portfolio | 112,541,510 | ||||||
| 18,454,470 | Thrivent Income Portfolio | 192,437,678 | ||||||
| 9,675,896 | Thrivent Limited Maturity Bond Portfolio | 94,798,625 | ||||||
|
| |||||||
| Total | 399,777,813 | |||||||
|
| |||||||
Total Mutual Funds (cost $1,748,855,121) | 1,612,023,063 | |||||||
|
| |||||||
Common Stock (24.6%) | ||||||||
| Consumer Discretionary (3.0%) | |||||||
| 14,771 | Abercrombie & Fitch Company | 504,282 | ||||||
| 33,792 | Amazon.com, Inc.d | 7,716,403 | ||||||
| 8,350 | AutoZone, Inc.d | 3,065,869 | ||||||
| 53,000 | Big Lots, Inc.d | 2,161,870 | ||||||
| 35,500 | BJ’s Restaurants, Inc.d | 1,349,000 | ||||||
| 13,120 | CBS Corporation | 430,074 | ||||||
| 15,100 | Charter Communications, Inc.d | 1,070,137 | ||||||
| 37,000 | Children’s Place Retail Stores, Inc.d | 1,843,710 | ||||||
| 30,300 | Coach, Inc. | 1,771,944 | ||||||
| 361,736 | Comcast Corporation | 11,564,700 | ||||||
| 10,674 | Darden Restaurants, Inc. | 540,425 | ||||||
| 33,489 | Delphi Automotive plcd | 853,969 | ||||||
| 27,162 | Discovery Communications, Inc.d | 1,466,748 | ||||||
| 21,100 | DISH Network Corporation | 602,405 | ||||||
| 49,376 | Dollar Tree, Inc.d | 2,656,429 | ||||||
| 77,988 | Foot Locker, Inc. | 2,384,873 | ||||||
| 13,279 | Gentex Corporation | 277,133 | ||||||
| 23,630 | GNC Holdings, Inc. | 926,296 | ||||||
| 6,370 | Harley-Davidson, Inc. | 291,300 | ||||||
| 112,300 | Home Depot, Inc. | 5,950,777 | ||||||
| 209,877 | Las Vegas Sands Corporation | 9,127,551 | ||||||
| 38,863 | Life Time Fitness, Inc.d | 1,807,518 | ||||||
| 22,649 | Limited Brands, Inc. | 963,262 | ||||||
| 43,000 | Lowe’s Companies, Inc. | 1,222,920 | ||||||
| 49,100 | Meredith Corporatione | 1,568,254 | ||||||
| 67,780 | News Corporation | 1,526,406 | ||||||
| 49,800 | NIKE, Inc. | 4,371,444 | ||||||
| 27,660 | Omnicom Group, Inc. | 1,344,276 | ||||||
| 6,913 | O’Reilly Automotive, Inc.d | 579,102 | ||||||
| 5,518 | Panera Bread Companyd | 769,430 | ||||||
| 52,000 | Penn National Gaming, Inc.d | 2,318,680 | ||||||
| 23,580 | PetSmart, Inc. | 1,607,684 | ||||||
| 136,988 | Pier 1 Imports, Inc. | 2,250,713 | ||||||
| 3,900 | Priceline.com, Inc.d | 2,591,628 | ||||||
| 103,000 | Sally Beauty Holdings, Inc.d | 2,651,220 | ||||||
| 10,580 | Time Warner Cable, Inc. | 868,618 | ||||||
| 44,900 | Toll Brothers, Inc.d | 1,334,877 | ||||||
| 13,780 | Tractor Supply Company | 1,144,567 | ||||||
| 3,938 | VF Corporation | 525,526 | ||||||
| 37,853 | WMS Industries, Inc.d | 755,167 | ||||||
|
| |||||||
| Total | 86,757,187 | |||||||
|
| |||||||
| Consumer Staples (2.1%) | |||||||
| 125,878 | Altria Group, Inc. | 4,349,085 | ||||||
| 96,835 | Anheuser-Busch InBev NV ADR | 7,712,908 | ||||||
| 83,290 | Archer-Daniels-Midland Company | 2,458,721 | ||||||
| 41,963 | British American Tobacco plc ADR | 4,285,262 | ||||||
| 22,900 | Bunge, Ltd. | 1,436,746 | ||||||
| 9,839 | Clorox Company | 712,934 | ||||||
| 71,990 | Coca-Cola Company | 5,628,898 | ||||||
| 47,300 | Colgate-Palmolive Company | 4,923,930 | ||||||
| 17,050 | CVS Caremark Corporation | 796,746 | ||||||
| 11,680 | Diageo plc ADR | 1,203,858 | ||||||
| 84,503 | Ingredion, Inc. | 4,184,589 | ||||||
| 8,390 | Kimberly-Clark Corporation | 702,830 | ||||||
| 47,960 | Kraft Foods, Inc. | 1,852,215 | ||||||
| 88,795 | Philip Morris International, Inc. | 7,748,252 | ||||||
| 14,887 | TreeHouse Foods, Inc.d | 927,311 | ||||||
| 161,800 | Walgreen Company | 4,786,044 | ||||||
| 63,620 | Wal-Mart Stores, Inc. | 4,435,586 | ||||||
| 18,248 | Whole Foods Market, Inc. | 1,739,399 | ||||||
|
| |||||||
| Total | 59,885,314 | |||||||
|
| |||||||
| Energy (3.6%) | |||||||
| 156,343 | Alpha Natural Resources, Inc.d | 1,361,748 | ||||||
| 158,798 | Apache Corporation | 13,956,756 | ||||||
| 83,500 | Arch Coal, Inc.e | 575,315 | ||||||
| 25,300 | Baker Hughes, Inc. | 1,039,830 | ||||||
| 58,783 | BP plc ADR | 2,383,063 | ||||||
| 22,100 | Cameron International Corporationd | 943,891 | ||||||
| 33,550 | Chevron Corporation | 3,539,525 | ||||||
| 11,160 | Concho Resources, Inc.d | 949,939 | ||||||
| 203,190 | ConocoPhillips | 11,354,257 | ||||||
| 176,700 | Consol Energy, Inc. | 5,343,408 | ||||||
| 22,900 | Dril-Quip, Inc.d | 1,502,011 | ||||||
| 120,297 | Ensco plc | 5,650,350 | ||||||
| 66,086 | EOG Resources, Inc. | 5,955,010 | ||||||
| 19,480 | EQT Corporation | 1,044,712 | ||||||
| 54,000 | Exxon Mobil Corporation | 4,620,780 | ||||||
| 86,284 | Helix Energy Solutions Group, Inc.d | 1,415,920 | ||||||
| 92,700 | Nabors Industries, Ltd.d | 1,334,880 | ||||||
| 32,338 | National Oilwell Varco, Inc. | 2,083,861 | ||||||
The accompanying Notes to Financial Statements are an integral part of this schedule.
38
Table of Contents
Moderately Aggressive Allocation Portfolio
Schedule of Investments as of June 29, 2012
(unaudited)
Shares | Common Stock (24.6%) | Value | ||||
Energy (3.6%) - continued | ||||||
46,900 | Newfield Exploration Companyd | $ | 1,374,639 | |||
85,070 | Occidental Petroleum Corporation | 7,296,454 | ||||
37,178 | Oil States International, Inc.d | 2,461,184 | ||||
74,209 | Peabody Energy Corporation | 1,819,605 | ||||
55,500 | Petroleo Brasileiro SA ADR | 1,041,735 | ||||
138,062 | Petroleum Geo-Services ASA | 1,687,389 | ||||
51,300 | Plains Exploration & Production Companyd | 1,804,734 | ||||
8,100 | Range Resources Corporation | 501,147 | ||||
7,240 | Schlumberger, Ltd. | 469,948 | ||||
8,500 | SM Energy Company | 417,435 | ||||
21,000 | Southwestern Energy Companyd | 670,530 | ||||
101,733 | Swift Energy Companyd | 1,893,251 | ||||
45,700 | Ultra Petroleum Corporationd,e | 1,054,299 | ||||
249,280 | Valero Energy Corporation | 6,020,112 | ||||
685,507 | Weatherford International, Ltd.d | 8,657,953 | ||||
5,139 | Whiting Petroleum Corporationd | 211,316 | ||||
|
| |||||
| Total | 102,436,987 | |||||
|
| |||||
Financials (3.4%) | ||||||
13,760 | ACE, Ltd. | 1,020,029 | ||||
28,373 | Affiliated Managers Group, Inc.d | 3,105,425 | ||||
6,200 | Allied World Assurance Company Holdings AG | 492,714 | ||||
18,800 | American Campus Communities, Inc. | 845,624 | ||||
104,800 | Ameriprise Financial, Inc. | 5,476,848 | ||||
34,200 | Apartment Investment & Management Company | 924,426 | ||||
14,500 | Aspen Insurance Holdings, Ltd. | 419,050 | ||||
52,680 | Bank of America Corporation | 430,922 | ||||
14,392 | Boston Properties, Inc. | 1,559,661 | ||||
9,370 | Capital One Financial Corporation | 512,164 | ||||
41,200 | CBL & Associates Properties, Inc. | 805,048 | ||||
51,560 | Charles Schwab Corporation | 666,671 | ||||
362,487 | Citigroup, Inc. | 9,935,769 | ||||
20,634 | CME Group, Inc. | 5,532,182 | ||||
45,859 | Discover Financial Services | 1,585,804 | ||||
40,600 | Douglas Emmett, Inc. | 937,860 | ||||
46,931 | Duke Realty Corporation | 687,070 | ||||
17,500 | Endurance Specialty Holdings, Ltd. | 670,600 | ||||
11,700 | Equity Lifestyle Properties, Inc. | 806,949 | ||||
25,488 | Equity Residential | 1,589,432 | ||||
55,772 | HCC Insurance Holdings, Inc. | 1,751,241 | ||||
14,100 | Home Properties, Inc. | 865,176 | ||||
58,995 | Host Hotels & Resorts, Inc. | 933,301 | ||||
551,600 | Huntington Bancshares, Inc. | 3,530,240 | ||||
30,800 | iShares Russell 2000 Index Funde | 2,453,220 | ||||
277,929 | J.P. Morgan Chase & Company | 9,930,403 | ||||
79,076 | Kimco Realty Corporation | 1,504,816 | ||||
62,120 | KKR & Company, LP | 800,727 | ||||
21,350 | Lazard, Ltd. | 554,886 | ||||
9,200 | M&T Bank Corporation | 759,644 | ||||
143,681 | Marsh & McLennan Companies, Inc. | 4,630,838 | ||||
46,010 | MetLife, Inc. | 1,419,408 | ||||
31,500 | NASDAQ OMX Group, Inc. | 714,105 | ||||
17,300 | Northern Trust Corporation | 796,146 | ||||
58,300 | Och-Ziff Capital Management Group, LLC | 441,914 | ||||
118,205 | Ocwen Financial Corporationd | 2,219,890 | ||||
119,826 | Popular, Inc.d | 1,990,310 | ||||
4,900 | ProAssurance Corporation | 436,541 | ||||
141,460 | Progressive Corporation | 2,946,612 | ||||
13,400 | Protective Life Corporation | 394,094 | ||||
10,553 | Public Storage, Inc. | 1,523,959 | ||||
6,438 | S&P 500 Large Index Depository Receipts | 877,306 | ||||
10,792 | Simon Property Group, Inc. | 1,679,883 | ||||
33,520 | State Street Corporation | 1,496,333 | ||||
53,810 | SunTrust Banks, Inc. | 1,303,816 | ||||
11,150 | SVB Financial Groupd | 654,728 | ||||
26,700 | Tanger Factory Outlet Centers, Inc. | 855,735 | ||||
6,201 | Taubman Centers, Inc. | 478,469 | ||||
36,795 | TD Ameritrade Holding Corporation | 625,515 | ||||
18,800 | Tower Group, Inc. | 392,356 | ||||
17,715 | Vornado Realty Trust | 1,487,706 | ||||
39,796 | W.R. Berkley Corporation | 1,548,860 | ||||
200,084 | Wells Fargo & Company | 6,690,809 | ||||
139,931 | Zions Bancorporation | 2,717,460 | ||||
|
| |||||
| Total | 99,410,695 | |||||
|
| |||||
Health Care (3.2%) | ||||||
48,700 | Abbott Laboratories | 3,139,689 | ||||
18,325 | Alexion Pharmaceuticals, Inc.d | 1,819,673 | ||||
75,900 | Align Technology, Inc.d | 2,539,614 | ||||
22,140 | AmerisourceBergen Corporation | 871,209 | ||||
66,087 | Amgen, Inc. | 4,826,994 | ||||
127,837 | Baxter International, Inc. | 6,794,537 | ||||
62,100 | Biogen Idec, Inc.d | 8,965,998 | ||||
12,900 | BioMarin Pharmaceutical, Inc.d | 510,582 | ||||
252,400 | Bristol-Myers Squibb Company | 9,073,780 | ||||
7,087 | C.R. Bard, Inc. | 761,427 | ||||
10,862 | CIGNA Corporation | 477,928 | ||||
35,830 | Covance, Inc.d | 1,714,465 | ||||
24,650 | Covidien plc | 1,318,775 | ||||
128,700 | Eli Lilly and Company | 5,522,517 | ||||
72,541 | Health Net, Inc.d | 1,760,570 | ||||
32,590 | Johnson & Johnson | 2,201,780 | ||||
21,600 | Medicines Companyd | 495,504 | ||||
45,290 | Merck & Company, Inc. | 1,890,858 | ||||
3,850 | Mettler-Toledo International, Inc.d | 600,023 | ||||
7,489 | Onyx Pharmaceuticals, Inc.d | 497,644 | ||||
7,000 | Perrigo Company | 825,510 | ||||
219,987 | Pfizer, Inc. | 5,059,701 | ||||
72,938 | PSS World Medical, Inc.d | 1,530,969 | ||||
32,580 | Sanofi ADR | 1,230,872 | ||||
73,000 | Shire Pharmaceuticals Group plc ADR | 6,306,470 | ||||
11,862 | SXC Health Solutions Corporationd,e | 1,176,829 | ||||
25,900 | Thoratec Corporationd | 869,722 | ||||
38,067 | United Therapeutics Corporationd | 1,879,748 | ||||
224,988 | UnitedHealth Group, Inc. | 13,161,798 | ||||
7,800 | Waters Corporationd | 619,866 | ||||
20,344 | Watson Pharmaceuticals, Inc.d | 1,505,253 | ||||
The accompanying Notes to Financial Statements are an integral part of this schedule.
39
Table of Contents
Moderately Aggressive Allocation Portfolio
Schedule of Investments as of June 29, 2012
(unaudited)
Shares | Common Stock (24.6%) | Value | ||||||
| Health Care (3.2%) - continued | |||||||
| 12,923 | Zimmer Holdings, Inc. | $ | 831,724 | |||||
|
| |||||||
| Total | 90,782,029 | |||||||
|
| |||||||
| Industrials (2.9%) | |||||||
| 40,000 | 3M Company | 3,584,000 | ||||||
| 68,400 | Actuant Corporation | 1,857,744 | ||||||
| 21,213 | AMETEK, Inc. | 1,058,741 | ||||||
| 26,239 | BE Aerospace, Inc.d | 1,145,595 | ||||||
| 78,081 | Boeing Company | 5,801,418 | ||||||
| 32,289 | Chicago Bridge and Iron Company | 1,225,690 | ||||||
| 25,584 | CSX Corporation | 572,058 | ||||||
| 28,000 | Cummins, Inc. | 2,713,480 | ||||||
| 73,294 | Deluxe Corporation | 1,827,952 | ||||||
| 129,100 | Dover Corporation | 6,921,051 | ||||||
| 64,314 | EMCOR Group, Inc. | 1,789,216 | ||||||
| 32,337 | Expeditors International of Washington, Inc. | 1,253,059 | ||||||
| 6,950 | FedEx Corporation | 636,690 | ||||||
| 8,136 | Flowserve Corporation | 933,606 | ||||||
| 50,200 | GATX Corporation | 1,932,700 | ||||||
| 33,260 | General Electric Company | 693,138 | ||||||
| 16,202 | Honeywell International, Inc. | 904,720 | ||||||
| 44,240 | Jacobs Engineering Group, Inc.d | 1,674,926 | ||||||
| 27,206 | JB Hunt Transport Services, Inc. | 1,621,478 | ||||||
| 21,056 | Kansas City Southern | 1,464,655 | ||||||
| 39,200 | L-3 Communications Holdings, Inc. | 2,901,192 | ||||||
| 28,300 | Landstar System, Inc. | 1,463,676 | ||||||
| 88,800 | Lockheed Martin Corporation | 7,732,704 | ||||||
| 190,562 | Manitowoc Company, Inc. | 2,229,575 | ||||||
| 11,600 | Manpower, Inc. | 425,140 | ||||||
| 9,070 | Norfolk Southern Corporation | 650,954 | ||||||
| 33,666 | Oshkosh Corporationd | 705,303 | ||||||
| 119,172 | Parker Hannifin Corporation | 9,161,943 | ||||||
| 19,315 | Pentair, Inc. | 739,378 | ||||||
| 15,432 | Roper Industries, Inc. | 1,521,287 | ||||||
| 57,043 | Shaw Group, Inc.d | 1,557,844 | ||||||
| 29,567 | SPX Corporation | 1,931,317 | ||||||
| 10,953 | Stericycle, Inc.d | 1,004,062 | ||||||
| 120,100 | Tyco International, Ltd. | 6,347,285 | ||||||
| 72,617 | United Technologies Corporation | 5,484,762 | ||||||
|
| |||||||
| Total | 83,468,339 | |||||||
|
| |||||||
| Information Technology (5.2%) | |||||||
| 51,900 | Accenture plc | 3,118,671 | ||||||
| 55,200 | ADTRAN, Inc. | 1,666,488 | ||||||
| 73,622 | Akamai Technologies, Inc.d | 2,337,498 | ||||||
| 12,600 | Alliance Data Systems Corporationd | 1,701,000 | ||||||
| 20,364 | ANSYS, Inc.d | 1,285,172 | ||||||
| 51,278 | Apple, Inc.d | 29,946,352 | ||||||
| 251,473 | Atmel Corporationd | 1,684,869 | ||||||
| 17,108 | Autodesk, Inc.d | 598,609 | ||||||
| 35,876 | Broadcom Corporationd | 1,212,609 | ||||||
| 67,400 | Cavium, Inc.d | 1,887,200 | ||||||
| 44,300 | Ciena Corporationd,e | 725,191 | ||||||
| 93,685 | Cognizant Technology Solutions Corporationd | 5,621,100 | ||||||
| 50,600 | CoreLogic, Inc.d | 926,486 | ||||||
| 131,025 | eBay, Inc.d | 5,504,360 | ||||||
| 50,228 | Electronic Arts, Inc.d | 620,316 | ||||||
| 13,084 | F5 Networks, Inc.d | 1,302,643 | ||||||
| 20,401 | Fortinet, Inc.d | 473,711 | ||||||
| 18,473 | Google, Inc.d | 10,715,633 | ||||||
| 17,100 | International Business Machines Corporation | 3,344,418 | ||||||
| 18,367 | Itron, Inc.d | 757,455 | ||||||
| 34,027 | Juniper Networks, Inc.d | 554,980 | ||||||
| 5,693 | Lam Research Corporationd | 214,854 | ||||||
| 83,159 | Marvell Technology Group, Ltd. | 938,033 | ||||||
| 7,800 | MasterCard, Inc. | 3,354,858 | ||||||
| 6,776 | Mercadolibre, Inc. | 513,621 | ||||||
| 445,535 | Microsoft Corporation | 13,628,916 | ||||||
| 195,549 | NetApp, Inc.d | 6,222,369 | ||||||
| 7,151 | Nice Systems, Ltd. ADRd | 261,727 | ||||||
| 51,791 | Nuance Communications, Inc.d | 1,233,662 | ||||||
| 155,769 | NVIDIA Corporationd | 2,152,728 | ||||||
| 67,300 | ON Semiconductor Corporationd | 477,830 | ||||||
| 63,800 | OpenTable, Inc.d,e | 2,871,638 | ||||||
| 428,979 | Oracle Corporation | 12,740,676 | ||||||
| 45,904 | Plantronics, Inc. | 1,533,194 | ||||||
| 131,900 | Polycom, Inc.d | 1,387,588 | ||||||
| 116,811 | QUALCOMM, Inc. | 6,504,036 | ||||||
| 13,827 | Red Hat, Inc.d | 780,949 | ||||||
| 24,700 | Riverbed Technology, Inc.d | 398,905 | ||||||
| 2,850 | ServiceNow, Inc.c,d | 70,110 | ||||||
| 58,539 | Teradata Corporationd | 4,215,393 | ||||||
| 179,054 | Teradyne, Inc.d | 2,517,499 | ||||||
| 267,410 | Texas Instruments, Inc. | 7,671,993 | ||||||
| 51,193 | TIBCO Software, Inc.d | 1,531,695 | ||||||
| 55,140 | VeriFone Systems, Inc.d | 1,824,583 | ||||||
| 61,848 | Xilinx, Inc. | 2,076,237 | ||||||
|
| |||||||
| Total | 151,107,855 | |||||||
|
| |||||||
| Materials (0.8%) | |||||||
| 4,100 | Agrium, Inc. | 362,727 | ||||||
| 70,700 | AK Steel Holding Corporatione | 415,009 | ||||||
| 13,833 | Albemarle Corporation | 825,000 | ||||||
| 18,200 | BHP Billiton, Ltd. ADR | 1,188,460 | ||||||
| 15,900 | Buckeye Technologies, Inc. | 452,991 | ||||||
| 9,787 | Celanese Corporation | 338,826 | ||||||
| 23,000 | Cliffs Natural Resources, Inc. | 1,133,670 | ||||||
| 14,400 | Eagle Materials, Inc. | 537,696 | ||||||
| 16,266 | FMC Corporation | 869,906 | ||||||
| 207,203 | Freeport-McMoRan Copper & Gold, Inc. | 7,059,406 | ||||||
| 15,500 | H.B. Fuller Company | 475,850 | ||||||
| 8,700 | LyondellBasell Industries NV | 350,349 | ||||||
| 22,900 | Materials Select Sector SPDR Fund | 808,141 | ||||||
| 20,800 | Mosaic Company | 1,139,008 | ||||||
| 11,533 | Newmont Mining Corporation | 559,466 | ||||||
| 24,600 | Rio Tinto plc ADRe | 1,176,126 | ||||||
| 9,446 | Sigma-Aldrich Corporation | 698,343 | ||||||
| 20,110 | Silgan Holdings, Inc. | 858,496 | ||||||
| 20,302 | Silver Wheaton Corporation | 544,905 | ||||||
| 56,920 | Steel Dynamics, Inc. | 668,810 | ||||||
| 34,300 | SunCoke Energy, Inc.d | 502,495 | ||||||
| 33,586 | Walter Energy, Inc. | 1,483,158 | ||||||
|
| |||||||
| Total | 22,448,838 | |||||||
|
| |||||||
The accompanying Notes to Financial Statements are an integral part of this schedule.
40
Table of Contents
Moderately Aggressive Allocation Portfolio
Schedule of Investments as of June 29, 2012
(unaudited)
Shares | Common Stock (24.6%) | Value | ||||||
| Telecommunications Services (0.1%) |
| ||||||
| 12,416 | SBA Communications Corporationd | $ | 708,333 | |||||
| 42,883 | TW Telecom, Inc.d | 1,100,378 | ||||||
| 34,139 | Verizon Communications, Inc. | 1,517,137 | ||||||
|
| |||||||
| Total | 3,325,848 | |||||||
|
| |||||||
| Utilities (0.3%) |
| ||||||
| 37,800 | CMS Energy Corporation | 888,300 | ||||||
| 55,760 | NiSource, Inc. | 1,380,060 | ||||||
| 51,169 | NV Energy, Inc. | 899,551 | ||||||
| 96,600 | PNM Resources, Inc. | 1,887,564 | ||||||
| 21,600 | Public Service Enterprise Group, Inc. | 702,000 | ||||||
| 41,718 | Southwest Gas Corporation | 1,820,990 | ||||||
| 30,430 | Utilities Select Sector SPDR Fund | 1,125,606 | ||||||
|
| |||||||
| Total | 8,704,071 | |||||||
|
| |||||||
Total Common Stock (cost $678,233,015) | 708,327,163 | |||||||
|
| |||||||
| Principal Amount | Long-Term Fixed Income (9.9%) | |||||||
| Asset-Backed Securities (0.2%) |
| ||||||
J.P. Morgan Mortgage Acquisition Corporation | ||||||||
| $ | 3,593,309 | 5.461%, 10/25/2036 | 2,804,158 | |||||
Morgan Stanley Capital, Inc. | ||||||||
| 1,315,594 | 0.395%, 2/25/2037f | 654,665 | ||||||
Renaissance Home Equity Loan Trust | ||||||||
| 1,795,370 | 5.746%, 5/25/2036 | 1,144,575 | ||||||
| 2,800,000 | 6.011%, 5/25/2036 | 1,579,057 | ||||||
| 1,320,362 | 5.580%, 11/25/2036 | 699,877 | ||||||
|
| |||||||
| Total | 6,882,332 | |||||||
|
| |||||||
| Basic Materials (0.2%) |
| ||||||
ArcelorMittal | ||||||||
| 45,000 | 5.375%, 6/1/2013 | 46,281 | ||||||
Arch Coal, Inc. | ||||||||
| 700,000 | 7.000%, 6/15/2019e | 591,500 | ||||||
BHP Billiton Finance, Ltd. | ||||||||
| 177,000 | 1.000%, 2/24/2015 | 177,303 | ||||||
Dow Chemical Company | ||||||||
| 177,000 | 5.900%, 2/15/2015 | 197,378 | ||||||
| 105,000 | 4.250%, 11/15/2020 | 113,911 | ||||||
FMG Resources Property, Ltd. | ||||||||
| 700,000 | 8.250%, 11/1/2019g | 742,000 | ||||||
Hexion US Finance Corporation/Hexion Nova Scotia Finance ULC | ||||||||
| 715,000 | 8.875%, 2/1/2018 | 729,300 | ||||||
International Paper Company | ||||||||
| 117,000 | 5.300%, 4/1/2015 | 128,044 | ||||||
LyondellBasell Industries NV | ||||||||
| 730,000 | 5.000%, 4/15/2019g | 765,588 | ||||||
Novelis, Inc. | ||||||||
| 690,000 | 8.375%, 12/15/2017 | 738,300 | ||||||
Rio Tinto Finance USA, Ltd. | ||||||||
| 252,000 | 1.125%, 3/20/2015 | 252,566 | ||||||
|
| |||||||
| Total | 4,482,171 | |||||||
|
| |||||||
| Capital Goods (0.2%) |
| ||||||
Bombardier, Inc. | ||||||||
| 715,000 | 5.750%, 3/15/2022g | 712,319 | ||||||
Case New Holland, Inc. | ||||||||
| 700,000 | 7.875%, 12/1/2017 | 808,500 | ||||||
Caterpillar Financial Services Corporation | ||||||||
| 105,000 | 1.050%, 3/26/2015 | 105,609 | ||||||
| 75,000 | 1.100%, 5/29/2015 | 75,420 | ||||||
John Deere Capital Corporation | ||||||||
| 97,000 | 0.875%, 4/17/2015 | 97,109 | ||||||
Raytheon Company | ||||||||
| 176,000 | 1.625%, 10/15/2015 | 180,664 | ||||||
RBS Global, Inc./Rexnord, LLC | ||||||||
| 715,000 | 8.500%, 5/1/2018 | 775,775 | ||||||
Sealed Air Corporation | ||||||||
| 700,000 | 8.375%, 9/15/2021g | 791,000 | ||||||
Textron, Inc. | ||||||||
| 231,000 | 5.600%, 12/1/2017 | 254,444 | ||||||
United Technologies Corporation | ||||||||
| 38,000 | 0.967%, 6/1/2015f | 38,406 | ||||||
| 38,000 | 1.800%, 6/1/2017 | 38,807 | ||||||
| 19,000 | 4.500%, 6/1/2042 | 20,869 | ||||||
UR Financing Escrow Corporation | ||||||||
| 715,000 | 7.375%, 5/15/2020g | 747,175 | ||||||
|
| |||||||
| Total | 4,646,097 | |||||||
|
| |||||||
| Collateralized Mortgage Obligations (0.5%) |
| ||||||
Citigroup Mortgage Loan Trust, Inc. | ||||||||
| 693,229 | 5.500%, 11/25/2035 | 571,945 | ||||||
CitiMortgage Alternative Loan Trust | ||||||||
| 2,391,332 | 5.750%, 4/25/2037 | 1,691,815 | ||||||
Countrywide Alternative Loan Trust | ||||||||
| 483,017 | 6.000%, 1/25/2037 | 347,753 | ||||||
| 2,197,745 | 5.500%, 5/25/2037 | 1,504,957 | ||||||
| 1,819,014 | 7.000%, 10/25/2037 | 1,098,266 | ||||||
Countrywide Home Loans, Inc. | ||||||||
| 1,073,188 | 5.750%, 4/25/2037 | 896,013 | ||||||
Deutsche Alt-A Securities, Inc. | ||||||||
| 398,963 | 5.500%, 10/25/2021 | 385,641 | ||||||
| 813,523 | 6.000%, 10/25/2021 | 699,647 | ||||||
HomeBanc Mortgage Trust | ||||||||
| 3,040,580 | 2.591%, 4/25/2037 | 1,980,026 | ||||||
J.P. Morgan Mortgage Trust | ||||||||
| 208,192 | 2.747%, 10/25/2036 | 148,650 | ||||||
| 2,421,546 | 6.250%, 8/25/2037 | 1,529,153 | ||||||
MASTR Alternative Loans Trust | ||||||||
| 538,797 | 6.500%, 7/25/2034 | 566,201 | ||||||
Merrill Lynch Alternative Note Asset Trust | ||||||||
| 530,879 | 6.000%, 3/25/2037 | 391,297 | ||||||
Sequoia Mortgage Trust | ||||||||
| 699,349 | 5.371%, 9/20/2046 | 237,639 | ||||||
WaMu Mortgage Pass Through Certificates | ||||||||
| 327,762 | 2.506%, 9/25/2036 | 234,382 | ||||||
| 683,874 | 2.561%, 10/25/2036 | 482,404 | ||||||
The accompanying Notes to Financial Statements are an integral part of this schedule.
41
Table of Contents
Moderately Aggressive Allocation Portfolio
Schedule of Investments as of June 29, 2012
(unaudited)
| Principal Amount | Long-Term Fixed Income (9.9%) | Value | ||||||
| Collateralized Mortgage Obligations (0.5%) – continued |
| ||||||
| WaMu Mortgage Pass-Through Certificates | ||||||||
| $4,715,432 | 2.248%, 11/25/2036 | $ | 3,346,080 | |||||
|
| |||||||
| Total | 16,111,869 | |||||||
|
| |||||||
| Commercial Mortgage-Backed Securities (0.9%) | |||||||
| Banc of America Commercial Mortgage, Inc. | ||||||||
| 2,800,000 | 5.807%, 4/10/2049 | 3,205,350 | ||||||
| 3,675,000 | 5.805%, 6/10/2049 | 4,151,894 | ||||||
| Bear Stearns Commercial Mortgage Securities, Inc. | ||||||||
| 1,710,000 | 5.331%, 2/11/2044 | 1,840,427 | ||||||
| Citigroup/Deutsche Bank Commercial Mortgage | ||||||||
| 3,900,000 | 5.322%, 12/11/2049 | 4,331,800 | ||||||
| Credit Suisse First Boston Mortgage Securities | ||||||||
| 2,800,000 | 5.542%, 1/15/2049 | 3,015,113 | ||||||
| Credit Suisse Mortgage Capital Certificates | ||||||||
| 3,350,000 | 5.509%, 9/15/2039 | 3,281,512 | ||||||
| Government National Mortgage Association | ||||||||
| 402,331 | 2.164%, 3/16/2033 | 408,546 | ||||||
| 356,942 | 3.214%, 1/16/2040 | 374,526 | ||||||
| Greenwich Capital Commercial Funding Corporation | ||||||||
| 1,750,000 | 5.867%, 12/10/2049 | 1,716,447 | ||||||
| J.P. Morgan Chase Commercial Mortgage Securities Corporation | ||||||||
| 1,300,000 | 5.924%, 2/12/2049 | 1,308,684 | ||||||
| Morgan Stanley Capital, Inc. | ||||||||
| 900,000 | 5.406%, 3/15/2044 | 881,896 | ||||||
| Wachovia Bank Commercial Mortgage Trust | ||||||||
| 2,100,000 | 5.603%, 10/15/2048 | 2,104,143 | ||||||
|
| |||||||
| Total | 26,620,338 | |||||||
|
| |||||||
| Communications Services (0.4%) | |||||||
| AMC Networks, Inc. | ||||||||
| 460,000 | 7.750%, 7/15/2021g | 507,150 | ||||||
| AT&T, Inc. | ||||||||
| 210,000 | 2.400%, 8/15/2016 | 218,180 | ||||||
| British Telecommunications plc | ||||||||
| 150,000 | 2.000%, 6/22/2015 | 152,061 | ||||||
| Cablevision Systems Corporation | ||||||||
| 700,000 | 8.625%, 9/15/2017 | 780,500 | ||||||
| CCO Holdings, LLC | ||||||||
| 700,000 | 7.000%, 1/15/2019 | 756,000 | ||||||
| CenturyLink, Inc. | ||||||||
| 240,000 | 5.800%, 3/15/2022 | 238,921 | ||||||
| Comcast Corporation | ||||||||
| 252,000 | 6.500%, 1/15/2015 | 284,252 | ||||||
| 75,000 | 4.650%, 7/15/2042 | 75,034 | ||||||
| Digicel, Ltd. | ||||||||
| 490,000 | 8.250%, 9/1/2017g | 498,575 | ||||||
| DIRECTV Holdings, LLC/DIRECTV Financing Company, Inc. | ||||||||
| 177,000 | 2.400%, 3/15/2017 | 178,166 | ||||||
| Dish DBS Corporation | ||||||||
| 640,000 | 4.625%, 7/15/2017g | 640,800 | ||||||
| 640,000 | 5.875%, 7/15/2022g | 646,400 | ||||||
| Frontier Communications Corporation | ||||||||
| 700,000 | 8.125%, 10/1/2018 | 743,750 | ||||||
| Hughes Satellite Systems Corporation | ||||||||
| 700,000 | 6.500%, 6/15/2019 | 743,750 | ||||||
| Intelsat Jackson Holdings SA | ||||||||
| 700,000 | 7.250%, 4/1/2019 | 735,000 | ||||||
| Level 3 Financing, Inc. | ||||||||
| 620,000 | 8.625%, 7/15/2020 | 651,000 | ||||||
| NBCUniversal Media, LLC | ||||||||
| 177,000 | 2.875%, 4/1/2016 | 184,559 | ||||||
| News America, Inc. | ||||||||
| 55,000 | 5.300%, 12/15/2014 | 60,281 | ||||||
| Sprint Nextel Corporation | ||||||||
| 360,000 | 9.125%, 3/1/2017g | 378,000 | ||||||
| 340,000 | 9.000%, 11/15/2018g | 379,950 | ||||||
| Telefonica Emisiones SAU | ||||||||
| 75,000 | 3.729%, 4/27/2015 | 68,290 | ||||||
| Time Warner Cable, Inc. | ||||||||
| 98,000 | 7.500%, 4/1/2014 | 108,652 | ||||||
| 98,000 | 3.500%, 2/1/2015 | 103,656 | ||||||
| UPCB Finance V, Ltd. | ||||||||
| 700,000 | 7.250%, 11/15/2021g | 731,500 | ||||||
| Verizon Communications, Inc. | ||||||||
| 210,000 | 5.500%, 2/15/2018 | 248,567 | ||||||
| Virgin Media Finance plc | ||||||||
| 715,000 | 5.250%, 2/15/2022 | 731,088 | ||||||
| Vivendi SA | ||||||||
| 177,000 | 2.400%, 4/10/2015g | 175,247 | ||||||
| Vodafone Group plc | ||||||||
| 105,000 | 3.375%, 11/24/2015 | 112,179 | ||||||
|
| |||||||
| Total | 11,131,508 | |||||||
|
| |||||||
| Consumer Cyclical (0.3%) | |||||||
| Chrysler Group, LLC | ||||||||
| 660,000 | 8.000%, 6/15/2019e | 678,150 | ||||||
| Daimler Finance North America, LLC | ||||||||
| 98,000 | 1.650%, 4/10/2015g | 98,385 | ||||||
| Federated Retail Holdings, Inc. | ||||||||
| 176,000 | 5.900%, 12/1/2016 | 202,868 | ||||||
| Ford Motor Credit Company, LLC | ||||||||
| 153,000 | 2.750%, 5/15/2015 | 154,241 | ||||||
| 715,000 | 5.000%, 5/15/2018 | 759,246 | ||||||
| Host Hotels and Resorts, LP | ||||||||
| 640,000 | 6.000%, 11/1/2020 | 694,400 | ||||||
| Lennar Corporation | ||||||||
| 700,000 | 12.250%, 6/1/2017 | 904,750 | ||||||
| Limited Brands, Inc. | ||||||||
| 595,000 | 5.625%, 2/15/2022 | 612,850 | ||||||
The accompanying Notes to Financial Statements are an integral part of this schedule.
42
Table of Contents
Moderately Aggressive Allocation Portfolio
Schedule of Investments as of June 29, 2012
(unaudited)
| Principal Amount | Long-Term Fixed Income (9.9%) | Value | ||||||
| Consumer Cyclical (0.3%) - continued | ||||||||
Macy’s Retail Holdings, Inc. | ||||||||
| $ | 177,000 | 3.875%, 1/15/2022 | $ | 186,093 | ||||
MGM Resorts International | ||||||||
| 640,000 | 11.125%, 11/15/2017 | 718,400 | ||||||
Rite Aid Corporation | ||||||||
| 700,000 | 7.500%, 3/1/2017 | 714,000 | ||||||
Service Corporation International | ||||||||
| 715,000 | 8.000%, 11/15/2021 | 820,463 | ||||||
Time Warner, Inc. | ||||||||
| 98,000 | 3.150%, 7/15/2015 | 103,353 | ||||||
Toyota Motor Credit Corporation | ||||||||
| 75,000 | 1.750%, 5/22/2017 | 75,608 | ||||||
Toys R Us Property Company II, LLC | ||||||||
| 695,000 | 8.500%, 12/1/2017 | 723,669 | ||||||
Viacom, Inc. | ||||||||
| 25,000 | 4.375%, 9/15/2014 | 26,761 | ||||||
| 25,000 | 1.250%, 2/27/2015 | 25,062 | ||||||
Volkswagen International Finance NV | ||||||||
| 100,000 | 1.625%, 3/22/2015g | 100,346 | ||||||
|
| |||||||
Total | 7,598,645 | |||||||
|
| |||||||
| Consumer Non-Cyclical (0.4%) | ||||||||
Amgen, Inc. | ||||||||
| 80,000 | 4.850%, 11/18/2014 | 86,867 | ||||||
| 80,000 | 2.125%, 5/15/2017 | 80,939 | ||||||
Anheuser-Busch InBev Worldwide, Inc. | ||||||||
| 96,000 | 1.016%, 1/27/2014f | 96,783 | ||||||
Aristotle Holding, Inc. | ||||||||
| 117,000 | 2.750%, 11/21/2014g | 119,503 | ||||||
BAT International Finance plc | ||||||||
| 150,000 | 1.400%, 6/5/2015g | 149,982 | ||||||
| 75,000 | 2.125%, 6/7/2017g | 74,901 | ||||||
Beam, Inc. | ||||||||
| 40,000 | 1.875%, 5/15/2017 | 40,193 | ||||||
Boston Scientific Corporation | ||||||||
| 160,000 | 5.450%, 6/15/2014 | 171,471 | ||||||
| 111,000 | 4.500%, 1/15/2015 | 118,276 | ||||||
Bunge Limited Finance Corporation | ||||||||
| 150,000 | 3.200%, 6/15/2017 | 150,332 | ||||||
Capella Healthcare, Inc. | ||||||||
| 640,000 | 9.250%, 7/1/2017 | 662,400 | ||||||
Cardinal Health, Inc. | ||||||||
| 75,000 | 1.900%, 6/15/2017 | 75,562 | ||||||
Community Health Systems, Inc. | ||||||||
| 268,000 | 8.875%, 7/15/2015 | 275,035 | ||||||
| 715,000 | 8.000%, 11/15/2019 | 761,475 | ||||||
Covidien International Finance SA | ||||||||
| 150,000 | 1.350%, 5/29/2015 | 150,195 | ||||||
| 75,000 | 3.200%, 6/15/2022 | 77,323 | ||||||
Express Scripts, Inc. | ||||||||
| 98,000 | 3.125%, 5/15/2016 | 102,035 | ||||||
Fresenius Medical Care US Finance II, Inc. | ||||||||
| 700,000 | 5.625%, 7/31/2019g | 729,750 | ||||||
Gilead Sciences, Inc. | ||||||||
| 110,000 | 2.400%, 12/1/2014 | 113,369 | ||||||
| 110,000 | 3.050%, 12/1/2016 | 116,128 | ||||||
GlaxoSmithKline Capital plc | ||||||||
| 80,000 | 0.750%, 5/8/2015 | 79,991 | ||||||
| 80,000 | 1.500%, 5/8/2017 | 80,145 | ||||||
Grifols, Inc. | ||||||||
| 800,000 | 8.250%, 2/1/2018 | 858,000 | ||||||
HCA, Inc. | ||||||||
| 715,000 | 5.875%, 3/15/2022 | 747,175 | ||||||
JBS USA, LLC | ||||||||
| 700,000 | 7.250%, 6/1/2021g | 651,000 | ||||||
Kellogg Company | ||||||||
| 80,000 | 1.125%, 5/15/2015 | 80,385 | ||||||
| 80,000 | 1.750%, 5/17/2017 | 79,996 | ||||||
Kinetic Concepts, Inc./KCI USA, Inc. | ||||||||
| 700,000 | 10.500%, 11/1/2018g | 735,000 | ||||||
Kraft Foods, Inc. | ||||||||
| 150,000 | 1.625%, 6/4/2015g | 151,587 | ||||||
| 94,000 | 2.250%, 6/5/2017g | 96,244 | ||||||
Libbey Glass, Inc. | ||||||||
| 140,000 | 6.875%, 5/15/2020g | 143,850 | ||||||
Lorillard Tobacco Company | ||||||||
| 212,000 | 3.500%, 8/4/2016 | 221,002 | ||||||
Pfizer, Inc. | ||||||||
| 177,000 | 6.200%, 3/15/2019 | 221,843 | ||||||
Reynolds Group Issuer, Inc. | ||||||||
| 700,000 | 6.875%, 2/15/2021g | 728,000 | ||||||
SABMiller Holdings, Inc. | ||||||||
| 176,000 | 1.850%, 1/15/2015g | 178,514 | ||||||
| 176,000 | 2.450%, 1/15/2017g | 181,410 | ||||||
Spectrum Brands Holdings, Inc. | ||||||||
| 700,000 | 9.500%, 6/15/2018 | 791,000 | ||||||
Teva Pharmaceutical Finance Company BV | ||||||||
| 80,000 | 2.400%, 11/10/2016 | 82,657 | ||||||
Teva Pharmaceutical Finance IV, LLC | ||||||||
| 137,000 | 1.700%, 11/10/2014 | 139,777 | ||||||
Tyson Foods, Inc. | ||||||||
| 150,000 | 4.500%, 6/15/2022 | 154,500 | ||||||
Valeant Pharmaceuticals International | ||||||||
| 700,000 | 6.875%, 12/1/2018g | 723,625 | ||||||
|
| |||||||
Total | 11,278,220 | |||||||
|
| |||||||
| Energy (0.2%) | ||||||||
Anadarko Petroleum Corporation | ||||||||
| 20,000 | 5.750%, 6/15/2014 | 21,496 | ||||||
Apache Corporation | ||||||||
| 177,000 | 1.750%, 4/15/2017 | 180,503 | ||||||
BP Capital Markets plc | ||||||||
| 176,000 | 3.625%, 5/8/2014 | 184,488 | ||||||
| 176,000 | 3.125%, 10/1/2015 | 187,111 | ||||||
| 80,000 | 1.846%, 5/5/2017 | 80,796 | ||||||
| 120,000 | 3.245%, 5/6/2022 | 124,247 | ||||||
Concho Resources, Inc. | ||||||||
| 1,430,000 | 5.500%, 10/1/2022 | 1,415,700 | ||||||
Denbury Resources, Inc. | ||||||||
| 700,000 | 6.375%, 8/15/2021 | 728,000 | ||||||
The accompanying Notes to Financial Statements are an integral part of this schedule.
43
Table of Contents
Moderately Aggressive Allocation Portfolio
Schedule of Investments as of June 29, 2012
(unaudited)
| Principal Amount | Long-Term Fixed Income (9.9%) | Value | ||||||
| Energy (0.2%) - continued | |||||||
Harvest Operations Corporation | ||||||||
| $ | 650,000 | 6.875%, 10/1/2017g | $ | 690,625 | ||||
Linn Energy, LLC | ||||||||
| 700,000 | 7.750%, 2/1/2021 | 731,500 | ||||||
Phillips 66 | ||||||||
| 102,000 | 1.950%, 3/5/2015g | 102,730 | ||||||
| 136,000 | 2.950%, 5/1/2017g | 139,749 | ||||||
Samson Investment Company | ||||||||
| 640,000 | 9.750%, 2/15/2020g | 636,800 | ||||||
Suncor Energy, Inc. | ||||||||
| 97,000 | 6.100%, 6/1/2018 | 114,883 | ||||||
Weatherford International, Ltd. | ||||||||
| 177,000 | 6.750%, 9/15/2040 | 198,666 | ||||||
|
| |||||||
Total | 5,537,294 | |||||||
|
| |||||||
| Financials (0.6%) | ||||||||
Achmea Hypotheekbank NV | ||||||||
| 283,000 | 3.200%, 11/3/2014g | 295,206 | ||||||
Ally Financial, Inc. | ||||||||
| 715,000 | 5.500%, 2/15/2017 | 726,255 | ||||||
American Express Company | ||||||||
| 98,000 | 7.250%, 5/20/2014 | 108,675 | ||||||
American Express Credit Corporation | ||||||||
| 75,000 | 2.375%, 3/24/2017 | 76,870 | ||||||
American International Group, Inc. | ||||||||
| 177,000 | 3.000%, 3/20/2015 | 177,894 | ||||||
| 177,000 | 3.800%, 3/22/2017 | 180,432 | ||||||
ANZ National International, Ltd. of London | ||||||||
| 160,000 | 3.125%, 8/10/2015g | 164,276 | ||||||
Bank of America Corporation | ||||||||
| 253,000 | 7.750%, 8/15/2015 | 275,426 | ||||||
| 175,000 | 3.875%, 3/22/2017e | 178,272 | ||||||
Bank of New York Mellon Corporation | ||||||||
| 175,000 | 1.700%, 11/24/2014 | 177,948 | ||||||
| 40,000 | 1.969%, 6/20/2017 | 40,469 | ||||||
Bank of Nova Scotia | ||||||||
| 450,000 | 1.450%, 7/26/2013g | 454,563 | ||||||
| 175,000 | 1.850%, 1/12/2015 | 177,797 | ||||||
Berkshire Hathaway, Inc. | ||||||||
| 160,000 | 1.600%, 5/15/2017 | 161,114 | ||||||
BlackRock, Inc. | ||||||||
| 75,000 | 1.375%, 6/1/2015 | 75,536 | ||||||
Canadian Imperial Bank of Commerce | ||||||||
| 465,000 | 2.600%, 7/2/2015g | 489,059 | ||||||
Capital One Financial Corporation | ||||||||
| 40,000 | 1.617%, 7/15/2014f | 39,750 | ||||||
| 175,000 | 2.150%, 3/23/2015 | 176,364 | ||||||
CIT Group, Inc. | ||||||||
| 274,496 | 7.000%, 5/2/2017g | 275,011 | ||||||
Citigroup, Inc. | ||||||||
| 175,000 | 5.850%, 7/2/2013 | 183,054 | ||||||
| 175,000 | 5.125%, 5/5/2014 | 182,483 | ||||||
| 310,000 | 5.000%, 9/15/2014 | 317,771 | ||||||
| 175,000 | 4.750%, 5/19/2015 | 183,687 | ||||||
CNA Financial Corporation | ||||||||
| 265,000 | 7.350%, 11/15/2019 | 313,500 | ||||||
Credit Suisse New York, NY | ||||||||
| 135,000 | 5.500%, 5/1/2014 | 143,120 | ||||||
Credit Suisse USA, Inc. | ||||||||
| 175,000 | 5.375%, 3/2/2016 | 194,090 | ||||||
Developers Diversified Realty Corporation | ||||||||
| 240,000 | 7.500%, 4/1/2017 | 275,345 | ||||||
Dexia Credit Local SA | ||||||||
| 450,000 | 2.750%, 4/29/2014g | 439,128 | ||||||
Discover Bank | ||||||||
| 160,000 | 8.700%, 11/18/2019 | 198,784 | ||||||
Eksportfinans ASA | ||||||||
| 80,000 | 3.000%, 11/17/2014 | 75,795 | ||||||
General Electric Capital Corporation | ||||||||
| 80,000 | 1.166%, 4/24/2014f | 80,000 | ||||||
| 105,000 | 0.728%, 9/15/2014f | 103,730 | ||||||
| 177,000 | 2.150%, 1/9/2015 | 179,983 | ||||||
| 55,000 | 1.336%, 5/9/2016f | 54,112 | ||||||
| 99,000 | 2.950%, 5/9/2016 | 102,161 | ||||||
| 80,000 | 2.300%, 4/27/2017 | 80,541 | ||||||
| 105,000 | 6.750%, 3/15/2032 | 130,009 | ||||||
Goldman Sachs Group, Inc. | ||||||||
| 176,000 | 5.000%, 10/1/2014 | 183,497 | ||||||
| 176,000 | 3.700%, 8/1/2015 | 177,555 | ||||||
| 171,000 | 0.918%, 3/22/2016f | 154,733 | ||||||
Hartford Financial Services | ||||||||
Group, Inc. | ||||||||
| 30,000 | 7.300%, 11/1/2015 | 33,381 | ||||||
| 177,000 | 4.000%, 10/15/2017 | 177,734 | ||||||
Health Care REIT, Inc. | ||||||||
| 105,000 | 6.500%, 3/15/2041 | 112,179 | ||||||
HSBC Bank plc | ||||||||
| 55,000 | 1.266%, 1/17/2014f,g | 55,120 | ||||||
HSBC Holdings plc | ||||||||
| 137,000 | 4.000%, 3/30/2022 | 142,261 | ||||||
Icahn Enterprises, LP | ||||||||
| 715,000 | 8.000%, 1/15/2018 | 759,687 | ||||||
ING Bank NV | ||||||||
| 195,000 | 3.750%, 3/7/2017g | 194,085 | ||||||
International Bank for Reconstruction & Development | ||||||||
| 465,000 | 2.375%, 5/26/2015 | 491,083 | ||||||
International Lease Finance Corporation | ||||||||
| 715,000 | 5.875%, 4/1/2019 | 715,693 | ||||||
J.P. Morgan Chase & Company | ||||||||
| 175,000 | 4.650%, 6/1/2014 | 184,245 | ||||||
| 225,000 | 1.875%, 3/20/2015 | 224,826 | ||||||
J.P. Morgan Chase Bank NA | ||||||||
| 155,000 | 0.798%, 6/13/2016f | 144,359 | ||||||
Lloyds TSB Bank plc | ||||||||
| 465,000 | 4.200%, 3/28/2017 | 479,651 | ||||||
MetLife Institutional Funding II | ||||||||
| 105,000 | 1.368%, 4/4/2014f,g | 105,509 | ||||||
Morgan Stanley | ||||||||
| 252,000 | 6.000%, 5/13/2014 | 261,205 | ||||||
The accompanying Notes to Financial Statements are an integral part of this schedule.
44
Table of Contents
Moderately Aggressive Allocation Portfolio
Schedule of Investments as of June 29, 2012
(unaudited)
| Principal Amount | Long-Term Fixed Income (9.9%) | Value | ||||||
| Financials (0.6%) - continued | |||||||
| $ | 252,000 | 4.750%, 3/22/2017 | $ | 251,446 | ||||
Murray Street Investment Trust I | ||||||||
| 194,000 | 4.647%, 3/9/2017 | 194,374 | ||||||
Nordea Bank AB | ||||||||
| 180,000 | 2.250%, 3/20/2015g | 180,649 | ||||||
Omega Healthcare Investors, Inc. | ||||||||
| 640,000 | 5.875%, 3/15/2024g | 640,000 | ||||||
PNC Funding Corporation | ||||||||
| 176,000 | 3.300%, 3/8/2022 | 179,485 | ||||||
Prudential Covered Trust | ||||||||
| 100,000 | 2.997%, 9/30/2015g | 101,583 | ||||||
Prudential Financial, Inc. | ||||||||
| 176,000 | 6.200%, 11/15/2040 | 192,047 | ||||||
Regions Bank | ||||||||
| 250,000 | 7.500%, 5/15/2018 | 281,250 | ||||||
Royal Bank of Canada | ||||||||
| 400,000 | 3.125%, 4/14/2015e,g | 423,617 | ||||||
Royal Bank of Scotland plc | ||||||||
| 177,000 | 4.875%, 8/25/2014g | 181,981 | ||||||
Santander US Debt SAU | ||||||||
| 150,000 | 3.724%, 1/20/2015g | 139,517 | ||||||
SLM Corporation | ||||||||
| 310,000 | 6.250%, 1/25/2016 | 325,500 | ||||||
Svenska Handelsbanken AB | ||||||||
| 177,000 | 3.125%, 7/12/2016 | 182,913 | ||||||
Toronto-Dominion Bank | ||||||||
| 465,000 | 2.200%, 7/29/2015g | 483,897 | ||||||
U.S. Bancorp | ||||||||
| 177,000 | 3.150%, 3/4/2015 | 186,910 | ||||||
| 80,000 | 1.650%, 5/15/2017 | 80,584 | ||||||
Ventas Realty, LP | ||||||||
| 27,000 | 4.000%, 4/30/2019 | 27,688 | ||||||
Wachovia Corporation | ||||||||
| 420,000 | 5.625%, 10/15/2016 | 473,444 | ||||||
WEA Finance, LLC | ||||||||
| 60,000 | 5.125%, 11/15/2014g | 63,480 | ||||||
| 177,000 | 5.700%, 10/1/2016g | 194,762 | ||||||
WEA Finance, LLC/WT Finance Australia, Pty Ltd. | ||||||||
| 32,000 | 7.500%, 6/2/2014g | 34,915 | ||||||
Wells Fargo & Company | ||||||||
| 115,000 | 2.100%, 5/8/2017 | 115,257 | ||||||
|
| |||||||
| Total | 17,020,312 | |||||||
|
| |||||||
| Foreign Government (<0.1%) |
| ||||||
Kommunalbanken AS | ||||||||
| 450,000 | 2.750%, 5/5/2015g | 472,519 | ||||||
Kreditanstalt fuer Wiederaufbau | ||||||||
| 205,000 | 0.253%, 6/17/2013f | 205,016 | ||||||
|
| |||||||
| Total | 677,535 | |||||||
|
| |||||||
| Mortgage-Backed Securities (3.1%) |
| ||||||
Federal Home Loan Mortgage Corporation Gold 15-Yr. Pass Through | ||||||||
| 13,400,000 | 3.000%, 7/1/2027c | 14,009,285 | ||||||
Federal National Mortgage Association Conventional 15- Yr. Pass Through | ||||||||
| 11,730,000 | 3.000%, 7/1/2027c | 12,289,005 | ||||||
Federal National Mortgage Association Conventional 30- Yr. Pass Through | ||||||||
| 9,770,000 | 3.500%, 7/1/2042c | 10,269,188 | ||||||
| 32,097,500 | 4.000%, 7/1/2042c | 34,158,769 | ||||||
| 16,052,500 | 5.500%, 7/1/2042c | 17,509,762 | ||||||
|
| |||||||
Total | 88,236,009 | |||||||
|
| |||||||
| Technology (0.1%) |
| ||||||
Amkor Technology, Inc. | ||||||||
| 200,000 | 6.625%, 6/1/2021 | 199,500 | ||||||
Equinix, Inc. | ||||||||
| 700,000 | 8.125%, 3/1/2018 | 775,250 | ||||||
First Data Corporation | ||||||||
| 715,000 | 7.375%, 6/15/2019g | 729,300 | ||||||
Freescale Semiconductor, Inc. | ||||||||
| 420,000 | 9.250%, 4/15/2018g | 449,400 | ||||||
Hewlett-Packard Company | ||||||||
| 105,000 | 2.018%, 9/19/2014f | 106,182 | ||||||
| 255,000 | 2.600%, 9/15/2017 | 255,970 | ||||||
International Business Machines Corporation | ||||||||
| 160,000 | 0.750%, 5/11/2015 | 159,757 | ||||||
Samsung Electronics America, Inc. | ||||||||
| 195,000 | 1.750%, 4/10/2017g | 194,495 | ||||||
Xerox Corporation | ||||||||
| 111,000 | 7.200%, 4/1/2016 | 129,415 | ||||||
|
| |||||||
Total | 2,999,269 | |||||||
|
| |||||||
| Transportation (0.1%) |
| ||||||
Avis Budget Car Rental, LLC | ||||||||
| 640,000 | 8.250%, 1/15/2019 | 686,400 | ||||||
Continental Airlines, Inc. | ||||||||
| 715,000 | 6.750%, 9/15/2015g | 734,662 | ||||||
| 80,000 | 4.150%, 4/11/2024 | 78,800 | ||||||
CSX Corporation | ||||||||
| 96,000 | 6.250%, 4/1/2015 | 109,374 | ||||||
Delta Air Lines, Inc. | ||||||||
| 160,000 | 6.750%, 5/23/2017 | 158,608 | ||||||
| 30,000 | 4.750%, 5/7/2020c | 30,375 | ||||||
Hertz Corporation | ||||||||
| 640,000 | 6.750%, 4/15/2019 | 665,600 | ||||||
Kansas City Southern de Mexico SA de CV | ||||||||
| 160,000 | 8.000%, 2/1/2018 | 178,208 | ||||||
Navios Maritime Acquisition Corporation | ||||||||
| 700,000 | 8.625%, 11/1/2017 | 651,000 | ||||||
Navios Maritime Holdings, Inc. | ||||||||
| 640,000 | 8.875%, 11/1/2017c,g | 641,600 | ||||||
|
| |||||||
Total | 3,934,627 | |||||||
|
| |||||||
| U.S. Government and Agencies (2.6%) |
| ||||||
Eksportfinans ASA | ||||||||
| 80,000 | 5.500%, 5/25/2016 | 78,612 | ||||||
FDIC Structured Sale Guaranteed Notes | ||||||||
| 185,000 | Zero Coupon, 1/7/2014g | 182,593 | ||||||
The accompanying Notes to Financial Statements are an integral part of this schedule.
45
Table of Contents
Moderately Aggressive Allocation Portfolio
Schedule of Investments as of June 29, 2012
(unaudited)
| Principal Amount | Long-Term Fixed Income (9.9%) | Value | ||||||
| U.S. Government and Agencies (2.6%) - continued | |||||||
| Federal Agricultural Mortgage Corporation | ||||||||
| $ | 465,000 | 2.125%, 9/15/2015 | $ | 483,056 | ||||
| Federal Home Loan Banks | ||||||||
| 2,830,000 | 0.375%, 1/29/2014 | 2,831,101 | ||||||
| 2,235,000 | 1.000%, 6/21/2017 | 2,236,641 | ||||||
| 2,215,000 | 5.000%, 11/17/2017 | 2,674,601 | ||||||
| Federal National Mortgage Association | ||||||||
| 1,725,000 | 1.250%, 2/27/2014 | 1,753,821 | ||||||
| 920,000 | 0.500%, 5/27/2015 | 919,332 | ||||||
| 735,000 | 4.375%, 10/15/2015 | 824,982 | ||||||
| 1,870,000 | 1.375%, 11/15/2016 | 1,913,954 | ||||||
| 505,000 | 6.250%, 5/15/2029 | 727,219 | ||||||
| Tennessee Valley Authority | ||||||||
| 390,000 | 5.250%, 9/15/2039 | 508,506 | ||||||
| U.S. Treasury Bonds | ||||||||
| 950,000 | 7.625%, 2/15/2025 | 1,555,031 | ||||||
| 5,000,000 | 6.500%, 11/15/2026 | 7,707,810 | ||||||
| 2,250,000 | 4.375%, 5/15/2040 | 2,998,476 | ||||||
| 875,000 | 3.125%, 11/15/2041 | 940,625 | ||||||
| U.S. Treasury Bonds, TIPS | ||||||||
| 164,753 | 2.375%, 1/15/2025 | 216,972 | ||||||
| 138,360 | 2.125%, 2/15/2040 | 196,385 | ||||||
| U.S. Treasury Notes | ||||||||
| 300,000 | 0.250%, 4/30/2014 | 299,637 | ||||||
| 150,000 | 2.250%, 5/31/2014 | 155,461 | ||||||
| 4,315,000 | 0.750%, 6/15/2014 | 4,350,733 | ||||||
| 9,000,000 | 2.500%, 4/30/2015 | 9,526,644 | ||||||
| 4,500,000 | 0.250%, 5/15/2015 | 4,480,313 | ||||||
| 1,035,000 | 2.000%, 1/31/2016 | 1,089,015 | ||||||
| 1,390,000 | 2.625%, 2/29/2016 | 1,495,879 | ||||||
| 3,350,000 | 3.250%, 3/31/2017 | 3,744,409 | ||||||
| 7,000,000 | 1.250%, 4/30/2019 | 7,077,658 | ||||||
| 9,840,000 | 2.000%, 2/15/2022 | 10,171,332 | ||||||
| U.S. Treasury Notes, TIPS | ||||||||
| 834,130 | 2.000%, 1/15/2014 | 866,061 | ||||||
| 626,465 | 1.625%, 1/15/2015 | 665,717 | ||||||
| 700,583 | 0.500%, 4/15/2015 | 727,402 | ||||||
| 546,912 | 0.125%, 4/15/2017 | 577,334 | ||||||
| 743,646 | 2.625%, 7/15/2017 | 883,312 | ||||||
| 578,375 | 1.125%, 1/15/2021 | 665,582 | ||||||
|
| |||||||
| Total | 75,526,206 | |||||||
|
| |||||||
| Utilities (0.1%) | |||||||
| AES Corporation | ||||||||
| 700,000 | 7.375%, 7/1/2021g | 778,750 | ||||||
| CenterPoint Energy, Inc. | ||||||||
| 160,000 | 6.850%, 6/1/2015 | 180,324 | ||||||
| Consolidated Edison Company of New York, Inc. | ||||||||
| 176,000 | 4.200%, 3/15/2042 | 187,580 | ||||||
| Crosstex Energy/Crosstex Energy | ||||||||
| Finance Corporation | ||||||||
| 700,000 | 8.875%, 2/15/2018 | 739,375 | ||||||
| Exelon Corporation | ||||||||
| 255,000 | 4.900%, 6/15/2015 | 277,155 | ||||||
| FirstEnergy Solutions Corporation | ||||||||
| 255,000 | 4.800%, 2/15/2015 | 270,700 | ||||||
| Inergy, LP | ||||||||
| 340,000 | 7.000%, 10/1/2018 | 350,200 | ||||||
| ITC Holdings Corporation | ||||||||
| 155,000 | 5.875%, 9/30/2016g | 178,110 | ||||||
| NextEra Energy Capital Holdings, Inc. | ||||||||
| 75,000 | 1.611%, 6/1/2014 | 75,203 | ||||||
| NGPL PipeCo, LLC | ||||||||
| 640,000 | 9.625%, 6/1/2019g | 686,400 | ||||||
| NiSource Finance Corporation | ||||||||
| 45,000 | 5.400%, 7/15/2014 | 48,496 | ||||||
| 98,000 | 6.400%, 3/15/2018 | 114,474 | ||||||
| Pacific Gas & Electric Company | ||||||||
| 177,000 | 5.625%, 11/30/2017 | 212,299 | ||||||
| Sempra Energy | ||||||||
| 137,000 | 2.300%, 4/1/2017 | 140,404 | ||||||
| 177,000 | 6.150%, 6/15/2018 | 213,662 | ||||||
|
| |||||||
| Total | 4,453,132 | |||||||
|
| |||||||
Total Long-Term Fixed Income (cost $280,774,276) | 287,135,564 | |||||||
|
| |||||||
Shares | Preferred Stock (<0.1%) | |||||||
| Financials (<0.1%) | |||||||
| 3,500 | U.S. Bancorp, 6.000%h | 95,830 | ||||||
|
| |||||||
| Total | 95,830 | |||||||
|
| |||||||
| Total Preferred Stock (cost $88,865) | 95,830 | |||||||
|
| |||||||
Collateral Held for Securities Loaned (0.4%) | ||||||||
| 12,639,496 | Thrivent Financial Securities Lending Trust | 12,639,496 | ||||||
|
| |||||||
Total Collateral Held for Securities Loaned (cost $12,639,496) | 12,639,496 | |||||||
|
| |||||||
| Principal Amount | Short-Term Investments (11.8%)i | |||||||
| Federal Home Loan Bank Discount Notes | ||||||||
| 54,500,000 | 0.096%, 7/11/2012j | 54,498,393 | ||||||
| 5,000,000 | 0.110%, 7/20/2012j | 4,999,694 | ||||||
| 8,000,000 | 0.065%, 7/25/2012j | 7,999,639 | ||||||
| 70,000,000 | 0.085%, 8/8/2012j | 69,993,554 | ||||||
| 6,000,000 | 0.111%, 8/17/2012j | 5,999,116 | ||||||
| 115,000,000 | 0.105%, 8/22/2012j | 114,982,223 | ||||||
| 15,000,000 | 0.100%, 8/31/2012j | 14,997,417 | ||||||
| Federal Home Loan Mortgage Corporation Discount Notes | ||||||||
| 3,100,000 | 0.105%, 7/16/2012j,k | 3,099,855 | ||||||
| 22,000,000 | 0.105%, 8/27/2012j | 21,996,278 | ||||||
The accompanying Notes to Financial Statements are an integral part of this schedule.
46
Table of Contents
Moderately Aggressive Allocation Portfolio
Schedule of Investments as of June 29, 2012
(unaudited)
| Principal Amount | Short-Term Investments (11.8%)i | Value | ||||||
| Federal National Mortgage Association Discount Notes | ||||||||
| $16,600,000 | 0.120%, 7/18/2012j,k | $ | 16,599,004 | |||||
| Straight-A Funding, LLC | ||||||||
| 7,105,000 | 0.180%, 8/2/2012g,j | 7,103,828 | ||||||
| 10,289,000 | 0.180%, 9/25/2012g,j | 10,284,524 | ||||||
| U.S. Treasury Bills | ||||||||
| 6,000,000 | 0.100%, 7/19/2012j,k | 5,999,684 | ||||||
|
| |||||||
| Total Short-Term Investments (at amortized cost) | 338,553,209 | |||||||
|
| |||||||
| Total Investments (cost $3,082,689,137) 103.5% | $ | 2,982,138,131 | ||||||
|
| |||||||
| Other Assets and Liabilities, Net (3.5%) | (101,279,644 | ) | ||||||
|
| |||||||
| Total Net Assets 100.0% | $ | 2,880,858,487 | ||||||
|
| |||||||
| a | The stated interest rate represents the weighted average of all contracts within the bank loan facility. |
| b | All or a portion of the loan is unfunded. |
| c | Denotes investments purchased on a when-issued or delayed delivery basis. |
| d | Non-income producing security. |
| e | All or a portion of the security is on loan. |
| f | Denotes variable rate securities. Variable rate securities are securities whose yields vary with a designated market index or market rate. The rate shown is as of June 29, 2012. |
| g | Denotes securities sold under Rule 144A of the Securities Act of 1933, which exempts them from registration. These securities have been deemed liquid and may be resold to other dealers in the program or to other qualified institutional buyers. As of June 29, 2012, the value of these investments was $41,500,244 or 1.4% of total net assets. |
| h | Denotes perpetual securities. Perpetual securities pay an indefinite stream of interest, but may be called by the issuer at an earlier date. |
| i | The interest rate shown reflects the yield, coupon rate or the discount rate at the date of purchase. |
| j | Denotes investments that benefit from credit enhancement or liquidity support provided by a third party bank, institution or government. |
| k | At June 29, 2012, $25,698,543 of investments were held on deposit with the counterparty and pledged as the initial margin deposit for open futures contracts. |
Definitions:
| ADR | - | American Depositary Receipt, which are certificates for an underlying foreign security’s shares held by an issuing U.S. depository bank. | ||
| REIT | - | Real Estate Investment Trust is a company that buys, develops, manages and/or sells real estate assets. | ||
| TIPS | - | Treasury Inflation Protected Security. |
Unrealized Appreciation (Depreciation)
Gross unrealized appreciation and depreciation of investments, based on cost for federal income tax purposes, were as follows:
Gross unrealized appreciation | $ | 115,882,723 | ||
Gross unrealized depreciation | (219,438,889 | ) | ||
|
| |||
Net unrealized appreciation (depreciation) | $ | (103,556,166 | ) | |
Cost for federal income tax purposes | $ | 3,085,694,297 | ||
The accompanying Notes to Financial Statements are an integral part of this schedule.
47
Table of Contents
Moderately Aggressive Allocation Portfolio
Schedule of Investments as of June 29, 2012
(unaudited)
Fair Valuation Measurements
The following table is a summary of the inputs used, as of June 29, 2012, in valuing Moderately Aggressive Allocation Portfolio’s assets carried at fair value.
Investments in Securities | Total | Level 1 | Level 2 | Level 3 | ||||||||||||
Bank Loans | ||||||||||||||||
Basic Materials | 1,800,364 | — | 1,800,364 | — | ||||||||||||
Capital Goods | 804,013 | — | 804,013 | — | ||||||||||||
Communications Services | 6,941,205 | — | 6,941,205 | — | ||||||||||||
Consumer Cyclical | 1,942,574 | — | 1,942,574 | — | ||||||||||||
Consumer Non-Cyclical | 4,418,194 | — | 4,418,194 | — | ||||||||||||
Energy | 1,703,231 | — | 1,703,231 | — | ||||||||||||
Financials | 786,400 | — | 786,400 | — | ||||||||||||
Technology | 2,877,926 | — | 2,877,926 | — | ||||||||||||
Transportation | 919,791 | — | 919,791 | — | ||||||||||||
Utilities | 1,170,108 | — | 1,170,108 | — | ||||||||||||
Mutual Funds | ||||||||||||||||
Equity Mutual Funds | 1,212,245,250 | 1,212,245,250 | — | — | ||||||||||||
Fixed Income Mutual Funds | 399,777,813 | 399,777,813 | — | — | ||||||||||||
Common Stock | ||||||||||||||||
Consumer Discretionary | 86,757,187 | 86,757,187 | — | — | ||||||||||||
Consumer Staples | 59,885,314 | 59,885,314 | — | — | ||||||||||||
Energy | 102,436,987 | 100,749,598 | 1,687,389 | — | ||||||||||||
Financials | 99,410,695 | 99,410,695 | — | — | ||||||||||||
Health Care | 90,782,029 | 90,782,029 | — | — | ||||||||||||
Industrials | 83,468,339 | 83,468,339 | — | — | ||||||||||||
Information Technology | 151,107,855 | 151,107,855 | — | — | ||||||||||||
Materials | 22,448,838 | 22,448,838 | — | — | ||||||||||||
Telecommunications Services | 3,325,848 | 3,325,848 | — | — | ||||||||||||
Utilities | 8,704,071 | 8,704,071 | — | — | ||||||||||||
Long-Term Fixed Income | ||||||||||||||||
Asset-Backed Securities | 6,882,332 | — | 6,882,332 | — | ||||||||||||
Basic Materials | 4,482,171 | — | 4,482,171 | — | ||||||||||||
Capital Goods | 4,646,097 | — | 4,646,097 | — | ||||||||||||
Collateralized Mortgage Obligations | 16,111,869 | — | 16,111,869 | — | ||||||||||||
Commercial Mortgage-Backed Securities | 26,620,338 | — | 26,620,338 | — | ||||||||||||
Communications Services | 11,131,508 | — | 11,131,508 | — | ||||||||||||
Consumer Cyclical | 7,598,645 | — | 7,598,645 | — | ||||||||||||
Consumer Non-Cyclical | 11,278,220 | — | 11,278,220 | — | ||||||||||||
Energy | 5,537,294 | — | 5,537,294 | — | ||||||||||||
Financials | 17,020,312 | — | 17,020,312 | — | ||||||||||||
Foreign Government | 677,535 | — | 677,535 | — | ||||||||||||
Mortgage-Backed Securities | 88,236,009 | — | 88,236,009 | — | ||||||||||||
Technology | 2,999,269 | — | 2,999,269 | — | ||||||||||||
Transportation | 3,934,627 | — | 3,293,027 | 641,600 | ||||||||||||
U.S. Government and Agencies | 75,526,206 | — | 75,526,206 | — | ||||||||||||
Utilities | 4,453,132 | — | 4,453,132 | — | ||||||||||||
Preferred Stock | ||||||||||||||||
Financials | 95,830 | 95,830 | — | — | ||||||||||||
Collateral Held for Securities Loaned | 12,639,496 | 12,639,496 | — | — | ||||||||||||
Short-Term Investments | 338,553,209 | — | 338,553,209 | — | ||||||||||||
|
|
|
|
|
|
|
| |||||||||
Total | $ | 2,982,138,131 | $ | 2,331,398,163 | $ | 650,098,368 | $ | 641,600 | ||||||||
|
|
|
|
|
|
|
| |||||||||
The accompanying Notes to Financial Statements are an integral part of this schedule.
48
Table of Contents
Moderately Aggressive Allocation Portfolio
Schedule of Investments as of June 29, 2012
(unaudited)
Other Financial Instruments | Total | Level 1 | Level 2 | Level 3 | ||||||||||||
Asset Derivatives | ||||||||||||||||
Futures Contracts | 12,596,491 | 12,596,491 | — | — | ||||||||||||
|
|
|
|
|
|
|
| |||||||||
Total Asset Derivatives | $ | 12,596,491 | $ | 12,596,491 | $ | — | $ | — | ||||||||
|
|
|
|
|
|
|
| |||||||||
Liability Derivatives | ||||||||||||||||
Futures Contracts | 5,853,142 | 5,853,142 | — | — | ||||||||||||
|
|
|
|
|
|
|
| |||||||||
Total Liability Derivatives | $ | 5,853,142 | $ | 5,853,142 | $ | — | $ | — | ||||||||
|
|
|
|
|
|
|
| |||||||||
The significant unobservable input used in the fair value measurement of the Long-Term Fixed Income Transportation Level 3 security is the lack of marketability. A significant increase or decrease in the input in isolation would result in a significantly lower or higher fair value measurement.
There were no significant transfers between the Levels during the period ended June 29, 2012. Transfers between the levels are identified as of the end of the period.
Futures Contracts | Number of Contracts Long/(Short) | Expiration Date | Notional Principal Amount | Value | Unrealized Gain/(Loss) | |||||||||||||||
2-Yr. U.S. Treasury Bond Futures | (110 | ) | September 2012 | ($24,223,727 | ) | ($24,220,625 | ) | $3,102 | ||||||||||||
10-Yr. U.S. Treasury Bond Futures | 65 | September 2012 | 8,632,322 | 8,669,375 | 37,053 | |||||||||||||||
20-Yr. U.S. Treasury Bond Futures | 245 | September 2012 | 35,981,295 | 36,252,343 | 271,048 | |||||||||||||||
Mini MSCI EAFE Index Futures | 704 | September 2012 | 47,317,959 | 50,117,760 | 2,799,801 | |||||||||||||||
Russell 2000 Index Mini-Futures | (825 | ) | September 2012 | (62,434,103 | ) | (65,620,500 | ) | (3,186,397 | ) | |||||||||||
S&P 400 Index Mini-Futures | (1,178 | ) | September 2012 | (108,006,355 | ) | (110,673,100 | ) | (2,666,745 | ) | |||||||||||
S&P 500 Index Futures | 818 | September 2012 | 267,898,313 | 277,383,800 | 9,485,487 | |||||||||||||||
Total Futures Contracts | $ | 6,743,349 | ||||||||||||||||||
The following table summarizes the fair value and Statement of Assets and Liabilities location, as of June 29, 2012, for Moderately Aggressive Allocation Portfolio’s investments in financial derivative instruments by primary risk exposure as discussed under item (2) Significant Accounting Policies of the Notes to Financial Statements.
Derivatives by risk category | Statement of Assets and Liabilities Location | Fair Value | ||||
Asset Derivatives | ||||||
Interest Rate Contracts | ||||||
Futures* | Net Assets - Net unrealized appreciation/(depreciation) on Futures contracts | 311,203 | ||||
Total Interest Rate Contracts | 311,203 | |||||
Equity Contracts | ||||||
Futures* | Net Assets - Net unrealized appreciation/(depreciation) on Futures contracts | 12,285,288 | ||||
Total Equity Contracts | 12,285,288 | |||||
|
| |||||
Total Asset Derivatives | $ | 12,596,491 | ||||
|
| |||||
Liability Derivatives | ||||||
Equity Contracts | ||||||
Futures* | Net Assets - Net unrealized appreciation/(depreciation) on Futures contracts | 5,853,142 | ||||
Total Equity Contracts | 5,853,142 | |||||
|
| |||||
Total Liability Derivatives | $ | 5,853,142 | ||||
|
| |||||
| * | Includes cumulative appreciation/depreciation of futures contracts as reported in the Schedule of Investments. Only current day’s variation margin is reported within the Statement of Assets and Liabilities. |
The accompanying Notes to Financial Statements are an integral part of this schedule.
49
Table of Contents
Moderately Aggressive Allocation Portfolio
Schedule of Investments as of June 29, 2012
(unaudited)
The following table summarizes the net realized gains/(losses) and Statement of Operations location, for the period ended June 29, 2012, for Moderately Aggressive Allocation Portfolio’s investments in financial derivative instruments by primary risk exposure.
Derivatives by risk category | Statement of Operations Location | Realized Gains/(Losses) recognized in Income | ||||
Equity Contracts | ||||||
| Futures | Net realized gains/(losses) on Futures contracts | 8,475,728 | ||||
Total Equity Contracts | 8,475,728 | |||||
Foreign Exchange Contracts | ||||||
| Forward Contracts | Net realized gains/(losses) on Foreign currency transactions | (29,803 | ) | |||
Total Foreign Exchange Contracts | (29,803 | ) | ||||
Interest Rate Contracts | ||||||
Futures | Net realized gains/(losses) on Futures contracts | 1,699,376 | ||||
Total Interest Rate Contracts | 1,699,376 | |||||
Credit Contracts | ||||||
Credit Default Swaps | Net realized gains/(losses) on Swap agreements | 833,223 | ||||
Total Credit Contracts | 833,223 | |||||
|
| |||||
Total | $ | 10,978,524 | ||||
|
| |||||
The following table summarizes the change in net unrealized appreciation/(depreciation) and Statement of Operations location, for the period ended June 29, 2012, for Moderately Aggressive Allocation Portfolio’s investments in financial derivative instruments by primary risk exposure.
Derivatives by risk category | Statement of Operations Location | Change in unrealized appreciation/(depreciation) recognized in Income | ||||
Equity Contracts | ||||||
| Futures | Change in net unrealized appreciation/(depreciation) on Futures contracts | 3,913,394 | ||||
Total Equity Contracts | 3,913,394 | |||||
Interest Rate Contracts | ||||||
| Futures | Change in net unrealized appreciation/(depreciation) on Futures contracts | 641,504 | ||||
Total Interest Rate Contracts | 641,504 | |||||
Credit Contracts | ||||||
| Credit Default Swaps | Change in net unrealized appreciation/(depreciation) on Swap agreements | (153,504 | ) | |||
Total Credit Contracts | (153,504 | ) | ||||
|
| |||||
Total | $ | 4,401,394 | ||||
|
| |||||
The following table presents Moderately Aggressive Allocation Portfolio’s average volume of derivative activity during the period ended June 29, 2012.
Derivative Risk Category | Futures (Notional*) | Futures (Percentage of Average Net Assets) | Forwards (Notional*) | Forwards (Percentage of Average Net Assets) | Swaps (Notional*) | Swaps (Percentage of Average Net Assets) | ||||||||||||||||||
Equity Contracts | $ | 518,389,377 | 18.2 | % | N/A | N/A | N/A | N/A | ||||||||||||||||
Interest Rate Contracts | 62,008,154 | 2.2 | N/A | N/A | N/A | N/A | ||||||||||||||||||
Foreign Exchange Contracts | N/A | N/A | $ | 432,742 | <0.1 | % | N/A | N/A | ||||||||||||||||
Credit Contracts | N/A | N/A | N/A | N/A | $ | 3,947,696 | 0.1 | % | ||||||||||||||||
| * | Notional amount represents long or short, or both, derivative positions held by the Portfolio. |
The accompanying Notes to Financial Statements are an integral part of this schedule.
50
Table of Contents
Moderately Aggressive Allocation Portfolio
Schedule of Investments as of June 29, 2012
(unaudited)
Investment in Affiliates
Affiliated issuers, as defined under the Investment Company Act of 1940, include those in which the Portfolio’s holdings of an issuer represent 5% or more of the outstanding voting securities of an issuer, or any affiliated mutual fund.
A summary of transactions for the fiscal year to date, in Moderately Aggressive Allocation Portfolio, is as follows:
Portfolio | Value December 31, 2011 | Gross Purchases | Gross Sales | Shares Held at June 29, 2012 | Value June 29, 2012 | Income Earned January 1, 2012 - June 29, 2012 | ||||||||||||||||||
Partner Small Cap Growth | $ | 62,803,020 | $ | — | $ | — | 5,056,075 | $ | 66,662,828 | $ | — | |||||||||||||
Partner Small Cap Value | 64,077,118 | 447,567 | — | 3,460,967 | 67,157,638 | 447,567 | ||||||||||||||||||
Small Cap Stock | 54,297,906 | — | — | 4,528,335 | 55,433,159 | — | ||||||||||||||||||
Partner Mid Cap Value | 77,040,544 | 694,339 | — | 6,211,851 | 82,874,786 | 694,339 | ||||||||||||||||||
Mid Cap Stock | 161,523,408 | 432,674 | — | 14,108,172 | 170,518,417 | 432,674 | ||||||||||||||||||
Partner Worldwide Allocation | 136,290,534 | 27,053,414 | — | 21,862,556 | 169,854,574 | 53,414 | ||||||||||||||||||
Partner International Stock | 178,908,630 | 5,142,457 | — | 20,052,862 | 185,164,114 | 5,142,457 | ||||||||||||||||||
Large Cap Value | 191,568,241 | 3,581,679 | — | 18,770,587 | 204,158,288 | 3,581,679 | ||||||||||||||||||
Large Cap Stock | 175,660,184 | 1,976,722 | — | 21,892,974 | 189,293,218 | 1,976,722 | ||||||||||||||||||
Equity Income Plus | 19,597,241 | 319,019 | — | 2,259,027 | 21,128,228 | 319,019 | ||||||||||||||||||
High Yield | 105,113,270 | 4,035,114 | 874,514 | 23,202,043 | 112,541,510 | 4,035,114 | ||||||||||||||||||
Income | 183,615,301 | 3,796,523 | 1,224,320 | 18,454,470 | 192,437,678 | 3,797,056 | ||||||||||||||||||
Limited Maturity Bond | 104,562,151 | 917,910 | 12,029,611 | 9,675,896 | 94,798,625 | 917,910 | ||||||||||||||||||
Thrivent Financial Securities Lending Trust | — | 25,702,358 | 13,062,862 | 12,639,496 | 12,639,496 | 49,481 | ||||||||||||||||||
Total Value and Income Earned | 1,515,057,548 | 1,624,662,559 | 21,447,432 | |||||||||||||||||||||
The accompanying Notes to Financial Statements are an integral part of this schedule.
51
Table of Contents
Schedule of Investments as of June 29, 2012
(unaudited)
| Principal Amount | Bank Loans (1.0%)a | Value | ||||||
| Basic Materials (0.1%) | |||||||
Arch Coal, Inc., Term Loan | ||||||||
| $1,695,000 | 5.750%, 5/1/2018 | $ | 1,662,507 | |||||
Ineos Group Holdings, Term Loan | ||||||||
| 2,197,582 | 6.391%, 5/4/2018b,c | 2,148,752 | ||||||
|
| |||||||
Total | 3,811,259 | |||||||
|
| |||||||
| Capital Goods (<0.1%) | |||||||
Reynolds Group, Term Loan | ||||||||
| 1,691,610 | 5.250%, 8/9/2018b,c | 1,703,502 | ||||||
|
| |||||||
Total | 1,703,502 | |||||||
|
| |||||||
| Communications Services (0.3%) | |||||||
Atlantic Broadband Finance, LLC, Term Loan | ||||||||
| 1,905,000 | 5.250%, 3/20/2019 | 1,905,800 | ||||||
Charter Communications Operation, Term Loan | ||||||||
| 1,521,187 | 4.000%, 3/28/2019 | 1,509,505 | ||||||
Clear Channel Communications, Term Loan | ||||||||
| 1,905,000 | 3.895%, 1/29/2016 | 1,517,656 | ||||||
Cumulus Media Holdings, Inc., Term Loan | ||||||||
| 2,364,618 | 4.903%, 9/16/2018b,c | 2,352,369 | ||||||
Lawson Software, Inc., Term Loan | ||||||||
| 1,904,050 | 7.475%, 3/16/2018b,c | 1,910,886 | ||||||
Toys R Us, Inc., Term Loan | ||||||||
| 1,525,000 | 5.250%, 5/25/2018 | 1,385,844 | ||||||
Univision Communications, Inc., Term Loan | ||||||||
| 1,360,000 | 2.245%, 9/29/2014 | 1,331,671 | ||||||
Zayo Group, LLC, Term Loan | ||||||||
| 2,540,000 | 0.000%, 6/14/2019b,c | 2,545,893 | ||||||
|
| |||||||
Total | 14,459,624 | |||||||
|
| |||||||
| Consumer Cyclical (0.1%) | |||||||
Burlington Coat Factory Warehouse Corporation, Term Loan | ||||||||
| 2,135,117 | 5.500%, 2/28/2017 | 2,121,473 | ||||||
Chrysler Group, LLC, Term Loan | ||||||||
| 1,900,201 | 6.000%, 5/24/2017 | 1,912,078 | ||||||
|
| |||||||
Total | 4,033,551 | |||||||
|
| |||||||
| Consumer Non-Cyclical (0.2%) | |||||||
Bausch & Lomb, Inc., Term Loan | ||||||||
| 1,695,000 | 5.250%, 4/17/2019 | 1,683,982 | ||||||
CHS/Community Health Systems, Inc., Term Loan | ||||||||
| 1,695,000 | 3.967%, 1/25/2017 | 1,668,066 | ||||||
DJO Finance, LLC, Term Loan | ||||||||
| 1,695,000 | 5.000%, 9/15/2017b,c | 1,679,457 | ||||||
Roundy’s Supermarkets, Inc., Term Loan | ||||||||
| 2,069,813 | 5.729%, 2/13/2019b,c | 2,071,655 | ||||||
Visant Corporation, Term Loan | ||||||||
| 2,250,000 | 4.636%, 12/22/2016b,c | 2,176,875 | ||||||
|
| |||||||
Total | 9,280,035 | |||||||
|
| |||||||
| Energy (0.1%) | |||||||
Chesapeake Energy Corporation, Term Loan | ||||||||
| 2,290,000 | 8.110%, 12/2/2017b,c | 2,269,711 | ||||||
GenOn Energy, Inc., Term Loan | ||||||||
| 1,355,000 | 4.250%, 9/20/2017b,c | 1,339,756 | ||||||
|
| |||||||
Total | 3,609,467 | |||||||
|
| |||||||
| Financials (<0.1%) | |||||||
Nuveen Investments, Inc., Term Loan | ||||||||
| 1,700,000 | 5.685%, 5/13/2017b,c | 1,671,100 | ||||||
|
| |||||||
Total | 1,671,100 | |||||||
|
| |||||||
| Technology (0.1%) | |||||||
First Data Corporation Extended, Term Loan | ||||||||
| 1,905,000 | 4.245%, 3/26/2018 | 1,744,751 | ||||||
Freescale Semiconductor, Inc., Term Loan | ||||||||
| 2,443,875 | 5.653%, 2/28/2019b,c | 2,401,987 | ||||||
Intelsat Jackson Holdings SA, Term Loan | ||||||||
| 1,905,000 | 5.250%, 4/2/2018 | 1,900,638 | ||||||
|
| |||||||
Total | 6,047,376 | |||||||
|
| |||||||
| Transportation (<0.1%) | |||||||
Delta Air Lines, Inc., Term Loan | ||||||||
| 1,900,202 | 5.600%, 4/20/2017 | 1,894,273 | ||||||
|
| |||||||
Total | 1,894,273 | |||||||
|
| |||||||
| Utilities (0.1%) | |||||||
NGPL PipeCo, LLC, Term Loan | ||||||||
| 2,540,000 | 6.750%, 5/15/2017 | 2,487,092 | ||||||
|
| |||||||
Total | 2,487,092 | |||||||
|
| |||||||
Total Bank Loans (cost $49,376,191) | 48,997,279 | |||||||
|
| |||||||
The accompanying Notes to Financial Statements are an integral part of this schedule.
52
Table of Contents
Moderate Allocation Portfolio
Schedule of Investments as of June 29, 2012
(unaudited)
| Shares | Mutual Funds (54.9%) | Value | ||||||
| Equity Mutual Funds (27.9%) | |||||||
| 5,698,281 | Thrivent Partner Small Cap Growth Portfoliod | $ | 75,130,127 | |||||
| 4,264,932 | Thrivent Partner Small Cap Value Portfolio | 82,758,023 | ||||||
| 3,596,908 | Thrivent Small Cap Stock Portfoliod | 44,031,189 | ||||||
| 5,904,171 | Thrivent Partner Mid Cap Value Portfolio | 78,769,911 | ||||||
| 11,654,145 | Thrivent Mid Cap Stock Portfolio | 140,857,826 | ||||||
| 30,368,157 | Thrivent Partner Worldwide Allocation Portfolio | 235,936,287 | ||||||
| 18,065,561 | Thrivent Partner International Stock Portfolio | 166,813,778 | ||||||
| 26,115,820 | Thrivent Large Cap Value Portfolio | 284,048,713 | ||||||
| 20,286,779 | Thrivent Large Cap Stock Portfolio | 175,405,577 | ||||||
| 2,977,010 | Thrivent Equity Income Plus Portfolio | 27,843,380 | ||||||
|
| |||||||
| Total | 1,311,594,811 | |||||||
|
| |||||||
| Fixed Income Mutual Funds (27.0%) | |||||||
| 35,170,761 | Thrivent High Yield Portfolio | 170,595,777 | ||||||
| 60,484,253 | Thrivent Income Portfolio | 630,711,649 | ||||||
| 47,573,255 | Thrivent Limited Maturity Bond Portfolio | 466,094,210 | ||||||
|
| |||||||
Total | 1,267,401,636 | |||||||
|
| |||||||
Total Mutual Funds (cost $2,680,246,870) | 2,578,996,447 | |||||||
|
| |||||||
Common Stock (17.6%) | ||||||||
| Consumer Discretionary (2.1%) | |||||||
| 6,189 | Abercrombie & Fitch Company | 211,293 | ||||||
| 42,892 | Amazon.com, Inc.d | 9,794,388 | ||||||
| 10,600 | AutoZone, Inc.d | 3,892,002 | ||||||
| 56,600 | Big Lots, Inc.d | 2,308,714 | ||||||
| 37,900 | BJ’s Restaurants, Inc.d | 1,440,200 | ||||||
| 19,060 | CBS Corporation | 624,787 | ||||||
| 13,700 | Charter Communications, Inc.d | 970,919 | ||||||
| 39,600 | Children’s Place Retail Stores, Inc.d | 1,973,268 | ||||||
| 36,000 | Coach, Inc. | 2,105,280 | ||||||
| 460,094 | Comcast Corporation | 14,709,205 | ||||||
| 4,512 | Darden Restaurants, Inc. | 228,443 | ||||||
| 48,828 | Delphi Automotive plcd | 1,245,114 | ||||||
| 11,437 | Discovery Communications, Inc.d | 617,598 | ||||||
| 19,200 | DISH Network Corporation | 548,160 | ||||||
| 30,180 | Dollar Tree, Inc.d | 1,623,684 | ||||||
| 83,426 | Foot Locker, Inc. | 2,551,167 | ||||||
| 5,591 | Gentex Corporation | 116,684 | ||||||
| 9,978 | GNC Holdings, Inc. | 391,138 | ||||||
| 9,300 | Harley-Davidson, Inc. | 425,289 | ||||||
| 142,900 | Home Depot, Inc. | 7,572,271 | ||||||
| 266,965 | Las Vegas Sands Corporation | 11,610,308 | ||||||
| 41,583 | Life Time Fitness, Inc.d | 1,934,025 | ||||||
| 9,545 | Limited Brands, Inc. | 405,949 | ||||||
| 62,700 | Lowe’s Companies, Inc. | 1,783,188 | ||||||
| 52,500 | Meredith Corporatione | 1,676,850 | ||||||
| 98,720 | News Corporation | 2,223,174 | ||||||
| 63,400 | NIKE, Inc. | 5,565,252 | ||||||
| 30,190 | Omnicom Group, Inc. | 1,467,234 | ||||||
| 2,933 | O’Reilly Automotive, Inc.d | 245,697 | ||||||
| 5,091 | Panera Bread Companyd | 709,889 | ||||||
| 53,200 | Penn National Gaming, Inc.d | 2,372,188 | ||||||
| 13,602 | PetSmart, Inc. | 927,384 | ||||||
| 146,572 | Pier 1 Imports, Inc. | 2,408,178 | ||||||
| 4,600 | Priceline.com, Inc.d | 3,056,792 | ||||||
| 131,000 | Sally Beauty Holdings, Inc.d | 3,371,940 | ||||||
| 15,430 | Time Warner Cable, Inc. | 1,266,803 | ||||||
| 30,800 | Toll Brothers, Inc.d | 915,684 | ||||||
| 5,781 | Tractor Supply Company | 480,170 | ||||||
| 1,643 | VF Corporation | 219,258 | ||||||
| 34,491 | WMS Industries, Inc.d | 688,096 | ||||||
|
| |||||||
Total | 96,677,663 | |||||||
|
| |||||||
| Consumer Staples (1.6%) | |||||||
| 161,182 | Altria Group, Inc. | 5,568,838 | ||||||
| 123,484 | Anheuser-Busch InBev NV ADR | 9,835,501 | ||||||
| 125,920 | Archer-Daniels-Midland Company | 3,717,158 | ||||||
| 53,345 | British American Tobacco plc ADR | 5,447,591 | ||||||
| 35,400 | Bunge, Ltd. | 2,220,996 | ||||||
| 4,115 | Clorox Company | 298,173 | ||||||
| 91,550 | Coca-Cola Company | 7,158,295 | ||||||
| 56,200 | Colgate-Palmolive Company | 5,850,420 | ||||||
| 24,830 | CVS Caremark Corporation | 1,160,306 | ||||||
| 17,020 | Diageo plc ADR | 1,754,251 | ||||||
| 98,396 | Ingredion, Inc. | 4,872,570 | ||||||
| 12,240 | Kimberly-Clark Corporation | 1,025,345 | ||||||
| 69,922 | Kraft Foods, Inc. | 2,700,388 | ||||||
| 107,790 | Philip Morris International, Inc. | 9,405,755 | ||||||
| 13,546 | TreeHouse Foods, Inc.d | 843,780 | ||||||
| 191,800 | Walgreen Company | 5,673,444 | ||||||
| 80,732 | Wal-Mart Stores, Inc. | 5,628,635 | ||||||
| 7,643 | Whole Foods Market, Inc. | 728,531 | ||||||
|
| |||||||
Total | 73,889,977 | |||||||
|
| |||||||
| Energy (2.7%) | |||||||
| 177,813 | Alpha Natural Resources, Inc.d | 1,548,751 | ||||||
| 199,388 | Apache Corporation | 17,524,211 | ||||||
| 129,300 | Arch Coal, Inc. | 890,877 | ||||||
| 39,100 | Baker Hughes, Inc. | 1,607,010 | ||||||
| 88,746 | BP plc ADR | 3,597,763 | ||||||
| 9,300 | Cameron International Corporationd | 397,203 | ||||||
| 50,970 | Chevron Corporation | 5,377,335 | ||||||
| 4,625 | Concho Resources, Inc.d | 393,680 | ||||||
| 244,060 | ConocoPhillips | 13,638,073 | ||||||
| 224,600 | Consol Energy, Inc. | 6,791,904 | ||||||
| 35,400 | Dril-Quip, Inc.d | 2,321,886 | ||||||
| 136,390 | Ensco plc | 6,406,238 | ||||||
| 90,767 | EOG Resources, Inc. | 8,179,014 | ||||||
| 28,410 | EQT Corporation | 1,523,628 | ||||||
| 64,100 | Exxon Mobil Corporation | 5,485,037 | ||||||
| 56,866 | Helix Energy Solutions Group, Inc.d | 933,171 | ||||||
| 143,500 | Nabors Industries, Ltd.d | 2,066,400 | ||||||
| 41,583 | National Oilwell Varco, Inc. | 2,679,608 | ||||||
| 62,100 | Newfield Exploration Companyd | 1,820,151 | ||||||
The accompanying Notes to Financial Statements are an integral part of this schedule.
53
Table of Contents
Moderate Allocation Portfolio
Schedule of Investments as of June 29, 2012
(unaudited)
| Shares | Common Stock (17.6%) | Value | ||||||
| Energy (2.7%) - continued | |||||||
| 110,010 | Occidental Petroleum Corporation | $ | 9,435,558 | |||||
| 40,833 | Oil States International, Inc.d | 2,703,145 | ||||||
| 88,530 | Peabody Energy Corporation | 2,170,756 | ||||||
| 86,000 | Petroleo Brasileiro SA ADR | 1,614,220 | ||||||
| 147,608 | Petroleum Geo-Services ASA | 1,804,060 | ||||||
| 79,400 | Plains Exploration & Production Companyd | 2,793,292 | ||||||
| 3,400 | Range Resources Corporation | 210,358 | ||||||
| 10,570 | Schlumberger, Ltd. | 686,099 | ||||||
| 3,600 | SM Energy Company | 176,796 | ||||||
| 19,100 | Southwestern Energy Companyd | 609,863 | ||||||
| 134,479 | Swift Energy Companyd | 2,502,654 | ||||||
| 70,700 | Ultra Petroleum Corporationd,e | 1,631,049 | ||||||
| 337,930 | Valero Energy Corporation | 8,161,009 | ||||||
| 821,252 | Weatherford International, Ltd.d | 10,372,413 | ||||||
| 2,065 | Whiting Petroleum Corporationd | 84,913 | ||||||
|
| |||||||
| Total | 128,138,125 | |||||||
|
| |||||||
| Financials (2.5%) | |||||||
| 20,070 | ACE, Ltd. | 1,487,789 | ||||||
| 23,079 | Affiliated Managers Group, Inc.d | 2,525,997 | ||||||
| 6,600 | Allied World Assurance Company Holdings AG | 524,502 | ||||||
| 20,100 | American Campus Communities, Inc. | 904,098 | ||||||
| 133,300 | Ameriprise Financial, Inc. | 6,966,258 | ||||||
| 36,500 | Apartment Investment & Management Company | 986,595 | ||||||
| 15,500 | Aspen Insurance Holdings, Ltd. | 447,950 | ||||||
| 76,780 | Bank of America Corporation | 628,060 | ||||||
| 22,259 | Boston Properties, Inc. | 2,412,208 | ||||||
| 13,670 | Capital One Financial Corporation | 747,202 | ||||||
| 37,500 | CBL & Associates Properties, Inc. | 732,750 | ||||||
| 75,180 | Charles Schwab Corporation | 972,077 | ||||||
| 443,157 | Citigroup, Inc. | 12,146,933 | ||||||
| 26,191 | CME Group, Inc. | 7,022,069 | ||||||
| 19,329 | Discover Financial Services | 668,397 | ||||||
| 43,400 | Douglas Emmett, Inc. | 1,002,540 | ||||||
| 42,689 | Duke Realty Corporation | 624,967 | ||||||
| 15,700 | Endurance Specialty Holdings, Ltd. | 601,624 | ||||||
| 12,500 | Equity Lifestyle Properties, Inc. | 862,125 | ||||||
| 39,564 | Equity Residential | 2,467,211 | ||||||
| 52,863 | HCC Insurance Holdings, Inc. | 1,659,898 | ||||||
| 15,000 | Home Properties, Inc. | 920,400 | ||||||
| 53,546 | Host Hotels & Resorts, Inc. | 847,098 | ||||||
| 624,500 | Huntington Bancshares, Inc. | 3,996,800 | ||||||
| 32,700 | iShares Russell 2000 Index Funde | 2,604,555 | ||||||
| 353,357 | J.P. Morgan Chase & Company | 12,625,446 | ||||||
| 122,401 | Kimco Realty Corporation | 2,329,291 | ||||||
| 90,490 | KKR & Company, LP | 1,166,416 | ||||||
| 19,507 | Lazard, Ltd. | 506,987 | ||||||
| 8,700 | M&T Bank Corporation | 718,359 | ||||||
| 172,819 | Marsh & McLennan Companies, Inc. | 5,569,956 | ||||||
| 67,090 | MetLife, Inc. | 2,069,726 | ||||||
| 28,700 | NASDAQ OMX Group, Inc. | 650,629 | ||||||
| 15,700 | Northern Trust Corporation | 722,514 | ||||||
| 53,100 | Och-Ziff Capital Management Group, LLC | 402,498 | ||||||
| 126,400 | Ocwen Financial Corporationd | 2,373,792 | ||||||
| 128,109 | Popular, Inc.d | 2,127,890 | ||||||
| 5,300 | ProAssurance Corporation | 472,177 | ||||||
| 175,950 | Progressive Corporation | 3,665,039 | ||||||
| 14,300 | Protective Life Corporation | 420,563 | ||||||
| 16,392 | Public Storage, Inc. | 2,367,169 | ||||||
| 9,392 | S&P 500 Large Index Depository Receipts | 1,279,848 | ||||||
| 16,729 | Simon Property Group, Inc. | 2,604,036 | ||||||
| 48,850 | State Street Corporation | 2,180,664 | ||||||
| 78,420 | SunTrust Banks, Inc. | 1,900,117 | ||||||
| 16,250 | SVB Financial Groupd | 954,200 | ||||||
| 28,500 | Tanger Factory Outlet Centers, Inc. | 913,425 | ||||||
| 6,648 | Taubman Centers, Inc. | 512,960 | ||||||
| 15,483 | TD Ameritrade Holding Corporation | 263,211 | ||||||
| 20,100 | Tower Group, Inc. | 419,487 | ||||||
| 27,496 | Vornado Realty Trust | 2,309,114 | ||||||
| 36,034 | W.R. Berkley Corporation | 1,402,443 | ||||||
| 263,823 | Wells Fargo & Company | 8,822,241 | ||||||
| 143,583 | Zions Bancorporation | 2,788,382 | ||||||
|
| |||||||
| Total | 119,298,683 | |||||||
|
| |||||||
| Health Care (2.2%) | |||||||
| 57,800 | Abbott Laboratories | 3,726,366 | ||||||
| 11,348 | Alexion Pharmaceuticals, Inc.d | 1,126,856 | ||||||
| 81,100 | Align Technology, Inc.d | 2,713,606 | ||||||
| 9,329 | AmerisourceBergen Corporation | 367,096 | ||||||
| 84,000 | Amgen, Inc. | 6,135,360 | ||||||
| 166,169 | Baxter International, Inc. | 8,831,882 | ||||||
| 79,000 | Biogen Idec, Inc.d | 11,406,020 | ||||||
| 5,400 | BioMarin Pharmaceutical, Inc.d | 213,732 | ||||||
| 299,100 | Bristol-Myers Squibb Company | 10,752,645 | ||||||
| 6,401 | C.R. Bard, Inc. | 687,723 | ||||||
| 4,517 | CIGNA Corporation | 198,748 | ||||||
| 38,297 | Covance, Inc.d | 1,832,511 | ||||||
| 36,030 | Covidien plc | 1,927,605 | ||||||
| 152,500 | Eli Lilly and Company | 6,543,775 | ||||||
| 74,224 | Health Net, Inc.d | 1,801,416 | ||||||
| 47,510 | Johnson & Johnson | 3,209,776 | ||||||
| 19,600 | Medicines Companyd | 449,624 | ||||||
| 65,950 | Merck & Company, Inc. | 2,753,413 | ||||||
| 1,661 | Mettler-Toledo International, Inc.d | 258,867 | ||||||
| 3,179 | Onyx Pharmaceuticals, Inc.d | 211,245 | ||||||
| 2,900 | Perrigo Company | 341,997 | ||||||
| 285,522 | Pfizer, Inc. | 6,567,006 | ||||||
| 78,041 | PSS World Medical, Inc.d | 1,638,081 | ||||||
| 47,480 | Sanofi ADR | 1,793,794 | ||||||
| 92,800 | Shire Pharmaceuticals Group plc ADR | 8,016,992 | ||||||
| 4,946 | SXC Health Solutions Corporationd | 490,693 | ||||||
| 23,800 | Thoratec Corporationd | 799,204 | ||||||
| 40,280 | United Therapeutics Corporationd | 1,989,026 | ||||||
| 283,847 | UnitedHealth Group, Inc. | 16,605,050 | ||||||
| 6,800 | Waters Corporationd | 540,396 | ||||||
The accompanying Notes to Financial Statements are an integral part of this schedule.
54
Table of Contents
Moderate Allocation Portfolio
Schedule of Investments as of June 29, 2012
(unaudited)
| Shares | Common Stock (17.6%) | Value | ||||||
| Health Care (2.2%) - continued | |||||||
| 8,530 | Watson Pharmaceuticals, Inc.d | $ | 631,135 | |||||
| 11,782 | Zimmer Holdings, Inc. | 758,290 | ||||||
|
| |||||||
| Total | 105,319,930 | |||||||
|
| |||||||
| Industrials (1.9%) | |||||||
| 47,500 | 3M Company | 4,256,000 | ||||||
| 73,100 | Actuant Corporation | 1,985,396 | ||||||
| 8,856 | AMETEK, Inc. | 442,003 | ||||||
| 10,975 | BE Aerospace, Inc.d | 479,169 | ||||||
| 99,260 | Boeing Company | 7,375,018 | ||||||
| 22,725 | Chicago Bridge and Iron Company | 862,641 | ||||||
| 23,197 | CSX Corporation | 518,685 | ||||||
| 33,200 | Cummins, Inc. | 3,217,412 | ||||||
| 78,340 | Deluxe Corporation | 1,953,800 | ||||||
| 164,200 | Dover Corporation | 8,802,762 | ||||||
| 68,781 | EMCOR Group, Inc. | 1,913,487 | ||||||
| 20,882 | Expeditors International of Washington, Inc. | 809,178 | ||||||
| 10,140 | FedEx Corporation | 928,925 | ||||||
| 3,416 | Flowserve Corporation | 391,986 | ||||||
| 53,700 | GATX Corporation | 2,067,450 | ||||||
| 48,480 | General Electric Company | 1,010,323 | ||||||
| 23,662 | Honeywell International, Inc. | 1,321,286 | ||||||
| 50,370 | Jacobs Engineering Group, Inc.d | 1,907,008 | ||||||
| 11,430 | JB Hunt Transport Services, Inc. | 681,228 | ||||||
| 8,845 | Kansas City Southern | 615,258 | ||||||
| 46,400 | L-3 Communications Holdings, Inc. | 3,434,064 | ||||||
| 30,300 | Landstar System, Inc. | 1,567,116 | ||||||
| 105,100 | Lockheed Martin Corporation | 9,152,108 | ||||||
| 192,731 | Manitowoc Company, Inc. | 2,254,953 | ||||||
| 10,600 | Manpower, Inc. | 388,490 | ||||||
| 13,230 | Norfolk Southern Corporation | 949,517 | ||||||
| 30,758 | Oshkosh Corporationd | 644,380 | ||||||
| 149,898 | Parker Hannifin Corporation | 11,524,158 | ||||||
| 8,102 | Pentair, Inc. | 310,145 | ||||||
| 6,492 | Roper Industries, Inc. | 639,981 | ||||||
| 60,927 | Shaw Group, Inc.d | 1,663,916 | ||||||
| 25,039 | SPX Corporation | 1,635,548 | ||||||
| 4,605 | Stericycle, Inc.d | 422,140 | ||||||
| 146,400 | Tyco International, Ltd. | 7,737,240 | ||||||
| 90,737 | United Technologies Corporation | 6,853,366 | ||||||
|
| |||||||
| Total | 90,716,137 | |||||||
|
| |||||||
| Information Technology (3.7%) | |||||||
| 61,500 | Accenture plc | 3,695,535 | ||||||
| 59,000 | ADTRAN, Inc. | 1,781,210 | ||||||
| 72,054 | Akamai Technologies, Inc.d | 2,287,714 | ||||||
| 11,600 | Alliance Data Systems Corporationd | 1,566,000 | ||||||
| 8,566 | ANSYS, Inc.d | 540,600 | ||||||
| 65,007 | Apple, Inc.d | 37,964,088 | ||||||
| 244,834 | Atmel Corporationd | 1,640,388 | ||||||
| 7,189 | Autodesk, Inc.d | 251,543 | ||||||
| 15,124 | Broadcom Corporationd | 511,191 | ||||||
| 72,000 | Cavium, Inc.d,e | 2,016,000 | ||||||
| 18,600 | Ciena Corporationd,e | 304,482 | ||||||
| 118,976 | Cognizant Technology Solutions Corporationd | 7,138,560 | ||||||
| 45,900 | CoreLogic, Inc.d | 840,429 | ||||||
| 161,429 | eBay, Inc.d | 6,781,632 | ||||||
| 21,072 | Electronic Arts, Inc.d | 260,239 | ||||||
| 5,502 | F5 Networks, Inc.d | 547,779 | ||||||
| 8,512 | Fortinet, Inc.d | 197,649 | ||||||
| 23,584 | Google, Inc.d | 13,680,371 | ||||||
| 20,200 | International Business Machines Corporation | 3,950,716 | ||||||
| 16,793 | Itron, Inc.d | 692,543 | ||||||
| 31,524 | Juniper Networks, Inc.d | 514,156 | ||||||
| 2,414 | Lam Research Corporationd | 91,104 | ||||||
| 34,889 | Marvell Technology Group, Ltd. | 393,548 | ||||||
| 9,300 | MasterCard, Inc. | 4,000,023 | ||||||
| 2,887 | Mercadolibre, Inc. | 218,835 | ||||||
| 550,715 | Microsoft Corporation | 16,846,372 | ||||||
| 253,900 | NetApp, Inc.d | 8,079,098 | ||||||
| 3,056 | Nice Systems, Ltd. ADRd | 111,850 | ||||||
| 21,726 | Nuance Communications, Inc.d | 517,513 | ||||||
| 98,506 | NVIDIA Corporationd | 1,361,353 | ||||||
| 28,300 | ON Semiconductor Corporationd | 200,930 | ||||||
| 65,700 | OpenTable, Inc.d,e | 2,957,157 | ||||||
| 551,615 | Oracle Corporation | 16,382,966 | ||||||
| 49,066 | Plantronics, Inc. | 1,638,804 | ||||||
| 141,100 | Polycom, Inc.d | 1,484,372 | ||||||
| 148,592 | QUALCOMM, Inc. | 8,273,603 | ||||||
| 5,817 | Red Hat, Inc.d | 328,544 | ||||||
| 10,400 | Riverbed Technology, Inc.d | 167,960 | ||||||
| 2,500 | ServiceNow, Inc.c,d | 61,500 | ||||||
| 54,675 | Teradata Corporationd | 3,937,147 | ||||||
| 178,696 | Teradyne, Inc.d | 2,512,466 | ||||||
| 349,720 | Texas Instruments, Inc. | 10,033,467 | ||||||
| 54,765 | TIBCO Software, Inc.d | 1,638,569 | ||||||
| 43,621 | VeriFone Systems, Inc.d | 1,443,419 | ||||||
| 66,813 | Xilinx, Inc. | 2,242,912 | ||||||
|
| |||||||
| Total | 172,086,337 | |||||||
|
| |||||||
| Materials (0.6%) | |||||||
| 1,700 | Agrium, Inc. | 150,399 | ||||||
| 75,600 | AK Steel Holding Corporatione | 443,772 | ||||||
| 12,104 | Albemarle Corporation | 721,883 | ||||||
| 28,200 | BHP Billiton, Ltd. ADRe | 1,841,460 | ||||||
| 17,000 | Buckeye Technologies, Inc. | 484,330 | ||||||
| 4,145 | Celanese Corporation | 143,500 | ||||||
| 35,600 | Cliffs Natural Resources, Inc. | 1,754,724 | ||||||
| 15,400 | Eagle Materials, Inc. | 575,036 | ||||||
| 6,892 | FMC Corporation | 368,584 | ||||||
| 276,107 | Freeport-McMoRan Copper & Gold, Inc. | 9,406,965 | ||||||
| 16,600 | H.B. Fuller Company | 509,620 | ||||||
| 12,670 | LyondellBasell Industries NV | 510,221 | ||||||
| 24,500 | Materials Select Sector SPDR Fund | 864,605 | ||||||
| 32,200 | Mosaic Company | 1,763,272 | ||||||
| 4,869 | Newmont Mining Corporation | 236,195 | ||||||
| 38,200 | Rio Tinto plc ADRe | 1,826,342 | ||||||
| 14,377 | Sigma-Aldrich Corporation | 1,062,892 | ||||||
| 18,322 | Silgan Holdings, Inc. | 782,166 | ||||||
| 8,586 | Silver Wheaton Corporation | 230,448 | ||||||
| 52,530 | Steel Dynamics, Inc. | 617,228 | ||||||
| 36,700 | SunCoke Energy, Inc.d | 537,655 | ||||||
| 38,153 | Walter Energy, Inc. | 1,684,836 | ||||||
|
| |||||||
| Total | 26,516,133 | |||||||
|
| |||||||
The accompanying Notes to Financial Statements are an integral part of this schedule.
55
Table of Contents
Moderate Allocation Portfolio
Schedule of Investments as of June 29, 2012
(unaudited)
| Shares | Common Stock (17.6%) | Value | ||||||
| Telecommunications Services (0.1%) | |||||||
| 5,156 | SBA Communications Corporationd | $ | 294,150 | |||||
| 18,005 | TW Telecom, Inc.d | 462,008 | ||||||
| 49,706 | Verizon Communications, Inc. | 2,208,935 | ||||||
|
| |||||||
| Total | 2,965,093 | |||||||
|
| |||||||
| Utilities (0.2%) | |||||||
| 34,400 | CMS Energy Corporation | 808,400 | ||||||
| 81,030 | NiSource, Inc. | 2,005,493 | ||||||
| 46,573 | NV Energy, Inc. | 818,753 | ||||||
| 103,300 | PNM Resources, Inc. | 2,018,482 | ||||||
| 19,700 | Public Service Enterprise Group, Inc. | 640,250 | ||||||
| 44,561 | Southwest Gas Corporation | 1,945,088 | ||||||
| 44,380 | Utilities Select Sector SPDR Fund | 1,641,616 | ||||||
|
| |||||||
| Total | 9,878,082 | |||||||
|
| |||||||
Total Common Stock (cost $794,978,815) | 825,486,160 | |||||||
|
| |||||||
| Principal Amount | Long-Term Fixed Income (16.2%) | |||||||
| Asset-Backed Securities (0.3%) | |||||||
| J.P. Morgan Mortgage Acquisition Corporation | ||||||||
| 5,011,721 | 5.461%, 10/25/2036 | 3,911,062 | ||||||
| Morgan Stanley Capital, Inc. | ||||||||
| 3,824,717 | 0.395%, 2/25/2037f | 1,903,252 | ||||||
| Renaissance Home Equity Loan Trust | ||||||||
| 6,500,000 | 6.011%, 5/25/2036 | 3,665,669 | ||||||
| 3,961,085 | 5.580%, 11/25/2036 | 2,099,632 | ||||||
|
| |||||||
| Total | 11,579,615 | |||||||
|
| |||||||
| Basic Materials (0.2%) | |||||||
| ArcelorMittal | ||||||||
| 300,000 | 5.375%, 6/1/2013 | 308,539 | ||||||
| Arch Coal, Inc. | ||||||||
| 1,420,000 | 7.000%, 6/15/2019e | 1,199,900 | ||||||
| BHP Billiton Finance, Ltd. | ||||||||
| 840,000 | 1.000%, 2/24/2015 | 841,438 | ||||||
| Dow Chemical Company | ||||||||
| 842,000 | 5.900%, 2/15/2015 | 938,939 | ||||||
| 760,000 | 4.250%, 11/15/2020 | 824,499 | ||||||
| FMG Resources Property, Ltd. | ||||||||
| 1,420,000 | 8.250%, 11/1/2019g | 1,505,200 | ||||||
| Hexion US Finance Corporation/Hexion Nova Scotia Finance ULC | ||||||||
| 1,475,000 | 8.875%, 2/1/2018 | 1,504,500 | ||||||
| International Paper Company | ||||||||
| 560,000 | 5.300%, 4/1/2015 | 612,860 | ||||||
| LyondellBasell Industries NV | ||||||||
| 1,505,000 | 5.000%, 4/15/2019g | 1,578,369 | ||||||
| Novelis, Inc. | ||||||||
| 1,420,000 | 8.375%, 12/15/2017 | 1,519,400 | ||||||
| Rio Tinto Finance USA, Ltd. | ||||||||
| 1,197,000 | 1.125%, 3/20/2015 | 1,199,690 | ||||||
|
| |||||||
| Total | 12,033,334 | |||||||
|
| |||||||
| Capital Goods (0.3%) | |||||||
| Bombardier, Inc. | ||||||||
| 1,475,000 | 5.750%, 3/15/2022g | 1,469,469 | ||||||
| Case New Holland, Inc. | ||||||||
| 1,440,000 | 7.875%, 12/1/2017 | 1,663,200 | ||||||
| Caterpillar Financial Services Corporation | ||||||||
| 760,000 | 1.050%, 3/26/2015 | 764,412 | ||||||
| 380,000 | 1.100%, 5/29/2015 | 382,126 | ||||||
| John Deere Capital Corporation | ||||||||
| 467,000 | 0.875%, 4/17/2015 | 467,524 | ||||||
| Raytheon Company | ||||||||
| 840,000 | 1.625%, 10/15/2015 | 862,262 | ||||||
| RBS Global, Inc./Rexnord, LLC | ||||||||
| 1,475,000 | 8.500%, 5/1/2018 | 1,600,375 | ||||||
| Sealed Air Corporation | ||||||||
| 1,610,000 | 8.375%, 9/15/2021g | 1,819,300 | ||||||
| Textron, Inc. | ||||||||
| 1,120,000 | 5.600%, 12/1/2017 | 1,233,667 | ||||||
| United Technologies Corporation | ||||||||
| 190,000 | 0.967%, 6/1/2015f | 192,029 | ||||||
| 190,000 | 1.800%, 6/1/2017 | 194,035 | ||||||
| 95,000 | 4.500%, 6/1/2042 | 104,348 | ||||||
| UR Financing Escrow Corporation | ||||||||
| 1,475,000 | 7.375%, 5/15/2020g | 1,541,375 | ||||||
|
| |||||||
| Total | 12,294,122 | |||||||
|
| |||||||
| Collateralized Mortgage Obligations (0.7%) | |||||||
| Citigroup Mortgage Loan Trust, Inc. | ||||||||
| 1,617,533 | 5.500%, 11/25/2035 | 1,334,539 | ||||||
| CitiMortgage Alternative Loan Trust | ||||||||
| 5,465,902 | 5.750%, 4/25/2037 | 3,867,006 | ||||||
| Countrywide Alternative Loan Trust | ||||||||
| 2,307,495 | 6.000%, 4/25/2036 | 1,535,684 | ||||||
| 1,127,040 | 6.000%, 1/25/2037 | 811,424 | ||||||
| 6,374,073 | 5.500%, 5/25/2037 | 4,364,793 | ||||||
| 5,269,791 | 7.000%, 10/25/2037 | 3,181,742 | ||||||
| Countrywide Home Loans, Inc. | ||||||||
| 2,414,673 | 5.750%, 4/25/2037 | 2,016,030 | ||||||
| Deutsche Alt-A Securities, Inc. | ||||||||
| 930,914 | 5.500%, 10/25/2021 | 899,830 | ||||||
| 1,870,588 | 6.000%, 10/25/2021 | 1,608,745 | ||||||
| GSR Mortgage Loan Trust | ||||||||
| 2,673,488 | 0.435%, 8/25/2046f | 2,179,962 | ||||||
| HomeBanc Mortgage Trust | ||||||||
| 2,525,643 | 2.591%, 4/25/2037 | 1,644,698 | ||||||
| J.P. Morgan Mortgage Trust | ||||||||
| 1,331,247 | 2.783%, 6/25/2036 | 940,125 | ||||||
| 485,782 | 2.747%, 10/25/2036 | 346,848 | ||||||
| 6,499,940 | 6.250%, 8/25/2037 | 4,104,569 | ||||||
| MASTR Alternative Loans Trust | ||||||||
| 1,251,399 | 6.500%, 7/25/2034 | 1,315,048 | ||||||
| Merrill Lynch Alternative Note Asset Trust | ||||||||
| 1,238,717 | 6.000%, 3/25/2037 | 913,026 | ||||||
The accompanying Notes to Financial Statements are an integral part of this schedule.
56
Table of Contents
Moderate Allocation Portfolio
Schedule of Investments as of June 29, 2012
(unaudited)
| Principal Amount | Long-Term Fixed Income (16.2%) | Value | ||||||
| Collateralized Mortgage Obligations (0.7%) - continued | |||||||
| Sequoia Mortgage Trust | ||||||||
| $ | 1,765,856 | 5.371%, 9/20/2046 | $ | 600,038 | ||||
| WaMu Mortgage Pass Through Certificates | ||||||||
| 458,867 | 2.506%, 9/25/2036 | 328,135 | ||||||
| 1,702,707 | 2.561%, 10/25/2036 | 1,201,088 | ||||||
| WaMu Mortgage Pass-Through Certificates | ||||||||
| 4,715,432 | 2.248%, 11/25/2036 | 3,346,080 | ||||||
|
| |||||||
| Total | 36,539,410 | |||||||
|
| |||||||
| Commercial Mortgage-Backed Securities (1.2%) | |||||||
| Banc of America Commercial Mortgage, Inc. | ||||||||
| 7,200,000 | 5.807%, 4/10/2049 | 8,242,330 | ||||||
| 4,975,000 | 5.805%, 6/10/2049 | 5,620,591 | ||||||
| Bear Stearns Commercial Mortgage Securities, Inc. | ||||||||
| 3,500,000 | 5.331%, 2/11/2044 | 3,766,955 | ||||||
| Citigroup/Deutsche Bank Commercial Mortgage | ||||||||
| 3,000,000 | 5.322%, 12/11/2049 | 3,332,154 | ||||||
| Credit Suisse First Boston Mortgage Securities | ||||||||
| 7,200,000 | 5.542%, 1/15/2049 | 7,753,147 | ||||||
| Credit Suisse Mortgage Capital Certificates | ||||||||
| 8,875,000 | 5.509%, 9/15/2039 | 8,693,559 | ||||||
| Government National Mortgage Association | ||||||||
| 527,789 | 2.164%, 3/16/2033 | 535,942 | ||||||
| 468,247 | 3.214%, 1/16/2040 | 491,313 | ||||||
| Greenwich Capital Commercial Funding Corporation | ||||||||
| 4,650,000 | 5.867%, 12/10/2049 | 4,560,846 | ||||||
| J.P. Morgan Chase Commercial Mortgage Securities Corporation | ||||||||
| 3,650,000 | 5.924%, 2/12/2049 | 3,674,382 | ||||||
| Morgan Stanley Capital, Inc. | ||||||||
| 2,650,000 | 5.406%, 3/15/2044 | 2,596,693 | ||||||
| Wachovia Bank Commercial Mortgage Trust | ||||||||
| 5,400,000 | 5.603%, 10/15/2048 | 5,410,654 | ||||||
|
| |||||||
| Total | 54,678,566 | |||||||
|
| |||||||
| Communications Services (0.6%) | |||||||
| AMC Networks, Inc. | ||||||||
| 1,050,000 | 7.750%, 7/15/2021g | 1,157,625 | ||||||
| AT&T, Inc. | ||||||||
| 1,145,000 | 2.400%, 8/15/2016 | 1,189,601 | ||||||
| British Telecommunications plc | ||||||||
| 750,000 | 2.000%, 6/22/2015 | 760,306 | ||||||
| Cablevision Systems Corporation | ||||||||
| 1,410,000 | 8.625%, 9/15/2017 | 1,572,150 | ||||||
| CCO Holdings, LLC | ||||||||
| 1,440,000 | 7.000%, 1/15/2019 | 1,555,200 | ||||||
| CenturyLink, Inc. | ||||||||
| 1,200,000 | 5.800%, 3/15/2022 | 1,194,606 | ||||||
| Comcast Corporation | ||||||||
| 1,198,000 | 6.500%, 1/15/2015 | 1,351,324 | ||||||
| 375,000 | 4.650%, 7/15/2042 | 375,172 | ||||||
| Digicel, Ltd. | ||||||||
| 1,177,000 | 8.250%, 9/1/2017g | 1,197,598 | ||||||
| DIRECTV Holdings, LLC/DIRECTV Financing Company, Inc. | ||||||||
| 841,000 | 2.400%, 3/15/2017 | 846,538 | ||||||
| Dish DBS Corporation | ||||||||
| 1,355,000 | 4.625%, 7/15/2017g | 1,356,694 | ||||||
| 1,355,000 | 5.875%, 7/15/2022g | 1,368,550 | ||||||
| Frontier Communications Corporation | ||||||||
| 1,610,000 | 8.125%, 10/1/2018 | 1,710,625 | ||||||
| Hughes Satellite Systems Corporation | ||||||||
| 1,410,000 | 6.500%, 6/15/2019 | 1,498,125 | ||||||
| Intelsat Jackson Holdings SA | ||||||||
| 1,410,000 | 7.250%, 4/1/2019 | 1,480,500 | ||||||
| Level 3 Financing, Inc. | ||||||||
| 1,520,000 | 8.625%, 7/15/2020 | 1,596,000 | ||||||
| NBCUniversal Media, LLC | ||||||||
| 841,000 | 2.875%, 4/1/2016 | 876,917 | ||||||
| News America, Inc. | ||||||||
| 385,000 | 5.300%, 12/15/2014 | 421,970 | ||||||
| Sprint Nextel Corporation | ||||||||
| 740,000 | 9.125%, 3/1/2017g | 777,000 | ||||||
| 690,000 | 9.000%, 11/15/2018g | 771,075 | ||||||
| Telefonica Emisiones SAU | ||||||||
| 380,000 | 3.729%, 4/27/2015 | 346,002 | ||||||
| Time Warner Cable, Inc. | ||||||||
| 466,000 | 7.500%, 4/1/2014 | 516,650 | ||||||
| 466,000 | 3.500%, 2/1/2015 | 492,895 | ||||||
| UPCB Finance V, Ltd. | ||||||||
| 1,420,000 | 7.250%, 11/15/2021g | 1,483,900 | ||||||
| Verizon Communications, Inc. | ||||||||
| 1,145,000 | 5.500%, 2/15/2018 | 1,355,279 | ||||||
| Virgin Media Finance plc | ||||||||
| 1,475,000 | 5.250%, 2/15/2022 | 1,508,188 | ||||||
| Vivendi SA | ||||||||
| 841,000 | 2.400%, 4/10/2015g | 832,671 | ||||||
| Vodafone Group plc | ||||||||
| 760,000 | 3.375%, 11/24/2015 | 811,963 | ||||||
|
| |||||||
| Total | 30,405,124 | |||||||
|
| |||||||
| Consumer Cyclical (0.4%) | |||||||
| Chrysler Group, LLC | ||||||||
| 1,405,000 | 8.000%, 6/15/2019e | 1,443,638 | ||||||
| Daimler Finance North America, LLC | ||||||||
| 360,000 | 1.249%, 4/10/2014f,g | 360,188 | ||||||
| 435,000 | 1.650%, 4/10/2015g | 436,710 | ||||||
| Federated Retail Holdings, Inc. | ||||||||
| 839,000 | 5.900%, 12/1/2016 | 967,082 | ||||||
| Ford Motor Credit Company, LLC | ||||||||
| 748,000 | 2.750%, 5/15/2015 | 754,069 | ||||||
| 1,475,000 | 5.000%, 5/15/2018 | 1,566,276 | ||||||
The accompanying Notes to Financial Statements are an integral part of this schedule.
57
Table of Contents
Moderate Allocation Portfolio
Schedule of Investments as of June 29, 2012
(unaudited)
| Principal Amount | Long-Term Fixed Income (16.2%) | Value | ||||||
| Consumer Cyclical (0.4%) - continued | |||||||
| Host Hotels and Resorts, LP | ||||||||
| $1,355,000 | 6.000%, 11/1/2020 | $ | 1,470,175 | |||||
| Lennar Corporation | ||||||||
| 1,420,000 | 12.250%, 6/1/2017 | 1,835,350 | ||||||
| Limited Brands, Inc. | ||||||||
| 1,240,000 | 5.625%, 2/15/2022 | 1,277,200 | ||||||
| Macy’s Retail Holdings, Inc. | ||||||||
| 841,000 | 3.875%, 1/15/2022 | 884,205 | ||||||
| MGM Resorts International | ||||||||
| 1,335,000 | 11.125%, 11/15/2017 | 1,498,538 | ||||||
| Rite Aid Corporation | ||||||||
| 1,420,000 | 7.500%, 3/1/2017 | 1,448,400 | ||||||
| Service Corporation International | ||||||||
| 1,475,000 | 8.000%, 11/15/2021 | 1,692,562 | ||||||
| Time Warner, Inc. | ||||||||
| 465,000 | 3.150%, 7/15/2015 | 490,402 | ||||||
| Toyota Motor Credit Corporation | ||||||||
| 380,000 | 1.750%, 5/22/2017 | 383,079 | ||||||
| Toys R Us Property Company II, LLC | ||||||||
| 1,420,000 | 8.500%, 12/1/2017 | 1,478,575 | ||||||
| Viacom, Inc. | ||||||||
| 180,000 | 4.375%, 9/15/2014 | 192,679 | ||||||
| 180,000 | 1.250%, 2/27/2015 | 180,448 | ||||||
| Volkswagen International Finance NV | ||||||||
| 725,000 | 1.625%, 3/22/2015g | 727,511 | ||||||
|
| |||||||
| Total | 19,087,087 | |||||||
|
| |||||||
| Consumer Non-Cyclical (0.7%) | |||||||
| Amgen, Inc. | ||||||||
| 390,000 | 4.850%, 11/18/2014 | 423,476 | ||||||
| 390,000 | 2.125%, 5/15/2017 | 394,579 | ||||||
| Anheuser-Busch InBev Worldwide, Inc. | ||||||||
| 466,000 | 1.016%, 1/27/2014f | 469,802 | ||||||
| Aristotle Holding, Inc. | ||||||||
| 559,000 | 2.750%, 11/21/2014g | 570,959 | ||||||
| BAT International Finance plc | ||||||||
| 760,000 | 1.400%, 6/5/2015g | 759,911 | ||||||
| 380,000 | 2.125%, 6/7/2017e,g | 379,500 | ||||||
| Beam, Inc. | ||||||||
| 195,000 | 1.875%, 5/15/2017 | 195,939 | ||||||
| Boston Scientific Corporation | ||||||||
| 1,125,000 | 5.450%, 6/15/2014 | 1,205,656 | ||||||
| Bunge Limited Finance Corporation | ||||||||
| 760,000 | 3.200%, 6/15/2017 | 761,683 | ||||||
| Capella Healthcare, Inc. | ||||||||
| 1,360,000 | 9.250%, 7/1/2017 | 1,407,600 | ||||||
| Cardinal Health, Inc. | ||||||||
| 380,000 | 1.900%, 6/15/2017 | 382,845 | ||||||
| Community Health Systems, Inc. | ||||||||
| 367,000 | 8.875%, 7/15/2015 | 376,634 | ||||||
| 1,475,000 | 8.000%, 11/15/2019 | 1,570,875 | ||||||
| Covidien International Finance SA | ||||||||
| 760,000 | 1.350%, 5/29/2015 | 760,987 | ||||||
| 380,000 | 3.200%, 6/15/2022 | 391,769 | ||||||
| Express Scripts, Inc. | ||||||||
| 466,000 | 3.125%, 5/15/2016 | 485,186 | ||||||
| Fresenius Medical Care US Finance II, Inc. | ||||||||
| 1,470,000 | 5.625%, 7/31/2019g | 1,532,475 | ||||||
| Gilead Sciences, Inc. | ||||||||
| 415,000 | 2.400%, 12/1/2014 | 427,711 | ||||||
| 415,000 | 3.050%, 12/1/2016 | 438,118 | ||||||
| GlaxoSmithKline Capital plc | ||||||||
| 390,000 | 0.750%, 5/8/2015 | 389,956 | ||||||
| 390,000 | 1.500%, 5/8/2017 | 390,706 | ||||||
| Grifols, Inc. | ||||||||
| 1,695,000 | 8.250%, 2/1/2018 | 1,817,888 | ||||||
| HCA, Inc. | ||||||||
| 1,475,000 | 5.875%, 3/15/2022 | 1,541,375 | ||||||
| JBS USA, LLC | ||||||||
| 1,420,000 | 7.250%, 6/1/2021g | 1,320,600 | ||||||
| Kellogg Company | ||||||||
| 390,000 | 1.125%, 5/15/2015 | 391,877 | ||||||
| 390,000 | 1.750%, 5/17/2017 | 389,979 | ||||||
| Kinetic Concepts, Inc./KCI USA, Inc. | ||||||||
| 1,440,000 | 10.500%, 11/1/2018g | 1,512,000 | ||||||
| Kraft Foods, Inc. | ||||||||
| 760,000 | 1.625%, 6/4/2015g | 768,040 | ||||||
| 475,000 | 2.250%, 6/5/2017g | 486,342 | ||||||
| Libbey Glass, Inc. | ||||||||
| 320,000 | 6.875%, 5/15/2020g | 328,800 | ||||||
| Lorillard Tobacco Company | ||||||||
| 1,007,000 | 3.500%, 8/4/2016 | 1,049,759 | ||||||
| Pfizer, Inc. | ||||||||
| 841,000 | 6.200%, 3/15/2019 | 1,054,067 | ||||||
| Reynolds Group Issuer, Inc. | ||||||||
| 1,430,000 | 6.875%, 2/15/2021g | 1,487,200 | ||||||
| SABMiller Holdings, Inc. | ||||||||
| 835,000 | 1.850%, 1/15/2015g | 846,925 | ||||||
| 835,000 | 2.450%, 1/15/2017g | 860,666 | ||||||
| Spectrum Brands Holdings, Inc. | ||||||||
| 1,610,000 | 9.500%, 6/15/2018 | 1,819,300 | ||||||
| Teva Pharmaceutical Finance Company BV | ||||||||
| 390,000 | 2.400%, 11/10/2016 | 402,951 | ||||||
| Teva Pharmaceutical Finance IV, LLC | ||||||||
| 652,000 | 1.700%, 11/10/2014 | 665,217 | ||||||
| Tyson Foods, Inc. | ||||||||
| 760,000 | 4.500%, 6/15/2022 | 782,800 | ||||||
| Valeant Pharmaceuticals International | ||||||||
| 1,420,000 | 6.875%, 12/1/2018g | 1,467,925 | ||||||
|
| |||||||
| Total | 32,710,078 | |||||||
|
| |||||||
| Energy (0.3%) | |||||||
| Anadarko Petroleum Corporation | ||||||||
| 155,000 | 5.750%, 6/15/2014 | 166,596 | ||||||
| Apache Corporation | ||||||||
| 841,000 | 1.750%, 4/15/2017 | 857,645 | ||||||
| BP Capital Markets plc | ||||||||
| 840,000 | 3.625%, 5/8/2014 | 880,508 | ||||||
The accompanying Notes to Financial Statements are an integral part of this schedule.
58
Table of Contents
Moderate Allocation Portfolio
Schedule of Investments as of June 29, 2012
(unaudited)
| Principal Amount | Long-Term Fixed Income (16.2%) | Value | ||||||
| Energy (0.3%) - continued | |||||||
| $ | 840,000 | 3.125%, 10/1/2015 | $ | 893,030 | ||||
| 390,000 | 1.846%, 5/5/2017 | 393,879 | ||||||
| 585,000 | 3.245%, 5/6/2022 | 605,703 | ||||||
| Concho Resources, Inc. | ||||||||
| 2,950,000 | 5.500%, 10/1/2022 | 2,920,500 | ||||||
| Denbury Resources, Inc. | ||||||||
| 1,470,000 | 6.375%, 8/15/2021 | 1,528,800 | ||||||
| Harvest Operations Corporation | ||||||||
| 1,190,000 | 6.875%, 10/1/2017g | 1,264,375 | ||||||
| Linn Energy, LLC | ||||||||
| 1,430,000 | 7.750%, 2/1/2021 | 1,494,350 | ||||||
| Phillips 66 | ||||||||
| 466,000 | 1.950%, 3/5/2015g | 469,337 | ||||||
| 653,000 | 2.950%, 5/1/2017g | 671,002 | ||||||
| Samson Investment Company | ||||||||
| 1,355,000 | 9.750%, 2/15/2020g | 1,348,225 | ||||||
| Suncor Energy, Inc. | ||||||||
| 467,000 | 6.100%, 6/1/2018 | 553,097 | ||||||
| Weatherford International, Ltd. | ||||||||
| 841,000 | 6.750%, 9/15/2040 | 943,945 | ||||||
|
| |||||||
| Total | 14,990,992 | |||||||
|
| |||||||
| Financials (1.4%) | |||||||
| Achmea Hypotheekbank NV | ||||||||
| 371,000 | 3.200%, 11/3/2014g | 387,001 | ||||||
| Ally Financial, Inc. | ||||||||
| 1,475,000 | 5.500%, 2/15/2017 | 1,498,218 | ||||||
| American Express Company | ||||||||
| 465,000 | 7.250%, 5/20/2014 | 515,652 | ||||||
| American Express Credit Corporation | ||||||||
| 380,000 | 2.375%, 3/24/2017 | 389,474 | ||||||
| American International Group, Inc. | ||||||||
| 841,000 | 3.000%, 3/20/2015 | 845,250 | ||||||
| 841,000 | 3.800%, 3/22/2017 | 857,307 | ||||||
| ANZ National International, Ltd. of London | ||||||||
| 790,000 | 3.125%, 8/10/2015g | 811,110 | ||||||
| Bank of America Corporation | ||||||||
| 1,214,000 | 7.750%, 8/15/2015 | 1,321,608 | ||||||
| 840,000 | 3.875%, 3/22/2017e | 855,705 | ||||||
| Bank of New York Mellon Corporation | ||||||||
| 840,000 | 1.700%, 11/24/2014 | 854,152 | ||||||
| 195,000 | 1.969%, 6/20/2017 | 197,288 | ||||||
| Bank of Nova Scotia | ||||||||
| 600,000 | 1.450%, 7/26/2013g | 606,083 | ||||||
| 840,000 | 1.850%, 1/12/2015 | 853,426 | ||||||
| Berkshire Hathaway, Inc. | ||||||||
| 780,000 | 1.600%, 5/15/2017 | 785,431 | ||||||
| BlackRock, Inc. | ||||||||
| 380,000 | 1.375%, 6/1/2015 | 382,717 | ||||||
| Canadian Imperial Bank of Commerce | ||||||||
| 610,000 | 2.600%, 7/2/2015g | 641,561 | ||||||
| Capital One Financial Corporation | ||||||||
| 195,000 | 1.617%, 7/15/2014f | 193,782 | ||||||
| 840,000 | 2.150%, 3/23/2015 | 846,548 | ||||||
| CIT Group, Inc. | ||||||||
| 566,268 | 7.000%, 5/2/2017g | 567,330 | ||||||
| Citigroup, Inc. | ||||||||
| 840,000 | 5.850%, 7/2/2013 | 878,658 | ||||||
| 840,000 | 5.125%, 5/5/2014 | 875,920 | ||||||
| 1,495,000 | 5.000%, 9/15/2014 | 1,532,475 | ||||||
| 840,000 | 4.750%, 5/19/2015 | 881,698 | ||||||
| CNA Financial Corporation | ||||||||
| 1,885,000 | 7.350%, 11/15/2019 | 2,229,989 | ||||||
| Credit Suisse New York, NY | ||||||||
| 654,000 | 5.500%, 5/1/2014 | 693,335 | ||||||
| Credit Suisse USA, Inc. | ||||||||
| 840,000 | 5.375%, 3/2/2016 | 931,633 | ||||||
| Developers Diversified Realty Corporation | ||||||||
| 1,163,000 | 7.500%, 4/1/2017 | 1,334,275 | ||||||
| Dexia Credit Local SA | ||||||||
| 600,000 | 2.750%, 4/29/2014g | 585,504 | ||||||
| Discover Bank | ||||||||
| 790,000 | 8.700%, 11/18/2019 | 981,494 | ||||||
| Eksportfinans ASA | ||||||||
| 390,000 | 3.000%, 11/17/2014 | 369,500 | ||||||
| General Electric Capital Corporation | ||||||||
| 390,000 | 1.166%, 4/24/2014f | 390,002 | ||||||
| 760,000 | 0.728%, 9/15/2014f | 750,805 | ||||||
| 841,000 | 2.150%, 1/9/2015 | 855,173 | ||||||
| 385,000 | 1.336%, 5/9/2016f | 378,782 | ||||||
| 467,000 | 2.950%, 5/9/2016e | 481,912 | ||||||
| 390,000 | 2.300%, 4/27/2017 | 392,637 | ||||||
| 760,000 | 6.750%, 3/15/2032 | 941,019 | ||||||
| Goldman Sachs Group, Inc. | ||||||||
| 840,000 | 5.000%, 10/1/2014 | 875,781 | ||||||
| 840,000 | 3.700%, 8/1/2015 | 847,423 | ||||||
| 841,000 | 0.918%, 3/22/2016f | 760,998 | ||||||
| Hartford Financial Services Group, Inc. | ||||||||
| 195,000 | 7.300%, 11/1/2015 | 216,974 | ||||||
| 841,000 | 4.000%, 10/15/2017 | 844,488 | ||||||
| Health Care REIT, Inc. | ||||||||
| 760,000 | 6.500%, 3/15/2041 | 811,960 | ||||||
| HSBC Bank plc | ||||||||
| 385,000 | 1.266%, 1/17/2014f,g | 385,838 | ||||||
| HSBC Holdings plc | ||||||||
| 652,000 | 4.000%, 3/30/2022 | 677,036 | ||||||
| Icahn Enterprises, LP | ||||||||
| 1,465,000 | 8.000%, 1/15/2018 | 1,556,563 | ||||||
| ING Bank NV | ||||||||
| 893,000 | 3.750%, 3/7/2017g | 888,811 | ||||||
| International Bank for Reconstruction & Development | ||||||||
| 600,000 | 2.375%, 5/26/2015 | 633,655 | ||||||
| International Lease Finance Corporation | ||||||||
| 1,475,000 | 5.875%, 4/1/2019 | 1,476,429 | ||||||
| J.P. Morgan Chase & Company | ||||||||
| 840,000 | 4.650%, 6/1/2014 | 884,376 | ||||||
| 1,140,000 | 1.875%, 3/20/2015 | 1,139,119 | ||||||
| J.P. Morgan Chase Bank NA | ||||||||
| 747,000 | 0.798%, 6/13/2016f | 695,716 | ||||||
The accompanying Notes to Financial Statements are an integral part of this schedule.
59
Table of Contents
Moderate Allocation Portfolio
Schedule of Investments as of June 29, 2012
(unaudited)
| Principal Amount | Long-Term Fixed Income (16.2%) | Value | ||||||
| Financials (1.4%) - continued | |||||||
| Lloyds TSB Bank plc | ||||||||
| $2,205,000 | 4.200%, 3/28/2017 | $ | 2,274,473 | |||||
| MetLife Institutional Funding II | ||||||||
| 760,000 | 1.368%, 4/4/2014f,g | 763,685 | ||||||
| Morgan Stanley | ||||||||
| 1,197,000 | 6.000%, 5/13/2014 | 1,240,724 | ||||||
| 1,197,000 | 4.750%, 3/22/2017 | 1,194,369 | ||||||
| Murray Street Investment Trust I | ||||||||
| 935,000 | 4.647%, 3/9/2017 | 936,804 | ||||||
| Nordea Bank AB | ||||||||
| 800,000 | 2.250%, 3/20/2015g | 802,886 | ||||||
| Omega Healthcare Investors, Inc. | ||||||||
| 1,355,000 | 5.875%, 3/15/2024g | 1,355,000 | ||||||
| PNC Funding Corporation | ||||||||
| 840,000 | 3.300%, 3/8/2022 | 856,635 | ||||||
| Prudential Covered Trust | ||||||||
| 570,000 | 2.997%, 9/30/2015g | 579,025 | ||||||
| Prudential Financial, Inc. | ||||||||
| 834,000 | 6.200%, 11/15/2040 | 910,042 | ||||||
| Regions Bank | ||||||||
| 1,320,000 | 7.500%, 5/15/2018 | 1,485,000 | ||||||
| Royal Bank of Canada | ||||||||
| 550,000 | 3.125%, 4/14/2015e,g | 582,474 | ||||||
| Royal Bank of Scotland plc | ||||||||
| 841,000 | 4.875%, 8/25/2014g | 864,667 | ||||||
| Santander US Debt SAU | ||||||||
| 720,000 | 3.724%, 1/20/2015g | 669,684 | ||||||
| SLM Corporation | ||||||||
| 1,495,000 | 6.250%, 1/25/2016 | 1,569,750 | ||||||
| Svenska Handelsbanken AB | ||||||||
| 841,000 | 3.125%, 7/12/2016 | 869,094 | ||||||
| Toronto-Dominion Bank | ||||||||
| 610,000 | 2.200%, 7/29/2015g | 634,789 | ||||||
| U.S. Bancorp | ||||||||
| 841,000 | 3.150%, 3/4/2015 | 888,088 | ||||||
| 390,000 | 1.650%, 5/15/2017 | 392,848 | ||||||
| Ventas Realty, LP | ||||||||
| 193,000 | 4.000%, 4/30/2019 | 197,920 | ||||||
| Wachovia Corporation | ||||||||
| 2,045,000 | 5.625%, 10/15/2016 | 2,305,222 | ||||||
| WEA Finance, LLC | ||||||||
| 395,000 | 5.125%, 11/15/2014g | 417,908 | ||||||
| 841,000 | 5.700%, 10/1/2016g | 925,395 | ||||||
| WEA Finance, LLC/WT Finance | ||||||||
| Australia, Pty Ltd. | ||||||||
| 44,000 | 7.500%, 6/2/2014g | 48,008 | ||||||
| Wells Fargo & Company | ||||||||
| 561,000 | 2.100%, 5/8/2017 | 562,254 | ||||||
|
| |||||||
| Total | 64,916,365 | |||||||
|
| |||||||
| Foreign Government (<0.1%) | |||||||
| Kommunalbanken AS | ||||||||
| 600,000 | 2.750%, 5/5/2015g | 630,026 | ||||||
| Kreditanstalt fuer Wiederaufbau | ||||||||
| 295,000 | 0.253%, 6/17/2013f | 295,022 | ||||||
|
| |||||||
| Total | 925,048 | |||||||
|
| |||||||
| Mortgage-Backed Securities (6.5%) | |||||||
| Federal Home Loan Mortgage Corporation Gold 15-Yr. Pass Through | ||||||||
| 46,400,000 | 3.000%, 7/1/2027c | 48,509,762 | ||||||
| Federal National Mortgage Association Conventional 15- Yr. Pass Through | ||||||||
| 29,320,000 | 3.000%, 7/1/2027c | 30,717,274 | ||||||
| Federal National Mortgage Association Conventional 30- Yr. Pass Through | ||||||||
| 57,310,000 | 3.500%, 7/1/2042c | 60,238,197 | ||||||
| 100,027,500 | 4.000%, 7/1/2042c | 106,451,166 | ||||||
| 52,572,500 | 5.500%, 7/1/2042c | 57,345,084 | ||||||
|
| |||||||
| Total | 303,261,483 | |||||||
|
| |||||||
| Technology (0.2%) | |||||||
| Amkor Technology, Inc. | ||||||||
| 470,000 | 6.625%, 6/1/2021 | 468,825 | ||||||
| Equinix, Inc. | ||||||||
| 1,610,000 | 8.125%, 3/1/2018 | 1,783,075 | ||||||
| First Data Corporation | ||||||||
| 1,475,000 | 7.375%, 6/15/2019g | 1,504,500 | ||||||
| Freescale Semiconductor, Inc. | ||||||||
| 890,000 | 9.250%, 4/15/2018g | 952,300 | ||||||
| Hewlett-Packard Company | ||||||||
| 760,000 | 2.018%, 9/19/2014f | 768,559 | ||||||
| 1,174,000 | 2.600%, 9/15/2017 | 1,178,465 | ||||||
| International Business Machines Corporation | ||||||||
| 780,000 | 0.750%, 5/11/2015 | 778,814 | ||||||
| Samsung Electronics America, Inc. | ||||||||
| 933,000 | 1.750%, 4/10/2017g | 930,584 | ||||||
| Xerox Corporation | ||||||||
| 545,000 | 7.200%, 4/1/2016 | 635,415 | ||||||
|
| |||||||
| Total | 9,000,537 | |||||||
|
| |||||||
| Transportation (0.2%) | |||||||
| Avis Budget Car Rental, LLC | ||||||||
| 1,345,000 | 8.250%, 1/15/2019 | 1,442,512 | ||||||
| Continental Airlines, Inc. | ||||||||
| 1,475,000 | 6.750%, 9/15/2015g | 1,515,563 | ||||||
| 390,000 | 4.150%, 4/11/2024 | 384,150 | ||||||
| CSX Corporation | ||||||||
| 466,000 | 6.250%, 4/1/2015 | 530,919 | ||||||
| Delta Air Lines, Inc. | ||||||||
| 780,000 | 6.750%, 5/23/2017 | 773,214 | ||||||
| 150,000 | 4.750%, 5/7/2020c | 151,875 | ||||||
| Hertz Corporation | ||||||||
| 1,355,000 | 6.750%, 4/15/2019 | 1,409,200 | ||||||
| Kansas City Southern de Mexico SA de CV | ||||||||
| 780,000 | 8.000%, 2/1/2018 | 868,764 | ||||||
| Navios Maritime Acquisition Corporation | ||||||||
| 1,610,000 | 8.625%, 11/1/2017 | 1,497,300 | ||||||
The accompanying Notes to Financial Statements are an integral part of this schedule.
60
Table of Contents
Moderate Allocation Portfolio
Schedule of Investments as of June 29, 2012
(unaudited)
| Principal Amount | Long-Term Fixed Income (16.2%) | Value | ||||||
| Transportation (0.2%) - continued | |||||||
| Navios Maritime Holdings, Inc. | ||||||||
| $1,355,000 | 8.875%, 11/1/2017c,g | $ | 1,358,387 | |||||
|
| |||||||
| Total | 9,931,884 | |||||||
|
| |||||||
| U.S. Government and Agencies (2.9%) | |||||||
| Eksportfinans ASA | ||||||||
| 390,000 | 5.500%, 5/25/2016 | 383,231 | ||||||
| FDIC Structured Sale Guaranteed Notes | ||||||||
| 240,000 | Zero Coupon, 1/7/2014g | 236,878 | ||||||
| Federal Agricultural Mortgage Corporation | ||||||||
| 600,000 | 2.125%, 9/15/2015 | 623,299 | ||||||
| Federal Home Loan Banks | ||||||||
| 3,640,000 | 0.375%, 1/29/2014 | 3,641,416 | ||||||
| 2,790,000 | 1.000%, 6/21/2017 | 2,792,048 | ||||||
| 2,760,000 | 5.000%, 11/17/2017 | 3,332,686 | ||||||
| Federal National Mortgage Association | ||||||||
| 2,250,000 | 1.250%, 2/27/2014 | 2,287,593 | ||||||
| 1,200,000 | 0.500%, 5/27/2015 | 1,199,129 | ||||||
| 910,000 | 4.375%, 10/15/2015 | 1,021,407 | ||||||
| 2,400,000 | 1.375%, 11/15/2016 | 2,456,412 | ||||||
| 680,000 | 6.250%, 5/15/2029 | 979,226 | ||||||
| Tennessee Valley Authority | ||||||||
| 520,000 | 5.250%, 9/15/2039 | 678,008 | ||||||
| U.S. Treasury Bonds | ||||||||
| 1,250,000 | 7.625%, 2/15/2025 | 2,046,094 | ||||||
| 2,975,000 | 4.375%, 5/15/2040 | 3,964,652 | ||||||
| 1,200,000 | 3.125%, 11/15/2041 | 1,290,000 | ||||||
| U.S. Treasury Bonds, TIPS | ||||||||
| 207,466 | 2.375%, 1/15/2025 | 273,223 | ||||||
| 186,254 | 2.125%, 2/15/2040 | 264,365 | ||||||
| U.S. Treasury Notes | ||||||||
| 400,000 | 0.250%, 4/30/2014 | 399,516 | ||||||
| 200,000 | 2.250%, 5/31/2014 | 207,281 | ||||||
| 5,580,000 | 0.750%, 6/15/2014 | 5,626,208 | ||||||
| 12,950,000 | 2.500%, 4/30/2015 | 13,707,782 | ||||||
| 14,000,000 | 0.250%, 5/15/2015 | 13,938,750 | ||||||
| 1,225,000 | 2.000%, 1/31/2016 | 1,288,930 | ||||||
| 1,785,000 | 2.625%, 2/29/2016 | 1,920,967 | ||||||
| 4,350,000 | 3.250%, 3/31/2017 | 4,862,143 | ||||||
| 45,000,000 | 1.250%, 4/30/2019 | 45,499,230 | ||||||
| 13,410,000 | 2.000%, 2/15/2022 | 13,861,541 | ||||||
| U.S. Treasury Notes, TIPS | ||||||||
| 1,039,550 | 2.000%, 1/15/2014 | 1,079,345 | ||||||
| 843,318 | 1.625%, 1/15/2015 | 896,157 | ||||||
| 918,189 | 0.500%, 4/15/2015 | 953,338 | ||||||
| 719,088 | 0.125%, 4/15/2017 | 759,087 | ||||||
| 960,081 | 2.625%, 7/15/2017 | 1,140,395 | ||||||
| 762,403 | 1.125%, 1/15/2021 | 877,358 | ||||||
|
| |||||||
| Total | 134,487,695 | |||||||
|
| |||||||
| Utilities (0.3%) | |||||||
| AES Corporation | ||||||||
| 1,435,000 | 7.375%, 7/1/2021g | 1,596,438 | ||||||
| CenterPoint Energy, Inc. | ||||||||
| 780,000 | 6.850%, 6/1/2015 | 879,080 | ||||||
| Consolidated Edison Company of New York, Inc. | ||||||||
| 840,000 | 4.200%, 3/15/2042 | 895,268 | ||||||
| Crosstex Energy/Crosstex Energy Finance Corporation | ||||||||
| 1,610,000 | 8.875%, 2/15/2018 | 1,700,562 | ||||||
| Exelon Corporation | ||||||||
| 1,190,000 | 4.900%, 6/15/2015 | 1,293,388 | ||||||
| FirstEnergy Solutions Corporation | ||||||||
| 1,190,000 | 4.800%, 2/15/2015 | 1,263,267 | ||||||
| Inergy, LP | ||||||||
| 700,000 | 7.000%, 10/1/2018 | 721,000 | ||||||
| ITC Holdings Corporation | ||||||||
| 746,000 | 5.875%, 9/30/2016g | 857,226 | ||||||
| NextEra Energy Capital Holdings, Inc. | ||||||||
| 380,000 | 1.611%, 6/1/2014 | 381,030 | ||||||
| NGPL PipeCo, LLC | ||||||||
| 1,355,000 | 9.625%, 6/1/2019g | 1,453,238 | ||||||
| NiSource Finance Corporation | ||||||||
| 325,000 | 5.400%, 7/15/2014 | 350,248 | ||||||
| 466,000 | 6.400%, 3/15/2018 | 544,334 | ||||||
| Pacific Gas & Electric Company | ||||||||
| 841,000 | 5.625%, 11/30/2017 | 1,008,721 | ||||||
| Sempra Energy | ||||||||
| 651,000 | 2.300%, 4/1/2017 | 667,175 | ||||||
| 841,000 | 6.150%, 6/15/2018 | 1,015,196 | ||||||
|
| |||||||
| Total | 14,626,171 | |||||||
|
| |||||||
Total Long-Term Fixed Income (cost $751,619,033) | 761,467,511 | |||||||
|
| |||||||
Preferred Stock (<0.1%) | ||||||||
| Financials (<0.1%) | ||||||||
| 15,400 | U.S. Bancorp, 6.000%h | 421,652 | ||||||
|
| |||||||
| Total | 421,652 | |||||||
|
| |||||||
Total Preferred Stock (cost $385,000) | 421,652 | |||||||
|
| |||||||
Collateral Held for Securities Loaned (0.4%) | ||||||||
| 16,771,065 | Thrivent Financial Securities Lending Trust | 16,771,065 | ||||||
|
| |||||||
Total Collateral Held for Securities Loaned (cost $16,771,065) | 16,771,065 | |||||||
|
| |||||||
The accompanying Notes to Financial Statements are an integral part of this schedule.
61
Table of Contents
Moderate Allocation Portfolio
Schedule of Investments as of June 29, 2012
(unaudited)
| Principal Amount | Short-Term Investments (16.9%)i | Value | ||||||
Federal Home Loan Bank Discount Notes | ||||||||
| 179,000,000 | 0.092%, 7/11/2012j | $ | 178,994,937 | |||||
| 8,500,000 | 0.090%, 7/13/2012j | 8,499,724 | ||||||
| 54,000,000 | 0.106%, 7/20/2012j | 53,996,811 | ||||||
| 10,000,000 | 0.065%, 7/25/2012j | 9,999,549 | ||||||
| 10,000,000 | 0.060%, 7/27/2012j | 9,999,550 | ||||||
| 70,000,000 | 0.085%, 8/8/2012j,k | 69,993,554 | ||||||
| 50,000,000 | 0.085%, 8/10/2012j | 49,995,160 | ||||||
| 159,000,000 | 0.109%, 8/17/2012j | 158,976,853 | ||||||
| 108,000,000 | 0.103%, 8/22/2012j | 107,983,599 | ||||||
| 18,000,000 | 0.112%, 8/29/2012j | 17,996,640 | ||||||
| 15,000,000 | 0.100%, 8/31/2012j,k | 14,997,417 | ||||||
| Federal Home Loan Mortgage Corporation Discount Notes | ||||||||
| 1,300,000 | 0.105%, 7/16/2012j,l | 1,299,939 | ||||||
| 63,000,000 | 0.105%, 8/27/2012j | 62,989,342 | ||||||
| Federal National Mortgage Association Discount Notes | ||||||||
| 19,755,000 | 0.120%, 7/18/2012j,l | 19,753,815 | ||||||
| Straight-A Funding, LLC | ||||||||
| 3,985,000 | 0.180%, 7/9/2012g,j | 3,984,821 | ||||||
| 5,000,000 | 0.180%, 8/7/2012g,j | 4,999,050 | ||||||
| 3,000,000 | 0.180%, 8/22/2012g,j | 2,999,205 | ||||||
| 5,028,000 | 0.180%, 9/26/2012g,j | 5,025,788 | ||||||
| U.S. Treasury Bills | ||||||||
| 7,600,000 | 0.100%, 7/19/2012j,l | 7,599,599 | ||||||
| 2,895,000 | 0.145%, 9/13/2012j | 2,894,125 | ||||||
|
| |||||||
| Total Short-Term Investments (at amortized cost) | 792,979,478 | |||||||
|
| |||||||
Total Investments (cost $5,086,356,452) 107.0% | $ | 5,025,119,592 | ||||||
|
| |||||||
| Other Assets and Liabilities, Net (7.0%) | (326,684,731 | ) | ||||||
|
| |||||||
| Total Net Assets 100.0% | $ | 4,698,434,861 | ||||||
|
| |||||||
| a | The stated interest rate represents the weighted average of all contracts within the bank loan facility. |
| b | All or a portion of the loan is unfunded. |
| c | Denotes investments purchased on a when-issued or delayed delivery basis. |
| d | Non-income producing security. |
| e | All or a portion of the security is on loan. |
| f | Denotes variable rate securities. Variable rate securities are securities whose yields vary with a designated market index or market rate. The rate shown is as of June 29, 2012. |
| g | Denotes securities sold under Rule 144A of the Securities Act of 1933, which exempts them from registration. These securities have been deemed liquid and may be resold to other dealers in the program or to other qualified institutional buyers. As of June 29, 2012, the value of these investments was $75,018,280 or 1.6% of total net assets. |
| h | Denotes perpetual securities. Perpetual securities pay an indefinite stream of interest, but may be called by the issuer at an earlier date. |
| i | The interest rate shown reflects the yield, coupon rate or the discount rate at the date of purchase. |
| j | Denotes investments that benefit from credit enhancement or liquidity support provided by a third party bank, institution or government. |
| k | At June 29, 2012, $1,562,332 of investments were pledged as collateral with the custodian under the agreement between the counterparty, the custodian and the fund for open swap contracts. |
| l | At June 29, 2012, $26,798,464 of investments were held on deposit with the counterparty and pledged as the initial margin deposit for open futures contracts. |
Definitions:
| ADR | - | American Depositary Receipt, which are certificates for an underlying foreign security’s shares held by an issuing U.S. depository bank. | ||
| REIT | - | Real Estate Investment Trust is a company that buys, develops, manages and/or sells real estate assets. | ||
| TIPS | - | Treasury Inflation Protected Security. |
Unrealized Appreciation (Depreciation)
Gross unrealized appreciation and depreciation of investments, based on cost for federal income tax purposes, were as follows:
Gross unrealized appreciation | $ | 147,959,450 | ||
Gross unrealized depreciation | (212,936,804 | ) | ||
|
| |||
Net unrealized appreciation (depreciation) | $ | (64,977,354 | ) | |
Cost for federal income tax purposes | $ | 5,090,096,946 | ||
The accompanying Notes to Financial Statements are an integral part of this schedule.
62
Table of Contents
Moderate Allocation Portfolio
Schedule of Investments as of June 29, 2012
(unaudited)
Fair Valuation Measurements
The following table is a summary of the inputs used, as of June 29, 2012, in valuing Moderate Allocation Portfolio’s assets carried at fair value.
Investments in Securities | Total | Level 1 | Level 2 | Level 3 | ||||||||||||
Bank Loans | ||||||||||||||||
Basic Materials | 3,811,259 | — | 3,811,259 | — | ||||||||||||
Capital Goods | 1,703,502 | — | 1,703,502 | — | ||||||||||||
Communications Services | 14,459,624 | 2,545,893 | 11,913,731 | — | ||||||||||||
Consumer Cyclical | 4,033,551 | — | 4,033,551 | — | ||||||||||||
Consumer Non-Cyclical | 9,280,035 | — | 9,280,035 | — | ||||||||||||
Energy | 3,609,467 | — | 3,609,467 | — | ||||||||||||
Financials | 1,671,100 | — | 1,671,100 | — | ||||||||||||
Technology | 6,047,376 | — | 6,047,376 | — | ||||||||||||
Transportation | 1,894,273 | — | 1,894,273 | — | ||||||||||||
Utilities | 2,487,092 | — | 2,487,092 | — | ||||||||||||
Mutual Funds | ||||||||||||||||
Equity Mutual Funds | 1,311,594,811 | 1,311,594,811 | — | �� | — | |||||||||||
Fixed Income Mutual Funds | 1,267,401,636 | 1,267,401,636 | — | — | ||||||||||||
Common Stock | ||||||||||||||||
Consumer Discretionary | 96,677,663 | 96,677,663 | — | — | ||||||||||||
Consumer Staples | 73,889,977 | 73,889,977 | — | — | ||||||||||||
Energy | 128,138,125 | 126,334,065 | 1,804,060 | — | ||||||||||||
Financials | 119,298,683 | 119,298,683 | — | — | ||||||||||||
Health Care | 105,319,930 | 105,319,930 | — | — | ||||||||||||
Industrials | 90,716,137 | 90,716,137 | — | — | ||||||||||||
Information Technology | 172,086,337 | 172,086,337 | — | — | ||||||||||||
Materials | 26,516,133 | 26,516,133 | — | — | ||||||||||||
Telecommunications Services | 2,965,093 | 2,965,093 | — | — | ||||||||||||
Utilities | 9,878,082 | 9,878,082 | — | — | ||||||||||||
Long-Term Fixed Income | ||||||||||||||||
Asset-Backed Securities | 11,579,615 | — | 11,579,615 | — | ||||||||||||
Basic Materials | 12,033,334 | — | 12,033,334 | — | ||||||||||||
Capital Goods | 12,294,122 | — | 12,294,122 | — | ||||||||||||
Collateralized Mortgage Obligations | 36,539,410 | — | 36,539,410 | — | ||||||||||||
Commercial Mortgage-Backed Securities | 54,678,566 | — | 54,678,566 | — | ||||||||||||
Communications Services | 30,405,124 | — | 30,405,124 | — | ||||||||||||
Consumer Cyclical | 19,087,087 | — | 19,087,087 | — | ||||||||||||
Consumer Non-Cyclical | 32,710,078 | — | 32,710,078 | — | ||||||||||||
Energy | 14,990,992 | — | 14,990,992 | — | ||||||||||||
Financials | 64,916,365 | — | 64,916,365 | — | ||||||||||||
Foreign Government | 925,048 | — | 925,048 | — | ||||||||||||
Mortgage-Backed Securities | 303,261,483 | — | 303,261,483 | — | ||||||||||||
Technology | 9,000,537 | — | 9,000,537 | — | ||||||||||||
Transportation | 9,931,884 | — | 8,573,497 | 1,358,387 | ||||||||||||
U.S. Government and Agencies | 134,487,695 | — | 134,487,695 | — | ||||||||||||
Utilities | 14,626,171 | — | 14,626,171 | — | ||||||||||||
Preferred Stock | ||||||||||||||||
Financials | 421,652 | 421,652 | — | — | ||||||||||||
Collateral Held for Securities Loaned | 16,771,065 | 16,771,065 | — | — | ||||||||||||
Short-Term Investments | 792,979,478 | — | 792,979,478 | — | ||||||||||||
|
|
|
|
|
|
|
| |||||||||
Total | $ | 5,025,119,592 | $ | 3,422,417,157 | $ | 1,601,344,048 | $ | 1,358,387 | ||||||||
|
|
|
|
|
|
|
| |||||||||
The accompanying Notes to Financial Statements are an integral part of this schedule.
63
Table of Contents
Moderate Allocation Portfolio
Schedule of Investments as of June 29, 2012
(unaudited)
Other Financial Instruments | Total | Level 1 | Level 2 | Level 3 | ||||||||||||
Asset Derivatives | ||||||||||||||||
Futures Contracts | 14,811,011 | 14,811,011 | — | — | ||||||||||||
Credit Default Swaps | 294,202 | — | 294,202 | — | ||||||||||||
|
|
|
|
|
|
|
| |||||||||
Total Asset Derivatives | $ | 15,105,213 | $ | 14,811,011 | $ | 294,202 | $ | — | ||||||||
|
|
|
|
|
|
|
| |||||||||
Liability Derivatives | ||||||||||||||||
Futures Contracts | 1,371,857 | 1,371,857 | — | — | ||||||||||||
Total Liability Derivatives | $ | 1,371,857 | $ | 1,371,857 | $ | — | $ | — | ||||||||
The significant unobservable input used in the fair value measurement of the Long-Term Fixed Income Transportation Level 3 security is the lack of marketability. A significant increase or decrease in the input in isolation would result in a significantly lower or higher fair value measurement.
There were no significant transfers between the Levels during the period ended June 29, 2012. Transfers between the levels are identified as of the end of the period.
Futures Contracts | Number of Contracts Long/(Short) | Expiration Date | Notional Principal Amount | Value | Unrealized Gain/(Loss) | |||||||||||||||
2-Yr. U.S. Treasury Bond Futures | (295 | ) | September 2012 | ($ | 64,963,632 | ) | ($ | 64,955,313 | ) | $ | 8,319 | |||||||||
10-Yr. U.S. Treasury Bond Futures | 815 | September 2012 | 108,236,042 | 108,700,625 | 464,583 | |||||||||||||||
20-Yr. U.S. Treasury Bond Futures | 800 | September 2012 | 117,489,944 | 118,375,000 | 885,056 | |||||||||||||||
Mini MSCI EAFE Index Futures | 881 | September 2012 | 59,214,662 | 62,718,390 | 3,503,728 | |||||||||||||||
S&P 400 Index Mini-Futures | (606 | ) | September 2012 | (55,561,843 | ) | (56,933,700 | ) | (1,371,857 | ) | |||||||||||
S&P 500 Index Futures | 858 | September 2012 | 280,998,475 | 290,947,800 | 9,949,325 | |||||||||||||||
Total Futures Contracts | $ | 13,439,154 | ||||||||||||||||||
Credit Default Swaps and Counterparty | Buy/Sell Protection1 | Termination Date | Notional Principal Amount2 | Upfront Payments Received (Made) | Value3 | Unrealized Gain/(Loss) | ||||||||||||||||||
CDX HY, Series 18, 5 Year, at 5.00%; J.P. Morgan Chase and Co. | Sell | 6/20/2017 | $ | 45,540,000 | $ | 1,897,056 | ($ | 1,602,854 | ) | $ | 294,202 | |||||||||||||
Total Credit Default Swaps | ($ | 1,602,854 | ) | $ | 294,202 | |||||||||||||||||||
| 1 | As the buyer of protection, Moderate Allocation Portfolio pays periodic fees in return for payment by the seller which is contingent upon an adverse credit event occurring in the underlying issuer or reference entity. As the seller of protection, Moderate Allocation Portfolio collects periodic fees from the buyer and profits if the credit of the underlying issuer or reference entity remains stable or improves while the swap is outstanding, but the seller in a credit default swap contract would be required to pay the amount of credit loss, determined as specified in the agreement, to the buyer in the event of an adverse credit event in the reference entity. |
| 2 | The maximum potential amount of future payments Moderate Allocation Portfolio could be required to make as the seller or receive as the buyer of protection. |
| 3 | The values for credit indexes (CDX or LCDX) serve as an indicator of the current status of the payment/performance risk and represent the liability or profit for the credit default swap contract had the contract been closed as of the reporting date. When protection has been sold, the value of the swap will increase when the swap spread declines representing an improvement in the reference entity’s credit worthiness. The value of the swap will decrease when the swap spread increases representing a deterioration in the reference entity’s credit worthiness. When protection has been purchased, the value of the swap will increase when the swap spread increases representing a deterioration in the reference entity’s credit worthiness. The value of the swap will decrease when the swap spread declines representing an improvement in the reference entity’s credit worthiness. |
The accompanying Notes to Financial Statements are an integral part of this schedule.
64
Table of Contents
Moderate Allocation Portfolio
Schedule of Investments as of June 29, 2012
(unaudited)
The following table summarizes the fair value and Statement of Assets and Liabilities location, as of June 29, 2012, for Moderate Allocation Portfolio’s investments in financial derivative instruments by primary risk exposure as discussed under item (2) Significant Accounting Policies of the Notes to Financial Statements.
Derivatives by risk category | Statement of Assets and Liabilities Location | Fair Value | ||||
Asset Derivatives | ||||||
Interest Rate Contracts | ||||||
Futures* | Net Assets - Net unrealized appreciation/(depreciation) on Futures contracts | $ | 1,357,958 | |||
Total Interest Rate Contracts | 1,357,958 | |||||
Equity Contracts | ||||||
Futures* | Net Assets - Net unrealized appreciation/(depreciation) on Futures contracts | 13,453,053 | ||||
Total Equity Contracts | 13,453,053 | |||||
Credit Contracts | ||||||
Credit Default Swaps | Receivable/Payable - Swap agreements, at value; Net Assets - Net unrealized appreciation/(depreciation) on Swap agreements | 294,202 | ||||
Total Credit Contracts | 294,202 | |||||
|
| |||||
Total Asset Derivatives | $ | 15,105,213 | ||||
|
| |||||
Liability Derivatives | ||||||
Equity Contracts | ||||||
Futures* | Net Assets - Net unrealized appreciation/(depreciation) on Futures contracts | 1,371,857 | ||||
Total Equity Contracts | 1,371,857 | |||||
|
| |||||
Total Liability Derivatives | $ | 1,371,857 | ||||
|
| |||||
| * | Includes cumulative appreciation/depreciation of futures contracts as reported in the Schedule of Investments. Only current day’s variation margin is reported within the Statement of Assets and Liabilities. |
The following table summarizes the net realized gains/(losses) and Statement of Operations location, for the period ended June 29, 2012, for Moderate Allocation Portfolio’s investments in financial derivative instruments by primary risk exposure.
Derivatives by risk category | Statement of Operations Location | Realized Gains/(Losses) recognized in Income | ||||
Equity Contracts | ||||||
Futures | Net realized gains/(losses) on Futures contracts | 14,727,705 | ||||
Total Equity Contracts | 14,727,705 | |||||
Foreign Exchange Contracts | ||||||
Forward Contracts | Net realized gains/(losses) on Foreign currency transactions | (27,049 | ) | |||
Total Foreign Exchange Contracts | (27,049 | ) | ||||
Interest Rate Contracts | ||||||
Futures | Net realized gains/(losses) on Futures contracts | 7,970,588 | ||||
Total Interest Rate Contracts | 7,970,588 | |||||
Credit Contracts | ||||||
Credit Default Swaps | Net realized gains/(losses) on Swap agreements | 4,493,266 | ||||
Total Credit Contracts | 4,493,266 | |||||
|
| |||||
Total | $ | 27,164,510 | ||||
|
| |||||
The accompanying Notes to Financial Statements are an integral part of this schedule.
65
Table of Contents
Moderate Allocation Portfolio
Schedule of Investments as of June 29, 2012
(unaudited)
The following table summarizes the change in net unrealized appreciation/(depreciation) and Statement of Operations location, for the period ended June 29, 2012, for Moderate Allocation Portfolio’s investments in financial derivative instruments by primary risk exposure.
Derivatives by risk category | Statement of Operations Location | Change in unrealized appreciation/(depreciation) recognized in Income | ||||
Interest Rate Contracts | ||||||
Futures | Change in net unrealized appreciation/(depreciation) on Futures contracts | 1,313,499 | ||||
Total Interest Rate Contracts | 1,313,499 | |||||
Equity Contracts | ||||||
Futures | Change in net unrealized appreciation/(depreciation) on Futures contracts | 8,371,583 | ||||
Total Equity Contracts | 8,371,583 | |||||
Credit Contracts | ||||||
Credit Default Swaps | Change in net unrealized appreciation/(depreciation) on Swap agreements | (625,348 | ) | |||
Total Credit Contracts | (625,348 | ) | ||||
|
| |||||
Total | $ | 9,059,734 | ||||
|
| |||||
The following table presents Moderate Allocation Portfolio’s average volume of derivative activity during the period ended June 29, 2012.
Derivative Risk Category | Futures (Notional*) | Futures (Percentage of Average Net Assets) | Forwards (Notional*) | Forwards (Percentage of Average Net Assets) | Swaps (Notional*) | Swaps (Percentage of Average Net Assets) | ||||||||||||||||||
Equity Contracts | $ | 430,219,358 | 9.6 | % | N/A | N/A | N/A | N/A | ||||||||||||||||
Interest Rate | ||||||||||||||||||||||||
Contracts | 264,234,773 | 5.9 | N/A | N/A | N/A | N/A | ||||||||||||||||||
Foreign Exchange | ||||||||||||||||||||||||
Contracts | N/A | N/A | $ | 391,993 | <0.1 | % | N/A | N/A | ||||||||||||||||
Credit Contracts | N/A | N/A | N/A | N/A | $ | 38,602,342 | 0.9 | % | ||||||||||||||||
| * | Notional amount represents long or short, or both, derivative positions held by the Portfolio. |
Investment in Affiliates
Affiliated issuers, as defined under the Investment Company Act of 1940, include those in which the Portfolio’s holdings of an issuer represent 5% or more of the outstanding voting securities of an issuer, or any affiliated mutual fund.
A summary of transactions for the fiscal year to date, in Moderate Allocation Portfolio, is as follows:
Portfolio | Value December 31, 2011 | Gross Purchases | Gross Sales | Shares Held at June 29, 2012 | Value June 29, 2012 | Income Earned January 1, 2012 - June 29, 2012 | ||||||||||||||||||
Partner Small Cap Growth | $ | 55,795,259 | $ | 15,000,000 | $ | — | 5,698,281 | $ | 75,130,127 | $ | — | |||||||||||||
Partner Small Cap Value | 78,961,913 | 551,535 | — | 4,264,932 | 82,758,023 | 551,535 | ||||||||||||||||||
Small Cap Stock | 43,129,445 | — | — | 3,596,908 | 44,031,189 | — | ||||||||||||||||||
Partner Mid Cap Value | 73,224,646 | 659,948 | — | 5,904,171 | 78,769,911 | 659,948 | ||||||||||||||||||
Mid Cap Stock | 133,427,441 | 357,413 | — | 11,654,145 | 140,857,826 | 357,413 | ||||||||||||||||||
Partner Worldwide Allocation | 202,887,736 | 23,074,195 | — | 30,368,157 | 235,936,287 | 74,195 | ||||||||||||||||||
Partner International Stock | 161,178,231 | 4,632,823 | — | 18,065,561 | 166,813,778 | 4,632,823 | ||||||||||||||||||
Large Cap Value | 266,531,978 | 4,983,248 | — | 26,115,820 | 284,048,713 | 4,983,248 | ||||||||||||||||||
Large Cap Stock | 162,772,741 | 1,831,698 | — | 20,286,779 | 175,405,577 | 1,831,698 | ||||||||||||||||||
Equity Income Plus | 25,825,801 | 420,413 | — | 2,977,010 | 27,843,380 | 420,413 | ||||||||||||||||||
High Yield | 164,217,962 | 6,284,300 | 6,509,233 | 35,170,761 | 170,595,777 | 6,284,300 | ||||||||||||||||||
Income | 598,279,774 | 12,401,993 | 376,244 | 60,484,253 | 630,711,649 | 12,403,730 | ||||||||||||||||||
Limited Maturity Bond | 578,468,960 | 4,972,863 | 124,823,119 | 47,573,255 | 466,094,210 | 4,972,863 | ||||||||||||||||||
Thrivent Financial Securities Lending Trust | — | 129,455,027 | 112,683,962 | 16,771,065 | 16,771,065 | 59,997 | ||||||||||||||||||
Total Value and Income Earned | 2,544,701,887 | 2,595,767,512 | 37,232,163 | |||||||||||||||||||||
The accompanying Notes to Financial Statements are an integral part of this schedule.
66
Table of Contents
Moderately Conservative Allocation Portfolio
Schedule of Investments as of June 29, 2012
(unaudited)
| Principal Amount | Bank Loans (1.3%)a | Value | ||||||
| Basic Materials (0.1%) | |||||||
| Arch Coal, Inc., Term Loan | ||||||||
| $1,300,000 | 5.750%, 5/1/2018 | $ | 1,275,079 | |||||
| Ineos Group Holdings, Term Loan | ||||||||
| 1,683,197 | 6.981%, 5/4/2018b,c | 1,645,796 | ||||||
|
| |||||||
| Total | 2,920,875 | |||||||
|
| |||||||
| Capital Goods (0.1%) | |||||||
| Reynolds Group, Term Loan | ||||||||
| 1,297,400 | 5.250%, 8/9/2018b,c | 1,306,521 | ||||||
|
| |||||||
| Total | 1,306,521 | |||||||
|
| |||||||
| Communications Services (0.4%) | |||||||
| Atlantic Broadband Finance, LLC, Term Loan | ||||||||
| 950,000 | 5.250%, 3/20/2019 | 950,399 | ||||||
| Charter Communications Operation, Term Loan | ||||||||
| 758,100 | 4.000%, 3/28/2019 | 752,278 | ||||||
| Clear Channel Communications, Term Loan | ||||||||
| 950,000 | 3.895%, 1/29/2016 | 756,836 | ||||||
| Cumulus Media Holdings, Inc., Term Loan | ||||||||
| 1,820,855 | 4.901%, 9/16/2018b,c | 1,811,423 | ||||||
| Lawson Software, Inc., Term Loan | ||||||||
| 949,525 | 7.480%, 3/16/2018b,c | 952,934 | ||||||
| Toys R Us, Inc., Term Loan | ||||||||
| 760,000 | 5.250%, 5/25/2018 | 690,650 | ||||||
| Univision Communications, Inc., Term Loan | ||||||||
| 1,040,000 | 2.245%, 9/29/2014 | 1,018,337 | ||||||
| Zayo Group, LLC, Term Loan | ||||||||
| 1,950,000 | 0.000%, 6/14/2019b,c | 1,954,524 | ||||||
|
| |||||||
| Total | 8,887,381 | |||||||
|
| |||||||
| Consumer Cyclical (0.1%) | |||||||
| Burlington Coat Factory Warehouse Corporation, Term Loan | ||||||||
| 1,332,401 | 5.500%, 2/28/2017 | 1,323,887 | ||||||
| Chrysler Group, LLC, Term Loan | ||||||||
| 947,607 | 6.000%, 5/24/2017 | 953,530 | ||||||
|
| |||||||
| Total | 2,277,417 | |||||||
|
| |||||||
| Consumer Non-Cyclical (0.3%) | |||||||
| Bausch & Lomb, Inc., Term Loan | ||||||||
| 1,305,000 | 5.250%, 4/17/2019 | 1,296,517 | ||||||
| CHS/Community Health Systems, Inc., Term Loan | ||||||||
| 1,300,000 | 3.967%, 1/25/2017 | 1,279,343 | ||||||
| DJO Finance, LLC, Term Loan | ||||||||
| 1,300,000 | 5.000%, 9/15/2017b,c | 1,288,079 | ||||||
| Roundy’s Supermarkets, Inc., Term Loan | ||||||||
| 1,077,300 | 5.720%, 2/13/2019b,c | 1,078,259 | ||||||
| Visant Corporation, Term Loan | ||||||||
| 1,415,000 | 4.504%, 12/22/2016b,c | 1,369,013 | ||||||
|
| |||||||
| Total | 6,311,211 | |||||||
|
| |||||||
| Energy (0.1%) | |||||||
| Chesapeake Energy Corporation, Term Loan | ||||||||
| 1,755,000 | 8.111%, 12/2/2017b,c | 1,739,451 | ||||||
| GenOn Energy, Inc., Term Loan | ||||||||
| 1,040,000 | 4.250%, 9/20/2017b,c | 1,028,300 | ||||||
|
| |||||||
| Total | 2,767,751 | |||||||
|
| |||||||
| Financials (<0.1%) | |||||||
| Nuveen Investments, Inc., Term Loan | ||||||||
| 1,300,000 | 5.685%, 5/13/2017b,c | 1,277,900 | ||||||
|
| |||||||
| Total | 1,277,900 | |||||||
|
| |||||||
| Technology (0.1%) | |||||||
| First Data Corporation Extended, Term Loan | ||||||||
| 950,000 | 4.245%, 3/26/2018 | 870,086 | ||||||
| Freescale Semiconductor, Inc., Term Loan | ||||||||
| 1,795,500 | 5.639%, 2/28/2019b,c | 1,764,725 | ||||||
| Intelsat Jackson Holdings SA, Term Loan | ||||||||
| 950,000 | 5.250%, 4/2/2018 | 947,825 | ||||||
|
| |||||||
| Total | 3,582,636 | |||||||
|
| |||||||
| Transportation (<0.1%) | |||||||
| Delta Air Lines, Inc., Term Loan | ||||||||
| 947,607 | 5.500%, 4/20/2017 | 944,650 | ||||||
|
| |||||||
| Total | 944,650 | |||||||
|
| |||||||
| Utilities (0.1%) | |||||||
| NGPL PipeCo, LLC, Term Loan | ||||||||
| 1,955,000 | 6.750%, 5/15/2017 | 1,914,277 | ||||||
|
| |||||||
| Total | 1,914,277 | |||||||
|
| |||||||
Total Bank Loans (cost $32,421,547) | 32,190,619 | |||||||
|
| |||||||
The accompanying Notes to Financial Statements are an integral part of this schedule.
67
Table of Contents
Moderately Conservative Allocation Portfolio
Schedule of Investments as of June 29, 2012
(unaudited)
Shares | Mutual Funds (50.4%) | Value | ||||||
| Equity Mutual Funds (14.2%) | |||||||
| 1,273,911 | Thrivent Partner Small Cap Value Portfolio | $ | 24,719,359 | |||||
| 1,614,844 | Thrivent Small Cap Stock Portfoliod | 19,767,952 | ||||||
| 2,151,794 | Thrivent Partner Mid Cap Value Portfolio | 28,707,943 | ||||||
| 2,934,910 | Thrivent Mid Cap Stock Portfolio | 35,472,793 | ||||||
| 10,578,907 | Thrivent Partner Worldwide Allocation Portfolio | 82,189,647 | ||||||
| 3,906,101 | Thrivent Partner International Stock Portfolio | 36,068,157 | ||||||
| 7,600,011 | Thrivent Large Cap Value Portfolio | 82,661,516 | ||||||
| 2,756,082 | Thrivent Large Cap Stock Portfolio | 23,829,911 | ||||||
| 1,179,786 | Thrivent Equity Income Plus Portfolio | 11,034,305 | ||||||
|
| |||||||
| Total | 344,451,583 | |||||||
|
| |||||||
| Fixed Income Mutual Funds (36.2%) | |||||||
| 18,156,072 | Thrivent High Yield Portfolio | 88,066,025 | ||||||
| 26,516,892 | Thrivent Income Portfolio | 276,510,196 | ||||||
| 52,816,331 | Thrivent Limited Maturity Bond Portfolio | 517,462,720 | ||||||
|
| |||||||
| Total | 882,038,941 | |||||||
|
| |||||||
| Total Mutual Funds (cost $1,238,832,237) | 1,226,490,524 | |||||||
|
| |||||||
Principal | Long-Term Fixed Income (22.8%) | |||||||
| Asset-Backed Securities (0.5%) | |||||||
| J.P. Morgan Mortgage Acquisition Corporation | ||||||||
| 7,092,058 | 5.461%, 10/25/2036 | 5,534,521 | ||||||
| Morgan Stanley Capital, Inc. | ||||||||
| 2,536,249 | 0.395%, 2/25/2037e | 1,262,085 | ||||||
| Renaissance Home Equity Loan Trust | ||||||||
| 5,500,000 | 6.011%, 5/25/2036 | 3,101,720 | ||||||
| 2,640,723 | 5.580%, 11/25/2036 | 1,399,755 | ||||||
|
| |||||||
| Total | 11,298,081 | |||||||
|
| |||||||
| Basic Materials (0.3%) | |||||||
| ArcelorMittal | ||||||||
| 290,000 | 5.375%, 6/1/2013 | 298,255 | ||||||
| Arch Coal, Inc. | ||||||||
| 860,000 | 7.000%, 6/15/2019f | 726,700 | ||||||
| BHP Billiton Finance, Ltd. | ||||||||
| 715,000 | 1.000%, 2/24/2015 | 716,224 | ||||||
| Dow Chemical Company | ||||||||
| 718,000 | 5.900%, 2/15/2015 | 800,663 | ||||||
| 715,000 | 4.250%, 11/15/2020 | 775,680 | ||||||
| FMG Resources Property, Ltd. | ||||||||
| 860,000 | 8.250%, 11/1/2019g | 911,600 | ||||||
| Hexion US Finance Corporation/Hexion Nova Scotia Finance ULC | ||||||||
| 795,000 | 8.875%, 2/1/2018 | 810,900 | ||||||
| International Paper Company | ||||||||
| 481,000 | 5.300%, 4/1/2015 | 526,403 | ||||||
| Basic Materials (0.3%) - continued | |||||||
| LyondellBasell Industries NV | ||||||||
| $750,000 | 5.000%, 4/15/2019g | 786,562 | ||||||
| Novelis, Inc. | ||||||||
| 860,000 | 8.375%, 12/15/2017 | 920,200 | ||||||
| Rio Tinto Finance USA, Ltd. | ||||||||
| 1,065,000 | 1.125%, 3/20/2015 | 1,067,393 | ||||||
|
| |||||||
| Total | 8,340,580 | |||||||
|
| |||||||
| Capital Goods (0.4%) | |||||||
| Bombardier, Inc. | ||||||||
| 795,000 | 5.750%, 3/15/2022g | 792,019 | ||||||
| Case New Holland, Inc. | ||||||||
| 840,000 | 7.875%, 12/1/2017 | 970,200 | ||||||
| Caterpillar Financial Services Corporation | ||||||||
| 715,000 | 1.050%, 3/26/2015 | 719,151 | ||||||
| 325,000 | 1.100%, 5/29/2015 | 326,819 | ||||||
| John Deere Capital Corporation | ||||||||
| 400,000 | 0.875%, 4/17/2015 | 400,449 | ||||||
| Raytheon Company | ||||||||
| 718,000 | 1.625%, 10/15/2015 | 737,028 | ||||||
| RBS Global, Inc./Rexnord, LLC | ||||||||
| 795,000 | 8.500%, 5/1/2018 | 862,575 | ||||||
| Sealed Air Corporation | ||||||||
| 1,290,000 | 8.375%, 9/15/2021g | 1,457,700 | ||||||
| Textron, Inc. | ||||||||
| 970,000 | 5.600%, 12/1/2017 | 1,068,443 | ||||||
| United Technologies Corporation | ||||||||
| 162,000 | 0.967%, 6/1/2015e | 163,730 | ||||||
| 162,000 | 1.800%, 6/1/2017 | 165,440 | ||||||
| 81,000 | 4.500%, 6/1/2042 | 88,971 | ||||||
| UR Financing Escrow Corporation | ||||||||
| 795,000 | 7.375%, 5/15/2020g | 830,775 | ||||||
|
| |||||||
| Total | 8,583,300 | |||||||
|
| |||||||
| Collateralized Mortgage Obligations (0.8%) | |||||||
| Citigroup Mortgage Loan Trust, Inc. | ||||||||
| 878,089 | 5.500%, 11/25/2035 | 724,464 | ||||||
| CitiMortgage Alternative Loan Trust | ||||||||
| 3,006,246 | 5.750%, 4/25/2037 | 2,126,853 | ||||||
| Countrywide Alternative Loan Trust | ||||||||
| 611,822 | 6.000%, 1/25/2037 | 440,487 | ||||||
| 4,147,513 | 5.500%, 5/25/2037 | 2,840,105 | ||||||
| 3,424,027 | 7.000%, 10/25/2037 | 2,067,325 | ||||||
| Countrywide Home Loans, Inc. | ||||||||
| 1,341,485 | 5.750%, 4/25/2037 | 1,120,017 | ||||||
| Deutsche Alt-A Securities, Inc. | ||||||||
| 505,353 | 5.500%, 10/25/2021 | 488,479 | ||||||
| 1,026,990 | 6.000%, 10/25/2021 | 883,233 | ||||||
| HomeBanc Mortgage Trust | ||||||||
| 1,419,754 | 2.591%, 4/25/2037 | 924,544 | ||||||
| J.P. Morgan Mortgage Trust | ||||||||
| 263,710 | 2.747%, 10/25/2036 | 188,289 | ||||||
| 4,651,918 | 6.250%, 8/25/2037 | 2,937,584 | ||||||
| MASTR Alternative Loans Trust | ||||||||
| 712,603 | 6.500%, 7/25/2034 | 748,847 | ||||||
The accompanying Notes to Financial Statements are an integral part of this schedule.
68
Table of Contents
Moderately Conservative Allocation Portfolio
Schedule of Investments as of June 29, 2012
(unaudited)
Principal | Long-Term Fixed Income (22.8%) | Value | ||||||
| Collateralized Mortgage Obligations (0.8%) - continued | |||||||
| Merrill Lynch Alternative Note Asset Trust | ||||||||
| $672,446 | 6.000%, 3/25/2037 | $ | 495,643 | |||||
| Sequoia Mortgage Trust | ||||||||
| 655,640 | 5.371%, 9/20/2046 | 222,786 | ||||||
| WaMu Mortgage Pass Through Certificates | ||||||||
| 630,942 | 2.506%, 9/25/2036 | 451,185 | ||||||
| 632,700 | 2.561%, 10/25/2036 | 446,306 | ||||||
| WaMu Mortgage Pass-Through Certificates | ||||||||
| 2,052,977 | 2.248%, 11/25/2036 | 1,456,797 | ||||||
|
| |||||||
| Total | 18,562,944 | |||||||
|
| |||||||
| Commercial Mortgage-Backed Securities (1.5%) | |||||||
| Banc of America Commercial Mortgage, Inc. | ||||||||
| 4,600,000 | 5.807%, 4/10/2049 | 5,265,933 | ||||||
| 6,000,000 | 5.805%, 6/10/2049 | 6,778,602 | ||||||
| Bear Stearns Commercial Mortgage Securities, Inc. | ||||||||
| 2,000,000 | 5.331%, 2/11/2044 | 2,152,546 | ||||||
| Citigroup/Deutsche Bank Commercial Mortgage | ||||||||
| 1,700,000 | 5.322%, 12/11/2049 | 1,888,221 | ||||||
| Credit Suisse First Boston Mortgage Securities | ||||||||
| 4,600,000 | 5.542%, 1/15/2049 | 4,953,399 | ||||||
| Credit Suisse Mortgage Capital Certificates | ||||||||
| 5,800,000 | 5.509%, 9/15/2039 | 5,681,425 | ||||||
| Government National Mortgage Association | ||||||||
| 190,350 | 2.164%, 3/16/2033 | 193,290 | ||||||
| 168,876 | 3.214%, 1/16/2040 | 177,195 | ||||||
| Greenwich Capital Commercial Funding Corporation | ||||||||
| 3,100,000 | 5.867%, 12/10/2049 | 3,040,564 | ||||||
| J.P. Morgan Chase Commercial Mortgage Securities Corporation | ||||||||
| 2,300,000 | 5.924%, 2/12/2049 | 2,315,364 | ||||||
| Morgan Stanley Capital, Inc. | ||||||||
| 1,750,000 | 5.406%, 3/15/2044 | 1,714,797 | ||||||
| Wachovia Bank Commercial Mortgage Trust | ||||||||
| 3,450,000 | 5.603%, 10/15/2048 | 3,456,807 | ||||||
|
| |||||||
| Total | 37,618,143 | |||||||
|
| |||||||
| Communications Services (0.9%) | |||||||
| AMC Networks, Inc. | ||||||||
| 850,000 | 7.750%, 7/15/2021g | 937,125 | ||||||
| AT&T, Inc. | ||||||||
| 976,000 | 2.400%, 8/15/2016 | 1,014,018 | ||||||
| British Telecommunications plc | ||||||||
| 650,000 | 2.000%, 6/22/2015 | 658,932 | ||||||
| Cablevision Systems Corporation | ||||||||
| 860,000 | 8.625%, 9/15/2017 | 958,900 | ||||||
| CCO Holdings, LLC | ||||||||
| 850,000 | 7.000%, 1/15/2019 | 918,000 | ||||||
| CenturyLink, Inc. | ||||||||
| 1,050,000 | 5.800%, 3/15/2022 | 1,045,280 | ||||||
| Comcast Corporation | ||||||||
| 1,065,000 | 6.500%, 1/15/2015 | 1,201,302 | ||||||
| 325,000 | 4.650%, 7/15/2042 | 325,149 | ||||||
| Digicel, Ltd. | ||||||||
| 930,000 | 8.250%, 9/1/2017g | 946,275 | ||||||
| DIRECTV Holdings, LLC/DIRECTV Financing Company, Inc. | ||||||||
| 715,000 | 2.400%, 3/15/2017 | 719,708 | ||||||
| Dish DBS Corporation | ||||||||
| 1,040,000 | 4.625%, 7/15/2017g | 1,041,300 | ||||||
| 1,040,000 | 5.875%, 7/15/2022g | 1,050,400 | ||||||
| Frontier Communications Corporation | ||||||||
| 1,290,000 | 8.125%, 10/1/2018 | 1,370,625 | ||||||
| Hughes Satellite Systems Corporation | ||||||||
| 860,000 | 6.500%, 6/15/2019 | 913,750 | ||||||
| Intelsat Jackson Holdings SA | ||||||||
| 860,000 | 7.250%, 4/1/2019 | 903,000 | ||||||
| Level 3 Financing, Inc. | ||||||||
| 800,000 | 8.625%, 7/15/2020 | 840,000 | ||||||
| NBCUniversal Media, LLC | ||||||||
| 715,000 | 2.875%, 4/1/2016 | 745,536 | ||||||
| News America, Inc. | ||||||||
| 365,000 | 5.300%, 12/15/2014 | 400,050 | ||||||
| Sprint Nextel Corporation | ||||||||
| 400,000 | 9.125%, 3/1/2017g | 420,000 | ||||||
| 450,000 | 9.000%, 11/15/2018g | 502,875 | ||||||
| Telefonica Emisiones SAU | ||||||||
| 325,000 | 3.729%, 4/27/2015 | 295,923 | ||||||
| Time Warner Cable, Inc. | ||||||||
| 400,000 | 7.500%, 4/1/2014 | 443,477 | ||||||
| 400,000 | 3.500%, 2/1/2015 | 423,086 | ||||||
| UPCB Finance V, Ltd. | ||||||||
| 860,000 | 7.250%, 11/15/2021g | 898,700 | ||||||
| Verizon Communications, Inc. | ||||||||
| 976,000 | 5.500%, 2/15/2018 | 1,155,242 | ||||||
| Virgin Media Finance plc | ||||||||
| 795,000 | 5.250%, 2/15/2022 | 812,887 | ||||||
| Vivendi SA | ||||||||
| 715,000 | 2.400%, 4/10/2015g | 707,919 | ||||||
| Vodafone Group plc | ||||||||
| 715,000 | 3.375%, 11/24/2015 | 763,887 | ||||||
|
| |||||||
| Total | 22,413,346 | |||||||
|
| |||||||
| Consumer Cyclical (0.6%) | |||||||
| Chrysler Group, LLC | ||||||||
| 1,100,000 | 8.000%, 6/15/2019f | 1,130,250 | ||||||
| Daimler Finance North America, LLC | ||||||||
| 340,000 | 1.249%, 4/10/2014e,g | 340,178 | ||||||
| 370,000 | 1.650%, 4/10/2015g | 371,454 | ||||||
| Federated Retail Holdings, Inc. | ||||||||
| 718,000 | 5.900%, 12/1/2016 | 827,610 | ||||||
The accompanying Notes to Financial Statements are an integral part of this schedule.
69
Table of Contents
Moderately Conservative Allocation Portfolio
Schedule of Investments as of June 29, 2012
(unaudited)
| Principal Amount | Long-Term Fixed Income (22.8%) | Value | ||||||
| Consumer Cyclical (0.6%) - continued | |||||||
| Ford Motor Credit Company, LLC | ||||||||
| $647,000 | 2.750%, 5/15/2015 | $ | 652,250 | |||||
| 795,000 | 5.000%, 5/15/2018 | 844,196 | ||||||
| Host Hotels and Resorts, LP | ||||||||
| 1,040,000 | 6.000%, 11/1/2020 | 1,128,400 | ||||||
| Lennar Corporation | ||||||||
| 860,000 | 12.250%, 6/1/2017 | 1,111,550 | ||||||
| Limited Brands, Inc. | ||||||||
| 710,000 | 5.625%, 2/15/2022 | 731,300 | ||||||
| Macy’s Retail Holdings, Inc. | ||||||||
| 715,000 | 3.875%, 1/15/2022 | 751,732 | ||||||
| MGM Resorts International | ||||||||
| 770,000 | 11.125%, 11/15/2017 | 864,325 | ||||||
| Rite Aid Corporation | ||||||||
| 860,000 | 7.500%, 3/1/2017 | 877,200 | ||||||
| Service Corporation International | ||||||||
| 795,000 | 8.000%, 11/15/2021 | 912,262 | ||||||
| Time Warner, Inc. | ||||||||
| 400,000 | 3.150%, 7/15/2015 | 421,851 | ||||||
| Toyota Motor Credit Corporation | ||||||||
| 325,000 | 1.750%, 5/22/2017 | 327,633 | ||||||
| Toys R Us Property Company II, LLC | ||||||||
| 855,000 | 8.500%, 12/1/2017 | 890,269 | ||||||
| Viacom, Inc. | ||||||||
| 170,000 | 4.375%, 9/15/2014 | 181,975 | ||||||
| 170,000 | 1.250%, 2/27/2015 | 170,423 | ||||||
| Volkswagen International Finance NV | ||||||||
| 700,000 | 1.625%, 3/22/2015g | 702,425 | ||||||
|
| |||||||
| Total | 13,237,283 | |||||||
|
| |||||||
| Consumer Non-Cyclical (1.0%) | |||||||
| Amgen, Inc. | ||||||||
| 330,000 | 4.850%, 11/18/2014 | 358,326 | ||||||
| 330,000 | 2.125%, 5/15/2017 | 333,874 | ||||||
| Anheuser-Busch InBev Worldwide, Inc. | ||||||||
| 403,000 | 1.016%, 1/27/2014e | 406,288 | ||||||
| Aristotle Holding, Inc. | ||||||||
| 480,000 | 2.750%, 11/21/2014g | 490,269 | ||||||
| BAT International Finance plc | ||||||||
| 650,000 | 1.400%, 6/5/2015g | 649,924 | ||||||
| 325,000 | 2.125%, 6/7/2017f,g | 324,572 | ||||||
| Beam, Inc. | ||||||||
| 165,000 | 1.875%, 5/15/2017 | 165,795 | ||||||
| Boston Scientific Corporation | ||||||||
| 1,065,000 | 5.450%, 6/15/2014 | 1,141,354 | ||||||
| Bunge Limited Finance Corporation | ||||||||
| 650,000 | 3.200%, 6/15/2017 | 651,440 | ||||||
| Capella Healthcare, Inc. | ||||||||
| 1,040,000 | 9.250%, 7/1/2017 | 1,076,400 | ||||||
| Cardinal Health, Inc. | ||||||||
| 325,000 | 1.900%, 6/15/2017 | 327,434 | ||||||
| Community Health Systems, Inc. | ||||||||
| 214,000 | 8.875%, 7/15/2015 | 219,618 | ||||||
| 795,000 | 8.000%, 11/15/2019 | 846,675 | ||||||
| Covidien International Finance SA | ||||||||
| 650,000 | 1.350%, 5/29/2015 | 650,844 | ||||||
| 325,000 | 3.200%, 6/15/2022 | 335,066 | ||||||
| Express Scripts, Inc. | ||||||||
| 400,000 | 3.125%, 5/15/2016 | 416,468 | ||||||
| Fresenius Medical Care US Finance II, Inc. | ||||||||
| 830,000 | 5.625%, 7/31/2019g | 865,275 | ||||||
| Gilead Sciences, Inc. | ||||||||
| 365,000 | 2.400%, 12/1/2014 | 376,180 | ||||||
| 365,000 | 3.050%, 12/1/2016 | 385,333 | ||||||
| GlaxoSmithKline Capital plc | ||||||||
| 330,000 | 0.750%, 5/8/2015 | 329,962 | ||||||
| 330,000 | 1.500%, 5/8/2017 | 330,598 | ||||||
| Grifols, Inc. | ||||||||
| 1,300,000 | 8.250%, 2/1/2018 | 1,394,250 | ||||||
| HCA, Inc. | ||||||||
| 795,000 | 5.875%, 3/15/2022 | 830,775 | ||||||
| JBS USA, LLC | ||||||||
| 860,000 | 7.250%, 6/1/2021g | 799,800 | ||||||
| Kellogg Company | ||||||||
| 330,000 | 1.125%, 5/15/2015 | 331,588 | ||||||
| 330,000 | 1.750%, 5/17/2017 | 329,982 | ||||||
| Kinetic Concepts, Inc./KCI USA, Inc. | ||||||||
| 850,000 | 10.500%, 11/1/2018g | 892,500 | ||||||
| Kraft Foods, Inc. | ||||||||
| 650,000 | 1.625%, 6/4/2015g | 656,876 | ||||||
| 406,000 | 2.250%, 6/5/2017g | 415,695 | ||||||
| Libbey Glass, Inc. | ||||||||
| 260,000 | 6.875%, 5/15/2020g | 267,150 | ||||||
| Lorillard Tobacco Company | ||||||||
| 909,000 | 3.500%, 8/4/2016 | 947,598 | ||||||
| Pfizer, Inc. | ||||||||
| 715,000 | 6.200%, 3/15/2019 | 896,145 | ||||||
| Reynolds Group Issuer, Inc. | ||||||||
| 850,000 | 6.875%, 2/15/2021g | 884,000 | ||||||
| SABMiller Holdings, Inc. | ||||||||
| 716,000 | 1.850%, 1/15/2015g | 726,226 | ||||||
| 716,000 | 2.450%, 1/15/2017g | 738,008 | ||||||
| Spectrum Brands Holdings, Inc. | ||||||||
| 1,290,000 | 9.500%, 6/15/2018 | 1,457,700 | ||||||
| Teva Pharmaceutical Finance Company BV | ||||||||
| 330,000 | 2.400%, 11/10/2016 | 340,958 | ||||||
| Teva Pharmaceutical Finance IV, LLC | ||||||||
| 560,000 | 1.700%, 11/10/2014 | 571,352 | ||||||
| Tyson Foods, Inc. | ||||||||
| 650,000 | 4.500%, 6/15/2022 | 669,500 | ||||||
| Valeant Pharmaceuticals International | ||||||||
| 860,000 | 6.875%, 12/1/2018g | 889,025 | ||||||
|
| |||||||
| Total | 24,720,823 | |||||||
|
| |||||||
| Energy (0.4%) | |||||||
| Anadarko Petroleum Corporation | ||||||||
| 155,000 | 5.750%, 6/15/2014 | 166,596 | ||||||
| Apache Corporation | ||||||||
| 715,000 | 1.750%, 4/15/2017 | 729,151 | ||||||
| BP Capital Markets plc | ||||||||
| 715,000 | 3.625%, 5/8/2014 | 749,480 | ||||||
The accompanying Notes to Financial Statements are an integral part of this schedule.
70
Table of Contents
Moderately Conservative Allocation Portfolio
Schedule of Investments as of June 29, 2012
(unaudited)
| Principal Amount | Long-Term Fixed Income (22.8%) | Value | ||||||
| Energy (0.4%) - continued | |||||||
| $715,000 | 3.125%, 10/1/2015 | $ | 760,138 | |||||
| 330,000 | 1.846%, 5/5/2017 | 333,282 | ||||||
| 495,000 | 3.245%, 5/6/2022 | 512,518 | ||||||
| Concho Resources, Inc. | ||||||||
| 1,590,000 | 5.500%, 10/1/2022 | 1,574,100 | ||||||
| Denbury Resources, Inc. | ||||||||
| 830,000 | 6.375%, 8/15/2021 | 863,200 | ||||||
| Harvest Operations Corporation | ||||||||
| 720,000 | 6.875%, 10/1/2017g | 765,000 | ||||||
| Linn Energy, LLC | ||||||||
| 850,000 | 7.750%, 2/1/2021 | 888,250 | ||||||
| Phillips 66 | ||||||||
| 400,000 | 1.950%, 3/5/2015g | 402,865 | ||||||
| 556,000 | 2.950%, 5/1/2017g | 571,328 | ||||||
| Samson Investment Company | ||||||||
| 1,040,000 | 9.750%, 2/15/2020g | 1,034,800 | ||||||
| Suncor Energy, Inc. | ||||||||
| 396,000 | 6.100%, 6/1/2018 | 469,007 | ||||||
| Weatherford International, Ltd. | ||||||||
| 715,000 | 6.750%, 9/15/2040 | 802,522 | ||||||
|
| |||||||
| Total | 10,622,237 | |||||||
|
| |||||||
| Financials (2.2%) | |||||||
| Achmea Hypotheekbank NV | ||||||||
| 220,000 | 3.200%, 11/3/2014g | 229,489 | ||||||
| Ally Financial, Inc. | ||||||||
| 795,000 | 5.500%, 2/15/2017 | 807,514 | ||||||
| American Express Company | ||||||||
| 398,000 | 7.250%, 5/20/2014 | 441,354 | ||||||
| American Express Credit Corporation | ||||||||
| 325,000 | 2.375%, 3/24/2017 | 333,103 | ||||||
| American International Group, Inc. | ||||||||
| 715,000 | 3.000%, 3/20/2015 | 718,613 | ||||||
| 715,000 | 3.800%, 3/22/2017 | 728,864 | ||||||
| ANZ National International, Ltd. of London | ||||||||
| 715,000 | 3.125%, 8/10/2015g | 734,106 | ||||||
| Bank of America Corporation | ||||||||
| 1,041,000 | 7.750%, 8/15/2015 | 1,133,273 | ||||||
| 720,000 | 3.875%, 3/22/2017 | 733,462 | ||||||
| Bank of New York Mellon Corporation | ||||||||
| 720,000 | 1.700%, 11/24/2014 | 732,131 | ||||||
| 165,000 | 1.969%, 6/20/2017 | 166,936 | ||||||
| Bank of Nova Scotia | ||||||||
| 225,000 | 1.450%, 7/26/2013g | 227,281 | ||||||
| 720,000 | 1.850%, 1/12/2015 | 731,508 | ||||||
| Berkshire Hathaway, Inc. | ||||||||
| 660,000 | 1.600%, 5/15/2017 | 664,596 | ||||||
| BlackRock, Inc. | ||||||||
| 325,000 | 1.375%, 6/1/2015 | 327,324 | ||||||
| Canadian Imperial Bank of Commerce | ||||||||
| 220,000 | 2.600%, 7/2/2015g | 231,383 | ||||||
| Capital One Financial Corporation | ||||||||
| 165,000 | 1.617%, 7/15/2014e | 163,969 | ||||||
| 720,000 | 2.150%, 3/23/2015 | 725,612 | ||||||
| CIT Group, Inc. | ||||||||
| 305,209 | 7.000%, 5/2/2017g | 305,781 | ||||||
| Citigroup, Inc. | ||||||||
| 720,000 | 5.850%, 7/2/2013 | 753,135 | ||||||
| 720,000 | 5.125%, 5/5/2014 | 750,789 | ||||||
| 1,280,000 | 5.000%, 9/15/2014 | 1,312,086 | ||||||
| 720,000 | 4.750%, 5/19/2015 | 755,741 | ||||||
| CNA Financial Corporation | ||||||||
| 1,780,000 | 7.350%, 11/15/2019 | 2,105,772 | ||||||
| Credit Suisse New York, NY | ||||||||
| 565,000 | 5.500%, 5/1/2014 | 598,982 | ||||||
| Credit Suisse USA, Inc. | ||||||||
| 720,000 | 5.375%, 3/2/2016 | 798,543 | ||||||
| Developers Diversified Realty Corporation | ||||||||
| 1,002,000 | 7.500%, 4/1/2017 | 1,149,565 | ||||||
| Dexia Credit Local SA | ||||||||
| 225,000 | 2.750%, 4/29/2014g | 219,564 | ||||||
| Discover Bank | ||||||||
| 715,000 | 8.700%, 11/18/2019 | 888,315 | ||||||
| Eksportfinans ASA | ||||||||
| 330,000 | 3.000%, 11/17/2014 | 312,654 | ||||||
| General Electric Capital Corporation | ||||||||
| 330,000 | 1.166%, 4/24/2014e | 330,002 | ||||||
| 715,000 | 0.728%, 9/15/2014e | 706,349 | ||||||
| 715,000 | 2.150%, 1/9/2015 | 727,049 | ||||||
| 365,000 | 1.336%, 5/9/2016e | 359,105 | ||||||
| 396,000 | 2.950%, 5/9/2016 | 408,645 | ||||||
| 330,000 | 2.300%, 4/27/2017 | 332,231 | ||||||
| 715,000 | 6.750%, 3/15/2032 | 885,301 | ||||||
| Goldman Sachs Group, Inc. | ||||||||
| 718,000 | 5.000%, 10/1/2014 | 748,584 | ||||||
| 718,000 | 3.700%, 8/1/2015 | 724,345 | ||||||
| 726,000 | 0.918%, 3/22/2016e | 656,938 | ||||||
| Hartford Financial Services Group, Inc. | ||||||||
| 185,000 | 7.300%, 11/1/2015 | 205,847 | ||||||
| 715,000 | 4.000%, 10/15/2017 | 717,966 | ||||||
| Health Care REIT, Inc. | ||||||||
| 715,000 | 6.500%, 3/15/2041 | 763,884 | ||||||
| HSBC Bank plc | ||||||||
| 365,000 | 1.266%, 1/17/2014e,g | 365,794 | ||||||
| HSBC Holdings plc | ||||||||
| 560,000 | 4.000%, 3/30/2022 | 581,503 | ||||||
| Icahn Enterprises, LP | ||||||||
| 805,000 | 8.000%, 1/15/2018 | 855,312 | ||||||
| ING Bank NV | ||||||||
| 802,000 | 3.750%, 3/7/2017g | 798,238 | ||||||
| International Bank for Reconstruction & Development | ||||||||
| 225,000 | 2.375%, 5/26/2015 | 237,621 | ||||||
| International Lease Finance Corporation | ||||||||
| 795,000 | 5.875%, 4/1/2019 | 795,770 | ||||||
| J.P. Morgan Chase & Company | ||||||||
| 722,000 | 4.650%, 6/1/2014 | 760,142 | ||||||
| 975,000 | 1.875%, 3/20/2015 | 974,246 | ||||||
| J.P. Morgan Chase Bank NA | ||||||||
| 642,000 | 0.798%, 6/13/2016e | 597,924 | ||||||
The accompanying Notes to Financial Statements are an integral part of this schedule.
71
Table of Contents
Moderately Conservative Allocation Portfolio
Schedule of Investments as of June 29, 2012
(unaudited)
| Principal Amount | Long-Term Fixed Income (22.8%) | Value | ||||||
| Financials (2.2%) - continued | |||||||
| Lloyds TSB Bank plc | ||||||||
| $1,965,000 | 4.200%, 3/28/2017 | $ | 2,026,911 | |||||
| MetLife Institutional Funding II | ||||||||
| 715,000 | 1.368%, 4/4/2014e,g | 718,467 | ||||||
| Morgan Stanley | ||||||||
| 1,065,000 | 6.000%, 5/13/2014 | 1,103,902 | ||||||
| 1,065,000 | 4.750%, 3/22/2017 | 1,062,659 | ||||||
| Murray Street Investment Trust I | ||||||||
| 800,000 | 4.647%, 3/9/2017 | 801,543 | ||||||
| Nordea Bank AB | ||||||||
| 775,000 | 2.250%, 3/20/2015g | 777,795 | ||||||
| Omega Healthcare Investors, Inc. | ||||||||
| 1,035,000 | 5.875%, 3/15/2024g | 1,035,000 | ||||||
| PNC Funding Corporation | ||||||||
| 711,000 | 3.300%, 3/8/2022 | 725,081 | ||||||
| Prudential Covered Trust | ||||||||
| 550,000 | 2.997%, 9/30/2015g | 558,709 | ||||||
| Prudential Financial, Inc. | ||||||||
| 716,000 | 6.200%, 11/15/2040 | 781,283 | ||||||
| Regions Bank | ||||||||
| 1,175,000 | 7.500%, 5/15/2018 | 1,321,875 | ||||||
| Royal Bank of Canada | ||||||||
| 215,000 | 3.125%, 4/14/2015g | 227,694 | ||||||
| Royal Bank of Scotland plc | ||||||||
| 715,000 | 4.875%, 8/25/2014g | 735,121 | ||||||
| Santander US Debt SAU | ||||||||
| 650,000 | 3.724%, 1/20/2015g | 604,575 | ||||||
| SLM Corporation | ||||||||
| 1,280,000 | 6.250%, 1/25/2016 | 1,344,000 | ||||||
| Svenska Handelsbanken AB | ||||||||
| 715,000 | 3.125%, 7/12/2016 | 738,885 | ||||||
| Toronto-Dominion Bank | ||||||||
| 220,000 | 2.200%, 7/29/2015g | 228,940 | ||||||
| U.S. Bancorp | ||||||||
| 715,000 | 3.150%, 3/4/2015 | 755,033 | ||||||
| 330,000 | 1.650%, 5/15/2017 | 332,410 | ||||||
| Ventas Realty, LP | ||||||||
| 182,000 | 4.000%, 4/30/2019 | 186,640 | ||||||
| Wachovia Corporation | ||||||||
| 1,780,000 | 5.625%, 10/15/2016 | 2,006,501 | ||||||
| WEA Finance, LLC | ||||||||
| 369,000 | 5.125%, 11/15/2014g | 390,400 | ||||||
| 715,000 | 5.700%, 10/1/2016g | 786,751 | ||||||
| Wells Fargo & Company | ||||||||
| 485,000 | 2.100%, 5/8/2017 | 486,084 | ||||||
|
| |||||||
| Total | 53,050,500 | |||||||
|
| |||||||
| Foreign Government (<0.1%) | |||||||
| Kommunalbanken AS | ||||||||
| 225,000 | 2.750%, 5/5/2015g | 236,260 | ||||||
| Kreditanstalt fuer Wiederaufbau | ||||||||
| 120,000 | 0.253%, 6/17/2013e | 120,009 | ||||||
|
| |||||||
| Total | 356,269 | |||||||
|
| |||||||
| Mortgage-Backed Securities (10.7%) | |||||||
| Federal Home Loan Mortgage Corporation Gold 15-Yr. Pass Through | ||||||||
| 34,845,000 | 3.000%, 7/1/2027c | 36,429,367 | ||||||
| Federal National Mortgage Association Conventional 15- Yr. Pass Through | ||||||||
| 37,760,000 | 3.000%, 7/1/2027c | 39,559,491 | ||||||
| Federal National Mortgage Association Conventional 30- Yr. Pass Through | ||||||||
| 27,405,000 | 3.500%, 7/1/2042c | 28,805,231 | ||||||
| 96,040,000 | 4.000%, 7/1/2042c | 102,207,593 | ||||||
| 48,720,000 | 5.500%, 7/1/2042c | 53,142,850 | ||||||
|
| |||||||
| Total | 260,144,532 | |||||||
|
| |||||||
| Technology (0.3%) | |||||||
| Amkor Technology, Inc. | ||||||||
| 370,000 | 6.625%, 6/1/2021 | 369,075 | ||||||
| Equinix, Inc. | ||||||||
| 1,290,000 | 8.125%, 3/1/2018 | 1,428,675 | ||||||
| First Data Corporation | ||||||||
| 795,000 | 7.375%, 6/15/2019g | 810,900 | ||||||
| Freescale Semiconductor, Inc. | ||||||||
| 680,000 | 9.250%, 4/15/2018g | 727,600 | ||||||
| Hewlett-Packard Company | ||||||||
| 715,000 | 2.018%, 9/19/2014e | 723,052 | ||||||
| 1,050,000 | 2.600%, 9/15/2017 | 1,053,993 | ||||||
| International Business Machines Corporation | ||||||||
| 660,000 | 0.750%, 5/11/2015 | 658,997 | ||||||
| Samsung Electronics America, Inc. | ||||||||
| 798,000 | 1.750%, 4/10/2017g | 795,933 | ||||||
| Xerox Corporation | ||||||||
| 500,000 | 7.200%, 4/1/2016 | 582,950 | ||||||
|
| |||||||
| Total | 7,151,175 | |||||||
|
| |||||||
| Transportation (0.3%) | |||||||
| Avis Budget Car Rental, LLC | ||||||||
| 1,055,000 | 8.250%, 1/15/2019 | 1,131,487 | ||||||
| Continental Airlines, Inc. | ||||||||
| 795,000 | 6.750%, 9/15/2015g | 816,863 | ||||||
| 330,000 | 4.150%, 4/11/2024 | 325,050 | ||||||
| CSX Corporation | ||||||||
| 403,000 | 6.250%, 4/1/2015 | 459,142 | ||||||
| Delta Air Lines, Inc. | ||||||||
| 660,000 | 6.750%, 5/23/2017 | 654,258 | ||||||
| 130,000 | 4.750%, 5/7/2020c | 131,625 | ||||||
| Hertz Corporation | ||||||||
| 1,040,000 | 6.750%, 4/15/2019 | 1,081,600 | ||||||
| Kansas City Southern de Mexico SA de CV | ||||||||
| 660,000 | 8.000%, 2/1/2018 | 735,108 | ||||||
| Navios Maritime Acquisition Corporation | ||||||||
| 1,290,000 | 8.625%, 11/1/2017 | 1,199,700 | ||||||
| Navios Maritime Holdings, Inc. | ||||||||
| 1,040,000 | 8.875%, 11/1/2017c,g | 1,042,600 | ||||||
|
| |||||||
| Total | 7,577,433 | |||||||
|
| |||||||
| U.S. Government and Agencies (2.4%) | |||||||
| Eksportfinans ASA | ||||||||
| 330,000 | 5.500%, 5/25/2016 | 324,273 | ||||||
The accompanying Notes to Financial Statements are an integral part of this schedule.
72
Table of Contents
Moderately Conservative Allocation Portfolio
Schedule of Investments as of June 29, 2012
(unaudited)
| Principal Amount | Long-Term Fixed Income (22.8%) | Value | ||||||
| U.S. Government and Agencies (2.4%) - continued | |||||||
FDIC Structured Sale Guaranteed Notes | ||||||||
| $90,000 | Zero Coupon, 1/7/2014g | $ | 88,829 | |||||
Federal Agricultural Mortgage Corporation | ||||||||
| 225,000 | 2.125%, 9/15/2015 | 233,737 | ||||||
Federal Home Loan Banks | ||||||||
| 1,355,000 | 0.375%, 1/29/2014 | 1,355,527 | ||||||
| 1,020,000 | 1.000%, 6/21/2017 | 1,020,749 | ||||||
| 1,015,000 | 5.000%, 11/17/2017 | 1,225,607 | ||||||
Federal National Mortgage Association | ||||||||
| 710,000 | 1.250%, 2/27/2014 | 721,863 | ||||||
| 430,000 | 0.500%, 5/27/2015 | 429,688 | ||||||
| 325,000 | 4.375%, 10/15/2015 | 364,788 | ||||||
| 870,000 | 1.375%, 11/15/2016 | 890,449 | ||||||
| 255,000 | 6.250%, 5/15/2029 | 367,210 | ||||||
Tennessee Valley Authority | ||||||||
| 200,000 | 5.250%, 9/15/2039 | 260,772 | ||||||
U.S. Treasury Bonds | ||||||||
| 455,000 | 7.625%, 2/15/2025 | 744,778 | ||||||
| 1,275,000 | 4.375%, 5/15/2040 | 1,699,136 | ||||||
| 425,000 | 3.125%, 11/15/2041 | 456,875 | ||||||
U.S. Treasury Bonds, TIPS | ||||||||
| 79,325 | 2.375%, 1/15/2025 | 104,468 | ||||||
| 69,180 | 2.125%, 2/15/2040 | 98,193 | ||||||
U.S. Treasury Notes | ||||||||
| 150,000 | 0.250%, 4/30/2014 | 149,818 | ||||||
| 75,000 | 2.250%, 5/31/2014 | 77,731 | ||||||
| 2,005,000 | 0.750%, 6/15/2014 | 2,021,603 | ||||||
| 5,150,000 | 2.500%, 4/30/2015 | 5,451,357 | ||||||
| 8,000,000 | 0.250%, 5/15/2015 | 7,965,000 | ||||||
| 475,000 | 2.000%, 1/31/2016 | 499,789 | ||||||
| 650,000 | 2.625%, 2/29/2016 | 699,512 | ||||||
| 1,550,000 | 3.250%, 3/31/2017 | 1,732,488 | ||||||
| 22,000,000 | 1.250%, 4/30/2019 | 22,244,068 | ||||||
| 5,110,000 | 2.000%, 2/15/2022 | 5,282,064 | ||||||
U.S. Treasury Notes, TIPS | ||||||||
| 373,491 | 2.000%, 1/15/2014 | 387,789 | ||||||
| 313,232 | 1.625%, 1/15/2015 | 332,858 | ||||||
| 323,755 | 0.500%, 4/15/2015 | 336,148 | ||||||
| 268,392 | 0.125%, 4/15/2017 | 283,321 | ||||||
| 349,625 | 2.625%, 7/15/2017 | 415,289 | ||||||
| 315,477 | 1.125%, 1/15/2021 | 363,045 | ||||||
|
| |||||||
| Total | 58,628,822 | |||||||
|
| |||||||
| Utilities (0.5%) | |||||||
AES Corporation | ||||||||
| 840,000 | 7.375%, 7/1/2021g | 934,500 | ||||||
CenterPoint Energy, Inc. | ||||||||
| 660,000 | 6.850%, 6/1/2015 | 743,837 | ||||||
Consolidated Edison Company of New York, Inc. | ||||||||
| 708,000 | 4.200%, 3/15/2042 | 754,583 | ||||||
Crosstex Energy/Crosstex Energy Finance Corporation | ||||||||
| 1,290,000 | 8.875%, 2/15/2018 | 1,362,563 | ||||||
Exelon Corporation | ||||||||
| 1,065,000 | 4.900%, 6/15/2015 | 1,157,528 | ||||||
| FirstEnergy Solutions Corporation | ||||||||
| 1,065,000 | 4.800%, 2/15/2015 | 1,130,571 | ||||||
| Inergy, LP | ||||||||
| 380,000 | 7.000%, 10/1/2018 | 391,400 | ||||||
| ITC Holdings Corporation | ||||||||
| 644,000 | 5.875%, 9/30/2016g | 740,018 | ||||||
| NextEra Energy Capital Holdings, Inc. | ||||||||
| 325,000 | 1.611%, 6/1/2014 | 325,881 | ||||||
| NGPL PipeCo, LLC | ||||||||
| 1,040,000 | 9.625%, 6/1/2019g | 1,115,400 | ||||||
| NiSource Finance Corporation | ||||||||
| 320,000 | 5.400%, 7/15/2014 | 344,859 | ||||||
| 397,000 | 6.400%, 3/15/2018 | 463,735 | ||||||
| Pacific Gas & Electric Company | ||||||||
| 715,000 | 5.625%, 11/30/2017 | 857,593 | ||||||
| Sempra Energy | ||||||||
| 560,000 | 2.300%, 4/1/2017 | 573,914 | ||||||
| 715,000 | 6.150%, 6/15/2018 | 863,098 | ||||||
|
| |||||||
| Total | 11,759,480 | |||||||
|
| |||||||
Total Long-Term Fixed Income (cost $547,353,023) | 554,064,948 | |||||||
|
| |||||||
Shares | Common Stock (11.9%) | Value | ||||||
| Consumer Discretionary (1.3%) | |||||||
| 13,356 | Amazon.com, Inc.d | 3,049,843 | ||||||
| 3,250 | AutoZone, Inc.d | 1,193,302 | ||||||
| 16,400 | Big Lots, Inc.d | 668,956 | ||||||
| 11,000 | BJ’s Restaurants, Inc.d | 418,000 | ||||||
| 9,370 | CBS Corporation | 307,149 | ||||||
| 6,700 | Charter Communications, Inc.d | 474,829 | ||||||
| 11,400 | Children’s Place Retail Stores, Inc.d | 568,062 | ||||||
| 12,900 | Coach, Inc. | 754,392 | ||||||
| 142,713 | Comcast Corporation | 4,562,535 | ||||||
| 23,919 | Delphi Automotive plcd | 609,934 | ||||||
| 9,300 | DISH Network Corporation | 265,515 | ||||||
| 8,604 | Dollar Tree, Inc.d | 462,895 | ||||||
| 24,235 | Foot Locker, Inc. | 741,106 | ||||||
| 4,550 | Harley-Davidson, Inc. | 208,071 | ||||||
| 44,200 | Home Depot, Inc. | 2,342,158 | ||||||
| 82,776 | Las Vegas Sands Corporation | 3,599,928 | ||||||
| 11,964 | Life Time Fitness, Inc.d | 556,446 | ||||||
| 30,720 | Lowe’s Companies, Inc. | 873,677 | ||||||
| 15,200 | Meredith Corporationf | 485,488 | ||||||
| 48,390 | News Corporation | 1,089,743 | ||||||
| 19,600 | NIKE, Inc. | 1,720,488 | ||||||
| 14,700 | Omnicom Group, Inc. | 714,420 | ||||||
| 2,254 | Panera Bread Companyd | 314,298 | ||||||
| 18,100 | Penn National Gaming, Inc.d | 807,079 | ||||||
| 3,300 | PetSmart, Inc. | 224,994 | ||||||
| 42,549 | Pier 1 Imports, Inc. | 699,080 | ||||||
| 1,700 | Priceline.com, Inc.d | 1,129,684 | ||||||
| 40,600 | Sally Beauty Holdings, Inc.d | 1,045,044 | ||||||
| 7,560 | Time Warner Cable, Inc. | 620,676 | ||||||
| 10,200 | Toll Brothers, Inc.d | 303,246 | ||||||
The accompanying Notes to Financial Statements are an integral part of this schedule.
73
Table of Contents
Moderately Conservative Allocation Portfolio
Schedule of Investments as of June 29, 2012
(unaudited)
Shares | Common Stock (11.9%) | Value | ||||||
| Consumer Discretionary (1.3%) - continued | ||||||||
| 16,761 | WMS Industries, Inc.d | $ | 334,382 | |||||
|
| |||||||
| Total | 31,145,420 | |||||||
|
| |||||||
| Consumer Staples (1.1%) | |||||||
| 50,091 | Altria Group, Inc. | 1,730,644 | ||||||
| 38,312 | Anheuser-Busch InBev NV ADR | 3,051,551 | ||||||
| 60,970 | Archer-Daniels-Midland Company | 1,799,834 | ||||||
| 16,756 | British American Tobacco plc ADR | 1,711,123 | ||||||
| 17,000 | Bunge, Ltd. | 1,066,580 | ||||||
| 28,272 | Coca-Cola Company | 2,210,588 | ||||||
| 20,000 | Colgate-Palmolive Company | 2,082,000 | ||||||
| 12,160 | CVS Caremark Corporation | 568,237 | ||||||
| 8,340 | Diageo plc ADR | 859,604 | ||||||
| 39,688 | Ingredion, Inc. | 1,965,350 | ||||||
| 5,990 | Kimberly-Clark Corporation | 501,782 | ||||||
| 34,259 | Kraft Foods, Inc. | 1,323,082 | ||||||
| 40,406 | Philip Morris International, Inc. | 3,525,827 | ||||||
| 6,578 | TreeHouse Foods, Inc.d | 409,744 | ||||||
| 68,500 | Walgreen Company | 2,026,230 | ||||||
| 25,128 | Wal-Mart Stores, Inc. | 1,751,924 | ||||||
|
| |||||||
| Total | 26,584,100 | |||||||
|
| |||||||
| Energy (2.0%) | ||||||||
| 79,261 | Alpha Natural Resources, Inc.d | 690,363 | ||||||
| 70,092 | Apache Corporation | 6,160,386 | ||||||
| 62,100 | Arch Coal, Inc. | 427,869 | ||||||
| 18,800 | Baker Hughes, Inc. | 772,680 | ||||||
| 43,003 | BP plc ADR | 1,743,342 | ||||||
| 24,630 | Chevron Corporation | 2,598,465 | ||||||
| 89,610 | ConocoPhillips | 5,007,407 | ||||||
| 69,600 | Consol Energy, Inc. | 2,104,704 | ||||||
| 17,000 | Dril-Quip, Inc.d | 1,115,030 | ||||||
| 49,883 | Ensco plc | 2,343,005 | ||||||
| 35,496 | EOG Resources, Inc. | 3,198,545 | ||||||
| 13,920 | EQT Corporation | 746,530 | ||||||
| 23,000 | Exxon Mobil Corporation | 1,968,110 | ||||||
| 18,800 | Helix Energy Solutions Group, Inc.d | 308,508 | ||||||
| 68,900 | Nabors Industries, Ltd.d | 992,160 | ||||||
| 20,109 | National Oilwell Varco, Inc. | 1,295,824 | ||||||
| 29,800 | Newfield Exploration Companyd | 873,438 | ||||||
| 44,720 | Occidental Petroleum Corporation | 3,835,634 | ||||||
| 16,600 | Oil States International, Inc.d | 1,098,920 | ||||||
| 37,800 | Peabody Energy Corporation | 926,856 | ||||||
| 41,300 | Petroleo Brasileiro SA ADR | 775,201 | ||||||
| 42,846 | Petroleum Geo-Services ASA | 523,662 | ||||||
| 38,100 | Plains Exploration & Production Companyd | 1,340,358 | ||||||
| 5,170 | Schlumberger, Ltd. | 335,585 | ||||||
| 9,300 | Southwestern Energy Companyd | 296,949 | ||||||
| 54,881 | Swift Energy Companyd | 1,021,335 | ||||||
| 33,900 | Ultra Petroleum Corporationd,f | 782,073 | ||||||
| 126,280 | Valero Energy Corporation | 3,049,662 | ||||||
| 280,061 | Weatherford International, Ltd.d | 3,537,170 | ||||||
|
| |||||||
| Total | 49,869,771 | |||||||
|
| |||||||
| Financials (1.9%) | ||||||||
| 9,830 | ACE, Ltd. | 728,698 | ||||||
| 5,343 | Affiliated Managers Group, Inc.d | 584,791 | ||||||
| 1,900 | Allied World Assurance Company Holdings AG | 150,993 | ||||||
| 5,800 | American Campus Communities, Inc. | 260,884 | ||||||
| 41,300 | Ameriprise Financial, Inc. | 2,158,338 | ||||||
| 10,600 | Apartment Investment & Management Company | 286,518 | ||||||
| 4,500 | Aspen Insurance Holdings, Ltd. | 130,050 | ||||||
| 37,630 | Bank of America Corporation | 307,813 | ||||||
| 10,697 | Boston Properties, Inc. | 1,159,234 | ||||||
| 6,700 | Capital One Financial Corporation | 366,222 | ||||||
| 18,200 | CBL & Associates Properties, Inc. | 355,628 | ||||||
| 36,840 | Charles Schwab Corporation | 476,341 | ||||||
| 157,688 | Citigroup, Inc. | 4,322,228 | ||||||
| 8,146 | CME Group, Inc. | 2,184,024 | ||||||
| 12,600 | Douglas Emmett, Inc. | 291,060 | ||||||
| 21,083 | Duke Realty Corporation | 308,655 | ||||||
| 7,500 | Endurance Specialty Holdings, Ltd. | 287,400 | ||||||
| 3,600 | Equity Lifestyle Properties, Inc. | 248,292 | ||||||
| 18,969 | Equity Residential | 1,182,907 | ||||||
| 23,018 | HCC Insurance Holdings, Inc. | 722,765 | ||||||
| 4,400 | Home Properties, Inc. | 269,984 | ||||||
| 26,398 | Host Hotels & Resorts, Inc. | 417,616 | ||||||
| 235,300 | Huntington Bancshares, Inc. | 1,505,920 | ||||||
| 9,500 | iShares Russell 2000 Index Fundf | 756,675 | ||||||
| 129,079 | J.P. Morgan Chase & Company | 4,611,993 | ||||||
| 58,732 | Kimco Realty Corporation | 1,117,670 | ||||||
| 44,360 | KKR & Company, LP | 571,800 | ||||||
| 9,488 | Lazard, Ltd. | 246,593 | ||||||
| 4,500 | M&T Bank Corporation | 371,565 | ||||||
| 63,817 | Marsh & McLennan Companies, Inc. | 2,056,822 | ||||||
| 32,880 | MetLife, Inc. | 1,014,348 | ||||||
| 14,000 | NASDAQ OMX Group, Inc. | 317,380 | ||||||
| 7,600 | Northern Trust Corporation | 349,752 | ||||||
| 25,500 | Och-Ziff Capital Management Group, LLC | 193,290 | ||||||
| 36,666 | Ocwen Financial Corporationd | 688,588 | ||||||
| 37,188 | Popular, Inc.d | 617,693 | ||||||
| 1,500 | ProAssurance Corporation | 133,635 | ||||||
| 68,970 | Progressive Corporation | 1,436,645 | ||||||
| 4,100 | Protective Life Corporation | 120,581 | ||||||
| 7,851 | Public Storage, Inc. | 1,133,763 | ||||||
| 4,600 | S&P 500 Large Index Depository Receipts | 626,842 | ||||||
| 8,098 | Simon Property Group, Inc. | 1,260,535 | ||||||
| 23,940 | State Street Corporation | 1,068,682 | ||||||
| 38,430 | SunTrust Banks, Inc. | 931,159 | ||||||
| 7,960 | SVB Financial Groupd | 467,411 | ||||||
| 8,300 | Tanger Factory Outlet Centers, Inc. | 266,015 | ||||||
| 1,935 | Taubman Centers, Inc. | 149,305 | ||||||
| 5,800 | Tower Group, Inc. | 121,046 | ||||||
| 13,167 | Vornado Realty Trust | 1,105,765 | ||||||
| 17,924 | W.R. Berkley Corporation | 697,602 | ||||||
| 95,046 | Wells Fargo & Company | 3,178,338 | ||||||
| 49,093 | Zions Bancorporation | 953,386 | ||||||
|
| |||||||
| Total | 45,271,240 | |||||||
|
| |||||||
The accompanying Notes to Financial Statements are an integral part of this schedule.
74
Table of Contents
Moderately Conservative Allocation Portfolio
Schedule of Investments as of June 29, 2012
(unaudited)
| Shares | Common Stock (11.9%) | Value | ||||||
| Health Care (1.5%) | |||||||
| 20,600 | Abbott Laboratories | $ | 1,328,082 | |||||
| 3,200 | Alexion Pharmaceuticals, Inc.d | 317,760 | ||||||
| 23,600 | Align Technology, Inc.d | 789,656 | ||||||
| 26,074 | Amgen, Inc. | 1,904,445 | ||||||
| 56,537 | Baxter International, Inc. | 3,004,941 | ||||||
| 24,500 | Biogen Idec, Inc.d | 3,537,310 | ||||||
| 107,000 | Bristol-Myers Squibb Company | 3,846,650 | ||||||
| 3,072 | C.R. Bard, Inc. | 330,056 | ||||||
| 11,111 | Covance, Inc.d | 531,661 | ||||||
| 17,600 | Covidien plc | 941,600 | ||||||
| 54,700 | Eli Lilly and Company | 2,347,177 | ||||||
| 25,243 | Health Net, Inc.d | 612,648 | ||||||
| 23,280 | Johnson & Johnson | 1,572,797 | ||||||
| 9,500 | Medicines Companyd | 217,930 | ||||||
| 32,320 | Merck & Company, Inc. | 1,349,360 | ||||||
| 119,766 | Pfizer, Inc. | 2,754,618 | ||||||
| 22,663 | PSS World Medical, Inc.d | 475,696 | ||||||
| 23,260 | Sanofi ADR | 878,763 | ||||||
| 28,700 | Shire Pharmaceuticals Group plc ADR | 2,479,393 | ||||||
| 11,500 | Thoratec Corporationd | 386,170 | ||||||
| 12,662 | United Therapeutics Corporationd | 625,250 | ||||||
| 98,473 | UnitedHealth Group, Inc. | 5,760,670 | ||||||
| 3,000 | Waters Corporationd | 238,410 | ||||||
| 5,671 | Zimmer Holdings, Inc. | 364,986 | ||||||
|
| |||||||
| Total | 36,596,029 | |||||||
|
| |||||||
| Industrials (1.2%) | |||||||
| 16,900 | 3M Company | 1,514,240 | ||||||
| 21,300 | Actuant Corporation | 578,508 | ||||||
| 30,654 | Boeing Company | 2,277,592 | ||||||
| 8,303 | Chicago Bridge and Iron Company | 315,182 | ||||||
| 11,271 | CSX Corporation | 252,020 | ||||||
| 12,000 | Cummins, Inc. | 1,162,920 | ||||||
| 22,691 | Deluxe Corporation | 565,914 | ||||||
| 50,900 | Dover Corporation | 2,728,749 | ||||||
| 20,050 | EMCOR Group, Inc. | 557,791 | ||||||
| 6,618 | Expeditors International of Washington, Inc. | 256,447 | ||||||
| 4,970 | FedEx Corporation | 455,302 | ||||||
| 15,600 | GATX Corporation | 600,600 | ||||||
| 23,760 | General Electric Company | 495,158 | ||||||
| 11,571 | Honeywell International, Inc. | 646,125 | ||||||
| 21,890 | Jacobs Engineering Group, Inc.d | 828,755 | ||||||
| 16,600 | L-3 Communications Holdings, Inc. | 1,228,566 | ||||||
| 8,800 | Landstar System, Inc. | 455,136 | ||||||
| 37,700 | Lockheed Martin Corporation | 3,282,916 | ||||||
| 68,260 | Manitowoc Company, Inc. | 798,642 | ||||||
| 4,900 | Manpower, Inc. | 179,585 | ||||||
| 6,480 | Norfolk Southern Corporation | 465,070 | ||||||
| 15,017 | Oshkosh Corporationd | 314,606 | ||||||
| 50,656 | Parker Hannifin Corporation | 3,894,433 | ||||||
| 17,734 | Shaw Group, Inc.d | 484,315 | ||||||
| 9,677 | SPX Corporation | 632,102 | ||||||
| 48,300 | Tyco International, Ltd. | 2,552,655 | ||||||
| 35,774 | United Technologies Corporation | 2,702,010 | ||||||
|
| |||||||
| Total | 30,225,339 | |||||||
|
| |||||||
| Information Technology (2.3%) | |||||||
| 22,000 | Accenture plc | 1,321,980 | ||||||
| 17,200 | ADTRAN, Inc. | 519,268 | ||||||
| 21,586 | Akamai Technologies, Inc.d | 685,356 | ||||||
| 5,800 | Alliance Data Systems Corporationd | 783,000 | ||||||
| 20,512 | Apple, Inc.d | 11,979,008 | ||||||
| 66,600 | Atmel Corporationd | 446,220 | ||||||
| 20,900 | Cavium, Inc.d | 585,200 | ||||||
| 36,981 | Cognizant Technology Solutions Corporationd | 2,218,860 | ||||||
| 22,300 | CoreLogic, Inc.d | 408,313 | ||||||
| 52,322 | eBay, Inc.d | 2,198,047 | ||||||
| 7,269 | Google, Inc.d | 4,216,529 | ||||||
| 7,300 | International Business Machines Corporation | 1,427,734 | ||||||
| 8,147 | Itron, Inc.d | 335,982 | ||||||
| 15,307 | Juniper Networks, Inc.d | 249,657 | ||||||
| 3,200 | MasterCard, Inc. | 1,376,352 | ||||||
| 195,878 | Microsoft Corporation | 5,991,908 | ||||||
| 85,787 | NetApp, Inc.d | 2,729,742 | ||||||
| 29,906 | NVIDIA Corporationd | 413,301 | ||||||
| 21,700 | OpenTable, Inc.d,f | 976,717 | ||||||
| 198,119 | Oracle Corporation | 5,884,134 | ||||||
| 14,357 | Plantronics, Inc. | 479,524 | ||||||
| 40,900 | Polycom, Inc.d | 430,268 | ||||||
| 46,127 | QUALCOMM, Inc. | 2,568,351 | ||||||
| 650 | ServiceNow, Inc.c,d | 15,990 | ||||||
| 13,800 | Teradata Corporationd | 993,738 | ||||||
| 66,162 | Teradyne, Inc.d | 930,238 | ||||||
| 121,980 | Texas Instruments, Inc. | 3,499,606 | ||||||
| 15,973 | TIBCO Software, Inc.d | 477,912 | ||||||
| 9,900 | VeriFone Systems, Inc.d | 327,591 | ||||||
| 31,671 | Xilinx, Inc. | 1,063,196 | ||||||
|
| |||||||
| Total | 55,533,722 | |||||||
|
| |||||||
| Materials (0.4%) | |||||||
| 21,900 | AK Steel Holding Corporationf | 128,553 | ||||||
| 5,758 | Albemarle Corporation | 343,407 | ||||||
| 13,600 | BHP Billiton, Ltd. ADR | 888,080 | ||||||
| 4,900 | Buckeye Technologies, Inc. | 139,601 | ||||||
| 17,100 | Cliffs Natural Resources, Inc. | 842,859 | ||||||
| 4,400 | Eagle Materials, Inc. | 164,296 | ||||||
| 97,536 | Freeport-McMoRan Copper & Gold, Inc. | 3,323,051 | ||||||
| 4,800 | H.B. Fuller Company | 147,360 | ||||||
| 6,200 | LyondellBasell Industries NV | 249,674 | ||||||
| 7,100 | Materials Select Sector SPDR Fund | 250,559 | ||||||
| 15,500 | Mosaic Company | 848,780 | ||||||
| 18,300 | Rio Tinto plc ADRf | 874,923 | ||||||
| 6,902 | Sigma-Aldrich Corporation | 510,265 | ||||||
| 8,978 | Silgan Holdings, Inc. | 383,271 | ||||||
| 25,680 | Steel Dynamics, Inc. | 301,740 | ||||||
| 10,600 | SunCoke Energy, Inc.d | 155,290 | ||||||
| 15,800 | Walter Energy, Inc. | 697,728 | ||||||
|
| |||||||
| Total | 10,249,437 | |||||||
|
| |||||||
| Telecommunications Services (<0.1%) | |||||||
| 24,369 | Verizon Communications, Inc. | 1,082,959 | ||||||
|
| |||||||
| Total | 1,082,959 | |||||||
|
| |||||||
| Utilities (0.2%) | |||||||
| 16,800 | CMS Energy Corporation | 394,800 | ||||||
The accompanying Notes to Financial Statements are an integral part of this schedule.
75
Table of Contents
Moderately Conservative Allocation Portfolio
Schedule of Investments as of June 29, 2012
(unaudited)
Shares | Common Stock (11.9%) | Value | ||||||
| Utilities (0.2%) - continued | ||||||||
| 39,750 | NiSource, Inc. | $ | 983,812 | |||||
| 22,992 | NV Energy, Inc. | 404,199 | ||||||
| 30,000 | PNM Resources, Inc. | 586,200 | ||||||
| 9,400 | Public Service Enterprise Group, Inc. | 305,500 | ||||||
| 12,981 | Southwest Gas Corporation | 566,621 | ||||||
| 21,740 | Utilities Select Sector SPDR Fund | 804,163 | ||||||
|
| |||||||
| Total | 4,045,295 | |||||||
|
| |||||||
Total Common Stock (cost $281,062,008) | 290,603,312 | |||||||
|
| |||||||
Preferred Stock (<0.1%) | ||||||||
| Financials (<0.1%) | ||||||||
| 14,600 | U.S. Bancorp, 6.000%h | 399,748 | ||||||
|
| |||||||
| Total | 399,748 | |||||||
|
| |||||||
Total Preferred Stock (cost $365,000) | 399,748 | |||||||
|
| |||||||
Collateral Held for Securities Loaned (0.2%) | ||||||||
| 5,844,049 | Thrivent Financial Securities Lending Trust | 5,844,049 | ||||||
|
| |||||||
Total Collateral Held for Securities Loaned (cost $5,844,049) | 5,844,049 | |||||||
|
| |||||||
| Principal Amount | Short-Term Investments (24.6%)i | |||||||
Federal Home Loan Bank Discount Notes | ||||||||
| 48,000,000 | 0.107%, 7/11/2012j | 47,998,432 | ||||||
| 4,500,000 | 0.090%, 7/13/2012j | 4,499,854 | ||||||
| 5,000,000 | 0.080%, 7/18/2012j | 4,999,800 | ||||||
| 9,000,000 | 0.088%, 7/20/2012j | 8,999,561 | ||||||
| 5,000,000 | 0.065%, 7/25/2012j | 4,999,774 | ||||||
| 8,000,000 | 0.060%, 7/27/2012j | 7,999,640 | ||||||
| 125,000,000 | 0.085%, 8/8/2012j,k | 124,988,490 | ||||||
| 35,000,000 | 0.085%, 8/10/2012j | 34,996,612 | ||||||
| 75,000,000 | 0.108%, 8/17/2012j | 74,989,220 | ||||||
| 130,000,000 | 0.104%, 8/22/2012j | 129,980,051 | ||||||
| 65,000,000 | 0.100%, 8/31/2012j | 64,988,805 | ||||||
Federal Home Loan Mortgage Corporation Discount Notes | ||||||||
| 500,000 | 0.105%, 7/16/2012j,l | 499,977 | ||||||
| 10,000,000 | 0.070%, 7/20/2012j | 9,999,611 | ||||||
| 58,039,000 | 0.105%, 8/27/2012j | 58,029,182 | ||||||
Federal National Mortgage Association Discount Notes | ||||||||
| 7,300,000 | 0.120%, 7/18/2012j,l | 7,299,562 | ||||||
Straight-A Funding, LLC | ||||||||
| 5,000,000 | 0.180%, 7/9/2012g,j | 4,999,775 | ||||||
| 3,000,000 | 0.180%, 8/22/2012g,j | 2,999,205 | ||||||
U.S. Treasury Bills | ||||||||
| 4,000,000 | 0.100%, 7/19/2012j,l | 3,999,788 | ||||||
| 2,895,000 | 0.130%, 8/30/2012j | 2,894,362 | ||||||
|
| |||||||
| Total Short-Term Investments (at amortized cost) | 600,161,701 | |||||||
|
| |||||||
Total Investments (cost $2,706,039,565) 111.2% | $ | 2,709,754,901 | ||||||
|
| |||||||
| Other Assets and Liabilities, Net (11.2%) | (273,884,633 | ) | ||||||
|
| |||||||
| Total Net Assets 100.0% | $ | 2,435,870,268 | ||||||
|
| |||||||
| a | The stated interest rate represents the weighted average of all contracts within the bank loan facility. |
| b | All or a portion of the loan is unfunded. |
| c | Denotes investments purchased on a when-issued or delayed delivery basis. |
| d | Non-income producing security. |
| e | Denotes variable rate securities. Variable rate securities are securities whose yields vary with a designated market index or market rate. The rate shown is as of June 29, 2012. |
| f | All or a portion of the security is on loan. |
| g | Denotes securities sold under Rule 144A of the Securities Act of 1933, which exempts them from registration. These securities have been deemed liquid and may be resold to other dealers in the program or to other qualified institutional buyers. As of June 29, 2012, the value of these investments was $48,553,591 or 2.0% of total net assets. |
| h | Denotes perpetual securities. Perpetual securities pay an indefinite stream of interest, but may be called by the issuer at an earlier date. |
| i | The interest rate shown reflects the yield, coupon rate or the discount rate at the date of purchase. |
| j | Denotes investments that benefit from credit enhancement or liquidity support provided by a third party bank, institution or government. |
| k | At June 29, 2012, $1,729,841 of investments were pledged as collateral with the custodian under the agreement between the counterparty, the custodian and the fund for open swap contracts. |
| l | At June 29, 2012, $11,799,327 of investments were held on deposit with the counterparty and pledged as the initial margin deposit for open futures contracts. |
Definitions:
| ADR | - | American Depositary Receipt, which are certificates for an underlying foreign security’s shares held by an issuing U.S. depository bank. | ||
| REIT | - | Real Estate Investment Trust is a company that buys, develops, manages and/or sells real estate assets. | ||
| TIPS | - | Treasury Inflation Protected Security. |
Unrealized Appreciation (Depreciation)
Gross unrealized appreciation and depreciation of investments, based on cost for federal income tax purposes, were as follows:
Gross unrealized appreciation | $ | 60,431,773 | ||
Gross unrealized depreciation | (57,938,087 | ) | ||
|
| |||
Net unrealized appreciation (depreciation) | $ | 2,493,686 | ||
Cost for federal income tax purposes | $ | 2,707,261,215 |
The accompanying Notes to Financial Statements are an integral part of this schedule.
76
Table of Contents
Moderately Conservative Allocation Portfolio
Schedule of Investments as of June 29, 2012
(unaudited)
Fair Valuation Measurements
The following table is a summary of the inputs used, as of June 29, 2012, in valuing Moderately Conservative Allocation Portfolio’s assets carried at fair value.
Investments in Securities | Total | Level 1 | Level 2 | Level 3 | ||||||||||||
Bank Loans | ||||||||||||||||
Basic Materials | 2,920,875 | — | 2,920,875 | — | ||||||||||||
Capital Goods | 1,306,521 | — | 1,306,521 | — | ||||||||||||
Communications Services | 8,887,381 | — | 8,887,381 | — | ||||||||||||
Consumer Cyclical | 2,277,417 | — | 2,277,417 | — | ||||||||||||
Consumer Non-Cyclical | 6,311,211 | — | 6,311,211 | — | ||||||||||||
Energy | 2,767,751 | — | 2,767,751 | — | ||||||||||||
Financials | 1,277,900 | — | 1,277,900 | — | ||||||||||||
Technology | 3,582,636 | — | 3,582,636 | — | ||||||||||||
Transportation | 944,650 | — | 944,650 | — | ||||||||||||
Utilities | 1,914,277 | — | 1,914,277 | — | ||||||||||||
Mutual Funds | ||||||||||||||||
Equity Mutual Funds | 344,451,583 | 344,451,583 | — | — | ||||||||||||
Fixed Income Mutual Funds | 882,038,941 | 882,038,941 | — | — | ||||||||||||
Long-Term Fixed Income | ||||||||||||||||
Asset-Backed Securities | 11,298,081 | — | 11,298,081 | — | ||||||||||||
Basic Materials | 8,340,580 | — | 8,340,580 | — | ||||||||||||
Capital Goods | 8,583,300 | — | 8,583,300 | — | ||||||||||||
Collateralized Mortgage Obligations | 18,562,944 | — | 18,562,944 | — | ||||||||||||
Commercial Mortgage-Backed Securities | 37,618,143 | — | 37,618,143 | — | ||||||||||||
Communications Services | 22,413,346 | — | 22,413,346 | — | ||||||||||||
Consumer Cyclical | 13,237,283 | — | 13,237,283 | — | ||||||||||||
Consumer Non-Cyclical | 24,720,823 | — | 24,720,823 | — | ||||||||||||
Energy | 10,622,237 | — | 10,622,237 | — | ||||||||||||
Financials | 53,050,500 | — | 53,050,500 | — | ||||||||||||
Foreign Government | 356,269 | — | 356,269 | — | ||||||||||||
Mortgage-Backed Securities | 260,144,532 | — | 260,144,532 | — | ||||||||||||
Technology | 7,151,175 | — | 7,151,175 | — | ||||||||||||
Transportation | 7,577,433 | — | 6,534,833 | 1,042,600 | ||||||||||||
U.S. Government and Agencies | 58,628,822 | — | 58,628,822 | — | ||||||||||||
Utilities | 11,759,480 | — | 11,759,480 | — | ||||||||||||
Common Stock | ||||||||||||||||
Consumer Discretionary | 31,145,420 | 31,145,420 | — | — | ||||||||||||
Consumer Staples | 26,584,100 | 26,584,100 | — | — | ||||||||||||
Energy | 49,869,771 | 49,346,109 | 523,662 | — | ||||||||||||
Financials | 45,271,240 | 45,271,240 | — | — | ||||||||||||
Health Care | 36,596,029 | 36,596,029 | — | — | ||||||||||||
Industrials | 30,225,339 | 30,225,339 | — | — | ||||||||||||
Information Technology | 55,533,722 | 55,533,722 | — | — | ||||||||||||
Materials | 10,249,437 | 10,249,437 | — | — | ||||||||||||
Telecommunications Services | 1,082,959 | 1,082,959 | — | — | ||||||||||||
Utilities | 4,045,295 | 4,045,295 | — | — | ||||||||||||
Preferred Stock | ||||||||||||||||
Financials | 399,748 | 399,748 | — | — | ||||||||||||
Collateral Held for Securities Loaned | 5,844,049 | 5,844,049 | — | — | ||||||||||||
Short-Term Investments | 600,161,701 | — | 600,161,701 | — | ||||||||||||
|
|
|
|
|
|
|
| |||||||||
Total | $ | 2,709,754,901 | $ | 1,522,813,971 | $ | 1,185,898,330 | $ | 1,042,600 | ||||||||
|
|
|
|
|
|
|
| |||||||||
The accompanying Notes to Financial Statements are an integral part of this schedule.
77
Table of Contents
Moderately Conservative Allocation Portfolio
Schedule of Investments as of June 29, 2012
(unaudited)
Other Financial Instruments | Total | Level 1 | Level 2 | Level 3 | ||||||||||||
Asset Derivatives | ||||||||||||||||
Futures Contracts | 7,618,624 | 7,618,624 | — | — | ||||||||||||
Credit Default Swaps | 371,963 | — | 371,963 | — | ||||||||||||
|
|
|
|
|
|
|
| |||||||||
Total Asset Derivatives | $ | 7,990,587 | $ | 7,618,624 | $ | 371,963 | $ | — | ||||||||
|
|
|
|
|
|
|
| |||||||||
Liability Derivatives | ||||||||||||||||
Futures Contracts | 303,348 | 303,348 | — | — | ||||||||||||
|
|
|
|
|
|
|
| |||||||||
Total Liability Derivatives | $ | 303,348 | $ | 303,348 | $ | — | $ | — | ||||||||
|
|
|
|
|
|
|
| |||||||||
The significant unobservable input used in the fair value measurement of the Long-Term Fixed Income Transportation Level 3 security is the lack of marketability. A significant increase or decrease in the input in isolation would result in a significantly lower or higher fair value measurement.
There were no significant transfers between the Levels during the period ended June 29, 2012. Transfers between the levels are identified as of the end of the period.
Futures Contracts | Number of Contracts Long/(Short) | Expiration Date | Notional Principal Amount | Value | Unrealized Gain/(Loss) | |||||||||||||||
2-Yr. U.S. Treasury Bond Futures | (250 | ) | September 2012 | ($ | 55,053,925 | ) | ($ | 55,046,875 | ) | $ | 7,050 | |||||||||
10-Yr. U.S. Treasury Bond Futures | 1,280 | September 2012 | 169,990,349 | 170,720,000 | 729,651 | |||||||||||||||
20-Yr. U.S. Treasury Bond Futures | 645 | September 2012 | 94,726,267 | 95,439,844 | 713,577 | |||||||||||||||
Mini MSCI EAFE Index Futures | 414 | September 2012 | 27,826,186 | 29,472,660 | 1,646,474 | |||||||||||||||
Russell 2000 Index Mini-Futures | 72 | September 2012 | 5,449,126 | 5,726,880 | 277,754 | |||||||||||||||
S&P 400 Index Mini-Futures | (134 | ) | September 2012 | (12,285,952 | ) | (12,589,300 | ) | (303,348 | ) | |||||||||||
S&P 500 Index Futures | 366 | September 2012 | 119,866,482 | 124,110,600 | 4,244,118 | |||||||||||||||
Total Futures Contracts | $ | 7,315,276 | ||||||||||||||||||
Credit Default Swaps and Counterparty | Buy/Sell Protection1 | Termination Date | Notional Principal Amount2 | Upfront Payments Received (Made) | Value3 | Unrealized Gain/(Loss) | ||||||||||||||||
CDX HY, Series 18, 5 Year, at 5.00%; Bank of America | Sell | 6/20/2017 | $ | 48,510,000 | $ | 2,079,350 | ($ | 1,707,387 | ) | $ | 371,963 | |||||||||||
Total Credit Default Swaps | ($ | 1,707,387 | ) | $ | 371,963 | |||||||||||||||||
| 1 | As the buyer of protection, Moderately Conservative Allocation Portfolio pays periodic fees in return for payment by the seller which is contingent upon an adverse credit event occurring in the underlying issuer or reference entity. As the seller of protection, Moderately Conservative Allocation Portfolio collects periodic fees from the buyer and profits if the credit of the underlying issuer or reference entity remains stable or improves while the swap is outstanding, but the seller in a credit default swap contract would be required to pay the amount of credit loss, determined as specified in the agreement, to the buyer in the event of an adverse credit event in the reference entity. |
| 2 | The maximum potential amount of future payments Moderately Conservative Allocation Portfolio could be required to make as the seller or receive as the buyer of protection. |
| 3 | The values for credit indexes (CDX or LCDX) serve as an indicator of the current status of the payment/performance risk and represent the liability or profit for the credit default swap contract had the contract been closed as of the reporting date. When protection has been sold, the value of the swap will increase when the swap spread declines representing an improvement in the reference entity’s credit worthiness. The value of the swap will decrease when the swap spread increases representing a deterioration in the reference entity’s credit worthiness. When protection has been purchased, the value of the swap will increase when the swap spread increases representing a deterioration in the reference entity’s credit worthiness. The value of the swap will decrease when the swap spread declines representing an improvement in the reference entity’s credit worthiness. |
The accompanying Notes to Financial Statements are an integral part of this schedule.
78
Table of Contents
Moderately Conservative Allocation Portfolio
Schedule of Investments as of June 29, 2012
(unaudited)
The following table summarizes the fair value and Statement of Assets and Liabilities location, as of June 29, 2012, for Moderately Conservative Allocation Portfolio’s investments in financial derivative instruments by primary risk exposure as discussed under item (2) Significant Accounting Policies of the Notes to Financial Statements.
Derivatives by risk category | Statement of Assets and Liabilities Location | Fair Value | ||||
Asset Derivatives | ||||||
Equity Contracts | ||||||
Futures* | Net Assets - Net unrealized appreciation/(depreciation) on Futures contracts | $ | 6,168,346 | |||
Total Equity Contracts | 6,168,346 | |||||
Interest Rate Contracts | ||||||
Futures* | Net Assets - Net unrealized appreciation/(depreciation) on Futures contracts | 1,450,278 | ||||
Total Interest Rate Contracts | 1,450,278 | |||||
Credit Contracts | ||||||
Credit Default Swaps | Receivable/Payable - Swap agreements, at value; Net Assets - Net unrealized appreciation/(depreciation) on Swap agreements | 371,963 | ||||
Total Credit Contracts | 371,963 | |||||
|
| |||||
Total Asset Derivatives | $ | 7,990,587 | ||||
|
| |||||
Liability Derivatives | ||||||
Equity Contracts | ||||||
Futures* | Net Assets - Net unrealized appreciation/(depreciation) on Futures contracts | 303,348 | ||||
Total Equity Contracts | 303,348 | |||||
|
| |||||
Total Liability Derivatives | $ | 303,348 | ||||
|
| |||||
| * | Includes cumulative appreciation/depreciation of futures contracts as reported in the Schedule of Investments. Only current day’s variation margin is reported within the Statement of Assets and Liabilities. |
The following table summarizes the net realized gains/(losses) and Statement of Operations location, for the period ended June 29, 2012, for Moderately Conservative Allocation Portfolio’s investments in financial derivative instruments by primary risk exposure.
Derivatives by risk category | Statement of Operations Location | Realized Gains/ (Losses) recognized in Income | ||||
Equity Contracts | ||||||
Futures | Net realized gains/(losses) on Futures contracts | 7,140,275 | ||||
Total Equity Contracts | 7,140,275 | |||||
Foreign Exchange Contracts | ||||||
Forward Contracts | Net realized gains/(losses) on Foreign currency transactions | (180 | ) | |||
Total Foreign Exchange Contracts | (180 | ) | ||||
Interest Rate Contracts | ||||||
Futures | Net realized gains/(losses) on Futures contracts | 9,462,573 | ||||
Total Interest Rate Contracts | 9,462,573 | |||||
Credit Contracts | ||||||
Credit Default Swaps | Net realized gains/(losses) on Swap agreements | 2,367,793 | ||||
Total Credit Contracts | 2,367,793 | |||||
|
| |||||
Total | $ | 18,970,461 | ||||
|
| |||||
The accompanying Notes to Financial Statements are an integral part of this schedule.
79
Table of Contents
Moderately Conservative Allocation Portfolio
Schedule of Investments as of June 29, 2012
(unaudited)
The following table summarizes the change in net unrealized appreciation/(depreciation) and Statement of Operations location, for the period ended June 29, 2012, for Moderately Conservative Allocation Portfolio’s investments in financial derivative instruments by primary risk exposure.
Derivatives by risk category | Statement of Operations Location | Change in unrealized appreciation/(depreciation) recognized in Income | ||||
Equity Contracts | ||||||
Futures | Change in net unrealized appreciation/(depreciation) on Futures contracts | 3,983,982 | ||||
Total Equity Contracts | 3,983,982 | |||||
Interest Rate Contracts | ||||||
Futures | Change in net unrealized appreciation/(depreciation) on Futures contracts | (1,652,537 | ) | |||
Total Interest Rate Contracts | (1,652,537 | ) | ||||
Credit Contracts | ||||||
Credit Default Swaps | Change in net unrealized appreciation/(depreciation) on Swap agreements | (72,577 | ) | |||
Total Credit Contracts | (72,577 | ) | ||||
|
| |||||
Total | $ | 2,258,868 | ||||
|
| |||||
The following table presents Moderately Conservative Allocation Portfolio’s average volume of derivative activity during the period ended June 29, 2012.
Derivative Risk Category | Futures (Notional*) | Futures (Percentage of Average Net Assets) | Forwards (Notional*) | Forwards (Percentage of Average Net Assets) | Swaps (Notional*) | Swaps (Percentage of Average Net Assets) | ||||||||||||||||||
Equity Contracts | $ | 160,875,020 | 7.0 | % | N/A | N/A | N/A | N/A | ||||||||||||||||
Interest Rate Contracts | 319,647,493 | 14.0 | N/A | N/A | N/A | N/A | ||||||||||||||||||
Foreign Exchange Contracts | N/A | N/A | $ | 312 | <0.1 | % | N/A | N/A | ||||||||||||||||
Credit Contracts | N/A | N/A | N/A | N/A | $ | 27,772,777 | 1.2 | % | ||||||||||||||||
| * | Notional amount represents long or short, or both, derivative positions held by the Portfolio. |
Investment in Affiliates
Affiliated issuers, as defined under the Investment Company Act of 1940, include those in which the Portfolio’s holdings of an issuer represent 5% or more of the outstanding voting securities of an issuer, or any affiliated mutual fund.
A summary of transactions for the fiscal year to date, in Moderately Conservative Allocation Portfolio, is as follows:
Portfolio | Value December 31, 2011 | Gross Purchases | Gross Sales | Shares Held at June 29, 2012 | Value June 29, 2012 | Income Earned January 1, 2012 - June 29, 2012 | ||||||||||||||||||
Partner Small Cap Value | $ | 23,585,482 | $ | 164,740 | $ | — | 1,273,911 | $ | 24,719,359 | $ | 164,740 | |||||||||||||
Small Cap Stock | 19,363,111 | — | — | 1,614,844 | 19,767,952 | — | ||||||||||||||||||
Partner Mid Cap Value | 26,686,954 | 240,520 | — | 2,151,794 | 28,707,943 | 240,520 | ||||||||||||||||||
Mid Cap Stock | 33,601,569 | 90,009 | — | 2,934,910 | 35,472,793 | 90,009 | ||||||||||||||||||
Partner Worldwide Allocation | 68,816,746 | 10,025,846 | — | 10,578,907 | 82,189,647 | 25,846 | ||||||||||||||||||
Partner International Stock | 34,849,649 | 1,001,700 | — | 3,906,101 | 36,068,157 | 1,001,700 | ||||||||||||||||||
Large Cap Value | 77,563,939 | 1,450,184 | — | 7,600,011 | 82,661,516 | 1,450,184 | ||||||||||||||||||
Large Cap Stock | 22,113,664 | 248,847 | — | 2,756,082 | 23,829,911 | 248,847 | ||||||||||||||||||
Equity Income Plus | 10,234,741 | 166,609 | — | 1,179,786 | 11,034,305 | 166,610 | ||||||||||||||||||
High Yield | 81,625,810 | 3,143,959 | 24,658 | 18,156,072 | 88,066,025 | 3,143,959 | ||||||||||||||||||
Income | 262,194,274 | 5,436,087 | 64,111 | 26,516,892 | 276,510,196 | 5,436,848 | ||||||||||||||||||
Limited Maturity Bond | 582,200,860 | 5,070,830 | 77,352,881 | 52,816,331 | 517,462,720 | 5,070,830 | ||||||||||||||||||
Thrivent Financial Securities Lending Trust | — | 52,299,382 | 46,455,333 | 5,844,049 | 5,844,049 | 17,410 | ||||||||||||||||||
Total Value and Income Earned | 1,242,836,799 | 1,232,334,573 | 17,057,503 | |||||||||||||||||||||
The accompanying Notes to Financial Statements are an integral part of this schedule.
80
Table of Contents
Schedule of Investments as of June 29, 2012
(unaudited)
| Shares | Common Stock (99.5%) | Value | ||||||
| Communications Equipment (7.9%) | ||||||||
| 46,838 | Calix, Inc.a,b | $ | 385,008 | |||||
| 35,528 | Juniper Networks, Inc.b | 579,462 | ||||||
| 30,999 | QUALCOMM, Inc. | 1,726,024 | ||||||
|
| |||||||
| Total | 2,690,494 | |||||||
|
| |||||||
| Computers & Peripherals (16.3%) | ||||||||
| 6,293 | Apple, Inc.b | 3,675,112 | ||||||
| 20,507 | EMC Corporationb | 525,594 | ||||||
| 42,739 | NetApp, Inc.b | 1,359,955 | ||||||
|
| |||||||
| Total | 5,560,661 | |||||||
|
| |||||||
| Consumer Discretionary (10.6%) | ||||||||
| 5,171 | Amazon.com, Inc.b | 1,180,798 | ||||||
| 14,570 | Coinstar, Inc.a,b | 1,000,376 | ||||||
| 75,611 | Pandora Media, Inc.a,b | 821,892 | ||||||
| 931 | Priceline.com, Inc.b | 618,668 | ||||||
|
| |||||||
| Total | 3,621,734 | |||||||
|
| |||||||
| Electronic Equipment, Instruments & Components (5.2%) | ||||||||
| 17,531 | Amphenol Corporation | 962,803 | ||||||
| 54,471 | RealD, Inc.a,b | 814,886 | ||||||
|
| |||||||
| Total | 1,777,689 | |||||||
|
| |||||||
| Financials (2.0%) | ||||||||
| 5,165 | IntercontinentalExchange, Inc.b | 702,337 | ||||||
|
| |||||||
| Total | 702,337 | |||||||
|
| |||||||
| Internet Software & Services (17.3%) | ||||||||
| 30,371 | 21Vianet Group, Inc. ADRb | 347,748 | ||||||
| 4,801 | Equinix, Inc.b | 843,295 | ||||||
| 31,398 | Facebook, Inc.a,b | 977,106 | ||||||
| 3,215 | Google, Inc.b | 1,864,925 | ||||||
| 35,952 | Rackspace Hosting, Inc.b | 1,579,731 | ||||||
| 15,221 | Yandex NVb | 289,960 | ||||||
|
| |||||||
| Total | 5,902,765 | |||||||
|
| |||||||
| IT Consulting & Services (4.2%) | ||||||||
| 45,278 | InterXion Holding NVb | 819,985 | ||||||
| 18,870 | VeriFone Systems, Inc.b | 624,408 | ||||||
|
| |||||||
| Total | 1,444,393 | |||||||
|
| |||||||
| Semiconductors & Semiconductor Equipment (7.8%) | ||||||||
| 18,953 | Altera Corporation | 641,369 | ||||||
| 12,531 | Cavium, Inc.b | 350,868 | ||||||
| 10,074 | Hittite Microwave Corporationb | 514,983 | ||||||
| 25,156 | Intermolecular, Inc.b | 194,959 | ||||||
| 29,040 | Xilinx, Inc. | 974,873 | ||||||
|
| |||||||
| Total | 2,677,052 | |||||||
|
| |||||||
| Software (20.3%) | ||||||||
| 9,224 | Citrix Systems, Inc.b | 774,263 | ||||||
| 12,927 | MICROS Systems, Inc.b | 661,862 | ||||||
| 56,144 | Microsoft Corporation | 1,717,445 | ||||||
| 12,557 | NetSuite, Inc.b | 687,747 | ||||||
| 48,805 | Oracle Corporation | 1,449,508 | ||||||
| 21,888 | Rovi Corporationb | 429,443 | ||||||
| 7,939 | Salesforce.com, Inc.b | 1,097,646 | ||||||
| 5,785 | ServiceNow, Inc.b,c | 142,311 | ||||||
|
| |||||||
| Total | 6,960,225 | |||||||
|
| |||||||
| Telecommunications Services (7.9%) | ||||||||
| 13,710 | American Tower Corporation | 958,466 | ||||||
| 18,319 | SBA Communications Corporationb | 1,045,099 | ||||||
| 26,942 | TW Telecom, Inc.b | 691,332 | ||||||
| Total | 2,694,897 | |||||||
|
| |||||||
Total Common Stock (cost $28,529,593) | 34,032,247 | |||||||
|
| |||||||
Collateral Held for Securities Loaned (10.8%) | ||||||||
| 3,702,075 | Thrivent Financial Securities Lending Trust | 3,702,075 | ||||||
|
| |||||||
Total Collateral Held for Securities Loaned (cost $3,702,075) | 3,702,075 | |||||||
|
| |||||||
Total Investments (cost $32,231,668) 110.3% | $ | 37,734,322 | ||||||
|
| |||||||
| Other Assets and Liabilities, Net (10.3%) | (3,529,645 | ) | ||||||
|
| |||||||
| Total Net Assets 100.0% | $ | 34,204,677 | ||||||
|
| |||||||
| a | All or a portion of the security is on loan. |
| b | Non-income producing security. |
| c | Denotes investments purchased on a when-issued or delayed delivery basis. |
Definitions:
ADR | - | American Depositary Receipt, which are certificates for an underlying foreign security’s shares held by an issuing U.S. depository bank. |
Unrealized Appreciation (Depreciation)
Gross unrealized appreciation and depreciation of investments, based on cost for federal income tax purposes, were as follows:
Gross unrealized appreciation | $ | 7,416,086 | ||
Gross unrealized depreciation | (2,259,749 | ) | ||
|
| |||
Net unrealized appreciation (depreciation) | $ | 5,156,337 | ||
Cost for federal income tax purposes | $ | 32,577,985 | ||
The accompanying Notes to Financial Statements are an integral part of this schedule.
81
Table of Contents
Partner Technology Portfolio
Schedule of Investments as of June 29, 2012
(unaudited)
Fair Valuation Measurements
The following table is a summary of the inputs used, as of June 29, 2012, in valuing Partner Technology Portfolio’s assets carried at fair value.
Investments in Securities | Total | Level 1 | Level 2 | Level 3 | ||||||||||||
Common Stock | ||||||||||||||||
Communications Equipment | 2,690,494 | 2,690,494 | — | — | ||||||||||||
Computers & Peripherals | 5,560,661 | 5,560,661 | — | — | ||||||||||||
Consumer Discretionary | 3,621,734 | 3,621,734 | — | — | ||||||||||||
Electronic Equipment, Instruments & Components | 1,777,689 | 1,777,689 | — | — | ||||||||||||
Financials | 702,337 | 702,337 | — | — | ||||||||||||
Internet Software & Services | 5,902,765 | 5,902,765 | — | — | ||||||||||||
IT Consulting & Services | 1,444,393 | 1,444,393 | — | — | ||||||||||||
Semiconductors & Semiconductor Equipment | 2,677,052 | 2,677,052 | — | — | ||||||||||||
Software | 6,960,225 | 6,960,225 | — | — | ||||||||||||
Telecommunications Services | 2,694,897 | 2,694,897 | — | — | ||||||||||||
Collateral Held for Securities Loaned | 3,702,075 | 3,702,075 | — | — | ||||||||||||
|
|
|
|
|
|
|
| |||||||||
Total | $ | 37,734,322 | $ | 37,734,322 | $ | — | $ | — | ||||||||
|
|
|
|
|
|
|
| |||||||||
There were no significant transfers between the Levels during the period ended June 29, 2012. Transfers between the levels are identified as of the end of the period.
Investment in Affiliates
Affiliated issuers, as defined under the Investment Company Act of 1940, include those in which the Portfolio’s holdings of an issuer represent 5% or more of the outstanding voting securities of an issuer, or any affiliated mutual fund.
A summary of transactions for the fiscal year to date, in Partner Technology Portfolio, is as follows:
Portfolio | Value December 31, 2011 | Gross Purchases | Gross Sales | Shares Held at June 29, 2012 | Value June 29, 2012 | Income Earned January 1, 2012 - June 29, 2012 | ||||||||||||||||||
Thrivent Financial Securities Lending Trust | $ | 3,695,344 | $ | 13,169,546 | $ | 13,162,815 | 3,702,075 | $ | 3,702,075 | $ | 55,765 | |||||||||||||
Total Value and Income Earned | 3,695,344 | 3,702,075 | 55,765 | |||||||||||||||||||||
The accompanying Notes to Financial Statements are an integral part of this schedule.
82
Table of Contents
Schedule of Investments as of June 29, 2012
(unaudited)
| Shares | Common Stock (96.9%) | Value | ||||||
| Biotechnology (26.1%) | |||||||
| 22,852 | Algeta ASAa | $ | 655,037 | |||||
| 28,309 | Amarin Corporation plc ADRa | 409,348 | ||||||
| 17,982 | ARIAD Pharmaceuticals, Inc.a | 309,470 | ||||||
| 4,300 | Biogen Idec, Inc.a | 620,834 | ||||||
| 14,200 | Gilead Sciences, Inc.a | 728,176 | ||||||
| 18,326 | Incyte Corporationa | 416,000 | ||||||
| 29,800 | InterMune, Inc.a | 356,110 | ||||||
| 15,800 | Ironwood Pharmaceuticals, Inc.a | 217,724 | ||||||
| 11,800 | Onyx Pharmaceuticals, Inc.a | 784,110 | ||||||
| 8,095 | United Therapeutics Corporationa | 399,731 | ||||||
| 11,107 | Vertex Pharmaceuticals, Inc.a | 621,104 | ||||||
|
| |||||||
| Total | 5,517,644 | |||||||
|
| |||||||
| Health Care Equipment (15.9%) | |||||||
| 13,700 | Covidien plc | 732,950 | ||||||
| 16,433 | Dexcom, Inc.a | 212,972 | ||||||
| 6,178 | Edwards Lifesciences Corporationa | 638,187 | ||||||
| 23,100 | EOS Imaging SAa | 111,671 | ||||||
| 12,989 | Given Imaging, Ltd.a | 205,226 | ||||||
| 2,898 | HeartWare International, Inc.a | 257,342 | ||||||
| 11,800 | Hologic, Inc.a | 212,872 | ||||||
| 13,300 | NxStage Medical, Inc.a | 222,908 | ||||||
| 5,100 | St. Jude Medical, Inc. | 203,541 | ||||||
| 2,947 | Thoratec Corporationa | 98,960 | ||||||
| 7,762 | Varian Medical Systems, Inc.a | 471,697 | ||||||
|
| |||||||
| Total | 3,368,326 | |||||||
|
| |||||||
| Health Care Supplies (2.5%) | |||||||
| 15,610 | Align Technology, Inc.a | 522,311 | ||||||
|
| |||||||
| Total | 522,311 | |||||||
|
| |||||||
| Life Sciences Tools & Services (1.0%) | |||||||
| 49,987 | Sequenom, Inc.a | 202,947 | ||||||
|
| |||||||
| Total | 202,947 | |||||||
|
| |||||||
| Pharmaceuticals (51.4%) | |||||||
| 37,300 | Aspen Pharmacare Holdings, Ltd.a | 574,775 | ||||||
| 910,999 | CFR Pharmaceuticals SA | 204,668 | ||||||
| 15,240 | Elan Corporation plc ADRa | 222,351 | ||||||
| 14,100 | Eli Lilly and Company | 605,031 | ||||||
| 57,493 | GlaxoSmithKline plc | 1,305,915 | ||||||
| 51,097 | Hikma Pharmaceuticals plca | 522,414 | ||||||
| 40,600 | Merck & Company, Inc. | 1,695,050 | ||||||
| 29,000 | Mylan, Inc.a | 619,730 | ||||||
| 23,200 | Novartis AG | 1,297,073 | ||||||
| 6,340 | Novo Nordisk A/S ADR | 921,456 | ||||||
| 4,300 | Perrigo Company | 507,099 | ||||||
| 13,596 | Pharmstandard GDRa | 193,743 | ||||||
| 9,510 | Roche Holding AG | 1,642,604 | ||||||
| 5,071 | Sawai Pharmaceutical Company, Ltd.a | 545,546 | ||||||
|
| |||||||
| Total | 10,857,455 | |||||||
|
| |||||||
Total Common Stock (cost $16,861,343) | 20,468,683 | |||||||
|
| |||||||
Total Investments (cost $16,861,343) 96.9% | $ | 20,468,683 | ||||||
|
| |||||||
| Other Assets and Liabilities, Net 3.1% | 649,504 | |||||||
|
| |||||||
| Total Net Assets 100.0% | $ | 21,118,187 | ||||||
|
| |||||||
| a | Non-income producing security. |
Definitions:
| ADR | - | American Depositary Receipt, which are certificates for an underlying foreign security’s shares held by an issuing U.S. depository bank. | ||
| GDR | - | Global Depository Receipts, which are certificates for shares of an underlying foreign security’s shares held by an issuing depository bank from more than one country. |
Unrealized Appreciation (Depreciation)
Gross unrealized appreciation and depreciation of investments, based on cost for federal income tax purposes, were as follows:
Gross unrealized appreciation | $ | 4,132,766 | ||
Gross unrealized depreciation | (542,842 | ) | ||
|
| |||
Net unrealized appreciation (depreciation) | $ | 3,589,924 | ||
Cost for federal income tax purposes | $ | 16,878,759 | ||
The accompanying Notes to Financial Statements are an integral part of this schedule.
83
Table of Contents
Partner Healthcare Portfolio
Schedule of Investments as of June 29, 2012
(unaudited)
Fair Valuation Measurements
The following table is a summary of the inputs used, as of June 29, 2012, in valuing Partner Healthcare Portfolio’s assets carried at fair value.
Investments in Securities | Total | Level 1 | Level 2 | Level 3 | ||||||||||||
Common Stock | ||||||||||||||||
Biotechnology | 5,517,644 | 4,862,607 | 655,037 | — | ||||||||||||
Health Care Equipment | 3,368,326 | 3,256,655 | 111,671 | — | ||||||||||||
Health Care Supplies | 522,311 | 522,311 | — | — | ||||||||||||
Life Sciences Tools & Services | 202,947 | 202,947 | — | — | ||||||||||||
Pharmaceuticals | 10,857,455 | 4,764,460 | 6,092,995 | — | ||||||||||||
|
|
|
|
|
|
|
| |||||||||
Total | $ | 20,468,683 | $ | 13,608,980 | $ | 6,859,703 | $ | — | ||||||||
|
|
|
|
|
|
|
| |||||||||
There were no significant transfers between the Levels during the period ended June 29, 2012. Transfers between the levels are identified as of the end of the period.
The following table summarizes the net realized gains/(losses) and Statement of Operations location, for the period ended June 29, 2012, for Partner Healthcare Portfolio’s investments in financial derivative instruments by primary risk exposure.
Derivatives by risk category | Statement of Operations Location | Realized Gains/ (Losses) recognized in Income | ||||
Foreign Exchange Contracts | ||||||
Forward Contracts | Net realized gains/(losses) on Foreign currency transactions | (2,120 | ) | |||
Total Foreign Exchange Contracts | (2,120 | ) | ||||
|
| |||||
Total | ($ | 2,120 | ) | |||
|
| |||||
The following table presents Partner Healthcare Portfolio’s average volume of derivative activity during the period ended June 29, 2012.
Derivative Risk Category | Forwards (Notional*) | Forwards (Percentage of Average Net Assets) | ||||||
Foreign Exchange Contracts | $ | 12,623 | 0.1 | |||||
| * | Notional amount represents long or short, or both, derivative positions held by the Portfolio. |
The accompanying Notes to Financial Statements are an integral part of this schedule.
84
Table of Contents
Partner Natural Resources Portfolio
Schedule of Investments as of June 29, 2012
(unaudited)
Shares | Common Stock (96.0%) | Value | ||||||
| Coal & Consumable Fuels (5.1%) | |||||||
| 48,514 | Alpha Natural Resources, Inc.a | $ | 422,557 | |||||
| 51,600 | Arch Coal, Inc. | 355,524 | ||||||
| 31,394 | Peabody Energy Corporation | 769,781 | ||||||
|
| |||||||
| Total | 1,547,862 | |||||||
|
| |||||||
| Consumer Staples (8.8%) | |||||||
| 29,903 | Archer-Daniels-Midland Company | 882,737 | ||||||
| 13,710 | Bunge, Ltd. | 860,165 | ||||||
| 18,695 | Ingredion, Inc. | 925,776 | ||||||
|
| |||||||
| Total | 2,668,678 | |||||||
|
| |||||||
| Financials (19.1%) | |||||||
| 8,935 | Boston Properties, Inc. | 968,286 | ||||||
| 15,786 | Equity Residential | 984,415 | ||||||
| 48,700 | Kimco Realty Corporation | 926,761 | ||||||
| 6,594 | Public Storage, Inc. | 952,239 | ||||||
| 6,679 | Simon Property Group, Inc. | 1,039,653 | ||||||
| 10,960 | Vornado Realty Trust | 920,421 | ||||||
|
| |||||||
| Total | 5,791,775 | |||||||
|
| |||||||
| Integrated Oil & Gas (12.3%) | |||||||
| 20,743 | BP plc ADR | 840,921 | ||||||
| 13,729 | Chevron Corporation | 1,448,410 | ||||||
| 9,582 | Occidental Petroleum Corporation | 821,848 | ||||||
| 33,226 | Petroleo Brasileiro SA ADR | 623,652 | ||||||
|
| |||||||
| Total | 3,734,831 | |||||||
|
| |||||||
| Materials (14.5%) | |||||||
| 11,200 | BHP Billiton, Ltd. ADR | 731,360 | ||||||
| 14,000 | Cliffs Natural Resources, Inc. | 690,060 | ||||||
| 28,208 | Freeport-McMoRan Copper & Gold, Inc. | 961,047 | ||||||
| 12,800 | Mosaic Company | 700,928 | ||||||
| 15,200 | Rio Tinto plc ADR | 726,712 | ||||||
| 13,075 | Walter Energy, Inc. | 577,392 | ||||||
|
| |||||||
| Total | 4,387,499 | |||||||
|
| |||||||
| Oil & Gas Drilling (5.5%) | |||||||
| 18,404 | Ensco plc | 864,436 | ||||||
| 55,500 | Nabors Industries, Ltd.a | 799,200 | ||||||
|
| |||||||
| Total | 1,663,636 | |||||||
|
| |||||||
| Oil & Gas Equipment & Services (12.8%) | |||||||
| 15,191 | Baker Hughes, Inc. | 624,350 | ||||||
| 13,701 | Dril-Quip, Inc.a | 898,649 | ||||||
| 11,800 | National Oilwell Varco, Inc. | 760,392 | ||||||
| 13,322 | Oil States International, Inc.a | 881,916 | ||||||
| 56,800 | Weatherford International, Ltd.a | 717,384 | ||||||
|
| |||||||
| Total | 3,882,691 | |||||||
|
| |||||||
| Oil & Gas Exploration & Production (14.6%) | |||||||
| 8,888 | Apache Corporation | 781,166 | ||||||
| 9,100 | EOG Resources, Inc. | 820,001 | ||||||
| 18,100 | Newfield Exploration Companya | 530,511 | ||||||
| 30,699 | Plains Exploration & Production Companya | 1,079,991 | ||||||
| 32,100 | Swift Energy Companya | 597,381 | ||||||
| 27,300 | Ultra Petroleum Corporationa | 629,811 | ||||||
|
| |||||||
| Total | 4,438,861 | |||||||
|
| |||||||
| Oil & Gas Refining & Marketing (3.3%) | |||||||
| 40,800 | Valero Energy Corporation | 985,320 | ||||||
|
| |||||||
| Total | 985,320 | |||||||
|
| |||||||
Total Common Stock (cost $36,347,175) | 29,101,153 | |||||||
|
| |||||||
Total Investments (cost $36,347,175) 96.0% | $ | 29,101,153 | ||||||
|
| |||||||
| Other Assets and Liabilities, Net 4.0% | 1,206,076 | |||||||
|
| |||||||
| Total Net Assets 100.0% | $ | 30,307,229 | ||||||
|
| |||||||
| a | Non-income producing security. |
Definitions:
| ADR | - | American Depositary Receipt, which are certificates for an underlying foreign security’s shares held by an issuing U.S. depository bank. |
Unrealized Appreciation (Depreciation)
Gross unrealized appreciation and depreciation of investments, based on cost for federal income tax purposes, were as follows:
Gross unrealized appreciation | $ | 1,196,958 | ||
Gross unrealized depreciation | (8,442,980 | ) | ||
|
| |||
Net unrealized appreciation (depreciation) | $ | (7,246,022 | ) | |
Cost for federal income tax purposes | $ | 36,347,175 | ||
The accompanying Notes to Financial Statements are an integral part of this schedule.
85
Table of Contents
Partner Natural Resources Portfolio
Schedule of Investments as of June 29, 2012
(unaudited)
Fair Valuation Measurements
The following table is a summary of the inputs used, as of June 29, 2012, in valuing Partner Natural Resources Portfolio’s assets carried at fair value.
Investments in Securities | Total | Level 1 | Level 2 | Level 3 | ||||||||||||
Common Stock | ||||||||||||||||
Coal & Consumable Fuels | 1,547,862 | 1,547,862 | ��� | — | ||||||||||||
Consumer Staples | 2,668,678 | 2,668,678 | — | — | ||||||||||||
Financials | 5,791,775 | 5,791,775 | — | — | ||||||||||||
Integrated Oil & Gas | 3,734,831 | 3,734,831 | — | — | ||||||||||||
Materials | 4,387,499 | 4,387,499 | — | — | ||||||||||||
Oil & Gas Drilling | 1,663,636 | 1,663,636 | — | — | ||||||||||||
Oil & Gas Equipment & Services | 3,882,691 | 3,882,691 | — | — | ||||||||||||
Oil & Gas Exploration & Production | 4,438,861 | 4,438,861 | — | — | ||||||||||||
Oil & Gas Refining & Marketing | 985,320 | 985,320 | — | — | ||||||||||||
|
|
|
|
|
|
|
| |||||||||
Total | $ | 29,101,153 | $ | 29,101,153 | $ | — | $ | — | ||||||||
|
|
|
|
|
|
|
| |||||||||
There were no significant transfers between the Levels during the period ended June 29, 2012. Transfers between the levels are identified as of the end of the period.
The accompanying Notes to Financial Statements are an integral part of this schedule.
86
Table of Contents
Partner Emerging Markets Portfolio
Schedule of Investments as of June 29, 2012
(unaudited)
Shares | Common Stock (97.7%) | Value | ||||||
| Brazil (16.7%) | |||||||
| 98,072 | Banco Bradesco SA ADR | $ | 1,458,331 | |||||
| 17,521 | Lojas Renner SA | 489,820 | ||||||
| 22,000 | Multiplan Empreendimentos Imobiliarios SA | 536,719 | ||||||
| 65,500 | Petroleo Brasileiro SA PREF ADRa | 1,188,170 | ||||||
| 56,500 | Souza Cruz SA | 820,846 | ||||||
| 59,400 | Ultrapar Participacoes SA | 1,350,955 | ||||||
| 89,947 | Vale SA SP PREF ADR | 1,754,866 | ||||||
|
| |||||||
| Total | 7,599,707 | |||||||
|
| |||||||
| Chile (1.7%) | |||||||
| 10,200 | Banco Santander Chile SA ADR | 790,398 | ||||||
|
| |||||||
| Total | 790,398 | |||||||
|
| |||||||
| China (2.7%) | |||||||
| 961,000 | PetroChina Company, Ltd. | 1,243,775 | ||||||
|
| |||||||
| Total | 1,243,775 | |||||||
|
| |||||||
| Hong Kong (11.4%) | |||||||
| 263,000 | AIA Group, Ltd. | 908,411 | ||||||
| 176,000 | China Mobile, Ltd. | 1,932,025 | ||||||
| 153,000 | Hang Lung Group, Ltd. | 946,019 | ||||||
| 43,000 | Hang Lung Properties, Ltd. | 147,085 | ||||||
| 82,000 | Swire Pacific, Ltd., Class A | 953,723 | ||||||
| 60,000 | Swire Pacific, Ltd., Class B | 138,475 | ||||||
| 59,500 | Swire Properties, Ltd. | 179,182 | ||||||
|
| |||||||
| Total | 5,204,920 | |||||||
|
| |||||||
| Hungary (1.9%) | |||||||
| 5,371 | Richter Gedeon Nyrt | 886,410 | ||||||
|
| |||||||
| Total | 886,410 | |||||||
|
| |||||||
| India (12.0%) | |||||||
| 53,390 | Bharti Airtel, Ltd. | 293,925 | ||||||
| 9,500 | GlaxoSmithKline Pharmaceuticals, Ltd. | 344,842 | ||||||
| 2,200 | Grasim Industries, Ltd. | 104,366 | ||||||
| 4,350 | Grasim Industries, Ltd. GDR | 207,922 | ||||||
| 21,000 | Hero Motocorp, Ltd. | 814,767 | ||||||
| 58,000 | Hindustan Unilever, Ltd. | 473,629 | ||||||
| 90,050 | Housing Development Finance Corporation | 1,061,884 | ||||||
| 30,000 | ICICI Bank, Ltd. | 487,295 | ||||||
| 5,000 | ICICI Bank, Ltd. ADR | 162,050 | ||||||
| 21,000 | Infosys, Ltd. | 952,039 | ||||||
| 3,900 | Infosys, Ltd. ADR | 175,734 | ||||||
| 12,947 | Ultra Tech Cement, Ltd. | 352,667 | ||||||
| 2,484 | Ultra Tech Cement, Ltd. GDR | 67,466 | ||||||
|
| |||||||
| Total | 5,498,586 | |||||||
|
| |||||||
| Indonesia (2.9%) | |||||||
| 1,800,000 | PT Astra International Tbk | 1,326,958 | ||||||
|
| |||||||
| Total | 1,326,958 | |||||||
|
| |||||||
| Luxembourg (2.2%) | |||||||
| 28,465 | Tenaris SA ADRa | 995,421 | ||||||
|
| |||||||
| Total | 995,421 | |||||||
|
| |||||||
| Malaysia (2.6%) | |||||||
| 320,000 | CIMB Group Holdings Berhad | 766,841 | ||||||
| 96,500 | Public Bank Berhad | 419,419 | ||||||
|
| |||||||
| Total | 1,186,260 | |||||||
|
| |||||||
| Mexico (8.0%) | |||||||
| 16,400 | Fomento Economico Mexicano SAB de CV ADR | 1,463,700 | ||||||
| 6,800 | Grupo Aeroportuario del Sureste SAB de CV ADRa | 530,876 | ||||||
| 251,128 | Grupo Financiero Banorte SAB de CV ADR | 1,297,838 | ||||||
| 120,300 | Organizacion Soriana SAB de CVb | 377,862 | ||||||
|
| |||||||
| Total | 3,670,276 | |||||||
|
| |||||||
| Philippines (2.7%) | |||||||
| 5,000 | Ayala Corporation | 55,993 | ||||||
| 1,209,700 | Ayala Land, Inc. | 623,888 | ||||||
| 312,897 | Bank of the Philippine Islands | 556,345 | ||||||
|
| |||||||
| Total | 1,236,226 | |||||||
|
| |||||||
| Poland (1.8%) | |||||||
| 18,372 | Bank Pekao SA | 838,011 | ||||||
|
| |||||||
| Total | 838,011 | |||||||
|
| |||||||
| Russia (2.9%) | |||||||
| 23,400 | Lukoil ADR | 1,311,296 | ||||||
|
| |||||||
| Total | 1,311,296 | |||||||
|
| |||||||
| South Africa (3.8%) | |||||||
| 30,047 | Massmart Holdings, Ltd. | 622,130 | ||||||
| 99,800 | Truworths International, Ltd. | 1,095,056 | ||||||
|
| |||||||
| Total | 1,717,186 | |||||||
|
| |||||||
| South Korea (5.2%) | |||||||
| 1,670 | E-Mart Company, Ltd. | 366,556 | ||||||
| 2,250 | Samsung Electronics Company, Ltd. | 1,485,341 | ||||||
| 1,570 | Samsung Electronics Company, Ltd. GDR | 514,682 | ||||||
|
| |||||||
| Total | 2,366,579 | |||||||
|
| |||||||
| Taiwan (5.0%) | |||||||
| 168,400 | Taiwan Mobile Company, Ltd. | 556,894 | ||||||
| 635,499 | Taiwan Semiconductor Manufacturing Company, Ltd.b | 1,739,657 | ||||||
|
| |||||||
| Total | 2,296,551 | |||||||
|
| |||||||
| Thailand (5.0%) | |||||||
| 156,000 | PTT Exploration & Production pcl | 831,484 | ||||||
| 64,400 | Siam Cement pcl | 738,854 | ||||||
| 148,600 | Siam Commercial Bank pcl | 695,408 | ||||||
|
| |||||||
| Total | 2,265,746 | |||||||
|
| |||||||
| Turkey (5.4%) | |||||||
| 310,833 | Akbank TAS | 1,139,572 | ||||||
| 17,518 | BIM Birlesik Magazalar AS | 723,166 | ||||||
| 151,000 | Turkiye Garanti Bankasi AS | 594,406 | ||||||
|
| |||||||
| Total | 2,457,144 | |||||||
|
| |||||||
| United Kingdom (3.8%) | |||||||
| 17,139 | SABMiller plc | 693,692 | ||||||
The accompanying Notes to Financial Statements are an integral part of this schedule.
87
Table of Contents
Partner Emerging Markets Portfolio
Schedule of Investments as of June 29, 2012
(unaudited)
| Shares | Common Stock (97.7%) | Value | ||||||
| United Kingdom (3.8%) - continued | |||||||
| 47,950 | Standard Chartered plc | $ | 1,041,630 | |||||
|
| |||||||
| Total | 1,735,322 | |||||||
|
| |||||||
Total Common Stock (cost $40,194,564) | 44,626,772 | |||||||
|
| |||||||
Collateral Held for Securities Loaned (3.6%) | ||||||||
| 1,650,131 | Thrivent Financial Securities Lending Trust | 1,650,131 | ||||||
|
| |||||||
Total Collateral Held for Securities Loaned (cost $1,650,131) | 1,650,131 | |||||||
|
| |||||||
Total Investments (cost $41,844,695) 101.3% | $ | 46,276,903 | ||||||
|
| |||||||
| Other Assets and Liabilities, Net (1.3%) | (585,606 | ) | ||||||
|
| |||||||
| Total Net Assets 100.0% | $ | 45,691,297 | ||||||
|
| |||||||
| a | All or a portion of the security is on loan. |
| b | Non-income producing security. |
Definitions:
| ADR | - | American Depositary Receipt, which are certificates for an underlying foreign security’s shares held by an issuing U.S. depository bank. | ||
| GDR | - | Global Depository Receipts, which are certificates for shares of an underlying foreign security’s shares held by an issuing depository bank from more than one country. |
Unrealized Appreciation (Depreciation)
Gross unrealized appreciation and depreciation of investments, based on cost for federal income tax purposes, were as follows:
Gross unrealized appreciation | $ | 7,599,213 | ||
Gross unrealized depreciation | (3,202,287 | ) | ||
|
| |||
Net unrealized appreciation (depreciation) | $ | 4,396,926 | ||
Cost for federal income tax purposes | $ | 41,879,977 | ||
Fair Valuation Measurements
The following table is a summary of the inputs used, as of June 29, 2012, in valuing Partner Emerging Markets Portfolio’s assets carried at fair value.
Investments in Securities | Total | Level 1 | Level 2 | Level 3 | ||||||||||||
Common Stock | ||||||||||||||||
Consumer Discretionary | 4,471,019 | — | 4,471,019 | — | ||||||||||||
Consumer Staples | 4,797,163 | 1,463,700 | 3,333,463 | — | ||||||||||||
Energy | 6,921,101 | 3,494,887 | 3,426,214 | — | ||||||||||||
Financials | 14,170,006 | 2,410,779 | 11,759,227 | — | ||||||||||||
Health Care | 1,231,252 | — | 1,231,252 | — | ||||||||||||
Industrials | 3,631,068 | 598,342 | 3,032,726 | — | ||||||||||||
Information Technology | 4,867,453 | 690,416 | 4,177,037 | — | ||||||||||||
Materials | 1,754,866 | 1,754,866 | — | — | ||||||||||||
Telecommunications Services | 2,782,844 | — | 2,782,844 | — | ||||||||||||
Collateral Held for Securities Loaned | 1,650,131 | 1,650,131 | — | — | ||||||||||||
|
|
|
|
|
|
|
| |||||||||
Total | $ | 46,276,903 | $ | 12,063,121 | $ | 34,213,782 | $ | — | ||||||||
|
|
|
|
|
|
|
| |||||||||
There were no significant transfers between the Levels during the period ended June 29, 2012. Transfers between the levels are identified as of the end of the period.
The accompanying Notes to Financial Statements are an integral part of this schedule.
88
Table of Contents
Partner Emerging Markets Portfolio
Schedule of Investments as of June 29, 2012
(unaudited)
The following table summarizes the net realized gains/(losses) and Statement of Operations location, for the period ended June 29, 2012, for Partner Emerging Markets Portfolio’s investments in financial derivative instruments by primary risk exposure.
Derivatives by risk category | Statement of Operations Location | Realized Gains/ (Losses) recognized in Income | ||||
Foreign Exchange Contracts | ||||||
Forward Contracts | Net realized gains/(losses) on Foreign currency transactions | (2,059 | ) | |||
Total Foreign Exchange Contracts | (2,059 | ) | ||||
|
| |||||
Total | ($ | 2,059 | ) | |||
|
| |||||
The following table summarizes the change in net unrealized appreciation/(depreciation) and Statement of Operations location, for the period ended June 29, 2012, for Partner Emerging Markets Portfolio’s investments in financial derivative instruments by primary risk exposure.
Derivatives by risk category | Statement of Operations Location | Change in unrealized appreciation/(depreciation) recognized in Income | ||||
Foreign Exchange Contracts | ||||||
Forward Contracts | Change in net unrealized appreciation/(depreciation) on Foreign currency forward contracts | (176 | ) | |||
Total Foreign Exchange Contracts | (176 | ) | ||||
|
| |||||
Total | ($ | 176 | ) | |||
|
| |||||
The following table presents Partner Emerging Markets Portfolio’s average volume of derivative activity during the period ended June 29, 2012.
Derivative Risk Category | Forwards (Notional*) | Forwards (Percentage of Average Net Assets) | ||||||
Foreign Exchange Contracts | $ | 27,775 | 0.1 | |||||
| * | Notional amount represents long or short, or both, derivative positions held by the Portfolio. |
Investment in Affiliates
Affiliated issuers, as defined under the Investment Company Act of 1940, include those in which the Portfolio’s holdings of an issuer represent 5% or more of the outstanding voting securities of an issuer, or any affiliated mutual fund.
A summary of transactions for the fiscal year to date, in Partner Emerging Markets Portfolio, is as follows:
Portfolio | Value December 31, 2011 | Gross Purchases | Gross Sales | Shares Held at June 29, 2012 | Value June 29, 2012 | Income Earned January 1, 2012 - June 29, 2012 | ||||||||||||||||||
Thrivent Financial Securities Lending Trust | $ | — | $ | 2,521,805 | $ | 871,674 | 1,650,131 | $ | 1,650,131 | $ | 27 | |||||||||||||
Total Value and Income Earned | — | 1,650,131 | 27 | |||||||||||||||||||||
The accompanying Notes to Financial Statements are an integral part of this schedule.
89
Table of Contents
Real Estate Securities Portfolio
Schedule of Investments as of June 29, 2012
(unaudited)
Shares | Common Stock (98.7%) | Value | ||||
Diversified Real Estate Activities (0.1%) | ||||||
| 5,019 | Brookfield Asset Management, Inc. | $ | 166,129 | |||
|
| |||||
| Total | 166,129 | |||||
|
| |||||
| Diversified REITS (5.9%) | ||||||
| 13,692 | American Assets Trust, Inc. | 332,031 | ||||
| 12,380 | American Realty Capital Trust, Inc. | 135,190 | ||||
| 28,057 | Colonial Properties Trust | 621,182 | ||||
| 62,670 | Duke Realty Corporation | 917,489 | ||||
| 27,243 | Liberty Property Trust | 1,003,632 | ||||
| 5,270 | PS Business Parks, Inc. | 356,884 | ||||
| 2,000 | Select Income REITa | 47,520 | ||||
| 39,350 | Vornado Realty Trust | 3,304,613 | ||||
| 10,515 | Washington Real Estate Investment Trust | 299,152 | ||||
|
| |||||
| Total | 7,017,693 | |||||
|
| |||||
| Hotels, Resorts & Cruise Lines (0.9%) | ||||||
| 1,908 | Gaylord Entertainment Companya | 73,572 | ||||
| 4,000 | Hyatt Hotels Corporationa | 148,640 | ||||
| 3,500 | Marriott International, Inc. | 137,200 | ||||
| 13,626 | Starwood Hotels & Resorts Worldwide, Inc. | 722,723 | ||||
|
| |||||
| Total | 1,082,135 | |||||
|
| |||||
| Industrial REITS (4.5%) | ||||||
| 59,616 | DCT Industrial Trust, Inc. | 375,581 | ||||
| 8,624 | EastGroup Properties, Inc. | 459,659 | ||||
| 14,246 | First Industrial Realty Trust, Inc.a | 179,784 | ||||
| 11,126 | First Potomac Realty Trust | 130,953 | ||||
| 125,273 | Prologis, Inc. | 4,162,822 | ||||
| 5,450 | STAG Industrial, Inc. | 79,461 | ||||
|
| |||||
| Total | 5,388,260 | |||||
|
| |||||
| Mortgage REITS (0.1%) | ||||||
| 3,584 | Colony Financial, Inc. | 62,003 | ||||
| 4,040 | CreXus Investment Corporation | 41,087 | ||||
|
| |||||
| Total | 103,090 | |||||
|
| |||||
| Office REITS (15.3%) | ||||||
| 16,462 | Alexandria Real Estate Equities, Inc. | 1,197,117 | ||||
| 30,662 | BioMed Realty Trust, Inc. | 572,766 | ||||
| 47,924 | Boston Properties, Inc. | 5,193,524 | ||||
| 44,380 | Brandywine Realty Trust | 547,649 | ||||
| 9,455 | CommonWealth REIT | 180,780 | ||||
| 5,646 | Coresite Realty Corporation | 145,780 | ||||
| 9,807 | Corporate Office Properties Trust | 230,562 | ||||
| 33,668 | Digital Realty Trust, Inc. | 2,527,457 | ||||
| 44,757 | Douglas Emmett, Inc. | 1,033,887 | ||||
| 26,043 | DuPont Fabros Technology, Inc. | 743,788 | ||||
| 4,879 | Government Properties Income Trust | 110,363 | ||||
| 19,612 | Highwoods Properties, Inc. | 659,944 | ||||
| 17,949 | Hudson Pacific Properties, Inc. | 312,492 | ||||
| 23,263 | Kilroy Realty Corporation | 1,126,162 | ||||
| 17,555 | Lexington Realty Trust | 148,691 | ||||
| 21,305 | Mack-Cali Realty Corporation | 619,336 | ||||
| 16,963 | Piedmont Office Realty Trust, Inc. | 291,933 | ||||
| 33,277 | SL Green Realty Corporation | 2,670,146 | ||||
|
| |||||
| Total | 18,312,377 | |||||
|
| |||||
| Real Estate Operating Companies (0.7%) | ||||||
| 32,357 | Brookfield Office Properties, Inc. | 563,659 | ||||
| 20,743 | Forest City Enterprises, Inc.a | 302,848 | ||||
|
| |||||
| Total | 866,507 | |||||
|
| |||||
| Real Estate Services (0.1%) | ||||||
| 5,000 | CBRE Group, Inc.a | 81,800 | ||||
|
| |||||
| Total | 81,800 | |||||
|
| |||||
| Residential REITS (19.2%) | ||||||
| 16,103 | American Campus Communities, Inc. | 724,313 | ||||
| 73,684 | Apartment Investment & Management Company | 1,991,679 | ||||
| 14,159 | Associated Estates Realty Corporation | 211,677 | ||||
| 29,749 | AvalonBay Communities, Inc. | 4,208,889 | ||||
| 22,257 | BRE Properties, Inc. | 1,113,295 | ||||
| 30,851 | Camden Property Trust | 2,087,687 | ||||
| 16,676 | Campus Crest Communities, Inc. | 173,264 | ||||
| 28,314 | Education Realty Trust, Inc. | 313,719 | ||||
| 14,539 | Equity Lifestyle Properties, Inc. | 1,002,755 | ||||
| 93,140 | Equity Residential | 5,808,210 | ||||
| 10,699 | Essex Property Trust, Inc. | 1,646,790 | ||||
| 10,887 | Home Properties, Inc. | 668,026 | ||||
| 9,334 | Mid-America Apartment Communities, Inc. | 636,952 | ||||
| 15,335 | Post Properties, Inc. | 750,648 | ||||
| 4,717 | Sun Communities, Inc. | 208,680 | ||||
| 58,094 | UDR, Inc. | 1,501,149 | ||||
|
| |||||
| Total | 23,047,733 | |||||
|
| |||||
| Retail REITS (25.7%) | ||||||
| 13,863 | Acadia Realty Trust | 321,344 | ||||
| 38,739 | CBL & Associates Properties, Inc. | 756,960 | ||||
| 112,056 | DDR Corporation | 1,640,500 | ||||
| 12,417 | Equity One, Inc. | 263,240 | ||||
| 7,032 | Excel Trust, Inc. | 84,103 | ||||
| 17,195 | Federal Realty Investment Trust | 1,789,828 | ||||
| 104,605 | General Growth Properties, Inc. | 1,892,305 | ||||
| 55,924 | Glimcher Realty Trust | 571,543 | ||||
| 13,832 | Inland Real Estate Corporation | 115,912 | ||||
| 92,287 | Kimco Realty Corporation | 1,756,222 | ||||
| 19,197 | Kite Realty Group Trust | 95,793 | ||||
| 40,166 | Macerich Company | 2,371,802 | ||||
| 21,186 | National Retail Properties, Inc. | 599,352 | ||||
| 5,526 | Pennsylvania Real Estate Investment Trust | 82,780 | ||||
| 20,348 | Ramco-Gershenson Properties Trust | 255,774 | ||||
| 1,782 | Realty Income Corporation | 74,434 | ||||
| 23,692 | Regency Centers Corporation | 1,127,029 | ||||
| 9,222 | Retail Opportunity Investments Corporation | 111,217 | ||||
| 27,900 | Retail Properties of America, Inc. | 271,188 | ||||
| 4,073 | Rouse Properties, Inc.a | 55,189 | ||||
| 2,138 | Saul Centers, Inc. | 91,656 | ||||
| 89,061 | Simon Property Group, Inc. | 13,863,235 | ||||
The accompanying Notes to Financial Statements are an integral part of this schedule.
90
Table of Contents
Real Estate Securities Portfolio
Schedule of Investments as of June 29, 2012
(unaudited)
| Shares | Common Stock (98.7%) | Value | ||||||
| Retail REITS (25.7%) - continued | |||||||
| 27,863 | Tanger Factory Outlet Centers, Inc. | $ | 893,009 | |||||
| 14,841 | Taubman Centers, Inc. | 1,145,132 | ||||||
| 23,142 | Weingarten Realty Investors | 609,560 | ||||||
|
| |||||||
| Total | 30,839,107 | |||||||
|
| |||||||
| Specialized REITS (26.2%) | ||||||||
| 12,100 | American Tower Corporation | 845,911 | ||||||
| 26,278 | Ashford Hospitality Trust, Inc. | 221,524 | ||||||
| 6,227 | Chatham Lodging Trust | 88,922 | ||||||
| 9,233 | Chesapeake Lodging Trust | 158,992 | ||||||
| 44,172 | CubeSmart | 515,487 | ||||||
| 50,495 | DiamondRock Hospitality Company | 515,049 | ||||||
| 13,683 | Entertainment Properties Trust | 562,508 | ||||||
| 30,420 | Extra Space Storage, Inc. | 930,852 | ||||||
| 20,843 | FelCor Lodging Trust, Inc.a | 97,962 | ||||||
| 122,244 | HCP, Inc. | 5,397,073 | ||||||
| 43,494 | Health Care REIT, Inc. | 2,535,700 | ||||||
| 16,712 | Healthcare Realty Trust, Inc. | 398,414 | ||||||
| 55,647 | Hersha Hospitality Trust | 293,816 | ||||||
| 15,749 | Hospitality Properties Trust | 390,103 | ||||||
| 212,440 | Host Hotels & Resorts, Inc. | 3,360,801 | ||||||
| 24,640 | LaSalle Hotel Properties | 718,010 | ||||||
| 4,472 | LTC Properties, Inc. | 162,244 | ||||||
| 23,864 | Medical Properties Trust, Inc. | 229,572 | ||||||
| 19,461 | Omega Healthcare Investors, Inc. | 437,872 | ||||||
| 17,008 | Pebblebrook Hotel Trust | 396,456 | ||||||
| 5,465 | Plum Creek Timber Company, Inc. | 216,961 | ||||||
| 36,383 | Public Storage, Inc. | 5,254,069 | ||||||
| 10,494 | Rayonier, Inc. REIT | 471,181 | ||||||
| 23,180 | RLJ Lodging Trust | 420,253 | ||||||
| 5,792 | Sabra Healthcare REIT, Inc. | 99,101 | ||||||
| 22,066 | Senior Housing Property Trust | 492,513 | ||||||
| 3,099 | Sovran Self Storage, Inc. | 155,229 | ||||||
| 69,274 | Strategic Hotel Capital, Inc.a | 447,510 | ||||||
| 6,457 | Summit Hotel Properties, Inc. | 54,045 | ||||||
| 43,274 | Sunstone Hotel Investors, Inc.a | 475,581 | ||||||
| 79,820 | Ventas, Inc. | 5,038,238 | ||||||
|
| |||||||
| Total | 31,381,949 | |||||||
|
| |||||||
Total Common Stock (cost $126,729,773) | 118,286,780 | |||||||
|
| |||||||
Total Investments (cost $126,729,773) 98.7% | $ | 118,286,780 | ||||||
|
| |||||||
Other Assets and Liabilities, Net 1.3% | 1,573,402 | |||||||
|
| |||||||
| Total Net Assets 100.0% | $ | 119,860,182 | ||||||
|
| |||||||
| a | Non-income producing security. |
Definitions:
| REIT | - | Real Estate Investment Trust is a company that buys, develops, manages and/or sells real estate assets. |
Unrealized Appreciation (Depreciation)
Gross unrealized appreciation and depreciation of investments, based on cost for federal income tax purposes, were as follows:
Gross unrealized appreciation | $ | 16,925,518 | ||
Gross unrealized depreciation | (25,399,265 | ) | ||
|
| |||
Net unrealized appreciation (depreciation) | $ | (8,473,747 | ) | |
Cost for federal income tax purposes | $ | 126,760,527 | ||
The accompanying Notes to Financial Statements are an integral part of this schedule.
91
Table of Contents
Real Estate Securities Portfolio
Schedule of Investments as of June 29, 2012
(unaudited)
Fair Valuation Measurements
The following table is a summary of the inputs used, as of June 29, 2012, in valuing Real Estate Securities Portfolio’s assets carried at fair value.
Investments in Securities | Total | Level 1 | Level 2 | Level 3 | ||||||||||||
Common Stock | ||||||||||||||||
Diversified Real Estate Activities | 166,129 | 166,129 | — | — | ||||||||||||
Diversified REITS | 7,017,693 | 7,017,693 | — | — | ||||||||||||
Hotels, Resorts & Cruise Lines | 1,082,135 | 1,082,135 | — | — | ||||||||||||
Industrial REITS | 5,388,260 | 5,388,260 | — | — | ||||||||||||
Mortgage REITS | 103,090 | 103,090 | — | — | ||||||||||||
Office REITS | 18,312,377 | 18,312,377 | — | — | ||||||||||||
Real Estate Operating Companies | 866,507 | 866,507 | — | — | ||||||||||||
Real Estate Services | 81,800 | 81,800 | — | — | ||||||||||||
Residential REITS | 23,047,733 | 23,047,733 | — | — | ||||||||||||
Retail REITS | 30,839,107 | 30,839,107 | — | — | ||||||||||||
Specialized REITS | 31,381,949 | 31,381,949 | — | — | ||||||||||||
|
|
|
|
|
|
|
| |||||||||
Total | $ | 118,286,780 | $ | 118,286,780 | $ | — | $ | — | ||||||||
|
|
|
|
|
|
|
| |||||||||
There were no significant transfers between the Levels during the period ended June 29, 2012. Transfers between the levels are identified as of the end of the period.
The accompanying Notes to Financial Statements are an integral part of this schedule.
92
Table of Contents
Schedule of Investments as of June 29, 2012
(unaudited)
| Shares | Common Stock (95.1%) | Value | ||||||
| Alternative Carriers (3.7%) | |||||||
| 4,950 | Lumos Networks Corporation | $ | 46,777 | |||||
| 16,807 | TW Telecom, Inc.a | 431,268 | ||||||
|
| |||||||
| Total | 478,045 | |||||||
|
| |||||||
| Consumer Discretionary (6.2%) | |||||||
| 13,255 | Comcast Corporation | 423,763 | ||||||
| 4,633 | Time Warner Cable, Inc. | 380,369 | ||||||
|
| |||||||
| Total | 804,132 | |||||||
|
| |||||||
| Electric Utilities (31.6%) | |||||||
| 4,700 | American Electric Power Company, Inc. | 187,530 | ||||||
| 9,275 | Cleco Corporation | 387,973 | ||||||
| 4,356 | Edison International, Inc. | 201,247 | ||||||
| 13,728 | Exelon Corporation | 516,448 | ||||||
| 10,200 | FirstEnergy Corporation | 501,738 | ||||||
| 12,100 | IDACORP, Inc. | 509,168 | ||||||
| 4,717 | ITC Holdings Corporation | 325,049 | ||||||
| 2,916 | NextEra Energy, Inc. | 200,650 | ||||||
| 28,740 | NV Energy, Inc. | 505,249 | ||||||
| 28,784 | PNM Resources, Inc. | 562,439 | ||||||
| 6,100 | PPL Corporation | 169,641 | ||||||
|
| |||||||
| Total | 4,067,132 | |||||||
|
| |||||||
| Gas Utilities (6.5%) | |||||||
| 9,000 | Laclede Group, Inc. | 358,290 | ||||||
| 10,953 | Southwest Gas Corporation | 478,098 | ||||||
|
| |||||||
| Total | 836,388 | |||||||
|
| |||||||
| Independent Power Producers & Energy Traders (7.6%) | |||||||
| 12,501 | AES Corporationa | 160,388 | ||||||
| 27,975 | Calpine Corporationa | 461,867 | ||||||
| 20,800 | NRG Energy, Inc.a | 361,088 | ||||||
|
| |||||||
| Total | 983,343 | |||||||
|
| |||||||
| Multi-Utilities (31.9%) | |||||||
| 10,878 | Alliant Energy Corporation | 495,710 | ||||||
| 13,959 | Avista Corporation | 372,705 | ||||||
| 18,100 | CenterPoint Energy, Inc. | 374,127 | ||||||
| 21,983 | CMS Energy Corporation | 516,601 | ||||||
| 3,515 | Dominion Resources, Inc. | 189,810 | ||||||
| 6,669 | DTE Energy Company | 395,672 | ||||||
| 19,300 | NiSource, Inc. | 477,675 | ||||||
| 6,521 | OGE Energy Corporation | 337,723 | ||||||
| 8,100 | PG&E Corporation | 366,687 | ||||||
| 5,200 | Public Service Enterprise Group, Inc. | 169,000 | ||||||
| 2,900 | Sempra Energy | 199,752 | ||||||
| 7,378 | Xcel Energy, Inc. | 209,609 | ||||||
|
| |||||||
| Total | 4,105,071 | |||||||
|
| |||||||
| Water Utilities (3.1%) | |||||||
| 11,487 | American Water Works Company, Inc. | 393,774 | ||||||
|
| |||||||
| Total | 393,774 | |||||||
|
| |||||||
| Wireless Telecommunication Services (4.5%) | |||||||
| 4,950 | NTELOS Holdings Corporation | 93,307 | ||||||
| 8,514 | SBA Communications Corporationa | 485,724 | ||||||
|
| |||||||
| Total | 579,031 | |||||||
|
| |||||||
Total Common Stock (cost $10,839,478) | 12,246,916 | |||||||
|
| |||||||
Total Investments (cost $10,839,478) 95.1% | $ | 12,246,916 | ||||||
|
| |||||||
| Other Assets and Liabilities, Net 4.9% | 629,070 | |||||||
|
| |||||||
| Total Net Assets 100.0% | $ | 12,875,986 | ||||||
|
| |||||||
| a | Non-income producing security. |
Unrealized Appreciation (Depreciation)
Gross unrealized appreciation and depreciation of investments, based on cost for federal income tax purposes, were as follows:
Gross unrealized appreciation | $ | 1,551,250 | ||
Gross unrealized depreciation | (143,812 | ) | ||
|
| |||
Net unrealized appreciation (depreciation) | $ | 1,407,438 | ||
Cost for federal income tax purposes | $ | 10,839,478 | ||
The accompanying Notes to Financial Statements are an integral part of this schedule.
93
Table of Contents
Partner Utilities Portfolio
Schedule of Investments as of June 29, 2012
(unaudited)
Fair Valuation Measurements
The following table is a summary of the inputs used, as of June 29, 2012, in valuing Partner Utilities Portfolio’s assets carried at fair value.
Investments in Securities | Total | Level 1 | Level 2 | Level 3 | ||||||||||||
Common Stock | ||||||||||||||||
Alternative Carriers | 478,045 | 478,045 | — | — | ||||||||||||
Consumer Discretionary | 804,132 | 804,132 | — | — | ||||||||||||
Electric Utilities | 4,067,132 | 4,067,132 | — | — | ||||||||||||
Gas Utilities | 836,388 | 836,388 | — | — | ||||||||||||
Independent Power Producers & Energy Traders | 983,343 | 983,343 | — | — | ||||||||||||
Multi-Utilities | 4,105,071 | 4,105,071 | — | — | ||||||||||||
Water Utilities | 393,774 | 393,774 | — | — | ||||||||||||
Wireless Telecommunication Services | 579,031 | 579,031 | — | — | ||||||||||||
|
|
|
|
|
|
|
| |||||||||
Total | $ | 12,246,916 | $ | 12,246,916 | $ | — | $ | — | ||||||||
|
|
|
|
|
|
|
| |||||||||
There were no significant transfers between the Levels during the period ended June 29, 2012. Transfers between the levels are identified as of the end of the period.
The accompanying Notes to Financial Statements are an integral part of this schedule.
94
Table of Contents
Partner Small Cap Growth Portfolio
Schedule of Investments as of June 29, 2012
(unaudited)
Shares | Common Stock (96.1%) | Value | ||||
Consumer Discretionary (16.2%) | ||||||
25,890 | Aeropostale, Inc.a | $ | 461,619 | |||
15,390 | Ann, Inc.a | 392,291 | ||||
13,030 | Arctic Cat, Inc.a | 476,377 | ||||
38,670 | BJ’s Restaurants, Inc.a | 1,469,460 | ||||
71,962 | Bravo Brio Restaurant Group, Inc.a | 1,283,082 | ||||
65,950 | Bridgepoint Education, Inc.a,b | 1,437,710 | ||||
78,330 | Brunswick Corporation | 1,740,493 | ||||
3,190 | Buffalo Wild Wings, Inc.a | 276,382 | ||||
9,870 | Children’s Place Retail Stores, Inc.a | 491,822 | ||||
13,720 | Cracker Barrel Old Country Store, Inc. | 861,616 | ||||
107,840 | Crocs, Inc.a | 1,741,616 | ||||
29,190 | DSW, Inc. | 1,587,936 | ||||
37,262 | Gaylord Entertainment Companya | 1,436,823 | ||||
45,560 | GNC Holdings, Inc. | 1,785,952 | ||||
7,500 | Ignite Restaurant Group, Inc.a | 135,825 | ||||
47,770 | Meritage Homes Corporationa | 1,621,314 | ||||
9,640 | Oxford Industries, Inc. | 430,908 | ||||
11,690 | Red Robin Gourmet Burgers, Inc.a | 356,662 | ||||
152,050 | Scientific Games Corporationa | 1,300,027 | ||||
20,160 | Select Comfort Corporationa | 421,747 | ||||
134,690 | Shuffle Master, Inc.a | 1,858,722 | ||||
60,140 | Shutterfly, Inc.a,b | 1,845,696 | ||||
103,770 | Sonic Automotive, Inc.b | 1,418,536 | ||||
62,210 | Sotheby’s Holdings, Inc. | 2,075,326 | ||||
24,290 | Stamps.com, Inc.a | 599,234 | ||||
42,410 | Steven Madden, Ltd.a | 1,346,517 | ||||
58,750 | Tenneco, Inc.a | 1,575,675 | ||||
86,720 | Texas Roadhouse, Inc. | 1,598,249 | ||||
65,070 | True Religion Apparel, Inc. | 1,885,729 | ||||
6,340 | Ulta Salon Cosmetics & Fragrance, Inc. | 592,029 | ||||
31,260 | Vera Bradley, Inc.a,b | 658,961 | ||||
18,420 | Vitamin Shoppe, Inc.a | 1,011,811 | ||||
|
| |||||
| Total | 36,176,147 | |||||
|
| |||||
Consumer Staples (2.8%) | ||||||
13,070 | B&G Foods, Inc. | 347,662 | ||||
1,740 | Boston Beer Company, Inc.a,b | 210,540 | ||||
30,420 | Hain Celestial Group, Inc.a | 1,674,317 | ||||
8,320 | Susser Holdings Corporationa | 309,254 | ||||
13,150 | TreeHouse Foods, Inc.a | 819,113 | ||||
52,260 | United Natural Foods, Inc.a | 2,866,984 | ||||
|
| |||||
| Total | 6,227,870 | |||||
|
| |||||
Energy (5.8%) | ||||||
58,370 | Carrizo Oil & Gas, Inc.a | 1,372,279 | ||||
96,040 | Comstock Resources, Inc.a | 1,576,977 | ||||
29,560 | Dril-Quip, Inc.a | 1,938,840 | ||||
44,020 | Energy XXI, Ltd. | 1,377,386 | ||||
7,560 | GeoResources, Inc.a | 276,772 | ||||
5,640 | Gulfmark Offshore, Inc.a | 191,985 | ||||
52,920 | Gulfport Energy Corporationa | 1,091,740 | ||||
245,200 | Hercules Offshore, Inc.a | 868,008 | ||||
202,890 | Kodiak Oil & Gas Corporationa,b | 1,665,727 | ||||
2,670 | Lufkin Industries, Inc. | 145,034 | ||||
43,720 | Rex Energy Corporationa | 490,101 | ||||
53,870 | Stone Energy Corporationa | 1,365,066 | ||||
30,410 | Swift Energy Companya | 565,930 | ||||
|
| |||||
| Total | 12,925,845 | |||||
|
| |||||
Financials (8.1%) | ||||||
59,320 | Alterra Capital Holdings, Ltd. | 1,385,122 | ||||
47,856 | Bank of the Ozarks, Inc. | 1,439,508 | ||||
63,130 | Colonial Properties Trust | 1,397,698 | ||||
109,800 | CubeSmart | 1,281,366 | ||||
188,970 | Education Realty Trust, Inc. | 2,093,788 | ||||
62,900 | Equity One, Inc. | 1,333,480 | ||||
7,270 | iShares Russell 2000 Growth Index Fundb | 664,987 | ||||
65,850 | LaSalle Hotel Properties | 1,918,869 | ||||
56,470 | MarketAxess Holdings, Inc. | 1,504,361 | ||||
14,080 | ProAssurance Corporation | 1,254,387 | ||||
14,210 | Signature Banka | 866,384 | ||||
10,050 | Sovran Self Storage, Inc. | 503,405 | ||||
7,640 | Sun Communities, Inc. | 337,994 | ||||
46,370 | Texas Capital Bancshares, Inc.a | 1,872,884 | ||||
17,570 | Umpqua Holdings Corporation | 231,221 | ||||
|
| |||||
| Total | 18,085,454 | |||||
|
| |||||
Health Care (18.9%) | ||||||
14,920 | ABIOMED, Inc.a,b | 340,474 | ||||
81,030 | Acadia Healthcare Company, Inc.a,b | 1,421,266 | ||||
20,710 | Air Methods Corporationa | 2,034,758 | ||||
159,364 | Akorn, Inc.a | 2,513,170 | ||||
54,860 | Align Technology, Inc.a | 1,835,616 | ||||
7,320 | Analogic Corporation | 453,840 | ||||
95,300 | ARIAD Pharmaceuticals, Inc.a | 1,640,113 | ||||
27,700 | ArthroCare Corporationa | 811,056 | ||||
65,650 | Bruker Corporationa | 873,801 | ||||
26,330 | Catalyst Health Solutions, Inc.a | 2,460,275 | ||||
44,180 | Cepheid, Inc.a | 1,977,055 | ||||
8,040 | Computer Programs and Systems, Inc. | 460,049 | ||||
44,870 | Cubist Pharmaceuticals, Inc.a | 1,701,022 | ||||
12,350 | Cyberonics, Inc.a | 555,009 | ||||
72,920 | Endologix, Inc.a | 1,125,885 | ||||
58,270 | Incyte Corporationa,b | 1,322,729 | ||||
40,170 | Integra LifeSciences Holdings Corporationa | 1,493,521 | ||||
26,920 | IPC The Hospitalist Company, Inc.a | 1,220,014 | ||||
17,910 | Jazz Pharmaceuticals, Inc.a | 806,129 | ||||
3,650 | Luminex Corporationa | 89,388 | ||||
20,260 | Medivation, Inc.a | 1,851,764 | ||||
16,960 | Molina Healthcare, Inc.a | 397,882 | ||||
18,690 | Onyx Pharmaceuticals, Inc.a | 1,241,950 | ||||
5,990 | Optimer Pharmaceuticals, Inc.a,b | 92,965 | ||||
8,510 | Orthofix International NVa | 351,038 | ||||
12,800 | PAREXEL International Corporationa | 361,344 | ||||
25,000 | Pharmacyclics, Inc.a,b | 1,365,250 | ||||
75,400 | PSS World Medical, Inc.a | 1,582,646 | ||||
5,390 | QLT, Inc.a | 41,072 | ||||
64,260 | Questcor Pharmaceuticals, Inc.a,b | 3,421,202 | ||||
26,390 | Salix Pharmaceuticals, Ltd.a | 1,436,672 | ||||
19,430 | Sirona Dental Systems, Inc.a | 874,544 | ||||
20,440 | Spectrum Pharmaceuticals, Inc.a | 318,046 | ||||
The accompanying Notes to Financial Statements are an integral part of this schedule.
95
Table of Contents
Partner Small Cap Growth Portfolio
Schedule of Investments as of June 29, 2012
(unaudited)
Shares | Common Stock (96.1%) | Value | ||||
Health Care (18.9%) - continued | ||||||
10,590 | SXC Health Solutions Corporationa,b | $ | 1,050,634 | |||
27,540 | VCA Antech, Inc.a | 605,329 | ||||
35,790 | VIVUS, Inc.a | 1,021,447 | ||||
18,370 | Wellcare Health Plans, Inc.a | 973,610 | ||||
|
| |||||
| Total | 42,122,565 | |||||
|
| |||||
Industrials (16.8%) | ||||||
136,590 | Avis Budget Group, Inc.a | 2,076,168 | ||||
53,350 | Belden, Inc. | 1,779,223 | ||||
34,670 | Chart Industries, Inc.a | 2,383,909 | ||||
46,370 | Clean Harbors, Inc.a | 2,616,195 | ||||
64,560 | Colfax Corporationa | 1,779,919 | ||||
30,720 | Copa Holdings SA | 2,533,786 | ||||
13,210 | EnPro Industries, Inc.a | 493,658 | ||||
6,560 | ESCO Technologies, Inc. | 239,046 | ||||
41,500 | Genesee & Wyoming, Inc.a | 2,192,860 | ||||
67,220 | Healthcare Services Group, Inc. | 1,302,724 | ||||
52,010 | Herman Miller, Inc. | 963,225 | ||||
79,820 | Hexcel Corporationa | 2,058,558 | ||||
12,590 | Hub Group, Inc.a | 455,758 | ||||
29,720 | Huron Consulting Group, Inc.a | 940,638 | ||||
15,930 | Kforce, Inc.a | 214,418 | ||||
8,050 | Middleby Corporationa | 801,860 | ||||
42,590 | Old Dominion Freight Line, Inc.a | 1,843,721 | ||||
21,310 | On Assignment, Inc.a | 340,108 | ||||
3,560 | RBC Bearings, Inc.a | 168,388 | ||||
4,203 | Robbins & Myers, Inc. | 175,769 | ||||
49,660 | Shaw Group, Inc.a | 1,356,215 | ||||
62,830 | Titan International, Inc.b | 1,541,220 | ||||
30,040 | Triumph Group, Inc. | 1,690,351 | ||||
113,610 | TrueBlue, Inc.a | 1,758,683 | ||||
137,670 | US Airways Group, Inc.a,b | 1,835,141 | ||||
32,220 | WESCO International, Inc.a | 1,854,261 | ||||
52,926 | Woodward, Inc. | 2,087,401 | ||||
|
| |||||
| Total | 37,483,203 | |||||
|
| |||||
Information Technology (22.5%) | ||||||
51,070 | ADTRAN, Inc. | 1,541,803 | ||||
53,070 | Allot Communications, Ltd.a | 1,478,530 | ||||
10,930 | ANSYS, Inc.a | 689,792 | ||||
63,040 | Bankrate, Inc.a,b | 1,159,306 | ||||
11,320 | Bottomline Technologies, Inc.a | 204,326 | ||||
64,540 | Broadsoft, Inc.a,b | 1,869,078 | ||||
81,510 | Cardtronics, Inc.a | 2,462,417 | ||||
66,480 | Cavium, Inc.a,b | 1,861,440 | ||||
97,730 | Cirrus Logic, Inc.a | 2,920,172 | ||||
45,540 | Cognex Corporation | 1,441,341 | ||||
6,610 | Coherent, Inc.a | 286,213 | ||||
34,960 | CommVault Systems, Inc.a | 1,732,967 | ||||
24,350 | Concur Technologies, Inc.a | 1,658,235 | ||||
60,830 | DealerTrack Holdings, Inc.a | 1,831,591 | ||||
12,290 | Diodes, Inc.a | 230,683 | ||||
22,810 | Electronics for Imaging, Inc.a | 370,663 | ||||
10,130 | Ellie Mae, Inc.a | 182,340 | ||||
105,920 | Fairchild Semiconductor International, Inc.a | 1,493,472 | ||||
95,470 | Finisar Corporationa | 1,428,231 | ||||
32,890 | GSI Group, Inc.a | 376,919 | ||||
29,620 | Guidewire Software, Inc.a,b | 832,914 | ||||
58,746 | Heartland Payment Systems, Inc. | 1,767,080 | ||||
1,660 | Hittite Microwave Corporationa | 84,859 | ||||
12,510 | Imperva, Inc.a | 360,538 | ||||
2,240 | Infoblox, Inc.a | 51,363 | ||||
27,950 | IPG Photonics Corporationa | 1,218,341 | ||||
71,320 | Kenexa Corporationa | 2,070,420 | ||||
2,890 | Liquidity Services, Inc.a | 147,939 | ||||
8,950 | Manhattan Associates, Inc.a | 409,105 | ||||
20,770 | MAXIMUS, Inc. | 1,074,848 | ||||
6,510 | Monolithic Power Systems, Inc.a | 129,354 | ||||
68,088 | NETGEAR, Inc.a | 2,349,717 | ||||
30,760 | OCZ Technology Group, Inc.a,b | 163,028 | ||||
29,810 | OSI Systems, Inc.a | 1,888,165 | ||||
37,140 | Plexus Corporationa | 1,047,348 | ||||
49,760 | Power Integrations, Inc. | 1,856,048 | ||||
10,320 | Procera Networks, Inc.a | 250,879 | ||||
55,610 | QLIK Technologies, Inc.a | 1,230,093 | ||||
8,650 | Radware, Inc.a | 331,209 | ||||
62,360 | Semtech Corporationa | 1,516,595 | ||||
8,650 | Synchronoss Technologies, Inc.a | 159,766 | ||||
48,200 | Tangoe, Inc.a | 1,027,142 | ||||
95,300 | Teradyne, Inc.a | 1,339,918 | ||||
8,810 | Tyler Technologies, Inc.a | 355,484 | ||||
13,910 | Ultimate Software Group, Inc.a | 1,239,659 | ||||
60,400 | Ultratech, Inc.a | 1,902,600 | ||||
|
| |||||
| Total | 50,023,931 | |||||
|
| |||||
Materials (4.1%) | ||||||
55,090 | Allied Nevada Gold Corporationa | 1,563,454 | ||||
218,990 | Boise, Inc. | 1,440,954 | ||||
24,100 | Carpenter Technology Corporation | 1,152,944 | ||||
91,780 | Chemtura Corporationa | 1,330,810 | ||||
4,160 | Domtar Corporation | 319,114 | ||||
16,770 | KapStone Paper and Packaging Corporationa | 265,804 | ||||
164,210 | Louisiana-Pacific Corporationa | 1,786,605 | ||||
9,890 | LSB Industries, Inc.a | 305,700 | ||||
37,400 | Methanex Corporation | 1,041,216 | ||||
|
| |||||
| Total | 9,206,601 | |||||
|
| |||||
Telecommunications Services (0.8%) | ||||||
10,190 | AboveNet, Inc.a | 855,960 | ||||
49,670 | Cogent Communications Group, Inc.a | 956,148 | ||||
|
| |||||
| Total | 1,812,108 | |||||
|
| |||||
Utilities (0.1%) | ||||||
5,882 | Artesian Resources Corporation | 126,698 | ||||
|
| |||||
| Total | 126,698 | |||||
|
| |||||
Total Common Stock (cost $190,429,977) | 214,190,422 | |||||
|
| |||||
The accompanying Notes to Financial Statements are an integral part of this schedule.
96
Table of Contents
Partner Small Cap Growth Portfolio
Schedule of Investments as of June 29, 2012
(unaudited)
| Shares | Collateral Held for Securities Loaned (10.1%) | Value | ||||||
| 22,565,603 | Thrivent Financial Securities Lending Trust | $ | 22,565,603 | |||||
|
| |||||||
Total Collateral Held for Securities Loaned (cost $22,565,603) | 22,565,603 | |||||||
|
| |||||||
Total Investments (cost $212,995,580) 106.2% | $ | 236,756,025 | ||||||
|
| |||||||
| Other Assets and Liabilities, Net (6.2%) | (13,852,896 | ) | ||||||
|
| |||||||
| Total Net Assets 100.0% | $ | 222,903,129 | ||||||
|
| |||||||
| a | Non-income producing security. |
| b | All or a portion of the security is on loan. |
Unrealized Appreciation (Depreciation)
Gross unrealized appreciation and depreciation of investments, based on cost for federal income tax purposes, were as follows:
Gross unrealized appreciation | $ | 30,339,834 | ||
Gross unrealized depreciation | (7,327,585 | ) | ||
|
| |||
Net unrealized appreciation (depreciation) | $ | 23,012,249 | ||
Cost for federal income tax purposes | $ | 213,743,776 | ||
Fair Valuation Measurements
The following table is a summary of the inputs used, as of June 29, 2012, in valuing Partner Small Cap Growth Portfolio’s assets carried at fair value.
Investments in Securities | Total | Level 1 | Level 2 | Level 3 | ||||||||||||
Common Stock | ||||||||||||||||
Consumer Discretionary | 36,176,147 | 36,176,147 | — | — | ||||||||||||
Consumer Staples | 6,227,870 | 6,227,870 | — | — | ||||||||||||
Energy | 12,925,845 | 12,925,845 | — | — | ||||||||||||
Financials | 18,085,454 | 18,085,454 | — | — | ||||||||||||
Health Care | 42,122,565 | 42,122,565 | — | — | ||||||||||||
Industrials | 37,483,203 | 37,483,203 | — | — | ||||||||||||
Information Technology | 50,023,931 | 50,023,931 | — | — | ||||||||||||
Materials | 9,206,601 | 9,206,601 | — | — | ||||||||||||
Telecommunications Services | 1,812,108 | 1,812,108 | — | — | ||||||||||||
Utilities | 126,698 | 126,698 | — | — | ||||||||||||
Collateral Held for Securities Loaned | 22,565,603 | 22,565,603 | — | — | ||||||||||||
|
|
|
|
|
|
|
| |||||||||
Total | $ | 236,756,025 | $ | 236,756,025 | $ | — | $ | — | ||||||||
|
|
|
|
|
|
|
| |||||||||
There were no significant transfers between the Levels during the period ended June 29, 2012. Transfers between the levels are identified as of the end of the period.
Investment in Affiliates
Affiliated issuers, as defined under the Investment Company Act of 1940, include those in which the Portfolio’s holdings of an issuer represent 5% or more of the outstanding voting securities of an issuer, or any affiliated mutual fund.
A summary of transactions for the fiscal year to date, in Partner Small Cap Growth Portfolio, is as follows:
Portfolio | Value December 31, 2011 | Gross Purchases | Gross Sales | Shares Held at June 29, 2012 | Value June 29, 2012 | Income Earned January 1, 2012 - June 29, 2012 | ||||||||||||||||||
Thrivent Financial Securities Lending Trust | $ | 20,479,131 | $ | 64,735,284 | $ | 62,648,812 | 22,565,603 | $ | 22,565,603 | $ | 89,194 | |||||||||||||
Total Value and Income Earned | 20,479,131 | 22,565,603 | 89,194 | |||||||||||||||||||||
The accompanying Notes to Financial Statements are an integral part of this schedule.
97
Table of Contents
Partner Small Cap Value Portfolio
Schedule of Investments as of June 29, 2012
(unaudited)
| Shares | Common Stock (96.7%) | Value | ||||||
| Consumer Discretionary (13.9%) | ||||||||
| 208,500 | Aaron’s, Inc. | $ | 5,902,635 | |||||
| 34,400 | Ascent Capital Group, Inc., LLCa | 1,780,200 | ||||||
| 53,500 | CSS Industries, Inc. | 1,099,425 | ||||||
| 114,800 | Dorman Products, Inc.a | 2,880,332 | ||||||
| 100,000 | Drew Industries, Inc.a | 2,785,000 | ||||||
| 60,000 | Ethan Allen Interiors, Inc.b | 1,195,800 | ||||||
| 130,400 | Fifth & Pacific Companies, Inc.a | 1,399,192 | ||||||
| 86,300 | Fred’s, Inc. | 1,319,527 | ||||||
| 96,000 | Haverty Furniture Companies, Inc. | 1,072,320 | ||||||
| 42,000 | Hooker Furniture Corporation | 495,180 | ||||||
| 68,000 | M/I Homes, Inc.a | 1,177,760 | ||||||
| 97,700 | MarineMax, Inc.a | 929,127 | ||||||
| 56,500 | Matthews International Corporation | 1,835,685 | ||||||
| 74,600 | Men’s Wearhouse, Inc. | 2,099,244 | ||||||
| 106,600 | Meritage Homes Corporationa | 3,618,004 | ||||||
| 212,000 | Orient-Express Hotels, Ltd.a | 1,774,440 | ||||||
| 150,000 | Shiloh Industries, Inc. | 1,725,000 | ||||||
| 62,100 | Stanley Furniture Company, Inc.a | 247,779 | ||||||
| 161,000 | Stein Mart, Inc.a | 1,279,950 | ||||||
| 28,200 | Steven Madden, Ltd.a | 895,350 | ||||||
|
| |||||||
| Total | 35,511,950 | |||||||
|
| |||||||
| Consumer Staples (0.6%) | ||||||||
| 245,000 | Alliance One International, Inc.a,b | 847,700 | ||||||
| 28,300 | Nash Finch Company | 607,884 | ||||||
|
| |||||||
| Total | 1,455,584 | |||||||
|
| |||||||
| Energy (3.8%) | ||||||||
| 8,800 | Atwood Oceanics, Inc.a | 332,992 | ||||||
| 7,900 | Carbo Ceramics, Inc.b | 606,167 | ||||||
| 93,000 | Cloud Peak Energy, Inc.a | 1,572,630 | ||||||
| 89,000 | Gulf Island Fabrication, Inc. | 2,510,690 | ||||||
| 213,000 | Hercules Offshore, Inc.a | 754,020 | ||||||
| 53,000 | Lone Pine Resources, Inc.a | 145,750 | ||||||
| 45,100 | Overseas Shipholding Group, Inc.b | 501,061 | ||||||
| 71,700 | Swift Energy Companya | 1,334,337 | ||||||
| 243,100 | Teekay Tankers, Ltd.b | 1,108,536 | ||||||
| 122,700 | Tetra Technologies, Inc.a | 874,851 | ||||||
|
| |||||||
| Total | 9,741,034 | |||||||
|
| |||||||
| Financials (24.6%) | ||||||||
| 78,100 | Alterra Capital Holdings, Ltd. | 1,823,635 | ||||||
| 204,000 | Ares Capital Corporation | 3,255,840 | ||||||
| 33,100 | Assured Guaranty, Ltd. | 466,710 | ||||||
| 188,000 | CBL & Associates Properties, Inc. | 3,673,520 | ||||||
| 329,900 | Cedar Realty Trust, Inc. | 1,665,995 | ||||||
| 391,000 | CoBiz Financial, Inc. | 2,447,660 | ||||||
| 69,900 | Columbia Banking System, Inc. | 1,315,518 | ||||||
| 35,000 | Compass Diversified Trustb | 488,600 | ||||||
| 132,800 | Cousins Properties, Inc. | 1,029,200 | ||||||
| 108,800 | East West Bancorp, Inc. | 2,552,448 | ||||||
| 48,500 | Employers Holdings, Inc. | 874,940 | ||||||
| 77,500 | First Potomac Realty Trust | 912,175 | ||||||
| 89,000 | Glacier Bancorp, Inc. | 1,378,610 | ||||||
| 90,900 | Golub Capital BDC, Inc.b | 1,371,681 | ||||||
| 66,900 | Hatteras Financial Corporation | 1,913,340 | ||||||
| 190,000 | Hercules Technology Growth Capital, Inc. | 2,154,600 | ||||||
| 86,200 | Home Bancshares, Inc. | 2,635,996 | ||||||
| 26,900 | iShares Russell 2000 Value Index Fund | 1,893,491 | ||||||
| 56,400 | JMP Group, Inc. | 348,552 | ||||||
| 57,100 | Kilroy Realty Corporation | 2,764,211 | ||||||
| 325,027 | Kite Realty Group Trust | 1,621,885 | ||||||
| 86,000 | LaSalle Hotel Properties | 2,506,040 | ||||||
| 2,600 | Markel Corporationa | 1,148,420 | ||||||
| 103,000 | Meadowbrook Insurance Group, Inc. | 905,370 | ||||||
| 76,200 | National Interstate Corporation | 2,026,158 | ||||||
| 17,000 | Potlatch Corporation | 542,980 | ||||||
| 69,300 | ProAssurance Corporation | 6,173,937 | ||||||
| 101,200 | Radian Group, Inc.b | 332,948 | ||||||
| 164,700 | Redwood Trust, Inc. | 2,055,456 | ||||||
| 130,000 | Safeguard Scientifics, Inc.a | 2,012,400 | ||||||
| 114,000 | Sandy Spring Bancorp, Inc. | 2,052,000 | ||||||
| 75,900 | SeaBright Holdings, Inc. | 674,751 | ||||||
| 18,000 | Stifel Financial Corporationa | 556,200 | ||||||
| 53,000 | SVB Financial Groupa | 3,112,160 | ||||||
| 63,000 | Wintrust Financial Corporation | 2,236,500 | ||||||
|
| |||||||
| Total | 62,923,927 | |||||||
|
| |||||||
| Health Care (5.3%) | ||||||||
| 6,800 | Atrion Corporation | 1,393,864 | ||||||
| 842,100 | Lexicon Pharmaceuticals, Inc.a,b | 1,894,725 | ||||||
| 32,500 | National Healthcare Corporationb | 1,469,975 | ||||||
| 110,500 | Owens & Minor, Inc. | 3,384,615 | ||||||
| 90,500 | Triple-S Management Corporationa | 1,654,340 | ||||||
| 67,700 | Vanguard Health Systems, Inc.a | 601,853 | ||||||
| 61,100 | West Pharmaceutical Services, Inc. | 3,084,939 | ||||||
|
| |||||||
| Total | 13,484,311 | |||||||
|
| |||||||
| Industrials (24.3%) | ||||||||
| 60,600 | A.O. Smith Corporation | 2,962,734 | ||||||
| 95,000 | Aegion Corporationa | 1,699,550 | ||||||
| 87,100 | Alaska Air Group, Inc.a | 3,126,890 | ||||||
| 38,700 | Applied Industrial Technologies, Inc. | 1,426,095 | ||||||
| 24,300 | Astec Industries, Inc.a | 745,524 | ||||||
| 148,000 | Beacon Roofing Supply, Inc.a | 3,732,560 | ||||||
| 57,000 | Belden, Inc. | 1,900,950 | ||||||
| 27,100 | Cascade Corporation | 1,275,055 | ||||||
| 35,700 | Circor International, Inc. | 1,217,013 | ||||||
| 87,200 | Comfort Systems USA, Inc. | 873,744 | ||||||
| 70,000 | Dolan Companya | 471,100 | ||||||
| 17,400 | Franklin Electric Company, Inc. | 889,662 | ||||||
| 22,800 | FTI Consulting, Inc.a | 655,500 | ||||||
| 63,000 | G & K Services, Inc. | 1,964,970 | ||||||
| 84,400 | Genesee & Wyoming, Inc.a | 4,459,696 | ||||||
| 107,100 | Gibraltar Industries, Inc.a | 1,111,698 | ||||||
| 106,000 | Greenbrier Companies, Inc.a | 1,863,480 | ||||||
| 41,200 | Hub Group, Inc.a | 1,491,440 | ||||||
| 54,300 | IDEX Corporation | 2,116,614 | ||||||
| 49,000 | Kaman Corporation | 1,516,060 | ||||||
| 95,800 | Kforce, Inc.a | 1,289,468 | ||||||
| 75,600 | Kirby Corporationa | 3,559,248 | ||||||
| 130,000 | Kratos Defense & Security Solutions, Inc.a | 759,200 | ||||||
| 114,000 | McGrath Rentcorp | 3,021,000 | ||||||
| 41,500 | Mine Safety Appliances Company | 1,669,960 | ||||||
The accompanying Notes to Financial Statements are an integral part of this schedule.
98
Table of Contents
Partner Small Cap Value Portfolio
Schedule of Investments as of June 29, 2012
(unaudited)
| Shares | Common Stock (96.7%) | Value | ||||||
| Industrials (24.3%) - continued | ||||||||
| 120,000 | Navigant Consulting, Inc.a | $ | 1,516,800 | |||||
| 48,100 | Nordson Corporation | 2,467,049 | ||||||
| 13,900 | RBC Bearings, Inc.a | 657,470 | ||||||
| 71,500 | Robbins & Myers, Inc. | 2,990,130 | ||||||
| 26,100 | Sterling Construction Company, Inc.a | 266,742 | ||||||
| 44,100 | Sun Hydraulics Corporationb | 1,071,189 | ||||||
| 28,400 | Universal Forest Products, Inc. | 1,107,032 | ||||||
| 80,900 | Universal Truckload Services, Inc. | 1,223,612 | ||||||
| 94,000 | Vitran Corporation, Inc.a | 564,000 | ||||||
| 65,300 | Waste Connections, Inc. | 1,953,776 | ||||||
| 65,400 | Woodward, Inc. | 2,579,376 | ||||||
|
| |||||||
| Total | 62,196,387 | |||||||
|
| |||||||
| Information Technology (9.4%) | ||||||||
| 69,812 | Accelrys, Inc.a | 564,779 | ||||||
| 135,000 | Advanced Energy Industries, Inc.a | 1,811,700 | ||||||
| 36,500 | ATMI, Inc.a | 750,805 | ||||||
| 137,500 | Brooks Automation, Inc. | 1,298,000 | ||||||
| 24,500 | Cabot Microelectronics Corporation | 715,645 | ||||||
| 30,300 | Cognex Corporation | 958,995 | ||||||
| 59,100 | Cohu, Inc. | 600,456 | ||||||
| 125,000 | Electro Rent Corporation | 2,028,750 | ||||||
| 66,900 | Electro Scientific Industries, Inc. | 790,758 | ||||||
| 160,300 | Intevac, Inc.a | 1,205,456 | ||||||
| 16,800 | Littelfuse, Inc. | 955,752 | ||||||
| 3,714 | MaxLinear, Inc.a | 18,422 | ||||||
| 89,000 | Methode Electronics, Inc. | 757,390 | ||||||
| 69,600 | Monotype Imaging Holdings, Inc.a | 1,167,192 | ||||||
| 40,500 | Newport Corporationa | 486,810 | ||||||
| 112,000 | Progress Software Corporationa | 2,337,440 | ||||||
| 85,400 | RealNetworks, Inc. | 737,856 | ||||||
| 156,000 | ShoreTel, Inc.a | 683,280 | ||||||
| 316,000 | Sonus Networks, Inc.a | 679,400 | ||||||
| 66,500 | Synnex Corporationa | 2,293,585 | ||||||
| 75,600 | Teradyne, Inc.a | 1,062,936 | ||||||
| 66,200 | Xyratex, Ltd. | 748,722 | ||||||
| 79,500 | Zygo Corporationa | 1,419,870 | ||||||
|
| |||||||
| Total | 24,073,999 | |||||||
|
| |||||||
| Materials (9.1%) | ||||||||
| 39,300 | AMCOL International Corporation | 1,112,583 | ||||||
| 74,000 | AptarGroup, Inc. | 3,777,700 | ||||||
| 25,900 | Carpenter Technology Corporation | 1,239,056 | ||||||
| 82,800 | Clearwater Paper Corporationa | 2,825,136 | ||||||
| 120,200 | Franco-Nevada Corporationb | 2,717,811 | ||||||
| 21,300 | Haynes International, Inc. | 1,085,022 | ||||||
| 90,400 | Innospec, Inc.a | 2,676,744 | ||||||
| 23,600 | Minerals Technologies, Inc. | 1,505,208 | ||||||
| 121,000 | Myers Industries, Inc. | 2,076,360 | ||||||
| 310,000 | North American Palladium, Ltd.a,b | 629,300 | ||||||
| 33,000 | Schnitzer Steel Industries, Inc. | 924,660 | ||||||
| 15,900 | Texas Industries, Inc.b | 620,259 | ||||||
| 216,000 | Wausau Paper Corporation | 2,101,680 | ||||||
|
| |||||||
| Total | 23,291,519 | |||||||
|
| |||||||
| Telecommunications Services (0.3%) | ||||||||
| 95,000 | Premiere Global Services, Inc.a | 797,050 | ||||||
|
| |||||||
| Total | 797,050 | |||||||
|
| |||||||
| Utilities (5.4%) | ||||||||
| 30,300 | Black Hills Corporation | 974,751 | ||||||
| 99,800 | Cleco Corporation | 4,174,634 | ||||||
| 66,300 | El Paso Electric Company | 2,198,508 | ||||||
| 53,700 | NorthWestern Corporation | 1,970,790 | ||||||
| 51,300 | PNM Resources, Inc. | 1,002,402 | ||||||
| 65,400 | Southwest Gas Corporation | 2,854,710 | ||||||
| 25,300 | Vectren Corporation | 746,856 | ||||||
|
| |||||||
| Total | 13,922,651 | |||||||
|
| |||||||
Total Common Stock (cost $201,807,209) | 247,398,412 | |||||||
|
| |||||||
Preferred Stock (0.8%) | ||||||||
| Financials (0.5%) | ||||||||
| 820 | East West Bancorp, Inc.c | 1,307,900 | ||||||
|
| |||||||
| Total | 1,307,900 | |||||||
|
| |||||||
| Health Care (0.3%) | ||||||||
| 51,400 | National Healthcare Corporation, Convertiblec | 755,580 | ||||||
|
| |||||||
| Total | 755,580 | |||||||
|
| |||||||
| Total Preferred Stock (cost $1,505,546) | 2,063,480 | |||||||
|
| |||||||
Collateral Held for Securities Loaned (3.7%) | ||||||||
| 9,560,205 | Thrivent Financial Securities Lending Trust | 9,560,205 | ||||||
|
| |||||||
| Total Collateral Held for Securities Loaned (cost $9,560,205) | 9,560,205 | |||||||
|
| |||||||
| Principal Amount | Short-Term Investments (2.2%)d | Value | ||||||
| Nieuw Amsterdam Receivables Corporation | ||||||||
| 5,500,000 | 0.150%, 7/2/2012e,f | 5,499,954 | ||||||
|
| |||||||
| Total Short-Term Investments (at amortized cost) | 5,499,954 | |||||||
|
| |||||||
Total Investments (cost $218,372,914) 103.4% | $ | 264,522,051 | ||||||
|
| |||||||
| Other Assets and Liabilities, Net (3.4%) | (8,701,247 | ) | ||||||
|
| |||||||
| Total Net Assets 100.0% | $ | 255,820,804 | ||||||
|
| |||||||
| a | Non-income producing security. |
| b | All or a portion of the security is on loan. |
| c | Denotes perpetual securities. Perpetual securities pay an indefinite stream of interest, but may be called by the issuer at an earlier date. |
| d | The interest rate shown reflects the yield, coupon rate or the discount rate at the date of purchase. |
The accompanying Notes to Financial Statements are an integral part of this schedule.
99
Table of Contents
Partner Small Cap Value Portfolio
Schedule of Investments as of June 29, 2012
(unaudited)
| e | Denotes securities sold under Rule 144A of the Securities Act of 1933, which exempts them from registration. These securities have been deemed liquid and may be resold to other dealers in the program or to other qualified institutional buyers. As of June 29, 2012, the value of these investments was $5,499,954 or 2.1% of total net assets. |
| f | Denotes investments that benefit from credit enhancement or liquidity support provided by a third party bank, institution or government. |
Unrealized Appreciation (Depreciation)
Gross unrealized appreciation and depreciation of investments, based on cost for federal income tax purposes, were as follows:
Gross unrealized appreciation | $ | 64,212,938 | ||
Gross unrealized depreciation | (19,690,542 | ) | ||
Net unrealized appreciation (depreciation) | $ | 44,522,396 | ||
|
| |||
Cost for federal income tax purposes | $ | 219,999,655 | ||
Fair Valuation Measurements
The following table is a summary of the inputs used, as of June 29, 2012, in valuing Partner Small Cap Value Portfolio’s assets carried at fair value.
Investments in Securities | Total | Level 1 | Level 2 | Level 3 | ||||||||||||
Common Stock | ||||||||||||||||
Consumer Discretionary | 35,511,950 | 35,511,950 | — | — | ||||||||||||
Consumer Staples | 1,455,584 | 1,455,584 | — | — | ||||||||||||
Energy | 9,741,034 | 9,741,034 | — | — | ||||||||||||
Financials | 62,923,927 | 62,923,927 | — | — | ||||||||||||
Health Care | 13,484,311 | 13,484,311 | — | — | ||||||||||||
Industrials | 62,196,387 | 62,196,387 | — | — | ||||||||||||
Information Technology | 24,073,999 | 24,073,999 | — | — | ||||||||||||
Materials | 23,291,519 | 20,573,708 | 2,717,811 | — | ||||||||||||
Telecommunications Services | 797,050 | 797,050 | — | — | ||||||||||||
Utilities | 13,922,651 | 13,922,651 | — | — | ||||||||||||
Preferred Stock | ||||||||||||||||
Financials | 1,307,900 | — | 1,307,900 | — | ||||||||||||
Health Care | 755,580 | 755,580 | — | — | ||||||||||||
Collateral Held for Securities Loaned | 9,560,205 | 9,560,205 | — | — | ||||||||||||
Short-Term Investments | 5,499,954 | — | 5,499,954 | — | ||||||||||||
|
|
|
|
|
|
|
| |||||||||
Total | $ | 264,522,051 | $ | 254,996,386 | $ | 9,525,665 | $ | — | ||||||||
|
|
|
|
|
|
|
| |||||||||
There were no significant transfers between the Levels during the period ended June 29, 2012. Transfers between the levels are identified as of the end of the period.
Investment in Affiliates
Affiliated issuers, as defined under the Investment Company Act of 1940, include those in which the Portfolio’s holdings of an issuer represent 5% or more of the outstanding voting securities of an issuer, or any affiliated mutual fund.
A summary of transactions for the fiscal year to date, in Partner Small Cap Value Portfolio, is as follows:
Portfolio | Value December 31, 2011 | Gross Purchases | Gross Sales | Shares Held at June 29, 2012 | Value June 29, 2012 | Income Earned January 1, 2012 - June 29, 2012 | ||||||||||||||||||
Thrivent Financial Securities Lending Trust | $ | 15,559,565 | $ | 23,041,639 | $ | 29,040,999 | 9,560,205 | $ | 9,560,205 | $ | 84,295 | |||||||||||||
Total Value and Income Earned | 15,559,565 | 9,560,205 | 84,295 | |||||||||||||||||||||
The accompanying Notes to Financial Statements are an integral part of this schedule.
100
Table of Contents
Schedule of Investments as of June 29, 2012
(unaudited)
| Shares | Common Stock (85.4%) | Value | ||||||
| Consumer Discretionary (13.3%) | |||||||
| 80,100 | Big Lots, Inc.a | $ | 3,267,279 | |||||
| 85,700 | BJ’s Restaurants, Inc.a | 3,256,600 | ||||||
| 90,000 | Children’s Place Retail Stores, Inc.a | 4,484,700 | ||||||
| 194,131 | Foot Locker, Inc. | 5,936,526 | ||||||
| 94,012 | Life Time Fitness, Inc.a | 4,372,498 | ||||||
| 128,000 | Meredith Corporationb | 4,088,320 | ||||||
| 119,300 | Penn National Gaming, Inc.a | 5,319,587 | ||||||
| 236,862 | Pier 1 Imports, Inc. | 3,891,643 | ||||||
|
| |||||||
| Total | 34,617,153 | |||||||
|
| |||||||
| Consumer Staples (2.4%) | |||||||
| 125,537 | Ingredion, Inc. | 6,216,592 | ||||||
|
| |||||||
| Total | 6,216,592 | |||||||
|
| |||||||
| Energy (3.4%) | |||||||
| 462,812 | Petroleum Geo-Services ASA | 5,656,472 | ||||||
| 173,843 | Swift Energy Companya | 3,235,218 | ||||||
|
| |||||||
| Total | 8,891,690 | |||||||
|
| |||||||
| Financials (21.3%) | |||||||
| 39,096 | Affiliated Managers Group, Inc.a | 4,279,057 | ||||||
| 42,300 | Allied World Assurance Company Holdings AG | 3,361,581 | ||||||
| 66,400 | American Campus Communities, Inc. | 2,986,672 | ||||||
| 107,100 | Apartment Investment & Management Company | 2,894,913 | ||||||
| 97,900 | Aspen Insurance Holdings, Ltd. | 2,829,310 | ||||||
| 129,600 | Douglas Emmett, Inc. | 2,993,760 | ||||||
| 42,400 | Equity Lifestyle Properties, Inc. | 2,924,328 | ||||||
| 86,700 | HCC Insurance Holdings, Inc. | 2,722,380 | ||||||
| 44,800 | Home Properties, Inc. | 2,748,928 | ||||||
| 33,700 | iShares Russell 2000 Index Fundb | 2,684,205 | ||||||
| 225,236 | Ocwen Financial Corporationa | 4,229,932 | ||||||
| 243,282 | Popular, Inc.a | 4,040,914 | ||||||
| 29,800 | ProAssurance Corporation | 2,654,882 | ||||||
| 100,400 | Protective Life Corporation | 2,952,764 | ||||||
| 69,800 | Tanger Factory Outlet Centers, Inc. | 2,237,090 | ||||||
| 35,220 | Taubman Centers, Inc. | 2,717,575 | ||||||
| 118,659 | Tower Group, Inc. | 2,476,414 | ||||||
| 185,303 | Zions Bancorporation | 3,598,584 | ||||||
|
| |||||||
| Total | 55,333,289 | |||||||
|
| |||||||
| Health Care (7.1%) | |||||||
| 109,500 | Align Technology, Inc.a | 3,663,870 | ||||||
| 93,842 | Covance, Inc.a | 4,490,340 | ||||||
| 134,011 | Health Net, Inc.a | 3,252,447 | ||||||
| 191,117 | PSS World Medical, Inc.a | 4,011,546 | ||||||
| 57,911 | United Therapeutics Corporationa | 2,859,645 | ||||||
|
| |||||||
| Total | 18,277,848 | |||||||
|
| |||||||
| Industrials (16.0%) | |||||||
| 241,200 | Actuant Corporation | 6,550,992 | ||||||
| 304,468 | Deluxe Corporation | 7,593,432 | ||||||
| 277,704 | EMCOR Group, Inc. | 7,725,726 | ||||||
| 155,200 | GATX Corporation | 5,975,200 | ||||||
| 110,900 | Landstar System, Inc. | 5,735,748 | ||||||
| 273,499 | Manitowoc Company, Inc. | 3,199,938 | ||||||
| 176,372 | Shaw Group, Inc.a | 4,816,719 | ||||||
|
| |||||||
| Total | 41,597,755 | |||||||
|
| |||||||
| Information Technology (13.7%) | |||||||
| 148,500 | ADTRAN, Inc. | 4,483,215 | ||||||
| 377,600 | Atmel Corporationa | 2,529,920 | ||||||
| 129,600 | Cavium, Inc.a | 3,628,800 | ||||||
| 64,600 | OpenTable, Inc.a,b | 2,907,646 | ||||||
| 174,845 | Plantronics, Inc. | 5,839,823 | ||||||
| 194,900 | Polycom, Inc.a | 2,050,348 | ||||||
| 6,750 | ServiceNow, Inc.a,c | 166,050 | ||||||
| 436,720 | Teradyne, Inc.a | 6,140,283 | ||||||
| 145,472 | TIBCO Software, Inc.a | 4,352,522 | ||||||
| 100,000 | VeriFone Systems, Inc.a | 3,309,000 | ||||||
|
| |||||||
| Total | 35,407,607 | |||||||
|
| |||||||
| Materials (3.9%) | |||||||
| 274,400 | AK Steel Holding Corporationb | 1,610,728 | ||||||
| 64,000 | Buckeye Technologies, Inc. | 1,823,360 | ||||||
| 34,500 | Eagle Materials, Inc. | 1,288,230 | ||||||
| 62,400 | H.B. Fuller Company | 1,915,680 | ||||||
| 74,700 | Materials Select Sector SPDR Fund | 2,636,163 | ||||||
| 63,300 | SunCoke Energy, Inc.a | 927,345 | ||||||
|
| |||||||
| Total | 10,201,506 | |||||||
|
| |||||||
| Utilities (4.3%) | |||||||
| 253,100 | PNM Resources, Inc. | 4,945,574 | ||||||
| 142,687 | Southwest Gas Corporation | 6,228,288 | ||||||
|
| |||||||
| Total | 11,173,862 | |||||||
|
| |||||||
Total Common Stock (cost $223,281,490) | 221,717,302 | |||||||
|
| |||||||
Collateral Held for Securities Loaned (4.4%) | ||||||||
| 11,411,700 | Thrivent Financial Securities Lending Trust | 11,411,700 | ||||||
|
| |||||||
Total Collateral Held for Securities Loaned (cost $11,411,700) | 11,411,700 | |||||||
|
| |||||||
| Principal Amount | Short-Term Investments (13.6%)d | Value | ||||||
| Federal Home Loan Bank Discount Notes | ||||||||
| 10,000,000 | 0.080%, 7/11/2012e | 9,999,756 | ||||||
| 3,000,000 | 0.060%, 7/27/2012e | 2,999,865 | ||||||
| 15,000,000 | 0.080%, 8/10/2012e | 14,998,633 | ||||||
| 4,000,000 | 0.100%, 8/17/2012e | 3,999,467 | ||||||
| Federal National Mortgage Association Discount Notes | ||||||||
| 1,400,000 | 0.121%, 7/18/2012e,f | 1,399,916 | ||||||
The accompanying Notes to Financial Statements are an integral part of this schedule.
101
Table of Contents
Small Cap Stock Portfolio
Schedule of Investments as of June 29, 2012
(unaudited)
| Principal Amount | Short-Term Investments (13.6%)d | Value | ||||||
| U.S. Treasury Bills | ||||||||
| 1,800,000 | 0.100%, 7/19/2012e,f | $ | 1,799,905 | |||||
Total Short-Term Investments (at amortized cost) | 35,197,542 | |||||||
|
| |||||||
Total Investments (cost $269,890,732) 103.4% | $ | 268,326,544 | ||||||
|
| |||||||
| Other Assets and Liabilities, Net (3.4%) | (8,827,319 | ) | ||||||
|
| |||||||
| Total Net Assets 100.0% | $ | 259,499,225 | ||||||
|
| |||||||
| a | Non-income producing security. |
| b | All or a portion of the security is on loan. |
| c | Denotes investments purchased on a when-issued or delayed delivery basis. |
| d | The interest rate shown reflects the yield, coupon rate or the discount rate at the date of purchase. |
| e | Denotes investments that benefit from credit enhancement or liquidity support provided by a third party bank, institution or government. |
| f | At June 29, 2012, $3,199,821 of investments were held on deposit with the counterparty and pledged as the initial margin deposit for open futures contracts. |
Unrealized Appreciation (Depreciation)
Gross unrealized appreciation and depreciation of investments, based on cost for federal income tax purposes, were as follows:
Gross unrealized appreciation | $ | 18,366,859 | ||
Gross unrealized depreciation | (20,077,480 | ) | ||
|
| |||
Net unrealized appreciation (depreciation) | ($ | 1,710,621 | ) | |
Cost for federal income tax purposes | $ | 270,037,165 |
Fair Valuation Measurements
The following table is a summary of the inputs used, as of June 29, 2012, in valuing Small Cap Stock Portfolio’s assets carried at fair value.
Investments in Securities | Total | Level 1 | Level 2 | Level 3 | ||||||||||||
Common Stock | ||||||||||||||||
Consumer Discretionary | 34,617,153 | 34,617,153 | — | — | ||||||||||||
Consumer Staples | 6,216,592 | 6,216,592 | — | — | ||||||||||||
Energy | 8,891,690 | 3,235,218 | 5,656,472 | — | ||||||||||||
Financials | 55,333,289 | 55,333,289 | — | — | ||||||||||||
Health Care | 18,277,848 | 18,277,848 | — | — | ||||||||||||
Industrials | 41,597,755 | 41,597,755 | — | — | ||||||||||||
Information Technology | 35,407,607 | 35,407,607 | — | — | ||||||||||||
Materials | 10,201,506 | 10,201,506 | — | — | ||||||||||||
Utilities | 11,173,862 | 11,173,862 | — | — | ||||||||||||
Collateral Held for Securities Loaned | 11,411,700 | 11,411,700 | — | — | ||||||||||||
Short-Term Investments | 35,197,542 | — | 35,197,542 | — | ||||||||||||
|
|
|
|
|
|
|
| |||||||||
Total | $ | 268,326,544 | $ | 227,472,530 | $ | 40,854,014 | $ | — | ||||||||
|
|
|
|
|
|
|
| |||||||||
Other Financial Instruments | Total | Level 1 | Level 2 | Level 3 | ||||||||||||
Asset Derivatives | ||||||||||||||||
Futures Contracts | 1,462,068 | 1,462,068 | — | — | ||||||||||||
|
|
|
|
|
|
|
| |||||||||
Total Asset Derivatives | $ | 1,462,068 | $ | 1,462,068 | $ | — | $ | — | ||||||||
|
|
|
|
|
|
|
| |||||||||
There were no significant transfers between the Levels during the period ended June 29, 2012. Transfers between the levels are identified as of the end of the period.
Futures Contracts | Number of Contracts Long/(Short) | Expiration Date | Notional Principal Amount | Value | Unrealized Gain/(Loss) | |||||||||||||||
Russell 2000 Index Mini-Futures | 379 | September 2012 | $ | 28,683,592 | $ | 30,145,660 | $ | 1,462,068 | ||||||||||||
Total Futures Contracts | $ | 1,462,068 | ||||||||||||||||||
The accompanying Notes to Financial Statements are an integral part of this schedule.
102
Table of Contents
Small Cap Stock Portfolio
Schedule of Investments as of June 29, 2012
(unaudited)
The following table summarizes the fair value and Statement of Assets and Liabilities location, as of June 29, 2012, for Small Cap Stock Portfolio’s investments in financial derivative instruments by primary risk exposure as discussed under item (2) Significant Accounting Policies of the Notes to Financial Statements.
Derivatives by risk category | Statement of Assets and Liabilities Location | Fair Value | ||||
Asset Derivatives | ||||||
Equity Contracts | ||||||
Futures* | Net Assets - Net unrealized appreciation/(depreciation) on Futures contracts | $ | 1,462,068 | |||
Total Equity Contracts | 1,462,068 | |||||
|
| |||||
Total Asset Derivatives | $ | 1,462,068 | ||||
|
| |||||
| * | Includes cumulative appreciation/depreciation of futures contracts as reported in the Schedule of Investments. Only current day’s variation margin is reported within the Statement of Assets and Liabilities. |
The following table summarizes the net realized gains/(losses) and Statement of Operations location, for the period ended June 29, 2012, for Small Cap Stock Portfolio’s investments in financial derivative instruments by primary risk exposure.
Derivatives by risk category | Statement of Operations Location | Realized Gains/(Losses) recognized in Income | ||||
| Equity Contracts | ||||||
Futures | Net realized gains/(losses) on Futures contracts | 1,697,376 | ||||
Total Equity Contracts | 1,697,376 | |||||
| Foreign Exchange Contracts | ||||||
Forward Contracts | Net realized gains/(losses) on Foreign currency transactions | (1,459 | ) | |||
Total Foreign Exchange Contracts | (1,459 | ) | ||||
|
| |||||
Total | $ | 1,695,917 | ||||
|
| |||||
The following table summarizes the change in net unrealized appreciation/(depreciation) and Statement of Operations location, for the period ended June 29, 2012, for Small Cap Stock Portfolio’s investments in financial derivative instruments by primary risk exposure.
Derivatives by risk category | Statement of Operations Location | Change in unrealized appreciation/(depreciation) recognized in Income | ||||
Equity Contracts | ||||||
Futures | Change in net unrealized appreciation/(depreciation) on Futures contracts | 1,023,936 | ||||
Total Equity Contracts | 1,023,936 | |||||
|
| |||||
Total | $ | 1,023,936 | ||||
|
| |||||
The following table presents Small Cap Stock Portfolio’s average volume of derivative activity during the period ended June 29, 2012.
Derivative Risk Category | Futures (Notional*) | Futures (Percentage of Average Net Assets) | Forwards (Notional*) | Forwards (Percentage of Average Net Assets) | ||||||||||||
Equity Contracts | $ | 35,702,617 | 13.1 | % | N/A | N/A | ||||||||||
Foreign Exchange Contracts | N/A | N/A | $ | 24,526 | <0.1 | % | ||||||||||
| * | Notional amount represents long or short, or both, derivative positions held by the Portfolio. |
The accompanying Notes to Financial Statements are an integral part of this schedule.
103
Table of Contents
Small Cap Stock Portfolio
Schedule of Investments as of June 29, 2012
(unaudited)
Investment in Affiliates
Affiliated issuers, as defined under the Investment Company Act of 1940, include those in which the Portfolio’s holdings of an issuer represent 5% or more of the outstanding voting securities of an issuer, or any affiliated mutual fund.
A summary of transactions for the fiscal year to date, in Small Cap Stock Portfolio, is as follows:
Portfolio | Value December 31, 2011 | Gross Purchases | Gross Sales | Shares Held at June 29, 2012 | Value June 29, 2012 | Income Earned January 1, 2012 - June 29, 2012 | ||||||||||||||||||
Thrivent Financial | ||||||||||||||||||||||||
Securities Lending Trust | $ | 2,316,500 | $ | 65,064,678 | $ | 55,969,478 | 11,411,700 | $ | 11,411,700 | $ | 118,231 | |||||||||||||
Total Value and Income Earned | 2,316,500 | 11,411,700 | 118,231 | |||||||||||||||||||||
The accompanying Notes to Financial Statements are an integral part of this schedule.
104
Table of Contents
Schedule of Investments as of June 29, 2012
(unaudited)
| Shares | Common Stock (99.4%) | Value | ||||||
| Consumer Discretionary (15.4%) | ||||||||
| 14,200 | American Greetings Corporationa | $ | 207,604 | |||||
| 7,100 | American Public Education, Inc.a,b | 227,200 | ||||||
| 10,700 | Arbitron, Inc. | 374,500 | ||||||
| 5,000 | Arctic Cat, Inc.b | 182,800 | ||||||
| 8,500 | Big 5 Sporting Goods Corporation | 64,260 | ||||||
| 615 | Biglari Holdings, Inc.b | 237,630 | ||||||
| 9,500 | BJ’s Restaurants, Inc.b | 361,000 | ||||||
| 5,500 | Blue Nile, Inc.a,b | 163,405 | ||||||
| 4,200 | Blyth, Inc. | 145,152 | ||||||
| 21,400 | Boyd Gaming Corporationa,b | 154,080 | ||||||
| 16,425 | Brown Shoe Company, Inc. | 212,047 | ||||||
| 35,000 | Brunswick Corporation | 777,700 | ||||||
| 10,450 | Buckle, Inc.a | 413,506 | ||||||
| 7,300 | Buffalo Wild Wings, Inc.b | 632,472 | ||||||
| 16,800 | Cabela’s, Inc.b | 635,208 | ||||||
| 25,500 | Callaway Golf Companya | 150,705 | ||||||
| 5,400 | Capella Education Companyb | 187,704 | ||||||
| 21,000 | Career Education Corporationb | 140,490 | ||||||
| 11,500 | Cato Corporation | 350,290 | ||||||
| 7,225 | CEC Entertainment, Inc. | 262,773 | ||||||
| 9,800 | Children’s Place Retail Stores, Inc.b | 488,334 | ||||||
| 14,125 | Christopher & Banks Corporation | 16,667 | ||||||
| 12,300 | Coinstar, Inc.a,b | 844,518 | ||||||
| 34,900 | Coldwater Creek, Inc.b | 19,055 | ||||||
| 33,300 | Corinthian Colleges, Inc.a,b | 96,237 | ||||||
| 9,100 | Cracker Barrel Old Country Store, Inc. | 571,480 | ||||||
| 35,300 | Crocs, Inc.b | 570,095 | ||||||
| 10,800 | Digital Generation, Inc.b | 133,596 | ||||||
| 6,200 | DineEquity, Inc.b | 276,768 | ||||||
| 7,500 | Drew Industries, Inc.b | 208,875 | ||||||
| 12,133 | E.W. Scripps Companyb | 116,598 | ||||||
| 10,250 | Ethan Allen Interiors, Inc.a | 204,282 | ||||||
| 42,000 | Fifth & Pacific Companies, Inc.b | 450,660 | ||||||
| 20,393 | Finish Line, Inc. | 426,418 | ||||||
| 14,550 | Fred’s, Inc. | 222,470 | ||||||
| 9,500 | Genesco, Inc.b | 571,425 | ||||||
| 8,900 | Group 1 Automotive, Inc. | 405,929 | ||||||
| 17,300 | Harte-Hanks, Inc. | 158,122 | ||||||
| 7,500 | Haverty Furniture Companies, Inc. | 83,775 | ||||||
| 12,400 | Helen of Troy, Ltd.b | 420,236 | ||||||
| 10,350 | Hibbett Sports, Inc.b | 597,299 | ||||||
| 24,500 | Hillenbrand, Inc. | 450,310 | ||||||
| 16,575 | Hot Topic, Inc. | 160,612 | ||||||
| 28,400 | Iconix Brand Group, Inc.b | 496,148 | ||||||
| 15,600 | Interval Leisure Group, Inc. | 296,556 | ||||||
| 10,700 | iRobot Corporationb | 237,005 | ||||||
| 17,300 | Jack in the Box, Inc.b | 482,324 | ||||||
| 10,100 | JAKKS Pacific, Inc.a | 161,701 | ||||||
| 10,962 | Joseph A. Bank Clothiers, Inc.b | 465,447 | ||||||
| 6,100 | Kirkland’s, Inc.b | 68,625 | ||||||
| 10,800 | K-Swiss, Inc.a,b | 33,264 | ||||||
| 20,300 | La-Z-Boy, Inc.b | 249,487 | ||||||
| 9,000 | Lincoln Educational Services | 58,500 | ||||||
| 8,500 | Lithia Motors, Inc. | 195,925 | ||||||
| 57,218 | Live Nation Entertainment, Inc.b | 525,261 | ||||||
| 11,000 | Lumber Liquidators Holdings, Inc.a,b | 371,690 | ||||||
| 7,400 | M/I Homes, Inc.b | 128,168 | ||||||
| 9,200 | Maidenform Brands, Inc.b | 183,264 | ||||||
| 7,800 | Marcus Corporation | 107,328 | ||||||
| 9,100 | MarineMax, Inc.b | 86,541 | ||||||
| 10,600 | Marriott Vacations Worldwide Corporationa,b | 328,388 | ||||||
| 20,100 | Men’s Wearhouse, Inc. | 565,614 | ||||||
| 11,100 | Meritage Homes Corporationb | 376,734 | ||||||
| 4,600 | Monarch Casino & Resort, Inc.b | 42,044 | ||||||
| 12,150 | Monro Muffler Brake, Inc. | 403,866 | ||||||
| 6,800 | Movado Group, Inc. | 170,136 | ||||||
| 10,600 | Multimedia Games Holding Company, Inc.b | 148,400 | ||||||
| 10,700 | NutriSystem, Inc.a | 123,692 | ||||||
| 33,900 | OfficeMax, Inc.b | 171,534 | ||||||
| 5,500 | Oxford Industries, Inc. | 245,850 | ||||||
| 7,200 | Papa John’s International, Inc.b | 342,504 | ||||||
| 5,200 | Peet’s Coffee & Tea, Inc.a,b | 312,208 | ||||||
| 20,700 | Pep Boys - Manny, Moe & Jack | 204,930 | ||||||
| 4,800 | Perry Ellis International, Inc.b | 99,600 | ||||||
| 7,700 | PetMed Express, Inc. | 93,632 | ||||||
| 24,400 | Pinnacle Entertainment, Inc.b | 234,728 | ||||||
| 18,612 | Pool Corporation | 753,042 | ||||||
| 48,100 | Quiksilver, Inc.b | 112,073 | ||||||
| 4,400 | Red Robin Gourmet Burgers, Inc.b | 134,244 | ||||||
| 24,600 | Ruby Tuesday, Inc.b | 167,526 | ||||||
| 6,200 | Rue21, Inc.b | 156,488 | ||||||
| 13,800 | Ruth’s Hospitality Group, Inc.b | 91,080 | ||||||
| 17,500 | Ryland Group, Inc. | 447,650 | ||||||
| 22,200 | Select Comfort Corporationb | 464,424 | ||||||
| 21,625 | Shuffle Master, Inc.b | 298,425 | ||||||
| 14,500 | Skechers USA, Inc.b | 295,365 | ||||||
| 13,700 | Sonic Automotive, Inc.a | 187,279 | ||||||
| 23,752 | Sonic Corporationb | 237,995 | ||||||
| 13,200 | Spartan Motors, Inc. | 69,168 | ||||||
| 11,900 | Stage Stores, Inc. | 218,008 | ||||||
| 5,400 | Stamps.com, Inc.b | 133,218 | ||||||
| 7,700 | Standard Motor Products, Inc. | 108,416 | ||||||
| 39,700 | Standard Pacific Corporationb | 245,743 | ||||||
| 10,600 | Stein Mart, Inc.b | 84,270 | ||||||
| 15,350 | Steven Madden, Ltd.b | 487,362 | ||||||
| 7,600 | Sturm, Ruger & Company, Inc.a | 305,140 | ||||||
| 9,300 | Superior Industries International, Inc. | 152,241 | ||||||
| 23,400 | Texas Roadhouse, Inc. | 431,262 | ||||||
| 10,000 | True Religion Apparel, Inc. | 289,800 | ||||||
| 16,400 | Tuesday Morning Corporationb | 70,356 | ||||||
| 5,800 | Universal Electronic, Inc.b | 76,386 | ||||||
| 8,500 | Universal Technical Institute, Inc. | 114,835 | ||||||
| 11,500 | Vitamin Shoppe, Inc.b | 631,695 | ||||||
| 7,300 | VOXX International Corporationb | 68,036 | ||||||
| 11,400 | Winnebago Industries, Inc.a,b | 116,166 | ||||||
| 19,100 | Wolverine World Wide, Inc. | 740,698 | ||||||
| 10,200 | Zale Corporationb | 27,438 | ||||||
| 8,600 | Zumiez, Inc.b | 340,560 | ||||||
|
| |||||||
| Total | 29,441,770 | |||||||
|
| |||||||
| Consumer Staples (4.7%) | ||||||||
| 34,200 | Alliance One International, Inc.b | 118,332 | ||||||
| 7,300 | Andersons, Inc. | 311,418 | ||||||
| 19,000 | B&G Foods, Inc. | 505,400 | ||||||
| 3,400 | Boston Beer Company, Inc.a,b | 411,400 | ||||||
The accompanying Notes to Financial Statements are an integral part of this schedule.
105
Table of Contents
Small Cap Index Portfolio
Schedule of Investments as of June 29, 2012
(unaudited)
| Shares | Common Stock (99.4%) | Value | ||||||
| Consumer Staples (4.7%) - continued | ||||||||
| 5,000 | Calavo Growers, Inc.a | $ | 127,900 | |||||
| 5,700 | Cal-Maine Foods, Inc. | 222,870 | ||||||
| 15,000 | Casey’s General Stores, Inc. | 884,850 | ||||||
| 16,600 | Central Garden & Pet Companyb | 180,774 | ||||||
| 46,100 | Darling International, Inc.b | 760,189 | ||||||
| 8,700 | Diamond Foods, Inc.a | 155,208 | ||||||
| 17,400 | Hain Celestial Group, Inc.b | 957,696 | ||||||
| 6,400 | Inter Parfums, Inc. | 110,528 | ||||||
| 5,700 | J & J Snack Foods Corporation | 336,870 | ||||||
| 5,500 | Medifast, Inc.a,b | 108,240 | ||||||
| 4,800 | Nash Finch Company | 103,104 | ||||||
| 20,200 | Prestige Brands Holdings, Inc.b | 319,362 | ||||||
| 7,400 | Sanderson Farms, Inc.a | 339,068 | ||||||
| 3,600 | Seneca Foods Corporationb | 96,840 | ||||||
| 18,400 | Snyders-Lance, Inc. | 464,232 | ||||||
| 8,700 | Spartan Stores, Inc. | 157,731 | ||||||
| 14,100 | TreeHouse Foods, Inc.b | 878,289 | ||||||
| 19,100 | United Natural Foods, Inc.b | 1,047,826 | ||||||
| 6,370 | WD-40 Company | 317,290 | ||||||
|
| |||||||
| Total | 8,915,417 | |||||||
|
| |||||||
| Energy (4.0%) | ||||||||
| 10,400 | Approach Resources, Inc.a,b | 265,616 | ||||||
| 11,600 | Basic Energy Services, Inc.b | 119,712 | ||||||
| 14,000 | Bristow Group, Inc. | 569,380 | ||||||
| 23,900 | Cloud Peak Energy, Inc.b | 404,149 | ||||||
| 18,900 | Comstock Resources, Inc.b | 310,338 | ||||||
| 5,100 | Contango Oil & Gas Companyb | 301,920 | ||||||
| 24,600 | Exterran Holdings, Inc.b | 313,650 | ||||||
| 7,800 | GeoResources, Inc.b | 285,558 | ||||||
| 5,700 | Gulf Island Fabrication, Inc. | 160,797 | ||||||
| 17,700 | Gulfport Energy Corporationb | 365,151 | ||||||
| 13,700 | Hornbeck Offshore Services, Inc.b | 531,286 | ||||||
| 50,100 | ION Geophysical Corporationb | 330,159 | ||||||
| 13,000 | Lufkin Industries, Inc. | 706,160 | ||||||
| 10,100 | Matrix Service Companyb | 114,635 | ||||||
| 10,300 | Overseas Shipholding Group, Inc.a | 114,433 | ||||||
| 2,500 | OYO Geospace Corporationb | 224,975 | ||||||
| 12,400 | PDC Energy, Inc.b | 304,048 | ||||||
| 18,000 | Penn Virginia Corporation | 132,120 | ||||||
| 22,400 | PetroQuest Energy, Inc.b | 112,000 | ||||||
| 24,200 | Pioneer Drilling Companyb | 192,874 | ||||||
| 8,250 | SEACOR Holdings, Inc.b | 737,385 | ||||||
| 19,200 | Stone Energy Corporationb | 486,528 | ||||||
| 16,700 | Swift Energy Companyb | 310,787 | ||||||
| 30,350 | Tetra Technologies, Inc.b | 216,395 | ||||||
|
| |||||||
| Total | 7,610,056 | |||||||
|
| |||||||
| Financials (20.5%) | ||||||||
| 16,828 | Acadia Realty Trust | 390,073 | ||||||
| 7,200 | Amerisafe, Inc.b | 186,840 | ||||||
| 18,200 | Bank Mutual Corporation | 80,262 | ||||||
| 11,300 | Bank of the Ozarks, Inc. | 339,904 | ||||||
| 30,600 | BBCN Bancorp, Inc.b | 333,234 | ||||||
| 30,700 | Boston Private Financial Holdings, Inc. | 274,151 | ||||||
| 27,500 | Brookline Bancorp, Inc. | 243,375 | ||||||
| 7,900 | Calamos Asset Management, Inc. | 90,455 | ||||||
| 11,500 | Cash America International, Inc. | 506,460 | ||||||
| 22,300 | Cedar Realty Trust, Inc. | 112,615 | ||||||
| 5,900 | City Holding Companya | 198,771 | ||||||
| 34,500 | Colonial Properties Trust | 763,830 | ||||||
| 15,600 | Columbia Banking System, Inc. | 293,592 | ||||||
| 15,400 | Community Bank System, Inc. | 417,648 | ||||||
| 40,900 | Cousins Properties, Inc. | 316,975 | ||||||
| 34,400 | CVB Financial Corporationa | 400,760 | ||||||
| 66,067 | DiamondRock Hospitality Company | 673,883 | ||||||
| 10,975 | Dime Community Bancshares, Inc. | 145,858 | ||||||
| 10,900 | EastGroup Properties, Inc. | 580,970 | ||||||
| 7,900 | eHealth, Inc.b | 127,269 | ||||||
| 12,800 | Employers Holdings, Inc. | 230,912 | ||||||
| 8,700 | Encore Capital Group, Inc.b | 257,694 | ||||||
| 18,300 | Entertainment Properties Trust | 752,313 | ||||||
| 40,700 | Extra Space Storage, Inc. | 1,245,420 | ||||||
| 17,200 | EZCORP, Inc.b | 403,512 | ||||||
| 54,700 | F.N.B. Corporation | 594,589 | ||||||
| 15,600 | Financial Engines, Inc.a,b | 334,620 | ||||||
| 8,073 | First Bancorpa,b | 31,969 | ||||||
| 11,600 | First Cash Financial Services, Inc.b | 465,972 | ||||||
| 41,300 | First Commonwealth Financial Corporation | 277,949 | ||||||
| 22,900 | First Financial Bancorp | 365,942 | ||||||
| 12,350 | First Financial Bankshares, Inc.a | 426,816 | ||||||
| 29,412 | First Midwest Bancorp, Inc. | 322,944 | ||||||
| 13,600 | Forestar Real Estate Group, Inc.b | 174,216 | ||||||
| 28,300 | Franklin Street Properties Corporation | 299,414 | ||||||
| 10,600 | Getty Realty Corporation | 202,990 | ||||||
| 28,200 | Glacier Bancorp, Inc. | 436,818 | ||||||
| 12,362 | Hanmi Financial Corporationb | 129,554 | ||||||
| 30,600 | Healthcare Realty Trust, Inc. | 729,504 | ||||||
| 8,720 | Home Bancshares, Inc. | 266,657 | ||||||
| 15,700 | Horace Mann Educators Corporation | 274,436 | ||||||
| 8,400 | Independent Bank Corporation (MA) | 245,364 | ||||||
| 4,700 | Infinity Property & Casualty Corporation | 271,049 | ||||||
| 30,400 | Inland Real Estate Corporation | 254,752 | ||||||
| 15,200 | Interactive Brokers Group, Inc. | 223,744 | ||||||
| 15,400 | Investment Technology Group, Inc.b | 141,680 | ||||||
| 26,800 | Kilroy Realty Corporation | 1,297,388 | ||||||
| 25,000 | Kite Realty Group Trust | 124,750 | ||||||
| 33,600 | LaSalle Hotel Properties | 979,104 | ||||||
| 53,059 | Lexington Realty Trust | 449,410 | ||||||
| 11,900 | LTC Properties, Inc. | 431,732 | ||||||
| 20,074 | Meadowbrook Insurance Group, Inc. | 176,450 | ||||||
| 53,100 | Medical Properties Trust, Inc. | 510,822 | ||||||
| 16,100 | Mid-America Apartment Communities, Inc. | 1,098,664 | ||||||
| 15,800 | National Financial Partnersb | 211,720 | ||||||
| 48,400 | National Penn Bancshares, Inc. | 463,188 | ||||||
| 4,300 | Navigators Group, Inc.b | 215,215 | ||||||
| 13,000 | NBT Bancorp, Inc. | 280,670 | ||||||
| 38,200 | Northwest Bancshares, Inc. | 447,322 | ||||||
| 37,200 | Old National Bancorp | 446,772 | ||||||
| 17,900 | Oritani Financial Corporation | 257,581 | ||||||
| 13,200 | PacWest Bancorp | 312,444 | ||||||
| 8,000 | Parkway Properties, Inc. | 91,520 | ||||||
The accompanying Notes to Financial Statements are an integral part of this schedule.
106
Table of Contents
Small Cap Index Portfolio
Schedule of Investments as of June 29, 2012
(unaudited)
| Shares | Common Stock (99.4%) | Value | ||||||
| Financials (20.5%) - continued | ||||||||
| 21,800 | Pennsylvania Real Estate Investment Trust | $ | 326,564 | |||||
| 13,500 | Pinnacle Financial Partners, Inc.b | 263,385 | ||||||
| 6,200 | Piper Jaffray Companiesb | 145,266 | ||||||
| 6,700 | Portfolio Recovery Associates, Inc.b | 611,442 | ||||||
| 20,900 | Post Properties, Inc. | 1,023,055 | ||||||
| 8,400 | Presidential Life Corporation | 82,572 | ||||||
| 23,600 | PrivateBancorp, Inc. | 348,336 | ||||||
| 12,000 | ProAssurance Corporation | 1,069,080 | ||||||
| 46,971 | Prospect Capital Corporationa | 535,000 | ||||||
| 21,100 | Provident Financial Services, Inc. | 323,885 | ||||||
| 7,300 | PS Business Parks, Inc. | 494,356 | ||||||
| 6,600 | RLI Corporation | 450,120 | ||||||
| 11,100 | S&T Bancorp, Inc.a | 205,017 | ||||||
| 14,700 | Sabra Healthcare REIT, Inc. | 251,517 | ||||||
| 6,000 | Safety Insurance Group, Inc. | 243,840 | ||||||
| 4,700 | Saul Centers, Inc. | 201,489 | ||||||
| 21,500 | Selective Insurance Group, Inc. | 374,315 | ||||||
| 6,800 | Simmons First National Corporation | 158,100 | ||||||
| 11,400 | Sovran Self Storage, Inc. | 571,026 | ||||||
| 12,100 | Sterling Bancorp | 120,758 | ||||||
| 7,600 | Stewart Information Services Corporation | 116,660 | ||||||
| 21,050 | Stifel Financial Corporationb | 650,445 | ||||||
| 73,500 | Susquehanna Bancshares, Inc. | 757,050 | ||||||
| 11,626 | SWS Group, Inc.b | 61,966 | ||||||
| 36,400 | Tanger Factory Outlet Centers, Inc. | 1,166,620 | ||||||
| 14,800 | Texas Capital Bancshares, Inc.b | 597,772 | ||||||
| 3,540 | Tompkins Financial Corporation | 133,387 | ||||||
| 15,500 | Tower Group, Inc. | 323,485 | ||||||
| 36,782 | Trustco Bank Corporation NY | 200,830 | ||||||
| 12,700 | UMB Financial Corporation | 650,621 | ||||||
| 44,000 | Umpqua Holdings Corporation | 579,040 | ||||||
| 17,800 | United Bankshares, Inc.a | 460,664 | ||||||
| 7,475 | United Community Banks, Inc.a,b | 64,061 | ||||||
| 8,100 | United Fire Group, Inc. | 172,773 | ||||||
| 5,000 | Universal Health Realty Income Trust | 207,650 | ||||||
| 9,100 | Urstadt Biddle Properties, Inc. | 179,907 | ||||||
| 12,800 | ViewPoint Financial Group | 200,192 | ||||||
| 3,100 | Virtus Investment Partners, Inc.b | 251,100 | ||||||
| 23,500 | Wilshire Bancorp, Inc.b | 128,780 | ||||||
| 14,200 | Wintrust Financial Corporation | 504,100 | ||||||
| 5,412 | World Acceptance Corporationa,b | 356,110 | ||||||
|
| |||||||
| Total | 39,194,843 | |||||||
|
| |||||||
| Health Care (11.4%) | ||||||||
| 8,500 | Abaxis, Inc.b | 314,500 | ||||||
| 27,700 | Affymetrix, Inc.b | 129,913 | ||||||
| 4,500 | Air Methods Corporationb | 442,125 | ||||||
| 26,400 | Akorn, Inc.b | 416,328 | ||||||
| 27,100 | Align Technology, Inc.b | 906,766 | ||||||
| 3,300 | Almost Family, Inc.b | 73,722 | ||||||
| 11,833 | Amedisys, Inc.a,b | 147,321 | ||||||
| 15,600 | AMN Healthcare Services, Inc.b | 92,508 | ||||||
| 12,350 | AmSurg Corporationb | 370,253 | ||||||
| 4,900 | Analogic Corporation | 303,800 | ||||||
| 23,600 | ArQule, Inc.b | 139,948 | ||||||
| 9,800 | Bio-Reference Laboratories, Inc.a,b | 257,544 | ||||||
| 11,600 | Cambrex Corporationb | 109,156 | ||||||
| 7,950 | Cantel Medical Corporation | 216,637 | ||||||
| 20,000 | Centene Corporationb | 603,200 | ||||||
| 7,500 | Chemed Corporation | 453,300 | ||||||
| 4,400 | Computer Programs and Systems, Inc. | 251,768 | ||||||
| 11,050 | CONMED Corporation | 305,754 | ||||||
| 2,500 | Corvel Corporationb | 122,500 | ||||||
| 12,200 | Cross Country Healthcare, Inc.b | 53,314 | ||||||
| 10,850 | CryoLife, Inc.b | 56,745 | ||||||
| 24,700 | Cubist Pharmaceuticals, Inc.b | 936,377 | ||||||
| 9,700 | Cyberonics, Inc.b | 435,918 | ||||||
| 9,700 | Emergent Biosolutions, Inc.b | 146,955 | ||||||
| 6,500 | Ensign Group, Inc. | 183,755 | ||||||
| 13,197 | Enzo Biochem, Inc.b | 22,039 | ||||||
| 17,200 | eResearch Technology, Inc.b | 137,428 | ||||||
| 12,100 | Gentiva Health Services, Inc.b | 83,853 | ||||||
| 9,200 | Greatbatch, Inc.b | 208,932 | ||||||
| 9,900 | Haemonetics Corporationb | 733,689 | ||||||
| 13,300 | Hanger, Inc.b | 341,012 | ||||||
| 13,000 | Healthways, Inc.b | 103,740 | ||||||
| 4,100 | Hi-Tech Pharmacal Companyb | 132,840 | ||||||
| 4,800 | ICU Medical, Inc.b | 256,224 | ||||||
| 7,800 | Integra LifeSciences Holdings Corporationb | 290,004 | ||||||
| 12,500 | Invacare Corporation | 192,875 | ||||||
| 6,500 | IPC The Hospitalist Company, Inc.b | 294,580 | ||||||
| 20,500 | Kindred Healthcare, Inc.b | 201,515 | ||||||
| 3,800 | Landauer, Inc. | 217,854 | ||||||
| 6,300 | LHC Group, Inc.b | 106,848 | ||||||
| 14,900 | Luminex Corporationb | 364,901 | ||||||
| 10,700 | Magellan Health Services, Inc.b | 485,031 | ||||||
| 21,300 | Medicines Companyb | 488,622 | ||||||
| 8,700 | Medidata Solutions, Inc.b | 284,229 | ||||||
| 16,200 | Meridian Bioscience, Inc.a | 331,452 | ||||||
| 16,475 | Merit Medical Systems, Inc.b | 227,520 | ||||||
| 11,200 | Molina Healthcare, Inc.b | 262,752 | ||||||
| 17,300 | Momenta Pharmaceuticals, Inc.b | 233,896 | ||||||
| 5,000 | MWI Veterinary Supply, Inc.b | 513,850 | ||||||
| 11,500 | Natus Medical, Inc.b | 133,630 | ||||||
| 9,250 | Neogen Corporationb | 427,350 | ||||||
| 16,800 | NuVasive, Inc.b | 426,048 | ||||||
| 13,000 | Omnicell, Inc.b | 190,320 | ||||||
| 7,700 | Palomar Medical Technologies, Inc.b | 65,450 | ||||||
| 14,400 | Par Pharmaceutical Companies, Inc.b | 520,416 | ||||||
| 23,400 | PAREXEL International Corporationb | 660,582 | ||||||
| 11,600 | PharMerica Corporationb | 126,672 | ||||||
| 20,200 | PSS World Medical, Inc.b | 423,998 | ||||||
| 15,500 | Quality Systems, Inc. | 426,405 | ||||||
| 23,900 | Questcor Pharmaceuticals, Inc.a,b | 1,272,436 | ||||||
| 22,800 | Salix Pharmaceuticals, Ltd.b | 1,241,232 | ||||||
| 28,100 | Savient Pharmaceuticals, Inc.a,b | 15,177 | ||||||
| 19,800 | Spectrum Pharmaceuticals, Inc.a,b | 308,088 | ||||||
| 5,800 | SurModics, Inc.b | 100,340 | ||||||
| 14,200 | Symmetry Medical, Inc.b | 121,836 | ||||||
| 27,800 | Viropharma, Inc.b | 658,860 | ||||||
The accompanying Notes to Financial Statements are an integral part of this schedule.
107
Table of Contents
Small Cap Index Portfolio
Schedule of Investments as of June 29, 2012
(unaudited)
| Shares | Common Stock (99.4%) | Value | ||||||
| Health Care (11.4%) - continued | ||||||||
| 13,300 | West Pharmaceutical Services, Inc. | $ | 671,517 | |||||
|
| |||||||
| Total | 21,776,150 | |||||||
|
| |||||||
| Industrials (14.8%) | ||||||||
| 15,200 | A.O. Smith Corporation | 743,128 | ||||||
| 7,450 | AAON, Inc.a | 140,433 | ||||||
| 15,800 | AAR Corporation | 212,984 | ||||||
| 19,000 | ABM Industries, Inc. | 371,640 | ||||||
| 26,800 | Actuant Corporation | 727,888 | ||||||
| 15,500 | Aegion Corporationb | 277,295 | ||||||
| 7,200 | Aerovironment, Inc.b | 189,432 | ||||||
| 11,100 | Albany International Corporation | 207,681 | ||||||
| 6,000 | Allegiant Travel Companyb | 418,080 | ||||||
| 3,500 | American Science & Engineering, Inc. | 197,575 | ||||||
| 11,000 | Apogee Enterprises, Inc. | 176,770 | ||||||
| 16,450 | Applied Industrial Technologies, Inc. | 606,182 | ||||||
| 10,000 | Arkansas Best Corporation | 126,000 | ||||||
| 7,900 | Astec Industries, Inc.b | 242,372 | ||||||
| 5,000 | AZZ, Inc. | 306,300 | ||||||
| 18,400 | Barnes Group, Inc. | 446,936 | ||||||
| 18,025 | Belden, Inc. | 601,134 | ||||||
| 20,600 | Brady Corporation | 566,706 | ||||||
| 19,600 | Briggs & Stratton Corporation | 342,804 | ||||||
| 3,400 | Cascade Corporation | 159,970 | ||||||
| 5,100 | CDI Corporation | 83,640 | ||||||
| 9,550 | Ceradyne, Inc. | 244,957 | ||||||
| 6,800 | Circor International, Inc. | 231,812 | ||||||
| 14,700 | Comfort Systems USA, Inc. | 147,294 | ||||||
| 3,500 | Consolidated Graphics, Inc.b | 101,675 | ||||||
| 6,200 | Cubic Corporation | 298,096 | ||||||
| 18,300 | Curtiss-Wright Corporation | 568,215 | ||||||
| 11,800 | Dolan Companyb | 79,414 | ||||||
| 13,400 | Dycom Industries, Inc.b | 249,374 | ||||||
| 26,200 | EMCOR Group, Inc. | 728,884 | ||||||
| 7,500 | Encore Wire Corporation | 200,850 | ||||||
| 18,800 | EnerSysb | 659,316 | ||||||
| 8,100 | EnPro Industries, Inc.b | 302,697 | ||||||
| 10,500 | ESCO Technologies, Inc. | 382,620 | ||||||
| 5,300 | Exponent, Inc.b | 279,999 | ||||||
| 24,300 | Federal Signal Corporationb | 141,912 | ||||||
| 11,300 | Forward Air Corporation | 364,651 | ||||||
| 7,400 | Franklin Electric Company, Inc. | 378,362 | ||||||
| 7,400 | G & K Services, Inc. | 230,806 | ||||||
| 23,100 | GenCorp, Inc.b | 150,381 | ||||||
| 24,000 | Geo Group, Inc.b | 545,280 | ||||||
| 11,900 | Gibraltar Industries, Inc.b | 123,522 | ||||||
| 18,130 | Griffon Corporation | 155,555 | ||||||
| 26,237 | Healthcare Services Group, Inc. | 508,473 | ||||||
| 22,448 | Heartland Express, Inc. | 321,231 | ||||||
| 7,000 | Heidrick & Struggles International, Inc. | 122,500 | ||||||
| 14,800 | Hub Group, Inc.b | 535,760 | ||||||
| 21,500 | II-VI, Inc.b | 358,405 | ||||||
| 8,800 | Insperity, Inc. | 238,040 | ||||||
| 22,600 | Interface, Inc. | 308,038 | ||||||
| 11,300 | John Bean Technologies Corporation | 153,341 | ||||||
| 10,300 | Kaman Corporation | 318,682 | ||||||
| 12,600 | Kaydon Corporation | 269,514 | ||||||
| 11,200 | Kelly Services, Inc. | 144,592 | ||||||
| 23,150 | Knight Transportation, Inc. | 370,169 | ||||||
| 1,500 | Lawson Products, Inc. | 13,875 | ||||||
| 5,050 | Lindsay Manufacturing Companya | 327,745 | ||||||
| 6,700 | Lydall, Inc.b | 90,584 | ||||||
| 14,300 | Mobile Mini, Inc.b | 205,920 | ||||||
| 17,750 | Moog, Inc.b | 733,963 | ||||||
| 15,000 | Mueller Industries, Inc. | 638,850 | ||||||
| 1,900 | National Presto Industries, Inc.a | 132,563 | ||||||
| 20,400 | Navigant Consulting, Inc.b | 257,856 | ||||||
| 7,960 | NCI Building Systems, Inc.b | 86,207 | ||||||
| 18,525 | Old Dominion Freight Line, Inc.b | 801,947 | ||||||
| 17,000 | On Assignment, Inc.b | 271,320 | ||||||
| 23,200 | Orbital Sciences Corporationb | 299,744 | ||||||
| 10,700 | Orion Marine Group, Inc.b | 74,472 | ||||||
| 3,600 | Powell Industries, Inc.b | 134,496 | ||||||
| 14,375 | Quanex Building Products Corporation | 257,025 | ||||||
| 16,900 | Resources Global Professionals | 207,870 | ||||||
| 17,300 | Robbins & Myers, Inc. | 723,486 | ||||||
| 16,000 | Simpson Manufacturing Company, Inc. | 472,160 | ||||||
| 20,000 | SkyWest, Inc. | 130,600 | ||||||
| 5,000 | Standex International Corporation | 212,850 | ||||||
| 15,400 | Sykes Enterprises, Inc.b | 245,784 | ||||||
| 14,400 | Teledyne Technologies, Inc.b | 887,760 | ||||||
| 7,500 | Tennant Company | 299,625 | ||||||
| 24,806 | Tetra Tech, Inc.b | 646,940 | ||||||
| 11,800 | Toro Company | 864,822 | ||||||
| 15,200 | TrueBlue, Inc.b | 235,296 | ||||||
| 6,100 | UniFirst Corporation | 388,875 | ||||||
| 16,600 | United Stationers, Inc. | 447,370 | ||||||
| 7,800 | Universal Forest Products, Inc. | 304,044 | ||||||
| 8,000 | Viad Corporation | 160,000 | ||||||
| 7,700 | Vicor Corporation | 53,438 | ||||||
| 11,500 | Watts Water Technologies, Inc. | 383,410 | ||||||
|
| |||||||
| Total | 28,350,264 | |||||||
|
| |||||||
| Information Technology (18.3%) | ||||||||
| 14,000 | 3D Systems Corporationa,b | 477,960 | ||||||
| 15,800 | Advanced Energy Industries, Inc.b | 212,036 | ||||||
| 5,800 | Agilysys, Inc.b | 50,286 | ||||||
| 10,900 | Anixter International, Inc. | 578,245 | ||||||
| 45,223 | Arris Group, Inc.b | 629,052 | ||||||
| 12,500 | ATMI, Inc.b | 257,125 | ||||||
| 11,613 | Avid Technology, Inc.b | 86,285 | ||||||
| 6,000 | Badger Meter, Inc. | 225,300 | ||||||
| 4,000 | Bel Fuse, Inc. | 70,440 | ||||||
| 22,750 | Benchmark Electronics, Inc.b | 317,362 | ||||||
| 6,900 | Black Box Corporation | 198,030 | ||||||
| 17,700 | Blackbaud, Inc. | 454,359 | ||||||
| 15,500 | Blucora, Inc.b | 190,960 | ||||||
| 14,200 | Bottomline Technologies, Inc.b | 256,310 | ||||||
| 27,100 | Brightpoint, Inc.b | 146,611 | ||||||
| 26,007 | Brooks Automation, Inc. | 245,506 | ||||||
| 9,000 | Cabot Microelectronics Corporation | 262,890 | ||||||
| 10,400 | CACI International, Inc.b | 572,208 | ||||||
| 17,300 | Cardtronics, Inc.b | 522,633 | ||||||
| 9,200 | Ceva, Inc.b | 162,012 | ||||||
The accompanying Notes to Financial Statements are an integral part of this schedule.
108
Table of Contents
Small Cap Index Portfolio
Schedule of Investments as of June 29, 2012
(unaudited)
| Shares | Common Stock (99.4%) | Value | ||||||
| Information Technology (18.3%) - continued | ||||||||
| 15,800 | Checkpoint Systems, Inc.b | $ | 137,618 | |||||
| 28,400 | CIBER, Inc.b | 122,404 | ||||||
| 25,200 | Cirrus Logic, Inc.b | 752,976 | ||||||
| 16,700 | Cognex Corporation | 528,555 | ||||||
| 9,600 | Cohu, Inc. | 97,536 | ||||||
| 17,400 | CommVault Systems, Inc.b | 862,518 | ||||||
| 13,300 | comScore, Inc.b | 218,918 | ||||||
| 7,500 | Comtech Telecommunications Corporation | 214,350 | ||||||
| 13,300 | CSG Systems International, Inc.b | 229,824 | ||||||
| 13,400 | CTS Corporation | 126,228 | ||||||
| 12,100 | Cymer, Inc.b | 713,295 | ||||||
| 14,500 | Daktronics, Inc. | 100,195 | ||||||
| 16,500 | DealerTrack Holdings, Inc.b | 496,815 | ||||||
| 10,100 | Digi International, Inc.b | 103,424 | ||||||
| 14,000 | Digital River, Inc.b | 232,680 | ||||||
| 14,450 | Diodes, Inc.b | 271,227 | ||||||
| 8,700 | DSP Group, Inc.b | 55,158 | ||||||
| 6,500 | DTS, Inc.b | 169,520 | ||||||
| 12,500 | Ebix, Inc.a | 249,375 | ||||||
| 9,600 | Electro Scientific Industries, Inc. | 113,472 | ||||||
| 34,300 | Entropic Communications, Inc.b | 193,452 | ||||||
| 12,600 | EPIQ Systems, Inc. | 154,350 | ||||||
| 17,600 | Exar Corporationb | 143,616 | ||||||
| 6,400 | ExlService Holdings, Inc.b | 157,696 | ||||||
| 6,600 | FARO Technologies, Inc.b | 277,728 | ||||||
| 14,900 | FEI Companyb | 712,816 | ||||||
| 5,800 | Forrester Research, Inc. | 196,388 | ||||||
| 47,000 | GT Advanced Technologies, Inc.a,b | 248,160 | ||||||
| 46,000 | Harmonic, Inc.b | 195,960 | ||||||
| 15,300 | Heartland Payment Systems, Inc. | 460,224 | ||||||
| 12,300 | Higher One Holdings, Inc.a,b | 150,306 | ||||||
| 11,000 | Hittite Microwave Corporationb | 562,320 | ||||||
| 11,800 | iGATE Corporationb | 200,836 | ||||||
| 17,375 | Insight Enterprises, Inc.b | 292,421 | ||||||
| 5,700 | Interactive Intelligence Groupb | 160,797 | ||||||
| 20,200 | Intermec, Inc.b | 125,240 | ||||||
| 9,100 | Intevac, Inc.b | 68,432 | ||||||
| 18,400 | j2 Global, Inc. | 486,128 | ||||||
| 16,700 | JDA Software Group, Inc.b | 495,823 | ||||||
| 26,600 | Kopin Corporationb | 91,504 | ||||||
| 29,000 | Kulicke and Soffa Industries, Inc.b | 258,680 | ||||||
| 9,200 | Liquidity Services, Inc.b | 470,948 | ||||||
| 8,500 | Littelfuse, Inc. | 483,565 | ||||||
| 18,600 | Liveperson, Inc.b | 354,516 | ||||||
| 8,400 | LogMeIn, Inc.b | 256,368 | ||||||
| 8,100 | Manhattan Associates, Inc.b | 370,251 | ||||||
| 13,300 | MAXIMUS, Inc. | 688,275 | ||||||
| 6,000 | Measurement Specialties, Inc.b | 195,060 | ||||||
| 12,100 | Mercury Computer Systems, Inc.b | 156,453 | ||||||
| 14,500 | Methode Electronics, Inc. | 123,395 | ||||||
| 19,400 | Micrel, Inc. | 184,882 | ||||||
| 34,400 | Microsemi Corporationb | 636,056 | ||||||
| 3,200 | MicroStrategy, Inc.b | 415,552 | ||||||
| 20,600 | MKS Instruments, Inc. | 595,958 | ||||||
| 11,700 | Monolithic Power Systems, Inc.b | 232,479 | ||||||
| 14,300 | Monotype Imaging Holdings, Inc.b | 239,811 | ||||||
| 6,300 | MTS Systems Corporation | 242,865 | ||||||
| 6,700 | Nanometrics, Inc.b | 102,912 | ||||||
| 3,100 | NCI, Inc.b | 12,555 | ||||||
| 14,800 | NETGEAR, Inc.b | 510,748 | ||||||
| 13,500 | NetScout Systems, Inc.b | 291,465 | ||||||
| 14,800 | Newport Corporationb | 177,896 | ||||||
| 12,700 | Novatel Wireless, Inc.b | 31,623 | ||||||
| 8,900 | OpenTable, Inc.a,b | 400,589 | ||||||
| 7,500 | Oplink Communications, Inc.b | 101,475 | ||||||
| 5,800 | Opnet Technologies, Inc. | 154,222 | ||||||
| 7,800 | OSI Systems, Inc.b | 494,052 | ||||||
| 8,250 | Park Electrochemical Corporation | 213,510 | ||||||
| 7,100 | PC-Tel, Inc. | 45,937 | ||||||
| 12,400 | Perficient, Inc.b | 139,252 | ||||||
| 9,400 | Pericom Semiconductor Corporationb | 84,600 | ||||||
| 13,700 | Plexus Corporationb | 386,340 | ||||||
| 11,100 | Power Integrations, Inc. | 414,030 | ||||||
| 24,350 | Progress Software Corporationb | 508,184 | ||||||
| 16,200 | Pulse Electronics Corporation | 31,914 | ||||||
| 10,000 | QuinStreet, Inc.b | 92,600 | ||||||
| 9,000 | RadiSys Corporationb | 56,520 | ||||||
| 11,200 | Rofin-Sinar Technologies, Inc.b | 212,016 | ||||||
| 6,400 | Rogers Corporationb | 253,504 | ||||||
| 6,900 | Rubicon Technology, Inc.a,b | 70,380 | ||||||
| 12,500 | Rudolph Technologies, Inc.b | 109,000 | ||||||
| 10,800 | ScanSource, Inc.b | 330,912 | ||||||
| 12,700 | Sigma Designs, Inc.b | 81,026 | ||||||
| 11,400 | Sourcefire, Inc.b | 585,960 | ||||||
| 8,700 | Standard Microsystems Corporationb | 320,943 | ||||||
| 16,100 | STR Holdings, Inc.a,b | 73,416 | ||||||
| 8,300 | Stratasys, Inc.b | 411,265 | ||||||
| 10,800 | Super Micro Computer, Inc.b | 171,288 | ||||||
| 4,800 | Supertex, Inc.b | 90,480 | ||||||
| 16,450 | Symmetricom, Inc.b | 98,536 | ||||||
| 12,900 | Synaptics, Inc.a,b | 369,327 | ||||||
| 10,600 | Synchronoss Technologies, Inc.b | 195,782 | ||||||
| 10,200 | Synnex Corporationb | 351,798 | ||||||
| 35,150 | Take-Two Interactive Software, Inc.b | 332,519 | ||||||
| 9,900 | TeleTech Holdings, Inc.b | 158,400 | ||||||
| 20,400 | Tessera Technologies, Inc. | 313,548 | ||||||
| 65,300 | TriQuint Semiconductor, Inc.b | 359,150 | ||||||
| 20,100 | TTM Technologies, Inc.b | 189,141 | ||||||
| 9,700 | Tyler Technologies, Inc.b | 391,395 | ||||||
| 10,300 | Ultratech, Inc.b | 324,450 | ||||||
| 35,400 | United Online, Inc. | 149,388 | ||||||
| 11,200 | VASCO Data Security International, Inc.b | 91,616 | ||||||
| 15,200 | Veeco Instruments, Inc.a,b | 522,272 | ||||||
| 16,800 | Viasat, Inc.b | 634,536 | ||||||
| 7,300 | Virtusa Corporationb | 97,455 | ||||||
| 9,800 | Volterra Semiconductor Corporationb | 229,810 | ||||||
| 14,800 | Websense, Inc.b | 277,204 | ||||||
| 10,700 | XO Group, Inc.b | 94,909 | ||||||
|
| |||||||
| Total | 35,132,859 | |||||||
|
| |||||||
| Materials (5.6%) | ||||||||
| 11,600 | A. Schulman, Inc. | 230,260 | ||||||
| 6,600 | A.M. Castle & Companyb | 70,092 | ||||||
| 43,500 | AK Steel Holding Corporationa | 255,345 | ||||||
The accompanying Notes to Financial Statements are an integral part of this schedule.
109
Table of Contents
Small Cap Index Portfolio
Schedule of Investments as of June 29, 2012
(unaudited)
| Shares | Common Stock (99.4%) | Value | ||||||
| Materials (5.6%) - continued | ||||||||
| 9,900 | AMCOL International Corporation | $ | 280,269 | |||||
| 9,100 | American Vanguard Corporation | 241,969 | ||||||
| 11,500 | Balchem Corporation | 375,015 | ||||||
| 15,500 | Buckeye Technologies, Inc. | 441,595 | ||||||
| 22,300 | Calgon Carbon Corporationb | 317,106 | ||||||
| 21,300 | Century Aluminum Companyb | 156,129 | ||||||
| 9,000 | Clearwater Paper Corporationb | 307,080 | ||||||
| 4,300 | Deltic Timber Corporation | 262,214 | ||||||
| 17,700 | Eagle Materials, Inc. | 660,918 | ||||||
| 25,000 | Globe Specialty Metals, Inc. | 335,750 | ||||||
| 19,300 | H.B. Fuller Company | 592,510 | ||||||
| 3,600 | Hawkins, Inc.a | 137,448 | ||||||
| 4,800 | Haynes International, Inc. | 244,512 | ||||||
| 24,000 | Headwaters, Inc.b | 123,600 | ||||||
| 8,500 | Innophos Holdings, Inc. | 479,910 | ||||||
| 6,300 | Kaiser Aluminum Corporation | 326,592 | ||||||
| 15,300 | KapStone Paper and Packaging Corporationb | 242,505 | ||||||
| 8,100 | Koppers Holdings, Inc. | 275,400 | ||||||
| 12,600 | Kraton Performance Polymers, Inc.b | 276,066 | ||||||
| 7,300 | LSB Industries, Inc.b | 225,643 | ||||||
| 8,000 | Materion Corporation | 184,240 | ||||||
| 13,163 | Myers Industries, Inc. | 225,877 | ||||||
| 6,300 | Neenah Paper, Inc. | 168,147 | ||||||
| 3,600 | Olympic Steel, Inc. | 59,112 | ||||||
| 12,700 | OM Group, Inc.b | 241,300 | ||||||
| 35,000 | PolyOne Corporation | 478,800 | ||||||
| 5,100 | Quaker Chemical Corporation | 235,671 | ||||||
| 11,900 | RTI International Metals, Inc.b | 269,297 | ||||||
| 6,300 | Schweitzer-Mauduit International, Inc. | 429,282 | ||||||
| 3,300 | Stepan Company | 310,794 | ||||||
| 27,527 | SunCoke Energy, Inc.b | 403,271 | ||||||
| 11,000 | Texas Industries, Inc.a | 429,110 | ||||||
| 9,200 | Tredegar Corporation | 133,952 | ||||||
| 19,400 | Wausau Paper Corporation | 188,762 | ||||||
| 8,650 | Zep, Inc. | 118,764 | ||||||
|
| |||||||
| Total | 10,734,307 | |||||||
|
| |||||||
| Telecommunications Services (0.5%) | ||||||||
| 3,700 | Atlantic Tele-Network, Inc. | 124,801 | ||||||
| 12,100 | Cbeyond, Inc.b | 81,917 | ||||||
| 77,200 | Cincinnati Bell, Inc.b | 287,184 | ||||||
| 12,900 | General Communication, Inc.b | 107,199 | ||||||
| 5,900 | Lumos Networks Corporation | 55,755 | ||||||
| 12,400 | Neutral Tandem, Inc.b | 163,432 | ||||||
| 5,900 | NTELOS Holdings Corporation | 111,215 | ||||||
| 8,800 | USA Mobility, Inc. | 113,168 | ||||||
|
| |||||||
| Total | 1,044,671 | |||||||
|
| |||||||
| Utilities (4.2%) | ||||||||
| 12,933 | ALLETE, Inc. | 540,599 | ||||||
| 7,450 | American States Water Company | 294,871 | ||||||
| 23,000 | Avista Corporation | 614,100 | ||||||
| 5,900 | CH Energy Group, Inc. | 387,571 | ||||||
| 15,700 | El Paso Electric Company | 520,612 | ||||||
| 8,800 | Laclede Group, Inc. | 350,328 | ||||||
| 16,250 | New Jersey Resources Corporation | 708,663 | ||||||
| 10,500 | Northwest Natural Gas Company | 499,800 | ||||||
| 14,200 | NorthWestern Corporation | 521,140 | ||||||
| 28,400 | Piedmont Natural Gas Company, Inc.a | 914,196 | ||||||
| 11,900 | South Jersey Industries, Inc. | 606,543 | ||||||
| 18,100 | Southwest Gas Corporation | 790,065 | ||||||
| 19,866 | UIL Holdings Corporation | 712,395 | ||||||
| 16,100 | UNS Energy Corporation | 618,401 | ||||||
|
| |||||||
| Total | 8,079,284 | |||||||
|
| |||||||
Total Common Stock (cost $154,399,901) | 190,279,621 | |||||||
|
| |||||||
Collateral Held for Securities Loaned (7.4%) | ||||||||
| 14,186,996 | Thrivent Financial Securities Lending Trust | 14,186,996 | ||||||
|
| |||||||
Total Collateral Held for Securities Loaned (cost $14,186,996) | 14,186,996 | |||||||
|
| |||||||
| Principal Amount | Short-Term Investments (0.2%)c | |||||||
| Federal National Mortgage Association Discount Notes | ||||||||
| 150,000 | 0.110%, 7/18/2012d,e | 149,992 | ||||||
| U.S. Treasury Bills | ||||||||
| 200,000 | 0.100%, 7/19/2012d,e | 199,990 | ||||||
|
| |||||||
| Total Short-Term Investments (at amortized cost) | 349,982 | |||||||
|
| |||||||
| Total Investments (cost $168,936,879) 107.0% | $ | 204,816,599 | ||||||
|
| |||||||
| Other Assets and Liabilities, Net (7.0%) | (13,363,964 | ) | ||||||
|
| |||||||
| Total Net Assets 100.0% | $ | 191,452,635 | ||||||
|
| |||||||
| a | All or a portion of the security is on loan. |
| b | Non-income producing security. |
| c | The interest rate shown reflects the yield, coupon rate or the discount rate at the date of purchase. |
| d | Denotes investments that benefit from credit enhancement or liquidity support provided by a third party bank, institution or government. |
| e | At June 29, 2012, $349,982 of investments were held on deposit with the counterparty and pledged as the initial margin deposit for open futures contracts. |
Definitions:
| REIT | - | Real Estate Investment Trust is a company that buys, develops, manages and/or sells real estate assets. |
Unrealized Appreciation (Depreciation)
Gross unrealized appreciation and depreciation of investments, based on cost for federal income tax purposes, were as follows:
Gross unrealized appreciation | $ | 52,058,073 | ||
Gross unrealized depreciation | (21,029,110 | ) | ||
|
| |||
Net unrealized appreciation (depreciation) | $ | 31,028,963 | ||
Cost for federal income tax purposes | $ | 173,787,636 | ||
The accompanying Notes to Financial Statements are an integral part of this schedule.
110
Table of Contents
Small Cap Index Portfolio
Schedule of Investments as of June 29, 2012
(unaudited)
Fair Valuation Measurements
The following table is a summary of the inputs used, as of June 29, 2012, in valuing Small Cap Index Portfolio’s assets carried at fair value.
Investments in Securities | Total | Level 1 | Level 2 | Level 3 | ||||||||||||
Common Stock | ||||||||||||||||
Consumer Discretionary | 29,441,770 | 29,441,770 | — | — | ||||||||||||
Consumer Staples | 8,915,417 | 8,915,417 | — | — | ||||||||||||
Energy | 7,610,056 | 7,610,056 | — | — | ||||||||||||
Financials | 39,194,843 | 39,194,843 | — | — | ||||||||||||
Health Care | 21,776,150 | 21,776,150 | — | — | ||||||||||||
Industrials | 28,350,264 | 28,350,264 | — | — | ||||||||||||
Information Technology | 35,132,859 | 35,132,859 | — | — | ||||||||||||
Materials | 10,734,307 | 10,734,307 | — | — | ||||||||||||
Telecommunications Services | 1,044,671 | 1,044,671 | — | — | ||||||||||||
Utilities | 8,079,284 | 8,079,284 | — | — | ||||||||||||
Collateral Held for Securities Loaned | 14,186,996 | 14,186,996 | — | — | ||||||||||||
Short-Term Investments | 349,982 | — | 349,982 | — | ||||||||||||
|
|
|
|
|
|
|
| |||||||||
Total | $ | 204,816,599 | $ | 204,466,617 | $ | 349,982 | $ | — | ||||||||
|
|
|
|
|
|
|
| |||||||||
Other Financial Instruments | Total | Level 1 | Level 2 | Level 3 | ||||||||||||
Asset Derivatives | ||||||||||||||||
Futures Contracts | 39,842 | 39,842 | — | — | ||||||||||||
|
|
|
|
|
|
|
| |||||||||
Total Asset Derivatives | $ | 39,842 | $ | 39,842 | $ | — | $ | — | ||||||||
|
|
|
|
|
|
|
| |||||||||
There were no significant transfers between the Levels during the period ended June 29, 2012. Transfers between the levels are identified as of the end of the period.
Futures Contracts | Number of Contracts Long/(Short) | Expiration Date | Notional Principal Amount | Value | Unrealized Gain/(Loss) | |||||||||||||||
Russell 2000 Index Mini-Futures | 12 | September 2012 | $ | 914,638 | $ | 954,480 | $ | 39,842 | ||||||||||||
Total Futures Contracts | $ | 39,842 | ||||||||||||||||||
The following table summarizes the fair value and Statement of Assets and Liabilities location, as of June 29, 2012, for Small Cap Index Portfolio’s investments in financial derivative instruments by primary risk exposure as discussed under item (2) Significant Accounting Policies of the Notes to Financial Statements.
Derivatives by risk category | Statement of Assets and Liabilities Location | Fair Value | ||||
Asset Derivatives | ||||||
Equity Contracts | ||||||
Futures* | Net Assets - Net unrealized appreciation/(depreciation) on Futures contracts | 39,842 | ||||
Total Equity Contracts | 39,842 | |||||
|
| |||||
Total Asset Derivatives | $ | 39,842 | ||||
|
| |||||
| * | Includes cumulative appreciation/depreciation of futures contracts as reported in the Schedule of Investments. Only current day’s variation margin is reported within the Statement of Assets and Liabilities. |
The accompanying Notes to Financial Statements are an integral part of this schedule.
111
Table of Contents
Small Cap Index Portfolio
Schedule of Investments as of June 29, 2012
(unaudited)
The following table summarizes the net realized gains/(losses) and Statement of Operations location, for the period ended June 29, 2012, for Small Cap Index Portfolio’s investments in financial derivative instruments by primary risk exposure.
Derivatives by risk category | Statement of Operations Location | Realized Gains/(Losses) recognized in Income | ||||
Equity Contracts | ||||||
Futures | Net realized gains/(losses) on Futures contracts | 101,646 | ||||
Total Equity Contracts | 101,646 | |||||
|
| |||||
Total | $ | 101,646 | ||||
|
| |||||
The following table summarizes the change in net unrealized appreciation/(depreciation) and Statement of Operations location, for the period ended June 29, 2012, for Small Cap Index Portfolio’s investments in financial derivative instruments by primary risk exposure.
Derivatives by risk category | Statement of Operations Location | Change in unrealized appreciation/(depreciation) recognized in Income | ||||
Equity Contracts | ||||||
Futures | Change in net unrealized appreciation/(depreciation) on Futures contracts | (20,026 | ) | |||
Total Equity Contracts | (20,026 | ) | ||||
|
| |||||
Total | ($ | 20,026 | ) | |||
|
| |||||
The following table presents Small Cap Index Portfolio’s average volume of derivative activity during the period ended June 29, 2012.
Derivative Risk Category | Futures (Notional*) | Futures (Percentage of Average Net Assets) | ||||||
Equity Contracts | $ | 2,094,969 | 1.1 | % | ||||
| * | Notional amount represents long or short, or both, derivative positions held by the Portfolio. |
Investment in Affiliates
Affiliated issuers, as defined under the Investment Company Act of 1940, include those in which the Portfolio’s holdings of an issuer represent 5% or more of the outstanding voting securities of an issuer, or any affiliated mutual fund.
A summary of transactions for the fiscal year to date, in Small Cap Index Portfolio, is as follows:
Portfolio | Value December 31, 2011 | Gross Purchases | Gross Sales | Shares Held at June 29, 2012 | Value June 29, 2012 | Income Earned January 1, 2012 - June 29, 2012 | ||||||||||||||||||
Thrivent Financial Securities Lending Trust | $ | 16,002,829 | $ | 25,485,431 | $ | 27,301,264 | 14,186,996 | $ | 14,186,996 | $ | 83,896 | |||||||||||||
Total Value and Income Earned | 16,002,829 | 14,186,996 | 83,896 | |||||||||||||||||||||
The accompanying Notes to Financial Statements are an integral part of this schedule.
112
Table of Contents
Schedule of Investments as of June 29, 2012
(unaudited)
| Shares | Common Stock (96.7%) | Value | ||||||
| Consumer Discretionary (15.8%) | |||||||
| 3,098 | Abercrombie & Fitch Company | $ | 105,766 | |||||
| 2,864 | Darden Restaurants, Inc. | 145,004 | ||||||
| 6,852 | Discovery Communications, Inc.a | 370,008 | ||||||
| 7,846 | Dollar Tree, Inc.a | 422,115 | ||||||
| 3,450 | Gentex Corporation | 72,002 | ||||||
| 6,062 | GNC Holdings, Inc. | 237,630 | ||||||
| 7,787 | Limited Brands, Inc. | 331,181 | ||||||
| 1,786 | O’Reilly Automotive, Inc.a | 149,613 | ||||||
| 4,026 | PetSmart, Inc. | 274,493 | ||||||
| 5,100 | Toll Brothers, Inc.a | 151,623 | ||||||
| 3,466 | Tractor Supply Company | 287,886 | ||||||
| 993 | VF Corporation | 132,516 | ||||||
|
| |||||||
| Total | 2,679,837 | |||||||
|
| |||||||
| Consumer Staples (4.1%) | |||||||
| 2,307 | Clorox Company | 167,165 | ||||||
| 1,731 | Ingredion, Inc. | 85,719 | ||||||
| 4,683 | Whole Foods Market, Inc. | 446,384 | ||||||
|
| |||||||
| Total | 699,268 | |||||||
|
| |||||||
| Energy (11.4%) | |||||||
| 7,500 | Alpha Natural Resources, Inc.a | 65,325 | ||||||
| 5,700 | Cameron International Corporationa | 243,447 | ||||||
| 2,917 | Concho Resources, Inc.a | 248,295 | ||||||
| 6,025 | Ensco plc | 282,994 | ||||||
| 11,221 | Helix Energy Solutions Group, Inc.a | 184,136 | ||||||
| 4,021 | Oil States International, Inc.a | 266,190 | ||||||
| 5,982 | Peabody Energy Corporation | 146,679 | ||||||
| 2,000 | Range Resources Corporation | 123,740 | ||||||
| 2,200 | SM Energy Company | 108,042 | ||||||
| 16,935 | Weatherford International, Ltd.a | 213,889 | ||||||
| 1,347 | Whiting Petroleum Corporationa | 55,389 | ||||||
|
| |||||||
| Total | 1,938,126 | |||||||
|
| |||||||
| Financials (5.0%) | |||||||
| 2,919 | Affiliated Managers Group, Inc.a | 319,485 | ||||||
| 11,130 | Discover Financial Services | 384,875 | ||||||
| 8,557 | TD Ameritrade Holding Corporation | 145,469 | ||||||
|
| |||||||
| Total | 849,829 | |||||||
|
| |||||||
| Health Care (11.7%) | |||||||
| 2,720 | Alexion Pharmaceuticals, Inc.a | 270,096 | ||||||
| 5,651 | AmerisourceBergen Corporation | 222,367 | ||||||
| 3,200 | BioMarin Pharmaceutical, Inc.a | 126,656 | ||||||
| 2,791 | CIGNA Corporation | 122,804 | ||||||
| 1,035 | Mettler-Toledo International, Inc.a | 161,305 | ||||||
| 1,849 | Onyx Pharmaceuticals, Inc.a | 122,866 | ||||||
| 1,800 | Perrigo Company | 212,274 | ||||||
| 3,879 | SXC Health Solutions Corporationa | 384,836 | ||||||
| 5,047 | Watson Pharmaceuticals, Inc.a | 373,427 | ||||||
|
| |||||||
| Total | 1,996,631 | |||||||
|
| |||||||
| Industrials (17.7%) | |||||||
| 5,355 | AMETEK, Inc. | 267,268 | ||||||
| 6,690 | BE Aerospace, Inc.a | 292,085 | ||||||
| 3,611 | Chicago Bridge and Iron Company | 137,074 | ||||||
| 4,500 | Expeditors International of Washington, Inc. | 174,375 | ||||||
| 2,014 | Flowserve Corporation | 231,107 | ||||||
| 3,500 | Jacobs Engineering Group, Inc.a | 132,510 | ||||||
| 6,784 | JB Hunt Transport Services, Inc. | 404,326 | ||||||
| 5,181 | Kansas City Southern | 360,390 | ||||||
| 5,091 | Pentair, Inc. | 194,883 | ||||||
| 3,844 | Roper Industries, Inc. | 378,942 | ||||||
| 2,861 | SPX Corporation | 186,881 | ||||||
| 2,761 | Stericycle, Inc.a | 253,101 | ||||||
|
| |||||||
| Total | 3,012,942 | |||||||
|
| |||||||
| Information Technology (23.7%) | |||||||
| 5,235 | Akamai Technologies, Inc.a | 166,211 | ||||||
| 5,135 | ANSYS, Inc.a | 324,070 | ||||||
| 9,299 | Atmel Corporationa | 62,303 | ||||||
| 4,363 | Autodesk, Inc.a | 152,661 | ||||||
| 9,099 | Broadcom Corporationa | 307,546 | ||||||
| 11,200 | Ciena Corporationa | 183,344 | ||||||
| 13,392 | Electronic Arts, Inc.a | 165,391 | ||||||
| 3,322 | F5 Networks, Inc.a | 330,738 | ||||||
| 5,036 | Fortinet, Inc.a | 116,936 | ||||||
| 1,552 | Lam Research Corporationa | 58,572 | ||||||
| 21,014 | Marvell Technology Group, Ltd. | 237,038 | ||||||
| 1,684 | Mercadolibre, Inc. | 127,647 | ||||||
| 1,818 | Nice Systems, Ltd. ADRa | 66,539 | ||||||
| 12,990 | Nuance Communications, Inc.a | 309,422 | ||||||
| 22,046 | NVIDIA Corporationa | 304,676 | ||||||
| 17,000 | ON Semiconductor Corporationa | 120,700 | ||||||
| 3,526 | Red Hat, Inc.a | 199,149 | ||||||
| 6,400 | Riverbed Technology, Inc.a | 103,360 | ||||||
| 1,150 | ServiceNow, Inc.a,b | 28,290 | ||||||
| 5,890 | Teradata Corporationa | 424,139 | ||||||
| 6,011 | VeriFone Systems, Inc.a | 198,904 | ||||||
| 1,533 | Xilinx, Inc. | 51,463 | ||||||
|
| |||||||
| Total | 4,039,099 | |||||||
|
| |||||||
| Materials (4.7%) | |||||||
| 1,100 | Agrium, Inc. | 97,317 | ||||||
| 2,450 | Celanese Corporation | 84,819 | ||||||
| 4,010 | FMC Corporation | 214,455 | ||||||
| 2,774 | Newmont Mining Corporation | 134,567 | ||||||
| 4,959 | Silver Wheaton Corporation | 133,099 | ||||||
| 3,075 | Walter Energy, Inc. | 135,792 | ||||||
|
| |||||||
| Total | 800,049 | |||||||
|
| |||||||
| Telecommunications Services (2.6%) | ||||||||
| 2,952 | SBA Communications Corporationa | 168,412 | ||||||
| 10,937 | TW Telecom, Inc.a | 280,643 | ||||||
|
| |||||||
| Total | 449,055 | |||||||
|
| |||||||
Total Common Stock (cost $15,541,251) | 16,464,836 | |||||||
|
| |||||||
| Total Investments (cost $15,541,251) 96.7% | $ | 16,464,836 | ||||||
|
| |||||||
| Other Assets and Liabilities, Net 3.3% | 561,959 | |||||||
|
| |||||||
| Total Net Assets 100.0% | $ | 17,026,795 | ||||||
|
| |||||||
The accompanying Notes to Financial Statements are an integral part of this schedule.
113
Table of Contents
Mid Cap Growth Portfolio II
Schedule of Investments as of June 29, 2012
(unaudited)
| a | Non-income producing security. |
| b | Denotes investments purchased on a when-issued or delayed delivery basis. |
Definitions:
| ADR | - | American Depositary Receipt, which are certificates for an underlying foreign security’s shares held by an issuing U.S. depository bank. |
Unrealized Appreciation (Depreciation)
Gross unrealized appreciation and depreciation of investments, based on cost for federal income tax purposes, were as follows:
Gross unrealized appreciation | $ | 2,311,406 | ||
Gross unrealized depreciation | (1,387,821 | ) | ||
|
| |||
Net unrealized appreciation (depreciation) | $ | 923,585 | ||
Cost for federal income tax purposes | $ | 15,541,251 | ||
Fair Valuation Measurements
The following table is a summary of the inputs used, as of June 29, 2012, in valuing Mid Cap Growth Portfolio II’s assets carried at fair value.
Investments in Securities | Total | Level 1 | Level 2 | Level 3 | ||||||||||||
Common Stock | ||||||||||||||||
Consumer Discretionary | 2,679,837 | 2,679,837 | — | — | ||||||||||||
Consumer Staples | 699,268 | 699,268 | — | — | ||||||||||||
Energy | 1,938,126 | 1,938,126 | — | — | ||||||||||||
Financials | 849,829 | 849,829 | — | — | ||||||||||||
Health Care | 1,996,631 | 1,996,631 | — | — | ||||||||||||
Industrials | 3,012,942 | 3,012,942 | — | — | ||||||||||||
Information Technology | 4,039,099 | 4,039,099 | — | — | ||||||||||||
Materials | 800,049 | 800,049 | — | — | ||||||||||||
Telecommunications Services | 449,055 | 449,055 | — | — | ||||||||||||
|
|
|
|
|
|
|
| |||||||||
Total | $ | 16,464,836 | $ | 16,464,836 | $ | — | $ | — | ||||||||
|
|
|
|
|
|
|
| |||||||||
There were no significant transfers between the Levels during the period ended June 29, 2012. Transfers between the levels are identified as of the end of the period.
Investment in Affiliates
Affiliated issuers, as defined under the Investment Company Act of 1940, include those in which the Portfolio’s holdings of an issuer represent 5% or more of the outstanding voting securities of an issuer, or any affiliated mutual fund.
A summary of transactions for the fiscal year to date, in Mid Cap Growth Portfolio II, is as follows:
Portfolio | Value December 31, 2011 | Gross Purchases | Gross Sales | Shares Held at June 29, 2012 | Value June 29, 2012 | Income Earned January 1, 2012 - June 29, 2012 | ||||||||||||||||||
Thrivent Financial Securities Lending Trust | $ | 17,250 | $ | 1,299,453 | $ | 1,316,703 | — | $ | — | $ | 217 | |||||||||||||
Total Value and Income Earned | 17,250 | — | 217 | |||||||||||||||||||||
The accompanying Notes to Financial Statements are an integral part of this schedule.
114
Table of Contents
Schedule of Investments as of June 29, 2012
(unaudited)
| Shares | Common Stock (96.4%) | Value | ||||||
| Consumer Discretionary (15.4%) | |||||||
| 79,600 | Abercrombie & Fitch Company | $ | 2,717,544 | |||||
| 58,500 | Darden Restaurants, Inc. | 2,961,855 | ||||||
| 143,950 | Discovery Communications, Inc.a | 7,773,300 | ||||||
| 160,000 | Dollar Tree, Inc.a | 8,608,000 | ||||||
| 69,273 | Gentex Corporation | 1,445,727 | ||||||
| 123,719 | GNC Holdings, Inc. | 4,849,785 | ||||||
| 120,100 | Limited Brands, Inc. | 5,107,853 | ||||||
| 35,400 | O’Reilly Automotive, Inc.a | 2,965,458 | ||||||
| 81,600 | PetSmart, Inc. | 5,563,488 | ||||||
| 104,000 | Toll Brothers, Inc.a | 3,091,920 | ||||||
| 71,600 | Tractor Supply Company | 5,947,096 | ||||||
| 20,500 | VF Corporation | 2,735,725 | ||||||
|
| |||||||
| Total | 53,767,751 | |||||||
|
| |||||||
| Consumer Staples (4.2%) | |||||||
| 51,300 | Clorox Company | 3,717,198 | ||||||
| 33,500 | Ingredion, Inc. | 1,658,920 | ||||||
| 96,570 | Whole Foods Market, Inc. | 9,205,052 | ||||||
|
| |||||||
| Total | 14,581,170 | |||||||
|
| |||||||
| Energy (11.2%) | |||||||
| 154,000 | Alpha Natural Resources, Inc.a | 1,341,340 | ||||||
| 116,500 | Cameron International Corporationa | 4,975,715 | ||||||
| 58,300 | Concho Resources, Inc.a | 4,962,496 | ||||||
| 121,500 | Ensco plc | 5,706,855 | ||||||
| 228,003 | Helix Energy Solutions Group, Inc.a | 3,741,529 | ||||||
| 77,900 | Oil States International, Inc.a | 5,156,980 | ||||||
| 122,700 | Peabody Energy Corporation | 3,008,604 | ||||||
| 41,900 | Range Resources Corporation | 2,592,353 | ||||||
| 44,700 | SM Energy Company | 2,195,217 | ||||||
| 346,000 | Weatherford International, Ltd.a | 4,369,980 | ||||||
| 26,670 | Whiting Petroleum Corporationa | 1,096,671 | ||||||
|
| |||||||
| Total | 39,147,740 | |||||||
|
| |||||||
| Financials (5.2%) | |||||||
| 58,200 | Affiliated Managers Group, Inc.a | 6,369,990 | ||||||
| 244,400 | Discover Financial Services | 8,451,352 | ||||||
| 199,500 | TD Ameritrade Holding Corporation | 3,391,500 | ||||||
|
| |||||||
| Total | 18,212,842 | |||||||
|
| |||||||
| Health Care (11.3%) | |||||||
| 57,300 | Alexion Pharmaceuticals, Inc.a | 5,689,890 | ||||||
| 117,400 | AmerisourceBergen Corporation | 4,619,690 | ||||||
| 67,000 | BioMarin Pharmaceutical, Inc.a | 2,651,860 | ||||||
| 56,500 | CIGNA Corporation | 2,486,000 | ||||||
| 20,300 | Mettler-Toledo International, Inc.a | 3,163,755 | ||||||
| 39,500 | Onyx Pharmaceuticals, Inc.a | 2,624,775 | ||||||
| 35,400 | Perrigo Company | 4,174,722 | ||||||
| 61,419 | SXC Health Solutions Corporationa,b | 6,093,379 | ||||||
| 105,100 | Watson Pharmaceuticals, Inc.a | 7,776,349 | ||||||
|
| |||||||
| Total | 39,280,420 | |||||||
|
| |||||||
| Industrials (17.9%) | |||||||
| 110,531 | AMETEK, Inc. | 5,516,602 | ||||||
| 137,500 | BE Aerospace, Inc.a | 6,003,250 | ||||||
| 71,672 | Chicago Bridge and Iron Company | 2,720,669 | ||||||
| 91,100 | Expeditors International of Washington, Inc. | 3,530,125 | ||||||
| 42,252 | Flowserve Corporation | 4,848,417 | ||||||
| 71,100 | Jacobs Engineering Group, Inc.a | 2,691,846 | ||||||
| 141,100 | JB Hunt Transport Services, Inc. | 8,409,560 | ||||||
| 111,500 | Kansas City Southern | 7,755,940 | ||||||
| 103,575 | Pentair, Inc. | 3,964,851 | ||||||
| 81,775 | Roper Industries, Inc. | 8,061,380 | ||||||
| 59,100 | SPX Corporation | 3,860,412 | ||||||
| 57,700 | Stericycle, Inc.a | 5,289,359 | ||||||
|
| |||||||
| Total | 62,652,411 | |||||||
|
| |||||||
| Information Technology (23.5%) | |||||||
| 107,414 | Akamai Technologies, Inc.a | 3,410,395 | ||||||
| 106,100 | ANSYS, Inc.a | 6,695,971 | ||||||
| 191,441 | Atmel Corporationa | 1,282,655 | ||||||
| 88,497 | Autodesk, Inc.a | 3,096,510 | ||||||
| 185,700 | Broadcom Corporationa | 6,276,660 | ||||||
| 229,000 | Ciena Corporationa,b | 3,748,730 | ||||||
| 263,225 | Electronic Arts, Inc.a | 3,250,829 | ||||||
| 69,675 | F5 Networks, Inc.a | 6,936,843 | ||||||
| 106,900 | Fortinet, Inc.a | 2,482,218 | ||||||
| 30,100 | Lam Research Corporationa | 1,135,974 | ||||||
| 429,900 | Marvell Technology Group, Ltd. | 4,849,272 | ||||||
| 35,300 | Mercadolibre, Inc. | 2,675,740 | ||||||
| 41,200 | Nice Systems, Ltd. ADRa | 1,507,920 | ||||||
| 267,600 | Nuance Communications, Inc.a | 6,374,232 | ||||||
| 447,625 | NVIDIA Corporationa | 6,186,177 | ||||||
| 349,900 | ON Semiconductor Corporationa | 2,484,290 | ||||||
| 72,200 | Red Hat, Inc.a | 4,077,856 | ||||||
| 127,800 | Riverbed Technology, Inc.a | 2,063,970 | ||||||
| 6,700 | ServiceNow, Inc.a,c | 164,820 | ||||||
| 117,900 | Teradata Corporationa | 8,489,979 | ||||||
| 122,326 | VeriFone Systems, Inc.a | 4,047,767 | ||||||
| 28,600 | Xilinx, Inc. | 960,102 | ||||||
|
| |||||||
| Total | 82,198,910 | |||||||
|
| |||||||
| Materials (4.9%) | |||||||
| 21,400 | Agrium, Inc. | 1,893,258 | ||||||
| 50,475 | Celanese Corporation | 1,747,445 | ||||||
| 85,000 | FMC Corporation | 4,545,800 | ||||||
| 64,200 | Newmont Mining Corporation | 3,114,342 | ||||||
| 108,100 | Silver Wheaton Corporation | 2,901,404 | ||||||
| 65,900 | Walter Energy, Inc. | 2,910,144 | ||||||
|
| |||||||
| Total | 17,112,393 | |||||||
|
| |||||||
| Telecommunications Services (2.8%) | |||||||
| 66,600 | SBA Communications Corporationa | 3,799,530 | ||||||
| 227,200 | TW Telecom, Inc.a | 5,829,952 | ||||||
|
| |||||||
| Total | 9,629,482 | |||||||
|
| |||||||
Total Common Stock (cost $294,159,858) | 336,583,119 | |||||||
|
| |||||||
The accompanying Notes to Financial Statements are an integral part of this schedule.
115
Table of Contents
Mid Cap Growth Portfolio
Schedule of Investments as of June 29, 2012
(unaudited)
| Shares | Collateral Held for Securities Loaned (2.3%) | Value | ||||||
| 8,213,181 | Thrivent Financial Securities Lending Trust | $ | 8,213,181 | |||||
|
| |||||||
Total Collateral Held for Securities Loaned (cost $8,213,181) | 8,213,181 | |||||||
|
| |||||||
| Principal Amount | Short-Term Investments (2.9%)d | |||||||
Federal Home Loan Bank Discount Notes | ||||||||
| $5,000,000 | 0.060%, 7/27/2012e | 4,999,775 | ||||||
| 5,000,000 | 0.100%, 8/17/2012e | 4,999,333 | ||||||
|
| |||||||
| Total Short-Term Investments (at amortized cost) | 9,999,108 | |||||||
|
| |||||||
| Total Investments (cost $312,372,147) 101.6% | $ | 354,795,408 | ||||||
|
| |||||||
| Other Assets and Liabilities, Net (1.6%) | (5,555,010 | ) | ||||||
|
| |||||||
| Total Net Assets 100.0% | $ | 349,240,398 | ||||||
|
| |||||||
| a | Non-income producing security. |
| b | All or a portion of the security is on loan. |
| c | Denotes investments purchased on a when-issued or delayed delivery basis. |
| d | The interest rate shown reflects the yield, coupon rate or the discount rate at the date of purchase. |
| e | Denotes investments that benefit from credit enhancement or liquidity support provided by a third party bank, institution or government. |
Definitions:
| ADR | - | American Depositary Receipt, which are certificates for an underlying foreign security’s shares held by an issuing U.S. depository bank. |
Unrealized Appreciation (Depreciation)
Gross unrealized appreciation and depreciation of investments, based on cost for federal income tax purposes, were as follows:
Gross unrealized appreciation | $ | 65,902,245 | ||
Gross unrealized depreciation | (24,148,981 | ) | ||
|
| |||
Net unrealized appreciation (depreciation) | $ | 41,753,264 | ||
Cost for federal income tax purposes | $ | 313,042,144 |
Fair Valuation Measurements
The following table is a summary of the inputs used, as of June 29, 2012, in valuing Mid Cap Growth Portfolio’s assets carried at fair value.
Investments in Securities | Total | Level 1 | Level 2 | Level 3 | ||||||||||||
Common Stock | ||||||||||||||||
Consumer Discretionary | 53,767,751 | 53,767,751 | — | — | ||||||||||||
Consumer Staples | 14,581,170 | 14,581,170 | — | — | ||||||||||||
Energy | 39,147,740 | 39,147,740 | — | — | ||||||||||||
Financials | 18,212,842 | 18,212,842 | — | — | ||||||||||||
Health Care | 39,280,420 | 39,280,420 | — | — | ||||||||||||
Industrials | 62,652,411 | 62,652,411 | — | — | ||||||||||||
Information Technology | 82,198,910 | 82,198,910 | — | — | ||||||||||||
Materials | 17,112,393 | 17,112,393 | — | — | ||||||||||||
Telecommunications Services | 9,629,482 | 9,629,482 | — | — | ||||||||||||
Collateral Held for Securities Loaned | 8,213,181 | 8,213,181 | — | — | ||||||||||||
Short-Term Investments | 9,999,108 | — | 9,999,108 | — | ||||||||||||
|
|
|
|
|
|
|
| |||||||||
Total | $ | 354,795,408 | $ | 344,796,300 | $ | 9,999,108 | $ | — | ||||||||
|
|
|
|
|
|
|
| |||||||||
There were no significant transfers between the Levels during the period ended June 29, 2012. Transfers between the levels are identified as of the end of the period.
Investment in Affiliates
Affiliated issuers, as defined under the Investment Company Act of 1940, include those in which the Portfolio’s holdings of an issuer represent 5% or more of the outstanding voting securities of an issuer, or any affiliated mutual fund.
A summary of transactions for the fiscal year to date, in Mid Cap Growth Portfolio, is as follows:
Portfolio | Value December 31, 2011 | Gross Purchases | Gross Sales | Shares Held at June 29, 2012 | Value June 29, 2012 | Income Earned January 1, 2012 - June 29, 2012 | ||||||||||||||||||
Thrivent Financial Securities Lending Trust | $ | — | $ | 39,109,461 | $ | 30,896,280 | 8,213,181 | $ | 8,213,181 | $ | 5,091 | |||||||||||||
Total Value and Income Earned | — | 8,213,181 | 5,091 | |||||||||||||||||||||
The accompanying Notes to Financial Statements are an integral part of this schedule.
116
Table of Contents
Partner Mid Cap Value Portfolio
Schedule of Investments as of June 29, 2012
(unaudited)
| Shares | Common Stock (99.2%) | Value | ||||||
| Consumer Discretionary (9.9%) | ||||||||
| 4,200 | AutoZone, Inc.a | $ | 1,542,114 | |||||
| 23,612 | Lear Corporation | 890,881 | ||||||
| 162,118 | Liberty Interactive Corporationa | 2,884,079 | ||||||
| 86,040 | Macy’s, Inc. | 2,955,474 | ||||||
| 193,940 | MGM Resorts Internationala | 2,164,370 | ||||||
| 1,785 | NVR, Inc.a | 1,517,250 | ||||||
| 24,609 | PetSmart, Inc. | 1,677,842 | ||||||
| 21,589 | PVH Corporation | 1,679,408 | ||||||
| 20,278 | Ross Stores, Inc. | 1,266,767 | ||||||
| 52,645 | Scripps Networks Interactive | 2,993,395 | ||||||
| 20,085 | Starwood Hotels & Resorts Worldwide, Inc. | 1,065,308 | ||||||
| 32,971 | TRW Automotive Holdings Corporationa | 1,212,014 | ||||||
| 33,921 | Urban Outfitters, Inc.a | 935,880 | ||||||
|
| |||||||
| Total | 22,784,782 | |||||||
|
| |||||||
| Consumer Staples (5.5%) | ||||||||
| 16,979 | Church & Dwight Company, Inc. | 941,825 | ||||||
| 81,599 | Coca-Cola Enterprises, Inc. | 2,288,036 | ||||||
| 92,972 | Constellation Brands, Inc.a | 2,515,822 | ||||||
| 31,308 | Ingredion, Inc. | 1,550,372 | ||||||
| 47,285 | J.M. Smucker Company | 3,570,963 | ||||||
| 12,968 | Lorillard, Inc. | 1,711,128 | ||||||
|
| |||||||
| Total | 12,578,146 | |||||||
|
| |||||||
| Energy (7.3%) | ||||||||
| 56,593 | Cabot Oil & Gas Corporation | 2,229,764 | ||||||
| 50,083 | Cameron International Corporationa | 2,139,045 | ||||||
| 42,699 | Energen Corporation | 1,927,006 | ||||||
| 42,565 | EQT Corporation | 2,282,761 | ||||||
| 35,016 | HollyFrontier Corporation | 1,240,617 | ||||||
| 91,315 | Key Energy Services, Inc.a | 693,994 | ||||||
| 49,388 | Marathon Petroleum Corporation | 2,218,509 | ||||||
| 24,293 | Pioneer Natural Resources Company | 2,142,885 | ||||||
| 33,454 | Range Resources Corporation | 2,069,799 | ||||||
|
| |||||||
| Total | 16,944,380 | |||||||
|
| |||||||
| Financials (31.3%) | ||||||||
| 40,738 | Alexandria Real Estate Equities, Inc. | 2,962,467 | ||||||
| 61,273 | Ameriprise Financial, Inc. | 3,202,127 | ||||||
| 23,454 | AvalonBay Communities, Inc. | 3,318,272 | ||||||
| 25,282 | Camden Property Trust | 1,710,833 | ||||||
| 40,371 | CIT Group, Inc.a | 1,438,822 | ||||||
| 49,650 | Discover Financial Services | 1,716,897 | ||||||
| 69,655 | Douglas Emmett, Inc. | 1,609,031 | ||||||
| 40,866 | Everest Re Group, Ltd. | 4,229,222 | ||||||
| 44,294 | First Republic Banka | 1,488,278 | ||||||
| 84,766 | Hartford Financial Services Group, Inc. | 1,494,425 | ||||||
| 214,152 | Host Hotels & Resorts, Inc. | 3,387,885 | ||||||
| 148,814 | Invesco, Ltd. | 3,363,196 | ||||||
| 47,200 | iShares Russell Midcap Value Index Fund | 2,184,416 | ||||||
| 127,862 | Kimco Realty Corporation | 2,433,214 | ||||||
| 35,722 | Lazard, Ltd. | 928,415 | ||||||
| 76,601 | Liberty Property Trust | 2,821,981 | ||||||
| 37,315 | M&T Bank Corporation | 3,081,100 | ||||||
| 286,563 | MFA Financial, Inc. | 2,260,982 | ||||||
| 118,873 | NASDAQ OMX Group, Inc. | 2,694,851 | ||||||
| 29,895 | PartnerRe, Ltd. | 2,262,155 | ||||||
| 152,331 | Principal Financial Group, Inc. | 3,995,642 | ||||||
| 232,116 | SLM Corporation | 3,646,542 | ||||||
| 134,301 | SunTrust Banks, Inc. | 3,254,113 | ||||||
| 65,576 | Tanger Factory Outlet Centers, Inc. | 2,101,711 | ||||||
| 36,664 | Ventas, Inc. | 2,314,232 | ||||||
| 80,096 | W.R. Berkley Corporation | 3,117,336 | ||||||
| 66,031 | Willis Group Holdings plc | 2,409,471 | ||||||
| 127,311 | XL Group plc | 2,678,623 | ||||||
|
| |||||||
| Total | 72,106,239 | |||||||
|
| |||||||
| Health Care (7.2%) | ||||||||
| 77,639 | Aetna, Inc. | 3,010,064 | ||||||
| 505,594 | Boston Scientific Corporationa | 2,866,718 | ||||||
| 124,315 | Hologic, Inc.a | 2,242,643 | ||||||
| 68,908 | Life Technologies Corporationa | 3,100,171 | ||||||
| 126,024 | Mylan, Inc.a | 2,693,133 | ||||||
| 155,447 | Warner Chilcott plca | 2,785,610 | ||||||
|
| |||||||
| Total | 16,698,339 | |||||||
|
| |||||||
| Industrials (8.4%) | ||||||||
| 39,941 | BE Aerospace, Inc.a | 1,743,824 | ||||||
| 53,445 | Dover Corporation | 2,865,187 | ||||||
| 21,154 | Fortune Brands Home and Security, Inc.a | 471,100 | ||||||
| 23,563 | Gardner Denver, Inc. | 1,246,718 | ||||||
| 53,810 | Lennox International, Inc. | 2,509,160 | ||||||
| 54,513 | Pentair, Inc. | 2,086,758 | ||||||
| 2,291 | Regal-Beloit Corporation | 142,638 | ||||||
| 54,918 | Republic Services, Inc. | 1,453,130 | ||||||
| 35,701 | Rockwell Automation, Inc. | 2,358,408 | ||||||
| 81,316 | Spirit Aerosystems Holdings, Inc.a | 1,937,760 | ||||||
| 99,591 | Textron, Inc. | 2,476,828 | ||||||
|
| |||||||
| Total | 19,291,511 | |||||||
|
| |||||||
| Information Technology (11.3%) | ||||||||
| 35,818 | Adobe Systems, Inc.a | 1,159,429 | ||||||
| 88,163 | Altera Corporation | 2,983,436 | ||||||
| 29,220 | Amphenol Corporation | 1,604,762 | ||||||
| 44,735 | Analog Devices, Inc. | 1,685,167 | ||||||
| 40,929 | Cavium, Inc.a | 1,146,012 | ||||||
| 21,015 | Check Point Software Technologies, Ltd.a | 1,042,134 | ||||||
| 65,307 | Fidelity National Information Services, Inc. | 2,225,663 | ||||||
| 131,623 | Juniper Networks, Inc.a | 2,146,771 | ||||||
| 27,663 | KLA-Tencor Corporation | 1,362,403 | ||||||
| 67,207 | Lam Research Corporationa,b | 2,536,392 | ||||||
| 55,240 | NetApp, Inc.a | 1,757,737 | ||||||
| 99,425 | Parametric Technology Corporationa | 2,083,948 | ||||||
| 38,001 | Paychex, Inc. | 1,193,611 | ||||||
| 112,803 | Polycom, Inc.a | 1,186,688 | ||||||
| 42,542 | QLIK Technologies, Inc.a | 941,029 | ||||||
| 30,710 | SanDisk Corporationa | 1,120,301 | ||||||
|
| |||||||
| Total | 26,175,483 | |||||||
|
| |||||||
| Materials (5.5%) | ||||||||
| 54,791 | Albemarle Corporation | 3,267,735 | ||||||
| 37,946 | Ball Corporation | 1,557,683 | ||||||
The accompanying Notes to Financial Statements are an integral part of this schedule.
117
Table of Contents
Partner Mid Cap Value Portfolio
Schedule of Investments as of June 29, 2012
(unaudited)
| Shares | Common Stock (99.2%) | Value | ||||||
| Materials (5.5%) - continued | ||||||||
| 22,029 | Carpenter Technology Corporation | $ | 1,053,868 | |||||
| 35,237 | Crown Holdings, Inc.a | 1,215,324 | ||||||
| 36,107 | Cytec Industries, Inc. | 2,117,315 | ||||||
| 14,527 | Martin Marietta Materials, Inc. | 1,145,018 | ||||||
| 46,508 | Reliance Steel & Aluminum Company | 2,348,654 | ||||||
|
| |||||||
| Total | 12,705,597 | |||||||
|
| |||||||
| Telecommunications Services (0.8%) | ||||||||
| 553,515 | Sprint Nextel Corporationa | 1,804,459 | ||||||
|
| |||||||
| Total | 1,804,459 | |||||||
|
| |||||||
| Utilities (12.0%) | ||||||||
| 46,111 | AES Corporationa | 591,604 | ||||||
| 78,553 | Calpine Corporationa | 1,296,910 | ||||||
| 38,458 | CMS Energy Corporation | 903,763 | ||||||
| 56,010 | Edison International, Inc. | 2,587,662 | ||||||
| 41,043 | Great Plains Energy, Inc. | 878,731 | ||||||
| 49,105 | Northeast Utilities | 1,905,765 | ||||||
| 117,994 | NV Energy, Inc. | 2,074,334 | ||||||
| 10,602 | OGE Energy Corporation | 549,078 | ||||||
| 35,226 | Pinnacle West Capital Corporation | 1,822,593 | ||||||
| 129,559 | PPL Corporation | 3,603,036 | ||||||
| 38,036 | Questar Corporation | 793,431 | ||||||
| 64,505 | SCANA Corporationb | 3,085,919 | ||||||
| 52,751 | Sempra Energy | 3,633,489 | ||||||
| 140,586 | Xcel Energy, Inc. | 3,994,048 | ||||||
|
| |||||||
| Total | 27,720,363 | |||||||
|
| |||||||
Total Common Stock (cost $212,147,336) | 228,809,299 | |||||||
Collateral Held for Securities Loaned (0.9%) | ||||||||
| 2,021,325 | Thrivent Financial Securities Lending Trust | 2,021,325 | ||||||
|
| |||||||
Total Collateral Held for Securities Loaned (cost $2,021,325) | 2,021,325 | |||||||
|
| |||||||
Total Investments (cost $214,168,661) 100.1% | $ | 230,830,624 | ||||||
|
| |||||||
| Other Assets and Liabilities, Net (0.1%) | (227,503 | ) | ||||||
|
| |||||||
| Total Net Assets 100.0% | $ | 230,603,121 | ||||||
|
| |||||||
| a | Non-income producing security. |
| b | All or a portion of the security is on loan. |
Unrealized Appreciation (Depreciation)
Gross unrealized appreciation and depreciation of investments, based on cost for federal income tax purposes, were as follows:
Gross unrealized appreciation | $ | 24,995,162 | ||
Gross unrealized depreciation | (9,067,530 | ) | ||
|
| |||
Net unrealized appreciation (depreciation) | $ | 15,927,632 | ||
Cost for federal income tax purposes | $ | 214,902,992 | ||
The accompanying Notes to Financial Statements are an integral part of this schedule.
118
Table of Contents
Partner Mid Cap Value Portfolio
Schedule of Investments as of June 29, 2012
(unaudited)
Fair Valuation Measurements
The following table is a summary of the inputs used, as of June 29, 2012, in valuing Partner Mid Cap Value Portfolio’s assets carried at fair value.
Investments in Securities | Total | Level 1 | Level 2 | Level 3 | ||||||||||||
Common Stock | ||||||||||||||||
Consumer Discretionary | 22,784,782 | 22,784,782 | — | — | ||||||||||||
Consumer Staples | 12,578,146 | 12,578,146 | — | — | ||||||||||||
Energy | 16,944,380 | 16,944,380 | — | — | ||||||||||||
Financials | 72,106,239 | 72,106,239 | — | — | ||||||||||||
Health Care | 16,698,339 | 16,698,339 | — | — | ||||||||||||
Industrials | 19,291,511 | 19,291,511 | — | — | ||||||||||||
Information Technology | 26,175,483 | 26,175,483 | — | — | ||||||||||||
Materials | 12,705,597 | 12,705,597 | — | — | ||||||||||||
Telecommunications Services | 1,804,459 | 1,804,459 | — | — | ||||||||||||
Utilities | 27,720,363 | 27,720,363 | — | — | ||||||||||||
Collateral Held for Securities Loaned | 2,021,325 | 2,021,325 | — | — | ||||||||||||
|
|
|
|
|
|
|
| |||||||||
Total | $ | 230,830,624 | $ | 230,830,624 | $ | — | $ | — | ||||||||
|
|
|
|
|
|
|
| |||||||||
There were no significant transfers between the Levels during the period ended June 29, 2012. Transfers between the levels are identified as of the end of the period.
Investment in Affiliates
Affiliated issuers, as defined under the Investment Company Act of 1940, include those in which the Portfolio’s holdings of an issuer represent 5% or more of the outstanding voting securities of an issuer, or any affiliated mutual fund.
A summary of transactions for the fiscal year to date, in Partner Mid Cap Value Portfolio, is as follows:
Portfolio | Value December 31, 2011 | Gross Purchases | Gross Sales | Shares Held at June 29, 2012 | Value June 29, 2012 | Income Earned January 1, 2012 - June 29, 2012 | ||||||||||||||||||
Thrivent Financial Securities Lending Trust | $ | 3,702,175 | $ | 29,740,925 | $ | 31,421,775 | 2,021,325 | $ | 2,021,325 | $ | 2,776 | |||||||||||||
Total Value and Income Earned | 3,702,175 | 2,021,325 | 2,776 | |||||||||||||||||||||
The accompanying Notes to Financial Statements are an integral part of this schedule.
119
Table of Contents
Schedule of Investments as of June 29, 2012
(unaudited)
| Shares | Common Stock (94.0%) | Value | ||||||
| Consumer Discretionary (13.7%) | |||||||
| 138,000 | Charter Communications, Inc.a | $ | 9,780,060 | |||||
| 196,400 | DISH Network Corporation | 5,607,220 | ||||||
| 175,472 | Dollar Tree, Inc.a | 9,440,394 | ||||||
| 167,500 | Omnicom Group, Inc. | 8,140,500 | ||||||
| 49,555 | Panera Bread Companya | 6,909,949 | ||||||
| 145,000 | Penn National Gaming, Inc.a | 6,465,550 | ||||||
| 73,700 | PetSmart, Inc. | 5,024,866 | ||||||
| 230,700 | Toll Brothers, Inc.a | 6,858,711 | ||||||
| 356,878 | WMS Industries, Inc.a | 7,119,716 | ||||||
|
| |||||||
| Total | 65,346,966 | |||||||
|
| |||||||
| Consumer Staples (3.2%) | |||||||
| 142,100 | Ingredion, Inc. | 7,036,792 | ||||||
| 134,690 | TreeHouse Foods, Inc.a | 8,389,840 | ||||||
|
| |||||||
| Total | 15,426,632 | |||||||
|
| |||||||
| Energy (8.8%) | |||||||
| 448,092 | Alpha Natural Resources, Inc.a | 3,902,881 | ||||||
| 141,000 | Ensco plc | 6,622,770 | ||||||
| 382,800 | Helix Energy Solutions Group, Inc.a | 6,281,748 | ||||||
| 123,606 | National Oilwell Varco, Inc. | 7,965,171 | ||||||
| 159,900 | Newfield Exploration Companya | 4,686,669 | ||||||
| 191,400 | Southwestern Energy Companya | 6,111,402 | ||||||
| 487,800 | Weatherford International, Ltd.a | 6,160,914 | ||||||
|
| |||||||
| Total | 41,731,555 | |||||||
|
| |||||||
| Financials (20.3%) | |||||||
| 377,300 | CBL & Associates Properties, Inc. | 7,372,442 | ||||||
| 419,673 | Duke Realty Corporation | 6,144,013 | ||||||
| 155,171 | Endurance Specialty Holdings, Ltd. | 5,946,153 | ||||||
| 371,920 | HCC Insurance Holdings, Inc. | 11,678,288 | ||||||
| 525,248 | Host Hotels & Resorts, Inc. | 8,309,423 | ||||||
| 1,002,300 | Huntington Bancshares, Inc. | 6,414,720 | ||||||
| 193,924 | Lazard, Ltd. | 5,040,085 | ||||||
| 78,500 | M&T Bank Corporation | 6,481,745 | ||||||
| 288,900 | NASDAQ OMX Group, Inc. | 6,549,363 | ||||||
| 158,433 | Northern Trust Corporation | 7,291,087 | ||||||
| 544,100 | Och-Ziff Capital Management Group, LLC | 4,124,278 | ||||||
| 354,460 | W.R. Berkley Corporation | 13,795,583 | ||||||
| 368,872 | Zions Bancorporation | 7,163,494 | ||||||
|
| |||||||
| Total | 96,310,674 | |||||||
|
| |||||||
| Health Care (9.6%) | |||||||
| 67,700 | Alexion Pharmaceuticals, Inc.a | 6,722,610 | ||||||
| 65,482 | C.R. Bard, Inc. | 7,035,386 | ||||||
| 200,831 | Health Net, Inc.a | 4,874,168 | ||||||
| 204,600 | Medicines Companya | 4,693,524 | ||||||
| 238,900 | Thoratec Corporationa | 8,022,262 | ||||||
| 14,800 | United Therapeutics Corporationa | 730,824 | ||||||
| 69,700 | Waters Corporationa | 5,539,059 | ||||||
| 121,169 | Zimmer Holdings, Inc. | 7,798,437 | ||||||
|
| |||||||
| Total | 45,416,270 | |||||||
|
| |||||||
| Industrials (11.9%) | |||||||
| 168,682 | Chicago Bridge and Iron Company | 6,403,169 | ||||||
| 231,093 | CSX Corporation | 5,167,240 | ||||||
| 135,748 | Expeditors International of Washington, Inc. | 5,260,235 | ||||||
| 656,266 | Manitowoc Company, Inc. | 7,678,312 | ||||||
| 105,408 | Manpower, Inc. | 3,863,203 | ||||||
| 309,034 | Oshkosh Corporationa | 6,474,262 | ||||||
| 85,982 | Parker Hannifin Corporation | 6,610,296 | ||||||
| 103,232 | SPX Corporation | 6,743,114 | ||||||
| 155,388 | Tyco International, Ltd. | 8,212,256 | ||||||
|
| |||||||
| Total | 56,412,087 | |||||||
|
| |||||||
| Information Technology (17.2%) | |||||||
| 112,700 | Akamai Technologies, Inc.a | 3,578,225 | ||||||
| 117,100 | Alliance Data Systems Corporationa | 15,808,500 | ||||||
| 479,500 | CoreLogic, Inc.a | 8,779,645 | ||||||
| 134,404 | eBay, Inc.a | 5,646,312 | ||||||
| 169,552 | Itron, Inc.a | 6,992,324 | ||||||
| 311,832 | Juniper Networks, Inc.a | 5,085,980 | ||||||
| 643,766 | NVIDIA Corporationa | 8,896,846 | ||||||
| 145,500 | OpenTable, Inc.a,b | 6,548,955 | ||||||
| 754,413 | Teradyne, Inc.a | 10,607,047 | ||||||
| 285,691 | Xilinx, Inc. | 9,590,647 | ||||||
|
| |||||||
| Total | 81,534,481 | |||||||
|
| |||||||
| Materials (4.5%) | |||||||
| 124,917 | Albemarle Corporation | 7,450,050 | �� | |||||
| 178,424 | Silgan Holdings, Inc. | 7,616,921 | ||||||
| 528,200 | Steel Dynamics, Inc. | 6,206,350 | ||||||
|
| |||||||
| Total | 21,273,321 | |||||||
|
| |||||||
| Utilities (4.8%) | |||||||
| 337,200 | CMS Energy Corporation | 7,924,200 | ||||||
| 456,578 | NV Energy, Inc. | 8,026,641 | ||||||
| 205,300 | Public Service Enterprise Group, Inc. | 6,672,250 | ||||||
|
| |||||||
| Total | 22,623,091 | |||||||
|
| |||||||
| Total Common Stock (cost $394,972,308) | 446,075,077 | |||||||
|
| |||||||
Collateral Held for Securities Loaned (1.3%) | ||||||||
| 6,402,000 | Thrivent Financial Securities Lending Trust | 6,402,000 | ||||||
|
| |||||||
Total Collateral Held for Securities Loaned (cost $6,402,000) | 6,402,000 | |||||||
|
| |||||||
| Principal Amount | Short-Term Investments (5.7%)c | |||||||
Federal Home Loan Bank Discount Notes | ||||||||
| 10,000,000 | 0.075%, 7/11/2012d | 9,999,771 | ||||||
| 15,000,000 | 0.080%, 8/10/2012d | 14,998,633 | ||||||
| 2,000,000 | 0.100%, 8/17/2012d | 1,999,733 | ||||||
|
| |||||||
| Total Short-Term Investments (at amortized cost) | 26,998,137 | |||||||
|
| |||||||
| Total Investments (cost $428,372,445) 101.0% | $ | 479,475,214 | ||||||
|
| |||||||
| Other Assets and Liabilities, Net (1.0%) | (4,685,639 | ) | ||||||
|
| |||||||
| Total Net Assets 100.0% | $ | 474,789,575 | ||||||
|
| |||||||
The accompanying Notes to Financial Statements are an integral part of this schedule.
120
Table of Contents
Mid Cap Stock Portfolio
Schedule of Investments as of June 29, 2012
(unaudited)
| a | Non-income producing security. |
| b | All or a portion of the security is on loan. |
| c | The interest rate shown reflects the yield, coupon rate or the discount rate at the date of purchase. |
| d | Denotes investments that benefit from credit enhancement or liquidity support provided by a third party bank, institution or government. |
Unrealized Appreciation (Depreciation)
Gross unrealized appreciation and depreciation of investments, based on cost for federal income tax purposes, were as follows:
Gross unrealized appreciation | $ | 74,554,472 | ||
Gross unrealized depreciation | (25,747,557 | ) | ||
|
| |||
Net unrealized appreciation (depreciation) | $ | 48,806,915 | ||
Cost for federal income tax purposes | $ | 430,668,299 | ||
Fair Valuation Measurements
The following table is a summary of the inputs used, as of June 29, 2012, in valuing Mid Cap Stock Portfolio’s assets carried at fair value.
Investments in Securities | Total | Level 1 | Level 2 | Level 3 | ||||||||||||
Common Stock | ||||||||||||||||
Consumer Discretionary | 65,346,966 | 65,346,966 | — | — | ||||||||||||
Consumer Staples | 15,426,632 | 15,426,632 | — | — | ||||||||||||
Energy | 41,731,555 | 41,731,555 | — | — | ||||||||||||
Financials | 96,310,674 | 96,310,674 | — | — | ||||||||||||
Health Care | 45,416,270 | 45,416,270 | — | — | ||||||||||||
Industrials | 56,412,087 | 56,412,087 | — | — | ||||||||||||
Information Technology | 81,534,481 | 81,534,481 | — | — | ||||||||||||
Materials | 21,273,321 | 21,273,321 | — | — | ||||||||||||
Utilities | 22,623,091 | 22,623,091 | — | — | ||||||||||||
Collateral Held for Securities Loaned | 6,402,000 | 6,402,000 | — | — | ||||||||||||
Short-Term Investments | 26,998,137 | — | 26,998,137 | — | ||||||||||||
|
|
|
|
|
|
|
| |||||||||
Total | $ | 479,475,214 | $ | 452,477,077 | $ | 26,998,137 | $ | — | ||||||||
|
|
|
|
|
|
|
| |||||||||
There were no significant transfers between the Levels during the period ended June 29, 2012. Transfers between the levels are identified as of the end of the period.
Investment in Affiliates
Affiliated issuers, as defined under the Investment Company Act of 1940, include those in which the Portfolio’s holdings of an issuer represent 5% or more of the outstanding voting securities of an issuer, or any affiliated mutual fund.
A summary of transactions for the fiscal year to date, in Mid Cap Stock Portfolio, is as follows:
Portfolio | Value December 31, 2011 | Gross Purchases | Gross Sales | Shares Held at June 29, 2012 | Value June 29, 2012 | Income Earned January 1, 2012 - June 29, 2012 | ||||||||||||||||||
Thrivent Financial Securities Lending Trust | $ | 9,724,975 | $ | 17,801,285 | $ | 21,124,260 | 6,402,000 | $ | 6,402,000 | $ | 48,023 | |||||||||||||
Total Value and Income Earned | 9,724,975 | 6,402,000 | 48,023 | |||||||||||||||||||||
The accompanying Notes to Financial Statements are an integral part of this schedule.
121
Table of Contents
Schedule of Investments as of June 29, 2012
(unaudited)
| Shares | Common Stock (98.5%) | Value | ||||||
| Consumer Discretionary (13.3%) | |||||||
| 5,400 | Aaron’s, Inc. | $ | 152,874 | |||||
| 5,300 | Advance Auto Parts, Inc. | 361,566 | ||||||
| 5,850 | Aeropostale, Inc.a | 104,305 | ||||||
| 4,200 | AMC Networks, Inc.a | 149,310 | ||||||
| 14,080 | American Eagle Outfitters, Inc. | 277,798 | ||||||
| 3,550 | Ann, Inc.a | 90,490 | ||||||
| 9,600 | Ascena Retail Group, Inc.a | 178,752 | ||||||
| 3,200 | Bally Technologies, Inc.a | 149,312 | ||||||
| 2,970 | Barnes & Noble, Inc.a,b | 48,886 | ||||||
| 2,010 | Bob Evans Farms, Inc. | 80,802 | ||||||
| 5,455 | Brinker International, Inc. | 173,851 | ||||||
| 3,700 | Carter’s, Inc.a | 194,620 | ||||||
| 3,900 | Cheesecake Factory, Inc.a | 124,644 | ||||||
| 12,200 | Chico’s FAS, Inc. | 181,048 | ||||||
| 7,600 | Cinemark Holdings, Inc. | 173,660 | ||||||
| 4,400 | Collective Brands, Inc.a | 94,248 | ||||||
| 2,700 | Deckers Outdoor Corporationa,b | 118,827 | ||||||
| 6,900 | Dick’s Sporting Goods, Inc. | 331,200 | ||||||
| 5,200 | DreamWorks Animation SKG, Inc.a,b | 99,112 | ||||||
| 10,900 | Foot Locker, Inc. | 333,322 | ||||||
| 10,420 | Gentex Corporation | 217,465 | ||||||
| 4,800 | Guess ?, Inc. | 145,776 | ||||||
| 7,100 | Hanesbrands, Inc.a | 196,883 | ||||||
| 2,800 | HSN, Inc. | 112,980 | ||||||
| 2,070 | International Speedway Corporation | 54,193 | ||||||
| 1,400 | ITT Educational Services, Inc.a | 85,050 | ||||||
| 3,400 | John Wiley and Sons, Inc. | 166,566 | ||||||
| 5,300 | KB Homeb | 51,940 | ||||||
| 4,300 | Lamar Advertising Companya | 122,980 | ||||||
| 3,000 | Life Time Fitness, Inc.a | 139,530 | ||||||
| 10,600 | LKQ Corporationa | 354,040 | ||||||
| 2,800 | M.D.C. Holdings, Inc. | 91,476 | ||||||
| 2,000 | Matthews International Corporation | 64,980 | ||||||
| 2,600 | Meredith Corporationb | 83,044 | ||||||
| 4,070 | Mohawk Industries, Inc.a | 284,208 | ||||||
| 9,300 | New York Times Companya | 72,540 | ||||||
| 400 | NVR, Inc.a | 340,000 | ||||||
| 20,800 | Office Depot, Inc.a | 44,928 | ||||||
| 2,100 | Panera Bread Companya | 292,824 | ||||||
| 7,800 | PetSmart, Inc. | 531,804 | ||||||
| 4,900 | Polaris Industries, Inc. | 350,252 | ||||||
| 5,100 | PVH Corporation | 396,729 | ||||||
| 7,400 | RadioShack Corporationb | 28,416 | ||||||
| 4,200 | Regis Corporation | 75,432 | ||||||
| 4,200 | Rent-A-Center, Inc. | 141,708 | ||||||
| 11,350 | Saks, Inc.a,b | 120,878 | ||||||
| 1,810 | Scholastic Corporation | 50,970 | ||||||
| 4,300 | Scientific Games Corporationa | 36,765 | ||||||
| 16,500 | Service Corporation International | 204,105 | ||||||
| 6,200 | Signet Jewelers, Ltd. | 272,862 | ||||||
| 4,820 | Sotheby’s Holdings, Inc. | 160,795 | ||||||
| 800 | Strayer Education, Inc. | 87,216 | ||||||
| 4,600 | Tempur-Pedic International, Inc.a | 107,594 | ||||||
| 3,100 | Thor Industries, Inc. | 84,971 | ||||||
| 10,600 | Toll Brothers, Inc.a | 315,138 | ||||||
| 5,100 | Tractor Supply Company | 423,606 | ||||||
| 4,000 | Tupperware Brands Corporation | 219,040 | ||||||
| 2,600 | Under Armour, Inc.a | 245,648 | ||||||
| 3,000 | Valassis Communications, Inc.a,b | 65,250 | ||||||
| 2,900 | Warnaco Group, Inc.a | 123,482 | ||||||
| 22,314 | Wendy’s Company | 105,322 | ||||||
| 7,380 | Williams-Sonoma, Inc. | 258,079 | ||||||
| 3,900 | WMS Industries, Inc.a | 77,805 | ||||||
|
| |||||||
| Total | 10,823,897 | |||||||
|
| |||||||
| Consumer Staples (3.6%) | |||||||
| 10,020 | Church & Dwight Company, Inc. | 555,809 | ||||||
| 4,750 | Energizer Holdings, Inc.a | 357,438 | ||||||
| 8,250 | Flowers Foods, Inc. | 191,648 | ||||||
| 9,300 | Green Mountain Coffee Roasters, Inc.a,b | 202,554 | ||||||
| 3,510 | Harris Teeter Supermarkets, Inc. | 143,875 | ||||||
| 11,000 | Hillshire Brands Company | 318,890 | ||||||
| 5,500 | Ingredion, Inc. | 272,360 | ||||||
| 1,440 | Lancaster Colony Corporation | 102,542 | ||||||
| 2,000 | Post Holdings, Inc.a | 61,500 | ||||||
| 4,000 | Ralcorp Holdings, Inc.a | 266,960 | ||||||
| 11,700 | Smithfield Foods, Inc.a | 253,071 | ||||||
| 15,800 | SUPERVALU, Inc.b | 81,844 | ||||||
| 2,012 | Tootsie Roll Industries, Inc.b | 48,006 | ||||||
| 1,740 | Universal Corporation | 80,614 | ||||||
|
| |||||||
| Total | 2,937,111 | |||||||
|
| |||||||
| Energy (5.2%) | |||||||
| 15,500 | Arch Coal, Inc.b | 106,795 | ||||||
| 4,000 | Atwood Oceanics, Inc.a | 151,360 | ||||||
| 3,300 | Bill Barrett Corporationa | 70,686 | ||||||
| 1,400 | Carbo Ceramics, Inc.b | 107,422 | ||||||
| 6,100 | Cimarex Energy Company | 336,232 | ||||||
| 5,400 | Dresser-Rand Group, Inc.a | 240,516 | ||||||
| 2,500 | Dril-Quip, Inc.a | 163,975 | ||||||
| 5,200 | Energen Corporation | 234,676 | ||||||
| 8,400 | Forest Oil Corporationa | 61,572 | ||||||
| 7,700 | Helix Energy Solutions Group, Inc.a | 126,357 | ||||||
| 14,990 | HollyFrontier Corporation | 531,096 | ||||||
| 4,500 | Northern Oil and Gas, Inc.a,b | 71,730 | ||||||
| 7,700 | Oceaneering International, Inc. | 368,522 | ||||||
| 3,700 | Oil States International, Inc.a | 244,940 | ||||||
| 11,200 | Patterson-UTI Energy, Inc. | 163,072 | ||||||
| 9,339 | Plains Exploration & Production Companya | 328,546 | ||||||
| 8,800 | Quicksilver Resources, Inc.a,b | 47,696 | ||||||
| 4,600 | SM Energy Company | 225,906 | ||||||
| 11,300 | Superior Energy Services, Inc.a | 228,599 | ||||||
| 3,700 | Tidewater, Inc. | 171,532 | ||||||
| 2,900 | Unit Corporationa | 106,981 | ||||||
| 5,100 | World Fuel Services Corporation | 193,953 | ||||||
|
| |||||||
| Total | 4,282,164 | |||||||
|
| |||||||
| Financials (22.0%) | |||||||
| 3,700 | Affiliated Managers Group, Inc.a | 404,965 | ||||||
| 4,400 | Alexandria Real Estate Equities, Inc. | 319,968 | ||||||
| 1,000 | Alleghany Corporationa | 339,750 | ||||||
| 5,300 | American Campus Communities, Inc. | 238,394 | ||||||
| 5,435 | American Financial Group, Inc. | 213,215 | ||||||
| 15,480 | Apollo Investment Corporation | 118,886 | ||||||
| 8,300 | Arthur J. Gallagher & Company | 291,081 | ||||||
The accompanying Notes to Financial Statements are an integral part of this schedule.
122
Table of Contents
Mid Cap Index Portfolio
Schedule of Investments as of June 29, 2012
(unaudited)
| Shares | Common Stock (98.5%) | Value | ||||||
| Financials (22.0%) - continued | ||||||||
| 5,100 | Aspen Insurance Holdings, Ltd. | $ | 147,390 | |||||
| 12,793 | Associated Banc-Corp | 168,740 | ||||||
| 6,370 | Astoria Financial Corporation | 62,426 | ||||||
| 6,100 | BancorpSouth, Inc. | 88,572 | ||||||
| 3,300 | Bank of Hawaii Corporation | 151,635 | ||||||
| 11,300 | BioMed Realty Trust, Inc. | 211,084 | ||||||
| 5,400 | BRE Properties, Inc. | 270,108 | ||||||
| 8,600 | Brown & Brown, Inc. | 234,522 | ||||||
| 5,800 | Camden Property Trust | 392,486 | ||||||
| 5,800 | Cathay General Bancorp | 95,758 | ||||||
| 6,400 | CBOE Holdings, Inc. | 177,152 | ||||||
| 3,320 | City National Corporation | 161,286 | ||||||
| 5,769 | Commerce Bancshares, Inc. | 218,645 | ||||||
| 5,300 | Corporate Office Properties Trust | 124,603 | ||||||
| 4,400 | Cullen/Frost Bankers, Inc. | 252,956 | ||||||
| 19,100 | Duke Realty Corporation | 279,624 | ||||||
| 10,500 | East West Bancorp, Inc. | 246,330 | ||||||
| 8,400 | Eaton Vance Corporation | 226,380 | ||||||
| 4,600 | Equity One, Inc. | 97,520 | ||||||
| 2,500 | Essex Property Trust, Inc. | 384,800 | ||||||
| 3,810 | Everest Re Group, Ltd. | 394,297 | ||||||
| 4,600 | Federal Realty Investment Trust | 478,814 | ||||||
| 16,405 | Fidelity National Financial, Inc. | 315,960 | ||||||
| 7,900 | First American Financial Corporation | 133,984 | ||||||
| 26,300 | First Niagara Financial Group, Inc. | 201,195 | ||||||
| 8,098 | FirstMerit Corporation | 133,779 | ||||||
| 14,900 | Fulton Financial Corporation | 148,851 | ||||||
| 2,000 | Greenhill & Company, Inc. | 71,300 | ||||||
| 6,100 | Hancock Holding Company | 185,684 | ||||||
| 3,170 | Hanover Insurance Group, Inc. | 124,042 | ||||||
| 7,450 | HCC Insurance Holdings, Inc. | 233,930 | ||||||
| 5,300 | Highwoods Properties, Inc. | 178,345 | ||||||
| 3,500 | Home Properties, Inc. | 214,760 | ||||||
| 8,900 | Hospitality Properties Trust | 220,453 | ||||||
| 4,000 | International Bancshares Corporation | 78,080 | ||||||
| 14,100 | Janus Capital Group, Inc. | 110,262 | ||||||
| 10,900 | Jefferies Group, Inc. | 141,591 | ||||||
| 3,100 | Jones Lang LaSalle, Inc. | 218,147 | ||||||
| 3,600 | Kemper Corporation | 110,700 | ||||||
| 8,400 | Liberty Property Trust | 309,456 | ||||||
| 9,468 | Macerich Company | 559,085 | ||||||
| 6,400 | Mack-Cali Realty Corporation | 186,048 | ||||||
| 2,600 | Mercury General Corporation | 108,342 | ||||||
| 8,700 | MSCI, Inc.a | 295,974 | ||||||
| 7,900 | National Retail Properties, Inc. | 223,491 | ||||||
| 31,711 | New York Community Bancorp, Inc. | 397,339 | ||||||
| 19,350 | Old Republic International Corporation | 160,411 | ||||||
| 7,700 | Omega Healthcare Investors, Inc. | 173,250 | ||||||
| 2,907 | Potlatch Corporation | 92,849 | ||||||
| 3,400 | Prosperity Bancshares, Inc. | 142,902 | ||||||
| 5,870 | Protective Life Corporation | 172,637 | ||||||
| 8,025 | Raymond James Financial, Inc. | 274,776 | ||||||
| 8,812 | Rayonier, Inc. REIT | 395,659 | ||||||
| 9,700 | Realty Income Corporation | 405,169 | ||||||
| 6,400 | Regency Centers Corporation | 304,448 | ||||||
| 5,200 | Reinsurance Group of America, Inc. | 276,692 | ||||||
| 10,640 | SEI Investments Company | 211,630 | ||||||
| 12,000 | Senior Housing Property Trust | 267,840 | ||||||
| 3,300 | Signature Banka | 201,201 | ||||||
| 6,400 | SL Green Realty Corporation | 513,536 | ||||||
| 3,200 | StanCorp Financial Group, Inc. | 118,912 | ||||||
| 3,230 | SVB Financial Groupa | 189,666 | ||||||
| 59,200 | Synovus Financial Corporation | 117,216 | ||||||
| 4,200 | Taubman Centers, Inc. | 324,072 | ||||||
| 11,720 | TCF Financial Corporation | 134,546 | ||||||
| 4,800 | Trustmark Corporation | 117,504 | ||||||
| 18,003 | UDR, Inc. | 465,197 | ||||||
| 14,284 | Valley National Bancorpb | 151,410 | ||||||
| 7,975 | W.R. Berkley Corporation | 310,387 | ||||||
| 6,140 | Waddell & Reed Financial, Inc. | 185,919 | ||||||
| 7,827 | Washington Federal, Inc. | 132,198 | ||||||
| 5,330 | Webster Financial Corporation | 115,448 | ||||||
| 8,800 | Weingarten Realty Investors | 231,792 | ||||||
| 2,020 | Westamerica Bancorporation | 95,324 | ||||||
|
| |||||||
| Total | 17,974,776 | |||||||
|
| |||||||
| Health Care (10.8%) | ||||||||
| 13,800 | Allscripts Healthcare Solutions, Inc.a | 150,834 | ||||||
| 3,400 | AMERIGROUP Corporationa | 224,094 | ||||||
| 1,400 | Bio-Rad Laboratories, Inc.a | 140,014 | ||||||
| 3,600 | Catalyst Health Solutions, Inc.a | 336,384 | ||||||
| 3,600 | Charles River Laboratories International, Inc.a | 117,936 | ||||||
| 6,400 | Community Health Systems, Inc.a | 179,392 | ||||||
| 3,400 | Cooper Companies, Inc. | 271,184 | ||||||
| 4,010 | Covance, Inc.a | 191,878 | ||||||
| 8,400 | Endo Pharmaceutical Holdings, Inc.a | 260,232 | ||||||
| 3,200 | Gen-Probe, Inc.a | 263,040 | ||||||
| 18,800 | Health Management Associates, Inc.a | 147,580 | ||||||
| 5,980 | Health Net, Inc.a | 145,135 | ||||||
| 6,400 | Henry Schein, Inc.a | 502,336 | ||||||
| 4,450 | Hill-Rom Holdings, Inc. | 137,283 | ||||||
| 6,200 | HMS Holdings Corporationa | 206,522 | ||||||
| 19,200 | Hologic, Inc.a | 346,368 | ||||||
| 3,900 | IDEXX Laboratories, Inc.a,b | 374,907 | ||||||
| 3,400 | LifePoint Hospitals, Inc.a | 139,332 | ||||||
| 6,230 | Lincare Holdings, Inc. | 211,945 | ||||||
| 4,200 | Masimo Corporationa | 93,996 | ||||||
| 4,200 | Medicis Pharmaceutical Corporation | 143,430 | ||||||
| 3,500 | Mednax, Inc.a | 239,890 | ||||||
| 2,200 | Mettler-Toledo International, Inc.a | 342,870 | ||||||
| 8,120 | Omnicare, Inc. | 253,588 | ||||||
| 4,550 | Owens & Minor, Inc. | 139,366 | ||||||
| 5,600 | Regeneron Pharmaceuticals, Inc.a | 639,632 | ||||||
| 10,300 | ResMed, Inc.a | 321,360 | ||||||
| 4,200 | STERIS Corporation | 131,754 | ||||||
| 2,600 | Techne Corporation | 192,920 | ||||||
| 2,940 | Teleflex, Inc. | 179,075 | ||||||
| 4,200 | Thoratec Corporationa | 141,036 | ||||||
| 3,800 | United Therapeutics Corporationa | 187,644 | ||||||
| 7,000 | Universal Health Services, Inc. | 302,120 | ||||||
| 6,300 | VCA Antech, Inc.a | 138,474 | ||||||
| 15,120 | Vertex Pharmaceuticals, Inc.a | 845,510 | ||||||
The accompanying Notes to Financial Statements are an integral part of this schedule.
123
Table of Contents
Mid Cap Index Portfolio
Schedule of Investments as of June 29, 2012
(unaudited)
| Shares | Common Stock (98.5%) | Value | ||||||
| Health Care (10.8%) - continued | |||||||
| 3,000 | Wellcare Health Plans, Inc.a | $ | 159,000 | |||||
|
| |||||||
Total | 8,798,061 | |||||||
|
| |||||||
| Industrials (15.9%) | |||||||
| 3,000 | Acuity Brands, Inc. | 152,730 | ||||||
| 8,500 | Aecom Technology Corporationa | 139,825 | ||||||
| 6,930 | AGCO Corporationa | 316,909 | ||||||
| 5,180 | Alaska Air Group, Inc.a | 185,962 | ||||||
| 2,960 | Alexander & Baldwin, Inc.a | 157,620 | ||||||
| 2,300 | Alliant Techsystems, Inc. | 116,311 | ||||||
| 11,555 | AMETEK, Inc. | 576,710 | ||||||
| 7,500 | BE Aerospace, Inc.a | 327,450 | ||||||
| 3,360 | Brink’s Company | 77,885 | ||||||
| 4,440 | Carlisle Companies, Inc. | 235,409 | ||||||
| 3,600 | CLARCOR, Inc. | 173,376 | ||||||
| 3,400 | Clean Harbors, Inc.a | 191,828 | ||||||
| 4,030 | Con-way, Inc. | 145,523 | ||||||
| 7,600 | Copart, Inc.a | 180,044 | ||||||
| 2,400 | Corporate Executive Board Company | 98,112 | ||||||
| 7,100 | Corrections Corporation of America | 209,095 | ||||||
| 3,500 | Crane Company | 127,330 | ||||||
| 3,700 | Deluxe Corporation | 92,278 | ||||||
| 10,600 | Donaldson Company, Inc. | 353,722 | ||||||
| 2,300 | Esterline Technologies Corporationa | 143,405 | ||||||
| 13,600 | Exelis, Inc. | 134,096 | ||||||
| 11,600 | Fortune Brands Home and Security, Inc.a | 258,332 | ||||||
| 3,100 | FTI Consulting, Inc.a | 89,125 | ||||||
| 3,600 | Gardner Denver, Inc. | 190,476 | ||||||
| 3,420 | GATX Corporation | 131,670 | ||||||
| 3,500 | General Cable Corporationa | 90,790 | ||||||
| 4,300 | Graco, Inc. | 198,144 | ||||||
| 2,460 | Granite Construction, Inc. | 64,231 | ||||||
| 5,800 | Harsco Corporation | 118,204 | ||||||
| 4,290 | Herman Miller, Inc. | 79,451 | ||||||
| 3,230 | HNI Corporation | 83,173 | ||||||
| 4,230 | Hubbell, Inc. | 329,686 | ||||||
| 3,501 | Huntington Ingalls Industries, Inc.a | 140,880 | ||||||
| 6,100 | IDEX Corporation | 237,778 | ||||||
| 6,900 | ITT Corporation | 121,440 | ||||||
| 6,440 | JB Hunt Transport Services, Inc. | 383,824 | ||||||
| 15,475 | JetBlue Airways Corporationa | 82,017 | ||||||
| 8,000 | Kansas City Southern | 556,480 | ||||||
| 10,600 | KBR, Inc. | 261,926 | ||||||
| 5,740 | Kennametal, Inc. | 190,281 | ||||||
| 4,000 | Kirby Corporationa | 188,320 | ||||||
| 3,540 | Korn/Ferry Internationala | 50,799 | ||||||
| 3,300 | Landstar System, Inc. | 170,676 | ||||||
| 3,600 | Lennox International, Inc. | 167,868 | ||||||
| 6,000 | Lincoln Electric Holdings, Inc. | 262,740 | ||||||
| 5,770 | Manpower, Inc. | 211,471 | ||||||
| 2,200 | Mine Safety Appliances Company | 88,528 | ||||||
| 3,300 | MSC Industrial Direct Company, Inc. | 216,315 | ||||||
| 4,080 | Nordson Corporation | 209,263 | ||||||
| 6,600 | Oshkosh Corporationa | 138,270 | ||||||
| 7,060 | Pentair, Inc. | 270,257 | ||||||
| 3,000 | Regal-Beloit Corporation | 186,780 | ||||||
| 4,822 | Rollins, Inc. | 107,868 | ||||||
| 4,700 | Shaw Group, Inc.a | 128,357 | ||||||
| 3,660 | SPX Corporation | 239,071 | ||||||
| 7,900 | Terex Corporationa | 140,857 | ||||||
| 6,000 | Timken Company | 274,740 | ||||||
| 3,600 | Towers Watson & Company | 215,640 | ||||||
| 5,695 | Trinity Industries, Inc. | 142,261 | ||||||
| 3,700 | Triumph Group, Inc. | 208,199 | ||||||
| 6,098 | United Rentals, Inc.a,b | 207,576 | ||||||
| 5,400 | URS Corporation | 188,352 | ||||||
| 7,500 | UTI Worldwide, Inc. | 109,575 | ||||||
| 1,600 | Valmont Industries, Inc. | 193,552 | ||||||
| 3,400 | Wabtec Corporation | 265,234 | ||||||
| 8,800 | Waste Connections, Inc. | 263,296 | ||||||
| 2,100 | Watsco, Inc. | 154,980 | ||||||
| 3,200 | Werner Enterprises, Inc. | 76,448 | ||||||
| 4,300 | Woodward, Inc. | 169,592 | ||||||
|
| |||||||
Total | 12,990,413 | |||||||
|
| |||||||
| Information Technology (15.3%) | |||||||
| 2,820 | ACI Worldwide, Inc.a | 124,672 | ||||||
| 5,690 | Acxiom Corporationa | 85,976 | ||||||
| 4,580 | ADTRAN, Inc. | 138,270 | ||||||
| 2,300 | Advent Software, Inc.a | 62,353 | ||||||
| 3,600 | Alliance Data Systems Corporationa | 486,000 | ||||||
| 6,600 | ANSYS, Inc.a | 416,526 | ||||||
| 6,900 | AOL, Inc.a | 193,752 | ||||||
| 8,070 | Arrow Electronics, Inc.a | 264,777 | ||||||
| 32,620 | Atmel Corporationa | 218,554 | ||||||
| 10,420 | Avnet, Inc.a | 321,561 | ||||||
| 9,100 | Broadridge Financial Solutions, Inc. | 193,557 | ||||||
| 20,180 | Cadence Design Systems, Inc.a | 221,778 | ||||||
| 7,200 | Ciena Corporationa | 117,864 | ||||||
| 16,300 | Compuware Corporationa | 151,427 | ||||||
| 3,300 | Concur Technologies, Inc.a | 224,730 | ||||||
| 8,800 | Convergys Corporation | 129,976 | ||||||
| 7,700 | CoreLogic, Inc.a | 140,987 | ||||||
| 8,300 | Cree, Inc.a,b | 213,061 | ||||||
| 11,300 | Cypress Semiconductor Corporationa | 149,386 | ||||||
| 4,430 | Diebold, Inc. | 163,511 | ||||||
| 2,510 | DST Systems, Inc. | 136,318 | ||||||
| 3,400 | Equinix, Inc.a | 597,210 | ||||||
| 3,200 | FactSet Research Systems, Inc. | 297,408 | ||||||
| 2,450 | Fair Isaac Corporation | 103,586 | ||||||
| 9,200 | Fairchild Semiconductor International, Inc.a | 129,720 | ||||||
| 6,700 | Gartner, Inc.a | 288,435 | ||||||
| 5,600 | Global Payments, Inc. | 242,088 | ||||||
| 7,700 | Informatica Corporationa | 326,172 | ||||||
| 11,000 | Ingram Micro, Inc.a | 192,170 | ||||||
| 10,750 | Integrated Device Technology, Inc.a | 60,415 | ||||||
| 4,950 | International Rectifier Corporationa | 98,951 | ||||||
| 9,400 | Intersil Corporation | 100,110 | ||||||
| 2,800 | Itron, Inc.a | 115,472 | ||||||
| 6,260 | Jack Henry & Associates, Inc. | 216,095 | ||||||
| 6,000 | Lender Processing Services, Inc. | 151,680 | ||||||
The accompanying Notes to Financial Statements are an integral part of this schedule.
124
Table of Contents
Mid Cap Index Portfolio
Schedule of Investments as of June 29, 2012
(unaudited)
| Shares | Common Stock (98.5%) | Value | ||||||
| Information Technology (15.3%) - continued | |||||||
| 1,600 | ManTech International Corporation | $ | 37,552 | |||||
| 17,100 | MEMC Electronic Materials, Inc.a,b | 37,107 | ||||||
| 6,870 | Mentor Graphics Corporationa | 103,050 | ||||||
| 5,700 | MICROS Systems, Inc.a | 291,840 | ||||||
| 9,000 | Monster Worldwide, Inc.a | 76,500 | ||||||
| 6,662 | National Instruments Corporation | 178,941 | ||||||
| 11,400 | NCR Corporationa | 259,122 | ||||||
| 4,800 | NeuStar, Inc.a | 160,320 | ||||||
| 8,500 | Parametric Technology Corporationa | 178,160 | ||||||
| 3,040 | Plantronics, Inc. | 101,536 | ||||||
| 12,840 | Polycom, Inc.a | 135,077 | ||||||
| 7,200 | QLogic Corporationa | 98,568 | ||||||
| 4,100 | Quest Software, Inc.a | 114,185 | ||||||
| 7,700 | Rackspace Hosting, Inc.a | 338,338 | ||||||
| 20,540 | RF Micro Devices, Inc.a | 87,295 | ||||||
| 11,300 | Riverbed Technology, Inc.a | 182,495 | ||||||
| 7,740 | Rovi Corporationa | 151,859 | ||||||
| 4,690 | Semtech Corporationa | 114,061 | ||||||
| 3,000 | Silicon Laboratories, Inc.a | 113,700 | ||||||
| 13,500 | Skyworks Solutions, Inc.a | 369,495 | ||||||
| 5,100 | Solera Holdings, Inc. | 213,129 | ||||||
| 10,680 | Synopsys, Inc.a | 314,312 | ||||||
| 2,980 | Tech Data Corporationa | 143,547 | ||||||
| 27,400 | Tellabs, Inc. | 91,242 | ||||||
| 12,100 | TIBCO Software, Inc.a | 362,032 | ||||||
| 8,900 | Trimble Navigation, Ltd.a | 409,489 | ||||||
| 5,800 | ValueClick, Inc.a | 95,062 | ||||||
| 7,600 | VeriFone Systems, Inc.a | 251,484 | ||||||
| 10,520 | Vishay Intertechnology, Inc.a | 99,204 | ||||||
| 2,800 | Wright Express Corporationa | 172,816 | ||||||
| 3,700 | Zebra Technologies Corporationa | 127,132 | ||||||
|
| |||||||
Total | 12,483,198 | |||||||
|
| |||||||
| Materials (6.8%) | |||||||
| 6,420 | Albemarle Corporation | 382,889 | ||||||
| 4,700 | AptarGroup, Inc. | 239,935 | ||||||
| 5,700 | Ashland, Inc. | 395,067 | ||||||
| 4,490 | Cabot Corporation | 182,743 | ||||||
| 3,100 | Carpenter Technology Corporation | 148,304 | ||||||
| 8,500 | Commercial Metals Company | 107,440 | ||||||
| 2,300 | Compass Minerals International, Inc. | 175,444 | ||||||
| 3,260 | Cytec Industries, Inc. | 191,167 | ||||||
| 2,600 | Domtar Corporation | 199,446 | ||||||
| 2,300 | Greif, Inc. | 94,300 | ||||||
| 3,800 | Intrepid Potash, Inc.a | 86,488 | ||||||
| 10,100 | Louisiana-Pacific Corporationa | 109,888 | ||||||
| 3,320 | Martin Marietta Materials, Inc.b | 261,682 | ||||||
| 1,280 | Minerals Technologies, Inc. | 81,638 | ||||||
| 800 | NewMarket Corporation | 173,280 | ||||||
| 5,900 | Olin Corporation | 123,251 | ||||||
| 7,000 | Packaging Corporation of America | 197,680 | ||||||
| 5,400 | Reliance Steel & Aluminum Company | 272,700 | ||||||
| 5,000 | Rock-Tenn Company | 272,750 | ||||||
| 4,200 | Royal Gold, Inc. | 329,280 | ||||||
| 9,500 | RPM International, Inc. | 258,400 | ||||||
| 3,200 | Scotts Miracle-Gro Companyb | 131,584 | ||||||
| 3,630 | Sensient Technologies Corporation | 133,330 | ||||||
| 3,500 | Silgan Holdings, Inc. | 149,415 | ||||||
| 7,180 | Sonoco Products Company | 216,477 | ||||||
| 16,100 | Steel Dynamics, Inc. | 189,175 | ||||||
| 6,660 | Valspar Corporation | 349,583 | ||||||
| 3,900 | Worthington Industries, Inc. | 79,833 | ||||||
|
| |||||||
Total | 5,533,169 | |||||||
|
| |||||||
| Telecommunications Services (0.5%) | |||||||
| 6,995 | Telephone & Data Systems, Inc. | 148,924 | ||||||
| 11,000 | TW Telecom, Inc.a | 282,260 | ||||||
|
| |||||||
| Total | 431,184 | |||||||
|
| |||||||
| Utilities (5.1%) | |||||||
| 8,100 | Alliant Energy Corporation | 369,117 | ||||||
| 9,966 | Aqua America, Inc. | 248,751 | ||||||
| 6,600 | Atmos Energy Corporation | 231,462 | ||||||
| 3,100 | Black Hills Corporation | 99,727 | ||||||
| 4,400 | Cleco Corporation | 184,052 | ||||||
| 10,963 | Great Plains Energy, Inc. | 234,718 | ||||||
| 7,080 | Hawaiian Electric Industries, Inc. | 201,922 | ||||||
| 3,530 | IDACORP, Inc. | 148,542 | ||||||
| 13,925 | MDU Resources Group, Inc. | 300,919 | ||||||
| 5,900 | National Fuel Gas Company | 277,182 | ||||||
| 17,100 | NV Energy, Inc. | 300,618 | ||||||
| 6,990 | OGE Energy Corporation | 362,012 | ||||||
| 5,975 | PNM Resources, Inc. | 116,752 | ||||||
| 12,900 | Questar Corporation | 269,094 | ||||||
| 8,000 | UGI Corporation | 235,440 | ||||||
| 6,090 | Vectren Corporation | 179,777 | ||||||
| 9,120 | Westar Energy, Inc. | 273,144 | ||||||
| 3,710 | WGL Holdings, Inc. | 147,472 | ||||||
|
| |||||||
| Total | 4,180,701 | |||||||
|
| |||||||
Total Common Stock (cost $66,823,335) | 80,434,674 | |||||||
|
| |||||||
Collateral Held for Securities Loaned (3.0%) | ||||||||
| 2,437,401 | Thrivent Financial Securities Lending Trust | 2,437,401 | ||||||
|
| |||||||
Total Collateral Held for Securities Loaned (cost $2,437,401) | 2,437,401 | |||||||
|
| |||||||
| Principal Amount | Short-Term Investments (0.2%)c | |||||||
Federal National Mortgage Association Discount Notes | ||||||||
| 200,000 | 0.120%, 7/18/2012d,e | 199,988 | ||||||
|
| |||||||
| Total Short-Term Investments (at amortized cost) | 199,988 | |||||||
|
| |||||||
| Total Investments (cost $69,460,724) 101.7% | $ | 83,072,063 | ||||||
|
| |||||||
| Other Assets and Liabilities, Net (1.7%) | (1,407,750 | ) | ||||||
|
| |||||||
| Total Net Assets 100.0% | $ | 81,664,313 | ||||||
|
| |||||||
The accompanying Notes to Financial Statements are an integral part of this schedule.
125
Table of Contents
Mid Cap Index Portfolio
Schedule of Investments as of June 29, 2012
(unaudited)
| a | Non-income producing security. |
| b | All or a portion of the security is on loan. |
| c | The interest rate shown reflects the yield, coupon rate or the discount rate at the date of purchase. |
| d | Denotes investments that benefit from credit enhancement or liquidity support provided by a third party bank, institution or government. |
| e | At June 29, 2012, $199,988 of investments were held on deposit with the counterparty and pledged as the initial margin deposit for open futures contracts. |
Definitions:
| REIT | - | Real Estate Investment Trust is a company that buys, develops, manages and/or sells real estate assets. |
Unrealized Appreciation (Depreciation)
Gross unrealized appreciation and depreciation of investments, based on cost for federal income tax purposes, were as follows:
Gross unrealized appreciation | $ | 17,952,816 | ||
Gross unrealized depreciation | (6,303,034 | ) | ||
|
| |||
Net unrealized appreciation (depreciation) | $ | 11,649,782 | ||
Cost for federal income tax purposes | $ | 71,422,281 | ||
Fair Valuation Measurements
The following table is a summary of the inputs used, as of June 29, 2012, in valuing Mid Cap Index Portfolio’s assets carried at fair value.
Investments in Securities | Total | Level 1 | Level 2 | Level 3 | ||||||||||||
Common Stock | ||||||||||||||||
Consumer Discretionary | 10,823,897 | 10,823,897 | — | — | ||||||||||||
Consumer Staples | 2,937,111 | 2,937,111 | — | — | ||||||||||||
Energy | 4,282,164 | 4,282,164 | — | — | ||||||||||||
Financials | 17,974,776 | 17,974,776 | — | — | ||||||||||||
Health Care | 8,798,061 | 8,798,061 | — | — | ||||||||||||
Industrials | 12,990,413 | 12,990,413 | — | — | ||||||||||||
Information Technology | 12,483,198 | 12,483,198 | — | — | ||||||||||||
Materials | 5,533,169 | 5,533,169 | — | — | ||||||||||||
Telecommunications Services | 431,184 | 431,184 | — | — | ||||||||||||
Utilities | 4,180,701 | 4,180,701 | — | — | ||||||||||||
Collateral Held for Securities Loaned | 2,437,401 | 2,437,401 | — | — | ||||||||||||
Short-Term Investments | 199,988 | — | 199,988 | — | ||||||||||||
|
|
|
|
|
|
|
| |||||||||
Total | $ | 83,072,063 | $ | 82,872,075 | $ | 199,988 | $ | — | ||||||||
|
|
|
|
|
|
|
| |||||||||
Other Financial Instruments | Total | Level 1 | Level 2 | Level 3 | ||||||||||||
Asset Derivatives | ||||||||||||||||
Futures Contracts | 20,282 | 20,282 | — | — | ||||||||||||
|
|
|
|
|
|
|
| |||||||||
Total Asset Derivatives | $ | 20,282 | $ | 20,282 | $ | — | $ | — | ||||||||
|
|
|
|
|
|
|
| |||||||||
There were no significant transfers between the Levels during the period ended June 29, 2012. Transfers between the levels are identified as of the end of the period.
Futures Contracts | Number of Contracts Long/(Short) | Expiration Date | Notional Principal Amount | Value | Unrealized Gain/(Loss) | |||||||||||||||
S&P 400 Index Mini-Futures | 13 | September 2012 | $ | 1,201,068 | $ | 1,221,350 | $ | 20,282 | ||||||||||||
Total Futures Contracts | $ | 20,282 | ||||||||||||||||||
The accompanying Notes to Financial Statements are an integral part of this schedule.
126
Table of Contents
Mid Cap Index Portfolio
Schedule of Investments as of June 29, 2012
(unaudited)
The following table summarizes the fair value and Statement of Assets and Liabilities location, as of June 29, 2012, for Mid Cap Index Portfolio’s investments in financial derivative instruments by primary risk exposure as discussed under item (2) Significant Accounting Policies of the Notes to Financial Statements.
Derivatives by risk category | Statement of Assets and Liabilities Location | Fair Value | ||||
Asset Derivatives | ||||||
Equity Contracts | ||||||
Futures* | Net Assets - Net unrealized appreciation/(depreciation) on Futures contracts | $ | 20,282 | |||
Total Equity Contracts | 20,282 | |||||
|
| |||||
Total Asset Derivatives | $ | 20,282 | ||||
|
| |||||
| * | Includes cumulative appreciation/depreciation of futures contracts as reported in the Schedule of Investments. Only current day’s variation margin is reported within the Statement of Assets and Liabilities. |
The following table summarizes the net realized gains/(losses) and Statement of Operations location, for the period ended June 29, 2012, for Mid Cap Index Portfolio’s investments in financial derivative instruments by primary risk exposure.
Derivatives by risk category | Statement of Operations Location | Realized Gains/(Losses) recognized in Income | ||||
| Equity Contracts | ||||||
Futures | Net realized gains/(losses) on Futures contracts | 251,008 | ||||
Total Equity Contracts | 251,008 | |||||
|
| |||||
Total | $ 251,008 | |||||
|
| |||||
The following table summarizes the change in net unrealized appreciation/(depreciation) and Statement of Operations location, for the period ended June 29, 2012, for Mid Cap Index Portfolio’s investments in financial derivative instruments by primary risk exposure.
Derivatives by risk category | Statement of Operations Location | Change in unrealized appreciation/(depreciation) recognized in Income | ||||
| Equity Contracts | ||||||
Futures | Change in net unrealized appreciation/(depreciation) on Futures contracts | (65,090 | ) | |||
Total Equity Contracts | (65,090 | ) | ||||
|
| |||||
Total | ($ 65,090 | ) | ||||
|
| |||||
The following table presents Mid Cap Index Portfolio’s average volume of derivative activity during the period ended June 29, 2012.
Derivative Risk Category | Futures (Notional*) | Futures (Percentage of Average Net Assets) | ||||||
Equity Contracts | $ | 1,548,933 | 1.9 | % | ||||
| * | Notional amount represents long or short, or both, derivative positions held by the Portfolio. |
Investment in Affiliates
Affiliated issuers, as defined under the Investment Company Act of 1940, include those in which the Portfolio’s holdings of an issuer represent 5% or more of the outstanding voting securities of an issuer, or any affiliated mutual fund.
A summary of transactions for the fiscal year to date, in Mid Cap Index Portfolio, is as follows:
Portfolio | Value December 31, 2011 | Gross Purchases | Gross Sales | Shares Held at June 29, 2012 | Value June 29, 2012 | Income Earned January 1, 2012 - June 29, 2012 | ||||||||||||||||||
Thrivent Financial Securities Lending Trust | $ | 3,326,354 | $ | 11,109,528 | $ | 11,998,481 | 2,437,401 | $ | 2,437,401 | $ | 21,746 | |||||||||||||
Total Value and Income Earned | 3,326,354 | 2,437,401 | 21,746 | |||||||||||||||||||||
The accompanying Notes to Financial Statements are an integral part of this schedule.
127
Table of Contents
Partner Worldwide Allocation Portfolio
Schedule of Investments as of June 29, 2012
(unaudited)
| Shares | Common Stock (77.2%) | Value | ||||||
| Australia (3.4%) | ||||||||
| 52,917 | Australia & New Zealand Banking Group, Ltd. | $ | 1,205,501 | |||||
| 1,135,712 | Beach Energy, Ltd. | 1,105,953 | ||||||
| 186,105 | BHP Billiton, Ltd. | 6,062,108 | ||||||
| 313,795 | Boart Longyear Group | 935,250 | ||||||
| 17,841 | Campbell Brothers, Ltd. | 1,000,239 | ||||||
| 246,188 | Challenger, Ltd. | 826,884 | ||||||
| 22,445 | Flight Centre, Ltd.a | 438,746 | ||||||
| 148,673 | GrainCorp, Ltd. | 1,455,596 | ||||||
| 106,844 | Iluka Resources, Ltd. | 1,261,054 | ||||||
| 685,590 | Imdex, Ltd. | 1,254,623 | ||||||
| 137,181 | Mineral Resources, Ltd. | 1,272,568 | ||||||
| 96,254 | NRW Holdings, Ltd. | 301,471 | ||||||
| 44,061 | Ramsay Health Care, Ltd. | 1,023,807 | ||||||
| 33,664 | Rio Tinto, Ltd. | 1,976,387 | ||||||
| 276,072 | SAI Global, Ltd. | 1,354,533 | ||||||
| 352,644 | Westfield Retail Trust | 1,034,398 | ||||||
|
| |||||||
Total | 22,509,118 | |||||||
|
| |||||||
| Austria (<0.1%) | |||||||
| 9,465 | Voestalpine AGa | 251,384 | ||||||
|
| |||||||
Total | 251,384 | |||||||
|
| |||||||
| Belgium (0.8%) | |||||||
| 43,785 | Anheuser-Busch InBev NV | 3,452,066 | ||||||
| 19,642 | Compagnie d’ Entreprises CFE | 1,045,605 | ||||||
| 8,783 | EVS Broadcast Equipment SA | 414,342 | ||||||
|
| |||||||
Total | 4,912,013 | |||||||
|
| |||||||
| Brazil (2.5%) | |||||||
| 148,320 | Banco Bradesco SA ADR | 2,205,518 | ||||||
| 37,849 | Lojas Renner SA | 1,058,114 | ||||||
| 47,168 | Multiplan Empreendimentos Imobiliarios SA | 1,150,725 | ||||||
| 97,350 | Petroleo Brasileiro SA ADR | 1,827,260 | ||||||
| 119,000 | Petroleo Brasileiro SA PREF ADR | 2,158,660 | ||||||
| 274,000 | Rossi Residencial SA | 672,552 | ||||||
| 102,500 | Souza Cruz SA | 1,489,146 | ||||||
| 126,000 | Ultrapar Participacoes SA ADRa | 2,857,680 | ||||||
| 154,000 | Vale SA SP PREF ADRa | 3,004,540 | ||||||
|
| |||||||
Total | 16,424,195 | |||||||
|
| |||||||
| Canada (2.9%) | |||||||
| 22,253 | Agrium, Inc.a | 1,972,192 | ||||||
| 35,072 | Alimentation Couche-Tard, Inc. | 1,531,580 | ||||||
| 8,300 | Bank of Nova Scotia | 429,960 | ||||||
| 55,903 | Barrick Gold Corporation | 2,105,766 | ||||||
| 31,794 | Canadian National Railway Company | 2,688,796 | ||||||
| 13,124 | Dollarama, Inc. | 788,652 | ||||||
| 42,086 | Enbridge, Inc. | 1,680,794 | ||||||
| 120,950 | Encana Corporation | 2,519,389 | ||||||
| 498 | Goldcorp, Inc. | 18,749 | ||||||
| 9,740 | Metro, Inc. | 498,719 | ||||||
| 65,471 | Nexen, Inc. | 1,108,653 | ||||||
| 52,156 | Pacific Rubiales Energy Corporationa | 1,104,492 | ||||||
| 30,114 | Suncor Energy, Inc. | 870,795 | ||||||
| 11,825 | TMX Group, Inc. | 538,925 | ||||||
| 75,482 | Yamana Gold, Inc.a | 1,164,740 | ||||||
|
| |||||||
Total | 19,022,202 | |||||||
|
| |||||||
| Cayman Islands (0.1%) | |||||||
| 1,169,637 | Comba Telecom Systems Holdings, Ltd. | 491,404 | ||||||
|
| |||||||
Total | 491,404 | |||||||
|
| |||||||
| Chile (0.2%) | |||||||
| 18,200 | Banco Santander Chile SA ADRa | 1,410,318 | ||||||
|
| |||||||
Total | 1,410,318 | |||||||
|
| |||||||
| China (0.4%) | |||||||
| 1,866,000 | PetroChina Company, Ltd. | 2,415,073 | ||||||
|
| |||||||
Total | 2,415,073 | |||||||
|
| |||||||
| Cyprus (0.2%) | |||||||
| 144,551 | Prosafe SE | 1,049,383 | ||||||
|
| |||||||
Total | 1,049,383 | |||||||
|
| |||||||
| Denmark (1.4%) | |||||||
| 36,837 | Christian Hansen Holding AS | 949,113 | ||||||
| 8,175 | Coloplast AS | 1,469,928 | ||||||
| 223,400 | Danske Bank AS ADRb | 3,106,244 | ||||||
| 23,758 | Novo Nordisk AS | 3,445,786 | ||||||
|
| |||||||
Total | 8,971,071 | |||||||
|
| |||||||
| Finland (0.7%) | |||||||
| 100,820 | Amer Sports OYJ | 1,149,682 | ||||||
| 155,500 | Neste Oil OYJ | 1,749,818 | ||||||
| 30,046 | Outotec OYJ | 1,372,827 | ||||||
|
| |||||||
Total | 4,272,327 | |||||||
|
| |||||||
| France (5.0%) | |||||||
| 37,712 | Alten, Ltd. | 1,047,618 | ||||||
| 16,127 | AtoS | 964,444 | ||||||
| 256,579 | AXA SA | 3,430,112 | ||||||
| 89,540 | Beneteau SAa | 865,791 | ||||||
| 42,588 | Bouygues SA | 1,142,789 | ||||||
| 93,500 | Cap Gemini SA | 3,441,337 | ||||||
| 12,370 | Casino Guichard Perrachon SA | 1,087,308 | ||||||
| 8,554 | Christian Dior SA | 1,176,408 | ||||||
| 91,892 | Compagnie de Saint-Gobain | 3,395,342 | ||||||
| 42,474 | Faureciaa | 706,481 | ||||||
| 25,579 | Ingenico | 1,241,753 | ||||||
| 204 | Legrand SAa | 6,924 | ||||||
| 6,080 | Remy Cointreau SA | 667,985 | ||||||
| 9,373 | Sanofi | 709,545 | ||||||
| 13,265 | Sartorius Stedim Biotech | 972,780 | ||||||
| 75,950 | Total SA | 3,418,432 | ||||||
| 8,524 | Unibail-Rodamco | 1,570,210 | ||||||
| 31,773 | Vinci SA | 1,484,915 | ||||||
| 6,602 | Virbac SA | 1,091,381 | ||||||
| 179,386 | Vivendi SAa | 3,333,147 | ||||||
| 10,241 | Wendel SA | 758,342 | ||||||
|
| |||||||
Total | 32,513,044 | |||||||
|
| |||||||
| Germany (5.6%) | |||||||
| 41,284 | BASF SE | 2,870,664 | ||||||
| 28,696 | Bayerische Motoren Werke AG | 2,076,672 | ||||||
| 1,998,300 | Commerzbank AGb | 3,393,974 | ||||||
| 80,750 | Daimler AG | 3,628,865 | ||||||
| 16,724 | Delticom AGa | 1,101,486 | ||||||
| 64,700 | Deutsche Boerse AG | 3,490,640 | ||||||
| 156,960 | Deutz AGb | 798,724 | ||||||
The accompanying Notes to Financial Statements are an integral part of this schedule.
128
Table of Contents
Partner Worldwide Allocation Portfolio
Schedule of Investments as of June 29, 2012
(unaudited)
| Shares | Common Stock (77.2%) | Value | ||||||
| Germany (5.6%) - continued | |||||||
| 18,025 | Duerr AG | $ | 1,112,178 | |||||
| 24,830 | Gerresheimer AGb | 1,168,779 | ||||||
| 26,368 | Gerry Weber International AG | 1,090,641 | ||||||
| 25,150 | Henkel AG & Company KGaA | 1,671,116 | ||||||
| 90,796 | Infineon Technologies AG | 614,522 | ||||||
| 72,400 | Metro AG | 2,111,190 | ||||||
| 10,970 | Pfeiffer Vacuum Technology AG | 1,119,698 | ||||||
| 24,296 | Rheinmetall AG | 1,194,323 | ||||||
| 35,388 | RWE AG | 1,447,178 | ||||||
| 42,159 | SAP AG ADR | 2,496,467 | ||||||
| 15,090 | Siemens AG | 1,267,973 | ||||||
| 45,221 | Suedzucker AGa | 1,604,235 | ||||||
| 40,226 | Symrise AG | 1,225,967 | ||||||
| 10,667 | Volkswagen AG | 1,689,954 | ||||||
|
| |||||||
Total | 37,175,246 | |||||||
|
| |||||||
| Hong Kong (2.9%) | |||||||
| 484,800 | AIA Group, Ltd. | 1,674,516 | ||||||
| 243,000 | Cathay Pacific Airways, Ltd. | 393,956 | ||||||
| 340,000 | China Mobile, Ltd. | 3,732,322 | ||||||
| 863,747 | Dah Chong Hong Holdings, Ltd. | 777,161 | ||||||
| 1,899,150 | Guangzhou Automobile Group Company, Ltd.b | 1,596,578 | ||||||
| 336,000 | Hang Lung Group, Ltd. | 2,077,531 | ||||||
| 331,500 | Hutchison Whampoa, Ltd. | 2,875,379 | ||||||
| 261,000 | Link REIT | 1,069,794 | ||||||
| 2,017,742 | New World Development Company, Ltd. | 2,377,596 | ||||||
| 113,000 | Swire Pacific, Ltd., Class A | 1,314,277 | ||||||
| 340,000 | Swire Pacific, Ltd., Class B | 784,691 | ||||||
| 126,700 | Swire Properties, Ltd. | 381,552 | ||||||
|
| |||||||
Total | 19,055,353 | |||||||
|
| |||||||
| Hungary (0.2%) | |||||||
| 8,200 | Richter Gedeon Nyrt | 1,353,298 | ||||||
|
| |||||||
Total | 1,353,298 | |||||||
|
| |||||||
| India (1.4%) | |||||||
| 96,992 | Bharti Airtel, Ltd. | 533,965 | ||||||
| 16,100 | GlaxoSmithKline Pharmaceuticals, Ltd. | 584,417 | ||||||
| 7,344 | Grasim Industries, Ltd. | 348,392 | ||||||
| 8,000 | Grasim Industries, Ltd. GDR | 382,385 | ||||||
| 35,500 | Hero Motocorp, Ltd. | 1,377,344 | ||||||
| 116,000 | Hindustan Unilever, Ltd. | 947,257 | ||||||
| 140,200 | Housing Development Finance Corporation | 1,653,259 | ||||||
| 25,000 | ICICI Bank, Ltd. | 406,080 | ||||||
| 10,400 | ICICI Bank, Ltd. ADR | 337,064 | ||||||
| 21,500 | Infosys, Ltd. | 974,707 | ||||||
| 16,504 | Infosys, Ltd. ADRa | 743,670 | ||||||
| 20,696 | Ultra Tech Cement, Ltd. | 563,745 | ||||||
| 4,570 | Ultra Tech Cement, Ltd. GDR | 124,123 | ||||||
|
| |||||||
Total | 8,976,408 | |||||||
|
| |||||||
| Indonesia (0.4%) | |||||||
| 3,270,000 | PT Astra International Tbk | 2,410,640 | ||||||
|
| |||||||
Total | 2,410,640 | |||||||
|
| |||||||
| Ireland (0.5%) | |||||||
| 27,147 | Paddy Power plc | 1,772,168 | ||||||
| 40,062 | Ryanair Holdings plc ADRb | 1,217,885 | ||||||
|
| |||||||
Total | 2,990,053 | |||||||
|
| |||||||
| Israel (0.8%) | |||||||
| 17,592 | Mellanox Technologies, Ltd.b | 1,246,217 | ||||||
| 21,844 | Radware, Inc.b | 836,407 | ||||||
| 83,100 | Teva Pharmaceutical Industries, Ltd. ADR | 3,277,464 | ||||||
|
| |||||||
Total | 5,360,088 | |||||||
|
| |||||||
| Italy (1.3%) | |||||||
| 120,449 | Ansaldo STS SPA | 857,105 | ||||||
| 34,476 | DiaSorin SPAa | 1,004,621 | ||||||
| 181,400 | Eni SPA | 3,853,867 | ||||||
| 3,064,825 | Telecom Italia SPA | 2,483,431 | ||||||
|
| |||||||
Total | 8,199,024 | |||||||
|
| |||||||
| Japan (13.0%) | |||||||
| 20,100 | Aisin Seiki Company, Ltd. | 671,900 | ||||||
| 29,900 | Aoyama Trading Company, Ltd. | 613,761 | ||||||
| 112,100 | Asics Corporation | 1,422,057 | ||||||
| 163,000 | Bank of Yokohama, Ltd. | 770,685 | ||||||
| 183,550 | Bridgestone Corporationa | 4,215,061 | ||||||
| 51,600 | Canon, Inc.a | 2,059,383 | ||||||
| 88,000 | Chiyoda Corporationa | 1,078,206 | ||||||
| 64,800 | CMK Corporation | 273,853 | ||||||
| �� | 39,000 | Daihatsu Motor Company, Ltd. | 682,780 | |||||
| 193,450 | Daiichi Sankyo Company, Ltd. | 3,261,926 | ||||||
| 926,356 | Daiwa Securities Group, Inc. | 3,491,183 | ||||||
| 23,900 | East Japan Railway Company | 1,500,710 | ||||||
| 16,000 | FamilyMart Company, Ltd. | 732,304 | ||||||
| 20,100 | HIS Company, Ltd. | 714,734 | ||||||
| 181,000 | Hitachi, Ltd. | 1,116,017 | ||||||
| 13,300 | Idemitsu Kosan Company, Ltd. | 1,193,032 | ||||||
| 426,000 | IHI Corporation | 911,209 | ||||||
| 112,600 | ITOCHU Corporation | 1,183,500 | ||||||
| 57,400 | Japan Tobacco, Inc. | 1,700,512 | ||||||
| 68,200 | JX Holdings, Inc. | 351,504 | ||||||
| 118 | KDDI Corporation | 761,208 | ||||||
| 42,500 | Konica Minolta Holdings, Inc. | 334,813 | ||||||
| 274,261 | Kureha Corporation | 1,214,746 | ||||||
| 122,000 | Marubeni Corporation | 812,874 | ||||||
| 346 | Message Company, Ltd. | 1,099,565 | ||||||
| 169,000 | Mitsubishi Chemical Holdings Corporation | 745,002 | ||||||
| 37,300 | Mitsubishi Corporation | 753,993 | ||||||
| 157,900 | Mitsubishi UFJ Financial Group, Inc. | 756,480 | ||||||
| 34,100 | Mitsui & Company, Ltd. | 506,721 | ||||||
| 161,800 | Mori Seiki Company, Ltd. | 1,408,394 | ||||||
| 187,700 | MS and AD Insurance Group Holdings, Inc. | 3,283,865 | ||||||
| 56,800 | Nabtesco Corporation | 1,266,873 | ||||||
| 189,000 | Nachi-Fujikoshi Corporation | 804,404 | ||||||
| 117,000 | Nikkiso Company, Ltd. | 1,229,230 | ||||||
| 142,350 | Nikon Corporation | 4,333,238 | ||||||
| 545,350 | Nippon Sheet Glass Companya | 600,846 | ||||||
| 99,000 | Nippon Shokubai Company, Ltd. | 1,198,097 | ||||||
| 82,000 | Nippon Soda Company, Ltd. | 330,255 | ||||||
| 14,600 | Nippon Telegraph & Telephone Corporation | 680,806 | ||||||
| 149,000 | Nippon Yusen Kabushiki Kaisha | 394,082 | ||||||
The accompanying Notes to Financial Statements are an integral part of this schedule.
129
Table of Contents
Partner Worldwide Allocation Portfolio
Schedule of Investments as of June 29, 2012
(unaudited)
| Shares | Common Stock (77.2%) | Value | ||||||
| Japan (13.0%) - continued | ||||||||
| 470,000 | Nissan Motor Company, Ltd. | $ | 4,462,992 | |||||
| 595 | NTT DoCoMo, Inc. | 990,081 | ||||||
| 70,600 | OSG Corporation | 1,015,621 | ||||||
| 25,100 | Otsuka Holdings Company, Ltd. | 770,450 | ||||||
| 36,003 | Pigeon Corporation | 1,577,336 | ||||||
| 27,500 | Ryohin Keikaku Company, Ltd. | 1,494,861 | ||||||
| 32,300 | Ship Healthcare Holdings, Inc. | 778,439 | ||||||
| 634,500 | Sojitz Corporation | 1,049,813 | ||||||
| 238 | So-net M3, Inc.a | 1,139,112 | ||||||
| 218,000 | Sumitomo Bakelite Company, Ltd | 1,019,554 | ||||||
| 315,150 | Sumitomo Corporation | 4,409,518 | ||||||
| 109,700 | Sumitomo Electric Industries, Ltd. | 1,366,958 | ||||||
| 1,290,350 | Sumitomo Mitsui Trust Holdings, Inc. | 3,856,367 | ||||||
| 302,000 | Sumitomo Osaka Cement Company, Ltd. | 1,003,088 | ||||||
| 35,200 | Suzuki Motor Corporation | 722,757 | ||||||
| 29,900 | Sysmex Corporation | 1,182,480 | ||||||
| 36,400 | Tamron Company, Ltd. | 1,210,043 | ||||||
| 7,000 | TDK Corporationa | 284,959 | ||||||
| 160,000 | Toda Kogyo Corporation | 860,916 | ||||||
| 21,000 | Toyo Suisan Kaisha, Ltd. | 560,007 | ||||||
| 53,000 | Toyota Motor Corporation | 2,139,198 | ||||||
| 45,600 | Unipres Corporation | 1,191,931 | ||||||
| 132,100 | UNY Company, Ltd. | 1,446,934 | ||||||
| 22,900 | West Japan Railway Company | 942,060 | ||||||
|
| |||||||
Total | 85,935,284 | |||||||
|
| |||||||
| Luxembourg (0.3%) | ||||||||
| 47,000 | Tenaris SA ADRa | 1,643,590 | ||||||
|
| |||||||
Total | 1,643,590 | |||||||
|
| |||||||
| Malaysia (0.4%) | ||||||||
| 640,000 | CIMB Group Holdings Berhad | 1,533,682 | ||||||
| 199,400 | Public Bank Berhad | 866,654 | ||||||
|
| |||||||
Total | 2,400,336 | |||||||
|
| |||||||
| Mexico (1.1%) | ||||||||
| 172,000 | Consorcio ARA SAB de CVb | 57,507 | ||||||
| 31,500 | Fomento Economico Mexicano SAB de CV ADR | 2,811,374 | ||||||
| 13,500 | Grupo Aeroportuario del Sureste SAB de CV ADRa | 1,053,945 | ||||||
| 483,500 | Grupo Financiero Banorte SAB de CV ADR | 2,498,744 | ||||||
| 259,000 | Organizacion Soriana SAB de CVb | 813,519 | ||||||
|
| |||||||
Total | 7,235,089 | |||||||
|
| |||||||
| Netherlands (2.5%) | ||||||||
| 76,978 | Aalberts Industries NV | 1,198,614 | ||||||
| 906,150 | Aegon NVa | 4,202,325 | ||||||
| 19,966 | ASM International NV | 758,412 | ||||||
| 31,397 | ASML Holding NV | 1,612,429 | ||||||
| 13,564 | Gemalto NV | 974,213 | ||||||
| 35,831 | Imtech NV | 855,582 | ||||||
| 55,412 | Koninklijke (Royal) Ahold NV | 686,402 | ||||||
| 97,318 | Koninklijke DSM NVa | 4,797,733 | ||||||
| 47,400 | TKH Group NVa | 1,018,194 | ||||||
| 2,907 | Ziggo NVb | 92,651 | ||||||
|
| |||||||
Total | 16,196,555 | |||||||
|
| |||||||
| New Zealand (0.1%) | ||||||||
| 300,215 | Telecom Corporation of New Zealand, Ltd. | 571,617 | ||||||
|
| |||||||
Total | 571,617 | |||||||
|
| |||||||
| Norway (1.6%) | ||||||||
| 32,000 | Schibsted ASAa | 1,039,502 | ||||||
| 30,607 | Seadrill, Ltd. | 1,091,604 | ||||||
| 156,629 | Statoil ASA | 3,735,338 | ||||||
| 417,000 | STX OSV Holdings, Ltd. | 498,076 | ||||||
| 40,285 | TGS Nopec Geophysical Company ASA | 1,087,714 | ||||||
| 150,813 | Tomra Systems ASA | 1,282,472 | ||||||
| 32,616 | Yara International ASA | 1,427,322 | ||||||
|
| |||||||
Total | 10,162,028 | |||||||
|
| |||||||
| Philippines (0.4%) | ||||||||
| 2,576,000 | Ayala Land, Inc. | 1,328,540 | ||||||
| 658,242 | Bank of the Philippine Islands | 1,170,383 | ||||||
|
| |||||||
Total | 2,498,923 | |||||||
|
| |||||||
| Poland (0.2%) | ||||||||
| 31,000 | Bank Pekao SA | 1,414,019 | ||||||
|
| |||||||
Total | 1,414,019 | |||||||
|
| |||||||
| Portugal (0.3%) | ||||||||
| 2,449,837 | Banco Espirito Santo SAb | 1,674,768 | ||||||
|
| |||||||
Total | 1,674,768 | |||||||
|
| |||||||
| Russia (0.3%) | ||||||||
| 36,500 | Lukoil ADR | 2,045,398 | ||||||
|
| |||||||
Total | 2,045,398 | |||||||
|
| |||||||
| Singapore (1.4%) | ||||||||
| 1,113,000 | Biosenors International Group, Ltd.a,b | 1,005,460 | ||||||
| 1,463,000 | Ezion Holdings, Ltd. | 1,078,079 | ||||||
| 9,974,000 | GMG Global, Ltd. | 970,788 | ||||||
| 1,596,000 | Golden Agri-Resources, Ltd. | 852,300 | ||||||
| 381,925 | Keppel Corporation, Ltd. | 3,128,783 | ||||||
| 589,000 | Raffles Medical Group, Ltd. | 1,030,843 | ||||||
| 225,000 | SembCorp Industries, Ltd. | 920,905 | ||||||
|
| |||||||
Total | 8,987,158 | |||||||
|
| |||||||
| South Africa (0.5%) | ||||||||
| 59,584 | Massmart Holdings, Ltd. | 1,233,701 | ||||||
| 181,000 | Truworths International, Ltd.a | 1,986,023 | ||||||
|
| |||||||
Total | 3,219,724 | |||||||
|
| |||||||
| South Korea (2.1%) | ||||||||
| 12,181 | BS Financial Group, Inc. | 136,182 | ||||||
| 4,101 | E-Mart Company, Ltd. | 900,148 | ||||||
| 40,710 | Lock & Lock Company, Ltd. | 1,206,001 | ||||||
| 10,250 | POSCO | 3,281,559 | ||||||
| 6,250 | Samsung Electronics Company, Ltd. | 4,125,949 | ||||||
| 1,448 | Shinsegae Company, Ltd. | 266,851 | ||||||
| 8,673 | SK Telecom Company, Ltd. | 949,122 | ||||||
| 189,907 | SK Telecom Company, Ltd. ADRa | 2,297,874 | ||||||
| 31,333 | Tera Semicon Company, Ltd.b | 901,858 | ||||||
|
| |||||||
Total | 14,065,544 | |||||||
|
| |||||||
The accompanying Notes to Financial Statements are an integral part of this schedule.
130
Table of Contents
Partner Worldwide Allocation Portfolio
Schedule of Investments as of June 29, 2012
(unaudited)
| Shares | Common Stock (77.2%) | Value | ||||||
| Spain (0.6%) | |||||||
| 443,463 | Banco Bilbao Vizcaya Argentaria SA | $ | 3,166,927 | |||||
| 13,880 | Viscofan SA | 596,436 | ||||||
|
| |||||||
Total | 3,763,363 | |||||||
|
| |||||||
| Sweden (1.5%) | ||||||||
| 63,884 | Atlas Copco AB | 1,374,823 | ||||||
| 52,862 | Boliden AB | 737,622 | ||||||
| 37,755 | Hexpol AB | 1,287,123 | ||||||
| 36,040 | Hoganas AB | 1,146,190 | ||||||
| 71,642 | JM ABa | 1,266,034 | ||||||
| 28,156 | Skanska AB | 431,474 | ||||||
| 112,240 | Swedbank AB | 1,768,211 | ||||||
| 143,752 | Volvo AB | 1,643,577 | ||||||
|
| |||||||
Total | 9,655,054 | |||||||
|
| |||||||
| Switzerland (5.6%) | ||||||||
| 69,800 | Adecco SAb | 3,103,827 | ||||||
| 31,414 | Aryzta AGb | 1,563,538 | ||||||
| 5,523 | Bucher Industries AG | 882,050 | ||||||
| 4,123 | Burckhardt Compression Holding AG | 1,058,956 | ||||||
| 34,588 | Compagnie Financiere Richemont SA | 1,899,119 | ||||||
| 167,300 | Credit Suisse Groupb | 3,060,927 | ||||||
| 3,973 | Dufry AGb | 481,537 | ||||||
| 2,182 | Galenica AGa | 1,388,009 | ||||||
| 2,972 | Givaudan SAb | 2,916,758 | ||||||
| 57,432 | Holcim, Ltd.b | 3,181,879 | ||||||
| 66,698 | Nestle SA | 3,980,182 | ||||||
| 65,250 | Novartis AG | 3,648,019 | ||||||
| 48,577 | Roche Holding AG | 8,390,408 | ||||||
| 6,325 | Zehnder Group AG | 378,047 | ||||||
| 5,354 | Zurich Insurance Group AGb | 1,210,604 | ||||||
|
| |||||||
Total | 37,143,860 | |||||||
|
| |||||||
| Taiwan (0.6%) | ||||||||
| 337,300 | Taiwan Mobile Company, Ltd. | 1,115,441 | ||||||
| 1,124,951 | Taiwan Semiconductor Manufacturing Company, Ltd.b | 3,079,516 | ||||||
|
| |||||||
Total | 4,194,957 | |||||||
|
| |||||||
| Thailand (1.6%) | ||||||||
| 345,000 | Bangkok Bank pcl | 2,268,697 | ||||||
| 280,100 | PTT Exploration & Production pcl | 1,492,942 | ||||||
| 387,300 | PTT pcl | 3,967,383 | ||||||
| 133,100 | Siam Cement pcl | 1,527,041 | ||||||
| 269,200 | Siam Commercial Bank pcl | 1,259,783 | ||||||
|
| |||||||
Total | 10,515,846 | |||||||
|
| |||||||
| Turkey (0.6%) | ||||||||
| 563,982 | Akbank TAS | 2,067,664 | ||||||
| 31,670 | BIM Birlesik Magazalar AS | 1,307,378 | ||||||
| 220,000 | Turkiye Garanti Bankasi AS | 866,023 | ||||||
|
| |||||||
Total | 4,241,065 | |||||||
|
| |||||||
| United Kingdom (10.7%) | ||||||||
| 45,006 | Aveva Group plc | 1,149,080 | ||||||
| 177,092 | Babcock International Group plc | 2,371,868 | ||||||
| 1,208,477 | BAE Systems plc | 5,478,745 | ||||||
| 43,180 | Bellway plc | 566,162 | ||||||
| 72,865 | BG Group plc | 1,491,673 | ||||||
| 32,632 | British American Tobacco plc | 1,659,029 | ||||||
| 505,430 | BT Group plc | 1,674,766 | ||||||
| 133,696 | BTG plcb | 854,963 | ||||||
| 39,954 | Burberry Group plc | 831,882 | ||||||
| 222,717 | Carillion plc | 964,816 | ||||||
| 129,925 | Diageo plc | 3,348,850 | ||||||
| 68,462 | Drax Group plc | 602,262 | ||||||
| 224,297 | Fenner plc | 1,271,941 | ||||||
| 44,194 | GlaxoSmithKline plc | 1,003,838 | ||||||
| 206,851 | Halma plc | 1,353,910 | ||||||
| 79,800 | HSBC Holdings plc ADRa | 3,521,573 | ||||||
| 66,144 | Imperial Tobacco Group plc | 2,548,445 | ||||||
| 124,088 | Inchcape plc | 644,130 | ||||||
| 36,076 | InterContinental Hotels Group plc | 868,519 | ||||||
| 208,392 | Intermediate Capital Group plc | 883,210 | ||||||
| 490,834 | ITV plc | 590,615 | ||||||
| 85,553 | Lancashire Holdings, Ltd. | 1,069,071 | ||||||
| 359,029 | Legal & General Group plc | 717,777 | ||||||
| 83,863 | London Stock Exchange Group plc | 1,323,932 | ||||||
| 136,561 | Mondi plc | 1,169,698 | ||||||
| 299,285 | Morgan Crucible Company plc | 1,309,167 | ||||||
| 110,232 | National Grid plc | 1,168,252 | ||||||
| 98,650 | Pearson plc | 1,957,411 | ||||||
| 122,913 | Persimmon plc | 1,176,769 | ||||||
| 106,804 | Prudential plc | 1,238,408 | ||||||
| 40,990 | Rightmove plc | 1,024,256 | ||||||
| 41,166 | Rio Tinto plc | 1,956,381 | ||||||
| 32,588 | SABMiller plc | 1,318,982 | ||||||
| 38,566 | Spirax-Sarco Engineering plc | 1,201,930 | ||||||
| 460,203 | Spirent plc | 1,159,913 | ||||||
| 70,818 | Sports Direct International plcb | 339,538 | ||||||
| 90,489 | Standard Chartered plc | 1,965,716 | ||||||
| 80,358 | Telecity Group plcb | 1,012,763 | ||||||
| 1,156,327 | Tesco plc | 5,619,549 | ||||||
| 47,476 | Ultra Electronics Holdings plc | 1,183,465 | ||||||
| 39,036 | Unilever plc | 1,310,601 | ||||||
| 1,249,550 | Vodafone Group plc | 3,512,048 | ||||||
| 365,000 | WPP plc | 4,431,049 | ||||||
|
| |||||||
Total | 70,846,953 | |||||||
|
| |||||||
| United States (1.1%) | ||||||||
| 33,687 | iShares MSCI EAFE Index Fund | 1,683,003 | ||||||
| 5,684 | Molycorp, Inc.a,b | 122,490 | ||||||
| 130,500 | Vanguard MSCI Emerging Markets ETF | 5,213,475 | ||||||
|
| |||||||
Total | 7,018,968 | |||||||
|
| |||||||
Total Common Stock (cost $518,159,306) | 505,191,741 | |||||||
|
| |||||||
| Principal Amount | Long-Term Fixed Income (8.4%) | |||||||
| Argentina (0.4%) | ||||||||
Arcos Dorados SA | ||||||||
| 73,000 | 7.500%, 10/1/2019 | 78,840 | ||||||
Argentina Government International Bond | ||||||||
| 380,000 | 7.000%, 9/12/2013 | 342,950 | ||||||
| 680,000 | 7.000%, 10/3/2015 | 526,320 | ||||||
| 90,000 | 7.000%, 4/17/2017 | 62,100 | ||||||
The accompanying Notes to Financial Statements are an integral part of this schedule.
131
Table of Contents
Partner Worldwide Allocation Portfolio
Schedule of Investments as of June 29, 2012
(unaudited)
| Principal Amount | Long-Term Fixed Income (8.4%) | Value | ||||||
| Argentina (0.4%) - continued | ||||||||
| $347,882 | 7.820%, 12/31/2033c | $ | 233,330 | |||||
| 616,999 | 7.820%, 12/31/2033c | 413,831 | ||||||
| 53,352 | 8.280%, 12/31/2033 | 33,745 | ||||||
| 280,100 | 8.280%, 12/31/2033 | 183,466 | ||||||
| 520,000 | 0.000%, 12/15/2035d | 52,000 | ||||||
| 590,000 | 0.000%, 12/15/2035d | 59,148 | ||||||
| 3,546,001 | 0.000%, 12/15/2035c,d | 401,180 | ||||||
|
| |||||||
| Total | 2,386,910 | |||||||
|
| |||||||
| Azerbaijan (<0.1%) | ||||||||
State Oil Company of Azerbaijan Republic | ||||||||
| 200,000 | 5.450%, 2/9/2017 | 205,250 | ||||||
|
| |||||||
| Total | 205,250 | |||||||
|
| |||||||
| Belarus (<0.1%) | ||||||||
Belarus Government International Bond | ||||||||
| 239,000 | 8.750%, 8/3/2015 | 233,623 | ||||||
| 100,000 | 8.950%, 1/26/2018 | 92,500 | ||||||
|
| |||||||
| Total | 326,123 | |||||||
|
| |||||||
| Belize (<0.1%) | ||||||||
Belize Government International Bond | ||||||||
| 120,000 | 8.500%, 2/20/2029 | 63,900 | ||||||
|
| |||||||
| Total | 63,900 | |||||||
|
| |||||||
| Bermuda (<0.1%) | ||||||||
China Resources Gas Group, Ltd | ||||||||
| 200,000 | 4.500%, 4/5/2022 | 207,490 | ||||||
|
| |||||||
| Total | 207,490 | |||||||
|
| |||||||
| Brazil (0.1%) | ||||||||
Banco do Estado do Rio Grande do Sul SA | ||||||||
| 200,000 | 7.375%, 2/2/2022e | 205,000 | ||||||
Brazil Government International Bond | ||||||||
| 100,000 | 5.875%, 1/15/2019 | 120,700 | ||||||
| 260,000 | 5.625%, 1/7/2041 | 318,890 | ||||||
Independencia International, Ltd. | ||||||||
| 95,246 | 12.000%, 12/30/2016e,f,g | 10 | ||||||
OGX Austria GmbH | ||||||||
| 200,000 | 8.375%, 4/1/2022e | 172,500 | ||||||
|
| |||||||
| Total | 817,100 | |||||||
|
| |||||||
| Canada (0.1%) | ||||||||
Inmet Mining Corporation | ||||||||
| 290,000 | 8.750%, 6/1/2020e | 287,100 | ||||||
PTTEP Canada International Finance, Ltd. | ||||||||
| 270,000 | 5.692%, 4/5/2021e | 287,816 | ||||||
| 210,000 | 6.350%, 6/12/2042e | 220,574 | ||||||
|
| |||||||
| Total | 795,490 | |||||||
|
| |||||||
| Cayman Islands (0.2%) | ||||||||
CCL Finance, Ltd. | ||||||||
| 110,000 | 9.500%, 8/15/2014 | 122,408 | ||||||
Country Garden Holdings Company | ||||||||
| 600,000 | 2.500%, 2/22/2013h | 109,787 | ||||||
Evergrande Real Estate Group, Ltd. | ||||||||
| 1,440,000 | 7.500%, 1/19/2014h | 203,324 | ||||||
Petrobras International Finance Company | ||||||||
| 130,000 | 5.375%, 1/27/2021 | 140,110 | ||||||
Vale Overseas, Ltd. | ||||||||
| 110,000 | 5.625%, 9/15/2019 | 121,943 | ||||||
| 310,000 | 4.625%, 9/15/2020 | 324,290 | ||||||
| 60,000 | 4.375%, 1/11/2022 | 61,099 | ||||||
|
| |||||||
| Total | 1,082,961 | |||||||
|
| |||||||
| Chile (0.3%) | ||||||||
AES Gener SA | ||||||||
| 30,000 | 5.250%, 8/15/2021 | 31,711 | ||||||
| 120,000 | 5.250%, 8/15/2021e | 126,844 | ||||||
Banco del Estado de Chile | ||||||||
| 200,000 | 4.125%, 10/7/2020 | 209,471 | ||||||
| 260,000 | 4.125%, 10/7/2020e | 272,313 | ||||||
Chile Government International Bond | ||||||||
| 130,000 | 3.875%, 8/5/2020 | 144,300 | ||||||
| 350,000 | 3.250%, 9/14/2021 | 371,000 | ||||||
Corporacion Nacional del Cobre de Chile - Codelco | ||||||||
| 100,000 | 3.750%, 11/4/2020 | 104,289 | ||||||
| 120,000 | 3.750%, 11/4/2020e | 125,146 | ||||||
| 160,000 | 6.150%, 10/24/2036 | 200,219 | ||||||
E-CL SA | ||||||||
| 140,000 | 5.625%, 1/15/2021e | 151,773 | ||||||
|
| |||||||
| Total | 1,737,066 | |||||||
|
| |||||||
| China (<0.1%) | ||||||||
Sinochem Overseas Capital Company, Ltd. | ||||||||
| 130,000 | 6.300%, 11/12/2040e | 131,591 | ||||||
|
| |||||||
| Total | 131,591 | |||||||
|
| |||||||
| Colombia (0.7%) | ||||||||
Banco de Bogota SA | ||||||||
| 200,000 | 5.000%, 1/15/2017 | 211,000 | ||||||
Colombia Government International Bond | ||||||||
| 30,000 | 8.250%, 12/22/2014 | 35,100 | ||||||
| 400,000 | 7.375%, 1/27/2017 | 495,400 | ||||||
| 580,000 | 7.375%, 3/18/2019 | 758,350 | ||||||
| 210,000 | 4.375%, 7/12/2021 | 235,830 | ||||||
| 40,000 | 8.125%, 5/21/2024 | 58,140 | ||||||
| 1,100,000 | 7.375%, 9/18/2037 | 1,624,699 | ||||||
| 790,000 | 6.125%, 1/18/2041 | 1,027,000 | ||||||
Empresa de Energia de Bogota SA | ||||||||
| 420,000 | 6.125%, 11/10/2021e | 443,100 | ||||||
Transportadora de Gas del Internacional SA ESP | ||||||||
| 200,000 | 5.700%, 3/20/2022e | 207,500 | ||||||
|
| |||||||
| Total | 5,096,119 | |||||||
|
| |||||||
The accompanying Notes to Financial Statements are an integral part of this schedule.
132
Table of Contents
Partner Worldwide Allocation Portfolio
Schedule of Investments as of June 29, 2012
(unaudited)
| Principal Amount | Long-Term Fixed Income (8.4%) | Value | ||||||
| Dominican Republic (0.3%) | |||||||
Dominican Republic Government International Bond | ||||||||
| 284,174 | 9.040%, 1/23/2018 | $ | 316,854 | |||||
| 100,000 | 7.500%, 5/6/2021e | 106,500 | ||||||
| 1,108,000 | 7.500%, 5/6/2021 | 1,180,020 | ||||||
| 100,000 | 8.625%, 4/20/2027 | 108,000 | ||||||
|
| |||||||
| Total | 1,711,374 | |||||||
|
| |||||||
| Gabon (<0.1%) | ||||||||
Gabon Government International Bond | ||||||||
| 150,000 | 8.200%, 12/12/2017 | 174,000 | ||||||
|
| |||||||
| Total | 174,000 | |||||||
|
| |||||||
| Greece (<0.1%) | ||||||||
Greece Government International Bond | ||||||||
| 10,000 | 2.000%, 2/24/2023c,i | 2,143 | ||||||
| 10,000 | 2.000%, 2/24/2024c,i | 2,048 | ||||||
| 20,000 | 2.000%, 2/24/2025c,i | 3,802 | ||||||
| 10,000 | 2.000%, 2/24/2026c,i | 1,845 | ||||||
| 10,000 | 2.000%, 2/24/2027c,i | 1,810 | ||||||
| 20,000 | 2.000%, 2/24/2028c,i | 3,709 | ||||||
| 20,000 | 2.000%, 2/24/2029c,i | 3,478 | ||||||
| 30,000 | 2.000%, 2/24/2030c,i | 5,010 | ||||||
| 50,000 | 2.000%, 2/24/2031c,i | 8,511 | ||||||
| 70,000 | 2.000%, 2/24/2032c,i | 11,693 | ||||||
| 10,000 | 2.000%, 2/24/2033c,i | 1,668 | ||||||
| 50,000 | 2.000%, 2/24/2034c,i | 8,295 | ||||||
| 100,000 | 2.000%, 2/24/2035c,i | 16,540 | ||||||
| 90,000 | 2.000%, 2/24/2036c,i | 14,829 | ||||||
| 90,000 | 2.000%, 2/24/2037c,i | 14,806 | ||||||
| 150,000 | 2.000%, 2/24/2038c,i | 24,583 | ||||||
| 140,000 | 2.000%, 2/24/2039c,i | 22,890 | ||||||
| 170,000 | 2.000%, 2/24/2040c,i | 27,753 | ||||||
| 110,000 | 2.000%, 2/24/2041c,i | 17,832 | ||||||
| 130,000 | 2.000%, 2/24/2042c,i | 21,222 | ||||||
|
| |||||||
| Total | 214,467 | |||||||
|
| |||||||
| Guatemala (0.1%) | ||||||||
Guatemala Government International Bond | ||||||||
| 350,000 | 5.750%, 6/6/2022e | 364,000 | ||||||
|
| |||||||
| Total | 364,000 | |||||||
|
| |||||||
| Hong Kong (<0.1%) | ||||||||
Zijin International Finance Company, Ltd. | ||||||||
| 120,000 | 4.250%, 6/30/2016 | 122,625 | ||||||
|
| |||||||
| Total | 122,625 | |||||||
|
| |||||||
| Hungary (0.1%) | ||||||||
Hungary Government International Bond | ||||||||
| 80,000 | 3.500%, 7/18/2016c | 89,329 | ||||||
| 150,000 | 4.375%, 7/4/2017c | 167,293 | ||||||
| 140,000 | 6.250%, 1/29/2020 | 136,429 | ||||||
| 21,000 | 3.875%, 2/24/2020c | 21,566 | ||||||
| 96,000 | 7.625%, 3/29/2041 | 93,840 | ||||||
|
| |||||||
| Total | 508,457 | |||||||
|
| |||||||
| Iceland (0.1%) | ||||||||
Iceland Government International Bond | ||||||||
| 100,000 | 4.875%, 6/16/2016 | 100,131 | ||||||
| 400,000 | 4.875%, 6/16/2016e | 400,522 | ||||||
| 100,000 | 5.875%, 5/11/2022e | 96,978 | ||||||
|
| |||||||
| Total | 597,631 | |||||||
|
| |||||||
| Indonesia (1.0%) | ||||||||
Berau Coal Energy Tbk PT | ||||||||
| 200,000 | 7.250%, 3/13/2017e | 194,500 | ||||||
Indonesia Government International Bond | ||||||||
| 49,000 | 6.875%, 1/17/2018 | 57,943 | ||||||
| 1,440,000 | 11.625%, 3/4/2019 | 2,123,999 | ||||||
| 590,000 | 4.875%, 5/5/2021e | 643,100 | ||||||
| 400,000 | 4.875%, 5/5/2021 | 436,000 | ||||||
| 360,000 | 3.750%, 4/25/2022e | 359,100 | ||||||
| 955,000 | 8.500%, 10/12/2035 | 1,399,074 | ||||||
| 200,000 | 7.750%, 1/17/2038 | 275,000 | ||||||
| 350,000 | 5.250%, 1/17/2042e | 366,188 | ||||||
Perusahaan Penerbit SBSN | ||||||||
| 200,000 | 4.000%, 11/21/2018e | 202,000 | ||||||
|
| |||||||
| Total | 6,056,904 | |||||||
|
| |||||||
| Iraq (0.1%) | ||||||||
Iraq Government International Bond | ||||||||
| 500,000 | 5.800%, 1/15/2028 | 407,500 | ||||||
|
| |||||||
| Total | 407,500 | |||||||
|
| |||||||
| Ireland (<0.1%) | ||||||||
MTS International Funding, Ltd. | ||||||||
| 100,000 | 8.625%, 6/22/2020 | 114,469 | ||||||
|
| |||||||
| Total | 114,469 | |||||||
|
| |||||||
| Ivory Coast (0.2%) | ||||||||
Ivory Coast Government International Bond | ||||||||
| 1,472,000 | 2.500%, 12/31/2032i | 1,089,280 | ||||||
|
| |||||||
| Total | 1,089,280 | |||||||
|
| |||||||
| Kazakhstan (0.2%) | ||||||||
Kazatomprom Natsionalnaya Atomnaya Kompaniya AO | ||||||||
| 110,000 | 6.250%, 5/20/2015 | 116,050 | ||||||
KazMunayGas National Company | ||||||||
| 450,000 | 11.750%, 1/23/2015 | 535,478 | ||||||
| 470,000 | 6.375%, 4/9/2021e | 517,000 | ||||||
|
| |||||||
| Total | 1,168,528 | |||||||
|
| |||||||
| Luxembourg (0.3%) | ||||||||
Gazprom OAO Via Gaz Capital SA | ||||||||
| 217,000 | 9.250%, 4/23/2019 | 270,662 | ||||||
| 200,000 | 5.999%, 1/23/2021 | 214,404 | ||||||
| 200,000 | 5.999%, 1/23/2021e | 214,404 | ||||||
Gazprom Via Gazprom International, Ltd. | ||||||||
| 68,650 | 7.201%, 2/1/2020 | 74,912 | ||||||
TNK-BP Finance SA | ||||||||
| 390,000 | 7.875%, 3/13/2018 | 446,062 | ||||||
| 130,000 | 7.250%, 2/2/2020 | 146,006 | ||||||
The accompanying Notes to Financial Statements are an integral part of this schedule.
133
Table of Contents
Partner Worldwide Allocation Portfolio
Schedule of Investments as of June 29, 2012
(unaudited)
| Principal Amount | Long-Term Fixed Income (8.4%) | Value | ||||||
| Luxembourg (0.3%) - continued | ||||||||
Vimpel Communications OJSC Via UBS Luxembourg SA | ||||||||
| $100,000 | 8.250%, 5/23/2016 | $ | 104,362 | |||||
VTB Capital SA | ||||||||
| 390,000 | 6.000%, 4/12/2017e | 395,850 | ||||||
|
| |||||||
| Total | 1,866,662 | |||||||
|
| |||||||
| Mexico (0.8%) | ||||||||
Corporacion GEO SAB de CV | ||||||||
| 310,000 | 8.875%, 3/27/2022a,e | 319,300 | ||||||
Mexican Bonos | ||||||||
| 2,788,000 | 7.500%, 6/3/2027j | 237,381 | ||||||
| 5,360,600 | 7.750%, 11/13/2042j | 447,210 | ||||||
Mexico Cetes | ||||||||
| 10,674,320 | Zero Coupon, 10/4/2012j | 790,797 | ||||||
Mexico Government International Bond | ||||||||
| 30,000 | 5.875%, 1/15/2014 | 32,040 | ||||||
| 20,000 | 6.625%, 3/3/2015 | 22,600 | ||||||
| 100,000 | 5.625%, 1/15/2017 | 116,375 | ||||||
| 266,000 | 5.950%, 3/19/2019 | 324,254 | ||||||
| 260,000 | 3.625%, 3/15/2022 | 275,990 | ||||||
| 90,000 | 8.300%, 8/15/2031 | 139,500 | ||||||
| 230,000 | 6.750%, 9/27/2034 | 313,950 | ||||||
| 370,000 | 6.050%, 1/11/2040 | 477,300 | ||||||
| 690,000 | 4.750%, 3/8/2044 | 743,475 | ||||||
| 180,000 | 5.750%, 10/12/2110 | 204,750 | ||||||
Pemex Project Funding Master Trust | ||||||||
| 590,000 | 6.625%, 6/15/2035 | 702,100 | ||||||
Petroleos Mexicanos | ||||||||
| 45,000 | 8.000%, 5/3/2019 | 57,150 | ||||||
| 80,000 | 5.500%, 1/21/2021 | 90,400 | ||||||
|
| |||||||
| Total | 5,294,572 | |||||||
|
| |||||||
| Netherlands (<0.1%) | ||||||||
VimpelCom Holdings BV | ||||||||
| 230,000 | 7.504%, 3/1/2022e | 216,071 | ||||||
|
| |||||||
| Total | 216,071 | |||||||
|
| |||||||
| Nigeria (<0.1%) | ||||||||
Nigeria Government International Bond | ||||||||
| 200,000 | 6.750%, 1/28/2021 | 215,500 | ||||||
|
| |||||||
| Total | 215,500 | |||||||
|
| |||||||
| Pakistan (<0.1%) | ||||||||
Pakistan Government International Bond | ||||||||
| 200,000 | 6.875%, 6/1/2017 | 156,000 | ||||||
| 100,000 | 7.875%, 3/31/2036 | 62,250 | ||||||
|
| |||||||
| Total | 218,250 | |||||||
|
| |||||||
| Panama (0.2%) | ||||||||
Panama Government International Bond | ||||||||
| 286,000 | 8.875%, 9/30/2027 | 443,300 | ||||||
| 260,000 | 9.375%, 4/1/2029 | 425,100 | ||||||
| 70,000 | 6.700%, 1/26/2036 | 94,500 | ||||||
|
| |||||||
| Total | 962,900 | |||||||
|
| |||||||
| Peru (0.3%) | ||||||||
Corporacion Financiera de Desarrollo SA | ||||||||
| 200,000 | 4.750%, 2/8/2022e | 209,000 | ||||||
Corporacion Lindley SA | ||||||||
| 70,000 | 6.750%, 11/23/2021e | 75,600 | ||||||
Peru Government International Bond | ||||||||
| 230,000 | 5.625%, 11/18/2050 | 278,875 | ||||||
| 200,000 | 7.350%, 7/21/2025 | 281,000 | ||||||
| 354,000 | 8.750%, 11/21/2033 | 580,560 | ||||||
Volcan Cia Minera SAA | ||||||||
| 60,000 | 5.375%, 2/2/2022e | 62,400 | ||||||
|
| |||||||
| Total | 1,487,435 | |||||||
|
| |||||||
| Philippines (0.4%) | ||||||||
Energy Development Corporation | ||||||||
| 120,000 | 6.500%, 1/20/2021 | 126,138 | ||||||
Philippines Government International Bond | ||||||||
| 100,000 | 7.500%, 9/25/2024 | 132,750 | ||||||
| 70,000 | 9.500%, 10/21/2024 | 106,050 | ||||||
| 200,000 | 5.500%, 3/30/2026 | 236,500 | ||||||
| 547,000 | 9.500%, 2/2/2030 | 886,824 | ||||||
| 100,000 | 7.750%, 1/14/2031 | 142,250 | ||||||
| 961,000 | 6.375%, 10/23/2034 | 1,230,080 | ||||||
|
| |||||||
| Total | 2,860,592 | |||||||
|
| |||||||
| Qatar (<0.1%) | ||||||||
Ras Laffan Liquefied Natural Gas Company, Ltd. II | ||||||||
| 209,950 | 5.298%, 9/30/2020 | 229,895 | ||||||
|
| |||||||
| Total | 229,895 | |||||||
|
| |||||||
| Romania (0.1%) | ||||||||
Romania Government International Bond | ||||||||
| 320,000 | 6.750%, 2/7/2022e | 333,600 | ||||||
|
| |||||||
| Total | 333,600 | |||||||
|
| |||||||
| Russia (0.7%) | ||||||||
Russia Government International Bond | ||||||||
| 1,200,000 | 4.500%, 4/4/2022e | 1,257,132 | ||||||
| 1,867,601 | 7.500%, 3/31/2030 | 2,242,221 | ||||||
| 800,000 | 5.625%, 4/4/2042e | 855,840 | ||||||
|
| |||||||
| Total | 4,355,193 | |||||||
|
| |||||||
| Serbia (<0.1%) | ||||||||
Serbia Government International Bond | ||||||||
| 150,000 | 6.750%, 11/1/2024 | 144,000 | ||||||
|
| |||||||
| Total | 144,000 | |||||||
|
| |||||||
| South Africa (0.1%) | ||||||||
Peermont Global Proprietary, Ltd. | ||||||||
| 220,000 | 7.750%, 4/30/2014c | 258,922 | ||||||
The accompanying Notes to Financial Statements are an integral part of this schedule.
134
Table of Contents
Partner Worldwide Allocation Portfolio
Schedule of Investments as of June 29, 2012
(unaudited)
| Principal Amount | Long-Term Fixed Income (8.4%) | Value | ||||||
| South Africa (0.1%) - continued | ||||||||
South Africa Government International Bond | ||||||||
| $630,000 | 4.665%, 1/17/2024 | $ | 681,975 | |||||
|
| |||||||
| Total | 940,897 | |||||||
|
| |||||||
| South Korea (0.1%) | ||||||||
South Korea Government International Bond | ||||||||
| 390,000 | 7.125%, 4/16/2019 | 491,840 | ||||||
|
| |||||||
| Total | 491,840 | |||||||
|
| |||||||
| Sri Lanka (<0.1%) | ||||||||
Sri Lanka Government International Bond | ||||||||
| 200,000 | 6.250%, 7/27/2021e | 201,170 | ||||||
|
| |||||||
| Total | 201,170 | |||||||
|
| |||||||
| Supranational (0.1%) | ||||||||
Corporacion Andina de Fomento | ||||||||
| 639,000 | 3.750%, 1/15/2016 | 664,074 | ||||||
| 153,000 | 4.375%, 6/15/2022 | 156,279 | ||||||
|
| |||||||
| Total | 820,353 | |||||||
|
| |||||||
| Turkey (0.4%) | ||||||||
Export Credit Bank of Turkey | ||||||||
| 250,000 | 5.375%, 11/4/2016e | 258,125 | ||||||
Turkey Government International Bond | ||||||||
| 430,000 | 5.625%, 3/30/2021 | 469,238 | ||||||
| 1,060,000 | 6.250%, 9/26/2022 | 1,200,450 | ||||||
| 130,000 | 7.375%, 2/5/2025 | 159,900 | ||||||
| 90,000 | 7.250%, 3/5/2038 | 110,700 | ||||||
| 330,000 | 6.750%, 5/30/2040 | 383,625 | ||||||
|
| |||||||
| Total | 2,582,038 | |||||||
|
| |||||||
| Ukraine (<0.1%) | ||||||||
Ukraine Government International Bond | ||||||||
| 100,000 | 8.375%, 11/3/2017 | 83,500 | ||||||
|
| |||||||
| Total | 83,500 | |||||||
|
| |||||||
| United Arab Emirates (<0.1%) | ||||||||
Dolphin Energy, Ltd. | ||||||||
| 128,064 | 5.888%, 6/15/2019 | 140,230 | ||||||
|
| |||||||
| Total | 140,230 | |||||||
|
| |||||||
| United States (0.3%) | ||||||||
HSBC Bank USA | ||||||||
| 480,000 | 5.910%, 8/15/2040g,k | 625,002 | ||||||
HSBC Bank USA NA/New York | ||||||||
| 761,000 | Zero Coupon, 1/4/2013g,l | 365,046 | ||||||
U.S. Treasury Notes | ||||||||
| 500,000 | 0.375%, 7/31/2013 | 500,606 | ||||||
|
| |||||||
| Total | 1,490,654 | |||||||
|
| |||||||
| Uruguay (0.1%) | ||||||||
Uruguay Government International Bond | ||||||||
| 468,000 | 7.625%, 3/21/2036 | 673,920 | ||||||
|
| |||||||
| Total | 673,920 | |||||||
|
| |||||||
| Venezuela (0.6%) | ||||||||
Petroleos de Venezuela SA | ||||||||
| 611,600 | 5.250%, 4/12/2017 | 434,236 | ||||||
| 510,000 | 9.000%, 11/17/2021 | 370,770 | ||||||
| 180,000 | 5.375%, 4/12/2027 | 101,250 | ||||||
| 30,000 | 5.500%, 4/12/2037 | 16,800 | ||||||
Venezuela Government International Bond | ||||||||
| 100,000 | 13.625%, 8/15/2018 | 101,500 | ||||||
| 480,000 | 7.750%, 10/13/2019 | 368,400 | ||||||
| 196,500 | 6.000%, 12/9/2020 | 132,146 | ||||||
| 900,000 | 9.000%, 5/7/2023 | 693,000 | ||||||
| 1,415,000 | 8.250%, 10/13/2024 | 1,022,338 | ||||||
| 510,000 | 7.650%, 4/21/2025 | 351,900 | ||||||
| 20,000 | 11.750%, 10/21/2026 | 17,750 | ||||||
| 80,000 | 9.250%, 5/7/2028 | 60,800 | ||||||
| 360,000 | 11.950%, 8/5/2031 | 320,400 | ||||||
|
| |||||||
| Total | 3,991,290 | |||||||
|
| |||||||
| Virgin Islands, British (<0.1%) | ||||||||
Central American Bottling Corporation | ||||||||
| 40,000 | 6.750%, 2/9/2022e | 42,200 | ||||||
Talent Yield Investments, Ltd. | ||||||||
| 230,000 | 4.500%, 4/25/2022e | 235,301 | ||||||
|
| |||||||
| Total | 277,501 | |||||||
|
| |||||||
Total Long-Term Fixed Income (cost $52,256,269) | 55,257,298 | |||||||
|
| |||||||
| Shares | Collateral Held for Securities Loaned (5.1%) | |||||||
| 33,307,673 | Thrivent Financial Securities Lending Trust | 33,307,673 | ||||||
|
| |||||||
Total Collateral Held for Securities Loaned (cost $33,307,673) | 33,307,673 | |||||||
|
| |||||||
| Principal Amount | Short-Term Investments (0.9%)m | |||||||
Chariot Funding, LLC | ||||||||
| 5,580,000 | 0.150%, 7/2/2012e,n | 5,579,954 | ||||||
Federal National Mortgage Association Discount Notes | ||||||||
| 200,000 | 0.120%, 7/18/2012n,o | 199,988 | ||||||
|
| |||||||
Total Short-Term Investments (at amortized cost) | 5,779,942 | |||||||
|
| |||||||
Total Investments (cost $609,503,190) 91.6% | $ | 599,536,654 | ||||||
|
| |||||||
| Other Assets and Liabilities, Net 8.4% | 55,272,776 | |||||||
|
| |||||||
| Total Net Assets 100.0% | $ | 654,809,430 | ||||||
|
| |||||||
The accompanying Notes to Financial Statements are an integral part of this schedule.
135
Table of Contents
Partner Worldwide Allocation Portfolio
Schedule of Investments as of June 29, 2012
(unaudited)
| a | All or a portion of the security is on loan. |
| b | Non-income producing security. |
| c | Principal amount is displayed in Euros. |
| d | Denotes variable rate securities. Variable rate securities are securities whose yields vary with a designated market index or market rate. The rate shown is as of June 29, 2012. |
| e | Denotes securities sold under Rule 144A of the Securities Act of 1933, which exempts them from registration. These securities have been deemed liquid and may be resold to other dealers in the program or to other qualified institutional buyers. As of June 29, 2012, the value of these investments was $16,137,102 or 2.5% of total net assets. |
| f | Defaulted security. Interest is not being accrued. |
| g | Security is fair valued. |
| h | Principal amount is displayed in Chinese Yuan. |
| i | Denotes step coupon securities. Step coupon securities pay an initial coupon rate for the first period and then different coupon rates for following periods. The rate shown is as of June 29, 2012. |
| j | Principal amount is displayed in Mexican Pesos. |
| k | Principal amount is displayed in Brazilian Real. Security is linked to Brazilian Government Bonds due August 15, 2040. |
| l | Principal amount is displayed in Brazilian Real. |
| m | The interest rate shown reflects the yield, coupon rate or the discount rate at the date of purchase. |
| n | Denotes investments that benefit from credit enhancement or liquidity support provided by a third party bank, institution or government. |
| o | At June 29, 2012, $199,988 of investments were held on deposit with the counterparty and pledged as the initial margin deposit for open futures contracts. |
Definitions:
| ADR | - | American Depositary Receipt, which are certificates for an underlying foreign security’s shares held by an issuing U.S. depository bank. | ||
| GDR | - | Global Depository Receipts, which are certificates for shares of an underlying foreign security’s shares held by an issuing depository bank from more than one country. | ||
| REIT | - | Real Estate Investment Trust is a company that buys, develops, manages and/or sells real estate assets. | ||
| ETF | - | Exchange Traded Fund. |
Unrealized Appreciation (Depreciation)
Gross unrealized appreciation and depreciation of investments, based on cost for federal income tax purposes, were as follows:
Gross unrealized appreciation | $ | 51,480,794 | ||
Gross unrealized depreciation | (62,779,778 | ) | ||
|
| |||
Net unrealized appreciation (depreciation) | $ | (11,298,984 | ) | |
Cost for federal income tax purposes | $ | 610,835,638 | ||
The accompanying Notes to Financial Statements are an integral part of this schedule.
136
Table of Contents
Partner Worldwide Allocation Portfolio
Schedule of Investments as of June 29, 2012
(unaudited)
Fair Valuation Measurements
The following table is a summary of the inputs used, as of June 29, 2012, in valuing Partner Worldwide Allocation Portfolio’s assets carried at fair value.
Investments in Securities | Total | Level 1 | Level 2 | Level 3 | ||||||||||||
Common Stock | ||||||||||||||||
Communications Services | 491,404 | — | 491,404 | — | ||||||||||||
Consumer Discretionary | 77,942,592 | — | 77,942,592 | — | ||||||||||||
Consumer Staples | 48,826,541 | 2,811,374 | 46,015,167 | — | ||||||||||||
Energy | 46,591,082 | 13,051,977 | 33,539,105 | — | ||||||||||||
Financials | 92,578,248 | 14,370,951 | 78,207,297 | — | ||||||||||||
Health Care | 42,585,334 | 3,277,464 | 39,307,870 | — | ||||||||||||
Industrials | 80,036,665 | 2,395,953 | 77,640,712 | — | ||||||||||||
Information Technology | 35,409,330 | 2,826,294 | 32,583,036 | — | ||||||||||||
Materials | 56,984,385 | 3,127,030 | 53,857,355 | — | ||||||||||||
Telecommunications Services | 19,395,332 | 2,297,874 | 17,097,458 | — | ||||||||||||
Utilities | 4,350,828 | — | 4,350,828 | — | ||||||||||||
Long-Term Fixed Income | ||||||||||||||||
Basic Materials | 1,735,202 | — | 1,735,202 | — | ||||||||||||
Capital Goods | 319,300 | — | 319,300 | — | ||||||||||||
Communications Services | 434,902 | — | 434,902 | — | ||||||||||||
Consumer Cyclical | 447,549 | — | 447,549 | — | ||||||||||||
Consumer Non-Cyclical | 240,218 | — | 240,208 | 10 | ||||||||||||
Energy | 4,823,996 | — | 4,823,996 | — | ||||||||||||
Financials | 2,472,347 | — | 1,482,299 | 990,048 | ||||||||||||
Foreign Government | 41,873,258 | — | 41,873,258 | — | ||||||||||||
U.S. Government and Agencies | 1,202,706 | — | 1,202,706 | — | ||||||||||||
Utilities | 1,707,820 | — | 1,707,820 | — | ||||||||||||
Collateral Held for Securities Loaned | 33,307,673 | 33,307,673 | — | — | ||||||||||||
Short-Term Investments | 5,779,942 | — | 5,779,942 | — | ||||||||||||
|
|
|
|
|
|
|
| |||||||||
Total | $ | 599,536,654 | $ | 77,466,590 | $ | 521,080,006 | $ | 990,058 | ||||||||
|
|
|
|
|
|
|
| |||||||||
Other Financial Instruments | Total | Level 1 | Level 2 | Level 3 | ||||||||||||
Asset Derivatives | ||||||||||||||||
Futures Contracts | 103,151 | 103,151 | — | — | ||||||||||||
Foreign Currency Forward Contracts | 178,722 | — | 178,722 | — | ||||||||||||
|
|
|
|
|
|
|
| |||||||||
Total Asset Derivatives | $ | 281,873 | $ | 103,151 | $ | 178,722 | $ | — | ||||||||
|
|
|
|
|
|
|
| |||||||||
Liability Derivatives | ||||||||||||||||
Futures Contracts | 102,635 | 102,635 | — | — | ||||||||||||
Foreign Currency Forward Contracts | 108,761 | — | 108,761 | — | ||||||||||||
|
|
|
|
|
|
|
| |||||||||
Total Liability Derivatives | $ | 211,396 | $ | 102,635 | $ | 108,761 | $ | — | ||||||||
|
|
|
|
|
|
|
| |||||||||
The significant unobservable input used in the fair value measurement of the Long-Term Fixed Income Consumer Non-Cyclical Level 3 security is the lack of marketability. A significant increase or decrease in the input in isolation would result in a significantly lower or higher fair value measurement.
The significant unobservable inputs used in the fair value measurement of the Long-Term Fixed Income Financials Level 3 securities are the lack of marketability and the volatility of the benchmark securities. A significant increase or decrease in the inputs in isolation would result in a significantly lower or higher fair value measurement.
There were no significant transfers between the Levels during the period ended June 29, 2012. Transfers between the levels are identified as of the end of the period.
The accompanying Notes to Financial Statements are an integral part of this schedule.
137
Table of Contents
Partner Worldwide Allocation Portfolio
Schedule of Investments as of June 29, 2012
(unaudited)
Futures Contracts | Number of Contracts Long/(Short) | Expiration Date | Notional Principal Amount | Value | Unrealized Gain/(Loss) | |||||||||||||||
2-Yr. U.S. Treasury Bond Futures | 4 | September 2012 | $ | 881,281 | $ | 880,750 | ($ | 531 | ) | |||||||||||
5-Yr. U.S. Treasury Bond Futures | 28 | September 2012 | 3,469,131 | 3,471,125 | 1,994 | |||||||||||||||
10-Yr. U.S. Treasury Bond Futures | 21 | September 2012 | 2,809,457 | 2,800,875 | (8,582 | ) | ||||||||||||||
20-Yr. U.S. Treasury Bond Futures | 26 | September 2012 | 3,876,218 | 3,847,187 | (29,031 | ) | ||||||||||||||
90 Day Euro$ Futures | 20 | September 2014 | 4,942,874 | 4,963,500 | 20,626 | |||||||||||||||
90 Day Euro$ Futures | (20 | ) | September 2015 | (4,907,212 | ) | (4,943,500 | ) | (36,288 | ) | |||||||||||
90 Day Euro$ Futures | 10 | March 2014 | 2,479,497 | 2,484,251 | 4,754 | |||||||||||||||
90 Day Euro$ Futures | (10 | ) | March 2015 | (2,466,203 | ) | (2,477,626 | ) | (11,423 | ) | |||||||||||
Mini MSCI EAFE Index Futures | �� | 21 | September 2012 | 1,419,213 | 1,494,990 | 75,777 | ||||||||||||||
Ultra Long Term U.S Treasury Bond Futures | (14 | ) | September 2012 | (2,319,033 | ) | (2,335,813 | ) | (16,780 | ) | |||||||||||
Total Futures Contracts | $ | 516 | ||||||||||||||||||
The accompanying Notes to Financial Statements are an integral part of this schedule.
138
Table of Contents
Partner Worldwide Allocation Portfolio
Schedule of Investments as of June 29, 2012
(unaudited)
Foreign Currency Forward Contracts | Counterparty | Contracts to Deliver/Receive | Settlement Date | Value on Settlement Date | Value | Unrealized Gain/(Loss) | ||||||||||||||||
Purchases | ||||||||||||||||||||||
Brazilian Real | SSB | 158,890 | 7/23/2012 | $ | 77,000 | $ | 78,714 | $ | 1,714 | |||||||||||||
Chinese Yuan | DB | 2,042,497 | 9/4/2012 | 324,980 | 320,728 | (4,252 | ) | |||||||||||||||
Chinese Yuan | BOA | 964,971 | 9/4/2012 | 153,000 | 151,527 | (1,473 | ) | |||||||||||||||
Euro | BIO | 89,084 | 7/3/2012 | 112,773 | 112,736 | (37 | ) | |||||||||||||||
Euro | SSB | 142,197 | 7/2/2012 - 7/3/2012 | 179,097 | 179,950 | 853 | ||||||||||||||||
Israeli Shekel | DB | 586,499 | 9/19/2012 | 150,919 | 149,775 | (1,144 | ) | |||||||||||||||
Israeli Shekel | CITI | 294,561 | 9/19/2012 | 76,000 | 75,223 | (777 | ) | |||||||||||||||
Malaysian Ringgit | HSBC | 289,653 | 7/9/2012 | 91,000 | 91,177 | 177 | ||||||||||||||||
Malaysian Ringgit | BB | 480,527 | 7/5/2012 - 7/9/2012 | 151,846 | 151,312 | (534 | ) | |||||||||||||||
Mexican Peso | HSBC | 893,411 | 9/19/2012 | 64,211 | 66,451 | 2,240 | ||||||||||||||||
Mexican Peso | UBS | 223,337 | 9/19/2012 | 16,052 | 16,612 | 560 | ||||||||||||||||
Mexican Peso | JPM | 4,287,854 | 9/19/2012 | 303,619 | 318,926 | 15,307 | ||||||||||||||||
Mexican Peso | DB | 6,489,351 | 7/27/2012 - 9/19/2012 | 463,838 | 484,571 | 20,733 | ||||||||||||||||
Mexican Peso | SSB | 4,399,436 | 9/19/2012 | 313,000 | 327,225 | 14,225 | ||||||||||||||||
Mexican Peso | BB | 5,820,050 | 9/19/2012 | 419,032 | 432,890 | 13,858 | ||||||||||||||||
Norwegian Krone | SSB | 259,729 | 7/3/2012 | 42,891 | 43,662 | 771 | ||||||||||||||||
Philippines Peso | DB | 3,296,120 | 7/9/2012 | 76,000 | 78,179 | 2,179 | ||||||||||||||||
Russian Ruble | CSFB | 5,080,135 | 7/6/2012 | 154,289 | 156,911 | 2,622 | ||||||||||||||||
Russian Ruble | DB | 5,088,650 | 8/2/2012 | 155,000 | 156,258 | 1,258 | ||||||||||||||||
Russian Ruble | BB | 5,102,600 | 8/2/2012 | 155,000 | 156,686 | 1,686 | ||||||||||||||||
Russian Ruble | CITI | 12,718,984 | 7/5/2012 - 7/30/2012 | 385,000 | 391,159 | 6,159 | ||||||||||||||||
Russian Ruble | UBS | 5,610,655 | 7/5/2012 - 7/16/2012 | 171,000 | 173,055 | 2,055 | ||||||||||||||||
South African Rand | BB | 2,703,419 | 9/19/2012 | 320,230 | 327,082 | 6,852 | ||||||||||||||||
South Korea Won | DB | 173,085,263 | 7/13/2012 | 150,225 | 151,102 | 877 | ||||||||||||||||
Taiwan Dollar | CITI | 4,623,650 | 7/19/2012 | 155,000 | 154,805 | (195 | ) | |||||||||||||||
Turkish Lira | RBS | 142,177 | 9/19/2012 | 77,000 | 77,376 | 376 | ||||||||||||||||
Total Purchases | $ | 4,738,002 | $ | 4,824,092 | $ | 86,090 | ||||||||||||||||
Sales | ||||||||||||||||||||||
Brazilian Real | HSBC | 157,157 | 7/23/2012 | $ | 77,000 | $ | 77,855 | ($ | 855 | ) | ||||||||||||
Brazilian Real | BB | 72,436 | 7/18/2012 | 35,876 | 35,922 | (46 | ) | |||||||||||||||
Brazilian Real | SSB | 84,124 | 7/2/2012 | 41,241 | 41,884 | (643 | ) | |||||||||||||||
Brazilian Real | CITI | 1,876,145 | 7/18/2012 | 1,005,360 | 930,406 | 74,954 | ||||||||||||||||
Canadian Dollar | SSB | 450,006 | 7/3/2012 | 441,003 | 442,006 | (1,003 | ) | |||||||||||||||
Chinese Yuan | RBS | 1,936,368 | 9/4/2012 | 306,000 | 304,063 | 1,937 | ||||||||||||||||
Chinese Yuan | DB | 3,101,667 | 9/4/2012 | 488,881 | 487,047 | 1,834 | ||||||||||||||||
Euro | UBS | 12,711 | 9/19/2012 | 16,052 | 16,097 | (45 | ) | |||||||||||||||
Euro | HSBC | 174,831 | 9/19/2012 | 218,898 | 221,403 | (2,505 | ) | |||||||||||||||
Euro | SSB | 97,462 | 7/2/2012 - 7/5/2012 | 123,315 | 123,339 | (24 | ) | |||||||||||||||
Euro | BB | 122,000 | 9/19/2012 | 154,739 | 154,498 | 241 | ||||||||||||||||
Euro | DB | 122,000 | 9/19/2012 | 154,363 | 154,498 | (135 | ) | |||||||||||||||
Euro | JPM | 1,816,039 | 7/25/2012 - 9/19/2012 | 2,289,843 | 2,298,310 | (8,467 | ) | |||||||||||||||
Euro | CITI | 345,375 | 9/19/2012 | 434,670 | 437,375 | (2,705 | ) | |||||||||||||||
Hong Kong Dollar | SSB | 627,357 | 7/3/2012 - 7/5/2012 | 80,856 | 80,866 | (10 | ) | |||||||||||||||
Israeli Shekel | JPM | 891,520 | 9/19/2012 | 229,000 | 227,670 | 1,330 | ||||||||||||||||
Japanese Yen | SSB | 56,220,167 | 7/2/2012 | 706,460 | 703,325 | 3,135 | ||||||||||||||||
Malaysian Ringgit | RBS | 240,900 | 7/5/2012 | 75,000 | 75,883 | (883 | ) | |||||||||||||||
Malaysian Ringgit | BB | 536,928 | 7/9/2012 | 168,000 | 169,014 | (1,014 | ) | |||||||||||||||
Mexican Peso | BB | 2,610,492 | 7/2/2012 | 191,525 | 195,693 | (4,168 | ) | |||||||||||||||
Mexican Peso | CITI | 1,082,351 | 9/19/2012 | 77,000 | 80,504 | (3,504 | ) | |||||||||||||||
Mexican Peso | SSB | 1,077,372 | 9/19/2012 | 77,000 | 80,134 | (3,134 | ) | |||||||||||||||
Mexican Peso | DB | 14,020,176 | 7/27/2012 | 996,600 | 1,048,284 | (51,684 | ) | |||||||||||||||
Mexican Peso | HSBC | 694,967 | 9/19/2012 | 49,000 | 51,691 | (2,691 | ) | |||||||||||||||
Philippines Peso | UBS | 3,261,720 | 7/9/2012 | 77,000 | 77,363 | (363 | ) | |||||||||||||||
Russian Ruble | HSBC | 2,905,543 | 7/16/2012 | 88,651 | 89,514 | (863 | ) | |||||||||||||||
Russian Ruble | UBS | 1,972,370 | 7/6/2012 | 59,000 | 60,921 | (1,921 | ) | |||||||||||||||
Russian Ruble | CSFB | 5,080,135 | 7/5/2012 | 154,318 | 156,903 | (2,585 | ) | |||||||||||||||
Russian Ruble | CITI | 2,815,640 | 7/6/2012 | 86,000 | 86,967 | (967 | ) | |||||||||||||||
South African Rand | BB | 1,564,835 | 9/19/2012 | 185,000 | 189,326 | (4,326 | ) | |||||||||||||||
South African Rand | RBS | 650,397 | 9/19/2012 | 76,230 | 78,690 | (2,460 | ) | |||||||||||||||
South African Rand | DB | 496,928 | 9/19/2012 | 59,000 | 60,122 | (1,122 | ) | |||||||||||||||
South Korea Won | DB | 168,781,201 | 7/13/2012 | 146,537 | 147,344 | (807 | ) | |||||||||||||||
The accompanying Notes to Financial Statements are an integral part of this schedule.
139
Table of Contents
Partner Worldwide Allocation Portfolio
Schedule of Investments as of June 29, 2012
(unaudited)
Foreign Currency Forward Contracts | Counterparty | Contracts to Deliver/Receive | Settlement Date | Value on Settlement Date | Value | Unrealized Gain/(Loss) | ||||||||||||||||||
Sales - continued | ||||||||||||||||||||||||
Swiss Franc | SSB | 67,680 | 7/2/2012 - 7/5/2012 | $ | 70,658 | $ | 71,302 | ($644 | ) | |||||||||||||||
Taiwan Dollar | DB | 4,643,800 | 7/19/2012 | 155,000 | 155,479 | (479 | ) | |||||||||||||||||
Turkish Lira | RBS | 140,579 | 9/19/2012 | 77,000 | 76,507 | 493 | ||||||||||||||||||
Total Sales | $ | 9,672,076 | $ | 9,688,205 | ($16,129 | ) | ||||||||||||||||||
Net Unrealized Gain/(Loss) on Foreign Currency Forward Contracts |
| $69,961 | ||||||||||||||||||||||
Counterparty | ||||||||
BOA | - | Bank of America | ||||||
BB | - | Barclays Bank | ||||||
BIO | - | Brown Brothers Harriman | ||||||
CITI | - | Citibank | ||||||
CSFB | - | CS First Boston Corporation | ||||||
DB | - | Deutsche Bank | ||||||
HSBC | - | HSBC Securities, Inc. | ||||||
JPM | - | J.P. Morgan | ||||||
RBS | - | The Royal Bank of Scotland | ||||||
SSB | - | State Street Bank | ||||||
UBS | - | UBS Securities, Ltd. | ||||||
The following table summarizes the fair value and Statement of Assets and Liabilities location, as of June 29, 2012, for Partner Worldwide Allocation Portfolio’s investments in financial derivative instruments by primary risk exposure as discussed under item (2) Significant Accounting Policies of the Notes to Financial Statements.
Derivatives by risk category | Statement of Assets and Liabilities Location | Fair Value | ||||
Asset Derivatives | ||||||
Interest Rate Contracts | ||||||
Futures* | Net Assets - Net unrealized appreciation/(depreciation) on Futures contracts | 27,374 | ||||
Total Interest Rate Contracts | 27,374 | |||||
Equity Contracts | ||||||
Futures* | Net Assets - Net unrealized appreciation/(depreciation) on Futures contracts | 75,777 | ||||
Total Equity Contracts | 75,777 | |||||
Foreign Exchange Contracts Forward Contracts | Receivable/Payable for forward contracts, Net Assets - Net unrealized appreciation/(depreciation) on Foreign currency forward contracts | 178,722 | ||||
Total Foreign Exchange Contracts | 178,722 | |||||
|
| |||||
Total Asset Derivatives | $ | 281,873 | ||||
|
| |||||
Liability Derivatives | ||||||
Interest Rate Contracts | ||||||
Futures* | Net Assets - Net unrealized appreciation/(depreciation) on Futures contracts | 102,635 | ||||
Total Interest Rate Contracts | 102,635 | |||||
Foreign Exchange Contracts | ||||||
Forward Contracts | Receivable/Payable for forward contracts, Net Assets - Net unrealized appreciation/(depreciation) on Foreign currency forward contracts | 108,761 | ||||
Total Foreign Exchange Contracts | 108,761 | |||||
|
| |||||
Total Liability Derivatives | $ | 211,396 | ||||
|
| |||||
| * | Includes cumulative appreciation/depreciation of futures contracts as reported in the Schedule of Investments. Only current day’s variation margin is reported within the Statement of Assets and Liabilities. |
The accompanying Notes to Financial Statements are an integral part of this schedule.
140
Table of Contents
Partner Worldwide Allocation Portfolio
Schedule of Investments as of June 29, 2012
(unaudited)
The following table summarizes the net realized gains/(losses) and Statement of Operations location, for the period ended June 29, 2012, for Partner Worldwide Allocation Portfolio’s investments in financial derivative instruments by primary risk exposure.
Derivatives by risk category | Statement of Operations Location | Realized Gains/(Losses) recognized in Income | ||||
Equity Contracts | ||||||
Futures | Net realized gains/(losses) on Futures contracts | (42,012 | ) | |||
Total Equity Contracts | (42,012 | ) | ||||
Foreign Exchange Contracts | ||||||
Forward Contracts | Net realized gains/(losses) on Foreign currency transactions | 485,434 | ||||
Total Foreign Exchange Contracts | 485,434 | |||||
Interest Rate Contracts | ||||||
Futures | Net realized gains/(losses) on Futures contracts | 194,549 | ||||
Total Interest Rate Contracts | 194,549 | |||||
|
| |||||
Total | $ | 637,971 | ||||
|
| |||||
The following table summarizes the change in net unrealized appreciation/(depreciation) and Statement of Operations location, for the period ended June 29, 2012, for Partner Worldwide Allocation Portfolio’s investments in financial derivative instruments by primary risk exposure.
Derivatives by risk category | Statement of Operations Location | Change in unrealized appreciation/(depreciation) recognized in Income | ||||
Interest Rate Contracts | ||||||
| Futures | Change in net unrealized appreciation/(depreciation) on Futures contracts | (83,484 | ) | |||
Total Interest Rate Contracts | (83,484 | ) | ||||
Equity Contracts | ||||||
| Futures | Change in net unrealized appreciation/(depreciation) on Futures contracts | 61,900 | ||||
Total Equity Contracts | 61,900 | |||||
Foreign Exchange Contracts | ||||||
| Forward Contracts | Change in net unrealized appreciation/(depreciation) on Foreign currency forward contracts | 78,433 | ||||
Total Foreign Exchange Contracts | 78,433 | |||||
|
| |||||
Total | $ | 56,849 | ||||
|
| |||||
The following table presents Partner Worldwide Allocation Portfolio’s average volume of derivative activity during the period ended June 29, 2012.
Derivative Risk Category | Futures (Notional*) | Futures (Percentage of Average Net Assets) | Forwards (Notional*) | Forwards (Percentage of Average Net Assets) | ||||||||||||
Equity Contracts | $ | 1,662,816 | 0.3 | % | N/A | N/A | ||||||||||
Interest Rate Contracts | 19,805,674 | 3.4 | N/A | N/A | ||||||||||||
Foreign Exchange Contracts | N/A | N/A | $ | 37,856,390 | 6.5 | |||||||||||
| * | Notional amount represents long or short, or both, derivative positions held by the Portfolio. |
The accompanying Notes to Financial Statements are an integral part of this schedule.
141
Table of Contents
Partner Worldwide Allocation Portfolio
Schedule of Investments as of June 29, 2012
(unaudited)
Investment in Affiliates
Affiliated issuers, as defined under the Investment Company Act of 1940, include those in which the Portfolio’s holdings of an issuer represent 5% or more of the outstanding voting securities of an issuer, or any affiliated mutual fund.
A summary of transactions for the fiscal year to date, in Partner Worldwide Allocation Portfolio, is as follows:
Portfolio | Value December 31, 2011 | Gross Purchases | Gross Sales | Shares Held at June 29, 2012 | Value June 29, 2012 | Income Earned January 1, 2012 - June 29, 2012 | ||||||||||||||||||
Thrivent Financial Securities Lending Trust | $ | — | $ | 113,121,658 | $ | 79,813,985 | 33,307,673 | $ | 33,307,673 | $ | 325,719 | |||||||||||||
Total Value and Income Earned | — | 33,307,673 | 325,719 | |||||||||||||||||||||
The accompanying Notes to Financial Statements are an integral part of this schedule.
142
Table of Contents
Partner International Stock Portfolio
Schedule of Investments as of June 29, 2012
(unaudited)
| Shares | Common Stock (97.9%) | Value | ||||||
| Australia (5.1%) | ||||||||
| 115,876 | Australia & New Zealand Banking Group, Ltd. | $ | 2,639,767 | |||||
| 2,441,900 | Beach Energy, Ltd. | 2,377,915 | ||||||
| 395,556 | BHP Billiton, Ltd. | 12,884,680 | ||||||
| 536,253 | Challenger, Ltd. | 1,801,140 | ||||||
| 48,277 | Flight Centre, Ltd.a | 943,699 | ||||||
| 319,925 | GrainCorp, Ltd. | 3,132,252 | ||||||
| 234,906 | Iluka Resources, Ltd. | 2,772,540 | ||||||
| 336,129 | Imdex, Ltd. | 615,113 | ||||||
| 201,381 | NRW Holdings, Ltd. | 630,733 | ||||||
| 94,468 | Ramsay Health Care, Ltd. | 2,195,071 | ||||||
| 73,792 | Rio Tinto, Ltd. | 4,332,270 | ||||||
| 756,087 | Westfield Retail Trust | 2,217,804 | ||||||
|
| |||||||
| Total | 36,542,984 | |||||||
|
| |||||||
| Austria (0.1%) | ||||||||
| 20,491 | Voestalpine AGa | 544,228 | ||||||
|
| |||||||
| Total | 544,228 | |||||||
|
| |||||||
| Belgium (1.1%) | ||||||||
| 95,848 | Anheuser-Busch InBev NV | 7,556,781 | ||||||
|
| |||||||
| Total | 7,556,781 | |||||||
|
| |||||||
| Brazil (0.7%) | ||||||||
| 199,950 | Petroleo Brasileiro SA ADR | 3,753,062 | ||||||
| 568,100 | Rossi Residencial SA | 1,394,440 | ||||||
|
| |||||||
| Total | 5,147,502 | |||||||
|
| |||||||
| Canada (5.7%) | ||||||||
| 48,816 | Agrium, Inc.a | 4,326,361 | ||||||
| 74,945 | Alimentation Couche-Tard, Inc. | 3,272,817 | ||||||
| 16,231 | Bank of Nova Scotiaa | 840,804 | ||||||
| 119,876 | Barrick Gold Corporation | 4,515,513 | ||||||
| 69,079 | Canadian National Railway Company | 5,841,962 | ||||||
| 28,360 | Dollarama, Inc. | 1,704,218 | ||||||
| 90,235 | Enbridge, Inc. | 3,603,728 | ||||||
| 249,150 | Encana Corporation | 5,189,794 | ||||||
| 1,096 | Goldcorp, Inc. | 41,263 | ||||||
| 21,017 | Metro, Inc. | 1,076,138 | ||||||
| 141,485 | Nexen, Inc. | 2,395,837 | ||||||
| 112,071 | Pacific Rubiales Energy Corporationa | 2,373,294 | ||||||
| 65,163 | Suncor Energy, Inc. | 1,884,293 | ||||||
| 25,619 | TMX Group, Inc. | 1,167,589 | ||||||
| 163,629 | Yamana Gold, Inc.a | 2,524,911 | ||||||
|
| |||||||
| Total | 40,758,522 | |||||||
|
| |||||||
| Denmark (2.4%) | ||||||||
| 17,433 | Coloplast AS | 3,134,588 | ||||||
| 464,250 | Danske Bank AS ADRb | 6,455,121 | ||||||
| 52,920 | Novo Nordisk AS | 7,675,351 | ||||||
|
| |||||||
| Total | 17,265,060 | |||||||
|
| |||||||
| Finland (0.5%) | ||||||||
| 320,150 | Neste Oil OYJ | 3,602,599 | ||||||
|
| |||||||
| Total | 3,602,599 | |||||||
|
| |||||||
| France (8.0%) | ||||||||
| 34,697 | AtoS | 2,074,988 | ||||||
| 529,725 | AXA SA | 7,081,703 | ||||||
| 92,158 | Bouygues SA | 2,472,930 | ||||||
| 193,350 | Cap Gemini SA | 7,116,391 | ||||||
| 26,731 | Casino Guichard Perrachon SA | 2,349,621 | ||||||
| 18,805 | Christian Dior SA | 2,586,199 | ||||||
| 189,500 | Compagnie de Saint-Gobain | 7,001,883 | ||||||
| 90,180 | Faureciaa | 1,499,987 | ||||||
| 443 | Legrand SAa | 15,036 | ||||||
| 13,105 | Remy Cointreau SA | 1,439,794 | ||||||
| 20,096 | Sanofi | 1,521,287 | ||||||
| 153,950 | Total SA | 6,929,133 | ||||||
| 18,399 | Unibail-Rodamco | 3,389,288 | ||||||
| 68,392 | Vinci SA | 3,196,309 | ||||||
| 369,468 | Vivendi SA | 6,865,035 | ||||||
| 22,171 | Wendel SA | 1,641,754 | ||||||
|
| |||||||
| Total | 57,181,338 | |||||||
|
| |||||||
| Germany (8.4%) | ||||||||
| 89,348 | BASF SE | 6,212,773 | ||||||
| 62,320 | Bayerische Motoren Werke AG | 4,509,974 | ||||||
| 4,113,450 | Commerzbank AGb | 6,986,410 | ||||||
| 166,600 | Daimler AG | 7,486,923 | ||||||
| 134,700 | Deutsche Boerse AG | 7,267,220 | ||||||
| 54,339 | Henkel AG & Company KGaA | 3,610,607 | ||||||
| 194,414 | Infineon Technologies AG | 1,315,825 | ||||||
| 152,150 | Metro AG | 4,436,707 | ||||||
| 75,895 | RWE AG | 3,103,694 | ||||||
| 90,710 | SAP AG ADR | 5,371,439 | ||||||
| 33,633 | Siemens AG | 2,826,091 | ||||||
| 98,710 | Suedzucker AGa | 3,501,782 | ||||||
| 23,292 | Volkswagen AG | 3,690,111 | ||||||
|
| |||||||
| Total | 60,319,556 | |||||||
|
| |||||||
| Hong Kong (2.4%) | ||||||||
| 527,000 | Cathay Pacific Airways, Ltd. | 854,381 | ||||||
| 3,904,550 | Guangzhou Automobile Group Company, Ltd.b | 3,282,480 | ||||||
| 675,000 | Hutchison Whampoa, Ltd. | 5,854,847 | ||||||
| 560,000 | Link REIT | 2,295,343 | ||||||
| 4,175,075 | New World Development Company, Ltd. | 4,919,678 | ||||||
|
| |||||||
| Total | 17,206,729 | |||||||
|
| |||||||
| Ireland (0.5%) | ||||||||
| 19,199 | Paddy Power plc | 1,253,319 | ||||||
| 86,085 | Ryanair Holdings plc ADRb | 2,616,984 | ||||||
|
| |||||||
| Total | 3,870,303 | |||||||
|
| |||||||
| Israel (0.9%) | ||||||||
| 172,400 | Teva Pharmaceutical Industries, Ltd. ADR | 6,799,456 | ||||||
|
| |||||||
| Total | 6,799,456 | |||||||
|
| |||||||
| Italy (1.9%) | ||||||||
| 369,650 | Eni SPA | 7,853,262 | ||||||
| 6,736,050 | Telecom Italia SPA | 5,458,229 | ||||||
|
| |||||||
| Total | 13,311,491 | |||||||
|
| |||||||
| Japan (19.2%) | ||||||||
| 43,900 | Aisin Seiki Company, Ltd. | 1,467,484 | ||||||
| 64,700 | Aoyama Trading Company, Ltd. | 1,328,104 | ||||||
| 348,000 | Bank of Yokohama, Ltd. | 1,645,389 | ||||||
| 379,150 | Bridgestone Corporationa | 8,706,839 | ||||||
The accompanying Notes to Financial Statements are an integral part of this schedule.
143
Table of Contents
Partner International Stock Portfolio
Schedule of Investments as of June 29, 2012
(unaudited)
| Shares | Common Stock (97.9%) | Value | ||||||
| Japan (19.2%) - continued | ||||||||
| 111,500 | Canon, Inc.a | $ | 4,450,023 | |||||
| 141,100 | CMK Corporation | 596,306 | ||||||
| 85,000 | Daihatsu Motor Company, Ltd. | 1,488,110 | ||||||
| 398,800 | Daiichi Sankyo Company, Ltd. | 6,724,506 | ||||||
| 1,890,200 | Daiwa Securities Group, Inc. | 7,123,648 | ||||||
| 52,100 | East Japan Railway Company | 3,271,422 | ||||||
| 34,600 | FamilyMart Company, Ltd. | 1,583,607 | ||||||
| 43,500 | HIS Company, Ltd. | 1,546,813 | ||||||
| 405,000 | Hitachi, Ltd. | 2,497,165 | ||||||
| 29,000 | Idemitsu Kosan Company, Ltd. | 2,601,349 | ||||||
| 928,000 | IHI Corporation | 1,984,981 | ||||||
| 246,600 | ITOCHU Corporation | 2,591,928 | ||||||
| 123,800 | Japan Tobacco, Inc. | 3,667,655 | ||||||
| 149,100 | JX Holdings, Inc. | 768,463 | ||||||
| 263 | KDDI Corporation | 1,696,590 | ||||||
| 92,000 | Konica Minolta Holdings, Inc. | 724,772 | ||||||
| 264,000 | Marubeni Corporation | 1,759,005 | ||||||
| 369,000 | Mitsubishi Chemical Holdings Corporation | 1,626,661 | ||||||
| 79,900 | Mitsubishi Corporation | 1,615,122 | ||||||
| 338,000 | Mitsubishi UFJ Financial Group, Inc. | 1,619,317 | ||||||
| 74,800 | Mitsui & Company, Ltd. | 1,111,517 | ||||||
| 347,400 | Mori Seiki Company, Ltd. | 3,023,956 | ||||||
| 389,145 | MS and AD Insurance Group Holdings, Inc. | 6,808,204 | ||||||
| 289,700 | Nikon Corporation | 8,818,680 | ||||||
| 1,144,550 | Nippon Sheet Glass Company | 1,261,022 | ||||||
| 178,000 | Nippon Soda Company, Ltd. | 716,894 | ||||||
| 31,400 | Nippon Telegraph & Telephone Corporation | 1,464,198 | ||||||
| 327,000 | Nippon Yusen Kabushiki Kaisha | 864,864 | ||||||
| 974,450 | Nissan Motor Company, Ltd. | 9,253,114 | ||||||
| 1,278 | NTT DoCoMo, Inc. | 2,126,595 | ||||||
| 53,600 | Otsuka Holdings Company, Ltd. | 1,645,265 | ||||||
| 69,800 | Ship Healthcare Holdings, Inc. | 1,682,199 | ||||||
| 1,369,700 | Sojitz Corporation | 2,266,240 | ||||||
| 625,750 | Sumitomo Corporation | 8,755,374 | ||||||
| 236,800 | Sumitomo Electric Industries, Ltd. | 2,950,736 | ||||||
| 2,664,400 | Sumitomo Mitsui Trust Holdings, Inc. | 7,962,881 | ||||||
| 76,200 | Suzuki Motor Corporation | 1,564,605 | ||||||
| 15,000 | TDK Corporation | 610,627 | ||||||
| 46,000 | Toyo Suisan Kaisha, Ltd. | 1,226,683 | ||||||
| 114,600 | Toyota Motor Corporation | 4,625,510 | ||||||
| 287,700 | UNY Company, Ltd. | 3,151,272 | ||||||
| 49,900 | West Japan Railway Company | 2,052,785 | ||||||
|
| |||||||
| Total | 137,028,480 | |||||||
|
| |||||||
| Netherlands (3.8%) | ||||||||
| 1,873,850 | Aegon NV | 8,690,092 | ||||||
| 43,622 | ASM International NV | 1,656,990 | ||||||
| 67,664 | ASML Holding NV | 3,474,960 | ||||||
| 29,082 | Gemalto NV | 2,088,770 | ||||||
| 121,064 | Koninklijke (Royal) Ahold NV | 1,499,649 | ||||||
| 199,335 | Koninklijke DSM NV | 9,827,125 | ||||||
| 6,307 | Ziggo NVb | 201,015 | ||||||
|
| |||||||
| Total | 27,438,601 | |||||||
|
| |||||||
| New Zealand (0.2%) | ||||||||
| 643,676 | Telecom Corporation of New Zealand, Ltd. | 1,225,576 | ||||||
|
| |||||||
| Total | 1,225,576 | |||||||
|
| |||||||
| Norway (2.0%) | ||||||||
| 67,574 | Seadrill, Ltd. | 2,410,038 | ||||||
| 332,311 | Statoil ASA | 7,925,059 | ||||||
| 880,000 | STX OSV Holdings, Ltd. | 1,051,096 | ||||||
| 70,300 | Yara International ASA | 3,076,426 | ||||||
|
| |||||||
| Total | 14,462,619 | |||||||
|
| |||||||
| Portugal (0.5%) | ||||||||
| 5,098,600 | Banco Espirito Santo SAb | 3,485,527 | ||||||
|
| |||||||
| Total | 3,485,527 | |||||||
|
| |||||||
| Singapore (1.4%) | ||||||||
| 3,461,000 | Golden Agri-Resources, Ltd. | 1,848,253 | ||||||
| 783,765 | Keppel Corporation, Ltd. | 6,420,710 | ||||||
| 487,000 | SembCorp Industries, Ltd. | 1,993,248 | ||||||
|
| |||||||
| Total | 10,262,211 | |||||||
|
| |||||||
| South Korea (1.8%) | ||||||||
| 21,350 | POSCO | 6,835,246 | ||||||
| 28,254 | SK Telecom Company, Ltd. | 3,091,951 | ||||||
| 273,240 | SK Telecom Company, Ltd. ADR | 3,306,204 | ||||||
|
| |||||||
| Total | 13,233,401 | |||||||
|
| |||||||
| Spain (1.1%) | ||||||||
| 915,942 | Banco Bilbao Vizcaya Argentaria SA | 6,541,068 | ||||||
| 29,959 | Viscofan SA | 1,287,365 | ||||||
|
| |||||||
| Total | 7,828,433 | |||||||
|
| |||||||
| Sweden (1.8%) | ||||||||
| 137,322 | Atlas Copco AB | 2,955,254 | ||||||
| 113,920 | Boliden AB | 1,589,608 | ||||||
| 60,995 | Skanska AB | 934,712 | ||||||
| 242,108 | Swedbank AB | 3,814,131 | ||||||
| 313,738 | Volvo AB | 3,587,099 | ||||||
|
| |||||||
| Total | 12,880,804 | |||||||
|
| |||||||
| Switzerland (10.3%) | ||||||||
| 143,650 | Adecco SAb | 6,387,749 | ||||||
| 68,436 | Aryzta AGb | 3,406,198 | ||||||
| 74,159 | Compagnie Financiere Richemont SA | 4,071,838 | ||||||
| 346,600 | Credit Suisse Groupb | 6,341,407 | ||||||
| 8,607 | Dufry AGb | 1,043,188 | ||||||
| 4,721 | Galenica AG | 3,003,112 | ||||||
| 6,427 | Givaudan SAb | 6,307,539 | ||||||
| 119,536 | Holcim, Ltd.b | 6,622,599 | ||||||
| 147,807 | Nestle SA | 8,820,335 | ||||||
| 131,500 | Novartis AG | 7,351,947 | ||||||
| 102,357 | Roche Holding AG | 17,679,497 | ||||||
| 11,697 | Zurich Insurance Group AGb | 2,644,832 | ||||||
|
| |||||||
| Total | 73,680,241 | |||||||
|
| |||||||
| Thailand (1.8%) | ||||||||
| 729,325 | Bangkok Bank pcl | 4,795,992 | ||||||
The accompanying Notes to Financial Statements are an integral part of this schedule.
144
Table of Contents
Partner International Stock Portfolio
Schedule of Investments as of June 29, 2012
(unaudited)
| Shares | Common Stock (97.9%) | Value | ||||||
| Thailand (1.8%) - continued | ||||||||
| 802,750 | PTT pcl | $ | 8,223,127 | |||||
|
| |||||||
| Total | 13,019,119 | |||||||
|
| |||||||
| United Kingdom (16.3%) | ||||||||
| 202,670 | Babcock International Group plc | 2,714,445 | ||||||
| 2,517,996 | BAE Systems plc | 11,415,572 | ||||||
| 94,338 | Bellway plc | 1,236,929 | ||||||
| 165,139 | BG Group plc | 3,380,681 | ||||||
| 72,697 | British American Tobacco plc | 3,695,956 | ||||||
| 1,115,030 | BT Group plc | 3,694,705 | ||||||
| 286,650 | BTG plcb | 1,833,078 | ||||||
| 87,194 | Burberry Group plc | 1,815,465 | ||||||
| 282,767 | Diageo plc | 7,288,391 | ||||||
| 147,538 | Drax Group plc | 1,297,895 | ||||||
| 95,562 | GlaxoSmithKline plc | 2,170,627 | ||||||
| 157,250 | HSBC Holdings plc ADR | 6,939,442 | ||||||
| 147,360 | Imperial Tobacco Group plc | 5,677,595 | ||||||
| 267,507 | Inchcape plc | 1,388,606 | ||||||
| 77,349 | InterContinental Hotels Group plc | 1,862,154 | ||||||
| 449,248 | Intermediate Capital Group plc | 1,904,009 | ||||||
| 1,060,704 | ITV plc | 1,276,333 | ||||||
| 783,950 | Legal & General Group plc | 1,567,286 | ||||||
| 180,729 | London Stock Exchange Group plc | 2,853,141 | ||||||
| 293,726 | Mondi plc | 2,515,877 | ||||||
| 236,344 | National Grid plc | 2,504,802 | ||||||
| 202,600 | Pearson plc | 4,019,984 | ||||||
| 264,915 | Persimmon plc | 2,536,297 | ||||||
| 231,721 | Prudential plc | 2,686,839 | ||||||
| 88,336 | Rightmove plc | 2,207,335 | ||||||
| 92,560 | Rio Tinto plc | 4,398,840 | ||||||
| 151,837 | Sports Direct International plcb | 727,985 | ||||||
| 20,620 | Standard Chartered plc | 447,934 | ||||||
| 2,411,643 | Tesco plc | 11,720,171 | ||||||
| 86,213 | Unilever plc | 2,894,529 | ||||||
| 2,579,637 | Vodafone Group plc | 7,250,456 | ||||||
| 754,300 | WPP plc | 9,157,097 | ||||||
|
| |||||||
| Total | 117,080,456 | |||||||
|
| |||||||
| United States (<0.1%) | ||||||||
| 12,234 | Molycorp, Inc.b | 263,643 | ||||||
|
| |||||||
| Total | 263,643 | |||||||
|
| |||||||
Total Common Stock (cost $772,843,014) | 701,995,660 | |||||||
|
| |||||||
Collateral Held for Securities Loaned (4.1%) | ||||||||
| 29,171,018 | Thrivent Financial Securities Lending Trust | 29,171,018 | ||||||
|
| |||||||
Total Collateral Held for Securities Loaned (cost $29,171,018) | 29,171,018 | |||||||
|
| |||||||
| Principal Amount | Short-Term Investments (1.3%)c | |||||||
Nieuw Amsterdam Receivables Corporation | ||||||||
| 9,000,000 | 0.150%, 7/2/2012d,e | $ | 8,999,925 | |||||
|
| |||||||
Total Short-Term Investments (at amortized cost) | 8,999,925 | |||||||
|
| |||||||
Total Investments (cost $811,013,957) 103.3% | $ | 740,166,603 | ||||||
|
| |||||||
| Other Assets and Liabilities, Net (3.3%) | (23,985,580 | ) | ||||||
|
| |||||||
| Total Net Assets 100.0% | $ | 716,181,023 | ||||||
|
| |||||||
| a | All or a portion of the security is on loan. |
| b | Non-income producing security. |
| c | The interest rate shown reflects the yield, coupon rate or the discount rate at the date of purchase. |
| d | Denotes securities sold under Rule 144A of the Securities Act of 1933, which exempts them from registration. These securities have been deemed liquid and may be resold to other dealers in the program or to other qualified institutional buyers. As of June 29, 2012, the value of these investments was $8,999,925 or 1.3% of total net assets. |
| e | Denotes investments that benefit from credit enhancement or liquidity support provided by a third party bank, institution or government. |
Definitions:
ADR | - | American Depositary Receipt, which are certificates for an underlying foreign security’s shares held by an issuing U.S. depository bank. | ||||
REIT | - | Real Estate Investment Trust is a company that buys, develops, manages and/or sells real estate assets. |
Unrealized Appreciation (Depreciation)
Gross unrealized appreciation and depreciation of investments, based on cost for federal income tax purposes, were as follows:
Gross unrealized appreciation | $ | 48,070,588 | ||
Gross unrealized depreciation | (120,491,064 | ) | ||
|
| |||
Net unrealized appreciation (depreciation) | $ | (72,420,476 | ) | |
Cost for federal income tax purposes | $ | 812,587,079 |
The accompanying Notes to Financial Statements are an integral part of this schedule.
145
Table of Contents
Partner International Stock Portfolio
Schedule of Investments as of June 29, 2012
(unaudited)
Fair Valuation Measurements
The following table is a summary of the inputs used, as of June 29, 2012, in valuing Partner International Stock Portfolio’s assets carried at fair value.
Investments in Securities | Total | Level 1 | Level 2 | Level 3 | ||||||||||||
Common Stock | ||||||||||||||||
Consumer Discretionary | 112,789,082 | — | 112,789,082 | — | ||||||||||||
Consumer Staples | 81,873,913 | — | 81,873,913 | — | ||||||||||||
Energy | 62,363,277 | 8,942,856 | 53,420,421 | — | ||||||||||||
Financials | 124,243,926 | 6,939,442 | 117,304,484 | — | ||||||||||||
Health Care | 63,415,984 | 6,799,456 | 56,616,528 | — | ||||||||||||
Industrials | 106,187,810 | 2,616,984 | 103,570,826 | — | ||||||||||||
Information Technology | 30,963,654 | — | 30,963,654 | — | ||||||||||||
Materials | 86,144,445 | 263,643 | 85,880,802 | — | ||||||||||||
Telecommunications Services | 29,515,519 | 3,306,204 | 26,209,315 | — | ||||||||||||
Utilities | 4,498,050 | — | 4,498,050 | — | ||||||||||||
Collateral Held for Securities Loaned | 29,171,018 | 29,171,018 | — | — | ||||||||||||
Short-Term Investments | 8,999,925 | — | 8,999,925 | — | ||||||||||||
|
|
|
|
|
|
|
| |||||||||
Total | $ | 740,166,603 | $ | 58,039,603 | $ | 682,127,000 | $ | — | ||||||||
|
|
|
|
|
|
|
| |||||||||
Other Financial Instruments | Total | Level 1 | Level 2 | Level 3 | ||||||||||||
Asset Derivatives | 5,675 | — | 5,675 | — | ||||||||||||
|
|
|
|
|
|
|
| |||||||||
Total Asset Derivatives | $ | 5,675 | $ | — | $ | 5,675 | $ | — | ||||||||
|
|
|
|
|
|
|
| |||||||||
Liability Derivatives | 3,553 | — | 3,553 | — | ||||||||||||
|
|
|
|
|
|
|
| |||||||||
Total Liability Derivatives | $ | 3,553 | $ | — | $ | 3,553 | $ | — | ||||||||
|
|
|
|
|
|
|
| |||||||||
There were no significant transfers between the Levels during the period ended June 29, 2012. Transfers between the levels are identified as of the end of the period.
Foreign Currency | Counterparty | Contracts to Deliver/Receive | Settlement Date | Value on Settlement Date | Value | Unrealized Gain/(Loss) | ||||||||||||||||||
Purchases | ||||||||||||||||||||||||
Euro | BIO | 152,715 | 7/3/2012 | $ | 193,325 | $ | 193,261 | ($ | 64 | ) | ||||||||||||||
Total Purchases | $ | 193,325 | $ | 193,261 | ($ | 64 | ) | |||||||||||||||||
Sales | ||||||||||||||||||||||||
Brazilian Real | SSB | 174,419 | 7/2/2012 | $ | 85,508 | $ | 86,841 | ($ | 1,333 | ) | ||||||||||||||
Canadian Dollar | SSB | 968,524 | 7/3/2012 | 949,148 | 951,304 | (2,156 | ) | |||||||||||||||||
Japanese Yen | SSB | 80,255,130 | 7/2/2012 | 1,009,680 | 1,004,005 | 5,675 | ||||||||||||||||||
Total Sales | $ | 2,044,336 | $ | 2,042,150 | $ | 2,186 | ||||||||||||||||||
Net Unrealized Gain/(Loss) on Foreign Currency Forward Contracts | $ | 2,122 | ||||||||||||||||||||||
Counterparty | ||||
BIO | - | Brown Brothers Harriman | ||
SSB | - | State Street Bank |
The accompanying Notes to Financial Statements are an integral part of this schedule.
146
Table of Contents
Partner International Stock Portfolio
Schedule of Investments as of June 29, 2012
(unaudited)
The following table summarizes the fair value and Statement of Assets and Liabilities location, as of June 29, 2012, for Partner International Stock Portfolio’s investments in financial derivative instruments by primary risk exposure as discussed under item (2) Significant Accounting Policies of the Notes to Financial Statements.
Derivatives by risk category | Statement of Assets and Liabilities Location | Fair Value | ||||
Asset Derivatives | ||||||
Foreign Exchange Contracts | ||||||
Forward Contracts | Receivable/Payable for forward contracts, Net Assets - Net unrealized appreciation/(depreciation) on Foreign currency forward contracts | 5,675 | ||||
Total Foreign Exchange Contracts | 5,675 | |||||
|
| |||||
Total Asset Derivatives | $ | 5,675 | ||||
|
| |||||
Liability Derivatives | ||||||
Foreign Exchange Contracts | ||||||
Forward Contracts | Receivable/Payable for forward contracts, Net Assets - Net unrealized appreciation/(depreciation) on Foreign currency forward contracts | 3,553 | ||||
Total Foreign Exchange Contracts | 3,553 | |||||
|
| |||||
Total Liability Derivatives | $ | 3,553 | ||||
|
| |||||
The following table summarizes the net realized gains/(losses) and Statement of Operations location, for the period ended June 29, 2012, for Partner International Stock Portfolio’s investments in financial derivative instruments by primary risk exposure.
Derivatives by risk category | Statement of Operations Location | Realized Gains/(Losses) recognized in Income | ||||
Foreign Exchange Contracts | ||||||
Forward Contracts | Net realized gains/(losses) on Foreign currency transactions | 75,777 | ||||
Total Foreign Exchange Contracts | 75,777 | |||||
|
| |||||
Total | $ | 75,777 | ||||
|
| |||||
The following table summarizes the change in net unrealized appreciation/(depreciation) and Statement of Operations location, for the period ended June 29, 2012, for Partner International Stock Portfolio’s investments in financial derivative instruments by primary risk exposure.
Derivatives by risk category | Statement of Operations Location | Change in unrealized appreciation/(depreciation) recognized in Income | ||||
Foreign Exchange Contracts | ||||||
Forward Contracts | Change in net unrealized appreciation/(depreciation) on Foreign currency forward contracts | 2,264 | ||||
Total Foreign Exchange Contracts | 2,264 | |||||
|
| |||||
Total | $ | 2,264 | ||||
|
| |||||
The following table presents Partner International Stock Portfolio’s average volume of derivative activity during the period ended June 29, 2012.
Derivative Risk Category | Forwards (Notional*) | Forwards (Percentage of Average Net Assets) | ||||||
Foreign Exchange Contracts | $ | 6,328,150 | 0.8 | |||||
| * | Notional amount represents long or short, or both, derivative positions held by the Portfolio. |
The accompanying Notes to Financial Statements are an integral part of this schedule.
147
Table of Contents
Partner International Stock Portfolio
Schedule of Investments as of June 29, 2012
(unaudited)
Investment in Affiliates
Affiliated issuers, as defined under the Investment Company Act of 1940, include those in which the Portfolio’s holdings of an issuer represent 5% or more of the outstanding voting securities of an issuer, or any affiliated mutual fund.
A summary of transactions for the fiscal year to date, in Partner International Stock Portfolio, is as follows:
Portfolio | Value December 31, 2011 | Gross Purchases | Gross Sales | Shares Held at June 29, 2012 | Value June 29, 2012 | Income Earned January 1, 2012 - June 29, 2012 | ||||||||||||||||||
Thrivent Financial Securities Lending Trust | $ | 38,197,124 | $ | 308,135,093 | $ | 317,161,199 | 29,171,018 | $ | 29,171,018 | $ | 797,987 | |||||||||||||
Total Value and Income Earned | 38,197,124 | 29,171,018 | 797,987 | |||||||||||||||||||||
The accompanying Notes to Financial Statements are an integral part of this schedule.
148
Table of Contents
Partner Socially Responsible Stock Portfolio
Schedule of Investments as of June 29, 2012
(unaudited)
Shares | Common Stock (96.8%) | Value | ||||
| Consumer Discretionary (12.6%) | ||||||
| 690 | Amazon.com, Inc.a | $ | 157,561 | |||
| 6,350 | CarMax, Inc.a | 164,719 | ||||
| 3,270 | Kohl’s Corporation | 148,752 | ||||
| 4,620 | Lowe’s Companies, Inc. | 131,393 | ||||
| 340 | Priceline.com, Inc.a | 225,937 | ||||
| 3,280 | Starbucks Corporation | 174,890 | ||||
|
| |||||
| Total | 1,003,252 | |||||
|
| |||||
| Consumer Staples (10.9%) | ||||||
| 2,270 | Coca-Cola Company | 177,491 | ||||
| 2,290 | Costco Wholesale Corporation | 217,550 | ||||
| 7,060 | CVS Caremark Corporation | 329,914 | ||||
| 2,070 | PepsiCo, Inc. | 146,266 | ||||
|
| |||||
| Total | 871,221 | |||||
|
| |||||
| Energy (10.3%) | ||||||
| 5,440 | Cameron International Corporationa | 232,342 | ||||
| 4,480 | Noble Corporationa | 145,734 | ||||
| 6,110 | QEP Resources, Inc. | 183,117 | ||||
| 8,930 | Suncor Energy, Inc. ADR | 258,524 | ||||
|
| |||||
| Total | 819,717 | |||||
|
| |||||
| Financials (10.8%) | ||||||
| 2,030 | Aflac, Inc. | 86,458 | ||||
| 3,720 | American Express Company | 216,541 | ||||
| 920 | IntercontinentalExchange, Inc.a | 125,101 | ||||
| 5,060 | SunTrust Banks, Inc. | 122,604 | ||||
| 2,100 | T. Rowe Price Group, Inc. | 132,216 | ||||
| 5,170 | Wells Fargo & Company | 172,885 | ||||
|
| |||||
| Total | 855,805 | |||||
|
| |||||
| Health Care (14.2%) | ||||||
| 3,940 | Allergan, Inc. | 364,726 | ||||
| 800 | Cerner Corporationa | 66,128 | ||||
| 1,350 | Edwards Lifesciences Corporationa | 139,455 | ||||
| 3,870 | Gilead Sciences, Inc.a | 198,453 | ||||
| 110 | Intuitive Surgical, Inc.a | 60,917 | ||||
| 2,020 | Novartis AG ADR | 112,918 | ||||
| 1,060 | Perrigo Company | 125,006 | ||||
| 980 | Varian Medical Systems, Inc.a | 59,555 | ||||
|
| |||||
| Total | 1,127,158 | |||||
|
| |||||
| Industrials (8.9%) | ||||||
| 1,180 | 3M Company | 105,728 | ||||
| 2,610 | C.H. Robinson Worldwide, Inc. | 152,763 | ||||
| 1,840 | Cooper Industries plc | 125,451 | ||||
| 4,070 | Danaher Corporation | 211,966 | ||||
| 2,910 | Expeditors International of Washington, Inc. | 112,762 | ||||
|
| |||||
| Total | 708,670 | |||||
|
| |||||
| Information Technology (25.9%) | ||||||
| 2,520 | Acme Packet, Inc.a | 46,998 | ||||
| 550 | Apple, Inc.a | 321,200 | ||||
| 4,040 | Cognizant Technology Solutions Corporationa | 242,400 | ||||
| 320 | Google, Inc.a | 185,622 | ||||
| 690 | Informatica Corporationa | 29,229 | ||||
| 730 | International Business Machines Corporation | 142,773 | ||||
| 2,620 | Intuit, Inc. | 155,497 | ||||
| 4,610 | Juniper Networks, Inc.a | 75,189 | ||||
| 1,550 | Mercadolibre, Inc. | 117,490 | ||||
| 6,340 | Microsoft Corporation | 193,941 | ||||
| 5,860 | QUALCOMM, Inc. | 326,285 | ||||
| 440 | Salesforce.com, Inc.a | 60,834 | ||||
| 3,810 | Texas Instruments, Inc. | 109,309 | ||||
| 590 | VMware, Inc.a | 53,714 | ||||
|
| |||||
| Total | 2,060,481 | |||||
|
| |||||
| Materials (3.2%) | ||||||
| 3,690 | Ecolab, Inc. | 252,876 | ||||
|
| |||||
| Total | 252,876 | |||||
|
| |||||
| Total Common Stock (cost $7,135,155) | 7,699,180 | |||||
|
| |||||
| Total Investments (cost $7,135,155) 96.8% | $ | 7,699,180 | ||||
|
| |||||
| Other Assets and Liabilities, Net 3.2% | 254,200 | |||||
|
| |||||
| Total Net Assets 100.0% | $ | 7,953,380 | ||||
|
| |||||
| a | Non-income producing security. |
Definitions:
| ADR - | American Depositary Receipt, which are certificates for an underlying foreign security’s shares held by an issuing U.S. depository bank. |
Unrealized Appreciation (Depreciation)
Gross unrealized appreciation and depreciation of investments, based on cost for federal income tax purposes, were as follows:
Gross unrealized appreciation | $ | 883,018 | ||
Gross unrealized depreciation | (325,466 | ) | ||
|
| |||
Net unrealized appreciation (depreciation) | $ | 557,552 | ||
Cost for federal income tax purposes | $ | 7,141,628 | ||
The accompanying Notes to Financial Statements are an integral part of this schedule.
149
Table of Contents
Partner Socially Responsible Stock Portfolio
Schedule of Investments as of June 29, 2012
(unaudited)
Fair Valuation Measurements
The following table is a summary of the inputs used, as of June 29, 2012, in valuing Partner Socially Responsible Stock Portfolio’s assets carried at fair value.
Investments in Securities | Total | Level 1 | Level 2 | Level 3 | ||||||||||||
Common Stock | ||||||||||||||||
Consumer Discretionary | 1,003,252 | 1,003,252 | — | — | ||||||||||||
Consumer Staples | 871,221 | 871,221 | — | — | ||||||||||||
Energy | 819,717 | 819,717 | — | — | ||||||||||||
Financials | 855,805 | 855,805 | — | — | ||||||||||||
Health Care | 1,127,158 | 1,127,158 | — | — | ||||||||||||
Industrials | 708,670 | 708,670 | — | — | ||||||||||||
Information Technology | 2,060,481 | 2,060,481 | — | — | ||||||||||||
Materials | 252,876 | 252,876 | — | — | ||||||||||||
|
|
|
|
|
|
|
| |||||||||
Total | $ | 7,699,180 | $ | 7,699,180 | $ | — | $ | — | ||||||||
|
|
|
|
|
|
|
| |||||||||
There were no significant transfers between the Levels during the period ended June 29, 2012. Transfers between the levels are identified as of the end of the period.
The accompanying Notes to Financial Statements are an integral part of this schedule.
150
Table of Contents
Partner All Cap Growth Portfolio
Schedule of Investments as of June 29, 2012
(unaudited)
| Shares | Common Stock (95.8%) | Value | ||||||
| Consumer Discretionary (13.2%) | ||||||||
| 1,505 | Amazon.com, Inc.a | $ | 343,667 | |||||
| 1,825 | Coach, Inc. | 106,726 | ||||||
| 2,250 | DIRECTVa | 109,845 | ||||||
| 2,150 | Expedia, Inc. | 103,350 | ||||||
| 2,200 | Harman International Industries, Inc. | 87,120 | ||||||
| 2,350 | Michael Kors Holdings, Ltd.a | 98,324 | ||||||
| 700 | Panera Bread Companya | 97,608 | ||||||
| 600 | Priceline.com, Inc.a | 398,712 | ||||||
| 4,005 | Starbucks Corporation | 213,547 | ||||||
| 2,950 | TJX Companies, Inc. | 126,643 | ||||||
| 2,500 | TripAdvisor, Inc.a | 111,725 | ||||||
|
| |||||||
| Total | 1,797,267 | |||||||
|
| |||||||
| Consumer Staples (5.7%) | ||||||||
| 2,200 | Coca-Cola Company | 172,018 | ||||||
| 4,050 | Companhia de Bebidas das Americas ADR | 155,237 | ||||||
| 1,425 | Herbalife, Ltd. | 68,870 | ||||||
| 3,175 | Mead Johnson Nutrition Company | 255,619 | ||||||
| 1,725 | Monster Beverage Corporationa | 122,820 | ||||||
|
| |||||||
| Total | 774,564 | |||||||
|
| |||||||
| Energy (7.8%) | ||||||||
| 1,775 | Apache Corporation | 156,005 | ||||||
| 450 | CNOOC, Ltd. ADR | 90,562 | ||||||
| 4,150 | Helmerich & Payne, Inc. | 180,442 | ||||||
| 4,075 | National Oilwell Varco, Inc. | 262,593 | ||||||
| 1,525 | Occidental Petroleum Corporation | 130,799 | ||||||
| 2,875 | Schlumberger, Ltd. | 186,616 | ||||||
| 2,764 | Superior Energy Services, Inc.a | 55,916 | ||||||
|
| |||||||
| Total | 1,062,933 | |||||||
|
| |||||||
| Financials (3.5%) | ||||||||
| 2,100 | American Express Company | 122,241 | ||||||
| 750 | Franklin Resources, Inc. | 83,242 | ||||||
| 870 | IntercontinentalExchange, Inc.a | 118,303 | ||||||
| 2,400 | T. Rowe Price Group, Inc. | 151,104 | ||||||
|
| |||||||
| Total | 474,890 | |||||||
|
| |||||||
| Health Care (10.7%) | ||||||||
| 1,650 | Amgen, Inc. | 120,516 | ||||||
| 1,450 | Cerner Corporationa | 119,857 | ||||||
| 5,625 | Cubist Pharmaceuticals, Inc.a | 213,244 | ||||||
| 775 | Edwards Lifesciences Corporationa | 80,058 | ||||||
| 850 | Intuitive Surgical, Inc.a | 470,721 | ||||||
| 2,550 | Johnson & Johnson | 172,278 | ||||||
| 1,950 | Novo Nordisk A/S ADR | 283,413 | ||||||
|
| |||||||
| Total | 1,460,087 | |||||||
|
| |||||||
| Industrials (5.6%) | ||||||||
| 7,075 | ABB, Ltd. ADRa | 115,464 | ||||||
| 2,850 | Dover Corporation | 152,789 | ||||||
| 4,775 | Eaton Corporation | 189,233 | ||||||
| 3,125 | Fluor Corporation | 154,188 | ||||||
| 3,075 | Komatsu, Ltd. ADR | 72,908 | ||||||
| 1,025 | Parker Hannifin Corporation | 78,802 | ||||||
|
| |||||||
| Total | 763,384 | |||||||
|
| |||||||
| Information Technology (42.2%) | ||||||||
| 3,950 | Accenture plc | 237,356 | ||||||
| 1,120 | Apple, Inc.a | 654,080 | ||||||
| 2,675 | ASML Holding NV | 137,548 | ||||||
| 4,925 | Autodesk, Inc.a | 172,326 | ||||||
| 3,700 | Check Point Software Technologies, Ltd.a | 183,483 | ||||||
| 1,475 | Citrix Systems, Inc.a | 123,812 | ||||||
| 2,925 | Cognizant Technology Solutions Corporationa | 175,500 | ||||||
| 2,650 | CommVault Systems, Inc.a | 131,360 | ||||||
| 5,225 | eBay, Inc.a | 219,502 | ||||||
| 11,125 | EMC Corporationa | 285,134 | ||||||
| 825 | F5 Networks, Inc.a | 82,137 | ||||||
| 3,025 | Facebook, Inc.a | 94,138 | ||||||
| 4,000 | Fortinet, Inc.a | 92,880 | ||||||
| 947 | Google, Inc.a | 549,326 | ||||||
| 2,000 | Informatica Corporationa | 84,720 | ||||||
| 5,325 | Intel Corporation | 141,911 | ||||||
| 1,525 | Intuit, Inc. | 90,509 | ||||||
| 3,050 | Lam Research Corporationa | 115,107 | ||||||
| 475 | MasterCard, Inc. | 204,302 | ||||||
| 3,825 | Nuance Communications, Inc.a | 91,111 | ||||||
| 14,250 | Oracle Corporation | 423,225 | ||||||
| 8,050 | QUALCOMM, Inc. | 448,224 | ||||||
| 1,550 | Salesforce.com, Inc.a | 214,303 | ||||||
| 2,625 | SAP AG ADR | 155,820 | ||||||
| 4,550 | Solarwinds, Inc.a | 198,198 | ||||||
| 1,850 | Teradata Corporationa | 133,219 | ||||||
| 3,725 | TIBCO Software, Inc.a | 111,452 | ||||||
| 2,200 | VMware, Inc.a | 200,288 | ||||||
|
| |||||||
| Total | 5,750,971 | |||||||
|
| |||||||
| Materials (6.3%) | ||||||||
| 2,050 | Agrium, Inc. | 181,363 | ||||||
| 6,050 | Barrick Gold Corporation | 227,299 | ||||||
| 1,250 | Cliffs Natural Resources, Inc. | 61,613 | ||||||
| 2,800 | Goldcorp, Inc. | 105,224 | ||||||
| 2,600 | Rio Tinto plc ADR | 124,306 | ||||||
| 10,050 | Yamana Gold, Inc. | 154,770 | ||||||
|
| |||||||
| Total | 854,575 | |||||||
|
| |||||||
| Telecommunications Services (0.8%) | ||||||||
| 3,656 | Tim Participacoes SA ADR | 100,394 | ||||||
|
| |||||||
| Total | 100,394 | |||||||
|
| |||||||
| Total Common Stock (cost $11,418,822) | 13,039,065 | |||||||
|
| |||||||
| Total Investments (cost $11,418,822) 95.8% | $ | 13,039,065 | ||||||
|
| |||||||
| Other Assets and Liabilities, Net 4.2% | 577,290 | |||||||
|
| |||||||
| Total Net Assets 100.0% | $ | 13,616,355 | ||||||
|
| |||||||
| a | Non-income producing security. |
Definitions:
| ADR | - American Depositary Receipt, which are certificates for an underlying foreign security’s shares held by an issuing U.S. depository bank. |
The accompanying Notes to Financial Statements are an integral part of this schedule.
151
Table of Contents
Partner All Cap Growth Portfolio
Schedule of Investments as of June 29, 2012
(unaudited)
| Unrealized Appreciation (Depreciation) | ||||
| Gross unrealized appreciation and depreciation of investments, based on cost for federal income tax purposes, were as follows: | ||||
Gross unrealized appreciation | $ | 2,152,589 | ||
Gross unrealized depreciation | (536,768 | ) | ||
|
| |||
Net unrealized appreciation (depreciation) | $ | 1,615,821 | ||
Cost for federal income tax purposes | $ | 11,423,244 | ||
Fair Valuation Measurements
The following table is a summary of the inputs used, as of June 29, 2012, in valuing Partner All Cap Growth Portfolio’s assets carried at fair value.
Investments in Securities | Total | Level 1 | Level 2 | Level 3 | ||||||||||||
Common Stock | ||||||||||||||||
Consumer Discretionary | 1,797,267 | 1,797,267 | — | — | ||||||||||||
Consumer Staples | 774,564 | 774,564 | — | — | ||||||||||||
Energy | 1,062,933 | 1,062,933 | — | — | ||||||||||||
Financials | 474,890 | 474,890 | — | — | ||||||||||||
Health Care | 1,460,087 | 1,460,087 | — | — | ||||||||||||
Industrials | 763,384 | 763,384 | — | — | ||||||||||||
Information Technology | 5,750,971 | 5,750,971 | — | — | ||||||||||||
Materials | 854,575 | 854,575 | — | — | ||||||||||||
Telecommunications Services | 100,394 | 100,394 | — | — | ||||||||||||
|
|
|
|
|
|
|
| |||||||||
Total | $ | 13,039,065 | $ | 13,039,065 | $ | — | $ | — | ||||||||
|
|
|
|
|
|
|
| |||||||||
There were no significant transfers between the Levels during the period ended June 29, 2012. Transfers between the levels are identified as of the end of the period.
The following table summarizes the net realized gains/(losses) and Statement of Operations location, for the period ended June 29, 2012, for Partner All Cap Growth Portfolio’s investments in financial derivative instruments by primary risk exposure.
Derivatives by risk category | Statement of Operations Location | Realized Gains/(Losses) recognized in Income | ||||
Equity Contracts | ||||||
Options Purchased | Net realized gains/(losses) on Investments | (19,221 | ) | |||
Total Equity Contracts | (19,221 | ) | ||||
|
| |||||
Total | ($19,221 | ) | ||||
|
| |||||
The following table presents Partner All Cap Growth Portfolio’s average volume of derivative activity during the period ended June 29, 2012.
Derivative Risk Category | Options (Contracts) | |||
Equity Contracts | 5 | |||
The accompanying Notes to Financial Statements are an integral part of this schedule.
152
Table of Contents
Partner All Cap Value Portfolio
Schedule of Investments as of June 29, 2012
(unaudited)
| Shares | Common Stock (97.2%) | Value | ||||||
| Consumer Discretionary (7.8%) | ||||||||
| 1,980 | Ascena Retail Group, Inc.a | $ | 36,868 | |||||
| 4,333 | Comcast Corporation | 138,526 | ||||||
| 2,914 | Mohawk Industries, Inc.a | 203,485 | ||||||
| 10,820 | Talbots, Inc.a | 27,266 | ||||||
| 1,890 | Target Corporation | 109,979 | ||||||
|
| |||||||
| Total | 516,124 | |||||||
|
| |||||||
| Consumer Staples (9.2%) | ||||||||
| 7,620 | Adecoagro SAa | 69,876 | ||||||
| 3,780 | Coca-Cola Company | 295,558 | ||||||
| 4,200 | Molson Coors Brewing Company | 174,762 | ||||||
| 940 | PepsiCo, Inc. | 66,420 | ||||||
|
| |||||||
| Total | 606,616 | |||||||
|
| |||||||
| Energy (10.6%) | ||||||||
| 910 | Apache Corporation | 79,980 | ||||||
| 2,460 | Baker Hughes, Inc. | 101,106 | ||||||
| 2,410 | Bill Barrett Corporationa | 51,622 | ||||||
| 3,350 | Chevron Corporation | 353,425 | ||||||
| 800 | Exxon Mobil Corporation | 68,456 | ||||||
| 1,980 | Valero Energy Corporation | 47,817 | ||||||
|
| |||||||
| Total | 702,406 | |||||||
|
| |||||||
| Financials (23.3%) | ||||||||
| 2,060 | ACE, Ltd. | 152,708 | ||||||
| 950 | BlackRock, Inc. | 161,329 | ||||||
| 3,810 | Brown & Brown, Inc. | 103,899 | ||||||
| 6,300 | Citigroup, Inc. | 172,683 | ||||||
| 2,140 | Goldman Sachs Group, Inc. | 205,140 | ||||||
| 2,570 | M&T Bank Corporation | 212,205 | ||||||
| 3,450 | Marsh & McLennan Companies, Inc. | 111,194 | ||||||
| 1,640 | PNC Financial Services Group, Inc. | 100,220 | ||||||
| 5,160 | SunTrust Banks, Inc. | 125,027 | ||||||
| 5,680 | Wells Fargo & Company | 189,939 | ||||||
|
| |||||||
| Total | 1,534,344 | |||||||
|
| |||||||
| Health Care (10.7%) | ||||||||
| 1,680 | Baxter International, Inc. | 89,292 | ||||||
| 3,930 | Humana, Inc. | 304,339 | ||||||
| 4,000 | Merck & Company, Inc. | 167,000 | ||||||
| 2,480 | UnitedHealth Group, Inc. | 145,080 | ||||||
|
| |||||||
| Total | 705,711 | |||||||
|
| |||||||
| Industrials (11.1%) | ||||||||
| 24,601 | AerCap Holdings NVa | 277,499 | ||||||
| 2,550 | Honeywell International, Inc. | 142,392 | ||||||
| 3,710 | Navistar International | |||||||
Corporationa | 105,253 | |||||||
| 6,720 | Quanta Services, Inc.a | 161,750 | ||||||
| 1,980 | United Continental Holdings, Inc.a | 48,174 | ||||||
| Total | 735,068 | |||||||
| Information Technology (11.6%) | ||||||||
| 8,520 | Ciena Corporationa | 139,473 | ||||||
| 5,460 | Cisco Systems, Inc. | 93,748 | ||||||
| 13,900 | Juniper Networks, Inc.a | 226,709 | ||||||
| 5,190 | TE Connectivity, Ltd. | 165,613 | ||||||
| 4,120 | Xilinx, Inc. | 138,308 | ||||||
|
| |||||||
| Total | 763,851 | |||||||
|
| |||||||
| Materials (4.6%) | ||||||||
| 3,550 | Mosaic Company | 194,398 | ||||||
| 1,960 | Rock-Tenn Company | 106,918 | ||||||
|
| |||||||
| Total | 301,316 | |||||||
|
| |||||||
| Telecommunications Services (2.3%) | ||||||||
| 3,350 | Verizon Communications, Inc. | 148,874 | ||||||
|
| |||||||
| Total | 148,874 | |||||||
|
| |||||||
| Utilities (6.0%) | ||||||||
| 57,840 | GenOn Energy, Inc.a | 98,906 | ||||||
| 3,330 | NiSource, Inc. | 82,418 | ||||||
| 2,000 | Public Service Enterprise Group, Inc. | 65,000 | ||||||
| 3,160 | SCANA Corporation | 151,174 | ||||||
|
| |||||||
| Total | 397,498 | |||||||
|
| |||||||
| Total Common Stock (cost $6,791,487) | 6,411,808 | |||||||
| Contracts | Options Purchased (<0.1%) | |||||||
Put on Humana, Inc. | ||||||||
| 5 | $72.50, expires 7/21/2012 | 150 | ||||||
| 5 | $67.50, expires 8/18/2012 | 250 | ||||||
Put on Unitedhealth Group, Inc. | ||||||||
| 8 | $55.00, expires 7/21/2012 | 360 | ||||||
| 8 | $52.50, expires 8/18/2012 | 480 | ||||||
|
| |||||||
| Total Options Purchased (cost $2,632) | 1,240 | |||||||
|
| |||||||
| Total Investments (cost $6,794,119) 97.2% | $ | 6,413,048 | ||||||
|
| |||||||
| Other Assets and Liabilities, Net 2.8% | 185,952 | |||||||
|
| |||||||
| Total Net Assets 100.0% | $ | 6,599,000 | ||||||
|
| |||||||
| a | Non-income producing security. |
| Unrealized Appreciation (Depreciation) | ||||
Gross unrealized appreciation and depreciation of investments, based on cost for federal income tax purposes, were as follows: |
| |||
Gross unrealized appreciation | $ | 380,808 | ||
Gross unrealized depreciation | (763,009 | ) | ||
|
| |||
Net unrealized appreciation (depreciation) | $ | (382,201 | ) | |
Cost for federal income tax purposes | $ | 6,795,249 | ||
The accompanying Notes to Financial Statements are an integral part of this schedule.
153
Table of Contents
Partner All Cap Value Portfolio
Schedule of Investments as of June 29, 2012
(unaudited)
Fair Valuation Measurements
The following table is a summary of the inputs used, as of June 29, 2012, in valuing Partner All Cap Value Portfolio’s assets carried at fair value.
Investments in Securities | Total | Level 1 | Level 2 | Level 3 | ||||||||||||
Common Stock | ||||||||||||||||
Consumer Discretionary | 516,124 | 516,124 | — | — | ||||||||||||
Consumer Staples | 606,616 | 606,616 | — | — | ||||||||||||
Energy | 702,406 | 702,406 | — | — | ||||||||||||
Financials | 1,534,344 | 1,534,344 | — | — | ||||||||||||
Health Care | 705,711 | 705,711 | — | — | ||||||||||||
Industrials | 735,068 | 735,068 | — | — | ||||||||||||
Information Technology | 763,851 | 763,851 | — | — | ||||||||||||
Materials | 301,316 | 301,316 | — | — | ||||||||||||
Telecommunications Services | 148,874 | 148,874 | — | — | ||||||||||||
Utilities | 397,498 | 397,498 | — | — | ||||||||||||
Options Purchased | 1,240 | 1,240 | — | — | ||||||||||||
|
|
|
|
|
|
|
| |||||||||
Total | $ | 6,413,048 | $ | 6,413,048 | $ | — | $ | — | ||||||||
|
|
|
|
|
|
|
| |||||||||
There were no significant transfers between the Levels during the period ended June 29, 2012. Transfers between the levels are identified as of the end of the period.
The following table summarizes the fair value and Statement of Assets and Liabilities location, as of June 29, 2012, for Partner All Cap Value Portfolio's investments in financial derivative instruments by primary risk exposure as discussed under item (2) Significant Accounting Policies of the Notes to Financial Statements.
Derivatives by risk category | Statement of Assets and Liabilities Location | Fair Value | ||||
Asset Derivatives | ||||||
Equity Contracts | ||||||
Options Purchased | Investments in securities at value, Net Assets - Net unrealized appreciation/ | 1,240 | ||||
Total Equity Contracts | 1,240 | |||||
|
| |||||
Total Asset Derivatives | $ | 1,240 | ||||
|
| |||||
The following table summarizes the net realized gains/(losses) and Statement of Operations location, for the period ended June 29, 2012, for Partner All Cap Value Portfolio’s investments in financial derivative instruments by primary risk exposure.
Derivatives by risk category | Statement of Operations Location | Realized Gains/(Losses) recognized in Income | ||||
Foreign Exchange Contracts | ||||||
Forward Contracts | Net realized gains/(losses) on Foreign currency transactions | (4 | ) | |||
Total Foreign Exchange Contracts | (4 | ) | ||||
|
| |||||
Total | ($4 | ) | ||||
|
| |||||
The following table summarizes the change in net unrealized appreciation/(depreciation) and Statement of Operations location, for the period ended June 29, 2012, for Partner All Cap Value Portfolio’s investments in financial derivative instruments by primary risk exposure.
Derivatives by risk category | Statement of Operations Location | Change in unrealized appreciation/(depreciation) recognized in Income | ||||
Equity Contracts | ||||||
Options Purchased | Change in net unrealized appreciation/(depreciation) on Investments | (1,392 | ) | |||
Total Equity Contracts | (1,392 | ) | ||||
|
| |||||
Total | ($1,392 | ) | ||||
|
| |||||
Partner All Cap Value Portfolio’s average volume of derivative activity for foreign exchange and options purchased contracts during the period was <0.1% of average net assets.
The accompanying Notes to Financial Statements are an integral part of this schedule.
154
Table of Contents
Schedule of Investments as of June 29, 2012
(unaudited)
| Shares | Common Stock (99.0%) | Value | ||||||
| Consumer Discretionary (10.8%) | ||||||||
| 2,860 | Amazon.com, Inc.a | $ | 653,081 | |||||
| 6,150 | Coach, Inc. | 359,652 | ||||||
| 18,170 | Comcast Corporation | 580,895 | ||||||
| 11,800 | DIRECTVa | 576,076 | ||||||
| 15,780 | DISH Network Corporation | 450,519 | ||||||
| 9,590 | Home Depot, Inc. | 508,174 | ||||||
| 8,300 | Macy’s, Inc. | 285,105 | ||||||
| 590 | Priceline.com, Inc.a | 392,067 | ||||||
| 2,350 | Ralph Lauren Corporation | 329,141 | ||||||
| 3,120 | VF Corporation | 416,364 | ||||||
| 13,610 | Viacom, Inc. | 639,942 | ||||||
| 5,930 | Yum! Brands, Inc. | 382,011 | ||||||
|
| |||||||
| Total | 5,573,027 | |||||||
|
| |||||||
| Consumer Staples (11.1%) | ||||||||
| 25,640 | Altria Group, Inc. | 885,862 | ||||||
| 30,760 | CVS Caremark Corporation | 1,437,415 | ||||||
| 3,650 | Estee Lauder Companies, Inc. | 197,538 | ||||||
| 15,060 | Kraft Foods, Inc. | 581,617 | ||||||
| 1,670 | Lorillard, Inc. | 220,357 | ||||||
| 1,800 | Mead Johnson Nutrition Company | 144,918 | ||||||
| 14,220 | PepsiCo, Inc. | 1,004,785 | ||||||
| 4,990 | Procter & Gamble Company | 305,638 | ||||||
| 13,520 | Wal-Mart Stores, Inc. | 942,614 | ||||||
|
| |||||||
| Total | 5,720,744 | |||||||
|
| |||||||
| Energy (10.8%) | ||||||||
| 2,980 | Anadarko Petroleum Corporation | 197,276 | ||||||
| 3,510 | Apache Corporation | 308,494 | ||||||
| 9,720 | Chevron Corporation | 1,025,460 | ||||||
| 7,854 | Ensco plc | 368,902 | ||||||
| 19,760 | Exxon Mobil Corporation | 1,690,863 | ||||||
| 12,710 | Halliburton Company | 360,837 | ||||||
| 5,980 | Marathon Petroleum Corporation | 268,622 | ||||||
| 5,660 | National Oilwell Varco, Inc. | 364,731 | ||||||
| 11,390 | Occidental Petroleum Corporation | 976,920 | ||||||
|
| |||||||
| Total | 5,562,105 | |||||||
|
| |||||||
| Financials (14.3%) | ||||||||
| 5,120 | American Tower Corporation | 357,939 | ||||||
| 13,280 | Berkshire Hathaway, Inc.a | 1,106,622 | ||||||
| 5,290 | Boston Properties, Inc. | 573,277 | ||||||
| 10,300 | Capital One Financial Corporation | 562,998 | ||||||
| 1,450 | CME Group, Inc. | 388,760 | ||||||
| 28,500 | Invesco, Ltd. | 644,100 | ||||||
| 33,630 | J.P. Morgan Chase & Company | 1,201,600 | ||||||
| 60,630 | KeyCorp | 469,276 | ||||||
| 25,550 | MetLife, Inc. | 788,217 | ||||||
| 2,880 | Public Storage, Inc. | 415,901 | ||||||
| 60,490 | Regions Financial Corporation | 408,308 | ||||||
| 1,520 | Simon Property Group, Inc. | 236,603 | ||||||
| 13,910 | TD Ameritrade Holding Corporation | 236,470 | ||||||
|
| |||||||
| Total | 7,390,071 | |||||||
|
| |||||||
| Health Care (11.6%) | ||||||||
| 3,510 | Allergan, Inc. | 324,921 | ||||||
| 7,270 | Amgen, Inc. | 531,001 | ||||||
| 3,640 | Biogen Idec, Inc.a | 525,543 | ||||||
| 2,920 | C.R. Bard, Inc. | 313,725 | ||||||
| 3,400 | Edwards Lifesciences Corporationa | 351,220 | ||||||
| 7,160 | Express Scripts Holding Companya | 399,743 | ||||||
| 10,670 | Gilead Sciences, Inc.a | 547,157 | ||||||
| 4,680 | Hospira, Inc.a | 163,706 | ||||||
| 7,570 | Medicis Pharmaceutical Corporation | 258,515 | ||||||
| 2,000 | Medivation, Inc.a | 182,800 | ||||||
| 3,820 | Onyx Pharmaceuticals, Inc.a | 253,839 | ||||||
| 48,815 | Pfizer, Inc. | 1,122,745 | ||||||
| 8,620 | UnitedHealth Group, Inc. | 504,270 | ||||||
| 7,563 | Valeant Pharmaceuticals International, Inc.a | 338,747 | ||||||
| 2,870 | Varian Medical Systems, Inc.a | 174,410 | ||||||
|
| |||||||
| Total | 5,992,342 | |||||||
|
| |||||||
| Industrials (10.4%) | ||||||||
| 7,620 | Boeing Company | 566,166 | ||||||
| 4,210 | Caterpillar, Inc. | 357,471 | ||||||
| 1,800 | Colfax Corporationa | 49,626 | ||||||
| 3,420 | Cummins, Inc. | 331,432 | ||||||
| 11,290 | Danaher Corporation | 587,983 | ||||||
| 1,480 | Flowserve Corporation | 169,830 | ||||||
| 41,810 | General Electric Company | 871,320 | ||||||
| 6,500 | Ingersoll-Rand plc | 274,170 | ||||||
| 2,340 | Precision Castparts Corporation | 384,907 | ||||||
| 3,240 | Republic Services, Inc. | 85,731 | ||||||
| 3,630 | Union Pacific Corporation | 433,095 | ||||||
| 8,010 | United Parcel Service, Inc. | 630,868 | ||||||
| 8,470 | United Technologies Corporation | 639,739 | ||||||
|
| |||||||
| Total | 5,382,338 | |||||||
|
| |||||||
| Information Technology (19.7%) | ||||||||
| 6,600 | Accenture plc | 396,594 | ||||||
| 9,400 | ADTRAN, Inc. | 283,786 | ||||||
| 4,450 | Altera Corporation | 150,588 | ||||||
| 4,900 | Apple, Inc.a | 2,861,600 | ||||||
| 5,200 | Avago Technologies, Ltd. | 186,680 | ||||||
| 6,340 | BMC Software, Inc.a | 270,591 | ||||||
| 13,070 | Broadcom Corporationa | 441,766 | ||||||
| 8,400 | Check Point Software Technologies, Ltd.a | 416,556 | ||||||
| 6,770 | Cognizant Technology Solutions Corporationa | 406,200 | ||||||
| 1,780 | Google, Inc.a | 1,032,525 | ||||||
| 24,090 | Hewlett-Packard Company | 484,450 | ||||||
| 22,180 | Juniper Networks, Inc.a | 361,756 | ||||||
| 10,640 | Maxim Integrated Products, Inc. | 272,809 | ||||||
| 9,000 | NXP Semiconductors NVa | 209,250 | ||||||
| 24,040 | Oracle Corporation | 713,988 | ||||||
| 13,000 | QUALCOMM, Inc. | 723,840 | ||||||
| 5,260 | Visa, Inc. | 650,294 | ||||||
| 3,390 | VMware, Inc.a | 308,625 | ||||||
|
| |||||||
| Total | 10,171,898 | |||||||
|
| |||||||
| Materials (3.6%) | ||||||||
| 1,170 | CF Industries Holdings, Inc. | 226,676 | ||||||
| 5,280 | Ecolab, Inc. | 361,838 | ||||||
| 7,790 | Freeport-McMoRan Copper & Gold, Inc. | 265,405 | ||||||
The accompanying Notes to Financial Statements are an integral part of this schedule.
155
Table of Contents
Partner All Cap Portfolio
Schedule of Investments as of June 29, 2012
(unaudited)
| Shares | Common Stock (99.0%) | Value | ||||||
| Materials (3.6%) - continued | ||||||||
| 7,600 | LyondellBasell Industries NV | $ | 306,052 | |||||
| 5,290 | Newmont Mining Corporation | 256,618 | ||||||
| 1,930 | PPG Industries, Inc. | 204,812 | ||||||
| 1,880 | Praxair, Inc. | 204,412 | ||||||
|
| |||||||
| Total | 1,825,813 | |||||||
|
| |||||||
| Telecommunications Services (3.1%) | ||||||||
| 10,842 | AT&T, Inc. | 386,626 | ||||||
| 10,089 | CenturyLink, Inc. | 398,415 | ||||||
| 90,590 | Frontier Communications Corporationb | 346,960 | ||||||
| 9,140 | NII Holdings, Inc.a | 93,502 | ||||||
| 6,570 | SBA Communications Corporationa | 374,818 | ||||||
|
| |||||||
| Total | 1,600,321 | |||||||
|
| |||||||
| Utilities (3.6%) | ||||||||
| 8,990 | Dominion Resources, Inc. | 485,460 | ||||||
| 14,520 | Edison International, Inc. | 670,824 | ||||||
| 2,910 | ITC Holdings Corporation | 200,528 | ||||||
| 17,380 | PPL Corporation | 483,338 | ||||||
|
| |||||||
| Total | 1,840,150 | |||||||
|
| |||||||
| Total Common Stock (cost $48,612,368) | 51,058,809 | |||||||
|
| |||||||
Collateral Held for Securities Loaned (0.7%) | ||||||||
| 362,240 | Thrivent Financial Securities Lending Trust | 362,240 | ||||||
| Total Collateral Held for Securities Loaned (cost $362,240) | 362,240 | |||||||
|
| |||||||
Total Investments (cost $48,974,608) 99.7% | $ | 51,421,049 | ||||||
|
| |||||||
| Other Assets and Liabilities, Net 0.3% | 138,326 | |||||||
|
| |||||||
| Total Net Assets 100.0% | $ | 51,559,375 | ||||||
|
| |||||||
| a | Non-income producing security. |
| b | All or a portion of the security is on loan. |
Unrealized Appreciation (Depreciation)
Gross unrealized appreciation and depreciation of investments, based on cost for federal income tax purposes, were as follows:
Gross unrealized appreciation | $ | 4,516,656 | ||
Gross unrealized depreciation | (2,307,042 | ) | ||
|
| |||
Net unrealized appreciation (depreciation) | $ | 2,209,614 | ||
Cost for federal income tax purposes | $ | 49,211,435 | ||
The accompanying Notes to Financial Statements are an integral part of this schedule.
156
Table of Contents
Partner All Cap Portfolio
Schedule of Investments as of June 29, 2012
(unaudited)
Fair Valuation Measurements
The following table is a summary of the inputs used, as of June 29, 2012, in valuing Partner All Cap Portfolio’s assets carried at fair value.
Investments in Securities | Total | Level 1 | Level 2 | Level 3 | ||||||||||||
Common Stock | ||||||||||||||||
Consumer Discretionary | 5,573,027 | 5,573,027 | — | — | ||||||||||||
Consumer Staples | 5,720,744 | 5,720,744 | — | — | ||||||||||||
Energy | 5,562,105 | 5,562,105 | — | — | ||||||||||||
Financials | 7,390,071 | 7,390,071 | — | — | ||||||||||||
Health Care | 5,992,342 | 5,992,342 | — | — | ||||||||||||
Industrials | 5,382,338 | 5,382,338 | — | — | ||||||||||||
Information Technology | 10,171,898 | 10,171,898 | — | — | ||||||||||||
Materials | 1,825,813 | 1,825,813 | — | — | ||||||||||||
Telecommunications Services | 1,600,321 | 1,600,321 | — | — | ||||||||||||
Utilities | 1,840,150 | 1,840,150 | — | — | ||||||||||||
Collateral Held for Securities Loaned | 362,240 | 362,240 | — | — | ||||||||||||
|
|
|
|
|
|
|
| |||||||||
Total | $ | 51,421,049 | $ | 51,421,049 | $ | — | $ | — | ||||||||
|
|
|
|
|
|
|
| |||||||||
There were no significant transfers between the Levels during the period ended June 29, 2012. Transfers between the levels are identified as of the end of the period.
Investment in Affiliates
Affiliated issuers, as defined under the Investment Company Act of 1940, include those in which the Portfolio’s holdings of an issuer represent 5% or more of the outstanding voting securities of an issuer, or any affiliated mutual fund.
A summary of transactions for the fiscal year to date, in Partner All Cap Portfolio, is as follows:
Portfolio | Value December 31, 2011 | Gross Purchases | Gross Sales | Shares Held at June 29, 2012 | Value June 29, 2012 | Income Earned January 1, 2012 - June 29, 2012 | ||||||||||||||||||
Thrivent Financial Securities Lending Trust | $ | — | $ | 1,979,665 | $ | 1,617,425 | 362,240 | $ | 362,240 | $ | 2,593 | |||||||||||||
Total Value and Income Earned | — | 362,240 | 2,593 | |||||||||||||||||||||
The accompanying Notes to Financial Statements are an integral part of this schedule.
157
Table of Contents
Schedule of Investments as of June 29, 2012
(unaudited)
| Shares | Common Stock (99.3%) | Value | ||||||
| Consumer Discretionary (16.2%) | ||||||||
| 1,654 | Amazon.com, Inc.a | $ | 377,691 | |||||
| 400 | AutoZone, Inc.a | 146,868 | ||||||
| 17,359 | Comcast Corporation | 554,967 | ||||||
| 5,300 | Home Depot, Inc. | 280,847 | ||||||
| 10,050 | Las Vegas Sands Corporation | 437,075 | ||||||
| 2,300 | NIKE, Inc. | 201,894 | ||||||
| 4,900 | Sally Beauty Holdings, Inc.a | 126,126 | ||||||
|
| |||||||
| Total | 2,125,468 | |||||||
|
| |||||||
| Consumer Staples (9.7%) | ||||||||
| 5,996 | Altria Group, Inc. | 207,162 | ||||||
| 4,707 | Anheuser-Busch InBev NV ADR | 374,913 | ||||||
| 2,017 | British American Tobacco plc ADR | 205,976 | ||||||
| 3,460 | Coca-Cola Company | 270,537 | ||||||
| 3,066 | Wal-Mart Stores, Inc. | 213,761 | ||||||
|
| |||||||
| Total | 1,272,349 | |||||||
|
| |||||||
| Energy (10.2%) | ||||||||
| 3,397 | Apache Corporation | 298,562 | ||||||
| 8,400 | Consol Energy, Inc. | 254,016 | ||||||
| 2,563 | Ensco plc | 120,384 | ||||||
| 1,800 | EOG Resources, Inc. | 162,198 | ||||||
| 8,400 | Valero Energy Corporation | 202,860 | ||||||
| 23,427 | Weatherford International, Ltd.a | 295,883 | ||||||
|
| |||||||
| Total | 1,333,903 | |||||||
|
| |||||||
| Financials (8.6%) | ||||||||
| 5,200 | Ameriprise Financial, Inc. | 271,752 | ||||||
| 4,377 | Citigroup, Inc. | 119,974 | ||||||
| 1,004 | CME Group, Inc. | 269,182 | ||||||
| 5,968 | J.P. Morgan Chase & Company | 213,237 | ||||||
| 7,605 | Wells Fargo & Company | 254,311 | ||||||
|
| |||||||
| Total | 1,128,456 | |||||||
|
| |||||||
| Health Care (12.5%) | ||||||||
| 3,281 | Amgen, Inc. | 239,644 | ||||||
| 5,529 | Baxter International, Inc. | 293,867 | ||||||
| 3,000 | Biogen Idec, Inc.a | 433,140 | ||||||
| 3,600 | Shire Pharmaceuticals Group plc ADR | 311,004 | ||||||
| 6,240 | UnitedHealth Group, Inc. | 365,040 | ||||||
|
| |||||||
| Total | 1,642,695 | |||||||
|
| |||||||
| Industrials (9.5%) | ||||||||
| 3,750 | Boeing Company | 278,625 | ||||||
| 6,200 | Dover Corporation | 332,382 | ||||||
| 4,830 | Parker Hannifin Corporation | 371,330 | ||||||
| 5,000 | Tyco International, Ltd. | 264,250 | ||||||
|
| |||||||
| Total | 1,246,587 | |||||||
|
| |||||||
| Information Technology (30.5%) | ||||||||
| 2,129 | Akamai Technologies, Inc.a | 67,596 | ||||||
| 2,251 | Apple, Inc.a | 1,314,584 | ||||||
| 4,406 | Cognizant Technology Solutions Corporationa | 264,360 | ||||||
| 5,804 | eBay, Inc.a | 243,826 | ||||||
| 887 | Google, Inc.a | 514,522 | ||||||
| 6,905 | Microsoft Corporation | 211,224 | ||||||
| 8,002 | NetApp, Inc.a | 254,623 | ||||||
| 12,174 | Oracle Corporation | 361,568 | ||||||
| 5,950 | QUALCOMM, Inc. | 331,296 | ||||||
| 1,700 | Teradata Corporationa | 122,417 | ||||||
| 10,800 | Texas Instruments, Inc. | 309,852 | ||||||
|
| |||||||
| Total | 3,995,868 | |||||||
|
| |||||||
| Materials (2.1%) | ||||||||
| 7,954 | Freeport-McMoRan Copper & Gold, Inc. | 270,993 | ||||||
|
| |||||||
| Total | 270,993 | |||||||
|
| |||||||
| Total Common Stock (cost $12,334,352) | 13,016,319 | |||||||
|
| |||||||
| Total Investments (cost $12,334,352) 99.3% | $ | 13,016,319 | ||||||
|
| |||||||
| Other Assets and Liabilities, Net 0.7% | 85,163 | |||||||
|
| |||||||
| Total Net Assets 100.0% | $ | 13,101,482 | ||||||
|
| |||||||
| a | Non-income producing security. |
Definitions:
ADR | - | American Depositary Receipt, which are certificates for an underlying foreign security’s shares held by an issuing U.S. depository bank. |
Unrealized Appreciation (Depreciation)
Gross unrealized appreciation and depreciation of investments, based on cost for federal income tax purposes, were as follows:
Gross unrealized appreciation | $ | 1,800,577 | ||
Gross unrealized depreciation | (1,118,208 | ) | ||
|
| |||
Net unrealized appreciation (depreciation) | $ | 682,369 | ||
Cost for federal income tax purposes | $ | 12,333,950 | ||
The accompanying Notes to Financial Statements are an integral part of this schedule.
158
Table of Contents
Large Cap Growth Portfolio II
Schedule of Investments as of June 29, 2012
(unaudited)
Fair Valuation Measurements
The following table is a summary of the inputs used, as of June 29, 2012, in valuing Large Cap Growth Portfolio II’s assets carried at fair value.
Investments in Securities | Total | Level 1 | Level 2 | Level 3 | ||||||||||||
Common Stock | ||||||||||||||||
Consumer Discretionary | 2,125,468 | 2,125,468 | — | — | ||||||||||||
Consumer Staples | 1,272,349 | 1,272,349 | — | — | ||||||||||||
Energy | 1,333,903 | 1,333,903 | — | — | ||||||||||||
Financials | 1,128,456 | 1,128,456 | — | — | ||||||||||||
Health Care | 1,642,695 | 1,642,695 | — | — | ||||||||||||
Industrials | 1,246,587 | 1,246,587 | — | — | ||||||||||||
Information Technology | 3,995,868 | 3,995,868 | — | — | ||||||||||||
Materials | 270,993 | 270,993 | — | — | ||||||||||||
|
|
|
|
|
|
|
| |||||||||
Total | $ | 13,016,319 | $ | 13,016,319 | $ | — | $ | — | ||||||||
|
|
|
|
|
|
|
| |||||||||
There were no significant transfers between the Levels during the period ended June 29, 2012. Transfers between the levels are identified as of the end of the period.
Investment in Affiliates
Affiliated issuers, as defined under the Investment Company Act of 1940, include those in which the Portfolio’s holdings of an issuer represent 5% or more of the outstanding voting securities of an issuer, or any affiliated mutual fund.
A summary of transactions for the fiscal year to date, in Large Cap Growth Portfolio II, is as follows:
Portfolio | Value December 31, 2011 | Gross Purchases | Gross Sales | Shares Held at June 29, 2012 | Value June 29, 2012 | Income Earned January 1, 2012 - June 29, 2012 | ||||||||||||||||||
Thrivent Financial Securities Lending Trust | $ | — | $ | 291,650 | $ | 291,650 | — | $ | — | $ | 333 | |||||||||||||
Total Value and Income Earned | — | — | 333 | |||||||||||||||||||||
The accompanying Notes to Financial Statements are an integral part of this schedule.
159
Table of Contents
Schedule of Investments as of June 29, 2012
(unaudited)
| Shares | Common Stock (96.0%) | Value | ||||||
| Consumer Discretionary (15.8%) | ||||||||
| 102,500 | Amazon.com, Inc.a | $ | 23,405,875 | |||||
| 25,300 | AutoZone, Inc.a | 9,289,401 | ||||||
| 748,000 | Comcast Corporation | 23,913,560 | ||||||
| 547,100 | Home Depot, Inc. | 28,990,829 | ||||||
| 597,500 | Las Vegas Sands Corporation | 25,985,275 | ||||||
| 151,500 | NIKE, Inc. | 13,298,670 | ||||||
| 313,300 | Sally Beauty Holdings, Inc.a | 8,064,342 | ||||||
|
| |||||||
| Total | 132,947,952 | |||||||
|
| |||||||
| Consumer Staples (11.9%) | ||||||||
| 813,100 | Altria Group, Inc. | 28,092,605 | ||||||
| 119,081 | Anheuser-Busch InBev NV ADR | 9,484,802 | ||||||
| 87,458 | British American Tobacco plc ADR | 8,931,211 | ||||||
| 392,996 | Coca-Cola Company | 30,728,357 | ||||||
| 322,400 | Wal-Mart Stores, Inc. | 22,477,728 | ||||||
|
| |||||||
| Total | 99,714,703 | |||||||
|
| |||||||
| Energy (7.4%) | ||||||||
| 109,908 | Apache Corporation | 9,659,814 | ||||||
| 268,500 | Consol Energy, Inc. | 8,119,440 | ||||||
| 310,846 | Ensco plc | 14,600,437 | ||||||
| 132,400 | EOG Resources, Inc. | 11,930,564 | ||||||
| 313,800 | Valero Energy Corporation | 7,578,270 | ||||||
| 836,500 | Weatherford International, Ltd.a | 10,564,995 | ||||||
|
| |||||||
| Total | 62,453,520 | |||||||
|
| |||||||
| Financials (6.6%) | ||||||||
| 221,500 | Ameriprise Financial, Inc. | 11,575,590 | ||||||
| 252,500 | Citigroup, Inc. | 6,921,025 | ||||||
| 40,900 | CME Group, Inc. | 10,965,699 | ||||||
| 215,371 | J.P. Morgan Chase & Company | 7,695,206 | ||||||
| 547,100 | Wells Fargo & Company | 18,295,024 | ||||||
|
| |||||||
| Total | 55,452,544 | |||||||
|
| |||||||
| Health Care (10.8%) | ||||||||
| 272,183 | Amgen, Inc. | 19,880,246 | ||||||
| 254,100 | Baxter International, Inc. | 13,505,415 | ||||||
| 151,800 | Biogen Idec, Inc.a | 21,916,884 | ||||||
| 169,400 | Shire Pharmaceuticals Group plc ADR | 14,634,466 | ||||||
| 357,600 | UnitedHealth Group, Inc. | 20,919,600 | ||||||
|
| |||||||
| Total | 90,856,611 | |||||||
|
| |||||||
| Industrials (9.8%) | ||||||||
| 344,900 | Boeing Company | 25,626,070 | ||||||
| 374,000 | Dover Corporation | 20,050,140 | ||||||
| 226,000 | Parker Hannifin Corporation | 17,374,880 | ||||||
| 357,300 | Tyco International, Ltd. | 18,883,305 | ||||||
|
| |||||||
| Total | 81,934,395 | |||||||
|
| |||||||
| Information Technology (31.8%) | ||||||||
| 242,228 | Akamai Technologies, Inc.a | 7,690,739 | ||||||
| 142,800 | Apple, Inc.a | 83,395,200 | ||||||
| 352,602 | Cognizant Technology Solutions Corporationa | 21,156,120 | ||||||
| 422,500 | eBay, Inc.a | 17,749,225 | ||||||
| 52,152 | Google, Inc.a | 30,251,810 | ||||||
| 619,700 | Microsoft Corporation | 18,956,623 | ||||||
| 223,000 | NetApp, Inc.a | 7,095,860 | ||||||
| 892,350 | Oracle Corporation | 26,502,795 | ||||||
| 483,300 | QUALCOMM, Inc. | 26,910,144 | ||||||
| 155,500 | Teradata Corporationa | 11,197,555 | ||||||
| 567,800 | Texas Instruments, Inc. | 16,290,182 | ||||||
|
| |||||||
| Total | 267,196,253 | |||||||
|
| |||||||
| Materials (1.9%) | ||||||||
| 468,300 | Freeport-McMoRan Copper & Gold, Inc. | 15,954,981 | ||||||
|
| |||||||
| Total | 15,954,981 | |||||||
|
| |||||||
Total Common Stock (cost $751,071,751) | 806,510,959 | |||||||
|
| |||||||
| Principal Amount | Short-Term Investments (3.9%)b | Value | ||||||
Federal Home Loan Bank Discount Notes | ||||||||
| 15,000,000 | 0.077%, 7/11/2012c | 14,999,649 | ||||||
| 10,000,000 | 0.070%, 7/20/2012c | 9,999,611 | ||||||
| 5,000,000 | 0.060%, 7/27/2012c | 4,999,775 | ||||||
| 3,000,000 | 0.100%, 8/17/2012c | 2,999,600 | ||||||
|
| |||||||
| Total Short-Term Investments (at amortized cost) | 32,998,635 | |||||||
|
| |||||||
Total Investments (cost $784,070,386) 99.9% | $ | 839,509,594 | ||||||
|
| |||||||
| Other Assets and Liabilities, Net 0.1% | 1,234,166 | |||||||
|
| |||||||
| Total Net Assets 100.0% | $ | 840,743,760 | ||||||
|
| |||||||
| a | Non-income producing security. |
| b | The interest rate shown reflects the yield, coupon rate or the discount rate at the date of purchase. |
| c | Denotes investments that benefit from credit enhancement or liquidity support provided by a third party bank, institution or government. |
Definitions:
ADR | - | American Depositary Receipt, which are certificates for an underlying foreign security’s shares held by an issuing U.S. depository bank. |
Unrealized Appreciation (Depreciation)
Gross unrealized appreciation and depreciation of investments, based on cost for federal income tax purposes, were as follows:
Gross unrealized appreciation | $ | 104,141,822 | ||
Gross unrealized depreciation | (50,671,006 | ) | ||
|
| |||
Net unrealized appreciation (depreciation) | $ | 53,470,816 | ||
Cost for federal income tax purposes | $ | 786,038,778 | ||
The accompanying Notes to Financial Statements are an integral part of this schedule.
160
Table of Contents
Large Cap Growth Portfolio
Schedule of Investments as of June 29, 2012
(unaudited)
Fair Valuation Measurements
The following table is a summary of the inputs used, as of June 29, 2012, in valuing Large Cap Growth Portfolio’s assets carried at fair value.
Investments in Securities | Total | Level 1 | Level 2 | Level 3 | ||||||||||||
Common Stock | ||||||||||||||||
Consumer Discretionary | 132,947,952 | 132,947,952 | — | — | ||||||||||||
Consumer Staples | 99,714,703 | 99,714,703 | — | — | ||||||||||||
Energy | 62,453,520 | 62,453,520 | — | — | ||||||||||||
Financials | 55,452,544 | 55,452,544 | — | — | ||||||||||||
Health Care | 90,856,611 | 90,856,611 | — | — | ||||||||||||
Industrials | 81,934,395 | 81,934,395 | — | — | ||||||||||||
Information Technology | 267,196,253 | 267,196,253 | — | — | ||||||||||||
Materials | 15,954,981 | 15,954,981 | — | — | ||||||||||||
Short-Term Investments | 32,998,635 | — | 32,998,635 | — | ||||||||||||
|
|
|
|
|
|
|
| |||||||||
Total | $ | 839,509,594 | $ | 806,510,959 | $ | 32,998,635 | $ | — | ||||||||
|
|
|
|
|
|
|
| |||||||||
There were no significant transfers between the Levels during the period ended June 29, 2012. Transfers between the levels are identified as of the end of the period.
Investment in Affiliates
Affiliated issuers, as defined under the Investment Company Act of 1940, include those in which the Portfolio’s holdings of an issuer represent 5% or more of the outstanding voting securities of an issuer, or any affiliated mutual fund.
A summary of transactions for the fiscal year to date, in Large Cap Growth Portfolio, is as follows:
Portfolio | Value December 31, 2011 | Gross Purchases | Gross Sales | Shares Held at June 29, 2012 | Value June 29, 2012 | Income Earned January 1, 2012 - June 29, 2012 | ||||||||||||||||||
Thrivent Financial Securities | $ | — | $ | 115,828,650 | $ | 115,828,650 | — | $ | — | $ | 14,570 | |||||||||||||
Total Value and Income Earned | — | — | 14,570 | |||||||||||||||||||||
The accompanying Notes to Financial Statements are an integral part of this schedule.
161
Table of Contents
Partner Growth Stock Portfolio
Schedule of Investments as of June 29, 2012
(unaudited)
| Shares | Common Stock (95.8%) | Value | ||||||
| Consumer Discretionary (21.7%) | ||||||||
| 8,600 | Amazon.com, Inc.a | $ | 1,963,810 | |||||
| 1,100 | AutoZone, Inc.a | 403,887 | ||||||
| 10,600 | CarMax, Inc.a | 274,964 | ||||||
| 6,724 | Carnival plc | 229,900 | ||||||
| 1,400 | Chipotle Mexican Grill, Inc.a | 531,930 | ||||||
| 2,000 | Coach, Inc. | 116,960 | ||||||
| 8,800 | D.R. Horton, Inc. | 161,744 | ||||||
| 3,000 | Dollar Tree, Inc.a | 161,400 | ||||||
| 2,400 | Fossil, Inc.a | 183,696 | ||||||
| 14,200 | Groupon, Inc.a,b | 150,946 | ||||||
| 4,400 | Harley-Davidson, Inc. | 201,212 | ||||||
| 8,000 | Home Depot, Inc. | 423,920 | ||||||
| 9,700 | Las Vegas Sands Corporation | 421,853 | ||||||
| 5,200 | Lennar Corporationb | 160,732 | ||||||
| 10,633 | Marriott International, Inc. | 416,813 | ||||||
| 10,700 | MGM Resorts Internationala | 119,412 | ||||||
| 6,300 | NIKE, Inc. | 553,014 | ||||||
| 200 | NVR, Inc.a | 170,000 | ||||||
| 30,600 | Prada Holding SPA | 206,484 | ||||||
| 2,600 | Priceline.com, Inc.a | 1,727,752 | ||||||
| 1,500 | Ralph Lauren Corporation | 210,090 | ||||||
| 5,100 | Ross Stores, Inc. | 318,597 | ||||||
| 3,900 | Sherwin-Williams Company | 516,165 | ||||||
| 21,000 | Starbucks Corporation | 1,119,720 | ||||||
| 7,000 | Starwood Hotels & Resorts Worldwide, Inc. | 371,280 | ||||||
| 1,100 | Tractor Supply Company | 91,366 | ||||||
| 10,300 | Walt Disney Company | 499,550 | ||||||
| 5,700 | Yum! Brands, Inc. | 367,194 | ||||||
|
| |||||||
| Total | 12,074,391 | |||||||
|
| |||||||
| Consumer Staples (2.5%) | ||||||||
| 4,700 | Costco Wholesale Corporation | 446,500 | ||||||
| 9,900 | CVS Caremark Corporation | 462,627 | ||||||
| 3,800 | Monster Beverage Corporationa | 270,560 | ||||||
| 2,200 | Whole Foods Market, Inc. | 209,704 | ||||||
|
| |||||||
| Total | 1,389,391 | |||||||
|
| |||||||
| Energy (3.6%) | ||||||||
| 3,900 | EOG Resources, Inc. | 351,429 | ||||||
| 8,200 | FMC Technologies, Inc.a | 321,686 | ||||||
| 4,000 | Occidental Petroleum Corporation | 343,080 | ||||||
| 3,400 | Range Resources Corporation | 210,358 | ||||||
| 6,500 | Schlumberger, Ltd. | 421,915 | ||||||
| 11,200 | Williams Companies, Inc. | 322,784 | ||||||
|
| |||||||
| Total | 1,971,252 | |||||||
|
| |||||||
| Financials (6.0%) | ||||||||
| 13,100 | American Express Company | 762,551 | ||||||
| 17,600 | American Tower Corporation | 1,230,416 | ||||||
| 4,300 | Franklin Resources, Inc. | 477,257 | ||||||
| 1,900 | IntercontinentalExchange, Inc.a | 258,362 | ||||||
| 17,000 | Invesco, Ltd. | 384,200 | ||||||
| 6,800 | U.S. Bancorp | 218,688 | ||||||
|
| |||||||
| Total | 3,331,474 | |||||||
|
| |||||||
| Health Care (8.8%) | ||||||||
| 4,000 | Alexion Pharmaceuticals, Inc.a | 397,200 | ||||||
| 2,500 | Allergan, Inc. | 231,425 | ||||||
| 2,600 | Baxter International, Inc. | 138,190 | ||||||
| 2,900 | Biogen Idec, Inc.a | 418,702 | ||||||
| 1,500 | Catalyst Health Solutions, Inc.a | 140,160 | ||||||
| 2,900 | Celgene Corporationa | 186,064 | ||||||
| 1,200 | Covidien plc | 64,200 | ||||||
| 3,300 | Edwards Lifesciences Corporationa | 340,890 | ||||||
| 8,400 | Express Scripts Holding Companya | 468,972 | ||||||
| 6,000 | Gilead Sciences, Inc.a | 307,680 | ||||||
| 1,500 | Human Genome Sciences, Inc.a | 19,695 | ||||||
| 6,900 | McKesson Corporation | 646,875 | ||||||
| 982 | Novo Nordisk AS | 142,426 | ||||||
| 1,300 | Regeneron Pharmaceuticals, Inc.a | 148,486 | ||||||
| 5,600 | Stryker Corporation | 308,560 | ||||||
| 1,900 | SXC Health Solutions Corporationa | 188,499 | ||||||
| 6,500 | UnitedHealth Group, Inc. | 380,250 | ||||||
| 5,400 | Valeant Pharmaceuticals International, Inc.a | 241,866 | ||||||
| 2,500 | Vertex Pharmaceuticals, Inc.a | 139,800 | ||||||
|
| |||||||
| Total | 4,909,940 | |||||||
|
| |||||||
| Industrials (12.7%) | ||||||||
| 4,900 | Babcock & Wilcox Companya | 120,050 | ||||||
| 5,200 | Boeing Company | 386,360 | ||||||
| 29,700 | Danaher Corporation | 1,546,776 | ||||||
| 2,600 | Deere & Company | 210,262 | ||||||
| 16,300 | Fastenal Company | 657,053 | ||||||
| 6,300 | FedEx Corporation | 577,143 | ||||||
| 2,500 | IHS, Inc.a | 269,325 | ||||||
| 4,800 | JB Hunt Transport Services, Inc. | 286,080 | ||||||
| 4,800 | Kansas City Southern | 333,888 | ||||||
| 5,500 | Precision Castparts Corporation | 904,695 | ||||||
| 2,800 | Roper Industries, Inc. | 276,024 | ||||||
| 4,900 | Union Pacific Corporation | 584,619 | ||||||
| 5,500 | United Continental Holdings, Inc.a | 133,815 | ||||||
| 7,500 | United Parcel Service, Inc. | 590,700 | ||||||
| 1,000 | W.W. Grainger, Inc. | 191,240 | ||||||
|
| |||||||
| Total | 7,068,030 | |||||||
|
| |||||||
| Information Technology (35.5%) | ||||||||
| 9,800 | Accenture plc | 588,882 | ||||||
| 7,900 | Akamai Technologies, Inc.a | 250,825 | ||||||
| 10,900 | Apple, Inc.a | 6,365,600 | ||||||
| 6,200 | Autodesk, Inc.a | 216,938 | ||||||
| 6,700 | Baidu.com, Inc. ADRa | 770,366 | ||||||
| 11,900 | Broadcom Corporationa | 402,220 | ||||||
| 4,000 | Check Point Software Technologies, Ltd.a | 198,360 | ||||||
| 20,400 | eBay, Inc.a | 857,004 | ||||||
| 16,500 | EMC Corporationa | 422,895 | ||||||
| 5,217 | Facebook, Inc., Class Aa,c,d | 154,235 | ||||||
| 9,948 | Facebook, Inc., Class Ba,c,d | 294,103 | ||||||
| 3,650 | Google, Inc.a | 2,117,256 | ||||||
| 5,800 | Informatica Corporationa | 245,688 | ||||||
| 27,700 | Juniper Networks, Inc.a | 451,787 | ||||||
| 3,400 | LinkedIn Corporationa,b | 361,318 | ||||||
| 3,750 | MasterCard, Inc. | 1,612,912 | ||||||
| 11,800 | Nuance Communications, Inc.a | 281,076 | ||||||
| 25,000 | QUALCOMM, Inc. | 1,392,000 | ||||||
| 6,400 | Red Hat, Inc.a | 361,472 | ||||||
| 2,200 | Salesforce.com, Inc.a | 304,172 | ||||||
The accompanying Notes to Financial Statements are an integral part of this schedule.
162
Table of Contents
Partner Growth Stock Portfolio
Schedule of Investments as of June 29, 2012
(unaudited)
| Shares | Common Stock (95.8%) | Value | ||||||
| Information Technology (35.5%) - continued | ||||||||
| 16,700 | Tencent Holdings, Ltd. | $ | 493,169 | |||||
| 4,200 | Teradata Corporationa | 302,442 | ||||||
| 5,200 | Trimble Navigation, Ltd.a | 239,252 | ||||||
| 2,380 | Twitter, Inc.a,c,d | 38,080 | ||||||
| 8,300 | Visa, Inc. | 1,026,129 | ||||||
|
| |||||||
| Total | 19,748,181 | |||||||
|
| |||||||
| Materials (2.3%) | ||||||||
| 1,900 | Ecolab, Inc. | 130,207 | ||||||
| 10,700 | Praxair, Inc. | 1,163,411 | ||||||
|
| |||||||
| Total | 1,293,618 | |||||||
|
| |||||||
| Telecommunications Services (2.7%) | ||||||||
| 25,100 | Crown Castle International | |||||||
| Corporationa | 1,472,366 | |||||||
|
| |||||||
| Total | 1,472,366 | |||||||
|
| |||||||
| Total Common Stock (cost $33,354,522) | 53,258,643 | |||||||
|
| |||||||
Preferred Stock (0.2%) | ||||||||
| Information Technology (0.2%) | ||||||||
| 4,432 | LivingSocial.com Convertiblea,c,d | 23,614 | ||||||
| 6 | Twitter, Inc., Convertible, Series Aa,c,d | 96 | ||||||
| 96 | Twitter, Inc., Convertible, Series Ba,c,d | 1,536 | ||||||
| 1,615 | Twitter, Inc., Convertible, Series B, Restricteda,c,d | 25,840 | ||||||
| 25 | Twitter, Inc., Convertible, Series Ca,c,d | 400 | ||||||
| 438 | Twitter, Inc., Convertible, Series C, Restricteda,c,d | 7,008 | ||||||
| 913 | Twitter, Inc., Convertible, Series Da,c,d | 14,608 | ||||||
| 292 | Twitter, Inc., Convertible, Series Fa,c,d | 4,672 | ||||||
| 3,855 | Twitter, Inc., Convertible, Series G-2a,c,d | 61,680 | ||||||
|
| |||||||
| Total | 139,454 | |||||||
|
| |||||||
| Total Preferred Stock (cost $150,380) | 139,454 | |||||||
|
| |||||||
Collateral Held for Securities Loaned (0.8%) | ||||||||
| 421,880 | Thrivent Financial Securities Lending Trust | 421,880 | ||||||
|
| |||||||
| Total Collateral Held for Securities Loaned (cost $421,880) | 421,880 | |||||||
|
| |||||||
| Total Investments (cost $33,926,782) 96.8% | $ | 53,819,977 | ||||||
|
| |||||||
| Other Assets and Liabilities, Net 3.2% | 1,761,220 | |||||||
|
| |||||||
| Total Net Assets 100.0% | $ | 55,581,197 | ||||||
|
| |||||||
| a | Non-income producing security. |
| b | All or a portion of the security is on loan. |
| c | Denotes restricted securities. Restricted securities are investment securities which have been deemed illiquid and cannot be offered for public sale without first being registered under the Securities Act of 1933. The following table indicates the acquisition date and cost of restricted securities Partner Growth Stock Portfolio owned as of June 29, 2012. |
Security | Acquisition Date | Cost | ||||||
Facebook, Inc., Class A | 8/12/2011 | $ | 157,818 | |||||
Facebook, Inc., Class B | 3/31/2011 | $ | 248,758 | |||||
LivingSocial.com Convertible | 11/18/2011 | $ | 34,082 | |||||
Twitter, Inc. | 9/13/2011 | $ | 38,303 | |||||
Twitter, Inc., Convertible, Series A | 9/13/2011 | $ | 97 | |||||
Twitter, Inc., Convertible, Series B | 9/13/2011 | $ | 1,545 | |||||
Twitter, Inc., Convertible, Series B, Restricted | 3/30/2012 | $ | 25,840 | |||||
Twitter, Inc., Convertible, Series C | 9/13/2011 | $ | 402 | |||||
Twitter, Inc., Convertible, Series C, Restricted | 3/30/2012 | $ | 7,008 | |||||
Twitter, Inc., Convertible, Series D | 9/13/2011 | $ | 14,693 | |||||
Twitter, Inc., Convertible, Series F | 3/30/2012 | $ | 4,672 | |||||
Twitter, Inc., Convertible, Series G-2 | 7/28/2011 | $ | 62,041 | |||||
| d | Security is fair valued. |
Definitions:
ADR | - | American Depositary Receipt, which are certificates for an underlying foreign security’s shares held by an issuing U.S. depository bank. |
Unrealized Appreciation (Depreciation)
Gross unrealized appreciation and depreciation of investments, based on cost for federal income tax purposes, were as follows:
Gross unrealized appreciation | $ | 20,441,852 | ||
Gross unrealized depreciation | (668,554 | ) | ||
|
| |||
Net unrealized appreciation (depreciation) | $ | 19,773,298 | ||
Cost for federal income tax purposes | $ | 34,046,679 |
The accompanying Notes to Financial Statements are an integral part of this schedule.
163
Table of Contents
Partner Growth Stock Portfolio
Schedule of Investments as of June 29, 2012
(unaudited)
Fair Valuation Measurements
The following table is a summary of the inputs used, as of June 29, 2012, in valuing Partner Growth Stock Portfolio's assets carried at fair value.
Investments in Securities | Total | Level 1 | Level 2 | Level 3 | ||||||||||||
Common Stock | ||||||||||||||||
Consumer Discretionary | 12,074,391 | 11,638,007 | 436,384 | — | ||||||||||||
Consumer Staples | 1,389,391 | 1,389,391 | — | — | ||||||||||||
Energy | 1,971,252 | 1,971,252 | — | — | ||||||||||||
Financials | 3,331,474 | 3,331,474 | — | — | ||||||||||||
Health Care | 4,909,940 | 4,767,514 | 142,426 | — | ||||||||||||
Industrials | 7,068,030 | 7,068,030 | — | — | ||||||||||||
Information Technology | 19,748,181 | 18,768,594 | 493,169 | 486,418 | ||||||||||||
Materials | 1,293,618 | 1,293,618 | — | — | ||||||||||||
Telecommunications Services | 1,472,366 | 1,472,366 | — | — | ||||||||||||
Preferred Stock | ||||||||||||||||
Information Technology | 139,454 | — | — | 139,454 | ||||||||||||
Collateral Held for Securities Loaned | 421,880 | 421,880 | — | — | ||||||||||||
|
|
|
|
|
|
|
| |||||||||
Total | $ | 53,819,977 | $ | 52,122,126 | $ | 1,071,979 | $ | 625,872 | ||||||||
|
|
|
|
|
|
|
| |||||||||
The significant unobservable inputs used in the fair value measurement of the reporting entity’s Common Stock Information Technology Level 3 securities are market activity, private-market activity, and illiquidity. A significant increase or decrease in any of the inputs in isolation would result in a significantly lower or higher fair value measurement.
The significant unobservable inputs used in the fair value measurement of the reporting entity’s Preferred Stock Information Technology Level 3 securities are market activity, private-market activity, rate of growth, and cash flow. A significant increase or decrease in any of the inputs in isolation would result in a significantly lower or higher fair value measurement.
There were no significant transfers between the Levels during the period ended June 29, 2012. Transfers between the levels are identified as of the end of the period.
The following table summarizes the net realized gains/(losses) and Statement of Operations location, for the period ended June 29, 2012, for Partner Growth Stock Portfolio's investments in financial derivative instruments by primary risk exposure.
Derivatives by risk category | Statement of Operations Location | Realized Gains/(Losses) recognized in Income | ||||
Foreign Exchange Contracts | ||||||
Forward Contracts | Net realized gains/(losses) on Foreign currency transactions | 259 | ||||
Total Foreign Exchange Contracts | 259 | |||||
|
| |||||
Total | $ | 259 | ||||
|
| |||||
The following table presents Partner Growth Stock Portfolio's average volume of derivative activity during the period ended June 29, 2012.
Derivative Risk Category | Forwards (Notional*) | Forwards (Percentage of Average Net Assets) | ||||||
Foreign Exchange Contracts | $ | 8,780 | <0.1 | % | ||||
| * | Notional amount represents long or short, or both, derivative positions held by the Portfolio. |
The accompanying Notes to Financial Statements are an integral part of this schedule.
164
Table of Contents
Partner Growth Stock Portfolio
Schedule of Investments as of June 29, 2012
(unaudited)
Investment in Affiliates
Affiliated issuers, as defined under the Investment Company Act of 1940, include those in which the Portfolio's holdings of an issuer represent 5% or more of the outstanding voting securities of an issuer, or any affiliated mutual fund.
A summary of transactions for the fiscal year to date, in Partner Growth Stock Portfolio, is as follows:
Portfolio | Value December 31, 2011 | Gross Purchases | Gross Sales | Shares Held at June 29, 2012 | Value June 29, 2012 | Income Earned January 1, 2012 - June 29, 2012 | ||||||||||||||||||
Thrivent Financial Securities Lending Trust | $ | 1,659,825 | $ | 4,383,722 | $ | 5,621,667 | 421,880 | $ | 421,880 | $ | 27,805 | |||||||||||||
Total Value and Income Earned | 1,659,825 | 421,880 | 27,805 | |||||||||||||||||||||
The accompanying Notes to Financial Statements are an integral part of this schedule.
165
Table of Contents
Schedule of Investments as of June 29, 2012
(unaudited)
| Shares | Common Stock (97.2%) | Value | ||||||
| Consumer Discretionary (9.1%) | |||||||
| 115,007 | Carnival Corporation | $ | 3,941,290 | |||||
| 154,130 | CBS Corporation | 5,052,381 | ||||||
| 403,650 | Delphi Automotive plca | 10,293,075 | ||||||
| 76,290 | Harley-Davidson, Inc. | 3,488,742 | ||||||
| 529,540 | Lowe's Companies, Inc. | 15,060,118 | ||||||
| 822,900 | News Corporation | 18,531,708 | ||||||
| 101,700 | Omnicom Group, Inc. | 4,942,620 | ||||||
| 127,710 | Time Warner Cable, Inc. | 10,484,991 | ||||||
|
| |||||||
| Total | 71,794,925 | |||||||
|
| |||||||
| Consumer Staples (10.2%) | |||||||
| 397,750 | Archer-Daniels-Midland Company | 11,741,580 | ||||||
| 205,610 | CVS Caremark Corporation | 9,608,155 | ||||||
| 140,640 | Diageo plc ADR | 14,495,765 | ||||||
| 101,340 | Kimberly-Clark Corporation | 8,489,252 | ||||||
| 563,232 | Kraft Foods, Inc. | 21,752,020 | ||||||
| 113,809 | Philip Morris International, Inc. | 9,930,973 | ||||||
| 121,400 | Unilever NV ADRb | 4,048,690 | ||||||
|
| |||||||
| Total | 80,066,435 | |||||||
|
| |||||||
| Energy (10.7%) | |||||||
| 294,220 | BP plc ADR | 11,927,679 | ||||||
| 132,395 | Chevron Corporation | 13,967,673 | ||||||
| 146,872 | ConocoPhillips | 8,207,207 | ||||||
| 163,609 | EOG Resources, Inc. | 14,742,807 | ||||||
| 240,670 | EQT Corporation | 12,907,132 | ||||||
| 145,630 | Occidental Petroleum Corporation | 12,490,685 | ||||||
| 87,450 | Schlumberger, Ltd. | 5,676,379 | ||||||
| 196,520 | Valero Energy Corporation | 4,745,958 | ||||||
|
| |||||||
| Total | 84,665,520 | |||||||
|
| |||||||
| Financials (21.9%) | |||||||
| 166,230 | ACE, Ltd. | 12,322,630 | ||||||
| 636,990 | Bank of America Corporation | 5,210,578 | ||||||
| 113,410 | Capital One Financial Corporation | 6,198,991 | ||||||
| 623,350 | Charles Schwab Corporation | 8,059,915 | ||||||
| 272,380 | Citigroup, Inc. | 7,465,936 | ||||||
| 610,096 | J.P. Morgan Chase & Company | 21,798,730 | ||||||
| 747,940 | KKR & Company, LP | 9,640,947 | ||||||
| 119,258 | Marsh & McLennan Companies, Inc. | 3,843,685 | ||||||
| 556,930 | MetLife, Inc. | 17,181,290 | ||||||
| 375,270 | Progressive Corporation | 7,816,874 | ||||||
| 77,032 | S&P 500 Large Index Depository Receipts | 10,497,151 | ||||||
| 408,840 | State Street Corporation | 18,250,618 | ||||||
| 650,520 | SunTrust Banks, Inc. | 15,762,100 | ||||||
| 134,899 | SVB Financial Groupa | 7,921,269 | ||||||
| 610,670 | Wells Fargo & Company | 20,420,805 | ||||||
|
| |||||||
| Total | 172,391,519 | |||||||
|
| |||||||
| Health Care (17.1%) | |||||||
| 235,090 | Baxter International, Inc. | 12,495,034 | ||||||
| 287,740 | Covidien plc | 15,394,090 | ||||||
| 397,215 | Johnson & Johnson | 26,835,845 | ||||||
| 545,360 | Merck & Company, Inc. | 22,768,780 | ||||||
| 1,109,925 | Pfizer, Inc. | 25,528,275 | ||||||
| 392,680 | Sanofi ADR | 14,835,450 | ||||||
| 280,417 | UnitedHealth Group, Inc. | 16,404,395 | ||||||
|
| |||||||
| Total | 134,261,869 | |||||||
|
| |||||||
| Industrials (10.1%) | |||||||
| 85,740 | FedEx Corporation | 7,854,641 | ||||||
| 400,640 | General Electric Company | 8,349,338 | ||||||
| 186,930 | Honeywell International, Inc. | 10,438,171 | ||||||
| 369,180 | Jacobs Engineering Group, Inc.a | 13,977,155 | ||||||
| 112,110 | Norfolk Southern Corporation | 8,046,135 | ||||||
| 128,340 | Parker Hannifin Corporation | 9,866,779 | ||||||
| 82,070 | SPX Corporation | 5,360,812 | ||||||
| 211,064 | United Technologies Corporation | 15,941,664 | ||||||
|
| |||||||
| Total | 79,834,695 | |||||||
|
| |||||||
| Information Technology (10.4%) | |||||||
| 460,850 | Microsoft Corporation | 14,097,401 | ||||||
| 331,190 | NetApp, Inc.a | 10,538,466 | ||||||
| 991,260 | Oracle Corporation | 29,440,422 | ||||||
| 620,310 | Texas Instruments, Inc. | 17,796,694 | ||||||
| 291,500 | Xilinx, Inc. | 9,785,655 | ||||||
|
| |||||||
| Total | 81,658,638 | |||||||
|
| |||||||
| Materials (1.6%) | |||||||
| 106,390 | LyondellBasell Industries NV | 4,284,325 | ||||||
| 110,204 | Sigma-Aldrich Corporation | 8,147,382 | ||||||
|
| |||||||
| Total | 12,431,707 | |||||||
|
| |||||||
| Telecommunications Services (2.3%) | |||||||
| 407,714 | Verizon Communications, Inc. | 18,118,810 | ||||||
|
| |||||||
| Total | 18,118,810 | |||||||
|
| |||||||
| Utilities (3.8%) | |||||||
| 648,900 | NiSource, Inc. | 16,060,275 | ||||||
| 371,700 | Utilities Select Sector SPDR Fund | 13,749,183 | ||||||
|
| |||||||
| Total | 29,809,458 | |||||||
|
| |||||||
| Total Common Stock (cost $711,653,047) | 765,033,576 | |||||||
|
| |||||||
Collateral Held for Securities Loaned (0.3%) | ||||||||
| 2,112,000 | Thrivent Financial Securities Lending Trust | 2,112,000 | ||||||
|
| |||||||
| Total Collateral Held for Securities Loaned (cost $2,112,000) | 2,112,000 | |||||||
|
| |||||||
The accompanying Notes to Financial Statements are an integral part of this schedule.
166
Table of Contents
Large Cap Value Portfolio
Schedule of Investments as of June 29, 2012
(unaudited)
| Principal Amount | Short-Term Investments (1.9%)c | Value | ||||||
| Federal Home Loan Bank Discount Notes | ||||||||
| 5,000,000 | 0.080%, 7/11/2012d | $ | 4,999,878 | |||||
| 1,000,000 | 0.090%, 7/13/2012d | 999,967 | ||||||
| 5,000,000 | 0.060%, 7/27/2012d | 4,999,775 | ||||||
| 4,000,000 | 0.100%, 8/17/2012d | 3,999,467 | ||||||
|
| |||||||
| Total Short-Term Investments (at amortized cost) | 14,999,087 | |||||||
|
| |||||||
| Total Investments (cost $728,764,134) 99.4% | $ | 782,144,663 | ||||||
|
| |||||||
| Other Assets and Liabilities, Net 0.6% | 4,456,187 | |||||||
|
| |||||||
| Total Net Assets 100.0% | $ | 786,600,850 | ||||||
|
| |||||||
| a | Non-income producing security. |
| b | All or a portion of the security is on loan. |
| c | The interest rate shown reflects the yield, coupon rate or the discount rate at the date of purchase. |
| d | Denotes investments that benefit from credit enhancement or liquidity support provided by a third party bank, institution or government. |
Definitions:
ADR | - | American Depositary Receipt, which are certificates for an underlying foreign security’s shares held by an issuing U.S. depository bank. |
Unrealized Appreciation (Depreciation)
Gross unrealized appreciation and depreciation of investments, based on cost for federal income tax purposes, were as follows:
Gross unrealized appreciation | $ | 74,699,224 | ||
Gross unrealized depreciation | (22,964,261 | ) | ||
|
| |||
Net unrealized appreciation (depreciation) | $ | 51,734,963 | ||
Cost for federal income tax purposes | $ | 730,409,700 | ||
Fair Valuation Measurements
The following table is a summary of the inputs used, as of June 29, 2012, in valuing Large Cap Value Portfolio’s assets carried at fair value.
Investments in Securities | Total | Level 1 | Level 2 | Level 3 | ||||||||||||
Common Stock | ||||||||||||||||
Consumer Discretionary | 71,794,925 | 71,794,925 | — | — | ||||||||||||
Consumer Staples | 80,066,435 | 80,066,435 | — | — | ||||||||||||
Energy | 84,665,520 | 84,665,520 | — | — | ||||||||||||
Financials | 172,391,519 | 172,391,519 | — | — | ||||||||||||
Health Care | 134,261,869 | 134,261,869 | — | — | ||||||||||||
Industrials | 79,834,695 | 79,834,695 | — | — | ||||||||||||
Information Technology | 81,658,638 | 81,658,638 | — | — | ||||||||||||
Materials | 12,431,707 | 12,431,707 | — | — | ||||||||||||
Telecommunications Services | 18,118,810 | 18,118,810 | — | — | ||||||||||||
Utilities | 29,809,458 | 29,809,458 | — | — | ||||||||||||
Collateral Held for Securities Loaned | 2,112,000 | 2,112,000 | — | — | ||||||||||||
Short-Term Investments | 14,999,087 | — | 14,999,087 | — | ||||||||||||
|
|
|
|
|
|
|
| |||||||||
Total | $ | 782,144,663 | $ | 767,145,576 | $ | 14,999,087 | $ | — | ||||||||
|
|
|
|
|
|
|
| |||||||||
There were no significant transfers between the Levels during the period ended June 29, 2012. Transfers between the levels are identified as of the end of the period.
Investment in Affiliates
Affiliated issuers, as defined under the Investment Company Act of 1940, include those in which the Portfolio’s holdings of an issuer represent 5% or more of the outstanding voting securities of an issuer, or any affiliated mutual fund.
A summary of transactions for the fiscal year to date, in Large Cap Value Portfolio, is as follows:
Portfolio | Value December 31, 2011 | Gross Purchases | Gross Sales | Shares Held at June 29, 2012 | Value June 29, 2012 | Income Earned January 1, 2012 - June 29, 2012 | ||||||||||||||||||
Thrivent Financial Securities Lending Trust | $ | 6,250,075 | $ | 57,220,110 | $ | 61,358,185 | 2,112,000 | $ | 2,112,000 | $ | 11,041 | |||||||||||||
Total Value and Income Earned | 6,250,075 | 2,112,000 | 11,041 | |||||||||||||||||||||
The accompanying Notes to Financial Statements are an integral part of this schedule.
167
Table of Contents
Schedule of Investments as of June 29, 2012
(unaudited)
| Shares | Common Stock (95.7%) | Value | ||||||
| Consumer Discretionary (11.8%) | ||||||||
| 33,750 | Amazon.com, Inc.a | $ | 7,706,812 | |||||
| 8,300 | AutoZone, Inc.a | 3,047,511 | ||||||
| 55,950 | CBS Corporation | 1,834,041 | ||||||
| 361,100 | Comcast Corporation | 11,544,367 | ||||||
| 142,766 | Delphi Automotive plca | 3,640,533 | ||||||
| 27,100 | Harley-Davidson, Inc. | 1,239,283 | ||||||
| 112,200 | Home Depot, Inc. | 5,945,478 | ||||||
| 209,575 | Las Vegas Sands Corporation | 9,114,417 | ||||||
| 183,040 | Lowe’s Companies, Inc. | 5,205,658 | ||||||
| 21,500 | McDonald’s Corporation | 1,903,395 | ||||||
| 290,260 | News Corporation | 6,536,655 | ||||||
| 49,800 | NIKE, Inc. | 4,371,444 | ||||||
| 37,300 | Omnicom Group, Inc. | 1,812,780 | ||||||
| 103,000 | Sally Beauty Holdings, Inc.a | 2,651,220 | ||||||
| 45,300 | Time Warner Cable, Inc. | 3,719,130 | ||||||
|
| |||||||
| Total | 70,272,724 | |||||||
|
| |||||||
| Consumer Staples (12.0%) | ||||||||
| 126,200 | Altria Group, Inc. | 4,360,210 | ||||||
| 96,938 | Anheuser-Busch InBev NV ADR | 7,721,112 | ||||||
| 140,770 | Archer-Daniels-Midland Company | 4,155,530 | ||||||
| 42,073 | British American Tobacco plc ADR | 4,296,495 | ||||||
| 47,200 | Campbell Soup Companyb | 1,575,536 | ||||||
| 99,925 | Coca-Cola Company | 7,813,136 | ||||||
| 20,400 | Colgate-Palmolive Company | 2,123,640 | ||||||
| 73,040 | CVS Caremark Corporation | 3,413,159 | ||||||
| 49,710 | Diageo plc ADR | 5,123,610 | ||||||
| 21,900 | Dr. Pepper Snapple Group, Inc. | 958,125 | ||||||
| 45,800 | General Mills, Inc. | 1,765,132 | ||||||
| 33,900 | H.J. Heinz Company | 1,843,482 | ||||||
| 48,500 | Hormel Foods Corporation | 1,475,370 | ||||||
| 62,580 | Kimberly-Clark Corporation | 5,242,326 | ||||||
| 203,564 | Kraft Foods, Inc. | 7,861,642 | ||||||
| 30,300 | PepsiCo, Inc. | 2,140,998 | ||||||
| 40,321 | Philip Morris International, Inc. | 3,518,410 | ||||||
| 30,400 | Procter & Gamble Company | 1,862,000 | ||||||
| 63,700 | Wal-Mart Stores, Inc. | 4,441,164 | ||||||
|
| |||||||
| Total | 71,691,077 | |||||||
|
| |||||||
| Energy (9.5%) | ||||||||
| 66,335 | Apache Corporation | 5,830,183 | ||||||
| 101,650 | BP plc ADR | 4,120,891 | ||||||
| 46,340 | Chevron Corporation | 4,888,870 | ||||||
| 51,940 | ConocoPhillips | 2,902,407 | ||||||
| 176,400 | Consol Energy, Inc. | 5,334,336 | ||||||
| 51,057 | Ensco plc | 2,398,147 | ||||||
| 94,383 | EOG Resources, Inc. | 8,504,852 | ||||||
| 83,090 | EQT Corporation | 4,456,117 | ||||||
| 51,470 | Occidental Petroleum Corporation | 4,414,582 | ||||||
| 30,860 | Schlumberger, Ltd. | 2,003,123 | ||||||
| 235,870 | Valero Energy Corporation | 5,696,260 | ||||||
| 468,400 | Weatherford International, Ltd.a | 5,915,892 | ||||||
|
| |||||||
| Total | 56,465,660 | |||||||
|
| |||||||
| Financials (13.9%) | ||||||||
| 58,510 | ACE, Ltd. | 4,337,346 | ||||||
| 104,600 | Ameriprise Financial, Inc. | 5,466,396 | ||||||
| 223,380 | Bank of America Corporation | 1,827,248 | ||||||
| 39,800 | Capital One Financial Corporation | 2,175,468 | ||||||
| 218,160 | Charles Schwab Corporation | 2,820,809 | ||||||
| 182,050 | Citigroup, Inc. | 4,989,991 | ||||||
| 20,600 | CME Group, Inc. | 5,523,066 | ||||||
| 331,924 | J.P. Morgan Chase & Company | 11,859,645 | ||||||
| 266,570 | KKR & Company, LP | 3,436,087 | ||||||
| 41,202 | Marsh & McLennan Companies, Inc. | 1,327,941 | ||||||
| 195,160 | MetLife, Inc. | 6,020,686 | ||||||
| 130,900 | Progressive Corporation | 2,726,647 | ||||||
| 27,476 | S&P 500 Large Index Depository Receipts | 3,744,155 | ||||||
| 141,910 | State Street Corporation | 6,334,862 | ||||||
| 227,590 | SunTrust Banks, Inc. | 5,514,506 | ||||||
| 47,320 | SVB Financial Groupa | 2,778,630 | ||||||
| 365,980 | Wells Fargo & Company | 12,238,371 | ||||||
|
| |||||||
| Total | 83,121,854 | |||||||
|
| |||||||
| Health Care (15.0%) | ||||||||
| 37,100 | Abbott Laboratories | 2,391,837 | ||||||
| 87,729 | Amgen, Inc. | 6,407,726 | ||||||
| 190,820 | Baxter International, Inc. | 10,142,083 | ||||||
| 61,900 | Biogen Idec, Inc.a | 8,937,122 | ||||||
| 48,000 | Bristol-Myers Squibb Company | 1,725,600 | ||||||
| 105,110 | Covidien plc | 5,623,385 | ||||||
| 51,900 | Eli Lilly and Company | 2,227,029 | ||||||
| 33,100 | Forest Laboratories, Inc.a | 1,158,169 | ||||||
| 138,440 | Johnson & Johnson | 9,353,007 | ||||||
| 194,060 | Merck & Company, Inc. | 8,102,005 | ||||||
| 384,285 | Pfizer, Inc. | 8,838,555 | ||||||
| 138,850 | Sanofi ADR | 5,245,753 | ||||||
| 72,600 | Shire Pharmaceuticals Group plc ADR | 6,271,914 | ||||||
| 223,900 | UnitedHealth Group, Inc. | 13,098,150 | ||||||
|
| |||||||
| Total | 89,522,335 | |||||||
|
| |||||||
| Industrials (9.0%) | ||||||||
| 77,650 | Boeing Company | 5,769,395 | ||||||
| 128,600 | Dover Corporation | 6,894,246 | ||||||
| 29,610 | FedEx Corporation | 2,712,572 | ||||||
| 141,580 | General Electric Company | 2,950,527 | ||||||
| 68,140 | Honeywell International, Inc. | 3,804,938 | ||||||
| 130,450 | Jacobs Engineering Group, Inc.a | 4,938,837 | ||||||
| 38,710 | Norfolk Southern Corporation | 2,778,217 | ||||||
| 143,220 | Parker Hannifin Corporation | 11,010,753 | ||||||
| 28,900 | SPX Corporation | 1,887,748 | ||||||
| 101,900 | Tyco International, Ltd. | 5,385,415 | ||||||
| 73,210 | United Technologies Corporation | 5,529,551 | ||||||
|
| |||||||
| Total | 53,662,199 | |||||||
|
| |||||||
| Information Technology (18.5%) | ||||||||
| 41,673 | Akamai Technologies, Inc.a | 1,323,118 | ||||||
| 45,824 | Apple, Inc.a | 26,761,216 | ||||||
| 93,432 | Cognizant Technology Solutions Corporationa | 5,605,920 | ||||||
| 116,500 | eBay, Inc.a | 4,894,165 | ||||||
| 18,521 | Google, Inc.a | 10,743,476 | ||||||
| 302,010 | Microsoft Corporation | 9,238,486 | ||||||
| 285,100 | NetApp, Inc.a | 9,071,882 | ||||||
| 585,460 | Oracle Corporation | 17,388,162 | ||||||
| 116,950 | QUALCOMM, Inc. | 6,511,776 | ||||||
| 35,300 | Teradata Corporationa | 2,541,953 | ||||||
| 435,930 | Texas Instruments, Inc. | 12,506,832 | ||||||
The accompanying Notes to Financial Statements are an integral part of this schedule.
168
Table of Contents
Large Cap Stock Portfolio
Schedule of Investments as of June 29, 2012
(unaudited)
| Shares | Common Stock (95.7%) | Value | ||||||
| Information Technology (18.5%) - continued | ||||||||
| 105,770 | Xilinx, Inc. | $ | 3,550,699 | |||||
|
| |||||||
| Total | 110,137,685 | |||||||
|
| |||||||
| Materials (1.7%) | ||||||||
| 161,265 | Freeport-McMoRan Copper & Gold, Inc. | 5,494,299 | ||||||
| 36,840 | LyondellBasell Industries NV | 1,483,547 | ||||||
| 39,466 | Sigma-Aldrich Corporation | 2,917,721 | ||||||
|
| |||||||
| Total | 9,895,567 | |||||||
|
| |||||||
| Telecommunications Services (1.5%) | ||||||||
| 66,000 | AT&T, Inc. | 2,353,560 | ||||||
| 145,694 | Verizon Communications, Inc. | 6,474,641 | ||||||
|
| |||||||
| Total | 8,828,201 | |||||||
|
| |||||||
| Utilities (2.8%) | ||||||||
| 33,100 | Consolidated Edison, Inc. | 2,058,489 | ||||||
| 93,100 | Duke Energy Corporation | 2,146,886 | ||||||
| 237,710 | NiSource, Inc. | 5,883,323 | ||||||
| 44,900 | Southern Company | 2,078,870 | ||||||
| 129,470 | Utilities Select Sector SPDR Fund | 4,789,095 | ||||||
|
| |||||||
| Total | 16,956,663 | |||||||
|
| |||||||
Total Common Stock (cost $537,528,995) | 570,553,965 | |||||||
|
| |||||||
Collateral Held for Securities Loaned (0.3%) | ||||||||
| 1,569,400 | Thrivent Financial Securities Lending Trust | 1,569,400 | ||||||
|
| |||||||
Total Collateral Held for Securities Loaned (cost $1,569,400) | 1,569,400 | |||||||
|
| |||||||
| Principal Amount | Short-Term Investments (2.2%)c | |||||||
| Federal Home Loan Bank Discount Notes | ||||||||
| 5,000,000 | 0.080%, 7/11/2012d | 4,999,878 | ||||||
| 100,000 | 0.125%, 7/18/2012d,e | 99,994 | ||||||
| 8,000,000 | 0.100%, 8/17/2012d | 7,998,933 | ||||||
| Federal National Mortgage Association Discount Notes | ||||||||
| 100,000 | 0.120%, 7/18/2012d,e | 99,994 | ||||||
|
| |||||||
| Total Short-Term Investments (at amortized cost) | 13,198,799 | |||||||
|
| |||||||
| Total Investments (cost $552,297,194) 98.2% | $ | 585,322,164 | ||||||
|
| |||||||
| Other Assets and Liabilities, Net 1.8% | 10,556,930 | |||||||
|
| |||||||
| Total Net Assets 100.0% | $ | 595,879,094 | ||||||
|
| |||||||
| a | Non-income producing security. |
| b | All or a portion of the security is on loan. |
| c | The interest rate shown reflects the yield, coupon rate or the discount rate at the date of purchase. |
| d | Denotes investments that benefit from credit enhancement or liquidity support provided by a third party bank, institution or government. |
| e | At June 29, 2012, $199,988 of investments were held on deposit with the counterparty and pledged as the initial margin deposit for open futures contracts. |
Definitions:
ADR | - | American Depositary Receipt, which are certificates for an underlying foreign security's shares held by an issuing U.S. depository bank. |
Unrealized Appreciation (Depreciation)
Gross unrealized appreciation and depreciation of investments, based on cost for federal income tax purposes, were as follows:
Gross unrealized appreciation | $ | 57,561,321 | ||
Gross unrealized depreciation | (26,895,720 | ) | ||
|
| |||
Net unrealized appreciation (depreciation) | $ | 30,665,601 | ||
Cost for federal income tax purposes | $ | 554,656,563 | ||
The accompanying Notes to Financial Statements are an integral part of this schedule.
169
Table of Contents
Large Cap Stock Portfolio
Schedule of Investments as of June 29, 2012
(unaudited)
Fair Valuation Measurements
The following table is a summary of the inputs used, as of June 29, 2012, in valuing Large Cap Stock Portfolio's assets carried at fair value.
Investments in Securities | Total | Level 1 | Level 2 | Level 3 | ||||||||||||
Common Stock | ||||||||||||||||
Consumer Discretionary | 70,272,724 | 70,272,724 | — | — | ||||||||||||
Consumer Staples | 71,691,077 | 71,691,077 | — | — | ||||||||||||
Energy | 56,465,660 | 56,465,660 | — | — | ||||||||||||
Financials | 83,121,854 | 83,121,854 | — | — | ||||||||||||
Health Care | 89,522,335 | 89,522,335 | — | — | ||||||||||||
Industrials | 53,662,199 | 53,662,199 | — | — | ||||||||||||
Information Technology | 110,137,685 | 110,137,685 | — | — | ||||||||||||
Materials | 9,895,567 | 9,895,567 | — | — | ||||||||||||
Telecommunications Services | 8,828,201 | 8,828,201 | — | — | ||||||||||||
Utilities | 16,956,663 | 16,956,663 | — | — | ||||||||||||
Collateral Held for Securities Loaned | 1,569,400 | 1,569,400 | — | — | ||||||||||||
Short-Term Investments | 13,198,799 | — | 13,198,799 | — | ||||||||||||
|
|
|
|
|
|
|
| |||||||||
Total | $ | 585,322,164 | $ | 572,123,365 | $ | 13,198,799 | $ | — | ||||||||
|
|
|
|
|
|
|
| |||||||||
Other Financial Instruments | Total | Level 1 | Level 2 | Level 3 | ||||||||||||
Asset Derivatives | ||||||||||||||||
Futures Contracts | 134,276 | 134,276 | — | — | ||||||||||||
|
|
|
|
|
|
|
| |||||||||
Total Asset Derivatives | $ | 134,276 | $ | 134,276 | $ | — | $ | — | ||||||||
|
|
|
|
|
|
|
| |||||||||
There were no significant transfers between the Levels during the period ended June 29, 2012. Transfers between the levels are identified as of the end of the period.
Futures Contracts | Number of Contracts Long/(Short) | Expiration Date | Notional Principal Amount | Value | Unrealized Gain/(Loss) | |||||||||||||||
S&P 500 Index Futures | 12 | September 2012 | $ | 3,934,924 | $ | 4,069,200 | $ | 134,276 | ||||||||||||
Total Futures Contracts | $ | 134,276 | ||||||||||||||||||
The following table summarizes the fair value and Statement of Assets and Liabilities location, as of June 29, 2012, for Large Cap Stock Portfolio's investments in financial derivative instruments by primary risk exposure as discussed under item (2) Significant Accounting Policies of the Notes to Financial Statements.
Derivatives by risk category | Statement of Assets and Liabilities Location | Fair Value | ||||
Asset Derivatives | ||||||
Equity Contracts | ||||||
Futures* | Net Assets - Net unrealized appreciation/(depreciation) on Futures contracts | 134,276 | ||||
Total Equity Contracts | 134,276 | |||||
|
| |||||
Total Asset Derivatives | $ | 134,276 | ||||
|
| |||||
| * | Includes cumulative appreciation/depreciation of futures contracts as reported in the Schedule of Investments. Only current day's variation margin is reported within the Statement of Assets and Liabilities. |
The accompanying Notes to Financial Statements are an integral part of this schedule.
170
Table of Contents
Large Cap Stock Portfolio
Schedule of Investments as of June 29, 2012
(unaudited)
The following table summarizes the net realized gains/(losses) and Statement of Operations location, for the period ended June 29, 2012, for Large Cap Stock Portfolio's investments in financial derivative instruments by primary risk exposure.
Derivatives by risk category | Statement of Operations Location | Realized Gains/(Losses) recognized in Income | ||||
Equity Contracts | ||||||
Options Written | Net realized gains/(losses) on Written option contracts | (50,431 | ) | |||
Futures | Net realized gains/(losses) on Futures contracts | (155,618 | ) | |||
Total Equity Contracts | (206,049 | ) | ||||
|
| |||||
Total | ($ | 206,049 | ) | |||
|
| |||||
The following table summarizes the change in net unrealized appreciation/(depreciation) and Statement of Operations location, for the period ended June 29, 2012, for Large Cap Stock Portfolio's investments in financial derivative instruments by primary risk exposure.
Derivatives by risk category | Statement of Operations Location | Change in unrealized appreciation/(depreciation) recognized in Income | ||||
Equity Contracts | ||||||
Options Written | Change in net unrealized appreciation/(depreciation) on Written option contracts | 7,050 | ||||
Futures | Change in net unrealized appreciation/(depreciation) on Futures contracts | 93,474 | ||||
Total Equity Contracts | 100,524 | |||||
|
| |||||
Total | $ | 100,524 | ||||
|
| |||||
The following table presents Large Cap Stock Portfolio's average volume of derivative activity during the period ended June 29, 2012.
Derivative Risk Category | Futures (Notional*) | Futures (Percentage of Average Net Assets) | Options (Contracts) | |||||||||
Equity Contracts | $ | 3,402,063 | 0.6 | % | 12 | |||||||
| * | Notional amount represents long or short, or both, derivative positions held by the Portfolio. |
Investment in Affiliates
Affiliated issuers, as defined under the Investment Company Act of 1940, include those in which the Portfolio's holdings of an issuer represent 5% or more of the outstanding voting securities of an issuer, or any affiliated mutual fund.
A summary of transactions for the fiscal year to date, in Large Cap Stock Portfolio, is as follows:
Portfolio | Value December 31, 2011 | Gross Purchases | Gross Sales | Shares Held at June 29, 2012 | Value June 29, 2012 | Income Earned January 1, 2012 - June 29, 2012 | ||||||||||||||||||
Thrivent Financial Securities Lending Trust | $ | 1,256,975 | $ | 33,349,770 | $ | 33,037,345 | 1,569,400 | $ | 1,569,400 | $ | 13,133 | |||||||||||||
Total Value and Income Earned | 1,256,975 | 1,569,400 | 13,133 | |||||||||||||||||||||
The accompanying Notes to Financial Statements are an integral part of this schedule.
171
Table of Contents
Schedule of Investments as of June 29, 2012
(unaudited)
| Shares | Common Stock (98.9%) | Value | ||||||
| Consumer Discretionary (11.0%) | |||||||
| 2,100 | Abercrombie & Fitch Company | $ | 71,694 | |||||
| 8,800 | Amazon.com, Inc.a | 2,009,480 | ||||||
| 2,700 | Apollo Group, Inc.a | 97,713 | ||||||
| 1,100 | AutoNation, Inc.a,b | 38,808 | ||||||
| 700 | AutoZone, Inc.a | 257,019 | ||||||
| 5,700 | Bed Bath & Beyond, Inc.a | 352,260 | ||||||
| 6,925 | Best Buy Company, Inc. | 145,148 | ||||||
| 1,600 | Big Lots, Inc.a | 65,264 | ||||||
| 2,800 | BorgWarner, Inc.a | 183,652 | ||||||
| 5,200 | Cablevision Systems Corporation | 69,108 | ||||||
| 5,500 | CarMax, Inc.a | 142,670 | ||||||
| 11,000 | Carnival Corporation | 376,970 | ||||||
| 15,772 | CBS Corporation | 517,006 | ||||||
| 800 | Chipotle Mexican Grill, Inc.a | 303,960 | ||||||
| 7,000 | Coach, Inc. | 409,360 | ||||||
| 65,415 | Comcast Corporation | 2,091,318 | ||||||
| 6,700 | D.R. Horton, Inc. | 123,146 | ||||||
| 3,150 | Darden Restaurants, Inc. | 159,485 | ||||||
| 1,400 | DeVry, Inc. | 43,358 | ||||||
| 16,400 | DIRECTVa | 800,648 | ||||||
| 6,300 | Discovery Communications, Inc.a | 340,200 | ||||||
| 5,800 | Dollar Tree, Inc.a | 312,040 | ||||||
| 2,350 | Expedia, Inc. | 112,965 | ||||||
| 2,900 | Family Dollar Stores, Inc. | 192,792 | ||||||
| 92,111 | Ford Motor Company | 883,344 | ||||||
| 1,300 | Fossil, Inc.a | 99,502 | ||||||
| 5,700 | Gannett Company, Inc. | 83,961 | ||||||
| 8,062 | Gap, Inc. | 220,576 | ||||||
| 3,800 | Genuine Parts Company | 228,950 | ||||||
| 5,900 | Goodyear Tire & Rubber Companya | 69,679 | ||||||
| 7,100 | H&R Block, Inc. | 113,458 | ||||||
| 5,500 | Harley-Davidson, Inc. | 251,515 | ||||||
| 1,800 | Harman International Industries, Inc. | 71,280 | ||||||
| 2,850 | Hasbro, Inc. | 96,530 | ||||||
| 37,400 | Home Depot, Inc. | 1,981,826 | ||||||
| 7,200 | International Game Technology | 113,400 | ||||||
| 10,867 | Interpublic Group of Companies, Inc. | 117,907 | ||||||
| 3,600 | J.C. Penney Company, Inc. | 83,916 | ||||||
| 16,500 | Johnson Controls, Inc. | 457,215 | ||||||
| 6,100 | Kohl’s Corporation | 277,489 | ||||||
| 3,300 | Leggett & Platt, Inc. | 69,729 | ||||||
| 4,000 | Lennar Corporationb | 123,640 | ||||||
| 6,004 | Limited Brands, Inc. | 255,350 | ||||||
| 28,600 | Lowe’s Companies, Inc. | 813,384 | ||||||
| 10,068 | Macy’s, Inc. | 345,836 | ||||||
| 6,506 | Marriott International, Inc. | 255,035 | ||||||
| 8,250 | Mattel, Inc. | 267,630 | ||||||
| 24,700 | McDonald’s Corporation | 2,186,691 | ||||||
| 6,800 | McGraw-Hill Companies, Inc. | 306,000 | ||||||
| 1,400 | Netflix, Inc.a,b | 95,858 | ||||||
| 6,973 | Newell Rubbermaid, Inc. | 126,490 | ||||||
| 52,200 | News Corporation | 1,163,538 | ||||||
| 8,900 | NIKE, Inc. | 781,242 | ||||||
| 3,900 | Nordstrom, Inc. | 193,791 | ||||||
| 6,600 | Omnicom Group, Inc. | 320,760 | ||||||
| 3,100 | O’Reilly Automotive, Inc.a | 259,687 | ||||||
| 1,200 | Priceline.com, Inc.a | 797,424 | ||||||
| 8,192 | Pulte Group, Inc.a | 87,654 | ||||||
| 1,600 | Ralph Lauren Corporation | 224,096 | ||||||
| 5,600 | Ross Stores, Inc. | 349,832 | ||||||
| 2,400 | Scripps Networks Interactive | 136,464 | ||||||
| 932 | Sears Holdings Corporationa,b | 55,640 | ||||||
| 2,100 | Sherwin-Williams Company | 277,935 | ||||||
| 1,400 | Snap-On, Inc. | 87,150 | ||||||
| 16,875 | Staples, Inc. | 220,219 | ||||||
| 18,300 | Starbucks Corporation | 975,756 | ||||||
| 4,800 | Starwood Hotels & Resorts Worldwide, Inc. | 254,592 | ||||||
| 16,300 | Target Corporation | 948,497 | ||||||
| 3,100 | Tiffany & Company | 164,145 | ||||||
| 7,658 | Time Warner Cable, Inc. | 628,722 | ||||||
| 23,550 | Time Warner, Inc. | 906,675 | ||||||
| 18,300 | TJX Companies, Inc. | 785,619 | ||||||
| 2,250 | TripAdvisor, Inc.a | 100,553 | ||||||
| 2,700 | Urban Outfitters, Inc.a | 74,493 | ||||||
| 2,100 | VF Corporation | 280,245 | ||||||
| 13,072 | Viacom, Inc. | 614,645 | ||||||
| 43,447 | Walt Disney Company | 2,107,180 | ||||||
| 70 | Washington Post Company | 26,167 | ||||||
| 1,857 | Whirlpool Corporation | 113,574 | ||||||
| 3,572 | Wyndham Worldwide Corporation | 188,387 | ||||||
| 2,000 | Wynn Resorts, Ltd. | 207,440 | ||||||
| 11,180 | Yum! Brands, Inc. | 720,216 | ||||||
|
| |||||||
| Total | 33,264,593 | |||||||
|
| |||||||
| Consumer Staples (11.2%) | |||||||
| 49,600 | Altria Group, Inc. | 1,713,680 | ||||||
| 16,068 | Archer-Daniels-Midland Company | 474,327 | ||||||
| 10,500 | Avon Products, Inc. | 170,205 | ||||||
| 3,900 | Beam, Inc. | 243,711 | ||||||
| 2,425 | Brown-Forman Corporation | 234,861 | ||||||
| 4,300 | Campbell Soup Companyb | 143,534 | ||||||
| 3,100 | Clorox Company | 224,626 | ||||||
| 54,900 | Coca-Cola Company | 4,292,631 | ||||||
| 7,200 | Coca-Cola Enterprises, Inc. | 201,888 | ||||||
| 11,600 | Colgate-Palmolive Company | 1,207,560 | ||||||
| 10,000 | ConAgra Foods, Inc. | 259,300 | ||||||
| 3,800 | Constellation Brands, Inc.a | 102,828 | ||||||
| 10,500 | Costco Wholesale Corporation | 997,500 | ||||||
| 31,544 | CVS Caremark Corporation | 1,474,051 | ||||||
| 4,400 | Dean Foods Companya | 74,932 | ||||||
| 5,200 | Dr. Pepper Snapple Group, Inc. | 227,500 | ||||||
| 5,500 | Estee Lauder Companies, Inc. | 297,660 | ||||||
| 15,700 | General Mills, Inc. | 605,078 | ||||||
| 7,800 | H.J. Heinz Company | 424,164 | ||||||
| 3,800 | Hershey Company | 273,714 | ||||||
| 3,300 | Hormel Foods Corporation | 100,386 | ||||||
| 2,751 | J.M. Smucker Company | 207,756 | ||||||
| 6,000 | Kellogg Company | 295,980 | ||||||
| 9,592 | Kimberly-Clark Corporation | 803,522 | ||||||
| 42,852 | Kraft Foods, Inc. | 1,654,944 | ||||||
| 13,900 | Kroger Company | 322,341 | ||||||
| 3,300 | Lorillard, Inc. | 435,435 | ||||||
| 3,300 | McCormick & Company, Inc. | 200,145 | ||||||
| 4,928 | Mead Johnson Nutrition Company | 396,753 | ||||||
| 3,900 | Molson Coors Brewing Company | 162,279 | ||||||
| 4,100 | Monster Beverage Corporationa | 291,920 | ||||||
The accompanying Notes to Financial Statements are an integral part of this schedule.
172
Table of Contents
Large Cap Index Portfolio
Schedule of Investments as of June 29, 2012
(unaudited)
| Shares | Common Stock (98.9%) | Value | ||||||
| Consumer Staples (11.2%) - continued | |||||||
| 38,130 | PepsiCo, Inc. | $ | 2,694,266 | |||||
| 41,800 | Philip Morris International, Inc. | 3,647,468 | ||||||
| 66,838 | Procter & Gamble Company | 4,093,828 | ||||||
| 8,100 | Reynolds American, Inc. | 363,447 | ||||||
| 6,000 | Safeway, Inc.b | 108,900 | ||||||
| 14,200 | Sysco Corporation | 423,302 | ||||||
| 7,000 | Tyson Foods, Inc. | 131,810 | ||||||
| 21,200 | Walgreen Company | 627,096 | ||||||
| 42,000 | Wal-Mart Stores, Inc. | 2,928,240 | ||||||
| 3,900 | Whole Foods Market, Inc. | 371,748 | ||||||
|
| |||||||
| Total | 33,905,316 | |||||||
|
| |||||||
| Energy (10.6%) | |||||||
| 5,369 | Alpha Natural Resources, Inc.a | 46,764 | ||||||
| 12,072 | Anadarko Petroleum Corporation | 799,166 | ||||||
| 9,320 | Apache Corporation | 819,135 | ||||||
| 10,583 | Baker Hughes, Inc. | 434,961 | ||||||
| 5,100 | Cabot Oil & Gas Corporation | 200,940 | ||||||
| 6,000 | Cameron International Corporationa | 256,260 | ||||||
| 16,100 | Chesapeake Energy Corporation | 299,460 | ||||||
| 47,896 | Chevron Corporation | 5,053,028 | ||||||
| 31,049 | ConocoPhillips | 1,735,018 | ||||||
| 5,500 | Consol Energy, Inc. | 166,320 | ||||||
| 9,500 | Denbury Resources, Inc.a | 143,545 | ||||||
| 9,800 | Devon Energy Corporation | 568,302 | ||||||
| 1,700 | Diamond Offshore Drilling, Inc.b | 100,521 | ||||||
| 6,500 | EOG Resources, Inc. | 585,715 | ||||||
| 3,600 | EQT Corporation | 193,068 | ||||||
| 113,790 | Exxon Mobil Corporation | 9,737,010 | ||||||
| 5,800 | FMC Technologies, Inc.a | 227,534 | ||||||
| 22,400 | Halliburton Company | 635,936 | ||||||
| 2,600 | Helmerich & Payne, Inc. | 113,048 | ||||||
| 7,300 | Hess Corporation | 317,185 | ||||||
| 13,000 | Kinder Morgan, Inc. | 418,860 | ||||||
| 17,068 | Marathon Oil Corporation | 436,429 | ||||||
| 8,384 | Marathon Petroleum Corporation | 376,609 | ||||||
| 4,700 | Murphy Oil Corporation | 236,363 | ||||||
| 7,000 | Nabors Industries, Ltd.a | 100,800 | ||||||
| 10,300 | National Oilwell Varco, Inc. | 663,732 | ||||||
| 3,300 | Newfield Exploration Companya | 96,723 | ||||||
| 6,100 | Noble Corporationa | 198,433 | ||||||
| 4,300 | Noble Energy, Inc. | 364,726 | ||||||
| 19,700 | Occidental Petroleum Corporation | 1,689,669 | ||||||
| 6,600 | Peabody Energy Corporation | 161,832 | ||||||
| 15,524 | Phillips 66a | 516,018 | ||||||
| 3,000 | Pioneer Natural Resources Company | 264,630 | ||||||
| 4,300 | QEP Resources, Inc. | 128,871 | ||||||
| 3,800 | Range Resources Corporation | 235,106 | ||||||
| 3,000 | Rowan Companies plca | 96,990 | ||||||
| 32,394 | Schlumberger, Ltd. | 2,102,695 | ||||||
| 8,500 | Southwestern Energy Companya | 271,405 | ||||||
| 15,804 | Spectra Energy Corporation | 459,264 | ||||||
| 2,600 | Sunoco, Inc. | 123,500 | ||||||
| 3,400 | Tesoro Corporationa | 84,864 | ||||||
| 13,500 | Valero Energy Corporation | 326,025 | ||||||
| 15,400 | Williams Companies, Inc. | 443,828 | ||||||
| 4,900 | WPX Energy, Inc.a | 79,282 | ||||||
|
| |||||||
| Total | 32,309,570 | |||||||
|
| |||||||
| Financials (14.2%) | |||||||
| 8,200 | ACE, Ltd. | 607,866 | ||||||
| 11,300 | Aflac, Inc. | 481,267 | ||||||
| 12,082 | Allstate Corporation | 423,957 | ||||||
| 24,600 | American Express Company | 1,431,966 | ||||||
| 16,367 | American International Group, Inc.a | 525,217 | ||||||
| 9,500 | American Tower Corporation | 664,145 | ||||||
| 5,400 | Ameriprise Financial, Inc. | 282,204 | ||||||
| 7,925 | Aon plc | 370,731 | ||||||
| 3,536 | Apartment Investment & Management Company | 95,578 | ||||||
| 2,100 | Assurant, Inc. | 73,164 | ||||||
| 2,301 | AvalonBay Communities, Inc. | 325,545 | ||||||
| 260,310 | Bank of America Corporation | 2,129,336 | ||||||
| 29,252 | Bank of New York Mellon Corporation | 642,081 | ||||||
| 16,900 | BB&T Corporation | 521,365 | ||||||
| 42,669 | Berkshire Hathaway, Inc.a | 3,555,608 | ||||||
| 3,100 | BlackRock, Inc. | 526,442 | ||||||
| 3,600 | Boston Properties, Inc. | 390,132 | ||||||
| 14,073 | Capital One Financial Corporation | 769,230 | ||||||
| 8,000 | CBRE Group, Inc.a | 130,880 | ||||||
| 26,225 | Charles Schwab Corporation | 339,089 | ||||||
| 6,600 | Chubb Corporation | 480,612 | ||||||
| 3,938 | Cincinnati Financial Corporation | 149,920 | ||||||
| 70,993 | Citigroup, Inc. | 1,945,918 | ||||||
| 1,600 | CME Group, Inc. | 428,976 | ||||||
| 4,850 | Comerica, Inc. | 148,943 | ||||||
| 12,825 | Discover Financial Services | 443,489 | ||||||
| 6,110 | E*TRADE Financial Corporationa | 49,124 | ||||||
| 7,300 | Equity Residential | 455,228 | ||||||
| 2,200 | Federated Investors, Inc.b | 48,070 | ||||||
| 22,294 | Fifth Third Bancorp | 298,740 | ||||||
| 6,181 | First Horizon National Corporation | 53,466 | ||||||
| 3,500 | Franklin Resources, Inc. | 388,465 | ||||||
| 11,900 | Genworth Financial, Inc.a | 67,354 | ||||||
| 12,000 | Goldman Sachs Group, Inc. | 1,150,320 | ||||||
| 10,700 | Hartford Financial Services Group, Inc. | 188,641 | ||||||
| 9,900 | HCP, Inc. | 437,085 | ||||||
| 5,100 | Health Care REIT, Inc. | 297,330 | ||||||
| 17,141 | Host Hotels & Resorts, Inc. | 271,171 | ||||||
| 12,800 | Hudson City Bancorp, Inc. | 81,536 | ||||||
| 20,971 | Huntington Bancshares, Inc. | 134,214 | ||||||
| 1,800 | IntercontinentalExchange, Inc.a | 244,764 | ||||||
| 10,800 | Invesco, Ltd. | 244,080 | ||||||
| 92,548 | J.P. Morgan Chase & Company | 3,306,740 | ||||||
| 23,100 | KeyCorp | 178,794 | ||||||
| 9,900 | Kimco Realty Corporation | 188,397 | ||||||
| 3,000 | Legg Mason, Inc. | 79,110 | ||||||
| 4,800 | Leucadia National Corporation | 102,096 | ||||||
| 7,094 | Lincoln National Corporation | 155,146 | ||||||
| 7,400 | Loews Corporation | 302,734 | ||||||
| 3,100 | M&T Bank Corporation | 255,967 | ||||||
| 13,200 | Marsh & McLennan Companies, Inc. | 425,436 | ||||||
| 25,732 | MetLife, Inc. | 793,832 | ||||||
| 4,800 | Moody’s Corporation | 175,440 | ||||||
| 36,950 | Morgan Stanley | 539,100 | ||||||
| 3,000 | NASDAQ OMX Group, Inc. | 68,010 | ||||||
The accompanying Notes to Financial Statements are an integral part of this schedule.
173
Table of Contents
Large Cap Index Portfolio
Schedule of Investments as of June 29, 2012
(unaudited)
| Shares | Common Stock (98.9%) | Value | ||||||
| Financials (14.2%) - continued | |||||||
| 5,800 | Northern Trust Corporation | �� | $ | 266,916 | ||||
| 6,300 | NYSE Euronext | 161,154 | ||||||
| 8,700 | People's United Financial, Inc. | 101,007 | ||||||
| 3,900 | Plum Creek Timber Company, Inc. | 154,830 | ||||||
| 12,814 | PNC Financial Services Group, Inc. | 783,064 | ||||||
| 7,400 | Principal Financial Group, Inc. | 194,102 | ||||||
| 14,800 | Progressive Corporation | 308,284 | ||||||
| 11,096 | Prologis, Inc. | 368,720 | ||||||
| 11,400 | Prudential Financial, Inc. | 552,102 | ||||||
| 3,400 | Public Storage, Inc. | 490,994 | ||||||
| 34,177 | Regions Financial Corporation | 230,695 | ||||||
| 7,444 | Simon Property Group, Inc. | 1,158,733 | ||||||
| 12,400 | SLM Corporation | 194,804 | ||||||
| 11,800 | State Street Corporation | 526,752 | ||||||
| 12,900 | SunTrust Banks, Inc. | 312,567 | ||||||
| 6,168 | T. Rowe Price Group, Inc. | 388,337 | ||||||
| 2,400 | Torchmark Corporation | 121,320 | ||||||
| 9,581 | Travelers Companies, Inc. | 611,651 | ||||||
| 46,385 | U.S. Bancorp | 1,491,742 | ||||||
| 7,124 | Unum Group | 136,282 | ||||||
| 7,000 | Ventas, Inc. | 441,840 | ||||||
| 4,497 | Vornado Realty Trust | 377,658 | ||||||
| 129,240 | Wells Fargo & Company | 4,321,786 | ||||||
| 12,982 | Weyerhaeuser Company REIT | 290,278 | ||||||
| 7,700 | XL Group plc | 162,008 | ||||||
| 4,500 | Zions Bancorporation | 87,390 | ||||||
|
| |||||||
| Total | 43,099,067 | |||||||
|
| |||||||
| Health Care (11.7%) | |||||||
| 38,100 | Abbott Laboratories | 2,456,307 | ||||||
| 8,596 | Aetna, Inc. | 333,267 | ||||||
| 4,400 | Alexion Pharmaceuticals, Inc.a | 436,920 | ||||||
| 7,400 | Allergan, Inc. | 685,018 | ||||||
| 6,300 | AmerisourceBergen Corporation | 247,905 | ||||||
| 19,240 | Amgen, Inc. | 1,405,290 | ||||||
| 13,600 | Baxter International, Inc. | 722,840 | ||||||
| 5,100 | Becton, Dickinson and Company | 381,225 | ||||||
| 5,800 | Biogen Idec, Inc.a | 837,404 | ||||||
| 35,250 | Boston Scientific Corporationa | 199,868 | ||||||
| 40,898 | Bristol-Myers Squibb Company | 1,470,283 | ||||||
| 2,000 | C.R. Bard, Inc. | 214,880 | ||||||
| 8,375 | Cardinal Health, Inc. | 351,750 | ||||||
| 5,487 | CareFusion Corporationa | 140,906 | ||||||
| 10,600 | Celgene Corporationa | 680,096 | ||||||
| 3,500 | Cerner Corporationa | 289,310 | ||||||
| 6,900 | CIGNA Corporation | 303,600 | ||||||
| 3,500 | Coventry Health Care, Inc. | 111,265 | ||||||
| 11,700 | Covidien plc | 625,950 | ||||||
| 2,300 | DaVita, Inc.a | 225,883 | ||||||
| 3,400 | DENTSPLY International, Inc. | 128,554 | ||||||
| 2,800 | Edwards Lifesciences Corporationa | 289,240 | ||||||
| 24,800 | Eli Lilly and Company | 1,064,168 | ||||||
| 19,945 | Express Scripts Holding Companya | 1,113,529 | ||||||
| 6,500 | Forest Laboratories, Inc.a | 227,435 | ||||||
| 18,400 | Gilead Sciences, Inc.a | 943,552 | ||||||
| 3,980 | Hospira, Inc.a | 139,220 | ||||||
| 4,000 | Humana, Inc. | 309,760 | ||||||
| 1,000 | Intuitive Surgical, Inc.a | 553,790 | ||||||
| 66,540 | Johnson & Johnson | 4,495,442 | ||||||
| 2,400 | Laboratory Corporation of America Holdingsa | 222,264 | ||||||
| 4,343 | Life Technologies Corporationa | 195,392 | ||||||
| 5,942 | McKesson Corporation | 557,063 | ||||||
| 25,200 | Medtronic, Inc. | 975,996 | ||||||
| 73,783 | Merck & Company, Inc. | 3,080,440 | ||||||
| 10,400 | Mylan, Inc.a | 222,248 | ||||||
| 2,100 | Patterson Companies, Inc. | 72,387 | ||||||
| 2,700 | PerkinElmer, Inc. | 69,660 | ||||||
| 2,300 | Perrigo Company | 271,239 | ||||||
| 182,760 | Pfizer, Inc. | 4,203,480 | ||||||
| 3,800 | Quest Diagnostics, Inc. | 227,620 | ||||||
| 7,784 | St. Jude Medical, Inc. | 310,659 | ||||||
| 7,900 | Stryker Corporation | 435,290 | ||||||
| 9,900 | Tenet Healthcare Corporationa | 51,876 | ||||||
| 8,900 | Thermo Fisher Scientific, Inc. | 461,999 | ||||||
| 25,300 | UnitedHealth Group, Inc. | 1,480,050 | ||||||
| 2,700 | Varian Medical Systems, Inc.a | 164,079 | ||||||
| 2,200 | Waters Corporationa | 174,834 | ||||||
| 3,100 | Watson Pharmaceuticals, Inc.a | 229,369 | ||||||
| 8,100 | WellPoint, Inc. | 516,699 | ||||||
| 4,350 | Zimmer Holdings, Inc. | 279,966 | ||||||
|
| |||||||
| Total | 35,587,267 | |||||||
|
| |||||||
| Industrials (10.3%) | |||||||
| 16,800 | 3M Company | 1,505,280 | ||||||
| 2,600 | Avery Dennison Corporation | 71,084 | ||||||
| 18,060 | Boeing Company | 1,341,858 | ||||||
| 4,000 | C.H. Robinson Worldwide, Inc. | 234,120 | ||||||
| 15,700 | Caterpillar, Inc. | 1,333,087 | ||||||
| 2,700 | Cintas Corporation | 104,247 | ||||||
| 3,800 | Cooper Industries plc | 259,084 | ||||||
| 25,500 | CSX Corporation | 570,180 | ||||||
| 4,700 | Cummins, Inc. | 455,477 | ||||||
| 13,900 | Danaher Corporation | 723,912 | ||||||
| 9,700 | Deere & Company | 784,439 | ||||||
| 4,500 | Dover Corporation | 241,245 | ||||||
| 1,200 | Dun & Bradstreet Corporation | 85,404 | ||||||
| 8,100 | Eaton Corporation | 321,003 | ||||||
| 17,800 | Emerson Electric Company | 829,124 | ||||||
| 3,000 | Equifax, Inc. | 139,800 | ||||||
| 5,100 | Expeditors International of Washington, Inc. | 197,625 | ||||||
| 7,200 | Fastenal Company | 290,232 | ||||||
| 7,660 | FedEx Corporation | 701,733 | ||||||
| 1,500 | First Solar, Inc.a,b | 22,590 | ||||||
| 1,400 | Flowserve Corporation | 160,650 | ||||||
| 4,100 | Fluor Corporation | 202,294 | ||||||
| 8,700 | General Dynamics Corporation | 573,852 | ||||||
| 256,500 | General Electric Company | 5,345,460 | ||||||
| 3,100 | Goodrich Corporation | 393,390 | ||||||
| 18,775 | Honeywell International, Inc. | 1,048,396 | ||||||
| 11,700 | Illinois Tool Works, Inc. | 618,813 | ||||||
| 7,200 | Ingersoll-Rand plc | 303,696 | ||||||
| 4,200 | Iron Mountain, Inc. | 138,432 | ||||||
| 3,100 | Jacobs Engineering Group, Inc.a | 117,366 | ||||||
| 2,600 | Joy Global, Inc. | 147,498 | ||||||
| 2,400 | L-3 Communications Holdings, Inc. | 177,624 | ||||||
| 6,500 | Lockheed Martin Corporation | 566,020 | ||||||
| 8,600 | Masco Corporation | 119,282 | ||||||
The accompanying Notes to Financial Statements are an integral part of this schedule.
174
Table of Contents
Large Cap Index Portfolio
Schedule of Investments as of June 29, 2012
(unaudited)
| Shares | Common Stock (98.9%) | Value | ||||||
| Industrials (10.3%) - continued | |||||||
| 8,000 | Norfolk Southern Corporation | $ | 574,160 | |||||
| 6,198 | Northrop Grumman Corporation | 395,370 | ||||||
| 8,637 | PACCAR, Inc. | 338,484 | ||||||
| 2,800 | Pall Corporation | 153,468 | ||||||
| 3,675 | Parker Hannifin Corporation | 282,534 | ||||||
| 4,800 | Pitney Bowes, Inc.b | 71,856 | ||||||
| 3,500 | Precision Castparts Corporation | 575,715 | ||||||
| 5,100 | Quanta Services, Inc.a | 122,757 | ||||||
| 4,300 | R.R. Donnelley & Sons Companyb | 50,611 | ||||||
| 8,200 | Raytheon Company | 464,038 | ||||||
| 7,620 | Republic Services, Inc. | 201,625 | ||||||
| 3,500 | Robert Half International, Inc. | 99,995 | ||||||
| 3,500 | Rockwell Automation, Inc. | 231,210 | ||||||
| 3,600 | Rockwell Collins, Inc. | 177,660 | ||||||
| 2,400 | Roper Industries, Inc. | 236,592 | ||||||
| 1,300 | Ryder System, Inc. | 46,813 | ||||||
| 18,800 | Southwest Airlines Company | 173,336 | ||||||
| 4,100 | Stanley Black & Decker, Inc. | 263,876 | ||||||
| 2,100 | Stericycle, Inc.a | 192,507 | ||||||
| 6,800 | Textron, Inc. | 169,116 | ||||||
| 11,200 | Tyco International, Ltd. | 591,920 | ||||||
| 11,600 | Union Pacific Corporation | 1,383,996 | ||||||
| 23,300 | United Parcel Service, Inc. | 1,835,108 | ||||||
| 22,100 | United Technologies Corporation | 1,669,213 | ||||||
| 1,500 | W.W. Grainger, Inc. | 286,860 | ||||||
| 11,199 | Waste Management, Inc. | 374,047 | ||||||
| 4,400 | Xylem, Inc. | 110,748 | ||||||
|
| |||||||
| Total | 31,197,912 | |||||||
|
| |||||||
| Information Technology (19.7%) | |||||||
| 15,700 | Accenture plc | 943,413 | ||||||
| 12,000 | Adobe Systems, Inc.a | 388,440 | ||||||
| 14,200 | Advanced Micro Devices, Inc.a | 81,366 | ||||||
| 8,415 | Agilent Technologies, Inc. | 330,205 | ||||||
| 4,300 | Akamai Technologies, Inc.a | 136,525 | ||||||
| 7,800 | Altera Corporation | 263,952 | ||||||
| 4,000 | Amphenol Corporation | 219,680 | ||||||
| 7,200 | Analog Devices, Inc. | 271,224 | ||||||
| 22,700 | Apple, Inc.a | 13,256,800 | ||||||
| 31,300 | Applied Materials, Inc. | 358,698 | ||||||
| 5,500 | Autodesk, Inc.a | 192,445 | ||||||
| 11,900 | Automatic Data Processing, Inc. | 662,354 | ||||||
| 4,000 | BMC Software, Inc.a | 170,720 | ||||||
| 11,900 | Broadcom Corporationa | 402,220 | ||||||
| 8,812 | CA, Inc. | 238,717 | ||||||
| 130,600 | Cisco Systems, Inc. | 2,242,402 | ||||||
| 4,500 | Citrix Systems, Inc.a | 377,730 | ||||||
| 7,400 | Cognizant Technology Solutions Corporationa | 444,000 | ||||||
| 3,800 | Computer Sciences Corporation | 94,316 | ||||||
| 36,900 | Corning, Inc. | 477,117 | ||||||
| 37,000 | Dell, Inc.a | 463,240 | ||||||
| 27,800 | eBay, Inc.a | 1,167,878 | ||||||
| 8,100 | Electronic Arts, Inc.a | 100,035 | ||||||
| 51,086 | EMC Corporationa | 1,309,334 | ||||||
| 1,900 | F5 Networks, Inc.a | 189,164 | ||||||
| 5,700 | Fidelity National Information Services, Inc. | 194,256 | ||||||
| 3,400 | Fiserv, Inc.a | 245,548 | ||||||
| 3,700 | FLIR Systems, Inc. | 72,150 | ||||||
| 3,300 | GameStop Corporationb | 60,588 | ||||||
| 6,200 | Google, Inc.a | 3,596,434 | ||||||
| 2,800 | Harris Corporation | 117,180 | ||||||
| 47,886 | Hewlett-Packard Company | 962,987 | ||||||
| 122,400 | Intel Corporation | 3,261,960 | ||||||
| 28,100 | International Business Machines Corporation | 5,495,798 | ||||||
| 7,200 | Intuit, Inc. | 427,320 | ||||||
| 4,500 | Jabil Circuit, Inc. | 91,485 | ||||||
| 5,662 | JDS Uniphase Corporationa | 62,282 | ||||||
| 12,800 | Juniper Networks, Inc.a | 208,768 | ||||||
| 4,000 | KLA-Tencor Corporation | 197,000 | ||||||
| 5,000 | Lam Research Corporationa | 188,700 | ||||||
| 1,700 | Lexmark International, Inc. | 45,186 | ||||||
| 5,600 | Linear Technology Corporation | 175,448 | ||||||
| 13,700 | LSI Corporationa | 87,269 | ||||||
| 2,600 | MasterCard, Inc. | 1,118,286 | ||||||
| 4,700 | Microchip Technology, Inc.b | 155,476 | ||||||
| 24,000 | Micron Technology, Inc.a | 151,440 | ||||||
| 181,100 | Microsoft Corporation | 5,539,849 | ||||||
| 3,300 | Molex, Inc. | 79,002 | ||||||
| 7,155 | Motorola Solutions, Inc. | 344,227 | ||||||
| 8,800 | NetApp, Inc.a | 280,016 | ||||||
| 14,850 | NVIDIA Corporationa | 205,227 | ||||||
| 95,037 | Oracle Corporation | 2,822,599 | ||||||
| 7,800 | Paychex, Inc. | 244,998 | ||||||
| 41,700 | QUALCOMM, Inc. | 2,321,856 | ||||||
| 4,700 | Red Hat, Inc.a | 265,456 | ||||||
| 6,700 | SAIC, Inc. | 81,204 | ||||||
| 3,300 | Salesforce.com, Inc.a | 456,258 | ||||||
| 5,900 | SanDisk Corporationa | 215,232 | ||||||
| 9,100 | Seagate Technology plc | 225,043 | ||||||
| 17,724 | Symantec Corporationa | 258,948 | ||||||
| 10,300 | TE Connectivity, Ltd. | 328,673 | ||||||
| 4,100 | Teradata Corporationa | 295,241 | ||||||
| 4,500 | Teradyne, Inc.a | 63,270 | ||||||
| 27,800 | Texas Instruments, Inc. | 797,582 | ||||||
| 3,900 | Total System Services, Inc. | 93,327 | ||||||
| 3,900 | VeriSign, Inc.a | 169,923 | ||||||
| 12,100 | Visa, Inc. | 1,495,923 | ||||||
| 5,700 | Western Digital Corporationa | 173,736 | ||||||
| 15,080 | Western Union Company | 253,947 | ||||||
| 32,385 | Xerox Corporation | 254,870 | ||||||
| 6,400 | Xilinx, Inc. | 214,848 | ||||||
| 29,400 | Yahoo!, Inc.a | 465,402 | ||||||
|
| |||||||
| Total | 59,644,193 | |||||||
|
| |||||||
| Materials (3.3%) | |||||||
| 5,100 | Air Products and Chemicals, Inc. | 411,723 | ||||||
| 1,700 | Airgas, Inc. | 142,817 | ||||||
| 25,864 | Alcoa, Inc. | 226,310 | ||||||
| 2,669 | Allegheny Technologies, Inc. | 85,114 | ||||||
| 3,800 | Ball Corporation | 155,990 | ||||||
| 2,500 | Bemis Company, Inc. | 78,350 | ||||||
| 1,600 | CF Industries Holdings, Inc. | 309,984 | ||||||
| 3,400 | Cliffs Natural Resources, Inc. | 167,586 | ||||||
| 28,793 | Dow Chemical Company | 906,980 | ||||||
| 22,611 | E.I. du Pont de Nemours and Company | 1,143,438 | ||||||
| 3,400 | Eastman Chemical Company | 171,258 | ||||||
| 7,100 | Ecolab, Inc.b | 486,563 | ||||||
| 3,400 | FMC Corporation | 181,832 | ||||||
The accompanying Notes to Financial Statements are an integral part of this schedule.
175
Table of Contents
Large Cap Index Portfolio
Schedule of Investments as of June 29, 2012
(unaudited)
| Shares | Common Stock (98.9%) | Value | ||||||
| Materials (3.3%) - continued | |||||||
| 22,992 | Freeport-McMoRan Copper & Gold, Inc. | $ | 783,337 | |||||
| 2,000 | International Flavors & Fragrances, Inc. | 109,600 | ||||||
| 10,571 | International Paper Company | 305,608 | ||||||
| 4,081 | MeadWestvaco Corporation | 117,329 | ||||||
| 12,978 | Monsanto Company | 1,074,319 | ||||||
| 7,200 | Mosaic Company | 394,272 | ||||||
| 12,048 | Newmont Mining Corporation | 584,448 | ||||||
| 7,700 | Nucor Corporation | 291,830 | ||||||
| 4,000 | Owens-Illinois, Inc.a | 76,680 | ||||||
| 3,700 | PPG Industries, Inc. | 392,644 | ||||||
| 7,200 | Praxair, Inc. | 782,856 | ||||||
| 4,652 | Sealed Air Corporation | 71,827 | ||||||
| 3,000 | Sigma-Aldrich Corporation | 221,790 | ||||||
| 2,000 | Titanium Metals Corporation | 22,620 | ||||||
| 3,500 | United States Steel Corporationb | 72,100 | ||||||
| 3,100 | Vulcan Materials Company | 123,101 | ||||||
|
| |||||||
| Total | 9,892,306 | |||||||
|
| |||||||
| Telecommunications Services (3.2%) | |||||||
| 142,639 | AT&T, Inc. | 5,086,507 | ||||||
| 15,025 | CenturyLink, Inc. | 593,337 | ||||||
| 6,100 | Crown Castle International Corporationa | 357,826 | ||||||
| 24,178 | Frontier Communications Corporationb | 92,602 | ||||||
| 7,100 | MetroPCS Communications, Inc.a | 42,955 | ||||||
| 72,720 | Sprint Nextel Corporationa | 237,067 | ||||||
| 68,796 | Verizon Communications, Inc. | 3,057,294 | ||||||
| 14,207 | Windstream Corporationb | 137,240 | ||||||
|
| |||||||
| Total | 9,604,828 | |||||||
|
| |||||||
| Utilities (3.7%) | |||||||
| 15,600 | AES Corporationa | 200,148 | ||||||
| 2,805 | AGL Resources, Inc. | 108,694 | ||||||
| 5,900 | Ameren Corporation | 197,886 | ||||||
| 11,760 | American Electric Power Company, Inc. | 469,224 | ||||||
| 10,373 | CenterPoint Energy, Inc. | 214,410 | ||||||
| 6,200 | CMS Energy Corporation | 145,700 | ||||||
| 7,100 | Consolidated Edison, Inc. | 441,549 | ||||||
| 13,794 | Dominion Resources, Inc. | 744,876 | ||||||
| 4,200 | DTE Energy Company | 249,186 | ||||||
| 32,408 | Duke Energy Corporation | 747,329 | ||||||
| 7,900 | Edison International, Inc. | 364,980 | ||||||
| 4,300 | Entergy Corporation | 291,927 | ||||||
| 20,674 | Exelon Corporation | 777,756 | ||||||
| 10,134 | FirstEnergy Corporation | 498,491 | ||||||
| 1,915 | Integrys Energy Group, Inc. | 108,906 | ||||||
| 10,100 | NextEra Energy, Inc. | 694,981 | ||||||
| 6,809 | NiSource, Inc. | 168,523 | ||||||
| 7,700 | Northeast Utilities | 298,837 | ||||||
| 5,500 | NRG Energy, Inc.a | 95,480 | ||||||
| 5,200 | ONEOK, Inc. | 220,012 | ||||||
| 5,500 | Pepco Holdings, Inc. | 107,635 | ||||||
| 10,000 | PG&E Corporation | 452,700 | ||||||
| 2,700 | Pinnacle West Capital Corporation | 139,698 | ||||||
| 14,100 | PPL Corporation | 392,121 | ||||||
| 7,120 | Progress Energy, Inc. | 428,410 | ||||||
| 12,300 | Public Service Enterprise Group, Inc. | 399,750 | ||||||
| 2,800 | SCANA Corporationb | 133,952 | ||||||
| 5,875 | Sempra Energy | 404,670 | ||||||
| 21,000 | Southern Company | 972,300 | ||||||
| 5,200 | TECO Energy, Inc. | 93,912 | ||||||
| 5,500 | Wisconsin Energy Corporation | 217,635 | ||||||
| 11,805 | Xcel Energy, Inc. | 335,380 | ||||||
|
| |||||||
| Total | 11,117,058 | |||||||
|
| |||||||
| Total Common Stock (cost $244,281,428) | 299,622,110 | |||||||
|
| |||||||
Collateral Held for Securities Loaned (0.5%) | ||||||||
| 1,694,368 | Thrivent Financial Securities Lending Trust | 1,694,368 | ||||||
|
| |||||||
| Total Collateral Held for Securities Loaned (cost $1,694,368) | 1,694,368 | |||||||
|
| |||||||
| Total Investments (cost $245,975,796) 99.4% | $ | 301,316,478 | ||||||
|
| |||||||
| Other Assets and Liabilities, Net 0.6% | 1,709,947 | |||||||
|
| |||||||
| Total Net Assets 100.0% | $ | 303,026,425 | ||||||
|
| |||||||
| a | Non-income producing security. |
| b | All or a portion of the security is on loan. |
Definitions:
REIT | - | Real Estate Investment Trust is a company that buys, develops, manages and/or sells real estate assets. |
Unrealized Appreciation (Depreciation)
Gross unrealized appreciation and depreciation of investments, based on cost for federal income tax purposes, were as follows:
Gross unrealized appreciation | $ | 70,490,516 | ||
Gross unrealized depreciation | (35,363,982 | ) | ||
|
| |||
Net unrealized appreciation (depreciation) | $ | 35,126,534 | ||
Cost for federal income tax purposes | $ | 266,189,944 | ||
The accompanying Notes to Financial Statements are an integral part of this schedule.
176
Table of Contents
Large Cap Index Portfolio
Schedule of Investments as of June 29, 2012
(unaudited)
Fair Valuation Measurements
The following table is a summary of the inputs used, as of June 29, 2012, in valuing Large Cap Index Portfolio's assets carried at fair value.
Investments in Securities | Total | Level 1 | Level 2 | Level 3 | ||||||||||||
Common Stock | ||||||||||||||||
Consumer Discretionary | 33,264,593 | 33,264,593 | — | — | ||||||||||||
Consumer Staples | 33,905,316 | 33,905,316 | — | — | ||||||||||||
Energy | 32,309,570 | 32,309,570 | — | — | ||||||||||||
Financials | 43,099,067 | 43,099,067 | — | — | ||||||||||||
Health Care | 35,587,267 | 35,587,267 | — | — | ||||||||||||
Industrials | 31,197,912 | 31,197,912 | — | — | ||||||||||||
Information Technology | 59,644,193 | 59,644,193 | — | — | ||||||||||||
Materials | 9,892,306 | 9,892,306 | — | — | ||||||||||||
Telecommunications Services | 9,604,828 | 9,604,828 | — | — | ||||||||||||
Utilities | 11,117,058 | 11,117,058 | — | — | ||||||||||||
Collateral Held for Securities Loaned | 1,694,368 | 1,694,368 | — | — | ||||||||||||
|
|
|
|
|
|
|
| |||||||||
Total | $ | 301,316,478 | $ | 301,316,478 | $ | — | $ | — | ||||||||
|
|
|
|
|
|
|
| |||||||||
Other Financial Instruments | Total | Level 1 | Level 2 | Level 3 | ||||||||||||
Asset Derivatives | ||||||||||||||||
Futures Contracts | 111,084 | 111,084 | — | — | ||||||||||||
|
|
|
|
|
|
|
| |||||||||
Total Asset Derivatives | $ | 111,084 | $ | 111,084 | $ | — | $ | — | ||||||||
|
|
|
|
|
|
|
| |||||||||
There were no significant transfers between the Levels during the period ended June 29, 2012. Transfers between the levels are identified as of the end of the period.
Futures Contracts | Number of Contracts Long/(Short) | Expiration Date | Notional Principal Amount | Value | Unrealized Gain/(Loss) | |||||||||||||||
S&P 500 Index Futures | 10 | September 2012 | $ | 3,279,916 | $ | 3,391,000 | $ | 111,084 | ||||||||||||
Total Futures Contracts | $ | 111,084 | ||||||||||||||||||
The following table summarizes the fair value and Statement of Assets and Liabilities location, as of June 29, 2012, for Large Cap Index Portfolio’s investments in financial derivative instruments by primary risk exposure as discussed under item (2) Significant Accounting Policies of the Notes to Financial Statements.
Derivatives by risk category | Statement of Assets and Liabilities Location | Fair Value | ||||
Asset Derivatives | ||||||
Equity Contracts | ||||||
Futures* | Net Assets - Net unrealized appreciation/(depreciation) on Futures contracts | 111,084 | ||||
Total Equity Contracts | 111,084 | |||||
|
| |||||
Total Asset Derivatives | $ | 111,084 | ||||
|
| |||||
| * | Includes cumulative appreciation/depreciation of futures contracts as reported in the Schedule of Investments. Only current day’s variation margin is reported within the Statement of Assets and Liabilities. |
The following table summarizes the net realized gains/(losses) and Statement of Operations location, for the period ended June 29, 2012, for Large Cap Index Portfolio's investments in financial derivative instruments by primary risk exposure.
Derivatives by risk category | Statement of Operations Location | Realized Gains/(Losses) recognized in Income | ||||
Equity Contracts | ||||||
Futures | Net realized gains/(losses) on Futures contracts | 245,356 | ||||
Total Equity Contracts | 245,356 | |||||
|
| |||||
Total | $ | 245,356 | ||||
|
| |||||
The accompanying Notes to Financial Statements are an integral part of this schedule.
177
Table of Contents
Large Cap Index Portfolio
Schedule of Investments as of June 29, 2012
(unaudited)
The following table summarizes the change in net unrealized appreciation/(depreciation) and Statement of Operations location, for the period ended June 29, 2012, for Large Cap Index Portfolio’s investments in financial derivative instruments by primary risk exposure.
Derivatives by risk category | Statement of Operations Location | Change in unrealized appreciation/(depreciation) recognized in Income | ||||
Equity Contracts | ||||||
Futures | Change in net unrealized appreciation/(depreciation) on Futures contracts | (70,205 | ) | |||
Total Equity Contracts | (70,205 | ) | ||||
|
| |||||
Total | ($ | 70,205 | ) | |||
|
| |||||
The following table presents Large Cap Index Portfolio's average volume of derivative activity during the period ended June 29, 2012.
Derivative Risk Category | Futures (Notional*) | Futures (Percentage of Average Net Assets) | ||||||
Equity Contracts | $ | 4,415,106 | 1.4 | % | ||||
| * | Notional amount represents long or short, or both, derivative positions held by the Portfolio. |
Investment in Affiliates
Affiliated issuers, as defined under the Investment Company Act of 1940, include those in which the Portfolio's holdings of an issuer represent 5% or more of the outstanding voting securities of an issuer, or any affiliated mutual fund.
A summary of transactions for the fiscal year to date, in Large Cap Index Portfolio, is as follows:
Portfolio | Value December 31, 2011 | Gross Purchases | Gross Sales | Shares Held at June 29, 2012 | Value June 29, 2012 | Income Earned January 1, 2012 - June 29, 2012 | ||||||||||||||||||
Thrivent Financial Securities Lending Trust | $ | 1,237,026 | $ | 10,176,580 | $ | 9,719,238 | 1,694,368 | $ | 1,694,368 | $ | 11,958 | |||||||||||||
Total Value and Income Earned | 1,237,026 | 1,694,368 | 11,958 | |||||||||||||||||||||
The accompanying Notes to Financial Statements are an integral part of this schedule.
178
Table of Contents
Schedule of Investments as of June 29, 2012
(unaudited)
| Shares | Common Stock (92.2%) | Value | ||||||
| Consumer Discretionary (8.6%) | ||||||||
| 13,800 | Arbitron, Inc. | $ | 483,000 | |||||
| 9,600 | Coach, Inc. | 561,408 | ||||||
| 26,200 | Comcast Corporation | 837,614 | ||||||
| 14,900 | Garmin, Ltd. | 570,521 | ||||||
| 23,200 | Home Depot, Inc. | 1,229,368 | ||||||
| 7,400 | Kohl's Corporation | 336,626 | ||||||
| 11,300 | McDonald's Corporation | 1,000,389 | ||||||
| 5,100 | Sherwin-Williams Company | 674,985 | ||||||
| 17,500 | TJX Companies, Inc. | 751,275 | ||||||
| 5,400 | Toyota Motor Corporation ADR | 434,592 | ||||||
| 10,100 | Tupperware Brands Corporation | 553,076 | ||||||
| 4,900 | WPP plc | 298,214 | ||||||
| 10,200 | Yum! Brands, Inc. | 657,084 | ||||||
|
| |||||||
| Total | 8,388,152 | |||||||
|
| |||||||
| Consumer Staples (9.6%) | ||||||||
| 27,300 | Altria Group, Inc. | 943,215 | ||||||
| 4,100 | Anheuser-Busch InBev NV ADR | 326,565 | ||||||
| 2,700 | British American Tobacco plc ADR | 275,724 | ||||||
| 10,200 | Campbell Soup Company | 340,476 | ||||||
| 17,700 | Coca-Cola Company | 1,383,963 | ||||||
| 7,700 | Colgate-Palmolive Company | 801,570 | ||||||
| 17,900 | CVS Caremark Corporation | 836,467 | ||||||
| 2,600 | Lorillard, Inc. | 343,070 | ||||||
| 20,400 | Philip Morris International, Inc. | 1,780,104 | ||||||
| 8,700 | Unilever NV ADR | 290,145 | ||||||
| 9,000 | Unilever plc ADR | 303,570 | ||||||
| 10,700 | Universal Corporation | 495,731 | ||||||
| 17,500 | Wal-Mart Stores, Inc. | 1,220,100 | ||||||
|
| |||||||
| Total | 9,340,700 | |||||||
|
| |||||||
| Energy (12.5%) | ||||||||
| 7,000 | BP plc ADR | 283,780 | ||||||
| 18,800 | C&J Energy Services, Inc.a | 347,800 | ||||||
| 6,100 | Canadian Natural Resources, Ltd. | 163,785 | ||||||
| 23,500 | Chevron Corporation | 2,479,250 | ||||||
| 2,100 | China Petroleum & Chemical Corporation | 187,299 | ||||||
| 1,000 | CNOOC, Ltd. ADR | 201,250 | ||||||
| 28,700 | ConocoPhillips | 1,603,756 | ||||||
| 5,300 | Diamond Offshore Drilling, Inc. | 313,389 | ||||||
| 23,900 | Exxon Mobil Corporation | 2,045,123 | ||||||
| 6,100 | Imperial Oil, Ltd. | 254,492 | ||||||
| 21,900 | Kinder Morgan, Inc. | 705,618 | ||||||
| 23,100 | Marathon Oil Corporation | 590,667 | ||||||
| 10,200 | Occidental Petroleum Corporation | 874,854 | ||||||
| 3,900 | PetroChina Company, Ltd. ADR | 503,646 | ||||||
| 13,000 | Petroleo Brasileiro SA ADR | 244,010 | ||||||
| 4,153 | Royal Dutch Shell plc ADR, Class A | 280,037 | ||||||
| 8,200 | Royal Dutch Shell plc ADR, Class B | 573,426 | ||||||
| 7,700 | Suncor Energy, Inc. ADR | 222,915 | ||||||
| 6,600 | Total SA ADR | 296,670 | ||||||
|
| |||||||
| Total | 12,171,767 | |||||||
|
| |||||||
| Financials (22.0%) | ||||||||
| 16,100 | Aflac, Inc. | 685,699 | ||||||
| 1,000 | Alexandria Real Estate Equities, Inc. | 72,720 | ||||||
| 9,800 | American Tower Corporation | 685,118 | ||||||
| 2,200 | Apartment Investment & Management Company | 59,466 | ||||||
| 1,200 | AvalonBay Communities, Inc. | 169,776 | ||||||
| 18,400 | Aviva plc ADR | 157,872 | ||||||
| 12,500 | Banco Bradesco SA ADR | 185,875 | ||||||
| 3,900 | Bancolombia SA | 241,176 | ||||||
| 13,200 | Barclays plc ADR | 135,960 | ||||||
| 4,000 | Berkshire Hathaway, Inc.a | 333,320 | ||||||
| 2,800 | BioMed Realty Trust, Inc. | 52,304 | ||||||
| 1,900 | Boston Properties, Inc. | 205,903 | ||||||
| 1,300 | BRE Properties, Inc. | 65,026 | ||||||
| 1,200 | Camden Property Trust | 81,204 | ||||||
| 2,700 | CBL & Associates Properties, Inc. | 52,758 | ||||||
| 21,400 | CBOE Holdings, Inc. | 592,352 | ||||||
| 4,400 | China Life Insurance Company, Ltd. ADR | 173,756 | ||||||
| 1,900 | CommonWealth REIT | 36,328 | ||||||
| 1,700 | Corporate Office Properties Trust | 39,967 | ||||||
| 4,500 | DDR Corporation | 65,880 | ||||||
| 3,600 | DiamondRock Hospitality Company | 36,720 | ||||||
| 11,400 | Digital Realty Trust, Inc. | 855,798 | ||||||
| 4,200 | Duke Realty Corporation | 61,488 | ||||||
| 800 | Equity Lifestyle Properties, Inc. | 55,176 | ||||||
| 3,800 | Equity Residential | 236,968 | ||||||
| 500 | Essex Property Trust, Inc. | 76,960 | ||||||
| 900 | Federal Realty Investment Trust | 93,681 | ||||||
| 6,400 | General Growth Properties, Inc. | 115,776 | ||||||
| 5,200 | HCP, Inc. | 229,580 | ||||||
| 2,600 | Health Care REIT, Inc. | 151,580 | ||||||
| 1,500 | Highwoods Properties, Inc. | 50,475 | ||||||
| 900 | Home Properties, Inc. | 55,224 | ||||||
| 27,500 | Hospitality Properties Trust | 681,175 | ||||||
| 9,400 | Host Hotels & Resorts, Inc. | 148,708 | ||||||
| 7,600 | HSBC Holdings plc ADR | 335,388 | ||||||
| 2,500 | iShares Dow Jones Select Dividend Index Fund ETF | 140,475 | ||||||
| 33,500 | iShares S&P U.S. Preferred Stock Index Fund | 1,308,510 | ||||||
| 12,300 | Itau Unibanco Holding SA ADR | 171,216 | ||||||
| 9,800 | J.P. Morgan Chase & Company | 350,154 | ||||||
| 1,100 | Kilroy Realty Corporation | 53,251 | ||||||
| 5,800 | Kimco Realty Corporation | 110,374 | ||||||
| 1,600 | LaSalle Hotel Properties | 46,624 | ||||||
| 1,900 | Liberty Property Trust | 69,996 | ||||||
| 67,700 | Lloyds Banking Group plc ADRa | 129,984 | ||||||
| 1,900 | Macerich Company | 112,195 | ||||||
| 1,800 | Mack-Cali Realty Corporation | 52,326 | ||||||
| 17,800 | Manulife Financial Corporation | 193,842 | ||||||
| 22,000 | Marsh & McLennan Companies, Inc. | 709,060 | ||||||
| 10,600 | Mercury General Corporation | 441,702 | ||||||
| 57,500 | Mitsubishi UFJ Financial Group, Inc. ADR | 273,125 | ||||||
| 2,000 | Omega Healthcare Investors, Inc. | 45,000 | ||||||
| 61,300 | People's United Financial, Inc. | 711,693 | ||||||
| 22,700 | Piedmont Office Realty Trust, Inc. | 390,667 | ||||||
| 2,500 | Plum Creek Timber Company, Inc. | 99,250 | ||||||
| 47,100 | PowerShares Preferred Portfolio | 683,892 | ||||||
| 22,100 | Progressive Corporation | 460,343 | ||||||
| 5,978 | Prologis, Inc. | 198,649 | ||||||
The accompanying Notes to Financial Statements are an integral part of this schedule.
179
Table of Contents
Equity Income Plus Portfolio
Schedule of Investments as of June 29, 2012
(unaudited)
| Shares | Common Stock (92.2%) | Value | ||||||
| Financials (22.0%) - continued | ||||||||
| 6,400 | Public Storage, Inc. | $ | 924,224 | |||||
| 1,800 | Rayonier, Inc. REIT | 80,820 | ||||||
| 2,100 | Realty Income Corporation | 87,717 | ||||||
| 1,500 | Regency Centers Corporation | 71,355 | ||||||
| 1,800 | RLJ Lodging Trust | 32,634 | ||||||
| 2,700 | Senior Housing Property Trust | 60,264 | ||||||
| 3,600 | Simon Property Group, Inc. | 560,376 | ||||||
| 1,300 | SL Green Realty Corporation | 104,312 | ||||||
| 53,170 | SPDR Dow Jones Wilshire International Real Estate ETF | 1,955,592 | ||||||
| 1,000 | Taubman Centers, Inc. | 77,160 | ||||||
| 30,000 | U.S. Bancorp | 964,800 | ||||||
| 17,400 | UBS AG ADRa | 203,754 | ||||||
| 3,300 | UDR, Inc. | 85,272 | ||||||
| 10,100 | Validus Holdings, Ltd. | 323,503 | ||||||
| 500 | Vanguard REIT ETF | 32,715 | ||||||
| 3,722 | Ventas, Inc. | 234,933 | ||||||
| 2,400 | Vornado Realty Trust | 201,552 | ||||||
| 2,200 | Weingarten Realty Investors | 57,948 | ||||||
| 33,400 | Wells Fargo & Company | 1,116,896 | ||||||
| 7,200 | Weyerhaeuser Company REIT | 160,992 | ||||||
|
| |||||||
| Total | 21,366,304 | |||||||
|
| |||||||
| Health Care (9.7%) | ||||||||
| 33,400 | Bristol-Myers Squibb Company | 1,200,730 | ||||||
| 5,300 | C.R. Bard, Inc. | 569,432 | ||||||
| 27,700 | Eli Lilly and Company | 1,188,607 | ||||||
| 5,300 | GlaxoSmithKline plc ADR | 241,521 | ||||||
| 7,500 | McKesson Corporation | 703,125 | ||||||
| 21,400 | Medtronic, Inc. | 828,822 | ||||||
| 6,250 | Novartis AG ADR | 349,375 | ||||||
| 1,600 | Novo Nordisk A/S ADR | 232,544 | ||||||
| 81,300 | PDL BioPharma, Inc. | 539,019 | ||||||
| 104,000 | Pfizer, Inc. | 2,392,000 | ||||||
| 7,800 | Sanofi ADR | 294,684 | ||||||
| 14,900 | UnitedHealth Group, Inc. | 871,650 | ||||||
|
| |||||||
| Total | 9,411,509 | |||||||
|
| |||||||
| Industrials (6.8%) | ||||||||
| 13,300 | AMETEK, Inc. | 663,803 | ||||||
| 3,200 | Canadian Pacific Railway, Ltd. | 234,432 | ||||||
| 13,000 | Copart, Inc.a | 307,970 | ||||||
| 8,600 | Corporate Executive Board Company | 351,568 | ||||||
| 6,300 | Cummins, Inc. | 610,533 | ||||||
| 31,400 | Delta Air Lines, Inc.a | 343,830 | ||||||
| 7,300 | Dun & Bradstreet Corporation | 519,541 | ||||||
| 10,100 | Emerson Electric Company | 470,458 | ||||||
| 6,300 | Nordson Corporation | 323,127 | ||||||
| 5,400 | Northrop Grumman Corporation | 344,466 | ||||||
| 34,000 | Pitney Bowes, Inc. | 508,980 | ||||||
| 1,900 | Precision Castparts Corporation | 312,531 | ||||||
| 2,500 | Siemens AG ADR | 210,175 | ||||||
| 17,600 | United Parcel Service, Inc. | 1,386,176 | ||||||
|
| |||||||
| Total | 6,587,590 | |||||||
|
| |||||||
| Information Technology (8.3%) | ||||||||
| 13,300 | Accenture plc | 799,197 | ||||||
| 550 | Apple, Inc.a | 321,200 | ||||||
| 4,700 | Canon, Inc. ADR | 187,718 | ||||||
| 58,700 | Intel Corporation | 1,564,355 | ||||||
| 6,200 | International Business Machines Corporation | 1,212,596 | ||||||
| 800 | MasterCard, Inc. | 344,088 | ||||||
| 68,500 | Microsoft Corporation | 2,095,415 | ||||||
| 25,500 | Oracle Corporation | 757,350 | ||||||
| 3,700 | SAP AG ADR | 219,632 | ||||||
| 14,200 | Seagate Technology plc | 351,166 | ||||||
| 16,300 | Taiwan Semiconductor Manufacturing Company, Ltd. ADR | 227,548 | ||||||
|
| |||||||
| Total | 8,080,265 | |||||||
|
| |||||||
| Materials (4.8%) | ||||||||
| 7,600 | BHP Billiton plc ADR | 434,644 | ||||||
| 6,100 | BHP Billiton, Ltd. ADR | 398,330 | ||||||
| 3,600 | CF Industries Holdings, Inc. | 697,464 | ||||||
| 4,100 | Cia de Minas Buenaventura SA | 155,718 | ||||||
| 27,600 | Gold Resource Corporation | 717,324 | ||||||
| 9,200 | Monsanto Company | 761,576 | ||||||
| 5,800 | Rio Tinto plc ADR | 277,298 | ||||||
| 23,500 | Southern Copper Corporation | 740,485 | ||||||
| 3,300 | Syngenta AG ADR | 225,852 | ||||||
| 12,000 | Vale SA SP ADR | 238,200 | ||||||
|
| |||||||
| Total | 4,646,891 | |||||||
|
| |||||||
| Telecommunications Services (5.4%) | ||||||||
| 11,400 | America Movil SAB de CV ADR | 297,084 | ||||||
| 64,200 | AT&T, Inc. | 2,289,372 | ||||||
| 9,000 | BCE, Inc. | 370,800 | ||||||
| 7,700 | China Mobile, Ltd. ADR | 420,959 | ||||||
| 15,700 | NTT DOCOMO, INC. ADR | 261,405 | ||||||
| 13,600 | Telefonica SA ADR | 178,160 | ||||||
| 32,700 | Verizon Communications, Inc. | 1,453,188 | ||||||
|
| |||||||
| Total | 5,270,968 | |||||||
|
| |||||||
| Utilities (4.5%) | ||||||||
| 8,600 | American Electric Power Company, Inc. | 343,140 | ||||||
| 12,400 | Consolidated Edison, Inc. | 771,156 | ||||||
| 7,600 | CPFL Energia SA ADR | 189,924 | ||||||
| 6,200 | Integrys Energy Group, Inc. | 352,594 | ||||||
| 22,400 | Public Service Enterprise Group, Inc. | 728,000 | ||||||
| 28,700 | Questar Corporation | 598,682 | ||||||
| 23,400 | Southern Company | 1,083,420 | ||||||
| 20,200 | TECO Energy, Inc. | 364,812 | ||||||
|
| |||||||
| Total | 4,431,728 | |||||||
|
| |||||||
Total Common Stock (cost $86,293,960) | 89,695,874 | |||||||
|
| |||||||
| Principal Amount | Long-Term Fixed Income (4.7%) | Value | ||||||
| Energy (0.4%) | ||||||||
| Enbridge Energy Partners, LP | ||||||||
| 350,000 | 8.050%, 10/1/2037 | 379,180 | ||||||
|
| |||||||
| Total | 379,180 | |||||||
|
| |||||||
The accompanying Notes to Financial Statements are an integral part of this schedule.
180
Table of Contents
Equity Income Plus Portfolio
Schedule of Investments as of June 29, 2012
(unaudited)
| Principal Amount | Long-Term Fixed Income (4.7%) | Value | ||||||
| Financials (3.5%) | ||||||||
| Aegon NV | ||||||||
| $500,000 | 2.248%, 7/29/2049b,c | $ | 230,350 | |||||
| American International Group, Inc. | ||||||||
| 150,000 | 8.175%, 5/15/2058 | 162,750 | ||||||
| Bank of America Corporation | ||||||||
| 305,000 | 7.625%, 6/1/2019 | 358,644 | ||||||
| BBVA International Preferred SA Unipersonal | ||||||||
| 175,000 | 5.919%, 12/29/2049c | 103,117 | ||||||
| J.P. Morgan Chase & Company | ||||||||
| 175,000 | 7.900%, 4/29/2049c | 191,851 | ||||||
| Liberty Mutual Group, Inc. | ||||||||
| 350,000 | 10.750%, 6/15/2058d | 476,000 | ||||||
| MetLife Capital Trust IV | ||||||||
| 400,000 | 7.875%, 12/15/2037d | 444,000 | ||||||
| Reinsurance Group of America, Inc. | ||||||||
| 425,000 | 6.750%, 12/15/2065 | 392,716 | ||||||
| Wachovia Capital Trust III | ||||||||
| 250,000 | 5.570%, 3/29/2049b,c | 238,750 | ||||||
| XL Group plc | ||||||||
| 475,000 | 6.500%, 12/31/2049c | 385,937 | ||||||
| ZFS Finance USA Trust II | ||||||||
| 400,000 | 6.450%, 12/15/2065d | 400,000 | ||||||
|
| |||||||
| Total | 3,384,115 | |||||||
|
| |||||||
| Utilities (0.8%) | ||||||||
| Enterprise Products Operating, LLC | ||||||||
| 425,000 | 7.034%, 1/15/2068 | 454,750 | ||||||
| Southern California Edison Company | ||||||||
| 315,000 | 6.250%, 8/1/2049c | 329,049 | ||||||
|
| |||||||
| Total | 783,799 | |||||||
|
| |||||||
| Total Long-Term Fixed Income (cost $4,383,630) | 4,547,094 | |||||||
|
| |||||||
| Shares | Preferred Stock (0.5%) | |||||||
| Financials (0.4%) | ||||||||
| 5,000 | Bank of America Corporationc | 129,650 | ||||||
| 2,500 | J.P. Morgan Chase Capital XXIX | 64,075 | ||||||
| 8,000 | U.S. Bancorpc | 228,640 | ||||||
|
| |||||||
| Total | 422,365 | |||||||
|
| |||||||
| Utilities (0.1%) | ||||||||
| 2,870 | Xcel Energy, Inc. | 76,773 | ||||||
|
| |||||||
| Total | 76,773 | |||||||
|
| |||||||
| Total Preferred Stock (cost $461,631) | 499,138 | |||||||
|
| |||||||
| Principal Amount | Short-Term Investments (0.8%)e | |||||||
| Federal National Mortgage Association Discount Notes | ||||||||
| 800,000 | 0.120%, 7/18/2012f,g | 799,952 | ||||||
|
| |||||||
| Total Short-Term Investments (at amortized cost) | 799,952 | |||||||
|
| |||||||
| Total Investments (cost $91,939,173) 98.2% | $ | 95,542,058 | ||||||
|
| |||||||
| Other Assets and Liabilities, Net 1.8% | 1,740,409 | |||||||
|
| |||||||
| Total Net Assets 100.0% | $ | 97,282,467 | ||||||
|
| |||||||
| a | Non-income producing security. |
| b | Denotes variable rate securities. Variable rate securities are securities whose yields vary with a designated market index or market rate. The rate shown is as of June 29, 2012. |
| c | Denotes perpetual securities. Perpetual securities pay an indefinite stream of interest, but may be called by the issuer at an earlier date. |
| d | Denotes securities sold under Rule 144A of the Securities Act of 1933, which exempts them from registration. These securities have been deemed liquid and may be resold to other dealers in the program or to other qualified institutional buyers. As of June 29, 2012, the value of these investments was $1,320,000 or 1.4% of total net assets. |
| e | The interest rate shown reflects the yield, coupon rate or the discount rate at the date of purchase. |
| f | Denotes investments that benefit from credit enhancement or liquidity support provided by a third party bank, institution or government. |
| g | At June 29, 2012, $799,952 of investments were held on deposit with the counterparty and pledged as the initial margin deposit for open futures contracts. |
Definitions:
| ADR - | American Depositary Receipt, which are certificates for an underlying foreign security’s shares held by an issuing U.S. depository bank. |
| REIT - | Real Estate Investment Trust is a company that buys, develops, manages and/or sells real estate assets. |
| ETF - | Exchange Traded Fund. |
Unrealized Appreciation (Depreciation)
Gross unrealized appreciation and depreciation of investments, based on cost for federal income tax purposes, were as follows:
Gross unrealized appreciation | $ | 6,435,521 | ||
Gross unrealized depreciation | (2,924,124 | ) | ||
|
| |||
Net unrealized appreciation (depreciation) | $ | 3,511,397 | ||
Cost for federal income tax purposes | $ | 92,030,661 | ||
The accompanying Notes to Financial Statements are an integral part of this schedule.
181
Table of Contents
Equity Income Plus Portfolio
Schedule of Investments as of June 29, 2012
(unaudited)
Fair Valuation Measurements
The following table is a summary of the inputs used, as of June 29, 2012, in valuing Equity Income Plus Portfolio's assets carried at fair value.
Investments in Securities | Total | Level 1 | Level 2 | Level 3 | ||||||||||||
Common Stock | ||||||||||||||||
Consumer Discretionary | 8,388,152 | 8,388,152 | — | — | ||||||||||||
Consumer Staples | 9,340,700 | 9,340,700 | — | — | ||||||||||||
Energy | 12,171,767 | 12,171,767 | — | — | ||||||||||||
Financials | 21,366,304 | 21,366,304 | — | — | ||||||||||||
Health Care | 9,411,509 | 9,411,509 | — | — | ||||||||||||
Industrials | 6,587,590 | 6,587,590 | — | — | ||||||||||||
Information Technology | 8,080,265 | 8,080,265 | — | — | ||||||||||||
Materials | 4,646,891 | 4,646,891 | — | — | ||||||||||||
Telecommunications Services | 5,270,968 | 5,270,968 | — | — | ||||||||||||
Utilities | 4,431,728 | 4,431,728 | — | — | ||||||||||||
Long-Term Fixed Income | ||||||||||||||||
Energy | 379,180 | — | 379,180 | — | ||||||||||||
Financials | 3,384,115 | — | 3,384,115 | — | ||||||||||||
Utilities | 783,799 | — | 783,799 | — | ||||||||||||
Preferred Stock | ||||||||||||||||
Financials | 422,365 | 422,365 | — | — | ||||||||||||
Utilities | 76,773 | 76,773 | — | — | ||||||||||||
Short-Term Investments | 799,952 | — | 799,952 | — | ||||||||||||
|
|
|
|
|
|
|
| |||||||||
Total | $ | 95,542,058 | $ | 90,195,012 | $ | 5,347,046 | $ | — | ||||||||
|
|
|
|
|
|
|
| |||||||||
Other Financial Instruments | Total | Level 1 | Level 2 | Level 3 | ||||||||||||
Asset Derivatives | ||||||||||||||||
Futures Contracts | 44,455 | 44,455 | — | — | ||||||||||||
|
|
|
|
|
|
|
| |||||||||
Total Asset Derivatives | $ | 44,455 | $ | 44,455 | $ | — | $ | — | ||||||||
|
|
|
|
|
|
|
| |||||||||
There were no significant transfers between the Levels during the period ended June 29, 2012. Transfers between the levels are identified as of the end of the period.
Futures Contracts | Number of Contracts Long/(Short) | Expiration Date | Notional Principal Amount | Value | Unrealized Gain/(Loss) | |||||||||||||||
S&P 500 Index Mini-Futures | 21 | September 2012 | $ | 1,379,765 | $ | 1,424,220 | $ | 44,455 | ||||||||||||
Total Futures Contracts | $ | 44,455 | ||||||||||||||||||
The following table summarizes the fair value and Statement of Assets and Liabilities location, as of June 29, 2012, for Equity Income Plus Portfolio's investments in financial derivative instruments by primary risk exposure as discussed under item (2) Significant Accounting Policies of the Notes to Financial Statements.
Derivatives by risk category | Statement of Assets and Liabilities Location | Fair Value | ||||
Asset Derivatives | ||||||
Equity Contracts | ||||||
Futures* | Net Assets - Net unrealized appreciation/(depreciation) on Futures contracts | 44,455 | ||||
Total Equity Contracts | 44,455 | |||||
|
| |||||
Total Asset Derivatives | $ | 44,455 | ||||
|
| |||||
| * | Includes cumulative appreciation/depreciation of futures contracts as reported in the Schedule of Investments. Only current day's variation margin is reported within the Statement of Assets and Liabilities. |
The accompanying Notes to Financial Statements are an integral part of this schedule.
182
Table of Contents
Equity Income Plus Portfolio
Schedule of Investments as of June 29, 2012
(unaudited)
The following table summarizes the net realized gains/(losses) and Statement of Operations location, for the period ended June 29, 2012, for Equity Income Plus Portfolio's investments in financial derivative instruments by primary risk exposure.
Derivatives by risk category | Statement of Operations Location | Realized Gains/(Losses) recognized in Income | ||||
Equity Contracts | ||||||
Options Written | Net realized gains/(losses) on Written option contracts | (225,240 | ) | |||
Options Purchased | Net realized gains/(losses) on Investments | (127,099 | ) | |||
Futures | Net realized gains/(losses) on Futures contracts | 977,041 | ||||
Total Equity Contracts | 624,702 | |||||
|
| |||||
Total | $624,702 | |||||
|
| |||||
The following table summarizes the change in net unrealized appreciation/(depreciation) and Statement of Operations location, for the period ended June 29, 2012, for Equity Income Plus Portfolio's investments in financial derivative instruments by primary risk exposure.
Derivatives by risk category | Statement of Operations Location | Change in unrealized appreciation/(depreciation) recognized in Income | ||||
Equity Contracts | ||||||
Options Written | Change in net unrealized appreciation/(depreciation) on Written option contracts | 89,026 | ||||
Futures | Change in net unrealized appreciation/(depreciation) on Futures contracts | (130,610 | ) | |||
Total Equity Contracts | 57,616 | |||||
|
| |||||
Total | $57,616 | |||||
|
| |||||
The following table presents Equity Income Plus Portfolio's average volume of derivative activity during the period ended June 29, 2012.
Derivative Risk Category | Futures (Notional*) | Futures (Percentage of Average Net Assets) | Options (Contracts) | |||||||||
Equity Contracts | $ | 6,847,202 | 7.2 | % | 222 | |||||||
| * | Notional amount represents long or short, or both, derivative positions held by the Portfolio. |
The accompanying Notes to Financial Statements are an integral part of this schedule.
183
Table of Contents
Schedule of Investments as of June 29, 2012
(unaudited)
| Shares | Common Stock (63.9%) | Value | ||||||
| Consumer Discretionary (7.1%) | ||||||||
| 1,100 | Abercrombie & Fitch Company | $ | 37,554 | |||||
| 4,500 | Amazon.com, Inc.a | 1,027,575 | ||||||
| 1,500 | Apollo Group, Inc.a | 54,285 | ||||||
| 600 | AutoNation, Inc.a,b | 21,168 | ||||||
| 300 | AutoZone, Inc.a | 110,151 | ||||||
| 3,000 | Bed Bath & Beyond, Inc.a | 185,400 | ||||||
| 3,575 | Best Buy Company, Inc. | 74,932 | ||||||
| 900 | Big Lots, Inc.a | 36,711 | ||||||
| 1,400 | BorgWarner, Inc.a | 91,826 | ||||||
| 2,500 | Cablevision Systems Corporation | 33,225 | ||||||
| 2,900 | CarMax, Inc.a | 75,226 | ||||||
| 5,600 | Carnival Corporation | 191,912 | ||||||
| 8,162 | CBS Corporation | 267,550 | ||||||
| 400 | Chipotle Mexican Grill, Inc.a | 151,980 | ||||||
| 3,700 | Coach, Inc. | 216,376 | ||||||
| 33,865 | Comcast Corporation | 1,082,664 | ||||||
| 3,300 | D.R. Horton, Inc. | 60,654 | ||||||
| 1,700 | Darden Restaurants, Inc. | 86,071 | ||||||
| 800 | DeVry, Inc. | 24,776 | ||||||
| 8,400 | DIRECTVa | 410,088 | ||||||
| 3,200 | Discovery Communications, Inc.a | 172,800 | ||||||
| 3,000 | Dollar Tree, Inc.a | 161,400 | ||||||
| 1,200 | Expedia, Inc. | 57,684 | ||||||
| 1,500 | Family Dollar Stores, Inc. | 99,720 | ||||||
| 46,888 | Ford Motor Company | 449,656 | ||||||
| 600 | Fossil, Inc.a | 45,924 | ||||||
| 2,800 | Gannett Company, Inc. | 41,244 | ||||||
| 4,100 | Gap, Inc. | 112,176 | ||||||
| 2,000 | Genuine Parts Company | 120,500 | ||||||
| 2,900 | Goodyear Tire & Rubber Companya | 34,249 | ||||||
| 3,400 | H&R Block, Inc. | 54,332 | ||||||
| 2,900 | Harley-Davidson, Inc. | 132,617 | ||||||
| 900 | Harman International Industries, Inc. | 35,640 | ||||||
| 1,500 | Hasbro, Inc. | 50,805 | ||||||
| 19,400 | Home Depot, Inc. | 1,028,006 | ||||||
| 3,500 | International Game Technology | 55,125 | ||||||
| 5,189 | Interpublic Group of Companies, Inc. | 56,301 | ||||||
| 1,800 | J.C. Penney Company, Inc. | 41,958 | ||||||
| 8,500 | Johnson Controls, Inc. | 235,535 | ||||||
| 3,200 | Kohl's Corporation | 145,568 | ||||||
| 1,700 | Leggett & Platt, Inc. | 35,921 | ||||||
| 2,100 | Lennar Corporation | 64,911 | ||||||
| 3,162 | Limited Brands, Inc. | 134,480 | ||||||
| 14,800 | Lowe's Companies, Inc. | 420,912 | ||||||
| 5,200 | Macy's, Inc. | 178,620 | ||||||
| 3,263 | Marriott International, Inc. | 127,910 | ||||||
| 4,025 | Mattel, Inc. | 130,571 | ||||||
| 12,700 | McDonald's Corporation | 1,124,331 | ||||||
| 3,500 | McGraw-Hill Companies, Inc. | 157,500 | ||||||
| 800 | Netflix, Inc.a | 54,776 | ||||||
| 3,426 | Newell Rubbermaid, Inc. | 62,148 | ||||||
| 26,600 | News Corporation | 592,914 | ||||||
| 4,700 | NIKE, Inc. | 412,566 | ||||||
| 2,100 | Nordstrom, Inc. | 104,349 | ||||||
| 3,500 | Omnicom Group, Inc. | 170,100 | ||||||
| 1,700 | O’Reilly Automotive, Inc.a | 142,409 | ||||||
| 600 | Priceline.com, Inc.a | 398,712 | ||||||
| 3,837 | Pulte Group, Inc.a | 41,056 | ||||||
| 900 | Ralph Lauren Corporation | 126,054 | ||||||
| 2,900 | Ross Stores, Inc. | 181,163 | ||||||
| 1,300 | Scripps Networks Interactive | 73,918 | ||||||
| 580 | Sears Holdings Corporationa,b | 34,626 | ||||||
| 1,100 | Sherwin-Williams Company | 145,585 | ||||||
| 800 | Snap-On, Inc. | 49,800 | ||||||
| 8,500 | Staples, Inc. | 110,925 | ||||||
| 9,400 | Starbucks Corporation | 501,208 | ||||||
| 2,500 | Starwood Hotels & Resorts Worldwide, Inc. | 132,600 | ||||||
| 8,500 | Target Corporation | 494,615 | ||||||
| 1,600 | Tiffany & Company | 84,720 | ||||||
| 3,980 | Time Warner Cable, Inc. | 326,758 | ||||||
| 12,216 | Time Warner, Inc. | 470,316 | ||||||
| 9,400 | TJX Companies, Inc. | 403,542 | ||||||
| 1,200 | TripAdvisor, Inc.a | 53,628 | ||||||
| 1,400 | Urban Outfitters, Inc.a | 38,626 | ||||||
| 1,100 | VF Corporation | 146,795 | ||||||
| 6,862 | Viacom, Inc. | 322,651 | ||||||
| 22,387 | Walt Disney Company | 1,085,769 | ||||||
| 60 | Washington Post Company | 22,429 | ||||||
| 1,058 | Whirlpool Corporation | 64,707 | ||||||
| 1,932 | Wyndham Worldwide Corporation | 101,894 | ||||||
| 1,100 | Wynn Resorts, Ltd. | 114,092 | ||||||
| 5,820 | Yum! Brands, Inc. | 374,924 | ||||||
|
| |||||||
| Total | 17,186,895 | |||||||
|
| |||||||
| Consumer Staples (7.2%) | ||||||||
| 25,200 | Altria Group, Inc. | 870,660 | ||||||
| 8,241 | Archer-Daniels-Midland Company | 243,274 | ||||||
| 5,200 | Avon Products, Inc. | 84,292 | ||||||
| 2,000 | Beam, Inc. | 124,980 | ||||||
| 1,325 | Brown-Forman Corporation | 128,326 | ||||||
| 2,300 | Campbell Soup Companyb | 76,774 | ||||||
| 1,700 | Clorox Company | 123,182 | ||||||
| 28,300 | Coca-Cola Company | 2,212,777 | ||||||
| 3,700 | Coca-Cola Enterprises, Inc. | 103,748 | ||||||
| 6,100 | Colgate-Palmolive Company | 635,010 | ||||||
| 4,900 | ConAgra Foods, Inc. | 127,057 | ||||||
| 1,900 | Constellation Brands, Inc.a | 51,414 | ||||||
| 5,500 | Costco Wholesale Corporation | 522,500 | ||||||
| 16,105 | CVS Caremark Corporation | 752,587 | ||||||
| 2,100 | Dean Foods Companya | 35,763 | ||||||
| 2,600 | Dr. Pepper Snapple Group, Inc. | 113,750 | ||||||
| 2,900 | Estee Lauder Companies, Inc. | 156,948 | ||||||
| 7,800 | General Mills, Inc. | 300,612 | ||||||
| 4,050 | H.J. Heinz Company | 220,239 | ||||||
| 2,000 | Hershey Company | 144,060 | ||||||
| 1,400 | Hormel Foods Corporation | 42,588 | ||||||
| 1,455 | J.M. Smucker Company | 109,882 | ||||||
| 3,100 | Kellogg Company | 152,923 | ||||||
| 4,980 | Kimberly-Clark Corporation | 417,175 | ||||||
| 21,960 | Kraft Foods, Inc. | 848,095 | ||||||
| 7,300 | Kroger Company | 169,287 | ||||||
| 1,700 | Lorillard, Inc. | 224,315 | ||||||
| 1,600 | McCormick & Company, Inc. | 97,040 | ||||||
| 2,622 | Mead Johnson Nutrition Company | 211,097 | ||||||
| 2,000 | Molson Coors Brewing Company | 83,220 | ||||||
| 2,100 | Monster Beverage Corporationa | 149,520 | ||||||
The accompanying Notes to Financial Statements are an integral part of this schedule.
184
Table of Contents
Balanced Portfolio
Schedule of Investments as of June 29, 2012
(unaudited)
| Shares | Common Stock (63.9%) | Value | ||||||
| Consumer Staples (7.2%) - continued | ||||||||
| 19,597 | PepsiCo, Inc. | $ | 1,384,724 | |||||
| 21,500 | Philip Morris International, Inc. | 1,876,090 | ||||||
| 34,479 | Procter & Gamble Company | 2,111,839 | ||||||
| 4,000 | Reynolds American, Inc. | 179,480 | ||||||
| 3,100 | Safeway, Inc.b | 56,265 | ||||||
| 7,100 | Sysco Corporation | 211,651 | ||||||
| 3,300 | Tyson Foods, Inc. | 62,139 | ||||||
| 10,900 | Walgreen Company | 322,422 | ||||||
| 21,800 | Wal-Mart Stores, Inc. | 1,519,896 | ||||||
| 2,100 | Whole Foods Market, Inc. | 200,172 | ||||||
|
| |||||||
| Total | 17,457,773 | |||||||
|
| |||||||
| Energy (6.9%) | ||||||||
| 2,737 | Alpha Natural Resources, Inc.a | 23,839 | ||||||
| 6,336 | Anadarko Petroleum Corporation | 419,443 | ||||||
| 4,768 | Apache Corporation | 419,060 | ||||||
| 5,561 | Baker Hughes, Inc. | 228,557 | ||||||
| 2,700 | Cabot Oil & Gas Corporation | 106,380 | ||||||
| 3,100 | Cameron International Corporationa | 132,401 | ||||||
| 8,300 | Chesapeake Energy Corporation | 154,380 | ||||||
| 24,774 | Chevron Corporation | 2,613,657 | ||||||
| 15,982 | ConocoPhillips | 893,074 | ||||||
| 2,900 | Consol Energy, Inc. | 87,696 | ||||||
| 4,800 | Denbury Resources, Inc.a | 72,528 | ||||||
| 5,000 | Devon Energy Corporation | 289,950 | ||||||
| 900 | Diamond Offshore Drilling, Inc. | 53,217 | ||||||
| 3,400 | EOG Resources, Inc. | 306,374 | ||||||
| 1,900 | EQT Corporation | 101,897 | ||||||
| 58,634 | Exxon Mobil Corporation | 5,017,311 | ||||||
| 3,000 | FMC Technologies, Inc.a | 117,690 | ||||||
| 11,500 | Halliburton Company | 326,485 | ||||||
| 1,400 | Helmerich & Payne, Inc. | 60,872 | ||||||
| 3,800 | Hess Corporation | 165,110 | ||||||
| 6,700 | Kinder Morgan, Inc. | 215,874 | ||||||
| 8,722 | Marathon Oil Corporation | 223,022 | ||||||
| 4,461 | Marathon Petroleum Corporation | 200,388 | ||||||
| 2,500 | Murphy Oil Corporation | 125,725 | ||||||
| 3,600 | Nabors Industries, Ltd.a | 51,840 | ||||||
| 5,400 | National Oilwell Varco, Inc. | 347,976 | ||||||
| 1,700 | Newfield Exploration Companya | 49,827 | ||||||
| 3,200 | Noble Corporationa | 104,096 | ||||||
| 2,300 | Noble Energy, Inc. | 195,086 | ||||||
| 10,100 | Occidental Petroleum Corporation | 866,277 | ||||||
| 3,400 | Peabody Energy Corporation | 83,368 | ||||||
| 7,991 | Phillips 66a | 265,621 | ||||||
| 1,600 | Pioneer Natural Resources Company | 141,136 | ||||||
| 2,300 | QEP Resources, Inc. | 68,931 | ||||||
| 2,000 | Range Resources Corporation | 123,740 | ||||||
| 1,600 | Rowan Companies plca | 51,728 | ||||||
| 16,625 | Schlumberger, Ltd. | 1,079,129 | ||||||
| 4,400 | Southwestern Energy Companya | 140,492 | ||||||
| 8,221 | Spectra Energy Corporation | 238,902 | ||||||
| 1,400 | Sunoco, Inc. | 66,500 | ||||||
| 1,800 | Tesoro Corporationa | 44,928 | ||||||
| 6,900 | Valero Energy Corporation | 166,635 | ||||||
| 7,900 | Williams Companies, Inc. | 227,678 | ||||||
| 2,433 | WPX Energy, Inc.a | 39,366 | ||||||
|
| |||||||
| Total | 16,708,186 | |||||||
|
| |||||||
| Financials (9.1%) | ||||||||
| 4,300 | ACE, Ltd. | 318,759 | ||||||
| 5,800 | Aflac, Inc. | 247,022 | ||||||
| 6,296 | Allstate Corporation | 220,927 | ||||||
| 12,700 | American Express Company | 739,267 | ||||||
| 8,420 | American International Group, Inc.a | 270,198 | ||||||
| 5,000 | American Tower Corporation | 349,550 | ||||||
| 2,840 | Ameriprise Financial, Inc. | 148,418 | ||||||
| 4,150 | Aon plc | 194,137 | ||||||
| 1,854 | Apartment Investment & Management Company | 50,114 | ||||||
| 1,200 | Assurant, Inc. | 41,808 | ||||||
| 1,253 | AvalonBay Communities, Inc. | 177,274 | ||||||
| 133,854 | Bank of America Corporation | 1,094,926 | ||||||
| 14,901 | Bank of New York Mellon Corporation | 327,077 | ||||||
| 8,800 | BB&T Corporation | 271,480 | ||||||
| 21,950 | Berkshire Hathaway, Inc.a | 1,829,093 | ||||||
| 1,600 | BlackRock, Inc. | 271,712 | ||||||
| 1,900 | Boston Properties, Inc. | 205,903 | ||||||
| 7,265 | Capital One Financial Corporation | 397,105 | ||||||
| 4,000 | CBRE Group, Inc.a | 65,440 | ||||||
| 13,025 | Charles Schwab Corporation | 168,413 | ||||||
| 3,400 | Chubb Corporation | 247,588 | ||||||
| 1,751 | Cincinnati Financial Corporation | 66,661 | ||||||
| 36,638 | Citigroup, Inc. | 1,004,248 | ||||||
| 800 | CME Group, Inc. | 214,488 | ||||||
| 2,400 | Comerica, Inc. | 73,704 | ||||||
| 6,695 | Discover Financial Services | 231,513 | ||||||
| 2,930 | E*TRADE Financial Corporationa | 23,557 | ||||||
| 3,800 | Equity Residential | 236,968 | ||||||
| 1,000 | Federated Investors, Inc. | 21,850 | ||||||
| 11,016 | Fifth Third Bancorp | 147,614 | ||||||
| 2,744 | First Horizon National Corporation | 23,736 | ||||||
| 1,700 | Franklin Resources, Inc. | 188,683 | ||||||
| 5,800 | Genworth Financial, Inc.a | 32,828 | ||||||
| 6,300 | Goldman Sachs Group, Inc. | 603,918 | ||||||
| 5,400 | Hartford Financial Services Group, Inc. | 95,202 | ||||||
| 5,200 | HCP, Inc. | 229,580 | ||||||
| 2,700 | Health Care REIT, Inc. | 157,410 | ||||||
| 8,347 | Host Hotels & Resorts, Inc. | 132,049 | ||||||
| 5,300 | Hudson City Bancorp, Inc. | 33,761 | ||||||
| 9,516 | Huntington Bancshares, Inc. | 60,902 | ||||||
| 1,000 | IntercontinentalExchange, Inc.a | 135,980 | ||||||
| 5,400 | Invesco, Ltd. | 122,040 | ||||||
| 47,824 | J.P. Morgan Chase & Company | 1,708,751 | ||||||
| 10,400 | KeyCorp | 80,496 | ||||||
| 4,600 | Kimco Realty Corporation | 87,538 | ||||||
| 1,500 | Legg Mason, Inc. | 39,555 | ||||||
| 2,400 | Leucadia National Corporation | 51,048 | ||||||
| 3,611 | Lincoln National Corporation | 78,973 | ||||||
| 3,700 | Loews Corporation | 151,367 | ||||||
| 1,600 | M&T Bank Corporation | 132,112 | ||||||
| 6,500 | Marsh & McLennan Companies, Inc. | 209,495 | ||||||
| 13,216 | MetLife, Inc. | 407,714 | ||||||
| 2,500 | Moody’s Corporation | 91,375 | ||||||
| 18,890 | Morgan Stanley | 275,605 | ||||||
| 1,400 | NASDAQ OMX Group, Inc. | 31,738 | ||||||
The accompanying Notes to Financial Statements are an integral part of this schedule.
185
Table of Contents
Balanced Portfolio
Schedule of Investments as of June 29, 2012
(unaudited)
| Shares | Common Stock (63.9%) | Value | ||||||
| Financials (9.1%) - continued | ||||||||
| 3,100 | Northern Trust Corporation | $ | 142,662 | |||||
| 3,200 | NYSE Euronext | 81,856 | ||||||
| 3,600 | People’s United Financial, Inc. | 41,796 | ||||||
| 2,100 | Plum Creek Timber Company, Inc. | 83,370 | ||||||
| 6,620 | PNC Financial Services Group, Inc. | 404,548 | ||||||
| 3,600 | Principal Financial Group, Inc. | 94,428 | ||||||
| 7,000 | Progressive Corporation | 145,810 | ||||||
| 5,681 | Prologis, Inc. | 188,780 | ||||||
| 5,900 | Prudential Financial, Inc. | 285,737 | ||||||
| 1,700 | Public Storage, Inc. | 245,497 | ||||||
| 18,200 | Regions Financial Corporation | 122,850 | ||||||
| 3,753 | Simon Property Group, Inc. | 584,192 | ||||||
| 6,000 | SLM Corporation | 94,260 | ||||||
| 6,200 | State Street Corporation | 276,768 | ||||||
| 6,600 | SunTrust Banks, Inc. | 159,918 | ||||||
| 3,200 | T. Rowe Price Group, Inc. | 201,472 | ||||||
| 1,300 | Torchmark Corporation | 65,715 | ||||||
| 4,925 | Travelers Companies, Inc. | 314,412 | ||||||
| 23,521 | U.S. Bancorp | 756,435 | ||||||
| 3,258 | Unum Group | 62,326 | ||||||
| 3,700 | Ventas, Inc. | 233,544 | ||||||
| 2,370 | Vornado Realty Trust | 199,033 | ||||||
| 66,682 | Wells Fargo & Company | 2,229,846 | ||||||
| 6,540 | Weyerhaeuser Company REIT | 146,234 | ||||||
| 3,700 | XL Group plc | 77,848 | ||||||
| 2,400 | Zions Bancorporation | 46,608 | ||||||
|
| |||||||
| Total | 22,104,615 | |||||||
|
| |||||||
| Health Care (7.6%) | ||||||||
| 19,700 | Abbott Laboratories | 1,270,059 | ||||||
| 4,356 | Aetna, Inc. | 168,882 | ||||||
| 2,300 | Alexion Pharmaceuticals, Inc.a | 228,390 | ||||||
| 3,900 | Allergan, Inc. | 361,023 | ||||||
| 3,200 | AmerisourceBergen Corporation | 125,920 | ||||||
| 9,952 | Amgen, Inc. | 726,894 | ||||||
| 7,100 | Baxter International, Inc. | 377,365 | ||||||
| 2,700 | Becton, Dickinson and Company | 201,825 | ||||||
| 3,030 | Biogen Idec, Inc.a | 437,471 | ||||||
| 16,550 | Boston Scientific Corporationa | 93,839 | ||||||
| 21,205 | Bristol-Myers Squibb Company | 762,320 | ||||||
| 1,100 | C.R. Bard, Inc. | 118,184 | ||||||
| 4,275 | Cardinal Health, Inc. | 179,550 | ||||||
| 2,687 | CareFusion Corporationa | 69,002 | ||||||
| 5,600 | Celgene Corporationa | 359,296 | ||||||
| 1,900 | Cerner Corporationa | 157,054 | ||||||
| 3,600 | CIGNA Corporation | 158,400 | ||||||
| 1,850 | Coventry Health Care, Inc. | 58,812 | ||||||
| 6,100 | Covidien plc | 326,350 | ||||||
| 1,200 | DaVita, Inc.a | 117,852 | ||||||
| 1,800 | DENTSPLY International, Inc. | 68,058 | ||||||
| 1,500 | Edwards Lifesciences Corporationa | 154,950 | ||||||
| 12,600 | Eli Lilly and Company | 540,666 | ||||||
| 10,077 | Express Scripts Holding Companya | 562,599 | ||||||
| 3,200 | Forest Laboratories, Inc.a | 111,968 | ||||||
| 9,500 | Gilead Sciences, Inc.a | 487,160 | ||||||
| 2,130 | Hospira, Inc.a | 74,507 | ||||||
| 2,100 | Humana, Inc. | 162,624 | ||||||
| 500 | Intuitive Surgical, Inc.a | 276,895 | ||||||
| 34,406 | Johnson & Johnson | 2,324,469 | ||||||
| 1,300 | Laboratory Corporation of America Holdingsa | 120,393 | ||||||
| 2,337 | Life Technologies Corporationa | 105,142 | ||||||
| 2,980 | McKesson Corporation | 279,375 | ||||||
| 13,100 | Medtronic, Inc. | 507,363 | ||||||
| 38,027 | Merck & Company, Inc. | 1,587,627 | ||||||
| 5,200 | Mylan, Inc.a | 111,124 | ||||||
| 1,200 | Patterson Companies, Inc. | 41,364 | ||||||
| 1,500 | PerkinElmer, Inc. | 38,700 | ||||||
| 1,200 | Perrigo Company | 141,516 | ||||||
| 94,055 | Pfizer, Inc. | 2,163,265 | ||||||
| 2,000 | Quest Diagnostics, Inc. | 119,800 | ||||||
| 3,980 | St. Jude Medical, Inc. | 158,842 | ||||||
| 4,100 | Stryker Corporation | 225,910 | ||||||
| 4,450 | Tenet Healthcare Corporationa | 23,318 | ||||||
| 4,600 | Thermo Fisher Scientific, Inc. | 238,786 | ||||||
| 13,100 | UnitedHealth Group, Inc. | 766,350 | ||||||
| 1,500 | Varian Medical Systems, Inc.a | 91,155 | ||||||
| 1,200 | Waters Corporationa | 95,364 | ||||||
| 1,700 | Watson Pharmaceuticals, Inc.a | 125,783 | ||||||
| 4,200 | WellPoint, Inc. | 267,918 | ||||||
| 2,290 | Zimmer Holdings, Inc. | 147,384 | ||||||
|
| |||||||
| Total | 18,418,863 | |||||||
|
| |||||||
| Industrials (6.7%) | ||||||||
| 8,700 | 3M Company | 779,520 | ||||||
| 1,300 | Avery Dennison Corporation | 35,542 | ||||||
| 9,428 | Boeing Company | 700,500 | ||||||
| 2,100 | C.H. Robinson Worldwide, Inc. | 122,913 | ||||||
| 8,200 | Caterpillar, Inc. | 696,262 | ||||||
| 1,400 | Cintas Corporation | 54,054 | ||||||
| 2,000 | Cooper Industries plc | 136,360 | ||||||
| 12,800 | CSX Corporation | 286,208 | ||||||
| 2,500 | Cummins, Inc. | 242,275 | ||||||
| 7,100 | Danaher Corporation | 369,768 | ||||||
| 5,100 | Deere & Company | 412,437 | ||||||
| 2,400 | Dover Corporation | 128,664 | ||||||
| 700 | Dun & Bradstreet Corporation | 49,819 | ||||||
| 4,200 | Eaton Corporation | 166,446 | ||||||
| 9,200 | Emerson Electric Company | 428,536 | ||||||
| 1,600 | Equifax, Inc. | 74,560 | ||||||
| 2,700 | Expeditors International of Washington, Inc. | 104,625 | ||||||
| 3,800 | Fastenal Company | 153,178 | ||||||
| 4,040 | FedEx Corporation | 370,104 | ||||||
| 800 | First Solar, Inc.a,b | 12,048 | ||||||
| 700 | Flowserve Corporation | 80,325 | ||||||
| 2,100 | Fluor Corporation | 103,614 | ||||||
| 4,400 | General Dynamics Corporation | 290,224 | ||||||
| 132,600 | General Electric Company | 2,763,384 | ||||||
| 1,600 | Goodrich Corporation | 203,040 | ||||||
| 9,637 | Honeywell International, Inc. | 538,130 | ||||||
| 6,000 | Illinois Tool Works, Inc. | 317,340 | ||||||
| 3,700 | Ingersoll-Rand plc | 156,066 | ||||||
| 2,000 | Iron Mountain, Inc. | 65,920 | ||||||
| 1,700 | Jacobs Engineering Group, Inc.a | 64,362 | ||||||
| 1,400 | Joy Global, Inc. | 79,422 | ||||||
| 1,300 | L-3 Communications Holdings, Inc. | 96,213 | ||||||
| 3,400 | Lockheed Martin Corporation | 296,072 | ||||||
| 4,200 | Masco Corporation | 58,254 | ||||||
The accompanying Notes to Financial Statements are an integral part of this schedule.
186
Table of Contents
Balanced Portfolio
Schedule of Investments as of June 29, 2012
(unaudited)
| Shares | Common Stock (63.9%) | Value | ||||||
| Industrials (6.7%) - continued | |||||||
| 4,200 | Norfolk Southern Corporation | $ | 301,434 | |||||
| 3,206 | Northrop Grumman Corporation | 204,511 | ||||||
| 4,550 | PACCAR, Inc. | 178,315 | ||||||
| 1,500 | Pall Corporation | 82,215 | ||||||
| 1,950 | Parker Hannifin Corporation | 149,916 | ||||||
| 2,200 | Pitney Bowes, Inc.b | 32,934 | ||||||
| 1,900 | Precision Castparts Corporation | 312,531 | ||||||
| 2,500 | Quanta Services, Inc.a | 60,175 | ||||||
| 1,900 | R.R. Donnelley & Sons Companyb | 22,363 | ||||||
| 4,300 | Raytheon Company | 243,337 | ||||||
| 4,005 | Republic Services, Inc. | 105,972 | ||||||
| 1,700 | Robert Half International, Inc. | 48,569 | ||||||
| 1,800 | Rockwell Automation, Inc. | 118,908 | ||||||
| 1,900 | Rockwell Collins, Inc. | 93,765 | ||||||
| 1,300 | Roper Industries, Inc. | 128,154 | ||||||
| 700 | Ryder System, Inc. | 25,207 | ||||||
| 8,480 | Southwest Airlines Company | 78,186 | ||||||
| 2,200 | Stanley Black & Decker, Inc. | 141,592 | ||||||
| 1,100 | Stericycle, Inc.a | 100,837 | ||||||
| 3,500 | Textron, Inc. | 87,045 | ||||||
| 5,800 | Tyco International, Ltd. | 306,530 | ||||||
| 6,100 | Union Pacific Corporation | 727,791 | ||||||
| 12,100 | United Parcel Service, Inc. | 952,996 | ||||||
| 11,400 | United Technologies Corporation | 861,042 | ||||||
| 800 | W.W. Grainger, Inc. | 152,992 | ||||||
| 5,830 | Waste Management, Inc. | 194,722 | ||||||
| 2,200 | Xylem, Inc. | 55,374 | ||||||
|
| |||||||
| Total | 16,203,598 | |||||||
|
| |||||||
| Information Technology (12.7%) | |||||||
| 8,200 | Accenture plc | 492,738 | ||||||
| 6,100 | Adobe Systems, Inc.a | 197,457 | ||||||
| 6,900 | Advanced Micro Devices, Inc.a | 39,537 | ||||||
| 4,363 | Agilent Technologies, Inc. | 171,204 | ||||||
| 2,300 | Akamai Technologies, Inc.a | 73,025 | ||||||
| 4,100 | Altera Corporation | 138,744 | ||||||
| 2,100 | Amphenol Corporation | 115,332 | ||||||
| 3,700 | Analog Devices, Inc. | 139,379 | ||||||
| 11,700 | Apple, Inc.a | 6,832,800 | ||||||
| 15,600 | Applied Materials, Inc. | 178,776 | ||||||
| 2,900 | Autodesk, Inc.a | 101,471 | ||||||
| 6,200 | Automatic Data Processing, Inc. | 345,092 | ||||||
| 2,100 | BMC Software, Inc.a | 89,628 | ||||||
| 6,150 | Broadcom Corporationa | 207,870 | ||||||
| 4,475 | CA, Inc. | 121,228 | ||||||
| 67,200 | Cisco Systems, Inc. | 1,153,824 | ||||||
| 2,400 | Citrix Systems, Inc.a | 201,456 | ||||||
| 3,900 | Cognizant Technology Solutions Corporationa | 234,000 | ||||||
| 2,000 | Computer Sciences Corporation | 49,640 | ||||||
| 18,800 | Corning, Inc. | 243,084 | ||||||
| 18,800 | Dell, Inc.a | 235,376 | ||||||
| 14,300 | eBay, Inc.a | 600,743 | ||||||
| 4,000 | Electronic Arts, Inc.a | 49,400 | ||||||
| 26,324 | EMC Corporationa | 674,684 | ||||||
| 1,100 | F5 Networks, Inc.a | 109,516 | ||||||
| 2,900 | Fidelity National Information Services, Inc. | 98,832 | ||||||
| 1,750 | Fiserv, Inc.a | 126,385 | ||||||
| 1,900 | FLIR Systems, Inc. | 37,050 | ||||||
| 1,600 | GameStop Corporationb | 29,376 | ||||||
| 3,200 | Google, Inc.a | 1,856,224 | ||||||
| 1,500 | Harris Corporation | 62,775 | ||||||
| 24,661 | Hewlett-Packard Company | 495,933 | ||||||
| 63,100 | Intel Corporation | 1,681,615 | ||||||
| 14,500 | International Business Machines Corporation | 2,835,910 | ||||||
| 3,800 | Intuit, Inc. | 225,530 | ||||||
| 2,400 | Jabil Circuit, Inc. | 48,792 | ||||||
| 2,800 | JDS Uniphase Corporationa | 30,800 | ||||||
| 6,500 | Juniper Networks, Inc.a | 106,015 | ||||||
| 2,100 | KLA-Tencor Corporation | 103,425 | ||||||
| 2,600 | Lam Research Corporationa | 98,124 | ||||||
| 900 | Lexmark International, Inc. | 23,922 | ||||||
| 2,900 | Linear Technology Corporation | 90,857 | ||||||
| 6,600 | LSI Corporationa | 42,042 | ||||||
| 1,300 | MasterCard, Inc. | 559,143 | ||||||
| 2,500 | Microchip Technology, Inc.b | 82,700 | ||||||
| 12,000 | Micron Technology, Inc.a | 75,720 | ||||||
| 93,500 | Microsoft Corporation | 2,860,165 | ||||||
| 1,650 | Molex, Inc. | 39,501 | ||||||
| 3,717 | Motorola Solutions, Inc. | 178,825 | ||||||
| 4,600 | NetApp, Inc.a | 146,372 | ||||||
| 7,550 | NVIDIA Corporationa | 104,341 | ||||||
| 49,059 | Oracle Corporation | 1,457,052 | ||||||
| 3,850 | Paychex, Inc. | 120,929 | ||||||
| 21,500 | QUALCOMM, Inc. | 1,197,120 | ||||||
| 2,500 | Red Hat, Inc.a | 141,200 | ||||||
| 2,900 | SAIC, Inc. | 35,148 | ||||||
| 1,800 | Salesforce.com, Inc.a | 248,868 | ||||||
| 3,100 | SanDisk Corporationa | 113,088 | ||||||
| 4,700 | Seagate Technology plc | 116,231 | ||||||
| 8,772 | Symantec Corporationa | 128,159 | ||||||
| 5,400 | TE Connectivity, Ltd. | 172,314 | ||||||
| 2,200 | Teradata Corporationa | 158,422 | ||||||
| 2,200 | Teradyne, Inc.a | 30,932 | ||||||
| 14,200 | Texas Instruments, Inc. | 407,398 | ||||||
| 2,100 | Total System Services, Inc. | 50,253 | ||||||
| 2,100 | VeriSign, Inc.a | 91,497 | ||||||
| 6,200 | Visa, Inc. | 766,506 | ||||||
| 3,000 | Western Digital Corporationa | 91,440 | ||||||
| 7,462 | Western Union Company | 125,660 | ||||||
| 15,783 | Xerox Corporation | 124,212 | ||||||
| 3,200 | Xilinx, Inc. | 107,424 | ||||||
| 15,000 | Yahoo!, Inc.a | 237,450 | ||||||
|
| |||||||
| Total | 30,757,681 | |||||||
|
| |||||||
| Materials (2.1%) | |||||||
| 2,700 | Air Products and Chemicals, Inc. | 217,971 | ||||||
| 900 | Airgas, Inc. | 75,609 | ||||||
| 12,464 | Alcoa, Inc. | 109,060 | ||||||
| 1,381 | Allegheny Technologies, Inc. | 44,040 | ||||||
| 2,000 | Ball Corporation | 82,100 | ||||||
| 1,400 | Bemis Company, Inc. | 43,876 | ||||||
| 900 | CF Industries Holdings, Inc. | 174,366 | ||||||
| 1,700 | Cliffs Natural Resources, Inc. | 83,793 | ||||||
| 14,777 | Dow Chemical Company | 465,476 | ||||||
| 11,619 | E.I. du Pont de Nemours and Company | 587,573 | ||||||
| 1,800 | Eastman Chemical Company | 90,666 | ||||||
| 3,600 | Ecolab, Inc.b | 246,708 | ||||||
| 1,800 | FMC Corporation | 96,264 | ||||||
The accompanying Notes to Financial Statements are an integral part of this schedule.
187
Table of Contents
Balanced Portfolio
Schedule of Investments as of June 29, 2012
(unaudited)
| Shares | Common Stock (63.9%) | Value | ||||||
| Materials (2.1%) - continued | |||||||
| 11,888 | Freeport-McMoRan Copper & Gold, Inc. | $ | 405,024 | |||||
| 1,100 | International Flavors & Fragrances, Inc. | 60,280 | ||||||
| 5,421 | International Paper Company | 156,721 | ||||||
| 1,980 | MeadWestvaco Corporation | 56,925 | ||||||
| 6,766 | Monsanto Company | 560,089 | ||||||
| 3,800 | Mosaic Company | 208,088 | ||||||
| 6,117 | Newmont Mining Corporation | 296,736 | ||||||
| 3,900 | Nucor Corporation | 147,810 | ||||||
| 2,000 | Owens-Illinois, Inc.a | 38,340 | ||||||
| 2,000 | PPG Industries, Inc. | 212,240 | ||||||
| 3,800 | Praxair, Inc. | 413,174 | ||||||
| 2,128 | Sealed Air Corporation | 32,856 | ||||||
| 1,600 | Sigma-Aldrich Corporation | 118,288 | ||||||
| 600 | Titanium Metals Corporation | 6,786 | ||||||
| 1,800 | United States Steel Corporationb | 37,080 | ||||||
| 1,700 | Vulcan Materials Company | 67,507 | ||||||
|
| |||||||
| Total | 5,135,446 | |||||||
|
| |||||||
| Telecommunications Services (2.1%) | |||||||
| 73,879 | AT&T, Inc. | 2,634,525 | ||||||
| 7,694 | CenturyLink, Inc. | 303,836 | ||||||
| 3,200 | Crown Castle International Corporationa | 187,712 | ||||||
| 11,110 | Frontier Communications Corporationb | 42,552 | ||||||
| 3,500 | MetroPCS Communications, Inc.a | 21,175 | ||||||
| 35,969 | Sprint Nextel Corporationa | 117,259 | ||||||
| 35,470 | Verizon Communications, Inc. | 1,576,287 | ||||||
| 6,217 | Windstream Corporationb | 60,056 | ||||||
|
| |||||||
| Total | 4,943,402 | |||||||
|
| |||||||
| Utilities (2.4%) | |||||||
| 7,400 | AES Corporationa | 94,942 | ||||||
| 1,386 | AGL Resources, Inc. | 53,707 | ||||||
| 2,800 | Ameren Corporation | 93,912 | ||||||
| 5,940 | American Electric Power Company, Inc. | 237,006 | ||||||
| 5,324 | CenterPoint Energy, Inc. | 110,047 | ||||||
| 2,700 | CMS Energy Corporation | 63,450 | ||||||
| 3,700 | Consolidated Edison, Inc. | 230,103 | ||||||
| 7,130 | Dominion Resources, Inc. | 385,020 | ||||||
| 2,200 | DTE Energy Company | 130,526 | ||||||
| 16,742 | Duke Energy Corporation | 386,071 | ||||||
| 4,100 | Edison International, Inc. | 189,420 | ||||||
| 2,200 | Entergy Corporation | 149,358 | ||||||
| 10,685 | Exelon Corporation | 401,970 | ||||||
| 5,267 | FirstEnergy Corporation | 259,084 | ||||||
| 907 | Integrys Energy Group, Inc. | 51,581 | ||||||
| 5,200 | NextEra Energy, Inc. | 357,812 | ||||||
| 3,634 | NiSource, Inc. | 89,941 | ||||||
| 3,900 | Northeast Utilities | 151,359 | ||||||
| 2,600 | NRG Energy, Inc.a | 45,136 | ||||||
| 2,800 | ONEOK, Inc. | 118,468 | ||||||
| 2,300 | Pepco Holdings, Inc. | 45,011 | ||||||
| 5,200 | PG&E Corporation | 235,404 | ||||||
| 1,300 | Pinnacle West Capital Corporation | 67,262 | ||||||
| 7,300 | PPL Corporation | 203,013 | ||||||
| 3,691 | Progress Energy, Inc. | 222,087 | ||||||
| 6,400 | Public Service Enterprise Group, Inc. | 208,000 | ||||||
| 1,500 | SCANA Corporation | 71,760 | ||||||
| 3,087 | Sempra Energy | 212,633 | ||||||
| 10,900 | Southern Company | 504,670 | ||||||
| 2,700 | TECO Energy, Inc. | 48,762 | ||||||
| 2,600 | Wisconsin Energy Corporation | 102,882 | ||||||
| 5,610 | Xcel Energy, Inc. | 159,380 | ||||||
| Total | 5,679,777 | |||||||
|
| |||||||
| Total Common Stock (cost $123,951,576) | 154,596,236 | |||||||
|
| |||||||
| Principal Amount | Long-Term Fixed Income (36.7%) | |||||||
| Asset-Backed Securities (1.3%) | |||||||
Countrywide Home Loans, Inc. | ||||||||
| 389,519 | 6.085%, 6/25/2021c | 273,024 | ||||||
Credit Based Asset Servicing and Securitization, LLC | ||||||||
| 297,842 | 4.624%, 12/25/2036 | 176,950 | ||||||
First Horizon ABS Trust | ||||||||
| 390,517 | 0.375%, 10/25/2026c,d | 289,018 | ||||||
| 720,220 | 0.405%, 10/25/2034c,d | 465,053 | ||||||
GMAC Mortgage Corporation Loan Trust | ||||||||
| 1,128,129 | 0.425%, 8/25/2035c,d | 750,839 | ||||||
| 689,003 | 0.425%, 12/25/2036c,d | 489,274 | ||||||
IndyMac Seconds Asset-Backed Trust | ||||||||
| 376,403 | 0.415%, 10/25/2036c,d | 67,972 | ||||||
Wachovia Asset Securitization, Inc. | ||||||||
| 860,090 | 0.385%, 7/25/2037c,d,e | 616,806 | ||||||
|
| |||||||
| Total | 3,128,936 | |||||||
|
| |||||||
| Basic Materials (0.1%) | |||||||
Alcoa, Inc. | ||||||||
| 250,000 | 5.400%, 4/15/2021 | 248,942 | ||||||
Freeport-McMoRan Copper & Gold, Inc. | ||||||||
| 100,000 | 3.550%, 3/1/2022 | 98,388 | ||||||
|
| |||||||
| Total | 347,330 | |||||||
|
| |||||||
| Capital Goods (0.3%) | |||||||
Caterpillar Financial Services Corporation | ||||||||
| 175,000 | 1.625%, 6/1/2017 | 175,856 | ||||||
John Deere Capital Corporation | ||||||||
| 175,000 | 0.638%, 6/16/2014d | 175,511 | ||||||
United Technologies Corporation | ||||||||
| 225,000 | 6.050%, 6/1/2036 | 290,346 | ||||||
|
| |||||||
| Total | 641,713 | |||||||
|
| |||||||
| Collateralized Mortgage Obligations (<0.1%) | |||||||
Bear Stearns Mortgage Funding Trust | ||||||||
| 168,264 | 0.525%, 8/25/2036d | 47,921 | ||||||
|
| |||||||
| Total | 47,921 | |||||||
|
| |||||||
The accompanying Notes to Financial Statements are an integral part of this schedule.
188
Table of Contents
Balanced Portfolio
Schedule of Investments as of June 29, 2012
(unaudited)
| Principal Amount | Long-Term Fixed Income (36.7%) | Value | ||||||
| Commercial Mortgage-Backed Securities (2.8%) | ||||||||
Banc of America Commercial Mortgage, Inc. | ||||||||
| $ 600,000 | 5.805%, 6/10/2049 | $ | 677,860 | |||||
Bear Stearns Commercial Mortgage Securities, Inc. | ||||||||
| 645,784 | 0.392%, 3/15/2022d,f | 636,156 | ||||||
Commercial Mortgage Pass- Through Certificates | ||||||||
| 2,000,000 | 0.372%, 12/15/2020d,f | 1,816,346 | ||||||
| 750,000 | 5.306%, 12/10/2046 | 842,579 | ||||||
Credit Suisse Mortgage Capital Certificates | ||||||||
| 810,219 | 0.412%, 10/15/2021d,f | 758,044 | ||||||
| 700,000 | 5.467%, 9/15/2039 | 775,007 | ||||||
GE Capital Commercial Mortgage Corporation | ||||||||
| 84,053 | 4.641%, 3/10/2040 | 85,438 | ||||||
GS Mortgage Securities Corporation II | ||||||||
| 1,000,000 | 1.260%, 3/6/2020d,f | 986,447 | ||||||
Morgan Stanley Capital I | ||||||||
| 225,000 | 3.224%, 7/15/2049 | 239,841 | ||||||
|
| |||||||
| Total | 6,817,718 | |||||||
|
| |||||||
| Communications Services (0.6%) | ||||||||
AT&T, Inc. | ||||||||
| 200,000 | 6.400%, 5/15/2038 | 251,727 | ||||||
CBS Corporation | ||||||||
| 200,000 | 7.875%, 9/1/2023 | 251,437 | ||||||
CenturyLink, Inc. | ||||||||
| 125,000 | 5.800%, 3/15/2022 | 124,438 | ||||||
Cox Communications, Inc. | ||||||||
| 115,000 | 6.450%, 12/1/2036f | 131,999 | ||||||
Crown Castle Towers, LLC | ||||||||
| 250,000 | 4.174%, 8/15/2017f | 264,245 | ||||||
Time Warner Cable, Inc. | ||||||||
| 200,000 | 7.300%, 7/1/2038 | 256,866 | ||||||
Vodafone Group plc | ||||||||
| 150,000 | 1.625%, 3/20/2017 | 150,026 | ||||||
|
| |||||||
| Total | 1,430,738 | |||||||
|
| |||||||
| Consumer Cyclical (0.7%) | ||||||||
California Institute of Technology | ||||||||
| 175,000 | 4.700%, 11/1/2111 | 190,337 | ||||||
Ford Motor Credit Company, LLC | ||||||||
| 150,000 | 3.000%, 6/12/2017 | 149,173 | ||||||
FUEL Trust | ||||||||
| 100,000 | 4.207%, 4/15/2016f | 103,838 | ||||||
| 200,000 | 3.984%, 6/15/2016f | 205,982 | ||||||
Time Warner, Inc. | ||||||||
| 125,000 | 3.400%, 6/15/2022 | 126,050 | ||||||
Wal-Mart Stores, Inc. | ||||||||
| 150,000 | 7.550%, 2/15/2030 | 224,817 | ||||||
Walt Disney Company | ||||||||
| 500,000 | 5.625%, 9/15/2016 | 587,965 | ||||||
|
| |||||||
| Total | 1,588,162 | |||||||
|
| |||||||
| Consumer Non-Cyclical (1.2%) | ||||||||
AmerisourceBergen Corporation | ||||||||
| 300,000 | 4.875%, 11/15/2019 | 343,071 | ||||||
Beam, Inc. | ||||||||
| 150,000 | 1.875%, 5/15/2017 | 150,722 | ||||||
Boston Scientific Corporation | ||||||||
| 225,000 | 7.000%, 11/15/2035 | 280,914 | ||||||
Bunge Limited Finance Corporation | ||||||||
| 150,000 | 3.200%, 6/15/2017 | 150,332 | ||||||
Colgate-Palmolive Company | ||||||||
| 250,000 | 1.250%, 5/1/2014 | 253,095 | ||||||
Diageo Capital plc | ||||||||
| 150,000 | 1.500%, 5/11/2017 | 150,553 | ||||||
GlaxoSmithKline Capital, Inc. | ||||||||
| 200,000 | 6.375%, 5/15/2038 | 275,013 | ||||||
Grupo Bimbo SAB de CV | ||||||||
| 100,000 | 4.500%, 1/25/2022f | 106,380 | ||||||
Kraft Foods, Inc. | ||||||||
| 150,000 | 2.250%, 6/5/2017f | 153,582 | ||||||
Molson Coors Brewing Company | ||||||||
| 175,000 | 2.000%, 5/1/2017 | 176,600 | ||||||
Philip Morris International, Inc. | ||||||||
| 200,000 | 6.375%, 5/16/2038 | 267,555 | ||||||
Wyeth | ||||||||
| 450,000 | 6.000%, 2/15/2036 | 588,548 | ||||||
|
| |||||||
| Total | 2,896,365 | |||||||
|
| |||||||
| Energy (0.6%) | ||||||||
BP Capital Markets plc | ||||||||
| 250,000 | 4.742%, 3/11/2021 | 286,148 | ||||||
Cameron International Corporation | ||||||||
| 100,000 | 4.500%, 6/1/2021 | 106,960 | ||||||
Energy Transfer Partners, LP | ||||||||
| 300,000 | 6.700%, 7/1/2018 | 344,116 | ||||||
NiSource Finance Corporation | ||||||||
| 150,000 | 3.850%, 2/15/2023 | 149,855 | ||||||
Petro-Canada | ||||||||
| 200,000 | 6.800%, 5/15/2038 | 249,633 | ||||||
Phillips 66 | ||||||||
| 175,000 | 1.950%, 3/5/2015f | 176,253 | ||||||
| 125,000 | 4.300%, 4/1/2022f | 131,496 | ||||||
|
| |||||||
| Total | 1,444,461 | |||||||
|
| |||||||
| Financials (2.4%) | ||||||||
Bank of America Corporation | ||||||||
| 75,000 | 5.875%, 2/7/2042 | 82,154 | ||||||
Barclays Bank plc | ||||||||
| 200,000 | 5.000%, 9/22/2016b | 217,192 | ||||||
Bear Stearns Companies, LLC | ||||||||
| 250,000 | 4.650%, 7/2/2018 | 263,194 | ||||||
Berkshire Hathaway, Inc. | ||||||||
| 150,000 | 1.600%, 5/15/2017 | 151,044 | ||||||
Chubb Corporation | ||||||||
| 400,000 | 6.500%, 5/15/2038 | 543,707 | ||||||
Citigroup, Inc. | ||||||||
| 250,000 | 1.398%, 4/1/2014d | 246,000 | ||||||
Cooperatieve Centrale Raiffeisen- Boerenleenbank BA | ||||||||
| 100,000 | 4.750%, 1/15/2020f | 108,485 | ||||||
Credit Suisse AG Guernsey | ||||||||
| 350,000 | 1.625%, 3/6/2015f | 351,236 | ||||||
The accompanying Notes to Financial Statements are an integral part of this schedule.
189
Table of Contents
Schedule of Investments as of June 29, 2012
(unaudited)
| Principal Amount | Long-Term Fixed Income (36.7%) | Value | ||||||
| Financials (2.4%) - continued | ||||||||
Dartmouth College | ||||||||
| $125,000 | 3.760%, 6/1/2043 | $ | 124,544 | |||||
General Electric Capital Corporation | ||||||||
| 225,000 | 5.875%, 1/14/2038 | 258,301 | ||||||
HCP, Inc. | ||||||||
| 175,000 | 3.750%, 2/1/2016 | 181,997 | ||||||
Health Care REIT, Inc. | ||||||||
| 300,000 | 6.125%, 4/15/2020 | 333,959 | ||||||
HSBC Holdings plc | ||||||||
| 200,000 | 6.800%, 6/1/2038 | 229,076 | ||||||
J.P. Morgan Chase & Company | ||||||||
| 250,000 | 3.450%, 3/1/2016 | 259,120 | ||||||
Lloyds TSB Bank plc | ||||||||
| 150,000 | 5.800%, 1/13/2020f | 160,352 | ||||||
MassMutual Global Funding II | ||||||||
| 150,000 | 2.000%, 4/5/2017f | 150,874 | ||||||
MetLife, Inc. | ||||||||
| 150,000 | 5.000%, 6/15/2015 | 164,910 | ||||||
New York Life Global Funding | ||||||||
| 250,000 | 1.300%, 1/12/2015f | 250,532 | ||||||
Nordea Bank AB | ||||||||
| 175,000 | 3.125%, 3/20/2017f | 175,747 | ||||||
Northern Trust Corporation | ||||||||
| 250,000 | 3.450%, 11/4/2020 | 267,949 | ||||||
Preferred Term Securities XXIII, Ltd. | ||||||||
| 984,301 | 0.668%, 12/22/2036d,e | 516,758 | ||||||
Prudential Financial, Inc. | ||||||||
| 225,000 | 5.700%, 12/14/2036 | 230,176 | ||||||
UBS AG/London | ||||||||
| 250,000 | 1.875%, 1/23/2015f | 252,499 | ||||||
University of Pennsylvania | ||||||||
| 175,000 | 4.674%, 9/1/2112 | 200,984 | ||||||
Ventas Realty, LP | ||||||||
| 75,000 | 4.250%, 3/1/2022 | 75,519 | ||||||
Washington Mutual Bank | ||||||||
| 500,000 | 5.500%, 1/15/2013g,h | 0 | ||||||
|
| |||||||
| Total | 5,796,309 | |||||||
|
| |||||||
| Foreign Government (1.3%) | ||||||||
Bank Nederlandse Gemeenten NV | ||||||||
| 300,000 | 4.375%, 2/16/2021f | 331,721 | ||||||
Chile Government International Bond | ||||||||
| 150,000 | 3.875%, 8/5/2020 | 166,500 | ||||||
Newfoundland Government Notes | ||||||||
| 500,000 | 8.650%, 10/22/2022 | 752,604 | ||||||
Province of British Columbia | ||||||||
| 250,000 | 1.200%, 4/25/2017 | 252,444 | ||||||
| 375,000 | 2.650%, 9/22/2021 | 397,031 | ||||||
Province of Manitoba | ||||||||
| 325,000 | 1.300%, 4/3/2017 | 329,640 | ||||||
Province of New Brunswick | ||||||||
| 250,000 | 2.750%, 6/15/2018 | 268,158 | ||||||
Quebec Government Notes | ||||||||
| 600,000 | 4.875%, 5/5/2014 | 647,738 | ||||||
|
| |||||||
| Total | 3,145,836 | |||||||
|
| |||||||
| Mortgage-Backed Securities (10.5%) | ||||||||
Federal Home Loan Mortgage Corporation Gold 15-Yr. Pass Through | ||||||||
| 78 | 7.000%, 8/1/2012 | 78 | ||||||
| 478 | 6.500%, 11/1/2012 | 483 | ||||||
| 6,726 | 6.000%, 2/1/2014 | 7,127 | ||||||
| 16,550 | 5.500%, 4/1/2014 | 17,826 | ||||||
| 7,672 | 6.000%, 4/1/2014 | 8,130 | ||||||
| 3,564 | 6.000%, 4/1/2014 | 3,777 | ||||||
| 8,807 | 6.500%, 6/1/2014 | 9,167 | ||||||
| 7,281 | 7.500%, 9/1/2014 | 7,723 | ||||||
| 293,876 | 5.500%, 12/1/2017 | 318,748 | ||||||
| 6,150,000 | 3.000%, 7/1/2027i | 6,429,634 | ||||||
Federal Home Loan Mortgage Corporation Gold 30-Yr. Pass Through | ||||||||
| 14,486 | 6.500%, 4/1/2024 | 16,356 | ||||||
| 23,053 | 9.000%, 11/1/2024 | 27,683 | ||||||
| 1,278 | 9.000%, 4/1/2025 | 1,550 | ||||||
| 1,729 | 7.000%, 9/1/2025 | 2,044 | ||||||
| 1,215 | 8.500%, 9/1/2025 | 1,457 | ||||||
| 709 | 6.500%, 5/1/2026 | 813 | ||||||
| 6,955 | 6.000%, 7/1/2026 | 7,716 | ||||||
| 1,178 | 7.500%, 7/1/2026 | 1,378 | ||||||
| 2,168 | 8.000%, 11/1/2026 | 2,569 | ||||||
| 1,871 | 7.500%, 1/1/2027 | 2,188 | ||||||
| 2,970 | 6.500%, 2/1/2027 | 3,398 | ||||||
| 5,205 | 7.000%, 2/1/2027 | 6,209 | ||||||
| 17,443 | 8.000%, 3/1/2027 | 20,671 | ||||||
| 3,153 | 7.500%, 4/1/2027 | 3,698 | ||||||
| 9,322 | 8.000%, 6/1/2027 | 11,076 | ||||||
| 2,822 | 8.500%, 7/1/2027 | 3,401 | ||||||
| 3,612 | 7.000%, 9/1/2027 | 4,309 | ||||||
| 6,582 | 8.000%, 10/1/2027 | 7,819 | ||||||
| 5,615 | 7.500%, 11/1/2027 | 6,585 | ||||||
| 3,113 | 7.500%, 12/1/2027 | 3,651 | ||||||
| 19,154 | 6.500%, 6/1/2028 | 21,914 | ||||||
| 10,389 | 7.000%, 10/1/2028 | 12,440 | ||||||
| 57,372 | 6.500%, 11/1/2028 | 65,639 | ||||||
| 29,531 | 6.000%, 3/1/2029 | 33,110 | ||||||
| 15,004 | 6.500%, 4/1/2029 | 17,167 | ||||||
| 27,355 | 6.000%, 5/1/2029 | 30,670 | ||||||
| 28,771 | 7.000%, 5/1/2029 | 34,500 | ||||||
| 9,579 | 6.500%, 7/1/2029 | 10,960 | ||||||
| 18,019 | 6.500%, 8/1/2029 | 20,615 | ||||||
| 5,847 | 7.000%, 9/1/2029 | 7,011 | ||||||
| 5,902 | 7.000%, 10/1/2029 | 7,077 | ||||||
| 6,478 | 7.500%, 11/1/2029 | 7,639 | ||||||
| 8,480 | 7.000%, 1/1/2030 | 10,104 | ||||||
| 14,267 | 7.500%, 1/1/2030 | 16,868 | ||||||
| 5,378 | 8.000%, 8/1/2030 | 6,436 | ||||||
| 17,173 | 6.000%, 3/1/2031 | 19,255 | ||||||
| 64,571 | 6.000%, 6/1/2031 | 72,398 | ||||||
| 66,829 | 6.000%, 1/1/2032 | 74,930 | ||||||
Federal National Mortgage Association Conventional 15- Yr. Pass Through | ||||||||
| 603 | 7.000%, 10/1/2012 | 608 | ||||||
| 5,831 | 6.000%, 11/1/2013 | 6,208 | ||||||
| 18,019 | 5.500%, 12/1/2013 | 19,569 | ||||||
| 11,297 | 6.000%, 12/1/2013 | 11,370 | ||||||
The accompanying Notes to Financial Statements are an integral part of this schedule.
190
Table of Contents
Balanced Portfolio
Schedule of Investments as of June 29, 2012
(unaudited)
| Principal Amount | Long-Term Fixed Income (36.7%) | Value | ||||||
| Mortgage-Backed Securities (10.5%) - continued | |||||||
| $ 1,881 | 7.500%, 4/1/2015 | $ | 2,022 | |||||
Federal National Mortgage Association Conventional 30- Yr. Pass Through | ||||||||
| 3,439 | 10.500%, 8/1/2020 | 3,989 | ||||||
| 5,081 | 9.500%, 4/1/2025 | 6,219 | ||||||
| 960 | 7.500%, 9/1/2025 | 1,119 | ||||||
| 1,652 | 8.500%, 11/1/2025 | 1,979 | ||||||
| 4,300 | 6.500%, 2/1/2026 | 4,944 | ||||||
| 2,372 | 7.000%, 3/1/2026 | 2,815 | ||||||
| 3,048 | 6.500%, 4/1/2026 | 3,505 | ||||||
| 1,431 | 8.500%, 5/1/2026 | 1,718 | ||||||
| 1,614 | 7.500%, 7/1/2026 | 1,885 | ||||||
| 8,495 | 7.500%, 8/1/2026 | 9,925 | ||||||
| 1,410 | 8.000%, 8/1/2026 | 1,670 | ||||||
| 5,458 | 7.000%, 11/1/2026 | 6,478 | ||||||
| 1,815 | 8.000%, 11/1/2026 | 2,149 | ||||||
| 594 | 7.500%, 12/1/2026 | 694 | ||||||
| 2,705 | 7.000%, 3/1/2027 | 3,210 | ||||||
| 1,092 | 7.500%, 5/1/2027 | 1,280 | ||||||
| 7,347 | 6.500%, 7/1/2027 | 8,446 | ||||||
| 1,094 | 7.500%, 8/1/2027 | 1,282 | ||||||
| 25,400 | 8.000%, 9/1/2027 | 30,150 | ||||||
| 4,322 | 7.000%, 10/1/2027 | 5,151 | ||||||
| 3,760 | 8.000%, 12/1/2027 | 4,463 | ||||||
| 10,162 | 6.500%, 2/1/2028 | 11,683 | ||||||
| 5,656 | 7.000%, 2/1/2028 | 6,742 | ||||||
| 53,173 | 6.500%, 7/1/2028 | 61,131 | ||||||
| 24,644 | 7.000%, 8/1/2028 | 29,489 | ||||||
| 4,206 | 6.500%, 11/1/2028 | 4,835 | ||||||
| 29,254 | 6.500%, 11/1/2028 | 33,632 | ||||||
| 1,651 | 7.000%, 11/1/2028 | 1,975 | ||||||
| 48,198 | 6.000%, 12/1/2028 | 54,078 | ||||||
| 19,883 | 7.000%, 12/1/2028 | 23,791 | ||||||
| 21,969 | 6.000%, 3/1/2029 | 24,739 | ||||||
| 22,812 | 6.500%, 6/1/2029 | 26,226 | ||||||
| 28,439 | 6.000%, 7/1/2029 | 32,024 | ||||||
| 1,954 | 6.500%, 7/1/2029 | 2,246 | ||||||
| 33,530 | 7.500%, 8/1/2029 | 39,502 | ||||||
| 11,427 | 7.000%, 11/1/2029 | 13,692 | ||||||
| 20,876 | 7.000%, 11/1/2029 | 25,015 | ||||||
| 10,335 | 8.500%, 4/1/2030 | 12,501 | ||||||
| 8,247 | 7.500%, 8/1/2030 | 9,742 | ||||||
| 62,567 | 6.500%, 7/1/2031 | 71,618 | ||||||
| 22,315 | 6.500%, 10/1/2031 | 25,544 | ||||||
| 27,133 | 6.500%, 12/1/2031 | 31,058 | ||||||
| 35,277 | 6.500%, 5/1/2032 | 40,380 | ||||||
| 180,998 | 6.500%, 7/1/2032 | 207,180 | ||||||
| 2,600,000 | 3.500%, 7/1/2042i | 2,732,844 | ||||||
| 2,800,000 | 4.000%, 7/1/2042i | 2,979,813 | ||||||
| 9,800,000 | 5.500%, 7/1/2042i | 10,689,654 | ||||||
Government National Mortgage Association 15-Yr. Pass Through | ||||||||
| 12,263 | 6.000%, 7/15/2014 | 13,425 | ||||||
Government National Mortgage Association 30-Yr. Pass Through | ||||||||
| 3,609 | 9.500%, 1/15/2025 | 4,347 | ||||||
| 10,813 | 7.000%, 1/15/2026 | 12,842 | ||||||
| 9,793 | 7.000%, 1/15/2026 | 11,631 | ||||||
| 4,519 | 7.000%, 4/15/2026 | 5,367 | ||||||
| 10,954 | 6.000%, 5/15/2026 | 12,345 | ||||||
| 10,822 | 7.000%, 6/15/2026 | 12,853 | ||||||
| 6,501 | 8.500%, 6/15/2026 | 7,690 | ||||||
| 2,322 | 8.500%, 7/15/2026 | 2,747 | ||||||
| 10,232 | 8.000%, 9/15/2026 | 11,952 | ||||||
| 3,422 | 7.500%, 10/15/2026 | 3,949 | ||||||
| 1,798 | 8.000%, 11/15/2026 | 2,100 | ||||||
| 1,503 | 8.500%, 11/15/2026 | 1,779 | ||||||
| 1,852 | 9.000%, 12/15/2026 | 2,207 | ||||||
| 12,546 | 7.500%, 4/15/2027 | 14,513 | ||||||
| 4,641 | 8.000%, 6/20/2027 | 5,429 | ||||||
| 436 | 8.000%, 8/15/2027 | 510 | ||||||
| 27,730 | 6.500%, 10/15/2027 | 32,402 | ||||||
| 14,935 | 7.000%, 10/15/2027 | 17,814 | ||||||
| 21,988 | 7.000%, 11/15/2027 | 26,228 | ||||||
| 1,105 | 7.000%, 11/15/2027 | 1,318 | ||||||
| 62,288 | 7.000%, 7/15/2028 | 74,586 | ||||||
| 15,639 | 7.500%, 7/15/2028 | 18,133 | ||||||
| 33,253 | 6.500%, 9/15/2028 | 38,856 | ||||||
| 33,189 | 6.000%, 12/15/2028 | 37,848 | ||||||
| 22,248 | 6.500%, 1/15/2029 | 25,961 | ||||||
| 123,221 | 6.500%, 3/15/2029 | 143,788 | ||||||
| 26,576 | 6.500%, 4/15/2029 | 31,012 | ||||||
| 17,831 | 7.000%, 4/15/2029 | 21,426 | ||||||
| 47,294 | 6.000%, 6/15/2029 | 53,845 | ||||||
| 41,431 | 7.000%, 6/15/2029 | 49,783 | ||||||
| 10,334 | 8.000%, 5/15/2030 | 12,162 | ||||||
| 28,833 | 7.000%, 9/15/2031 | 34,850 | ||||||
| 34,609 | 6.500%, 2/15/2032 | 40,083 | ||||||
|
| |||||||
| Total | 25,525,760 | |||||||
|
| |||||||
| Technology (0.1%) | |||||||
Hewlett-Packard Company | ||||||||
| 100,000 | 4.300%, 6/1/2021 | 103,058 | ||||||
Xerox Corporation | ||||||||
| 200,000 | 4.500%, 5/15/2021 | 207,542 | ||||||
|
| |||||||
| Total | 310,600 | |||||||
|
| |||||||
| Transportation (0.1%) | |||||||
Continental Airlines, Inc. | ||||||||
| 175,000 | 4.150%, 4/11/2024 | 172,375 | ||||||
Delta Air Lines, Inc. | ||||||||
| 137,433 | 4.950%, 5/23/2019b | 145,514 | ||||||
|
| |||||||
| Total | 317,889 | |||||||
|
| |||||||
| U.S. Government and Agencies (13.5%) | |||||||
Federal Home Loan Banks | ||||||||
| 2,000,000 | 1.375%, 5/28/2014 | 2,040,462 | ||||||
Federal Home Loan Mortgage Corporation | ||||||||
| 1,500,000 | 5.125%, 11/17/2017 | 1,816,852 | ||||||
Federal National Mortgage Association | ||||||||
| 1,500,000 | 5.625%, 4/17/2028 | 1,976,242 | ||||||
Resolution Funding Corporation | ||||||||
| 1,000,000 | 8.625%, 1/15/2021 | 1,531,305 | ||||||
Tennessee Valley Authority | ||||||||
| 150,000 | 5.250%, 9/15/2039 | 195,579 | ||||||
The accompanying Notes to Financial Statements are an integral part of this schedule.
191
Table of Contents
Balanced Portfolio
Schedule of Investments as of June 29, 2012
(unaudited)
| Principal Amount | Long-Term Fixed Income (36.7%) | Value | ||||||
| U.S. Government and Agencies (13.5%) - continued | |||||||
U.S. Treasury Bonds | ||||||||
| $ | 2,050,000 | 3.125%, 11/15/2041 | $ | 2,203,750 | ||||
U.S. Treasury Notes | ||||||||
| 1,000,000 | 0.125%, 8/31/2013 | 998,320 | ||||||
| 500,000 | 1.500%, 12/31/2013 | 508,867 | ||||||
| 5,250,000 | 2.375%, 8/31/2014 | 5,478,869 | ||||||
| 2,075,000 | 0.250%, 2/15/2015 | 2,067,704 | ||||||
| 1,650,000 | 1.250%, 10/31/2015 | 1,691,121 | ||||||
| 900,000 | 2.000%, 1/31/2016 | 946,969 | ||||||
| 1,000,000 | 2.625%, 2/29/2016 | 1,076,172 | ||||||
| 3,000,000 | 1.000%, 10/31/2016 | 3,045,702 | ||||||
| 750,000 | 3.000%, 2/28/2017 | 828,926 | ||||||
| 1,375,000 | 0.750%, 6/30/2017 | 1,376,397 | ||||||
| 1,000,000 | 2.375%, 6/30/2018 | 1,083,984 | ||||||
| 3,380,000 | 1.250%, 4/30/2019 | 3,417,498 | ||||||
| 495,000 | 2.000%, 2/15/2022 | 511,668 | ||||||
|
| |||||||
| Total | 32,796,387 | |||||||
|
| |||||||
| U.S. Municipals (0.2%) | |||||||
Chicago Metropolitan Water Reclamation District General Obligation Bonds (Build America Bonds) | ||||||||
| 150,000 | 5.720%, 12/1/2038 | 189,408 | ||||||
Illinois General Obligation Refunding Bonds | ||||||||
| 150,000 | 5.000%, 8/1/2017 | 169,130 | ||||||
|
| |||||||
| Total | 358,538 | |||||||
|
| |||||||
| Utilities (1.0%) | |||||||
Commonwealth Edison Company | ||||||||
| 225,000 | 5.900%, 3/15/2036 | 291,807 | ||||||
Kinder Morgan Energy Partners, LP | ||||||||
| 200,000 | 5.300%, 9/15/2020 | 221,537 | ||||||
Oncor Electric Delivery Company | ||||||||
| 425,000 | 6.375%, 1/15/2015 | 470,008 | ||||||
ONEOK Partners, LP | ||||||||
| 225,000 | 6.650%, 10/1/2036 | 264,204 | ||||||
Progress Energy, Inc. | ||||||||
| 300,000 | 7.000%, 10/30/2031 | 395,769 | ||||||
Sempra Energy | ||||||||
| 175,000 | 2.300%, 4/1/2017 | 179,348 | ||||||
Southern California Edison Company | ||||||||
| 225,000 | 5.000%, 1/15/2014 | 240,154 | ||||||
Xcel Energy, Inc. | ||||||||
| 225,000 | 6.500%, 7/1/2036 | 304,551 | ||||||
|
| |||||||
| Total | 2,367,378 | |||||||
|
| |||||||
Total Long-Term Fixed Income (cost $87,151,894) | 88,962,041 | |||||||
|
| |||||||
| Shares | Collateral Held for Securities Loaned (0.4%) | |||||||
| 1,045,730 | Thrivent Financial Securities Lending Trust | 1,045,730 | ||||||
|
| |||||||
Total Collateral Held for Securities Loaned (cost $1,045,730) | 1,045,730 | |||||||
|
| |||||||
| Principal Amount | Short-Term Investments (8.3%)j | |||||||
Federal Home Loan Bank Discount Notes | ||||||||
| 15,000,000 | 0.070%, 7/18/2012k | 14,999,475 | ||||||
| 3,000,000 | 0.060%, 7/20/2012k | 2,999,900 | ||||||
| 2,000,000 | 0.100%, 8/17/2012k | 1,999,733 | ||||||
Federal National Mortgage Association Discount Notes | ||||||||
| 100,000 | 0.120%, 7/18/2012k,l | 99,994 | ||||||
|
| |||||||
| Total Short-Term Investments (at amortized cost) | 20,099,102 | |||||||
|
| |||||||
| Total Investments (cost $232,248,302) 109.3% | $ | 264,703,109 | ||||||
|
| |||||||
| Other Assets and Liabilities, Net (9.3%) | (22,551,785 | ) | ||||||
|
| |||||||
| Total Net Assets 100.0% | $ | 242,151,324 | ||||||
|
| |||||||
| a | Non-income producing security. |
| b | All or a portion of the security is on loan. |
| c | All or a portion of the security is insured or guaranteed. |
| d | Denotes variable rate securities. Variable rate securities are securities whose yields vary with a designated market index or market rate. The rate shown is as of June 29, 2012. |
| e | Denotes restricted securities. Restricted securities are investment securities which have been deemed illiquid and cannot be offered for public sale without first being registered under the Securities Act of 1933. The following table indicates the acquisition date and cost of restricted securities Balanced Portfolio owned as of June 29, 2012. |
Security | Acquisition Date | Cost | ||||||
Preferred Term Securities XXIII, Ltd. | 9/14/2006 | $ | 984,301 | |||||
Wachovia Asset Securitization, Inc. | 3/16/2007 | 860,090 | ||||||
| f | Denotes securities sold under Rule 144A of the Securities Act of 1933, which exempts them from registration. These securities have been deemed liquid and may be resold to other dealers in the program or to other qualified institutional buyers. As of June 29, 2012, the value of these investments was $7,252,214 or 3.0% of total net assets. |
| g | Defaulted security. Interest is not being accrued. |
| h | Security is fair valued. |
| i | Denotes investments purchased on a when-issued or delayed delivery basis. |
| j | The interest rate shown reflects the yield, coupon rate or the discount rate at the date of purchase. |
| k | Denotes investments that benefit from credit enhancement or liquidity support provided by a third party bank, institution or government. |
The accompanying Notes to Financial Statements are an integral part of this schedule.
192
Table of Contents
Balanced Portfolio
Schedule of Investments as of June 29, 2012
(unaudited)
| l | At June 29, 2012, $99,994 of investments were held on deposit with the counterparty and pledged as the initial margin deposit for open futures contracts. |
Definitions:
REIT | - | Real Estate Investment Trust is a company that buys, develops, manages and/or sells real estate assets. |
Unrealized Appreciation (Depreciation)
Gross unrealized appreciation and depreciation of investments, based on cost for federal income tax purposes, were as follows:
Gross unrealized appreciation | $ | 60,917,496 | ||
Gross unrealized depreciation | (33,843,790 | ) | ||
|
| |||
Net unrealized appreciation (depreciation) | $ | 27,073,706 | ||
Cost for federal income tax purposes | $ | 237,629,403 | ||
Fair Valuation Measurements
The following table is a summary of the inputs used, as of June 29, 2012, in valuing Balanced Portfolio's assets carried at fair value.
Investments in Securities | Total | Level 1 | Level 2 | Level 3 | ||||||||||||
Common Stock | ||||||||||||||||
Consumer Discretionary | 17,186,895 | 17,186,895 | — | — | ||||||||||||
Consumer Staples | 17,457,773 | 17,457,773 | — | — | ||||||||||||
Energy | 16,708,186 | 16,708,186 | — | — | ||||||||||||
Financials | 22,104,615 | 22,104,615 | — | — | ||||||||||||
Health Care | 18,418,863 | 18,418,863 | — | — | ||||||||||||
Industrials | 16,203,598 | 16,203,598 | — | — | ||||||||||||
Information Technology | 30,757,681 | 30,757,681 | — | — | ||||||||||||
Materials | 5,135,446 | 5,135,446 | — | — | ||||||||||||
Telecommunications Services | 4,943,402 | 4,943,402 | — | — | ||||||||||||
Utilities | 5,679,777 | 5,679,777 | — | — | ||||||||||||
Long-Term Fixed Income | ||||||||||||||||
Asset-Backed Securities | 3,128,936 | — | 3,128,936 | — | ||||||||||||
Basic Materials | 347,330 | — | 347,330 | — | ||||||||||||
Capital Goods | 641,713 | — | 641,713 | — | ||||||||||||
Collateralized Mortgage Obligations | 47,921 | — | 47,921 | — | ||||||||||||
Commercial Mortgage-Backed Securities | 6,817,718 | — | 6,817,718 | — | ||||||||||||
Communications Services | 1,430,738 | — | 1,430,738 | — | ||||||||||||
Consumer Cyclical | 1,588,162 | — | 1,588,162 | — | ||||||||||||
Consumer Non-Cyclical | 2,896,365 | — | 2,896,365 | — | ||||||||||||
Energy | 1,444,461 | — | 1,444,461 | — | ||||||||||||
Financials | 5,796,309 | — | 5,279,551 | 516,758 | ||||||||||||
Foreign Government | 3,145,836 | — | 3,145,836 | — | ||||||||||||
Mortgage-Backed Securities | 25,525,760 | — | 25,525,760 | — | ||||||||||||
Technology | 310,600 | — | 310,600 | — | ||||||||||||
Transportation | 317,889 | — | 317,889 | — | ||||||||||||
U.S. Government and Agencies | 32,796,387 | — | 32,796,387 | — | ||||||||||||
U.S. Municipals | 358,538 | — | 358,538 | — | ||||||||||||
Utilities | 2,367,378 | — | 2,367,378 | — | ||||||||||||
Collateral Held for Securities Loaned | 1,045,730 | 1,045,730 | — | — | ||||||||||||
Short-Term Investments | 20,099,102 | — | 20,099,102 | — | ||||||||||||
|
|
|
|
|
|
|
| |||||||||
Total | $ | 264,703,109 | $ | 155,641,966 | $ | 108,544,385 | $ | 516,758 | ||||||||
|
|
|
|
|
|
|
| |||||||||
Other Financial Instruments | Total | Level 1 | Level 2 | Level 3 | ||||||||||||
Asset Derivatives | ||||||||||||||||
Futures Contracts | 113,380 | 113,380 | — | — | ||||||||||||
|
|
|
|
|
|
|
| |||||||||
Total Asset Derivatives | $ | 113,380 | $ | 113,380 | $ | — | $ | — | ||||||||
|
|
|
|
|
|
|
| |||||||||
There are two securities that are classified as Level 3 securities in the Long-Term Fixed Income Financials line item. The first security has been fair valued worthless. The significant unobservable input used in the fair value measurement of the reporting entity’s Long-Term Fixed Income Financials Level 3 security is the lack of marketability. A significant increase or decrease in the inputs in isolation would result in a significantly lower or higher fair value measurement.
The other Level 3 security is valued at $516,758 and the significant unobservable input used in the fair value measurement of the reporting entity’s Long-Term Fixed Income Financials Level 3 security is the lack of marketability and the volatility of a benchmark security. A significant increase or decrease in the inputs in isolation would result in a significantly lower or higher fair value measurement.
The accompanying Notes to Financial Statements are an integral part of this schedule.
193
Table of Contents
Balanced Portfolio
Schedule of Investments as of June 29, 2012
(unaudited)
There were no significant transfers between the Levels during the period ended June 29, 2012. Transfers between the levels are identified as of the end of the period.
Futures Contracts | Number of Contracts Long/(Short) | Expiration Date | Notional Principal Amount | Value | Unrealized Gain/(Loss) | |||||||||||||||
S&P 500 Index Futures | 11 | September 2012 | $ | 3,616,720 | $ | 3,730,100 | $ | 113,380 | ||||||||||||
Total Futures Contracts | $ | 113,380 | ||||||||||||||||||
The following table summarizes the fair value and Statement of Assets and Liabilities location, as of June 29, 2012, for Balanced Portfolio's investments in financial derivative instruments by primary risk exposure as discussed under item (2) Significant Accounting Policies of the Notes to Financial Statements.
Derivatives by risk category | Statement of Assets and Liabilities Location | Fair Value | ||||
Asset Derivatives | ||||||
Equity Contracts | ||||||
Futures* | Net Assets - Net unrealized appreciation/(depreciation) on Futures contracts | 113,380 | ||||
Total Equity Contracts | 113,380 | |||||
|
| |||||
Total Asset Derivatives | $ | 113,380 | ||||
|
| |||||
| * | Includes cumulative appreciation/depreciation of futures contracts as reported in the Schedule of Investments. Only current day's variation margin is reported within the Statement of Assets and Liabilities. |
The following table summarizes the net realized gains/(losses) and Statement of Operations location, for the period ended June 29, 2012, for Balanced Portfolio's investments in financial derivative instruments by primary risk exposure.
Derivatives by risk category | Statement of Operations Location | Realized Gains/(Losses) recognized in Income | ||||
Equity Contracts | ||||||
Futures | Net realized gains/(losses) on Futures contracts | (20,112 | ) | |||
Total Equity Contracts | (20,112 | ) | ||||
|
| |||||
Total | ($ | 20,112 | ) | |||
|
| |||||
The following table summarizes the change in net unrealized appreciation/(depreciation) and Statement of Operations location, for the period ended June 29, 2012, for Balanced Portfolio's investments in financial derivative instruments by primary risk exposure.
Derivatives by risk category | Statement of Operations Location | Change in unrealized appreciation/(depreciation) recognized in Income | ||||
Equity Contracts | ||||||
Futures | Change in net unrealized appreciation/(depreciation) on Futures contracts | 78,407 | ||||
Total Equity Contracts | 78,407 | |||||
|
| |||||
Total | $ | 78,407 | ||||
|
| |||||
The following table presents Balanced Portfolio's average volume of derivative activity during the period ended June 29, 2012.
Derivative Risk Category | Futures (Notional*) | Futures (Percentage of Average Net Assets) | ||||||
Equity Contracts | $ | 2,509,102 | 1.0 | % | ||||
| * | Notional amount represents long or short, or both, derivative positions held by the Portfolio. |
The accompanying Notes to Financial Statements are an integral part of this schedule.
194
Table of Contents
Balanced Portfolio
Schedule of Investments as of June 29, 2012
(unaudited)
Investment in Affiliates
Affiliated issuers, as defined under the Investment Company Act of 1940, include those in which the Portfolio's holdings of an issuer represent 5% or more of the outstanding voting securities of an issuer, or any affiliated mutual fund.
A summary of transactions for the fiscal year to date, in Balanced Portfolio, is as follows:
Portfolio | Value December 31, 2011 | Gross Purchases | Gross Sales | Shares Held at June 29, 2012 | Value June 29, 2012 | Income Earned January 1, 2012 - June 29, 2012 | ||||||||||||||||||
Thrivent Financial Securities Lending Trust | $ | 1,713,875 | $ | 7,361,363 | $ | 8,029,508 | 1,045,730 | $ | 1,045,730 | $ | 6,355 | |||||||||||||
Total Value and Income Earned | 1,713,875 | 1,045,730 | 6,355 | |||||||||||||||||||||
The accompanying Notes to Financial Statements are an integral part of this schedule.
195
Table of Contents
Schedule of Investments as of June 29, 2012
(unaudited)
| Principal Amount | Bank Loans (1.2%)a | Value | ||||||
| Energy (0.4%) | |||||||
| Chesapeake Energy Corporation, Term Loan | ||||||||
| $3,170,000 | 8.500%, 12/2/2017 | $ | 3,141,914 | |||||
|
| |||||||
| Total | 3,141,914 | |||||||
|
| |||||||
| Financials (0.3%) | |||||||
| Nuveen Investments, Inc., Term Loan | ||||||||
| 2,650,000 | 8.250%, 3/1/2019 | 2,653,312 | ||||||
|
| |||||||
| Total | 2,653,312 | |||||||
|
| |||||||
| Technology (0.5%) | |||||||
| First Data Corporation Extended, Term Loan | ||||||||
| 4,280,676 | 4.245%, 3/26/2018 | 3,920,586 | ||||||
|
| |||||||
| Total | 3,920,586 | |||||||
|
| |||||||
Total Bank Loans (cost $9,600,532) | 9,715,812 | |||||||
|
| |||||||
Long-Term Fixed Income (93.0%) | ||||||||
| Asset-Backed Securities (0.6%) | |||||||
| J.P. Morgan Mortgage Acquisition Corporation | ||||||||
| 2,458,580 | 5.461%, 10/25/2036 | 1,918,634 | ||||||
| Renaissance Home Equity Loan Trust | ||||||||
| 2,645,809 | 5.746%, 5/25/2036 | 1,686,743 | ||||||
| 1,800,000 | 6.011%, 5/25/2036 | 1,015,108 | ||||||
|
| |||||||
| Total | 4,620,485 | |||||||
|
| |||||||
| Basic Materials (8.7%) | |||||||
| AbitibiBowater, Inc. | ||||||||
| 4,823,000 | 10.250%, 10/15/2018 | 5,353,530 | ||||||
| APERAM | ||||||||
| 1,570,000 | 7.750%, 4/1/2018b | 1,334,500 | ||||||
| Arch Coal, Inc. | ||||||||
| 2,100,000 | 7.000%, 6/15/2019c | 1,774,500 | ||||||
| 1,650,000 | 7.250%, 10/1/2020c | 1,394,250 | ||||||
| 1,050,000 | 7.250%, 6/15/2021c | 879,375 | ||||||
| Consol Energy, Inc. | ||||||||
| 1,900,000 | 8.000%, 4/1/2017 | 1,971,250 | ||||||
| 2,770,000 | 8.250%, 4/1/2020 | 2,908,500 | ||||||
| FMG Resources Property, Ltd. | ||||||||
| 2,630,000 | 7.000%, 11/1/2015b,c | 2,682,600 | ||||||
| 1,590,000 | 6.000%, 4/1/2017b,c | 1,597,950 | ||||||
| 3,700,000 | 6.875%, 2/1/2018b | 3,737,000 | ||||||
| 4,390,000 | 8.250%, 11/1/2019b | 4,653,400 | ||||||
| Graphic Packaging International, Inc. | ||||||||
| 800,000 | 9.500%, 6/15/2017 | 880,000 | ||||||
| 1,600,000 | 7.875%, 10/1/2018 | 1,760,000 | ||||||
| Hexion US Finance Corporation/Hexion Nova Scotia Finance ULC | ||||||||
| 3,220,000 | 8.875%, 2/1/2018 | 3,284,400 | ||||||
| 3,150,000 | 9.000%, 11/15/2020 | 2,716,875 | ||||||
| Ineos Finance plc | ||||||||
| 870,000 | 7.500%, 5/1/2020b | 876,525 | ||||||
| Inmet Mining Corporation | ||||||||
| 3,800,000 | 8.750%, 6/1/2020b | 3,762,000 | ||||||
| LyondellBasell Industries NV | ||||||||
| 5,290,000 | 5.000%, 4/15/2019b | 5,547,888 | ||||||
| 1,600,000 | 6.000%, 11/15/2021b,c | 1,756,000 | ||||||
| Midwest Vanadium Pty., Ltd. | ||||||||
| 3,430,000 | 11.500%, 2/15/2018b | 2,126,600 | ||||||
| NOVA Chemicals Corporation | ||||||||
| 5,610,000 | 8.625%, 11/1/2019 | 6,353,325 | ||||||
| Novelis, Inc. | ||||||||
| 3,950,000 | 8.750%, 12/15/2020 | 4,256,125 | ||||||
| Ryerson Holding Corporation | ||||||||
| 4,770,000 | Zero Coupon, 2/1/2015c | 2,480,400 | ||||||
| Ryerson, Inc. | ||||||||
| 2,300,000 | 12.000%, 11/1/2015 | 2,311,500 | ||||||
| Sappi Papier Holding GmbH | ||||||||
| 1,580,000 | 7.750%, 7/15/2017b,d | 1,599,750 | ||||||
| Severstal Columbus, LLC | ||||||||
| 1,600,000 | 10.250%, 2/15/2018 | 1,602,000 | ||||||
| Tembec Industries, Inc. | ||||||||
| 1,060,000 | 11.250%, 12/15/2018 | 1,057,350 | ||||||
| 2,120,000 | 11.250%, 12/15/2018b | 2,114,700 | ||||||
|
| |||||||
| Total | 72,772,293 | |||||||
|
| |||||||
| Capital Goods (8.6%) | |||||||
| BE Aerospace, Inc. | ||||||||
| 3,720,000 | 6.875%, 10/1/2020 | 4,110,600 | ||||||
| Case New Holland, Inc. | ||||||||
| 5,300,000 | 7.875%, 12/1/2017 | 6,121,500 | ||||||
| Cemex SAB de CV | ||||||||
| 5,130,000 | 9.000%, 1/11/2018b,c | 4,578,525 | ||||||
| Coleman Cable, Inc. | ||||||||
| 2,420,000 | 9.000%, 2/15/2018 | 2,492,600 | ||||||
| EnergySolutions, Inc. | ||||||||
| 2,650,000 | 10.750%, 8/15/2018 | 2,212,750 | ||||||
| Liberty Tire Recycling | ||||||||
| 2,660,000 | 11.000%, 10/1/2016b | 2,447,200 | ||||||
| Manitowoc Company, Inc. | ||||||||
| 4,730,000 | 8.500%, 11/1/2020c | 5,108,400 | ||||||
| Nortek, Inc. | ||||||||
| 3,160,000 | 10.000%, 12/1/2018 | 3,318,000 | ||||||
| 3,140,000 | 8.500%, 4/15/2021 | 3,069,350 | ||||||
| Owens-Illinois, Inc. | ||||||||
| 3,470,000 | 7.800%, 5/15/2018 | 3,951,462 | ||||||
| Packaging Dynamics Corporation | ||||||||
| 790,000 | 8.750%, 2/1/2016b | 829,500 | ||||||
| Plastipak Holdings, Inc. | ||||||||
| 2,995,000 | 8.500%, 12/15/2015b | 3,092,338 | ||||||
| 500,000 | 10.625%, 8/15/2019b | 566,875 | ||||||
| RBS Global, Inc./Rexnord, LLC | ||||||||
| 4,520,000 | 8.500%, 5/1/2018 | 4,904,200 | ||||||
| Reynolds Group Issuer, Inc. | ||||||||
| 1,580,000 | 9.000%, 4/15/2019b | 1,576,050 | ||||||
| 2,660,000 | 9.875%, 8/15/2019b | 2,759,750 | ||||||
| 2,630,000 | 8.500%, 2/15/2021b | 2,498,500 | ||||||
| RSC Equipment Rental, Inc. | ||||||||
| 3,120,000 | 8.250%, 2/1/2021 | 3,322,800 | ||||||
| Sealed Air Corporation | ||||||||
| 1,650,000 | 8.375%, 9/15/2021b | 1,864,500 | ||||||
| Silgan Holdings, Inc. | ||||||||
| 3,970,000 | 5.000%, 4/1/2020b | 4,059,325 | ||||||
The accompanying Notes to Financial Statements are an integral part of this schedule.
196
Table of Contents
High Yield Portfolio
Schedule of Investments as of June 29, 2012
(unaudited)
| Principal Amount | Long-Term Fixed Income (93.0%) | Value | ||||||
| Capital Goods (8.6%) - continued | |||||||
| Tekni-Plex, Inc. | ||||||||
| $3,700,000 | 9.750%, 6/1/2019b | $ | 3,737,000 | |||||
| UR Financing Escrow Corporation | ||||||||
| 1,070,000 | 7.375%, 5/15/2020b | 1,118,150 | ||||||
| 4,250,000 | 7.625%, 4/15/2022b | 4,451,875 | ||||||
|
| |||||||
| Total | 72,191,250 | |||||||
|
| |||||||
| Communications Services (16.2%) | |||||||
| AMC Networks, Inc. | ||||||||
| 5,310,000 | 7.750%, 7/15/2021b | 5,854,275 | ||||||
| Cablevision Systems Corporation | ||||||||
| 4,260,000 | 8.625%, 9/15/2017 | 4,749,900 | ||||||
| CCO Holdings, LLC | ||||||||
| 4,250,000 | 7.250%, 10/30/2017 | 4,632,500 | ||||||
| 2,110,000 | 7.000%, 1/15/2019 | 2,278,800 | ||||||
| 800,000 | 7.375%, 6/1/2020 | 879,000 | ||||||
| Clear Channel Worldwide Holdings, Inc. | ||||||||
| 8,030,000 | 9.250%, 12/15/2017 | 8,752,700 | ||||||
| CSC Holdings, LLC | ||||||||
| 2,660,000 | 6.750%, 11/15/2021b | 2,832,900 | ||||||
| Digicel, Ltd. | ||||||||
| 4,210,000 | 8.250%, 9/1/2017b | 4,283,675 | ||||||
| 1,680,000 | 7.000%, 2/15/2020b | 1,625,400 | ||||||
| Dish DBS Corporation | ||||||||
| 2,680,000 | 6.750%, 6/1/2021 | 2,894,400 | ||||||
| 2,480,000 | 5.875%, 7/15/2022b | 2,504,800 | ||||||
| Eileme 2 AB | ||||||||
| 4,260,000 | 11.625%, 1/31/2020b | 4,377,150 | ||||||
| Frontier Communications Corporation | ||||||||
| 3,190,000 | 8.250%, 4/15/2017c | 3,429,250 | ||||||
| Hughes Satellite Systems Corporation | ||||||||
| 4,850,000 | 6.500%, 6/15/2019 | 5,153,125 | ||||||
| Intelsat Bermuda, Ltd. | ||||||||
| 7,040,000 | 11.250%, 2/4/2017 | 7,251,200 | ||||||
| Intelsat Jackson Holdings SA | ||||||||
| 7,180,000 | 7.250%, 10/15/2020 | 7,556,950 | ||||||
| 790,000 | 7.250%, 10/15/2020b | 829,500 | ||||||
| Intelsat Luxembourg SA | ||||||||
| 790,000 | 11.500%, 2/4/2017b | 815,675 | ||||||
| 2,712,153 | 11.500%, 2/4/2017 | 2,800,298 | ||||||
| Level 3 Financing, Inc. | ||||||||
| 2,130,000 | 8.750%, 2/15/2017 | 2,215,200 | ||||||
| 2,120,000 | 8.125%, 7/1/2019 | 2,175,650 | ||||||
| 4,230,000 | 8.625%, 7/15/2020 | 4,441,500 | ||||||
| Nara Cable Funding, Ltd. | ||||||||
| 4,750,000 | 8.875%, 12/1/2018b | 4,085,000 | ||||||
| Satmex Escrow SA de CV | ||||||||
| 5,230,000 | 9.500%, 5/15/2017 | 5,465,350 | ||||||
| Sprint Nextel Corporation | ||||||||
| 6,900,000 | 9.125%, 3/1/2017b | 7,245,000 | ||||||
| 8,680,000 | 9.000%, 11/15/2018b | 9,699,900 | ||||||
| 2,870,000 | 7.000%, 3/1/2020b | 2,984,800 | ||||||
| Telesat Canada | ||||||||
| 3,170,000 | 6.000%, 5/15/2017b | 3,225,475 | ||||||
| UPC Holding BV | ||||||||
| 4,500,000 | 9.875%, 4/15/2018b | 4,927,500 | ||||||
| UPCB Finance V, Ltd. | ||||||||
| 1,600,000 | 7.250%, 11/15/2021b | 1,672,000 | ||||||
| Videotron Ltee | ||||||||
| 1,230,000 | 5.000%, 7/15/2022b | 1,248,450 | ||||||
| Virgin Media Finance plc | ||||||||
| 1,790,000 | 8.375%, 10/15/2019 | 2,011,512 | ||||||
| 2,780,000 | 5.250%, 2/15/2022 | 2,842,550 | ||||||
| XM Satellite Radio, Inc. | ||||||||
| 3,680,000 | 7.625%, 11/1/2018b | 3,956,000 | ||||||
| Zayo Group, LLC | ||||||||
| 3,425,000 | 8.125%, 1/1/2020b | 3,579,125 | ||||||
|
| |||||||
| Total | 135,276,510 | |||||||
|
| |||||||
| Consumer Cyclical (15.7%) | |||||||
| American Axle & Manufacturing, Inc. | ||||||||
| 1,080,000 | 5.250%, 2/11/2014c | 1,112,400 | ||||||
| 3,200,000 | 7.875%, 3/1/2017c | 3,304,000 | ||||||
| Ameristar Casinos, Inc. | ||||||||
| 530,000 | 7.500%, 4/15/2021b | 567,100 | ||||||
| Beazer Homes USA, Inc. | ||||||||
| 3,200,000 | 6.875%, 7/15/2015 | 3,072,000 | ||||||
| 2,630,000 | 9.125%, 5/15/2019 | 2,294,675 | ||||||
| Boyd Gaming Corporation | ||||||||
| 5,300,000 | 9.000%, 7/1/2020b | 5,313,250 | ||||||
| Burlington Coat Factory Warehouse Corporation | ||||||||
| 3,650,000 | 10.000%, 2/15/2019c | 3,869,000 | ||||||
| Choice Hotels International, Inc. | ||||||||
| 2,120,000 | 5.750%, 7/1/2022 | 2,216,630 | ||||||
| Chrysler Group, LLC | ||||||||
| 2,770,000 | 8.000%, 6/15/2019c | 2,846,175 | ||||||
| 2,600,000 | 8.250%, 6/15/2021c | 2,671,500 | ||||||
| DineEquity, Inc. | ||||||||
| 4,200,000 | 9.500%, 10/30/2018 | 4,599,000 | ||||||
| Eldorado Resorts, LLC | ||||||||
| 4,820,000 | 8.625%, 6/15/2019b | 4,579,000 | ||||||
| Ford Motor Credit Company, LLC | ||||||||
| 2,650,000 | 7.000%, 4/15/2015 | 2,945,154 | ||||||
| 5,330,000 | 5.000%, 5/15/2018 | 5,659,831 | ||||||
| Gaylord Entertainment Company | ||||||||
| 5,060,000 | 6.750%, 11/15/2014c | 5,085,300 | ||||||
| General Motors Financial Company, Inc. | ||||||||
| 1,310,000 | 6.750%, 6/1/2018c | 1,431,994 | ||||||
| Host Hotels and Resorts, Inc. | ||||||||
| 3,710,000 | 5.250%, 3/15/2022b,c | 3,802,750 | ||||||
| KB Home | ||||||||
| 1,070,000 | 7.250%, 6/15/2018 | 1,064,650 | ||||||
| 3,580,000 | 8.000%, 3/15/2020c | 3,651,600 | ||||||
| Lear Corporation | ||||||||
| 2,200,000 | 7.875%, 3/15/2018 | 2,428,250 | ||||||
| 2,200,000 | 8.125%, 3/15/2020 | 2,464,000 | ||||||
| Limited Brands, Inc. | ||||||||
| 1,570,000 | 6.625%, 4/1/2021 | 1,715,225 | ||||||
| 1,860,000 | 5.625%, 2/15/2022 | 1,915,800 | ||||||
| MGM Resorts International | ||||||||
| 5,365,000 | 10.000%, 11/1/2016c | 5,941,738 | ||||||
| NCL Corporation, Ltd. | ||||||||
| 2,170,000 | 11.750%, 11/15/2016 | 2,490,075 | ||||||
| 5,530,000 | 9.500%, 11/15/2018 | 6,000,050 | ||||||
The accompanying Notes to Financial Statements are an integral part of this schedule.
197
Table of Contents
High Yield Portfolio
Schedule of Investments as of June 29, 2012
(unaudited)
| Principal Amount | Long-Term Fixed Income (93.0%) | Value | ||||||
| Consumer Cyclical (15.7%) - continued | ||||||||
Peninsula Gaming, LLC | ||||||||
| $5,050,000 | 10.750%, 8/15/2017 | $ | 5,757,000 | |||||
Realogy Corporation | ||||||||
| 2,980,000 | 11.500%, 4/15/2017c | 2,823,550 | ||||||
Rite Aid Corporation | ||||||||
| 2,870,000 | 7.500%, 3/1/2017 | 2,927,400 | ||||||
| 2,060,000 | 9.500%, 6/15/2017 | 2,106,350 | ||||||
ROC Finance, LLC | ||||||||
| 4,780,000 | 12.125%, 9/1/2018b | 5,377,500 | ||||||
Seminole Indian Tribe of Florida | ||||||||
| 5,145,000 | 7.804%, 10/1/2020b | 5,101,833 | ||||||
Service Corporation International | ||||||||
| 2,100,000 | 6.750%, 4/1/2015 | 2,278,500 | ||||||
Seven Seas Cruises S de RL, LLC | ||||||||
| 5,270,000 | 9.125%, 5/15/2019 | 5,441,275 | ||||||
Shingle Springs Tribal Gaming Authority | ||||||||
| 4,800,000 | 9.375%, 6/15/2015e | 3,672,000 | ||||||
Tunica-Biloxi Gaming Authority | ||||||||
| 4,770,000 | 9.000%, 11/15/2015e | 4,459,950 | ||||||
West Corporation | ||||||||
| 4,650,000 | 8.625%, 10/1/2018 | 4,929,000 | ||||||
| 2,360,000 | 7.875%, 1/15/2019 | 2,466,200 | ||||||
WMG Acquisition Corporation | ||||||||
| 530,000 | 9.500%, 6/15/2016b | 577,700 | ||||||
|
| |||||||
| Total | 130,959,405 | |||||||
|
| |||||||
| Consumer Non-Cyclical (12.3%) | ||||||||
Biomet, Inc. | ||||||||
| 2,090,000 | 10.375%, 10/15/2017 | 2,233,687 | ||||||
| 3,400,000 | 11.625%, 10/15/2017 | 3,667,750 | ||||||
Capella Healthcare, Inc. | ||||||||
| 5,115,000 | 9.250%, 7/1/2017 | 5,294,025 | ||||||
Community Health Systems, Inc. | ||||||||
| 4,230,000 | 8.000%, 11/15/2019 | 4,504,950 | ||||||
Del Monte Corporation | ||||||||
| 1,300,000 | 7.625%, 2/15/2019 | 1,311,375 | ||||||
DJO Finance, LLC | ||||||||
| 1,600,000 | 9.750%, 10/15/2017 | 1,144,000 | ||||||
| 3,120,000 | 8.750%, 3/15/2018b | 3,182,400 | ||||||
Emergency Medical Services Corporation | ||||||||
| 4,320,000 | 8.125%, 6/1/2019c | 4,509,000 | ||||||
Fresenius Medical Care US Finance, Inc. | ||||||||
| 2,660,000 | 6.500%, 9/15/2018b | 2,892,750 | ||||||
Grifols, Inc. | ||||||||
| 4,380,000 | 8.250%, 2/1/2018 | 4,697,550 | ||||||
HCA, Inc. | ||||||||
| 4,270,000 | 7.250%, 9/15/2020 | 4,697,000 | ||||||
| 5,180,000 | 7.500%, 2/15/2022 | 5,646,200 | ||||||
Ingles Markets, Inc. | ||||||||
| 1,600,000 | 8.875%, 5/15/2017 | 1,742,000 | ||||||
Jarden Corporation | ||||||||
| 1,070,000 | 7.500%, 1/15/2020 | 1,168,975 | ||||||
JBS Finance II, Ltd. | ||||||||
| 5,050,000 | 8.250%, 1/29/2018c,e | 4,898,500 | ||||||
JBS USA, LLC/JBS USA Finance, Inc. | ||||||||
| 3,150,000 | 11.625%, 5/1/2014 | 3,583,125 | ||||||
Kinetic Concepts, Inc./KCI USA, Inc. | ||||||||
| 4,740,000 | 10.500%, 11/1/2018b | 4,977,000 | ||||||
Libbey Glass, Inc. | ||||||||
| 3,690,000 | 6.875%, 5/15/2020b | 3,791,475 | ||||||
Michael Foods, Inc. | ||||||||
| 4,240,000 | 9.750%, 7/15/2018 | 4,653,400 | ||||||
Mylan, Inc. | ||||||||
| 3,210,000 | 7.875%, 7/15/2020b | 3,599,213 | ||||||
Revlon Consumer Products Corporation | ||||||||
| 3,730,000 | 9.750%, 11/15/2015 | 3,991,100 | ||||||
Select Medical Corporation | ||||||||
| 3,100,000 | 6.494%, 9/15/2015c,f | 3,007,000 | ||||||
Spectrum Brands Holdings, Inc. | ||||||||
| 930,000 | 9.500%, 6/15/2018b | 1,050,900 | ||||||
| 3,700,000 | 9.500%, 6/15/2018 | 4,181,000 | ||||||
Teleflex, Inc. | ||||||||
| 4,210,000 | 6.875%, 6/1/2019 | 4,473,125 | ||||||
Tenet Healthcare Corporation | ||||||||
| 2,150,000 | 8.875%, 7/1/2019 | 2,413,375 | ||||||
Valeant Pharmaceuticals International | ||||||||
| 2,120,000 | 6.875%, 12/1/2018b | 2,191,550 | ||||||
| 1,610,000 | 6.750%, 8/15/2021b,c | 1,577,800 | ||||||
Vanguard Health Holding Company II, LLC | ||||||||
| 2,380,000 | 7.750%, 2/1/2019 | 2,403,800 | ||||||
Visant Corporation | ||||||||
| 4,890,000 | 10.000%, 10/1/2017 | 4,853,325 | ||||||
|
| |||||||
| Total | 102,337,350 | |||||||
|
| |||||||
| Energy (10.1%) | ||||||||
Chaparral Energy, Inc. | ||||||||
| 2,650,000 | 7.625%, 11/15/2022b | 2,703,000 | ||||||
Chesapeake Energy Corporation | ||||||||
| 3,190,000 | 6.875%, 8/15/2018 | 3,174,050 | ||||||
Coffeyville Resources, LLC | ||||||||
| 1,584,000 | 9.000%, 4/1/2015b | 1,686,960 | ||||||
| 3,600,000 | 10.875%, 4/1/2017b,c | 4,014,000 | ||||||
Concho Resources, Inc. | ||||||||
| 5,240,000 | 6.500%, 1/15/2022 | 5,449,600 | ||||||
Continental Resources, Inc. | ||||||||
| 3,710,000 | 5.000%, 9/15/2022b | 3,765,650 | ||||||
Denbury Resources, Inc. | ||||||||
| 800,000 | 9.750%, 3/1/2016 | 879,000 | ||||||
| 428,000 | 8.250%, 2/15/2020 | 468,660 | ||||||
| 1,710,000 | 6.375%, 8/15/2021 | 1,778,400 | ||||||
Energy XXI Gulf Coast, Inc. | ||||||||
| 2,110,000 | 9.250%, 12/15/2017 | 2,257,700 | ||||||
| 1,580,000 | 7.750%, 6/15/2019 | 1,595,800 | ||||||
Harvest Operations Corporation | ||||||||
| 5,290,000 | 6.875%, 10/1/2017b | 5,620,625 | ||||||
Helix Energy Solutions Group, Inc. | ||||||||
| 2,316,000 | 9.500%, 1/15/2016b,c | 2,426,010 | ||||||
Helix Energy Solutions Group, Inc., Convertible | ||||||||
| 1,050,000 | 3.250%, 3/15/2032 | 1,090,688 | ||||||
The accompanying Notes to Financial Statements are an integral part of this schedule.
198
Table of Contents
High Yield Portfolio
Schedule of Investments as of June 29, 2012
(unaudited)
| Principal Amount | Long-Term Fixed Income (93.0%) | Value | ||||||
| Energy (10.1%) - continued | |||||||
| Key Energy Services, Inc. | ||||||||
| $1,590,000 | 6.750%, 3/1/2021b | $ | 1,542,300 | |||||
| Linn Energy, LLC | ||||||||
| 2,250,000 | 8.625%, 4/15/2020 | 2,424,375 | ||||||
| 2,195,000 | 7.750%, 2/1/2021 | 2,293,775 | ||||||
| Markwest Energy Partners, LP/Markwest Energy Finance Corporation | ||||||||
| 2,660,000 | 6.250%, 6/15/2022 | 2,739,800 | ||||||
| McJunkin Red Man Corporation | ||||||||
| 3,230,000 | 9.500%, 12/15/2016c | 3,488,400 | ||||||
| Oasis Petroleum, Inc. | ||||||||
| 2,670,000 | 7.250%, 2/1/2019 | 2,736,750 | ||||||
| 1,590,000 | 6.500%, 11/1/2021 | 1,574,100 | ||||||
| Pioneer Natural Resources Company | ||||||||
| 3,200,000 | 7.500%, 1/15/2020 | 3,959,338 | ||||||
| Plains Exploration & Production Company | ||||||||
| 2,130,000 | 8.625%, 10/15/2019 | 2,350,987 | ||||||
| 2,500,000 | 6.750%, 2/1/2022 | 2,550,000 | ||||||
| Precision Drilling Corporation | ||||||||
| 2,450,000 | 6.625%, 11/15/2020 | 2,523,500 | ||||||
| 1,060,000 | 6.500%, 12/15/2021 | 1,081,200 | ||||||
| QEP Resources, Inc. | ||||||||
| 3,670,000 | 6.875%, 3/1/2021 | 4,073,700 | ||||||
| SandRidge Energy, Inc. | ||||||||
| 3,680,000 | 8.000%, 6/1/2018b | 3,726,000 | ||||||
| SESI, LLC | ||||||||
| 1,700,000 | 6.375%, 5/1/2019 | 1,780,750 | ||||||
| 3,200,000 | 7.125%, 12/15/2021b | 3,480,000 | ||||||
| United Refining Company | ||||||||
| 4,710,000 | 10.500%, 2/28/2018 | 4,827,750 | ||||||
|
| |||||||
| Total | 84,062,868 | |||||||
|
| |||||||
| Financials (8.4%) | |||||||
| Alliance Data Systems Corporation | ||||||||
| 2,650,000 | 6.375%, 4/1/2020b,c | 2,716,250 | ||||||
| Ally Financial, Inc. | ||||||||
| 2,080,000 | 7.500%, 12/31/2013 | 2,204,800 | ||||||
| 1,810,000 | 5.500%, 2/15/2017 | 1,838,491 | ||||||
| 2,650,000 | 8.000%, 3/15/2020 | 3,047,500 | ||||||
| 5,590,000 | 7.500%, 9/15/2020 | 6,281,762 | ||||||
| Aviv Healthcare Properties, LP | ||||||||
| 4,220,000 | 7.750%, 2/15/2019 | 4,346,600 | ||||||
| CIT Group, Inc. | ||||||||
| 2,870,000 | 5.250%, 4/1/2014b,c | 2,970,450 | ||||||
| 2,410,000 | 5.000%, 5/15/2017 | 2,482,300 | ||||||
| Community Choice Financial, Inc. | ||||||||
| 2,620,000 | 10.750%, 5/1/2019b | 2,593,800 | ||||||
| DDR Corporation | ||||||||
| 780,000 | 4.625%, 7/15/2022 | 769,802 | ||||||
| Developers Diversified Realty Corporation | ||||||||
| 3,190,000 | 7.875%, 9/1/2020 | 3,814,315 | ||||||
| Eksportfinans ASA | ||||||||
| 2,670,000 | 2.375%, 5/25/2016 | 2,373,286 | ||||||
| Harbinger Group, Inc. | ||||||||
| 2,890,000 | 10.625%, 11/15/2015c | 3,012,825 | ||||||
| Icahn Enterprises, LP | ||||||||
| 4,730,000 | 7.750%, 1/15/2016 | 4,972,412 | ||||||
| 5,780,000 | 8.000%, 1/15/2018 | 6,141,250 | ||||||
| International Lease Finance Corporation | ||||||||
| 2,250,000 | 8.625%, 9/15/2015 | 2,486,250 | ||||||
| 1,950,000 | 8.750%, 3/15/2017 | 2,188,875 | ||||||
| 1,600,000 | 8.875%, 9/1/2017 | 1,804,000 | ||||||
| 1,850,000 | 5.875%, 4/1/2019 | 1,851,793 | ||||||
| Nuveen Investments, Inc. | ||||||||
| 2,630,000 | 10.500%, 11/15/2015 | 2,669,450 | ||||||
| Omega Healthcare Investors, Inc. | ||||||||
| 6,900,000 | 5.875%, 3/15/2024b | 6,900,000 | ||||||
| Speedy Cash, Inc. | ||||||||
| 2,500,000 | 10.750%, 5/15/2018b | 2,581,250 | ||||||
|
| |||||||
| Total | 70,047,461 | |||||||
|
| |||||||
| Technology (4.4%) | |||||||
| Advanced Micro Devices, Inc. | ||||||||
| 3,200,000 | 8.125%, 12/15/2017 | 3,472,000 | ||||||
| 930,000 | 7.750%, 8/1/2020 | 1,023,000 | ||||||
| Amkor Technology, Inc. | ||||||||
| 5,480,000 | 6.625%, 6/1/2021c | 5,466,300 | ||||||
| Equinix, Inc. | ||||||||
| 3,770,000 | 8.125%, 3/1/2018 | 4,175,275 | ||||||
| 1,050,000 | 7.000%, 7/15/2021 | 1,155,000 | ||||||
| First Data Corporation | ||||||||
| 3,680,000 | 11.250%, 3/31/2016c | 3,468,400 | ||||||
| 1,000,000 | 7.375%, 6/15/2019b | 1,020,000 | ||||||
| 1,850,000 | 12.625%, 1/15/2021 | 1,852,312 | ||||||
| Freescale Semiconductor, Inc. | ||||||||
| 2,110,000 | 8.050%, 2/1/2020c | 2,083,625 | ||||||
| 2,400,000 | 10.750%, 8/1/2020c | 2,580,000 | ||||||
| Lawson Software, Inc. | ||||||||
| 1,590,000 | 9.375%, 4/1/2019b | 1,697,325 | ||||||
| NXP BV/NXP Funding, LLC | ||||||||
| 2,660,000 | 9.750%, 8/1/2018b | 3,032,400 | ||||||
| Seagate HDD Cayman | ||||||||
| 3,140,000 | 7.750%, 12/15/2018 | 3,473,625 | ||||||
| Sensata Technologies BV | ||||||||
| 2,100,000 | 6.500%, 5/15/2019b | 2,168,250 | ||||||
|
| |||||||
| Total | 36,667,512 | |||||||
|
| |||||||
| Transportation (3.2%) | |||||||
| American Petroleum Tankers, LLC | ||||||||
| 1,204,000 | 10.250%, 5/1/2015 | 1,255,170 | ||||||
| Avis Budget Car Rental, LLC | ||||||||
| 5,830,000 | 8.250%, 1/15/2019 | 6,252,675 | ||||||
| CMA CGM SA | ||||||||
| 4,710,000 | 8.500%, 4/15/2017b,c | 2,590,500 | ||||||
| Continental Airlines, Inc. | ||||||||
| 3,000,000 | 6.750%, 9/15/2015b | 3,082,500 | ||||||
| 530,000 | 6.250%, 4/11/2020c | 535,300 | ||||||
| Delta Air Lines, Inc. | ||||||||
| 1,246,000 | 9.500%, 9/15/2014b | 1,316,087 | ||||||
| Navios Maritime Acquisition Corporation | ||||||||
| 1,570,000 | 8.625%, 11/1/2017 | 1,460,100 | ||||||
| Navios Maritime Holdings, Inc. | ||||||||
| 1,580,000 | 8.875%, 11/1/2017b,d | 1,583,950 | ||||||
| 1,330,000 | 8.875%, 11/1/2017 | 1,339,975 | ||||||
The accompanying Notes to Financial Statements are an integral part of this schedule.
199
Table of Contents
High Yield Portfolio
Schedule of Investments as of June 29, 2012
(unaudited)
| Principal Amount | Long-Term Fixed Income (93.0%) | Value | ||||||
| Transportation (3.2%) - continued | ||||||||
| $2,220,000 | 8.125%, 2/15/2019 | $ | 1,898,100 | |||||
Navios South American Logistics, Inc./Navios Logistics Finance US, Inc. | ||||||||
| 1,360,000 | 9.250%, 4/15/2019 | 1,251,200 | ||||||
United Air Lines, Inc. | ||||||||
| 1,920,238 | 9.750%, 1/15/2017 | 2,184,271 | ||||||
United Maritime Group, LLC/United Maritime Group Finance Corporation | ||||||||
| 2,140,000 | 11.750%, 6/15/2015 | 2,337,950 | ||||||
|
| |||||||
| Total | 27,087,778 | |||||||
|
| |||||||
| Utilities (4.8%) | ||||||||
AES Corporation | ||||||||
| 5,900,000 | 7.375%, 7/1/2021b | 6,563,750 | ||||||
Chesapeake Midstream Partners, LP | ||||||||
| 930,000 | 6.125%, 7/15/2022 | 911,400 | ||||||
Covanta Holding Corporation | ||||||||
| 2,600,000 | 7.250%, 12/1/2020 | 2,816,874 | ||||||
| 1,850,000 | 6.375%, 10/1/2022 | 1,955,439 | ||||||
Crosstex Energy/Crosstex Energy Finance Corporation | ||||||||
| 3,730,000 | 8.875%, 2/15/2018 | 3,939,812 | ||||||
| 1,060,000 | 7.125%, 6/1/2022b | 1,044,100 | ||||||
Energy Future Intermediate Holding Company, LLC | ||||||||
| 4,780,000 | 11.750%, 3/1/2022b,c | 4,887,550 | ||||||
Holly Energy Partners, LP | ||||||||
| 2,130,000 | 8.250%, 3/15/2018 | 2,257,800 | ||||||
| 930,000 | 6.500%, 3/1/2020b | 936,975 | ||||||
Inergy, LP | ||||||||
| 5,060,000 | 7.000%, 10/1/2018 | 5,211,800 | ||||||
NGPL PipeCo, LLC | ||||||||
| 790,000 | 9.625%, 6/1/2019b | 847,275 | ||||||
Regency Energy Partners, LP | ||||||||
| 3,670,000 | 6.875%, 12/1/2018 | 3,862,675 | ||||||
Targa Resources Partners, LP | ||||||||
| 3,460,000 | 7.875%, 10/15/2018 | 3,736,800 | ||||||
| 1,330,000 | 6.375%, 8/1/2022b | 1,326,675 | ||||||
|
| |||||||
| Total | 40,298,925 | |||||||
|
| |||||||
Total Long-Term Fixed Income (cost $750,360,946) | 776,321,837 | |||||||
|
| |||||||
| Shares | Preferred Stock (0.8%) | |||||||
| Financials (0.8%) | ||||||||
| 3,381 | Ally Financial, Inc., 7.000%b,g | 3,012,154 | ||||||
| 62,690 | Ally Financial, Inc., 8.500%g | 1,438,736 | ||||||
| 26,500 | Citigroup, Inc., Convertibleh | 2,267,340 | ||||||
|
| |||||||
| Total | 6,718,230 | |||||||
|
| |||||||
| Total Preferred Stock (cost $6,204,528) | 6,718,230 | |||||||
|
| |||||||
Common Stock (<0.1%) | ||||||||
| Consumer Discretionary (<0.1%) | ||||||||
| 121,520 | TVMAX Holdings, Inc.i,j | 0 | ||||||
|
| |||||||
| Total | 0 | |||||||
|
| |||||||
| Total Common Stock (cost $6,270,446) | 0 | |||||||
|
| |||||||
Collateral Held for Securities Loaned (8.9%) | ||||||||
| 74,349,519 | Thrivent Financial Securities Lending Trust | 74,349,519 | ||||||
|
| |||||||
| Total Collateral Held for Securities Loaned (cost $74,349,519) | 74,349,519 | |||||||
|
| |||||||
| Principal Amount | Short-Term Investments (3.8%)k | |||||||
Federal Home Loan Bank Discount Notes | ||||||||
| 10,000,000 | 0.090%, 7/13/2012l | 9,999,675 | ||||||
| 10,000,000 | 0.075%, 7/20/2012l | 9,999,583 | ||||||
| 7,000,000 | 0.096%, 8/17/2012l | 6,999,100 | ||||||
Federal Home Loan Mortgage Corporation Discount Notes | ||||||||
| 5,000,000 | 0.070%, 7/11/2012l | 4,999,893 | ||||||
|
| |||||||
| Total Short-Term Investments (at amortized cost) | 31,998,251 | |||||||
|
| |||||||
| Total Investments (cost $878,784,222) 107.7% | $ | 899,103,649 | ||||||
|
| |||||||
| Other Assets and Liabilities, Net (7.7%) | (64,387,471 | ) | ||||||
|
| |||||||
| Total Net Assets 100.0% | $ | 834,716,178 | ||||||
|
| |||||||
| a | The stated interest rate represents the weighted average of all contracts within the bank loan facility. |
| b | All or a portion of the loan is unfunded. |
| c | Denotes investments purchased on a when-issued or delayed delivery basis. |
| d | Denotes securities sold under Rule 144A of the Securities Act of 1933, which exempts them from registration. These securities have been deemed liquid and may be resold to other dealers in the program or to other qualified institutional buyers. As of June 29, 2012, the value of these investments was $261,533,133 or 31.3% of total net assets. |
| e | All or a portion of the security is on loan. |
The accompanying Notes to Financial Statements are an integral part of this schedule.
200
Table of Contents
High Yield Portfolio
Schedule of Investments as of June 29, 2012
(unaudited)
| f | Denotes restricted securities. Restricted securities are investment securities which have been deemed illiquid and cannot be offered for public sale without first being registered under the Securities Act of 1933. The following table indicates the acquisition date and cost of restricted securities High Yield Portfolio owned as of June 29, 2012. |
Security | Acquisition Date | Cost | ||||||
JBS Finance II, Ltd. | 7/22/2010 | $ | 4,981,017 | |||||
Shingle Springs Tribal Gaming Authority | 6/22/2007 | $ | 4,742,336 | |||||
Tunica-Biloxi Gaming Authority | 11/8/2005 | $ | 4,752,663 | |||||
| g | Denotes variable rate securities. Variable rate securities are securities whose yields vary with a designated market index or market rate. The rate shown is as of June 29, 2012. |
| h | Denotes perpetual securities. Perpetual securities pay an indefinite stream of interest, but may be called by the issuer at an earlier date. |
| i | Comprised of a 79.7% prepaid stock purchase contract for common stock of Citigroup, Inc. and a 20.3% amortizing note. The quarterly payments received consists of return of capital and 6.15% interest on only the portion that is the note. |
| j | Security is fair valued. |
| k | Non-income producing security. |
| l | The interest rate shown reflects the yield, coupon rate or the discount rate at the date of purchase. |
| m | Denotes investments that benefit from credit enhancement or liquidity support provided by a third party bank, institution or government. |
Unrealized Appreciation (Depreciation) | ||||
Gross unrealized appreciation and depreciation of investments, based on cost for federal income tax purposes, were as follows: |
| |||
Gross unrealized appreciation | $ | 38,986,931 | ||
Gross unrealized depreciation | (18,765,117 | ) | ||
|
| |||
Net unrealized appreciation (depreciation) | $ | 20,221,814 | ||
Cost for federal income tax purposes | $ | 878,881,835 | ||
The accompanying Notes to Financial Statements are an integral part of this schedule.
201
Table of Contents
High Yield Portfolio
Schedule of Investments as of June 29, 2012
(unaudited)
Fair Valuation Measurements
The following table is a summary of the inputs used, as of June 29, 2012, in valuing High Yield Portfolio’s assets carried at fair value.
Investments in Securities | Total | Level 1 | Level 2 | Level 3 | ||||||||||||
Bank Loans | ||||||||||||||||
Energy | 3,141,914 | — | 3,141,914 | — | ||||||||||||
Financials | 2,653,312 | — | 2,653,312 | — | ||||||||||||
Technology | 3,920,586 | — | 3,920,586 | — | ||||||||||||
Long-Term Fixed Income | ||||||||||||||||
Asset-Backed Securities | 4,620,485 | — | 4,620,485 | — | ||||||||||||
Basic Materials | 72,772,293 | — | 72,772,293 | — | ||||||||||||
Capital Goods | 72,191,250 | — | 72,191,250 | — | ||||||||||||
Communications Services | 135,276,510 | — | 135,276,510 | — | ||||||||||||
Consumer Cyclical | 130,959,405 | — | 130,959,405 | — | ||||||||||||
Consumer Non-Cyclical | 102,337,350 | — | 102,337,350 | — | ||||||||||||
Energy | 84,062,868 | — | 84,062,868 | — | ||||||||||||
Financials | 70,047,461 | — | 70,047,461 | — | ||||||||||||
Technology | 36,667,512 | — | 36,667,512 | — | ||||||||||||
Transportation | 27,087,778 | — | 25,503,828 | 1,583,950 | ||||||||||||
Utilities | 40,298,925 | — | 40,298,925 | — | ||||||||||||
Preferred Stock | ||||||||||||||||
Financials | 6,718,230 | 3,706,076 | 3,012,154 | — | ||||||||||||
Common Stock | ||||||||||||||||
Consumer Discretionary^ | — | — | — | — | ||||||||||||
Collateral Held for Securities Loaned | 74,349,519 | 74,349,519 | — | — | ||||||||||||
Short-Term Investments | 31,998,251 | — | 31,998,251 | — | ||||||||||||
|
|
|
|
|
|
|
| |||||||||
Total | $ | 899,103,649 | $ | 78,055,595 | $ | 819,464,104 | $ | 1,583,950 | ||||||||
|
|
|
|
|
|
|
| |||||||||
| ^ | Securities in this section are fair valued at $0. |
The significant unobservable input used in the fair value measurement of the Long-Term Fixed Income Transportation Level 3 security is the lack of marketability. A significant increase or decrease in the input in isolation would result in a significantly lower or higher fair value measurement.
The significant unobservable input used in the fair value measurement of the reporting entity’s Common Stock Consumer Discretionary Level 3 security is the lack of marketability. This Level 3 security is fair valued at $0. A significant increase or decrease in the input in isolation would result in a significantly lower or higher fair value measurement.
There were no significant transfers between the Levels during the period ended June 29, 2012. Transfers between the levels are identified as of the end of the period.
The following table summarizes the net realized gains/(losses) and Statement of Operations location, for the period ended June 29, 2012, for High Yield Portfolio’s investments in financial derivative instruments by primary risk exposure.
Derivatives by risk category | Statement of Operations Location | Realized Gains/(Losses) recognized in Income | ||||
Equity Contracts | ||||||
Futures | Net realized gains/(losses) on Futures contracts | 266,760 | ||||
Total Equity Contracts | 266,760 | |||||
Credit Contracts | ||||||
Credit Default Swaps | Net realized gains/(losses) on Swap agreements | (133,156 | ) | |||
Total Credit Contracts | (133,156 | ) | ||||
|
| |||||
Total | $ | 133,604 | ||||
|
| |||||
The accompanying Notes to Financial Statements are an integral part of this schedule.
202
Table of Contents
High Yield Portfolio
Schedule of Investments as of June 29, 2012
(unaudited)
The following table presents High Yield Portfolio’s average volume of derivative activity during the period ended June 29, 2012.
Derivative Risk Category | Futures (Notional*) | Futures (Percentage of Average Net Assets) | Swaps (Notional*) | Swaps (Percentage of Average Net Assets) | ||||||||||||
Equity Contracts | $ | 691,880 | 0.1 | % | N/A | N/A | ||||||||||
Credit Contracts | N/A | N/A | $ | 2,514,050 | 0.3 | % | ||||||||||
| * | Notional amount represents long or short, or both, derivative positions held by the Portfolio. |
Investment in Affiliates
Affiliated issuers, as defined under the Investment Company Act of 1940, include those in which the Portfolio’s holdings of an issuer represent 5% or more of the outstanding voting securities of an issuer, or any affiliated mutual fund.
A summary of transactions for the fiscal year to date, in High Yield Portfolio, is as follows:
Portfolio | Value December 31, 2011 | Gross Purchases | Gross Sales | Shares Held at June 29, 2012 | Value June 29, 2012 | Income Earned January 1, 2012 - June 29, 2012 | ||||||||||||||||||
Thrivent Financial | $ | 50,915,269 | $ | 177,582,079 | $ | 154,147,829 | 74,349,519 | $ | 74,349,519 | $ | 159,070 | |||||||||||||
Total Value and Income Earned | 50,915,269 | 74,349,519 | 159,070 | |||||||||||||||||||||
The accompanying Notes to Financial Statements are an integral part of this schedule.
203
Table of Contents
Diversified Income Plus Portfolio
Schedule of Investments as of June 29, 2012
(unaudited)
| Principal Amount | Bank Loans (7.1%)a | Value | ||||||
| Basic Materials (0.7%) | ||||||||
Arch Coal, Inc., Term Loan | ||||||||
| $ 460,000 | 5.750%, 5/1/2018 | $ | 451,182 | |||||
Ineos Group Holdings, Term Loan | ||||||||
| 538,650 | 6.456%, 5/4/2018b,c | 526,681 | ||||||
|
| |||||||
| Total | 977,863 | |||||||
|
| |||||||
| Communications Services (2.3%) | ||||||||
Atlantic Broadband Finance, LLC, Term Loan | ||||||||
| 500,000 | 5.250%, 3/20/2019 | 500,210 | ||||||
Charter Communications Operation, Term Loan | ||||||||
| 179,550 | 4.000%, 3/28/2019 | 178,171 | ||||||
Clear Channel Communications, Term Loan | ||||||||
| 450,000 | 3.895%, 1/29/2016 | 358,501 | ||||||
Cumulus Media Holdings, Inc., Term Loan | ||||||||
| 429,023 | 5.023%, 9/16/2018b,c | 426,801 | ||||||
Lawson Software, Inc., Term Loan | ||||||||
| 449,775 | 7.500%, 3/16/2018b,c | 451,390 | ||||||
Toys R Us, Inc., Term Loan | ||||||||
| 435,000 | 5.250%, 5/25/2018 | 395,306 | ||||||
Univision Communications, Inc., Term Loan | ||||||||
| 450,000 | 2.245%, 9/29/2014 | 440,627 | ||||||
Zayo Group, LLC, Term Loan | ||||||||
| 750,000 | 0.000%, 6/14/2019b,c | 751,740 | ||||||
|
| |||||||
| Total | 3,502,746 | |||||||
|
| |||||||
| Consumer Cyclical (0.6%) | ||||||||
Burlington Coat Factory Warehouse Corporation, Term Loan | ||||||||
| 442,911 | 5.500%, 2/28/2017 | 440,081 | ||||||
Chrysler Group, LLC, Term Loan | ||||||||
| 448,867 | 6.000%, 5/24/2017 | 451,672 | ||||||
| Total | 891,753 | |||||||
| Consumer Non-Cyclical (1.4%) | ||||||||
Bausch & Lomb, Inc., Term Loan | ||||||||
| 450,000 | 5.250%, 4/17/2019 | 447,075 | ||||||
CHS/Community Health Systems, Inc., Term Loan | ||||||||
| 450,000 | 3.967%, 1/25/2017 | 442,850 | ||||||
Roundy’s Supermarkets, Inc., Term Loan | ||||||||
| 448,875 | 5.700%, 2/13/2019 | 449,274 | ||||||
Visant Corporation, Term Loan | ||||||||
| 856,972 | 5.250%, 12/22/2016 | 829,120 | ||||||
|
| |||||||
| Total | 2,168,319 | |||||||
|
| |||||||
| Energy (0.3%) | ||||||||
Chesapeake Energy Corporation, Term Loan | ||||||||
| 450,000 | 8.500%, 12/2/2017 | 446,013 | ||||||
|
| |||||||
| Total | 446,013 | |||||||
|
| |||||||
| Financials (0.3%) | ||||||||
Nuveen Investments, Inc., Term Loan | ||||||||
| 450,000 | 5.963%, 5/13/2017 | 442,350 | ||||||
|
| |||||||
| Total | 442,350 | |||||||
|
| |||||||
| Technology (0.9%) | ||||||||
First Data Corporation Extended, Term Loan | ||||||||
| 450,000 | 4.245%, 3/26/2018 | 412,146 | ||||||
Freescale Semiconductor, Inc., Term Loan | ||||||||
| 448,875 | 6.000%, 2/28/2019 | 441,181 | ||||||
Intelsat Jackson Holdings SA, Term Loan | ||||||||
| 450,000 | 5.250%, 4/2/2018 | 448,970 | ||||||
|
| |||||||
| Total | 1,302,297 | |||||||
|
| |||||||
| Transportation (0.3%) | ||||||||
Delta Air Lines, Inc., Term Loan | ||||||||
| 448,867 | 9.739%, 4/20/2017b,c | 447,466 | ||||||
|
| |||||||
| Total | 447,466 | |||||||
|
| |||||||
| Utilities (0.3%) | ||||||||
NGPL PipeCo, LLC, Term Loan | ||||||||
| 450,000 | 6.750%, 5/15/2017 | 440,627 | ||||||
|
| |||||||
| Total | 440,627 | |||||||
|
| |||||||
| Total Bank Loans (cost $10,684,915) | 10,619,434 | |||||||
|
| |||||||
Long-Term Fixed Income (48.8%) | ||||||||
| Asset-Backed Securities (1.4%) | ||||||||
Carrington Mortgage Loan Trust | ||||||||
| 1,200,000 | 0.395%, 8/25/2036d | 408,201 | ||||||
J.P. Morgan Mortgage Trust | ||||||||
| 813,091 | 2.783%, 2/25/2036 | 627,705 | ||||||
Renaissance Home Equity Loan Trust | ||||||||
| 510,263 | 5.746%, 5/25/2036 | 325,300 | ||||||
| 632,000 | 6.011%, 5/25/2036 | 356,416 | ||||||
| 950,000 | 5.797%, 8/25/2036 | 400,399 | ||||||
|
| |||||||
| Total | 2,118,021 | |||||||
|
| |||||||
| Basic Materials (2.3%) | ||||||||
ArcelorMittal | ||||||||
| 165,000 | 4.500%, 2/25/2017 | 162,477 | ||||||
Arch Coal, Inc. | ||||||||
| 620,000 | 7.000%, 6/15/2019e | 523,900 | ||||||
Dow Chemical Company | ||||||||
| 400,000 | 8.550%, 5/15/2019 | 532,030 | ||||||
FMG Resources Property, Ltd. | ||||||||
| 620,000 | 8.250%, 11/1/2019f | 657,200 | ||||||
Freeport-McMoRan Copper & Gold, Inc. | ||||||||
| 250,000 | 3.550%, 3/1/2022 | 245,969 | ||||||
Ineos Finance plc | ||||||||
| 620,000 | 7.500%, 5/1/2020f | 624,650 | ||||||
Novelis, Inc. | ||||||||
| 620,000 | 8.375%, 12/15/2017 | 663,400 | ||||||
The accompanying Notes to Financial Statements are an integral part of this schedule.
204
Table of Contents
Diversified Income Plus Portfolio
Schedule of Investments as of June 29, 2012
(unaudited)
| Principal Amount | Long-Term Fixed Income (48.8%) | Value | ||||||
| Basic Materials (2.3%) - continued | ||||||||
Rock-Tenn Company | ||||||||
| $80,000 | 4.450%, 3/1/2019f | $ | 82,175 | |||||
|
| |||||||
| Total | 3,491,801 | |||||||
|
| |||||||
| Capital Goods (1.9%) | ||||||||
AGCO Corporation, Convertible | ||||||||
| 300,000 | 1.250%, 12/15/2036 | 375,750 | ||||||
Bombardier, Inc. | ||||||||
| 620,000 | 7.750%, 3/15/2020f | 689,750 | ||||||
Case New Holland, Inc. | ||||||||
| 620,000 | 7.875%, 12/1/2017 | 716,100 | ||||||
Textron, Inc. | ||||||||
| 300,000 | 7.250%, 10/1/2019 | 353,096 | ||||||
United Technologies Corporation | ||||||||
| 85,000 | 3.100%, 6/1/2022 | 89,068 | ||||||
UR Financing Escrow Corporation | ||||||||
| 625,000 | 7.375%, 5/15/2020f | 653,125 | ||||||
|
| |||||||
| Total | 2,876,889 | |||||||
|
| |||||||
| Collateralized Mortgage Obligations (8.6%) | ||||||||
Banc of America Alternative Loan Trust | ||||||||
| 700,594 | 0.745%, 4/25/2035d | 500,396 | ||||||
Banc of America Funding Corporation | ||||||||
| 494,781 | 5.240%, 5/20/2036 | 312,800 | ||||||
Bear Stearns Adjustable Rate Mortgage Trust | ||||||||
| 420,208 | 2.400%, 10/25/2035d | 366,337 | ||||||
Citigroup Mortgage Loan Trust, Inc. | ||||||||
| 567,845 | 5.500%, 11/25/2035 | 468,498 | ||||||
CitiMortgage Alternative Loan Trust | ||||||||
| 819,885 | 5.750%, 4/25/2037 | 580,051 | ||||||
Countrywide Alternative Loan Trust | ||||||||
| 761,534 | 0.645%, 2/25/2035d | 595,049 | ||||||
| 354,999 | 6.000%, 4/25/2036 | 236,259 | ||||||
| 322,011 | 6.000%, 1/25/2037 | 231,835 | ||||||
Countrywide Home Loans | ||||||||
| 903,253 | 2.707%, 11/25/2035 | 638,328 | ||||||
Deutsche Alt-A Securities, Inc. | ||||||||
| 249,352 | 5.500%, 10/25/2021 | 241,026 | ||||||
| 1,173,995 | 0.917%, 4/25/2047d | 745,728 | ||||||
Deutsche Alt-A Securities, Inc. Alternative Loan Trust | ||||||||
| 549,881 | 0.445%, 11/25/2035d | 258,806 | ||||||
First Horizon Mortgage Pass- Through Trust | ||||||||
| 857,758 | 3.008%, 8/25/2037 | 598,800 | ||||||
GSR Mortgage Loan Trust | ||||||||
| 445,581 | 0.435%, 8/25/2046d | 363,327 | ||||||
HomeBanc Mortgage Trust | ||||||||
| 490,416 | 2.591%, 4/25/2037 | 319,359 | ||||||
J.P. Morgan Alternative Loan Trust | ||||||||
| 1,129,273 | 6.500%, 3/25/2036 | 778,943 | ||||||
J.P. Morgan Mortgage Trust | ||||||||
| 301,991 | 6.500%, 1/25/2035 | 300,977 | ||||||
| 222,072 | 2.747%, 10/25/2036 | 158,559 | ||||||
| 719,893 | 2.720%, 1/25/2037 | 507,092 | ||||||
| 669,112 | 6.250%, 8/25/2037 | 422,529 | ||||||
Lehman Mortgage Trust | ||||||||
| 839,900 | 0.995%, 12/25/2035d | 479,417 | ||||||
Master Asset Securitization Trust | ||||||||
| 958,237 | 0.745%, 6/25/2036d | 518,570 | ||||||
MASTR Alternative Loans Trust | ||||||||
| 335,577 | 6.500%, 7/25/2034 | 352,646 | ||||||
MortgageIT Trust | ||||||||
| 971,605 | 0.505%, 12/25/2035d | 657,678 | ||||||
New York Mortgage Trust, Inc. | ||||||||
| 579,855 | 2.947%, 5/25/2036 | 71,786 | ||||||
Structured Adjustable Rate Mortgage Loan Trust | ||||||||
| 467,574 | 5.246%, 9/25/2036 | 61,720 | ||||||
WaMu Mortgage Pass-Through Certificates | ||||||||
| 731,373 | 2.248%, 11/25/2036 | 518,984 | ||||||
| 184,144 | 2.499%, 8/25/2046 | 129,121 | ||||||
Washington Mutual Alternative Mortgage Pass-Through Certificates | ||||||||
| 946,027 | 0.845%, 6/25/2035d | 576,975 | ||||||
| 970,031 | 0.897%, 2/25/2047d | 422,933 | ||||||
Wells Fargo Mortgage Backed Securities Trust | ||||||||
| 454,203 | 6.000%, 7/25/2037 | 419,658 | ||||||
|
| |||||||
| Total | 12,834,187 | |||||||
|
| |||||||
| Commercial Mortgage-Backed Securities | ||||||||
| (0.7%) | ||||||||
Greenwich Capital Commercial Funding Corporation | ||||||||
| 650,000 | 5.867%, 12/10/2049 | 637,538 | ||||||
Wachovia Bank Commercial Mortgage Trust | ||||||||
| 450,000 | 0.362%, 9/15/2021d,g | 421,375 | ||||||
|
| |||||||
| Total | 1,058,913 | |||||||
|
| |||||||
| Communications Services (4.9%) | ||||||||
British Telecommunications plc | ||||||||
| 200,000 | 2.000%, 6/22/2015 | 202,748 | ||||||
Cablevision Systems Corporation | ||||||||
| 620,000 | 8.625%, 9/15/2017 | 691,300 | ||||||
CCO Holdings, LLC | ||||||||
| 620,000 | 7.000%, 1/15/2019 | 669,600 | ||||||
CenturyLink, Inc. | ||||||||
| 350,000 | 6.450%, 6/15/2021 | 364,202 | ||||||
Dish DBS Corporation | ||||||||
| 620,000 | 4.625%, 7/15/2017f | 620,775 | ||||||
| 90,000 | 6.750%, 6/1/2021 | 97,200 | ||||||
Hughes Satellite Systems Corporation | ||||||||
| 620,000 | 6.500%, 6/15/2019 | 658,750 | ||||||
Intelsat Jackson Holdings SA | ||||||||
| 620,000 | 7.250%, 4/1/2019 | 651,000 | ||||||
Interpublic Group of Companies, Inc. | ||||||||
| 85,000 | 4.000%, 3/15/2022 | 86,294 | ||||||
The accompanying Notes to Financial Statements are an integral part of this schedule.
205
Table of Contents
Diversified Income Plus Portfolio
Schedule of Investments as of June 29, 2012
(unaudited)
| Principal Amount | Long-Term Fixed Income (48.8%) | Value | ||||||
| Communications Services (4.9%) - continued | ||||||||
Level 3 Financing, Inc. | ||||||||
| $620,000 | 8.625%, 7/15/2020 | $ | 651,000 | |||||
Liberty Interactive, LLC, Convertible | ||||||||
| 805,000 | 3.500%, 1/15/2031 | 352,187 | ||||||
News America, Inc. | ||||||||
| 175,000 | 4.500%, 2/15/2021 | 191,862 | ||||||
Sprint Nextel Corporation | ||||||||
| 310,000 | 9.125%, 3/1/2017f | 325,500 | ||||||
| 310,000 | 9.000%, 11/15/2018f | 346,425 | ||||||
Telecom Italia Capital SA | ||||||||
| 85,000 | 6.999%, 6/4/2018 | 84,575 | ||||||
Telefonica Emisiones SAU | ||||||||
| 87,000 | 5.462%, 2/16/2021 | 75,759 | ||||||
UPCB Finance V, Ltd. | ||||||||
| 620,000 | 7.250%, 11/15/2021f | 647,900 | ||||||
Virgin Media Finance plc | ||||||||
| 620,000 | 5.250%, 2/15/2022 | 633,950 | ||||||
|
| |||||||
| Total | 7,351,027 | |||||||
|
| |||||||
| Consumer Cyclical (4.0%) | ||||||||
Ford Motor Company, Convertible | ||||||||
| 245,000 | 4.250%, 11/15/2016 | 340,550 | ||||||
Ford Motor Credit Company, LLC | ||||||||
| 350,000 | 6.625%, 8/15/2017 | 398,116 | ||||||
| 620,000 | 5.000%, 5/15/2018 | 658,367 | ||||||
Home Depot, Inc. | ||||||||
| 200,000 | 3.950%, 9/15/2020 | 223,879 | ||||||
Host Hotels and Resorts, LP | ||||||||
| 620,000 | 6.000%, 11/1/2020 | 672,700 | ||||||
Lennar Corporation | ||||||||
| 620,000 | 12.250%, 6/1/2017 | 801,350 | ||||||
Limited Brands, Inc. | ||||||||
| 575,000 | 5.625%, 2/15/2022 | 592,250 | ||||||
Macy’s Retail Holdings, Inc. | ||||||||
| 260,000 | 6.700%, 7/15/2034 | 312,445 | ||||||
MGM Resorts International | ||||||||
| 610,000 | 11.125%, 11/15/2017 | 684,725 | ||||||
Rite Aid Corporation | ||||||||
| 620,000 | 7.500%, 3/1/2017 | 632,400 | ||||||
Toys R Us Property Company II, LLC | ||||||||
| 620,000 | 8.500%, 12/1/2017 | 645,575 | ||||||
|
| |||||||
| Total | 5,962,357 | |||||||
|
| |||||||
| Consumer Non-Cyclical (3.7%) | ||||||||
Beam, Inc. | ||||||||
| 175,000 | 5.375%, 1/15/2016 | 194,635 | ||||||
Bunge Limited Finance Corporation | ||||||||
| 125,000 | 4.100%, 3/15/2016 | 130,344 | ||||||
Community Health Systems, Inc. | ||||||||
| 307,000 | 8.875%, 7/15/2015 | 315,059 | ||||||
| 310,000 | 8.000%, 11/15/2019 | 330,150 | ||||||
Covidien International Finance SA | ||||||||
| 350,000 | 3.200%, 6/15/2022 | 360,840 | ||||||
Fresenius Medical Care US Finance II, Inc. | ||||||||
| 620,000 | 5.625%, 7/31/2019f | 646,350 | ||||||
Gilead Sciences, Inc. | ||||||||
| 85,000 | 3.050%, 12/1/2016 | 89,735 | ||||||
Gilead Sciences, Inc., Convertible | ||||||||
| 262,000 | 1.625%, 5/1/2016 | 338,962 | ||||||
Grifols, Inc. | ||||||||
| 620,000 | 8.250%, 2/1/2018 | 664,950 | ||||||
HCA, Inc. | ||||||||
| 620,000 | 5.875%, 3/15/2022 | 647,900 | ||||||
Kraft Foods, Inc. | ||||||||
| 260,000 | 2.250%, 6/5/2017f | 266,208 | ||||||
| 170,000 | 3.500%, 6/6/2022f | 174,448 | ||||||
Reynolds Group Issuer, Inc. | ||||||||
| 620,000 | 6.875%, 2/15/2021f | 644,800 | ||||||
SABMiller Holdings, Inc. | ||||||||
| 200,000 | 3.750%, 1/15/2022f | 212,691 | ||||||
| 200,000 | 4.950%, 1/15/2042f | 221,371 | ||||||
Teva Pharmaceutical Finance IV BV | ||||||||
| 165,000 | 3.650%, 11/10/2021 | 173,543 | ||||||
Tyson Foods, Inc. | ||||||||
| 175,000 | 4.500%, 6/15/2022 | 180,250 | ||||||
|
| |||||||
| Total | 5,592,236 | |||||||
|
| |||||||
| Energy (3.4%) | ||||||||
BP Capital Markets plc | ||||||||
| 175,000 | 4.750%, 3/10/2019 | 198,046 | ||||||
| 340,000 | 3.245%, 5/6/2022 | 352,032 | ||||||
Concho Resources, Inc. | ||||||||
| 620,000 | 5.500%, 10/1/2022 | 613,800 | ||||||
Denbury Resources, Inc. | ||||||||
| 620,000 | 6.375%, 8/15/2021 | 644,800 | ||||||
Enbridge Energy Partners, LP | ||||||||
| 600,000 | 8.050%, 10/1/2037 | 650,024 | ||||||
Linn Energy, LLC | ||||||||
| 620,000 | 7.750%, 2/1/2021 | 647,900 | ||||||
Nexen, Inc. | ||||||||
| 175,000 | 6.400%, 5/15/2037 | 185,444 | ||||||
Phillips 66 | ||||||||
| 120,000 | 4.300%, 4/1/2022f | 126,236 | ||||||
Pioneer Natural Resources Company | ||||||||
| 140,000 | 3.950%, 7/15/2022 | 140,339 | ||||||
Samson Investment Company | ||||||||
| 620,000 | 9.750%, 2/15/2020f | 616,900 | ||||||
Stone Energy Corporation, Convertible | ||||||||
| 385,000 | 1.750%, 3/1/2017f | 354,200 | ||||||
Weatherford International, Ltd. | ||||||||
| 210,000 | 6.000%, 3/15/2018 | 239,427 | ||||||
| 260,000 | 4.500%, 4/15/2022 | 266,475 | ||||||
|
| |||||||
| Total | 5,035,623 | |||||||
|
| |||||||
| Financials (11.7%) | ||||||||
Abbey National Capital Trust I | ||||||||
| 525,000 | 8.963%, 12/29/2049h | 504,000 | ||||||
The accompanying Notes to Financial Statements are an integral part of this schedule.
206
Table of Contents
Diversified Income Plus Portfolio
Schedule of Investments as of June 29, 2012
(unaudited)
| Principal Amount | Long-Term Fixed Income (48.8%) | Value | ||||||
| Financials (11.7%) - continued | ||||||||
ABN Amro North American Holding Preferred Capital Repackage Trust I | ||||||||
| $350,000 | 6.523%, 12/29/2049f,h | $ | 309,312 | |||||
Aegon NV | ||||||||
| 400,000 | 2.248%, 7/29/2049d,h | 184,280 | ||||||
Ally Financial, Inc. | ||||||||
| 620,000 | 7.500%, 9/15/2020 | 696,725 | ||||||
American Express Company | ||||||||
| 750,000 | 6.800%, 9/1/2066 | 774,750 | ||||||
American International Group, Inc. | ||||||||
| 175,000 | 8.250%, 8/15/2018 | 211,258 | ||||||
Apollo Investment Corporation, Convertible | ||||||||
| 700,000 | 5.750%, 1/15/2016 | 687,750 | ||||||
Bank of America Corporation | ||||||||
| 350,000 | 5.650%, 5/1/2018 | 374,253 | ||||||
| 240,000 | 8.000%, 12/29/2049h | 250,003 | ||||||
BB&T Capital Trust IV | ||||||||
| 375,000 | 6.820%, 6/12/2057 | 377,344 | ||||||
BBVA International Preferred SA Unipersonal | ||||||||
| 525,000 | 5.919%, 12/29/2049h | 309,352 | ||||||
BNP Paribas SA | ||||||||
| 87,000 | 3.600%, 2/23/2016 | 88,000 | ||||||
Capital One Capital IV | ||||||||
| 525,000 | 6.745%, 2/17/2037 | 525,000 | ||||||
CIT Group, Inc. | ||||||||
| 238,025 | 7.000%, 5/2/2017f | 238,471 | ||||||
Citigroup, Inc. | ||||||||
| 165,000 | 4.450%, 1/10/2017 | 172,960 | ||||||
CNA Financial Corporation | ||||||||
| 400,000 | 7.350%, 11/15/2019 | 473,207 | ||||||
Cooperatieve Centrale Raiffeisen- Boerenleenbank BA | ||||||||
| 525,000 | 11.000%, 12/29/2049f,h | 660,450 | ||||||
Coventry Health Care, Inc. | ||||||||
| 85,000 | 5.450%, 6/15/2021 | 95,549 | ||||||
Developers Diversified Realty Corporation | ||||||||
| 260,000 | 7.875%, 9/1/2020 | 310,885 | ||||||
Discover Bank | ||||||||
| 400,000 | 8.700%, 11/18/2019 | 496,959 | ||||||
Eksportfinans ASA | ||||||||
| 85,000 | 2.375%, 5/25/2016 | 75,554 | ||||||
Hartford Financial Services Group, Inc. | ||||||||
| 170,000 | 5.125%, 4/15/2022 | 175,058 | ||||||
Health Care REIT, Inc. | ||||||||
| 380,000 | 6.500%, 3/15/2041 | 405,980 | ||||||
HSBC Finance Corporation | ||||||||
| 285,000 | 6.676%, 1/15/2021 | 308,573 | ||||||
Huntington National Bank | ||||||||
| 400,000 | 6.600%, 6/15/2018 | 423,677 | ||||||
Icahn Enterprises, LP | ||||||||
| 620,000 | 8.000%, 1/15/2018 | 658,750 | ||||||
ING Bank NV | ||||||||
| 170,000 | 5.000%, 6/9/2021f | 176,694 | ||||||
ING Capital Funding Trust III | ||||||||
| 350,000 | 4.061%, 12/31/2049d,h | 290,946 | ||||||
International Lease Finance Corporation | ||||||||
| 620,000 | 5.875%, 4/1/2019 | 620,601 | ||||||
J.P. Morgan Chase & Company | ||||||||
| 170,000 | 3.150%, 7/5/2016 | 174,829 | ||||||
J.P. Morgan Chase Capital XX | ||||||||
| 440,000 | 6.550%, 9/29/2036 | 440,000 | ||||||
J.P. Morgan Chase Capital XXVII | ||||||||
| 350,000 | 7.000%, 11/1/2039 | 350,000 | ||||||
KeyCorp | ||||||||
| 110,000 | 5.100%, 3/24/2021 | 122,684 | ||||||
Liberty Mutual Group, Inc. | ||||||||
| 525,000 | 10.750%, 6/15/2058f | 714,000 | ||||||
| 85,000 | 4.950%, 5/1/2022f | 84,473 | ||||||
Lincoln National Corporation | ||||||||
| 770,000 | 6.050%, 4/20/2067 | 704,550 | ||||||
Lloyds TSB Bank plc | ||||||||
| 100,000 | 6.500%, 9/14/2020e,f | 98,495 | ||||||
MetLife Capital Trust IV | ||||||||
| 575,000 | 7.875%, 12/15/2037f | 638,250 | ||||||
Murray Street Investment Trust I | ||||||||
| 175,000 | 4.647%, 3/9/2017 | 175,338 | ||||||
Northern Trust Corporation | ||||||||
| 175,000 | 3.375%, 8/23/2021 | 188,023 | ||||||
Reinsurance Group of America, Inc. | ||||||||
| 600,000 | 6.750%, 12/15/2065 | 554,422 | ||||||
Santander US Debt SAU | ||||||||
| 175,000 | 3.724%, 1/20/2015f | 162,770 | ||||||
SLM Corporation | ||||||||
| 350,000 | 8.000%, 3/25/2020 | 383,250 | ||||||
Societe Generale SA | ||||||||
| 175,000 | 5.200%, 4/15/2021f | 167,241 | ||||||
Swiss RE Capital I, LP | ||||||||
| 420,000 | 6.854%, 5/29/2049f,h | 386,914 | ||||||
Ventas Realty, LP | ||||||||
| 80,000 | 4.250%, 3/1/2022 | 80,554 | ||||||
XL Group plc | ||||||||
| 600,000 | 6.500%, 12/31/2049h | 487,500 | ||||||
ZFS Finance USA Trust II | ||||||||
| 725,000 | 6.450%, 12/15/2065f | 725,000 | ||||||
|
| |||||||
| Total | 17,514,634 | |||||||
|
| |||||||
| Mortgage-Backed Securities (1.6%) | ||||||||
Federal National Mortgage Association Conventional 15- Yr. Pass Through | ||||||||
| 2,350,000 | 3.000%, 7/1/2027c | 2,461,992 | ||||||
|
| |||||||
| Total | 2,461,992 | |||||||
|
| |||||||
| Technology (0.9%) | ||||||||
First Data Corporation | ||||||||
| 620,000 | 7.375%, 6/15/2019f | 632,400 | ||||||
Freescale Semiconductor, Inc. | ||||||||
| 320,000 | 9.250%, 4/15/2018f | 342,400 | ||||||
Hewlett-Packard Company | ||||||||
| 85,000 | 4.650%, 12/9/2021 | 89,097 | ||||||
Xilinx, Inc., Convertible | ||||||||
| 280,000 | 2.625%, 6/15/2017 | 359,100 | ||||||
|
| |||||||
| Total | 1,422,997 | |||||||
|
| |||||||
The accompanying Notes to Financial Statements are an integral part of this schedule.
207
Table of Contents
Diversified Income Plus Portfolio
Schedule of Investments as of June 29, 2012
(unaudited)
| Principal Amount | Long-Term Fixed Income (48.8%) | Value | ||||||
| Transportation (0.6%) | ||||||||
Delta Air Lines, Inc. | ||||||||
| $70,000 | 4.750%, 5/7/2020c | $ | 70,875 | |||||
Hertz Corporation | ||||||||
| 620,000 | 6.750%, 4/15/2019 | 644,800 | ||||||
United Air Lines, Inc. | ||||||||
| 127,407 | 10.400%, 11/1/2016 | 145,410 | ||||||
|
| |||||||
| Total | 861,085 | |||||||
|
| |||||||
| U.S. Government and Agencies (0.1%) | ||||||||
Petrobras International Finance Company | ||||||||
| 165,000 | 3.500%, 2/6/2017 | 169,370 | ||||||
|
| |||||||
| Total | 169,370 | |||||||
|
| |||||||
| Utilities (3.0%) | ||||||||
AES Corporation | ||||||||
| 620,000 | 7.375%, 7/1/2021f | 689,750 | ||||||
CenterPoint Energy, Inc. | ||||||||
| 140,000 | 6.500%, 5/1/2018 | 166,229 | ||||||
CenterPoint Energy, Inc., Convertible, 2.000% | ||||||||
| 9,975 | 3.375%, 9/15/2012 | 364,711 | ||||||
Energy Transfer Partners, LP | ||||||||
| 80,000 | 5.200%, 2/1/2022 | 85,673 | ||||||
| 80,000 | 6.500%, 2/1/2042 | 85,731 | ||||||
Enterprise Products Operating, LLC | ||||||||
| 700,000 | 7.034%, 1/15/2068 | 749,000 | ||||||
NGPL PipeCo, LLC | ||||||||
| 620,000 | 9.625%, 6/1/2019f | 664,950 | ||||||
NiSource Finance Corporation | ||||||||
| 350,000 | 6.125%, 3/1/2022 | 410,598 | ||||||
Southern California Edison Company | ||||||||
| 700,000 | 6.250%, 8/1/2049h | 731,220 | ||||||
Southern Union Company | ||||||||
| 200,000 | 3.483%, 11/1/2066d | 162,750 | ||||||
TransCanada PipeLines, Ltd. | ||||||||
| 400,000 | 6.350%, 5/15/2067 | 411,901 | ||||||
|
| |||||||
| Total | 4,522,513 | |||||||
|
| |||||||
Total Long-Term Fixed Income (cost $72,246,156) | 73,273,645 | |||||||
|
| |||||||
| Shares | Common Stock (36.6%) | Value | ||||||
| Consumer Discretionary (2.8%) | ||||||||
| 9,300 | Buckle, Inc.e | 368,001 | ||||||
| 9,100 | DIRECTVi | 444,262 | ||||||
| 16,000 | Gap, Inc. | 437,760 | ||||||
| 11,800 | Home Depot, Inc. | 625,282 | ||||||
| 11,500 | Macy’s, Inc. | 395,025 | ||||||
| 16,600 | Mattel, Inc. | 538,504 | ||||||
| 5,000 | McDonald’s Corporation | 442,650 | ||||||
| 7,800 | Ross Stores, Inc. | 487,266 | ||||||
| 11,600 | TJX Companies, Inc. | 497,988 | ||||||
|
| |||||||
| Total | 4,236,738 | |||||||
|
| |||||||
| Consumer Staples (3.6%) | ||||||||
| 5,000 | Brown-Forman Corporation | 484,250 | ||||||
| 8,900 | Church & Dwight Company, Inc. | 493,683 | ||||||
| 11,700 | Coca-Cola Company | 914,823 | ||||||
| 5,200 | Colgate-Palmolive Company | 541,320 | ||||||
| 4,800 | Herbalife, Ltd. | 231,984 | ||||||
| 7,200 | Hormel Foods Corporation | 219,024 | ||||||
| 10,100 | Nu Skin Enterprises, Inc. | 473,690 | ||||||
| 12,600 | Philip Morris International, Inc. | 1,099,476 | ||||||
| 15,000 | Unilever NV ADR | 500,250 | ||||||
| 6,600 | Wal-Mart Stores, Inc. | 460,152 | ||||||
|
| |||||||
| Total | 5,418,652 | |||||||
|
| |||||||
| Energy (4.3%) | ||||||||
| 15,500 | Chevron Corporation | 1,635,250 | ||||||
| 15,800 | ConocoPhillips | 882,904 | ||||||
| 6,800 | Ecopetrol SA ADRe | 379,372 | ||||||
| 15,800 | Exxon Mobil Corporation | 1,352,006 | ||||||
| 20,000 | First Trust Energy Income and Growth Funde | 610,400 | ||||||
| 14,500 | Kinder Morgan, Inc. | 467,190 | ||||||
| 9,000 | Murphy Oil Corporation | 452,610 | ||||||
| 5,900 | Occidental Petroleum Corporation | 506,043 | ||||||
| 10,200 | Statoil ASA | 243,372 | ||||||
|
| |||||||
| Total | 6,529,147 | |||||||
|
| |||||||
| Financials (10.0%) | ||||||||
| 12,100 | Aflac, Inc. | 515,339 | ||||||
| 25,889 | Annaly Capital Management, Inc. | 434,417 | ||||||
| 79,500 | Anworth Mortgage Asset Corporation | 560,475 | ||||||
| 62,500 | Ares Capital Corporation | 997,500 | ||||||
| 11,800 | Assurant, Inc. | 411,112 | ||||||
| 7,200 | Bank of Montreal | 397,872 | ||||||
| 5,700 | Berkshire Hathaway, Inc.i | 474,981 | ||||||
| 8,900 | Capital One Financial Corporation | 486,474 | ||||||
| 15,300 | CBOE Holdings, Inc. | 423,504 | ||||||
| 35,000 | CYS Investments, Inc. | 481,950 | ||||||
| 67,500 | Eaton Vance Tax-Managed Global Diversified Equity Income Fund | 560,250 | ||||||
| 52,050 | Invesco Mortgage Capital, Inc. | 954,597 | ||||||
| 31,500 | iPath S&P 500 VIX Short-Term Futures ETNe,i | 479,115 | ||||||
| 17,100 | J.P. Morgan Chase & Company | 610,983 | ||||||
| 44,400 | MFA Financial, Inc. | 350,316 | ||||||
| 45,500 | NFJ Dividend Interest & Premium Strategy Fund | 763,945 | ||||||
| 4,800 | ProAssurance Corporation | 427,632 | ||||||
| 19,600 | Progressive Corporation | 408,268 | ||||||
| 8,000 | Reinsurance Group of America, Inc. | 425,680 | ||||||
| 60,500 | Solar Capital, Ltd. | 1,346,730 | ||||||
| 6,200 | Torchmark Corporation | 313,410 | ||||||
| 92,050 | Two Harbors Investment Corporation | 953,638 | ||||||
| 22,600 | U.S. Bancorp | 726,816 | ||||||
| 31,900 | UBS AG ADRi | 373,549 | ||||||
| 32,400 | Wells Fargo & Company | 1,083,456 | ||||||
|
| |||||||
| Total | 14,962,009 | |||||||
|
| |||||||
| Health Care (3.6%) | ||||||||
| 14,700 | Abbott Laboratories | 947,709 | ||||||
| 20,300 | Eli Lilly and Company | 871,073 | ||||||
The accompanying Notes to Financial Statements are an integral part of this schedule.
208
Table of Contents
Diversified Income Plus Portfolio
Schedule of Investments as of June 29, 2012
(unaudited)
| Shares | Common Stock (36.6%) | Value | ||||||
| Health Care (3.6%) - continued | ||||||||
| 12,800 | Forest Laboratories, Inc.i | $ | 447,872 | |||||
| 5,700 | Henry Schein, Inc.i | 447,393 | ||||||
| 15,000 | Medtronic, Inc. | 580,950 | ||||||
| 3,200 | Novo Nordisk A/S ADR | 465,088 | ||||||
| 54,200 | PDL BioPharma, Inc.e | 359,346 | ||||||
| 20,353 | Pfizer, Inc. | 468,119 | ||||||
| 12,900 | UnitedHealth Group, Inc. | 754,650 | ||||||
|
| |||||||
| Total | 5,342,200 | |||||||
|
| |||||||
| Industrials (3.9%) | ||||||||
| 6,800 | 3M Company | 609,280 | ||||||
| 80,700 | Alerian MLP ETFe | 1,289,586 | ||||||
| 16,600 | Copart, Inc.i | 393,254 | ||||||
| 5,400 | Dun & Bradstreet Corporation | 384,318 | ||||||
| 7,400 | Emerson Electric Company | 344,692 | ||||||
| 8,300 | JB Hunt Transport Services, Inc. | 494,680 | ||||||
| 20,800 | Knight Transportation, Inc. | 332,592 | ||||||
| 6,300 | Lockheed Martin Corporation | 548,604 | ||||||
| 8,400 | Northrop Grumman Corporation | 535,836 | ||||||
| 1,300 | Precision Castparts Corporation | 213,837 | ||||||
| 2,800 | United Parcel Service, Inc. | 220,528 | ||||||
| 9,000 | Verisk Analytics, Inc.i | 443,340 | ||||||
|
| |||||||
| Total | 5,810,547 | |||||||
|
| |||||||
| Information Technology (3.3%) | ||||||||
| 8,600 | Accenture plc | 516,774 | ||||||
| 500 | Apple, Inc.i | 292,000 | ||||||
| 24,100 | Intel Corporation | 642,265 | ||||||
| 4,100 | International Business Machines Corporation | 801,878 | ||||||
| 1,200 | MasterCard, Inc. | 516,132 | ||||||
| 41,100 | Microsoft Corporation | 1,257,249 | ||||||
| 4,300 | Visa, Inc. | 531,609 | ||||||
| 4,000 | VMware, Inc.i | 364,160 | ||||||
|
| |||||||
| Total | 4,922,067 | |||||||
|
| |||||||
| Materials (1.9%) | ||||||||
| 1,300 | CF Industries Holdings, Inc. | 251,862 | ||||||
| 14,900 | Gold Resource Corporatione | 387,251 | ||||||
| 2,700 | Monsanto Company | 223,506 | ||||||
| 21,000 | Newmont Mining Corporation | 1,018,710 | ||||||
| 5,000 | PPG Industries, Inc. | 530,600 | ||||||
| 15,300 | Southern Copper Corporation | 482,103 | ||||||
|
| |||||||
| Total | 2,894,032 | |||||||
|
| |||||||
| Telecommunications Services (1.7%) | ||||||||
| 22,500 | AT&T, Inc. | 802,350 | ||||||
| 6,500 | Philippine Long Distance Telephone Company ADR | 413,400 | ||||||
| 13,700 | Telekomunikasi Indonesia Tbk PT ADR | 477,171 | ||||||
| 5,100 | Verizon Communications, Inc. | 226,644 | ||||||
| 21,600 | Vodafone Group plc ADR | 608,688 | ||||||
|
| |||||||
| Total | 2,528,253 | |||||||
|
| |||||||
| Utilities (1.5%) | ||||||||
| 6,300 | Consolidated Edison, Inc. | 391,797 | ||||||
| 21,200 | Enersis SA ADR | 396,440 | ||||||
| 4,900 | Northwest Natural Gas Company | 233,240 | ||||||
| 22,800 | Questar Corporation | 475,608 | ||||||
| 15,500 | Southern Company | 717,650 | ||||||
|
| |||||||
| Total | 2,214,735 | |||||||
|
| |||||||
Total Common Stock (cost $52,459,920) | 54,858,380 | |||||||
|
| |||||||
Preferred Stock (1.4%) | ||||||||
| Financials (0.9%) | ||||||||
| 6,000 | ING Groep NVh | 152,760 | ||||||
| 10,500 | PNC Financial Services Group, Inc., 6.125%h,i | 276,675 | ||||||
| 8,000 | Royal Bank of Scotland Group plc, 7.250%h | 157,200 | ||||||
| 28,000 | U.S. Bancorp, 6.500%h | 800,240 | ||||||
|
| |||||||
| Total | 1,386,875 | |||||||
|
| |||||||
| Industrials (0.5%) | ||||||||
| 2,975 | Stanley Black & Decker, Inc., Convertible, 4.750% | 348,105 | ||||||
| 7,000 | United Technologies Corporation, Convertible, 7.500%i | 368,830 | ||||||
|
| |||||||
| Total | 716,935 | |||||||
|
| |||||||
Total Preferred Stock (cost $1,962,000) | 2,103,810 | |||||||
|
| |||||||
Collateral Held for Securities Loaned (2.8%) | ||||||||
| 4,207,675 | Thrivent Financial Securities Lending Trust | 4,207,675 | ||||||
|
| |||||||
| Total Collateral Held for Securities Loaned (cost $4,207,675) | 4,207,675 | |||||||
|
| |||||||
| Principal Amount | Short-Term Investments (5.8%)j | |||||||
Federal Home Loan Bank Discount Notes | ||||||||
| 5,000,000 | 0.095%, 7/13/2012k | 4,999,828 | ||||||
| 3,000,000 | 0.060%, 7/20/2012k | 2,999,900 | ||||||
Federal National Mortgage Association Discount Notes | ||||||||
| 600,000 | 0.120%, 7/18/2012k,l | 599,964 | ||||||
|
| |||||||
| Total Short-Term Investments (at amortized cost) | 8,599,692 | |||||||
|
| |||||||
| Total Investments (cost $150,160,358) 102.5% | $ | 153,662,636 | ||||||
|
| |||||||
| Other Assets and Liabilities, Net (2.5%) | (3,759,949 | ) | ||||||
|
| |||||||
| Total Net Assets 100.0% | $ | 149,902,687 | ||||||
|
| |||||||
| a | The stated interest rate represents the weighted average of all contracts within the bank loan facility. |
| b | All or a portion of the loan is unfunded. |
| c | Denotes investments purchased on a when-issued or delayed delivery basis. |
The accompanying Notes to Financial Statements are an integral part of this schedule.
209
Table of Contents
Diversified Income Plus Portfolio
Schedule of Investments as of June 29, 2012
(unaudited)
| d | Denotes variable rate securities. Variable rate securities are securities whose yields vary with a designated market index or market rate. The rate shown is as of June 29, 2012. |
| e | All or a portion of the security is on loan. |
| f | Denotes securities sold under Rule 144A of the Securities Act of 1933, which exempts them from registration. These securities have been deemed liquid and may be resold to other dealers in the program or to other qualified institutional buyers. As of June 29, 2012, the value of these investments was $14,602,274 or 9.7% of total net assets. |
| g | Denotes restricted securities. Restricted securities are investment securities which have been deemed illiquid and cannot be offered for public sale without first being registered under the Securities Act of 1933. The following table indicates the acquisition date and cost of restricted securities Diversified Income Plus Portfolio owned as of June 29, 2012. |
Security | Acquisition Date | Cost | ||||||
Wachovia Bank Commercial Mortgage Trust | 4/25/2007 | $ | 450,000 | |||||
| h | Denotes perpetual securities. Perpetual securities pay an indefinite stream of interest, but may be called by the issuer at an earlier date. |
| i | Non-income producing security. |
| j | The interest rate shown reflects the yield, coupon rate or the discount rate at the date of purchase. |
| k | Denotes investments that benefit from credit enhancement or liquidity support provided by a third party bank, institution or government. |
| l | At June 29, 2012, $599,964 of investments were held on deposit with the counterparty and pledged as the initial margin deposit for open futures contracts. |
Definitions:
ADR | - | American Depositary Receipt, which are certificates for an underlying foreign security’s shares held by an issuing U.S. depository bank. | ||
REIT | - | Real Estate Investment Trust is a company that buys, develops, manages and/or sells real estate assets. | ||
ETF | - | Exchange Traded Fund. | ||
ETN | - | Exchange Traded Note. |
Unrealized Appreciation (Depreciation)
Gross unrealized appreciation and depreciation of investments, based on cost for federal income tax purposes, were as follows:
Gross unrealized appreciation | $ | 7,344,106 | ||
Gross unrealized depreciation | (3,900,215 | ) | ||
|
| |||
Net unrealized appreciation (depreciation) | $ | 3,443,891 | ||
Cost for federal income tax purposes | $ | 150,218,745 |
The accompanying Notes to Financial Statements are an integral part of this schedule.
210
Table of Contents
Diversified Income Plus Portfolio
Schedule of Investments as of June 29, 2012
(unaudited)
Fair Valuation Measurements
The following table is a summary of the inputs used, as of June 29, 2012, in valuing Diversified Income Plus Portfolio’s assets carried at fair value.
Investments in Securities | Total | Level 1 | Level 2 | Level 3 | ||||||||||||
Bank Loans | ||||||||||||||||
Basic Materials | 977,863 | — | 977,863 | — | ||||||||||||
Communications Services | 3,502,746 | — | 3,502,746 | — | ||||||||||||
Consumer Cyclical | 891,753 | — | 891,753 | — | ||||||||||||
Consumer Non-Cyclical | 2,168,319 | — | 2,168,319 | — | ||||||||||||
Energy | 446,013 | — | 446,013 | — | ||||||||||||
Financials | 442,350 | — | 442,350 | — | ||||||||||||
Technology | 1,302,297 | — | 1,302,297 | — | ||||||||||||
Transportation | 447,466 | — | 447,466 | — | ||||||||||||
Utilities | 440,627 | — | 440,627 | — | ||||||||||||
Long-Term Fixed Income | ||||||||||||||||
Asset-Backed Securities | 2,118,021 | — | 2,118,021 | — | ||||||||||||
Basic Materials | 3,491,801 | — | 3,491,801 | — | ||||||||||||
Capital Goods | 2,876,889 | — | 2,876,889 | — | ||||||||||||
Collateralized Mortgage Obligations | 12,834,187 | — | 12,834,187 | — | ||||||||||||
Commercial Mortgage-Backed Securities | 1,058,913 | — | 1,058,913 | — | ||||||||||||
Communications Services | 7,351,027 | — | 7,351,027 | — | ||||||||||||
Consumer Cyclical | 5,962,357 | — | 5,962,357 | — | ||||||||||||
Consumer Non-Cyclical | 5,592,236 | — | 5,592,236 | — | ||||||||||||
Energy | 5,035,623 | — | 5,035,623 | — | ||||||||||||
Financials | 17,514,634 | — | 17,514,634 | — | ||||||||||||
Mortgage-Backed Securities | 2,461,992 | — | 2,461,992 | — | ||||||||||||
Technology | 1,422,997 | — | 1,422,997 | — | ||||||||||||
Transportation | 861,085 | — | 861,085 | — | ||||||||||||
U.S. Government and Agencies | 169,370 | — | 169,370 | — | ||||||||||||
Utilities | 4,522,513 | — | 4,522,513 | — | ||||||||||||
Common Stock | ||||||||||||||||
Consumer Discretionary | 4,236,738 | 4,236,738 | — | — | ||||||||||||
Consumer Staples | 5,418,652 | 5,418,652 | — | — | ||||||||||||
Energy | 6,529,147 | 6,529,147 | — | — | ||||||||||||
Financials | 14,962,009 | 14,962,009 | — | — | ||||||||||||
Health Care | 5,342,200 | 5,342,200 | — | — | ||||||||||||
Industrials | 5,810,547 | 5,810,547 | — | — | ||||||||||||
Information Technology | 4,922,067 | 4,922,067 | — | — | ||||||||||||
Materials | 2,894,032 | 2,894,032 | — | — | ||||||||||||
Telecommunications Services | 2,528,253 | 2,528,253 | — | — | ||||||||||||
Utilities | 2,214,735 | 2,214,735 | — | — | ||||||||||||
Preferred Stock | ||||||||||||||||
Financials | 1,386,875 | 1,386,875 | — | — | ||||||||||||
Industrials | 716,935 | 716,935 | — | — | ||||||||||||
Collateral Held for Securities Loaned | 4,207,675 | 4,207,675 | — | — | ||||||||||||
Short-Term Investments | 8,599,692 | — | 8,599,692 | — | ||||||||||||
|
|
|
|
|
|
|
| |||||||||
Total | $ | 153,662,636 | $ | 61,169,865 | $ | 92,492,771 | $ | — | ||||||||
|
|
|
|
|
|
|
| |||||||||
Other Financial Instruments | Total | Level 1 | Level 2 | Level 3 | ||||||||||||
Asset Derivatives | ||||||||||||||||
Futures Contracts | 47,474 | 47,474 | — | — | ||||||||||||
|
|
|
|
|
|
|
| |||||||||
Total Asset Derivatives | $ | 47,474 | $ | 47,474 | $ | — | $ | — | ||||||||
|
|
|
|
|
|
|
| |||||||||
Liability Derivatives | ||||||||||||||||
Futures Contracts | 151,940 | 151,940 | — | — | ||||||||||||
|
|
|
|
|
|
|
| |||||||||
Total Liability Derivatives | $ | 151,940 | $ | 151,940 | $ | — | $ | — | ||||||||
|
|
|
|
|
|
|
| |||||||||
There were no significant transfers between the Levels during the period ended June 29, 2012. Transfers between the levels are identified as of the end of the period.
The accompanying Notes to Financial Statements are an integral part of this schedule.
211
Table of Contents
Diversified Income Plus Portfolio
Schedule of Investments as of June 29, 2012
(unaudited)
Futures Contracts | Number of Contracts Long/(Short) | Expiration Date | Notional Principal Amount | Value | Unrealized Gain/(Loss) | |||||||||||||||
5-Yr. U.S. Treasury Bond Futures | 26 | September 2012 | $ | 3,216,767 | $ | 3,223,188 | $ | 6,421 | ||||||||||||
10-Yr. U.S. Treasury Bond Futures | (5 | ) | September 2012 | (663,500 | ) | (666,875 | ) | (3,375 | ) | |||||||||||
S&P 500 Index Futures | (16 | ) | September 2012 | (5,277,035 | ) | (5,425,600 | ) | (148,565 | ) | |||||||||||
S&P 500 Index Mini-Futures | 23 | September 2012 | 1,518,808 | 1,559,861 | 41,053 | |||||||||||||||
Total Futures Contracts | ($ | 104,466 | ) | |||||||||||||||||
The following table summarizes the fair value and Statement of Assets and Liabilities location, as of June 29, 2012, for Diversified Income Plus Portfolio’s investments in financial derivative instruments by primary risk exposure as discussed under item (2) Significant Accounting Policies of the Notes to Financial Statements.
Derivatives by risk category | Statement of Assets and Liabilities Location | Fair Value | ||||
Asset Derivatives | ||||||
Interest Rate Contracts | ||||||
Futures* | Net Assets - Net unrealized appreciation/(depreciation) on Futures contracts | 6,421 | ||||
Total Interest Rate Contracts | 6,421 | |||||
Equity Contracts | ||||||
Futures* | Net Assets - Net unrealized appreciation/(depreciation) on Futures contracts | 41,053 | ||||
Total Equity Contracts | 41,053 | |||||
|
| |||||
Total Asset Derivatives | $ | 47,474 | ||||
|
| |||||
Liability Derivatives | ||||||
Equity Contracts | ||||||
Futures* | Net Assets - Net unrealized appreciation/(depreciation) on Futures contracts | 148,565 | ||||
Total Equity Contracts | 148,565 | |||||
Interest Rate Contracts | ||||||
Futures* | Net Assets - Net unrealized appreciation/(depreciation) on Futures contracts | 3,375 | ||||
Total Interest Rate Contracts | 3,375 | |||||
|
| |||||
Total Liability Derivatives | $ | 151,940 | ||||
|
| |||||
| * | Includes cumulative appreciation/depreciation of futures contracts as reported in the Schedule of Investments. Only current day’s variation margin is reported within the Statement of Assets and Liabilities. |
The following table summarizes the net realized gains/(losses) and Statement of Operations location, for the period ended June 29, 2012, for Diversified Income Plus Portfolio’s investments in financial derivative instruments by primary risk exposure.
Derivatives by risk category | Statement of Operations Location | Realized Gains/(Losses) recognized in Income | ||||
Equity Contracts | ||||||
Options Written | Net realized gains/(losses) on Written option contracts | (41,346 | ) | |||
Futures | Net realized gains/(losses) on Futures contracts | 528,388 | ||||
Total Equity Contracts | 487,042 | |||||
Interest Rate Contracts | ||||||
Futures | Net realized gains/(losses) on Futures contracts | 9,583 | ||||
Total Interest Rate Contracts | 9,583 | |||||
|
| |||||
Total | $ | 496,625 | ||||
|
| |||||
The accompanying Notes to Financial Statements are an integral part of this schedule.
212
Table of Contents
Diversified Income Plus Portfolio
Schedule of Investments as of June 29, 2012
(unaudited)
The following table summarizes the change in net unrealized appreciation/(depreciation) and Statement of Operations location, for the period ended June 29, 2012, for Diversified Income Plus Portfolio’s investments in financial derivative instruments by primary risk exposure.
Derivatives by risk category | Statement of Operations Location | Change in unrealized appreciation/(depreciation) recognized in Income | ||||
Interest Rate Contracts | ||||||
Futures | Change in net unrealized appreciation/(depreciation) on Futures contracts | 1,914 | ||||
Total Interest Rate Contracts | 1,914 | |||||
Equity Contracts | ||||||
Options Written | Change in net unrealized appreciation/(depreciation) on Written option contracts | 7,050 | ||||
Futures | Change in net unrealized appreciation/(depreciation) on Futures contracts | (128,200 | ) | |||
Total Equity Contracts | (121,150 | ) | ||||
|
| |||||
Total | ($ | 119,236 | ) | |||
|
| |||||
The following table presents Diversified Income Plus Portfolio’s average volume of derivative activity during the period ended June 29, 2012.
Derivative Risk Category | Futures (Notional*) | Futures (Percentage of Average Net Assets) | Options (Contracts) | |||||||||
Equity Contracts | $ | 5,905,899 | 4.4 | % | 7 | |||||||
Interest Rate Contracts | 3,911,195 | 2.9 | N/A | |||||||||
| * | Notional amount represents long or short, or both, derivative positions held by the Portfolio. |
Investment in Affiliates
Affiliated issuers, as defined under the Investment Company Act of 1940, include those in which the Portfolio’s holdings of an issuer represent 5% or more of the outstanding voting securities of an issuer, or any affiliated mutual fund.
A summary of transactions for the fiscal year to date, in Diversified Income Plus Portfolio, is as follows:
Portfolio | Value December 31, 2011 | Gross Purchases | Gross Sales | Shares Held at June 29, 2012 | Value June 29, 2012 | Income Earned January 1, 2012 - June 29, 2012 | ||||||||||||||||||
Thrivent Financial Securities Lending Trust | $ | 4,748,550 | $ | 26,278,535 | $ | 26,819,410 | 4,207,675 | $ | 4,207,675 | $ | 33,161 | |||||||||||||
Total Value and | 4,748,550 | 4,207,675 | 33,161 | |||||||||||||||||||||
The accompanying Notes to Financial Statements are an integral part of this schedule.
213
Table of Contents
Partner Socially Responsible Bond Portfolio
Schedule of Investments as of June 29, 2012
(unaudited)
| Principal Amount | Long-Term Fixed Income (87.5%) | Value | ||||||
| Asset-Backed Securities (0.7%) | ||||||||
Americredit Automobile Receivables Trust | ||||||||
| $ 6,713 | 5.239%, 1/6/2015a | $ | 6,812 | |||||
CPS Auto Trust | ||||||||
| 4,206 | 6.480%, 7/15/2013b | 4,226 | ||||||
DT Auto Owner Trust | ||||||||
| 12,358 | 0.960%, 1/15/2014b | 12,356 | ||||||
| 27,471 | 1.400%, 12/15/2041b | 27,503 | ||||||
Franklin Auto Trust | ||||||||
| 28,759 | 7.160%, 5/20/2016b | 29,019 | ||||||
Santander Drive Auto Receivables Trust | ||||||||
| 2,224 | 1.010%, 7/15/2013b | 2,224 | ||||||
| 6,688 | 1.370%, 8/15/2013b | 6,692 | ||||||
|
| |||||||
| Total | 88,832 | |||||||
|
| |||||||
| Basic Materials (0.9%) | ||||||||
Ecolab, Inc. | ||||||||
| 40,000 | 4.350%, 12/8/2021 | 44,334 | ||||||
Yara International ASA | ||||||||
| 50,000 | 7.875%, 6/11/2019b | 62,627 | ||||||
|
| |||||||
| Total | 106,961 | |||||||
|
| |||||||
| Capital Goods (0.6%) | ||||||||
John Deere Capital Corporation | ||||||||
| 15,000 | 1.250%, 12/2/2014 | 15,198 | ||||||
Masco Corporation | ||||||||
| 60,000 | 5.875%, 7/15/2012 | 60,056 | ||||||
|
| |||||||
| Total | 75,254 | |||||||
|
| |||||||
| Collateralized Mortgage Obligations (0.4%) | ||||||||
Countrywide Alternative Loan Trust | ||||||||
| 28,636 | 4.968%, 7/25/2035 | 28,953 | ||||||
GMAC Mortgage Corporation Loan Trust | ||||||||
| 18,531 | 5.500%, 10/25/2033 | 18,790 | ||||||
J.P. Morgan Mortgage Trust | ||||||||
| 1,140 | 3.780%, 7/25/2035 | 1,139 | ||||||
|
| |||||||
| Total | 48,882 | |||||||
|
| |||||||
| Commercial Mortgage-Backed Securities (4.0%) | ||||||||
Credit Suisse First Boston Mortgage Securities Corporation | ||||||||
| 78,329 | 4.597%, 3/15/2035 | 79,281 | ||||||
Federal Home Loan Mortgage Corporation | ||||||||
| 100,000 | 5.250%, 4/18/2016 | 117,037 | ||||||
GE Capital Commercial Mortgage Corporation | ||||||||
| 30,884 | 4.996%, 12/10/2037 | 31,003 | ||||||
Morgan Stanley Dean Witter Capital I | ||||||||
| 150,000 | 6.550%, 7/15/2033 | 154,328 | ||||||
Wachovia Bank Commercial Mortgage Trust | ||||||||
| 73,183 | 4.566%, 4/15/2035 | 74,351 | ||||||
| 20,612 | 5.230%, 7/15/2041 | 20,614 | ||||||
|
| |||||||
| Total | 476,614 | |||||||
|
| |||||||
| Communications Services (8.4%) | ||||||||
American Tower Corporation | ||||||||
| 80,000 | 4.500%, 1/15/2018 | 84,561 | ||||||
| 50,000 | 5.900%, 11/1/2021 | 55,641 | ||||||
AT&T, Inc. | ||||||||
| 100,000 | 2.950%, 5/15/2016 | 105,917 | ||||||
| 50,000 | 3.875%, 8/15/2021 | 54,463 | ||||||
CenturyLink, Inc. | ||||||||
| 100,000 | 7.875%, 8/15/2012 | 100,816 | ||||||
| 100,000 | 5.800%, 3/15/2022 | 99,550 | ||||||
Crown Castle Towers, LLC | ||||||||
| 80,000 | 4.883%, 8/15/2020b | 86,857 | ||||||
France Telecom SA | ||||||||
| 50,000 | 5.375%, 1/13/2042 | 52,821 | ||||||
SBA Tower Trust | ||||||||
| 60,000 | 4.254%, 4/15/2015b | 62,749 | ||||||
Telefonica Emisiones SAU | ||||||||
| 60,000 | 3.992%, 2/16/2016 | 53,639 | ||||||
| 70,000 | 5.134%, 4/27/2020 | 60,297 | ||||||
Time Warner Cable, Inc. | ||||||||
| 200,000 | 4.000%, 9/1/2021 | 210,170 | ||||||
|
| |||||||
| Total | 1,027,481 | |||||||
|
| |||||||
| Consumer Cyclical (5.8%) | ||||||||
Darden Restaurants, Inc. | ||||||||
| 50,000 | 4.500%, 10/15/2021 | 52,793 | ||||||
FUEL Trust | ||||||||
| 200,000 | 4.207%, 4/15/2016b | 207,676 | ||||||
Gap, Inc. | ||||||||
| 60,000 | 5.950%, 4/12/2021 | 62,190 | ||||||
Home Depot, Inc. | ||||||||
| 60,000 | 5.875%, 12/16/2036 | 76,813 | ||||||
Lowe’s Companies, Inc. | ||||||||
| 20,000 | 3.800%, 11/15/2021 | 21,649 | ||||||
O’Reilly Automotive, Inc. | ||||||||
| 30,000 | 4.625%, 9/15/2021 | 31,352 | ||||||
Spencer Spirit Holdings, Inc. | ||||||||
| 50,000 | 11.000%, 5/1/2017b | 51,750 | ||||||
Target Corporation | ||||||||
| 50,000 | 2.900%, 1/15/2022 | 51,089 | ||||||
Time Warner, Inc. | ||||||||
| 20,000 | 4.000%, 1/15/2022 | 21,153 | ||||||
| 30,000 | 5.375%, 10/15/2041 | 31,924 | ||||||
Volkswagen International Finance NV | ||||||||
| 100,000 | 1.078%, 4/1/2014a,b | 99,793 | ||||||
|
| |||||||
| Total | 708,182 | |||||||
|
| |||||||
| Consumer Non-Cyclical (4.2%) | ||||||||
Amgen, Inc. | ||||||||
| 25,000 | 2.500%, 11/15/2016 | 25,975 | ||||||
| 25,000 | 3.875%, 11/15/2021 | 26,396 | ||||||
Aristotle Holding, Inc. | ||||||||
| 20,000 | 2.750%, 11/21/2014b | 20,428 | ||||||
Becton Dickinson and Company | ||||||||
| 25,000 | 3.125%, 11/8/2021 | 26,019 | ||||||
The accompanying Notes to Financial Statements are an integral part of this schedule.
214
Table of Contents
Partner Socially Responsible Bond Portfolio
Schedule of Investments as of June 29, 2012
(unaudited)
| Principal Amount | Long-Term Fixed Income (87.5%) | Value | ||||||
| Consumer Non-Cyclical (4.2%) - continued | ||||||||
Coca-Cola Company | ||||||||
| $ 150,000 | 0.418%, 3/14/2014a | $ | 150,232 | |||||
| 70,000 | 1.800%, 9/1/2016 | 71,895 | ||||||
Colgate-Palmolive Company | ||||||||
| 25,000 | 1.300%, 1/15/2017 | 25,319 | ||||||
Dr Pepper Snapple Group, Inc. | ||||||||
| 20,000 | 3.200%, 11/15/2021 | 20,445 | ||||||
Hershey Company | ||||||||
| 10,000 | 1.500%, 11/1/2016 | 10,083 | ||||||
PepsiCo, Inc. | ||||||||
| 50,000 | 2.750%, 3/5/2022 | 50,466 | ||||||
| 50,000 | 4.000%, 3/5/2042 | 52,252 | ||||||
St. Jude Medical, Inc. | ||||||||
| 40,000 | 2.500%, 1/15/2016 | 41,550 | ||||||
|
| |||||||
| Total | 521,060 | |||||||
|
| |||||||
| Energy (1.2%) | ||||||||
Great River Energy | ||||||||
| 41,077 | 5.829%, 7/1/2017b | 43,867 | ||||||
Kinder Morgan Energy Partners, LP | ||||||||
| 40,000 | 5.625%, 9/1/2041 | 41,509 | ||||||
Pioneer Natural Resources Company | ||||||||
| 60,000 | 5.875%, 7/15/2016 | 66,688 | ||||||
|
| |||||||
| Total | 152,064 | |||||||
|
| |||||||
| Financials (19.8%) | ||||||||
Ally Financial, Inc. | ||||||||
| 100,000 | 6.875%, 8/28/2012 | 100,500 | ||||||
| 25,000 | 4.500%, 2/11/2014 | 25,344 | ||||||
American Express Credit Corporation | ||||||||
| 25,000 | 2.800%, 9/19/2016 | 26,079 | ||||||
Bank of America Corporation | ||||||||
| 100,000 | 2.019%, 7/11/2014a | 98,430 | ||||||
| 220,000 | 5.700%, 1/24/2022 | 242,285 | ||||||
Bank of Montreal | ||||||||
| 70,000 | 2.625%, 1/25/2016b | 73,895 | ||||||
Bank of New York Mellon Corporation | ||||||||
| 100,000 | 1.700%, 11/24/2014 | 101,685 | ||||||
Bank of Nova Scotia | ||||||||
| 100,000 | 1.250%, 11/7/2014b | 101,253 | ||||||
Boston Properties, LP | ||||||||
| 50,000 | 3.700%, 11/15/2018 | 52,245 | ||||||
Canadian Imperial Bank of Commerce | ||||||||
| 60,000 | 2.750%, 1/27/2016b | 63,680 | ||||||
CIT Group, Inc. | ||||||||
| 100,000 | 5.250%, 3/15/2018 | 103,250 | ||||||
Discover Bank | ||||||||
| 60,000 | 8.700%, 11/18/2019 | 74,544 | ||||||
ERP Operating, LP | ||||||||
| 50,000 | 4.625%, 12/15/2021 | 54,309 | ||||||
Fifth Third Bank | ||||||||
| 60,000 | 0.576%, 5/17/2013a | 59,783 | ||||||
Glitnir Banki HF | ||||||||
| 50,000 | 3.226%, 9/22/2012b,c | 13,375 | ||||||
Goldman Sachs Group, Inc. | ||||||||
| 25,000 | 5.250%, 7/27/2021 | 25,395 | ||||||
| 100,000 | 5.750%, 1/24/2022 | 105,560 | ||||||
Harley-Davidson Funding Corporation | ||||||||
| 95,000 | 5.250%, 12/15/2012b | 96,564 | ||||||
HSBC Finance Corporation | ||||||||
| 100,000 | 0.818%, 9/14/2012a | 100,002 | ||||||
J.P. Morgan Chase & Company | ||||||||
| 50,000 | 4.400%, 7/22/2020 | 52,737 | ||||||
| 50,000 | 4.350%, 8/15/2021 | 52,770 | ||||||
| 100,000 | 4.500%, 1/24/2022 | 107,722 | ||||||
Nationwide Health Properties, Inc. | ||||||||
| 100,000 | 6.250%, 2/1/2013 | 102,701 | ||||||
| 60,000 | 6.900%, 10/1/2037 | 68,203 | ||||||
Royal Bank of Canada | ||||||||
| 100,000 | 1.450%, 10/30/2014 | 101,268 | ||||||
Simon Property Group, LP | ||||||||
| 30,000 | 4.125%, 12/1/2021 | 31,962 | ||||||
SSIF Nevada, LP | ||||||||
| 70,000 | 1.167%, 4/14/2014a,b | 69,531 | ||||||
Stadshypotek AB | ||||||||
| 60,000 | 1.011%, 9/30/2013a,b | 59,963 | ||||||
SunTrust Bank | ||||||||
| 25,000 | 0.757%, 8/24/2015a | 23,333 | ||||||
Toronto-Dominion Bank | ||||||||
| 50,000 | 2.375%, 10/19/2016 | 51,346 | ||||||
U.S. Bank National Association | ||||||||
| 60,000 | 3.778%, 4/29/2020 | 62,686 | ||||||
Wachovia Capital Trust III | ||||||||
| 120,000 | 5.570%, 3/29/2049a,d | 114,600 | ||||||
|
| |||||||
| Total | 2,417,000 | |||||||
|
| |||||||
| Foreign Government (0.9%) | ||||||||
Province of Ontario | ||||||||
| 100,000 | 3.000%, 7/16/2018 | 107,402 | ||||||
|
| |||||||
| Total | 107,402 | |||||||
|
| |||||||
| Mortgage-Backed Securities (0.8%) | ||||||||
Federal National Mortgage Association Conventional 30- Yr. Pass Through | ||||||||
| 90,000 | 4.000%, 7/1/2042e | 95,780 | ||||||
|
| |||||||
| Total | 95,780 | |||||||
|
| |||||||
| Technology (5.4%) | ||||||||
Corning, Inc. | ||||||||
| 100,000 | 4.750%, 3/15/2042 | 104,789 | ||||||
Dun & Bradstreet Corporation | ||||||||
| 60,000 | 2.875%, 11/15/2015 | 61,690 | ||||||
Hewlett-Packard Company | ||||||||
| 50,000 | 0.867%, 5/30/2014a | 49,561 | ||||||
Intel Corporation | ||||||||
| 75,000 | 4.800%, 10/1/2041 | 85,893 | ||||||
International Business Machines Corporation | ||||||||
| 150,000 | 0.875%, 10/31/2014 | 150,720 | ||||||
Symantec Corporation | ||||||||
| 60,000 | 2.750%, 9/15/2015 | 61,659 | ||||||
Xerox Corporation | ||||||||
| 75,000 | 1.868%, 9/13/2013a | 75,525 | ||||||
The accompanying Notes to Financial Statements are an integral part of this schedule.
215
Table of Contents
Partner Socially Responsible Bond Portfolio
Schedule of Investments as of June 29, 2012
(unaudited)
| Principal Amount | Long-Term Fixed Income (87.5%) | Value | ||||||
| Technology (5.4%) - continued | ||||||||
| $60,000 | 4.500%, 5/15/2021 | $ | 62,262 | |||||
|
| |||||||
| Total | 652,099 | |||||||
|
| |||||||
| Transportation (1.0%) | ||||||||
APL, Ltd. | ||||||||
| 50,000 | 8.000%, 1/15/2024f | 35,977 | ||||||
Asciano Finance, Ltd. | ||||||||
| 60,000 | 5.000%, 4/7/2018b | 62,674 | ||||||
Canadian National Railway Company | ||||||||
| 25,000 | 1.450%, 12/15/2016 | 25,139 | ||||||
|
| |||||||
| Total | 123,790 | |||||||
|
| |||||||
| U.S. Government and Agencies (32.5%) | ||||||||
Federal Home Loan Banks | ||||||||
| 60,000 | 5.000%, 11/17/2017 | 72,450 | ||||||
U.S. Treasury Bonds | ||||||||
| 287,000 | 3.125%, 2/15/2042 | 308,256 | ||||||
| 49,000 | 3.000%, 5/15/2042 | 51,320 | ||||||
U.S. Treasury Notes | ||||||||
| 105,000 | 0.250%, 5/15/2015 | 104,540 | ||||||
| 490,000 | 0.625%, 5/31/2017 | 487,741 | ||||||
| 23,000 | 1.125%, 5/31/2019 | 23,036 | �� | |||||
| 2,885,000 | 1.750%, 5/15/2022 | 2,908,441 | ||||||
|
| |||||||
| Total | 3,955,784 | |||||||
|
| |||||||
| Utilities (0.9%) | ||||||||
Consolidated Edison Company of New York, Inc. | ||||||||
| 25,000 | 4.450%, 6/15/2020 | 28,804 | ||||||
Enterprise Products Operating, LLC | ||||||||
| 75,000 | 7.034%, 1/15/2068 | 80,250 | ||||||
|
| |||||||
| Total | 109,054 | |||||||
|
| |||||||
Total Long-Term Fixed Income (cost $10,426,222) | 10,666,239 | |||||||
|
| |||||||
Short-Term Investments (0.8%)g | ||||||||
Federal National Mortgage Association Discount Notes | ||||||||
| 100,000 | 0.120%, 7/18/2012h,i | 99,994 | ||||||
|
| |||||||
| Total Short-Term Investments (at amortized cost) | 99,994 | |||||||
|
| |||||||
| Total Investments (cost $10,526,216) 88.3% | $ | 10,766,233 | ||||||
|
| |||||||
| Other Assets and Liabilities, Net 11.7% | 1,421,961 | |||||||
|
| |||||||
| Total Net Assets 100.0% | $ | 12,188,194 | ||||||
|
| |||||||
| a | Denotes variable rate securities. Variable rate securities are securities whose yields vary with a designated market index or market rate. The rate shown is as of June 29, 2012. |
| b | Denotes securities sold under Rule 144A of the Securities Act of 1933, which exempts them from registration. These securities have been deemed liquid and may be resold to other dealers in the program or to other qualified institutional buyers. As of June 29, 2012, the value of these investments was $1,258,702 or 10.3% of total net assets. |
| c | In bankruptcy. Interest is not being accrued. |
| d | Denotes perpetual securities. Perpetual securities pay an indefinite stream of interest, but may be called by the issuer at an earlier date. |
| e | Denotes investments purchased on a when-issued or delayed delivery basis. |
| f | Security is fair valued. |
| g | The interest rate shown reflects the yield, coupon rate or the discount rate at the date of purchase. |
| h | Denotes investments that benefit from credit enhancement or liquidity support provided by a third party bank, institution or government. |
| i | At June 29, 2012, $99,994 of investments were held on deposit with the counterparty and pledged as the initial margin deposit for open futures contracts. |
Unrealized Appreciation (Depreciation)
Gross unrealized appreciation and depreciation of investments, based on cost for federal income tax purposes, were as follows:
Gross unrealized appreciation | $ | 286,112 | ||
Gross unrealized depreciation | (53,069 | ) | ||
|
| |||
Net unrealized appreciation (depreciation) | $ | 233,043 | ||
Cost for federal income tax purposes | $ | 10,533,190 |
The accompanying Notes to Financial Statements are an integral part of this schedule.
216
Table of Contents
Partner Socially Responsible Bond Portfolio
Schedule of Investments as of June 29, 2012
(unaudited)
Fair Valuation Measurements
The following table is a summary of the inputs used, as of June 29, 2012, in valuing Partner Socially Responsible Bond Portfolio’s assets carried at fair value.
Investments in Securities | Total | Level 1 | Level 2 | Level 3 | ||||||||||||
Long-Term Fixed Income | ||||||||||||||||
Asset-Backed Securities | 88,832 | — | 88,832 | — | ||||||||||||
Basic Materials | 106,961 | — | 106,961 | — | ||||||||||||
Capital Goods | 75,254 | — | 75,254 | — | ||||||||||||
Collateralized Mortgage Obligations | 48,882 | — | 48,882 | — | ||||||||||||
Commercial Mortgage-Backed Securities | 476,614 | — | 476,614 | — | ||||||||||||
Communications Services | 1,027,481 | — | 1,027,481 | — | ||||||||||||
Consumer Cyclical | 708,182 | — | 708,182 | — | ||||||||||||
Consumer Non-Cyclical | 521,060 | — | 521,060 | — | ||||||||||||
Energy | 152,064 | — | 152,064 | — | ||||||||||||
Financials | 2,417,000 | — | 2,417,000 | — | ||||||||||||
Foreign Government | 107,402 | — | 107,402 | — | ||||||||||||
Mortgage-Backed Securities | 95,780 | — | 95,780 | — | ||||||||||||
Technology | 652,099 | — | 652,099 | — | ||||||||||||
Transportation | 123,790 | — | 87,813 | 35,977 | ||||||||||||
U.S. Government and Agencies | 3,955,784 | — | 3,955,784 | — | ||||||||||||
Utilities | 109,054 | — | 109,054 | — | ||||||||||||
Short-Term Investments | 99,994 | — | 99,994 | — | ||||||||||||
|
|
|
|
|
|
|
| |||||||||
Total | $ | 10,766,233 | $ | — | $ | 10,730,256 | $ | 35,977 | ||||||||
|
|
|
|
|
|
|
| |||||||||
The Long-Term Fixed Income Transportation Level 3 security’s fair value is calculated using a yield and spread analysis. The 10 year note and basis points spread of the most recent trade is also used in the calculation. The spread of the most recent trade for June 29, 2012 was 1,104.80. This spread is updated when the security trades. A significant increase or decrease in the inputs in isolation would result in a significantly lower or higher fair value measurement.
There were no significant transfers between the Levels during the period ended June 29, 2012. Transfers between the levels are identified as of the end of the period.
The following table summarizes the net realized gains/(losses) and Statement of Operations location, for the period ended June 29, 2012, for Partner Socially Responsible Bond Portfolio’s investments in financial derivative instruments by primary risk exposure.
Derivatives by risk category | Statement of Operations Location | Realized Gains/(Losses) recognized in Income | ||||
Interest Rate Contracts | ||||||
Futures | Net realized gains/(losses) on Futures contracts | 36,663 | ||||
Total Interest Rate Contracts | 36,663 | |||||
|
| |||||
Total | $ | 36,663 | ||||
|
| |||||
The following table summarizes the change in net unrealized appreciation/(depreciation) and Statement of Operations location, for the period ended June 29, 2012, for Partner Socially Responsible Bond Portfolio’s investments in financial derivative instruments by primary risk exposure.
Derivatives by risk category | Statement of Operations Location | Change in unrealized appreciation/(depreciation) recognized in Income | ||||
Interest Rate Contracts | ||||||
Futures | Change in net unrealized appreciation/(depreciation) on Futures contracts | (22,228 | ) | |||
Total Interest Rate Contracts | (22,228 | ) | ||||
|
| |||||
Total | ($ | 22,228 | ) | |||
|
| |||||
The following table presents Partner Socially Responsible Bond Portfolio’s average volume of derivative activity during the period ended June 29, 2012.
The accompanying Notes to Financial Statements are an integral part of this schedule.
217
Table of Contents
Partner Socially Responsible Bond Portfolio
Schedule of Investments as of June 29, 2012
(unaudited)
Derivative Risk Category | Futures (Notional*) | Futures (Percentage of Average Net Assets) | ||||||
Interest Rate Contracts (Long Position) | $ | 1,004,906 | 8.7 | % | ||||
Interest Rate Contracts (Short Position) | N/A | N/A | ||||||
| * | Notional amount represents long or short, or both, derivative positions held by the Portfolio. |
The accompanying Notes to Financial Statements are an integral part of this schedule.
218
Table of Contents
Schedule of Investments as of June 29, 2012
(unaudited)
| Principal Amount | Bank Loans (2.6%)a | Value | ||||||
| Basic Materials (0.2%) | ||||||||
Arch Coal, Inc., Term Loan | ||||||||
| $1,605,000 | 5.750%, 5/1/2018 | $ | 1,574,232 | |||||
Ineos Group Holdings, Term Loan | ||||||||
| 1,596,000 | 6.448%, 5/4/2018b,c | 1,560,537 | ||||||
|
| |||||||
| Total | 3,134,769 | |||||||
|
| |||||||
| Communications Services (0.7%) | ||||||||
Atlantic Broadband Finance, LLC, Term Loan | ||||||||
| 1,600,000 | 5.250%, 3/20/2019 | 1,600,672 | ||||||
Charter Communications Operation, Term Loan | ||||||||
| 967,575 | 4.000%, 3/28/2019 | 960,144 | ||||||
Clear Channel Communications, Term Loan | ||||||||
| 1,600,000 | 3.895%, 1/29/2016 | 1,274,672 | ||||||
Cumulus Media Holdings, Inc., Term Loan | ||||||||
| 1,601,355 | 4.952%, 9/16/2018b,c | 1,593,060 | ||||||
Lawson Software, Inc., Term Loan | ||||||||
| 1,599,200 | 7.477%, 3/16/2018b,c | 1,604,941 | ||||||
Toys R Us, Inc., Term Loan | ||||||||
| 1,625,000 | 5.250%, 5/25/2018 | 1,476,719 | ||||||
Univision Communications, Inc., Term Loan | ||||||||
| 1,280,000 | 2.245%, 9/29/2014 | 1,253,337 | ||||||
Zayo Group, LLC, Term Loan | ||||||||
| 1,600,000 | 0.000%, 6/14/2019b,c | 1,603,712 | ||||||
|
| |||||||
| Total | 11,367,257 | |||||||
|
| |||||||
| Consumer Cyclical (0.3%) | ||||||||
Burlington Coat Factory Warehouse Corporation, Term Loan | ||||||||
| 1,584,624 | 5.500%, 2/28/2017 | 1,574,498 | ||||||
Chrysler Group, LLC, Term Loan | ||||||||
| 2,534,400 | 5.220%, 5/24/2017 | 2,550,240 | ||||||
|
| |||||||
| Total | 4,124,738 | |||||||
|
| |||||||
| Consumer Non-Cyclical (0.5%) | ||||||||
Bausch & Lomb, Inc., Term Loan | ||||||||
| 1,600,000 | 5.250%, 4/17/2019 | 1,589,600 | ||||||
CHS/Community Health Systems, Inc., Term Loan | ||||||||
| 1,600,000 | 3.967%, 1/25/2017 | 1,574,576 | ||||||
Dole Food Company, Term Loan | ||||||||
| 209,641 | 5.038%, 7/8/2018b,c | 209,377 | ||||||
Michael Foods, Inc., Term Loan | ||||||||
| 1,344,667 | 4.250%, 2/25/2018 | 1,344,102 | ||||||
Roundy’s Supermarkets, Inc., Term Loan | ||||||||
| 1,596,000 | 5.700%, 2/13/2019 | 1,597,420 | ||||||
Solvest, Ltd., Term Loan | ||||||||
| 375,148 | 5.023%, 7/8/2018b,c | 374,676 | ||||||
Visant Corporation, Term Loan | ||||||||
| 1,290,000 | 5.250%, 12/22/2016 | 1,248,075 | ||||||
|
| |||||||
| Total | 7,937,826 | |||||||
|
| |||||||
| Energy (0.1%) | ||||||||
Chesapeake Energy Corporation, Term Loan | ||||||||
| 1,600,000 | 8.500%, 12/2/2017 | 1,585,824 | ||||||
|
| |||||||
| Total | 1,585,824 | |||||||
|
| |||||||
| Financials (0.1%) | ||||||||
Nuveen Investments, Inc., Term Loan | ||||||||
| 1,600,000 | 5.639%, 5/13/2017b,c | 1,572,800 | ||||||
|
| |||||||
| Total | 1,572,800 | |||||||
|
| |||||||
| Technology (0.4%) | ||||||||
First Data Corporation Extended, Term Loan | ||||||||
| 1,600,000 | 4.245%, 3/26/2018 | 1,465,408 | ||||||
Freescale Semiconductor, Term Loan | ||||||||
| 1,631,736 | 4.489%, 12/1/2016 | 1,541,991 | ||||||
Intelsat Jackson Holdings SA, Term Loan | ||||||||
| 1,871,100 | 5.250%, 4/2/2018 | 1,866,815 | ||||||
Syniverse Holdings, Inc., Term Loan | ||||||||
| 640,000 | 5.000%, 4/10/2019 | 634,931 | ||||||
|
| |||||||
| Total | 5,509,145 | |||||||
|
| |||||||
| Transportation (0.2%) | ||||||||
Delta Air Lines, Inc., Term Loan | ||||||||
| 2,524,500 | 5.500%, 4/20/2017 | 2,516,624 | ||||||
|
| |||||||
| Total | 2,516,624 | |||||||
|
| |||||||
| Utilities (0.1%) | ||||||||
NGPL PipeCo, LLC, Term Loan | ||||||||
| 1,600,000 | 6.750%, 5/15/2017 | 1,566,672 | ||||||
|
| |||||||
| Total | 1,566,672 | |||||||
|
| |||||||
Total Bank Loans (cost $39,513,677) | 39,315,655 | |||||||
|
| |||||||
Long-Term Fixed Income (94.8%) | ||||||||
| Asset-Backed Securities (0.7%) | ||||||||
Carrington Mortgage Loan Trust | ||||||||
| 2,200,000 | 0.395%, 8/25/2036d | 748,368 | ||||||
GMAC Mortgage Corporation Loan Trust | ||||||||
| 4,512,517 | 0.425%, 8/25/2035d,e | 3,003,355 | ||||||
| 5,282,353 | 0.425%, 12/25/2036d,e | 3,751,099 | ||||||
IndyMac Seconds Asset-Backed Trust | ||||||||
| 752,805 | 0.415%, 10/25/2036d,e | 135,945 | ||||||
Renaissance Home Equity Loan Trust | ||||||||
| 3,023,781 | 5.746%, 5/25/2036 | 1,927,706 | ||||||
| 2,000,000 | 6.011%, 5/25/2036 | 1,127,898 | ||||||
|
| |||||||
| Total | 10,694,371 | |||||||
|
| |||||||
| Basic Materials (4.4%) | ||||||||
AbitibiBowater, Inc. | ||||||||
| 2,104,000 | 10.250%, 10/15/2018 | 2,335,440 | ||||||
The accompanying Notes to Financial Statements are an integral part of this schedule.
219
Table of Contents
Income Portfolio
Schedule of Investments as of June 29, 2012
(unaudited)
| Principal Amount | Long-Term Fixed Income (94.8%) | Value | ||||||
| Basic Materials (4.4%) - continued | ||||||||
Alcoa, Inc. | ||||||||
| $2,570,000 | 5.720%, 2/23/2019 | $ | 2,723,755 | |||||
| 1,325,000 | 6.150%, 8/15/2020 | 1,394,816 | ||||||
| 2,000,000 | 6.750%, 1/15/2028 | 2,119,510 | ||||||
ArcelorMittal | ||||||||
| 2,500,000 | 9.000%, 2/15/2015 | 2,809,618 | ||||||
| 3,000,000 | 6.125%, 6/1/2018 | 3,041,841 | ||||||
| 2,750,000 | 5.250%, 8/5/2020 | 2,636,238 | ||||||
| 1,620,000 | 6.750%, 3/1/2041 | 1,512,093 | ||||||
Arch Coal, Inc. | ||||||||
| 1,915,000 | 7.000%, 6/15/2019f | 1,618,175 | ||||||
CF Industries, Inc. | ||||||||
| 3,330,000 | 6.875%, 5/1/2018 | 3,950,212 | ||||||
Dow Chemical Company | ||||||||
| 3,850,000 | 4.250%, 11/15/2020 | 4,176,738 | ||||||
| 1,930,000 | 4.125%, 11/15/2021 | 2,070,124 | ||||||
| 1,620,000 | 5.250%, 11/15/2041 | 1,790,808 | ||||||
FMG Resources Property, Ltd. | ||||||||
| 1,890,000 | 7.000%, 11/1/2015f,g | 1,927,800 | ||||||
Freeport-McMoRan Copper & Gold, Inc. | ||||||||
| 4,540,000 | 3.550%, 3/1/2022 | 4,466,806 | ||||||
Georgia-Pacific, LLC | ||||||||
| 2,190,000 | 5.400%, 11/1/2020g | 2,541,208 | ||||||
International Paper Company | ||||||||
| 2,500,000 | 7.500%, 8/15/2021 | 3,188,858 | ||||||
| 1,250,000 | 7.300%, 11/15/2039 | 1,560,646 | ||||||
LyondellBasell Industries NV | ||||||||
| 2,900,000 | 5.000%, 4/15/2019g | 3,041,375 | ||||||
| 320,000 | 6.000%, 11/15/2021g | 351,200 | ||||||
NOVA Chemicals Corporation | ||||||||
| 1,250,000 | 8.625%, 11/1/2019 | 1,415,625 | ||||||
Novelis, Inc. | ||||||||
| 1,920,000 | 8.375%, 12/15/2017 | 2,054,400 | ||||||
Rio Tinto Finance USA, Ltd. | ||||||||
| 3,285,000 | 6.500%, 7/15/2018 | 4,048,881 | ||||||
Rock-Tenn Company | ||||||||
| 1,800,000 | 4.450%, 3/1/2019g | 1,848,944 | ||||||
Teck Resources, Ltd. | ||||||||
| 1,469,000 | 10.250%, 5/15/2016 | 1,639,771 | ||||||
Vale Overseas, Ltd. | ||||||||
| 3,125,000 | 6.875%, 11/10/2039f | 3,651,178 | ||||||
Weyerhaeuser Company | ||||||||
| 2,570,000 | 7.375%, 3/15/2032 | 2,870,513 | ||||||
|
| |||||||
| Total | 66,786,573 | |||||||
|
| |||||||
| Capital Goods (2.6%) | ||||||||
BAE Systems plc | ||||||||
| 3,880,000 | 4.750%, 10/11/2021g | 4,168,575 | ||||||
Boeing Capital Corporation | ||||||||
| 1,600,000 | 2.125%, 8/15/2016 | 1,668,957 | ||||||
Bombardier, Inc. | ||||||||
| 1,940,000 | 5.750%, 3/15/2022g | 1,932,725 | ||||||
Case New Holland, Inc. | ||||||||
| 1,250,000 | 7.750%, 9/1/2013 | 1,328,125 | ||||||
| 1,635,000 | 7.875%, 12/1/2017 | 1,888,425 | ||||||
CNH Capital, LLC | ||||||||
| 450,000 | 6.250%, 11/1/2016g | 481,500 | ||||||
CRH America, Inc. | ||||||||
| 1,750,000 | 4.125%, 1/15/2016 | 1,778,947 | ||||||
| 1,900,000 | 8.125%, 7/15/2018 | 2,263,265 | ||||||
John Deere Capital Corporation | ||||||||
| 3,300,000 | 5.350%, 4/3/2018 | 3,928,386 | ||||||
Masco Corporation | ||||||||
| 1,625,000 | 5.950%, 3/15/2022f | 1,672,752 | ||||||
Republic Services, Inc. | ||||||||
| 630,000 | 5.500%, 9/15/2019 | 729,003 | ||||||
| 1,600,000 | 5.000%, 3/1/2020 | 1,810,357 | ||||||
| 2,200,000 | 5.250%, 11/15/2021 | 2,525,789 | ||||||
Reynolds Group Issuer, Inc. | ||||||||
| 1,940,000 | 9.875%, 8/15/2019g | 2,012,750 | ||||||
Sealed Air Corporation | ||||||||
| 1,290,000 | 8.375%, 9/15/2021g | 1,457,700 | ||||||
Textron, Inc. | ||||||||
| 2,500,000 | 6.200%, 3/15/2015 | 2,747,432 | ||||||
| 2,570,000 | 5.600%, 12/1/2017 | 2,830,824 | ||||||
United Technologies Corporation | ||||||||
| 1,930,000 | 1.800%, 6/1/2017 | 1,970,989 | ||||||
| 645,000 | 3.100%, 6/1/2022 | 675,871 | ||||||
UR Financing Escrow Corporation | ||||||||
| 1,300,000 | 5.750%, 7/15/2018g | 1,352,000 | ||||||
|
| |||||||
| Total | 39,224,372 | |||||||
|
| |||||||
| Collateralized Mortgage Obligations (0.9%) | ||||||||
Bear Stearns Mortgage Funding Trust | ||||||||
| 785,231 | 0.525%, 8/25/2036d | 223,632 | ||||||
CitiMortgage Alternative Loan Trust | ||||||||
| 3,040,408 | 5.750%, 4/25/2037 | 2,151,022 | ||||||
Countrywide Alternative Loan Trust | ||||||||
| 4,226,401 | 6.000%, 1/25/2037 | 3,042,840 | ||||||
Deutsche Alt-A Securities, Inc. | ||||||||
| 2,934,989 | 0.917%, 4/25/2047d | 1,864,319 | ||||||
HomeBanc Mortgage Trust | ||||||||
| 2,819,892 | 2.591%, 4/25/2037 | 1,836,314 | ||||||
Wachovia Mortgage Loan Trust, LLC | ||||||||
| 3,000,480 | 2.889%, 5/20/2036 | 2,118,639 | ||||||
WaMu Mortgage Pass-Through Certificates | ||||||||
| 831,718 | 0.535%, 10/25/2045d | 665,872 | ||||||
Washington Mutual Alternative Mortgage Pass-Through Certificates | ||||||||
| 5,820,185 | 0.897%, 2/25/2047d | 2,537,595 | ||||||
|
| |||||||
| Total | 14,440,233 | |||||||
|
| |||||||
| Commercial Mortgage-Backed Securities (1.5%) | ||||||||
Bear Stearns Commercial Mortgage Securities, Inc. | ||||||||
| 774,941 | 0.392%, 3/15/2022d,g | 763,388 | ||||||
| 3,500,000 | 5.331%, 2/11/2044 | 3,766,956 | ||||||
Citigroup/Deutsche Bank Commercial Mortgage | ||||||||
| 1,900,000 | 5.322%, 12/11/2049 | 2,110,364 | ||||||
The accompanying Notes to Financial Statements are an integral part of this schedule.
220
Table of Contents
Income Portfolio
Schedule of Investments as of June 29, 2012
(unaudited)
| Principal Amount | Long-Term Fixed Income (94.8%) | Value | ||||||
| Commercial Mortgage-Backed Securities (1.5%) - continued | ||||||||
Commercial Mortgage Pass- Through Certificates | ||||||||
| $2,000,000 | 0.372%, 12/15/2020d,g | $ | 1,816,346 | |||||
Credit Suisse First Boston Mortgage Securities | ||||||||
| 3,200,000 | 5.542%, 1/15/2049 | 3,445,843 | ||||||
Credit Suisse Mortgage Capital Certificates | ||||||||
| 3,038,324 | 0.412%, 10/15/2021d,g | 2,842,665 | ||||||
| 3,250,000 | 5.467%, 9/15/2039 | 3,598,247 | ||||||
Wachovia Bank Commercial Mortgage Trust | ||||||||
| 5,200,000 | 0.362%, 9/15/2021d,h | 4,869,228 | ||||||
|
| |||||||
| Total | 23,213,037 | |||||||
|
| |||||||
| Communications Services (8.9%) | ||||||||
Alltel Corporation | ||||||||
| 3,875,000 | 7.000%, 3/15/2016 | 4,634,814 | ||||||
America Movil SAB de CV | ||||||||
| 3,800,000 | 5.000%, 3/30/2020 | 4,315,447 | ||||||
American Tower Corporation | ||||||||
| 1,250,000 | 4.500%, 1/15/2018 | 1,321,267 | ||||||
AT&T, Inc. | ||||||||
| 2,600,000 | 4.450%, 5/15/2021 | 2,943,234 | ||||||
| 2,255,000 | 5.550%, 8/15/2041 | 2,687,863 | ||||||
Cablevision Systems Corporation | ||||||||
| 1,300,000 | 8.625%, 9/15/2017 | 1,449,500 | ||||||
| 2,000,000 | 8.000%, 4/15/2020 | 2,160,000 | ||||||
CBS Corporation | ||||||||
| 3,220,000 | 1.950%, 7/1/2017 | 3,216,780 | ||||||
| 1,300,000 | 7.875%, 9/1/2023 | 1,634,338 | ||||||
CCO Holdings, LLC | ||||||||
| 1,880,000 | 7.250%, 10/30/2017 | 2,049,200 | ||||||
| 1,280,000 | 7.000%, 1/15/2019 | 1,382,400 | ||||||
Cellco Partnership/Verizon Wireless Capital, LLC | ||||||||
| 2,600,000 | 8.500%, 11/15/2018 | 3,557,801 | ||||||
CenturyLink, Inc. | ||||||||
| 2,520,000 | 5.150%, 6/15/2017 | 2,578,255 | ||||||
| 3,600,000 | 5.800%, 3/15/2022 | 3,583,818 | ||||||
Clear Channel Worldwide Holdings, Inc. | ||||||||
| 3,170,000 | 9.250%, 12/15/2017 | 3,455,300 | ||||||
Comcast Corporation | ||||||||
| 1,900,000 | 6.300%, 11/15/2017 | 2,284,283 | ||||||
| 2,900,000 | 5.700%, 5/15/2018 | 3,420,069 | ||||||
| 2,570,000 | 3.125%, 7/15/2022 | 2,582,092 | ||||||
| 2,700,000 | 6.400%, 5/15/2038 | 3,291,335 | ||||||
Cox Communications, Inc. | ||||||||
| 1,900,000 | 9.375%, 1/15/2019g | 2,543,726 | ||||||
| 2,500,000 | 8.375%, 3/1/2039g | 3,518,230 | ||||||
Crown Castle Towers, LLC | ||||||||
| 5,050,000 | 4.174%, 8/15/2017g | 5,337,749 | ||||||
CSC Holdings, Inc. | ||||||||
| 1,290,000 | 7.625%, 7/15/2018 | 1,441,575 | ||||||
DIRECTV Holdings, LLC | ||||||||
| 3,875,000 | 5.000%, 3/1/2021 | 4,257,056 | ||||||
| 2,030,000 | 3.800%, 3/15/2022 | 2,052,925 | ||||||
Discovery Communications, LLC | ||||||||
| 1,920,000 | 4.375%, 6/15/2021 | 2,084,905 | ||||||
| 965,000 | 3.300%, 5/15/2022 | 973,897 | ||||||
Dish DBS Corporation | ||||||||
| 1,945,000 | 6.750%, 6/1/2021 | 2,100,600 | ||||||
Hughes Satellite Systems Corporation | ||||||||
| 3,220,000 | 6.500%, 6/15/2019 | 3,421,250 | ||||||
Intelsat Jackson Holdings SA | ||||||||
| 1,290,000 | 7.250%, 4/1/2019 | 1,354,500 | ||||||
| 1,900,000 | 7.500%, 4/1/2021 | 2,009,250 | ||||||
Interpublic Group of Companies, Inc. | ||||||||
| 2,575,000 | 4.000%, 3/15/2022 | 2,614,204 | ||||||
NBCUniversal Media, LLC | ||||||||
| 3,750,000 | 5.150%, 4/30/2020 | 4,305,266 | ||||||
| 4,510,000 | 4.375%, 4/1/2021 | 4,961,568 | ||||||
News America, Inc. | ||||||||
| 1,900,000 | 7.625%, 11/30/2028 | 2,241,979 | ||||||
| 2,140,000 | 6.400%, 12/15/2035 | 2,467,360 | ||||||
Oi SA | ||||||||
| 1,775,000 | 5.750%, 2/10/2022g | 1,808,725 | ||||||
Omnicom Group, Inc. | ||||||||
| 2,900,000 | 3.625%, 5/1/2022 | 2,946,693 | ||||||
Qwest Communications International, Inc. | ||||||||
| 3,180,000 | 7.125%, 4/1/2018 | 3,354,900 | ||||||
Qwest Corporation | ||||||||
| 3,200,000 | 6.500%, 6/1/2017 | 3,595,254 | ||||||
SBA Tower Trust | ||||||||
| 3,500,000 | 5.101%, 4/15/2017g | 3,834,281 | ||||||
Sprint Nextel Corporation | ||||||||
| 1,290,000 | 9.125%, 3/1/2017g | 1,354,500 | ||||||
| 650,000 | 7.000%, 3/1/2020g | 676,000 | ||||||
Telemar Norte Leste SA | ||||||||
| 2,830,000 | 5.500%, 10/23/2020g | 2,886,600 | ||||||
Time Warner Cable, Inc. | ||||||||
| 2,500,000 | 8.250%, 4/1/2019 | 3,266,745 | ||||||
| 2,550,000 | 6.750%, 6/15/2039 | 3,107,881 | ||||||
Time Warner Entertainment Company, LP | ||||||||
| 1,850,000 | 8.375%, 3/15/2023 | 2,505,927 | ||||||
UPCB Finance VI, Ltd. | ||||||||
| 2,600,000 | 6.875%, 1/15/2022g | 2,652,000 | ||||||
Verizon Communications, Inc. | ||||||||
| 2,600,000 | 3.500%, 11/1/2021 | 2,768,137 | ||||||
Virgin Media Finance plc | ||||||||
| 1,043,000 | 9.500%, 8/15/2016 | 1,162,945 | ||||||
|
| |||||||
| Total | 136,154,424 | |||||||
|
| |||||||
| Consumer Cyclical (5.1%) | ||||||||
American Honda Finance Corporation | ||||||||
| 4,400,000 | 3.875%, 9/21/2020g | 4,714,635 | ||||||
Daimler Finance North America, LLC | ||||||||
| 2,260,000 | 3.875%, 9/15/2021g | 2,402,837 | ||||||
Ford Motor Credit Company, LLC | ||||||||
| 3,900,000 | 3.875%, 1/15/2015 | 4,016,275 | ||||||
| 1,930,000 | 7.000%, 4/15/2015 | 2,144,961 | ||||||
| 3,250,000 | 4.250%, 2/3/2017 | 3,406,741 | ||||||
| 630,000 | 6.625%, 8/15/2017 | 716,609 | ||||||
The accompanying Notes to Financial Statements are an integral part of this schedule.
221
Table of Contents
Income Portfolio
Schedule of Investments as of June 29, 2012
(unaudited)
| Principal Amount | Long-Term Fixed Income (94.8%) | Value | ||||||
| Consumer Cyclical (5.1%) - continued | ||||||||
FUEL Trust | ||||||||
| $1,275,000 | 4.207%, 4/15/2016g | $ | 1,323,932 | |||||
| 3,200,000 | 3.984%, 6/15/2016g | 3,295,709 | ||||||
Home Depot, Inc. | ||||||||
| 3,900,000 | 5.875%, 12/16/2036 | 4,992,870 | ||||||
Hyatt Hotels Corporation | ||||||||
| 3,100,000 | 5.750%, 8/15/2015g | 3,399,280 | ||||||
Hyundai Motor Manufacturing Czech | ||||||||
| 2,525,000 | 4.500%, 4/15/2015g | 2,654,830 | ||||||
Johnson Controls, Inc. | ||||||||
| 3,150,000 | 5.250%, 12/1/2041 | 3,493,233 | ||||||
KIA Motors Corporation | ||||||||
| 3,260,000 | 3.625%, 6/14/2016g | 3,347,270 | ||||||
Macy’s Retail Holdings, Inc. | ||||||||
| 3,210,000 | 7.450%, 7/15/2017 | 3,908,669 | ||||||
| 3,570,000 | 3.875%, 1/15/2022 | 3,753,402 | ||||||
Marriott International, Inc. | ||||||||
| 3,250,000 | 3.000%, 3/1/2019 | 3,285,961 | ||||||
MGM Resorts International | ||||||||
| 1,280,000 | 11.125%, 11/15/2017 | 1,436,800 | ||||||
| 1,300,000 | 9.000%, 3/15/2020 | 1,443,000 | ||||||
QVC, Inc. | ||||||||
| 1,930,000 | 5.125%, 7/2/2022g | 1,970,094 | ||||||
Sheraton Holding Corporation | ||||||||
| 1,290,000 | 7.375%, 11/15/2015 | 1,480,501 | ||||||
Starwood Hotels & Resorts Worldwide, Inc. | ||||||||
| 1,850,000 | 6.750%, 5/15/2018 | 2,148,886 | ||||||
Time Warner, Inc. | ||||||||
| 1,300,000 | 4.000%, 1/15/2022 | 1,374,958 | ||||||
| 710,000 | 3.400%, 6/15/2022 | 715,966 | ||||||
| 1,600,000 | 7.700%, 5/1/2032 | 2,089,338 | ||||||
Toll Brothers Finance Corporation | ||||||||
| 2,000,000 | 6.750%, 11/1/2019 | 2,214,804 | ||||||
Toys R Us Property Company II, LLC | ||||||||
| 2,570,000 | 8.500%, 12/1/2017 | 2,676,013 | ||||||
Wal-Mart Stores, Inc. | ||||||||
| 5,000,000 | 3.250%, 10/25/2020 | 5,364,980 | ||||||
West Corporation | ||||||||
| 1,580,000 | 7.875%, 1/15/2019 | 1,651,100 | ||||||
Wyndham Worldwide Corporation | ||||||||
| 1,270,000 | 5.625%, 3/1/2021 | 1,382,809 | ||||||
| 1,300,000 | 4.250%, 3/1/2022 | 1,309,023 | ||||||
|
| |||||||
| Total | 78,115,486 | |||||||
|
| |||||||
| Consumer Non-Cyclical (8.6%) | ||||||||
Altria Group, Inc. | ||||||||
| 1,750,000 | 9.700%, 11/10/2018 | 2,421,594 | ||||||
| 1,595,000 | 4.750%, 5/5/2021 | 1,808,803 | ||||||
| 2,500,000 | 9.950%, 11/10/2038 | 3,975,170 | ||||||
Amgen, Inc. | ||||||||
| 3,850,000 | 2.125%, 5/15/2017 | 3,895,199 | ||||||
Anheuser-Busch InBev Worldwide, Inc. | ||||||||
| 2,550,000 | 5.375%, 1/15/2020 | 3,038,634 | ||||||
| 2,525,000 | 5.000%, 4/15/2020 | 2,956,906 | ||||||
Aristotle Holding, Inc. | ||||||||
| 3,225,000 | 2.650%, 2/15/2017g | 3,281,015 | ||||||
| 3,235,000 | 4.750%, 11/15/2021g | 3,579,783 | ||||||
BAT International Finance plc | ||||||||
| 3,860,000 | 3.250%, 6/7/2022g | 3,814,718 | ||||||
Beam, Inc. | ||||||||
| 236,000 | 5.375%, 1/15/2016 | 262,479 | ||||||
| 1,600,000 | 1.875%, 5/15/2017 | 1,607,707 | ||||||
| 1,518,000 | 5.875%, 1/15/2036 | 1,751,980 | ||||||
Biomet, Inc. | ||||||||
| 2,525,000 | 10.000%, 10/15/2017g | 2,697,016 | ||||||
Boston Scientific Corporation | ||||||||
| 3,800,000 | 4.500%, 1/15/2015 | 4,049,105 | ||||||
Bunge Limited Finance Corporation | ||||||||
| 2,220,000 | 5.100%, 7/15/2015 | 2,372,285 | ||||||
| 1,600,000 | 4.100%, 3/15/2016 | 1,668,407 | ||||||
| 3,215,000 | 3.200%, 6/15/2017 | 3,222,121 | ||||||
Cargill, Inc. | ||||||||
| 1,950,000 | 3.250%, 11/15/2021g | 1,983,097 | ||||||
Celgene Corporation | ||||||||
| 2,500,000 | 3.950%, 10/15/2020 | 2,626,023 | ||||||
Community Health Systems, Inc. | ||||||||
| 971,000 | 8.875%, 7/15/2015f | 996,489 | ||||||
| 970,000 | 8.000%, 11/15/2019 | 1,033,050 | ||||||
Covidien International Finance SA | ||||||||
| 3,860,000 | 3.200%, 6/15/2022 | 3,979,548 | ||||||
DJO Finance, LLC/DJO Finance Corporation | ||||||||
| 640,000 | 7.750%, 4/15/2018 | 528,000 | ||||||
Energizer Holdings, Inc. | ||||||||
| 1,750,000 | 4.700%, 5/19/2021 | 1,844,673 | ||||||
| 1,450,000 | 4.700%, 5/24/2022 | 1,512,876 | ||||||
Express Scripts, Inc. | ||||||||
| 2,235,000 | 3.125%, 5/15/2016 | 2,327,017 | ||||||
Fresenius Medical Care US Finance II, Inc. | ||||||||
| 710,000 | 5.625%, 7/31/2019g | 740,175 | ||||||
Fresenius Medical Care US Finance, Inc. | ||||||||
| 1,290,000 | 6.500%, 9/15/2018g | 1,402,875 | ||||||
Grifols, Inc. | ||||||||
| 1,930,000 | 8.250%, 2/1/2018 | 2,069,925 | ||||||
Grupo Bimbo SAB de CV | ||||||||
| 3,890,000 | 4.500%, 1/25/2022g | 4,138,170 | ||||||
Hasbro, Inc. | ||||||||
| 3,250,000 | 6.350%, 3/15/2040 | 3,775,379 | ||||||
HCA, Inc. | ||||||||
| 2,490,000 | 8.500%, 4/15/2019 | 2,788,800 | ||||||
JBS Finance II, Ltd. | ||||||||
| 1,250,000 | 8.250%, 1/29/2018h | 1,212,500 | ||||||
Kinetic Concepts, Inc./KCI USA, Inc. | ||||||||
| 1,940,000 | 10.500%, 11/1/2018g | 2,037,000 | ||||||
Koninklijke Philips Electronics NV | ||||||||
| 2,765,000 | 3.750%, 3/15/2022 | 2,869,733 | ||||||
Kraft Foods, Inc. | ||||||||
| 1,930,000 | 2.250%, 6/5/2017g | 1,976,085 | ||||||
The accompanying Notes to Financial Statements are an integral part of this schedule.
222
Table of Contents
Income Portfolio
Schedule of Investments as of June 29, 2012
(unaudited)
| Principal Amount | Long-Term Fixed Income (94.8%) | Value | ||||||
| Consumer Non-Cyclical (8.6%) - continued | |||||||
| $ 2,600,000 | 6.125%, 2/1/2018 | $ | 3,115,622 | |||||
| 3,200,000 | 5.375%, 2/10/2020 | 3,786,736 | ||||||
| 1,600,000 | 5.000%, 6/4/2042g | 1,693,402 | ||||||
| Life Technologies Corporation | ||||||||
| 3,700,000 | 6.000%, 3/1/2020 | 4,340,718 | ||||||
| Molson Coors Brewing Company | ||||||||
| 1,600,000 | 3.500%, 5/1/2022 | 1,642,856 | ||||||
| 1,600,000 | 5.000%, 5/1/2042 | 1,728,595 | ||||||
| Mylan, Inc. | ||||||||
| 2,565,000 | 7.875%, 7/15/2020g | 2,876,006 | ||||||
| Pernod-Ricard SA | ||||||||
| 4,850,000 | 2.950%, 1/15/2017g | 4,909,393 | ||||||
| Roche Holdings, Inc. | ||||||||
| 3,210,000 | 6.000%, 3/1/2019g | 3,992,739 | ||||||
| SABMiller Holdings, Inc. | ||||||||
| 1,615,000 | 2.450%, 1/15/2017g | 1,664,642 | ||||||
| 3,225,000 | 3.750%, 1/15/2022g | 3,429,636 | ||||||
| Safeway, Inc. | ||||||||
| 1,610,000 | 5.000%, 8/15/2019 | 1,665,382 | ||||||
| Teva Pharmaceutical Finance IV BV | ||||||||
| 4,225,000 | 3.650%, 11/10/2021 | 4,443,762 | ||||||
| Tyson Foods, Inc. | ||||||||
| 3,940,000 | 6.850%, 4/1/2016 | 4,506,375 | ||||||
| 1,285,000 | 4.500%, 6/15/2022 | 1,323,550 | ||||||
|
| |||||||
| Total | 131,363,751 | |||||||
|
| |||||||
| Energy (10.0%) | |||||||
| Anadarko Petroleum Corporation | ||||||||
| 3,400,000 | 6.375%, 9/15/2017 | 3,949,556 | ||||||
| 1,940,000 | 6.450%, 9/15/2036 | 2,242,890 | ||||||
| BP Capital Markets plc | ||||||||
| 3,250,000 | 2.248%, 11/1/2016 | 3,347,068 | ||||||
| 3,525,000 | 4.500%, 10/1/2020 | 3,968,572 | ||||||
| 1,930,000 | 3.245%, 5/6/2022 | 1,998,303 | ||||||
| Canadian Natural Resources, Ltd. | ||||||||
| 2,275,000 | 3.450%, 11/15/2021 | 2,357,958 | ||||||
| Canadian Oil Sands, Ltd. | ||||||||
| 2,600,000 | 4.500%, 4/1/2022g | 2,695,358 | ||||||
| CenterPoint Energy Resources Corporation | ||||||||
| 6,850,000 | 6.125%, 11/1/2017 | 8,016,274 | ||||||
| CNPC HK Overseas Capital, Ltd. | ||||||||
| 2,870,000 | 5.950%, 4/28/2041g | 3,489,685 | ||||||
| Concho Resources, Inc. | ||||||||
| 1,280,000 | 6.500%, 1/15/2022 | 1,331,200 | ||||||
| Devon Energy Corporation | ||||||||
| 2,575,000 | 1.875%, 5/15/2017 | 2,575,453 | ||||||
| El Paso Pipeline Partners Operating Company, LLC | ||||||||
| 1,290,000 | 5.000%, 10/1/2021 | 1,395,687 | ||||||
| Enbridge Energy Partners, LP | ||||||||
| 950,000 | 5.200%, 3/15/2020 | 1,076,557 | ||||||
| 3,800,000 | 8.050%, 10/1/2037 | 4,116,817 | ||||||
| Energy Transfer Partners, LP | ||||||||
| 5,120,000 | 6.700%, 7/1/2018 | 5,872,906 | ||||||
| Enterprise Products Operating, LLC | ||||||||
| 2,070,000 | 6.300%, 9/15/2017 | 2,470,783 | ||||||
| 1,930,000 | 6.650%, 4/15/2018 | 2,316,789 | ||||||
| EQT Corporation | ||||||||
| 1,300,000 | 8.125%, 6/1/2019 | 1,559,042 | ||||||
| Gazprom OAO Via Gaz Capital SA | ||||||||
| 3,250,000 | 4.950%, 5/23/2016g | 3,365,342 | ||||||
| Inergy, LP | ||||||||
| 630,000 | 6.875%, 8/1/2021 | 630,000 | ||||||
| Key Energy Services, Inc. | ||||||||
| 2,075,000 | 6.750%, 3/1/2021 | 2,023,125 | ||||||
| Kinder Morgan Energy Partners, LP | ||||||||
| 1,290,000 | 6.850%, 2/15/2020 | 1,548,809 | ||||||
| 3,100,000 | 5.800%, 3/1/2021 | 3,536,325 | ||||||
| 1,290,000 | 3.950%, 9/1/2022 | 1,306,914 | ||||||
| Linn Energy, LLC | ||||||||
| 3,250,000 | 7.750%, 2/1/2021 | 3,396,250 | ||||||
| Marathon Oil Corporation | ||||||||
| 2,364,000 | 5.900%, 3/15/2018 | 2,767,376 | ||||||
| Markwest Energy Partners, LP/Markwest Energy Finance Corporation | ||||||||
| 1,300,000 | 6.250%, 6/15/2022 | 1,339,000 | ||||||
| Nabors Industries, Inc. | ||||||||
| 2,575,000 | 4.625%, 9/15/2021 | 2,675,546 | ||||||
| Newfield Exploration Company | ||||||||
| 1,290,000 | 6.625%, 4/15/2016 | 1,322,250 | ||||||
| 710,000 | 5.750%, 1/30/2022 | 741,950 | ||||||
| 1,125,000 | 5.625%, 7/1/2024 | 1,150,313 | ||||||
| Nexen, Inc. | ||||||||
| 1,910,000 | 7.400%, 5/1/2028 | 2,248,185 | ||||||
| Noble Energy, Inc. | ||||||||
| 3,100,000 | 8.250%, 3/1/2019 | 3,963,055 | ||||||
| 1,270,000 | 6.000%, 3/1/2041 | 1,450,109 | ||||||
| ONEOK Partners, LP | ||||||||
| 3,250,000 | 6.850%, 10/15/2037 | 3,871,559 | ||||||
| Petrobras International Finance Company | ||||||||
| 4,800,000 | 5.375%, 1/27/2021 | 5,173,301 | ||||||
| Phillips 66 | ||||||||
| 1,300,000 | 4.300%, 4/1/2022g | 1,367,557 | ||||||
| Pioneer Natural Resources Company | ||||||||
| 2,500,000 | 6.875%, 5/1/2018 | 2,942,088 | ||||||
| 770,000 | 3.950%, 7/15/2022 | 771,863 | ||||||
| Plains All American Pipeline, LP | ||||||||
| 3,150,000 | 6.500%, 5/1/2018 | 3,779,298 | ||||||
| Plains Exploration & Production Company | ||||||||
| 1,870,000 | 8.625%, 10/15/2019 | 2,064,012 | ||||||
| QEP Resources, Inc. | ||||||||
| 1,940,000 | 5.375%, 10/1/2022 | 1,944,850 | ||||||
| Rowan Companies, Inc. | ||||||||
| 4,450,000 | 5.000%, 9/1/2017 | 4,790,238 | ||||||
| 2,125,000 | 4.875%, 6/1/2022 | 2,143,692 | ||||||
| Samson Investment Company | ||||||||
| 1,290,000 | 9.750%, 2/15/2020g | 1,283,550 | ||||||
| SandRidge Energy, Inc. | ||||||||
| 950,000 | 7.500%, 3/15/2021 | 938,125 | ||||||
| Southwestern Energy Company | ||||||||
| 2,750,000 | 4.100%, 3/15/2022g | 2,787,232 | ||||||
| Spectra Energy Partners, LP | ||||||||
| 3,200,000 | 4.600%, 6/15/2021 | 3,380,090 | ||||||
The accompanying Notes to Financial Statements are an integral part of this schedule.
223
Table of Contents
Income Portfolio
Schedule of Investments as of June 29, 2012
(unaudited)
| Principal Amount | Long-Term Fixed Income (94.8%) | Value | ||||||
| Energy (10.0%) - continued | |||||||
| Suncor Energy, Inc. | ||||||||
| $ 4,710,000 | 6.100%, 6/1/2018 | $ | 5,578,345 | |||||
| 1,940,000 | 6.850%, 6/1/2039 | 2,438,192 | ||||||
| Transocean, Inc. | ||||||||
| 2,200,000 | 5.050%, 12/15/2016 | 2,386,217 | ||||||
| 1,920,000 | 7.375%, 4/15/2018 | 2,256,478 | ||||||
| Valero Energy Corporation | ||||||||
| 3,125,000 | 6.125%, 2/1/2020 | 3,607,994 | ||||||
| Weatherford International, Inc. | ||||||||
| 2,245,000 | 6.350%, 6/15/2017 | 2,592,513 | ||||||
| Weatherford International, Ltd. | ||||||||
| 4,500,000 | 6.000%, 3/15/2018 | 5,130,571 | ||||||
| 800,000 | 4.500%, 4/15/2022 | 819,923 | ||||||
| Woodside Finance, Ltd. | ||||||||
| 3,125,000 | 4.500%, 11/10/2014g | 3,305,706 | ||||||
|
| |||||||
| Total | 153,598,841 | |||||||
|
| |||||||
| Financials (25.5%) | |||||||
| Abbey National Capital Trust I | ||||||||
| 1,890,000 | 8.963%, 12/29/2049i | 1,814,400 | ||||||
| Aegon NV | ||||||||
| 2,600,000 | 2.248%, 7/29/2049d,i | 1,197,820 | ||||||
| Ally Financial, Inc. | ||||||||
| 1,900,000 | 4.500%, 2/11/2014 | 1,926,125 | ||||||
| 3,215,000 | 4.625%, 6/26/2015 | 3,234,917 | ||||||
| 1,290,000 | 5.500%, 2/15/2017 | 1,310,306 | ||||||
| American Express Credit Corporation | ||||||||
| 5,175,000 | 2.800%, 9/19/2016 | 5,398,379 | ||||||
| 3,225,000 | 2.375%, 3/24/2017 | 3,305,406 | ||||||
| American International Group, Inc. | ||||||||
| 3,225,000 | 4.250%, 9/15/2014 | 3,342,164 | ||||||
| 1,950,000 | 3.800%, 3/22/2017 | 1,987,810 | ||||||
| 3,000,000 | 6.400%, 12/15/2020 | 3,394,431 | ||||||
| Associated Banc Corporation | ||||||||
| 3,180,000 | 5.125%, 3/28/2016 | 3,403,672 | ||||||
| Associates Corporation of North America | ||||||||
| 3,800,000 | 6.950%, 11/1/2018 | 4,284,538 | ||||||
| AXA SA | ||||||||
| 2,580,000 | 8.600%, 12/15/2030 | 2,759,643 | ||||||
| Axis Specialty Finance, LLC | ||||||||
| 3,250,000 | 5.875%, 6/1/2020 | 3,519,643 | ||||||
| Banco do Brasil SA | ||||||||
| 2,555,000 | 5.875%, 1/26/2022g | 2,622,196 | ||||||
| 1,950,000 | 9.250%, 10/31/2049f,g,i | 2,162,160 | ||||||
| Bank of America Corporation | ||||||||
| 2,580,000 | 5.625%, 10/14/2016 | 2,741,926 | ||||||
| 3,300,000 | 5.750%, 12/1/2017 | 3,521,747 | ||||||
| 3,880,000 | 7.625%, 6/1/2019 | 4,562,418 | ||||||
| 1,940,000 | 5.875%, 1/5/2021 | 2,118,106 | ||||||
| 660,000 | 5.700%, 1/24/2022 | 726,854 | ||||||
| 1,950,000 | 5.875%, 2/7/2042 | 2,135,991 | ||||||
| Bank of Nova Scotia | ||||||||
| 3,855,000 | 2.150%, 8/3/2016g | 4,006,417 | ||||||
| Bank of Tokyo-Mitsubishi UFJ, Ltd. | ||||||||
| 3,235,000 | 2.350%, 2/23/2017g | 3,306,325 | ||||||
| Barclays Bank plc | ||||||||
| 5,000,000 | 2.500%, 9/21/2015f,g | 5,103,500 | ||||||
| BB&T Capital Trust IV | ||||||||
| 3,220,000 | 6.820%, 6/12/2057 | 3,240,125 | ||||||
| Bear Stearns Companies, LLC | ||||||||
| 2,100,000 | 4.650%, 7/2/2018 | 2,210,825 | ||||||
| Berkshire Hathaway, Inc. | ||||||||
| 3,215,000 | 3.750%, 8/15/2021 | 3,429,701 | ||||||
| Boston Properties, LP | ||||||||
| 3,750,000 | 5.875%, 10/15/2019 | 4,322,828 | ||||||
| Capital One Capital IV | ||||||||
| 1,930,000 | 6.745%, 2/17/2037 | 1,930,000 | ||||||
| Capital One Financial Corporation | ||||||||
| 3,850,000 | 2.150%, 3/23/2015 | 3,880,011 | ||||||
| 1,500,000 | 6.150%, 9/1/2016 | 1,676,959 | ||||||
| 3,210,000 | 4.750%, 7/15/2021 | 3,502,688 | ||||||
| Cigna Corporation | ||||||||
| 3,220,000 | 4.000%, 2/15/2022 | 3,358,038 | ||||||
| CIT Group, Inc. | ||||||||
| 950,000 | 5.250%, 4/1/2014g | 983,250 | ||||||
| 1,820,000 | 5.250%, 3/15/2018 | 1,879,150 | ||||||
| 1,300,000 | 5.500%, 2/15/2019g | 1,335,750 | ||||||
| Citigroup, Inc. | ||||||||
| 3,125,000 | 6.010%, 1/15/2015 | 3,357,572 | ||||||
| 4,800,000 | 4.750%, 5/19/2015 | 5,038,277 | ||||||
| 2,700,000 | 6.125%, 5/15/2018 | 3,014,750 | ||||||
| 2,550,000 | 8.500%, 5/22/2019 | 3,149,329 | ||||||
| 1,925,000 | 4.500%, 1/14/2022 | 1,989,782 | ||||||
| CNA Financial Corporation | ||||||||
| 3,775,000 | 7.350%, 11/15/2019 | 4,465,893 | ||||||
| 1,300,000 | 5.875%, 8/15/2020 | 1,429,550 | ||||||
| CommonWealth REIT | ||||||||
| 3,150,000 | 6.250%, 8/15/2016 | 3,324,041 | ||||||
| Cooperatieve Centrale Raiffeisen- Boerenleenbank BA | ||||||||
| 1,915,000 | 5.250%, 5/24/2041 | 2,062,323 | ||||||
| 1,290,000 | 11.000%, 12/29/2049g,i | 1,622,820 | ||||||
| Credit Suisse of New York, Convertible | ||||||||
| 1,280,000 | 0.500%, 6/22/2018j | 1,245,440 | ||||||
| DDR Corporation | ||||||||
| 965,000 | 4.625%, 7/15/2022 | 952,383 | ||||||
| Discover Bank | ||||||||
| 1,875,000 | 8.700%, 11/18/2019 | 2,329,496 | ||||||
| 2,200,000 | 7.000%, 4/15/2020 | 2,560,516 | ||||||
| DnB NOR Boligkreditt | ||||||||
| 4,400,000 | 2.900%, 3/29/2016g | 4,569,070 | ||||||
| Eksportfinans ASA | ||||||||
| 3,250,000 | 2.375%, 5/25/2016 | 2,888,831 | ||||||
| Fairfax Financial Holdings, Ltd. | ||||||||
| 2,875,000 | 5.800%, 5/15/2021g | 2,814,455 | ||||||
| Fifth Third Bancorp | ||||||||
| 3,210,000 | 0.888%, 12/20/2016d | 2,959,065 | ||||||
| 2,800,000 | 5.450%, 1/15/2017 | 3,062,203 | ||||||
| Fifth Third Capital Trust IV | ||||||||
| 1,950,000 | 6.500%, 4/15/2067 | 1,937,813 | ||||||
| GE Capital Trust I | ||||||||
| 4,500,000 | 6.375%, 11/15/2067 | 4,629,375 | ||||||
| General Electric Capital Corporation | ||||||||
| 3,225,000 | 3.800%, 6/18/2019g | 3,254,225 | ||||||
| 1,900,000 | 6.000%, 8/7/2019 | 2,223,144 | ||||||
The accompanying Notes to Financial Statements are an integral part of this schedule.
224
Table of Contents
Income Portfolio
Schedule of Investments as of June 29, 2012
(unaudited)
| Principal Amount | Long-Term Fixed Income (94.8%) | Value | ||||||
| Financials (25.5%) - continued | |||||||
| $ 1,600,000 | 5.300%, 2/11/2021 | $ | 1,795,811 | |||||
| 1,550,000 | 6.750%, 3/15/2032 | 1,919,184 | ||||||
| 3,200,000 | 7.125%, 12/15/2049i | 3,380,672 | ||||||
| Goldman Sachs Group, Inc. | ||||||||
| 3,250,000 | 6.250%, 9/1/2017 | 3,533,624 | ||||||
| 2,850,000 | 5.950%, 1/18/2018 | 3,050,321 | ||||||
| 3,250,000 | 5.250%, 7/27/2021 | 3,301,408 | ||||||
| 1,260,000 | 6.750%, 10/1/2037 | 1,234,867 | ||||||
| HCP, Inc. | ||||||||
| 800,000 | 3.750%, 2/1/2019 | 798,596 | ||||||
| Health Care Property Investors, Inc. | ||||||||
| 3,100,000 | 5.625%, 5/1/2017 | 3,422,952 | ||||||
| Health Care REIT, Inc. | ||||||||
| 3,200,000 | 6.125%, 4/15/2020 | 3,562,234 | ||||||
| 3,150,000 | 4.950%, 1/15/2021 | 3,304,016 | ||||||
| HSBC Holdings plc | ||||||||
| 2,600,000 | 4.000%, 3/30/2022 | 2,699,835 | ||||||
| HSBC USA, Inc. | ||||||||
| 1,900,000 | 5.000%, 9/27/2020 | 1,930,607 | ||||||
| Huntington Bancshares, Inc. | ||||||||
| 2,850,000 | 7.000%, 12/15/2020 | 3,337,133 | ||||||
| Icahn Enterprises, LP | ||||||||
| 1,290,000 | 7.750%, 1/15/2016 | 1,356,112 | ||||||
| 660,000 | 8.000%, 1/15/2018 | 701,250 | ||||||
| International Lease Finance Corporation | ||||||||
| 1,950,000 | 4.875%, 4/1/2015 | 1,959,651 | ||||||
| 1,600,000 | 5.750%, 5/15/2016 | 1,623,331 | ||||||
| 1,875,000 | 6.750%, 9/1/2016g | 2,015,625 | ||||||
| J.P. Morgan Chase & Company | ||||||||
| 1,600,000 | 3.150%, 7/5/2016 | 1,645,446 | ||||||
| 3,150,000 | 5.500%, 10/15/2040 | 3,474,935 | ||||||
| J.P. Morgan Chase Bank NA | ||||||||
| 3,215,000 | 5.875%, 6/13/2016 | 3,525,707 | ||||||
| 2,580,000 | 6.000%, 10/1/2017 | 2,888,625 | ||||||
| J.P. Morgan Chase Capital XXV | ||||||||
| 3,100,000 | 6.800%, 10/1/2037 | 3,099,984 | ||||||
| Kilroy Realty, LP | ||||||||
| 2,565,000 | 4.800%, 7/15/2018 | 2,695,825 | ||||||
| Liberty Mutual Group, Inc. | ||||||||
| 1,285,000 | 4.950%, 5/1/2022g | 1,277,027 | ||||||
| Liberty Property, LP | ||||||||
| 2,840,000 | 5.500%, 12/15/2016 | 3,149,407 | ||||||
| 1,875,000 | 4.750%, 10/1/2020 | 1,995,388 | ||||||
| Merrill Lynch & Company, Inc. | ||||||||
| 3,050,000 | 6.875%, 4/25/2018 | 3,412,755 | ||||||
| 3,000,000 | 7.750%, 5/14/2038 | 3,421,968 | ||||||
| MetLife Capital Trust IV | ||||||||
| 700,000 | 7.875%, 12/15/2037g | 777,000 | ||||||
| MetLife Capital Trust X | ||||||||
| 2,250,000 | 9.250%, 4/8/2038g | 2,756,250 | ||||||
| Mizuho Corporate Bank, Ltd. | ||||||||
| 3,225,000 | 2.550%, 3/17/2017g | 3,272,053 | ||||||
| Morgan Stanley | ||||||||
| 2,580,000 | 5.375%, 10/15/2015 | 2,637,325 | ||||||
| 3,730,000 | 6.625%, 4/1/2018 | 3,899,969 | ||||||
| 1,900,000 | 5.625%, 9/23/2019 | 1,880,430 | ||||||
| 3,400,000 | 5.500%, 1/26/2020 | 3,330,028 | ||||||
| MUFG Capital Finance 1, Ltd. | ||||||||
| 3,230,000 | 6.346%, 7/29/2049i | 3,472,082 | ||||||
| Murray Street Investment Trust I | ||||||||
| 2,600,000 | 4.647%, 3/9/2017 | 2,605,015 | ||||||
| National Bank of Canada | ||||||||
| 3,890,000 | 2.200%, 10/19/2016g | 4,056,893 | ||||||
| National City Bank | ||||||||
| 1,830,000 | 5.800%, 6/7/2017 | 2,083,371 | ||||||
| Nationwide Building Society | ||||||||
| 2,400,000 | 6.250%, 2/25/2020g | 2,588,957 | ||||||
| Nordea Bank AB | ||||||||
| 3,170,000 | 4.875%, 5/13/2021g | 3,088,648 | ||||||
| Omega Healthcare Investors, Inc. | ||||||||
| 1,680,000 | 5.875%, 3/15/2024g | 1,680,000 | ||||||
| ORIX Corporation | ||||||||
| 4,450,000 | 5.000%, 1/12/2016 | 4,661,455 | ||||||
| Preferred Term Securities XXIII, Ltd. | ||||||||
| 4,593,405 | 0.668%, 12/22/2036d,h | 2,411,537 | ||||||
| ProLogis, LP | ||||||||
| 2,550,000 | 6.250%, 3/15/2017 | 2,898,287 | ||||||
| 1,930,000 | 6.875%, 3/15/2020 | 2,308,363 | ||||||
| Prudential Financial, Inc. | ||||||||
| 1,250,000 | 6.200%, 1/15/2015 | 1,372,145 | ||||||
| 3,125,000 | 5.375%, 6/21/2020 | 3,458,078 | ||||||
| 1,120,000 | 5.700%, 12/14/2036 | 1,145,764 | ||||||
| 1,425,000 | 6.200%, 11/15/2040 | 1,554,927 | ||||||
| QBE Capital Funding III, Ltd. | ||||||||
| 2,240,000 | 7.250%, 5/24/2041g | 2,021,428 | ||||||
| Rabobank Capital Funding Trust II | ||||||||
| 2,126,000 | 5.260%, 12/29/2049g,i | 2,030,245 | ||||||
| Regions Financial Corporation | ||||||||
| 3,175,000 | 5.750%, 6/15/2015 | 3,333,750 | ||||||
| Reinsurance Group of America, Inc. | ||||||||
| 1,855,000 | 5.625%, 3/15/2017 | 2,022,419 | ||||||
| 1,930,000 | 6.450%, 11/15/2019 | 2,189,334 | ||||||
| Royal Bank of Scotland plc | ||||||||
| 2,500,000 | 4.875%, 3/16/2015 | 2,586,870 | ||||||
| Simon Property Group, LP | ||||||||
| 2,280,000 | 5.750%, 12/1/2015 | 2,547,453 | ||||||
| 1,250,000 | 10.350%, 4/1/2019 | 1,753,507 | ||||||
| 2,000,000 | 5.650%, 2/1/2020 | 2,332,996 | ||||||
| SLM Corporation | ||||||||
| 1,910,000 | 5.000%, 10/1/2013 | 1,967,300 | ||||||
| 3,300,000 | 5.375%, 5/15/2014 | 3,415,378 | ||||||
| 3,670,000 | 6.250%, 1/25/2016 | 3,853,500 | ||||||
| 3,555,000 | 6.000%, 1/25/2017 | 3,672,407 | ||||||
| SunTrust Banks, Inc. | ||||||||
| 3,220,000 | 3.600%, 4/15/2016 | 3,343,561 | ||||||
| Swiss RE Capital I, LP | ||||||||
| 4,200,000 | 6.854%, 5/29/2049g,i | 3,869,137 | ||||||
| TD Ameritrade Holding Corporation | ||||||||
| 3,775,000 | 5.600%, 12/1/2019 | 4,290,733 | ||||||
| U.S. Bank National Association | ||||||||
| 3,200,000 | 3.778%, 4/29/2020 | 3,343,277 | ||||||
| UnionBanCal Corporation | ||||||||
| 2,580,000 | 3.500%, 6/18/2022 | 2,605,950 | ||||||
| UnitedHealth Group, Inc. | ||||||||
| 2,500,000 | 6.500%, 6/15/2037 | 3,314,560 | ||||||
The accompanying Notes to Financial Statements are an integral part of this schedule.
225
Table of Contents
Income Portfolio
Schedule of Investments as of June 29, 2012
(unaudited)
| Principal Amount | Long-Term Fixed Income (94.8%) | Value | ||||||
| Financials (25.5%) - continued | |||||||
| Unum Group | ||||||||
| $ 2,500,000 | 7.125%, 9/30/2016 | $ | 2,883,425 | |||||
| Wachovia Corporation | ||||||||
| 2,500,000 | 5.250%, 8/1/2014 | 2,666,927 | ||||||
| WEA Finance, LLC | ||||||||
| 1,940,000 | 5.700%, 10/1/2016g | 2,134,681 | ||||||
| 2,790,000 | 7.125%, 4/15/2018g | 3,304,934 | ||||||
| WellPoint, Inc. | ||||||||
| 3,215,000 | 3.700%, 8/15/2021 | 3,394,114 | ||||||
| Wells Fargo & Company | ||||||||
| 2,520,000 | 2.625%, 12/15/2016 | 2,589,786 | ||||||
| 1,865,000 | 4.600%, 4/1/2021 | 2,080,665 | ||||||
| 3,220,000 | 7.980%, 2/28/2049i | 3,533,950 | ||||||
| Willis North America, Inc. | ||||||||
| 3,500,000 | 6.200%, 3/28/2017 | 3,937,549 | ||||||
| 1,900,000 | 7.000%, 9/29/2019 | 2,201,813 | ||||||
| ZFS Finance USA Trust II | ||||||||
| 2,500,000 | 6.450%, 12/15/2065f,g | 2,500,000 | ||||||
|
| |||||||
| Total | 389,691,094 | |||||||
|
| |||||||
| Foreign Government (5.0%) | |||||||
| Brazil Government International Bond | ||||||||
| 1,930,000 | 4.875%, 1/22/2021 | 2,232,045 | ||||||
| Canada Government International Bond | ||||||||
| 3,875,000 | 0.875%, 2/14/2017 | 3,894,960 | ||||||
| Chile Government International Bond | ||||||||
| 4,520,000 | 3.250%, 9/14/2021 | 4,791,200 | ||||||
| Corporacion Andina de Fomento | ||||||||
| 1,968,000 | 4.375%, 6/15/2022 | 2,010,178 | ||||||
| Export-Import Bank of Korea | ||||||||
| 2,580,000 | 4.375%, 9/15/2021 | 2,733,144 | ||||||
| Hydro Quebec | ||||||||
| 3,200,000 | 2.000%, 6/30/2016 | 3,312,906 | ||||||
| Korea Development Bank | ||||||||
| 2,500,000 | 4.375%, 8/10/2015 | 2,664,760 | ||||||
| Mexico Government International Bond | ||||||||
| 3,150,000 | 5.125%, 1/15/2020 | 3,693,375 | ||||||
| 2,230,000 | 6.050%, 1/11/2040 | 2,876,700 | ||||||
| Peru Government International Bond | ||||||||
| 1,290,000 | 5.625%, 11/18/2050 | 1,564,125 | ||||||
| Province of British Columbia | ||||||||
| 3,830,000 | 2.100%, 5/18/2016 | 4,012,434 | ||||||
| 1,450,000 | 1.200%, 4/25/2017 | 1,464,175 | ||||||
| 3,250,000 | 2.650%, 9/22/2021 | 3,440,937 | ||||||
| Province of Manitoba | ||||||||
| 4,515,000 | 1.300%, 4/3/2017 | 4,579,456 | ||||||
| Province of New Brunswick | ||||||||
| 3,850,000 | 2.750%, 6/15/2018 | 4,129,633 | ||||||
| Province of Ontario | ||||||||
| 6,800,000 | 2.300%, 5/10/2016 | 7,094,121 | ||||||
| 3,230,000 | 1.600%, 9/21/2016 | 3,288,201 | ||||||
| 8,680,000 | 3.000%, 7/16/2018 | 9,322,468 | ||||||
| Province of Quebec | ||||||||
| 3,230,000 | 5.125%, 11/14/2016 | 3,772,556 | ||||||
| 4,507,000 | 2.750%, 8/25/2021 | 4,661,937 | ||||||
| Russia Government International Bond | ||||||||
| 1,950,000 | 3.250%, 4/4/2017g | 1,962,168 | ||||||
|
| |||||||
| Total | 77,501,479 | |||||||
|
| |||||||
| Mortgage-Backed Securities (5.6%) | |||||||
| Federal Home Loan Mortgage Corporation Gold 15-Yr. Pass Through | ||||||||
| 18,085,000 | 3.000%, 7/1/2027c | 18,907,307 | ||||||
| Federal National Mortgage Association Conventional 15- Yr. Pass Through | ||||||||
| 11,375,000 | 3.000%, 7/1/2027c | 11,917,087 | ||||||
| Federal National Mortgage Association Conventional 30- Yr. Pass Through | ||||||||
| 11,000,000 | 3.500%, 7/1/2042c | 11,562,034 | ||||||
| 13,200,000 | 4.000%, 7/1/2042c | 14,047,691 | ||||||
| 26,075,000 | 5.500%, 7/1/2042c | 28,442,114 | ||||||
|
| |||||||
| Total | 84,876,233 | |||||||
|
| |||||||
| Technology (1.4%) | |||||||
| CA, Inc. | ||||||||
| 3,075,000 | 5.375%, 12/1/2019 | 3,460,974 | ||||||
| Equinix, Inc. | ||||||||
| 1,800,000 | 8.125%, 3/1/2018 | 1,993,500 | ||||||
| 640,000 | 7.000%, 7/15/2021 | 704,000 | ||||||
| Hewlett-Packard Company | ||||||||
| 3,200,000 | 2.650%, 6/1/2016 | 3,271,555 | ||||||
| 1,300,000 | 2.600%, 9/15/2017 | 1,304,944 | ||||||
| 1,300,000 | 4.650%, 12/9/2021 | 1,362,665 | ||||||
| Motorola Solutions, Inc. | ||||||||
| 4,500,000 | 3.750%, 5/15/2022 | 4,437,765 | ||||||
| Seagate HDD Cayman | ||||||||
| 1,260,000 | 7.750%, 12/15/2018 | 1,393,875 | ||||||
| Xerox Corporation | ||||||||
| 1,250,000 | 6.400%, 3/15/2016 | 1,429,470 | ||||||
| 1,950,000 | 2.950%, 3/15/2017 | 1,972,088 | ||||||
|
| |||||||
| Total | 21,330,836 | |||||||
|
| |||||||
| Transportation (1.5%) | |||||||
| Continental Airlines, Inc. | ||||||||
| 2,200,000 | 6.750%, 9/15/2015g | 2,260,500 | ||||||
| 1,014,464 | 7.250%, 11/10/2019 | 1,148,880 | ||||||
| CSX Corporation | ||||||||
| 1,293,000 | 7.900%, 5/1/2017 | 1,610,201 | ||||||
| 1,280,000 | 4.250%, 6/1/2021 | 1,397,923 | ||||||
| 1,807,000 | 6.220%, 4/30/2040 | 2,228,483 | ||||||
| Delta Air Lines, Inc. | ||||||||
| 2,382,168 | 4.950%, 5/23/2019f | 2,522,239 | ||||||
| 1,285,000 | 4.750%, 5/7/2020c | 1,301,062 | ||||||
| ERAC USA Finance, LLC | ||||||||
| 3,450,000 | 5.250%, 10/1/2020g | 3,842,127 | ||||||
| 1,915,000 | 4.500%, 8/16/2021g | 2,037,114 | ||||||
| Hertz Corporation | ||||||||
| 2,570,000 | 6.750%, 4/15/2019 | 2,672,800 | ||||||
| Kansas City Southern de Mexico SA de CV | ||||||||
| 480,000 | 6.125%, 6/15/2021 | 528,000 | ||||||
The accompanying Notes to Financial Statements are an integral part of this schedule.
226
Table of Contents
Income Portfolio
Schedule of Investments as of June 29, 2012
(unaudited)
| Principal Amount | Long-Term Fixed Income (94.8%) | Value | ||||||
| Transportation (1.5%) - continued | ||||||||
Navios Maritime Holdings, Inc. | ||||||||
| $1,510,000 | 8.875%, 11/1/2017f | $ | 1,521,325 | |||||
Navios South American Logistics, Inc./Navios Logistics Finance US, Inc. | ||||||||
| 480,000 | 9.250%, 4/15/2019 | 441,600 | ||||||
|
| |||||||
| Total | 23,512,254 | |||||||
|
| |||||||
| U.S. Government and Agencies (7.8%) | ||||||||
Federal Home Loan Mortgage Corporation | ||||||||
| 4,500,000 | 1.250%, 5/12/2017 | 4,559,472 | ||||||
| 1,950,000 | 1.750%, 5/30/2019 | 1,994,499 | ||||||
| 3,250,000 | 2.375%, 1/13/2022 | 3,335,325 | ||||||
U.S. Treasury Bonds | ||||||||
| 2,000,000 | 3.875%, 8/15/2040 | 2,462,188 | ||||||
| 1,500,000 | 4.375%, 5/15/2041 | 2,003,437 | ||||||
| 7,760,000 | 3.125%, 11/15/2041 | 8,342,000 | ||||||
| 3,220,000 | 3.000%, 5/15/2042 | 3,372,448 | ||||||
U.S. Treasury Notes | ||||||||
| 8,400,000 | 1.000%, 10/31/2016 | 8,527,966 | ||||||
| 3,000,000 | 3.000%, 2/28/2017 | 3,315,702 | ||||||
| 3,220,000 | 1.000%, 3/31/2017 | 3,264,275 | ||||||
| 3,190,000 | 2.875%, 3/31/2018 | 3,544,887 | ||||||
| 7,110,000 | 2.375%, 6/30/2018 | 7,707,126 | ||||||
| 5,160,000 | 3.625%, 2/15/2020 | 6,069,852 | ||||||
| 9,500,000 | 3.500%, 5/15/2020 | 11,100,161 | ||||||
| 7,020,000 | 2.625%, 11/15/2020 | 7,715,970 | ||||||
| 7,605,000 | 3.125%, 5/15/2021 | 8,657,821 | ||||||
| 3,860,000 | 2.125%, 8/15/2021 | 4,057,223 | ||||||
| 12,045,000 | 2.000%, 11/15/2021 | 12,488,220 | ||||||
U.S. Treasury Notes, TIPS | ||||||||
| 4,043,620 | 0.125%, 4/15/2016 | 4,208,838 | ||||||
| 4,567,728 | 0.125%, 4/15/2017 | 4,821,808 | ||||||
| 6,603,605 | 0.625%, 7/15/2021 | 7,354,766 | ||||||
|
| |||||||
| Total | 118,903,984 | |||||||
|
| |||||||
| U.S. Municipals (0.5%) | ||||||||
California General Obligation Bonds (Build America Bonds) | ||||||||
| 1,280,000 | 7.950%, 3/1/2036 | 1,514,547 | ||||||
Denver, Colorado City & County Airport Revenue Bonds | ||||||||
| 2,550,000 | 5.250%, 11/15/2022 | 2,985,642 | ||||||
Illinois State General Obligation Bonds | ||||||||
| 3,175,000 | 5.877%, 3/1/2019 | 3,520,758 | ||||||
|
| |||||||
| Total | 8,020,947 | |||||||
|
| |||||||
| Utilities (4.8%) | ||||||||
AES Corporation | ||||||||
| 1,565,000 | 7.750%, 10/15/2015 | 1,756,712 | ||||||
| 740,000 | 7.375%, 7/1/2021g | 823,250 | ||||||
Ameren Illinois Company | ||||||||
| 3,200,000 | 6.125%, 11/15/2017 | 3,739,843 | ||||||
Cleveland Electric Illuminating Company | ||||||||
| 1,775,000 | 5.700%, 4/1/2017 | 1,995,916 | ||||||
Columbus Southern Power Company | ||||||||
| 2,400,000 | 6.050%, 5/1/2018 | 2,870,230 | ||||||
Comision Federal de Electricidad | ||||||||
| 1,125,000 | 4.875%, 5/26/2021g | 1,215,000 | ||||||
Commonwealth Edison Company | ||||||||
| 1,500,000 | 6.150%, 9/15/2017 | 1,816,259 | ||||||
Dolphin Subsidiary II, Inc. | ||||||||
| 3,230,000 | 6.500%, 10/15/2016g | 3,488,400 | ||||||
DTE Energy Company | ||||||||
| 2,500,000 | 6.375%, 4/15/2033 | 3,204,950 | ||||||
Energy Transfer Partners, LP | ||||||||
| 3,500,000 | 4.650%, 6/1/2021 | 3,615,888 | ||||||
| 1,750,000 | 5.200%, 2/1/2022 | 1,874,096 | ||||||
Enterprise Products Operating, LLC | ||||||||
| 2,600,000 | 7.034%, 1/15/2068 | 2,782,000 | ||||||
Exelon Generation Company, LLC | ||||||||
| 1,050,000 | 5.200%, 10/1/2019 | 1,148,463 | ||||||
| 2,500,000 | 4.000%, 10/1/2020 | 2,515,597 | ||||||
Florida Power Corporation | ||||||||
| 2,000,000 | 6.400%, 6/15/2038 | 2,727,664 | ||||||
ITC Holdings Corporation | ||||||||
| 3,000,000 | 5.875%, 9/30/2016g | 3,447,288 | ||||||
| 2,600,000 | 6.050%, 1/31/2018g | 3,016,757 | ||||||
Markwest Energy Partners, LP | ||||||||
| 1,910,000 | 6.500%, 8/15/2021 | 1,991,175 | ||||||
Nevada Power Company | ||||||||
| 2,800,000 | 6.750%, 7/1/2037 | 3,787,759 | ||||||
NiSource Finance Corporation | ||||||||
| 2,800,000 | 6.400%, 3/15/2018 | 3,270,674 | ||||||
| 3,200,000 | 5.450%, 9/15/2020 | 3,590,157 | ||||||
Ohio Edison Company | ||||||||
| 1,550,000 | 6.875%, 7/15/2036 | 1,990,679 | ||||||
Pennsylvania Electric Company | ||||||||
| 3,700,000 | 5.200%, 4/1/2020 | 4,173,796 | ||||||
PSEG Power, LLC | ||||||||
| 1,300,000 | 5.320%, 9/15/2016 | 1,466,017 | ||||||
Southern California Edison Company | ||||||||
| 2,585,000 | 6.250%, 8/1/2049f,i | 2,700,291 | ||||||
Southern Star Central Corporation | ||||||||
| 1,600,000 | 6.750%, 3/1/2016 | 1,616,000 | ||||||
Southwestern Public Service Company | ||||||||
| 2,770,000 | 6.000%, 10/1/2036 | 3,261,966 | ||||||
Union Electric Company | ||||||||
| 2,900,000 | 6.400%, 6/15/2017 | 3,479,527 | ||||||
|
| |||||||
| Total | 73,366,354 | |||||||
|
| |||||||
Total Long-Term Fixed Income (cost $1,373,032,426) | 1,450,794,269 | |||||||
|
| |||||||
| Shares | Preferred Stock (1.0%) | |||||||
| Financials (1.0%) | ||||||||
| 22,000 | Citigroup, Inc., Convertiblek | 1,882,320 | ||||||
| 359,990 | Federal National Mortgage Association, 8.250%i,l | 586,784 | ||||||
| 81,250 | HSBC Holdings plc, 8.000%i | 2,208,375 | ||||||
The accompanying Notes to Financial Statements are an integral part of this schedule.
227
Table of Contents
Income Portfolio
Schedule of Investments as of June 29, 2012
(unaudited)
| Shares | Preferred Stock (1.0%) | Value | ||||||
| Financials (1.0%) - continued | ||||||||
| 168,214 | PNC Financial Services Group, | $ | 4,432,439 | |||||
| 129,063 | Royal Bank of Scotland Group | 2,536,088 | ||||||
| 65,000 | U.S. Bancorp, 6.000%i | 1,779,700 | ||||||
| 82,600 | U.S. Bancorp, 6.500%i | 2,360,708 | ||||||
|
| |||||||
| Total | 15,786,414 | |||||||
|
| |||||||
| Total Preferred Stock (cost $21,241,853) | 15,786,414 | |||||||
|
| |||||||
Common Stock (0.1%) | ||||||||
| Financials (0.1%) | ||||||||
| 17,331 | CIT Group, Inc.l | 617,677 | ||||||
|
| |||||||
| Total | 617,677 | |||||||
|
| |||||||
Total Common Stock (cost $554,987) | 617,677 | |||||||
|
| |||||||
Collateral Held for Securities Loaned (0.9%) | ||||||||
| 14,054,913 | Thrivent Financial Securities Lending Trust | 14,054,913 | ||||||
|
| |||||||
Total Collateral Held for Securities Loaned (cost $14,054,913) | 14,054,913 | |||||||
|
| |||||||
| Principal Amount | Short-Term Investments (6.1%)m | |||||||
Federal Home Loan Bank Discount Notes | ||||||||
| 15,000,000 | 0.077%, 7/11/2012n | 14,999,649 | ||||||
| 6,000,000 | 0.090%, 7/13/2012n | 5,999,805 | ||||||
| 41,999,000 | 0.065%, 7/18/2012n | 41,997,635 | ||||||
| 5,000,000 | 0.075%, 7/20/2012n | 4,999,792 | ||||||
| 5,000,000 | 0.060%, 7/27/2012n | 4,999,775 | ||||||
| 5,000,000 | 0.095%, 8/17/2012n | 4,999,367 | ||||||
Federal Home Loan Mortgage Corporation Discount Notes | ||||||||
| 15,000,000 | 0.070%, 7/11/2012n | 14,999,679 | ||||||
| 100,000 | 0.105%, 7/16/2012n,o | 99,995 | ||||||
Federal National Mortgage Association Discount Notes | ||||||||
| 800,000 | 0.120%, 7/18/2012n,o | 799,952 | ||||||
|
| |||||||
| Total Short-Term Investments (at amortized cost) | 93,895,649 | |||||||
|
| |||||||
| Total Investments (cost $1,542,293,505) 105.5% | $ | 1,614,464,577 | ||||||
|
| |||||||
| Other Assets and Liabilities, Net (5.5%) | (83,754,129 | ) | ||||||
|
| |||||||
| Total Net Assets 100.0% | $ | 1,530,710,448 | ||||||
|
| |||||||
| a | The stated interest rate represents the weighted average of all contracts within the bank loan facility. |
| b | All or a portion of the loan is unfunded. |
| c | Denotes investments purchased on a when-issued or delayed delivery basis. |
| d | Denotes variable rate securities. Variable rate securities are securities whose yields vary with a designated market index or market rate. The rate shown is as of June 29, 2012. |
| e | All or a portion of the security is insured or guaranteed. |
| f | All or a portion of the security is on loan. |
| g | Denotes securities sold under Rule 144A of the Securities Act of 1933, which exempts them from registration. These securities have been deemed liquid and may be resold to other dealers in the program or to other qualified institutional buyers. As of June 29, 2012, the value of these investments was $228,014,406 or 14.9% of total net assets. |
| h | Denotes restricted securities. Restricted securities are investment securities which have been deemed illiquid and cannot be offered for public sale without first being registered under the Securities Act of 1933. The following table indicates the acquisition date and cost of restricted securities Income Portfolio owned as of June 29, 2012. |
Security | Acquisition Date | Cost | ||||||
JBS Finance II, Ltd. | 7/22/2010 | $ | 1,232,925 | |||||
Preferred Term Securities XXIII, Ltd. | 9/14/2006 | $ | 4,593,405 | |||||
Wachovia Bank Commercial Mortgage Trust | 5/2/2007 | $ | 5,200,267 | |||||
| i | Denotes perpetual securities. Perpetual securities pay an indefinite stream of interest, but may be called by the issuer at an earlier date. |
| j | Denotes equity-linked structured security. This security is linked to the common stock of Berkshire Hathaway, Inc. |
| k | Comprised of a 79.7% prepaid stock purchase contract for common stock of Citigroup, Inc. and a 20.3% amortizing note. The quarterly payments received consists of return of capital and 6.15% interest on only the portion that is the note. |
| l | Non-income producing security. |
| m | The interest rate shown reflects the yield, coupon rate or the discount rate at the date of purchase. |
| n | Denotes investments that benefit from credit enhancement or liquidity support provided by a third party bank, institution or government. |
| o | At June 29, 2012, $899,948 of investments were held on deposit with the counterparty and pledged as the initial margin deposit for open futures contracts. |
Definitions:
REIT - Real Estate Investment Trust is a company that buys, develops, manages and/or sells real estate assets.
TIPS - Treasury Inflation Protected Security.
Unrealized Appreciation (Depreciation)
Gross unrealized appreciation and depreciation of investments, based on cost for federal income tax purposes, were as follows:
Gross unrealized appreciation | $ | 96,891,314 | ||
Gross unrealized depreciation | (24,733,607 | ) | ||
|
| |||
Net unrealized appreciation (depreciation) | $ | 72,157,707 | ||
Cost for federal income tax purposes | $ | 1,542,306,870 |
The accompanying Notes to Financial Statements are an integral part of this schedule.
228
Table of Contents
Income Portfolio
Schedule of Investments as of June 29, 2012
(unaudited)
Fair Valuation Measurements
The following table is a summary of the inputs used, as of June 29, 2012, in valuing Income Portfolio’s assets carried at fair value.
Investments in Securities | Total | Level 1 | Level 2 | Level 3 | ||||||||||||
Bank Loans | ||||||||||||||||
Basic Materials | 3,134,769 | — | 3,134,769 | — | ||||||||||||
Communications Services | 11,367,257 | — | 11,367,257 | — | ||||||||||||
Consumer Cyclical | 4,124,738 | — | 4,124,738 | — | ||||||||||||
Consumer Non-Cyclical | 7,937,826 | — | 7,937,826 | — | ||||||||||||
Energy | 1,585,824 | — | 1,585,824 | — | ||||||||||||
Financials | 1,572,800 | — | 1,572,800 | — | ||||||||||||
Technology | 5,509,145 | — | 5,509,145 | — | ||||||||||||
Transportation | 2,516,624 | — | 2,516,624 | — | ||||||||||||
Utilities | 1,566,672 | — | 1,566,672 | — | ||||||||||||
Long-Term Fixed Income | ||||||||||||||||
Asset-Backed Securities | 10,694,371 | — | 10,694,371 | — | ||||||||||||
Basic Materials | 66,786,573 | — | 66,786,573 | — | ||||||||||||
Capital Goods | 39,224,372 | — | 39,224,372 | — | ||||||||||||
Collateralized Mortgage Obligations | 14,440,233 | — | 14,440,233 | — | ||||||||||||
Commercial Mortgage-Backed Securities | 23,213,037 | — | 23,213,037 | — | ||||||||||||
Communications Services | 136,154,424 | — | 136,154,424 | — | ||||||||||||
Consumer Cyclical | 78,115,486 | — | 78,115,486 | — | ||||||||||||
Consumer Non-Cyclical | 131,363,751 | — | 131,363,751 | — | ||||||||||||
Energy | 153,598,841 | — | 153,598,841 | — | ||||||||||||
Financials | 389,691,094 | — | 386,034,117 | 3,656,977 | ||||||||||||
Foreign Government | 77,501,479 | — | 77,501,479 | — | ||||||||||||
Mortgage-Backed Securities | 84,876,233 | — | 84,876,233 | — | ||||||||||||
Technology | 21,330,836 | — | 21,330,836 | — | ||||||||||||
Transportation | 23,512,254 | — | 23,512,254 | — | ||||||||||||
U.S. Government and Agencies | 118,903,984 | — | 118,903,984 | — | ||||||||||||
U.S. Municipals | 8,020,947 | — | 8,020,947 | — | ||||||||||||
Utilities | 73,366,354 | — | 73,366,354 | — | ||||||||||||
Preferred Stock | ||||||||||||||||
Financials | 15,786,414 | 15,786,414 | — | — | ||||||||||||
Common Stock | ||||||||||||||||
Financials | 617,677 | 617,677 | — | — | ||||||||||||
Collateral Held for Securities Loaned | 14,054,913 | 14,054,913 | — | — | ||||||||||||
Short-Term Investments | 93,895,649 | — | 93,895,649 | — | ||||||||||||
|
|
|
|
|
|
|
| |||||||||
Total | $ | 1,614,464,577 | $ | 30,459,004 | $ | 1,580,348,596 | $ | 3,656,977 | ||||||||
|
|
|
|
|
|
|
| |||||||||
Other Financial Instruments | Total | Level 1 | Level 2 | Level 3 | ||||||||||||
Asset Derivatives | ||||||||||||||||
Futures Contracts | 663,792 | 663,792 | — | — | ||||||||||||
|
|
|
|
|
|
|
| |||||||||
Total Asset Derivatives | $ | 663,792 | $ | 663,792 | $ | — | $ | — | ||||||||
|
|
|
|
|
|
|
| |||||||||
Liability Derivatives | ||||||||||||||||
Futures Contracts | 1,308,713 | 1,308,713 | — | — | ||||||||||||
Credit Default Swaps | 120,881 | — | 120,881 | — | ||||||||||||
|
|
|
|
|
|
|
| |||||||||
Total Liability Derivatives | $ | 1,429,594 | $ | 1,308,713 | $ | 120,881 | $ | — | ||||||||
|
|
|
|
|
|
|
| |||||||||
The significant unobservable inputs used in the fair value measurement of the Long-Term Fixed Income Financials Level 3 securities are market activity, dividends, interest rates, and the implied volatility of any underlying security/index. A significant increase or decrease in the inputs in isolation would result in a significantly lower or higher fair value measurement.
There were no significant transfers between the Levels during the period ended June 29, 2012. Transfers between the levels are identified as of the end of the period.
The accompanying Notes to Financial Statements are an integral part of this schedule.
229
Table of Contents
Income Portfolio
Schedule of Investments as of June 29, 2012
(unaudited)
Futures Contracts | Number of Contracts Long/(Short) | Expiration Date | Notional Principal Amount | Value | Unrealized Gain/(Loss) | |||||||||||||||
2-Yr. U.S. Treasury Bond Futures | 315 | September 2012 | $ | 69,374,790 | $ | 69,359,062 | ($ | 15,728 | ) | |||||||||||
5-Yr. U.S. Treasury Bond Futures | (595 | ) | September 2012 | (73,638,735 | ) | (73,761,406 | ) | (122,671 | ) | |||||||||||
10-Yr. U.S. Treasury Bond Futures | (1,435 | ) | September 2012 | (190,222,811 | ) | (191,393,125 | ) | (1,170,314 | ) | |||||||||||
20-Yr. U.S. Treasury Bond Futures | 600 | September 2012 | 88,117,458 | 88,781,250 | 663,792 | |||||||||||||||
Total Futures Contracts | ($ | 644,921 | ) | |||||||||||||||||
Credit Default Swaps and Counterparty | Buy/Sell Protection1 | Termination Date | Notional Principal Amount2 | Upfront Payments Received (Made) | Value3 | Unrealized Gain/(Loss) | ||||||||||||||||||
CDX HY, Series 18, 5 Year, at | Buy | 6/20/2017 | $ | 9,504,000 | ($ | 455,389 | ) | $ | 334,508 | ($ | 120,881 | ) | ||||||||||||
Total Credit Default Swaps | $ | 334,508 | ($ | 120,881 | ) | |||||||||||||||||||
| 1 | As the buyer of protection, Income Portfolio pays periodic fees in return for payment by the seller which is contingent upon an adverse credit event occurring in the underlying issuer or reference entity. As the seller of protection, Income Portfolio collects periodic fees from the buyer and profits if the credit of the underlying issuer or reference entity remains stable or improves while the swap is outstanding, but the seller in a credit default swap contract would be required to pay the amount of credit loss, determined as specified in the agreement, to the buyer in the event of an adverse credit event in the reference entity. |
| 2 | The maximum potential amount of future payments Income Portfolio could be required to make as the seller or receive as the buyer of protection. |
| 3 | The values for credit indexes (CDX or LCDX) serve as an indicator of the current status of the payment/performance risk and represent the liability or profit for the credit default swap contract had the contract been closed as of the reporting date. When protection has been sold, the value of the swap will increase when the swap spread declines representing an improvement in the reference entity’s credit worthiness. The value of the swap will decrease when the swap spread increases representing a deterioration in the reference entity’s credit worthiness. When protection has been purchased, the value of the swap will increase when the swap spread increases representing a deterioration in the reference entity’s credit worthiness. The value of the swap will decrease when the swap spread declines representing an improvement in the reference entity’s credit worthiness. |
The following table summarizes the fair value and Statement of Assets and Liabilities location, as of June 29, 2012, for Income Portfolio’s investments in financial derivative instruments by primary risk exposure as discussed under item (2) Significant Accounting Policies of the Notes to Financial Statements.
Derivatives by risk category | Statement of Assets and Liabilities Location | Fair Value | ||||
Asset Derivatives | ||||||
Interest Rate Contracts | ||||||
Futures* | Net Assets - Net unrealized appreciation/(depreciation) on Futures contracts | 663,792 | ||||
Total Interest Rate Contracts | 663,792 | |||||
|
| |||||
Total Asset Derivatives | $ | 663,792 | ||||
|
| |||||
Liability Derivatives | ||||||
Interest Rate Contracts | ||||||
Futures* | Net Assets - Net unrealized appreciation/(depreciation) on Futures contracts | 1,308,713 | ||||
Total Interest Rate Contracts | 1,308,713 | |||||
Credit Contracts | ||||||
Credit Default Swaps | Receivable/Payable - Swap agreements, at value; Net Assets - Net unrealized appreciation/(depreciation) on Swap agreements | 120,881 | ||||
Total Credit Contracts | 120,881 | |||||
|
| |||||
Total Liability Derivatives | $ | 1,429,594 | ||||
|
| |||||
| * | Includes cumulative appreciation/depreciation of futures contracts as reported in the Schedule of Investments. Only current day’s variation margin is reported within the Statement of Assets and Liabilities. |
The accompanying Notes to Financial Statements are an integral part of this schedule.
230
Table of Contents
Income Portfolio
Schedule of Investments as of June 29, 2012
(unaudited)
The following table summarizes the net realized gains/(losses) and Statement of Operations location, for the period ended June 29, 2012, for Income Portfolio’s investments in financial derivative instruments by primary risk exposure.
Derivatives by risk category | Statement of Operations Location | Realized Gains/(Losses) recognized in Income | ||||
Interest Rate Contracts | ||||||
Futures | Net realized gains/(losses) on Futures contracts | (4,449,992 | ) | |||
Total Interest Rate Contracts | (4,449,992 | ) | ||||
Credit Contracts | ||||||
Credit Default Swaps | Net realized gains/(losses) on Swap agreements | 71,592 | ||||
Total Credit Contracts | 71,592 | |||||
|
| |||||
Total | ($ | 4,378,400 | ) | |||
|
| |||||
The following table summarizes the change in net unrealized appreciation/(depreciation) and Statement of Operations location, for the period ended June 29, 2012, for Income Portfolio’s investments in financial derivative instruments by primary risk exposure.
Derivatives by risk category | Statement of Operations Location | Change in unrealized appreciation/(depreciation) recognized in Income | ||||
Interest Rate Contracts | ||||||
Futures | Change in net unrealized appreciation/(depreciation) on Futures contracts | 1,797,648 | ||||
Total Interest Rate Contracts | 1,797,648 | |||||
Credit Contracts | ||||||
Credit Default Swaps | Change in net unrealized appreciation/(depreciation) on Swap agreements | (120,881 | ) | |||
Total Credit Contracts | (120,881 | ) | ||||
|
| |||||
Total | $ | 1,676,767 | ||||
|
| |||||
The following table presents Income Portfolio’s average volume of derivative activity during the period ended June 29, 2012.
Derivative Risk Category | Futures (Notional*) | Futures (Percentage of Average Net Assets) | Swaps (Notional*) | Swaps (Percentage of Average Net Assets) | ||||||||||||
Interest Rate Contracts | $ | 422,525,683 | 28.1 | % | N/A | N/A | ||||||||||
Credit Contracts | N/A | N/A | $ | 10,627,164 | 0.7 | % | ||||||||||
| * | Notional amount represents long or short, or both, derivative positions held by the Portfolio. |
Investment in Affiliates
Affiliated issuers, as defined under the Investment Company Act of 1940, include those in which the Portfolio’s holdings of an issuer represent 5% or more of the outstanding voting securities of an issuer, or any affiliated mutual fund.
A summary of transactions for the fiscal year to date, in Income Portfolio, is as follows:
Portfolio | Value December 31, 2011 | Gross Purchases | Gross Sales | Shares Held at June 29, 2012 | Value June 29, 2012 | Income Earned January 1, 2012 - June 29, 2012 | ||||||||||||||||||
Thrivent Financial Securities Lending Trust | $ | 27,407,116 | $ | 65,002,190 | $ | 78,354,393 | 14,054,913 | $ | 14,054,913 | $ | 33,826 | |||||||||||||
Total Value and Income Earned | 27,407,116 | 14,054,913 | 33,826 | |||||||||||||||||||||
The accompanying Notes to Financial Statements are an integral part of this schedule.
231
Table of Contents
Schedule of Investments as of June 29, 2012
(unaudited)
| Principal Amount | Long-Term Fixed Income (106.9%) | Value | ||||||
| Asset-Backed Securities (2.7%) | ||||||||
Conseco Financial Corporation | ||||||||
| $ 18,356 | 6.330%, 11/1/2029 | $ | 19,499 | |||||
Countrywide Home Loans, Inc. | ||||||||
| 389,520 | 6.085%, 6/25/2021a | 273,024 | ||||||
Credit Based Asset Servicing and Securitization, LLC | ||||||||
| 372,302 | 4.624%, 12/25/2036 | 221,187 | ||||||
First Horizon ABS Trust | ||||||||
| 976,293 | 0.375%, 10/25/2026a,b | 722,545 | ||||||
| 900,275 | 0.405%, 10/25/2034a,b | 581,317 | ||||||
GMAC Mortgage Corporation Loan Trust | ||||||||
| 1,128,129 | 0.425%, 8/25/2035a,b | 750,839 | ||||||
| 1,378,005 | 0.425%, 12/25/2036a,b | 978,548 | ||||||
IndyMac Seconds Asset-Backed Trust | ||||||||
| 501,870 | 0.415%, 10/25/2036a,b | 90,630 | ||||||
Wachovia Asset Securitization, Inc. | ||||||||
| 1,146,787 | 0.385%, 7/25/2037a,b,c | 822,408 | ||||||
|
| |||||||
| Total | 4,459,997 | |||||||
|
| |||||||
| Basic Materials (0.5%) | ||||||||
Dow Chemical Company | ||||||||
| 27,000 | 7.375%, 11/1/2029 | 36,122 | ||||||
Freeport-McMoRan Copper & Gold, Inc. | ||||||||
| 250,000 | 3.550%, 3/1/2022 | 245,969 | ||||||
Rio Tinto Alcan, Inc. | ||||||||
| 500,000 | 5.200%, 1/15/2014 | 529,276 | ||||||
|
| |||||||
| Total | 811,367 | |||||||
|
| |||||||
| Capital Goods (1.3%) | ||||||||
Caterpillar Financial Services Corporation | ||||||||
| 325,000 | 1.625%, 6/1/2017 | 326,590 | ||||||
General Electric Company | ||||||||
| 600,000 | 5.000%, 2/1/2013 | 615,345 | ||||||
John Deere Capital Corporation | ||||||||
| 325,000 | 0.638%, 6/16/2014b | 325,949 | ||||||
Republic Services, Inc. | ||||||||
| 500,000 | 5.250%, 11/15/2021 | 574,043 | ||||||
United Technologies Corporation | ||||||||
| 275,000 | 6.050%, 6/1/2036 | 354,867 | ||||||
|
| |||||||
| Total | 2,196,794 | |||||||
|
| |||||||
| Collateralized Mortgage Obligations (<0.1%) | ||||||||
Bear Stearns Mortgage Funding Trust | ||||||||
| 168,264 | 0.525%, 8/25/2036b | 47,921 | ||||||
|
| |||||||
| Total | 47,921 | |||||||
|
| |||||||
| Commercial Mortgage-Backed Securities (5.5%) | ||||||||
Banc of America Commercial Mortgage, Inc. | ||||||||
| 645,000 | 5.805%, 6/10/2049 | 728,700 | ||||||
Bear Stearns Commercial Mortgage Securities, Inc. | ||||||||
| 645,784 | 0.392%, 3/15/2022b,d | 636,156 | ||||||
Commercial Mortgage Pass- Through Certificates | ||||||||
| 2,500,000 | 0.372%, 12/15/2020b,d | 2,270,433 | ||||||
| 500,000 | 5.306%, 12/10/2046 | 561,719 | ||||||
Credit Suisse Mortgage Capital Certificates | ||||||||
| 1,012,775 | 0.412%, 10/15/2021b,d | 947,555 | ||||||
| 235,000 | 5.467%, 9/15/2039 | 260,181 | ||||||
GE Capital Commercial Mortgage Corporation | ||||||||
| 336,211 | 4.641%, 3/10/2040 | 341,751 | ||||||
GS Mortgage Securities Corporation II | ||||||||
| 2,000,000 | 1.260%, 3/6/2020b,d | 1,972,894 | ||||||
LB-UBS Commercial Mortgage Trust | ||||||||
| 900,000 | 4.786%, 10/15/2029 | 963,137 | ||||||
Morgan Stanley Capital I | ||||||||
| 500,000 | 3.224%, 7/15/2049 | 532,980 | ||||||
|
| |||||||
| Total | 9,215,506 | |||||||
|
| |||||||
| Communications Services (1.5%) | ||||||||
AT&T, Inc. | ||||||||
| 300,000 | 6.400%, 5/15/2038 | 377,591 | ||||||
BellSouth Corporation | ||||||||
| 27,000 | 6.875%, 10/15/2031 | 32,809 | ||||||
CBS Corporation | ||||||||
| 350,000 | 7.875%, 9/1/2023 | 440,014 | ||||||
CenturyLink, Inc. | ||||||||
| 250,000 | 5.800%, 3/15/2022 | 248,876 | ||||||
Cox Communications, Inc. | ||||||||
| 135,000 | 6.450%, 12/1/2036d | 154,955 | ||||||
Crown Castle Towers, LLC | ||||||||
| 500,000 | 4.174%, 8/15/2017d | 528,490 | ||||||
Time Warner Cable, Inc. | ||||||||
| 300,000 | 7.300%, 7/1/2038 | 385,299 | ||||||
Verizon Global Funding Corporation | ||||||||
| 27,000 | 7.750%, 12/1/2030 | 38,084 | ||||||
Vodafone Group plc | ||||||||
| 350,000 | 1.625%, 3/20/2017 | 350,061 | ||||||
|
| |||||||
| Total | 2,556,179 | |||||||
|
| |||||||
| Consumer Cyclical (1.5%) | ||||||||
California Institute of Technology | ||||||||
| 325,000 | 4.700%, 11/1/2111 | 353,483 | ||||||
Daimler Finance North America, LLC | ||||||||
| 27,000 | 8.500%, 1/18/2031 | 41,308 | ||||||
Ford Motor Credit Company, LLC | ||||||||
| 350,000 | 3.000%, 6/12/2017 | 348,072 | ||||||
FUEL Trust | ||||||||
| 150,000 | 4.207%, 4/15/2016d | 155,757 | ||||||
| 200,000 | 3.984%, 6/15/2016d | 205,982 | ||||||
Target Corporation | ||||||||
| 27,000 | 7.000%, 7/15/2031 | 37,024 | ||||||
Time Warner, Inc. | ||||||||
| 275,000 | 3.400%, 6/15/2022 | 277,311 | ||||||
| 27,000 | 7.625%, 4/15/2031 | 34,874 | ||||||
The accompanying Notes to Financial Statements are an integral part of this schedule.
232
Table of Contents
Bond Index Portfolio
Schedule of Investments as of June 29, 2012
(unaudited)
| Principal Amount | Long-Term Fixed Income (106.9%) | Value | ||||||
| Consumer Cyclical (1.5%) - continued | ||||||||
Wal-Mart Stores, Inc. | ||||||||
| $327,000 | 7.550%, 2/15/2030 | $ | 490,100 | |||||
Walt Disney Company | ||||||||
| 500,000 | 5.625%, 9/15/2016 | 587,965 | ||||||
|
| |||||||
| Total | 2,531,876 | |||||||
|
| |||||||
| Consumer Non-Cyclical (2.9%) | ||||||||
AmerisourceBergen Corporation | ||||||||
| 500,000 | 4.875%, 11/15/2019 | 571,785 | ||||||
Beam, Inc. | ||||||||
| 300,000 | 1.875%, 5/15/2017 | 301,445 | ||||||
Boston Scientific Corporation | ||||||||
| 275,000 | 7.000%, 11/15/2035 | 343,340 | ||||||
Bunge Limited Finance Corporation | ||||||||
| 350,000 | 3.200%, 6/15/2017 | 350,775 | ||||||
Colgate-Palmolive Company | ||||||||
| 500,000 | 1.250%, 5/1/2014 | 506,190 | ||||||
Diageo Capital plc | ||||||||
| 300,000 | 1.500%, 5/11/2017 | 301,105 | ||||||
GlaxoSmithKline Capital, Inc. | ||||||||
| 300,000 | 6.375%, 5/15/2038 | 412,521 | ||||||
Grupo Bimbo SAB de CV | ||||||||
| 300,000 | 4.500%, 1/25/2022d | 319,139 | ||||||
Kellogg Company | ||||||||
| 27,000 | 7.450%, 4/1/2031 | 36,980 | ||||||
Kraft Foods, Inc. | ||||||||
| 300,000 | 2.250%, 6/5/2017d | 307,163 | ||||||
Molson Coors Brewing Company | ||||||||
| 325,000 | 2.000%, 5/1/2017 | 327,971 | ||||||
Philip Morris International, Inc. | ||||||||
| 300,000 | 6.375%, 5/16/2038 | 401,332 | ||||||
Wyeth | ||||||||
| 550,000 | 6.000%, 2/15/2036 | 719,336 | ||||||
|
| |||||||
| Total | 4,899,082 | |||||||
|
| |||||||
| Energy (1.6%) | ||||||||
Anadarko Finance Company | ||||||||
| 27,000 | 7.500%, 5/1/2031 | 33,991 | ||||||
Cameron International Corporation | ||||||||
| 200,000 | 4.500%, 6/1/2021 | 213,919 | ||||||
ConocoPhillips Holding Company | ||||||||
| 27,000 | 6.950%, 4/15/2029 | 37,040 | ||||||
Devon Financing Corporation, ULC | ||||||||
| 27,000 | 7.875%, 9/30/2031 | 38,613 | ||||||
Energy Transfer Partners, LP | ||||||||
| 450,000 | 6.700%, 7/1/2018 | 516,174 | ||||||
NiSource Finance Corporation | ||||||||
| 350,000 | 3.850%, 2/15/2023 | 349,662 | ||||||
Petro-Canada | ||||||||
| 300,000 | 6.800%, 5/15/2038 | 374,450 | ||||||
Phillips 66 | ||||||||
| 325,000 | 1.950%, 3/5/2015d | 327,327 | ||||||
| 275,000 | 4.300%, 4/1/2022d | 289,291 | ||||||
Valero Energy Corporation | ||||||||
| 500,000 | 4.750%, 6/15/2013 | 517,020 | ||||||
|
| |||||||
| Total | 2,697,487 | |||||||
|
| |||||||
| Financials (8.0%) | ||||||||
African Development Bank | ||||||||
| 250,000 | 6.875%, 10/15/2015 | 285,955 | ||||||
AXA SA | ||||||||
| 27,000 | 8.600%, 12/15/2030 | 28,880 | ||||||
Bank of America Corporation | ||||||||
| 150,000 | 5.875%, 2/7/2042 | 164,307 | ||||||
Barclays Bank plc | ||||||||
| 500,000 | 2.375%, 1/13/2014 | 501,182 | ||||||
| 300,000 | 5.000%, 9/22/2016 | 325,788 | ||||||
Bear Stearns Companies, LLC | ||||||||
| 500,000 | 4.650%, 7/2/2018 | 526,387 | ||||||
Berkshire Hathaway, Inc. | ||||||||
| 300,000 | 1.600%, 5/15/2017 | 302,089 | ||||||
Chubb Corporation | ||||||||
| 600,000 | 6.500%, 5/15/2038 | 815,561 | ||||||
Citigroup, Inc. | ||||||||
| 500,000 | 1.398%, 4/1/2014b | 492,000 | ||||||
| 250,000 | 4.700%, 5/29/2015 | 260,977 | ||||||
Cooperatieve Centrale Raiffeisen- Boerenleenbank BA | ||||||||
| 250,000 | 4.750%, 1/15/2020d | 271,213 | ||||||
Credit Suisse AG Guernsey | ||||||||
| 650,000 | 1.625%, 3/6/2015d | 652,295 | ||||||
Dartmouth College | ||||||||
| 250,000 | 3.760%, 6/1/2043 | 249,088 | ||||||
General Electric Capital Corporation | ||||||||
| 475,000 | 5.875%, 1/14/2038 | 545,302 | ||||||
HCP, Inc. | ||||||||
| 325,000 | 3.750%, 2/1/2016 | 337,994 | ||||||
Health Care REIT, Inc. | ||||||||
| 450,000 | 6.125%, 4/15/2020 | 500,939 | ||||||
HSBC Finance Corporation | ||||||||
| 650,000 | 6.375%, 11/27/2012 | 663,754 | ||||||
HSBC Holdings plc | ||||||||
| 300,000 | 6.800%, 6/1/2038 | 343,614 | ||||||
International Lease Finance Corporation | ||||||||
| 850,000 | 5.875%, 5/1/2013 | 869,125 | ||||||
J.P. Morgan Chase & Company | ||||||||
| 250,000 | 3.450%, 3/1/2016 | 259,120 | ||||||
Lloyds TSB Bank plc | ||||||||
| 350,000 | 5.800%, 1/13/2020d | 374,154 | ||||||
Marsh & McLennan Companies, Inc. | ||||||||
| 185,000 | 5.750%, 9/15/2015 | 205,182 | ||||||
MassMutual Global Funding II | ||||||||
| 350,000 | 2.000%, 4/5/2017d | 352,039 | ||||||
MetLife, Inc. | ||||||||
| 200,000 | 5.000%, 6/15/2015 | 219,880 | ||||||
New York Life Global Funding | ||||||||
| 750,000 | 1.300%, 1/12/2015d | 751,595 | ||||||
Nordea Bank AB | ||||||||
| 325,000 | 3.125%, 3/20/2017d | 326,387 | ||||||
Northern Trust Corporation | ||||||||
| 500,000 | 3.450%, 11/4/2020 | 535,899 | ||||||
Preferred Term Securities XXIII, Ltd. | ||||||||
| 984,301 | 0.668%, 12/22/2036b,c | 516,758 | ||||||
Prudential Financial, Inc. | ||||||||
| 275,000 | 5.700%, 12/14/2036 | 281,326 | ||||||
The accompanying Notes to Financial Statements are an integral part of this schedule.
233
Table of Contents
Bond Index Portfolio
Schedule of Investments as of June 29, 2012
(unaudited)
| Principal Amount | Long-Term Fixed Income (106.9%) | Value | ||||||
| Financials (8.0%) - continued | ||||||||
Royal Bank of Canada | ||||||||
| $ 500,000 | 1.166%, 10/30/2014b | $ | 503,550 | |||||
UBS AG/London | ||||||||
| 500,000 | 1.875%, 1/23/2015d | 504,998 | ||||||
University of Pennsylvania | ||||||||
| 325,000 | 4.674%, 9/1/2112 | 373,256 | ||||||
Ventas Realty, LP | ||||||||
| 175,000 | 4.250%, 3/1/2022 | 176,211 | ||||||
Washington Mutual Bank | ||||||||
| 500,000 | 5.500%, 1/15/2013e,f | 0 | ||||||
|
| |||||||
Total | 13,516,805 | |||||||
|
| |||||||
| Foreign Government (2.5%) | ||||||||
Bank Nederlandse Gemeenten NV | ||||||||
| 500,000 | 4.375%, 2/16/2021d | 552,868 | ||||||
Chile Government International Bond | ||||||||
| 350,000 | 3.875%, 8/5/2020 | 388,500 | ||||||
Hydro-Quebec | ||||||||
| 27,000 | 8.400%, 1/15/2022 | 39,061 | ||||||
Nova Scotia Government Notes | ||||||||
| 250,000 | 7.250%, 7/27/2013 | 268,470 | ||||||
Province of British Columbia | ||||||||
| 500,000 | 1.200%, 4/25/2017 | 504,888 | ||||||
| 750,000 | 2.650%, 9/22/2021 | 794,062 | ||||||
Province of Manitoba | ||||||||
| 600,000 | 1.300%, 4/3/2017 | 608,566 | ||||||
Province of New Brunswick | ||||||||
| 125,000 | 2.750%, 6/15/2018 | 134,079 | ||||||
Quebec Government Notes | ||||||||
| 400,000 | 4.875%, 5/5/2014 | 431,825 | ||||||
| 400,000 | 7.500%, 7/15/2023 | 568,638 | ||||||
|
| |||||||
| Total | 4,290,957 | |||||||
|
| |||||||
| Mortgage-Backed Securities (31.0%) | ||||||||
Federal Home Loan Mortgage Corporation Gold 15-Yr. Pass Through | ||||||||
| 279 | 6.500%, 10/1/2012 | 282 | ||||||
| 420 | 6.500%, 1/1/2013 | 429 | ||||||
| 710 | 6.000%, 9/1/2013 | 752 | ||||||
| 338 | 5.500%, 3/1/2014 | 364 | ||||||
| 3,948 | 6.000%, 4/1/2014 | 4,183 | ||||||
| 1,982 | 7.000%, 10/1/2014 | 2,084 | ||||||
| 3,982 | 6.500%, 3/1/2016 | 4,213 | ||||||
| 10,124 | 6.000%, 6/1/2016 | 10,908 | ||||||
| 8,043 | 6.000%, 9/1/2016 | 8,666 | ||||||
| 116,965 | 7.000%, 6/1/2017 | 126,876 | ||||||
| 146,938 | 5.500%, 12/1/2017 | 159,374 | ||||||
| 14,100,000 | 3.000%, 7/1/2027g | 14,741,113 | ||||||
Federal Home Loan Mortgage Corporation Gold 30-Yr. Pass Through | ||||||||
| 4,117 | 6.500%, 4/1/2024 | 4,658 | ||||||
| 3,653 | 7.000%, 5/1/2024 | 4,295 | ||||||
| 1,167 | 7.500%, 8/1/2025 | 1,361 | ||||||
| 13,641 | 8.500%, 11/1/2025 | 16,364 | ||||||
| 1,302 | 8.000%, 1/1/2026 | 1,540 | ||||||
| 1,536 | 7.000%, 4/1/2027 | 1,833 | ||||||
| 2,111 | 7.500%, 7/1/2027 | �� | 2,468 | |||||
| 4,309 | 7.000%, 8/1/2027 | 5,140 | ||||||
| 2,119 | 7.500%, 10/1/2027 | 2,485 | ||||||
| 2,498 | 7.000%, 5/1/2028 | 2,992 | ||||||
| 14,812 | 6.000%, 8/1/2028 | 16,608 | ||||||
| 5,419 | 6.500%, 2/1/2029 | 6,200 | ||||||
| 9,383 | 6.000%, 3/1/2029 | 10,521 | ||||||
| 8,511 | 7.500%, 10/1/2029 | 10,037 | ||||||
| 3,594 | 7.500%, 11/1/2029 | 4,238 | ||||||
| 5,176 | 6.500%, 5/1/2031 | 5,895 | ||||||
| 21,954 | 6.000%, 6/1/2031 | 24,615 | ||||||
| 6,177 | 7.000%, 6/1/2031 | 7,307 | ||||||
| 6,392 | 7.000%, 6/1/2031 | 7,562 | ||||||
| 17,422 | 6.000%, 7/1/2031 | 19,534 | ||||||
| 6,634 | 7.000%, 9/1/2031 | 7,848 | ||||||
| 9,897 | 6.500%, 10/1/2031 | 11,274 | ||||||
| 22,276 | 6.000%, 1/1/2032 | 24,977 | ||||||
| 96,583 | 6.000%, 1/1/2032 | 108,291 | ||||||
| 14,820 | 7.000%, 5/1/2032 | 17,401 | ||||||
| 104,681 | 6.500%, 7/1/2032 | 119,243 | ||||||
| 112,127 | 6.500%, 10/1/2032 | 127,724 | ||||||
| 144,873 | 6.000%, 11/1/2032 | 162,434 | ||||||
Federal National Mortgage Association Conventional 15- Yr. Pass Through | ||||||||
| 3 | 8.000%, 7/1/2012 | 3 | ||||||
| 131 | 6.500%, 12/1/2012 | 132 | ||||||
| 819 | 6.500%, 6/1/2013 | 836 | ||||||
| 2,109 | 6.000%, 12/1/2013 | 2,245 | ||||||
Federal National Mortgage Association Conventional 30- Yr. Pass Through | ||||||||
| 3,439 | 10.500%, 8/1/2020 | 3,989 | ||||||
| 2,442 | 8.000%, 12/1/2024 | 2,862 | ||||||
| 3,254 | 7.000%, 10/1/2025 | 3,844 | ||||||
| 11,040 | 6.500%, 11/1/2025 | 12,633 | ||||||
| 558 | 8.500%, 12/1/2025 | 669 | ||||||
| 2,357 | 7.500%, 1/1/2026 | 2,747 | ||||||
| 3,499 | 6.500%, 5/1/2026 | 4,023 | ||||||
| 2,098 | 8.000%, 9/1/2026 | 2,484 | ||||||
| 4,721 | 7.500%, 2/1/2027 | 5,515 | ||||||
| 3,390 | 7.000%, 3/1/2027 | 4,024 | ||||||
| 4,250 | 9.000%, 11/1/2027 | 5,151 | ||||||
| 1,904 | 7.000%, 1/1/2028 | 2,270 | ||||||
| 35,061 | 7.500%, 2/1/2028 | 41,083 | ||||||
| 2,811 | 6.000%, 5/1/2028 | 3,154 | ||||||
| 1,430 | 6.500%, 9/1/2028 | 1,644 | ||||||
| 9,831 | 7.000%, 10/1/2028 | 11,764 | ||||||
| 23,973 | 7.500%, 11/1/2028 | 28,008 | ||||||
| 5,979 | 6.500%, 2/1/2029 | 6,874 | ||||||
| 18,849 | 6.000%, 3/1/2029 | 21,148 | ||||||
| 9,299 | 7.000%, 3/1/2029 | 11,143 | ||||||
| 23,435 | 6.500%, 4/1/2029 | 26,943 | ||||||
| 2,457 | 6.500%, 8/1/2029 | 2,825 | ||||||
| 6,706 | 7.500%, 8/1/2029 | 7,900 | ||||||
| 6,063 | 7.000%, 10/1/2029 | 7,265 | ||||||
| 6,523 | 7.500%, 12/1/2029 | 7,684 | ||||||
| 4,016 | 8.000%, 4/1/2030 | 4,801 | ||||||
| 1,716 | 7.500%, 12/1/2030 | 2,027 | ||||||
| 24,871 | 6.000%, 5/1/2031 | 28,007 | ||||||
| 96,821 | 6.500%, 4/1/2032 | 110,826 | ||||||
| 70,554 | 6.500%, 5/1/2032 | 80,760 | ||||||
The accompanying Notes to Financial Statements are an integral part of this schedule.
234
Table of Contents
Bond Index Portfolio
Schedule of Investments as of June 29, 2012
(unaudited)
| Principal Amount | Long-Term Fixed Income (106.9%) | Value | ||||||
| Mortgage-Backed Securities (31.0%) - continued | ||||||||
| $ 63,191 | 7.000%, 5/1/2032 | $ | 74,704 | |||||
| 268,010 | 6.500%, 7/1/2032 | 306,779 | ||||||
| 134,275 | 6.500%, 8/1/2032 | 153,699 | ||||||
| 6,300,000 | 3.500%, 7/1/2042g | 6,621,892 | ||||||
| 4,500,000 | 4.000%, 7/1/2042g | 4,788,985 | ||||||
| 21,800,000 | 5.500%, 7/1/2042g | 23,779,026 | ||||||
Government National Mortgage Association 15-Yr. Pass Through | ||||||||
| 1,556 | 7.000%, 9/15/2013 | 1,604 | ||||||
Government National Mortgage Association 30-Yr. Pass Through | ||||||||
| 4,581 | 7.500%, 3/15/2023 | 5,215 | ||||||
| 1,499 | 7.000%, 1/15/2024 | 1,763 | ||||||
| 2,337 | 9.000%, 9/15/2024 | 2,765 | ||||||
| 2,503 | 8.000%, 6/15/2025 | 2,919 | ||||||
| 1,767 | 8.000%, 9/15/2026 | 2,064 | ||||||
| 7,596 | 7.500%, 10/15/2027 | 8,787 | ||||||
| 6,075 | 7.000%, 11/15/2027 | 7,246 | ||||||
| 1,504 | 7.000%, 1/15/2028 | 1,801 | ||||||
| 6,083 | 6.500%, 7/15/2028 | 7,108 | ||||||
| 4,130 | 7.000%, 8/15/2028 | 4,945 | ||||||
| 23,177 | 7.500%, 11/15/2028 | 26,873 | ||||||
| 6,768 | 6.500%, 12/15/2028 | 7,908 | ||||||
| 28,179 | 6.500%, 3/15/2029 | 32,882 | ||||||
| 2,849 | 6.500%, 4/15/2029 | 3,324 | ||||||
| 5,451 | 8.000%, 10/15/2030 | 6,416 | ||||||
| 9,701 | 7.500%, 1/15/2031 | 11,320 | ||||||
| 4,572 | 7.000%, 4/15/2031 | 5,525 | ||||||
| 14,540 | 6.500%, 6/15/2031 | 16,894 | ||||||
| 15,525 | 7.000%, 9/15/2031 | 18,765 | ||||||
| 164,267 | 6.500%, 1/15/2032 | 190,248 | ||||||
| 24,725 | 6.500%, 4/15/2032 | 28,635 | ||||||
|
| |||||||
| Total | 52,371,464 | |||||||
|
| |||||||
| Technology (0.7%) | ||||||||
Hewlett-Packard Company | ||||||||
| 200,000 | 4.300%, 6/1/2021 | 206,116 | ||||||
International Business Machines Corporation | ||||||||
| 500,000 | 1.000%, 8/5/2013 | 502,881 | ||||||
Xerox Corporation | ||||||||
| 400,000 | 4.500%, 5/15/2021 | 415,084 | ||||||
|
| |||||||
| Total | 1,124,081 | |||||||
|
| |||||||
| Transportation (0.7%) | ||||||||
Continental Airlines, Inc. | ||||||||
| 350,000 | 4.150%, 4/11/2024 | 344,750 | ||||||
Delta Air Lines, Inc. | ||||||||
| 274,865 | 4.950%, 5/23/2019h | 291,028 | ||||||
Union Pacific Corporation | ||||||||
| 437,000 | 4.163%, 7/15/2022 | 486,857 | ||||||
|
| |||||||
| Total | 1,122,635 | |||||||
|
| |||||||
| U.S. Government and Agencies (44.0%) | ||||||||
Federal Agricultural Mortgage Corporation | ||||||||
| 1,000,000 | 2.125%, 9/15/2015 | 1,038,831 | ||||||
Federal Home Loan Banks | ||||||||
| 1,000,000 | 3.625%, 5/29/2013 | 1,030,508 | ||||||
| 5,000,000 | 0.390%, 9/16/2013b | 5,008,890 | ||||||
| 850,000 | 4.500%, 9/16/2013 | 892,923 | ||||||
| 1,000,000 | 3.625%, 10/18/2013 | 1,042,490 | ||||||
| 1,000,000 | 1.375%, 5/28/2014 | 1,020,231 | ||||||
| 2,990,000 | 1.000%, 6/21/2017 | 2,992,195 | ||||||
Federal Home Loan Mortgage Corporation | ||||||||
| 500,000 | 3.750%, 6/28/2013 | 517,579 | ||||||
| 1,000,000 | 5.125%, 11/17/2017 | 1,211,235 | ||||||
| 350,000 | 6.750%, 3/15/2031 | 537,068 | ||||||
Federal National Mortgage Association | ||||||||
| 500,000 | 5.960%, 9/11/2028 | 672,686 | ||||||
| 100,000 | 6.250%, 5/15/2029 | 144,004 | ||||||
Resolution Funding Corporation | ||||||||
| 200,000 | 8.125%, 10/15/2019 | 286,268 | ||||||
Tennessee Valley Authority | ||||||||
| 250,000 | 6.000%, 3/15/2013 | 260,141 | ||||||
| 350,000 | 5.250%, 9/15/2039 | 456,351 | ||||||
U.S. Treasury Bonds | ||||||||
| 2,500,000 | 5.250%, 11/15/2028 | 3,518,360 | ||||||
| 500,000 | 3.500%, 2/15/2039 | 578,594 | ||||||
| 4,800,000 | 3.125%, 11/15/2041 | 5,160,000 | ||||||
U.S. Treasury Notes | ||||||||
| 2,100,000 | 0.250%, 11/30/2013 | 2,098,606 | ||||||
| 2,750,000 | 2.000%, 11/30/2013 | 2,816,063 | ||||||
| 150,000 | 1.500%, 12/31/2013 | 152,660 | ||||||
| 1,500,000 | 2.250%, 5/31/2014 | 1,554,609 | ||||||
| 2,000,000 | 4.250%, 8/15/2014 | 2,164,532 | ||||||
| 3,000,000 | 2.375%, 8/31/2014 | 3,130,782 | ||||||
| 3,945,000 | 0.250%, 2/15/2015 | 3,931,129 | ||||||
| 850,000 | 1.250%, 10/31/2015 | 871,184 | ||||||
| 3,150,000 | 2.000%, 1/31/2016 | 3,314,392 | ||||||
| 4,000,000 | 2.625%, 2/29/2016 | 4,304,688 | ||||||
| 1,500,000 | 1.000%, 10/31/2016 | 1,522,851 | ||||||
| 3,250,000 | 3.000%, 2/28/2017 | 3,592,011 | ||||||
| 2,350,000 | 0.750%, 6/30/2017 | 2,352,388 | ||||||
| 1,000,000 | 2.250%, 11/30/2017 | 1,075,000 | ||||||
| 4,250,000 | 2.375%, 6/30/2018 | 4,606,932 | ||||||
| 7,375,000 | 1.250%, 4/30/2019 | 7,456,818 | ||||||
| 2,925,000 | 2.000%, 2/15/2022 | 3,023,491 | ||||||
|
| |||||||
| Total | 74,336,490 | |||||||
|
| |||||||
| U.S. Municipals (0.4%) | ||||||||
Chicago Metropolitan Water Reclamation District General Obligation Bonds (Build America Bonds) | ||||||||
| 350,000 | 5.720%, 12/1/2038 | 441,952 | ||||||
Illinois General Obligation Refunding Bonds | ||||||||
| 300,000 | 5.000%, 8/1/2017 | 338,259 | ||||||
|
| |||||||
| Total | 780,211 | |||||||
|
| |||||||
| Utilities (2.1%) | ||||||||
CenterPoint Energy Houston Electric, LLC | ||||||||
| 400,000 | 5.600%, 7/1/2023 | 497,168 | ||||||
The accompanying Notes to Financial Statements are an integral part of this schedule.
235
Table of Contents
Bond Index Portfolio
Schedule of Investments as of June 29, 2012
(unaudited)
| Principal Amount | Long-Term Fixed Income (106.9%) | Value | ||||||
| Utilities (2.1%) - continued | ||||||||
Commonwealth Edison Company | ||||||||
| $ 275,000 | 5.900%, 3/15/2036 | $ | 356,653 | |||||
FirstEnergy Corporation | ||||||||
| 27,000 | 7.375%, 11/15/2031 | 33,892 | ||||||
Kinder Morgan Energy Partners, LP | ||||||||
| 300,000 | 5.300%, 9/15/2020 | 332,306 | ||||||
National Rural Utilities Cooperative Finance Corporation | ||||||||
| 27,000 | 8.000%, 3/1/2032 | 39,666 | ||||||
Oncor Electric Delivery Company | ||||||||
| 475,000 | 6.375%, 1/15/2015 | 525,303 | ||||||
ONEOK Partners, LP | ||||||||
| 275,000 | 6.650%, 10/1/2036 | 322,916 | ||||||
Progress Energy, Inc. | ||||||||
| 400,000 | 7.000%, 10/30/2031 | 527,692 | ||||||
Sempra Energy | ||||||||
| 325,000 | 2.300%, 4/1/2017 | 333,075 | ||||||
Southern California Edison Company | ||||||||
| 225,000 | 5.000%, 1/15/2014 | 240,154 | ||||||
Xcel Energy, Inc. | ||||||||
| 275,000 | 6.500%, 7/1/2036 | 372,229 | ||||||
|
| |||||||
| Total | 3,581,054 | |||||||
|
| |||||||
Total Long-Term Fixed Income (cost $175,913,669) | 180,539,906 | |||||||
|
| |||||||
| Shares | Collateral Held for Securities Loaned (0.2%) | |||||||
| 302,258 | Thrivent Financial Securities Lending Trust | 302,258 | ||||||
|
| |||||||
Total Collateral Held for Securities Loaned (cost $302,258) | 302,258 | |||||||
|
| |||||||
| Principal Amount | Short-Term Investments (21.4%)i | |||||||
Federal Home Loan Bank Discount Notes | ||||||||
| 5,000,000 | 0.070%, 7/13/2012j | 4,999,874 | ||||||
| 17,216,000 | 0.070%, 7/18/2012j | 17,215,397 | ||||||
| 1,000,000 | 0.060%, 7/20/2012j | 999,967 | ||||||
| 10,000,000 | 0.085%, 8/8/2012j | 9,999,079 | ||||||
| 3,000,000 | 0.100%, 8/17/2012j | 2,999,600 | ||||||
|
| |||||||
| Total Short-Term Investments (at amortized cost) | 36,213,917 | |||||||
|
| |||||||
| Total Investments (cost $212,429,844) 128.5% | $ | 217,056,081 | ||||||
|
| |||||||
| Other Assets and Liabilities, Net (28.5%) | (48,118,898 | ) | ||||||
|
| |||||||
| Total Net Assets 100.0% | $ | 168,937,183 | ||||||
|
| |||||||
| a | All or a portion of the security is insured or guaranteed. |
| b | Denotes variable rate securities. Variable rate securities are securities whose yields vary with a designated market index or market rate. The rate shown is as of June 29, 2012. |
| c | Denotes restricted securities. Restricted securities are investment securities which have been deemed illiquid and cannot be offered for public sale without first being registered under the Securities Act of 1933. The following table indicates the acquisition date and cost of restricted securities Bond Index Portfolio owned as of June 29, 2012. |
Security | Acquisition Date | Cost | ||||||
Preferred Term Securities XXIII, Ltd. | 9/14/2006 | $ | 984,301 | |||||
Wachovia Asset Securitization, Inc. | 3/16/2007 | $ | 1,146,787 | |||||
| d | Denotes securities sold under Rule 144A of the Securities Act of 1933, which exempts them from registration. These securities have been deemed liquid and may be resold to other dealers in the program or to other qualified institutional buyers. As of June 29, 2012, the value of these investments was $11,900,691 or 7.0% of total net assets. |
| e | Defaulted security. Interest is not being accrued. |
| f | Security is fair valued. |
| g | Denotes investments purchased on a when-issued or delayed delivery basis. |
| h | All or a portion of the security is on loan. |
| i | The interest rate shown reflects the yield, coupon rate or the discount rate at the date of purchase. |
| j | Denotes investments that benefit from credit enhancement or liquidity support provided by a third party bank, institution or government. |
Definitions:
| REIT | - | Real Estate Investment Trust is a company that buys, develops, manages and/or sells real estate assets. |
Unrealized Appreciation (Depreciation) |
| |||
Gross unrealized appreciation and depreciation of investments, based on cost for federal income tax purposes, were as follows: | ||||
Gross unrealized appreciation | $ | 8,336,691 | ||
Gross unrealized depreciation | (3,775,433 | ) | ||
|
| |||
Net unrealized appreciation (depreciation) | $ | 4,561,258 | ||
Cost for federal income tax purposes | $ | 212,494,823 | ||
The accompanying Notes to Financial Statements are an integral part of this schedule.
236
Table of Contents
Bond Index Portfolio
Schedule of Investments as of June 29, 2012
(unaudited)
Fair Valuation Measurements
The following table is a summary of the inputs used, as of June 29, 2012, in valuing Bond Index Portfolio’s assets carried at fair value.
Investments in Securities | Total | Level 1 | Level 2 | Level 3 | ||||||||||||
Long-Term Fixed Income | ||||||||||||||||
Asset-Backed Securities | 4,459,997 | — | 4,459,997 | — | ||||||||||||
Basic Materials | 811,367 | — | 811,367 | — | ||||||||||||
Capital Goods | 2,196,794 | — | 2,196,794 | — | ||||||||||||
Collateralized Mortgage Obligations | 47,921 | — | 47,921 | — | ||||||||||||
Commercial Mortgage-Backed Securities | 9,215,506 | — | 9,215,506 | — | ||||||||||||
Communications Services | 2,556,179 | — | 2,556,179 | — | ||||||||||||
Consumer Cyclical | 2,531,876 | — | 2,531,876 | — | ||||||||||||
Consumer Non-Cyclical | 4,899,082 | — | 4,899,082 | — | ||||||||||||
Energy | 2,697,487 | — | 2,697,487 | — | ||||||||||||
Financials | 13,516,805 | — | 13,000,047 | 516,758 | ||||||||||||
Foreign Government | 4,290,957 | — | 4,290,957 | — | ||||||||||||
Mortgage-Backed Securities | 52,371,464 | — | 52,371,464 | — | ||||||||||||
Technology | 1,124,081 | — | 1,124,081 | — | ||||||||||||
Transportation | 1,122,635 | — | 1,122,635 | — | ||||||||||||
U.S. Government and Agencies | 74,336,490 | — | 74,336,490 | — | ||||||||||||
U.S. Municipals | 780,211 | — | 780,211 | — | ||||||||||||
Utilities | 3,581,054 | — | 3,581,054 | — | ||||||||||||
Collateral Held for Securities Loaned | 302,258 | 302,258 | — | — | ||||||||||||
Short-Term Investments | 36,213,917 | — | 36,213,917 | — | ||||||||||||
|
|
|
|
|
|
|
| |||||||||
Total | $ | 217,056,081 | $ | 302,258 | $ | 216,237,065 | $ | 516,758 | ||||||||
|
|
|
|
|
|
|
| |||||||||
There are two securities that are classified as Level 3 in the Long-Term Fixed Income Financials line item. The first security has been fair valued worthless. The significant unobservable input used in the fair value measurement of the reporting entity’s Long-Term Fixed Income Financials Level 3 security is the lack of marketability. A significant increase or decrease in the inputs in isolation would result in a significantly lower or higher fair value measurement.
The second Level 3 security is valued at $516,758 and the significant unobservable input used in the fair value measurement of the reporting entity’s Long-Term Fixed Income Financials Level 3 security is the lack of marketability and volatility of benchmark security. A significant increase or decrease in the inputs in isolation would result in a significantly lower or higher fair value measurement.
There were no significant transfers between the Levels during the period ended June 29, 2012. Transfers between the levels are identified as of the end of the period.
Investment in Affiliates
Affiliated issuers, as defined under the Investment Company Act of 1940, include those in which the Portfolio’s holdings of an issuer represent 5% or more of the outstanding voting securities of an issuer, or any affiliated mutual fund.
A summary of transactions for the fiscal year to date, in Bond Index Portfolio, is as follows:
Portfolio | Value December 31, 2011 | Gross Purchases | Gross Sales | Shares Held at June 29, 2012 | Value June 29, 2012 | Income Earned January 1, 2012 - June 29, 2012 | ||||||||||||||||||
Thrivent Financial Securities Lending Trust | $ | 4,114,838 | $ | 19,785,430 | $ | 23,598,010 | 302,258 | $ | 302,258 | $ | 1,688 | |||||||||||||
Total Value and Income Earned | 4,114,838 | 302,258 | 1,688 | |||||||||||||||||||||
The accompanying Notes to Financial Statements are an integral part of this schedule.
237
Table of Contents
Limited Maturity Bond Portfolio
Schedule of Investments as of June 29, 2012
(unaudited)
Principal | Long-Term Fixed Income (97.4%) | Value | ||||||
| Asset-Backed Securities (10.7%) | |||||||
| Avis Budget Rental Car Funding | ||||||||
| $ 5,500,000 | 2.370%, 11/20/2014a | $ | 5,606,942 | |||||
| Bank of America Auto Trust | ||||||||
| 965,814 | 1.390%, 3/15/2014a | 967,135 | ||||||
| Carrington Mortgage Loan Trust | ||||||||
| 1,400,000 | 0.395%, 8/25/2036b | 476,234 | ||||||
| Chrysler Financial Auto Securitization | ||||||||
| 517,403 | 2.820%, 1/15/2016 | 518,942 | ||||||
| Citibank Omni Master Trust | ||||||||
| 6,000,000 | 4.900%, 11/15/2018a | 6,550,902 | ||||||
| Countrywide Home Loans, Inc. | ||||||||
| 2,337,117 | 6.085%, 6/25/2021c | 1,638,144 | ||||||
| Credit Based Asset Servicing and Securitization, LLC | ||||||||
| 1,787,051 | 4.624%, 12/25/2036 | 1,061,699 | ||||||
| Discover Card Master Trust | ||||||||
| 9,500,000 | 0.892%, 9/15/2015b | 9,536,119 | ||||||
| Enterprise Fleet Financing, LLC | ||||||||
| 5,784,735 | 1.430%, 10/20/2016a | 5,800,418 | ||||||
| First Franklin Mortgage Loan Asset-Backed Certificates | ||||||||
| 215,069 | 5.500%, 3/25/2036d,e | 2 | ||||||
| First Horizon ABS Trust | ||||||||
| 669,840 | 0.375%, 9/25/2029b,c | 506,610 | ||||||
| First National Master Note Trust | ||||||||
| 7,500,000 | 1.592%, 7/15/2015b | 7,495,770 | ||||||
| Fosse Master Issuer plc | ||||||||
| 6,500,000 | 1.866%, 10/18/2054a,b | 6,535,679 | ||||||
| GE Capital Credit Card Master Note Trust | ||||||||
| 7,000,000 | 3.690%, 7/15/2015 | 7,000,000 | ||||||
| GMAC Mortgage Corporation Loan Trust | ||||||||
| 1,353,755 | 0.425%, 8/25/2035b,c | 901,006 | ||||||
| 2,000,379 | 5.750%, 10/25/2036c | 1,454,140 | ||||||
| 3,215,345 | 0.425%, 12/25/2036b,c | 2,283,278 | ||||||
| Montana Higher Education Student Assistance Corporation | ||||||||
| 5,823,958 | 0.844%, 9/20/2022b | 5,837,856 | ||||||
| Mortgage Equity Conversion Asset Trust | ||||||||
| 5,955,669 | 0.680%, 1/25/2042b,d | 4,764,535 | ||||||
| 5,824,250 | 0.660%, 2/25/2042b,d | 4,659,400 | ||||||
| Nissan Auto Receivables Owner Trust | ||||||||
| 3,493,897 | 4.740%, 8/17/2015 | 3,533,472 | ||||||
| Renaissance Home Equity Loan Trust | ||||||||
| 3,789,024 | 5.608%, 5/25/2036 | 2,165,120 | ||||||
| 1,250,000 | 5.285%, 1/25/2037 | 589,940 | ||||||
| Santander Drive Auto Receivables Trust | ||||||||
| 634,908 | 0.950%, 8/15/2013 | 634,968 | ||||||
| SLM Student Loan Trust | ||||||||
| 10,965,580 | 0.536%, 4/27/2020b | 10,906,289 | ||||||
| 4,542,074 | 1.342%, 1/18/2022a,b | 4,549,241 | ||||||
| 10,332,487 | 0.536%, 4/25/2022b | 10,300,766 | ||||||
| 5,453,087 | 0.546%, 4/25/2023b | 5,435,457 | ||||||
| 3,352,660 | 0.645%, 3/25/2025b | 3,357,196 | ||||||
| 9,502,024 | 0.765%, 3/25/2026b | 9,493,111 | ||||||
| USAA Auto Owner Trust | ||||||||
| 3,086,320 | 4.770%, 9/15/2014 | 3,110,806 | ||||||
| Volkswagen Auto Loan Enhanced Trust | ||||||||
| 449,493 | 1.310%, 1/20/2014 | 450,067 | ||||||
| Wachovia Asset Securitization, Inc. | ||||||||
| 1,433,484 | 0.385%, 7/25/2037b,c,d | 1,028,010 | ||||||
| Wachovia Student Loan Trust | ||||||||
| 6,756,802 | 0.576%, 7/27/2020b | 6,724,262 | ||||||
| World Omni Auto Receivables Trust | ||||||||
| 748,923 | 1.340%, 12/16/2013 | 749,687 | ||||||
| 4,000,000 | 1.330%, 1/15/2018 | 4,046,424 | ||||||
|
| |||||||
| Total | 140,669,627 | |||||||
|
| |||||||
| Basic Materials (1.0%) | |||||||
| ArcelorMittal | ||||||||
| 2,500,000 | 9.000%, 2/15/2015 | 2,809,617 | ||||||
| BHP Billiton Finance USA, Ltd. | ||||||||
| 4,000,000 | 0.737%, 2/18/2014b | 4,013,780 | ||||||
| Dow Chemical Company | ||||||||
| 2,000,000 | 2.500%, 2/15/2016 | 2,054,304 | ||||||
| Freeport-McMoRan Copper & Gold, Inc. | ||||||||
| 3,000,000 | 1.400%, 2/13/2015 | 2,989,758 | ||||||
| 1,250,000 | 2.150%, 3/1/2017 | 1,232,434 | ||||||
|
| |||||||
| Total | 13,099,893 | |||||||
|
| |||||||
| Capital Goods (1.0%) | |||||||
| CRH America, Inc. | ||||||||
| 2,000,000 | 4.125%, 1/15/2016 | 2,033,082 | ||||||
| Danaher Corporation | ||||||||
| 2,000,000 | 0.718%, 6/21/2013b | 2,006,004 | ||||||
| John Deere Capital Corporation | ||||||||
| 5,000,000 | 0.868%, 10/4/2013b | 5,021,735 | ||||||
| Textron, Inc. | ||||||||
| 2,700,000 | 6.200%, 3/15/2015 | 2,967,227 | ||||||
| United Technologies Corporation | ||||||||
| 1,000,000 | 0.967%, 6/1/2015b | 1,010,677 | ||||||
|
| |||||||
| Total | 13,038,725 | |||||||
|
| |||||||
| Collateralized Mortgage Obligations (4.1%) | ||||||||
| American Home Mortgage Assets Trust | ||||||||
| 3,266,172 | 1.067%, 11/25/2046b | 1,351,212 | ||||||
| Bear Stearns Adjustable Rate Mortgage Trust | ||||||||
| 1,763,194 | 2.400%, 10/25/2035b | 1,537,151 | ||||||
| Countrywide Alternative Loan Trust | ||||||||
| 1,009,117 | 5.500%, 11/25/2035 | 949,746 | ||||||
| 1,111,187 | 5.500%, 2/25/2036 | 831,552 | ||||||
| 2,012,572 | 6.000%, 1/25/2037 | 1,448,972 | ||||||
| Countrywide Home Loans, Inc. | ||||||||
| 2,436,540 | 2.730%, 3/20/2036 | 1,343,822 | ||||||
| 2,470,305 | 2.744%, 9/20/2036 | 1,227,001 | ||||||
The accompanying Notes to Financial Statements are an integral part of this schedule.
238
Table of Contents
Limited Maturity Bond Portfolio
Schedule of Investments as of June 29, 2012
(unaudited)
Principal | Long-Term Fixed Income (97.4%) | Value | ||||||
| Collateralized Mortgage Obligations (4.1%) - continued | |||||||
| Deutsche Alt-A Securities, Inc. | ||||||||
| $ 4,108,984 | 0.917%, 4/25/2047b | $ | 2,610,047 | |||||
| Federal National Mortgage Association | ||||||||
| 8,985,685 | 2.250%, 6/25/2025 | 9,233,968 | ||||||
| GSR Mortgage Loan Trust | ||||||||
| 3,172,539 | 0.435%, 8/25/2046b | 2,586,888 | ||||||
| HomeBanc Mortgage Trust | ||||||||
| 1,961,664 | 2.591%, 4/25/2037 | 1,277,436 | ||||||
| Impac CMB Trust | ||||||||
| 1,011,886 | 0.765%, 4/25/2035b | 815,480 | ||||||
| 723,934 | 0.885%, 8/25/2035b | 505,161 | ||||||
| J.P. Morgan Alternative Loan Trust | ||||||||
| 3,918,720 | 2.789%, 3/25/2036 | 2,261,889 | ||||||
| J.P. Morgan Mortgage Trust | ||||||||
| 577,386 | 2.747%, 10/25/2036 | 412,254 | ||||||
| Master Asset Securitization Trust | ||||||||
| 2,321,881 | 0.745%, 6/25/2036b | 1,256,535 | ||||||
| Permanent Master plc | ||||||||
| 10,000,000 | 2.067%, 7/15/2042a,b | 10,055,780 | ||||||
| Residential Accredit Loans, Inc. | ||||||||
| 1,774,087 | 3.717%, 9/25/2035 | 1,078,643 | ||||||
| Wachovia Mortgage Loan Trust, LLC | ||||||||
| 1,818,472 | 2.889%, 5/20/2036 | 1,284,024 | ||||||
| WaMu Mortgage Pass-Through Certificates | ||||||||
| 1,188,169 | 0.535%, 10/25/2045b | 951,246 | ||||||
| 3,451,829 | 1.027%, 10/25/2046b | 2,162,025 | ||||||
| 3,399,400 | 0.967%, 12/25/2046b | 2,013,124 | ||||||
| 3,628,050 | 0.887%, 1/25/2047b | 2,124,952 | ||||||
| Washington Mutual Alternative Mortgage Pass-Through Certificates | ||||||||
| 3,177,035 | 1.067%, 9/25/2046b | 1,126,577 | ||||||
| 4,979,492 | 0.897%, 2/25/2047b | 2,171,054 | ||||||
| Wells Fargo Mortgage Backed Securities Trust | ||||||||
| 526,287 | 2.622%, 3/25/2036 | 464,765 | ||||||
| 1,450,005 | 2.668%, 3/25/2036 | 1,225,601 | ||||||
|
| |||||||
| Total | 54,306,905 | |||||||
|
| |||||||
| Commercial Mortgage-Backed Securities (6.7%) | |||||||
| Bear Stearns Commercial Mortgage Securities, Inc. | ||||||||
| 5,642,550 | 5.613%, 6/11/2050 | 5,803,583 | ||||||
| 1,033,254 | 0.392%, 3/15/2022a,b | 1,017,850 | ||||||
| 1,206,680 | 5.854%, 6/11/2040 | 1,247,932 | ||||||
| 2,000,000 | 5.331%, 2/11/2044 | 2,152,546 | ||||||
| Citigroup Commercial Mortgage Trust | ||||||||
| 1,250,000 | 5.889%, 12/10/2049 | 1,443,205 | ||||||
| Citigroup/Deutsche Bank Commercial Mortgage | ||||||||
| 3,000,000 | 5.322%, 12/11/2049 | 3,332,154 | ||||||
| Commercial Mortgage Pass-Through Certificates | ||||||||
| 1,500,000 | 5.306%, 12/10/2046 | 1,685,157 | ||||||
| Credit Suisse First Boston Mortgage Securities Corporation | ||||||||
| 6,013,579 | 4.691%, 4/15/2037 | 6,200,336 | ||||||
| Credit Suisse Mortgage Capital Certificates | ||||||||
| 4,000,000 | 5.467%, 9/15/2039 | 4,428,612 | ||||||
| Government National Mortgage Association | ||||||||
| 5,384,294 | 2.870%, 3/16/2051 | 5,566,848 | ||||||
| 9,517,508 | 2.164%, 3/16/2033 | 9,664,525 | ||||||
| 8,443,798 | 3.214%, 1/16/2040 | 8,859,748 | ||||||
| Greenwich Capital Commercial Funding Corporation | ||||||||
| 3,000,000 | 5.074%, 1/5/2036 | 3,073,128 | ||||||
| 5,500,000 | 5.224%, 4/10/2037 | 6,010,631 | ||||||
| J.P. Morgan Chase Commercial Mortgage Securities Corporation | ||||||||
| 6,500,000 | 5.429%, 12/12/2043 | 7,274,774 | ||||||
| LB-UBS Commercial Mortgage Trust | ||||||||
| 1,102,715 | 5.303%, 2/15/2040 | 1,103,110 | ||||||
| Morgan Stanley Capital, Inc. | ||||||||
| 4,138,205 | 5.781%, 4/12/2049 | 4,247,326 | ||||||
| NCUA Guaranteed Notes | ||||||||
| 5,000,000 | 2.900%, 10/29/2020 | 5,331,250 | ||||||
| Network Rail Infrastructure Finance plc | ||||||||
| 6,000,000 | 1.500%, 1/13/2014a,f | 6,086,532 | ||||||
| Wachovia Bank Commercial Mortgage Trust | ||||||||
| 2,500,000 | 5.765%, 7/15/2045 | 2,817,145 | ||||||
|
| |||||||
| Total | 87,346,392 | |||||||
|
| |||||||
| Communications Services (1.7%) | |||||||
| Alltel Corporation | ||||||||
| 2,675,000 | 7.000%, 7/1/2012 | 2,674,924 | ||||||
| CBS Corporation | ||||||||
| 2,500,000 | 8.875%, 5/15/2019 | 3,305,965 | ||||||
| Crown Castle Towers, LLC | ||||||||
| 2,500,000 | 3.214%, 8/15/2015a | 2,542,512 | ||||||
| 1,650,000 | 4.174%, 8/15/2017a | 1,744,017 | ||||||
| GTP Acquisition Partners I, LLC | ||||||||
| 2,000,000 | 4.347%, 6/15/2016a | 2,093,530 | ||||||
| Qwest Communications International, Inc. | ||||||||
| 2,000,000 | 7.125%, 4/1/2018 | 2,110,000 | ||||||
| SBA Tower Trust | ||||||||
| 4,500,000 | 4.254%, 4/15/2015a | 4,706,186 | ||||||
| Telemar Norte Leste SA | ||||||||
| 1,000,000 | 5.500%, 10/23/2020a | 1,020,000 | ||||||
| Time Warner Cable, Inc. | ||||||||
| 2,400,000 | 5.400%, 7/2/2012 | 2,395,560 | ||||||
|
| |||||||
| Total | 22,592,694 | |||||||
|
| |||||||
| Consumer Cyclical (1.4%) | |||||||
| American Honda Finance Corporation | ||||||||
| 5,000,000 | 1.850%, 9/19/2014a | 5,063,280 | ||||||
The accompanying Notes to Financial Statements are an integral part of this schedule.
239
Table of Contents
Limited Maturity Bond Portfolio
Schedule of Investments as of June 29, 2012
(unaudited)
| Principal Amount | Long-Term Fixed Income (97.4%) | Value | ||||||
| Consumer Cyclical (1.4%) - continued | ||||||||
Daimler Finance North America, LLC | ||||||||
| $4,000,000 | 1.071%, 3/28/2014a,b | $ | 3,990,528 | |||||
Ford Motor Credit Company, LLC | ||||||||
| 1,000,000 | 3.000%, 6/12/2017 | 994,491 | ||||||
FUEL Trust | ||||||||
| 2,000,000 | 4.207%, 4/15/2016a | 2,076,756 | ||||||
| 2,300,000 | 3.984%, 6/15/2016a | 2,368,791 | ||||||
Volkswagen International Finance NV | ||||||||
| 4,000,000 | 1.625%, 3/22/2015a | 4,013,856 | ||||||
|
| |||||||
| Total | 18,507,702 | |||||||
|
| |||||||
| Consumer Non-Cyclical (2.6%) | ||||||||
Anheuser-Busch InBev Worldwide, Inc. | ||||||||
| 2,500,000 | 1.016%, 1/27/2014b | 2,520,395 | ||||||
Aristotle Holding, Inc. | ||||||||
| 3,000,000 | 2.650%, 2/15/2017a | 3,052,107 | ||||||
Bunge Limited Finance Corporation | ||||||||
| 1,500,000 | 4.100%, 3/15/2016 | 1,564,131 | ||||||
| 2,500,000 | 3.200%, 6/15/2017 | 2,505,538 | ||||||
Cargill, Inc. | ||||||||
| 2,146,000 | 4.307%, 5/14/2021a | 2,355,694 | ||||||
Celgene Corporation | ||||||||
| 2,500,000 | 2.450%, 10/15/2015 | 2,560,788 | ||||||
Coca-Cola Enterprises, Inc. | ||||||||
| 3,000,000 | 2.000%, 8/19/2016 | 3,029,559 | ||||||
General Mills, Inc. | ||||||||
| 2,000,000 | 0.816%, 5/16/2014b | 2,003,890 | ||||||
Kraft Foods, Inc. | ||||||||
| 2,300,000 | 2.250%, 6/5/2017a | 2,354,919 | ||||||
Lorillard Tobacco Company | ||||||||
| 2,000,000 | 3.500%, 8/4/2016 | 2,084,924 | ||||||
Molson Coors Brewing Company | ||||||||
| 1,000,000 | 2.000%, 5/1/2017 | 1,009,142 | ||||||
Quest Diagnostics, Inc. | ||||||||
| 3,000,000 | 1.318%, 3/24/2014b | 3,024,624 | ||||||
SABMiller Holdings, Inc. | ||||||||
| 2,500,000 | 2.450%, 1/15/2017a | 2,576,845 | ||||||
Teva Pharmaceutical Finance III BV | ||||||||
| 3,000,000 | 0.968%, 3/21/2014b | 3,005,151 | ||||||
|
| |||||||
| Total | 33,647,707 | |||||||
|
| |||||||
| Energy (1.9%) | ||||||||
BP Capital Markets plc | ||||||||
| 4,000,000 | 1.068%, 3/11/2014b | 4,027,700 | ||||||
Cameron International Corporation | ||||||||
| 3,000,000 | 1.397%, 6/2/2014b | 2,995,617 | ||||||
Cenovus Energy, Inc. | ||||||||
| 2,000,000 | 4.500%, 9/15/2014 | 2,135,466 | ||||||
Energy Transfer Partners, LP | ||||||||
| 2,000,000 | 6.000%, 7/1/2013 | 2,085,204 | ||||||
Enterprise Products Operating, LLC | ||||||||
| 2,857,000 | 6.300%, 9/15/2017 | 3,410,158 | ||||||
International Petroleum Investment Company, Ltd. | ||||||||
| 2,000,000 | 3.125%, 11/15/2015a | 2,062,500 | ||||||
Nabors Industries, Inc. | ||||||||
| 1,000,000 | 4.625%, 9/15/2021 | 1,039,047 | ||||||
Rowan Companies, Inc. | ||||||||
| 1,500,000 | 5.000%, 9/1/2017 | 1,614,687 | ||||||
Schlumberger SA | ||||||||
| 3,500,000 | 2.650%, 1/15/2016a | 3,664,370 | ||||||
Valero Energy Corporation | ||||||||
| 650,000 | 6.125%, 2/1/2020 | 750,463 | ||||||
Weatherford International, Ltd. | ||||||||
| 1,500,000 | 6.000%, 3/15/2018 | 1,710,191 | ||||||
|
| |||||||
| Total | 25,495,403 | |||||||
|
| |||||||
| Financials (23.8%) | ||||||||
ABN Amro Bank NV | ||||||||
| 5,000,000 | 2.236%, 1/30/2014a,b,f | 5,001,870 | ||||||
Achmea Hypotheekbank NV | ||||||||
| 6,079,000 | 3.200%, 11/3/2014a | 6,341,187 | ||||||
Ally Financial, Inc. | ||||||||
| 1,750,000 | 4.500%, 2/11/2014 | 1,774,062 | ||||||
American International Group, Inc. | ||||||||
| 2,000,000 | 5.050%, 10/1/2015 | 2,122,762 | ||||||
Australia and New Zealand Banking Group, Ltd. | ||||||||
| 6,500,000 | 2.400%, 11/23/2016a | 6,655,422 | ||||||
Bank Nederlandse Gemeenten NV | ||||||||
| 6,500,000 | 1.500%, 3/28/2014a,f | 6,560,242 | ||||||
Bank of America Corporation | ||||||||
| 3,000,000 | 1.886%, 1/30/2014b | 2,968,665 | ||||||
| 2,000,000 | 5.625%, 10/14/2016 | 2,125,524 | ||||||
Bank of Montreal | ||||||||
| 6,000,000 | 2.625%, 1/25/2016a | 6,333,846 | ||||||
Bank of New York Mellon Corporation | ||||||||
| 2,500,000 | 1.317%, 11/24/2014b | 2,526,672 | ||||||
| 2,500,000 | 1.700%, 11/24/2014f | 2,542,120 | ||||||
Bank of Nova Scotia | ||||||||
| 3,000,000 | 1.250%, 11/7/2014a | 3,037,590 | ||||||
| 4,000,000 | 2.150%, 8/3/2016a | 4,157,112 | ||||||
Barclays Bank plc | ||||||||
| 1,800,000 | 2.375%, 1/13/2014 | 1,804,255 | ||||||
| 6,000,000 | 2.500%, 9/21/2015a,f | 6,124,200 | ||||||
Bear Stearns Companies, LLC | ||||||||
| 2,500,000 | 6.400%, 10/2/2017 | 2,882,955 | ||||||
| 2,200,000 | 4.650%, 7/2/2018 | 2,316,103 | ||||||
Berkshire Hathaway Finance Corporation | ||||||||
| 3,000,000 | 2.450%, 12/15/2015 | 3,130,914 | ||||||
Caisse centrale Desjardins du Quebec | ||||||||
| 4,000,000 | 2.550%, 3/24/2016a | 4,209,816 | ||||||
Canadian Imperial Bank of Commerce | ||||||||
| 6,500,000 | 0.900%, 9/19/2014a | 6,531,421 | ||||||
Capital One Financial Corporation | ||||||||
| 4,000,000 | 1.617%, 7/15/2014b | 3,975,012 | ||||||
The accompanying Notes to Financial Statements are an integral part of this schedule.
240
Table of Contents
Limited Maturity Bond Portfolio
Schedule of Investments as of June 29, 2012
(unaudited)
| Principal Amount | Long-Term Fixed Income (97.4%) | Value | ||||||
| Financials (23.8%) - continued | ||||||||
CDP Financial, Inc. | ||||||||
| $6,000,000 | 3.000%, 11/25/2014a | $ | 6,309,354 | |||||
Citigroup, Inc. | ||||||||
| 4,600,000 | 1.398%, 4/1/2014b | 4,526,405 | ||||||
CNA Financial Corporation | ||||||||
| 3,000,000 | 6.500%, 8/15/2016 | 3,375,819 | ||||||
Commonwealth Bank of Australia | ||||||||
| 6,700,000 | 2.500%, 12/10/2012a | 6,755,811 | ||||||
Cooperatieve Centrale Raiffeisen-Boerenleenbank BA | ||||||||
| 3,000,000 | 3.200%, 3/11/2015a | 3,088,461 | ||||||
Credit Agricole Home Loan SFH | ||||||||
| 6,000,000 | 1.216%, 7/21/2014a,b | 5,864,328 | ||||||
Credit Suisse AG Guernsey | ||||||||
| 2,000,000 | 2.600%, 5/27/2016a | 2,054,738 | ||||||
Credit Suisse of New York, Convertible | ||||||||
| 1,600,000 | 0.500%, 6/22/2018g | 1,556,800 | ||||||
Credit Suisse Securities USA, LLC | ||||||||
| 5,500,000 | 1.000%, 4/28/2017h | 5,553,350 | ||||||
Dexia Credit Local SA | ||||||||
| 9,500,000 | 2.750%, 4/29/2014a | 9,270,480 | ||||||
DnB NOR Boligkreditt | ||||||||
| 6,500,000 | 2.900%, 3/29/2016a | 6,749,762 | ||||||
Eksportfinans ASA | ||||||||
| 2,450,000 | 2.375%, 5/25/2016 | 2,177,734 | ||||||
Fifth Third Bank | ||||||||
| 4,165,000 | 0.576%, 5/17/2013b | 4,149,960 | ||||||
General Electric Capital Corporation | ||||||||
| 4,500,000 | 0.669%, 1/8/2016b | 4,345,196 | ||||||
Goldman Sachs Group, Inc., Convertible | ||||||||
| 85,672 | 1.000%, 11/9/2012a,i | 2,578,727 | ||||||
HCP, Inc. | ||||||||
| 2,000,000 | 2.700%, 2/1/2014 | 2,031,946 | ||||||
Health Care REIT, Inc. | ||||||||
| 750,000 | 6.125%, 4/15/2020 | 834,899 | ||||||
HSBC Bank plc | ||||||||
| 6,000,000 | 1.625%, 7/7/2014a,f | 6,048,474 | ||||||
ING Bank NV | ||||||||
| 6,500,000 | 2.500%, 1/14/2016a | 6,606,158 | ||||||
International Lease Finance Corporation | ||||||||
| 1,100,000 | 8.625%, 9/15/2015 | 1,215,500 | ||||||
Irish Life & Permanent plc | ||||||||
| 8,000,000 | 3.600%, 1/14/2013a | 7,752,752 | ||||||
J.P. Morgan Chase & Company | ||||||||
| 4,000,000 | 1.211%, 9/30/2013b | 4,014,272 | ||||||
J.P. Morgan Chase Bank NA | ||||||||
| 1,800,000 | 5.875%, 6/13/2016 | 1,973,957 | ||||||
Landwirtschaftliche Rentenbank | ||||||||
| 7,000,000 | 0.668%, 3/15/2016a,b | 6,985,188 | ||||||
Lehman Brothers Holdings E-Capital Trust I | ||||||||
| 3,500,000 | 1.247%, 8/19/2065b,j,k | 0 | ||||||
Lloyds TSB Bank plc | ||||||||
| 4,000,000 | 4.375%, 1/12/2015a | 4,130,912 | ||||||
| 300,000 | 6.500%, 9/14/2020a,f | 295,486 | ||||||
MassMutual Global Funding II | ||||||||
| 3,500,000 | 2.000%, 4/5/2017a | 3,520,388 | ||||||
Metropolitan Life Global Funding I | ||||||||
| 2,680,000 | 5.125%, 4/10/2013a | 2,768,628 | ||||||
| 3,250,000 | 3.650%, 6/14/2018a | 3,442,046 | ||||||
Morgan Stanley | ||||||||
| 2,000,000 | 4.200%, 11/20/2014 | 1,996,966 | ||||||
National Bank of Canada | ||||||||
| 3,000,000 | 1.650%, 1/30/2014a | 3,051,159 | ||||||
| 2,750,000 | 2.200%, 10/19/2016a | 2,867,983 | ||||||
NCUA Guaranteed Notes | ||||||||
| 3,707,384 | 0.589%, 12/7/2020b | 3,709,381 | ||||||
Nederlandse Waterschapsbank NV | ||||||||
| 6,500,000 | 1.375%, 5/16/2014a | 6,539,032 | ||||||
New York Life Global Funding | ||||||||
| 6,000,000 | 3.000%, 5/4/2015a | 6,310,956 | ||||||
Nordea Bank AB | ||||||||
| 2,500,000 | 3.125%, 3/20/2017a | 2,510,672 | ||||||
Private Export Funding Corporation | ||||||||
| 5,000,000 | 2.125%, 7/15/2016 | 5,270,755 | ||||||
Prudential Financial, Inc. | ||||||||
| 3,000,000 | 5.100%, 9/20/2014 | 3,215,613 | ||||||
| 2,000,000 | 6.100%, 6/15/2017 | 2,281,810 | ||||||
Rabobank Capital Funding Trust II | ||||||||
| 1,856,000 | 5.260%, 12/29/2049a,l | 1,772,406 | ||||||
Royal Bank of Canada | ||||||||
| 5,000,000 | 1.166%, 10/30/2014b | 5,035,505 | ||||||
| 6,500,000 | 3.125%, 4/14/2015a | 6,883,780 | ||||||
SLM Corporation | ||||||||
| 1,500,000 | 8.000%, 3/25/2020 | 1,642,500 | ||||||
Stadshypotek AB | ||||||||
| 6,000,000 | 1.011%, 9/30/2013a,b | 5,996,310 | ||||||
State Street Capital Trust III | ||||||||
| 2,000,000 | 5.458%, 3/15/2042b,l | 2,005,560 | ||||||
Swedbank Hypotek AB | ||||||||
| 7,000,000 | 0.911%, 3/28/2014a,b | 6,986,336 | ||||||
Toronto-Dominion Bank | ||||||||
| 4,000,000 | 0.646%, 7/26/2013b | 4,008,352 | ||||||
| 3,000,000 | 2.200%, 7/29/2015a | 3,121,914 | ||||||
U.S. Bank National Association | ||||||||
| 4,000,000 | 3.778%, 4/29/2020 | 4,179,096 | ||||||
U.S. Central Federal Credit Union | ||||||||
| 6,500,000 | 1.900%, 10/19/2012 | 6,532,754 | ||||||
UBS AG/London | ||||||||
| 7,500,000 | 1.875%, 1/23/2015a | 7,574,977 | ||||||
Vestjysk Bank AS | ||||||||
| 6,500,000 | 1.018%, 6/17/2013a,b | 6,520,787 | ||||||
WEA Finance, LLC/WT Finance Australia, Pty, Ltd. | ||||||||
| 3,350,000 | 5.750%, 9/2/2015a | 3,642,994 | ||||||
Wells Fargo & Company | ||||||||
| 4,500,000 | 2.625%, 12/15/2016 | 4,624,618 | ||||||
|
| |||||||
| Total | 311,381,497 | |||||||
|
| |||||||
The accompanying Notes to Financial Statements are an integral part of this schedule.
241
Table of Contents
Limited Maturity Bond Portfolio
Schedule of Investments as of June 29, 2012
(unaudited)
| Principal Amount | Long-Term Fixed Income (97.4%) | Value | ||||||
| Foreign Government (4.4%) | ||||||||
Bank Nederlandse Gemeenten NV | ||||||||
| $5,500,000 | 1.000%, 11/17/2014a | $ | 5,473,765 | |||||
Canada Government International Bond | ||||||||
| 8,500,000 | 0.875%, 2/14/2017 | 8,543,783 | ||||||
Corporacion Andina de Fomento | ||||||||
| 2,555,000 | 4.375%, 6/15/2022 | 2,609,759 | ||||||
European Investment Bank | ||||||||
| 6,000,000 | 1.750%, 3/15/2017 | 6,083,838 | ||||||
Hydro Quebec | ||||||||
| 3,000,000 | 2.000%, 6/30/2016 | 3,105,849 | ||||||
Kommunalbanken AS | ||||||||
| 6,000,000 | 2.750%, 5/5/2015a | 6,300,258 | ||||||
Kreditanstalt fuer Wiederaufbau | ||||||||
| 10,000,000 | 0.253%, 6/17/2013b | 10,000,750 | ||||||
Mexico Government International Bond | ||||||||
| 1,250,000 | 5.125%, 1/15/2020 | 1,465,625 | ||||||
Province of British Columbia | ||||||||
| 6,500,000 | 2.100%, 5/18/2016 | 6,809,614 | ||||||
| 575,000 | 2.650%, 9/22/2021 | 608,781 | ||||||
Province of Manitoba | ||||||||
| 5,100,000 | 1.300%, 4/3/2017 | 5,172,808 | ||||||
Province of Ontario | ||||||||
| 2,000,000 | 1.600%, 9/21/2016 | 2,036,038 | ||||||
|
| |||||||
| Total | 58,210,868 | |||||||
|
| |||||||
| Mortgage-Backed Securities (3.0%) | ||||||||
Federal Home Loan Mortgage Corporation Gold 15-Yr. Pass Through | ||||||||
| 7,550,000 | 3.000%, 7/1/2027m | 7,893,291 | ||||||
Federal Home Loan Mortgage Corporation Gold 30-Yr. Pass Through | ||||||||
| 2,683,603 | 6.500%, 9/1/2037 | 3,013,300 | ||||||
Federal National Mortgage Association Conventional 15- Yr. Pass Through | ||||||||
| 10,650,000 | 3.000%, 7/1/2027m | 11,157,537 | ||||||
Federal National Mortgage Association Conventional 30- Yr. Pass Through | ||||||||
| 4,002,230 | 5.826%, 9/1/2037b | 4,346,530 | ||||||
| 2,088,277 | 5.625%, 10/1/2037b | 2,263,556 | ||||||
| 10,000,000 | 5.500%, 7/1/2042m | 10,907,810 | ||||||
|
| |||||||
| Total | 39,582,024 | |||||||
|
| |||||||
| Technology (0.8%) | ||||||||
Affiliated Computer Services, Inc. | ||||||||
| 2,000,000 | 5.200%, 6/1/2015 | 2,151,316 | ||||||
Hewlett-Packard Company | ||||||||
| 3,000,000 | 0.867%, 5/30/2014b | 2,973,657 | ||||||
Texas Instruments, Inc. | ||||||||
| 3,000,000 | 0.647%, 5/15/2013b,f | 3,009,537 | ||||||
Xerox Corporation | ||||||||
| 3,000,000 | 1.286%, 5/16/2014b | 2,995,953 | ||||||
|
| |||||||
| Total | 11,130,463 | |||||||
|
| |||||||
| Transportation (1.3%) | ||||||||
Continental Airlines, Inc. | ||||||||
| 2,650,000 | 6.750%, 9/15/2015a | 2,722,875 | ||||||
| 3,250,000 | 4.150%, 4/11/2024 | 3,201,250 | ||||||
CSX Corporation | ||||||||
| 2,500,000 | 6.250%, 4/1/2015 | 2,848,278 | ||||||
Delta Air Lines, Inc. | ||||||||
| 950,000 | 4.750%, 5/7/2020m | 961,875 | ||||||
Erac USA Finance Company | ||||||||
| 4,500,000 | 2.750%, 7/1/2013a | 4,559,940 | ||||||
Kansas City Southern de Mexico SA de CV | ||||||||
| 2,150,000 | 8.000%, 2/1/2018 | 2,394,670 | ||||||
|
| |||||||
| Total | 16,688,888 | |||||||
|
| |||||||
| U.S. Government and Agencies (32.1%) | ||||||||
FDIC Structured Sale Guaranteed Notes | ||||||||
| 8,000,000 | Zero Coupon, 1/7/2013a | 7,986,400 | ||||||
Federal Agricultural Mortgage Corporation | ||||||||
| 8,000,000 | 1.250%, 12/6/2013 | 8,094,560 | ||||||
| 3,500,000 | 2.000%, 7/27/2016 | 3,652,071 | ||||||
Federal Farm Credit Bank | ||||||||
| 10,000,000 | 1.375%, 6/25/2013 | 10,111,230 | ||||||
| 4,950,000 | 0.413%, 9/23/2013b | 4,958,346 | ||||||
Federal Home Loan Banks | ||||||||
| 10,000,000 | 0.390%, 9/16/2013b | 10,017,780 | ||||||
| 4,000,000 | 0.375%, 1/29/2014 | 4,001,556 | ||||||
| 28,100,000 | 1.375%, 5/28/2014 | 28,668,491 | ||||||
Federal Home Loan Mortgage Corporation | ||||||||
| 4,000,000 | 0.193%, 6/17/2013b | 4,001,496 | ||||||
Federal National Mortgage Association | ||||||||
| 6,500,000 | 0.500%, 5/27/2015 | 6,495,281 | ||||||
U.S. Treasury Bonds | ||||||||
| 1,750,000 | 3.125%, 11/15/2041 | 1,881,250 | ||||||
U.S. Treasury Bonds, TIPS | ||||||||
| 4,581,225 | 0.750%, 2/15/2042 | 4,805,632 | ||||||
U.S. Treasury Notes | ||||||||
| 800,000 | 2.250%, 5/31/2014 | 829,125 | ||||||
| 58,800,000 | 0.750%, 6/15/2014 | 59,286,923 | ||||||
| 28,800,000 | 0.250%, 2/15/2015 | 28,698,739 | ||||||
| 62,200,000 | 2.000%, 1/31/2016 | 65,446,094 | ||||||
| 76,450,000 | 0.750%, 6/30/2017 | 76,527,673 | ||||||
| 8,250,000 | 2.375%, 6/30/2018 | 8,942,868 | ||||||
| 37,320,000 | 1.250%, 4/30/2019 | 37,734,028 | ||||||
U.S. Treasury Notes, TIPS | ||||||||
| 16,711,200 | 0.125%, 4/15/2017 | 17,640,760 | ||||||
| 15,773,850 | 1.125%, 1/15/2021 | 18,152,247 | ||||||
| 11,891,529 | 0.125%, 1/15/2022 | 12,581,797 | ||||||
|
| |||||||
| Total | 420,514,347 | |||||||
|
| |||||||
| Utilities (0.9%) | ||||||||
National Rural Utilities Cooperative Finance Corporation | ||||||||
| 2,650,000 | 5.500%, 7/1/2013 | 2,780,838 | ||||||
Northeast Utilities | ||||||||
| 3,000,000 | 1.218%, 9/20/2013b | 3,012,003 | ||||||
The accompanying Notes to Financial Statements are an integral part of this schedule.
242
Table of Contents
Limited Maturity Bond Portfolio
Schedule of Investments as of June 29, 2012
(unaudited)
| Principal Amount | Long-Term Fixed Income (97.4%) | Value | ||||||
| Utilities (0.9%) - continued | ||||||||
Oncor Electric Delivery Company, LLC | ||||||||
| $2,700,000 | 5.750%, 9/30/2020 | $ | 3,046,772 | |||||
ONEOK Partners, LP | ||||||||
| 650,000 | 8.625%, 3/1/2019 | 843,518 | ||||||
Sempra Energy | ||||||||
| 2,750,000 | 2.300%, 4/1/2017 | 2,818,329 | ||||||
|
| |||||||
| Total | 12,501,460 | |||||||
|
| |||||||
Total Long-Term Fixed Income (cost $1,286,844,421) | 1,278,714,595 | |||||||
|
| |||||||
| Shares | Mutual Funds (1.6%) | |||||||
| Fixed Income Mutual Funds (1.6%) | ||||||||
| 4,208,125 | Thrivent High Yield Fund | 20,493,570 | ||||||
|
| |||||||
| Total | 20,493,570 | |||||||
|
| |||||||
Total Mutual Funds (cost $15,500,000) | 20,493,570 | |||||||
|
| |||||||
Preferred Stock (0.5%) | ||||||||
| Financials (0.3%) | ||||||||
| 18,750 | Citigroup, Inc., Convertiblen | 1,604,250 | ||||||
| 148,505 | Federal National Mortgage Association, 8.250%l,o | 242,063 | ||||||
| 66,000 | HSBC Holdings plc, 8.000%l | 1,793,880 | ||||||
|
| |||||||
| Total | 3,640,193 | |||||||
|
| |||||||
| Utilities (0.2%) | ||||||||
| 24,375 | Southern California Edison Company, 4.580%l | 2,434,453 | ||||||
|
| |||||||
| Total | 2,434,453 | |||||||
|
| |||||||
Total Preferred Stock (cost $8,979,474) | 6,074,646 | |||||||
|
| |||||||
Collateral Held for Securities Loaned (1.6%) | ||||||||
| 20,540,900 | Thrivent Financial Securities Lending Trust | 20,540,900 | ||||||
|
| |||||||
Total Collateral Held for Securities Loaned (cost $20,540,900) | 20,540,900 | |||||||
|
| |||||||
| Principal Amount | Short-Term Investments (5.5%)p | |||||||
Chariot Funding, LLC | ||||||||
| 15,000,000 | 0.150%, 7/2/2012a,q | 14,999,875 | ||||||
Federal Home Loan Bank Discount Notes | ||||||||
| 9,000,000 | 0.060%, 7/20/2012q | 8,999,700 | ||||||
Federal National Mortgage Association Discount Notes | ||||||||
| 1,800,000 | 0.120%, 7/18/2012q,r | 1,799,892 | ||||||
Liberty Street Funding, LLC | ||||||||
| 26,000,000 | 0.100%, 7/2/2012a,q | 25,999,856 | ||||||
Thunder Bay Funding, Inc. | ||||||||
| 20,001,000 | 0.080%, 7/2/2012q | 20,000,911 | ||||||
|
| |||||||
| Total Short-Term Investments (at amortized cost) | 71,800,234 | |||||||
|
| |||||||
| Total Investments (cost $1,403,665,029) 106.6% | $ | 1,397,623,945 | ||||||
|
| |||||||
| Other Assets and Liabilities, Net (6.6%) | (86,195,628 | ) | ||||||
|
| |||||||
| Total Net Assets 100.0% | $ | 1,311,428,317 | ||||||
|
| |||||||
| a | Denotes securities sold under Rule 144A of the Securities Act of 1933, which exempts them from registration. These securities have been deemed liquid and may be resold to other dealers in the program or to other qualified institutional buyers. As of June 29, 2012, the value of these investments was $363,853,044 or 27.7% of total net assets. |
| b | Denotes variable rate securities. Variable rate securities are securities whose yields vary with a designated market index or market rate. The rate shown is as of June 29, 2012. |
| c | All or a portion of the security is insured or guaranteed. |
| d | Denotes restricted securities. Restricted securities are investment securities which have been deemed illiquid and cannot be offered for public sale without first being registered under the Securities Act of 1933. The following table indicates the acquisition date and cost of restricted securities Limited Maturity Bond Portfolio owned as of June 29, 2012. |
Security | Acquisition Date | Cost | ||||||
First Franklin Mortgage Loan Asset-Backed Certificates | 4/19/2006 | $ | 214,738 | |||||
Mortgage Equity Conversion Asset Trust | 2/14/2007 | 5,824,250 | ||||||
Mortgage Equity Conversion Asset Trust | 1/18/2007 | 5,955,669 | ||||||
Wachovia Asset Securitization, Inc. | 3/16/2007 | 1,433,484 | ||||||
| e | Defaulted security. Interest is not being accrued. |
| f | All or a portion of the security is on loan. |
| g | Denotes equity-linked structured security. This security is linked to the common stock of Berkshire Hathaway, Inc. |
| h | Denotes equity-linked structured security. This security is linked to the S&P 500 Index. |
| i | Security is displayed in shares. This security is an equity-linked structured security. This security is linked to the common stock of Microsoft Corporation. |
| j | Security is fair valued. |
| k | In bankruptcy. Interest is not being accrued. |
| l | Denotes perpetual securities. Perpetual securities pay an indefinite stream of interest, but may be called by the issuer at an earlier date. |
| m | Denotes investments purchased on a when-issued or delayed delivery basis. |
| n | Comprised of a 79.7% prepaid stock purchase contract for common stock of Citigroup, Inc. and a 20.3% amortizing note. The quarterly payments received consists of return of capital and 6.15% interest on only the portion that is the note. |
| o | Non-income producing security. |
The accompanying Notes to Financial Statements are an integral part of this schedule.
243
Table of Contents
Limited Maturity Bond Portfolio
Schedule of Investments as of June 29, 2012
(unaudited)
| p | The interest rate shown reflects the yield, coupon rate or the discount rate at the date of purchase. |
| q | Denotes investments that benefit from credit enhancement or liquidity support provided by a third party bank, institution or government. |
| r | At June 29, 2012, $1,799,892 of investments were held on deposit with the counterparty and pledged as the initial margin deposit for open futures contracts. |
Definitions:
| REIT | - | Real Estate Investment Trust is a company that buys, develops, manages and/or sells real estate assets. | ||
| TIPS | - | Treasury Inflation Protected Security. |
Unrealized Appreciation (Depreciation)
Gross unrealized appreciation and depreciation of investments, based on cost for federal income tax purposes, were as follows:
Gross unrealized appreciation | $ | 30,634,324 | ||
Gross unrealized depreciation | (36,948,181 | ) | ||
|
| |||
Net unrealized appreciation (depreciation) | $ | (6,313,857 | ) | |
Cost for federal income tax purposes | $ | 1,403,937,802 |
Fair Valuation Measurements
The following table is a summary of the inputs used, as of June 29, 2012, in valuing Limited Maturity Bond Portfolio’s assets carried at fair value.
Investments in Securities | Total | Level 1 | Level 2 | Level 3 | ||||||||||||
Long-Term Fixed Income | ||||||||||||||||
Asset-Backed Securities | 140,669,627 | — | 131,245,692 | 9,423,935 | ||||||||||||
Basic Materials | 13,099,893 | — | 13,099,893 | — | ||||||||||||
Capital Goods | 13,038,725 | — | 13,038,725 | — | ||||||||||||
Collateralized Mortgage Obligations | 54,306,905 | — | 54,306,905 | — | ||||||||||||
Commercial Mortgage-Backed Securities | 87,346,392 | — | 82,015,142 | 5,331,250 | ||||||||||||
Communications Services | 22,592,694 | — | 22,592,694 | — | ||||||||||||
Consumer Cyclical | 18,507,702 | — | 18,507,702 | — | ||||||||||||
Consumer Non-Cyclical | 33,647,707 | — | 33,647,707 | — | ||||||||||||
Energy | 25,495,403 | — | 25,495,403 | — | ||||||||||||
Financials | 311,381,497 | — | 301,692,620 | 9,688,877 | ||||||||||||
Foreign Government | 58,210,868 | — | 58,210,868 | — | ||||||||||||
Mortgage-Backed Securities | 39,582,024 | — | 39,582,024 | — | ||||||||||||
Technology | 11,130,463 | — | 11,130,463 | — | ||||||||||||
Transportation | 16,688,888 | — | 16,688,888 | — | ||||||||||||
U.S. Government and Agencies | 420,514,347 | — | 420,514,347 | — | ||||||||||||
Utilities | 12,501,460 | — | 12,501,460 | — | ||||||||||||
Mutual Funds | ||||||||||||||||
Fixed Income Mutual Funds | 20,493,570 | 20,493,570 | — | — | ||||||||||||
Preferred Stock | ||||||||||||||||
Financials | 3,640,193 | 3,640,193 | — | — | ||||||||||||
Utilities | 2,434,453 | — | 2,434,453 | — | ||||||||||||
Collateral Held for Securities Loaned | 20,540,900 | 20,540,900 | — | — | ||||||||||||
Short-Term Investments | 71,800,234 | — | 71,800,234 | — | ||||||||||||
|
|
|
|
|
|
|
| |||||||||
Total | $ | 1,397,623,945 | $ | 44,674,663 | $ | 1,328,505,220 | $ | 24,444,062 | ||||||||
|
|
|
|
|
|
|
| |||||||||
Other Financial Instruments | Total | Level 1 | Level 2 | Level 3 | ||||||||||||
Asset Derivatives | ||||||||||||||||
Futures Contracts | 7,083 | 7,083 | — | — | ||||||||||||
Credit Default Swaps | 263,466 | — | 263,466 | — | ||||||||||||
|
|
|
|
|
|
|
| |||||||||
Total Asset Derivatives | $ | 270,549 | $ | 7,083 | $ | 263,466 | $ | — | ||||||||
|
|
|
|
|
|
|
| |||||||||
Liability Derivatives | ||||||||||||||||
Futures Contracts | 731,116 | 731,116 | — | — | ||||||||||||
Credit Default Swaps | 207,599 | — | 207,599 | — | ||||||||||||
|
|
|
|
|
|
|
| |||||||||
Total Liability Derivatives | $ | 938,715 | $ | 731,116 | $ | 207,599 | $ | — | ||||||||
|
|
|
|
|
|
|
| |||||||||
The significant unobservable input used in the fair value measurement of the reporting entity’s Long-Term Fixed Income Asset-Backed Securities is market activity. A significant increase or decrease in the inputs in isolation would result in a significantly lower or higher fair value measurement.
The accompanying Notes to Financial Statements are an integral part of this schedule.
244
Table of Contents
Limited Maturity Bond Portfolio
Schedule of Investments as of June 29, 2012
(unaudited)
The significant unobservable inputs used in the fair value measurement of the reporting entity’s Long-Term Fixed Income Commercial Mortgage-Backed Securities are market activity, spread, and average life. A significant increase or decrease in the inputs in isolation would result in a significantly lower or higher fair value measurement.
The significant unobservable inputs used in the fair value measurement of the reporting entity’s Long-Term Fixed Income Financial Securities are dividends, interest (coupon) rates, credit spread of issuer, implied volatility of an underlying security/index, any option values, and lack of marketability. A significant increase or decrease in the inputs in isolation would result in a significantly lower or higher fair value measurement.
There were no significant transfers between the Levels during the period ended June 29, 2012. Transfers between the levels are identified as of the end of the period.
Futures Contracts | Number of Contracts Long/(Short) | Expiration Date | Notional Principal Amount | Value | Unrealized Gain/(Loss) | |||||||||||||||
2-Yr. U.S. Treasury Bond Futures | (55 | ) | September 2012 | ($ | 12,111,864 | ) | ($ | 12,110,313 | ) | $ | 1,551 | |||||||||
5-Yr. U.S. Treasury Bond Futures | (1,865 | ) | September 2012 | (230,817,212 | ) | (231,201,719 | ) | (384,507 | ) | |||||||||||
10-Yr. U.S. Treasury Bond Futures | (425 | ) | September 2012 | (56,337,766 | ) | (56,684,375 | ) | (346,609 | ) | |||||||||||
20-Yr. U.S. Treasury Bond Futures | 5 | September 2012 | 734,312 | 739,844 | 5,532 | |||||||||||||||
Total Futures Contracts | ($ | 724,033 | ) | |||||||||||||||||
Credit Default Swaps and Counterparty | Buy/Sell Protection1 | Termination Date | Notional Principal Amount2 | Upfront Payments Received (Made) | Value3 | Unrealized Gain/(Loss) | ||||||||||||||||
CDX HY, Series 18, 5 Year, at 5.00%; | Buy | 6/20/2017 | $ | 11,632,500 | ($ | 617,023 | ) | $ | 409,424 | ($ | 207,599 | ) | ||||||||||
CDX IG, Series 18, 5 Year, at 1.00%; | Buy | 6/20/2017 | 23,500,000 | 121,953 | 141,513 | 263,466 | ||||||||||||||||
Total Credit Default Swaps | $ | 550,937 | $ | 55,867 | ||||||||||||||||||
| 1 | As the buyer of protection, Limited Maturity Bond Portfolio pays periodic fees in return for payment by the seller which is contingent upon an adverse credit event occurring in the underlying issuer or reference entity. As the seller of protection, Limited Maturity Bond Portfolio collects periodic fees from the buyer and profits if the credit of the underlying issuer or reference entity remains stable or improves while the swap is outstanding, but the seller in a credit default swap contract would be required to pay the amount of credit loss, determined as specified in the agreement, to the buyer in the event of an adverse credit event in the reference entity. |
| 2 | The maximum potential amount of future payments Limited Maturity Bond Portfolio could be required to make as the seller or receive as the buyer of protection. |
| 3 | The values for credit indexes (CDX or LCDX) serve as an indicator of the current status of the payment/performance risk and represent the liability or profit for the credit default swap contract had the contract been closed as of the reporting date. When protection has been sold, the value of the swap will increase when the swap spread declines representing an improvement in the reference entity’s credit worthiness. The value of the swap will decrease when the swap spread increases representing a deterioration in the reference entity’s credit worthiness. When protection has been purchased, the value of the swap will increase when the swap spread increases representing a deterioration in the reference entity’s credit worthiness. The value of the swap will decrease when the swap spread declines representing an improvement in the reference entity’s credit worthiness. |
The accompanying Notes to Financial Statements are an integral part of this schedule.
245
Table of Contents
Limited Maturity Bond Portfolio
Schedule of Investments as of June 29, 2012
(unaudited)
The following table summarizes the fair value and Statement of Assets and Liabilities location, as of June 29, 2012, for Limited Maturity Bond Portfolio’s investments in financial derivative instruments by primary risk exposure as discussed under item (2) Significant Accounting Policies of the Notes to Financial Statements.
Derivatives by risk category | Statement of Assets and Liabilities Location | Fair Value | ||||
Asset Derivatives | ||||||
Interest Rate Contracts | ||||||
Futures* | Net Assets - Net unrealized appreciation/(depreciation) on Futures contracts | $ | 7,083 | |||
Total Interest Rate Contracts | 7,083 | |||||
Credit Contracts | ||||||
Credit Default Swaps | Receivable/Payable - Swap agreements, at value; Net Assets - Net unrealized appreciation/(depreciation) on Swap agreements | 263,466 | ||||
Total Credit Contracts | 263,466 | |||||
|
| |||||
Total Asset Derivatives | $ | 270,549 | ||||
|
| |||||
Liability Derivatives | ||||||
Interest Rate Contracts | ||||||
Futures* | Net Assets - Net unrealized appreciation/(depreciation) on Futures contracts | 731,116 | ||||
Total Interest Rate Contracts | 731,116 | |||||
Credit Contracts | ||||||
Credit Default Swaps | Receivable/Payable - Swap agreements, at value; Net Assets - Net unrealized appreciation/(depreciation) on Swap agreements | 207,599 | ||||
Total Credit Contracts | | 207,599 | | |||
|
| |||||
Total Liability Derivatives | $ | 938,715 | ||||
|
| |||||
| * | Includes cumulative appreciation/depreciation of futures contracts as reported in the Schedule of Investments. Only current day’s variation margin is reported within the Statement of Assets and Liabilities. |
The following table summarizes the net realized gains/(losses) and Statement of Operations location, for the period ended June 29, 2012, for Limited Maturity Bond Portfolio’s investments in financial derivative instruments by primary risk exposure.
Derivatives by risk category | Statement of Operations Location | Realized Gains/(Losses) recognized in Income | ||||
Equity Contracts | ||||||
Options Purchased | Net realized gains/(losses) on Investments | (98,888 | ) | |||
Total Equity Contracts | (98,888 | ) | ||||
Interest Rate Contracts | ||||||
Options Written | Net realized gains/(losses) on Written option contracts | 22,537 | ||||
Futures | Net realized gains/(losses) on Futures contracts | (4,791,244 | ) | |||
Total Interest Rate Contracts | (4,768,707 | ) | ||||
Credit Contracts | ||||||
Credit Default Swaps | Net realized gains/(losses) on Swap agreements | (1,709,029 | ) | |||
Total Credit Contracts | (1,709,029 | ) | ||||
|
| |||||
Total | ($ | 6,576,624 | ) | |||
|
| |||||
The accompanying Notes to Financial Statements are an integral part of this schedule.
246
Table of Contents
Limited Maturity Bond Portfolio
Schedule of Investments as of June 29, 2012
(unaudited)
The following table summarizes the change in net unrealized appreciation/(depreciation) and Statement of Operations location, for the period ended June 29, 2012, for Limited Maturity Bond Portfolio’s investments in financial derivative instruments by primary risk exposure.
Derivatives by risk category | Statement of Operations Location | Change in unrealized appreciation/(depreciation) recognized in Income | ||||
Interest Rate Contracts | ||||||
Futures | Change in net unrealized appreciation/(depreciation) on Futures contracts | 1,252,689 | ||||
Total Interest Rate Contracts | 1,252,689 | |||||
Credit Contracts | ||||||
Credit Default Swaps | Change in net unrealized appreciation/(depreciation) on Swap agreements | 786,940 | ||||
Total Credit Contracts | 786,940 | |||||
|
| |||||
Total | $ | 2,039,629 | ||||
|
| |||||
The following table presents Limited Maturity Bond Portfolio’s average volume of derivative activity during the period ended June 29, 2012.
Derivative Risk Category | Futures (Notional*) | Futures (Percentage of Average Net Assets) | Swaps (Notional*) | Swaps (Percentage of Average Net Assets) | Options (Contracts) | |||||||||||||||
Equity Contracts | N/A | N/A | N/A | N/A | 41 | |||||||||||||||
Interest Rate Contracts | $ | 302,373,902 | 21.1 | % | N/A | N/A | N/A | |||||||||||||
Credit Contracts | N/A | N/A | $ | 34,916,485 | 2.4 | % | N/A | |||||||||||||
| * | Notional amount represents long or short, or both, derivative positions held by the Portfolio. |
Investment in Affiliates
Affiliated issuers, as defined under the Investment Company Act of 1940, include those in which the Portfolio’s holdings of an issuer represent 5% or more of the outstanding voting securities of an issuer, or any affiliated mutual fund.
A summary of transactions for the fiscal year to date, in Limited Maturity Bond Portfolio, is as follows:
Portfolio | Value December 31, 2011 | Gross Purchases | Gross Sales | Shares Held at June 29, 2012 | Value June 29, 2012 | Income Earned January 1, 2012 - June 29, 2012 | ||||||||||||||||||
High Yield Fund | $ | 19,694,026 | $ | — | $ | — | 4,208,125 | $ | 20,493,570 | $ | 744,329 | |||||||||||||
Thrivent Financial Securities Lending Trust | 88,106,653 | 227,635,878 | 295,201,631 | 20,540,900 | 20,540,900 | 68,576 | ||||||||||||||||||
Total Value and Income Earned | 107,800,679 | 41,034,470 | 812,905 | |||||||||||||||||||||
The accompanying Notes to Financial Statements are an integral part of this schedule.
247
Table of Contents
Schedule of Investments as of June 29, 2012
(unaudited)
| Principal Amount | Long-Term Fixed Income (102.7%) | Value | ||||||
| Asset-Backed Securities (6.6%) | ||||||||
Carrington Mortgage Loan Trust | ||||||||
| $200,000 | 0.395%, 8/25/2036a | $ | 68,033 | |||||
Countrywide Asset-Backed Certificates | ||||||||
| 195,000 | 5.859%, 10/25/2046 | 109,264 | ||||||
Credit Based Asset Servicing and Securitization, LLC | ||||||||
| 119,137 | 4.624%, 12/25/2036 | 70,780 | ||||||
First Horizon ABS Trust | ||||||||
| 390,517 | 0.375%, 10/25/2026a,b | 289,018 | ||||||
| 720,220 | 0.405%, 10/25/2034a,b | 465,053 | ||||||
GMAC Mortgage Corporation Loan Trust | ||||||||
| 902,503 | 0.425%, 8/25/2035a,b | 600,671 | ||||||
Popular ABS Mortgage Pass- Through Trust | ||||||||
| 100,000 | 5.297%, 11/25/2035 | 59,107 | ||||||
Renaissance Home Equity Loan Trust | ||||||||
| 250,000 | 5.797%, 8/25/2036 | 105,368 | ||||||
| 200,000 | 5.285%, 1/25/2037 | 94,391 | ||||||
Wachovia Asset Securitization, Inc. | ||||||||
| 573,394 | 0.385%, 7/25/2037a,b,c | 411,204 | ||||||
|
| |||||||
| Total | 2,272,889 | |||||||
|
| |||||||
| Collateralized Mortgage Obligations (8.2%) | ||||||||
CitiMortgage Alternative Loan Trust | ||||||||
| 215,220 | 5.750%, 4/25/2037 | 152,263 | ||||||
Countrywide Alternative Loan Trust | ||||||||
| 70,450 | 5.500%, 10/25/2035 | 61,396 | ||||||
| 111,119 | 5.500%, 2/25/2036 | 83,155 | ||||||
| 161,006 | 6.000%, 1/25/2037 | 115,918 | ||||||
Federal National Mortgage Association | ||||||||
| 336,963 | 2.250%, 6/25/2025 | 346,274 | ||||||
GMAC Mortgage Corporation Loan Trust | ||||||||
| 123,618 | 4.943%, 9/19/2035 | 109,538 | ||||||
GSR Mortgage Loan Trust | ||||||||
| 54,584 | 0.435%, 8/25/2046a | 44,508 | ||||||
Impac CMB Trust | ||||||||
| 337,295 | 0.765%, 4/25/2035a | 271,827 | ||||||
| 60,397 | 0.885%, 8/25/2035a | 42,145 | ||||||
J.P. Morgan Alternative Loan Trust | ||||||||
| 138,857 | 6.500%, 3/25/2036 | 95,780 | ||||||
J.P. Morgan Mortgage Trust | ||||||||
| 171,128 | 6.500%, 1/25/2035 | 170,554 | ||||||
| 78,419 | 2.747%, 10/25/2036 | 55,991 | ||||||
MLCC Mortgage Investors, Inc. | ||||||||
| 333,125 | 0.905%, 8/25/2029a | 312,471 | ||||||
Residential Accredit Loans, Inc. | ||||||||
| 201,399 | 5.500%, 12/25/2034 | 199,110 | ||||||
| 199,585 | 3.717%, 9/25/2035 | 121,347 | ||||||
WaMu Mortgage Pass Through Certificates | ||||||||
| 93,044 | 2.561%, 10/25/2036 | 65,633 | ||||||
WaMu Mortgage Pass-Through Certificates | ||||||||
| 61,381 | 2.499%, 8/25/2046 | 43,041 | ||||||
Wells Fargo Mortgage Backed Securities Trust | ||||||||
| 378,927 | 2.622%, 3/25/2036 | 334,631 | ||||||
| 99,441 | 2.696%, 4/25/2036 | 80,498 | ||||||
| 111,280 | 6.000%, 7/25/2037 | 102,816 | ||||||
|
| |||||||
| Total | 2,808,896 | |||||||
|
| |||||||
| Commercial Mortgage-Backed Securities (7.7%) | ||||||||
Bear Stearns Commercial Mortgage Securities, Inc. | ||||||||
| 36,200 | 5.854%, 6/11/2040 | 37,438 | ||||||
Commercial Mortgage Pass- Through Certificates | ||||||||
| 250,000 | 5.306%, 12/10/2046 | 280,859 | ||||||
Credit Suisse First Boston Mortgage Securities | ||||||||
| 200,000 | 5.542%, 1/15/2049 | 215,365 | ||||||
GE Capital Commercial Mortgage Corporation | ||||||||
| 128,181 | 4.641%, 3/10/2040 | 130,293 | ||||||
Government National Mortgage Association | ||||||||
| 259,568 | 2.164%, 3/16/2033 | 263,578 | ||||||
LB-UBS Commercial Mortgage Trust | ||||||||
| 300,000 | 4.786%, 10/15/2029 | 321,046 | ||||||
| 39,444 | 5.303%, 2/15/2040 | 39,458 | ||||||
| 100,000 | 5.866%, 9/15/2045 | 114,624 | ||||||
Morgan Stanley Capital I | ||||||||
| 100,000 | 3.224%, 7/15/2049 | 106,596 | ||||||
Morgan Stanley Capital, Inc. | ||||||||
| 285,000 | 5.332%, 12/15/2043 | 323,760 | ||||||
Wachovia Bank Commercial Mortgage Trust | ||||||||
| 850,000 | 0.362%, 9/15/2021a,c | 795,931 | ||||||
|
| |||||||
| Total | 2,628,948 | |||||||
|
| |||||||
| Mortgage-Backed Securities (75.5%) | ||||||||
Federal Home Loan Mortgage Corporation Gold 15-Yr. Pass Through | ||||||||
| 9,280,000 | 3.000%, 7/1/2027d | 9,701,950 | ||||||
Federal Home Loan Mortgage Corporation Gold 20-Yr. Pass Through | ||||||||
| 103,482 | 5.500%, 9/1/2024 | 113,619 | ||||||
Federal National Mortgage Association Conventional 20- Yr. Pass Through | ||||||||
| 703,909 | 6.000%, 8/1/2024 | 787,314 | ||||||
Federal National Mortgage Association Conventional 30- Yr. Pass Through | ||||||||
| 4,320,000 | 3.500%, 7/1/2042d | 4,540,725 | ||||||
| 2,000,000 | 4.000%, 7/1/2042d | 2,128,438 | ||||||
The accompanying Notes to Financial Statements are an integral part of this schedule.
248
Table of Contents
Mortgage Securities Portfolio
Schedule of Investments as of June 29, 2012
(unaudited)
| Principal Amount | Long-Term Fixed Income (102.7%) | Value | ||||||
| Mortgage-Backed Securities (75.5%) - continued | ||||||||
| $7,900,000 | 5.500%, 7/1/2042d | $ | 8,617,172 | |||||
|
| |||||||
| Total | 25,889,218 | |||||||
|
| |||||||
| U.S. Government and Agencies (4.7%) | ||||||||
U.S. Treasury Notes, TIPS | ||||||||
| 1,012,800 | 0.125%, 4/15/2017 | 1,069,137 | ||||||
| 508,200 | 0.125%, 1/15/2022 | 537,684 | ||||||
|
| |||||||
| Total | 1,606,821 | |||||||
|
| |||||||
Total Long-Term Fixed Income (cost $35,949,982) | 35,206,772 | |||||||
|
| |||||||
Short-Term Investments (60.1%)e | ||||||||
Federal Home Loan Bank Discount Notes | ||||||||
| 8,500,000 | 0.110%, 7/20/2012f | 8,499,480 | ||||||
Federal National Mortgage Association Discount Notes | ||||||||
| 100,000 | 0.120%, 7/18/2012f,g | 99,994 | ||||||
Liberty Street Funding, LLC | ||||||||
| 1,000,000 | 0.170%, 7/16/2012f | 999,924 | ||||||
Old Line Funding, LLC | ||||||||
| 1,000,000 | 0.230%, 8/15/2012f,h | 999,770 | ||||||
Straight-A Funding, LLC | ||||||||
| 1,028,000 | 0.180%, 8/22/2012f,h | 1,027,728 | ||||||
Thunder Bay Funding, LLC | ||||||||
| 1,000,000 | 0.150%, 7/5/2012f,h | 999,979 | ||||||
U.S. Treasury Bills | ||||||||
| 8,000,000 | 0.060%, 7/12/2012f | 7,999,840 | ||||||
|
| |||||||
| Total Short-Term Investments (at amortized cost) | 20,626,715 | |||||||
|
| |||||||
| Total Investments (cost $56,576,697) 162.8% | $ | 55,833,487 | ||||||
|
| |||||||
| Other Assets and Liabilities, Net (62.8%) | (21,529,648 | ) | ||||||
|
| |||||||
| Total Net Assets 100.0% | $ | 34,303,839 | ||||||
|
| |||||||
| a | Denotes variable rate securities. Variable rate securities are securities whose yields vary with a designated market index or market rate. The rate shown is as of June 29, 2012. |
| b | All or a portion of the security is insured or guaranteed. |
| c | Denotes restricted securities. Restricted securities are investment securities which have been deemed illiquid and cannot be offered for public sale without first being registered under the Securities Act of 1933. The following table indicates the acquisition date and cost of restricted securities Mortgage Securities Portfolio owned as of June 29, 2012. |
Security | Acquisition Date | Cost | ||||||
Wachovia Asset Securitization, Inc. | 3/16/2007 | $ | 573,393 | |||||
Wachovia Bank Commercial Mortgage Trust | 2/28/2007 | $ | 850,065 | |||||
| d | Denotes investments purchased on a when-issued or delayed delivery basis. |
| e | The interest rate shown reflects the yield, coupon rate or the discount rate at the date of purchase. |
| f | Denotes investments that benefit from credit enhancement or liquidity support provided by a third party bank, institution or government. |
| g | At June 29, 2012, $99,994 of investments were held on deposit with the counterparty and pledged as the initial margin deposit for open futures contracts. |
| h | Denotes securities sold under Rule 144A of the Securities Act of 1933, which exempts them from registration. These securities have been deemed liquid and may be resold to other dealers in the program or to other qualified institutional buyers. As of June 29, 2012, the value of these investments was $3,027,477 or 8.8% of total net assets. |
Definitions:
TIPS | - | Treasury Inflation Protected Security. |
Unrealized Appreciation (Depreciation)
Gross unrealized appreciation and depreciation of investments, based on cost for federal income tax purposes, were as follows:
Gross unrealized appreciation | $ | 459,898 | ||
Gross unrealized depreciation | (1,203,108 | ) | ||
|
| |||
Net unrealized appreciation (depreciation) | $ | (743,210 | ) | |
Cost for federal income tax purposes | $ | 56,576,697 | ||
The accompanying Notes to Financial Statements are an integral part of this schedule.
249
Table of Contents
Mortgage Securities Portfolio
Schedule of Investments as of June 29, 2012
(unaudited)
Fair Valuation Measurements
The following table is a summary of the inputs used, as of June 29, 2012, in valuing Mortgage Securities Portfolio’s assets carried at fair value.
Investments in Securities | Total | Level 1 | Level 2 | Level 3 | ||||||||||||
Long-Term Fixed Income | ||||||||||||||||
Asset-Backed Securities | 2,272,889 | — | 2,272,889 | — | ||||||||||||
Collateralized Mortgage Obligations | 2,808,896 | — | 2,808,896 | — | ||||||||||||
Commercial Mortgage-Backed Securities | 2,628,948 | — | 2,628,948 | — | ||||||||||||
Mortgage-Backed Securities | 25,889,218 | — | 25,889,218 | — | ||||||||||||
U.S. Government and Agencies | 1,606,821 | — | 1,606,821 | — | ||||||||||||
Short-Term Investments | 20,626,715 | — | 20,626,715 | — | ||||||||||||
|
|
|
|
|
|
|
| |||||||||
Total | $ | 55,833,487 | $ | — | $ | 55,833,487 | $ | — | ||||||||
|
|
|
|
|
|
|
| |||||||||
Other Financial Instruments | Total | Level 1 | Level 2 | Level 3 | ||||||||||||
Asset Derivatives | ||||||||||||||||
Futures Contracts | 2,850 | 2,850 | — | — | ||||||||||||
|
|
|
|
|
|
|
| |||||||||
Total Asset Derivatives | $ | 2,850 | $ | 2,850 | $ | — | $ | — | ||||||||
|
|
|
|
|
|
|
| |||||||||
There were no significant transfers between the Levels during the period ended June 29, 2012. Transfers between the levels are identified as of the end of the period.
Futures Contracts | Number of Contracts Long/(Short) | Expiration Date | Notional Principal Amount | Value | Unrealized Gain/(Loss) | |||||||||||||||
10-Yr. U.S. Treasury Bond Futures | 5 | September 2012 | $ | 664,025 | $ | 666,875 | $2,850 | |||||||||||||
Total Futures Contracts | $2,850 | |||||||||||||||||||
The following table summarizes the fair value and Statement of Assets and Liabilities location, as of June 29, 2012, for Mortgage Securities Portfolio’s investments in financial derivative instruments by primary risk exposure as discussed under item (2) Significant Accounting Policies of the Notes to Financial Statements.
Derivatives by risk category | Statement of Assets and Liabilities Location | Fair Value | ||||
Asset Derivatives | ||||||
Interest Rate Contracts | ||||||
Futures* | Net Assets - Net unrealized appreciation/(depreciation) on Futures contracts | 2,850 | ||||
Total Interest Rate Contracts | 2,850 | |||||
|
| |||||
Total Asset Derivatives | $ | 2,850 | ||||
|
| |||||
| * | Includes cumulative appreciation/depreciation of futures contracts as reported in the Schedule of Investments. Only current day’s variation margin is reported within the Statement of Assets and Liabilities. |
The following table summarizes the net realized gains/(losses) and Statement of Operations location, for the period ended June 29, 2012, for Mortgage Securities Portfolio’s investments in financial derivative instruments by primary risk exposure.
Derivatives by risk category | Statement of Operations Location | Realized Gains/(Losses) recognized in Income | ||||
Interest Rate Contracts | ||||||
Futures | Net realized gains/(losses) on Futures contracts | 20,408 | ||||
Total Interest Rate Contracts | 20,408 | |||||
|
| |||||
Total | $ | 20,408 | ||||
|
| |||||
The accompanying Notes to Financial Statements are an integral part of this schedule.
250
Table of Contents
Mortgage Securities Portfolio
Schedule of Investments as of June 29, 2012
(unaudited)
The following table summarizes the change in net unrealized appreciation/(depreciation) and Statement of Operations location, for the period ended June 29, 2012, for Mortgage Securities Portfolio’s investments in financial derivative instruments by primary risk exposure.
Derivatives by risk category | Statement of Operations Location | Change in unrealized appreciation/(depreciation) recognized in Income | ||||
Interest Rate Contracts | ||||||
Futures | Change in net unrealized appreciation/(depreciation) on Futures contracts | (2,838 | ) | |||
Total Interest Rate Contracts | (2,838 | ) | ||||
|
| |||||
Total | $ | (2,838 | ) | |||
|
| |||||
The following table presents Mortgage Securities Portfolio’s average volume of derivative activity during the period ended June 29, 2012.
Derivative Risk Category | Futures (Notional*) | Futures (Percentage of Average Net Assets) | ||||||
Interest Rate Contracts | $ | 665,519 | 2.0 | % | ||||
| * | Notional amount represents long or short, or both, derivative positions held by the Portfolio. |
The accompanying Notes to Financial Statements are an integral part of this schedule.
251
Table of Contents
Schedule of Investments as of June 29, 2012
(unaudited)
| Principal Amount | Asset Backed Commercial Paper (20.7%)a | Value | ||||||
Chariot Funding, LLC | ||||||||
| $4,545,000 | 0.150%, 7/2/2012b,c | $ | 4,544,962 | |||||
Dealers Capital Access | ||||||||
| 1,420,000 | 0.490%, 9/5/2012b | 1,418,705 | ||||||
| 1,420,000 | 0.500%, 9/14/2012b | 1,418,501 | ||||||
Golden Funding Corporation | ||||||||
| 1,405,000 | 0.200%, 7/2/2012b,c | 1,404,984 | ||||||
| 1,500,000 | 0.210%, 7/10/2012b,c | 1,499,913 | ||||||
Jupiter Securitization Company, LLC | ||||||||
| 1,500,000 | 0.320%, 9/21/2012b,c | 1,498,893 | ||||||
Liberty Street Funding, LLC | ||||||||
| 1,410,000 | 0.150%, 7/5/2012b,c | 1,409,971 | ||||||
| 1,405,000 | 0.160%, 7/18/2012b,c | 1,404,888 | ||||||
Nieuw Amsterdam Receivables Corporation | ||||||||
| 1,420,000 | 0.200%, 7/20/2012c | 1,419,842 | ||||||
Old Line Funding, LLC | ||||||||
| 1,490,000 | 0.240%, 7/25/2012b,c | 1,489,751 | ||||||
| 1,470,000 | 0.230%, 8/15/2012b,c | 1,469,568 | ||||||
| 1,400,000 | 0.180%, 8/21/2012b,c | 1,399,636 | ||||||
Sydney Capital Corporation | ||||||||
| 1,405,000 | 0.250%, 8/13/2012b,c | 1,404,571 | ||||||
| 1,420,000 | 0.300%, 9/14/2012b,c | 1,419,101 | ||||||
Thunder Bay Funding, LLC | ||||||||
| 1,420,000 | 0.160%, 7/20/2012b,c | 1,419,874 | ||||||
| 1,480,000 | 0.230%, 8/10/2012b,c | 1,479,613 | ||||||
| 1,400,000 | 0.210%, 9/18/2012b,c | 1,399,347 | ||||||
Variable Funding Capital Company, LLC | ||||||||
| 1,400,000 | 0.170%, 7/26/2012b,c | 1,399,828 | ||||||
|
| |||||||
| Total | 28,901,948 | |||||||
|
| |||||||
Certificate of Deposit (4.5%)a | ||||||||
Bank of Nova Scotia/Houston | ||||||||
| 780,000 | 0.547%, 5/10/2013d | 780,000 | ||||||
Royal Bank of Canada, New York | ||||||||
| 1,550,000 | 0.479%, 7/9/2012d | 1,550,000 | ||||||
Toronto-Dominion Bank NY | ||||||||
| 1,340,000 | 0.190%, 8/20/2012 | 1,340,000 | ||||||
| 885,000 | 0.486%, 10/19/2012d | 885,000 | ||||||
Westpac Banking Corporation of New York | ||||||||
| 1,645,000 | 0.526%, 10/24/2012d | 1,645,000 | ||||||
|
| |||||||
| Total | 6,200,000 | |||||||
|
| |||||||
Financial Company Commercial Paper (1.6%)a | ||||||||
Toronto Dominion Holdings | ||||||||
| 750,000 | 0.270%, 9/20/2012b,c | 749,538 | ||||||
US Bank NA | ||||||||
| 1,460,000 | 0.290%, 7/9/2012 | 1,459,894 | ||||||
|
| |||||||
| Total | 2,209,432 | |||||||
|
| |||||||
Government Agency Debt (35.3%)a | ||||||||
Federal Farm Credit Bank | ||||||||
| 900,000 | 0.250%, 8/8/2012b,d | 899,988 | ||||||
| 1,540,000 | 0.265%, 8/22/2013b,d | 1,541,441 | ||||||
| 1,450,000 | 0.216%, 8/27/2013b,d | 1,450,000 | ||||||
| 800,000 | 0.211%, 1/13/2014b,d | 800,132 | ||||||
| 1,650,000 | 0.265%, 2/24/2014b,d | 1,652,095 | ||||||
Federal Home Loan Bank | ||||||||
| 1,570,000 | 0.240%, 1/25/2013b,d | 1,570,045 | ||||||
| 1,420,000 | 0.180%, 12/20/2013b,d | 1,419,364 | ||||||
Federal Home Loan Mortgage Corporation | ||||||||
| 1,130,000 | 0.290%, 10/12/2012b,d | 1,130,200 | ||||||
| 930,000 | 0.320%, 9/3/2013b,d | 929,761 | ||||||
| 1,440,000 | 0.181%, 9/13/2013b,d | 1,439,927 | ||||||
| 1,540,000 | 0.209%, 11/4/2013b,d | 1,540,435 | ||||||
Federal National Mortgage Association | ||||||||
| 3,570,000 | 0.320%, 9/13/2012b,d | 3,570,587 | ||||||
| 2,000,000 | 0.273%, 9/17/2012b,d | 2,000,000 | ||||||
| 900,000 | 0.290%, 11/23/2012b,d | 899,929 | ||||||
| 1,400,000 | 0.274%, 12/20/2012b,d | 1,400,818 | ||||||
| 850,000 | 0.390%, 10/28/2013b,d | 849,885 | ||||||
| 1,410,000 | 0.224%, 6/20/2014b,d | 1,409,437 | ||||||
Overseas Private Investment Corporation | ||||||||
| 1,280,000 | 0.500%, 12/9/2012b | 1,283,550 | ||||||
| 5,435,000 | 0.500%, 12/9/2012b | 5,450,165 | ||||||
| 2,115,000 | 0.500%, 12/9/2012b | 2,120,902 | ||||||
| 3,515,000 | 0.500%, 12/9/2012b | 3,524,808 | ||||||
Straight-A Funding, LLC | ||||||||
| 1,470,000 | 0.180%, 7/9/2012b,c | 1,469,934 | ||||||
| 1,460,000 | 0.180%, 7/11/2012b,c | 1,459,920 | ||||||
| 1,460,000 | 0.180%, 7/12/2012b,c | 1,459,912 | ||||||
| 1,440,000 | 0.180%, 8/2/2012b,c | 1,439,762 | ||||||
| 1,400,000 | 0.180%, 8/9/2012b,c | 1,399,720 | ||||||
| 1,390,000 | 0.180%, 8/14/2012b,c | 1,389,687 | ||||||
| 1,420,000 | 0.180%, 9/10/2012b,c | 1,419,489 | ||||||
| 1,500,000 | 0.180%, 9/20/2012b,c | 1,499,385 | ||||||
| 1,410,000 | 0.180%, 9/25/2012b,c | 1,409,387 | ||||||
|
| |||||||
| Total | 49,830,665 | |||||||
|
| |||||||
| Shares | Investment Company (7.5%) | |||||||
AIM Investments Institutional Government and Agency Portfolio | ||||||||
| 15,000 | 0.030% | 15,000 | ||||||
BlackRock Cash Funds | �� | |||||||
| 6,533,000 | 0.210% | 6,533,000 | ||||||
Dreyfus Institutional Cash Advantage Fund | ||||||||
| 3,780,000 | 0.150% | 3,780,000 | ||||||
DWS Money Market Series | ||||||||
| 150,029 | 0.150% | 150,029 | ||||||
|
| |||||||
| Total | 10,478,029 | |||||||
|
| |||||||
| Principal Amount | Other Commercial Paper (11.7%)a | |||||||
General Electric Capital Corporation | ||||||||
| 1,400,000 | 0.250%, 10/19/2012b | 1,398,921 | ||||||
Georgia Transmission Corporation | ||||||||
| 1,040,000 | 0.290%, 8/29/2012c | 1,039,498 | ||||||
Nestle Australia, Ltd. | ||||||||
| 1,390,000 | 0.200%, 9/26/2012b | 1,389,320 | ||||||
The accompanying Notes to Financial Statements are an integral part of this schedule.
252
Table of Contents
Money Market Portfolio
Schedule of Investments as of June 29, 2012
(unaudited)
| Principal Amount | Other Commercial Paper (11.7%)a | Value | ||||||
Nestle Finance International, Ltd. | ||||||||
| $1,440,000 | 0.170%, 8/29/2012b | $ | 1,439,592 | |||||
| 1,410,000 | 0.180%, 8/30/2012b | 1,409,570 | ||||||
Novartis Finance Corporation | ||||||||
| 2,500,000 | 0.110%, 7/2/2012b,c | 2,499,985 | ||||||
Novartis Securities Investment, Ltd. | ||||||||
| 1,500,000 | 0.130%, 7/2/2012b,c | 1,499,989 | ||||||
| 1,500,000 | 0.180%, 9/12/2012b,c | 1,499,445 | ||||||
Reckitt Benckiser Treasury Services plc | ||||||||
| 1,410,000 | 0.230%, 9/13/2012b,c | 1,409,324 | ||||||
Total Capital Canada, Ltd. | ||||||||
| 1,420,000 | 0.180%, 7/19/2012b,c | 1,419,865 | ||||||
| 1,390,000 | 0.170%, 7/26/2012b,c | 1,389,829 | ||||||
|
| |||||||
| Total | 16,395,338 | |||||||
|
| |||||||
Other Note (2.3%)a | ||||||||
General Electric Capital Corporation | ||||||||
| 1,600,000 | 0.636%, 7/27/2012b,d | 1,600,211 | ||||||
| 1,645,000 | 0.485%, 8/13/2012b | 1,650,953 | ||||||
|
| |||||||
| Total | 3,251,164 | |||||||
|
| |||||||
Treasury Debt (4.4%)a | ||||||||
U.S. Treasury Bills | ||||||||
| 1,590,000 | 0.115%, 8/9/2012b | 1,589,797 | ||||||
| 1,535,000 | 0.130%, 8/23/2012b | 1,534,700 | ||||||
| 1,535,000 | 0.130%, 8/30/2012b | 1,534,662 | ||||||
| 1,535,000 | 0.145%, 9/13/2012b | 1,534,536 | ||||||
|
| |||||||
| Total | 6,193,695 | |||||||
|
| |||||||
Variable Rate Demand Note (11.4%)a | ||||||||
Denver, Colorado Airport System Revenue Bonds | ||||||||
| 5,200,000 | 0.170%, 7/6/2012b,d | 5,200,000 | ||||||
Douglas County, Nebraska Hospital Authority No. 2 Health Facilities Revenue Refunding Bonds (Children’s Hospital) | ||||||||
| 1,600,000 | 0.170%, 7/2/2012b,d | 1,600,000 | ||||||
Lancaster County, Nebraska Hospital Authority No. 1 Hospital Revenue Refunding Bonds (BryanLGH Medical Center) | ||||||||
| 1,890,000 | 0.170%, 7/6/2012b,d | 1,890,000 | ||||||
Louisiana Housing Finance Agency Qualified Gulf Opportunity Zone Bonds (Canterbury House Apartments - Sherwood) | ||||||||
| 1,940,000 | 0.170%, 7/6/2012b,d | 1,940,000 | ||||||
Overseas Private Investment Corporation | ||||||||
| 1,724,137 | 0.180%, 7/5/2012b,d | 1,724,137 | ||||||
St. Cloud, Minnesota Health Care Refunding Revenue Bonds (CentraCare Health System) | ||||||||
| 2,050,000 | 0.140%, 7/6/2012b,d | 2,050,000 | ||||||
Wisconsin State Health & Educational Facilities Authority Revenue Prohealth Care Inc. | ||||||||
| 1,565,000 | 0.170%, 7/2/2012b,d | 1,565,000 | ||||||
|
| |||||||
| Total | 15,969,137 | |||||||
|
| |||||||
| Total Investments (at amortized cost) 99.4% | $ | 139,429,408 | ||||||
|
| |||||||
| Other Assets and Liabilities, Net 0.6% | 874,765 | |||||||
|
| |||||||
| Total Net Assets 100.0% | $ | 140,304,173 | ||||||
|
| |||||||
| a | The interest rate shown reflects the yield, coupon rate or the discount rate at the date of purchase. |
| b | Denotes investments that benefit from credit enhancement or liquidity support provided by a third party bank, institution or government. |
| c | Denotes securities sold under Rule 144A of the Securities Act of 1933, which exempts them from registration. These securities have been deemed liquid and may be resold to other dealers in the program or to other qualified institutional buyers. As of June 29, 2012, the value of these investments was $50,519,411 or 36.0% of total net assets. |
| d | Denotes variable rate securities. Variable rate securities are securities whose yields vary with a designated market index or market rate. The rate shown is as of June 29, 2012. |
| Cost for federal income tax purposes | $ | 139,429,408 |
The accompanying Notes to Financial Statements are an integral part of this schedule.
253
Table of Contents
Money Market Portfolio
Schedule of Investments as of June 29, 2012
(unaudited)
Fair Valuation Measurements
The following table is a summary of the inputs used, as of June 29, 2012, in valuing Money Market Portfolio’s assets carried at fair value or amortized cost, which approximates fair value.
Investments in Securities | Total | Level 1 | Level 2 | Level 3 | ||||||||||||
Asset Backed Commercial Paper | 28,901,948 | — | 28,901,948 | — | ||||||||||||
Certificate of Deposit | 6,200,000 | — | 6,200,000 | — | ||||||||||||
Financial Company Commercial Paper | 2,209,432 | — | 2,209,432 | — | ||||||||||||
Government Agency Debt | 49,830,665 | — | 49,830,665 | — | ||||||||||||
Investment Company | 10,478,029 | 10,478,029 | — | — | ||||||||||||
Other Commercial Paper | 16,395,338 | — | 16,395,338 | — | ||||||||||||
Other Note | 3,251,164 | — | 3,251,164 | — | ||||||||||||
Treasury Debt | 6,193,695 | — | 6,193,695 | — | ||||||||||||
Variable Rate Demand Note | 15,969,137 | — | 15,969,137 | — | ||||||||||||
|
|
|
|
|
|
|
| |||||||||
Total | $ | 139,429,408 | $ | 10,478,029 | $ | 128,951,379 | $ | — | ||||||||
|
|
|
|
|
|
|
| |||||||||
There were no significant transfers between the Levels during the period ended June 29, 2012. Transfers between the levels are identified as of the end of the period.
The accompanying Notes to Financial Statements are an integral part of this schedule.
254
Table of Contents
[THIS PAGE INTENTIONALLY LEFT BLANK]
The accompanying Notes to Financial Statements are an integral part of this schedule.
255
Table of Contents
Thrivent Series Fund, Inc.
Statement of Assets and Liabilities
As of June 29, 2012 (unaudited) | Aggressive Allocation Portfolio | Moderately Aggressive Allocation Portfolio | Moderate Allocation Portfolio | Moderately Conservative Allocation Portfolio | ||||||||||||
Assets | ||||||||||||||||
Investments at cost | $ | 630,710,697 | $ | 3,082,689,137 | $ | 5,086,356,452 | $ | 2,706,039,565 | ||||||||
Investments in securities at value | 288,758,286 | 1,357,475,572 | 2,429,352,080 | 1,477,420,328 | ||||||||||||
Investments in affiliates at value | 304,465,306 | 1,624,662,559 | 2,595,767,512 | 1,232,334,573 | ||||||||||||
Investments at Value | 593,223,592 | 2,982,138,131 | 5,025,119,592 | 2,709,754,901 | ||||||||||||
Cash | 1,565,795 | 3,146,024 | 1,991,720 | 2,021,945 | ||||||||||||
Dividends and interest receivable | 307,445 | 2,291,826 | 4,640,768 | 2,937,571 | ||||||||||||
Prepaid expenses | 5,132 | 15,355 | 22,601 | 12,619 | ||||||||||||
Receivable for investments sold | 8,960,541 | 34,443,398 | 80,058,659 | 30,357,420 | ||||||||||||
Receivable for fund shares sold | 8,519 | 1,186,492 | 3,244,386 | 2,103,960 | ||||||||||||
Receivable for variation margin | 3,485,206 | 8,730,518 | 9,522,339 | 4,331,293 | ||||||||||||
Total Assets | 607,556,230 | 3,031,951,744 | 5,124,600,065 | 2,751,519,709 | ||||||||||||
Liabilities | ||||||||||||||||
Accrued expenses | 32,198 | 62,319 | 82,392 | 52,973 | ||||||||||||
Payable for investments purchased | 13,014,359 | 131,100,988 | 401,737,490 | 304,724,702 | ||||||||||||
Payable upon return of collateral for securities loaned | — | 12,639,496 | 16,771,065 | 5,844,049 | ||||||||||||
Payable for fund shares redeemed | 473,528 | 718,083 | 767,317 | 77,276 | ||||||||||||
Swap agreements, at value | — | — | 1,602,853 | 1,707,387 | ||||||||||||
Payable for variation margin | 3,710,690 | 5,590,712 | 3,569,787 | 2,268,501 | ||||||||||||
Payable to affiliate | 218,124 | 908,802 | 1,425,478 | 797,006 | ||||||||||||
Mortgage dollar roll deferred revenue | 7,528 | 72,857 | 208,822 | 177,547 | ||||||||||||
Total Liabilities | 17,456,427 | 151,093,257 | 426,165,204 | 315,649,441 | ||||||||||||
Net Assets | ||||||||||||||||
Capital stock (beneficial interest) | 617,686,593 | 2,915,122,693 | 4,648,006,651 | 2,377,510,827 | ||||||||||||
Accumulated undistributed net investment income/(loss) | 4,309,439 | 27,516,341 | 47,881,241 | 23,224,536 | ||||||||||||
Accumulated undistributed net realized gain/(loss) | 5,420,782 | 32,027,396 | 50,050,733 | 23,732,330 | ||||||||||||
Net unrealized appreciation/(depreciation) on: | ||||||||||||||||
Investments | 10,356,485 | 36,281,053 | 40,013,564 | 16,057,049 | ||||||||||||
Affiliated investments | (47,843,590 | ) | (136,832,059 | ) | (101,250,424 | ) | (12,341,713 | ) | ||||||||
Futures contracts | 170,200 | 6,743,349 | 13,439,154 | 7,315,276 | ||||||||||||
Foreign currency transactions | (106 | ) | (286 | ) | (260 | ) | — | |||||||||
Swap agreements | — | — | 294,202 | 371,963 | ||||||||||||
Total Net Assets | $ | 590,099,803 | $ | 2,880,858,487 | $ | 4,698,434,861 | $ | 2,435,870,268 | ||||||||
Shares of beneficial interest outstanding | 51,811,236 | 250,091,257 | 405,281,871 | 211,345,733 | ||||||||||||
Net asset value per share | $ | 11.39 | $ | 11.52 | $ | 11.59 | $ | 11.53 | ||||||||
The accompanying Notes to Financial Statements are an integral part of this schedule.
256
Table of Contents
Thrivent Series Fund, Inc.
Statement of Assets and Liabilities – continued
| Partner Technology Portfolio | Partner Healthcare Portfolio | Partner Natural Resources Portfolio | Partner Emerging Markets Portfolio | Real Estate Securities Portfolio | Partner Utilities Portfolio | Partner Small Cap Growth Portfolio | ||||||||||||||||||||
| $ | 32,231,668 | $ | 16,861,343 | $ | 36,347,175 | $ | 41,844,695 | $ | 126,729,773 | $ | 10,839,478 | $ | 212,995,580 | |||||||||||||
| 34,032,247 | 20,468,683 | 29,101,153 | 44,626,772 | 118,286,780 | 12,246,916 | 214,190,422 | ||||||||||||||||||||
| 3,702,075 | — | — | 1,650,131 | — | — | 22,565,603 | ||||||||||||||||||||
| 37,734,322 | 20,468,683 | 29,101,153 | 46,276,903 | 118,286,780 | 12,246,916 | 236,756,025 | ||||||||||||||||||||
| 327,796 | 606,305 | (a) | 1,222,130 | 1,115,771 | (b) | 1,035,463 | 624,273 | 8,815,390 | ||||||||||||||||||
| 10,433 | 80,222 | 19,207 | 77,284 | 295,898 | 23,832 | 70,649 | ||||||||||||||||||||
| 2,589 | 2,517 | 2,578 | 2,636 | 2,942 | 2,484 | 3,396 | ||||||||||||||||||||
| — | 33,196 | — | — | 1,002,518 | — | 3,162,989 | ||||||||||||||||||||
| 2,853 | 33,791 | 261 | 3,407 | 43,364 | 546 | 23,017 | ||||||||||||||||||||
| — | — | — | — | — | — | — | ||||||||||||||||||||
| 38,077,993 | 21,224,714 | 30,345,329 | 47,476,001 | 120,666,965 | 12,898,051 | 248,831,466 | ||||||||||||||||||||
| 20,058 | 13,963 | 13,630 | 23,861 | 45,978 | 13,388 | 32,281 | ||||||||||||||||||||
| 104,130 | 63,608 | — | — | 630,569 | — | 3,156,399 | ||||||||||||||||||||
| 3,702,075 | — | — | 1,650,131 | — | — | 22,565,603 | ||||||||||||||||||||
| 20,240 | 12,813 | 3,911 | 70,114 | 49,207 | 2,630 | 24,265 | ||||||||||||||||||||
| — | — | — | — | — | — | — | ||||||||||||||||||||
| — | — | — | — | — | — | — | ||||||||||||||||||||
| 26,813 | 16,143 | 20,559 | 40,598 | 81,029 | 6,047 | 149,789 | ||||||||||||||||||||
| — | — | — | — | — | — | — | ||||||||||||||||||||
| 3,873,316 | 106,527 | 38,100 | 1,784,704 | 806,783 | 22,065 | 25,928,337 | ||||||||||||||||||||
| 34,168,060 | 16,983,694 | 38,406,217 | 40,976,670 | 131,549,855 | 12,283,067 | 203,027,309 | ||||||||||||||||||||
| (77,674 | ) | 89,855 | 88,686 | 388,502 | 770,767 | 102,769 | (427,736 | ) | ||||||||||||||||||
| (5,388,363 | ) | 439,418 | (941,652 | ) | (106,864 | ) | (4,017,324 | ) | (917,265 | ) | (3,456,889 | ) | ||||||||||||||
| 5,502,654 | 3,607,340 | (7,246,022 | ) | 4,432,208 | (8,442,993 | ) | 1,407,438 | 23,760,445 | ||||||||||||||||||
| — | — | — | — | — | — | — | ||||||||||||||||||||
| — | — | — | — | — | — | — | ||||||||||||||||||||
| — | (2,120 | ) | — | 781 | (123 | ) | (23 | ) | — | |||||||||||||||||
| — | — | — | — | — | — | — | ||||||||||||||||||||
| $ | 34,204,677 | $ | 21,118,187 | $ | 30,307,229 | $ | 45,691,297 | $ | 119,860,182 | $ | 12,875,986 | $ | 222,903,129 | |||||||||||||
| 4,797,835 | 1,664,466 | 4,628,279 | 3,848,236 | 6,891,114 | 1,436,955 | 16,906,197 | ||||||||||||||||||||
| $ | 7.13 | $ | 12.69 | $ | 6.55 | $ | 11.87 | $ | 17.39 | $ | 8.96 | $ | 13.18 | |||||||||||||
| (a) | Includes foreign currency holdings of $4,720 (cost $4,738). |
| (b) | Includes foreign currency holdings of $27,222 (cost $27,017). |
The accompanying Notes to Financial Statements are an integral part of this schedule.
257
Table of Contents
Thrivent Series Fund, Inc.
Statement of Assets and Liabilities – continued
As of June 29, 2012 (unaudited) | Partner Small Cap Value Portfolio | Small Cap Stock Portfolio | Small Cap Index Portfolio | Mid Cap Growth Portfolio II | ||||||||||||
Assets | ||||||||||||||||
Investments at cost | $ | 218,372,914 | $ | 269,890,732 | $ | 168,936,879 | $ | 15,541,251 | ||||||||
Investments in securities at value | 254,961,846 | 256,914,844 | 190,629,603 | 16,464,836 | ||||||||||||
Investments in affiliates at value | 9,560,205 | 11,411,700 | 14,186,996 | — | ||||||||||||
Investments at Value | 264,522,051 | 268,326,544 | 204,816,599 | 16,464,836 | ||||||||||||
Cash | 642,951 | 2,038,653 | 820,900 | 663,857 | ||||||||||||
Dividends and interest receivable | 292,323 | 214,205 | 208,427 | 5,728 | ||||||||||||
Prepaid expenses | 3,612 | 3,685 | 3,327 | 2,511 | ||||||||||||
Receivable for investments sold | 106,368 | — | 10,170 | 71,950 | ||||||||||||
Receivable for fund shares sold | 46,452 | 841 | 154,722 | 216 | ||||||||||||
Unrealized gain on forward contracts | — | — | — | — | ||||||||||||
Receivable for variation margin | — | 890,650 | 26,498 | — | ||||||||||||
Total Assets | 265,613,757 | 271,474,578 | 206,040,643 | 17,209,098 | ||||||||||||
Liabilities | ||||||||||||||||
Accrued expenses | 38,959 | 54,312 | 59,457 | 73,552 | ||||||||||||
Payable for investments purchased | — | 121,500 | 241,928 | 78,641 | ||||||||||||
Payable upon return of collateral for securities loaned | 9,560,205 | 11,411,700 | 14,186,996 | — | ||||||||||||
Payable for fund shares redeemed | 27,371 | 240,352 | 39,050 | 15,309 | ||||||||||||
Unrealized loss on forward contracts | — | — | — | — | ||||||||||||
Payable for variation margin | — | — | — | — | ||||||||||||
Payable to affiliate | 166,418 | 147,489 | 60,577 | 14,801 | ||||||||||||
Total Liabilities | 9,792,953 | 11,975,353 | 14,588,008 | 182,303 | ||||||||||||
Net Assets | ||||||||||||||||
Capital stock (beneficial interest) | 211,403,088 | 288,862,268 | 154,681,137 | 15,706,754 | ||||||||||||
Accumulated undistributed net investment income/(loss) | 815,977 | 179,483 | 955,205 | (137,075 | ) | |||||||||||
Accumulated undistributed net realized gain/(loss) | (2,547,398 | ) | (29,440,406 | ) | (103,269 | ) | 533,531 | |||||||||
Net unrealized appreciation/(depreciation) on: | ||||||||||||||||
Investments | 46,149,137 | (1,564,188 | ) | 35,879,720 | 923,585 | |||||||||||
Futures contracts | — | 1,462,068 | 39,842 | — | ||||||||||||
Foreign currency forward contracts | — | — | — | — | ||||||||||||
Foreign currency transactions | — | — | — | — | ||||||||||||
Total Net Assets | $ | 255,820,804 | $ | 259,499,225 | $ | 191,452,635 | $ | 17,026,795 | ||||||||
Shares of beneficial interest outstanding | 13,183,719 | 21,198,496 | 15,344,657 | 2,028,531 | ||||||||||||
Net asset value per share | $ | 19.40 | $ | 12.24 | $ | 12.48 | $ | 8.39 | ||||||||
The accompanying Notes to Financial Statements are an integral part of this schedule.
258
Table of Contents
Thrivent Series Fund, Inc.
Statement of Assets and Liabilities – continued
Mid Cap Growth Portfolio | Partner Mid Cap Value Portfolio | Mid Cap Stock Portfolio | Mid Cap Index Portfolio | Partner Worldwide Allocation Portfolio | Partner International Stock Portfolio | Partner Socially Responsible Stock Portfolio | ||||||||||||||||||||
| $ | 312,372,147 | $ | 214,168,661 | $ | 428,372,445 | $ | 69,460,724 | $ | 609,503,190 | $ | 811,013,957 | $ | 7,135,155 | |||||||||||||
| 346,582,227 | 228,809,299 | 473,073,214 | 80,634,662 | 566,228,981 | 710,995,585 | 7,699,180 | ||||||||||||||||||||
| 8,213,181 | 2,021,325 | 6,402,000 | 2,437,401 | 33,307,673 | 29,171,018 | — | ||||||||||||||||||||
| 354,795,408 | 230,830,624 | 479,475,214 | 83,072,063 | 599,536,654 | 740,166,603 | 7,699,180 | ||||||||||||||||||||
| 2,591,295 | 1,889,836 | 3,387,737 | 652,309 | 12,356,486 | (a) | 3,620,491 | (b) | 407,011 | ||||||||||||||||||
| 119,258 | 429,468 | 493,786 | 86,585 | 2,486,781 | 2,594,768 | 5,483 | ||||||||||||||||||||
| 4,100 | 3,494 | 4,646 | 2,812 | 5,157 | 5,899 | 2,462 | ||||||||||||||||||||
| 1,497,867 | 1,801,701 | 1,663,370 | 772,878 | 878,251 | — | — | ||||||||||||||||||||
| 84,690 | 1,644 | 11,236 | 13,055 | 74,016,317 | 7,149 | 42 | ||||||||||||||||||||
| — | — | — | — | 178,722 | 5,675 | — | ||||||||||||||||||||
| — | — | �� | — | 25,168 | 96,448 | — | — | |||||||||||||||||||
| 359,092,618 | 234,956,767 | 485,035,989 | 84,624,870 | 689,554,816 | 746,400,585 | 8,114,178 | ||||||||||||||||||||
| 75,485 | 30,700 | 61,087 | 26,149 | 62,485 | 309,159 | 13,766 | ||||||||||||||||||||
| 1,340,734 | 2,157,638 | 3,490,652 | 331,425 | 797,833 | 193,261 | 137,281 | ||||||||||||||||||||
| 8,213,181 | 2,021,325 | 6,402,000 | 2,437,401 | 33,307,673 | 29,171,018 | — | ||||||||||||||||||||
| 102,688 | 695 | 34,311 | 135,691 | 1,446 | 106,770 | 7,312 | ||||||||||||||||||||
| — | — | — | — | 108,761 | 3,553 | — | ||||||||||||||||||||
| — | — | — | — | 66,766 | — | — | ||||||||||||||||||||
| 120,132 | 143,288 | 258,364 | 29,891 | 400,422 | 435,801 | 2,439 | ||||||||||||||||||||
| 9,852,220 | 4,353,646 | 10,246,414 | 2,960,557 | 34,745,386 | 30,219,562 | 160,798 | ||||||||||||||||||||
| 311,404,584 | 207,807,655 | 458,535,712 | 68,673,704 | 660,152,923 | 1,025,008,396 | 7,554,660 | ||||||||||||||||||||
| 133,894 | 1,015,339 | 599,785 | 310,813 | 9,438,055 | 14,078,554 | (2,105 | ) | |||||||||||||||||||
| (4,721,341 | ) | 5,118,164 | (35,448,691 | ) | (951,825 | ) | (4,886,733 | ) | (252,065,618 | ) | (163,200 | ) | ||||||||||||||
| 42,423,261 | 16,661,963 | 51,102,769 | 13,611,339 | (9,966,536 | ) | (70,847,354 | ) | 564,025 | ||||||||||||||||||
| — | — | — | 20,282 | 516 | — | — | ||||||||||||||||||||
| — | — | — | — | 69,961 | 2,122 | — | ||||||||||||||||||||
| — | — | — | — | 1,244 | 4,923 | — | ||||||||||||||||||||
| $ | 349,240,398 | $ | 230,603,121 | $ | 474,789,575 | $ | 81,664,313 | $ | 654,809,430 | $ | 716,181,023 | $ | 7,953,380 | |||||||||||||
| 18,797,357 | 17,284,761 | 39,282,719 | 7,197,421 | 84,283,004 | 77,561,200 | 714,651 | ||||||||||||||||||||
| $ | 18.58 | $ | 13.34 | $ | 12.09 | $ | 11.35 | $ | 7.77 | $ | 9.23 | $ | 11.13 | |||||||||||||
| (a) | Includes foreign currency holdings of $963,881 (cost $953,232). |
| (b) | Includes foreign currency holdings of $1,795,759 (cost $1,775,753). |
The accompanying Notes to Financial Statements are an integral part of this schedule.
259
Table of Contents
Thrivent Series Fund, Inc.
Statement of Assets and Liabilities – continued
As of June 29, 2012 (unaudited) | Partner All Cap Growth Portfolio | Partner All Cap Value Portfolio | Partner All Cap Portfolio | Large Cap Growth Portfolio II | ||||||||||||
Assets | ||||||||||||||||
Investments at cost | $ | 11,418,822 | $ | 6,794,119 | $ | 48,974,608 | $ | 12,334,352 | ||||||||
Investments in securities at value | 13,039,065 | 6,413,048 | 51,058,809 | 13,016,319 | ||||||||||||
Investments in affiliates at value | — | — | 362,240 | — | ||||||||||||
Investments at Value | 13,039,065 | 6,413,048 | 51,421,049 | 13,016,319 | ||||||||||||
Cash | 713,323 | 472,128 | 439,365 | 175,927 | ||||||||||||
Dividends and interest receivable | 9,216 | 6,795 | 67,884 | 9,724 | ||||||||||||
Prepaid expenses | 2,495 | 2,462 | 2,675 | 2,493 | ||||||||||||
Receivable for investments sold | — | 69,206 | 729,138 | — | ||||||||||||
Receivable for fund shares sold | 474 | 3,444 | 18,022 | 135 | ||||||||||||
Receivable for variation margin | — | — | — | — | ||||||||||||
Total Assets | 13,764,573 | 6,967,083 | 52,678,133 | 13,204,598 | ||||||||||||
Liabilities | ||||||||||||||||
Accrued expenses | 13,623 | 14,070 | 21,550 | 87,707 | ||||||||||||
Payable for investments purchased | 95,218 | 351,808 | 695,616 | — | ||||||||||||
Payable upon return of collateral for securities loaned | — | — | 362,240 | — | ||||||||||||
Payable for fund shares redeemed | 31,722 | 130 | 5,217 | 2,018 | ||||||||||||
Payable to affiliate | 7,655 | 2,075 | 34,135 | 13,391 | ||||||||||||
Mortgage dollar roll deferred revenue | — | — | — | — | ||||||||||||
Total Liabilities | 148,218 | 368,083 | 1,118,758 | 103,116 | ||||||||||||
Net Assets | ||||||||||||||||
Capital stock (beneficial interest) | 12,167,425 | 7,319,553 | 60,568,905 | 12,841,750 | ||||||||||||
Accumulated undistributed net investment income/(loss) | (10,060 | ) | 23,317 | 234,374 | (77,827 | ) | ||||||||||
Accumulated undistributed net realized gain/(loss) | (161,253 | ) | (362,799 | ) | (11,690,345 | ) | (344,408 | ) | ||||||||
Net unrealized appreciation/(depreciation) on: | ||||||||||||||||
Investments | 1,620,243 | (381,071 | ) | 2,446,441 | 681,967 | |||||||||||
Futures contracts | — | — | — | — | ||||||||||||
Foreign currency transactions | — | — | — | — | ||||||||||||
Total Net Assets | $ | 13,616,355 | $ | 6,599,000 | $ | 51,559,375 | $ | 13,101,482 | ||||||||
Shares of beneficial interest outstanding | 1,353,576 | 794,466 | 5,671,230 | 2,852,995 | ||||||||||||
Net asset value per share | $ | 10.06 | $ | 8.31 | $ | 9.09 | $ | 4.59 | ||||||||
The accompanying Notes to Financial Statements are an integral part of this schedule.
260
Table of Contents
Thrivent Series Fund, Inc.
Statement of Assets and Liabilities – continued
Large Cap Growth Portfolio | Partner Growth Stock Portfolio | Large Cap Value Portfolio | Large Cap Stock Portfolio | Large Cap Index Portfolio | Equity Income Plus Portfolio | Balanced Portfolio | ||||||||||||||||||||
| $ | 784,070,386 | $ | 33,926,782 | $ | 728,764,134 | $ | 552,297,194 | $ | 245,975,796 | $ | 91,939,173 | $ | 232,248,302 | |||||||||||||
| 839,509,594 | 53,398,097 | 780,032,663 | 583,752,764 | 299,622,110 | 95,542,058 | 263,657,379 | ||||||||||||||||||||
| — | 421,880 | 2,112,000 | 1,569,400 | 1,694,368 | — | 1,045,730 | ||||||||||||||||||||
| 839,509,594 | 53,819,977 | 782,144,663 | 585,322,164 | 301,316,478 | 95,542,058 | 264,703,109 | ||||||||||||||||||||
| 1,151,026 | 2,236,247 | 1,191,233 | 10,251,651 | 3,366,865 | 1,574,067 | 2,279,932 | ||||||||||||||||||||
| 795,454 | 32,567 | 1,079,674 | 644,396 | 390,251 | 180,537 | 609,921 | ||||||||||||||||||||
| 6,414 | 2,673 | 6,087 | 5,198 | 3,825 | 2,864 | 3,534 | ||||||||||||||||||||
| — | 68,076 | 13,891,014 | 2,781,501 | 272,924 | — | 3,496,363 | ||||||||||||||||||||
| 111,622 | 47,643 | 24,856 | 94 | 106,796 | 20,071 | 6,256 | ||||||||||||||||||||
| — | — | — | 102,000 | 85,000 | 36,890 | 87,271 | ||||||||||||||||||||
| 841,574,110 | 56,207,183 | 798,337,527 | 599,107,004 | 305,542,139 | 97,356,487 | 271,186,386 | ||||||||||||||||||||
| 217,159 | 22,435 | 99,848 | 95,496 | 89,421 | 15,689 | 81,672 | ||||||||||||||||||||
| — | 137,685 | 9,109,892 | 1,189,504 | 506,422 | — | 27,689,727 | ||||||||||||||||||||
| — | 421,880 | 2,112,000 | 1,569,400 | 1,694,368 | — | 1,045,730 | ||||||||||||||||||||
| 332,206 | 6,343 | 35,352 | 64,249 | 134,254 | 1,758 | 131,039 | ||||||||||||||||||||
| 280,985 | 37,643 | 379,585 | 309,261 | 91,249 | 56,573 | 76,356 | ||||||||||||||||||||
| — | — | — | — | — | — | 10,538 | ||||||||||||||||||||
| 830,350 | 625,986 | 11,736,677 | 3,227,910 | 2,515,714 | 74,020 | 29,035,062 | ||||||||||||||||||||
| 1,092,158,579 | 37,187,544 | 826,707,481 | 656,365,361 | 266,213,274 | 97,481,744 | 209,097,241 | ||||||||||||||||||||
| 4,679,186 | (70,061 | ) | 6,851,141 | 4,013,786 | 2,641,054 | 1,054,797 | 2,250,568 | |||||||||||||||||||
| (311,533,213 | ) | (1,429,500 | ) | (100,338,301 | ) | (97,659,299 | ) | (21,279,669 | ) | (4,901,414 | ) | (1,764,672 | ) | |||||||||||||
| 55,439,208 | 19,893,195 | 53,380,529 | 33,024,970 | 55,340,682 | 3,602,885 | 32,454,807 | ||||||||||||||||||||
| — | — | — | 134,276 | 111,084 | 44,455 | 113,380 | ||||||||||||||||||||
| — | 19 | — | — | — | — | — | ||||||||||||||||||||
| $ | 840,743,760 | $ | 55,581,197 | $ | 786,600,850 | $ | 595,879,094 | $ | 303,026,425 | $ | 97,282,467 | $ | 242,151,324 | |||||||||||||
| 47,450,247 | 4,304,186 | 72,321,062 | 68,917,145 | 15,937,621 | 10,401,462 | 16,453,897 | ||||||||||||||||||||
| $ | 17.72 | $ | 12.91 | $ | 10.88 | $ | 8.65 | $ | 19.01 | $ | 9.35 | $ | 14.72 | |||||||||||||
The accompanying Notes to Financial Statements are an integral part of this schedule.
261
Table of Contents
Thrivent Series Fund, Inc.
Statement of Assets and Liabilities – continued
As of June 29, 2012 (unaudited) | High Yield Portfolio | Diversified Income Plus Portfolio | Partner Socially Responsible Bond Portfolio | Income Portfolio | ||||||||||||
Assets | ||||||||||||||||
Investments at cost | $ | 878,784,222 | $ | 150,160,358 | $ | 10,526,216 | $ | 1,542,293,505 | ||||||||
Investments in securities at value | 824,754,130 | 149,454,961 | 10,766,233 | 1,600,409,664 | ||||||||||||
Investments in affiliates at value | 74,349,519 | 4,207,675 | — | 14,054,913 | ||||||||||||
Investments at Value | 899,103,649 | 153,662,636 | 10,766,233 | 1,614,464,577 | ||||||||||||
Cash | 803,100 | 2,580,714 | 1,421,576 | 3,949,718 | ||||||||||||
Dividends and interest receivable | 14,947,661 | 1,186,253 | 78,880 | 15,190,489 | ||||||||||||
Prepaid expenses | 6,025 | 3,020 | 2,481 | 9,017 | ||||||||||||
Receivable for investments sold | — | 638,396 | 33,624 | 25,680,199 | ||||||||||||
Receivable for fund shares sold | 401,955 | 626,609 | — | 163,946 | ||||||||||||
Swap agreements, at value | — | — | — | 334,508 | ||||||||||||
Receivable for variation margin | — | 41,834 | — | 910,282 | ||||||||||||
Total Assets | 915,262,390 | 158,739,462 | 12,302,794 | 1,660,702,736 | ||||||||||||
Liabilities | ||||||||||||||||
Accrued expenses | 109,611 | 26,962 | 13,992 | 158,149 | ||||||||||||
Payable for investments purchased | 5,624,529 | 4,397,284 | 95,510 | 113,956,801 | ||||||||||||
Payable upon return of collateral for securities loaned | 74,349,519 | 4,207,675 | — | 14,054,913 | ||||||||||||
Payable for fund shares redeemed | 182,821 | 6,856 | 1,750 | 127,799 | ||||||||||||
Payable for variation margin | — | 141,484 | — | 1,134,844 | ||||||||||||
Payable to affiliate | 279,732 | 54,386 | 3,348 | 513,498 | ||||||||||||
Mortgage dollar roll deferred revenue | — | 2,128 | — | 46,284 | ||||||||||||
Total Liabilities | 80,546,212 | 8,836,775 | 114,600 | 129,992,288 | ||||||||||||
Net Assets | ||||||||||||||||
Capital stock (beneficial interest) | 944,691,106 | 157,626,680 | 11,802,873 | 1,474,185,608 | ||||||||||||
Accumulated undistributed net investment income/(loss) | 289,096 | 3,147,877 | 105 | 16,979 | ||||||||||||
Accumulated undistributed net realized gain/(loss) | (130,583,451 | ) | (14,269,682 | ) | 145,199 | (14,897,409 | ) | |||||||||
Net unrealized appreciation/(depreciation) on: | ||||||||||||||||
Investments | 20,319,427 | 3,502,278 | 240,017 | 72,171,072 | ||||||||||||
Affiliated investments | — | — | — | — | ||||||||||||
Futures contracts | — | (104,466 | ) | — | (644,921 | ) | ||||||||||
Swap agreements | — | — | — | (120,881 | ) | |||||||||||
Total Net Assets | $ | 834,716,178 | $ | 149,902,687 | $ | 12,188,194 | $ | 1,530,710,448 | ||||||||
Shares of beneficial interest outstanding | 172,090,168 | 21,999,539 | 1,140,728 | 146,792,938 | ||||||||||||
Net asset value per share | $ | 4.85 | $ | 6.81 | $ | 10.68 | $ | 10.43 | ||||||||
The accompanying Notes to Financial Statements are an integral part of this schedule.
262
Table of Contents
Thrivent Series Fund, Inc.
Statement of Assets and Liabilities – continued
Bond Index Portfolio | Limited Maturity Bond Portfolio | Mortgage Securities Portfolio | Money Market Portfolio | |||||||||||
| $ | 212,429,844 | $ | 1,403,665,029 | $ | 56,576,697 | $ | 139,429,408 | |||||||
| 216,753,823 | 1,356,589,475 | 55,833,487 | 139,429,408 | |||||||||||
| 302,258 | 41,034,470 | — | — | |||||||||||
| 217,056,081 | 1,397,623,945 | 55,833,487 | 139,429,408 | a | ||||||||||
| 3,315,735 | 26,526,623 | 3,486,351 | 2,293 | |||||||||||
| 795,408 | 5,166,169 | 23,784 | 37,505 | |||||||||||
| 3,155 | 8,745 | 2,576 | 3,086 | |||||||||||
| 5,641,360 | 12,773,516 | 2,248,906 | 795,092 | |||||||||||
| 232,476 | 152,687 | 11,502 | 112,611 | |||||||||||
| — | 550,937 | — | — | |||||||||||
| — | 627,546 | — | — | |||||||||||
| 227,044,215 | 1,443,430,168 | 61,606,606 | 140,379,995 | |||||||||||
| 46,650 | 125,593 | 19,288 | 9,538 | |||||||||||
| 57,626,395 | 110,827,047 | 27,246,866 | — | |||||||||||
| 302,258 | 20,540,900 | — | — | |||||||||||
| 51,815 | 38,791 | 1,908 | 40,135 | |||||||||||
| — | 9,375 | 2,734 | — | |||||||||||
| 55,750 | 442,855 | 18,060 | 26,149 | |||||||||||
| 24,164 | 17,290 | 13,911 | — | |||||||||||
| 58,107,032 | 132,001,851 | 27,302,767 | 75,822 | |||||||||||
| 161,871,426 | 1,328,174,795 | 35,028,319 | 140,304,173 | |||||||||||
| (1,583 | ) | (144,365 | ) | — | (2,543 | ) | ||||||||
| 2,441,103 | (9,892,863 | ) | 15,880 | 2,543 | ||||||||||
| 4,626,237 | (11,034,654 | ) | (743,210 | ) | — | |||||||||
| — | 4,993,570 | — | — | |||||||||||
| — | (724,033 | ) | 2,850 | — | ||||||||||
| — | 55,867 | — | — | |||||||||||
| $ | 168,937,183 | $ | 1,311,428,317 | $ | 34,303,839 | $ | 140,304,173 | |||||||
| 15,000,941 | 133,854,236 | 3,302,971 | 140,304,173 | |||||||||||
| $ | 11.26 | $ | 9.80 | $ | 10.39 | $ | 1.00 | |||||||
| a | Securities held by this fund are valued on the basis of amortized cost, which approximates market value. |
The accompanying Notes to Financial Statements are an integral part of this schedule.
263
Table of Contents
Thrivent Series Fund, Inc.
For the six months ended June 29, 2012 (unaudited) | Aggressive Allocation Portfolio | Moderately Aggressive Allocation Portfolio | Moderate Allocation Portfolio | Moderately Conservative Allocation Portfolio | ||||||||||||
Investment Income | ||||||||||||||||
Dividends | $ | 1,708,174 | $ | 5,767,179 | $ | 6,708,066 | $ | 2,391,650 | ||||||||
Interest | 528,197 | 4,504,197 | 9,655,070 | 5,852,532 | ||||||||||||
Income from mortgage dollar rolls | 171,518 | 1,484,477 | 2,493,665 | 2,507,592 | ||||||||||||
Income from securities loaned | 60 | 49,481 | 59,997 | 17,410 | ||||||||||||
Income from affiliated investments | 3,391,349 | 21,397,951 | 37,172,166 | 17,040,093 | ||||||||||||
Foreign tax withholding | (12,691 | ) | (37,255 | ) | (43,087 | ) | (14,921 | ) | ||||||||
Total Investment Income | 5,786,607 | 33,166,030 | 56,045,877 | 27,794,356 | ||||||||||||
Expenses | ||||||||||||||||
Adviser fees | 1,329,983 | 5,379,931 | 7,731,839 | 4,247,927 | ||||||||||||
Sub-Adviser fees | — | — | — | — | ||||||||||||
Administrative service fees | 98,708 | 321,530 | 484,203 | 265,733 | ||||||||||||
Audit and legal fees | 12,588 | 29,686 | 42,178 | 25,412 | ||||||||||||
Custody fees | 33,340 | 48,541 | 58,311 | 42,498 | ||||||||||||
Insurance expenses | 3,525 | 9,883 | 13,686 | 7,233 | ||||||||||||
Directors’ fees | 6,316 | 18,396 | 25,780 | 15,109 | ||||||||||||
Other expenses | 8,466 | 12,233 | 13,360 | 10,084 | ||||||||||||
Total Expenses Before Reimbursement | 1,492,926 | 5,820,200 | 8,369,357 | 4,613,996 | ||||||||||||
Less: | ||||||||||||||||
Reimbursement from adviser | — | — | — | — | ||||||||||||
Custody earnings credit | (782 | ) | (907 | ) | (851 | ) | (862 | ) | ||||||||
Total Net Expenses | 1,492,144 | 5,819,293 | 8,368,506 | 4,613,134 | ||||||||||||
Net Investment Income/(Loss) | 4,294,463 | 27,346,737 | 47,677,371 | 23,181,222 | ||||||||||||
Realized and Unrealized Gains/(Losses) | ||||||||||||||||
Net realized gains/(losses) on: | ||||||||||||||||
Investments | 5,738,740 | 29,782,329 | 35,489,667 | 13,833,044 | ||||||||||||
Affiliated investments | 31,650 | (73,116 | ) | (1,391,971 | ) | (271,480 | ) | |||||||||
Futures contracts | 1,946,305 | 10,175,104 | 22,698,293 | 16,602,848 | ||||||||||||
Foreign currency transactions | (38,580 | ) | (101,679 | ) | (92,056 | ) | (377 | ) | ||||||||
Swap agreements | 28,857 | 833,223 | 4,493,266 | 2,367,793 | ||||||||||||
Change in net unrealized appreciation/(depreciation) on: | ||||||||||||||||
Investments | 6,108,318 | 14,534,366 | 16,835,498 | 6,377,225 | ||||||||||||
Affiliated investments | 11,796,405 | 62,769,658 | 92,224,697 | 34,327,524 | ||||||||||||
Futures contracts | (653,919 | ) | 4,554,898 | 9,685,082 | 2,331,445 | |||||||||||
Foreign currency forward contracts | — | — | — | — | ||||||||||||
Foreign currency transactions | 254 | 648 | 581 | — | ||||||||||||
Swap agreements | (3,247 | ) | (153,504 | ) | (625,348 | ) | (72,577 | ) | ||||||||
Net Realized and Unrealized Gains/(Losses) | 24,954,783 | 122,321,927 | 179,317,709 | 75,495,445 | ||||||||||||
Net Increase/(Decrease) in Net Assets Resulting From Operations | $ | 29,249,246 | $ | 149,668,664 | $ | 226,995,080 | $ | 98,676,667 | ||||||||
The accompanying Notes to Financial Statements are an integral part of this schedule.
264
Table of Contents
Thrivent Series Fund, Inc.
Statement of Operations – continued
Partner | Partner Healthcare Portfolio | Partner Natural Resources Portfolio | Partner Emerging Markets Portfolio | Real Estate Securities Portfolio | Partner Utilities Portfolio | Partner Small Cap Growth Portfolio | ||||||||||||||||||||
| $ | 67,901 | $ | 255,727 | $ | 271,660 | $ | 779,400 | $ | 1,335,700 | $ | 160,817 | $ | 548,282 | |||||||||||||
| — | — | — | 49 | — | — | 2,267 | ||||||||||||||||||||
| — | — | — | — | — | — | — | ||||||||||||||||||||
| 55,765 | — | — | 27 | — | — | 89,194 | ||||||||||||||||||||
| — | — | — | — | — | — | — | ||||||||||||||||||||
| — | (22,602 | ) | (1,991 | ) | (53,696 | ) | (1,562 | ) | — | (1,644 | ) | |||||||||||||||
| 123,666 | 233,125 | 269,669 | 725,780 | 1,334,138 | 160,817 | 638,099 | ||||||||||||||||||||
| 50,081 | 28,832 | 120,136 | 103,932 | 451,807 | 45,011 | 386,725 | ||||||||||||||||||||
| 75,122 | 62,469 | — | 158,782 | — | — | 665,951 | ||||||||||||||||||||
| 43,339 | 41,922 | 43,203 | 44,379 | 51,295 | 41,200 | 61,053 | ||||||||||||||||||||
| 8,361 | 8,283 | 8,399 | 12,566 | 8,643 | 8,233 | 9,695 | ||||||||||||||||||||
| 5,503 | 3,236 | 2,485 | 27,154 | 3,026 | 1,636 | 14,109 | ||||||||||||||||||||
| 1,781 | 1,727 | 1,760 | 1,777 | 2,374 | 1,700 | 2,314 | ||||||||||||||||||||
| 2,676 | 1,767 | 1,767 | 1,767 | 5,609 | 1,766 | 5,354 | ||||||||||||||||||||
| 3,208 | 4,020 | 3,192 | 7,481 | 4,394 | 3,141 | 4,656 | ||||||||||||||||||||
| 190,071 | 152,256 | 180,942 | 357,838 | 527,148 | 102,687 | 1,149,857 | ||||||||||||||||||||
| — | (32,048 | ) | (5,791 | ) | (51,013 | ) | — | (48,150 | ) | (105,267 | ) | |||||||||||||||
| (194) | (76 | ) | (494 | ) | (324 | ) | (82 | ) | (524 | ) | (664 | ) | ||||||||||||||
| 189,877 | 120,132 | 174,657 | 306,501 | 527,066 | 54,013 | 1,043,926 | ||||||||||||||||||||
| (66,211) | 112,993 | 95,012 | 419,279 | 807,072 | 106,804 | (405,827 | ) | |||||||||||||||||||
| 1,616,202 | 443,328 | (941,652 | ) | (91,565 | ) | 1,443,497 | (92,150 | ) | 8,510,905 | |||||||||||||||||
| — | — | — | — | — | — | — | ||||||||||||||||||||
| — | — | — | — | — | — | — | ||||||||||||||||||||
| — | (3,306 | ) | — | (4,503 | ) | — | — | — | ||||||||||||||||||
| — | — | — | — | — | — | — | ||||||||||||||||||||
| 2,840,961 | 2,065,378 | (1,963,459 | ) | 3,384,124 | 13,252,527 | 634,445 | 4,973,121 | |||||||||||||||||||
| — | — | — | — | — | — | — | ||||||||||||||||||||
| — | — | — | — | — | — | — | ||||||||||||||||||||
| — | — | — | (176 | ) | — | — | — | |||||||||||||||||||
| — | (1,448 | ) | — | 1,719 | (27 | ) | (5 | ) | — | |||||||||||||||||
| — | — | — | — | — | — | — | ||||||||||||||||||||
| 4,457,163 | 2,503,952 | (2,905,111 | ) | 3,289,599 | 14,695,997 | 542,290 | 13,484,026 | |||||||||||||||||||
| $4,390,952 | $ | 2,616,945 | $ | (2,810,099 | ) | $ | 3,708,878 | $ | 15,503,069 | $ | 649,094 | $ | 13,078,199 | |||||||||||||
The accompanying Notes to Financial Statements are an integral part of this schedule.
265
Table of Contents
Thrivent Series Fund, Inc.
Statement of Operations – continued
For the six months ended June 29, 2012 (unaudited) | Partner Small Cap Value Portfolio | Small Cap Stock Portfolio | Small Cap Index Portfolio | Mid Cap Growth Portfolio II | ||||||||||||
Investment Income | ||||||||||||||||
Dividends | $ | 2,677,137 | $ | 1,138,971 | $ | 1,359,758 | $ | 51,658 | ||||||||
Interest | 1,606 | 16,344 | 314 | — | ||||||||||||
Income from securities loaned | 84,295 | 118,231 | 83,896 | 217 | ||||||||||||
Foreign tax withholding | (2,164 | ) | (22,357 | ) | — | (337 | ) | |||||||||
Total Investment Income | 2,760,874 | 1,251,189 | 1,443,968 | 51,538 | ||||||||||||
Expenses | ||||||||||||||||
Adviser fees | 257,056 | 925,810 | 339,722 | 79,501 | ||||||||||||
Sub-Adviser fees | 771,169 | — | — | — | ||||||||||||
Administrative service fees | 65,705 | 66,965 | 59,412 | 41,766 | ||||||||||||
Audit and legal fees | 10,089 | 10,175 | 9,586 | 7,986 | ||||||||||||
Custody fees | 8,362 | 11,658 | 16,301 | 2,079 | ||||||||||||
Insurance expenses | 2,516 | 2,581 | 2,353 | 1,944 | ||||||||||||
Printing and postage expenses | — | — | — | 60,000 | ||||||||||||
Directors’ fees | 6,817 | 8,682 | 9,171 | 2,236 | ||||||||||||
Other expenses | 4,525 | 4,045 | 7,393 | 3,739 | ||||||||||||
Total Expenses Before Reimbursement | 1,126,239 | 1,029,916 | 443,938 | 199,251 | ||||||||||||
Less: | ||||||||||||||||
Reimbursement from adviser | — | — | — | (26,500 | ) | |||||||||||
Custody earnings credit | (404 | ) | (258 | ) | (258 | ) | (234 | ) | ||||||||
Total Net Expenses | 1,125,835 | 1,029,658 | 443,680 | 172,517 | ||||||||||||
Net Investment Income/(Loss) | 1,635,039 | 221,531 | 1,000,288 | (120,979 | ) | |||||||||||
Realized and Unrealized Gains/(Losses) | ||||||||||||||||
Net realized gains/(losses) on: | ||||||||||||||||
Investments | 664,268 | 6,033,299 | 4,735,279 | 512,927 | ||||||||||||
Futures contracts | — | 1,697,376 | 101,646 | — | ||||||||||||
Foreign currency transactions | — | (6,467 | ) | — | — | |||||||||||
Change in net unrealized appreciation/(depreciation) on: | ||||||||||||||||
Investments | 9,793,139 | (3,091,288 | ) | 8,918,542 | 664,654 | |||||||||||
Futures contracts | — | 1,023,936 | (20,026 | ) | — | |||||||||||
Foreign currency forward contracts | — | — | — | — | ||||||||||||
Foreign currency transactions | — | — | — | — | ||||||||||||
Net Realized and Unrealized Gains/(Losses) | 10,457,407 | 5,656,856 | 13,735,441 | 1,177,581 | ||||||||||||
Net Increase/(Decrease) in Net Assets Resulting From Operations | $ | 12,092,446 | $ | 5,878,387 | $ | 14,735,729 | $ | 1,056,602 | ||||||||
The accompanying Notes to Financial Statements are an integral part of this schedule.
266
Table of Contents
Thrivent Series Fund, Inc.
Statement of Operations – continued
Mid Cap Growth | Partner Mid Cap Value Portfolio | Mid Cap Stock Portfolio | Mid Cap Index Portfolio | Partner Worldwide Allocation Portfolio | Partner International Stock Portfolio | Partner Socially Responsible Stock Portfolio | ||||||||||||||||||||
| $ | 1,081,272 | $ | 2,010,939 | $ | 2,420,181 | $ | 525,876 | $ | 11,604,001 | $ | 18,535,129 | $ | 39,922 | |||||||||||||
| 5,817 | 1,689 | 9,531 | 93 | 1,715,629 | 4,296 | — | ||||||||||||||||||||
| 5,091 | 2,776 | 48,023 | 21,746 | 325,719 | 797,987 | — | ||||||||||||||||||||
| (6,958) | (103 | ) | (2,514 | ) | — | (1,100,171 | ) | (1,827,472 | ) | (902 | ) | |||||||||||||||
| 1,085,222 | 2,015,301 | 2,475,221 | 547,715 | 12,545,178 | 17,509,940 | 39,020 | ||||||||||||||||||||
| 722,796 | 311,437 | 1,608,618 | 144,642 | 1,079,642 | 1,741,458 | 10,575 | ||||||||||||||||||||
| — | 547,651 | — | — | 1,431,685 | 1,334,739 | 17,625 | ||||||||||||||||||||
| 76,140 | 62,909 | 87,974 | 48,265 | 97,635 | 113,814 | 40,705 | ||||||||||||||||||||
| 10,769 | 9,828 | 11,669 | 8,727 | 17,518 | 13,533 | 8,191 | ||||||||||||||||||||
| 7,454 | 17,585 | 12,264 | 7,364 | 146,834 | 93,009 | 3,432 | ||||||||||||||||||||
| 2,919 | 2,399 | 3,238 | 1,963 | 3,170 | 4,402 | 1,688 | ||||||||||||||||||||
| — | — | — | — | — | 246,666 | — | ||||||||||||||||||||
| 13,194 | 5,502 | 10,713 | 3,832 | 8,500 | 20,434 | 1,767 | ||||||||||||||||||||
| 4,276 | 4,134 | 4,387 | 5,785 | 44,483 | 21,677 | 3,218 | ||||||||||||||||||||
| 837,548 | 961,445 | 1,738,863 | 220,578 | 2,829,467 | 3,589,732 | 87,201 | ||||||||||||||||||||
| — | — | — | — | — | (265,167 | ) | (52,577 | ) | ||||||||||||||||||
| (222) | (321 | ) | (239 | ) | (369 | ) | (2,062 | ) | (428 | ) | (78 | ) | ||||||||||||||
| 837,326 | 961,124 | 1,738,624 | 220,209 | 2,827,405 | 3,324,137 | 34,546 | ||||||||||||||||||||
| 247,896 | 1,054,177 | 736,597 | 327,506 | 9,717,773 | 14,185,803 | 4,474 | ||||||||||||||||||||
| 23,817,192 | 9,133,060 | 23,634,247 | 1,775,455 | (669,329 | ) | (1,436,452 | ) | 229,606 | ||||||||||||||||||
| — | — | — | 251,008 | 152,537 | — | — | ||||||||||||||||||||
| — | — | — | — | (151,030 | ) | (257,564 | ) | — | ||||||||||||||||||
| (1,210,926) | 6,168,226 | 1,208,794 | 3,762,866 | 15,357,931 | 13,168,756 | 323,828 | ||||||||||||||||||||
| — | — | — | (65,090 | ) | (21,584 | ) | — | — | ||||||||||||||||||
| — | — | — | — | 78,433 | 2,264 | — | ||||||||||||||||||||
| — | — | — | — | 20,460 | 13,455 | — | ||||||||||||||||||||
| 22,606,266 | 15,301,286 | 24,843,041 | 5,724,239 | 14,767,418 | 11,490,459 | 553,434 | ||||||||||||||||||||
| $22,854,162 | $ | 16,355,463 | $ | 25,579,638 | $ | 6,051,745 | $ | 24,485,191 | $ | 25,676,262 | $ | 557,908 | ||||||||||||||
The accompanying Notes to Financial Statements are an integral part of this schedule.
267
Table of Contents
Thrivent Series Fund, Inc.
Statement of Operations – continued
For the six months ended June 29, 2012 (unaudited) | Partner All Cap Growth Portfolio | Partner All Cap Value Portfolio | Partner All Cap Portfolio | Large Cap Growth Portfolio II | ||||||||||||
Investment Income | ||||||||||||||||
Dividends | $ | 67,526 | $ | 61,517 | $ | 462,548 | $ | 108,074 | ||||||||
Interest | — | — | — | — | ||||||||||||
Income from mortgage dollar rolls | — | — | — | — | ||||||||||||
Income from securities loaned | — | — | 2,593 | 333 | ||||||||||||
Foreign tax withholding | (2,952 | ) | (203 | ) | (948 | ) | (1,265 | ) | ||||||||
Total Investment Income | 64,574 | 61,314 | 464,193 | 107,142 | ||||||||||||
Expenses | ||||||||||||||||
Adviser fees | 20,492 | 10,105 | 92,034 | 53,966 | ||||||||||||
Sub-Adviser fees | 44,400 | 15,158 | 157,773 | — | ||||||||||||
Administrative service fees | 41,366 | 40,674 | 45,259 | 41,349 | ||||||||||||
Audit and legal fees | 8,273 | 8,192 | 8,555 | 7,524 | ||||||||||||
Custody fees | 2,467 | 5,966 | 16,564 | 2,529 | ||||||||||||
Insurance expenses | 1,708 | 1,692 | 1,867 | 2,364 | ||||||||||||
Printing and postage expenses | — | — | — | 63,332 | ||||||||||||
Directors’ fees | 1,767 | 1,766 | 2,654 | 1,992 | ||||||||||||
Other expenses | 3,387 | 3,209 | 3,719 | 3,998 | ||||||||||||
Total Expenses Before Reimbursement | 123,860 | 86,762 | 328,425 | 177,054 | ||||||||||||
Less: | ||||||||||||||||
Reimbursement from adviser | (55,389 | ) | (53,662 | ) | (52,591 | ) | (10,119 | ) | ||||||||
Custody earnings credit | (163 | ) | (90 | ) | (119 | ) | (91 | ) | ||||||||
Total Net Expenses | 68,308 | 33,010 | 275,715 | 166,844 | ||||||||||||
Net Investment Income/(Loss) | (3,734 | ) | 28,304 | 188,478 | (59,702 | ) | ||||||||||
Realized and Unrealized Gains/(Losses) | ||||||||||||||||
Net realized gains/(losses) on: | ||||||||||||||||
Investments | (60,230 | ) | 68,991 | 2,730,520 | (344,408 | ) | ||||||||||
Written option contracts | — | — | — | — | ||||||||||||
Futures contracts | — | — | — | — | ||||||||||||
Foreign currency transactions | — | (8 | ) | — | — | |||||||||||
Change in net unrealized appreciation/(depreciation) on: | ||||||||||||||||
Investments | 936,931 | 88,611 | 1,284,036 | 1,550,296 | ||||||||||||
Written option contracts | — | — | — | — | ||||||||||||
Futures contracts | — | — | — | — | ||||||||||||
Foreign currency transactions | — | — | — | — | ||||||||||||
Net Realized and Unrealized Gains/(Losses) | 876,701 | 157,594 | 4,014,556 | 1,205,888 | ||||||||||||
Net Increase/(Decrease) in Net Assets Resulting From Operations | $ | 872,967 | $ | 185,898 | $ | 4,203,034 | $ | 1,146,186 | ||||||||
The accompanying Notes to Financial Statements are an integral part of this schedule.
268
Table of Contents
Thrivent Series Fund, Inc.
Statement of Operations – continued
Large Cap | Partner Growth Stock Portfolio | Large Cap Value Portfolio | Large Cap Stock Portfolio | Large Cap Index Portfolio | Equity Income Plus Portfolio | Balanced Portfolio | ||||||||||||||||||||
| $ | 6,749,953 | $ | 183,353 | $ | 9,985,291 | $ | 6,322,494 | $ | 3,236,635 | $ | 1,265,885 | $ | 1,688,338 | |||||||||||||
| 13,927 | — | 5,848 | 10,876 | 1,831 | 161,594 | 918,602 | ||||||||||||||||||||
| — | — | — | — | — | — | 201,468 | ||||||||||||||||||||
| 14,570 | 27,805 | 11,041 | 13,133 | 11,958 | — | 6,355 | ||||||||||||||||||||
| (29,251 | ) | (438 | ) | (71,103 | ) | (47,577 | ) | — | (23,819 | ) | — | |||||||||||||||
| 6,749,199 | 210,720 | 9,931,077 | 6,298,926 | 3,250,424 | 1,403,660 | 2,814,763 | ||||||||||||||||||||
| 1,703,969 | 110,551 | 2,353,679 | 1,895,644 | 514,656 | 305,572 | 423,678 | ||||||||||||||||||||
| — | 110,551 | — | — | — | — | — | ||||||||||||||||||||
| 125,198 | 45,527 | 118,456 | 99,485 | 70,189 | 49,402 | 64,213 | ||||||||||||||||||||
| 14,202 | 8,524 | 14,034 | 12,554 | 13,943 | 8,871 | 11,855 | ||||||||||||||||||||
| 13,514 | 12,249 | 13,372 | 16,008 | 14,772 | 8,409 | 17,972 | ||||||||||||||||||||
| 4,870 | 1,882 | 4,306 | 3,736 | 2,753 | 1,924 | 2,551 | ||||||||||||||||||||
| — | — | — | — | — | — | — | ||||||||||||||||||||
| 33,668 | 3,177 | 17,511 | 15,591 | 13,532 | 1,794 | 11,926 | ||||||||||||||||||||
| 5,633 | 4,147 | 5,469 | 5,305 | 6,951 | 4,799 | 11,409 | ||||||||||||||||||||
| 1,901,054 | 296,608 | 2,526,827 | 2,048,323 | 636,796 | 380,771 | 543,604 | ||||||||||||||||||||
| — | (27,638 | ) | — | — | — | — | — | |||||||||||||||||||
| (196 | ) | (188 | ) | (289 | ) | (715 | ) | (334 | ) | (659 | ) | (397 | ) | |||||||||||||
| 1,900,858 | 268,782 | 2,526,538 | 2,047,608 | 636,462 | 380,112 | 543,207 | ||||||||||||||||||||
| 4,848,341 | (58,062 | ) | 7,404,539 | 4,251,318 | 2,613,962 | 1,023,548 | 2,271,556 | |||||||||||||||||||
| 39,661,690 | 2,014,018 | 37,897,880 | 13,379,244 | 3,184,993 | 1,597,805 | 4,367,380 | ||||||||||||||||||||
| — | — | — | (50,431 | ) | — | (225,240 | ) | — | ||||||||||||||||||
| — | — | — | (155,618 | ) | 245,356 | 977,041 | (20,112 | ) | ||||||||||||||||||
| — | (464 | ) | — | — | — | — | — | |||||||||||||||||||
| 44,068,541 | 4,715,444 | 4,198,290 | 26,398,401 | 20,813,029 | 3,559,190 | 10,502,125 | ||||||||||||||||||||
| — | — | — | 7,050 | — | 89,026 | — | ||||||||||||||||||||
| — | — | — | 93,474 | (70,205 | ) | (130,610 | ) | 78,407 | ||||||||||||||||||
| — | 19 | — | — | — | — | — | ||||||||||||||||||||
| 83,730,231 | 6,729,017 | 42,096,170 | 39,672,120 | 24,173,173 | 5,867,212 | 14,927,800 | ||||||||||||||||||||
| $ | 88,578,572 | $ | 6,670,955 | $ | 49,500,709 | $ | 43,923,438 | $ | 26,787,135 | $ | 6,890,760 | $ | 17,199,356 | |||||||||||||
The accompanying Notes to Financial Statements are an integral part of this schedule.
269
Table of Contents
Thrivent Series Fund, Inc.
Statement of Operations – continued
For the six months ended June 29, 2012 (unaudited) | High Yield Portfolio | Diversified Income Plus Portfolio | Partner Socially Responsible Bond Portfolio | Income Portfolio | ||||||||||||
Investment Income | ||||||||||||||||
Dividends | $ | 245,813 | $ | 997,116 | $ | 1,528 | $ | 299,591 | ||||||||
Interest | 31,079,367 | 2,442,036 | 155,739 | 32,183,988 | ||||||||||||
Income from mortgage dollar rolls | — | 42,420 | — | 817,873 | ||||||||||||
Income from securities loaned | 159,070 | 33,161 | — | 33,826 | ||||||||||||
Income from affiliated investments | — | — | — | — | ||||||||||||
Foreign tax withholding | — | (18,656 | ) | — | — | |||||||||||
Total Investment Income | 31,484,250 | 3,496,077 | 157,267 | 33,335,278 | ||||||||||||
Expenses | ||||||||||||||||
Adviser fees | 1,609,514 | 263,182 | 17,163 | 2,971,784 | ||||||||||||
Sub-Adviser fees | — | — | 22,885 | — | ||||||||||||
Administrative service fees | 120,476 | 53,159 | 41,144 | 188,589 | ||||||||||||
Audit and legal fees | 14,265 | 9,100 | 8,222 | 19,913 | ||||||||||||
Custody fees | 13,075 | 9,526 | 3,592 | 24,523 | ||||||||||||
Insurance expenses | 4,272 | 2,031 | 1,699 | 6,247 | ||||||||||||
Directors’ fees | 20,696 | 4,641 | 1,766 | 30,931 | ||||||||||||
Other expenses | 10,294 | 8,520 | 5,341 | 18,496 | ||||||||||||
Total Expenses Before Reimbursement | 1,792,592 | 350,159 | 101,812 | 3,260,483 | ||||||||||||
Less: | ||||||||||||||||
Reimbursement from adviser | — | — | (62,522 | ) | — | |||||||||||
Custody earnings credit | (290 | ) | (876 | ) | (386 | ) | (352 | ) | ||||||||
Total Net Expenses | 1,792,302 | 349,283 | 38,904 | 3,260,131 | ||||||||||||
Net Investment Income/(Loss) | 29,691,948 | 3,146,794 | 118,363 | 30,075,147 | ||||||||||||
Realized and Unrealized Gains/(Losses) | ||||||||||||||||
Net realized gains/(losses) on: | ||||||||||||||||
Investments | 1,030,128 | 1,575,111 | 141,393 | 14,456,244 | ||||||||||||
Written option contracts | — | (41,346 | ) | — | — | |||||||||||
Futures contracts | 266,760 | 537,971 | 36,663 | (4,449,992 | ) | |||||||||||
Swap agreements | (133,156 | ) | — | — | 71,592 | |||||||||||
Change in net unrealized appreciation/(depreciation) on: | ||||||||||||||||
Investments | 30,549,844 | 4,717,702 | 150,773 | 38,055,695 | ||||||||||||
Affiliated investments | — | — | — | — | ||||||||||||
Written option contracts | — | 7,050 | — | — | ||||||||||||
Futures contracts | — | (126,286 | ) | (22,228 | ) | 1,797,648 | ||||||||||
Swap agreements | — | — | — | (120,881 | ) | |||||||||||
Net Realized and Unrealized Gains/(Losses) | 31,713,576 | 6,670,202 | 306,601 | 49,810,306 | ||||||||||||
Net Increase/(Decrease) in Net Assets Resulting From Operations | $ | 61,405,524 | $ | 9,816,996 | $ | 424,964 | $ | 79,885,453 | ||||||||
The accompanying Notes to Financial Statements are an integral part of this schedule.
270
Table of Contents
Thrivent Series Fund, Inc.
Statement of Operations – continued
Bond Index | Limited Maturity Bond Portfolio | Mortgage Securities Portfolio | Money Market Portfolio | |||||||||||
| $ | — | $ | 132,748 | $ | — | $ | 9,926 | |||||||
| 1,755,458 | 15,043,930 | 191,793 | 221,551 | |||||||||||
| 474,046 | 328,612 | 234,776 | — | |||||||||||
| 1,688 | 68,576 | — | — | |||||||||||
| — | 744,329 | — | — | |||||||||||
| — | — | — | — | |||||||||||
| 2,231,192 | 16,318,195 | 426,569 | 231,477 | |||||||||||
| 286,788 | 2,832,383 | 82,201 | 299,807 | |||||||||||
| — | — | — | — | |||||||||||
| 56,388 | 181,619 | 43,288 | 54,990 | |||||||||||
| 9,421 | 20,294 | 8,389 | 9,219 | |||||||||||
| 8,638 | 23,113 | 4,315 | 8,107 | |||||||||||
| 2,199 | 5,869 | 1,777 | 2,286 | |||||||||||
| 7,204 | 25,408 | 2,658 | 5,217 | |||||||||||
| 8,286 | 13,273 | 3,686 | 3,761 | |||||||||||
| 378,924 | 3,101,959 | 146,314 | 383,387 | |||||||||||
| — | (38,686 | ) | (4,266 | ) | (149,314 | ) | ||||||||
| (450) | (148 | ) | (717 | ) | (53 | ) | ||||||||
| 378,474 | 3,063,125 | 141,331 | 234,020 | |||||||||||
| 1,852,718 | 13,255,070 | 285,238 | (2,543 | ) | ||||||||||
| 2,506,080 | 10,789,325 | 1,160 | 2,543 | |||||||||||
| — | 22,537 | — | — | |||||||||||
| — | (4,791,244 | ) | 20,408 | — | ||||||||||
| — | (1,709,029 | ) | — | — | ||||||||||
| 253,553 | 11,996,726 | 576,717 | — | |||||||||||
| — | 799,543 | — | — | |||||||||||
| — | — | — | — | |||||||||||
| — | 1,252,689 | (2,838 | ) | — | ||||||||||
| — | 786,940 | — | — | |||||||||||
| 2,759,633 | 19,147,487 | 595,447 | 2,543 | |||||||||||
|
$4,612,351 |
| $ | 32,402,557 | $ | 880,685 | $ | — | ||||||
The accompanying Notes to Financial Statements are an integral part of this schedule.
271
Table of Contents
Thrivent Series Fund, Inc.
Statement of Changes in Net Assets
| Aggressive Allocation Portfolio | Moderately Aggressive Allocation Portfolio | |||||||||||||||
For the periods ended | 6/29/2012 (unaudited) | 12/31/2011 | 6/29/2012 (unaudited) | 12/31/2011 | ||||||||||||
Operations | ||||||||||||||||
Net investment income/(loss) | $ | 4,294,463 | $ | 2,856,314 | $ | 27,346,737 | $ | 32,267,256 | ||||||||
Net realized gains/(losses) | 7,706,972 | 24,893,720 | 40,615,861 | 33,081,780 | ||||||||||||
Change in net unrealized appreciation/(depreciation) | 17,247,811 | (51,092,533 | ) | 81,706,066 | (144,710,173 | ) | ||||||||||
Net Change in Net Assets Resulting From Operations | 29,249,246 | (23,342,499 | ) | 149,668,664 | (79,361,137 | ) | ||||||||||
Distributions to Shareholders | ||||||||||||||||
From net investment income | (3,721,260 | ) | (7,624,972 | ) | (34,281,853 | ) | (51,900,841 | ) | ||||||||
From net realized gains | (25,646,417 | ) | (9,854,172 | ) | (37,872,965 | ) | (31,682,401 | ) | ||||||||
Total Distributions to Shareholders | (29,367,677 | ) | (17,479,144 | ) | (72,154,818 | ) | (83,583,242 | ) | ||||||||
Capital Stock Transactions | ||||||||||||||||
Sold | 27,019,549 | 54,562,284 | 127,558,050 | 339,804,960 | ||||||||||||
Distributions reinvested | 29,367,677 | 17,479,144 | 72,154,818 | 83,583,242 | ||||||||||||
Redeemed | (26,723,312 | ) | (57,770,507 | ) | (55,969,507 | ) | (106,396,856 | ) | ||||||||
Total Capital Stock Transactions | 29,663,914 | 14,270,921 | 143,743,361 | 316,991,346 | ||||||||||||
Net Increase/(Decrease) in Net Assets | 29,545,483 | (26,550,722 | ) | 221,257,207 | 154,046,967 | |||||||||||
Net Assets, Beginning of Period | 560,554,320 | 587,105,042 | 2,659,601,280 | 2,505,554,313 | ||||||||||||
Net Assets, End of Period | $ | 590,099,803 | $ | 560,554,320 | $ | 2,880,858,487 | $ | 2,659,601,280 | ||||||||
Accumulated Undistributed Net Investment Income/(Loss) | $ | 4,309,439 | $ | 3,736,236 | $ | 27,516,341 | $ | 34,451,457 | ||||||||
Capital Stock Share Transactions | ||||||||||||||||
Sold | 2,209,927 | 4,497,044 | 10,779,984 | 28,933,351 | ||||||||||||
Distributions reinvested | 2,649,580 | 1,452,649 | 6,408,009 | 7,154,139 | ||||||||||||
Redeemed | (2,210,329 | ) | (4,814,726 | ) | (4,761,751 | ) | (9,153,921 | ) | ||||||||
|
|
|
|
|
|
|
| |||||||||
Total Capital Stock Share Transactions | 2,649,178 | 1,134,967 | 12,426,242 | 26,933,569 | ||||||||||||
|
|
|
|
|
|
|
| |||||||||
The accompanying Notes to Financial Statements are an integral part of this schedule.
272
Table of Contents
Thrivent Series Fund, Inc.
Statement of Changes in Net Assets – continued
| Moderate Allocation Portfolio | Moderately Conservative Allocation Portfolio | Partner Technology Portfolio | Partner Healthcare Portfolio | |||||||||||||||||||||||||||
| 6/29/2012 (unaudited) | 12/31/2011 | 6/29/2012 (unaudited) | 12/31/2011 | 6/29/2012 (unaudited) | 12/31/2011 | 6/29/2012 (unaudited) | 12/31/2011 | |||||||||||||||||||||||
| $ | 47,677,371 | $ | 72,847,582 | $ | 23,181,222 | $ | 38,974,199 | $ | (66,211 | ) | $ | (70,586 | ) | $ | 112,993 | $ | 43,220 | |||||||||||||
| 61,197,199 | 25,087,353 | 32,531,828 | 10,895,547 | 1,616,202 | 3,927,971 | 440,022 | 243,209 | |||||||||||||||||||||||
| 118,120,510 | (146,819,447 | ) | 42,963,617 | (48,724,566 | ) | 2,840,961 | (8,364,415 | ) | 2,063,930 | (996,129 | ) | |||||||||||||||||||
| 226,995,080 | (48,884,512 | ) | 98,676,667 | 1,145,180 | 4,390,952 | (4,507,030 | ) | 2,616,945 | (709,700 | ) | ||||||||||||||||||||
| (73,898,100 | ) | (86,731,755 | ) | (38,883,526 | ) | (38,905,574 | ) | — | — | (55,995 | ) | — | ||||||||||||||||||
| (31,454,770 | ) | (56,121,130 | ) | (17,675,615 | ) | (23,432,837 | ) | — | — | (248,326 | ) | (593,771 | ) | |||||||||||||||||
| (105,352,870 | ) | (142,852,885 | ) | (56,559,141 | ) | (62,338,411 | ) | — | — | (304,321 | ) | (593,771 | ) | |||||||||||||||||
| 400,789,853 | 735,610,343 | 315,427,249 | 524,415,702 | 2,381,260 | 4,028,249 | 1,578,091 | 3,532,995 | |||||||||||||||||||||||
| 105,352,870 | 142,852,885 | 56,559,141 | 62,338,411 | — | — | 304,321 | 593,771 | |||||||||||||||||||||||
| (62,996,788 | ) | (122,448,401 | ) | (33,500,442 | ) | (61,611,570 | ) | (2,182,945 | ) | (6,210,837 | ) | (1,076,561 | ) | (2,691,766 | ) | |||||||||||||||
| 443,145,935 | 756,014,827 | 338,485,948 | 525,142,543 | 198,315 | (2,182,588 | ) | 805,851 | 1,435,000 | ||||||||||||||||||||||
| 564,788,145 | 564,277,430 | 380,603,474 | 463,949,312 | 4,589,267 | (6,689,618 | ) | 3,118,475 | 131,529 | ||||||||||||||||||||||
| 4,133,646,716 | 3,569,369,286 | 2,055,266,794 | 1,591,317,482 | 29,615,410 | 36,305,028 | 17,999,712 | 17,868,183 | |||||||||||||||||||||||
| $ | 4,698,434,861 | $ | 4,133,646,716 | $ | 2,435,870,268 | $ | 2,055,266,794 | $ | 34,204,677 | $ | 29,615,410 | $ | 21,118,187 | $ | 17,999,712 | |||||||||||||||
| $ | 47,881,241 | $ | 74,101,970 | $ | 23,224,536 | $ | 38,926,840 | $ | (77,674 | ) | $ | (11,463 | ) | $ | 89,855 | $ | 32,857 | |||||||||||||
| 34,000,334 | 62,941,549 | 27,077,625 | 45,578,099 | 332,487 | 588,137 | 130,994 | 299,511 | |||||||||||||||||||||||
| 9,243,912 | 12,349,397 | 4,962,504 | 5,439,794 | — | — | 24,696 | 49,636 | |||||||||||||||||||||||
| (5,349,083 | ) | (10,622,664 | ) | (2,867,279 | ) | (5,337,581 | ) | (311,091 | ) | (915,838 | ) | (89,712 | ) | (229,385 | ) | |||||||||||||||
|
|
|
|
|
|
|
|
|
|
|
|
|
|
|
| |||||||||||||||
| 37,895,163 | 64,668,282 | 29,172,850 | 45,680,312 | 21,396 | (327,701 | ) | 65,978 | 119,762 | ||||||||||||||||||||||
|
|
|
|
|
|
|
|
|
|
|
|
|
|
|
| |||||||||||||||
The accompanying Notes to Financial Statements are an integral part of this schedule.
273
Table of Contents
Thrivent Series Fund, Inc.
Statement of Changes in Net Assets – continued
| Partner Natural Resources Portfolio | Partner Emerging Markets Portfolio | |||||||||||||||
For the periods ended | 6/29/2012 (unaudited) | 12/31/2011 | 6/29/2012 (unaudited) | 12/31/2011 | ||||||||||||
Operations | ||||||||||||||||
Net investment income/(loss) | $ | 95,012 | $ | 57,547 | $ | 419,279 | $ | 514,909 | ||||||||
Net realized gains/(losses) | (941,652 | ) | 4,340,546 | (96,068 | ) | 1,068,226 | ||||||||||
Change in net unrealized appreciation/(depreciation) | (1,963,459 | ) | (9,582,231 | ) | 3,385,667 | (6,288,280 | ) | |||||||||
Net Change in Net Assets Resulting From Operations | (2,810,099 | ) | (5,184,138 | ) | 3,708,878 | (4,705,145 | ) | |||||||||
Distributions to Shareholders | ||||||||||||||||
From net investment income | (77,727 | ) | (24,409 | ) | (252,692 | ) | (432,330 | ) | ||||||||
From net realized gains | (4,038,356 | ) | — | (239,345 | ) | — | ||||||||||
Total Distributions to Shareholders | (4,116,083 | ) | (24,409 | ) | (492,037 | ) | (432,330 | ) | ||||||||
Capital Stock Transactions | ||||||||||||||||
Sold | 3,914,815 | 12,752,094 | 7,178,124 | 12,171,485 | ||||||||||||
Distributions reinvested | 4,116,083 | 24,409 | 492,037 | 432,330 | ||||||||||||
Redeemed | (2,399,890 | ) | (4,664,964 | ) | (4,049,277 | ) | (9,556,440 | ) | ||||||||
In-kind redemptions | — | — | — | — | ||||||||||||
Total Capital Stock Transactions | 5,631,008 | 8,111,539 | 3,620,884 | 3,047,375 | ||||||||||||
Net Increase/(Decrease) in Net Assets | (1,295,174 | ) | 2,902,992 | 6,837,725 | (2,090,100 | ) | ||||||||||
Net Assets, Beginning of Period | 31,602,403 | 28,699,411 | 38,853,572 | 40,943,672 | ||||||||||||
Net Assets, End of Period | $ | 30,307,229 | $ | 31,602,403 | $ | 45,691,297 | $ | 38,853,572 | ||||||||
Accumulated Undistributed Net Investment Income/(Loss) | $ | 88,686 | $ | 71,401 | $ | 388,502 | $ | 221,915 | ||||||||
Capital Stock Share Transactions | ||||||||||||||||
Sold | 461,308 | 1,293,529 | 588,854 | 1,023,676 | ||||||||||||
Distributions reinvested | 660,581 | 2,450 | 43,088 | 35,959 | ||||||||||||
Redeemed | (288,155 | ) | (502,842 | ) | (340,550 | ) | (810,480 | ) | ||||||||
In-kind redemptions | — | — | — | — | ||||||||||||
|
|
|
|
|
|
|
| |||||||||
Total Capital Stock Share Transactions | 833,734 | 793,137 | 291,392 | 249,155 | ||||||||||||
|
|
|
|
|
|
|
| |||||||||
The accompanying Notes to Financial Statements are an integral part of this schedule.
274
Table of Contents
Thrivent Series Fund, Inc.
Statement of Changes in Net Assets – continued
| Real Estate Securities Portfolio | Partner Utilities Portfolio | Partner Small Cap Growth Portfolio | Partner Small Cap Value Portfolio | |||||||||||||||||||||||||||
| 6/29/2012 (unaudited) | 12/31/2011 | 6/29/2012 (unaudited) | 12/31/2011 | 6/29/2012 (unaudited) | 12/31/2011 | 6/29/2012 (unaudited) | 12/31/2011 | |||||||||||||||||||||||
| $ | 807,072 | $ | 4,302,879 | $ | 106,804 | $ | 195,073 | $ | (405,827 | ) | $ | (1,328,119 | ) | $ | 1,635,039 | $ | 1,323,363 | |||||||||||||
| 1,443,497 | 46,825,514 | (92,150 | ) | 129,743 | 8,510,905 | 30,411,991 | 664,268 | 3,364,074 | ||||||||||||||||||||||
| 13,252,500 | (49,731,078 | ) | 634,440 | 486,911 | 4,973,121 | (37,113,124 | ) | 9,793,139 | (9,846,842 | ) | ||||||||||||||||||||
| 15,503,069 | 1,397,315 | 649,094 | 811,727 | 13,078,199 | (8,029,252 | ) | 12,092,446 | (5,159,405 | ) | |||||||||||||||||||||
| (4,305,833 | ) | — | (193,478 | ) | (188,302 | ) | — | — | (1,705,822 | ) | (560,137 | ) | ||||||||||||||||||
| — | — | — | — | — | — | — | — | |||||||||||||||||||||||
| (4,305,833 | ) | — | (193,478 | ) | (188,302 | ) | — | — | (1,705,822 | ) | (560,137 | ) | ||||||||||||||||||
| 6,659,911 | 10,492,356 | 2,543,818 | 3,664,291 | 16,261,032 | 5,269,479 | 2,005,590 | 4,001,480 | |||||||||||||||||||||||
| 4,305,833 | — | 193,478 | 188,302 | — | — | 1,705,822 | 560,137 | |||||||||||||||||||||||
| (10,268,797 | ) | (26,179,966 | ) | (1,435,473 | ) | (1,264,285 | ) | (3,926,528 | ) | (8,274,466 | ) | (8,658,382 | ) | (15,399,807 | ) | |||||||||||||||
| — | (207,194,357 | ) | — | — | — | — | — | — | ||||||||||||||||||||||
| 696,947 | (222,881,967 | ) | 1,301,823 | 2,588,308 | 12,334,504 | (3,004,987 | ) | (4,946,970 | ) | (10,838,190 | ) | |||||||||||||||||||
| 11,894,183 | (221,484,652 | ) | 1,757,439 | 3,211,733 | 25,412,703 | (11,034,239 | ) | 5,439,654 | (16,557,732 | ) | ||||||||||||||||||||
| 107,965,999 | 329,450,651 | 11,118,547 | 7,906,814 | 197,490,426 | 208,524,665 | 250,381,150 | 266,938,882 | |||||||||||||||||||||||
| $ | 119,860,182 | $ | 107,965,999 | $ | 12,875,986 | $ | 11,118,547 | $ | 222,903,129 | $ | 197,490,426 | $ | 255,820,804 | $ | 250,381,150 | |||||||||||||||
| $ | 770,767 | $ | 4,269,528 | $ | 102,769 | $ | 189,443 | $ | (427,736 | ) | $ | (21,909 | ) | $ | 815,977 | $ | 886,760 | |||||||||||||
| 392,049 | 686,920 | 294,985 | 438,639 | 1,300,055 | 389,293 | 101,726 | 213,874 | |||||||||||||||||||||||
| 257,367 | — | 22,176 | 22,572 | — | — | 91,888 | 29,458 | |||||||||||||||||||||||
| (604,313 | ) | (1,720,834 | ) | (165,731 | ) | (152,395 | ) | (293,135 | ) | (631,342 | ) | (439,396 | ) | (816,570 | ) | |||||||||||||||
| — | (14,854,346 | ) | — | — | — | — | — | — | ||||||||||||||||||||||
|
|
|
|
|
|
|
|
|
|
|
|
|
|
|
| |||||||||||||||
| 45,103 | (15,888,260 | ) | 151,430 | 308,816 | 1,006,920 | (242,049 | ) | (245,782 | ) | (573,238 | ) | |||||||||||||||||||
|
|
|
|
|
|
|
|
|
|
|
|
|
|
|
| |||||||||||||||
The accompanying Notes to Financial Statements are an integral part of this schedule.
275
Table of Contents
Thrivent Series Fund, Inc.
Statement of Changes in Net Assets – continued
| Small Cap Stock Portfolio | Small Cap Index Portfolio | |||||||||||||||
For the periods ended | 6/29/2012 (unaudited) | 12/31/2011 | 6/29/2012 (unaudited) | 12/31/2011 | ||||||||||||
Operations | ||||||||||||||||
Net investment income/(loss) | $ | 221,531 | $ | (272,455 | ) | $ | 1,000,288 | $ | 1,293,444 | |||||||
Net realized gains/(losses) | 7,724,208 | 38,698,937 | 4,836,925 | 15,858,302 | ||||||||||||
Change in net unrealized appreciation/(depreciation) | (2,067,352 | ) | (52,961,455 | ) | 8,898,516 | (15,798,990 | ) | |||||||||
Net Change in Net Assets Resulting From Operations | 5,878,387 | (14,534,973 | ) | 14,735,729 | 1,352,756 | |||||||||||
Distributions to Shareholders | ||||||||||||||||
From net investment income | — | — | (1,295,441 | ) | (1,738,716 | ) | ||||||||||
From net realized gains | — | — | (15,926,080 | ) | (5,929,388 | ) | ||||||||||
Total Distributions to Shareholders | — | — | (17,221,521 | ) | (7,668,104 | ) | ||||||||||
Capital Stock Transactions | ||||||||||||||||
Sold | 3,282,869 | 9,883,221 | 2,935,620 | 3,467,541 | ||||||||||||
Distributions reinvested | — | — | 17,221,521 | 7,668,104 | ||||||||||||
Redeemed | (13,500,033 | ) | (34,747,549 | ) | (15,209,030 | ) | (35,931,155 | ) | ||||||||
In-kind redemptions | — | — | — | — | ||||||||||||
Total Capital Stock Transactions | (10,217,164 | ) | (24,864,328 | ) | 4,948,111 | (24,795,510 | ) | |||||||||
Net Increase/(Decrease) in Net Assets | (4,338,777 | ) | (39,399,301 | ) | 2,462,319 | (31,110,858 | ) | |||||||||
Net Assets, Beginning of Period | 263,838,002 | 303,237,303 | 188,990,316 | 220,101,174 | ||||||||||||
Net Assets, End of Period | $ | 259,499,225 | $ | 263,838,002 | $ | 191,452,635 | $ | 188,990,316 | ||||||||
Accumulated Undistributed Net Investment Income/(Loss) | $ | 179,483 | $ | (42,048 | ) | $ | 955,205 | $ | 1,250,358 | |||||||
Capital Stock Share Transactions | ||||||||||||||||
Sold | 260,293 | 817,829 | 216,583 | 266,080 | ||||||||||||
Distributions reinvested | — | — | 1,444,298 | 585,316 | ||||||||||||
Redeemed | (1,065,317 | ) | (2,759,965 | ) | (1,116,542 | ) | (2,742,693 | ) | ||||||||
In-kind redemptions | — | — | — | — | ||||||||||||
|
|
|
|
|
|
|
| |||||||||
Total Capital Stock Share Transactions | (805,024 | ) | (1,942,136 | ) | 544,339 | (1,891,297 | ) | |||||||||
|
|
|
|
|
|
|
| |||||||||
The accompanying Notes to Financial Statements are an integral part of this schedule.
276
Table of Contents
Thrivent Series Fund, Inc.
Statement of Changes in Net Assets – continued
| Mid Cap Growth Portfolio II | Mid Cap Growth Portfolio | Partner Mid Cap Value Portfolio | Mid Cap Stock Portfolio | |||||||||||||||||||||||||||
| 6/29/2012 (unaudited) | 12/31/2011 | 6/29/2012 (unaudited) | 12/31/2011 | 6/29/2012 (unaudited) | 12/31/2011 | 6/29/2012 (unaudited) | 12/31/2011 | |||||||||||||||||||||||
| $ | (120,979 | ) | $ | (181,125 | ) | $ | 247,896 | $ | 809,887 | $ | 1,054,177 | $ | 1,929,624 | $ | 736,597 | $ | 1,201,376 | |||||||||||||
| 512,927 | 37,293,684 | 23,817,192 | 17,854,603 | 9,133,060 | 19,848,018 | 23,634,247 | 31,255,555 | |||||||||||||||||||||||
| 664,654 | (38,135,402 | ) | (1,210,926 | ) | (38,786,888 | ) | 6,168,226 | (36,357,876 | ) | 1,208,794 | (62,951,078 | ) | ||||||||||||||||||
| 1,056,602 | (1,022,843 | ) | 22,854,162 | (20,122,398 | ) | 16,355,463 | (14,580,234 | ) | 25,579,638 | (30,494,147 | ) | |||||||||||||||||||
| — | (164,024 | ) | (813,792 | ) | (1,271,495 | ) | (1,932,483 | ) | (501,793 | ) | (1,205,625 | ) | (227,230 | ) | ||||||||||||||||
| (2,279,396 | ) | (5,762,903 | ) | — | — | — | — | — | — | |||||||||||||||||||||
| (2,279,396 | ) | (5,926,927 | ) | (813,792 | ) | (1,271,495 | ) | (1,932,483 | ) | (501,793 | ) | (1,205,625 | ) | (227,230 | ) | |||||||||||||||
| 590,248 | 1,181,655 | 4,551,165 | 14,564,553 | 836,766 | 3,149,836 | 1,331,513 | 4,514,214 | |||||||||||||||||||||||
| 2,279,396 | 5,926,927 | 813,792 | 1,271,495 | 1,932,483 | 501,793 | 1,205,625 | 227,230 | |||||||||||||||||||||||
| (1,591,902 | ) | (9,586,659 | ) | (26,998,443 | ) | (65,517,978 | ) | (2,419,171 | ) | (4,902,288 | ) | (9,146,994 | ) | (28,471,182 | ) | |||||||||||||||
| — | (133,828,325 | ) | — | — | — | — | — | — | ||||||||||||||||||||||
| 1,277,742 | (136,306,402 | ) | (21,633,486 | ) | (49,681,930 | ) | 350,078 | (1,250,659 | ) | (6,609,856 | ) | (23,729,738 | ) | |||||||||||||||||
| 54,948 | (143,256,172 | ) | 406,884 | (71,075,823 | ) | 14,773,058 | (16,332,686 | ) | 17,764,157 | (54,451,115 | ) | |||||||||||||||||||
| 16,971,847 | 160,228,019 | 348,833,514 | 419,909,337 | 215,830,063 | 232,162,749 | 457,025,418 | 511,476,533 | |||||||||||||||||||||||
| $ | 17,026,795 | $ | 16,971,847 | $ | 349,240,398 | $ | 348,833,514 | $ | 230,603,121 | $ | 215,830,063 | $ | 474,789,575 | $ | 457,025,418 | |||||||||||||||
| $ | (137,075 | ) | $ | (16,096 | ) | $ | 133,894 | $ | 699,790 | $ | 1,015,339 | $ | 1,893,645 | $ | 599,785 | $ | 1,068,813 | |||||||||||||
| 58,600 | 119,495 | 239,875 | 778,985 | 62,105 | 238,184 | 109,500 | 364,509 | |||||||||||||||||||||||
| 279,605 | 605,165 | 45,076 | 67,592 | 149,406 | 36,760 | 102,995 | 18,241 | |||||||||||||||||||||||
| (159,514 | ) | (993,586 | ) | (1,421,430 | ) | (3,532,552 | ) | (178,983 | ) | (368,342 | ) | (743,764 | ) | (2,306,482 | ) | |||||||||||||||
| — | (13,980,645 | ) | — | — | — | — | — | — | ||||||||||||||||||||||
|
|
|
|
|
|
|
|
|
|
|
|
|
|
|
| |||||||||||||||
| 178,691 | (14,249,571 | ) | (1,136,479 | ) | (2,685,975 | ) | 32,528 | (93,398 | ) | (531,269 | ) | (1,923,732 | ) | |||||||||||||||||
|
|
|
|
|
|
|
|
|
|
|
|
|
|
|
| |||||||||||||||
The accompanying Notes to Financial Statements are an integral part of this schedule.
277
Table of Contents
Thrivent Series Fund, Inc.
Statement of Changes in Net Assets – continued
| Mid Cap Index Portfolio | Partner Worldwide Allocation Portfolio | |||||||||||||||
For the periods ended | 6/29/2012 (unaudited) | 12/31/2011 | 6/29/2012 (unaudited) | 12/31/2011 | ||||||||||||
Operations | ||||||||||||||||
Net investment income/(loss) | $ | 327,506 | $ | 636,118 | $ | 9,717,773 | $ | 12,066,451 | ||||||||
Net realized gains/(losses) | 2,026,463 | 7,431,994 | (667,822 | ) | 16,701,013 | |||||||||||
Change in net unrealized appreciation/(depreciation) | 3,697,776 | (9,526,961 | ) | 15,435,240 | (98,812,015 | ) | ||||||||||
Net Change in Net Assets Resulting From Operations | 6,051,745 | (1,458,849 | ) | 24,485,191 | (70,044,551 | ) | ||||||||||
Distributions to Shareholders | ||||||||||||||||
From net investment income | (637,407 | ) | (714,334 | ) | (182,626 | ) | (11,145,255 | ) | ||||||||
From net realized gains | (7,803,365 | ) | (5,251,300 | ) | — | (9,296,969 | ) | |||||||||
Total Distributions to Shareholders | (8,440,772 | ) | (5,965,634 | ) | (182,626 | ) | (20,442,224 | ) | ||||||||
Capital Stock Transactions | ||||||||||||||||
Sold | 2,680,275 | 3,054,967 | 138,003,996 | 51,510,070 | ||||||||||||
Distributions reinvested | 8,440,772 | 5,965,634 | 182,626 | 20,442,224 | ||||||||||||
Redeemed | (5,181,729 | ) | (17,658,888 | ) | (3,266,169 | ) | (8,484,281 | ) | ||||||||
Total Capital Stock Transactions | 5,939,318 | (8,638,287 | ) | 134,920,453 | 63,468,013 | |||||||||||
Net Increase/(Decrease) in Net Assets | 3,550,291 | (16,062,770 | ) | 159,223,018 | (27,018,762 | ) | ||||||||||
Net Assets, Beginning of Period | 78,114,022 | 94,176,792 | 495,586,412 | 522,605,174 | ||||||||||||
Net Assets, End of Period | $ | 81,664,313 | $ | 78,114,022 | $ | 654,809,430 | $ | 495,586,412 | ||||||||
Accumulated Undistributed Net Investment Income/(Loss) | $ | 310,813 | $ | 620,714 | $ | 9,438,055 | $ | (97,092 | ) | |||||||
Capital Stock Share Transactions | ||||||||||||||||
Sold | 210,298 | 240,808 | 17,625,002 | 5,715,846 | ||||||||||||
Distributions reinvested | 769,224 | 472,525 | 24,205 | 2,759,006 | ||||||||||||
Redeemed | (407,102 | ) | (1,381,798 | ) | (414,457 | ) | (997,461 | ) | ||||||||
|
|
|
|
|
|
|
| |||||||||
Total Capital Stock Share Transactions | 572,420 | (668,465 | ) | 17,234,750 | 7,477,391 | |||||||||||
|
|
|
|
|
|
|
| |||||||||
The accompanying Notes to Financial Statements are an integral part of this schedule.
278
Table of Contents
Thrivent Series Fund, Inc.
Statement of Changes in Net Assets – continued
| Partner International Stock Portfolio | Partner Socially Responsible Stock Portfolio | Partner All Cap Growth Portfolio | Partner All Cap Value Portfolio | |||||||||||||||||||||||||||
| 6/29/2012 (unaudited) | 12/31/2011 | 6/29/2012 (unaudited) | 12/31/2011 | 6/29/2012 (unaudited) | 12/31/2011 | 6/29/2012 (unaudited) | 12/31/2011 | |||||||||||||||||||||||
| $ | 14,185,803 | $ | 20,190,593 | $ | 4,474 | $ | 356 | $ | (3,734 | ) | $ | (35,294 | ) | $ | 28,304 | $ | 43,500 | |||||||||||||
| (1,694,016 | ) | 38,789,623 | 229,606 | 217,579 | (60,230 | ) | 992,252 | 68,983 | 591,490 | |||||||||||||||||||||
| 13,184,475 | (174,424,501 | ) | 323,828 | (398,153 | ) | 936,931 | (2,010,738 | ) | 88,611 | (1,408,253 | ) | |||||||||||||||||||
| 25,676,262 | (115,444,285 | ) | 557,908 | (180,218 | ) | 872,967 | (1,053,780 | ) | 185,898 | (773,263 | ) | |||||||||||||||||||
| (19,917,035 | ) | (312,749 | ) | (1,439 | ) | (45 | ) | — | — | (43,276 | ) | (44,465 | ) | |||||||||||||||||
| — | — | — | — | — | — | — | — | |||||||||||||||||||||||
| (19,917,035 | ) | (312,749 | ) | (1,439 | ) | (45 | ) | — | — | (43,276 | ) | (44,465 | ) | |||||||||||||||||
| 3,811,605 | 7,217,381 | 1,698,152 | 2,616,339 | 1,918,046 | 4,620,594 | 775,699 | 1,688,814 | |||||||||||||||||||||||
| 19,917,035 | 312,749 | 1,439 | 45 | — | — | 43,276 | 44,465 | |||||||||||||||||||||||
| (23,134,349 | ) | (71,285,023 | ) | (448,971 | ) | (717,117 | ) | (1,884,159 | ) | (2,615,700 | ) | (1,068,311 | ) | (1,567,521 | ) | |||||||||||||||
| 594,291 | (63,754,893 | ) | 1,250,620 | 1,899,267 | 33,887 | 2,004,894 | (249,336 | ) | 165,758 | |||||||||||||||||||||
| 6,353,518 | (179,511,927 | ) | 1,807,089 | 1,719,004 | 906,854 | 951,114 | (106,714 | ) | (651,970 | ) | ||||||||||||||||||||
| 709,827,505 | 889,339,432 | 6,146,291 | 4,427,287 | 12,709,501 | 11,758,387 | 6,705,714 | 7,357,684 | |||||||||||||||||||||||
| $ | 716,181,023 | $ | 709,827,505 | $ | 7,953,380 | $ | 6,146,291 | $ | 13,616,355 | $ | 12,709,501 | $ | 6,599,000 | $ | 6,705,714 | |||||||||||||||
| $ | 14,078,554 | $ | 19,809,786 | $ | (2,105 | ) | $ | (5,140 | ) | $ | (10,060 | ) | $ | (6,326 | ) | $ | 23,317 | $ | 38,289 | |||||||||||
| 391,861 | 683,763 | 150,913 | 245,680 | 181,353 | 448,817 | 89,025 | 188,169 | |||||||||||||||||||||||
| 2,230,051 | 29,241 | 134 | 4 | — | — | 5,385 | 4,853 | |||||||||||||||||||||||
| (2,346,936 | ) | (6,757,650 | ) | (41,144 | ) | (68,601 | ) | (187,384 | ) | (257,354 | ) | (125,572 | ) | (176,547 | ) | |||||||||||||||
|
|
|
|
|
|
|
|
|
|
|
|
|
|
|
| |||||||||||||||
| 274,976 | (6,044,646 | ) | 109,903 | 177,083 | (6,031 | ) | 191,463 | (31,162 | ) | 16,475 | ||||||||||||||||||||
|
|
|
|
|
|
|
|
|
|
|
|
|
|
|
| |||||||||||||||
The accompanying Notes to Financial Statements are an integral part of this schedule.
279
Table of Contents
Thrivent Series Fund, Inc.
Statement of Changes in Net Assets – continued
| Partner All Cap Portfolio | Large Cap Growth Portfolio II | |||||||||||||||
For the periods ended | 6/29/2012 (unaudited) | 12/31/2011 | 6/29/2012 (unaudited) | 12/31/2011 | ||||||||||||
Operations | ||||||||||||||||
Net investment income/(loss) | $ | 188,478 | $ | 323,914 | $ | (59,702 | ) | $ | 1,137,519 | |||||||
Net realized gains/(losses) | 2,730,520 | 5,397,966 | (344,408 | ) | 13,252,329 | |||||||||||
Change in net unrealized appreciation/(depreciation) | 1,284,036 | (8,435,631 | ) | 1,550,296 | (47,505,736 | ) | ||||||||||
Net Change in Net Assets Resulting From Operations | 4,203,034 | (2,713,751 | ) | 1,146,186 | (33,115,888 | ) | ||||||||||
Distributions to Shareholders | ||||||||||||||||
From net investment income | (239,038 | ) | (361,337 | ) | (260,734 | ) | (548,812 | ) | ||||||||
From net realized gains | — | — | (4,072,904 | ) | (7,238,369 | ) | ||||||||||
Total Distributions to Shareholders | (239,038 | ) | (361,337 | ) | (4,333,638 | ) | (7,787,181 | ) | ||||||||
Capital Stock Transactions | ||||||||||||||||
Sold | 866,752 | 2,630,190 | 261,451 | 683,861 | ||||||||||||
Distributions reinvested | 239,038 | 361,337 | 4,333,638 | 7,787,181 | ||||||||||||
Redeemed | (4,878,513 | ) | (10,971,976 | ) | (1,213,141 | ) | (4,428,415 | ) | ||||||||
In-kind redemptions | — | — | — | (335,344,769 | ) | |||||||||||
Total Capital Stock Transactions | (3,772,723 | ) | (7,980,449 | ) | 3,381,948 | (331,302,142 | ) | |||||||||
Net Increase/(Decrease) in Net Assets | 191,273 | (11,055,537 | ) | 194,496 | (372,205,211 | ) | ||||||||||
Net Assets, Beginning of Period | 51,368,102 | 62,423,639 | 12,906,986 | 385,112,197 | ||||||||||||
Net Assets, End of Period | $ | 51,559,375 | $ | 51,368,102 | $ | 13,101,482 | $ | 12,906,986 | ||||||||
Accumulated Undistributed Net Investment Income/(Loss) | $ | 234,374 | $ | 284,934 | $ | (77,827 | ) | $ | 242,609 | |||||||
Capital Stock Share Transactions | ||||||||||||||||
Sold | 94,025 | 292,227 | 37,100 | 98,054 | ||||||||||||
Distributions reinvested | 27,000 | 41,168 | 965,391 | 1,155,762 | ||||||||||||
Redeemed | (534,958 | ) | (1,242,268 | ) | (174,767 | ) | (669,723 | ) | ||||||||
In-kind redemptions | — | — | — | (54,050,379 | ) | |||||||||||
|
|
|
|
|
|
|
| |||||||||
Total Capital Stock Share Transactions | (413,933 | ) | (908,873 | ) | 827,724 | (53,466,286 | ) | |||||||||
|
|
|
|
|
|
|
| |||||||||
The accompanying Notes to Financial Statements are an integral part of this schedule.
280
Table of Contents
Thrivent Series Fund, Inc.
Statement of Changes in Net Assets – continued
| Large Cap Growth Portfolio | Partner Growth Stock Portfolio | Large Cap Value Portfolio | Large Cap Stock Portfolio | |||||||||||||||||||||||||||
| 6/29/2012 (unaudited) | 12/31/2011 | 6/29/2012 (unaudited) | 12/31/2011 | 6/29/2012 (unaudited) | 12/31/2011 | 6/29/2012 (unaudited) | 12/31/2011 | |||||||||||||||||||||||
| $ | 4,848,341 | $ | 4,960,065 | $ | (58,062 | ) | $ | (111,777 | ) | $ | 7,404,539 | $ | 13,333,675 | $ | 4,251,318 | $ | 6,064,467 | |||||||||||||
| 39,661,690 | 95,983,133 | 2,013,554 | 6,715,627 | 37,897,880 | 46,625,093 | 13,173,195 | 43,460,499 | |||||||||||||||||||||||
| 44,068,541 | (147,794,994 | ) | 4,715,463 | (7,257,510 | ) | 4,198,290 | (84,034,835 | ) | 26,498,925 | (76,999,830 | ) | |||||||||||||||||||
| 88,578,572 | (46,851,796 | ) | 6,670,955 | (653,660 | ) | 49,500,709 | (24,076,067 | ) | 43,923,438 | (27,474,864 | ) | |||||||||||||||||||
| (243,304 | ) | (4,952,199 | ) | — | — | (13,811,639 | ) | (178,536 | ) | (6,228,672 | ) | (72,332 | ) | |||||||||||||||||
| — | — | — | — | — | — | — | — | |||||||||||||||||||||||
| (243,304 | ) | (4,952,199 | ) | — | — | (13,811,639 | ) | (178,536 | ) | (6,228,672 | ) | (72,332 | ) | |||||||||||||||||
| 8,541,786 | 31,961,443 | 2,527,994 | 2,771,906 | 1,849,490 | 5,504,321 | 1,530,126 | 4,646,041 | |||||||||||||||||||||||
| 243,304 | 4,952,199 | — | — | 13,811,639 | 178,536 | 6,228,672 | 72,332 | |||||||||||||||||||||||
| (61,659,730 | ) | (163,129,043 | ) | (4,717,567 | ) | (12,445,518 | ) | (16,803,625 | ) | (40,657,075 | ) | (15,424,057 | ) | (39,602,993 | ) | |||||||||||||||
| — | — | — | — | — | — | — | — | |||||||||||||||||||||||
| (52,874,640 | ) | (126,215,401 | ) | (2,189,573 | ) | (9,673,612 | ) | (1,142,496 | ) | (34,974,218 | ) | (7,665,259 | ) | (34,884,620 | ) | |||||||||||||||
| 35,460,628 | (178,019,396 | ) | 4,481,382 | (10,327,272 | ) | 34,546,574 | (59,228,821 | ) | 30,029,507 | (62,431,816 | ) | |||||||||||||||||||
| 805,283,132 | 983,302,528 | 51,099,815 | 61,427,087 | 752,054,276 | 811,283,097 | 565,849,587 | 628,281,403 | |||||||||||||||||||||||
| $ | 840,743,760 | $ | 805,283,132 | $ | 55,581,197 | $ | 51,099,815 | $ | 786,600,850 | $ | 752,054,276 | $ | 595,879,094 | $ | 565,849,587 | |||||||||||||||
| $ | 4,679,186 | $ | 74,149 | $ | (70,061 | ) | $ | (11,999 | ) | $ | 6,851,141 | $ | 13,258,241 | $ | 4,013,786 | $ | 5,991,140 | |||||||||||||
| 477,973 | 1,852,307 | 193,261 | 234,864 | 166,747 | 512,876 | 176,441 | 549,110 | |||||||||||||||||||||||
| 14,018 | 308,812 | — | — | 1,310,837 | 16,597 | 740,090 | 8,524 | |||||||||||||||||||||||
| (3,487,553 | ) | (9,617,541 | ) | (368,132 | ) | (1,060,071 | ) | (1,511,214 | ) | (3,805,123 | ) | (1,765,750 | ) | (4,701,845 | ) | |||||||||||||||
| — | — | — | — | — | — | — | — | |||||||||||||||||||||||
|
|
|
|
|
|
|
|
|
|
|
|
|
|
|
| |||||||||||||||
| (2,995,562 | ) | (7,456,422 | ) | (174,871 | ) | (825,207 | ) | (33,630 | ) | (3,275,650 | ) | (849,219 | ) | (4,144,211 | ) | |||||||||||||||
|
|
|
|
|
|
|
|
|
|
|
|
|
|
|
| |||||||||||||||
The accompanying Notes to Financial Statements are an integral part of this schedule.
281
Table of Contents
Thrivent Series Fund, Inc.
Statement of Changes in Net Assets – continued
| Large Cap Index Portfolio | Equity Income Plus Portfolio | |||||||||||||||
For the periods ended | 6/29/2012 (unaudited) | 12/31/2011 | 6/29/2012 (unaudited) | 12/31/2011 | ||||||||||||
Operations | ||||||||||||||||
Net investment income/(loss) | $ | 2,613,962 | $ | 5,238,643 | $ | 1,023,548 | $ | 1,521,680 | ||||||||
Net realized gains/(losses) | 3,430,349 | 3,778,704 | 2,349,606 | 2,864,212 | ||||||||||||
Change in net unrealized appreciation/(depreciation) | 20,742,824 | (3,129,196 | ) | 3,517,606 | (6,856,731 | ) | ||||||||||
Net Change in Net Assets Resulting From Operations | 26,787,135 | 5,888,151 | 6,890,760 | (2,470,839 | ) | |||||||||||
Distributions to Shareholders | ||||||||||||||||
From net investment income | (5,141,254 | ) | (5,204,623 | ) | (1,466,534 | ) | (238,167 | ) | ||||||||
From net realized gains | — | — | — | — | ||||||||||||
Total Distributions to Shareholders | (5,141,254 | ) | (5,204,623 | ) | (1,466,534 | ) | (238,167 | ) | ||||||||
Capital Stock Transactions | ||||||||||||||||
Sold | 7,577,846 | 6,327,864 | 4,721,906 | 17,179,648 | ||||||||||||
Distributions reinvested | 5,141,254 | 5,204,623 | 1,466,534 | 238,167 | ||||||||||||
Redeemed | (22,623,857 | ) | (52,460,205 | ) | (2,408,018 | ) | (2,933,661 | ) | ||||||||
Total Capital Stock Transactions | (9,904,757 | ) | (40,927,718 | ) | 3,780,422 | 14,484,154 | ||||||||||
Net Increase/(Decrease) in Net Assets | 11,741,124 | (40,244,190 | ) | 9,204,648 | 11,775,148 | |||||||||||
Net Assets, Beginning of Period | 291,285,301 | 331,529,491 | 88,077,819 | 76,302,671 | ||||||||||||
Net Assets, End of Period | $ | 303,026,425 | $ | 291,285,301 | $ | 97,282,467 | $ | 88,077,819 | ||||||||
Accumulated Undistributed Net Investment Income/(Loss) | $ | 2,641,054 | $ | 5,168,346 | $ | 1,054,797 | $ | 1,497,783 | ||||||||
Capital Stock Share Transactions | ||||||||||||||||
Sold | 399,376 | 356,181 | 501,183 | 1,868,977 | ||||||||||||
Distributions reinvested | 277,975 | 294,086 | 161,241 | 25,758 | ||||||||||||
Redeemed | (1,185,235 | ) | (2,925,178 | ) | (256,244 | ) | (322,694 | ) | ||||||||
|
|
|
|
|
|
|
| |||||||||
Total Capital Stock Share Transactions | (507,884 | ) | (2,274,911 | ) | 406,180 | 1,572,041 | ||||||||||
|
|
|
|
|
|
|
| |||||||||
The accompanying Notes to Financial Statements are an integral part of this schedule.
282
Table of Contents
Thrivent Series Fund, Inc.
Statement of Changes in Net Assets – continued
| Balanced Portfolio | High Yield Portfolio | Diversified Income Plus Portfolio | Partner Socially Responsible Bond Portfolio | |||||||||||||||||||||||||||
6/29/2012 | 12/31/2011 | 6/29/2012 (unaudited) | 12/31/2011 | 6/29/2012 (unaudited) | 12/31/2011 | 6/29/2012 (unaudited) | 12/31/2011 | |||||||||||||||||||||||
| $ | 2,271,556 | $ | 5,287,379 | $ | 29,691,948 | $ | 60,932,423 | $ | 3,146,794 | $ | 5,703,186 | $ | 118,363 | $ | 232,578 | |||||||||||||||
| 4,347,268 | 7,334,674 | 1,163,732 | 20,999,442 | 2,071,736 | 3,123,792 | 178,056 | 315,835 | |||||||||||||||||||||||
| 10,580,532 | (1,963,279 | ) | 30,549,844 | (45,857,753 | ) | 4,598,466 | (6,384,519 | ) | 128,545 | 2,628 | ||||||||||||||||||||
| 17,199,356 | 10,658,774 | 61,405,524 | 36,074,112 | 9,816,996 | 2,442,459 | 424,964 | 551,041 | |||||||||||||||||||||||
| (5,235,804 | ) | (5,741,540 | ) | (29,834,135 | ) | (60,572,233 | ) | (5,452,096 | ) | (5,830,693 | ) | (117,409 | ) | (232,005 | ) | |||||||||||||||
| (7,316,452 | ) | (8,517,319 | ) | — | — | — | — | (337,736 | ) | — | ||||||||||||||||||||
| (12,552,256 | ) | (14,258,859 | ) | (29,834,135 | ) | (60,572,233 | ) | (5,452,096 | ) | (5,830,693 | ) | (455,145 | ) | (232,005 | ) | |||||||||||||||
| 4,024,470 | 8,642,974 | 29,945,007 | 80,264,421 | 26,131,231 | 26,678,361 | 2,981,264 | 3,646,516 | |||||||||||||||||||||||
| 12,552,256 | 14,258,859 | 29,834,135 | 60,572,233 | 5,452,096 | 5,830,693 | 455,145 | 232,005 | |||||||||||||||||||||||
| (19,594,542 | ) | (49,372,777 | ) | (35,160,634 | ) | (120,800,753 | ) | (4,438,464 | ) | (16,736,539 | ) | (1,448,397 | ) | (2,769,272 | ) | |||||||||||||||
| (3,017,816 | ) | (26,470,944 | ) | 24,618,508 | 20,035,901 | 27,144,863 | 15,772,515 | 1,988,012 | 1,109,249 | |||||||||||||||||||||
| 1,629,284 | (30,071,029 | ) | 56,189,897 | (4,462,220 | ) | 31,509,763 | 12,384,281 | 1,957,831 | 1,428,285 | |||||||||||||||||||||
| 240,522,040 | 270,593,069 | 778,526,281 | 782,988,501 | 118,392,924 | 106,008,643 | 10,230,363 | 8,802,078 | |||||||||||||||||||||||
| $ | 242,151,324 | $ | 240,522,040 | $ | 834,716,178 | $ | 778,526,281 | $ | 149,902,687 | $ | 118,392,924 | $ | 12,188,194 | $ | 10,230,363 | |||||||||||||||
| $ | 2,250,568 | $ | 5,214,816 | $ | 289,096 | $ | 431,283 | $ | 3,147,877 | $ | 5,453,179 | $ | 105 | $ | (849 | ) | ||||||||||||||
| 263,787 | 582,865 | 6,223,665 | 16,614,795 | 3,781,107 | 3,954,790 | 276,598 | 346,053 | |||||||||||||||||||||||
| 868,290 | 999,857 | 6,201,666 | 12,711,981 | 810,540 | 888,202 | 42,453 | 22,178 | |||||||||||||||||||||||
| (1,286,233 | ) | (3,360,829 | ) | (7,318,931 | ) | (25,047,046 | ) | (647,294 | ) | (2,502,061 | ) | (133,734 | ) | (266,171 | ) | |||||||||||||||
|
|
|
|
|
|
|
|
|
|
|
|
|
|
|
| |||||||||||||||
| (154,156 | ) | (1,778,107 | ) | 5,106,400 | 4,279,730 | 3,944,353 | 2,340,931 | 185,317 | 102,060 | |||||||||||||||||||||
|
|
|
|
|
|
|
|
|
|
|
|
|
|
|
| |||||||||||||||
The accompanying Notes to Financial Statements are an integral part of this schedule.
283
Table of Contents
Thrivent Series Fund, Inc.
Statement of Changes in Net Assets – continued
| Income Portfolio | Bond Index Portfolio | |||||||||||||||
For the periods ended | 6/29/2012 (unaudited) | 12/31/2011 | 6/29/2012 (unaudited) | 12/31/2011 | ||||||||||||
Operations | ||||||||||||||||
Net investment income/(loss) | $ | 30,075,147 | $ | 64,042,746 | $ | 1,852,718 | $ | 4,471,690 | ||||||||
Net realized gains/(losses) | 10,077,844 | 27,762,211 | 2,506,080 | 2,271,157 | ||||||||||||
Change in net unrealized appreciation/(depreciation) | 39,732,462 | (11,245,943 | ) | 253,553 | 5,624,220 | |||||||||||
Net Change in Net Assets Resulting From Operations | 79,885,453 | 80,559,014 | 4,612,351 | 12,367,067 | ||||||||||||
Distributions to Shareholders | ||||||||||||||||
From net investment income | (30,176,121 | ) | (63,413,810 | ) | (1,882,656 | ) | (4,452,733 | ) | ||||||||
From net realized gains | — | — | (2,019,243 | ) | (996,560 | ) | ||||||||||
Total Distributions to Shareholders | �� | (30,176,121 | ) | (63,413,810 | ) | (3,901,899 | ) | (5,449,293 | ) | |||||||
Capital Stock Transactions | ||||||||||||||||
Sold | 19,185,864 | 165,217,508 | 13,096,521 | 23,741,777 | ||||||||||||
Distributions reinvested | 30,176,121 | 63,413,810 | 3,901,899 | 5,449,293 | ||||||||||||
Redeemed | (31,430,330 | ) | (104,919,017 | ) | (13,234,024 | ) | (33,033,339 | ) | ||||||||
Total Capital Stock Transactions | 17,931,655 | 123,712,301 | 3,764,396 | (3,842,269 | ) | |||||||||||
Net Increase/(Decrease) in Net Assets | 67,640,987 | 140,857,505 | 4,474,848 | 3,075,505 | ||||||||||||
Net Assets, Beginning of Period | 1,463,069,461 | 1,322,211,956 | 164,462,335 | 161,386,830 | ||||||||||||
Net Assets, End of Period | $ | 1,530,710,448 | $ | 1,463,069,461 | $ | 168,937,183 | $ | 164,462,335 | ||||||||
Accumulated Undistributed Net Investment Income/(Loss) | $ | 16,979 | $ | 117,953 | $ | (1,583 | ) | $ | 28,355 | |||||||
Capital Stock Share Transactions | ||||||||||||||||
Sold | 1,859,823 | 16,387,092 | 1,161,835 | 2,152,749 | ||||||||||||
Distributions reinvested | 2,926,758 | 6,298,371 | 346,131 | 498,530 | ||||||||||||
Redeemed | (3,053,016 | ) | (10,426,939 | ) | (1,174,648 | ) | (3,029,092 | ) | ||||||||
|
|
|
|
|
|
|
| |||||||||
Total Capital Stock Share Transactions | 1,733,565 | 12,258,524 | 333,318 | (377,813 | ) | |||||||||||
|
|
|
|
|
|
|
| |||||||||
The accompanying Notes to Financial Statements are an integral part of this schedule.
284
Table of Contents
Thrivent Series Fund, Inc.
Statement of Changes in Net Assets – continued
| Limited Maturity Bond Portfolio | Mortgage Securities Portfolio | Money Market Portfolio | ||||||||||||||||||||
| 6/29/2012 (unaudited) | 12/31/2011 | 6/29/2012 (unaudited) | 12/31/2011 | 6/29/2012 (unaudited) | 12/31/2011 | |||||||||||||||||
| $ | 13,255,070 | $ | 33,286,629 | $ | 285,238 | $ | 955,653 | $ | (2,543 | ) | $ | (3,050 | ) | |||||||||
| 4,311,589 | (2,036,487 | ) | 21,568 | 947,926 | 2,543 | 3,050 | ||||||||||||||||
| 14,835,898 | (19,900,581 | ) | 573,879 | (438,737 | ) | — | — | |||||||||||||||
| 32,402,557 | 11,349,561 | 880,685 | 1,464,842 | — | — | |||||||||||||||||
| (13,072,090 | ) | (32,036,799 | ) | (286,320 | ) | (954,571 | ) | — | — | |||||||||||||
| — | — | (801,702 | ) | (126,365 | ) | — | — | |||||||||||||||
| (13,072,090 | ) | (32,036,799 | ) | (1,088,022 | ) | (1,080,936 | ) | — | — | |||||||||||||
| 21,352,774 | 235,573,770 | 3,437,021 | 4,387,941 | 24,536,891 | 111,357,087 | |||||||||||||||||
| 13,072,090 | 32,036,799 | 1,088,022 | 1,080,936 | — | — | |||||||||||||||||
| (240,159,415 | ) | (67,825,943 | ) | (2,436,195 | ) | (6,958,496 | ) | (54,692,599 | ) | (112,663,789 | ) | |||||||||||
| (205,734,551 | ) | 199,784,626 | 2,088,848 | (1,489,619 | ) | (30,155,708 | ) | (1,306,702 | ) | |||||||||||||
| (186,404,084 | ) | 179,097,388 | 1,881,511 | (1,105,713 | ) | (30,155,708 | ) | (1,306,702 | ) | |||||||||||||
| 1,497,832,401 | 1,318,735,013 | 32,422,328 | 33,528,041 | 170,459,881 | 171,766,583 | |||||||||||||||||
| $ | 1,311,428,317 | $ | 1,497,832,401 | $ | 34,303,839 | $ | 32,422,328 | $ | 140,304,173 | $ | 170,459,881 | |||||||||||
| $ | (144,365 | ) | $ | (327,345 | ) | $ | — | $ | 1,082 | $ | (2,543 | ) | $ | — | ||||||||
| 2,181,626 | 23,994,742 | 325,477 | 421,586 | 24,536,891 | 111,357,087 | |||||||||||||||||
| 1,337,389 | 3,270,092 | 104,411 | 103,802 | — | — | |||||||||||||||||
| (24,527,390 | ) | (6,938,394 | ) | (230,809 | ) | (668,997 | ) | (54,692,599 | ) | (112,663,789 | ) | |||||||||||
|
|
|
|
|
|
|
|
|
|
|
| |||||||||||
| (21,008,375 | ) | 20,326,440 | 199,079 | (143,609 | ) | (30,155,708 | ) | (1,306,702 | ) | |||||||||||||
|
|
|
|
|
|
|
|
|
|
|
| |||||||||||
The accompanying Notes to Financial Statements are an integral part of this schedule.
285
Table of Contents
Thrivent Series Fund, Inc.
As of June 29, 2012
(unaudited)
(1) ORGANIZATION
Thrivent Series Fund, Inc. (the “Fund”), a company organized under the laws of Minnesota, is registered under the Investment Company Act of 1940 (the “1940 Act”). As of the date of this report, the Fund is divided into forty-one separate series (each, a “Portfolio”), each with its own investment objective and policies. The Fund consists of four asset allocation portfolios, twenty-eight equity portfolios, two hybrid portfolios, six fixed-income portfolios, and one money market portfolio. The assets of each Portfolio are segregated, and each has a separate class of capital stock. Shares in the Fund are currently sold, without sales charges, only to retirement plans sponsored by Thrivent Financial for Lutherans (“Thrivent Financial” or the “Adviser”) or separate accounts of Thrivent Financial or Thrivent Life Insurance Company (“Thrivent Life”), which are used to fund benefits of variable life insurance and variable annuity contracts issued by Thrivent Financial and Thrivent Life.
Under the Fund’s organizational documents, its officers and directors are indemnified against certain liabilities arising out of the performance of their duties to the Fund. In addition, in the normal course of business, the Fund enters into contracts with service providers and others that provide general damage clauses. The Fund’s maximum exposure under these contracts is unknown, as this would involve future claims that may be made against the Fund. However, based on experience, the Fund expects the risk of loss to be remote.
(2) SIGNIFICANT ACCOUNTING POLICIES
(A) Valuation of Investments – Securities traded on U.S. or foreign securities exchanges or included in a national market system are valued at the official closing price at the close of each business day unless otherwise stated below. Over-the-counter securities and listed securities for which no price is readily available are valued at the current bid price considered best to represent the value at that time. Swap agreements are valued at the fair value of the contract as furnished by an independent pricing service. Security prices are based on quotes that are obtained from an independent pricing service approved by the Board of Directors (the “Board”). The pricing service, in determining values of fixed-income securities, takes into consideration such factors as current quotations by broker/dealers, coupon, maturity, quality, type of issue, trading characteristics, and other yield and risk factors it deems relevant in determining valuations. Securities which cannot be valued by the approved pricing service are valued using valuations obtained from dealers that make markets in the securities. Exchange-listed options and futures contracts are valued at the last quoted sales price. Investments in open-ended mutual funds are valued at their net asset value at the close of each business day. Short-term securities are valued at amortized cost (which approximates market value) to the extent it is not materially different than market value.
Securities held by Money Market Portfolio are valued on the basis of amortized cost, whereby a portfolio security is valued at its cost initially and thereafter valued to reflect a constant amortization to maturity of any discount or premium. Money Market Portfolio and the Adviser follow procedures necessary to maintain a constant net asset value of $1.00 per share.
The Board has delegated responsibility for daily valuation to the Adviser, which has formed a Portfolio Compliance and Valuation Committee (“Committee”) that is responsible for overseeing the Portfolios’ valuation policies in accordance with Policies and Procedures. The Committee meets on a monthly and on an as-needed basis to review, among other things, price challenges, price overrides, stale prices, shadow prices, manual prices, money market pricing, international fair valuation, and other securities requiring fair valuation.
The Committee monitors for significant events occurring prior to the close of trading on the New York Stock Exchange that could have a material impact on the value of any securities that are held by the Portfolios. Examples of such events include trading halts, national news/events, and issuer-specific developments. If the Committee decides that such events warrant using fair value estimates, the Committee will take such events into consideration in determining the fair value of such securities. If market quotations or prices are not readily available or determined to be unreliable, the securities will be valued at fair value as determined in good faith pursuant to procedures adopted by the Board.
Financial Accounting Standards Board (FASB) guidelines require increased fair value disclosure intended to improve the consistency and comparability of fair value measurements used in financial reporting. The guidelines define fair value, establish a framework for measuring fair value in U.S. Generally Accepted Accounting Principles (“GAAP”) and expand disclosures about fair value requirements. The various inputs used to determine the fair value of the Portfolios’ investments are summarized in three broad levels: Level 1 includes quoted prices in active markets for identical securities, typically categorized in this level are U.S. equity securities, futures and options; Level 2 includes other significant observable inputs such as quoted prices for similar securities, interest rates, prepayment speeds and credit risk, typically categorized in this level are fixed income securities, international equity securities, swaps and forward contracts; and Level 3 includes significant unobservable
286
Table of Contents
Thrivent Series Fund, Inc.
Notes to Financial Statements
As of June 29, 2012
(unaudited)
inputs such as the Adviser’s own assumptions and broker evaluations in determining the fair value of investments. Of the Level 3 securities, those for which market values were not readily available or were deemed unreliable were fair valued as determined in good faith under procedures established by the Board. As of June 29, 2012, the following Portfolios held these types of Level 3 securities:
Portfolio | Number of Securities | Percent of Portfolio's Net Assets | ||||||
Partner Worldwide Allocation | 3 | 0.15 | % | |||||
Partner Growth Stock | 12 | 1.13 | % | |||||
Balanced | 1 | 0.00 | % | |||||
High Yield | 1 | 0.00 | % | |||||
Partner Socially Responsible Bond | 1 | 0.30 | % | |||||
Bond Index | 1 | 0.00 | % | |||||
Limited Maturity Bond | 1 | 0.00 | % | |||||
The valuation levels are not necessarily an indication of the risk associated with investing in these securities or other investments.
Valuation of International Securities – Because many foreign markets close before the U.S. markets, events may occur between the close of the foreign market and the close of the U.S. markets that could have a material impact on the valuation of foreign securities. The Portfolios, under the supervision of the Board, evaluate the impacts of these events and may adjust the valuation of foreign securities to reflect the fair value as of the close of the U.S. markets. The Board has authorized the Adviser to make fair valuation determinations pursuant to policies approved by the Board.
(B) Foreign Currency Translation – The accounting records of each Portfolio are maintained in U.S. dollars. Securities and other assets and liabilities that are denominated in foreign currencies are translated into U.S. dollars at the daily closing rates of exchange.
Foreign currency amounts related to the purchase or sale of securities and income and expenses are translated at the exchange rate on the transaction date. Net realized and unrealized currency gains and losses are recorded from sales of foreign currency, exchange gains or losses between the trade date and settlement dates on securities transactions, and other translation gains or losses on dividends, interest income and foreign withholding taxes. The Portfolios do not separately report the effect of changes in foreign exchange rates from changes in market prices on securities held. Such changes are included in net realized and unrealized gain or loss from investments in the Statement of Operations.
For federal income tax purposes, the Portfolios treat the effect of changes in foreign exchange rates arising from actual foreign currency transactions and the changes in foreign exchange rates between the trade date and settlement date as ordinary income.
(C) Foreign Currency Forward Contracts – In connection with purchases and sales of securities denominated in foreign currencies all Portfolios, except Money Market Portfolio, may enter into foreign currency forward contracts. Additionally, the Portfolios may enter into such contracts to hedge certain other foreign-currency-denominated investments. These contracts are recorded at value and the related realized and change in unrealized foreign exchange gains and losses are included in the Statement of Operations. In the event that counterparties fail to settle these forward contracts, the Portfolios could be exposed to foreign currency fluctuations. Foreign currency contracts are valued daily and unrealized appreciation or depreciation is recorded daily as the difference between the contract exchange rate and the closing forward rate applied to the face amount of the contract. A realized gain or loss is recorded at the time a forward contract is closed. These contracts are over-the-counter and the Portfolio is exposed to counterparty risk equal to the discounted net amount of payments to the Portfolio. During the six months ended June 29, 2012, Aggressive Allocation Portfolio, Moderately Aggressive Allocation Portfolio, Moderate Allocation Portfolio, Moderately Conservative Allocation Portfolio, Partner Healthcare Portfolio, Partner Emerging Markets Portfolio, Small Cap Stock Portfolio, Partner Worldwide Allocation Portfolio, Partner International Stock Portfolio, Partner All Cap Value Portfolio and Partner Growth Stock Portfolio engaged in this type of investment.
(D) Foreign Denominated Investments – Foreign denominated assets and currency contracts may involve more risks than domestic transactions including currency risk, political and economic risk, regulatory risk, and market risk. Certain Portfolios may also invest in securities of companies located in emerging markets. Future economic or political developments could adversely affect the liquidity or value, or both, of such securities.
(E) Federal Income Taxes – No provision has been made for income taxes because each Portfolio’s policy is to qualify as a regulated investment company under the Internal Revenue Code and distribute substantially all investment company taxable income and net capital gain on a timely basis. It is also the intention of each Portfolio to distribute an amount sufficient to avoid imposition of any federal excise tax. The Portfolios, accordingly, anticipate paying no federal taxes and no federal tax provision was recorded. Each Portfolio is treated as a separate taxable entity for federal income tax purposes. Certain Portfolios may utilize earnings and profits distributed to shareholders on the redemption of shares as part of the dividends paid deduction.
287
Table of Contents
Thrivent Series Fund, Inc.
Notes to Financial Statements
As of June 29, 2012
(unaudited)
GAAP requires management of the Portfolios to make additional tax disclosures with respect to the tax effects of certain income tax positions, whether those positions were taken on previously filed tax returns or are expected to be taken on future returns. These positions must meet a “more likely than not” standard that, based on the technical merits of the position, would have a greater than 50 percent likelihood of being sustained upon examination. In evaluating whether a tax position has met the more-likely-than-not recognition threshold, management of the Portfolio must presume that the position will be examined by the appropriate taxing authority that has full knowledge of all relevant information.
The Adviser analyzed all open tax years, as defined by the statute of limitations, for all major jurisdictions. Open tax years are those that are open for examination by taxing authorities. Major jurisdictions for the Portfolios include U.S. Federal, Minnesota, and Wisconsin, as well as certain foreign countries. As of June 29, 2012, open U.S. Federal, Minnesota, and Wisconsin tax years include the tax years ended December 31, 2008 through 2011. Additionally, as of June 29, 2012, the tax year ended December 31, 2007 is open for Wisconsin. The Portfolios have no examinations in progress and none are expected at this time.
As of June 29, 2012, the Adviser has reviewed all open tax years and major jurisdictions and concluded that there is no effect to the Portfolios’ tax liability, financial position or results of operations. There is no tax liability resulting from unrecognized tax benefits related to uncertain income tax positions taken or expected to be taken in future tax returns. The Portfolios are also not aware of any tax positions for which it is reasonably possible that the total amounts of unrecognized tax benefits will significantly change in the next 12 months.
Foreign Income Taxes – Certain Portfolios are subject to foreign income taxes imposed by certain countries in which they invest. Withholding taxes on foreign dividends have been provided for in accordance with the applicable country’s tax rules and rates. These amounts are shown as foreign dividend tax withholding in the Statement of Operations. The Portfolios pay tax on foreign capital gains, where applicable. These amounts are shown as part of net realized gains/(losses) on investments in the Statement of Operations.
(F) Expenses and Income – Estimated expenses are accrued daily. The Portfolios are charged for those expenses that are directly attributable to them. Expenses that are not directly attributable to a Portfolio are allocated among all appropriate Portfolios in proportion to their respective net assets, number of shareholder accounts or other reasonable basis.
Interest income is accrued daily including accretion of market discount and original issue discount and amortization of premium. Paydown gains and losses on mortgage- and asset-backed securities are recorded as components of interest income. Dividend income is recorded on the ex-dividend date.
For certain securities, including real estate investment trusts, the Fund records distributions received in excess of income as a reduction of cost of investments and/or realized gain. Such amounts are based on estimates if actual amounts are not available. Actual amounts of income, realized gain and return of capital may differ from the estimated amounts. The Fund adjusts the estimated amounts of the components of distributions as adjustments to investment income, unrealized appreciation/depreciation and realized gain/loss on investments as necessary, once the issuers provide information about the actual composition of the distributions.
(G) Custody Earnings Credit – The Portfolios have a deposit arrangement with the custodian whereby interest earned on uninvested cash balances is used to pay a portion of custodian fees. This deposit arrangement is an alternative to overnight investments. Earnings credits are shown as a reduction of total expenses on the Statement of Operations.
(H) Distributions to Shareholders – Dividends and capital gain distributions are recorded on the ex-dividend date. With the exception of Money Market Portfolio, net realized gains from securities transactions, if any, are paid at least annually after the close of the fiscal year. Any Portfolio subject to excise tax would require an additional distribution prior to the close of the fiscal year.
Dividends are declared and reinvested daily for High Yield Portfolio, Partner Socially Responsible Bond Portfolio, Income Portfolio, Bond Index Portfolio, Limited Maturity Bond Portfolio and Mortgage Securities Portfolio; declared daily and reinvested monthly for Money Market Portfolio; and declared and reinvested at least annually for all other Portfolios.
(I) Options – All Portfolios, with the exception of Money Market Portfolio, may buy put and call options and write put and covered call options. The Portfolios intend to use such derivative instruments as hedges to facilitate buying or selling securities or to provide protection against adverse movements in security prices or interest rates. The Portfolios may also enter into options contracts to protect against adverse foreign exchange rate fluctuations. Option contracts are valued daily and unrealized appreciation or depreciation is recorded. A Portfolio will realize a gain or loss upon expiration or closing of the option transaction. When an option is exercised, the proceeds upon sale for a written call
288
Table of Contents
Thrivent Series Fund, Inc.
Notes to Financial Statements
As of June 29, 2012
(unaudited)
option or the cost of a security for purchased put and call options is adjusted by the amount of premium received or paid.
Buying put options tends to decrease a Portfolio’s exposure to the underlying security while buying call options tends to increase a Portfolio’s exposure to the underlying security. The risk associated with purchasing put and call options is limited to the premium paid. There is no significant counterparty risk on exchange-traded options as the exchange guarantees the contract against default. Writing put options tends to increase a Portfolio’s exposure to the underlying security while writing call options tends to decrease a Portfolio’s exposure to the underlying security. The writer of an option has no control over whether the underlying security may be bought or sold, and therefore bears the market risk of an unfavorable change in the price of the underlying security. The counterparty risk for purchased options arises when the Portfolio has purchased an option, exercises that option, and the counterparty doesn’t buy from the Portfolio or sell to the Portfolio the underlying asset as required. In the case where the Portfolio has written an option, the Portfolio doesn’t have counterparty risk. Counterparty risk on purchased over-the-counter options is partially mitigated by the Portfolio’s collateral posting requirements. As the option increases in value to the Portfolio, the Portfolio receives collateral from the counterparty. Risks of loss may exceed amounts recognized on the Statement of Assets and Liabilities. During the six months ended June 29, 2012, no Portfolios engaged in over-the-counter options. Partner All Cap Growth Portfolio, Partner All Cap Value Portfolio, Large Cap Stock Portfolio, Equity Income Plus Portfolio, Diversified Income Plus Portfolio and Limited Maturity Bond Portfolio engaged in exchange-traded options.
(J) Futures Contracts – Certain Portfolios may use futures contracts to manage the exposure to interest rate and market or currency fluctuations. Gains or losses on futures contracts can offset changes in the yield of securities. When a futures contract is opened, cash or other investments equal to the required “initial margin deposit” are held on deposit with and pledged to the broker. Additional securities held by the Portfolios may be earmarked to cover open futures contracts. The futures contract’s daily change in value (“variation margin”) is either paid to or received from the broker, and is recorded as an unrealized gain or loss. When the contract is closed, realized gain or loss is recorded equal to the difference between the value of the contract when opened and the value of the contract when closed. Futures contracts involve, to varying degrees, risk of loss in excess of the variation margin disclosed in the Statement of Assets and Liabilities. Exchange-traded futures have no significant counterparty risk as the exchange guarantees the contracts against default. During the six months ended June 29, 2012, Aggressive Allocation Portfolio, Moderately Aggressive Allocation Portfolio, Moderate Allocation Portfolio, Moderately Conservative Allocation Portfolio, Small Cap Stock Portfolio, Small Cap Index Portfolio, Mid Cap Index Portfolio, Partner Worldwide Allocation Portfolio, Large Cap Stock Portfolio, Large Cap Index Portfolio, Equity Income Plus Portfolio, Balanced Portfolio, High Yield Portfolio, Diversified Income Plus Portfolio, Partner Socially Responsible Bond Portfolio, Income Portfolio, Limited Maturity Bond Portfolio and Mortgage Securities Portfolio engaged in this type of investment.
(K) Swap Agreements – Certain Portfolios enter into swap transactions, which involve swapping one or more investment characteristics of a security or a basket of securities with another party. Such transactions include market risk, risk of default by the other party to the transaction, risk of imperfect correlation and manager risk and may involve commissions or other costs. Swap transactions generally do not involve delivery of securities, other underlying assets or principal. Accordingly, the risk of loss with respect to swap transactions is generally limited to the net amount of payments that the Portfolio is contractually obligated to make, or in the case of the counterparty defaulting, the net amount of payments that the Portfolio is contractually entitled to receive. Risks of loss may exceed amounts recognized on the Statement of Assets and Liabilities. If there is a default by the counterparty, the Portfolio may have contractual remedies pursuant to the agreements related to the transaction. The contracts are valued daily and unrealized appreciation or depreciation is recorded. Swap agreements are valued at fair value of the contract as provided by an independent pricing service. The pricing service takes into account such factors as swap curves, default probabilities, recent trades, recovery rates and other factors it deems relevant in determining valuations. The Portfolio accrues for the periodic payment and amortizes upfront payments, if any, on swap agreements on a daily basis with the net amount recorded as realized gains or losses on the Statement of Operations. Receipts and payments received or made as a result of a credit event or termination of the contract are also recognized as realized gains or losses on the Statement of Operations. Collateral, in the form of cash or securities, may be required to be held with the Portfolio’s custodian, or a third party, in connection with these agreements. These swap agreements are over-the-counter and the Portfolio is exposed to counterparty risk, which is the discounted net amount of payments owed to the Portfolio. This risk is partially mitigated by the Portfolio’s collateral posting requirements. As the swap increases in value to the Portfolio, the Portfolio receives collateral from the counterparty.
Credit Default Swaps – A credit default swap is a swap agreement between two parties to exchange the credit risk of a particular issuer, basket of securities or reference entity. In a credit default swap transaction, a buyer pays periodic fees in return for payment by
289
Table of Contents
Thrivent Series Fund, Inc.
Notes to Financial Statements
As of June 29, 2012
(unaudited)
the seller which is contingent upon an adverse credit event occurring in the underlying issuer or reference entity. The seller collects periodic fees from the buyer and profits if the credit of the underlying issuer or reference entity remains stable or improves while the swap is outstanding, but the seller in a credit default swap contract would be required to pay the amount of credit loss, determined as specified in the agreement, to the buyer in the event of an adverse credit event in the reference entity. A buyer of a credit default swap is said to buy protection whereas a seller of a credit default swap is said to sell protection. The Portfolios may be either the protection buyer or the protection seller.
Certain Portfolios enter into credit default derivative contracts directly through credit default swaps (CDS) or through credit default swap indices (CDX Indices). CDX Indices are static pools of equally weighted credit default swaps referencing corporate bonds and/or loans designed to provide diversified credit exposure to these asset classes. Portfolios sell default protection and assume long-risk positions in individual credits or indices. Index positions are entered into to gain exposure to the corporate bond and/or loan markets in a cost-efficient and diversified structure. In the event that a position defaults, by going into bankruptcy and failing to pay interest or principal on borrowed money, within any given CDX Index held, the maximum potential amount of future payments required would be equal to the pro-rata share of that position within the index based on the notional amount of the index. In the event of a default under a CDS contract, the maximum potential amount of future payments would be the notional amount. For CDS, the default events could be bankruptcy and failing to pay interest or principal on borrowed money or a restructuring. A restructuring is a change in the underlying obligations which would include reduction in interest or principal, maturity extension and subordination to other obligations. Refer to the credit default swap tables located within the Portfolios’ Schedules of Investments for additional information as of June 29, 2012. During the six months ended June 29, 2012, Aggressive Allocation Portfolio, Moderately Aggressive Allocation Portfolio, Moderate Allocation Portfolio, Moderately Conservative Allocation Portfolio, High Yield Portfolio, Income Portfolio and Limited Maturity Bond Portfolio engaged in these types of investments.
(L) Mortgage Dollar Roll Transactions – Certain Portfolios enter into dollar roll transactions on securities issued or to be issued by the Government National Mortgage Association, Federal National Mortgage Association and Federal Home Loan Mortgage Corporation, in which the Portfolios transfer mortgage securities to a counterparty and simultaneously agree to the return of similar (same type and coupon) securities at a later date at an agreed upon price. The Portfolios maintain liquid securities having a value not less than the agreed upon price (including accrued interest) for such dollar rolls. The value of the securities that the Portfolios are required to accept on return may decline below the agreed upon price of those securities.
During the term of the agreement, the Portfolios forgo principal and interest paid on the mortgage securities transferred. The Portfolios are compensated from negotiated fees paid by brokers offered as an inducement to the Portfolios to “roll over” their commitments, thus enhancing the yield. Mortgage dollar rolls may be renewed with a new return date and agreed upon price and a cash settlement made on settlement date without physical delivery of the securities subject to the contract. The fees received are recognized over the roll period and are included in Income from mortgage dollar rolls in the Statement of Operations. The recognition of the gains/losses are deferred until the closing of the roll and are included in Net realized gains/(losses) in the Statement of Operations. During the six months ended June 29, 2012, Aggressive Allocation Portfolio, Moderately Aggressive Allocation Portfolio, Moderate Allocation Portfolio, Moderately Conservative Allocation Portfolio, Balanced Portfolio, Diversified Income Plus Portfolio, Income Portfolio, Bond Index Portfolio, Limited Maturity Bond Portfolio and Mortgage Securities Portfolio engaged in this type of transaction.
(M) Securities Lending – The Fund has entered into a Securities Lending Agreement (the “Agreement”) with Deutsche Bank AG (“Deutsche”). The Agreement authorizes Deutsche to lend securities to authorized borrowers on behalf of the Portfolios. Pursuant to the Agreement, all loaned securities are initially collateralized by cash equal to at least 102% of the value of the loaned securities. All cash collateral received is invested in Thrivent Financial Securities Lending Trust. The Portfolios receive dividends and interest that would have been earned on the securities loaned while simultaneously seeking to earn income on the investment of cash collateral. Amounts earned on investments in Thrivent Financial Securities Lending Trust, net of rebates, fees paid to Deutsche for services provided and any other securities lending expenses, are included in Income from securities loaned on the Statement of Operations. By investing any cash collateral it receives in these transactions, a Portfolio could realize additional gains or losses. If the borrower fails to return the securities or the invested collateral has declined in value, the Portfolio could lose money.
During the six months ended June 29, 2012, all Portfolios except Aggressive Allocation Portfolio, Partner Healthcare Portfolio, Partner Natural Resources Portfolio, Real Estate Securities Portfolio, Partner Utilities Portfolio, Mid Cap
290
Table of Contents
Thrivent Series Fund, Inc.
Notes to Financial Statements
As of June 29, 2012
(unaudited)
Growth Portfolio II, Partner Socially Responsible Stock Portfolio, Partner All Cap Growth Portfolio, Partner All Cap Value Portfolio, Large Cap Growth Portfolio II, Large Cap Growth Portfolio, Equity Income Plus Portfolio, Partner Socially Responsible Bond Portfolio, Mortgage Securities Portfolio and Money Market Portfolio had securities on loan. As of June 29, 2012, the value of securities on loan is as follows:
Portfolio | Securities on Loan | |||
Moderately Aggressive Allocation | $ | 12,698,682 | ||
Moderate Allocation | 16,792,094 | |||
Moderately Conservative Allocation | 5,841,022 | |||
Partner Technology | 3,732,510 | |||
Partner Emerging Markets | 1,663,229 | |||
Partner Small Cap Growth | 22,848,644 | |||
Partner Small Cap Value | 7,830,445 | |||
Small Cap Stock | 11,290,899 | |||
Small Cap Index | 14,170,165 | |||
Mid Cap Growth | 8,364,959 | |||
Partner Mid Cap Value | 2,013,258 | |||
Mid Cap Stock | 6,548,955 | |||
Mid Cap Index | 2,431,269 | |||
Partner Worldwide Allocation | 32,477,435 | |||
Partner International Stock | 28,303,031 | |||
Partner All Cap | 346,845 | |||
Partner Growth Stock | 433,463 | |||
Large Cap Value | 2,134,400 | |||
Large Cap Stock | 1,575,536 | |||
Large Cap Index | 1,694,309 | |||
Balanced | 1,031,795 | |||
High Yield | 71,607,585 | |||
Diversified Income Plus | 4,115,587 | |||
Income | 13,584,417 | |||
Bond Index | 290,937 | |||
Limited Maturity Bond | 19,974,343 | |||
(N) When Issued and Delayed Delivery Transactions – Certain Portfolios may purchase or sell securities on a when-issued or delayed delivery basis. These transactions involve a commitment by a Portfolio to purchase or sell securities for a predetermined price or yield, with payment and delivery taking place beyond the customary settlement period. When delayed delivery purchases are outstanding, a Portfolio will designate liquid assets in an amount sufficient to meet the purchase price. When purchasing a security on a delayed delivery basis, a Portfolio assumes the rights and risks of ownership of the security, including the risk of price and yield fluctuations, and takes such fluctuations into account when determining its net asset value. A Portfolio may dispose of a delayed delivery transaction after it is entered into, and may sell when-issued securities before they are delivered, which may result in a capital gain or loss. When a Portfolio has sold a security on a delayed delivery basis, a Portfolio does not participate in future gains and losses with respect to the security.
(O) Treasury Inflation Protected Securities – Certain Portfolios may invest in treasury inflation protected securities (TIPS). These securities are fixed income securities whose principal value is periodically adjusted to the rate of inflation. The interest rate is generally fixed at issuance. Interest is paid based on the principal value, which is adjusted for inflation. Any increase in the principal amount will be included as taxable interest in the Statement of Operations and received upon maturity or sale of the security. During the six months ended June 29, 2012, Aggressive Allocation Portfolio, Moderately Aggressive Allocation Portfolio, Moderate Allocation Portfolio, Moderately Conservative Allocation Portfolio, Income Portfolio, Limited Maturity Bond Portfolio and Mortgage Securities Portfolio engaged in this type of investment.
(P) Repurchase Agreements – Each Portfolio may engage in repurchase agreement transactions in pursuit of its investment objective. A repurchase agreement consists of a purchase and a simultaneous agreement to resell an investment for later delivery at an agreed upon price and rate of interest. The Portfolio uses a third-party custodian to maintain the collateral. If the original seller of a security subject to a repurchase agreement fails to repurchase the security at the agreed upon time, the Portfolio could incur a loss due to a drop in the value of the security during the time it takes the Portfolio to either sell the security or take action to enforce the original seller’s agreement to repurchase the security. Also, if a defaulting original seller filed for bankruptcy or became insolvent, disposition of such security might be delayed by pending legal action. The Portfolio may only enter into repurchase agreements with banks and other recognized financial institutions such as broker/dealers that are found by the Adviser or subadviser to be creditworthy. During the six months ended June 29, 2012, no Portfolios engaged in this type of investment.
(Q) Equity-Linked Structured Securities – Certain Portfolios may invest in equity-linked structured notes. Equity-linked structured notes are debt securities which combine the characteristics of common stock and the sale of an option. The return component is based upon the performance of a single equity security, a basket of equity securities, or an equity index and the sale of an option. There is no guaranteed return of principal with these securities. The appreciation potential of these securities may be limited by a maximum payment or call right and can be influenced by many unpredictable factors. In addition to the performance of the equity, the nature and credit of the issuer may also impact return. During the six months ended June 29, 2012, Income Portfolio and Limited Maturity Bond Portfolio engaged in this type of investment.
(R) Credit Risk – The Portfolios may be susceptible to credit risk to the extent the issuer or counterparty defaults on its payment obligation. The Portfolios’ policy is to monitor
291
Table of Contents
Thrivent Series Fund, Inc.
Notes to Financial Statements
As of June 29, 2012
(unaudited)
the creditworthiness of the issuers. Interest receivable on defaulted securities is monitored for the ability to collect payments in default and adjusted accordingly.
(S) Accounting Estimates – The preparation of financial statements in conformity with GAAP require management to make estimates and assumptions that affect the reported amounts of assets and liabilities and disclosure of contingent assets and liabilities at the date of the financial statements and the reported amounts of income and expenses during the reporting period. Actual results could differ from those estimates.
(T) Loan Commitments – Certain Portfolios may enter into loan commitments, which generally have interest rates which are reset daily, monthly, quarterly or semi-annually by reference to a base lending rate, plus a premium. These base rates are primarily the London-Interbank Offered Rate (“LIBOR”), and secondarily the prime rate offered by one or more major United States banks (the “Prime Rate”) and the certificate of deposit (“CD”) rate or other base lending rates used by commercial lenders. Loan commitments often require prepayments from excess cash flows or allow the borrower to repay at its election. The rate at which the borrower repays cannot be predicted with accuracy. Therefore, the remaining maturity may be considerably less than the stated maturity shown in the Schedule of Investments.
All or a portion of these loan commitments may be unfunded. The Portfolio is obligated to fund these commitments at the borrower’s discretion. Therefore, the Portfolio must have funds sufficient to cover its contractual obligation. These unfunded loan commitments, which are marked-to-market daily, are presented in the Schedule of Investments.
(U) Loss Contingencies – High Yield Portfolio and Income Portfolio are defendants in an adversary action filed on July 31, 2009 by the Official Committee of Unsecured Creditors of Motors Liquidation Company, formerly known as General Motors Corporation (GM), against prior and current holders of term loan debt of GM. The suit seeks to determine whether GM’s term loan facility was secured at the time it entered bankruptcy. High Yield Portfolio at one time held term loans in an original principal amount of at least $4,627,531 and, if the plaintiffs are successful, it is reasonably possible that the Portfolio will be required to make payments in some amount. Management does not believe it is possible at this time to predict with any reasonable certainty the amount or probability of any potential loss.
Balanced Portfolio and Large Cap Index Portfolio are defendants in two separate adversary actions: One was filed in federal court on November 1, 2010 by the Official Committee of Unsecured Creditors of Tribune Company (“Tribune”) and the other was filed in the state of Minnesota on June 2, 2011 by the successor trustees of certain series of debt securities issued by Tribune. These actions have since been consolidated and moved to the United States District Court of the Southern District of New York as consolidated multi-district litigation. The actions seek to determine whether stock repurchases of Tribune stock in connection with a leveraged buyout of Tribune in 2007 (the “LBO Transaction”) were fraudulent transactions that can be voided requiring repurchase payments to be returned to the Tribune bankruptcy estate. Balanced Portfolio and Large Cap Index Portfolio tendered Tribune stock in the LBO Transaction in exchange for $115,600 and $219,300 respectively. If the plaintiffs are successful, it is reasonably possible that these Portfolios would be required to return payments in some amount. Management does not believe it is possible at this time to predict with any reasonable certainty the amount or probability of any potential loss.
Mid Cap Index Portfolio is a potential defendant in an adversary action filed on October 22, 2010 by the trustee of the LB Creditor Trust. The suit seeks to determine whether certain pre-bankruptcy distributions in December 2007 by Lyondell Chemical Company (“Lyondell”) to its shareholders were fraudulent transactions that can be voided and repaid to Lyondell’s creditors. Mid Cap Index Portfolio owned shares of Lyondell stock before the merger. On December 21, 2007, Mid Cap Index Portfolio tendered its shares of Lyondell for $1,542,720.
(V) Litigation – Awards from class action litigation are recorded as a reduction of cost if the Portfolio still owns the applicable securities on the payment date. If the Portfolio no longer owns the applicable securities, the proceeds are recorded as realized gains.
(W) Recent Accounting Pronouncements – In December 2011, FASB released Accounting Standards Update 2011-11 (ASU 2011-11), Balance Sheet (Topic 210), Disclosures about Offsetting Assets and Liabilities. This updated standard is a result of collaboration between FASB and International Accounting Standards Board (IASB) to enhance current disclosures. The amendments include new disclosure requirements of gross and net information about instruments and transactions, such as derivatives, eligible for offset in the Statement of Assets and Liabilities or are subject to a master netting arrangement or similar agreement. The disclosures required by ASU 2011-11 will be effective any reporting period (annual or quarterly interim) beginning on or after January 1, 2013. Management is currently evaluating the application of ASU 2011-11 on the Fund’s financial statements.
292
Table of Contents
Thrivent Series Fund, Inc.
Notes to Financial Statements
As of June 29, 2012
(unaudited)
(X) In-kind Redemptions – During the year ended December 31, 2011, the Thrivent Asset Allocation Portfolios, as the shareholders of underlying Thrivent Series Funds (the “underlying portfolios”), redeemed their shares in-kind (“in-kind redemption”). The underlying portfolios distributed portfolio securities rather than cash as payment for the redemption of these fund shares. For financial reporting purposes, the underlying funds recognize gain on these transactions to the extent the value of the distributed securities on the date of redemption exceeds the cost of those securities; they recognize a loss if the cost exceeds the value. Gains or losses on in-kind redemptions are not recognized for tax purposes. The realized gains or losses below are included in the Statement of Operations of the underlying portfolios as net realized gains/losses on in-kind redemptions. The in-kind amounts and shares redeemed are included in the Capital Stock Transactions of the Statement of Changes in Net Assets of the underlying portfolios. These in-kind transactions were conducted at market value. The transactions were as follows:
Underlying Portfolio | Underlying Shares Redeemed | Date | In-kind Amount | Realized Gain/(Loss) | ||||||||||||
Aggressive Allocation Portfolio | ||||||||||||||||
Real Estate Securities | 810,212 | 10/17/2011 | $ | 11,301,165 | ($ | 1,195,433 | ) | |||||||||
Mid Cap Growth II | 4,438,418 | 11/11/2011 | 42,486,309 | 6,007,001 | ||||||||||||
Large Cap Growth II | 3,733,062 | 11/21/2011 | 23,161,040 | (1,897,783 | ) | |||||||||||
Moderately Aggressive Allocation Portfolio | ||||||||||||||||
Real Estate Securities | 5,203,112 | 10/17/2011 | $ | 72,575,081 | $ | 1,481,061 | ||||||||||
Mid Cap Growth II | 6,718,565 | 11/11/2011 | 64,312,796 | 16,763,029 | ||||||||||||
Large Cap Growth II | 22,733,298 | 11/21/2011 | 141,044,198 | (6,185,156 | ) | |||||||||||
Moderate Allocation Portfolio | ||||||||||||||||
Real Estate Securities | 6,860,851 | 10/17/2011 | $ | 95,697,896 | $ | 21,151,702 | ||||||||||
Mid Cap Growth II | 2,823,662 | 11/11/2011 | 27,029,220 | 8,325,290 | ||||||||||||
Large Cap Growth II | 22,153,231 | 11/21/2011 | 137,445,293 | 2,311,946 | ||||||||||||
Moderately Conservative Allocation Portfolio | ||||||||||||||||
Real Estate Securities | 1,980,171 | 10/17/2011 | $ | 27,620,215 | $ | 10,646,581 | ||||||||||
Large Cap Growth II | 5,430,788 | 11/21/2011 | 33,694,238 | 1,813,262 | ||||||||||||
(Y) Other – For financial statement purposes, investment security transactions are accounted for on the trade date. Realized gains and losses from investment transactions are determined on a specific cost identification basis, which is the same basis used for federal income tax purposes.
(3) FEES AND COMPENSATION PAID TO AFFILIATES
(A) Investment Advisory Fees – The Fund has entered into an Investment Advisory Agreement with Thrivent Financial, the Adviser. Under the Investment Advisory Agreement, each of the Portfolios pays a fee for investment advisory services. The fees are accrued daily and paid monthly.
The four Asset Allocation Portfolios – Aggressive Allocation Portfolio, Moderately Aggressive Allocation Portfolio, Moderate Allocation Portfolio and Moderately Conservative Allocation Portfolio – pay investment advisory fees for asset allocation services. In addition, for investments (other than underlying Thrivent Portfolios) held directly by the Asset Allocation Portfolios, each Asset Allocation Portfolio will pay an additional advisory fee. The annual rates of fees as a percentage of average daily net assets under the Investment Advisory Agreement are as follows:
293
Table of Contents
Thrivent Series Fund, Inc.
Notes to Financial Statements
As of June 29, 2012
(unaudited)
Portfolio (M – Millions) | $0 to $500M | $500 to $2,000M | Over $2,000M | |||||||||
Aggressive Allocation | 0.150 | % | 0.125 | % | 0.100 | % | ||||||
Aggressive Allocation – Direct Holdings | 0.600 | % | 0.600 | % | 0.600 | % | ||||||
Moderately Aggressive Allocation | 0.150 | % | 0.125 | % | 0.100 | % | ||||||
Moderately Aggressive Allocation – Direct Holdings | 0.550 | % | 0.550 | % | 0.550 | % | ||||||
Moderate Allocation | 0.150 | % | 0.125 | % | 0.100 | % | ||||||
Moderate Allocation – Direct Holdings | 0.500 | % | 0.500 | % | 0.500 | % | ||||||
Moderately Conservative Allocation | 0.150 | % | 0.125 | % | 0.100 | % | ||||||
Moderately Conservative Allocation – Direct Holdings | 0.450 | % | 0.450 | % | 0.450 | % | ||||||
For all other Portfolios, the annual rates of fees as a percent of average daily net assets under the Investment Advisory Agreement were as follows:
Portfolio (M - Millions) | $0 to $50M | $50 to $200M | $200 to $250M | $250 to $500M | $500 to $750M | $750 to $1,000M | $1,000 to $1,500M | $1,500 to $2,000M | $2,000 to $2,500M | $2,500 to $5,000M | Over $5,000M | |||||||||||||||||||||||||||||||||
Partner Technology | 0.750 | % | 0.750 | % | 0.750 | % | 0.750 | % | 0.750 | % | 0.750 | % | 0.750 | % | 0.750 | % | 0.750 | % | 0.750 | % | 0.750 | % | ||||||||||||||||||||||
Partner Healthcare | 0.950 | % | 0.900 | % | 0.900 | % | 0.900 | % | 0.900 | % | 0.900 | % | 0.900 | % | 0.900 | % | 0.900 | % | 0.900 | % | 0.900 | % | ||||||||||||||||||||||
Partner Natural Resources | 0.750 | % | 0.725 | % | 0.725 | % | 0.725 | % | 0.725 | % | 0.725 | % | 0.725 | % | 0.725 | % | 0.725 | % | 0.725 | % | 0.725 | % | ||||||||||||||||||||||
Partner Emerging Markets | 1.200 | % | 1.070 | % | 1.070 | % | 1.070 | % | 1.070 | % | 1.070 | % | 1.070 | % | 1.070 | % | 1.070 | % | 1.070 | % | 1.070 | % | ||||||||||||||||||||||
Real Estate Securities | 0.800 | % | 0.800 | % | 0.800 | % | 0.800 | % | 0.750 | % | 0.750 | % | 0.750 | % | 0.750 | % | 0.750 | % | 0.750 | % | 0.750 | % | ||||||||||||||||||||||
Partner Utilities | 0.750 | % | 0.725 | % | 0.725 | % | 0.725 | % | 0.725 | % | 0.725 | % | 0.725 | % | 0.725 | % | 0.725 | % | 0.725 | % | 0.725 | % | ||||||||||||||||||||||
Partner Small Cap Growth | 1.000 | % | 1.000 | % | 1.000 | % | 1.000 | % | 0.900 | % | 0.900 | % | 0.900 | % | 0.900 | % | 0.900 | % | 0.900 | % | 0.900 | % | ||||||||||||||||||||||
Partner Small Cap Value | 0.800 | % | 0.800 | % | 0.800 | % | 0.800 | % | 0.800 | % | 0.800 | % | 0.800 | % | 0.800 | % | 0.800 | % | 0.800 | % | 0.800 | % | ||||||||||||||||||||||
Small Cap Stock | 0.700 | % | 0.700 | % | 0.650 | % | 0.650 | % | 0.650 | % | 0.650 | % | 0.600 | % | 0.600 | % | 0.600 | % | 0.550 | % | 0.525 | % | ||||||||||||||||||||||
Small Cap Index | 0.350 | % | 0.350 | % | 0.350 | % | 0.300 | % | 0.250 | % | 0.250 | % | 0.200 | % | 0.150 | % | 0.100 | % | 0.100 | % | 0.100 | % | ||||||||||||||||||||||
Mid Cap Growth II | 0.900 | % | 0.900 | % | 0.900 | % | 0.900 | % | 0.800 | % | 0.800 | % | 0.800 | % | 0.800 | % | 0.800 | % | 0.800 | % | 0.800 | % | ||||||||||||||||||||||
Mid Cap Growth | 0.400 | % | 0.400 | % | 0.400 | % | 0.400 | % | 0.400 | % | 0.400 | % | 0.400 | % | 0.400 | % | 0.400 | % | 0.400 | % | 0.400 | % | ||||||||||||||||||||||
Partner Mid Cap Value | 0.750 | % | 0.750 | % | 0.700 | % | 0.700 | % | 0.700 | % | 0.700 | % | 0.700 | % | 0.700 | % | 0.700 | % | 0.700 | % | 0.700 | % | ||||||||||||||||||||||
Mid Cap Stock | 0.700 | % | 0.700 | % | 0.650 | % | 0.650 | % | 0.650 | % | 0.650 | % | 0.600 | % | 0.600 | % | 0.600 | % | 0.550 | % | 0.525 | % | ||||||||||||||||||||||
Mid Cap Index | 0.350 | % | 0.350 | % | 0.350 | % | 0.300 | % | 0.250 | % | 0.250 | % | 0.200 | % | 0.150 | % | 0.100 | % | 0.100 | % | 0.100 | % | ||||||||||||||||||||||
Partner Worldwide | 0.900 | % | 0.900 | % | 0.900 | % | 0.850 | % | 0.850 | % | 0.850 | % | 0.800 | % | 0.750 | % | 0.750 | % | 0.750 | % | 0.750 | % | ||||||||||||||||||||||
Partner International Stock | 0.850 | % | 0.850 | % | 0.850 | % | 0.850 | % | 0.800 | % | 0.800 | % | 0.750 | % | 0.700 | % | 0.700 | % | 0.700 | % | 0.700 | % | ||||||||||||||||||||||
Partner Socially Responsible Stock | 0.800 | % | 0.775 | % | 0.775 | % | 0.775 | % | 0.775 | % | 0.775 | % | 0.775 | % | 0.775 | % | 0.775 | % | 0.775 | % | 0.775 | % | ||||||||||||||||||||||
Partner All Cap Growth | 0.950 | % | 0.950 | % | 0.950 | % | 0.900 | % | 0.900 | % | 0.900 | % | 0.900 | % | 0.900 | % | 0.900 | % | 0.900 | % | 0.900 | % | ||||||||||||||||||||||
Partner All Cap Value | 0.750 | % | 0.700 | % | 0.700 | % | 0.700 | % | 0.700 | % | 0.700 | % | 0.700 | % | 0.700 | % | 0.700 | % | 0.700 | % | 0.700 | % | ||||||||||||||||||||||
Partner All Cap | 0.950 | % | 0.950 | % | 0.950 | % | 0.950 | % | 0.900 | % | 0.900 | % | 0.900 | % | 0.900 | % | 0.900 | % | 0.900 | % | 0.900 | % | ||||||||||||||||||||||
Large Cap Growth II | 0.800 | % | 0.800 | % | 0.800 | % | 0.800 | % | 0.700 | % | 0.700 | % | 0.700 | % | 0.700 | % | 0.700 | % | 0.700 | % | 0.700 | % | ||||||||||||||||||||||
Large Cap Growth | 0.400 | % | 0.400 | % | 0.400 | % | 0.400 | % | 0.400 | % | 0.400 | % | 0.400 | % | 0.400 | % | 0.400 | % | 0.400 | % | 0.400 | % | ||||||||||||||||||||||
Partner Growth Stock | 0.800 | % | 0.800 | % | 0.800 | % | 0.800 | % | 0.700 | % | 0.700 | % | 0.700 | % | 0.700 | % | 0.700 | % | 0.700 | % | 0.700 | % | ||||||||||||||||||||||
Large Cap Value | 0.600 | % | 0.600 | % | 0.600 | % | 0.600 | % | 0.600 | % | 0.600 | % | 0.600 | % | 0.600 | % | 0.600 | % | 0.600 | % | 0.600 | % | ||||||||||||||||||||||
Large Cap Stock | 0.650 | % | 0.650 | % | 0.650 | % | 0.650 | % | 0.575 | % | 0.550 | % | 0.475 | % | 0.475 | % | 0.475 | % | 0.450 | % | 0.425 | % | ||||||||||||||||||||||
Large Cap Index | 0.350 | % | 0.350 | % | 0.350 | % | 0.300 | % | 0.250 | % | 0.250 | % | 0.200 | % | 0.150 | % | 0.100 | % | 0.100 | % | 0.100 | % | ||||||||||||||||||||||
Equity Income Plus | 0.650 | % | 0.650 | % | 0.650 | % | 0.600 | % | 0.600 | % | 0.600 | % | 0.600 | % | 0.600 | % | 0.600 | % | 0.600 | % | 0.600 | % | ||||||||||||||||||||||
Balanced | 0.350 | % | 0.350 | % | 0.350 | % | 0.300 | % | 0.300 | % | 0.300 | % | 0.300 | % | 0.300 | % | 0.300 | % | 0.300 | % | 0.300 | % | ||||||||||||||||||||||
High Yield | 0.400 | % | 0.400 | % | 0.400 | % | 0.400 | % | 0.400 | % | 0.400 | % | 0.400 | % | 0.400 | % | 0.400 | % | 0.400 | % | 0.400 | % | ||||||||||||||||||||||
Diversified Income Plus | 0.400 | % | 0.400 | % | 0.400 | % | 0.400 | % | 0.400 | % | 0.400 | % | 0.400 | % | 0.400 | % | 0.400 | % | 0.400 | % | 0.400 | % | ||||||||||||||||||||||
Partner Socially Responsible Bond | 0.700 | % | 0.675 | % | 0.675 | % | 0.675 | % | 0.675 | % | 0.675 | % | 0.675 | % | 0.675 | % | 0.675 | % | 0.675 | % | 0.675 | % | ||||||||||||||||||||||
Income | 0.400 | % | 0.400 | % | 0.400 | % | 0.400 | % | 0.400 | % | 0.400 | % | 0.400 | % | 0.400 | % | 0.400 | % | 0.400 | % | 0.400 | % | ||||||||||||||||||||||
Bond Index | 0.350 | % | 0.350 | % | 0.350 | % | 0.300 | % | 0.250 | % | 0.250 | % | 0.200 | % | 0.150 | % | 0.100 | % | 0.100 | % | 0.100 | % | ||||||||||||||||||||||
Limited Maturity Bond | 0.400 | % | 0.400 | % | 0.400 | % | 0.400 | % | 0.400 | % | 0.400 | % | 0.400 | % | 0.400 | % | 0.400 | % | 0.400 | % | 0.400 | % | ||||||||||||||||||||||
Mortgage Securities | 0.500 | % | 0.500 | % | 0.500 | % | 0.500 | % | 0.500 | % | 0.500 | % | 0.500 | % | 0.500 | % | 0.500 | % | 0.500 | % | 0.500 | % | ||||||||||||||||||||||
Money Market | 0.400 | % | 0.400 | % | 0.400 | % | 0.400 | % | 0.400 | % | 0.400 | % | 0.400 | % | 0.400 | % | 0.400 | % | 0.400 | % | 0.400 | % | ||||||||||||||||||||||
| * | As of July 27, 2012. |
294
Table of Contents
Thrivent Series Fund, Inc.
Notes to Financial Statements
As of June 29, 2012
(unaudited)
(B) Sub-Adviser Fees – The following subadvisory fees are charged as part of the total investment advisory fees stated in the table above. The subadvisory fees are borne directly by the Adviser and do not increase the overall fees paid by the Portfolio.
Partner Technology Portfolio
The Adviser has entered into a subadvisory agreement with Goldman Sachs Asset Management, LP (“GSAM”) for the performance of subadvisory services. The fee payable is equal to 0.45% of average daily net assets.
Partner Healthcare Portfolio
The Adviser has entered into a subadvisory agreement with Sectoral Asset Management, Inc. for the performance of subadvisory services. The fee payable is equal to 0.65% of the first $50 million of average daily net assets, 0.60% of the next $50 million, 0.40% of the next $150 million and 0.35% of average daily net assets over $250 million.
Partner Emerging Markets Portfolio
The Adviser has entered into a subadvisory agreement with Aberdeen Asset Managers Limited (“Aberdeen”) for the performance of subadvisory services. The fee payable is equal to 0.85% of the first $50 million of average daily net assets, 0.72% of the next $50 million and 0.68% of average daily net assets over $100 million. Thrivent Partner Worldwide Allocation Portfolio and Thrivent Partner Worldwide Allocation Fund are included in determining breakpoints for the assets managed by Aberdeen.
Partner Small Cap Growth Portfolio
The Adviser has entered into a subadvisory agreement with Turner Investments, L.P. (“Turner”) for the performance of subadvisory services. For assets that are invested in companies that have market capitalizations that fall within the bottom half of the Russell 2000® Growth Index (the “microcap portion”), the fee payable is equal to 0.80% of the average daily net assets in that microcap portion. For all other assets, the fee payable is equal to 0.65% of the average daily net assets when the entire portfolio assets (including the microcap portion) are no greater than $100 million, 0.60% of the average daily net assets when the entire portfolio assets are greater than $100 million but no greater than $350 million, and 0.575% of the average daily net assets when the entire portfolio assets are greater than $350 million. Thrivent Partner Small Cap Growth Fund (including the microcap portion of that Fund) is included in determining breakpoints for the assets managed by Turner.
Partner Small Cap Value Portfolio
The Adviser has entered into a subadvisory agreement with T. Rowe Price Associates, Inc. for the performance of subadvisory services. The fee payable is equal to 0.60% of average daily net assets.
Partner Mid Cap Value Portfolio
The Adviser has entered into a subadvisory agreement with GSAM for the performance of subadvisory services. The fee payable is equal to 0.50% of average daily net assets for the first $200 million and 0.45% for assets over $200 million. Thrivent Partner Mid Cap Value Fund is included in determining breakpoints for the assets managed by GSAM.
Partner Worldwide Allocation Portfolio
The Adviser has entered into subadvisory agreements with Mercator Asset Management, LP (“Mercator”), Principal Global Investors, LLC (“Principal”), Aberdeen, Victory Capital Management, Inc. (“Victory”) and GSAM for the performance of subadvisory services. In addition, effective July 27, 2012, the Advisor entered into a subadvisory agreement with DuPont Capital Management (“DuPont Capital”) to manage a portion of the Portfolio’s allocation to emerging market equity securities.
The fee payable for Mercator is equal to 0.75% of the first $25 million of average daily net assets managed by Mercator, 0.60% of the next $25 million, 0.55% of the next $25 million, 0.50% of the next $225 million, 0.40% of the next $200 million and 0.20% of average daily net assets over $500 million. Thrivent Partner Worldwide Allocation Fund and Thrivent Partner International Stock Portfolio are included in determining breakpoints for the assets managed by Mercator.
The fee payable for Principal is equal to 0.35% of the first $500 million of average daily net assets managed by Principal, 0.30% of the next $500 million and 0.25% of average daily net assets over $1 billion. Thrivent Partner Worldwide Allocation Fund and Thrivent Partner International Stock Portfolio are included in determining breakpoints for the assets managed by Principal.
The fee payable for Aberdeen is equal to 0.85% of the first $50 million of average daily net assets managed by Aberdeen, 0.72% of the next $50 million and 0.68% of average daily net assets over $100 million. Thrivent Partner Emerging Markets Portfolio and Partner Worldwide Allocation Fund are included in determining breakpoints for the assets managed by Aberdeen.
The fee payable for Victory is equal to 0.95% of the first $25 million of average daily net assets, 0.85% of the next $75 million, 0.80% of the next $50 million, 0.75% of the next $100 million and 0.70% of average daily net assets over $250 million. Thrivent Partner Worldwide Allocation Fund is included in determining breakpoints for the assets managed by Victory.
The fee payable for GSAM is equal to 0.55% of the first $50 million of average daily net assets managed by GSAM, 0.50% of the next $200 million and 0.45% of average daily net
295
Table of Contents
Thrivent Series Fund, Inc.
Notes to Financial Statements
As of June 29, 2012
(unaudited)
assets over $250 million. Thrivent Partner Worldwide Allocation Fund is included in determining breakpoints for the assets managed by GSAM.
The fee payable for DuPont Capital is equal to 0.72% of the first $50 million of average daily net assets managed by DuPont Capital and 0.68% of average daily net assets over $50 million. Thrivent Partner Worldwide Allocation Fund and Thrivent Partner Emerging Markets Equity Fund is included in determining breakpoints for the assets managed by DuPont Capital.
Partner International Stock Portfolio
The Adviser has entered into subadvisory agreements with Principal and Mercator for the performance of subadvisory services.
The fee payable for Mercator is equal to 0.75% of the first $25 million of average daily net assets managed by Mercator, 0.60% of the next $25 million, 0.55% of the next $25 million, 0.50% of the next $225 million, 0.40% of the next $200 million and 0.20% of average daily net assets over $500 million. Thrivent Partner Worldwide Allocation Portfolio and Thrivent Partner Worldwide Allocation Fund are included in determining breakpoints for the assets managed by Mercator.
The fee payable for Principal is equal to 0.35% of the first $500 million of average daily net assets managed by Principal, 0.30% of the next $500 million and 0.25% of average daily net assets over $1 billion. Thrivent Partner Worldwide Allocation Portfolio and Thrivent Partner Worldwide Allocation Fund are included in determining breakpoints for the assets managed by Principal.
Partner Socially Responsible Stock Portfolio
The Adviser has entered into a subadvisory agreement with Calvert Investment Management, Inc. (“Calvert”) for the performance of subadvisory services. The fee payable is equal to 0.50% of average daily net assets for the first $50 million, 0.475% for the next $50 million, 0.45% for the next $50 million, 0.425% of the next $100 million and 0.40% for assets over $250 million.
Partner All Cap Growth Portfolio
The Adviser has entered into a subadvisory agreement with Calamos Advisors LLC for the performance of subadvisory services. The fee payable is equal to 0.65% of average daily net assets.
Partner All Cap Value Portfolio
The Adviser has entered into a subadvisory agreement with OppenheimerFunds, Inc. for the performance of subadvisory services. The fee payable is equal to 0.45% of the first $50 million of average daily net assets, 0.40% of the next $200 million and 0.35% of average daily net assets over $250 million.
Partner All Cap Portfolio
The Adviser has entered into a subadvisory agreement with Pyramis Global Advisors, LLC (“Pyramis Advisors”) for the performance of subadvisory services. Pyramis Advisors is a wholly owned subsidiary of Fidelity Management & Research Corporation. The fee payable is equal to 0.60% of average daily net assets for the first $100 million, 0.55% for the next $400 million, 0.50% for the next $250 million and 0.45% for assets over $750 million.
Partner Growth Stock Portfolio
The Adviser has entered into a subadvisory agreement with T. Rowe Price Associates, Inc. for the performance of subadvisory services. The fee payable is equal to 0.40% of average daily net assets for the first $500 million and 0.35% for assets over $500 million.
Partner Socially Responsible Bond Portfolio
The Adviser has entered into a subadvisory agreement with Calvert for the performance of subadvisory services. The fee payable is equal to 0.40% of average daily net assets for the first $50 million, 0.375% for the next $50 million, 0.35% for the next $50 million, 0.325% of the next $100 million and 0.30% for assets over $250 million.
(C) Expense Reimbursements – As of June 29, 2012, the following voluntary expense reimbursements, as a percentage of net assets, were in effect:
Portfolio | Expense Reimbursement | Expiration Date | ||||||
Partner Small Cap Growth | 0.10 | % | N/A | |||||
Mid Cap Growth II | 0.30 | % | N/A | |||||
Partner International Stock | 0.08 | % | N/A | |||||
Partner All Cap | 0.20 | % | N/A | |||||
Large Cap Growth II | 0.15 | % | N/A | |||||
Partner Growth Stock | 0.10 | % | N/A | |||||
Money Market1 | 0.10 | % | N/A | |||||
| 1 | Thrivent Asset Mgt. has voluntarily agreed to reimburse certain portfolio level expenses of Thrivent Money Market Portfolio to the extent necessary in order to maintain a minimum annualized net yield of 0.00%. |
As of June 29, 2012, contractual expense reimbursements to limit expenses to the following percentages were in effect:
Portfolio | Expense Limit | Expiration Date | ||||||
Partner Healthcare | 1.25 | % | 4/30/2013 | |||||
Partner Natural Resources1 | 1.02 | % | 4/30/2013 | |||||
Partner Emerging Markets | 1.40 | % | 4/30/2013 | |||||
Partner Utilities | 0.90 | % | 4/30/2013 | |||||
Partner Socially Responsible Stock | 0.98 | % | 4/30/2013 | |||||
Partner All Cap Growth | 1.00 | % | 4/30/2013 | |||||
Partner All Cap Value | 0.98 | % | 4/30/2013 | |||||
Partner Socially Responsible Bond | 0.68 | % | 4/30/2013 | |||||
Mortgage Securities | 0.79 | % | 4/30/2013 | |||||
| 1 | Prior contractual expense limit of 1.19% expired on April 30, 2012. |
296
Table of Contents
Thrivent Series Fund, Inc.
Notes to Financial Statements
As of June 29, 2012
(unaudited)
Thrivent does not recoup amounts previously reimbursed or waived in prior fiscal years.
Each equity, hybrid and fixed income Portfolio may invest cash in High Yield Fund, subject to certain limitations. During the six months ended June 29, 2012, Limited Maturity Bond Portfolio invested in High Yield Fund. This related-party transactions is subject to the same terms as non-related party transactions except that, to avoid duplicate investment advisory fees, Thrivent Financial reimburses an amount equal to the advisory fee which is charged to the Portfolio for its investment in High Yield Fund.
(D) Other Expenses — The Fund has entered into an accounting and administrative services agreement with the Adviser to provide certain accounting and administrative personnel and services to the Portfolios. For the six months ended June 29, 2012, the Adviser received aggregate fees for accounting and administrative personnel and services of $3,738,631 from the Fund.
Each Director is eligible to participate in a deferred compensation plan with respect to fees received from the Fund. Participants in the plan may designate their deferred Director’s fees as if invested in any one of the portfolios of Thrivent Mutual Funds. The value of each Director’s deferred compensation account will increase or decrease as if it were invested in shares of the selected portfolios of Thrivent Mutual Funds. Their fees as well as the change in value are included in Director’s fees in the Statement of Operations. The deferred fees remain in the appropriate fund until distribution in accordance with the plan. The deferred fee liability, included in accrued expenses in the Statement of Assets and Liabilities, is unsecured.
Those Directors not participating in the above plan received $235,285 in fees from the Fund for the six months ended June 29, 2012. In addition, the Fund reimbursed independent Directors for reasonable expenses incurred in relation to attendance at the meetings and industry conferences.
Certain officers and non-independent directors of the Fund are officers and directors of Thrivent Financial and Thrivent Life; however, they receive no compensation from the Fund.
(E) Indirect Expenses — Some Portfolios invest in other mutual funds. Fees and expenses of those underlying funds are not included in the Portfolios’ expense ratios. The Portfolios indirectly bear their proportionate share of the annualized weighted average expense ratio of the underlying funds in which they invest.
(4) TAX INFORMATION
Distributions are based on amounts calculated in accordance with applicable federal income tax regulations, which may differ from GAAP. To the extent that these differences are permanent in nature, such amounts are reclassified within the capital accounts based on their federal tax-basis treatment; temporary differences do not require reclassifications. At fiscal year-end, the character and amount of distributions, on a tax-basis, and components of distributable earnings, are finalized. Therefore, as of June 29, 2012, tax-basis balances have not yet been determined.
At December 31, 2011, the following Portfolios had accumulated net realized capital loss carryovers expiring as follows:
Portfolio | Capital Loss Carryover | Expiration Year | ||||||
Partner Technology | $ | 4,457,272 | 2016 | |||||
| 2,198,564 | 2017 | |||||||
|
| |||||||
| $ | 6,655,836 | |||||||
|
| |||||||
Real Estate Securities | 5,515,463 | 2017 | ||||||
|
| |||||||
| $ | 5,515,463 | |||||||
|
| |||||||
Partner Utilities | 241,547 | 2016 | ||||||
| 285,260 | 2017 | |||||||
| 296,017 | 2018 | |||||||
|
| |||||||
| $ | 822,824 | |||||||
|
| |||||||
Partner Small Cap Growth | 11,237,188 | 2017 | ||||||
|
| |||||||
| $ | 11,237,188 | |||||||
|
| |||||||
Partner Small Cap Value | 2,376,105 | 2017 | ||||||
|
| |||||||
| $ | 2,376,105 | |||||||
|
| |||||||
Small Cap Stock | 36,499,516 | 2017 | ||||||
|
| |||||||
| $ | 36,499,516 | |||||||
|
| |||||||
Mid Cap Growth | 27,922,302 | 2017 | ||||||
|
| |||||||
| $ | 27,922,302 | |||||||
|
| |||||||
Partner Mid Cap Value | 3,300,531 | 2017 | ||||||
|
| |||||||
| $ | 3,300,531 | |||||||
|
| |||||||
Mid Cap Stock | 28,879,374 | 2016 | ||||||
| 27,996,719 | 2017 | |||||||
|
| |||||||
| $ | 56,876,093 | |||||||
|
| |||||||
Partner International Stock | 62,173,678 | 2016 | ||||||
| 186,079,623 | 2017 | |||||||
|
| |||||||
| $ | 248,253,301 | |||||||
|
| |||||||
Partner Socially Responsible | ||||||||
Stock | 372,421 | 2017 | ||||||
| 14,165 | 2018 | |||||||
|
| |||||||
| $ | 386,586 | |||||||
|
| |||||||
297
Table of Contents
Thrivent Series Fund, Inc.
Notes to Financial Statements
As of June 29, 2012
(unaudited)
Portfolio | Capital Loss Carryover | Expiration Year | ||||||
Partner All Cap Growth | 95,936 | 2017 | ||||||
|
| |||||||
| $ | 95,936 | |||||||
|
| |||||||
Partner All Cap Value | 429,313 | 2017 | ||||||
|
| |||||||
| $ | 429,313 | |||||||
|
| |||||||
Partner All Cap | 2,815,301 | 2016 | ||||||
| 11,312,120 | 2017 | |||||||
|
| |||||||
| $ | 14,127,421 | |||||||
|
| |||||||
Large Cap Growth | 163,432,783 | 2016 | ||||||
| 185,657,815 | 2017 | |||||||
|
| |||||||
| $ | 349,090,598 | |||||||
|
| |||||||
Partner Growth Stock | 3,321,959 | 2017 | ||||||
|
| |||||||
| $ | 3,321,959 | |||||||
|
| |||||||
Large Cap Value | 137,060,849 | 2017 | ||||||
|
| |||||||
| $ | 137,060,849 | |||||||
|
| |||||||
Large Cap Stock | 10,245,853 | 2016 | ||||||
| 98,352,276 | 2017 | |||||||
|
| |||||||
| $ | 108,598,129 | |||||||
|
| |||||||
Large Cap Index | 3,661,314 | 2017 | ||||||
|
| |||||||
| $ | 3,661,314 | |||||||
|
| |||||||
Equity Income Plus | 1,477,681 | 2016 | ||||||
| 5,497,079 | 2017 | |||||||
|
| |||||||
| $ | 6,974,760 | |||||||
|
| |||||||
High Yield | 30,516,064 | 2012 | ||||||
| 10,993,224 | 2013 | |||||||
| 560,014 | 2014 | |||||||
| 42,742,264 | 2016 | |||||||
| 46,838,004 | 2017 | |||||||
|
| |||||||
| $ | 131,649,570 | |||||||
|
| |||||||
Diversified Income Plus | 6,841,580 | 2016 | ||||||
| 9,354,607 | 2017 | |||||||
|
| |||||||
| $ | 16,196,187 | |||||||
Income | 17,640,507 | 2017 | ||||||
|
| |||||||
| $ | 17,640,507 | |||||||
|
| |||||||
Limited Maturity Bond | 2,074,889 | 2016 | ||||||
| 6,959,975 | 2017 | |||||||
|
| |||||||
| $ | 9,034,864 | |||||||
|
| |||||||
To the extent that these Portfolios realize future net capital gains, taxable distributions will be reduced by any unused capital loss carryovers as permitted by the Internal Revenue Code.
Capital losses generated during the year ending December 31, 2011 and later, will be subject to the provisions of the Regulated Investment Company Modernization Act of 2010 (the Act). The Act made several changes to the tax rules that impact the Portfolios. Under the Act, if the losses are not reduced by gains, the losses will be carried forward with no expiration and with the short-term or long-term character of the loss retained. Additionally, these capital losses must be fully utilized before those capital loss carryovers listed with noted expiration dates in the table above, which may make them more likely to expire unused. No new capital losses were generated during the year ending December 31, 2011.
The following Portfolios deferred, on a tax basis, the following Post-October 2011 losses:
Portfolio | Post-October Loss | |||
Partner Worldwide Allocation | $ | 3,055,731 | ||
These amounts are deferred for tax purposes, deemed to occur in the next fiscal year, and will be subject to the provisions of the Regulated Investment Company Modernization Act of 2010. If the losses are not reduced by gains during the year ending December 31, 2012, the losses will be carried forward with no expiration and with the short-term or long-term character of the loss retained.
(5) SECURITY TRANSACTIONS
(A) Purchases and Sales of Investment Securities – For the six months ended June 29, 2012, the cost of purchases and the proceeds from sales of investment securities, other than U.S. Government and short-term securities, were as follows:
| In thousands | ||||||||
Portfolio | Purchases | Sales | ||||||
Aggressive Allocation | $ | 140,646 | $ | 124,648 | ||||
Moderately Aggressive Allocation | 545,218 | 470,960 | ||||||
Moderate Allocation | 867,268 | 713,061 | ||||||
Moderately Conservative Allocation | 425,463 | 294,722 | ||||||
Partner Technology | 9,704 | 8,681 | ||||||
Partner Healthcare | 3,991 | 3,804 | ||||||
Partner Natural Resources | 6,797 | 4,425 | ||||||
Partner Emerging Markets | 5,065 | 1,608 | ||||||
Real Estate Securities | 17,933 | 21,086 | ||||||
Partner Utilities | 3,722 | 1,068 | ||||||
Partner Small Cap Growth | 113,891 | 106,285 | ||||||
Partner Small Cap Value | 18,789 | 24,478 | ||||||
Small Cap Stock | 140,196 | 141,043 | ||||||
Small Cap Index | 7,770 | 16,990 | ||||||
Mid Cap Growth II | 3,212 | 3,960 | ||||||
Mid Cap Growth | 66,120 | 84,182 | ||||||
Partner Mid Cap Value | 115,524 | 109,383 | ||||||
Mid Cap Stock | 103,134 | 115,044 | ||||||
Mid Cap Index | 3,467 | 4,272 | ||||||
Partner Worldwide Allocation | 215,713 | 150,838 | ||||||
Partner International Stock | 202,171 | 215,542 | ||||||
Partner Socially Responsible Stock | 2,313 | 1,076 | ||||||
Partner All Cap Growth | 3,631 | 3,602 | ||||||
Partner All Cap Value | 4,700 | 4,807 | ||||||
Partner All Cap | 30,911 | 34,663 | ||||||
Large Cap Growth II | 5,048 | 5,953 | ||||||
Large Cap Growth | 415,639 | 479,622 | ||||||
Partner Growth Stock | 9,447 | 12,645 | ||||||
298
Table of Contents
Thrivent Series Fund, Inc.
Notes to Financial Statements
As of June 29, 2012
(unaudited)
| In thousands | ||||||||
Portfolio | Purchases | Sales | ||||||
Large Cap Value | 434,539 | 444,247 | ||||||
Large Cap Stock | 260,022 | 281,175 | ||||||
Large Cap Index | 6,838 | 16,931 | ||||||
Equity Income Plus | 82,507 | 69,775 | ||||||
Balanced | 10,716 | 27,726 | ||||||
High Yield | 224,338 | 197,700 | ||||||
Diversified Income Plus | 94,839 | 70,276 | ||||||
Partner Socially Responsible Bond | 2,564 | 3,336 | ||||||
Income | 394,641 | 385,063 | ||||||
Bond Index | 16,847 | 18,241 | ||||||
Limited Maturity Bond | 175,145 | 391,523 | ||||||
Mortgage Securities | 1,083 | 2,066 | ||||||
Purchases and Sales of U.S. Government Securities were:
| In thousands | ||||||||
Portfolio | Purchases | Sales | ||||||
Aggressive Allocation | $ | 93,149 $ | 104,347 | |||||
Moderately Aggressive Allocation | 806,082 | 843,524 | ||||||
Moderate Allocation | 1,751,774 | 1,600,099 | ||||||
Moderately Conservative Allocation | 1,560,479 | 1,463,153 | ||||||
Partner Worldwide Allocation | — | 701 | ||||||
Balanced | 160,302 | 159,386 | ||||||
Diversified Income Plus | 17,985 | 18,976 | ||||||
Partner Socially Responsible Bond | 10,697 | 8,384 | ||||||
Income | 540,176 | 521,430 | ||||||
Bond Index | 336,734 | 334,389 | ||||||
Limited Maturity Bond | 612,933 | 629,883 | ||||||
Mortgage Securities | 149,836 | 148,417 | ||||||
(B) Investments in Restricted Securities – Certain Portfolios may own restricted securities that have been deemed illiquid and were purchased in private placement transactions without registration under the Securities Act of 1933. Unless such securities subsequently become registered, they generally may be resold only in privately negotiated transactions with a limited number of purchasers. As of June 29, 2012, the following Portfolios held restricted securities:
Portfolio | Number of Securities | Percent of Portfolio’s Net Assets | ||||||
Partner Growth Stock | 12 | 1.13 | % | |||||
Balanced | 2 | 0.47 | % | |||||
High Yield | 3 | 1.56 | % | |||||
Diversified Income Plus | 1 | 0.28 | % | |||||
Income | 3 | 0.55 | % | |||||
Bond Index | 2 | 0.79 | % | |||||
Limited Maturity Bond | 4 | 0.80 | % | |||||
Mortgage Securities | 2 | 3.52 | % | |||||
The Portfolios have no right to require registration of unregistered securities.
(C) Investments in High-Yielding Securities – High Yield Portfolio invests primarily in high-yielding fixed income securities. Each of the other Portfolios, except Money Market Portfolio, may also invest in high-yielding securities. These securities will typically be in lower rated categories or will be non-rated and generally will involve more risk than securities in higher rated categories. Lower rated or unrated securities are more likely to react to developments affecting market risk and credit risk than are more highly rated securities, which react primarily to movements in the general level of interest rates.
(D) Investments in Options and Futures Contracts – The movement in the price of the security underlying an option or futures contract may not correlate perfectly with the movement in the prices of the portfolio securities being hedged. A lack of correlation could render the Portfolio’s hedging strategy unsuccessful and could result in a loss to the Portfolio. In the event that a liquid secondary market would not exist, the Portfolio could be prevented from entering into a closing transaction which could result in additional losses to the Portfolio.
(E) Written Option Contracts – The number of contracts and premium amounts associated with covered call option contracts written during the six months ended June 29, 2012, were as follows:
| Number of Contracts | Premium Amount | |||||||
Large Cap Stock | ||||||||
Balance at December 31, 2011 | 30 | $ | 17,050 | |||||
Opened | 170 | 259,450 | ||||||
Closed | (200 | ) | (276,500 | ) | ||||
Expired | — | — | ||||||
Exercised | — | — | ||||||
|
|
|
| |||||
Balance at June 29, 2012 | — | $ | — | |||||
|
|
|
| |||||
Equity Income Plus | ||||||||
Balance at December 31, 2011 | 891 | $ | 181,439 | |||||
Opened | 510 | 571,560 | ||||||
Closed | (1,401 | ) | (752,999 | ) | ||||
Expired | — | — | ||||||
Exercised | — | — | ||||||
|
|
|
| |||||
Balance at June 29, 2012 | — | $ | — | |||||
|
|
|
| |||||
Diversified Income Plus | ||||||||
Balance at December 31, 2011 | 30 | $ | 17,050 | |||||
Opened | 90 | 132,150 | ||||||
Closed | (120 | ) | (149,200 | ) | ||||
Expired | — | — | ||||||
Exercised | — | — | ||||||
|
|
|
| |||||
Balance at June 29, 2012 | — | $ | — | |||||
|
|
|
| |||||
Limited Maturity Bond | ||||||||
Balance at December 31, 2011 | — | $ | — | |||||
Opened | 150 | 32,363 | ||||||
Closed | (150 | ) | (32,363 | ) | ||||
Expired | — | — | ||||||
Exercised | — | — | ||||||
|
|
|
| |||||
Balance at June 29, 2012 | — | $ | — | |||||
|
|
|
| |||||
The accompanying Notes to Financial Statements are an integral part of this schedule.
299
Table of Contents
Thrivent Series Fund, Inc.
Notes to Financial Statements
As of June 29, 2012
(unaudited)
(6) SECURITY TRANSACTIONS WITH AFFILIATED FUNDS
The Portfolios are permitted to purchase or sell securities from or to certain other Portfolios under specified conditions outlined in procedures adopted by the Board. The procedures have been designed to ensure that any purchase or sale of securities by the Portfolio from or to another portfolio or fund that is or could be considered an affiliate by virtue of having a common investment adviser (or affiliated investment advisers), common Directors and/ or common officers complies with Rule 17a-7 of the 1940 Act. Further, as defined under the procedures, each transaction is executed at the current market price. Pursuant to these procedures, during the six months ended June 29, 2012, the Portfolios engaged in purchases and sales of securities of $9,620,806 and $7,170,573 respectively.
(7) SHARES OF BENEFICIAL INTEREST
The shares of each Portfolio have equal rights and privileges with all shares of that Portfolio. Shares in the Portfolio are currently sold only to separate accounts of Thrivent Financial, Thrivent Life and retirement plans sponsored by Thrivent Financial.
As of June 29, 2012, authorized capital stock consists of ten billion shares as follows:
Portfolio | Shares Authorized | Par Value | ||||||
Aggressive Allocation | 300,000,000 | $ | 0.01 | |||||
Moderately Aggressive Allocation | 550,000,000 | 0.01 | ||||||
Moderate Allocation | 850,000,000 | 0.01 | ||||||
Moderately Conservative Allocation | 600,000,000 | 0.01 | ||||||
Partner Technology | 100,000,000 | 0.01 | ||||||
Partner Healthcare | 50,000,000 | 0.01 | ||||||
Partner Natural Resources | 200,000,000 | 0.01 | ||||||
Partner Emerging Markets | 150,000,000 | 0.01 | ||||||
Real Estate Securities | 200,000,000 | 0.01 | ||||||
Partner Utilities | 150,000,000 | 0.01 | ||||||
Partner Small Cap Growth | 50,000,000 | 0.01 | ||||||
Partner Small Cap Value | 150,000,000 | 0.01 | ||||||
Small Cap Stock | 200,000,000 | 0.01 | ||||||
Small Cap Index | 200,000,000 | 0.01 | ||||||
Mid Cap Growth II | 200,000,000 | 0.01 | ||||||
Mid Cap Growth | 200,000,000 | 0.01 | ||||||
Partner Mid Cap Value | 50,000,000 | 0.01 | ||||||
Mid Cap Stock | 200,000,000 | 0.01 | ||||||
Mid Cap Index | 200,000,000 | 0.01 | ||||||
Partner Worldwide Allocation | 200,000,000 | 0.01 | ||||||
Partner International Stock | 250,000,000 | 0.01 | ||||||
Partner Socially Responsible Stock | 100,000,000 | 0.01 | ||||||
Partner All Cap Growth | 200,000,000 | 0.01 | ||||||
Partner All Cap Value | 50,000,000 | 0.01 | ||||||
Partner All Cap | 200,000,000 | 0.01 | ||||||
Large Cap Growth II | 200,000,000 | 0.01 | ||||||
Large Cap Growth | 300,000,000 | 0.01 | ||||||
Partner Growth Stock | 100,000,000 | 0.01 | ||||||
Large Cap Value | 200,000,000 | 0.01 | ||||||
Large Cap Stock | 250,000,000 | 0.01 | ||||||
Large Cap Index | 200,000,000 | 0.01 | ||||||
Equity Income Plus | 200,000,000 | 0.01 | ||||||
Balanced | 200,000,000 | 0.01 | ||||||
High Yield | 300,000,000 | 0.01 | ||||||
Diversified Income Plus | 200,000,000 | 0.01 | ||||||
Partner Socially Responsible Bond | 50,000,000 | 0.01 | ||||||
Income | 300,000,000 | 0.01 | ||||||
Bond Index | 200,000,000 | 0.01 | ||||||
Limited Maturity Bond | 450,000,000 | 0.01 | ||||||
Mortgage Securities | 50,000,000 | 0.01 | ||||||
Money Market | 1,200,000,000 | 0.01 | ||||||
(8) SUBSEQUENT EVENTS
Management of the Portfolios has evaluated the impact of subsequent events and, except as already included in the Notes to Financial Statements, has determined that no additional items require disclosure.
300
Table of Contents
[THIS PAGE INTENTIONALLY LEFT BLANK]
301
Table of Contents
Thrivent Series Fund, Inc.
| FOR A SHARE OUTSTANDING THROUGHOUT EACH PERIOD* | ||||||||||||||||||||||||
| Income from Investment Operations | Less Distributions from | |||||||||||||||||||||||
| Net Asset Value, Beginning of Period | Net Investment Income/(Loss) | Net Realized and Unrealized Gain/(Loss) on Investments(a) | Total from Investment Operations | Net Investment Income | Net Realized Gain on Investments | |||||||||||||||||||
AGGRESSIVE ALLOCATION PORTFOLIO | ||||||||||||||||||||||||
Period Ended 6/29/2012 (unaudited) | $ | 11.40 | $ | 0.08 | $ | 0.51 | $ | 0.59 | $ | (0.08 | ) | $ | (0.52 | ) | ||||||||||
Year Ended 12/31/2011 | 12.22 | 0.06 | (0.52 | ) | (0.46 | ) | (0.16 | ) | (0.20 | ) | ||||||||||||||
Year Ended 12/31/2010 | 10.66 | 0.10 | 1.72 | 1.82 | (0.16 | ) | (0.10 | ) | ||||||||||||||||
Year Ended 12/31/2009 | 8.51 | 0.09 | 2.47 | 2.56 | (0.41 | ) | — | |||||||||||||||||
Year Ended 12/31/2008 | 14.09 | 0.25 | (5.34 | ) | (5.09 | ) | (0.18 | ) | (0.31 | ) | ||||||||||||||
Year Ended 12/31/2007 | 13.01 | 0.13 | 1.09 | 1.22 | (0.08 | ) | (0.06 | ) | ||||||||||||||||
|
|
|
|
|
|
|
|
|
|
|
| |||||||||||||
MODERATELY AGGRESSIVE ALLOCATION PORTFOLIO | ||||||||||||||||||||||||
Period Ended 6/29/2012 (unaudited) | 11.19 | 0.11 | 0.52 | 0.63 | (0.14 | ) | (0.16 | ) | ||||||||||||||||
Year Ended 12/31/2011 | 11.89 | 0.12 | (0.45 | ) | (0.33 | ) | (0.23 | ) | (0.14 | ) | ||||||||||||||
Year Ended 12/31/2010 | 10.72 | 0.17 | 1.42 | 1.59 | (0.25 | ) | (0.17 | ) | ||||||||||||||||
Year Ended 12/31/2009 | 8.64 | 0.17 | 2.37 | 2.54 | (0.46 | ) | — | |||||||||||||||||
Year Ended 12/31/2008 | 13.48 | 0.33 | (4.71 | ) | (4.38 | ) | (0.23 | ) | (0.23 | ) | ||||||||||||||
Year Ended 12/31/2007 | 12.66 | 0.18 | 0.80 | 0.98 | (0.11 | ) | (0.05 | ) | ||||||||||||||||
|
|
|
|
|
|
|
|
|
|
|
| |||||||||||||
MODERATE ALLOCATION PORTFOLIO | ||||||||||||||||||||||||
Period Ended 6/29/2012 (unaudited) | 11.25 | 0.10 | 0.51 | 0.61 | (0.19 | ) | (0.08 | ) | ||||||||||||||||
Year Ended 12/31/2011 | 11.79 | 0.17 | (0.28 | ) | (0.11 | ) | (0.26 | ) | (0.17 | ) | ||||||||||||||
Year Ended 12/31/2010 | 10.82 | 0.22 | 1.21 | 1.43 | (0.29 | ) | (0.17 | ) | ||||||||||||||||
Year Ended 12/31/2009 | 8.92 | 0.23 | 2.14 | 2.37 | (0.47 | ) | — | |||||||||||||||||
Year Ended 12/31/2008 | 12.82 | 0.37 | (3.83 | ) | (3.46 | ) | (0.27 | ) | (0.17 | ) | ||||||||||||||
Year Ended 12/31/2007 | 12.22 | 0.24 | 0.58 | 0.82 | (0.15 | ) | (0.07 | ) | ||||||||||||||||
|
|
|
|
|
|
|
|
|
|
|
| |||||||||||||
MODERATELY CONSERVATIVE ALLOCATION PORTFOLIO | ||||||||||||||||||||||||
Period Ended 6/29/2012 (unaudited) | 11.28 | 0.09 | 0.44 | 0.53 | (0.19 | ) | (0.09 | ) | ||||||||||||||||
Year Ended 12/31/2011 | 11.66 | 0.18 | (0.16 | ) | 0.02 | (0.25 | ) | (0.15 | ) | |||||||||||||||
Year Ended 12/31/2010 | 10.91 | 0.23 | 0.97 | 1.20 | (0.28 | ) | (0.17 | ) | ||||||||||||||||
Year Ended 12/31/2009 | 9.27 | 0.24 | 1.82 | 2.06 | (0.42 | ) | — | |||||||||||||||||
Year Ended 12/31/2008 | 12.08 | 0.37 | (2.80 | ) | (2.43 | ) | (0.29 | ) | (0.09 | ) | ||||||||||||||
Year Ended 12/31/2007 | 11.69 | 0.27 | 0.39 | 0.66 | (0.20 | ) | (0.07 | ) | ||||||||||||||||
|
|
|
|
|
|
|
|
|
|
|
| |||||||||||||
PARTNER TECHNOLOGY PORTFOLIO | ||||||||||||||||||||||||
Period Ended 6/29/2012 (unaudited) | 6.20 | (0.01 | ) | 0.94 | 0.93 | — | — | |||||||||||||||||
Year Ended 12/31/2011 | 7.11 | (0.01 | ) | (0.90 | ) | (0.91 | ) | — | — | |||||||||||||||
Year Ended 12/31/2010 | 5.69 | (0.04 | ) | 1.46 | 1.42 | — | — | |||||||||||||||||
Year Ended 12/31/2009 | 3.63 | (0.03 | ) | 2.09 | 2.06 | — | — | |||||||||||||||||
Year Ended 12/31/2008 | 8.24 | — | (3.59 | ) | (3.59 | ) | — | (1.02 | ) | |||||||||||||||
Year Ended 12/31/2007 | 7.67 | (0.01 | ) | 0.85 | 0.84 | — | (0.27 | ) | ||||||||||||||||
|
|
|
|
|
|
|
|
|
|
|
| |||||||||||||
PARTNER HEALTHCARE PORTFOLIO | ||||||||||||||||||||||||
Period Ended 6/29/2012 (unaudited) | 11.26 | 0.07 | 1.55 | 1.62 | (0.04 | ) | (0.15 | ) | ||||||||||||||||
Year Ended 12/31/2011 | 12.08 | 0.03 | (0.46 | ) | (0.43 | ) | — | (0.39 | ) | |||||||||||||||
Year Ended 12/31/2010 | 11.08 | (0.02 | ) | 1.22 | 1.20 | (0.02 | ) | (0.18 | ) | |||||||||||||||
Year Ended 12/31/2009 | 8.94 | 0.02 | 2.12 | 2.14 | — | — | ||||||||||||||||||
Year Ended 12/31/2008 (c) | 10.00 | — | (1.05 | ) | (1.05 | ) | (0.01 | ) | — | |||||||||||||||
| (a) | The amount shown may not correlate with the change in aggregate gains and losses of portfolio securities due to the timing of sales and redemptions of fund shares. |
| (c) | Since inception, April 30, 2008. |
| * | All per share amounts have been rounded to the nearest cent. |
The accompanying Notes to Financial Statements are an integral part of this schedule.
302
Table of Contents
Thrivent Series Fund, Inc.
Financial Highlights – continued
| RATIOS / SUPPLEMENTAL DATA | ||||||||||||||||||||||||||||||||||
| Ratio to Average Net Assets** | Ratios to Average Net Assets Before Expenses Waived, Credited or Paid Indirectly** | |||||||||||||||||||||||||||||||||
Total | Net Asset Value, End of Period | Total Return(b) | Net Assets, End of Period (in millions) | Expenses | Net Investment Income/(Loss) | Expenses | Net Investment Income/(Loss) | Portfolio Turnover Rate | ||||||||||||||||||||||||||
|
|
| ||||||||||||||||||||||||||||||||
| $ | (0.60) | $ | 11.39 | 5.26 | % | $ | 590.1 | 0.51 | % | 1.46 | % | 0.51 | % | 1.46 | % | 40 | % | |||||||||||||||||
| (0.36) | 11.40 | (3.93 | )% | 560.6 | 0.42 | % | 0.49 | % | 0.43 | % | 0.47 | % | 74 | % | ||||||||||||||||||||
| (0.26) | 12.22 | 17.53 | % | 587.1 | 0.34 | % | 0.95 | % | 0.39 | % | 0.90 | % | 68 | % | ||||||||||||||||||||
| (0.41) | 10.66 | 30.62 | % | 497.6 | 0.23 | % | 1.29 | % | 0.26 | % | 1.27 | % | 22 | % | ||||||||||||||||||||
| (0.49) | 8.51 | (37.23 | )% | 354.3 | 0.20 | % | 2.45 | % | 0.20 | % | 2.45 | % | 30 | % | ||||||||||||||||||||
| (0.14) | 14.09 | 9.33 | % | 496.4 | 0.15 | % | 1.17 | % | 0.20 | % | 1.12 | % | 16 | % | ||||||||||||||||||||
|
|
|
|
|
|
|
|
|
|
|
|
|
|
|
|
|
| |||||||||||||||||
|
|
| ||||||||||||||||||||||||||||||||
| (0.30) | 11.52 | 5.65 | % | 2,880.9 | 0.41 | % | 1.94 | % | 0.41 | % | 1.94 | % | 50 | % | ||||||||||||||||||||
| (0.37) | 11.19 | (2.86 | )% | 2,659.6 | 0.33 | % | 1.22 | % | 0.33 | % | 1.22 | % | 64 | % | ||||||||||||||||||||
| (0.42) | 11.89 | 15.43 | % | 2,505.6 | 0.28 | % | 1.83 | % | 0.28 | % | 1.83 | % | 39 | % | ||||||||||||||||||||
| (0.46) | 10.72 | 29.80 | % | 1,983.0 | 0.20 | % | 2.41 | % | 0.20 | % | 2.41 | % | 17 | % | ||||||||||||||||||||
| (0.46) | 8.64 | (33.40 | )% | 1,354.6 | 0.17 | % | 3.36 | % | 0.17 | % | 3.36 | % | 27 | % | ||||||||||||||||||||
| (0.16) | 13.48 | 7.74 | % | 1,780.8 | 0.13 | % | 1.86 | % | 0.17 | % | 1.82 | % | 18 | % | ||||||||||||||||||||
|
|
|
|
|
|
|
|
|
|
|
|
|
|
|
|
|
| |||||||||||||||||
|
|
| ||||||||||||||||||||||||||||||||
| (0.27) | 11.59 | 5.45 | % | 4,698.4 | 0.38 | % | 2.15 | % | 0.38 | % | 2.15 | % | 57 | % | ||||||||||||||||||||
| (0.43) | 11.25 | (1.02 | )% | 4,133.6 | 0.29 | % | 1.86 | % | 0.29 | % | 1.86 | % | 53 | % | ||||||||||||||||||||
| (0.46) | 11.79 | 13.68 | % | 3,569.4 | 0.26 | % | 2.51 | % | 0.26 | % | 2.51 | % | 30 | % | ||||||||||||||||||||
| (0.47) | 10.82 | 26.89 | % | 2,658.5 | 0.19 | % | 3.16 | % | 0.19 | % | 3.16 | % | 16 | % | ||||||||||||||||||||
| (0.44) | 8.92 | (27.74 | )% | 1,811.6 | 0.17 | % | 3.91 | % | 0.17 | % | 3.91 | % | 22 | % | ||||||||||||||||||||
| (0.22) | 12.82 | 6.75 | % | 2,168.9 | 0.14 | % | 2.68 | % | 0.17 | % | 2.65 | % | 18 | % | ||||||||||||||||||||
|
|
|
|
|
|
|
|
|
|
|
|
|
|
|
|
|
| |||||||||||||||||
|
|
| ||||||||||||||||||||||||||||||||
| (0.28) | 11.53 | 4.63 | % | 2,435.9 | 0.41 | % | 2.05 | % | 0.41 | % | 2.05 | % | 88 | % | ||||||||||||||||||||
| (0.40) | 11.28 | 0.20 | % | 2,055.3 | 0.31 | % | 2.14 | % | 0.31 | % | 2.14 | % | 46 | % | ||||||||||||||||||||
| (0.45) | 11.66 | 11.41 | % | 1,591.3 | 0.28 | % | 2.81 | % | 0.28 | % | 2.81 | % | 30 | % | ||||||||||||||||||||
| (0.42) | 10.91 | 22.53 | % | 1,075.4 | 0.22 | % | 3.41 | % | 0.22 | % | 3.41 | % | 16 | % | ||||||||||||||||||||
| (0.38) | 9.27 | (20.61 | )% | 714.8 | 0.18 | % | 4.09 | % | 0.18 | % | 4.09 | % | 21 | % | ||||||||||||||||||||
| (0.27) | 12.08 | 5.59 | % | 756.9 | 0.17 | % | 3.36 | % | 0.19 | % | 3.34 | % | 13 | % | ||||||||||||||||||||
|
|
|
|
|
|
|
|
|
|
|
|
|
|
|
|
|
| |||||||||||||||||
| — | 7.13 | 14.98 | % | 34.2 | 1.14 | % | (0.40 | )% | 1.14 | % | (0.40 | )% | 26 | % | ||||||||||||||||||||
| — | 6.20 | (12.83 | )% | 29.6 | 1.13 | % | (0.21 | )% | 1.13 | % | (0.21 | )% | 56 | % | ||||||||||||||||||||
| — | 7.11 | 25.00 | % | 36.3 | 1.15 | % | (0.57 | )% | 1.15 | % | (0.57 | )% | 54 | % | ||||||||||||||||||||
| — | 5.69 | 56.58 | % | 30.9 | 1.22 | % | (0.67 | )% | 1.23 | % | (0.68 | )% | 181 | % | ||||||||||||||||||||
| (1.02) | 3.63 | (48.32 | )% | 24.3 | 0.89 | % | (0.01 | )% | 0.91 | % | (0.03 | )% | 269 | % | ||||||||||||||||||||
| (0.27) | 8.24 | 11.08 | % | 56.6 | 0.86 | % | (0.14 | )% | 0.87 | % | (0.15 | )% | 147 | % | ||||||||||||||||||||
|
|
|
|
|
|
|
|
|
|
|
|
|
|
|
|
|
| |||||||||||||||||
| (0.19) | 12.69 | 14.38 | % | 21.1 | 1.25 | % | 1.17 | % | 1.58 | % | 0.84 | % | 20 | % | ||||||||||||||||||||
| (0.39) | 11.26 | (3.79 | )% | 18.0 | 1.30 | % | 0.24 | % | 1.64 | % | (0.11 | )% | 66 | % | ||||||||||||||||||||
| (0.20) | 12.08 | 11.13 | % | 17.9 | 1.39 | % | (0.15 | )% | 1.71 | % | (0.47 | )% | 45 | % | ||||||||||||||||||||
| — | 11.08 | 23.83 | % | 13.3 | 1.39 | % | 0.19 | % | 2.10 | % | (0.52 | )% | 80 | % | ||||||||||||||||||||
| (0.01) | 8.94 | (10.48 | )% | 7.1 | 1.39 | % | (0.09 | )% | 2.12 | % | (0.83 | )% | 40 | % | ||||||||||||||||||||
| (b) | Total investment return assumes dividend reinvestment and does not reflect any deduction for applicable sales charges. Not annualized for periods less than one year. Total return shown does not reflect charges and expenses imposed on contract holders by the variable accounts. Those charges and expenses reduce the return received by contract holders as compared to the return presented. |
| ** | Computed on an annualized basis for periods less than one year. |
The accompanying Notes to Financial Statements are an integral part of this schedule.
303
Table of Contents
Thrivent Series Fund, Inc.
Financial Highlights – continued
| FOR A SHARE OUTSTANDING THROUGHOUT EACH PERIOD* | ||||||||||||||||||||||||||||
| Income from Investment Operations | Less Distributions from | |||||||||||||||||||||||||||
| Net Asset Value, Beginning of Period | Net Investment Income/ (Loss) | Net Realized and Unrealized Gain/(Loss) on Investments(a) | Total from Investment Operations | Net Investment Income | Net Realized Gain on Investments | Return of Capital | ||||||||||||||||||||||
PARTNER NATURAL RESOURCES PORTFOLIO | ||||||||||||||||||||||||||||
Period Ended 6/29/2012 (unaudited) | $ | 8.33 | $ | 0.02 | $ | (0.76 | ) | $ | (0.74 | ) | $ | (0.02 | ) | $ | (1.02 | ) | $ | — | ||||||||||
Year Ended 12/31/2011 | 9.56 | 0.02 | (1.24 | ) | (1.22 | ) | (0.01 | ) | — | — | ||||||||||||||||||
Year Ended 12/31/2010 | 8.23 | — | 1.34 | 1.34 | (0.01 | ) | — | — | ||||||||||||||||||||
Year Ended 12/31/2009 | 5.72 | 0.01 | 2.50 | 2.51 | — | — | — | |||||||||||||||||||||
Year Ended 12/31/2008 (c) | 10.00 | 0.01 | (4.28 | ) | (4.27 | ) | (0.01 | ) | — | — | ||||||||||||||||||
|
|
|
|
|
|
|
|
|
|
|
|
|
| |||||||||||||||
PARTNER EMERGING MARKETS PORTFOLIO | ||||||||||||||||||||||||||||
Period Ended 6/29/2012 (unaudited) | 10.92 | 0.10 | 0.98 | 1.08 | (0.07 | ) | (0.06 | ) | — | |||||||||||||||||||
Year Ended 12/31/2011 | 12.38 | 0.15 | (1.48 | ) | (1.33 | ) | (0.13 | ) | — | — | ||||||||||||||||||
Year Ended 12/31/2010 | 9.72 | 0.06 | 2.60 | 2.66 | — | — | — | |||||||||||||||||||||
Year Ended 12/31/2009 | 5.59 | 0.04 | 4.13 | 4.17 | (0.04 | ) | — | — | ||||||||||||||||||||
Year Ended 12/31/2008 (c) | 10.00 | 0.06 | (4.42 | ) | (4.36 | ) | (0.05 | ) | — | — | ||||||||||||||||||
|
|
|
|
|
|
|
|
|
|
|
|
|
| |||||||||||||||
REAL ESTATE SECURITIES PORTFOLIO | ||||||||||||||||||||||||||||
Period Ended 6/29/2012 (unaudited) | 15.77 | 0.14 | 2.13 | 2.27 | (0.65 | ) | — | — | ||||||||||||||||||||
Year Ended 12/31/2011 (d) | 14.49 | 0.22 | 1.06 | 1.28 | — | — | — | |||||||||||||||||||||
Year Ended 12/31/2010 | 11.67 | 0.22 | 2.99 | 3.21 | (0.39 | ) | — | — | ||||||||||||||||||||
Year Ended 12/31/2009 | 9.34 | 0.29 | 2.44 | 2.73 | (0.29 | ) | — | (0.11 | ) | |||||||||||||||||||
Year Ended 12/31/2008 | 17.74 | 0.41 | (6.35 | ) | (5.94 | ) | (0.74 | ) | (1.46 | ) | (0.26 | ) | ||||||||||||||||
Year Ended 12/31/2007 | 22.93 | 0.32 | (3.84 | ) | (3.52 | ) | (0.30 | ) | (1.37 | ) | — | |||||||||||||||||
|
|
|
|
|
|
|
|
|
|
|
|
|
| |||||||||||||||
PARTNER UTILITIES PORTFOLIO | ||||||||||||||||||||||||||||
Period Ended 6/29/2012 (unaudited) | 8.65 | 0.06 | 0.39 | 0.45 | (0.14 | ) | — | — | ||||||||||||||||||||
Year Ended 12/31/2011 | 8.10 | 0.13 | 0.60 | 0.73 | (0.18 | ) | — | — | ||||||||||||||||||||
Year Ended 12/31/2010 | 7.76 | 0.18 | 0.33 | 0.51 | (0.17 | ) | — | — | ||||||||||||||||||||
Year Ended 12/31/2009 | 6.93 | 0.18 | 0.65 | 0.83 | — | — | — | |||||||||||||||||||||
Year Ended 12/31/2008 (c) | 10.00 | 0.12 | (3.08 | ) | (2.96 | ) | (0.11 | ) | — | — | ||||||||||||||||||
|
|
|
|
|
|
|
|
|
|
|
|
|
| |||||||||||||||
PARTNER SMALL CAP GROWTH PORTFOLIO | ||||||||||||||||||||||||||||
Period Ended 6/29/2012 (unaudited) | 12.42 | (0.02 | ) | 0.78 | 0.76 | — | — | — | ||||||||||||||||||||
Year Ended 12/31/2011 | 12.92 | (0.08 | ) | 0.42 | (0.50 | ) | — | — | — | |||||||||||||||||||
Year Ended 12/31/2010 | 10.03 | (0.07 | ) | 2.96 | 2.89 | — | — | — | ||||||||||||||||||||
Year Ended 12/31/2009 | 7.45 | (0.03 | ) | 2.62 | 2.59 | (0.01 | ) | — | — | |||||||||||||||||||
Year Ended 12/31/2008 | 13.94 | 0.01 | (5.77 | ) | (5.76 | ) | — | (0.73 | ) | — | ||||||||||||||||||
Year Ended 12/31/2007 | 13.58 | (0.04 | ) | 1.21 | 1.17 | — | (0.81 | ) | — | |||||||||||||||||||
|
|
|
|
|
|
|
|
|
|
|
|
|
| |||||||||||||||
PARTNER SMALL CAP VALUE PORTFOLIO | ||||||||||||||||||||||||||||
Period Ended 6/29/2012 (unaudited) | 18.64 | 0.13 | 0.76 | 0.89 | (0.13 | ) | — | — | ||||||||||||||||||||
Year Ended 12/31/2011 | 19.06 | 0.10 | (0.48 | ) | (0.38 | ) | (0.04 | ) | — | — | ||||||||||||||||||
Year Ended 12/31/2010 | 15.58 | 0.13 | 3.52 | 3.65 | (0.17 | ) | — | — | ||||||||||||||||||||
Year Ended 12/31/2009 | 12.07 | 0.11 | 3.52 | 3.63 | (0.11 | ) | (0.01 | ) | — | |||||||||||||||||||
Year Ended 12/31/2008 | 18.44 | 0.13 | (4.85 | ) | (4.72 | ) | (0.20 | ) | (1.45 | ) | — | |||||||||||||||||
Year Ended 12/31/2007 | 19.57 | 0.11 | (0.21 | ) | (0.10 | ) | (0.07 | ) | (0.96 | ) | — | |||||||||||||||||
| (a) | The amount shown may not correlate with the change in aggregate gains and losses of portfolio securities due to the timing of sales and redemptions of fund shares. |
| (c) | Since inception, April 30, 2008. |
| (d) | Per share amounts have been calculated using the average shares outstanding method. |
| * | All per share amounts have been rounded to the nearest cent. |
The accompanying Notes to Financial Statements are an integral part of this schedule.
304
Table of Contents
Thrivent Series Fund, Inc.
Financial Highlights – continued
| RATIOS / SUPPLEMENTAL DATA | ||||||||||||||||||||||||||||||||||
| Ratio to Average Net Assets** | Ratios to Average Net Assets Before Expenses Waived, Credited or Paid Indirectly** | |||||||||||||||||||||||||||||||||
Total | Net Asset Value, End of Period | Total Return(b) | Net Assets, End of Period (in millions) | Expenses | Net Investment Income/(Loss) | Expenses | Net Investment Income/(Loss) | Portfolio Turnover Rate | ||||||||||||||||||||||||||
|
|
| ||||||||||||||||||||||||||||||||
| $ | (1.04) | $ | 6.55 | (8.27 | )% | $ | 30.3 | 1.09 | % | 0.59 | % | 1.13 | % | 0.55 | % | 14 | % | |||||||||||||||||
| (0.01) | 8.33 | (12.84 | )% | 31.6 | 1.12 | % | 0.17 | % | 1.12 | % | 0.17 | % | 118 | % | ||||||||||||||||||||
| (0.01) | 9.56 | 16.33 | % | 28.7 | 1.20 | % | (0.06 | )% | 1.28 | % | (0.15 | )% | 2 | % | ||||||||||||||||||||
| — | 8.23 | 43.72 | % | 21.1 | 1.19 | % | 0.15 | % | 1.70 | % | (0.36 | )% | 2 | % | ||||||||||||||||||||
| (0.01) | 5.72 | (42.68 | )% | 6.6 | 1.19 | % | 0.23 | % | 1.87 | % | (0.45 | )% | 1 | % | ||||||||||||||||||||
|
|
|
|
|
|
|
|
|
|
|
|
|
|
|
|
|
| |||||||||||||||||
|
|
| ||||||||||||||||||||||||||||||||
| (0.13) | 11.87 | 9.92 | % | 45.7 | 1.40 | % | 1.91 | % | 1.63 | % | 1.68 | % | 4 | % | ||||||||||||||||||||
| (0.13) | 10.92 | (10.83 | )% | 38.9 | 1.43 | % | 1.27 | % | 1.66 | % | 1.04 | % | 6 | % | ||||||||||||||||||||
| — | 12.38 | 27.33 | % | 40.9 | 1.50 | % | 0.74 | % | 1.88 | % | 0.36 | % | 4 | % | ||||||||||||||||||||
| (0.04) | 9.72 | 74.70 | % | 17.4 | 1.50 | % | 0.78 | % | 2.91 | % | (0.63 | )% | 13 | % | ||||||||||||||||||||
| (0.05) | 5.59 | (43.58 | )% | 5.3 | 1.50 | % | 1.18 | % | 2.68 | % | 0.00 | % | 25 | % | ||||||||||||||||||||
|
|
|
|
|
|
|
|
|
|
|
|
| �� |
|
|
|
| |||||||||||||||||
|
|
| ||||||||||||||||||||||||||||||||
| (0.65) | 17.39 | 14.56 | % | 119.9 | 0.93 | % | 1.43 | % | 0.93 | % | 1.43 | % | 16 | % | ||||||||||||||||||||
| — | 15.77 | 8.83 | % | 108.0 | 0.87 | % | 1.47 | % | 0.87 | % | 1.47 | % | 16 | % | ||||||||||||||||||||
| (0.39) | 14.49 | 27.56 | % | 329.5 | 0.87 | % | 1.62 | % | 0.87 | % | 1.62 | % | 15 | % | ||||||||||||||||||||
| (0.40) | 11.67 | 29.08 | % | 265.4 | 0.89 | % | 3.34 | % | 0.90 | % | 3.33 | % | 18 | % | ||||||||||||||||||||
| (2.46) | 9.34 | (37.24 | )% | 197.4 | 0.85 | % | 2.74 | % | 0.86 | % | 2.73 | % | 45 | % | ||||||||||||||||||||
| (1.67) | 17.74 | (16.80 | )% | 326.4 | 0.86 | % | 1.60 | % | 0.86 | % | 1.60 | % | 71 | % | ||||||||||||||||||||
|
|
|
|
|
|
|
|
|
|
|
|
|
|
|
|
|
| |||||||||||||||||
|
|
| ||||||||||||||||||||||||||||||||
| (0.14) | 8.96 | 5.23 | % | 12.9 | 0.91 | % | 1.77 | % | 1.71 | % | 0.97 | % | 10 | % | ||||||||||||||||||||
| (0.18) | 8.65 | 9.08 | % | 11.1 | 0.90 | % | 2.13 | % | 2.05 | % | 0.99 | % | 92 | % | ||||||||||||||||||||
| (0.17) | 8.10 | 6.69 | % | 7.9 | 0.91 | % | 2.80 | % | 2.48 | % | 1.23 | % | 22 | % | ||||||||||||||||||||
| — | 7.76 | 12.00 | % | 6.4 | 0.90 | % | 2.93 | % | 3.10 | % | 0.73 | % | 22 | % | ||||||||||||||||||||
| (0.11) | 6.93 | (29.57 | )% | 4.4 | 0.90 | % | 2.55 | % | 2.31 | % | 1.14 | % | 22 | % | ||||||||||||||||||||
|
|
|
|
|
|
|
|
|
|
|
|
|
|
|
|
|
| |||||||||||||||||
|
|
| ||||||||||||||||||||||||||||||||
| — | 13.18 | 6.15 | % | 222.9 | 0.99 | % | (0.39 | )% | 1.09 | % | (0.49 | )% | 51 | % | ||||||||||||||||||||
| — | 12.42 | (3.85 | )% | 197.5 | 1.00 | % | (0.63 | )% | 1.10 | % | (0.73 | )% | 101 | % | ||||||||||||||||||||
| — | 12.92 | 28.86 | % | 208.5 | 1.01 | % | (0.62 | )% | 1.11 | % | (0.72 | )% | 100 | % | ||||||||||||||||||||
| (0.01) | 10.03 | 34.75 | % | 160.5 | 1.02 | % | (0.39 | )% | 1.14 | % | (0.51 | )% | 118 | % | ||||||||||||||||||||
| (0.73) | 7.45 | (43.23 | )% | 112.5 | 0.98 | % | 0.08 | % | 1.09 | % | (0.04 | )% | 199 | % | ||||||||||||||||||||
| (0.81) | 13.94 | 8.52 | % | 167.6 | 0.99 | % | (0.32 | )% | 1.10 | % | (0.42 | )% | 98 | % | ||||||||||||||||||||
|
|
|
|
|
|
|
|
|
|
|
|
|
|
|
|
|
| |||||||||||||||||
|
|
| ||||||||||||||||||||||||||||||||
| (0.13) | 19.40 | 4.81 | % | 255.8 | 0.88 | % | 1.27 | % | 0.88 | % | 1.27 | % | 7 | % | ||||||||||||||||||||
| (0.04) | 18.64 | (1.99 | )% | 250.4 | 0.88 | % | 0.52 | % | 0.88 | % | 0.52 | % | 10 | % | ||||||||||||||||||||
| (0.17) | 19.06 | 23.46 | % | 266.9 | 0.88 | % | 0.75 | % | 0.88 | % | 0.75 | % | 19 | % | ||||||||||||||||||||
| (0.12) | 15.58 | 30.24 | % | 226.3 | 0.89 | % | 0.86 | % | 0.90 | % | 0.85 | % | 19 | % | ||||||||||||||||||||
| (1.65) | 12.07 | (27.05 | )% | 167.9 | 0.86 | % | 1.08 | % | 0.87 | % | 1.07 | % | 31 | % | ||||||||||||||||||||
| (1.03) | 18.44 | (1.03 | )% | 185.6 | 0.86 | % | 0.68 | % | 0.87 | % | 0.66 | % | 29 | % | ||||||||||||||||||||
| (b) | Total investment return assumes dividend reinvestment and does not reflect any deduction for applicable sales charges. Not annualized for periods less than one year. Total return shown does not reflect charges and expenses imposed on contract holders by the variable accounts. Those charges and expenses reduce the return received by contract holders as compared to the return presented. |
| ** | Computed on an annualized basis for periods less than one year. |
The accompanying Notes to Financial Statements are an integral part of this schedule.
305
Table of Contents
Thrivent Series Fund, Inc.
Financial Highlights – continued
| FOR A SHARE OUTSTANDING THROUGHOUT EACH PERIOD* | ||||||||||||||||||||||||
| Income from Investment Operations | Less Distributions from | |||||||||||||||||||||||
| Net Asset Value, Beginning of Period | Net Investment Income/(Loss) | Net Realized and Unrealized Gain/(Loss) on Investments(a) | Total from Investment Operations | Net Investment Income | Net Realized Gain on Investments | |||||||||||||||||||
SMALL CAP STOCK PORTFOLIO |
| |||||||||||||||||||||||
Period Ended 6/29/2012 (unaudited) | $ | 11.99 | $ | 0.01 | $ | 0.24 | $ | 0.25 | $ | — | $ | — | ||||||||||||
Year Ended 12/31/2011 | 12.66 | (0.01 | ) | (0.66 | ) | (0.67 | ) | — | — | |||||||||||||||
Year Ended 12/31/2010 | 10.13 | (0.01 | ) | 2.54 | 2.53 | — | — | |||||||||||||||||
Year Ended 12/31/2009 | 8.49 | 0.07 | 1.65 | 1.72 | (0.08 | ) | — | |||||||||||||||||
Year Ended 12/31/2008 | 15.48 | 0.06 | (5.34 | ) | (5.28 | ) | (0.13 | ) | (1.58 | ) | ||||||||||||||
Year Ended 12/31/2007 | 15.43 | 0.10 | 0.88 | 0.98 | (0.05 | ) | (0.88 | ) | ||||||||||||||||
SMALL CAP INDEX PORTFOLIO |
| |||||||||||||||||||||||
Period Ended 6/29/2012 (unaudited) | 12.77 | 0.07 | 0.87 | 0.94 | (0.09 | ) | (1.14 | ) | ||||||||||||||||
Year Ended 12/31/2011 | 13.19 | 0.10 | (0.02 | ) | 0.08 | (0.11 | ) | (0.39 | ) | |||||||||||||||
Year Ended 12/31/2010 | 10.57 | 0.11 | 2.60 | 2.71 | (0.09 | ) | — | |||||||||||||||||
Year Ended 12/31/2009 | 10.54 | 0.11 | 2.03 | 2.14 | (0.22 | ) | (1.89 | ) | ||||||||||||||||
Year Ended 12/31/2008 | 19.21 | 0.22 | (5.15 | ) | (4.93 | ) | (0.20 | ) | (3.54 | ) | ||||||||||||||
Year Ended 12/31/2007 | 21.55 | 0.24 | (0.11 | ) | 0.13 | (0.14 | ) | (2.33 | ) | |||||||||||||||
|
|
|
|
|
|
|
|
|
|
|
| |||||||||||||
MID CAP GROWTH PORTFOLIO II |
| |||||||||||||||||||||||
Period Ended 6/29/2012 (unaudited) | 9.17 | (0.06 | ) | 0.58 | 0.52 | — | (1.30 | ) | ||||||||||||||||
Year Ended 12/31/2011 (c) | 9.95 | (0.01 | ) | (0.40 | ) | (0.41 | ) | (0.01 | ) | (0.36 | ) | |||||||||||||
Year Ended 12/31/2010 | 8.43 | 0.01 | 2.32 | 2.33 | — | (0.81 | ) | |||||||||||||||||
Year Ended 12/31/2009 | 5.65 | — | 2.78 | 2.78 | — | — | ||||||||||||||||||
Year Ended 12/31/2008 | 11.42 | 0.01 | (4.37 | ) | (4.36 | ) | (0.03 | ) | (1.38 | ) | ||||||||||||||
Year Ended 12/31/2007 | 11.37 | 0.03 | 2.13 | 2.16 | (0.06 | ) | (2.05 | ) | ||||||||||||||||
|
|
|
|
|
|
|
|
|
|
|
| |||||||||||||
MID CAP GROWTH PORTFOLIO |
| |||||||||||||||||||||||
Period Ended 6/29/2012 (unaudited) | 17.50 | 0.02 | 1.10 | 1.12 | (0.04 | ) | — | |||||||||||||||||
Year Ended 12/31/2011 | 18.56 | 0.04 | (1.04 | ) | (1.00 | ) | (0.06 | ) | — | |||||||||||||||
Year Ended 12/31/2010 | 14.42 | 0.06 | 4.12 | 4.18 | (0.04 | ) | — | |||||||||||||||||
Year Ended 12/31/2009 | 9.55 | 0.04 | 4.83 | 4.87 | — | — | ||||||||||||||||||
Year Ended 12/31/2008 | 20.18 | 0.10 | (7.19 | ) | (7.09 | ) | (0.18 | ) | (3.36 | ) | ||||||||||||||
Year Ended 12/31/2007 | 17.59 | 0.08 | 3.38 | 3.46 | (0.08 | ) | (0.79 | ) | ||||||||||||||||
|
|
|
|
|
|
|
|
|
|
|
| |||||||||||||
PARTNER MID CAP VALUE PORTFOLIO |
| |||||||||||||||||||||||
Period Ended 6/29/2012 (unaudited) | 12.51 | 0.06 | 0.88 | 0.94 | (0.11 | ) | — | |||||||||||||||||
Year Ended 12/31/2011 | 13.38 | 0.11 | (0.95 | ) | (0.84 | ) | (0.03 | ) | — | |||||||||||||||
Year Ended 12/31/2010 | 10.82 | 0.08 | 2.58 | 2.66 | (0.10 | ) | — | |||||||||||||||||
Year Ended 12/31/2009 | 8.25 | 0.12 | 2.54 | 2.66 | (0.09 | ) | — | |||||||||||||||||
Year Ended 12/31/2008 | 13.41 | 0.08 | (4.61 | ) | (4.53 | ) | (0.18 | ) | (0.45 | ) | ||||||||||||||
Year Ended 12/31/2007 | 13.06 | 0.14 | 0.28 | 0.42 | — | (0.07 | ) | |||||||||||||||||
|
|
|
|
|
|
|
|
|
|
|
| |||||||||||||
MID CAP STOCK PORTFOLIO |
| |||||||||||||||||||||||
Period Ended 6/29/2012 (unaudited) | 11.48 | 0.02 | 0.62 | 0.64 | (0.03 | ) | — | |||||||||||||||||
Year Ended 12/31/2011 | 12.25 | 0.03 | (0.79 | ) | (0.76 | ) | (0.01 | ) | — | |||||||||||||||
Year Ended 12/31/2010 | 9.80 | 0.05 | 2.45 | 2.50 | (0.05 | ) | — | |||||||||||||||||
Year Ended 12/31/2009 | 7.08 | 0.05 | 2.72 | 2.77 | (0.05 | ) | — | |||||||||||||||||
Year Ended 12/31/2008 | 13.15 | 0.04 | (5.08 | ) | (5.04 | ) | (0.12 | ) | (0.91 | ) | ||||||||||||||
Year Ended 12/31/2007 | 13.41 | 0.08 | 0.76 | 0.84 | (0.12 | ) | (0.98 | ) | ||||||||||||||||
| (a) | The amount shown may not correlate with the change in aggregate gains and losses of portfolio securities due to the timing of sales and redemptions of fund shares. |
| (c) | Per share amounts have been calculated using the average shares outstanding method. |
| * | All per share amounts have been rounded to the nearest cent. |
The accompanying Notes to Financial Statements are an integral part of this schedule.
306
Table of Contents
Thrivent Series Fund, Inc.
Financial Highlights – continued
| RATIOS / SUPPLEMENTAL DATA | ||||||||||||||||||||||||||||||||||
| Ratio to Average Net Assets** | Ratios to Average Net Assets Before Expenses Waived, Credited or Paid Indirectly** | |||||||||||||||||||||||||||||||||
Total | Net Asset Value, End of Period | Total Return(b) | Net Assets, End of Period (in millions) | Expenses | Net Investment Income/(Loss) | Expenses | Net Investment Income/(Loss) | Portfolio Turnover Rate | ||||||||||||||||||||||||||
| $ | — | $ | 12.24 | 2.09 | % | $ | 259.5 | 0.76 | % | 0.16 | % | 0.76 | % | 0.16 | % | 62 | % | |||||||||||||||||
| — | 11.99 | (5.31 | )% | 263.8 | 0.76 | % | (0.10 | )% | 0.76 | % | (0.10 | )% | 88 | % | ||||||||||||||||||||
| — | 12.66 | 25.09 | % | 303.2 | 0.77 | % | (0.11 | )% | 0.77 | % | (0.11 | )% | 208 | % | ||||||||||||||||||||
| (0.08) | 10.13 | 20.38 | % | 258.5 | 0.78 | % | 0.65 | % | 0.78 | % | 0.65 | % | 254 | % | ||||||||||||||||||||
| (1.71) | 8.49 | (37.52 | )% | 288.1 | 0.73 | % | 0.66 | % | 0.75 | % | 0.64 | % | 286 | % | ||||||||||||||||||||
| (0.93) | 15.48 | 6.14 | % | 399.9 | 0.72 | % | 0.66 | % | 0.74 | % | 0.65 | % | 126 | % | ||||||||||||||||||||
|
|
|
|
|
|
|
|
|
|
|
|
|
|
|
|
|
| |||||||||||||||||
| (1.23) | 12.48 | 7.82 | % | 191.5 | 0.46 | % | 1.03 | % | 0.46 | % | 1.03 | % | 4 | % | ||||||||||||||||||||
| (0.50) | 12.77 | 0.53 | % | 189.0 | 0.45 | % | 0.63 | % | 0.45 | % | 0.63 | % | 13 | % | ||||||||||||||||||||
| (0.09) | 13.19 | 25.88 | % | 220.1 | 0.46 | % | 0.86 | % | 0.46 | % | 0.86 | % | 11 | % | ||||||||||||||||||||
| (2.11) | 10.57 | 25.29 | % | 203.9 | 0.47 | % | 0.94 | % | 0.48 | % | 0.94 | % | 13 | % | ||||||||||||||||||||
| (3.74) | 10.54 | (31.07 | )% | 192.2 | 0.42 | % | 1.28 | % | 0.42 | % | 1.28 | % | 31 | % | ||||||||||||||||||||
| (2.47) | 19.21 | (0.50 | )% | 357.9 | 0.39 | % | 1.00 | % | 0.39 | % | 0.99 | % | 16 | % | ||||||||||||||||||||
|
|
|
|
|
|
|
|
|
|
|
|
|
|
|
|
|
| |||||||||||||||||
| (1.30) | 8.39 | 6.09 | % | 17.0 | 1.96 | % | (1.37 | )% | 2.26 | % | (1.67 | )% | 19 | % | ||||||||||||||||||||
| (0.37) | 9.17 | (4.32 | )% | 17.0 | 0.72 | % | (0.13 | )% | 1.02 | % | (0.43 | )% | 83 | % | ||||||||||||||||||||
| (0.81) | 9.95 | 28.03 | % | 160.2 | 0.72 | % | 0.12 | % | 1.02 | % | (0.18 | )% | 55 | % | ||||||||||||||||||||
| — | 8.43 | 49.31 | % | 125.8 | 0.68 | % | (0.05 | )% | 1.05 | % | (0.42 | )% | 73 | % | ||||||||||||||||||||
| (1.41) | 5.65 | (42.71 | )% | 80.8 | 0.56 | % | 0.30 | % | 1.07 | % | (0.22 | )% | 104 | % | ||||||||||||||||||||
| (2.11) | 11.42 | 19.80 | % | 32.4 | 0.59 | % | 0.18 | % | 1.11 | % | (0.33 | )% | 81 | % | ||||||||||||||||||||
|
|
|
|
|
|
|
|
|
|
|
|
|
|
|
|
|
| |||||||||||||||||
| (0.04) | 18.58 | 6.42 | % | 349.2 | 0.46 | % | 0.14 | % | 0.46 | % | 0.14 | % | 19 | % | ||||||||||||||||||||
| (0.06) | 17.50 | (5.43 | )% | 348.8 | 0.46 | % | 0.21 | % | 0.46 | % | 0.21 | % | 67 | % | ||||||||||||||||||||
| (0.04) | 18.56 | 29.11 | % | 419.9 | 0.46 | % | 0.34 | % | 0.46 | % | 0.34 | % | 48 | % | ||||||||||||||||||||
| — | 14.42 | 50.94 | % | 365.2 | 0.48 | % | 0.30 | % | 0.48 | % | 0.29 | % | 61 | % | ||||||||||||||||||||
| (3.54) | 9.55 | (41.13 | )% | 275.1 | 0.44 | % | 0.54 | % | 0.45 | % | 0.52 | % | 82 | % | ||||||||||||||||||||
| (0.87) | 20.18 | 19.92 | % | 669.8 | 0.44 | % | 0.35 | % | 0.45 | % | 0.34 | % | 80 | % | ||||||||||||||||||||
|
|
|
|
|
|
|
|
|
|
|
|
|
|
|
|
|
| |||||||||||||||||
| (0.11) | 13.34 | 7.57 | % | 230.6 | 0.84 | % | 0.92 | % | 0.84 | % | 0.92 | % | 48 | % | ||||||||||||||||||||
| (0.03) | 12.51 | (6.33 | )% | 215.8 | 0.84 | % | 0.84 | % | 0.84 | % | 0.84 | % | 76 | % | ||||||||||||||||||||
| (0.10) | 13.38 | 24.73 | % | 232.2 | 0.85 | % | 0.72 | % | 0.85 | % | 0.72 | % | 91 | % | ||||||||||||||||||||
| (0.09) | 10.82 | 32.33 | % | 183.7 | 0.87 | % | 1.42 | % | 0.88 | % | 1.41 | % | 114 | % | ||||||||||||||||||||
| (0.63) | 8.25 | (35.05 | )% | 123.3 | 0.83 | % | 1.41 | % | 0.85 | % | 1.39 | % | 97 | % | ||||||||||||||||||||
| (0.07) | 13.41 | 3.16 | % | 95.0 | 0.89 | % | 1.24 | % | 0.90 | % | 1.23 | % | 85 | % | ||||||||||||||||||||
|
|
|
|
|
|
|
|
|
|
|
|
|
|
|
|
|
| |||||||||||||||||
| (0.03) | 12.09 | 5.57 | % | 474.8 | 0.72 | % | 0.31 | % | 0.72 | % | 0.31 | % | 23 | % | ||||||||||||||||||||
| (0.01) | 11.48 | (6.29 | )% | 457.0 | 0.72 | % | 0.24 | % | 0.72 | % | 0.24 | % | 35 | % | ||||||||||||||||||||
| (0.05) | 12.25 | 25.60 | % | 511.5 | 0.73 | % | 0.45 | % | 0.73 | % | 0.45 | % | 78 | % | ||||||||||||||||||||
| (0.05) | 9.80 | 39.10 | % | 443.5 | 0.73 | % | 0.55 | % | 0.74 | % | 0.54 | % | 53 | % | ||||||||||||||||||||
| (1.03) | 7.08 | (40.75 | )% | 379.9 | 0.72 | % | 0.81 | % | 0.73 | % | 0.80 | % | 234 | % | ||||||||||||||||||||
| (1.10) | 13.15 | 5.70 | % | 387.9 | 0.72 | % | 0.70 | % | 0.74 | % | 0.69 | % | 215 | % | ||||||||||||||||||||
| (b) | Total investment return assumes dividend reinvestment and does not reflect any deduction for applicable sales charges. Not annualized for periods less than one year. Total return shown does not reflect charges and expenses imposed on contract holders by the variable accounts. Those charges and expenses reduce the return received by contract holders as compared to the return presented. |
| ** | Computed on an annualized basis for periods less than one year. |
The accompanying Notes to Financial Statements are an integral part of this schedule.
307
Table of Contents
Thrivent Series Fund, Inc.
Financial Highlights – continued
| FOR A SHARE OUTSTANDING THROUGHOUT EACH PERIOD* | ||||||||||||||||||||||||
| Income from Investment Operations | Less Distributions from | |||||||||||||||||||||||
| Net Asset Value, Beginning of Period | Net Investment Income/(Loss) | Net Realized and Unrealized Gain/(Loss) on Investments(a) | Total from Investment Operations | Net Investment Income | Net Realized Gain on Investments | |||||||||||||||||||
MID CAP INDEX PORTFOLIO | ||||||||||||||||||||||||
Period Ended 6/29/2012 (unaudited) | $ | 11.79 | $ | 0.05 | $ | 0.82 | $ | 0.87 | $ | (0.10 | ) | $ | (1.21 | ) | ||||||||||
Year Ended 12/31/2011 | 12.91 | 0.10 | (0.33 | ) | (0.23 | ) | (0.11 | ) | (0.78 | ) | ||||||||||||||
Year Ended 12/31/2010 | 10.37 | 0.11 | 2.55 | 2.66 | (0.12 | ) | — | |||||||||||||||||
Year Ended 12/31/2009 | 8.31 | 0.12 | 2.72 | 2.84 | (0.18 | ) | (0.60 | ) | ||||||||||||||||
Year Ended 12/31/2008 | 15.20 | 0.19 | (5.02 | ) | (4.83 | ) | (0.19 | ) | (1.87 | ) | ||||||||||||||
Year Ended 12/31/2007 | 15.05 | 0.20 | 1.00 | 1.20 | (0.15 | ) | (0.90 | ) | ||||||||||||||||
|
|
|
|
|
|
|
|
|
|
|
| |||||||||||||
PARTNER WORLDWIDE ALLOCATION PORTFOLIO | ||||||||||||||||||||||||
Period Ended 6/29/2012 (unaudited) | 7.39 | 0.12 | 0.26 | 0.38 | — | — | ||||||||||||||||||
Year Ended 12/31/2011 | 8.77 | 0.19 | (1.26 | ) | (1.07 | ) | (0.17 | ) | (0.14 | ) | ||||||||||||||
Year Ended 12/31/2010 | 7.84 | 0.11 | 0.93 | 1.04 | (0.11 | ) | — | |||||||||||||||||
Year Ended 12/31/2009 | 6.03 | 0.10 | 1.81 | 1.91 | (0.10 | ) | — | |||||||||||||||||
Year Ended 12/31/2008 (c) | 10.00 | 0.07 | (3.98 | ) | (3.91 | ) | (0.06 | ) | — | |||||||||||||||
|
|
|
|
|
|
|
|
|
|
|
| |||||||||||||
PARTNER INTERNATIONAL STOCK PORTFOLIO | ||||||||||||||||||||||||
Period Ended 6/29/2012 (unaudited) | 9.18 | 0.19 | 0.12 | 0.31 | (0.26 | ) | — | |||||||||||||||||
Year Ended 12/31/2011 | 10.67 | 0.26 | (1.75 | ) | (1.49 | ) | — | — | ||||||||||||||||
Year Ended 12/31/2010 | 9.99 | 0.20 | 0.68 | 0.88 | (0.20 | ) | — | |||||||||||||||||
Year Ended 12/31/2009 | 8.18 | 0.20 | 1.82 | 2.02 | (0.21 | ) | — | |||||||||||||||||
Year Ended 12/31/2008 | 17.26 | 0.33 | (6.56 | ) | (6.23 | ) | (0.68 | ) | (2.17 | ) | ||||||||||||||
Year Ended 12/31/2007 | 16.32 | 0.36 | 1.37 | 1.73 | (0.24 | ) | (0.55 | ) | ||||||||||||||||
|
|
|
|
|
|
|
|
|
|
|
| |||||||||||||
PARTNER SOCIALLY RESPONSIBLE STOCK PORTFOLIO | ||||||||||||||||||||||||
Period Ended 6/29/2012 (unaudited) | 10.16 | 0.01 | 0.96 | 0.97 | — | — | ||||||||||||||||||
Year Ended 12/31/2011 | 10.35 | — | (0.19 | ) | (0.19 | ) | — | — | ||||||||||||||||
Year Ended 12/31/2010 | 8.76 | — | 1.60 | 1.60 | (0.01 | ) | — | |||||||||||||||||
Year Ended 12/31/2009 | 6.48 | 0.03 | 2.29 | 2.32 | (0.04 | ) | — | |||||||||||||||||
Year Ended 12/31/2008 (c) | 10.00 | 0.02 | (3.52 | ) | (3.50 | ) | (0.02 | ) | — | |||||||||||||||
|
|
|
|
|
|
|
|
|
|
|
| |||||||||||||
PARTNER ALL CAP GROWTH PORTFOLIO | ||||||||||||||||||||||||
Period Ended 6/29/2012 (unaudited) | 9.35 | — | 0.71 | 0.71 | — | — | ||||||||||||||||||
Year Ended 12/31/2011 | 10.07 | (0.03 | ) | (0.69 | ) | (0.72 | ) | — | — | |||||||||||||||
Year Ended 12/31/2010 | 8.03 | (0.01 | ) | 2.05 | 2.04 | — | — | |||||||||||||||||
Year Ended 12/31/2009 | 5.34 | (0.01 | ) | 2.70 | 2.69 | — | — | |||||||||||||||||
Year Ended 12/31/2008 (c) | 10.00 | (0.01 | ) | (4.65 | ) | (4.66 | ) | — | — | |||||||||||||||
|
|
|
|
|
|
|
|
|
|
|
| |||||||||||||
PARTNER ALL CAP VALUE PORTFOLIO | ||||||||||||||||||||||||
Period Ended 6/29/2012 (unaudited) | 8.12 | 0.04 | 0.20 | 0.24 | (0.05 | ) | — | |||||||||||||||||
Year Ended 12/31/2011 | 9.09 | 0.05 | (0.97 | ) | (0.92 | ) | (0.05 | ) | — | |||||||||||||||
Year Ended 12/31/2010 | 7.65 | 0.03 | 1.41 | 1.44 | — | — | ||||||||||||||||||
Year Ended 12/31/2009 | 5.47 | 0.06 | 2.20 | 2.26 | (0.08 | ) | — | |||||||||||||||||
Year Ended 12/31/2008 (c) | 10.00 | 0.08 | (4.51 | ) | (4.43 | ) | (0.10 | ) | — | |||||||||||||||
| (a) | The amount shown may not correlate with the change in aggregate gains and losses of portfolio securities due to the timing of sales and redemptions of fund shares. |
| (c) | Since inception, April 30, 2008. |
| * | All per share amounts have been rounded to the nearest cent. |
The accompanying Notes to Financial Statements are an integral part of this schedule.
308
Table of Contents
Thrivent Series Fund, Inc.
Financial Highlights – continued
| RATIOS / SUPPLEMENTAL DATA | ||||||||||||||||||||||||||||||||||
| Ratio to Average Net Assets** | Ratios to Average Net Assets Before Expenses Waived, Credited or Paid Indirectly** | |||||||||||||||||||||||||||||||||
Total | Net Asset Value, End of Period | Total Return(b) | Net Assets, End of Period (in millions) | Expenses | Net Investment Income/(Loss) | Expenses | Net Investment Income/(Loss) | Portfolio Turnover Rate | ||||||||||||||||||||||||||
| $(1.31) | $ | 11.35 | 7.71 | % | $ | 81.7 | 0.53 | % | 0.79 | % | 0.53 | % | 0.79 | % | 4 | % | ||||||||||||||||||
| (0.89) | 11.79 | (2.23 | )% | 78.1 | 0.53 | % | 0.72 | % | 0.53 | % | 0.72 | % | 16 | % | ||||||||||||||||||||
| (0.12) | 12.91 | 25.91 | % | 94.2 | 0.54 | % | 0.81 | % | 0.54 | % | 0.81 | % | 13 | % | ||||||||||||||||||||
| (0.78) | 10.37 | 36.69 | % | 86.9 | 0.56 | % | 1.19 | % | 0.57 | % | 1.19 | % | 18 | % | ||||||||||||||||||||
| (2.06) | 8.31 | (36.29 | )% | 75.1 | 0.46 | % | 1.33 | % | 0.46 | % | 1.32 | % | 24 | % | ||||||||||||||||||||
| (1.05) | 15.20 | 7.63 | % | 146.2 | 0.43 | % | 1.16 | % | 0.43 | % | 1.15 | % | 20 | % | ||||||||||||||||||||
|
|
|
|
|
|
|
|
|
|
|
|
|
|
|
| |||||||||||||||||||
|
|
| ||||||||||||||||||||||||||||||||
| — | 7.77 | 5.14 | % | 654.8 | 0.98 | % | 3.37 | % | 0.98 | % | 3.37 | % | 27 | % | ||||||||||||||||||||
| (0.31) | 7.39 | (12.13 | )% | 495.6 | 0.99 | % | 2.25 | % | 0.99 | % | 2.25 | % | 64 | % | ||||||||||||||||||||
| (0.11) | 8.77 | 13.43 | % | 522.6 | 1.00 | % | 1.73 | % | 1.05 | % | 1.68 | % | 84 | % | ||||||||||||||||||||
| (0.10) | 7.84 | 31.67 | % | 254.9 | 1.00 | % | 2.01 | % | 1.20 | % | 1.81 | % | 80 | % | ||||||||||||||||||||
| (0.06) | 6.03 | (39.09 | )% | 105.9 | 1.00 | % | 2.17 | % | 1.25 | % | 1.92 | % | 49 | % | ||||||||||||||||||||
|
|
|
|
|
|
|
|
|
|
|
|
|
|
|
| |||||||||||||||||||
|
|
| ||||||||||||||||||||||||||||||||
| (0.26) | 9.23 | 3.50 | % | 716.2 | 0.90 | % | 3.84 | % | 0.97 | % | 3.77 | % | 28 | % | ||||||||||||||||||||
| — | 9.18 | (13.91 | )% | 709.8 | 0.82 | % | 2.43 | % | 0.90 | % | 2.35 | % | 73 | % | ||||||||||||||||||||
| (0.20) | 10.67 | 8.78 | % | 889.3 | 0.83 | % | 1.97 | % | 0.91 | % | 1.89 | % | 100 | % | ||||||||||||||||||||
| (0.21) | 9.99 | 24.79 | % | 882.9 | 0.85 | % | 2.29 | % | 0.91 | % | 2.23 | % | 76 | % | ||||||||||||||||||||
| (2.85) | 8.18 | (41.10 | )% | 778.1 | 0.81 | % | 2.54 | % | 0.89 | % | 2.46 | % | 70 | % | ||||||||||||||||||||
| (0.79) | 17.26 | 10.57 | % | 1,443.8 | 0.81 | % | 2.11 | % | 0.88 | % | 2.04 | % | 113 | % | ||||||||||||||||||||
|
|
|
|
|
|
|
|
|
|
|
|
|
|
|
| |||||||||||||||||||
|
|
| ||||||||||||||||||||||||||||||||
| — | 11.13 | 9.52 | % | 8.0 | 0.98 | % | 0.12 | % | 2.47 | % | (1.37 | )% | 16 | % | ||||||||||||||||||||
| — | 10.16 | (1.82 | )% | 6.1 | 0.98 | % | 0.01 | % | 2.99 | % | (2.00 | )% | 45 | % | ||||||||||||||||||||
| (0.01) | 10.35 | 18.31 | % | 4.4 | 0.98 | % | 0.05 | % | 3.63 | % | (2.60 | )% | 41 | % | ||||||||||||||||||||
| (0.04) | 8.76 | 35.65 | % | 4.1 | 0.98 | % | 0.41 | % | 4.06 | % | (2.67 | )% | 41 | % | ||||||||||||||||||||
| (0.02) | 6.48 | (34.98 | )% | 3.2 | 0.98 | % | 0.30 | % | 2.19 | % | (0.92 | )% | 32 | % | ||||||||||||||||||||
|
|
|
|
|
|
|
|
|
|
|
|
|
|
|
| |||||||||||||||||||
|
|
|
| ||||||||||||||||||||||||||||||||
| — | 10.06 | 7.61 | % | 13.6 | 1.00 | % | (0.06 | )% | 1.81 | % | (0.87 | )% | 27 | % | ||||||||||||||||||||
| — | 9.35 | (7.13 | )% | 12.7 | 1.00 | % | (0.26 | )% | 1.85 | % | (1.12 | )% | 76 | % | ||||||||||||||||||||
| — | 10.07 | 25.33 | % | 11.8 | 1.00 | % | (0.17 | )% | 2.26 | % | (1.42 | )% | 77 | % | ||||||||||||||||||||
| — | 8.03 | 50.32 | % | 8.1 | 1.00 | % | (0.15 | )% | 3.79 | % | (2.94 | )% | 46 | % | ||||||||||||||||||||
| — | 5.34 | (46.57 | )% | 2.4 | 1.00 | % | (0.14 | )% | 2.64 | % | (1.79 | )% | 62 | % | ||||||||||||||||||||
|
|
|
|
|
|
|
|
|
|
|
|
|
|
|
| |||||||||||||||||||
|
|
|
| ||||||||||||||||||||||||||||||||
| (0.05) | 8.31 | 2.96 | % | 6.6 | 0.98 | % | 0.84 | % | 2.58 | % | (0.76 | )% | 72 | % | ||||||||||||||||||||
| (0.05) | 8.12 | (10.16 | )% | 6.7 | 0.98 | % | 0.59 | % | 2.42 | % | (0.85 | )% | 139 | % | ||||||||||||||||||||
| — | 9.09 | 18.86 | % | 7.4 | 0.99 | % | 0.39 | % | 2.77 | % | (1.39 | )% | 146 | % | ||||||||||||||||||||
| (0.08) | 7.65 | 41.20 | % | 5.5 | 0.98 | % | 1.26 | % | 4.67 | % | (2.43 | )% | 143 | % | ||||||||||||||||||||
| (0.10) | 5.47 | (44.21 | )% | 2.5 | 0.98 | % | 1.43 | % | 2.80 | % | (0.40 | )% | 168 | % | ||||||||||||||||||||
| (b) | Total investment return assumes dividend reinvestment and does not reflect any deduction for applicable sales charges. Not annualized for periods less than one year. Total return shown does not reflect charges and expenses imposed on contract holders by the variable accounts. Those charges and expenses reduce the return received by contract holders as compared to the return presented. |
| ** | Computed on an annualized basis for periods less than one year. |
The accompanying Notes to Financial Statements are an integral part of this schedule.
309
Table of Contents
Thrivent Series Fund, Inc.
Financial Highlights – continued
| FOR A SHARE OUTSTANDING THROUGHOUT EACH PERIOD* | ||||||||||||||||||||||||
| Income from Investment Operations | Less Distributions from | |||||||||||||||||||||||
| Net Asset Value, Beginning of Period | Net Investment Income/(Loss) | Net Realized and Unrealized Gain/(Loss) on Investments(a) | Total from Investment Operations | Net Investment Income | Net Realized Gain on Investments | |||||||||||||||||||
PARTNER ALL CAP PORTFOLIO | ||||||||||||||||||||||||
Period Ended 6/29/2012 (unaudited) | $ | 8.44 | $ | 0.04 | $ | 0.65 | $ | 0.69 | $ | (0.04 | ) | $ | — | |||||||||||
Year Ended 12/31/2011 | 8.93 | 0.06 | (0.49 | ) | (0.43 | ) | (0.06 | ) | — | |||||||||||||||
Year Ended 12/31/2010 | 7.73 | 0.04 | 1.22 | 1.26 | (0.06 | ) | — | |||||||||||||||||
Year Ended 12/31/2009 | 6.10 | 0.06 | 1.66 | 1.72 | (0.09 | ) | — | |||||||||||||||||
Year Ended 12/31/2008 | 13.00 | 0.09 | (5.05 | ) | (4.96 | ) | (0.08 | ) | (1.86 | ) | ||||||||||||||
Year Ended 12/31/2007 | 12.03 | 0.07 | 2.28 | 2.35 | (0.06 | ) | (1.32 | ) | ||||||||||||||||
|
|
|
|
|
|
|
|
|
|
|
| |||||||||||||
LARGE CAP GROWTH PORTFOLIO II | ||||||||||||||||||||||||
Period Ended 6/29/2012 (unaudited) | 6.37 | (0.01 | ) | 0.52 | 0.51 | (0.14 | ) | (2.15 | ) | |||||||||||||||
Year Ended 12/31/2011 (c) | 6.94 | 0.02 | (0.45 | ) | (0.43 | ) | (0.01 | ) | (0.13 | ) | ||||||||||||||
Year Ended 12/31/2010 | 7.32 | 0.02 | 0.55 | 0.57 | (0.02 | ) | (0.93 | ) | ||||||||||||||||
Year Ended 12/31/2009 | 5.85 | 0.05 | 2.26 | 2.31 | (0.04 | ) | (0.80 | ) | ||||||||||||||||
Year Ended 12/31/2008 | 11.96 | 0.02 | (4.49 | ) | (4.47 | ) | (0.06 | ) | (1.58 | ) | ||||||||||||||
Year Ended 12/31/2007 | 11.00 | 0.06 | 1.71 | 1.77 | (0.08 | ) | (0.73 | ) | ||||||||||||||||
|
|
|
|
|
|
|
|
|
|
|
| |||||||||||||
LARGE CAP GROWTH PORTFOLIO | ||||||||||||||||||||||||
Period Ended 6/29/2012 (unaudited) | 15.96 | 0.10 | 1.67 | 1.77 | (0.01 | ) | — | |||||||||||||||||
Year Ended 12/31/2011 | 16.98 | 0.10 | (1.02 | ) | (0.92 | ) | (0.10 | ) | — | |||||||||||||||
Year Ended 12/31/2010 | 15.40 | 0.09 | 1.58 | 1.67 | (0.09 | ) | — | |||||||||||||||||
Year Ended 12/31/2009 | 10.96 | 0.11 | 4.43 | 4.54 | (0.10 | ) | — | |||||||||||||||||
Year Ended 12/31/2008 | 19.23 | 0.18 | (8.26 | ) | (8.08 | ) | (0.19 | ) | — | |||||||||||||||
Year Ended 12/31/2007 | 16.64 | 0.12 | 2.67 | 2.79 | (0.20 | ) | — | |||||||||||||||||
|
|
|
|
|
|
|
|
|
|
|
| |||||||||||||
PARTNER GROWTH STOCK PORTFOLIO | ||||||||||||||||||||||||
Period Ended 6/29/2012 (unaudited) | 11.41 | (0.01 | ) | 1.51 | 1.50 | — | — | |||||||||||||||||
Year Ended 12/31/2011 | 11.58 | (0.03 | ) | (0.14 | ) | (0.17 | ) | — | — | |||||||||||||||
Year Ended 12/31/2010 | 9.93 | (0.02 | ) | 1.67 | 1.65 | — | — | |||||||||||||||||
Year Ended 12/31/2009 | 6.96 | — | 3.00 | 3.00 | (0.03 | ) | — | |||||||||||||||||
Year Ended 12/31/2008 | 13.55 | 0.05 | (5.29 | ) | (5.24 | ) | (0.09 | ) | (1.26 | ) | ||||||||||||||
Year Ended 12/31/2007 | 13.08 | 0.08 | 1.14 | 1.22 | (0.07 | ) | (0.68 | ) | ||||||||||||||||
|
|
|
|
|
|
|
|
|
|
|
| |||||||||||||
LARGE CAP VALUE PORTFOLIO | ||||||||||||||||||||||||
Period Ended 6/29/2012 (unaudited) | 10.39 | 0.11 | 0.57 | 0.68 | (0.19 | ) | — | |||||||||||||||||
Year Ended 12/31/2011 | 10.73 | 0.18 | (0.52 | ) | (0.34 | ) | — | — | ||||||||||||||||
Year Ended 12/31/2010 | 9.65 | 0.14 | 1.08 | 1.22 | (0.14 | ) | — | |||||||||||||||||
Year Ended 12/31/2009 | 8.10 | 0.16 | 1.55 | 1.71 | (0.16 | ) | — | |||||||||||||||||
Year Ended 12/31/2008 | 13.41 | 0.23 | (4.66 | ) | (4.43 | ) | (0.43 | ) | (0.45 | ) | ||||||||||||||
Year Ended 12/31/2007 | 13.50 | 0.19 | 0.48 | 0.67 | (0.17 | ) | (0.59 | ) | ||||||||||||||||
|
|
|
|
|
|
|
|
|
|
|
| |||||||||||||
LARGE CAP STOCK PORTFOLIO | ||||||||||||||||||||||||
Period Ended 6/29/2012 (unaudited) | 8.11 | 0.06 | 0.57 | 0.63 | (0.09 | ) | — | |||||||||||||||||
Year Ended 12/31/2011 | 8.50 | 0.09 | (0.48 | ) | (0.39 | ) | — | — | ||||||||||||||||
Year Ended 12/31/2010 | 7.72 | 0.06 | 0.78 | 0.84 | (0.06 | ) | — | |||||||||||||||||
Year Ended 12/31/2009 | 6.11 | 0.07 | 1.61 | 1.68 | (0.07 | ) | — | |||||||||||||||||
Year Ended 12/31/2008 | 11.04 | 0.15 | (4.05 | ) | (3.90 | ) | (0.28 | ) | (0.75 | ) | ||||||||||||||
Year Ended 12/31/2007 | 10.54 | 0.12 | 0.68 | 0.80 | (0.12 | ) | (0.18 | ) | ||||||||||||||||
| (a) | The amount shown may not correlate with the change in aggregate gains and losses of portfolio securities due to the timing of sales and redemptions of fund shares. |
| (c) | Per share amounts have been calculated using the average shares outstanding method. |
| * | All per share amounts have been rounded to the nearest cent. |
The accompanying Notes to Financial Statements are an integral part of this schedule.
310
Table of Contents
Thrivent Series Fund, Inc.
Financial Highlights – continued
| RATIOS / SUPPLEMENTAL DATA | ||||||||||||||||||||||||||||||||||
| Ratio to Average Net Assets** | Ratios to Average Net Assets Before Expenses Waived, Credited or Paid Indirectly** | |||||||||||||||||||||||||||||||||
Total | Net Asset Value, End of Period | Total Return(b) | Net Assets, End of Period (in millions) | Expenses | Net Investment Income/ (Loss) | Expenses | Net Investment Income/ (Loss) | Portfolio Turnover Rate | ||||||||||||||||||||||||||
| $ | (0.04 | ) | $ | 9.09 | 8.21 | % | $ | 51.6 | 1.05 | % | 0.72 | % | 1.25 | % | 0.52 | % | 59 | % | ||||||||||||||||
| (0.06 | ) | 8.44 | (4.83 | )% | 51.4 | 1.03 | % | 0.56 | % | 1.23 | % | 0.36 | % | 124 | % | |||||||||||||||||||
| (0.06 | ) | 8.93 | 16.34 | % | 62.4 | 1.02 | % | 0.47 | % | 1.22 | % | 0.27 | % | 180 | % | |||||||||||||||||||
| (0.09 | ) | 7.73 | 28.48 | % | 62.6 | 1.04 | % | 0.76 | % | 1.24 | % | 0.56 | % | 231 | % | |||||||||||||||||||
| (1.94 | ) | 6.10 | (42.91 | )% | 56.2 | 0.86 | % | 0.84 | % | 1.07 | % | 0.64 | % | 260 | % | |||||||||||||||||||
| (1.38 | ) | 13.00 | 20.37 | % | 117.6 | 0.84 | % | 0.61 | % | 1.05 | % | 0.41 | % | 169 | % | |||||||||||||||||||
|
|
|
|
|
|
|
|
|
|
|
|
|
|
|
|
|
| |||||||||||||||||
|
|
| ||||||||||||||||||||||||||||||||
| (2.29 | ) | 4.59 | 8.78 | % | 13.1 | 2.47 | % | (0.89 | )% | 2.62 | % | (1.04 | )% | 38 | % | |||||||||||||||||||
| (0.14 | ) | 6.37 | (6.25 | )% | 12.9 | 0.68 | % | 0.33 | % | 0.87 | % | 0.14 | % | 169 | % | |||||||||||||||||||
| (0.95 | ) | 6.94 | 8.35 | % | 385.1 | 0.62 | % | 0.32 | % | 0.87 | % | 0.07 | % | 231 | % | |||||||||||||||||||
| (0.84 | ) | 7.32 | 39.78 | % | 357.4 | 0.57 | % | 0.67 | % | 0.87 | % | 0.37 | % | 235 | % | |||||||||||||||||||
| (1.64 | ) | 5.85 | (41.92 | )% | 309.0 | 0.62 | % | 0.90 | % | 1.03 | % | 0.49 | % | 149 | % | |||||||||||||||||||
| (0.81 | ) | 11.96 | 16.47 | % | 34.0 | 0.65 | % | 0.39 | % | 1.06 | % | (0.01 | )% | 156 | % | |||||||||||||||||||
|
|
|
|
|
|
|
|
|
|
|
|
|
|
|
|
|
| |||||||||||||||||
| (0.01 | ) | 17.72 | 11.03 | % | 840.7 | 0.45 | % | 1.14 | % | 0.45 | % | 1.14 | % | 51 | % | |||||||||||||||||||
| (0.10 | ) | 15.96 | (5.42 | )% | 805.3 | 0.44 | % | 0.55 | % | 0.44 | % | 0.55 | % | 216 | % | |||||||||||||||||||
| (0.09 | ) | 16.98 | 10.90 | % | 983.3 | 0.45 | % | 0.56 | % | 0.45 | % | 0.56 | % | 231 | % | |||||||||||||||||||
| (0.10 | ) | 15.40 | 41.40 | % | 1,025.3 | 0.45 | % | 0.79 | % | 0.45 | % | 0.79 | % | 216 | % | |||||||||||||||||||
| (0.19 | ) | 10.96 | (42.00 | )% | 844.5 | 0.44 | % | 0.74 | % | 0.45 | % | 0.73 | % | 177 | % | |||||||||||||||||||
| (0.20 | ) | 19.23 | 16.75 | % | 2,553.5 | 0.44 | % | 0.63 | % | 0.45 | % | 0.63 | % | 163 | % | |||||||||||||||||||
|
|
|
|
|
|
|
|
|
|
|
|
|
|
|
|
|
| |||||||||||||||||
|
|
| ||||||||||||||||||||||||||||||||
| — | 12.91 | 13.19 | % | 55.6 | 0.97 | % | (0.21 | )% | 1.07 | % | (0.31 | )% | 17 | % | ||||||||||||||||||||
| — | 11.41 | (1.49 | )% | 51.1 | 0.96 | % | (0.20 | )% | 1.06 | % | (0.30 | )% | 26 | % | ||||||||||||||||||||
| — | 11.58 | 16.62 | % | 61.4 | 0.95 | % | (0.19 | )% | 1.05 | % | (0.29 | )% | 36 | % | ||||||||||||||||||||
| (0.03 | ) | 9.93 | 43.17 | % | 61.3 | 0.98 | % | 0.01 | % | 1.08 | % | (0.09 | )% | 53 | % | |||||||||||||||||||
| (1.35 | ) | 6.96 | (42.13 | )% | 52.1 | 0.82 | % | 0.34 | % | 0.92 | % | 0.23 | % | 44 | % | |||||||||||||||||||
| (0.75 | ) | 13.55 | 9.28 | % | 118.1 | 0.80 | % | 0.59 | % | 0.91 | % | 0.48 | % | 55 | % | |||||||||||||||||||
|
|
|
|
|
|
|
|
|
|
|
|
|
|
|
|
|
| |||||||||||||||||
| (0.19 | ) | 10.88 | 6.57 | % | 786.6 | 0.64 | % | 1.89 | % | 0.64 | % | 1.89 | % | 56 | % | |||||||||||||||||||
| — | 10.39 | (3.08 | )% | 752.1 | 0.64 | % | 1.70 | % | 0.64 | % | 1.70 | % | 73 | % | ||||||||||||||||||||
| (0.14 | ) | 10.73 | 12.61 | % | 811.3 | 0.65 | % | 1.39 | % | 0.65 | % | 1.39 | % | 109 | % | |||||||||||||||||||
| (0.16 | ) | 9.65 | 21.11 | % | 733.0 | 0.65 | % | 1.77 | % | 0.65 | % | 1.77 | % | 110 | % | |||||||||||||||||||
| (0.88 | ) | 8.10 | (34.33 | )% | 664.1 | 0.64 | % | 2.16 | % | 0.65 | % | 2.16 | % | 53 | % | |||||||||||||||||||
| (0.76 | ) | 13.41 | 4.70 | % | 1,004.9 | 0.64 | % | 1.68 | % | 0.65 | % | 1.67 | % | 37 | % | |||||||||||||||||||
|
|
|
|
|
|
|
|
|
|
|
|
|
|
|
|
|
| |||||||||||||||||
| (0.09 | ) | 8.65 | 7.76 | % | 595.9 | 0.69 | % | 1.43 | % | 0.69 | % | 1.43 | % | 45 | % | |||||||||||||||||||
| — | 8.11 | (4.58 | )% | 565.8 | 0.69 | % | 1.00 | % | 0.69 | % | 1.00 | % | 139 | % | ||||||||||||||||||||
| (0.06 | ) | 8.50 | 10.82 | % | 628.3 | 0.69 | % | 0.74 | % | 0.69 | % | 0.74 | % | 181 | % | |||||||||||||||||||
| (0.07 | ) | 7.72 | 27.59 | % | 617.3 | 0.70 | % | 1.03 | % | 0.71 | % | 1.03 | % | 169 | % | |||||||||||||||||||
| (1.03 | ) | 6.11 | (37.68 | )% | 497.4 | 0.66 | % | 1.42 | % | 0.67 | % | 1.41 | % | 100 | % | |||||||||||||||||||
| (0.30 | ) | 11.04 | 7.57 | % | 1,060.1 | 0.65 | % | 1.31 | % | 0.66 | % | 1.30 | % | 114 | % | |||||||||||||||||||
| (b) | Total investment return assumes dividend reinvestment and does not reflect any deduction for applicable sales charges. Not annualized for periods less than one year. Total return shown does not reflect charges and expenses imposed on contract holders by the variable accounts. Those charges and expenses reduce the return received by contract holders as compared to the return presented. |
| ** | Computed on an annualized basis for periods less than one year. |
The accompanying Notes to Financial Statements are an integral part of this schedule.
311
Table of Contents
Thrivent Series Fund, Inc.
Financial Highlights – continued
| FOR A SHARE OUTSTANDING THROUGHOUT EACH PERIOD* | ||||||||||||||||||||||||
| Income from Investment Operations | Less Distributions from | |||||||||||||||||||||||
| Net Asset Value, Beginning of Period | Net Investment Income/(Loss) | Net Realized and Unrealized Gain/(Loss) on Investments(a) | Total from Investment Operations | Net Investment Income | Net Realized Gain on Investments | |||||||||||||||||||
LARGE CAP INDEX PORTFOLIO | ||||||||||||||||||||||||
Period Ended 6/29/2012 (unaudited) | $ | 17.71 | $ | 0.18 | $ | 1.45 | $ | 1.63 | $ | (0.33 | ) | $ | — | |||||||||||
Year Ended 12/31/2011 | 17.71 | 0.34 | (0.04 | ) | 0.30 | (0.30 | ) | — | ||||||||||||||||
Year Ended 12/31/2010 | 15.76 | 0.30 | 1.95 | 2.25 | (0.30 | ) | — | |||||||||||||||||
Year Ended 12/31/2009 | 13.72 | 0.33 | 2.98 | 3.31 | (0.45 | ) | (0.82 | ) | ||||||||||||||||
Year Ended 12/31/2008 | 25.18 | 0.47 | (8.99 | ) | (8.52 | ) | (0.50 | ) | (2.44 | ) | ||||||||||||||
Year Ended 12/31/2007 | 25.32 | 0.49 | 0.87 | 1.36 | (0.44 | ) | (1.06 | ) | ||||||||||||||||
|
|
|
|
|
|
|
|
|
|
|
| |||||||||||||
EQUITY INCOME PLUS PORTFOLIO | ||||||||||||||||||||||||
Period Ended 6/29/2012 (unaudited) | 8.81 | 0.10 | 0.58 | 0.68 | (0.14 | ) | — | |||||||||||||||||
Year Ended 12/31/2011 | 9.06 | 0.15 | (0.37 | ) | (0.22 | ) | (0.03 | ) | — | |||||||||||||||
Year Ended 12/31/2010 | 7.91 | 0.15 | 1.13 | 1.28 | (0.13 | ) | — | |||||||||||||||||
Year Ended 12/31/2009 | 6.89 | 0.14 | 1.01 | 1.15 | (0.13 | ) | — | |||||||||||||||||
Year Ended 12/31/2008 (c) | 10.00 | 0.15 | (3.11 | ) | (2.96 | ) | (0.15 | ) | — | |||||||||||||||
|
|
|
|
|
|
|
|
|
|
|
| |||||||||||||
BALANCED PORTFOLIO | ||||||||||||||||||||||||
Period Ended 6/29/2012 (unaudited) | 14.48 | 0.16 | 0.88 | 1.04 | (0.33 | ) | (0.47 | ) | ||||||||||||||||
Year Ended 12/31/2011 | 14.72 | 0.34 | 0.26 | 0.60 | (0.34 | ) | (0.50 | ) | ||||||||||||||||
Year Ended 12/31/2010 | 13.44 | 0.34 | 1.39 | 1.73 | (0.36 | ) | (0.09 | ) | ||||||||||||||||
Year Ended 12/31/2009 | 11.75 | 0.38 | 2.06 | 2.44 | (0.55 | ) | (0.20 | ) | ||||||||||||||||
Year Ended 12/31/2008 | 17.16 | 0.56 | (4.82 | ) | (4.26 | ) | (0.58 | ) | (0.57 | ) | ||||||||||||||
Year Ended 12/31/2007 | 16.77 | 0.57 | 0.35 | 0.92 | (0.53 | ) | — | |||||||||||||||||
|
|
|
|
|
|
|
|
|
|
|
| |||||||||||||
HIGH YIELD PORTFOLIO | ||||||||||||||||||||||||
Period Ended 6/29/2012 (unaudited) | 4.66 | 0.18 | 0.19 | 0.37 | (0.18 | ) | — | |||||||||||||||||
Year Ended 12/31/2011 | 4.81 | 0.37 | (0.15 | ) | 0.22 | (0.37 | ) | — | ||||||||||||||||
Year Ended 12/31/2010 | 4.56 | 0.38 | 0.25 | 0.63 | (0.38 | ) | — | |||||||||||||||||
Year Ended 12/31/2009 | 3.48 | 0.38 | 1.07 | 1.45 | (0.37 | ) | — | |||||||||||||||||
Year Ended 12/31/2008 | 4.84 | 0.37 | (1.34 | ) | (0.97 | ) | (0.39 | ) | — | |||||||||||||||
Year Ended 12/31/2007 | 5.11 | 0.40 | (0.26 | ) | 0.14 | (0.41 | ) | — | ||||||||||||||||
|
|
|
|
|
|
|
|
|
|
|
| |||||||||||||
DIVERSIFIED INCOME PLUS PORTFOLIO | ||||||||||||||||||||||||
Period Ended 6/29/2012 (unaudited) | 6.56 | 0.10 | 0.41 | 0.51 | (0.26 | ) | — | |||||||||||||||||
Year Ended 12/31/2011 | 6.75 | 0.29 | (0.13 | ) | 0.16 | (0.35 | ) | — | ||||||||||||||||
Year Ended 12/31/2010 | 6.14 | 0.38 | 0.55 | 0.93 | (0.32 | ) | — | |||||||||||||||||
Year Ended 12/31/2009 | 5.01 | 0.43 | 1.15 | 1.58 | (0.45 | ) | — | |||||||||||||||||
Year Ended 12/31/2008 | 6.98 | 0.46 | (2.00 | ) | (1.54 | ) | (0.43 | ) | — | |||||||||||||||
Year Ended 12/31/2007 | 7.19 | 0.34 | (0.41 | ) | (0.07 | ) | (0.14 | ) | — | |||||||||||||||
|
|
|
|
|
|
|
|
|
|
|
| |||||||||||||
PARTNER SOCIALLY RESPONSIBLE BOND PORTFOLIO | ||||||||||||||||||||||||
Period Ended 6/29/2012 (unaudited) | 10.71 | 0.11 | 0.27 | 0.38 | (0.11 | ) | (0.30 | ) | ||||||||||||||||
Year Ended 12/31/2011 | 10.31 | 0.29 | 0.40 | 0.69 | (0.29 | ) | — | |||||||||||||||||
Year Ended 12/31/2010 | 10.16 | 0.33 | 0.48 | 0.81 | (0.33 | ) | (0.33 | ) | ||||||||||||||||
Year Ended 12/31/2009 | 10.02 | 0.43 | 0.62 | 1.05 | (0.36 | ) | (0.55 | ) | ||||||||||||||||
Year Ended 12/31/2008(c) | 10.00 | 0.26 | 0.01 | 0.27 | (0.25 | ) | — | |||||||||||||||||
| (a) | The amount shown may not correlate with the change in aggregate gains and losses of portfolio securities due to the timing of sales and redemptions of fund shares. |
| (c) | Since inception, April 30, 2008. |
| * | All per share amounts have been rounded to the nearest cent. |
The accompanying Notes to Financial Statements are an integral part of this schedule.
312
Table of Contents
Thrivent Series Fund, Inc.
Financial Highlights – continued
| RATIOS / SUPPLEMENTAL DATA | ||||||||||||||||||||||||||||||||||
| Ratio to Average Net Assets** | Ratios to Average Net Assets Before Expenses Waived, Credited or Paid Indirectly** | |||||||||||||||||||||||||||||||||
Total | Net Asset Value, End of Period | Total Return(b) | Net Assets, End of Period (in millions) | Expenses | Net Investment Income/(Loss) | Expenses | Net Investment Income/(Loss) | Portfolio Turnover Rate | ||||||||||||||||||||||||||
|
|
| ||||||||||||||||||||||||||||||||
| $ | (0.33) | $ | 19.01 | 9.25 | % | $ | 303.0 | 0.42 | % | 1.73 | % | 0.42 | % | 1.73 | % | 2 | % | |||||||||||||||||
| (0.30) | 17.71 | 1.71 | % | 291.3 | 0.42 | % | 1.67 | % | 0.42 | % | 1.67 | % | 4 | % | ||||||||||||||||||||
| (0.30) | 17.71 | 14.63 | % | 331.5 | 0.42 | % | 1.64 | % | 0.42 | % | 1.64 | % | 6 | % | ||||||||||||||||||||
| (1.27) | 15.76 | 26.20 | % | 338.2 | 0.43 | % | 2.00 | % | 0.43 | % | 2.00 | % | 7 | % | ||||||||||||||||||||
| (2.94) | 13.72 | (37.12 | )% | 319.7 | 0.38 | % | 2.01 | % | 0.39 | % | 2.00 | % | 8 | % | ||||||||||||||||||||
| (1.50) | 25.18 | 5.17 | % | 633.5 | 0.36 | % | 1.64 | % | 0.36 | % | 1.64 | % | 5 | % | ||||||||||||||||||||
|
|
|
|
|
|
|
|
|
|
|
|
|
|
|
|
|
| |||||||||||||||||
|
|
| ||||||||||||||||||||||||||||||||
| (0.14) | 9.35 | 7.81 | % | 97.3 | 0.81 | % | 2.18 | % | 0.81 | % | 2.18 | % | 80 | % | ||||||||||||||||||||
| (0.03) | 8.81 | (2.46 | )% | 88.1 | 0.83 | % | 1.78 | % | 0.83 | % | 1.78 | % | 195 | % | ||||||||||||||||||||
| (0.13) | 9.06 | 16.23 | % | 76.3 | 0.85 | % | 2.06 | % | 0.89 | % | 2.02 | % | 362 | % | ||||||||||||||||||||
| (0.13) | 7.91 | 16.68 | % | 55.0 | 0.85 | % | 2.24 | % | 0.99 | % | 2.10 | % | 416 | % | ||||||||||||||||||||
| (0.15) | 6.89 | (29.58 | )% | 41.4 | 0.80 | % | 2.74 | % | 0.84 | % | 2.71 | % | 74 | % | ||||||||||||||||||||
|
|
|
|
|
|
|
|
|
|
|
|
|
|
|
|
|
| |||||||||||||||||
|
|
| ||||||||||||||||||||||||||||||||
| (0.80) | 14.72 | 7.27 | % | 242.2 | 0.45 | % | 1.88 | % | 0.45 | % | 1.88 | % | 69 | % | ||||||||||||||||||||
| (0.84) | 14.48 | 4.18 | % | 240.5 | 0.44 | % | 2.06 | % | 0.44 | % | 2.06 | % | 143 | % | ||||||||||||||||||||
| (0.45) | 14.72 | 13.30 | % | 270.6 | 0.44 | % | 2.13 | % | 0.44 | % | 2.13 | % | 136 | % | ||||||||||||||||||||
| (0.75) | 13.44 | 21.76 | % | 281.2 | 0.44 | % | 2.55 | % | 0.44 | % | 2.54 | % | 115 | % | ||||||||||||||||||||
| (1.15) | 11.75 | (26.06 | )% | 280.0 | 0.39 | % | 3.00 | % | 0.41 | % | 2.98 | % | 133 | % | ||||||||||||||||||||
| (0.53) | 17.16 | 5.46 | % | 488.4 | 0.38 | % | 2.78 | % | 0.39 | % | 2.77 | % | 121 | % | ||||||||||||||||||||
|
|
|
|
|
|
|
|
|
|
|
|
|
|
|
|
|
| |||||||||||||||||
|
|
| ||||||||||||||||||||||||||||||||
| (0.18) | 4.85 | 7.92 | % | 834.7 | 0.45 | % | 7.38 | % | 0.45 | % | 7.38 | % | 26 | % | ||||||||||||||||||||
| (0.37) | 4.66 | 4.71 | % | 778.5 | 0.45 | % | 7.81 | % | 0.45 | % | 7.81 | % | 58 | % | ||||||||||||||||||||
| (0.38) | 4.81 | 14.58 | % | 783.0 | 0.45 | % | 8.20 | % | 0.45 | % | 8.20 | % | 82 | % | ||||||||||||||||||||
| (0.37) | 4.56 | 43.49 | % | 756.0 | 0.45 | % | 9.28 | % | 0.46 | % | 9.28 | % | 61 | % | ||||||||||||||||||||
| (0.39) | 3.48 | (21.19 | )% | 597.2 | 0.43 | % | 8.63 | % | 0.45 | % | 8.61 | % | 50 | % | ||||||||||||||||||||
| (0.41) | 4.84 | 2.71 | % | 774.6 | 0.45 | % | 8.00 | % | 0.45 | % | 8.00 | % | 69 | % | ||||||||||||||||||||
|
|
|
|
|
|
|
|
|
|
|
|
|
|
|
|
|
| |||||||||||||||||
|
|
| ||||||||||||||||||||||||||||||||
| (0.26) | 6.81 | 7.94 | % | 149.9 | 0.53 | % | 4.78 | % | 0.53 | % | 4.78 | % | 73 | % | ||||||||||||||||||||
| (0.35) | 6.56 | 2.32 | % | 118.4 | 0.55 | % | 4.98 | % | 0.55 | % | 4.98 | % | 127 | % | ||||||||||||||||||||
| (0.32) | 6.75 | 15.85 | % | 106.0 | 0.57 | % | 6.28 | % | 0.57 | % | 6.28 | % | 116 | % | ||||||||||||||||||||
| (0.45) | 6.14 | 33.06 | % | 87.2 | 0.61 | % | 7.08 | % | 0.63 | % | 7.07 | % | 88 | % | ||||||||||||||||||||
| (0.43) | 5.01 | (23.30 | )% | 75.0 | 0.51 | % | 5.61 | % | 0.52 | % | 5.59 | % | 115 | % | ||||||||||||||||||||
| (0.14) | 6.98 | (0.99 | )% | 131.3 | 0.48 | % | 5.30 | % | 0.50 | % | 5.28 | % | 168 | % | ||||||||||||||||||||
|
|
|
|
|
|
|
|
|
|
|
|
|
|
|
|
|
| |||||||||||||||||
|
|
| ||||||||||||||||||||||||||||||||
| (0.41) | 10.68 | 3.68 | % | 12.2 | 0.69 | % | 2.06 | % | 1.78 | % | 0.97 | % | 115 | % | ||||||||||||||||||||
| (0.29) | 10.71 | 6.70 | % | 10.2 | 0.68 | % | 2.73 | % | 2.17 | % | 1.25 | % | 254 | % | ||||||||||||||||||||
| (0.66) | 10.31 | 8.05 | % | 8.8 | 0.69 | % | 3.09 | % | 2.40 | % | 1.39 | % | 146 | % | ||||||||||||||||||||
| (0.91) | 10.16 | 10.98 | % | 6.2 | 0.68 | % | 4.17 | % | 2.51 | % | 2.33 | % | 148 | % | ||||||||||||||||||||
| (0.25) | 10.02 | 2.68 | % | 6.8 | 0.68 | % | 3.89 | % | 1.66 | % | 2.91 | % | 60 | % | ||||||||||||||||||||
| (b) | Total investment return assumes dividend reinvestment and does not reflect any deduction for applicable sales charges. Not annualized for periods less than one year. Total return shown does not reflect charges and expenses imposed on contract holders by the variable accounts. Those charges and expenses reduce the return received by contract holders as compared to the return presented. |
| ** | Computed on an annualized basis for periods less than one year. |
The accompanying Notes to Financial Statements are an integral part of this schedule.
313
Table of Contents
Thrivent Series Fund, Inc.
Financial Highlights – continued
| FOR A SHARE OUTSTANDING THROUGHOUT EACH PERIOD* | ||||||||||||||||||||||||
| Income from Investment Operations | Less Distributions from | |||||||||||||||||||||||
| Net Asset Value, Beginning of Period | Net Investment Income/(Loss) | Net Realized and Unrealized Gain/(Loss) on Investments(a) | Total from Investment Operations | Net Investment Income | Net Realized Gain on Investments | |||||||||||||||||||
INCOME PORTFOLIO | ||||||||||||||||||||||||
Period Ended 6/29/2012 (unaudited) | $ | 10.09 | $ | 0.21 | $ | 0.34 | $ | 0.55 | $ | (0.21 | ) | $ | — | |||||||||||
Year Ended 12/31/2011 | 9.96 | 0.46 | 0.12 | 0.58 | (0.45 | ) | — | |||||||||||||||||
Year Ended 12/31/2010 | 9.39 | 0.49 | 0.57 | 1.06 | (0.49 | ) | — | |||||||||||||||||
Year Ended 12/31/2009 | 8.20 | 0.50 | 1.19 | 1.69 | (0.50 | ) | — | |||||||||||||||||
Year Ended 12/31/2008 | 9.74 | 0.51 | (1.53 | ) | (1.02 | ) | (0.52 | ) | — | |||||||||||||||
Year Ended 12/31/2007 | 9.90 | 0.53 | (0.17 | ) | 0.36 | (0.52 | ) | — | ||||||||||||||||
|
|
|
|
|
|
|
|
|
|
|
| |||||||||||||
BOND INDEX PORTFOLIO | ||||||||||||||||||||||||
Period Ended 6/29/2012 (unaudited) | 11.21 | 0.13 | 0.19 | 0.32 | (0.13 | ) | (0.14 | ) | ||||||||||||||||
Year Ended 12/31/2011 | 10.73 | 0.31 | 0.55 | 0.86 | (0.31 | ) | (0.07 | ) | ||||||||||||||||
Year Ended 12/31/2010 | 10.13 | 0.33 | 0.60 | 0.93 | (0.33 | ) | — | |||||||||||||||||
Year Ended 12/31/2009 | 9.72 | 0.37 | 0.43 | 0.80 | (0.39 | ) | — | |||||||||||||||||
Year Ended 12/31/2008 | 10.29 | 0.48 | (0.56 | ) | (0.08 | ) | (0.49 | ) | — | |||||||||||||||
Year Ended 12/31/2007 | 10.22 | 0.50 | 0.07 | 0.57 | (0.50 | ) | — | |||||||||||||||||
|
|
|
|
|
|
|
|
|
|
|
| |||||||||||||
LIMITED MATURITY BOND PORTFOLIO | ||||||||||||||||||||||||
Period Ended 6/29/2012 (unaudited) | 9.67 | 0.09 | 0.13 | 0.22 | (0.09 | ) | — | |||||||||||||||||
Year Ended 12/31/2011 | 9.80 | 0.23 | (0.14 | ) | 0.09 | (0.22 | ) | — | ||||||||||||||||
Year Ended 12/31/2010 | 9.62 | 0.32 | 0.18 | 0.50 | (0.32 | ) | — | |||||||||||||||||
Year Ended 12/31/2009 | 8.79 | 0.39 | 0.82 | 1.21 | (0.38 | ) | — | |||||||||||||||||
Year Ended 12/31/2008 | 9.84 | 0.42 | (1.04 | ) | (0.62 | ) | (0.43 | ) | — | |||||||||||||||
Year Ended 12/31/2007 | 9.92 | 0.47 | (0.08 | ) | 0.39 | (0.47 | ) | — | ||||||||||||||||
|
|
|
|
|
|
|
|
|
|
|
| |||||||||||||
MORTGAGE SECURITIES PORTFOLIO | ||||||||||||||||||||||||
Period Ended 6/29/2012 (unaudited) | 10.45 | 0.09 | 0.19 | 0.28 | (0.09 | ) | (0.25 | ) | ||||||||||||||||
Year Ended 12/31/2011 | 10.32 | 0.30 | 0.17 | 0.47 | (0.30 | ) | (0.04 | ) | ||||||||||||||||
Year Ended 12/31/2010 | 9.62 | 0.35 | 0.80 | 1.15 | (0.35 | ) | (0.10 | ) | ||||||||||||||||
Year Ended 12/31/2009 | 8.82 | 0.43 | 0.69 | 1.12 | (0.32 | ) | — | |||||||||||||||||
Year Ended 12/31/2008 | 9.71 | 0.44 | (0.91 | ) | (0.47 | ) | (0.42 | ) | — | |||||||||||||||
Year Ended 12/31/2007 | 9.71 | 0.49 | (0.01 | ) | 0.48 | (0.48 | ) | — | ||||||||||||||||
|
|
|
|
|
|
|
|
|
|
|
| |||||||||||||
MONEY MARKET PORTFOLIO | ||||||||||||||||||||||||
Period Ended 6/29/2012 (unaudited) | 1.00 | — | — | — | — | — | ||||||||||||||||||
Year Ended 12/31/2011 | 1.00 | — | — | — | — | — | ||||||||||||||||||
Year Ended 12/31/2010 | 1.00 | — | — | — | — | — | ||||||||||||||||||
Year Ended 12/31/2009 | 1.00 | — | — | — | — | — | ||||||||||||||||||
Year Ended 12/31/2008 | 1.00 | 0.03 | — | 0.03 | (0.03 | ) | — | |||||||||||||||||
Year Ended 12/31/2007 | 1.00 | 0.05 | — | 0.05 | (0.05 | ) | — | |||||||||||||||||
| (a) | The amount shown may not correlate with the change in aggregate gains and losses of portfolio securities due to the timing of sales and redemptions of fund shares. |
| * | All per share amounts have been rounded to the nearest cent. |
The accompanying Notes to Financial Statements are an integral part of this schedule.
314
Table of Contents
Thrivent Series Fund, Inc.
Financial Highlights – continued
| RATIOS / SUPPLEMENTAL DATA | ||||||||||||||||||||||||||||||||||
| Ratio to Average Net Assets** | Ratios to Average Net Assets Before Expenses Waived, Credited or Paid Indirectly** | |||||||||||||||||||||||||||||||||
Total | Net Asset Value, End of Period | Total Return(b) | Net Assets, End of Period (in millions) | Expenses | Net Investment Income/(Loss) | Expenses | Net Investment Income/(Loss) | Portfolio Turnover Rate | ||||||||||||||||||||||||||
| $ | (0.21) | $ | 10.43 | 5.48 | % | $ | 1,530.7 | 0.44 | % | 4.05 | % | 0.44 | % | 4.05 | % | 61 | % | |||||||||||||||||
| (0.45) | 10.09 | 5.96 | % | 1,463.1 | 0.44 | % | 4.53 | % | 0.44 | % | 4.53 | % | 142 | % | ||||||||||||||||||||
| (0.49) | 9.96 | 11.55 | % | 1,322.2 | 0.44 | % | 5.06 | % | 0.44 | % | 5.05 | % | 146 | % | ||||||||||||||||||||
| (0.50) | 9.39 | 21.29 | % | 1,278.2 | 0.44 | % | 5.72 | % | 0.45 | % | 5.71 | % | 160 | % | ||||||||||||||||||||
| (0.52) | 8.20 | (10.85 | )% | 1,097.1 | 0.44 | % | 5.61 | % | 0.45 | % | 5.60 | % | 160 | % | ||||||||||||||||||||
| (0.52) | 9.74 | 3.77 | % | 1,418.3 | 0.44 | % | 5.43 | % | 0.45 | % | 5.43 | % | 228 | % | ||||||||||||||||||||
|
|
|
|
|
|
|
|
|
|
|
|
|
|
|
|
|
| |||||||||||||||||
| (0.27) | 11.26 | 2.83 | % | 168.9 | 0.46 | % | 2.26 | % | 0.46 | % | 2.26 | % | 197 | % | ||||||||||||||||||||
| (0.38) | 11.21 | 8.23 | % | 164.5 | 0.46 | % | 2.83 | % | 0.46 | % | 2.83 | % | 415 | % | ||||||||||||||||||||
| (0.33) | 10.73 | 9.24 | % | 161.4 | 0.46 | % | 3.12 | % | 0.46 | % | 3.12 | % | 387 | % | ||||||||||||||||||||
| (0.39) | 10.13 | 8.47 | % | 156.5 | 0.46 | % | 3.78 | % | 0.47 | % | 3.77 | % | 388 | % | ||||||||||||||||||||
| (0.49) | 9.72 | (0.82 | )% | 174.6 | 0.39 | % | 4.83 | % | 0.43 | % | 4.79 | % | 346 | % | ||||||||||||||||||||
| (0.50) | 10.29 | 5.66 | % | 215.2 | 0.40 | % | 4.86 | % | 0.43 | % | 4.84 | % | 331 | % | ||||||||||||||||||||
|
|
|
|
|
|
|
|
|
|
|
|
|
|
|
|
|
| |||||||||||||||||
| (0.09) | 9.80 | 2.23 | % | 1,311.4 | 0.43 | % | 1.87 | % | 0.44 | % | 1.87 | % | 55 | % | ||||||||||||||||||||
| (0.22) | 9.67 | 0.90 | % | 1,497.8 | 0.43 | % | 2.31 | % | 0.44 | % | 2.30 | % | 91 | % | ||||||||||||||||||||
| (0.32) | 9.80 | 5.25 | % | 1,318.7 | 0.43 | % | 3.27 | % | 0.44 | % | 3.27 | % | 102 | % | ||||||||||||||||||||
| (0.38) | 9.62 | 14.04 | % | 1,105.6 | 0.44 | % | 4.23 | % | 0.45 | % | 4.23 | % | 145 | % | ||||||||||||||||||||
| (0.43) | 8.79 | (6.46 | )% | 925.9 | 0.44 | % | 4.44 | % | 0.45 | % | 4.43 | % | 121 | % | ||||||||||||||||||||
| (0.47) | 9.84 | 3.98 | % | 973.8 | 0.44 | % | 4.82 | % | 0.45 | % | 4.81 | % | 128 | % | ||||||||||||||||||||
|
|
|
|
|
|
|
|
|
|
|
|
|
|
|
|
|
| |||||||||||||||||
| (0.34) | 10.39 | 2.70 | % | 34.3 | 0.86 | % | 1.73 | % | 0.89 | % | 1.70 | % | 437 | % | ||||||||||||||||||||
| (0.34) | 10.45 | 4.53 | % | 32.4 | 0.90 | % | 2.89 | % | 0.90 | % | 2.89 | % | 854 | % | ||||||||||||||||||||
| (0.45) | 10.32 | 12.09 | % | 33.5 | 0.89 | % | 3.43 | % | 0.89 | % | 3.43 | % | 676 | % | ||||||||||||||||||||
| (0.32) | 9.62 | 13.02 | % | 31.6 | 0.92 | % | 4.67 | % | 0.92 | % | 4.67 | % | 643 | % | ||||||||||||||||||||
| (0.42) | 8.82 | (4.96 | )% | 35.2 | 0.67 | % | 4.67 | % | 0.67 | % | 4.67 | % | 721 | % | ||||||||||||||||||||
| (0.48) | 9.71 | 5.09 | % | 49.8 | 0.65 | % | 5.05 | % | 0.65 | % | 5.05 | % | 731 | % | ||||||||||||||||||||
|
|
|
|
|
|
|
|
|
|
|
|
|
|
|
|
|
| |||||||||||||||||
| — | 1.00 | 0.00 | % | 140.3 | 0.31 | % | 0.00 | % | 0.51 | % | (0.20 | )% | N/A | |||||||||||||||||||||
| — | 1.00 | 0.00 | % | 170.5 | 0.30 | % | 0.00 | % | 0.51 | % | (0.21 | )% | N/A | |||||||||||||||||||||
| — | 1.00 | 0.00 | % | 171.8 | 0.31 | % | (0.01 | )% | 0.50 | % | (0.19 | )% | N/A | |||||||||||||||||||||
| — | 1.00 | 0.43 | % | 246.0 | 0.39 | % | 0.47 | % | 0.49 | % | 0.37 | % | N/A | |||||||||||||||||||||
| (0.03) | 1.00 | 2.95 | % | 683.4 | 0.36 | % | 2.93 | % | 0.46 | % | 2.83 | % | N/A | |||||||||||||||||||||
| (0.05) | 1.00 | 5.14 | % | 741.6 | 0.35 | % | 5.03 | % | 0.45 | % | 4.93 | % | N/A | |||||||||||||||||||||
| (b) | Total investment return assumes dividend reinvestment and does not reflect any deduction for applicable sales charges. Not annualized for periods less than one year. Total return shown does not reflect charges and expenses imposed on contract holders by the variable accounts. Those charges and expenses reduce the return received by contract holders as compared to the return presented. |
| ** | Computed on an annualized basis for periods less than one year. |
The accompanying Notes to Financial Statements are an integral part of this schedule.
315
Table of Contents
(unaudited)
Proxy Voting
The policies and procedures that the Fund uses to determine how to vote proxies relating to portfolio securities are attached to the Fund’s Statement of Additional Information. You may request a free copy of the Statement of Additional Information or the report of how the Fund voted proxies relating to portfolio securities during the most recent 12-month period ended June 30 by calling 1-800-847-4836. You also may review the Statement of Additional Information or the report of how the Fund voted proxies relating to portfolio securities during the most recent 12-month period ended June 30 at Thrivent.com or www.sec.gov.
Quarterly Schedule of Portfolio Holdings
The Fund files its Schedule of Portfolio Holdings on Form N-Q with the SEC for the first and third quarters of each fiscal year. You may request a free copy of the Fund’s Forms N-Q by calling 1-800-847-4836. The Fund’s most recent Form N-Q Schedule of Investments also is available at Thrivent.com or www.sec.gov. You also may review and copy the Forms N-Q for the Fund at the SEC’s Public Reference Room in Washington, DC. You may get information about the operation of the Public Reference Room by calling 1-800-SEC-0330.
Results of Special Contractholder Meetings
Special meetings of the contractholders of Thrivent Partner Utilities Portfolio, Thrivent Partner Socially Responsible Bond Portfolio, Thrivent Partner International Stock Portfolio, Thrivent Large Cap Growth Portfolio II and Thrivent Mid Cap Growth Portfolio II convened on July 13, 2012 to approve the mergers of each Portfolio into Thrivent Diversified Income Plus Portfolio, Thrivent Income Portfolio, Thrivent Partner Worldwide Allocation Portfolio, Thrivent Large Cap Growth Portfolio and Thrivent Mid Cap Growth Portfolio, respectively.
The results were as such:
Name | For | Against | Abstain | |||||||||
Thrivent Partner Utilities Portfolio | 1,303,746 | 57,440 | 50,175 | |||||||||
Thrivent Partner Socially Responsible Bond Portfolio | 999, 525 | 81,872 | 29,254 | |||||||||
Thrivent Partner International Stock Portfolio | 71,008,649 | 2,062,519 | 2,603,983 | |||||||||
Thrivent Large Cap Growth Portfolio II | 1,798,376 | 23,131 | 90,401 | |||||||||
Thrivent Mid Cap Growth Portfolio II | 1,702,842 | 20,492 | 47,537 | |||||||||
Board Approval of Investment Subadvisory Agreement
Under Section 15 of the Investment Company Act of 1940 (the “Investment Company Act”), the Board of Directors (the “Board”) of Thrivent Series Fund, Inc. (the “Fund”), a majority of the members of which have no direct or indirect interest in the investment advisory or subadvisory agreements and are not “interested persons” of the Fund, as defined in the Investment Company Act (the “Independent Directors”), must determine whether to approve any new advisory agreement (including any new subadvisory agreement) for any series of the Fund. In this regard, at an in person meeting held on May 22-23, 2012 (the “meeting”), the Board reviewed and approved a new investment subadvisory agreement (the “Subadvisory Agreement”) among the Fund (on behalf of Thrivent Partner Worldwide Allocation Portfolio (the “Portfolio”)), Thrivent Financial and DuPont Capital Management Corporation (“DuPont Capital”) with respect to managing a portion of the Portfolio allocated to emerging market equity securities.
At the meeting, the Board considered the factors and reached the conclusions described below relating to the selection of DuPont Capital as a subadviser to the Portfolio and the approval of the Subadvisory Agreement. Prior to the meeting, the Independent Directors conferred among themselves and with representatives of Thrivent Financial about these matters. The Independent Directors were assisted in their evaluation of the Subadvisory Agreement by independent legal counsel, from whom they receive separate legal advice and with whom they met separately from Thrivent Financial. Each Independent Director relied on his or her own business judgment in determining the weight to be given to each factor considered in evaluating the materials that were presented.
Nature, Extent and Quality of Services
The Board received and considered information regarding the nature, extent and quality of services that are anticipated to be provided to the Portfolio by DuPont Capital under the Subadvisory Agreement. Thrivent Financial
316
Table of Contents
Additional Information
(unaudited)
began by discussing its rationale for recommending a new subadviser to manage the portion of the Portfolio dedicated to an emerging markets equity strategy. Management of Thrivent Financial explained its process for selecting a new subadviser to recommend to the Board. The Board received and considered information about the investment strategies and investment processes for the Portfolio, and information about DuPont Capital and its history and experience with managing accounts utilizing an investment style and strategy similar to that proposed for the allocated portion of the Portfolio.
The Board evaluated the ability of DuPont Capital, based on its resources, reputation and other attributes, including research and advisory capabilities. The Board considered the due diligence review of DuPont Capital’s compliance program discussed by the Fund’s Chief Compliance Officer. The Board considered Thrivent Financial’s oversight of the Portfolio’s service providers, include DuPont Capital, if approved by the Board. The Board concluded that the nature, extent and quality of the investment subadvisory services anticipated to be provided to the Portfolio by DuPont Capital supported approval of the Subadvisory Agreement.
Performance of the Portfolio
The Board considered the performance of another account managed by DuPont Capital utilizing an investment style and strategy similar to that proposed for the allocated portion of the Portfolio, including how such account performed in relation to a benchmark index. Thrivent Financial presented DuPont Capital’s risk-adjusted performance across the span of several years, relative to the MSCI Emerging Markets Index. The Board noted that DuPont Capital’s strategy delivered higher returns over time in comparison to the benchmark index.
Subadvisory Fees and Fund Expenses
The Board reviewed and considered the contractual investment subadvisory fee rate that would be payable by Thrivent Financial to DuPont Capital for investment subadvisory services. The Board reviewed the amount of the fees and considered that the contract had been negotiated at arm’s length between Thrivent Financial and DuPont Capital and that the markup for additional services to be provided by Thrivent Financial was reasonable. In addition, the Board was informed of all material separate arrangements for unrelated services between DuPont Capital and Thrivent Financial or its affiliates.
Cost of Services and Profitability
As part of the annual contract review process, the Board noted that it would have an opportunity to review profitability attributable to the Portfolio in the context of future annual contract renewals. The Board did not consider separate profitability information with respect to DuPont Capital, which is not affiliated with Thrivent Financial. The Board considered that the subadvisory fees payable to DuPont Capital had been negotiated on an arm’s-length basis and that DuPont Capital’s profitability from its relationship with the Portfolio was not a material factor in determining whether to approve the Subadvisory Agreement.
Economies of Scale and Breakpoints
The Board considered whether economies of scale might be realized as the Portfolio’s assets increase as a result of a pending merger. Based on these Board considerations, including the amount of assets by which the Portfolio would increase, Thrivent Financial agreed to institute two additional breakpoints at the Portfolio level (i.e., with respect to the investment advisory agreement between the Portfolio and Thrivent Financial). It was also noted that the subadvisory fee included a breakpoint that took into account the assets managed by DuPont Capital for other Thrivent-sponsored mandates (i.e., the proposed Thrivent Partner Emerging Markets Equity Fund and a portion of the Thrivent Partner Worldwide Allocation Fund).
Other Benefits to the Adviser and its Affiliates
The Board considered information regarding potential “fall-out” or ancillary benefits that Thrivent Financial and its affiliates may receive as a result of their relationship with the Portfolio, both tangible and intangible, such as their ability to leverage investment professionals who manage other portfolios, reputational benefits in the investment advisory community and the engagement of affiliates as service providers to the Portfolio. The Board noted that such benefits were difficult to quantify but were consistent with benefits received by other mutual fund advisers.
Based on the factors discussed above, the Board, including a majority of the Independent Directors, approved the Subadvisory Agreement with DuPont Capital.
317
Table of Contents
Thrivent Series Fund, Inc.
Supplement to Prospectus dated April 30, 2012
With respect to
Thrivent Partner Natural Resources Portfolio
Thrivent Partner Emerging Markets Portfolio
Thrivent Partner Utilities Portfolio
Thrivent Mid Cap Growth Portfolio II
Thrivent Partner International Stock Portfolio
Thrivent Large Cap Growth Portfolio II
Thrivent Partner Socially Responsible Bond Portfolio
Effective July 27, 2012, the name of Thrivent Partner Natural Resources Portfolio of Thrivent Series Fund, Inc. (the “Fund”) will change to “Thrivent Natural Resources Portfolio.” All references in the prospectus to Thrivent Partner Natural Resources Portfolio are replaced by the new name of Thrivent Natural Resources Portfolio.
Effective July 27, 2012, the name of Thrivent Partner Emerging Markets Portfolio of the Fund will change to “Thrivent Partner Emerging Markets Equity Portfolio.” All references in the prospectus to Thrivent Partner Emerging Markets Portfolio are replaced by Thrivent Partner Emerging Markets Equity Portfolio (the “EME Portfolio”).
In addition, the summary and non-summary sections of the EME Portfolio prospectus are revised. The first sentences of the “Principal Strategies” sections are deleted in their entirety and replaced with the following:
Under normal circumstances, the Portfolio invests at least 80% of its net assets in emerging market equities, with such equities possibly including common stock, preferred stock, convertible securities, depositary receipts and rights and warrants to buy common stock.
The following sentence is also added as the last sentence of the first paragraph to each “Principal Strategies” section:
Should the Adviser determine that the Portfolio would benefit from reducing the percentage of its net assets invested in emerging market equities from 80% to a lesser amount, it will notify you at least 60 days prior to the change.
In addition, the name of the EME Portfolio’s subadviser is Aberdeen Asset Managers Limited.
Effective July 27, 2012, Thrivent Partner Utilities Portfolio, Thrivent Mid Cap Growth Portfolio II, Thrivent Partner International Stock Portfolio, Thrivent Large Cap Growth Portfolio II and Thrivent Partner Socially Responsible Bond Portfolio (collectively, the “Target Portfolios”) will merge into the following respective series of the Fund: Thrivent Diversified Income Plus Portfolio, Thrivent Mid Cap Growth Portfolio, Thrivent Partner Worldwide Allocation Portfolio, Thrivent Large Cap Growth Portfolio and Thrivent Income Portfolio. A Special Meeting of Contractholders of each Target Portfolio was held on July 13, 2012, and the applicable contractholders of record approved each merger. Therefore, the prospectuses of the Target Portfolios are eliminated from the Fund’s catalogue prospectus.
The date of this Supplement is July 17, 2012.
Please include this Supplement with your Prospectus.
318
Table of Contents
Thrivent Series Fund, Inc.
Supplement to Prospectus dated April 30, 2012
THRIVENT VARIABLE LIFE ACCOUNT I
THRIVENT VARIABLE INSURANCE ACCOUNT A
TLIC VARIABLE INSURANCE ACCOUNT A
THRIVENT VARIABLE ANNUITY ACCOUNT I
THRIVENT VARIABLE ANNUITY ACCOUNT II
THRIVENT VARIABLE ANNUITY ACCOUNT A
THRIVENT VARIABLE ANNUITY ACCOUNT B
TLIC VARIABLE ANNUITY ACCOUNT A
A Special Meeting of Contractholders of the Thrivent Partner International Stock Portfolio, Thrivent Mid Cap Growth Portfolio II, Thrivent Large Cap Growth Portfolio II, Thrivent Partner Socially Responsible Bond Portfolio and Thrivent Partner Utilities Portfolio, each of which is a separate series of Thrivent Series Fund, Inc. (the “Fund”), was held on July 13, 2012, and the Contractholders of each voted in favor of merging the Portfolios listed below effective July 27, 2012.
| From Fund Portfolio | Into Fund Portfolio | |||
| Thrivent Partner International Stock Portfolio | g | Thrivent Partner Worldwide Allocation Portfolio | ||
| Thrivent Mid Cap Growth Portfolio II | g | Thrivent Mid Cap Growth Portfolio | ||
| Thrivent Large Cap Growth Portfolio II | g | Thrivent Large Cap Growth Portfolio | ||
| Thrivent Partner Socially Responsible Bond Portfolio | g | Thrivent Income Portfolio | ||
| Thrivent Partner Utilities Portfolio | g | Thrivent Diversified Income Plus Portfolio | ||
As described in the prospectuses for Contracts offered by the Variable Accounts listed above, we allocate premiums based on your designation to one or more Subaccounts of the Variable Account associated with your Contract. The assets of each Subaccount are invested in a corresponding Portfolio of the Fund. At the close of business on July 27, 2012, the portion of any purchase payment or other transaction allocated to a Subaccount that invests in the Thrivent Partner International Stock Portfolio, Thrivent Mid Cap Growth Portfolio II, Thrivent Large Cap Growth Portfolio II, Thrivent Partner Socially Responsible Bond Portfolio and Thrivent Partner Utilities Portfolio will be automatically reallocated to the corresponding Subaccount that invests in the applicable Portfolio. As a result of these mergers, the shares of each of the above Portfolio’s that fund benefits under your variable contract or retirement plan automatically will be exchanged for an equal dollar value of shares of the corresponding Portfolio.
Effective July 27, 2012, the name of Thrivent Partner Natural Resources Portfolio of the Fund has changed to become “Thrivent Natural Resources Portfolio” (the “Portfolio”). Correspondingly, the Subaccount that invests in the Portfolio has changed its name to “Thrivent Natural Resources Subaccount.” All references to Thrivent Partner Natural Resources Portfolio or Thrivent Partner Natural Resources Subaccount are replaced by the new names.
Effective July 27, 2012, the name of Thrivent Partner Emerging Markets Portfolio of the Fund has changed to become “Thrivent Partner Emerging Markets Equity Portfolio” (the “Portfolio”). Correspondingly, the Subaccount that invests in the Portfolio has changed its name to “Thrivent Partner Emerging Markets Equity Subaccount.” All references to Thrivent Partner Emerging Markets Portfolio or Thrivent Partner Emerging Markets Subaccount are replaced by the new names.
Also effective July 27, 2012, the prospectuses for Contracts offered by the Variable Accounts listed above are amended to reflect the hiring of DuPont Capital Management Corporation as a subadviser for Thrivent Partner Worldwide Allocation Portfolio. The supplement to the prospectus for the Fund dated July 27, 2012 describes further information about DuPont Capital Management Corporation.
The date of this Supplement is July 17, 2012
Please include this Supplement with your Prospectus.
319
Table of Contents
Thrivent Series Fund, Inc.
Supplement to Prospectus dated April 30, 2012
With respect to
Thrivent Partner Worldwide Allocation Portfolio
The summary section of the prospectus for Thrivent Partner Worldwide Allocation Portfolio (the “Portfolio”) is amended, effective July 27, 2012. The last paragraph of the “Principal Strategies” section of the prospectus is deleted in its entirety and replaced with the following:
Principal Global Investors, LLC manages the international large-cap growth assets. Mercator Asset Management, LP manages the international large-cap value assets but also manages, to a lesser extent, emerging markets equity assets. Aberdeen Asset Managers Limited and DuPont Capital Management Corporation also manage the emerging markets equity assets. Victory Capital Management Inc. manages the international small- and mid-cap assets. Goldman Sachs Asset Management, L.P. manages the emerging markets debt assets. The Adviser manages the assets allocated to U.S. securities.
The “Investment Adviser(s)” paragraph is also amended to add DuPont Capital Management Corporation as an additional sub-adviser that Thrivent Financial for Lutherans has engaged to manage a portion of the Portfolio’s assets.
In addition, the “Portfolio Manager(s)” paragraph is also amended to add the following sentence:
Rafi U. Zaman, CFA has served as portfolio manager for the portion of the Portfolio managed by DuPont Capital since 2012. He is the Managing Director and Senior Portfolio Manager, Global Equities, at DuPont Capital and has oversight for all Global Equity strategies at the firm. He joined DuPont Capital in 1998.
The non-summary section of the prospectus for the Portfolio is also amended, effective July 27, 2012. The following paragraph is added after the last full paragraph of page 139 of the prospectus:
The investment focus for DuPont Capital Management Corporation (“DuPont Capital”), one of the Portfolio’s subadvisers, is emerging markets equity assets. DuPont Capital seeks to identify emerging market companies trading at a discount relative to such companies’ estimated normalized earning potential by using in-depth fundamental analysis combined with top-down country-risk assessment. It attempts to build a portfolio with a long-term investment horizon that it believes will achieve excess returns with below average risk relative to the broader emerging market equity universe.
The “Portfolio Management” section, which is underneath the “Management” heading, with respect to the Portfolio is also revised. The first paragraph underneath “Thrivent Partner Worldwide Allocation Portfolio” is deleted in its entirety and replaced with the following:
Thrivent Financial has engaged Mercator Asset Management, LP (“Mercator”), 5200 Town Center Circle, Suite 550, Boca Raton, Florida 33486; Principal Global Investors, LLC (“Principal”), 801 Grand Avenue, Des Moines, Iowa 50392; Aberdeen Asset Managers Limited (“Aberdeen”), 10 Queen’s Terrace, Aberdeen, United Kingdom AB10 1YG; DuPont Capital Management Corporation (“DuPont Capital”), One Righter Parkway, Suite 3200, Wilmington, Delaware 19803; Victory Capital Management Inc. (“Victory”), 127 Public Square, Cleveland, OH 44114; and Goldman Sachs Asset Management, L.P. (“GSAM”), 200 West Street, New York, New York 10282-2198, as investment subadvisers for Thrivent Partner Worldwide Allocation Portfolio.
In addition, the following paragraph is added after the first full paragraph on page 167 of the prospectus:
DuPont Capital is a wholly owned subsidiary of the E. I. du Pont de Nemours and Company and is an independent registered investment adviser with a broadly diversified product offering. It was established in 1975 and became an SEC-registered investment adviser in 1993. As of December 31, 2011, DuPont Capital managed approximately $25.9 billion in assets, including separate accounts and mutual funds. Rafi U. Zaman, CFA has served as portfolio manager for the portion of the Portfolio managed by DuPont Capital since 2012. He is the Managing Director and Senior Portfolio Manager, Global Equities, at DuPont Capital and has oversight for all Global Equity strategies at the firm. He joined DuPont Capital in 1998.
The date of this Supplement is June 28, 2012.
Please include this Supplement with your Prospectus.
320
Table of Contents
Table of Contents
Table of Contents
| Item 2. | Code of Ethics |
Not applicable to semiannual report
| Item 3. | Audit Committee Financial Expert |
Not applicable to semiannual report
| Item 4. | Principal Accountant Fees and Services |
Not applicable to semiannual report
| Item 5. | Audit Committee of Listed Registrants |
Not applicable.
| Item 6. | Schedule of Investments |
| (1) | Registrant’s Schedule of Investments is included in the report to shareholders filed under Item 1. |
| (2) | Not applicable to this filing. |
| Item 7. | Disclosure of Proxy Voting Policies and Procedures for Closed-End Management Investment Companies |
Not applicable.
| Item 8. | Portfolio Managers of Closed-End Management Investment Companies |
Not applicable.
| Item 9. | Purchases of Equity Securities by Closed-End Management Investment Company and Affiliated Purchasers. |
Not applicable.
| Item 10. | Submission of Matters to a Vote of Security Holders |
There have been no material changes to the procedures by which shareholders may recommend nominees to registrant’s board of directors.
| Item 11. | Controls and Procedures |
(a)(i) Registrant’s President and Treasurer have concluded that registrant’s disclosure controls and procedures (as defined in Rule 30a-3(c) under the Investment Company Act) are effective, based on their evaluation of these controls and procedures as of a date within 90 days of the filing date of this report.
(a)(ii) Registrant’s President and Treasurer are aware of no change in registrant’s internal control over financial reporting (as defined in Rule 30a-3(d) under the Investment Company Act) that occurred during registrant’s most recent fiscal quarter that has materially affected, or is reasonably likely to materially affect, registrant’s internal control over financial reporting.
| Item 12. | Exhibits |
| (a) | Certifications pursuant to Rules 30a-2(a) and 30a-2(b) under the Investment Company Act of 1940 are attached hereto. |
Table of Contents
SIGNATURES
Pursuant to the requirements of the Securities Exchange Act of 1934 and the Investment Company Act of 1940, the registrant has duly caused this report to be signed on its behalf by the undersigned, thereunto duly authorized.
| Date: August 28, 2012 | THRIVENT SERIES FUND, INC. | |||||
| By: | /s/ Russell W. Swansen | |||||
| Russell W. Swansen | ||||||
| President | ||||||
Pursuant to the requirements of the Securities Exchange Act of 1934 and the Investment Company Act of 1940, this report has been signed below by the following persons on behalf of the registrant and in the capacities and on the dates indicated.
| Date: August 28, 2012 | By: | /s/ Russell W. Swansen | ||||
| Russell W. Swansen | ||||||
| President |
| Date: August 28, 2012 | By: | /s/ Gerard V. Vaillancourt | ||||
| Gerard V. Vaillancourt | ||||||
| Treasurer |